Consequences of bi-literacy in bilingual individuals - CentAUR
362
i UNIVERSITY OF READING Consequences of bi-literacy in bilingual individuals: in the healthy and neurologically impaired Thesis submitted for the degree of Doctor of Philosophy School of Psychology and Clinical Language Sciences Anusha Balasubramanian December 2018
-
Upload
khangminh22 -
Category
Documents
-
view
1 -
download
0
Transcript of Consequences of bi-literacy in bilingual individuals - CentAUR

i
UNIVERSITY OF READING
Consequences of bi-literacy in bilingual individuals: in the
healthy and neurologically impaired
Thesis submitted for the degree of Doctor of Philosophy
School of Psychology and Clinical Language Sciences
Anusha Balasubramanian
December 2018

ii
DECLARATION OF ORIGINAL AUTHORSHIP
I confirm that this is my own work and the use of all material from other sources has
been properly and fully acknowledged.
Anusha Balasubramanian
iii
Acknowledgement
First and foremost, this research would not have been possible without funding from the Felix
trust. I would like to thank the Felix trust and the University of Reading for all the support
during this wonderful academic journey. I would like to thank all my participants specially the
persons with aphasia for their valuable time, effort and enthusiastic involvement in this
research.
I would like to express my heartfelt gratitude to my primary supervisor, Dr. Arpita Bose for her
constant support and patience throughout my PhD journey. I would like to offer my special
thanks to my co-supervisor, Professor Ianthi Tsimpli for her valuable guidance and insights into
the project.
I greatly appreciate the support received from the ABCD lab members. This has been a platform
for me to present my work through the course of my PhD on several occasions and receive
constructive feedback and encouragement from all the members.
I take this opportunity to thank all of my fellow speech language therapists and friends who
helped with the recruitment of participants in India. Special thanks to Ms. Raheela Baksh, Ms.
Yashaswini Rangaswamy and Mr. Prasanna Hegde for their assistance, cooperation and
patience.
I am also very grateful to Abhijeet Patra, Che Suhaili BinTaha, Emmanuel Sarku, Luke Kendrick,
Madhawi Altaib, Mona Indargiri and Tessa Reardon who all helped me in numerous ways during
the course of my PhD journey. I would also like to thank my friends- Biaani, Bismarck, Gagan,
Micael and Mzie for being there for me.
Last but not the least, is my family who have been a constant source of encouragement and
support even when they were miles away. I would not have been able to pursue my dream if not
for my parents and my beloved brother Ashwin. I take this opportunity to thank Rakesh for all
the motivation, encouragement, patience and assistance. My family has been and continues to be
one of the greatest pillars of my strength.
Thank you one and all!
iv
कर्मणे्यवाधिकारसे्त र्ा फलेषु कदाचन |
र्ा कर्मफलहेतुर्भमर्ाम ते सङ्गोऽस्त्वकर्मधि || 2.47 ||
“Perform your duty and do not be attached to your expectations”
ॐ पभिमर्दः पभिमधर्दर्् पभिामत् पभिमरु्दच्यते
पभिमस्य पभिमर्ादाय पभिमरे्वावधिष्यते ||
“From the completeness comes the completeness and what is complete remains complete forever”
v
Table of Contents
ABSTRACT ............................................................................................................................................................. 1
CHAPTER 1 INTRODUCTION. .......................................................................................................................... 4
1.1. BILINGUALISM AND BI-LITERACY ...................................................................................................................... 5
1.1.1 Importance of measuring the variables of bilingualism and bi-literacy ............................................ 7
1.2 IMPACT OF PRINT EXPOSURE ON ORAL LANGUAGE PRODUCTION (WORD LEVEL AND CONNECTED SPEECH),
COMPREHENSION AND EXECUTIVE FUNCTIONS IN BI-LITERATE BILINGUALS IN UK (PHASE I) ...................................... 10
1.2.1 Impact of print exposure on oral language production (word level and connected speech) in bi-
literate bilinguals. ....................................................................................................................................... 10
1.2.2 Impact of print exposure on comprehension in bi-literate bilinguals .............................................. 12
1.2.3 Impact of print exposure on executive functions in bi-literate bilinguals ........................................ 13
1.3 READING IMPAIRMENTS IN BI-LITERATE BILINGUAL PERSONS WITH APHASIA (BPWA) (PHASE II) ....................... 16
1.3.1. Challenges in measuring impairments in bi-literate bilinguals ....................................................... 17
1.3.2. Reading impairments and tasks chosen in BPWA. ............................................................................. 19
CHAPTER 2 . IMPACT OF PRINT EXPOSURE ON ORAL LANGUAGE PRODUCTION AND
COMPREHENSION IN BI-LITERATE BILINGUAL HEALTHY ADULTS ............................................. 26
2.1 ABSTRACT ..................................................................................................................................................... 26
2.2 INTRODUCTION .............................................................................................................................................. 28
2.2.1 Impact of print exposure on oral language production tasks .......................................................... 29
2.2.3. Impact of print exposure on language comprehension .................................................................... 37
2.2.4. Oral language production and comprehension in the bilingual population ................................... 39
2.4 METHODS ..................................................................................................................................................... 48
2.4.1 Participant profile .............................................................................................................................. 48
2.4.2. Background measures. ...................................................................................................................... 51
2.4.2.1 Measuring bilingualism and print exposure. ............................................................................................ 51 2.4.2.1.1 Subjective Measures of Language Proficiency and Dominance ....................................................... 51 2.4.2.1.2 Objective measures ............................................................................................................................ 54
2.4.2.1.2.1 Lexical decision task. .................................................................................................................. 54 2.4.2.1.2.2 Picture naming task .................................................................................................................... 55 2.4.2.1.2.3 Grammaticality judgment task. ................................................................................................. 57
2.4.2.1 Results from the background subjective and objective measures of language proficiency, dominance
and print exposure .................................................................................................................................................. 58 2.4.2.2 Grouping of participants based on L2 print exposure .............................................................................. 62
2.4.3 Experimental measures ...................................................................................................................... 63
2.4.4 Verbal Fluency measures ................................................................................................................... 65
2.4.4.1 Trials and procedures. ................................................................................................................................ 65 2.4.4.2 Data coding and analysis ............................................................................................................................ 65
2.4.4.2.1 Total number of correct responses (CR). .......................................................................................... 65 2.4.4.2.2 Fluency Difference score (FDS).......................................................................................................... 66 2.4.4.2.3 Time-course analysis. ......................................................................................................................... 66
2.4.4.2.3.1 First-RT. ...................................................................................................................................... 67 2.4.4.2.3.2 Subsequent-RT (Sub-RT). .......................................................................................................... 67 2.4.4.2.3.3 Initiation parameter. .................................................................................................................. 67 2.4.4.2.3.4 Slope. ........................................................................................................................................... 67
2.4.4.2.4 Qualitative analysis. ............................................................................................................................ 68 2.4.4.2.4.1 Mean cluster size. ....................................................................................................................... 68 2.4.4.2.4.2 Number of switches.................................................................................................................... 68
2.4.5 Word and non-word repetition .......................................................................................................... 69
vi
2.4.5.1 Trials and procedures ................................................................................................................................. 69 2.4.5.2 Data coding and analysis ............................................................................................................................ 69
2.4.5.2.1 Difference score. ................................................................................................................................. 70 2.4.6 Comprehension measures .................................................................................................................. 70
2.4.6.1 Synonymy triplets task ............................................................................................................................... 70 2.4.6.1.1 Trials and procedure .......................................................................................................................... 70 2.4.6.1.2 Data coding and analysis .................................................................................................................... 70 2.4.6.1.4 Error analysis ...................................................................................................................................... 70
2.4.6.2 Sentence comprehension task ................................................................................................................... 71 2.4.6.2.1 Trials and procedures. ........................................................................................................................ 71 2.4.6.2.2 Data coding and analysis .................................................................................................................... 71 2.4.6.2.3 Accuracy score. ................................................................................................................................... 72 2.4.6.2.4 Block-wise error analysis. .................................................................................................................. 72
2.5 STATISTICAL ANALYSES .................................................................................................................................. 73
2.6 RESULTS ....................................................................................................................................................... 74
2.6.1 Performance on verbal fluency measures.......................................................................................... 74
2.6.2 Performance on word and non-word repetition ............................................................................... 79
2.6.4 Findings of Correlation analyses. ....................................................................................................... 85
2.7 DISCUSSION ................................................................................................................................................... 91
2.7.1 Summary of findings .......................................................................................................................... 91
2.7.2 Oral language production tasks ........................................................................................................ 93
2.7.3 Comprehension measures .................................................................................................................. 94
2.7.4 Limitations and Future directions ..................................................................................................... 95
CHAPTER 3 IMPACT OF PRINT EXPOSURE ON NARRATIVES IN BI-LITERATE BILINGUAL HEALTHY
ADULTS. ............................................................................................................................................................... 97
3.1 ABSTRACT ..................................................................................................................................................... 97
3.2 INTRODUCTION .............................................................................................................................................. 99
3.2.1 Effect of print exposure on oral language production (word level and connected speech) in
monolinguals. .............................................................................................................................................. 99
3.2.2 Print exposure in bilinguals ............................................................................................................. 101
3.2.3 Narratives in bilinguals and gaps in the literature ......................................................................... 103
3.2.4 Narrative analysis ............................................................................................................................ 104
3.3 CURRENT INVESTIGATIONS, RESEARCH QUESTIONS AND PREDICTIONS ............................................................... 106
3.4.1 Participants and grouping of participants ...................................................................................... 108
3.4.2 Oral narrative task ........................................................................................................................... 108
3.4.2.1 Procedure. ................................................................................................................................................. 108 3.4.2.2 Transcription of oral narratives............................................................................................................... 108 3.4.2.3 Reliability analysis. ................................................................................................................................... 108 3.4.2.4 Data coding and CLAN. ............................................................................................................................. 109 3.4.2.5 CLAN analysis ............................................................................................................................................ 110
3.5 STATISTICAL ANALYSIS ................................................................................................................................. 112
3.6 RESULTS ..................................................................................................................................................... 113
3.6.1 Group comparisons on oral narratives ............................................................................................ 113
3.6.2 Findings of Correlation analyses...................................................................................................... 116
3.7 DISCUSSION ................................................................................................................................................. 124
3.7.1 Summary of findings ........................................................................................................................ 124
3.7.2 Limitations ....................................................................................................................................... 128
3.7.2.1 Sample size ................................................................................................................................................ 128
vii
3.7.2.2 Methodology and analyses .............................................................................................................. 129 3.7.3 Future Directions.............................................................................................................................. 129
CHAPTER 4 IMPACT OF PRINT EXPOSURE ON EXECUTIVE FUNCTIONS IN BI-LITERATE BILINGUAL
HEALTHY ADULTS ........................................................................................................................................... 131
4.1 ABSTRACT ................................................................................................................................................... 131
4.2 INTRODUCTION ............................................................................................................................................ 133
4.2.1 Impact of print exposure on executive functions ............................................................................. 135
4.2.2 Debate of bilingual advantage in executive functions .................................................................... 139
4.2.2.1 Debate on bilingual advantage in inhibitory control .............................................................................. 139 4.2.2.2 Debate on bilingual advantage in working memory............................................................................... 142 4.2.2.3 Debate on bilingual advantage in task-switching. .................................................................................. 144 4.2.2.4 Bilingual advantage and script differences ............................................................................................. 146
4.3 THE CURRENT INVESTIGATION, RESEARCH QUESTIONS AND PREDICTIONS .......................................................... 150
4.4 METHODS ................................................................................................................................................... 154
4.4.1 Participants and grouping of participants ...................................................................................... 154
4.4.2 Experimental tasks ........................................................................................................................... 154
4.4.2.1 Measures of inhibition .............................................................................................................................. 154 4.4.2.1.1 Spatial Stroop. ................................................................................................................................... 154
4.4.2.1.1.1 Trials and procedures. ............................................................................................................. 154 4.4.2.1.1.2 Mean Reaction time (RT) and Mean accuracy ........................................................................ 155 4.4.2.1.1.3 Stroop effect for reaction time (SERT) and mean accuracy (SEACC) ....................................... 156
4.4.2.1.2 Flanker task. ...................................................................................................................................... 156 4.4.2.1.2.1 Trials and procedures .............................................................................................................. 156 4.4.2.1.2.2 Mean Reaction time (RT) and Mean accuracy. ....................................................................... 157 4.4.2.1.2.3 Conflict effect for reaction time (CERT) and mean accuracy (CEACC). .................................... 158
4.4.2.2.1 Visual n-back ..................................................................................................................................... 158 4.4.2.1.2.1 Trials and procedures. ............................................................................................................. 158 4.4.2.1.2.2 Data analyses using D-prime(d’). ............................................................................................ 159
4.4.2.2.2 Auditory n-back ................................................................................................................................ 160 4.4.2.2.2.1 Trials and procedures. ............................................................................................................. 160
4.4.2.3 Measure of Task switching ....................................................................................................................... 160 4.4.2.3.1 Colour-shape task ............................................................................................................................. 160
4.4.2.3.1.4 Switch cost for reaction time (SCRT) and mean accuracy (SCACC). ......................................... 162 4.4.3. Detecting and Excluding outliers .................................................................................................... 163
4.5 STATISTICAL ANALYSES ................................................................................................................................ 164
4.6 RESULTS ..................................................................................................................................................... 165
4.6.1 Performance on measures of inhibition ........................................................................................... 165
4.6.2 Performance on measures of working memory .............................................................................. 167
4.6.3 Performance on measure of task switching .................................................................................... 168
4.6.4 Findings of Correlation analyses...................................................................................................... 169
4.7 DISCUSSION ................................................................................................................................................. 171
4.7.1 Summary of findings ........................................................................................................................ 171
4.7.2 Limitations and future directions .................................................................................................... 173
CHAPTER 5 READING DIFFICULTIES IN BI-LITERATE BILINGUAL PERSONS WITH APHASIA........... 177
5.1 ABSTRACT ................................................................................................................................................... 177
5.1 INTRODUCTION ............................................................................................................................................ 179
5.1.1 General introduction on bilingual aphasia...................................................................................... 179
5.1.2 Characterisation of acquired dyslexia in persons with aphasia based on models of reading ....... 180
5.1.3 Characteristics of different writing systems and script differences ................................................ 185
viii
5.1.4 Acquired dyslexia in non-alphabetic scripts .................................................................................... 187
5.1.5 Reading impairments (dyslexia) in BPWA ...................................................................................... 190
5.2 THE CURRENT INVESTIGATION, RESEARCH QUESTIONS AND PREDICTIONS .......................................................... 197
5.2.1 Research question and aims. ............................................................................................................ 198
How are reading difficulties manifested in bi-scriptal bilingual persons with aphasia (BPWA ............ 198
5.3 METHODS ................................................................................................................................................... 201
5.3.1 Participants profile .......................................................................................................................... 201
5.3.2.1 Results of Language profile of BPWA. ........................................................................................... 205
5.3.3 Language assessment ....................................................................................................................... 209
5.4.3.1 Results of WAB assessment. ..................................................................................................................... 209 5.3.4.2 Semantic processing ................................................................................................................................. 216 5.3.4.3 Reading aloud ............................................................................................................................................ 217
5.3.5 Characterising and profiling reading difficulties in Kannada and Hindi. ...................................... 218
5.3.5.1 Reading Acquisition profile in Kannada (RAP-K, Rao, 1997). ................................................................ 218 5.3.5.2. Word list from Bilingual aphasia test -Hindi (BAT-Hindi; Paradis & Libben, 1987). .......................... 219
5.4 STATISTICAL ANALYSES ................................................................................................................................ 221
5.5 RESULTS ..................................................................................................................................................... 222
5.5.1 Performance of AP02 on experimental tasks .................................................................................. 228
5.5.2 Performance of AP03 on experimental tasks .................................................................................. 228
5.5.3 Performance of AP05 on experimental tasks .................................................................................. 230
5.5.4 Performance of AP07 on experimental tasks .................................................................................. 232
5.6 DISCUSSION ................................................................................................................................................. 233
5.6.1 Summary of findings ........................................................................................................................ 233
5.6.1 Profiling and Characterisation of Acquired dyslexia ...................................................................... 236
5.6.1.1 Reading characteristics of AP02 .............................................................................................................. 236 5.6.1.2 Reading characteristics of AP03 .............................................................................................................. 236 5.6.1.3 Reading characteristics of AP05 .............................................................................................................. 238 5.6.1.4 Reading characteristics of AP07 .............................................................................................................. 239
5.6.3 Conclusions ....................................................................................................................................... 240
5.6.4 Limitations of our study ................................................................................................................... 240
5.6.4.1 Recruitment problems .............................................................................................................................. 240 5.6.4.2 Lack of parallel material in Indian languages for testing ....................................................................... 241
5.6.5 Future directions .............................................................................................................................. 241
CHAPTER 6 SUMMARY AND CONCLUSIONS ................................................................................................ 242
6.1 OVERALL SUMMARY ..................................................................................................................................... 242
6.2 REVIEW AND CONTRIBUTIONS OF THIS RESEARCH............................................................................................ 243
6.3 CONCLUSIONS .............................................................................................................................................. 252
6.4 SIGNIFICANT CONTRIBUTIONS TO LITERATURE OF PHASE I AND FUTURE DIRECTIONS ......................................... 253 6.5 SIGNIFICANT CONTRIBUTIONS TO LITERATURE OF PHASE II AND FUTURE DIRECTIONS .............................. 255
6.6 LIMITATIONS AND FUTURE DIRECTIONS ......................................................................................................... 258
APPENDICES ................................................................................................................................................... 260
APPENDIX 2.1: RAW VALUES OF PARTICIPANTS ON BACKGROUND MEASURES (AGE, GENDER, YEARS OF EDUCATION,
OCCUPATION AND L1) ........................................................................................................................................ 260
APPENDIX 2.2: LANGUAGE BACKGROUND, USAGE, PROFICIENCY AND DOMINANCE QUESTIONNAIRE ......................... 261
DEMOGRAPHIC DATA ......................................................................................................................................... 261
APPENDIX 2.3: STIMULI FOR GRAMMATICALITY JUDGEMENT TASK .......................................................................... 269
APPENDIX 2.4: SENTENCE VERIFICATION MATERIALS PASSAGES AND SENTENCES .................................................... 271
ix
APPENDIX 2.5: SAMPLE CONSENT FORM .............................................................................................................. 278
APPENDIX 2.6: CLUSTERING AND SWITCHING CATEGORIES .................................................................................... 280
APPENDIX 2.7: STIMULI FOR WORD AND NON-WORD REPETITION ......................................................................... 282
APPENDIX 2.8: SYNONYMY TRIPLETS SCORE SHEET ............................................................................................... 283
APPENDIX 2.9 SENTENCE COMPREHENSION (TEST OF RECEPTION OF GRAMMAR (TROG -2)) ................................. 285
APPENDIX 3.1: EXAMPLE TRANSCRIPT: TRANSCRIPTION > EXTRACTION OF NARRATIVE WORDS > SEGMENTATION >
PREPARATION FOR INPUT TO CLAN. ................................................................................................................... 287
APPENDIX 3.2: COMPARISON OF TRANSCRIPT CODED INDEPENDENTLY BY 2 SPEECH AND LANGUAGE THERAPY
STUDENTS. ........................................................................................................................................................ 289
APPENDIX 3.3: DEPENDENT VARIABLES & CLAN COMMANDS .............................................................................. 293
APPENDIX 3.4: RAW SCORES OF NARRATIVE VARIABLES ........................................................................................ 294
Appendix 3.4.1: Discourse Level Measures - Individual Data .................................................................. 294
Appendix 3.4.2 Morpho-Syntactic Measures Individual Data .................................................................. 295
Appendix 3.4.3: Lexical Diversity -Individual Data .................................................................................. 296
Appendix 3.4.4: Lexical Measures: Open Class Words- Individual Data .................................................. 297
Appendix 3.4.5: Lexical Measures: Closed class words- Individual data ................................................. 298
Appendix 3.4.6: Measures of Repair – Individual Data ............................................................................ 299
APPENDIX 5.1: PARTICIPANT CONSENT FORM ...................................................................................................... 300
APPENDIX 5.2 INFORMATION SHEET ................................................................................................................... 301
APPENDIX 5.3 PARTICIPANT STIMULI .................................................................................................................. 306
Appendix 5.3.1 Letter discrimination (PALPA 21) ................................................................................... 306
Appendix 5.3.2 Legality decision (PALPA 24) .......................................................................................... 307
Appendix 5.3.3: Visual Lexical Decision (PALPA 27) ................................................................................ 308
Appendix 5.3.4: Non-Word repetition (PALPA 8) ..................................................................................... 309
Appendix 5.3.5 Spoken word and picture matching (PALPA 47) ............................................................ 310
Appendix 5.3.6: Written word-to-picture matching (PALPA 48) ............................................................ 311
Appendix 5.3.7 Spelling sound regularity (PALPA 35) ............................................................................. 312
Appendix 5.3.8 Imageability and frequency reading task (PALPA 31) ................................................... 313
Appendix 5.3.9 grammatical class reading (PALPA 32) .......................................................................... 314
Appendix 5.3.10 Letter length reading (PALPA 29) ................................................................................. 315
Appendix 5.3.11 Non-word reading (PALPA 36) ...................................................................................... 315
APPENDIX 5.4 KANNADA STIMULI....................................................................................................................... 316
Appendix 5.4.1 RAP-K words and non-words ........................................................................................... 316
Appendix 5.4.2 RAP-K Reading Arka-Anuswara ...................................................................................... 317
Appendix 5.4.3 RAP-K Geminates and Polysyllabic .................................................................................. 318
REFERENCES ..................................................................................................................................................... 319
x
List of Figures
FIGURE 1.1 MAP OF INDIA DEPICTING THE LANGUAGES SPOKEN ACROSS THE COUNTRY. THE STATES IN GREEN SPEAK HINDI
(INDO-ARYAN LANGUAGE); THE STATE IN IVORY SPEAKS KANNADA; THE STATES IN DARKER GREEN SPEAK TELUGU
AND THE STATE IN BROWN SPEAKS TAMIL; THE STATE IN BLUE SPEAKS MALAYALAM. THESE FOUR TOGETHER
CONSTITUTE THE DRAVIDIAN LANGUAGES SPOKEN IN THE SOUTHERN PART OF INDIA............................................ 18
FIGURE 1.2 ARCHITECTURE OF THE DUAL-ROUTE CASCADED MODEL (COLTHEART ET AL, 2001). THE RED MARKINGS
INDICATE THE INDIRECT LEXICAL ROUTE/ SEMANTIC ROUTE/INDIRECT SEMANTIC ROUTE; THE BLUE MARKINGS
INDICATE THE DIRECT LEXICAL ROUTE/DIRECT NON-SEMANTIC ROUTE AND THE GREEN MARKINGS INDICATE THE SUB-
LEXICAL ROUTE/ ORTHOGRAPHY-PHONOLOGY CONVERSION ROUTE/NON-LEXICAL ROUTE. ..................................... 20
FIGURE 2.1 ILLUSTRATION OF VISUAL LEXICAL DECISION TASK TRIAL ............................................................................ 54
FIGURE 2.2 ILLUSTRATION OF PICTURE NAMING TRIAL FOR BOSTON NAMING TEST ........................................................ 55
FIGURE 2.3 AN EXAMPLE OF TIME-STAMPING OF VERBAL RESPONSE ELICITED DURING A PICTURE NAMING TASK. THE RED
LINE TO THE LEFT INDICATES THE ‘ONSET OF THE BEEP’ AND THE BLUE LINE TO THE RIGHT DENOTES THE ‘ONSET OF
THE VERBAL RESPONSE’ (THE WORD ‘TREE’). THE DURATION BETWEEN THESE TWO LINES IS THE REACTION TIME FOR
THE WORD ‘TREE’ WHICH IS 810 MILLISECONDS................................................................................................. 56
FIGURE 2.4 GROUPING OF PARTICIPANTS BASED ON Z- COMPOSITE SCORE DERIVED FROM GRAMMATICALITY JUDGEMENT AND
SENTENCE VERIFICATION TASK. ‘ZERO’ WAS CONSIDERED AS THE ARBITRARY CUT-OFF. PARTICIPANTS WITH A Z-
SCORE GREATER THAN ‘0’ WERE GROUPED AS HIGH PRINT EXPOSURE (HPE) AND PARTICIPANTS WITH A Z-SCORE LESS
THAN ‘0’ WERE GROUPED AS LOW PRINT EXPOSURE (LPE) ................................................................................. 62
FIGURE 2.5 TIME COURSE OF CORRECT RESPONSES OVER TWELVE 5-SECOND BINS. BEST FIT LINE IS LOGARITHMIC FUNCTION.
THE SOLID LINE REPRESENTS THE MEAN NUMBER OF CORRECT (CR) OF A SAMPLE PARTICIPANT IN 60 SECONDS SPLIT
INTO 12-TIME BINS (5-SECOND BIN EACH). THE DOTTED LINE INDICATES THE BEST FIT LINE WITH A LOGARITHMIC
FUNCTION USED TO FIT THE SAMPLE DATA. ........................................................................................................ 66
FIGURE 2.6 EXAMPLE STIMULI FOR SENTENCE COMPREHENSION. ON THE LEFT PANEL, THE TARGET SENTENCE IS ‘THE GIRL
IS SITTING’, PARTICIPANT IS EXPECTED TO POINT TO 1. ON THE RIGHT PANEL, THE TARGET SENTENCE IS ‘THE SHOE
THAT IS RED IS IN THE BOX’, PARTICIPANT IS EXPECTED TO POINT TO 4. ................................................................ 71
FIGURE 2.7 COMPARISON OF NUMBER OF CORRECT RESPONSES (CR) PRODUCED AS A FUNCTION OF 5-SECOND TIME
INTERVALS IN THE SEMANTIC (TOP PANEL) AND LETTER FLUENCY (BOTTOM PANEL) CONDITIONS BETWEEN THE
GROUPS. BEST-FIT LINES ARE LOGARITHMIC FUNCTIONS. ERROR BARS REPRESENT STANDARD ERROR OF THE MEAN. 77
FIGURE 2.8 COMPARISON OF MEAN NUMBER OF CORRECT RESPONSES (CR) BETWEEN GROUPS BY FLUENCY CONDITION
(SEMANTIC AND LETTER). ERROR BARS REPRESENT STANDARD ERRORS OF THE MEAN. ......................................... 78
FIGURE 2.9 COMPARISON OF MEAN CLUSTER SIZE BETWEEN THE GROUPS BY FLUENCY CONDITION (SEMANTIC AND
LETTER). ERROR BARS REPRESENT STANDARD ERROR OF THE MEAN. 78
FIGURE 2.10 COMPARISON OF MEAN NUMBER OF SWITCHES BETWEEN THE GROUPS BY FLUENCY CONDITION .................... 78
FIGURE 2.11 COMPARISON OF PERCENT CORRECT BETWEEN THE GROUPS BY CONDITION (WORD REPETITION AND NON-
WORD REPETITION). ERROR BARS REPRESENT STANDARD ERROR OF THE MEAN. ................................................... 80
FIGURE 2.12 GROUP DIFFERENCES OF ERROR DISTRIBUTION IN WORD AND NON-WORD REPETITION DISTRIBUTED BY
IMAGEABILITY AND FREQUENCY. ....................................................................................................................... 80
xi
FIGURE 2.13 COMPARISON OF PERCENT ACCURACY BETWEEN THE GROUPS BY CONDITION (NOUNS AND VERBS). ERROR
BARS REPRESENT STANDARD ERROR OF THE MEAN. ** P<.01. 83
FIGURE 2.14 COMPARISON OF PERCENT ACCURACY BETWEEN THE GROUPS ON SENTENCE COMPREHENSION. ERROR
BARS REPRESENT STANDARD ERROR OF THE MEAN.*P<.05 84
FIGURE 2.15 PERCENTAGE OF DIFFERENT TYPES OF ERRORS ON SENTENCE COMPREHENSION TASK BASED ON GRAMMATICAL
SUB- COMPONENTS. ERROR BARS REPRESENT STANDARD ERROR OF THE MEAN ..................................................... 84
FIGURE 2.16 SIGNIFICANT CORRELATIONS BETWEEN MEASURE OF PRINT EXPOSURE AND SEMANTIC FLUENCY (CR) AND
SWITCHES (TOTAL). ........................................................................................................................................ 87
FIGURE 2.17 SIGNIFICANT CORRELATIONS BETWEEN MEASURE OF PRINT EXPOSURE AND PERCENT CORRECT ON NON-
WORD REPETITION .......................................................................................................................................... 88
FIGURE 2.18 SIGNIFICANT CORRELATIONS BETWEEN MEASURE OF PRINT EXPOSURE AND PERCENT CORRECT ON SYNONYMY
TRIPLETS TASK AND SENTENCE COMPREHENSION. ..........................................................................................
..................................................................................................................................................................... 89
FIGURE 2.19 SIGNIFICANT CORRELATIONS BETWEEN YEARS OF EDUCATION AND INITIATION (TOTAL), SLOPE(TOTAL) AND
SUB-RT. ........................................................................................................................................................ 90
FIGURE 3.1 SIGNIFICANT CORRELATIONS BETWEEN MEASURE OF PRINT EXPOSURE AND UTTERANCE LEVEL MEASURES
(TOTAL WORDS, % GRAMMATICAL ERRORS) ................................................................................................... 119
FIGURE 3.2 SIGNIFICANT CORRELATIONS BETWEEN MEASURE OF PRINT EXPOSURE AND MORPHO-SYNTACTIC MEASURES
(VERBS PER UTTERANCE, % PRESENT PARTICIPLE) .......................................................................................... 120
FIGURE 3.3 SIGNIFICANT CORRELATIONS BETWEEN MEASURE OF PRINT EXPOSURE AND LEXICAL MEASURES (% NOUNS, TTR
NOUNS, % ADVERBS ..................................................................................................................................... 121
FIGURE 3.4 SIGNIFICANT CORRELATIONS BETWEEN MEASURE OF PRINT EXPOSURE AND REPAIR ..................................... 122
FIGURE 3.5 SIGNIFICANT CORRELATIONS BETWEEN YEARS OF EDUCATION AND TOTAL UTTERANCES, % OF..................... 123
FIGURE 4.1 ILLUSTRATING TWO WAYS OF REPRESENTING EXECUTIVE FUNCTION (MIYAKE AND FRIEDMAN, 2012) (A)
INDIVIDUAL COMPONENTS OF EXECUTIVE FUNCTIONS, SEPARABLE FROM EACH OTHER. (B) COMMON EXECUTIVE
FUNCTION VARIABLE WITH ADDITIONAL UPDATING AND SHIFTING SUB-COMPONENTS. ......................................... 134
FIGURE 4.2 AN EXAMPLE OF AN EXPERIMENTAL TRIAL IN THE SPATIAL STROOP TASK [(A) CONGRUENT: AN ARROW
POINTING LEFT APPEARS ON THE LEFT SIDE OF THE SCREEN, PARTICIPANT EXPECTED TO PRESS THE LEFT ARROW KEY
(NO RESPONSE CONFLICT); B) INCONGRUENT: AN ARROW POINTING RIGHT APPEARS ON THE LEFT SIDE OF THE
SCREEN, PARTICIPANT EXPECTED TO PRESS THE RIGHT ARROW (RESPONSE CONFLICT)] ....................................... 155
FIGURE 4.3 AN EXAMPLE OF AN EXPERIMENTAL TRIAL IN THE FLANKER TASK [(A) CONGRUENT TRIAL: THE TARGET
ARROWS AND THE FLANKER ARROWS ALL POINTING IN THE SAME DIRECTION (NO-RESPONSE CONFLICT) B)
INCONGRUENT TRIAL: THE TARGET ARROWS AND THE FLANKER ARROWS POINT IN DIFFERENT DIRECTIONS
(RESPONSE CONFLICT PRESENT)] ................................................................................................................... 157
FIGURE 4.4 SCHEMATIC OF AN EXPERIMENTAL TRIAL IN N-BACK TASK (A) 1-BACK CONDITION: IN THE EXAMPLE THE DIGIT
‘7’ OCCURRED ONE TRIAL BEFORE, MAKING THE DIGIT ‘7’ THE TARGET (B) 2-BACK CONDITION: IN THE EXAMPLE THE
DIGIT ‘9’ OCCURRED TWO TRIALS BEFORE, MAKING THE DIGIT ‘9’ THE TARGET. ................................................... 159
FIGURE 4.5 SCHEMATIC OF AN EXPERIMENTAL TRIAL IN THE COLOUR-SHAPE TASK: THE RESPONSE TO THE STIMULUS IS
DETERMINED BY THE CUE PRESENTED PRIOR TO THE STIMULUS. IN (A) BOTH CUES PRESENTED (ALONG WITH THE
xii
FIXATION CROSS) ARE COLOUR CUES; AND IN (B) THE FIRST CUE IS THE COLOUR CUE AND THE SECOND IS THE ‘SHAPE
CUE’. [(A)NON-SWITCH TRIAL: A COLOUR STIMULUS IS FOLLOWED BY A COLOUR STIMULUS; THE PARTICIPANT IS
EXPECTED TO RESPOND TO THE COLOUR OF THE STIMULUS AND NOT TO SHAPE. B) SWITCH TRIAL: A COLOUR
STIMULUS IS FOLLOWED BY THE SHAPE STIMULUS; IN THE FIRST INSTANCE THE PARTICIPANT IS EXPECTED TO
RESPOND TO COLOUR AND THEN TO SHAPE.] .................................................................................................... 162
FIGURE 4.6 COMPARISON OF D’ SCORES OF AUDITORY N-BACK (AVERAGE OF 1-BACK AND 2-BACK). ERROR BARS REPRESENT
STANDARD ERROR OF THE MEAN. * P<.05 ....................................................................................................... 168
FIGURE 4.7 SIGNIFICANT CORRELATIONS BETWEEN PRINT EXPOSURE AND D’ SCORE OF AUDITORY 2-BACK TASK ............ 170
FIGURE 4.8 SIGNIFICANT CORRELATIONS BETWEEN YEARS OF EDUCATION AND STROOP EFFECT (ACCURACY) ................. 170
FIGURE 5.1 ARCHITECTURE OF THE DUAL-ROUTE CASCADED MODEL (COLTHEART ET AL, 2001). THE RED MARKINGS
INDICATE THE INDIRECT LEXICAL ROUTE/ SEMANTIC ROUTE/INDIRECT SEMANTIC ROUTE; THE BLUE MARKINGS
INDICATE THE DIRECT LEXICAL ROUTE/DIRECT NON-SEMANTIC ROUTE AND THE GREEN MARKINGS INDICATE THE SUB-
LEXICAL ROUTE/ ORTHOGRAPHY-PHONOLOGY CONVERSION ROUTE/NON-LEXICAL ROUTE. ................................... 182
FIGURE 5.2 ARCHITECTURE OF THE DUAL-ROUTE CASCADED MODEL (COLTHEART ET AL, 2001). THE RED MARKINGS
INDICATE THE INDIRECT LEXICAL ROUTE/ SEMANTIC ROUTE/INDIRECT SEMANTIC ROUTE; THE BLUE MARKINGS
INDICATE THE DIRECT LEXICAL ROUTE/DIRECT NON-SEMANTIC ROUTE AND THE GREEN MARKINGS INDICATE THE SUB-
LEXICAL ROUTE/ ORTHOGRAPHY-PHONOLOGY CONVERSION ROUTE/NON-LEXICAL ROUTE. ................................... 199
FIGURE 5.3 MAP OF INDIA DEPICTING THE LANGUAGES SPOKEN ACROSS THE COUNTRY. THE STATES IN GREEN SPEAK HINDI
(INDO-ARYAN LANGUAGE); THE STATE IN IVORY SPEAKS KANNADA; THE STATES IN DARKER GREEN SPEAK TELUGU
AND THE STATE IN BROWN SPEAKS TAMIL; THE STATE IN BLUE SPEAKS MALAYALAM. THESE FOUR TOGETHER
CONSTITUTE THE DRAVIDIAN LANGUAGES SPOKEN IN THE SOUTHERN PART OF INDIA. ......................................... 203
FIGURE 5.4 SAMPLE STIMULI USED FOR SPOKEN WORD PANEL (A –LEFT ) AND WRITTEN WORD PICTURE MATCHING TASK
PANEL (B –RIGHT ). FOR SPOKEN WORD PICTURE MATCHING (PANEL A)-THE TARGET PICTURE IS ‘CARROT’, THE CLOSE
SEMANTIC DISTRACTOR IS (‘CABBAGE’), DISTANT SEMANTIC DISTRACTOR (‘LEMON’), A VISUALLY RELATED
DISTRACTOR (‘SAW’) AND AN UNRELATED DISTRACTOR (‘CHISEL’). FOR WRITTEN WORD PICTURE MATCHING (PANEL
B) THE TARGET WORD IS ‘AXE’, THE CLOSE SEMANTIC DISTRACTOR IS (‘HAMMER’), DISTANT SEMANTIC DISTRACTOR
(‘SCISSORS’), A VISUALLY RELATED DISTRACTOR (‘FLAG’) AND AN UNRELATED DISTRACTOR (‘KITE’). .................... 217
xiii
List of Tables
TABLE 1.1 SUMMARY OF RESEARCH QUESTIONS AND METHODS OF EXPERIMENTAL
CHAPTERS…………………………………………………………………………………………………………………….23
TABLE 2.1 CONTRIBUTION OF VERBAL FLUENCY VARIABLES TO THE LINGUISTIC AND EXECUTIVE CONTROL
COMPONENTS……………………………………………………………………………………………………………….45
TABLE 2.2 MEAN (M), MINIMUM (MIN) AND MAXIMUM (MAX) VALUES AND STATISTICAL RESULTS OF THE
DEMOGRAPHIC VARIABLES………………………………………………………………………………………………….50
TABLE 2.3 BACKGROUND SUBJECTIVE MEASURES OF LANGUAGE PROFICIENCY AND DOMINANCE………………..52
TABLE 2.4 BACKGROUND OBJECTIVE MEASURES OF LANGUAGE PROFICIENCY AND PRINT
EXPOSURE……………………………………………………………………………………………………………………... 53
TABLE 2.5 MEAN (M), MINIMUM (MIN) AND MAXIMUM (MAX) VALUES AND STATISTICAL RESULTS OF
PARTICIPANTS’ SUBJECTIVE LANGUAGE PROFILE…………………………………………………………………….60
TABLE 2.6 MEAN (M), MINIMUM (MIN) AND MAXIMUM (MAX) VALUES AND STATISTICAL RESULTS OF
PARTICIPANTS’ OBJECTIVE MEASURES…………………………………………………………………………………61
TABLE 2.7 EXPERIMENTAL MEASURES OF ORAL LANGUAGE PRODUCTION AND COMPREHENSION AND RELEVANT
VARIABLES USED IN THE ANALYSES. ALL THE EXPERIMENTAL TASKS WERE ADMINISTERED IN L2
(ENGLISH)……………………………………………………………………………………………………………………64
TABLE 2.8 MEAN (M), STANDARD DEVIATION (SD) AND STATISTICAL RESULTS OF PERFORMANCE BY GROUP
(HIGH PRINT EXPOSURE AND LOW PRINT EXPOSURE) AND CONDITIONS (AVERAGED ACROSS TRIALS) ON
VERBAL FLUENCY MEASURES……………………………………………………………………………………………76
TABLE 2.9 BEST FITTING MULTILEVEL MODEL FUNCTIONS FOR THE TIME COURSE OF CORRECT RESPONSES IN
VERBAL FLUENCY TASK…………………………………………………………………………………………………..77
TABLE 2.10 MEAN (M), MINIMUM (MIN) AND MAXIMUM (MAX) VALUES AND STATISTICAL RESULTS OF
PERFORMANCE ON WORD-NON-WORD REPETITION AND COMPREHENSION TASKS……………………….81
TABLE 2.11 ERROR DISTRIBUTION1 ON WORD AND NON-WORD REPETITION TASK ACROSS
CONDITIONS……........................................................................................................................................................82
TABLE 2.12 CORRELATION OF ORAL LANGUAGE PRODUCTION AND COMPREHENSION MEASURES WITH
MEASURE OF PRINT EXPOSURE, AGE AND YEARS OF EDUCATION ………………………………………………….86
TABLE 2.13 SUMMARY OF FINDINGS ON ORAL LANGUAGE PRODUCTION AND COMPREHENSION
MEASURES…................................................................................................................................................................92
TABLE 3.1 LINGUISTIC VARIABLES USED IN THE NARRATIVE ANALYSIS.................................................................105
TABLE 3.2 CODES USED IN THE SPEAKER TIER IN CLAN………………………………………………………………109
TABLE 3.3 CODES USED FOR WORD CLASS AND INFLECTIONALAFFIXES………………………………………………110
TABLE 3.4 DEFINITIONS OF NARRATIVE VARIABLES USED IN THE STUDY…………………………………………..111
TABLE 3.5 MINIMUM, MAXIMUM, MEAN, STANDARD DEVIATION AND GROUP COMPARISONS OF UTTERANCE
LEVEL AND MORPHO-SYNTACTIC VARIABLES………………………………………………………………………..114
xiv
TABLE 3.6 MINIMUM, MAXIMUM, MEAN, STANDARD DEVIATION AND GROUP COMPARISONS OF LEXICAL
MEASURES (LEXICAL DIVERSITY, OPEN CLASS AND CLOSED CLASS)………………………………………….115
TABLE 3.7 MINIMUM, MAXIMUM, MEAN, STANDARD DEVIATION AND GROUP COMPARISONS OF REPAIR
MEASURES…………………………………………………………………………………………………………………115
TABLE 3.8 CORRELATION OF NARRATIVE VARIABLES WITH MEASURE OF PRINT EXPOSURE, AGE AND YEARS OF
EDUCATION……………………………………………………………………………………………………………..…117
TABLE 3.9 SUMMARY OF FINDINGS OF THE NARRATIVE VARIABLE……………………………………………….. 125
TABLE 4.1 MEASURES OF EXECUTIVE FUNCTIONS USED IN THE CURRENT STUDY……………………………....152
TABLE 4.2 MINIMUM (MIN) AND MAXIMUM (MAX), MEAN (M) VALUES AND GROUP COMPARISONS ON
MEASURES OF INHIBITION………………………………………………………………………………………….…166
TABLE 4.3 MINIMUM (MIN) AND MAXIMUM (MAX), MEAN (M) VALUES AND STATISTICAL RESULTS OF
PERFORMANCE MEASURES OF WORKING MEMORY……………………………………………………….…….167
TABLE 4.4 MINIMUM (MIN) AND MAXIMUM (MAX), MEAN (M) VALUES AND GROUP COMPARISONS OF
PERFORMANCE ON MEASURE OF TASK SWITCHING………………………………………………………………168
TABLE 4.5 CORRELATION OF EXECUTIVE FUNCTION MEASURES WITH MEASURE OF PRINT EXPOSURE, AGE AND
YEARS OF EDUCATION…………………………………………………………………………………………………..169
TABLE 4.6 SUMMARY OF FINDINGS OF IMPACT OF PRINT EXPOSURE ON EXECUTIVE FUNCTION MEASURES173
TABLE 5.1 ERROR TYPES IN CENTRAL DYSLEXIAS WITH EXAMPLES………………………………………………..181
TABLE 5.2 ALPHABETS AND WORDS IN SCRIPTS OF KANNADA AND ENGLISH WITH DIFFERENT DIACRITICS186
TABLE 5.3 PERFORMANCE PATTERN FOR PROFILING THE TYPES OF DYSLEXIA…………………………………..200
TABLE 5.4 DEMOGRAPHIC DETAILS OF PARTICIPANTS RECRUITED..………………………………………………..204
TABLE 5.5 BILINGUAL LANGUAGE PROFILE OF BPWA. ………………………………………………………………...207
TABLE 5.6 LANGUAGE SCORES ON WESTERN APHASIA BATTERY IN KANNADA, HINDI (KARANTH, 1980) AND
ENGLISH (KERTESZ, 2006)……..........................................................................................................................210
TABLE 5.7 CONNECTED SPEECH ELICITED THROUGH PICTURE DESCRIPTION FOR EACH BPWA IN
KANNADA/HINDI AND ENGLISH1 ……………………………………………………..…………………………...…211
TABLE 5.8 EXPERIMENTAL TASKS USED FOR PROFILING AND CHARACTERIZING ACQUIRED DYSLEXIA IN
ENGLISH………………………………………………………………………..…………………………………………...213
TABLE 5.9 DESCRIPTION OF TYPES OF ERRORS IN READING ALOUD WITH EXAMPLES………………………..…218
TABLE 5.10 STIMULI USED TO PROFILE AND CHARACTERISE ACQUIRED DYSLEXIA IN KANNADA AND HINDI
……………………………………………………………...………………………………………………………………………..220
TABLE 5.11 PERFORMANCE OF PARTICIPANTS ON TASKS OF SEMANTIC PROCESSING, PHONOLOGY PROCESSING
AND READING ALOUD TASKS IN ENGLISH…………………………………………………………………………..223
TABLE 5.12 PERFORMANCE OF PARTICIPANTS ON READING ALOUD TASKS IN KANNADA.……………………225
TABLE 5.13 PATTERN OF PERFORMANCE FOR PROFILING THE TYPE OF DYSLEXIA……………………………..226

xv
TABLE 5.14 ERROR PROFILE OF BPWA ON NON-WORD REPETITION AND READING ALOUD TASKS FROM
SUBTESTS OF PALPA ……………………………………………………………………………………..………… 234
TABLE 5.15 SUMMARY OF FINDINGS FROM READING TASKS IN ENGLISH AND KANNADA/HINDI………....235
TABLE 5.16 PATTERN OF PERFORMANCE EXHIBITED BY AP03…………………………………………………...237
TABLE 5.17 PATTERN OF PERFORMANCE EXHIBITED BY AP05…………………………………………………..238
TABLE 6.1 SUMMARY OF RESULTS FROM THE EXPERIMENTAL CHAPTERS………………………………………244
1
Abstract
Background. In the current global, cross-cultural scenario, being bilingual or
multilingual is a norm rather than an exception. In such an environment an individual may be
actively involved in reading and writing in all their languages in addition to speaking them.
Regular use of two or more languages is termed as bilingualism and being able to read and write
in both of them is referred to as bi-literacy. Research indicates that bilingualism has an impact
on language production and cognition, specifically executive functions. Given the impact of
literacy and bilingualism, the reasonable question that arises, is whether bi-literacy would offer
an additional impact on language production and cognition. This becomes even more relevant in
a multilingual, multi-cultural society such as India. We examined the impact of bi-literacy on oral
language production (at word and connected speech level), comprehension and on non-verbal
executive function measures in bi-literate bilingual healthy adults in an immigrant diaspora
living in the UK. In addition to English, they were speakers of one of the South Indian languages
(Kannada, Malayalam, Tamil and Telugu). The significance of bi-literacy among bilinguals
assumes further importance in aphasia (language impairment due to brain damage). For those
who have aphasia in one or more languages due to brain damage, the severity of impairment
maybe different in both languages, also the modalities of language may be differentially affected.
In particular, reading and writing maybe impaired differently in the languages used by a
bi/multilingual. Manifestation of reading impairments are also dependent on the nature of the
script of the language being read [e.g., Raman & Weekes (2005) report differential dyslexia in a
Turkish-English speaker who exhibited surface dyslexia in English and deep dysgraphia in
Turkish]. Our study contributes to the field of bilingual aphasia by focusing specifically on
reading differing from the existing literature of aphasia in bilinguals, where the focus has
predominantly been on language production and comprehension. Studying reading impairments
provides a better understanding of how the reading impairments are manifested in the two
languages, which will aid appropriate assessment and intervention. This research investigated
the impact of bi-literacy in both populations (healthy adults and neurologically impaired) in two
phases: Phase I (in UK) and Phase II (in India).
Aim. Phase I investigated the impact of bi-literacy on oral language production (at word level
and connected speech), comprehension and non-verbal executive function in bi-literate
bilingual healthy adults. Phase II examined the reading impairments in two languages of
bilingual persons with aphasia (BPWA).
2
Methods. For Phase I, participants were thirty-four bi-literate bilingual healthy adults with
English as their L2 and one of the Dravidian languages (Kannada, Malayalam, Tamil and Telugu)
as their L1. We have used the term ‘print exposure’ as a proxy for literacy. They were divided
into a high print exposure (HPE, n=22) and a low print exposure (LPE, n=12) group based on
their performance on two tasks measuring L2 print exposure- grammaticality judgement task
and sentence verification task. We also quantified their bilingual characteristics- proficiency,
reading and writing characteristics and dominance. The groups were matched on years of
education, age and gender. Participants completed a set of oral language production tasks in L2
(at word level) namely -verbal fluency, word and non-word repetition; comprehension tasks in
L2 namely synonymy triplets task and sentence comprehension task (Chapter 2); oral narrative
task in L2 (at connected speech level) (Chapter 3) followed by non-verbal executive function
tasks tapping into inhibitory control (Spatial Stroop and Flanker tasks), working memory (visual
n-back and auditory n-back) and task switching (colour-shape task) (Chapter 4).
For Phase II, we characterized the reading abilities of four BPWA who spoke one of the
Dravidian languages (Kannada, Tamil, Telugu) (alpha-syllabic) as their L1 and English
(alphabetic) as their L2. We quantified their bilingual characteristics- proficiency, reading and
writing characteristics and dominance. Subtests from the Psycholinguistic Assessment of
Language Processing in Aphasia (PALPA; Kay, Lesser & Coltheart, 1992) were used to document
the reading profile of BPWA in English and reading subtests from Reading Acquisition Profile
(RAP-K; Rao, 1997) and words from Bilingual Aphasia test -Hindi (BAT; Paradis & Libben, 1987)
were used to document the reading profile of BPWA in Kannada and Hindi respectively.
Findings. Based on the findings of Phase I (i.e., results from Chapter 2-4), we found prominent
differences between HPE and LPE on comprehension measures (synonymy triplets and
sentence comprehension tasks). This is in contrast to the results observed in monolingual
adults, were semantics is less impacted by print exposure. Moreover, our predictions that HPE
will result in better oral language production skills were borne out in specific conditions-
semantic fluency and non-word repetition task (at word level) and higher number of words in
the narrative, higher verbs per utterance and fewer repetitions (at connected speech level). In
addition, the non-verbal executive functions, we found no direct link between print exposure (in
L2) and non-verbal executive functions in bi-literate bilinguals excepting working memory
(auditory N-back task). Additionally, another consistency in our findings is that there seems to
be a strong link between print exposure and semantic processing in our research. The findings
on the semantic tasks have been consistent across comprehension (synonymy triplets task and
sentence comprehension task) and production (semantic fluency) favouring HPE.
3
The findings from Phase II (Chapter 5) reveal differences of reading characteristics in the two
languages (with different scripts) of the four BPWA. This research provides preliminary
evidence that a script related difference exists in the manifestation of dyslexia in bi-scriptal
BPWA speaking a combination of alphabetic and alpha-syllabic languages.
Conclusions. Our research contributes to the existing literature by highlighting the relationship
between bi-literacy and language production, comprehension and non-verbal cognition where
bi-literacy seems to have a higher impact on language than cognition. The contrary findings
from the monolinguals and children literature, highlight the importance for considering nuances
of bilingual research and specifically challenges the notion that semantic comprehension is not
significantly affected by literacy. In the neurologically impaired population, our research
provides a comprehensive profiling of reading abilities in BPWA in the Indian population with
languages having different scripts. Using this profiling and classification, we are able to affirm
the findings previously found in literature emphasizing the importance of script in the
assessment of reading abilities in BPWA. Such profiling and classification assist in the
development of bilingual models of reading aloud and classifying different types of reading
impairments.
4
Chapter 1 Introduction.
Introduction
World societies are becoming global, multilingual and cross-cultural. Consequently, exposure to
different language and writing systems is becoming a norm rather than an exception.
Multicultural societies such as India, have a tendency to create an environment where becoming
multilingual is actively encouraged and almost imperative. Individuals in such a system
naturally tend to acquire reading and writing along with spoken language. Literacy implies the
ability to read and write using a writing system that requires a reader to map onto a particular
language. There is evidence to show that impact of literacy on cognitive-linguistic, social, and
psychological aspects begins from an early age and continues onto adulthood (Rao, 2014).
Therefore, literacy is an important psycho-linguistic attribute. An individual who is bilingual,
also tends to acquire reading and writing in two languages, also termed as bi-literate.
Bilingualism has shown to impact oral language and cognition. Research of oral language
production in bilingual population have shown mixed findings when compared to monolinguals
(Bialystok et al., 2008; Luo et al., 2010; Paap et al., 2017; Sandoval et al., 2010). On the other
hand, research suggests that bilingualism offers a cognitive advantage mostly with regard to a
boost in the executive functions in comparison to the monolinguals (Martin-Rhee & Bialystok,
2008; Bialystok, 2006; Bialystok, 2009).
Research on the impact of literacy on various psycholinguistic attributes is confined to
monolinguals and research thus far has indicated that literacy has an impact on oral language
skills [e.g. verbal fluency (Ardila et al., 2010) and non-word repetition (Kosmidis, Tsapkini,
Folia, Vlhou, & Kiosseoglou, 2004)] and cognitive processing [e.g. measures of executive function
like Stroop task and trail making (Barnes, Tager, Satariano & Yaffe, 2004)]. Therefore, there is
evidence to show that literacy impacts both spoken and written language e.g., Ventura
etal.,2004; Ziegler et al., 2004; Alario et al.,2007; Burgos et al.,2014) as well as cognition (Ardila
et al. 2010). With respect to the neurologically impaired population, individuals who have
language impairment in one or more languages due to brain damage (bilingual aphasia), the
5
severity of impairment maybe different in both languages, also the modalities of language may
be differentially affected. Reading and writing maybe impaired differently in the languages
spoken by a bi/multilingual. Manifestation of reading impairments are also dependent on the
nature of the script of the language being read (Raman & Weekes, 2003,2005; Weekes et al.,
2007; Senaha & Parente, 2012; Karanth, 1981; Ratnavalli et al, 2000).
Consequently, in this research, we explored how bi-literacy among bilinguals is
impacting oral language production, comprehension and executive functions. Specifically, we
explored the relationship of literacy in bilinguals in two phases. In the first phase (Phase I), we
explored the impact of literacy on cognitive-linguistic attributes such as oral language
production (single word and connected speech level), comprehension and cognitive aspects in
bilingual healthy adults. In the second phase (Phase II), we explored the relationship of literacy
in bilinguals in a neurologically impaired population. In this chapter, we will briefly introduce
the concept of bilingualism and bi-literacy (Section1.1.1), followed by importance of measuring
variables of bilingualism and bi-literacy (Section 1.2), we will discuss the background for Phase I
and its rationale (Section 1.3) and finally discuss the background for Phase II and its rationale
(Section 1.4).
1.1. Bilingualism and Bi-literacy
Bilingualism can be defined as “the regular use of two or more languages (or dialects), and
bilinguals are those people who use two or more languages (or dialects) in their everyday lives”
(Grosjean, 2008, p. 10). Bilinguals have both languages at their disposal at a given point in time
(Hernandez, Bates and Avila,1996; Rodriguez-Fornells et al.,2005; Chee,2006; Crinion et
al.,2006; Kroll, Bobb and Wodniecka,2006). The definition of bilingualism in Grosjean (2008)
does not specify whether it encompasses the modalities of reading and writing. Bilinguals may
possess the ability to read and write in the two languages that they use regularly. Such abilities
to read and write in more than one language is an additional skill. Such individuals are uniquely
qualified as bi-literate bilinguals.
6
Bi-literacy can be defined as ‘any and all instances in which communication occurs in
two (or more) languages in or around writing’ (Hornberger 1990, 213), where these instances
may be events, actors, interactions, practices, activities, classrooms, programs, situations,
societies, sites, or worlds (Hornberger 2000, 362; Hornberger and Skilton-Sylvester 2000, 98).
On the other hand, Rauch et al (2011) defines bi-literacy as being a proficient reader in both
one’s native language and second language. From the above definitions, it is clear that bi-
literates form a subset of bilinguals.
Interest in bilingualism has consistently increased because of various socio-political
factors such as migration and globalisation (Surrain & Luk, 2017) and therefore inquiry into
bilingualism has been increasingly common. Research on bi-literacy is still in the nascent state
and comparison can be drawn from bi-literacy acquisition in children (Bialystok, Luk & Kwan,
2005). Dworin (2003) suggests that knowledge of two writing systems influences language
learning in both languages. However, the impact of bi-literacy on language learning in children is
moderated by the proximity of the writing systems (Bialystok, Luk & Kwan, 2005). Despite
these findings, biliteracy remains an unexplored area, especially in adulthood.
A bi-literate bilingual can read and write in both languages, making bi-literacy an
important aspect of bilingualism research. In this research, question of the impact of bi-literacy
in bilinguals is framed differently for the healthy adults and the neurologically impaired
population. For the healthy adults, the research question is whether a bi-literate has an
additional impact on oral language production (at the word level and connected speech) and
non-verbal cognition. For the neurologically impaired population (with dyslexia) the research
question is how reading impairments are manifested in two languages of bi-literate bilingual
persons with aphasia (BPWA).
We address both these questions in a two-phase study. Phase I deals with the healthy
population investigating the impact of bi-literacy on oral language production (at word level and
connected speech), comprehension and non-verbal cognition in bi-literate bilingual adults.
Phase II deals with neurologically impaired population specifically examining reading
7
impairments in two languages of BPWA. This chapter is divided into two parts- Section 1.2
discusses Phase I and section 1.3 discusses Phase II. For phase I, we will briefly discuss the
difficulties of measuring the variables of bi-literacy and bilingualism in any population (Section
1.2), followed by a discussion of impact of these variables (Section 1.3) on oral language
production (Section 1.3.1), comprehension (section 1.3.2) and executive functions (section
1.3.3). For Phase II, we discuss the problems in measuring impairments in bi-literate bilinguals
(section 1.4.1) and then discuss how our study aims to address this problem (section 1.4.2).
1.1.1 Importance of measuring the variables of bilingualism and bi-literacy
Bilinguals are described based on various attributes such as language proficiency, language
dominance, language usage. These attributes are used to profile and characterise bilinguals.
Consequently, measuring variables like language proficiency, dominance and usage is crucial.
Quantifying the level of bilingualism using these attributes is a critical step towards
comparing findings across studies of bilingualism in areas such as cognitive functioning and
linguistic outcomes. In addition, measuring proficiency and dominance facilitates cross-
linguistic comparisons and to accurately estimate the effects of bilingualism on language
processing and cognition, it is important that language dominance be assessed uniformly
(Gollan et al., 2012). Another reason it is important to measure language dominance is when
bilinguals are restructuring their languages (Grosjean, 1998). Restructuring refers to losing
fluency in L1 and gaining fluency in L2 (Grosjean, 2002). This is highly relevant to the
immigrant population where they tend to lose the lexical or syntactic knowledge in either of the
languages (Grosjean, 1998). The participants in Phase I of our study are Indian immigrants
residing in the UK, hence language dominance is a key variable which we have addressed.
Similarly, we have included language usage as a variable as the amount that individuals use their
languages on a daily basis is likely an important attribute at all ages (Surrain & Luk, 2017).
Understanding and profiling all of these attributes will give a universal picture of language
8
status. Given this evidence in literature, it is important to measure “the extent of bilingualism”
by measuring language proficiency, dominance and current language usage patterns.
Research on bilinguals was mainly focused on monolingual versus bilingual comparisons
(Bialystok et al., 2012; Peal & Lambert, 1962; Costa, Hernandez & Sebastia-Galle, 2008).
However, the trend is now changing to focus more on bilingual comparisons in order to provide
a deeper insight into bi/multilingual population (Costa & Santesteban,2004; Bialystok, Craik &
Luk, 2007) E.g. Comparison across sub-groups- early vs. late proficiency; high vs. low
proficiency. Additionally, in bi-literate bilinguals it is also possible that L1 and L2 proficiency
may influence each other in the context of language combinations. (E.g. For a person with
Kannada as his first language and English as second language, the spoken form of L1 may be
acquired first informally and reading/writing much later at school in the formal context. On the
other hand for English (L2), literacy skills may be acquired first and spoken/ understanding
later with literacy skills).
Therefore, for better characterisation of bilinguals, especially with respect to reading
and writing, it is important to document and profile the reading and writing skills accurately.
We address this in Phase I. Phase I focuses by assessing the reading and writing skills in both the
languages that the bi-literate bilinguals speak. Within the bi-literate bilingual neurologically
impaired population, information on level of bilingualism and language status provides a
stronger basis for assessment and rehabilitation of various communication disorders (Dash &
Kar, 2012). Therefore, in Phase II, we assess the pre- and post-morbid reading and writing skills
of BPWA. In children studies, the term literacy refers to acquisition of reading and writing
(Bialystok, Luk & Kwan, 2005; Reyes, 2012). In adult literature, the same term is less direct and
could refer to level of education, schooling (Kosmidis et al, 2006; Silva et al, 2012). Therefore,
for the current study we use the term ‘print exposure’ as a proxy for measuring ‘literacy’.
Language proficiency and dominance can be measured in both subjective and objective
measures. Some researchers have used subjective measures like self-assessments,
9
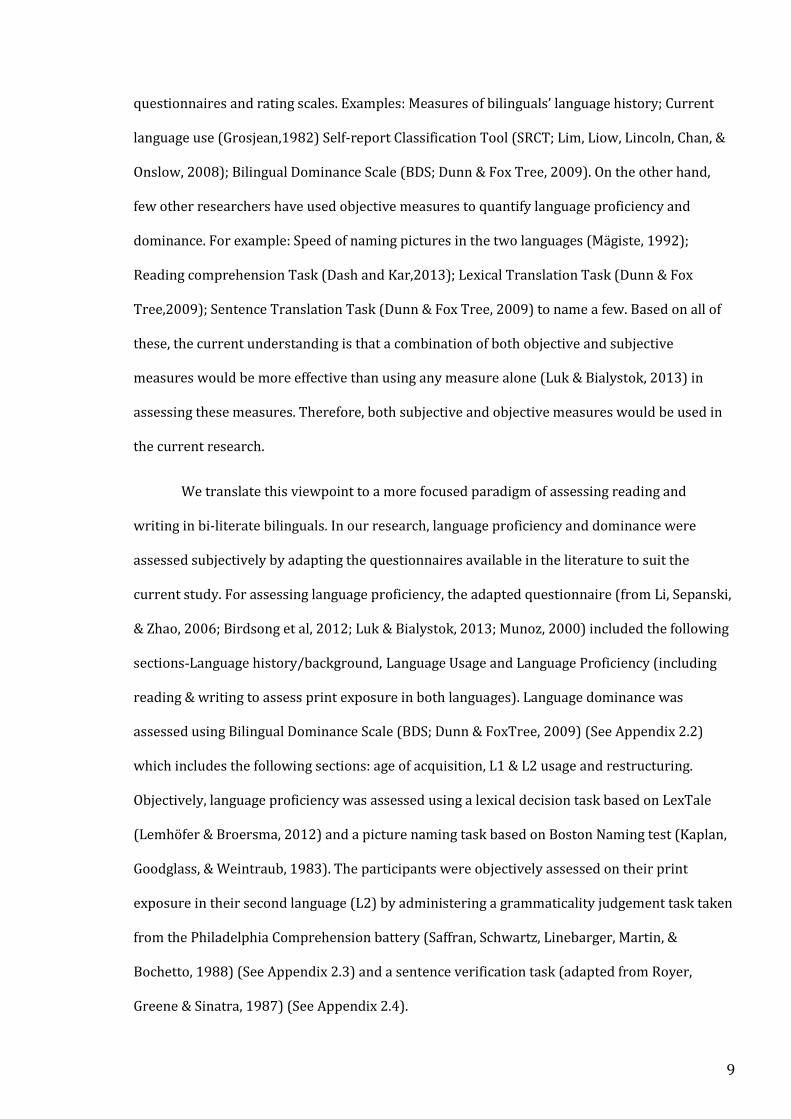
questionnaires and rating scales. Examples: Measures of bilinguals’ language history; Current
language use (Grosjean,1982) Self-report Classification Tool (SRCT; Lim, Liow, Lincoln, Chan, &
Onslow, 2008); Bilingual Dominance Scale (BDS; Dunn & Fox Tree, 2009). On the other hand,
few other researchers have used objective measures to quantify language proficiency and
dominance. For example: Speed of naming pictures in the two languages (Mägiste, 1992);
Reading comprehension Task (Dash and Kar,2013); Lexical Translation Task (Dunn & Fox
Tree,2009); Sentence Translation Task (Dunn & Fox Tree, 2009) to name a few. Based on all of
these, the current understanding is that a combination of both objective and subjective
measures would be more effective than using any measure alone (Luk & Bialystok, 2013) in
assessing these measures. Therefore, both subjective and objective measures would be used in
the current research.
We translate this viewpoint to a more focused paradigm of assessing reading and
writing in bi-literate bilinguals. In our research, language proficiency and dominance were
assessed subjectively by adapting the questionnaires available in the literature to suit the
current study. For assessing language proficiency, the adapted questionnaire (from Li, Sepanski,
& Zhao, 2006; Birdsong et al, 2012; Luk & Bialystok, 2013; Munoz, 2000) included the following
sections-Language history/background, Language Usage and Language Proficiency (including
reading & writing to assess print exposure in both languages). Language dominance was
assessed using Bilingual Dominance Scale (BDS; Dunn & FoxTree, 2009) (See Appendix 2.2)
which includes the following sections: age of acquisition, L1 & L2 usage and restructuring.
Objectively, language proficiency was assessed using a lexical decision task based on LexTale
(Lemhöfer & Broersma, 2012) and a picture naming task based on Boston Naming test (Kaplan,
Goodglass, & Weintraub, 1983). The participants were objectively assessed on their print
exposure in their second language (L2) by administering a grammaticality judgement task taken
from the Philadelphia Comprehension battery (Saffran, Schwartz, Linebarger, Martin, &
Bochetto, 1988) (See Appendix 2.3) and a sentence verification task (adapted from Royer,
Greene & Sinatra, 1987) (See Appendix 2.4).
10
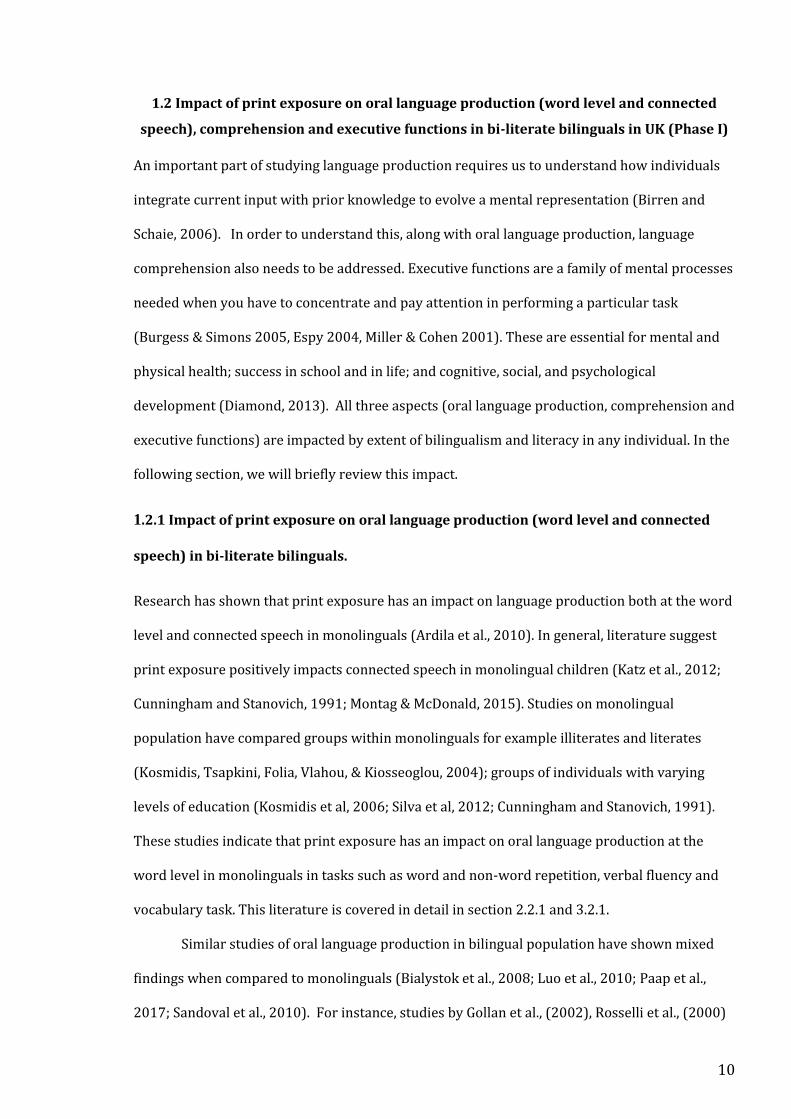
1.2 Impact of print exposure on oral language production (word level and connected
speech), comprehension and executive functions in bi-literate bilinguals in UK (Phase I)
An important part of studying language production requires us to understand how individuals
integrate current input with prior knowledge to evolve a mental representation (Birren and
Schaie, 2006). In order to understand this, along with oral language production, language
comprehension also needs to be addressed. Executive functions are a family of mental processes
needed when you have to concentrate and pay attention in performing a particular task
(Burgess & Simons 2005, Espy 2004, Miller & Cohen 2001). These are essential for mental and
physical health; success in school and in life; and cognitive, social, and psychological
development (Diamond, 2013). All three aspects (oral language production, comprehension and
executive functions) are impacted by extent of bilingualism and literacy in any individual. In the
following section, we will briefly review this impact.
1.2.1 Impact of print exposure on oral language production (word level and connected
speech) in bi-literate bilinguals.
Research has shown that print exposure has an impact on language production both at the word
level and connected speech in monolinguals (Ardila et al., 2010). In general, literature suggest
print exposure positively impacts connected speech in monolingual children (Katz et al., 2012;
Cunningham and Stanovich, 1991; Montag & McDonald, 2015). Studies on monolingual
population have compared groups within monolinguals for example illiterates and literates
(Kosmidis, Tsapkini, Folia, Vlahou, & Kiosseoglou, 2004); groups of individuals with varying
levels of education (Kosmidis et al, 2006; Silva et al, 2012; Cunningham and Stanovich, 1991).
These studies indicate that print exposure has an impact on oral language production at the
word level in monolinguals in tasks such as word and non-word repetition, verbal fluency and
vocabulary task. This literature is covered in detail in section 2.2.1 and 3.2.1.
Similar studies of oral language production in bilingual population have shown mixed
findings when compared to monolinguals (Bialystok et al., 2008; Luo et al., 2010; Paap et al.,
2017; Sandoval et al., 2010). For instance, studies by Gollan et al., (2002), Rosselli et al., (2000)
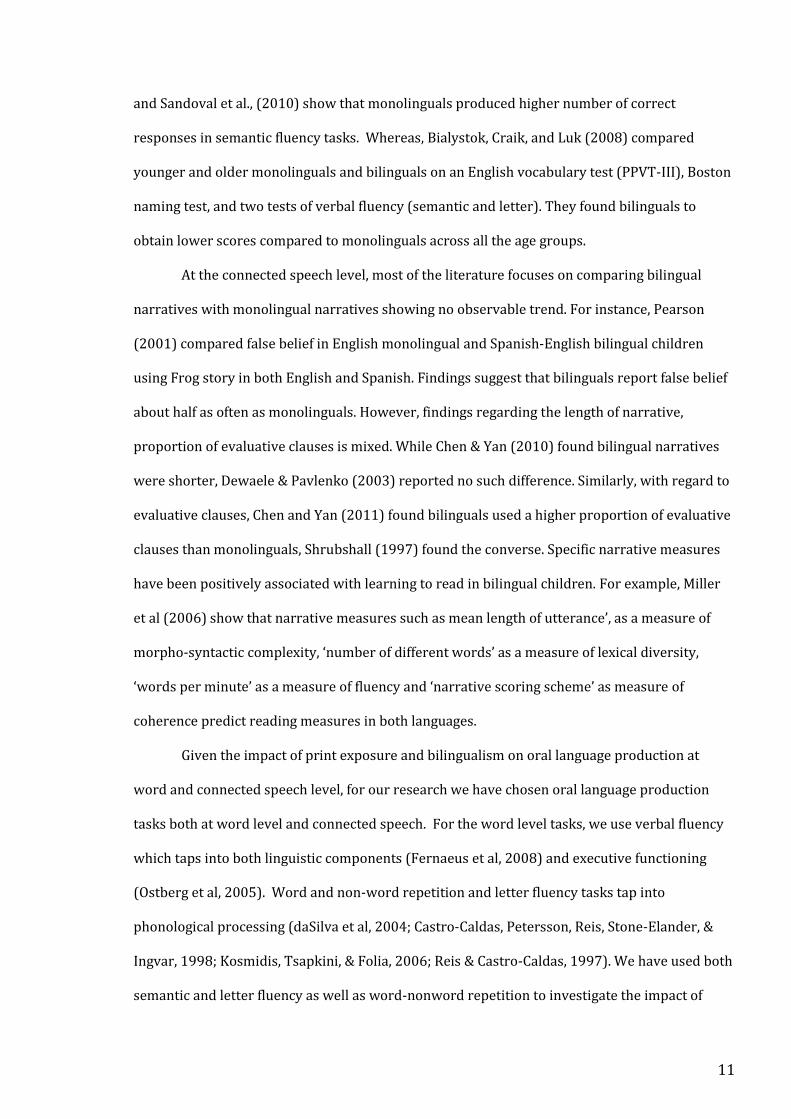
11
and Sandoval et al., (2010) show that monolinguals produced higher number of correct
responses in semantic fluency tasks. Whereas, Bialystok, Craik, and Luk (2008) compared
younger and older monolinguals and bilinguals on an English vocabulary test (PPVT-III), Boston
naming test, and two tests of verbal fluency (semantic and letter). They found bilinguals to
obtain lower scores compared to monolinguals across all the age groups.
At the connected speech level, most of the literature focuses on comparing bilingual
narratives with monolingual narratives showing no observable trend. For instance, Pearson
(2001) compared false belief in English monolingual and Spanish-English bilingual children
using Frog story in both English and Spanish. Findings suggest that bilinguals report false belief
about half as often as monolinguals. However, findings regarding the length of narrative,
proportion of evaluative clauses is mixed. While Chen & Yan (2010) found bilingual narratives
were shorter, Dewaele & Pavlenko (2003) reported no such difference. Similarly, with regard to
evaluative clauses, Chen and Yan (2011) found bilinguals used a higher proportion of evaluative
clauses than monolinguals, Shrubshall (1997) found the converse. Specific narrative measures
have been positively associated with learning to read in bilingual children. For example, Miller
et al (2006) show that narrative measures such as mean length of utterance’, as a measure of
morpho-syntactic complexity, ‘number of different words’ as a measure of lexical diversity,
‘words per minute’ as a measure of fluency and ‘narrative scoring scheme’ as measure of
coherence predict reading measures in both languages.
Given the impact of print exposure and bilingualism on oral language production at
word and connected speech level, for our research we have chosen oral language production
tasks both at word level and connected speech. For the word level tasks, we use verbal fluency
which taps into both linguistic components (Fernaeus et al, 2008) and executive functioning
(Ostberg et al, 2005). Word and non-word repetition and letter fluency tasks tap into
phonological processing (daSilva et al, 2004; Castro-Caldas, Petersson, Reis, Stone-Elander, &
Ingvar, 1998; Kosmidis, Tsapkini, & Folia, 2006; Reis & Castro-Caldas, 1997). We have used both
semantic and letter fluency as well as word-nonword repetition to investigate the impact of
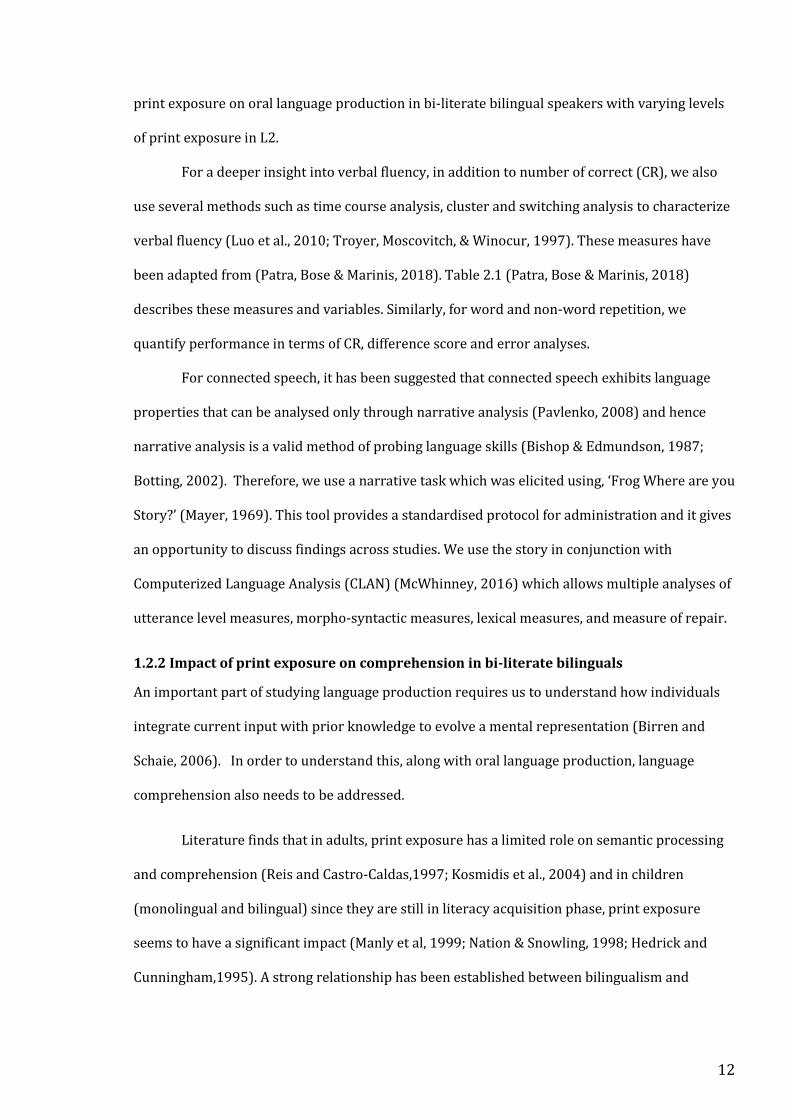
12
print exposure on oral language production in bi-literate bilingual speakers with varying levels
of print exposure in L2.
For a deeper insight into verbal fluency, in addition to number of correct (CR), we also
use several methods such as time course analysis, cluster and switching analysis to characterize
verbal fluency (Luo et al., 2010; Troyer, Moscovitch, & Winocur, 1997). These measures have
been adapted from (Patra, Bose & Marinis, 2018). Table 2.1 (Patra, Bose & Marinis, 2018)
describes these measures and variables. Similarly, for word and non-word repetition, we
quantify performance in terms of CR, difference score and error analyses.
For connected speech, it has been suggested that connected speech exhibits language
properties that can be analysed only through narrative analysis (Pavlenko, 2008) and hence
narrative analysis is a valid method of probing language skills (Bishop & Edmundson, 1987;
Botting, 2002). Therefore, we use a narrative task which was elicited using, ‘Frog Where are you
Story?’ (Mayer, 1969). This tool provides a standardised protocol for administration and it gives
an opportunity to discuss findings across studies. We use the story in conjunction with
Computerized Language Analysis (CLAN) (McWhinney, 2016) which allows multiple analyses of
utterance level measures, morpho-syntactic measures, lexical measures, and measure of repair.
1.2.2 Impact of print exposure on comprehension in bi-literate bilinguals
An important part of studying language production requires us to understand how individuals
integrate current input with prior knowledge to evolve a mental representation (Birren and
Schaie, 2006). In order to understand this, along with oral language production, language
comprehension also needs to be addressed.
Literature finds that in adults, print exposure has a limited role on semantic processing
and comprehension (Reis and Castro-Caldas,1997; Kosmidis et al., 2004) and in children
(monolingual and bilingual) since they are still in literacy acquisition phase, print exposure
seems to have a significant impact (Manly et al, 1999; Nation & Snowling, 1998; Hedrick and
Cunningham,1995). A strong relationship has been established between bilingualism and
13
comprehension in children (Nation & Snowling, 1998; Proctor et al, 2005) (Refer to section 2.2.3
for a review).
Typically, studies (Nation & Snowling, 1998; Proctor et al, 2005; Manly et al, 1999) have
focused on assessing comprehension either using comprehension measures at the word level
such as synonmy triplets, the Woodcock Language Proficiency Battery or sentence level such as
The BDAE Complex Ideational Material subtest. However, comprehension occurs both at word
and sentence level and hence it is important to consider both these aspects of comprehension.
Therefore, in our study, we investigate the effect of print exposure on comprehension at both
the word level and sentence level using the synonymy triplets’ task from the Philadelphia
comprehension battery (Saffran, Schwartz, Linebarger, Martin & Bochetto, 1988) and sentence
comprehension task taken from the Test for Reception of Grammar-2 (TROG-2) (Bishop, 2003)
respectively.
1.2.3 Impact of print exposure on executive functions in bi-literate bilinguals
Royall et al (2002) defines executive functions as a broad set of cognitive skills required for
“planning, initiation, sequencing, and monitoring of complex goal directed behaviour”. Each of
these components of executive functions are typically treated independently. However, many
authors (Miyake et al., 2000; Miyake & Friedman, 2012; Lehto et al, 2003; Diamond, 2013) have
made a case of considering all of these components as functioning co-dependently and yet
existing as separable constructs. In our research, we use this approach by examining executive
control within the categories of inhibitory control, working memory (WM), and cognitive
flexibility (also called set shifting, mental flexibility, or mental set shifting (Miyake et al., 2000;
Miyake & Friedman, 2012). This framework facilitates comparison of our results to the existing
literature.
Studying literacy skills provides a better understanding of the organisation of cognition.
For instance, learning to read improves the performance of verbal and visual memory (Folia and
14
Kosmidis,2003), generalised executive functions (Barnes, Tager, Satariano & Yaffe,2004),
improved working memory, [See Ardila et al. (2010) for critical review; Silva et al., (2012)].
Within the literature we have reviewed, we have noticed that print exposure/ literacy
seems to have a higher impact on verbal executive function tasks. In general, higher literacy
levels significantly predict performance on visuospatial tasks using a neuropsychological
battery (Ardila & Rosselli, 1989; Manly et al,1999), verbal working memory (Silva et al, 2012,
Folia and Kosmidis, 2003), general executive function tasks (Barnes et al, 2004). No such
association was observed for non-verbal executive function tasks (For instance, Folia and
Kosmidis, (2003) found null results on non-verbal memory tasks). An important limitation of
each of the above studies is that they tap into either a specific cognitive domain that are
independent of each other or tend to club these within a broad umbrella of neuropsychological
batteries (general executive functioning) (Ardila & Rosselli, 1989; Manly et al,1999).
Furthermore, research on bilingualism has shown that bilinguals exhibit an advantage
over monolinguals on tasks of non-verbal executive functions such as the Simon task (Bialystok,
Craik, Klein, & Viswanathan, 2004), Stroop task (Bialystok, Craik, & Luk, 2008) and task-
switching (Prior & Gollan, 2011). There are also reports suggesting that bilingual advantage in
executive function may be very restricted to a particular task as most studies use only a single
measure of executive function and others who have used multiple measures lack convergent
validity (Paap & Greenberg,2013). For a detailed review see section 4.2.1 to 4.2.3.
In terms of inhibitory control, research has shown bilingual advantage on tasks such as
Simon in children, young adults and older people (Martin & Bialystok, 2003; Bialystok, 2006;
Bialystok, Craik, Klein, & Viswanathan, 2004; van der Lubbe & Verleger, 2002), Stroop and
arrow Simon task (Bialystok et al, 2008), attentional network task (Costa, Hernandez &
Sebastian Galles, 2008), antisaccade task (Bunge, Dudukovic, Thomason, Vaidya, & Gabrieli,
2002). On the other hand, some authors [e.g., Kousaie & Phillips (2012)] have not found any
15
significant bilingual advantage in the Stroop, Simon and Flanker task (See section 4.2.2.1 for a
further details).
From the methodological perspective, majority of the studies in literature employ non-
verbal inhibitory control tasks. In our study, we have sought to investigate the impact of print
exposure on inhibitory control using non-verbal inhibitory control tasks (spatial Stroop and
Flanker) in a bi-literate bilingual population incorporating print exposure as an additional
variable. We quantified the performance in spatial Stroop and Flanker task using Stroop effect
and conflict effect respectively.
With respect working memory, the relationship between bilingualism and working
memory is not very clear (Dong et al., 2015). There is not enough evidence to suggest that
bilinguals are at an advantage in tasks such as free recall task (Fernandez et al, 2007), spatial N-
back (Soveri et al, 2011) either. N-back requires online monitoring and updating working
memory (Monk et al, 2011). The N-back task has been extensively used as a measure of working
memory (Monk et al., 2011; Kane et al, 2007; Jaeggi et al, 2010). In our study, we try to explore
the relationship between an extraneous factor (print exposure) and working memory updating
using the N-back task in bi-literate bilinguals. We use D prime (d’) to validate the results of the
N-back task as D prime is less prone to confounding factors such as demographic factors as
compared to digit span and letter-number sequencing (Haatveit et al, 2010).
In relation to task switching, Prior & McWhinney (2010) and Prior & Gollan (2011) have
found that language switching correlates with task switching, contrastively Paap et al (2015)
and Calabria et al (2012) have found no positive correlation between the two switches. We have
sought to investigate whether print exposure might impact switching ability in bi-literate
bilinguals. We have used the non-verbal task switching paradigm by computing the switch costs
described in Prior & McWhinney (2010) to examine whether print exposure could contribute to
task switching ability.
16
In general, it was noted that the relationship between print exposure and executive
function is not particularly well established. Within bilingual research, majority of the tasks
which have shown the impact of bilingualism are non-verbal executive function tasks. Since, we
want to elicit the relationship of print exposure within bilinguals, it was prudent to choose only
non-verbal executive function tasks. We have chosen two tasks in each of the executive function
measures in order to obtain convergent validity [as described in (Paap & Greenberg,2013)],
with the exception of task switching as the task switching paradigm itself tends to incur large
costs, are more difficult and may be more sensitive to group differences (see Monsell, 2003).
1.3 Reading impairments in bi-literate bilingual persons with aphasia (BPWA) (Phase II)
Bilingual aphasia can be defined as an impairment in one or more languages in bilingual
individuals following a brain damage (Kiran & Gray, 2018). In individuals with bilingual aphasia,
one or both languages may be affected and the severity of impairment maybe different in both
languages (Fabbro & Paradis, 1995; Fabbro, 2001). Similarly, different modalities such as
reading and writing maybe impaired differently in the different languages spoken by a
bi/multilingual (Wilson, Kahlaoui & Weekes, 2012). Reading and writing disorders in
individuals with aphasia are relatively under reported (Lorenzen & Murray,2008).
In bi-literate bilingual persons with aphasia (BPWA) measuring the impact of bi-literacy
on oral language production, comprehension and executive functions is complicated by the
presence of language impairments. This makes it impossible to administer BPWA with the same
set of tasks as used in Phase I with bi-literate bilingual healthy adults. Additionally, we have
studied the Indian population in UK in Phase I, and BPWA in Phase II in India speaking the
Indian languages to maintain uniformity. In Phase II we aimed to profile and characterise the
reading impairments within this Indian population. As the population we targeted was bi-
literate bilingual, characterising reading impairments was the only way we could evaluate the
reading skills in a BPWA.
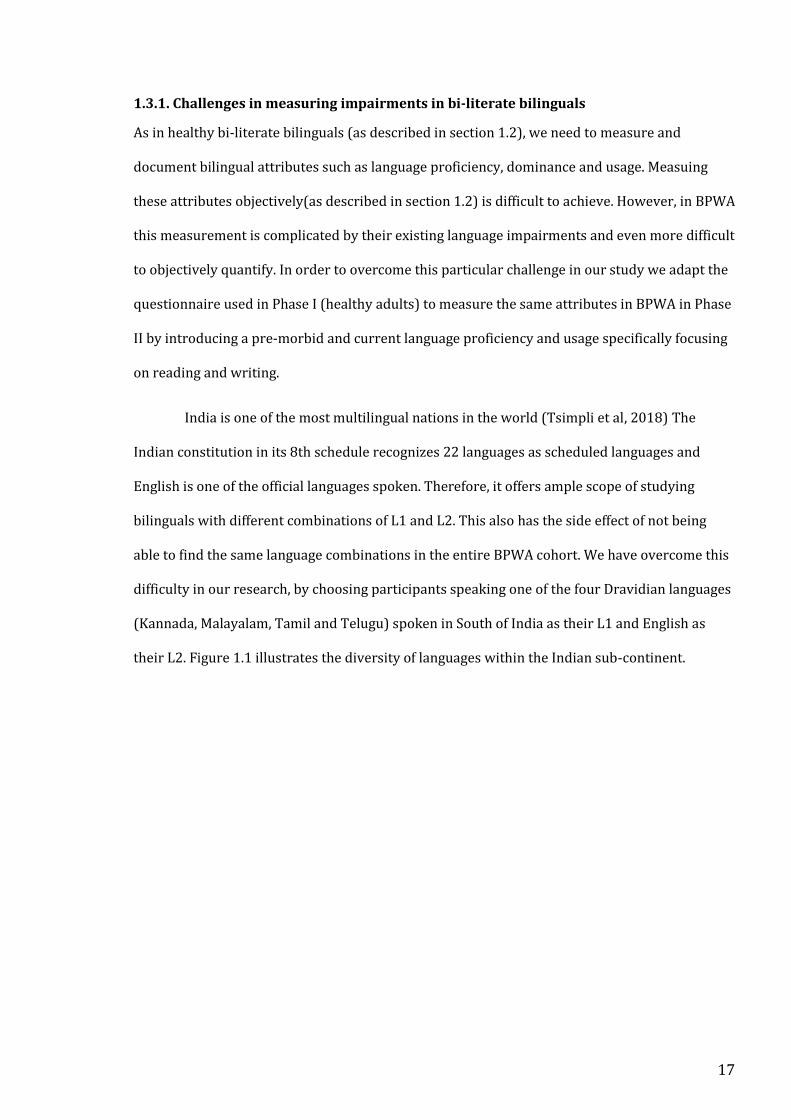
17
1.3.1. Challenges in measuring impairments in bi-literate bilinguals
As in healthy bi-literate bilinguals (as described in section 1.2), we need to measure and
document bilingual attributes such as language proficiency, dominance and usage. Measuing
these attributes objectively(as described in section 1.2) is difficult to achieve. However, in BPWA
this measurement is complicated by their existing language impairments and even more difficult
to objectively quantify. In order to overcome this particular challenge in our study we adapt the
questionnaire used in Phase I (healthy adults) to measure the same attributes in BPWA in Phase
II by introducing a pre-morbid and current language proficiency and usage specifically focusing
on reading and writing.
India is one of the most multilingual nations in the world (Tsimpli et al, 2018) The
Indian constitution in its 8th schedule recognizes 22 languages as scheduled languages and
English is one of the official languages spoken. Therefore, it offers ample scope of studying
bilinguals with different combinations of L1 and L2. This also has the side effect of not being
able to find the same language combinations in the entire BPWA cohort. We have overcome this
difficulty in our research, by choosing participants speaking one of the four Dravidian languages
(Kannada, Malayalam, Tamil and Telugu) spoken in South of India as their L1 and English as
their L2. Figure 1.1 illustrates the diversity of languages within the Indian sub-continent.
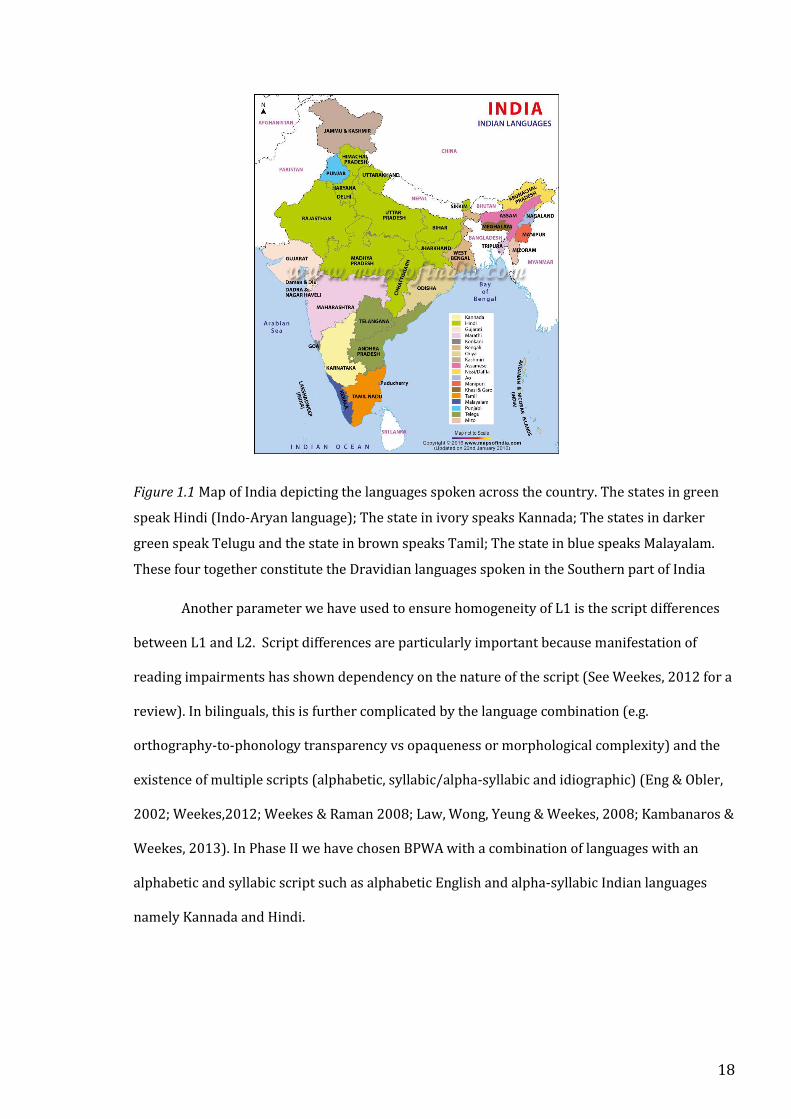
18
Figure 1.1 Map of India depicting the languages spoken across the country. The states in green
speak Hindi (Indo-Aryan language); The state in ivory speaks Kannada; The states in darker
green speak Telugu and the state in brown speaks Tamil; The state in blue speaks Malayalam.
These four together constitute the Dravidian languages spoken in the Southern part of India
Another parameter we have used to ensure homogeneity of L1 is the script differences
between L1 and L2. Script differences are particularly important because manifestation of
reading impairments has shown dependency on the nature of the script (See Weekes, 2012 for a
review). In bilinguals, this is further complicated by the language combination (e.g.
orthography-to-phonology transparency vs opaqueness or morphological complexity) and the
existence of multiple scripts (alphabetic, syllabic/alpha-syllabic and idiographic) (Eng & Obler,
2002; Weekes,2012; Weekes & Raman 2008; Law, Wong, Yeung & Weekes, 2008; Kambanaros &
Weekes, 2013). In Phase II we have chosen BPWA with a combination of languages with an
alphabetic and syllabic script such as alphabetic English and alpha-syllabic Indian languages
namely Kannada and Hindi.
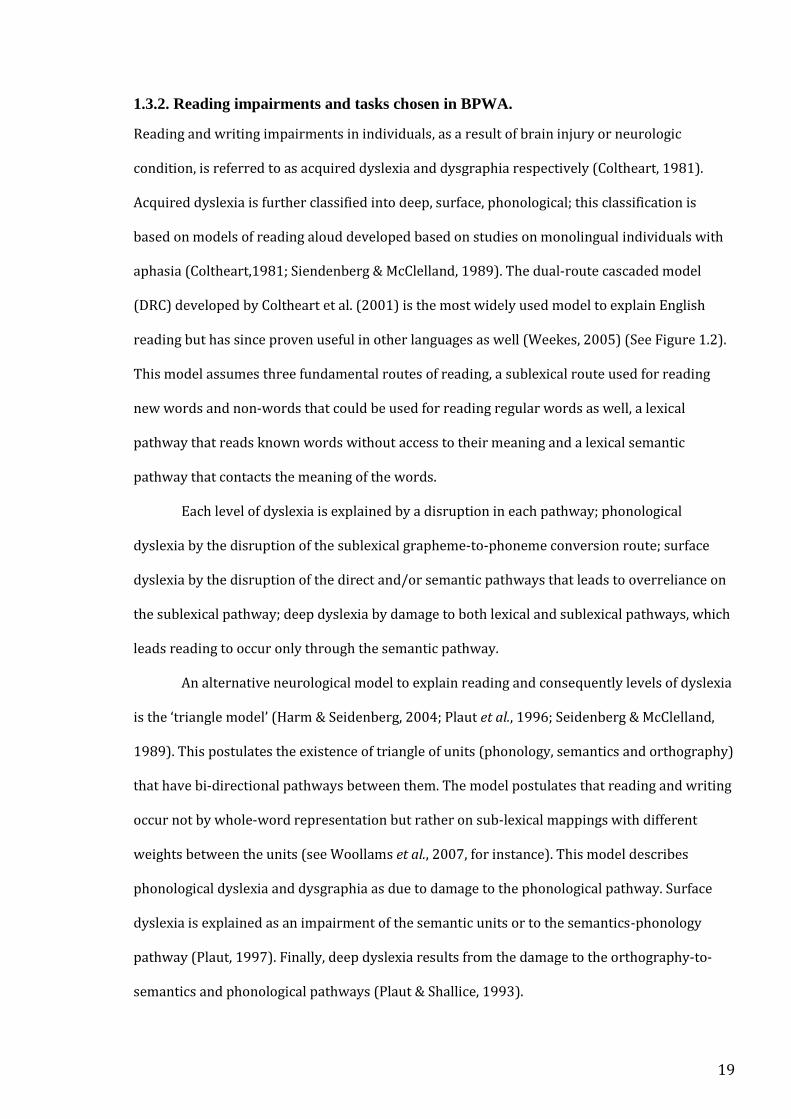
19
1.3.2. Reading impairments and tasks chosen in BPWA.
Reading and writing impairments in individuals, as a result of brain injury or neurologic
condition, is referred to as acquired dyslexia and dysgraphia respectively (Coltheart, 1981).
Acquired dyslexia is further classified into deep, surface, phonological; this classification is
based on models of reading aloud developed based on studies on monolingual individuals with
aphasia (Coltheart,1981; Siendenberg & McClelland, 1989). The dual-route cascaded model
(DRC) developed by Coltheart et al. (2001) is the most widely used model to explain English
reading but has since proven useful in other languages as well (Weekes, 2005) (See Figure 1.2).
This model assumes three fundamental routes of reading, a sublexical route used for reading
new words and non-words that could be used for reading regular words as well, a lexical
pathway that reads known words without access to their meaning and a lexical semantic
pathway that contacts the meaning of the words.
Each level of dyslexia is explained by a disruption in each pathway; phonological
dyslexia by the disruption of the sublexical grapheme-to-phoneme conversion route; surface
dyslexia by the disruption of the direct and/or semantic pathways that leads to overreliance on
the sublexical pathway; deep dyslexia by damage to both lexical and sublexical pathways, which
leads reading to occur only through the semantic pathway.
An alternative neurological model to explain reading and consequently levels of dyslexia
is the ‘triangle model’ (Harm & Seidenberg, 2004; Plaut et al., 1996; Seidenberg & McClelland,
1989). This postulates the existence of triangle of units (phonology, semantics and orthography)
that have bi-directional pathways between them. The model postulates that reading and writing
occur not by whole-word representation but rather on sub-lexical mappings with different
weights between the units (see Woollams et al., 2007, for instance). This model describes
phonological dyslexia and dysgraphia as due to damage to the phonological pathway. Surface
dyslexia is explained as an impairment of the semantic units or to the semantics-phonology
pathway (Plaut, 1997). Finally, deep dyslexia results from the damage to the orthography-to-
semantics and phonological pathways (Plaut & Shallice, 1993).
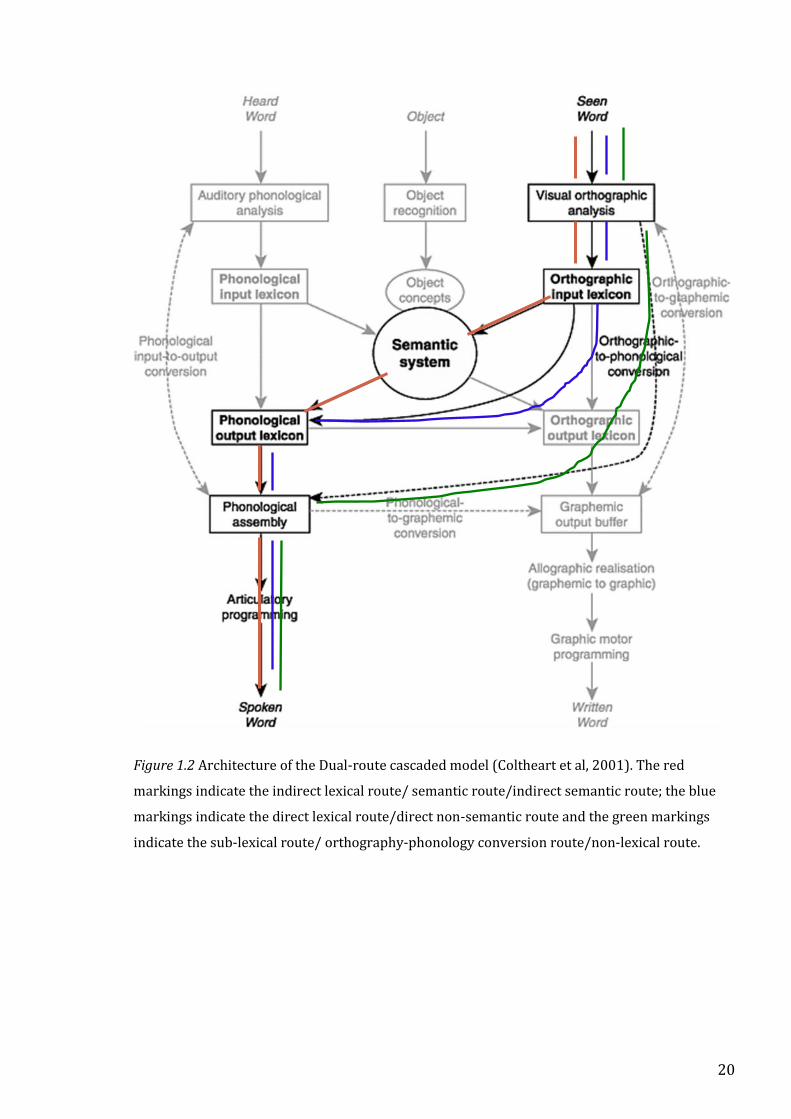
20
Figure 1.2 Architecture of the Dual-route cascaded model (Coltheart et al, 2001). The red
markings indicate the indirect lexical route/ semantic route/indirect semantic route; the blue
markings indicate the direct lexical route/direct non-semantic route and the green markings
indicate the sub-lexical route/ orthography-phonology conversion route/non-lexical route.
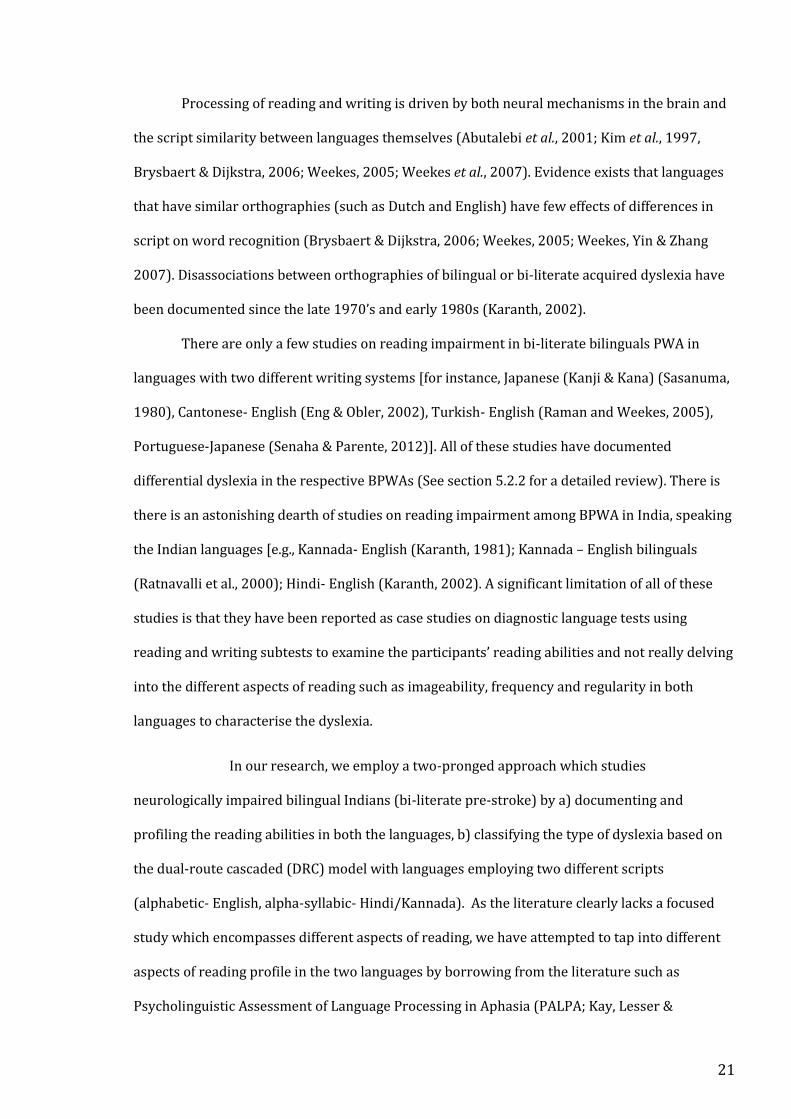
21
Processing of reading and writing is driven by both neural mechanisms in the brain and
the script similarity between languages themselves (Abutalebi et al., 2001; Kim et al., 1997,
Brysbaert & Dijkstra, 2006; Weekes, 2005; Weekes et al., 2007). Evidence exists that languages
that have similar orthographies (such as Dutch and English) have few effects of differences in
script on word recognition (Brysbaert & Dijkstra, 2006; Weekes, 2005; Weekes, Yin & Zhang
2007). Disassociations between orthographies of bilingual or bi-literate acquired dyslexia have
been documented since the late 1970’s and early 1980s (Karanth, 2002).
There are only a few studies on reading impairment in bi-literate bilinguals PWA in
languages with two different writing systems [for instance, Japanese (Kanji & Kana) (Sasanuma,
1980), Cantonese- English (Eng & Obler, 2002), Turkish- English (Raman and Weekes, 2005),
Portuguese-Japanese (Senaha & Parente, 2012)]. All of these studies have documented
differential dyslexia in the respective BPWAs (See section 5.2.2 for a detailed review). There is
there is an astonishing dearth of studies on reading impairment among BPWA in India, speaking
the Indian languages [e.g., Kannada- English (Karanth, 1981); Kannada – English bilinguals
(Ratnavalli et al., 2000); Hindi- English (Karanth, 2002). A significant limitation of all of these
studies is that they have been reported as case studies on diagnostic language tests using
reading and writing subtests to examine the participants’ reading abilities and not really delving
into the different aspects of reading such as imageability, frequency and regularity in both
languages to characterise the dyslexia.
In our research, we employ a two-pronged approach which studies
neurologically impaired bilingual Indians (bi-literate pre-stroke) by a) documenting and
profiling the reading abilities in both the languages, b) classifying the type of dyslexia based on
the dual-route cascaded (DRC) model with languages employing two different scripts
(alphabetic- English, alpha-syllabic- Hindi/Kannada). As the literature clearly lacks a focused
study which encompasses different aspects of reading, we have attempted to tap into different
aspects of reading profile in the two languages by borrowing from the literature such as
Psycholinguistic Assessment of Language Processing in Aphasia (PALPA; Kay, Lesser &
22
Coltheart, 1992) in English, reading subtests from Reading Acquisition Profile (RAP-K; Rao,
1997) in Kannada (used in children and adapted to adults in our study) and words from
Bilingual Aphasia test -Hindi (BAT; Paradis & Libben, 1987). The tasks chosen to characterise
the type of dyslexia were mapped onto the different levels of the DRC model. Letter
discrimination, visual (lexical decision and legality decision) tasks, word and syllable lengths
map onto the visual orthographic analysis and orthographic input lexicon. An effect of spelling
sound regularity can be mapped onto the lexical route. Imageability effects implicate the
semantic system and frequency effects could be attributed to the use of lexical route. The
orthography to phonology conversion is responsible for non-word reading.
Our research focuses on consequences of bi-literacy in bilingual individuals in healthy
and neurologically impaired. Table 1.1 provides a summary of the specific research questions
and methodology of the experimental chapters.
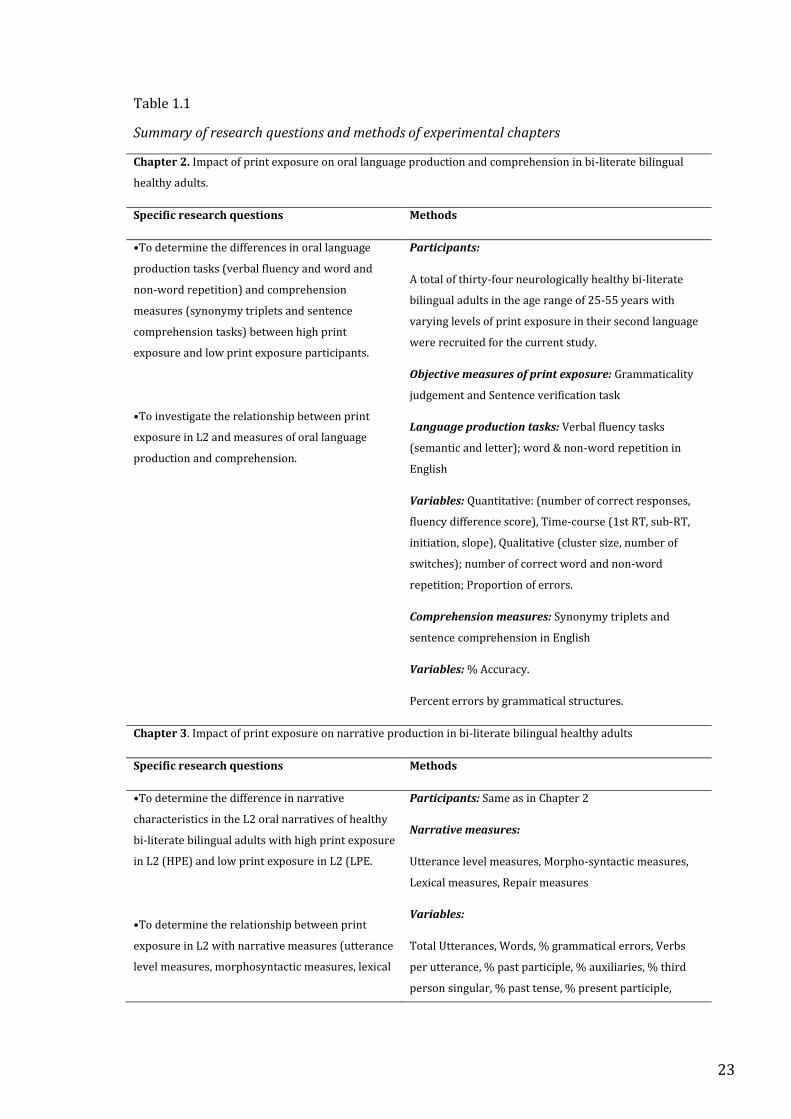
23
Table 1.1
Summary of research questions and methods of experimental chapters
Chapter 2. Impact of print exposure on oral language production and comprehension in bi-literate bilingual
healthy adults.
Specific research questions Methods
•To determine the differences in oral language
production tasks (verbal fluency and word and
non-word repetition) and comprehension
measures (synonymy triplets and sentence
comprehension tasks) between high print
exposure and low print exposure participants.
•To investigate the relationship between print
exposure in L2 and measures of oral language
production and comprehension.
Participants:
A total of thirty-four neurologically healthy bi-literate
bilingual adults in the age range of 25-55 years with
varying levels of print exposure in their second language
were recruited for the current study.
Objective measures of print exposure: Grammaticality
judgement and Sentence verification task
Language production tasks: Verbal fluency tasks
(semantic and letter); word & non-word repetition in
English
Variables: Quantitative: (number of correct responses,
fluency difference score), Time-course (1st RT, sub-RT,
initiation, slope), Qualitative (cluster size, number of
switches); number of correct word and non-word
repetition; Proportion of errors.
Comprehension measures: Synonymy triplets and
sentence comprehension in English
Variables: % Accuracy.
Percent errors by grammatical structures.
Chapter 3. Impact of print exposure on narrative production in bi-literate bilingual healthy adults
Specific research questions Methods
•To determine the difference in narrative
characteristics in the L2 oral narratives of healthy
bi-literate bilingual adults with high print exposure
in L2 (HPE) and low print exposure in L2 (LPE.
•To determine the relationship between print
exposure in L2 with narrative measures (utterance
level measures, morphosyntactic measures, lexical
Participants: Same as in Chapter 2
Narrative measures:
Utterance level measures, Morpho-syntactic measures,
Lexical measures, Repair measures
Variables:
Total Utterances, Words, % grammatical errors, Verbs
per utterance, % past participle, % auxiliaries, % third
person singular, % past tense, % present participle,
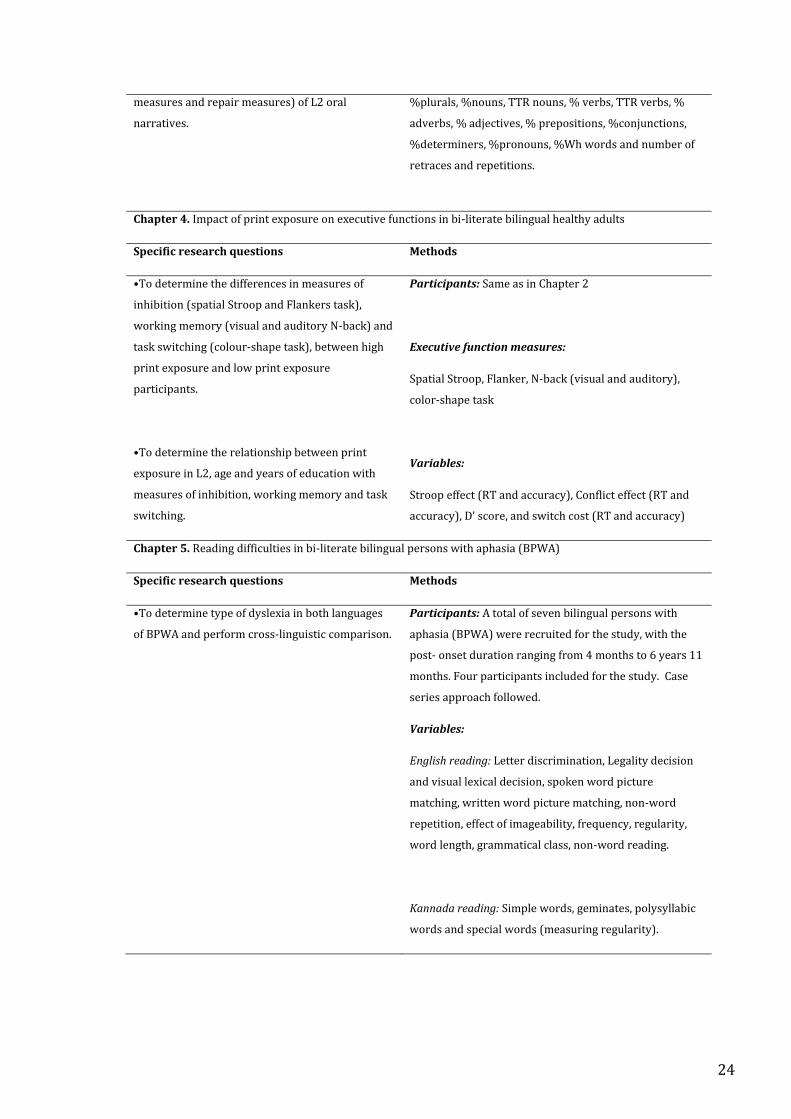
24
measures and repair measures) of L2 oral
narratives.
%plurals, %nouns, TTR nouns, % verbs, TTR verbs, %
adverbs, % adjectives, % prepositions, %conjunctions,
%determiners, %pronouns, %Wh words and number of
retraces and repetitions.
Chapter 4. Impact of print exposure on executive functions in bi-literate bilingual healthy adults
Specific research questions Methods
•To determine the differences in measures of
inhibition (spatial Stroop and Flankers task),
working memory (visual and auditory N-back) and
task switching (colour-shape task), between high
print exposure and low print exposure
participants.
•To determine the relationship between print
exposure in L2, age and years of education with
measures of inhibition, working memory and task
switching.
Participants: Same as in Chapter 2
Executive function measures:
Spatial Stroop, Flanker, N-back (visual and auditory),
color-shape task
Variables:
Stroop effect (RT and accuracy), Conflict effect (RT and
accuracy), D’ score, and switch cost (RT and accuracy)
Chapter 5. Reading difficulties in bi-literate bilingual persons with aphasia (BPWA)
Specific research questions Methods
•To determine type of dyslexia in both languages
of BPWA and perform cross-linguistic comparison.
Participants: A total of seven bilingual persons with
aphasia (BPWA) were recruited for the study, with the
post- onset duration ranging from 4 months to 6 years 11
months. Four participants included for the study. Case
series approach followed.
Variables:
English reading: Letter discrimination, Legality decision
and visual lexical decision, spoken word picture
matching, written word picture matching, non-word
repetition, effect of imageability, frequency, regularity,
word length, grammatical class, non-word reading.
Kannada reading: Simple words, geminates, polysyllabic
words and special words (measuring regularity).

25
In chapters 2-4, we focus on the bi-literate bilingual healthy population and design
experiments to tease apart the consequences in terms of oral language production,
comprehension and executive functions. In chapter 5, we focus on the reading impairments in
bi-literate bilingual persons with aphasia and design experiments to identify how script
differences affect the manifestation of reading impairment in the two languages.
26
Chapter 2 . Impact of print exposure on oral language production and comprehension in
bi-literate bilingual healthy adults
2.1 Abstract
Background. Research has demonstrated that print exposure has an impact on oral language
production and lesser impact on comprehension in monolinguals. On the other hand, studies of
oral language production (such as performance on verbal fluency tasks) in bilingual population
have shown mixed findings when compared to monolinguals without considering print
exposure. Among bilinguals, print exposure in both languages is a further variable adding to the
heterogeneity of the bilingual population. Consequently, the impact of print exposure on oral
language production and comprehension in bi-literate bilingual population remains unknown.
Aim. The aim of this study was to investigate the impact of print exposure on oral language
production and comprehension in bi-literate bilingual speakers with varying levels of print
exposure in L2.
Methods and Procedure Thirty-four bi-literate bilingual participants were divided into a high
print exposure and a low print exposure group based on their performance on print exposure.
The groups were matched on years of education, age and gender. We compared the performance
of these participants on a set of oral language production tasks namely semantic fluency and
letter fluency task, word and non-word repetition; comprehension tasks namely synonymy
triplets task and sentence comprehension task. We quantified the performance on verbal
fluency in terms of quantitative (number of correct, fluency difference score); time course (First-
RT, Subsequent-RT, Initiation parameter and slope and qualitatively (cluster size and number of
switches). For the word and non-word repetition we quantified the performance in terms of
number of correct and difference score. For the comprehension measures, we used number of
correct and error analysis.
Findings. The key findings are that there were no group differences on measures of verbal
fluency and overall accuracy for word and non-word repetition tasks. However, the error
analyses on word and non-word repetition task showed similar pattern of errors for both
groups on word repetition but a higher percentage of errors on low imageability items for LPE.
27
In addition, few variables (e.g., semantic fluency (CR), number of switches, non-word repetition)
showed a significant positive correlation with print exposure and years of education. In contrast,
the semantic comprehension measures showed significant group differences and significant
positive correlations with measures of print exposure.
Conclusions and Implications. This is a first-of -its-kind study that takes into account print
exposure in oral language production task and comprehension in bi-literate bilingual adults.
Contrary to expectation, there was a significant impact of print exposure on semantic
comprehension measures and none on oral language production measures.
28
2.2 Introduction
Research till date indicates that literacy has a significant impact on oral language skills (Ardila et
al., 2010), cognitive processing (Barnes et al 2004) and a lesser impact on semantic
comprehension (Kosmidis, Tsapkini, Folia, Vlahou, & Kiosseoglou, 2004) in monolingual adults.
Studies to date in this field have compared i) illiterates vs. literates; and ii) groups of individuals
with varying levels of education; but have focused on monolingual populations. Studies of oral
language production in bilingual population have shown mixed findings when compared to
monolinguals (Bialystok et al., 2008; Luo et al., 2010; Paap et al., 2017; Sandoval et al., 2010).
Studies by Gollan et al., (2002), Rosselli et al., (2000) and Sandoval et al., (2010) show that
monolinguals produced higher number of correct responses in semantic fluency tasks. On the
contrary, it is established that bilinguals are at a disadvantage in tasks involving language
processing such as vocabulary measures, picture naming etc (Bialystok & Luk, 2012; Ivanova &
Costa, 2005). (Further details in 2.2.4)
Among bilinguals, literacy is a further variable adding to the heterogeneity of the
bilingual population. A bi- literate bilingual is an individual who can read, write, understand and
speak more than one language (Ng, 2015). As with bilingualism, the degree of bi-literacy will
vary amongst individuals. Interest in bi-literacy has emerged only recently; it’s effect on
linguistic and cognitive performance remains largely unknown (Reyes, 2012). Literacy is
sometimes referred to as the acquisition of reading and writing (eg., Bialystok, Luk & Kwan,
2005; Reyes, 2012) and sometimes measured based on level of education, schooling or text
exposure (Kosmidis et al, 2006; Silva et al, 2012; Cunningham and Stanovich, 1991). For this
research, we use the term ‘print exposure’ as a proxy for ‘literacy’. We define print exposure as
the quantitative measure of literacy derived from the use of print material in one language. This
incorporates the advantages of different literacy measures. We measure print exposure
subjectively by using self-reported ratings of frequency of reading in each language, proficiency
of reading and writing in different contexts of a bilingual healthy adult. Print exposure is
measured objectively by using a grammaticality judgement task and sentence verification task.
29
In this chapter we will discuss our methods and results of exploring the impact of print
exposure on oral language production and comprehension within a bi-literate bilingual
population. Within this introduction we review the literature of impact of print exposure on oral
language production (2.2.1), impact of print exposure on comprehension (2.2.3), oral language
production and comprehension in the bilingual population (2.2.4), measuring print exposure
and bilingual status (2.2.5) and gaps in the literature (2.2.6). We then present the overarching
goal derived from our investigations of literature (2.3). We present the methods used in our
study starting with discussing the participant profile (2.4.1), our methods for measuring
language proficiency, dominance and print exposure (2.4.2), the experimental measures used
(2.4.3) for oral language production (2.4.4 & 2.4.5) and comprehension (2.4.6). We discuss the
statistical analyses used (2.5) and the results in the same order as the methods (2.6). Finally, we
discuss the results in 2.7.
2.2.1 Impact of print exposure on oral language production tasks
Research has shown that print exposure and reading ability contribute to differences in lexical
and syntactic language production measures such as verbal fluency (Ardila et al 2010; Kosmidis,
Tsapkini, Folia, Vlahou, & Kiosseoglou, 2004), non-word repetition (Kosmidis, Tsapkini, Folia,
2006) in monolingual healthy adults. Kosmidis et al (2004) used semantic fluency and letter
fluency task in the Greek language where illiterates performed comparably to low literates on
semantic fluency task; whereas illiterates performed poorer than low literates on letter fluency.
Kosmidis, Tsapkini & Folia (2006) found that there was no difference on the word repetition
across illiterates, low education and high education groups, however on the non-word repetition
task the illiterates performed poorer than the other two groups of literates suggesting a literacy
effect However, most of the research on these relationships has occurred in the monolingual
population. Little is known about the relationship between print exposure and oral language
production in bilingual adults. Understanding this relationship becomes relevant in the context
of growing bi-literate bilingual population in the world. However, there are a few studies
examining the relationship between print exposure and oral language production in bilingual
30
children. Therefore, we focus on reviewing the studies with monolingual populations and
bilingual children exploring the relationship between print exposure and several oral language
production tasks.
Katz et al (2012) examined the performance of a lexical decision task and a naming task
to predict reading skills (using decoding, sight word recognition, fluency, vocabulary and
comprehension) and speech factors closely related to reading i.e., phonological awareness and
rapid naming. This study recruited a cohort of 99 college students with varying reading abilities.
In this study, the lexical decision tasks highlight the cognitive processes used in identifying
printed text. It was hypothesised that the performance on the lexical decision task would reflect
the levels of print exposure. Reading ability was measured using the following tests- the
Woodcock-Johnson III Diagnostic Reading Battery (WJ, Woodcock, Mather, & Schrank, 2004),
the Test of Word Reading Efficiency, Form A (TOWRE; Torgesen, Wagner, & Rashotte, 1999) and
the Gray Oral Reading Test-4, Form A (GORT, 2001). Vocabulary size was measured using the
Peabody Picture Vocabulary Test, Form A (PPVT; Dunn & Dunn, 2007) and subtests from the
Woodcock-Johnson Diagnostic Reading Battery (WJ) (Woodcock, Mather & Schrank, 2004) and
the Weschler Abbreviated Scale of Intelligence (WASI) (Weschler, 1999). Findings suggested
that participants with larger vocabularies had lower reaction times on lexical decision task;
however, this correlation was not very strong (r<0.5). The interpretation of this finding is that,
higher print exposure would naturally increase vocabulary size. The major limitation of this
study is lack of use of a standardised tool such as LexTale (Lemhöfer, & Broersma, 2012) which
prevents easy comparison with other similar studies.
Cunningham and Stanovich (1991) investigated the impact of print exposure on verbal
fluency and vocabulary. This study recruited children from fourth, fifth and sixth grades with
cohort sizes of 34, 33 and 67 children in each grade respectively. A modified version of the Title
recognition Test (Stanovich & West, 1989) was used as a proxy to measure print exposure. The
Title recognition test consisted of 39 items in total of which 25 were genuine book titles and 14
31
foils for titles. The titles were chosen to be books outside the curriculum to probe reading
outside the classroom. Children were asked to read the list of titles and mark the titles they
identified as books. Within their cohort, children were divided into high print exposure group
(high Title recognition score) and low print exposure group (low Title recognition score) based
on a median spilt of the scores. As a next step, the low print exposure from each cohort were
combined to form a larger set of low print exposure cohort (low Title recognition score) and
similarly for the high print exposure group (high Title recognition score). The results revealed
that Title recognition test was significantly correlated to measures of verbal fluency and
vocabulary (as measured by the Peabody Picture Vocabulary Test – Revised (Dunn & Dunn,
1981)). This suggests that Title recognition test predicts both verbal fluency and vocabulary.
The limitations of the study are firstly the Title recognition test requires a tailor-made set of
items for each school making it difficult to generalise and use it as a standard tool in research.
Secondly, while the Title recognition test may have been a good measure of print exposure then
(early 90s), it does not account for the gamut of print resources available in the present day (e.g.
online resources, e-books etc). Finally, to adapt this to adults is still more challenging
considering the range of print resources used by adults such as books, online resources,
newspapers and academic reading material.
Montag and MacDonald (2015) examined the effects of print exposure on spoken
language production using the frequency of relative clauses in child-directed speech and
children’s literature in a corpus analyses and a picture description task. The written corpus
yielded higher number of passives compared to objective-relative clauses. Consequently, in the
written corpus analyses the study infers that children with higher print exposure experience
passive constructions more frequently. In the picture description part of the study- 30
undergraduate students, 30 eight-year olds and 30 twelve years olds were tested. Print
exposure was measured differently for adults and children. For adults they used the Author
Recognition Task (Acheson, Wells and MacDonald, 2008); and for children, a modified version of
the Title Recognition Test (Cunningham and Stanovich, 1991) was used. For the three groups a
32
picture description task was used to elicit object and passive relative clauses. Results showed
text exposure and age predicted production choices; older individuals and those with higher
rates of text exposure produced more passive constructions. The authors conclude that print
exposure can impact spoken production.
In monolingual adults, the focus of research has been to understand the relationship
between print exposure and oral language production tasks mainly comparing illiterates and
literates, and literates with different levels of education or informal screening of literacy levels.
da Silva et al., (2004) examined a population of monolingual adults to investigate
whether education affects the qualitative aspects of verbal fluency. Their participants were 37
females split into two groups – 19 literates and 18 illiterates. They were administered a category
fluency task for concrete (supermarket items) and less concrete (animals) categories. Print
exposure (literacy) was measured using a combination of letter identification task, a reading
comprehension task and a writing of words. They found that illiterates performed on par with
the literates on the category fluency task for categories which were more concrete (such as
supermarket items-edible things which have more sensori-motor realisations, hence considered
more concrete), but for less concrete (such as animals) there was a difference in performance
between the illiterates and literates. Two additional results of this study were, that firstly there
was a significant difference in the number of switches between the two groups, literates having
more switches, secondly the illiterates tended to produce larger clusters even though the mean
cluster size was not significantly different. The poor performance of illiterates on these tasks
was attributed to the over reliance on semantic processing due to an inadequacy in phonological
processing. This difference in grapheme-phoneme correspondence between the two groups
results in a disadvantage in illiterates specifically on the tasks of phonological processing such
as word repetition, non-word repetition and letter fluency that are found in other studies
(Castro-Caldas, Petersson, Reis, Stone-Elander, & Ingvar, 1998; Kosmidis, Tsapkini, & Folia,
2006; Reis & Castro-Caldas, 1997). This is a significant limitation of this study, where the
33
authors have not examined letter fluency that taps into the phonological processing. In our
study, we aim to quantify this effect (print exposure/literacy on oral language production) using
both measures of verbal fluency- letter and semantic fluency. We have incorporated different
analysis techniques such as quantitative (number of correct), qualitative (clustering and
switching) and time course analyses.
Petersson et al, (2000) compared Positron Emission Tomography (PET) images of 3
literate and 3 illiterate adults undertaking a simple, auditory verbal repetition task. The task
included word and pseudo-word items. Results showed the illiterate group used neural
interactions differently across words / pseudo-words whereas there were no significant
differences for the literate group. Differences between the two groups were not significant for
words, however there were differences for pseudo-words. The authors concluded that
acquisition of orthographic language skills modulates auditory verbal language networks in the
human brain.
Manly et al (1999) examined the effects of print exposure using a neuropsychological
test battery in adults over 65 years with 0- 3 years of education. A total of 251 participants were
recruited for this study. The tasks administered (that are relevant to the current chapter) were
naming [using Boston naming test (Kaplan et al., 1983)], letter fluency and category fluency
(animals, food and clothing). Print exposure was documented by self-report. The findings
suggest that illiterates performed poorer than literates on naming and letter fluency task.
Consequently, no significant differences were noted on the category fluency task. The authors
suggest that the difference in performance on naming could be because the drawings were
ambiguous or less recognisable by the illiterate cohort. Correspondingly, in the letter fluency
task the difference may be due to the fact that the illiterates being unaware of phoneme-
grapheme correspondence. The findings of category fluency were in-line with previous research
by Reis and Castro-Caldas (1997) and da Silva et al (2004). A severe drawback of this study was
that print exposure was measured subjectively and not objectively measured using a tool. The
34
current understanding is that a combination of both objective and subjective measures would be
more effective than using any measure alone(Luk & Bialystok, 2013) in assessing these
measures.
Some researchers have used different levels of education to differentiate among
literates. Kosmidis et al., (2004) investigated the distinction between processing information in
semantic fluency and letter fluency task in the Greek language. The demographics of this study
consisted of 19 illiterate women (mean age: 71.95 years) and another age-matched group of 20
women who had attended school from 1-9 years. The third group of 21 women who had
progressed beyond the basic level of education i.e., greater than 10 years. This naturally split the
participant cohort into illiterate, low literate (low education) and high literate (high education),
They administered the semantic fluency task (animals, fruits, objects) and letter fluency task
(chi, sigma, alpha) in Greek and carried out a cluster analysis. It was observed that illiterates
performed comparably to low literates (clusters of same size) on semantic fluency task whereas
in letter fluency illiterates performed poorer than lower literates. Therefore, literacy seems to
have the most impact on tasks of phonological processing even when controlled for years of
education.
Kosmidis, Tsapkini & Folia (2006) studied the lexical decision and word and non-word
repetition for measuring the effect of literacy/ education on lexical processing in Greek. The
participant cohort was the same as Kosmidis et al (2004). The stimuli for repetition task
consisted of real words and non-words which were read in a mixed order. Scoring was done
based on the number of correctly repeated words and non-words. The same stimuli were used
for lexical decision task where the participants had to judge whether the presented stimuli were
a word or not. They found that there was no difference on the word repetition across illiterates,
low education and high education groups, however on the non-word repetition task the
illiterates performed poorer than the other two groups of literates suggesting a literacy effect
for non-word repetition. This reduced performance of illiterates on non-word repetition was
35
attributed to the illiterates lacking knowledge of grapheme-phoneme correspondence, therefore
resorting to semantic information to process the auditory stimuli (Castro-Caldas et al., 1998).
For the lexical decision task, there was a gradation in performance of the three groups with the
high education group performing better than the low education group and the illiterate group’s
performance being the poorest among the three groups. This suggests that there was a distinct
education effect observed on lexical processing.
A study by Ratcliff et al (1998) claimed that literacy is a crucial factor for phonemic
processing. They used education level as a marker for literacy. They administered a semantic
fluency (animals and fruits) and Letter fluency (P&S) task on three groups of adults aged 34-35
years (Hindi speaking monolinguals). The groups consisted of 30 participants with no formal
education) 30 participants with 5 years of education and 30 participant 10 years of education.
They found a main effect of task (category scores > letter fluency score) and main effect of level
of education (higher education participants performed better). There was also a greater effect of
education on the letter fluency task. The authors posit that due to sensitivity of letter fluency
scores to the level of literacy, the letter fluency task is an important task to be included when
measuring the impact of literacy. Not all tasks that measure a given cognitive function such as
verbal fluency are equivalent. The factors limiting performance are presumably different for
different population dynamics. Consequently, measures of letter fluency from studies such as
Ratcliff et al (1998) form the baseline for a given population. Similarly, our current study could
form the baseline for Indian diasporic bi-literate bilingual population.
In sum, there seems to be a discrepancy in how print exposure is measured and
documented. Every measure has advantages as well as disadvantages. Some researchers have
used education level as a marker for categorizing literates as high vs. low literates (Ratcliff et al.,
1998; Kosmidis et al., 2004) while others have used literacy levels as a marker in literates
showing that high literates perform better than low literates on oral language production tasks
(non-word repetition, verbal fluency) (Kosmidis et al., 2004 & Kosmidis et al., 2006) or literacy
36
tertiles based on performance on a literacy task (reading words) where literacy was associated
with better cognitive function (Barnes, Tager, Satariano & Yaffe, 2004). These authors tested a
continuum of participants from illiterates to high literates (prolific readers with advance
vocabularies) on North American Adult Reading Test (NAART), word reading with irregular
spellings. Weiss et al (1995) used reading level as measured by a bilingual measure of reading
comprehension and found it to be more related to MMSE scores than years of education, age or
ethnicity. Studies on bi-literacy acquisition, have used literacy instruction to measure print
exposure (Proctor et al ,2005; Bialystok, Luk and Kwan, 2009).
From the methodological perspective, measurement of print exposure using measures
such as Title recognition test has its limitations and a more robust measurement tool for print
exposure is necessary. Moreover, none of the above-mentioned techniques can be directly
applied to measure print exposure in bi-literate bilingual adults as these does not account for
the gamut of print resources available in the present day (e.g. online resources, e-books etc).
Finally, to adapt this to adults is still more challenging considering the range of print resources
used by adults such as books, online resources, newspapers and academic reading material.
Drawing upon the literature, we have addressed the issue of measuring print exposure
in bi-literate bilingual adults in this research by measuring print exposure in both languages of
bi-literates using a subjective rating scale of reading and writing in both L1 and L2.
Consequently, we have also used two objective measures for measuring print exposure in L2
namely, grammaticality judgment task and sentence verification task. With these measures we
strive to improve the preciseness of measuring print exposure (literacy).
Furthermore, print exposure seems to predict well measures such as verbal fluency,
word and non-word repetition, syntactic verbal output and comprehension abilities to some
extent. However, it is not clear whether the same relationship exists in the bi-literate bilingual
adult population. An important part of studying language production requires us to understand
how individuals integrate current input with prior knowledge to evolve a mental representation
37
(Birren and Schaie, 2006). Therefore, for measuring oral language production, we will use
verbal fluency measures (semantic and letter fluency) adapted from Patra, Bose & Marinis (2018)
and word and non-word repetition task from Psycholinguistic assessment of language
processing in aphasia (PALPA, Kay, Lesser & Coltheart, 1992).
2.2.3. Impact of print exposure on language comprehension
Reis and Castro-Caldas (1997) discuss a three-path language processing which include semantic,
lexical and phonological strategies believed to be functioning in parallel. Processing of semantic
information is considered to be innate whereas the phonological information is explicitly
learned through acquiring phoneme-grapheme correspondence. The authors state that literates
have access to both lexico-semantic and phonological pathways in contrast to illiterates who
have no access or limited to the phonological pathway. Thus, illiterates have a deficit in
phonological processing (Manly et al., 1999; Morais, Cary, Alegria, & Bertelson, 1979).
Therefore, they tend to rely on semantic processing strategies alone. There have been reports in
the past suggesting that literacy has a lesser impact on semantic tasks as semantic ability is an
innate ability and it is not affected by education (Kosmidis et al., 2004).
One study by Manly et al (1999) examined the effects of print exposure on auditory
comprehension in adults over 65 years with 0- 3 years of education. A total of 251 participants
were recruited for this study. They administered an auditory comprehension task using first six
items of the Complex Ideational Material subtest of the BDAE (Goodglass & Kaplan, 1983). They
found significant print exposure related differences (literates better than illiterates) on the
BDAE Comprehension subtest. They relate the findings to literacy acquisition in children, where
preliterate children have difficulty understanding reversible sentences (Scribner & Cole, 1981).
Such reversible sentences have been used in The BDAE Complex Ideational Material subtest
(e.g., “Do two pounds of sugar weigh more than one?”) which adult illiterates also have
problems interpreting (Lecours et al., 1987; Rosselli et al., 1990). They attribute the poor
performance of the illiterates to lack of exposure to written language. This exposure in literates
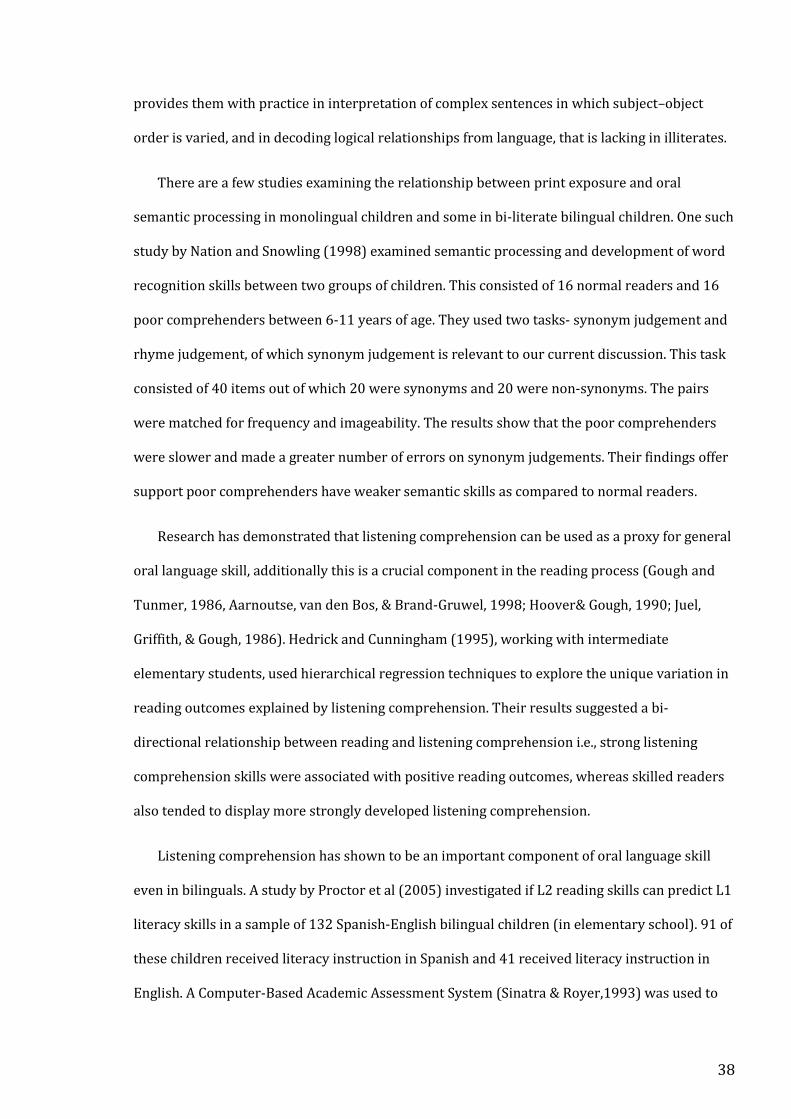
38
provides them with practice in interpretation of complex sentences in which subject–object
order is varied, and in decoding logical relationships from language, that is lacking in illiterates.
There are a few studies examining the relationship between print exposure and oral
semantic processing in monolingual children and some in bi-literate bilingual children. One such
study by Nation and Snowling (1998) examined semantic processing and development of word
recognition skills between two groups of children. This consisted of 16 normal readers and 16
poor comprehenders between 6-11 years of age. They used two tasks- synonym judgement and
rhyme judgement, of which synonym judgement is relevant to our current discussion. This task
consisted of 40 items out of which 20 were synonyms and 20 were non-synonyms. The pairs
were matched for frequency and imageability. The results show that the poor comprehenders
were slower and made a greater number of errors on synonym judgements. Their findings offer
support poor comprehenders have weaker semantic skills as compared to normal readers.
Research has demonstrated that listening comprehension can be used as a proxy for general
oral language skill, additionally this is a crucial component in the reading process (Gough and
Tunmer, 1986, Aarnoutse, van den Bos, & Brand-Gruwel, 1998; Hoover& Gough, 1990; Juel,
Griffith, & Gough, 1986). Hedrick and Cunningham (1995), working with intermediate
elementary students, used hierarchical regression techniques to explore the unique variation in
reading outcomes explained by listening comprehension. Their results suggested a bi-
directional relationship between reading and listening comprehension i.e., strong listening
comprehension skills were associated with positive reading outcomes, whereas skilled readers
also tended to display more strongly developed listening comprehension.
Listening comprehension has shown to be an important component of oral language skill
even in bilinguals. A study by Proctor et al (2005) investigated if L2 reading skills can predict L1
literacy skills in a sample of 132 Spanish-English bilingual children (in elementary school). 91 of
these children received literacy instruction in Spanish and 41 received literacy instruction in
English. A Computer-Based Academic Assessment System (Sinatra & Royer,1993) was used to
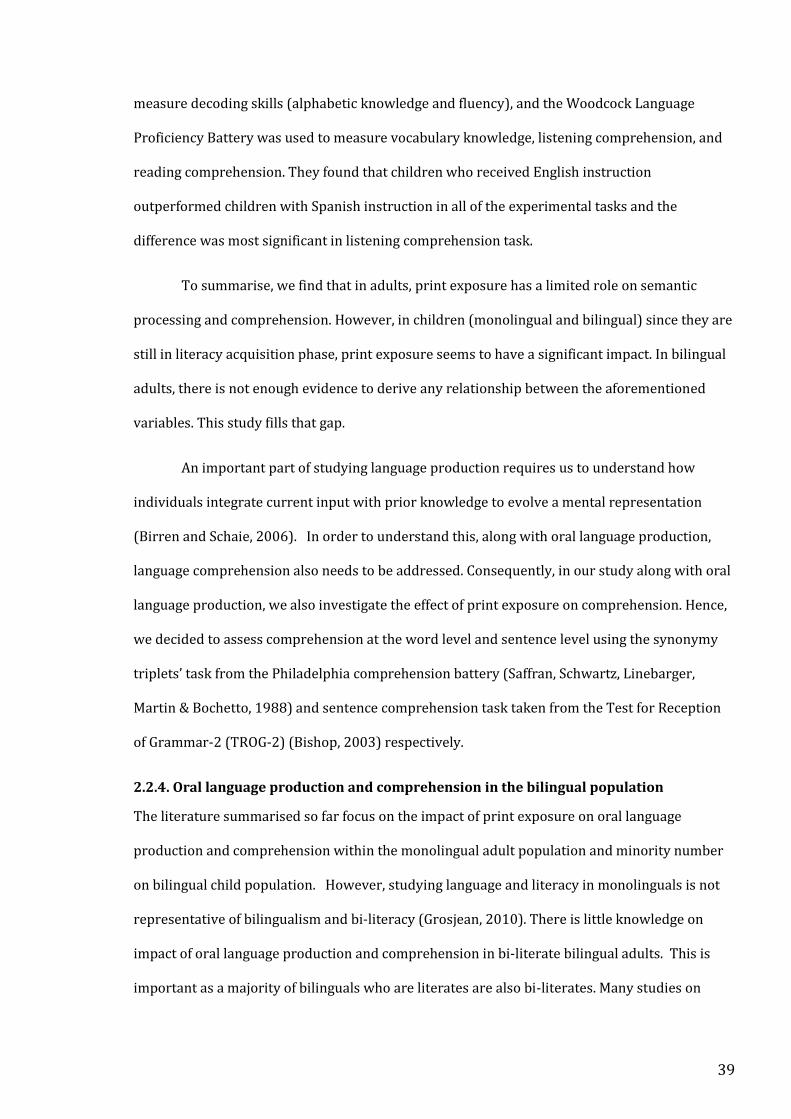
39
measure decoding skills (alphabetic knowledge and fluency), and the Woodcock Language
Proficiency Battery was used to measure vocabulary knowledge, listening comprehension, and
reading comprehension. They found that children who received English instruction
outperformed children with Spanish instruction in all of the experimental tasks and the
difference was most significant in listening comprehension task.
To summarise, we find that in adults, print exposure has a limited role on semantic
processing and comprehension. However, in children (monolingual and bilingual) since they are
still in literacy acquisition phase, print exposure seems to have a significant impact. In bilingual
adults, there is not enough evidence to derive any relationship between the aforementioned
variables. This study fills that gap.
An important part of studying language production requires us to understand how
individuals integrate current input with prior knowledge to evolve a mental representation
(Birren and Schaie, 2006). In order to understand this, along with oral language production,
language comprehension also needs to be addressed. Consequently, in our study along with oral
language production, we also investigate the effect of print exposure on comprehension. Hence,
we decided to assess comprehension at the word level and sentence level using the synonymy
triplets’ task from the Philadelphia comprehension battery (Saffran, Schwartz, Linebarger,
Martin & Bochetto, 1988) and sentence comprehension task taken from the Test for Reception
of Grammar-2 (TROG-2) (Bishop, 2003) respectively.
2.2.4. Oral language production and comprehension in the bilingual population
The literature summarised so far focus on the impact of print exposure on oral language
production and comprehension within the monolingual adult population and minority number
on bilingual child population. However, studying language and literacy in monolinguals is not
representative of bilingualism and bi-literacy (Grosjean, 2010). There is little knowledge on
impact of oral language production and comprehension in bi-literate bilingual adults. This is
important as a majority of bilinguals who are literates are also bi-literates. Many studies on
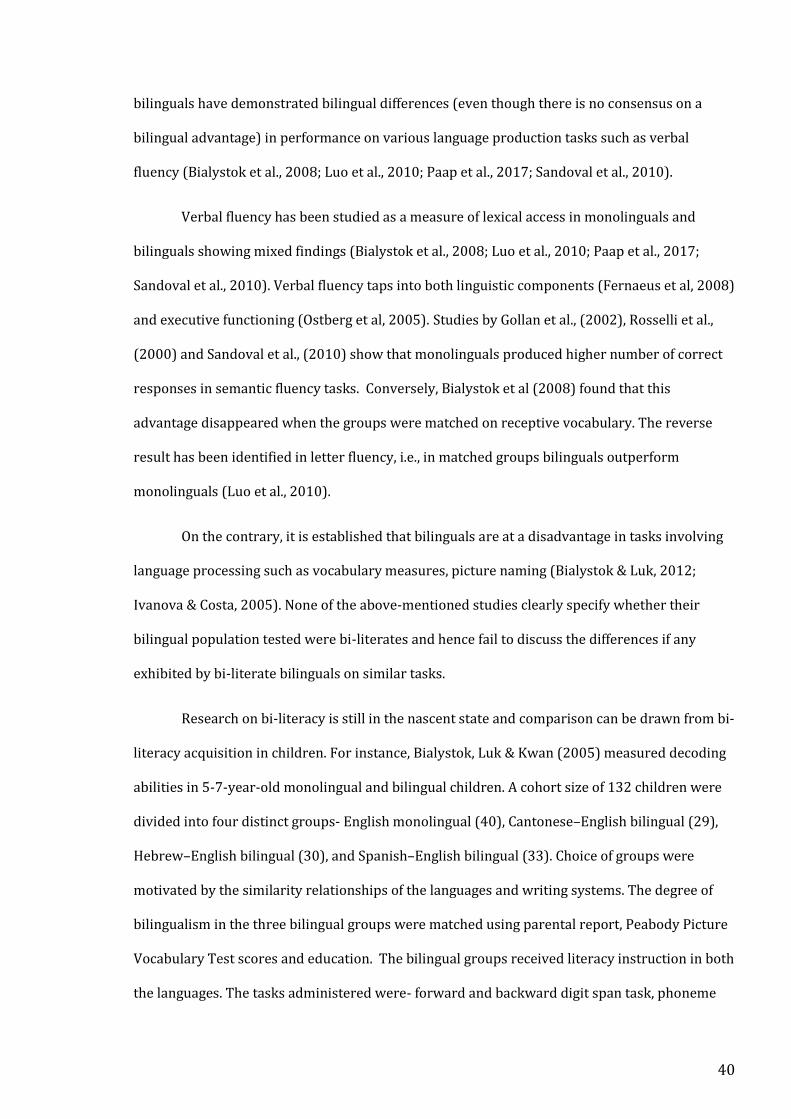
40
bilinguals have demonstrated bilingual differences (even though there is no consensus on a
bilingual advantage) in performance on various language production tasks such as verbal
fluency (Bialystok et al., 2008; Luo et al., 2010; Paap et al., 2017; Sandoval et al., 2010).
Verbal fluency has been studied as a measure of lexical access in monolinguals and
bilinguals showing mixed findings (Bialystok et al., 2008; Luo et al., 2010; Paap et al., 2017;
Sandoval et al., 2010). Verbal fluency taps into both linguistic components (Fernaeus et al, 2008)
and executive functioning (Ostberg et al, 2005). Studies by Gollan et al., (2002), Rosselli et al.,
(2000) and Sandoval et al., (2010) show that monolinguals produced higher number of correct
responses in semantic fluency tasks. Conversely, Bialystok et al (2008) found that this
advantage disappeared when the groups were matched on receptive vocabulary. The reverse
result has been identified in letter fluency, i.e., in matched groups bilinguals outperform
monolinguals (Luo et al., 2010).
On the contrary, it is established that bilinguals are at a disadvantage in tasks involving
language processing such as vocabulary measures, picture naming (Bialystok & Luk, 2012;
Ivanova & Costa, 2005). None of the above-mentioned studies clearly specify whether their
bilingual population tested were bi-literates and hence fail to discuss the differences if any
exhibited by bi-literate bilinguals on similar tasks.
Research on bi-literacy is still in the nascent state and comparison can be drawn from bi-
literacy acquisition in children. For instance, Bialystok, Luk & Kwan (2005) measured decoding
abilities in 5-7-year-old monolingual and bilingual children. A cohort size of 132 children were
divided into four distinct groups- English monolingual (40), Cantonese–English bilingual (29),
Hebrew–English bilingual (30), and Spanish–English bilingual (33). Choice of groups were
motivated by the similarity relationships of the languages and writing systems. The degree of
bilingualism in the three bilingual groups were matched using parental report, Peabody Picture
Vocabulary Test scores and education. The bilingual groups received literacy instruction in both
the languages. The tasks administered were- forward and backward digit span task, phoneme
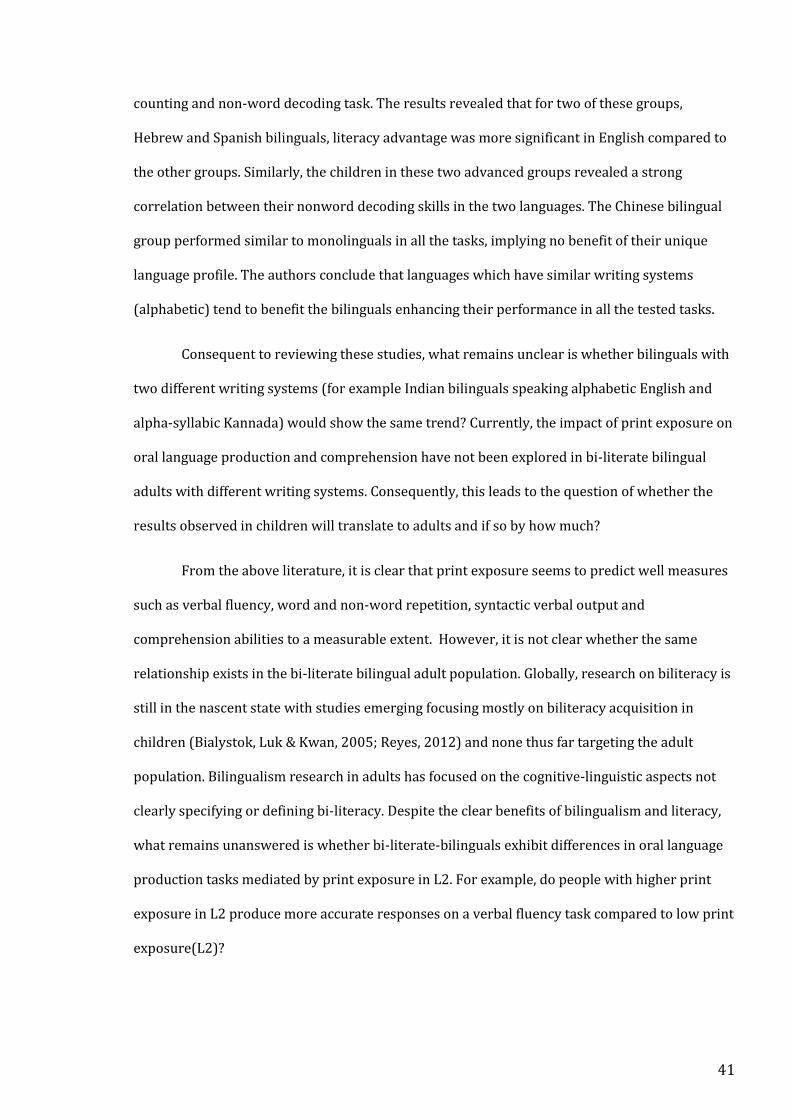
41
counting and non-word decoding task. The results revealed that for two of these groups,
Hebrew and Spanish bilinguals, literacy advantage was more significant in English compared to
the other groups. Similarly, the children in these two advanced groups revealed a strong
correlation between their nonword decoding skills in the two languages. The Chinese bilingual
group performed similar to monolinguals in all the tasks, implying no benefit of their unique
language profile. The authors conclude that languages which have similar writing systems
(alphabetic) tend to benefit the bilinguals enhancing their performance in all the tested tasks.
Consequent to reviewing these studies, what remains unclear is whether bilinguals with
two different writing systems (for example Indian bilinguals speaking alphabetic English and
alpha-syllabic Kannada) would show the same trend? Currently, the impact of print exposure on
oral language production and comprehension have not been explored in bi-literate bilingual
adults with different writing systems. Consequently, this leads to the question of whether the
results observed in children will translate to adults and if so by how much?
From the above literature, it is clear that print exposure seems to predict well measures
such as verbal fluency, word and non-word repetition, syntactic verbal output and
comprehension abilities to a measurable extent. However, it is not clear whether the same
relationship exists in the bi-literate bilingual adult population. Globally, research on biliteracy is
still in the nascent state with studies emerging focusing mostly on biliteracy acquisition in
children (Bialystok, Luk & Kwan, 2005; Reyes, 2012) and none thus far targeting the adult
population. Bilingualism research in adults has focused on the cognitive-linguistic aspects not
clearly specifying or defining bi-literacy. Despite the clear benefits of bilingualism and literacy,
what remains unanswered is whether bi-literate-bilinguals exhibit differences in oral language
production tasks mediated by print exposure in L2. For example, do people with higher print
exposure in L2 produce more accurate responses on a verbal fluency task compared to low print
exposure(L2)?
42
In addition, there seems to be a discrepancy in how print exposure is measured and
documented. Therefore, the gaps existing in the literature which need to be addressed are with
respect to the fact that most of the research on print exposure/literacy has primarily dealt with
the monolingual population. The research on oral language production and comprehension in
bilingual population has shown mixed results and does not take into account if the bilinguals in
question were also bi-literates. This therefore poses a question on how bi-literacy would impact
oral language production in bilinguals and whether it would actually result in creating an
additional advantage for the bilinguals.
The aim of the present study was to examine the impact of print exposure on oral
language production and comprehension in bi-literate bilingual healthy adults with varying
levels of print exposure in L2. We have measured print exposure in L2 using objective measures
(grammaticality judgement and sentence verification) and also subjectively documented the
print exposure in L1 and L2.
Furthermore, as this is a bi-literate bilingual study, it is important to gather information
on the extent of bilingualism in terms of language proficiency, dominance and language usage of
the participants in modalities such as listening and speaking along with reading and writing
(print exposure) in both L1 and L2 (Grosjean, 1998; Marian & Neisser, 2000; Birdsong, 2014).
Therefore, in the current study we have profiled the participants for their language proficiency,
dominance, current language usage using a subjective rating scale in both L1 and L2 and
objectively using lexical decision task and picture naming task in L2.
We have used both semantic and letter fluency as well as word-nonword repetition to
investigate the impact of print exposure on oral language production at the word level in bi-
literate bilingual speakers with varying levels of print exposure in L2. Additionally, we examine
the semantic comprehension abilities in bi-literate bilinguals using synonymy triplets task and
sentence comprehension task.
43
In this study, in addition to number of correct (CR), we use a number of methods such as
time course analysis, cluster and switching analysis to characterize verbal fluency (Luo et al.,
2010; Troyer, Moscovitch, & Winocur, 1997). These measures have been adapted from (Patra,
Bose & Marinis, 2018). Table 2.1 (Patra, Bose & Marinis, 2018) describes these measures and
variables. We also use verbal fluency measures used in Patra, Bose & Marinis (2018) to delve
deeper into our data.
Time-course analysis contributes to the understanding of linguistic knowledge and
executive control in verbal fluency (Luo et al., 2010; Sandoval et al., 2010). Time course analysis
revealed that high-vocabulary bilinguals generated higher number of correct responses and
demonstrated a longer Sub-RT and a flatter slope than the monolinguals. We are using time-
course analysis to examine if print exposure has a significant impact in bi-literate bilinguals’
word production.
Clustering is the strategic process that helps to generate words within a subcategory and
utilizes the speaker’s ability to access words within subcategories. A breakdown in the lexical
system or difficulty to access the lexical system could lead to the reduction in cluster size
(Troyer, Moscovitch, Winocur, Alexander, & Stuss, 1998). There have been reports of cluster size
being affected by levels of print exposure in monolinguals (Kosmidis et al., 2004).
Switching is the ability to shift efficiently to a new subcategory when a subcategory is
exhausted; reduced switching is suggestive of reduced executive control ability (Troyer et al.,
1997; Tröster et al., 1998). Research on print exposure/literacy (in monolinguals) and bilingual
population (without considering print exposure levels) has shown that both clustering and
switching abilities contribute to the total number of correct responses; however, in category
fluency, clustering accounts for more of the variance for number of correct; whilst in letter
fluency, switching accounts for more of the variance for number of correct. Thus, clustering and
switching analysis provides another well-established means to inform the linguistic and
executive debate for bi-literate bilinguals. We use clustering and switching analysis to inform

44
the linguistic and executive aspect for bi-literate bilinguals with different levels of print
exposure
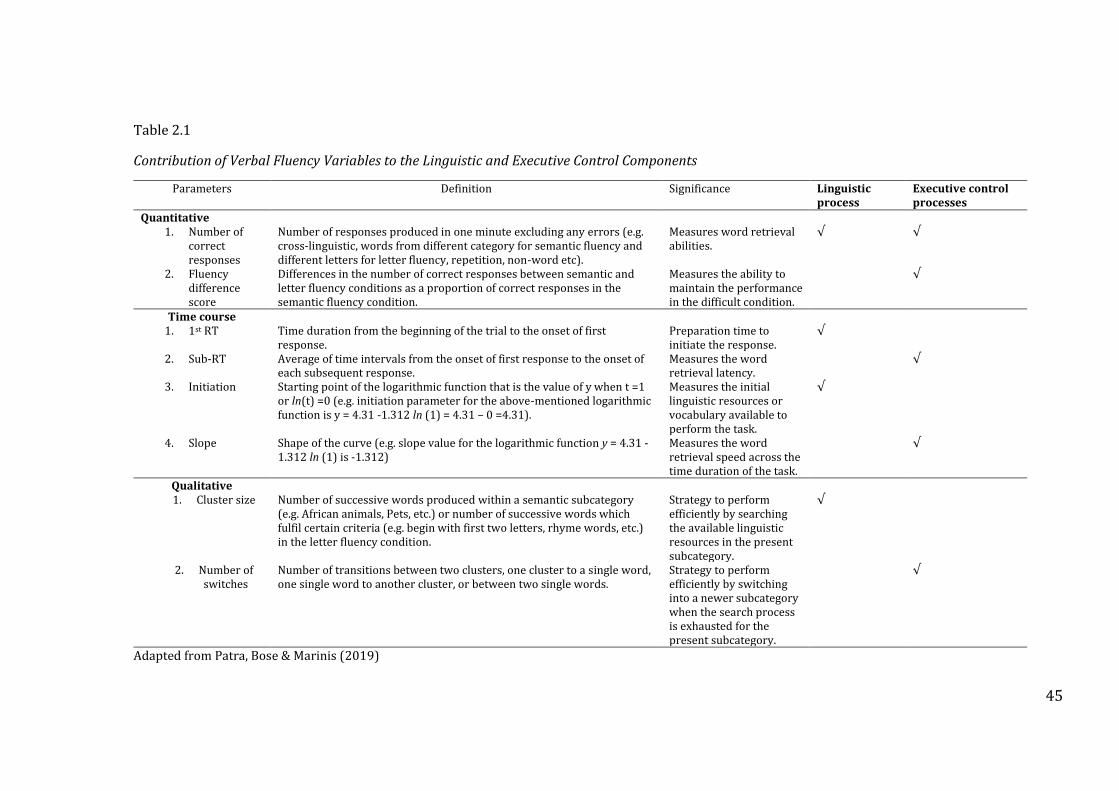
45
Table 2.1
Contribution of Verbal Fluency Variables to the Linguistic and Executive Control Components
Parameters Definition Significance Linguistic process
Executive control processes
Quantitative 1. Number of
correct responses
Number of responses produced in one minute excluding any errors (e.g. cross-linguistic, words from different category for semantic fluency and different letters for letter fluency, repetition, non-word etc).
Measures word retrieval abilities.
√ √
2. Fluency difference score
Differences in the number of correct responses between semantic and letter fluency conditions as a proportion of correct responses in the semantic fluency condition.
Measures the ability to maintain the performance in the difficult condition.
√
Time course 1. 1st RT Time duration from the beginning of the trial to the onset of first
response. Preparation time to initiate the response.
√
2. Sub-RT Average of time intervals from the onset of first response to the onset of each subsequent response.
Measures the word retrieval latency.
√
3. Initiation Starting point of the logarithmic function that is the value of y when t =1 or ln(t) =0 (e.g. initiation parameter for the above-mentioned logarithmic function is y = 4.31 -1.312 ln (1) = 4.31 – 0 =4.31).
Measures the initial linguistic resources or vocabulary available to perform the task.
√
4. Slope Shape of the curve (e.g. slope value for the logarithmic function y = 4.31 -1.312 ln (1) is -1.312)
Measures the word retrieval speed across the time duration of the task.
√
Qualitative 1. Cluster size Number of successive words produced within a semantic subcategory
(e.g. African animals, Pets, etc.) or number of successive words which fulfil certain criteria (e.g. begin with first two letters, rhyme words, etc.) in the letter fluency condition.
Strategy to perform efficiently by searching the available linguistic resources in the present subcategory.
√
2. Number of switches
Number of transitions between two clusters, one cluster to a single word, one single word to another cluster, or between two single words.
Strategy to perform efficiently by switching into a newer subcategory when the search process is exhausted for the present subcategory.
√
Adapted from Patra, Bose & Marinis (2019)
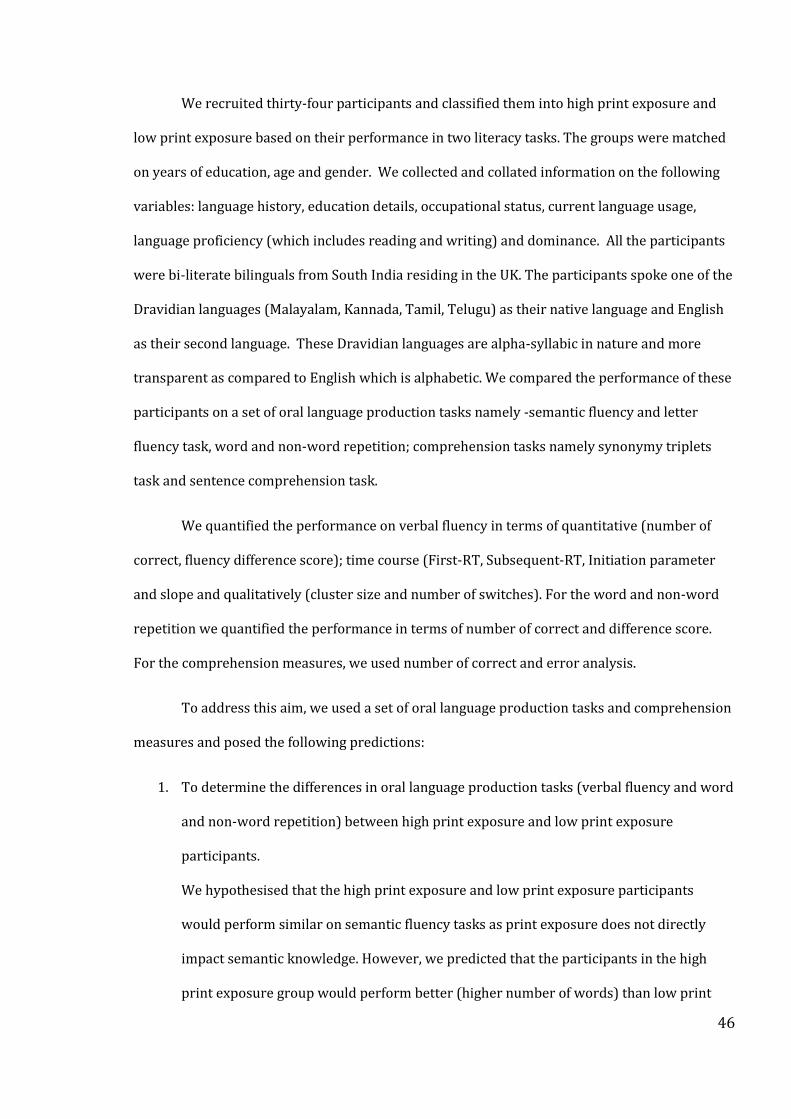
46
We recruited thirty-four participants and classified them into high print exposure and
low print exposure based on their performance in two literacy tasks. The groups were matched
on years of education, age and gender. We collected and collated information on the following
variables: language history, education details, occupational status, current language usage,
language proficiency (which includes reading and writing) and dominance. All the participants
were bi-literate bilinguals from South India residing in the UK. The participants spoke one of the
Dravidian languages (Malayalam, Kannada, Tamil, Telugu) as their native language and English
as their second language. These Dravidian languages are alpha-syllabic in nature and more
transparent as compared to English which is alphabetic. We compared the performance of these
participants on a set of oral language production tasks namely -semantic fluency and letter
fluency task, word and non-word repetition; comprehension tasks namely synonymy triplets
task and sentence comprehension task.
We quantified the performance on verbal fluency in terms of quantitative (number of
correct, fluency difference score); time course (First-RT, Subsequent-RT, Initiation parameter
and slope and qualitatively (cluster size and number of switches). For the word and non-word
repetition we quantified the performance in terms of number of correct and difference score.
For the comprehension measures, we used number of correct and error analysis.
To address this aim, we used a set of oral language production tasks and comprehension
measures and posed the following predictions:
1. To determine the differences in oral language production tasks (verbal fluency and word
and non-word repetition) between high print exposure and low print exposure
participants.
We hypothesised that the high print exposure and low print exposure participants
would perform similar on semantic fluency tasks as print exposure does not directly
impact semantic knowledge. However, we predicted that the participants in the high
print exposure group would perform better (higher number of words) than low print
47
exposure group on letter fluency condition. We expected, participants in the high print
exposure group to have a smaller fluency difference score; a smaller cluster size and
greater number of switches and in the time-course analysis, longer Sub-RT and flatter
slope in letter fluency.
We also predicted that the participants in the high print exposure group would produce
a greater number of correct words and non-words than low print exposure group on
word and non-word repetition task, as print exposure seems to have a positive impact
on word and non-word repetition.
2. To determine if the performance on comprehension measures (synonymy triplets and
sentence comprehension tasks) are mediated by the differences in L2 print exposure.
We predicted that there would be no differences between the high and low print
exposure groups on both the comprehension measures as we expected that print
exposure would not have a direct influence on semantic comprehension.
3. To investigate the correlations between print exposure in L2 and measures of oral
language production and comprehension.
We hypothesised that there would be a strong and positive correlation between print
exposure in L2 and measures of oral language production tasks in L2. Since we expected
no direct link between print exposure and comprehension measures, we hypothesised
that there would be no significant correlations between print exposure in L2 and
measures of comprehension on L2 (% accuracy on synonymy triplets and sentence
comprehension task).
48
2.4 Methods
2.4.1 Participant profile
A total of thirty-four neurologically healthy adults in the age range of 25-55 years with varying
levels of print exposure in their second language were recruited for the current study.
Participants were bi-literate bilinguals being able to read and write in the two languages that
they spoke. The aim was to classify them into high and low print exposure groups based on print
exposure in L2 as measured by grammaticality judgement and sentence verification task (See
section 2.4.2.1.2.3 & 2.4.2.1.2.4). All the participants belonged to a cohort of bi/multilinguals
speaking one of the south Indian languages (either Kannada/Tamil/ Telugu/ Malayalam) as
their native language and English as their second language. All the participants were immigrants
living in parts of Berkshire county, London or other regions of the UK. They acquired both the
languages before the age of ten years. The participants were fluent in both the native language
and English. Participation in this study was voluntary and a written consent was obtained from
the participants prior to participation in the study (See Appendix. 2.5 for an example of
information sheet and consent form). All the procedures in this study were approved by the
University of Reading Research Ethics Committee (Ethical approval code: 2015-071-AB).
All the participants reported that they were right-handed and had normal or corrected
to normal vision, no history of associated hearing problems and no previous history of speech,
language, cognitive and neurological deficits. The participants were screened on the Montreal
Cognitive Assessment (MOCA; Nassredine,2010) to rule out the presence of any underlying
cognitive deficits. To be included in the study, the participants had to be bi-literate bilingual
adults with their L1 being one of the Dravidian languages; should have had a minimum of ten
years of education. Participants with a history of any neurological and/or speech and language
problems were excluded from the study.
49
All the participants were administered a detailed questionnaire to collect information
with respect to their demographic details (age, gender, educational qualification, years of
education, occupation, handedness).
A background questionnaire was used to collect information about the demographic
details (age, gender, years of education, current occupational status) of all participants. The
mean and standard deviation values and the results of the statistical tests for the demographic
details of the participants are presented in table 2.2. Appendix 2.1 provides raw scores of each
participant for all the background measures (age, gender, years of education, occupation). The
participants in both groups had wide range of occupations. The participants in the high print
exposure group were university students (4), post-doctoral researchers (2), lecturer (1),
homemakers (2), managers (4), nurse (2), software engineer (2), business analyst (1), web
developer (2), tax assistant (1) and banking executive (1). Participants in the low print exposure
group were university students (3), homemaker (2), nurse (1), software engineer (2), social
worker (1), saleswoman (1), pharmacy dispenser (1) and research assistant (1). Independent
sample t-tests were performed where data was normally distributed and Mann-Whitney U tests
were performed where data was non-normally distributed. There was no significant difference
between high print exposure and low print exposure groups on measures of age, years of
education and gender. The participants in both the groups were highly educated as evident
from their years of education (HPE: M= 17.68 years; LPE: M= 16.08 years).
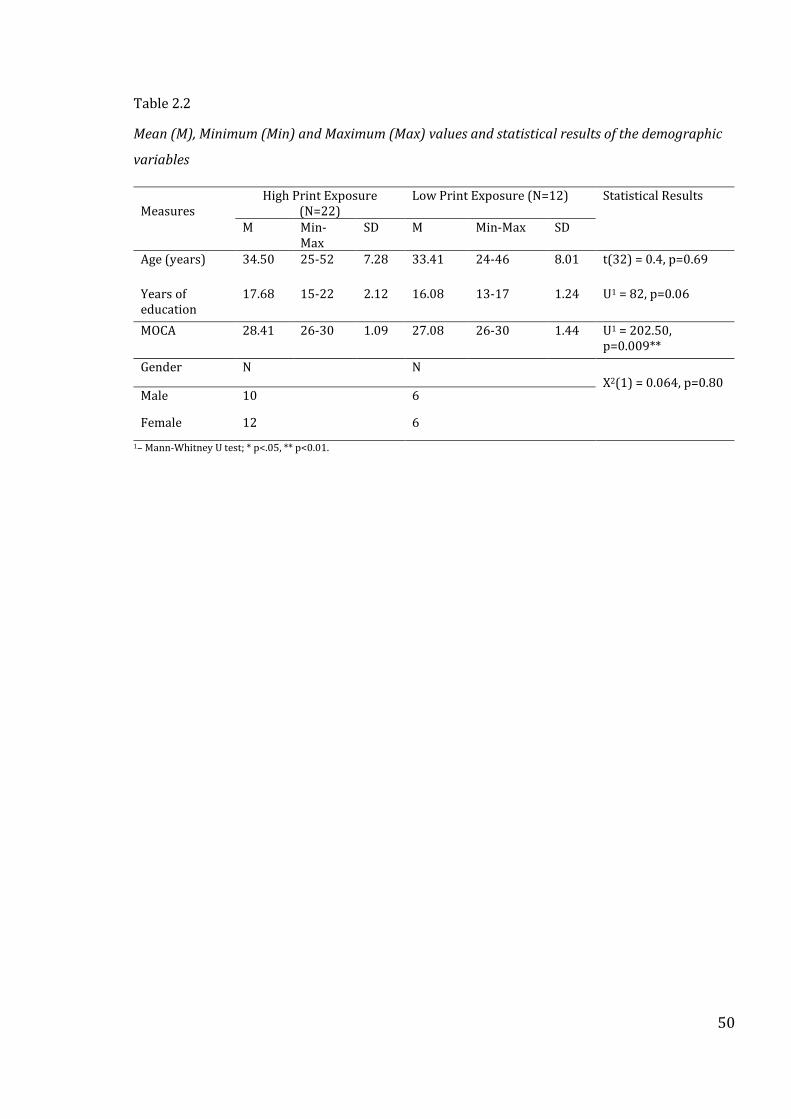
50
Table 2.2
Mean (M), Minimum (Min) and Maximum (Max) values and statistical results of the demographic
variables
Measures
High Print Exposure (N=22)
Low Print Exposure (N=12) Statistical Results
M Min-Max
SD M Min-Max SD
Age (years) 34.50 25-52 7.28 33.41 24-46 8.01 t(32) = 0.4, p=0.69
Years of education
17.68 15-22 2.12 16.08 13-17 1.24 U1 = 82, p=0.06
MOCA 28.41 26-30 1.09 27.08 26-30 1.44 U1 = 202.50, p=0.009**
Gender N N X2(1) = 0.064, p=0.80
Male 10 6
Female 12 6
1– Mann-Whitney U test; * p<.05, ** p<0.01.
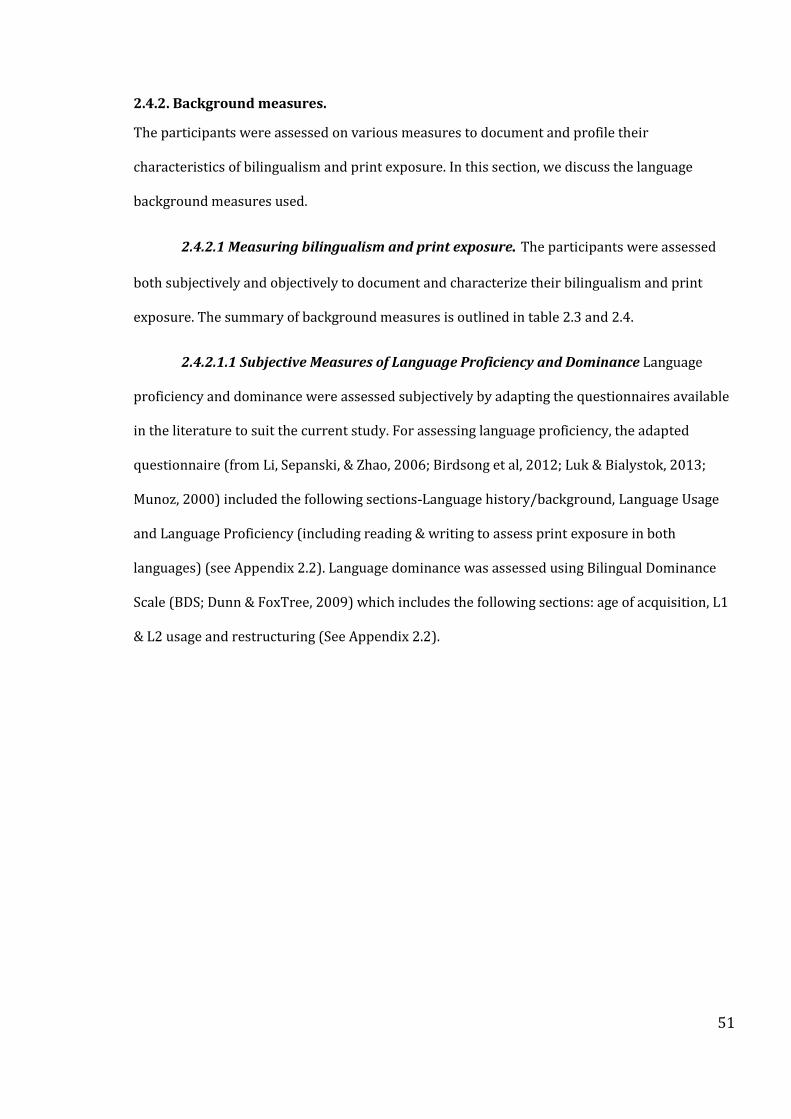
51
2.4.2. Background measures.
The participants were assessed on various measures to document and profile their
characteristics of bilingualism and print exposure. In this section, we discuss the language
background measures used.
2.4.2.1 Measuring bilingualism and print exposure. The participants were assessed
both subjectively and objectively to document and characterize their bilingualism and print
exposure. The summary of background measures is outlined in table 2.3 and 2.4.
2.4.2.1.1 Subjective Measures of Language Proficiency and Dominance Language
proficiency and dominance were assessed subjectively by adapting the questionnaires available
in the literature to suit the current study. For assessing language proficiency, the adapted
questionnaire (from Li, Sepanski, & Zhao, 2006; Birdsong et al, 2012; Luk & Bialystok, 2013;
Munoz, 2000) included the following sections-Language history/background, Language Usage
and Language Proficiency (including reading & writing to assess print exposure in both
languages) (see Appendix 2.2). Language dominance was assessed using Bilingual Dominance
Scale (BDS; Dunn & FoxTree, 2009) which includes the following sections: age of acquisition, L1
& L2 usage and restructuring (See Appendix 2.2).

52
Table 2.3
Background subjective measures of language proficiency and dominance
Subjective Measures of Language proficiency and dominance
Measures Materials Used
Details Time taken L1(Kannada, Tamil, Telugu, Malayalam)
L2 (English)
Scores Obtained
Language history/background, Language Usage and Language Proficiency (including print exposure in reading & writing)
Questionnaire adapted from (Li, Sepanski, & Zhao, 2006; Birdsong et al,2012; Luk & Bialystok, 2013; Munoz, 1999)
1. Demographic Details (8 Questions)
2. Language Background & History (4 Questions)
3. Educational History (2 Questions)
4. Current Language Usage & Frequency of Usage (5-point rating scale; 1- Not at all & 5-Very often)
5. Language Proficiency Rating (7-point rating scale; 1- Very poor & 7- Native like)
15 minutes ✓ ✓ - Descriptive (Qualitative Analysis) - - - Rating scale for current Language Usage &
Frequency of Usage (5-point rating scale; 1- Not at all & 5-Very often)
- Greater score in one language implies greater use of that language.
- - -Rating scale for proficiency: 7-point rating
scale (1- very poor; 7- native-like). - Greater score in one language implies higher
proficiency in that language. -
-
Language Dominance
Bilingual Dominance Scale (BDS)(Dunn & Fox Tree, 2009)
1. Age of acquisition, 2. L1 & L2 usage 3. Restructuring
15 minutes ✓ ✓ - Weighted Scoring System - Eg: Which country do you currently live in? - Score: +4 for predominant language of
country. - Dominant language is the language which
obtains a greater score than the other language
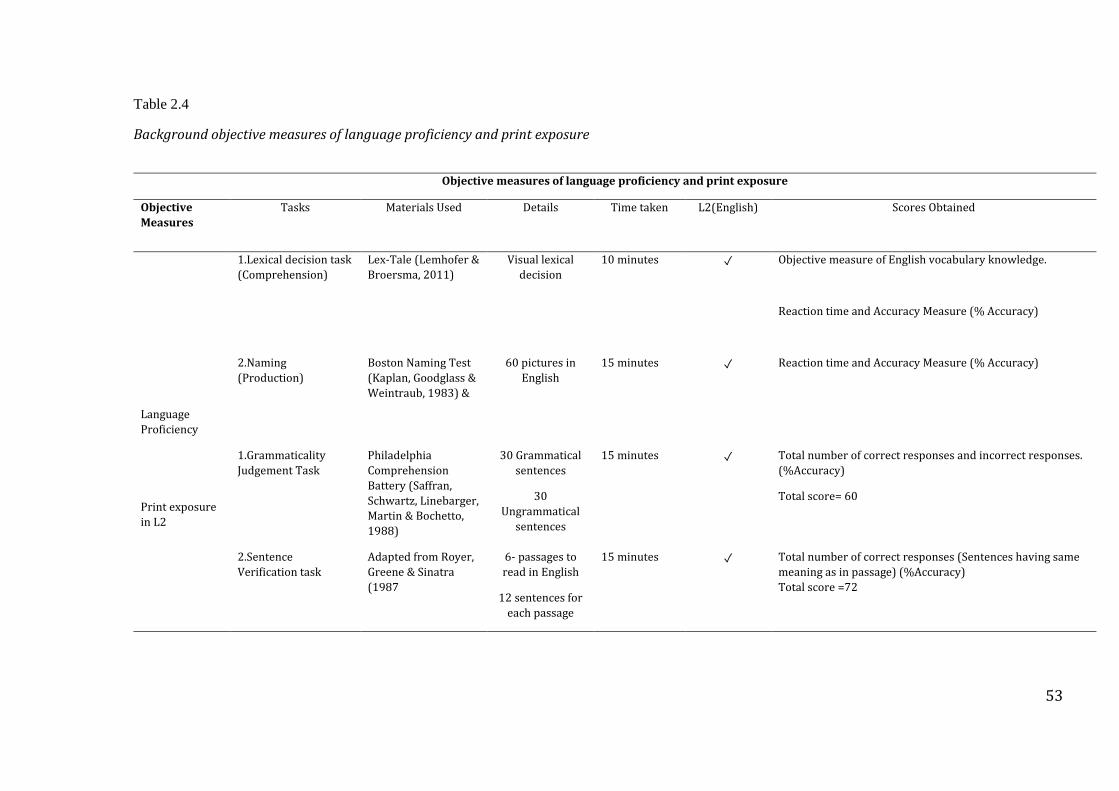
53
Table 2.4
Background objective measures of language proficiency and print exposure
Objective measures of language proficiency and print exposure
Objective
Measures
Tasks Materials Used
Details Time taken L2(English) Scores Obtained
Language
Proficiency
1.Lexical decision task
(Comprehension)
Lex-Tale (Lemhofer &
Broersma, 2011)
Visual lexical
decision
10 minutes ✓ Objective measure of English vocabulary knowledge.
Reaction time and Accuracy Measure (% Accuracy)
2.Naming
(Production)
Boston Naming Test
(Kaplan, Goodglass &
Weintraub, 1983) &
60 pictures in
English
15 minutes
✓ Reaction time and Accuracy Measure (% Accuracy)
Print exposure
in L2
1.Grammaticality
Judgement Task
Philadelphia
Comprehension
Battery (Saffran,
Schwartz, Linebarger,
Martin & Bochetto,
1988)
30 Grammatical
sentences
30
Ungrammatical
sentences
15 minutes ✓ Total number of correct responses and incorrect responses.
(%Accuracy)
Total score= 60
2.Sentence
Verification task
Adapted from Royer,
Greene & Sinatra
(1987
6- passages to
read in English
12 sentences for
each passage
15 minutes ✓ Total number of correct responses (Sentences having same
meaning as in passage) (%Accuracy)
Total score =72
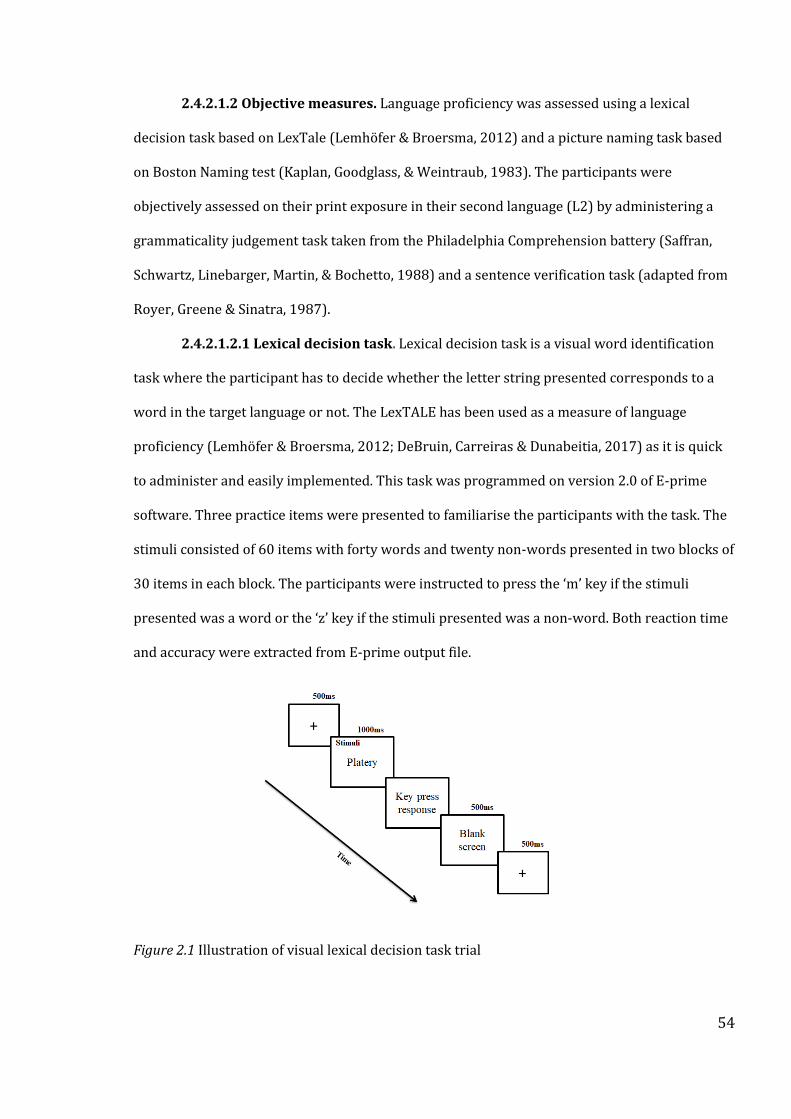
54
2.4.2.1.2 Objective measures. Language proficiency was assessed using a lexical
decision task based on LexTale (Lemhöfer & Broersma, 2012) and a picture naming task based
on Boston Naming test (Kaplan, Goodglass, & Weintraub, 1983). The participants were
objectively assessed on their print exposure in their second language (L2) by administering a
grammaticality judgement task taken from the Philadelphia Comprehension battery (Saffran,
Schwartz, Linebarger, Martin, & Bochetto, 1988) and a sentence verification task (adapted from
Royer, Greene & Sinatra, 1987).
2.4.2.1.2.1 Lexical decision task. Lexical decision task is a visual word identification
task where the participant has to decide whether the letter string presented corresponds to a
word in the target language or not. The LexTALE has been used as a measure of language
proficiency (Lemhöfer & Broersma, 2012; DeBruin, Carreiras & Dunabeitia, 2017) as it is quick
to administer and easily implemented. This task was programmed on version 2.0 of E-prime
software. Three practice items were presented to familiarise the participants with the task. The
stimuli consisted of 60 items with forty words and twenty non-words presented in two blocks of
30 items in each block. The participants were instructed to press the ‘m’ key if the stimuli
presented was a word or the ‘z’ key if the stimuli presented was a non-word. Both reaction time
and accuracy were extracted from E-prime output file.
Figure 2.1 Illustration of visual lexical decision task trial
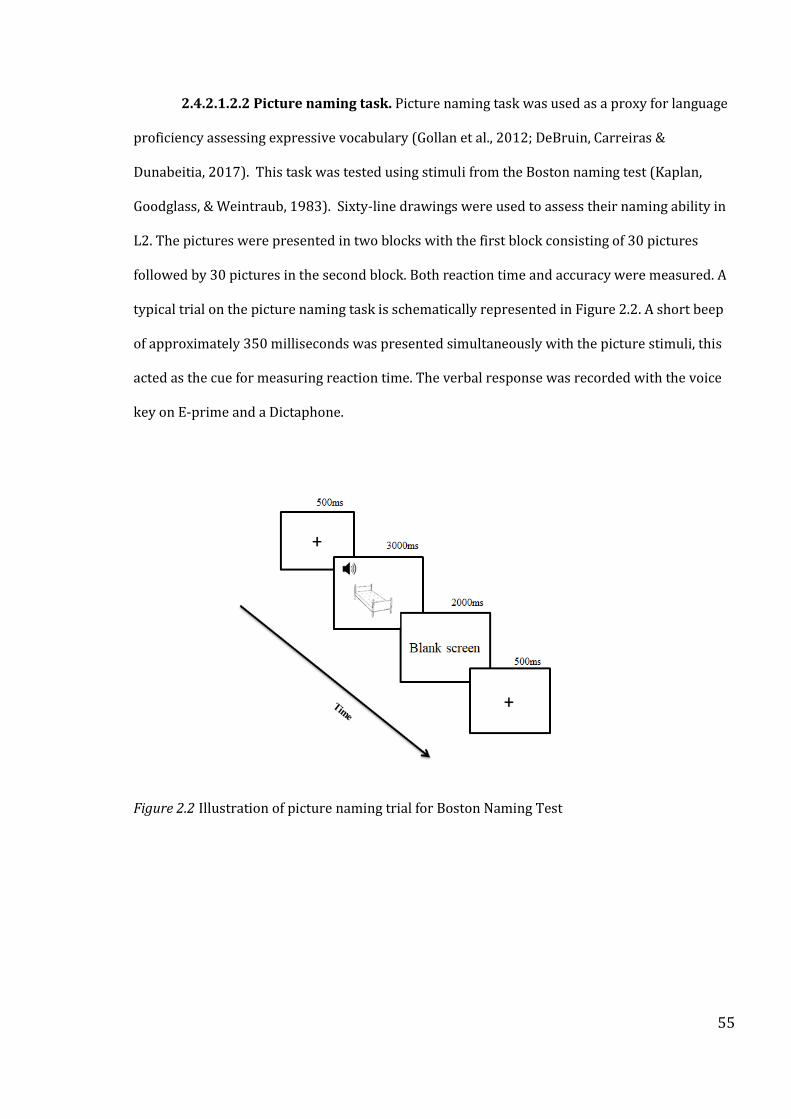
55
2.4.2.1.2.2 Picture naming task. Picture naming task was used as a proxy for language
proficiency assessing expressive vocabulary (Gollan et al., 2012; DeBruin, Carreiras &
Dunabeitia, 2017). This task was tested using stimuli from the Boston naming test (Kaplan,
Goodglass, & Weintraub, 1983). Sixty-line drawings were used to assess their naming ability in
L2. The pictures were presented in two blocks with the first block consisting of 30 pictures
followed by 30 pictures in the second block. Both reaction time and accuracy were measured. A
typical trial on the picture naming task is schematically represented in Figure 2.2. A short beep
of approximately 350 milliseconds was presented simultaneously with the picture stimuli, this
acted as the cue for measuring reaction time. The verbal response was recorded with the voice
key on E-prime and a Dictaphone.
Figure 2.2 Illustration of picture naming trial for Boston Naming Test
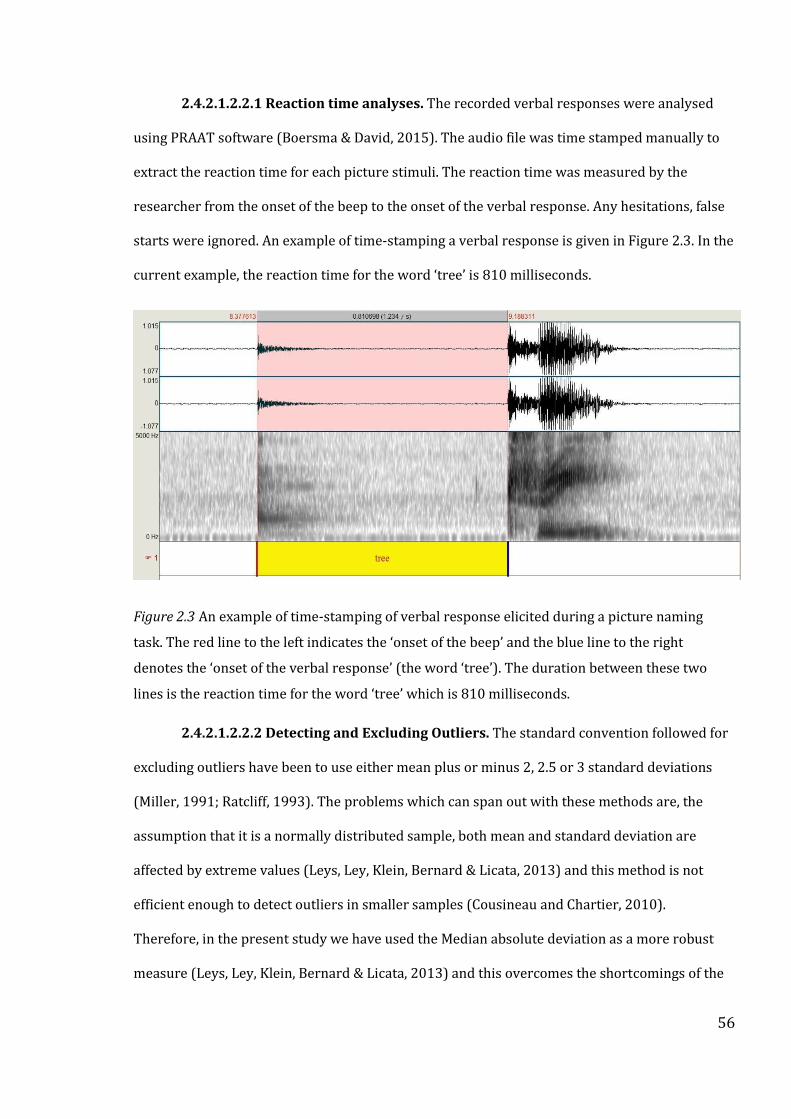
56
2.4.2.1.2.2.1 Reaction time analyses. The recorded verbal responses were analysed
using PRAAT software (Boersma & David, 2015). The audio file was time stamped manually to
extract the reaction time for each picture stimuli. The reaction time was measured by the
researcher from the onset of the beep to the onset of the verbal response. Any hesitations, false
starts were ignored. An example of time-stamping a verbal response is given in Figure 2.3. In the
current example, the reaction time for the word ‘tree’ is 810 milliseconds.
Figure 2.3 An example of time-stamping of verbal response elicited during a picture naming
task. The red line to the left indicates the ‘onset of the beep’ and the blue line to the right
denotes the ‘onset of the verbal response’ (the word ‘tree’). The duration between these two
lines is the reaction time for the word ‘tree’ which is 810 milliseconds.
2.4.2.1.2.2.2 Detecting and Excluding Outliers. The standard convention followed for
excluding outliers have been to use either mean plus or minus 2, 2.5 or 3 standard deviations
(Miller, 1991; Ratcliff, 1993). The problems which can span out with these methods are, the
assumption that it is a normally distributed sample, both mean and standard deviation are
affected by extreme values (Leys, Ley, Klein, Bernard & Licata, 2013) and this method is not
efficient enough to detect outliers in smaller samples (Cousineau and Chartier, 2010).
Therefore, in the present study we have used the Median absolute deviation as a more robust
measure (Leys, Ley, Klein, Bernard & Licata, 2013) and this overcomes the shortcomings of the

57
previous methods using mean. We have used median plus or minus 2.5 times the Median
absolute deviation method for outlier detection for all the reaction time tasks.
2.4.2.1.2.3 Grammaticality judgment task. Grammaticality judgement task is a task
where the participant is presented with sentences and then asked to judge whether the
sentences are grammatically correct or not. Sentences from the Philadelphia Comprehension
Battery (Saffran, Schwartz, Linebarger, Martin, & Bochetto, 1988) were chosen and were
presented auditorily through headphones using E-prime software (version 2.0). The
participants were presented fifteen sentences for practice. A total of 60 sentences were
presented in four blocks with 15 sentences in each block. The stimuli list is given in Appendix
2.3. Each trial consisted of a fixation cross which appeared on the screen for 1000ms followed
by the stimuli sentence presented through headphones and the participant responded with a
key press. The participants were instructed to respond with a key press of letter ‘m’ if the
sentence was grammatically correct or press ‘z’ when the sentence was grammatically incorrect.
For example, for the following sentence stimulus- ‘The farmer is planting corn’, the participant
was expected to press ‘m’ which indicates that the sentence is grammatically correct while for
the sentence stimulus- ‘The girl jumped the pool into’, the participant was expected to press ‘z’
which indicates the sentence is grammatically incorrect. A score of one was given for accurate
judgement of the task and a zero for an incorrect response. The maximum score that a
participant could receive was 60.
2.4.2.1.2.4 Sentence Verification task (Adapted from Royer, Greene & Sinatra
(1987) Sentence verification task measures the comprehension of a specific text (Royer et al,
1987; Hagen et al, 2014). The participants were given a total of six passages to read followed by
a series of sentences relating to the passage. There were four types of sentences- originals (exact
copies of the sentence in the text), paraphrases (same meaning but the words were changed),
meaning change (many words replaced from the original such that the meaning is altered) and
distractors (sentence relating to the same topic, but different in words and unrelated in
58
meaning). After reading each passage, the participants were given a set of 12 sentences (3 in
each sentence type) relating to the passage. The participants were expected to read each
passage and decide whether the information in the statements was already present in the
passage they read (originals and paraphrases) or whether it was new information (meaning
changes and distractors). See Appendix 2.4 for stimuli. A score of one was given if the correct
option was chosen, the maximum score that could be obtained was 72.
2.4.2.1 Results from the background subjective and objective measures of
language proficiency, dominance and print exposure. The subjective measures of
proficiency (speaking, listening, reading, writing) were non-normally distributed, therefore
Mann-Whitney U test was performed. Language use and language dominance scores were
normally distributed, independent sample t-tests were performed. All the objective measures of
proficiency were normally distributed except sentence verification task. A multivariate ANOVA
was performed for lexical decision and picture naming task with reaction time and accuracy as
dependent variables; groups as independent variables. Independent sample t-tests were
performed for grammaticality judgement tasks and Mann-Whitney U test for sentence
verification task.
The mean and standard deviation values and results of the statistical tests of the
participants’ subjective language profile in L1 and L2 are presented in Table 2.5. There was no
significant difference between HPE and LPE on language proficiency ratings in L1 (speaking,
listening, reading and writing); indicating that these groups were matched on their L1
proficiency. However, the two groups performed similar on all modalities of proficiency rating
in L2 except reading. The proficiency rating for reading in L2 was significantly higher for HPE
(M=6.31, SD = 0.80) compared to LPE (M=5.25, SD =1.73). Current language use was
predominantly English for the HPE; but was balanced usage of L1 and English for LPE. There
was no significant difference between L1 and L2 for HPE group on language dominance;
suggesting that the participants in HPE were balanced bilinguals. However, there was a
59
significant difference between L1 and L2 for the LPE group on language dominance measure,
with L1 (M= 19.50, SD=3.45) being dominant than L2 (M= 14.67, SD =4.75). This suggests that
LPE group were L1 dominant. Both the groups acquired reading and writing in L1 around the
same age (HPE: M= 4.68, SD=2.3; LPE: 4.75, SD=1.16), however there was a significant
difference between HPE and LPE in L2 reading and writing acquisition (HPE: M= 4.68, SD=2.11;
LPE: 7.5, SD=2.84).
The two groups were significantly different on the objective language proficiency
measures (See table 2.6). The participants in the HPE group (RT: M= 674.59, SD= 65.27;
Accuracy: M = 41.23, SD = 7.03) performed significantly better on both the RT and accuracy of
lexical decision task compared to the LPE group (RT: M= 737.07, SD= 65.87; Accuracy: M =
33.58, SD = 9.31). This suggests that the HPE were faster and more accurate in lexical decision
compared to LPE. There was a statistically significant difference in picture naming accuracy
between the two groups, F (1,32) = 9.17, p =0.005. The two groups also differed significantly on
measures of print exposure in L2 i.e., grammaticality judgement and sentence verification task.
In comparison to the LPE, HPE performed significantly better which is indicative of higher print
exposure in L2
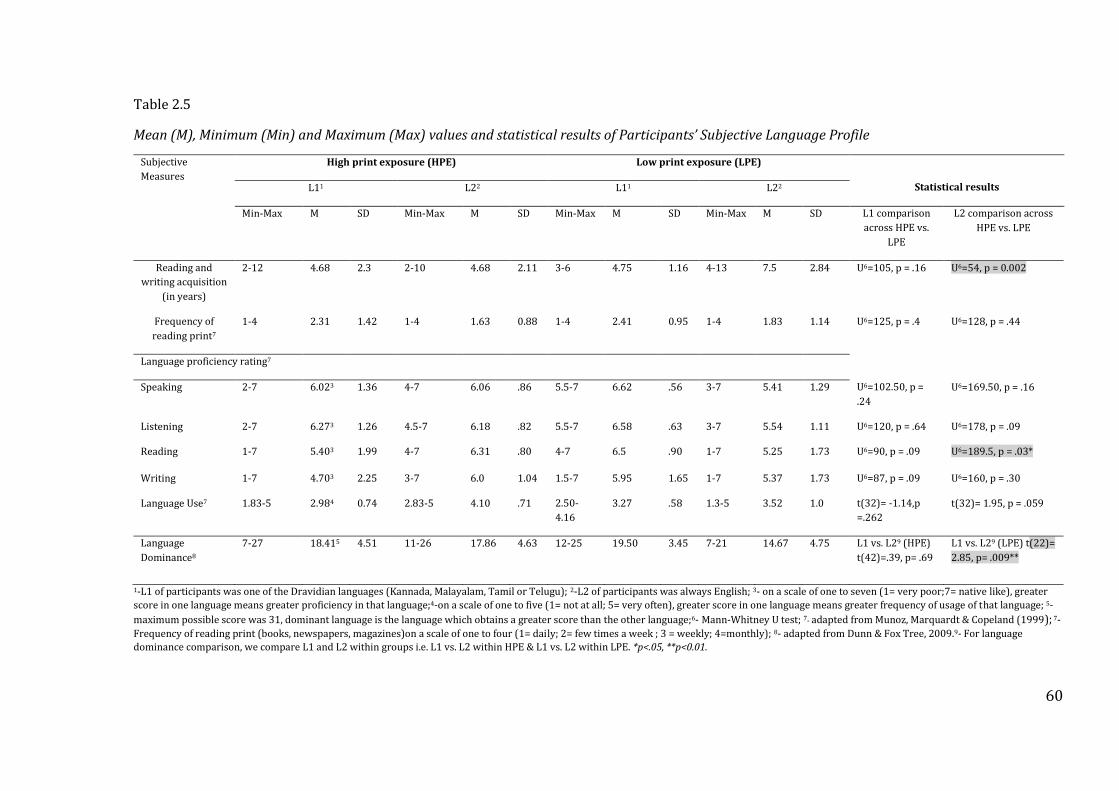
60
Table 2.5
Mean (M), Minimum (Min) and Maximum (Max) values and statistical results of Participants’ Subjective Language Profile
Subjective
Measures
High print exposure (HPE) Low print exposure (LPE)
Statistical results L11 L22 L11 L22
Min-Max M SD Min-Max M SD Min-Max M SD Min-Max M SD L1 comparison
across HPE vs.
LPE
L2 comparison across
HPE vs. LPE
Reading and
writing acquisition
(in years)
2-12 4.68 2.3 2-10 4.68 2.11 3-6 4.75 1.16 4-13 7.5 2.84 U6=105, p = .16 U6=54, p = 0.002
Frequency of
reading print7
1-4 2.31 1.42 1-4 1.63 0.88 1-4 2.41 0.95 1-4 1.83 1.14 U6=125, p = .4 U6=128, p = .44
Language proficiency rating7
Speaking 2-7 6.023 1.36 4-7 6.06 .86 5.5-7 6.62 .56 3-7 5.41 1.29 U6=102.50, p =
.24
U6=169.50, p = .16
Listening 2-7 6.273 1.26 4.5-7 6.18 .82 5.5-7 6.58 .63 3-7 5.54 1.11 U6=120, p = .64 U6=178, p = .09
Reading 1-7 5.403 1.99 4-7 6.31 .80 4-7 6.5 .90 1-7 5.25 1.73 U6=90, p = .09 U6=189.5, p = .03*
Writing 1-7 4.703 2.25 3-7 6.0 1.04 1.5-7 5.95 1.65 1-7 5.37 1.73 U6=87, p = .09 U6=160, p = .30
Language Use7 1.83-5 2.984 0.74 2.83-5 4.10 .71 2.50-
4.16
3.27 .58 1.3-5 3.52 1.0 t(32)= -1.14,p
=.262
t(32)= 1.95, p = .059
Language
Dominance8
7-27 18.415 4.51 11-26 17.86 4.63 12-25 19.50 3.45 7-21 14.67 4.75 L1 vs. L29 (HPE)
t(42)=.39, p= .69
L1 vs. L29 (LPE) t(22)=
2.85, p= .009**
1-L1 of participants was one of the Dravidian languages (Kannada, Malayalam, Tamil or Telugu); 2-L2 of participants was always English; 3- on a scale of one to seven (1= very poor;7= native like), greater
score in one language means greater proficiency in that language;4-on a scale of one to five (1= not at all; 5= very often), greater score in one language means greater frequency of usage of that language; 5-
maximum possible score was 31, dominant language is the language which obtains a greater score than the other language;6- Mann-Whitney U test; 7- adapted from Munoz, Marquardt & Copeland (1999); 7-
Frequency of reading print (books, newspapers, magazines)on a scale of one to four (1= daily; 2= few times a week ; 3 = weekly; 4=monthly); 8- adapted from Dunn & Fox Tree, 2009.9- For language
dominance comparison, we compare L1 and L2 within groups i.e. L1 vs. L2 within HPE & L1 vs. L2 within LPE. *p<.05, **p<0.01.
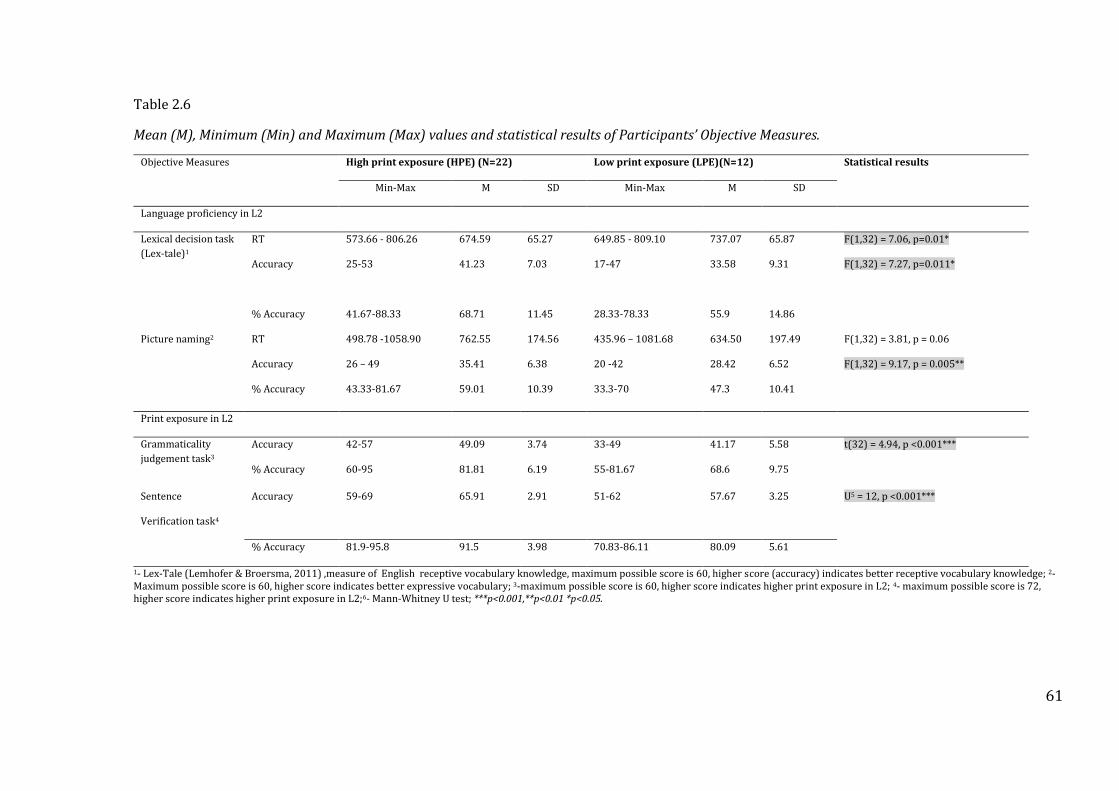
61
Table 2.6
Mean (M), Minimum (Min) and Maximum (Max) values and statistical results of Participants’ Objective Measures.
Objective Measures High print exposure (HPE) (N=22) Low print exposure (LPE)(N=12) Statistical results
Min-Max M SD Min-Max M SD
Language proficiency in L2
Lexical decision task
(Lex-tale)1
RT 573.66 - 806.26 674.59 65.27 649.85 - 809.10 737.07 65.87 F(1,32) = 7.06, p=0.01*
Accuracy 25-53 41.23
7.03
17-47
33.58
9.31 F(1,32) = 7.27, p=0.011*
% Accuracy 41.67-88.33 68.71 11.45 28.33-78.33 55.9 14.86
Picture naming2 RT 498.78 -1058.90 762.55 174.56 435.96 – 1081.68 634.50 197.49 F(1,32) = 3.81, p = 0.06
Accuracy 26 – 49 35.41 6.38 20 -42 28.42 6.52 F(1,32) = 9.17, p = 0.005**
% Accuracy 43.33-81.67 59.01 10.39 33.3-70 47.3 10.41
Print exposure in L2
Grammaticality
judgement task3
Accuracy 42-57 49.09 3.74 33-49 41.17 5.58 t(32) = 4.94, p <0.001***
% Accuracy 60-95 81.81 6.19 55-81.67 68.6 9.75
Sentence
Verification task4
Accuracy 59-69
65.91
2.91
51-62
57.67
3.25
U5 = 12, p <0.001***
% Accuracy 81.9-95.8 91.5 3.98 70.83-86.11 80.09 5.61
1- Lex-Tale (Lemhofer & Broersma, 2011) ,measure of English receptive vocabulary knowledge, maximum possible score is 60, higher score (accuracy) indicates better receptive vocabulary knowledge; 2- Maximum possible score is 60, higher score indicates better expressive vocabulary; 3-maximum possible score is 60, higher score indicates higher print exposure in L2; 4- maximum possible score is 72, higher score indicates higher print exposure in L2;6- Mann-Whitney U test; ***p<0.001,**p<0.01 *p<0.05.
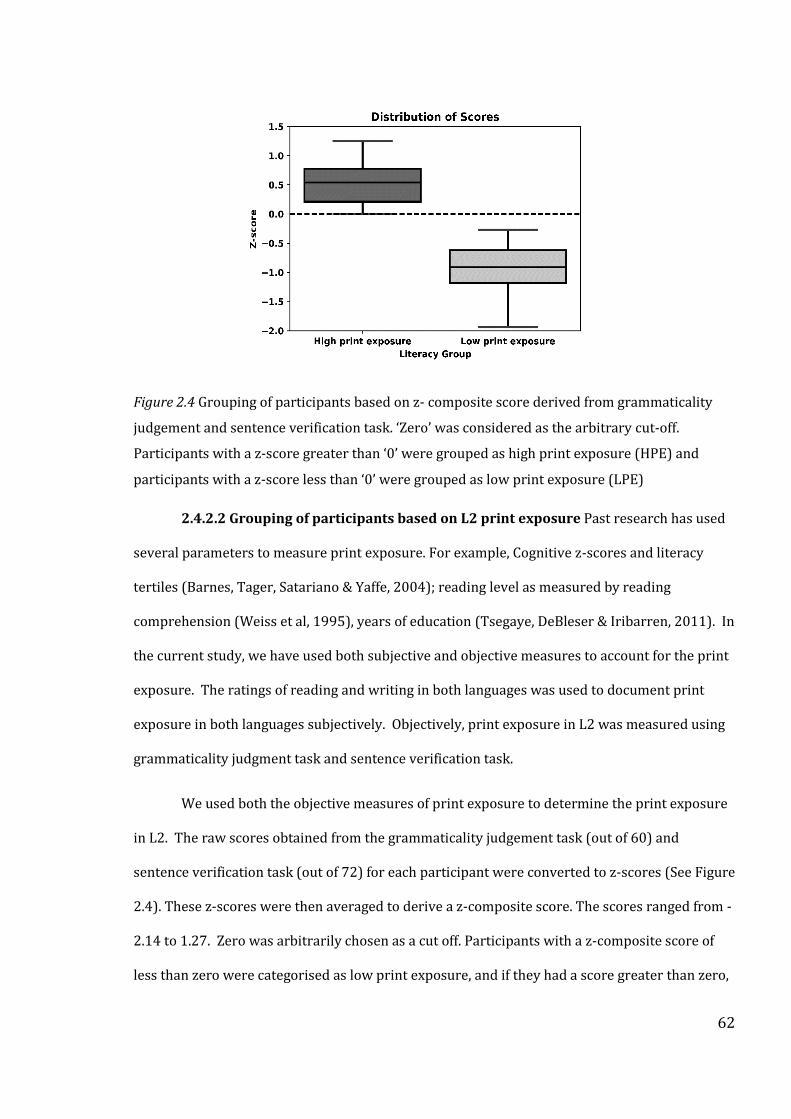
62
Figure 2.4 Grouping of participants based on z- composite score derived from grammaticality
judgement and sentence verification task. ‘Zero’ was considered as the arbitrary cut-off.
Participants with a z-score greater than ‘0’ were grouped as high print exposure (HPE) and
participants with a z-score less than ‘0’ were grouped as low print exposure (LPE)
2.4.2.2 Grouping of participants based on L2 print exposure Past research has used
several parameters to measure print exposure. For example, Cognitive z-scores and literacy
tertiles (Barnes, Tager, Satariano & Yaffe, 2004); reading level as measured by reading
comprehension (Weiss et al, 1995), years of education (Tsegaye, DeBleser & Iribarren, 2011). In
the current study, we have used both subjective and objective measures to account for the print
exposure. The ratings of reading and writing in both languages was used to document print
exposure in both languages subjectively. Objectively, print exposure in L2 was measured using
grammaticality judgment task and sentence verification task.
We used both the objective measures of print exposure to determine the print exposure
in L2. The raw scores obtained from the grammaticality judgement task (out of 60) and
sentence verification task (out of 72) for each participant were converted to z-scores (See Figure
2.4). These z-scores were then averaged to derive a z-composite score. The scores ranged from -
2.14 to 1.27. Zero was arbitrarily chosen as a cut off. Participants with a z-composite score of
less than zero were categorised as low print exposure, and if they had a score greater than zero,
63
they were grouped as high print exposure. This resulted in a total of 22 participants in the high
print exposure group and 12 participants in the low print exposure group.
2.4.3 Experimental measures.
The participants were administered a set of oral language production and comprehension tasks,
which will be discussed in this section. Table 2.7 summarises the experimental tasks used in the
study.
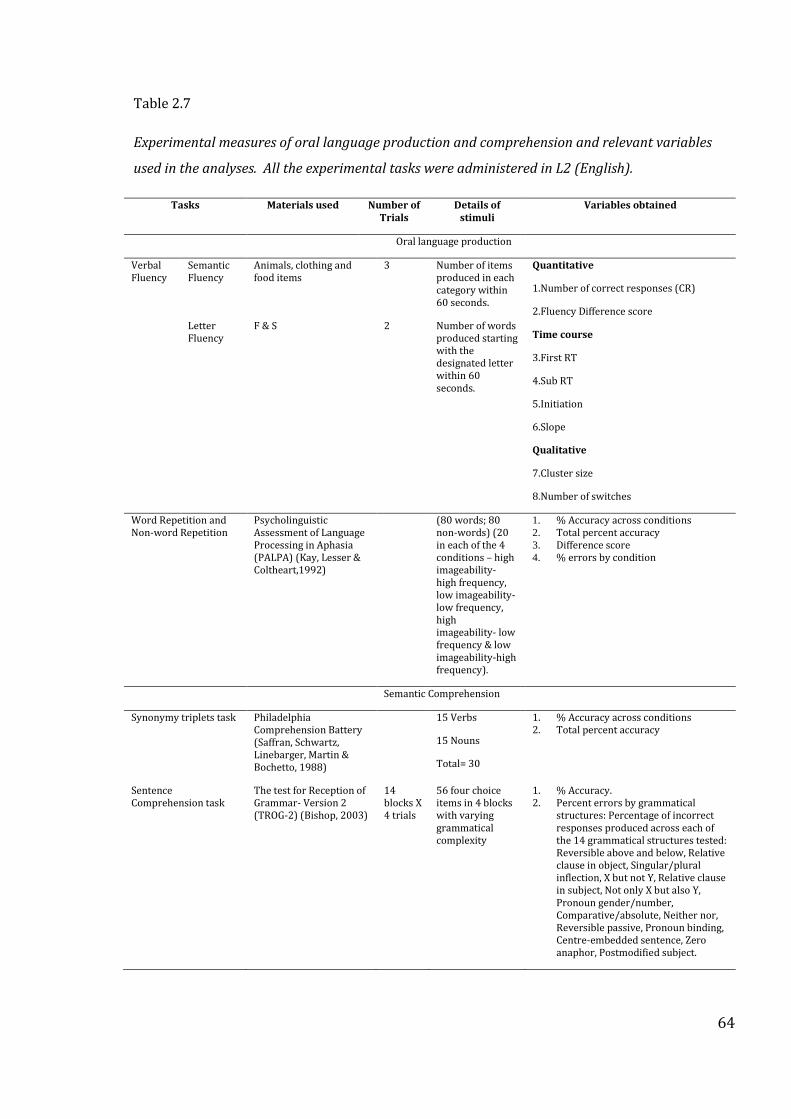
64
Table 2.7
Experimental measures of oral language production and comprehension and relevant variables
used in the analyses. All the experimental tasks were administered in L2 (English).
Tasks Materials used Number of Trials
Details of stimuli
Variables obtained
Oral language production
Verbal Fluency
Semantic Fluency
Animals, clothing and food items
3 Number of items produced in each category within 60 seconds.
Quantitative
1.Number of correct responses (CR)
2.Fluency Difference score
Time course
3.First RT
4.Sub RT
5.Initiation
6.Slope
Qualitative
7.Cluster size
8.Number of switches
Letter Fluency
F & S 2 Number of words produced starting with the designated letter within 60 seconds.
Word Repetition and Non-word Repetition
Psycholinguistic Assessment of Language Processing in Aphasia (PALPA) (Kay, Lesser & Coltheart,1992)
(80 words; 80 non-words) (20 in each of the 4 conditions – high imageability- high frequency, low imageability-low frequency, high imageability- low frequency & low imageability-high frequency).
1. % Accuracy across conditions 2. Total percent accuracy 3. Difference score 4. % errors by condition
Semantic Comprehension
Synonymy triplets task Philadelphia Comprehension Battery (Saffran, Schwartz, Linebarger, Martin & Bochetto, 1988)
15 Verbs
15 Nouns
Total= 30
1. % Accuracy across conditions 2. Total percent accuracy
Sentence Comprehension task
The test for Reception of Grammar- Version 2 (TROG-2) (Bishop, 2003)
14 blocks X 4 trials
56 four choice items in 4 blocks with varying grammatical complexity
1. % Accuracy. 2. Percent errors by grammatical
structures: Percentage of incorrect responses produced across each of the 14 grammatical structures tested: Reversible above and below, Relative clause in object, Singular/plural inflection, X but not Y, Relative clause in subject, Not only X but also Y, Pronoun gender/number, Comparative/absolute, Neither nor, Reversible passive, Pronoun binding, Centre-embedded sentence, Zero anaphor, Postmodified subject.
65
2.4.4 Verbal Fluency measures
2.4.4.1 Trials and procedures. All the participants were administered two verbal
fluency conditions- semantic and letter fluency in English. They were expected to produce as
many words as possible in sixty seconds. For the semantic fluency condition, participants were
instructed to produce as many words as possible in three categories- animals, clothing and food.
For the semantic fluency condition, the participants were instructed to avoid repetitions. For the
letter fluency condition, participants were instructed to produce as many words as possible
starting with letters F and S. The restrictions imposed on the letter fluency condition were not to
produce proper nouns (e.g., Australia) or numbers (e.g., six) or same word with different word
endings (e.g., friend, friends, friendly). Each participant was tested individually. The orders of
the fluency conditions were randomised across participants; however, the trials were blocked
by condition. A beep was presented at the beginning of the trial to ensure there was a definite
starting point for each trial. Responses were recorded using a Dictaphone and later analysed to
extract the relevant variables.
2.4.4.2 Data coding and analysis. The responses including repetitions and errors were
coded verbatim. Each correct response was time-stamped using PRAAT (Boersma & David,
2015). The time stamping helps mark the onset of the trial (i.e., beep) to the onset of the
response. The variables extracted from time stamping were used in the time-course analyses
which will be discussed later.
2.4.4.2.1 Total number of correct responses (CR). CR was calculated after excluding the
errors. The errors in semantic fluency task were- words not belonging to the target category
(eg., apple for animal category), repetition of the same words or cross-language intrusions. For
the letter fluency task, the errors were words beginning with a different letter (eg., old as a
response to letter A), repetition of the same words (were counted as a single CR), proper nouns
(eg., Singapore for letter S) and same words with different word endings (eg., friend, friends,
friendly were counted as a single CR) or cross-linguistic intrusions.
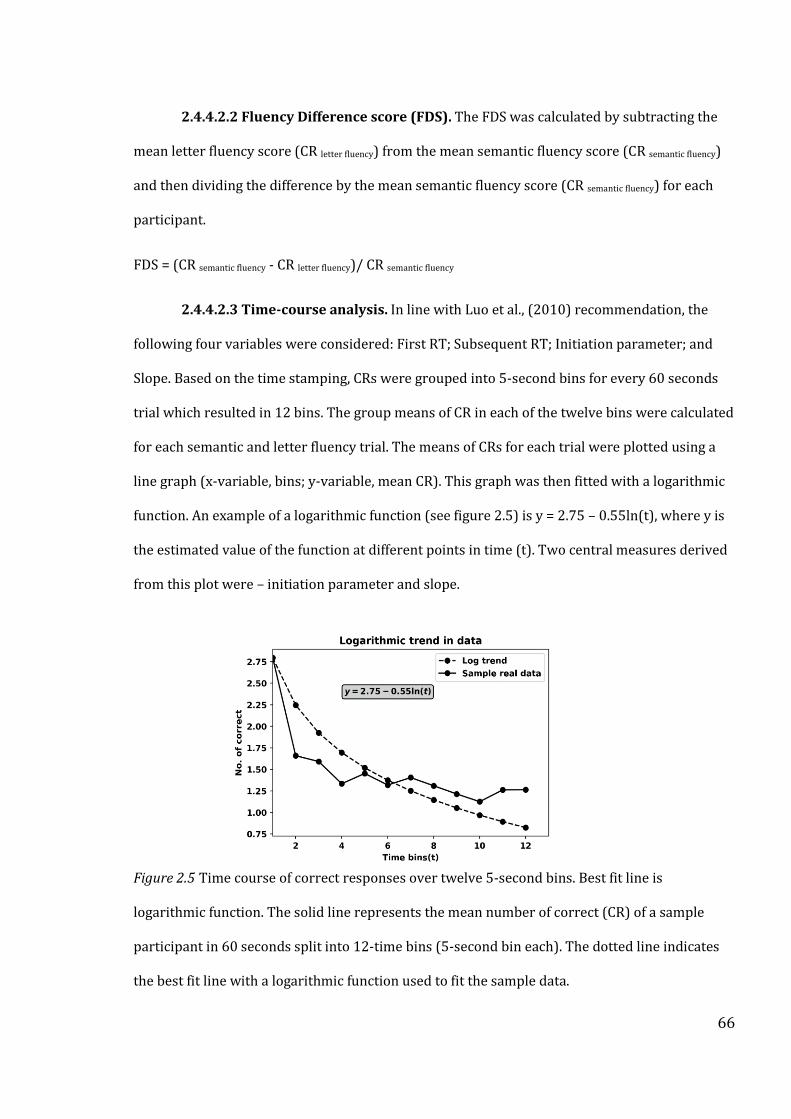
66
2.4.4.2.2 Fluency Difference score (FDS). The FDS was calculated by subtracting the
mean letter fluency score (CR letter fluency) from the mean semantic fluency score (CR semantic fluency)
and then dividing the difference by the mean semantic fluency score (CR semantic fluency) for each
participant.
FDS = (CR semantic fluency - CR letter fluency)/ CR semantic fluency
2.4.4.2.3 Time-course analysis. In line with Luo et al., (2010) recommendation, the
following four variables were considered: First RT; Subsequent RT; Initiation parameter; and
Slope. Based on the time stamping, CRs were grouped into 5-second bins for every 60 seconds
trial which resulted in 12 bins. The group means of CR in each of the twelve bins were calculated
for each semantic and letter fluency trial. The means of CRs for each trial were plotted using a
line graph (x-variable, bins; y-variable, mean CR). This graph was then fitted with a logarithmic
function. An example of a logarithmic function (see figure 2.5) is y = 2.75 – 0.55ln(t), where y is
the estimated value of the function at different points in time (t). Two central measures derived
from this plot were – initiation parameter and slope.
Figure 2.5 Time course of correct responses over twelve 5-second bins. Best fit line is
logarithmic function. The solid line represents the mean number of correct (CR) of a sample
participant in 60 seconds split into 12-time bins (5-second bin each). The dotted line indicates
the best fit line with a logarithmic function used to fit the sample data.
67
2.4.4.2.3.1 First-RT. The first-RT is the time interval from the beginning of the trial
(from the beep) to the onset of the first response. The first response usually takes longer than
the subsequent responses and this delay in first response has been attributed to task
preparation (Rohrer, Wixted, Salmon, & Butters, 1995).
2.4.4.2.3.2 Subsequent-RT (Sub-RT). Sub-RT is the average value of the time intervals
from the onset of first response to the onset of each subsequent response. Thus, Sub-RT
provides a good estimate of mean retrieval latency and represents the time point at which half
of the total responses have been generated (Sandoval et al., 2010). A longer mean Sub-RT
indicates that the performance extends later into the time course, but interpretation of this
variable depends on the total number of correct (Luo et al., 2010). In comparing two groups, if
one group produces more correct responses than another group and has longer mean Sub-RT,
then it could be interpreted that this group has superior control and could continue generating
responses longer. If one group produces fewer or equivalent correct responses but has longer
mean Sub-RT, then it could be interpreted that this group has an effortful control as it took
longer to produce the same or fewer number of items. In contrast, a shorter mean Sub-RT would
suggest a faster declining rate of retrieval because of a large proportion of the responses were
produced early during the trial.
2.4.4.2.3.3 Initiation parameter. The initiation parameter is the starting point of the
logarithmic function that is the value of y when t = 1 or ln (t) = 0 (eg., initiation parameter for
the above-mentioned logarithmic function is y = 2.75 – 0.55 ln (1) = 2.75 – 0 = 2.75). Initiation
parameter indicates the initial linguistic resources or breath of lexical items available for the
initial burst when the trial begins and is largely determined by vocabulary knowledge.
2.4.4.2.3.4 Slope. Slope is determined by the shape of the curve and refers to the rate of
retrieval output as a function of the change in time over sixty seconds. Slope for the above
example would be 0.55. It is representative of how the linguistic resources are monitored and
68
used over time and is largely determined by executive control. Flatter slope indicates that
participants were able to maintain their performance across the response period despite greater
lexical interference (e.g., avoiding repetition, searching for words from the already exhausted
vocabulary source) towards the end of the trial, reflecting better executive control.
2.4.4.2.4 Qualitative analysis. Based on Troyer et al (1997) study, we carried out
clustering and switching analyses. Repetitions were included for clustering and switching
analyses. Semantic fluency clustering was defined as words produced successively that shared a
semantic sub-category. (e.g., goat, sheep and cow belonged to the sub-category of farm
animals) Letter fluency clustering was defined as words generated successively fulfilling one of
the following criteria (Troyer et al., 1997): words that begin with the same first two letters (e.g.,
flick, flip); words that differ only by a vowel sound regardless of the actual spelling (e.g., son,
sun); words that rhyme (e.g., fame, frame); or words that are homonyms (e.g., sheep, ship).
Appendix 2.6 provides details of sub-categories. Owing to clustering of responses, the following
variables were generated-
2.4.4.2.4.1 Mean cluster size. Cluster size was calculated beginning with the second
word in each cluster. A single word was given a cluster size of zero (e.g., snake belongs to cluster
‘reptiles’ and cluster size of zero), two-word clusters was given a cluster size of one (e.g., cat, dog
belong to cluster ‘pets’ with a cluster size of one), three-word clusters was given a cluster size of
two (e.g., donkey, buffalo, pig belong to the cluster of ‘farm animals’ with a cluster size of two)
and so on. Mean cluster size for a trial was calculated by adding the size of each cluster and
dividing the total score by the number of clusters.
2.4.4.2.4.2 Number of switches. Number of switches was the number of transitions
between clusters. For example, in semantic fluency the responses lion, tiger; cat, dog; kangaroo,
koala bear contains two switches from tiger → cat and dog →kangaroo. Similarly, for letter
fluency, the responses frustrate, frown; flick, flip; fun, fundamental; fit contains three switches
from frown → flick, flip → fun and fundamental → fit.
69
2.4.5 Word and non-word repetition
2.4.5.1 Trials and procedures. The participants were presented eighty words and eighty non-
words from the Psycholinguistic Assessment of Language Processing in Aphasia (PALPA) (Kay,
Lesser & Coltheart,1992). The stimuli were controlled for imageability and frequency with
twenty in each of the 4 conditions: high imageability- high frequency (e.g., words: radio, hospital
;Non-words: ragio, hopsital), low imageability-low frequency (e.g., words: analogy, miracle ;Non-
words: atalogy, minacle), high imageability- low frequency (e.g., words: cart, spider ;Non-words:
calt, spuder) & low imageability-high frequency(e.g., words: concept, opinion ;Non-words:
boncept, opunion).The full list of stimuli is provided in the Appendix 2.7. The words and non-
words were interspersed in different blocks. Within each block, the words and non-words were
pseudorandomised ensuring that not more than four words or four non-words occurred in
succession.
The words and non-words were pre-recorded by the researcher and presented
auditorily using headphones via the E-Prime (Psychology Software Tools, Pittsburgh, PA). A
fixation cross appeared on the screen for 500 ms acting as a cue for the stimuli. The presentation
of the stimuli was manually controlled by the researcher based on the comfort of the
participants. The participants were instructed to repeat exactly what they heard. Six words and
six non-words were presented as practice items prior to the actual trial to familiarise the
participants with the task. Responses were recorded with a Dictaphone and later analysed.
2.4.5.2 Data coding and analysis. All responses were transcribed. A response was
marked as accurate if it was exactly same as the target stimuli. Total number of correct word
repetitions and total number of correct non-word repetitions were calculated after excluding
the errors. Total number of correct responses was calculated by adding the total number of
correct word repetitions and total number of correct non-word repetitions. Percentage accuracy
was computed for word repetition and non-word repetition separately on a maximum value of
80. Total percent accuracy was calculated by averaging the percentage accuracy of word
70
repetitions and non-word repetitions. The error responses were also examined to see if there
was a pattern of errors.
2.4.5.2.1 Difference score. The difference score was calculated by subtracting the total
number of correct non-word repetitions from the total number of word repetitions for each
participant.
2.4.6 Comprehension measures
2.4.6.1 Synonymy triplets task. The stimuli were taken from the Philadelphia comprehension
battery (Saffran, Schwartz, Linebarger, Martin & Bochetto, 1988). This consisted of a total of 30
stimuli items which included fifteen nouns and fifteen verbs (See Appendix 2.8)
2.4.6.1.1 Trials and procedure. The stimuli were presented on a power point slide.
Each presentation consisted of three nouns or verbs on the screen, the participants were
expected to point to two words which were closest in meaning. For example, when the following
three words were presented on the screen- (violin, fiddle, clarinet), the participant had to
choose violin and fiddle as these words are closest in meaning. To familiarise the participants to
the task, four practice items were administered prior to the actual test items.
2.4.6.1.2 Data coding and analysis. A score of one was assigned for the correct
response and zero for an incorrect response. Accuracy score was calculated by adding the
number of correct responses in each trial excluding the errors. The maximum obtainable score
was 30. Percentage accuracy was computed for the total number of correct responses on a
maximum score of 30.
2.4.6.1.4 Error analysis. The stimuli included both nouns and verbs and therefore we
further looked at examining whether the participants exhibited more errors in nouns or verbs.
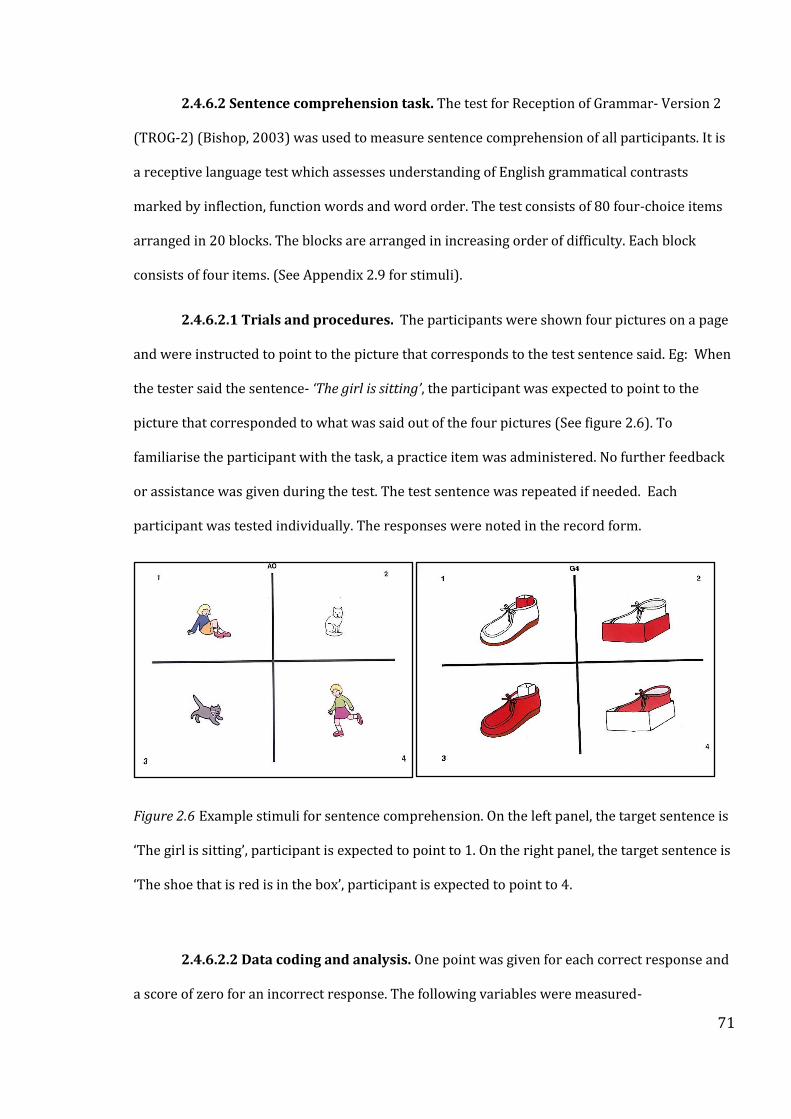
71
2.4.6.2 Sentence comprehension task. The test for Reception of Grammar- Version 2
(TROG-2) (Bishop, 2003) was used to measure sentence comprehension of all participants. It is
a receptive language test which assesses understanding of English grammatical contrasts
marked by inflection, function words and word order. The test consists of 80 four-choice items
arranged in 20 blocks. The blocks are arranged in increasing order of difficulty. Each block
consists of four items. (See Appendix 2.9 for stimuli).
2.4.6.2.1 Trials and procedures. The participants were shown four pictures on a page
and were instructed to point to the picture that corresponds to the test sentence said. Eg: When
the tester said the sentence- ‘The girl is sitting’, the participant was expected to point to the
picture that corresponded to what was said out of the four pictures (See figure 2.6). To
familiarise the participant with the task, a practice item was administered. No further feedback
or assistance was given during the test. The test sentence was repeated if needed. Each
participant was tested individually. The responses were noted in the record form.
Figure 2.6 Example stimuli for sentence comprehension. On the left panel, the target sentence is
‘The girl is sitting’, participant is expected to point to 1. On the right panel, the target sentence is
‘The shoe that is red is in the box’, participant is expected to point to 4.
2.4.6.2.2 Data coding and analysis. One point was given for each correct response and
a score of zero for an incorrect response. The following variables were measured-
72
2.4.6.2.3 Accuracy score. Accuracy score was calculated by adding the number of
correct responses in each block excluding the errors. The maximum obtainable score was 80.
Percentage accuracy was computed for the total number of correct responses on a maximum
score of 80.
2.4.6.2.4 Block-wise error analysis. Each block corresponded to a grammatical
structure. Therefore, we looked at errors in each block to examine which grammatical structure
was most affected in the participants.
73
2.5 Statistical Analyses
Normality checks were carried out for all the variables using Kolmogorov- Smirnov test.
Parametric statistical tests were performed on normally distributed data set, and for the non-
normally distributed data set, non-parametric statistical tests were performed.
In verbal fluency, all the variables were normally distributed. All the variables were
measured for each trial for the two fluency conditions for each participant. To arrive at the mean
scores for each variable, the trials were averaged in each condition; for semantic fluency,
animals, clothing and food items were averaged; for letter fluency, F and S trials were averaged.
A two-way repeated measures ANOVA was used on the following variables, number of CR, First
RT, Sub-RT, cluster size and number of switches. In the design, Group (High print exposure; Low
print exposure) was treated as between -subject factor, and Condition (Semantic; Letter) was
considered as within-subject factor. Two separate independent sample t-tests were conducted
for initiation parameter and slope for semantic and letter fluency conditions with Group as
between-subject factor.
In word and non-word repetition, the number of CR was normally distributed.
Therefore, a two-way repeated measures ANOVA was conducted with Group (High print
exposure; Low print exposure) as between -subject factor, and Type (Word repetition; Non-
word repetition) as within-subject factor. The variables of synonymy triplets and sentence
comprehension task were normally distributed. Two separate independent sample t-tests were
conducted for the two tasks with Group as between-subject factor. Additionally, in synonymy
triplets tasks for noun and verb differences in performance, a two-way repeated measures
ANOVA was conducted with Group (High print exposure; Low print exposure) as between -
subject factor, and Type (Nouns; Verbs) as within-subject factor.
74
2.6 Results
In this section, we present the findings of experimental tasks described in section 2.4. We
present the results of verbal fluency measures in section 2.5.1, followed by results of word and
non-word repetition in section 2.5.2. In section 2.5.3, we present the findings of the semantic
comprehension measures and in the last section 2.5.4 we present the findings of correlational
analyses of oral language production and comprehension measures with print exposure, years
of education and age.
2.6.1 Performance on verbal fluency measures
Differences between HPE and LPE are reported as either as a main effect of Group, main effect of
Condition (Semantic vs. Letter) or an interaction of Group X Condition for all the measures of
verbal fluency. There was no main effect of Group or interaction with Group X Condition in any
of the VF variables.
The CR showed only a main effect of Condition (Semantic: M =19.36, SD =4.32; Letter: M
=15.01, SD =4.43) (See figure 2.8). Likewise, for First RT, there was only a significant main effect
of Condition (Semantic: M =1.19, SD =0.55, Letter: M= 0.89, SD = 0.58). Sub-RT showed a
significant main effect of Condition as well, with a longer sub-RT for letter fluency compared to
semantic fluency (Semantic: M =22.89, SD =2.27, Letter: M= 24.05, SD = 2.53).
Initiation parameter and slope were analysed as a function of group after each time
course was fitted to multilevel model. The estimated function for each fluency condition and
groups are presented in Table 2.9. Figure 2.7 represents the time course of the correct
responses by the group for the two fluency conditions. There were no significant group
differences for initiation parameter and slope across HPE and LPE.
On cluster size, there was only a significant main effect of Condition, (Semantic: M =1.20,
SD =0.38, Letter: M= 0.44, SD = 0.28) (See Figure 2.9). Both groups produced bigger clusters for
semantic condition compared to letter condition. There was a main effect of Condition on

75
number of switches, with a higher number of switches on letter condition compared to semantic
condition (Semantic: M =8.82, SD =1.80, Letter: M= 10, SD = 2.81) (See Figure 2.10).
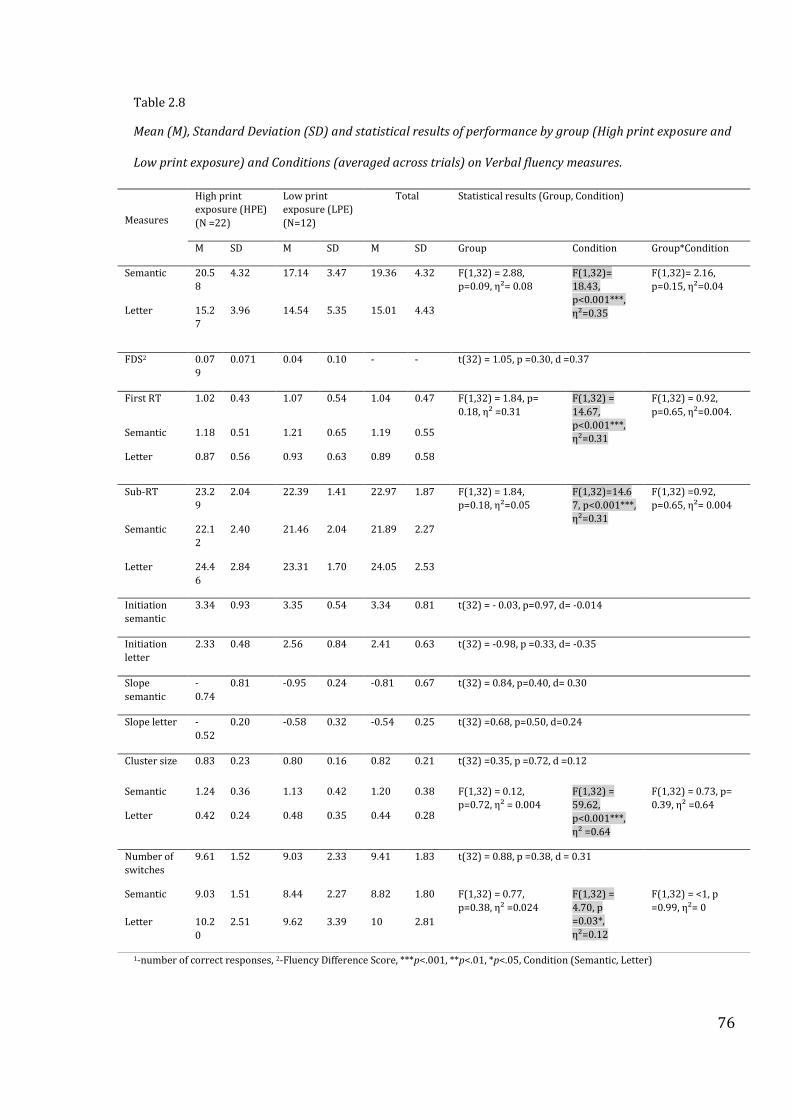
76
Table 2.8
Mean (M), Standard Deviation (SD) and statistical results of performance by group (High print exposure and
Low print exposure) and Conditions (averaged across trials) on Verbal fluency measures.
1-number of correct responses, 2-Fluency Difference Score, ***p<.001, **p<.01, *p<.05, Condition (Semantic, Letter)
Measures
High print
exposure (HPE)
(N =22)
Low print
exposure (LPE)
(N=12)
Total Statistical results (Group, Condition)
M SD M SD M SD Group Condition Group*Condition
Semantic 20.5
8
4.32 17.14 3.47 19.36 4.32 F(1,32) = 2.88,
p=0.09, η²= 0.08
F(1,32)=
18.43,
p<0.001***,
η²=0.35
F(1,32)= 2.16,
p=0.15, η²=0.04
Letter 15.2
7
3.96 14.54 5.35 15.01 4.43
FDS2 0.07
9
0.071 0.04 0.10 - - t(32) = 1.05, p =0.30, d =0.37
First RT 1.02 0.43 1.07 0.54 1.04 0.47 F(1,32) = 1.84, p=
0.18, η² =0.31
F(1,32) =
14.67,
p<0.001***,
η²=0.31
F(1,32) = 0.92,
p=0.65, η²=0.004.
Semantic 1.18 0.51 1.21 0.65 1.19 0.55
Letter 0.87 0.56 0.93 0.63 0.89 0.58
Sub-RT 23.2
9
2.04 22.39 1.41 22.97 1.87 F(1,32) = 1.84,
p=0.18, η²=0.05
F(1,32)=14.6
7, p<0.001***,
η²=0.31
F(1,32) =0.92,
p=0.65, η²= 0.004
Semantic 22.1
2
2.40 21.46 2.04 21.89 2.27
Letter 24.4
6
2.84 23.31 1.70 24.05 2.53
Initiation
semantic
3.34 0.93 3.35 0.54 3.34 0.81 t(32) = - 0.03, p=0.97, d= -0.014
Initiation
letter
2.33 0.48 2.56 0.84 2.41 0.63 t(32) = -0.98, p =0.33, d= -0.35
Slope
semantic
-
0.74
0.81 -0.95 0.24 -0.81 0.67 t(32) = 0.84, p=0.40, d= 0.30
Slope letter -
0.52
0.20 -0.58 0.32 -0.54 0.25 t(32) =0.68, p=0.50, d=0.24
Cluster size 0.83 0.23 0.80 0.16 0.82 0.21 t(32) =0.35, p =0.72, d =0.12
Semantic 1.24 0.36 1.13 0.42 1.20 0.38 F(1,32) = 0.12,
p=0.72, η² = 0.004
F(1,32) =
59.62,
p<0.001***,
η² =0.64
F(1,32) = 0.73, p=
0.39, η² =0.64 Letter 0.42 0.24 0.48 0.35 0.44 0.28
Number of
switches
9.61 1.52 9.03 2.33 9.41 1.83 t(32) = 0.88, p =0.38, d = 0.31
Semantic 9.03 1.51 8.44 2.27 8.82 1.80 F(1,32) = 0.77,
p=0.38, η² =0.024
F(1,32) =
4.70, p
=0.03*,
η²=0.12
F(1,32) = <1, p
=0.99, η²= 0
Letter 10.2
0
2.51 9.62 3.39 10 2.81
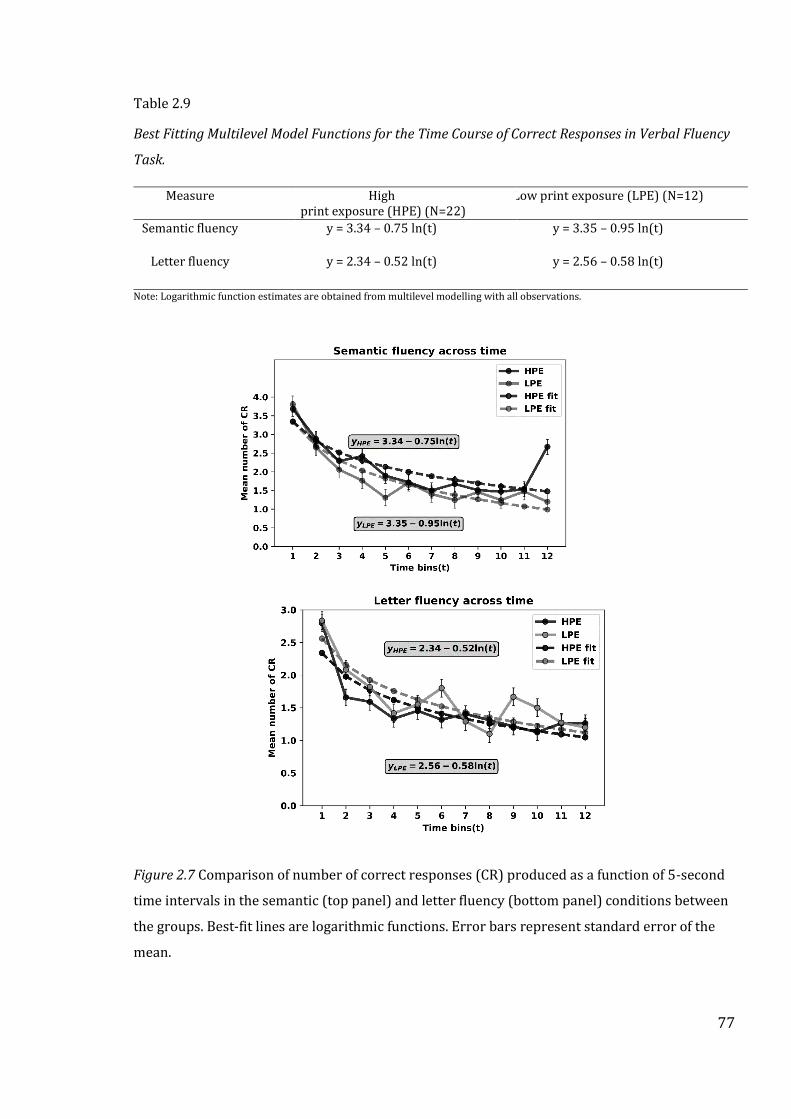
77
Table 2.9
Best Fitting Multilevel Model Functions for the Time Course of Correct Responses in Verbal Fluency
Task.
Measure High print exposure (HPE) (N=22)
Low print exposure (LPE) (N=12)
Semantic fluency y = 3.34 – 0.75 ln(t) y = 3.35 – 0.95 ln(t)
Letter fluency y = 2.34 – 0.52 ln(t) y = 2.56 – 0.58 ln(t)
Note: Logarithmic function estimates are obtained from multilevel modelling with all observations.
Figure 2.7 Comparison of number of correct responses (CR) produced as a function of 5-second
time intervals in the semantic (top panel) and letter fluency (bottom panel) conditions between
the groups. Best-fit lines are logarithmic functions. Error bars represent standard error of the
mean.
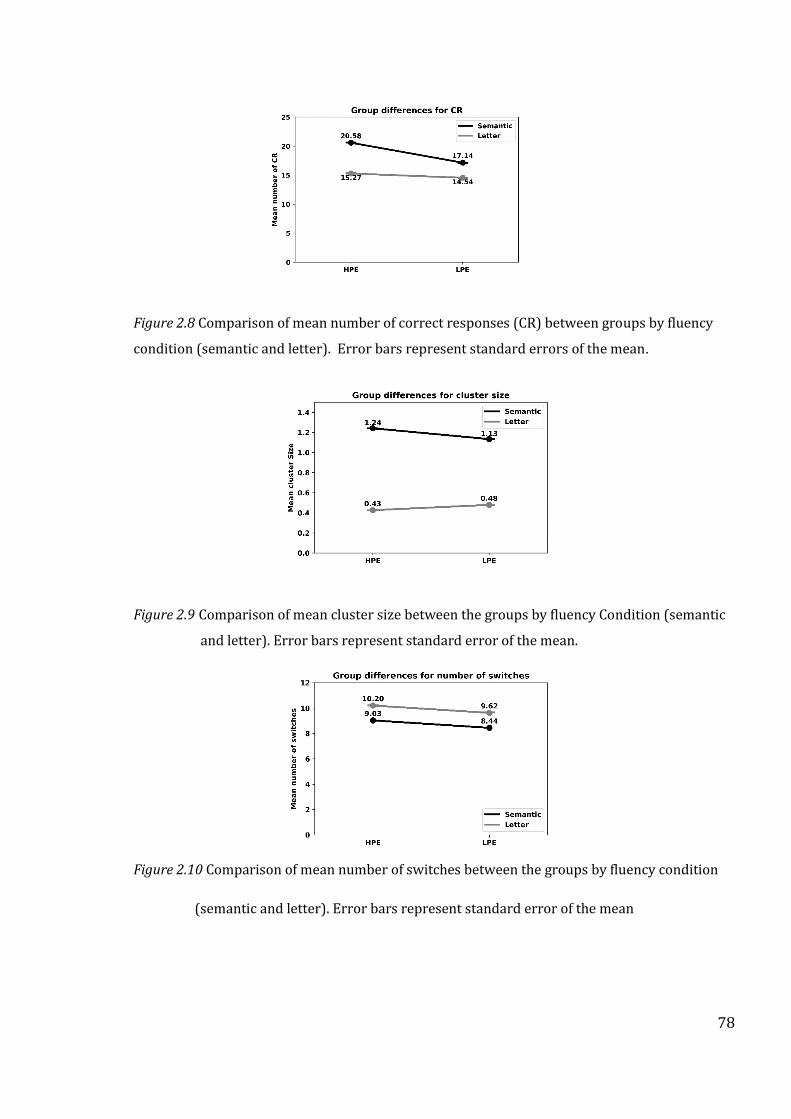
78
Figure 2.8 Comparison of mean number of correct responses (CR) between groups by fluency
condition (semantic and letter). Error bars represent standard errors of the mean.
Figure 2.9 Comparison of mean cluster size between the groups by fluency Condition (semantic
and letter). Error bars represent standard error of the mean.
Figure 2.10 Comparison of mean number of switches between the groups by fluency condition
(semantic and letter). Error bars represent standard error of the mean
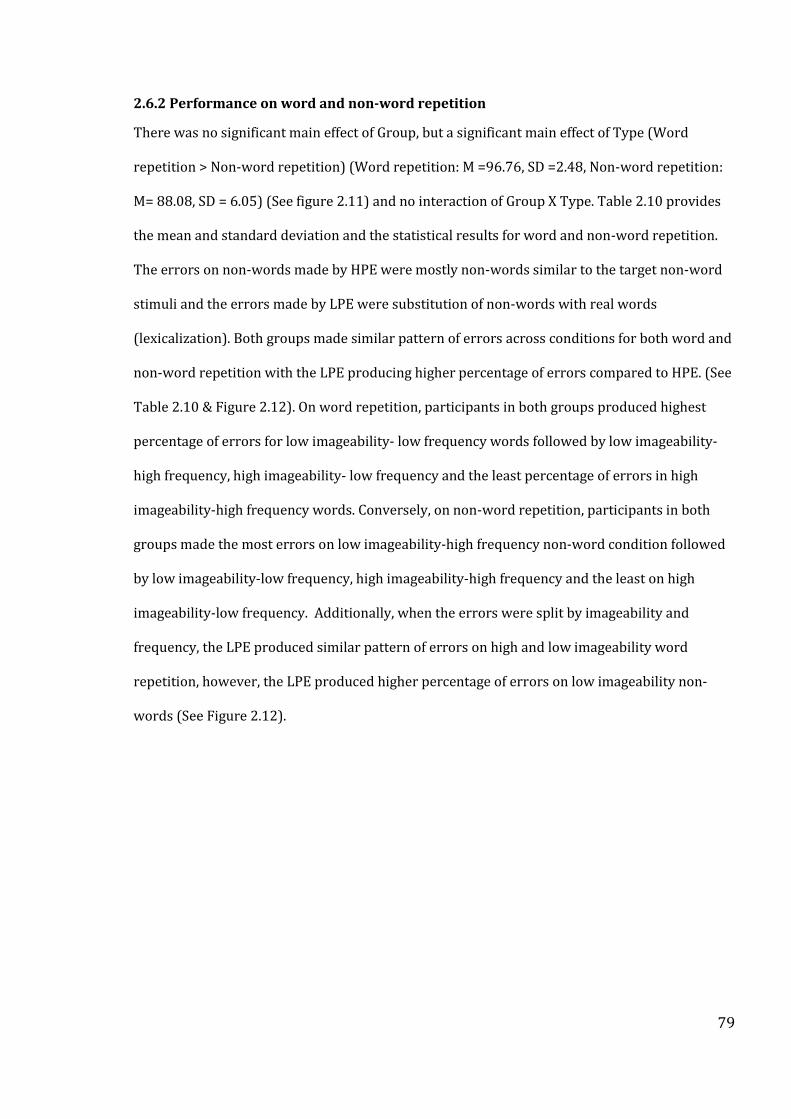
79
2.6.2 Performance on word and non-word repetition
There was no significant main effect of Group, but a significant main effect of Type (Word
repetition > Non-word repetition) (Word repetition: M =96.76, SD =2.48, Non-word repetition:
M= 88.08, SD = 6.05) (See figure 2.11) and no interaction of Group X Type. Table 2.10 provides
the mean and standard deviation and the statistical results for word and non-word repetition.
The errors on non-words made by HPE were mostly non-words similar to the target non-word
stimuli and the errors made by LPE were substitution of non-words with real words
(lexicalization). Both groups made similar pattern of errors across conditions for both word and
non-word repetition with the LPE producing higher percentage of errors compared to HPE. (See
Table 2.10 & Figure 2.12). On word repetition, participants in both groups produced highest
percentage of errors for low imageability- low frequency words followed by low imageability-
high frequency, high imageability- low frequency and the least percentage of errors in high
imageability-high frequency words. Conversely, on non-word repetition, participants in both
groups made the most errors on low imageability-high frequency non-word condition followed
by low imageability-low frequency, high imageability-high frequency and the least on high
imageability-low frequency. Additionally, when the errors were split by imageability and
frequency, the LPE produced similar pattern of errors on high and low imageability word
repetition, however, the LPE produced higher percentage of errors on low imageability non-
words (See Figure 2.12).
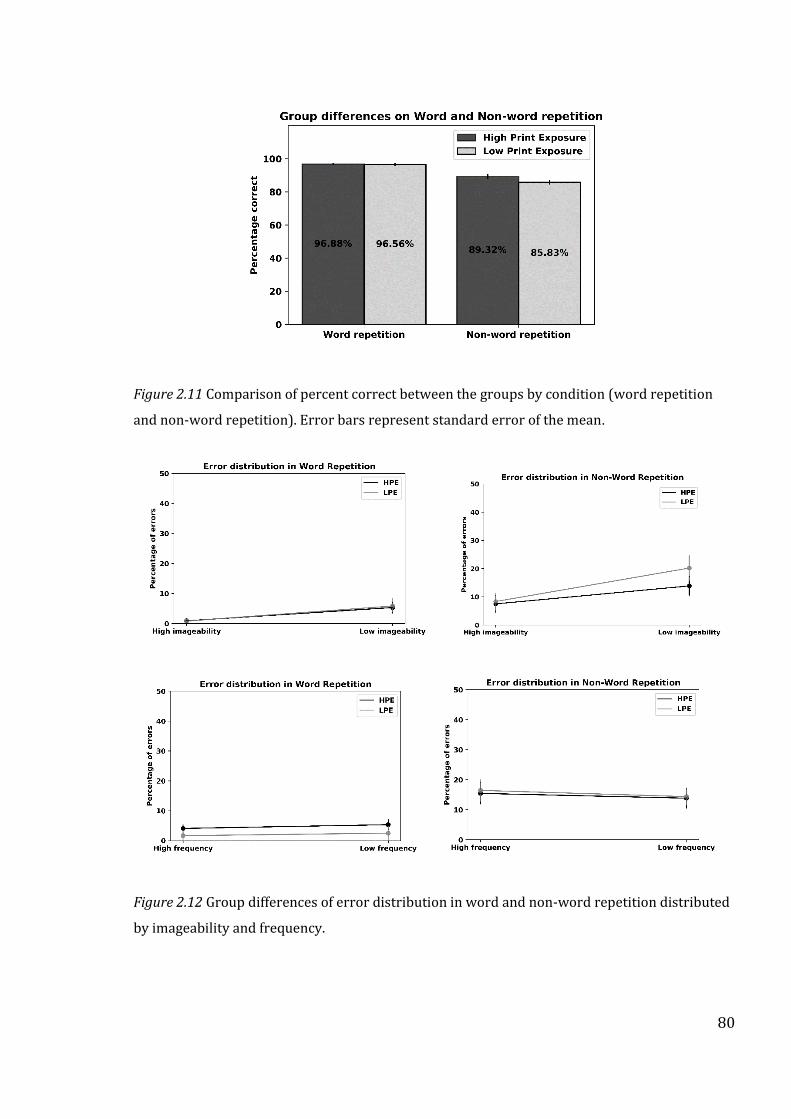
80
Figure 2.11 Comparison of percent correct between the groups by condition (word repetition
and non-word repetition). Error bars represent standard error of the mean.
Figure 2.12 Group differences of error distribution in word and non-word repetition distributed
by imageability and frequency.
81
Table 2.10
Mean (M), Minimum (Min) and Maximum (Max) values and statistical results of performance on Word-Non-word repetition and Comprehension tasks.
Experimental Measures
High print exposure (HPE) (N=22) Low print exposure (LPE)(N=12) Total Statistical results Min-Max M SD Min-Max M SD M SD Group Condition or type Group*c
ondition
Word Repetititon1
Raw score 73-80
77.50 1.94 72-80 77.25
2.13
77.41 1.98 F(1, 32) = 2.09, p = 0.15
F(1,32)= 89.53, p< 0.001***
F(1, 32) = 2.69, p = 0.11 % Accuracy 91.25-100 96.87 2.42 90-100 96.52 2.38 96.76 2.48
Non-word Repetition1
Raw score
57-78
71.45
5.18
62-76
68.67
3.70
70.47 4.84
% Accuracy 71.25-97.5
89.31 6.47 77.5-95 85.8 5.46 88.08 6.05
Total score 66-78 74.47 3.22 70-77.5 72.95 2,24 73.94 2.97 t(32) = 1.44, p =0.157 Total Percent Accuracy 82.5-97.5 95.4 4.03 87.5-96.88 91.18 3.93 92.42 3.71
Difference score 0-18 6.05 4.43 3-16 8.58 4.05 t(32) = -1.64, p=0.11 Comprehension measures
Synonymy triplets task2
Nouns Raw score 4-15 8.63 2.66 4-10 6.50 1.97 7.88 2.6 F(1,32)= 7.79, p = 0.009*
F(1,32)= 148.70, p<0.001***
F(1,32) = 0.98, p =0.32
% Accuracy 26.7-100 57.5 17.35 26.67-66.67
43.33 12.61 52.54 17.50
Verbs
Raw score 10-15 12.95 1.58 8-13 11.58 1.50 12.47 1.67 % Accuracy 66.67-100 86.33 10.34 53.33-
86.67 77.2 9.60 83.13 11.15
Total score
15-30
21.59
3.91
15-23
18.08
2.53
20.35
3.84
t(32) =2.79, p = 0.009**
Total Percent Accuracy 50-100 71.9 12.73 50-76.6 60.02 8.1 67.84 12.81
Sentence comprehension3
Raw score
41-56
49.86
3.73
32-53
44.92
6.34
48.12
5.29
t(32) =287, p = 0.007**
% Accuracy 68.33-93.33
83.3 8.675 53.3-88.3 74.83 10.12 85.992 9.45
1-Maximum possible scores for words and non-words was 80 each; 2-Maximum possible score was 30; 3-Maximum
possible score was 56; ***p<0.001 **p<0.01 *p<0.0
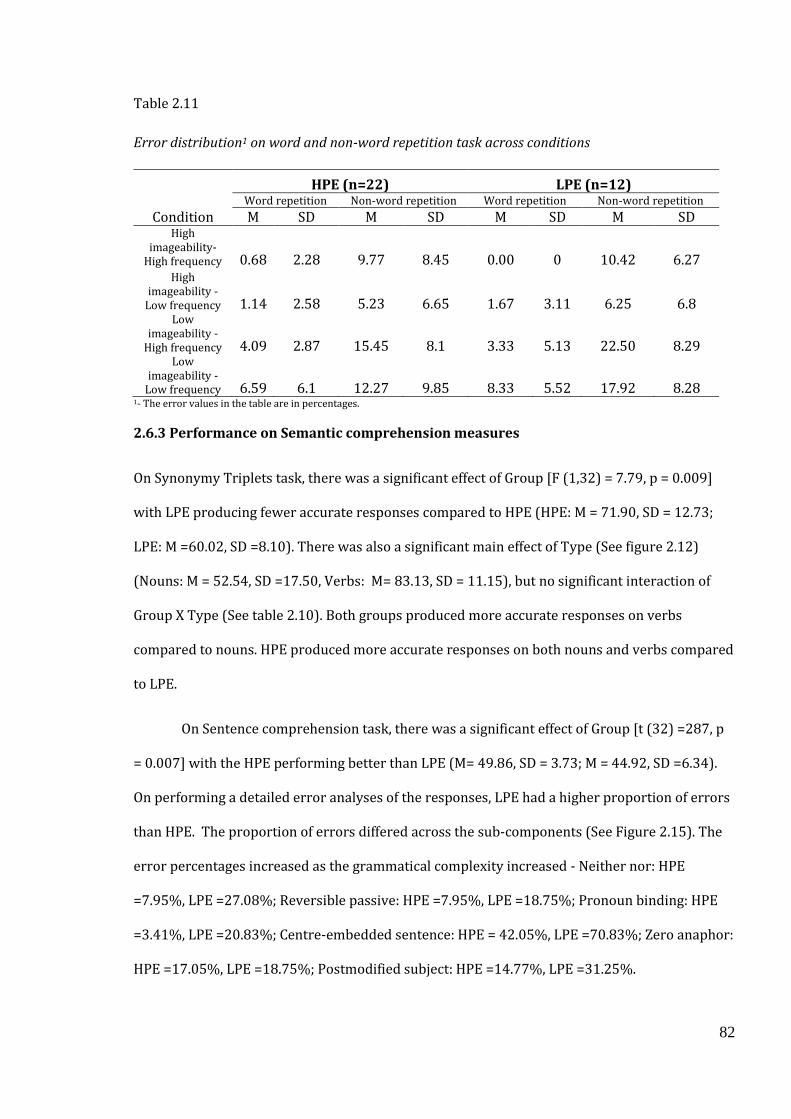
82
Table 2.11
Error distribution1 on word and non-word repetition task across conditions
Condition
HPE (n=22) LPE (n=12) Word repetition Non-word repetition Word repetition Non-word repetition
M SD M SD M SD M SD High
imageability-High frequency 0.68 2.28 9.77 8.45 0.00 0 10.42 6.27
High imageability -
Low frequency 1.14 2.58 5.23 6.65 1.67 3.11 6.25 6.8 Low
imageability - High frequency 4.09 2.87 15.45 8.1 3.33 5.13 22.50 8.29
Low imageability -
Low frequency 6.59 6.1 12.27 9.85 8.33 5.52 17.92 8.28 1- The error values in the table are in percentages.
2.6.3 Performance on Semantic comprehension measures
On Synonymy Triplets task, there was a significant effect of Group [F (1,32) = 7.79, p = 0.009]
with LPE producing fewer accurate responses compared to HPE (HPE: M = 71.90, SD = 12.73;
LPE: M =60.02, SD =8.10). There was also a significant main effect of Type (See figure 2.12)
(Nouns: M = 52.54, SD =17.50, Verbs: M= 83.13, SD = 11.15), but no significant interaction of
Group X Type (See table 2.10). Both groups produced more accurate responses on verbs
compared to nouns. HPE produced more accurate responses on both nouns and verbs compared
to LPE.
On Sentence comprehension task, there was a significant effect of Group [t (32) =287, p
= 0.007] with the HPE performing better than LPE (M= 49.86, SD = 3.73; M = 44.92, SD =6.34).
On performing a detailed error analyses of the responses, LPE had a higher proportion of errors
than HPE. The proportion of errors differed across the sub-components (See Figure 2.15). The
error percentages increased as the grammatical complexity increased - Neither nor: HPE
=7.95%, LPE =27.08%; Reversible passive: HPE =7.95%, LPE =18.75%; Pronoun binding: HPE
=3.41%, LPE =20.83%; Centre-embedded sentence: HPE = 42.05%, LPE =70.83%; Zero anaphor:
HPE =17.05%, LPE =18.75%; Postmodified subject: HPE =14.77%, LPE =31.25%.
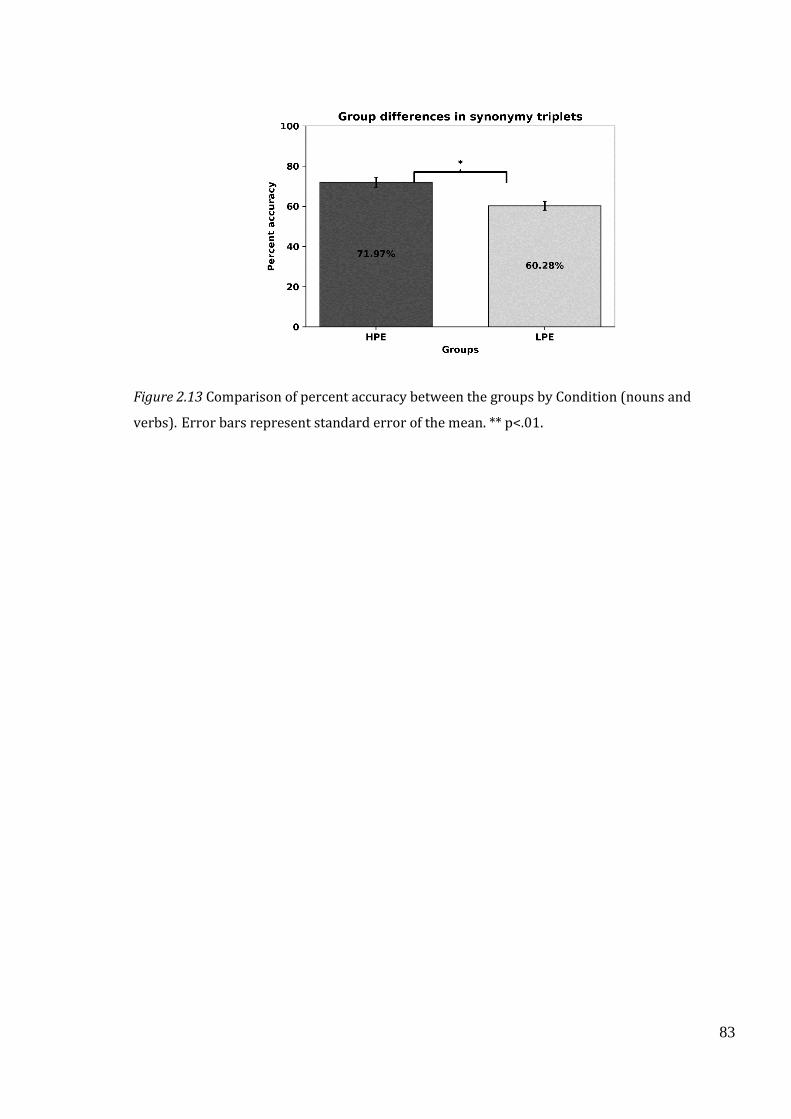
83
Figure 2.13 Comparison of percent accuracy between the groups by Condition (nouns and
verbs). Error bars represent standard error of the mean. ** p<.01.
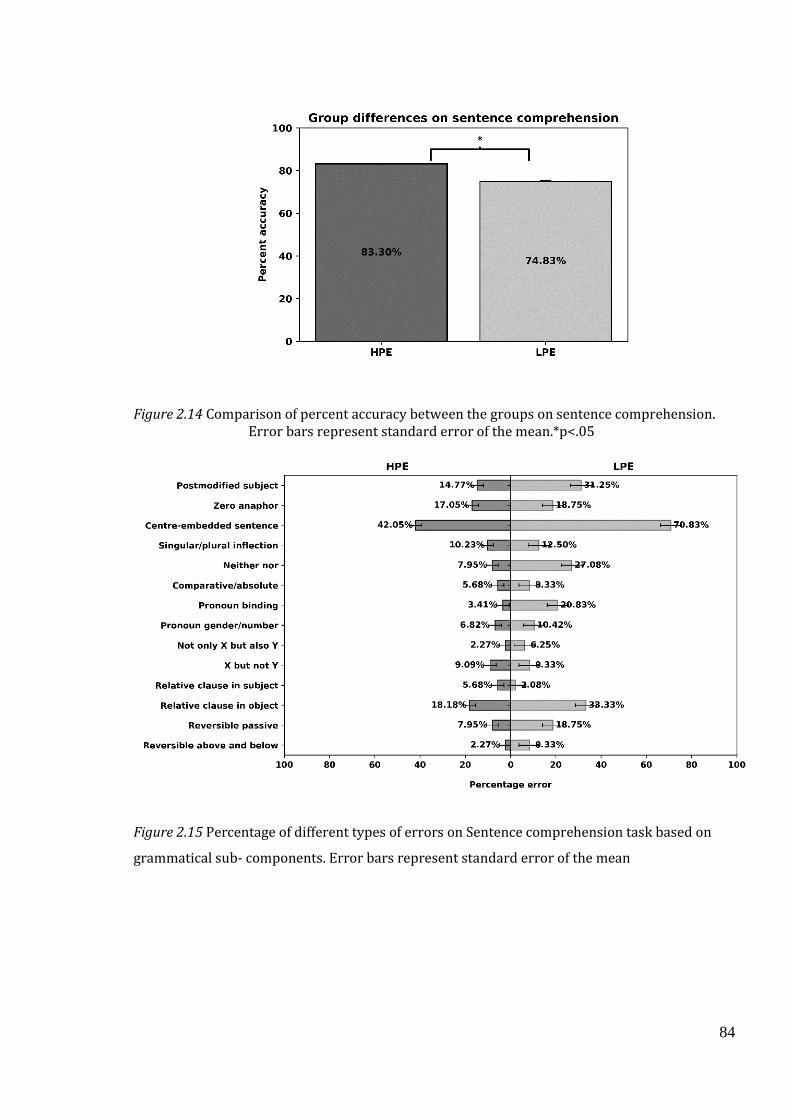
84
Figure 2.14 Comparison of percent accuracy between the groups on sentence comprehension. Error bars represent standard error of the mean.*p<.05
Figure 2.15 Percentage of different types of errors on Sentence comprehension task based on
grammatical sub- components. Error bars represent standard error of the mean
85
2.6.4 Findings of Correlation analyses.
The correlation of oral language production and comprehension measures with measure of
print exposure, age and years of education are presented in Table 2.12.
There was a significant moderate positive correlation of measure of print exposure with
CR for semantic fluency, total switches and percent correct non-word repetition. Participants
with higher print exposure produced higher CR on semantic fluency task, higher number of
switches and had a higher percentage of correct responses on non-word repetition. This is
clearly evident in the figures where two distinct clusters of data points representing HPE and
LPE are seen (See Figure 2.16 and 2.17). These figures are particularly interesting as both the
group differences and the difference produced by the measure of print exposure are equally
evident. All other correlations with print exposure were non-significant. There was a significant
positive correlation of measure of print exposure with both percentages correct of synonymy
triplets and sentence comprehension (See figure 2.18). Participants with higher print exposure
produced higher percentage of correct responses for both synonymy triplets and sentence
comprehension task.
Years of education showed a significant negative correlation with initiation total
suggesting that participants with greater number of years of education had smaller initiation
values. There was a significant positive correlation between years of education with slope and
years of education with Sub RT i.e., participants with higher number of years of education had a
larger slope and higher Sub RT (See Figure 2.19). A feature of this figure is that both the HPE
and LPE group are equally distributed about the years of education, this shows that our
selection and manipulation of data based on print exposure was unbiased and correctly matched
for years of education.
Age did not show any significant correlations with any of the oral language production
measures. Age showed a significant positive correlation only with percent correct of synonymy
triplets task i.e., older participants produced higher percentage of correct responses in the
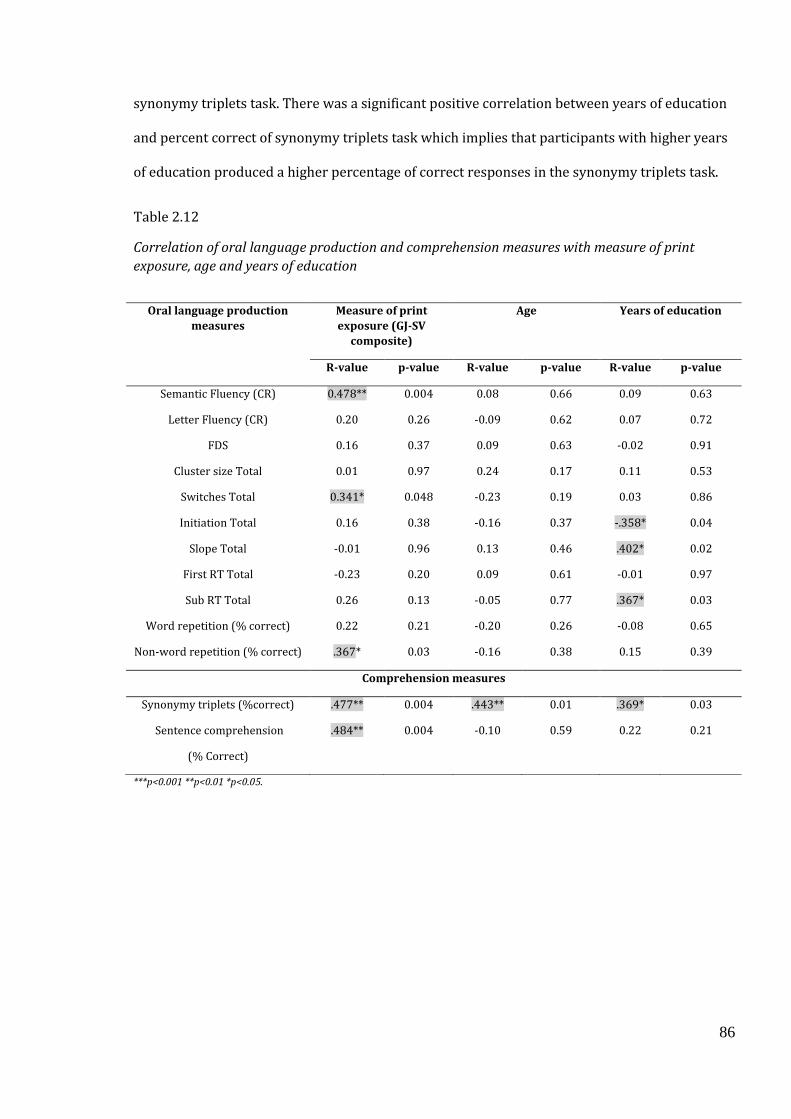
86
synonymy triplets task. There was a significant positive correlation between years of education
and percent correct of synonymy triplets task which implies that participants with higher years
of education produced a higher percentage of correct responses in the synonymy triplets task.
Table 2.12
Correlation of oral language production and comprehension measures with measure of print
exposure, age and years of education
***p<0.001 **p<0.01 *p<0.05.
Oral language production
measures
Measure of print
exposure (GJ-SV
composite)
Age Years of education
R-value p-value R-value p-value R-value p-value
Semantic Fluency (CR) 0.478** 0.004 0.08 0.66 0.09 0.63
Letter Fluency (CR) 0.20 0.26 -0.09 0.62 0.07 0.72
FDS 0.16 0.37 0.09 0.63 -0.02 0.91
Cluster size Total 0.01 0.97 0.24 0.17 0.11 0.53
Switches Total 0.341* 0.048 -0.23 0.19 0.03 0.86
Initiation Total 0.16 0.38 -0.16 0.37 -.358* 0.04
Slope Total -0.01 0.96 0.13 0.46 .402* 0.02
First RT Total -0.23 0.20 0.09 0.61 -0.01 0.97
Sub RT Total 0.26 0.13 -0.05 0.77 .367* 0.03
Word repetition (% correct) 0.22 0.21 -0.20 0.26 -0.08 0.65
Non-word repetition (% correct) .367* 0.03 -0.16 0.38 0.15 0.39
Comprehension measures
Synonymy triplets (%correct) .477** 0.004 .443** 0.01 .369* 0.03
Sentence comprehension
(% Correct)
.484** 0.004 -0.10 0.59 0.22 0.21
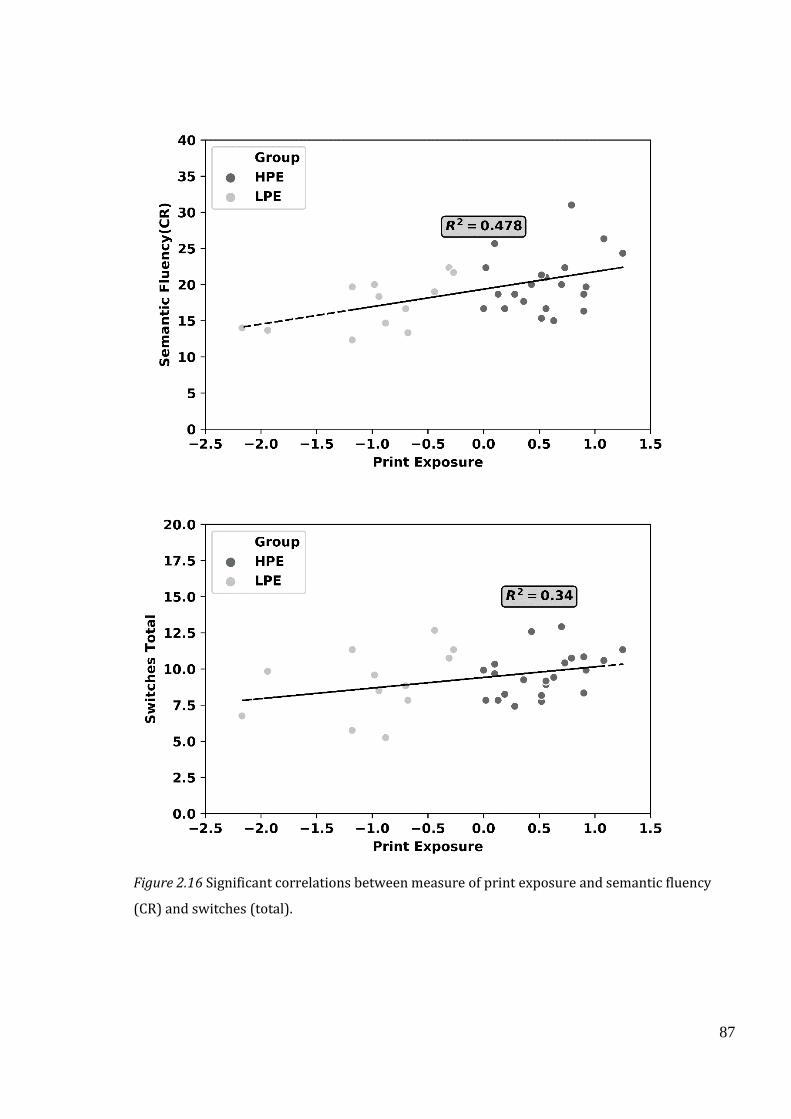
87
Figure 2.16 Significant correlations between measure of print exposure and semantic fluency
(CR) and switches (total).
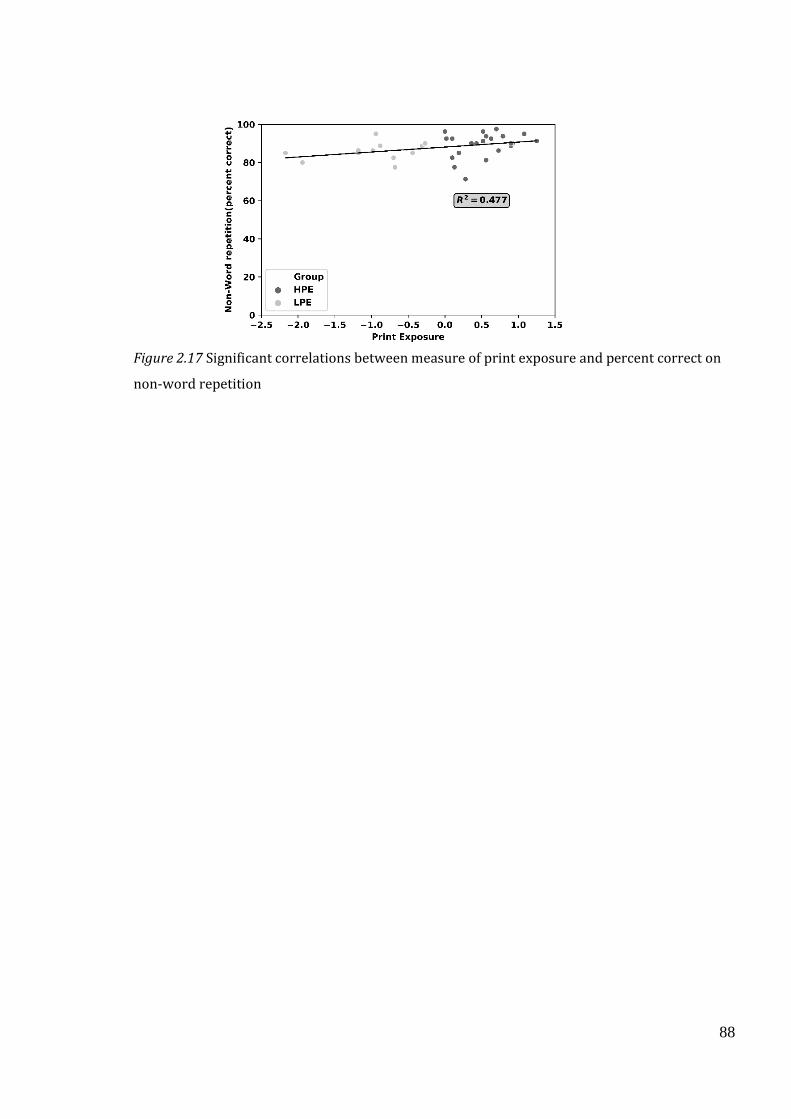
88
Figure 2.17 Significant correlations between measure of print exposure and percent correct on
non-word repetition
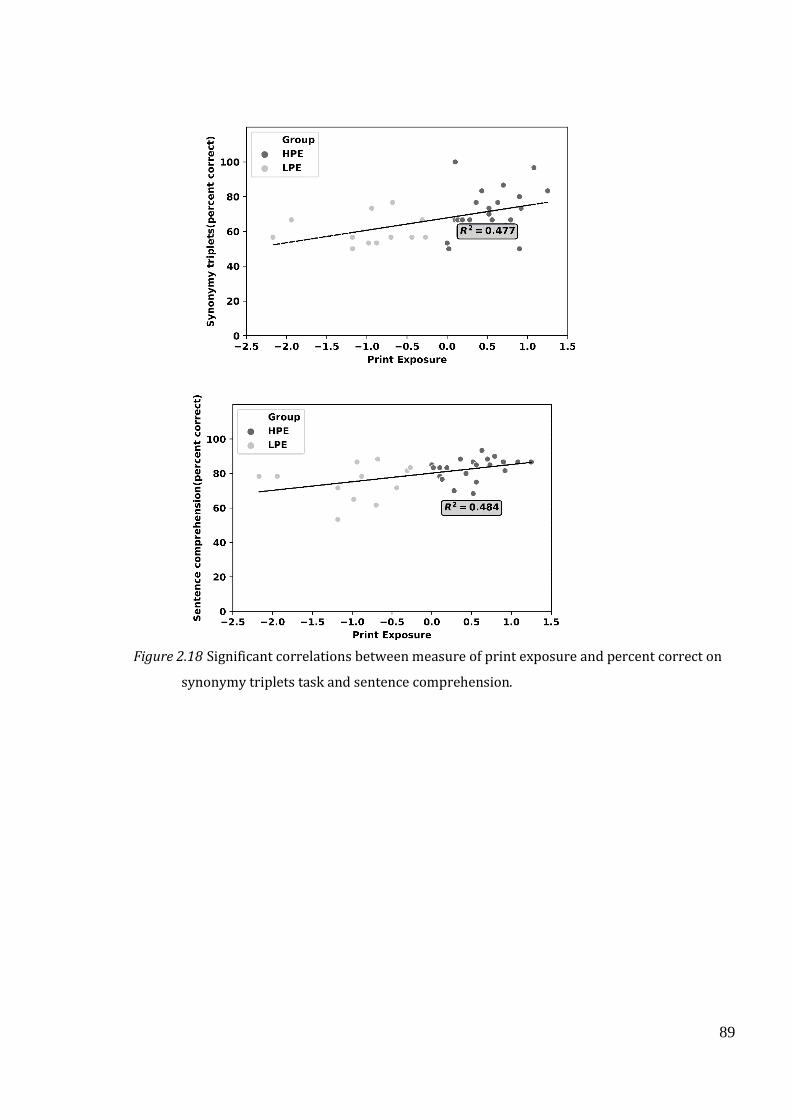
89
Figure 2.18 Significant correlations between measure of print exposure and percent correct on
synonymy triplets task and sentence comprehension.
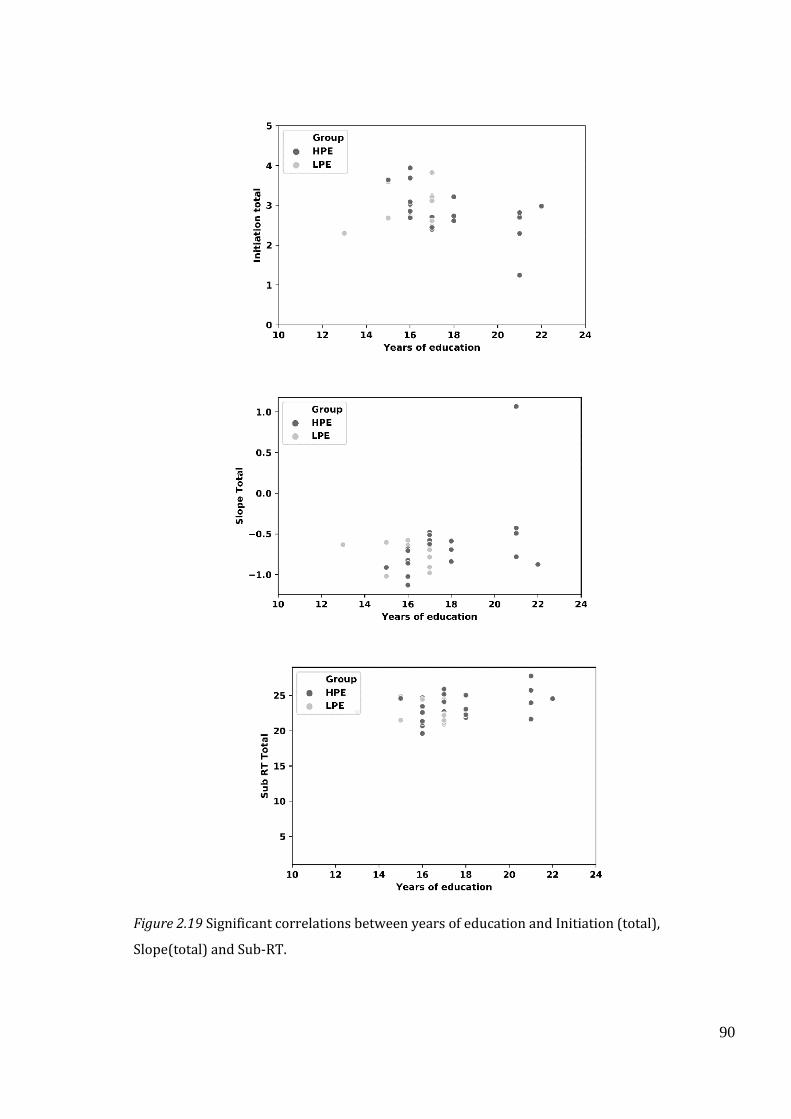
90
Figure 2.19 Significant correlations between years of education and Initiation (total),
Slope(total) and Sub-RT.
91
2.7 Discussion
2.7.1 Summary of findings
The aim of the current study was to examine the impact of oral language production and
comprehension in bi-literate bilingual individuals with a difference in print exposure in L2. To
attain this overall aim, the present study determined if there were group differences in oral
language production tasks – verbal fluency and word and non-word repetition and
comprehension measures – synonymy triplets task and sentence comprehension. We tested a
large group of bi-literate bilingual individuals speaking one of the South Indian languages as L1
(Kannada, Malayalam, Tamil, Telugu) and English as L2, who were matched for age, gender,
years of education and L1 proficiency. Based on their print exposure in L2 as measured by
grammaticality judgement task and sentence verification task, we grouped the participants as
belonging to HPE and LPE. The HPE group performed significantly better than LPE on objective
measures of language proficiency in L2- lexical decision task and picture naming task.
The key findings are that there were no group differences on measures of verbal fluency,
and accuracy of word and non-word repetition. In contrast, the semantic comprehension
measures showed significant group differences and significant correlations with measures of
print exposure. Table 2.13 provides the summary of findings on oral language production and
comprehension measures.
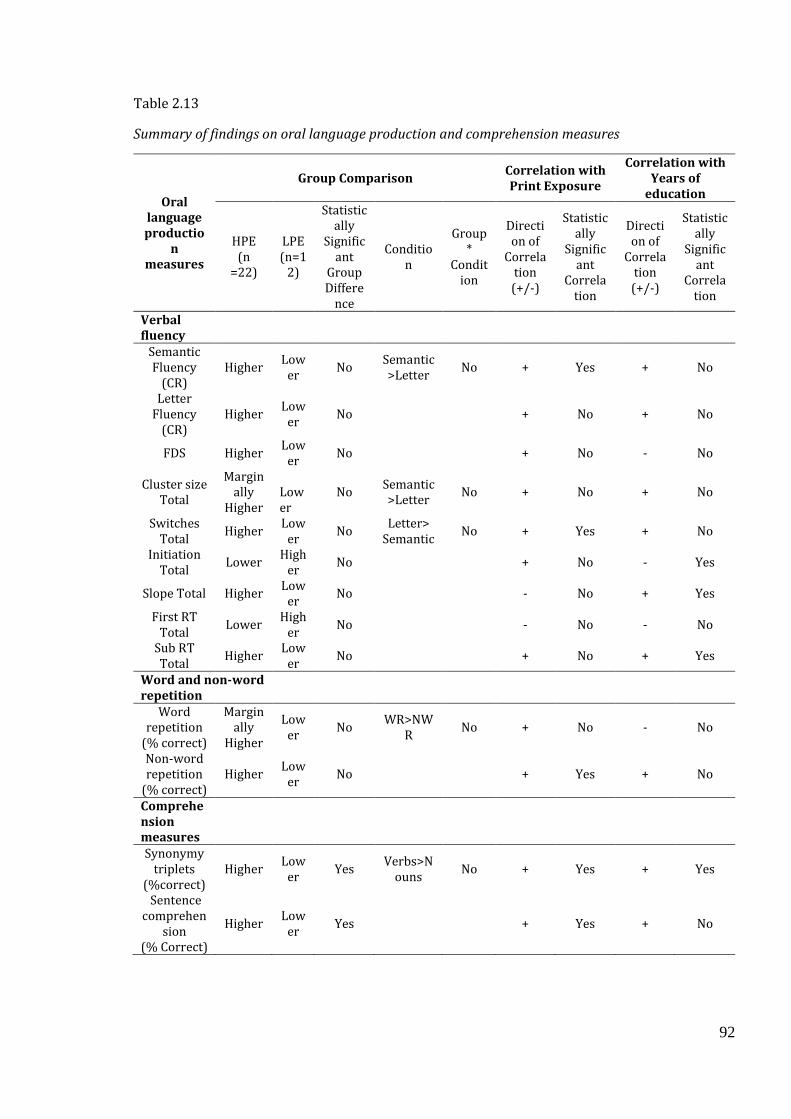
92
Table 2.13
Summary of findings on oral language production and comprehension measures
Oral language productio
n measures
Group Comparison Correlation with Print Exposure
Correlation with Years of
education
HPE (n
=22)
LPE (n=1
2)
Statistically
Significant
Group Differe
nce
Condition
Group *
Condition
Direction of
Correlation (+/-)
Statistically
Significant
Correlation
Direction of
Correlation (+/-)
Statistically
Significant
Correlation
Verbal fluency
Semantic Fluency
(CR) Higher
Lower
No Semantic >Letter
No + Yes + No
Letter Fluency
(CR) Higher
Lower
No + No + No
FDS Higher Low
er No + No - No
Cluster size Total
Marginally
Higher Lower
No Semantic >Letter
No + No + No
Switches Total
Higher Low
er No
Letter> Semantic
No + Yes + No
Initiation Total
Lower High
er No + No - Yes
Slope Total Higher Low
er No - No + Yes
First RT Total
Lower High
er No - No - No
Sub RT Total
Higher Low
er No + No + Yes
Word and non-word repetition
Word repetition
(% correct)
Marginally
Higher
Lower
No WR>NW
R No + No - No
Non-word repetition
(% correct) Higher
Lower
No + Yes + No
Comprehension measures
Synonymy triplets
(%correct) Higher
Lower
Yes Verbs>N
ouns No + Yes + Yes
Sentence comprehen
sion (% Correct)
Higher Low
er Yes + Yes + No
93
2.7.2 Oral language production tasks
The findings on the verbal fluency task does not support the hypothesis i.e., there were no
group differences on measures of verbal fluency- CR, FDS, First RT, Sub-RT, cluster size and
number of switches, initiation parameter and slope for both semantic and letter fluency.
However, semantic fluency (CR) showed a significant positive correlation with print exposure
i.e., higher print exposure scores were associated with higher number of correct on semantic
fluency. This was an unexpected finding which could be related to semantic knowledge being
important factor for reading words (Nation & Snowling, 2004). In our study, participants with
higher print exposure read more frequently and performed better on the reading task (sentence
verification task) which could mean that they have improved semantic knowledge. We
hypothesize that this could have translated into better performance on semantic fluency task.
Switches total showed a significant positive correlation with print exposure i.e., higher
print exposure scores were associated with greater number of switches. Switching requires
strategic search of subcategories and cognitive flexibility to shift efficiently between
subcategories (Da Silva, 2004) and dependent on more controlled processing than those
required for clustering (Troyer, 2000; Troyer et al.,1997). In the current study, participants with
higher print exposure have produced a greater number of switches, which probably suggests
that they have better cognitive flexibility.
The performance on letter fluency was comparable across both groups. Both the groups
have acquired orthography and phonology required for letter fluency task, unlike in children
where it is still in the acquisition state (Friesen, Luo, Luk, & Bialystok, 2014). In Friesen, Luo,
Luk, & Bialystok (2014), they found that number of correct on letter fluency task improved with
age in younger children, however in adults it plateaued and remained constant. In addition, as
both groups had very high average years of education (17 years), the effect on phonology could
be further minimised. Hence, the performance is comparable on letter fluency task. This could
be attributed to the findings of Kosmidis et al (2004) where they suggested that education plays
94
a more influential role in phonological rather than semantic word fluency. In our case, both
groups are matched for education.
The findings on the word and non-word repetition task does not support the hypothesis;
the performance of the two groups were not statistically different however, we found that the
participants in HPE produced marginally higher percentage of correct words and non-words
compared to LPE. There was a significant effect of type, i.e., word repetition had higher accuracy
compared to non-word repetition. This is in-line with previous research on monolingual
population (Petersson et al, 2000; Kosmidis et al., 2006) where words were repeated with
higher accuracy in both illiterate and literate groups.
Additionally, the error pattern on non-word repetition showed the pattern where the
LPE mirrored the HPE on the error pattern but produced higher percentage of errors in
comparison to HPE on categories of low imageability items. We could explain this by the fact
imageability is a function of semantics (Plaut & Shallice, 1993) and as errors in low imageability
items are higher for the LPE, it could imply that semantics are affected. The affected semantics
can also be inferred from the moderate positive correlation between semantic fluency (CR) and
print exposure.
Another important finding was that of a significant positive correlation between print
exposure and non-word repetition. In other words, participants with higher print exposure had
a higher percentage of correct responses on non-word repetition. This is supported by studies in
monolingual population (eg., Petersson et al, 2000; Kosmidis et al., 2006) where differences in
non-word repetition were observed because of print exposure.
2.7.3 Comprehension measures
The findings of both synonymy triplets and sentence comprehension task were in opposition to
our hypothesis. There was a significant group difference on synonymy triplets task where HPE
produced more accurate responses compared to LPE. Higher print exposure and greater years
of education was also associated with significantly higher percentage of correct responses on
synonymy triplets task. We can draw support for this finding from research of reading ability in
95
monolingual children. Nation and Snowling (1998) found a significant difference between their
groups of normal readers and poor readers on synonym judgement task. We also found a
significant difference between HPE and LPE on synonymy triplets task in our study.
On the sentence comprehension task, the participants in HPE were significantly more
accurate than the LPE group. This is also reflected in the correlation analyses i.e., higher print
exposure was associated significantly with higher accuracy on the sentence comprehension.
This sentence comprehension task was a listening task, where sentences were auditorily
presented and the participants had to choose the correct picture. Therefore, results from studies
in monolingual and bilingual children on listening comprehension are relevant. Hedrick and
Cunningham (1995) found that there was a bi-directional relationship between listening
comprehension and reading ability. Proctor et al (2005) found that in his bilingual sample of
Spanish-English children, children who received literacy instruction in English performed better
in listening comprehension task. In our study, we find our literacy proxy (print exposure) to be
significantly correlated with listening comprehension as measured by sentence comprehension
task. This is mirrored in both the studies that use reading ability and literacy instruction as
proxy.
Overall, our study has shown a convergence on all semantic tasks, both in
comprehension as well as production. The consistent trend has been that HPE has outperformed
LPE on all semantic tasks. Therefore, we suggest a link between print exposure and semantic
processing.
2.7.4 Limitations and Future directions
This is a first-of -its-kind study that takes into account print exposure in oral language
production task and comprehension in bi-literate bilingual individuals. The lack of group
differences could be explained by the fact that although the two groups were different on print
exposure, they were not too far apart, i.e., the range of scores on the composite score were not
too wide apart which could explain why the performance was similar. The HPE produced fewer

96
semantic clusters but a greater number of switches on letter fluency which is suggestive of
superior executive function. However, we would need to look at executive function tasks to
establish if this is true. This topic will be taken up in the next chapter.
Many of the measures of oral language production do not belie a direct link with print
exposure in bi-literate bilinguals. However, given that there are some significant correlations on
semantic fluency (CR), number of switches and non-word repetition task with print exposure
we cannot rule out the possibility that print exposure impacts oral language production.
Furthermore, factors beyond print exposure namely language dominance, language
proficiency and usage, years of education and age may be contributing to the findings. In the
current study, we have documented and profiled the participants based on these variables but
have not been able to control all of these factors and exploit the differences in print exposure.
Future studies should be directed at controlling all these variables as a whole only manipulating
the differences in print exposure. One method of testing for this could be to compare the current
data with three groups of bi-literate bilinguals separated by age, years of education and print
exposure and examine the effects for each group on oral language production and
comprehension task. Each group could be separated by controlling for one of the key variables
and manipulating the other two variables. This would help isolate the effects of the variables
much more clearly.
97
Chapter 3 Impact of print exposure on narratives in bi-literate bilingual healthy adults.
3.1 Abstract
Background. Research has shown that print exposure has an impact on language production
even at connected speech in monolinguals. Among bilinguals, research demonstrates a positive
relationship between oral language skills such as narration and learning to read in bilingual
children (for example, Miller et al., 2006). Currently, little is known about the relationship
between print exposure and oral language production in adults. Consequently, the impact of
print exposure on narrative characteristics have not been explored in Indian bi-literate bilingual
adults.
Aim. The aim of the present study was to examine the impact of print exposure on L2 narrative
production in bi-literate bilingual healthy adults.
Methods and procedure. We used the same participants as in Chapter 2. We grouped the
thirty-four participants of our study into two groups: HPE (n=22) and LPE (n=12). We compared
the performance of these participants on a range of narrative measures namely – utterance
level, morpho-syntactic, lexical and repair measures. A wordless picture book ‘Frog, where are
you?’ story (Mayer, 1969) was used to elicit the oral narratives from the participants. The
narratives were transcribed in a systematic manner and each of the variable used in the
narrative analysis was generated using CLAN.
Findings. There were significant group differences and significant correlations for total number
of words, verbs per utterance and repetitions which highlight that increased print exposure in
L2 is associated with higher number of words in the narrative, higher verbs per utterance and
fewer repetitions in L2 oral production.
Conclusions and Implications. Our study provides important quantification regarding the
relationship between print exposure and narrative characteristics in bi-literate bilingual adults.

98
In general, the results support our hypothesis that print exposure has an impact on the narrative
characteristics (total number of words, verbs per utterance and repetitions).
99
3.2 Introduction
3.2.1 Effect of print exposure on oral language production (word level and connected
speech) in monolinguals.
Research has shown that print exposure and reading ability contribute to differences in lexical
and syntactic verbal output measures as well as measures of verbal fluency. However, most of
the research on these relationships has occurred in the monolingual population. Therefore, we
focus on reviewing the studies with monolingual populations exploring the relationship
between print exposure and several verbal output measures.
Katz et al (2012) examined the ability of a lexical decision task and a naming task to
predict decoding, sight word recognition, fluency, vocabulary and comprehension (i.e., reading
skills) and phonological awareness and rapid naming (i.e., speech factors closely related to
reading). This study recruited a cohort of 99 college students with varying reading abilities. In
this study, lexical decision tasks provide insight to the cognitive processes used in identifying
printed text; therefore, performance on such tasks is presumably related to levels of print
exposure. It was hypothesised that the performance on the lexical decision task would reflect
the levels of print exposure.
Reading ability was measured using the following tests- the Woodcock-Johnson III
Diagnostic Reading Battery (Woodcock, Mather, & Schrank, 2004), the Test of Word Reading
Efficiency, Form A (Torgesen, Wagner, & Rashotte, 1999) and the Gray Oral Reading Test-4,
Form A (Wiederholt & Bryant, 2001). Vocabulary size was measured using the Peabody Picture
Vocabulary Test, Form A (Dunn & Dunn, 2007) and subtests from the Woodcock-Johnson
Diagnostic Reading Battery (Woodcock, Mather & Schrank, 2004) and the Weschler Abbreviated
Scale of Intelligence (Weschler, 1999). Findings suggested that participants with larger
vocabularies had lower reaction times on lexical decision task; however, this correlation was not
very strong. The interpretation of this finding is that, higher print exposure would naturally
increase vocabulary size. One of the drawbacks is lack of use of a standardised tool such as
100
LexTale (Lemhöfer, & Broersma, 2012) and this does not facilitate easy comparison with other
similar studies.
Another study by Cunningham and Stanovich (1991) looked at the impact of print
exposure on verbal fluency and vocabulary. This study recruited children from fourth, fifth and
sixth grades with cohort sizes of 34, 33 and 67 children in each grade respectively. A modified
version of the Title Recognition Test (TRT) (Stanovich & West, 1989) was used as a proxy to
measure print exposure. The TRT consisted of 39 items in total of which 25 were genuine book
titles and 14 foils for titles. The titles were chosen to be books outside the curriculum to probe
reading outside the classroom. Children were asked to read the list of titles and mark the titles
they identified as books. Within their cohort, children were divided into high print exposure
group (high TRT) and low print exposure group (low TRT) based on a median spilt of the scores.
As a next step, the low print exposure from each cohort were combined to form a larger
set of low print exposure cohort (low TRT) and similarly for the high print exposure group (high
TRT). The results revealed that TRT was significantly correlated to measures of verbal fluency
(number of correct) and vocabulary (as measured by the Peabody Picture Vocabulary Test –
Revised (Dunn & Dunn, 1981)). This suggests that TRT uniquely predicts both verbal fluency
and vocabulary. The limitations of the study are firstly the TRT requires a tailor-made set of
items for each school making it difficult to generalise and use it as a standard tool in research.
Secondly, while the TRT may have been a good measure of print exposure then (early 90s), it
does not account for the gamut of print resources available in the present day (e.g. online
resources, e-books etc). Finally, to adapt this to adults is still more challenging considering the
range of print resources used by adults such as books, online resources, newspapers and
academic reading material.
Montag and MacDonald (2015) examined the effects of print exposure on spoken
language production using the frequency of relative clauses in child-directed speech and
children’s literature in a corpus analyses and a picture description task in English. The written
corpus yielded higher number of passives compared to objective-relative clauses. Consequently,
101
in the written corpus analyses the study infers that children with higher print exposure
experience passive constructions more frequently. In the picture description part of the study-
30 undergraduate students, 30 eight-year olds and 30 twelve years olds were tested. Print
exposure was measured differently for adults and children.
For adults, they used the Author Recognition Task (Acheson, Wells and MacDonald,
2008); and for children, a modified version of the Title Recognition Test (Cunningham and
Stanovich, 1991) was used. For the three groups a picture description task was used to elicit
object and passive relative clauses. Results showed text exposure and age predicted production
choices; older individuals and those with higher rates of text exposure produced more passive
constructions. The authors conclude that print exposure can prime spoken production.
In sum, literature suggest print exposure predicts measures such as verbal fluency,
syntactic verbal output. However, it is not clear whether the same relationship exists in the
bilingual population. Currently, the impact of print exposure on narrative characteristics have
not been explored in bi-literate bilinguals.
From the methodological perspective, measurement of print exposure using measures
such as TRT has its limitations and a more robust measurement tool for print exposure is
necessary. There is a question of whether the use of standardised assessments which tap skills
related to reading and print exposure e.g. grammaticality judgement and sentence verification
tasks would provide better measures which can be consistently used in research. Therefore, we
fill this gap in our study by employing grammaticality judgement and sentence verification tasks
as measures of print exposure.
3.2.2 Print exposure in bilinguals
Literature to date focusing on the impact of print exposure on bilingualism has been on literacy
acquisition in bilingual children where bilinguals outperform monolinguals (Bialystok, Luk &
Kwan,2005; Geva & Siegel, 2000). The extent of this advantage may be related to the two
languages having a shared writing system (Bialystok, Luk & Kwan, 2005). Leikin, Schwartz, and
102
Share (2010) concluded bi-literacy offers cross-linguistic benefits to phonemic awareness and
spelling. Strong oral proficiency in L2 has shown an associated strength in reading
comprehension skills (Giambo & Szecsi,2015). Miller et al (2006) in a large cohort study (1500
Spanish-English bilingual children) examined whether oral narrative ability could predict
reading ability. Oral narratives were elicited using the ‘Frog Where are you?’ (Mayer, 1969)
story in a re-tell task and analysed using Systematic Analysis of Language Transcripts software
(Miller & Iglesias, 2003-2004). Reading comprehension was measured using a subtest of the
Woodcock Language Proficiency Battery – Revised Spanish and English Version (Woodcock,
1991) and the Test of Word Reading Efficiency (Torgesen, Wagner, & Rashotte, 1999) to
measure word reading.
The narratives were quantified using the following four measures- ‘mean length of
utterance’, as a measure of morpho-syntactic complexity, ‘number of different words’ as a
measure of lexical diversity, ‘words per minute’ as a measure of fluency and ‘narrative scoring
scheme’ as a measure of coherence. Regression analyses revealed that the narrative measures
significantly accounted for the variance in both reading measures in both languages. The oral
language skills predicted reading measures within a language and across languages i.e., Spanish
oral narrative skills predicted both Spanish and English reading skills, and English oral narrative
skills predicted both English and Spanish reading skills. This demonstrates that there is a
positive relationship between oral language skills such as narration and learning to read in
bilingual children. However, in children the literature has shown that the association between
oral narrative skills and reading is not language specific. For example., Chang (2006) found that
literacy skills and later language skills could be predicted by measuring early oral narrative
skills. Little is known about the relationship between print exposure and oral production in
adults.
103
3.2.3 Narratives in bilinguals and gaps in the literature
It has been suggested that connected speech exhibits language properties that can be analysed
only through narrative analysis (Pavlenko, 2008). Therefore, narrative analysis is considered as
a valid means of probing language skills (Bishop & Edmundson, 1987; Botting, 2002).
Most of the literature focuses on comparing bilingual narratives with monolingual
narratives. Pearson (2001) using a cohort of 79 English monolingual and 89 Spanish-English
bilingual children between 5-11 years of age compare the expression of false belief using Frog
story in both English and Spanish. Findings suggest that bilinguals report false belief about half
as often as monolinguals. However, they are known to make more errors in noun clauses and
their narratives are less episodically structured (Shrubshall, 1997). Significant differences have
been revealed concerning the use of planning components, tense and aspect marking, extended
aspectual categories (Bennett-Kastor, 2002) and lexical diversity (Dewaele and Pavlenko, 2003).
Typically, findings regarding the length of narrative, proportion of evaluative clauses is
mixed. While Chen & Yan (2010) found bilingual narratives were shorter, Dewaele & Pavlenko
(2003) reported no such difference. Similarly, with regard to evaluative clauses, Chen and Yan
(2011) found bilinguals used a higher proportion of evaluative clauses than monolinguals,
Shrushball (1997) found the converse. It remains unclear which aspects of bilingualism may
cause this difference. However, Stavans (2003) has suggested cultural and linguistic factors as a
probable cause.
In addition to this, studies of bilingual children have looked at relationship between
narrative production and reading ability between languages. For example, Miller et al (2006)
(described in section 3.2.2) show that narrative measures such as mean length of utterance’, as
a measure of morpho-syntactic complexity, ‘number of different words’ as a measure of lexical
diversity, ‘words per minute’ as a measure of fluency and ‘narrative scoring scheme’ as measure
of coherence predict reading measures in both languages. Little is known about the relationship
between print exposure and oral production in adults.
104
Based on the literature discussed above, there is a gap in understanding whether there is
a relationship between print exposure and narrative production for bi-literate bilingual adults in
their L2? The present study endeavours to explore this question by studying the relationship
between healthy bi-literate bilingual adult’s print exposure in L2 and their oral narratives in L2.
3.2.4 Narrative analysis
For narrative analysis, ‘Frog Where are you Story?’ (Mayer, 1969) is widely used. The reason for
use of this tool is that it provides a standardised protocol for administration and it gives an
opportunity to discuss findings across studies. It is also used in conjunction with Computerized
Language Analysis (CLAN) (MacWhinney, 2016) which allows multiple analyses of utterance
level measures, morpho-syntactic measures, lexical measures, and measure of repair.
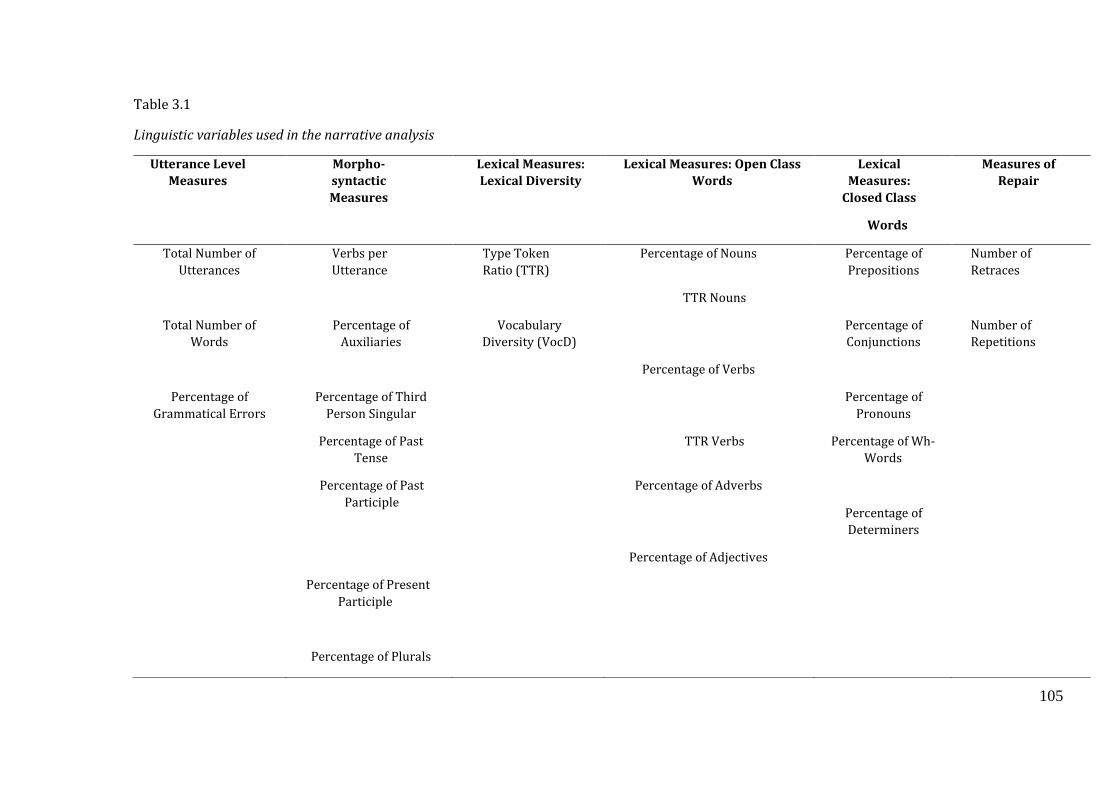
105
Table 3.1
Linguistic variables used in the narrative analysis
Utterance Level
Measures
Morpho-
syntactic
Measures
Lexical Measures:
Lexical Diversity
Lexical Measures: Open Class
Words
Lexical
Measures:
Closed Class
Words
Measures of
Repair
Total Number of
Utterances
Verbs per
Utterance
Type Token
Ratio (TTR)
Percentage of Nouns Percentage of
Prepositions
Number of
Retraces
Total Number of
Words
Percentage of
Auxiliaries
Vocabulary
Diversity (VocD)
TTR Nouns
Percentage of
Conjunctions
Number of
Repetitions
Percentage of
Grammatical Errors
Percentage of Third
Person Singular
Percentage of Verbs
Percentage of
Pronouns
Percentage of Past
Tense
TTR Verbs Percentage of Wh-
Words
Percentage of Past
Participle
Percentage of Adverbs
Percentage of
Determiners
Percentage of Present
Participle
Percentage of Adjectives
Percentage of Plurals
106
3.3 Current investigations, research questions and predictions
The same participants recruited for study 1 (Chapter 2, section 2.3) were participants in the
current study. The participants were split into two groups- high print exposure (HPE) and low
print exposure (LPE). The two groups were matched on other background measures as
explained in chapter 2. In the current study, the participants were 34 healthy bi-literate
bilingual adults. Print exposure was measured using a grammaticality judgement task from The
Philadelphia Comprehension Battery’ (Saffran, Schwartz, Linebarger, Martin & Bochetto, 1988)
and a sentence verification task adapted from Royer, Greene & Sinatra (1987). Narratives were
elicited using the ‘Frog, where are you?’ story (Mayer, 1969).
The goal of the present study was to examine the impact of print exposure on oral
narrative production in bi-literate bilingual healthy adults using the Frog story (Mayer, 1969).
Analysis included morpho-syntactic and lexical measures based on findings from research with
monolingual populations and the notion that a narrative’s quality is influenced by lexical and
syntactic competence (Leikin, Ibrahim, & Eghbaria, 2014). Measures of repair were analysed as
an indication of fluency.
For the present study, measures concerned with narrative samples in their entirety are
termed ‘utterance level measures’ and relate to the quantity of utterances / words used and
grammaticality. Table 3.1 summarises the linguistic variables analysed in the current study. We
compared the performance of these participants on a range of narrative measures namely –
utterance level, morpho-syntactic, lexical and repair measures.

107
To address this aim, we posed the following research questions:
1. To investigate the narrative characteristics in the L2 oral narratives of healthy bi-literate
bilingual adults with high print exposure in L2 (HPE) and low print exposure in L2 (LPE)
on the narrative measures of utterance level, morpho-syntactic, lexical and repair
measures.
We hypothesised that HPE L2 oral narratives will have significantly a greater
number of utterances, more morpho-syntactically rich, more lexically diverse and have
lesser repairs as compared to LPE L2 oral narratives.
2. To investigate if there is a relationship between print exposure in L2, age and years of
education and narrative measures (utterance level measures, morphosyntactic
measures, lexical measures and repair measures) of L2 oral narratives.
Based on the available literature, we predicted that there will be significant and
positive correlations between print exposure in L2 and the following measures –
utterance level (except percentage of grammatical errors where we expect a significant
negative correlation with print exposure), morpho-syntactic and lexical measures of L2
oral narratives. There will be a significant and negative correlation between print
exposure in L2 and the number of repairs used in L2 oral narratives.
108
3.4 Methods
3.4.1 Participants and grouping of participants
Based on the z-composite score generated from the measures of print exposure (grammaticality
judgement task and sentence verification task), we grouped the 34 participants of our study into
two groups: high print exposure (HPE) (n=22) and low print exposure (LPE) (n=12). Refer to
section 2.4.1 for further details.
3.4.2 Oral narrative task
3.4.2.1 Procedure. Participants were presented with the ‘Frog, where are you?’ story (Mayer,
1969) which is a wordless picture book. Participants were instructed to generate their own
story in English (L2) based on the pictures. They were allowed some preparation time to look at
the pictures and formulate a story before beginning their narrative. The instructions were as
follows, “This is a story of a boy, a dog and a frog. I would like you to take time to go through the
pictures and tell me a story based on the pictures in English, while you look through them”. Oral
narratives were recorded on a dictaphone. No prompts were given during the narration.
3.4.2.2 Transcription of oral narratives. A systematic process was used to transcribe
and prepare narratives for input into CLAN. Audio files were transcribed verbatim to text files.
Narrative words were extracted using applicable and relevant guidelines from Quantitative
Production Analysis (QPA; Berndt, 2000): A training manual for the analysis of aphasic sentence
production (Berndt, 2000). Narratives were segmented based on the guidance outlined in the
QPA. The details of the QPA and an example transcript with the procedures employed during the
transcription are outlined in Appendix 3.1.
3.4.2.3 Reliability analysis. Prior to coding the data in CLAN, an example transcript
taken from the CHILDES website (MacWhinney, 2016) was coded independently by two
students also using CLAN for a dissertation project and who assisted in the transcription of the
narratives. The inter-coder reliability was 84.211% (see Appendix 3.2). Despite some
differences; coders were consistent within their own sample e.g. coder 1 always treated ‘your’ as
a pronoun whereas coder 2 always treated ‘your’ as a determiner. To maintain objectivity and
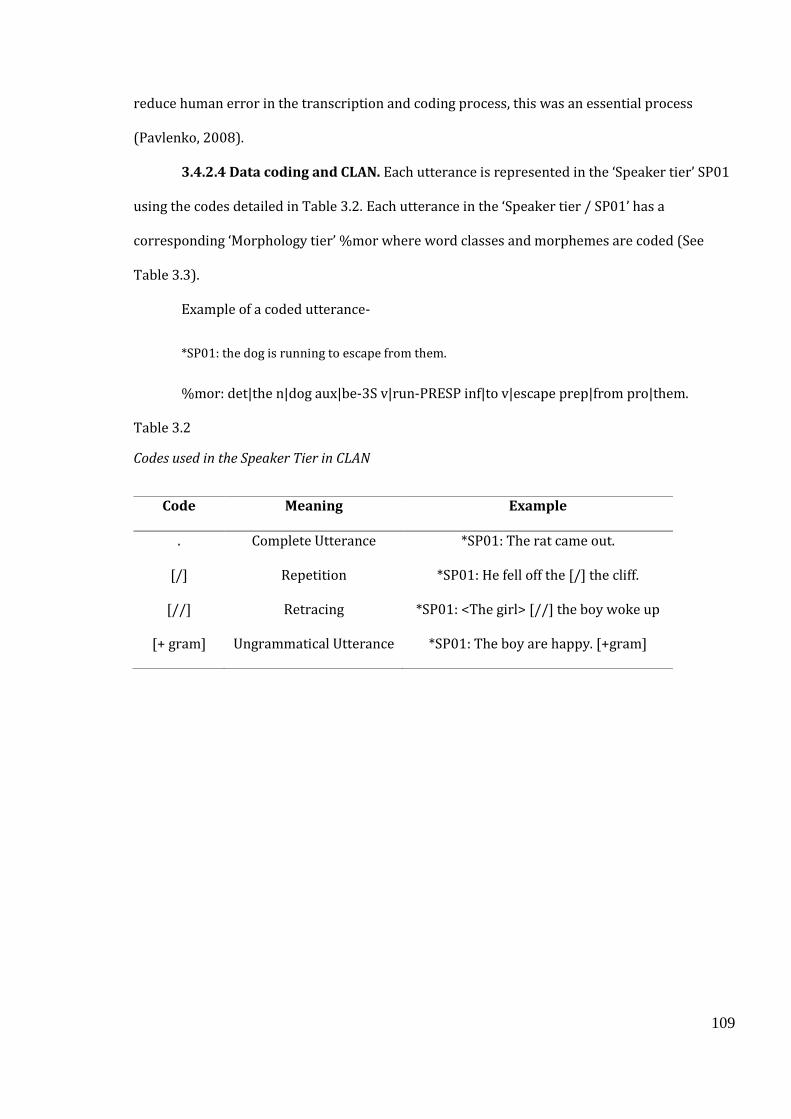
109
reduce human error in the transcription and coding process, this was an essential process
(Pavlenko, 2008).
3.4.2.4 Data coding and CLAN. Each utterance is represented in the ‘Speaker tier’ SP01
using the codes detailed in Table 3.2. Each utterance in the ‘Speaker tier / SP01’ has a
corresponding ‘Morphology tier’ %mor where word classes and morphemes are coded (See
Table 3.3).
Example of a coded utterance-
*SP01: the dog is running to escape from them.
%mor: det|the n|dog aux|be-3S v|run-PRESP inf|to v|escape prep|from pro|them.
Table 3.2
Codes used in the Speaker Tier in CLAN
Code Meaning Example
. Complete Utterance *SP01: The rat came out.
[/] Repetition *SP01: He fell off the [/] the cliff.
[//] Retracing *SP01: <The girl> [//] the boy woke up
[+ gram] Ungrammatical Utterance *SP01: The boy are happy. [+gram]
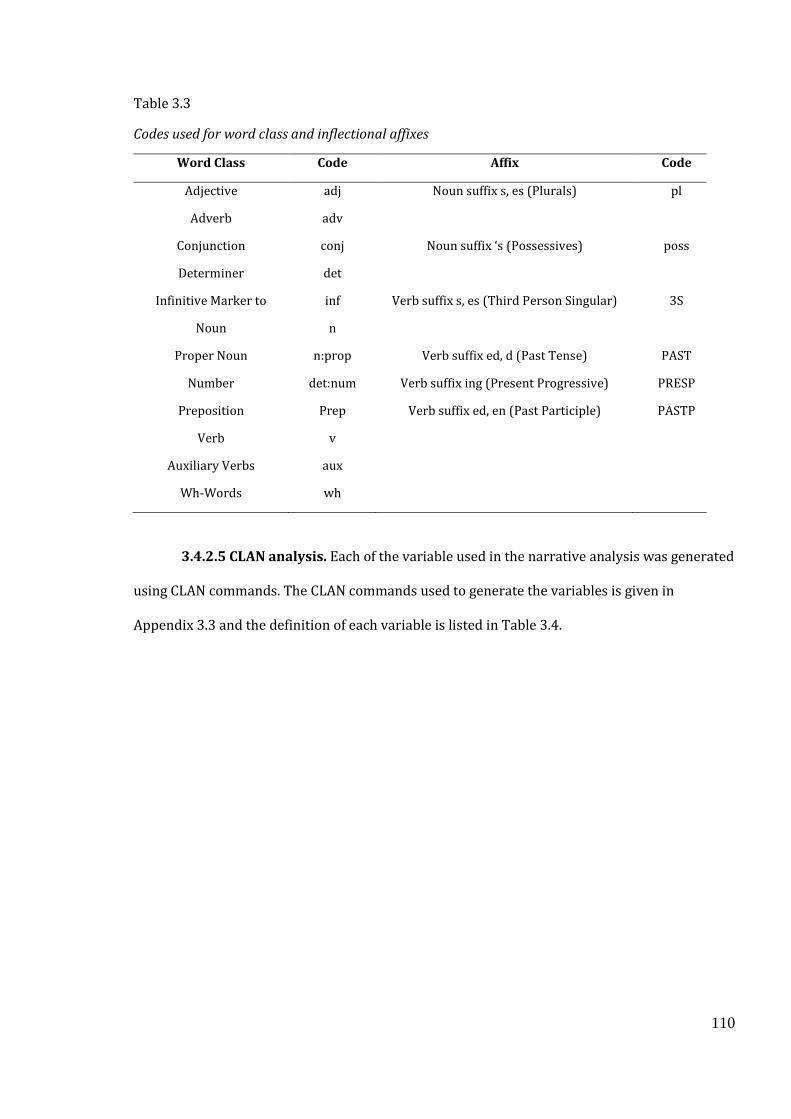
110
Table 3.3
Codes used for word class and inflectional affixes
Word Class Code Affix Code
Adjective adj Noun suffix s, es (Plurals) pl
Adverb adv
Conjunction conj Noun suffix ‘s (Possessives) poss
Determiner det
Infinitive Marker to inf Verb suffix s, es (Third Person Singular) 3S
Noun n
Proper Noun n:prop Verb suffix ed, d (Past Tense) PAST
Number det:num Verb suffix ing (Present Progressive) PRESP
Preposition Prep Verb suffix ed, en (Past Participle) PASTP
Verb v
Auxiliary Verbs aux
Wh-Words wh
3.4.2.5 CLAN analysis. Each of the variable used in the narrative analysis was generated
using CLAN commands. The CLAN commands used to generate the variables is given in
Appendix 3.3 and the definition of each variable is listed in Table 3.4.
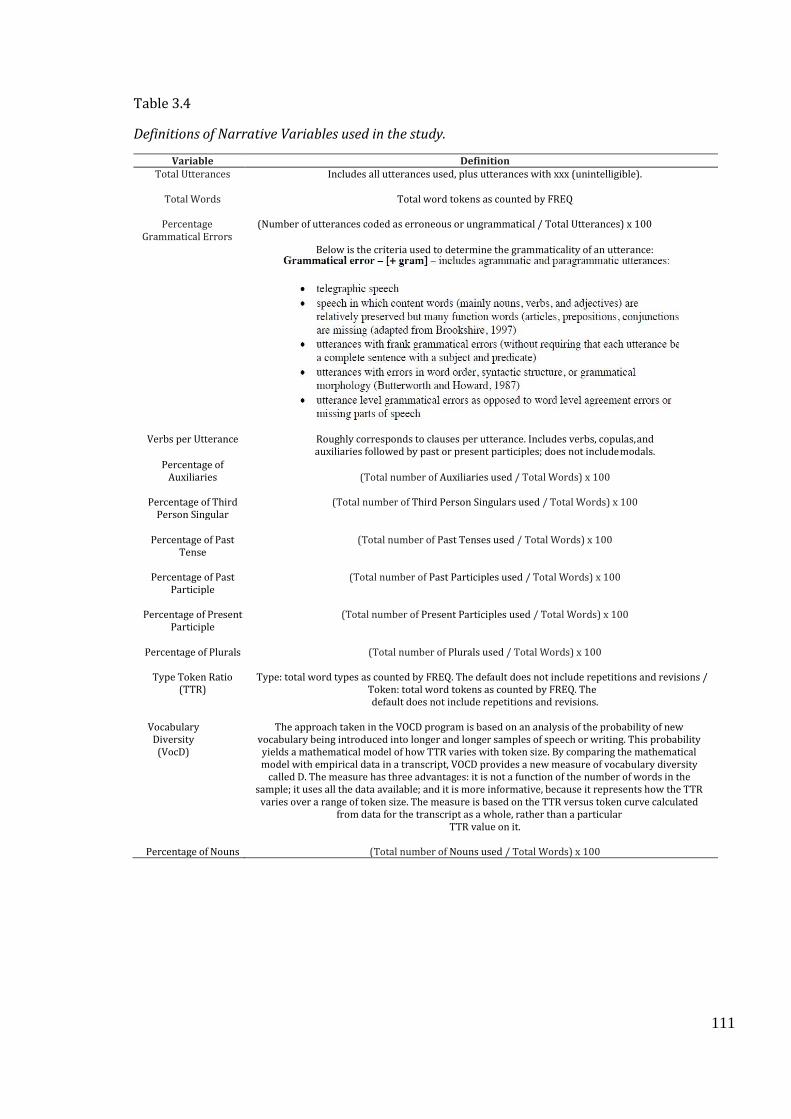
111
Table 3.4
Definitions of Narrative Variables used in the study.
Variable Definition Total Utterances Includes all utterances used, plus utterances with xxx (unintelligible).
Total Words
Total word tokens as counted by FREQ
Percentage
Grammatical Errors
(Number of utterances coded as erroneous or ungrammatical / Total Utterances) x 100
Below is the criteria used to determine the grammaticality of an utterance:
Verbs per Utterance Roughly corresponds to clauses per utterance. Includes verbs, copulas, and auxiliaries followed by past or present participles; does not include modals.
Percentage of Auxiliaries
(Total number of Auxiliaries used / Total Words) x 100
Percentage of Third
Person Singular
(Total number of Third Person Singulars used / Total Words) x 100
Percentage of Past
Tense
(Total number of Past Tenses used / Total Words) x 100
Percentage of Past
Participle
(Total number of Past Participles used / Total Words) x 100
Percentage of Present
Participle
(Total number of Present Participles used / Total Words) x 100
Percentage of Plurals
(Total number of Plurals used / Total Words) x 100
Type Token Ratio
(TTR)
Type: total word types as counted by FREQ. The default does not include repetitions and revisions /
Token: total word tokens as counted by FREQ. The default does not include repetitions and revisions.
Vocabulary
Diversity (VocD)
The approach taken in the VOCD program is based on an analysis of the probability of new
vocabulary being introduced into longer and longer samples of speech or writing. This probability yields a mathematical model of how TTR varies with token size. By comparing the mathematical model with empirical data in a transcript, VOCD provides a new measure of vocabulary diversity
called D. The measure has three advantages: it is not a function of the number of words in the sample; it uses all the data available; and it is more informative, because it represents how the TTR
varies over a range of token size. The measure is based on the TTR versus token curve calculated from data for the transcript as a whole, rather than a particular
TTR value on it.
Percentage of Nouns
(Total number of Nouns used / Total Words) x 100
112
3.5 Statistical analysis
Mean and standard deviation was calculated for all variables across both the groups. Group
comparisons were carried out with print exposure (HPE and LPE) as independent variables and
the linguistic variables of the narrative as dependent variables (as listed in Table 3.1). In this
design, Group was a between subject factor. All variables were tested for normality using
Shapiro-Wilk’s test. Independent sample t-test was performed on normally distributed data set
and Mann-Whitney U test was performed for non-normally distributed data set. An Alpha level
of 0.05 was used to determine the level of significance. Where p values were between 0.05-0.08,
the results were identified as trends.
Correlation analysis was carried out to examine the relationship among age, years of
education, print exposure and linguistic variables of the narrative (as listed in Table 3.1).
Measure of print exposure was normally distributed (p >0.05). Pearson’s correlations were
carried out for linguistic variables which were normally distributed (p >0.05) and Spearman’s
correlations for linguistic variables which were not normally distributed (p <0.05).
The minimum, maximum, mean, standard deviation and results of group comparisons
on utterance level measures and morphosyntactic measures are presented in Table 3.5. The
minimum, maximum, mean, standard deviation and results of group comparisons on lexical
measures are presented in Table 3.6. The minimum, maximum mean, standard deviation and
results of group comparisons on repair measures are presented in Table 3.7. The correlation
analyses among the narrative variables, measure of print exposure, age and years of education is
presented in Table 3.8.
113
3.6 Results
In this section, we present the findings from the narrative task described in section 3.4.2. We
present the results of group comparisons of oral narratives in section 3.6.1, followed by the
findings of the correlational analyses of oral narrative task with print exposure, years of
education and age in section 3.6.2.
3.6.1 Group comparisons on oral narratives
Differences between HPE and LPE were reported as group differences on each of the narrative
measures- utterance level, morpho-syntactic, lexical and repair measures.
There were no significant group differences for Total Utterances and Percentage of
grammatical errors. The Total words showed a significant group difference t (32) =2.14, p =.04, d
=.77, with the HPE producing a higher number of words compared to LPE. (HPE: M =433.04, SD =
154.06; LPE: M = 326.75, SD= 85.45). Table 3.5 below provides the mean and standard deviation
and the group comparisons for the utterance level and morpho-syntactic measures.
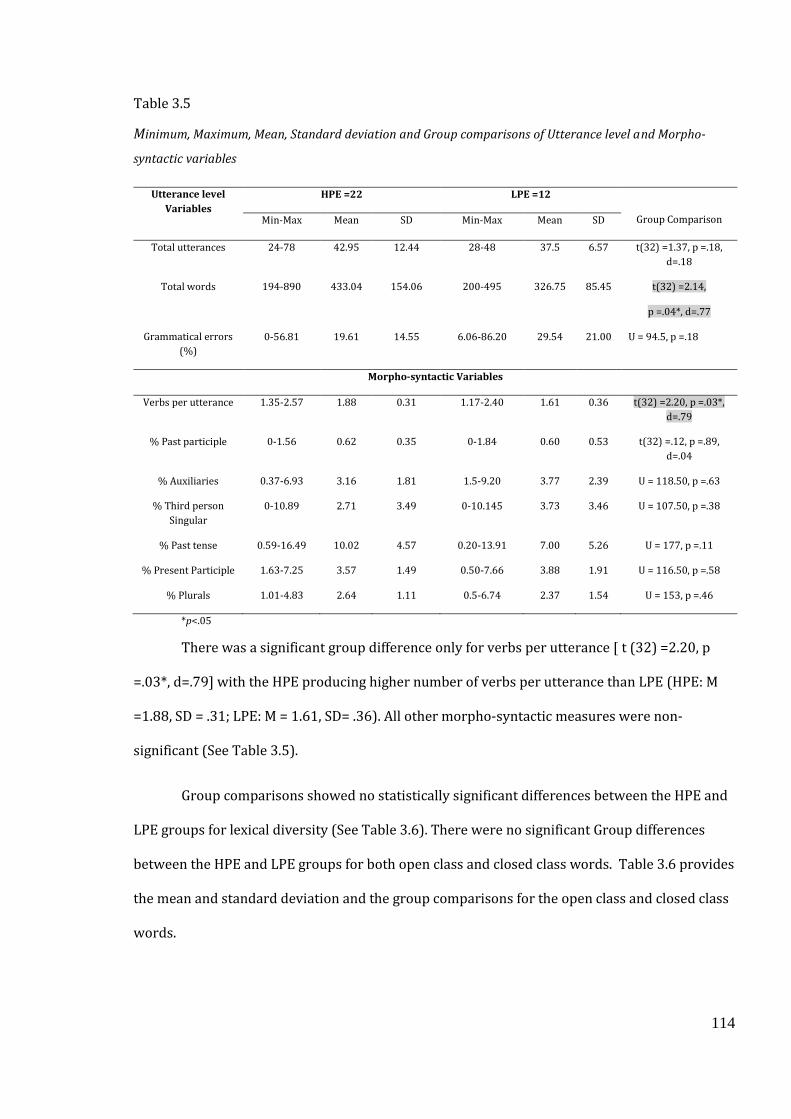
114
Table 3.5
Minimum, Maximum, Mean, Standard deviation and Group comparisons of Utterance level and Morpho-
syntactic variables
Utterance level
Variables
HPE =22 LPE =12
Group Comparison Min-Max Mean SD Min-Max Mean SD
Total utterances 24-78 42.95 12.44 28-48 37.5 6.57 t(32) =1.37, p =.18,
d=.18
Total words 194-890 433.04 154.06 200-495 326.75 85.45 t(32) =2.14,
p =.04*, d=.77
Grammatical errors
(%)
0-56.81 19.61 14.55 6.06-86.20 29.54 21.00 U = 94.5, p =.18
Morpho-syntactic Variables
Verbs per utterance 1.35-2.57 1.88 0.31 1.17-2.40 1.61 0.36 t(32) =2.20, p =.03*,
d=.79
% Past participle 0-1.56 0.62 0.35 0-1.84 0.60 0.53 t(32) =.12, p =.89,
d=.04
% Auxiliaries 0.37-6.93 3.16 1.81 1.5-9.20 3.77 2.39 U = 118.50, p =.63
% Third person
Singular
0-10.89 2.71 3.49 0-10.145 3.73 3.46 U = 107.50, p =.38
% Past tense 0.59-16.49 10.02 4.57 0.20-13.91 7.00 5.26 U = 177, p =.11
% Present Participle 1.63-7.25 3.57 1.49 0.50-7.66 3.88 1.91 U = 116.50, p =.58
% Plurals 1.01-4.83 2.64 1.11 0.5-6.74 2.37 1.54 U = 153, p =.46
*p<.05
There was a significant group difference only for verbs per utterance [ t (32) =2.20, p
=.03*, d=.79] with the HPE producing higher number of verbs per utterance than LPE (HPE: M
=1.88, SD = .31; LPE: M = 1.61, SD= .36). All other morpho-syntactic measures were non-
significant (See Table 3.5).
Group comparisons showed no statistically significant differences between the HPE and
LPE groups for lexical diversity (See Table 3.6). There were no significant Group differences
between the HPE and LPE groups for both open class and closed class words. Table 3.6 provides
the mean and standard deviation and the group comparisons for the open class and closed class
words.
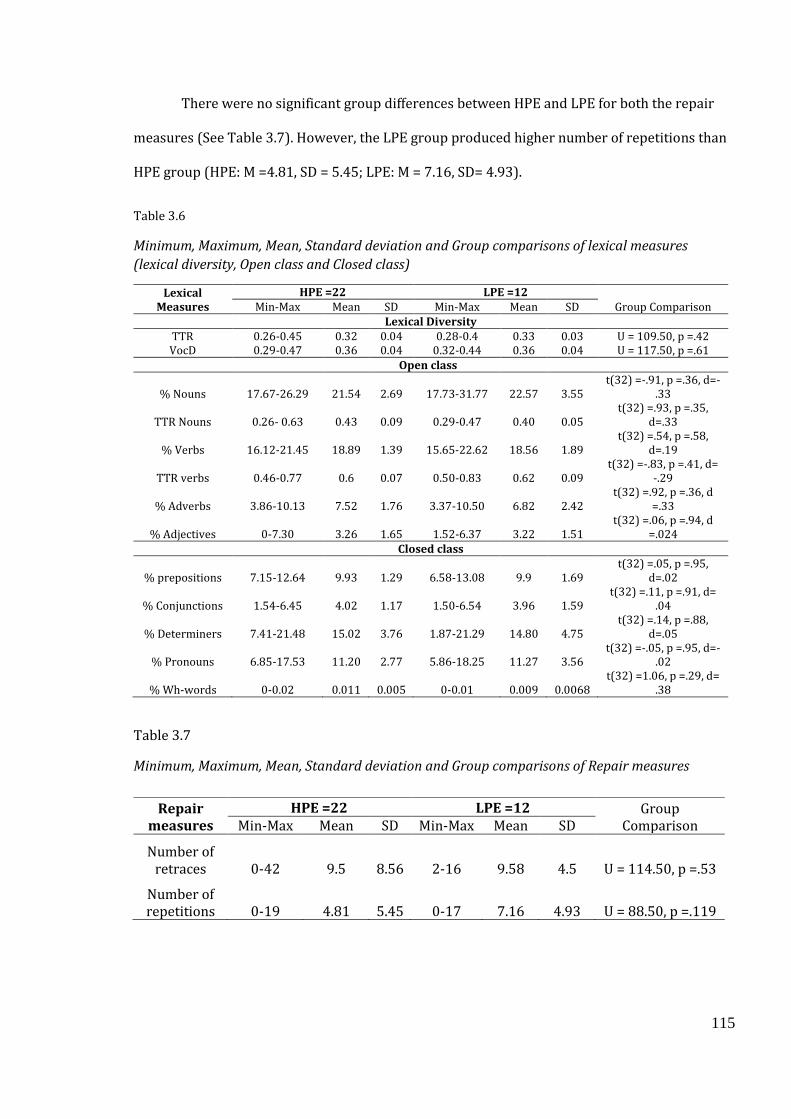
115
There were no significant group differences between HPE and LPE for both the repair
measures (See Table 3.7). However, the LPE group produced higher number of repetitions than
HPE group (HPE: M =4.81, SD = 5.45; LPE: M = 7.16, SD= 4.93).
Table 3.6
Minimum, Maximum, Mean, Standard deviation and Group comparisons of lexical measures
(lexical diversity, Open class and Closed class)
Lexical Measures
HPE =22 LPE =12 Group Comparison Min-Max Mean SD Min-Max Mean SD
Lexical Diversity TTR 0.26-0.45 0.32 0.04 0.28-0.4 0.33 0.03 U = 109.50, p =.42 VocD 0.29-0.47 0.36 0.04 0.32-0.44 0.36 0.04 U = 117.50, p =.61
Open class
% Nouns 17.67-26.29 21.54 2.69 17.73-31.77 22.57 3.55 t(32) =-.91, p =.36, d=-
.33
TTR Nouns 0.26- 0.63 0.43 0.09 0.29-0.47 0.40 0.05 t(32) =.93, p =.35,
d=.33
% Verbs 16.12-21.45 18.89 1.39 15.65-22.62 18.56 1.89 t(32) =.54, p =.58,
d=.19
TTR verbs 0.46-0.77 0.6 0.07 0.50-0.83 0.62 0.09 t(32) =-.83, p =.41, d=
-.29
% Adverbs 3.86-10.13 7.52 1.76 3.37-10.50 6.82 2.42 t(32) =.92, p =.36, d
=.33
% Adjectives 0-7.30 3.26 1.65 1.52-6.37 3.22 1.51 t(32) =.06, p =.94, d
=.024 Closed class
% prepositions 7.15-12.64 9.93 1.29 6.58-13.08 9.9 1.69 t(32) =.05, p =.95,
d=.02
% Conjunctions 1.54-6.45 4.02 1.17 1.50-6.54 3.96 1.59 t(32) =.11, p =.91, d=
.04
% Determiners 7.41-21.48 15.02 3.76 1.87-21.29 14.80 4.75 t(32) =.14, p =.88,
d=.05
% Pronouns 6.85-17.53 11.20 2.77 5.86-18.25 11.27 3.56 t(32) =-.05, p =.95, d=-
.02
% Wh-words 0-0.02 0.011 0.005 0-0.01 0.009 0.0068 t(32) =1.06, p =.29, d=
.38
Table 3.7
Minimum, Maximum, Mean, Standard deviation and Group comparisons of Repair measures
Repair measures
HPE =22 LPE =12 Group Comparison Min-Max Mean SD Min-Max Mean SD
Number of retraces 0-42 9.5 8.56 2-16 9.58 4.5 U = 114.50, p =.53
Number of repetitions 0-19 4.81 5.45 0-17 7.16 4.93 U = 88.50, p =.119
116
3.6.2 Findings of Correlation analyses
The correlation analyses are reported as a relationship of print exposure, age and years
of education with each of the narrative variables. None of the narrative variables correlated
significantly with age. The correlation analyses among the narrative variables, measure of print
exposure, age and years of education is presented in Table 3.8.
There was a significant positive correlation between print exposure and Total Words i.e.
participants with higher print exposure used more words (See Figure 3.1). There was a
significant negative correlation between print exposure and percentage of grammatical errors
i.e. participants with higher print exposure produced fewer grammatical errors. Correlations
between print exposure and Total Utterances were not significant. There was a significant
negative correlation of years of education with total utterances i.e., participants with higher
education used fewer utterances (See Figure 3.5). None of the other utterance variables
correlated significantly with years of education.
There was a significant positive correlation between print exposure and verbs per
utterance i.e. participants with higher print exposure used more verbs per utterance. There was
negative correlation between print exposure and percentage of present participle i.e.
participants with higher print exposure used the present participle tense less often (See Figure
3.2). All other correlations were not significant. Only the percentage of Auxiliaries showed a
significant negative correlation with years of education suggesting that participants with higher
number of years of education produced fewer auxiliaries (See figure 3.5).
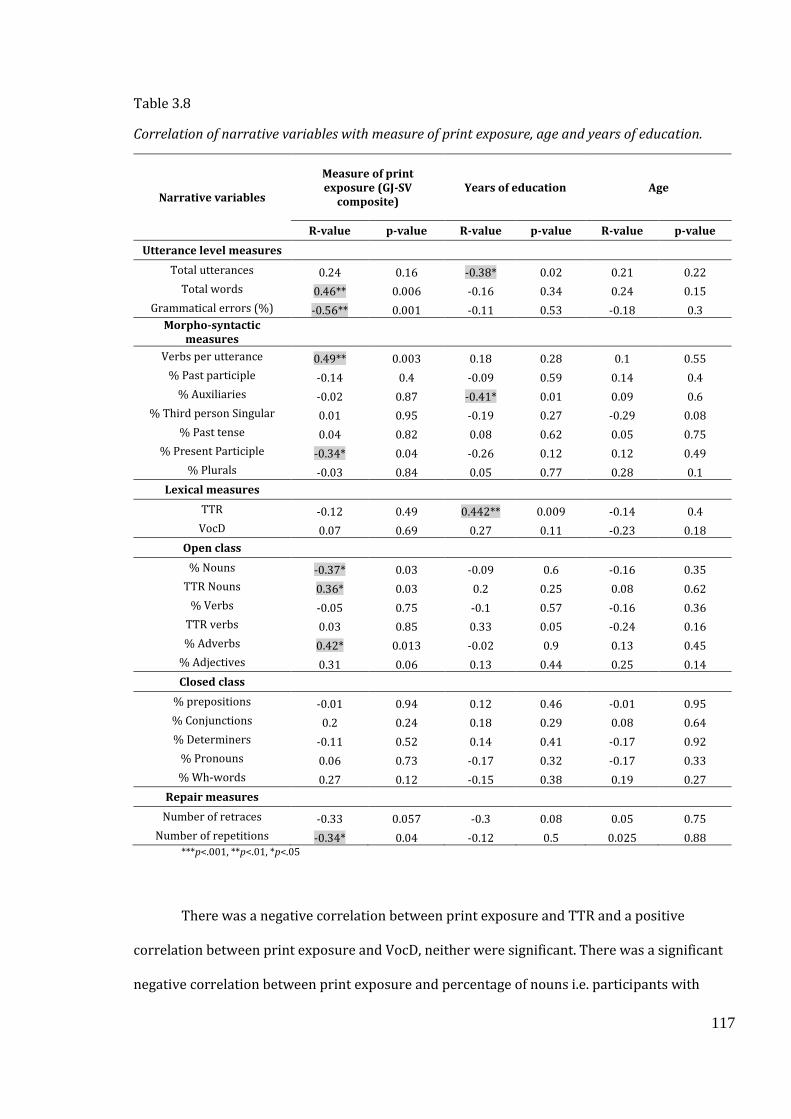
117
Table 3.8
Correlation of narrative variables with measure of print exposure, age and years of education.
Narrative variables
Measure of print exposure (GJ-SV
composite) Years of education Age
R-value p-value R-value p-value R-value p-value
Utterance level measures
Total utterances 0.24 0.16 -0.38* 0.02 0.21 0.22
Total words 0.46** 0.006 -0.16 0.34 0.24 0.15
Grammatical errors (%) -0.56** 0.001 -0.11 0.53 -0.18 0.3 Morpho-syntactic
measures Verbs per utterance 0.49** 0.003 0.18 0.28 0.1 0.55
% Past participle -0.14 0.4 -0.09 0.59 0.14 0.4
% Auxiliaries -0.02 0.87 -0.41* 0.01 0.09 0.6
% Third person Singular 0.01 0.95 -0.19 0.27 -0.29 0.08
% Past tense 0.04 0.82 0.08 0.62 0.05 0.75
% Present Participle -0.34* 0.04 -0.26 0.12 0.12 0.49
% Plurals -0.03 0.84 0.05 0.77 0.28 0.1
Lexical measures TTR -0.12 0.49 0.442** 0.009 -0.14 0.4
VocD 0.07 0.69 0.27 0.11 -0.23 0.18
Open class % Nouns -0.37* 0.03 -0.09 0.6 -0.16 0.35
TTR Nouns 0.36* 0.03 0.2 0.25 0.08 0.62
% Verbs -0.05 0.75 -0.1 0.57 -0.16 0.36
TTR verbs 0.03 0.85 0.33 0.05 -0.24 0.16
% Adverbs 0.42* 0.013 -0.02 0.9 0.13 0.45
% Adjectives 0.31 0.06 0.13 0.44 0.25 0.14
Closed class % prepositions -0.01 0.94 0.12 0.46 -0.01 0.95
% Conjunctions 0.2 0.24 0.18 0.29 0.08 0.64
% Determiners -0.11 0.52 0.14 0.41 -0.17 0.92
% Pronouns 0.06 0.73 -0.17 0.32 -0.17 0.33
% Wh-words 0.27 0.12 -0.15 0.38 0.19 0.27
Repair measures Number of retraces -0.33 0.057 -0.3 0.08 0.05 0.75
Number of repetitions -0.34* 0.04 -0.12 0.5 0.025 0.88 ***p<.001, **p<.01, *p<.05
There was a negative correlation between print exposure and TTR and a positive
correlation between print exposure and VocD, neither were significant. There was a significant
negative correlation between print exposure and percentage of nouns i.e. participants with
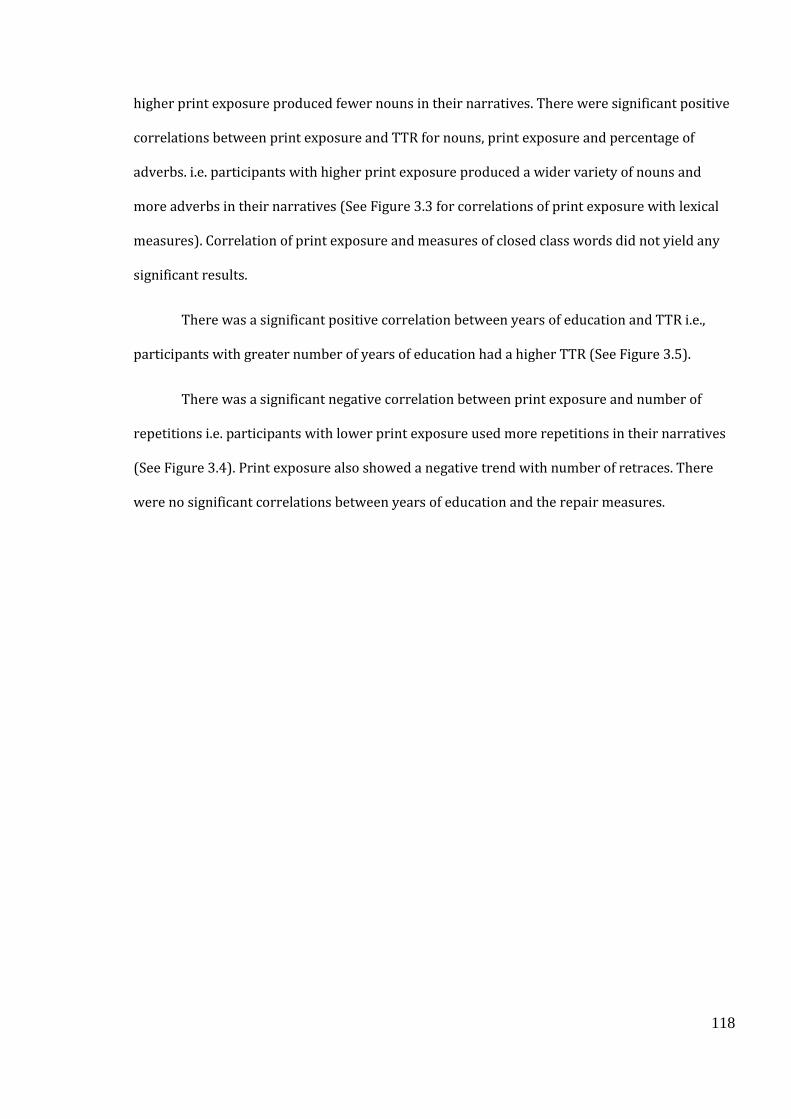
118
higher print exposure produced fewer nouns in their narratives. There were significant positive
correlations between print exposure and TTR for nouns, print exposure and percentage of
adverbs. i.e. participants with higher print exposure produced a wider variety of nouns and
more adverbs in their narratives (See Figure 3.3 for correlations of print exposure with lexical
measures). Correlation of print exposure and measures of closed class words did not yield any
significant results.
There was a significant positive correlation between years of education and TTR i.e.,
participants with greater number of years of education had a higher TTR (See Figure 3.5).
There was a significant negative correlation between print exposure and number of
repetitions i.e. participants with lower print exposure used more repetitions in their narratives
(See Figure 3.4). Print exposure also showed a negative trend with number of retraces. There
were no significant correlations between years of education and the repair measures.
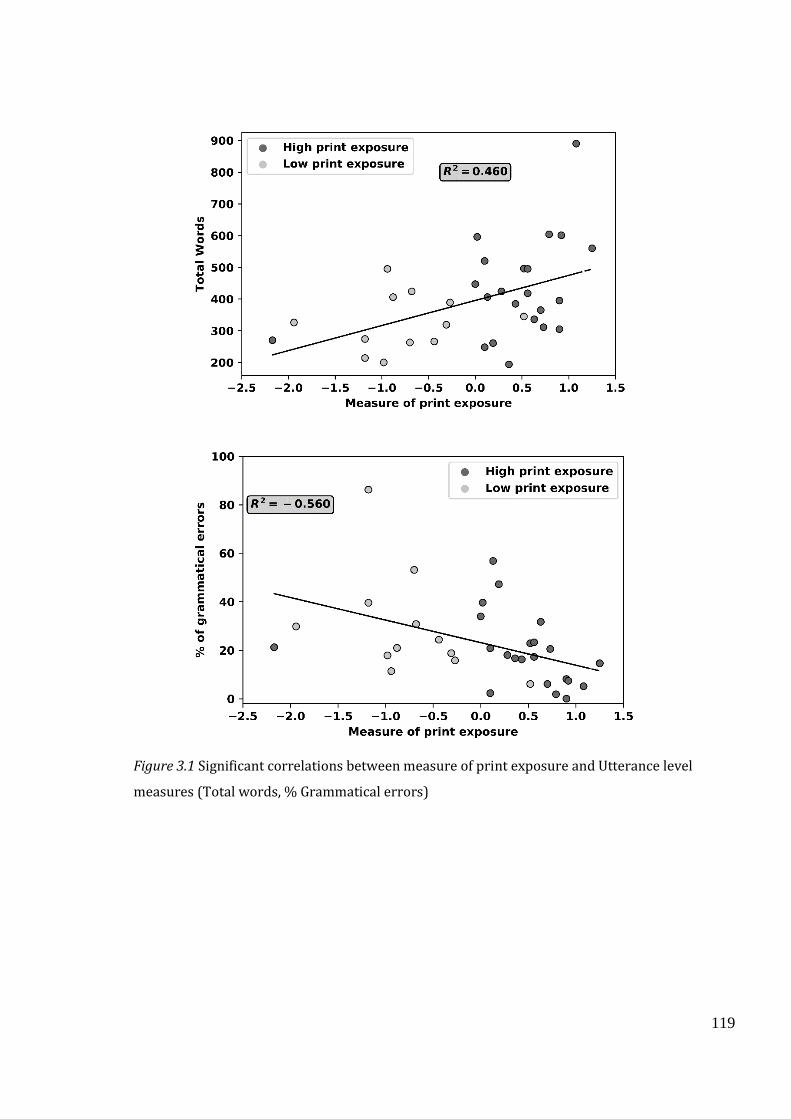
119
Figure 3.1 Significant correlations between measure of print exposure and Utterance level
measures (Total words, % Grammatical errors)

120
Figure 3.2 Significant correlations between measure of print exposure and morpho-syntactic
measures (verbs per utterance, % Present participle)
121
Figure 3.3 Significant correlations between measure of print exposure and lexical measures (%
Nouns, TTR Nouns, % Adverbs
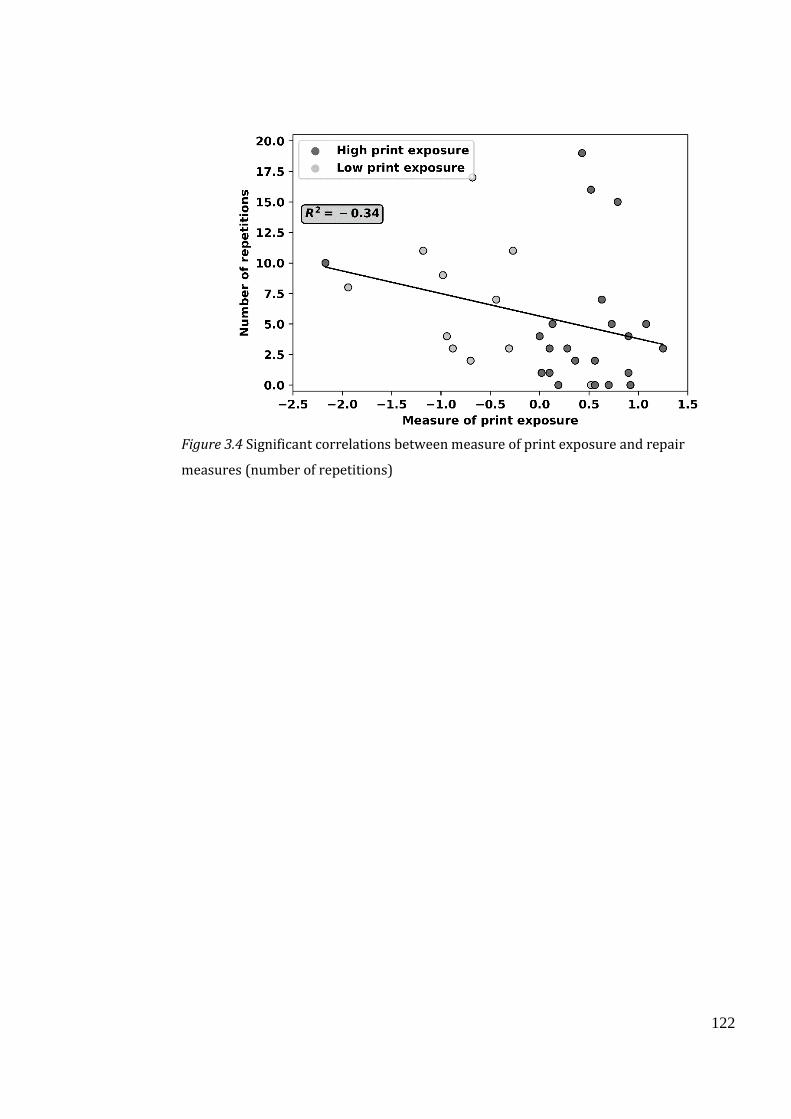
122
Figure 3.4 Significant correlations between measure of print exposure and repair
measures (number of repetitions)
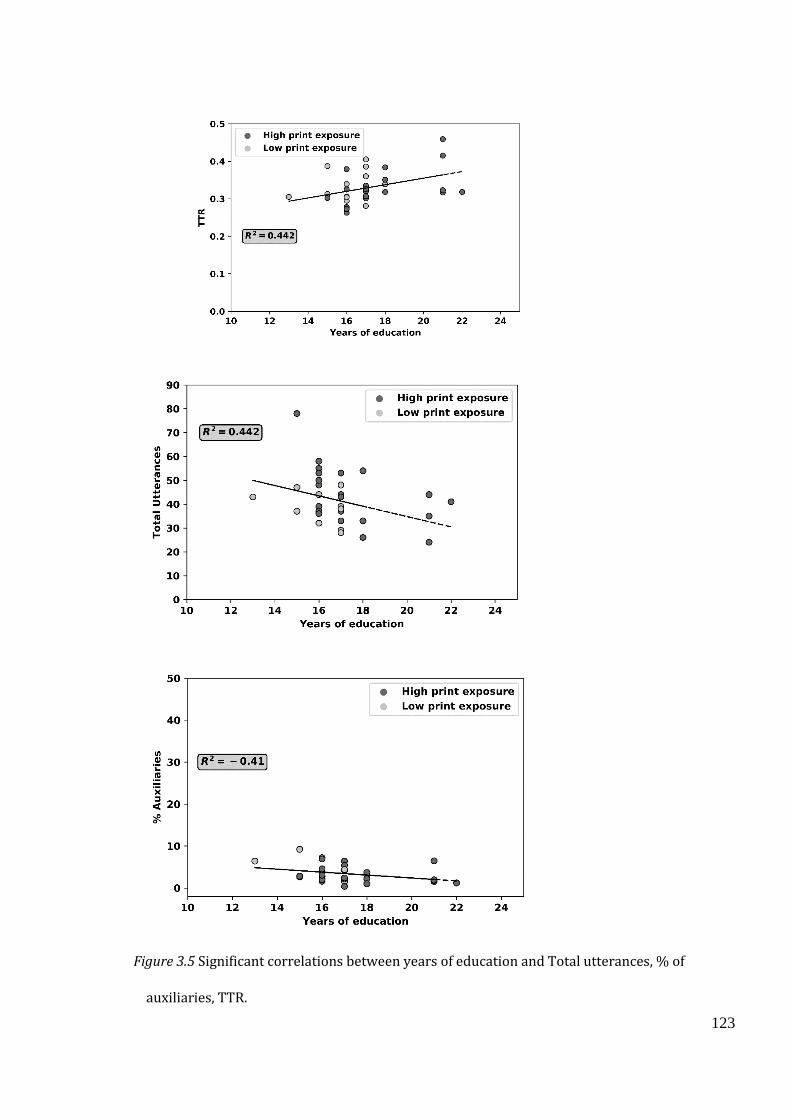
123
Figure 3.5 Significant correlations between years of education and Total utterances, % of
auxiliaries, TTR.
124
3.7 Discussion
3.7.1 Summary of findings
The main findings are the results for total words, verbs per utterance and the results for number
of repetitions. Table 3.9 provides the summary of findings of all the narrative variables. There
were significant group differences and significant correlations for all three variables and
highlight that increased print exposure in L2 is associated with higher number of words in the
narrative, higher verbs per utterance and fewer repetitions in L2 oral production.
Findings also suggest increase in L2 print exposure is associated with using- more
words, fewer grammatical errors, less present participle morphemes, more adverbs, fewer
nouns, a more diverse range of nouns and fewer repetitions. Additionally, results also inform
that increased number of years of education is related to the use of fewer utterances, fewer
auxiliaries and a higher TTR.
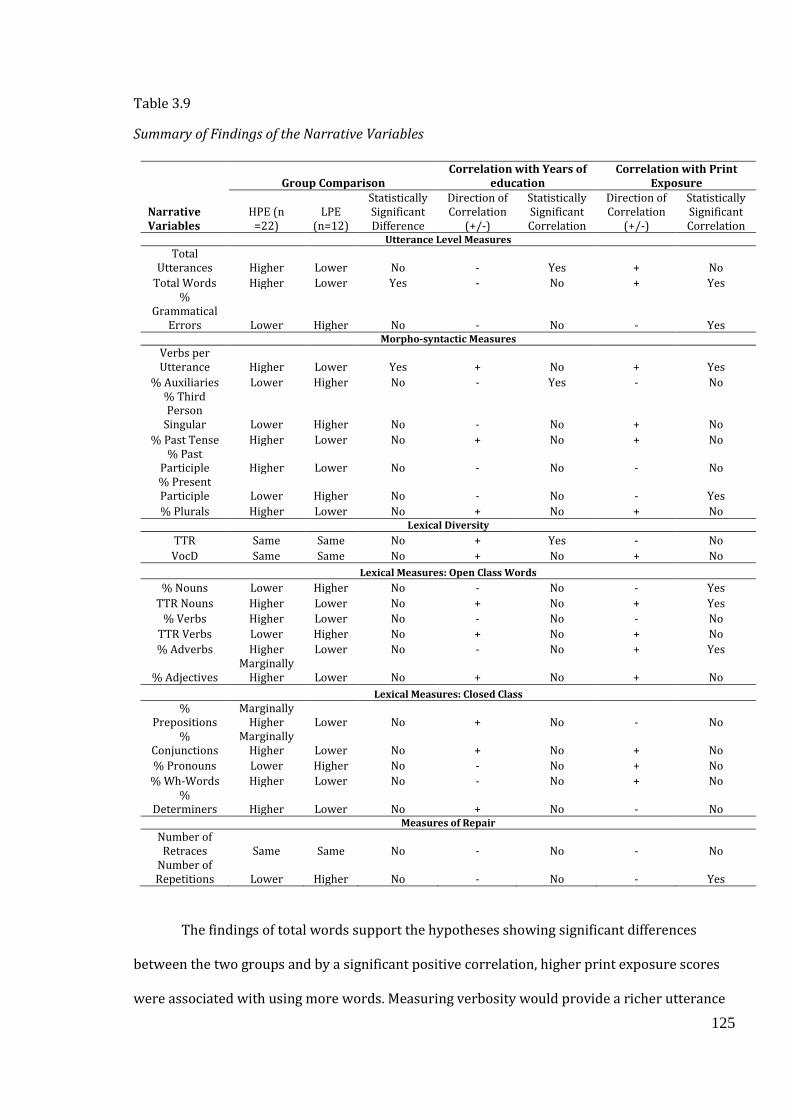
125
Table 3.9
Summary of Findings of the Narrative Variables
Narrative Variables
Group Comparison Correlation with Years of
education Correlation with Print
Exposure
HPE (n =22)
LPE (n=12)
Statistically Significant Difference
Direction of Correlation
(+/-)
Statistically Significant Correlation
Direction of Correlation
(+/-)
Statistically Significant Correlation
Utterance Level Measures
Total Utterances Higher Lower No - Yes + No
Total Words Higher Lower Yes - No + Yes %
Grammatical Errors Lower Higher No - No - Yes
Morpho-syntactic Measures
Verbs per Utterance Higher Lower Yes + No + Yes
% Auxiliaries Lower Higher No - Yes - No % Third Person
Singular Lower Higher No - No + No
% Past Tense Higher Lower No + No + No % Past
Participle Higher Lower No - No - No % Present Participle Lower Higher No - No - Yes
% Plurals Higher Lower No + No + No Lexical Diversity
TTR Same Same No + Yes - No
VocD Same Same No + No + No
Lexical Measures: Open Class Words
% Nouns Lower Higher No - No - Yes
TTR Nouns Higher Lower No + No + Yes
% Verbs Higher Lower No - No - No
TTR Verbs Lower Higher No + No + No
% Adverbs Higher Lower No - No + Yes
% Adjectives Marginally
Higher Lower No + No + No
Lexical Measures: Closed Class
% Prepositions
Marginally Higher Lower No + No - No
% Conjunctions
Marginally Higher Lower No + No + No
% Pronouns Lower Higher No - No + No
% Wh-Words Higher Lower No - No + No %
Determiners Higher Lower No + No - No Measures of Repair
Number of Retraces Same Same No - No - No
Number of Repetitions Lower Higher No - No - Yes
The findings of total words support the hypotheses showing significant differences
between the two groups and by a significant positive correlation, higher print exposure scores
were associated with using more words. Measuring verbosity would provide a richer utterance

126
level measure. However, firstly it is difficult to objectively measure the verbosity (Hussain,
1992), secondly there is a natural variation in participants’ verbosity. For instance, in a study
with Pakistani students speaking English as L2, Husain (1992) concluded that the spoken
English is verbose because of the written English study material that the students are exposed
to.
The findings of percentage of grammatical errors support the hypothesis with a
significant correlation showing higher print exposure scores were associated with fewer
grammatical errors. It was expected that participants with higher print exposure had lower
grammatical errors, since grammaticality judgement was one component used to measure print
exposure in the current study. This supports the idea that higher print exposure in L2 amounts
to better grammatical competence in spoken L2, which is in line with the findings of Sparks in
Dąbrowska (2012) where L1 print exposure predicts L1 language achievements
The findings of verbs per utterance support the hypothesis by a significant group
difference between HPE and LPE as well as a significant positive correlation between print
exposure and verbs per utterance. This is in line with our finding of one of the tasks of
comprehension (synonymy triplets task) where print exposure was associated with better verb
comprehension compared to noun comprehension. A sentence is considered grammatically
incomplete without a verb; therefore, they are essential in sentence production and
comprehension (Reyes & Thompson, 2012). Findings also corroborate with monolingual
literature (Montag & MacDonald, 2015) and can be accounted for by the following. Reading
requires structural and conceptual linguistic knowledge to decode simple sentences and to
extrapolate meaning from more complex sentences (Nippold et al, 2009). The sentence
structure of written language is more formal than spoken language and is often embedded via
constructions such as dependent clauses (Curenton & Justice, 2004). It is known that reading
increases familiarity with complex structures (Guasti, 2004) and therefore these morpho-
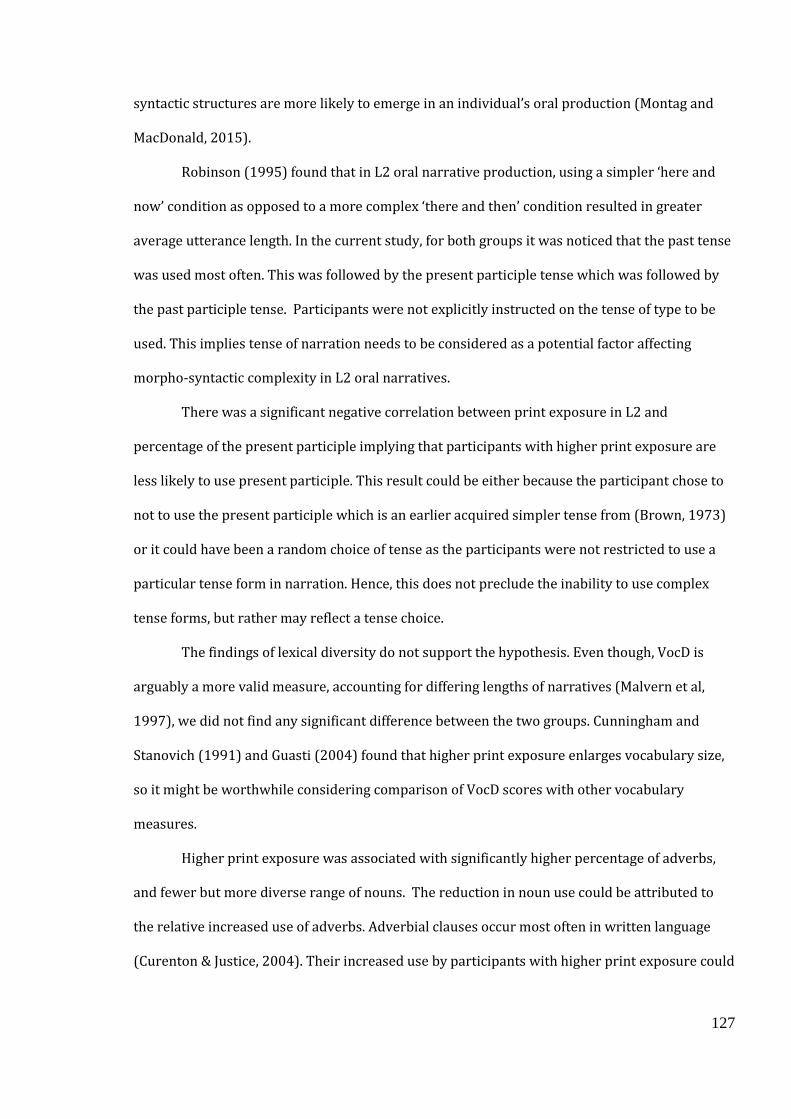
127
syntactic structures are more likely to emerge in an individual’s oral production (Montag and
MacDonald, 2015).
Robinson (1995) found that in L2 oral narrative production, using a simpler ‘here and
now’ condition as opposed to a more complex ‘there and then’ condition resulted in greater
average utterance length. In the current study, for both groups it was noticed that the past tense
was used most often. This was followed by the present participle tense which was followed by
the past participle tense. Participants were not explicitly instructed on the tense of type to be
used. This implies tense of narration needs to be considered as a potential factor affecting
morpho-syntactic complexity in L2 oral narratives.
There was a significant negative correlation between print exposure in L2 and
percentage of the present participle implying that participants with higher print exposure are
less likely to use present participle. This result could be either because the participant chose to
not to use the present participle which is an earlier acquired simpler tense from (Brown, 1973)
or it could have been a random choice of tense as the participants were not restricted to use a
particular tense form in narration. Hence, this does not preclude the inability to use complex
tense forms, but rather may reflect a tense choice.
The findings of lexical diversity do not support the hypothesis. Even though, VocD is
arguably a more valid measure, accounting for differing lengths of narratives (Malvern et al,
1997), we did not find any significant difference between the two groups. Cunningham and
Stanovich (1991) and Guasti (2004) found that higher print exposure enlarges vocabulary size,
so it might be worthwhile considering comparison of VocD scores with other vocabulary
measures.
Higher print exposure was associated with significantly higher percentage of adverbs,
and fewer but more diverse range of nouns. The reduction in noun use could be attributed to
the relative increased use of adverbs. Adverbial clauses occur most often in written language
(Curenton & Justice, 2004). Their increased use by participants with higher print exposure could
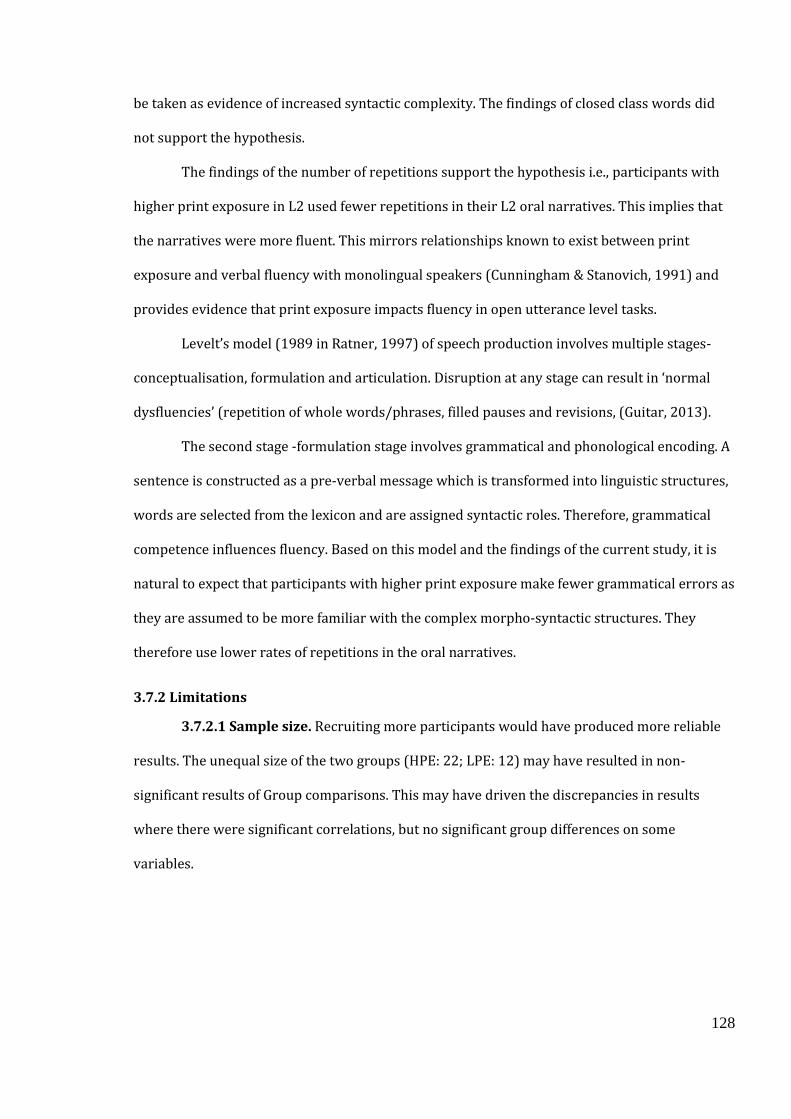
128
be taken as evidence of increased syntactic complexity. The findings of closed class words did
not support the hypothesis.
The findings of the number of repetitions support the hypothesis i.e., participants with
higher print exposure in L2 used fewer repetitions in their L2 oral narratives. This implies that
the narratives were more fluent. This mirrors relationships known to exist between print
exposure and verbal fluency with monolingual speakers (Cunningham & Stanovich, 1991) and
provides evidence that print exposure impacts fluency in open utterance level tasks.
Levelt’s model (1989 in Ratner, 1997) of speech production involves multiple stages-
conceptualisation, formulation and articulation. Disruption at any stage can result in ‘normal
dysfluencies’ (repetition of whole words/phrases, filled pauses and revisions, (Guitar, 2013).
The second stage -formulation stage involves grammatical and phonological encoding. A
sentence is constructed as a pre-verbal message which is transformed into linguistic structures,
words are selected from the lexicon and are assigned syntactic roles. Therefore, grammatical
competence influences fluency. Based on this model and the findings of the current study, it is
natural to expect that participants with higher print exposure make fewer grammatical errors as
they are assumed to be more familiar with the complex morpho-syntactic structures. They
therefore use lower rates of repetitions in the oral narratives.
3.7.2 Limitations
3.7.2.1 Sample size. Recruiting more participants would have produced more reliable
results. The unequal size of the two groups (HPE: 22; LPE: 12) may have resulted in non-
significant results of Group comparisons. This may have driven the discrepancies in results
where there were significant correlations, but no significant group differences on some
variables.
129
3.7.2.2 Methodology and analyses. Some methodological improvements could have
yielded better results. Including other subjective measures of print exposure such as self-rated
L2 reading and writing habits, would have strengthened the representation of participant’s print
exposure (Acheson et al, 2008).
Linguistic variables studied were partly limited by two aspects- the possible outputs of
the selected analysis tool (CLAN) and by the degree of coding that could be completed in the
allotted time. Alternative tools e.g. Sketch Engine (Kilgarriff et al, 2004) may have facilitated
inclusion of more or alternative variables. Additional coding of word level errors (e.g. case
errors) and subdivisions of words classes (e.g. comparative vs superlative adjectives) would
have allowed for a finer level of analysis. In this study, the reliability of coding was carried out
using an unrelated transcript. This could have been improved by using a sample of the
narratives.
In the current study, group comparisons and correlations were carried out. A next step
to this would be a regression analysis exploring the relative contribution of other independent
variables such as age, gender, years of education and print exposure in L2 to each of the
narrative variables. Adding these improvements to the current study, would makes its scope far
beyond what is feasible given comprehensiveness of the study and the time constraints.
3.7.3 Future Directions
Further research could explore the nature of grammatical errors made; using CLAN, this would
require classification, coding and analysis of errors at the word level in the speaker tier to
identify error types (e.g. errors of agreement / omission) and the structures affected (e.g. plurals
/ past tenses / possessives).
Measuring verbs per utterance provided a quantitative measure of syntactic complexity;
qualitative classification of structures (e.g. actives / passives) would give a richer description of
syntactic complexity. Alternatively, use of sketch engine tool could add more variables into the
analyses.
130
Measuring and analysing different features of print exposure in L2, such as frequency,
types of print (academic literature / newspapers / novels) and duration since first exposure,
could provide insight as to which aspects of print exposure in L2 are driving the differences
observed in L2 oral narratives. Further, it is important to adequately measure print exposure in
L1 using an objective measure and control for the same during the analyses.
The typological similarities or differences across languages determine interaction of the
language pairs (Sorace & Serratrice, 2009). Therefore, this makes it difficult to generalise the
findings across bilingual populations. This could be addressed by replication of this study using
different language pairs.
131
Chapter 4 Impact of print exposure on executive functions in bi-literate bilingual healthy
adults
4.1 Abstract
Background Research has indicated that print exposure has a positive impact on generalised
executive functions such as immediate recall (Ardila & Rosselli ,1989), Stroop task (Barnes,
Tager, Satariano & Yaffe ,2004) and working memory (Silva et al., 2012). This literature focuses
on impact of print exposure on executive function tasks in monolingual population. On the other
hand, some research has shown that bilinguals exhibit an advantage over monolinguals on tasks
of non-verbal executive functions such as the Simon task (Bialystok, Craik, Klein, & Viswanathan,
2004), Stroop task (Bialystok, Craik, & Luk, 2008) and task-switching (Prior & Gollan, 2011). As
a significant portion of the world’s population is bilingual, it is important to characterise the
impact of literacy as measured by print exposure on executive function tasks in bilinguals.
However, none of the bilingual studies report whether these bilinguals were bi-literates or
consider print exposure as a factor in examining executive function. Therefore, it remains to be
determined if print exposure in a bi-literate bilingual population would show similar effects on
non-verbal executive function tasks.
Aim The current study examines the impact of print exposure in non-verbal executive
functioning in bi-literate bilingual healthy adults.
Methods We used the same participants as in Chapter 2. We grouped the thirty-four
participants of our study into two groups: high print exposure (n=22) and low print exposure
(n=12). We administered a set of non-verbal executive function tasks tapping into inhibitory
control (Spatial Stroop and Flanker tasks), working memory (visual n-back and auditory n-back)
and task switching (colour-shape task). For the inhibitory control and task switching tasks, we
extracted the RT and accuracy to measure the Stroop effect, conflict effect and switch cost. For
the n-back tasks, we used D prime for analyses.
132
Findings There were no significant group differences or correlation of print exposure with any
executive function measure except auditory N-back. For both the 1-back and 2-back conditions,
the participants in HPE performed better than participants in LPE. Additionally, there was a
significant correlation between print exposure and d prime score on the auditory 2-back
condition.
Conclusions and implications Our results do not allude to a direct link of print exposure with
executive function measures of inhibitory control and task switching within bi-literate
bilinguals. Although, there seems to be a link of print exposure with working memory when
testing using an auditory stimuli, this does not hold true for the visual N-back task. This research
attempted to account for the impact of print exposure on non-verbal executive functions in bi-
literate bilingual adults. Future research comparing verbal and non-verbal executive function
measures in the same population will help us determine if print exposure has a differential
impact on verbal and non-verbal executive functions.
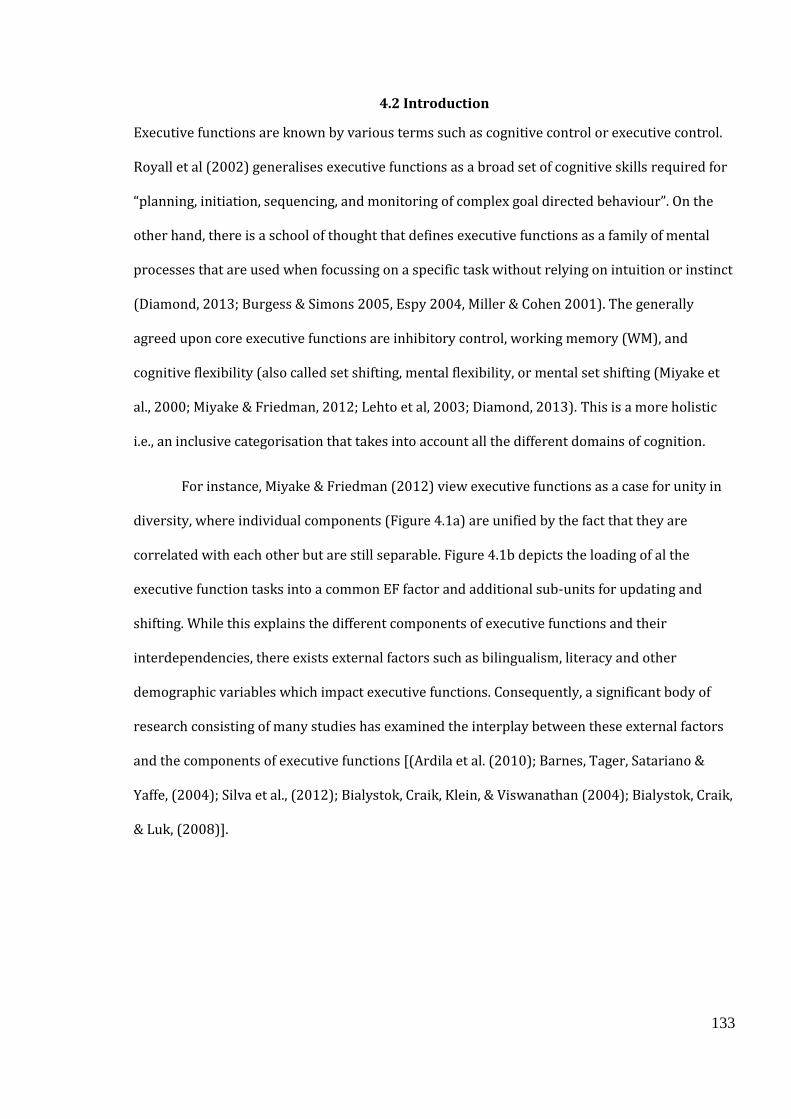
133
4.2 Introduction
Executive functions are known by various terms such as cognitive control or executive control.
Royall et al (2002) generalises executive functions as a broad set of cognitive skills required for
“planning, initiation, sequencing, and monitoring of complex goal directed behaviour”. On the
other hand, there is a school of thought that defines executive functions as a family of mental
processes that are used when focussing on a specific task without relying on intuition or instinct
(Diamond, 2013; Burgess & Simons 2005, Espy 2004, Miller & Cohen 2001). The generally
agreed upon core executive functions are inhibitory control, working memory (WM), and
cognitive flexibility (also called set shifting, mental flexibility, or mental set shifting (Miyake et
al., 2000; Miyake & Friedman, 2012; Lehto et al, 2003; Diamond, 2013). This is a more holistic
i.e., an inclusive categorisation that takes into account all the different domains of cognition.
For instance, Miyake & Friedman (2012) view executive functions as a case for unity in
diversity, where individual components (Figure 4.1a) are unified by the fact that they are
correlated with each other but are still separable. Figure 4.1b depicts the loading of al the
executive function tasks into a common EF factor and additional sub-units for updating and
shifting. While this explains the different components of executive functions and their
interdependencies, there exists external factors such as bilingualism, literacy and other
demographic variables which impact executive functions. Consequently, a significant body of
research consisting of many studies has examined the interplay between these external factors
and the components of executive functions [(Ardila et al. (2010); Barnes, Tager, Satariano &
Yaffe, (2004); Silva et al., (2012); Bialystok, Craik, Klein, & Viswanathan (2004); Bialystok, Craik,
& Luk, (2008)].
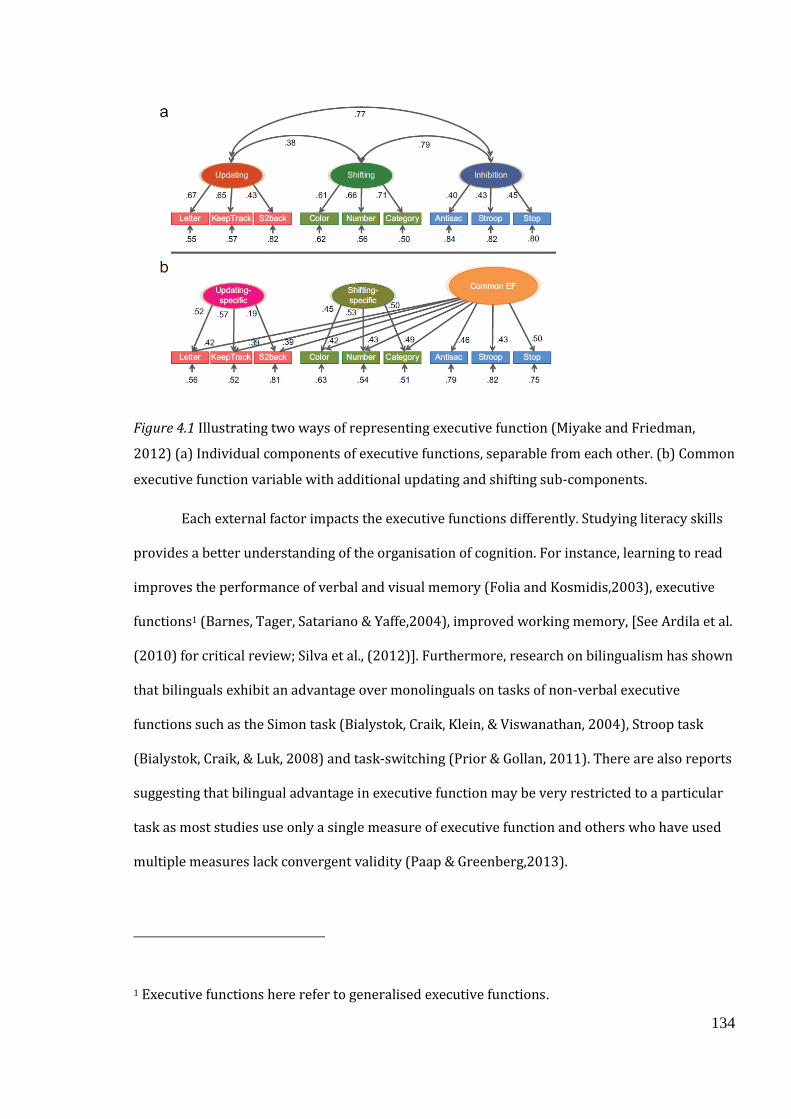
134
Figure 4.1 Illustrating two ways of representing executive function (Miyake and Friedman,
2012) (a) Individual components of executive functions, separable from each other. (b) Common
executive function variable with additional updating and shifting sub-components.
Each external factor impacts the executive functions differently. Studying literacy skills
provides a better understanding of the organisation of cognition. For instance, learning to read
improves the performance of verbal and visual memory (Folia and Kosmidis,2003), executive
functions1 (Barnes, Tager, Satariano & Yaffe,2004), improved working memory, [See Ardila et al.
(2010) for critical review; Silva et al., (2012)]. Furthermore, research on bilingualism has shown
that bilinguals exhibit an advantage over monolinguals on tasks of non-verbal executive
functions such as the Simon task (Bialystok, Craik, Klein, & Viswanathan, 2004), Stroop task
(Bialystok, Craik, & Luk, 2008) and task-switching (Prior & Gollan, 2011). There are also reports
suggesting that bilingual advantage in executive function may be very restricted to a particular
task as most studies use only a single measure of executive function and others who have used
multiple measures lack convergent validity (Paap & Greenberg,2013).
1 Executive functions here refer to generalised executive functions.
135
Paap et al (2015) suggests that the minority number of publications that suggest a
bilingual advantage in executive function may be due to the insensitivity of the dependent
variables measuring executive function or Type 1 errors, confounds in demographic factors such
as genetics, socio-economic status and immigration status (Valian, 2015), and questionable
statistical tests. Among these demographic factors, extent of literacy as measured by print
exposure could be a potential factor impacting executive functions in bilinguals. The degree of
bi-literacy is different across bilinguals. Interest in bi-literacy has emerged only recently; it’s
effect on linguistic and cognitive performance remains largely unknown (Reyes, 2012). Our
study examines the validity of this relationship between print exposure and executive functions
in bi-literate bilinguals.
Given the impact of print exposure (literacy) and bilingualism on executive functions, in
this chapter we will discuss our methods and results of exploring the impact of print exposure
on executive functions within a bi-literate bilingual population. In the review of the current state
of the art, we discuss the impact of print exposure on executive functions (4.2.1), debate on
bilingualism and executive functions (4.2.2), gaps in the literature with respect to impact of
print exposure on executive functions in bilinguals (4.2.3).
4.2.1 Impact of print exposure on executive functions
We will explore the literature related to the impact of print exposure (literacy) on executive
functions in mutually exclusive groups of illiterate and literate populations.
Ardila & Rosselli (1989) tested two groups consisting of extreme literates and extreme
illiterates on a neuropsychological battery of visuo-spatial and memory abilities to determine if
they performed statistically significant. Their study consisted of 200 normal right-handed
subjects split into groups based on three variables- education level, age and sex. The illiterate
population were those who had no opportunity to go to school and their parents were also
uneducated. The literate population were chosen from among the professionals who had
136
attended either university or school. The following visuo-spatial and memory tasks were
administered- digit retention, memory curve, delayed verbal recall, sentence repetition,
immediate and delayed logical memory, immediate recall of the Rey-Osterrieth complex figure,
immediate reproduction of a cube, visuospatial memory, sequential memory and immediate
memory of sentences. They found that literates were better (in accuracy) than illiterates in all
tasks except immediate memory of sentences. The authors claim that literacy improves an
individual’s ability to perform cognitive tasks.
Manly et al (1999) examined the effects of print exposure using a neuropsychological
test battery in adults over 65 years with 0- 3 years of education in Spanish speakers. A total of
251 participants were recruited for this study. Print exposure was measured by self-report. The
tasks administered (that are relevant to the current chapter) are verbal list learning and
memory [Selective Reminding Test ; Buschke & Fuld, 1974], nonverbal memory [multiple choice
version of the Benton Visual Retention Test (BVRT); Benton(1955)], orientation [items from the
Mini Mental State Examination (MMSE); Folstein et al., 1975], verbal reasoning [Similarities
subtest of the Wechsler Adult Intelligence Scale–Revised (WAIS–R); Wechsler, 1981] nonverbal
reasoning (Identities and Oddities subtest of the Mattis Dementia Rating Scale; Mattis, 1976),
visuo-construction (Rosen Drawing Test; Rosen, 1981), and visuo-perceptual skills (multiple
choice matching of figures from the BVRT; Benton, 1955). They found that overall, literates
outperformed illiterates in neuropsychological test scores. Specifically, they found that
illiterates obtained significantly lower scores than literates on BVRT matching and recognition,
WAIS–R Similarities subtest and MMSE Orientation. They attribute the higher BVRT matching
and recognition scores to visuospatial decision making rather than nonverbal memory. They did
not find an effect of print exposure on delayed recall.
Folia and Kosmidis (2003) investigated whether memory differences between illiterates
and literates were an artefact of the assessment tool, rather than an intrinsic difference between
the groups. They recruited 54 right-handed women grouping them into 3 groups based on years
137
of education: 19 women with zero years of education; 20 age matched women with 1-9 years of
education and the remaining 15 with greater than 9 years of education (mean of 10 years). They
subjected these groups to different memory tasks- a word list learning test (a modification of
the California verbal learning test, Delis, Kramer, Kaplan, & Ober, 1987) and an object learning
test. These memory tests consisted of 16 words/3-dimensional objects that were exposed to the
participants for 10 seconds. Each learning was followed by a recall of as many words/objects as
possible. This was followed by a delayed free recall and cued recall.
Variables of interest were: number of words/objects recalled on the first learning trial,
number of words/objects recalled on the fifth learning trial, number of words retrieved after 20
min on free recall, number of words/objects retrieved on cued recall, number of words/objects
recognized correctly among verbally presented distracter stimuli as belonging to the original
items and number of semantic clusters used during delayed free recall. The illiterate group
performed the worst in the study on all the tasks, however, specifically the illiterates performed
poorly on first trial, delayed recall, recognition and semantic clustering. In contrast, all three
groups performed similarly on object learning task, but the illiterates did not use semantic
clustering strategies or recall as many words after a 20-min delay as the other groups. The
authors conclude that the poor memory performance among illiterates can be attributed both to
the nature of the task, as well as to the use of different retrieval mechanisms.
A study by Silva et al (2012) compared verbal and non-verbal working memory in
illiterates and literates differentiated based on years of education and screening of literates on
reading of text and comprehension questions. This study consisted of 38 healthy female
volunteers who were divided into literate and illiterate groups, each group comprising of 19
participants. The task administered were digit and spatial span tasks (forward and backward)
from the Wechsler Memory Scale–Third Edition (WMS–III; Wechsler, 1997). They found that the
literacy effect was seen in forward digit span favouring the literates whereas the spatial span
showed similar performances across the two groups. In the backward span tasks, there was a
138
general decrease in performance compared to the forward tasks in both the groups however the
performance of the illiterate group was significantly poorer than the literate group. Their
forward digit span findings imply that literacy impacts the phonological loop component of
working memory. The authors attribute the better performance of the literates on the backward
span tasks to more efficient functioning of the central executive in literates.
Barnes, Tager, Satariano & Yaffe (2004) examined the impact of literacy on four
cognitive measures: global (MMSE), executive function and attention (trail making, Stroop
interference test and digit symbols test), verbal learning and memory (California Verbal
Learning Test), and verbal fluency (letter ‘‘s,’’ animals). The study recruited 664 community-
living adults aged 65 years or older English speakers. The participants were grouped as
illiterates and literates based on the performance on North American Adult Reading Test
(NAART) where they had to pronounce words with irregular spellings. Based on the
performance on NAART, the participants were divided into three literacy tertiles- low (M = 26
words), middle (M= 39 words) and high (M= 50 words). In all sub- groups, literacy was strongly
associated with all measures of cognition. This association was linear and largely unchanged for
years of education and age. They found that individual with higher literacy performed better on
all measures of cognition. In addition, they found that literacy was a predictor than education of
cognitive abilities.
Within the literature we have reviewed, we have noticed that print exposure/ literacy
seems to have a higher impact on verbal executive function tasks. In general, literature notes
that literates perform better than illiterates on visuospatial (Ardila & Rosselli, 1989), verbal
working memory (Silva et al, 2012, Folia and Kosmidis, 2003), general executive functions
(Barnes et al, 2004). However, literates and illiterates perform comparably on non-verbal
memory tasks (Folia and Kosmidis, 2003). A major drawback is that all of the above literature
focuses on impact of print exposure/ literacy on executive function tasks in monolingual
population. As a significant portion of the world’s population is bilingual, it is important to
139
characterise the impact of literacy as measured by print exposure on executive function tasks in
bilinguals. Studies in this regard are reviewed in the following section (4.2.2).
Additionally, each of the above studies tap into a specific cognitive domain which are
independent of each other or tend to club these within a broad umbrella of neuropsychological
batteries (general executive functioning). None of the studies use all the different domains of
executive functions in a holistic manner (Refer figure 4.1). Studies by Teuber (1972) and
Duncan, Johnson, Swales, & Freer, (1997) have asked whether all executive functions can be
viewed in a holistic manner. In response to this question, Miyake & Friedman (2012) have
grouped the processes of executive function under three domains- updating information
(working memory), inhibitory control and task switching (cognitive flexibility). This is a more
holistic i.e., an inclusive categorisation that takes into account all the different domains of
cognition.
4.2.2 Debate of bilingual advantage in executive functions
In reviewing the literature summarising the effects of bilingualism on executive function, there
has been evidence that the so-called cognitive advantage of bilinguals is not very conclusive
(Zhou & Krott, 2016). For instance, in monolingual vs. bilingual comparisons, the performance
on non-verbal inhibition tasks have had mixed results (de Bruin et al., 2015; Hilchey & Klein,
2011; Paap & Greenberg, 2013; Paap, 2014). Between groups of bilinguals and monolinguals
they found the younger bilinguals were less and older bilinguals were more skilled than older
monolinguals in performing in conditions that focused on all three of the executive components
manipulated in the experiment. In this section, we focus on reviewing literature pertaining to
impact of bilingualism on individual components of executive functions.
4.2.2.1 Debate on bilingual advantage in inhibitory control Costa, Hernandez and
Sebastian-Galles (2008) have tested the Attentional Network task (ANT) on a population of
Catalan-Spanish bilinguals and Spanish monolinguals. The goal of their study was to examine if
there is a bilingual advantage in attentional abilities. They studied this by measuring their
140
abilities to resolve conflict between congruent and incongruent information and to switch
between different types of trials. The attentional component of executive control is likely to be
impacted by bilingualism and may also involve inhibitory control. They used the ANT developed
by Fan, McCandliss, Sommer, Raz, and Posner (2002) to assess the attentional capabilities.
Participants were asked to indicate whether a central arrow points to the right or left
(the target stimulus is presented above or below a fixation point). This arrow is presented along
with two flanker arrows pointing to the same (congruent trials) or different direction
(incongruent trials). The alerting network is studied by presenting a cue before stimulus to
prime their participant responses. The hypothesis to using this sort of cueing is that bilingualism
inherently causes a smaller conflict effect as bilinguals have a stronger inhibitory control
component. Their results showed that bilinguals responded faster with a smaller conflict effect
and smaller switch cost. In our study, we have included a Flanker task and a switching task
measuring conflict effect and switch cost respectively to examine whether print exposure in
addition to bilingualism has the same impact.
A study by Bialystok et al (2008) studied the effects of aging and bilingualism on an
executive control task. This study builds on the results that the Simon task has shown a bilingual
advantage on children, young adults and older people (Martin & Bialystok, 2003; Bialystok,
2006; Bialystok, Craik, Klein, & Viswanathan, 2004; van der Lubbe & Verleger, 2002).
Consequently, this study tried to identify the precise executive processes that are advantaged in
bilinguals. To this end, three executive processes—response suppression( ability to withhold a
response to a habitual cue as in the go/no-go task (Casey et al., 1997; Diamond, 1988))
inhibitory control( the ability to identify the relevant cue when two conflicting ones are present)
, and task switching( the ability to identify the correct set of instructions between two sets in
response to a cue and execute them correctly) —were investigated with a modified antisaccade
task. The choice of tasks is motivated by studies of behavioural and imaging data.
141
Studies using both behavioural and imaging data have provided evidence for the
difference between task switching and inhibitory control (Sylvester et al., 2003; Ward, Roberts,
& Phillips, 2001) and between response suppression and inhibitory control (Bunge, Dudukovic,
Thomason, Vaidya, & Gabrieli, 2002). A total of 96 participants were included in the study, who
were split into 4 groups of monolingual young adults (mean age 20.7 years, mean education of
14.4 years), bilingual young adults(mean age of 20.8 years, mean education of 14.6 years),
monolingual older adults(mean age 70.4, mean education of 15.4 years), and bilingual older
adults(mean age of 71.3 and mean education of 16.6 years). An adapted version of antisaccade
task used by Friesen and Kingstone (1998) was used to isolate the effects of response
suppression, inhibitory control, and task switching on the other hand eye movement time was
measured with the prosaccade task.
The authors claim that in terms of the unitary nature of executive control components,
the results support the interpretation that executive control is a unitary construct but
compatible with accounts claiming that control depends on a set of related factors, both at the
level of cognitive processes (e.g., Miyake et al., 2000) and at the level of neural (typically frontal)
processes and mechanisms (e.g., Stuss et al., 2005; Stuss & Levine, 2002). Additionally, given the
fact that faster response times were elicited for older bilinguals where conflicting stimuli were
present, provides further evidence that bilingualism may act as a form of extended training in
aspects of executive control.
Kousaie & Phillips (2012) examined the bilingual advantage using three tasks – Stroop,
Simon and Flanker task. They compared two groups of adults – monolinguals (n=25) and
bilinguals (n=26). They studied the effect of bilingualism on the Stroop, Simon and Eriksen
flanker task (Eriksen & Eriksen, 1974) in order to validate the bilingual advantage in control
mechanisms. In their investigation, the authors found no bilingual advantage in any of the three
tasks in contrast to Bialystok et al. (2008) where bilingual advantage was demonstrated in both
the Stroop and the arrows version of Simon task.
142
The authors argue that compared to Costa et al. (2009) their task was not able to elicit
any advantage probably because the difficulty level of each task remained the same and
consequently did not pose enough of a challenge for the bilingual effect to be demonstrated.
They also imply that as a large number of trials were involved the bilingual advantage could also
have been eliminated by the practise effect (for a review see Hichley and Klien, 2011). To study
if this is true, they carried out certain supplemental analyses such as examining raw RT and
interference effect between neutral and incongruent trials but still found no bilingual
advantage/difference.
A significant limitation of the study is that it did not include the immigrant population in
contrast with say Costa et. al. (2008, 2009). Additionally, the ANT used by Costa et al. (2009)
includes cued and non-cued conditions that measures three attentional networks: alerting,
orienting and executive control, therefore this methodological difference could probably explain
the difference in findings.
To summarise, from the methodological perspective, all of the studies summarised
above employ non-verbal inhibitory control tasks. There is some evidence of positive impact of
bilingualism on inhibitory control (Bialystok et al., 2008; Costa et al, 2008) and other evidence
of a null effect (Kousaie & Philips, 2012). Consequently, multiple viewpoints exist on whether a
bilingual advantage exists in inhibitory control. In our study, we have sought to investigate the
impact of print exposure on inhibitory control using non-verbal inhibitory tasks (spatial Stroop
and Flanker) in a bi-literate bilingual population incorporating print exposure as an additional
variable.
4.2.2.2 Debate on bilingual advantage in working memory There has been evidence
that bilinguals have performed poorly on verbal memory tasks. A study by Fernandez et al
(2007) examined the effects of aging and bilingualism on memory performance in bilingual
adults. They recruited 104 participants divided into 4 groups- 2 groups of bilinguals (younger
and older adults) and 2 groups of monolinguals. The background tasks administered were
143
language background questionnaire, Peabody Picture Vocabulary test (Dunn & Dunn, 1997) and
digit span task. The experimental task included a free recall task using five items from five
semantic categories (animals, fruits, musical instruments, tools and kitchen items). Each word
was presented auditorily and a set of distractor words were visually presented. They found that
bilinguals recalled fewer words than monolinguals in a free recall task with the older adults
performing poorer than younger adults in both monolinguals and bilinguals.
There is not enough evidence to suggest that bilinguals are at an advantage on working
memory. A study by Soveri et al (2011) tested whether tasks measuring different executive
functions (inhibition, updating, and set shifting) could be predicted by the frequency of language
switches (as measured by a language switching questionnaire). The goal of this study is guided
by the hypothesis, that bilinguals with lifelong practise in processes that engage executive
functions may have positive effects in executive function performance (e.g., Bialystok et al.,
2006a; Carlson and Meltzoff, 2008) and their performance will be modulated by the degree of
usage in everyday life (Costa et al, 2009). This modulation is however, not easily explained
without understanding the underlying mechanisms that cause the bilingual advantage.
The study was made up of 38 participants (12 men and 26 women, age range of 30-75
with a mean age of 52.84) all of whom were Finish-Swedish bilinguals. They were administered
the Simon task and flanker task (adapted from Eriksen and Eriksen, 1974) to measure
inhibition, the spatial N-back (Carlsson et al., 1998) was used to measure working memory
updating and number-letter task (Rogers and Monsell, 1995) was used to measure shifting
abilities. The authors found a significant association between the predictor age of L2 acquisition
and the Simon effect as the outcome variable, indicating that younger age of L2 acquisition
resulted in a smaller Simon effect in RTs. However, none of the other predictors showed any
other significant result. A side result however was that the authors found that the language
switching frequency in bilinguals (from the questionnaire of measuring degree of bilingualism)
predicted the mixing cost (error rate) in the shifting task within the Number-letter task. This the
144
authors claim was due to the bilingual experience of managing two languages. They also found
age to be a significant predictor of working memory updating (N-back task) and the mixing cost
in set shifting. Younger bilinguals showed significantly lower costs on number-letter task. It was
clear to the authors that set shifting task showed most sensitivity to the bilingual advantage.
N-back requires online monitoring and updating working memory (Monk et al, 2011).
The N-back task has been extensively used as a measure of working memory (Monk et al., 2011;
Kane et al, 2007; Jaeggi et al, 2010). However, given that the relationship between bilingualism
and working memory is not very clear (Dong et al., 2015), Therefore in our study, we try to
explore the relationship between an extraneous factor (print exposure) and working memory
updating using the N-back task. In our study, we use D prime (D’) as a way to validate the results
of the N-back task as D prime is less prone to confounding factors such as demographic factors
as compared to digit span and letter-number sequencing (Haatveit et al, 2010).
4.2.2.3 Debate on bilingual advantage in task-switching. A study by Prior &
McWhinney (2010) investigated the possibility that lifelong bilinguals may have enhanced
ability to shift between mental sets. They examined task switching ability in bilinguals using the
colour-shape task which consisted of a set of non-switch and switch trials in a sandwich design.
They defined switch costs as the measure of difficulty in switching from one task set to another.
The choice of task was driven by the difficulty of the task and even young high-performing
participants are known to incur large costs (for a review, see Monsell, 2003). Therefore,
probability of encountering ceiling effects is low and more likely to elicit group differences in
performance. A total of 92 participants were recruited, 45 of these were monolinguals (mean
age: 18.7years) and 47 were heterogenous bilinguals (19.5 years) having acquired both
languages before the age of 6. They found that bilinguals were significantly faster and accurate
on switch trials and had smaller switch costs than monolinguals. The authors suggest that
bilinguals had a greater success in activating a task set in response to a cue and overcame faster
145
the residual interference or activation from the previous trial (Meiran et al., 2000; Philipp et al.,
2009).
One other study by Prior and Gollan (2011) examined the degree of bilingual advantage
in task switching in order to ascertain by how much role does a bilingual language use play in
producing a switch advantage. In order to probe this, they compared task switching and
language switching between three groups of participants – 47 English Monolinguals, 47 Spanish-
English bilinguals and 43 Mandarin- English bilinguals. The authors hypothesised that the
Spanish-English bilinguals would perform better on language and task switching tasks as they
are considered more balanced bilinguals than Mandarin-English bilinguals (Bialystok, Craik &
Ruocco, 2006).
The non-linguistic task switching involved the colour and shape task (adapted from
Prior & Mcwhinney,2010). For the language switching task, the stimuli consisted of digits from
1-9 which were presented in two single language blocks, followed by three mixed language
blocks and two more single language blocks. They found that the Spanish-English bilinguals
incurred a smaller switch cost both for language- and task-switching (when controlled for
parental education) compared to Mandarin-English bilinguals and monolinguals. The authors
attribute the smaller switch cost in both language and task switching to a “tight- link” between
language and general task switching ability. However, the results also indicate that the bilingual
advantage is not uniform across all bilingual populations and additional factors such as parental
education, socio-economic status need to be considered.
Calabria (2011) also examined the switching costs in a linguistic switching task (naming
in L1 and L2) and non-linguistic switching task (colour-shape task) in high proficient Catalan-
Spanish bilinguals. The participants were 14 bilinguals with a mean age of 23 years. The
linguistic switching task consisted of 8 pictures selected from Snodgrass & Vandarwart (1980)
with four cognate words and four non-cognate words. The participants were required to name
in Catalan and Spanish indicated by a Spanish or Catalan flag. The non-linguistic switching task
146
was a shape colour task where three shapes were displayed on the screen. The participants had
to match the top two shapes in the screen with the bottom shape on the screen based on either
colour or shape indicated by a cue. They found that the switching costs for the linguistic task
was symmetrical while the switching cost was asymmetrical for the non-linguistic switching
task. This suggests that language switching performance does not correlate with non-linguistic
switching task (Paap et al., 2015).
Few studies such as Prior & McWhinney (2010) and Prior & Gollan (2011) have found
that language switching correlates with task switching, contrastively authors such as Paap et al
2015 and Calabria (2011) have found no positive correlation between the two switches. Authors
have added that other factors such socio-economic status (Prior & McWhinney, 2010), parental
education (Prior & Gollan, 2011) and language proficiency (Calibria, 2011) also have an impact
on switching ability. We have sought to investigate an extraneous factor such as print exposure
might impact switching ability in bi-literate bilinguals. We have used the non-verbal task
switching paradigm by computing the switch costs described in Prior & McWhinney (2010) to
examine whether print exposure could contribute to task switching ability in bi-literate bilingual
healthy adults.
4.2.2.4 Bilingual advantage and script differences Another variable in testing for
bilingual executive function advantage is the script differences between the two languages
(Paap et al.,2015; Coderre & Heuven, 2014). Codere & van Heuven (2014) tested the hypothesis
that similar-script bilinguals have more effective domain-general executive control with three
bilingual groups with differing amounts of overlap between languages. Three groups of
bilinguals were included consisting of 19 German-English speakers (high amounts of
orthographic and phonological overlap), 22 Polish-English speakers (lesser amount of
orthographic and phonological overlap) and 17 Arabic-English speakers (no orthographic and
very little phonological overlap).
147
A monolingual group of 18 participants was also tested for comparison. All tested
participants lived in England at the time of testing. The participants were administered the
Stroop task and the Simon task. Monolingual participants performed one session, consisting of
the English Stroop task and the Simon task. Bilingual participants performed two experimental
sessions on consecutive days; each session consisted of the Simon task and the Stroop task in
one language (L1 or L2). The Stroop and Simon tasks were chosen because they measure
contrasting properties; while the Stroop task is a linguistic measure of the interference effect of
language in bilinguals (e.g. Brauer, 1998; van Heuven et al., 2011 find this effect to be larger
when the script is similar), the Simon task is a non-linguistic measure of bilingual advantage. To
assess the bilingual global RT advantage, the authors compared not just the global RTs
(collapsed over congruent, incongruent, and control conditions) but also RTs to the control
condition.
Overall, the authors found the smallest Stroop interference effects in the Arabic-English
bilinguals, however, there were no group differences in Simon interference effects. The authors
suggest that these contradictory results probably imply that the Stroop interference effect was
not driven by script similarity. Since the Simon task does not show any significant interference,
the authors conclude that, script similarity does not offer any inhibitory control advantage in
any group. Conversely when consulting the results of the global RTs, the Arabic-English
bilinguals had the longest RTs. This, the authors claim, could suggest less effective executive
processing abilities in different-script bilinguals. The authors finally conclude that in-spite of a
bilingual advantage, script similarity could modulate executive control abilities across bilingual
groups.
To summarise, script can become an important factor that modulates linguistic
inhibitory control measures across bilingual groups. The aim of this study is to measure the
isolated impact of print exposure on executive functions in bi-literate bilinguals without
148
considering script or any other linguistic extraneous factors. Therefore, in our study we have
chosen non-verbal spatial Stroop and Flanker(arrow) tasks as inhibitory control tasks.
An alternative view endorsed by Paap et al (2015) is that there is no convergent opinion
that the bilingual advantage exists in executive functions. In a meta-analysis of published data
De Bruin, Treccani, and Della Sala (2015) provided evidence that a publication bias resulting
from the combined effects of researchers deciding what to submit and editors deciding which
articles to publish have led to an underreporting of null and negative results. Consequently, a
perceptive body of research that reports significant bilingual advantage exists (Bialystok,
2004,2008; Kroll & Bialystok, 2013 etc).
Paap et al (2015) additionally suggests that the minority number of publications that
suggest a bilingual advantage in executive function may be due to the insensitivity of the
dependent variables measuring executive function or Type 1 errors, confounds in demographic
factors such as genetics, socio-economic status and immigration status (Valian, 2015), and
questionable statistical tests.
Authors such as Paap and Sawi (2014) found little or no convergence between
measures of inhibitory control. This is in opposition to Miyake et al (2000) that showed
significant correlations between the task variables assumed to require inhibition. Paap et al
(2015) point out that different variants of the Stroop task do not correlate with one another
(Shilling, Chetwynd, & Rabbitt, 2002). Similarly, different versions of the flanker task do not
correlate with one another (Salthouse, 2010). An important drawback mentioned by Paap et al
(2015) is that the bilingual advantage in executive function may be very restricted to a
particular task as most studies use only a single measure of executive function and others who
have used multiple measures lack convergent validity (Paap & Greenberg,2013). Therefore,
two or more measures under each domain of executive function are necessary to evaluate the
bilingual advantage. If both the measures converge, then a bilingual advantage can be posited.

149
Hence, in our study not only do we use multiple measures of non-verbal executive functions,
we also consider the additional factor of L2 print exposure in bilinguals.
150
4.3 The current investigation, research questions and predictions
Based on the discussion of literature above, it is clear that print exposure in monolinguals has a
significant impact on executive function measures mostly evaluated using neuropsychological
test batteries (generalized executive functions). On the other hand, research on bilinguals has
largely reported mixed results on the bilingual advantage in executive functions. Studies have
also shown that script differences play some role in predicting performance in executive
functions. However, none of the bilingual studies report whether these bilinguals were bi-
literates or consider print exposure as a factor in examining executive functions. Consequently,
the current study addresses this limitation by examining the impact of print exposure in
executive functions in bi-literate bilingual healthy adults.
The same participants recruited for study 1 (Chapter 2, section 2.3) were participants in
the current study. The participants were split into two groups- high print exposure (HPE) and
low print exposure (LPE). The two groups were matched on other background measures as
explained in chapter 2. We compared the performance of these participants on a set of executive
function tasks measuring inhibition (spatial Stroop and Flankers task), working memory (visual
and auditory N-back) and task switching (colour-shape switching task). We quantified the
performance on spatial Stroop, Flankers task and colour-shape task based on mean reaction
time and mean accuracy. We also calculated the Stroop effect, conflict effect for spatial Stroop
and Flankers task respectively. For the N-back task, the performance was quantified using D
prime.
Inhibitory control is exercised when two conflicting mental representations, each
associated with an opposite response, is presented and attention is to be paid to only one based
on the cues (Bialystok, 2008). This sort of control or conflict resolution is required in the Simon
and Stroop tasks wherein a misleading cue in the stimulus has to be correctly ignored while
choosing the correct response. Bilinguals are expected to exercise such control every day,
151
where misleading representations and responses (from language not in use) conflict with their
currently active system (the language that they use in that time frame). Thus, in supressing their
conflicting response they exercise inhibitory control. Task switching is the ability to hold in
mind two sets of instructions and execute the correct task in response to a cue (Bialystok, 2008).
This ability may be similar to the need to hold two language representations in mind and switch
between them to respond in the appropriate language when the context signals the need for a
language. For the current study, we have used two non-verbal executive function tasks under
each domain except task switching. We have tested inhibitory control using Spatial Stroop task
and Flanker task, working memory using visual and auditory N-back and task switching using
colour shape task. We chose just one task to measure task switching as the task tend to incur
large costs, are more difficult and may be more sensitive to group differences (see Monsell,
2003). The summary of measures of executive functions used in the current study is presented
in Table 4.1.
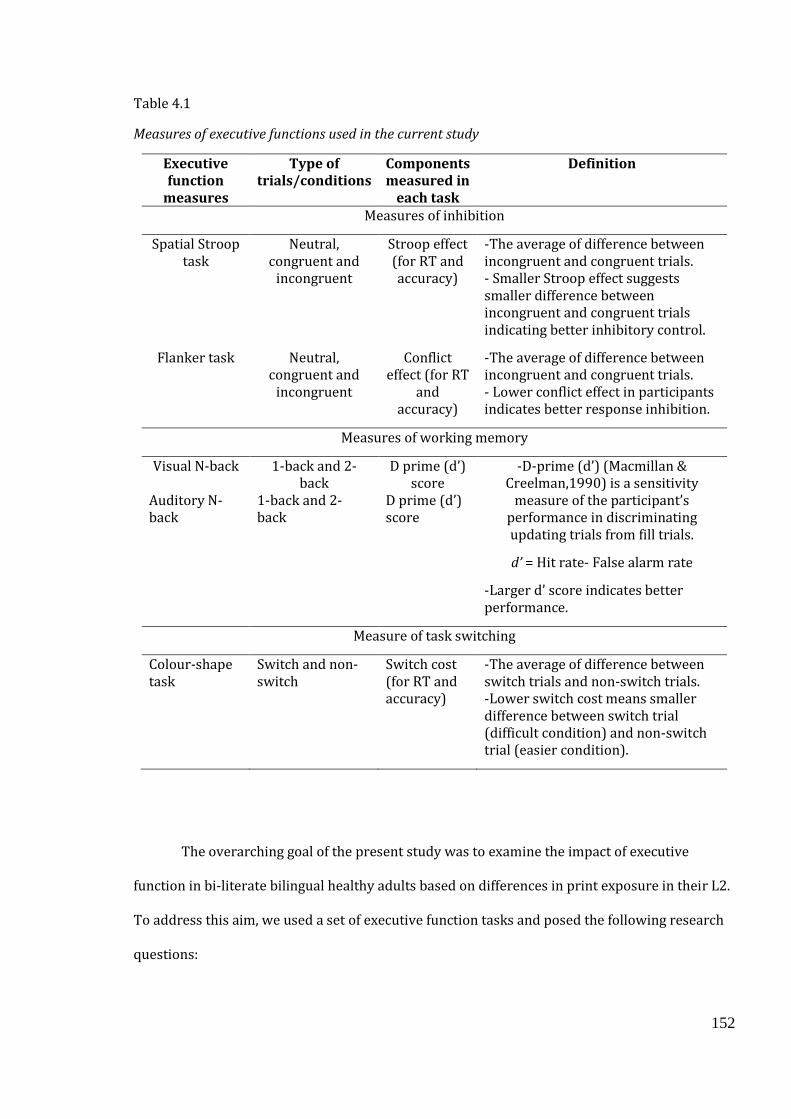
152
Table 4.1
Measures of executive functions used in the current study
Executive function
measures
Type of trials/conditions
Components measured in
each task
Definition
Measures of inhibition
Spatial Stroop task
Neutral, congruent and
incongruent
Stroop effect (for RT and accuracy)
-The average of difference between incongruent and congruent trials. - Smaller Stroop effect suggests smaller difference between incongruent and congruent trials indicating better inhibitory control.
Flanker task Neutral, congruent and
incongruent
Conflict effect (for RT
and accuracy)
-The average of difference between incongruent and congruent trials. - Lower conflict effect in participants indicates better response inhibition.
Measures of working memory
Visual N-back 1-back and 2-back
D prime (d’) score
-D-prime (d’) (Macmillan & Creelman,1990) is a sensitivity
measure of the participant’s performance in discriminating updating trials from fill trials.
d’ = Hit rate- False alarm rate
-Larger d’ score indicates better performance.
Auditory N-back
1-back and 2-back
D prime (d’) score
Measure of task switching
Colour-shape task
Switch and non-switch
Switch cost (for RT and accuracy)
-The average of difference between switch trials and non-switch trials. -Lower switch cost means smaller difference between switch trial (difficult condition) and non-switch trial (easier condition).
The overarching goal of the present study was to examine the impact of executive
function in bi-literate bilingual healthy adults based on differences in print exposure in their L2.
To address this aim, we used a set of executive function tasks and posed the following research
questions:
153
1. To determine the differences in measures of inhibition (spatial Stroop and Flankers
task), working memory (visual and auditory N-back) and task switching (colour-shape
task) between HPE and LPE participants.
We hypothesised that the participants in HPE group would perform better than
LPE group on the two measures of inhibition. We expected, participants in the HPE
group to have a smaller Stroop effect and conflict effect on the spatial Stroop and Flanker
task respectively. We anticipated that the HPE would have a larger D-prime compared to
LPE group on both 1-back and 2-back conditions suggesting a better working memory.
We hypothesised that the participants in the HPE would be quicker and more accurate
on the switch trials compared to LPE. We expected that the switch cost would be smaller
for HPE compared to LPE.
2. To determine the relationship between print exposure in L2, age and years of education
with measures of inhibition, working memory and task switching.
We anticipated that there will be a significant and positive correlation between
print exposure in L2 and performance measures of inhibition, working memory and task
switching (i.e., Stroop effect, conflict effect, D-prime, switch cost). Based on previous
literature (Bialystok et al, 2008), we hypothesised that there would be significant and
negative correlation between age and performance measures of inhibition, working
memory and task switching. We also expected that there would be a significant and
positive association between years of education and performance measures of
inhibition, working memory and task switching.
154
4.4 Methods
4.4.1 Participants and grouping of participants
Based on the z-composite score generated from the measures of print exposure (grammaticality
judgement task and sentence verification task), we grouped the 34 participants of our study into
two groups: high print exposure (n=22) and low print exposure (n=12). Refer to section 2.4.1
for further details.
4.4.2 Experimental tasks
4.4.2.1 Measures of inhibition
4.4.2.1.1 Spatial Stroop. The Stroop task is the most classic experimental paradigms
used to study interference control or inhibition (Bialystok et al., 2008). There have been
evidences to suggest that spatial location of a stimuli can interfere with the response time (Lu
and Proctor, 1995). The spatial Stroop requires the participant to press a left or right key
corresponding to the direction of the arrow on the screen (eg., ← or →). There is a response
conflict created when the location of the arrow is incongruent from the direction of the arrow.
In the present study, we resorted to using the Spatial Stroop task as we wanted the stimuli to be
non-linguistic or minimally dependent on language.
4.4.2.1.1.1 Trials and procedures. The spatial Stroop task was programmed on version
2.0 of E-prime software. In the current study, the spatial Stroop task consisted of presenting the
stimulus in three conditions- neutral, congruent and incongruent conditions. The stimuli
consisted of arrows facing either right or left direction. For the neutral condition, the arrows
always appeared in the centre of the screen. For the congruent condition, the arrow pointing
right always appeared on the right side of the screen and the arrow pointing left appeared on
the left side of the screen. For the incongruent condition, the arrow pointing right always
appeared on the left side of the screen and vice versa for the left pointing arrow, thus creating a
response conflict for the participant (See Figure 4.2). There was a total of 48 trials in each
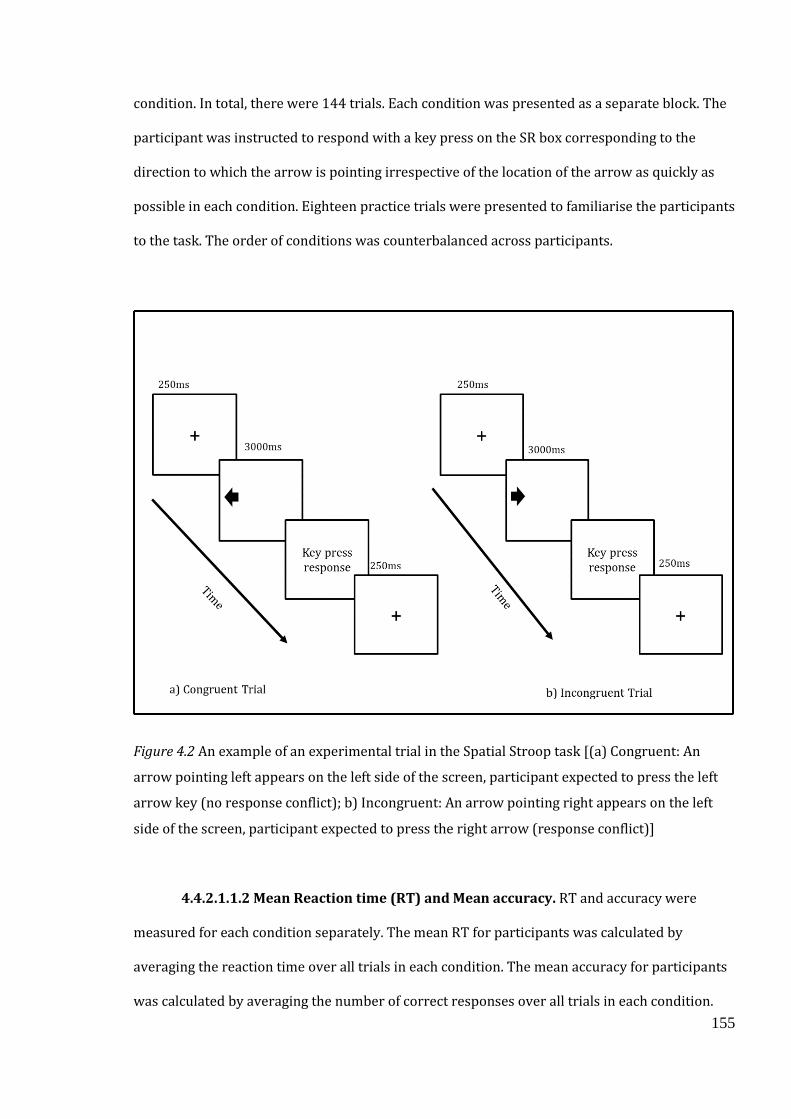
155
condition. In total, there were 144 trials. Each condition was presented as a separate block. The
participant was instructed to respond with a key press on the SR box corresponding to the
direction to which the arrow is pointing irrespective of the location of the arrow as quickly as
possible in each condition. Eighteen practice trials were presented to familiarise the participants
to the task. The order of conditions was counterbalanced across participants.
Figure 4.2 An example of an experimental trial in the Spatial Stroop task [(a) Congruent: An
arrow pointing left appears on the left side of the screen, participant expected to press the left
arrow key (no response conflict); b) Incongruent: An arrow pointing right appears on the left
side of the screen, participant expected to press the right arrow (response conflict)]
4.4.2.1.1.2 Mean Reaction time (RT) and Mean accuracy. RT and accuracy were
measured for each condition separately. The mean RT for participants was calculated by
averaging the reaction time over all trials in each condition. The mean accuracy for participants
was calculated by averaging the number of correct responses over all trials in each condition.
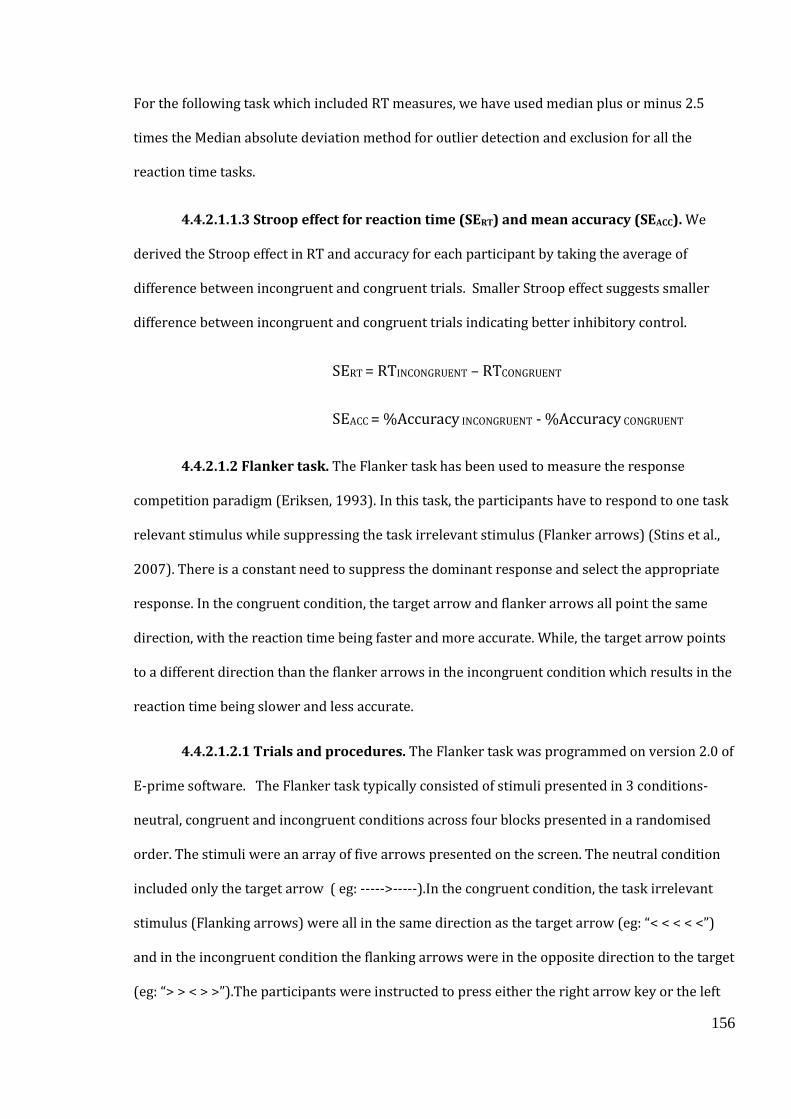
156
For the following task which included RT measures, we have used median plus or minus 2.5
times the Median absolute deviation method for outlier detection and exclusion for all the
reaction time tasks.
4.4.2.1.1.3 Stroop effect for reaction time (SERT) and mean accuracy (SEACC). We
derived the Stroop effect in RT and accuracy for each participant by taking the average of
difference between incongruent and congruent trials. Smaller Stroop effect suggests smaller
difference between incongruent and congruent trials indicating better inhibitory control.
SERT = RTINCONGRUENT – RTCONGRUENT
SEACC = %Accuracy INCONGRUENT - %Accuracy CONGRUENT
4.4.2.1.2 Flanker task. The Flanker task has been used to measure the response
competition paradigm (Eriksen, 1993). In this task, the participants have to respond to one task
relevant stimulus while suppressing the task irrelevant stimulus (Flanker arrows) (Stins et al.,
2007). There is a constant need to suppress the dominant response and select the appropriate
response. In the congruent condition, the target arrow and flanker arrows all point the same
direction, with the reaction time being faster and more accurate. While, the target arrow points
to a different direction than the flanker arrows in the incongruent condition which results in the
reaction time being slower and less accurate.
4.4.2.1.2.1 Trials and procedures. The Flanker task was programmed on version 2.0 of
E-prime software. The Flanker task typically consisted of stimuli presented in 3 conditions-
neutral, congruent and incongruent conditions across four blocks presented in a randomised
order. The stimuli were an array of five arrows presented on the screen. The neutral condition
included only the target arrow ( eg: ----->-----).In the congruent condition, the task irrelevant
stimulus (Flanking arrows) were all in the same direction as the target arrow (eg: “< < < < <”)
and in the incongruent condition the flanking arrows were in the opposite direction to the target
(eg: “> > < > >”).The participants were instructed to press either the right arrow key or the left
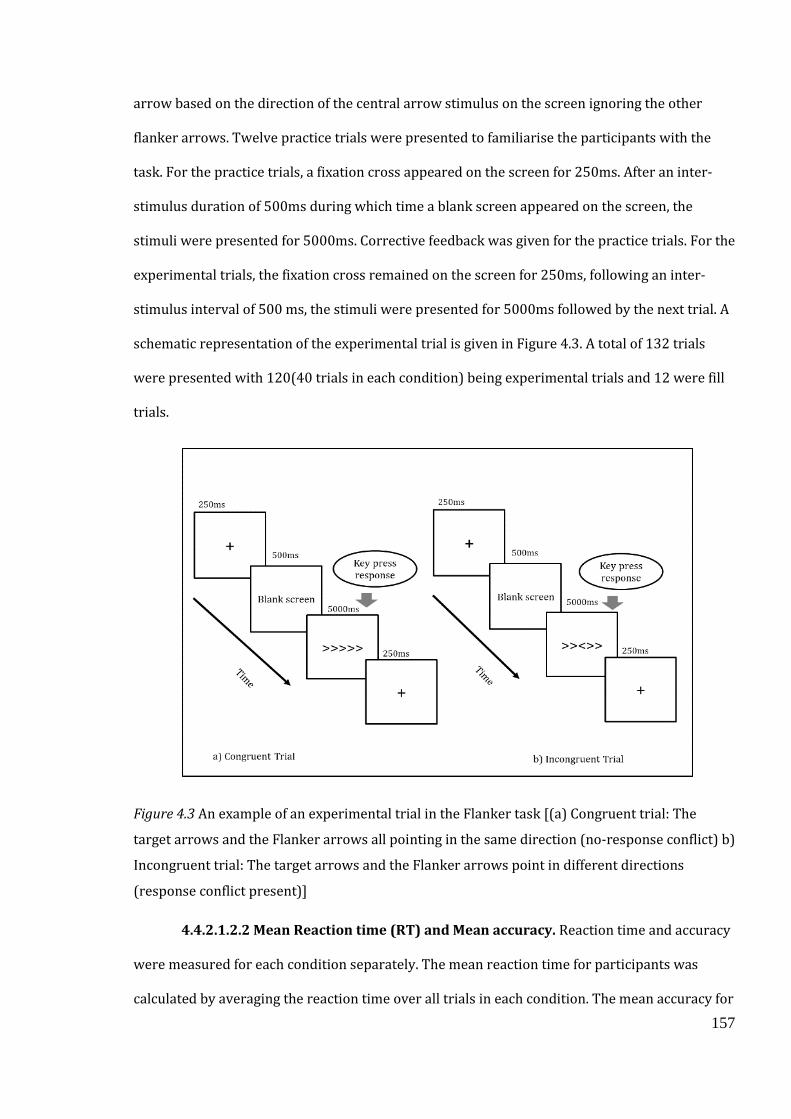
157
arrow based on the direction of the central arrow stimulus on the screen ignoring the other
flanker arrows. Twelve practice trials were presented to familiarise the participants with the
task. For the practice trials, a fixation cross appeared on the screen for 250ms. After an inter-
stimulus duration of 500ms during which time a blank screen appeared on the screen, the
stimuli were presented for 5000ms. Corrective feedback was given for the practice trials. For the
experimental trials, the fixation cross remained on the screen for 250ms, following an inter-
stimulus interval of 500 ms, the stimuli were presented for 5000ms followed by the next trial. A
schematic representation of the experimental trial is given in Figure 4.3. A total of 132 trials
were presented with 120(40 trials in each condition) being experimental trials and 12 were fill
trials.
Figure 4.3 An example of an experimental trial in the Flanker task [(a) Congruent trial: The
target arrows and the Flanker arrows all pointing in the same direction (no-response conflict) b)
Incongruent trial: The target arrows and the Flanker arrows point in different directions
(response conflict present)]
4.4.2.1.2.2 Mean Reaction time (RT) and Mean accuracy. Reaction time and accuracy
were measured for each condition separately. The mean reaction time for participants was
calculated by averaging the reaction time over all trials in each condition. The mean accuracy for
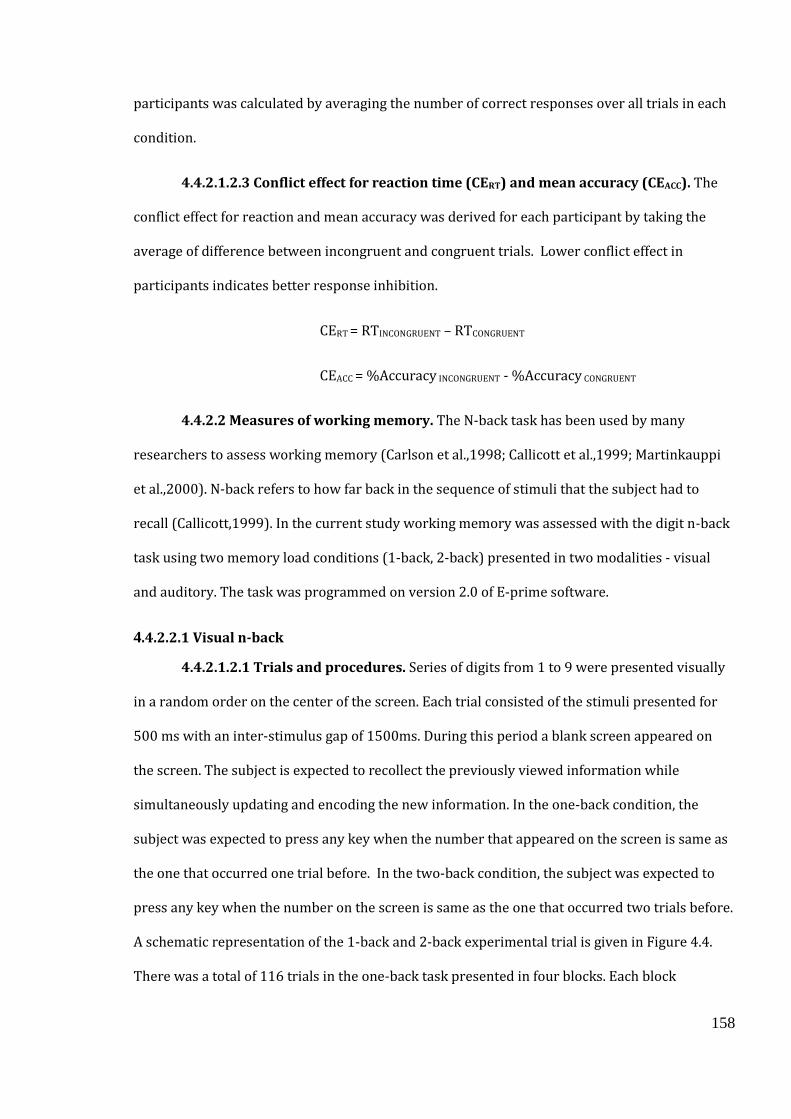
158
participants was calculated by averaging the number of correct responses over all trials in each
condition.
4.4.2.1.2.3 Conflict effect for reaction time (CERT) and mean accuracy (CEACC). The
conflict effect for reaction and mean accuracy was derived for each participant by taking the
average of difference between incongruent and congruent trials. Lower conflict effect in
participants indicates better response inhibition.
CERT = RTINCONGRUENT – RTCONGRUENT
CEACC = %Accuracy INCONGRUENT - %Accuracy CONGRUENT
4.4.2.2 Measures of working memory. The N-back task has been used by many
researchers to assess working memory (Carlson et al.,1998; Callicott et al.,1999; Martinkauppi
et al.,2000). N-back refers to how far back in the sequence of stimuli that the subject had to
recall (Callicott,1999). In the current study working memory was assessed with the digit n-back
task using two memory load conditions (1-back, 2-back) presented in two modalities - visual
and auditory. The task was programmed on version 2.0 of E-prime software.
4.4.2.2.1 Visual n-back
4.4.2.1.2.1 Trials and procedures. Series of digits from 1 to 9 were presented visually
in a random order on the center of the screen. Each trial consisted of the stimuli presented for
500 ms with an inter-stimulus gap of 1500ms. During this period a blank screen appeared on
the screen. The subject is expected to recollect the previously viewed information while
simultaneously updating and encoding the new information. In the one-back condition, the
subject was expected to press any key when the number that appeared on the screen is same as
the one that occurred one trial before. In the two-back condition, the subject was expected to
press any key when the number on the screen is same as the one that occurred two trials before.
A schematic representation of the 1-back and 2-back experimental trial is given in Figure 4.4.
There was a total of 116 trials in the one-back task presented in four blocks. Each block
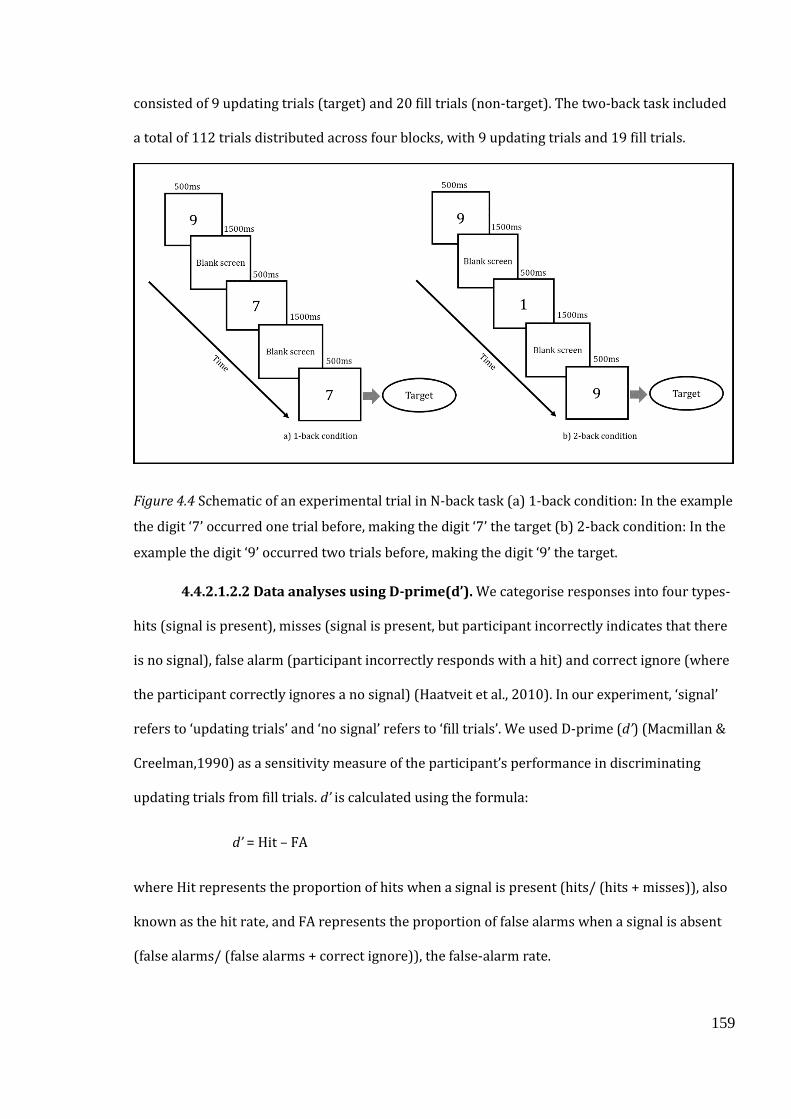
159
consisted of 9 updating trials (target) and 20 fill trials (non-target). The two-back task included
a total of 112 trials distributed across four blocks, with 9 updating trials and 19 fill trials.
Figure 4.4 Schematic of an experimental trial in N-back task (a) 1-back condition: In the example
the digit ‘7’ occurred one trial before, making the digit ‘7’ the target (b) 2-back condition: In the
example the digit ‘9’ occurred two trials before, making the digit ‘9’ the target.
4.4.2.1.2.2 Data analyses using D-prime(d’). We categorise responses into four types-
hits (signal is present), misses (signal is present, but participant incorrectly indicates that there
is no signal), false alarm (participant incorrectly responds with a hit) and correct ignore (where
the participant correctly ignores a no signal) (Haatveit et al., 2010). In our experiment, ‘signal’
refers to ‘updating trials’ and ‘no signal’ refers to ‘fill trials’. We used D-prime (d’) (Macmillan &
Creelman,1990) as a sensitivity measure of the participant’s performance in discriminating
updating trials from fill trials. d’ is calculated using the formula:
d’ = Hit – FA
where Hit represents the proportion of hits when a signal is present (hits/ (hits + misses)), also
known as the hit rate, and FA represents the proportion of false alarms when a signal is absent
(false alarms/ (false alarms + correct ignore)), the false-alarm rate.
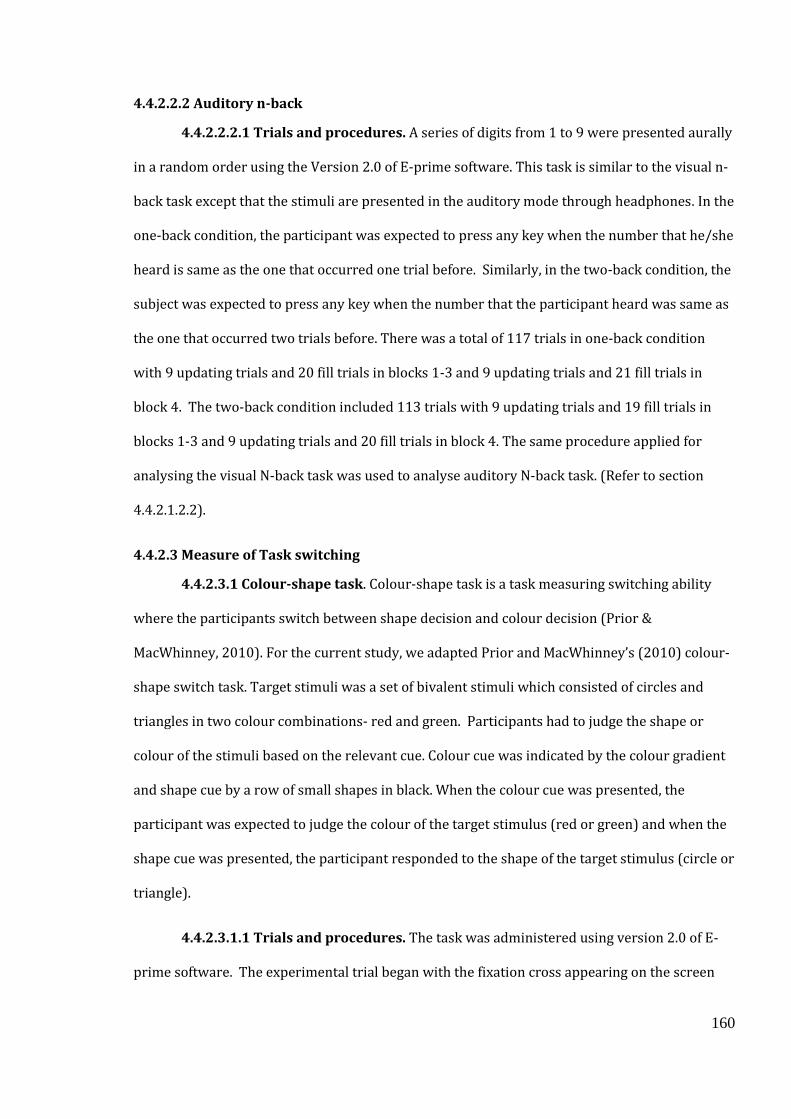
160
4.4.2.2.2 Auditory n-back
4.4.2.2.2.1 Trials and procedures. A series of digits from 1 to 9 were presented aurally
in a random order using the Version 2.0 of E-prime software. This task is similar to the visual n-
back task except that the stimuli are presented in the auditory mode through headphones. In the
one-back condition, the participant was expected to press any key when the number that he/she
heard is same as the one that occurred one trial before. Similarly, in the two-back condition, the
subject was expected to press any key when the number that the participant heard was same as
the one that occurred two trials before. There was a total of 117 trials in one-back condition
with 9 updating trials and 20 fill trials in blocks 1-3 and 9 updating trials and 21 fill trials in
block 4. The two-back condition included 113 trials with 9 updating trials and 19 fill trials in
blocks 1-3 and 9 updating trials and 20 fill trials in block 4. The same procedure applied for
analysing the visual N-back task was used to analyse auditory N-back task. (Refer to section
4.4.2.1.2.2).
4.4.2.3 Measure of Task switching
4.4.2.3.1 Colour-shape task. Colour-shape task is a task measuring switching ability
where the participants switch between shape decision and colour decision (Prior &
MacWhinney, 2010). For the current study, we adapted Prior and MacWhinney’s (2010) colour-
shape switch task. Target stimuli was a set of bivalent stimuli which consisted of circles and
triangles in two colour combinations- red and green. Participants had to judge the shape or
colour of the stimuli based on the relevant cue. Colour cue was indicated by the colour gradient
and shape cue by a row of small shapes in black. When the colour cue was presented, the
participant was expected to judge the colour of the target stimulus (red or green) and when the
shape cue was presented, the participant responded to the shape of the target stimulus (circle or
triangle).
4.4.2.3.1.1 Trials and procedures. The task was administered using version 2.0 of E-
prime software. The experimental trial began with the fixation cross appearing on the screen
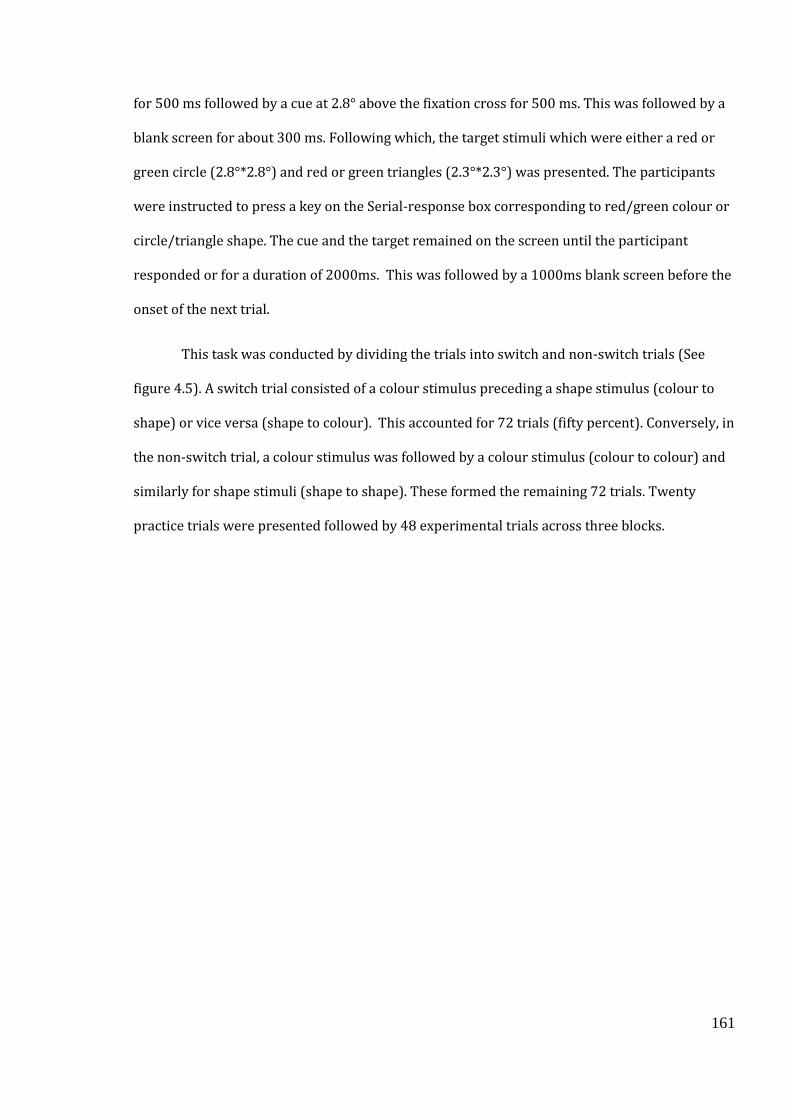
161
for 500 ms followed by a cue at 2.8° above the fixation cross for 500 ms. This was followed by a
blank screen for about 300 ms. Following which, the target stimuli which were either a red or
green circle (2.8°*2.8°) and red or green triangles (2.3°*2.3°) was presented. The participants
were instructed to press a key on the Serial-response box corresponding to red/green colour or
circle/triangle shape. The cue and the target remained on the screen until the participant
responded or for a duration of 2000ms. This was followed by a 1000ms blank screen before the
onset of the next trial.
This task was conducted by dividing the trials into switch and non-switch trials (See
figure 4.5). A switch trial consisted of a colour stimulus preceding a shape stimulus (colour to
shape) or vice versa (shape to colour). This accounted for 72 trials (fifty percent). Conversely, in
the non-switch trial, a colour stimulus was followed by a colour stimulus (colour to colour) and
similarly for shape stimuli (shape to shape). These formed the remaining 72 trials. Twenty
practice trials were presented followed by 48 experimental trials across three blocks.
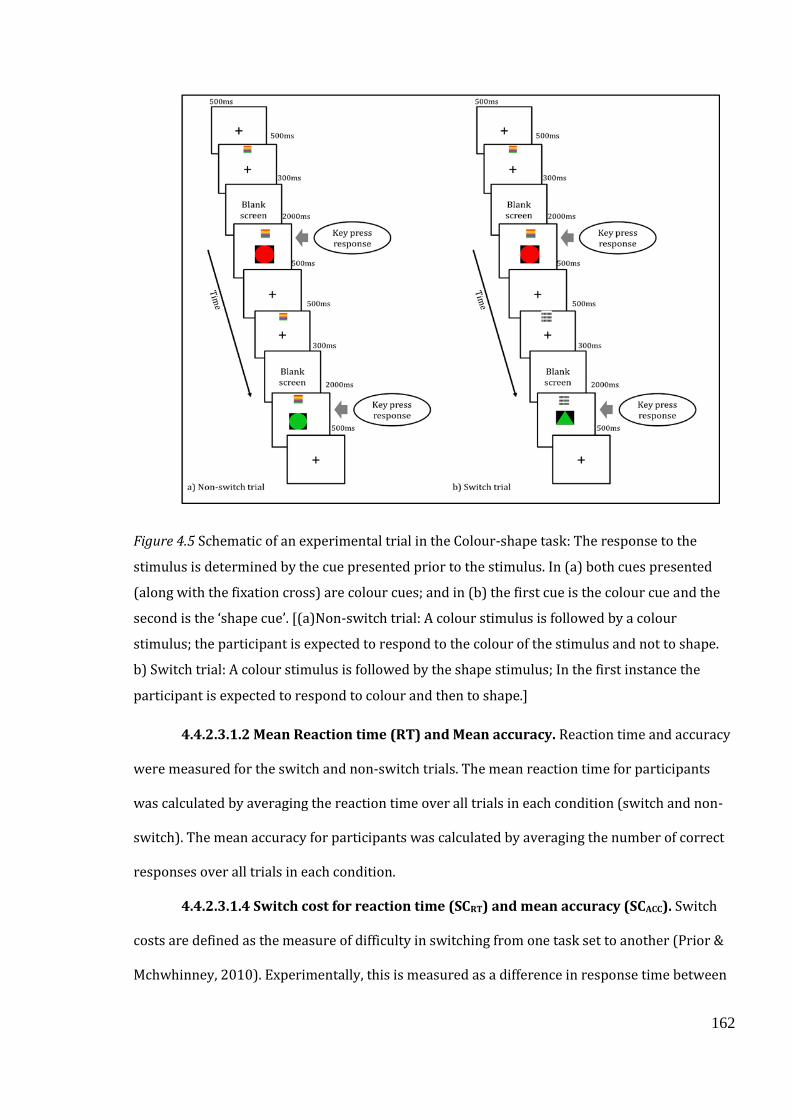
162
Figure 4.5 Schematic of an experimental trial in the Colour-shape task: The response to the
stimulus is determined by the cue presented prior to the stimulus. In (a) both cues presented
(along with the fixation cross) are colour cues; and in (b) the first cue is the colour cue and the
second is the ‘shape cue’. [(a)Non-switch trial: A colour stimulus is followed by a colour
stimulus; the participant is expected to respond to the colour of the stimulus and not to shape.
b) Switch trial: A colour stimulus is followed by the shape stimulus; In the first instance the
participant is expected to respond to colour and then to shape.]
4.4.2.3.1.2 Mean Reaction time (RT) and Mean accuracy. Reaction time and accuracy
were measured for the switch and non-switch trials. The mean reaction time for participants
was calculated by averaging the reaction time over all trials in each condition (switch and non-
switch). The mean accuracy for participants was calculated by averaging the number of correct
responses over all trials in each condition.
4.4.2.3.1.4 Switch cost for reaction time (SCRT) and mean accuracy (SCACC). Switch
costs are defined as the measure of difficulty in switching from one task set to another (Prior &
Mchwhinney, 2010). Experimentally, this is measured as a difference in response time between

163
switch and nonswitch trials. We derived the switch cost in reaction time and accuracy for each
participant by taking the average of difference between switch trials and non-switch trials.
SCRT = RTSWITCH TRIAL – RTNON-SWITCH TRIAL
SCACC = %Accuracy SWITCH TRIAL - %Accuracy NON-SWITCH TRIAL
Lower switch cost means smaller difference between switch trial (difficult condition) and non-
switch trial (easier condition). This is a measure of efficient shifting ability (Prior &
MacWhinney, 2010).
4.4.3. Detecting and Excluding outliers
We have used median plus or minus 2.5 times the Median absolute deviation method for outlier
detection for all the reaction time tasks. Refer to section 2.4.2.1.2.2.2 in Chapter 2 for further
details.
164
4.5 Statistical Analyses
Mean and standard deviation was calculated for all the tasks across both the groups. All
variables were tested for normality using Kolmogorov- Smirnov test. Parametric statistical tests
were performed on normally distributed data set, and for the non-normally distributed data set,
non-parametric statistical tests were performed where possible. An Alpha level of 0.05 was used
to determine the level of significance and effect sizes were measured by partial eta-squared (η2) with
small, medium, and large effects defined as .01, .06, and .16, respectively (Cohen, 1977).
To determine the differences in performance across the groups on the Stroop effect and
Conflict effect in Flanker task for RT and accuracy, a Mann-Whitney U test was performed, as
these variables were non-normally distributed. To determine the group differences on measures
of working memory (visual and auditory N-back) and condition (1-back, 2-back), two separate
two-way repeated measures ANOVA was carried out; with the D-prime as a dependent variable
and Group as an independent variable. In this design, the condition (1-back, 2-back) was a
within-subject factor and Group (HPE vs. LPE) was a between subject factor. To determine the
group differences in switch cost for RT and accuracy, two separate independent sample t-tests
were conducted with Group as a between-subject factor.
The mean, standard deviation and results of group comparisons on measures of
inhibition, working memory and task switching are presented in Table 4.2, 4.4, and 4.4,
respectively. The correlation of executive function measures with measure of print exposure,
age and years of education are presented in Table 4.5.
165
4.6 Results
In this section, we present the findings from the experimental tasks discussed in 4.4.2. We
present the findings from measures of inhibition in section 4.6.1, followed by results of working
memory in section 4.6.2. In section 4.6.3, we present the findings of task switching and in the
final section 4.6.4, we present the findings of correlational analyses of executive function
measures with print exposure, years of education and age.
4.6.1 Performance on measures of inhibition
Differences between HPE and LPE on measures of inhibition are reported as an effect of group
on the Stroop effect from Spatial Stroop task and the Conflict effect on the Flanker task. There
were no significant group differences for either RT and mean accuracy for spatial Stroop and
Flanker task.
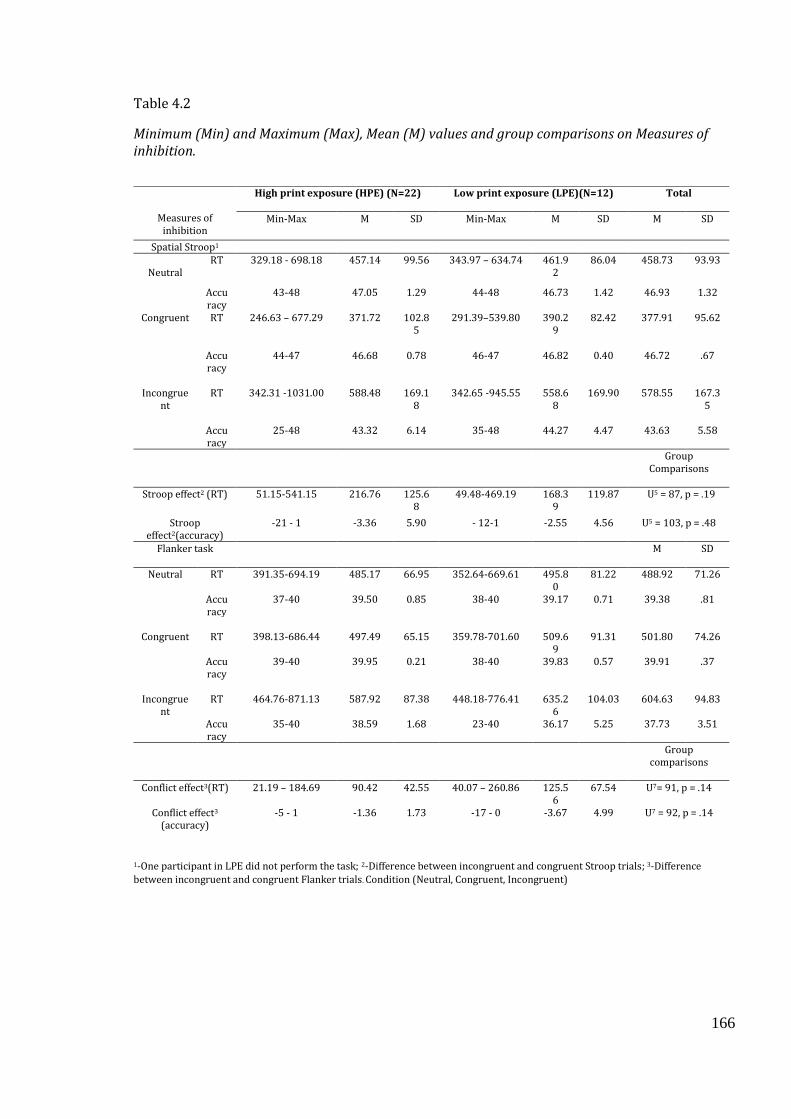
166
Table 4.2
Minimum (Min) and Maximum (Max), Mean (M) values and group comparisons on Measures of inhibition.
1-One participant in LPE did not perform the task; 2-Difference between incongruent and congruent Stroop trials; 3-Difference
between incongruent and congruent Flanker trials. Condition (Neutral, Congruent, Incongruent)
Measures of inhibition
High print exposure (HPE) (N=22) Low print exposure (LPE)(N=12) Total
Min-Max M SD Min-Max M SD M SD
Spatial Stroop1
Neutral RT 329.18 - 698.18 457.14 99.56 343.97 – 634.74 461.9
2 86.04 458.73 93.93
Accuracy
43-48 47.05 1.29 44-48 46.73 1.42 46.93 1.32
Congruent RT 246.63 – 677.29 371.72 102.85
291.39–539.80 390.29
82.42 377.91 95.62
Accuracy
44-47 46.68 0.78 46-47 46.82 0.40 46.72 .67
Incongrue
nt
RT
342.31 -1031.00
588.48
169.1
8
342.65 -945.55
558.6
8
169.90
578.55
167.3
5
Accuracy
25-48
43.32
6.14
35-48
44.27
4.47
43.63
5.58
Group Comparisons
Stroop effect2 (RT) 51.15-541.15 216.76 125.6
8 49.48-469.19 168.3
9 119.87 U5 = 87, p = .19
Stroop effect2(accuracy)
-21 - 1 -3.36 5.90 - 12-1 -2.55 4.56 U5 = 103, p = .48
Flanker task M SD
Neutral RT 391.35-694.19 485.17 66.95 352.64-669.61 495.80
81.22 488.92 71.26
Accuracy
37-40 39.50 0.85 38-40 39.17 0.71 39.38 .81
Congruent
RT
398.13-686.44
497.49
65.15
359.78-701.60
509.6
9
91.31
501.80
74.26
Accuracy
39-40 39.95 0.21 38-40 39.83 0.57 39.91 .37
Incongrue
nt
RT
464.76-871.13
587.92
87.38
448.18-776.41
635.2
6
104.03
604.63
94.83
Accuracy
35-40 38.59 1.68 23-40 36.17 5.25 37.73 3.51
Group comparisons
Conflict effect3(RT) 21.19 – 184.69 90.42 42.55 40.07 – 260.86 125.5
6 67.54 U7= 91, p = .14
Conflict effect3 (accuracy)
-5 - 1 -1.36 1.73 -17 - 0 -3.67 4.99 U7 = 92, p = .14
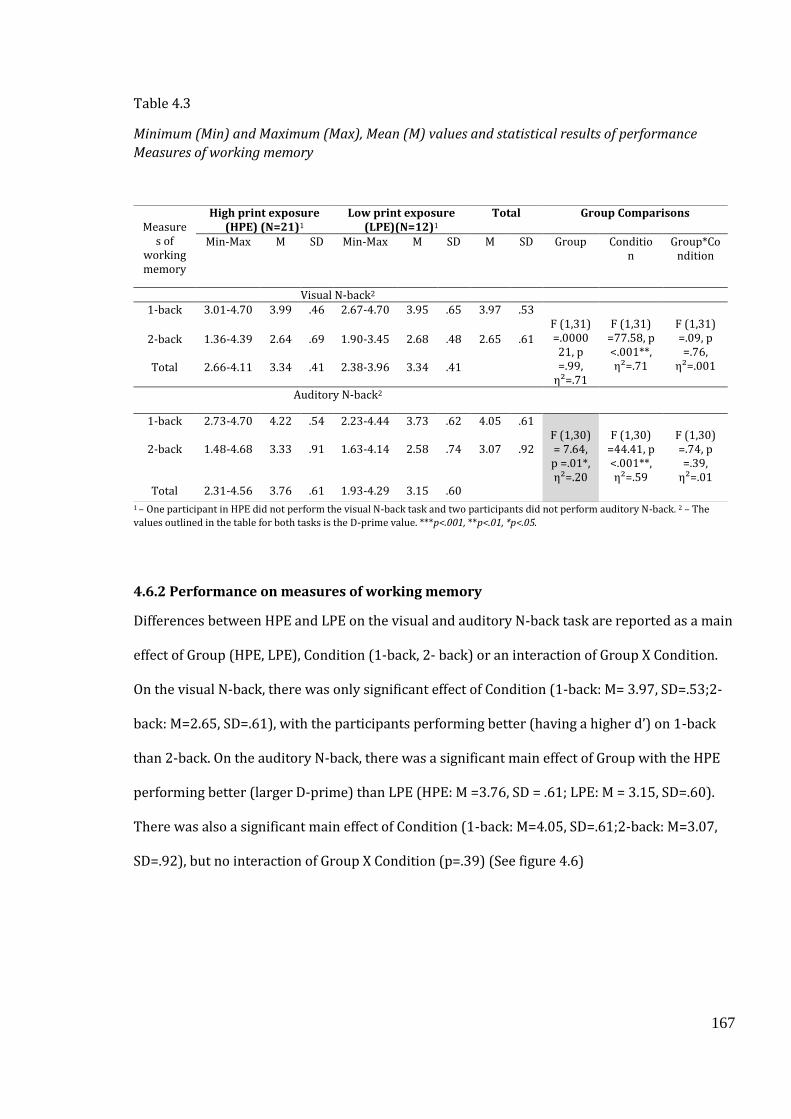
167
Table 4.3
Minimum (Min) and Maximum (Max), Mean (M) values and statistical results of performance
Measures of working memory
1 – One participant in HPE did not perform the visual N-back task and two participants did not perform auditory N-back. 2 – The
values outlined in the table for both tasks is the D-prime value. ***p<.001, **p<.01, *p<.05.
4.6.2 Performance on measures of working memory
Differences between HPE and LPE on the visual and auditory N-back task are reported as a main
effect of Group (HPE, LPE), Condition (1-back, 2- back) or an interaction of Group X Condition.
On the visual N-back, there was only significant effect of Condition (1-back: M= 3.97, SD=.53;2-
back: M=2.65, SD=.61), with the participants performing better (having a higher d’) on 1-back
than 2-back. On the auditory N-back, there was a significant main effect of Group with the HPE
performing better (larger D-prime) than LPE (HPE: M =3.76, SD = .61; LPE: M = 3.15, SD=.60).
There was also a significant main effect of Condition (1-back: M=4.05, SD=.61;2-back: M=3.07,
SD=.92), but no interaction of Group X Condition (p=.39) (See figure 4.6)
Measure
s of working memory
High print exposure (HPE) (N=21)1
Low print exposure (LPE)(N=12)1
Total Group Comparisons
Min-Max M SD Min-Max M SD M SD Group Condition
Group*Condition
Visual N-back2 1-back
3.01-4.70 3.99 .46 2.67-4.70 3.95 .65 3.97 .53
F (1,31) =.000021, p =.99,
η²=.71
F (1,31)
=77.58, p <.001**, η²=.71
F (1,31) =.09, p =.76,
η²=.001
2-back
1.36-4.39 2.64 .69 1.90-3.45 2.68 .48 2.65 .61
Total 2.66-4.11 3.34 .41 2.38-3.96 3.34 .41
Auditory N-back2
1-back
2.73-4.70 4.22 .54 2.23-4.44 3.73 .62 4.05 .61 F (1,30) = 7.64, p =.01*, η²=.20
F (1,30)
=44.41, p <.001**, η²=.59
F (1,30) =.74, p =.39,
η²=.01
2-back
1.48-4.68 3.33 .91 1.63-4.14 2.58 .74 3.07 .92
Total 2.31-4.56 3.76 .61 1.93-4.29 3.15 .60
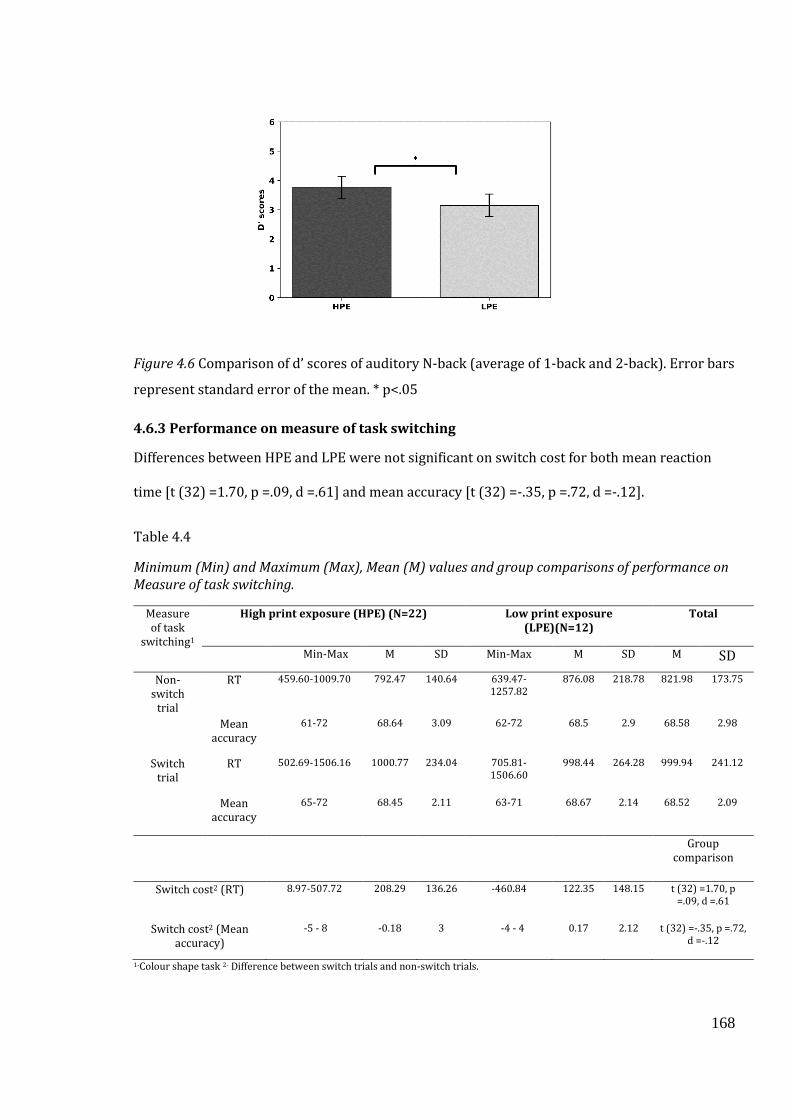
168
Figure 4.6 Comparison of d’ scores of auditory N-back (average of 1-back and 2-back). Error bars
represent standard error of the mean. * p<.05
4.6.3 Performance on measure of task switching
Differences between HPE and LPE were not significant on switch cost for both mean reaction
time [t (32) =1.70, p =.09, d =.61] and mean accuracy [t (32) =-.35, p =.72, d =-.12].
Table 4.4
Minimum (Min) and Maximum (Max), Mean (M) values and group comparisons of performance on Measure of task switching.
Measure of task
switching1
High print exposure (HPE) (N=22) Low print exposure (LPE)(N=12)
Total
Min-Max M SD Min-Max M SD M SD
Non-switch
trial
RT 459.60-1009.70 792.47 140.64 639.47-1257.82
876.08 218.78 821.98 173.75
Mean accuracy
61-72 68.64 3.09 62-72 68.5 2.9 68.58 2.98
Switch trial
RT 502.69-1506.16 1000.77 234.04 705.81-1506.60
998.44 264.28 999.94 241.12
Mean accuracy
65-72 68.45 2.11 63-71 68.67 2.14 68.52 2.09
Group comparison
Switch cost2 (RT) 8.97-507.72 208.29 136.26 -460.84 122.35 148.15 t (32) =1.70, p
=.09, d =.61
Switch cost2 (Mean accuracy)
-5 - 8 -0.18 3 -4 - 4 0.17 2.12 t (32) =-.35, p =.72, d =-.12
1-Colour shape task 2- Difference between switch trials and non-switch trials.
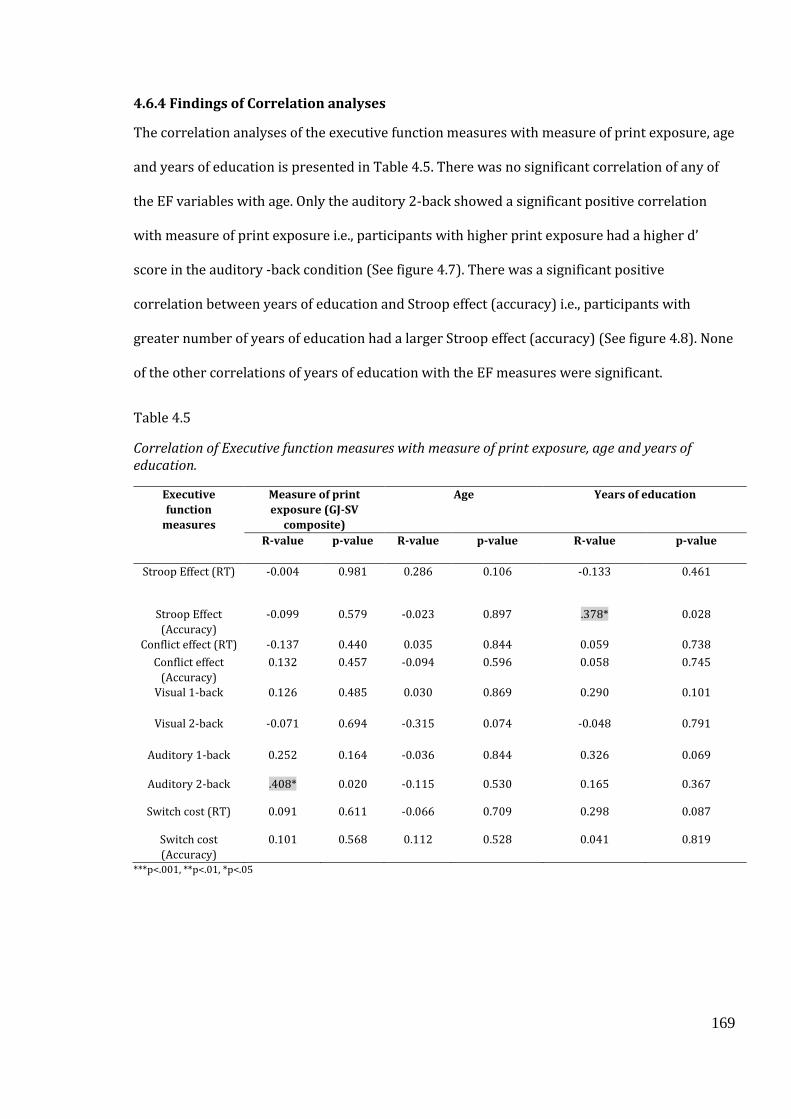
169
4.6.4 Findings of Correlation analyses
The correlation analyses of the executive function measures with measure of print exposure, age
and years of education is presented in Table 4.5. There was no significant correlation of any of
the EF variables with age. Only the auditory 2-back showed a significant positive correlation
with measure of print exposure i.e., participants with higher print exposure had a higher d’
score in the auditory -back condition (See figure 4.7). There was a significant positive
correlation between years of education and Stroop effect (accuracy) i.e., participants with
greater number of years of education had a larger Stroop effect (accuracy) (See figure 4.8). None
of the other correlations of years of education with the EF measures were significant.
Table 4.5
Correlation of Executive function measures with measure of print exposure, age and years of education.
Executive
function
measures
Measure of print
exposure (GJ-SV
composite)
Age Years of education
R-value p-value R-value p-value R-value p-value
Stroop Effect (RT) -0.004 0.981 0.286 0.106 -0.133 0.461
Stroop Effect
(Accuracy)
-0.099 0.579 -0.023 0.897 .378* 0.028
Conflict effect (RT) -0.137 0.440 0.035 0.844 0.059 0.738
Conflict effect
(Accuracy)
0.132 0.457 -0.094 0.596 0.058 0.745
Visual 1-back 0.126 0.485 0.030 0.869 0.290 0.101
Visual 2-back -0.071 0.694 -0.315 0.074 -0.048 0.791
Auditory 1-back 0.252 0.164 -0.036 0.844 0.326 0.069
Auditory 2-back .408* 0.020 -0.115 0.530 0.165 0.367
Switch cost (RT) 0.091 0.611 -0.066 0.709 0.298 0.087
Switch cost
(Accuracy)
0.101 0.568 0.112 0.528 0.041 0.819
***p<.001, **p<.01, *p<.05
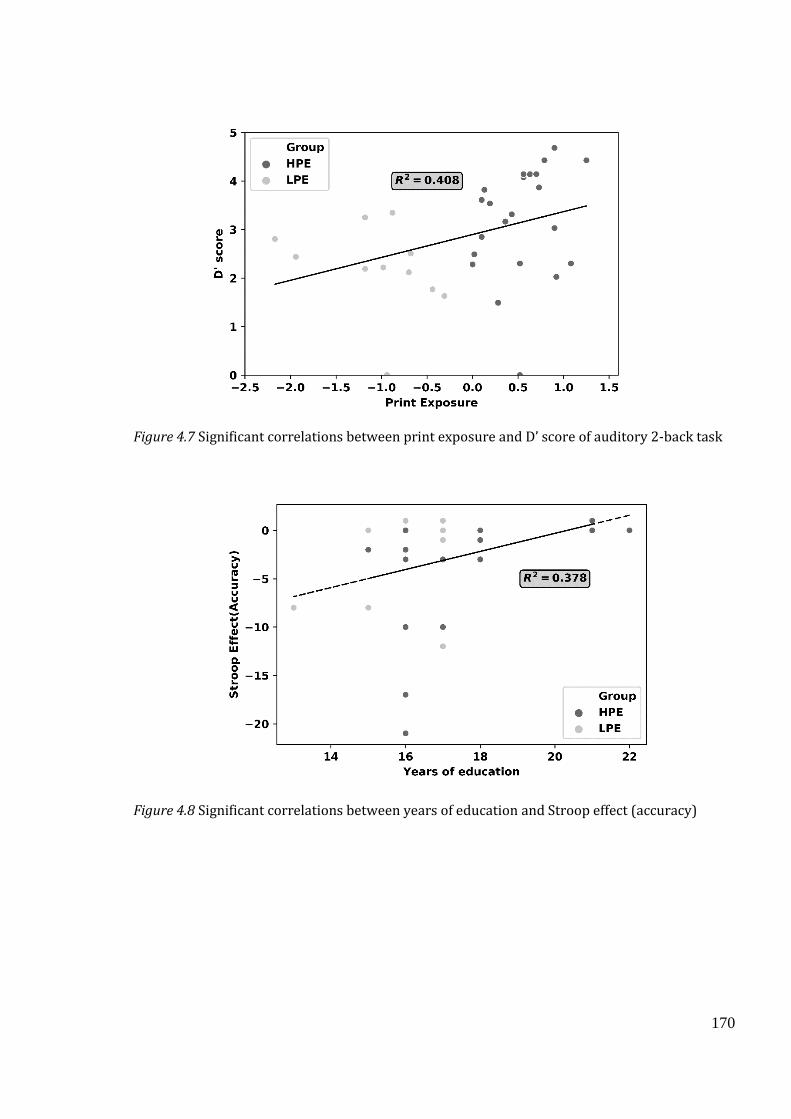
170
Figure 4.7 Significant correlations between print exposure and D’ score of auditory 2-back task
Figure 4.8 Significant correlations between years of education and Stroop effect (accuracy)
171
4.7 Discussion
4.7.1 Summary of findings
In this study, we aimed to investigate the impact of print exposure on non-verbal executive
functions among bi-literate bilingual adults. Specifically, we examined the non-verbal executive
function measures within the domains of inhibitory control, working memory and task
switching. For the purpose of convergent validity, we included multiple tasks in each domain
(Paap et al., 2015) except task-switching.
Table 4.6 summarises the findings of executive function measures. We hypothesised that
print exposure would show a positive impact on each of the executive function measures that
we examined. Contrary to our expectation, we did not find any statistical group difference or
correlation with print exposure for any executive function measure except auditory N-back.
Overall, on auditory N-back, the participants in HPE performed better (higher D prime) than
participants in LPE. Additionally, the 2-back condition (which is a higher memory load
condition) showed a significant positive correlation with print exposure i.e., participants with
higher print exposure had higher D prime scores. This means that they had a higher hit rate and
a lower false alarm rate. When compared with our results of comprehension measures in
Chapter 2, we find a similar trend for the sentence comprehension task that was auditorily
presented. Participants with higher print exposure were significantly more accurate than the
LPE group on the sentence comprehension.
Although, most of the findings from our non-verbal executive function tasks showed no
significant results, our findings from Chapter 2 on switches total in verbal fluency task showed a
significant positive correlation with print exposure i.e., higher print exposure scores were
associated with greater number of switches. Switching requires strategic search of
subcategories and cognitive flexibility to shift efficiently between subcategories (Da Silva, 2004)
and dependent on more controlled processing than those required for clustering (Troyer, 2000;
Troyer et al.,1997). In the current study, participants with higher print exposure have produced

172
a greater number of switches, which probably suggests that they have a better cognitive
flexibility. This finding further strengthens the idea of using verbal/ linguistic stimuli along with
non-verbal stimuli to measure impact of print exposure on executive functions in bi-literate
bilingual individuals.
To summarise, the lack of group differences on both the inhibitory control tasks (Spatial
Stroop and Flanker task) is in line with previous research by Kousaie & Phillips (2012) who
studied a bilingual population and found no group differences on Flanker and Stroop tasks.
Although, there seems to be a link of print exposure with working memory when testing using
an auditory stimuli, this does not hold true for the visual N-back task. Additionally, there
appears to be a relationship between print exposure and verbal switching ability (from verbal
fluency task) which needs to be further investigated.

173
Table 4.6
Summary of findings of impact of print exposure on executive function measures
4.7.2 Limitations and future directions
Studies such as Coderre & Heuven (2014) and Paap et al (2015) have studied the impact of
script similarity in executive function measures in bilinguals. However, this is the first time that
a quantitative measure of print exposure has been used as a predictor of executive function
measures in bi-literate bilingual individuals. As a next step, we could examine whether script
differences and print exposure would impact executive functions. This could be done by
replication of this study by comparing different groups of bi-literate bilinguals separated by
Executive function
measures
Group Comparison Correlation with Years of education
Correlation with Print Exposure
HPE (n =22)
LPE (n=12)
Statistically
Significant Group
Difference
Condition
Group *
Condition
Direction of
Correlation (+/-)
Statistically
Significant Correlation
Direction of
Correlation (+/-)
Statistically
Significant
Correlation
Inhibitory control
Stroop Effect (RT)
Higher Lower No
- No - No
Stroop Effect
(Accuracy)
Lower Higher No
+ Yes - No
Conflict effect (RT)
Lower Higher No
+ No - No
Conflict effect
(Accuracy)
Higher Lower No
+ No + No
Working memory
Visual 1-back
Similar Similar No 1-back > 2-back
No + No + No
Visual 2-back
Similar Similar - No - No
Auditory 1-back
Higher Lower Yes 1-back > 2-back
No + No + No
Auditory 2-back
Higher Lower + No + Yes
Task switching
Switch cost (RT)
Higher Lower No
+ No + No
Switch cost (Accuracy)
Lower Higher No + No + No
174
script differences and print exposure and examine the effects for each group on executive
function tasks.
In our study, we have manipulated the print exposure only in L2. Future studies could
control for print exposure in both languages by creating a composite score for print exposure
for L1 and L2, to study the impact of print exposure on executive function tasks.
As there is a known relationship between bilingualism and non-linguistic executive
functioning (Bialystok et al., 2008; Bialystok et al., 2009; Bialystok, 2011; Kroll & Bialystok,
2013), we chose non-linguistic/minimally linguistic executive function tasks to test impact of
print exposure on non-linguistic executive functions in bi-literate bilingual adults. By using non-
linguistic or minimally linguistic measures, we expected to eliminate/minimise the effect of
language variables manipulating only print exposure when measuring executive functions.
Literature has shown that print exposure has an association to some verbal executive
function tasks in monolinguals (Barnes et al, 2003; Silva et al., 2012). Also, our findings from
Chapter 2 on switches total in verbal fluency showed positive correlation with print exposure,
suggesting a relationship between print exposure and cognitive flexibility in bi-literate bilingual
adults. Since, the tasks that were chosen to measure executive functions were non-linguistic,
there is a possibility they were not sensitive enough to tap into the relationship between print
exposure and executive functions in bi-literate bilinguals. In future bi-literate bilingual studies,
one may have to look at tasks that have both linguistic and non-linguistic aspects of executive
functioning to check if there are differences in executive function measures when manipulating
print exposure.
Recruiting more participants would have produced more reliable results. The unequal
size of the two groups (HPE: 22; LPE: 12) may have resulted in non-significant results of Group
comparisons.

175
Interim Summary for Phase I
In Phase I we sought to investigate the impact of bi-literacy on oral language production (at
word and connected speech level), comprehension and executive functions in bilingual healthy
adults. We examined this by devising a measure of literacy which we termed as print exposure
and analysed its impact on oral language production and comprehension (Chapter 2), narrative
production (Chapter 3) and executive functions (Chapter 4). We recruited thirty-four bi-literate
bilinguals belonging to the South Indian diaspora (speaking Tamil, Telugu, Kannada and
Malayalam in addition to English) residing in the UK.
In this sample we quantified print exposure both subjectively (self-report of reading and
writing usage from participants in different contexts such as at work, home, formal and
informal) and objectively (using a composite numeric score based on performance of these
participants on grammaticality judgement and sentence verification tasks. The sample was
divided based on their exposure to print into a group of high PE (HPE, 22 participants) and low
PE (LPE, 12 participants). In addition to this we profiled the bilingualism variables such as
proficiency, usage and dominance in both languages. The participants performed oral language
production tasks (verbal fluency, word and non- word production), comprehension tasks
(synonymy triplets and sentence comprehension), narrative production task and executive
function tasks or measures (spatial Stroop, Flanker, N–back and colour-shape tasks).
We found that print exposure in L2 has some association with oral language production
tasks both at the word level and connected speech level. On the other hand, a strong relation
seems to exist between comprehension measures and print exposure (in L2) in our study. With
regard to the non-verbal executive functions, we conclude that no direct link between print
exposure (in L2) and non-verbal executive function measures in bi-literate bilinguals is
discernible excepting working memory.
Additionally, there seems to be a strong link between print exposure and semantic
processing in our research. The findings on the semantic tasks have been consistent across
176
comprehension (synonymy triplets task and sentence comprehension task) and production
(semantic fluency) favouring HPE. Higher print exposure was also associated with better
narrative characteristics in terms of utterance level measures, more diversity of noun usage,
higher percentage of adverbs, verbs per utterance and fewer repair measures.
In the subsequent phase (phase II- Chapter 5), we investigated the consequences of bi-
literacy on a neurologically impaired population and specifically characterized the manifestation
of reading difficulties at single word level in both languages of a bilingual person with aphasia.
177
Chapter 5 Reading difficulties in bi-literate bilingual persons with aphasia
5.1 Abstract
Background: A major proportion of the world’s population is bilingual/multilingual. For those
who have language impairments in one or more languages due to brain damage, the severity of
impairment maybe different in both languages, also the modalities of language may be
differentially affected. In particular, reading and writing maybe impaired differently in the
different languages spoken by a bi/multilingual. It is important to understand how the reading
impairments are manifested in the two languages to provide appropriate assessment and
intervention. Manifestation of reading impairments are also dependent on the nature of the
script of the language being read. The number of studies examining reading impairments in the
bi-scriptal bilinguals speaking the Indian languages are limited and those which have attempted
to profile and characterise the dyslexia in each language were based on models of reading aloud
which are mostly based on alphabetic languages (English).
Aim: The current study aims to profile and characterise the reading difficulties in bi-scriptal
BPWA speaking a combination of syllabic and alphabetic Kannada-English and Hindi-English.
Methods: We recruited seven BPWA, out of which we could extract usable data only for 4 BPWA
(AP02, AP03, AP05 and AP07) with respect to their reading abilities. The participants spoke one
of the Dravidian languages (Kannada, Tamil, Telugu) as their native language which are alpha-
syllabic and English as their second language which is alphabetic in nature. A detailed
questionnaire was administered to quantify the bilingual characteristics- proficiency, reading
and writing characteristics and dominance. Language assessment was carried out using WAB-R
in English and its adapted version in Kannada or Hindi to assess the type and severity of aphasia
in both languages. Subtests from Psycholinguistic Assessment of Language Processing in
Aphasia (PALPA; Kay, Lesser & Coltheart, 1992) were used to document the reading profile of
BPWA in English which included letter discrimination, legality decision and lexical decision,
spoken and written word matching and reading aloud. Reading subtests from Reading
178
Acquisition Profile (RAP-K; Rao, 1997) and words from Bilingual Aphasia test -Hindi (BAT;
Paradis & Libben, 1987) were used to document the reading profile of BPWA in Kannada and
Hindi respectively.
Results and outcomes: The results reveal differences of reading characteristics in the two
languages of the four BPWA. In general, semantic processing in English as measured by both
spoken and written word picture matching were affected in all the four participants. We have
tried to map our findings to the Dual Route Cascaded (DRC) reading aloud model developed for
alphabetic languages to explain the dyslexia in bi-scriptal bilingual persons with aphasia. While
AP03 and AP05 were able to read at word level in both languages and were diagnosed with
phonological dyslexia in English and alexia in Kannada, AP02’s reading was severely affected
and exhibited alexia in both Kannada and English Similarly, AP07 was able to read some familiar
words in English, but had severe difficulty reading aloud in both Kannada and English
characterising the reading impairment as alexia in both languages. This research provides
preliminary evidence that a script related difference exists in the manifestation of dyslexia in bi-
scriptal BPWA speaking a combination of alphabetic and alpha-syllabic languages.
179
5.1 Introduction
5.1.1 General introduction on bilingual aphasia
Majority of the world’s population is bi/multilingual (Grosjean 1982; Kiran & Gray, 2018).
Bilingual aphasia can be defined as an impairment in one or more languages in bilingual
individuals following a brain damage (Kiran & Gray, 2018). In individuals with bilingual aphasia,
one or both languages may be affected and the severity of impairment maybe different in both
languages (Fabbro & Paradis, 1995; Fabbro, 2001). Similarly, different modalities such as
reading and writing maybe impaired differently in the different languages spoken by a
bi/multilingual (Wilson, Kahlaoui & Weekes, 2012). Reading and writing disorders in
individuals with aphasia are relatively under reported (Lorenzen & Murray,2008). Reading and
writing impairments in individuals, as a result of brain injury or neurologic condition, is
referred to as acquired dyslexia and dysgraphia respectively (Coltheart, 1981). Acquired
dyslexia is further classified into deep, surface, phonological; this classification is based on
models of reading aloud developed based on studies on monolingual individuals with aphasia
(Coltheart,1981; Siendenberg & McClelland, 1989) (See section 5.2.2 for a detailed description).
Manifestation of reading impairments are also dependent on the nature of the script of
the language being read (See Weekes, 2012 for a review). In bilinguals, this is further
complicated by the language combination (e.g. orthography-to-phonology transparency vs
opaqueness or morphological complexity) and the existence of multiple scripts (alphabetic,
syllabic/alphasyllabic and idiographic) (Eng & Obler, 2002; Weekes,2012; Weekes & Raman
2008; Law, Wong, Yeung & Weekes, 2008; Kambanaros & Weekes, 2013), therefore individuals
with bilingual aphasia can have different combinations of scripts. Studies such as Raman &
Weekes (2005) have documented differential dyslexia in bi-scriptal bilinguals. They have
documented a Turkish-English speaker who exhibited surface dyslexia in English and deep
dysgraphia in Turkish. Weekes et al (2007) report a Mongolian-Chinese bilingual speaker who
exhibits different reading errors in both the scripts. For instance, Mongolian has an alphabetic
180
script while Chinese has an ideographic script. The errors produced were typically semantic oral
reading errors in Mongolian (within language errors) and semantically related translation
errors in Chinese (between language errors) i.e., reading aloud a Chinese word with a Mongolian
syllable.
All of these studies have used models of oral reading of alphabetic languages to
characterize dyslexia. Consequently, there is not enough evidence to suggest that
characterizations of dyslexia apply to a unique combination of languages with an alphabetic and
syllabic script such as alphabetic English and alphasyllabic Indian languages namely Kannada
and Hindi except for a few case studies (Ratnavalli, 2000; Karanth, 1981,2002). Therefore, the
current study aims to profile and characterise the reading difficulties in bi-scriptal BPWA
speaking a combination of syllabic and alphabetic Kannada-English and Hindi-English.
5.1.2 Characterisation of acquired dyslexia in persons with aphasia based on models of
reading
Acquired dyslexias can be classified as peripheral (neglect, attentional & pure) and central
(deep, surface & phonological) dyslexias. Central dyslexias such as surface dyslexia, deep
dyslexia and phonological dyslexia is typically observed in individuals with left hemisphere
brain damage and neglect dyslexia is commonly associated with right hemisphere damage. (See
table 5.1 for the different error characteristics of types of central dyslexia). Characteristics of
surface dyslexia are selective impairment to the reading aloud of irregularly spelled words
particularly low frequency (like yacht) (Funnell ,2000) and have an abstract meaning with a
preserved ability to read regular words and non-words and a tendency to regularize irregular
words. Phonological dyslexia is characterized by an impairment in reading of non-words with a
preserved ability in reading of regular and irregular words. Deep dyslexia is similar to
phonological dyslexia except that the errors in reading are characterised as semantic (arm read
as finger, visual (bus read as brush) and morphological errors (chairs read as chair). The errors
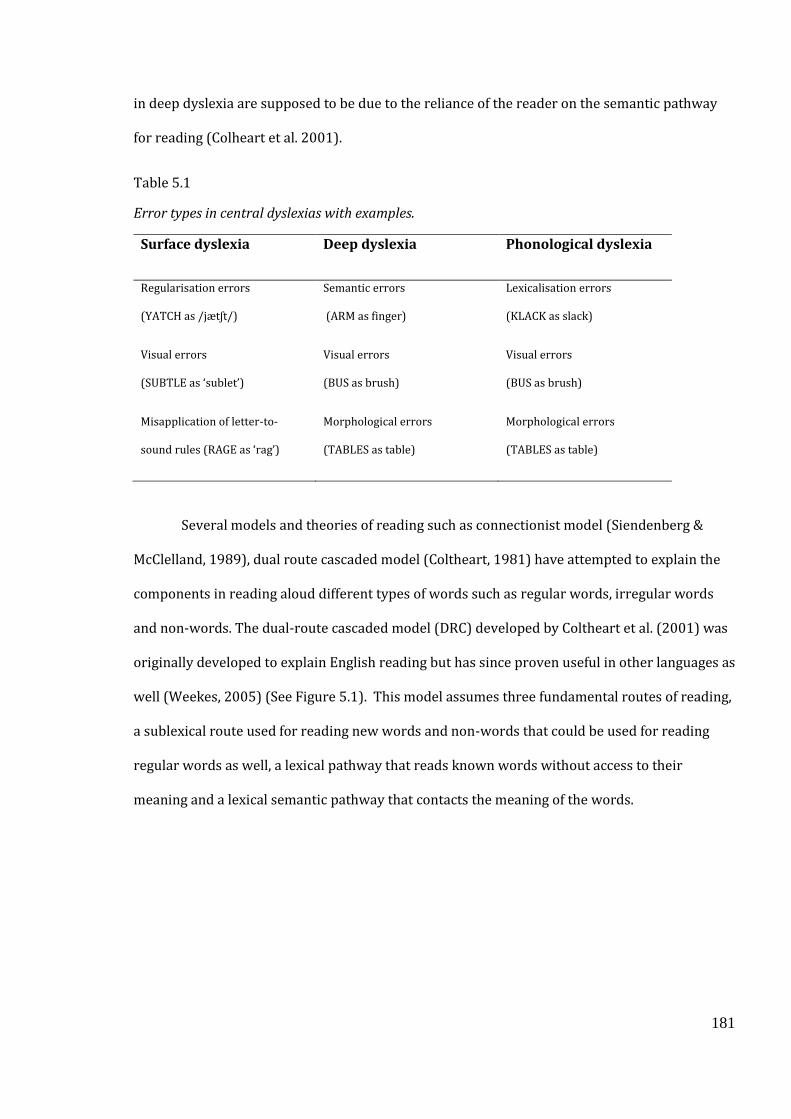
181
in deep dyslexia are supposed to be due to the reliance of the reader on the semantic pathway
for reading (Colheart et al. 2001).
Table 5.1
Error types in central dyslexias with examples.
Surface dyslexia Deep dyslexia Phonological dyslexia
Regularisation errors
(YATCH as /jætʃt/)
Semantic errors
(ARM as finger)
Lexicalisation errors
(KLACK as slack)
Visual errors
(SUBTLE as ‘sublet’)
Visual errors
(BUS as brush)
Visual errors
(BUS as brush)
Misapplication of letter-to-
sound rules (RAGE as ‘rag’)
Morphological errors
(TABLES as table)
Morphological errors
(TABLES as table)
Several models and theories of reading such as connectionist model (Siendenberg &
McClelland, 1989), dual route cascaded model (Coltheart, 1981) have attempted to explain the
components in reading aloud different types of words such as regular words, irregular words
and non-words. The dual-route cascaded model (DRC) developed by Coltheart et al. (2001) was
originally developed to explain English reading but has since proven useful in other languages as
well (Weekes, 2005) (See Figure 5.1). This model assumes three fundamental routes of reading,
a sublexical route used for reading new words and non-words that could be used for reading
regular words as well, a lexical pathway that reads known words without access to their
meaning and a lexical semantic pathway that contacts the meaning of the words.
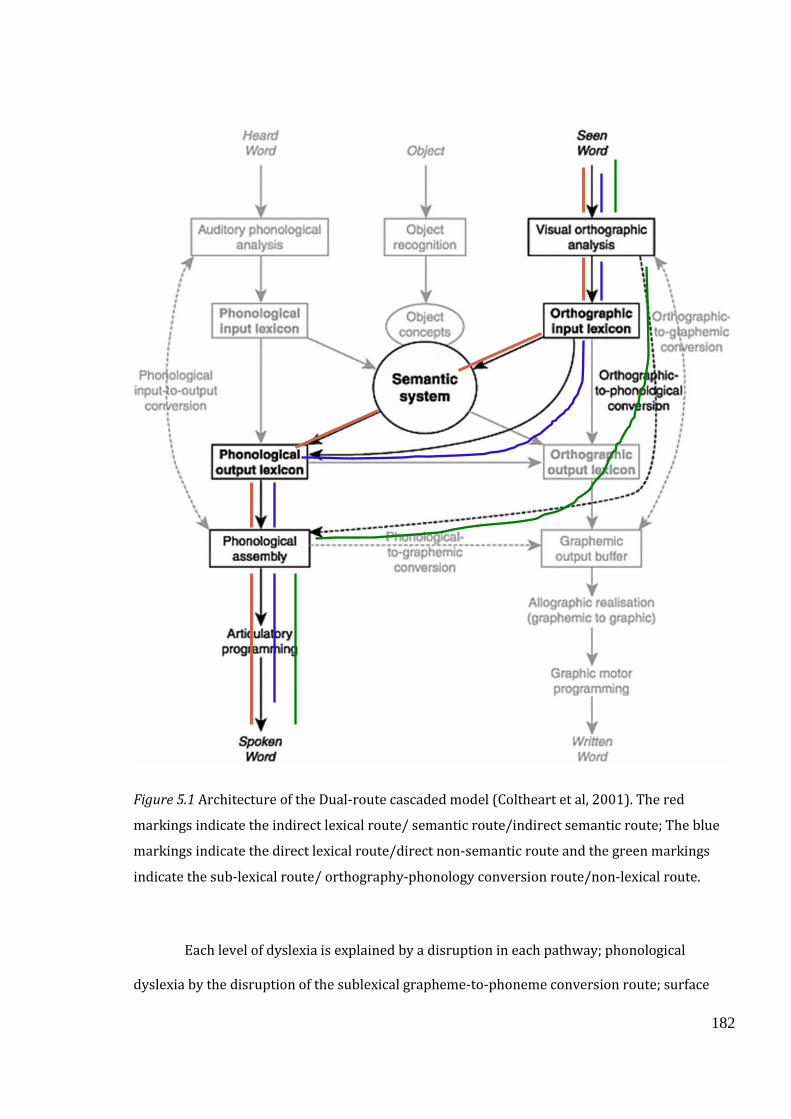
182
Figure 5.1 Architecture of the Dual-route cascaded model (Coltheart et al, 2001). The red
markings indicate the indirect lexical route/ semantic route/indirect semantic route; The blue
markings indicate the direct lexical route/direct non-semantic route and the green markings
indicate the sub-lexical route/ orthography-phonology conversion route/non-lexical route.
Each level of dyslexia is explained by a disruption in each pathway; phonological
dyslexia by the disruption of the sublexical grapheme-to-phoneme conversion route; surface
183
dyslexia by the disruption of the direct and/or semantic pathways that leads to overreliance on
the sublexical pathway; deep dyslexia by damage to both lexical and sublexical pathways, which
leads reading to occur only through the semantic pathway.
An alternative neurological model to explain reading and consequently levels of dyslexia
is the ‘triangle model’ (Harm & Seidenberg, 2004; Plaut et al., 1996; Seidenberg & McClelland,
1989). This postulates the existence of triangle of units (phonology, semantics and orthography)
that have bi-directional pathways between them. The model postulates that reading and writing
occur not by whole-word representation but rather on sub-lexical mappings with different
weights between the units (see Woollams et al., 2007, for instance). This model describes
phonological dyslexia and dysgraphia as due to damage to the phonological pathway. Surface
dyslexia is explained as an impairment of the semantic units or to the semantics-phonology
pathway (Plaut, 1997).
Similarly, surface dysgraphia could arise from the impairment of the semantic units or
the semantics-orthography pathway. Finally, deep dyslexia results from the damage to the
orthography-to-semantics and phonological pathways (Plaut & Shallice, 1993). The CDP+ model
proposed by Perry, Ziegler and Zorzi (2007) assumes a direct lexical pathway (similar to DRC)
and a connectionist sublexical pathway with units of graphemes and phonemes organized into
onsets and codas. A limitation of all of these models is that they try to explain underlying oral
reading mechanism through English orthography (see Perry et al. 2007). As these models are
based on English orthographies/alphabetic languages, it is non-trivial to apply these models to
other orthographies, in particular syllabic/alpha-syllabic languages such as Kannada and Hindi.
This problem is further aggravated in bi-scriptal bilinguals speaking a combination of
orthographies such as both alphabetic and alpha-syllabic (English and Kannada).
Within bilingual reading research, a model that has been used to explain reading aloud is
the Bilingual Interactive Activation (BIA) (Dijkstra, Van Heuven & Grainger, 1998; Dijkstra and
Van Heuven ,2002; see also Brysbaert & Dijkstra, 2006). Bilingual Interactive Activation (BIA)
model of reading in biscriptal readers is a computational model of word identification that is
184
based on the principles of statistical learning first proposed by McClelland and Rummelhart
(1981). The BIA model and more recently the BIA (+) (Dijkstra and Van Heuven, 2002) assumes
that the representations and mappings between orthography and phonology in both languages
of a biscriptal reader are learned, represented and processed by a common system even if there
are no similarities between features of the script in each language (e.g. Chinese and English).
This would mean that both languages would have similar reading difficulties. Multiple studies
[Kim et al 1997 (Korean-English); Dijkstra & Van Heuven, 2002 (Dutch-English)], [See Abutalebi
et al (2000) for review] have supported the model that neural representations and mappings
between orthography and phonology in both languages of a biscriptal reader are learned,
represented and processed by a common neurological system. However, there are studies that
do not support this based on the existence of differential dyslexia exhibited in the two languages
of bi-scriptal bilinguals .For instance, Sasanuma (1980) reported a deep dyslexic YH, with
difference in severity across the scripts within the same language(Kana the alpha-syllabic script
being more severely affected than Kanji which is an ideographic script).
Likewise, Karanth (2002) reported an individual with differential dyslexia with alexia in
Hindi (alpha-syllabic) and deep dyslexia in English (alphabetic). Consequently, there is no
consensus on the type of model to be applied to explain reading difficulties in bi-scriptal
bilinguals where the scripts have different orthographies such as both alphabetic and alpha-
syllabic scripts (English and Kannada; English and Hindi). Therefore, there is an urgent need to
not only profile but also observe persistent characteristics across bi-scriptal readers with
similar language and orthographic combinations. This is an aspect which is being addressed in
our study.
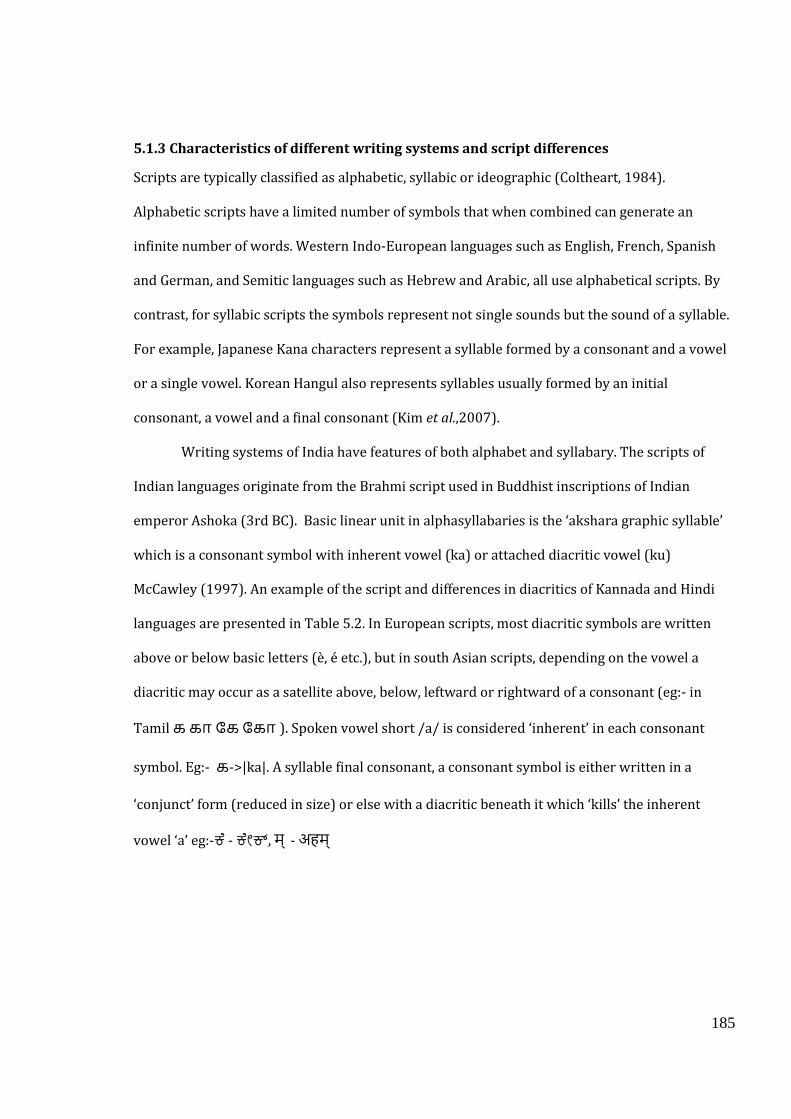
185
5.1.3 Characteristics of different writing systems and script differences
Scripts are typically classified as alphabetic, syllabic or ideographic (Coltheart, 1984).
Alphabetic scripts have a limited number of symbols that when combined can generate an
infinite number of words. Western Indo-European languages such as English, French, Spanish
and German, and Semitic languages such as Hebrew and Arabic, all use alphabetical scripts. By
contrast, for syllabic scripts the symbols represent not single sounds but the sound of a syllable.
For example, Japanese Kana characters represent a syllable formed by a consonant and a vowel
or a single vowel. Korean Hangul also represents syllables usually formed by an initial
consonant, a vowel and a final consonant (Kim et al.,2007).
Writing systems of India have features of both alphabet and syllabary. The scripts of
Indian languages originate from the Brahmi script used in Buddhist inscriptions of Indian
emperor Ashoka (3rd BC). Basic linear unit in alphasyllabaries is the ‘akshara graphic syllable’
which is a consonant symbol with inherent vowel (ka) or attached diacritic vowel (ku)
McCawley (1997). An example of the script and differences in diacritics of Kannada and Hindi
languages are presented in Table 5.2. In European scripts, most diacritic symbols are written
above or below basic letters (ѐ, é etc.), but in south Asian scripts, depending on the vowel a
diacritic may occur as a satellite above, below, leftward or rightward of a consonant (eg:- in
Tamil க கா கக ககா ). Spoken vowel short /a/ is considered ‘inherent’ in each consonant
symbol. Eg:- க->|ka|. A syllable final consonant, a consonant symbol is either written in a
‘conjunct’ form (reduced in size) or else with a diacritic beneath it which ‘kills’ the inherent
vowel ‘a’ eg:-ಕೆ - ಕೇಕ್, म् - अहम्
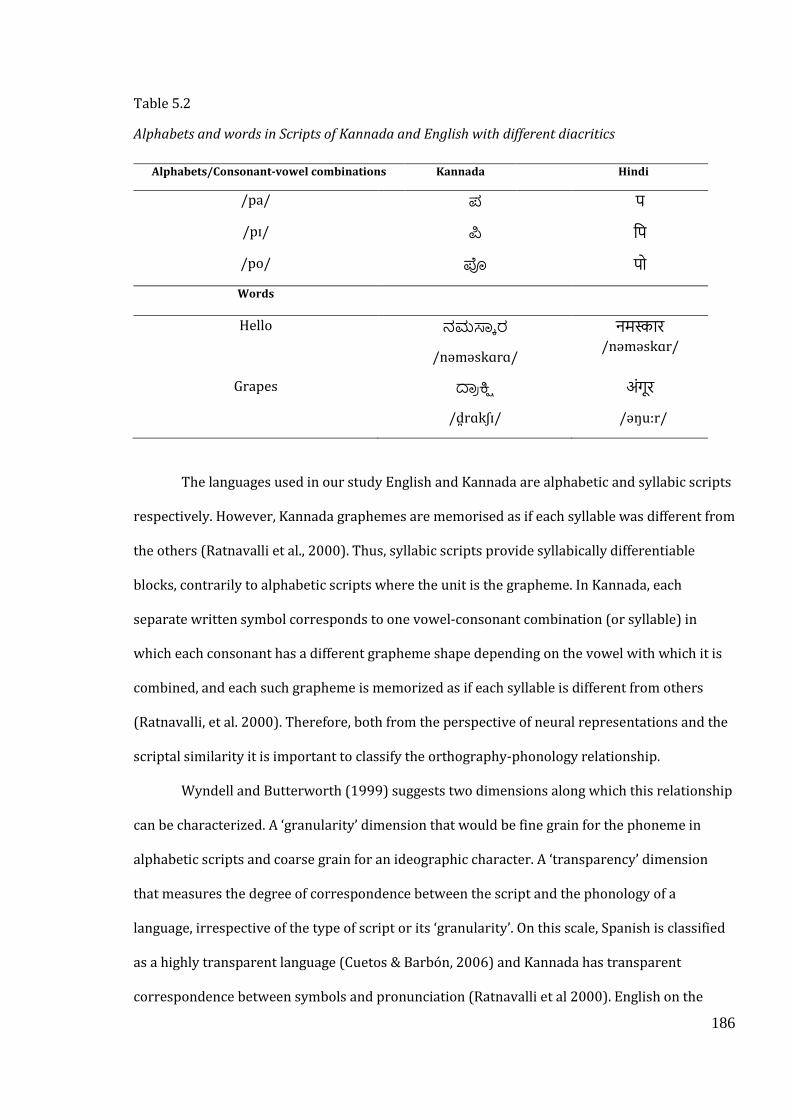
186
Table 5.2
Alphabets and words in Scripts of Kannada and English with different diacritics
Alphabets/Consonant-vowel combinations Kannada Hindi
/pa/ ಪ प
/pɪ/ ಪಿ पप
/po/ ಪೊ पो
Words
Hello ನಮಸ್ಕಾ ರ
/nəməskɑrɑ/
नमस्कार
/nəməskɑr/
Grapes ದ್ರಾ ಕಿ್ಷ
/d̪rɑkʃɪ/
अंगूर
/əŋu:r/
The languages used in our study English and Kannada are alphabetic and syllabic scripts
respectively. However, Kannada graphemes are memorised as if each syllable was different from
the others (Ratnavalli et al., 2000). Thus, syllabic scripts provide syllabically differentiable
blocks, contrarily to alphabetic scripts where the unit is the grapheme. In Kannada, each
separate written symbol corresponds to one vowel-consonant combination (or syllable) in
which each consonant has a different grapheme shape depending on the vowel with which it is
combined, and each such grapheme is memorized as if each syllable is different from others
(Ratnavalli, et al. 2000). Therefore, both from the perspective of neural representations and the
scriptal similarity it is important to classify the orthography-phonology relationship.
Wyndell and Butterworth (1999) suggests two dimensions along which this relationship
can be characterized. A ‘granularity’ dimension that would be fine grain for the phoneme in
alphabetic scripts and coarse grain for an ideographic character. A ‘transparency’ dimension
that measures the degree of correspondence between the script and the phonology of a
language, irrespective of the type of script or its ‘granularity’. On this scale, Spanish is classified
as a highly transparent language (Cuetos & Barbón, 2006) and Kannada has transparent
correspondence between symbols and pronunciation (Ratnavalli et al 2000). English on the
187
other hand is considered non-transparent (Weekes, 2005). Therefore, when presented with
scripts that have differential characterizations (say English and Kannada) it is expected to
generate an asymmetric pattern in brain-damaged persons (Béland & Mimouni, 2001; Weekes,
2005). A key theoretical question is whether the pattern of errors observed in individuals with
brain damage such as acquired dyslexia and dysgraphia are equivalent across different scripts.
5.1.4 Acquired dyslexia in non-alphabetic scripts
Currently, reading models developed using alphabetic scripts in monolinguals have been
successfully applied to non-alphabetic scripts (ideographic and Semitic) in other monolinguals
to characterise dyslexia. We summarise a few studies to illustrate this point.
A case study by Law & Or (2001) demonstrated that a brain-damaged patient
(Cantonese speaker) had performed better in oral reading than oral naming owing to, the
authors claim, use of non-semantic routes for the production of spoken words. Previous studies
such as Hillis & Caramazza (1991,1995) have argued that this result can be explained by a
summation hypothesis, i.e phonological representations can be achieved by a combination of the
semantic system and the conversion mechanism. Therefore, studying a brain-damaged person
can answer whether the semantic system can be bypassed to achieve better oral reading. In this
regard they tested a 42- year old Cantonese speaking Hong Kong female resident who had a
cerebral contusion resulting in cerebral oedema. Administration of the Cantonese Aphasia
Battery (CAB) (Yiu, 1992), a year after the accident, revealed that she failed to repeat single
words and short phrases no longer than four syllables on a few occasions making phonologically
similar errors. Comprehension of spoken and written words was diagnosed as impaired (17/20
on written word-picture matching and 15/20 on spoken word-picture matching). She was
diagnosed with anomic aphasia.
For their study, the brain damaged participant was tested for spoken word-picture
matching tasks using a series of 67 pictures as stimuli. In addition, a reading aloud task
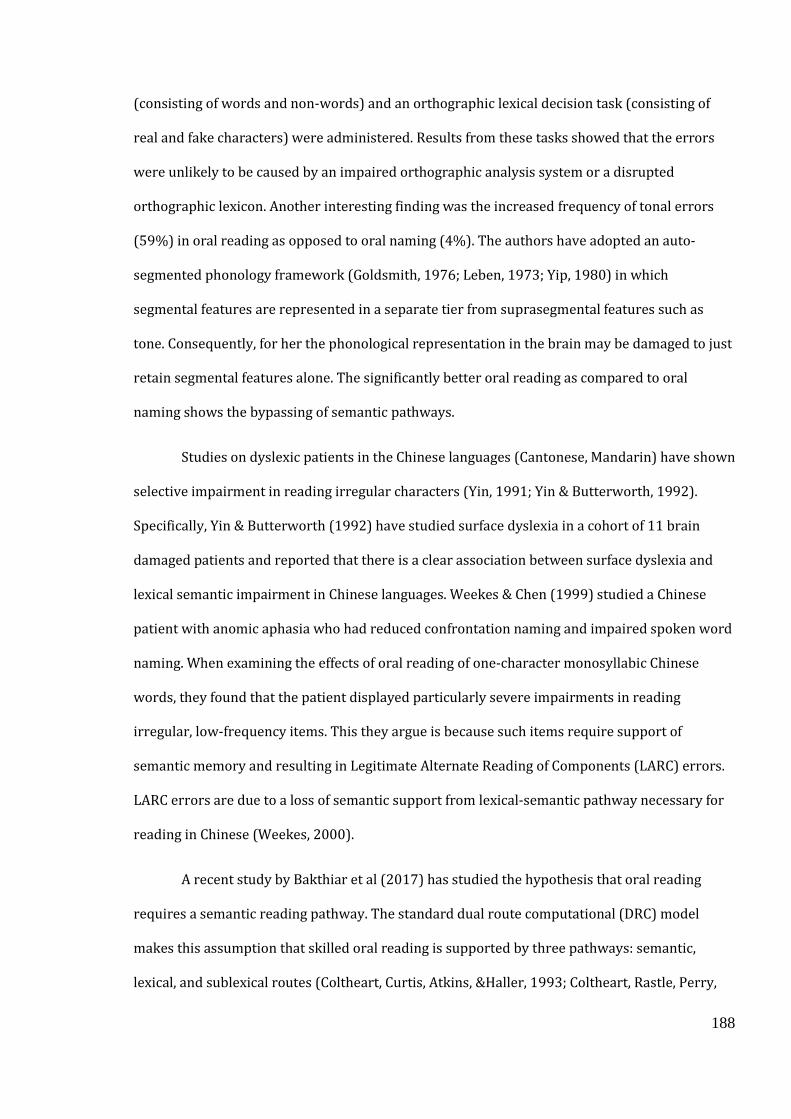
188
(consisting of words and non-words) and an orthographic lexical decision task (consisting of
real and fake characters) were administered. Results from these tasks showed that the errors
were unlikely to be caused by an impaired orthographic analysis system or a disrupted
orthographic lexicon. Another interesting finding was the increased frequency of tonal errors
(59%) in oral reading as opposed to oral naming (4%). The authors have adopted an auto-
segmented phonology framework (Goldsmith, 1976; Leben, 1973; Yip, 1980) in which
segmental features are represented in a separate tier from suprasegmental features such as
tone. Consequently, for her the phonological representation in the brain may be damaged to just
retain segmental features alone. The significantly better oral reading as compared to oral
naming shows the bypassing of semantic pathways.
Studies on dyslexic patients in the Chinese languages (Cantonese, Mandarin) have shown
selective impairment in reading irregular characters (Yin, 1991; Yin & Butterworth, 1992).
Specifically, Yin & Butterworth (1992) have studied surface dyslexia in a cohort of 11 brain
damaged patients and reported that there is a clear association between surface dyslexia and
lexical semantic impairment in Chinese languages. Weekes & Chen (1999) studied a Chinese
patient with anomic aphasia who had reduced confrontation naming and impaired spoken word
naming. When examining the effects of oral reading of one-character monosyllabic Chinese
words, they found that the patient displayed particularly severe impairments in reading
irregular, low-frequency items. This they argue is because such items require support of
semantic memory and resulting in Legitimate Alternate Reading of Components (LARC) errors.
LARC errors are due to a loss of semantic support from lexical-semantic pathway necessary for
reading in Chinese (Weekes, 2000).
A recent study by Bakthiar et al (2017) has studied the hypothesis that oral reading
requires a semantic reading pathway. The standard dual route computational (DRC) model
makes this assumption that skilled oral reading is supported by three pathways: semantic,
lexical, and sublexical routes (Coltheart, Curtis, Atkins, &Haller, 1993; Coltheart, Rastle, Perry,
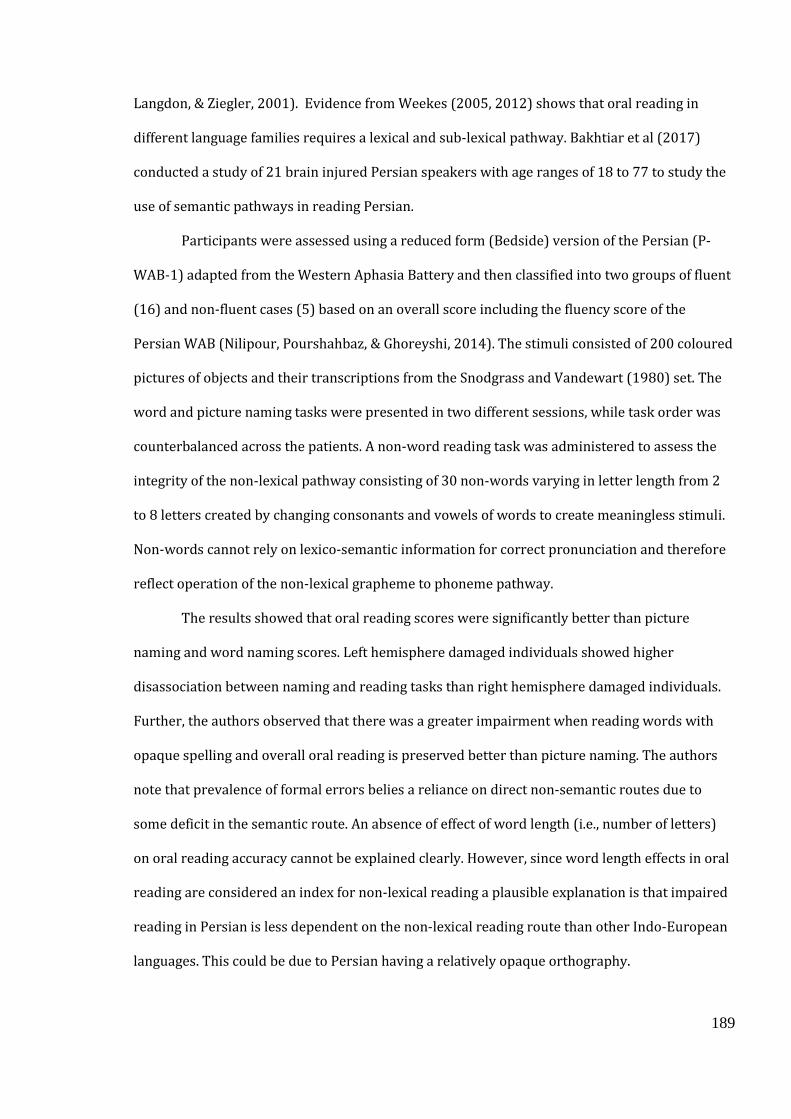
189
Langdon, & Ziegler, 2001). Evidence from Weekes (2005, 2012) shows that oral reading in
different language families requires a lexical and sub-lexical pathway. Bakhtiar et al (2017)
conducted a study of 21 brain injured Persian speakers with age ranges of 18 to 77 to study the
use of semantic pathways in reading Persian.
Participants were assessed using a reduced form (Bedside) version of the Persian (P-
WAB-1) adapted from the Western Aphasia Battery and then classified into two groups of fluent
(16) and non-fluent cases (5) based on an overall score including the fluency score of the
Persian WAB (Nilipour, Pourshahbaz, & Ghoreyshi, 2014). The stimuli consisted of 200 coloured
pictures of objects and their transcriptions from the Snodgrass and Vandewart (1980) set. The
word and picture naming tasks were presented in two different sessions, while task order was
counterbalanced across the patients. A non-word reading task was administered to assess the
integrity of the non-lexical pathway consisting of 30 non-words varying in letter length from 2
to 8 letters created by changing consonants and vowels of words to create meaningless stimuli.
Non-words cannot rely on lexico-semantic information for correct pronunciation and therefore
reflect operation of the non-lexical grapheme to phoneme pathway.
The results showed that oral reading scores were significantly better than picture
naming and word naming scores. Left hemisphere damaged individuals showed higher
disassociation between naming and reading tasks than right hemisphere damaged individuals.
Further, the authors observed that there was a greater impairment when reading words with
opaque spelling and overall oral reading is preserved better than picture naming. The authors
note that prevalence of formal errors belies a reliance on direct non-semantic routes due to
some deficit in the semantic route. An absence of effect of word length (i.e., number of letters)
on oral reading accuracy cannot be explained clearly. However, since word length effects in oral
reading are considered an index for non-lexical reading a plausible explanation is that impaired
reading in Persian is less dependent on the non-lexical reading route than other Indo-European
languages. This could be due to Persian having a relatively opaque orthography.
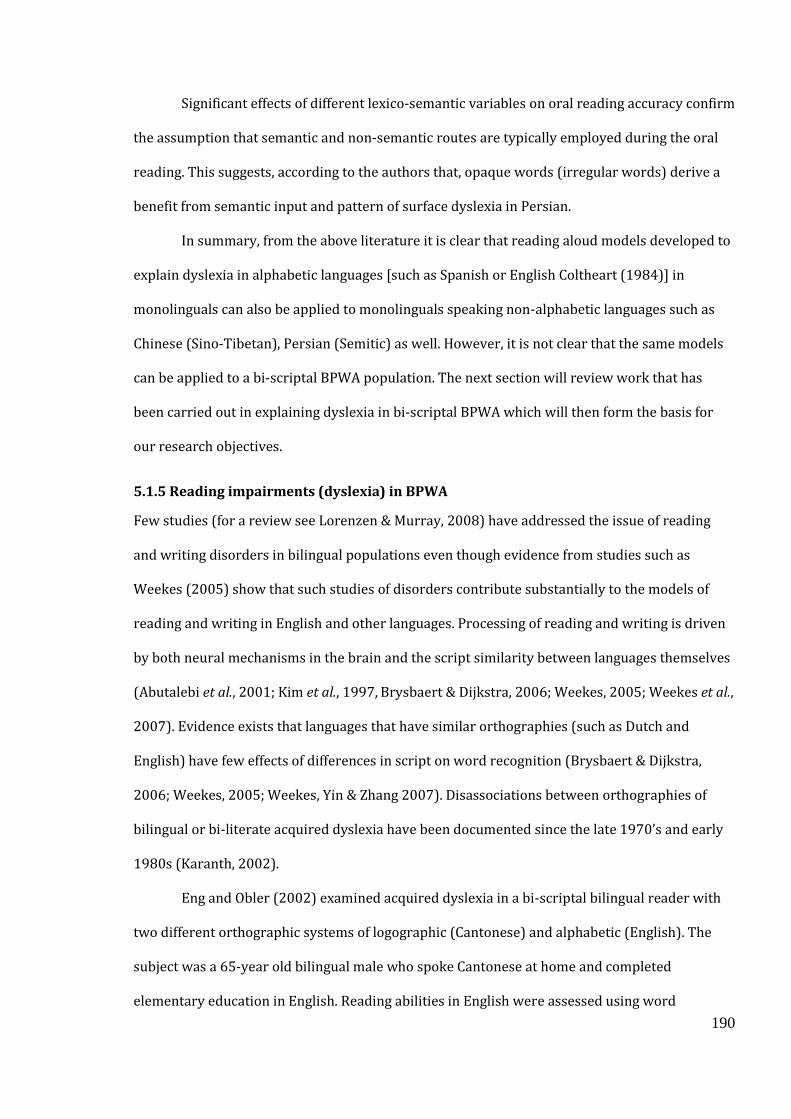
190
Significant effects of different lexico-semantic variables on oral reading accuracy confirm
the assumption that semantic and non-semantic routes are typically employed during the oral
reading. This suggests, according to the authors that, opaque words (irregular words) derive a
benefit from semantic input and pattern of surface dyslexia in Persian.
In summary, from the above literature it is clear that reading aloud models developed to
explain dyslexia in alphabetic languages [such as Spanish or English Coltheart (1984)] in
monolinguals can also be applied to monolinguals speaking non-alphabetic languages such as
Chinese (Sino-Tibetan), Persian (Semitic) as well. However, it is not clear that the same models
can be applied to a bi-scriptal BPWA population. The next section will review work that has
been carried out in explaining dyslexia in bi-scriptal BPWA which will then form the basis for
our research objectives.
5.1.5 Reading impairments (dyslexia) in BPWA
Few studies (for a review see Lorenzen & Murray, 2008) have addressed the issue of reading
and writing disorders in bilingual populations even though evidence from studies such as
Weekes (2005) show that such studies of disorders contribute substantially to the models of
reading and writing in English and other languages. Processing of reading and writing is driven
by both neural mechanisms in the brain and the script similarity between languages themselves
(Abutalebi et al., 2001; Kim et al., 1997, Brysbaert & Dijkstra, 2006; Weekes, 2005; Weekes et al.,
2007). Evidence exists that languages that have similar orthographies (such as Dutch and
English) have few effects of differences in script on word recognition (Brysbaert & Dijkstra,
2006; Weekes, 2005; Weekes, Yin & Zhang 2007). Disassociations between orthographies of
bilingual or bi-literate acquired dyslexia have been documented since the late 1970’s and early
1980s (Karanth, 2002).
Eng and Obler (2002) examined acquired dyslexia in a bi-scriptal bilingual reader with
two different orthographic systems of logographic (Cantonese) and alphabetic (English). The
subject was a 65-year old bilingual male who spoke Cantonese at home and completed
elementary education in English. Reading abilities in English were assessed using word
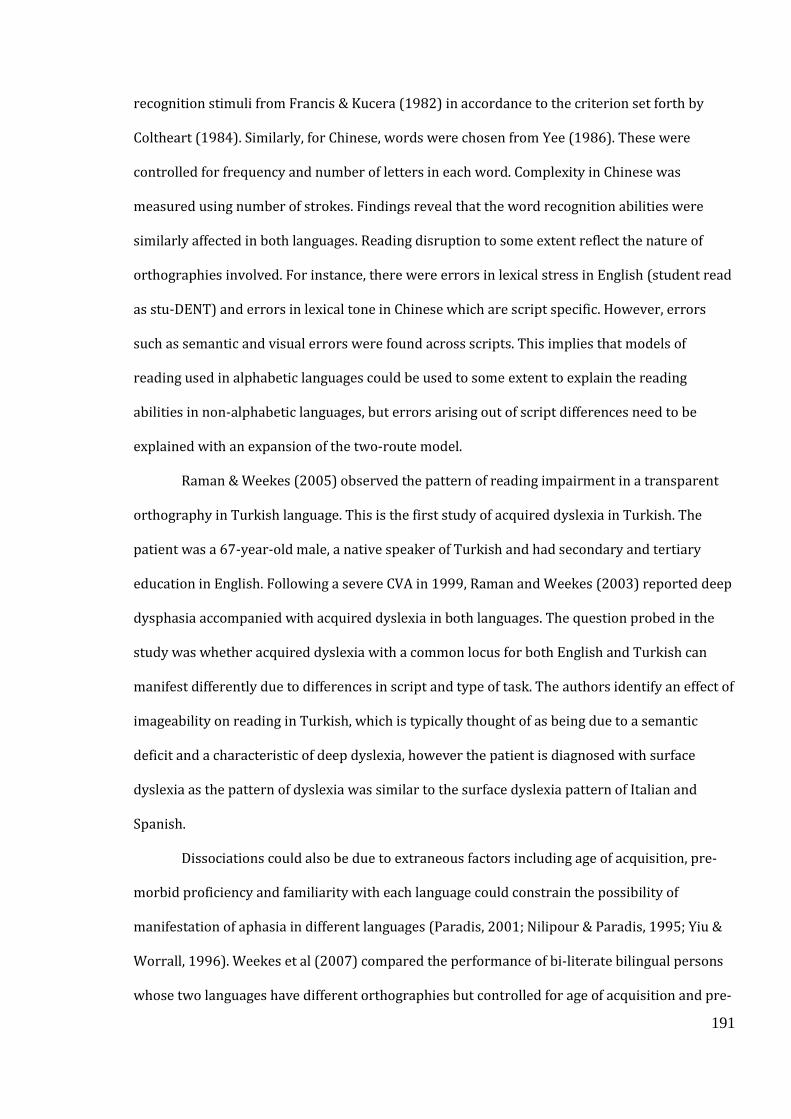
191
recognition stimuli from Francis & Kucera (1982) in accordance to the criterion set forth by
Coltheart (1984). Similarly, for Chinese, words were chosen from Yee (1986). These were
controlled for frequency and number of letters in each word. Complexity in Chinese was
measured using number of strokes. Findings reveal that the word recognition abilities were
similarly affected in both languages. Reading disruption to some extent reflect the nature of
orthographies involved. For instance, there were errors in lexical stress in English (student read
as stu-DENT) and errors in lexical tone in Chinese which are script specific. However, errors
such as semantic and visual errors were found across scripts. This implies that models of
reading used in alphabetic languages could be used to some extent to explain the reading
abilities in non-alphabetic languages, but errors arising out of script differences need to be
explained with an expansion of the two-route model.
Raman & Weekes (2005) observed the pattern of reading impairment in a transparent
orthography in Turkish language. This is the first study of acquired dyslexia in Turkish. The
patient was a 67-year-old male, a native speaker of Turkish and had secondary and tertiary
education in English. Following a severe CVA in 1999, Raman and Weekes (2003) reported deep
dysphasia accompanied with acquired dyslexia in both languages. The question probed in the
study was whether acquired dyslexia with a common locus for both English and Turkish can
manifest differently due to differences in script and type of task. The authors identify an effect of
imageability on reading in Turkish, which is typically thought of as being due to a semantic
deficit and a characteristic of deep dyslexia, however the patient is diagnosed with surface
dyslexia as the pattern of dyslexia was similar to the surface dyslexia pattern of Italian and
Spanish.
Dissociations could also be due to extraneous factors including age of acquisition, pre-
morbid proficiency and familiarity with each language could constrain the possibility of
manifestation of aphasia in different languages (Paradis, 2001; Nilipour & Paradis, 1995; Yiu &
Worrall, 1996). Weekes et al (2007) compared the performance of bi-literate bilingual persons
whose two languages have different orthographies but controlled for age of acquisition and pre-
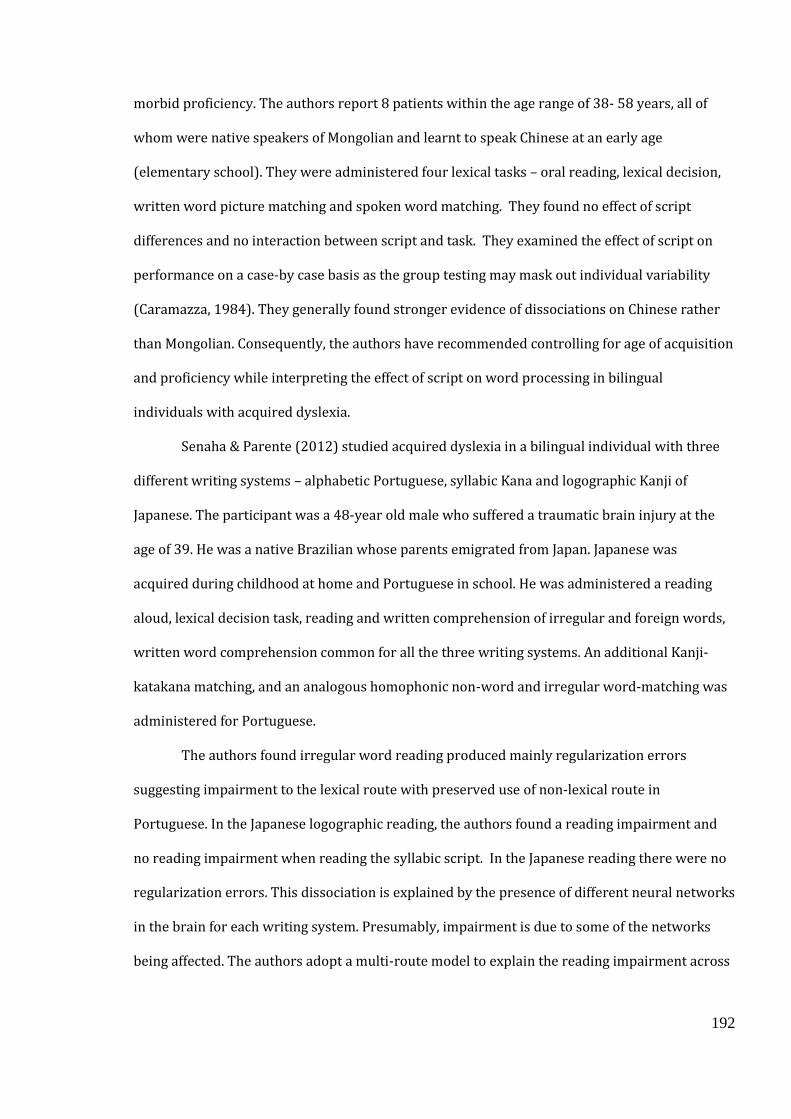
192
morbid proficiency. The authors report 8 patients within the age range of 38- 58 years, all of
whom were native speakers of Mongolian and learnt to speak Chinese at an early age
(elementary school). They were administered four lexical tasks – oral reading, lexical decision,
written word picture matching and spoken word matching. They found no effect of script
differences and no interaction between script and task. They examined the effect of script on
performance on a case-by case basis as the group testing may mask out individual variability
(Caramazza, 1984). They generally found stronger evidence of dissociations on Chinese rather
than Mongolian. Consequently, the authors have recommended controlling for age of acquisition
and proficiency while interpreting the effect of script on word processing in bilingual
individuals with acquired dyslexia.
Senaha & Parente (2012) studied acquired dyslexia in a bilingual individual with three
different writing systems – alphabetic Portuguese, syllabic Kana and logographic Kanji of
Japanese. The participant was a 48-year old male who suffered a traumatic brain injury at the
age of 39. He was a native Brazilian whose parents emigrated from Japan. Japanese was
acquired during childhood at home and Portuguese in school. He was administered a reading
aloud, lexical decision task, reading and written comprehension of irregular and foreign words,
written word comprehension common for all the three writing systems. An additional Kanji-
katakana matching, and an analogous homophonic non-word and irregular word-matching was
administered for Portuguese.
The authors found irregular word reading produced mainly regularization errors
suggesting impairment to the lexical route with preserved use of non-lexical route in
Portuguese. In the Japanese logographic reading, the authors found a reading impairment and
no reading impairment when reading the syllabic script. In the Japanese reading there were no
regularization errors. This dissociation is explained by the presence of different neural networks
in the brain for each writing system. Presumably, impairment is due to some of the networks
being affected. The authors adopt a multi-route model to explain the reading impairment across
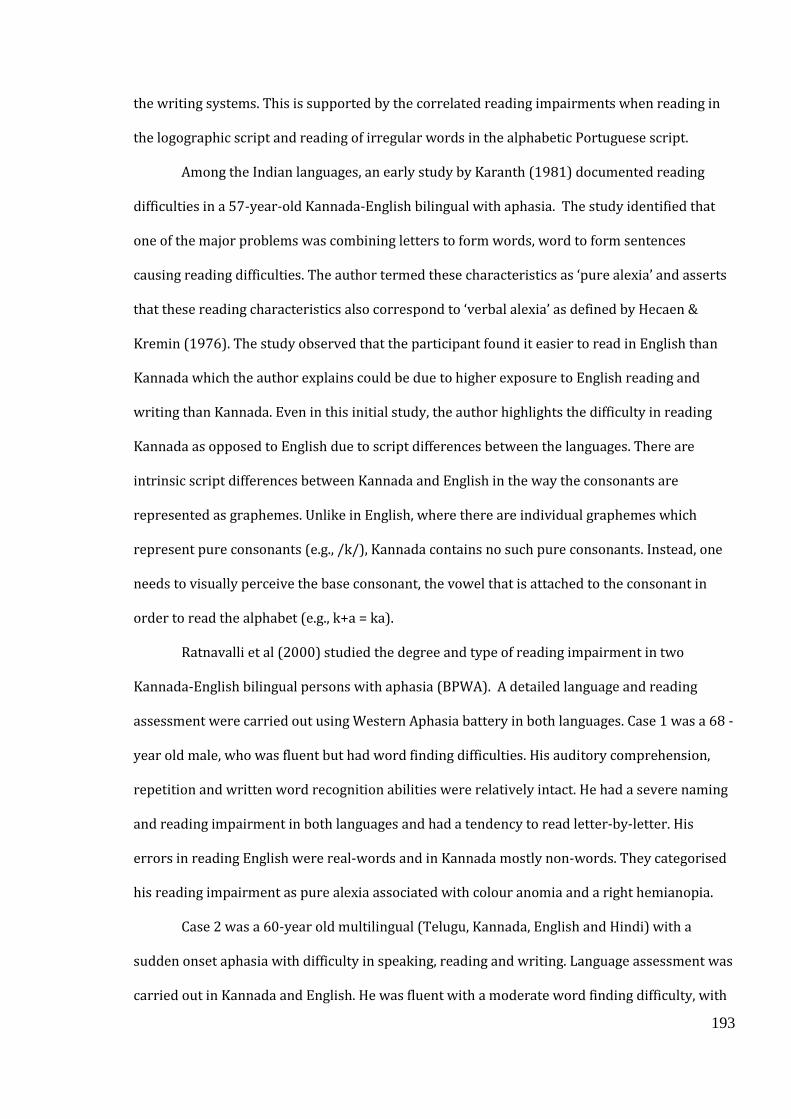
193
the writing systems. This is supported by the correlated reading impairments when reading in
the logographic script and reading of irregular words in the alphabetic Portuguese script.
Among the Indian languages, an early study by Karanth (1981) documented reading
difficulties in a 57-year-old Kannada-English bilingual with aphasia. The study identified that
one of the major problems was combining letters to form words, word to form sentences
causing reading difficulties. The author termed these characteristics as ‘pure alexia’ and asserts
that these reading characteristics also correspond to ‘verbal alexia’ as defined by Hecaen &
Kremin (1976). The study observed that the participant found it easier to read in English than
Kannada which the author explains could be due to higher exposure to English reading and
writing than Kannada. Even in this initial study, the author highlights the difficulty in reading
Kannada as opposed to English due to script differences between the languages. There are
intrinsic script differences between Kannada and English in the way the consonants are
represented as graphemes. Unlike in English, where there are individual graphemes which
represent pure consonants (e.g., /k/), Kannada contains no such pure consonants. Instead, one
needs to visually perceive the base consonant, the vowel that is attached to the consonant in
order to read the alphabet (e.g., k+a = ka).
Ratnavalli et al (2000) studied the degree and type of reading impairment in two
Kannada-English bilingual persons with aphasia (BPWA). A detailed language and reading
assessment were carried out using Western Aphasia battery in both languages. Case 1 was a 68 -
year old male, who was fluent but had word finding difficulties. His auditory comprehension,
repetition and written word recognition abilities were relatively intact. He had a severe naming
and reading impairment in both languages and had a tendency to read letter-by-letter. His
errors in reading English were real-words and in Kannada mostly non-words. They categorised
his reading impairment as pure alexia associated with colour anomia and a right hemianopia.
Case 2 was a 60-year old multilingual (Telugu, Kannada, English and Hindi) with a
sudden onset aphasia with difficulty in speaking, reading and writing. Language assessment was
carried out in Kannada and English. He was fluent with a moderate word finding difficulty, with
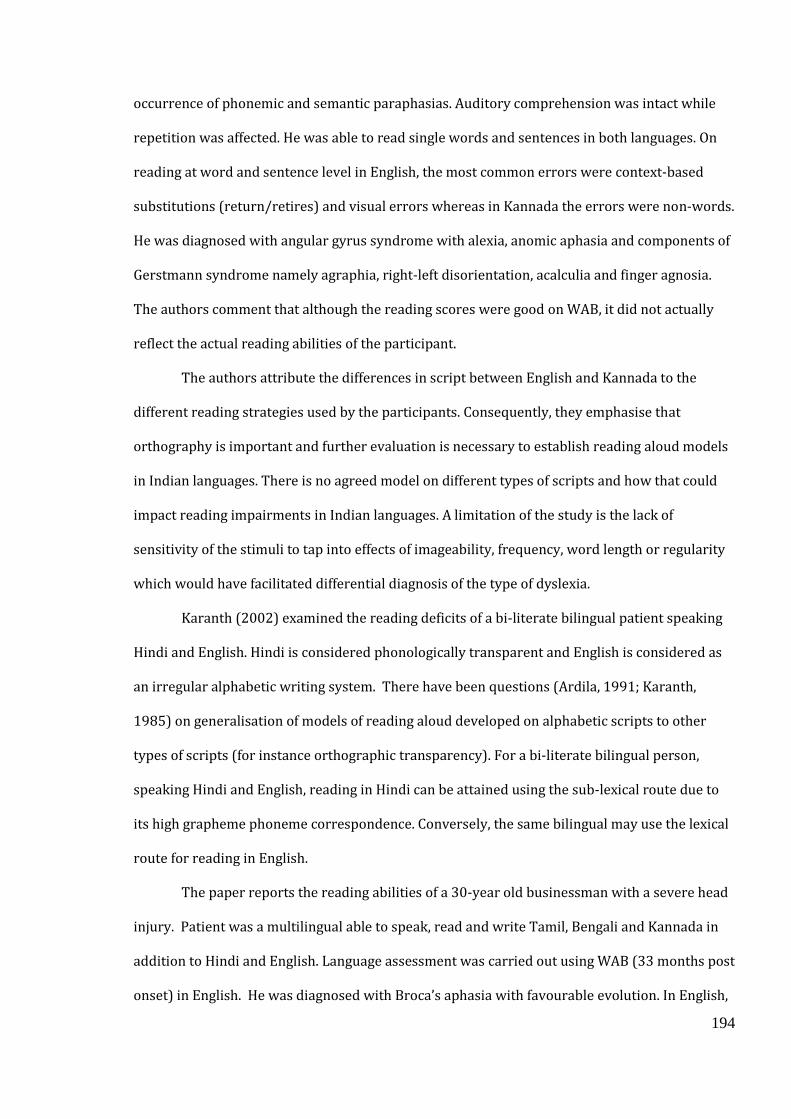
194
occurrence of phonemic and semantic paraphasias. Auditory comprehension was intact while
repetition was affected. He was able to read single words and sentences in both languages. On
reading at word and sentence level in English, the most common errors were context-based
substitutions (return/retires) and visual errors whereas in Kannada the errors were non-words.
He was diagnosed with angular gyrus syndrome with alexia, anomic aphasia and components of
Gerstmann syndrome namely agraphia, right-left disorientation, acalculia and finger agnosia.
The authors comment that although the reading scores were good on WAB, it did not actually
reflect the actual reading abilities of the participant.
The authors attribute the differences in script between English and Kannada to the
different reading strategies used by the participants. Consequently, they emphasise that
orthography is important and further evaluation is necessary to establish reading aloud models
in Indian languages. There is no agreed model on different types of scripts and how that could
impact reading impairments in Indian languages. A limitation of the study is the lack of
sensitivity of the stimuli to tap into effects of imageability, frequency, word length or regularity
which would have facilitated differential diagnosis of the type of dyslexia.
Karanth (2002) examined the reading deficits of a bi-literate bilingual patient speaking
Hindi and English. Hindi is considered phonologically transparent and English is considered as
an irregular alphabetic writing system. There have been questions (Ardila, 1991; Karanth,
1985) on generalisation of models of reading aloud developed on alphabetic scripts to other
types of scripts (for instance orthographic transparency). For a bi-literate bilingual person,
speaking Hindi and English, reading in Hindi can be attained using the sub-lexical route due to
its high grapheme phoneme correspondence. Conversely, the same bilingual may use the lexical
route for reading in English.
The paper reports the reading abilities of a 30-year old businessman with a severe head
injury. Patient was a multilingual able to speak, read and write Tamil, Bengali and Kannada in
addition to Hindi and English. Language assessment was carried out using WAB (33 months post
onset) in English. He was diagnosed with Broca’s aphasia with favourable evolution. In English,
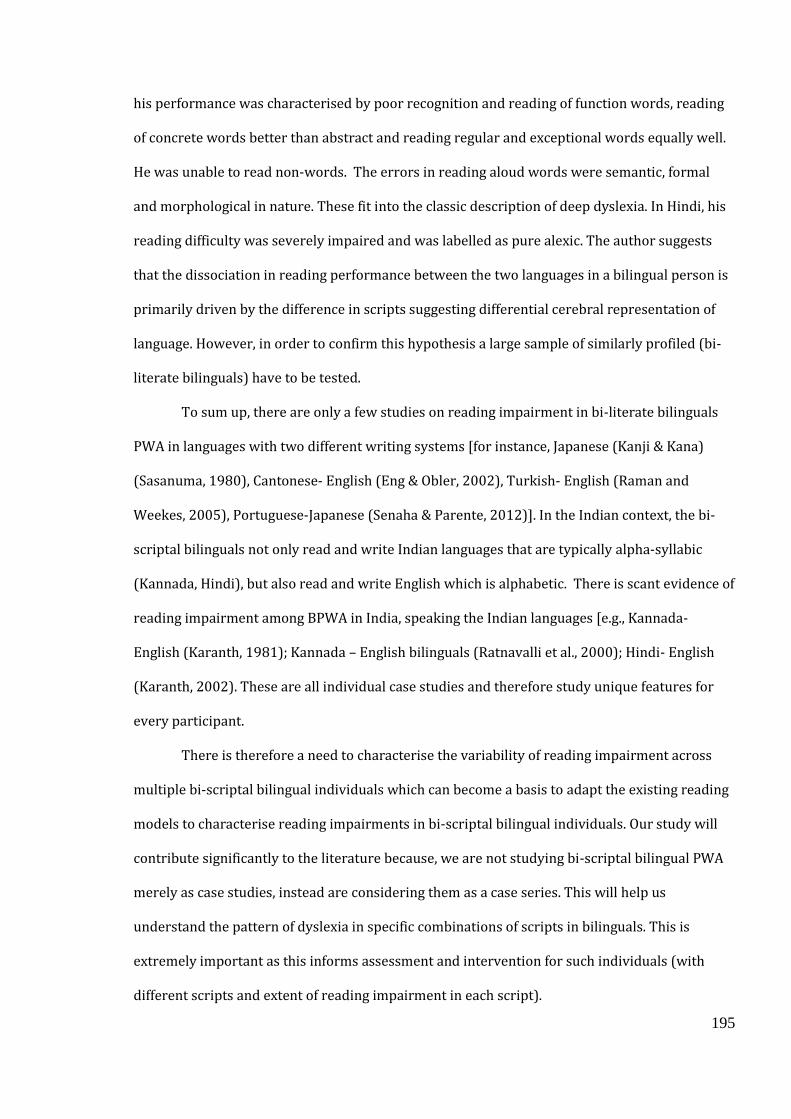
195
his performance was characterised by poor recognition and reading of function words, reading
of concrete words better than abstract and reading regular and exceptional words equally well.
He was unable to read non-words. The errors in reading aloud words were semantic, formal
and morphological in nature. These fit into the classic description of deep dyslexia. In Hindi, his
reading difficulty was severely impaired and was labelled as pure alexic. The author suggests
that the dissociation in reading performance between the two languages in a bilingual person is
primarily driven by the difference in scripts suggesting differential cerebral representation of
language. However, in order to confirm this hypothesis a large sample of similarly profiled (bi-
literate bilinguals) have to be tested.
To sum up, there are only a few studies on reading impairment in bi-literate bilinguals
PWA in languages with two different writing systems [for instance, Japanese (Kanji & Kana)
(Sasanuma, 1980), Cantonese- English (Eng & Obler, 2002), Turkish- English (Raman and
Weekes, 2005), Portuguese-Japanese (Senaha & Parente, 2012)]. In the Indian context, the bi-
scriptal bilinguals not only read and write Indian languages that are typically alpha-syllabic
(Kannada, Hindi), but also read and write English which is alphabetic. There is scant evidence of
reading impairment among BPWA in India, speaking the Indian languages [e.g., Kannada-
English (Karanth, 1981); Kannada – English bilinguals (Ratnavalli et al., 2000); Hindi- English
(Karanth, 2002). These are all individual case studies and therefore study unique features for
every participant.
There is therefore a need to characterise the variability of reading impairment across
multiple bi-scriptal bilingual individuals which can become a basis to adapt the existing reading
models to characterise reading impairments in bi-scriptal bilingual individuals. Our study will
contribute significantly to the literature because, we are not studying bi-scriptal bilingual PWA
merely as case studies, instead are considering them as a case series. This will help us
understand the pattern of dyslexia in specific combinations of scripts in bilinguals. This is
extremely important as this informs assessment and intervention for such individuals (with
different scripts and extent of reading impairment in each script).

196
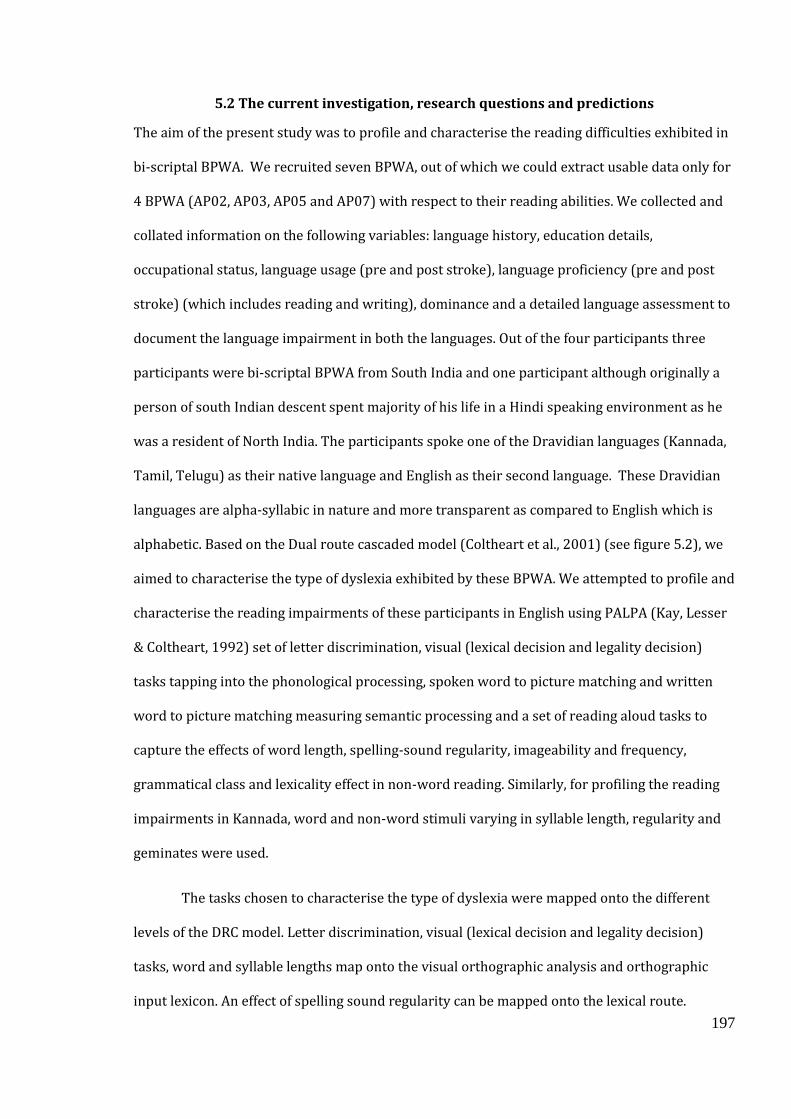
197
5.2 The current investigation, research questions and predictions
The aim of the present study was to profile and characterise the reading difficulties exhibited in
bi-scriptal BPWA. We recruited seven BPWA, out of which we could extract usable data only for
4 BPWA (AP02, AP03, AP05 and AP07) with respect to their reading abilities. We collected and
collated information on the following variables: language history, education details,
occupational status, language usage (pre and post stroke), language proficiency (pre and post
stroke) (which includes reading and writing), dominance and a detailed language assessment to
document the language impairment in both the languages. Out of the four participants three
participants were bi-scriptal BPWA from South India and one participant although originally a
person of south Indian descent spent majority of his life in a Hindi speaking environment as he
was a resident of North India. The participants spoke one of the Dravidian languages (Kannada,
Tamil, Telugu) as their native language and English as their second language. These Dravidian
languages are alpha-syllabic in nature and more transparent as compared to English which is
alphabetic. Based on the Dual route cascaded model (Coltheart et al., 2001) (see figure 5.2), we
aimed to characterise the type of dyslexia exhibited by these BPWA. We attempted to profile and
characterise the reading impairments of these participants in English using PALPA (Kay, Lesser
& Coltheart, 1992) set of letter discrimination, visual (lexical decision and legality decision)
tasks tapping into the phonological processing, spoken word to picture matching and written
word to picture matching measuring semantic processing and a set of reading aloud tasks to
capture the effects of word length, spelling-sound regularity, imageability and frequency,
grammatical class and lexicality effect in non-word reading. Similarly, for profiling the reading
impairments in Kannada, word and non-word stimuli varying in syllable length, regularity and
geminates were used.
The tasks chosen to characterise the type of dyslexia were mapped onto the different
levels of the DRC model. Letter discrimination, visual (lexical decision and legality decision)
tasks, word and syllable lengths map onto the visual orthographic analysis and orthographic
input lexicon. An effect of spelling sound regularity can be mapped onto the lexical route.
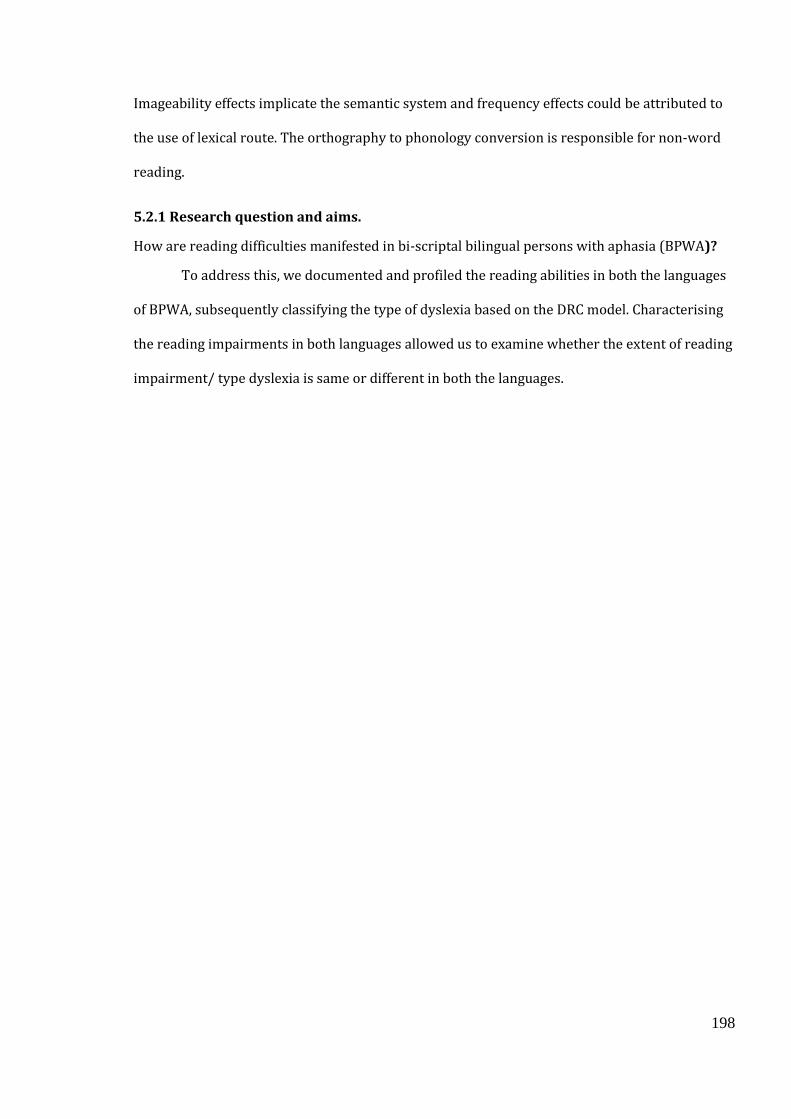
198
Imageability effects implicate the semantic system and frequency effects could be attributed to
the use of lexical route. The orthography to phonology conversion is responsible for non-word
reading.
5.2.1 Research question and aims.
How are reading difficulties manifested in bi-scriptal bilingual persons with aphasia (BPWA)?
To address this, we documented and profiled the reading abilities in both the languages
of BPWA, subsequently classifying the type of dyslexia based on the DRC model. Characterising
the reading impairments in both languages allowed us to examine whether the extent of reading
impairment/ type dyslexia is same or different in both the languages.
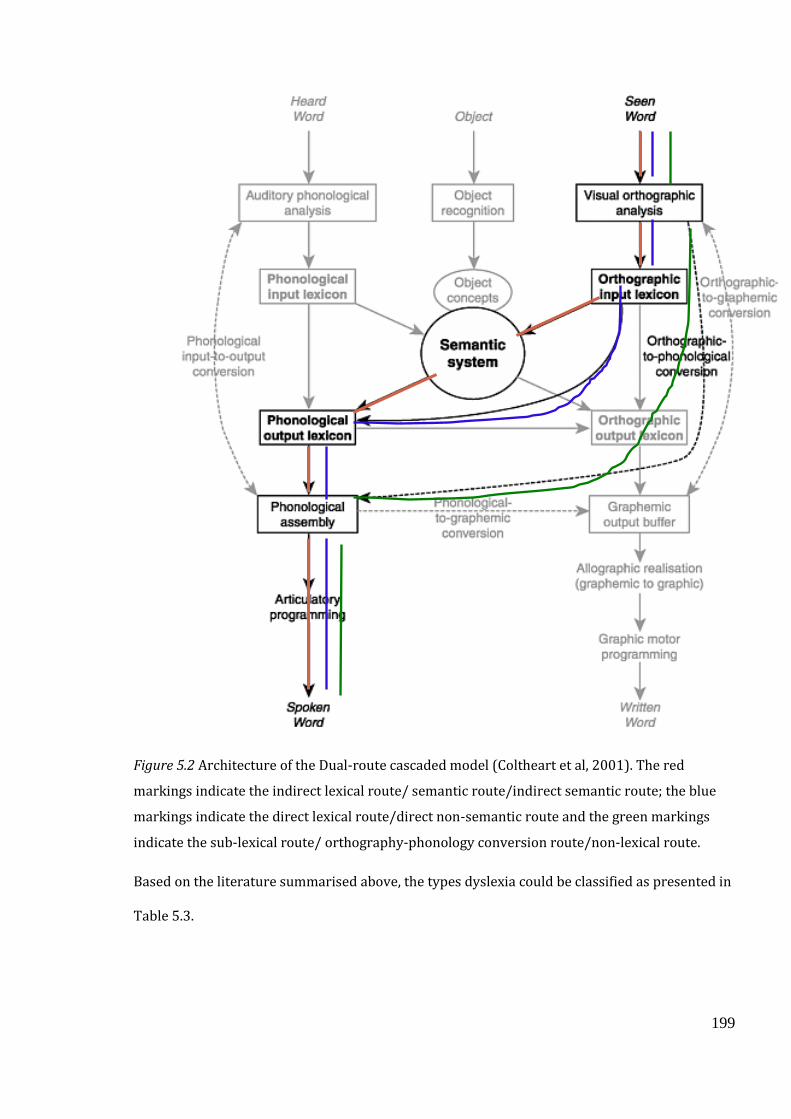
199
Figure 5.2 Architecture of the Dual-route cascaded model (Coltheart et al, 2001). The red
markings indicate the indirect lexical route/ semantic route/indirect semantic route; the blue
markings indicate the direct lexical route/direct non-semantic route and the green markings
indicate the sub-lexical route/ orthography-phonology conversion route/non-lexical route.
Based on the literature summarised above, the types dyslexia could be classified as presented in
Table 5.3.
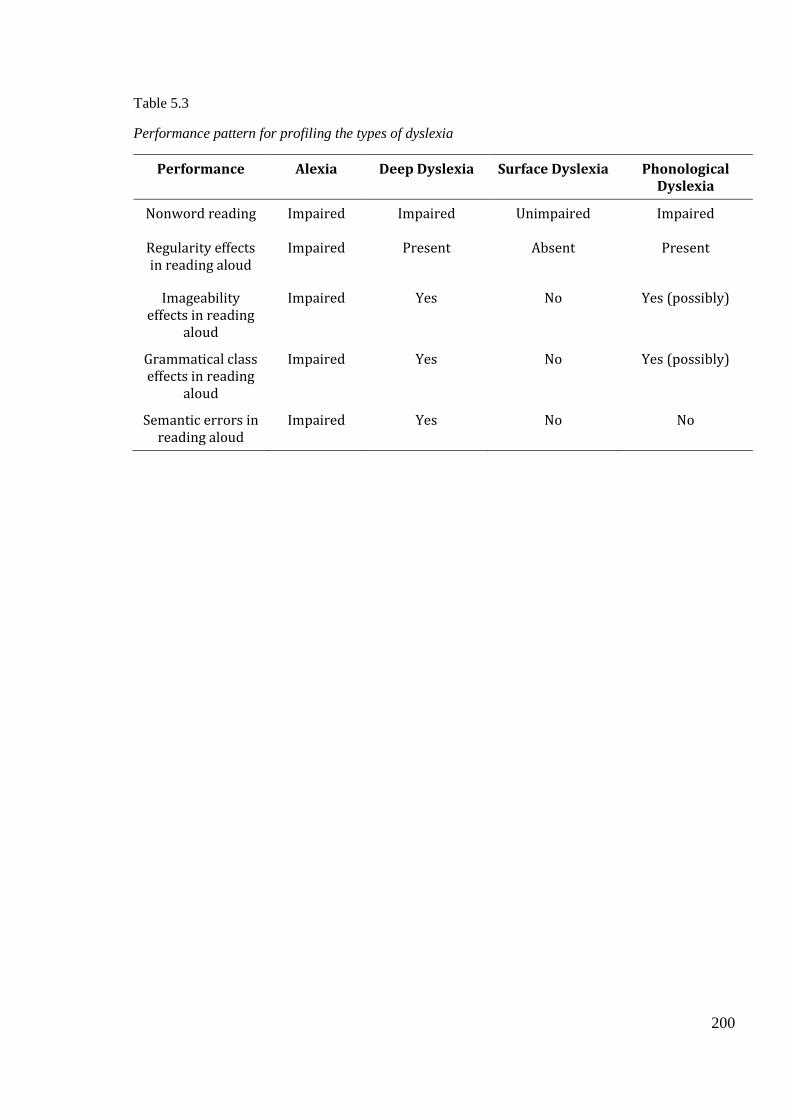
200
Table 5.3
Performance pattern for profiling the types of dyslexia
Performance Alexia Deep Dyslexia Surface Dyslexia Phonological Dyslexia
Nonword reading Impaired Impaired Unimpaired Impaired
Regularity effects in reading aloud
Impaired Present Absent Present
Imageability effects in reading
aloud
Impaired Yes No Yes (possibly)
Grammatical class effects in reading
aloud
Impaired Yes No Yes (possibly)
Semantic errors in reading aloud
Impaired Yes No No
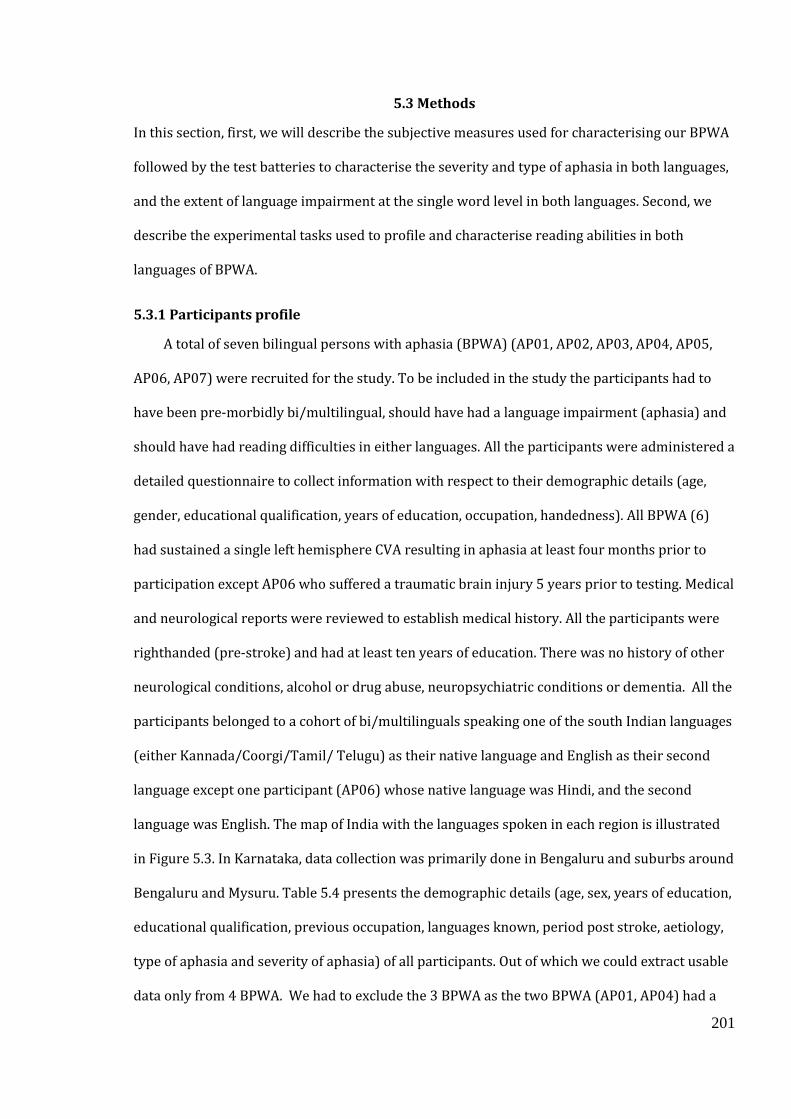
201
5.3 Methods
In this section, first, we will describe the subjective measures used for characterising our BPWA
followed by the test batteries to characterise the severity and type of aphasia in both languages,
and the extent of language impairment at the single word level in both languages. Second, we
describe the experimental tasks used to profile and characterise reading abilities in both
languages of BPWA.
5.3.1 Participants profile
A total of seven bilingual persons with aphasia (BPWA) (AP01, AP02, AP03, AP04, AP05,
AP06, AP07) were recruited for the study. To be included in the study the participants had to
have been pre-morbidly bi/multilingual, should have had a language impairment (aphasia) and
should have had reading difficulties in either languages. All the participants were administered a
detailed questionnaire to collect information with respect to their demographic details (age,
gender, educational qualification, years of education, occupation, handedness). All BPWA (6)
had sustained a single left hemisphere CVA resulting in aphasia at least four months prior to
participation except AP06 who suffered a traumatic brain injury 5 years prior to testing. Medical
and neurological reports were reviewed to establish medical history. All the participants were
righthanded (pre-stroke) and had at least ten years of education. There was no history of other
neurological conditions, alcohol or drug abuse, neuropsychiatric conditions or dementia. All the
participants belonged to a cohort of bi/multilinguals speaking one of the south Indian languages
(either Kannada/Coorgi/Tamil/ Telugu) as their native language and English as their second
language except one participant (AP06) whose native language was Hindi, and the second
language was English. The map of India with the languages spoken in each region is illustrated
in Figure 5.3. In Karnataka, data collection was primarily done in Bengaluru and suburbs around
Bengaluru and Mysuru. Table 5.4 presents the demographic details (age, sex, years of education,
educational qualification, previous occupation, languages known, period post stroke, aetiology,
type of aphasia and severity of aphasia) of all participants. Out of which we could extract usable
data only from 4 BPWA. We had to exclude the 3 BPWA as the two BPWA (AP01, AP04) had a
202
severe global aphasia, were unable to recognise alphabets and unable to read aloud at word
level in either language; AP06 had a moderate broca’s aphasia but was unable to read aloud at
word level in either language. Therefore, we discuss the bilingual language profile and language
assessment in detail only of the following participants- AP02, AP03, AP05 and AP07.
Participation in this study was voluntary and participants provided written consent prior to
participation (See Appendix 5.1 for an example of information sheet and consent form). All the
procedures in this study were approved by the University of Reading Research Ethics
Committee (Ethical approval code: 2017/038/AB).
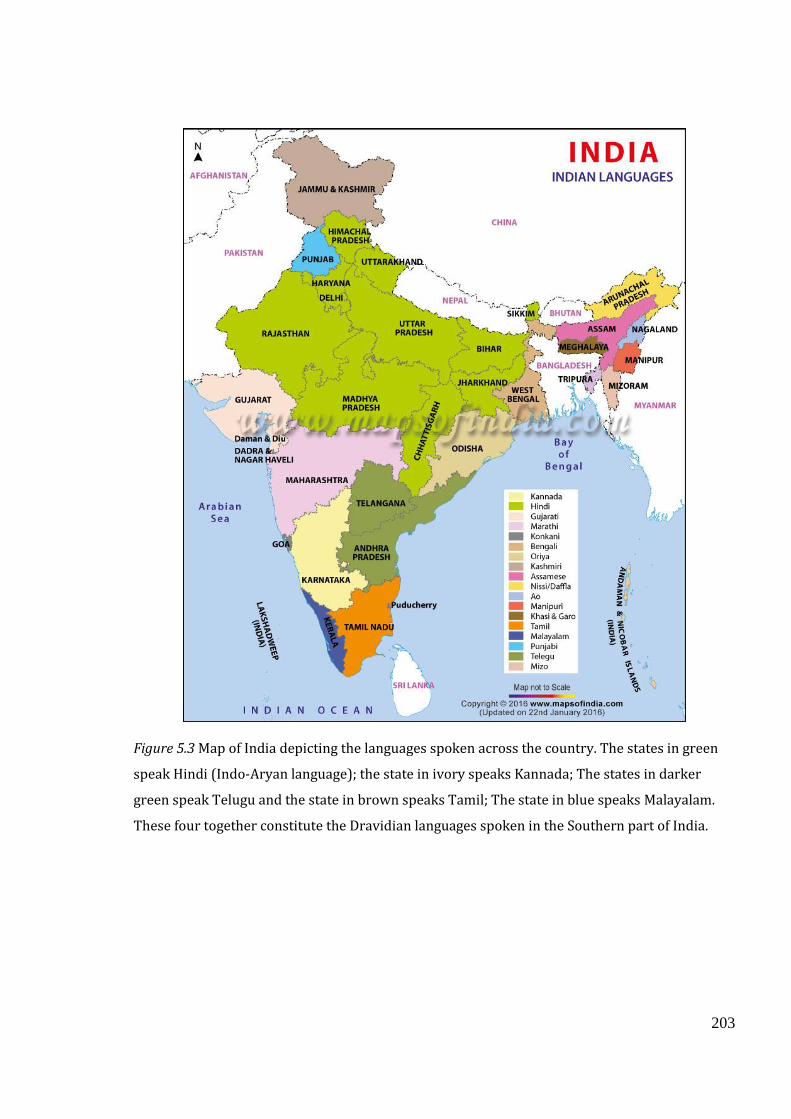
203
Figure 5.3 Map of India depicting the languages spoken across the country. The states in green
speak Hindi (Indo-Aryan language); the state in ivory speaks Kannada; The states in darker
green speak Telugu and the state in brown speaks Tamil; The state in blue speaks Malayalam.
These four together constitute the Dravidian languages spoken in the Southern part of India.
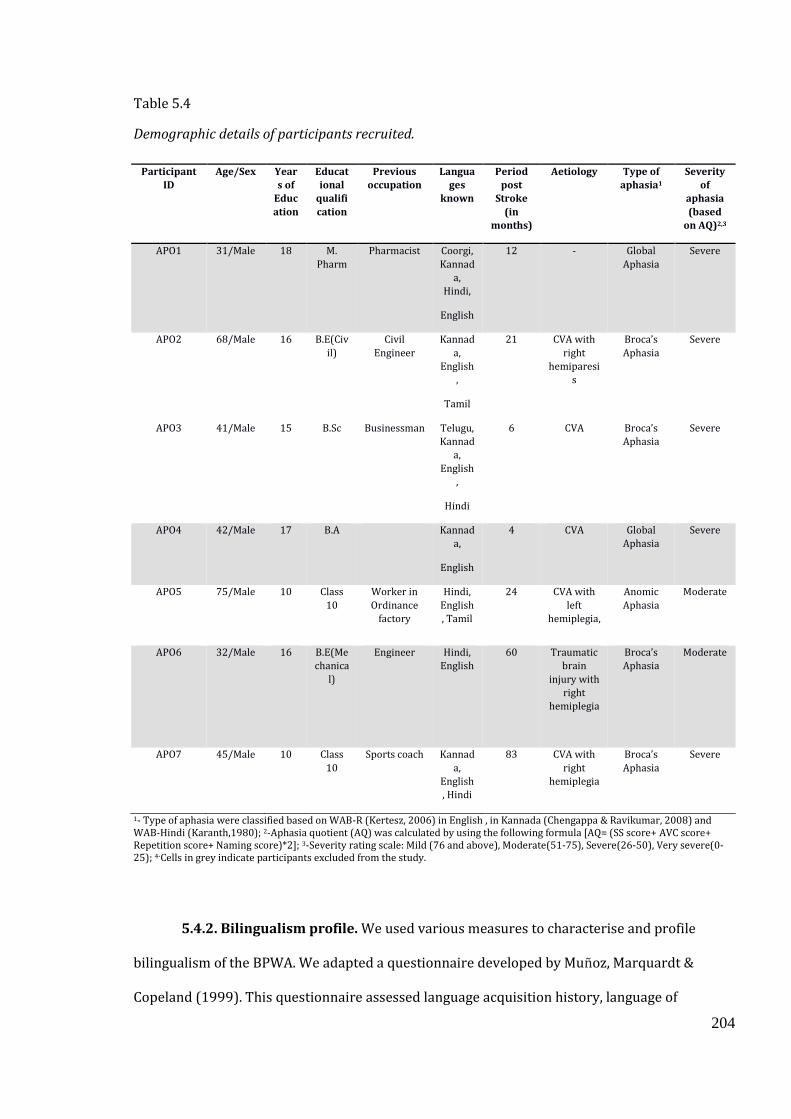
204
Table 5.4
Demographic details of participants recruited.
Participant
ID
Age/Sex Year
s of
Educ
ation
Educat
ional
qualifi
cation
Previous
occupation
Langua
ges
known
Period
post
Stroke
(in
months)
Aetiology Type of
aphasia1
Severity
of
aphasia
(based
on AQ)2,3
APO1 31/Male 18 M.
Pharm
Pharmacist Coorgi,
Kannad
a,
Hindi,
English
12 - Global
Aphasia
Severe
APO2 68/Male 16 B.E(Civ
il)
Civil
Engineer
Kannad
a,
English
,
Tamil
21 CVA with
right
hemiparesi
s
Broca’s
Aphasia
Severe
APO3 41/Male 15 B.Sc Businessman Telugu,
Kannad
a,
English
,
Hindi
6 CVA Broca’s
Aphasia
Severe
APO4 42/Male 17 B.A Kannad
a,
English
4 CVA Global
Aphasia
Severe
APO5 75/Male 10 Class
10
Worker in
Ordinance
factory
Hindi,
English
, Tamil
24 CVA with
left
hemiplegia,
Anomic
Aphasia
Moderate
APO6 32/Male 16 B.E(Me
chanica
l)
Engineer Hindi,
English
60 Traumatic
brain
injury with
right
hemiplegia
Broca’s
Aphasia
Moderate
APO7 45/Male 10 Class
10
Sports coach Kannad
a,
English
, Hindi
83 CVA with
right
hemiplegia
Broca’s
Aphasia
Severe
1- Type of aphasia were classified based on WAB-R (Kertesz, 2006) in English , in Kannada (Chengappa & Ravikumar, 2008) and WAB-Hindi (Karanth,1980); 2-Aphasia quotient (AQ) was calculated by using the following formula [AQ= (SS score+ AVC score+ Repetition score+ Naming score)*2]; 3-Severity rating scale: Mild (76 and above), Moderate(51-75), Severe(26-50), Very severe(0-25); 4-Cells in grey indicate participants excluded from the study.
5.4.2. Bilingualism profile. We used various measures to characterise and profile
bilingualism of the BPWA. We adapted a questionnaire developed by Muñoz, Marquardt &
Copeland (1999). This questionnaire assessed language acquisition history, language of
205
instruction during education, self-rated language proficiency (speaking, comprehension, reading
and writing), and the current language usage patterns which is same as the one we have used in
Chapter 2 (See appendix 2.2). Language dominance was measured using the language
dominance questionnaire (Dunn & Tree, 2009). All the participants filled the language
proficiency and usage part of the questionnaire twice to separately report pre-stroke and post-
stroke language proficiency and language usage, with the support from caregiver or family
members, as needed.
5.3.2.1 Results of Language profile of BPWA. All four participants were
bi/multilinguals with different native languages but had English as their second language. AP02
and AP07 had Kannada as their native language. AP03 reported Telugu as his native language
but had knowledge of Kannada as he moved to the state of Karnataka (where Kannada is the
predominantly spoken language) at the age of 18 and used Kannada and Hindi on a day to day
basis as a result of his job. He was more exposed to Telugu/Kannada; therefore, we have
profiled his Telugu/Kannada and English. On the other hand, AP05 reported his native language
to be Tamil, but he grew up in a city where Hindi was the predominantly spoken language. His
schooling was also in Hindi and English and he preferred using Hindi at home as well as at
school. Therefore, we have characterised his bilingual profile with respect to Hindi and English.
On a scale of 1 to seven (1 = very poor, 7 = native like proficiency), all four participants
completed self-rated proficiency questionnaires both pre and post stroke. Proficiency scores
were averaged across speaking, comprehension, reading and writing domains. All BPWA
reported proficiency level of 5.25 or more in their respective native languages and English prior
to stroke (except AP03 in English pre= 4.12). Post stroke the language proficiency level was
reduced, with all participants having a score below 4 for their native languages and English. The
reading and writing abilities were most affected for all participants post-stroke. All the
participants acquired reading and writing of both their languages between 5-6 years of age
except AP02 and AP03 who were introduced reading in L1 at about 4 years of age. All the
206
participants reported their respective native languages (Kannada, Telugu, Hindi, Kannada) as
their most frequently used language both pre-and -post stroke. On a scale of one to four (1-
daily; 4- monthly), AP02 and AP03 reported their frequency of reading print prior to stroke
(books, newspapers, magazines) to be daily in English, while AP05 and AP07’s frequency of
reading print in English was restricted to few times a week. However, all the participants were
daily readers of print in their native language excepting AP02 who read few times a week in
Kannada. The reading of print post stroke was severely affected for all participants (nil) except
for AP02 and AP03 who continued reading in English for few times a week. The current
language dominance score suggested that all the participants were dominant in their respective
native languages. The bilingual profile of BPWA with the scores obtained from the language
background questionnaire are presented in Table 5.5.
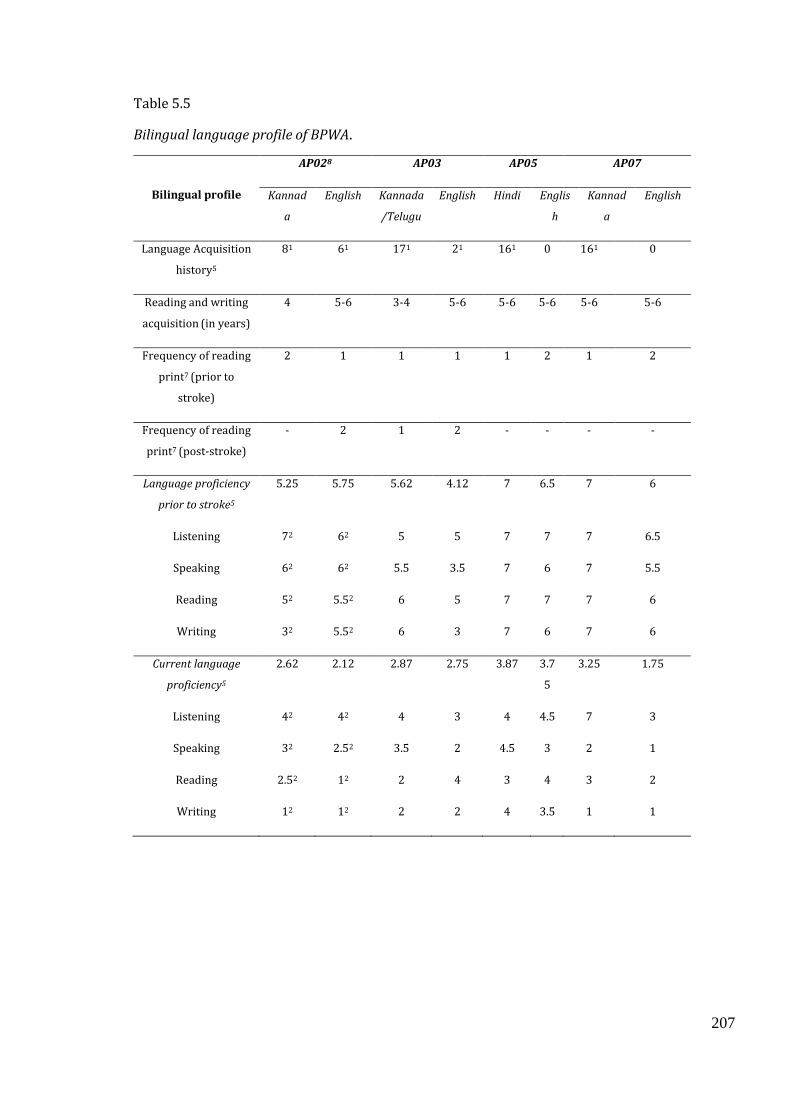
207
Table 5.5
Bilingual language profile of BPWA.
Bilingual profile
AP028 AP03 AP05 AP07
Kannad
a
English Kannada
/Telugu
English Hindi Englis
h
Kannad
a
English
Language Acquisition
history5
81 61 171 21 161 0 161 0
Reading and writing
acquisition (in years)
4 5-6 3-4 5-6 5-6 5-6 5-6 5-6
Frequency of reading
print7 (prior to
stroke)
2 1 1 1 1 2 1 2
Frequency of reading
print7 (post-stroke)
- 2 1 2 - - - -
Language proficiency
prior to stroke5
5.25 5.75 5.62 4.12 7 6.5 7 6
Listening 72 62 5 5 7 7 7 6.5
Speaking 62 62 5.5 3.5 7 6 7 5.5
Reading 52 5.52 6 5 7 7 7 6
Writing 32 5.52 6 3 7 6 7 6
Current language
proficiency5
2.62 2.12 2.87 2.75 3.87 3.7
5
3.25 1.75
Listening 42 42 4 3 4 4.5 7 3
Speaking 32 2.52 3.5 2 4.5 3 2 1
Reading 2.52 12 2 4 3 4 3 2
Writing 12 12 2 2 4 3.5 1 1
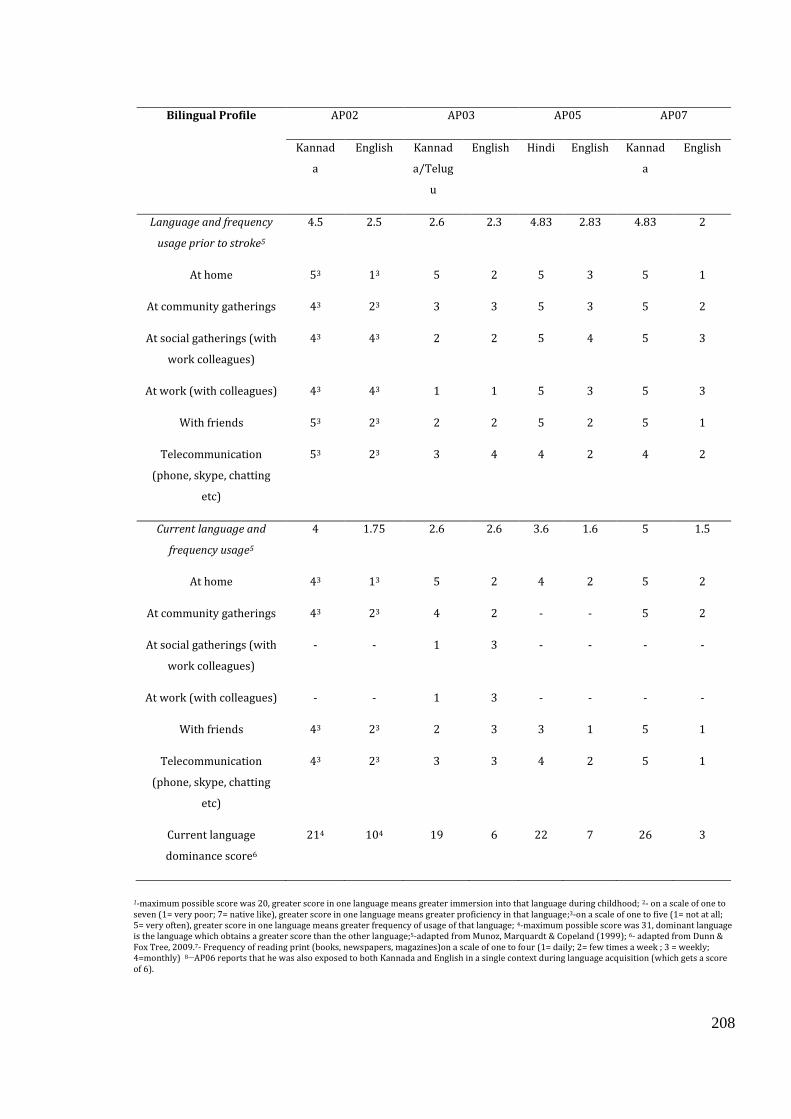
208
1-maximum possible score was 20, greater score in one language means greater immersion into that language during childhood; 2- on a scale of one to seven (1= very poor; 7= native like), greater score in one language means greater proficiency in that language;3-on a scale of one to five (1= not at all; 5= very often), greater score in one language means greater frequency of usage of that language; 4-maximum possible score was 31, dominant language is the language which obtains a greater score than the other language;5-adapted from Munoz, Marquardt & Copeland (1999); 6- adapted from Dunn & Fox Tree, 2009.7- Frequency of reading print (books, newspapers, magazines)on a scale of one to four (1= daily; 2= few times a week ; 3 = weekly; 4=monthly) 8—AP06 reports that he was also exposed to both Kannada and English in a single context during language acquisition (which gets a score of 6).
Bilingual Profile AP02 AP03 AP05 AP07
Kannad
a
English Kannad
a/Telug
u
English Hindi English Kannad
a
English
Language and frequency
usage prior to stroke5
4.5 2.5 2.6 2.3 4.83 2.83 4.83 2
At home 53 13 5 2 5 3 5 1
At community gatherings 43 23 3 3 5 3 5 2
At social gatherings (with
work colleagues)
43 43 2 2 5 4 5 3
At work (with colleagues) 43 43 1 1 5 3 5 3
With friends 53 23 2 2 5 2 5 1
Telecommunication
(phone, skype, chatting
etc)
53 23 3 4 4 2 4 2
Current language and
frequency usage5
4 1.75 2.6 2.6 3.6 1.6 5 1.5
At home 43 13 5 2 4 2 5 2
At community gatherings 43 23 4 2 - - 5 2
At social gatherings (with
work colleagues)
- - 1 3 - - - -
At work (with colleagues) - - 1 3 - - - -
With friends 43 23 2 3 3 1 5 1
Telecommunication
(phone, skype, chatting
etc)
43 23 3 3 4 2 5 1
Current language
dominance score6
214 104 19 6 22 7 26 3
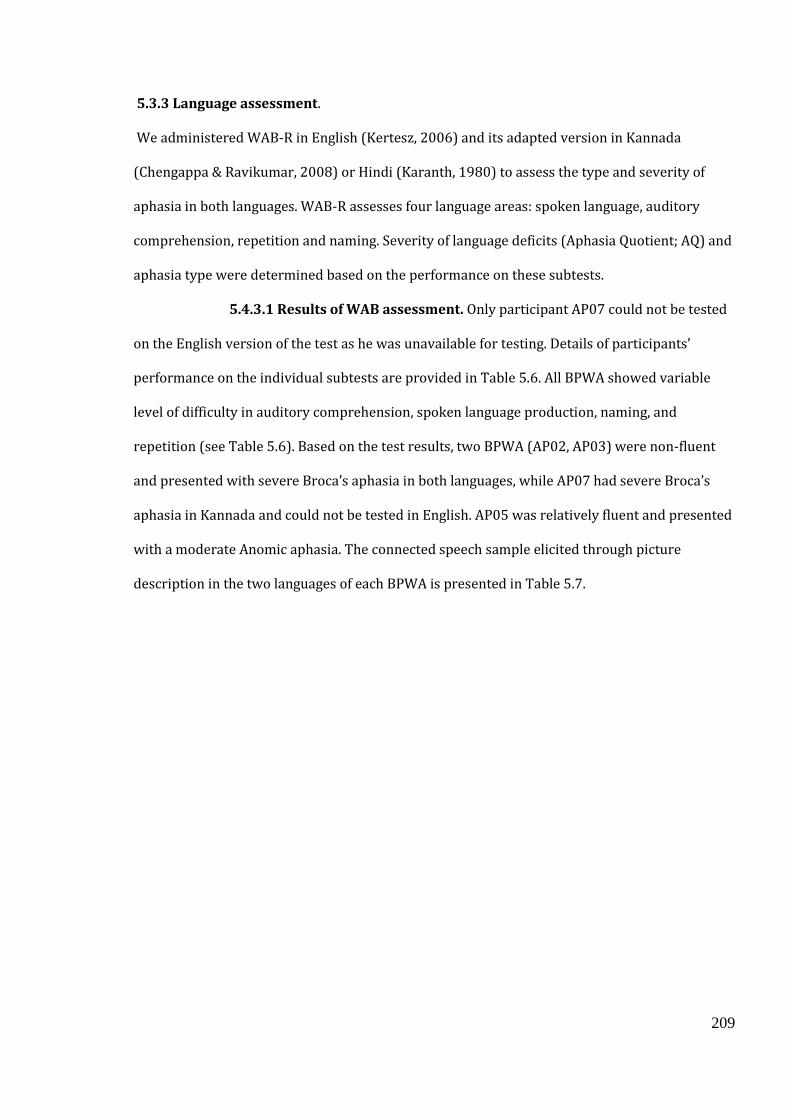
209
5.3.3 Language assessment.
We administered WAB-R in English (Kertesz, 2006) and its adapted version in Kannada
(Chengappa & Ravikumar, 2008) or Hindi (Karanth, 1980) to assess the type and severity of
aphasia in both languages. WAB-R assesses four language areas: spoken language, auditory
comprehension, repetition and naming. Severity of language deficits (Aphasia Quotient; AQ) and
aphasia type were determined based on the performance on these subtests.
5.4.3.1 Results of WAB assessment. Only participant AP07 could not be tested
on the English version of the test as he was unavailable for testing. Details of participants’
performance on the individual subtests are provided in Table 5.6. All BPWA showed variable
level of difficulty in auditory comprehension, spoken language production, naming, and
repetition (see Table 5.6). Based on the test results, two BPWA (AP02, AP03) were non-fluent
and presented with severe Broca’s aphasia in both languages, while AP07 had severe Broca’s
aphasia in Kannada and could not be tested in English. AP05 was relatively fluent and presented
with a moderate Anomic aphasia. The connected speech sample elicited through picture
description in the two languages of each BPWA is presented in Table 5.7.
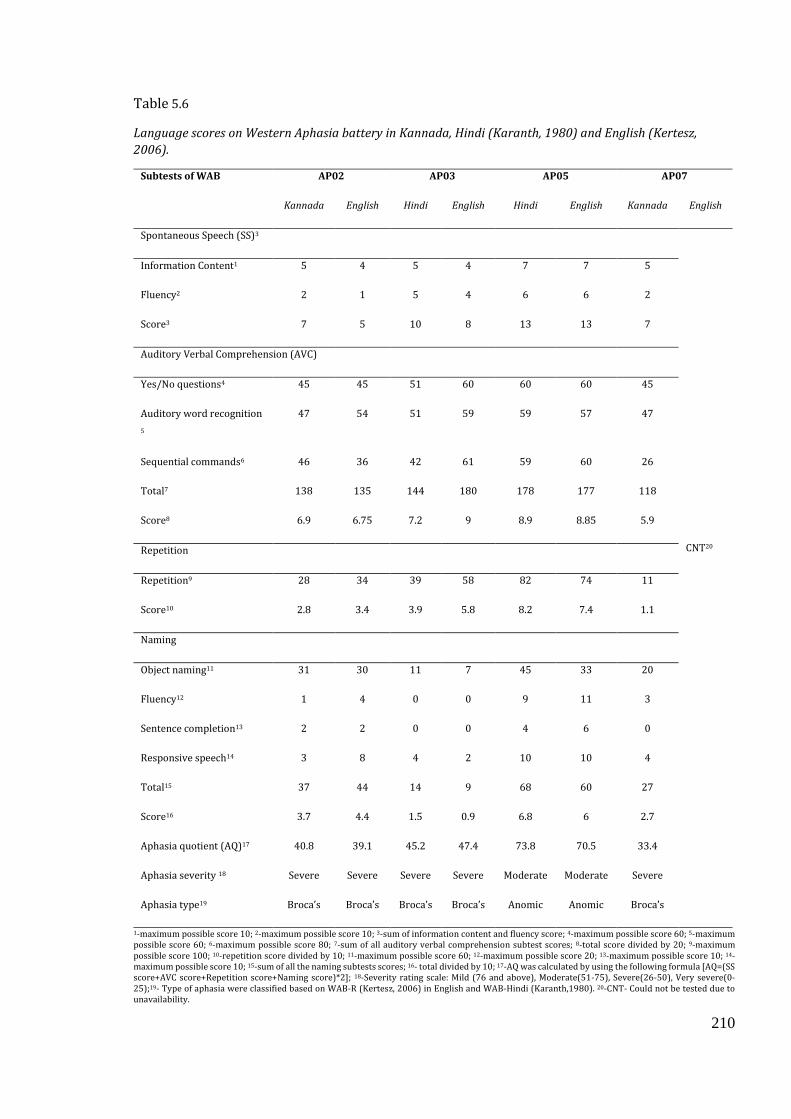
210
Table 5.6
Language scores on Western Aphasia battery in Kannada, Hindi (Karanth, 1980) and English (Kertesz,
2006).
Subtests of WAB AP02 AP03 AP05 AP07
Kannada English Hindi English Hindi English Kannada English
Spontaneous Speech (SS)3
CNT20
Information Content1 5 4 5 4 7 7 5
Fluency2 2 1 5 4 6 6 2
Score3 7 5 10 8 13 13 7
Auditory Verbal Comprehension (AVC)
Yes/No questions4 45 45 51 60 60 60 45
Auditory word recognition
5
47 54 51 59 59 57 47
Sequential commands6 46 36 42 61 59 60 26
Total7 138 135 144 180 178 177 118
Score8 6.9 6.75 7.2 9 8.9 8.85 5.9
Repetition
Repetition9 28 34 39 58 82 74 11
Score10 2.8 3.4 3.9 5.8 8.2 7.4 1.1
Naming
Object naming11 31 30 11 7 45 33 20
Fluency12 1 4 0 0 9 11 3
Sentence completion13 2 2 0 0 4 6 0
Responsive speech14 3 8 4 2 10 10 4
Total15 37 44 14 9 68 60 27
Score16 3.7 4.4 1.5 0.9 6.8 6 2.7
Aphasia quotient (AQ)17 40.8 39.1 45.2 47.4 73.8 70.5 33.4
Aphasia severity 18 Severe Severe Severe Severe Moderate Moderate Severe
Aphasia type19 Broca’s Broca’s Broca’s Broca’s Anomic Anomic Broca’s
1-maximum possible score 10; 2-maximum possible score 10; 3-sum of information content and fluency score; 4-maximum possible score 60; 5-maximum possible score 60; 6-maximum possible score 80; 7-sum of all auditory verbal comprehension subtest scores; 8-total score divided by 20; 9-maximum possible score 100; 10-repetition score divided by 10; 11-maximum possible score 60; 12-maximum possible score 20; 13-maximum possible score 10; 14-maximum possible score 10; 15-sum of all the naming subtests scores; 16- total divided by 10; 17-AQ was calculated by using the following formula [AQ=(SS score+AVC score+Repetition score+Naming score)*2]; 18-Severity rating scale: Mild (76 and above), Moderate(51-75), Severe(26-50), Very severe(0-25);19- Type of aphasia were classified based on WAB-R (Kertesz, 2006) in English and WAB-Hindi (Karanth,1980). 20-CNT- Could not be tested due to unavailability.
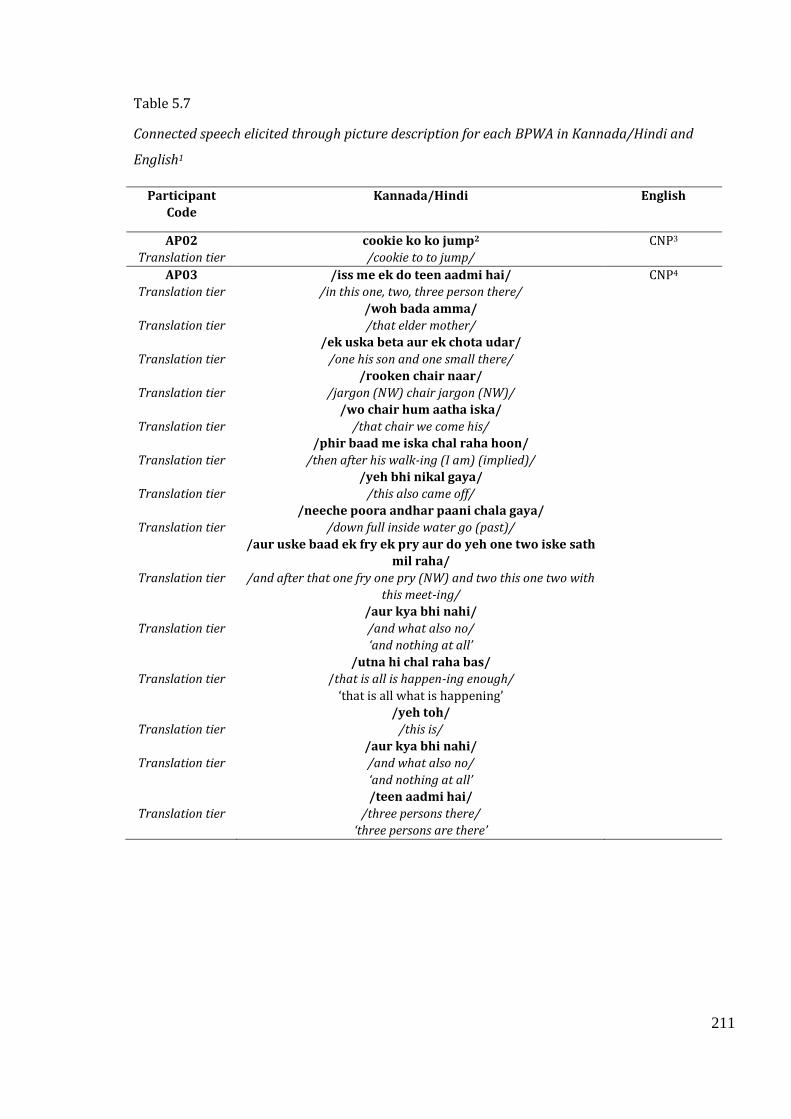
211
Table 5.7
Connected speech elicited through picture description for each BPWA in Kannada/Hindi and
English1
Participant
Code
Kannada/Hindi English
AP02
Translation tier
cookie ko ko jump2
/cookie to to jump/
CNP3
AP03
Translation tier
Translation tier
Translation tier
Translation tier
Translation tier
Translation tier
Translation tier
Translation tier
Translation tier
Translation tier
Translation tier
Translation tier
Translation tier
Translation tier
/iss me ek do teen aadmi hai/
/in this one, two, three person there/
/woh bada amma/
/that elder mother/
/ek uska beta aur ek chota udar/
/one his son and one small there/
/rooken chair naar/
/jargon (NW) chair jargon (NW)/
/wo chair hum aatha iska/
/that chair we come his/
/phir baad me iska chal raha hoon/
/then after his walk-ing (I am) (implied)/
/yeh bhi nikal gaya/
/this also came off/
/neeche poora andhar paani chala gaya/
/down full inside water go (past)/
/aur uske baad ek fry ek pry aur do yeh one two iske sath
mil raha/
/and after that one fry one pry (NW) and two this one two with
this meet-ing/
/aur kya bhi nahi/
/and what also no/
‘and nothing at all’
/utna hi chal raha bas/
/that is all is happen-ing enough/
‘that is all what is happening’
/yeh toh/
/this is/
/aur kya bhi nahi/
/and what also no/
‘and nothing at all’
/teen aadmi hai/
/three persons there/
‘three persons are there’
CNP4
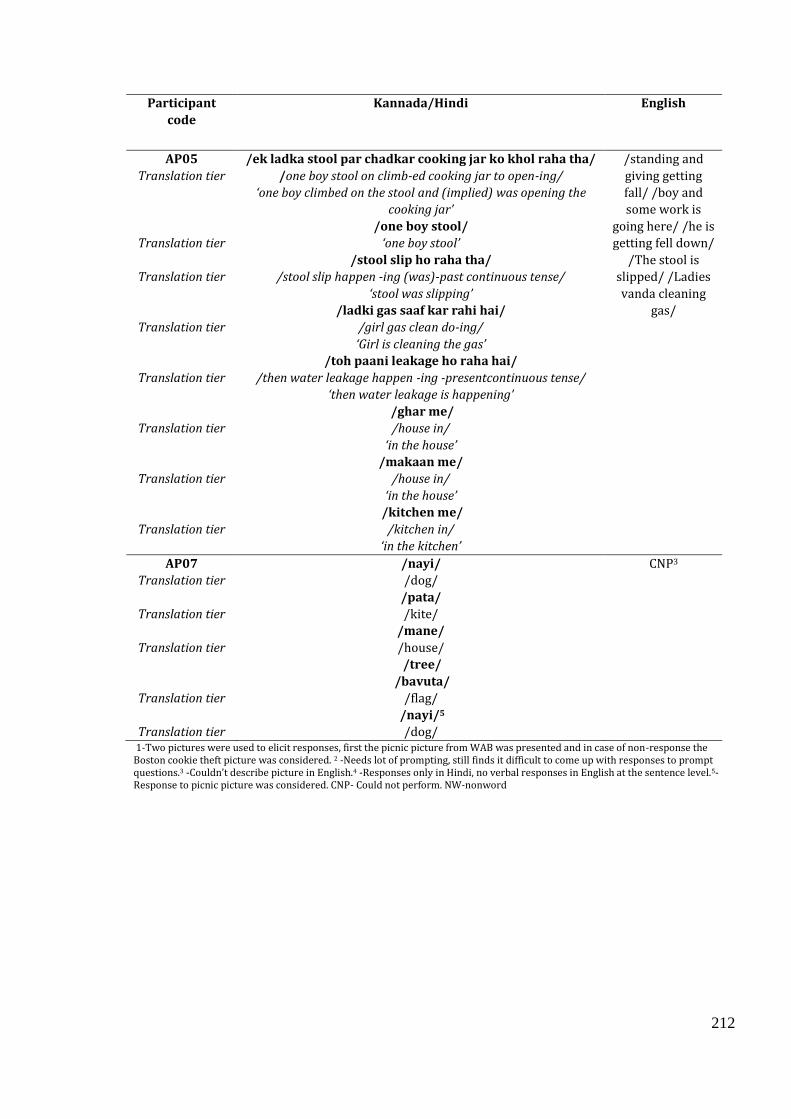
212
Participant
code
Kannada/Hindi English
AP05
Translation tier
Translation tier
Translation tier
Translation tier
Translation tier
Translation tier
Translation tier
Translation tier
/ek ladka stool par chadkar cooking jar ko khol raha tha/
/one boy stool on climb-ed cooking jar to open-ing/
‘one boy climbed on the stool and (implied) was opening the
cooking jar’
/one boy stool/
‘one boy stool’
/stool slip ho raha tha/
/stool slip happen -ing (was)-past continuous tense/
‘stool was slipping’
/ladki gas saaf kar rahi hai/
/girl gas clean do-ing/
‘Girl is cleaning the gas’
/toh paani leakage ho raha hai/
/then water leakage happen -ing -presentcontinuous tense/
‘then water leakage is happening’
/ghar me/
/house in/
‘in the house’
/makaan me/
/house in/
‘in the house’
/kitchen me/
/kitchen in/
‘in the kitchen’
/standing and
giving getting
fall/ /boy and
some work is
going here/ /he is
getting fell down/
/The stool is
slipped/ /Ladies
vanda cleaning
gas/
AP07
Translation tier
Translation tier
Translation tier
Translation tier
Translation tier
/nayi/
/dog/
/pata/
/kite/
/mane/
/house/
/tree/
/bavuta/
/flag/
/nayi/5
/dog/
CNP3
1-Two pictures were used to elicit responses, first the picnic picture from WAB was presented and in case of non-response the Boston cookie theft picture was considered. 2 -Needs lot of prompting, still finds it difficult to come up with responses to prompt questions.3 -Couldn’t describe picture in English.4 -Responses only in Hindi, no verbal responses in English at the sentence level.5- Response to picnic picture was considered. CNP- Could not perform. NW-nonword
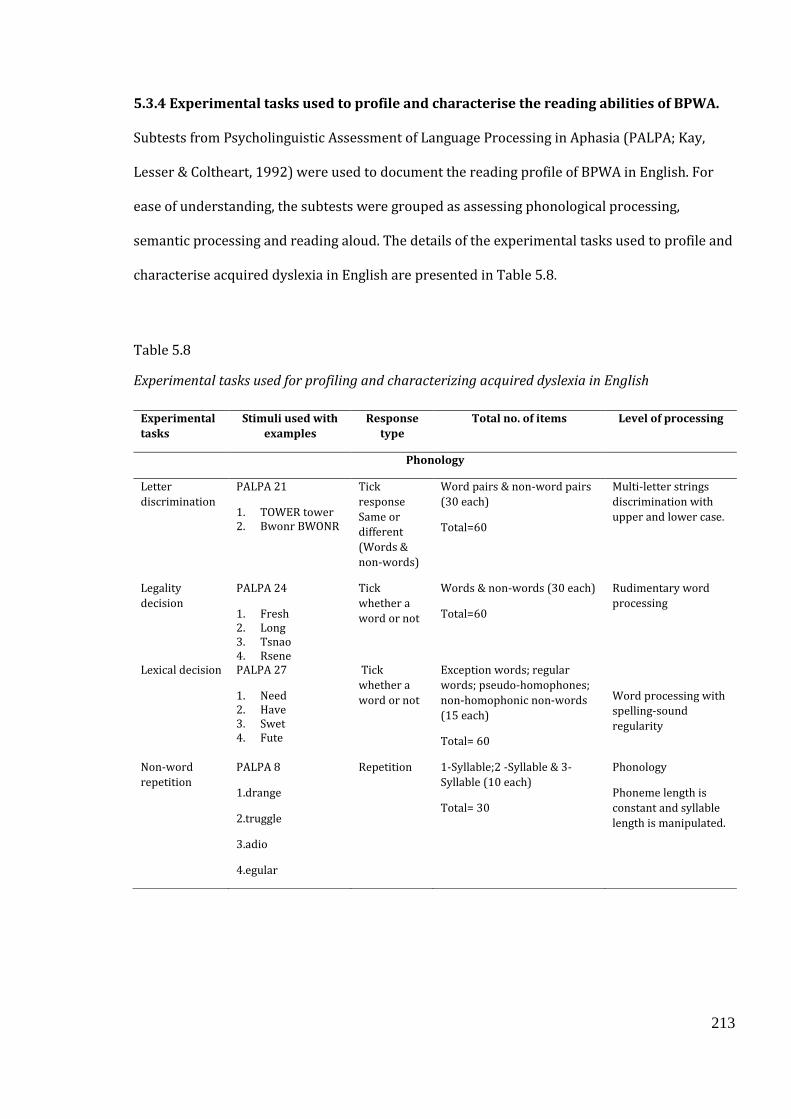
213
5.3.4 Experimental tasks used to profile and characterise the reading abilities of BPWA.
Subtests from Psycholinguistic Assessment of Language Processing in Aphasia (PALPA; Kay,
Lesser & Coltheart, 1992) were used to document the reading profile of BPWA in English. For
ease of understanding, the subtests were grouped as assessing phonological processing,
semantic processing and reading aloud. The details of the experimental tasks used to profile and
characterise acquired dyslexia in English are presented in Table 5.8.
Table 5.8
Experimental tasks used for profiling and characterizing acquired dyslexia in English
Experimental
tasks
Stimuli used with
examples
Response
type
Total no. of items Level of processing
Phonology
Letter
discrimination
PALPA 21
1. TOWER tower 2. Bwonr BWONR
Tick
response
Same or
different
(Words &
non-words)
Word pairs & non-word pairs
(30 each)
Total=60
Multi-letter strings
discrimination with
upper and lower case.
Legality
decision
PALPA 24
1. Fresh 2. Long 3. Tsnao 4. Rsene
Tick
whether a
word or not
Words & non-words (30 each)
Total=60
Rudimentary word
processing
Lexical decision PALPA 27
1. Need 2. Have 3. Swet 4. Fute
Tick
whether a
word or not
Exception words; regular
words; pseudo-homophones;
non-homophonic non-words
(15 each)
Total= 60
Word processing with
spelling-sound
regularity
Non-word
repetition
PALPA 8
1.drange
2.truggle
3.adio
4.egular
Repetition 1-Syllable;2 -Syllable & 3-
Syllable (10 each)
Total= 30
Phonology
Phoneme length is
constant and syllable
length is manipulated.
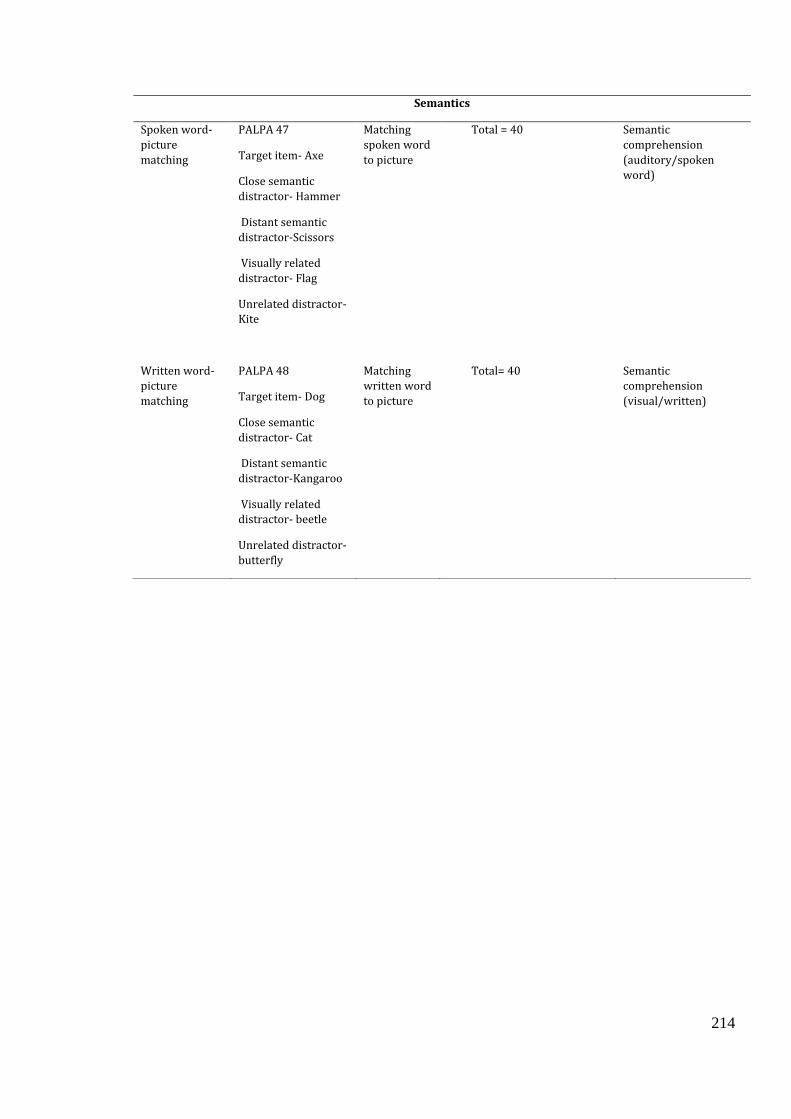
214
Semantics
Spoken word-
picture
matching
PALPA 47
Target item- Axe
Close semantic
distractor- Hammer
Distant semantic
distractor-Scissors
Visually related
distractor- Flag
Unrelated distractor-
Kite
Matching
spoken word
to picture
Total = 40 Semantic
comprehension
(auditory/spoken
word)
Written word-
picture
matching
PALPA 48
Target item- Dog
Close semantic
distractor- Cat
Distant semantic
distractor-Kangaroo
Visually related
distractor- beetle
Unrelated distractor-
butterfly
Matching
written word
to picture
Total= 40 Semantic
comprehension
(visual/written)
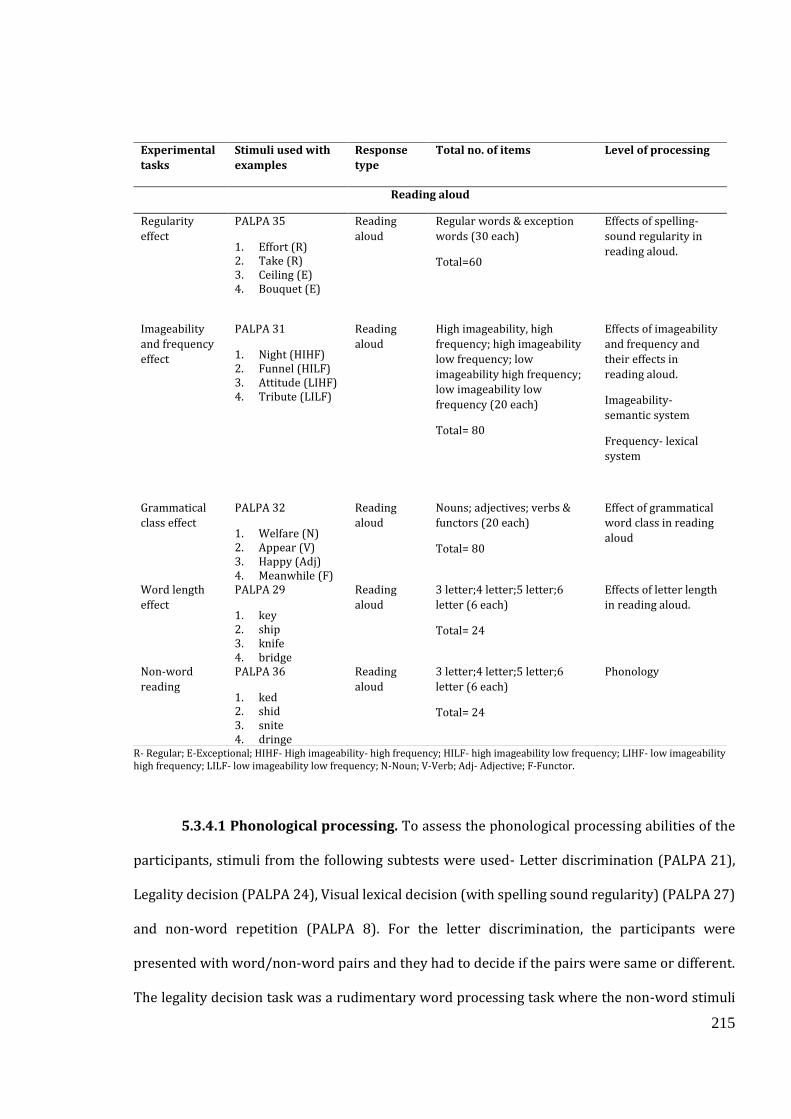
215
R- Regular; E-Exceptional; HIHF- High imageability- high frequency; HILF- high imageability low frequency; LIHF- low imageability high frequency; LILF- low imageability low frequency; N-Noun; V-Verb; Adj- Adjective; F-Functor.
5.3.4.1 Phonological processing. To assess the phonological processing abilities of the
participants, stimuli from the following subtests were used- Letter discrimination (PALPA 21),
Legality decision (PALPA 24), Visual lexical decision (with spelling sound regularity) (PALPA 27)
and non-word repetition (PALPA 8). For the letter discrimination, the participants were
presented with word/non-word pairs and they had to decide if the pairs were same or different.
The legality decision task was a rudimentary word processing task where the non-word stimuli
Experimental
tasks
Stimuli used with
examples
Response
type
Total no. of items Level of processing
Reading aloud
Regularity
effect
PALPA 35
1. Effort (R) 2. Take (R) 3. Ceiling (E) 4. Bouquet (E)
Reading
aloud
Regular words & exception
words (30 each)
Total=60
Effects of spelling-
sound regularity in
reading aloud.
Imageability
and frequency
effect
PALPA 31
1. Night (HIHF) 2. Funnel (HILF) 3. Attitude (LIHF) 4. Tribute (LILF)
Reading
aloud
High imageability, high
frequency; high imageability
low frequency; low
imageability high frequency;
low imageability low
frequency (20 each)
Total= 80
Effects of imageability
and frequency and
their effects in
reading aloud.
Imageability-
semantic system
Frequency- lexical
system
Grammatical
class effect
PALPA 32
1. Welfare (N) 2. Appear (V) 3. Happy (Adj) 4. Meanwhile (F)
Reading
aloud
Nouns; adjectives; verbs &
functors (20 each)
Total= 80
Effect of grammatical
word class in reading
aloud
Word length
effect
PALPA 29
1. key 2. ship 3. knife 4. bridge
Reading
aloud
3 letter;4 letter;5 letter;6
letter (6 each)
Total= 24
Effects of letter length
in reading aloud.
Non-word
reading
PALPA 36
1. ked 2. shid 3. snite 4. dringe
Reading
aloud
3 letter;4 letter;5 letter;6
letter (6 each)
Total= 24
Phonology
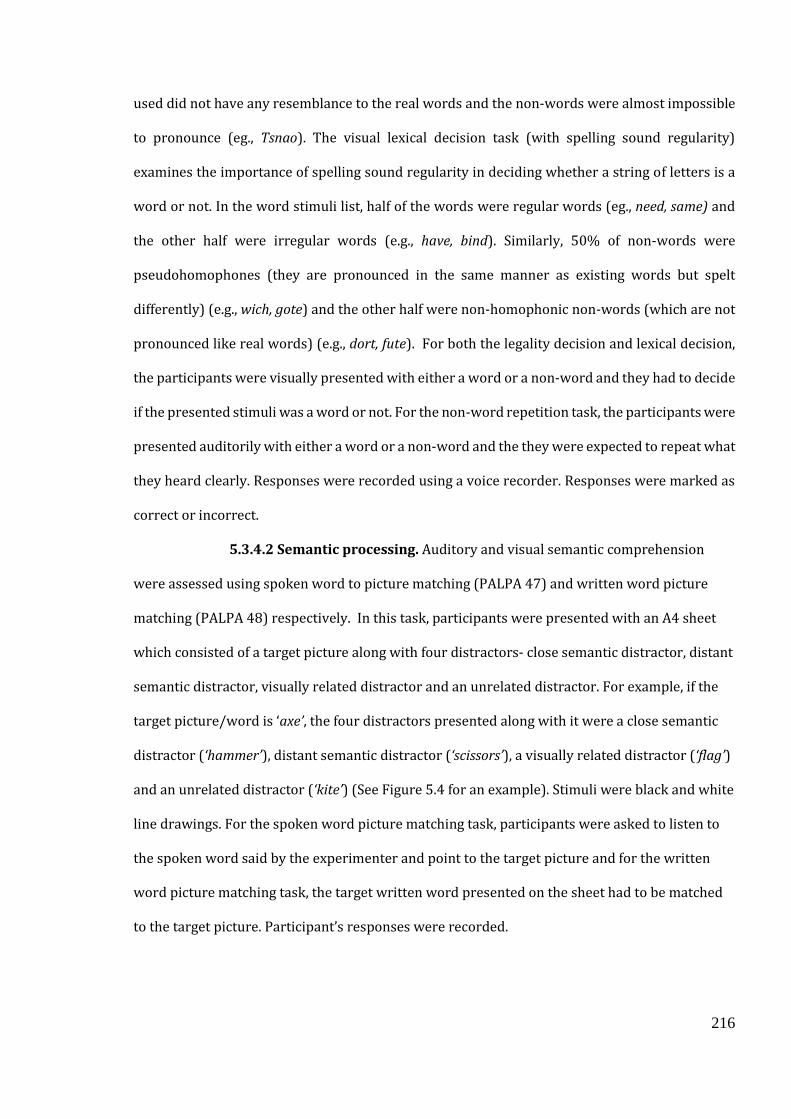
216
used did not have any resemblance to the real words and the non-words were almost impossible
to pronounce (eg., Tsnao). The visual lexical decision task (with spelling sound regularity)
examines the importance of spelling sound regularity in deciding whether a string of letters is a
word or not. In the word stimuli list, half of the words were regular words (eg., need, same) and
the other half were irregular words (e.g., have, bind). Similarly, 50% of non-words were
pseudohomophones (they are pronounced in the same manner as existing words but spelt
differently) (e.g., wich, gote) and the other half were non-homophonic non-words (which are not
pronounced like real words) (e.g., dort, fute). For both the legality decision and lexical decision,
the participants were visually presented with either a word or a non-word and they had to decide
if the presented stimuli was a word or not. For the non-word repetition task, the participants were
presented auditorily with either a word or a non-word and the they were expected to repeat what
they heard clearly. Responses were recorded using a voice recorder. Responses were marked as
correct or incorrect.
5.3.4.2 Semantic processing. Auditory and visual semantic comprehension
were assessed using spoken word to picture matching (PALPA 47) and written word picture
matching (PALPA 48) respectively. In this task, participants were presented with an A4 sheet
which consisted of a target picture along with four distractors- close semantic distractor, distant
semantic distractor, visually related distractor and an unrelated distractor. For example, if the
target picture/word is ‘axe’, the four distractors presented along with it were a close semantic
distractor (‘hammer’), distant semantic distractor (‘scissors’), a visually related distractor (‘flag’)
and an unrelated distractor (‘kite’) (See Figure 5.4 for an example). Stimuli were black and white
line drawings. For the spoken word picture matching task, participants were asked to listen to
the spoken word said by the experimenter and point to the target picture and for the written
word picture matching task, the target written word presented on the sheet had to be matched
to the target picture. Participant’s responses were recorded.

217
Figure 5.4 Sample stimuli used for spoken word panel (a –left ) and written word picture
matching task panel (b –right ). For spoken word picture matching (panel a)-The target picture
is ‘carrot’, the close semantic distractor is (‘cabbage’), distant semantic distractor (‘lemon’), a
visually related distractor (‘saw’) and an unrelated distractor (‘chisel’). For written word picture
matching (panel b) The target word is ‘axe’, the close semantic distractor is (‘hammer’), distant
semantic distractor (‘scissors’), a visually related distractor (‘flag’) and an unrelated distractor
(‘kite’).
5.3.4.3 Reading aloud. Considering the characteristics of the different types of acquired
dyslexia, the participants were tested on the following subtests of PALPA- spelling sound
regularity reading (PALPA 35)(measuring spelling sound regularity), imageability and
frequency reading (PALPA 31)(measuring imageability and frequency), grammatical class
reading(PALPA 32)( measuring grammatical class effect), word length reading (PALPA 29)
(measuring word length effect) and non-word reading (PALPA 36) [assesses the integrity of the
non-lexical pathway (Bakthiar, Jafary & Weekes, 2017)]. For each of these sub-tests, participants
were shown one written word at a time on a sheet of paper and were instructed to read the
word aloud. Responses were recorded using a voice recorder. Responses were marked as
correct or incorrect. Incorrect responses were classified into different error types. The
description of errors with examples is presented in table 5.9.
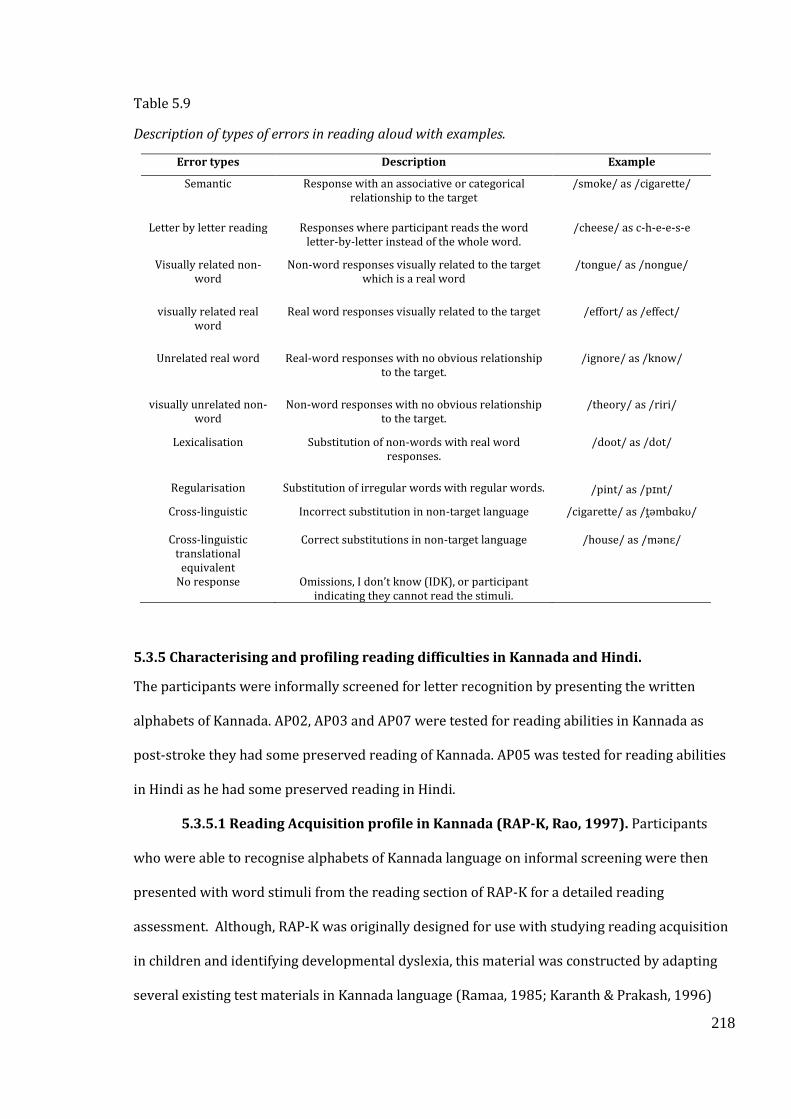
218
Table 5.9
Description of types of errors in reading aloud with examples.
Error types Description Example
Semantic Response with an associative or categorical relationship to the target
/smoke/ as /cigarette/
Letter by letter reading Responses where participant reads the word letter-by-letter instead of the whole word.
/cheese/ as c-h-e-e-s-e
Visually related non-word
Non-word responses visually related to the target which is a real word
/tongue/ as /nongue/
visually related real word
Real word responses visually related to the target /effort/ as /effect/
Unrelated real word Real-word responses with no obvious relationship to the target.
/ignore/ as /know/
visually unrelated non-word
Non-word responses with no obvious relationship to the target.
/theory/ as /riri/
Lexicalisation Substitution of non-words with real word responses.
/doot/ as /dot/
Regularisation Substitution of irregular words with regular words. /pint/ as /pɪnt/
Cross-linguistic Incorrect substitution in non-target language /cigarette/ as /t̪əmbɑkʊ/
Cross-linguistic translational
equivalent
Correct substitutions in non-target language /house/ as /mənɛ/
No response Omissions, I don’t know (IDK), or participant indicating they cannot read the stimuli.
5.3.5 Characterising and profiling reading difficulties in Kannada and Hindi.
The participants were informally screened for letter recognition by presenting the written
alphabets of Kannada. AP02, AP03 and AP07 were tested for reading abilities in Kannada as
post-stroke they had some preserved reading of Kannada. AP05 was tested for reading abilities
in Hindi as he had some preserved reading in Hindi.
5.3.5.1 Reading Acquisition profile in Kannada (RAP-K, Rao, 1997). Participants
who were able to recognise alphabets of Kannada language on informal screening were then
presented with word stimuli from the reading section of RAP-K for a detailed reading
assessment. Although, RAP-K was originally designed for use with studying reading acquisition
in children and identifying developmental dyslexia, this material was constructed by adapting
several existing test materials in Kannada language (Ramaa, 1985; Karanth & Prakash, 1996)
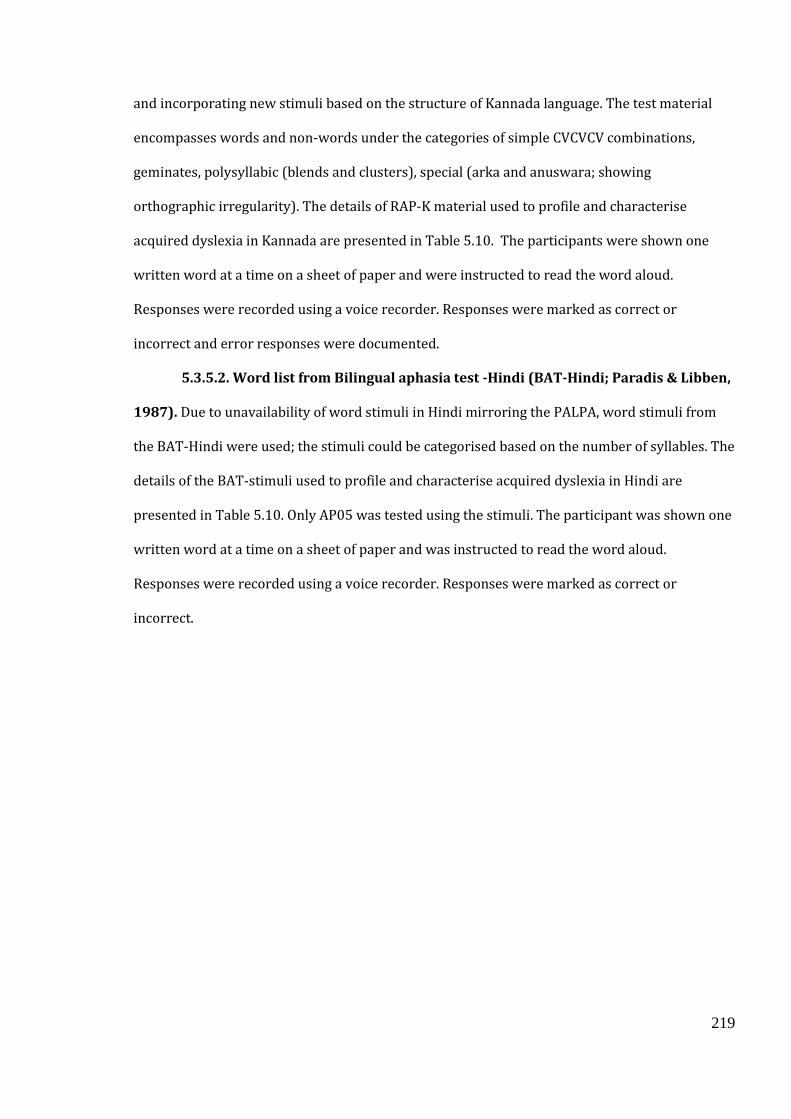
219
and incorporating new stimuli based on the structure of Kannada language. The test material
encompasses words and non-words under the categories of simple CVCVCV combinations,
geminates, polysyllabic (blends and clusters), special (arka and anuswara; showing
orthographic irregularity). The details of RAP-K material used to profile and characterise
acquired dyslexia in Kannada are presented in Table 5.10. The participants were shown one
written word at a time on a sheet of paper and were instructed to read the word aloud.
Responses were recorded using a voice recorder. Responses were marked as correct or
incorrect and error responses were documented.
5.3.5.2. Word list from Bilingual aphasia test -Hindi (BAT-Hindi; Paradis & Libben,
1987). Due to unavailability of word stimuli in Hindi mirroring the PALPA, word stimuli from
the BAT-Hindi were used; the stimuli could be categorised based on the number of syllables. The
details of the BAT-stimuli used to profile and characterise acquired dyslexia in Hindi are
presented in Table 5.10. Only AP05 was tested using the stimuli. The participant was shown one
written word at a time on a sheet of paper and was instructed to read the word aloud.
Responses were recorded using a voice recorder. Responses were marked as correct or
incorrect.
220
Table 5.10
Stimuli used to profile and characterise acquired dyslexia in Kannada and Hindi
Sub-tests of
RAP-K
Example stimuli Response type Number of
items
Level of
processing
Simple words
(CVCVCV)
/mələjɑ/
/kərəgɑ/
/jət̪ənɑ/
/ləbət̪ɑ/
Reading aloud Words and
non-words
(20 each)
Total = 40
Consonant
vowel
combinations
Geminates /əbbərɑ/
/kət̪t̪əlʊ/
/hʊnəbbɪ/
/nɛt̪t̪əkkʊ/
Reading aloud Words and
non-words
(10 each)
Total = 20
Consonants
longer than
singleton
consonants
Polysyllabic
words
/hallud͡ʒd͡ʒʊt̪t̪ɑ/
/rɛkkɛpʊkkɑ/
/nɑkeːrɪl̥ɑ/
/sʊt̪t̪ərɪkɑ/
Reading aloud Words and
non-words
(10 each)
Total = 20
Syllable length
Special words
(measuring
irregularity)
/kɑrmɪkɑ/
/bʰəŋɑ/
/pərt̪vənərɪ/
/ɑrələ̃kɑ/
Reading aloud Words and
non-words
(10 each)
Total = 20
Orthographic
irregularity
Words from
Bilingual
aphasia test-
Hindi (BAT-
Hindi)
/pɛd̥/
/kəmi:ʒ/
/ʊd̪ɑsɪ/
Reading aloud 1 syllable X6;
2 syllable X
12;
3 syllable X 6
Total =24
Syllable length
221
5.4 Statistical Analyses
The correct responses from each of the tasks were averaged to obtain a mean score. This
mean score was converted into percent correct score. A case series approach was employed to
profile the reading impairments of the participants. A within-subject design was used to
compare the performance of each participants on the sub-tests of PALPA for the reading aloud
tasks. Chi-square tests were used to determine the effects of word length, imageability,
frequency, regularity, grammatical class and lexicality effects in word and non-word reading
aloud tasks. An Alpha level of 0.05 was used to determine the level of significance.
The incorrect responses in reading aloud were classified into different types of errors
and an error distribution pattern for each BPWA was documented to further facilitate the
classification of dyslexia based on proportion and type of errors.
222
5.5 Results
The results will be presented as performance of individual BPWA (AP02, AP03, AP05 and AP07)
with reference to their performance on their language background measures and on tasks of
phonological processing, semantic processing and reading aloud tested using PALPA in English
and performance of participants in Kannada reading aloud using RAP-K. The performance of the
BPWA on phonological processing, semantic processing and reading aloud tasks in English are
presented in Table 5.11. The performance of BPWA (AP03) on reading aloud tasks of Kannada
are presented in Table 5.12. The error profile of BPWA on non-word repetition and reading
aloud subtests of PALPA are presented in Table 5.13.
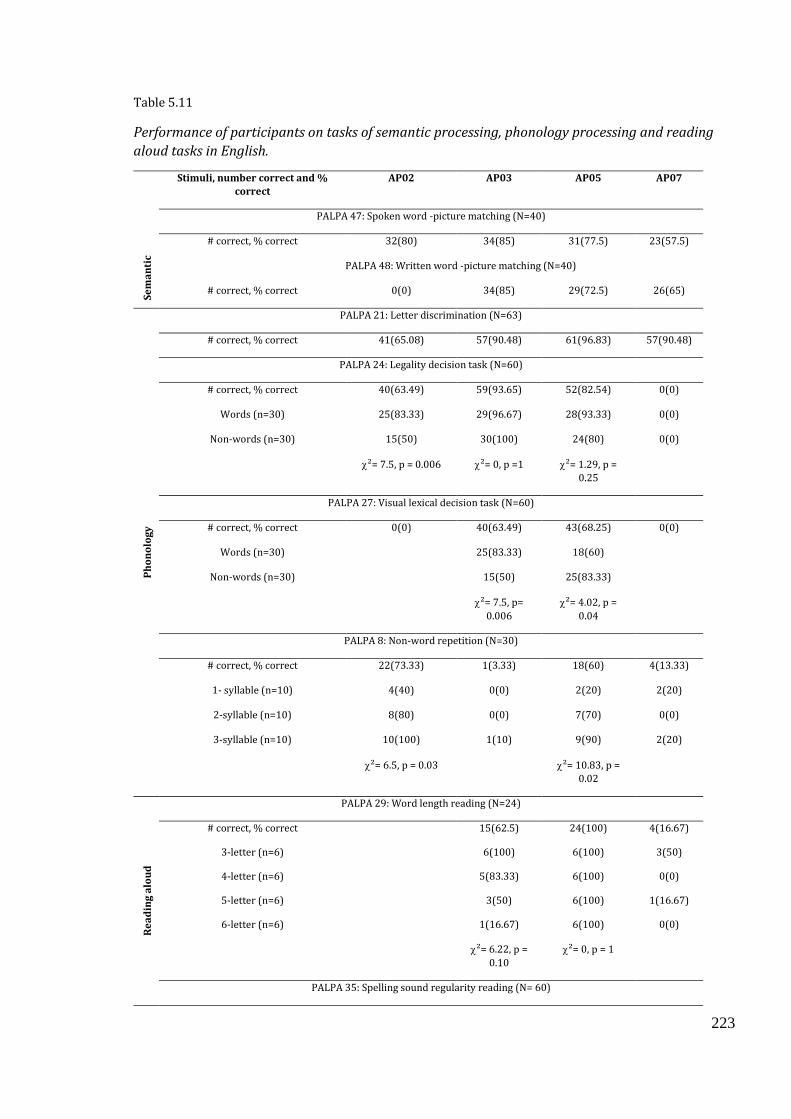
223
Table 5.11
Performance of participants on tasks of semantic processing, phonology processing and reading
aloud tasks in English.
Stimuli, number correct and %
correct
AP02 AP03 AP05 AP07
Se
ma
nti
c
PALPA 47: Spoken word -picture matching (N=40)
# correct, % correct 32(80) 34(85) 31(77.5) 23(57.5)
PALPA 48: Written word -picture matching (N=40)
# correct, % correct 0(0) 34(85) 29(72.5) 26(65)
Ph
on
olo
gy
PALPA 21: Letter discrimination (N=63)
# correct, % correct 41(65.08) 57(90.48) 61(96.83) 57(90.48)
PALPA 24: Legality decision task (N=60)
# correct, % correct 40(63.49) 59(93.65) 52(82.54) 0(0)
Words (n=30) 25(83.33) 29(96.67) 28(93.33) 0(0)
Non-words (n=30) 15(50) 30(100) 24(80) 0(0)
²= 7.5, p = 0.006 ²= 0, p =1 ²= 1.29, p =
0.25
PALPA 27: Visual lexical decision task (N=60)
# correct, % correct 0(0) 40(63.49) 43(68.25) 0(0)
Words (n=30)
25(83.33) 18(60)
Non-words (n=30)
15(50) 25(83.33)
²= 7.5, p=
0.006
²= 4.02, p =
0.04
PALPA 8: Non-word repetition (N=30)
# correct, % correct 22(73.33) 1(3.33) 18(60) 4(13.33)
1- syllable (n=10) 4(40) 0(0) 2(20) 2(20)
2-syllable (n=10) 8(80) 0(0) 7(70) 0(0)
3-syllable (n=10) 10(100) 1(10) 9(90) 2(20)
²= 6.5, p = 0.03
²= 10.83, p =
0.02
Re
ad
ing
alo
ud
PALPA 29: Word length reading (N=24)
# correct, % correct
15(62.5) 24(100) 4(16.67)
3-letter (n=6)
6(100) 6(100) 3(50)
4-letter (n=6)
5(83.33) 6(100) 0(0)
5-letter (n=6)
3(50) 6(100) 1(16.67)
6-letter (n=6)
1(16.67) 6(100) 0(0)
²= 6.22, p =
0.10
²= 0, p = 1
PALPA 35: Spelling sound regularity reading (N= 60)
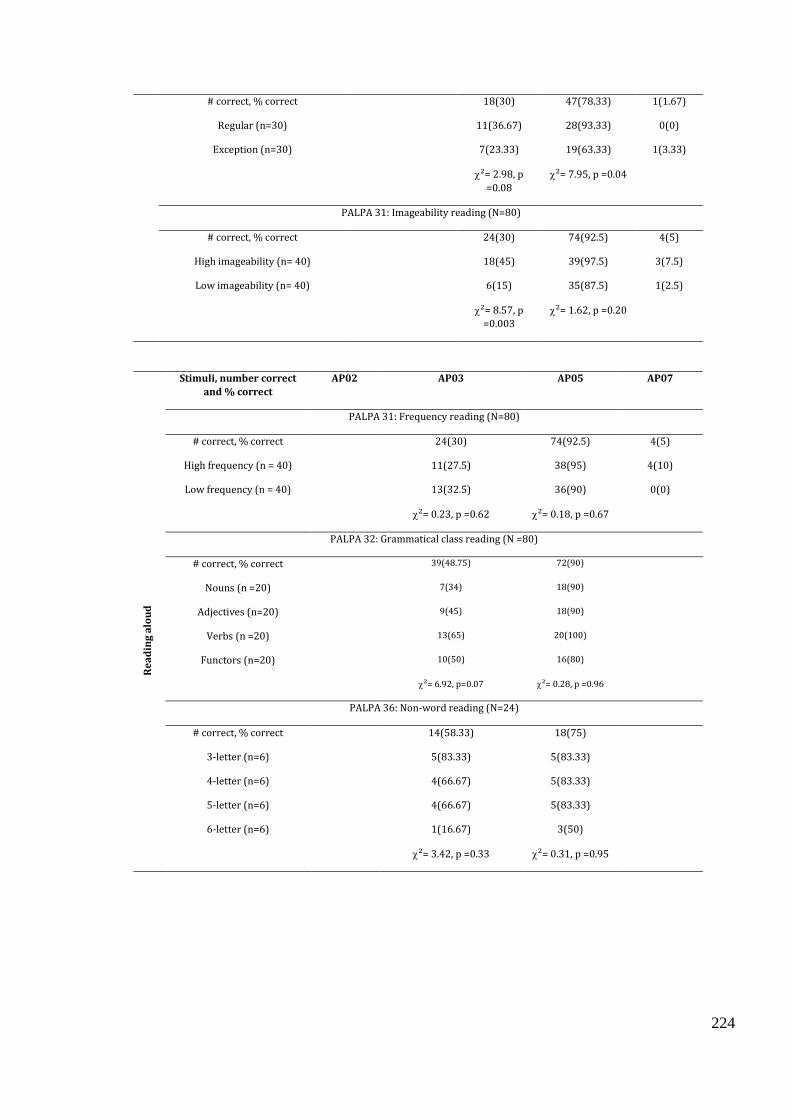
224
# correct, % correct
18(30) 47(78.33) 1(1.67)
Regular (n=30)
11(36.67) 28(93.33) 0(0)
Exception (n=30)
7(23.33) 19(63.33) 1(3.33)
²= 2.98, p
=0.08
²= 7.95, p =0.04
PALPA 31: Imageability reading (N=80)
# correct, % correct
24(30) 74(92.5) 4(5)
High imageability (n= 40)
18(45) 39(97.5) 3(7.5)
Low imageability (n= 40)
6(15) 35(87.5) 1(2.5)
²= 8.57, p
=0.003
²= 1.62, p =0.20
Stimuli, number correct
and % correct
AP02 AP03 AP05 AP07
Re
ad
ing
alo
ud
PALPA 31: Frequency reading (N=80)
# correct, % correct 24(30) 74(92.5) 4(5)
High frequency (n = 40) 11(27.5) 38(95) 4(10)
Low frequency (n = 40) 13(32.5) 36(90) 0(0)
²= 0.23, p =0.62 ²= 0.18, p =0.67
PALPA 32: Grammatical class reading (N =80)
# correct, % correct
39(48.75) 72(90)
Nouns (n =20)
7(34) 18(90)
Adjectives (n=20)
9(45) 18(90)
Verbs (n =20)
13(65) 20(100)
Functors (n=20)
10(50) 16(80)
²= 6.92, p=0.07 ²= 0.28, p =0.96
PALPA 36: Non-word reading (N=24)
# correct, % correct
14(58.33) 18(75)
3-letter (n=6)
5(83.33) 5(83.33)
4-letter (n=6)
4(66.67) 5(83.33)
5-letter (n=6)
4(66.67) 5(83.33)
6-letter (n=6)
1(16.67) 3(50)
²= 3.42, p =0.33 ²= 0.31, p =0.95
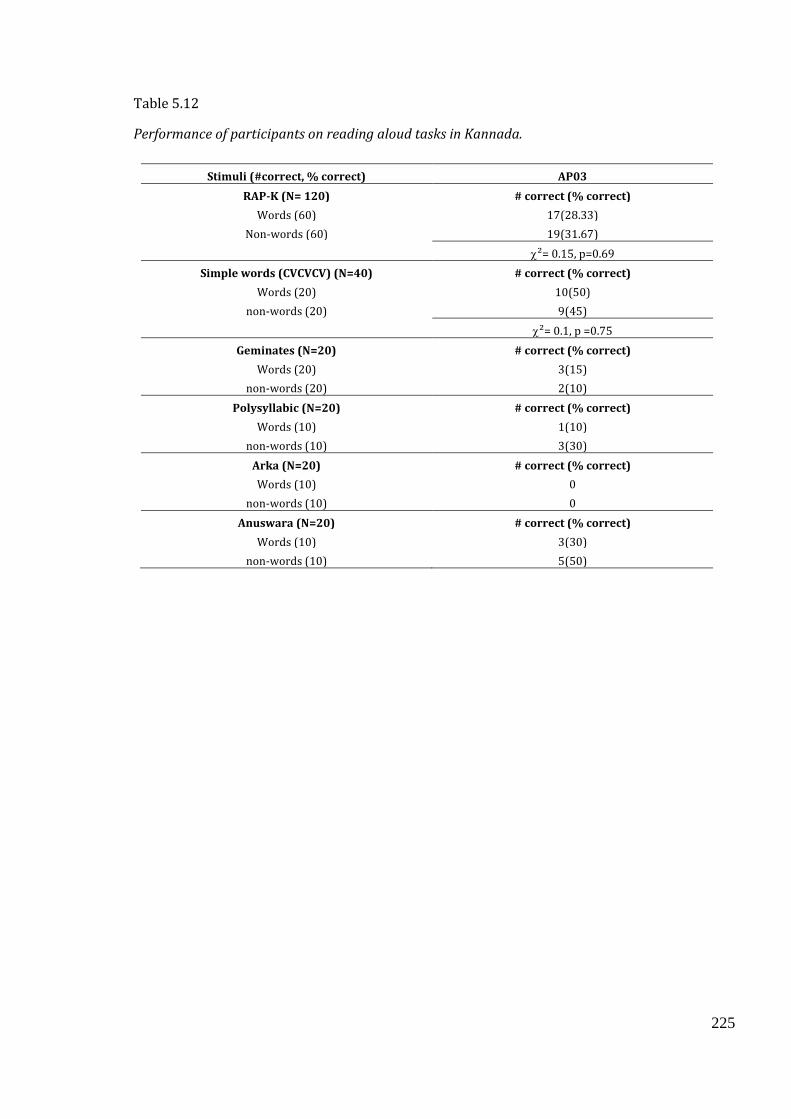
225
Table 5.12
Performance of participants on reading aloud tasks in Kannada.
Stimuli (#correct, % correct) AP03
RAP-K (N= 120) # correct (% correct)
Words (60) 17(28.33)
Non-words (60) 19(31.67)
²= 0.15, p=0.69
Simple words (CVCVCV) (N=40) # correct (% correct)
Words (20) 10(50)
non-words (20) 9(45)
²= 0.1, p =0.75
Geminates (N=20) # correct (% correct)
Words (20) 3(15)
non-words (20) 2(10)
Polysyllabic (N=20) # correct (% correct)
Words (10) 1(10)
non-words (10) 3(30)
Arka (N=20) # correct (% correct)
Words (10) 0
non-words (10) 0
Anuswara (N=20) # correct (% correct)
Words (10) 3(30)
non-words (10) 5(50)
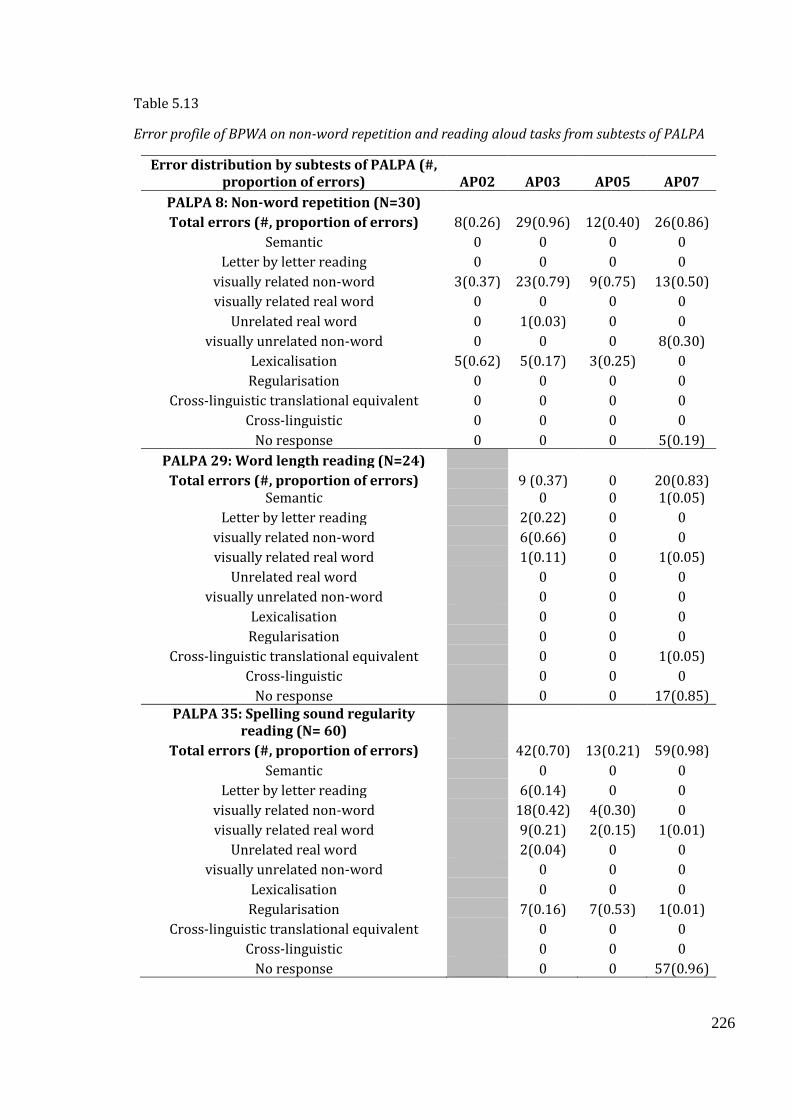
226
Table 5.13
Error profile of BPWA on non-word repetition and reading aloud tasks from subtests of PALPA
Error distribution by subtests of PALPA (#, proportion of errors) AP02 AP03 AP05 AP07
PALPA 8: Non-word repetition (N=30)
Total errors (#, proportion of errors) 8(0.26) 29(0.96) 12(0.40) 26(0.86)
Semantic 0 0 0 0
Letter by letter reading 0 0 0 0
visually related non-word 3(0.37) 23(0.79) 9(0.75) 13(0.50)
visually related real word 0 0 0 0
Unrelated real word 0 1(0.03) 0 0
visually unrelated non-word 0 0 0 8(0.30)
Lexicalisation 5(0.62) 5(0.17) 3(0.25) 0
Regularisation 0 0 0 0
Cross-linguistic translational equivalent 0 0 0 0
Cross-linguistic 0 0 0 0
No response 0 0 0 5(0.19)
PALPA 29: Word length reading (N=24)
Total errors (#, proportion of errors) 9 (0.37) 0 20(0.83) Semantic 0 0 1(0.05)
Letter by letter reading 2(0.22) 0 0
visually related non-word 6(0.66) 0 0
visually related real word 1(0.11) 0 1(0.05)
Unrelated real word 0 0 0
visually unrelated non-word 0 0 0
Lexicalisation 0 0 0
Regularisation 0 0 0
Cross-linguistic translational equivalent 0 0 1(0.05)
Cross-linguistic 0 0 0
No response 0 0 17(0.85) PALPA 35: Spelling sound regularity
reading (N= 60)
Total errors (#, proportion of errors) 42(0.70) 13(0.21) 59(0.98)
Semantic 0 0 0
Letter by letter reading 6(0.14) 0 0
visually related non-word 18(0.42) 4(0.30) 0
visually related real word 9(0.21) 2(0.15) 1(0.01)
Unrelated real word 2(0.04) 0 0
visually unrelated non-word 0 0 0
Lexicalisation 0 0 0
Regularisation 7(0.16) 7(0.53) 1(0.01)
Cross-linguistic translational equivalent 0 0 0
Cross-linguistic 0 0 0
No response 0 0 57(0.96)
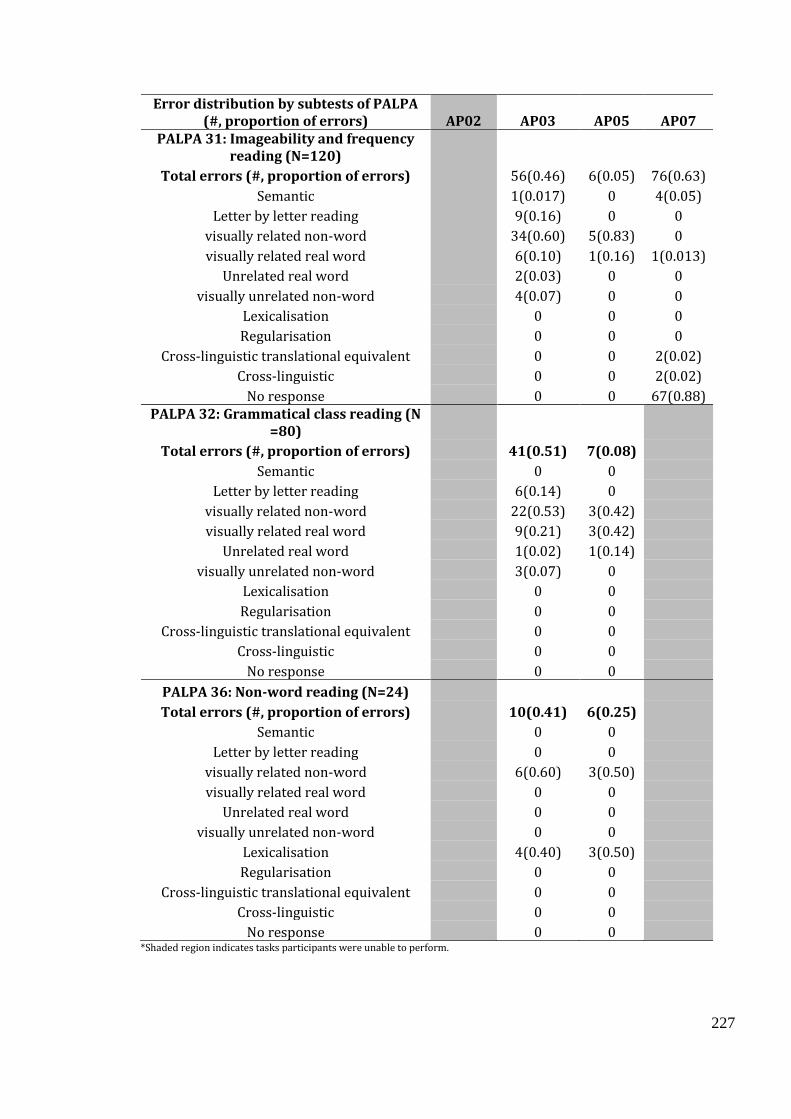
227
Error distribution by subtests of PALPA (#, proportion of errors) AP02 AP03 AP05 AP07
PALPA 31: Imageability and frequency reading (N=120)
Total errors (#, proportion of errors) 56(0.46) 6(0.05) 76(0.63)
Semantic 1(0.017) 0 4(0.05)
Letter by letter reading 9(0.16) 0 0
visually related non-word 34(0.60) 5(0.83) 0
visually related real word 6(0.10) 1(0.16) 1(0.013)
Unrelated real word 2(0.03) 0 0
visually unrelated non-word 4(0.07) 0 0
Lexicalisation 0 0 0
Regularisation 0 0 0
Cross-linguistic translational equivalent 0 0 2(0.02)
Cross-linguistic 0 0 2(0.02)
No response 0 0 67(0.88) PALPA 32: Grammatical class reading (N
=80)
Total errors (#, proportion of errors) 41(0.51) 7(0.08)
Semantic 0 0
Letter by letter reading 6(0.14) 0
visually related non-word 22(0.53) 3(0.42)
visually related real word 9(0.21) 3(0.42)
Unrelated real word 1(0.02) 1(0.14)
visually unrelated non-word 3(0.07) 0
Lexicalisation 0 0
Regularisation 0 0
Cross-linguistic translational equivalent 0 0
Cross-linguistic 0 0
No response 0 0
PALPA 36: Non-word reading (N=24)
Total errors (#, proportion of errors) 10(0.41) 6(0.25)
Semantic 0 0
Letter by letter reading 0 0
visually related non-word 6(0.60) 3(0.50)
visually related real word 0 0
Unrelated real word 0 0
visually unrelated non-word 0 0
Lexicalisation 4(0.40) 3(0.50)
Regularisation 0 0
Cross-linguistic translational equivalent 0 0
Cross-linguistic 0 0
No response 0 0 *Shaded region indicates tasks participants were unable to perform.
228
5.5.1 Performance of AP02 on experimental tasks
AP02 was a BPWA with Kannada as his native language and English as his second language. Pre-
stroke, he had a greater proficiency in English compared to Kannada, but used Kannada more
frequently compared to English. Post-stroke this changed, with a higher proficiency in Kannada
compared to English and usage of both the languages were limited owing to his language
impairment. The reading proficiency was similar in both the languages (Kannada: 4, English:
5.5) prior to the stroke, whereas post-stroke reading was the most affected (Kannada: 1.75;
English: 1). He was diagnosed with Broca’s aphasia in both the languages.
On the spoken word picture matching task, AP02 produced 80% correct responses. He
was unable to perform the written word picture matching task. AP02’s performance on all of
the phonological processing tasks were considerably impaired. He was able to discriminate
letters in English with 65% accuracy and was 64% accurate on legality decision task with a
higher percentage of words correctly identified compared to non-words (words: 83%; non-
words: 50%). He was unable to perform the visual lexical decision task in English. However, he
was 73% accurate on the non-word repetition task and there was a significant difference in
performance based on syllable length (²= 6.5, p = 0.03) with higher accuracy on 3-syllable non-
words (100%) compared to 1-syllable non-words (40%). He made 8 errors on non-word
repetition, out of which 0.65 proportion of errors were lexicalisation errors and 0.37 proportion
were visually related non-word errors (See table 5.13).
AP02 was unable to perform any of the reading aloud tasks in English or Kannada. It was
observed on informal screening that he was unable to identify the alphabets of Kannada
language.
5.5.2 Performance of AP03 on experimental tasks
AP03 was a multilingual pre-stroke, whose native language was Telugu and second language
were English; apart from that he was able to communicate in both Kannada and Hindi on a
regular basis. Prior to the stroke he had a higher proficiency in Kannada and Telugu compared
to English. Post-stroke, his language proficiency declined across all the languages and modalities
229
with the reading and writing proficiency being most affected (Kannada/Telugu:2; English:3).
Additionally, AP03 preferred using Hindi for communication and therefore, the WAB
assessment was carried out in Hindi. He was diagnosed with Broca’s aphasia in both Hindi and
English. He was unable to read in Hindi, and still had some preserved reading abilities in
Kannada and English, therefore profiling of his reading abilities were carried out in Kannada
and English.
AP03 performed similarly on both the spoken word picture matching and written word
picture matching tasks with 85% correct responses. AP03 performed the letter discrimination
task in English with 90% accuracy. On the legality decision task, he was 93% accurate with
higher accuracy on non-words (100%) than words (97%). On the visual lexical decision task, he
performed poorly with 64% correct responses. There was also a significant effect of lexicality
(²= 7.5, p = 0.006) with higher number of correct responses on words than non-words. He
performed very poorly on non-word repetition task (3%). He produced 29 errors on non-word
repetition, with the proportion of errors being visually related non-words (0.79), lexicalisation
(0.17) and unrelated real word errors (0.03).
On word length reading, AP03 read aloud 63% correctly and there was no significant
effect of word length (²= 6.22, p = 0.10). He made 9 errors on word length reading, out of which
0.66 proportion were visually related non-word errors ,0.22 proportion of errors were letter by
letter reading errors, and 0.11 proportion were visually related real word errors. (See table
5.13). On spelling sound regularity reading, he read aloud with 30% accuracy and there was no
significant effect of regularity (²= 2.98, p = 0.08). The error profile indicates that out of the 42
errors made, 0.42 proportion of errors were visually related non-words, 0.21 were visually
related real words, 0.16 were regularisation errors, 0.14 of letter by letter reading, 0.04 of
unrelated real words.
On imageability and frequency reading aloud, AP03 was able to read aloud with 30%
accuracy and there was a significant effect of imageability (²= 8.57, p = 0.003) with greater
accuracy on high imageable words compared to low imageable words. The proportion of errors
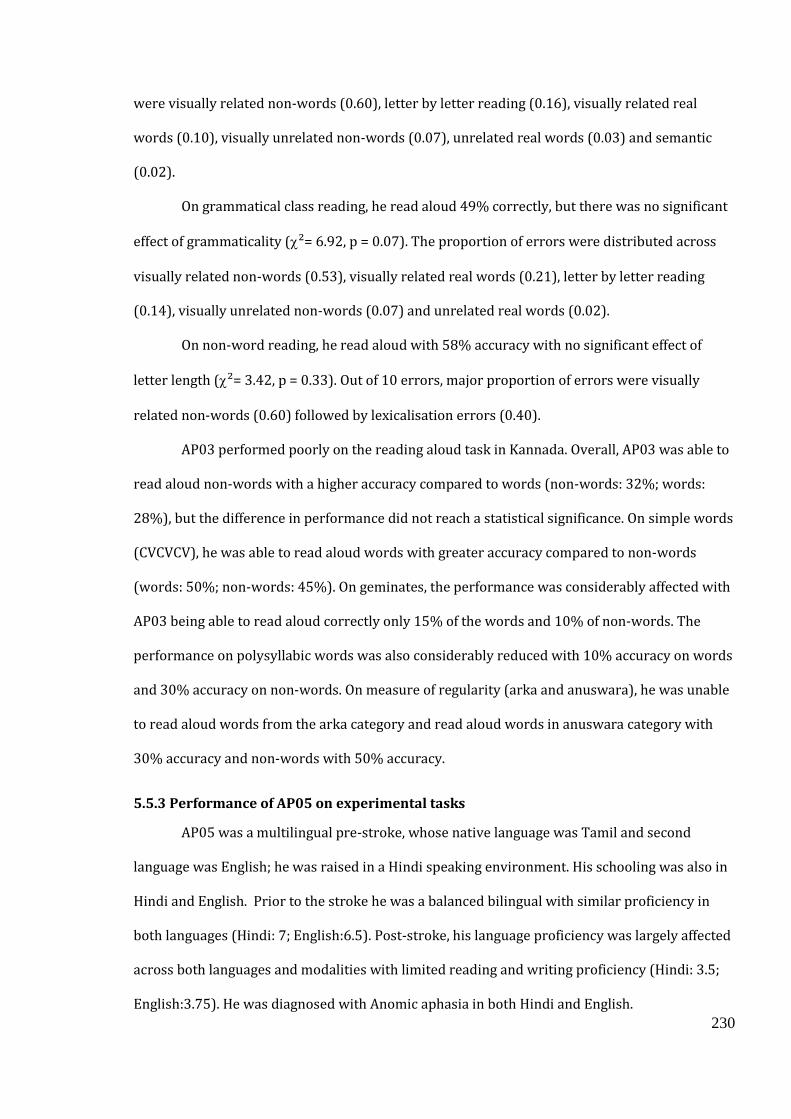
230
were visually related non-words (0.60), letter by letter reading (0.16), visually related real
words (0.10), visually unrelated non-words (0.07), unrelated real words (0.03) and semantic
(0.02).
On grammatical class reading, he read aloud 49% correctly, but there was no significant
effect of grammaticality (²= 6.92, p = 0.07). The proportion of errors were distributed across
visually related non-words (0.53), visually related real words (0.21), letter by letter reading
(0.14), visually unrelated non-words (0.07) and unrelated real words (0.02).
On non-word reading, he read aloud with 58% accuracy with no significant effect of
letter length (²= 3.42, p = 0.33). Out of 10 errors, major proportion of errors were visually
related non-words (0.60) followed by lexicalisation errors (0.40).
AP03 performed poorly on the reading aloud task in Kannada. Overall, AP03 was able to
read aloud non-words with a higher accuracy compared to words (non-words: 32%; words:
28%), but the difference in performance did not reach a statistical significance. On simple words
(CVCVCV), he was able to read aloud words with greater accuracy compared to non-words
(words: 50%; non-words: 45%). On geminates, the performance was considerably affected with
AP03 being able to read aloud correctly only 15% of the words and 10% of non-words. The
performance on polysyllabic words was also considerably reduced with 10% accuracy on words
and 30% accuracy on non-words. On measure of regularity (arka and anuswara), he was unable
to read aloud words from the arka category and read aloud words in anuswara category with
30% accuracy and non-words with 50% accuracy.
5.5.3 Performance of AP05 on experimental tasks
AP05 was a multilingual pre-stroke, whose native language was Tamil and second
language was English; he was raised in a Hindi speaking environment. His schooling was also in
Hindi and English. Prior to the stroke he was a balanced bilingual with similar proficiency in
both languages (Hindi: 7; English:6.5). Post-stroke, his language proficiency was largely affected
across both languages and modalities with limited reading and writing proficiency (Hindi: 3.5;
English:3.75). He was diagnosed with Anomic aphasia in both Hindi and English.
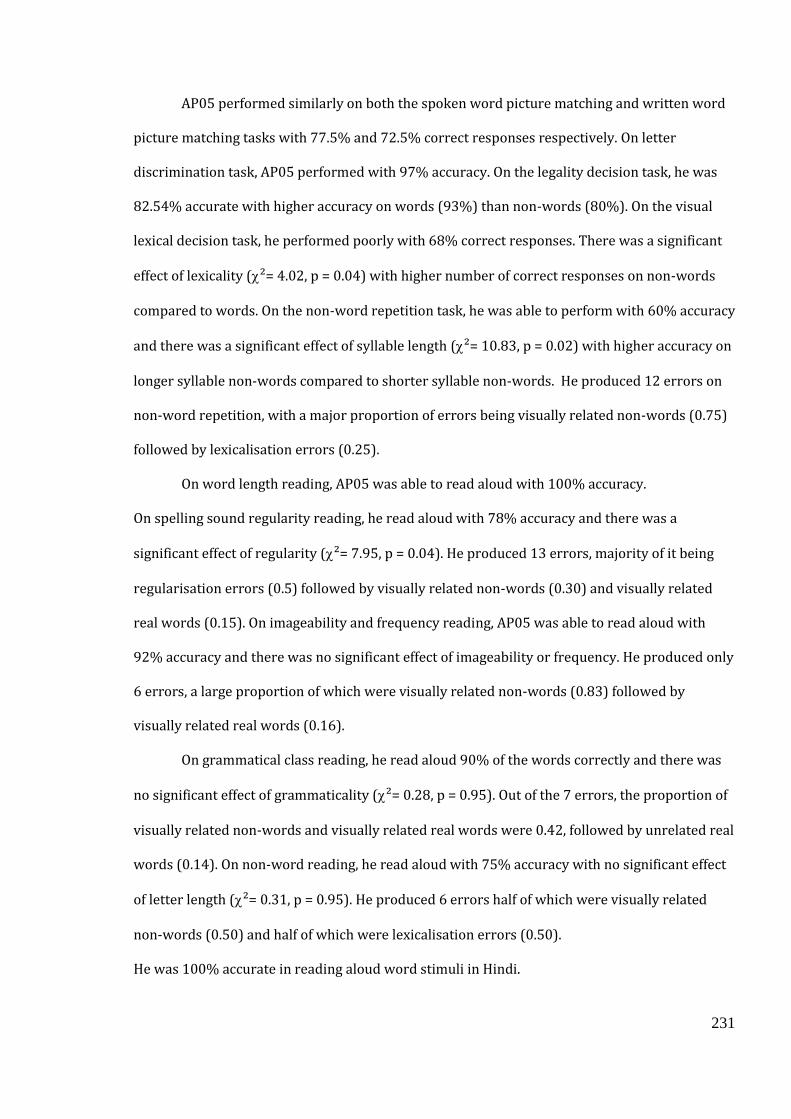
231
AP05 performed similarly on both the spoken word picture matching and written word
picture matching tasks with 77.5% and 72.5% correct responses respectively. On letter
discrimination task, AP05 performed with 97% accuracy. On the legality decision task, he was
82.54% accurate with higher accuracy on words (93%) than non-words (80%). On the visual
lexical decision task, he performed poorly with 68% correct responses. There was a significant
effect of lexicality (²= 4.02, p = 0.04) with higher number of correct responses on non-words
compared to words. On the non-word repetition task, he was able to perform with 60% accuracy
and there was a significant effect of syllable length (²= 10.83, p = 0.02) with higher accuracy on
longer syllable non-words compared to shorter syllable non-words. He produced 12 errors on
non-word repetition, with a major proportion of errors being visually related non-words (0.75)
followed by lexicalisation errors (0.25).
On word length reading, AP05 was able to read aloud with 100% accuracy.
On spelling sound regularity reading, he read aloud with 78% accuracy and there was a
significant effect of regularity (²= 7.95, p = 0.04). He produced 13 errors, majority of it being
regularisation errors (0.5) followed by visually related non-words (0.30) and visually related
real words (0.15). On imageability and frequency reading, AP05 was able to read aloud with
92% accuracy and there was no significant effect of imageability or frequency. He produced only
6 errors, a large proportion of which were visually related non-words (0.83) followed by
visually related real words (0.16).
On grammatical class reading, he read aloud 90% of the words correctly and there was
no significant effect of grammaticality (²= 0.28, p = 0.95). Out of the 7 errors, the proportion of
visually related non-words and visually related real words were 0.42, followed by unrelated real
words (0.14). On non-word reading, he read aloud with 75% accuracy with no significant effect
of letter length (²= 0.31, p = 0.95). He produced 6 errors half of which were visually related
non-words (0.50) and half of which were lexicalisation errors (0.50).
He was 100% accurate in reading aloud word stimuli in Hindi.
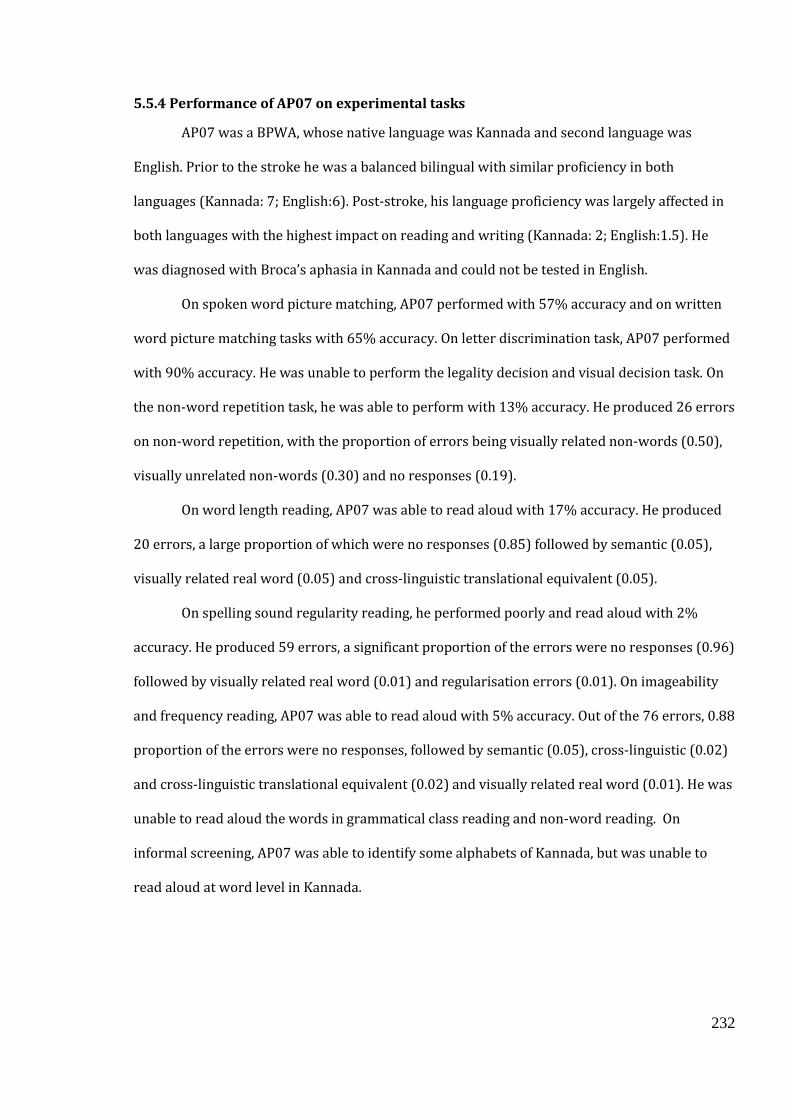
232
5.5.4 Performance of AP07 on experimental tasks
AP07 was a BPWA, whose native language was Kannada and second language was
English. Prior to the stroke he was a balanced bilingual with similar proficiency in both
languages (Kannada: 7; English:6). Post-stroke, his language proficiency was largely affected in
both languages with the highest impact on reading and writing (Kannada: 2; English:1.5). He
was diagnosed with Broca’s aphasia in Kannada and could not be tested in English.
On spoken word picture matching, AP07 performed with 57% accuracy and on written
word picture matching tasks with 65% accuracy. On letter discrimination task, AP07 performed
with 90% accuracy. He was unable to perform the legality decision and visual decision task. On
the non-word repetition task, he was able to perform with 13% accuracy. He produced 26 errors
on non-word repetition, with the proportion of errors being visually related non-words (0.50),
visually unrelated non-words (0.30) and no responses (0.19).
On word length reading, AP07 was able to read aloud with 17% accuracy. He produced
20 errors, a large proportion of which were no responses (0.85) followed by semantic (0.05),
visually related real word (0.05) and cross-linguistic translational equivalent (0.05).
On spelling sound regularity reading, he performed poorly and read aloud with 2%
accuracy. He produced 59 errors, a significant proportion of the errors were no responses (0.96)
followed by visually related real word (0.01) and regularisation errors (0.01). On imageability
and frequency reading, AP07 was able to read aloud with 5% accuracy. Out of the 76 errors, 0.88
proportion of the errors were no responses, followed by semantic (0.05), cross-linguistic (0.02)
and cross-linguistic translational equivalent (0.02) and visually related real word (0.01). He was
unable to read aloud the words in grammatical class reading and non-word reading. On
informal screening, AP07 was able to identify some alphabets of Kannada, but was unable to
read aloud at word level in Kannada.
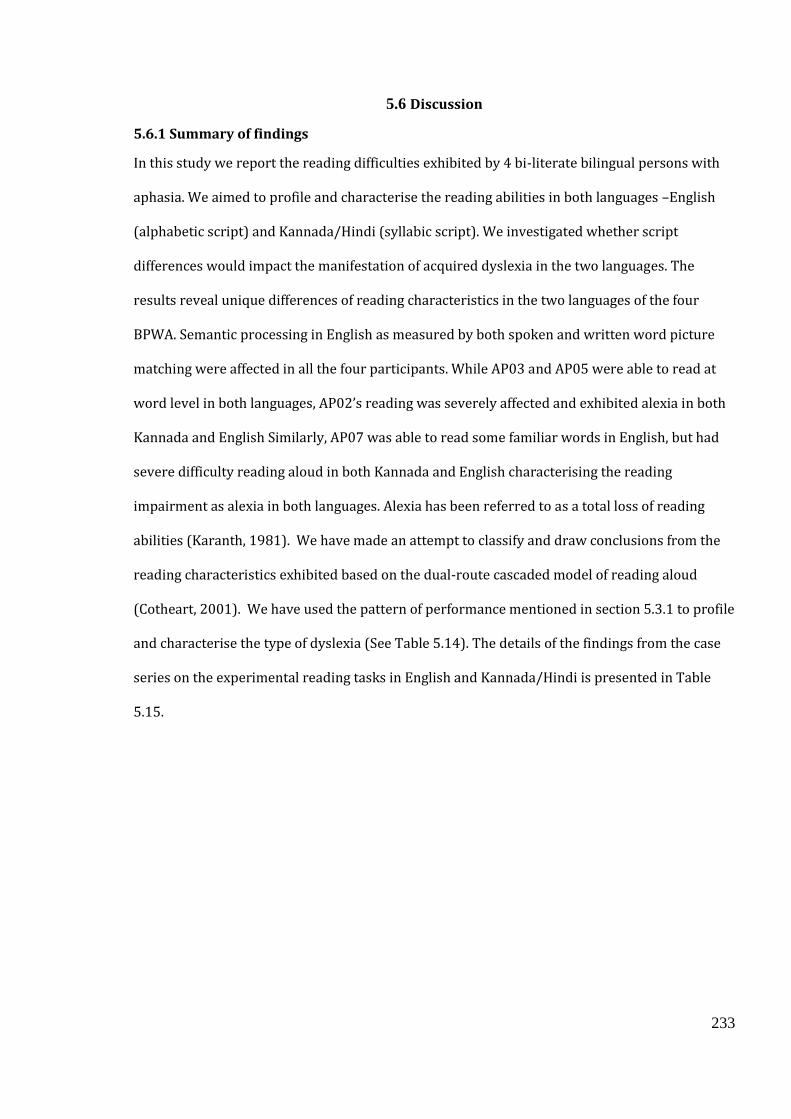
233
5.6 Discussion
5.6.1 Summary of findings
In this study we report the reading difficulties exhibited by 4 bi-literate bilingual persons with
aphasia. We aimed to profile and characterise the reading abilities in both languages –English
(alphabetic script) and Kannada/Hindi (syllabic script). We investigated whether script
differences would impact the manifestation of acquired dyslexia in the two languages. The
results reveal unique differences of reading characteristics in the two languages of the four
BPWA. Semantic processing in English as measured by both spoken and written word picture
matching were affected in all the four participants. While AP03 and AP05 were able to read at
word level in both languages, AP02’s reading was severely affected and exhibited alexia in both
Kannada and English Similarly, AP07 was able to read some familiar words in English, but had
severe difficulty reading aloud in both Kannada and English characterising the reading
impairment as alexia in both languages. Alexia has been referred to as a total loss of reading
abilities (Karanth, 1981). We have made an attempt to classify and draw conclusions from the
reading characteristics exhibited based on the dual-route cascaded model of reading aloud
(Cotheart, 2001). We have used the pattern of performance mentioned in section 5.3.1 to profile
and characterise the type of dyslexia (See Table 5.14). The details of the findings from the case
series on the experimental reading tasks in English and Kannada/Hindi is presented in Table
5.15.

234
Table 5.14
Pattern of performance for profiling the type of dyslexia
Performance Alexia Deep Dyslexia Surface Dyslexia Phonological Dyslexia
Nonword reading Impaired Impaired Unimpaired Impaired
Regularity effects in reading aloud
Impaired Present Absent Present
Imageability effects in reading
aloud
Impaired Yes No Yes (possibly)
Grammatical class effects in reading
aloud
Impaired Yes No Yes (possibly)
Semantic errors in reading aloud
Impaired Yes No No
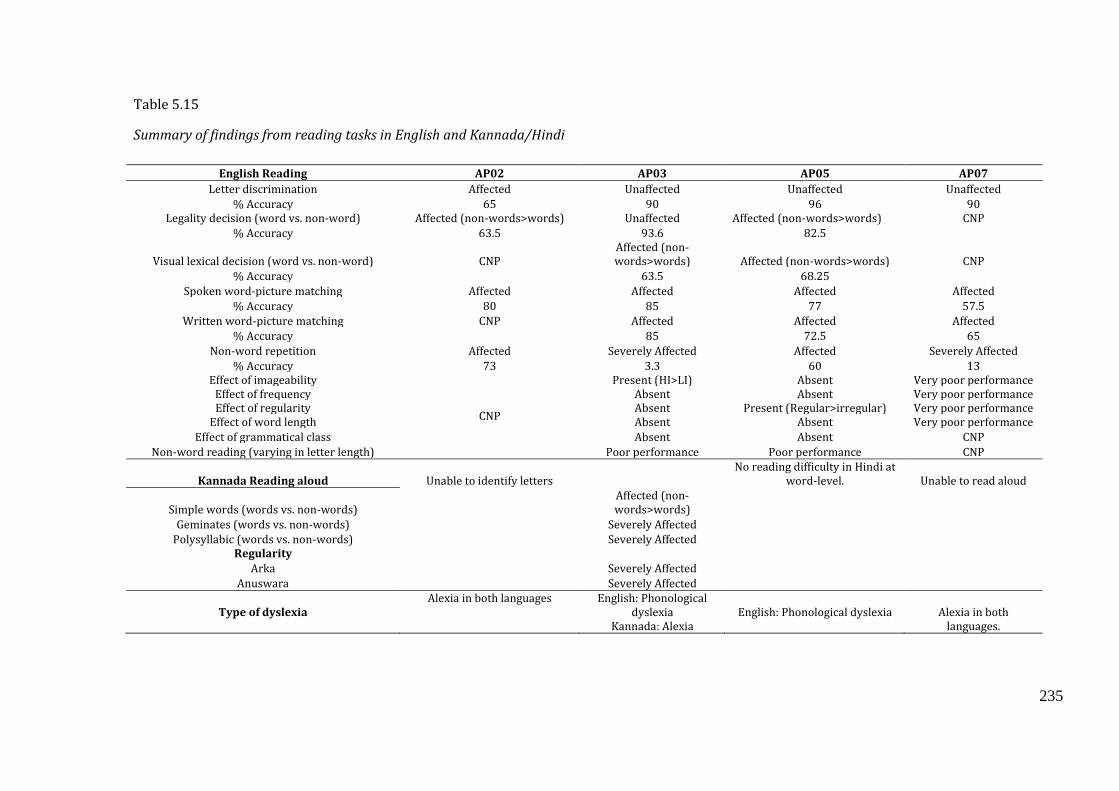
235
Table 5.15
Summary of findings from reading tasks in English and Kannada/Hindi
English Reading AP02 AP03 AP05 AP07
Letter discrimination Affected Unaffected Unaffected Unaffected
% Accuracy 65 90 96 90 Legality decision (word vs. non-word) Affected (non-words>words) Unaffected Affected (non-words>words) CNP
% Accuracy 63.5 93.6 82.5
Visual lexical decision (word vs. non-word) CNP Affected (non-words>words) Affected (non-words>words) CNP
% Accuracy 63.5 68.25 Spoken word-picture matching Affected Affected Affected Affected
% Accuracy 80 85 77 57.5 Written word-picture matching CNP Affected Affected Affected
% Accuracy 85 72.5 65
Non-word repetition Affected Severely Affected Affected Severely Affected
% Accuracy 73 3.3 60 13 Effect of imageability
CNP
Present (HI>LI) Absent Very poor performance Effect of frequency Absent Absent Very poor performance Effect of regularity Absent Present (Regular>irregular) Very poor performance
Effect of word length Absent Absent Very poor performance
Effect of grammatical class Absent Absent CNP
Non-word reading (varying in letter length) Poor performance Poor performance CNP
Kannada Reading aloud Unable to identify letters
No reading difficulty in Hindi at word-level. Unable to read aloud
Simple words (words vs. non-words)
Affected (non-words>words)
Geminates (words vs. non-words) Severely Affected Polysyllabic (words vs. non-words) Severely Affected
Regularity Arka Severely Affected
Anuswara Severely Affected
Type of dyslexia
Alexia in both languages
English: Phonological dyslexia
Kannada: Alexia English: Phonological dyslexia
Alexia in both languages.
236
5.6.1 Profiling and Characterisation of Acquired dyslexia
The current case series addresses the issue of manifestation and classification of acquired
dyslexia in bi-literate bilinguals with aphasia in languages having an alphabetic script (English)
and syllabic script (Kannada/Hindi).
5.6.1.1 Reading characteristics of AP02. AP02 was pre-morbidly a Kannada-English
bi-literate bilingual, who exhibited broca’s aphasia in both languages. In English, his letter
discrimination, legality decision task and lexical decision task were affected, suggesting that
rudimentary word processing abilities are impaired or impairment at the level of orthographic
analyses or orthographic input lexicon. He showed poor performance on spoken word-picture
matching task and was unable to perform the written word-picture matching task which is
reflective of a semantic deficit. The performance on non-word repetition was affected with a
significant proportion of lexicalisation errors and visually related non-words. However, he was
unable to read aloud in both English and Kannada, which means that there was a severe
impairment in reading abilities in both languages. Based on the pattern of performance in Table
5.14, all of the parameters listed are impaired in AP02. Therefore, we can classify the total loss
of reading abilities in both languages as alexia.
5.6.1.2 Reading characteristics of AP03. AP03 was a multilingual speaking Telugu,
Kannada, Hindi and English prior to stroke. He was diagnosed with Broca’s aphasia in Hindi and
English. However, he was unable to read in Hindi, Telugu and Kannada share some script
similarities and he had some preserved reading abilities in Kannada and English. His letter
discrimination and legality decision task abilities were unaffected, suggesting a relatively intact
rudimentary word processing ability. However, he exhibited poor performance on visual lexical
decision task (with spelling-sound regularity). His performance on spoken word picture
matching and written word picture matching were considerably affected implying a damage to
the semantic system. His performance on non-word repetition was impaired to a large extent
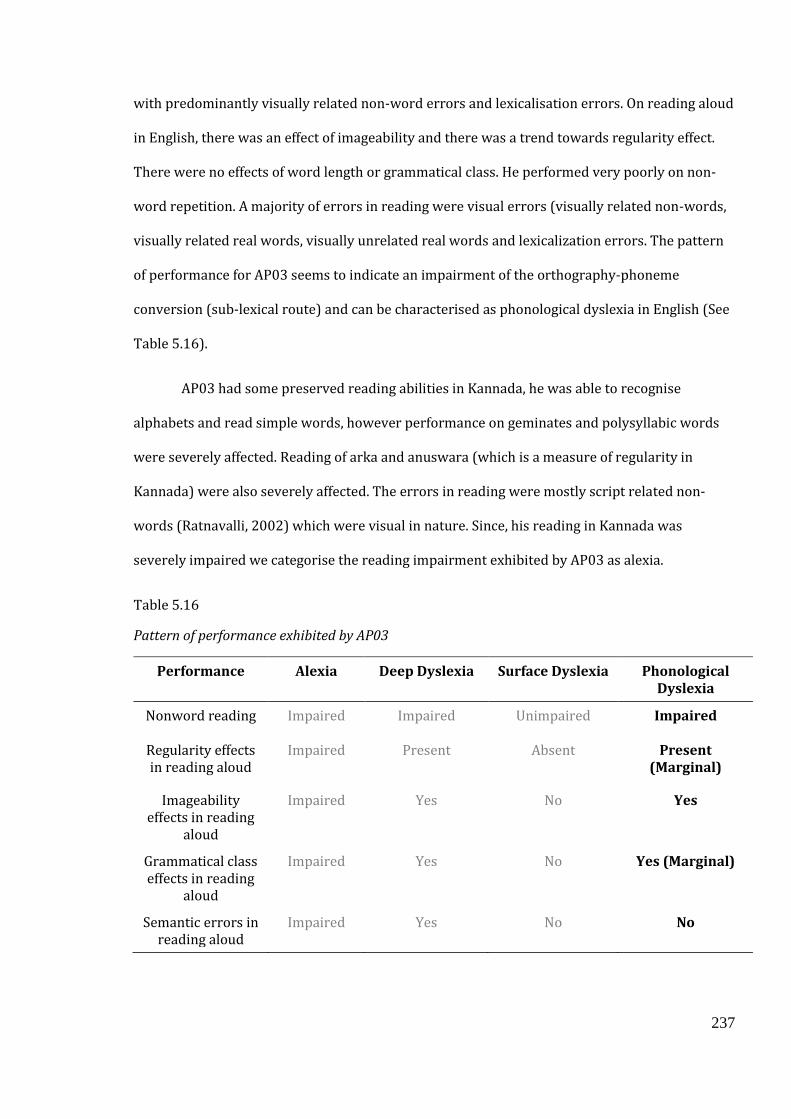
237
with predominantly visually related non-word errors and lexicalisation errors. On reading aloud
in English, there was an effect of imageability and there was a trend towards regularity effect.
There were no effects of word length or grammatical class. He performed very poorly on non-
word repetition. A majority of errors in reading were visual errors (visually related non-words,
visually related real words, visually unrelated real words and lexicalization errors. The pattern
of performance for AP03 seems to indicate an impairment of the orthography-phoneme
conversion (sub-lexical route) and can be characterised as phonological dyslexia in English (See
Table 5.16).
AP03 had some preserved reading abilities in Kannada, he was able to recognise
alphabets and read simple words, however performance on geminates and polysyllabic words
were severely affected. Reading of arka and anuswara (which is a measure of regularity in
Kannada) were also severely affected. The errors in reading were mostly script related non-
words (Ratnavalli, 2002) which were visual in nature. Since, his reading in Kannada was
severely impaired we categorise the reading impairment exhibited by AP03 as alexia.
Table 5.16
Pattern of performance exhibited by AP03
Performance Alexia Deep Dyslexia Surface Dyslexia Phonological Dyslexia
Nonword reading Impaired Impaired Unimpaired Impaired
Regularity effects in reading aloud
Impaired Present Absent Present (Marginal)
Imageability effects in reading
aloud
Impaired Yes No Yes
Grammatical class effects in reading
aloud
Impaired Yes No Yes (Marginal)
Semantic errors in reading aloud
Impaired Yes No No

238
5.6.1.3 Reading characteristics of AP05. AP05 was pre-morbidly a multilingual who
was fluent in Tamil, Hindi and English. He was diagnosed with Anomic aphasia in Hindi and
English. In English, his letter discrimination ability was relatively intact. However, his
performance on legality decision and lexical decision was affected with the performance being
better on words compared to non-words. His performance on spoken word picture matching
and written word picture matching was notably affected. This poor performance on legality
decision, lexical decision, spoken word and written word picture matching task implies damage
to the orthographic input lexicon. He also performed poorly on non-word repetition with a
significant proportion of the errors being visually related non-words and lexicalisation errors.
Table 5.17
Pattern of performance exhibited by AP05.
Performance Alexia Deep Dyslexia Surface Dyslexia Phonological Dyslexia
Nonword reading Impaired Impaired Unimpaired Impaired
Regularity effects in reading aloud
Impaired Present Absent Present
Imageability effects in reading
aloud
Impaired Yes No Absent
Grammatical class effects in reading
aloud
Impaired Yes No Absent
Semantic errors in reading aloud
Impaired Yes No No
On oral reading tasks in English, there was no effect of imageability, frequency,
grammatical class or word length, but there was a significant effect of regularity, with relatively
preserved reading of regular words and impaired irregular words with a major portion of errors
being regularisation errors followed by visually related non-words and real words. There was a
considerable impairment in reading non-words with lexicalization errors. Based on the above
239
features of reading errors and the pattern of performance of AP05 (See Table 5.17), we can
classify the reading impairment exhibited by AP05 in English as phonological dyslexia. He had
no difficulty in reading aloud in Hindi at word level as tested using stimuli from Bilingual
aphasia test (BAT), but the absence of a comprehensive reading test battery in Hindi does not
allow us to come to any conclusions regarding his reading abilities in Hindi.
5.6.1.4 Reading characteristics of AP07 AP07 was a Kannada-English bilingual pre-
stroke who was diagnosed with Broca’s aphasia in Kannada. He was unable to perform WAB in
English. His reading abilities in both English and Kannada were severely affected. His letter
discrimination ability is English was unaffected, however he was unable to perform the legality
decision and lexical decision task in English which suggests that access to orthographic input
lexicon is severely affected. He performed poorly on both spoken word picture matching and
written word picture matching which indicates an impairment of the semantic system. His non-
word repetition ability was severely affected, and errors were mostly visually related non-
words and real words. On reading aloud tasks in English, his performance was severely affected
with absence of responses for grammatical class reading and non-word reading. A significant
proportion of his errors were no responses and very few semantic and cross-linguistic errors.
He was able to identify very few letters in Kannada and had a total loss of reading ability in
Kannada. Based on the pattern of performance in Table 5.14, all of the parameters listed are
impaired in AP07, therefore, we can classify the total loss of reading abilities in both languages
as alexia.
240
5.6.3 Conclusions
It is a one of a kind study that attempts to profile reading impairments in bi-scriptal bilinguals in
specific Indian language groups. This study contributes to the current body of research that
facilitates better assessment and intervention of bi-scriptal bilingual BPWA. Overall, our results
suggest that there is a script related difference in the manifestation of dyslexia in line with
previous work on bi-scriptal BPWA (Sasanuma, 1980; Eng & Obler, 2002; Raman & Weekes,
2003,2005; Weekes et al., 2007; Senaha & Parente, 2012; Karanth, 1981; Ratnavalli et al, 2000).
5.6.4 Limitations of our study
In general, as two of our BPWA (AP02 and AP07) had severe reading impairments in English
and Kannada, we diagnosed them with alexia (Ratnavalli et al, 2000; Karanth, 1981; 2002) in
both languages. Two other BPWA (AP03 and AP05) exhibited features of phonological dyslexia
in the alphabetic English. AP03’s reading Kannada was significantly poor therefore, he was
diagnosed with alexia in Kannada. On the other hand, AP05 was able to read aloud accurately in
Hindi at the word level, but the stimuli were not sensitive enough to tap into variables such as
syllable length, imageability, frequency and regularity. Therefore, it is difficult to draw
conclusions regarding reading impairment in Hindi.
Although we attempted to classify the reading abilities in both the alphabetic and
syllabic languages based on the dual route cascaded model, none of our BPWA, had enough
reading abilities in the syllabic languages (near total loss of reading ability) except AP05 making
it difficult to adapt the model of reading aloud to Kannada/Hindi.
5.6.4.1 Recruitment problems Recruitment of BPWA was aggravated by the need to
have a homogenous group (same two language bilinguals) and the lack of institutional support
in identifying such BPWA. This further amplified the time constraint on me owing to which only
a few participants could be recruited (7 BPWA). Within these, we had to exclude three because
of the severity of aphasia (global aphasia). Consonant to the problem of homogeneity was the
241
multilingual nature of participants having different L1 (Telugu, Tamil, Hindi, Kannada) and
variance in reading proficiency.
5.6.4.2 Lack of parallel material in Indian languages for testing The study was
impacted by the lack of a parallel test stimuli that mirrors PALPA in Indian languages. PALPA in
English accounts for effects of imageability, frequency, regularity, word length and non-word
reading. The lack of reliable published and consequently usable materials significantly limited
the scope of our study. Access to institutionally authorised material that could be regarded as an
alternative in Indian languages was also denied.
5.6.5 Future directions
India is a predominantly multilingual country. The major language families in India include Indo
– Aryan (74.3%), Dravidian (23.9%), Austro – Asiatic (1.2%) and Tibeto – Burman (0.6%). Some
languages have scripts while many do not have. As per the 2001 census of India, approximately
25% of the total population are bilinguals in India which is growing even further. There is an
urgent need to develop and disseminate test materials to tap into the reading impairments in
Indian languages. Consequent to such development and dissemination, we also need to have
large scale studies that profile and characterise the reading impairments in bi-scriptal bilingual
Indian population. This will in-turn facilitate the characterisation of specific script to language
combinations among bilinguals (Kannada-English; Tamil-English) which can then be used to
derive/adapt models of reading among bilinguals.
All of these Indian languages have scripts that have varying scriptal differences with
English. Some languages such as Tamil have less transparent orthographies as compared to
Kannada which has a very transparent orthography. In this sense, Kannada is further away from
English (in terms of script) than Tamil. Consequently, bilinguals speaking unique combinations
of these languages need to be assessed to understand how reading difficulties manifest in both
language combinations (Kannada-English, Tamil-English). This would immensely benefit
assessment and treatment of bilinguals with neurological impairment.
242
Chapter 6 Summary and Conclusions
6.1 Overall summary
The overarching goal of our research was to characterize the effect of bi-literacy on bilingual
healthy adults and bilingual neurologically impaired adults (BPWA). The current research was
divided into Phase I (Chapters 2-4) and Phase II (Chapter 5). In Phase I, we examined the effect
of PE on oral language production and comprehension (Chapter 2), narrative production
(Chapter 3) and executive functions (Chapter 4). We recruited bi-literate bilinguals belonging to
the South Indian diaspora (speaking Tamil, Telugu, Kannada and Malayalam in addition to
English) residing in the UK. Within this sample we measured bi-literacy both subjectively (self-
report of reading and writing usage from participants in different contexts such as at work,
home, formal and informal), frequency of reading and objectively (using a composite numeric
score based on performance of these participants on grammaticality judgement and sentence
verification tasks, we have called the measure print exposure (PE). The sample (34 participants)
were matched for years of education, age and gender and divided based on their exposure to
print into a group of high PE (HPE, 22 participants) and low PE (LPE, 12 participants). In
addition to this we profiled the bilingualism variables such as proficiency, usage and dominance
in both languages. The participants performed oral language production tasks (verbal fluency,
word and non- word production), comprehension tasks (synonymy triplets and sentence
comprehension), narrative production task and executive function tasks or measures (spatial
Stroop, Flanker, N –back and colour-shape tasks).
In phase II, we investigated the consequences of bi-literacy on a neurologically impaired
population and specifically characterized the manifestation of reading difficulties at single word
level in both languages of a BPWA. We recruited BPWA in the South Indian state of Karnataka in
India. Participants were bi-literate bilinguals on one alphabetic language (English) and one
alpha-syllabic language (Kannada/Hindi) pre-stroke. Within this population, we profiled,
characterized and diagnosed the reading difficulty for BPWA in both languages (Chapter 5). We
243
documented the pre- and post-stroke bilingualism variables. We conducted a case series
analysis where BPWA performed a series of oral reading tasks in English and Kannada/Hindi.
6.2 Review and contributions of this research.
In this section, we will summarize and discuss the results of the preceding chapters, and the
implications of this study to the clinical and theoretical research on bi-literate bilinguals. We will
end this chapter with a discussion of limitations of the current project and suggested future
directions. Table 6.1 summarizes our findings from both Phase I and Phase II of our study.
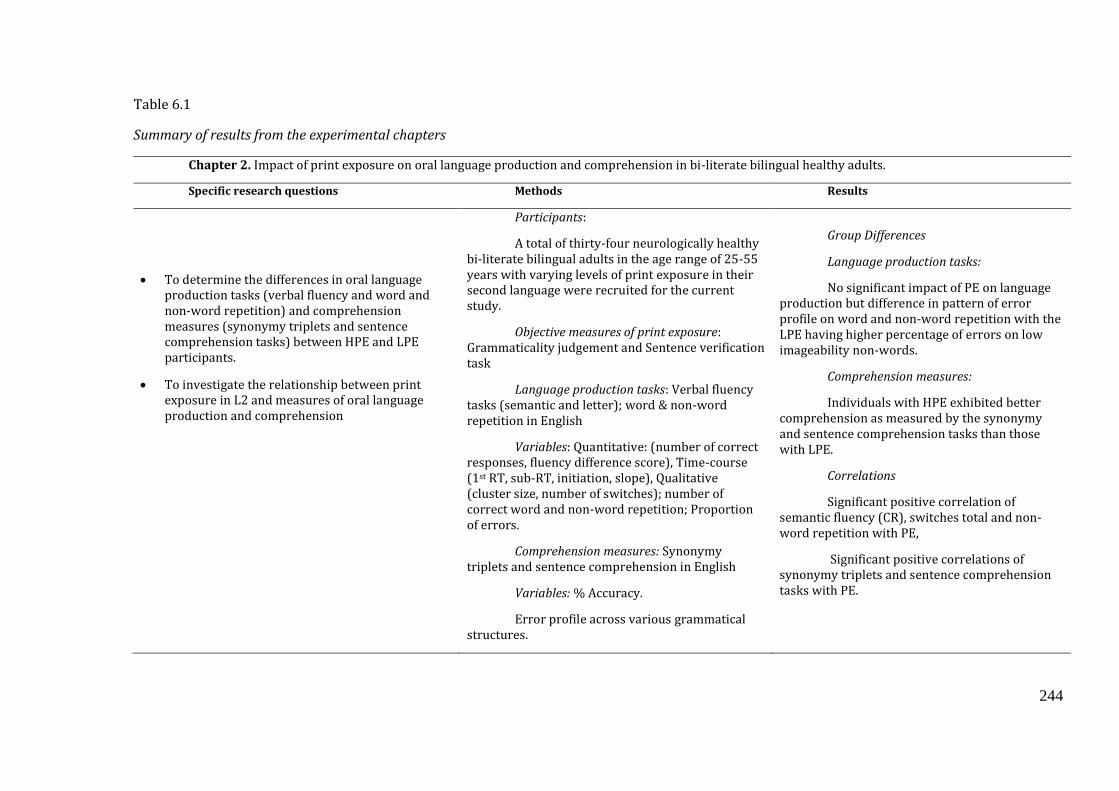
244
Table 6.1
Summary of results from the experimental chapters
Chapter 2. Impact of print exposure on oral language production and comprehension in bi-literate bilingual healthy adults.
Specific research questions Methods Results
• To determine the differences in oral language production tasks (verbal fluency and word and non-word repetition) and comprehension measures (synonymy triplets and sentence comprehension tasks) between HPE and LPE participants.
• To investigate the relationship between print exposure in L2 and measures of oral language production and comprehension
Participants:
A total of thirty-four neurologically healthy bi-literate bilingual adults in the age range of 25-55 years with varying levels of print exposure in their second language were recruited for the current study.
Objective measures of print exposure: Grammaticality judgement and Sentence verification task
Language production tasks: Verbal fluency tasks (semantic and letter); word & non-word repetition in English
Variables: Quantitative: (number of correct responses, fluency difference score), Time-course (1st RT, sub-RT, initiation, slope), Qualitative (cluster size, number of switches); number of correct word and non-word repetition; Proportion of errors.
Comprehension measures: Synonymy triplets and sentence comprehension in English
Variables: % Accuracy.
Error profile across various grammatical structures.
Group Differences
Language production tasks:
No significant impact of PE on language production but difference in pattern of error profile on word and non-word repetition with the LPE having higher percentage of errors on low imageability non-words.
Comprehension measures:
Individuals with HPE exhibited better comprehension as measured by the synonymy and sentence comprehension tasks than those with LPE.
Correlations
Significant positive correlation of semantic fluency (CR), switches total and non-word repetition with PE,
Significant positive correlations of synonymy triplets and sentence comprehension tasks with PE.
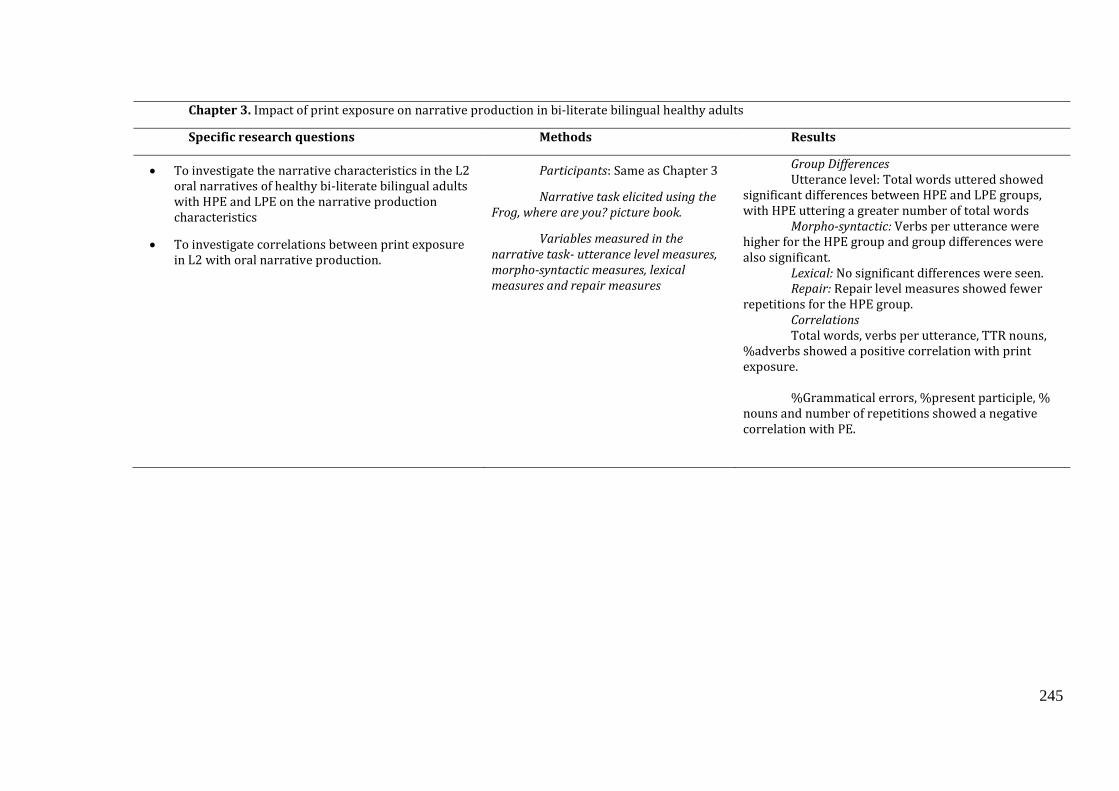
245
Chapter 3. Impact of print exposure on narrative production in bi-literate bilingual healthy adults
Specific research questions Methods Results
• To investigate the narrative characteristics in the L2 oral narratives of healthy bi-literate bilingual adults with HPE and LPE on the narrative production characteristics
• To investigate correlations between print exposure in L2 with oral narrative production.
Participants: Same as Chapter 3
Narrative task elicited using the Frog, where are you? picture book.
Variables measured in the narrative task- utterance level measures, morpho-syntactic measures, lexical measures and repair measures
Group Differences Utterance level: Total words uttered showed
significant differences between HPE and LPE groups, with HPE uttering a greater number of total words
Morpho-syntactic: Verbs per utterance were higher for the HPE group and group differences were also significant.
Lexical: No significant differences were seen. Repair: Repair level measures showed fewer
repetitions for the HPE group. Correlations Total words, verbs per utterance, TTR nouns,
%adverbs showed a positive correlation with print exposure.
%Grammatical errors, %present participle, %
nouns and number of repetitions showed a negative correlation with PE.
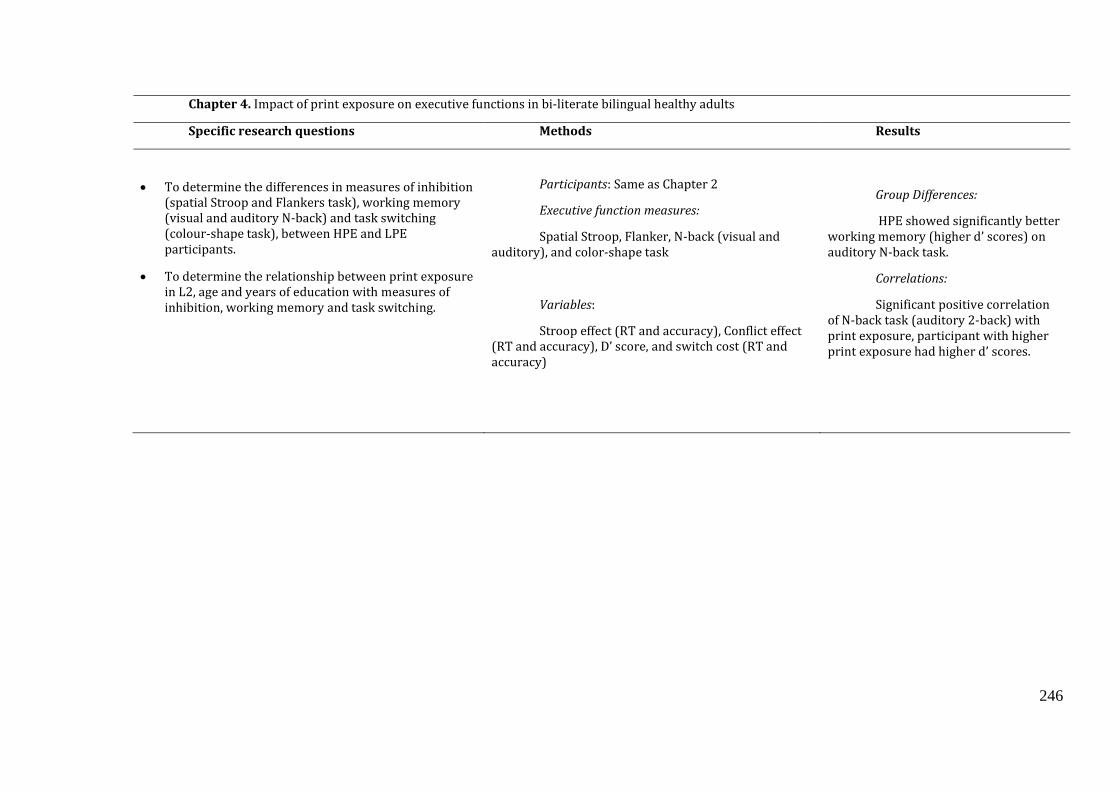
246
Chapter 4. Impact of print exposure on executive functions in bi-literate bilingual healthy adults
Specific research questions Methods Results
• To determine the differences in measures of inhibition (spatial Stroop and Flankers task), working memory (visual and auditory N-back) and task switching (colour-shape task), between HPE and LPE participants.
• To determine the relationship between print exposure in L2, age and years of education with measures of inhibition, working memory and task switching.
Participants: Same as Chapter 2
Executive function measures:
Spatial Stroop, Flanker, N-back (visual and auditory), and color-shape task
Variables:
Stroop effect (RT and accuracy), Conflict effect (RT and accuracy), D’ score, and switch cost (RT and accuracy)
Group Differences:
HPE showed significantly better working memory (higher d’ scores) on auditory N-back task.
Correlations:
Significant positive correlation of N-back task (auditory 2-back) with print exposure, participant with higher print exposure had higher d’ scores.
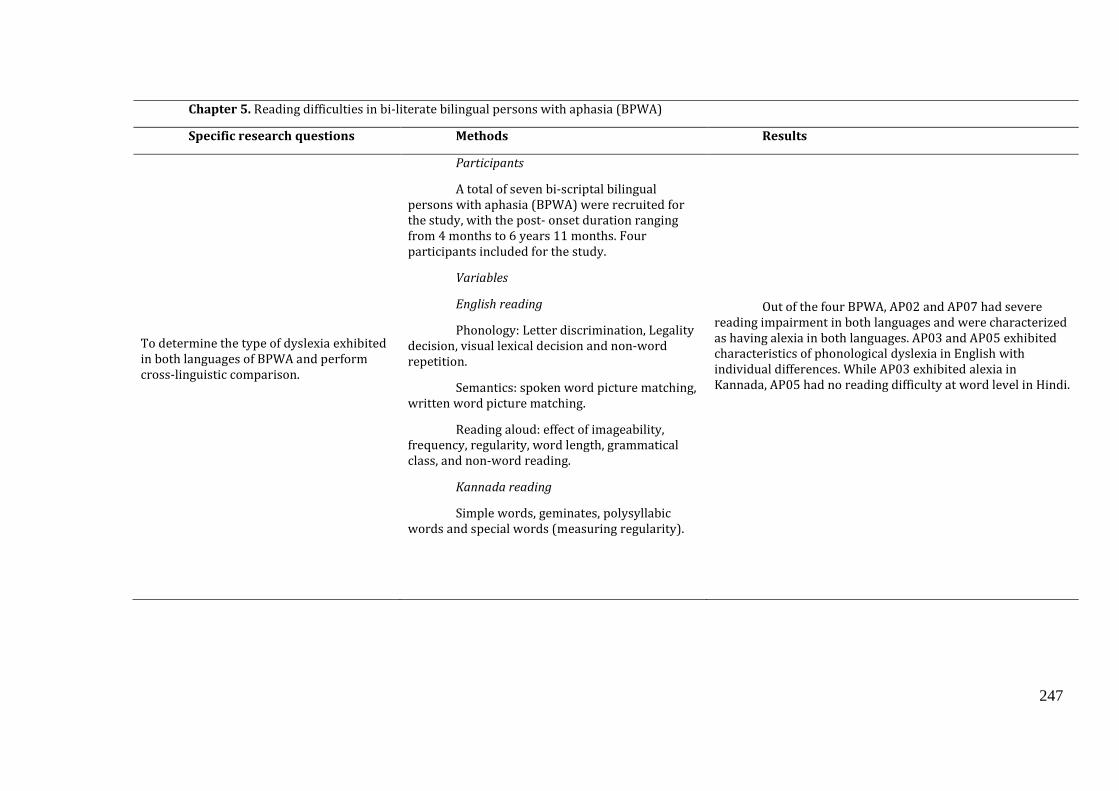
247
Chapter 5. Reading difficulties in bi-literate bilingual persons with aphasia (BPWA)
Specific research questions Methods Results
To determine the type of dyslexia exhibited in both languages of BPWA and perform cross-linguistic comparison.
Participants
A total of seven bi-scriptal bilingual persons with aphasia (BPWA) were recruited for the study, with the post- onset duration ranging from 4 months to 6 years 11 months. Four participants included for the study.
Variables
English reading
Phonology: Letter discrimination, Legality decision, visual lexical decision and non-word repetition.
Semantics: spoken word picture matching, written word picture matching.
Reading aloud: effect of imageability, frequency, regularity, word length, grammatical class, and non-word reading.
Kannada reading
Simple words, geminates, polysyllabic words and special words (measuring regularity).
Out of the four BPWA, AP02 and AP07 had severe reading impairment in both languages and were characterized as having alexia in both languages. AP03 and AP05 exhibited characteristics of phonological dyslexia in English with individual differences. While AP03 exhibited alexia in Kannada, AP05 had no reading difficulty at word level in Hindi.
248
For Phase I, we performed two types of comparisons on our sample, first we divided the
participants into two groups (HPE and LPE) based on the composite score (with z=0.0 as the
cut-off) derived from our measure of PE. All participants with scores greater than the cut off
were classified as HPE and the rest as LPE. The first comparison, therefore, was whether any
group differences exist in any of the experimental tasks. The second comparison was whether
there was a correlation between the composite score and the experimental tasks. Following are
the key findings from this research:
1. Impact of L2 print exposure on oral language production.
We predicted that print exposure would have a positive impact on verbal fluency (direct
impact on letter fluency and a relatively lesser impact on semantic fluency). We also predicted
that HPE group would produce a greater number of correct words and non-words than LPE
group on word and non-word repetition task. These predictions were not borne out; however,
we found some subtle differences between the groups.
Based on the performance on verbal fluency, word and non-word repetition tasks, there
was no obvious difference on the overall accuracy scores. However, contrary to expectation,
semantic fluency (CR) showed a significant positive correlation with PE and this suggests that
print exposure may be associated with improved semantics which is also evident from the
findings of other semantic measures in our study namely synonymy triplets task and sentence
comprehension task.
Switches total showed a significant positive correlation with print exposure. Switching
requires strategic search of subcategories and cognitive flexibility to shift efficiently between
subcategories (Da Silva, 2004) and dependent on more controlled processing than those
required for clustering (Troyer, 2000; Troyer et al, 1997). It was also observed that, participants
with HPE have produced a greater number of switches, which probably suggests that they have
better cognitive flexibility.
249
The key findings of word and non-word repetition are that, there was a significant
positive correlation between non-word repetition and PE but no significant group difference.
This is in consonance with previous research by Petersson et al. (2000) and Kosmidis et al.
(2006) on monolingual populations who have shown two groups with different literacy levels
show significant differences in non-word repetition between the groups but not so in word
repetition. Additionally, the error pattern on non-word repetition showed that LPE produced
higher percentage of errors in comparison to HPE on low imageability non-words. Since the
accuracy scores were at ceiling, perhaps probing into RT analyses would likely indicate
differences in performance of word vs. non-word repetition.
2. Impact of L2 print exposure on semantic comprehension.
We expected no significant differences between the groups based on previous literature
(Reis and Castro-Caldas,1997). However, the findings suggested otherwise. The findings showed
significant group difference on the synonymy triplets task and sentence comprehension task
(HPE more accurate than LPE). We draw support for these findings from children’s literature
and interpret this as a similar finding to Nation and Snowling (1998), where children with poor
reading skills performed poorly on a synonymy judgement task. The sentence comprehension
task used in our study is a listening task. Previous research (Hedrick & Cunningham, 1995;
Proctor et al., 2005) have shown that bilingual children with higher reading scores performed
better on listening comprehension tasks, and our results mirror these.
Our results showed that there was a positive correlation of print exposure with
synonymy triplets and sentence comprehension and a significant difference between both
groups. This suggests a strong link between print exposure and semantic processing. The
findings on the semantic tasks have been consistent across comprehension (synonymy triplets
task and sentence comprehension task) and production (semantic fluency) favouring HPE.
250
3. Impact of L2 print exposure on narrative production.
We hypothesised that HPE L2 oral narratives will have significantly greater number of
utterances, more morpho-syntactically rich, more lexically diverse and have lesser repairs as
compared to LPE L2 oral narratives and consequently significant positive correlations on all the
narrative measures except % grammatical errors, number of repetitions and repairs (which will
be negatively correlated).
On the Frog story narrative, there were significant group differences and significant
correlations for all three variables (total words, verbs per utterance and the number of
repetitions) which highlight that increased print exposure in L2 is associated with higher
number of words in the narrative, higher verbs per utterance and fewer repetitions in L2 oral
production.
The total words produced exhibit significant differences between the two groups and a
significant positive correlation with PE. In theory, verbosity could behave as a richer utterance
level measure. However, we have discussed why this is not so in section 3.7.1. The findings of
higher verbs per utterance is in line with our finding of one of the tasks of comprehension
(synonymy triplets task) where print exposure was associated with better verb comprehension
compared to noun comprehension (Chapter 2). A sentence is considered grammatically
incomplete without a verb; therefore, they are essential in sentence production and
comprehension (Reyes & Thompson, 2012).
The findings of fewer repetitions with increased print exposure implies that the
narratives were more fluent. This mirrors relationships known to exist between print exposure
and verbal fluency with monolingual speakers (Cunningham & Stanovich, 1991) and provides
evidence that print exposure impacts fluency in open utterance level tasks. Findings also suggest
increase in L2 print exposure is associated with using- more words, fewer grammatical errors
251
(in line with findings of Sparks in Dabrowska (2012), less present participle morphemes, more
adverbs, fewer nouns, a more diverse range of nouns and fewer repetitions.
To sum, higher print exposure is associated with better narrative characteristics in
terms of utterance level measures, more diversity of noun usage, higher percentage of adverbs,
verbs per utterance and fewer repair measures.
4. Impact of L2 print exposure on non-verbal executive functions
Based on the literature we predicted that there will be a significant group differences between
HPE and LPE; positive correlations between print exposure in L2 and performance measures of
inhibition, working memory and task switching (i.e., Stroop effect, conflict effect, D-prime,
switch cost).
Our findings suggest no significant group differences or correlations of print exposure in
L2 with any of the executive function tasks, excepting auditory N-back which is a working
memory measure. Higher print exposure was also associated with improved performance on the
auditory 2-back condition. We could hypothesise that the better performance on this condition
could be due to the task demanding higher working memory load. This is in line with our
findings on the sentence comprehension task. This was an auditorily presented task where
higher print exposure was associated with better accuracy score.
252
6.3 Conclusions
This study is a first-of-its-kind which investigated print exposure and various aspects of bi-
literate bilingual adults on oral language production at word and sentence level (narrative
production) and executive function measures in a holistic manner (integrating inhibitory
control, working memory and task switching).
We conclude that print exposure in L2 has some association with oral language
production tasks both at the word level and connected speech level. On the other hand, a strong
relation seems to exist between comprehension measures and print exposure (in L2) in our
study. With regard to the non-verbal executive functions, we conclude that no direct link
between print exposure (in L2) and non-verbal executive function measures in bi-literate
bilinguals is discernible excepting working memory.
Additionally, there seems to be a strong link between print exposure and semantic
processing in our research. The findings on the semantic tasks have been consistent across
comprehension (synonymy triplets task and sentence comprehension task) and production
(semantic fluency) favouring HPE.
253
6.4 Significant contributions to literature of Phase I and future directions
This research contributes significantly to our understanding of oral language production (word
and connected speech level), comprehension and executive functions in adult biliteracy. This
study is a first of its kind in many respects and has some substantial limitations that are
expected in its class of studies. It also has plenty of scope for exploratory next steps which can
facilitate stronger affirmations of some of the findings. In this section, we will elaborate on the
significant contributions that this research makes to the field of bi-literacy and bilingualism and
we also elaborate on the limitations that pave the way for future studies.
1. Characterization of the populations
We have successfully measured language proficiency subjectively. The goal of such
measurements was to tease apart the language proficiency in reading and writing. In order to
achieve that, not only did we record (with self-assessment) language usage, dominance and
proficiency with reading and writing separately but also documented the acquisition and
frequency of reading and writing. This has resulted in a comprehensive questionnaire which
catalogues and categorizes all these parameters for bi-literate bilingual healthy adults.
We also introduced print exposure (PE) as a measure of literacy combining scores of
grammaticality judgment and sentence verification. This has proven to be a sensitive measure
for evaluating the impact of print exposure on various tasks of oral language production (word
and connected speech level), comprehension and executive functions.
Measurement of language proficiency and reading and writing skills in L1 has been done
subjectively, since PE was objectively measured only in L2, the language proficiency and reading
and writing skills in L1 was only matched (when selecting the two groups). This proficiency was
based on self-report and hence has a tendency to be either over or underestimated. An objective
measure of proficiency would allow for a more nuanced characterization of the sample. A future
direction would be to make this an objective score based on an explicit test of performance.
Following creation of such objective scores, an immediate next step would be to control for the

254
bi-literacy, bilingual attributes measured by the questionnaire such as language proficiency and
usage while grouping participants and perform similar analyses.
2. Type of populations
All the participants in our study are matched on education. Despite this, the impact of print
exposure superseded the uniform impact of education. One of the limitations of this population
was the non-uniformity in L1 (although the languages were from the same language family)
leading to the probability of a bias in the data. To control for this bias, we suggest choosing
participants with the same L1.
3. Exposure to L2.
All of the participants were Indian immigrants in the UK, hence their usage of English (L2) was
very frequent and reportedly very proficient. However, in spite of this similarity the impact of
print exposure superseded the effect of exposure to L2 which is evident from group differences
in narratives and comprehension tasks.
4. Classification of groups
While print exposure in L2 is a robust measure to predict measures of oral language production
and comprehension, it still has some intrinsic limitations. Firstly, composite score of PE only
measures the print exposure in L2 and does not account for print exposure in L1 among
participants. Secondly, division of the groups into HPE and LPE was based on an arbitrary cut-
off. Since the cut-off was arbitrary, participants with scores very close to the cut-off were not
accurately classified. A larger participant pool would allow us to classify them into larger
number of groups. Participants who overlap between groups can be excluded thereby reducing
the confusion of accurate grouping. In addition, a larger sample size with homogeneity in both
L1 and L2 would also lend to more statistical measures such as regression and clustering.
5. Lack of parallel test material in L1 (the Indian native language of participants)
Phase I was significantly impaired by the absence of test material in L1 (the Indian native
language of participants) for many of the tasks. In such absence it did not behove to measure PE
255
in both L1 and L2, consequently only PE in L2 is considered, as test material was readily
available in English. A possible next step in this direction would be a) To develop a composite PE
score that combines PE in both L1 and L2, thus forming a holistic bilingual bi-literate PE score.
b) Consequently, testing would have to be done separately in L1 and L2 to quantify the
sensitivity of this composite PE in both L1 and L2. An unrelated, but strongly allied,
development would be the development of test material for different L1-L2 combinations i.e
Kannada-English, Tamil –English etc. which would develop complementary testing in both
languages and hence accurately quantify the sensitivity of this composite PE.
6. Type of tasks
A specific limitation of the executive function measures reported in Chapter 4 were that they
were all non-verbal measures of executive functions. Research on impact of PE in monolinguals
have used verbal executive function measures. In our study, we have not included verbal
executive function measures. An interesting study would be to repeat the same kind of
experiment with both verbal and non-verbal executive function measures (See Calabria et al,
2011) which would inform whether there is a differential impact of PE on verbal and non-verbal
executive function measures.
All of the tasks used in this research were behavioural tasks. Factors such as fatigue,
practice trials, noise levels and distractions could have influenced the performance and testing.
Perhaps, a more controlled and improvised method which could be used in the future could be
to incorporate an eye tracking method or functional neuroimaging which could further help
strengthen the findings.
6.5 Significant contributions to literature of Phase II and future directions
In phase II (Chapter 5), we aimed to profile and characterise the reading abilities in both
languages – English (alphabetic script) and Kannada/Hindi (syllabic script) of 4 BPWA based on
the dual-route cascaded model of reading aloud (Coltheart, 2001). We investigated whether
script differences would impact the manifestation of acquired dyslexia in the two languages. The
256
results reveal unique differences of reading characteristics in the two languages of the four
BPWA. Key findings and contribution of this research to the literature are-
1. Type of dyslexia in two languages.
Our key findings suggest, two of our BPWA (AP02 and AP07) had severe reading impairments in
English and Kannada, we diagnosed them with alexia (Ratnavalli et al, 2000; Karanth, 1981;
2002) in both languages. Two other BPWA (AP03 and AP05) exhibited features of phonological
dyslexia in the alphabetic English. AP03’s reading Kannada was significantly poor therefore, he
was diagnosed with alexia in Kannada. On the other hand, AP05 was able to read aloud
accurately in Hindi at the word level, but the stimuli was not sensitive enough to tap into
variables such as syllable length, imageability, frequency and regularity. Therefore, it was
difficult to draw conclusions regarding reading impairment in Hindi.
Previous research in Indian bilinguals has studied the neurologically impaired
population as single case studies (Ratnavalli et al, 2000; Karanth, 1981; 2002) in the form of
case reports on diagnostic language tests, not really delving into the different aspects of reading
such as imageability, frequency and regularity in both languages. Our study is the first of its kind
which studies neurologically impaired bilingual Indians (bi-literate pre-stroke) with languages
employing two different scripts (alphabetic- English, alpha-syllabic- Hindi/Kannada) tapping
into different aspects of reading profile in the two languages by borrowing from the literature
such as Psycholinguistic Assessment of Language Processing in Aphasia (PALPA; Kay, Lesser &
Coltheart, 1992) in English, reading subtests from Reading Acquisition Profile (RAP-K; Rao,
1997) in Kannada and words from Bilingual Aphasia test -Hindi (BAT; Paradis & Libben, 1987).
This gives a much more comprehensive picture of the reading characteristics in both the
languages.
2. Influence of various variables of bilingualism and usage
Profiling BPWA in Phase II involved adapting the language proficiency questionnaire developed
in Phase I to profile both pre and post morbid language proficiency in BPWA. This showed both

257
the strength and versatility of the questionnaire developed in Phase I. It also demonstrates the
depth of probing of the questionnaire developed in Phase I.
258
6.6 Limitations and Future directions
1. Unparallel tasks across the languages
The study was impacted by the lack of a parallel test stimuli that mirrors PALPA in Indian
languages. PALPA in English accounts for effects of imageability, frequency, regularity, word
length and non-word reading. The lack of reliable published and consequently usable materials
significantly limited the scope of our study. Access to institutionally authorised material that
could be regarded as an alternative in Indian languages was also denied. Therefore, there is an
urgent need to develop and disseminate test materials to tap into the reading impairments in
Indian languages.
2. Severity of impairment in participants recruited
Although we attempted to classify the reading abilities in both the alphabetic and syllabic
languages based on the dual route cascaded model, none of our BPWA, had enough reading
abilities in the syllabic languages (near total loss of reading ability) except AP05 making it
difficult to adapt the model of reading aloud to Kannada/Hindi. In future, studies could target at
recruiting BPWA with graded severity levels, which in turn would help us make more nuanced
classification of reading impairments in the two languages.
3. Difficulty in recruitment
Recruitment of BPWA was aggravated by the need to have a homogenous group (same two
language bilinguals) and the lack of institutional support in identifying such BPWA. This further
amplified the time constraint on me owing to which only a few participants could be recruited
(7 BPWA). Within these, we had to exclude three because of the severity of aphasia (global
aphasia). Consonant to the problem of homogeneity was the multilingual nature of participants
having different L1 (Telugu, Tamil, Hindi, Kannada) and variance in reading proficiency.
4. Reduced sample size and need for large-scale studies
Firstly, the sample size was small owing to recruitment difficulties and scope of the PhD. We
need to have large scale studies that profile and characterise the reading impairments in bi-
scriptal bilingual Indian population. This will in-turn facilitate the characterisation of specific

259
script to language combinations among bilinguals (Kannada-English; Tamil-English) which can
then be used to derive/adapt models of reading aloud among bilinguals.
5. Varying script differences
All of these Indian languages have scripts that have varying scriptal differences with English.
Some languages such as Tamil have less transparent orthographies as compared to Kannada
which has a very transparent orthography. In this sense, Kannada is further away from English
(in terms of script) than Tamil. Consequently, bilinguals speaking unique combinations of these
languages need to be assessed to understand how reading difficulties manifest in both language
combinations (Kannada-English, Tamil-English). This would immensely benefit assessment and
treatment of bilinguals with neurological impairment.
In conclusion, our research has demonstrated that bi-literacy has some significant
consequences for the healthy and the neurologically impaired population. Our research points
to there being a cognitive-linguistic impact of bi-literacy where language seems to show a
stronger impact than cognition for the healthy population. In the neurologically impaired
population, our research provides a comprehensive profiling of reading abilities in BPWA in the
Indian population. This research also provides plenty of scope for exploratory next steps which
can facilitate stronger affirmations of some of the findings.
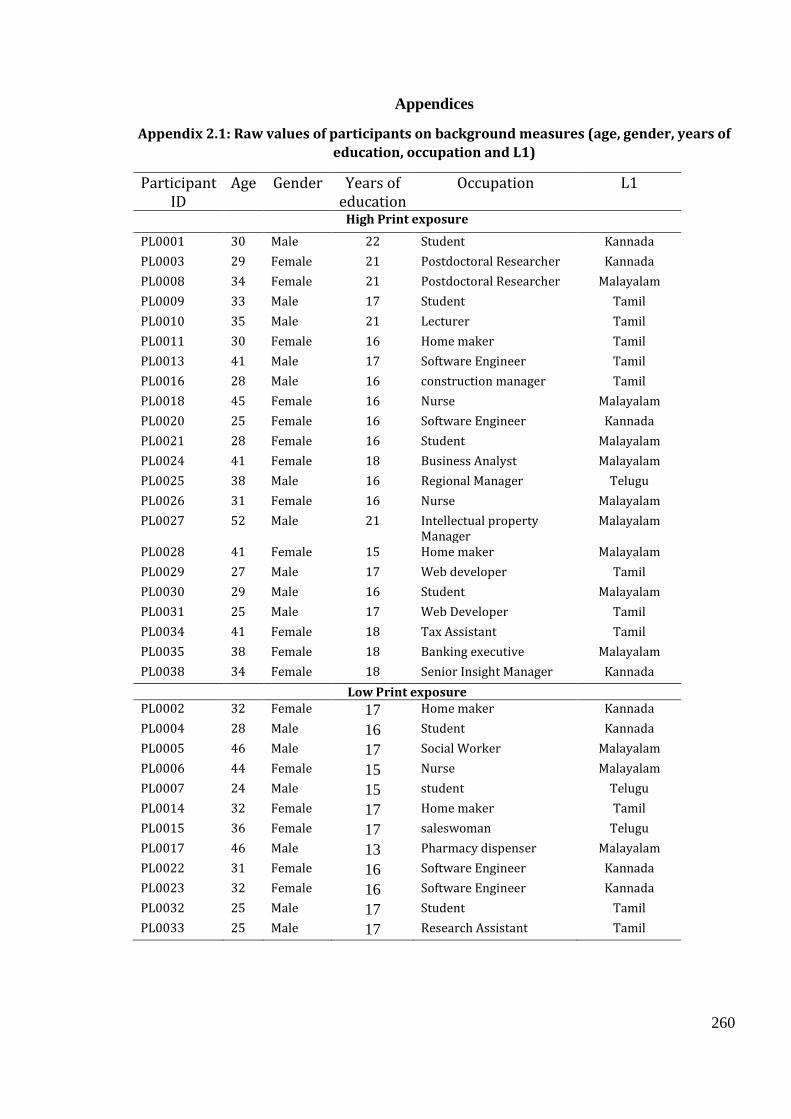
260
Appendices
Appendix 2.1: Raw values of participants on background measures (age, gender, years of
education, occupation and L1)
Participant ID
Age Gender Years of education
Occupation L1
High Print exposure
PL0001 30 Male 22 Student Kannada
PL0003 29 Female 21 Postdoctoral Researcher Kannada
PL0008 34 Female 21 Postdoctoral Researcher Malayalam
PL0009 33 Male 17 Student Tamil
PL0010 35 Male 21 Lecturer Tamil
PL0011 30 Female 16 Home maker Tamil
PL0013 41 Male 17 Software Engineer Tamil
PL0016 28 Male 16 construction manager Tamil
PL0018 45 Female 16 Nurse Malayalam
PL0020 25 Female 16 Software Engineer Kannada
PL0021 28 Female 16 Student Malayalam
PL0024 41 Female 18 Business Analyst Malayalam
PL0025 38 Male 16 Regional Manager Telugu
PL0026 31 Female 16 Nurse Malayalam
PL0027 52 Male 21 Intellectual property Manager
Malayalam
PL0028 41 Female 15 Home maker Malayalam
PL0029 27 Male 17 Web developer Tamil
PL0030 29 Male 16 Student Malayalam
PL0031 25 Male 17 Web Developer Tamil
PL0034 41 Female 18 Tax Assistant Tamil
PL0035 38 Female 18 Banking executive Malayalam
PL0038 34 Female 18 Senior Insight Manager Kannada
Low Print exposure PL0002 32 Female 17 Home maker Kannada
PL0004 28 Male 16 Student Kannada
PL0005 46 Male 17 Social Worker Malayalam
PL0006 44 Female 15 Nurse Malayalam
PL0007 24 Male 15 student Telugu
PL0014 32 Female 17 Home maker Tamil
PL0015 36 Female 17 saleswoman Telugu
PL0017 46 Male 13 Pharmacy dispenser Malayalam
PL0022 31 Female 16 Software Engineer Kannada
PL0023 32 Female 16 Software Engineer Kannada
PL0032 25 Male 17 Student Tamil
PL0033 25 Male 17 Research Assistant Tamil
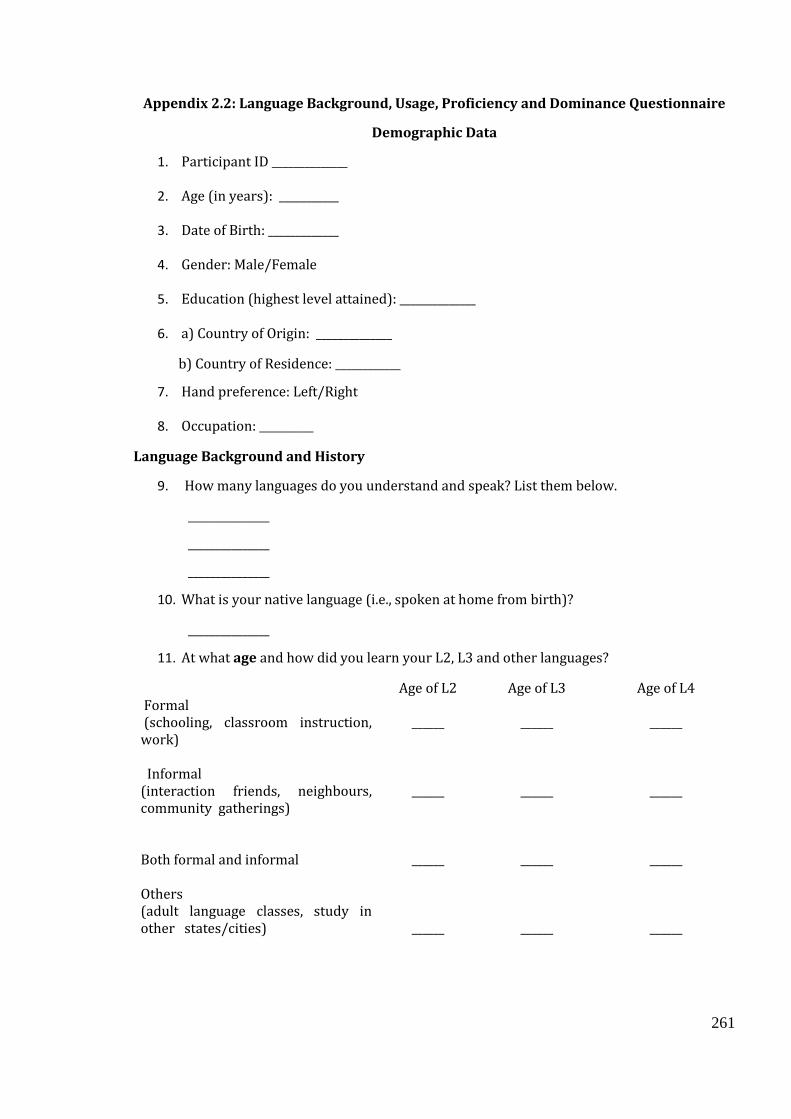
261
Appendix 2.2: Language Background, Usage, Proficiency and Dominance Questionnaire
Demographic Data
1. Participant ID ______________ 2. Age (in years): ___________ 3. Date of Birth: _____________ 4. Gender: Male/Female
5. Education (highest level attained): ______________ 6. a) Country of Origin: ______________
b) Country of Residence: ____________
7. Hand preference: Left/Right 8. Occupation: __________
Language Background and History
9. How many languages do you understand and speak? List them below.
_______________
_______________
_______________
10. What is your native language (i.e., spoken at home from birth)?
_______________
11. At what age and how did you learn your L2, L3 and other languages?
Age of L2 Age of L3 Age of L4 Formal (schooling, classroom instruction, work)
______
______
______
Informal (interaction friends, neighbours, community gatherings)
______
______
______
Both formal and informal
______
______
______
Others (adult language classes, study in other states/cities)
______
______
______
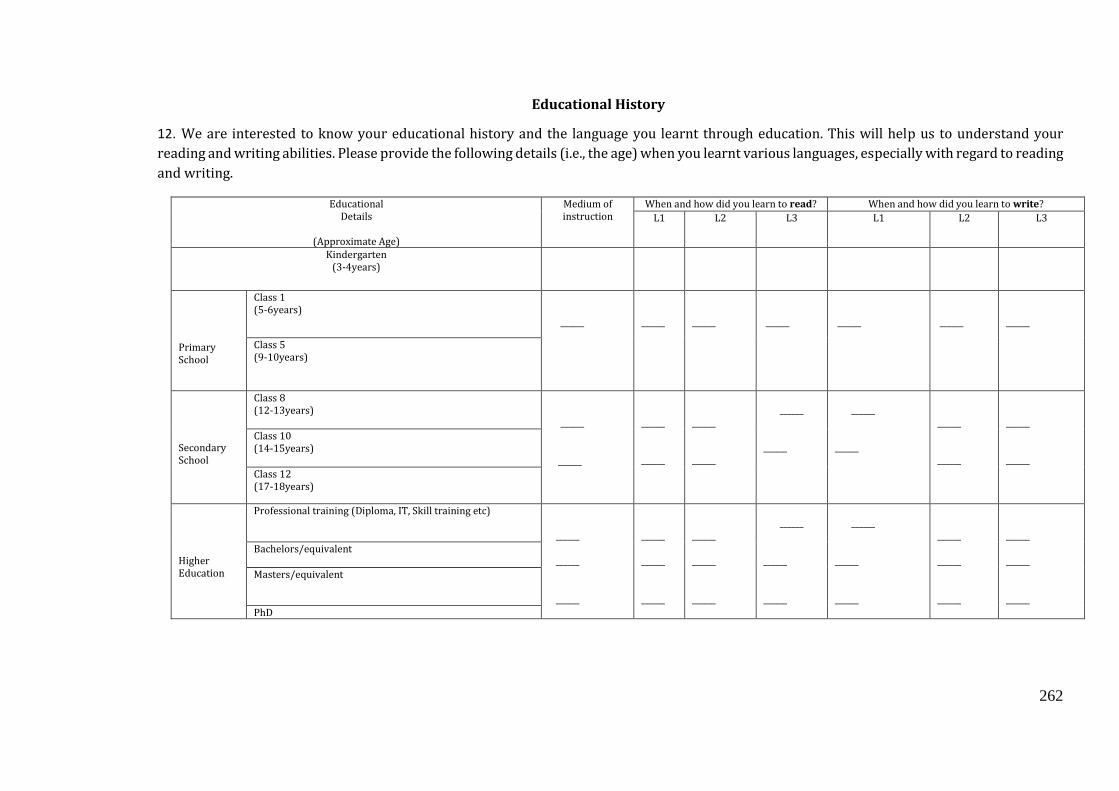
262
Educational History
12. We are interested to know your educational history and the language you learnt through education. This will help us to understand your
reading and writing abilities. Please provide the following details (i.e., the age) when you learnt various languages, especially with regard to reading
and writing.
Educational Details
(Approximate Age)
Medium of instruction
When and how did you learn to read? When and how did you learn to write?
L1 L2 L3 L1 L2 L3
Kindergarten (3-4years)
Primary School
Class 1 (5-6years)
______
______
______
______
______
______
______
Class 5 (9-10years)
Secondary School
Class 8 (12-13years)
______
______ ______
______ ______
______ ______
______ ______
______ ______
______ ______
Class 10 (14-15years)
______
Class 12 (17-18years)
Higher Education
Professional training (Diploma, IT, Skill training etc) ______
______
______
______
______
______
______
Bachelors/equivalent
______
______
______
______
______
______
______
Masters/equivalent ______
______
______
______
______
______
______
PhD

263
13. What is the educational qualification of your spouse/partner/someone you live with?
_________________
14. How often do you read books, newspapers, magazines etc in each of the languages?
L1: Daily Few times a week Weekly Monthly
L2: Daily Few times a week Weekly Monthly
L3: Daily Few times a week Weekly Monthly
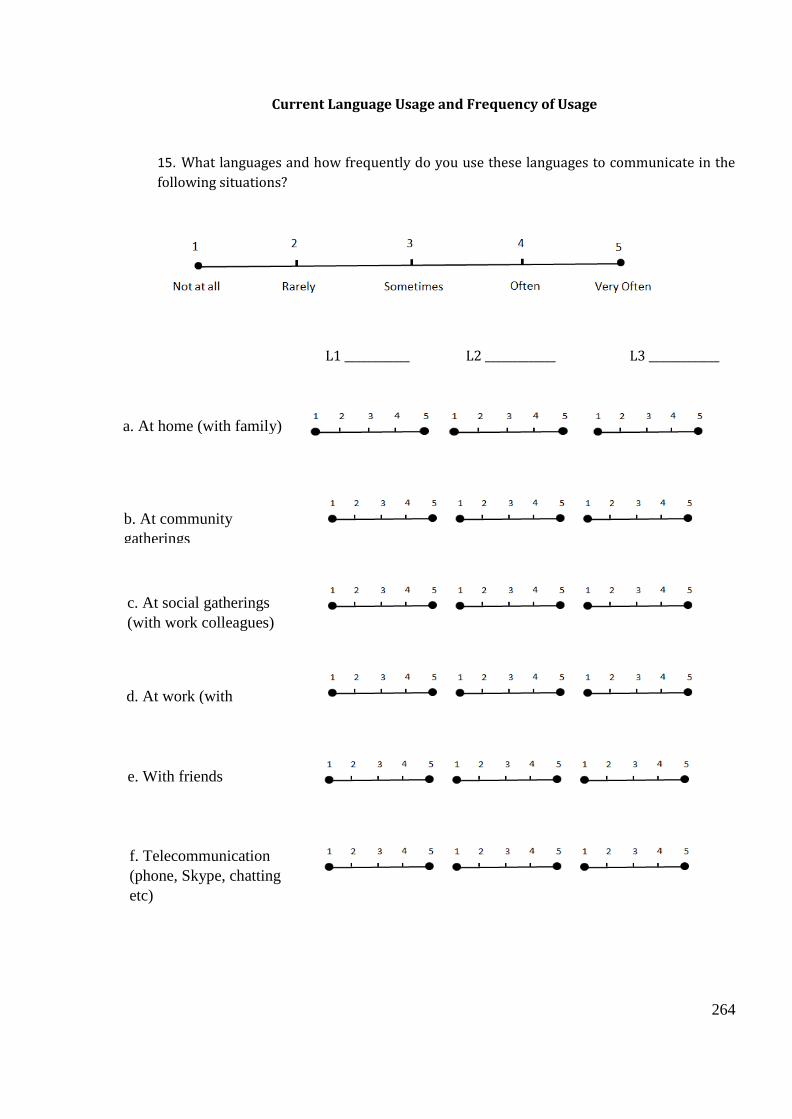
264
Current Language Usage and Frequency of Usage
15. What languages and how frequently do you use these languages to communicate in the
following situations?
L1 ____________ L2 _____________ L3 _____________
a. At home (with family)
b. At community
gatherings
d. At work (with
colleagues)
e. With friends
f. Telecommunication
(phone, Skype, chatting
etc)
c. At social gatherings
(with work colleagues)
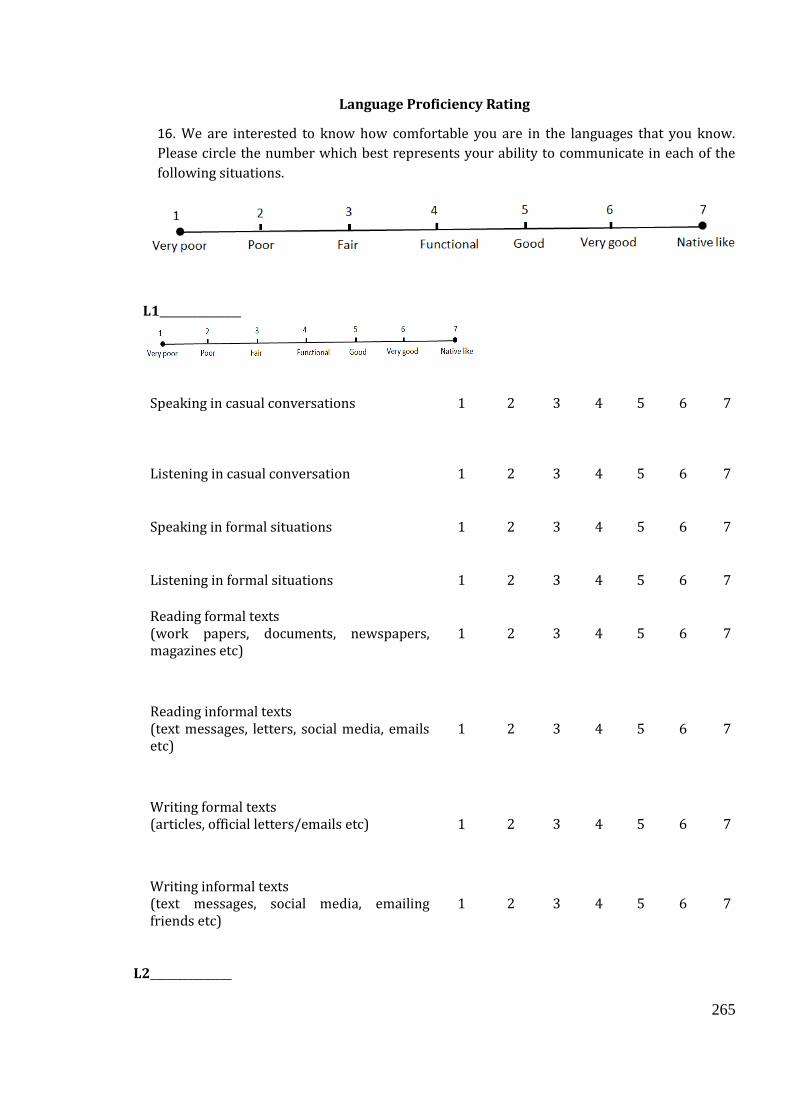
265
Language Proficiency Rating
16. We are interested to know how comfortable you are in the languages that you know.
Please circle the number which best represents your ability to communicate in each of the
following situations.
L1_______________
Speaking in casual conversations 1 2 3 4 5 6 7
Listening in casual conversation
1
2
3
4
5
6
7
Speaking in formal situations
1
2
3
4
5
6
7
Listening in formal situations
1
2
3
4
5
6
7
Reading formal texts (work papers, documents, newspapers, magazines etc)
1
2
3
4
5
6
7
Reading informal texts (text messages, letters, social media, emails etc)
1
2
3
4
5
6
7
Writing formal texts (articles, official letters/emails etc)
1
2
3
4
5
6
7
Writing informal texts (text messages, social media, emailing friends etc)
1
2
3
4
5
6
7
L2_______________
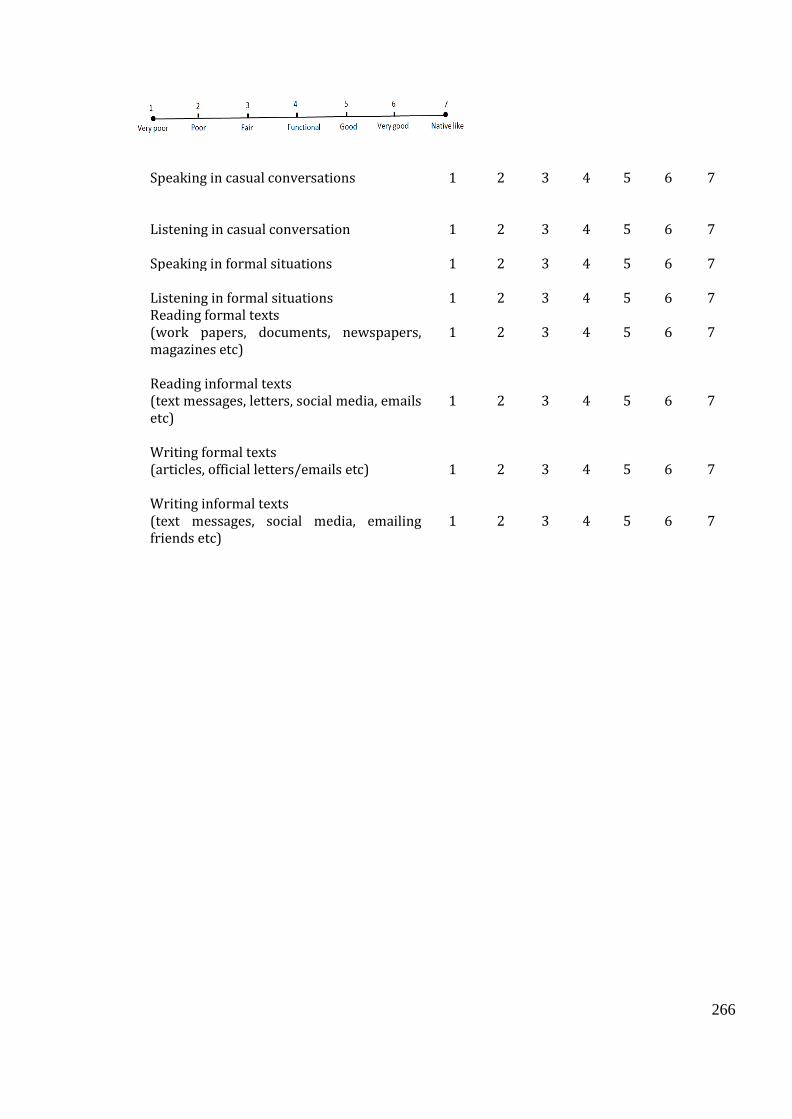
266
Speaking in casual conversations 1 2 3 4 5 6 7
Listening in casual conversation
1
2
3
4
5
6
7
Speaking in formal situations
1
2
3
4
5
6
7
Listening in formal situations
1
2
3
4
5
6
7
Reading formal texts (work papers, documents, newspapers, magazines etc)
1
2
3
4
5
6
7
Reading informal texts (text messages, letters, social media, emails etc)
1
2
3
4
5
6
7
Writing formal texts (articles, official letters/emails etc)
1
2
3
4
5
6
7
Writing informal texts (text messages, social media, emailing friends etc)
1
2
3
4
5
6
7
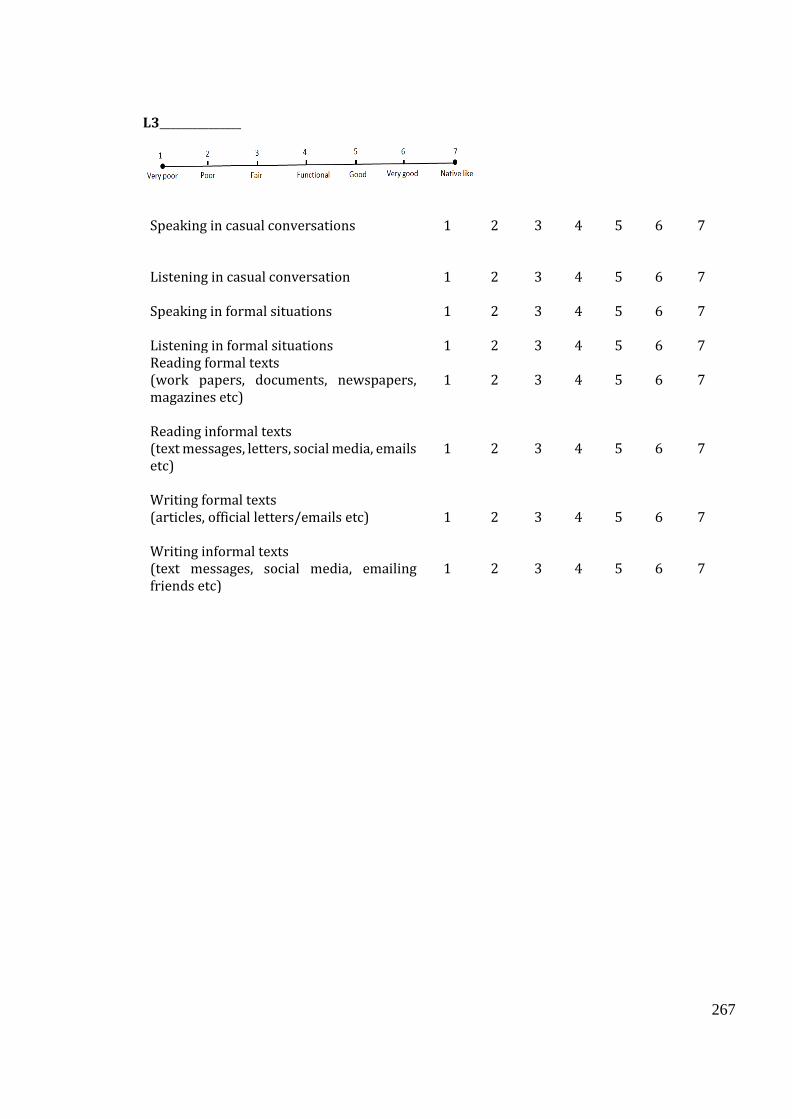
267
L3_______________
Speaking in casual conversations 1 2 3 4 5 6 7
Listening in casual conversation
1
2
3
4
5
6
7
Speaking in formal situations
1
2
3
4
5
6
7
Listening in formal situations
1
2
3
4
5
6
7
Reading formal texts (work papers, documents, newspapers, magazines etc)
1
2
3
4
5
6
7
Reading informal texts (text messages, letters, social media, emails etc)
1
2
3
4
5
6
7
Writing formal texts (articles, official letters/emails etc)
1
2
3
4
5
6
7
Writing informal texts (text messages, social media, emailing friends etc)
1
2
3
4
5
6
7
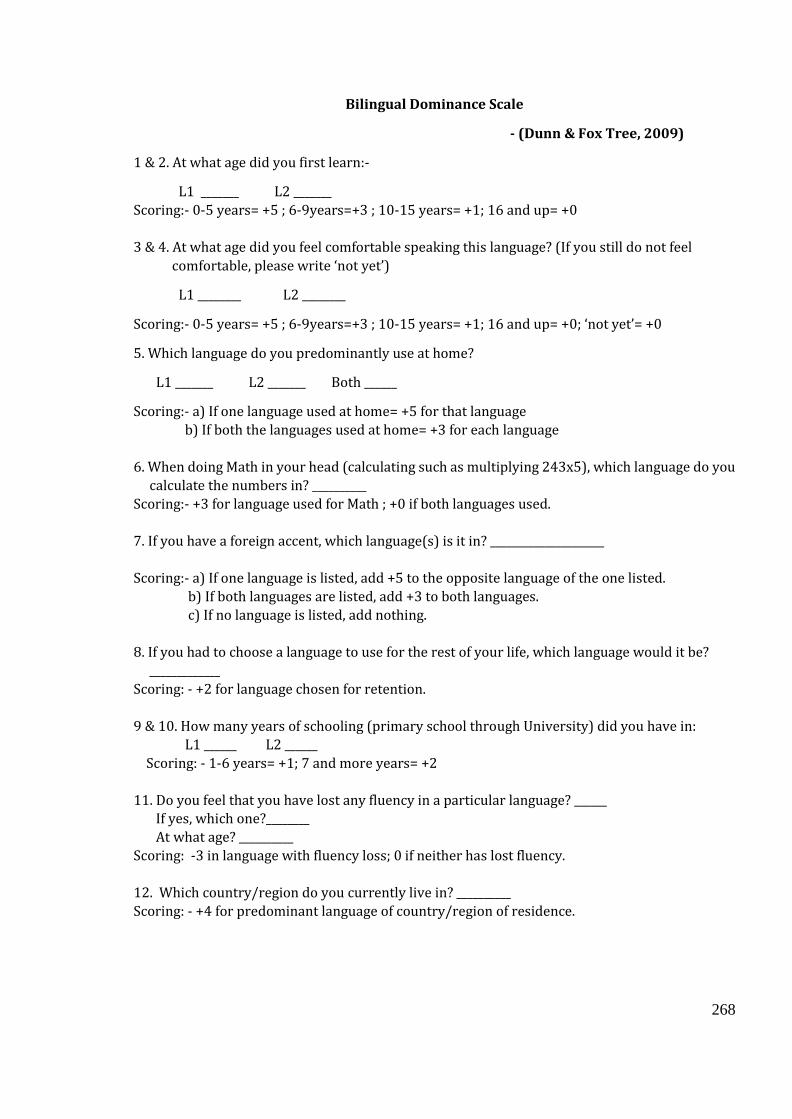
268
Bilingual Dominance Scale
- (Dunn & Fox Tree, 2009)
1 & 2. At what age did you first learn:-
L1 _______ L2 _______
Scoring:- 0-5 years= +5 ; 6-9years=+3 ; 10-15 years= +1; 16 and up= +0
3 & 4. At what age did you feel comfortable speaking this language? (If you still do not feel
comfortable, please write ‘not yet’)
L1 ________ L2 ________
Scoring:- 0-5 years= +5 ; 6-9years=+3 ; 10-15 years= +1; 16 and up= +0; ‘not yet’= +0
5. Which language do you predominantly use at home?
L1 _______ L2 _______ Both ______
Scoring:- a) If one language used at home= +5 for that language
b) If both the languages used at home= +3 for each language
6. When doing Math in your head (calculating such as multiplying 243x5), which language do you
calculate the numbers in? __________
Scoring:- +3 for language used for Math ; +0 if both languages used.
7. If you have a foreign accent, which language(s) is it in? _____________________
Scoring:- a) If one language is listed, add +5 to the opposite language of the one listed.
b) If both languages are listed, add +3 to both languages.
c) If no language is listed, add nothing.
8. If you had to choose a language to use for the rest of your life, which language would it be?
_____________
Scoring: - +2 for language chosen for retention.
9 & 10. How many years of schooling (primary school through University) did you have in:
L1 ______ L2 ______
Scoring: - 1-6 years= +1; 7 and more years= +2
11. Do you feel that you have lost any fluency in a particular language? ______ If yes, which one?________
At what age? __________
Scoring: -3 in language with fluency loss; 0 if neither has lost fluency.
12. Which country/region do you currently live in? __________
Scoring: - +4 for predominant language of country/region of residence.
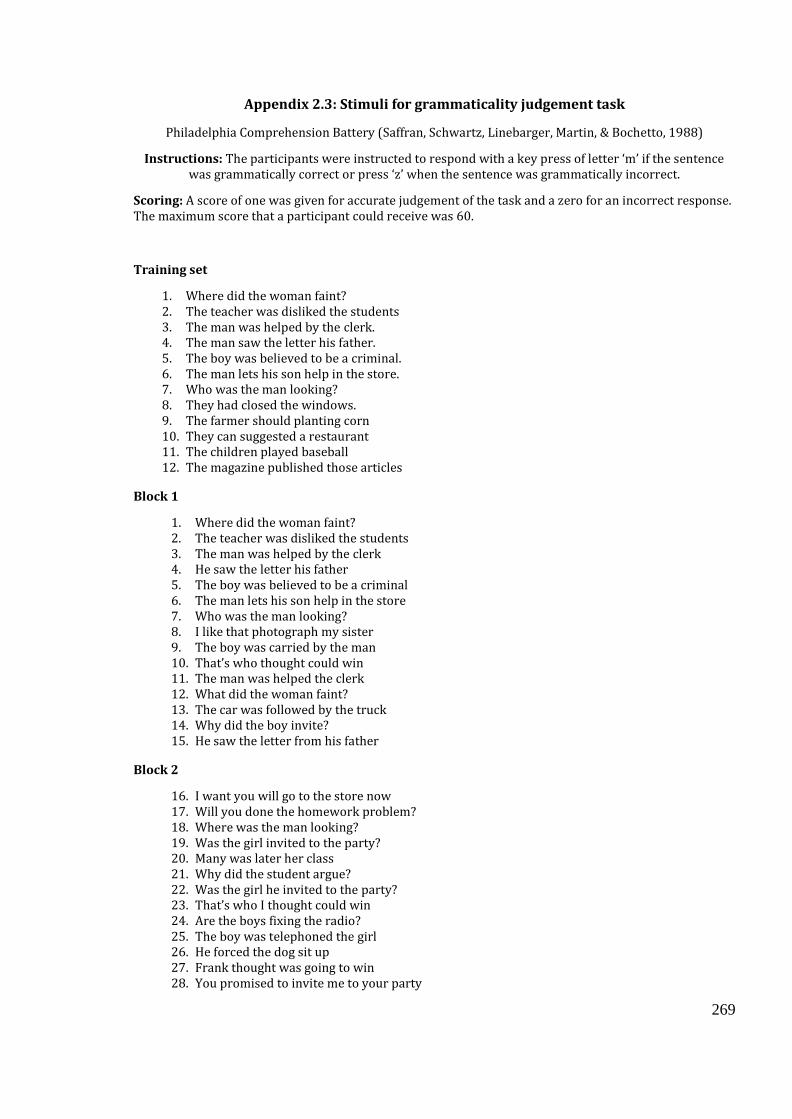
269
Appendix 2.3: Stimuli for grammaticality judgement task
Philadelphia Comprehension Battery (Saffran, Schwartz, Linebarger, Martin, & Bochetto, 1988)
Instructions: The participants were instructed to respond with a key press of letter ‘m’ if the sentence was grammatically correct or press ‘z’ when the sentence was grammatically incorrect.
Scoring: A score of one was given for accurate judgement of the task and a zero for an incorrect response. The maximum score that a participant could receive was 60.
Training set
1. Where did the woman faint? 2. The teacher was disliked the students 3. The man was helped by the clerk. 4. The man saw the letter his father. 5. The boy was believed to be a criminal. 6. The man lets his son help in the store. 7. Who was the man looking? 8. They had closed the windows. 9. The farmer should planting corn 10. They can suggested a restaurant 11. The children played baseball 12. The magazine published those articles
Block 1
1. Where did the woman faint? 2. The teacher was disliked the students 3. The man was helped by the clerk 4. He saw the letter his father 5. The boy was believed to be a criminal 6. The man lets his son help in the store 7. Who was the man looking? 8. I like that photograph my sister 9. The boy was carried by the man 10. That’s who thought could win 11. The man was helped the clerk 12. What did the woman faint? 13. The car was followed by the truck 14. Why did the boy invite? 15. He saw the letter from his father
Block 2
16. I want you will go to the store now 17. Will you done the homework problem? 18. Where was the man looking? 19. Was the girl invited to the party? 20. Many was later her class 21. Why did the student argue? 22. Was the girl he invited to the party? 23. That’s who I thought could win 24. Are the boys fixing the radio? 25. The boy was telephoned the girl 26. He forced the dog sit up 27. Frank thought was going to win 28. You promised to invite me to your party
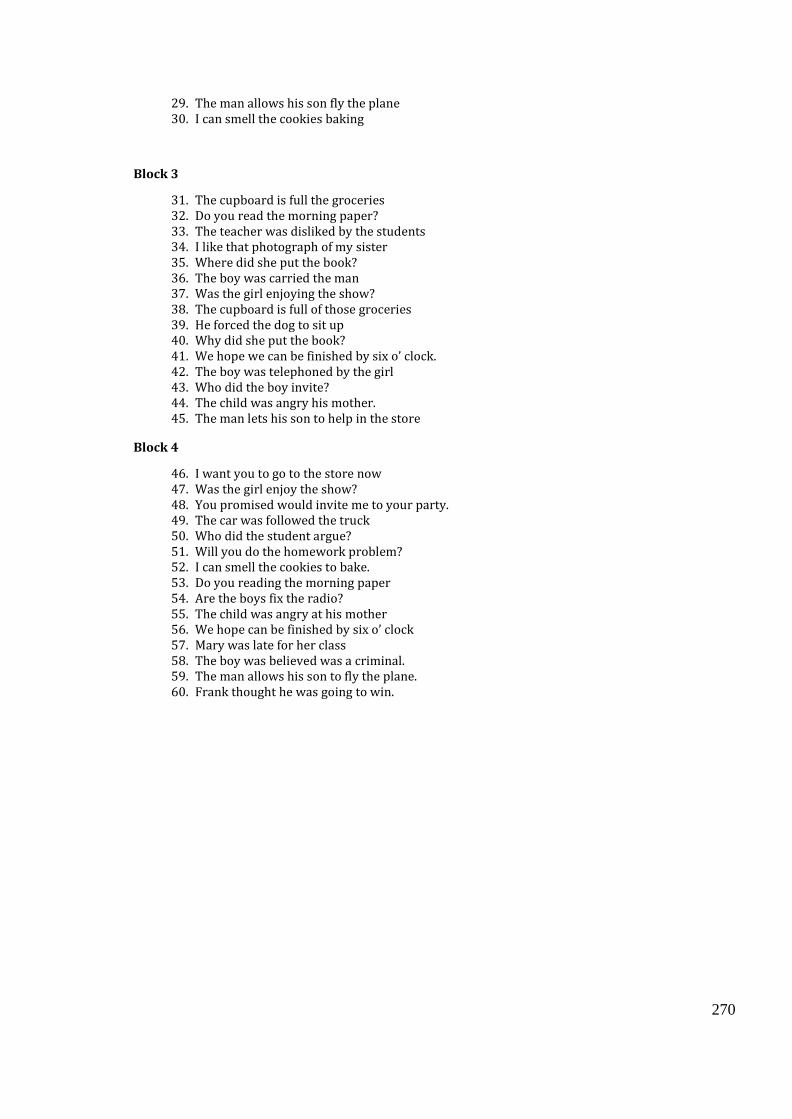
270
29. The man allows his son fly the plane 30. I can smell the cookies baking
Block 3
31. The cupboard is full the groceries 32. Do you read the morning paper? 33. The teacher was disliked by the students 34. I like that photograph of my sister 35. Where did she put the book? 36. The boy was carried the man 37. Was the girl enjoying the show? 38. The cupboard is full of those groceries 39. He forced the dog to sit up 40. Why did she put the book? 41. We hope we can be finished by six o’ clock. 42. The boy was telephoned by the girl 43. Who did the boy invite? 44. The child was angry his mother. 45. The man lets his son to help in the store
Block 4
46. I want you to go to the store now 47. Was the girl enjoy the show? 48. You promised would invite me to your party. 49. The car was followed the truck 50. Who did the student argue? 51. Will you do the homework problem? 52. I can smell the cookies to bake. 53. Do you reading the morning paper 54. Are the boys fix the radio? 55. The child was angry at his mother 56. We hope can be finished by six o’ clock 57. Mary was late for her class 58. The boy was believed was a criminal. 59. The man allows his son to fly the plane. 60. Frank thought he was going to win.
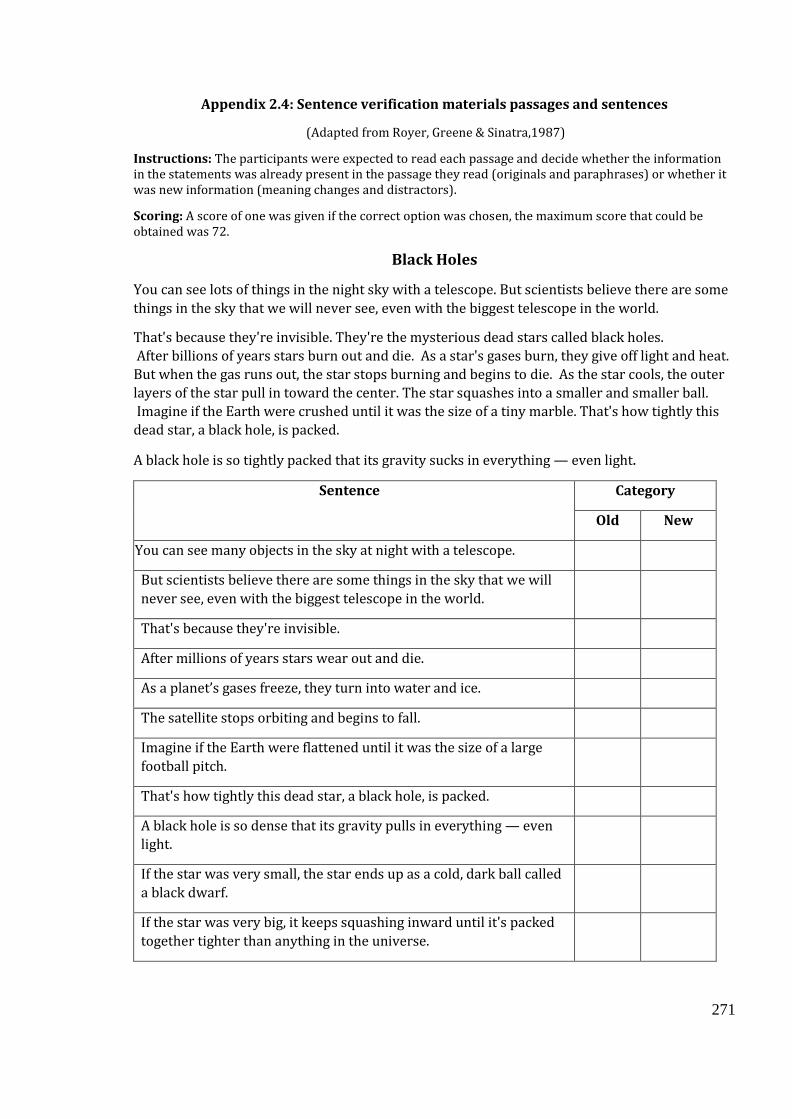
271
Appendix 2.4: Sentence verification materials passages and sentences
(Adapted from Royer, Greene & Sinatra,1987)
Instructions: The participants were expected to read each passage and decide whether the information in the statements was already present in the passage they read (originals and paraphrases) or whether it was new information (meaning changes and distractors).
Scoring: A score of one was given if the correct option was chosen, the maximum score that could be obtained was 72.
Black Holes
You can see lots of things in the night sky with a telescope. But scientists believe there are some
things in the sky that we will never see, even with the biggest telescope in the world.
That's because they're invisible. They're the mysterious dead stars called black holes.
After billions of years stars burn out and die. As a star's gases burn, they give off light and heat.
But when the gas runs out, the star stops burning and begins to die. As the star cools, the outer
layers of the star pull in toward the center. The star squashes into a smaller and smaller ball.
Imagine if the Earth were crushed until it was the size of a tiny marble. That's how tightly this
dead star, a black hole, is packed.
A black hole is so tightly packed that its gravity sucks in everything — even light.
Sentence Category
Old New
You can see many objects in the sky at night with a telescope.
But scientists believe there are some things in the sky that we will
never see, even with the biggest telescope in the world.
That's because they're invisible.
After millions of years stars wear out and die.
As a planet’s gases freeze, they turn into water and ice.
The satellite stops orbiting and begins to fall.
Imagine if the Earth were flattened until it was the size of a large
football pitch.
That's how tightly this dead star, a black hole, is packed.
A black hole is so dense that its gravity pulls in everything — even
light.
If the star was very small, the star ends up as a cold, dark ball called
a black dwarf.
If the star was very big, it keeps squashing inward until it's packed
together tighter than anything in the universe.

272
The light from a black hole can never come back to your eyes, so you
see nothing but blackness.
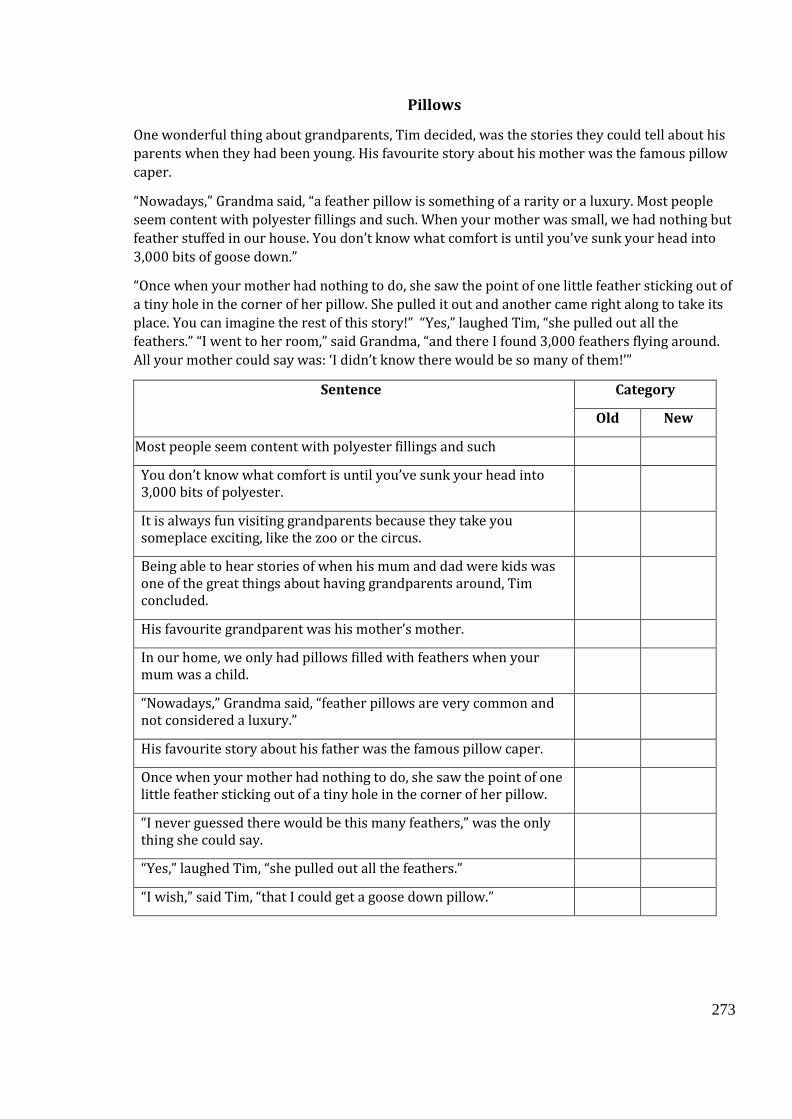
273
Pillows
One wonderful thing about grandparents, Tim decided, was the stories they could tell about his
parents when they had been young. His favourite story about his mother was the famous pillow
caper.
“Nowadays,” Grandma said, “a feather pillow is something of a rarity or a luxury. Most people
seem content with polyester fillings and such. When your mother was small, we had nothing but
feather stuffed in our house. You don’t know what comfort is until you’ve sunk your head into
3,000 bits of goose down.”
“Once when your mother had nothing to do, she saw the point of one little feather sticking out of
a tiny hole in the corner of her pillow. She pulled it out and another came right along to take its
place. You can imagine the rest of this story!” “Yes,” laughed Tim, “she pulled out all the
feathers.” “I went to her room,” said Grandma, “and there I found 3,000 feathers flying around.
All your mother could say was: ‘I didn’t know there would be so many of them!’”
Sentence Category
Old New
Most people seem content with polyester fillings and such
You don’t know what comfort is until you’ve sunk your head into 3,000 bits of polyester.
It is always fun visiting grandparents because they take you someplace exciting, like the zoo or the circus.
Being able to hear stories of when his mum and dad were kids was one of the great things about having grandparents around, Tim concluded.
His favourite grandparent was his mother’s mother.
In our home, we only had pillows filled with feathers when your mum was a child.
“Nowadays,” Grandma said, “feather pillows are very common and not considered a luxury.”
His favourite story about his father was the famous pillow caper.
Once when your mother had nothing to do, she saw the point of one little feather sticking out of a tiny hole in the corner of her pillow.
“I never guessed there would be this many feathers,” was the only thing she could say.
“Yes,” laughed Tim, “she pulled out all the feathers.”
“I wish,” said Tim, “that I could get a goose down pillow.”
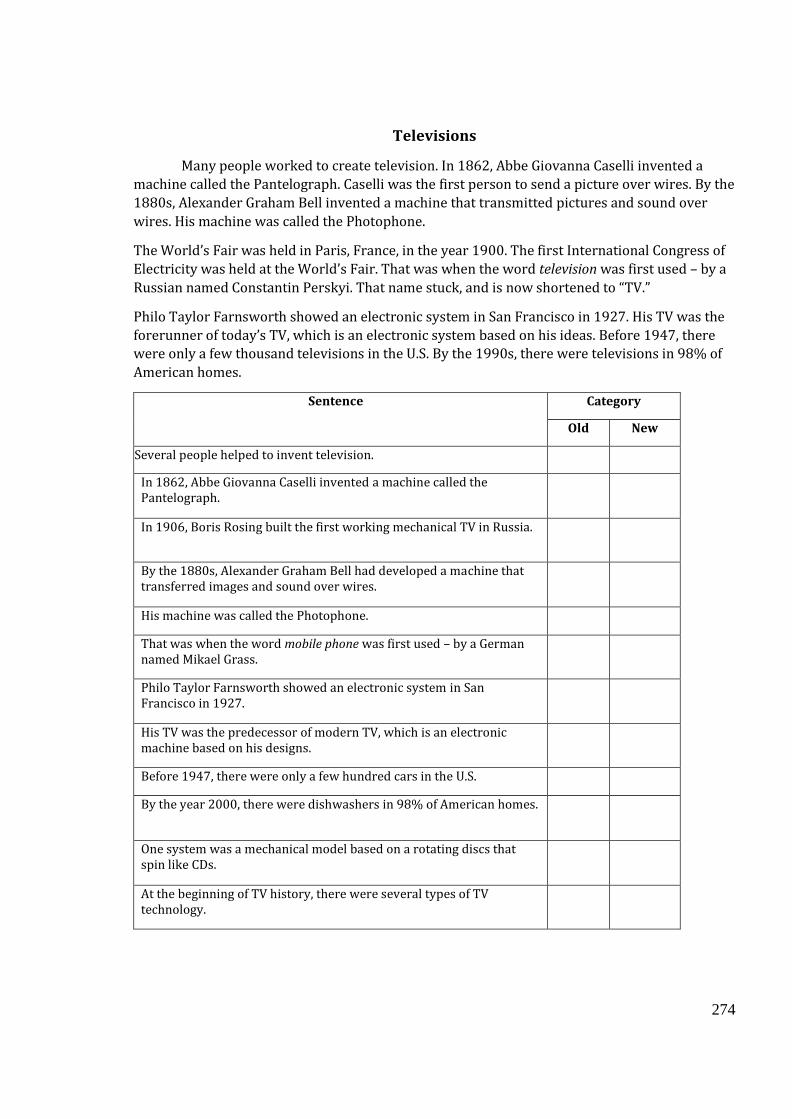
274
Televisions
Many people worked to create television. In 1862, Abbe Giovanna Caselli invented a
machine called the Pantelograph. Caselli was the first person to send a picture over wires. By the
1880s, Alexander Graham Bell invented a machine that transmitted pictures and sound over
wires. His machine was called the Photophone.
The World’s Fair was held in Paris, France, in the year 1900. The first International Congress of
Electricity was held at the World’s Fair. That was when the word television was first used – by a
Russian named Constantin Perskyi. That name stuck, and is now shortened to “TV.”
Philo Taylor Farnsworth showed an electronic system in San Francisco in 1927. His TV was the
forerunner of today’s TV, which is an electronic system based on his ideas. Before 1947, there were only a few thousand televisions in the U.S. By the 1990s, there were televisions in 98% of
American homes.
Sentence Category
Old New
Several people helped to invent television.
In 1862, Abbe Giovanna Caselli invented a machine called the Pantelograph.
In 1906, Boris Rosing built the first working mechanical TV in Russia.
By the 1880s, Alexander Graham Bell had developed a machine that transferred images and sound over wires.
His machine was called the Photophone.
That was when the word mobile phone was first used – by a German named Mikael Grass.
Philo Taylor Farnsworth showed an electronic system in San Francisco in 1927.
His TV was the predecessor of modern TV, which is an electronic machine based on his designs.
Before 1947, there were only a few hundred cars in the U.S.
By the year 2000, there were dishwashers in 98% of American homes.
One system was a mechanical model based on a rotating discs that spin like CDs.
At the beginning of TV history, there were several types of TV technology.
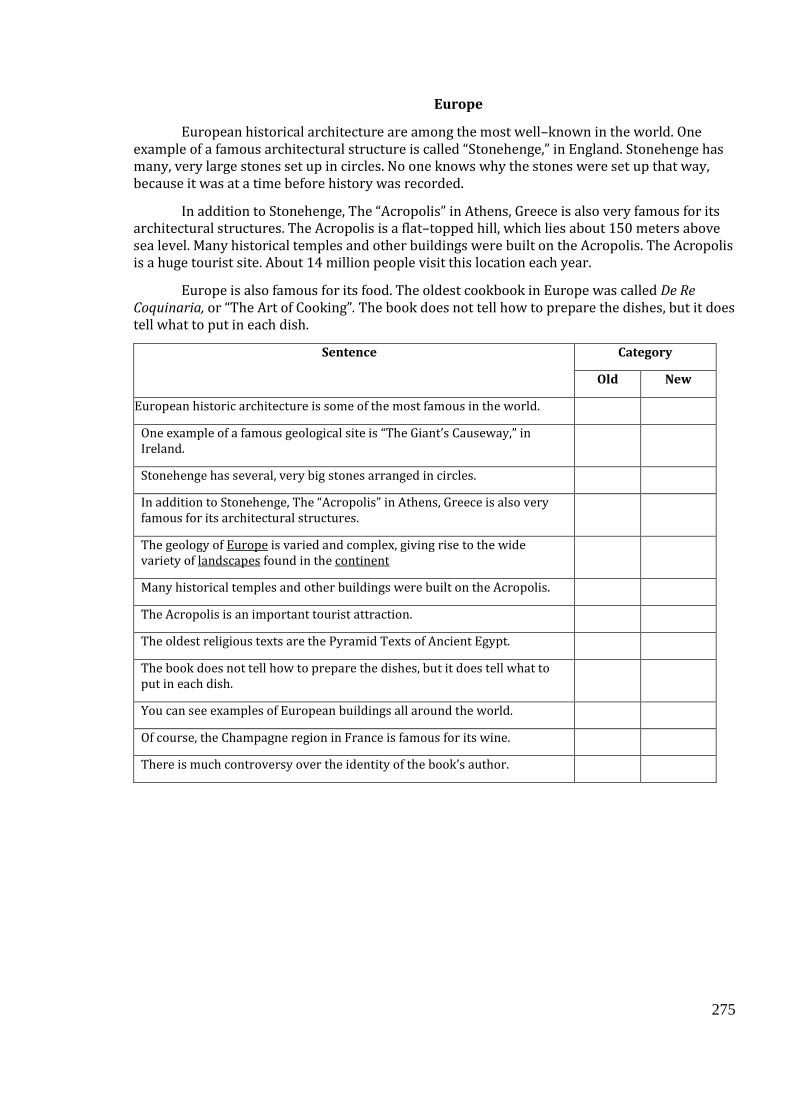
275
Europe
European historical architecture are among the most well–known in the world. One example of a famous architectural structure is called “Stonehenge,” in England. Stonehenge has many, very large stones set up in circles. No one knows why the stones were set up that way, because it was at a time before history was recorded.
In addition to Stonehenge, The “Acropolis” in Athens, Greece is also very famous for its architectural structures. The Acropolis is a flat–topped hill, which lies about 150 meters above sea level. Many historical temples and other buildings were built on the Acropolis. The Acropolis is a huge tourist site. About 14 million people visit this location each year.
Europe is also famous for its food. The oldest cookbook in Europe was called De Re Coquinaria, or “The Art of Cooking”. The book does not tell how to prepare the dishes, but it does tell what to put in each dish.
Sentence Category
Old New
European historic architecture is some of the most famous in the world.
One example of a famous geological site is “The Giant’s Causeway,” in Ireland.
Stonehenge has several, very big stones arranged in circles.
In addition to Stonehenge, The “Acropolis” in Athens, Greece is also very famous for its architectural structures.
The geology of Europe is varied and complex, giving rise to the wide variety of landscapes found in the continent
Many historical temples and other buildings were built on the Acropolis.
The Acropolis is an important tourist attraction.
The oldest religious texts are the Pyramid Texts of Ancient Egypt.
The book does not tell how to prepare the dishes, but it does tell what to put in each dish.
You can see examples of European buildings all around the world.
Of course, the Champagne region in France is famous for its wine.
There is much controversy over the identity of the book’s author.
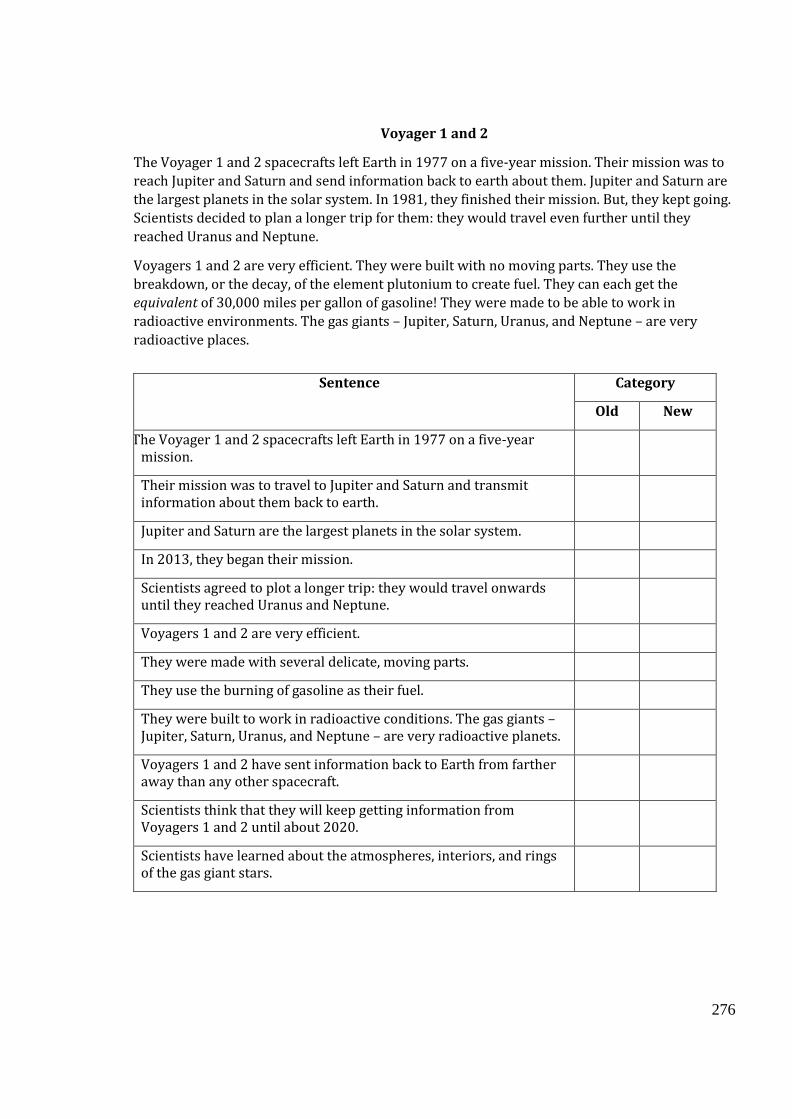
276
Voyager 1 and 2
The Voyager 1 and 2 spacecrafts left Earth in 1977 on a five-year mission. Their mission was to
reach Jupiter and Saturn and send information back to earth about them. Jupiter and Saturn are
the largest planets in the solar system. In 1981, they finished their mission. But, they kept going.
Scientists decided to plan a longer trip for them: they would travel even further until they
reached Uranus and Neptune.
Voyagers 1 and 2 are very efficient. They were built with no moving parts. They use the
breakdown, or the decay, of the element plutonium to create fuel. They can each get the
equivalent of 30,000 miles per gallon of gasoline! They were made to be able to work in
radioactive environments. The gas giants – Jupiter, Saturn, Uranus, and Neptune – are very
radioactive places.
Sentence Category
Old New
The Voyager 1 and 2 spacecrafts left Earth in 1977 on a five-year mission.
Their mission was to travel to Jupiter and Saturn and transmit information about them back to earth.
Jupiter and Saturn are the largest planets in the solar system.
In 2013, they began their mission.
Scientists agreed to plot a longer trip: they would travel onwards until they reached Uranus and Neptune.
Voyagers 1 and 2 are very efficient.
They were made with several delicate, moving parts.
They use the burning of gasoline as their fuel.
They were built to work in radioactive conditions. The gas giants – Jupiter, Saturn, Uranus, and Neptune – are very radioactive planets.
Voyagers 1 and 2 have sent information back to Earth from farther away than any other spacecraft.
Scientists think that they will keep getting information from Voyagers 1 and 2 until about 2020.
Scientists have learned about the atmospheres, interiors, and rings of the gas giant stars.
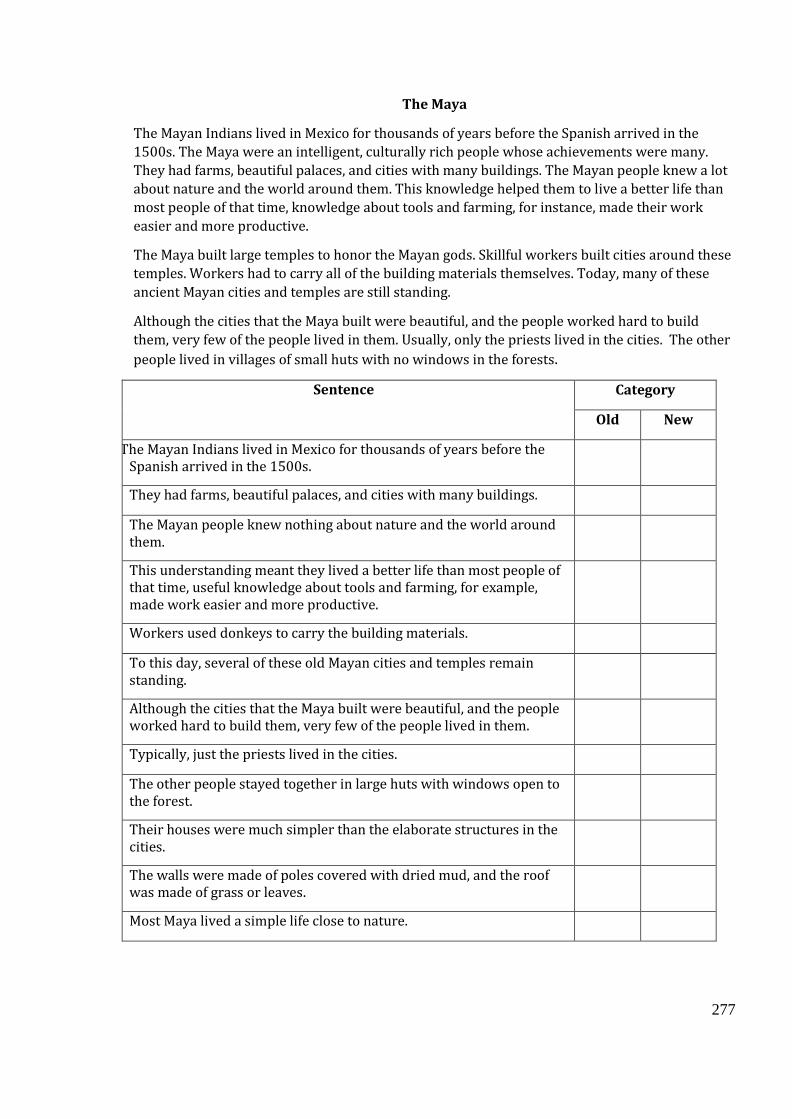
277
The Maya
The Mayan Indians lived in Mexico for thousands of years before the Spanish arrived in the
1500s. The Maya were an intelligent, culturally rich people whose achievements were many.
They had farms, beautiful palaces, and cities with many buildings. The Mayan people knew a lot
about nature and the world around them. This knowledge helped them to live a better life than
most people of that time, knowledge about tools and farming, for instance, made their work
easier and more productive.
The Maya built large temples to honor the Mayan gods. Skillful workers built cities around these
temples. Workers had to carry all of the building materials themselves. Today, many of these
ancient Mayan cities and temples are still standing.
Although the cities that the Maya built were beautiful, and the people worked hard to build
them, very few of the people lived in them. Usually, only the priests lived in the cities. The other
people lived in villages of small huts with no windows in the forests.
Sentence Category
Old New
The Mayan Indians lived in Mexico for thousands of years before the Spanish arrived in the 1500s.
They had farms, beautiful palaces, and cities with many buildings.
The Mayan people knew nothing about nature and the world around them.
This understanding meant they lived a better life than most people of that time, useful knowledge about tools and farming, for example, made work easier and more productive.
Workers used donkeys to carry the building materials.
To this day, several of these old Mayan cities and temples remain standing.
Although the cities that the Maya built were beautiful, and the people worked hard to build them, very few of the people lived in them.
Typically, just the priests lived in the cities.
The other people stayed together in large huts with windows open to the forest.
Their houses were much simpler than the elaborate structures in the cities.
The walls were made of poles covered with dried mud, and the roof was made of grass or leaves.
Most Maya lived a simple life close to nature.
278
Appendix 2.5: Sample consent form
Supervisor:
Dr. Arpita Bose
Email:
Phone:
PhD Student:
Anusha Balasubramanian
Email:
Research mobile:
Bi-literacy effects on language and cognition in bilingual healthy adults
Consent Form
I, ………………………………………………… agree to take part in this study. It is about how different levels of
literacy affects the ability to repeat words/sentences and also the memory and attention in bilingual
individuals. It is being carried out by Ms. Anusha Balasubramanian and Dr. Arpita Bose at The University
of Reading.
• I have seen and read a copy of the Participant’s Information Sheet.
• I was able to ask questions about the study. They have been answered.
• I understand that personal information is confidential and only a number will identify my data.
• I understand that the whole study will take two to three one-hour sessions to complete.
• I understand that I will get the honorarium for participation in the research only after completion of
the study and not in between.
• I know the information will be stored in secure locked cabinets.
• I know the information will be kept for five years.
• I understand that taking part in this study is voluntary.
• I can withdraw at any time without having to give an explanation.
• I am happy to proceed with my participation.
Signature ------------------------------------------------------------
Name (in capitals) ------------------------------------------------------------
Faculty of Life Sciences
School of Psychology and Clinical Language Sciences
Harry Pitt Building
University of Reading
Earley Gate
Reading RG6 6AL
279
Information sheet
Supervisor:
Dr. Arpita Bose
Email:
Phone: +44(0)1183786105
PhD Student:
Anusha Balasubramanian
Email:
Research mobile:
INFORMATION SHEET
Title: Bi-literacy effects on language and cognition in bilingual healthy adults
This research aims at investigating how different levels of literacy (i.e., ability to read and write in two
languages) might have an effect on language and cognitive abilities of bilingual individuals. This will
ideally help us understand the influence of literacy in bilingual individuals and further if these literacy
skills tend to have an impact on oral language and cognitive abilities.
We will be grateful if you will kindly consider participating in this research. This study will include a range
of easy language tasks like naming pictures, reading words or repeating words presented on a laptop
screen. The testing may take two to three one-hour sessions and will be scheduled on different days based
on your convenience. Participants will be remunerated for their time and travel with an honorarium of
£10/session at the end of the study. We will ensure that frequent breaks are provided during testing to
avoid fatigue and frustration, and if needed a session can be stopped and resumed on a later date.
Participant’s data will be kept confidential and securely stored, with only a number attached to each
participant, and therefore it will not be possible to link any set of data with any individual. All information
collected for the project will be destroyed after five years in accordance with the University’s procedures.
Your participation in this experiment is completely voluntary. You may withdraw at any time without
giving any reason. This application has been reviewed by the University Research Ethics Committee and
has been given a favourable ethical opinion for conduct.
Thank you for your help.
Anusha Balasubramanian
PhD Student
Faculty of Life Sciences
School of Psychology and Clinical Language Sciences
Harry Pitt Building
University of Reading
Earley Gate
Reading RG6 6AL
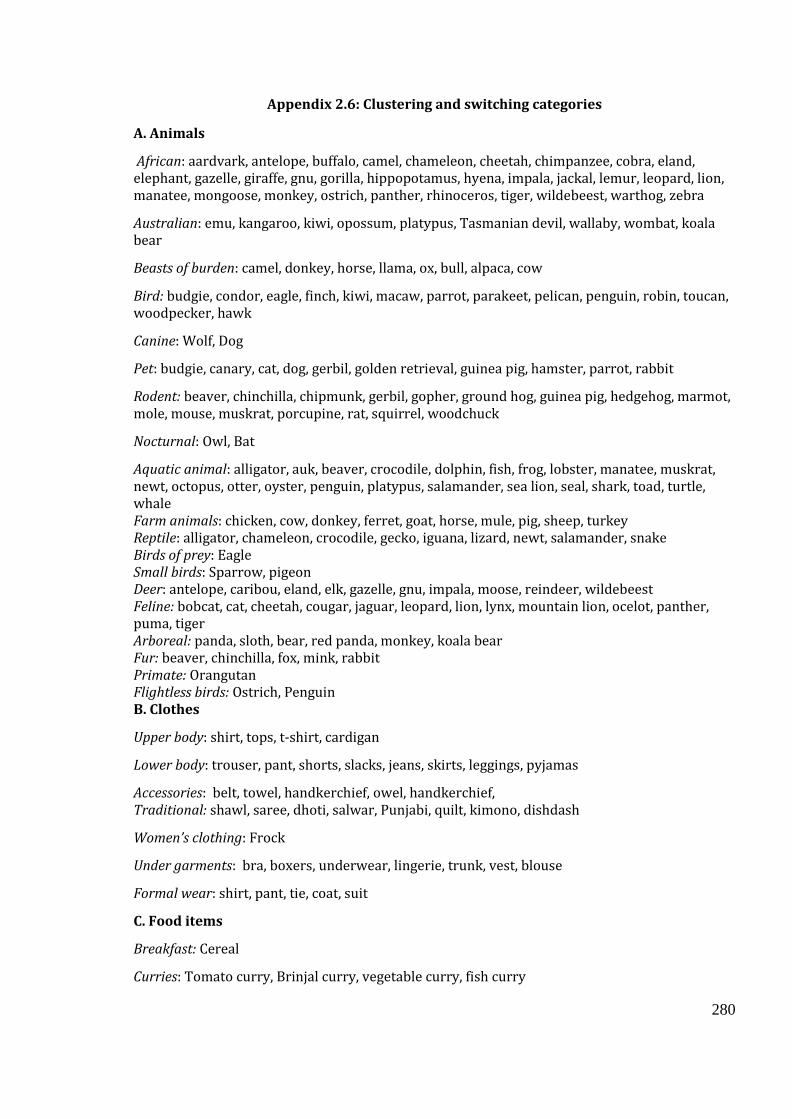
280
Appendix 2.6: Clustering and switching categories
A. Animals
African: aardvark, antelope, buffalo, camel, chameleon, cheetah, chimpanzee, cobra, eland, elephant, gazelle, giraffe, gnu, gorilla, hippopotamus, hyena, impala, jackal, lemur, leopard, lion, manatee, mongoose, monkey, ostrich, panther, rhinoceros, tiger, wildebeest, warthog, zebra
Australian: emu, kangaroo, kiwi, opossum, platypus, Tasmanian devil, wallaby, wombat, koala bear
Beasts of burden: camel, donkey, horse, llama, ox, bull, alpaca, cow
Bird: budgie, condor, eagle, finch, kiwi, macaw, parrot, parakeet, pelican, penguin, robin, toucan, woodpecker, hawk
Canine: Wolf, Dog
Pet: budgie, canary, cat, dog, gerbil, golden retrieval, guinea pig, hamster, parrot, rabbit
Rodent: beaver, chinchilla, chipmunk, gerbil, gopher, ground hog, guinea pig, hedgehog, marmot, mole, mouse, muskrat, porcupine, rat, squirrel, woodchuck
Nocturnal: Owl, Bat
Aquatic animal: alligator, auk, beaver, crocodile, dolphin, fish, frog, lobster, manatee, muskrat, newt, octopus, otter, oyster, penguin, platypus, salamander, sea lion, seal, shark, toad, turtle, whale Farm animals: chicken, cow, donkey, ferret, goat, horse, mule, pig, sheep, turkey Reptile: alligator, chameleon, crocodile, gecko, iguana, lizard, newt, salamander, snake Birds of prey: Eagle Small birds: Sparrow, pigeon Deer: antelope, caribou, eland, elk, gazelle, gnu, impala, moose, reindeer, wildebeest Feline: bobcat, cat, cheetah, cougar, jaguar, leopard, lion, lynx, mountain lion, ocelot, panther, puma, tiger Arboreal: panda, sloth, bear, red panda, monkey, koala bear Fur: beaver, chinchilla, fox, mink, rabbit Primate: Orangutan Flightless birds: Ostrich, Penguin B. Clothes
Upper body: shirt, tops, t-shirt, cardigan
Lower body: trouser, pant, shorts, slacks, jeans, skirts, leggings, pyjamas
Accessories: belt, towel, handkerchief, owel, handkerchief, Traditional: shawl, saree, dhoti, salwar, Punjabi, quilt, kimono, dishdash
Women’s clothing: Frock
Under garments: bra, boxers, underwear, lingerie, trunk, vest, blouse
Formal wear: shirt, pant, tie, coat, suit
C. Food items
Breakfast: Cereal
Curries: Tomato curry, Brinjal curry, vegetable curry, fish curry
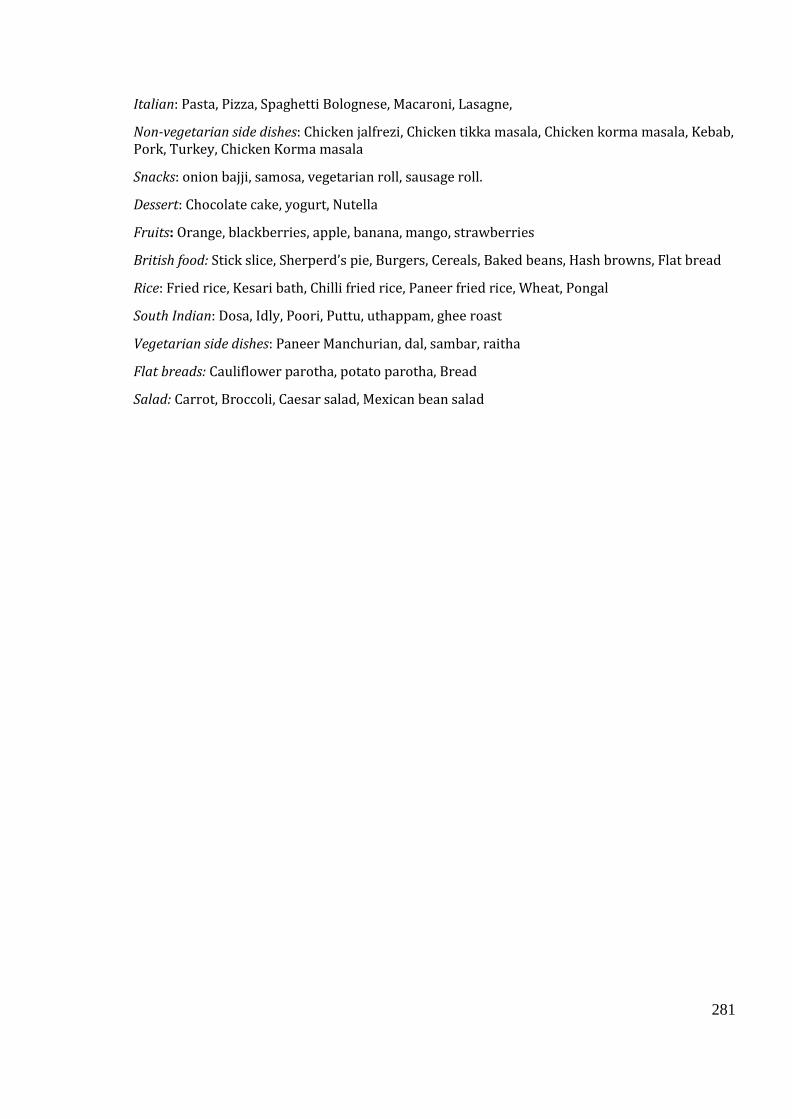
281
Italian: Pasta, Pizza, Spaghetti Bolognese, Macaroni, Lasagne,
Non-vegetarian side dishes: Chicken jalfrezi, Chicken tikka masala, Chicken korma masala, Kebab, Pork, Turkey, Chicken Korma masala
Snacks: onion bajji, samosa, vegetarian roll, sausage roll.
Dessert: Chocolate cake, yogurt, Nutella
Fruits: Orange, blackberries, apple, banana, mango, strawberries
British food: Stick slice, Sherperd’s pie, Burgers, Cereals, Baked beans, Hash browns, Flat bread
Rice: Fried rice, Kesari bath, Chilli fried rice, Paneer fried rice, Wheat, Pongal
South Indian: Dosa, Idly, Poori, Puttu, uthappam, ghee roast
Vegetarian side dishes: Paneer Manchurian, dal, sambar, raitha
Flat breads: Cauliflower parotha, potato parotha, Bread
Salad: Carrot, Broccoli, Caesar salad, Mexican bean salad

282
Appendix 2.7: Stimuli for Word and non-word repetition
High Imageability High Frequency (HIHF)
High Imageability Low
Frequency (HILF)
Low Imageability High
Frequency (LIHF)
Low Imageability Low
Frequency (LIHF)
Radio Cart boncept mercy
student Spider opunion plen
letter Funnel prisciple dend
hospital alcohol drister clee
village monkey settion voe
battle Onion sping merly
marriage Pill mimber prath
hand drum antitude felly
coffee elbow prought reash
fire pupil loment apisade
window gravy minner trabite
church tractor crasis itony
school pig shality sutire
mother tobacco affort grivity
hotel axe baranter trenson
summer elephant fict minacle
night potato purpise binus
plane feather pheory dalour
audience wheat clenth puct
picture slope idia sogmy
biffle weast fact tribute
cottee trantor crisis folly
hetal otion attitude valour
mirtage calt character analogy
sammer afe member bonus
pline pupit system dogma
hend pib thing episode
pisture pell idea pact
wembow dunkey length treason
ragio slape opinion woe
nirth eltow moment plea
slurch gramy effort deed
sprool halocle concept gravity
mither epilent theory realm
hopsitle pitaro quality irony
lutter drim purpose wrath
fide tanacco thought clue
vallige fannel principle miracle
Student spuder manner satire
Andience foaster session atalogy
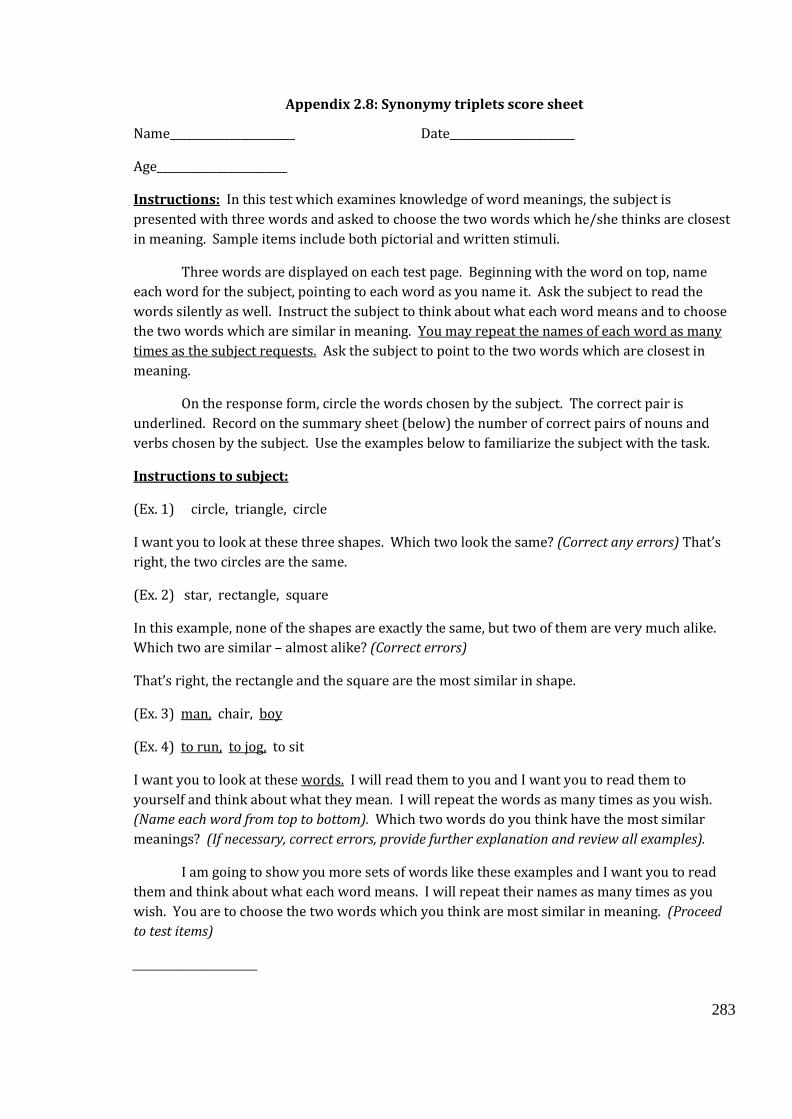
283
Appendix 2.8: Synonymy triplets score sheet
Name_______________________ Date_______________________
Age________________________
Instructions: In this test which examines knowledge of word meanings, the subject is
presented with three words and asked to choose the two words which he/she thinks are closest
in meaning. Sample items include both pictorial and written stimuli.
Three words are displayed on each test page. Beginning with the word on top, name
each word for the subject, pointing to each word as you name it. Ask the subject to read the
words silently as well. Instruct the subject to think about what each word means and to choose
the two words which are similar in meaning. You may repeat the names of each word as many
times as the subject requests. Ask the subject to point to the two words which are closest in
meaning.
On the response form, circle the words chosen by the subject. The correct pair is
underlined. Record on the summary sheet (below) the number of correct pairs of nouns and
verbs chosen by the subject. Use the examples below to familiarize the subject with the task.
Instructions to subject:
(Ex. 1) circle, triangle, circle
I want you to look at these three shapes. Which two look the same? (Correct any errors) That’s
right, the two circles are the same.
(Ex. 2) star, rectangle, square
In this example, none of the shapes are exactly the same, but two of them are very much alike.
Which two are similar – almost alike? (Correct errors)
That’s right, the rectangle and the square are the most similar in shape.
(Ex. 3) man, chair, boy
(Ex. 4) to run, to jog, to sit
I want you to look at these words. I will read them to you and I want you to read them to
yourself and think about what they mean. I will repeat the words as many times as you wish.
(Name each word from top to bottom). Which two words do you think have the most similar
meanings? (If necessary, correct errors, provide further explanation and review all examples).
I am going to show you more sets of words like these examples and I want you to read
them and think about what each word means. I will repeat their names as many times as you
wish. You are to choose the two words which you think are most similar in meaning. (Proceed
to test items)
_______________________
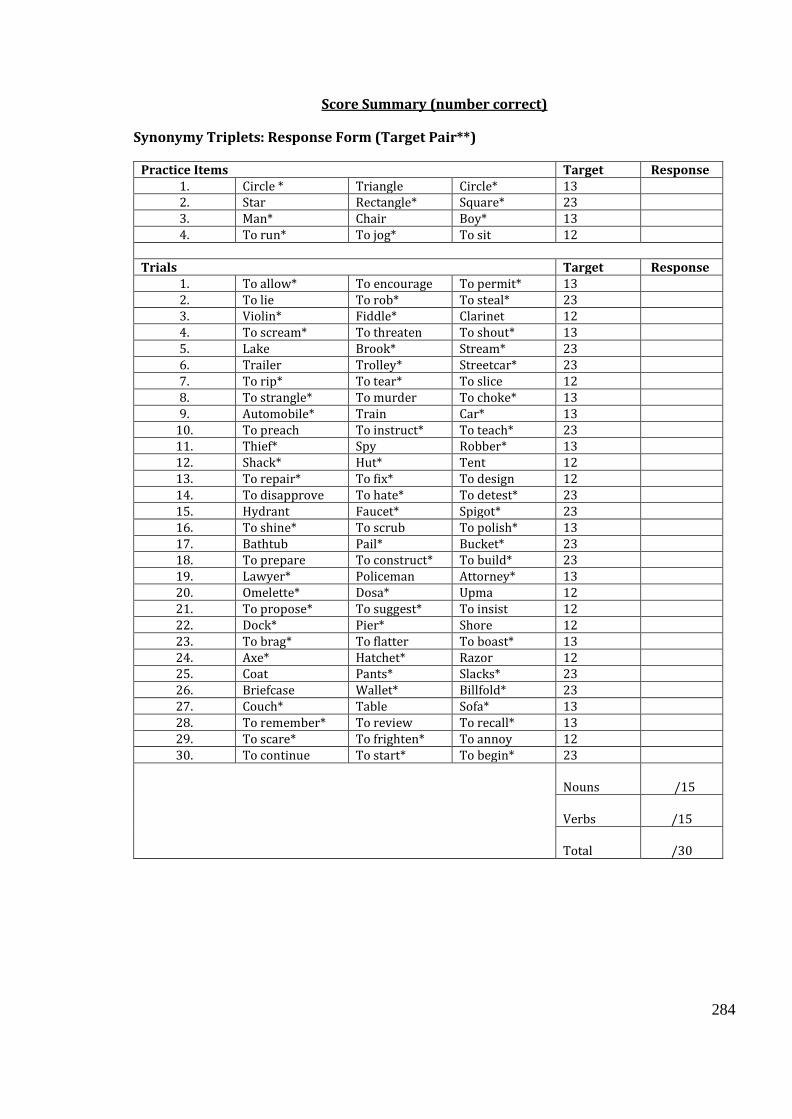
284
Score Summary (number correct)
Synonymy Triplets: Response Form (Target Pair**)
Practice Items Target Response 1. Circle * Triangle Circle* 13 2. Star Rectangle* Square* 23 3. Man* Chair Boy* 13 4. To run* To jog* To sit 12
Trials Target Response
1. To allow* To encourage To permit* 13 2. To lie To rob* To steal* 23 3. Violin* Fiddle* Clarinet 12 4. To scream* To threaten To shout* 13 5. Lake Brook* Stream* 23 6. Trailer Trolley* Streetcar* 23 7. To rip* To tear* To slice 12 8. To strangle* To murder To choke* 13 9. Automobile* Train Car* 13
10. To preach To instruct* To teach* 23 11. Thief* Spy Robber* 13 12. Shack* Hut* Tent 12 13. To repair* To fix* To design 12 14. To disapprove To hate* To detest* 23 15. Hydrant Faucet* Spigot* 23 16. To shine* To scrub To polish* 13 17. Bathtub Pail* Bucket* 23 18. To prepare To construct* To build* 23 19. Lawyer* Policeman Attorney* 13 20. Omelette* Dosa* Upma 12 21. To propose* To suggest* To insist 12 22. Dock* Pier* Shore 12 23. To brag* To flatter To boast* 13 24. Axe* Hatchet* Razor 12 25. Coat Pants* Slacks* 23 26. Briefcase Wallet* Billfold* 23 27. Couch* Table Sofa* 13 28. To remember* To review To recall* 13 29. To scare* To frighten* To annoy 12 30. To continue To start* To begin* 23
Nouns
/15
Verbs
/15
Total
/30
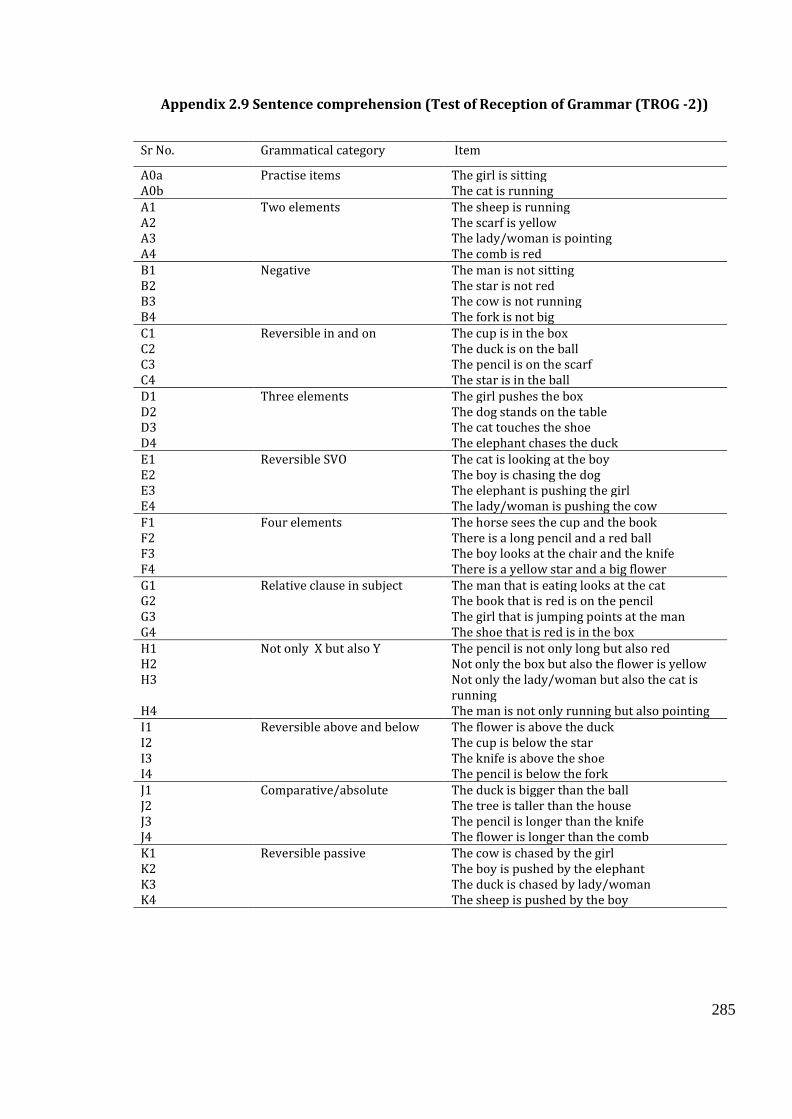
285
Appendix 2.9 Sentence comprehension (Test of Reception of Grammar (TROG -2))
Sr No. Grammatical category Item
A0a Practise items The girl is sitting A0b The cat is running A1 Two elements The sheep is running A2 The scarf is yellow A3 The lady/woman is pointing A4 The comb is red B1 Negative The man is not sitting B2 The star is not red B3 The cow is not running B4 The fork is not big C1 Reversible in and on The cup is in the box C2 The duck is on the ball C3 The pencil is on the scarf C4 The star is in the ball D1 Three elements The girl pushes the box D2 The dog stands on the table D3 The cat touches the shoe D4 The elephant chases the duck E1 Reversible SVO The cat is looking at the boy E2 The boy is chasing the dog E3 The elephant is pushing the girl E4 The lady/woman is pushing the cow F1 Four elements The horse sees the cup and the book F2 There is a long pencil and a red ball F3 The boy looks at the chair and the knife F4 There is a yellow star and a big flower G1 Relative clause in subject The man that is eating looks at the cat G2 The book that is red is on the pencil G3 The girl that is jumping points at the man G4 The shoe that is red is in the box H1 Not only X but also Y The pencil is not only long but also red H2 Not only the box but also the flower is yellow H3 Not only the lady/woman but also the cat is
running H4 The man is not only running but also pointing I1 Reversible above and below The flower is above the duck I2 The cup is below the star I3 The knife is above the shoe I4 The pencil is below the fork J1 Comparative/absolute The duck is bigger than the ball J2 The tree is taller than the house J3 The pencil is longer than the knife J4 The flower is longer than the comb K1 Reversible passive
The cow is chased by the girl
K2 The boy is pushed by the elephant K3 The duck is chased by lady/woman K4 The sheep is pushed by the boy
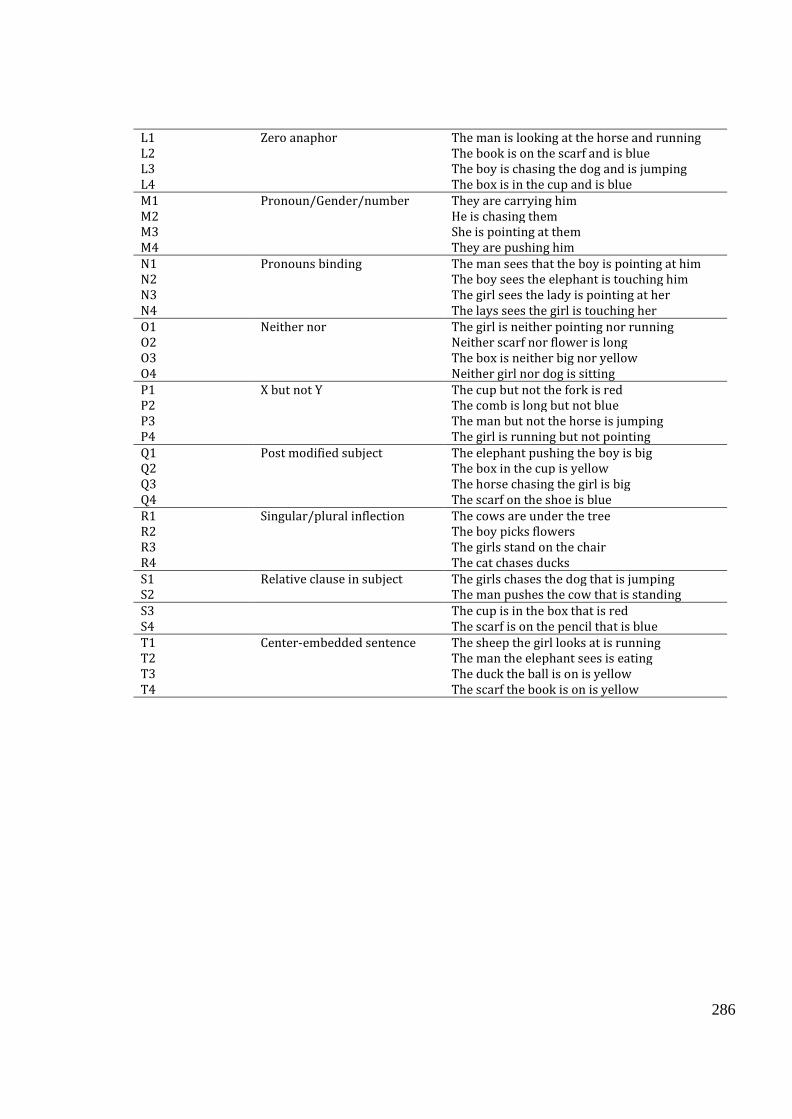
286
L1 Zero anaphor The man is looking at the horse and running L2 The book is on the scarf and is blue L3 The boy is chasing the dog and is jumping L4 The box is in the cup and is blue M1 Pronoun/Gender/number They are carrying him M2 He is chasing them M3 She is pointing at them M4 They are pushing him N1 Pronouns binding The man sees that the boy is pointing at him N2 The boy sees the elephant is touching him N3 The girl sees the lady is pointing at her N4 The lays sees the girl is touching her O1 Neither nor The girl is neither pointing nor running O2 Neither scarf nor flower is long O3 The box is neither big nor yellow O4 Neither girl nor dog is sitting P1 X but not Y The cup but not the fork is red P2 The comb is long but not blue P3 The man but not the horse is jumping P4 The girl is running but not pointing Q1 Post modified subject The elephant pushing the boy is big Q2 The box in the cup is yellow Q3 The horse chasing the girl is big Q4 The scarf on the shoe is blue R1 Singular/plural inflection The cows are under the tree R2 The boy picks flowers R3 The girls stand on the chair R4 The cat chases ducks S1 Relative clause in subject The girls chases the dog that is jumping S2 The man pushes the cow that is standing S3 The cup is in the box that is red S4 The scarf is on the pencil that is blue T1 Center-embedded sentence The sheep the girl looks at is running T2 The man the elephant sees is eating T3 The duck the ball is on is yellow T4 The scarf the book is on is yellow
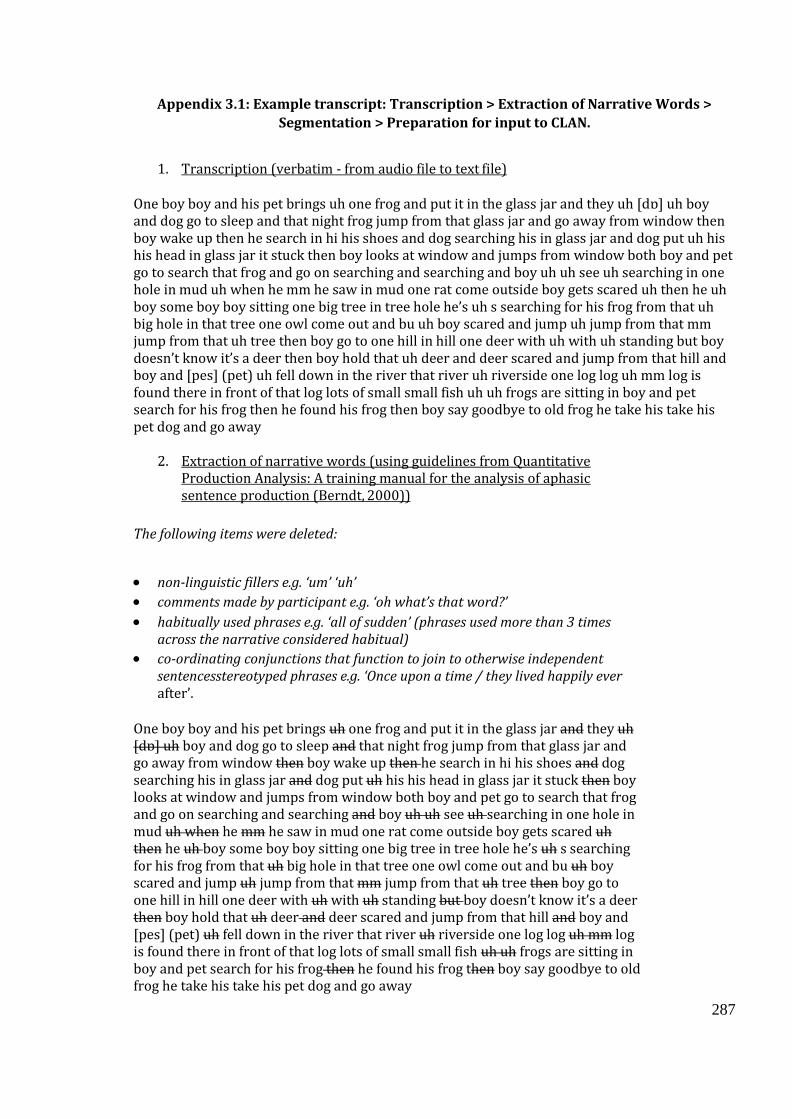
287
Appendix 3.1: Example transcript: Transcription > Extraction of Narrative Words >
Segmentation > Preparation for input to CLAN.
1. Transcription (verbatim - from audio file to text file)
One boy boy and his pet brings uh one frog and put it in the glass jar and they uh [dɒ] uh boy and dog go to sleep and that night frog jump from that glass jar and go away from window then boy wake up then he search in hi his shoes and dog searching his in glass jar and dog put uh his his head in glass jar it stuck then boy looks at window and jumps from window both boy and pet go to search that frog and go on searching and searching and boy uh uh see uh searching in one hole in mud uh when he mm he saw in mud one rat come outside boy gets scared uh then he uh boy some boy boy sitting one big tree in tree hole he’s uh s searching for his frog from that uh big hole in that tree one owl come out and bu uh boy scared and jump uh jump from that mm jump from that uh tree then boy go to one hill in hill one deer with uh with uh standing but boy doesn’t know it’s a deer then boy hold that uh deer and deer scared and jump from that hill and boy and [pes] (pet) uh fell down in the river that river uh riverside one log log uh mm log is found there in front of that log lots of small small fish uh uh frogs are sitting in boy and pet search for his frog then he found his frog then boy say goodbye to old frog he take his take his pet dog and go away
2. Extraction of narrative words (using guidelines from Quantitative Production Analysis: A training manual for the analysis of aphasic sentence production (Berndt, 2000))
The following items were deleted:
• non-linguistic fillers e.g. ‘um’ ‘uh’
• comments made by participant e.g. ‘oh what’s that word?’
• habitually used phrases e.g. ‘all of sudden’ (phrases used more than 3 times across the narrative considered habitual)
• co-ordinating conjunctions that function to join to otherwise independent sentencesstereotyped phrases e.g. ‘Once upon a time / they lived happily ever after’.
One boy boy and his pet brings uh one frog and put it in the glass jar and they uh [dɒ] uh boy and dog go to sleep and that night frog jump from that glass jar and go away from window then boy wake up then he search in hi his shoes and dog searching his in glass jar and dog put uh his his head in glass jar it stuck then boy looks at window and jumps from window both boy and pet go to search that frog and go on searching and searching and boy uh uh see uh searching in one hole in mud uh when he mm he saw in mud one rat come outside boy gets scared uh then he uh boy some boy boy sitting one big tree in tree hole he’s uh s searching for his frog from that uh big hole in that tree one owl come out and bu uh boy scared and jump uh jump from that mm jump from that uh tree then boy go to one hill in hill one deer with uh with uh standing but boy doesn’t know it’s a deer then boy hold that uh deer and deer scared and jump from that hill and boy and [pes] (pet) uh fell down in the river that river uh riverside one log log uh mm log is found there in front of that log lots of small small fish uh uh frogs are sitting in boy and pet search for his frog then he found his frog then boy say goodbye to old frog he take his take his pet dog and go away
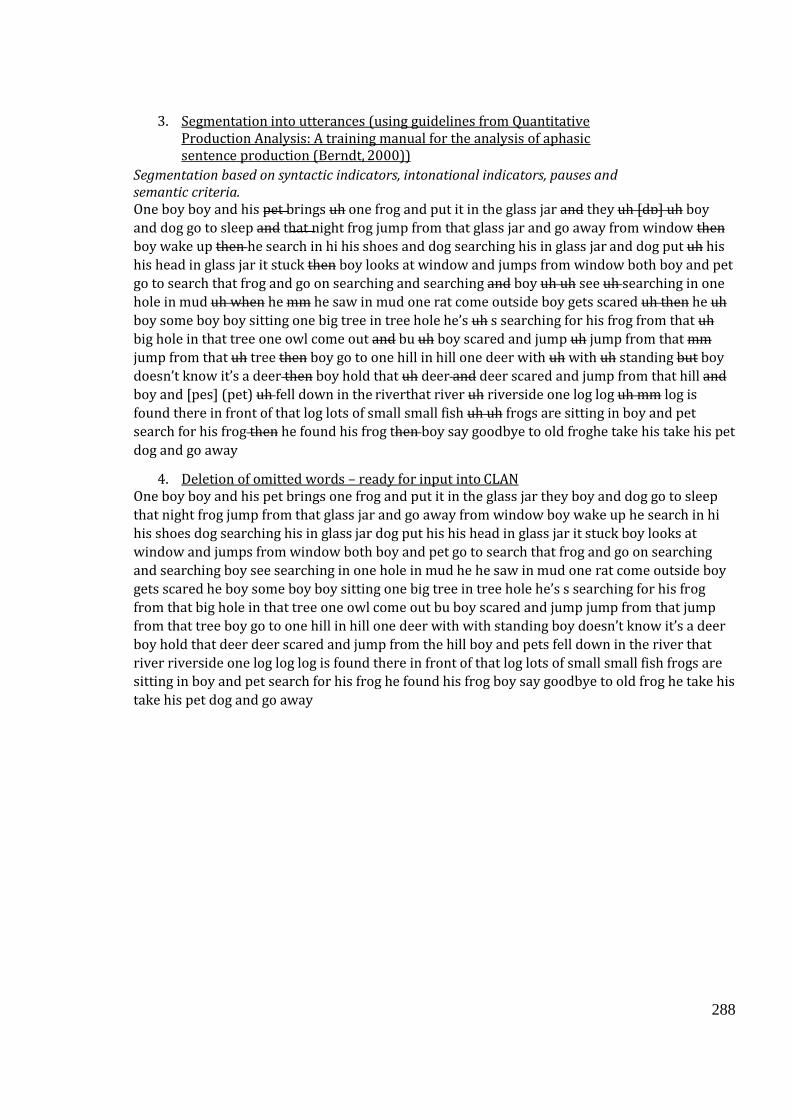
288
3. Segmentation into utterances (using guidelines from Quantitative
Production Analysis: A training manual for the analysis of aphasic sentence production (Berndt, 2000))
Segmentation based on syntactic indicators, intonational indicators, pauses and semantic criteria. One boy boy and his pet brings uh one frog and put it in the glass jar and they uh [dɒ] uh boy
and dog go to sleep and that night frog jump from that glass jar and go away from window then
boy wake up then he search in hi his shoes and dog searching his in glass jar and dog put uh his
his head in glass jar it stuck then boy looks at window and jumps from window both boy and pet
go to search that frog and go on searching and searching and boy uh uh see uh searching in one
hole in mud uh when he mm he saw in mud one rat come outside boy gets scared uh then he uh
boy some boy boy sitting one big tree in tree hole he’s uh s searching for his frog from that uh
big hole in that tree one owl come out and bu uh boy scared and jump uh jump from that mm
jump from that uh tree then boy go to one hill in hill one deer with uh with uh standing but boy
doesn’t know it’s a deer then boy hold that uh deer and deer scared and jump from that hill and
boy and [pes] (pet) uh fell down in the riverthat river uh riverside one log log uh mm log is
found there in front of that log lots of small small fish uh uh frogs are sitting in boy and pet
search for his frog then he found his frog then boy say goodbye to old froghe take his take his pet
dog and go away
4. Deletion of omitted words – ready for input into CLAN One boy boy and his pet brings one frog and put it in the glass jar they boy and dog go to sleep
that night frog jump from that glass jar and go away from window boy wake up he search in hi
his shoes dog searching his in glass jar dog put his his head in glass jar it stuck boy looks at
window and jumps from window both boy and pet go to search that frog and go on searching
and searching boy see searching in one hole in mud he he saw in mud one rat come outside boy
gets scared he boy some boy boy sitting one big tree in tree hole he’s s searching for his frog
from that big hole in that tree one owl come out bu boy scared and jump jump from that jump
from that tree boy go to one hill in hill one deer with with standing boy doesn’t know it’s a deer
boy hold that deer deer scared and jump from the hill boy and pets fell down in the river that
river riverside one log log log is found there in front of that log lots of small small fish frogs are
sitting in boy and pet search for his frog he found his frog boy say goodbye to old frog he take his
take his pet dog and go away
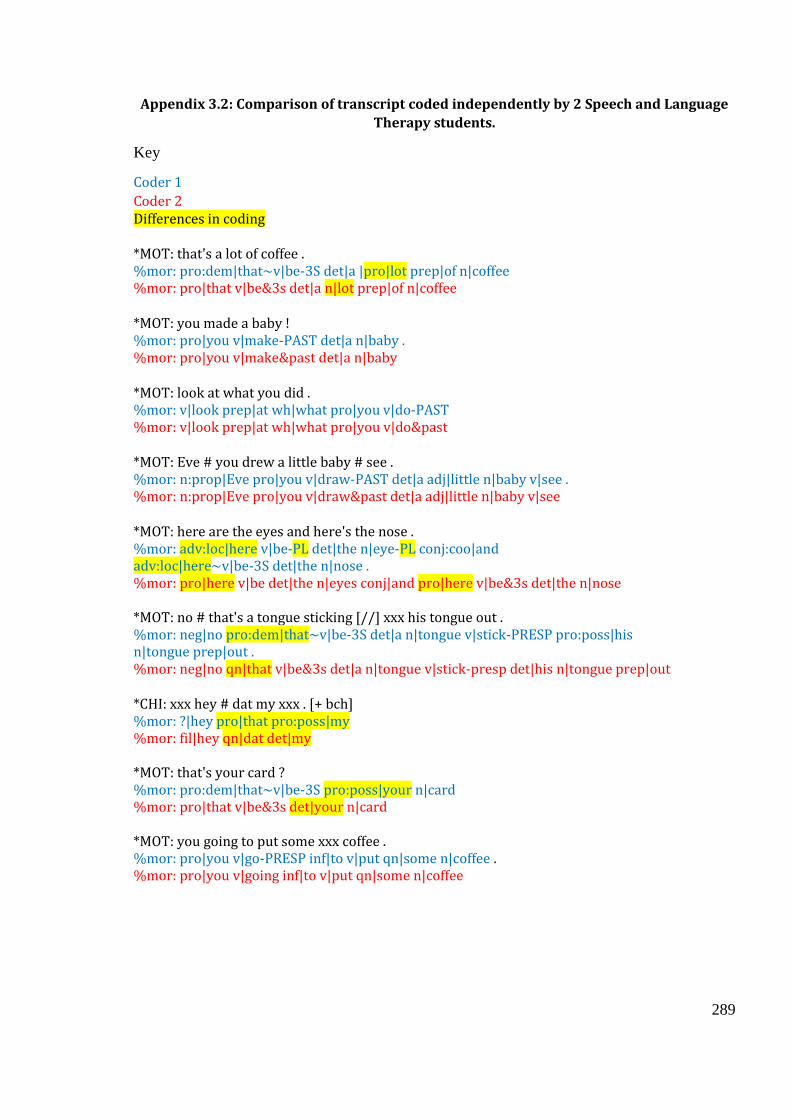
289
Appendix 3.2: Comparison of transcript coded independently by 2 Speech and Language
Therapy students.
Key
Coder 1
Coder 2 Differences in coding *MOT: that's a lot of coffee . %mor: pro:dem|that~v|be-3S det|a |pro|lot prep|of n|coffee %mor: pro|that v|be&3s det|a n|lot prep|of n|coffee *MOT: you made a baby ! %mor: pro|you v|make-PAST det|a n|baby . %mor: pro|you v|make&past det|a n|baby *MOT: look at what you did . %mor: v|look prep|at wh|what pro|you v|do-PAST %mor: v|look prep|at wh|what pro|you v|do&past *MOT: Eve # you drew a little baby # see . %mor: n:prop|Eve pro|you v|draw-PAST det|a adj|little n|baby v|see . %mor: n:prop|Eve pro|you v|draw&past det|a adj|little n|baby v|see *MOT: here are the eyes and here's the nose . %mor: adv:loc|here v|be-PL det|the n|eye-PL conj:coo|and adv:loc|here~v|be-3S det|the n|nose . %mor: pro|here v|be det|the n|eyes conj|and pro|here v|be&3s det|the n|nose *MOT: no # that's a tongue sticking [//] xxx his tongue out . %mor: neg|no pro:dem|that~v|be-3S det|a n|tongue v|stick-PRESP pro:poss|his n|tongue prep|out . %mor: neg|no qn|that v|be&3s det|a n|tongue v|stick-presp det|his n|tongue prep|out *CHI: xxx hey # dat my xxx . [+ bch] %mor: ?|hey pro|that pro:poss|my %mor: fil|hey qn|dat det|my *MOT: that's your card ? %mor: pro:dem|that~v|be-3S pro:poss|your n|card %mor: pro|that v|be&3s det|your n|card *MOT: you going to put some xxx coffee . %mor: pro|you v|go-PRESP inf|to v|put qn|some n|coffee . %mor: pro|you v|going inf|to v|put qn|some n|coffee
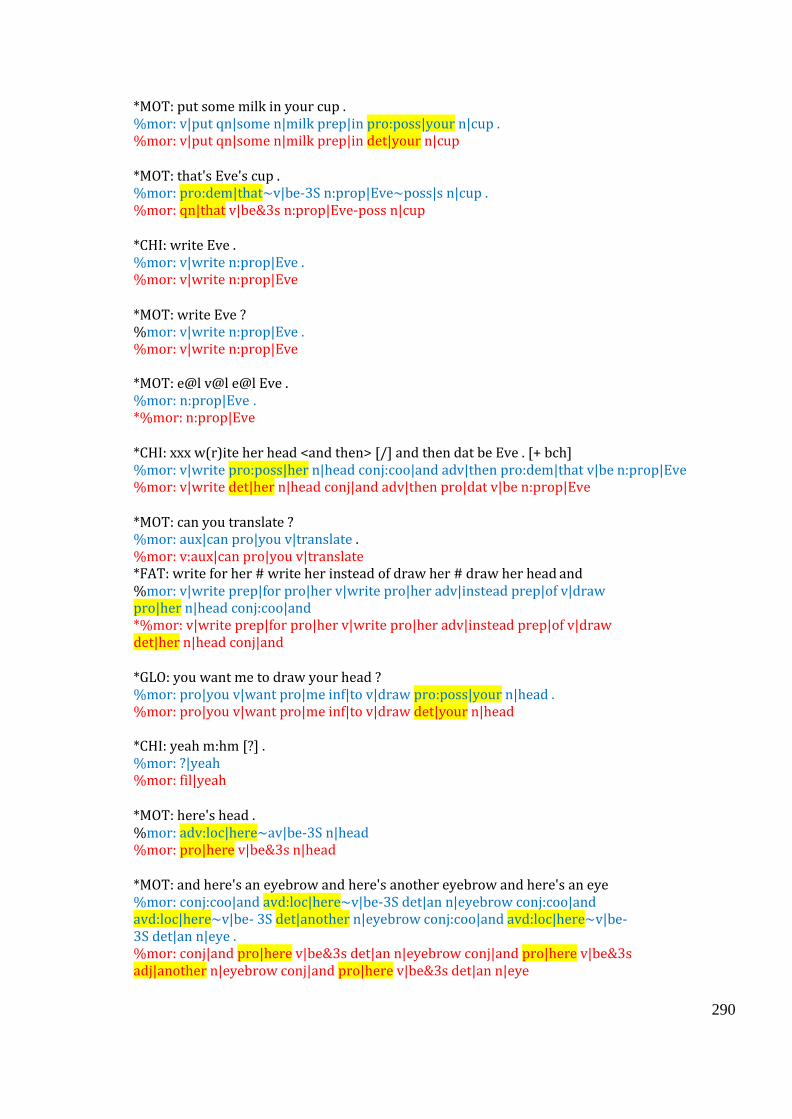
290
*MOT: put some milk in your cup . %mor: v|put qn|some n|milk prep|in pro:poss|your n|cup . %mor: v|put qn|some n|milk prep|in det|your n|cup *MOT: that's Eve's cup . %mor: pro:dem|that~v|be-3S n:prop|Eve~poss|s n|cup . %mor: qn|that v|be&3s n:prop|Eve-poss n|cup *CHI: write Eve . %mor: v|write n:prop|Eve . %mor: v|write n:prop|Eve *MOT: write Eve ? %mor: v|write n:prop|Eve . %mor: v|write n:prop|Eve *MOT: e@l v@l e@l Eve . %mor: n:prop|Eve . *%mor: n:prop|Eve *CHI: xxx w(r)ite her head <and then> [/] and then dat be Eve . [+ bch] %mor: v|write pro:poss|her n|head conj:coo|and adv|then pro:dem|that v|be n:prop|Eve %mor: v|write det|her n|head conj|and adv|then pro|dat v|be n:prop|Eve *MOT: can you translate ? %mor: aux|can pro|you v|translate . %mor: v:aux|can pro|you v|translate *FAT: write for her # write her instead of draw her # draw her head and %mor: v|write prep|for pro|her v|write pro|her adv|instead prep|of v|draw pro|her n|head conj:coo|and *%mor: v|write prep|for pro|her v|write pro|her adv|instead prep|of v|draw det|her n|head conj|and *GLO: you want me to draw your head ? %mor: pro|you v|want pro|me inf|to v|draw pro:poss|your n|head . %mor: pro|you v|want pro|me inf|to v|draw det|your n|head *CHI: yeah m:hm [?] . %mor: ?|yeah %mor: fil|yeah *MOT: here's head . %mor: adv:loc|here~av|be-3S n|head %mor: pro|here v|be&3s n|head *MOT: and here's an eyebrow and here's another eyebrow and here's an eye %mor: conj:coo|and avd:loc|here~v|be-3S det|an n|eyebrow conj:coo|and avd:loc|here~v|be- 3S det|another n|eyebrow conj:coo|and avd:loc|here~v|be-3S det|an n|eye . %mor: conj|and pro|here v|be&3s det|an n|eyebrow conj|and pro|here v|be&3s adj|another n|eyebrow conj|and pro|here v|be&3s det|an n|eye
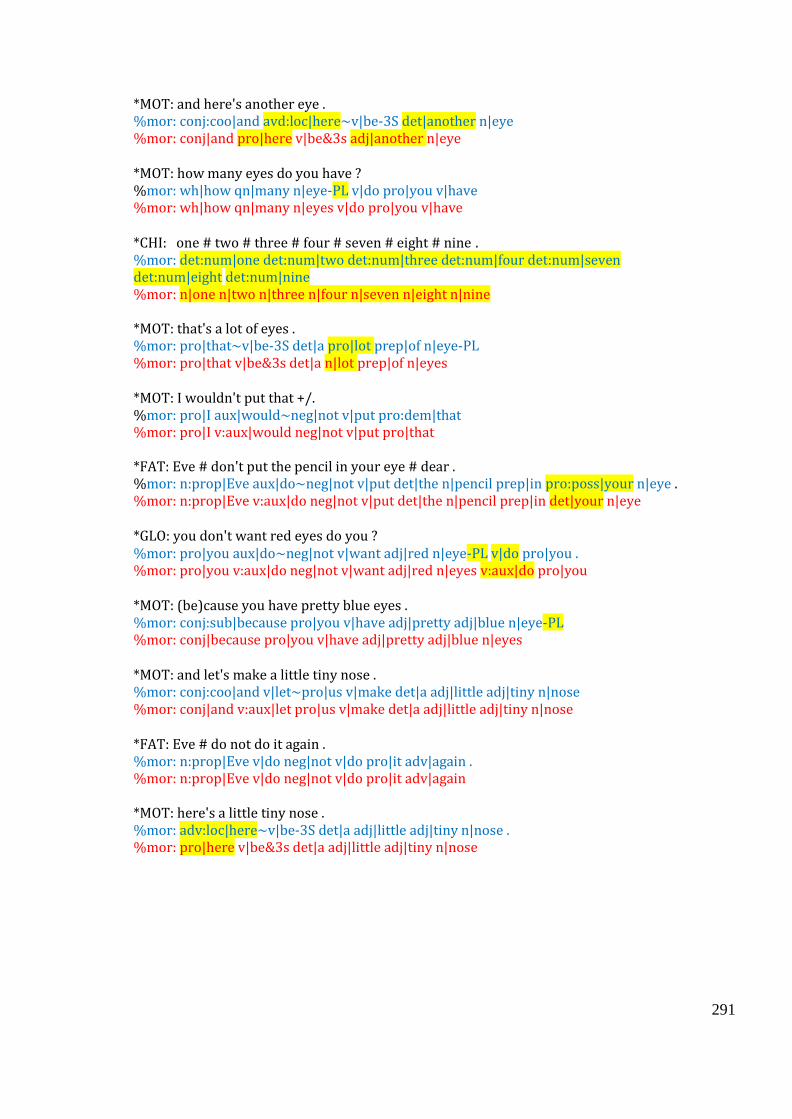
291
*MOT: and here's another eye . %mor: conj:coo|and avd:loc|here~v|be-3S det|another n|eye %mor: conj|and pro|here v|be&3s adj|another n|eye *MOT: how many eyes do you have ? %mor: wh|how qn|many n|eye-PL v|do pro|you v|have %mor: wh|how qn|many n|eyes v|do pro|you v|have *CHI: one # two # three # four # seven # eight # nine . %mor: det:num|one det:num|two det:num|three det:num|four det:num|seven det:num|eight det:num|nine %mor: n|one n|two n|three n|four n|seven n|eight n|nine *MOT: that's a lot of eyes . %mor: pro|that~v|be-3S det|a pro|lot prep|of n|eye-PL %mor: pro|that v|be&3s det|a n|lot prep|of n|eyes *MOT: I wouldn't put that +/. %mor: pro|I aux|would~neg|not v|put pro:dem|that %mor: pro|I v:aux|would neg|not v|put pro|that *FAT: Eve # don't put the pencil in your eye # dear . %mor: n:prop|Eve aux|do~neg|not v|put det|the n|pencil prep|in pro:poss|your n|eye . %mor: n:prop|Eve v:aux|do neg|not v|put det|the n|pencil prep|in det|your n|eye *GLO: you don't want red eyes do you ? %mor: pro|you aux|do~neg|not v|want adj|red n|eye-PL v|do pro|you . %mor: pro|you v:aux|do neg|not v|want adj|red n|eyes v:aux|do pro|you *MOT: (be)cause you have pretty blue eyes . %mor: conj:sub|because pro|you v|have adj|pretty adj|blue n|eye-PL %mor: conj|because pro|you v|have adj|pretty adj|blue n|eyes *MOT: and let's make a little tiny nose . %mor: conj:coo|and v|let~pro|us v|make det|a adj|little adj|tiny n|nose %mor: conj|and v:aux|let pro|us v|make det|a adj|little adj|tiny n|nose *FAT: Eve # do not do it again . %mor: n:prop|Eve v|do neg|not v|do pro|it adv|again . %mor: n:prop|Eve v|do neg|not v|do pro|it adv|again *MOT: here's a little tiny nose . %mor: adv:loc|here~v|be-3S det|a adj|little adj|tiny n|nose . %mor: pro|here v|be&3s det|a adj|little adj|tiny n|nose
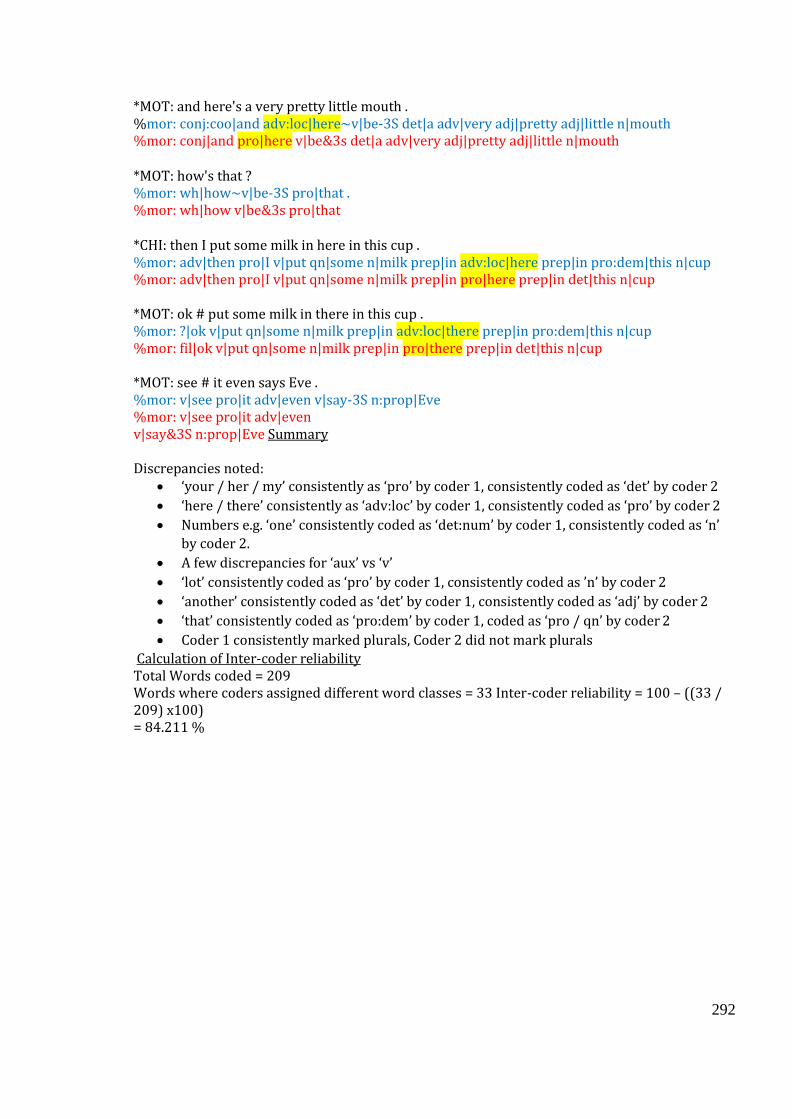
292
*MOT: and here's a very pretty little mouth . %mor: conj:coo|and adv:loc|here~v|be-3S det|a adv|very adj|pretty adj|little n|mouth %mor: conj|and pro|here v|be&3s det|a adv|very adj|pretty adj|little n|mouth *MOT: how's that ? %mor: wh|how~v|be-3S pro|that . %mor: wh|how v|be&3s pro|that *CHI: then I put some milk in here in this cup . %mor: adv|then pro|I v|put qn|some n|milk prep|in adv:loc|here prep|in pro:dem|this n|cup %mor: adv|then pro|I v|put qn|some n|milk prep|in pro|here prep|in det|this n|cup *MOT: ok # put some milk in there in this cup . %mor: ?|ok v|put qn|some n|milk prep|in adv:loc|there prep|in pro:dem|this n|cup %mor: fil|ok v|put qn|some n|milk prep|in pro|there prep|in det|this n|cup *MOT: see # it even says Eve . %mor: v|see pro|it adv|even v|say-3S n:prop|Eve %mor: v|see pro|it adv|even v|say&3S n:prop|Eve Summary Discrepancies noted:
• ‘your / her / my’ consistently as ‘pro’ by coder 1, consistently coded as ‘det’ by coder 2
• ‘here / there’ consistently as ‘adv:loc’ by coder 1, consistently coded as ‘pro’ by coder 2
• Numbers e.g. ‘one’ consistently coded as ‘det:num’ by coder 1, consistently coded as ‘n’
by coder 2.
• A few discrepancies for ‘aux’ vs ‘v’
• ‘lot’ consistently coded as ‘pro’ by coder 1, consistently coded as ’n’ by coder 2
• ‘another’ consistently coded as ‘det’ by coder 1, consistently coded as ‘adj’ by coder 2
• ‘that’ consistently coded as ‘pro:dem’ by coder 1, coded as ‘pro / qn’ by coder 2
• Coder 1 consistently marked plurals, Coder 2 did not mark plurals
Calculation of Inter-coder reliability Total Words coded = 209 Words where coders assigned different word classes = 33 Inter-coder reliability = 100 – ((33 / 209) x100) = 84.211 %

293
Appendix 3.3: Dependent Variables & CLAN Commands
Variable
CLAN Command Utterance Level Measures
Total Number of Utterances eval @ +t*SP01: +u Total Number of Words eval @ +t*SP01: +u
Percentage of Grammatical Errors
(freq @ +t*SP01 +s"<+ gram>") / (Total Utterances) x 100 Morpho-syntactic Measures
Verbs per Utterance eval @ +t*SP01: +u
Percentage of Auxiliaries eval @ +t*SP01: +u
Percentage of Third Person Singular
eval @ +t*SP01: +u Percentage of Past Tense eval @ +t*SP01: +u
Percentage of Past Participle eval @ +t*SP01: +u
Percentage of Present Participle
eval @ +t*SP01: +u
Percentage of Plurals eval @ +t*SP01: +u Lexical Measures: Open Class Words
Type Token Ratio (TTR) eval @ +t*SP01: +u
Vocabulary Diversity (VocD) vocd @ +t*SP01
Percentage of Nouns eval @ +t*SP01: +u
TTR Nouns freq @ +t%mor +s"@|-n"
Percentage of Verbs eval @ +t*SP01: +u
TTR Verbs freq @ +t%mor +s"@|-v"
Percentage of Adverbs eval @ +t*SP01: +u
Percentage of Adjectives eval @ +t*SP01: +u Lexical Measures: Closed Class Words
Percentage of Prepositions eval @ +t*SP01: +u
Percentage of Conjunctions eval @ +t*SP01: +u
Percentage of Pronouns eval @ +t*SP01: +u
Percentage of Wh-Words eval @ +t*SP01: +u
Percentage of Determiners eval @ +t*SP01: +u Measures of Repair
Number of Retraces eval @ +t*SP01: +u
Number of Repetitions eval @ +t*SP01: +u
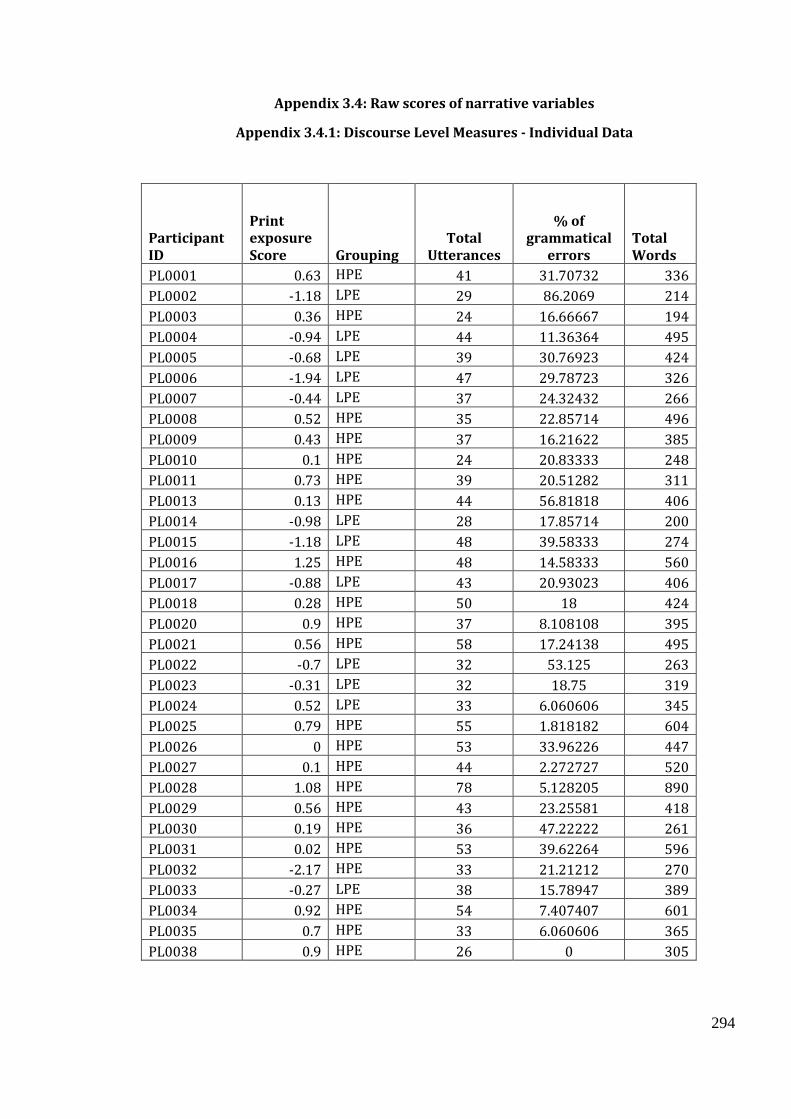
294
Appendix 3.4: Raw scores of narrative variables
Appendix 3.4.1: Discourse Level Measures - Individual Data
Participant ID
Print exposure Score Grouping
Total Utterances
% of grammatical
errors Total Words
PL0001 0.63 HPE 41 31.70732 336
PL0002 -1.18 LPE 29 86.2069 214
PL0003 0.36 HPE 24 16.66667 194
PL0004 -0.94 LPE 44 11.36364 495
PL0005 -0.68 LPE 39 30.76923 424
PL0006 -1.94 LPE 47 29.78723 326
PL0007 -0.44 LPE 37 24.32432 266
PL0008 0.52 HPE 35 22.85714 496
PL0009 0.43 HPE 37 16.21622 385
PL0010 0.1 HPE 24 20.83333 248
PL0011 0.73 HPE 39 20.51282 311
PL0013 0.13 HPE 44 56.81818 406
PL0014 -0.98 LPE 28 17.85714 200
PL0015 -1.18 LPE 48 39.58333 274
PL0016 1.25 HPE 48 14.58333 560
PL0017 -0.88 LPE 43 20.93023 406
PL0018 0.28 HPE 50 18 424
PL0020 0.9 HPE 37 8.108108 395
PL0021 0.56 HPE 58 17.24138 495
PL0022 -0.7 LPE 32 53.125 263
PL0023 -0.31 LPE 32 18.75 319
PL0024 0.52 LPE 33 6.060606 345
PL0025 0.79 HPE 55 1.818182 604
PL0026 0 HPE 53 33.96226 447
PL0027 0.1 HPE 44 2.272727 520
PL0028 1.08 HPE 78 5.128205 890
PL0029 0.56 HPE 43 23.25581 418
PL0030 0.19 HPE 36 47.22222 261
PL0031 0.02 HPE 53 39.62264 596
PL0032 -2.17 HPE 33 21.21212 270
PL0033 -0.27 LPE 38 15.78947 389
PL0034 0.92 HPE 54 7.407407 601
PL0035 0.7 HPE 33 6.060606 365
PL0038 0.9 HPE 26 0 305
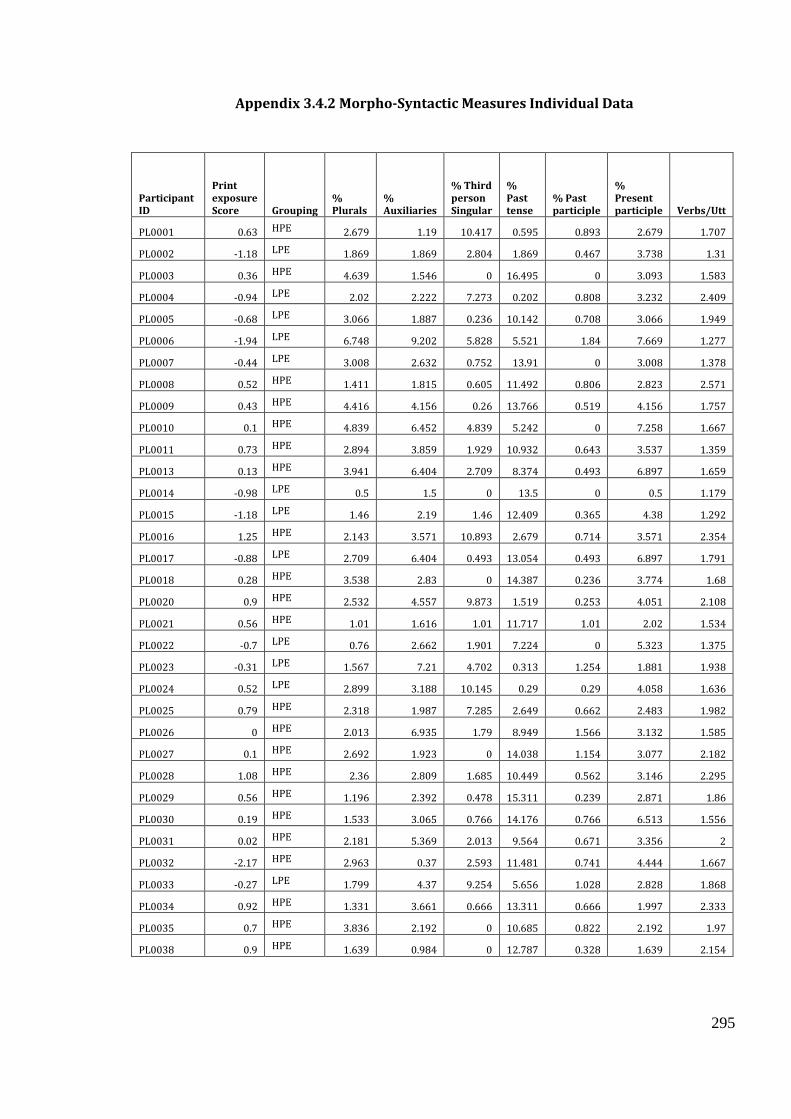
295
Appendix 3.4.2 Morpho-Syntactic Measures Individual Data
Participant ID
Print exposure Score Grouping
% Plurals
% Auxiliaries
% Third person Singular
% Past tense
% Past participle
% Present participle Verbs/Utt
PL0001 0.63 HPE 2.679 1.19 10.417 0.595 0.893 2.679 1.707
PL0002 -1.18 LPE 1.869 1.869 2.804 1.869 0.467 3.738 1.31
PL0003 0.36 HPE 4.639 1.546 0 16.495 0 3.093 1.583
PL0004 -0.94 LPE 2.02 2.222 7.273 0.202 0.808 3.232 2.409
PL0005 -0.68 LPE 3.066 1.887 0.236 10.142 0.708 3.066 1.949
PL0006 -1.94 LPE 6.748 9.202 5.828 5.521 1.84 7.669 1.277
PL0007 -0.44 LPE 3.008 2.632 0.752 13.91 0 3.008 1.378
PL0008 0.52 HPE 1.411 1.815 0.605 11.492 0.806 2.823 2.571
PL0009 0.43 HPE 4.416 4.156 0.26 13.766 0.519 4.156 1.757
PL0010 0.1 HPE 4.839 6.452 4.839 5.242 0 7.258 1.667
PL0011 0.73 HPE 2.894 3.859 1.929 10.932 0.643 3.537 1.359
PL0013 0.13 HPE 3.941 6.404 2.709 8.374 0.493 6.897 1.659
PL0014 -0.98 LPE 0.5 1.5 0 13.5 0 0.5 1.179
PL0015 -1.18 LPE 1.46 2.19 1.46 12.409 0.365 4.38 1.292
PL0016 1.25 HPE 2.143 3.571 10.893 2.679 0.714 3.571 2.354
PL0017 -0.88 LPE 2.709 6.404 0.493 13.054 0.493 6.897 1.791
PL0018 0.28 HPE 3.538 2.83 0 14.387 0.236 3.774 1.68
PL0020 0.9 HPE 2.532 4.557 9.873 1.519 0.253 4.051 2.108
PL0021 0.56 HPE 1.01 1.616 1.01 11.717 1.01 2.02 1.534
PL0022 -0.7 LPE 0.76 2.662 1.901 7.224 0 5.323 1.375
PL0023 -0.31 LPE 1.567 7.21 4.702 0.313 1.254 1.881 1.938
PL0024 0.52 LPE 2.899 3.188 10.145 0.29 0.29 4.058 1.636
PL0025 0.79 HPE 2.318 1.987 7.285 2.649 0.662 2.483 1.982
PL0026 0 HPE 2.013 6.935 1.79 8.949 1.566 3.132 1.585
PL0027 0.1 HPE 2.692 1.923 0 14.038 1.154 3.077 2.182
PL0028 1.08 HPE 2.36 2.809 1.685 10.449 0.562 3.146 2.295
PL0029 0.56 HPE 1.196 2.392 0.478 15.311 0.239 2.871 1.86
PL0030 0.19 HPE 1.533 3.065 0.766 14.176 0.766 6.513 1.556
PL0031 0.02 HPE 2.181 5.369 2.013 9.564 0.671 3.356 2
PL0032 -2.17 HPE 2.963 0.37 2.593 11.481 0.741 4.444 1.667
PL0033 -0.27 LPE 1.799 4.37 9.254 5.656 1.028 2.828 1.868
PL0034 0.92 HPE 1.331 3.661 0.666 13.311 0.666 1.997 2.333
PL0035 0.7 HPE 3.836 2.192 0 10.685 0.822 2.192 1.97
PL0038 0.9 HPE 1.639 0.984 0 12.787 0.328 1.639 2.154
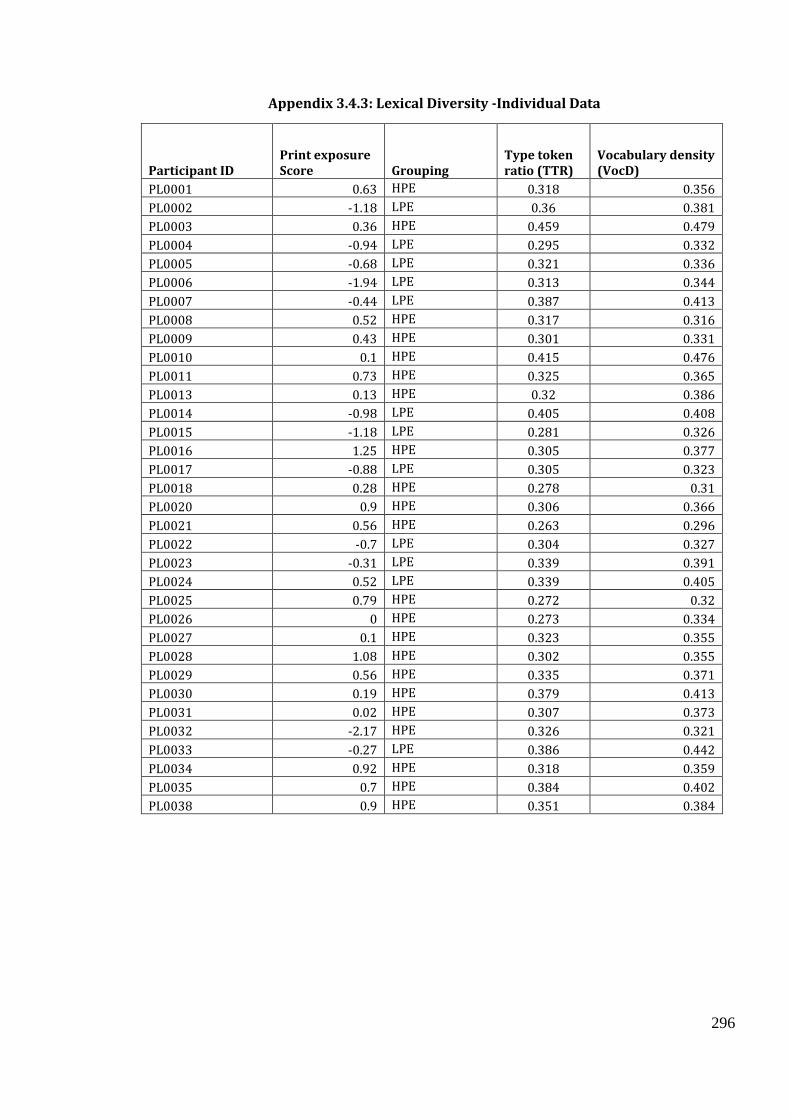
296
Appendix 3.4.3: Lexical Diversity -Individual Data
Participant ID Print exposure Score Grouping
Type token ratio (TTR)
Vocabulary density (VocD)
PL0001 0.63 HPE 0.318 0.356
PL0002 -1.18 LPE 0.36 0.381
PL0003 0.36 HPE 0.459 0.479
PL0004 -0.94 LPE 0.295 0.332
PL0005 -0.68 LPE 0.321 0.336
PL0006 -1.94 LPE 0.313 0.344
PL0007 -0.44 LPE 0.387 0.413
PL0008 0.52 HPE 0.317 0.316
PL0009 0.43 HPE 0.301 0.331
PL0010 0.1 HPE 0.415 0.476
PL0011 0.73 HPE 0.325 0.365
PL0013 0.13 HPE 0.32 0.386
PL0014 -0.98 LPE 0.405 0.408
PL0015 -1.18 LPE 0.281 0.326
PL0016 1.25 HPE 0.305 0.377
PL0017 -0.88 LPE 0.305 0.323
PL0018 0.28 HPE 0.278 0.31
PL0020 0.9 HPE 0.306 0.366
PL0021 0.56 HPE 0.263 0.296
PL0022 -0.7 LPE 0.304 0.327
PL0023 -0.31 LPE 0.339 0.391
PL0024 0.52 LPE 0.339 0.405
PL0025 0.79 HPE 0.272 0.32
PL0026 0 HPE 0.273 0.334
PL0027 0.1 HPE 0.323 0.355
PL0028 1.08 HPE 0.302 0.355
PL0029 0.56 HPE 0.335 0.371
PL0030 0.19 HPE 0.379 0.413
PL0031 0.02 HPE 0.307 0.373
PL0032 -2.17 HPE 0.326 0.321
PL0033 -0.27 LPE 0.386 0.442
PL0034 0.92 HPE 0.318 0.359
PL0035 0.7 HPE 0.384 0.402
PL0038 0.9 HPE 0.351 0.384
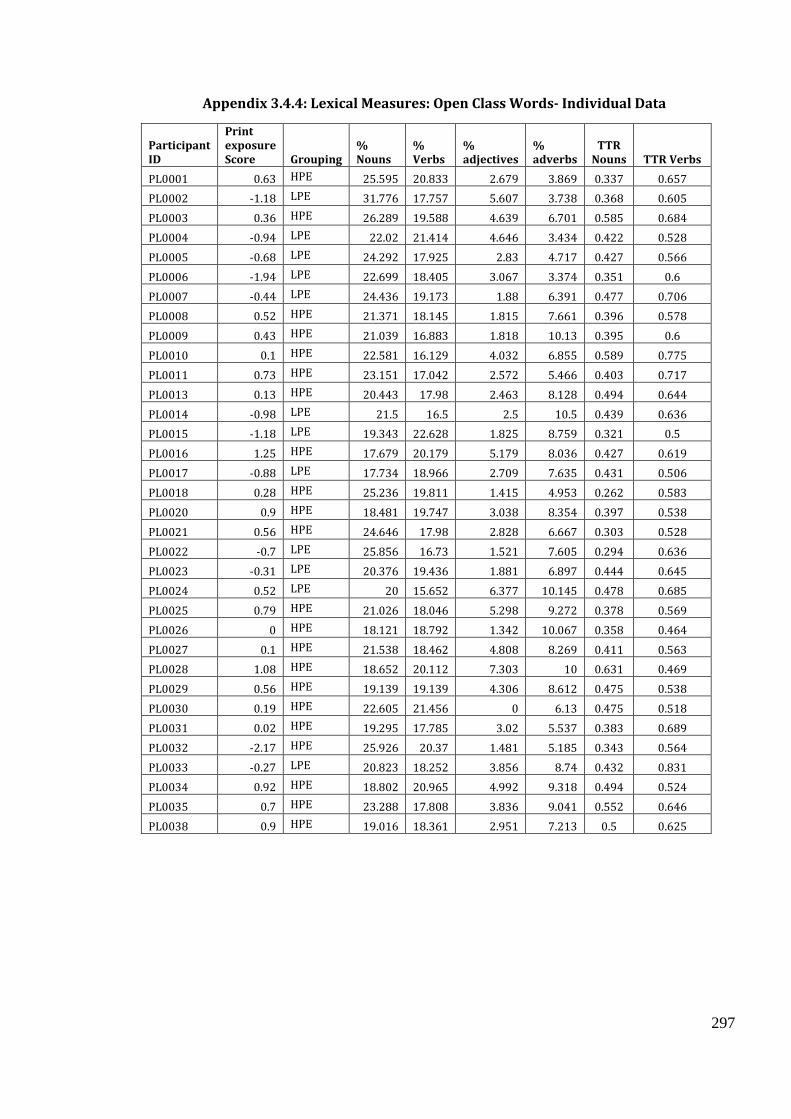
297
Appendix 3.4.4: Lexical Measures: Open Class Words- Individual Data
Participant ID
Print exposure Score Grouping
% Nouns
% Verbs
% adjectives
% adverbs
TTR Nouns TTR Verbs
PL0001 0.63 HPE 25.595 20.833 2.679 3.869 0.337 0.657
PL0002 -1.18 LPE 31.776 17.757 5.607 3.738 0.368 0.605
PL0003 0.36 HPE 26.289 19.588 4.639 6.701 0.585 0.684
PL0004 -0.94 LPE 22.02 21.414 4.646 3.434 0.422 0.528
PL0005 -0.68 LPE 24.292 17.925 2.83 4.717 0.427 0.566
PL0006 -1.94 LPE 22.699 18.405 3.067 3.374 0.351 0.6
PL0007 -0.44 LPE 24.436 19.173 1.88 6.391 0.477 0.706
PL0008 0.52 HPE 21.371 18.145 1.815 7.661 0.396 0.578
PL0009 0.43 HPE 21.039 16.883 1.818 10.13 0.395 0.6
PL0010 0.1 HPE 22.581 16.129 4.032 6.855 0.589 0.775
PL0011 0.73 HPE 23.151 17.042 2.572 5.466 0.403 0.717
PL0013 0.13 HPE 20.443 17.98 2.463 8.128 0.494 0.644
PL0014 -0.98 LPE 21.5 16.5 2.5 10.5 0.439 0.636
PL0015 -1.18 LPE 19.343 22.628 1.825 8.759 0.321 0.5
PL0016 1.25 HPE 17.679 20.179 5.179 8.036 0.427 0.619
PL0017 -0.88 LPE 17.734 18.966 2.709 7.635 0.431 0.506
PL0018 0.28 HPE 25.236 19.811 1.415 4.953 0.262 0.583
PL0020 0.9 HPE 18.481 19.747 3.038 8.354 0.397 0.538
PL0021 0.56 HPE 24.646 17.98 2.828 6.667 0.303 0.528
PL0022 -0.7 LPE 25.856 16.73 1.521 7.605 0.294 0.636
PL0023 -0.31 LPE 20.376 19.436 1.881 6.897 0.444 0.645
PL0024 0.52 LPE 20 15.652 6.377 10.145 0.478 0.685
PL0025 0.79 HPE 21.026 18.046 5.298 9.272 0.378 0.569
PL0026 0 HPE 18.121 18.792 1.342 10.067 0.358 0.464
PL0027 0.1 HPE 21.538 18.462 4.808 8.269 0.411 0.563
PL0028 1.08 HPE 18.652 20.112 7.303 10 0.631 0.469
PL0029 0.56 HPE 19.139 19.139 4.306 8.612 0.475 0.538
PL0030 0.19 HPE 22.605 21.456 0 6.13 0.475 0.518
PL0031 0.02 HPE 19.295 17.785 3.02 5.537 0.383 0.689
PL0032 -2.17 HPE 25.926 20.37 1.481 5.185 0.343 0.564
PL0033 -0.27 LPE 20.823 18.252 3.856 8.74 0.432 0.831
PL0034 0.92 HPE 18.802 20.965 4.992 9.318 0.494 0.524
PL0035 0.7 HPE 23.288 17.808 3.836 9.041 0.552 0.646
PL0038 0.9 HPE 19.016 18.361 2.951 7.213 0.5 0.625
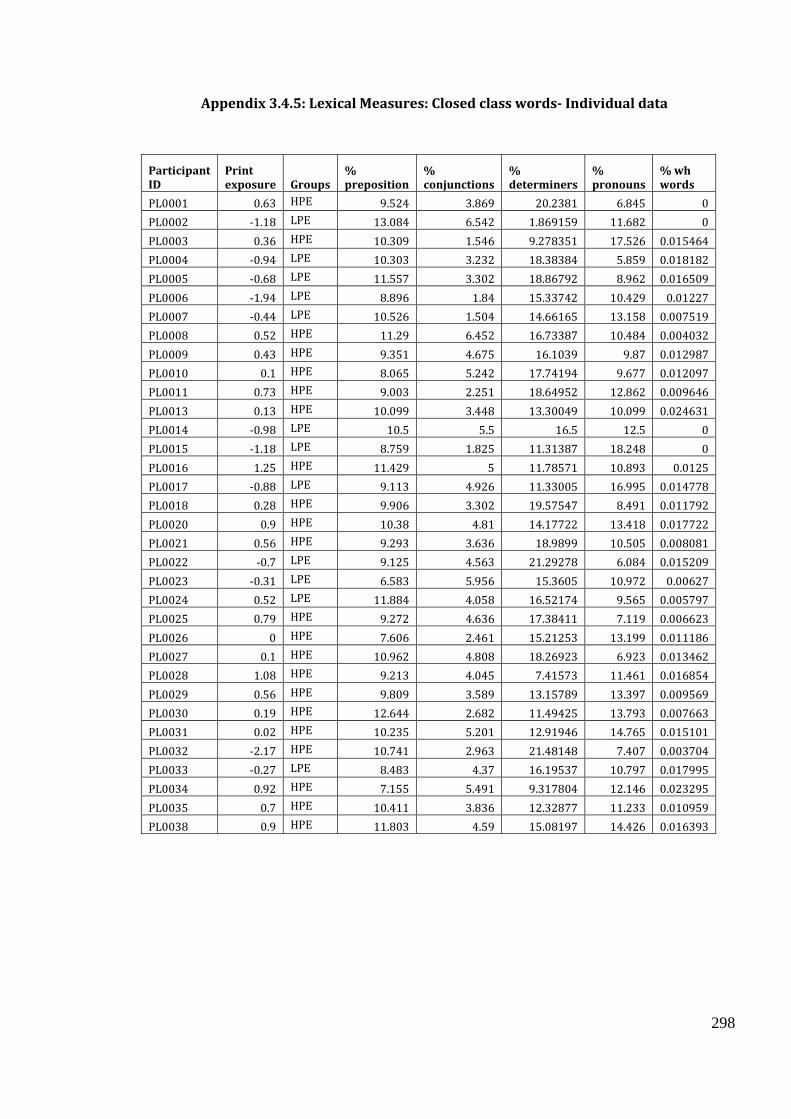
298
Appendix 3.4.5: Lexical Measures: Closed class words- Individual data
Participant ID
Print exposure Groups
% preposition
% conjunctions
% determiners
% pronouns
% wh words
PL0001 0.63 HPE 9.524 3.869 20.2381 6.845 0
PL0002 -1.18 LPE 13.084 6.542 1.869159 11.682 0
PL0003 0.36 HPE 10.309 1.546 9.278351 17.526 0.015464
PL0004 -0.94 LPE 10.303 3.232 18.38384 5.859 0.018182
PL0005 -0.68 LPE 11.557 3.302 18.86792 8.962 0.016509
PL0006 -1.94 LPE 8.896 1.84 15.33742 10.429 0.01227
PL0007 -0.44 LPE 10.526 1.504 14.66165 13.158 0.007519
PL0008 0.52 HPE 11.29 6.452 16.73387 10.484 0.004032
PL0009 0.43 HPE 9.351 4.675 16.1039 9.87 0.012987
PL0010 0.1 HPE 8.065 5.242 17.74194 9.677 0.012097
PL0011 0.73 HPE 9.003 2.251 18.64952 12.862 0.009646
PL0013 0.13 HPE 10.099 3.448 13.30049 10.099 0.024631
PL0014 -0.98 LPE 10.5 5.5 16.5 12.5 0
PL0015 -1.18 LPE 8.759 1.825 11.31387 18.248 0
PL0016 1.25 HPE 11.429 5 11.78571 10.893 0.0125
PL0017 -0.88 LPE 9.113 4.926 11.33005 16.995 0.014778
PL0018 0.28 HPE 9.906 3.302 19.57547 8.491 0.011792
PL0020 0.9 HPE 10.38 4.81 14.17722 13.418 0.017722
PL0021 0.56 HPE 9.293 3.636 18.9899 10.505 0.008081
PL0022 -0.7 LPE 9.125 4.563 21.29278 6.084 0.015209
PL0023 -0.31 LPE 6.583 5.956 15.3605 10.972 0.00627
PL0024 0.52 LPE 11.884 4.058 16.52174 9.565 0.005797
PL0025 0.79 HPE 9.272 4.636 17.38411 7.119 0.006623
PL0026 0 HPE 7.606 2.461 15.21253 13.199 0.011186
PL0027 0.1 HPE 10.962 4.808 18.26923 6.923 0.013462
PL0028 1.08 HPE 9.213 4.045 7.41573 11.461 0.016854
PL0029 0.56 HPE 9.809 3.589 13.15789 13.397 0.009569
PL0030 0.19 HPE 12.644 2.682 11.49425 13.793 0.007663
PL0031 0.02 HPE 10.235 5.201 12.91946 14.765 0.015101
PL0032 -2.17 HPE 10.741 2.963 21.48148 7.407 0.003704
PL0033 -0.27 LPE 8.483 4.37 16.19537 10.797 0.017995
PL0034 0.92 HPE 7.155 5.491 9.317804 12.146 0.023295
PL0035 0.7 HPE 10.411 3.836 12.32877 11.233 0.010959
PL0038 0.9 HPE 11.803 4.59 15.08197 14.426 0.016393
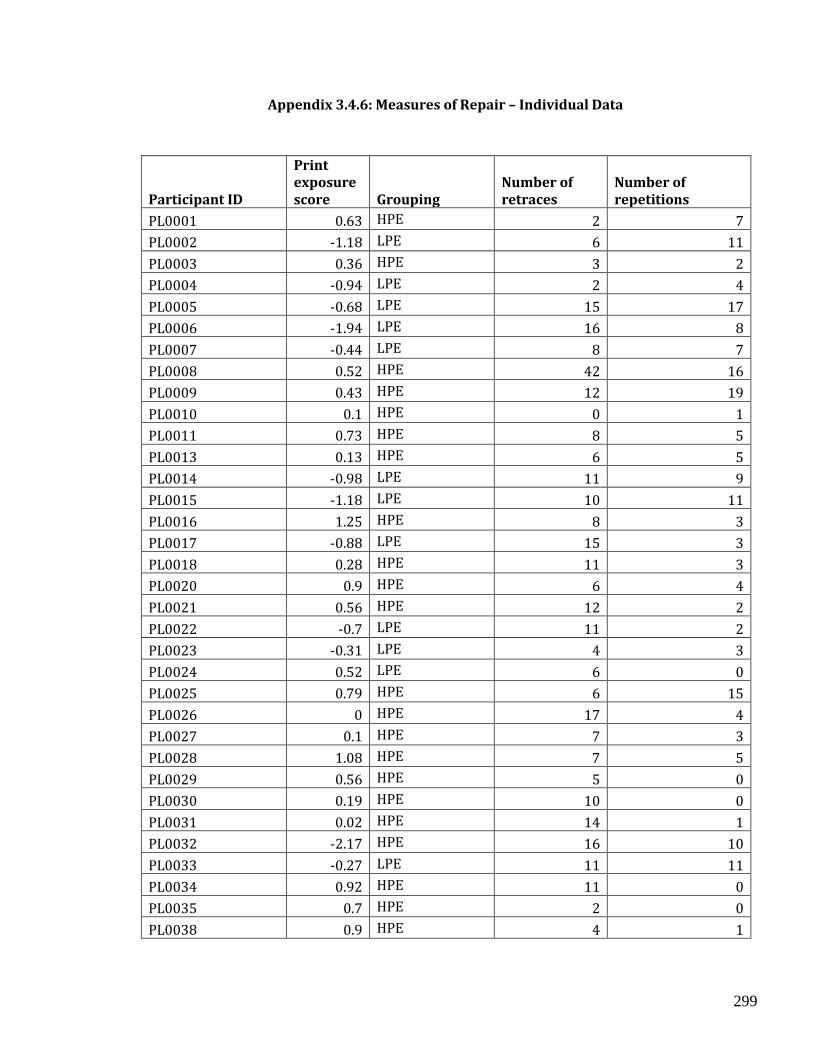
299
Appendix 3.4.6: Measures of Repair – Individual Data
Participant ID
Print exposure score Grouping
Number of retraces
Number of repetitions
PL0001 0.63 HPE 2 7
PL0002 -1.18 LPE 6 11
PL0003 0.36 HPE 3 2
PL0004 -0.94 LPE 2 4
PL0005 -0.68 LPE 15 17
PL0006 -1.94 LPE 16 8
PL0007 -0.44 LPE 8 7
PL0008 0.52 HPE 42 16
PL0009 0.43 HPE 12 19
PL0010 0.1 HPE 0 1
PL0011 0.73 HPE 8 5
PL0013 0.13 HPE 6 5
PL0014 -0.98 LPE 11 9
PL0015 -1.18 LPE 10 11
PL0016 1.25 HPE 8 3
PL0017 -0.88 LPE 15 3
PL0018 0.28 HPE 11 3
PL0020 0.9 HPE 6 4
PL0021 0.56 HPE 12 2
PL0022 -0.7 LPE 11 2
PL0023 -0.31 LPE 4 3
PL0024 0.52 LPE 6 0
PL0025 0.79 HPE 6 15
PL0026 0 HPE 17 4
PL0027 0.1 HPE 7 3
PL0028 1.08 HPE 7 5
PL0029 0.56 HPE 5 0
PL0030 0.19 HPE 10 0
PL0031 0.02 HPE 14 1
PL0032 -2.17 HPE 16 10
PL0033 -0.27 LPE 11 11
PL0034 0.92 HPE 11 0
PL0035 0.7 HPE 2 0
PL0038 0.9 HPE 4 1
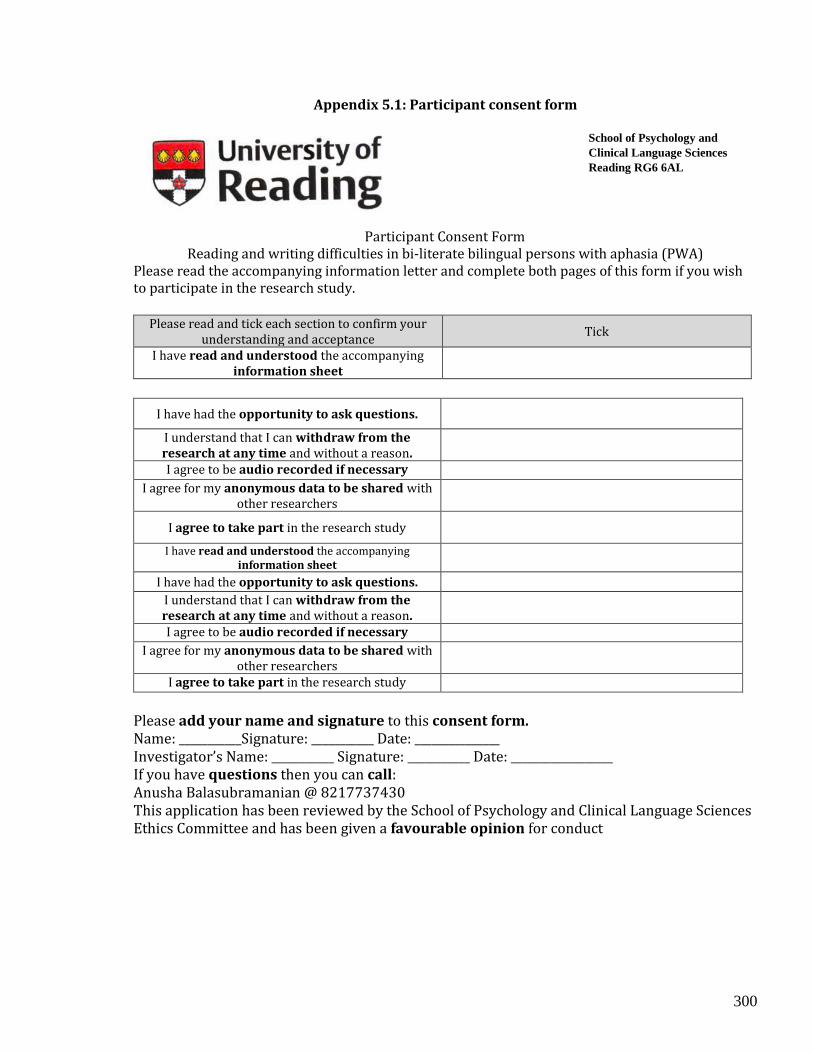
300
Appendix 5.1: Participant consent form
Participant Consent Form Reading and writing difficulties in bi-literate bilingual persons with aphasia (PWA)
Please read the accompanying information letter and complete both pages of this form if you wish to participate in the research study.
Please read and tick each section to confirm your
understanding and acceptance Tick
I have read and understood the accompanying information sheet
I have had the opportunity to ask questions.
I understand that I can withdraw from the research at any time and without a reason.
I agree to be audio recorded if necessary
I agree for my anonymous data to be shared with other researchers
I agree to take part in the research study
Please add your name and signature to this consent form. Name: ___________Signature: ___________ Date: _______________ Investigator’s Name: ___________ Signature: ___________ Date: __________________ If you have questions then you can call: Anusha Balasubramanian @ 8217737430 This application has been reviewed by the School of Psychology and Clinical Language Sciences Ethics Committee and has been given a favourable opinion for conduct
School of Psychology and
Clinical Language Sciences
Reading RG6 6AL

301
Appendix 5.2 Information sheet
Information Sheet
Reading and writing difficulties in bi-literate bilingual persons with aphasia (PWA)
Researchers:
Dr. Arpita Bose
Lecturer in Clinical Language Sciences
School of Psychology and Clinical Language Sciences,
University of Reading, UK
Tel:
Anusha Balasubramanian
PhD Student
School of Psychology and Clinical Language Sciences,
University of Reading, UK
Tel:
You are being invited to take part in a research study conducted by the University of Reading,
Reading, United Kingdom.
School of Psychology and
Clinical Language Sciences
Reading RG6 6AL

302
This is information about the research. You can choose whether you would like to take part.
What is the study about?
People with aphasia (PWA) can have communication difficulties and also problems in reading
and writing. If they speak more than one language, then their language abilities, reading and
writing difficulties in the two languages could be different.
We are collecting information from bilingual people with aphasia to understand how the reading
and writing impairments differ in two languages.
This data will be anonymous. Your name or personal details will not be identified.
In future, the anonymized data will be shared with other researchers, so they can look at reading
and writing difficulties.
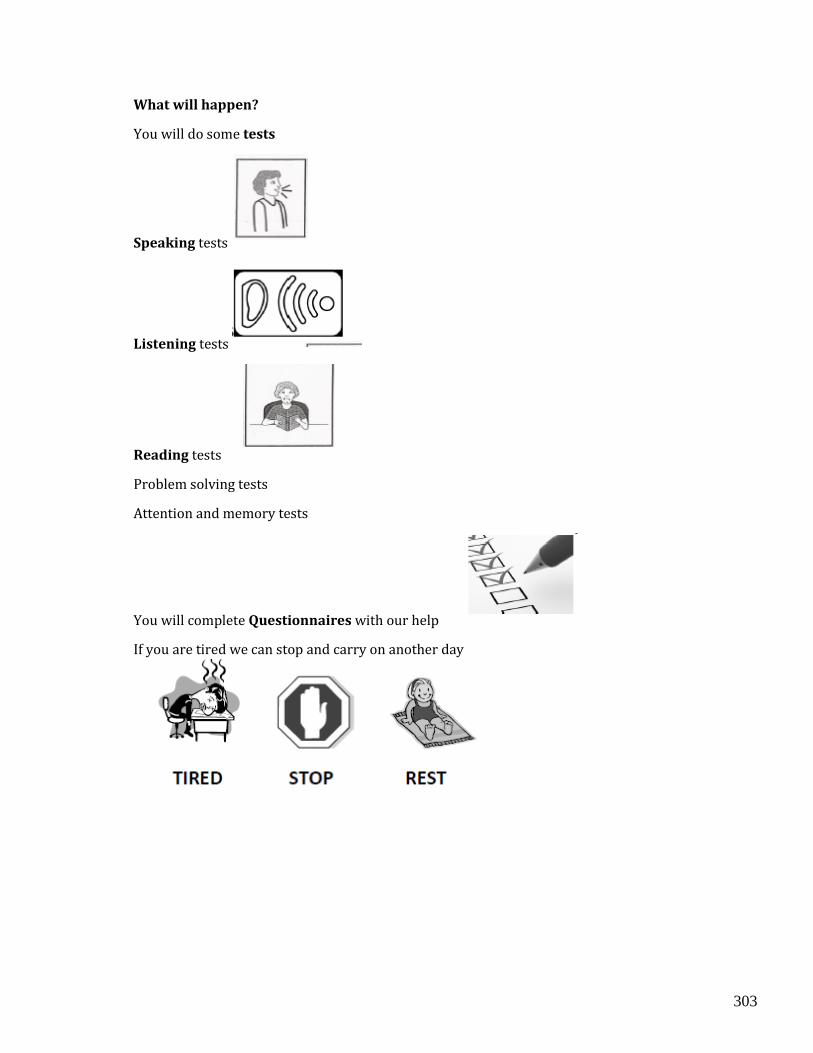
303
What will happen?
You will do some tests
Speaking tests
Listening tests
Reading tests
Problem solving tests
Attention and memory tests
You will complete Questionnaires with our help
If you are tired we can stop and carry on another day
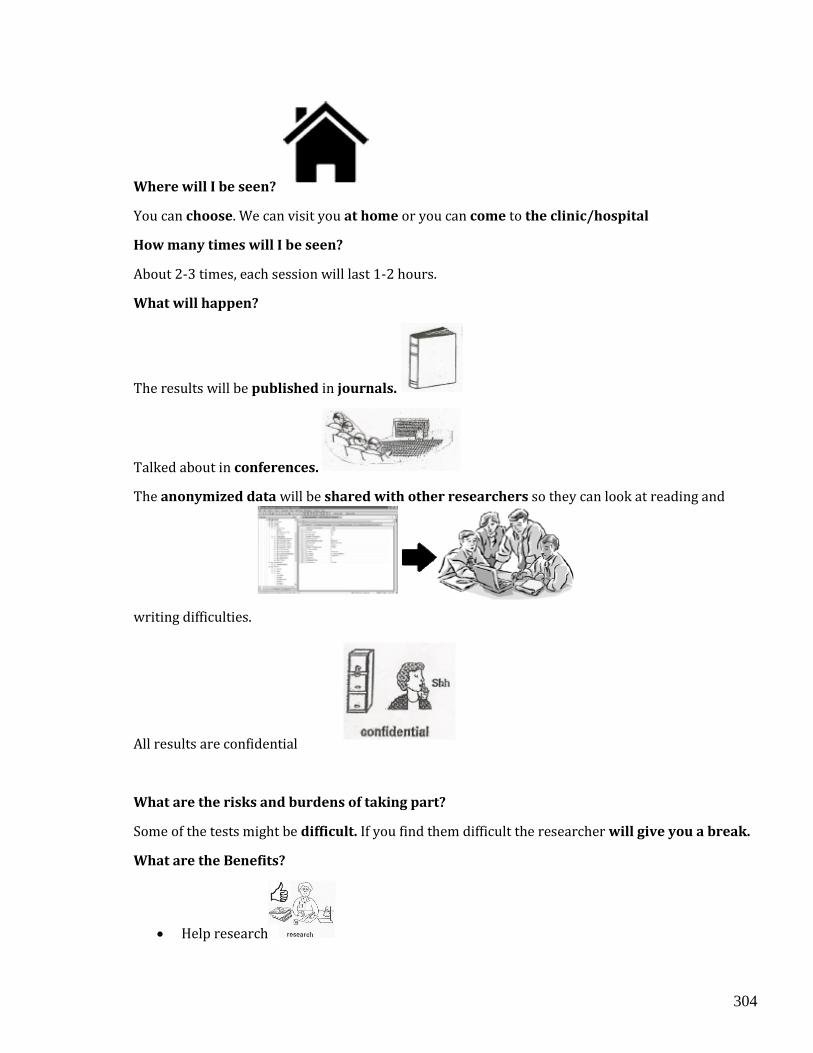
304
Where will I be seen?
You can choose. We can visit you at home or you can come to the clinic/hospital
How many times will I be seen?
About 2-3 times, each session will last 1-2 hours.
What will happen?
The results will be published in journals.
Talked about in conferences.
The anonymized data will be shared with other researchers so they can look at reading and
writing difficulties.
All results are confidential
What are the risks and burdens of taking part?
Some of the tests might be difficult. If you find them difficult the researcher will give you a break.
What are the Benefits?
• Help research

305
• You may help other people with language difficulties in the future
• You may understand more about your own reading and writing
Do I have to take part?
No, taking part is voluntary. You choose whether you would like to take part.
If you decide to take part you can stop
• At any time
• Without a reason
• Without it affecting your medical care
Please ask any questions you have, at any time.
This application has been reviewed by the University of Reading Research Ethics Committee
and has been given a favourable ethical opinion for conduct.
Thank you for participating in our research.
Dr. Arpita Bose & Anusha Balasubramanian
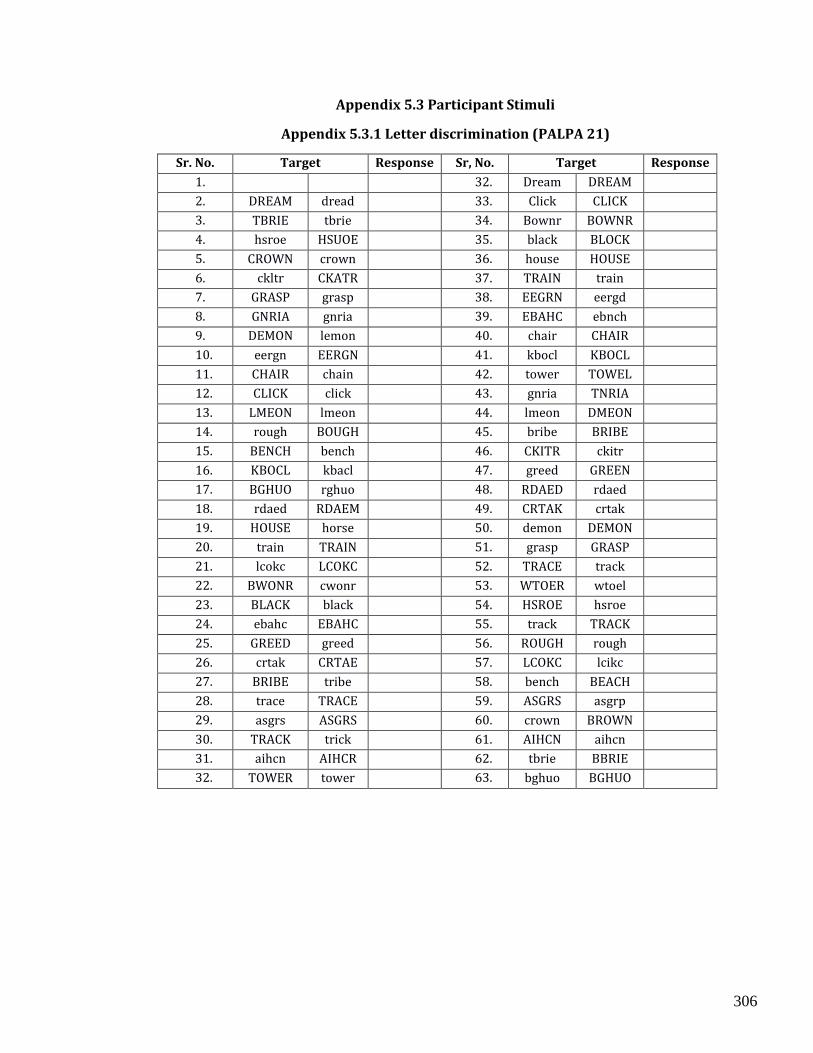
306
Appendix 5.3 Participant Stimuli
Appendix 5.3.1 Letter discrimination (PALPA 21)
Sr. No. Target Response Sr, No. Target Response
1. 32. Dream DREAM
2. DREAM dread 33. Click CLICK
3. TBRIE tbrie 34. Bownr BOWNR
4. hsroe HSUOE 35. black BLOCK
5. CROWN crown 36. house HOUSE
6. ckltr CKATR 37. TRAIN train
7. GRASP grasp 38. EEGRN eergd
8. GNRIA gnria 39. EBAHC ebnch
9. DEMON lemon 40. chair CHAIR
10. eergn EERGN 41. kbocl KBOCL
11. CHAIR chain 42. tower TOWEL
12. CLICK click 43. gnria TNRIA
13. LMEON lmeon 44. lmeon DMEON
14. rough BOUGH 45. bribe BRIBE
15. BENCH bench 46. CKITR ckitr
16. KBOCL kbacl 47. greed GREEN
17. BGHUO rghuo 48. RDAED rdaed
18. rdaed RDAEM 49. CRTAK crtak
19. HOUSE horse 50. demon DEMON
20. train TRAIN 51. grasp GRASP
21. lcokc LCOKC 52. TRACE track
22. BWONR cwonr 53. WTOER wtoel
23. BLACK black 54. HSROE hsroe
24. ebahc EBAHC 55. track TRACK
25. GREED greed 56. ROUGH rough
26. crtak CRTAE 57. LCOKC lcikc
27. BRIBE tribe 58. bench BEACH
28. trace TRACE 59. ASGRS asgrp
29. asgrs ASGRS 60. crown BROWN
30. TRACK trick 61. AIHCN aihcn
31. aihcn AIHCR 62. tbrie BBRIE
32. TOWER tower 63. bghuo BGHUO
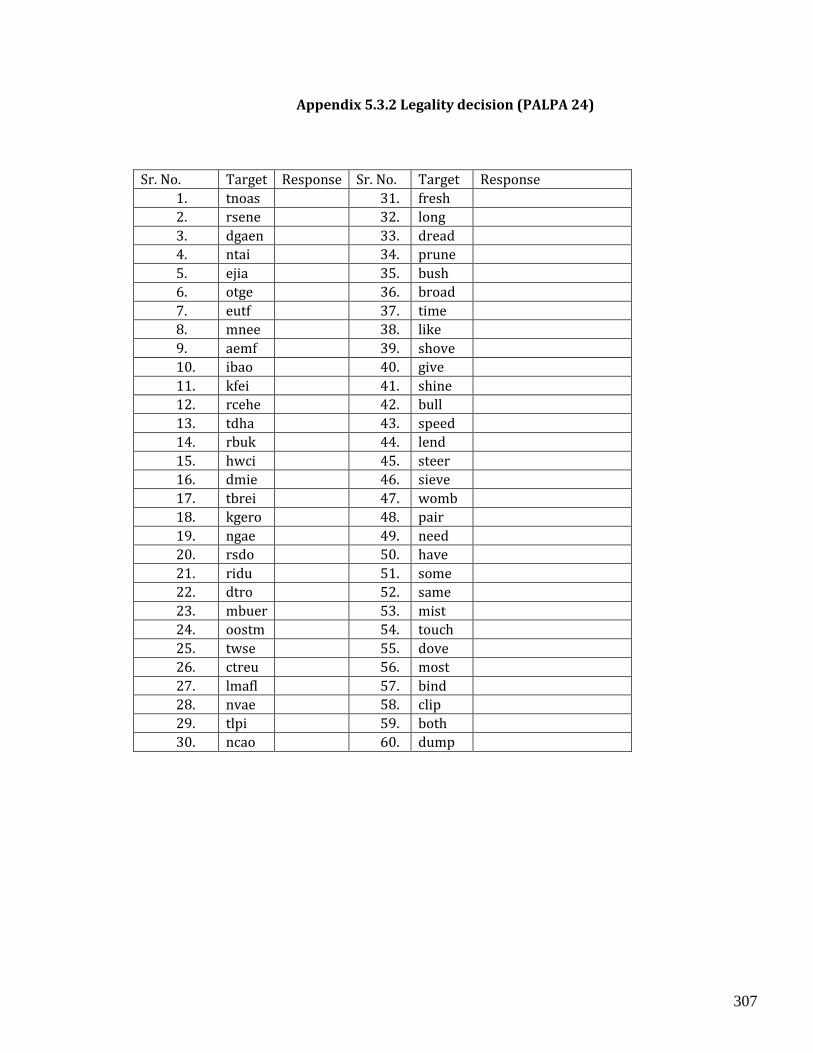
307
Appendix 5.3.2 Legality decision (PALPA 24)
Sr. No. Target Response Sr. No. Target Response
1. tnoas 31. fresh
2. rsene 32. long
3. dgaen 33. dread
4. ntai 34. prune
5. ejia 35. bush
6. otge 36. broad
7. eutf 37. time
8. mnee 38. like
9. aemf 39. shove
10. ibao 40. give
11. kfei 41. shine
12. rcehe 42. bull
13. tdha 43. speed
14. rbuk 44. lend
15. hwci 45. steer
16. dmie 46. sieve
17. tbrei 47. womb
18. kgero 48. pair
19. ngae 49. need
20. rsdo 50. have
21. ridu 51. some
22. dtro 52. same
23. mbuer 53. mist
24. oostm 54. touch
25. twse 55. dove
26. ctreu 56. most
27. lmafl 57. bind
28. nvae 58. clip
29. tlpi 59. both
30. ncao 60. dump
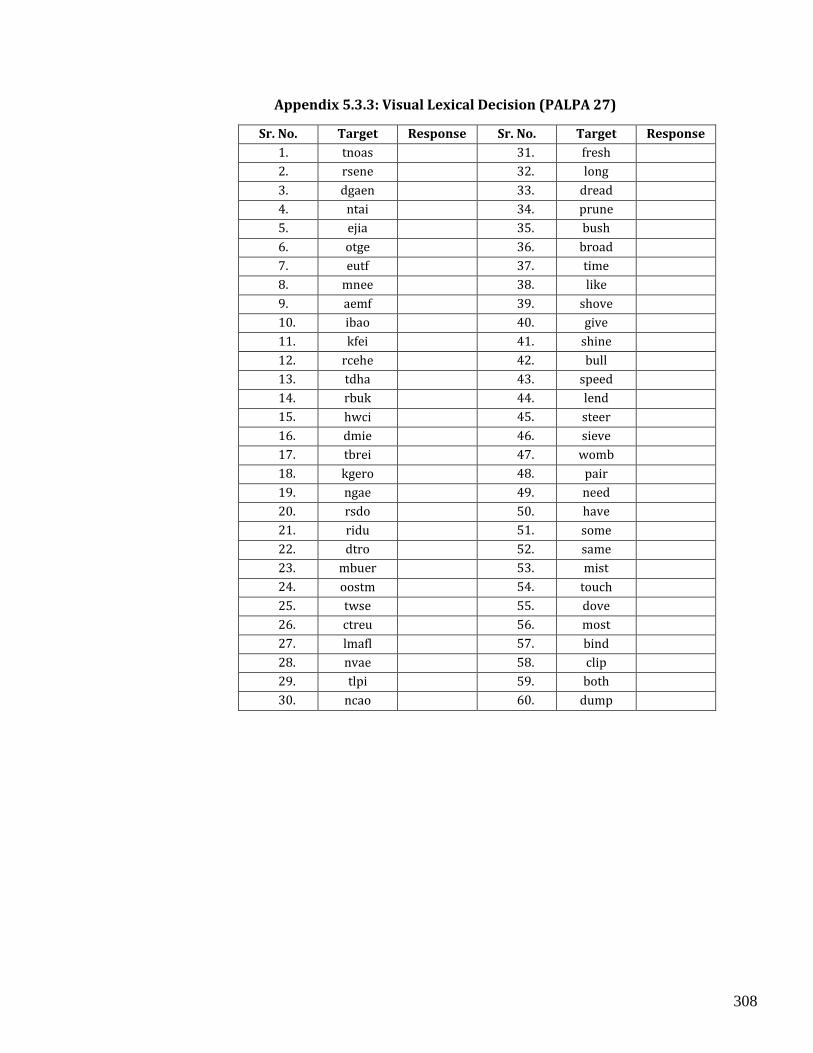
308
Appendix 5.3.3: Visual Lexical Decision (PALPA 27)
Sr. No. Target Response Sr. No. Target Response
1. tnoas 31. fresh
2. rsene 32. long
3. dgaen 33. dread
4. ntai 34. prune
5. ejia 35. bush
6. otge 36. broad
7. eutf 37. time
8. mnee 38. like
9. aemf 39. shove
10. ibao 40. give
11. kfei 41. shine
12. rcehe 42. bull
13. tdha 43. speed
14. rbuk 44. lend
15. hwci 45. steer
16. dmie 46. sieve
17. tbrei 47. womb
18. kgero 48. pair
19. ngae 49. need
20. rsdo 50. have
21. ridu 51. some
22. dtro 52. same
23. mbuer 53. mist
24. oostm 54. touch
25. twse 55. dove
26. ctreu 56. most
27. lmafl 57. bind
28. nvae 58. clip
29. tlpi 59. both
30. ncao 60. dump
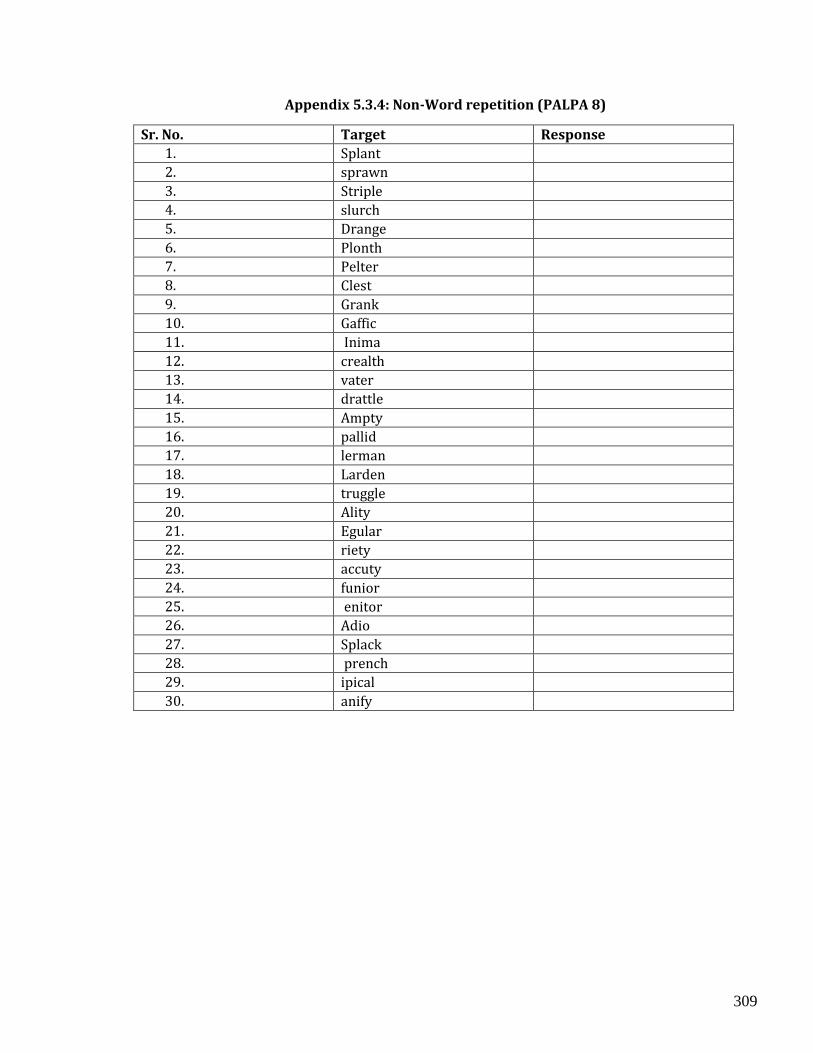
309
Appendix 5.3.4: Non-Word repetition (PALPA 8)
Sr. No. Target Response
1. Splant
2. sprawn
3. Striple
4. slurch
5. Drange
6. Plonth
7. Pelter
8. Clest
9. Grank
10. Gaffic
11. Inima
12. crealth
13. vater
14. drattle
15. Ampty
16. pallid
17. lerman
18. Larden
19. truggle
20. Ality
21. Egular
22. riety
23. accuty
24. funior
25. enitor
26. Adio
27. Splack
28. prench
29. ipical
30. anify
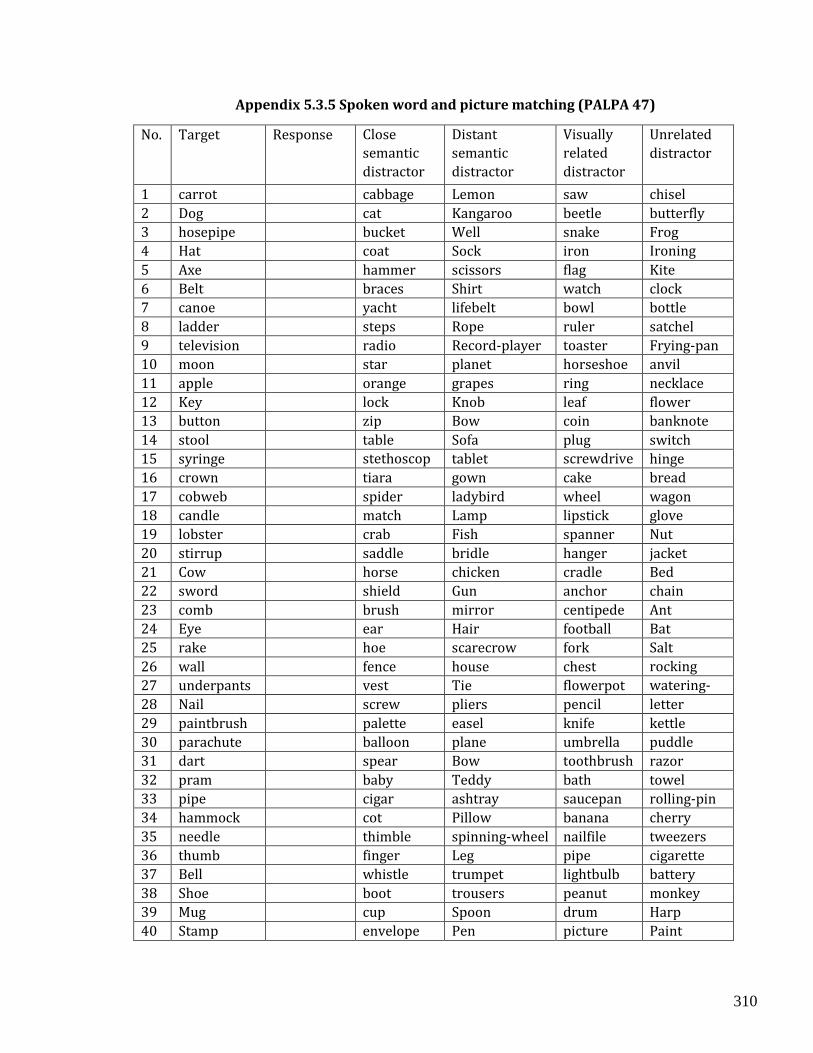
310
Appendix 5.3.5 Spoken word and picture matching (PALPA 47)
No. Target Response Close
semantic
distractor
Distant
semantic
distractor
Visually
related
distractor
Unrelated
distractor
1 carrot cabbage Lemon saw chisel
2 Dog cat Kangaroo beetle butterfly
3 hosepipe bucket Well snake Frog
4 Hat coat Sock iron Ironing
table 5 Axe hammer scissors flag Kite
6 Belt braces Shirt watch clock
7 canoe yacht lifebelt bowl bottle
8 ladder steps Rope ruler satchel
9 television radio Record-player toaster Frying-pan
10 moon star planet horseshoe anvil
11 apple orange grapes ring necklace
12 Key lock Knob leaf flower
13 button zip Bow coin banknote
14 stool table Sofa plug switch
15 syringe stethoscop
e
tablet screwdrive
r
hinge
16 crown tiara gown cake bread
17 cobweb spider ladybird wheel wagon
18 candle match Lamp lipstick glove
19 lobster crab Fish spanner Nut
20 stirrup saddle bridle hanger jacket
21 Cow horse chicken cradle Bed
22 sword shield Gun anchor chain
23 comb brush mirror centipede Ant
24 Eye ear Hair football Bat
25 rake hoe scarecrow fork Salt
26 wall fence house chest rocking
chair 27 underpants vest Tie flowerpot watering-
can 28 Nail screw pliers pencil letter
29 paintbrush palette easel knife kettle
30 parachute balloon plane umbrella puddle
31 dart spear Bow toothbrush razor
32 pram baby Teddy bath towel
33 pipe cigar ashtray saucepan rolling-pin
34 hammock cot Pillow banana cherry
35 needle thimble spinning-wheel nailfile tweezers
36 thumb finger Leg pipe cigarette
37 Bell whistle trumpet lightbulb battery
38 Shoe boot trousers peanut monkey
39 Mug cup Spoon drum Harp
40 Stamp envelope Pen picture Paint
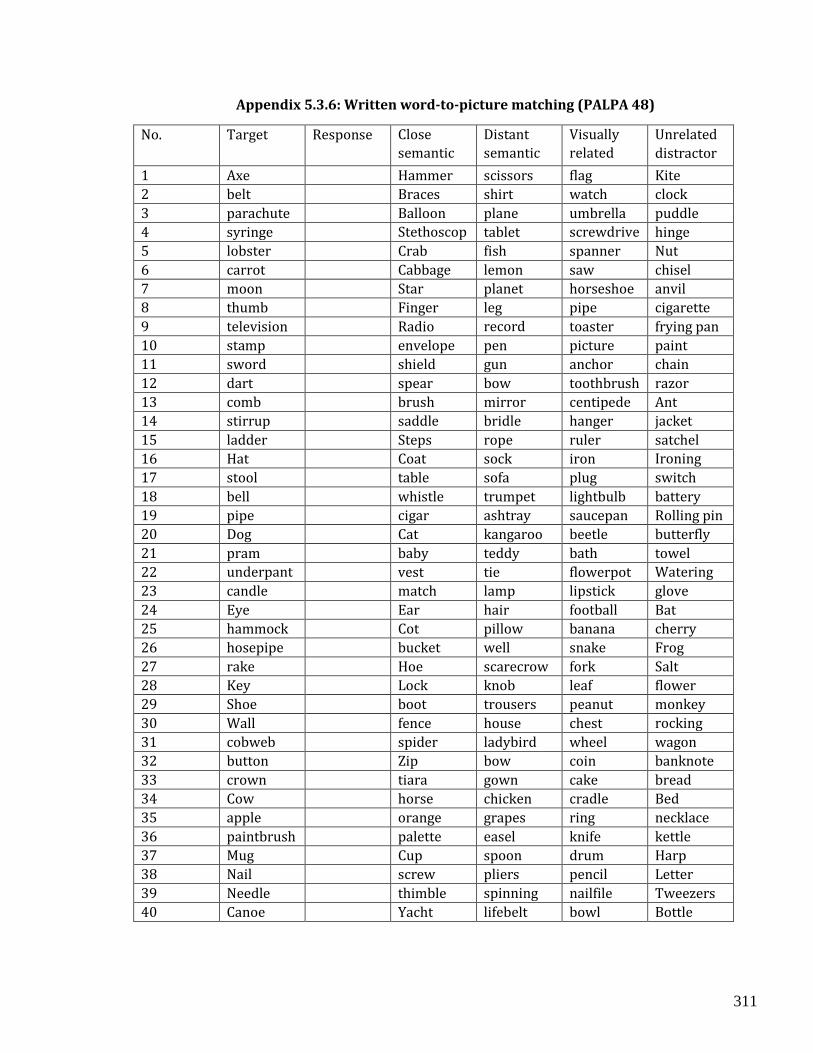
311
Appendix 5.3.6: Written word-to-picture matching (PALPA 48)
No. Target Response Close
semantic
distractor
Distant
semantic
distractor
Visually
related
distractor
Unrelated
distractor
1 Axe Hammer scissors flag Kite
2 belt Braces shirt watch clock
3 parachute Balloon plane umbrella puddle
4 syringe Stethoscop
e
tablet screwdrive
r
hinge
5 lobster Crab fish spanner Nut
6 carrot Cabbage lemon saw chisel
7 moon Star planet horseshoe anvil
8 thumb Finger leg pipe cigarette
9 television Radio record
player
toaster frying pan
10 stamp envelope pen picture paint
11 sword shield gun anchor chain
12 dart spear bow toothbrush razor
13 comb brush mirror centipede Ant
14 stirrup saddle bridle hanger jacket
15 ladder Steps rope ruler satchel
16 Hat Coat sock iron Ironing
table 17 stool table sofa plug switch
18 bell whistle trumpet lightbulb battery
19 pipe cigar ashtray saucepan Rolling pin
20 Dog Cat kangaroo beetle butterfly
21 pram baby teddy bath towel
22 underpant
s
vest tie flowerpot Watering
can 23 candle match lamp lipstick glove
24 Eye Ear hair football Bat
25 hammock Cot pillow banana cherry
26 hosepipe bucket well snake Frog
27 rake Hoe scarecrow fork Salt
28 Key Lock knob leaf flower
29 Shoe boot trousers peanut monkey
30 Wall fence house chest rocking
chair 31 cobweb spider ladybird wheel wagon
32 button Zip bow coin banknote
33 crown tiara gown cake bread
34 Cow horse chicken cradle Bed
35 apple orange grapes ring necklace
36 paintbrush palette easel knife kettle
37 Mug Cup spoon drum Harp
38 Nail screw pliers pencil Letter
39 Needle thimble spinning
wheel
nailfile Tweezers
40 Canoe Yacht lifebelt bowl Bottle
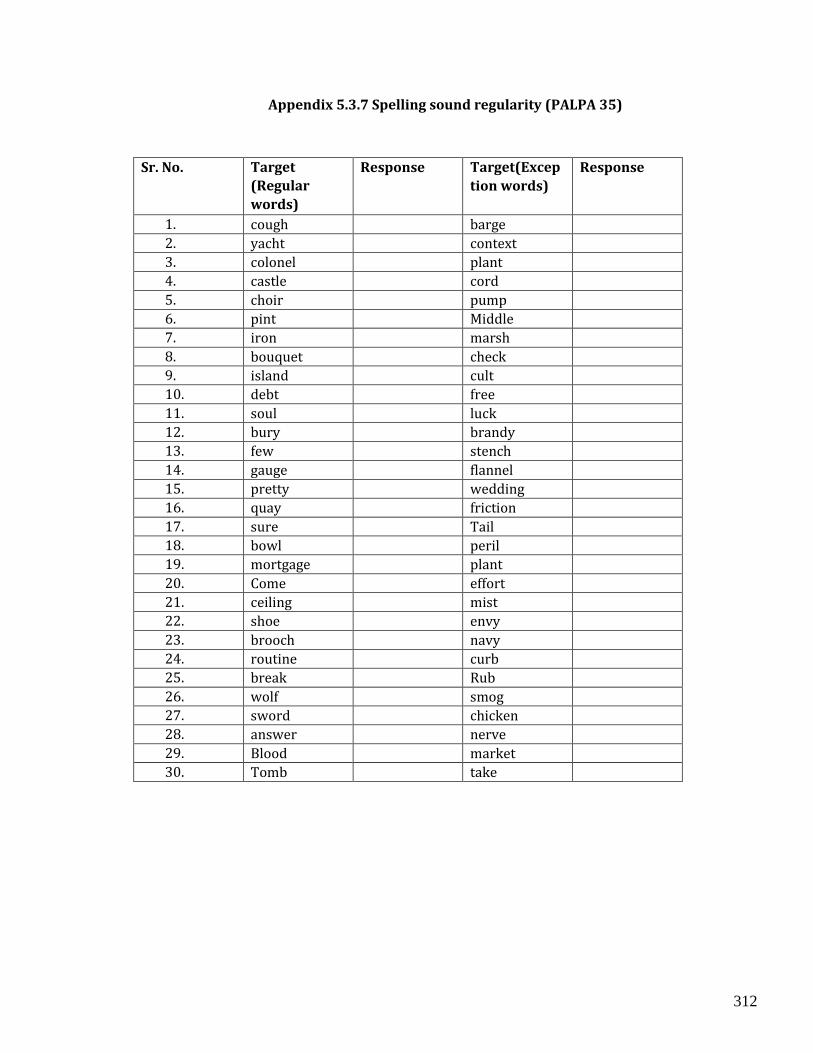
312
Appendix 5.3.7 Spelling sound regularity (PALPA 35)
Sr. No. Target
(Regular
words)
Response Target(Excep
tion words)
Response
1. cough barge
2. yacht context
3. colonel plant
4. castle cord
5. choir pump
6. pint Middle
7. iron marsh
8. bouquet check
9. island cult
10. debt free
11. soul luck
12. bury brandy
13. few stench
14. gauge flannel
15. pretty wedding
16. quay friction
17. sure Tail
18. bowl peril
19. mortgage plant
20. Come effort
21. ceiling mist
22. shoe envy
23. brooch navy
24. routine curb
25. break Rub
26. wolf smog
27. sword chicken
28. answer nerve
29. Blood market
30. Tomb take
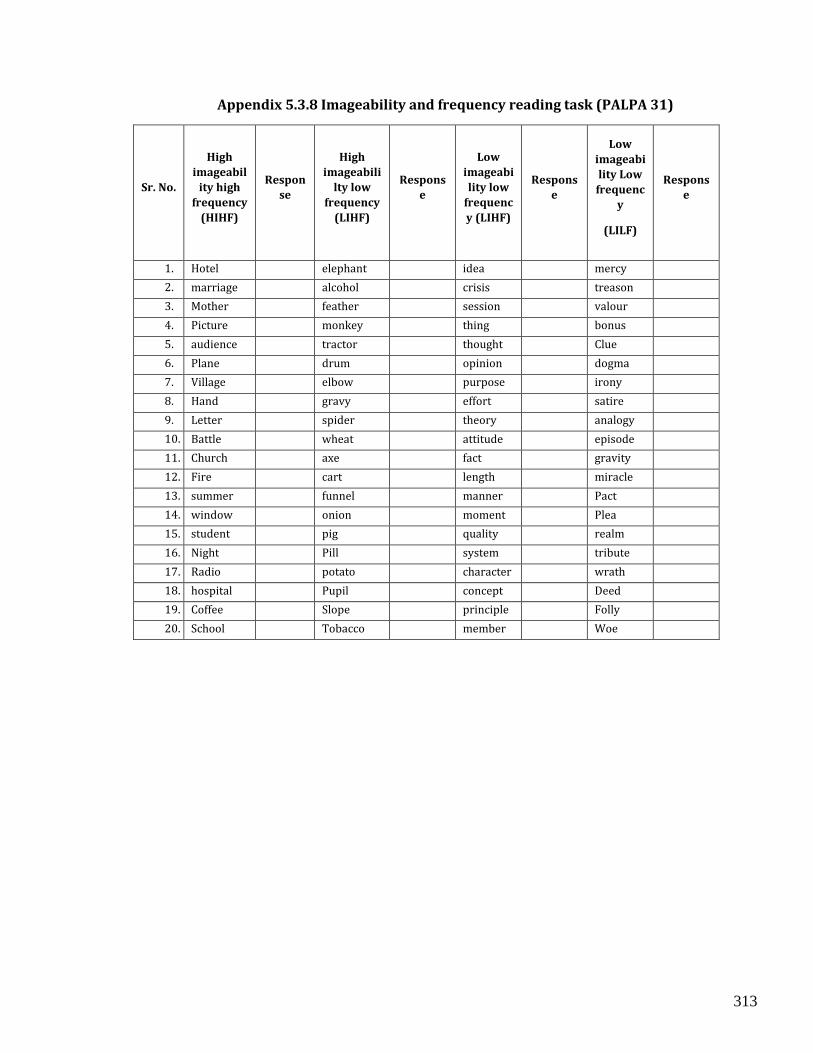
313
Appendix 5.3.8 Imageability and frequency reading task (PALPA 31)
Sr. No.
High
imageabil
ity high
frequency
(HIHF)
Respon
se
High
imageabili
lty low
frequency
(LIHF)
Respons
e
Low
imageabi
lity low
frequenc
y (LIHF)
Respons
e
Low
imageabi
lity Low
frequenc
y
(LILF)
Respons
e
1. Hotel elephant idea mercy
2. marriage alcohol crisis treason
3. Mother feather session valour
4. Picture monkey thing bonus
5. audience tractor thought Clue
6. Plane drum opinion dogma
7. Village elbow purpose irony
8. Hand gravy effort satire
9. Letter spider theory analogy
10. Battle wheat attitude episode
11. Church axe fact gravity
12. Fire cart length miracle
13. summer funnel manner Pact
14. window onion moment Plea
15. student pig quality realm
16. Night Pill system tribute
17. Radio potato character wrath
18. hospital Pupil concept Deed
19. Coffee Slope principle Folly
20. School Tobacco member Woe
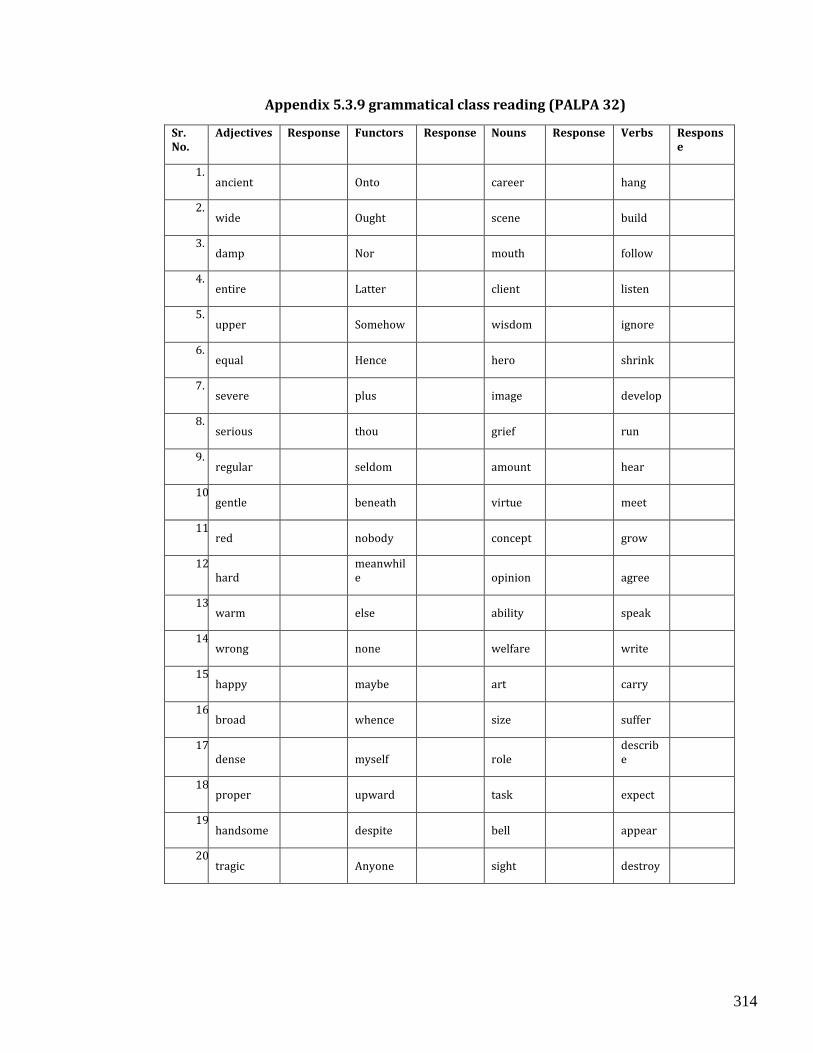
314
Appendix 5.3.9 grammatical class reading (PALPA 32)
Sr. No.
Adjectives Response Functors Response Nouns Response Verbs Response
1. ancient
Onto
career
hang
2. wide
Ought
scene
build
3. damp
Nor
mouth
follow
4. entire
Latter
client
listen
5. upper
Somehow
wisdom
ignore
6. equal
Hence
hero
shrink
7. severe
plus
image
develop
8. serious
thou
grief
run
9. regular
seldom
amount
hear
10. gentle
beneath
virtue
meet
11. red
nobody
concept
grow
12. hard
meanwhile
opinion
agree
13. warm
else
ability
speak
14. wrong
none
welfare
write
15. happy
maybe
art
carry
16. broad
whence
size
suffer
17. dense
myself
role
describe
18. proper
upward
task
expect
19. handsome
despite
bell
appear
20. tragic
Anyone
sight
destroy
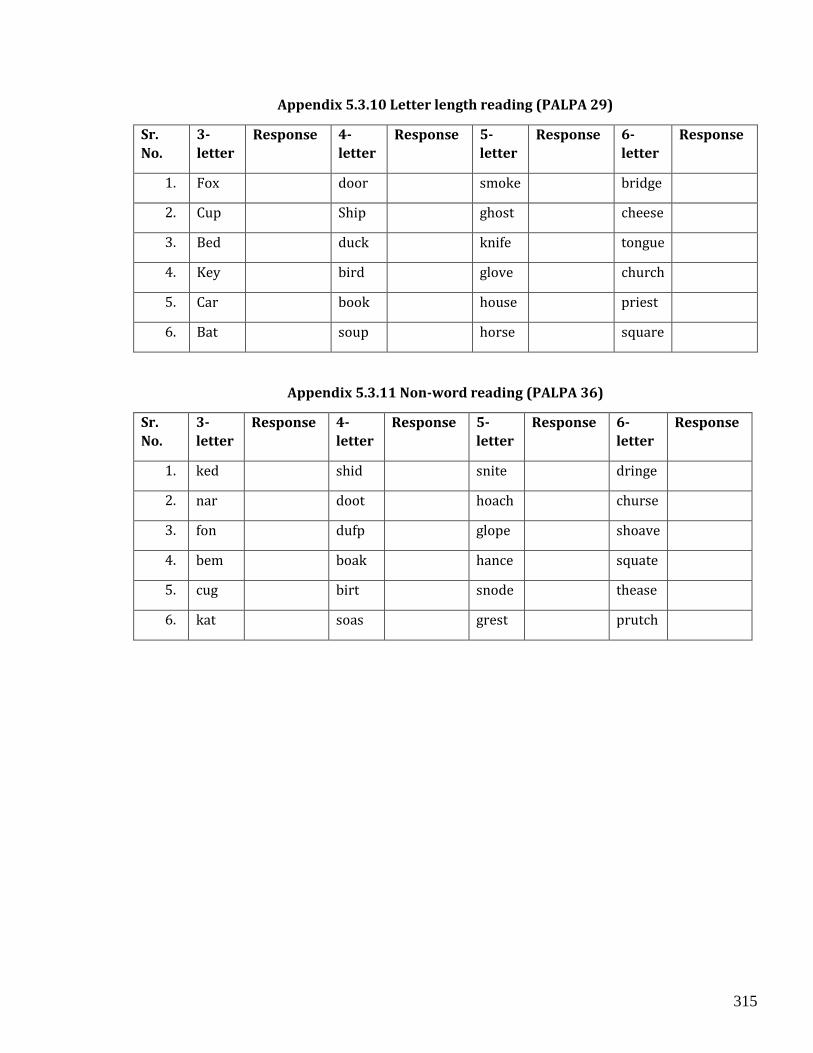
315
Appendix 5.3.10 Letter length reading (PALPA 29)
Sr.
No.
3-
letter
Response 4-
letter
Response 5-
letter
Response 6-
letter
Response
1. Fox door smoke bridge
2. Cup Ship ghost cheese
3. Bed duck knife tongue
4. Key bird glove church
5. Car book house priest
6. Bat soup horse square
Appendix 5.3.11 Non-word reading (PALPA 36)
Sr.
No.
3-
letter
Response 4-
letter
Response 5-
letter
Response 6-
letter
Response
1. ked shid snite dringe
2. nar doot hoach churse
3. fon dufp glope shoave
4. bem boak hance squate
5. cug birt snode thease
6. kat soas grest prutch
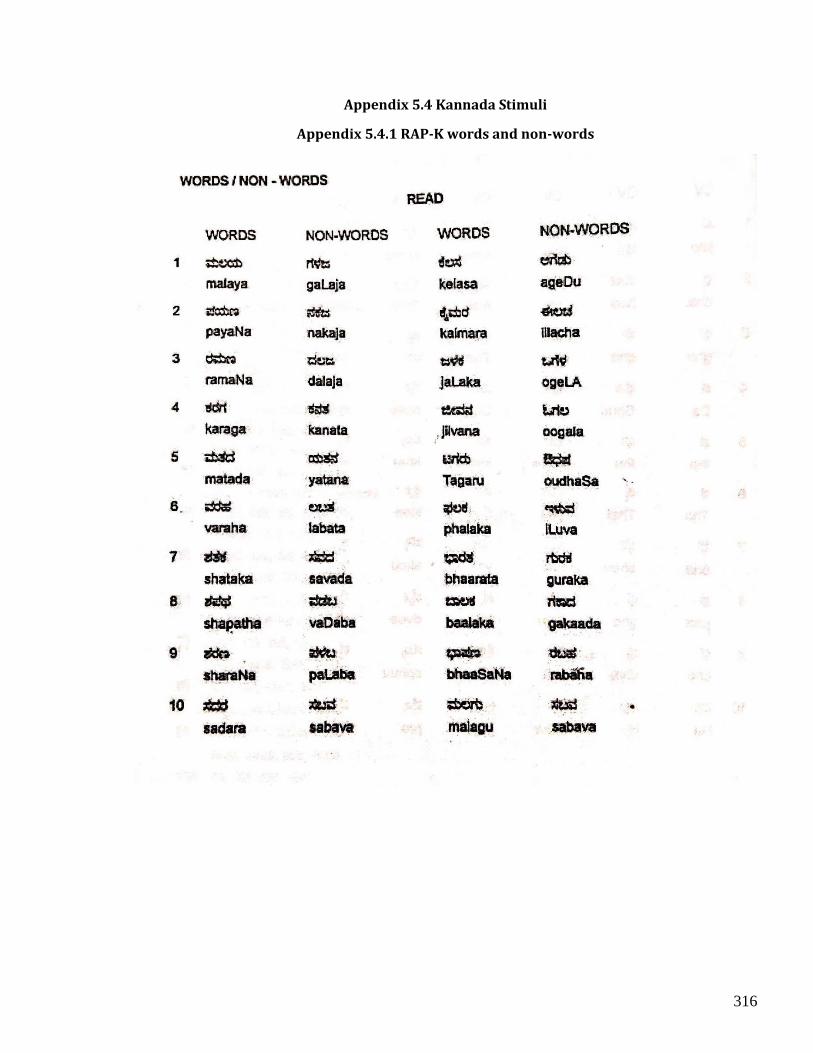
316
Appendix 5.4 Kannada Stimuli
Appendix 5.4.1 RAP-K words and non-words
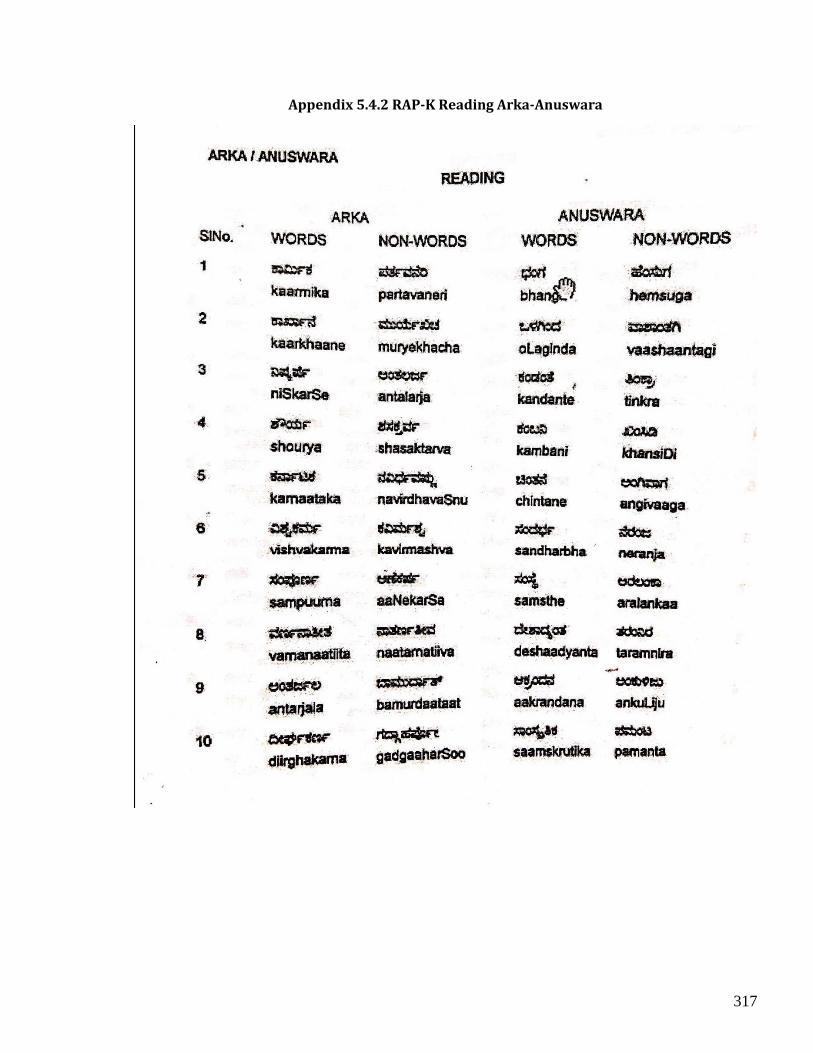
317
Appendix 5.4.2 RAP-K Reading Arka-Anuswara
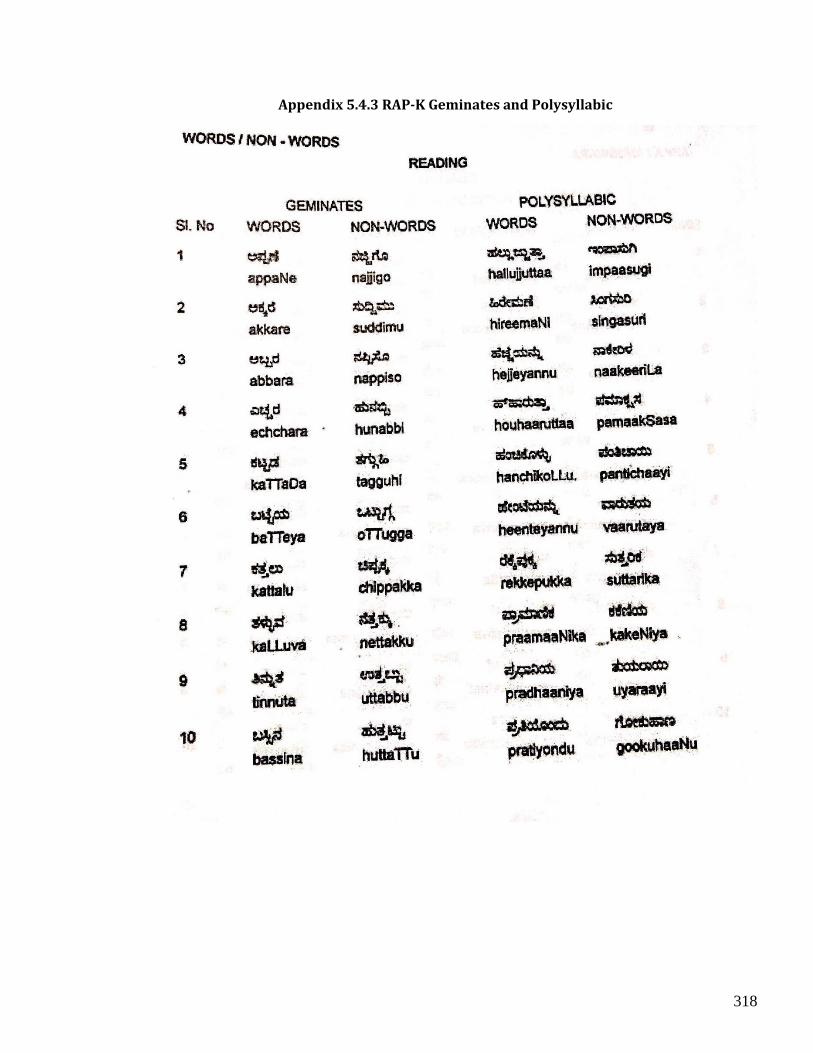
318
Appendix 5.4.3 RAP-K Geminates and Polysyllabic
319
References
Abutalebi, J., Cappa, S. F., & Perani, D. (2001). The bilingual brain as revealed by functional
neuroimaging. Bilingualism: Language and cognition, 4(2), 179-190.
doi:10.1017/s136672890100027x
Acheson, D. J., Wells, J. B., & MacDonald, M. C. (2008). New and updated tests of print exposure and reading
abilities in college students. Behavior Research Methods, 40(1), 278-289.
Alario, F., Perre, L., Castel, C., & Ziegler, J. C. (2007). The role of orthography in speech production
revisited. Cognition, 102(3), 464-475. doi:10.1016/j.cognition.2006.02.002
Ansaldo, A. I., Marcotte, K., Scherer, L., & Raboyeau, G. (2008). Language therapy and bilingual aphasia:
Clinical implications of psycholinguistic and neuroimaging research. Journal of Neurolinguistics,
21(6), 539-557.
Ardila, A. (1998). Bilingualism: A neglected and chaotic area. Aphasiology, 12(2), 131-134.
Ardila, A., & Rosselli, M. (1989). Neuropsychological characteristics of normal aging. Developmental
Neuropsychology, 5(4), 307-320. doi:10.1080/87565648909540441
Ardila, A., Bertolucci, P. H., Braga, L. W., Castro-Caldas, A., Judd, T., Kosmidis, M. H., ... & Rosselli, M. (2010).
Illiteracy: the neuropsychology of cognition without reading. Archives of clinical
neuropsychology, 25(8), 689-712.
Bakhtiar, M., Jafary, R., & Weekes, B. S. (2017). Aphasia in Persian: Implications for cognitive models of
lexical processing. Journal of neuropsychology, 11(3), 414-435. doi:10.1111/jnp.12095
Barnes, D. E., Tager, I. B., Satariano, W. A., & Yaffe, K. (2004). The relationship between literacy and
cognition in well-educated elders. The Journals of Gerontology Series A: Biological Sciences and
Medical Sciences, 59(4), 390-395.
Béland, R., & Mimouni, Z. (2001). Deep dyslexia in the two languages of an Arabic/French bilingual patient.
Cognition, 82(2), 77-126. doi:10.1016/s0010-0277(01)00148-2
320
Bennett-Kastor, T. (2002). The “frog story” narratives of Irish–English bilinguals. Bilingualism: Language
and Cognition, 5(02), 131-146.
Benton, A. L. (1955). Visual Retention Test Forms C, D, E. Psychological Corporation.
Benton, A. L., & Hamsher, K. D. S. (1976). Multilingual aphasia examination. Iowa City: University of Iowa.
Berndt, R. S. (2000). Quantitative production analysis a training manual for the analysis of aphasic sentence
production. Psychology Press.
Bialystok, E. (2006). Effect of bilingualism and computer video game experience on the Simon task.
Canadian Journal of Experimental Psychology/Revue Canadienne De Psychologie Expérimentale,
60(1), 68-79. doi:10.1037/cjep2006008
Bialystok, E. (2009). Bilingualism: The good, the bad, and the indifferent. Bilingualism: Language and
cognition, 12(1), 3-11.
Bialystok, E. (2009). Claiming evidence from non-evidence: A reply to Morton and Harper. Developmental
Science, 12(4), 499-501. doi:10.1111/j.1467-7687.2009.00868.x
Bialystok, E., & Craik, F. I. (2010). Cognitive and linguistic processing in the bilingual mind. Current
directions in psychological science, 19(1), 19-23.
Bialystok, E., & Martin, M. M. (2003). Notation to symbol: Development in children’s understanding of
print. Journal of Experimental Child Psychology, 86(3), 223-243. doi:10.1016/s0022-
0965(03)00138-3
Bialystok, E., Craik, F. I., & Freedman, M. (2007). Bilingualism as a protection against the onset of
symptoms of dementia. Neuropsychologia, 45(2), 459-464.
doi:10.1016/j.neuropsychologia.2006.10.009
Bialystok, E., Craik, F. I., & Luk, G. (2012). Bilingualism: consequences for mind and brain. Trends in
cognitive sciences, 16(4), 240-250.
321
Bialystok, E., Craik, F. I., Klein, R., & Viswanathan, M. (2004). Bilingualism, Aging, and Cognitive Control:
Evidence from the Simon Task. Psychology and Aging, 19(2), 290-303. doi:10.1037/0882-
7974.19.2.290
Bialystok, E., Craik, F., & Luk, G. (2008). Cognitive control and lexical access in younger and older
bilinguals. Journal of Experimental Psychology: Learning, memory, and cognition, 34(4), 859-873.
Bialystok, E., Luk, G., & Kwan, E. (2005). Bilingualism, biliteracy, and learning to read: Interactions among
languages and writing systems. Scientific studies of reading, 9(1), 43-61.
Birdsong, D. (2014). Dominance and age in bilingualism. Applied Linguistics, 35(4), 374-392.
Birdsong, D., Gertken, L. M., & Amengual, M. (2012). Bilingual language profile: An easy-to-use instrument
to assess bilingualism. COERLL, University of Texas at Austin.
Birren J E., & Schaie K W. (2006), Handbook of the Psychology of Aging, 6th edition. Academic Press
Bishop, D., & Edmundson, A. (1987). Language impaired 4-yearolds: Distinguishing transient from
persistent impairment. Journal of Speech and Hearing Disorders, 52, 156-173.
Bishop, D. V. M. (2003). TROG-2 test for reception of grammar-2.
Boersma, P., & Weenink, D. (2015). Praat: doing phonetics by computer [Computer program]. Version 5.4.
09.
Botting, N. (2002). Narrative as a tool for the assessment of linguistic and pragmatic impairments. Child
language teaching and therapy, 18(1), 1-21.
Bruin, A. D., Treccani, B., & Sala, S. D. (2014). Cognitive Advantage in Bilingualism. Psychological Science,
26(1), 99-107. doi:10.1177/0956797614557866
Brysbaert, M., & Dijkstra, T. (2006). Changing views on word recognition in bilinguals. Bilingualism and
second language acquisition. Royal Academes for Science and the Arts of Belgium.
Bunge, S. A., Dudukovic, N. M., Thomason, M. E., Vaidya, C. J., & Gabrieli, J. D. (2002). Immature Frontal
Lobe Contributions to Cognitive Control in Children. Neuron, 33(2), 301-311. doi:10.1016/s0896-
6273(01)00583-9
322
Burchfield, R. (1985). Frequency Analysis of English Usage: Lexicon and Grammar. By W. Nelson Francis
and Henry Kučera with the assistance of Andrew W. Mackie. Boston: Houghton Mifflin. 1982. x 561.
Journal of English Linguistics, 18(1), 64-70. doi:10.1177/007542428501800107
Burgess, P. W., & Simons, J. S. (2005). Theories of frontal lobe executive function: Clinical applications. The
Effectiveness of Rehabilitation for Cognitive Deficits, 211-231.
doi:10.1093/acprof:oso/9780198526544.003.0018
Burgos, P., Cucchiarini, C., Hout, R. V., & Strik, H. (2014). Phonology acquisition in Spanish learners of
Dutch: Error patterns in pronunciation. Language Sciences, 41, 129-142.
doi:10.1016/j.langsci.2013.08.015
Buschke, H., & Fuld, P. A. (1974). Evaluating storage, retention, and retrieval in disordered memory and
learning. Neurology, 24(11), 1019-1019. doi:10.1212/wnl.24.11.1019
Calabria, M., Hernández, M., Branzi, F. M., & Costa, A. (2012). Qualitative differences between bilingual
language control and executive control: Evidence from task-switching. Frontiers in psychology, 2,
(399), 1-10.
Callicott, J. H. (1999). Physiological Characteristics of Capacity Constraints in Working Memory as
Revealed by Functional MRI. Cerebral Cortex, 9(1), 20-26. doi:10.1093/cercor/9.1.20
Caramazza, A. (1984). The logic of neuropsychological research and the problem of patient classification
in aphasia. Brain and Language, 21(1), 9-20. doi:10.1016/0093-934x(84)90032-4
Carlson, S. (1998). Distribution of cortical activation during visuospatial n-back tasks as revealed by
functional magnetic resonance imaging. Cerebral Cortex, 8(8), 743-752. doi:10.1093/cercor/8.8.743
Carlson, S. M., & Meltzoff, A. N. (2008). Bilingual experience and executive functioning in young children.
Developmental Science, 11(2), 282-298. doi:10.1111/j.1467-7687.2008.00675.x
Casey, B. J., Trainor, R. J., Orendi, J. L., Schubert, A. B., Nystrom, L. E., Giedd, J. N., . . . Rapoport, J. L. (1997). A
Developmental Functional MRI Study of Prefrontal Activation during Performance of a Go-No-Go
Task. Journal of Cognitive Neuroscience, 9(6), 835-847. doi:10.1162/jocn.1997.9.6.835
323
Castro-Caldas, A., Petersson, K. M., Reis, A., Stone-Elander, S., & Ingvar, M. (1998). The illiterate brain.
Learning to read and write during childhood influences the functional organization of the adult
brain. Brain: a journal of neurology, 121(6), 1053-1063.
Chang, C. J. (2006). Linking early narrative skill to later language and reading ability in Mandarin-speaking
children: A longitudinal study over eight years. Narrative Inquiry, 16(2), 275-293.
Chee, M. W. (2006). Dissociating language and word meaning in the bilingual brain. Trends in Cognitive
Sciences, 10(12), 527-529.
Chen, I. L. (2011). Progress in clinical neurosciences. Byword Books.
Chen, L., & Yan, R. (2010, 2011). Development and use of English evaluative expressions in narratives of
Chinese–English bilinguals. Bilingualism: Language and Cognition, 14(04), 570-578
Coderre, E. L., & Heuven, W. J. (2014). The effect of script similarity on executive control in bilinguals.
Frontiers in Psychology, 5. doi:10.3389/fpsyg.2014.01070
Cohen, J. (1977). Statistical power analysis for the behavioral sciences, Rev. Ed. San Diego: Academic Press.
Coltheart, M. (1981). The MRC Psycholinguistic Database. The Quarterly Journal of Experimental
Psychology Section A, 33(4), 497-505. doi:10.1080/14640748108400805
Coltheart, M. (1984). Acquired Dyslexias and Normal Reading. Dyslexia: A Global Issue, 357-373.
doi:10.1007/978-94-009-6929-2_19
Coltheart, M., Curtis, B., Atkins, P., & Haller, M. (1993). Models of reading aloud: Dual-route and parallel-
distributed-processing approaches. Psychological Review, 100(4), 589-608. doi:10.1037/0033-
295x.100.4.589
Coltheart, M., Rastle, K., Perry, C., Langdon, R., & Ziegler, J. (2001). DRC: A dual route cascaded model of
visual word recognition and reading aloud. Psychological Review, 108(1), 204-256.
doi:10.1037/0033-295x.108.1.204
324
Costa, A., & Santesteban, M. (2004). Lexical access in bilingual speech production: Evidence from language
switching in highly proficient bilinguals and L2 learners. Journal of memory and Language, 50(4),
491-511.
Costa, A., Hernández, M., & Sebastián-Gallés, N. (2008). Bilingualism aids conflict resolution: Evidence
from the ANT task. Cognition, 106(1), 59-86. doi:10.1016/j.cognition.2006.12.013
Costa, A., Hernández, M., Costa-Faidella, J., & Sebastián-Gallés, N. (2009). On the bilingual advantage in
conflict processing: Now you see it, now you don’t. Cognition, 113(2), 135-149.
doi:10.1016/j.cognition.2009.08.001
Cousineau, D., & Chartier, S. (2010). Outliers detection and treatment: a review. International Journal of
Psychological Research, 3(1), 58-67.
Craik, F. I., Bialystok, E., & Freedman, M. (2010). Delaying the onset of Alzheimer disease: Bilingualism as a
form of cognitive reserve. Neurology, 75(19), 1726-1729. doi:10.1212/wnl.0b013e3181fc2a1c
Crinion, J., Turner, R., Grogan, A., Hanakawa, T., Noppeney, U., Devlin, J. T., ... & Usui, K. (2006). Language
control in the bilingual brain. Science, 312(5779), 1537-1540.
Cuetos, F., & Barbón, A. (2006). Word naming in Spanish. European Journal of Cognitive Psychology, 18(3),
415-436. doi:10.1080/13594320500165896
Cunningham, A. E., & Stanovich, K. E. (1991). Tracking the unique effects of print exposure in children:
Associations with vocabulary, general knowledge, and spelling. Journal of educational
psychology, 83(2), 264-274.
Curenton, S. M., & Justice, L. M. (2004). African American and Caucasian preschoolers’ use of
decontextualized language literate language features in oral narratives. Language, Speech, and
Hearing Services in Schools, 35(3), 240-253.
Da Silva, C. G., Petersson, K. M., Faísca, L., Ingvar, M., & Reis, A. (2004). The effects of literacy and education
on the quantitative and qualitative aspects of semantic verbal fluency. Journal of Clinical and
Experimental Neuropsychology, 26(2), 266-277.
325
Castro-Caldas, A., Petersson, K. M., Reis, A., Stone-Elander, S., & Ingvar, M. (1998). The illiterate brain.
Learning to read and write during childhood influences the functional organization of the adult
brain. Brain: a journal of neurology, 121(6), 1053-1063.
Dąbrowska, E. (2012). Explaining individual differences in linguistic proficiency. Linguistic Approaches to
Bilingualism, 2(3), 324-335
Dash, T., Kar, B. R., & Kar, B. R. (2012, 2013). Characterizing language proficiency in Hindi and English
language: implications for bilingual research. International journal of mind brain and cognition, 3(1),
73-105.
De Bruin, A., Carreiras, M., & Duñabeitia, J. A. (2017). The BEST dataset of language proficiency. Frontiers
in psychology, 8 (522), 1-7.
De Houwer, A. (2007). Parental language input patterns and children's bilingual use. Applied
psycholinguistics, 28(03), 411-424.
Delis, D. C., Freeland, J., Kramer, J. H., & Kaplan, E. (1988). Integrating clinical assessment with cognitive
neuroscience: Construct validation of the California Verbal Learning Test. Journal of Consulting and
Clinical Psychology, 56(1), 123-130. doi:10.1037/0022-006x.56.1.123
Dewaele, J. M., & Pavlenko, A. (2003). Productivity and lexical diversity in native and non- native speech: A
study of cross-cultural effects in Cook, V. (Eds) Effects of the second language on the first (pp. 120-
141) Bristol: Multilingual Matters.
Diamond, A. (2006). The Early Development of Executive Functions. Lifespan Cognition Mechanisms of
Change, 70-95. doi:10.1093/acprof:oso/9780195169539.003.0006
Diamond, A. (2013). Executive Functions. Annual Review of Psychology, 64(1), 135-168.
doi:10.1146/annurev-psych-113011-143750
Dijkstra, A., van Heuven, W. J. B. & Grainger, J. (1998). Simulating cross-language competition with the
Bilingual Interactive Activation model. Psychologica Belgica, 38, 177–196.
326
Dijkstra, T. (2003). Lexical processing in bilinguals and multilinguals: The word selection problem. In The
multilingual lexicon (pp. 11-26). Springer, Dordrecht.
Dijkstra, T., & Heuven, W. J. (2002). Modeling bilingual word recognition: Past, present and future.
Bilingualism: Language and Cognition, 5(03). doi:10.1017/s136672890228301
Dijkstra, T., & Heuven, W. J. (2012). Word Recognition in the Bilingual Brain. The Handbook of the
Neuropsychology of Language, 449-471. doi:10.1002/9781118432501.ch22
Dong, Y., & Li, P. (2015). The Cognitive Science of Bilingualism. Language and Linguistics Compass, 9(1), 1-
13. doi:10.1111/lnc3.12099
Duncan, J., Johnson, R., Swales, M., & Freer, C. (1997). Frontal lobe deficits after head injury: Unity and
diversity of function. Cognitive Neuropsychology, 14, 713–741.
Dunn, A. L., & Fox Tree, J. E. (2009). A quick, gradient bilingual dominance scale. Bilingualism: Language
and Cognition, 12(3), 273-289.
Dunn, L. M., & Dunn, D. M. (2007). PPVT-4: Peabody picture vocabulary test. Pearson Assessments.
Dunn, L. M., & Dunn, L. M. (1981). Peabody picture vocabulary test, revised: Circle Pines MN: American
Guidance Service.
Dworin, J. E. (2003). Insights into Biliteracy Development: Toward a Bidirectional Theory of Bilingual
Pedagogy. Journal of Hispanic Higher Education, 2(2), 171-186. doi:10.1177/1538192702250621
Ellis, A. W. (2016). Reading, writing, and dyslexia: A cognitive analysis. Psychology Press.
Eng, N., & Obler, L. K. (2002). Acquired Dyslexia in a Biscript Reader Following Traumatic Brain Injury.
Topics in Language Disorders, 22(5), 5-19. doi:10.1097/00011363-200211000-00005
Eriksen, B. A., & Eriksen, C. W. (1974). Effects of noise letters upon the identification of a target letter in a
nonsearch task. Perception & Psychophysics, 16(1), 143-149. doi:10.3758/bf03203267
Eriksen, C. W. (1995). The flankers task and response competition: A useful tool for investigating a variety
of cognitive problems. Visual Cognition, 2(2-3), 101-118. doi:10.1080/13506289508401726
327
Espy, K. A. (2004). Using Developmental, Cognitive, and Neuroscience Approaches to Understand
Executive Control in Young Children. Developmental Neuropsychology, 26(1), 379-384.
doi:10.1207/s15326942dn2601_1
Fabbro, F., & Paradis, M. (1995). Differential impairments in four multilingual patients with subcortical
lesions. Aspects of bilingual aphasia, 3, 139-176.
Fabbro, F. (2001). The Bilingual Brain: Cerebral Representation of Languages. Brain and Language, 79(2),
211-222. doi:10.1006/brln.2001.2481
Fan, J., Mccandliss, B. D., Sommer, T., Raz, A., & Posner, M. I. (2002). Testing the Efficiency and
Independence of Attentional Networks. Journal of Cognitive Neuroscience, 14(3), 340-347.
doi:10.1162/089892902317361886
Fernaeus, S. E., Östberg, P., Hellström, Å., & Wahlund, L. O. (2008). Cut the coda: Early fluency intervals
predict diagnoses. cortex, 44(2), 161-169.
Fernandes, M. A., Craik, F., Bialystok, E., & Kreuger, S. (2007). Effects of bilingualism, aging, and semantic
relatedness on memory under divided attention. Canadian Journal of Experimental
Psychology/Revue Canadienne De Psychologie Expérimentale, 61(2), 128-141.
doi:10.1037/cjep2007014
Folia, V., & Kosmidis, M. H. (2003). Assessment of Memory Skills in Illiterates: Strategy Differences or Test
Artifact? The Clinical Neuropsychologist, 17(2), 143-152. doi:10.1076/clin.17.2.143.16505
Folstein, M. F., Folstein, S. E., & Mchugh, P. R. (1975). Mini-Mental State Examination. PsycTESTS Dataset.
doi:10.1037/t07757-000
Francis, W. N. E. L. S. O. N., & Kucera, H. (1982). Frequency analysis of English usage.
Friesen, C. K., & Kingstone, A. (1998). The eyes have it! Reflexive orienting is triggered by nonpredictive
gaze. Psychonomic Bulletin & Review, 5(3), 490-495. doi:10.3758/bf03208827
Funnell, E. (2000). Case studies in neuropsychology of reading. Hove, UK: Psychology Press.
328
Geva, E., & Siegel, L. S. (2000). Orthographic and cognitive factors in the concurrent development of basic
reading skills in two languages. Reading and Writing, 12(1-2), 1-30.
Giambo, D. A., & Szecsi, T. (2015). Promoting and Maintaining Bilingualism and Biliteracy: Cognitive and
Biliteracy Benefits & Strategies for Monolingual Teachers. The Open Communication Journal, 9(1),
56-60.
Gitterman, M. R., Goral, M., & Obler, L. K. (2012). Aspects of multilingual aphasia. Multilingual Matters.
Goodglass, H., Kaplan, E., & Weintraub, S. (1983). Boston naming test. Lea & Febiger.
Gold, B. T., Johnson, N. F., & Powell, D. K. (2013). Lifelong bilingualism contributes to cognitive reserve
against white matter integrity declines in aging. Neuropsychologia, 51(13), 2841-2846.
doi:10.1016/j.neuropsychologia.2013.09.037
Goldberg, W. A., Prause, J., Lucas-Thompson, R., & Himsel, A. (2008). Maternal employment and children's
achievement in context: a meta-analysis of four decades of research. Psychological bulletin, 134(1),
77-108.
Goldsmith, J. (1976). Autosegmental phonology. London: MIT Press.
Gollan, T. H., Montoya, R. I., & Werner, G. A. (2002). Semantic and letter fluency in Spanish-English
bilinguals. Neuropsychology, 16(4), 562.
Gollan, T. H., Weissberger, G. H., Runnqvist, E., Montoya, R. I., & Cera, C. M. (2012). Self-ratings of spoken
language dominance: A Multilingual Naming Test (MINT) and preliminary norms for young and
aging Spanish–English bilinguals. Bilingualism: Language and Cognition, 15(3), 594-615.
Gough, P. B., & Tunmer, W. E. (1986). Decoding, reading, and reading disability. Remedial and special
education, 7(1), 6-10.
Grosjean, F. (1982). Life with two languages: An introduction to bilingualism. Cambridge, MA: Harvard
University Press.
Grosjean, F. (1989). Neurolinguists, beware! The bilingual is not two monolinguals in one person. Brain
and language, 36(1), 3-15.
329
Grosjean, F. (1998). Studying bilinguals: Methodological and conceptual issues. Bilingualism: Language
and cognition, 1(2), 131-149.
Grosjean, F. (2001). Life with two languages an introduction to bilingualism. Harvard University Press.
Grosjean, F. (2002). Francois Grosjean, Professor Emeritus, interview on bilingualism, with questions
asked by Judit Navracsics, Veszprem University, Hungary; interview conducted in February 2002.
http://www.francoisgrosjean.ch/ interview_en.html (retrieved November 12, 2018)
Grosjean, F. (2008), The bilingualism and biculturalism of the Deaf. In F. Grosjean, Studying bilinguals (pp.
221-240). Oxford: Oxford University Press.
Grosjean, F. (2010). Bilingual. Harvard University Press.
Guasti, M. T. (2004). Language acquisition: The growth of grammar. London: MIT Press.
Guitar, B. (2013). Stuttering: An integrated approach to its nature and treatment. Baltimore: Lippincott
Williams & Wilkins.
Haatveit, B. C., Sundet, K., Hugdahl, K., Ueland, T., Melle, I., & Andreassen, O. A. (2010). The validity of d
prime as a working memory index: Results from the “Bergen n-back task”. Journal of Clinical and
Experimental Neuropsychology, 32(8), 871-880. doi:10.1080/13803391003596421
Hagen, Å. M., Braasch, J. L., & Bråten, I. (2014). Relationships between spontaneous note‐taking, self‐
reported strategies and comprehension when reading multiple texts in different task
conditions. Journal of Research in Reading, 37(S1), S141-S157.
Harm, M. W., & Seidenberg, M. S. (2004). Computing the Meanings of Words in Reading: Cooperative
Division of Labor Between Visual and Phonological Processes. Psychological Review, 111(3), 662-
720. doi:10.1037/0033-295x.111.3.662
Hécaen, H., & Kremin, H. (1976). Neurolinguistic research on reading disorders resulting from left
hemisphere lesions: Aphasia and “pure” alexias. In Studies in neurolinguistics (pp. 269-329).
Academic Press.
330
Hedrick, W. B., & Cunningham, J. W. (1995). The relationship between wide reading and listening
comprehension of written language. Journal of Reading Behavior, 27(3), 425-438.
Hernandez, A. E., Bates, E. A., & Avila, L. X. (1996). Processing across the language boundary: A cross-
modal priming study of Spanish-English bilinguals. Journal of Experimental Psychology: Learning,
Memory, and Cognition, 22(4), 846.
Hilchey, M. D., & Klein, R. M. (2011). Are there bilingual advantages on nonlinguistic interference tasks?
Implications for the plasticity of executive control processes. Psychonomic Bulletin & Review, 18(4),
625-658. doi:10.3758/s13423-011-0116-7
Hillis, A. E., & Caramazza, A. (1991). Mechanisms for accessing lexical representations for output: Evidence
from a category-specific semantic deficit. Brain and language, 40(1), 106-144.
Hillis, A. E., & Caramazza, A. (1995). Representation of Grammatical Categories of Words in the Brain.
Journal of Cognitive Neuroscience, 7(3), 396-407. doi:10.1162/jocn.1995.7.3.396
Hoover, W. A., & Gough, P. B. (1990). The simple view of reading. Reading and writing, 2(2), 127-160.
Hornberger, N. H. (1990). Creating successful learning contexts for bilingual literacy. Teachers College
Record, 92(2), 212-29.
Hornberger, N. H., & Skilton-Sylvester, E. (2000). Revisiting the continua of biliteracy: International and
critical perspectives. Language and Education, 14(2), 96-122.
Hulk, A., & Müller, N. (2000). Bilingual first language acquisition at the interface between syntax and
pragmatics. Bilingualism: language and cognition, 3(03), 227-244.
Husain, A. M. (1992). Varieties of verbosity in Pakistani English. World Englishes, 11(1), 51-60.
Ivanova, I., & Costa, A. (2008). Does bilingualism hamper lexical access in speech production?. Acta
psychologica, 127(2), 277-288.
J. Aarnoutse, C. A., Van den Bos, K. P., & Brand-Gruwel, S. (1998). Effects of listening comprehension
training on listening and reading. The Journal of Special Education, 32(2), 115-126.
331
Jacobs, D. M., Sano, M., Albert, S., Schofield, P., Dooneief, G., & Stern, Y. (1997). Cross-cultural
neuropsychological assessment: A comparison of randomly selected, demographically matched
cohorts of English-and Spanish-speaking older adults. Journal of Clinical and Experimental
Neuropsychology, 19(3), 331-339.
Jaeggi, S. M., Studer-Luethi, B., Buschkuehl, M., Su, Y., Jonides, J., & Perrig, W. J. (2010). The relationship
between n-back performance and matrix reasoning — implications for training and transfer.
Intelligence, 38(6), 625-635. doi:10.1016/j.intell.2010.09.001
Juel, C., Griffith, P. L., & Gough, P. B. (1986). Acquisition of literacy: A longitudinal study of children in first
and second grade. Journal of educational psychology, 78(4), 243-255.
Kambanaros, M., & Weekes, B. S. (2013). Phonological dysgraphia in bilingual aphasia: Evidence from a
case study of Greek and English. Aphasiology, 27(1), 59-79. doi:10.1080/02687038.2012.720963
Kane, M. J., Conway, A. R., Miura, T. K., & Colflesh, G. J. (2007). Working memory, attention control, and the
n-back task: A question of construct validity. Journal of Experimental Psychology: Learning, Memory,
and Cognition, 33(3), 615-622. doi:10.1037/0278-7393.33.3.615
Kaplan, E., Goodglass, H., & Weintraub, S. (2001). Boston naming test. Pro-ed.
Karanth, P. (1980). Western Aphasia Battery in Hindi. Mysore: ICMR Project, All India Institute of Speech
and Hearing.
Karanth, P. (1981). Pure Alexia in a Kannada-English Bilingual. Cortex, 17(2), 187-197.
doi:10.1016/s0010-9452(81)80040-8
Karanth, P. (2002). The search for deep dyslexia in syllabic writing systems. Journal of Neurolinguistics,
15(2), 143-155. doi:10.1016/s0911-6044(00)00022-1
Karanth, P., and P. Prakash. (1996) "A developmental investigation of onset, progress and stages in the
acquisition of literacy." Project Funded by NCERT.
Katz, L., Brancazio, L., Irwin, J., Katz, S., Magnuson, J., & Whalen, D. H. (2012). What lexical decision and
naming tell us about reading. Reading and writing, 25(6), 1259-1282.
332
Kay, J., Lesser, R., & Coltheart, M. (1992). Psycholinguistic Assessments of Language Processing in Aphasia.
Hove: Psychology Press.
Kay, J., Lesser, R., & Coltheart, M. (1996). Psycholinguistic assessments of language processing in aphasia
(PALPA): An introduction. Aphasiology, 10(2), 159-180. doi:10.1080/02687039608248403
Kertesz, A. (2006). Western Aphasia Battery--Revised. PsycTESTS Dataset. doi:10.1037/t15168-000
Kilgarriff, A., Rychly, P., Smrz, P., & Tugwell, D. (2004). Itri-04-08 the sketch engine. Information
Technology, 105, 116.
Kim, K., Relkin, N., Lee, K., & Hirsch, J. (1997). Distinct cortical areas associated with native and second
languages. American Journal of Ophthalmology, 124(6), 868. doi:10.1016/s0002-9394(14)71720-9
Kiran, S., & Gray, T. (2018). Understanding the nature of bilingual aphasia. Bilingual Cognition and
Language: The state of the science across its subfields, 54, 371-400.
Kosmidis, M. H., Tsapkini, K., & Folia, V. (2006). Lexical processing in illiteracy: Effect of literacy or
education?. Cortex, 42(7), 1021-1027.
Kosmidis, M. H., Tsapkini, K., Folia, V., Vlahou, C. H., & Kiosseoglou, G. (2004). Semantic and phonological
processing in illiteracy. Journal of the International Neuropsychological Society, 10(6), 818-827.
Kosmidis, M. H., Vlahou, C. H., Panagiotaki, P., & Kiosseoglou, G. (2004). The verbal fluency task in the
Greek population: Normative data, and clustering and switching strategies. Journal of the
International Neuropsychological Society, 10(2), 164-172.
Kousaie, S., & Phillips, N. A. (2012). Ageing and bilingualism: Absence of a “bilingual advantage” in Stroop
interference in a nonimmigrant sample. Quarterly Journal of Experimental Psychology, 65(2), 356-
369. doi:10.1080/17470218.2011.604788
Kroll, J. F., & Bialystok, E. (2013). Understanding the consequences of bilingualism for language processing
and cognition. Journal of Cognitive Psychology, 25(5), 497-514. doi:10.1080/20445911.2013.799170
333
Kroll, J. F., Bobb, S. C., & Wodniecka, Z. (2006). Language selectivity is the exception, not the rule:
Arguments against a fixed locus of language selection in bilingual speech. Bilingualism: Language
and Cognition, 9(2), 119-135.
Law, S., & Or, B. (2001). A Case Study of Acquired Dyslexia and Dysgraphia in Cantonese: Evidence for
Nonsemantic Pathways for Reading and Writing Chinese. Cognitive Neuropsychology, 18(8), 729-
748. doi:10.1080/02643290143000024
Law, S., Wong, W., Yeung, O., & Weekes, B. S. (2008). A case study of the effect of age-of-acquisition on
reading aloud in Chinese dyslexia. Neurocase, 14(3), 276-289. doi:10.1080/13554790802270594
Leben, W. R. (1973). Suprasegmental phonology (Doctoral dissertation, Massachusetts Institute of
Technology).
Leben, W. R. (1980). Suprasegmental phonology. Garland.
Lecours, A., Mehler, J., Parente, M. A., Caldeira, A., Cary, L., Castro, M. J., ... & Jakubovitz, R. (1987). Illiteracy
and brain damage—1. Aphasia testing in culturally contrasted populations (control
subjects). Neuropsychologia, 25(1), 231-245.
Lehto, J. E., Juujärvi, P., Kooistra, L., & Pulkkinen, L. (2003). Dimensions of executive functioning: Evidence
from children. British Journal of Developmental Psychology, 21(1), 59-80.
doi:10.1348/026151003321164627
Leikin, M., Ibrahim, R., & Eghbaria, H. (2014). The influence of diglossia in Arabic on narrative ability:
evidence from analysis of the linguistic and narrative structure of discourse among pre-school
children. Reading and Writing, 27(4), 733-747
Leikin, M., Schwartz, M., & Share, D. L. (2010). General and specific benefits of bi-literate bilingualism: A
Russian-Hebrew study of beginning literacy learning. Reading and Writing, 23(3–4), 269–292.
Lemhöfer, K., & Broersma, M. (2012). Introducing LexTALE: A quick and valid lexical test for advanced
learners of English. Behavior research methods, 44(2), 325-343.

334
Leys, C., Ley, C., Klein, O., Bernard, P., & Licata, L. (2013). Detecting outliers: Do not use standard deviation
around the mean, use absolute deviation around the median. Journal of Experimental Social
Psychology, 49(4), 764-766.
Li, P., Sepanski, S., & Zhao, X. (2006). Language history questionnaire: A web-based interface for bilingual
research. Behavior research methods, 38(2), 202-210.
Lim, V. P., Liow, S. J. R., Lincoln, M., Chan, Y. H., & Onslow, M. (2008). Determining language dominance in
English–Mandarin bilinguals: Development of a self-report classification tool for clinical use. Applied
Psycholinguistics, 29(3), 389-412.
Lorenzen, B., & Murray, L. L. (2008). Bilingual Aphasia: A Theoretical and Clinical Review. American
Journal of Speech-Language Pathology, 17(3), 299-317. doi:10.1044/1058-0360(2008/026)
Lubbe, R. H., & Verleger, R. (2002). Aging and the Simon task. Psychophysiology, 39(1), 100-110.
doi:10.1111/1469-8986.3910100
Luk, G., & Bialystok, E. (2013). Bilingualism is not a categorical variable: Interaction between language
proficiency and usage. Journal of Cognitive Psychology, 25(5), 605-621.
Luo, L., Luk, G., & Bialystok, E. (2010). Effect of language proficiency and executive control on verbal
fluency performance in bilinguals. Cognition, 114(1), 29-41.
Macmillan, N. A., & Creelman, C. D. (1990). Response bias: Characteristics of detection theory, threshold
theory, and" nonparametric" indexes. Psychological Bulletin, 107(3), 401.
MacWhinney, B. (2016). The Talk Bank Project: Tools for Analyzing Talk. Electronic Edition. Part 2: The
CLAN Programs. Retrieved from: http://talkbank.org/manuals/CLAN.pdf
Mägiste, E. (1992). Second language learning in elementary and high school students. European Journal of
Cognitive Psychology, 4(4), 355-365.
Malvern, D. D., & Richards, B. J. (1997). A new measure of lexical diversity. British Studies in Applied
Linguistics, 12, 58-71.
335
Manly, J. J., Jacobs, D. M., Sano, M., Bell, K., Merchant, C. A., Small, S. A., & Stern, Y. (1999). Effect of literacy
on neuropsychological test performance in nondemented, education-matched elders. Journal of the
International Neuropsychological Society, 5(3), 191-202.
Manna, C. G., Alterescu, K., Borod, J. C., & Bender, H. A. (2011). Benton Visual Retention Test. Encyclopedia
of Clinical Neuropsychology, 392-394. doi:10.1007/978-0-387-79948-3_1110
Marian, V., & Neisser, U. (2000). Language-dependent recall of autobiographical memories. Journal of
Experimental Psychology: General, 129(3), 361.
Marian, V., Blumenfeld, H. K., & Kaushanskaya, M. (2007). The Language Experience and Proficiency
Questionnaire (LEAP-Q): Assessing language profiles in bilinguals and multilinguals. Journal of
Speech, Language, and Hearing Research, 50(4), 940-967.
Martinkauppi, S. (2000). Working Memory of Auditory Localization. Cerebral Cortex, 10(9), 889-898.
doi:10.1093/cercor/10.9.889
Martin-Rhee, M. M., & Bialystok, E. (2008). The development of two types of inhibitory control in
monolingual and bilingual children. Bilingualism: language and cognition, 11(1), 81-93.
Mattis, S. (1976). Mental status examination for organic mental syndrome in the elderly patient. In L.
Bellack & T. E. Karasu (Eds.), Geriatric psychiatry (pp. 77–121). New York: Grune & Stratton
Mayer, M. (1969). Frog, where are you? New York: Dial Press.
McCawley, James M. 1997. Han'gul and other writing systems. Literacy & Hangul: Proceedings of
International Conference (Memory of the 600th Anniversary of King Sejong), 5-16. Seoul: Ministry of
Culture & Sports, International Association for Korean Language Education.
Mcclelland, J. L., & Rumelhart, D. E. (1981). An interactive activation model of context effects in letter
perception: I. An account of basic findings. Psychological Review, 88(5), 375-407. doi:10.1037/0033-
295x.88.5.375
Meiran, N., Chorev, Z., & Sapir, A. (2000). Component Processes in Task Switching. Cognitive Psychology,
41(3), 211-253. doi:10.1006/cogp.2000.0736
336
Meisel, J. M. (2009). Second language acquisition in early childhood. Zeitschrift für Sprachwissenschaft,
28(1), 5-34.
Miller, E. K., & Cohen, J. D. (2001). An Integrative Theory of Prefrontal Cortex Function. Annual Review of
Neuroscience, 24(1), 167-202. doi:10.1146/annurev.neuro.24.1.167
Miller, J & Iglesias, A. (2003-2004) Systematic Analysis of English and Spanish Language Transcripts.
Language Analysis Laboratory. Waisman Center, University of Wisconsin- Madison, Madison, WI.
Miller, J. (1991). Reaction time analysis with outlier exclusion: Bias varies with sample size. The quarterly
journal of experimental psychology, 43(4), 907-912.
Miller, J. F., Heilmann, J., Nockerts, A., Iglesias, A., Fabiano, L., & Francis, D. J. (2006). Oral language and
reading in bilingual children. Learning Disabilities Research & Practice, 21(1), 30-43.
Miyake, A., Friedman, N. P., Emerson, M. J., Witzki, A. H., Howerter, A., & Wager, T. D. (2000). The Unity and
Diversity of Executive Functions and Their Contributions to Complex “Frontal Lobe” Tasks: A Latent
Variable Analysis. Cognitive Psychology, 41(1), 49-100. doi:10.1006/cogp.1999.0734
Miyake, A., & Friedman, N. P. (2012). The nature and organization of individual differences in executive
functions: Four general conclusions. Current directions in psychological science, 21(1), 8-14.
Monk, A. F., Jackson, D., Nielsen, D., Jefferies, E., & Olivier, P. (2011). N-backer: An auditory n-back task
with automatic scoring of spoken responses. Behavior Research Methods, 43(3), 888-896.
doi:10.3758/s13428-011-0074-z
Monsell, S. (2003). Task switching. Trends in Cognitive Sciences, 7(3), 134-140. doi:10.1016/s1364-
6613(03)00028-7
Montag, J. L., & MacDonald, M. C. (2015). Text exposure predicts spoken production of complex sentences
in 8-and 12-year-old children and adults. Journal of Experimental Psychology: General, 144(2), 447-
468.
Morais, J., Cary, L., Alegria, J., & Bertelson, P. (1979). Does awareness of speech as a sequence of phones
arise spontaneously?. Cognition, 7(4), 323-331
337
Muñoz, C. (2000). Bilingualism and trilingualism in school students in Catalonia. Bilingual Education and
Bilingualism, 157-178.
Muñoz, M. L., Marquardt, T. P., & Copeland, G. (1999). A Comparison of the Codeswitching Patterns of
Aphasic and Neurologically Normal Bilingual Speakers of English and Spanish. Brain and Language,
66(2), 249-274. doi:10.1006/brln.1998.2021
Nasreddine, Z. (2010). Montreal cognitive assessment (MOCA). Version 7.1.
Nation, K., & Snowling, M. J. (1998). Semantic processing and the development of word-recognition skills:
Evidence from children with reading comprehension difficulties. Journal of memory and
language, 39(1), 85-101.
Newton, P. K., & Barry, C. (1997). Concreteness Effects in Word Production but Not Word Comprehension
in Deep Dyslexia. Cognitive Neuropsychology, 14(4), 481-509. doi:10.1080/026432997381457
Ng, E. (2015). Bilingualism, biliteracy and cognitive effects: A review paper. University of Sydney Papers in
TESOL, 10 ,93-128.
Nilipour, R., & Paradis, M. (1995). Breakdown of functional categories in three Farsi-English bilingual
aphasic patients. Aspects of bilingual aphasia, 123-138.
Nilipour, R., Pourshahbaz, A., & Ghoreyshi, Z. S. (2014). Reliability and validity of bedside version of
Persian WAB (P-WAB-1). Basic and clinical neuroscience, 5(4), 253-258.
Nippold, M. A., Mansfield, T. C., Billow, J. L., & Tomblin, J. B. (2009). Syntactic development in adolescents
with a history of language impairments: A follow-up investigation. American Journal of Speech-
Language Pathology, 18(3), 241-251.
Östberg, P., Fernaeus, S. E., Hellström, Å., Bogdanović, N., & Wahlund, L. O. (2005). Impaired verb fluency:
A sign of mild cognitive impairment. Brain and Language, 95(2), 273-279.
Ostrosky‐Solís, F. (2004). Can literacy change brain anatomy? International Journal of Psychology, 39(1), 1-
4. doi:10.1080/00207590344000231
338
Paap, K. R. (2014). Bilingual advantages in executive functioning: Problems in convergent validity,
discriminant validity, and the identification of the theoretical constructs. Frontiers in Psychology, 5.
doi:10.3389/fpsyg.2014.00962
Paap, K. R. (2014). The role of componential analysis, categorical hypothesizing, replicability and
confirmation bias in testing for bilingual advantages in executive functioning. Journal of Cognitive
Psychology, 26(3), 242-255. doi:10.1080/20445911.2014.891597
Paap, K. R., & Greenberg, Z. I. (2013). There is no coherent evidence for a bilingual advantage in executive
processing. Cognitive Psychology, 66(2), 232-258. doi:10.1016/j.cogpsych.2012.12.002
Paap, K. R., Johnson, H. A., & Sawi, O. (2015). Bilingual advantages in executive functioning either do not
exist or are restricted to very specific and undetermined circumstances. Cortex, 69, 265-278.
doi:10.1016/j.cortex.2015.04.014
Paap, K. R., Myuz, H. A., Anders, R. T., Bockelman, M. F., Mikulinsky, R., & Sawi, O. M. (2017). No compelling
evidence for a bilingual advantage in switching or that frequent language switching reduces switch
cost. Journal of Cognitive Psychology, 29(2), 89-112.
Paradis, J. (2011). Individual differences in child English second language acquisition: Comparing child-
internal and child-external factors. Linguistic approaches to bilingualism, 1(3), 213-237.
Paradis, M. (2001). The need for awareness of aphasia symptoms in different languages. Journal of
Neurolinguistics, 14(2-4), 85-91. doi:10.1016/s0911-6044(01)00009-4
Paradis, M., & Libben, G. (1987). The assessment of bilingual aphasia: the Bilingual Aphasia Test. Hillsdale,
NJ: Erlbaum.
Patra A, Bose A, Marinis T (2019). Performance difference in verbal fluency in bilingual and monolingual
speakers. Bilingualism: Language and Cognition.1–15.
https://doi.org/10.1017/S1366728918001098
Pavelenko, A. (2008) Narrative analysis in the study of bi- and multilingualism. In Moyer, M. & Li Wei
(Eds). The Blackwell Guide to Research Methods in Bilingualism (pp. 311-325) Oxford: Blackwell.
339
Peal, E., & Lambert, W. E. (1962). The relation of bilingualism to intelligence. Psychological Monographs:
general and applied, 76(27), 1-23.
Pearson, B. Z., (2001) Logic and mind in Spanish-English children’s narratives in Verhoeven, L., &
Strömquist, S. (Eds) Narrative development in a multilingual context (pp. 373-399) Philadelphia:
John Benjamins Publishing Company.
Pearson, B. Z., Fernández, S. C., Lewedeg, V., & Oller, D. K. (1997). The relation of input factors to lexical
learning by bilingual infants. Applied Psycholinguistics, 18(01), 41-58.
Perry, C., Ziegler, J. C., & Zorzi, M. (2007). Nested incremental modeling in the development of
computational theories: The CDP model of reading aloud. Psychological Review, 114(2), 273-315.
doi:10.1037/0033-295x.114.2.273
Petersson, K. M., Reis, A., Askelöf, S., Castro-Caldas, A., & Ingvar, M. (2000). Language processing
modulated by literacy: A network analysis of verbal repetition in literate and illiterate
subjects. Journal of cognitive neuroscience, 12(3), 364-382.
Philipp, A. M., & Koch, I. (2009). Inhibition in language switching: What is inhibited when switching
between languages in naming tasks? Journal of Experimental Psychology: Learning, Memory, and
Cognition, 35(5), 1187-1195. doi:10.1037/a0016376
Plaut, D. C., & Shallice, T. (1993). Deep dyslexia: A case study of connectionist neuropsychology. Cognitive
Neuropsychology, 10(5), 377-500. doi:10.1080/02643299308253469
Plaut, D. C., Mcclelland, J. L., Seidenberg, M. S., & Patterson, K. (1996). Understanding normal and impaired
word reading: Computational principles in quasi-regular domains. Psychological Review, 103(1), 56-
115. doi:10.1037/0033-295x.103.1.56
Plaut, D. C. (1997). Structure and function in the lexical system: Insights from distributed models of word
reading and lexical decision. Language and cognitive processes, 12(5-6), 765-806.
340
Prior, A., & Gollan, T. H. (2011). Good Language-Switchers are Good Task-Switchers: Evidence from
Spanish–English and Mandarin–English Bilinguals. Journal of the International Neuropsychological
Society, 17(04), 682-691. doi:10.1017/s1355617711000580
Prior, A., & Macwhinney, B. (2009). A bilingual advantage in task switching. Bilingualism: Language and
Cognition, 13(2), 253-262. doi:10.1017/s1366728909990526
Proctor, C. P., Carlo, M., August, D., & Snow, C. (2005). Native Spanish-Speaking Children Reading in
English: Toward a Model of Comprehension. Journal of Educational Psychology, 97(2), 246-256.
Ramaa, S. (1985). Diagnosis and remediation of dyslexia. University of Mysore, Mysore: Ph. D. thesis.
Raman, I., & Weekes, B. S. (2003). Deep dysphasia in Turkish. Brain and Language, 1(87), 38-39.
Raman, I., & Weekes, B. S. (2005). Deep Dysgraphia in Turkish. Behavioural Neurology, 16(2-3), 59-69.
doi:10.1155/2005/568540
Raman, I., & Weekes, B. S. (2005). Acquired dyslexia in a Turkish-English speaker. Annals of Dyslexia,
55(1), 79-104. doi:10.1007/s11881-005-0005-8
Rao, P. K. (1997,1998). Reading acquisition profile in Kannada. Unpublished Doctoral dissertation,
University of Mysore, Mysore
Rao, P. K. (2014). Language, literacy and cognition issues for research in bilingual-biliterate context.
Journal of Child Language Acquisition and Development, 2(4), 25-41.
Ratcliff, R. (1993). Methods for dealing with reaction time outliers. Psychological bulletin, 114(3), 510.
Ratcliff, G., Ganguli, M., Chandra, V., Sharma, S., Belle, S., Seaberg, E., & Pandav, R. (1998). Effects of literacy
and education on measures of word fluency. Brain and Language, 61(1), 115-122.
Ratnavalli, E., Brayne, C., Dawson, K., & Hodges, J. R. (2002). The prevalence of frontotemporal dementia.
Neurology, 58(11), 1615-1621. doi:10.1212/wnl.58.11.1615
Ratnavalli, E., Murthy, G. G., Nagaraja, D., Veerendrakumar, M., Jayaram, M., & Jayakumar, P. (2000). Alexia
in Indian bilinguals. Journal of Neurolinguistics, 13(1), 37-46. doi:10.1016/s0911-6044(99)00010-x
341
Ratner, N. B. (1997). Stuttering: A psycholinguistic perspective. In Curlee, R. & Siegel, G. (Eds.), Nature and
treatment of stuttering: New directions (2nd ed., pp. 99– 127). Boston: Allyn & Bacon.
Chengappa, S. K., & Kumar, R. (2008). Normative & Clinical Data on the Kannada Version of Western
Aphasia Battery (WAB-K). Language in India, 8(6),1-15.
Reis, A., & Castro-Caldas, A. (1997). Illiteracy: A cause for biased cognitive development. Journal of the
International Neuropsychological Society, 3(5), 444-450. Retrieved from:
https://www.census.gov/prod/2013pubs/acs-22.pdf
Reyes, I. (2012). Biliteracy among children and youths. Reading Research Quarterly, 47(3), 307-327.
Cho-Reyes, S., & Thompson, C. K. (2012). Structural priming in agrammatic aphasia. Procedia-Social and
Behavioral Sciences, 61, 259-261.
Robinson, P. (1995). Task complexity and second language narrative discourse. Language learning, 45(1),
99-140.
Rodriguez-Fornells, A., Lugt, A. V. D., Rotte, M., Britti, B., Heinze, H. J., & Münte, T. F. (2005). Second
language interferes with word production in fluent bilinguals: brain potential and functional
imaging evidence. Journal of Cognitive Neuroscience, 17(3), 422-433.
Rogers, R. D., & Monsell, S. (1995). Costs of a predictable switch between simple cognitive tasks. Journal of
Experimental Psychology: General, 124(2), 207-231. doi:10.1037/0096-3445.124.2.207
Rohrer, D., Wixted, J. T., Salmon, D. P., & Butters, N. (1995). Retrieval from semantic memory and its
implications for Alzheimer's disease. Journal of Experimental Psychology: Learning, Memory, and
Cognition, 21(5), 1127.
Rosen, W. (1981). The Rosen drawing test. Bronx, NY: Veterans Administration Medical Center.
Rosselli, M., Ardila, A., Araujo, K., Weekes, V. A., Caracciolo, V., Padilla, M., & Ostrosky-Solí, F. (2000). Verbal
fluency and repetition skills in healthy older Spanish-English bilinguals. Applied
neuropsychology, 7(1), 17-24.
342
Roth, F. P., Speece, D. L., & Cooper, D. H. (2002). A longitudinal analysis of the connection between oral
language and early reading. The Journal of Educational Research, 95(5), 259- 272.
Royall, D. R., Lauterbach, E. C., Cummings, J. L., Reeve, A., Rummans, T. A., Kaufer, D. I., . . . Coffey, C. E.
(2002). Executive Control Function. The Journal of Neuropsychiatry and Clinical Neurosciences,
14(4), 377-405. doi:10.1176/jnp.14.4.377
Royer, J. M., Greene, B. A., & Sinatra, G. M. (1987). The sentence verification technique: A practical
procedure for testing comprehension. Journal of Reading, 30(5), 414-422.
Ryan, C. (2013) Language Use in the United States 2011: American Community Survey Reports.
Saffran, E. M., Schwartz, M. F., Linebarger, M. C., Martin, N., & Bochetto, P. (1988). The Philadelphia
comprehension battery. Unpublished test battery.
Salthouse, T. A. (2010). Selective review of cognitive aging. Journal of the International Neuropsychological
Society, 16(05), 754-760. doi:10.1017/s1355617710000706
Sandoval, T. C., Gollan, T. H., Ferreira, V. S., & Salmon, D. P. (2010). What causes the bilingual disadvantage
in verbal fluency? The dual task analogy. Bilingualism: Language and Cognition, 13(2), 231-252.
Sasanuma, S. (1980). Acquired dyslexia in Japanese; Clinical features and underlying mechanisms. Deep
dyslexia.
Scheffner Hammer, C., Lawrence, F. R., & Miccio, A. W. (2008). Exposure to English before and after entry
into Head Start 1: Bilingual children's receptive language growth in Spanish and English.
International Journal of Bilingual Education and Bilingualism, 11(1), 30-56.
Schwartz, M. F., Saffran, E. M., & Marin, O. S. (1980). The word order problem in agrammatism. Brain and
Language, 10(2), 249-262. doi:10.1016/0093-934x(80)90055-3
Scribner, S., & Cole, M. (1981). Unpackaging literacy. Writing. The nature, Development and Teaching of
Written Communication, 7-88.
Seidenberg, M. S., & Mcclelland, J. L. (1989). A distributed, developmental model of word recognition and
naming. Psychological Review, 96(4), 523-568. doi:10.1037/0033-295x.96.4.523
343
Senaha, M. L., & Maria Alice De Mattos Pimenta Parente. (2012). Acquired Dyslexia in Three Writing
Systems: Study of a Portuguese-Japanese Bilingual Aphasic Patient. Behavioural Neurology, 25(3),
255-272. doi:10.1155/2012/854519
Shilling, V., Chetwynd, A., & Rabbitt, P. (2002). Individual inconsistency across measures of inhibition: An
investigation of the construct validity of inhibition in older adults. Neuropsychologia, 40(6), 605-
619. doi:10.1016/s0028-3932(01)00157-9
Shrubshall, P. (1997). Narrative, argument and literacy: A comparative study of the narrative discourse
development of monolingual and bilingual 5-10-year-old learners. Journal of Multilingual and
Multicultural Development, 18(5), 402-421.
Silva, C., Faísca, L., Ingvar, M., Petersson, K. M., & Reis, A. (2012). Literacy: Exploring working memory
systems. Journal of clinical and experimental neuropsychology, 34(4), 369-377.
Sinatra, G. M., & Royer, J. M. (1993). Development of cognitive component processing skills that support
skilled reading. Journal of Educational Psychology, 85(3), 509.
Snodgrass, J. G., & Vanderwart, M. (1980). A standardized set of 260 pictures: Norms for name agreement,
image agreement, familiarity, and visual complexity. Journal of Experimental Psychology: Human
Learning and Memory, 6(2), 174-215. doi:10.1037/0278-7393.6.2.174
Snyder, L. S., & Downey, D. M. (1991). The language-reading relationship in normal and reading-disabled
children. Journal of Speech, Language, and Hearing Research, 34(1), 129- 140.
Sorace, A., & Serratrice, L. (2009). Internal and external interfaces in bilingual language development:
Beyond structural overlap. International Journal of Bilingualism, 13(2), 195- 210.
Soveri, A., Rodriguez-Fornells, A., & Laine, M. (2011). Is There a Relationship between Language Switching
and Executive Functions in Bilingualism? Introducing a within group Analysis Approach. Frontiers
in Psychology, 2(183), 1-8. doi:10.3389/fpsyg.2011.00183
Stanovich, K. E., & West, R. F. (1989). Exposure to print and orthographic processing. Reading Research
Quarterly, 402-433.
344
Stavans, A. (2003). Bilinguals as narrators: A comparison of bilingual and monolingual Hebrew and
English narratives. Narrative Inquiry, 13(1), 151-191.
Stern, Y. (2002). What is cognitive reserve? Theory and research application of the reserve concept.
Journal of the International Neuropsychological Society, 8(03), 448-460.
doi:10.1017/s1355617702813248
Stins, J. F., Polderman, J. C., Boomsma, D. I., & Geus, E. J. (2007). Conditional accuracy in response
interference tasks: Evidence from the Eriksen flanker task and the spatial conflict task. Advances in
Cognitive Psychology, 3(3), 409-417. doi:10.2478/v10053-008-0005-4
Stuss, D. T., & Levine, B. (2002). Adult Clinical Neuropsychology: Lessons from Studies of the Frontal
Lobes. Annual Review of Psychology, 53(1), 401-433. doi:10.1146/annurev.psych.53.100901.135220
Stuss, D. T., Alexander, M. P., Shallice, T., Picton, T. W., Binns, M. A., Macdonald, R., . . . Katz, D. I. (2005).
Multiple frontal systems controlling response speed. Neuropsychologia, 43(3), 396-417.
doi:10.1016/j.neuropsychologia.2004.06.010
Surrain, S., & Luk, G. (2017). Describing bilinguals: A systematic review of labels and descriptions used in
the literature between 2005–2015. Bilingualism: Language and Cognition, 1-15.
doi:10.1017/s1366728917000682
Sylvester, C. C., Wager, T. D., Lacey, S. C., Hernandez, L., Nichols, T. E., Smith, E. E., & Jonides, J. (2003).
Switching attention and resolving interference: FMRI measures of executive functions.
Neuropsychologia, 41(3), 357-370. doi:10.1016/s0028-3932(02)00167-7
Teuber, H. L. (1972). Unity and diversity of frontal lobe functions. Acta Neurobiologiae Experimentalis,
32, 615 –656
Thordardottir, E. (2011). The relationship between bilingual exposure and vocabulary development.
International Journal of Bilingualism, 15(4), 426-445.
Thornton, R., & Light, L. L. (2006). Language comprehension and production in normal aging. In Handbook
of the Psychology of Aging (Sixth Edition) (pp. 261-287).
345
Torgesen, J. K., Rashotte, C. A., & Wagner, R. K. (1999). TOWRE: Test of word reading efficiency. Austin, TX:
Pro-ed.
Tröster, A. I., Fields, J. A., Testa, J. A., Paul, R. H., Blanco, C. R., Hames, K. A., ... & Beatty, W. W. (1998).
Cortical and subcortical influences on clustering and switching in the performance of verbal fluency
tasks. Neuropsychologia, 36(4), 295-304.
Troyer, A. K., Moscovitch, M., & Winocur, G. (1997). Clustering and switching as two components of verbal
fluency: evidence from younger and older healthy adults. neuropsychology, 11(1), 138-146.
Troyer, A. K. (2000). Normative data for clustering and switching on verbal fluency tasks. Journal of
clinical and experimental neuropsychology, 22(3), 370-378.
Tsegaye, M. T., Bleser, R. D., & Iribarren, C. (2011). The effect of literacy on oral language processing:
Implications for aphasia tests. Clinical linguistics & phonetics, 25(6-7), 628-639.
Tsimpli, I., Mukhopadhyay, L., Treffers-Daller, J., Alladi, S., Marinis, T., Panda, M., ... & Sinha, P. (2018).
Multilingualism and multiliteracy in primary education in India: a discussion of some
methodological challenges of an interdisciplinary research project. Research in Comparative &
International Education, 14.
Valian, V. (2015). Bilingualism and cognition. Bilingualism: Language and Cognition, 18(1), 3-24.
Ventura, P., Morais, J., Pattamadilok, C., & Kolinsky, R. (2004). The locus of the orthographic consistency
effect in auditory word recognition. Language & Cognitive Processes, 19, 57-95.
Ward, G., Roberts, M. J., & Phillips, L. H. (2001). Task-Switching Costs, Stroop-Costs, and Executive Control:
A Correlational Study. The Quarterly Journal of Experimental Psychology Section A, 54(2), 491-511.
doi:10.1080/713755967
Wechsler, D. (1981). The psychometric tradition: Developing the wechsler adult intelligence scale.
Contemporary Educational Psychology, 6(2), 82-85. doi:10.1016/0361-476x(81)90035-7
Weekes, B. S. (1997). Differential Effects of Number of Letters on Word and Nonword Naming Latency. The
Quarterly Journal of Experimental Psychology Section A, 50(2), 439-456. doi:10.1080/713755710
346
Weekes, B., & Chen, H. Q. (1999). Surface dyslexia in Chinese. Neurocase, 5(2), 161-172.
Weekes, B. (2000). Oral reading in Chinese: evidence from dementia of the Alzheimer's type. International
journal of language & communication disorders, 35(4), 543-559.
Weekes, B. S., Su, I. F., Yin, W., & Zhang, X. (2007). Oral reading in bilingual aphasia: Evidence from
Mongolian and Chinese. Bilingualism: Language and Cognition, 10(2), 201-210.
Weekes, B. S., & Raman, I. (2008). Bilingual deep dysphasia. Cognitive Neuropsychology, 25(3), 411-436.
doi:10.1080/02643290802057311
Weekes, B. S., Su, I. F., Yin, W., & Zhang, X. (2007). Oral reading in bilingual aphasia: Evidence from
Mongolian and Chinese. Bilingualism: Language and Cognition, 10(02), 201-210.
doi:10.1017/s1366728907002945
Weekes, B. S. (2012). Acquired dyslexia and dysgraphia across scripts. Behavioural neurology, 25(3), 159-
163.
Weiss, B. D., Reed, R. L., & Kligman, E. W. (1995). Literacy skills and communication methods of low-
income older persons. Patient Education and Counseling, 25(2), 109-119
Weschler, D. (1999). Weschler abbreviated scale of intelligence (WASI). London: Psychological Corporation.
Wiederholt, J. L., & Bryant, B. R. (2001). Gray oral reading test–Fourth edition (GORT-4). Circle Pines, MN:
AGS Publishing.
Wilson, M. A., Kahlaoui, K., & Weekes, B. S. (2012). Acquired dyslexia and dysgraphia in bilinguals across
alphabetical and non-alphabetical scripts. Aspects of Multilingual Aphasia, 8, 187-204.
Woodcock, R. W. (1991). Woodcock Language Proficiency Battery-Revised: Itasca IL: Riverside Publishing.
Woodcock, R. W., Mather, N., & Schrank, F. A. (2004) Woodcock-Johnson III Diagnostic Reading Battery.
Itasca, IL: Riverside Publishing.
Woollams, A. M., Ralph, M. A., Plaut, D. C., & Patterson, K. (2007). SD-squared: On the association between
semantic dementia and surface dyslexia. Psychological Review, 114(2), 316-339. doi:10.1037/0033-
295x.114.2.316
347
Wydell, T. N., & Butterworth, B. (1999). A case study of an English-Japanese bilingual with monolingual
dyslexia. Cognition, 70(3), 273-305. doi:10.1016/s0010-0277(99)00016-5
Yee, S. C. (1986). Computational studies of the most frequent Chinese words and sounds (Vol. 3). World
Scientific.
Yin,W (1991). On Reading Chinese Characters. London: University of College London Dissertation.
Yin, W., & Butterworth, B. (1992). Deep and Surface Dyslexia in Chinese. Language Processing in Chinese
Advances in Psychology, 349-366. doi:10.1016/s0166-4115(08)61897-x
Yip, M. J. (1980). The tonal phonology of Chinese. Dept. of Linguistics and Philosophy, Massachusetts
Institute of Technology.
Yiu, E. M. (1992). Linguistic assessment of Chinese-speaking aphasics: Development of a Cantonese
aphasia battery. Journal of Neurolinguistics, 7(4), 379-424. doi:10.1016/0911-6044(92)90025
Yiu, E. M., & Worrall, L. E. (1996). Agrammatic production: A cross-linguistic comparison of English and
Cantonese. Aphasiology, 10(6), 623-647.
Zhou, B., & Krott, A. (2015). Data trimming procedure can eliminate bilingual cognitive advantage.
Psychonomic Bulletin & Review, 23(4), 1221-1230. doi:10.3758/s13423-015-0981-6
Ziegler, J. C., Ferrand, L., & Montant, M. (2004). Visual phonology: The effects of orthographic consistency
on different auditory word recognition tasks. Memory & Cognition, 32(5), 732-741.
doi:10.3758/bf03195863
Zorzi, M., Perry, C., & Ziegler, J. (2007). The CDP Model of Reading Aloud. PsycEXTRA Dataset.
doi:10.1037/e512682013-151