TEAM 2010 AGTEDU 2010 - TEAM Society
344
INTERNATIONAL TEAM SOCIETY PROCEEDINGS OF THE 2ND INTERNATIONAL SCIENTIFIC AND EXPERT CONFERENCE TEAM 2010 AGTEDU 2010 A MAGYAR TUDOMÁNY ÜNNEPE ALKALMÁBÓL RENDEZETT 11. TUDOMÁNYOS KONFERENCIA KIADVÁNYA VOLUME 1 KECSKEMÉT COLLEGE 4-5. NOVEMBER 2010.
-
Upload
khangminh22 -
Category
Documents
-
view
1 -
download
0
Transcript of TEAM 2010 AGTEDU 2010 - TEAM Society
INTERNATIONAL TEAM SOCIETY
PROCEEDINGS OF THE
2ND INTERNATIONAL SCIENTIFIC AND EXPERT CONFERENCE
TEAM 2010
AGTEDU 2010 A MAGYAR TUDOMÁNY ÜNNEPE ALKALMÁBÓL RENDEZETT
11. TUDOMÁNYOS KONFERENCIA KIADVÁNYA
VOLUME 1
KECSKEMÉT COLLEGE
4-5. NOVEMBER 2010.

Szerkesztő bizottság
Prof. Dr. Ferencz Árpád főiskola tanár
Dr. Klebniczki József főiskolai tanár
Lipócziné Dr. Csabai Sarolta főiskolai tanár
Borsné Dr. Pető Judit főiskolai docens
Dr. Fábián Csaba főiskolai tanár
ISSN: 1586 – 846x
Összkiadás: ISBN 978-963-7294-85-3 ö
I. kötet: ISBN 978-963-7294-86-0
Felelős kiadó: Dr. Danyi József rektor
Kiadó: Kecskeméti Főiskola
Munkaszám: 2010.154.
Contents
Contents
Volume 1
Plenary Talks ....................................................................................................... 9
Low-cost Fuzzy Control Solutions for Electromechanical Applications ....................... 10 Claudia-Adina Dragoş, Radu-Emil Precup, Stefan Preitl, Mircea-Bogdan Rădac
CFD analysis of originally designed car body in order to improve aerodynamic .......... 24 Dražan Kozak, Željko Ivandić, Marija Živić, Darko Damjanović
Modern materials and technologies in steam boiler power plant production ................. 42 Ivan Samardžić, Antun Stoić, Ivica Kladarić Marko Dunñer
Agriculture ......................................................................................................... 49
Musttisztítási eljárások hatása az Olaszrizling bor minőségére...................................... 50 Baglyas F., Földházi O.
Influence of sowing time on germination of different lettuce types (Lactuca sativa L.) ........................................................................................................ 56
Teuta Benković-Lačić, Krunoslav Mirosavljević, Robert Benković, Mirjana Brmež, Nataša Romanjek Fajdetić, Slavica Antunović
A gyümölcsösök ültetési anyagai ................................................................................... 63 Czinege Anikó
A nitrogén termésnövelő hatása az étkezési paprika terméstömegére tenyészedényekben, különböző talajtípusokon............................................................... 69
Cserni Imre, Rajkai Kálmán, Borsné Pető Judit, Hüvely Attila, Szili-Kovács Tibor, Németh Tamás, Kovács András, Rajkainé Végh Krisztina
Felsőoktatásban részt vevő hallgatók környezettudatossági hajlandósága, egy vetélkedő tükrében .......................................................................................................................... 74
Hoyk Edit
Eugley characteristics and limitations in plant production on the County of Slavonski Brod-Posavina area ......................................................................................................... 80
Božica Japundžić-Palenkić, Slavica Antunović, Nataša Romanjek-Fajdetić, Monika Marković
The difference in the germination of maize hybrids (Zea mays L.) ............................... 86 Božica Japundžić-Palenkić, Slavica Antunović, Nataša Romanjek-Fajdetić, Branimir Vujčić
Különféle baktériumtörzsek védő hatásának vizsgálata paprikánál Xanthomonas vesicatoria fertőzéssel szemben ...................................................................................... 92
Kovács András, Tóthné Taskovics Zsuzsanna, Hraskó Istvánné, Nagy Győzőné
The challenges and common tasks of rural development ............................................... 98 Prof. Dr. Péter Lévai, Prof. Dr. Árpád Ferencz
Vágottvirágok növényházi termesztése hidrokultúrában.............................................. 105 Lévai Péter, Turiné Farkas Zsuzsa
Yield and quality parameter of maize hybrids grown in irrigated and N fertilized conditions...................................................................................................................... 111
Monika Marković, Jasna Šoštarić, Vlado Kovačević, Marko Josipović, Dario Iljkić, Božica Japundžić-Palenkić
Contents
A parlagfű gyomszabályozása a Kiskunsági Nemzeti Park Fülöpházi kerületében ..... 117 Pölös Endre, Pál Szabó Ferenc
Difference in button mushroom (Agaricus bisporus) crop yield between regular and Cac-ing method............................................................................................................. 122
Nataša Romanjek-Fajdetić, Branimir Vujčić, Božica Japundžić- Palenkić, Slavica Antunović, Teuta Benković-Lačić
Agricultural spray nozzles ............................................................................................ 127 István Sztachó-Pekáry
Technologycal advancements of chemical application in plant protection .................. 134 István Sztachó-Pekáry
Educational science ......................................................................................... 139
A Selye János Egyetem hallgatóinak tanulással kapcsolatos motivációi ..................... 140 Albert Sándor
A járműépítő versenyek szerepe a felsőoktatásban ...................................................... 147 Dr. Bagány Mihály, Kiss László
Analysis of teaching methods of Physical Education by students of Agriculture In Vinkovci........................................................................................................................ 154
Mario Keskic, Hrvoje Sivric
The concept of a derivative at the university................................................................ 161 Lilla Kremžárová
The navigable canal Danube-Sava role in the development of the Croatia.................. 166 Anita Kulaš, Maja Vretenar, Sanja Knežević
Az etikus globalizáció – mint pedagógiai probléma..................................................... 172 Lesku Katalin
Teachers Sharing and Creating Knowledge on the Internet ......................................... 178 Fruzsina Lukács, Lilla Koltói
The comparative analysis of the first year full time and correspondence students’ studying motivations at Kecskemét College Faculty of Mechanical Engineering and Automation ................................................................................................................... 184
Dr. Müller Rudolf, Dr. Pap István, Tóth, Ákos
Management ICT in teaching accounting..................................................................... 190 I., Opačak, S. Bilić, D., Misirača M., Tokić
Educational training session for developing repetitive strength................................... 194 Hrvoje Sivrić, Mario Keškić, Damir Rukavina
The System of Values in a Biblical Upbringing ........................................................... 200 I. Vrbat Pejić, R. Gorkić, I. Gusak
Engineering and Technology.......................................................................... 207
Interesting Issues about Integrated Wheelend Control ................................................. 208 Gergely Bári
Stress analysis of thick-walled tubes with different degrees of plasticization ............. 215 Tomislav Baskaric, Darko Damjanovic, Franjo Matejicek, Drazan Kozak, Zeljko Ivandic
A töltőfeszültség és az agyagminőség hatásának vizsgálata a csúcsgyújtásos csaphegesztéssel készült kötések tulajdonságaira......................................................... 224
Bernáth Mihály
Contents
Presenting of students learning outcomes on the example of course "Structural product development" on Mechanical Engineering Faculty in Slavonski Brod ........................ 230
D. Damjanović, T. Baškarić, M. Holik, A. Koljenik, I. Krpan, M. Karakašić, M. Kokanović, M. Kljajin, Ž. Ivandić
Stress analysis of long beam by theory of elasticity..................................................... 236 Darko Damjanovic, Tomislav Baskaric, Franjo Matejicek, Drazan Kozak, Zeljko Ivandic
Fárasztógép fejlesztés polimer próbatestek ismétlő igénybevételének vizsgálatához.. 243 Fodor Antal, Dr. Boza Pál
Commercial vehicle’s active steering srategies ............................................................ 249 Zoltán Hankovszki, Roland Kovács, Dr. László Palkovics
Stress analysis of eave framework................................................................................ 255 M. Holik, D. Kozak, P. Konjatić, Ž. Ivandić, D. Damjanović
The process of the generating conceptual variant solutions of the garden device for the soil attrition ................................................................................................................... 261
I. Hradovi, M. Kokanović, I. Lacković, M. Pastović, A. Koljenik, Ž. Ivandić
Experimental installation for studying the rolling rolls durability in exploitation – General preview............................................................................................................ 268
Imre Kiss, Vasile George Cioata
Graphical Addenda in the Cast Iron Rolls Production ................................................. 274 Imre Kiss, Vasile Alexa
Cutting temperatures and the tool wear ........................................................................ 280 János Kodácsy, Viktor Molnár
Bioethanol Production and Applicability ..................................................................... 285 Nikolett Pézsa, Szabolcs Szemerey
Influence of the composition of structural steels on notch toughness translation temperature ................................................................................................................... 292
Željko Rosandić, Slavica Kladarić, Radojka Marković, Ivica Kladarić , Darko Samardžija
CAM stratégiák hatásai a felületek alakpontosságára és méretpontosságára ............... 297 Siket Katalin
Technology approval of locomotive wheel production ................................................ 305 A Stoić, M. Duspara, J. Stojšić
Analysis of resilient mounting of the river-marine cargo vessel’s main engine to interior noise on the vessel ........................................................................................................ 312
Ing. Sztankay Juraj, PhD, Ing. Németh Jozef
Analysis of the Reliability of Threaded Joints Sealed with Anaerobic Polymeric Sealants in Gas Pipeline Installations ........................................................................... 318
Zlatko Tonković, Pero Raos, Marija Somolanji
Mathematical Model for Life Prediction of Damaged PE 80 Gas-Pipes...................... 325 Zlatko Tonković, Pero Raos, Josip Stojšić
Ötvözés hatása acélok edzéshez való felmelegítésére .................................................. 333 Végvári Ferenc, Bata Attila, Kecskés Bertalan
The Effect of the Cooling Media’s Temperature on the Quenching Efficiency........... 339 Ferenc Végvári, Edit Johanyák, Bertalan Kecskés
Contents
Volume 2
Humanities ....................................................................................................... 345
Levél és levelezés Petelei István novelláiban ............................................................... 346 Bárdos Dóra
Egy működő gyermekirodalmi kánonért ...................................................................... 355 Bárdos József
Academic Vocabulary Identification ............................................................................ 361 Judit Hardi
Az erkölcs a középkori szamuráj társadalomban.......................................................... 367 Horváth Katalin
Description of mother love and nursing in Michael Ende’s Never-Ending Story........ 373 Nikolett Kovács
Alaktani ismeretek oktatásának problémái ................................................................... 378 Kozmács István
Az etikus globalizáció – mint pedagógiai probléma..................................................... 387 Lesku Katalin
Az isteni szerepek ......................................................................................................... 393 Lestyán Anita
A rendszerváltozás ábrázolása a német irodalomban ................................................... 401 Lipócziné Dr. Csabai Sarolta
Information Communities in the Age of Electronic Communication........................... 407 Gábor Szécsi
Informatics ....................................................................................................... 413
Design and development of AJAX based rias .............................................................. 414 Alvarez Gil, Rafael Pedro
IT development in the Croatian forests......................................................................... 420 Mirko Cobović, Sanja Knežević, Mirna Jerković
Practical functional programming with F# under the .NET Framework...................... 426 Rajmund Drenyovszki
ZigBee-DAQ, mérésadatgyűjtés vezeték nélküli hálózattal ......................................... 431 Illés Attila
Fuzzy számításokat segítő eljárásgyűjtemény fejlesztése ............................................ 437 Johanyák Zsolt Csaba, Bolla Kálmán Milán
Automotive communication protocols focused on the x-by-wire applications ............ 443 Dr. Tibor Kandár, Dr. László Gianone
Wireless Phone in Szombathely at the Turn of the 19th and 20th Centuries ................. 449 József Nemes
Application of fuzzy evaluation in the design of linear drives ..................................... 455 Attila Piros, Dr. Tibor Bercsey
Functional Structure of Entrepreneurial Accounting Information Systems ................. 462 M. Tokić, M. Španja, I. Tokić, I. Blažević
Kommunikáció villamos hálózaton keresztül............................................................... 467 Vigh György
Contents
Management..................................................................................................... 473
Principles of Talent Management as a Tool for Increasing Business Successful......... 474 Ing. Lucia Baňasová, doc. Ing. Andrea Holková PhD., Ing. Zuzana Hrúzová
Analysis of the use of voluntary environmental tools in the small and medium – sized enterprises in Slovakia .................................................................................................. 479
Mgr. Martina Bergelová, Bc. Juraj Jurík, prof. Ing Peter Sakál, CSc
Outsourcing as an Opportunity for Small Local Businesses ........................................ 485 S., Bilić, D., Misirača, I., Ilak
Commercial vehicle’s active steering srategies ............................................................ 488 Zoltán Hankovszki, Roland Kovács, Dr. László Palkovics
Vehicle program with present relevance ...................................................................... 494 Bence Kocsis, Gyula Pomázi
The navigable canal Danube-Sava role in the development of the Croatia.................. 501 Anita Kulaš, Maja Vretenar, Sanja Knežević
Accessibility of large scaled retail stores for pedestrian consumers ............................ 507 Dipl.- Wirtsch.- Ing. Raphael Kunz
Monitoring and evaluating the effectiveness as a part of the economic aspects of quality ........................................................................................................................... 513
Ondrej Kusý
Salaries of teachers in the education system as a determinant of social development . 517 Željko Požega, Boris Crnković, Ivo Mijoć
Instruments for Defining a Successful Business Strategy ............................................ 523 Lena Sigurnjak, Filip Tolić , Branimir Blajić
Financial reporting using e-business model.................................................................. 529 Ranko Simić, Darko Barišić
Anti-crisis arrangements of the Slovak Government.................................................... 533 Ing. Szabó Peter, PhD., Ing. Czifra Juraj, PhD.
The introduction effect of the cash pooling on the costs of the payment transaction in the city of Slavonski Brod ............................................................................................ 538
Filip Tolić, Lena Sigurnjak, Berislav Bolfek
European Dimensions of the European Capital of Culture in Pécs .............................. 545 Tóth, Ákos
Comparison of technical and economical parameters of gas pipelines with other transport systems........................................................................................................... 551
doc. Ing. Koloman Vincze, CSc., Ing. Jaroslava Vičíková
Natural Science ................................................................................................ 555
Application of fractals and fractal-shaped .................................................................... 556 M. Čuletić Čondrić1 Ž. Ivandić
Practical workshops as a contemporary approach to environmental education ........... 564 Ž. Ivandić, J. Čudina, M. Mršić Pavičić, L. Kevo
Solving the differential equation bending of thin rectangular plates by finite difference method .......................................................................................................................... 571
A. Koljenik, D. Kozak, J. Sertić, F. Matejiček, P. Baličević, Ž. Ivandić
Nonlinear viscoelasticity and thixotropy of a silicone fluid ......................................... 577 Z. Kőkuti, J. Kokavecz, A. Czirják, I. Holczer, A. Danyi, Z. Gábor, G. Szabó, N. Pézsa, P. Ailer, L. Palkovics

Contents
Multichromatic numbers of planar graphs.................................................................... 584 József Osztényi
Mathematical Model for Life Prediction of Damaged PE 80 Gas-Pipes...................... 588 Z. Tonković, P. Raos, J. Stojšić
Surface Optimization at Adverse Pressure Gradient Flow Conditions......................... 595 Árpád Veress, Attila Felföldi, László Palkovics
Hydrodynamic analysis of a flow in water supply city network .................................. 601 Marija Živić, Nataša Veljić, Zvonimir Janković
Numerical simulation of flow and heat transfer in a waste incinerator ........................ 607 Željko Zmaić, Marija Živić, Ivan Grgić

9
Plenary Talks
Plenary Talks
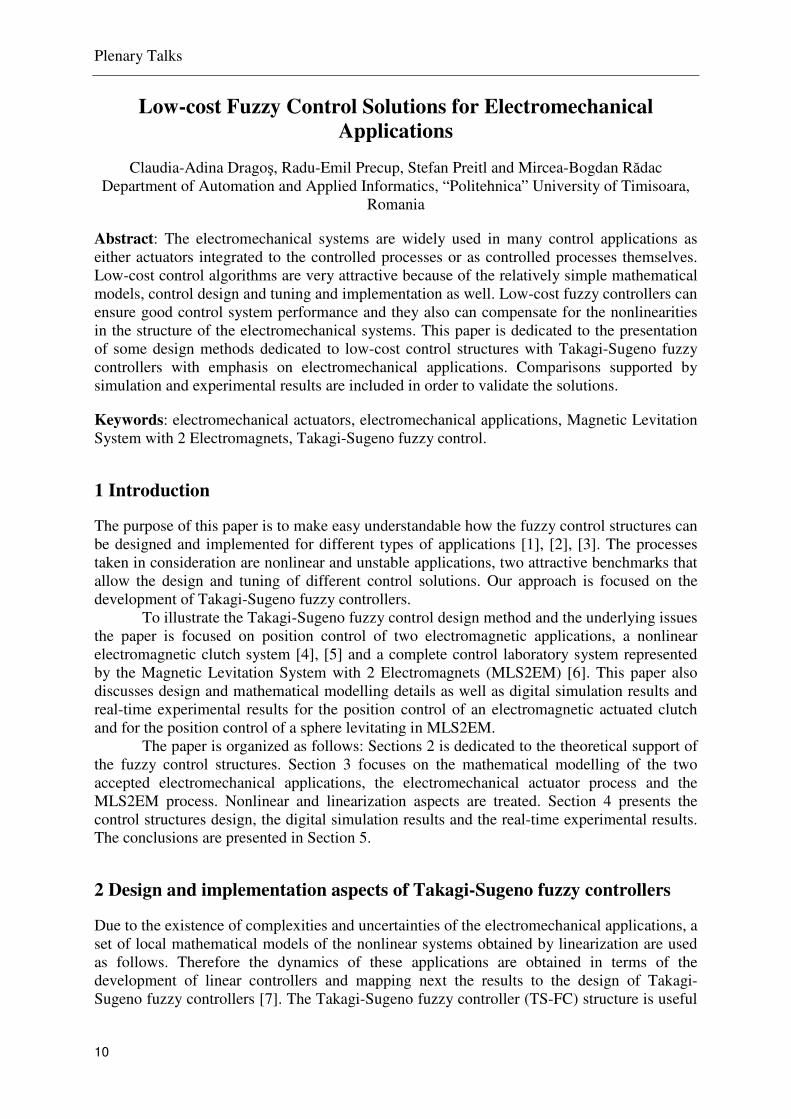
10
Low-cost Fuzzy Control Solutions for Electromechanical
Applications
Claudia-Adina Dragoş, Radu-Emil Precup, Stefan Preitl and Mircea-Bogdan Rădac Department of Automation and Applied Informatics, “Politehnica” University of Timisoara,
Romania
Abstract: The electromechanical systems are widely used in many control applications as either actuators integrated to the controlled processes or as controlled processes themselves. Low-cost control algorithms are very attractive because of the relatively simple mathematical models, control design and tuning and implementation as well. Low-cost fuzzy controllers can ensure good control system performance and they also can compensate for the nonlinearities in the structure of the electromechanical systems. This paper is dedicated to the presentation of some design methods dedicated to low-cost control structures with Takagi-Sugeno fuzzy controllers with emphasis on electromechanical applications. Comparisons supported by simulation and experimental results are included in order to validate the solutions.
Keywords: electromechanical actuators, electromechanical applications, Magnetic Levitation System with 2 Electromagnets, Takagi-Sugeno fuzzy control.
1 Introduction
The purpose of this paper is to make easy understandable how the fuzzy control structures can be designed and implemented for different types of applications [1], [2], [3]. The processes taken in consideration are nonlinear and unstable applications, two attractive benchmarks that allow the design and tuning of different control solutions. Our approach is focused on the development of Takagi-Sugeno fuzzy controllers. To illustrate the Takagi-Sugeno fuzzy control design method and the underlying issues the paper is focused on position control of two electromagnetic applications, a nonlinear electromagnetic clutch system [4], [5] and a complete control laboratory system represented by the Magnetic Levitation System with 2 Electromagnets (MLS2EM) [6]. This paper also discusses design and mathematical modelling details as well as digital simulation results and real-time experimental results for the position control of an electromagnetic actuated clutch and for the position control of a sphere levitating in MLS2EM. The paper is organized as follows: Sections 2 is dedicated to the theoretical support of the fuzzy control structures. Section 3 focuses on the mathematical modelling of the two accepted electromechanical applications, the electromechanical actuator process and the MLS2EM process. Nonlinear and linearization aspects are treated. Section 4 presents the control structures design, the digital simulation results and the real-time experimental results. The conclusions are presented in Section 5.
2 Design and implementation aspects of Takagi-Sugeno fuzzy controllers
Due to the existence of complexities and uncertainties of the electromechanical applications, a set of local mathematical models of the nonlinear systems obtained by linearization are used as follows. Therefore the dynamics of these applications are obtained in terms of the development of linear controllers and mapping next the results to the design of Takagi-Sugeno fuzzy controllers [7]. The Takagi-Sugeno fuzzy controller (TS-FC) structure is useful

Plenary Talks
11
to solve the tracking problem due to the flexibility of modifying the transfer properties of the TS-FC with respect to the operating point modifications. Due to the flexibility of the fuzzy controller structures around the operating points the TS-FCs prove to be very useful and ensure better performance in comparison with other conventional controllers in nonlinear control. Our approach starts with the theoretical support of the TS-FC with the integration of the output variable as presented in Figure 1.
Figure 1: Structure of fuzzy control system with Takagi-Sugeno fuzzy controller
The development of the TS-FC starts with the design of the linear continuous PI controllers with the transfer function (t.f.):
)1()1()( sTsT
ksT
s
ksC i
i
C
c
c +=+= , (1)
where the Modulus Optimum method leads to the following tuning equations:
)(2
1 ,
321
TTkT
kkTTT
Pi
C
cic+
==== . (2)
The continuous PI controller with the t.f. (1) is discretized using Tustin’s method with the sampling period Ts in order to obtain quasi-continuous digital PI controllers:
)( k
i
Pk
i
I
i
k ekeku α+∆γ=∆ , (3)
with the expressions of the parameters [8]:
i
P
i
I
i
i
s
i
Ci
Ii
i
si
C
i
Pk
k
T
Tkk
T
Tkk =α=−= ,,)
21( . (4)
where i is the rule index which corresponds also to the index of the operating points, ke is the
control error, ke∆ is the increment of control error, and i
ku∆ is the increment of control signal.
The following rules are used in the rule base of the TS-FC:
, THEN )LTDE IS AND LTE IS ( IF i
kk
i
k
i
k uuee ∆=∆∆ (5)
where P,ZE,NLTDE ,LTE ∈ii are the linguistic terms of the two input linguistic variables. In order to solve the inference, three linguistic terms with triangular membership functions (N, ZE, P), Figure 2, are used for each input variable of the nonlinear block TS-FC -
ke and ke∆ . The rule base of the nonlinear block FC can be expressed as a symmetrical
decision table. The parameters of the TS-FC with output integration,
eB and eB∆, are tuned according
to the modal equivalence principle:

Plenary Talks
12
eei
I
i
P
e BBk
kB α==∆
. (6)
Figure 2: Input membership functions of TS-FC
The block TS-FC makes use of the weighted average method for defuzzification. The inference engine operates on the basis of the MAX and MIN operators.
2 Process models
This section is dedicated to the mathematical modelling of two applications, the electromagnetic clutch system (in Section 2.1) and the MLS2EM (in Section 2.1). 2.1 Electromagnetic clutch system
The mathematical modelling of the electromagnetic actuator is based on the dynamic information of a mechanical subsystem actuated by the electromagnetic subsystem according to Figure 3 [4].
Figure 3: Schematic structure of magnetically actuated mass-spring-damper system
The basic equations that characterize the functionality of the electromagnetic actuator system are [4]:
,
),4/()/(2
),/(2
,
,
222
xdz
kzkikF
zkik
RiV
kxxcFxm
aba
ba
−=
λ=+=
+=λ
−=λ
−−=
&
&&&
(7)

Plenary Talks
13
where: x[m] – the mass position, F[N] – the electromagnetic force, k[N/m] – the spring stiffness, c[N s/m] – the damper coefficient, R[Ω] – the resistance, V[V] – the control input, λ
[V s] – the electromagnetic flux, i[A] – the current, ka and kb – constants, and d – the distance
between the contact position and the spring neutral position. The numerical values of the system are grouped in Table 1.
Table 1: Numerical values of process parameters
Parameter Numerical value m 3.5 [kg] d 0.004 [m] R 1.2 [Ω] c 700 k 325000 ka 0.00000192 kb 0.000384 i 0 – 12 [A]
Due to the nonlinearity of the system, the controllers design was done using the nonlinear input-output static map (Figure 4) and several state-space linearized models:
[ ]. 001 ,
,
)2/(
0
0
,
)2/()(//0
/)**2(//
010
3
2
1
2030
230
=
∆
∆
∆
=
=
−−−
−−=
=∆
∆+=
T
ababbb
ba
T
c
x
x
x
x
kk
b
kRkkxkx
mkxkmcmkA
xcy
VbxAx&
(8)
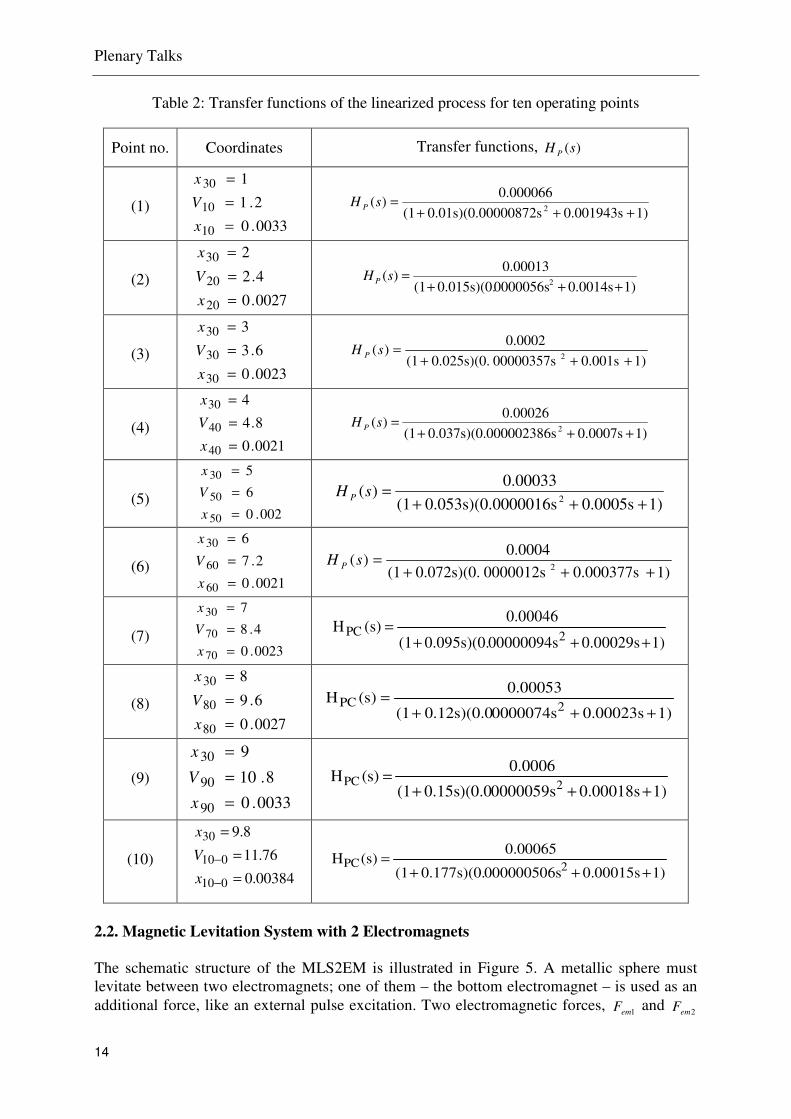
Based on these results a t.f. was obtained for each operating points as it is presented in Table 2. This t.f. is employed to develop the control structures.
Figure 4: Input-output static map F versus i
Plenary Talks
14
Table 2: Transfer functions of the linearized process for ten operating points
Point no. Coordinates Transfer functions, )(sH P
(1) 0033.0
2.1
1
10
10
30
=
=
=
x
V
x
1)0.001943s0000872s0.01s)(0.0(1
0.000066)(
2 +++=sH P
(2) 0027.0
4.2
2
20
20
30
=
=
=
x
V
x
1)0.0014s0000056s0.015s)(0.(1
0.00013)(
2 +++=sH P
(3) 0023.0
6.3
3
30
30
30
=
=
=
x
V
x
1)0.001s00000357s0.025s)(0.(1
0.0002)(
2 +++=sH P
(4) 0021.0
8.4
4
40
40
30
=
=
=
x
V
x
1)0.0007s000002386s0.037s)(0.(1
0.00026)(
2 +++=sH P
(5) 002.0
6
5
50
50
30
=
=
=
x
V
x
1)0.0005s0000016s0.053s)(0.(1
0.00033)(
2 +++=sH P
(6) 0021.0
2.7
6
60
60
30
=
=
=
x
V
x
1)0.000377s0000012s0.072s)(0.(1
0.0004)(
2 +++=sH P
(7) 0023.0
4.8
7
70
70
30
=
=
=
x
V
x
1)0.00029s00000094s0.095s)(0.(1
0.00046(s)H
2PC+++
=
(8) 0027.0
6.9
8
80
80
30
=
=
=
x
V
x
1)0.00023s0000074s0.12s)(0.0(1
0.00053(s)H
2PC+++
=
(9)
0033.0
8.10
9
90
90
30
=
=
=
x
V
x
1)0.00018s0000059s0.15s)(0.0(1
0.0006(s)H
2PC+++
=
(10) 00384.0
76.11
8.9
010
010
30
=
=
=
−
−
x
V
x
1)0.00015s000000506s0.177s)(0.(1
0.00065(s)H
2PC+++
=
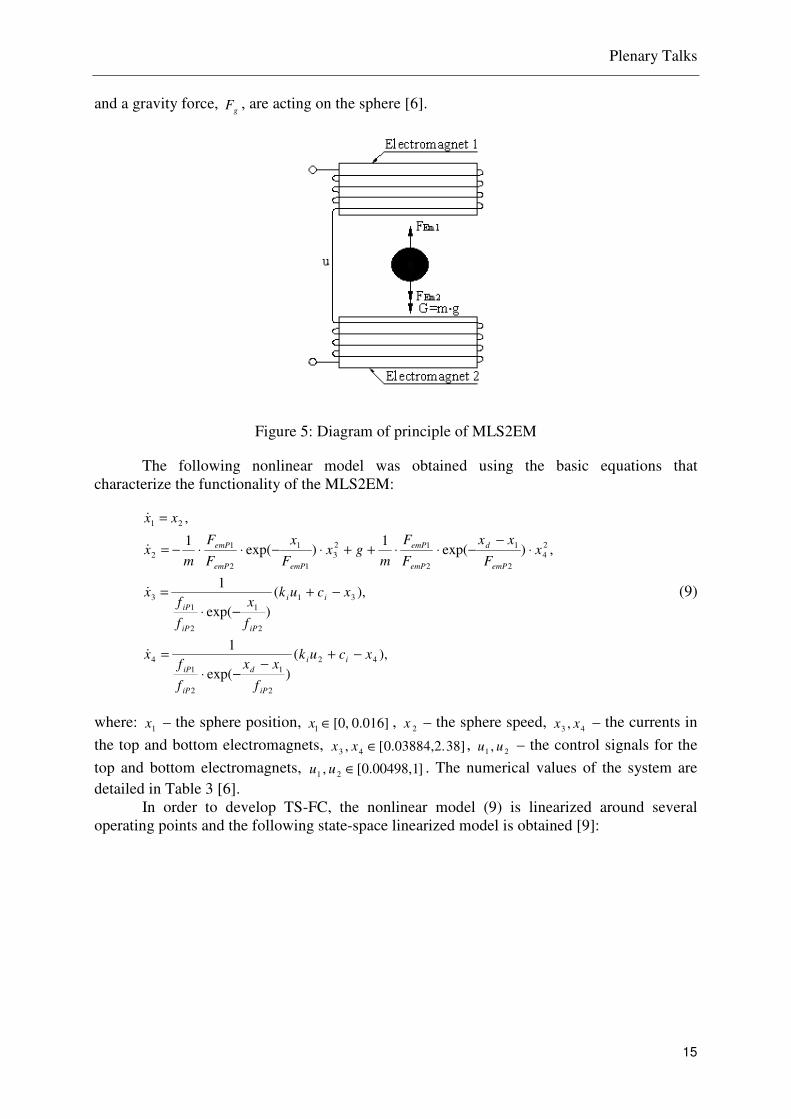
2.2. Magnetic Levitation System with 2 Electromagnets
The schematic structure of the MLS2EM is illustrated in Figure 5. A metallic sphere must levitate between two electromagnets; one of them – the bottom electromagnet – is used as an additional force, like an external pulse excitation. Two electromagnetic forces, 1emF and 2emF
Plenary Talks
15
and a gravity force, g
F , are acting on the sphere [6].
Figure 5: Diagram of principle of MLS2EM
The following nonlinear model was obtained using the basic equations that characterize the functionality of the MLS2EM:
),()exp(
1
),()exp(
1
,)exp(1
)exp(1
,
42
2
1
2
14
31
2
1
2
13
24
2
1
2
123
1
1
2
12
21
xcuk
f
xx
f
fx
xcuk
f
x
f
fx
xF
xx
F
F
mgx
F
x
F
F
mx
xx
ii
iP
d
iP
iP
ii
iPiP
iP
emP
d
emP
emP
emPemP
emP
−+−
−⋅
=
−+
−⋅
=
⋅−
−⋅⋅++⋅−⋅⋅−=
=
&
&
&
&
(9)
where: 1x – the sphere position, 0.016] [0,1 ∈x , 2x – the sphere speed, 43 , xx – the currents in
the top and bottom electromagnets, ]380.03884,2.[, 43 ∈xx , 21 , uu – the control signals for the
top and bottom electromagnets, ]0.00498,1[ , 21 ∈uu . The numerical values of the system are detailed in Table 3 [6]. In order to develop TS-FC, the nonlinear model (9) is linearized around several operating points and the following state-space linearized model is obtained [9]:

Plenary Talks
16
[ ]0001 , 0
0
,
00
00
0
0010
,
4
3
4,41,4
3,31,3
4,23,21,2
4
3
2
1
=
=
=
∆
∆
∆
∆
=
=∆
∆+=
T
T
c
b
bb
aa
aa
aaaA
x
x
x
x
xxcy
uBxAx&
(10)
where the elements of the matrices A and B are:
Table 3: Numerical values of process parameters
Parameter Numerical value m 0.0571[kg] g 9.81 [m/s2]
FemP1 1.7521*10-2 [H] FemP2 5.8231*10-3 [m] fiP1 1.4142*10-4 [ms] fiP2 4.5626*10-3 [m] ci 0.0243 [A]
ki 2.5165 [A]
).exp( ),exp(
),exp( ),()exp(1
),exp(1
),()exp(
),exp(2
),exp(2
),exp()exp(
2
10
1
24
2
10
1
23
2
10
1
244402
2
10
141
2
10
133301
2
10
1
231
2
10
2
14024
2
10
2
13023
2
102
2
1240
2
102
2
1230
21
emP
d
iP
iP
i
iPiP
iP
i
emP
d
iP
iP
ii
emP
d
iP
iPiP
ii
iPiP
iP
emP
d
emP
emP
emPemP
emP
emP
d
emP
emP
emPemP
emP
F
xx
f
fkb
f
x
f
fkb
F
xx
f
faxcuk
F
xx
fa
f
x
faxcuk
f
x
f
fa
F
xx
F
F
m
xa
F
x
F
F
m
xa
F
xx
F
F
m
x
F
x
F
F
m
xa
−⋅⋅=⋅⋅=
−⋅−=−+⋅
−⋅−=
⋅−=−+⋅⋅=
−−=−−=
−−+−=
(11)
Our approach considers the zero current in the bottom electromagnet, 04 =x . Therefore the linearized model (10) is reduced to a third order system, which is linearized around the following three operating points and the matrices and the transfer functions are:
[ ]
,)000064.00084.01)(066.01(
0152.0)(
,001,
376.5292
0
0
,
149.6242-015056
9.5028-0244.7866
010
,0,3.0,0,007.0
2
40302010
ssssH
cbA
xxxx
P
T
+++=
=
=
=
====
(12)

Plenary Talks
17
[ ]
,)000066.0011.01)(065.01(
0153.0)(
,001,
468.7966
0
0
,
186.2891-018125
7.6031-0186.0602
010
,0,285.0,0,008.0
2
40302010
ssssH
cbA
xxxx
P
T
+++=
=
=
=
====
(13)
[ ]
.)0000289.0006.01)(051.01(
0117.0)(
,001,
468.7966
0
0
,
186.2891-018125
7.6031-0186.0602
010
,0,6.0,0,009.0
2
40302010
ssssH
cbA
xxxx
P
T
+++=
=
=
=
====
(14)
3 Control solutions, simulation and experimental results
The TS-FC design is based on the t.f.s in (12), (13) and (14), and on taking into account the performance specifications expressed as zero steady-state control error, phase margin of 60o, and small settling time. The TS-FC structure is built upon the parameters of the linear controllers developed for the linearized models around the chosen operating points. The parameters in the consequents of the rules are calculated using (4) and their values are presented in Table 4. The relation (5) is next used in order to obtain the parameters ,, uee BBB ∆∆
, where the parameter
eB is set to 01.0=eB .
Table 4: Parameters in the consequents of the rules of TS-FC
Parameters of TS-FC Operating point
Pk Ik α
0023.0
6.3
3
30
30
30
=
=
=
x
V
x
13947
3289.5
0.021
002.0
6
5
50
50
30
=
=
=
x
V
x
28846
2828
0.021
0021.0
2.7
6
60
60
30
=
=
=
x
V
x
42188
3125
0.021
0023.0
4.8
7
70
70
30
=
=
=
x
V
x
50402
1366
0.021
Plenary Talks
18
0027.0
6.9
8
80
80
30
=
=
=
x
V
x
64681
1361.7
0.021
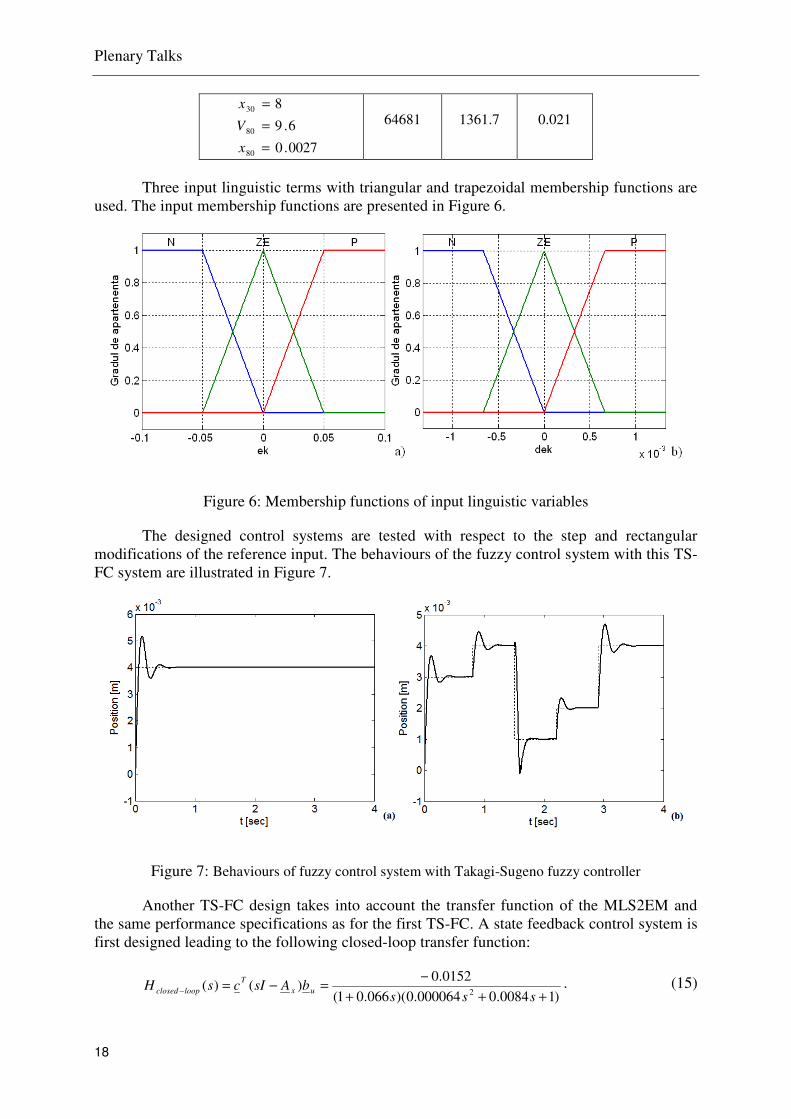
Three input linguistic terms with triangular and trapezoidal membership functions are used. The input membership functions are presented in Figure 6.
Figure 6: Membership functions of input linguistic variables
The designed control systems are tested with respect to the step and rectangular modifications of the reference input. The behaviours of the fuzzy control system with this TS-FC system are illustrated in Figure 7.
Figure 7: Behaviours of fuzzy control system with Takagi-Sugeno fuzzy controller
Another TS-FC design takes into account the transfer function of the MLS2EM and the same performance specifications as for the first TS-FC. A state feedback control system is first designed leading to the following closed-loop transfer function:
)10084.0000064.0)(066.01(
0152.0)()(
2 +++
−=−=−
sssbAsIcsH ux
T
loopclosed. (15)
Plenary Talks
19
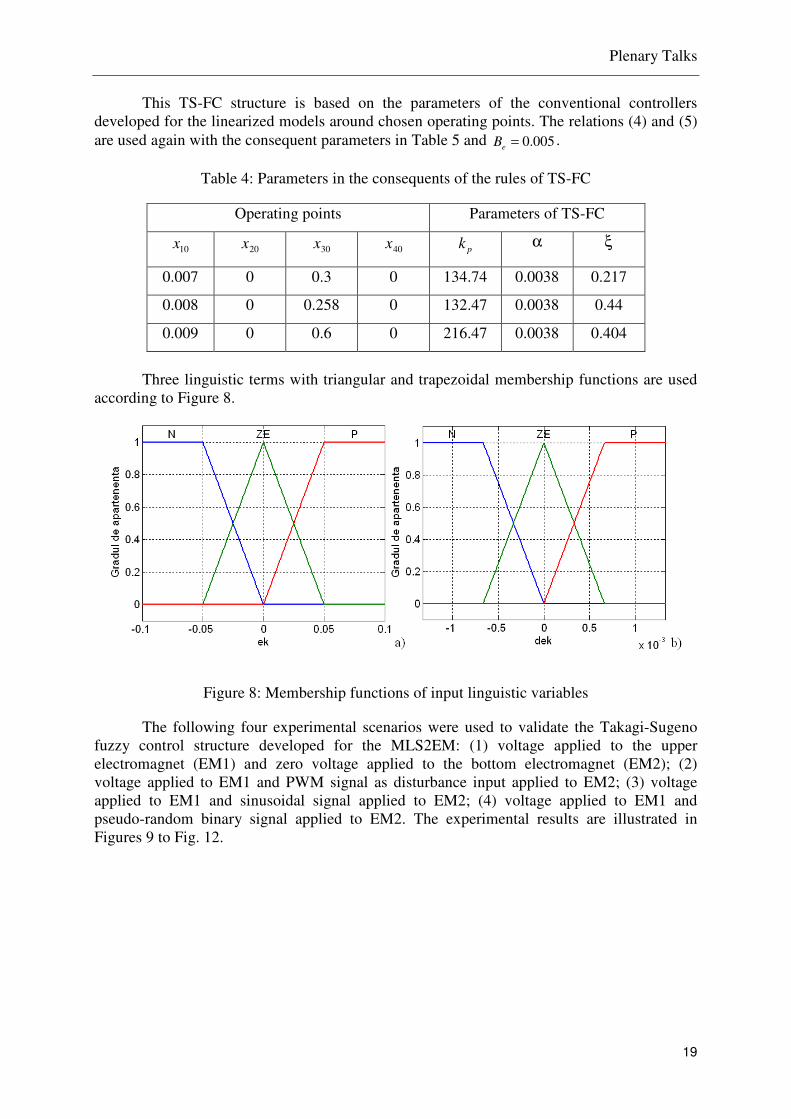
This TS-FC structure is based on the parameters of the conventional controllers developed for the linearized models around chosen operating points. The relations (4) and (5) are used again with the consequent parameters in Table 5 and 005.0=eB .
Table 4: Parameters in the consequents of the rules of TS-FC
Operating points Parameters of TS-FC
10x 20x 30x 40x pk α ξ
0.007 0 0.3 0 134.74 0.0038 0.217
0.008 0 0.258 0 132.47 0.0038 0.44
0.009 0 0.6 0 216.47 0.0038 0.404
Three linguistic terms with triangular and trapezoidal membership functions are used according to Figure 8.
Figure 8: Membership functions of input linguistic variables
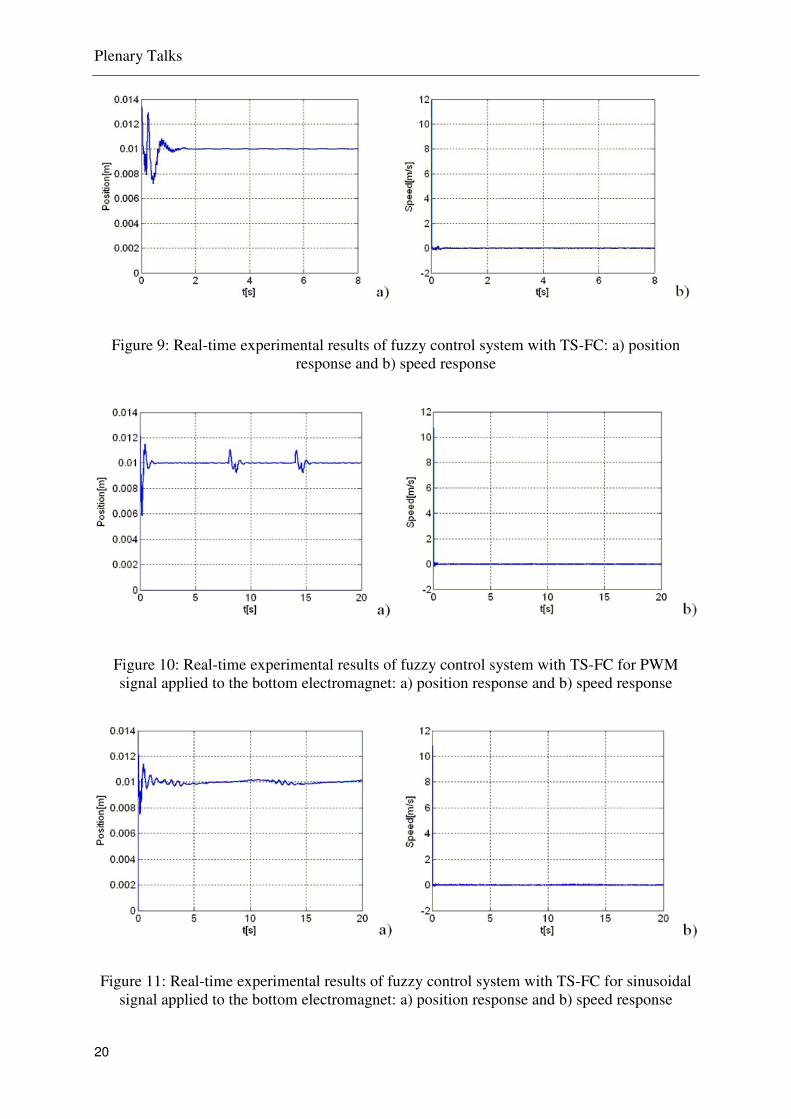
The following four experimental scenarios were used to validate the Takagi-Sugeno fuzzy control structure developed for the MLS2EM: (1) voltage applied to the upper electromagnet (EM1) and zero voltage applied to the bottom electromagnet (EM2); (2) voltage applied to EM1 and PWM signal as disturbance input applied to EM2; (3) voltage applied to EM1 and sinusoidal signal applied to EM2; (4) voltage applied to EM1 and pseudo-random binary signal applied to EM2. The experimental results are illustrated in Figures 9 to Fig. 12.
Plenary Talks
20
Figure 9: Real-time experimental results of fuzzy control system with TS-FC: a) position response and b) speed response
Figure 10: Real-time experimental results of fuzzy control system with TS-FC for PWM signal applied to the bottom electromagnet: a) position response and b) speed response
Figure 11: Real-time experimental results of fuzzy control system with TS-FC for sinusoidal signal applied to the bottom electromagnet: a) position response and b) speed response
Plenary Talks
21
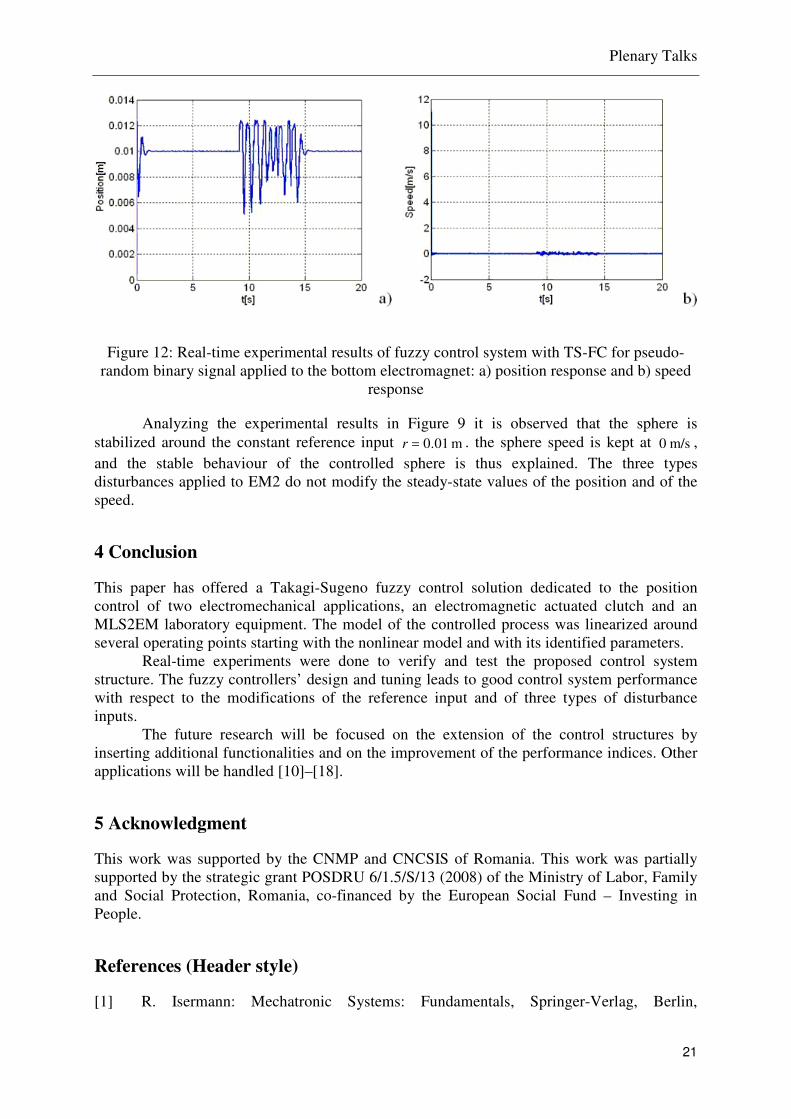
Figure 12: Real-time experimental results of fuzzy control system with TS-FC for pseudo-random binary signal applied to the bottom electromagnet: a) position response and b) speed
response
Analyzing the experimental results in Figure 9 it is observed that the sphere is stabilized around the constant reference input m01.0=r . the sphere speed is kept at m/s0 , and the stable behaviour of the controlled sphere is thus explained. The three types disturbances applied to EM2 do not modify the steady-state values of the position and of the speed.
4 Conclusion
This paper has offered a Takagi-Sugeno fuzzy control solution dedicated to the position control of two electromechanical applications, an electromagnetic actuated clutch and an MLS2EM laboratory equipment. The model of the controlled process was linearized around several operating points starting with the nonlinear model and with its identified parameters. Real-time experiments were done to verify and test the proposed control system structure. The fuzzy controllers’ design and tuning leads to good control system performance with respect to the modifications of the reference input and of three types of disturbance inputs. The future research will be focused on the extension of the control structures by inserting additional functionalities and on the improvement of the performance indices. Other applications will be handled [10]–[18].
5 Acknowledgment
This work was supported by the CNMP and CNCSIS of Romania. This work was partially supported by the strategic grant POSDRU 6/1.5/S/13 (2008) of the Ministry of Labor, Family and Social Protection, Romania, co-financed by the European Social Fund – Investing in People.
References (Header style)
[1] R. Isermann: Mechatronic Systems: Fundamentals, Springer-Verlag, Berlin,
Plenary Talks
22
Heidelberg, New York (2005). [2] U. Kiencke, L. Nielsen: Automotive Control Systems for Engine, Driveline and
Vehicle, 2nd ed., Springer-Verlag, Berlin, Heidelberg, New York (2005). [3] C. Lazăr et al.: Real-time informatics technologies for embedded-system-control of
power-train in automotive design and applications, Research Report 1 of the SICONA CNMP Grant, “Gh. Asachi” Technical University of Iasi, Iasi, Romania (in Romanian) (2009).
[4] S. Di Cairano, A. Bemporad, I. V. Kolmanovsky, D. Hrovat: Model predictive control of magnetically actuated mass spring dampers for automotive applications, International Journal of Control, 80 (2007) 1701-1716.
[5] S. Di Cairano, A. Bemporad, I. Kolmanovsky, Hrovat: Model predictive control of magnetic automotive actuators, Proceedings, 2007 American Control Conference (ACC ’07) (New York, NY, USA, 2007), 5082-5087.
[6] Inteco Ltd: Magnetic Levitation System 2EM (MLS2EM), User’s Manual (Laboratory Set), Inteco Ltd, Krakow, Poland (2008).
[7] Z. C. Johanyák, S. Kovács: Fuzzy rule interpolation based on polar cuts, in Computational Intelligence, Theory and Applications, B. Reusch, Ed., Springer-Verlag, Berlin, Heidelberg, New York (2006) 499-511.
[8] H. Wu, Y. Hu: Study on fuzzy control algorithm for magnetic levitated platform, Proceedings, 2009 International Conference on Measuring Technology and Mechatronics Automation (ICMTMA 2009) (Hunan, China, 2009), vol. 2, 598-601.
[9] C.-A. Dragoş, S. Preitl, R.-E. Precup, R.-G. Bulzan, C. Pozna, J. K. Tar: Takagi-Sugeno fuzzy controller for a magnetic levitation system laboratory equipment, Proceedings, International Joint Conferences on Computational Cybernetics and Technical Informatics (ICCC-CONTI 2010) (Timisoara, Romania, 2010), 55-60.
[10] J. Vaščák, K. Hirota, M. Mikloš: Hybrid fuzzy adaptive control of LEGO robots; International Journal of Fuzzy Logic and Intelligent Systems, 2 (2002) 65-69.
[11] I. Škrjanc, S. Blažič, D. Matko: Model-reference fuzzy adaptive control as a framework for nonlinear system control, Journal of Intelligent and Robotic Systems, 36 (2003) 331-347.
[12] R.-E. Precup, S. Preitl: Optimisation criteria in development of fuzzy controllers with dynamics, Engineering Applications of Artificial Intelligence, 17 (2004) 661-674.
[13] B. Paláncz, Z. Benyó, L. Kovács: Control System Professional Suite, IEEE Control Systems Magazine, 25 (2005) 67-75.
[14] I. Harmati, B. Lantos, S. Payandeh: Fitted stratified manipulation with decomposed path planning on submanifolds, International Journal of Robotics and Automation, 20 (2005) 135-144.
[15] G. Hermann: Geometric error correction in coordinate measurement, Acta Polytechnica Hungarica, 4 (2007) 47-62.
[16] B. M. Wilamowski, N. J. Cotton, O. Kaynak, G. Dundar: Computing gradient vector and Jacobian matrix in arbitrarily connected neural networks, IEEE Transactions on Industrial Electronics, 55 (2008) 3784-3790.
[16] R. E. Haber, R. Haber-Haber, A. Jiménez, R. Galán: An optimal fuzzy control system in a network environment based on simulated annealing. An application to a drilling process, Applied Soft Computing, 9 (2009) 889-895.
[17] J. L. Wright, M. Manic: The analysis of dimensionality reduction techniques in cryptographic object code classification, Proceedings, 3rd Conference on Human System Interaction (HIS ’10) (Rzeszow, Poland, 2010), 157-162.
[18] R. R. Sumar, A. A. R. Coelho, L. D. Coelho: Computational intelligence approach to PID controller design using the universal model, Information Sciences, 180 (2010)
Plenary Talks
23
3980-3991.
Author data
Claudia-Adina Dragoş: Department of Automation and Applied Informatics, Faculty of Automation and Computers, “Politehnica” University of Timisoara. Bd. V. Parvan 2, RO-300223 Timisoara, Romania. E-mail: [email protected] Radu-Emil Precup: Department of Automation and Applied Informatics, Faculty of Automation and Computers, “Politehnica” University of Timisoara. Bd. V. Parvan 2, RO-300223 Timisoara, Romania. E-mail: [email protected] Stefan Preitl: Department of Automation and Applied Informatics, Faculty of Automation and Computers, “Politehnica” University of Timisoara. Bd. V. Parvan 2, RO-300223 Timisoara, Romania. E-mail: [email protected] Mircea-Bogdan Rădac: Department of Automation and Applied Informatics, Faculty of Automation and Computers, “Politehnica” University of Timisoara. Bd. V. Parvan 2, RO-300223 Timisoara, Romania. E-mail: [email protected]
Plenary Talks
24
CFD analysis of originally designed car body in order to improve
aerodynamic
Dražan Kozak, Željko Ivandić, Marija Živić, Darko Damjanović Mechanical Engineering Faculty in Slavonski Brod, Josip Juraj Strossmayer University of
Osijek, CROATIA
Abstract: Nowadays, there are many software packages which make it easy for students and engineers to display and describe an imaginary idea in better quality, in better sense and in shortest possible time. Therefore, car is designed using the software package Autodesk 3ds Max. Polygonal modelling method was used and designed car represent a new conceptual solution car design. After modelling a car in mentioned software, final digital images are generated too. Final digital images are generated using the Mental Ray rendering tool as a default rendering tool of Autodesk 3ds Max. Attention is given only to the external design of the car, while the interior is not modelled. Furthermore, using the software ANSYS Fluent, 2D simulation of the airflow around the side contour of the vehicle was made in purpose of making changes in the geometry of the vehicle to improve the design in terms of reducing air resistance and improve aerodynamics. Most attention of that is given in changing value of angle between the hood and front windshield of car, and analysing back of the car with and without the rear wing. Also, using the software ANSYS CFX, 3D simulation of airflow around the car geometry was made. Taking into consideration results obtained by 2D and 3D analysis of existing car geometry, a new 3D car model was made. Assumption is that new 3D car model is resulting with better aerodynamic properties. 3D analysis of redesigned car model in terms of mentioned changes is performed too in order to analyse possible improvements.
Keywords: Autodesk 3ds Max, conceptual car design, Computational Fluid Dynamics (CFD), Finite volume method, structured finite volume mesh, k - ε turbulent model, ANSYS Fluent, ANSYS CFX.
1 Introduction
The whole idea of this paper was started from the learning of the Autodesk 3ds Max software, which is used for creating a 3D model of car. In purpose of easier car modelling, and elaborating some details of design, designing was started from freeform sketching, and finally, creating a 3D car model. Photorealistic images of finished car model where made using a standard tool for rendering in above mentioned software, called Mental Ray. Also, 2D simulation of the airflow around the side contour of the vehicle was made in purpose of making changes in the geometry of the vehicle to improve aerodynamics. Most attention of this is given in changing value of angle between the hood and front windshield of car, and analysing the back of the car with and without the rear wing. The importance of aerodynamics can be seen from simple example: If we need to raise the top speed of Ferrari Testarossa from 180 mph (≈289 km/h) to 200 mph (≈321 km/h) like Lamborghini Diablo, and without altering its shape, we need to raise its engine power from 390 hp to 535 hp. Besides that, another approach is to analyse geometry in wind tunnel, and making CFD analysis to decrease its Cd (Drag Coefficient) from 0.36 to 0.29, and with that we can do the same thing [1].
Plenary Talks
25
2 Car 3D model and renderings
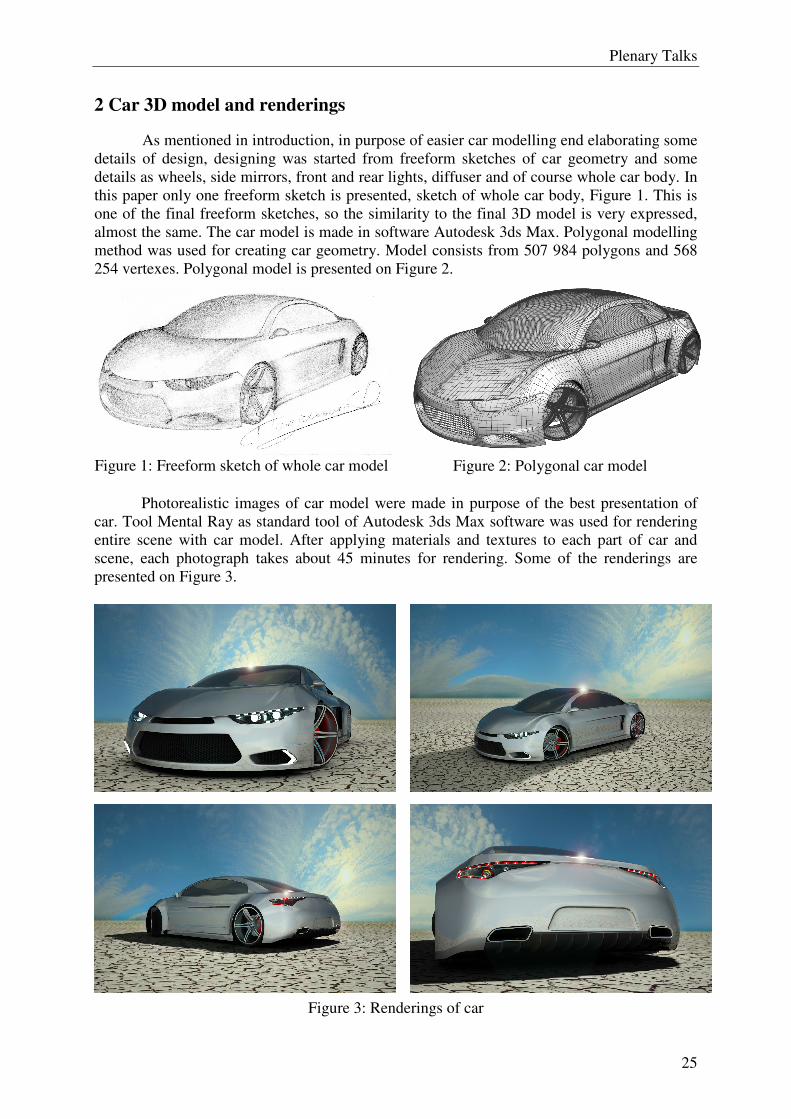
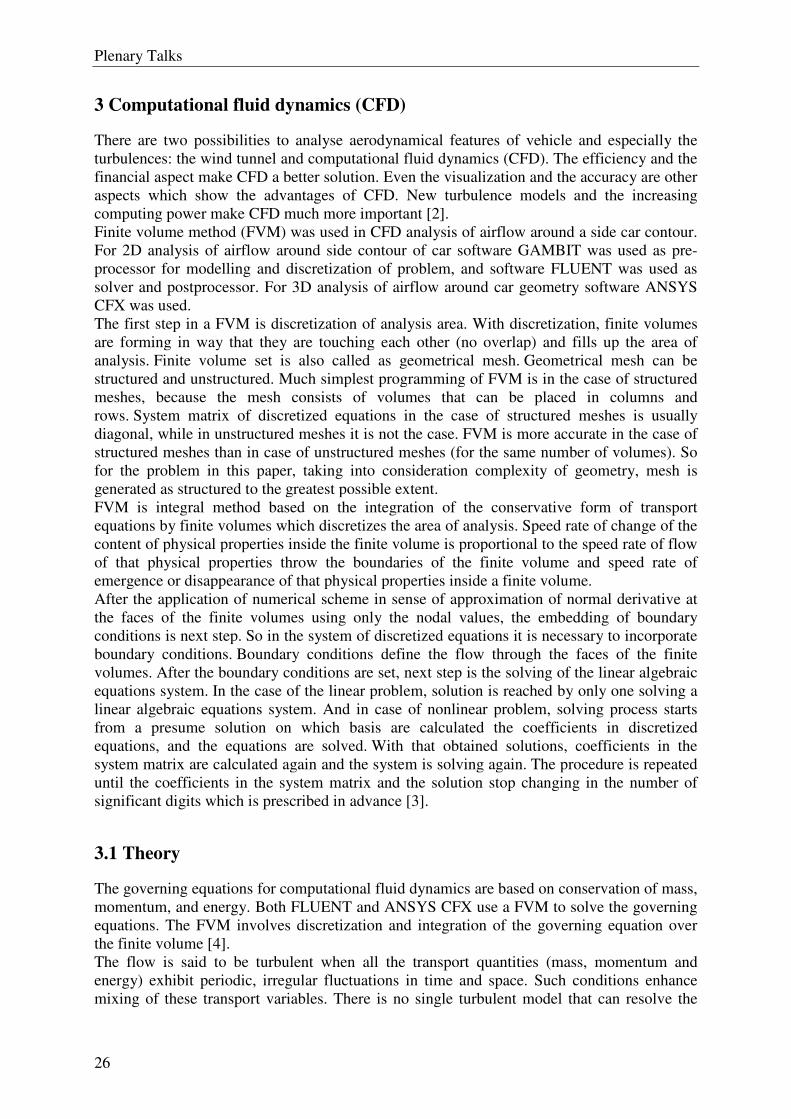
As mentioned in introduction, in purpose of easier car modelling end elaborating some details of design, designing was started from freeform sketches of car geometry and some details as wheels, side mirrors, front and rear lights, diffuser and of course whole car body. In this paper only one freeform sketch is presented, sketch of whole car body, Figure 1. This is one of the final freeform sketches, so the similarity to the final 3D model is very expressed, almost the same. The car model is made in software Autodesk 3ds Max. Polygonal modelling method was used for creating car geometry. Model consists from 507 984 polygons and 568 254 vertexes. Polygonal model is presented on Figure 2.
Figure 1: Freeform sketch of whole car model
Figure 2: Polygonal car model
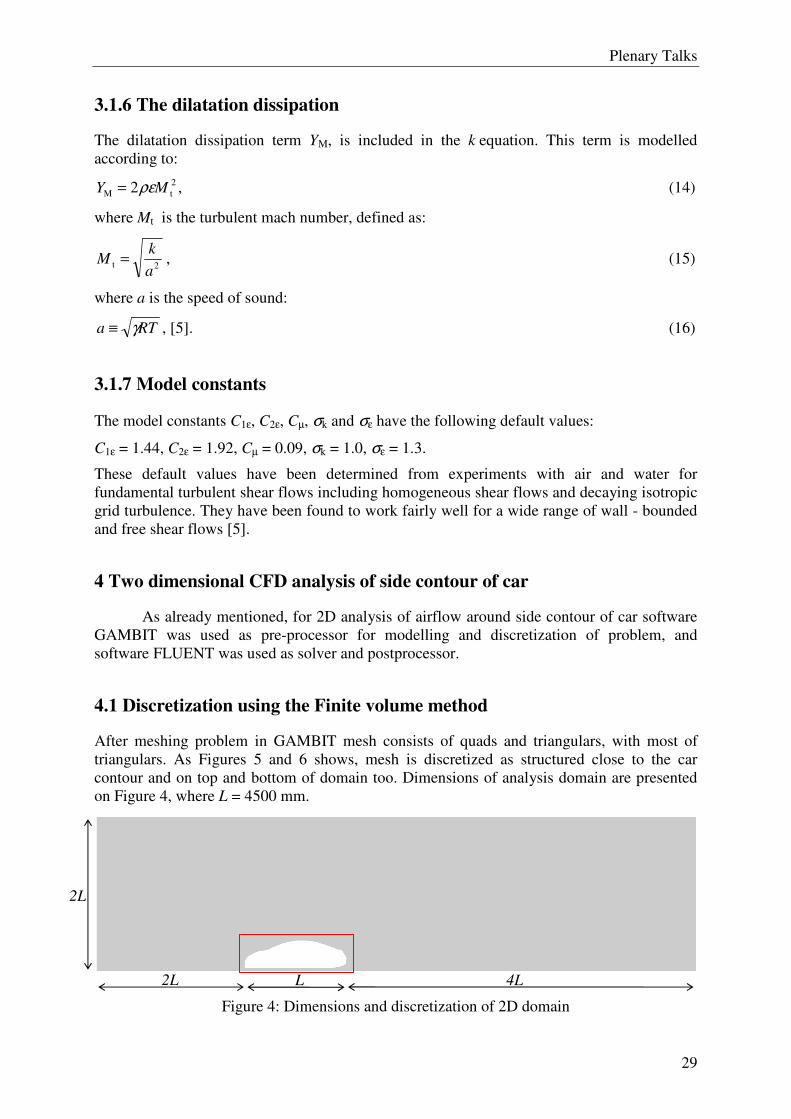
Photorealistic images of car model were made in purpose of the best presentation of car. Tool Mental Ray as standard tool of Autodesk 3ds Max software was used for rendering entire scene with car model. After applying materials and textures to each part of car and scene, each photograph takes about 45 minutes for rendering. Some of the renderings are presented on Figure 3.
Figure 3: Renderings of car
Plenary Talks
26
3 Computational fluid dynamics (CFD)
There are two possibilities to analyse aerodynamical features of vehicle and especially the turbulences: the wind tunnel and computational fluid dynamics (CFD). The efficiency and the financial aspect make CFD a better solution. Even the visualization and the accuracy are other aspects which show the advantages of CFD. New turbulence models and the increasing computing power make CFD much more important [2]. Finite volume method (FVM) was used in CFD analysis of airflow around a side car contour. For 2D analysis of airflow around side contour of car software GAMBIT was used as pre-processor for modelling and discretization of problem, and software FLUENT was used as solver and postprocessor. For 3D analysis of airflow around car geometry software ANSYS
CFX was used. The first step in a FVM is discretization of analysis area. With discretization, finite volumes are forming in way that they are touching each other (no overlap) and fills up the area of analysis. Finite volume set is also called as geometrical mesh. Geometrical mesh can be structured and unstructured. Much simplest programming of FVM is in the case of structured meshes, because the mesh consists of volumes that can be placed in columns and rows. System matrix of discretized equations in the case of structured meshes is usually diagonal, while in unstructured meshes it is not the case. FVM is more accurate in the case of structured meshes than in case of unstructured meshes (for the same number of volumes). So for the problem in this paper, taking into consideration complexity of geometry, mesh is generated as structured to the greatest possible extent. FVM is integral method based on the integration of the conservative form of transport equations by finite volumes which discretizes the area of analysis. Speed rate of change of the content of physical properties inside the finite volume is proportional to the speed rate of flow of that physical properties throw the boundaries of the finite volume and speed rate of emergence or disappearance of that physical properties inside a finite volume. After the application of numerical scheme in sense of approximation of normal derivative at the faces of the finite volumes using only the nodal values, the embedding of boundary conditions is next step. So in the system of discretized equations it is necessary to incorporate boundary conditions. Boundary conditions define the flow through the faces of the finite volumes. After the boundary conditions are set, next step is the solving of the linear algebraic equations system. In the case of the linear problem, solution is reached by only one solving a linear algebraic equations system. And in case of nonlinear problem, solving process starts from a presume solution on which basis are calculated the coefficients in discretized equations, and the equations are solved. With that obtained solutions, coefficients in the system matrix are calculated again and the system is solving again. The procedure is repeated until the coefficients in the system matrix and the solution stop changing in the number of significant digits which is prescribed in advance [3].
3.1 Theory
The governing equations for computational fluid dynamics are based on conservation of mass, momentum, and energy. Both FLUENT and ANSYS CFX use a FVM to solve the governing equations. The FVM involves discretization and integration of the governing equation over the finite volume [4]. The flow is said to be turbulent when all the transport quantities (mass, momentum and energy) exhibit periodic, irregular fluctuations in time and space. Such conditions enhance mixing of these transport variables. There is no single turbulent model that can resolve the

Plenary Talks
27
physics at all flow conditions. FLUENT and ANSYS CFX provides a wide variety of models to suit the demands of individual classes of problems. The choice of the turbulent model depends on the required level of accuracy, available computational resources, and the required turnaround time [5]. For the problem analysed in this paper, standard k - ε turbulent model is selected for both, 2D and 3D analysis. The k - ε model is one of the most common turbulent models. It is a semi - empirical, two equation model, that means, it includes two extra transport equations to represent the turbulent properties of the flow. The first transported variable is turbulent kinetic energy k. The second transported variable is the turbulent dissipation ε. It is the variable that determines the scale of the turbulence, whereas the first variable k determines the energy in the turbulence. The model transport equation for k is derived from the exact equation, while the model transport equation for ε is obtained using physical reasoning and bears little resemblance to its mathematically exact counterpart [5].
3.1.1 Governing equations
The continuity and momentum equations (Navier-Stokes equations) with a turbulence model were used to solve the airflow [9]:
0=∂
∂+
∂
∂+
∂
∂
z
w
y
v
x
u, (1)
x
xzxyB
zyx
p
z
uw
y
uv
x
uu +
∂
∂+
∂
∂+
∂
∂−=
∂
∂+
∂
∂+
∂
∂ ττ
ρρ
11, (2)
y
yzxyB
zxy
p
z
vw
y
vv
x
vu +
∂
∂+
∂
∂+
∂
∂−=
∂
∂+
∂
∂+
∂
∂ ττ
ρρ
11, (3)
z
yzxz Byxz
p
z
ww
y
wv
x
wu +
∂
∂+
∂
∂+
∂
∂−=
∂
∂+
∂
∂+
∂
∂ ττ
ρρ
11. (4)
Where u is x-component of velocity vector, v is y-component of velocity vector and w is z-component of velocity vector. ρ is density of air, p is static pressure, τ is shear stress and Bx, By, Bz are body forces [9].
3.1.2 Transport equations for standard k - εεεε turbulent model
- for turbulent kinetic energy k:
( ) ( ) kMbkjk
t
ji
i
SYGGx
k
xku
xk
t+−−++
∂
∂
+
∂
∂=
∂
∂+
∂
∂ρε
σ
µµρρ . (5)
- for dissipation ε:
( ) ( ) ( )ε
2
2bε3k1εjε
t
ji
i
Sk
CGCGk
Cxx
uxt
+−++
∂
∂
+
∂
∂=
∂
∂+
∂
∂ ερ
εε
σ
µµρερε ε . (6)

Plenary Talks
28
In these equations, Gk represents the generation of turbulence kinetic energy due to the mean velocity gradients. Gb is the generation of turbulence kinetic energy due to buoyancy. YM represents the contribution of the fluctuating dilatation in compressible turbulence to the overall dissipation rate. C1ε, C2ε and C3ε are constants. σk and σε are the turbulent Prandtl numbers for k and ε, respectively. Sk and Sε are user - defined source terms [5].
3.1.3 Turbulent viscosity
ερµ
2
µt
kC= , (7)
where Cµ is constant [5].
3.1.4 Production of turbulent kinetic energy
From the exact equation for the transport of k, this term may be defined as:
i
jjik ''
x
uuuG
∂
∂−= ρ . (8)
To evaluate Gk in a manner consistent with the Boussinesq hypothesis:
2tk SG µ= , (9)
where S is the modulus of the mean rate - of - strain tensor, defined as:
ijij2 SSS ≡ , (10)
where
∂
∂+
∂
∂=
i
j
j
iij 2
1
u
u
u
uS [5]. (11)
3.1.5 The generation of turbulence due to buoyancy
it
tib Pr x
TgG
∂
∂=
µβ , (12)
where Prt is the turbulent Prandtl number for energy and gi is the component of the gravitational vector in the i - th direction. For the standard and realizable models, the default value of Prt is 0.85 [4]. The coefficient of thermal expansion β is defined as:
p
1
∂
∂−=
T
p
ρβ [5]. (13)
Plenary Talks
29
3.1.6 The dilatation dissipation
The dilatation dissipation term YM, is included in the k equation. This term is modelled according to:
2tM 2 MY ρε= , (14)
where Mt is the turbulent mach number, defined as:
2ta
kM = , (15)
where a is the speed of sound:
RTa γ≡ , [5]. (16)
3.1.7 Model constants
The model constants C1ε, C2ε, Cµ, σk and σε have the following default values:
C1ε = 1.44, C2ε = 1.92, Cµ = 0.09, σk = 1.0, σε = 1.3.
These default values have been determined from experiments with air and water for fundamental turbulent shear flows including homogeneous shear flows and decaying isotropic grid turbulence. They have been found to work fairly well for a wide range of wall - bounded and free shear flows [5].
4 Two dimensional CFD analysis of side contour of car
As already mentioned, for 2D analysis of airflow around side contour of car software GAMBIT was used as pre-processor for modelling and discretization of problem, and software FLUENT was used as solver and postprocessor.
4.1 Discretization using the Finite volume method
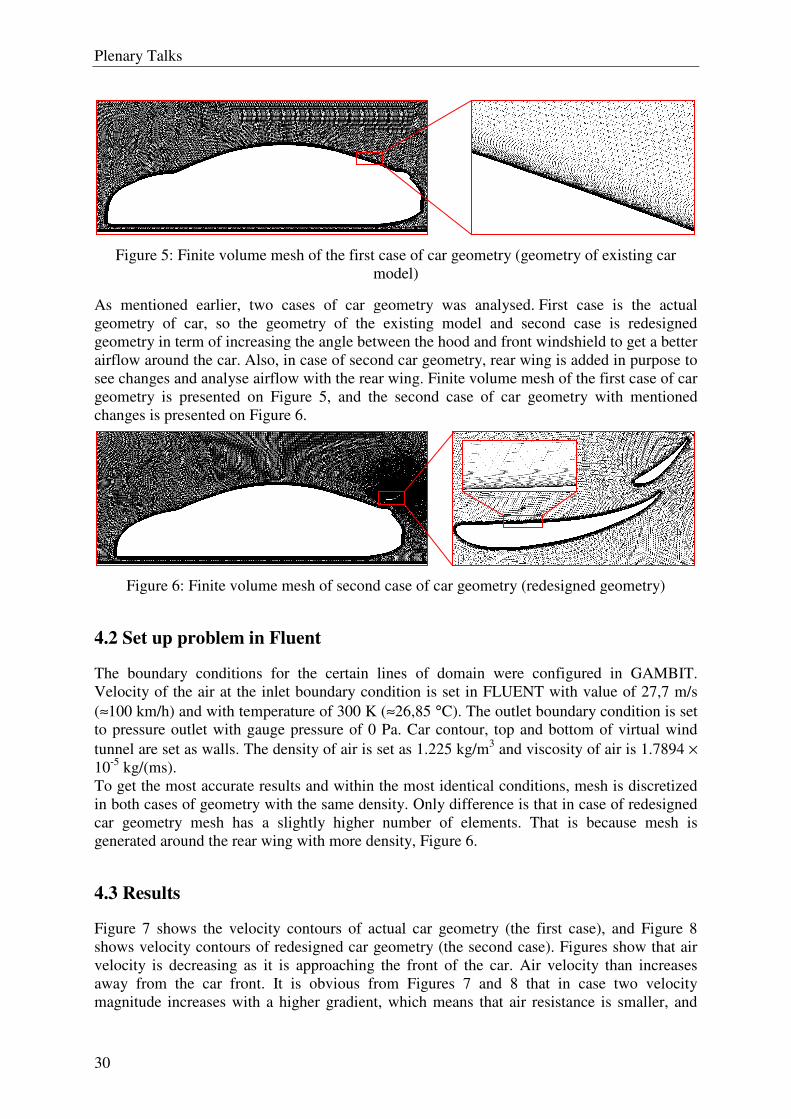
After meshing problem in GAMBIT mesh consists of quads and triangulars, with most of triangulars. As Figures 5 and 6 shows, mesh is discretized as structured close to the car contour and on top and bottom of domain too. Dimensions of analysis domain are presented on Figure 4, where L = 4500 mm.
Figure 4: Dimensions and discretization of 2D domain
L 4L 2L
2L
Plenary Talks
30
Figure 5: Finite volume mesh of the first case of car geometry (geometry of existing car model)
As mentioned earlier, two cases of car geometry was analysed. First case is the actual geometry of car, so the geometry of the existing model and second case is redesigned geometry in term of increasing the angle between the hood and front windshield to get a better airflow around the car. Also, in case of second car geometry, rear wing is added in purpose to see changes and analyse airflow with the rear wing. Finite volume mesh of the first case of car geometry is presented on Figure 5, and the second case of car geometry with mentioned changes is presented on Figure 6.
Figure 6: Finite volume mesh of second case of car geometry (redesigned geometry)
4.2 Set up problem in Fluent
The boundary conditions for the certain lines of domain were configured in GAMBIT. Velocity of the air at the inlet boundary condition is set in FLUENT with value of 27,7 m/s (≈100 km/h) and with temperature of 300 K (≈26,85 °C). The outlet boundary condition is set to pressure outlet with gauge pressure of 0 Pa. Car contour, top and bottom of virtual wind tunnel are set as walls. The density of air is set as 1.225 kg/m3 and viscosity of air is 1.7894 × 10⁻⁵ kg/(ms). To get the most accurate results and within the most identical conditions, mesh is discretized in both cases of geometry with the same density. Only difference is that in case of redesigned car geometry mesh has a slightly higher number of elements. That is because mesh is generated around the rear wing with more density, Figure 6.
4.3 Results
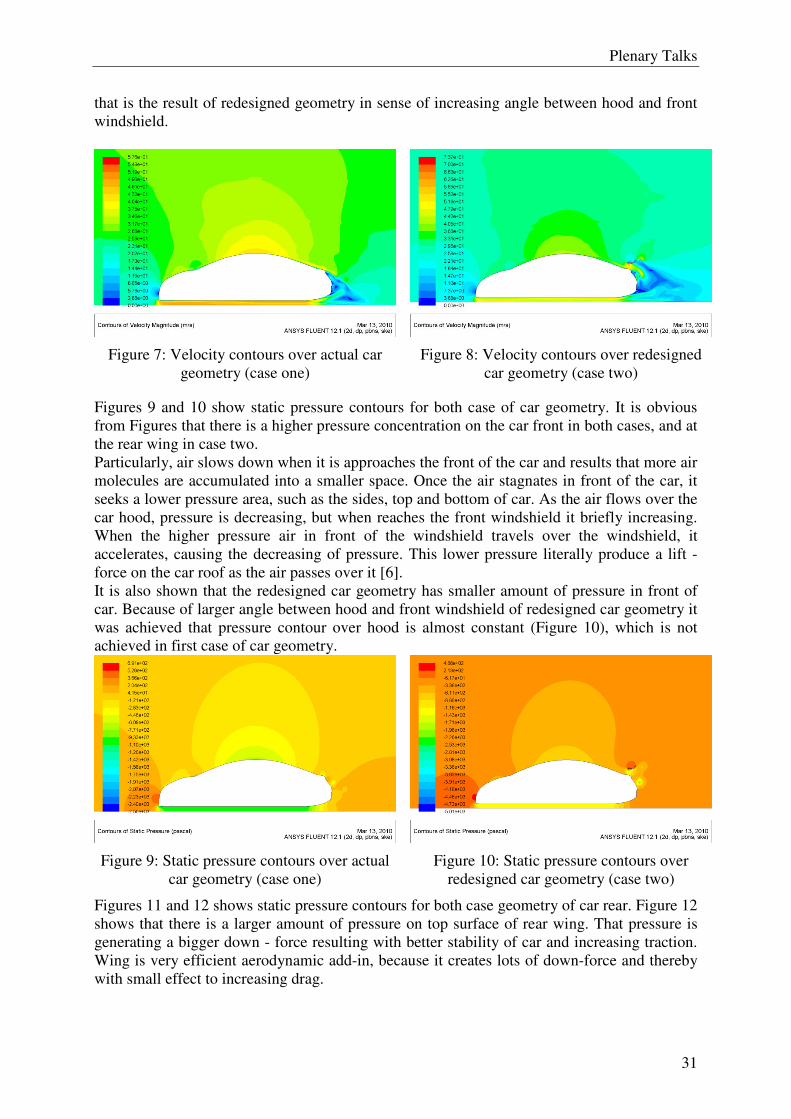
Figure 7 shows the velocity contours of actual car geometry (the first case), and Figure 8 shows velocity contours of redesigned car geometry (the second case). Figures show that air velocity is decreasing as it is approaching the front of the car. Air velocity than increases away from the car front. It is obvious from Figures 7 and 8 that in case two velocity magnitude increases with a higher gradient, which means that air resistance is smaller, and
Plenary Talks
31
that is the result of redesigned geometry in sense of increasing angle between hood and front windshield.
Figure 7: Velocity contours over actual car geometry (case one)
Figure 8: Velocity contours over redesigned car geometry (case two)
Figures 9 and 10 show static pressure contours for both case of car geometry. It is obvious from Figures that there is a higher pressure concentration on the car front in both cases, and at the rear wing in case two. Particularly, air slows down when it is approaches the front of the car and results that more air molecules are accumulated into a smaller space. Once the air stagnates in front of the car, it seeks a lower pressure area, such as the sides, top and bottom of car. As the air flows over the car hood, pressure is decreasing, but when reaches the front windshield it briefly increasing. When the higher pressure air in front of the windshield travels over the windshield, it accelerates, causing the decreasing of pressure. This lower pressure literally produce a lift - force on the car roof as the air passes over it [6]. It is also shown that the redesigned car geometry has smaller amount of pressure in front of car. Because of larger angle between hood and front windshield of redesigned car geometry it was achieved that pressure contour over hood is almost constant (Figure 10), which is not achieved in first case of car geometry.
Figure 9: Static pressure contours over actual car geometry (case one)
Figure 10: Static pressure contours over redesigned car geometry (case two)
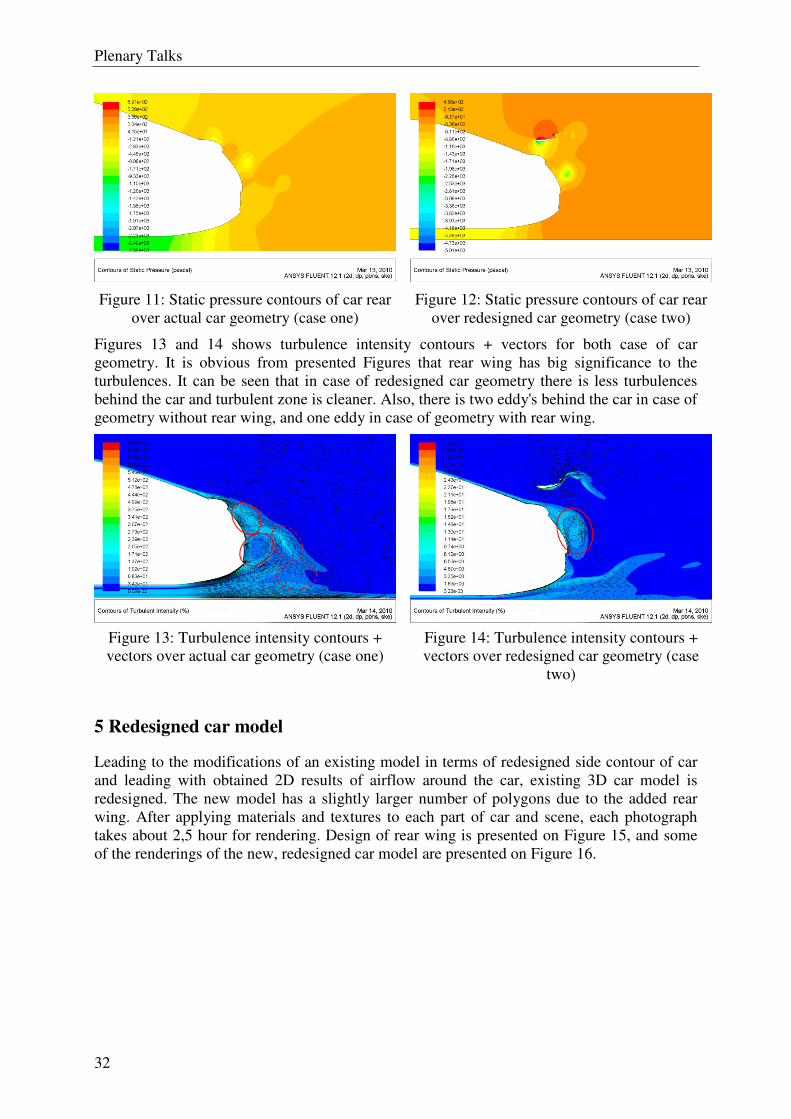
Figures 11 and 12 shows static pressure contours for both case geometry of car rear. Figure 12 shows that there is a larger amount of pressure on top surface of rear wing. That pressure is generating a bigger down - force resulting with better stability of car and increasing traction. Wing is very efficient aerodynamic add-in, because it creates lots of down-force and thereby with small effect to increasing drag.
Plenary Talks
32
Figure 11: Static pressure contours of car rear over actual car geometry (case one)
Figure 12: Static pressure contours of car rear over redesigned car geometry (case two)
Figures 13 and 14 shows turbulence intensity contours + vectors for both case of car geometry. It is obvious from presented Figures that rear wing has big significance to the turbulences. It can be seen that in case of redesigned car geometry there is less turbulences behind the car and turbulent zone is cleaner. Also, there is two eddy's behind the car in case of geometry without rear wing, and one eddy in case of geometry with rear wing.
Figure 13: Turbulence intensity contours + vectors over actual car geometry (case one)
Figure 14: Turbulence intensity contours + vectors over redesigned car geometry (case
two)
5 Redesigned car model
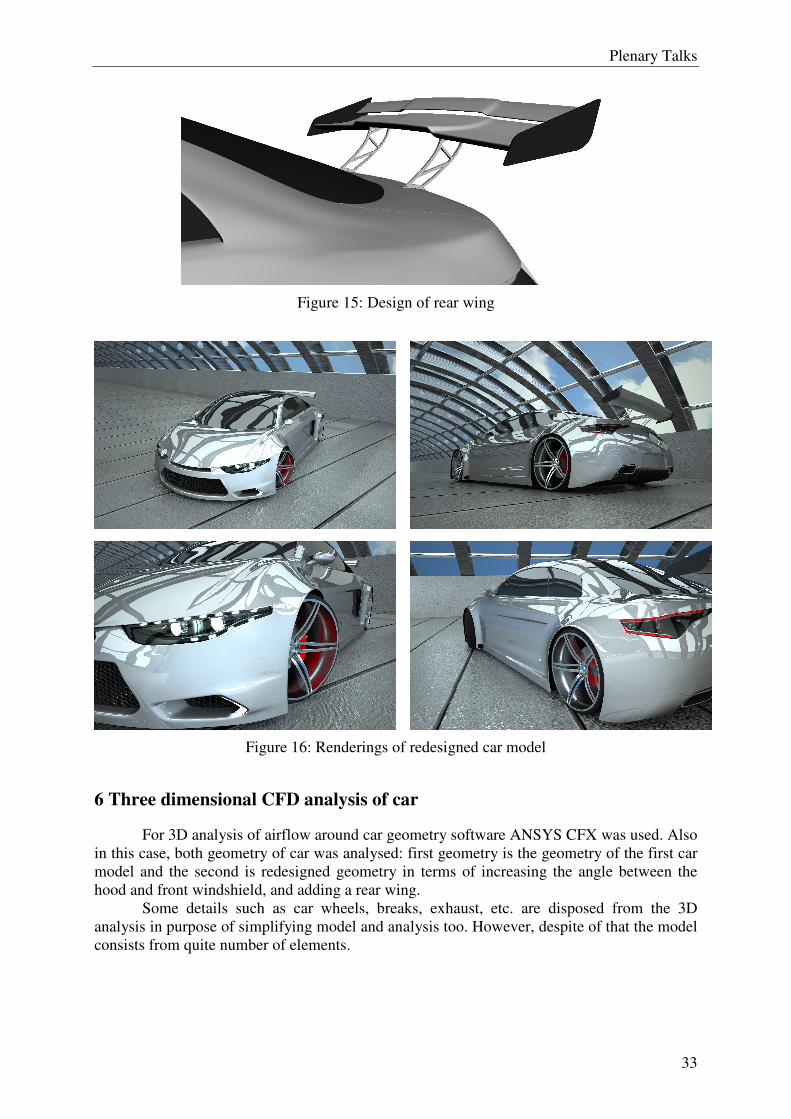
Leading to the modifications of an existing model in terms of redesigned side contour of car and leading with obtained 2D results of airflow around the car, existing 3D car model is redesigned. The new model has a slightly larger number of polygons due to the added rear wing. After applying materials and textures to each part of car and scene, each photograph takes about 2,5 hour for rendering. Design of rear wing is presented on Figure 15, and some of the renderings of the new, redesigned car model are presented on Figure 16.
Plenary Talks
33
Figure 15: Design of rear wing
Figure 16: Renderings of redesigned car model
6 Three dimensional CFD analysis of car
For 3D analysis of airflow around car geometry software ANSYS CFX was used. Also in this case, both geometry of car was analysed: first geometry is the geometry of the first car model and the second is redesigned geometry in terms of increasing the angle between the hood and front windshield, and adding a rear wing.
Some details such as car wheels, breaks, exhaust, etc. are disposed from the 3D analysis in purpose of simplifying model and analysis too. However, despite of that the model consists from quite number of elements.
Plenary Talks
34
6.1 Discretization using the Finite volume method
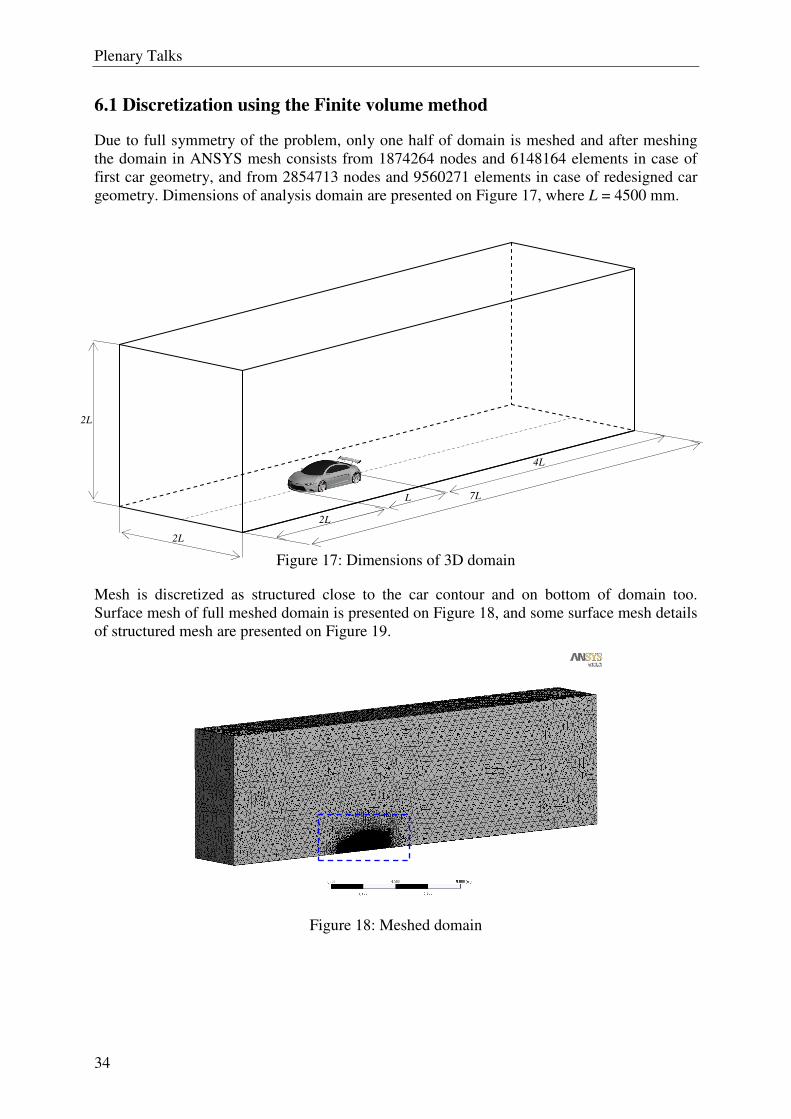
Due to full symmetry of the problem, only one half of domain is meshed and after meshing the domain in ANSYS mesh consists from 1874264 nodes and 6148164 elements in case of first car geometry, and from 2854713 nodes and 9560271 elements in case of redesigned car geometry. Dimensions of analysis domain are presented on Figure 17, where L = 4500 mm.
Figure 17: Dimensions of 3D domain
Mesh is discretized as structured close to the car contour and on bottom of domain too. Surface mesh of full meshed domain is presented on Figure 18, and some surface mesh details of structured mesh are presented on Figure 19.
Figure 18: Meshed domain
L
4L
2L
7L
2L
2L
Plenary Talks
35
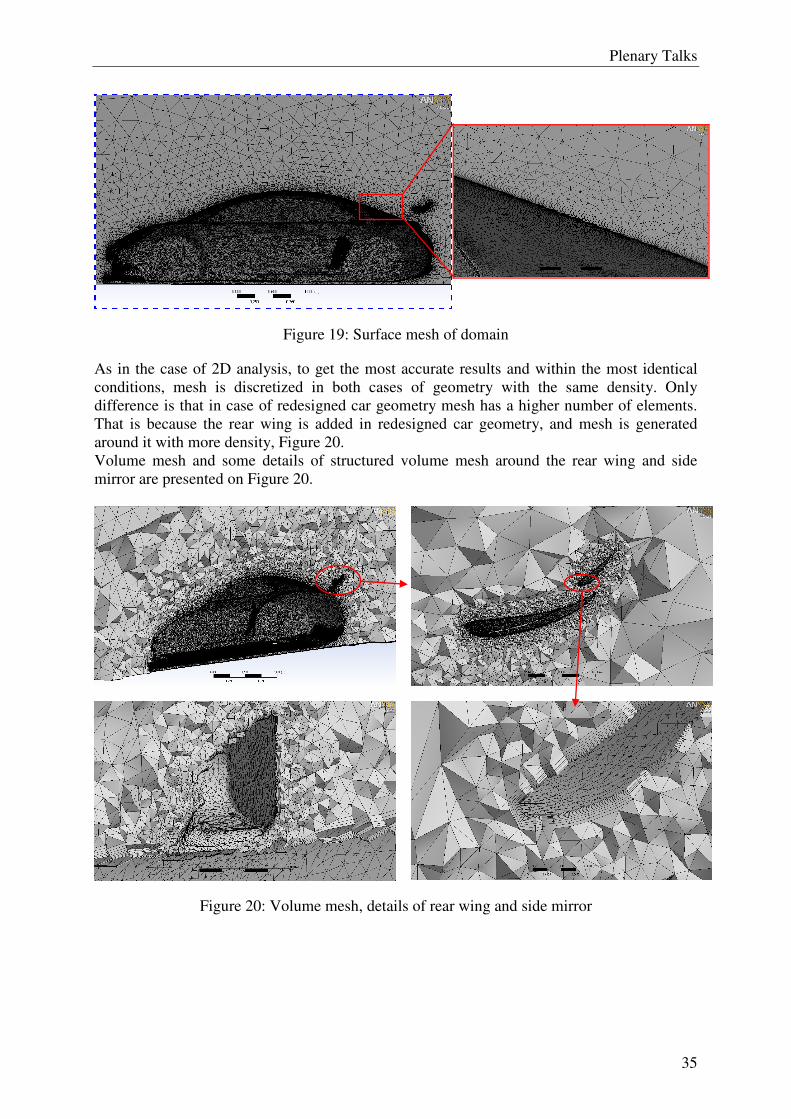
Figure 19: Surface mesh of domain
As in the case of 2D analysis, to get the most accurate results and within the most identical conditions, mesh is discretized in both cases of geometry with the same density. Only difference is that in case of redesigned car geometry mesh has a higher number of elements. That is because the rear wing is added in redesigned car geometry, and mesh is generated around it with more density, Figure 20. Volume mesh and some details of structured volume mesh around the rear wing and side mirror are presented on Figure 20.
Figure 20: Volume mesh, details of rear wing and side mirror
Plenary Talks
36
6.2 Set up problem in ANSYS CFX
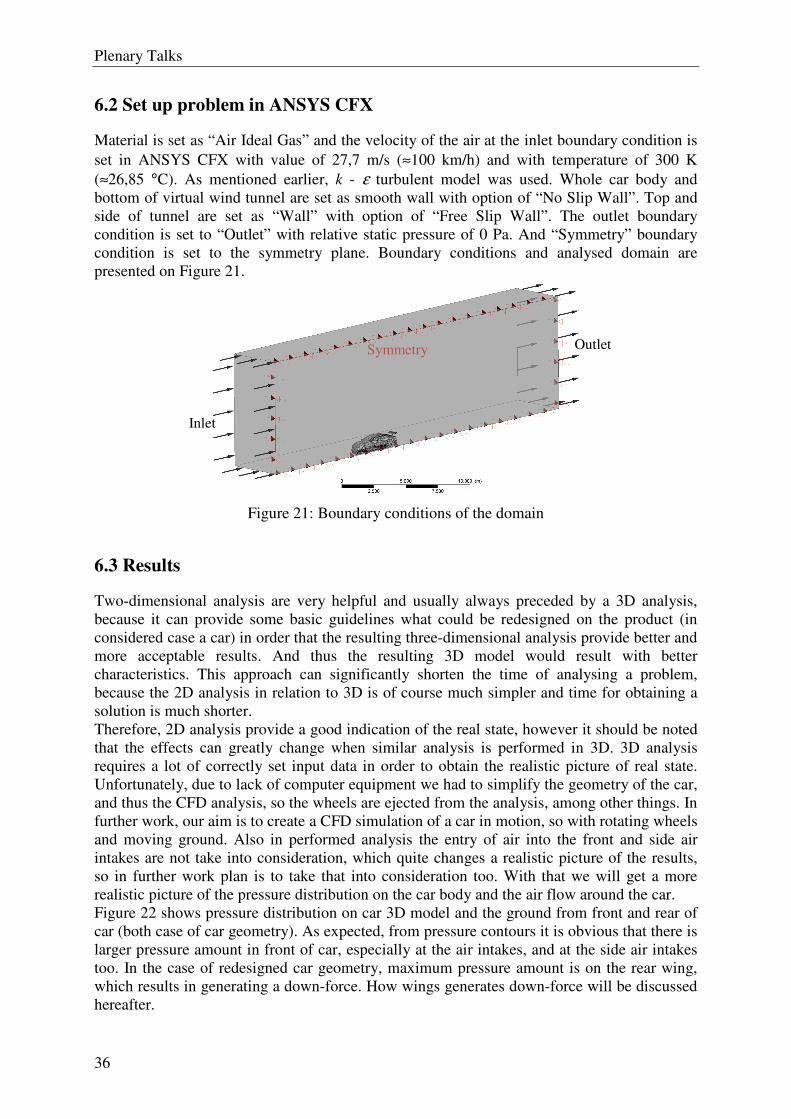
Material is set as “Air Ideal Gas” and the velocity of the air at the inlet boundary condition is set in ANSYS CFX with value of 27,7 m/s (≈100 km/h) and with temperature of 300 K (≈26,85 °C). As mentioned earlier, k - ε turbulent model was used. Whole car body and bottom of virtual wind tunnel are set as smooth wall with option of “No Slip Wall”. Top and side of tunnel are set as “Wall” with option of “Free Slip Wall”. The outlet boundary condition is set to “Outlet” with relative static pressure of 0 Pa. And “Symmetry” boundary condition is set to the symmetry plane. Boundary conditions and analysed domain are presented on Figure 21.
Figure 21: Boundary conditions of the domain
6.3 Results
Two-dimensional analysis are very helpful and usually always preceded by a 3D analysis, because it can provide some basic guidelines what could be redesigned on the product (in considered case a car) in order that the resulting three-dimensional analysis provide better and more acceptable results. And thus the resulting 3D model would result with better characteristics. This approach can significantly shorten the time of analysing a problem, because the 2D analysis in relation to 3D is of course much simpler and time for obtaining a solution is much shorter. Therefore, 2D analysis provide a good indication of the real state, however it should be noted that the effects can greatly change when similar analysis is performed in 3D. 3D analysis requires a lot of correctly set input data in order to obtain the realistic picture of real state. Unfortunately, due to lack of computer equipment we had to simplify the geometry of the car, and thus the CFD analysis, so the wheels are ejected from the analysis, among other things. In further work, our aim is to create a CFD simulation of a car in motion, so with rotating wheels and moving ground. Also in performed analysis the entry of air into the front and side air intakes are not take into consideration, which quite changes a realistic picture of the results, so in further work plan is to take that into consideration too. With that we will get a more realistic picture of the pressure distribution on the car body and the air flow around the car. Figure 22 shows pressure distribution on car 3D model and the ground from front and rear of car (both case of car geometry). As expected, from pressure contours it is obvious that there is larger pressure amount in front of car, especially at the air intakes, and at the side air intakes too. In the case of redesigned car geometry, maximum pressure amount is on the rear wing, which results in generating a down-force. How wings generates down-force will be discussed hereafter.
Inlet
Outlet Symmetry
Plenary Talks
37
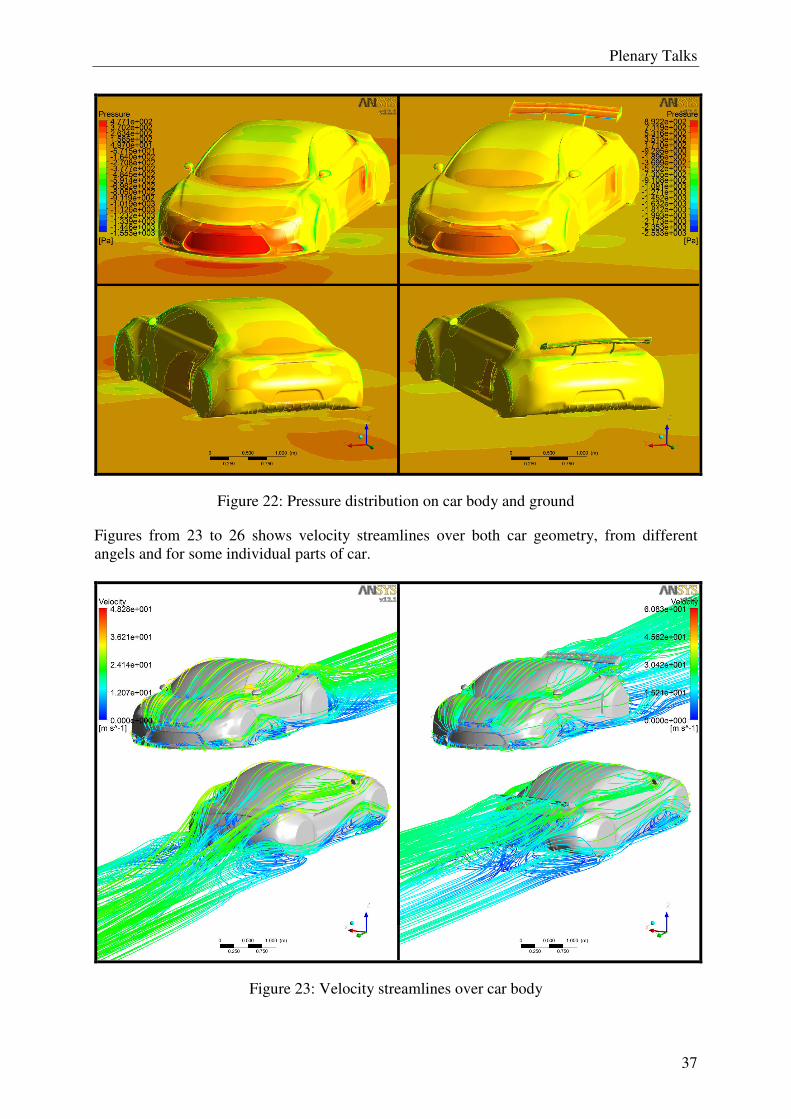
Figure 22: Pressure distribution on car body and ground
Figures from 23 to 26 shows velocity streamlines over both car geometry, from different angels and for some individual parts of car.
Figure 23: Velocity streamlines over car body
Plenary Talks
38
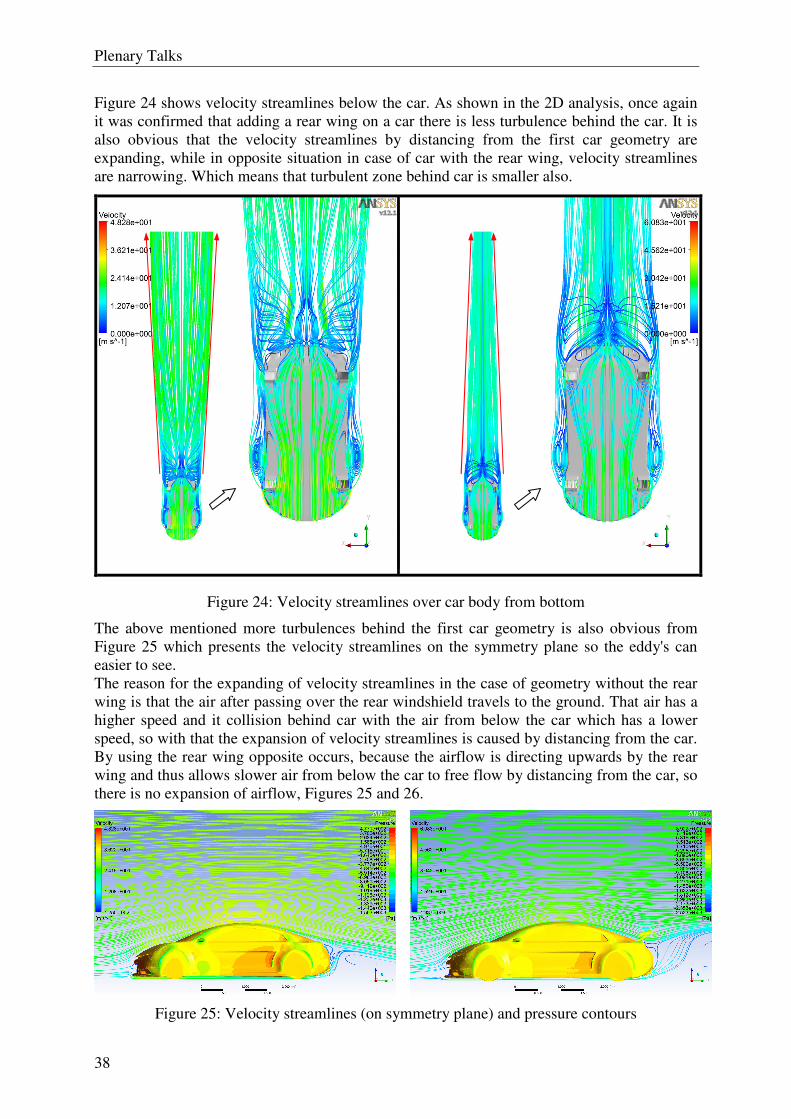
Figure 24 shows velocity streamlines below the car. As shown in the 2D analysis, once again it was confirmed that adding a rear wing on a car there is less turbulence behind the car. It is also obvious that the velocity streamlines by distancing from the first car geometry are expanding, while in opposite situation in case of car with the rear wing, velocity streamlines are narrowing. Which means that turbulent zone behind car is smaller also.
Figure 24: Velocity streamlines over car body from bottom
The above mentioned more turbulences behind the first car geometry is also obvious from Figure 25 which presents the velocity streamlines on the symmetry plane so the eddy's can easier to see. The reason for the expanding of velocity streamlines in the case of geometry without the rear wing is that the air after passing over the rear windshield travels to the ground. That air has a higher speed and it collision behind car with the air from below the car which has a lower speed, so with that the expansion of velocity streamlines is caused by distancing from the car. By using the rear wing opposite occurs, because the airflow is directing upwards by the rear wing and thus allows slower air from below the car to free flow by distancing from the car, so there is no expansion of airflow, Figures 25 and 26.
Figure 25: Velocity streamlines (on symmetry plane) and pressure contours
Plenary Talks
39
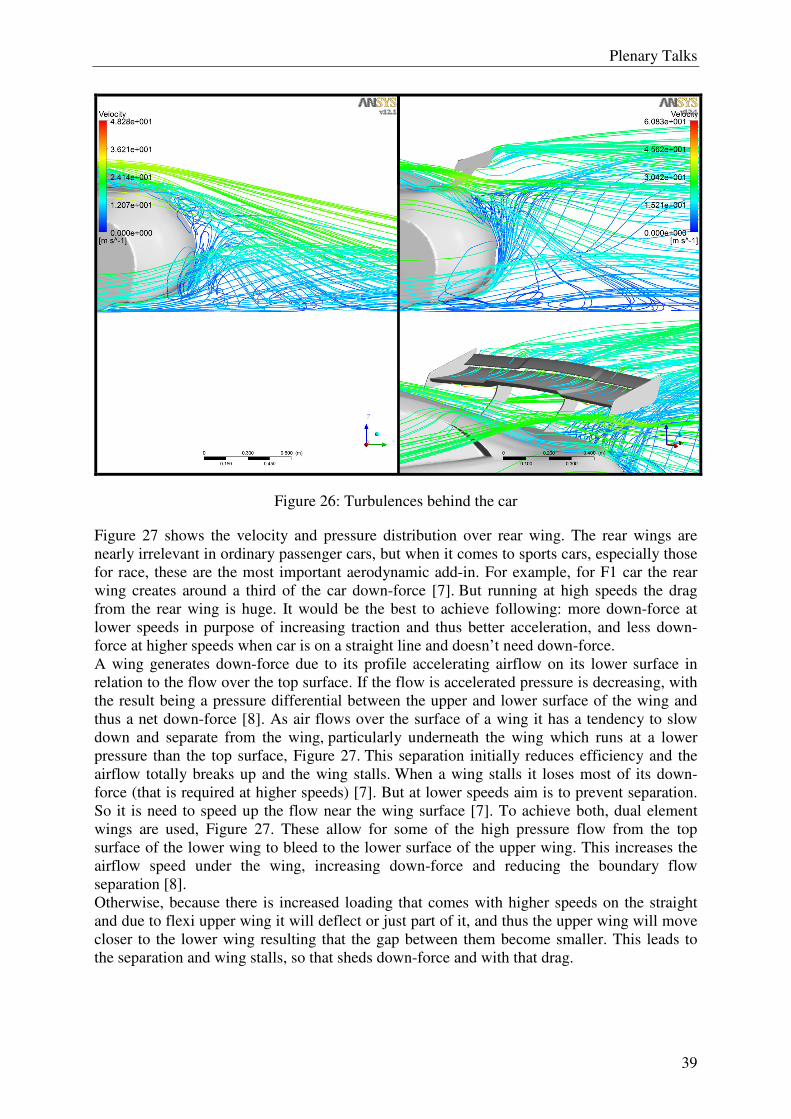
Figure 26: Turbulences behind the car
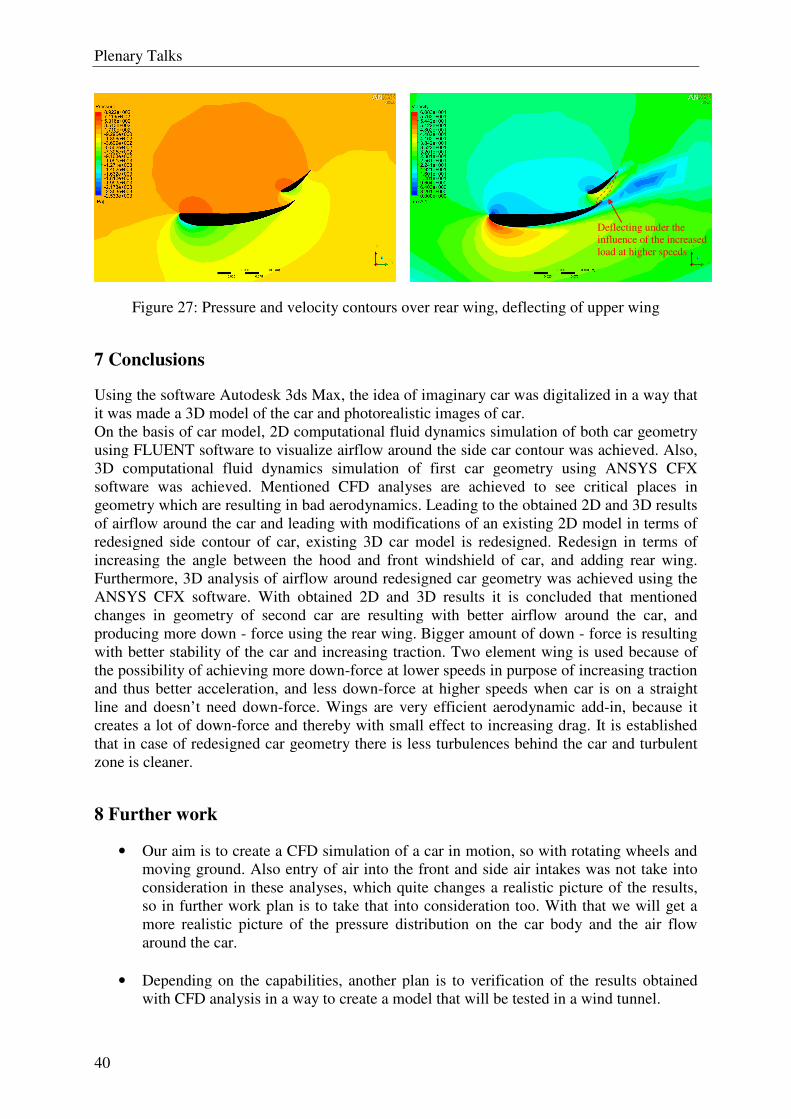
Figure 27 shows the velocity and pressure distribution over rear wing. The rear wings are nearly irrelevant in ordinary passenger cars, but when it comes to sports cars, especially those for race, these are the most important aerodynamic add-in. For example, for F1 car the rear wing creates around a third of the car down-force [7]. But running at high speeds the drag from the rear wing is huge. It would be the best to achieve following: more down-force at lower speeds in purpose of increasing traction and thus better acceleration, and less down-force at higher speeds when car is on a straight line and doesn’t need down-force. A wing generates down-force due to its profile accelerating airflow on its lower surface in relation to the flow over the top surface. If the flow is accelerated pressure is decreasing, with the result being a pressure differential between the upper and lower surface of the wing and thus a net down-force [8]. As air flows over the surface of a wing it has a tendency to slow down and separate from the wing, particularly underneath the wing which runs at a lower pressure than the top surface, Figure 27. This separation initially reduces efficiency and the airflow totally breaks up and the wing stalls. When a wing stalls it loses most of its down-force (that is required at higher speeds) [7]. But at lower speeds aim is to prevent separation. So it is need to speed up the flow near the wing surface [7]. To achieve both, dual element wings are used, Figure 27. These allow for some of the high pressure flow from the top surface of the lower wing to bleed to the lower surface of the upper wing. This increases the airflow speed under the wing, increasing down-force and reducing the boundary flow separation [8]. Otherwise, because there is increased loading that comes with higher speeds on the straight and due to flexi upper wing it will deflect or just part of it, and thus the upper wing will move closer to the lower wing resulting that the gap between them become smaller. This leads to the separation and wing stalls, so that sheds down-force and with that drag.
Plenary Talks
40
Figure 27: Pressure and velocity contours over rear wing, deflecting of upper wing
7 Conclusions
Using the software Autodesk 3ds Max, the idea of imaginary car was digitalized in a way that it was made a 3D model of the car and photorealistic images of car. On the basis of car model, 2D computational fluid dynamics simulation of both car geometry using FLUENT software to visualize airflow around the side car contour was achieved. Also, 3D computational fluid dynamics simulation of first car geometry using ANSYS CFX software was achieved. Mentioned CFD analyses are achieved to see critical places in geometry which are resulting in bad aerodynamics. Leading to the obtained 2D and 3D results of airflow around the car and leading with modifications of an existing 2D model in terms of redesigned side contour of car, existing 3D car model is redesigned. Redesign in terms of increasing the angle between the hood and front windshield of car, and adding rear wing. Furthermore, 3D analysis of airflow around redesigned car geometry was achieved using the ANSYS CFX software. With obtained 2D and 3D results it is concluded that mentioned changes in geometry of second car are resulting with better airflow around the car, and producing more down - force using the rear wing. Bigger amount of down - force is resulting with better stability of the car and increasing traction. Two element wing is used because of the possibility of achieving more down-force at lower speeds in purpose of increasing traction and thus better acceleration, and less down-force at higher speeds when car is on a straight line and doesn’t need down-force. Wings are very efficient aerodynamic add-in, because it creates a lot of down-force and thereby with small effect to increasing drag. It is established that in case of redesigned car geometry there is less turbulences behind the car and turbulent zone is cleaner.
8 Further work
• Our aim is to create a CFD simulation of a car in motion, so with rotating wheels and moving ground. Also entry of air into the front and side air intakes was not take into consideration in these analyses, which quite changes a realistic picture of the results, so in further work plan is to take that into consideration too. With that we will get a more realistic picture of the pressure distribution on the car body and the air flow around the car.
• Depending on the capabilities, another plan is to verification of the results obtained with CFD analysis in a way to create a model that will be tested in a wind tunnel.
Deflecting under the influence of the increased load at higher speeds
Plenary Talks
41
References
[1] http://www.autozine.org/technical_school/aero/tech_aero.htm (17.06.2010) [2] Milad Mafi, "Investigation of Turbulence Created by Formula One™ Cars with the
Aid of Numerical Fluid Dynamics and Optimization of Overtaking Potential", Competence Centre, Transtec AG, Tübingen, Germany
[3] Virag, Zdravko, Lectures from course "Numerical methods" [4] Luke Jongebloed, "Numerical Study using FLUENT of the Separation and
Reattachment Points for Backwards - Facing Step Flow", Mechanical Engineering Rensselaer Polytechnic Institute, Hartford, Connecticut, December, 2008
[5] ANSYS Fluent, Release 12.1: Help Topics [6] http://www.up22.com/Aerodynamics.htm (25.07.2010) [7] http://scarbsf1.wordpress.com/2010/03/04/blown-rear-wings-seperating-and-stalling/
(07.09.2010) [8] http://www.racecar-engineering.com/articles/f1/449813/f-ducts-how-do-they-
work.html (08.09.2010) [9] Popat, B.C., 1991. Study of Flow and Noise Generation from Car A-pillars, Ph.D.
Thesis, Department of Aeronautics, Imperial College of Science, Technology and Medicine, The University of London, UK.
Author data
Dražan Kozak, Željko Ivandić, Marija Živić, Darko Damjanović Mechanical Engineering Faculty in Slavonski Brod, Josip Juraj Strossmayer University of Osijek. Trg Ivane Brlić Mažuranić 2, 35000 Slavonski Brod, Croatia. E-mail: [email protected], [email protected], [email protected],
Plenary Talks
42
Modern materials and technologies
in steam boiler power plant production
1Ivan Samardžić, 1Antun Stoić, 1Ivica Kladarić and 2Marko Dunñer
1Ivan Samardžić, 1Antun Stoić, 1Ivica Kladarić and 2Marko Dunñer 1Mechanical Engineering Faculty in Slavonski Brod, University of Osijek, CROATIA, 2Politechnika department of Faculty for philosophy, University of Rijeka, CROATIA
Abstract: The paper presents some of the most recently used materials and welding technologies suitable for application in steam boiler power plants. It provides an insight into important properties of these materials and some aspects of weldability. Moreover, the authors explained the most important mechanical engineering technologies, which are necessary for fast, reliable and cost efficient production of components and whole steam boiler power plant.
Keywords: energy, power plant, materials, technologies, welding
1 Introduction
Energy plays an important role in our everyday life. Global demands for energy consumption are constantly increasing. Development of any country or society is closely connected with energy consumption. Energy is needed in all production processes, for heating in households and in every other aspect of everyday life. Rational energy use and energy saving on all levels and in all possible situations have to become our common obligation for future generations. The authors of the present paper briefly present some aspects and views of energy trends in EU up to 2030 and provide some practical instructions for successful application of modern welding technology in a workshop.
2 Demands for energy – assessment needs in EU up to 2030
Care about energy consumption has become not only an economical question, but also a political and strategic question. Each country developed a plan or strategy on how to be less independent in energy sense. The EU made an assessment of needs for energy up to 2030, which is shown in Figure 1. There is an evident increase of energy needs in almost all fields (industry, household, transport and tertiary sector). Furthermore, Figure 2 shows an estimation of production capacity according to individual energy sources – EU until 2030. Based on this assessment, one can conclude that an issue of thermal power plants setup, as well as their maintenance will be significantly present in the next two decades. In that sense, application of modern materials with better mechanical properties (strength at elevated temperatures, creep resistance, weldability…) will be also of high priority. Despite of crisis, investments in that field in new equipment and new technologies are still present. In near future it is possible to expect improvements in thermal power plant production, application of modern materials and technologies, which main task will be to provide energy necessary for each community.
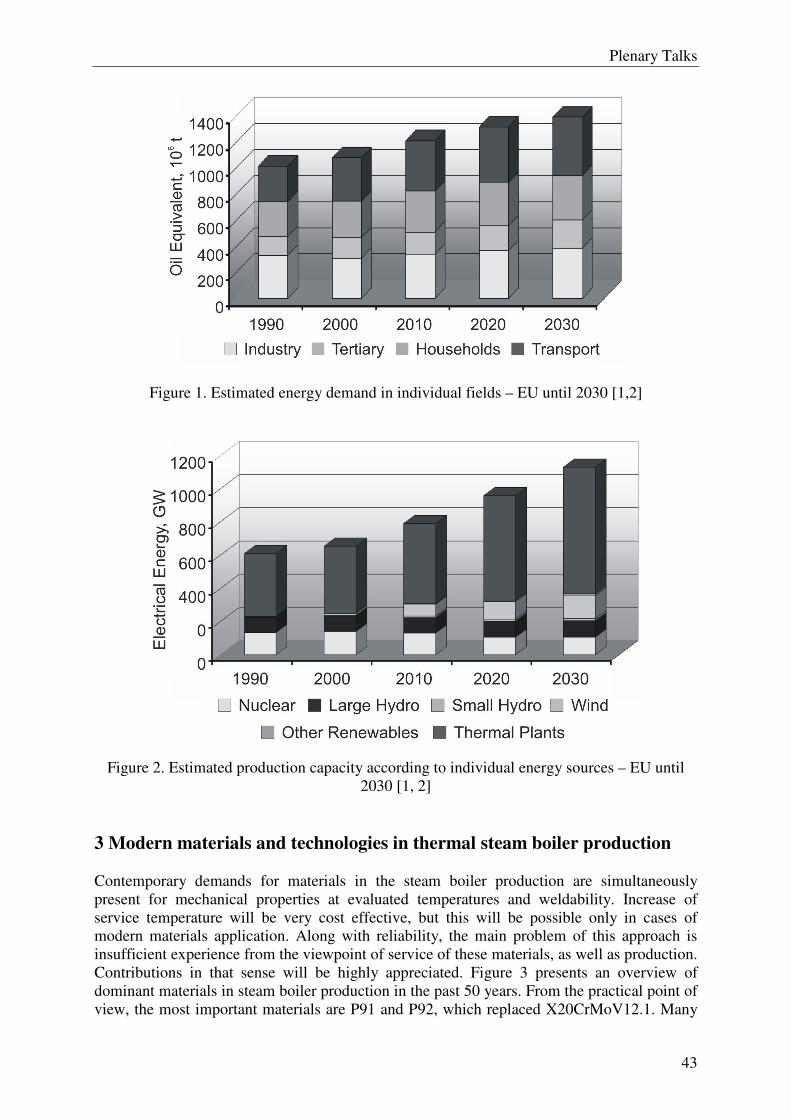
Plenary Talks
43
Figure 1. Estimated energy demand in individual fields – EU until 2030 [1,2]
Figure 2. Estimated production capacity according to individual energy sources – EU until 2030 [1, 2]
3 Modern materials and technologies in thermal steam boiler production Contemporary demands for materials in the steam boiler production are simultaneously present for mechanical properties at evaluated temperatures and weldability. Increase of service temperature will be very cost effective, but this will be possible only in cases of modern materials application. Along with reliability, the main problem of this approach is insufficient experience from the viewpoint of service of these materials, as well as production. Contributions in that sense will be highly appreciated. Figure 3 presents an overview of dominant materials in steam boiler production in the past 50 years. From the practical point of view, the most important materials are P91 and P92, which replaced X20CrMoV12.1. Many
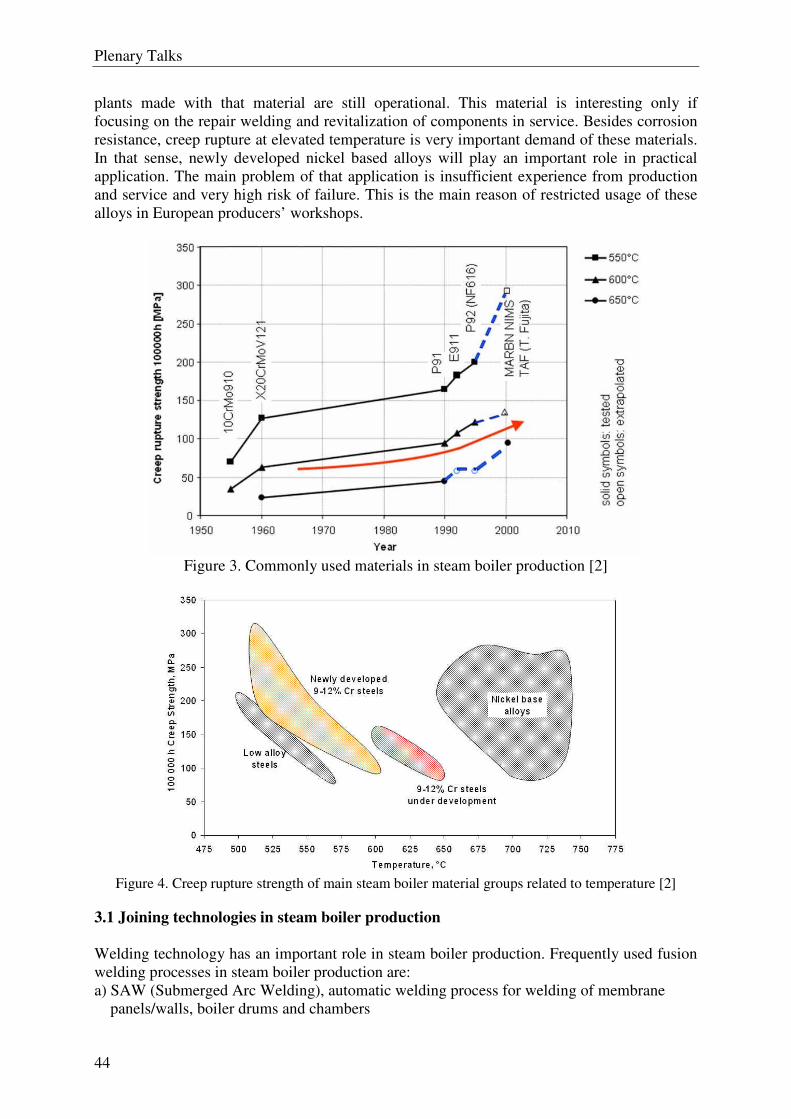
Plenary Talks
44
plants made with that material are still operational. This material is interesting only if focusing on the repair welding and revitalization of components in service. Besides corrosion resistance, creep rupture at elevated temperature is very important demand of these materials. In that sense, newly developed nickel based alloys will play an important role in practical application. The main problem of that application is insufficient experience from production and service and very high risk of failure. This is the main reason of restricted usage of these alloys in European producers’ workshops.
Figure 3. Commonly used materials in steam boiler production [2]
Figure 4. Creep rupture strength of main steam boiler material groups related to temperature [2]
3.1 Joining technologies in steam boiler production
Welding technology has an important role in steam boiler production. Frequently used fusion welding processes in steam boiler production are: a) SAW (Submerged Arc Welding), automatic welding process for welding of membrane panels/walls, boiler drums and chambers
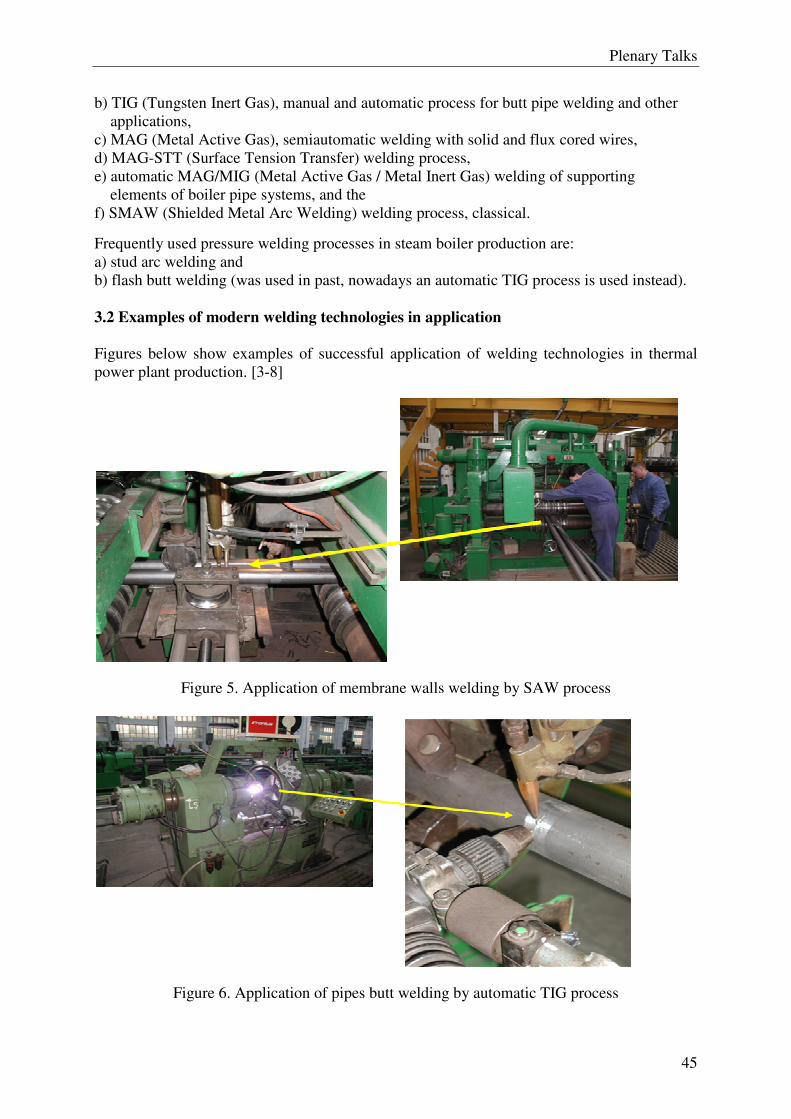
Plenary Talks
45
b) TIG (Tungsten Inert Gas), manual and automatic process for butt pipe welding and other applications, c) MAG (Metal Active Gas), semiautomatic welding with solid and flux cored wires, d) MAG-STT (Surface Tension Transfer) welding process, e) automatic MAG/MIG (Metal Active Gas / Metal Inert Gas) welding of supporting elements of boiler pipe systems, and the f) SMAW (Shielded Metal Arc Welding) welding process, classical.
Frequently used pressure welding processes in steam boiler production are: a) stud arc welding and b) flash butt welding (was used in past, nowadays an automatic TIG process is used instead).
3.2 Examples of modern welding technologies in application
Figures below show examples of successful application of welding technologies in thermal power plant production. [3-8]
Figure 5. Application of membrane walls welding by SAW process
Figure 6. Application of pipes butt welding by automatic TIG process
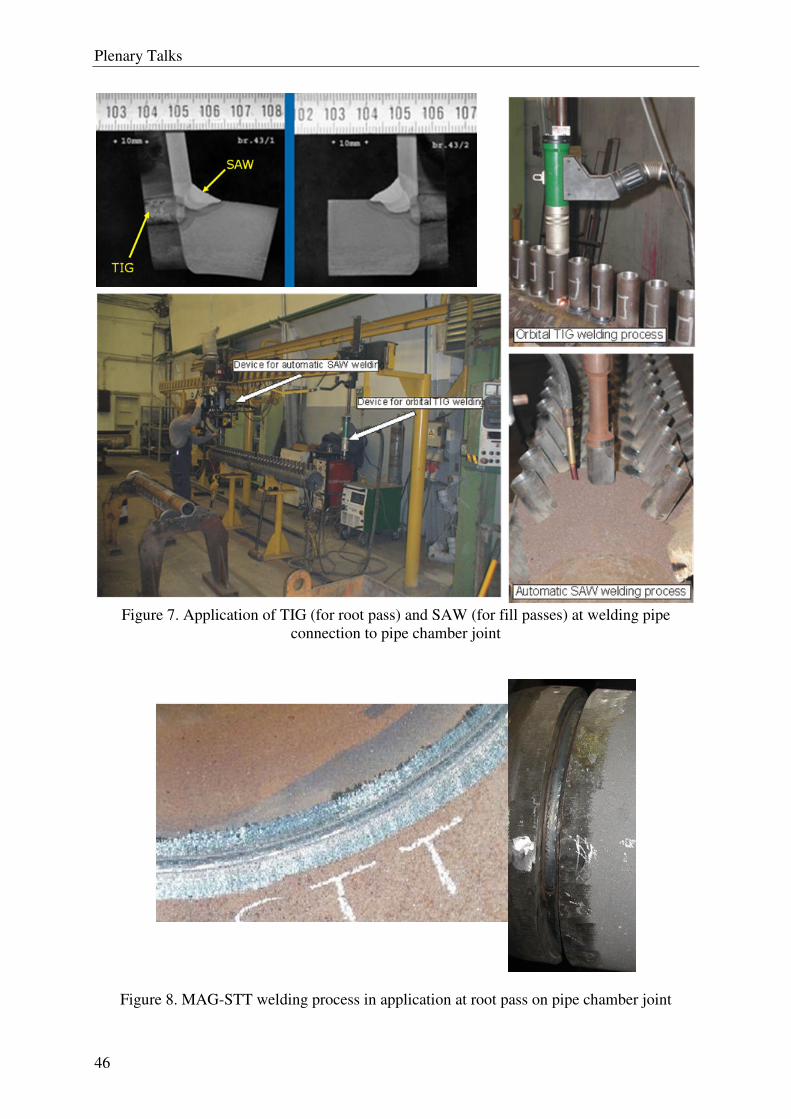
Plenary Talks
46
Figure 7. Application of TIG (for root pass) and SAW (for fill passes) at welding pipe
connection to pipe chamber joint
Figure 8. MAG-STT welding process in application at root pass on pipe chamber joint
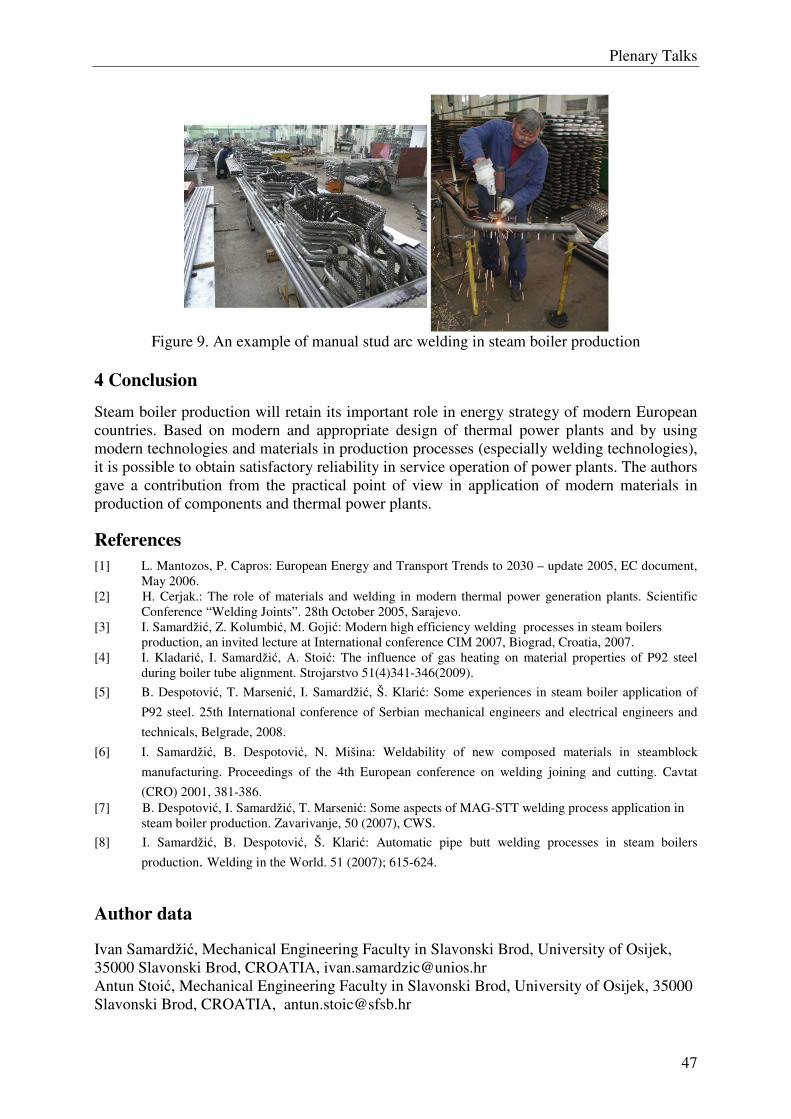
Plenary Talks
47
Figure 9. An example of manual stud arc welding in steam boiler production
4 Conclusion
Steam boiler production will retain its important role in energy strategy of modern European countries. Based on modern and appropriate design of thermal power plants and by using modern technologies and materials in production processes (especially welding technologies), it is possible to obtain satisfactory reliability in service operation of power plants. The authors gave a contribution from the practical point of view in application of modern materials in production of components and thermal power plants.
References
[1] L. Mantozos, P. Capros: European Energy and Transport Trends to 2030 – update 2005, EC document, May 2006.
[2] H. Cerjak.: The role of materials and welding in modern thermal power generation plants. Scientific Conference “Welding Joints”. 28th October 2005, Sarajevo.
[3] I. Samardžić, Z. Kolumbić, M. Gojić: Modern high efficiency welding processes in steam boilers production, an invited lecture at International conference CIM 2007, Biograd, Croatia, 2007.
[4] I. Kladarić, I. Samardžić, A. Stoić: The influence of gas heating on material properties of P92 steel during boiler tube alignment. Strojarstvo 51(4)341-346(2009).
[5] B. Despotović, T. Marsenić, I. Samardžić, Š. Klarić: Some experiences in steam boiler application of
P92 steel. 25th International conference of Serbian mechanical engineers and electrical engineers and
technicals, Belgrade, 2008.
[6] I. Samardžić, B. Despotović, N. Mišina: Weldability of new composed materials in steamblock
manufacturing. Proceedings of the 4th European conference on welding joining and cutting. Cavtat
(CRO) 2001, 381-386. [7] B. Despotović, I. Samardžić, T. Marsenić: Some aspects of MAG-STT welding process application in
steam boiler production. Zavarivanje, 50 (2007), CWS.
[8] I. Samardžić, B. Despotović, Š. Klarić: Automatic pipe butt welding processes in steam boilers
production. Welding in the World. 51 (2007); 615-624.
Author data
Ivan Samardžić, Mechanical Engineering Faculty in Slavonski Brod, University of Osijek, 35000 Slavonski Brod, CROATIA, [email protected] Antun Stoić, Mechanical Engineering Faculty in Slavonski Brod, University of Osijek, 35000 Slavonski Brod, CROATIA, [email protected]

Plenary Talks
48
Ivica Kladarić, Mechanical Engineering Faculty in Slavonski Brod, University of Osijek, 35000 Slavonski Brod, CROATIA, [email protected] Marko Dunñer, Politechnika department of Faculty for philosophy, University of Rijeka, CROATIA, [email protected]

49
Agriculture
Agriculture
50
Musttisztítási eljárások hatása az Olaszrizling bor minőségére
Baglyas F., Földházi O. 1Kecskeméti Főiskola Kertészeti Főiskolai Kar, Gyümölcs- és Szőlőtermesztési Intézet
Kecskemét, Erdei f. tér 1-3. [email protected]
Összefoglalás: A musttisztítás alapvető célja a must fizikai, fiziko-kémiai és biológiai állapotának
optimalizálása az erjedés irányításához és a borminőség javításához. Technológiai és minőségi szempontok (lassabb erjedés, tisztább illat, elsődleges és erjedési aromaanyagok jobb megőrzése) alapján ma a must minél hatékonyabb tisztítását célozzák meg a minőségi fehérbor készítésben.
A must normál körülmények között kb. 10-30% szedimentet tartalmaz és ez az arány rothadt szőlő és erőteljes préselés esetén csak növekedhet. A különböző kezelésekkel mennyiségét 10% de, inkább 5% alá kell csökkenteni. A szediment tartalom jelentős részének eltávolításával a must belső felülete lecsökken, megkönnyítve ezzel a must további kezelését. A tisztítás után visszamaradó anyagok a borélesztők számára nélkülözhetetlen tápanyagokat tartalmaznak, ezért fontos, hogy túltisztítással ne csökkentsük mennyiségüket az optimális szint alá. Kiemelendő még, hogy jelentős illat- és aroma anyagok károsodhatnak a flotációs, a hiperoxidációs, és a szeparációs musttisztításoknál, ezért ezek nem kerültek alkalmazásra. Abstract: The main goal of must clarification is to optimize physical-chemical and biological conditions in order to obtain to better manage fermentation and improve wine quality. Based on technologic and quality concerns a possibly most effective must clarification is inevitable (slower fermentation, cleaner fragrance, better conservation of primary and fermentation aromas).
Must usually contains 10-30% sediment and this ratio can be higher when rot grape is processed or the presser in the press is high. Different clarification treatments can lower this rate below 5-10%. By removing sediment the inner surface of must is reduced and further must/wine treatments became easier. It is important not to over clarify the must because sediment contains nutriments for yeasts. As must flotation, separation and hyper-oxidation can damage fragrance and aromas these methods were not applied. Keywords: must clarification methods, fragrances, aromas, overal wine qualiy
1. Bevezetés
A hagyományos, kisüzemi borászatokban évszázadokon keresztül alacsony nyomáson, kézi préssel préselték ki a zúzott cefrét (gyakran kocsánnyal együtt). A kíméletes préselés, kis nyomás következtében az elválasztott must lebegőanyag tartalma alacsony volt. Az erjesztés pincehőmérsékleten, kis űrtartalmú edényekben (leginkább fahordókban) történt. Ennek eredményeképpen az erjedés viszonylag lassan ment végbe és megőrződtek az elsődleges és erjedési zamatanyagok, illatok.
A nagyüzemi borászkodással iparszerűen, nagy tömegben dolgozzák fel a szőlőt. A feldolgozás, préselés során jelentős mennyiségű lebegő anyag kerül a mustba és a borba. Ez stabilitási problémát okoz, az erjedési hőmérsékletet emeli és az illat, aroma anyagok eltűnnek a borból vagy átalakulnak. Ezért ma már bevált gyakorlat a fehérborok készítésekor, hogy a mustot erjesztés előtt tisztítják.
A tisztításnak többféle módszere létezik:
Agriculture
51
– ülepítés (gravitációs úton) – nyálkázás (rothadt szőlő feldolgozásakor) – kénessavas ülepítés hűtéssel egybekötve – derítőszerek alkalmazása (agyagásvány, fehérje alapú) – derítőszerrel történő erjesztés – flotálás – szeparálás – hiperoxidáció
Ezek költséges beavatkozások, melyekkel vékonyítjuk a mustot, kivonunk belőle értékes
aromaanyagokat. Ebben a cikkben mikrovinifikációs körülmények között végeztünk különböző
musttisztítási eljárásokat és hasonlítottuk össze az ezekből kierjedt borok minőségét.
2. Irodalmi áttekintés
A musttisztítás alapvető célja a must fizikai, fiziko-kémiai és biológiai állapotának optimalizálása az erjedés irányításához és a borminőség javításához. Technológiai és minőségi szempontok (lassabb erjedés, tisztább illat, elsődleges és erjedési aromaanyagok jobb megőrzése) alapján ma a must minél hatékonyabb tisztítását célozzák meg a minőségi fehérbor készítésben [2].
A must normál körülmények között kb. 10-30% szedimentet tartalmaz és ez az arány rothadt szőlő és erőteljes préselés esetén csak növekedhet. A különböző kezelésekkel mennyiségét 10% de, inkább 5% alá kell csökkenteni. A szediment tartalom jelentős részének eltávolításával a must belső felülete lecsökken, megkönnyítve ezzel a must további kezelését. A tisztítás után visszamaradó anyagok a borélesztők számára nélkülözhetetlen tápanyagokat tartalmaznak, ezért fontos, hogy túltisztítással ne csökkentsük mennyiségüket az optimális szint alá. Kiemelendő még, hogy jelentős illat- és aroma anyagok károsodhatnak a flotációs, a hiperoxidációs, és a szeparációs musttisztításoknál.
A hiperoxidációs eljárás tekintetében, a szőlőfajtákra gyakorolt hatása nem egységes, az általam vizsgált olaszrizling fajtánál a szakirodalom a negatív hatásokat emeli ki [2].
Mindezek következtében, a most felsorolt eljárásokat nem vettem alkalmazásba, mint musttisztítási lehetőséget, helyette a kíméletesebbeket helyeztem előtérbe, illetve vizsgáltam a kísérletek során. I. Gravitációs ülepítés
Szerényebb mértékű tisztulást eredményező eljárás, amelynél az ülepedés a gravitációs erőnek köszönhető. Az ülepítési idő meghosszabbításával a letisztult must mennyisége növelhető. Célszerű a módszert hűtéssel kombinálni, a must lehűtése 10˚C alatti hőmérsékletre, fékezi az erjedés beindulását. A gravitációs ülepítésnek technológiai feltételei vannak, melyek között elsődleges a must erjedésmentessége. A must szabadkénessav-tartalma (15-25 mg/l) biztosítja üzemi körülmények között a 24-48 órás erjedésmentességet. A must zavarosító anyagai közül csak azok ülepíthetők, amelyek a folyadéknál nagyobb sűrűségűek. A folyadékkal azonos, vagy ettől kisebb sűrűségű anyagok, semmilyen ülepítő hatásra nem ülepszenek le. Azok a mustok, amelyek sok kis fajsúlyú üledékanyagot tartalmaznak, ülepítéssel nem tisztíthatók elég hatékonyan. Ülepítés után a tisztult mustot lefejtjük üledékéről [2].
Agriculture
52
II. Bentonitos derítés : A bentonit a borászatban termolabilis fehérjék megkötésére és ezáltal, a későbbi
fehérjezavarosodások megakadályozására használjuk. Derítő hatása abban áll, hogy a musthoz adva néhány perc alatt durva pehelyképződést okoz, majd a finom részecskék a bentonit pelyheken adszorbeálódnak. A keletkezett zavarosító anyagok flokkulálnak, kicsapódnak és leülepszenek. A bentonit igény nagyon eltérő lehet fajtától, termőhelytől is függ. Csapadékban szegény évek, főleg a nyár végi, őszi időszakban, magasabb bentonit igényt eredményeznek. A szőlő a bogyókban energiatárolóként fehérjét raktároz. Minél nagyobb stressznek van kitéve a növény, annál több tartalékot képez. Ezzel magyarázható a csapadékszegény évjáratokban a magasabb bentonitigény. Alacsonyabb hőmérsékleten a bentonitigény és a derítés ideje is megnő. A derítési művelet különösen ajánlható a Botrytises szőlő mustjánál, mivel a bentonit megköti a lakkáz fehérje komponenseit, ezzel az enzim működésképtelenné válik, így meggátolja a barnatörés kialakulását. Bentonitos derítés után a mustok extrakt-, invertcukor-, hamu-, hamualkalitás-, borkősav- és almasav tartalmában mérhető változás nem történik [3].
A bentonit túlzott mértékű használatával a mustba kerülő bizonyos anyagok, elsősorban a kalcium, kedvezőtlen hatást gyakorolnak az állóképességre.
A túlzott mértékű fém beoldódás számos kiválás előidézője, melyek esetenként igen nehezen szüntethetők meg [3].
A manapság alkalmazott korszerű bentonitokat szigorú tisztítási eljárásnak vetik alá, amellyel már kiküszöbölhető a fent nevezett probléma. A bentonitos kezelés a mustok értékes aminosavainak 20%-40%-át is kivonhatja.
A fehérjéken kívül jelentős mennyiségű alacsonyabb molekulasúlyú nitrogén vegyületet (peptonok, polipeptidek) is eltávolít. A bentonit fehérjemegkötő képessége akkor nagyobb ha a must savasabb és a cserzőanyag tartalom kevesebb. A fehér mustok bentonitos kezelés után világosabbá, zöldesebb árnyalatúvá válnak, mert részben adszorbeálja a mély színt okozó polifenolokat. A növényvédőszer maradványok eltávolításában a bentonit két értékes tulajdonsága vesz részt : a kation cserélő képessége és derítő hatása.
A bentonitok duzzadási képessége az egyik legfontosabb tulajdonsága, minél nagyobb, annál hatékonyabb az adszorbeáló képessége, mivel nagyobb aktív felülettel rendelkeznek. A túlzott duzzadás a növekvő bentonit térfogattal szemben viszont nagyobb termékveszteséget eredményez [4]. III. Zselatinos derítés:
A zselatin a legelterjedtebb fehérjetartalmú derítőszer a borászatban. Pozitív elektromos töltésének köszönhetően a must negatív töltésű tannintartalmával képez csapadékot. A keletkezett pelyhes csapadék a felületén adszorbeálja a szuszpendált részecskéket. A zselatin flokkulációját elősegítik a kationok, az oxigén, az alacsonyabb hőmérséklet és a magasabb pH érték. A fémek (kationok) közül elsősorban az igen aktív háromértékű vassal reagál, tannin-vas komplex formában flokkulálva a zselatinnal. Használatával csökkenthető a nem kívánt polifenolok (pl. a keserű ízt okozó katechinek) mennyisége. Meggátolja a barnulást és a nem tipikus öregedést is [2].
3. Anyag és módszer
Ugyanazt a megfelelően egalizált mustot különböző módszerekkel tisztítottuk. Az ezt megelőző és az ezt követő eljárások ugyanakkor, minden minta esetében ugyanazok voltak. Ennek megfelelően lehetőség nyílt a különböző eljárással tisztított mustokból erjesztett borok
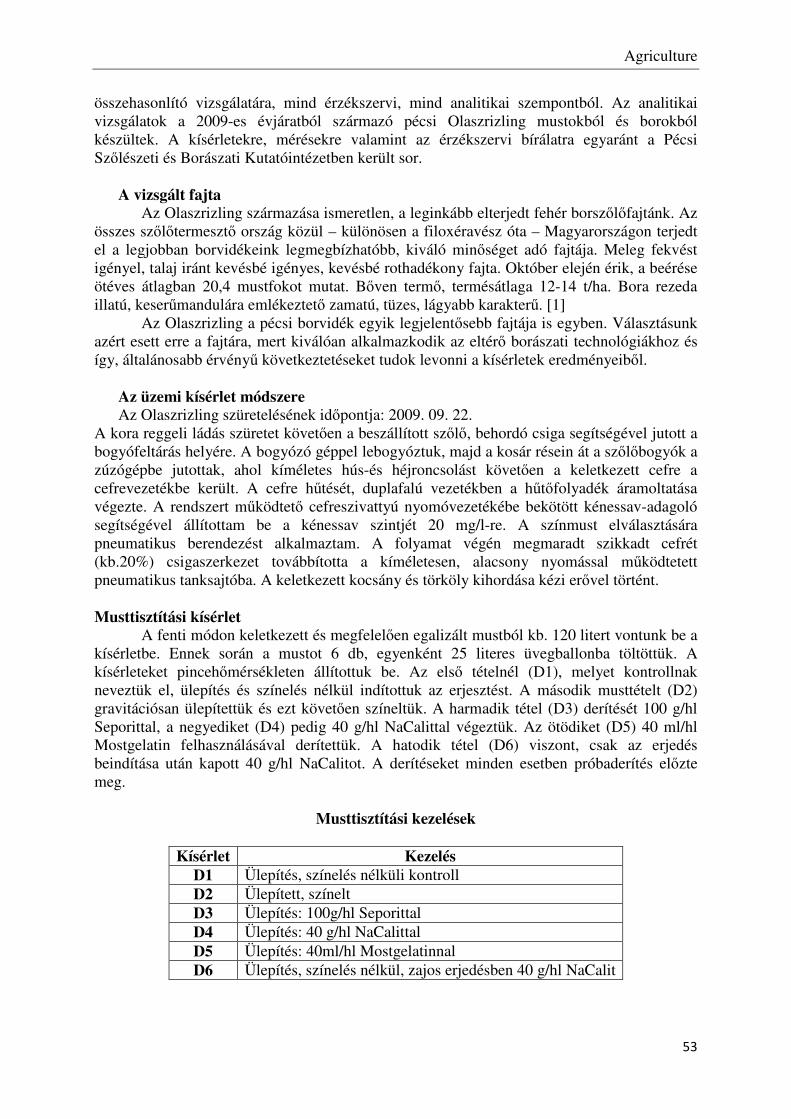
Agriculture
53
összehasonlító vizsgálatára, mind érzékszervi, mind analitikai szempontból. Az analitikai vizsgálatok a 2009-es évjáratból származó pécsi Olaszrizling mustokból és borokból készültek. A kísérletekre, mérésekre valamint az érzékszervi bírálatra egyaránt a Pécsi Szőlészeti és Borászati Kutatóintézetben került sor.
A vizsgált fajta
Az Olaszrizling származása ismeretlen, a leginkább elterjedt fehér borszőlőfajtánk. Az összes szőlőtermesztő ország közül – különösen a filoxéravész óta – Magyarországon terjedt el a legjobban borvidékeink legmegbízhatóbb, kiváló minőséget adó fajtája. Meleg fekvést igényel, talaj iránt kevésbé igényes, kevésbé rothadékony fajta. Október elején érik, a beérése ötéves átlagban 20,4 mustfokot mutat. Bőven termő, termésátlaga 12-14 t/ha. Bora rezeda illatú, keserűmandulára emlékeztető zamatú, tüzes, lágyabb karakterű. [1]
Az Olaszrizling a pécsi borvidék egyik legjelentősebb fajtája is egyben. Választásunk azért esett erre a fajtára, mert kiválóan alkalmazkodik az eltérő borászati technológiákhoz és így, általánosabb érvényű következtetéseket tudok levonni a kísérletek eredményeiből.
Az üzemi kísérlet módszere Az Olaszrizling szüretelésének időpontja: 2009. 09. 22.
A kora reggeli ládás szüretet követően a beszállított szőlő, behordó csiga segítségével jutott a bogyófeltárás helyére. A bogyózó géppel lebogyóztuk, majd a kosár résein át a szőlőbogyók a zúzógépbe jutottak, ahol kíméletes hús-és héjroncsolást követően a keletkezett cefre a cefrevezetékbe került. A cefre hűtését, duplafalú vezetékben a hűtőfolyadék áramoltatása végezte. A rendszert működtető cefreszivattyú nyomóvezetékébe bekötött kénessav-adagoló segítségével állítottam be a kénessav szintjét 20 mg/l-re. A színmust elválasztására pneumatikus berendezést alkalmaztam. A folyamat végén megmaradt szikkadt cefrét (kb.20%) csigaszerkezet továbbította a kíméletesen, alacsony nyomással működtetett pneumatikus tanksajtóba. A keletkezett kocsány és törköly kihordása kézi erővel történt. Musttisztítási kísérlet
A fenti módon keletkezett és megfelelően egalizált mustból kb. 120 litert vontunk be a kísérletbe. Ennek során a mustot 6 db, egyenként 25 literes üvegballonba töltöttük. A kísérleteket pincehőmérsékleten állítottuk be. Az első tételnél (D1), melyet kontrollnak neveztük el, ülepítés és színelés nélkül indítottuk az erjesztést. A második musttételt (D2) gravitációsan ülepítettük és ezt követően színeltük. A harmadik tétel (D3) derítését 100 g/hl Seporittal, a negyediket (D4) pedig 40 g/hl NaCalittal végeztük. Az ötödiket (D5) 40 ml/hl Mostgelatin felhasználásával derítettük. A hatodik tétel (D6) viszont, csak az erjedés beindítása után kapott 40 g/hl NaCalitot. A derítéseket minden esetben próbaderítés előzte meg.
Musttisztítási kezelések
Kísérlet Kezelés D1 Ülepítés, színelés nélküli kontroll D2 Ülepített, színelt D3 Ülepítés: 100g/hl Seporittal D4 Ülepítés: 40 g/hl NaCalittal D5 Ülepítés: 40ml/hl Mostgelatinnal D6 Ülepítés, színelés nélkül, zajos erjedésben 40 g/hl NaCalit

Agriculture
54
Az előzőekben leírt, eltérő kísérleti paramétereken kívül, a folyamat további részei mindenben megegyeztek. A vizsgált mustok alacsony savtartalmát savemeléssel javítottuk 2 g/l borkősav hozzáadásával. A nagyobb lényeredék érdekében pedig 1 g/hl Lallzyme HC enzimmel kezeltünk minden egyes tételt. A fajélesztős beoltás előtt rehidratáltuk az élesztő sejteket és fokozatosan a mustok hőmérsékletére hűtöttük. Ezt követően adagoltuk a normál erjedésintenzitású Uvaferm CEG típusú fajélesztőt 20 g/hl mennyiségben.
Az erjedés nyomon követése a cukorfogyás és az erjedési hőmérséklet mérésével, valamint érzékszervi vizsgálattal történt. Ennek során a szükséges mennyiségben (3x10g/hl) Uvavital élesztő tápsót adagoltunk az erjedés optimális lefutása érdekében. A folyamatok során a hőmérséklet 15-19 ºC között alakult, ugyanis az üvegballon miatt a hűtéses erjesztésre nem volt lehetőség, a viszonylagosan nagy felület azonban meggátolta a túlzott felmelegedést. A kierjedt újboroknál a biológiai almasav bontást megelőzendő, korai, zárt fejtést és hűtést alkalmaztunk. Ezt követően, próbakénezés alapján a szabad kénessav tartalmat 35-40 mg/l-re állítottuk be. A borok végső stabilitásukat és tükrös tisztaságukat a membránszűréssel érték el.
Vizsgálati módszerek:
A mustok és borok alap analízis vizsgálatai: • Magyar mustfok (MMº) mérés MSZ-9491-86 szerint • Etilalkohol tartalom mérés MSZ-9458-72 4.2. 2. szerint • Titrálható savtartalom: mérés sav-bázis titrálással, MSZ-9472-86 szerint • pH: mérés kombinált üvegelektróddal, MSZ-14849-79 szerint • Redukáló cukortartalom: mérés Schoorl-módszerrel MSZ-l4841-73 1 szerint • Kénessav tartalom: szabad/összes, MSZ-9465-85 szerint • Illósav tartalom: titrálással MSZ-9473-87 szerint • Összes extrakt-tartalom: mérés EGK 2676/90/4 szerint
4. Eredmények és megvitatásuk
Must alap analítika összefoglalása: Ki kell emelni, hogy a kísérletet csak az adott évjárat közegében szabad csak
megvizsgálni, mivel, nem függetleníthetjük magunkat tőle. A 2009-es évjáratban lágy mustok készültek, amelyeknél savemelést hajtottam végre. Nagyobb hangsúlyt kapott a pektinbontás, amely a mustban maradva, védőkolloid hatásával gátolta volna a tisztulást. Mustok ásványi anyag összefoglalása :
Az évjárat fényében vizsgáltuk a mustok tisztulását és azok ásványi anyagokra gyakorolt hatását is. A mustok ásványi anyag tartalma az optimális és az alsó határértékek (Mg és Zn tartalom) között mozgott, az időjárási viszonyok káros hatása miatt. Kiemelkedő eredmények az alábbiak : Az AFN mennyiségét a gravitációsan ülepített (D2) és a bentonitos tételek (D3,D4,D6) jelentősen lecsökkentették, mivel ezek hatására, a termolabilis fehérjék nagy arányban távoztak. A mustzselatin erre kevésbé bizonyult alkalmasnak. A cink mennyiségét a (kontrollhoz képest) szintén jól lecsökkentette a musttisztítás. Kiemelkedő fontosságú a vas mennyisége, amelynél a kontrollhoz viszonyítva 50%-al alacsonyabb volt a tisztított mustok Fe tartalma. Ez nélkülözhetetlen a vasas törések megelőzésében. A foszfor és a mangán tartalmat csak enyhén, a kálium és magnézium tartalmat, pedig gyakorlatilag nem csökkentette a musttisztítás.

Agriculture
55
Az alkoholos erjedés összefoglalása : A musttisztítás tápanyag csökkentő hatása és a kénfülledtség megelőzésére Uvavital
tápsó adagolása vált szükségesé. A D6-os tételt a kísérletnek csak ebben a szakaszában indítottuk el. Az erjedése nem
tekinthető optimális lefutásúnak. Kockázatot rejt magában az erjedés közben hozzáadott bentonit, mivel, gátolta az egyenletes lefutást a sok lebegő anyag. Végső soron csak félszárazra erjedt ki, ezért az eljárást alkalmazását a továbbiakban nem javasljuk.
Az oldhatatlan szediment anyagokat tartalmazó must (D1 és D6) erjedése lényegesen gyorsabb, de kompromisszumot kell kötni az erjedési idő hosszúságában, más előnyösebb tulajdonságok érdekében. A lassabb erjedés (D2, D4, D5) mellett tisztább illatú, elsődleges és erjedési aromaanyagok jobb megőrzését biztosítja. Óvakodjunk azonban, a túlzott mértékű musttisztítástól, mert az, az erjedés elhúzódásához, esetleg elakadásához vezethet.
A Seporitos (D3-as) tétel ötvözte a kedvező tulajdonságokat, mert a legrövidebb erjesztési idő mellett, az illat és aromamegőrzésben is az élen járt. Ezen tulajdonságai, a bentonitok között is kiemelkedővé tették. Bor alapanalítika összefoglalása:
Az újborok harmonikus savtartalommal rendelkeztek a kierjedés után. A D2 és D3 boroknál nagyobb az illósodás veszélye. A nagyobb szediment tartalmúak (D1 és D6) magasabb extrakt tartalommal is rendelkeztek. Borok ásványi anyag összefoglalása :
Az Uvavital hatását a mért ásványi anyag tartalomban ki kell emelni. Jelentősen növelte ugyanis a foszfor, kálium és a magnézium mennyiségét. A túlzott mennyiségek káros töréseket, kiválásokat (ferri-foszfát, kálium-hidrogén –tartarát) idézhetnek elő. Az átlagosnál alacsonyabb kiindulási értékek miatt, ezek a káros folyamatok nem játszódtak le. Egy magasabb értékekkel rendelkező mintában, azonban már kockázatot rejthet, ha túlzott mennyiségű tápsót adagolunk. Javasoljuk mindezek figyelembe vételét és további vizsgálatokat ebben a témában.
A kísérletben szereplő összes tétel, egyaránt megfelelt a szabvány által előírt határértékeknek. A cink és a vas tartalom, borokban is megtartotta a musttisztítással elért kedvező, alacsony mennyiségeit. A korábban magasabb Zn és Fe tartalmú kontroll (D1) a borkezelések folyamán.
Irodalomjegyzék
[1] Csepregi P.-Zilai J. (1988): Szőlőfajtaismeret és fajtahasználat, Mezőgazdasági Kiadó, Budapest
[2] Eperjesi I. – Kállay M. – Magyar I. (1998): Borászat, Mezőgazda Kiadó, Budapest [3] Ferenczi S. (1979): A borstabilitás irányai, Borgazdaság 27. (1) [4] Janky F. (1997): A minőségi fehérborkészítés, Kert. Élelmip. Egyetem nov. 26.
Agriculture
56
Influence of sowing time on germination of different lettuce types
(Lactuca sativa L.) Teuta Benković-Lačić1, Krunoslav Mirosavljević1, Robert Benković2, Mirjana Brmež3,
Nataša Romanjek Fajdetić1, Slavica Antunović1 1 University of Applied Sciences of Slavonski Brod, CROATIA
2 Integritet d.o.o., CROATIA 3 Faculty of Agriculture in Osijek, J.J. Strossmayer University, CROATIA
Abstract
For a successful production of lettuce (Lactuca Sativa L.) healthy and quality seed is basic requirement. Lettuce belongs to the leaf vegetable cultivars which are characterized by the modest temperature requirements at the stage of germination and emergence, as well as during the growth phase. The aim of this study was to determine the effect of two different sowing dates and two different environment on seed germination efficiency (percentage), germination energy, length and mass of germ and length of root for the four different lettuce types. Three types of lettuce studied: Ljubljanska Ledenka, Vegorka the Great Lakes belong to the iceberg lettuce, while the remaining Quattro Stagioni belongs to the butter lettuce. The results showed significant differences between examined characteristics of lettuces grown in different periods. For the same lettuce types the differences were also noticed between results obtained in different environment within the same period of growth.
Keywords: lettuce, seed, germination, sowing date
1 Introduction
For a successful production of lettuce (Lactuca Sativa L.) healthy and quality seed is basic requirement. In modern production lettuce is growing in specialized polystyrene and plastic containers. Lettuce is ready for replant when have 3-4 developed leaves and well developed root. According to conditions it can happen 20 days from sowing time [1]. Lettuce is sort of laminated vegetables which doesn’t need special temperature in any phase of growing. Minimal temperature for germination is 3-5°C [1], but in that case germination is very slow and there is a high probability to get some seed infection with pathogen organism [2]. Optimal temperature for germination of lettuce seed is 14-20°C [1]. Higher temperature, like 25°C or more, can cause secondary dormancy of seed and delay germination [2]. Nascimento [3] reports that during high temperatures germination can be interrupt. But, if the high temperatures ended in the early phase, germination can easy continue [4]. Influence of temperature on yield and germination was researched by Drew [5]. He noticed that low temperature (20°C during day and 10°C during night) causes lesser yield of larger seed, until high temperature (30°C during day and 20°C during night) causes higher yield of smaller seed. Temperatures from 15°C to 25°C are also optimal for water access. At temperature of 35°C, germination of lettuce is almost stopped [6]. For germination of seed environmental conditions are the most important, then comes temperature differences, water accessibility and day light duration.
Agriculture
57
The aim of this research is to determine influence of different terms of sowing on to seed germination, influence on length and weight, influence on length of the roots and upper ground plant part for four different lettuce variety.
2 Materials and metods
This research is made on 4 different lettuce varieties. Three of the varieties are Ljubljanska Ledenka, Vegorka and Great Lakes (sorts of iceberg lettuce) from Producer 1, and variety Quattro Stagioni is sort of the butter lettuce, from Producer 2. There were two different terms of sowing: first term - 09.04.2010. and second - 23.04.2010. on Family Farm Lačić, situated in Donja Vrba near Slavonski Brod, Croatia. During the first term containers with all four varieties were put in greenhouse and outside of it with main target to determine differences between varieties according to conditions in environment. During the first term of two week period average temperature in greenhouse was 22.9°C, and on the open space in same period was 14.6°C. Growth and germination of the transplants
were monitored until there were no new germinated seeds. In second experiment period all containers were put in greenhouse to determine differences between seed quality and the transplants of all for varieties between two planting periods. Average temperature during two weeks of monitoring in second period was 28.9°C. For determine quality of each variety seed we used next parameters: energy and percentage of germination, weight of transplants (on the Ohaus AV 4102C balance), root length and length of upper ground part of plant, and total lengths of transplants. All measurements were made in practicum of University of Applied Sciences of Slavonski Brod. Seed germination energy is calculated by formula [7]:
k
di
E i
i∑ ⋅
=g
Eg – germination energy expressed in days i – number of days during which the germination has been observed di – number of seeds germinated on ith day k – germination expressed in %. The average weight of transplants was calculated by dividing of total weight for all transplants with total number of germinated transplants. Length of root, length of upper ground plant part, and total plant length were measured for all germinated transplants. The average values for length parameters were calculated for each variety in the same way as it is described for weight parameters. For this research seed was planted in the plastic containers size of 49x28 cm with 100 cubes on. In each cube we planted one seed from every variety in one repetition. Plastic containers were held on 1.6 m above surface in greenhouse and on the open space too. For this experiment we used universal (multipurpose) soil for flowers, produced by: Domoflor UAB, Vilnius (EU).
3 Results and discussion
Germination energy shows seed quality, speed and equable of seed germination [7] expressed in days. The largest germination energy (shortest time needed for germination) in greenhouse
Agriculture
58
experiment in both terms of planting has variety Ljubljanska Ledenka. In outside conditions the fastest germination is characteristic of Great Lakes variety. The longest germination in first planting period has variety Quattro Stagioni (in both conditions). In second term of planting, the longest germination was observed for Great Lakes variety. By increasing the temperature in second planting period germination energy was decreased for all four varieties, as it was expected. Germination energy can give early look of independence of crops and better resistance to unfavorable meteorological conditions in the early beginning of growth [7].
Table 1. Seed germination energy according to different conditions and planting terms
Seed germination for all four varieties was different between two planting terms. Seed from variety Ouattro Stagioni in first term in both environments had the smallest percentage of germination. According to average temperatures, variety Ouattro Stagioni has better germination potential when temperatures are higher. Varieties Great Lakes i Ljubljanska Ledenka have the similar potential, but variety Vegorka has little less percentage of germination when average temperature increases (Table 2). In the conditions of very high temperatures (over 30°C) significant less germination of lettuce seed was noticed [8].
Table 2. Percentage of seed germination according to different environments and
planting terms
The smallest average weight during first planting term in greenhouse has variety Vegorka, and on the open space the smallest average weight had variety Quattro Stagioni. In second term of planting the smallest average weight has variety Ljubljanjska Ledenka. In both terms and in both environments the biggest average weight has variety Vegorka (Table 3). We have
Germination energy (days)
Place / Term of planting Greenhouse/
(09.04.)
Open space/ (09.04.)
Greenhouse/ (23.04.)
Ljubljanska
Ledenka 5.6 10.3 4.7 Vegorka 6.0 10.8 5.0 Great Lakes 5.9 10.1 5.6 Quattro Stagioni 6.4 11.0 5.2
Percentage of germination
Place / Term of planting Greenhouse/
(09.04.)
Open space/ (09.04.)
Greenhouse/ (23.04.)
Ljubljanska
Ledenka 84 58 92 Vegorka 83 43 72 Great Lakes 88 48 92 Quattro Stagioni 76 32 80
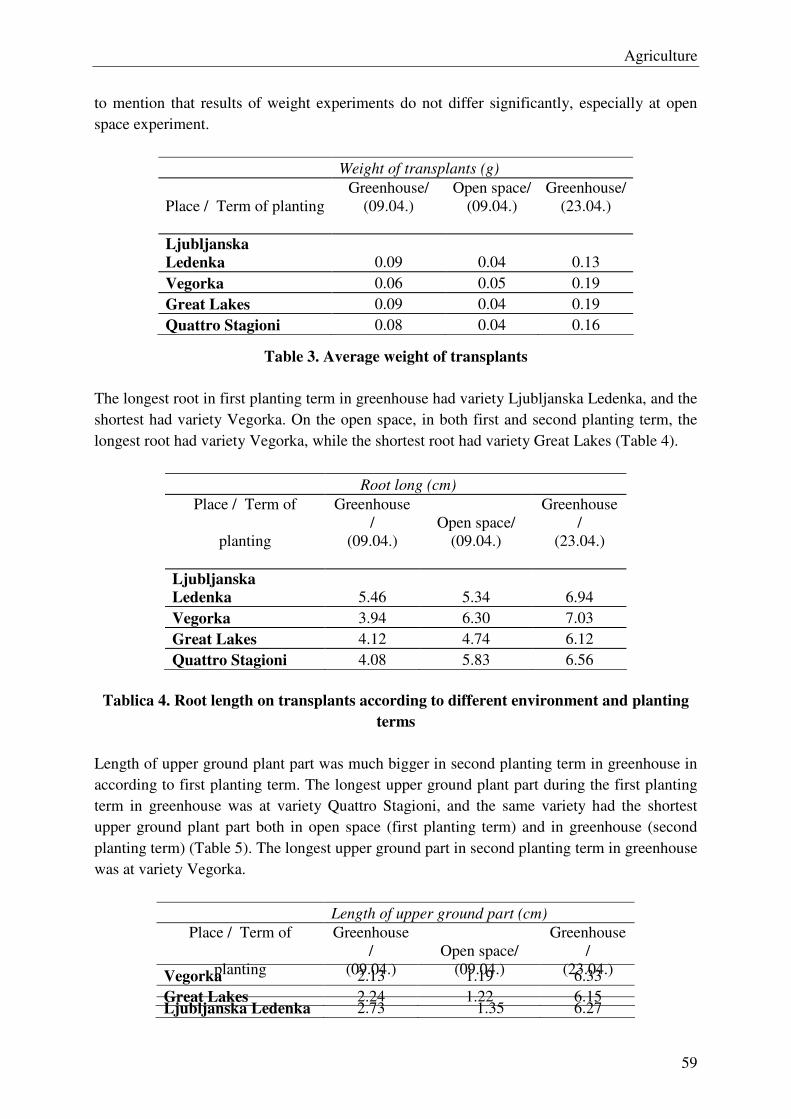
Agriculture
59
to mention that results of weight experiments do not differ significantly, especially at open space experiment.
Table 3. Average weight of transplants
The longest root in first planting term in greenhouse had variety Ljubljanska Ledenka, and the shortest had variety Vegorka. On the open space, in both first and second planting term, the longest root had variety Vegorka, while the shortest root had variety Great Lakes (Table 4).
Root long (cm)
Place / Term of
planting
Greenhouse/
(09.04.)
Open space/ (09.04.)
Greenhouse/
(23.04.)
Ljubljanska
Ledenka 5.46 5.34 6.94 Vegorka 3.94 6.30 7.03 Great Lakes 4.12 4.74 6.12 Quattro Stagioni 4.08 5.83 6.56
Tablica 4. Root length on transplants according to different environment and planting
terms
Length of upper ground plant part was much bigger in second planting term in greenhouse in according to first planting term. The longest upper ground plant part during the first planting term in greenhouse was at variety Quattro Stagioni, and the same variety had the shortest upper ground plant part both in open space (first planting term) and in greenhouse (second planting term) (Table 5). The longest upper ground part in second planting term in greenhouse was at variety Vegorka.
Weight of transplants (g)
Place / Term of planting Greenhouse/
(09.04.)
Open space/ (09.04.)
Greenhouse/ (23.04.)
Ljubljanska
Ledenka 0.09 0.04 0.13 Vegorka 0.06 0.05 0.19 Great Lakes 0.09 0.04 0.19 Quattro Stagioni 0.08 0.04 0.16
Length of upper ground part (cm)
Place / Term of
planting
Greenhouse/
(09.04.)
Open space/ (09.04.)
Greenhouse/
(23.04.)
Ljubljanska Ledenka 2.73 1.35 6.27
Vegorka 2.13 1.19 6.33 Great Lakes 2.24 1.22 6.15
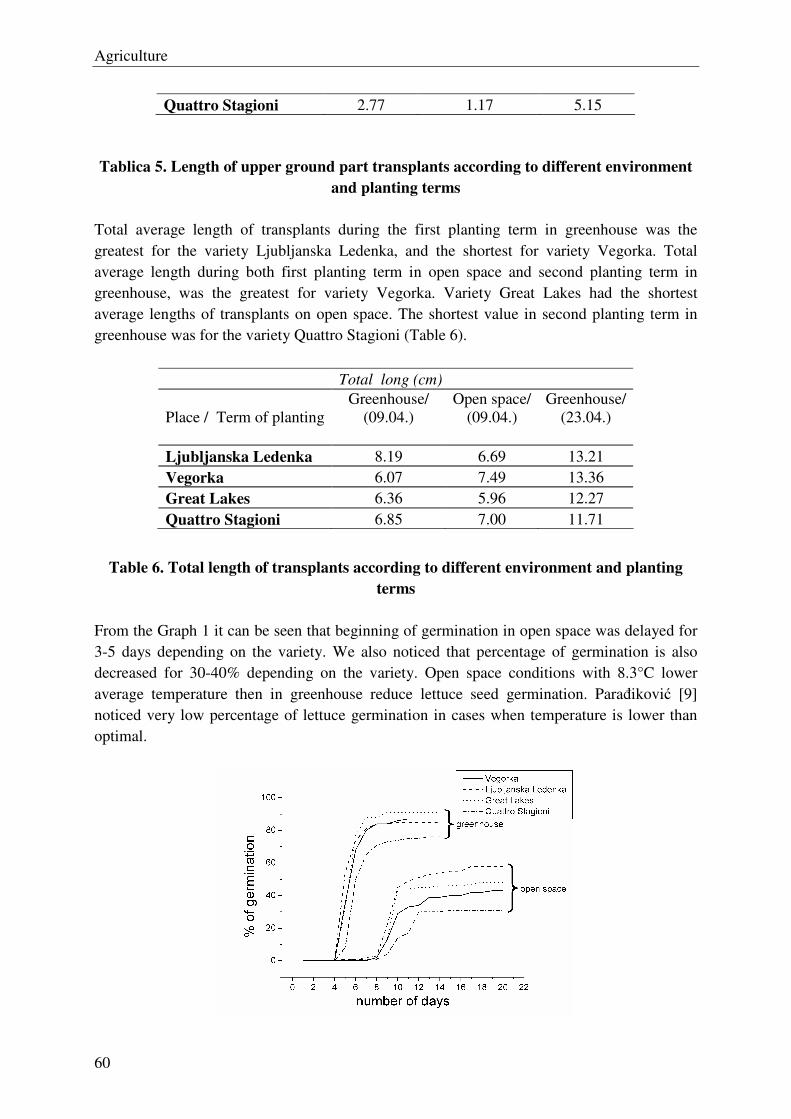
Agriculture
60
Tablica 5. Length of upper ground part transplants according to different environment
and planting terms
Total average length of transplants during the first planting term in greenhouse was the greatest for the variety Ljubljanska Ledenka, and the shortest for variety Vegorka. Total average length during both first planting term in open space and second planting term in greenhouse, was the greatest for variety Vegorka. Variety Great Lakes had the shortest average lengths of transplants on open space. The shortest value in second planting term in greenhouse was for the variety Quattro Stagioni (Table 6).
Table 6. Total length of transplants according to different environment and planting
terms
From the Graph 1 it can be seen that beginning of germination in open space was delayed for 3-5 days depending on the variety. We also noticed that percentage of germination is also decreased for 30-40% depending on the variety. Open space conditions with 8.3°C lower average temperature then in greenhouse reduce lettuce seed germination. Parañiković [9] noticed very low percentage of lettuce germination in cases when temperature is lower than optimal.
Quattro Stagioni 2.77 1.17 5.15
Total long (cm)
Place / Term of planting Greenhouse/
(09.04.)
Open space/ (09.04.)
Greenhouse/ (23.04.)
Ljubljanska Ledenka 8.19 6.69 13.21 Vegorka 6.07 7.49 13.36 Great Lakes 6.36 5.96 12.27 Quattro Stagioni 6.85 7.00 11.71
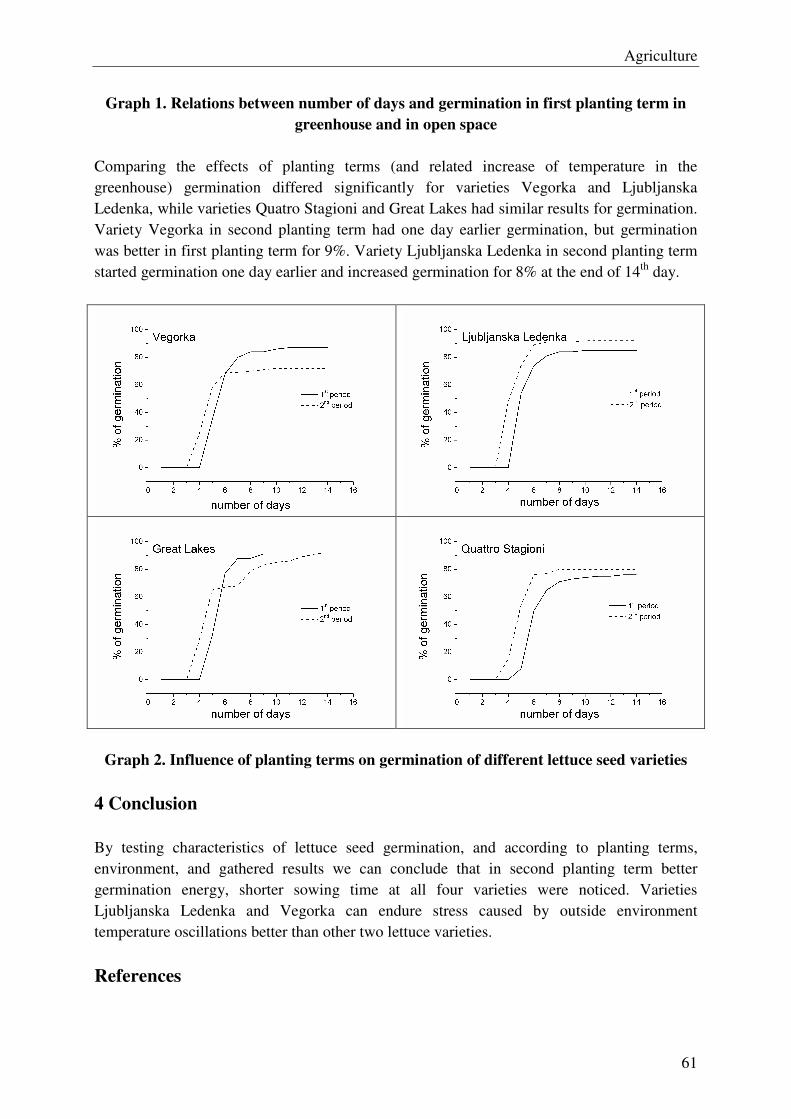
Agriculture
61
Graph 1. Relations between number of days and germination in first planting term in
greenhouse and in open space
Comparing the effects of planting terms (and related increase of temperature in the greenhouse) germination differed significantly for varieties Vegorka and Ljubljanska Ledenka, while varieties Quatro Stagioni and Great Lakes had similar results for germination. Variety Vegorka in second planting term had one day earlier germination, but germination was better in first planting term for 9%. Variety Ljubljanska Ledenka in second planting term started germination one day earlier and increased germination for 8% at the end of 14th day.
Graph 2. Influence of planting terms on germination of different lettuce seed varieties
4 Conclusion
By testing characteristics of lettuce seed germination, and according to planting terms, environment, and gathered results we can conclude that in second planting term better germination energy, shorter sowing time at all four varieties were noticed. Varieties Ljubljanska Ledenka and Vegorka can endure stress caused by outside environment temperature oscillations better than other two lettuce varieties.
References
Agriculture
62
[1] Parañiković, N., Opće i specijalno povrćarstvo, Poljoprivredni fakultet u Osijeku, Osijek, (2009)
[2] Lešić,R., Borošić, J., Buturac, I., Ćustić, M., Poljak, M., Romić, D., Povrćarstvo, Zrinski d.d., Čakovec, (2002)
[3] Nascimento, W. M., Preventing termoinhibition in a termosensitive lettuce genotype by seed inhibition at low temperature, Brasil, Science Agricola 60; 3(2003),
[4] Hills, P. N., van Staden, J., Termoinhibition of seed germination. Sout Africa Jurnal of Botany 69; 4 (2003): 455-461
[5] Drew, R. L. K., Brocklehurst, P. A., Effect of temperature of Mother-plant Environment on Yield and Germination of Seed of Lettuce (Lactuca sativa). Annals of Botany 66 (1990): 63-71,
[6] Bertagnolli, C. M., Menezes, N. L., Storck, L., Perforance of bare and pelleted lettuce (Lactuca sativa L.) seeds exposed to hydric and thermal stresses, Re. Bras. Semenes 25; 1 (2003): 7-13
[7] Butorac, A., Opća agronomija, Školska knjiga, Zagreb (1999) [8] Hegarty, T. W., Ross, H. A., Effect of Light and Growth Regulators on Germination
and Redicle Growth of Lettuce Seeds Held UNder High-Temperature Stress and Water Stress. Newv Phytologist 82; 1(1979): 49-57
[9] Parañiković, N., Tekilć T., Guberac, V.,Vinković, T., Utjecaj temperature na klijanje i nicanje salate (Lactuce sativa L.) i mrkve (Daucus carotaL.), Sjemenarstvo 24; 2 (2007): 111-119
Author data
Teuta Benković-Lačić: University of Applied Sciences of Slavonski Brod, Dr. Mile Budaka 1, 35000 Slavonski Brod, Croatia , [email protected] Krunoslav Mirosavljević: University of Applied Sciences of Slavonski Brod, Dr. Mile Budaka 1, 35000 Slavonski Brod, Croatia , [email protected] Robert Benković: Integritet d.o.o., Strossmayerova 48, 35000 Slavonski Brod, Croatia, [email protected] Mirjana Brmež: Faculty of Agriculture in Osijek, J.J. Strossmayer University, 31 000 Osijek, Croatia, [email protected] Nataša Romanjek Fajdetić: University of Applied Sciences of Slavonski Brod, Dr. Mile Budaka 1, 35000 Slavonski Brod, Croatia, [email protected] Slavica Antunović: University of Applied Sciences of Slavonski Brod, Dr. Mile Budaka 1, 35000 Slavonski Brod, Croatia, [email protected]
Agriculture
63
A gyümölcsösök ültetési anyagai
Czinege Anikó
Kecskeméti Főiskola, Kertészeti Főiskolai Kar, Gyümölcs- és Szőlőtermesztési Intézet Összefoglalás:
Tanulmányomban beszámolok a jelenleg faiskolai forgalomban kapható gyümölcs alanyoknak a használatáról, ezek szárazság tűréséről és téltűréséről. A szárazságtűrés szempontjából kiemelhető az ’MM 106’.-os, és az ’MM.111’.-es alma alany, a körte alanyai közül a Vadkörte magonc és az ’Egervár I.-II’. jobban elviseli a szárazságot, mint a birs alanyok. A cseresznye, meggy esetében a sajmeggy alanyok bírják jól a szárazságot. Az őszibarack alanyai közül a mandula bírja jobban a száraz körülményeket. A szilva alanyok közül a Marianna szilva tűri a legjobban a száraz viszonyokat.
A téltűréssel kapcsolatban elmondható, hogy a hazai teleket a meggy alanyok bírják a legjobban, a cseresznye és meggy alanyai közül. A kajszinál nagyon fontos lenne a hidegtűrő alanyfajta kinemesítése. A szilva alanyaihoz a Marianna alany felel meg a legjobban, ha a hidegtűrést vesszük alapul.
Az ültetési anyag megválasztásánál a suháng oltvány és az 1 éves koronás oltványok ajánlhatók a gyümölcsfák esetében, almánál, körténél és szilvánál ma már a Knipp-fa is használható. Őszibaracknál katlanozott oltványokat is lehet venni. Diónál és gesztenyénél a konténeres csemeték is gyakoriak.
Abstract: The study deals with utilisation of the planting material grafted on different types of
understocks and offered by the nurseries. The grafts are exposed in the new plantation to adversities either as drought or as winter-frosts. Apple grafts grown on MM 106 and MM 111 stocks, pear grafts grown on wild pear seedling or on Egervár I-II are most drought tolerant compared with pears e.g. grown on quince root. For sweet and sour cherries, the Prunus
mahaleb (seedling) stocks are recommended. For peach, the almond stocks, for plums, the ‘Marianna’ plum stocks tolerate best the dry periods.
The low temperatures of the winter in Hungary are less damaging the sour cherry roots. For apricots, some cold tolerant rootstocks would be badly needed, possibly obtained by breeding. For plums, the Marianna rootstocks are most advantageous.
As planting material, the simple spears or crowns formed on one year old trees are preferred, and for apple, pear and plum the Knipp trees are useful. Peach grafts may be trained for a vase crown. For walnuts and chestnuts, usually, the grafts are delivered in containers to be planted. Kulcsszavak: gyümölcsfaalanyok, szárazságtűrés, téltűrés, ültetési anyagok Keywords: fruit rootstock, drought tolerate, winter tolerate, planting material
Agriculture
64
1.Bevezetés
A gyümölcstermesztésben a klímaváltozás az alábbi következményekkel jár a közeljövőben: 1) kevesebb csapadék, aszályosabb klíma; 2) a jégesők gyakorisága megnő; 3) tavaszi fagyok kockázata növekszik 4) a növények téltűrése gyengül a kényszernyugalmi állapotban történő téli felmelegedések hatására. Ezeket a tényezőket figyelembe véve ajánlunk ültetési alapanyagot a gyümölcstermesztők számára, különös hangsúlyt fektetve az ültetés időpontjára.
A magas értéket képviselő gyümölcsültetvény létrehozásának alapvető fontosságú tényezője az ültetési anyag kiválasztása, legalább olyan fontos szempont, mint az alany helyes megválasztása.
Ennek érdekében érdemes figyelembe venni a környezeti adottságokat illetve termesztéstechnikai szempontokat is.
Az ültetési anyag megválasztása befolyásolja az ültetvény termőre-fordulásának idejét és élettartamát is, és a velük szemben felállított követelmények a klímaváltozás szempontjából a következők: fokozottabb szárazságtűrés, ezzel együtt mélyebben való gyökeresedés és a télállóság, szélsőséges hőmérsékletek tűrése, vagyis a vegetációs ideje hamar befejeződjön, és későn kezdődjön.
2. Ültetési anyag használata az almatermésűeknél
Az alanyok közül elsősorban a hazai faiskolai forgalomban beszerezhető alanyokról kívánok írni. Az intenzív almaültetvények kialakításában elterjedt ’M.9’, és ’M.26’-os alanyoknak gyenge a szárazságtűrő képessége, így ha ilyen alanyokkal kívánjuk az ültetvényünket kialakítani, feltétlenül fontos az öntözőberendezés kiépítése és valamilyen talajtakarás a sorokban. J.G Masabni (2007) szerint sem tűri az ’M.26’.-os a száraz talajviszonyokat. A félintenzív ültetvények számára alkalmas lehet a ’MM.106’, ’MM.111’, és az ’M.4’-es alany, amelyek mélyen gyökeresednek, és ezáltal jobban tudja hasznosítani a talaj mélyebb rétegeiben lévő vizet, ezeknek közepes illetve jó a szárazságtűrő képessége. Így elsősorban alföldi ültetvényekhez lehet javasolni, de az öntözésről ebben az esetben is gondoskodni kell, legfeljebb kevesebb öntözéssel kell számolni. Ez utóbbi alanyok alkalmazhatóak intenzív ültetvényekben is, amennyiben gyenge növekedésű alanyokat oltanak közbe, és 3 komponensű oltványokat telepítenek. Ez esetben az ’MM111’, és ’MM106’. –os alanyok biztosítják az erős, mélyen gyökeresedő gyökérzetet, és a gyenge növekedésű közbeoltott rész pedig a fa méretére hat gyengítő módon. J.G Masabni (2007) azt is írja, hogy az ’M9’/’MM.111’. közbeoltott alany jobban tolerálja a szárazságot, mint az ’M9’ önmagában.
J.G Masabni (2007) tapasztalata szerint az ’MM.106’-os alanyt a kora őszi fagyok károsíthatják, és az ’MM.111’ kellőképpen tűri a száraz talajviszonyokat.
A télállósággal kapcsolatban el lehet mondani, hogy az ’M.9’ –es alma alany korán befejezi a vegetációját és ezt a tulajdonságát a nemesre is kifejti. Ennek ellenére a szakirodalom gyenge télállóságról ír. A faiskolákban elterjedt alanyok közül az ’M.26’ , ’MM.106’, ’MM111’, ’M.4’-es alanyoknak közepes a télállósága (OMMI. 2004, 2006). Érdemes lenne olyan alanyokat kiválasztani, amelyek korán befejezik és későn indítják vegetációjukat.
J.G Masabni (2007) szerint a holland származású ’P. 22’-nek rendkívül jó a téltűrő képessége, ami egyébként valamivel kisebb növekedést biztosít a fáknak , mint az ’M. 9’.-es.
Ezután az alanyhasználatról rátérnék az ültetési anyag használatára. Diploid és spúr fajtáknál elsősorban a koronás oltványokat lehet ajánlani, míg a triploid és erős növekedésű
Agriculture
65
fajtáknál a suhángot, 1 éves koronás oltványt vagy Knipp-fát. Ennek oka a következő: Az intenzív ültetvényből szeretnénk minél előbb bevételt realizálni, ennek az a módja, hogy előbb termőre fordítsuk az ültetvényeket. A koronás oltványoknál ez lehetséges. Az 1 éves koronás oltványok jobban erednek, mint a 2 évesek, az oldalvezér-vessző szögállása is kedvezőbb az 1 éves koronás oltványnak és a Knipp-fának, mint a 2 éves koronásoltványnak. Triploid fajtáknál és az erős növekedésű fajták esetében a 2 éves koronás oltványoknál a hegyes szögű erőteljesen felfelé törő koronavesszőkből erőteljes kihajtást kapunk, ezt a növekedési erélyt igen nehéz visszafogni, de ha 1 éves koronás oltványokat vagy Knipp-fát telepítünk, a koronavesszők lapos szögállásúak, és ezek könnyen termőgallyá alakíthatóak. (Hrotkó, 2000)
Az intenzív művelésű karcsú orsó koronaforma lehetővé teszi, hogy jégvédő hálót vagy ma már klímahálónak is nevezett hálót feszítsünk ki, egyrészt a jégesők ellen védi meg az ültetvényt, másrészt a gyümölcsperzselődés ellen is jó szolgálatot tesz.
A körte esetében Magyarországon leginkább a vadkörtemagoncok (Vadkörte magonc, és az Egervár I.-II.)terjedtek el, amelyekre jellemző, hogy az öntözetlen körülményeket jobban elviselik. Az intenzív körteültetvények számára azonban a birs (’EM-A’, ’EM-C’) alanyok alkalmasabbak, de ezeket rendszeres öntözésben kell részesíteni, mert gyökerük sekélyen helyezkedik el és a szárazságra érzékenyebbek (OMMI, 2004, 2006).
A téltűrés tekintetében is a birs alanyok igen gyengén szerepelnek, ellenben az ’OHxF-333’ és az ’OHxF-69’ köretalanyoknak jó a téltűrésük, de faiskolai forgalomban korlátozottan szerezhetők be. Ebből a szempontból is előnyösek a vadkörte magoncok, mivel télállóságuk is jónak bizonyul.
A körténél is jól alkalmazhatók az 1 éves koronás oltványok és a Knipp-fa ültetési anyagok, szemben a suhánggal, vagy a 2 éves koronás oltvánnyal. Hiszen ez utóbbi kettőnél a koronavesszők elsőrendű elágazásból fejlődnek, és a rügyek gyakran vesszőhöz simulóak, ami hegyes szögű kihajtást eredményez. A hegyesszögű oldalvezér vesszőket pedig nehéz vízszinteshez közeli szögállásúra lekötözni, vagy kitámasztani. Azért is ajánlom az 1 éves koronás oltványokat vagy Knipp-fát, mert azok korábban termőre fordulnak, erősebb kondicióban vannak, több tartalék tápanyag van bennük, és jobb lesz a fák fakadása. A két éves koronás oltvány viszont már túl erősek a telepítéshez, a fejlett gyökérzet egy jelentős része a talajban marad a kitermelés során.
3. Ültetési anyag használata a csonthéjasoknál
A csonthéjasok esetében a művelési rendszer fogja elsősorban meghatározni az ültetési anyag használatot.
A kézi betakarítású karcsú orsó –cseresznye, meggy, szilva- ültetvényekhez suháng vagy 1 éves koronás oltvány ajánlható. Az 1 éves koronás oltványok egy évvel korábban termőre fordulnak, mint a suhángból nevelt korona. Ezeknek az oltványoknak rendelkeznie kell egy fővezérvesszővel, ami a központi tengely további növekedését biztosítja, és 3-8 oldalvezér-vesszővel, hogy az alsó vázkarokat ki lehessen választani. Továbbá az oldal vezéreknek lehetőleg lapos szögállásúnak kell lennie, különben lekötözéssel kell nevelnünk azokat.
A gépi betakarítású ültetvényekhez inkább a suháng oltvány javasolható, hiszen ebből teljesen tetszőleges korona alakítható ki, akár az Y-, vagy tölcsér, váza koronaforma is.
Cseresznye, meggy esetében vadcseresznye, sajmeggy (’Berhidai’, ’Cema’, ’Cemany’, ’Korponay’, ’SL.64’) és ’Brokforest’, ’Colt’, ’Gisella-A5’ alanyokat kaphatunk a faiskolákban. (OMMI, 2004, 2006) Ezek tél- és hidegtűrése a következő: vadcseresznye a legkevésbé tűri a hideget, sajmeggy közepesen tolerálja és a meggy alanyok bírják a
Agriculture
66
legjobban a téli lehűléseket. A szárazságot tekintve a sajmeggy jobban alkalmazkodik a szárazabb talajviszonyokhoz, mint a vadcseresznye. (Hrotkó, 2003)
Az ültetési anyaggal kapcsolatban elmondható, hogy a művelési rendszert kell figyelembe venni, karcsú orsó koronaforma kialakításához jól alkalmazhatóak a suháng és az 1 éves koronás oltványok is. A 2 éves koronás oltványok esetében az ágtorok hegyes szögállású, ez könnyen vázág-hasadáshoz vezethet. Az ’Érdi bőtermő’ meggy kifejezetten érzékeny az ághasadásra, ennél célszerű központi tengelyes koronaformát kialakítani.
Váza, tölcsér koronaformához a suhángot vagy az 1 éves koronás oltványt ajánlom elsősorban.
A kajszinál használható és a faiskolában kapható alanyok a következőek: Tengeribarackok(’C. 1300’, ’C. 1301’, ’C. 1650’, ’C. 1652’); Mirobalan magoncok. (OMMI, 2004, 2006) A kajszinál nagyon fontos lenne a hidegtűrő alanyfajta, hiszen rendkívül érzékeny a nagy hőingadozásokra a kajszi törzse, ezért is ajánlható a 3 komponensű szilvatörzses kajszi, ennek elsősorban növényvédelmi okai vannak. A szilva (’Brompton’) kevésbé hajlamos a fagylécek kialakulására, mint a kajszi. A kajszinak súlyos betegsége a Pseudomonas syringae okozta gutaütés, ezek télen seben keresztül fertőznek. A fagylécek kialakulása során jelentős sebfelület keletkezik a téli napokon, amin keresztül fertőződnek a fák. Ez -a 3 komponensű oltvány- áll egy mirobalan gyökéralanyból egy szilva törzsből és a nemes kajszi fajtából. A szárazabb alföldi körülmények közé vadkajszi (tengeribarack) alanyokat érdemes felhasználni, míg a magasabb talaj vizű ültetvényekben a szilva is számításba jöhet.
Az őszibarack alanyai közül faiskolai forgalomban kaphatók a Vadőszibarack magoncok(’CEPE’, ’C2630’) ; és Mandula magoncok(’C.431’, ’C. 446’, ’C. 447’, ’C. 4491); és Mandulabarack (’Avimag’, ’Pe-Da’, ’Pe-Ma’, ’GF677’) alanyok. (OMMI, 2004, 2006)
A hidegtűrésnél elmondható, hogy az őszibarackra még nem végeztek megfigyeléseket az alanyokat tekintve.
Az öntözés nélküli őszibarack-termesztésben fokozottan hangsúlyt kell fektetni a szárazságtűrő alanyok alkalmazására. A mandula jobban bírja a szárazságot, mint az őszibarack. De fel kell hívni a termesztők figyelmét, ha nagy terméshozamokat akarnak elérni az őszibarackot is öntözéssel termesszék!
Ültetési anyagként félkész oltványokat is telepíthetnek, de akkor a növények számára intenzív faiskolai nevelést kell biztosítani. A suháng oltvány szerencsésebb, mert a koronába metszés után tetszőlegesen nevelhetjük az oldalvezéreket, és magát a katlan vagy manapság inkább a tölcsér koronaformát. Ha katlan koronát akarunk nevelni, katlanozott oltványokat is be lehet szerezni, ezeknél a koronavesszőket kinevelték, így korán termőre fordulnak.
A szilva faiskolai forgalomban kapható alanyai ’Marianna GF8-1’; ’Saint Julien A’; ’Saint Julien 655/2’; ’Fehér besztercei’, ’Kisnánai Lószemű’, Mirobalan magoncok. (OMMI, 2004, 2006)
A Marianna szilva jobban tűri a lehűléseket, mint a mirobalan magoncok. A szárazságot tekintve is a Marianna szilva emelhető ki. A szilva alanyok igen vízigényesek, ezeket csak öntözéssel termeszthetjük.
Az ültetési anyaga lehet suháng, 1 vagy 2 éves koronás oltvány illetve, akár Knipp-fa is lehet (Soltész, 2009).
Agriculture
67
4. Ültetésianyag –használat a héjasoknál
A dió alanyai közül Magyarországon a fekete dió és a közönséges dió magoncokat tudjuk beszerezni. Ezen kívül számos alany dió létezik, de a hazai klímán nem jöhetnek számításba, hidegérzékenységük miatt. Ültetési anyaga lehet a 2 éves suháng oltvány, illetve konténeres suháng oltvány. (Szentiványi – Kállayné 2006; OMMI, 2004, 2006). A konténeres oltvány költséges, így azokat csak pótlásra tudom ajánlani.
A mandulát mandula-magoncokon szaporítják többnyire (’C.431’, ’C.446’, ’C.449’) ezen kívül ’Elberta’ és ’C. 2629’, ’C.2630’-as vadőszibarackra is rá lehet szemezni a nemes fajtákat, ha mészmentes területre ültetjük azokat. A klorózis elkerülése végett használhatjuk a mandula-barack magoncokat (ORT.50, ORT.51) és a mandulabarack klónalanyokat pl. ’Avimag’, ’Pe-Da’; ’Pe-Ma’, ’GF 677’, valamint magas talajvizű területen, kötött talajon a szilva alanyok is számításba jöhetnek. Mint pl: ’Marianna GF 8-1’, ’Saint Julien 655/2’, ’Saint Julien A’. (OMMI, 2004, 2006; Brózik, Kállayné, Apostol, 2003)
A mogyorót nevelhetjük bokornak és törzses fának, ettől függően kell megválasztani az alanyokat is. Törzses fa esetén Corillus colurn-t alkalmazhatunk, ugyanis ez egyenes törzsű, sarjak nélküli fát nevel. Így az ültetési anyag suháng- vagy koronás oltvány lesz. Ha bokorművelést szeretnénk kialakítani a nemes fajta tősarjait vagy bujtvány csemetéit kell eltelepítenünk (Mohácsy, Porpáczy –Maliga, 1957; OMMI, 2004, 2006).
A gesztenye alanyaként a gesztenye magcsemeték jöhetnek számításba, korábbi években voltak próbálkozások a tölgy és a bükk alanyként való felhasználásra is – hiszen ezek mésztűrőek- de ezeken a nemesnek gyengébb a termőképessége és korán elpusztulnak a fák rajta (Mohácsy, Porpáczy, Maliga, 1957; OMMI, 2004, 2006).
Ültetési anyaga lehet suháng, és esetleg koronás oltvány. Ebben az esetben a suhángot javasolom telepítésre a jobb fakadás miatt, mivel kitermelés során a gyökerek kevésbé sérülnek, mint a koronás oltványok esetében.
5. Ültetésianyag-használat a bogyós gyümölcsűeknél
A bogyósoknál alanyokat (Ribes Aureum ’Pallagi 2’) csak a törzses ribiszkéknél és a törzses köszméténél, riszméténél alkalmazunk. A málnánál, szedernél, szamócánál alanyok nincsenek. A málna ültetési anyaga gyökér vagy tősarj, a szedernél tősarj vagy fejbujtvány. A szamócánál frigópalántát, tűzdel- palántát és zöld palántát telepíthetünk attól függően, hogy mikor akarunk telepíteni. Augusztusi telepítés esetén a zöld palánták vagy a tűzdelt palánták lesznek alkalmasak. Ezek valamivel olcsóbbak, de nem ment végbe benne a rügydifferenciálódás. A frigópalánták tavaszi telepítés esetén alkalmazhatóak, ezek drágábbak, de sokkal jobb minőségű ültetési anyagok, ezekben a rügydifferenciálódás is végbe ment, vagyis a virágrügyek már a szívlevelek alatt megtalálhatóak.
A ribiszkénél, riszméténél és köszméténél telepíthetünk dugványcsemetéket, ebben az esetben bokor-művelést lehet alkalmazni, vagy telepíthetünk törzses fácskákat is, ekkor magas művelésű ültetvényt tudunk létrehozni. Ennek az az előnye, hogy a magasabb hőmérsékletű alföldi körülmények között is folytathatunk bogyós termesztést. Ekkor a korona szint a hűvösebb légrétegbe kerül és ez kedvezőbb, a hidegigényes bogyósok számára. Szemben a bokorműveléssel, ahol a bokor közvetlen a magas hőmérsékletű talajfelszín felett helyezkedik el.
Agriculture
68
6. Ültetési időpont
A gyümölcstermő növények telepítésénél nem mindegy, hogy milyen időpontot választunk. És az egyre szélsőségesebbé váló időjárás függvényében ez fokozottabban érvényes. A csonthéjasok közül az őszibarackot, a kajszit és a japán szilvát, míg az almatermésűek közül a birset csak és kizárólag tavasszal telepíthetjük, mivel a gyökerük érzékeny a kiszáradásra az őszi telepítés esetén ezek a növények kifagynának. Az utóbbi évek csapadék nélküli teleire ez fokozottabban igaz.
A bogyósok többségét, mint pl. a ribiszkék, köszméte, riszméte ősszel érdemes telepíteni, mivel nagyon korán fakadnak, és az idő nagyon rövid a telepítési munkálatokhoz. A szamócát augusztusban vagy kora tavasszal lehet telepíteni az ültetési anyagtól függően. A többi gyümölcstermő növényt tavasszal és ősszel egyaránt telepíthetjük.
Irodalomjegyzék
[1] Brózik S. Kállay T-né- Apostol J (2003) Mandula. Mezőgazda Kiadó. [2] Hrotkó K. (2005) A klímatényezőkhöz való alkalmazkodás lehetőségei a gyümölcsfaalany-használatban: „Agro-21” Füzetek 2005. 39. szám 24. [3] Hrotkó K.(2000) Gyümölcsfaiskola. Mezőgazda Kiadó. [4] Hrotkó K.(2003) Cseresznye és meggy Mezőgazda Kiadó. [5] Hrotkó. K. (2000) Az intenzív almaültetvények alanyai. In: Gonda I. (2000)
Minőségi almatermesztés. Primom [6] J. G. Masabni at al. (2007) Rootstocks for Kentacky Fruit Trees
www.ca.uky.edu/agc/pubs/ho/ho82/ho82.pdf [7] Mohácsy M – Porpáczy A –Maliga P(1957) Gesztenye , Mandula, Mogyoró
Mezőgazdasági Kiadó. [8] OMMI. (2004, 2006) Szőlő és gyümölcsfajták nemzeti és leíró fajtajegyzéke [9] Soltész M. (2009) Szóbeli közlés. [10] Soltész M. (1997) Integrált gyümölcstermesztés. [11] Szentiványi P– Kállay T.-né (2006) Dió. Mezőgazda Kiadó.
Szerzők
Czinege Anikó: Gyümölcstermesztési Szakcsoport. Gyümölcs és Szőlőtermesztési Intézet. Kertészeti Főiskolai Kar. Kecskeméti Főiskola. Kecskemét 6000 Erdei F tér 1.-3. Magyarország. [email protected]
Agriculture
69
A nitrogén termésnövelő hatása az étkezési paprika terméstömegére tenyészedényekben, különböző talajtípusokon
Cserni Imre 1– Rajkai Kálmán 2 – Borsné Pető Judit 3 - Hüvely Attila 4 – Szili-Kovács Tibor5– Németh Tamás 6 – Kovács András7 - Rajkainé Végh Krisztina8
134 Kecskeméti Főiskola, Kertészeti Főiskolai Kar, Környezettudományi Intézet 7 Kecskeméti Főiskola, Kertészeti Főiskolai Kar, Dísznövény- és Zöldségtermesztési Intézet
258MTA Talajtani és Agrokémiai Kutatóintézet, Budapest 6MTA
Összefoglalás: OTKA kísérlet keretében vizsgáltuk liziméteres rendszerű tenyészedényekben, homok-, öntés- és csernozjom talajokon étkezési paprika jelzőnövényen, a nitrogén és a szerves trágya termésnövelő hatását, hat ismétlésben. Eredményeink szerint a retard alapműtrágya (Cropcare 10:10:20), a nitrogén műtrágya és a szerves trágya hatása a terméstömegre igen pozitív volt, de a talajtípusok és különböző nitrogénműtrágya dózisok, jelentősen eltérő termésmennyiséget adtak. Az istállótrágya pozitív hatása rendkívül szembetűnő homoktalajon. Ez egyértelműen a szervesanyag utánpótlás fontosságára hívja fel a figyelmet. Szabadföldi termesztésben homoktalajainkon a szervesanyag utánpótlás nélkülözhetetlen az öntözéses zöldségtermesztésben.
Abstract: As a part of our research project according to nitrogen flow, we carried out our experiments in the study garden of our institute (KF KFK). We examined crop mass of green pepper under four different nitrogen doses in sandy, alluvial and chernozem soils. N-treatments were the follows: 1. control, 2. N60:P60:K120, 3. N120:P60:K120+165 t/ha barnyard manure, and 4. N180:P60:K120 kg/ha N, P2O5 és K2O, in six replicates. The effect of nitrogen fertilizer (ammonium-nitrate) and barnyard manure on crop mass seemed to be highly positive in our experiments.
Kulcsszavak: étkezési paprika termésmennyiség, nitrogén trágyázás, talajtípusok.
Keywords: green pepper crop mass, nitrogen fertilization, soil types.
1. Bevezetés
A gyakorlatban a tápanyag utánpótlást és öntözést ökonomikus és ökologikus módon szükséges végezni. A helytelenül végzett trágyázás és öntözés a környezetet, így talajainkat és vizeinket is terhelheti. Ezért öntözött szabadföldi étkezési paprika szerves- és szervetlen tápanyag utánpótlásának kérdéskörét vizsgáltuk a környezet terhelésének csökkentése mellett. Ezzel párhuzamosan kutatjuk a tápanyagfelvétel dinamikájához igazodó tápanyag utánpótlást. Az eddigi eredményeket több publikációban már közzétettük [4,5,6,7]. Jelen közleményünkben étkezési paprika tesztnövényen tanulmányoztuk a nitrogén-tápanyag termésmennyiségére gyakorolt hatását, különböző talajtípusokon.
2. Anyag és módszer
Kísérleteinket a Kecskeméti Főiskola Kertészeti Főiskolai Kar Környezettudományi Intézetének kísérleti tenyészkertjében végeztük 2009-ben, a „Szén- és nitrogénforgalom modellezése zöldségtermesztésben” című, K 62548 sz. OTKA kísérlet keretében. A kísérletet
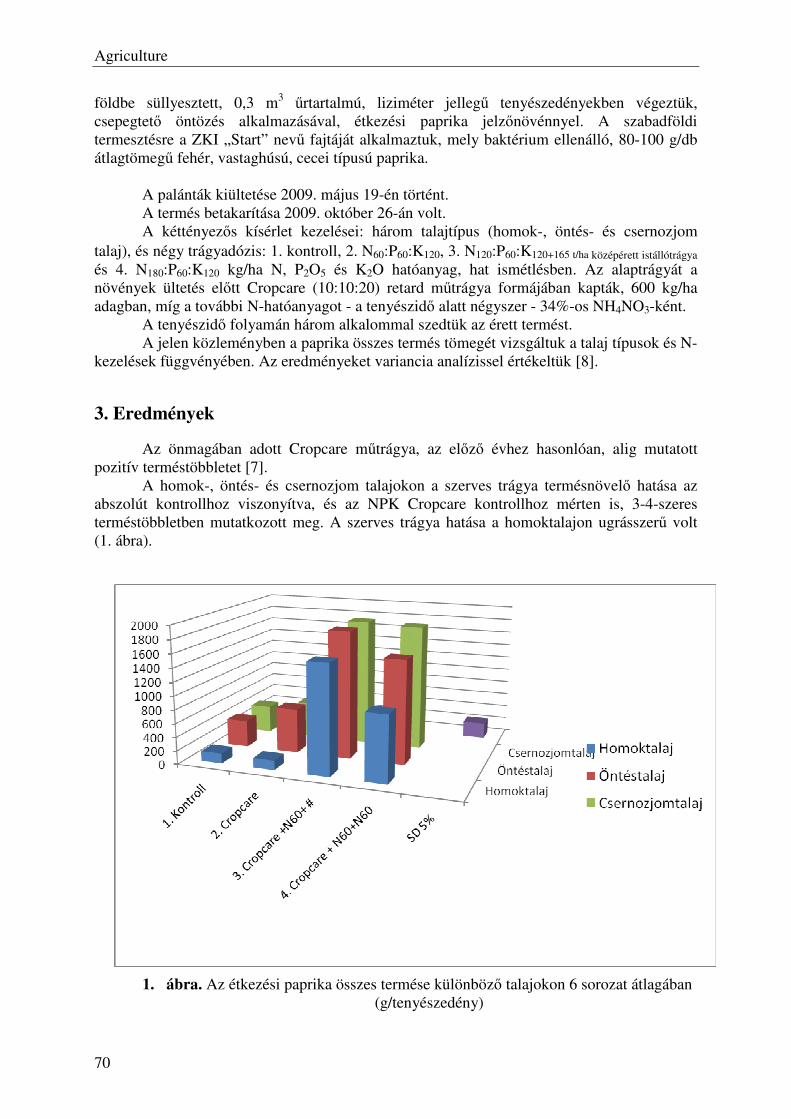
Agriculture
70
földbe süllyesztett, 0,3 m3 űrtartalmú, liziméter jellegű tenyészedényekben végeztük, csepegtető öntözés alkalmazásával, étkezési paprika jelzőnövénnyel. A szabadföldi termesztésre a ZKI „Start” nevű fajtáját alkalmaztuk, mely baktérium ellenálló, 80-100 g/db átlagtömegű fehér, vastaghúsú, cecei típusú paprika.
A palánták kiültetése 2009. május 19-én történt. A termés betakarítása 2009. október 26-án volt. A kéttényezős kísérlet kezelései: három talajtípus (homok-, öntés- és csernozjom
talaj), és négy trágyadózis: 1. kontroll, 2. N60:P60:K120, 3. N120:P60:K120+165 t/ha középérett istállótrágya és 4. N180:P60:K120 kg/ha N, P2O5 és K2O hatóanyag, hat ismétlésben. Az alaptrágyát a növények ültetés előtt Cropcare (10:10:20) retard műtrágya formájában kapták, 600 kg/ha adagban, míg a további N-hatóanyagot - a tenyészidő alatt négyszer - 34%-os NH4NO3-ként.
A tenyészidő folyamán három alkalommal szedtük az érett termést. A jelen közleményben a paprika összes termés tömegét vizsgáltuk a talaj típusok és N-
kezelések függvényében. Az eredményeket variancia analízissel értékeltük [8].
3. Eredmények
Az önmagában adott Cropcare műtrágya, az előző évhez hasonlóan, alig mutatott pozitív terméstöbbletet [7].
A homok-, öntés- és csernozjom talajokon a szerves trágya termésnövelő hatása az abszolút kontrollhoz viszonyítva, és az NPK Cropcare kontrollhoz mérten is, 3-4-szeres terméstöbbletben mutatkozott meg. A szerves trágya hatása a homoktalajon ugrásszerű volt (1. ábra).
1. ábra. Az étkezési paprika összes termése különböző talajokon 6 sorozat átlagában (g/tenyészedény)
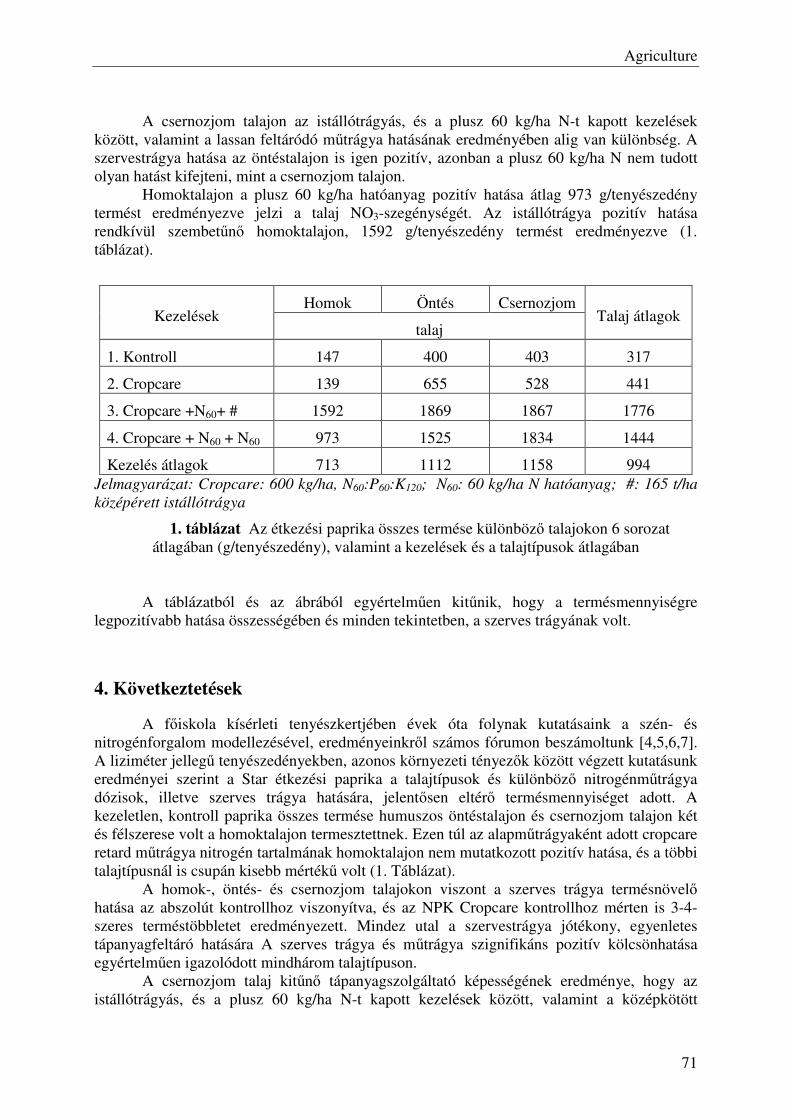
Agriculture
71
A csernozjom talajon az istállótrágyás, és a plusz 60 kg/ha N-t kapott kezelések
között, valamint a lassan feltáródó műtrágya hatásának eredményében alig van különbség. A szervestrágya hatása az öntéstalajon is igen pozitív, azonban a plusz 60 kg/ha N nem tudott olyan hatást kifejteni, mint a csernozjom talajon.
Homoktalajon a plusz 60 kg/ha hatóanyag pozitív hatása átlag 973 g/tenyészedény termést eredményezve jelzi a talaj NO3-szegénységét. Az istállótrágya pozitív hatása rendkívül szembetűnő homoktalajon, 1592 g/tenyészedény termést eredményezve (1. táblázat).
Homok Öntés Csernozjom Kezelések
talaj Talaj átlagok
1. Kontroll 147 400 403 317
2. Cropcare 139 655 528 441
3. Cropcare +N60+ # 1592 1869 1867 1776
4. Cropcare + N60 + N60 973 1525 1834 1444
Kezelés átlagok 713 1112 1158 994 Jelmagyarázat: Cropcare: 600 kg/ha, N60:P60:K120; N60: 60 kg/ha N hatóanyag; #: 165 t/ha
középérett istállótrágya
1. táblázat Az étkezési paprika összes termése különböző talajokon 6 sorozat átlagában (g/tenyészedény), valamint a kezelések és a talajtípusok átlagában
A táblázatból és az ábrából egyértelműen kitűnik, hogy a termésmennyiségre
legpozitívabb hatása összességében és minden tekintetben, a szerves trágyának volt.
4. Következtetések
A főiskola kísérleti tenyészkertjében évek óta folynak kutatásaink a szén- és nitrogénforgalom modellezésével, eredményeinkről számos fórumon beszámoltunk [4,5,6,7]. A liziméter jellegű tenyészedényekben, azonos környezeti tényezők között végzett kutatásunk eredményei szerint a Star étkezési paprika a talajtípusok és különböző nitrogénműtrágya dózisok, illetve szerves trágya hatására, jelentősen eltérő termésmennyiséget adott. A kezeletlen, kontroll paprika összes termése humuszos öntéstalajon és csernozjom talajon két és félszerese volt a homoktalajon termesztettnek. Ezen túl az alapműtrágyaként adott cropcare retard műtrágya nitrogén tartalmának homoktalajon nem mutatkozott pozitív hatása, és a többi talajtípusnál is csupán kisebb mértékű volt (1. Táblázat).
A homok-, öntés- és csernozjom talajokon viszont a szerves trágya termésnövelő hatása az abszolút kontrollhoz viszonyítva, és az NPK Cropcare kontrollhoz mérten is 3-4-szeres terméstöbbletet eredményezett. Mindez utal a szervestrágya jótékony, egyenletes tápanyagfeltáró hatására A szerves trágya és műtrágya szignifikáns pozitív kölcsönhatása egyértelműen igazolódott mindhárom talajtípuson.
A csernozjom talaj kitűnő tápanyagszolgáltató képességének eredménye, hogy az istállótrágyás, és a plusz 60 kg/ha N-t kapott kezelések között, valamint a középkötött
Agriculture
72
csernozjom talajon alkalmazott, lassan feltáródó műtrágya hatásának eredményeként alig van különbség. Ugyancsak kitűnő a szervestrágya hatása az öntéstalajon is, azonban itt már a plusz 60 kg/ha N nem tudott olyan hatást kifejteni, mint a csernozjom talajon. Ez az öntéstalaj kisebb humusztartalmára, valamint a gyengébb víz- és tápanyagszolgáltató képességének tulajdonítható.
Homoktalajon viszont a plusz 60 kg/ha hatóanyag pozitív hatása közel hétszeres (973 g/tenyészedény) termést eredményezve jelzi a talaj NO3-szegénységét. Ez igazolja a korábbi kísérleteink eredményeit, mely szerint homoktalajainkon minimumban levő tényező a nitrogén [1,2,3].
Az istállótrágya pozitív hatása rendkívül szembetűnő homoktalajon, hiszen a plusz 60 kg/ha N hatóanyag terméseredményének is közel kétszeresét (1592 g/tenyészedény termés) eredményezte. Ez egyértelműen a szervesanyag utánpótlás fontosságára hívja fel a figyelmet, hiszen szabadföldi termesztésben homoktalajainkon a szervesanyag utánpótlás nélkülözhetetlen az öntözéses zöldségtermesztésben (1. táblázat).
Eredményeink az ökológiai adottságok figyelembe vételén túl a körültekintő trágyázási módszerek betartására, valamint az istállótrágyának a rendkívül fontos szerepére hívják fel a figyelmet, elsősorban a gyenge szervesanyag-ellátottságú homoktalajok esetében.
Ezúton mondunk köszönetet az OTKA támogatásért, amelyet a kutatásaink
kivitelezéséhez kaptunk.
Irodalomjegyzék
[1] Bauer F., Cserni I.: Növénytermesztés és tápanyag-gazdálkodás Duna-Tisza közi lepelhomok talajokon. Tartamkísérletek, tájtermesztés, vidékfejlesztés. Nemzetközi konferencia. Debrecen, I. köt. 91-96., 2002.
[2] Bauer F.: 1976. Növénytermesztés és tápanyag-gazdálkodás Duna-Tisza közi homok-talajokon Akadémiai doktori értekezés, Kecskemét.
[3] Cserni I.: A mezőgazdaság fejlesztésének lehetőségei a Duna –Tisza közén. Gyakorlati Agrofórum. X .7/2 .9-11. 1999.
[4] Cserni I., Rajkainé Végh K., Hüvely A., Borsné Pető J., Rajkai K., Szili-Kovács T., Németh T.: Az NPK-tartalom alakulása paradicsom levélben és bogyóban a talajtípusok és nitrogénkezelések függvényében, AGTEDU 8. Kecskemét, 42-48., 2007
[5] Cserni I., Borsné Pető J., Hüvely A., Rajkainé Végh K., Rajkai K., Szili-Kovács T., Németh T: A talajok tápanyagtartalmának és a csemegekukorica beltartalmi értékeinek változása nitrogénkezelések függvényében, AGTEDU 9. Kecskemét, 57-62., 2008.
[6] Cserni I, Borsné Pető J., Rajkai K., Hüvely A., Szili-Kovács T., Kapitány J., Németh T., Rajkainé Végh K.: A fűszerpaprika terméstömege és őrleményének minősége, különböző talajtípusok és nitrogénkezelések függvényében AGTEDU Tudományos Konferencia, 49-53., 2009.
[7] Cserni I, Borsné Pető J., Rajkai K., Hüvely A., Szili-Kovács T., Kovács A., Rajkainé Végh K.: A paradicsom terméstömege és bogyó nagysága a talajtípusok és nitrogénkezelések függvényében, Erdei Ferenc V. Tudományos Konferencia, 1115-1119, 2009.
[8] Sváb J.: Biometriai módszerek a kutatásban, Mg-i Kiadó, Budapest,

Agriculture
73
Szerzők
Prof. Dr. Cserni Imre, professor emeritus, Kecskeméti Főiskola, Kertészeti Főiskolai Kar, Környezettudományi Intézet, Kecskemét, Erdei F. tér 1-3., [email protected] Dr.habil Rajkai Kálmán, tudományos tanácsadó, MTA Talajtani és Agrokémiai Kutatóintézet Borsné dr. Pető Judit, főiskolai docens, Kecskeméti Főiskola, Kertészeti Főiskolai Kar, Környezettudományi Intézet, [email protected] Hüvely Attila, főiskolai tanársegéd, Kecskeméti Főiskola, Kertészeti Főiskolai Kar, Környezettudományi Intézet, [email protected] Dr. Szili-Kovács Tibor, tudományos tanácsadó, MTA Talajtani és Agrokémiai Kutatóintézet Prof. Dr. Németh Tamás, MTA rendes tagja, MTA főtitkára Dr. Kovács András, főiskolai tanár, Kecskeméti Főiskola, Kertészeti Főiskolai Kar, Dísznövény- és Zöldségtermesztési Intézet, [email protected] Rajkainé dr. Végh Krisztina, tudományos főmunkatárs, MTA Talajtani és Agrokémiai Kutatóintézet

Agriculture
74
Felsőoktatásban részt vevő hallgatók környezettudatossági hajlandósága, egy vetélkedő tükrében
Hoyk Edit
Kecskeméti Főiskola Kertészeti Főiskolai Kar Környezettudományi Intézet
Összefoglalás: A budapesti székhelyű Iparfejlesztési Közalapítvány uniós pályázati forrás felhasználásával 2010. február-június között környezettudatossági vetélkedőt szervezett Gyere Egy Körre! címmel a hazai felsőoktatási intézmények hallgatói számára. A vetélkedőben 16 intézmény összesen 305 három fős csapata regisztrált, ami országos szinten 915 hallgató aktív bekapcsolódását jelentette. A Kecskeméti Főiskoláról 15 csapat nevezett. Közülük két csapat volt, akik a vetélkedő mind az öt fordulójában részt vettek, és az egyik csapat a vetélkedő elődöntőjébe is bejutott. A fordulók az ökológiai lábnyom-számítás témakörei alapján épültek fel, amely témák mindennapjaink részét alkotják, és nagyobb odafigyeléssel az egyén szintjén is hatásos tetteket eredményeznek környezetünk megóvása érdekében. A vetélkedőben való részvétel, a feladatok jellege, valamint az előzetes felmérés részeként kitöltött kérdőívek alapján képet alkothatunk a mai főiskolai-egyetemi hallgatók környezetvédelemhez, környezettudatossághoz való hozzáállásával kapcsolatban. Abstract: Foundation of Industrial Development in Budapest organized an environmental-consciousness quiz between February-June 2010. Participants of this quiz were students, and money came from the European Union for that. All together 305 teams and 915 students entered for this quiz from 16 universities and colleges in the country.
15 teams entered for the quiz from Kecskemét College. Majority of these students carried through a couple of tasks. Two teams achieved all the five tasks, and one of them got into the semi final. Rounds based on the Ecological Footprint, which is part of our ordinary life, and bigger concern to the everydays can result effective acts in environment protection.
On the base of the participation, character of the tasks and previously questionnaire among the students we can figure students attitude to the environment protection and environmental-consciousness. Kulcsszavak: környezettudatosság, ökológiai lábnyom, környezetvédelem Keywords: environmental-consciousness, ecological footprint, environment protection 1. Bevezetés
A budapesti székhelyű Iparfejlesztési Közalapítvány uniós pályázati forrás
felhasználásával 2010. február-június között környezettudatossági vetélkedőt szervezett Gyere Egy Körre! címmel a hazai felsőoktatási intézmények hallgatói számára. A vetélkedőben 16 intézmény összesen 305 három fős csapata regisztrált, ami országos szinten 915 hallgató aktív bekapcsolódását jelentette.
A Kecskeméti Főiskoláról 15 csapat nevezett. Két csapat teljesítette mind az öt fordulót, közülük egy az elődöntőbe is bejutott. Az egyes fordulók az ökológiai lábnyom-számítás témakörei alapján épültek fel, amely témák mindennapjaink részét alkotják, és nagyobb odafigyeléssel az egyén szintjén is hatásos tetteket eredményezhetnek környezetünk megóvása érdekében.
Agriculture
75
A vetélkedőben való részvétel, a feladatok jellege, valamint az előzetes felmérés részeként kitöltött kérdőívek alapján képet alkothatunk a mai főiskolai-egyetemi hallgatók környezetvédelemhez, környezettudatossághoz való hozzáállásával kapcsolatban. 2. Alkalmazott módszerek
A környezettudatossági vetélkedő kezdete előtt valamennyi résztvevő intézményben beharangozó napok ill. előadások voltak, amelynek részeként a hallgatóknak kérdőívet kellett kitölteni, ami általános tájékozottságuk felmérését célozta a környezetvédelem terén. A Kecskeméti Főiskola hallgatói összesen 280 kérdőívet töltöttek ki, amelyek feldolgozása, eredményeinek bemutatása Excel diagrammokkal történt.
A lebonyolított vetélkedő öt fordulója az ökológiai lábnyom-számítás témaköreit ölelte fel [3]. Az ökológiai lábnyom olyan erőforrás-menedzselésben használt érték, amely azt fejezi ki, hogy adott technológiai színvonal mellett egy emberi társadalomnak mekkora mennyiségű földre és vízre van szüksége önmaga fenntartásához, illetve az általa megtermelt hulladék elnyeléséhez. A kifejezést William Rees és Mathis Wackernagel használta először az 1990-es évek elején [1] [2]. Az érték nem csak a teljes emberi populációra számítható ki, hanem egyéni szinten, csoportokra, régiókra, országokra és vállalkozásokra is. Az elemzés során az adott csoport energia-, étel-, víz-, építőanyag- és egyéb fogyasztását vesszük figyelembe azért, hogy megbecsüljük az ezek eltartásához szükséges termelőképes földterület mennyiségét. Feltételezve, hogy mindenki az adott csoport életszínvonalán él, így meghatározható, hogy nagyjából mekkora Földre (illetve hány Földre) lenne szükség ahhoz, hogy a bolygó reprodukálni tudja önmagát, vagyis fenntartható legyen az életvitel. 2005-ben ez az érték a teljes emberiségre kiszámolva 1,3 bolygót eredményezett, más szóval, az emberiség 1,3-szor gyorsabban használja ki a bolygó tartalékait, mint ahogy az megújulni képes.
A verseny öt fordulója a következő témák köré épült: 1. mobilitás; 2. étel, ital; 3. lakhatás, otthon; 4. szabadidő, hobby; 5. munkahely ill. fenntartható egyetem/főiskola. A csapatoknak nem volt kötelező mind az öt fordulóban részt venni, és az egyes intézmények csapatainak többsége nem is teljesítette mind az öt fordulót, ált. 2-3 feladatban vettek részt. A résztvevő csapatok számát, az egyes feladatokban való részvételt, valamint az előzetesen kitöltött kérdőív eredményeit szintén Excel diagrammokkal szemléltetjük. 3. Eredmények
A Gyere Egy Körre! címen futó környezettudatossági vetélkedőben az ország összesen 16 felsőoktatási intézménye, egyetemi és főiskolai hallgatók vettek részt. A versenybe összesen 305 csapat regisztrált, ami a három fős csapatokkal számolva 915 hallgató aktív bekapcsolódását jelentette (1. ábra). Két kivételtől eltekintve (Kaposvári Egyetem ill. Pécsi Tudományegyetem) minden intézményben volt néhány csapat, akik csak a regisztrációig jutottak el, a feladatok közül egyet sem teljesítettek.
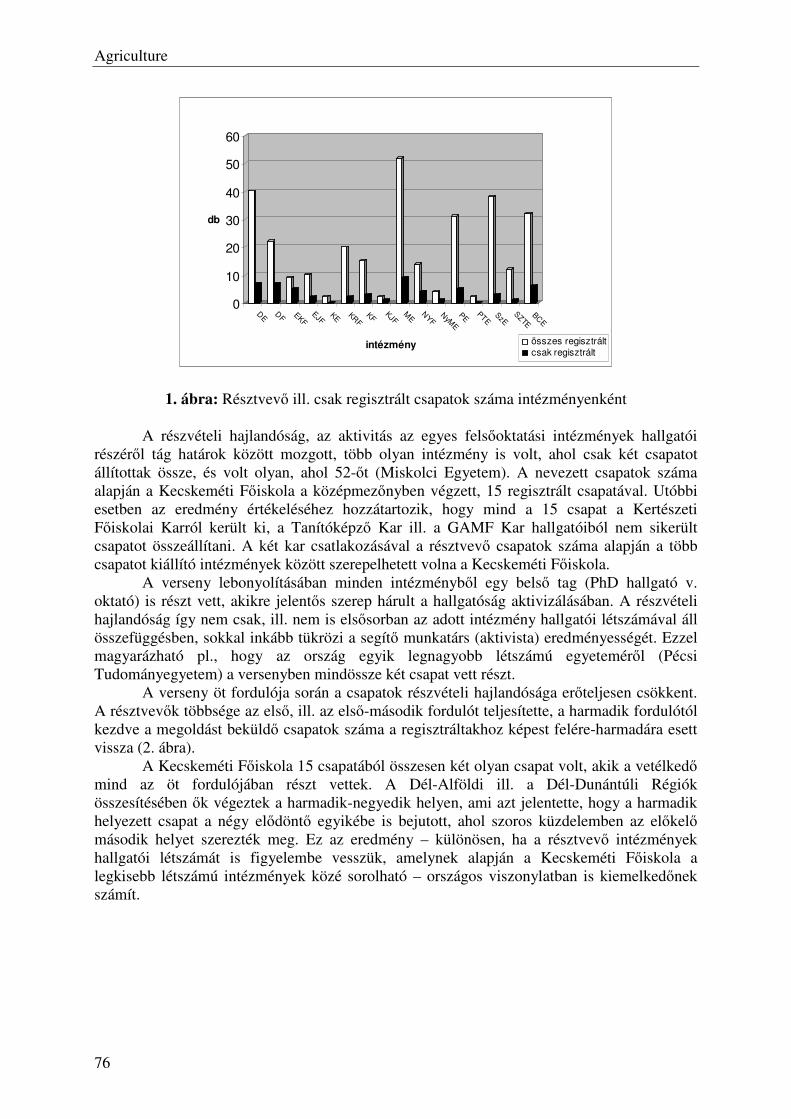
Agriculture
76
0
10
20
30
40
50
60
db
DE
DF EKF
EJFKE KR
FKF
KJFM
ENYF
NyM
E
PEPTE
SzESZTE
BCE
intézmény összes regisztráltcsak regisztrált
1. ábra: Résztvevő ill. csak regisztrált csapatok száma intézményenként
A részvételi hajlandóság, az aktivitás az egyes felsőoktatási intézmények hallgatói részéről tág határok között mozgott, több olyan intézmény is volt, ahol csak két csapatot állítottak össze, és volt olyan, ahol 52-őt (Miskolci Egyetem). A nevezett csapatok száma alapján a Kecskeméti Főiskola a középmezőnyben végzett, 15 regisztrált csapatával. Utóbbi esetben az eredmény értékeléséhez hozzátartozik, hogy mind a 15 csapat a Kertészeti Főiskolai Karról került ki, a Tanítóképző Kar ill. a GAMF Kar hallgatóiból nem sikerült csapatot összeállítani. A két kar csatlakozásával a résztvevő csapatok száma alapján a több csapatot kiállító intézmények között szerepelhetett volna a Kecskeméti Főiskola.
A verseny lebonyolításában minden intézményből egy belső tag (PhD hallgató v. oktató) is részt vett, akikre jelentős szerep hárult a hallgatóság aktivizálásában. A részvételi hajlandóság így nem csak, ill. nem is elsősorban az adott intézmény hallgatói létszámával áll összefüggésben, sokkal inkább tükrözi a segítő munkatárs (aktivista) eredményességét. Ezzel magyarázható pl., hogy az ország egyik legnagyobb létszámú egyeteméről (Pécsi Tudományegyetem) a versenyben mindössze két csapat vett részt.
A verseny öt fordulója során a csapatok részvételi hajlandósága erőteljesen csökkent. A résztvevők többsége az első, ill. az első-második fordulót teljesítette, a harmadik fordulótól kezdve a megoldást beküldő csapatok száma a regisztráltakhoz képest felére-harmadára esett vissza (2. ábra).
A Kecskeméti Főiskola 15 csapatából összesen két olyan csapat volt, akik a vetélkedő mind az öt fordulójában részt vettek. A Dél-Alföldi ill. a Dél-Dunántúli Régiók összesítésében ők végeztek a harmadik-negyedik helyen, ami azt jelentette, hogy a harmadik helyezett csapat a négy elődöntő egyikébe is bejutott, ahol szoros küzdelemben az előkelő második helyet szerezték meg. Ez az eredmény – különösen, ha a résztvevő intézmények hallgatói létszámát is figyelembe vesszük, amelynek alapján a Kecskeméti Főiskola a legkisebb létszámú intézmények közé sorolható – országos viszonylatban is kiemelkedőnek számít.
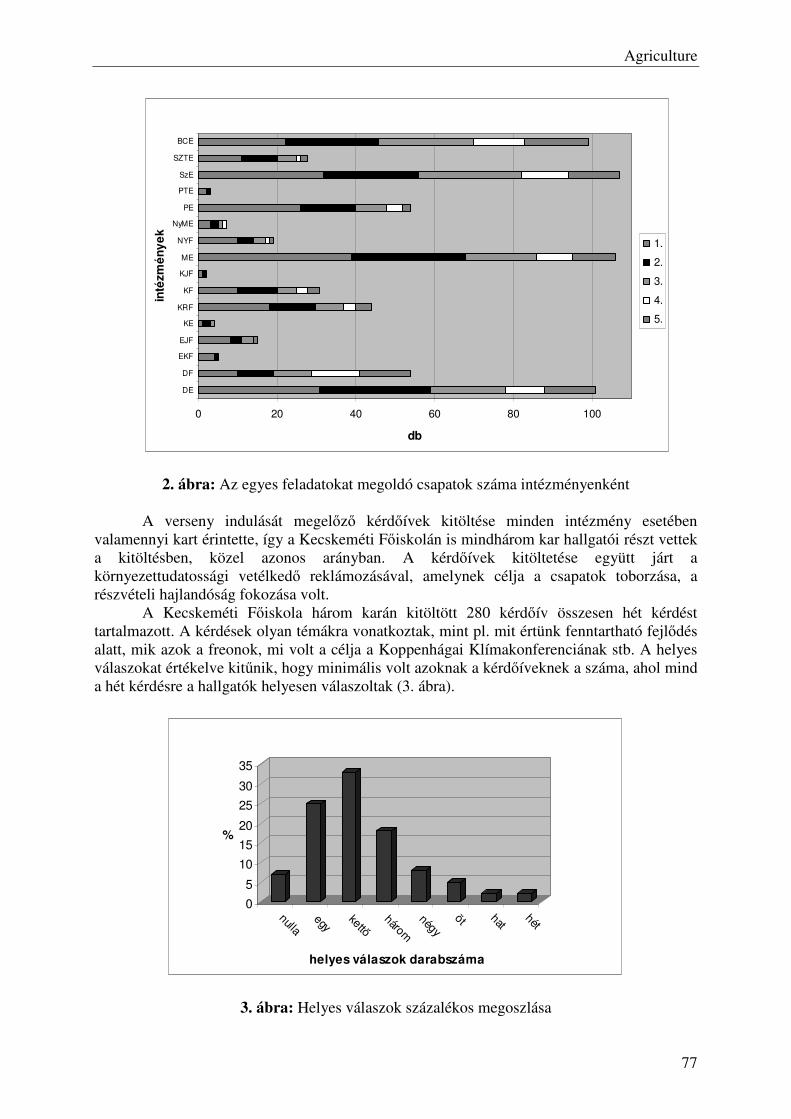
Agriculture
77
0 20 40 60 80 100
DE
DF
EKF
EJF
KE
KRF
KF
KJF
ME
NYF
NyME
PE
PTE
SzE
SZTE
BCE
inté
zm
én
ye
k
db
1.
2.
3.
4.
5.
2. ábra: Az egyes feladatokat megoldó csapatok száma intézményenként
A verseny indulását megelőző kérdőívek kitöltése minden intézmény esetében valamennyi kart érintette, így a Kecskeméti Főiskolán is mindhárom kar hallgatói részt vettek a kitöltésben, közel azonos arányban. A kérdőívek kitöltetése együtt járt a környezettudatossági vetélkedő reklámozásával, amelynek célja a csapatok toborzása, a részvételi hajlandóság fokozása volt.
A Kecskeméti Főiskola három karán kitöltött 280 kérdőív összesen hét kérdést tartalmazott. A kérdések olyan témákra vonatkoztak, mint pl. mit értünk fenntartható fejlődés alatt, mik azok a freonok, mi volt a célja a Koppenhágai Klímakonferenciának stb. A helyes válaszokat értékelve kitűnik, hogy minimális volt azoknak a kérdőíveknek a száma, ahol mind a hét kérdésre a hallgatók helyesen válaszoltak (3. ábra).
0
5
10
15
20
25
30
35
%
nullaegy
kettőhárom
négy
öt hathét
helyes válaszok darabszáma
3. ábra: Helyes válaszok százalékos megoszlása
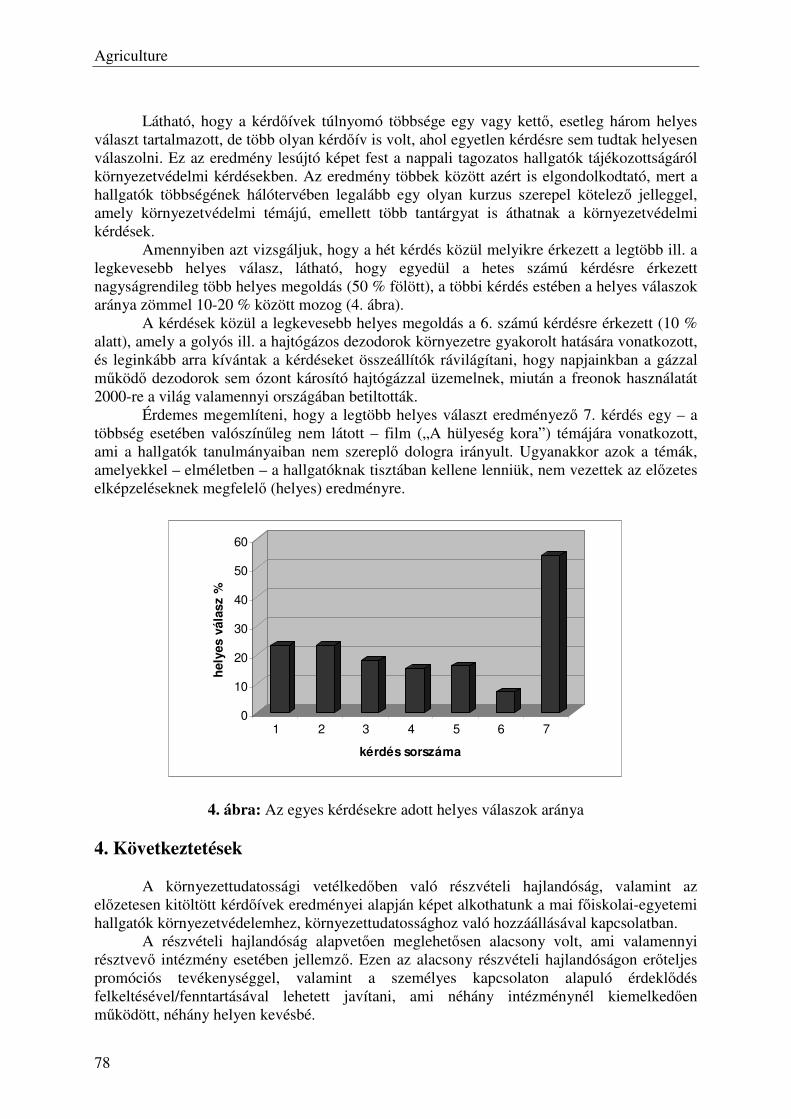
Agriculture
78
Látható, hogy a kérdőívek túlnyomó többsége egy vagy kettő, esetleg három helyes
választ tartalmazott, de több olyan kérdőív is volt, ahol egyetlen kérdésre sem tudtak helyesen válaszolni. Ez az eredmény lesújtó képet fest a nappali tagozatos hallgatók tájékozottságáról környezetvédelmi kérdésekben. Az eredmény többek között azért is elgondolkodtató, mert a hallgatók többségének hálótervében legalább egy olyan kurzus szerepel kötelező jelleggel, amely környezetvédelmi témájú, emellett több tantárgyat is áthatnak a környezetvédelmi kérdések.
Amennyiben azt vizsgáljuk, hogy a hét kérdés közül melyikre érkezett a legtöbb ill. a legkevesebb helyes válasz, látható, hogy egyedül a hetes számú kérdésre érkezett nagyságrendileg több helyes megoldás (50 % fölött), a többi kérdés estében a helyes válaszok aránya zömmel 10-20 % között mozog (4. ábra).
A kérdések közül a legkevesebb helyes megoldás a 6. számú kérdésre érkezett (10 % alatt), amely a golyós ill. a hajtógázos dezodorok környezetre gyakorolt hatására vonatkozott, és leginkább arra kívántak a kérdéseket összeállítók rávilágítani, hogy napjainkban a gázzal működő dezodorok sem ózont károsító hajtógázzal üzemelnek, miután a freonok használatát 2000-re a világ valamennyi országában betiltották.
Érdemes megemlíteni, hogy a legtöbb helyes választ eredményező 7. kérdés egy – a többség esetében valószínűleg nem látott – film („A hülyeség kora”) témájára vonatkozott, ami a hallgatók tanulmányaiban nem szereplő dologra irányult. Ugyanakkor azok a témák, amelyekkel – elméletben – a hallgatóknak tisztában kellene lenniük, nem vezettek az előzetes elképzeléseknek megfelelő (helyes) eredményre.
0
10
20
30
40
50
60
hely
es v
ála
sz %
1 2 3 4 5 6 7
kérdés sorszáma
4. ábra: Az egyes kérdésekre adott helyes válaszok aránya 4. Következtetések
A környezettudatossági vetélkedőben való részvételi hajlandóság, valamint az előzetesen kitöltött kérdőívek eredményei alapján képet alkothatunk a mai főiskolai-egyetemi hallgatók környezetvédelemhez, környezettudatossághoz való hozzáállásával kapcsolatban.
A részvételi hajlandóság alapvetően meglehetősen alacsony volt, ami valamennyi résztvevő intézmény esetében jellemző. Ezen az alacsony részvételi hajlandóságon erőteljes promóciós tevékenységgel, valamint a személyes kapcsolaton alapuló érdeklődés felkeltésével/fenntartásával lehetett javítani, ami néhány intézménynél kiemelkedően működött, néhány helyen kevésbé.
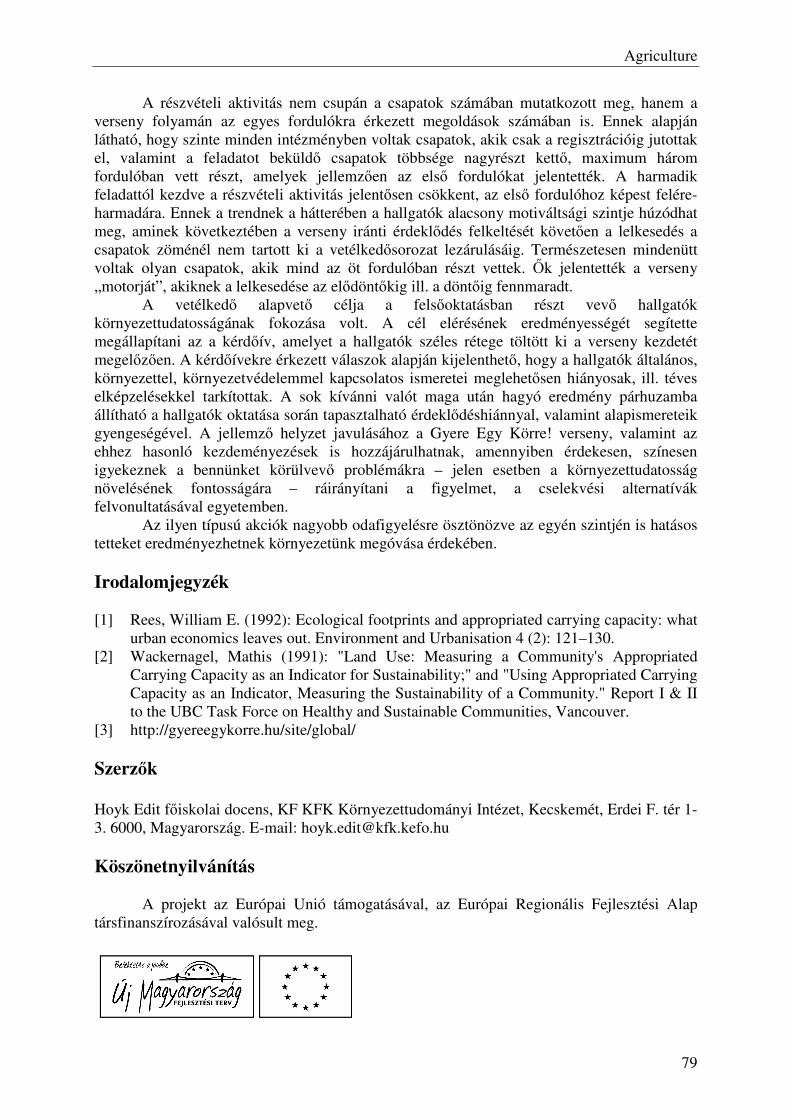
Agriculture
79
A részvételi aktivitás nem csupán a csapatok számában mutatkozott meg, hanem a verseny folyamán az egyes fordulókra érkezett megoldások számában is. Ennek alapján látható, hogy szinte minden intézményben voltak csapatok, akik csak a regisztrációig jutottak el, valamint a feladatot beküldő csapatok többsége nagyrészt kettő, maximum három fordulóban vett részt, amelyek jellemzően az első fordulókat jelentették. A harmadik feladattól kezdve a részvételi aktivitás jelentősen csökkent, az első fordulóhoz képest felére-harmadára. Ennek a trendnek a hátterében a hallgatók alacsony motiváltsági szintje húzódhat meg, aminek következtében a verseny iránti érdeklődés felkeltését követően a lelkesedés a csapatok zöménél nem tartott ki a vetélkedősorozat lezárulásáig. Természetesen mindenütt voltak olyan csapatok, akik mind az öt fordulóban részt vettek. Ők jelentették a verseny „motorját”, akiknek a lelkesedése az elődöntőkig ill. a döntőig fennmaradt.
A vetélkedő alapvető célja a felsőoktatásban részt vevő hallgatók környezettudatosságának fokozása volt. A cél elérésének eredményességét segítette megállapítani az a kérdőív, amelyet a hallgatók széles rétege töltött ki a verseny kezdetét megelőzően. A kérdőívekre érkezett válaszok alapján kijelenthető, hogy a hallgatók általános, környezettel, környezetvédelemmel kapcsolatos ismeretei meglehetősen hiányosak, ill. téves elképzelésekkel tarkítottak. A sok kívánni valót maga után hagyó eredmény párhuzamba állítható a hallgatók oktatása során tapasztalható érdeklődéshiánnyal, valamint alapismereteik gyengeségével. A jellemző helyzet javulásához a Gyere Egy Körre! verseny, valamint az ehhez hasonló kezdeményezések is hozzájárulhatnak, amennyiben érdekesen, színesen igyekeznek a bennünket körülvevő problémákra – jelen esetben a környezettudatosság növelésének fontosságára – ráirányítani a figyelmet, a cselekvési alternatívák felvonultatásával egyetemben.
Az ilyen típusú akciók nagyobb odafigyelésre ösztönözve az egyén szintjén is hatásos tetteket eredményezhetnek környezetünk megóvása érdekében. Irodalomjegyzék [1] Rees, William E. (1992): Ecological footprints and appropriated carrying capacity: what
urban economics leaves out. Environment and Urbanisation 4 (2): 121–130. [2] Wackernagel, Mathis (1991): "Land Use: Measuring a Community's Appropriated
Carrying Capacity as an Indicator for Sustainability;" and "Using Appropriated Carrying Capacity as an Indicator, Measuring the Sustainability of a Community." Report I & II to the UBC Task Force on Healthy and Sustainable Communities, Vancouver.
[3] http://gyereegykorre.hu/site/global/ Szerzők Hoyk Edit főiskolai docens, KF KFK Környezettudományi Intézet, Kecskemét, Erdei F. tér 1-3. 6000, Magyarország. E-mail: [email protected] Köszönetnyilvánítás
A projekt az Európai Unió támogatásával, az Európai Regionális Fejlesztési Alap társfinanszírozásával valósult meg.
Agriculture
80
Eugley characteristics and limitations in plant production on the
County of Slavonski Brod-Posavina area
Božica Japundžić-Palenkić1, Slavica Antunović2, Nataša Romanjek-Fajdetić2, Monika Marković3
1,2University of Applied Sciences of Slavonski Brod, CROATIA 3 Faculty of agriculture, J.J. Strossmayer University Osijek, CROATIA
Abstract: The aim of this paper was to determine the distribution and characteristics of hydromorphic soils, class gleysoil, soil type eugley of County of Slavonski Brod-Posavina. According to basic soil map of the Republic of Croatia (scale 1:50 000) and previous studies in these investigation area 17 soil types were determined, of which 10 belong to automorphic soils, and 7 to hydromorphic soils. Eugley is widespread soil (about 48 630 ha) in County of Slavonski Brod-Posavina. The texture of these soils is silty loam to silty clay loam in hypogley subtypes, or mostly loamy clay in amphygley. Vertic gleysol are characterized by a high clay contents, and very low air holding capacity. It was determined that soils are calcareous and non-calcareous and they vary from acid to alkaline (pHKCl 5.00 to 7,3) and show low to moderate supplies of phosphorus and potassium. Soil organic matter content is in wide range (from 0.6% to 9.59%). Main limiting factors of eugley for plant production are high level of underground water, high density, low infiltration, high level of clay particles, low air capacity, high soil plasticity and low phosphorus and potassium content. Key words: eugley, soil properties, soil suitability, County of Slavonski Brod-Posavina
1 Introduction
On the basis of original data, and in accordance with the national classification [1] 65 lower pedosystematic units have been determined in Croatia, belonging to 30 soil types. In the pedosphere of the Republic of Croatia, the largest group of soils consists of soils belonging to the class of Automorphic soils (56.63 percent), followed by Hydromorphic soils (29.05 percent), Halomorphic and Subaqual soils together (0.02 percent). The rest (14.304 percent) consists of rocks [2]. Eugley takes 499 526 ha (8.971 percent) of all soils in Croatia [3]. According to basic soil map of the Republic of Croatia (scale 1:50 000) and previous studies in County of Slavonski Brod-Posavina 17 soil types were determined, of which 10 belong to automorphic soils, and 7 to hydromorphic soils. Eugley is widespread soil (about 48 630 ha). Eugley forming is depended on topographically depression forms of relief with high levels of groundwater. Prolonged water saturation and seasonal alternation between water logging and drainage has profound effects on soil chemical and morphological properties. Permanent or periodic saturation of the soil by water, which is the starting point of redox processes causing the gley phenomena, can occur either from below (groundwater) or from above (rain or irrigation water). Changes in the degree of water saturation affect the supply of oxygen to the soil, which in turn affects the oxidation state of important elements. When pores are filled with water gas diffusion becomes very slow [4]. Clay destruction starts at the point when the unstable H+– clay converts to clay with exchangeable AL3+. Intermediate products of Al-hydrolysis can form Al-hydroxy interlayers between plates of 2:1 clay minerals. The resulting

Agriculture
81
Al- interlayered 2:1 clays („soil chlorites“) have a lower capacity to swell and shrink upon wetting and drying, and have a lower cation exchange capacity [4].
2 Materials and methods
For determination of the characteristics of eugley in County of Slavonski Brod-Posavina Soil Map at the scale of 1:100000, corrected with new topographic data, have been used. Afterwards correction and update have been done with Basic Soil Map at the scale of 1:50 000 [5] and other data from detailed pedologic research for the needs of agro technical and hydro technical meliorations on the soils of ex agro-industry of County of Slavonski Brod-Posavina [6]. Pedologyc maps were made by the criteria used for detailed maps [7,8]. Soil type map were made by GIS tool ARCVIEW 3.3. 3 Results and discussion On this map the distribution of eugley soil type has been shown and that classification has been made by the pedogenetic principals according to contemporary soil classification [9].
Picture 1 Map of distribution of eugley in County of Slavonski Brod-Posavina
The areas of eugley soil type in County of Slavonski Brod-Posavina is determined according to legend of pedologic map of that county. Total eugley area was 48 637.3 ha of which hydromeliorated with canals were 17 246.9 ha and with drainage 12 302 ha (table 1). Eugley areas in agricultural production without melioration takes 10 953.8 ha, hydromeliorated with canals 13 340.9 ha, eugley hydromeliorated with drainage 12 302 ha, the rest are forests and forest soils. Total areas of mapped units is177 132.2 ha which leads us to the conclusion that eugley is widespread soil in County of Slavonski Brod-Posavina.
Legend:
Eugley (1)
Eugley hydromeliorated with canals (2) Eugley hydromeliorated with drainage (3)
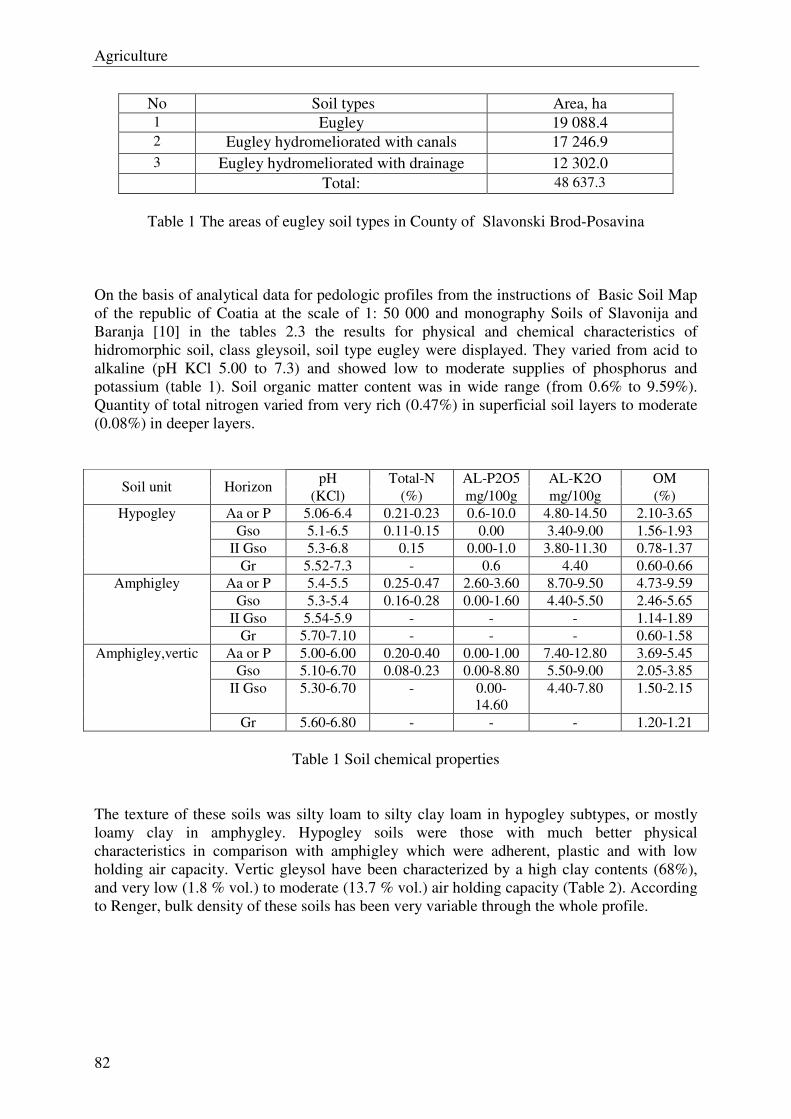
Agriculture
82
No Soil types Area, ha 1 Eugley 19 088.4 2 Eugley hydromeliorated with canals 17 246.9 3 Eugley hydromeliorated with drainage 12 302.0 Total: 48 637.3
Table 1 The areas of eugley soil types in County of Slavonski Brod-Posavina
On the basis of analytical data for pedologic profiles from the instructions of Basic Soil Map of the republic of Coatia at the scale of 1: 50 000 and monography Soils of Slavonija and Baranja [10] in the tables 2.3 the results for physical and chemical characteristics of hidromorphic soil, class gleysoil, soil type eugley were displayed. They varied from acid to alkaline (pH KCl 5.00 to 7.3) and showed low to moderate supplies of phosphorus and potassium (table 1). Soil organic matter content was in wide range (from 0.6% to 9.59%). Quantity of total nitrogen varied from very rich (0.47%) in superficial soil layers to moderate (0.08%) in deeper layers.
pH Total-N AL-P2O5 AL-K2O OM Soil unit Horizon
(KCl) (%) mg/100g mg/100g (%) Aa or P 5.06-6.4 0.21-0.23 0.6-10.0 4.80-14.50 2.10-3.65
Gso 5.1-6.5 0.11-0.15 0.00 3.40-9.00 1.56-1.93 II Gso 5.3-6.8 0.15 0.00-1.0 3.80-11.30 0.78-1.37
Hypogley
Gr 5.52-7.3 - 0.6 4.40 0.60-0.66 Aa or P 5.4-5.5 0.25-0.47 2.60-3.60 8.70-9.50 4.73-9.59
Gso 5.3-5.4 0.16-0.28 0.00-1.60 4.40-5.50 2.46-5.65 II Gso 5.54-5.9 - - - 1.14-1.89
Amphigley
Gr 5.70-7.10 - - - 0.60-1.58 Aa or P 5.00-6.00 0.20-0.40 0.00-1.00 7.40-12.80 3.69-5.45
Gso 5.10-6.70 0.08-0.23 0.00-8.80 5.50-9.00 2.05-3.85 II Gso 5.30-6.70 - 0.00-
14.60 4.40-7.80 1.50-2.15
Amphigley,vertic
Gr 5.60-6.80 - - - 1.20-1.21
Table 1 Soil chemical properties
The texture of these soils was silty loam to silty clay loam in hypogley subtypes, or mostly loamy clay in amphygley. Hypogley soils were those with much better physical characteristics in comparison with amphigley which were adherent, plastic and with low holding air capacity. Vertic gleysol have been characterized by a high clay contents (68%), and very low (1.8 % vol.) to moderate (13.7 % vol.) air holding capacity (Table 2). According to Renger, bulk density of these soils has been very variable through the whole profile.
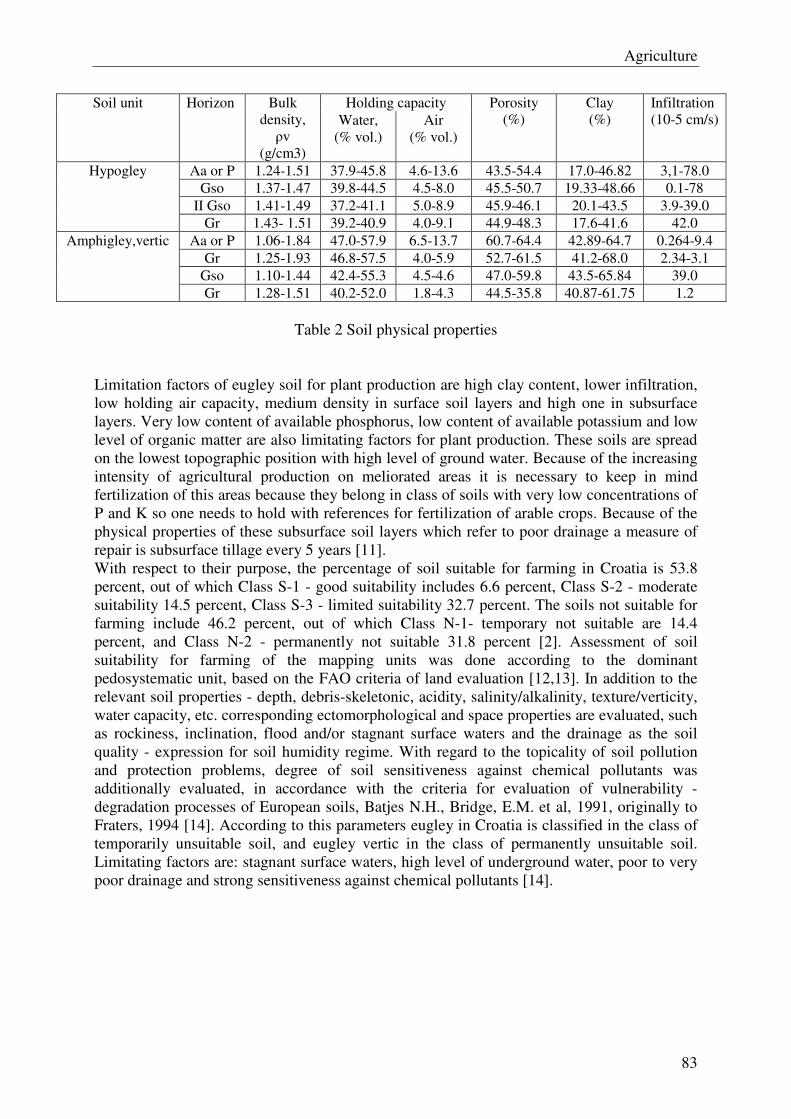
Agriculture
83
Holding capacity Soil unit Horizon Bulk density, ρv
(g/cm3)
Water, (% vol.)
Air (% vol.)
Porosity (%)
Clay (%)
Infiltration (10-5 cm/s)
Aa or P 1.24-1.51 37.9-45.8 4.6-13.6 43.5-54.4 17.0-46.82 3,1-78.0 Gso 1.37-1.47 39.8-44.5 4.5-8.0 45.5-50.7 19.33-48.66 0.1-78
II Gso 1.41-1.49 37.2-41.1 5.0-8.9 45.9-46.1 20.1-43.5 3.9-39.0
Hypogley
Gr 1.43- 1.51 39.2-40.9 4.0-9.1 44.9-48.3 17.6-41.6 42.0 Aa or P 1.06-1.84 47.0-57.9 6.5-13.7 60.7-64.4 42.89-64.7 0.264-9.4
Gr 1.25-1.93 46.8-57.5 4.0-5.9 52.7-61.5 41.2-68.0 2.34-3.1 Gso 1.10-1.44 42.4-55.3 4.5-4.6 47.0-59.8 43.5-65.84 39.0
Amphigley,vertic
Gr 1.28-1.51 40.2-52.0 1.8-4.3 44.5-35.8 40.87-61.75 1.2
Table 2 Soil physical properties Limitation factors of eugley soil for plant production are high clay content, lower infiltration, low holding air capacity, medium density in surface soil layers and high one in subsurface layers. Very low content of available phosphorus, low content of available potassium and low level of organic matter are also limitating factors for plant production. These soils are spread on the lowest topographic position with high level of ground water. Because of the increasing intensity of agricultural production on meliorated areas it is necessary to keep in mind fertilization of this areas because they belong in class of soils with very low concentrations of P and K so one needs to hold with references for fertilization of arable crops. Because of the physical properties of these subsurface soil layers which refer to poor drainage a measure of repair is subsurface tillage every 5 years [11]. With respect to their purpose, the percentage of soil suitable for farming in Croatia is 53.8 percent, out of which Class S-1 - good suitability includes 6.6 percent, Class S-2 - moderate suitability 14.5 percent, Class S-3 - limited suitability 32.7 percent. The soils not suitable for farming include 46.2 percent, out of which Class N-1- temporary not suitable are 14.4 percent, and Class N-2 - permanently not suitable 31.8 percent [2]. Assessment of soil suitability for farming of the mapping units was done according to the dominant pedosystematic unit, based on the FAO criteria of land evaluation [12,13]. In addition to the relevant soil properties - depth, debris-skeletonic, acidity, salinity/alkalinity, texture/verticity, water capacity, etc. corresponding ectomorphological and space properties are evaluated, such as rockiness, inclination, flood and/or stagnant surface waters and the drainage as the soil quality - expression for soil humidity regime. With regard to the topicality of soil pollution and protection problems, degree of soil sensitiveness against chemical pollutants was additionally evaluated, in accordance with the criteria for evaluation of vulnerability - degradation processes of European soils, Batjes N.H., Bridge, E.M. et al, 1991, originally to Fraters, 1994 [14]. According to this parameters eugley in Croatia is classified in the class of temporarily unsuitable soil, and eugley vertic in the class of permanently unsuitable soil. Limitating factors are: stagnant surface waters, high level of underground water, poor to very poor drainage and strong sensitiveness against chemical pollutants [14].
Agriculture
84
4 Conclusion According to map of distribution of eugley in County of Slavonski Brod-Posavina and data from legend of pedologyc map of these areas (48 637.3 ha) it can be concluded that eugley is widespread soil in that county. The results of chemical and physical properties of eugley showed that eugley is temporarily or permanently unsuitable soil for plant production. High levels of surface or underground water, shorter or long terms, alkalinity, low supply P and K (10mg/100g soil), low to very low drainage and high expenses of maintaining are the main limitating factors of eugley. [1] Škoric, A., Filipovski, G., Ciric, M. (1985): Land Classification of Yugoslavia, ANU
BiH, knjiga 13,Sarajevo [2] M.Bogunovic, Z. Vidacek, Z. Racz, S. Husnjak, M. Sraka Soil suitability map for
cultivation purposes of the Republic of Croatia, Scientific registration n° : 1843 Symposum no : 35, Presentation : poster,
[3] M.Bogunovic , Z. Vidacek, S. Husnjak, M. Sraka (1998): Inventory of Soils in Croatia, Agriculturae Conspectu Scientificus,vol.63,3.
[4] N. van Breemen and P. Buurman (2003): Soil Formation ,Kluwer Academic Publishers, 159-167.
[5] P. Kovačević, M. Kalinić, V. Pavlić, R. Paraker, B. Radman, B. Mayer, Ž. Vidaček, Z.Racz, A. Škorić (1964,1974) Soil Basic Map 1: 50000
[6] Plan navodnjavanja Brodsko-posavske županije, 2006. Agronomski fakultet sveučilišta u Zagrebu i Hidroing d.o.o.
[7] JDPZ, Priručnik za ispitivanje zemljišta, knjiga 4, Metodika terenskog ispitivanja zemljišta i izrada pedoloških karata, JDPZ, Beograd, (1967).
[8] M. Bogunović, Pedološko kartiranje (radni materijal za skriptu). Agroomski fakultet Sveučilišta u Zagrebu, Zagreb,(1994)
[9] A. Škorić, G. Filipovski, M. Ćirić (1985): Klasifikacija tala Jugoslavije, Zavod za pedologiju Poljoprivrednog i Šumarskog fakulteta Sveučilišta u Zagrebu.
[10] A.Škorić et al. (1977): Tla Slavonije i Baranje. Projektni savjet za izradu Pedološke karte Republike Hrvatske, str. 256, Zagreb
[11] Z. Semialjac, D. Rastija , V. Zebec, B. Japundžić-Palenkić (2009.): Irrigation Soil Suitability on Ivankovo Area, TEAM conference, Slavonski Brod
[12] FAO (1976): A. Framework for Land Evaluation. Soils Bulletin 32, Rome [13] Brinkman, R., Smyth, A.J. (1972): Land Evaluation for rural purposes. Summary of an
expert consultation, Wageningen [14] Z. Vidacek, M.Bogunovic, M. Sraka S. Husnjak (1998): Evaluation of Soil Suitability
for Regional Planning in Croatia, Agriculturae Conspectu Scientificus,vol.63,3. Author data First author: Božica Japundžić- Palenkić, University of applied sciences Slavonski Brod, Dr. M. Budaka 1, 35000 Slavonski Brod, Croatia, E-mail: [email protected] Second author: Slavica Antunović, University of applied sciences of Slavonski Brod, Dr. M. Budaka 1, 35000 Slavonski Brod, Croatia, E-mail: [email protected] Second author: Nataša Romanjek- Fajdetić, University of applied sciences Slavonski Brod, DR. M. Budaka 1, 35000 Slavonski Brod, Croatia, E-mail: [email protected] Second author: Monika Marković, Faculty of agriculture in Osijek, J.J. Strossmayer

Agriculture
85
University Osijek, Trg sv. Trojstva 3, 31000 Osijek, Croatia, E-mail: [email protected]
Agriculture
86
The difference in the germination of maize hybrids (Zea mays L.)
Božica Japundžić-Palenkić1, Slavica Antunović2, Nataša Romanjek-Fajdetić2,
Branimir Vujčić2
1,2University of Applied Sciences of Slavonski Brod, CROATIA
Abstract: The quantity and quality of corn yield depends on the maize seeds quality (Zea
mays L.). The aim of this experiment was to test the germiation in different maize hybrids under controlled conditions. The experiment was set up with five maize hibryds from the Agricultural Institute Osijek, FAO different groups: OS 298 P, OS Sk 444, OS Sk 494, OS 499, OS Sk 552. During the experiment, the following parameters were monitored: number of germinated seed and seedling mass. The statistical analysis in the average seedlings mass obtained results which showed that the average seedlings weight significantly dependens on the maize hybrids (F=16.139**). Statistically results that is based on seed germination of tested hybrids shows that germination was significantly under hybrids influence (F=49.478**).
Keywords: maize hybrids, difference, germination
1 Introduction
Seed quality and vigor should be better defined at genetical and physiological level in order to help seed producers to supply farmers with adequate planting material. Seed vigour can potentially affect yield in a number of ways eliminating the most obvious factor: reduced plant density (TeKrony and Egli, 1991) [1]. Numerous authors have reported that hybrid vigor in relation to the growth rate and yield potential may be associated with high physiological and biochemical activities in the F₁ hybrid plants [2,3]. Hybrid vigor, or heterozis, describes the increased vigor of plants or other organisms when compared with parents that wery unlike in one or more inhertited characters. Although there is no single, fully acceptable genetic definition of hybrid vigor [4], it may be observed in the offspring in terms of increased size, uniformity, volume, quality in earlines, or resistance to unfavourable environmental factors. Plant breeders express the degree of hybrid vigor of an agronomic character in different ways; the percentage increase over the best parent, over the midparent or average of the two parents, or over the best commercial cultivar in the area. The way the breeder chooses to express the hybrid vigor determines the percentage [5]. Although the biological basis of heterozis remains unknown, plant breeders have made wide use of this phenomenon and it is generally believed that the understanding of the mechanism underlying heterozis will enhance our ability to form new genotypes which may be used directly as F₁ hybrids or form the basis for future selection programmes [6]. Seed quality is a multiple criterion that encompasses several important seed attributes: genetic and chemical composition, physical condition, physiological germination and vigor, size, appearance and presence of seedborne pathogens, crop and varietals purity, weed and crop contaminants and moisture content [7]. Investigations show that larger seed gives longer and vigorous sprout and root [8].
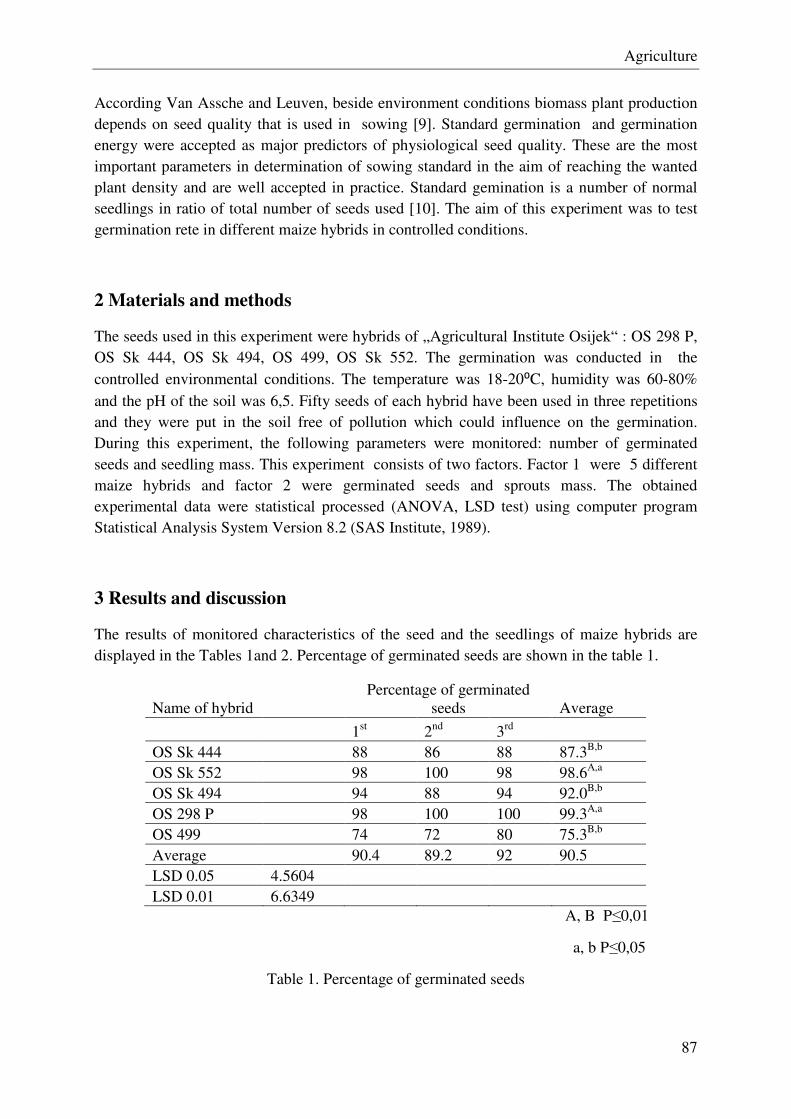
Agriculture
87
According Van Assche and Leuven, beside environment conditions biomass plant production depends on seed quality that is used in sowing [9]. Standard germination and germination energy were accepted as major predictors of physiological seed quality. These are the most important parameters in determination of sowing standard in the aim of reaching the wanted plant density and are well accepted in practice. Standard gemination is a number of normal seedlings in ratio of total number of seeds used [10]. The aim of this experiment was to test germination rete in different maize hybrids in controlled conditions.
2 Materials and methods
The seeds used in this experiment were hybrids of „Agricultural Institute Osijek“ : OS 298 P, OS Sk 444, OS Sk 494, OS 499, OS Sk 552. The germination was conducted in the controlled environmental conditions. The temperature was 18-20⁰C, humidity was 60-80% and the pH of the soil was 6,5. Fifty seeds of each hybrid have been used in three repetitions and they were put in the soil free of pollution which could influence on the germination. During this experiment, the following parameters were monitored: number of germinated seeds and seedling mass. This experiment consists of two factors. Factor 1 were 5 different maize hybrids and factor 2 were germinated seeds and sprouts mass. The obtained experimental data were statistical processed (ANOVA, LSD test) using computer program Statistical Analysis System Version 8.2 (SAS Institute, 1989).
3 Results and discussion
The results of monitored characteristics of the seed and the seedlings of maize hybrids are displayed in the Tables 1and 2. Percentage of germinated seeds are shown in the table 1.
Name of hybrid Percentage of germinated
seeds Average
1st 2nd 3rd OS Sk 444 88 86 88 87.3B,b
OS Sk 552 98 100 98 98.6A,a
OS Sk 494 94 88 94 92.0B,b
OS 298 P 98 100 100 99.3A,a
OS 499 74 72 80 75.3B,b
Average 90.4 89.2 92 90.5 LSD 0.05 4.5604 LSD 0.01 6.6349
A, B P≤0,01
a, b P≤0,05
Table 1. Percentage of germinated seeds
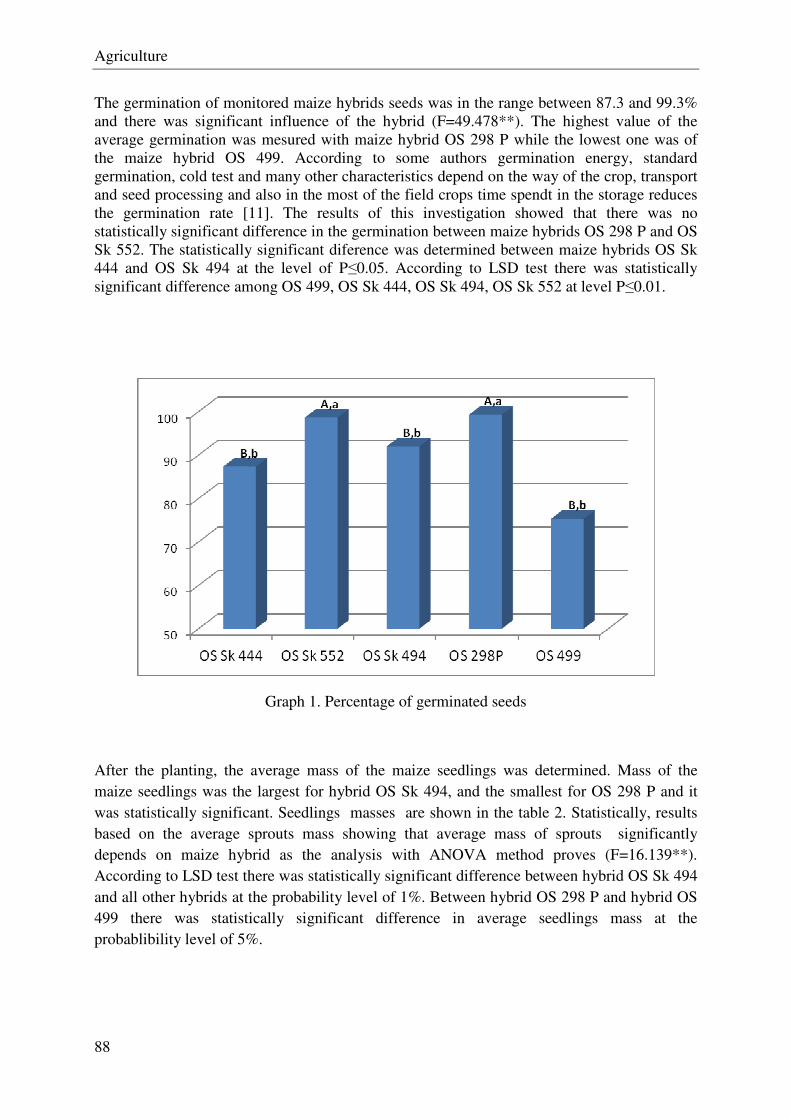
Agriculture
88
The germination of monitored maize hybrids seeds was in the range between 87.3 and 99.3% and there was significant influence of the hybrid (F=49.478**). The highest value of the average germination was mesured with maize hybrid OS 298 P while the lowest one was of the maize hybrid OS 499. According to some authors germination energy, standard germination, cold test and many other characteristics depend on the way of the crop, transport and seed processing and also in the most of the field crops time spendt in the storage reduces the germination rate [11]. The results of this investigation showed that there was no statistically significant difference in the germination between maize hybrids OS 298 P and OS Sk 552. The statistically significant diference was determined between maize hybrids OS Sk 444 and OS Sk 494 at the level of P≤0.05. According to LSD test there was statistically significant difference among OS 499, OS Sk 444, OS Sk 494, OS Sk 552 at level P≤0.01.
Graph 1. Percentage of germinated seeds
After the planting, the average mass of the maize seedlings was determined. Mass of the maize seedlings was the largest for hybrid OS Sk 494, and the smallest for OS 298 P and it was statistically significant. Seedlings masses are shown in the table 2. Statistically, results based on the average sprouts mass showing that average mass of sprouts significantly depends on maize hybrid as the analysis with ANOVA method proves (F=16.139**). According to LSD test there was statistically significant difference between hybrid OS Sk 494 and all other hybrids at the probability level of 1%. Between hybrid OS 298 P and hybrid OS 499 there was statistically significant difference in average seedlings mass at the probablibility level of 5%.
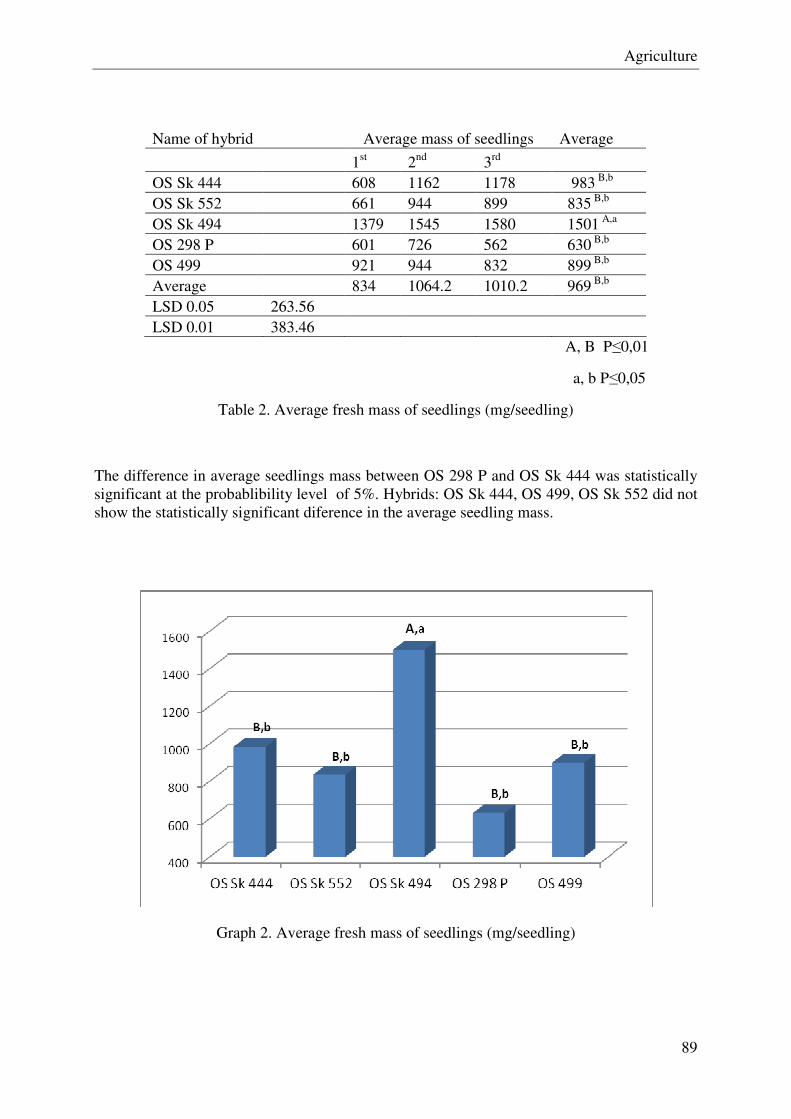
Agriculture
89
Name of hybrid Average mass of seedlings Average
1st 2nd 3rd OS Sk 444 608 1162 1178 983 B,b OS Sk 552 661 944 899 835 B,b OS Sk 494 1379 1545 1580 1501 A,a OS 298 P 601 726 562 630 B,b OS 499 921 944 832 899 B,b Average 834 1064.2 1010.2 969 B,b LSD 0.05 263.56 LSD 0.01 383.46
A, B P≤0,01
a, b P≤0,05
Table 2. Average fresh mass of seedlings (mg/seedling)
The difference in average seedlings mass between OS 298 P and OS Sk 444 was statistically significant at the probablibility level of 5%. Hybrids: OS Sk 444, OS 499, OS Sk 552 did not show the statistically significant diference in the average seedling mass.
Graph 2. Average fresh mass of seedlings (mg/seedling)
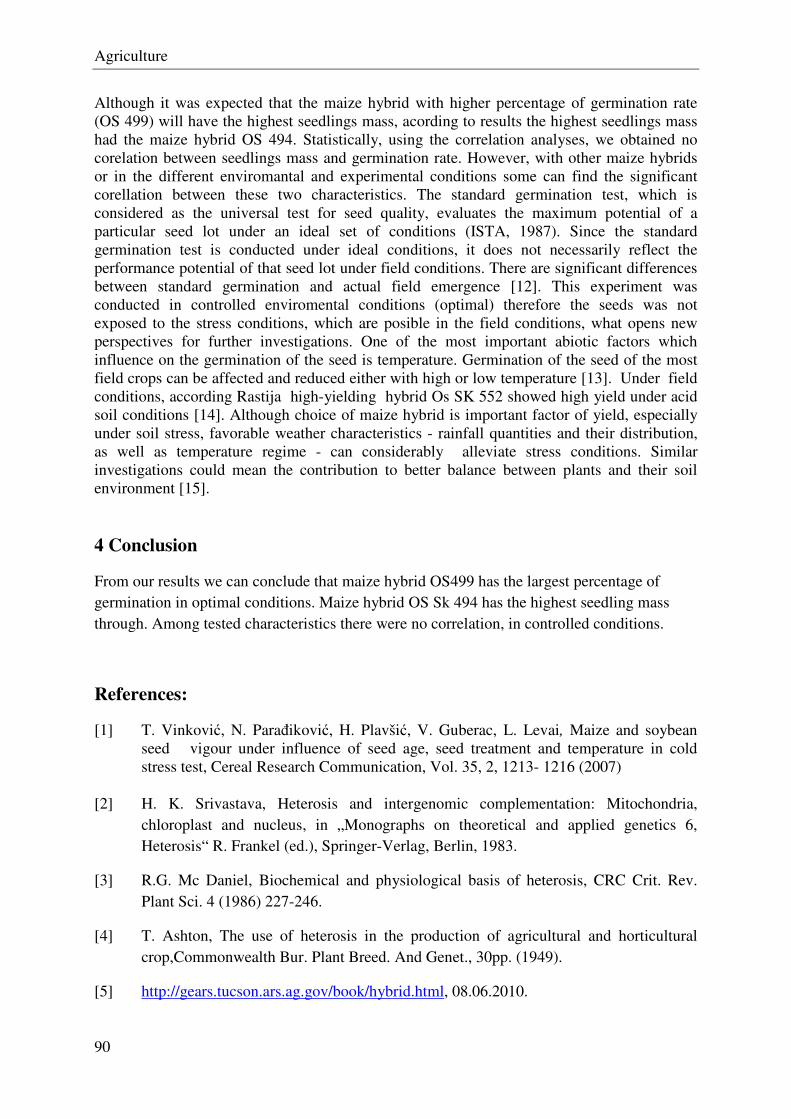
Agriculture
90
Although it was expected that the maize hybrid with higher percentage of germination rate (OS 499) will have the highest seedlings mass, acording to results the highest seedlings mass had the maize hybrid OS 494. Statistically, using the correlation analyses, we obtained no corelation between seedlings mass and germination rate. However, with other maize hybrids or in the different enviromantal and experimental conditions some can find the significant corellation between these two characteristics. The standard germination test, which is considered as the universal test for seed quality, evaluates the maximum potential of a particular seed lot under an ideal set of conditions (ISTA, 1987). Since the standard germination test is conducted under ideal conditions, it does not necessarily reflect the performance potential of that seed lot under field conditions. There are significant differences between standard germination and actual field emergence [12]. This experiment was conducted in controlled enviromental conditions (optimal) therefore the seeds was not exposed to the stress conditions, which are posible in the field conditions, what opens new perspectives for further investigations. One of the most important abiotic factors which influence on the germination of the seed is temperature. Germination of the seed of the most field crops can be affected and reduced either with high or low temperature [13]. Under field conditions, according Rastija high-yielding hybrid Os SK 552 showed high yield under acid soil conditions [14]. Although choice of maize hybrid is important factor of yield, especially under soil stress, favorable weather characteristics - rainfall quantities and their distribution, as well as temperature regime - can considerably alleviate stress conditions. Similar investigations could mean the contribution to better balance between plants and their soil environment [15]. 4 Conclusion
From our results we can conclude that maize hybrid OS499 has the largest percentage of germination in optimal conditions. Maize hybrid OS Sk 494 has the highest seedling mass through. Among tested characteristics there were no correlation, in controlled conditions.
References:
[1] T. Vinković, N. Parañiković, H. Plavšić, V. Guberac, L. Levai, Maize and soybean seed vigour under influence of seed age, seed treatment and temperature in cold stress test, Cereal Research Communication, Vol. 35, 2, 1213- 1216 (2007)
[2] H. K. Srivastava, Heterosis and intergenomic complementation: Mitochondria,
chloroplast and nucleus, in „Monographs on theoretical and applied genetics 6, Heterosis“ R. Frankel (ed.), Springer-Verlag, Berlin, 1983.
[3] R.G. Mc Daniel, Biochemical and physiological basis of heterosis, CRC Crit. Rev. Plant Sci. 4 (1986) 227-246.
[4] T. Ashton, The use of heterosis in the production of agricultural and horticultural crop,Commonwealth Bur. Plant Breed. And Genet., 30pp. (1949).
[5] http://gears.tucson.ars.ag.gov/book/hybrid.html, 08.06.2010.
Agriculture
91
[6] A. S. Tsaftaris and M. Kafka, Mechanisms of Heterosis in Crop Plants, Journal of Crop Production, Vol.1, Issue 1, (1997) 95-111.
[7] B. Šimić, M. Vratarić, A. Sudarić, M. Krizmanić and L. Andrić, Effect of storage longevity under different storage conditions on seed vigor and oil content in maize, soybean and sunflower, ISSN 1330-7142.(2005.)
[8] V. Guberac, J. Martinčić and S. Marić, Influence of seed size on germinability, germ length, rootlet lenght and grain yield in spring oat, Die Bodenkultur, 49 (1), (1998) 13-18
[9] C. van Assche, K. U. Leuven, The importance of seed control and seed treatment for a guaranteed plant production, Acta Horticulturae 220 (1988) 391-396.
[10] M. Lisjak, M. Špoljarević, D. Agić, L. Andrić, Praktikum iz fiziologije bilja, Agricultural faculty in Osijek, 2009.
[11] O.P.Saxena, G. Singh, T. Pakeeraiah, N. Pandey, Seed deterioration studies in some
vegetable seeds, Acta Horticulturae, 215:39-44 (1987) [12] Munn, M.T. 1926. Comparing laboratory and field variability tests of seed of garden
peas. Proceedings of Association of Official Seed Analysts 18:55. [13] N. Paradžiković, T. Teklić, V. Guberac, T. Vinković, Influence of temperature on
lettuce (Lactuca sativa L.) and carrot (Daucus carota L.) seed germination and emergence, Sjemenarstvo (1330-0121) 24 (2007), 2; 111-119.
[14] M. Rastija, Environmental and genotype influences on yield and concentrations of P,
K, Mn, Zn in maize, Doktorska disertacija (2006), Agricultural faculty in Osijek. [15] V. Kovačević, M. Rastija, A. Jambrović, Role of maize (Zea mays L.) hybrid in
overcoming of acid soil stress, Fifth Congress of ESA (European Society for Agronomy), Short Communications, Volume I / Zima, M. and Bartosova M.L. (ur.). - Nitra : European Society for Agronomy, 1998. 219-220.
Author data
First author: Božica Japundžić- Palenkić, University of applied sciences Slavonski Brod, Dr. M. Budaka 1, 35000 Slavonski Brod, Croatia, E-mail: [email protected] Second author: Slavica Antunović, University of applied sciences of Slavonski Brod, Dr. M. Budaka 1, 35000 Slavonski Brod, Croatia, E-mail: [email protected] Second author: Nataša Romanjek- Fajdetić, University of applied sciences Slavonski Brod, DR. M. Budaka 1, 35000 Slavonski Brod, Croatia, E-mail: [email protected] Second author: Branimir Vujčić, University of applied sciences Slavonski Brod, Dr. M. Budaka 1, 35000 Slavonski Brod, Croatia, E-mail: [email protected]
Agriculture
92
Különféle baktériumtörzsek védő hatásának vizsgálata paprikánál Xanthomonas vesicatoria fertőzéssel szemben
Kovács András1–Tóthné Taskovics Zsuzsanna2 – Hraskó Istvánné3 – Nagy Győzőné4 1-2-3-4KF Kertészeti Főiskolai Kar Dísznövény- és Zöldségtermesztési Intézet Zöldség-
Gomba- és Gyógynövénytermesztési Csoport
Összefoglalás: A hajtatott zöldségfélék nagy termelési értéket képviselnek a mezőgazdasági termékek sorában. A baktériumos fertőzések miatti megbetegedések mértéke kedvező évjáratokban a 10-30% közötti értéket mutathat, ami igen nagy veszteséget jelent a termelőnek és ezáltal a magyar gazdaságnak is.
Több éves kutatómunkánk célja, környezetkímélő biológiai védekezés kifejlesztése antagonista baktériumok alkalmazásával. Az előzetes kísérletek alkalmával kiválasztott leghatékonyabb antagonista baktérium törzsekkel kezeltük a paprika növényeket. A kísérleteket különféle kezeléskombinációk (ültetéskori beöntözés, virágzáskori beöntözés, szedéskori beöntözés, heti beöntözés) mellett folytattuk le kőzetgyapotba és tőzeges talajkeverékbe ültetett növényeknél Cheops F1 paprikafajtával.
A kezelések hatékonyságát Xanthomonas vesicatoria magyarországi patovarietasz törzsekkel végzett provokációs fertőzés mellett teszteltük. Két időpontban (virágzáskor, szedés kezdetén) fertőztük a növényeket és a leszedett termésmennyiségek alapján értékeltük a védőbaktériumok és a kezeléskombinációk hatékonyságát.
Abstract: Forced vegetable has a high value among agricultural products. Bacteria infections can be 10-30% in favorable which is a great lost for the growers but also for the national economy.
The aim of our long term research is to develop a biological protection through employing antagonist bacteria. We did a preliminary research and selected the most effective bacteria which we infected the pepper by. We did the research in the combination of different types of treatments (irrigation at planting, irrigation at bloom, irrigation at picking, weekly irrigation) in rock wool and in turf soil mixture with Cheops F1 variety.
We tested the effect of treatments with a provocative Xanthomonas vesicatoria infection. We infected the plants twice (at boom and at picking) and through the yield we evaluated the effectiveness of protecting bacteria and treatment combinations.
Kulcsszavak: paprika, Xanthomonas, baktériumtörzs.
Keywords: pepper, Xanthomonas, strain.
1. Bevezetés
A kísérleti munka a “Nagyhatékonyságú összetett biokontroll készítmények kifejlesztése a zöldség- és gombatermesztésben előforduló patogén mikroorganizmusok ellen” című 2008.-2010. év között tartó NKTH Jedlik (KPI SZINER-07 jelű) pályázat keretén belül valósult meg. Több éves kutatómunkánk célja, környezetkímélő szinergista biológiai védekezés kifejlesztése a zöldségtermesztésben antagonista baktériumok alkalmazásával.
A kísérletben alkalmazott leghatékonyabb védőbaktériumok kiválasztása több lépcsős vizsgálati sorozatban történt.
Első lépésként a paprika rizoszférájából gyűjtött talajmintákból izolálták a domináns baktérium törzseket. Ezek közül került kiválasztásra 20 törzs, amely a legjobb antagonistának

Agriculture
93
bizonyult laboratóriumi körülmények között a Xanthomonas-sal szemben. A 20 kiválasztott törzset in vitro körülmények között teszteltük palántakori növényekkel rizoszféra tűrésük megállapításához.
A 7 legjobb törzset, amelyet a növények növekedésserkentése alapján szelektáltunk ki, elicitor hatásuk alapján provokációs fertőzésű kísérletben tovább szelektáltuk. A 3 legjobb törzzsel kezdtük meg a termesztőházi kísérleteket.
2. Anyag és módszer
A három legjobb baktériumtörzs a következő volt: B-05 jelű Bacillus subtilis/mojavensis, B-23 jelű Bacillus subtilis, B-83 jelű Bacillus amyloliquefaciens volt.
Mindhárom bacillus törzzsel 106 sejt/ml koncentrációban különféle időpontokban öntöztük a növényeket.
A kísérleteket különféle kezelés kombinációkban folytattuk le: a1: beöntözés csak ültetéskor a2: beöntözés ültetéskor + virágzáskor a3: beöntözés ültetéskor, + virágzáskor + érés kezdetén a4: beöntözés ültetéskor + hetente
A kezelt növények mellett kezeletlen kontroll állományt is fenntartottunk. A vizsgálatokat zárt termesztőberendezésben kőgyapotba ültetett növényeknél
talajnélküli és talajos (konténeres) termesztési módnál Cheops paprikafajtával végeztük. Valamennyi antagonista baktériumos alapkezelést a provokációs fertőzést megelőzően kiegészítettük Bdellovibrio bacteriovorus-sal a hatásfok növelése érdekében.. A kezelések hatékonyságát Xanthomonas vesicatoria-val végzett provokációs fertőzés keretében vizsgáltuk.
A fertőzés mértékét 0-3 közötti pontszámmal értékeltük, ahol a 0 érték a fertőzésmentes, a 3-as érték a legfertőzöttebb növényeket jelentette. A táblázatban szereplő adatok a négy ismétlés átlagait tartalmazza, melyek három-három növény fertőzési számértékének egyszerű összegéből származnak. A provokációs fertőzésnél a kontrollnövények nem részesültek védőbaktériumos kezelésben.
3. Eredmények
A fertőzés hatásának felvételezése 2009. május 26.-án volt. Ennek eredményét mutatja az 1. táblázat.
A virágzáskor végzett fertőzés eredménye azt mutatja talajnélküli termesztési módnál, hogy mindhárom védőbaktérium esetében volt a kontrollnál szignifikánsan jobb kezelés.
A B-05 antagonista baktériumnál csak 1 kezelés, mégpedig az a2 (ültetés+virágzás) kezelés adott szignifikánsan jobb eredményt (amely kevesebb, mint felére mérsékelte a fertőzöttség mértékét) a kontrollhoz viszonyítva.
A B-23 antagonista baktériumos kezelés esetén a kontrollhoz viszonyítva szignifikánsan jobbak voltak az a1; a3; a4 kezelések.
A B-83-as antagonista baktériumos kezelés esetén a kontrollhoz viszonyítva szignifikánsan jobbak voltak az a1; a2 kezelések. Látható, hogy a védőbaktériumos kombinációk nem minden esetben voltak azonos
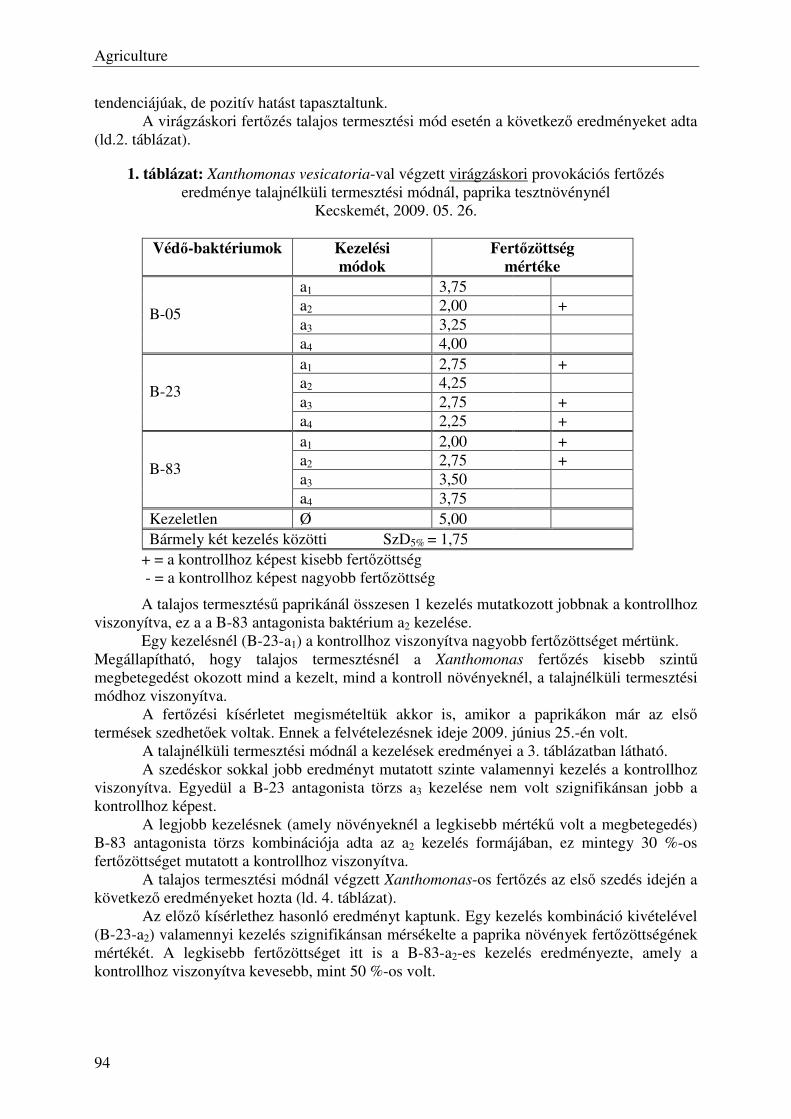
Agriculture
94
tendenciájúak, de pozitív hatást tapasztaltunk. A virágzáskori fertőzés talajos termesztési mód esetén a következő eredményeket adta
(ld.2. táblázat).
1. táblázat: Xanthomonas vesicatoria-val végzett virágzáskori provokációs fertőzés eredménye talajnélküli termesztési módnál, paprika tesztnövénynél
Kecskemét, 2009. 05. 26.
Védő-baktériumok Kezelési módok
Fertőzöttség mértéke
a1 3,75 a2 2,00 +
a3 3,25 B-05
a4 4,00
a1 2,75 + a2 4,25
a3 2,75 + B-23
a4 2,25 +
a1 2,00 + a2 2,75 + a3 3,50
B-83
a4 3,75
Kezeletlen Ø 5,00
Bármely két kezelés közötti SzD5% = 1,75
+ = a kontrollhoz képest kisebb fertőzöttség - = a kontrollhoz képest nagyobb fertőzöttség
A talajos termesztésű paprikánál összesen 1 kezelés mutatkozott jobbnak a kontrollhoz viszonyítva, ez a a B-83 antagonista baktérium a2 kezelése.
Egy kezelésnél (B-23-a1) a kontrollhoz viszonyítva nagyobb fertőzöttséget mértünk. Megállapítható, hogy talajos termesztésnél a Xanthomonas fertőzés kisebb szintű megbetegedést okozott mind a kezelt, mind a kontroll növényeknél, a talajnélküli termesztési módhoz viszonyítva.
A fertőzési kísérletet megismételtük akkor is, amikor a paprikákon már az első termések szedhetőek voltak. Ennek a felvételezésnek ideje 2009. június 25.-én volt.
A talajnélküli termesztési módnál a kezelések eredményei a 3. táblázatban látható. A szedéskor sokkal jobb eredményt mutatott szinte valamennyi kezelés a kontrollhoz
viszonyítva. Egyedül a B-23 antagonista törzs a3 kezelése nem volt szignifikánsan jobb a kontrollhoz képest.
A legjobb kezelésnek (amely növényeknél a legkisebb mértékű volt a megbetegedés) B-83 antagonista törzs kombinációja adta az a2 kezelés formájában, ez mintegy 30 %-os fertőzöttséget mutatott a kontrollhoz viszonyítva.
A talajos termesztési módnál végzett Xanthomonas-os fertőzés az első szedés idején a következő eredményeket hozta (ld. 4. táblázat).
Az előző kísérlethez hasonló eredményt kaptunk. Egy kezelés kombináció kivételével (B-23-a2) valamennyi kezelés szignifikánsan mérsékelte a paprika növények fertőzöttségének mértékét. A legkisebb fertőzöttséget itt is a B-83-a2-es kezelés eredményezte, amely a kontrollhoz viszonyítva kevesebb, mint 50 %-os volt.
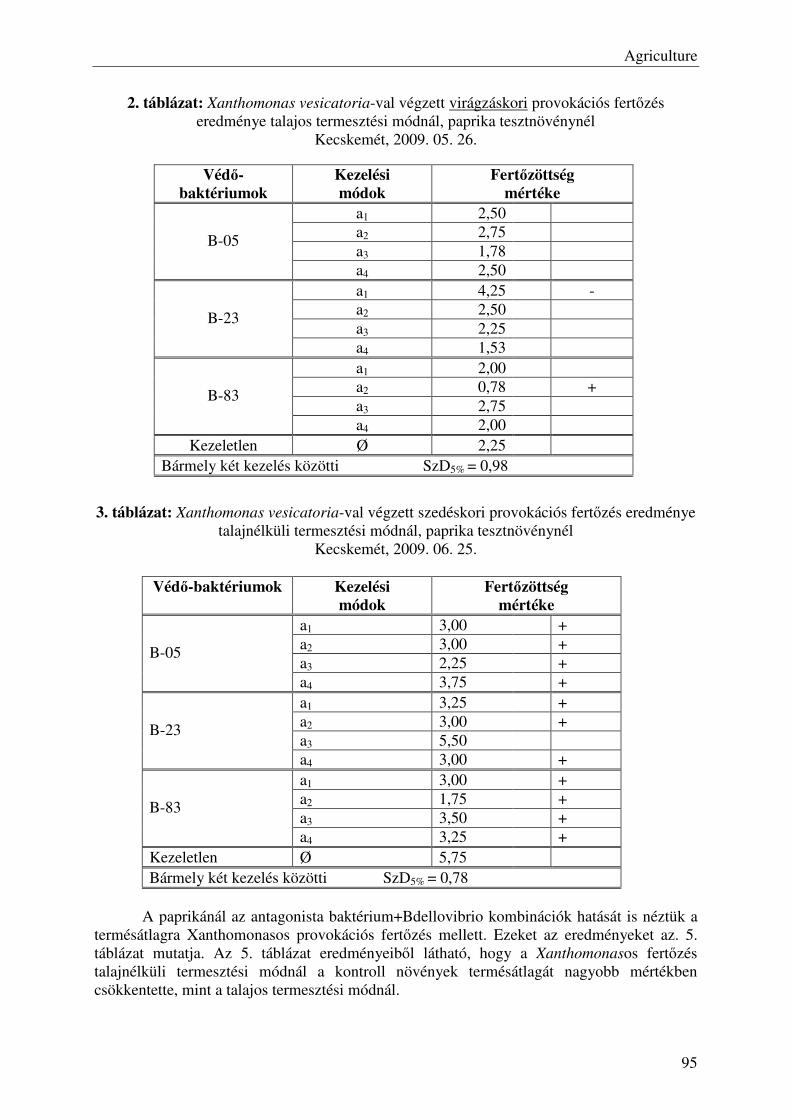
Agriculture
95
2. táblázat: Xanthomonas vesicatoria-val végzett virágzáskori provokációs fertőzés eredménye talajos termesztési módnál, paprika tesztnövénynél
Kecskemét, 2009. 05. 26.
Védő-baktériumok
Kezelési módok
Fertőzöttség mértéke
a1 2,50 a2 2,75
a3 1,78 B-05
a4 2,50
a1 4,25 - a2 2,50
a3 2,25 B-23
a4 1,53
a1 2,00 a2 0,78 +
a3 2,75 B-83
a4 2,00
Kezeletlen Ø 2,25
Bármely két kezelés közötti SzD5% = 0,98
3. táblázat: Xanthomonas vesicatoria-val végzett szedéskori provokációs fertőzés eredménye talajnélküli termesztési módnál, paprika tesztnövénynél
Kecskemét, 2009. 06. 25.
Védő-baktériumok Kezelési módok
Fertőzöttség mértéke
a1 3,00 + a2 3,00 + a3 2,25 +
B-05
a4 3,75 +
a1 3,25 + a2 3,00 +
a3 5,50 B-23
a4 3,00 +
a1 3,00 + a2 1,75 + a3 3,50 +
B-83
a4 3,25 +
Kezeletlen Ø 5,75
Bármely két kezelés közötti SzD5% = 0,78
A paprikánál az antagonista baktérium+Bdellovibrio kombinációk hatását is néztük a
termésátlagra Xanthomonasos provokációs fertőzés mellett. Ezeket az eredményeket az. 5. táblázat mutatja. Az 5. táblázat eredményeiből látható, hogy a Xanthomonasos fertőzés talajnélküli termesztési módnál a kontroll növények termésátlagát nagyobb mértékben csökkentette, mint a talajos termesztési módnál.
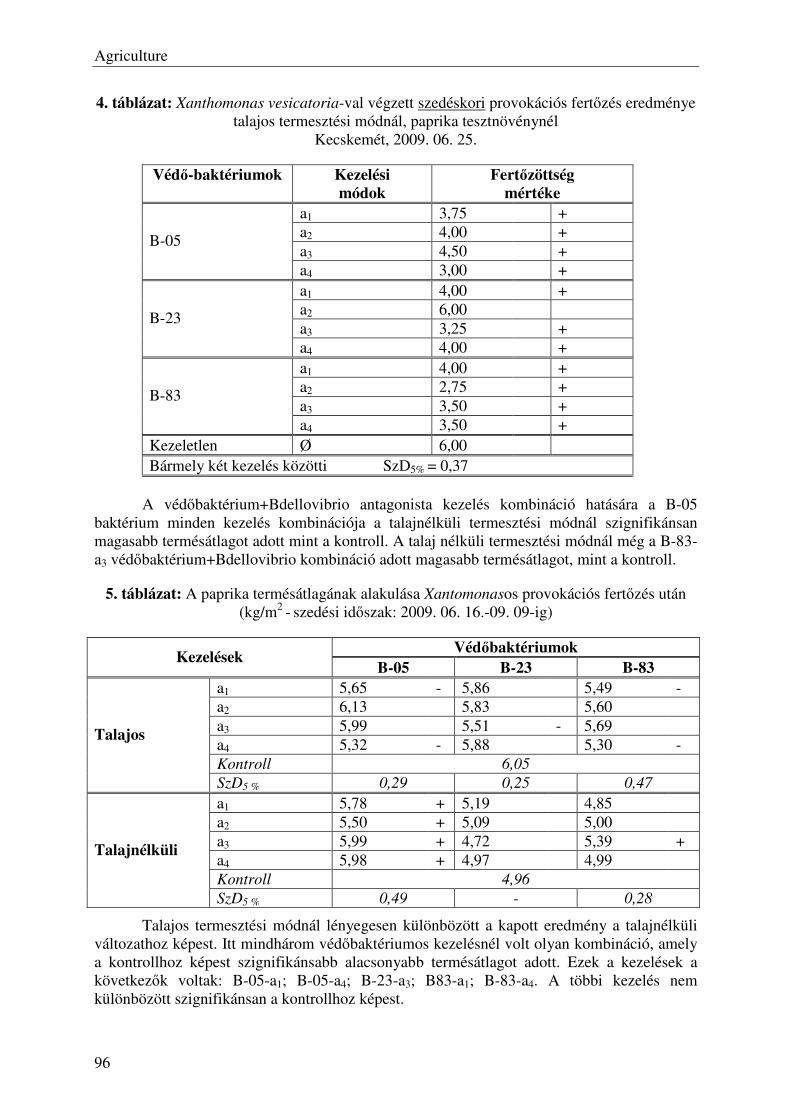
Agriculture
96
4. táblázat: Xanthomonas vesicatoria-val végzett szedéskori provokációs fertőzés eredménye talajos termesztési módnál, paprika tesztnövénynél
Kecskemét, 2009. 06. 25.
Védő-baktériumok Kezelési módok
Fertőzöttség mértéke
a1 3,75 + a2 4,00 +
a3 4,50 + B-05
a4 3,00 +
a1 4,00 + a2 6,00
a3 3,25 + B-23
a4 4,00 +
a1 4,00 + a2 2,75 +
a3 3,50 + B-83
a4 3,50 +
Kezeletlen Ø 6,00
Bármely két kezelés közötti SzD5% = 0,37
A védőbaktérium+Bdellovibrio antagonista kezelés kombináció hatására a B-05
baktérium minden kezelés kombinációja a talajnélküli termesztési módnál szignifikánsan magasabb termésátlagot adott mint a kontroll. A talaj nélküli termesztési módnál még a B-83-a3 védőbaktérium+Bdellovibrio kombináció adott magasabb termésátlagot, mint a kontroll.
5. táblázat: A paprika termésátlagának alakulása Xantomonasos provokációs fertőzés után (kg/m2 - szedési időszak: 2009. 06. 16.-09. 09-ig)
Védőbaktériumok Kezelések
B-05 B-23 B-83 a1 5,65 - 5,86 5,49 - a2 6,13 5,83 5,60
a3 5,99 5,51 - 5,69 a4 5,32 - 5,88 5,30 -
Kontroll 6,05
Talajos
SzD5 % 0,29 0,25 0,47
a1 5,78 + 5,19 4,85 a2 5,50 + 5,09 5,00
a3 5,99 + 4,72 5,39 +
a4 5,98 + 4,97 4,99 Kontroll 4,96
Talajnélküli
SzD5 % 0,49 - 0,28
Talajos termesztési módnál lényegesen különbözött a kapott eredmény a talajnélküli változathoz képest. Itt mindhárom védőbaktériumos kezelésnél volt olyan kombináció, amely a kontrollhoz képest szignifikánsabb alacsonyabb termésátlagot adott. Ezek a kezelések a következők voltak: B-05-a1; B-05-a4; B-23-a3; B83-a1; B-83-a4. A többi kezelés nem különbözött szignifikánsan a kontrollhoz képest.
Agriculture
97
4. Következtetések
A kapott eredmények alapján a következőket állapítottuk meg: - Talajos körülmények között jobb volt a védőbaktérium+fág kombináció hatása a
fertőzéssel szemben, mint a talajnélküli termesztési módnál. - Mindhárom antagonista védőbaktérium (B-05, B-23, B-83) esetén volt fertőzöttségi
szintet szignifikánsan csökkentő kezeléskombináció. - A Xanthomonas fertőzés a talajnélküli kontroll növényeken jelentős terméscsökkenést
eredményezett a talajos kontrollhoz képest. - Talajnélküli kezelésnél volt pozitív hatású szignifikáns kezelés a termésmennyiség
alapján a védőbaktériumok hatására. - A talajos kezeléseknél viszont néhány negatív hatású szignifikáns kezelés volt a
termésmennyiség alapján. - A kezelések nagyobbik része nem különbözött a kontrollhoz képest szignifikánsan.
A kutatómunkának még nincs vége, a következő időszakban a kapott eredmények ismeretében a kísérletek újbóli beállításra kerülnek megerősítés céljából
Szerzők
1Dr. Kovács András főiskolai tanár. KF KFK Dísznövény- és Zöldségtermesztési Intézet, Zöldség-, Gomba- és Gyógynövénytermesztési Csoport. H-6000 Kecskemét, Erdei F. tér 1-3. E-mail: ([email protected]) 2Dr. Tóthné Taskovics Zsuzsanna főiskolai adjunktus. KF KFK Dísznövény- és Zöldségtermesztési Intézet, Zöldség-, Gomba- és Gyógynövénytermesztési Csoport. H-6000 Kecskemét, Erdei F. tér 1-3. E-mail: ([email protected]) 3Hraskó Istvánné dr. főiskolai docens. KF KFK Dísznövény- és Zöldségtermesztési Intézet, Zöldség-, Gomba- és Gyógynövénytermesztési Csoport. H-6000 Kecskemét, Erdei F. tér 1-3. E-mail: ([email protected]) 4Nagy Győzőné főiskolai adjunktus. KF KFK Dísznövény- és Zöldségtermesztési Intézet, Zöldség-, Gomba- és Gyógynövénytermesztési Csoport. H-6000 Kecskemét, Erdei F. tér 1-3.

Agriculture
98
The challenges and common tasks of rural development
Prof. Dr. Péter Lévai1, Prof. Dr. Árpád Ferencz2 1-2 Kecskemét College Horticultural Faculty
Abstract: For Hungary as a member of the EU, it is important to meet the EU requirements and legislation. During the accession negotiations one of the most critical areas was the environmental protection and agriculture specialized administration which proved to be a significant gap to be overcome. The existence of the large number of the well-trained professionals who are able to act concerning the EU directives is strictly necessary. They need to be able to do appropriate actions to meet the requirements of the tasks, and to carry out a high level of achievement.
The aim of the education in connection to the rural development is to train agricultural engineers, who have proper skills in economy, management, regional and local knowledge. With these skills, they need to be able to control and organize production processes on operating surface and fulfil consultant tasks. With their special knowledge they need to be suitable for the interpretation of EU norms in the rural development and for the planning of programs and solutions. The farmers need to be able to:
• develop the essential conditions of the people, who live in the rural area• analyse the rural areas' problems and developments, make a business plan,
• continuously reform the farming construction, • treat the international requirements of the rural development, • write and co-ordinate the necessary projects in the development of the country.
The Local Professional Advisory Center serves the farmers' continuous professional
development, which works since 2007 on the Faculty. With the regular course professional developments – OKJ silver cereal-, golden cereal
farmer-course, agricultural entrepreneur, bio cultivating, park caretaker, grape grower, viticulturist, vine-dresser – we help in the smallholders' theoretical and practical competences.
Beyond that we provide a service on the Faculty in the accredited soil and plant examining laboratory for the growers. This laboratory we are going to enrich with environment protection, food stock and with microbiological examinations.
Keywords: rural development, farmers’ further training
1. Introduction
Hungary is a member of the EU, it is important to meet the EU requirements and legislation. During the accession negotiations, one of the most critical areas was the environmental protection and specialized agricultural administration which proved to be a significant gap to be overcome. To do so the existence of a significant number of well-trained professionals is strictly necessary, who are capable to do appropriate actions, carry out a high level achievements according to the European Union directives and requirements.
In light of the challenges the training of farmers in the country's future is a strategic task, in which the Kecskemét College is also willing to contribute actively. Over the basic training we aimed to give further professional development for the farmers in order to ensure the skill level of their economic, management, regional and spatial knowledge. The goal is

Agriculture
99
that they will be able to accomplish the management of production processes, organization, professional administration and consultancy tasks. With their advanced knowledge they need to be able to interpret the rural development of EU, planning and resolving programs.
2. Rural development in the European Union
EU rural development milestones are summarized as follows: • 1993 Maastricht Treaty - the cohesion of the EU 1st pillar of the legal basis for the rural
development policy, • 1994-1999 Support of the rural development goals from the Structural Funds, 1996 so
called Cork Declaration, the recommendations embodied in the Agenda 2000, 1999 acceptance of the Agenda2000 - the KAP rural development policy was the second defined pillar and it was valid for the 2000-2006-a budget period,
• 2003 the last KAP reform (in force since 2005), valid for the 2007-1014 budget periods. Regulation No 1698/2005EK rules the EU rural development policy. The creation of the New Rural Development Fund, the main content of the concept is the multifunctional agriculture.
3. Rural situation in Hungary
The 1. Figure introduces the area types of the Hungarian countryside
1. Figure: Regions’ area types
(Source: Csatári Balint, MTA Centre for Regional Studies, Great Plain Research Institute)
There are significant differences in the living standards of the people living in rural areas as well. The 1. Table compares with statistical indicators the people living in the Southern Great Plain and in Central Hungary.
I. Pole cities and their provinces II. Towns and their surroundings III. Villages, the key settlements of the countryside III. a The changing rural prairie towns in the Great Plain
α hamlet areas β farm areas
A environmentally sensitive area B agricultural area C recreational area
• developed area • join up area • obscurantist area

Agriculture
100
1. Table: The Economic Analysis of South Plain and Central Hungary
Statistical indicators (average of the
last 6 years), CSO South Plain Central Hungary
Population (mill people) 1.36 2.83 Population density (persons per km2) 74 409 Urban population ratio (%) 70 % 80 % Monthly income average 125 000 190 000 Unemployment rate (%) 7.5 % 5.5 % Rate of the homes which are connected to public sewer network
50 % 83 %
GDP per inhabitant of the national average in %
70 % 160 %
Investment per inhabitant (1000 HUF) 220 720 (Source: Kovács András Donát, MTA Centre for Regional Researches, Great Plain Scientific Institute)
4. The challenges and common tasks of rural development
The most significant challenge of the sand ridge is the drying and water scarcity. The most pressing tasks are summarized below: • the county's agricultural and rural development concept should be based on a strategy
which is elaborated for the handling of the drying-up, • on the ridge area further extend of the production, agro-environmental programs
expansion in a broader range, use of land in an appropriate adjustment to the conditions (stop the afforestation, prefer the farms),
• utilize the dry-agriculture in maximum potential, spread the drought-resistant species and varieties, and support the related research and development functions,• the priority development of animal husbandry,
• in Dunamellék, especially in Bácska retention and development of the large-scale cultivation,
• dissemination of the concept and means of precision agriculture• from the side of wider economy, it is recommended to develop three sectors: environmental industry, food processing, rural tourism.
The value of the region (including rural development activities) is increasing, the unique (environmentally friendly, bio-) agriculture of the Kiskunság get a chance, and it becomes possible to renew the farmsteads areas. Accordingly, the tasks are: • to improve professional organization of the rural area development, • there is a need for integrated rural development professionals with comprehensive
knowledge, (education), • It requires common, multi-disciplinary researches (applications), • individual farm-specific modelling is needed, • the Hungarian National Region network "sample meeting point" need to be organized.
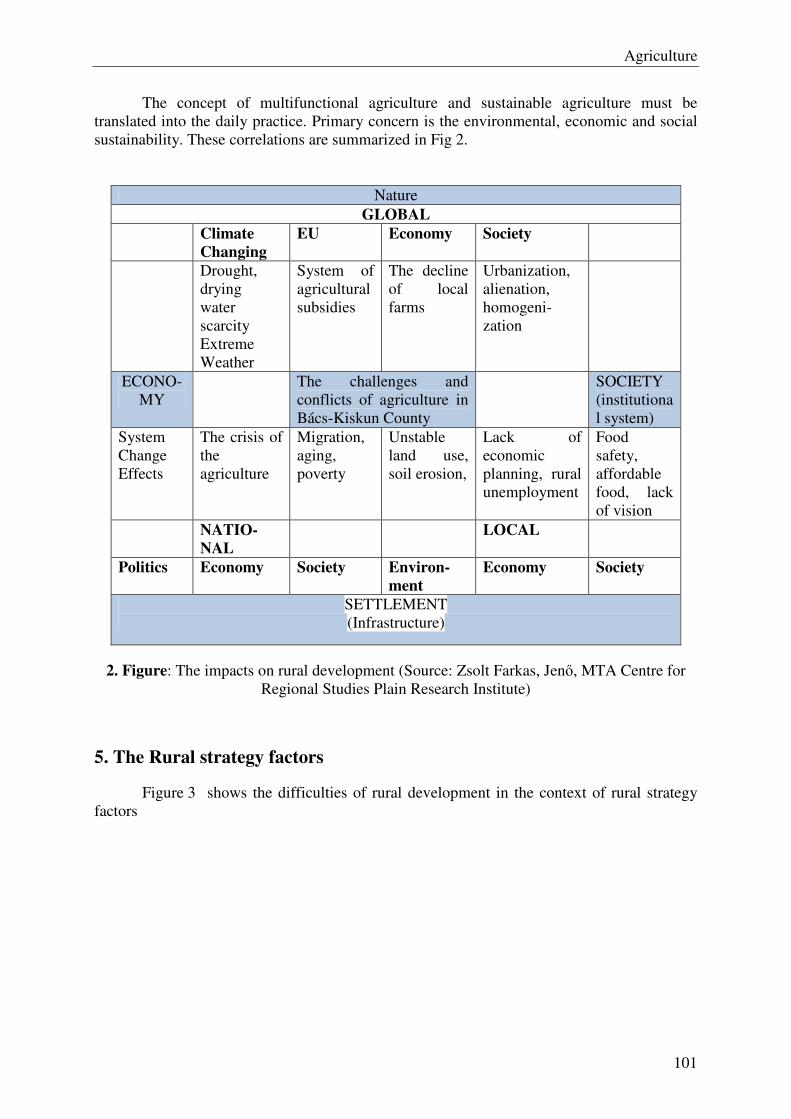
Agriculture
101
The concept of multifunctional agriculture and sustainable agriculture must be translated into the daily practice. Primary concern is the environmental, economic and social sustainability. These correlations are summarized in Fig 2.
Nature GLOBAL
Climate
Changing
EU Economy Society
Drought, drying water scarcity Extreme Weather
System of agricultural subsidies
The decline of local farms
Urbanization, alienation, homogeni-zation
ECONO-MY
The challenges and conflicts of agriculture in Bács-Kiskun County
SOCIETY (institutional system)
System Change Effects
The crisis of the agriculture
Migration, aging, poverty
Unstable land use, soil erosion,
Lack of economic planning, rural unemployment
Food safety, affordable food, lack of vision
NATIO-
NAL
LOCAL
Politics Economy Society Environ-
ment
Economy Society
SETTLEMENT (Infrastructure)
2. Figure: The impacts on rural development (Source: Zsolt Farkas, Jenő, MTA Centre for Regional Studies Plain Research Institute)
5. The Rural strategy factors
Figure 3 shows the difficulties of rural development in the context of rural strategy factors
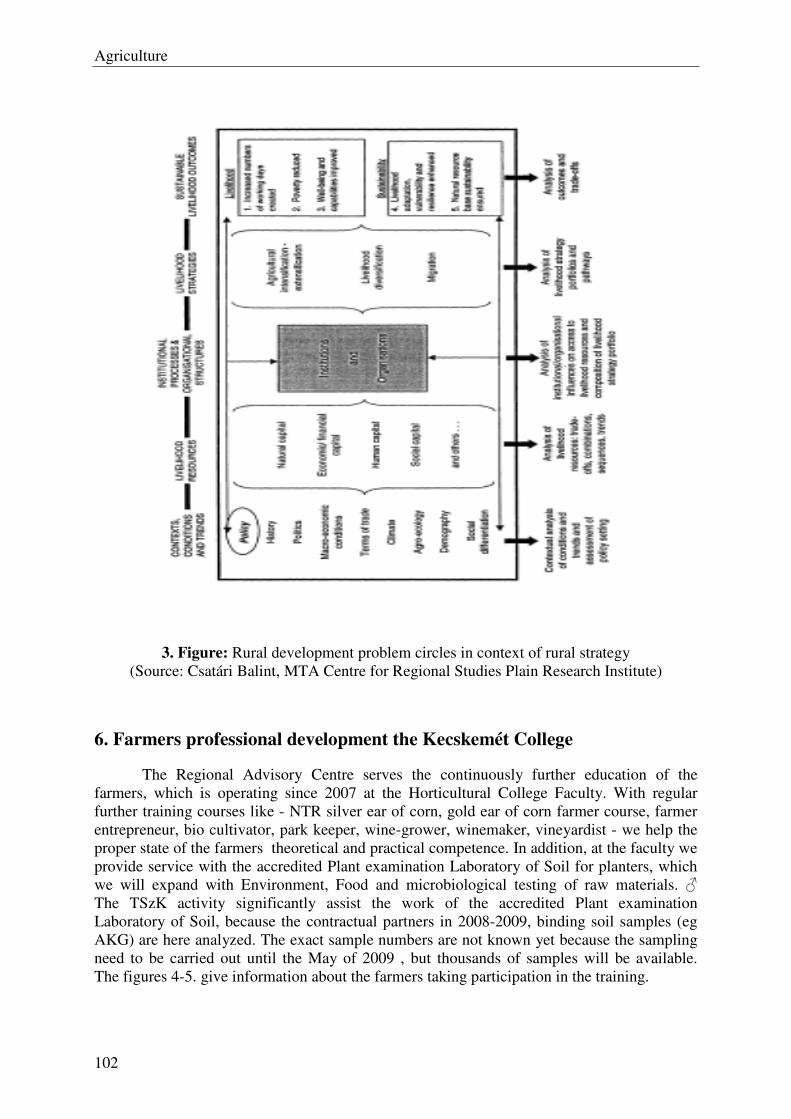
Agriculture
102
3. Figure: Rural development problem circles in context of rural strategy (Source: Csatári Balint, MTA Centre for Regional Studies Plain Research Institute)
6. Farmers professional development the Kecskemét College
The Regional Advisory Centre serves the continuously further education of the farmers, which is operating since 2007 at the Horticultural College Faculty. With regular further training courses like - NTR silver ear of corn, gold ear of corn farmer course, farmer entrepreneur, bio cultivator, park keeper, wine-grower, winemaker, vineyardist - we help the proper state of the farmers theoretical and practical competence. In addition, at the faculty we provide service with the accredited Plant examination Laboratory of Soil for planters, which we will expand with Environment, Food and microbiological testing of raw materials. The TSzK activity significantly assist the work of the accredited Plant examination Laboratory of Soil, because the contractual partners in 2008-2009, binding soil samples (eg AKG) are here analyzed. The exact sample numbers are not known yet because the sampling need to be carried out until the May of 2009 , but thousands of samples will be available. The figures 4-5. give information about the farmers taking participation in the training.
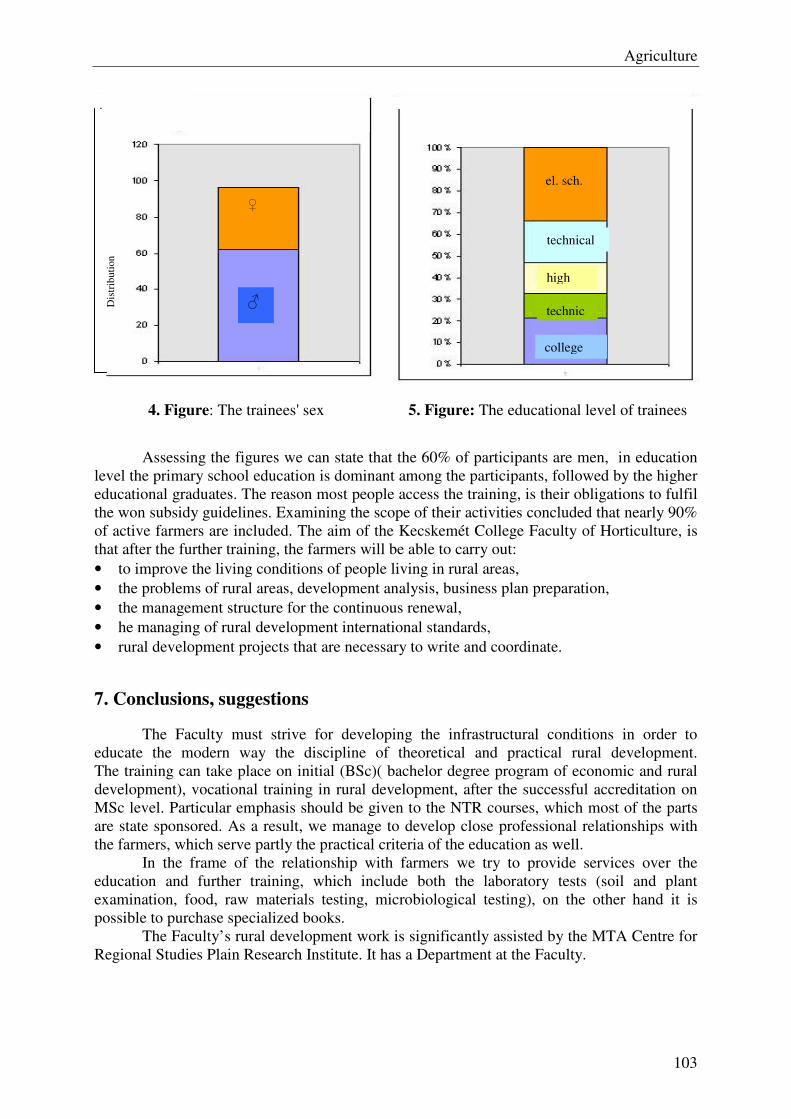
Agriculture
103
4. Figure: The trainees' sex 5. Figure: The educational level of trainees
Assessing the figures we can state that the 60% of participants are men, in education level the primary school education is dominant among the participants, followed by the higher educational graduates. The reason most people access the training, is their obligations to fulfil the won subsidy guidelines. Examining the scope of their activities concluded that nearly 90% of active farmers are included. The aim of the Kecskemét College Faculty of Horticulture, is that after the further training, the farmers will be able to carry out: • to improve the living conditions of people living in rural areas, • the problems of rural areas, development analysis, business plan preparation, • the management structure for the continuous renewal, • he managing of rural development international standards, • rural development projects that are necessary to write and coordinate.
7. Conclusions, suggestions
The Faculty must strive for developing the infrastructural conditions in order to educate the modern way the discipline of theoretical and practical rural development. The training can take place on initial (BSc)( bachelor degree program of economic and rural development), vocational training in rural development, after the successful accreditation on MSc level. Particular emphasis should be given to the NTR courses, which most of the parts are state sponsored. As a result, we manage to develop close professional relationships with the farmers, which serve partly the practical criteria of the education as well.
In the frame of the relationship with farmers we try to provide services over the education and further training, which include both the laboratory tests (soil and plant examination, food, raw materials testing, microbiological testing), on the other hand it is possible to purchase specialized books.
The Faculty’s rural development work is significantly assisted by the MTA Centre for Regional Studies Plain Research Institute. It has a Department at the Faculty.
Dis
trib
utio
n
el. sch.
technical
high
technic
college
Agriculture
104
8. References
[1] Csatári, B. (2010): the common future of the countryside. Dialogue in the countryside, II. grade, 1 No, 6 p.
[2] Glatz, F. (2009): The future of farms and the future of farm research. National Rural Forum. Dialogue in the countryside, I Vol. 1st No, 16-17. p.
[3] 3rd F. Glatz (2009): The Present and Future of Farms. II. National Rural Forum. Dialogue in the countryside, I Vol. 3rd No, 3-5. p.
[4] Koponicsné Gy. D. -Varga, Gy. (2009): Learning and education opportunities in rural areas. The vision for agriculture and rural areas. West Hungarian University of Agriculture and Food Science, Mosonmagyaróvár, 2009. April 17 to 18. Conference Proceedings, I Volume, p. 120-130.
[5] Kozar, J. – Toth, K. (2009): Regional aspects of the consultancy. The vision for agriculture and rural areas. West Hungarian University of Agriculture and Food Science, Mosonmagyaróvár, 2009. April 17 to 18. Conference Proceedings, I Volume, p. 30-36.
[6] Stark A. (2009): rural development funding in 2008-2010. II. National Rural Forum. Dialogue in the countryside, I Vol. 3rd No, 12-15. p.
Authors
Prof. Dr. Péter Lévai1:Kecskemét College Horticultural Faculty. H-6000 Kecskemét, Erdei F. tér 1-3. Hungary. E-mail: [email protected]. Prof. Dr. Árpád Ferencz2: Kecskemét College Horticultural Faculty. H-6000 Kecskemét, Erdei F. tér 1-3. Hungary. E-mail: [email protected].
Agriculture
105
Vágottvirágok növényházi termesztése hidrokultúrában
Lévai Péter1 – Turiné Farkas Zsuzsa2 1-2 KF Kertészeti Főiskolai Kar Dísznövény- és Zöldségtermesztési Intézet
Dísznövénytermesztési és Kertfenntartási Csoport
Összefoglalás: Napjainkban növekszik a hidrokultúrás termesztési mód jelentősége. A Kecskeméti Főiskola Kertészeti Főiskolai Kar Dísznövénytermesztési- és Kertfenntartási Tanszékén 1988. óta foglalkozunk vágott virágok hidrokultúrás termesztésével. A kísérlet sorozatot a növényházi szegfű talaj nélküli termesztésével indítottuk, majd újabb vágott virág és cserepes virágos dísznövény fajt vontunk be a tematikus kutatási munkába.
Abstract: The importance of hydro-cultural growing is significantly increasing. We have been dealing with the hydro-cultural growing of cut flowers at the Department of Ornamental Plant Growing and Maintenance of Gardens at the College Faculty of Horticulture at Kecskemét College since 1988. We started our experiments by growing carnation in growing establishment without soil then we introduced other species of cut flowers and potted ornamental plants into our research work
Kulcsszavak: hidrokultúra, növényházi szegfű, PU-szivacs, Grodan, Phytomonitor
Keywords: hydroculture, carnation, Rose, PU sponge, Grodan, Phytomonitor
1. Bevezetés
A kutatómunka során a növényházi szegfű esetében célunk a Grodan márkájú kőzetgyapot és a PU-szivacs hatásának vizsgálata volt a ’Pink Castellaro’ fajta növekedésére, virághozamára, virágátmérőjére és szárhosszúságára. A fajtaösszehasonlítás esetében célunk a fajták hatásának a vizsgálata volt a növények fejlődésére, a hozamra és a virágminőségi tulajdonságokra: a virágátmérőre és a virágszár hosszára. A Phytomonitor műszer a Dísznövénytermesztési- és Kertfenntartási Csoport francia gyártmányú Filclaire termesztő-berendezésében van elhelyezve, mellyel a hidrokultúrás rózsa kultúra paramétereinek mérését végezzük. Mérési tényezők: levegőhőmérséklet, levélhőmérséklet, sugárzás, a levegő relatív páratartalma, szárvastagság és talajnedvesség mérése. A fitomonitori adatfeldolgozás lehetővé teszi az optimális tápanyag-ellátás kidolgozását és ezzel költségtakarékos, környezetbarát technológia-fejlesztését.
2. Anyag és módszer
A szegfű hidrokultúrás termesztését a következő fajtákkal végeztük: ’Danton’, ’Gigi’, ’Iury’, ’White Castellaro’, ’Pink Castellaro’, és ’Candy’ ’Rimini’, ’Rodolfo’, ’Ondina’, ’Olivia’.
A kísérleteket francia gyártmányú Ficlaire termesztő-berendezésben állítottuk be, a termesztést zárt, cirkulációs rendszerben végeztük. A gyökeres dugványok ültetése minden évben 40 db/m2 sűrűségben május végén történt, a fajta összehasonlító kísérleteknél ültetési közegként a PU-szivacsot alkalmaztuk, a tenyészidő hossza egy év volt. A kísérletet négy ismétlésbe állítottuk be. A tápanyagellátást komplex műtrágya felhasználásával végeztük, a tápoldat pH-ját 5,0-6,5 között állítottuk be és biztosítottuk a 2,5-3,5 mS vezetőképességet, ezen paramétereket folyamatosan ellenőriztük. Szeptembertől a tenyészidő végéig hetente

Agriculture
106
mértük a növények magasságát. A mérési időszak kezdetekor ismétlésenként véletlenszerűen 20-20 db növényt kiválasztottunk, megjelöltük őket és minden alkalommal a megjelölt növények magasságát mértük. A virágzás kezdetétől minden egyes virágszedés alkalmával mértük a leszedett virágok mennyiségét. A leszedett virágokból mindkét közeg estében ismétlésenként véletlenszerűen 10-10 szálat kiválasztottunk és lemértük a virágminőségi tulajdonságokat: a virágátmérőt és a szárhosszúságot.
A rózsa esetében a környezeti tényezők hatását vizsgáljuk a növény fejlődésére. A PhyTech cég úttörő és vezető szerepet tölt be a Phytomonitoring ™ rendszerben, a
távérzékelést és a növények ellenőrzését végzi Fejlett megoldásokat használ érzékelőkkel, vezeték nélküli kommunikációval és innovatív szoftverrel, adatok összegyűjtésével és elemzésével. Cél a növényre ható stressz hatás korai kimutatása, a növények növekedésének optimalizálása, a termésminőség javítása és az árbevétel növelése.
3. Eredmények
A közeg hatása a szegfű növénymagasságára A szegfű hidrokultúrás termesztésénél a poliuretán-éter szivacs és a Grodan egyaránt
jó hatással volt a növény fejlődésére, mindkettő alkalmas ültetési közegként, azonban a szivacsba ültetett állomány magasabb volt.
A közeg hatása a szegfű hozamára A hidrokultúrás termesztéssel a poliuretán-éter szivacs és a Grodan esetében is elértük
a hagyományos kemokultúrás termesztésre jellemző éves 7-9 szál közötti tövenkénti virághozamot (1. ábra), tehát mindkét ültetési közeg egyaránt alkalmazható hidrokultúrás termesztéshez.
A közeg hatása a szegfű virágátmérőjére A vizsgált két tenyészidőszak folyamán a poliuretán-éter szivacsba és a Grodanba
ültetett állomány virágainak évi átlagos átmérője elérte a szabványban előírt I. osztályú virág paraméterét, a 7 cm-es virágátmérőt. Szignifikánsan jobb eredményt egyik közeg esetében sem tapasztaltunk, így mindkét közeg egyaránt alkalmas a szegfű hidrokultúrás termesztésének közegeként.
A közeg hatása a szegfű virágszárának hosszára Az ültetési közegek egyik vizsgált évben sem befolyásolták szignifikánsan sem az
éves, sem a havi szárhosszúságot. Az éves átlagokat tekintve mindkét közeggel elértük a szabványban előírt I. osztályú
áru követelményét, az 55-60 cm közötti szárhosszúságot. Mindezek figyelembe vételével a poliuretán-éter szivacs és a Grodan egyaránt
alkalmas a hidrokultúrás termesztés közegeként.
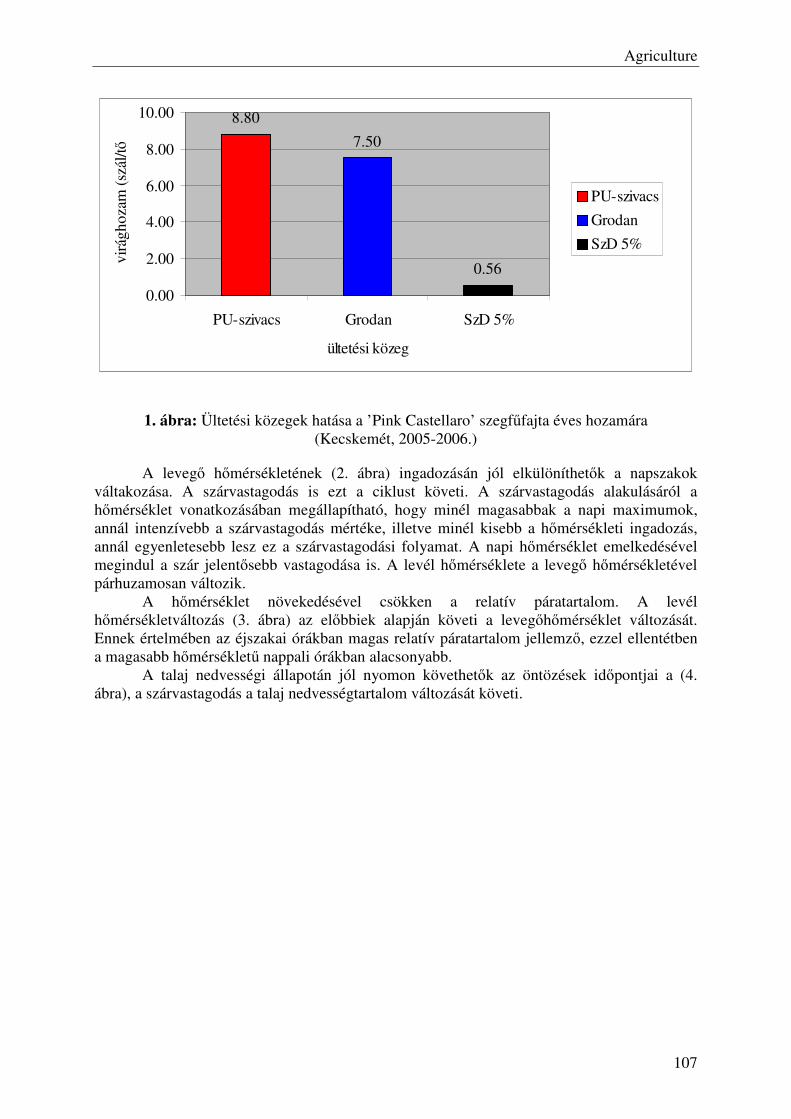
Agriculture
107
8.80
7.50
0.56
0.00
2.00
4.00
6.00
8.00
10.00
PU-szivacs Grodan SzD 5%
ültetési közeg
virá
ghoz
am (
szál
/tő)
PU-szivacs
Grodan
SzD 5%
1. ábra: Ültetési közegek hatása a ’Pink Castellaro’ szegfűfajta éves hozamára (Kecskemét, 2005-2006.)
A levegő hőmérsékletének (2. ábra) ingadozásán jól elkülöníthetők a napszakok váltakozása. A szárvastagodás is ezt a ciklust követi. A szárvastagodás alakulásáról a hőmérséklet vonatkozásában megállapítható, hogy minél magasabbak a napi maximumok, annál intenzívebb a szárvastagodás mértéke, illetve minél kisebb a hőmérsékleti ingadozás, annál egyenletesebb lesz ez a szárvastagodási folyamat. A napi hőmérséklet emelkedésével megindul a szár jelentősebb vastagodása is. A levél hőmérséklete a levegő hőmérsékletével párhuzamosan változik.
A hőmérséklet növekedésével csökken a relatív páratartalom. A levél hőmérsékletváltozás (3. ábra) az előbbiek alapján követi a levegőhőmérséklet változását. Ennek értelmében az éjszakai órákban magas relatív páratartalom jellemző, ezzel ellentétben a magasabb hőmérsékletű nappali órákban alacsonyabb.
A talaj nedvességi állapotán jól nyomon követhetők az öntözések időpontjai a (4. ábra), a szárvastagodás a talaj nedvességtartalom változását követi.
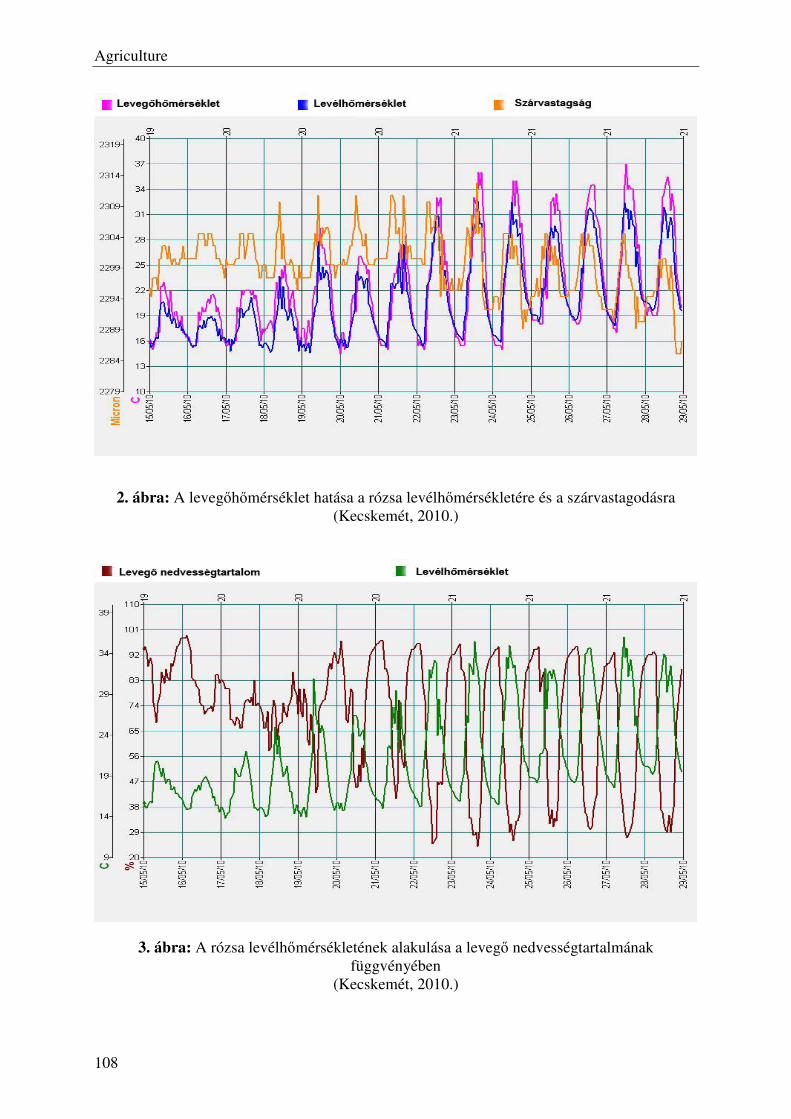
Agriculture
108
2. ábra: A levegőhőmérséklet hatása a rózsa levélhőmérsékletére és a szárvastagodásra (Kecskemét, 2010.)
3. ábra: A rózsa levélhőmérsékletének alakulása a levegő nedvességtartalmának függvényében
(Kecskemét, 2010.)
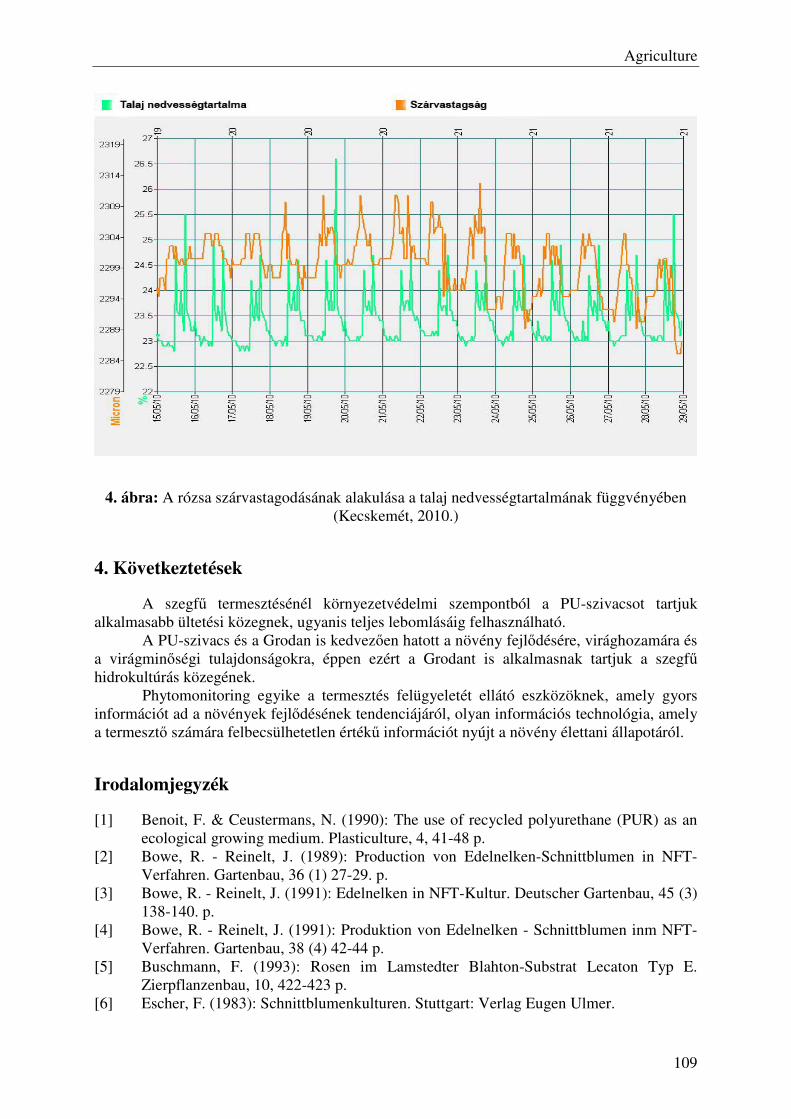
Agriculture
109
4. ábra: A rózsa szárvastagodásának alakulása a talaj nedvességtartalmának függvényében (Kecskemét, 2010.)
4. Következtetések
A szegfű termesztésénél környezetvédelmi szempontból a PU-szivacsot tartjuk alkalmasabb ültetési közegnek, ugyanis teljes lebomlásáig felhasználható.
A PU-szivacs és a Grodan is kedvezően hatott a növény fejlődésére, virághozamára és a virágminőségi tulajdonságokra, éppen ezért a Grodant is alkalmasnak tartjuk a szegfű hidrokultúrás közegének.
Phytomonitoring egyike a termesztés felügyeletét ellátó eszközöknek, amely gyors információt ad a növények fejlődésének tendenciájáról, olyan információs technológia, amely a termesztő számára felbecsülhetetlen értékű információt nyújt a növény élettani állapotáról.
Irodalomjegyzék
[1] Benoit, F. & Ceustermans, N. (1990): The use of recycled polyurethane (PUR) as an ecological growing medium. Plasticulture, 4, 41-48 p.
[2] Bowe, R. - Reinelt, J. (1989): Production von Edelnelken-Schnittblumen in NFT-Verfahren. Gartenbau, 36 (1) 27-29. p.
[3] Bowe, R. - Reinelt, J. (1991): Edelnelken in NFT-Kultur. Deutscher Gartenbau, 45 (3) 138-140. p.
[4] Bowe, R. - Reinelt, J. (1991): Produktion von Edelnelken - Schnittblumen inm NFT-Verfahren. Gartenbau, 38 (4) 42-44 p.
[5] Buschmann, F. (1993): Rosen im Lamstedter Blahton-Substrat Lecaton Typ E. Zierpflanzenbau, 10, 422-423 p.
[6] Escher, F. (1983): Schnittblumenkulturen. Stuttgart: Verlag Eugen Ulmer.
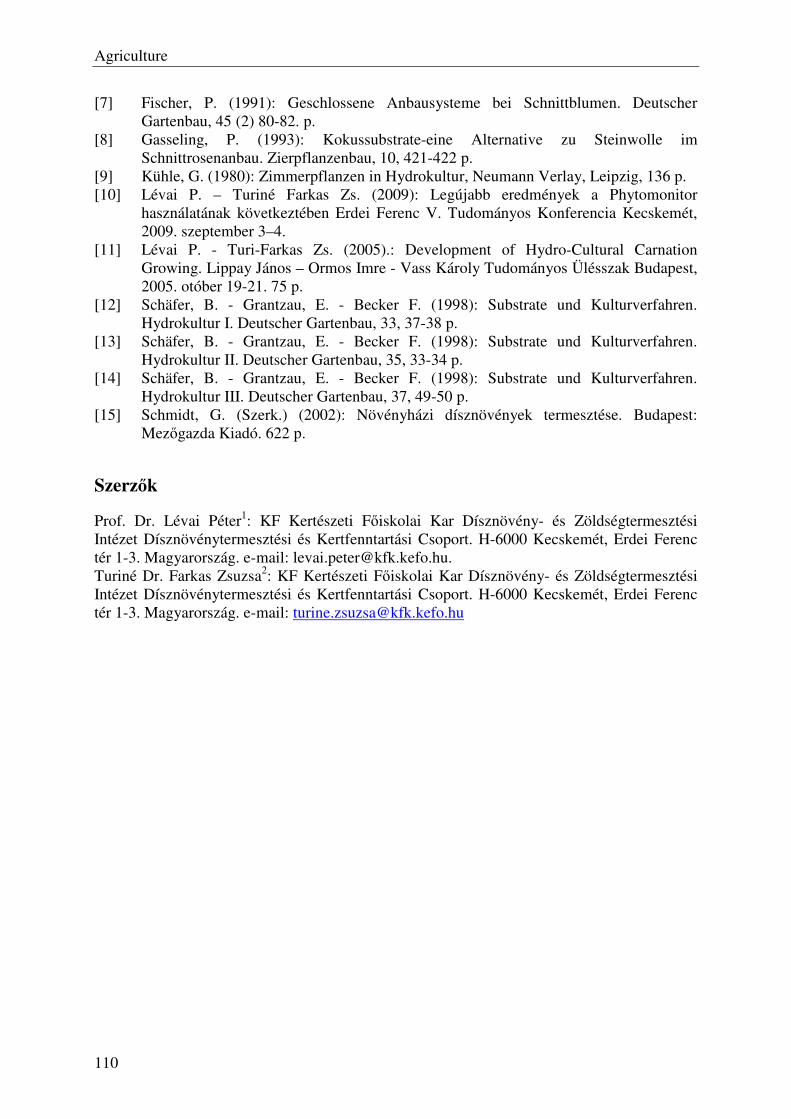
Agriculture
110
[7] Fischer, P. (1991): Geschlossene Anbausysteme bei Schnittblumen. Deutscher Gartenbau, 45 (2) 80-82. p.
[8] Gasseling, P. (1993): Kokussubstrate-eine Alternative zu Steinwolle im Schnittrosenanbau. Zierpflanzenbau, 10, 421-422 p.
[9] Kühle, G. (1980): Zimmerpflanzen in Hydrokultur, Neumann Verlay, Leipzig, 136 p. [10] Lévai P. – Turiné Farkas Zs. (2009): Legújabb eredmények a Phytomonitor
használatának következtében Erdei Ferenc V. Tudományos Konferencia Kecskemét, 2009. szeptember 3–4.
[11] Lévai P. - Turi-Farkas Zs. (2005).: Development of Hydro-Cultural Carnation Growing. Lippay János – Ormos Imre - Vass Károly Tudományos Ülésszak Budapest, 2005. otóber 19-21. 75 p.
[12] Schäfer, B. - Grantzau, E. - Becker F. (1998): Substrate und Kulturverfahren. Hydrokultur I. Deutscher Gartenbau, 33, 37-38 p.
[13] Schäfer, B. - Grantzau, E. - Becker F. (1998): Substrate und Kulturverfahren. Hydrokultur II. Deutscher Gartenbau, 35, 33-34 p.
[14] Schäfer, B. - Grantzau, E. - Becker F. (1998): Substrate und Kulturverfahren. Hydrokultur III. Deutscher Gartenbau, 37, 49-50 p.
[15] Schmidt, G. (Szerk.) (2002): Növényházi dísznövények termesztése. Budapest: Mezőgazda Kiadó. 622 p.
Szerzők
Prof. Dr. Lévai Péter1: KF Kertészeti Főiskolai Kar Dísznövény- és Zöldségtermesztési Intézet Dísznövénytermesztési és Kertfenntartási Csoport. H-6000 Kecskemét, Erdei Ferenc tér 1-3. Magyarország. e-mail: [email protected]. Turiné Dr. Farkas Zsuzsa2: KF Kertészeti Főiskolai Kar Dísznövény- és Zöldségtermesztési Intézet Dísznövénytermesztési és Kertfenntartási Csoport. H-6000 Kecskemét, Erdei Ferenc tér 1-3. Magyarország. e-mail: [email protected]
Agriculture
111
Yield and quality parameter of maize hybrids grown in irrigated
and N fertilized conditions
Monika Marković1, Jasna Šoštarić1, Vlado Kovačević1, Marko Josipović2, Dario Iljkić1, Božica Japundžić-Palenkić3
1Plant production, Agricultural Faculty in Osijek, CROATIA 2Basic seed production, Agricultural Institute in Osijek, CROATIA
3Department for horticulture, University of applied science in Slavonski Brod, CROATIA
Abstract: A 4-year study (2006-2009) with three irrigation regimes (A= control variant without irrigation, A2 = 60–100 % Field Water Capacity (FWC), A3 = 80–100 % FWC, three levels of nitrogen fertilizer (B1 = control variant without any nitrogen fertilizer, B2 = 100 kg N ha-1, B3 = 200 kg N ha-1), and four genotypes (C1 = OSSK596; C2 = OSSK617; C3 = OSSK602; C4 = OSSK552) with similar vegetation length (FAO 500 and FAO 600) were conducted on trial fields of Agricultural institute in Osijek. Vegetation seasons where quite different regarding weather conditions, mean air temperatures and precipitation quantity. Although all four years of research where unfavorable for maize production, years 2007 and 2009 where especially unfavorable because of the severe drought. Aim of the study was to evaluate influence of genotype, nitrogen fertilizer and available amount of water to maize yield and hectoliter weight as quality parameter. Irrigation treatment was significant for all four years of experiment with yield increasing for 13%. For hectoliter weight irrigation was significant in dry years 2007 and 2009, with P≥0.05 level of significance. Nitrogen fertilizer increased maize yield (for 16%) and hectoliter weight as well. Maize yield (C1 = 9 259 kg ha-
1; C2 = 9 814 kg ha-1) and hectoliter weight (C3 = 66.62 kg; C4 = 72.45 kg) varied thru tested genotypes.
Keywords: irrigation, nitrogen fertilization, maize hybrids, yields, hectoliter weight
1 Introduction
Maize is very important and highly represented cereal on agricultural surfaces in Croatia. In the decade period 1998-2007 maize harvested area in Croatia was, depending on year, from 288 380 ha to 407 272 ha while annual yield variation was among 3.93 t ha-1 to 6.92 t ha -1 [1].
Maize belongs to a group of plants who tolerates the drought very well, but the yields are getting very low during dry periods. This is the main reason for yield variation among years. Yield decreased because of the heat and drought stress [1].
More than half of produced maize in Croatia has been growth in eastern part of Croatia. Irrigation in this area has supplementary character so irrigation regime must be conducted when it has been needed and in the right quantities as well-timed. Good irrigation management must decide when to irrigate and how much to apply. The adequate supply of irrigation water and nitrogen fertilizer is two main factors affecting directly the plant growth and quality of maize [3]. The fertilizers have considerable effect on maize quality [2]. Optimum water supply is especially important in periods critical for the growth, development and yield formation of maize [3].
Although yield is main goal in maize production, quality of maize grain lately becomes very important as well. Hectoliters weight is one the parameters who indicate the quality of maize grain. Larger hectoliter weight means a better grain quality and so it has become an important parameter in breeding program.
Agriculture
112
The main object of our research was, therefore, to determine whether differences in the hectoliter weight among maize hybrids are affected by the level of water and nitrogen supply, while maize yield was showed by Josipović at. al. [11].
2 Materials and methods
Four experiments were carried out during four vegetation seasons at the trial fields of Agricultural Institute in Osijek from year 2006 – 2009. Four maize hybrids have been tested in order to determine the influence of irrigation management, nitrogen fertilization and genotype on maize yield and hectoliter weight.
The split split-plot method with three repetitions was used in all four vegetation
seasons. Soil type on trial fields of Agricultural institute is eutric cambisol, silt clay loam texture, shallow gley, pH in KCl from 6.5 to 6.9, P2O5 content is from 22.6 to 26.4 mg per 100 grams of soil, K2O content is from 30.4 to 36.5 mg per 100 grams of soil. Planned plant density was 58 309 plants ha-1 (spacing between rows 70 cm and distance in the row 24.5 cm).
Main treatment includes three irrigation regimes. Variant A1 was control variant without irrigation. Irrigation in A2 variant - 60% to 100% field water capacity. A3 variant – irrigation from 80% to 100% field water capacity. On each variant of irrigation, soil water content has been measured with Watermark (US company) device. Water content has been scanned every second day. Irrigation started when soil water content was 60% of field water capacity (FC) in A2 variant and 80% field water capacity on A3 variant. The maize crops were sprinkler irrigated with a linear move system.
Three rates of the nitrogen fertilizer (B1 – control variant without fertilization. B2 variant – fertilization with 100 kg N ha-1, and B3 variant – fertilization with 200 kg N ha-1) were used. Two-thirds of nitrogen were added in autumn and before sowing (urea: 46% N) and the rest by two top-dressings at early growth stages (calcium ammonium nitrate: 27% N). Phosphorus (100 kg P2O5 ha-1) and potassium (150 kg ha-1 K2O) were applied in form of triplesuperphosphate (45% P2O5) and potassium salt (60% K2O as KCl).
Four different genotypes with similar vegetation group (end of FAO 500 and beginning of FAO 600) were tested: C1 = OSSK596; C2 = OSSK617; C3 = OSSK602; C4 = OSSK552. All four maize hybrids were created on Agricultural institute in Osijek.
Mean air temperatures, precipitation quantity in vegetation season during 2006-2009 and
1961-1990 – thirty year mean Mean air temperatures (oC) Precipitation quantities (mm) Month 2006 2007 2008 2009 61-90 2006 2007 2008 2009 61-90 April 12.9 13.7 12.6 14.6 11.3 95.5 0.7 50.6 15.7 54.1 May 17.0 19.0 19.3 19.0 16.5 79.3 48.5 114.5 45.5 58.9 June 20.5 22.7 22.0 19.7 19.4 92.5 60.6 88.9 73.9 83.5 July 24.8 24.8 22.8 23.6 21.1 15.3 31.7 70.1 31.0 66.6 August 20.5 23.5 23.1 23.5 20.3 122.6 89.0 27.8 61.9 59.6 September 17.9 14.8 15.9 19.6 16.6 8.7 71.2 85.4 2.8 51.8 18.9 19.7 19.3 20.0 17.5 414 302 438 231 368
Table 1. Monthly mean air temperatures and rainfall during vegetation seasons in years of
experiments 2006 – 2009 and long term average for Osijek region
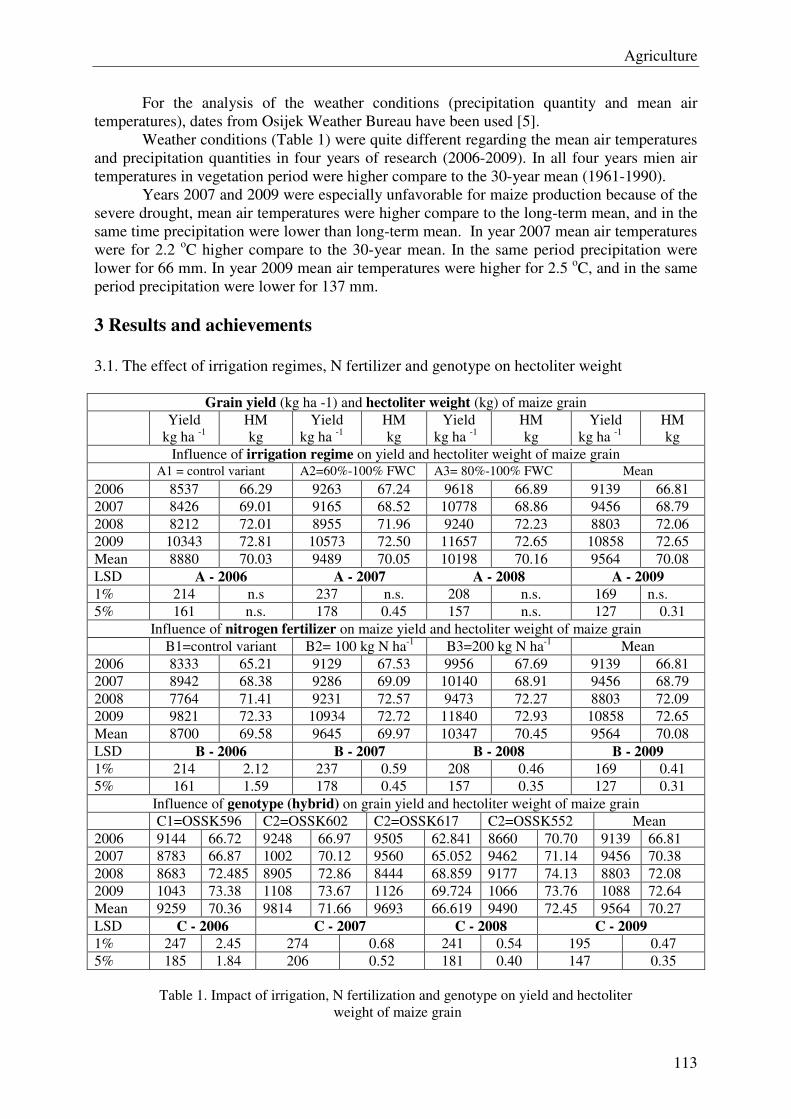
Agriculture
113
For the analysis of the weather conditions (precipitation quantity and mean air temperatures), dates from Osijek Weather Bureau have been used [5].
Weather conditions (Table 1) were quite different regarding the mean air temperatures and precipitation quantities in four years of research (2006-2009). In all four years mien air temperatures in vegetation period were higher compare to the 30-year mean (1961-1990).
Years 2007 and 2009 were especially unfavorable for maize production because of the severe drought, mean air temperatures were higher compare to the long-term mean, and in the same time precipitation were lower than long-term mean. In year 2007 mean air temperatures were for 2.2 oC higher compare to the 30-year mean. In the same period precipitation were lower for 66 mm. In year 2009 mean air temperatures were higher for 2.5 oC, and in the same period precipitation were lower for 137 mm.
3 Results and achievements
3.1. The effect of irrigation regimes, N fertilizer and genotype on hectoliter weight
Grain yield (kg ha -1) and hectoliter weight (kg) of maize grain
Yield kg ha -1
HM kg
Yield kg ha -1
HM kg
Yield kg ha -1
HM kg
Yield kg ha -1
HM kg
Influence of irrigation regime on yield and hectoliter weight of maize grain A1 = control variant A2=60%-100% FWC A3= 80%-100% FWC Mean
2006 8537 66.29 9263 67.24 9618 66.89 9139 66.81 2007 8426 69.01 9165 68.52 10778 68.86 9456 68.79 2008 8212 72.01 8955 71.96 9240 72.23 8803 72.06 2009 10343 72.81 10573 72.50 11657 72.65 10858 72.65 Mean 8880 70.03 9489 70.05 10198 70.16 9564 70.08 LSD A - 2006 A - 2007 A - 2008 A - 2009
1% 214 n.s 237 n.s. 208 n.s. 169 n.s. 5% 161 n.s. 178 0.45 157 n.s. 127 0.31
Influence of nitrogen fertilizer on maize yield and hectoliter weight of maize grain B1=control variant B2= 100 kg N ha-1 B3=200 kg N ha-1 Mean 2006 8333 65.21 9129 67.53 9956 67.69 9139 66.81 2007 8942 68.38 9286 69.09 10140 68.91 9456 68.79 2008 7764 71.41 9231 72.57 9473 72.27 8803 72.09 2009 9821 72.33 10934 72.72 11840 72.93 10858 72.65 Mean 8700 69.58 9645 69.97 10347 70.45 9564 70.08 LSD B - 2006 B - 2007 B - 2008 B - 2009
1% 214 2.12 237 0.59 208 0.46 169 0.41 5% 161 1.59 178 0.45 157 0.35 127 0.31
Influence of genotype (hybrid) on grain yield and hectoliter weight of maize grain C1=OSSK596 C2=OSSK602 C2=OSSK617 C2=OSSK552 Mean 2006 9144 66.72 9248 66.97 9505 62.841 8660 70.70 9139 66.81 2007 8783 66.87 1002 70.12 9560 65.052 9462 71.14 9456 70.38 2008 8683 72.485 8905 72.86 8444 68.859 9177 74.13 8803 72.08 2009 1043 73.38 1108 73.67 1126 69.724 1066 73.76 1088 72.64 Mean 9259 70.36 9814 71.66 9693 66.619 9490 72.45 9564 70.27 LSD C - 2006 C - 2007 C - 2008 C - 2009
1% 247 2.45 274 0.68 241 0.54 195 0.47 5% 185 1.84 206 0.52 181 0.40 147 0.35
Table 1. Impact of irrigation, N fertilization and genotype on yield and hectoliter weight of maize grain
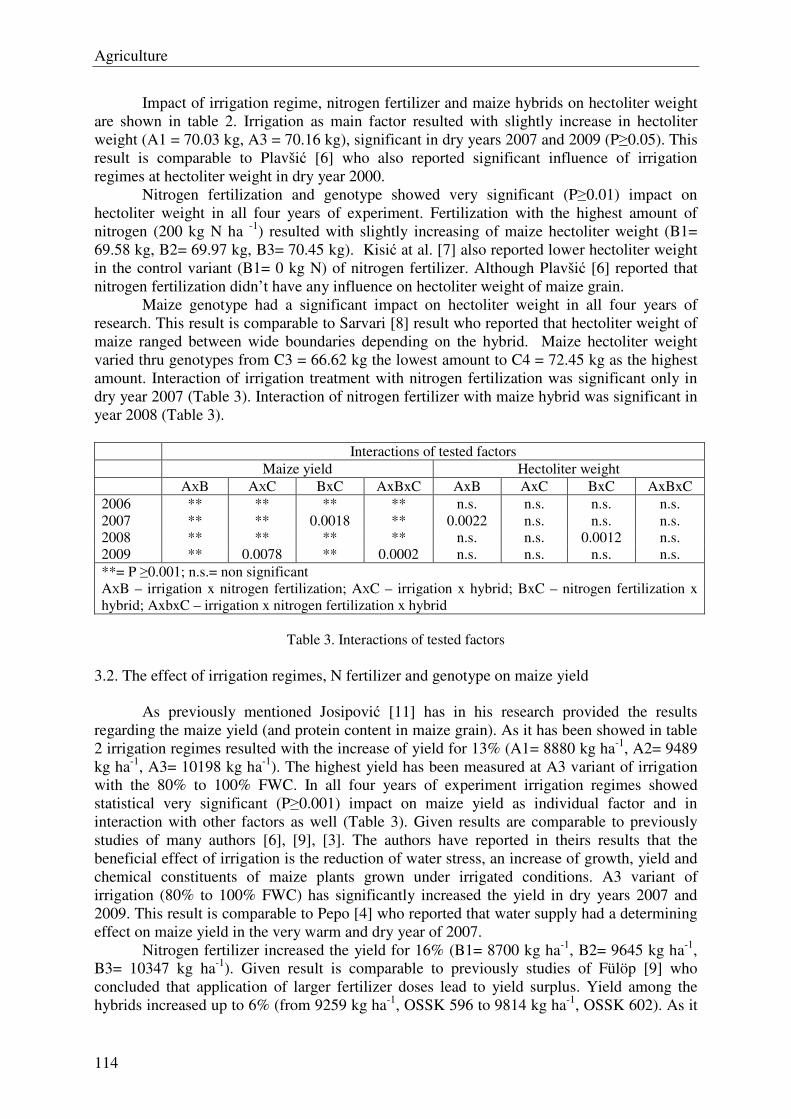
Agriculture
114
Impact of irrigation regime, nitrogen fertilizer and maize hybrids on hectoliter weight are shown in table 2. Irrigation as main factor resulted with slightly increase in hectoliter weight (A1 = 70.03 kg, A3 = 70.16 kg), significant in dry years 2007 and 2009 (P≥0.05). This result is comparable to Plavšić [6] who also reported significant influence of irrigation regimes at hectoliter weight in dry year 2000.
Nitrogen fertilization and genotype showed very significant (P≥0.01) impact on hectoliter weight in all four years of experiment. Fertilization with the highest amount of nitrogen (200 kg N ha -1) resulted with slightly increasing of maize hectoliter weight (B1= 69.58 kg, B2= 69.97 kg, B3= 70.45 kg). Kisić at al. [7] also reported lower hectoliter weight in the control variant (B1= 0 kg N) of nitrogen fertilizer. Although Plavšić [6] reported that nitrogen fertilization didn’t have any influence on hectoliter weight of maize grain.
Maize genotype had a significant impact on hectoliter weight in all four years of research. This result is comparable to Sarvari [8] result who reported that hectoliter weight of maize ranged between wide boundaries depending on the hybrid. Maize hectoliter weight varied thru genotypes from C3 = 66.62 kg the lowest amount to C4 = 72.45 kg as the highest amount. Interaction of irrigation treatment with nitrogen fertilization was significant only in dry year 2007 (Table 3). Interaction of nitrogen fertilizer with maize hybrid was significant in year 2008 (Table 3). Interactions of tested factors Maize yield Hectoliter weight AXB AXC BxC AxBxC AxB AxC BxC AxBxC 2006 ** ** ** ** n.s. n.s. n.s. n.s. 2007 ** ** 0.0018 ** 0.0022 n.s. n.s. n.s. 2008 ** ** ** ** n.s. n.s. 0.0012 n.s. 2009 ** 0.0078 ** 0.0002 n.s. n.s. n.s. n.s. **= P ≥0.001; n.s.= non significant AXB – irrigation x nitrogen fertilization; AXC – irrigation x hybrid; BxC – nitrogen fertilization x hybrid; AxbxC – irrigation x nitrogen fertilization x hybrid
Table 3. Interactions of tested factors
3.2. The effect of irrigation regimes, N fertilizer and genotype on maize yield
As previously mentioned Josipović [11] has in his research provided the results regarding the maize yield (and protein content in maize grain). As it has been showed in table 2 irrigation regimes resulted with the increase of yield for 13% (A1= 8880 kg ha-1, A2= 9489 kg ha-1, A3= 10198 kg ha-1). The highest yield has been measured at A3 variant of irrigation with the 80% to 100% FWC. In all four years of experiment irrigation regimes showed statistical very significant (P≥0.001) impact on maize yield as individual factor and in interaction with other factors as well (Table 3). Given results are comparable to previously studies of many authors [6], [9], [3]. The authors have reported in theirs results that the beneficial effect of irrigation is the reduction of water stress, an increase of growth, yield and chemical constituents of maize plants grown under irrigated conditions. A3 variant of irrigation (80% to 100% FWC) has significantly increased the yield in dry years 2007 and 2009. This result is comparable to Pepo [4] who reported that water supply had a determining effect on maize yield in the very warm and dry year of 2007.
Nitrogen fertilizer increased the yield for 16% (B1= 8700 kg ha-1, B2= 9645 kg ha-1, B3= 10347 kg ha-1). Given result is comparable to previously studies of Fülöp [9] who concluded that application of larger fertilizer doses lead to yield surplus. Yield among the hybrids increased up to 6% (from 9259 kg ha-1, OSSK 596 to 9814 kg ha-1, OSSK 602). As it
Agriculture
115
has been showed in Table 3 irrigation, nitrogen fertilization, genotype and their interaction showed very significant impact on maize yield (P ≥0.001). 4 Conclusions
This paper encourage the knowledge about the importance of irrigation management,
nitrogen application rate and their interaction as well on grain yield and quality of maize genotypes. Irrigation management increased yield as single factor and in interaction with nitrogen and genotype as well. Application of nitrogen fertilizer increased maize yield and hectoliter weight as well. Further, variation among genotypes regarding yield and hectoliter weight was significant in all four tested years with high level of signification and as so presents a potential to new researches to select genotypes that produce both high yield and high quality of maize grain. 5 References [1] V. Kovačević; J. Šoštarić; M. Josipović; D. Iljkić; M. Marković (2009). Precipitation and temperature regime impacts on maize yields in eastern Croatia. Research Journal of Agricultural Science. 41 (1). pp. 49-53. [2] N. El Hallof; M. Sarvari (2007): Relationship between yield quality quantity of maize hybrids and fertilizer. Proceedings of VI. Alps-Adria scientific workshop. Vol. 35, No. 2, p.p.369-372 [3] S.A. Ibrahim; H. Kandil; (2007): Growth, Yield and Chemical Constituents of corn (Zea Maize L.) as Affected by Nitrogen and Phosphors Fertilization under different Irrigation Intervals. Journal of Applied Sciences Research, 3(10): 1112-1120. [4] P. Pepo; A. Vad; S. Berenyi (2008): Effect of irrigation on yields of maize (Zea mays L.) in different crop rotations. Proceedings of VII. Alps-Adria Scientific Workshop. 735-738. [5] State Hydrometeorological Institute in Zagreb. The monthly reports (2009) [6] H. Plavšić; M. Josipović; L. Andrić; A. Jambrović; J. Šoštarić (2007): Influences of irrigation and fertilization on maize (Zea mays L.) properties. Proceedings of VI. Alps-Adria Scientific Workshop. 933-936 [7] I. Kisić; M. Mesić; F. Bašić; A. Butorac; Ž. Vañić (2004): The effect of liming and fertilization on yields of maize ind winter wheat. Agriculturae Conspectus Scientificus, Vol. 69, No. 2-3 (51-57). [8] M. Sarvari; N. El Hallof; Z. Molnar (2007): Effect of determininig factors on maize yield with special regards to plant density. Proceedings of VI. Alps-Adria scientific workshop. Vol. 35, No. 2, 1037-1040. [9] G. Abbas; H. Abid; A. Ashfyq; S. A. Wajid (2005): Effect of irriagation sheduels and nitrogen rates on yield and yield components of maize. Journal of agriculture&social sciences, Vol. 1, No. 4. 335-338. [10] D.L. Fülöp; P. Pepo (2007): Role of watersuply in monoculture maize (Zea Mays L.) production. Proceedings of VI. Alps-Adria scientific workshop. Vol. 35, No. 2, 353-356. [11] Josipović M., Plavšić H., Brkić I., Sudar R., Marković M. (2010): Irrigation, nitrogen fertilization and genotype impacts on yield and quality of maize. IX. Alps-Adria Scientific Workshop. Špičak, Czech Republic, 2010. Vol. 59, p.p. 255-259.
Author data
Monika Marković: Plant production and agricultural melioration, Faculty of Agriculture in Osijek, University J. J. Strosmayer in Osijek. Trg Sv. Trojstva 3, 31 000 Osijek, Croatia. E-

Agriculture
116
mail: [email protected] Jasna Šoštarić: Plant production and agricultural melioration, Faculty of Agriculture in Osijek, University J. J. Strosmayer in Osijek. Trg Sv. Trojstva 3, 31 000 Osijek, Croatia. E-mail: [email protected] Vlado Kovačević: Plant production and agricultural melioration, Faculty of Agriculture in Osijek, University J. J. Strosmayer in Osijek. Trg Sv. Trojstva 3, 31 000 Osijek, Croatia. E-mail: [email protected] Marko Josipović: Department of Basic Seed Production. Agricultural Institute in Osijek. J. predgrañe 17, 31 000 Osijek, Croatia. E- mail: [email protected] Dario Iljkić: Plant production and agricultural melioration, Faculty of Agriculture in Osijek, University J. J. Strosmayer in Osijek. Trg Sv. Trojstva 3, 31 000 Osijek, Croatia. E-mail: [email protected] Božica Japundzic-Palenkic: Department for Horticulture. Universety of applied science in Slavonski Brod. Dr. Mile Budaka 1, 35 000 Slavonski Brod. E-mail: [email protected]
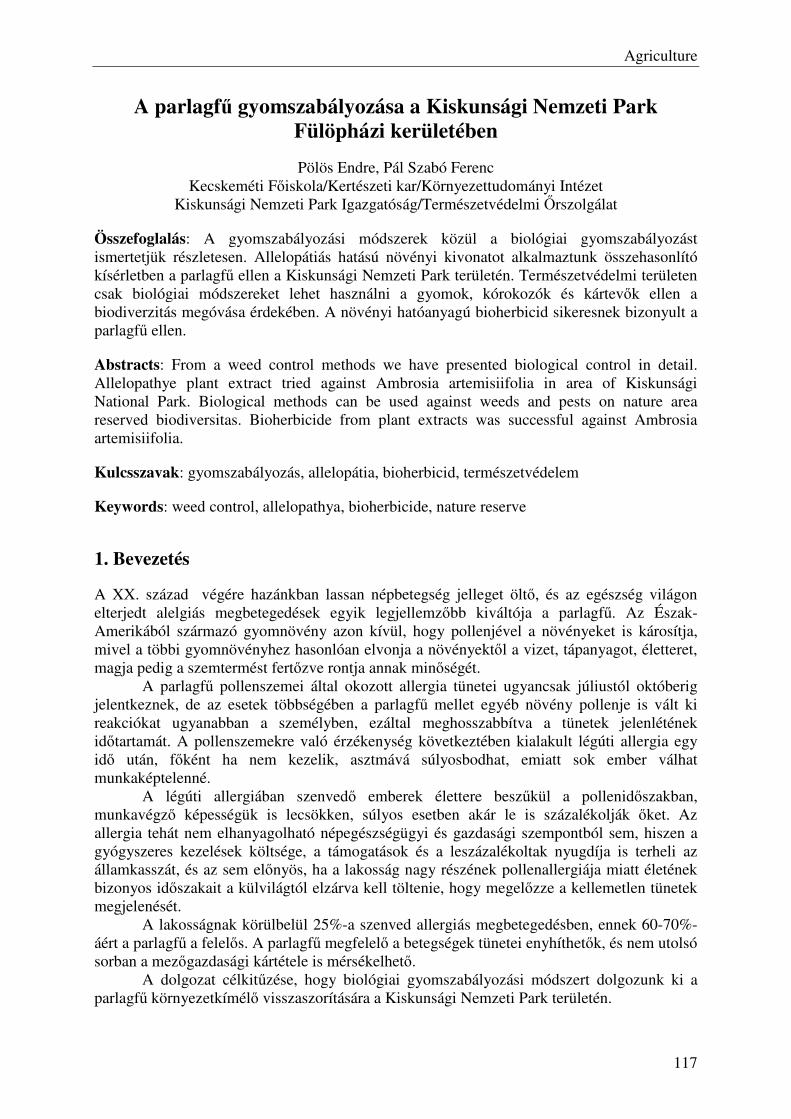
Agriculture
117
A parlagfű gyomszabályozása a Kiskunsági Nemzeti Park Fülöpházi kerületében
Pölös Endre, Pál Szabó Ferenc Kecskeméti Főiskola/Kertészeti kar/Környezettudományi Intézet
Kiskunsági Nemzeti Park Igazgatóság/Természetvédelmi Őrszolgálat
Összefoglalás: A gyomszabályozási módszerek közül a biológiai gyomszabályozást ismertetjük részletesen. Allelopátiás hatású növényi kivonatot alkalmaztunk összehasonlító kísérletben a parlagfű ellen a Kiskunsági Nemzeti Park területén. Természetvédelmi területen csak biológiai módszereket lehet használni a gyomok, kórokozók és kártevők ellen a biodiverzitás megóvása érdekében. A növényi hatóanyagú bioherbicid sikeresnek bizonyult a parlagfű ellen.
Abstracts: From a weed control methods we have presented biological control in detail. Allelopathye plant extract tried against Ambrosia artemisiifolia in area of Kiskunsági National Park. Biological methods can be used against weeds and pests on nature area reserved biodiversitas. Bioherbicide from plant extracts was successful against Ambrosia artemisiifolia.
Kulcsszavak: gyomszabályozás, allelopátia, bioherbicid, természetvédelem
Keywords: weed control, allelopathya, bioherbicide, nature reserve
1. Bevezetés
A XX. század végére hazánkban lassan népbetegség jelleget öltő, és az egészség világon elterjedt alelgiás megbetegedések egyik legjellemzőbb kiváltója a parlagfű. Az Észak- Amerikából származó gyomnövény azon kívül, hogy pollenjével a növényeket is károsítja, mivel a többi gyomnövényhez hasonlóan elvonja a növényektől a vizet, tápanyagot, életteret, magja pedig a szemtermést fertőzve rontja annak minőségét. A parlagfű pollenszemei által okozott allergia tünetei ugyancsak júliustól októberig jelentkeznek, de az esetek többségében a parlagfű mellet egyéb növény pollenje is vált ki reakciókat ugyanabban a személyben, ezáltal meghosszabbítva a tünetek jelenlétének időtartamát. A pollenszemekre való érzékenység következtében kialakult légúti allergia egy idő után, főként ha nem kezelik, asztmává súlyosbodhat, emiatt sok ember válhat munkaképtelenné. A légúti allergiában szenvedő emberek élettere beszűkül a pollenidőszakban, munkavégző képességük is lecsökken, súlyos esetben akár le is százalékolják őket. Az allergia tehát nem elhanyagolható népegészségügyi és gazdasági szempontból sem, hiszen a gyógyszeres kezelések költsége, a támogatások és a leszázalékoltak nyugdíja is terheli az államkasszát, és az sem előnyös, ha a lakosság nagy részének pollenallergiája miatt életének bizonyos időszakait a külvilágtól elzárva kell töltenie, hogy megelőzze a kellemetlen tünetek megjelenését. A lakosságnak körülbelül 25%-a szenved allergiás megbetegedésben, ennek 60-70%-áért a parlagfű a felelős. A parlagfű megfelelő a betegségek tünetei enyhíthetők, és nem utolsó sorban a mezőgazdasági kártétele is mérsékelhető. A dolgozat célkitűzése, hogy biológiai gyomszabályozási módszert dolgozunk ki a parlagfű környezetkímélő visszaszorítására a Kiskunsági Nemzeti Park területén.

Agriculture
118
2. A biológiai gyomszabályozás alkalmazott módszerei:
Biológiai gyomszabályozással már régóta próbálkozik az ember, a gyomok vegyszer nélküli elpusztítására sok módszert kipróbált. Egyes módszerekre megfigyelés útján, másokra pedig kísérletek hosszú sora után jöttek rá a termelők, kutatók. Az elsőre jó példa Indiában észlelt rovarok okozta Opunita állománypusztulás, a másodikra pedig a növényekből kinyert allelokemikáliákat lehet példaként felmutatni. Ha biológiai gyomszabályozásról beszélünk, nem hagyhatjuk ki a mechanikai és agrotechnikai eljárásokat sem, azonban ezeket az általában jól ismert módszereket (szántás tárcsázás, fogasolás, hőhatáson alapuló gyomirtás, vetésváltás, vetésforgó) nem kívánom részletezni, csupán egy kísérlet bemutatásán keresztül foglalkoznék vele. Talán kevésbé ismert megoldások körét képeik a következő eljárások:. érdekes, a gyakorlat által elismert, kísérletek által érthetetlen eredményeket mutató
eljárás a növényi részek elégetésével nyert hamu elvetése, és gyomnövekedés gátló hatása,
fényhatással szabályozott gyomtevékenység,
biológiai gyomszabályozás rovarokkal,
biológiai gyomszabályozás kórokozókkal, tisztán növényi eredetű, növényekből kivont allelokemikáliák.
A biológiai gyomszabályozások közül az allelopátiát kívánjuk alkalmazni a parlagfű
elpusztítására. Az allelopátiának kiemelt szerepe van a biológiai gyomszabályozásban [1]. Számos allelopatikus hatású növény él szerte a világban. A biológiai gyomszabályozásban ezeknek a növényeknek a forrázatait,főzeteit, présnedveit használják fel a gyomnövények elleni küzdelemben. Az allelokemikáliák e területén való alkalmazásnak nagy előnye, hogy kijuttatásuk a szintetikus gyomirtókéval közel azonos, így nem igényel többletráfordítást a termelőtől, annak gyomirtási technológiájába könnyen beilleszthető. A nagy arányú vegyszerhasználat, és az ennek következtében kialakuló negatív környezeti hatások nagy lökést adtak az allelopátiás kutatásoknak. A kedvező allelopatikus hatású növények már a vetésforgóba megfelelően beépítve gyomszabályozó hatásúak lehetnek.
3. Eredmények és megvitatásuk
A kezelések beállítása a parlagfű virágzása előtti fenológiai stádiumban 2010. 07.14-én történt a KNP- Fülöpházi kerületében. A10x 10m-es parcellák gyomborítottsága jelentős volt. Az egyedszám 1 m2 –enként 100-125 db volt. A permetezés háti permetezővel történt. Bioherbicides kezelés mellett végeztünk tárcsázást és kaszálást is 1-1 külön parcellában (1-4. ábra).
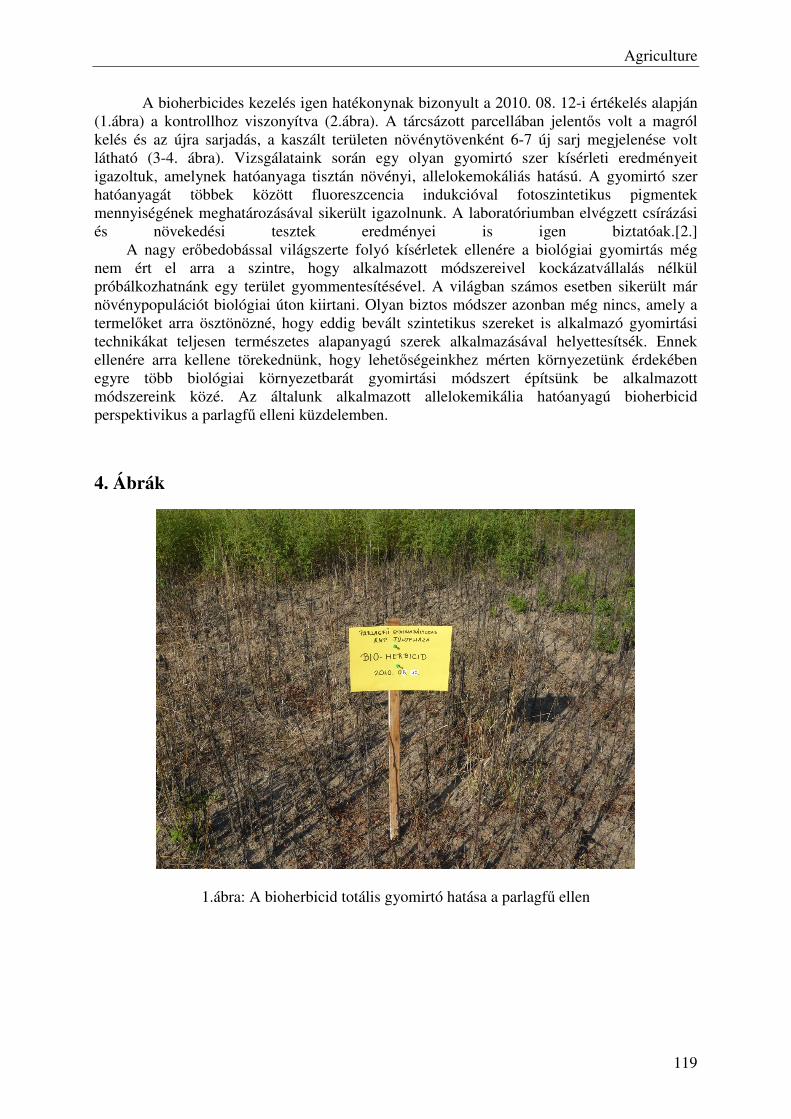
Agriculture
119
A bioherbicides kezelés igen hatékonynak bizonyult a 2010. 08. 12-i értékelés alapján (1.ábra) a kontrollhoz viszonyítva (2.ábra). A tárcsázott parcellában jelentős volt a magról kelés és az újra sarjadás, a kaszált területen növénytövenként 6-7 új sarj megjelenése volt látható (3-4. ábra). Vizsgálataink során egy olyan gyomirtó szer kísérleti eredményeit igazoltuk, amelynek hatóanyaga tisztán növényi, allelokemokáliás hatású. A gyomirtó szer hatóanyagát többek között fluoreszcencia indukcióval fotoszintetikus pigmentek mennyiségének meghatározásával sikerült igazolnunk. A laboratóriumban elvégzett csírázási és növekedési tesztek eredményei is igen biztatóak.[2.] A nagy erőbedobással világszerte folyó kísérletek ellenére a biológiai gyomirtás még nem ért el arra a szintre, hogy alkalmazott módszereivel kockázatvállalás nélkül próbálkozhatnánk egy terület gyommentesítésével. A világban számos esetben sikerült már növénypopulációt biológiai úton kiirtani. Olyan biztos módszer azonban még nincs, amely a termelőket arra ösztönözné, hogy eddig bevált szintetikus szereket is alkalmazó gyomirtási technikákat teljesen természetes alapanyagú szerek alkalmazásával helyettesítsék. Ennek ellenére arra kellene törekednünk, hogy lehetőségeinkhez mérten környezetünk érdekében egyre több biológiai környezetbarát gyomirtási módszert építsünk be alkalmazott módszereink közé. Az általunk alkalmazott allelokemikália hatóanyagú bioherbicid perspektivikus a parlagfű elleni küzdelemben.
4. Ábrák
1.ábra: A bioherbicid totális gyomirtó hatása a parlagfű ellen
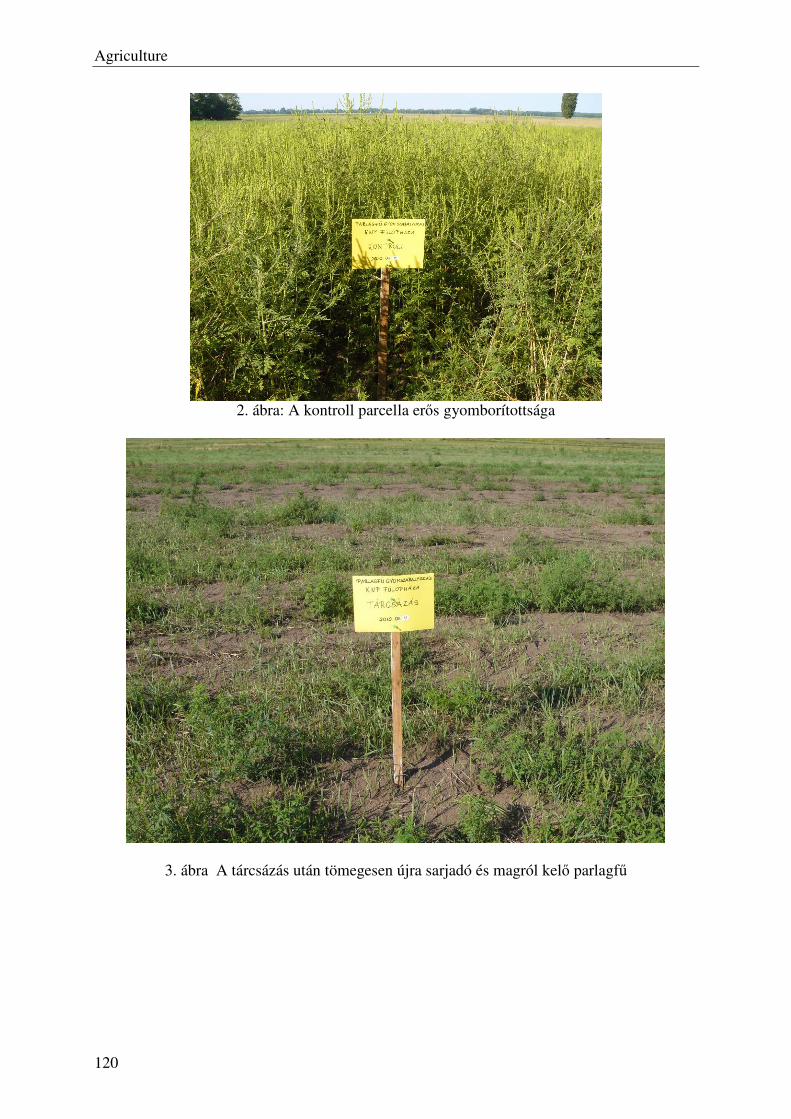
Agriculture
120
2. ábra: A kontroll parcella erős gyomborítottsága
3. ábra A tárcsázás után tömegesen újra sarjadó és magról kelő parlagfű
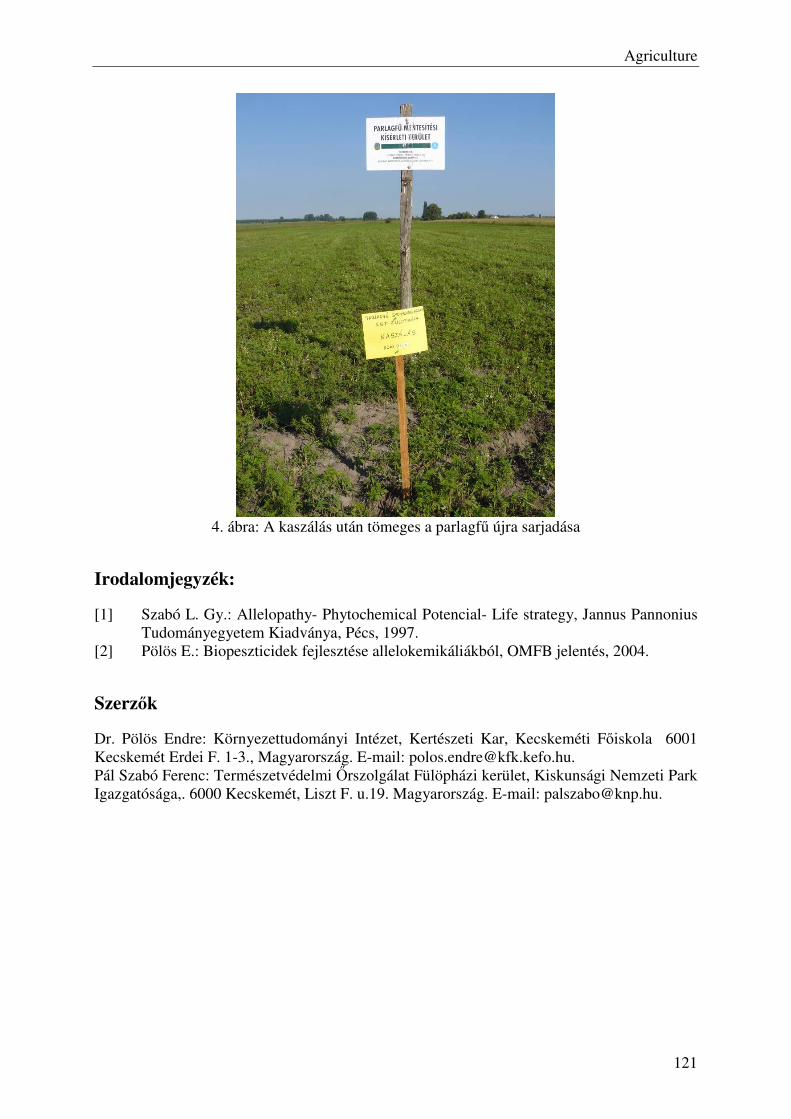
Agriculture
121
4. ábra: A kaszálás után tömeges a parlagfű újra sarjadása
Irodalomjegyzék:
[1] Szabó L. Gy.: Allelopathy- Phytochemical Potencial- Life strategy, Jannus Pannonius Tudományegyetem Kiadványa, Pécs, 1997.
[2] Pölös E.: Biopeszticidek fejlesztése allelokemikáliákból, OMFB jelentés, 2004.
Szerzők
Dr. Pölös Endre: Környezettudományi Intézet, Kertészeti Kar, Kecskeméti Főiskola 6001 Kecskemét Erdei F. 1-3., Magyarország. E-mail: [email protected]. Pál Szabó Ferenc: Természetvédelmi Őrszolgálat Fülöpházi kerület, Kiskunsági Nemzeti Park Igazgatósága,. 6000 Kecskemét, Liszt F. u.19. Magyarország. E-mail: [email protected].
Agriculture
122
Difference in button mushroom (Agaricus bisporus) crop yield
between regular and Cac-ing method
Nataša Romanjek- Fajdetić1, Branimir Vujčić
2, Božica Japundžić- Palenkić
2,
Slavica Antunović2, Teuta Benković-Lačić
2
1,2University of applied sciences Slavonski Brod, CROATIA
Abstract: The aim of this experiment was to determine if it is possible to produce button
mushrooms (Agaricus bisporus) using regular and Cac-ing method in the same growing space
with satisfactory results. Main components in button mushrooms production are the
mushroom production compost and the 5 cm thick casing soil layer that covers compost.
Mushroom compost is made of wheat straw that is inoculated by button mushrooms
mycelium. Cac-ing method is done by mixing mature compost into casing soil to speed up
the beginning of harvest. Another way is to add casing spawn. Compost Bio-fungi was used
in the research, and the same was mixed to the casing soil.
Keywords: button mushrooms, Cac-ing method, regular method, yield
1 Introduction
Mushrooms are a group of fungi endowed with ability to convert inedible out wastes into
palatable food that is praised for characteristic biting texture and flavor [1]. The mass
production of Agaricus bisporus, known as the button mushroom started in the first half of the
20th
century. Compost for cultivation of A.bisporus is prepared from a mixture of organic
materials subjected to a composting process for making it selective for the mushroom [2].
After colonization of Agaricus mycelia in the substrate is complete, a 1.5-inch layer called
casing, consisting of peat soil amended with calcium carbonate (to neutralize pH) and water
(about 80 percent moisture), is applied on top of the compost bed. This layer is called the
casing soil [3]. Under commercial conditions, fructification of A. bisporus is promoted by
covering the mycelium-colonized compost with a layer of soil or peat-chalk mixture known as
the casing layer [4]. A peat / limestone is the most widely used casing material. Once the
spawn has grown compost can be added to the casing material. At this stage, fully grown
compost can be added to the casing material. This is known as CAC-ing (compost added at
casing). The added compost acts as inoculums in the casing layer by the mushroom mycelium
and results in more even cropping. However those contemplating CAC-ing should follow
extreme hygiene practice and seek advice from an experienced grower or consultant as failure
to manage and select the correct CAC material can result in total crop loss [5]. Temperature is
one of the main factors affecting mushrooms development and introduction in new areas [6].
After colonization of Agaricus bisporus in the casing soil is completed it is time for ruffling.
Few days after, when the mycelium is on the top layer of casing soil it is time for ventilation
to initiate primordiums. A primordium was defined as a structure of greater than I mm diam.,
composed of a dense hyphal mesh, with a smooth surface and visibly distinct from knots and
strands of hyphae. [7]. This mean to add oxygen and to low the CO₂ concentration to 800 ppm
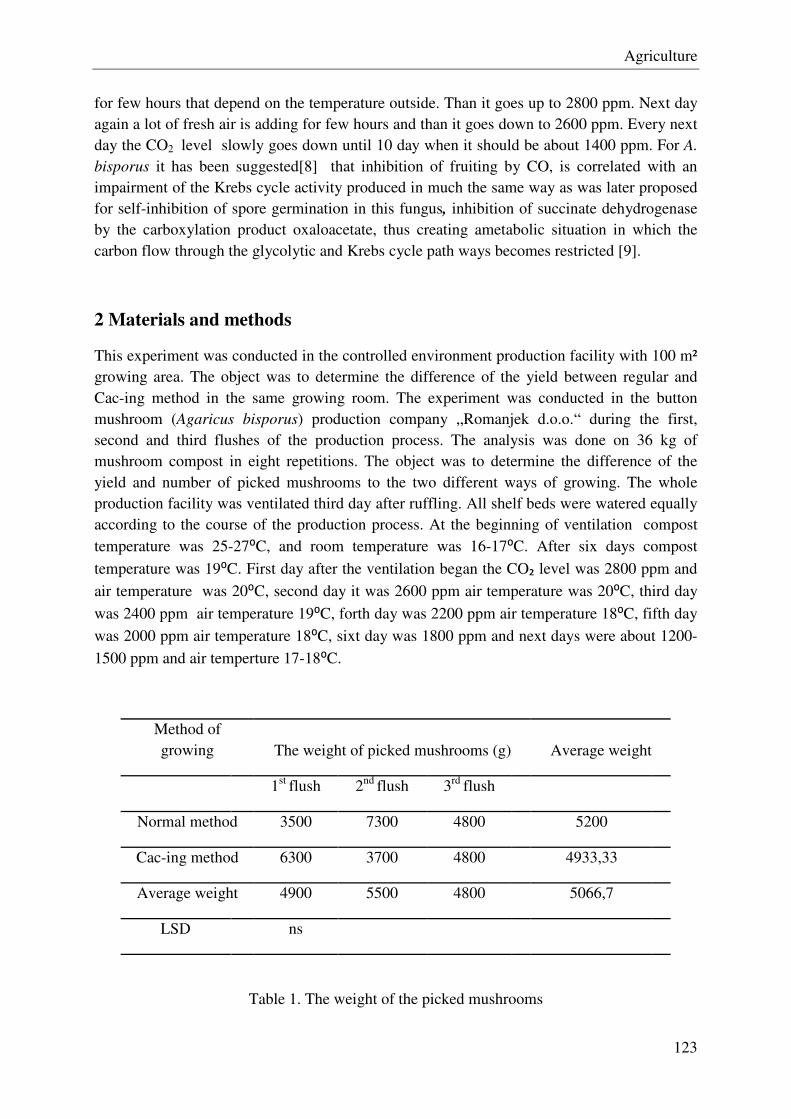
Agriculture
123
for few hours that depend on the temperature outside. Than it goes up to 2800 ppm. Next day
again a lot of fresh air is adding for few hours and than it goes down to 2600 ppm. Every next
day the CO2 level slowly goes down until 10 day when it should be about 1400 ppm. For A.
bisporus it has been suggested[8] that inhibition of fruiting by CO, is correlated with an
impairment of the Krebs cycle activity produced in much the same way as was later proposed
for self-inhibition of spore germination in this fungus, inhibition of succinate dehydrogenase
by the carboxylation product oxaloacetate, thus creating ametabolic situation in which the
carbon flow through the glycolytic and Krebs cycle path ways becomes restricted [9].
2 Materials and methods
This experiment was conducted in the controlled environment production facility with 100 m²
growing area. The object was to determine the difference of the yield between regular and
Cac-ing method in the same growing room. The experiment was conducted in the button
mushroom (Agaricus bisporus) production company „Romanjek d.o.o.“ during the first,
second and third flushes of the production process. The analysis was done on 36 kg of
mushroom compost in eight repetitions. The object was to determine the difference of the
yield and number of picked mushrooms to the two different ways of growing. The whole
production facility was ventilated third day after ruffling. All shelf beds were watered equally
according to the course of the production process. At the beginning of ventilation compost
temperature was 25-27⁰C, and room temperature was 16-17⁰C. After six days compost
temperature was 19⁰C. First day after the ventilation began the CO₂ level was 2800 ppm and
air temperature was 20⁰C, second day it was 2600 ppm air temperature was 20⁰C, third day
was 2400 ppm air temperature 19⁰C, forth day was 2200 ppm air temperature 18⁰C, fifth day
was 2000 ppm air temperature 18⁰C, sixt day was 1800 ppm and next days were about 1200-
1500 ppm and air temperture 17-18⁰C.
Method of
growing The weight of picked mushrooms (g) Average weight
1st
flush 2nd
flush 3rd
flush
Normal method 3500 7300 4800 5200
Cac-ing method 6300 3700 4800 4933,33
Average weight 4900 5500 4800 5066,7
LSD ns
Table 1. The weight of the picked mushrooms
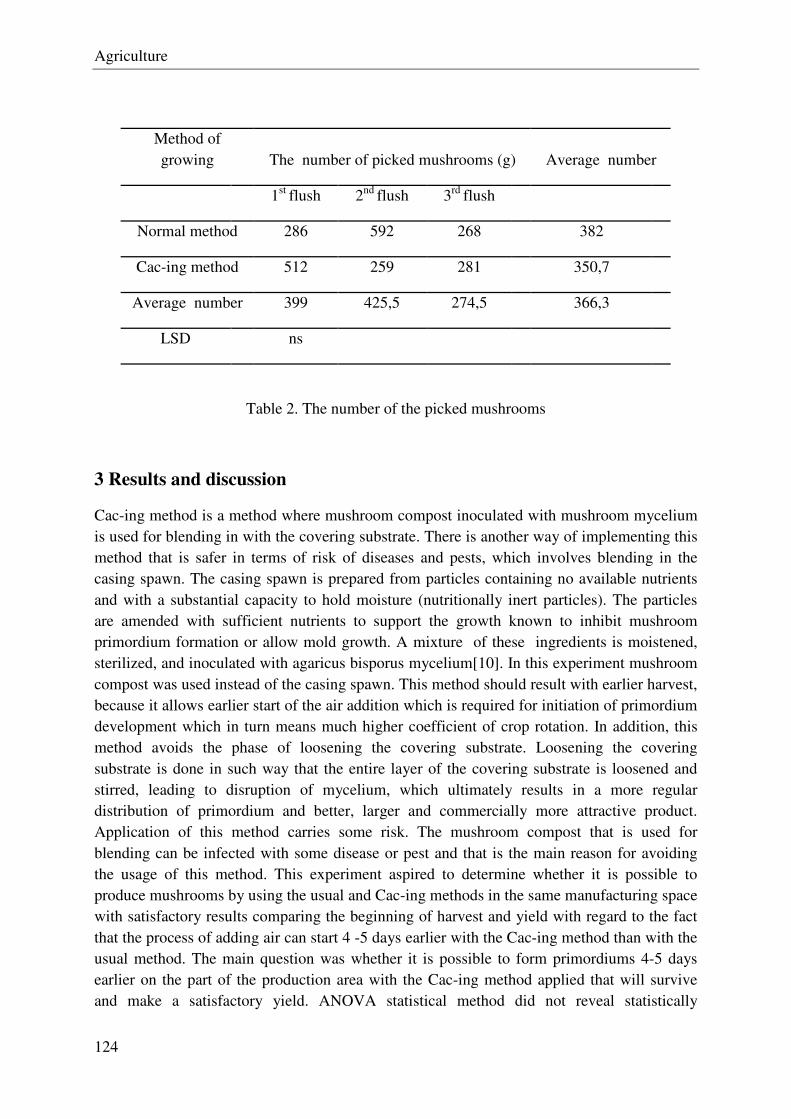
Agriculture
124
Method of
growing The number of picked mushrooms (g) Average number
1st
flush 2nd
flush 3rd
flush
Normal method 286 592 268 382
Cac-ing method 512 259 281 350,7
Average number 399 425,5 274,5 366,3
LSD ns
Table 2. The number of the picked mushrooms
3 Results and discussion
Cac-ing method is a method where mushroom compost inoculated with mushroom mycelium
is used for blending in with the covering substrate. There is another way of implementing this
method that is safer in terms of risk of diseases and pests, which involves blending in the
casing spawn. The casing spawn is prepared from particles containing no available nutrients
and with a substantial capacity to hold moisture (nutritionally inert particles). The particles
are amended with sufficient nutrients to support the growth known to inhibit mushroom
primordium formation or allow mold growth. A mixture of these ingredients is moistened,
sterilized, and inoculated with agaricus bisporus mycelium[10]. In this experiment mushroom
compost was used instead of the casing spawn. This method should result with earlier harvest,
because it allows earlier start of the air addition which is required for initiation of primordium
development which in turn means much higher coefficient of crop rotation. In addition, this
method avoids the phase of loosening the covering substrate. Loosening the covering
substrate is done in such way that the entire layer of the covering substrate is loosened and
stirred, leading to disruption of mycelium, which ultimately results in a more regular
distribution of primordium and better, larger and commercially more attractive product.
Application of this method carries some risk. The mushroom compost that is used for
blending can be infected with some disease or pest and that is the main reason for avoiding
the usage of this method. This experiment aspired to determine whether it is possible to
produce mushrooms by using the usual and Cac-ing methods in the same manufacturing space
with satisfactory results comparing the beginning of harvest and yield with regard to the fact
that the process of adding air can start 4 -5 days earlier with the Cac-ing method than with the
usual method. The main question was whether it is possible to form primordiums 4-5 days
earlier on the part of the production area with the Cac-ing method applied that will survive
and make a satisfactory yield. ANOVA statistical method did not reveal statistically
Agriculture
125
significant differences in yield. Also the beginning of harvest wasn't earlier in the
manufacturing area with the Cac-ing method when compared to the area with the usual
method. The primordiums formed four days sooner on the part of the production area with the
Cac-ing method than on the area with the usual method, but it was observed that there were
more atrophied primordiums in the production area with the Cac-ing method than in the area
with the usual method, which indicates that the formed primordiums atrophied because of the
high CO2 concentration (3000-4000 ppm). The only difference was a greater yield on the area
with the Cac-ing method during the first flush of the harvest, but during the second flush the
yield was higher on the area where the usual method was used.
4 Conclusion
One of the problems that the mushroom producers are facing is the possibility to
uninterruptedly supply the mushrooms to the market. Hence it would be very interesting to
have one part of the mushroom production area that could produce mushrooms before the
major harvest comes. It is possible to produce mushrooms in the same area using the usual
and Cac-ing method, but because of the crucial influence of the CO2 concentration in the
primordium formation and development, harvest will not start 4-5 days sooner and that
actually was the main reason for conducting this experiment.
References
[1] Mushroom Production and Processing Technology, V. N. Pathak, Nagendra Yadar and
Maneesha Gaur, Publisher Agrobios India, ISBN 9788177540062, (2010)
[2] M. Colak, Temperature profiles of Agaricus bisporus incomposting stages and effects
of different composts formulas and casing materials on yield. African Journal of
Biotechnology Vol.3(9) pp.456-462, (2004)
[3] N. Chikthimmah; R. Beelman; L. LaBorde, Sphagnum peat mushroom casing soils:
composition, function and microbiology. (composting @ raw materials). Mushroom
news, (2008)
[4] Primordium Formation in Axenic Cultures of Agaricus bisporus (Lange) Sing, D.A.
Wood, Journal of General Microbiology 95, 313-323 , Great Britain (1976)
[5] Introduction to commercial mushroom growing – please refer to 1999-2000 Statistical
information
[6] Regina Helena Marino, Augusto Ferreira da Eira, Eiko Eurya Kuramae, Elvio Cardoso
Queiroz Scientia Agricola Morphomolecular characterization of Pleurotus ostreatus
(Jacq. Fr.) kummer strains in relation to luminosity ond temperature of fructification .
ISSN 0103-9016. (2003)
[7] Primordium Formation in Axenic Cultures of Agaricus bisporus (Lange) Sing, D.A.
Wood, Journal of General Microbiology 95, 313-323, Great Britain
[8] D. Rast & Bachofner Carboxylierungsreaktionen in Agaricus bisporus. I. Der
endogene CO ₂-Acceptor. Archiv fur Mikrobiologie 57. 392-405 (1976)

Agriculture
126
[9] Rast, D. Staublee, J. 8c Zobristp, The Krebs cycle and control of dormancy in the
Agaricus bisporus spore. New Phytologist 76, 469-477 (1976) [10] Dahlberg et al.
United States Patent, Patent Number 5,503,647, 2. April 1996.
Author data
First author: Nataša Romanjek- Fajdetić, University of applied sciences Slavonski Brod,
Budakova 1, 35000 Slavonski Brod, Croatia, E-mail: [email protected]
Second author: Branimir Vujčić, University of applied sciences Slavonski Brod, Budakova 1,
35000 Slavonski Brod, Croatia, E-mail: [email protected]
Second author: Božica Japundžić- Palenkić, University of applied sciences Slavonski Brod,
Budakova 1, 35000 Slavonski Brod, Croatia, E-mail: [email protected]
Second author: Slavica Antunović, University of applied sciences Slavonski Brod, Budakova
1, 35000 Slavonski Brod, Croatia, E-mail: [email protected]
Second author: Teuta Benković-Lačić, University of applied sciences Slavonski Brod,
Budakova 1, 35000 Slavonski Brod, Croatia, E-mail: [email protected]
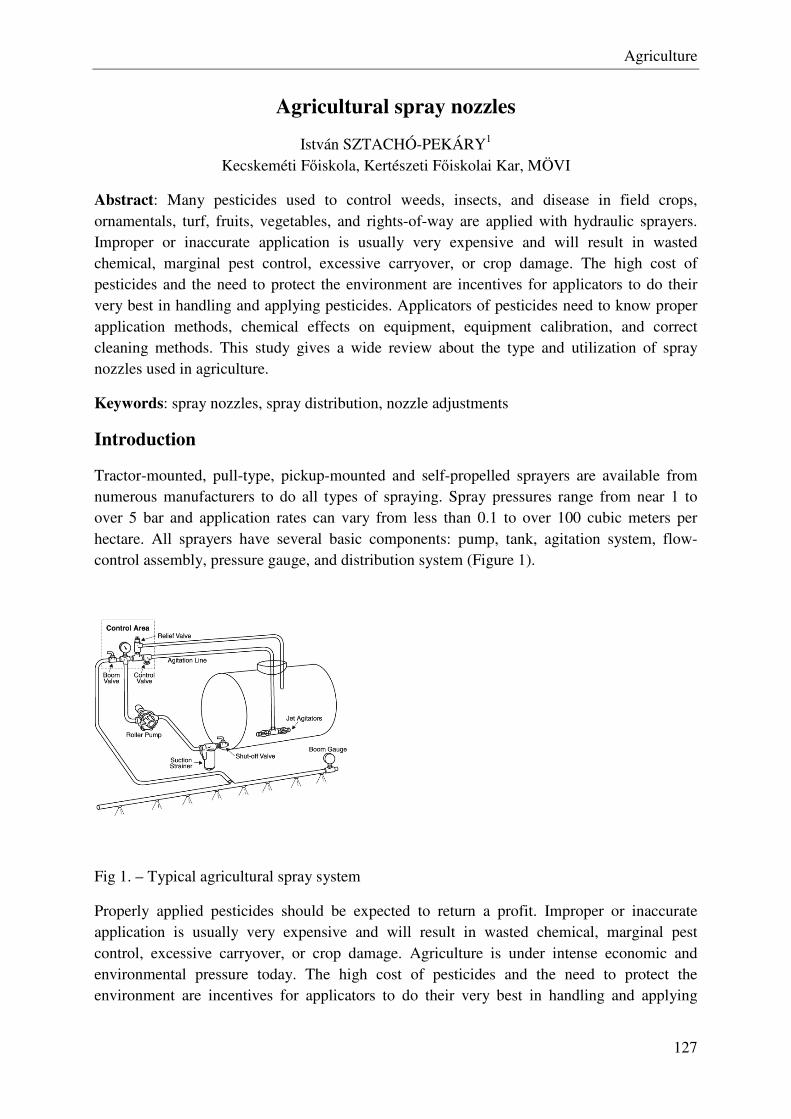
Agriculture
127
Agricultural spray nozzles
István SZTACHÓ-PEKÁRY1 Kecskeméti Főiskola, Kertészeti Főiskolai Kar, MÖVI
Abstract: Many pesticides used to control weeds, insects, and disease in field crops, ornamentals, turf, fruits, vegetables, and rights-of-way are applied with hydraulic sprayers. Improper or inaccurate application is usually very expensive and will result in wasted chemical, marginal pest control, excessive carryover, or crop damage. The high cost of pesticides and the need to protect the environment are incentives for applicators to do their very best in handling and applying pesticides. Applicators of pesticides need to know proper application methods, chemical effects on equipment, equipment calibration, and correct cleaning methods. This study gives a wide review about the type and utilization of spray nozzles used in agriculture.
Keywords: spray nozzles, spray distribution, nozzle adjustments
Introduction
Tractor-mounted, pull-type, pickup-mounted and self-propelled sprayers are available from numerous manufacturers to do all types of spraying. Spray pressures range from near 1 to over 5 bar and application rates can vary from less than 0.1 to over 100 cubic meters per hectare. All sprayers have several basic components: pump, tank, agitation system, flow-control assembly, pressure gauge, and distribution system (Figure 1).
Fig 1. – Typical agricultural spray system
Properly applied pesticides should be expected to return a profit. Improper or inaccurate application is usually very expensive and will result in wasted chemical, marginal pest control, excessive carryover, or crop damage. Agriculture is under intense economic and environmental pressure today. The high cost of pesticides and the need to protect the environment are incentives for applicators to do their very best in handling and applying

Agriculture
128
pesticides. Studies have shown that many application errors are due to improper calibration of the sprayer. A Zhu et al. [1] found that 60 percent of the applicators were over or under applying pesticides by more than 10 percent of their intended rate. Derksen et al. [2] found that four out of five sprayers had calibration errors and one out of three had mixing errors. Applicators of pesticides need to know proper application methods, chemical effects on equipment, equipment calibration, and correct cleaning methods. Dry flowables may wear nozzle tips and may cause an increase in application rates after spraying as little as 20 hectares [3].
NOZZLES
Functions of nozzles
The nozzle is a critical part of any sprayer. Nozzles perform three functions:
– regulate flow,
– atomize the mixture into droplets,
– disperse the spray in a desirable pattern.
Nozzles are generally best suited for certain purposes and less desirable for others. In general, herbicides are most effective when applied as droplets of approximately 250 µm; fungicides are most effective at 100 to 250 µm, and insecticides at about 100 µm. Figure 2 compares various nozzles, their droplet sizes and their effectiveness for broadcast spraying. Nozzles determine the rate of pesticide distribution at a particular pressure, forward speed, and nozzle spacing. Drift can be minimized by selecting nozzles that produce the largest droplet size while providing adequate coverage a t the intended application rate and pressure.
Fig 2. – Nozzles for broadcasting spraying
Flow rate
Nozzle flow rate is a function of the orifice size and pressure. Manufacturers’ catalogues list nozzle flow rates at various pressures and discharge rates per acre at various ground speeds. In general, as pressure goes up flow rate increases, but not in a one-to-one ratio. To double the
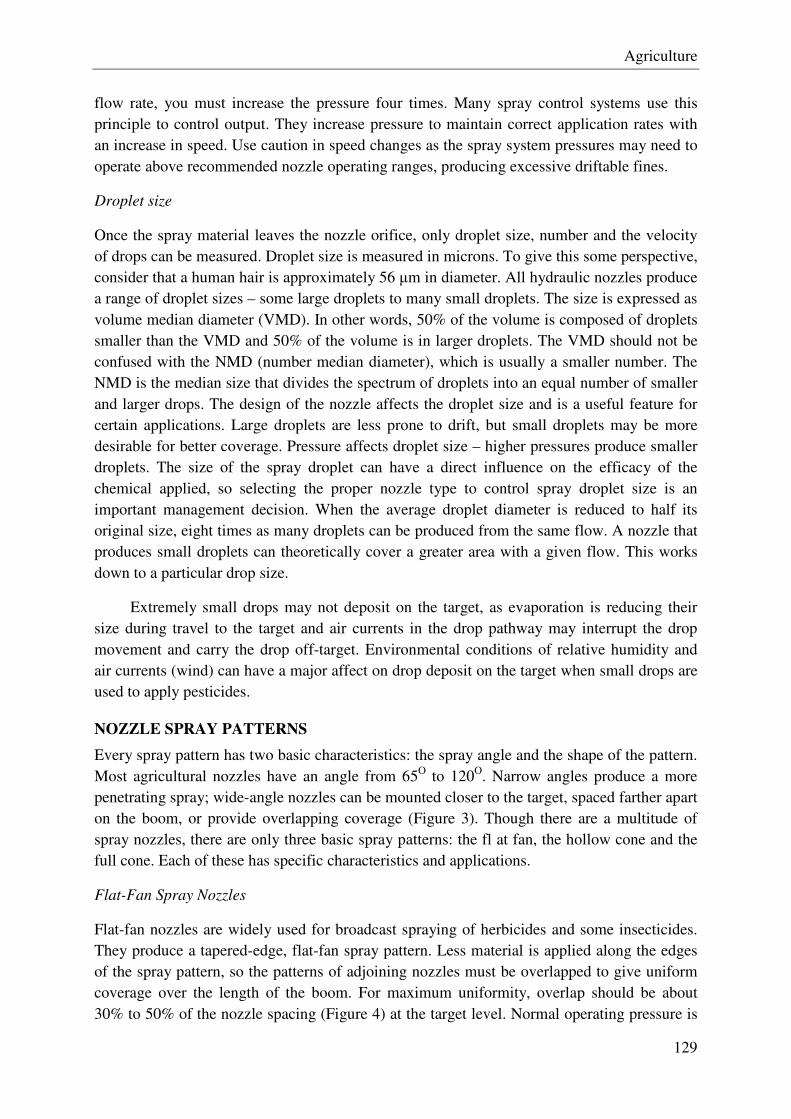
Agriculture
129
flow rate, you must increase the pressure four times. Many spray control systems use this principle to control output. They increase pressure to maintain correct application rates with an increase in speed. Use caution in speed changes as the spray system pressures may need to operate above recommended nozzle operating ranges, producing excessive driftable fines.
Droplet size
Once the spray material leaves the nozzle orifice, only droplet size, number and the velocity of drops can be measured. Droplet size is measured in microns. To give this some perspective, consider that a human hair is approximately 56 µm in diameter. All hydraulic nozzles produce a range of droplet sizes – some large droplets to many small droplets. The size is expressed as volume median diameter (VMD). In other words, 50% of the volume is composed of droplets smaller than the VMD and 50% of the volume is in larger droplets. The VMD should not be confused with the NMD (number median diameter), which is usually a smaller number. The NMD is the median size that divides the spectrum of droplets into an equal number of smaller and larger drops. The design of the nozzle affects the droplet size and is a useful feature for certain applications. Large droplets are less prone to drift, but small droplets may be more desirable for better coverage. Pressure affects droplet size – higher pressures produce smaller droplets. The size of the spray droplet can have a direct influence on the efficacy of the chemical applied, so selecting the proper nozzle type to control spray droplet size is an important management decision. When the average droplet diameter is reduced to half its original size, eight times as many droplets can be produced from the same flow. A nozzle that produces small droplets can theoretically cover a greater area with a given flow. This works down to a particular drop size.
Extremely small drops may not deposit on the target, as evaporation is reducing their size during travel to the target and air currents in the drop pathway may interrupt the drop movement and carry the drop off-target. Environmental conditions of relative humidity and air currents (wind) can have a major affect on drop deposit on the target when small drops are used to apply pesticides.
NOZZLE SPRAY PATTERNS
Every spray pattern has two basic characteristics: the spray angle and the shape of the pattern. Most agricultural nozzles have an angle from 65O to 120O. Narrow angles produce a more penetrating spray; wide-angle nozzles can be mounted closer to the target, spaced farther apart on the boom, or provide overlapping coverage (Figure 3). Though there are a multitude of spray nozzles, there are only three basic spray patterns: the fl at fan, the hollow cone and the full cone. Each of these has specific characteristics and applications.
Flat-Fan Spray Nozzles
Flat-fan nozzles are widely used for broadcast spraying of herbicides and some insecticides. They produce a tapered-edge, flat-fan spray pattern. Less material is applied along the edges of the spray pattern, so the patterns of adjoining nozzles must be overlapped to give uniform coverage over the length of the boom. For maximum uniformity, overlap should be about 30% to 50% of the nozzle spacing (Figure 4) at the target level. Normal operating pressure is
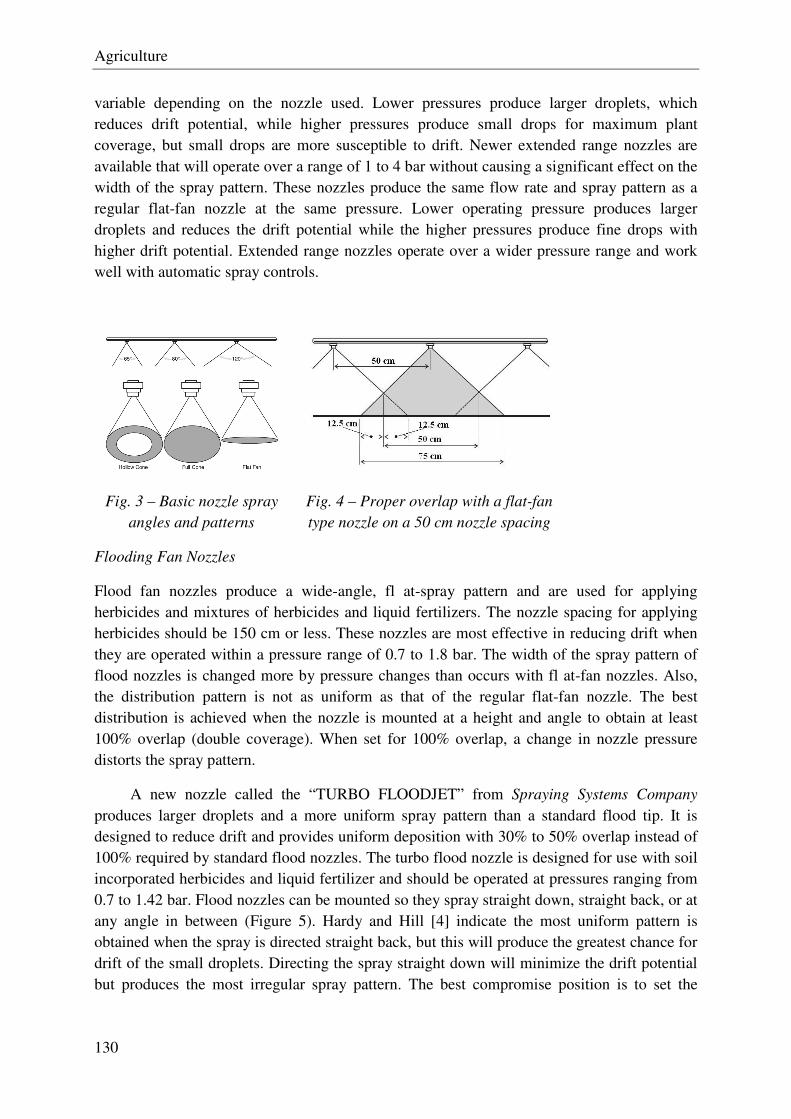
Agriculture
130
variable depending on the nozzle used. Lower pressures produce larger droplets, which reduces drift potential, while higher pressures produce small drops for maximum plant coverage, but small drops are more susceptible to drift. Newer extended range nozzles are available that will operate over a range of 1 to 4 bar without causing a significant effect on the width of the spray pattern. These nozzles produce the same flow rate and spray pattern as a regular flat-fan nozzle at the same pressure. Lower operating pressure produces larger droplets and reduces the drift potential while the higher pressures produce fine drops with higher drift potential. Extended range nozzles operate over a wider pressure range and work well with automatic spray controls.
Fig. 3 – Basic nozzle spray
angles and patterns
Fig. 4 – Proper overlap with a flat-fan
type nozzle on a 50 cm nozzle spacing
Flooding Fan Nozzles
Flood fan nozzles produce a wide-angle, fl at-spray pattern and are used for applying herbicides and mixtures of herbicides and liquid fertilizers. The nozzle spacing for applying herbicides should be 150 cm or less. These nozzles are most effective in reducing drift when they are operated within a pressure range of 0.7 to 1.8 bar. The width of the spray pattern of flood nozzles is changed more by pressure changes than occurs with fl at-fan nozzles. Also, the distribution pattern is not as uniform as that of the regular flat-fan nozzle. The best distribution is achieved when the nozzle is mounted at a height and angle to obtain at least 100% overlap (double coverage). When set for 100% overlap, a change in nozzle pressure distorts the spray pattern.
A new nozzle called the “TURBO FLOODJET” from Spraying Systems Company produces larger droplets and a more uniform spray pattern than a standard flood tip. It is designed to reduce drift and provides uniform deposition with 30% to 50% overlap instead of 100% required by standard flood nozzles. The turbo flood nozzle is designed for use with soil incorporated herbicides and liquid fertilizer and should be operated at pressures ranging from 0.7 to 1.42 bar. Flood nozzles can be mounted so they spray straight down, straight back, or at any angle in between (Figure 5). Hardy and Hill [4] indicate the most uniform pattern is obtained when the spray is directed straight back, but this will produce the greatest chance for drift of the small droplets. Directing the spray straight down will minimize the drift potential but produces the most irregular spray pattern. The best compromise position is to set the
Agriculture
131
nozzle at a 45o angle with the sprayed surface. Care should be taken so incorporation equipment does not intercept or interfere with the spray discharge pattern.
Fig. 5 – Various positions for mounting flood nozzles
Hollow Cone Nozzles
Hollow cone nozzles are generally used to apply insecticides or fungicides to field crops where complete coverage of the leaf surface is important. The hollow cone pattern is used for applications where a fine spray pattern is needed for thorough coverage. These nozzles usually operate in the pressure range of 2.76 to 6.9 bar
or more depending on the nozzle being used and the pesticide applied. Spray drift is higher with hollow cone nozzles than with other nozzles as small droplets are produced. A hollow cone nozzle produces a spray pattern with more of the liquid concentrated at the outer edge of the pattern (Figure 15) and less in the center. Any nozzle producing a cone pattern, including the whirl-chamber type, will not provide uniform distribution for broadcast applications when directed straight down at the sprayed surface. They must be angled 30 to 45 degrees from the vertical. Hollow cone nozzles used on high pressure sprayers for applying fungicides can be aimed straight down when they are spaced 25 to 30 cm apart. This produces extremely fine drops which move enough to compensate for the non-uniformity of the pattern.
“RAINDROP” nozzles from Delavan have been designed to produce large drops in a hollow cone pattern at pressures of 1.4 to 4.0 bar. They are designed to reduce spray drift and are recommended for broadcast applications when tilted 45 degrees or more from the vertical.
Full Cone Nozzles
The full cone nozzle produces a swirl and a counter swirl inside the nozzle that results in a full cone pattern. Full cone nozzles produce large, evenly distributed drops and high flow rates. A wide full cone tip maintains its spray pattern over a range of pressures and flow rates. It is a low-drift nozzle and is often used to apply soil incorporated herbicides.
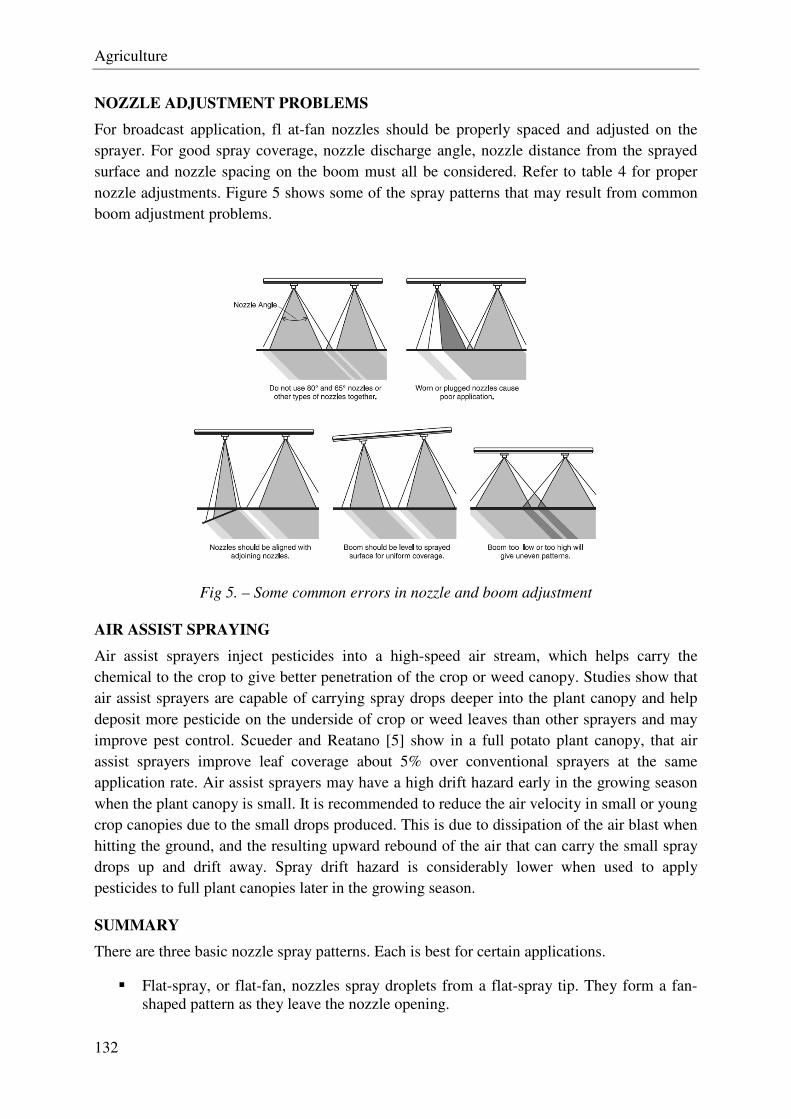
Agriculture
132
NOZZLE ADJUSTMENT PROBLEMS
For broadcast application, fl at-fan nozzles should be properly spaced and adjusted on the sprayer. For good spray coverage, nozzle discharge angle, nozzle distance from the sprayed surface and nozzle spacing on the boom must all be considered. Refer to table 4 for proper nozzle adjustments. Figure 5 shows some of the spray patterns that may result from common boom adjustment problems.
Fig 5. – Some common errors in nozzle and boom adjustment
AIR ASSIST SPRAYING
Air assist sprayers inject pesticides into a high-speed air stream, which helps carry the chemical to the crop to give better penetration of the crop or weed canopy. Studies show that air assist sprayers are capable of carrying spray drops deeper into the plant canopy and help deposit more pesticide on the underside of crop or weed leaves than other sprayers and may improve pest control. Scueder and Reatano [5] show in a full potato plant canopy, that air assist sprayers improve leaf coverage about 5% over conventional sprayers at the same application rate. Air assist sprayers may have a high drift hazard early in the growing season when the plant canopy is small. It is recommended to reduce the air velocity in small or young crop canopies due to the small drops produced. This is due to dissipation of the air blast when hitting the ground, and the resulting upward rebound of the air that can carry the small spray drops up and drift away. Spray drift hazard is considerably lower when used to apply pesticides to full plant canopies later in the growing season.
SUMMARY
There are three basic nozzle spray patterns. Each is best for certain applications.
Flat-spray, or flat-fan, nozzles spray droplets from a flat-spray tip. They form a fan-shaped pattern as they leave the nozzle opening.
Agriculture
133
— A flat-spray nozzle is the only kind that puts out herbicide accurately and uniformly.
— The edges of the pattern have a lower spray volume. So, patterns of adjacent nozzles must overlap to obtain uniform coverage.
— Wider-angle nozzles produce smaller droplets. — Narrow-angle spray tips produce a more penetrating spray. They are also less
likely to become clogged. Hollow-cone nozzles produce a spray pattern with the liquid on the outside of a cone.
— These are best when penetration and coverage are critical. — The typical spray distribution is saddle-shaped. There is less liquid in the
center of the distribution, tapering off rapidly at the edges. — It is not well suited for broadcast applications; proper overlap is difficult. — Generally produces the smallest droplets. — Spray drift can be high because of the many small droplets produced at the
normal operating pressure of 2.7 bar and above. Wide-angle full-cone nozzles produce large droplets distributed throughout a full
cone. — These are good for soil-applied and systemic herbicides. — Maximum drift control at pressures of 1.0 to 1.4 bar is achieved. — The uniform spray pattern is maintained over a pressure range of 0.7 to
2.8bar. — Droplets are larger than with other tip styles of equal capacity at similar
pressures.
REFERENCES
[1] Zhu, H. – D.L. Reichard – R.D. Fox – R.D. Brazee – H.E. Ozkan. (1994): Simulation of drift of discrete sizes of water droplets from field sprayers. Transactions of the ASAE, Vol.37, No.5, 1401-1407 p.
[2] Derksen, R.C. – H.E. Ozkan, R.D. – Fox and R.D. – Brazee (1997): Effectiveness of TurboDrop and Turbo TeeJet nozzles in drift reduction. ASAE Paper No. 971070, ASAE, 2950 Niles Road, St. Joseph, MI 49085.
[3] Sztachó-Pekáry I. (2006): Influence of Fan Nozzle Tip Orifice Wear on Spray Pattern Characteristics. Progress in Agricultural Engineering Sciences, (Budapest) Vol. 2. No. 1. 35-49 p.
[4] Hardy, S. – J Hill (2006): Calibrating boom sprayers. Spray Sense, No. 13, 2 p. [5] Scudeler, F. – C. G. Raetano (2006): Spray deposit and losses in potato as a function o
fair-assistance and spray boom angle. Scentia Agricola, (Piracicaba, Braz.), Vol.63, No.6, 515-521 p.
Author data
Prof. Dr. Istvan Sztachó-Pekáry, H-6000 Kecskemet College, Faculty of Horticulture, Kecskemét, Erdei F. tér 1-3., [email protected]
Agriculture
134
Technologycal advancements of chemical application in plant protection
István SZTACHÓ-PEKÁRY1 Kecskeméti Főiskola, Kertészeti Főiskolai Kar, MÖVI
Abstract: Significant changes in the techniques and practice of agricultural chemical application have occurred during the past 100 years, especially since the 1960s. New technology has continually entered the market during the past 50 years and has increased application efficiency while protecting the environment. Technological advances include direct injection, handling and control systems, air-assisted sprayers, electrostatic spraying, and nozzle development. This technology has allowed precise application of a wide array pesticides with minimal impact on the environment.
Összefoglalás: A vegyszeres növényvédelem technológiai fejlődésének lépései Az utóbbi száz évben jelentős változások voltak megfigyelhetők a kémiai növényvédőszerek alkalmazásának gyakorlatában és az alkalmazás-technikában. Különösen szembetűnő az 1960-as években kezdődött hatalmas fejlődés. Ebben az időszakban az új technológiai megoldások folyamatosan törtek be a piacra, ennek eredményeképp egyaránt nőtt az alkalmazás hatékonysága és jutott érvényre a környezet védelme. A technológia fejlődésének lépcsői: a permetezőszer közvetlen-befecskendezése, kezelő- és vezérlő-rendszerek alkalmazása, légszállításos szórószerkezetek kifejlesztése, a növényvédőszer elektrosztatikus feltöltése kijuttatás közben és a szórófejek konstrukciós fejlesztése. Ezen technológiai fejlesztések tették lehetővé a növényvédőszerek széles körének precíziós alkalmazását és a környezet minimális terhelését.
Keywords: alkalmazás-technológia, szórófejek, növényvédőszerek, permetezőgépek
1 Introduction
In the conventional pesticide market, agriculture accounts for over two-thirds of pesticide user expenditures and about three-quarters of the annual volume; the remainder of the market comprises industry, government, and home and garden uses. Herbicides are the leading type of conventional pesticide, accounting for more than 50% of both domestic sales and volume used.
Proper application of agricultural chemicals is a key factor in their ecologically and economically sound use for the production of food and fiber. Significant changes in techniques and practices of applying agricultural chemicals have occurred during the past 100 years, especially since the 1960s (Fig. 1). The purpose of this article is to document some of the major developments, discuss state-of-the-art technology, and look at future needs for new and improved ground application technology.
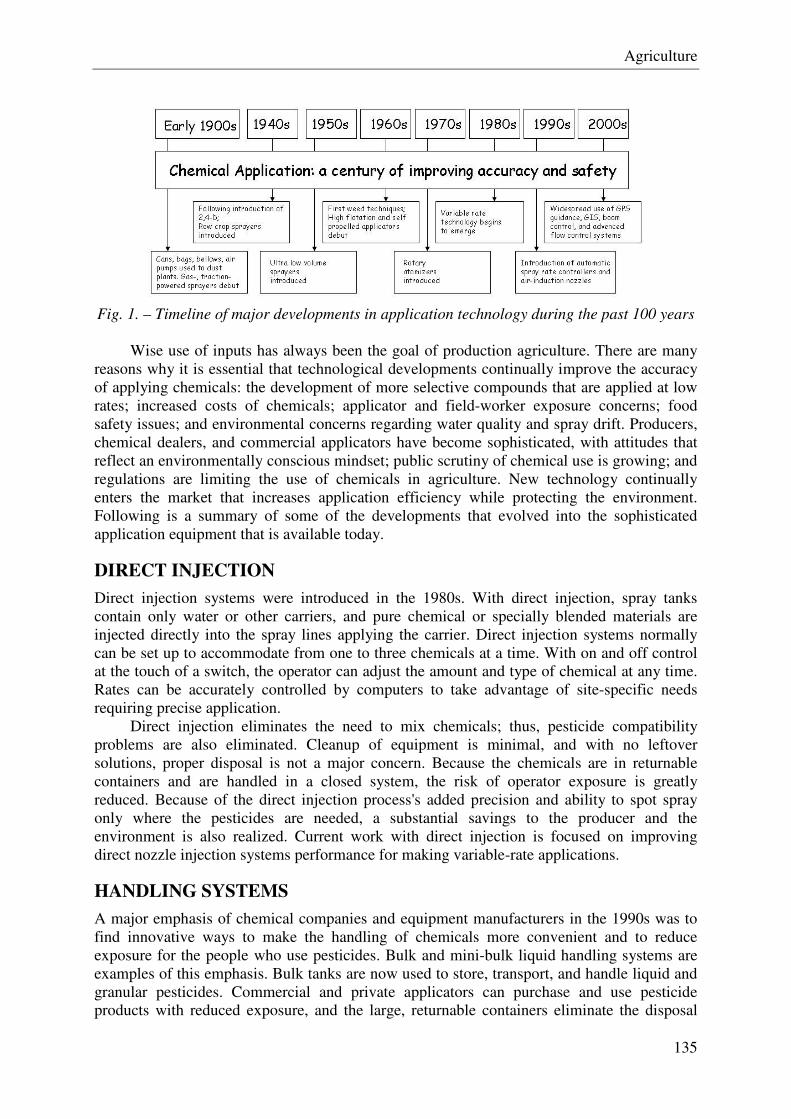
Agriculture
135
Fig. 1. – Timeline of major developments in application technology during the past 100 years
Wise use of inputs has always been the goal of production agriculture. There are many reasons why it is essential that technological developments continually improve the accuracy of applying chemicals: the development of more selective compounds that are applied at low rates; increased costs of chemicals; applicator and field-worker exposure concerns; food safety issues; and environmental concerns regarding water quality and spray drift. Producers, chemical dealers, and commercial applicators have become sophisticated, with attitudes that reflect an environmentally conscious mindset; public scrutiny of chemical use is growing; and regulations are limiting the use of chemicals in agriculture. New technology continually enters the market that increases application efficiency while protecting the environment. Following is a summary of some of the developments that evolved into the sophisticated application equipment that is available today.
DIRECT INJECTION
Direct injection systems were introduced in the 1980s. With direct injection, spray tanks contain only water or other carriers, and pure chemical or specially blended materials are injected directly into the spray lines applying the carrier. Direct injection systems normally can be set up to accommodate from one to three chemicals at a time. With on and off control at the touch of a switch, the operator can adjust the amount and type of chemical at any time. Rates can be accurately controlled by computers to take advantage of site-specific needs requiring precise application.
Direct injection eliminates the need to mix chemicals; thus, pesticide compatibility problems are also eliminated. Cleanup of equipment is minimal, and with no leftover solutions, proper disposal is not a major concern. Because the chemicals are in returnable containers and are handled in a closed system, the risk of operator exposure is greatly reduced. Because of the direct injection process's added precision and ability to spot spray only where the pesticides are needed, a substantial savings to the producer and the environment is also realized. Current work with direct injection is focused on improving direct nozzle injection systems performance for making variable-rate applications.
HANDLING SYSTEMS
A major emphasis of chemical companies and equipment manufacturers in the 1990s was to find innovative ways to make the handling of chemicals more convenient and to reduce exposure for the people who use pesticides. Bulk and mini-bulk liquid handling systems are examples of this emphasis. Bulk tanks are now used to store, transport, and handle liquid and granular pesticides. Commercial and private applicators can purchase and use pesticide products with reduced exposure, and the large, returnable containers eliminate the disposal

Agriculture
136
problems associated with smaller, non-returnable containers. Mini-bulk systems allow users the same safe handling opportunities with pesticides. The closed systems associated with bulk tanks reduce operator contact and potential spillage, and with the returnable 1000 to 1500 liter tanks, container disposal is eliminated.
ELECTROSTATIC SPRAYING
Electrostatic forces have been investigated for use in pesticide application for several decades. Electrostatic sprayers have been tested extensively, but the results have been inconsistent. Transport of droplets to the plants is influenced by the size and velocity of droplets, dynamics of the sprayer, weather conditions, and physical properties of the plant. The electrical phenomena governing the deposition of charged droplets are the electrical field gradient between the atomizer and the plant, space charge, and image charge effects. Charged sprays are effective for high-value vegetable crops but have not found general use in high-acreage field crops.
AIR-ASSISTED SPRAYERS
A technique introduced from Europe to increase spray penetration and coverage on plants while reducing spray drift is the use of air to help transport the spray to the target. Air-assisted sprayers are built like regular sprayers with hydraulic nozzles except that a sleeve with openings is mounted on the boom. High-velocity air is emitted from the openings and is accompanied by liquid spray from standard hydraulic nozzles. With the increased use of fungicides on field crops, air-assisted sprayers have the potential to increase pesticide deposition in the lower portion of the plant canopy. One type of air-assisted sprayer uses high-velocity air to carry out atomization in place of standard hydraulic nozzles.
CONTROL SYSTEMS
The driving force behind many of the previously mentioned application technologies was the development of sensors and the advancement of controllers. Spray controllers have been integrated into spray monitors that were widely used for many years. Spray controllers monitor the application process and compensate for any changes in application parameters. Controllers are designed to automatically compensate for changes in speed and application rates on the go. Computers and controllers work together to place fertilizer and pesticide inputs in the precise position at the prescribed amount.
Global Positioning Systems (GPS) also add to application accuracy. GPS technology is available for guidance systems, where devices such as a light bar are used to show the applicator the correct course, or used to directly control the sprayer path through the use of assisted steering systems. A geographic information system (GIS) can provide field information such as applied maps, field prescription maps, detailed application reports, and more. On-board sprayer weather stations monitor wind speed, wind direction, temperature, and humidity, and allow the applicator to monitor the weather conditions on site throughout the application, and save the weather data as part of the GIS data. Automatic boom controllers use GPS and GIS to automatically control boom sections or even turn individual nozzles off as they pass over previously applied areas or non-cropped areas such as waterways. Boom height controllers maintain the boom at a preset height above the ground or plant canopy using ultrasonic sensors to further increase application uniformity.
Pulse-width modulation of the nozzle flow rate by altering the duty cycle during a pulse allows electronic control of individual nozzles. Standard spray controllers use pressure to vary the nozzle flow rate in response to speed changes, which can alter droplet size. By using pulse-width modulation, an applicator has independent control of nozzle flow rate and
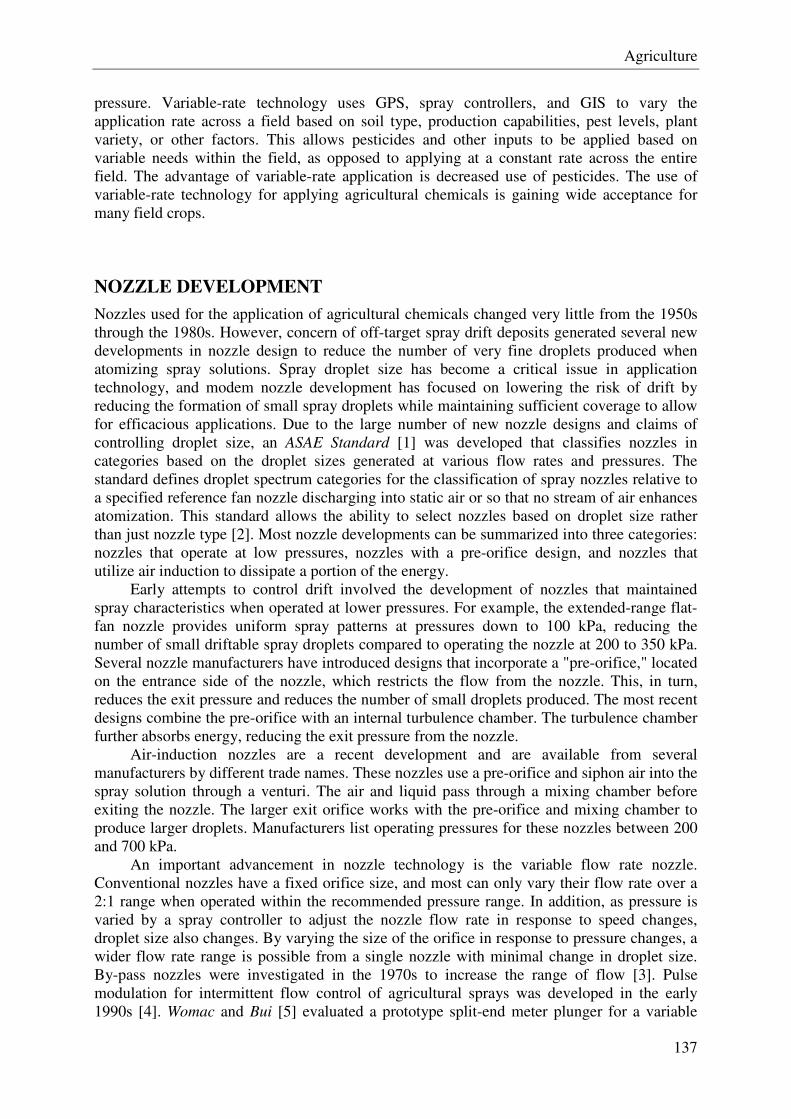
Agriculture
137
pressure. Variable-rate technology uses GPS, spray controllers, and GIS to vary the application rate across a field based on soil type, production capabilities, pest levels, plant variety, or other factors. This allows pesticides and other inputs to be applied based on variable needs within the field, as opposed to applying at a constant rate across the entire field. The advantage of variable-rate application is decreased use of pesticides. The use of variable-rate technology for applying agricultural chemicals is gaining wide acceptance for many field crops.
NOZZLE DEVELOPMENT
Nozzles used for the application of agricultural chemicals changed very little from the 1950s through the 1980s. However, concern of off-target spray drift deposits generated several new developments in nozzle design to reduce the number of very fine droplets produced when atomizing spray solutions. Spray droplet size has become a critical issue in application technology, and modem nozzle development has focused on lowering the risk of drift by reducing the formation of small spray droplets while maintaining sufficient coverage to allow for efficacious applications. Due to the large number of new nozzle designs and claims of controlling droplet size, an ASAE Standard [1] was developed that classifies nozzles in categories based on the droplet sizes generated at various flow rates and pressures. The standard defines droplet spectrum categories for the classification of spray nozzles relative to a specified reference fan nozzle discharging into static air or so that no stream of air enhances atomization. This standard allows the ability to select nozzles based on droplet size rather than just nozzle type [2]. Most nozzle developments can be summarized into three categories: nozzles that operate at low pressures, nozzles with a pre-orifice design, and nozzles that utilize air induction to dissipate a portion of the energy.
Early attempts to control drift involved the development of nozzles that maintained spray characteristics when operated at lower pressures. For example, the extended-range flat-fan nozzle provides uniform spray patterns at pressures down to 100 kPa, reducing the number of small driftable spray droplets compared to operating the nozzle at 200 to 350 kPa. Several nozzle manufacturers have introduced designs that incorporate a "pre-orifice," located on the entrance side of the nozzle, which restricts the flow from the nozzle. This, in turn, reduces the exit pressure and reduces the number of small droplets produced. The most recent designs combine the pre-orifice with an internal turbulence chamber. The turbulence chamber further absorbs energy, reducing the exit pressure from the nozzle.
Air-induction nozzles are a recent development and are available from several manufacturers by different trade names. These nozzles use a pre-orifice and siphon air into the spray solution through a venturi. The air and liquid pass through a mixing chamber before exiting the nozzle. The larger exit orifice works with the pre-orifice and mixing chamber to produce larger droplets. Manufacturers list operating pressures for these nozzles between 200 and 700 kPa.
An important advancement in nozzle technology is the variable flow rate nozzle. Conventional nozzles have a fixed orifice size, and most can only vary their flow rate over a 2:1 range when operated within the recommended pressure range. In addition, as pressure is varied by a spray controller to adjust the nozzle flow rate in response to speed changes, droplet size also changes. By varying the size of the orifice in response to pressure changes, a wider flow rate range is possible from a single nozzle with minimal change in droplet size. By-pass nozzles were investigated in the 1970s to increase the range of flow [3]. Pulse modulation for intermittent flow control of agricultural sprays was developed in the early 1990s [4]. Womac and Bui [5] evaluated a prototype split-end meter plunger for a variable
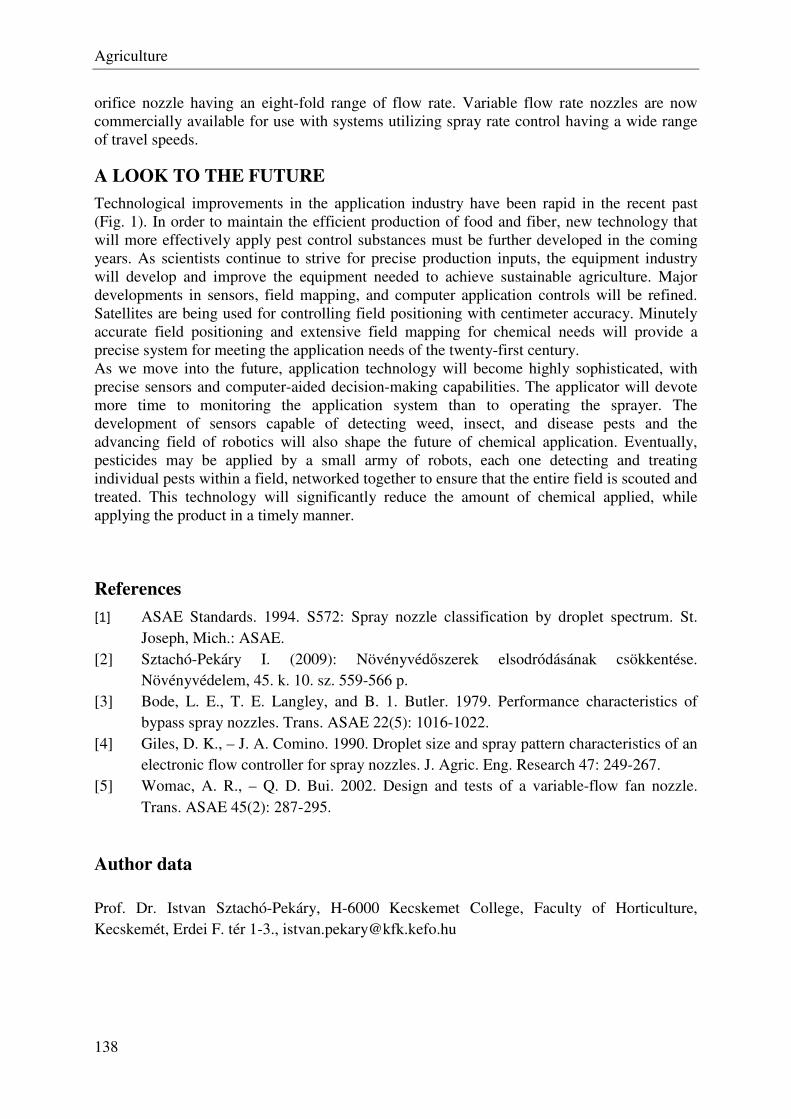
Agriculture
138
orifice nozzle having an eight-fold range of flow rate. Variable flow rate nozzles are now commercially available for use with systems utilizing spray rate control having a wide range of travel speeds.
A LOOK TO THE FUTURE
Technological improvements in the application industry have been rapid in the recent past (Fig. 1). In order to maintain the efficient production of food and fiber, new technology that will more effectively apply pest control substances must be further developed in the coming years. As scientists continue to strive for precise production inputs, the equipment industry will develop and improve the equipment needed to achieve sustainable agriculture. Major developments in sensors, field mapping, and computer application controls will be refined. Satellites are being used for controlling field positioning with centimeter accuracy. Minutely accurate field positioning and extensive field mapping for chemical needs will provide a precise system for meeting the application needs of the twenty-first century. As we move into the future, application technology will become highly sophisticated, with precise sensors and computer-aided decision-making capabilities. The applicator will devote more time to monitoring the application system than to operating the sprayer. The development of sensors capable of detecting weed, insect, and disease pests and the advancing field of robotics will also shape the future of chemical application. Eventually, pesticides may be applied by a small army of robots, each one detecting and treating individual pests within a field, networked together to ensure that the entire field is scouted and treated. This technology will significantly reduce the amount of chemical applied, while applying the product in a timely manner.
References
[1] ASAE Standards. 1994. S572: Spray nozzle classification by droplet spectrum. St. Joseph, Mich.: ASAE.
[2] Sztachó-Pekáry I. (2009): Növényvédőszerek elsodródásának csökkentése. Növényvédelem, 45. k. 10. sz. 559-566 p.
[3] Bode, L. E., T. E. Langley, and B. 1. Butler. 1979. Performance characteristics of bypass spray nozzles. Trans. ASAE 22(5): 1016-1022.
[4] Giles, D. K., – J. A. Comino. 1990. Droplet size and spray pattern characteristics of an electronic flow controller for spray nozzles. J. Agric. Eng. Research 47: 249-267.
[5] Womac, A. R., – Q. D. Bui. 2002. Design and tests of a variable-flow fan nozzle. Trans. ASAE 45(2): 287-295.
Author data Prof. Dr. Istvan Sztachó-Pekáry, H-6000 Kecskemet College, Faculty of Horticulture, Kecskemét, Erdei F. tér 1-3., [email protected]

139
Educational science
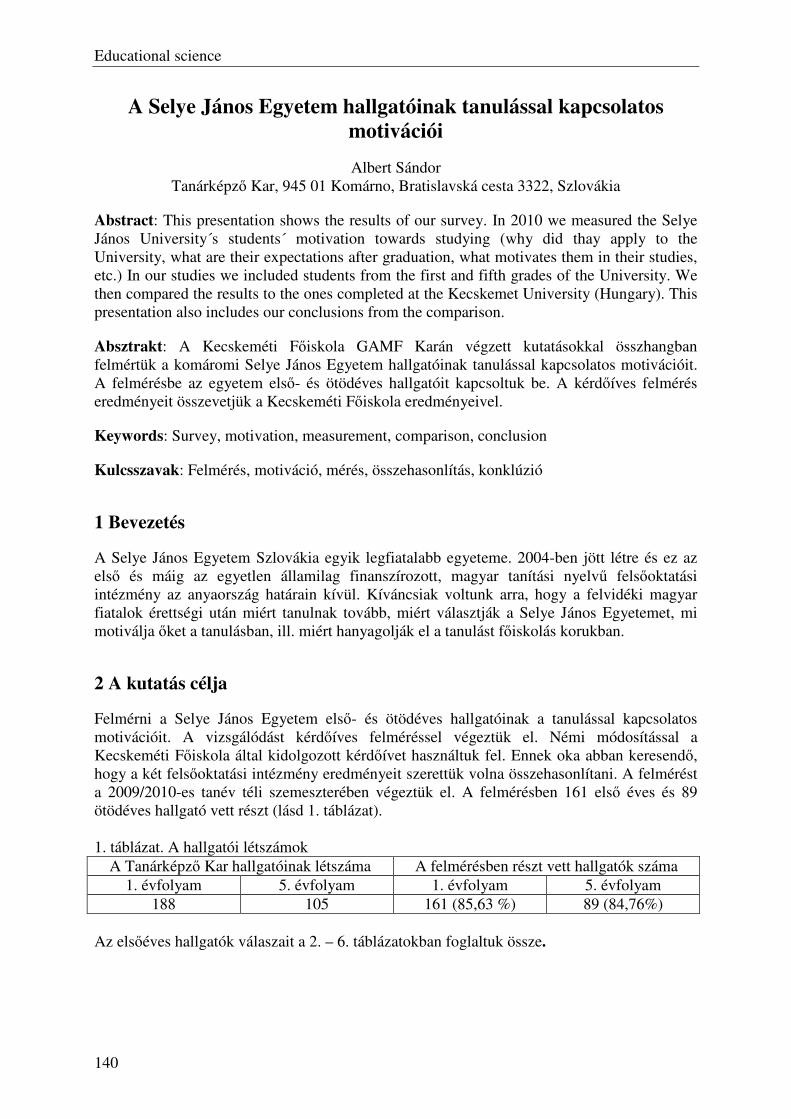
Educational science
140
A Selye János Egyetem hallgatóinak tanulással kapcsolatos
motivációi
Albert Sándor Tanárképző Kar, 945 01 Komárno, Bratislavská cesta 3322, Szlovákia
Abstract: This presentation shows the results of our survey. In 2010 we measured the Selye János University´s students´ motivation towards studying (why did thay apply to the University, what are their expectations after graduation, what motivates them in their studies, etc.) In our studies we included students from the first and fifth grades of the University. We then compared the results to the ones completed at the Kecskemet University (Hungary). This presentation also includes our conclusions from the comparison.
Absztrakt: A Kecskeméti Főiskola GAMF Karán végzett kutatásokkal összhangban felmértük a komáromi Selye János Egyetem hallgatóinak tanulással kapcsolatos motivációit. A felmérésbe az egyetem első- és ötödéves hallgatóit kapcsoltuk be. A kérdőíves felmérés eredményeit összevetjük a Kecskeméti Főiskola eredményeivel.
Keywords: Survey, motivation, measurement, comparison, conclusion
Kulcsszavak: Felmérés, motiváció, mérés, összehasonlítás, konklúzió
1 Bevezetés
A Selye János Egyetem Szlovákia egyik legfiatalabb egyeteme. 2004-ben jött létre és ez az első és máig az egyetlen államilag finanszírozott, magyar tanítási nyelvű felsőoktatási intézmény az anyaország határain kívül. Kíváncsiak voltunk arra, hogy a felvidéki magyar fiatalok érettségi után miért tanulnak tovább, miért választják a Selye János Egyetemet, mi motiválja őket a tanulásban, ill. miért hanyagolják el a tanulást főiskolás korukban.
2 A kutatás célja
Felmérni a Selye János Egyetem első- és ötödéves hallgatóinak a tanulással kapcsolatos motivációit. A vizsgálódást kérdőíves felméréssel végeztük el. Némi módosítással a Kecskeméti Főiskola által kidolgozott kérdőívet használtuk fel. Ennek oka abban keresendő, hogy a két felsőoktatási intézmény eredményeit szerettük volna összehasonlítani. A felmérést a 2009/2010-es tanév téli szemeszterében végeztük el. A felmérésben 161 első éves és 89 ötödéves hallgató vett részt (lásd 1. táblázat). 1. táblázat. A hallgatói létszámok
A Tanárképző Kar hallgatóinak létszáma A felmérésben részt vett hallgatók száma 1. évfolyam 5. évfolyam 1. évfolyam 5. évfolyam
188 105 161 (85,63 %) 89 (84,76%) Az elsőéves hallgatók válaszait a 2. – 6. táblázatokban foglaltuk össze.
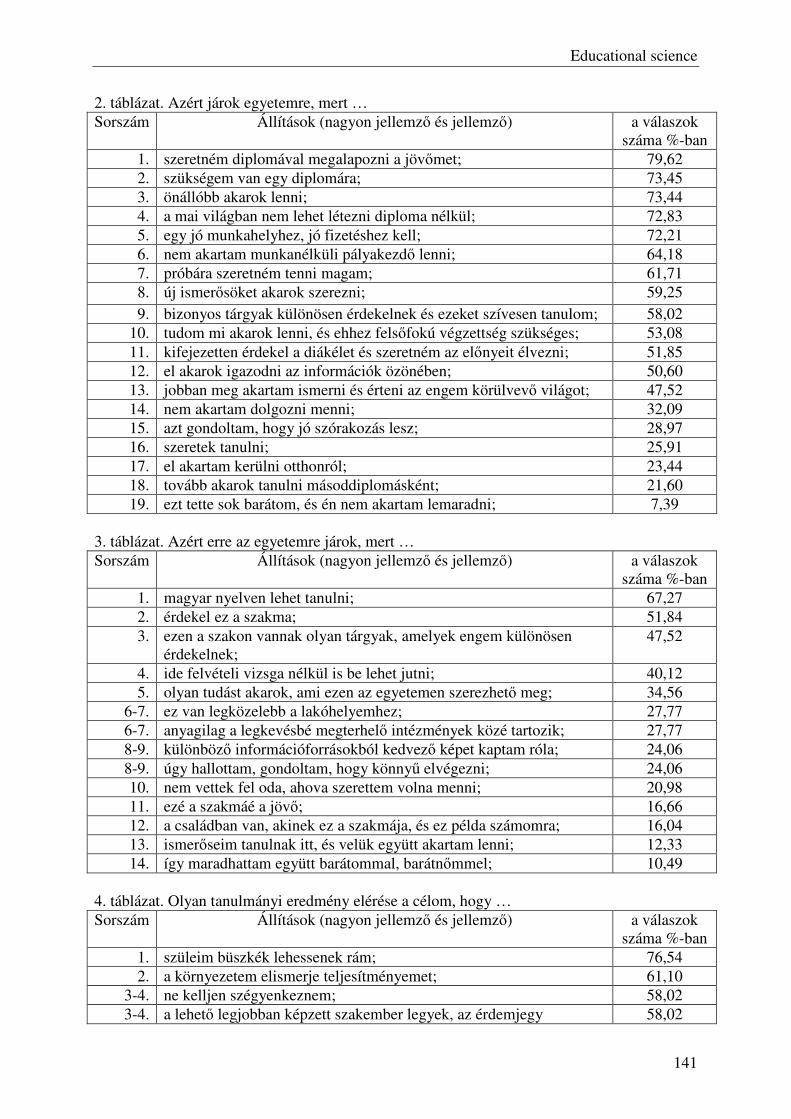
Educational science
141
2. táblázat. Azért járok egyetemre, mert … Sorszám Állítások (nagyon jellemző és jellemző) a válaszok
száma %-ban 1. szeretném diplomával megalapozni a jövőmet; 79,62 2. szükségem van egy diplomára; 73,45 3. önállóbb akarok lenni; 73,44 4. a mai világban nem lehet létezni diploma nélkül; 72,83 5. egy jó munkahelyhez, jó fizetéshez kell; 72,21 6. nem akartam munkanélküli pályakezdő lenni; 64,18 7. próbára szeretném tenni magam; 61,71 8. új ismerősöket akarok szerezni; 59,25 9. bizonyos tárgyak különösen érdekelnek és ezeket szívesen tanulom; 58,02
10. tudom mi akarok lenni, és ehhez felsőfokú végzettség szükséges; 53,08 11. kifejezetten érdekel a diákélet és szeretném az előnyeit élvezni; 51,85 12. el akarok igazodni az információk özönében; 50,60 13. jobban meg akartam ismerni és érteni az engem körülvevő világot; 47,52 14. nem akartam dolgozni menni; 32,09 15. azt gondoltam, hogy jó szórakozás lesz; 28,97 16. szeretek tanulni; 25,91 17. el akartam kerülni otthonról; 23,44 18. tovább akarok tanulni másoddiplomásként; 21,60 19. ezt tette sok barátom, és én nem akartam lemaradni; 7,39
3. táblázat. Azért erre az egyetemre járok, mert … Sorszám Állítások (nagyon jellemző és jellemző) a válaszok
száma %-ban 1. magyar nyelven lehet tanulni; 67,27 2. érdekel ez a szakma; 51,84 3. ezen a szakon vannak olyan tárgyak, amelyek engem különösen
érdekelnek; 47,52
4. ide felvételi vizsga nélkül is be lehet jutni; 40,12 5. olyan tudást akarok, ami ezen az egyetemen szerezhető meg; 34,56
6-7. ez van legközelebb a lakóhelyemhez; 27,77 6-7. anyagilag a legkevésbé megterhelő intézmények közé tartozik; 27,77 8-9. különböző információforrásokból kedvező képet kaptam róla; 24,06 8-9. úgy hallottam, gondoltam, hogy könnyű elvégezni; 24,06 10. nem vettek fel oda, ahova szerettem volna menni; 20,98 11. ezé a szakmáé a jövő; 16,66 12. a családban van, akinek ez a szakmája, és ez példa számomra; 16,04 13. ismerőseim tanulnak itt, és velük együtt akartam lenni; 12,33 14. így maradhattam együtt barátommal, barátnőmmel; 10,49
4. táblázat. Olyan tanulmányi eredmény elérése a célom, hogy … Sorszám Állítások (nagyon jellemző és jellemző) a válaszok
száma %-ban 1. szüleim büszkék lehessenek rám; 76,54 2. a környezetem elismerje teljesítményemet; 61,10
3-4. ne kelljen szégyenkeznem; 58,02 3-4. a lehető legjobban képzett szakember legyek, az érdemjegy 58,02
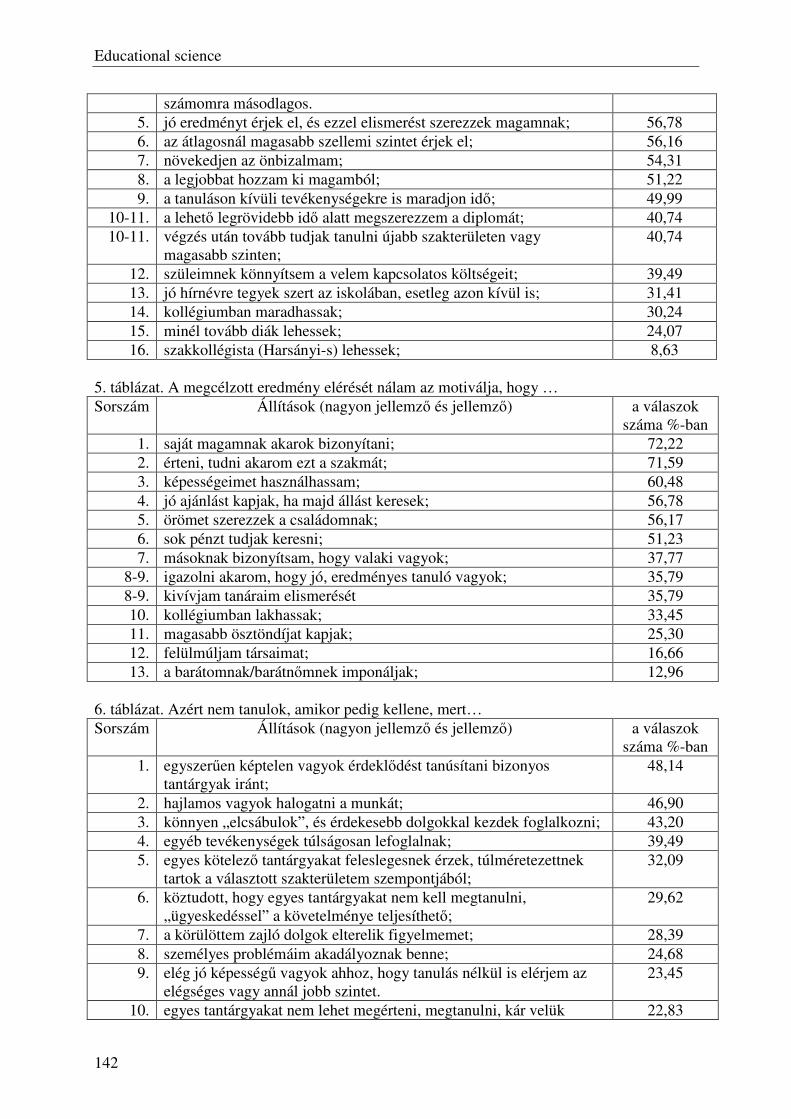
Educational science
142
számomra másodlagos. 5. jó eredményt érjek el, és ezzel elismerést szerezzek magamnak; 56,78 6. az átlagosnál magasabb szellemi szintet érjek el; 56,16 7. növekedjen az önbizalmam; 54,31 8. a legjobbat hozzam ki magamból; 51,22 9. a tanuláson kívüli tevékenységekre is maradjon idő; 49,99
10-11. a lehető legrövidebb idő alatt megszerezzem a diplomát; 40,74 10-11. végzés után tovább tudjak tanulni újabb szakterületen vagy
magasabb szinten; 40,74
12. szüleimnek könnyítsem a velem kapcsolatos költségeit; 39,49 13. jó hírnévre tegyek szert az iskolában, esetleg azon kívül is; 31,41 14. kollégiumban maradhassak; 30,24 15. minél tovább diák lehessek; 24,07 16. szakkollégista (Harsányi-s) lehessek; 8,63
5. táblázat. A megcélzott eredmény elérését nálam az motiválja, hogy … Sorszám Állítások (nagyon jellemző és jellemző) a válaszok
száma %-ban 1. saját magamnak akarok bizonyítani; 72,22 2. érteni, tudni akarom ezt a szakmát; 71,59 3. képességeimet használhassam; 60,48 4. jó ajánlást kapjak, ha majd állást keresek; 56,78 5. örömet szerezzek a családomnak; 56,17 6. sok pénzt tudjak keresni; 51,23 7. másoknak bizonyítsam, hogy valaki vagyok; 37,77
8-9. igazolni akarom, hogy jó, eredményes tanuló vagyok; 35,79 8-9. kivívjam tanáraim elismerését 35,79 10. kollégiumban lakhassak; 33,45 11. magasabb ösztöndíjat kapjak; 25,30 12. felülmúljam társaimat; 16,66 13. a barátomnak/barátnőmnek imponáljak; 12,96
6. táblázat. Azért nem tanulok, amikor pedig kellene, mert… Sorszám Állítások (nagyon jellemző és jellemző) a válaszok
száma %-ban 1. egyszerűen képtelen vagyok érdeklődést tanúsítani bizonyos
tantárgyak iránt; 48,14
2. hajlamos vagyok halogatni a munkát; 46,90 3. könnyen „elcsábulok”, és érdekesebb dolgokkal kezdek foglalkozni; 43,20 4. egyéb tevékenységek túlságosan lefoglalnak; 39,49 5. egyes kötelező tantárgyakat feleslegesnek érzek, túlméretezettnek
tartok a választott szakterületem szempontjából; 32,09
6. köztudott, hogy egyes tantárgyakat nem kell megtanulni, „ügyeskedéssel” a követelménye teljesíthető;
29,62
7. a körülöttem zajló dolgok elterelik figyelmemet; 28,39 8. személyes problémáim akadályoznak benne; 24,68 9. elég jó képességű vagyok ahhoz, hogy tanulás nélkül is elérjem az
elégséges vagy annál jobb szintet. 23,45
10. egyes tantárgyakat nem lehet megérteni, megtanulni, kár velük 22,83
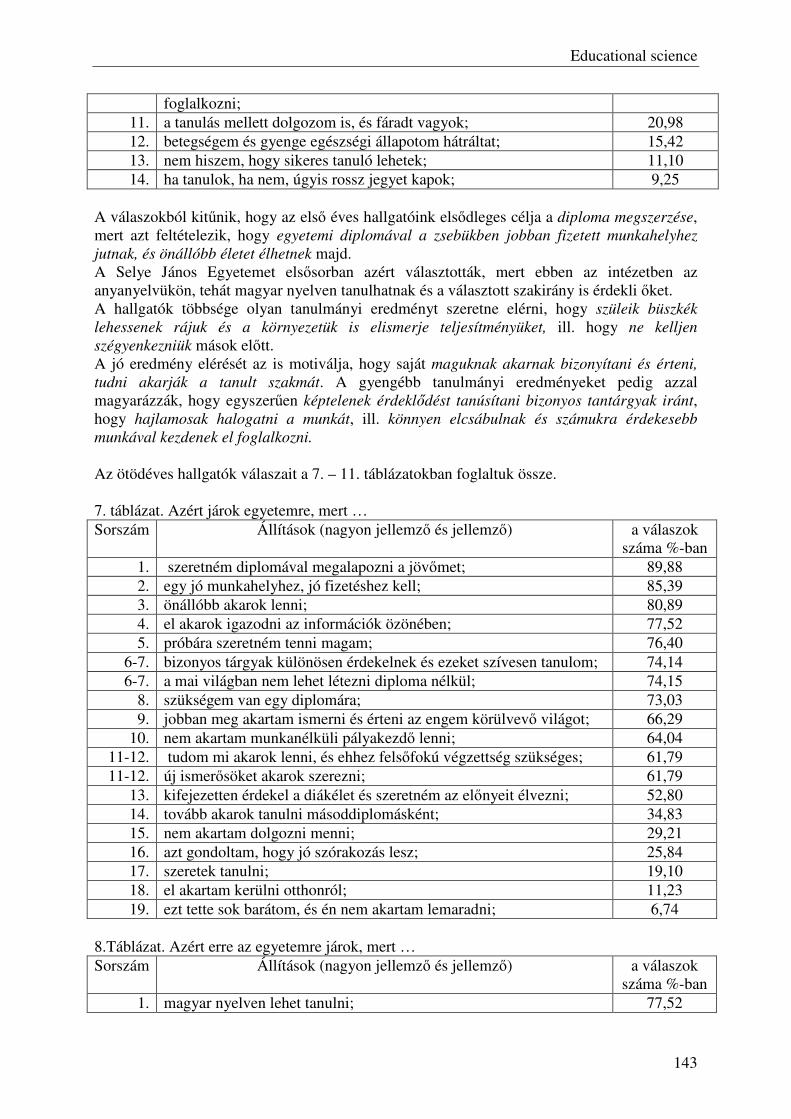
Educational science
143
foglalkozni; 11. a tanulás mellett dolgozom is, és fáradt vagyok; 20,98 12. betegségem és gyenge egészségi állapotom hátráltat; 15,42 13. nem hiszem, hogy sikeres tanuló lehetek; 11,10 14. ha tanulok, ha nem, úgyis rossz jegyet kapok; 9,25
A válaszokból kitűnik, hogy az első éves hallgatóink elsődleges célja a diploma megszerzése, mert azt feltételezik, hogy egyetemi diplomával a zsebükben jobban fizetett munkahelyhez
jutnak, és önállóbb életet élhetnek majd. A Selye János Egyetemet elsősorban azért választották, mert ebben az intézetben az anyanyelvükön, tehát magyar nyelven tanulhatnak és a választott szakirány is érdekli őket. A hallgatók többsége olyan tanulmányi eredményt szeretne elérni, hogy szüleik büszkék
lehessenek rájuk és a környezetük is elismerje teljesítményüket, ill. hogy ne kelljen
szégyenkezniük mások előtt. A jó eredmény elérését az is motiválja, hogy saját maguknak akarnak bizonyítani és érteni,
tudni akarják a tanult szakmát. A gyengébb tanulmányi eredményeket pedig azzal magyarázzák, hogy egyszerűen képtelenek érdeklődést tanúsítani bizonyos tantárgyak iránt, hogy hajlamosak halogatni a munkát, ill. könnyen elcsábulnak és számukra érdekesebb
munkával kezdenek el foglalkozni. Az ötödéves hallgatók válaszait a 7. – 11. táblázatokban foglaltuk össze. 7. táblázat. Azért járok egyetemre, mert … Sorszám Állítások (nagyon jellemző és jellemző) a válaszok
száma %-ban 1. szeretném diplomával megalapozni a jövőmet; 89,88 2. egy jó munkahelyhez, jó fizetéshez kell; 85,39 3. önállóbb akarok lenni; 80,89 4. el akarok igazodni az információk özönében; 77,52 5. próbára szeretném tenni magam; 76,40
6-7. bizonyos tárgyak különösen érdekelnek és ezeket szívesen tanulom; 74,14 6-7. a mai világban nem lehet létezni diploma nélkül; 74,15
8. szükségem van egy diplomára; 73,03 9. jobban meg akartam ismerni és érteni az engem körülvevő világot; 66,29
10. nem akartam munkanélküli pályakezdő lenni; 64,04 11-12. tudom mi akarok lenni, és ehhez felsőfokú végzettség szükséges; 61,79 11-12. új ismerősöket akarok szerezni; 61,79
13. kifejezetten érdekel a diákélet és szeretném az előnyeit élvezni; 52,80 14. tovább akarok tanulni másoddiplomásként; 34,83 15. nem akartam dolgozni menni; 29,21 16. azt gondoltam, hogy jó szórakozás lesz; 25,84 17. szeretek tanulni; 19,10 18. el akartam kerülni otthonról; 11,23 19. ezt tette sok barátom, és én nem akartam lemaradni; 6,74
8.Táblázat. Azért erre az egyetemre járok, mert … Sorszám Állítások (nagyon jellemző és jellemző) a válaszok
száma %-ban 1. magyar nyelven lehet tanulni; 77,52
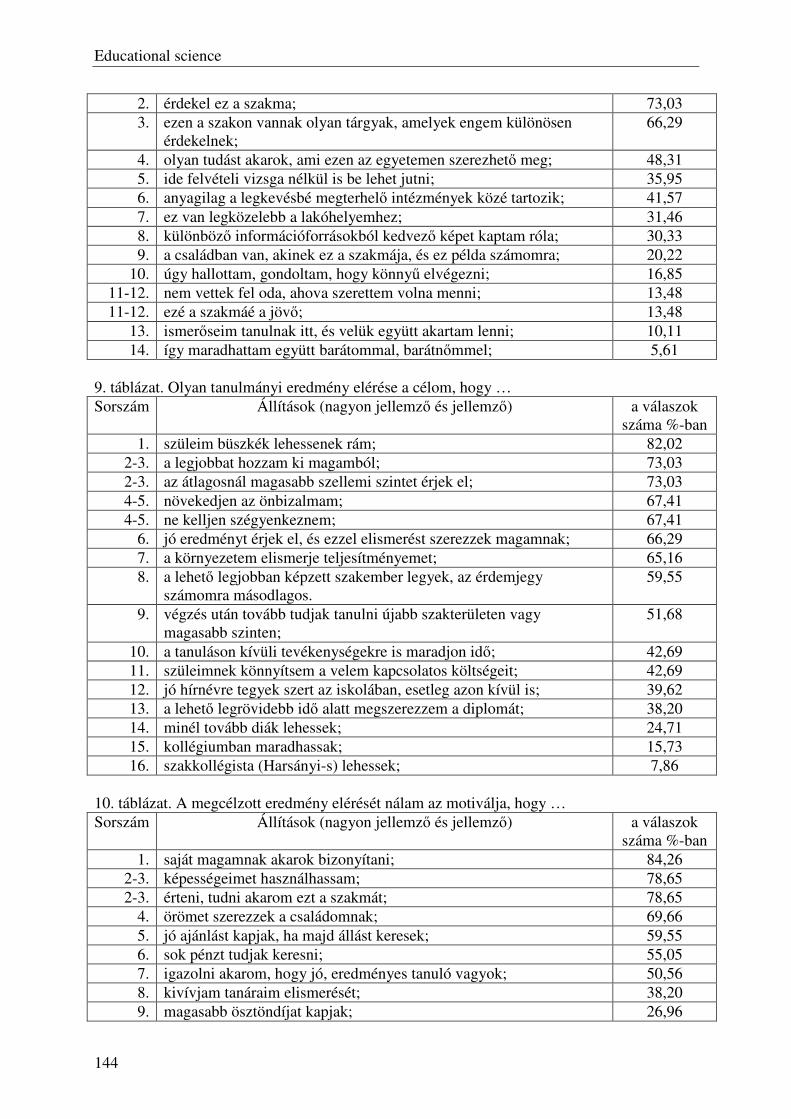
Educational science
144
2. érdekel ez a szakma; 73,03 3. ezen a szakon vannak olyan tárgyak, amelyek engem különösen
érdekelnek; 66,29
4. olyan tudást akarok, ami ezen az egyetemen szerezhető meg; 48,31 5. ide felvételi vizsga nélkül is be lehet jutni; 35,95 6. anyagilag a legkevésbé megterhelő intézmények közé tartozik; 41,57 7. ez van legközelebb a lakóhelyemhez; 31,46 8. különböző információforrásokból kedvező képet kaptam róla; 30,33 9. a családban van, akinek ez a szakmája, és ez példa számomra; 20,22
10. úgy hallottam, gondoltam, hogy könnyű elvégezni; 16,85 11-12. nem vettek fel oda, ahova szerettem volna menni; 13,48 11-12. ezé a szakmáé a jövő; 13,48
13. ismerőseim tanulnak itt, és velük együtt akartam lenni; 10,11 14. így maradhattam együtt barátommal, barátnőmmel; 5,61
9. táblázat. Olyan tanulmányi eredmény elérése a célom, hogy … Sorszám Állítások (nagyon jellemző és jellemző) a válaszok
száma %-ban 1. szüleim büszkék lehessenek rám; 82,02
2-3. a legjobbat hozzam ki magamból; 73,03 2-3. az átlagosnál magasabb szellemi szintet érjek el; 73,03 4-5. növekedjen az önbizalmam; 67,41 4-5. ne kelljen szégyenkeznem; 67,41
6. jó eredményt érjek el, és ezzel elismerést szerezzek magamnak; 66,29 7. a környezetem elismerje teljesítményemet; 65,16 8. a lehető legjobban képzett szakember legyek, az érdemjegy
számomra másodlagos. 59,55
9. végzés után tovább tudjak tanulni újabb szakterületen vagy magasabb szinten;
51,68
10. a tanuláson kívüli tevékenységekre is maradjon idő; 42,69 11. szüleimnek könnyítsem a velem kapcsolatos költségeit; 42,69 12. jó hírnévre tegyek szert az iskolában, esetleg azon kívül is; 39,62 13. a lehető legrövidebb idő alatt megszerezzem a diplomát; 38,20 14. minél tovább diák lehessek; 24,71 15. kollégiumban maradhassak; 15,73 16. szakkollégista (Harsányi-s) lehessek; 7,86
10. táblázat. A megcélzott eredmény elérését nálam az motiválja, hogy … Sorszám Állítások (nagyon jellemző és jellemző) a válaszok
száma %-ban 1. saját magamnak akarok bizonyítani; 84,26
2-3. képességeimet használhassam; 78,65 2-3. érteni, tudni akarom ezt a szakmát; 78,65
4. örömet szerezzek a családomnak; 69,66 5. jó ajánlást kapjak, ha majd állást keresek; 59,55 6. sok pénzt tudjak keresni; 55,05 7. igazolni akarom, hogy jó, eredményes tanuló vagyok; 50,56 8. kivívjam tanáraim elismerését; 38,20 9. magasabb ösztöndíjat kapjak; 26,96
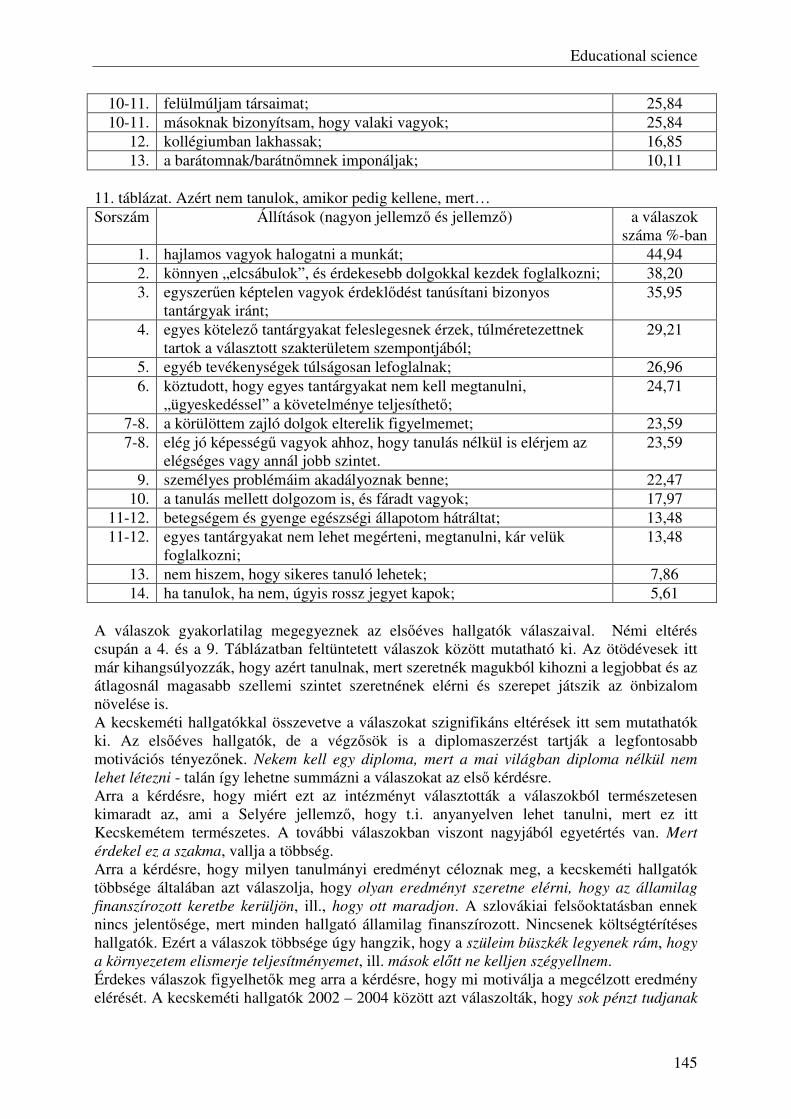
Educational science
145
10-11. felülmúljam társaimat; 25,84 10-11. másoknak bizonyítsam, hogy valaki vagyok; 25,84
12. kollégiumban lakhassak; 16,85 13. a barátomnak/barátnőmnek imponáljak; 10,11
11. táblázat. Azért nem tanulok, amikor pedig kellene, mert… Sorszám Állítások (nagyon jellemző és jellemző) a válaszok
száma %-ban 1. hajlamos vagyok halogatni a munkát; 44,94 2. könnyen „elcsábulok”, és érdekesebb dolgokkal kezdek foglalkozni; 38,20 3. egyszerűen képtelen vagyok érdeklődést tanúsítani bizonyos
tantárgyak iránt; 35,95
4. egyes kötelező tantárgyakat feleslegesnek érzek, túlméretezettnek tartok a választott szakterületem szempontjából;
29,21
5. egyéb tevékenységek túlságosan lefoglalnak; 26,96 6. köztudott, hogy egyes tantárgyakat nem kell megtanulni,
„ügyeskedéssel” a követelménye teljesíthető; 24,71
7-8. a körülöttem zajló dolgok elterelik figyelmemet; 23,59 7-8. elég jó képességű vagyok ahhoz, hogy tanulás nélkül is elérjem az
elégséges vagy annál jobb szintet. 23,59
9. személyes problémáim akadályoznak benne; 22,47 10. a tanulás mellett dolgozom is, és fáradt vagyok; 17,97
11-12. betegségem és gyenge egészségi állapotom hátráltat; 13,48 11-12. egyes tantárgyakat nem lehet megérteni, megtanulni, kár velük
foglalkozni; 13,48
13. nem hiszem, hogy sikeres tanuló lehetek; 7,86 14. ha tanulok, ha nem, úgyis rossz jegyet kapok; 5,61
A válaszok gyakorlatilag megegyeznek az elsőéves hallgatók válaszaival. Némi eltérés csupán a 4. és a 9. Táblázatban feltüntetett válaszok között mutatható ki. Az ötödévesek itt már kihangsúlyozzák, hogy azért tanulnak, mert szeretnék magukból kihozni a legjobbat és az átlagosnál magasabb szellemi szintet szeretnének elérni és szerepet játszik az önbizalom növelése is. A kecskeméti hallgatókkal összevetve a válaszokat szignifikáns eltérések itt sem mutathatók ki. Az elsőéves hallgatók, de a végzősök is a diplomaszerzést tartják a legfontosabb motivációs tényezőnek. Nekem kell egy diploma, mert a mai világban diploma nélkül nem
lehet létezni - talán így lehetne summázni a válaszokat az első kérdésre. Arra a kérdésre, hogy miért ezt az intézményt választották a válaszokból természetesen kimaradt az, ami a Selyére jellemző, hogy t.i. anyanyelven lehet tanulni, mert ez itt Kecskemétem természetes. A további válaszokban viszont nagyjából egyetértés van. Mert
érdekel ez a szakma, vallja a többség. Arra a kérdésre, hogy milyen tanulmányi eredményt céloznak meg, a kecskeméti hallgatók többsége általában azt válaszolja, hogy olyan eredményt szeretne elérni, hogy az államilag
finanszírozott keretbe kerüljön, ill., hogy ott maradjon. A szlovákiai felsőoktatásban ennek nincs jelentősége, mert minden hallgató államilag finanszírozott. Nincsenek költségtérítéses hallgatók. Ezért a válaszok többsége úgy hangzik, hogy a szüleim büszkék legyenek rám, hogy
a környezetem elismerje teljesítményemet, ill. mások előtt ne kelljen szégyellnem. Érdekes válaszok figyelhetők meg arra a kérdésre, hogy mi motiválja a megcélzott eredmény elérését. A kecskeméti hallgatók 2002 – 2004 között azt válaszolták, hogy sok pénzt tudjanak
Educational science
146
keresni, érteni, tudni akarják a szakmát és saját maguknak akarnak bizonyítani. 2005 – 2008 között viszont már a jó ajánlás áll az első helyen és a sok pénzt tudjanak keresni a második helyre került. A harmadik helyre az érteni, tudni a szakmát válaszok kerültek. A Selye hallgatóinál a saját magamnak akarok bizonyítani és az érteni, tudni a szakmát válaszok áll az első két helyen. A sok pénzt keresni válasz csak a hatodik helyen szerepel. A tanulást gátló tényezők közül a kecskeméti hallgatók a könnyen elcsábulok, és érdekesebb
dolgokkal kezdek foglalkozni válaszokat preferálják, míg a selyés hallgatók az első helyen azt emelték ki, hogy képtelenek érdeklődést tanúsítani bizonyos tantárgyak iránt, ill., hogy hajlamosak halogatni a munkát. A könnyen elcsábulok és érdekesebb dolgokkal foglalkozom válaszok a harmadik helyre kerültek.
3 Következtetés
Végezetül elmondható, hogy a két felsőoktatási intézmény hallgatóinak a tanulással kapcsolatos motivációi között lényeges eltérések nem mutathatók ki. A meglévő eltérések inkább társadalmi, ill. oktatáspolitikai eredetűek. Ezeket befolyásolni pedig nem áll módunkban.
Irodalomjegyzék
Müller, R. – Pap, I. – Tóth, A.: A hallgatók tanulással kapcsolatos motivációi a Kecskeméti Főiskola GAMF Karán. Kecskemét: Kecskeméti Főiskola, 2009. ISBN 978-963-7294-72-3
Szerző
Albert Sándor: Selye János Egyetem, Tanárképző Kar. 945 01 Komárno, Bratislavská cesta 3322, Szlovákia. e-mail: [email protected]
Educational science
147
A járműépítő versenyek szerepe a felsőoktatásban
Dr. Bagány Mihály, Kiss László Kecskeméti Főiskola GAMF Kar
Természet-és Műszaki Alaptudományi Intézet, Fizika Szakcsoport Gazdaság-és Társadalomtudományi Intézet, Mérnökpedagógiai és Médiatechnikai
Szakcsoport
Összefoglalás: Cikkünk bemutatja a hazai felsőoktatás számára is elérhető legérdekesebb járműépítő versenyeket, a KF GAMF eddigi eredményeit és a hallgatók részvételi motivációinak tapasztalatait.
Abstract: This article shows the accessible vehicle-building competitions for Hungarian higher education too, the results of KF GAMF up to till now and the participative motivation of students.
Kulcsszavak: felsőoktatás, járműépítés, verseny, motiváció
Keywords: higher education, vehicle-building, competition, motivation
Bevezetés
A járműépítő versenyek egyre nagyobb népszerűségnek örvendenek világszerte. A verse-nyeket több ezres nézőközönség előtt, népünnepély-szerű rendezvények keretében a média jelenlétében szervezik. A versenyeken egyetemi és főiskolai csapatok intézményük és szpon-zoraik támogatásával indulnak. Óriási harc folyik a helyezésekért, a jó eredmény nagy dicső-ség mind a versenyzőknek, mind az intézményeknek. A Kecskeméti Főiskola Gépipari és Automatizálási Műszaki Főiskolai Karának (KF GAMFK) csapatai csak 2008 óta vesznek részt ezeken a versenyeken, mégis kimagasló, nemzetközileg is ismert és elismert eredménye-ket értek el.
Mi a siker titka? Hogyan lehetett azt elérni, hogy az egyébként tanulásra alig motivált hallgatók több száz munkaórát fordítsanak a járművek tervezésére, kivitelezésére és a verse-nyeken való részvételre? Miért lelkesedtek, miért jelentkeztek önkéntesen olyan feladatra, amihez hasonlót a kötelező ismeretszerzés keretében nem szívesen teljesítenek? Ezekre a kér-désekre a versenyek bemutatásával, a KF GAMFK oktatói és hallgatói tapasztalatainak elem-zésével próbálunk választ adni. Kifejezett célunk, hogy eredményeink és tapasztalataink köz-readásával másokat is biztassunk a versenyeken való részvételre, a hallgatók értelmes felada-tokkal való ellátására.
A járműépítő versenyek bemutatása
A hallgatók számára szervezett hazai és nemzetközi műszaki-eszközépítő szakmai verse-nyek (tésztahíd, honlap, CNC-megmunkálógép, PLC, jármű stb.) közül a járműépítő verse-nyek a legnépszerűbbek. A lebonyolításukra szánt nagyon jelentős összegek mutatják, hogy nem csak a versenyző hallgatók, de a rendező felsőoktatási intézmények és vállalatok, illetve a támogató szponzorok is érdekeltek a sikerben. A felsőoktatási intézmények népszerűségük fokozását, tudományos eredményeik közzé tételét, ezen keresztül a beiskolázási munkájuk javítását érhetik el a versenyekkel. A vállalatok a reklám lehetőségén túl kapcsolatot teremte-nek olyan jól képzett fiatal mérnökökkel, akik nem csak az elméletet ismerik, akiknek vannak
Educational science
148
ötleteik, azokat meg is tudják valósítani, és akik csapattagként képesek egy összetett feladatot megoldani.
A versenyek általános jellemzői: − alaposan átgondolt, minden részletre kiterjedő versenykiírás; − a járművet egy nagyon részletes műszaki követelményrendszer alapján kell meg-
építeni, embernek kell benne ülni, aki azt vezeti; − a versenykiírás és a verseny között 5-8 hónap áll rendelkezésre a tervezésre, anyag-
beszerzésre, építésre; − az építés és a verseny költségeit részben a hallgatóknak kell előteremteni (támoga-
tók keresése, kapcsolatépítés szponzoráló vállalatokkal); − a munka során folyamatos a kapcsolat a csapatok és a szervező cég mérnökei kö-
zött (tervrajzokat, számításokat, fényképeket kell küldeni a munka menetéről); − a jármű a verseny színhelyén egy alapos műszaki vizsgán esik át, és csak akkor in-
dulhat, ha műszaki és biztonsági szempontból megfelel a kiírásnak; − a versenyek városközpontokban vagy ismert versenypályákon, nagy nyilvánosság
előtt folynak. A KF GAMF Kar részvétele a versenyeken Hallgatóink eddig a pneumobil, elektromobil és eco-marathon versenyeken indultak. Je-
lentkezni önkéntes alapon lehet, a csapatokat maguk a hallgatók állítják össze. Minden csapat választ egy vezetőt a tagok közül, és felkér egy segítő oktatót, aki figyelemmel kíséri, támo-gatja a munkájukat. Az építés költségeinek egy részét a főiskola fedezi, ugyanakkor arra ösz-tönözzük hallgatóinkat, hogy keressenek külső támogatókat is. A csapatok feladata a tervezés és kivitelezés mellett az anyagbeszerzés és a gazdálkodás is. A munka megkezdése előtt a csapattagoknak balesetvédelmi oktatásban kell részesülniük.
A járműépítésben induló csapattagok fölvehetik a járműhajtások című szabadon választ-ható tantárgyat. A tantárgy teljesítésének egyik feltétele, hogy a megépített jármű átmenjen a verseny előtti gépátvételen.
Pneumobil verseny
A Bosch Rexroth Pneumatika Kft. 2008-ban hirdette meg először a pneumobil építő ver-senyt főiskolák és egyetemek hallgatói részére. A versenyen négyfős csapatok indulhatnak, egy intézményből legföljebb 3 csapat. Az építéshez szükséges többszázezer forint értékű pne-umatikus elemeket (munkahengerek, szelepek, csövek, csatlakozók, PLC) a cég adja, és ezek az eszközök a verseny után az intézmény tulajdonába kerülnek.
A csapatoknak olyan járművet kell építeni, amelyet egy 10 literes fémpalackban tárolt 200 bar nyomású sűrített levegő hajt pneumatikus munkahengerek segítségével. Egy ilyen pneumobilt 1500-2000 munkaóra alatt lehet megépíteni. Három versenyszám van:
− távolsági: a palackban tárolt sűrített levegő energiájával ki tud nagyobb távolságot megtenni,
− gyorsasági: adott pályakört repülőrajttal ki tud legrövidebb idő alatt (legnagyobb sebességgel) megtenni,
− gyorsulási: adott távolságot állórajttal ki tud legrövidebb idő alatt megtenni. A 2008-as versenyt Egerben a gyár udvarán, a 2009-est és 2010-est a városközpontban és
az Érsekkertben rendezte a cég. A versenykiírás és a versenyszámok meghatározása egyér-telmű és kiforrott, a rendezés pontos. Az 1. táblázatban a KF GAMF Kar eredményeit foglal-tuk össze.
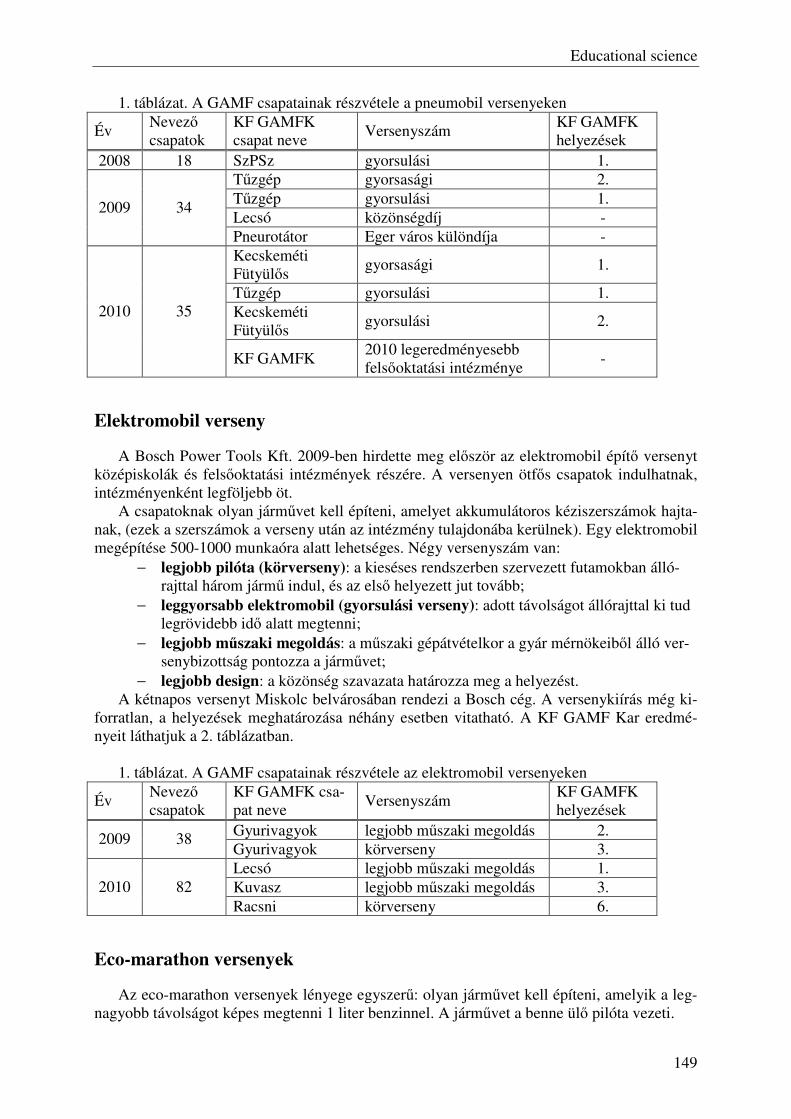
Educational science
149
1. táblázat. A GAMF csapatainak részvétele a pneumobil versenyeken
Év Nevező csapatok
KF GAMFK csapat neve
Versenyszám KF GAMFK helyezések
2008 18 SzPSz gyorsulási 1. Tűzgép gyorsasági 2. Tűzgép gyorsulási 1. Lecsó közönségdíj -
2009 34
Pneurotátor Eger város különdíja - Kecskeméti Fütyülős
gyorsasági 1.
Tűzgép gyorsulási 1. Kecskeméti Fütyülős
gyorsulási 2. 2010 35
KF GAMFK 2010 legeredményesebb felsőoktatási intézménye
-
Elektromobil verseny
A Bosch Power Tools Kft. 2009-ben hirdette meg először az elektromobil építő versenyt középiskolák és felsőoktatási intézmények részére. A versenyen ötfős csapatok indulhatnak, intézményenként legföljebb öt.
A csapatoknak olyan járművet kell építeni, amelyet akkumulátoros kéziszerszámok hajta-nak, (ezek a szerszámok a verseny után az intézmény tulajdonába kerülnek). Egy elektromobil megépítése 500-1000 munkaóra alatt lehetséges. Négy versenyszám van:
− legjobb pilóta (körverseny): a kieséses rendszerben szervezett futamokban álló-rajttal három jármű indul, és az első helyezett jut tovább;
− leggyorsabb elektromobil (gyorsulási verseny): adott távolságot állórajttal ki tud legrövidebb idő alatt megtenni;
− legjobb műszaki megoldás: a műszaki gépátvételkor a gyár mérnökeiből álló ver-senybizottság pontozza a járművet;
− legjobb design: a közönség szavazata határozza meg a helyezést. A kétnapos versenyt Miskolc belvárosában rendezi a Bosch cég. A versenykiírás még ki-
forratlan, a helyezések meghatározása néhány esetben vitatható. A KF GAMF Kar eredmé-nyeit láthatjuk a 2. táblázatban.
1. táblázat. A GAMF csapatainak részvétele az elektromobil versenyeken
Év Nevező csapatok
KF GAMFK csa-pat neve
Versenyszám KF GAMFK helyezések
Gyurivagyok legjobb műszaki megoldás 2. 2009 38 Gyurivagyok körverseny 3. Lecsó legjobb műszaki megoldás 1. Kuvasz legjobb műszaki megoldás 3. 2010 82 Racsni körverseny 6.
Eco-marathon versenyek
Az eco-marathon versenyek lényege egyszerű: olyan járművet kell építeni, amelyik a leg-nagyobb távolságot képes megtenni 1 liter benzinnel. A járművet a benne ülő pilóta vezeti.
Educational science
150
1976-ban Finnországban rendezték az első nemzetközi versenyt (Pisaralla Pisimmälle). Azóta több ország szervez hasonló megmérettetést (Franciaország, Anglia, Belgium, Hollan-dia, Németország stb.).
A legtöbb csapatot megmozgató, legrangosabb világverseny a Shell Eco-marathon, ame-lyet a jelenlegi formájában 1985-ben rendeztek meg először Franciaországban. (A cég azonos feltételekkel Amerikában és Ázsiában is megrendezi a versenyt.) A versenyen intézményen-ként legföljebb egy városi és egy prototípus kategóriába sorolt jármű indulhat. Az engedélye-zett üzemanyag: benzin, gázolaj, etanol, hidrogén, autógáz. A különböző üzemanyagokkal elért teljesítményeket a fűtőértékük alapján átszámítják benzinre. (Napelemes kategória is van, és 2011-től akkumulátoros járművek is indulhatnak.) A versenykiírás, a jelentkezés, a levelezés, egyes alkatrészek beszerzése, a műszaki dokumentálás és a verseny egy idegen nyelv alapos ismeretét igényli a versenyzőktől.
Ezek a versenyek népszerűek a felsőoktatási intézményekben. (A 2010-es európai verse-nyen Németországban mintegy 200 csapat, 4000 résztvevő és kb. 2500 akkreditált újságíró volt jelen.) A versenyen elért eredmény hozzájárul az intézmény kedvező rangsorolásához. A verseny szépségét rontja, hogy a csapatok mögött sokszor tőkeerős nagyvállalatok, kutatóin-tézetek állnak, így a tényleges hallgatói teljesítmények összemérése csorbul.
A KF GAMF Kar 2009 őszén szervezett egy 12 fős csapatot, és benevezett a 2010-es eu-rópai versenyre. A GAMF csapat a prototípus kategória benzinüzemű osztályában indult. Egy igényes, 1000 km/liter fölött teljesítő ilyen jármű és a motor tervezése, építése, tesztelése kb. 6000 munkaóra alatt lehetséges.
A május 6-7. között Lausitzban megrendezett versenyen 81 csapat akart győzni a benzines prototípus kategóriában. A Megameter nevű GAMF-os jármű a 8. helyen végzett: 1588 km-t tett meg 1 liter benzinnel. A sikert értékesebbé teszi, hogy a csapat először indult, és saját építésű négyütemű befecskendezéses motort használt. A szénszál erősítésű jármű 20 kg-os volt. Ebben a kategóriában állt rajthoz az Óbudai Egyetem járműve is, ők 333 km-es teljesít-ményükkel a 35. helyen végeztek.
A GAMF csapat indult az idei finnországi versenyen (augusztus 21-22., Nokia), ahol 1941 km/literes teljesítményt ért el.
A hallgatói motiváció vizsgálata
A vizsgálat a KF GAMF azon 75 hallgatójának és 18 oktatójának tapasztalata alapján ké-szült, akik az elmúlt 3 évben részt vettek valamelyik járműépítő csapatban. A résztvevők munkájának figyelemmel kísérése, a velük folytatott beszélgetések, kérdőíves felmérések ele-gendő információval szolgáltak ahhoz, hogy összegyűjtsük a tapasztalatokat, és ezek elemzé-sével megbízható véleményt alakítsunk ki a motiváló hatásokról. Arra is kíváncsiak voltunk, hogy a munkájuk során szerzett tapasztalataik mennyire igazolták vissza az előzetes elvárása-ikat.
Vizsgálataink két kérdéskörre terjedtek ki: − mi motiválta a hallgatókat a csapat munkájában való részvételre; − milyen tapasztalatokat szereztek a munka során.
Az elemzést a kérdőíves felmérésben szereplő válaszlehetőségek köré rendeztük. A záró-jelben levő első szám a 0-5-ig terjedő skálán pontozott motiváció erejét, a második pedig a szórását jelenti.
Mi motiválta a hallgatókat a csapat munkájában való részvételre?
Kihívás, a verseny lehetősége (4,69/0,63))
Educational science
151
Mind a kérdőíves felmérésben, mind a beszélgetések során, első helyen emelték ki azt a kihívást, amit a nagy nyilvánosság előtt tartott verseny lehetősége jelent számukra. Ez érthető, ha figyelembe vesszük, hogy a résztvevők 95%-a fiú, akik a koruknál fogva is erősen motivál-tak a versenyre. Ez a motiváció azért is értékes, mert belső hajtóerőt jelent, nem az oktatónak kell rábeszélni a hallgatót a részvételre, hanem önként vállalják a munkát.
Egy verseny vonzereje több tényezőtől függ. Hallgatóink azért részesítik előnyben a jár-műversenyeket, mert nemzetköziek, nagy nyilvánosság előtt zajlanak, nagy a médiavissz-hangjuk. Az ismerősök, barátok, rokonok saját szurkolói tábort alkotnak, hatalmas üdvrival-gás, taps fogadja a győztest. A nagy felhajtás legyezgeti hiúságukat, kialakul saját fontossá-guk tudata, életüknek azon ritka állomása ez, ahol sztárnak érezhetik magukat. A versenyen elismerést, díjat kapnak, amit el lehet tenni, még az unokáiknak is büszkén megmutathatják.
Gyakran hallják a felnőttektől, hogy a mai fiatalok nem elég kitartóak, „bezzeg a mi időnkben” minden jobb volt. A verseny egy kiváló lehetőséget biztosít arra, hogy kivívják a felnőttek elismerését, hogy megmutathassák a külvilágnak, hogy ők is ugyanolyan értékesek.
Az elvégzendő feladat műszaki tartalma (4,46/0,52), kíváncsiság, a járművek iránti ér-deklődés (4,46/0,88)
Nem csak a kérdőív eredményének számszerű elemzéséből, de a beszélgetésekből is az derül ki, hogy a két ösztönző nagyjából azonos erejű hatást fejt ki. Fiataljainkat nagyon érdek-lik a különleges gépjárművek, versenyautók, gokartok, quad-ok, terep-motorkerékpárok. So-kan mindent megtesznek azért, hogy minél többet megtudjanak róluk, hogy ilyet ők is készít-hessenek. Megragadja fantáziájukat az a lehetőség, hogy egy liter üzemanyaggal több ezer kilométert meg lehet tenni, (egy átlagos személyautó legföljebb 25 km megtételére képes) hogy egy búvárpalacknyi sűrített levegővel fél óráig lehet körözni a versenypályán, hogy egy saját építésű akkumulátoros villanyautóval 60 km/óra sebesség is elérhető. Nagyon érdekli őket a különböző technikai megoldások hatásossága. Szívesen összehasonlítják a saját gépü-ket a többi csapatéval, igyekeznek leszűrni a tanulságokat, és lehetőség szerint alkalmazni azokat.
Sok olyan ismeretet tanulnak a különböző tantárgyak keretében, aminek itt látják először hasznát. Az építés közben saját maguk találkoznak azokkal a problémákkal, amiket az elméle-ti órákon még csak a kötelező jellegük miatt tanultak, akkor még érdektelenek voltak számuk-ra. A munka során számtalanszor előfordult, hogy előszedték a jegyzeteket, tankönyveket és úja tanulták az elméleti hátteret. Egyik legnagyobb jelentősége a részvételnek, hogy életszerű körülmények között a gyakorlat felől közelítették meg a problémákat.
Az érdeklődésre jellemző, hogy sohasem kellett hallgatókat toborozni a munkára. Önként jelentkeztek, többen szerettek volna részt venni, mint ahánynak lehetőséget tudtunk biztosíta-ni. A csapatba kerülés elismerésnek számít, a tanulmányaikat befejező és a főiskoláról kikerü-lő tagok helyére versengés folyik. Egyáltalán nem jellemző a lemorzsolódás, a 2009-2010-es idényben a 48 csapattag közül senki nem lépett ki, kisebb-nagyobb szorgalommal ugyan, de mindenki eljutott a versenyig.
Sikerélmény, a megküzdés öröme (4,38/0,77), a saját teljesítőképesség kipróbálása (4,15/0,8)
Nem csak másoknak akarják megmutatni képességeiket, nem csak mások elismerése fon-tos számukra, hanem saját maguknak is bizonyítani akarnak. Önmaguk megismerésének fon-tos eleme a saját teljesítőképességük feltérképezése. Kevés lehetőségük kínálkozott az eddigi életükben arra, hogy egy összetett feladat elvégzése közben kipróbálhassák magukat, ezért igyekeznek kihasználni a lehetőséget.
Érdekes megfigyelni a saját képességeik néhány esetben szélsőségesen eltúlzott fölé vagy aláértékelésének alakulását a jármű építése közben. Van olyan, aki kezdetben félelemmel teli kishitűséggel áll neki a munkának, túlértékeli a feladat nehézségét, úgy érzi, hogy az ő képes-
Educational science
152
ségei nem elegendőek a megoldáshoz. Mások viszont alábecsülik a nehézségeket, túlzott ön-bizalommal állnak neki, úgy érzik, hogy számukra nincs semmilyen akadály sem, ami gátol-hatná őket. Idővel egyre jobban belelátnak a részletekbe, egyre pontosabban ítélik meg saját képességeiket, mernek vállalni részfeladatot, és rájönnek mit és milyen minőségben képesek elvégezni.
A gyakorlati munka szeretete (4,31/0,75) Felsőoktatásunk egyik gyengesége, hogy túlsúlyban vannak az elméleti ismeretek. Még a
mérnökképzésben is nagyon kevés lehetőség van arra, hogy a műhelyekben levő gépeket használhassák a hallgatók, hogy azokon kézzel fogható terméket állítsanak elő. A gyakorlati foglalkozások zömén is elméletet tanítunk, többnyire csak nézni lehet azt a munkafázist, amit az oktatók bemutatnak. A tudás ellenőrzése a nyelvi képességeken alapul: le kell írni, vagy élőszóban kell elmondani a munka menetét. Nagyon ritkán fordul elő, hogy el kell készíteni a munkadarabot, hogy a készterméket értékelnénk. Hallgatóink legtöbbje gyakorlatias beállí-tottságú, előnyben részesítik az új ismeretek gyakorlat felőli megközelítését. Az új ismeretek elsajátításához szükségük van a fizikai valóság érzékszervi megtapasztalására, tapasztalat hiányában egy bizonytalan alapokon nyugvó képzelt valóságot kell felépíteniük.
Járműépítés közben teljes mértékben kielégíthető az új ismeretek gyakorlati alapokra épü-lő elsajátítása. Kézbe vehetik az eszközöket, szerszámokat, megnézegethetik az alkatrészeket, kipróbálhatják a működésüket, méréseket végezhetnek, diagramokat vehetnek fel. Megfigyel-hető, hogy szeretnek tevékenység közben tanulni, a tárgyakat megismerve egyre jobban ér-dekli őket a vonatkozó elmélet, utána néznek, ötleteik születnek, amiket szívesen megvalósí-tanak és kipróbálnak. A járműépítés egy nagy lehetőség arra, hogy a gyakorlatban integrálják magukban azt a sok ismeretet, amit elméletben már tanultak.
Hallgatóink nagy része a kezdeti halogatások után lelkesen dolgozik. A versenyek köze-ledtével napi 10-12 órát is a műhelyben töltenek. Nehezen kezdik el, de amikor már látják a munkájuk eredményét, nem kell biztatni őket. Ha belelendülnek a munkába, nem szívesen hagyják abba még a kötelező tanórák miatt sem. Gyakran előfordul, hogy a versenyre hivat-kozva hiányoznak fontos előadásokról, ami konfliktus forrásává válhat az előadó és a hallgató között. A hiányzások ellenére sem romlik az általános tanulmányi eredményük, sőt a munká-ban aktív hallgatók érdeklődése fokozódik a szakelmélet iránt, ezért még javul is az eredmé-nyük.
Az előző években sok nehézséget okozott az, hogy a tanórák tartására kialakított műhe-lyekben zajlott a járművek építése. A járművek terjedelmesek, nagy a helyigényük, ami nem minden műhelyben volt könnyen biztosítható. A műhelyek tanrendje és a hallgatók szabadide-je sem volt könnyen összehangolható, ezért előfordult, hogy tanórák közben is ott dolgoztak, ezzel néha zavarták a kialakult rendet. A jobb munkafeltételek biztosítása érdekében - a kar vezetésének támogatásával - 2010-től megkezdtük egy önálló hallgatói műhely kialakítását és gépi felszerelését, amelyben nem csak a járműépítésre, hanem más hallgatói feladatok végre-hajtására is biztosítjuk a feltételeket.
Saját szakmai fejlődése (4,23/0,6), karrier, a megszerzett tudás használhatósága (4,15/0,8)
Hallgatóink bíznak abban, hogy a tudás alapú társadalomban megbecsülik a tudást, és az-zal alapozhatják meg a jövőjüket, ha használható ismereteket szereznek. Felértékelődik a jár-művek építése terén szerzett tapasztalatuk azáltal is, hogy rövidesen megindul a termelés a világ egyik vezető autógyártó cégének Kecskeméten épülő telephelyén. Az állásinterjúk során előnyt jelent a járművek iránti érdeklődés, a járműépítésben szerzett tapasztalat és a nemzet-közi versenyeken való megmérettetés.
A csapatban való munkavégzés lehetősége (3,85/0,99)
Educational science
153
Vegyes tapasztalataik vannak a csapatmunkáról. Gyakran hallanak a fontosságáról, tudják, hogy az állásinterjúk során is számításba veszik. Kezdetben nincs elég tapasztalatuk, illetve ami van, az sem mindig pozitív. Jónak tartják egymás megismerését, hogy tanulhatnak egy-mástól. Megfigyelhető, hogy a munka előrehaladtával összekovácsolódnak, igazi barátságok alakulnak ki. Ritkán, de előfordul, hogy ellentétek alakulnak ki csapaton belül, ezek megne-hezítik a munkát, ilyenkor az oktatónak kell ügyesen elsimítani a szembenállást.
Remény a jobb tanulmányi eredmények elérésében (3,00/1,53) A felsőoktatásban nagyon kicsi motiváló ereje van a tanulmányi eredménynek, az osztály-
zatnak. Az ösztöndíj értékének megállapítása az egyetlen alkalom, amikor figyelembe veszik a tanulmányi eredményt, egyébként sem az egyetemi-főiskolai évek alatt, sem utána nincs különösebb jelentősége. A versenyen elért eredmény jegyekben megnyilvánuló jutalmazása értelmetlen lenne, nincs hatása a hallgatókra. Sokkal fontosabb egy emlékérem, vagy egy ok-levél, ami igazolja a helyezést. Az anyagi elismerésnek sincs nagy motiváló ereje, sokkal többre tartanak egy külföldi tanulmányi utat, egy autógyári üzemlátogatást.
Oktatók hatása (3,38/1,61), barátok hatása (2,92/1,32), szülők hatása (2,77/1,42) Ahogy elvárható volt, a külső motiváló tényezők hatása sokkal kisebb, mint a belső ténye-
zőké. Nem azért vesznek részt a csapat munkájában, mert valaki biztatja, vagy felkéri őket, hanem belső késztetésük van rá. Soha nem kellett senkit sem rábeszélni a részvételre, épp ellenkezőleg, többen jelentkeznek annál, mint ahányan a szűk keretek között beléphettek a versenyekbe.
Senkit sem szabadna helyhiány miatt eltanácsolni a munkától, ezért igyekszünk bővíteni a versenyzési lehetőségeket. Nemzetközi napmotor építő versenyt tervezünk, aminek célja a napenergia lehető legjobb hatásfokú átalakítása forgási energiává. Ezen a téren jelentős fejlő-dés várható az elkövetkező évtizedekben, már megindultak a járműipari kutatások, megjelen-tek az első működőképes modellek. Reméljük, hogy sokan jelentkeznek majd a versenyre, és egy új területen lehet értelmes elfoglaltságot biztosítani a hallgatóknak. Szorgalmazzuk azt is, hogy versenyen kívül, csak a saját érdeklődés szerint is be lehessen kapcsolódni valamilyen hallgatói munkába. A hallgatókkal közösen dolgozunk ki olyan feladatokat, melyek kapcso-lódnak a szakterületükhöz, és jelentős érdeklődés mutatkozik iránta.
Irodalomjegyzék
[1] Bosch Rexroth Pneumobil (Versenyszabályzat 2010) [2] Bosch Elektromobil (Versenyszabályzat 2010) [3] Shell Eco-marathon: Official Rules 2010, 2011 [4] Shell Eco-marathon: European Rules 2010 [5] Finnish Mileage Marathon Club: XXXV Pisaralla Pisimmälle 2010
Szerzők
Dr. Bagány Mihály: Kecskeméti Főiskola GAMF Kar, Természet-és Műszaki Alaptudományi Intézet, Fizika Szakcsoport, [email protected] Kiss László: Kecskeméti Főiskola GAMF Kar, Gazdaság-és Társadalomtudományi Intézet, Mérnökpedagógiai és Médiatechnikai Szakcsoport, [email protected]
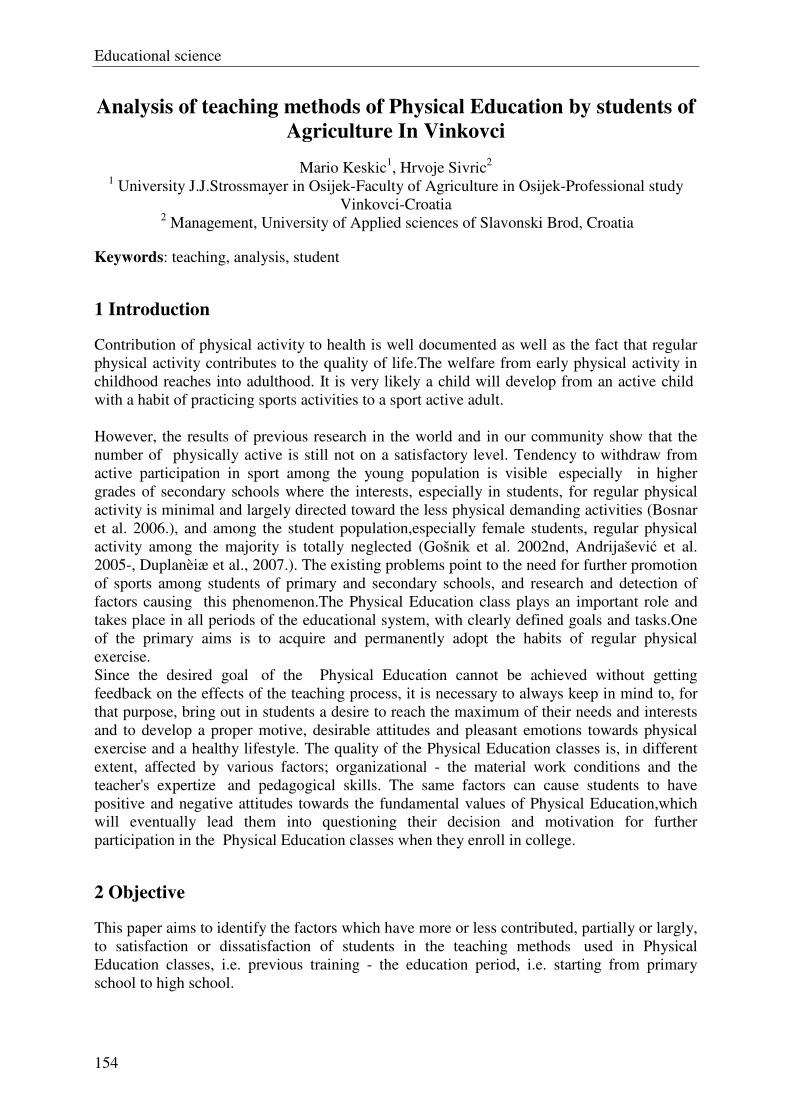
Educational science
154
Analysis of teaching methods of Physical Education by students of
Agriculture In Vinkovci
Mario Keskic1, Hrvoje Sivric2 1 University J.J.Strossmayer in Osijek-Faculty of Agriculture in Osijek-Professional study
Vinkovci-Croatia 2 Management, University of Applied sciences of Slavonski Brod, Croatia
Keywords: teaching, analysis, student
1 Introduction
Contribution of physical activity to health is well documented as well as the fact that regular physical activity contributes to the quality of life.The welfare from early physical activity in childhood reaches into adulthood. It is very likely a child will develop from an active child with a habit of practicing sports activities to a sport active adult. However, the results of previous research in the world and in our community show that the number of physically active is still not on a satisfactory level. Tendency to withdraw from active participation in sport among the young population is visible especially in higher grades of secondary schools where the interests, especially in students, for regular physical activity is minimal and largely directed toward the less physical demanding activities (Bosnar et al. 2006.), and among the student population,especially female students, regular physical activity among the majority is totally neglected (Gošnik et al. 2002nd, Andrijašević et al. 2005-, Duplanèiæ et al., 2007.). The existing problems point to the need for further promotion of sports among students of primary and secondary schools, and research and detection of factors causing this phenomenon.The Physical Education class plays an important role and takes place in all periods of the educational system, with clearly defined goals and tasks.One of the primary aims is to acquire and permanently adopt the habits of regular physical exercise. Since the desired goal of the Physical Education cannot be achieved without getting feedback on the effects of the teaching process, it is necessary to always keep in mind to, for that purpose, bring out in students a desire to reach the maximum of their needs and interests and to develop a proper motive, desirable attitudes and pleasant emotions towards physical exercise and a healthy lifestyle. The quality of the Physical Education classes is, in different extent, affected by various factors; organizational - the material work conditions and the teacher's expertize and pedagogical skills. The same factors can cause students to have positive and negative attitudes towards the fundamental values of Physical Education,which will eventually lead them into questioning their decision and motivation for further participation in the Physical Education classes when they enroll in college.
2 Objective
This paper aims to identify the factors which have more or less contributed, partially or largly, to satisfaction or dissatisfaction of students in the teaching methods used in Physical Education classes, i.e. previous training - the education period, i.e. starting from primary school to high school.
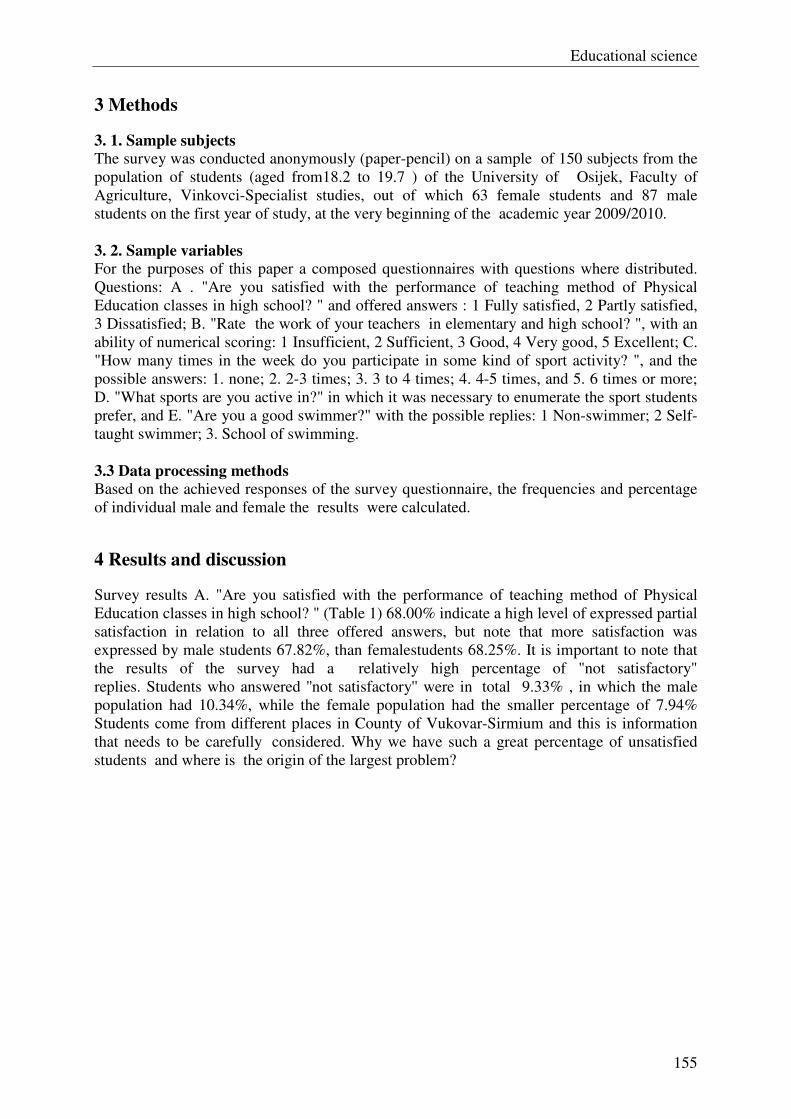
Educational science
155
3 Methods
3. 1. Sample subjects
The survey was conducted anonymously (paper-pencil) on a sample of 150 subjects from the population of students (aged from18.2 to 19.7 ) of the University of Osijek, Faculty of Agriculture, Vinkovci-Specialist studies, out of which 63 female students and 87 male students on the first year of study, at the very beginning of the academic year 2009/2010. 3. 2. Sample variables
For the purposes of this paper a composed questionnaires with questions where distributed. Questions: A . "Are you satisfied with the performance of teaching method of Physical Education classes in high school? " and offered answers : 1 Fully satisfied, 2 Partly satisfied, 3 Dissatisfied; B. "Rate the work of your teachers in elementary and high school? ", with an ability of numerical scoring: 1 Insufficient, 2 Sufficient, 3 Good, 4 Very good, 5 Excellent; C. "How many times in the week do you participate in some kind of sport activity? ", and the possible answers: 1. none; 2. 2-3 times; 3. 3 to 4 times; 4. 4-5 times, and 5. 6 times or more; D. "What sports are you active in?" in which it was necessary to enumerate the sport students prefer, and E. "Are you a good swimmer?" with the possible replies: 1 Non-swimmer; 2 Self-taught swimmer; 3. School of swimming. 3.3 Data processing methods
Based on the achieved responses of the survey questionnaire, the frequencies and percentage of individual male and female the results were calculated.
4 Results and discussion
Survey results A. "Are you satisfied with the performance of teaching method of Physical Education classes in high school? " (Table 1) 68.00% indicate a high level of expressed partial satisfaction in relation to all three offered answers, but note that more satisfaction was expressed by male students 67.82%, than femalestudents 68.25%. It is important to note that the results of the survey had a relatively high percentage of "not satisfactory" replies. Students who answered ''not satisfactory'' were in total 9.33% , in which the male population had 10.34%, while the female population had the smaller percentage of 7.94% Students come from different places in County of Vukovar-Sirmium and this is information that needs to be carefully considered. Why we have such a great percentage of unsatisfied students and where is the origin of the largest problem?
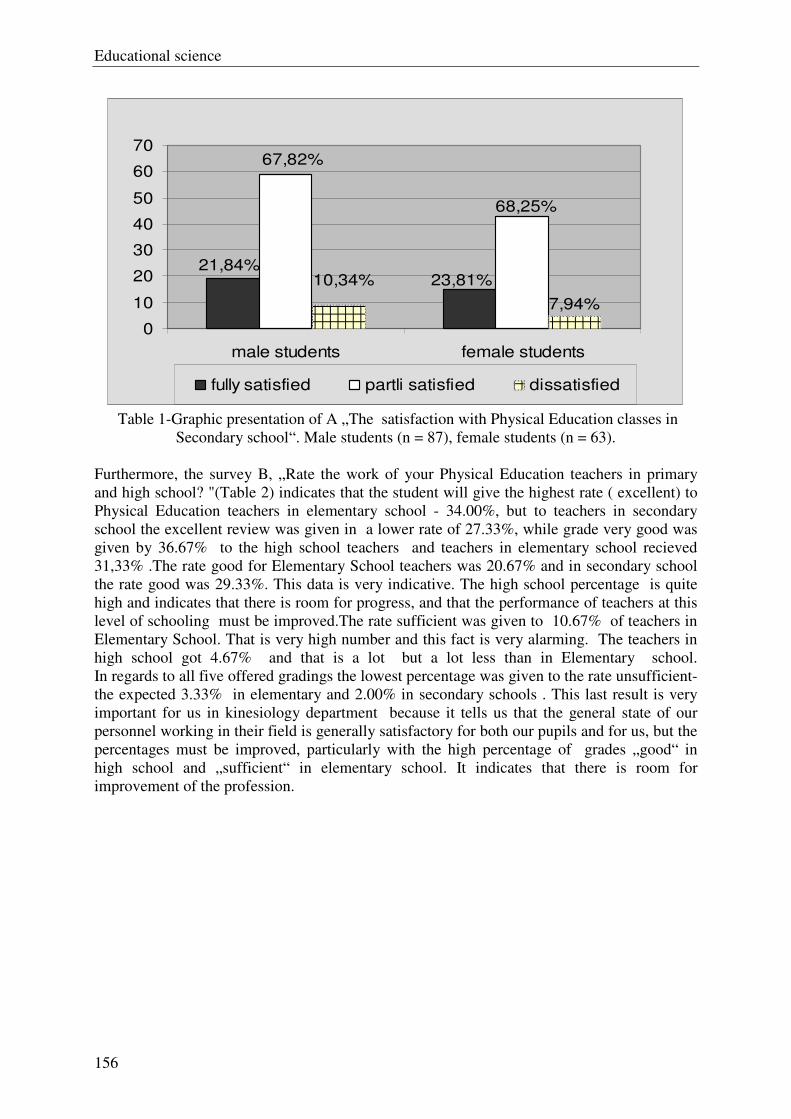
Educational science
156
0
10
20
30
40
50
60
70
male students female students
fully satisfied partli satisfied dissatisfied
67,82%
21,84%10,34%
7,94%
68,25%
23,81%
Table 1-Graphic presentation of A „The satisfaction with Physical Education classes in
Secondary school“. Male students (n = 87), female students (n = 63). Furthermore, the survey B, „Rate the work of your Physical Education teachers in primary and high school? "(Table 2) indicates that the student will give the highest rate ( excellent) to Physical Education teachers in elementary school - 34.00%, but to teachers in secondary school the excellent review was given in a lower rate of 27.33%, while grade very good was given by 36.67% to the high school teachers and teachers in elementary school recieved 31,33% .The rate good for Elementary School teachers was 20.67% and in secondary school the rate good was 29.33%. This data is very indicative. The high school percentage is quite high and indicates that there is room for progress, and that the performance of teachers at this level of schooling must be improved.The rate sufficient was given to 10.67% of teachers in Elementary School. That is very high number and this fact is very alarming. The teachers in high school got 4.67% and that is a lot but a lot less than in Elementary school. In regards to all five offered gradings the lowest percentage was given to the rate unsufficient- the expected 3.33% in elementary and 2.00% in secondary schools . This last result is very important for us in kinesiology department because it tells us that the general state of our personnel working in their field is generally satisfactory for both our pupils and for us, but the percentages must be improved, particularly with the high percentage of grades „good“ in high school and „sufficient“ in elementary school. It indicates that there is room for improvement of the profession.
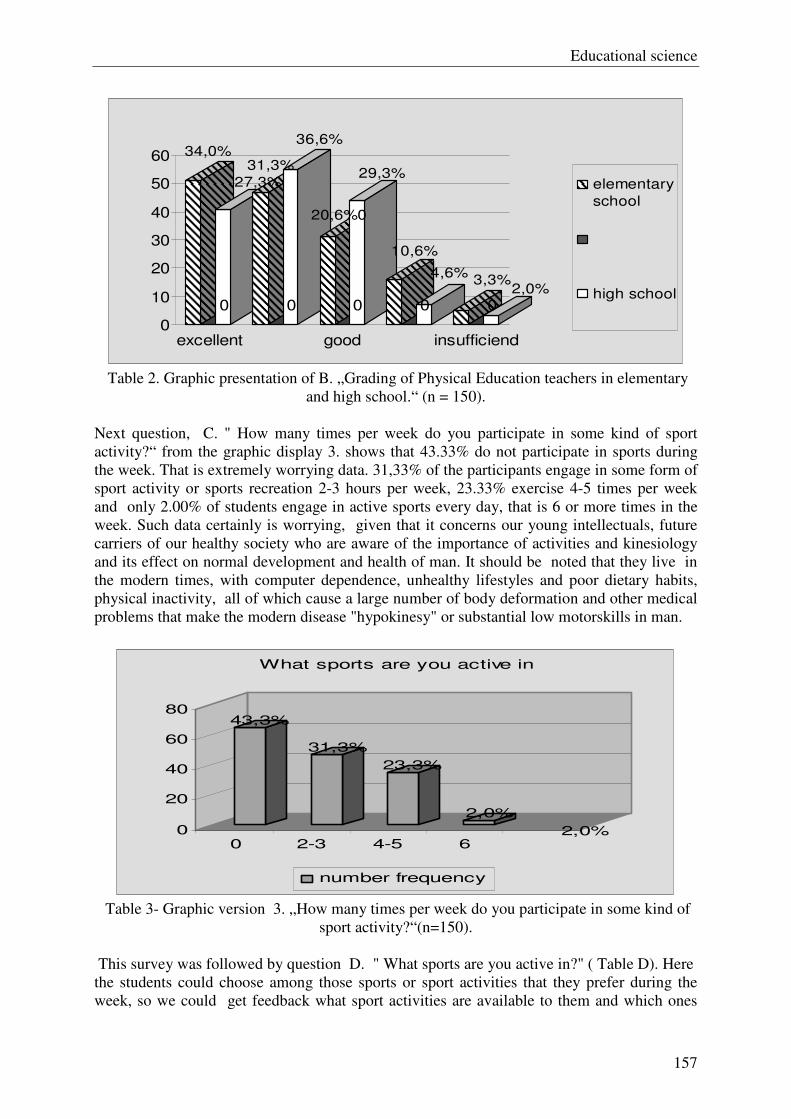
Educational science
157
0 0 0 0 0
0
10
20
30
40
50
60
excellent good insufficiend
elementary
school
high school
10,6%
34,0%31,3%
20,6%0
,6%
3,3%4,6%
29,3%
36,6%
27,3%
2,0%
Table 2. Graphic presentation of B. „Grading of Physical Education teachers in elementary
and high school.“ (n = 150). Next question, C. " How many times per week do you participate in some kind of sport activity?“ from the graphic display 3. shows that 43.33% do not participate in sports during the week. That is extremely worrying data. 31,33% of the participants engage in some form of sport activity or sports recreation 2-3 hours per week, 23.33% exercise 4-5 times per week and only 2.00% of students engage in active sports every day, that is 6 or more times in the week. Such data certainly is worrying, given that it concerns our young intellectuals, future carriers of our healthy society who are aware of the importance of activities and kinesiology and its effect on normal development and health of man. It should be noted that they live in the modern times, with computer dependence, unhealthy lifestyles and poor dietary habits, physical inactivity, all of which cause a large number of body deformation and other medical problems that make the modern disease "hypokinesy" or substantial low motorskills in man.
43,3%
31,3%
23,3%
2,0%
2,0%0
20
40
60
80
0 2-3 4-5 6
What sports are you active in
number frequency
Table 3- Graphic version 3. „How many times per week do you participate in some kind of
sport activity?“(n=150). This survey was followed by question D. " What sports are you active in?" ( Table D). Here the students could choose among those sports or sport activities that they prefer during the week, so we could get feedback what sport activities are available to them and which ones
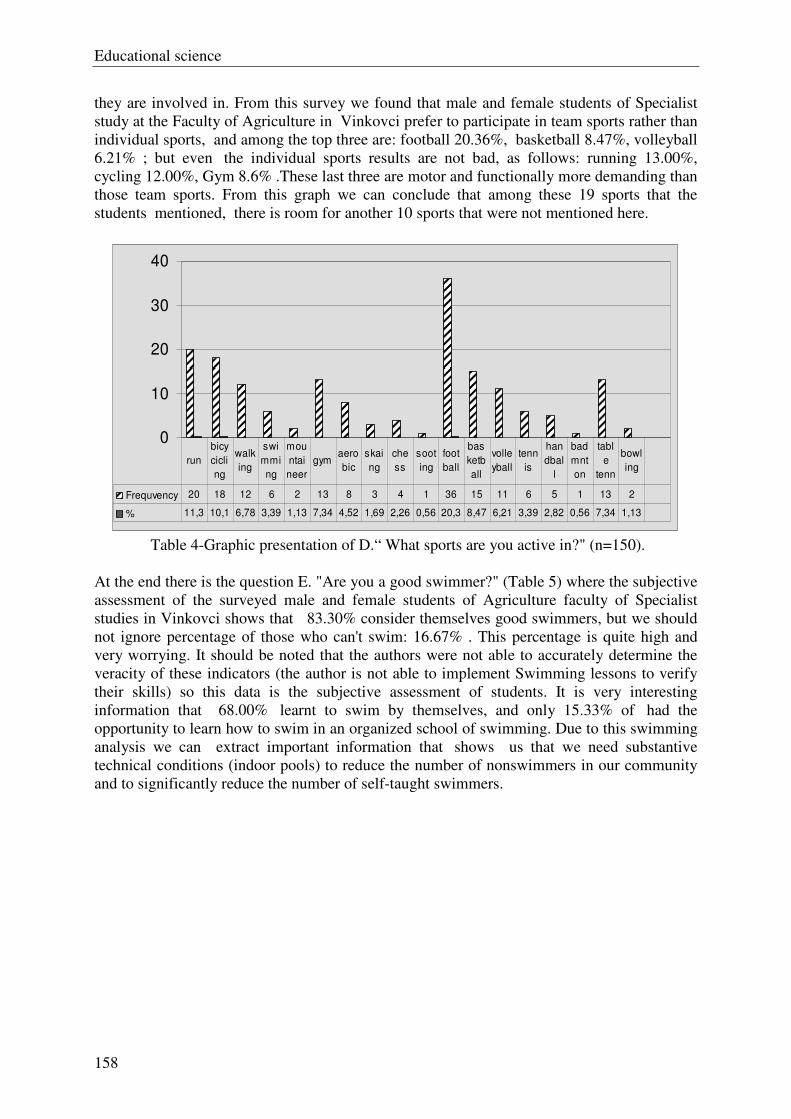
Educational science
158
they are involved in. From this survey we found that male and female students of Specialist study at the Faculty of Agriculture in Vinkovci prefer to participate in team sports rather than individual sports, and among the top three are: football 20.36%, basketball 8.47%, volleyball 6.21% ; but even the individual sports results are not bad, as follows: running 13.00%, cycling 12.00%, Gym 8.6% .These last three are motor and functionally more demanding than those team sports. From this graph we can conclude that among these 19 sports that the students mentioned, there is room for another 10 sports that were not mentioned here.
0
10
20
30
40
Frequvency 20 18 12 6 2 13 8 3 4 1 36 15 11 6 5 1 13 2
% 11,3 10,1 6,78 3,39 1,13 7,34 4,52 1,69 2,26 0,56 20,3 8,47 6,21 3,39 2,82 0,56 7,34 1,13
run
bicy
cicli
ng
walk
ing
swi
mmi
ng
mou
ntai
neer
gymaero
bic
skai
ng
che
ss
soot
ing
foot
ball
bas
ketb
all
volle
yball
tenn
is
han
dbal
l
bad
mnt
on
tabl
e
tenn
bowl
ing
Table 4-Graphic presentation of D.“ What sports are you active in?" (n=150).
At the end there is the question E. "Are you a good swimmer?" (Table 5) where the subjective assessment of the surveyed male and female students of Agriculture faculty of Specialist studies in Vinkovci shows that 83.30% consider themselves good swimmers, but we should not ignore percentage of those who can't swim: 16.67% . This percentage is quite high and very worrying. It should be noted that the authors were not able to accurately determine the veracity of these indicators (the author is not able to implement Swimming lessons to verify their skills) so this data is the subjective assessment of students. It is very interesting information that 68.00% learnt to swim by themselves, and only 15.33% of had the opportunity to learn how to swim in an organized school of swimming. Due to this swimming analysis we can extract important information that shows us that we need substantive technical conditions (indoor pools) to reduce the number of nonswimmers in our community and to significantly reduce the number of self-taught swimmers.
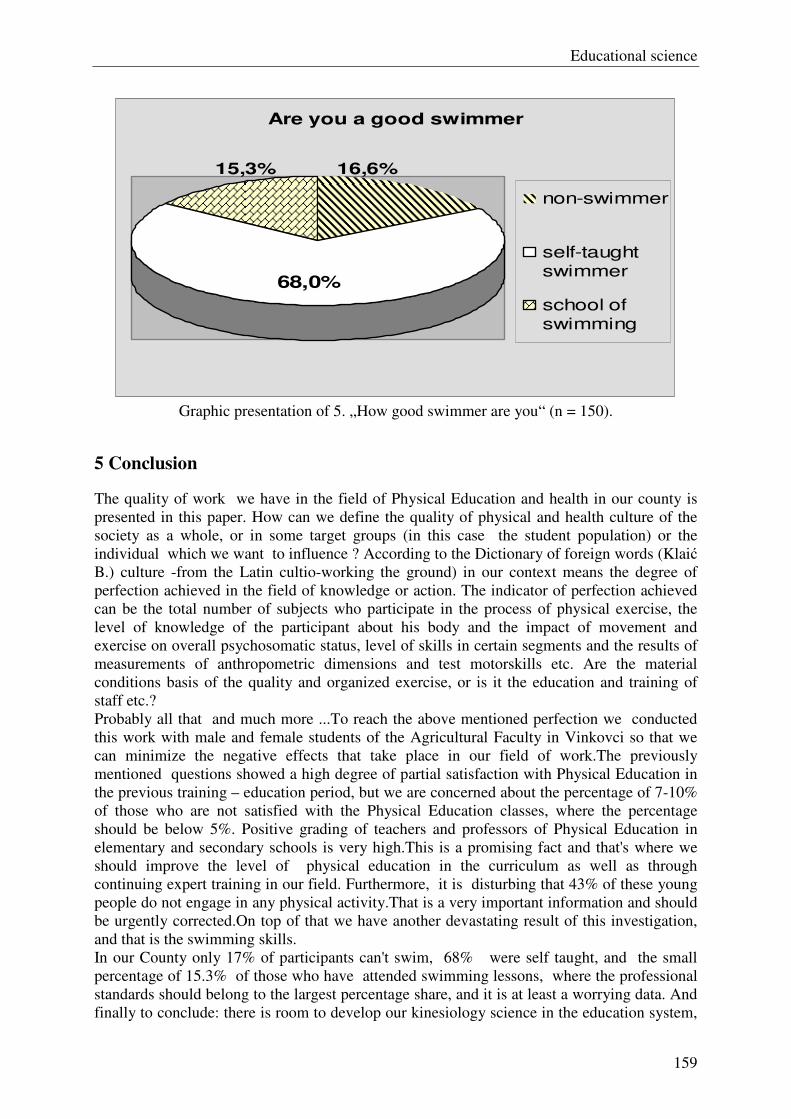
Educational science
159
Are you a good swimmer
non-swimmer
self-taught
swimmer
school of
swimming
68,0%
15,3% 16,6%
Graphic presentation of 5. „How good swimmer are you“ (n = 150).
5 Conclusion
The quality of work we have in the field of Physical Education and health in our county is presented in this paper. How can we define the quality of physical and health culture of the society as a whole, or in some target groups (in this case the student population) or the individual which we want to influence ? According to the Dictionary of foreign words (Klaić B.) culture -from the Latin cultio-working the ground) in our context means the degree of perfection achieved in the field of knowledge or action. The indicator of perfection achieved can be the total number of subjects who participate in the process of physical exercise, the level of knowledge of the participant about his body and the impact of movement and exercise on overall psychosomatic status, level of skills in certain segments and the results of measurements of anthropometric dimensions and test motorskills etc. Are the material conditions basis of the quality and organized exercise, or is it the education and training of staff etc.? Probably all that and much more ...To reach the above mentioned perfection we conducted this work with male and female students of the Agricultural Faculty in Vinkovci so that we can minimize the negative effects that take place in our field of work.The previously mentioned questions showed a high degree of partial satisfaction with Physical Education in the previous training – education period, but we are concerned about the percentage of 7-10% of those who are not satisfied with the Physical Education classes, where the percentage should be below 5%. Positive grading of teachers and professors of Physical Education in elementary and secondary schools is very high.This is a promising fact and that's where we should improve the level of physical education in the curriculum as well as through continuing expert training in our field. Furthermore, it is disturbing that 43% of these young people do not engage in any physical activity.That is a very important information and should be urgently corrected.On top of that we have another devastating result of this investigation, and that is the swimming skills. In our County only 17% of participants can't swim, 68% were self taught, and the small percentage of 15.3% of those who have attended swimming lessons, where the professional standards should belong to the largest percentage share, and it is at least a worrying data. And finally to conclude: there is room to develop our kinesiology science in the education system,
Educational science
160
swimming, recreation and sports in general and in popularization of kinesiology science. That is why these surveys have purpose and severity of the general responsibility of all segments of our community to have in mind and carefully address this issues.
References (Header style)
[1] Podvalej, L., Prot, F., Bosnar, K. (2000).. General mood students towards sport by a "typically female" faculty. In: Proceedings Papers 9th Summer School Teachers Croatian Republic of physical culture,24th-28th, June 2000.
[2] Andrijaševiæ, M., Bavèeviæ, T., Ciliga, D.,Paušiæ, J. (2005.) Participation in various activities in free time and subjective experience of health Students Split University, Kinesiology, Vol.37, No. 1st
[3] Caput-Jogunica, R.Jurkoviæ N. (2003).. 40 years of physical and health culture in the university of Zagreb Network. Zagreb: School books.
[4] Èuiæ, S., Berlot, S., Podvalej, L. (2000).. Some specificities in the teaching process of Physical Education in college. In: Proceedings of the 9th Summer School Teachers Croatian Republic of physical culture, 24th-28th, June 2000.
[5] Bosnar K., scratch, Z., Vukmir, V. (2006). Regular physical exercise disciples of high school 1.Hrvatski Congress of Applied Psychology, HPK, Zagreb.
[6] Bosnar, K. and Prot, F. (1999). Sports activities involving the Zagreb senior.Proceedings of the IV. Conference on sports Alps-Adriatic Rovinj.
[7] Duplanèiæ D., Mladineo M.Drašinac G. (2007). Current analysis of the situation in personal space experience in the sports activities of students, Messenger, no.12, Split.
[8] Findak, V., (2001.) Methods of physical and health education, School books Zagreb.
[9] Gošnik, J., Bunjevac, T., Sedar, M., Prot, F. STUDY, K. (2002.) Sport Experience of undergraduate students, Proceedings Book, 3rd ISC, Opatija.271
Author data
Mario Keskic: University J.J.Strossmayer in Osijek, Faculty of Agriculture in Osijek-Professional study Vinkovci, street D. H. Genscher 16B,32 100 Vinkovci,Croatia, E-mail: mario.keskic2 @vu.t-com.hr; or; [email protected] Hrvoje Sivric: Management, University of Applied sciences of Slavonski Brod, street dr. Mile Budaka 1, Slavonski Brod, Croatia, E-mail:[email protected]
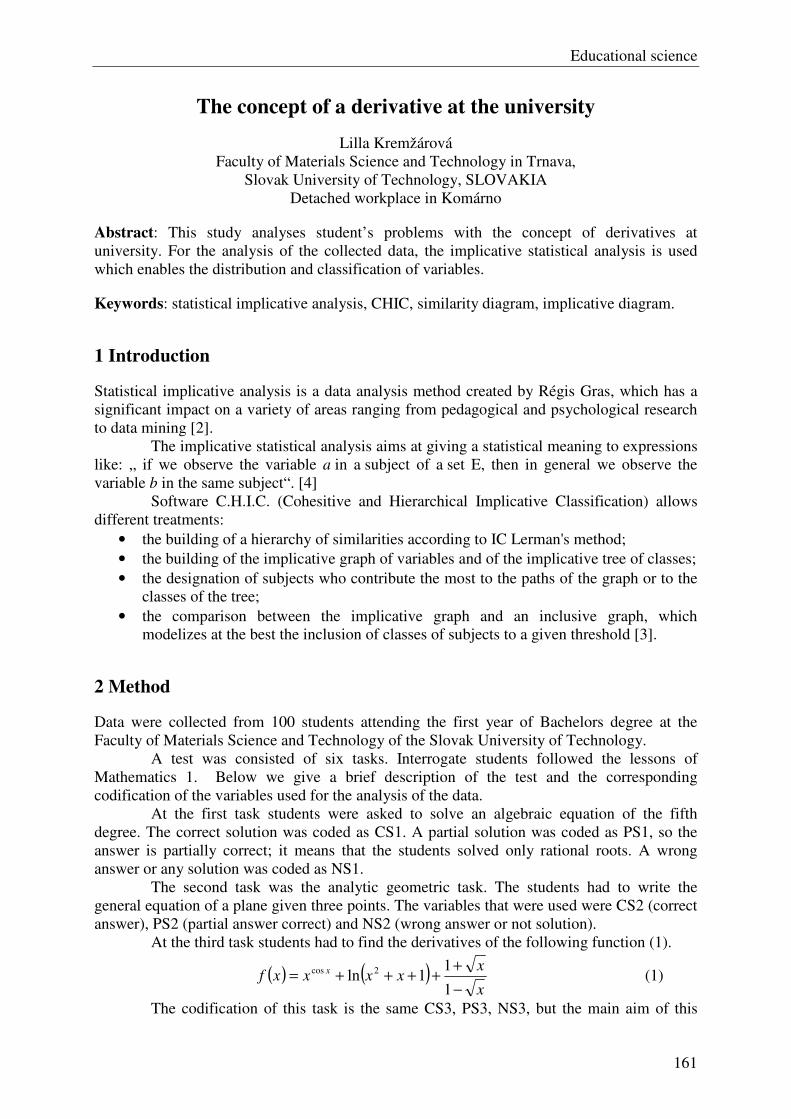
Educational science
161
The concept of a derivative at the university
Lilla Kremžárová
Faculty of Materials Science and Technology in Trnava,
Slovak University of Technology, SLOVAKIA
Detached workplace in Komárno
Abstract: This study analyses student’s problems with the concept of derivatives at
university. For the analysis of the collected data, the implicative statistical analysis is used
which enables the distribution and classification of variables.
Keywords: statistical implicative analysis, CHIC, similarity diagram, implicative diagram.
1 Introduction
Statistical implicative analysis is a data analysis method created by Régis Gras, which has a
significant impact on a variety of areas ranging from pedagogical and psychological research
to data mining [2].
The implicative statistical analysis aims at giving a statistical meaning to expressions
like: „ if we observe the variable a in a subject of a set E, then in general we observe the
variable b in the same subject“. [4]
Software C.H.I.C. (Cohesitive and Hierarchical Implicative Classification) allows
different treatments:
• the building of a hierarchy of similarities according to IC Lerman's method;
• the building of the implicative graph of variables and of the implicative tree of classes;
• the designation of subjects who contribute the most to the paths of the graph or to the
classes of the tree;
• the comparison between the implicative graph and an inclusive graph, which
modelizes at the best the inclusion of classes of subjects to a given threshold [3].
2 Method
Data were collected from 100 students attending the first year of Bachelors degree at the
Faculty of Materials Science and Technology of the Slovak University of Technology.
A test was consisted of six tasks. Interrogate students followed the lessons of
Mathematics 1. Below we give a brief description of the test and the corresponding
codification of the variables used for the analysis of the data.
At the first task students were asked to solve an algebraic equation of the fifth
degree. The correct solution was coded as CS1. A partial solution was coded as PS1, so the
answer is partially correct; it means that the students solved only rational roots. A wrong
answer or any solution was coded as NS1.
The second task was the analytic geometric task. The students had to write the
general equation of a plane given three points. The variables that were used were CS2 (correct
answer), PS2 (partial answer correct) and NS2 (wrong answer or not solution).
At the third task students had to find the derivatives of the following function (1).
( ) ( )x
xxxxxf x
−
+++++=
1
11ln 2cos (1)
The codification of this task is the same CS3, PS3, NS3, but the main aim of this
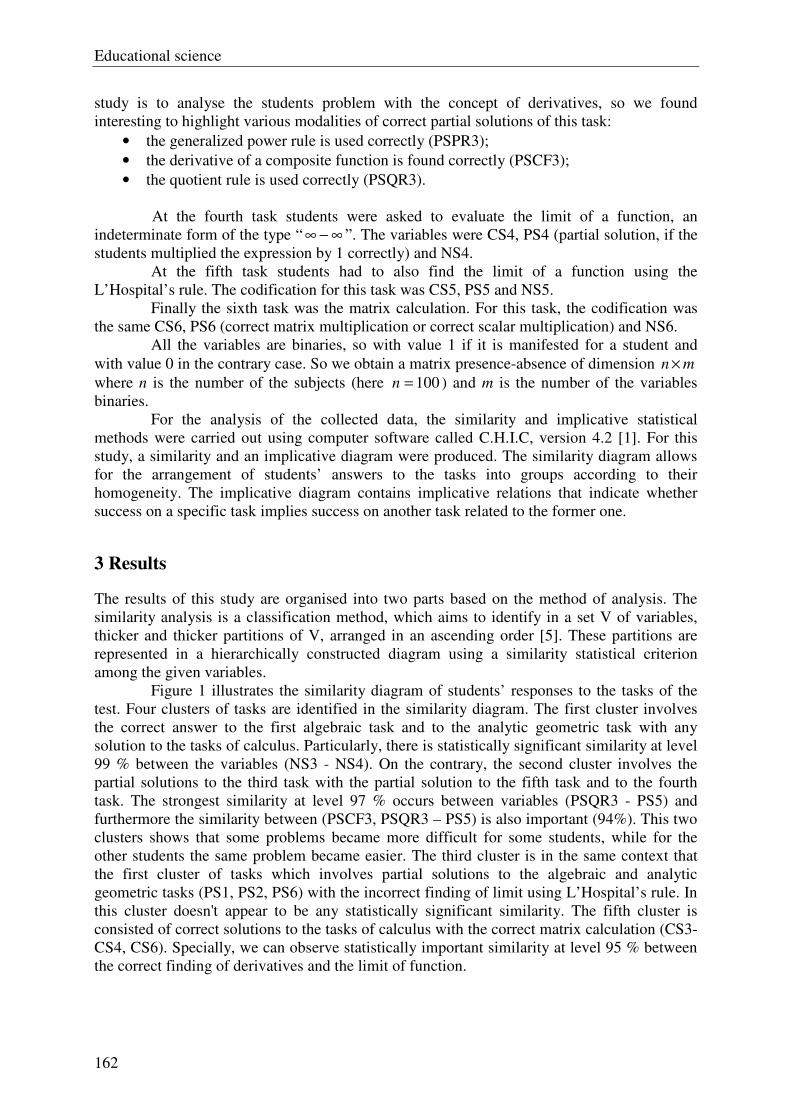
Educational science
162
study is to analyse the students problem with the concept of derivatives, so we found
interesting to highlight various modalities of correct partial solutions of this task:
• the generalized power rule is used correctly (PSPR3);
• the derivative of a composite function is found correctly (PSCF3);
• the quotient rule is used correctly (PSQR3).
At the fourth task students were asked to evaluate the limit of a function, an
indeterminate form of the type “ ∞−∞ ”. The variables were CS4, PS4 (partial solution, if the
students multiplied the expression by 1 correctly) and NS4.
At the fifth task students had to also find the limit of a function using the
L’Hospital’s rule. The codification for this task was CS5, PS5 and NS5.
Finally the sixth task was the matrix calculation. For this task, the codification was
the same CS6, PS6 (correct matrix multiplication or correct scalar multiplication) and NS6.
All the variables are binaries, so with value 1 if it is manifested for a student and
with value 0 in the contrary case. So we obtain a matrix presence-absence of dimension mn ×
where n is the number of the subjects (here 100=n ) and m is the number of the variables
binaries.
For the analysis of the collected data, the similarity and implicative statistical
methods were carried out using computer software called C.H.I.C, version 4.2 [1]. For this
study, a similarity and an implicative diagram were produced. The similarity diagram allows
for the arrangement of students’ answers to the tasks into groups according to their
homogeneity. The implicative diagram contains implicative relations that indicate whether
success on a specific task implies success on another task related to the former one.
3 Results
The results of this study are organised into two parts based on the method of analysis. The
similarity analysis is a classification method, which aims to identify in a set V of variables,
thicker and thicker partitions of V, arranged in an ascending order [5]. These partitions are
represented in a hierarchically constructed diagram using a similarity statistical criterion
among the given variables.
Figure 1 illustrates the similarity diagram of students’ responses to the tasks of the
test. Four clusters of tasks are identified in the similarity diagram. The first cluster involves
the correct answer to the first algebraic task and to the analytic geometric task with any
solution to the tasks of calculus. Particularly, there is statistically significant similarity at level
99 % between the variables (NS3 - NS4). On the contrary, the second cluster involves the
partial solutions to the third task with the partial solution to the fifth task and to the fourth
task. The strongest similarity at level 97 % occurs between variables (PSQR3 - PS5) and
furthermore the similarity between (PSCF3, PSQR3 – PS5) is also important (94%). This two
clusters shows that some problems became more difficult for some students, while for the
other students the same problem became easier. The third cluster is in the same context that
the first cluster of tasks which involves partial solutions to the algebraic and analytic
geometric tasks (PS1, PS2, PS6) with the incorrect finding of limit using L’Hospital’s rule. In
this cluster doesn't appear to be any statistically significant similarity. The fifth cluster is
consisted of correct solutions to the tasks of calculus with the correct matrix calculation (CS3-
CS4, CS6). Specially, we can observe statistically important similarity at level 95 % between
the correct finding of derivatives and the limit of function.
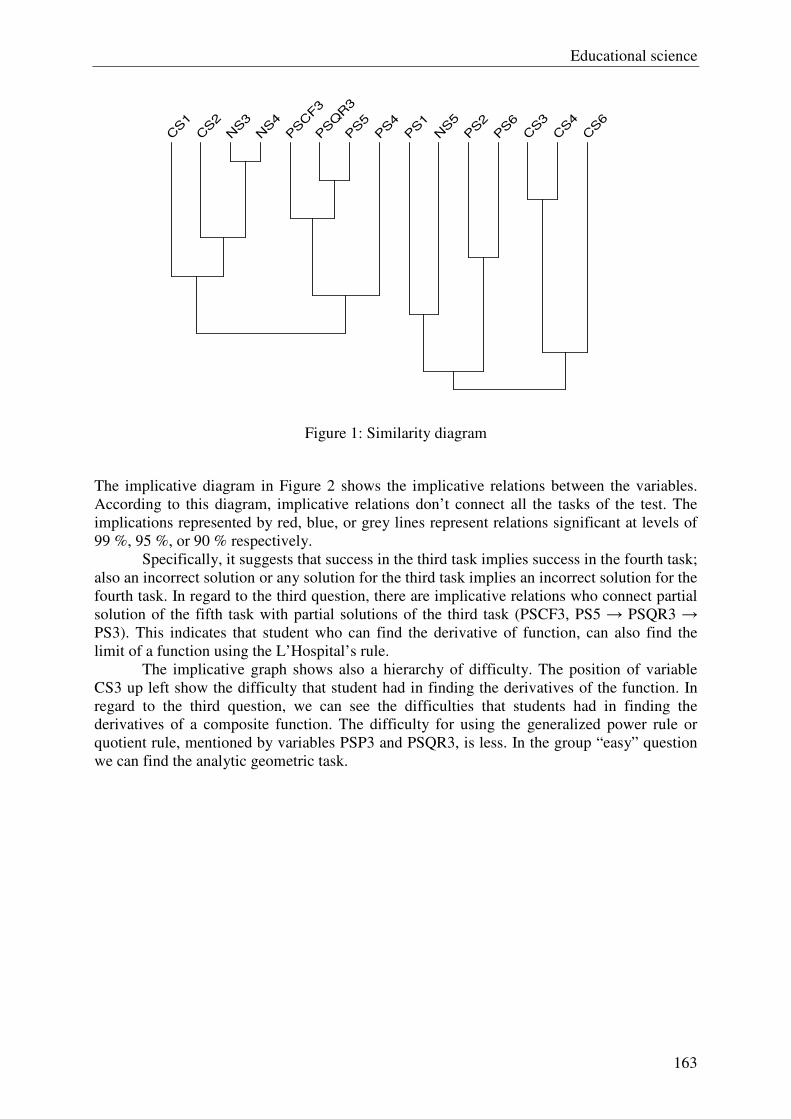
Educational science
163
CS1
CS2
NS3
NS4
PSCF3
PSQR3
PS5
PS4
PS1
NS5
PS2
PS6
CS3
CS4
CS6
Figure 1: Similarity diagram
The implicative diagram in Figure 2 shows the implicative relations between the variables.
According to this diagram, implicative relations don’t connect all the tasks of the test. The
implications represented by red, blue, or grey lines represent relations significant at levels of
99 %, 95 %, or 90 % respectively.
Specifically, it suggests that success in the third task implies success in the fourth task;
also an incorrect solution or any solution for the third task implies an incorrect solution for the
fourth task. In regard to the third question, there are implicative relations who connect partial
solution of the fifth task with partial solutions of the third task (PSCF3, PS5 → PSQR3 →
PS3). This indicates that student who can find the derivative of function, can also find the
limit of a function using the L’Hospital’s rule.
The implicative graph shows also a hierarchy of difficulty. The position of variable
CS3 up left show the difficulty that student had in finding the derivatives of the function. In
regard to the third question, we can see the difficulties that students had in finding the
derivatives of a composite function. The difficulty for using the generalized power rule or
quotient rule, mentioned by variables PSP3 and PSQR3, is less. In the group “easy” question
we can find the analytic geometric task.
Educational science
164
PS3
CS1
PS2
PSQR3
CS4
NS4PS6
PSCF3
CS2
CS3
NS3
PSPR3
PS5
Figure 2: Implicative diagram
4 Conclusions
This study analyses student’s problems with the tasks of calculus, mainly with the concept of
derivatives at the first year of Bachelors degree. For the analysis of the collected data, the
implicative statistical analysis is used which enables the distribution and classification of
variables, as well as the implicative identification among the variables or variable categories.
The results of this study show the student’s difficulties in finding the derivatives of a
function, as well as in finding the limit of a function using the L’Hospital’s rule. The study
also explored a hierarchy of difficulties in finding the derivatives of a function, in particular
finding the derivatives of a composite function, using the generalized power rule and using
the quotient rule have a difficulty in descending order.
The close similarity relation between students’ correct solutions for the algebraic and
analytic geometric tasks and incorrect solution or any solution for the tasks of calculus
indicates that students were more likely to solve the algebraic and analytic geometric tasks
rather than the tasks of calculus. This result shows the students unfamiliarity with the tasks of
calculus.
References
[1] A. Bodin, R. Couturier, R. Gras: CHIC: Classification Hiérarchique, Implicative et
Cohésitive - Version sous Windows – CHIC 1.2, Rennes, Association pour la
Recherche en didactique des Mathématiques (2000).
[2] R. Gras, E. Suzuki, F. Guillet, F. Spagnolo: Statistical implicative analysis, Theory
Educational science
165
and Applications, Springer (2007).
[3] R. Gras, P. Peter: From a cognitive complexity problem to an implicative model,
Actes de l'Intensive Programme Socrates/Erasmus 1998/1999, University of Cyprus, A
multidimensional approach to learning in mathematics and sciences, A. Gagatsis Ed.,
Intercollege press Cyprus (1999) 491-500.
[4] R. Gras, P. Peter, H. Briand, J. Philippé: Implicative Statistical Analysis, Proceedings
of the 5th
Conference of the International Federation of Classification Societies,
Springer-Verlag, 2, (1997) 412-419.
[5] I. C. Lerman: Classification et analyse ordinale des données, Dunod, Paris (1981)
[6] M. Modestou, A. Gagatsis: Students improper proportional reasoning: A result of the
epistemological obstacle of “linearity”, Educational Psychology, 27 (2007) 75-92.
[7] A. Panaoura, I. Elia, N. Stamboulides, P. Spyrou: Students structure for the
understanding of the axis reflective symmetry in mathematics, Acta Didactica
Universitatis Comenianae, Mathematics, 9 (2009) 41-62.
Author data
Lilla Kremžárová: Faculty of Materials Science and Technology in Trnava, Slovak University
of Technology, Detached workplace in Komárno. Petőfiho 2, 945 01 Komárno, Slovakia. E-
mail: [email protected]
Educational science
166
The navigable canal Danube-Sava role in the development of the
Croatia Anita Kulaš1, Maja Vretenar2, Sanja Knežević3
1 Management, University of Applied Sciences of Slavonski Brod, CROATIA 2 Management, University of Applied Sciences of Slavonski Brod, CROATIA 3 Management, University of Applied Sciences of Slavonski Brod, CROATIA
Abstract: The idea of building a canal which would connect two great Pannonian rivers, the Danube and the Sava, is almost two thousand years (from ancient Rome) old. This idea appeared and disappeared through the history depending on the political games and power of rulers, and every authority represented it as a fundamental issue of the agriculture, transport development and improvement of the living conditions and the survival of the people in these areas. As Croatia has become a sovereign state, this idea realized it. The construction of the Canal provides traffic connections of the region of Slavonia with the most commercial type of transport (water transport), next to simultaneously irrigation improvement, melioration and puts a real foundation for the development and improvement of the secondary and tertiary social and economic activities. The Canal represents a generator of the development in the segments of the transport, agriculture and processing industry. The Canal promotes employment, job creation in industries which would not existed without the Canal and with the growth of economic activity of the region, affects on the prosperity of the wider community. Canal encourages additional investment in infrastructural projects, such as the Port of Vukovar and the Port of Slavonski Brod, and the further development of the road and rail network.
Keywords: the Danube-Sava Canal, the river transport, Port of Vukovar, Port of Slavonski Brod, melioration.
1 Introduction
River transport is the transport of people, goods and information from one location to another, using the river transport infrastructure and superstructure, and all operations related to this way of transport. River transport infrastructure consists of “the fixed objects, devices and equipment that enable production of transportation services, regulation and the traffic safety, using the river superstructure.” [1]
River transport superstructure consists of all transport and transshipment means, using the river infrastructure they are used for the production services in river traffic. The commercial characteristics of the river traffic typically include mass transport, the speed of transportation, preservation and safety of the transport. The largest proportions of total transportation are rude, crude non-metallic minerals, petroleum and derivates, and cereals. River transport in the Republic of Croatia (hereinafter: RC) is a part of the European transport system. European trend diversion of goods is known especially for the bulk cargo on the inland waterways, because the river transportation is one of the most rentable and environmentally acceptable way of traffic. The RC is connected with its largest rivers: Danube, Drava and Sava, with the western, central and eastern Europe, and with combined traffic with the Adriatic Sea and with a rest of the Europe and the world.

Educational science
167
The Danube is an international river, like Drava, from its mouth, to the town of Osijek (23km). The remaining part are the interstate rivers: Drava and Sava. This wealth of the waterways is good predisposition for developing river traffic, but a potential that it offers, particulary in the economic terms, has not been exploited adequately.
2 Navigable canal Danube- Sava
The navigable canal Danube-Sava (hereinafter: Canal) will connect western and eastern Europe. The construction began at the end of October 2008. The canal will be long 61,5km and it will shorten the way to Europe by 417 km. The estimated value of the project is 4.5 billion kunas, and seven years long, and the total excavation of the canal construction will be about 50 million cubic meters. The following Figure 1.
Figure 1. Croatian inland waterways[2]
2.1 The basic documents for the canal construction
The multipurpose Danube-Sava Canal is planned in accordance with Strategic and Zoning Program of Croatia. Plan of areas with the special characteristics construction (hereinafter: Plan) was determined in the framework of the Zoning Program of Croatia. [3] The Plan was prepared in accordance with the Law of Zoning Planning. [4] Abstract and indicators of the Plan of areas with the special characteristics are defined in article 7, with the Regulation on the abstract, scale of map display, spatial mandatory indicators and standard surveys of spatial plans. [5]
The basic objectives of the spatial plan are: - Alignment of all functions of the canal corridor - The construction solutions for the conflict relationship elimination that will be created
after the build canal is finished

Educational science
168
- Determination of the optimal land purpose in the direct contact zone of the Canal - Defining measures to protect natural values and architectural heritage - Defining construction conditions and management space
In the construction plan were used spatial plans of cities/municipalities in which the canal passes.
2.2 The dynamics of the canal construction
There are 4 phases in the canal construction: Phase 1 is a function of ensuring the conditions for the irrigation of the agricultural area in the field Biñ - Bosutsko, and controlling the water regime of the areal and groundwater in the forest area – Spačva. In this phase canal construction on a planned route, from the river Sava to the junction with the river Biñ, will be made, which would provide water supply conditions from the river Sava in the main recipients in the broader area – Biñ and Bosut. Phase 2 is in a function of ensuring the conditions of navigation, of Vinkovci from the Danube and the water regime regulation of the large and small waters. In this phase it is realized, approximately 21 km of the future canal, in finite dimensions. Phase 3 is a function of extending the waterway from the city of Vinkovci to the village of Cerna. It performs full profile canal along the existing watercourse Bosut, Bazjaš and Biñ in a length of about 26 km. Phase 4 is a function of the final design of the waterway Danube-Sava. It is performed a full canal profile on a section of the first phase of works in a length of about 15 km and all remaining buildings planned in the final frame.
2.3 The aims and reasons for the canal construction
Multipurpose importance of the future canal is contained in its 3 main functions: 1. Irrigation 2. Navigation 3. Drainage The strategic objective is the irrigation the 33,050 ha of the agricultural land. Canal
navigation in the strategic transport policy of the Republic of Croatia should consider only through the accomplishment of a 570 km long traffic corridor Danube-Adriatic. The combined river-rail connection is realistic. It would eventually consist of 61.4 km of Canal (Vukovar-Šamac), 306 km channeled river Sava-Šamac to Sisak with 2 water levels (Županja and Jasenovac) and 200 km railway line Sisak-Zagreb-Rijeka. Water levels are located on the ten’s river Canal km from the mouth Danube and to 1,5 km from the mouth of the Canal into the Sava.
Another goal is the elimination of temporary and long-term uncontrolled floods of Spačva-Studva pool and the regulation of the water regime according to the forest vegetation. A low flow breeding is related to irrigation and ecology of settlements along the Canal. The Canal also provides the use of technological water.
Educational science
169
2.4 Canal influence on the environment
Systematic studies on the flora are not implemented on this area. There is not completed inventory on the fauna on this area. According to all available data from existing professional studies, permanently or temporarily there live a great number of threatened and endangered species – highlights, birds and fish at the area of the Spatial plan of areas with the specific characteristics.
The Canal constructions will undoubtedly affect the forest (forest biocenose or trees) and through that, the economic benefits and beneficial functions of forests. Canal constructions will exchange, in the total forest area in the Canal Corridor and beyond, the hydrological conditions, which will threw the increase/decrease in groundwater level, affect the individual forest stands and species. It is necessary to continue forest ecosystems monitoring, so that problems about such phenomen, and the measures to protect forest, could continuously be implemented. Based on the results of the observations, it will be possible to approach the concrete protection during the Canal construction and management. It will be necessary to cut a part of the existing forests, because of the Canal construction. But, considering the size of buildings and beneficial effects, this is not considered as a significant loss. Simulations off the future conditions knowledge of the presence of certain plant communities and knowledge of the optimal growth conditions of these communities, as previous research in the field, found that, if the Canal construction achieves optimum level and the groundwater regime, the positive effect on the forest will be far above the damage.
In order to protect forests, it is necessary to maintain the current water conditions of its underground and surface water, or to improve it, if the climate change becomes unfavourable for the forests. The named measures can be implemented in the hydro technical objects on the Canal. The forestry profession will set up the requirements based on objective data and projections. Those requirements must be accomplished.
3 The role and importance of the Canal in the economic development of the
Port of Vukovar and the Port of Slavonski Brod
Hereafter follows a short description of the Port of Vukovar and Slavonski Brod.
3.1 The Port of Vukovar
The Port of Vukovar during the war suffered a great destruction and damage, and because of that was not ready for the public traffic immediately after the peaceful reintegration of this area in a legal and economic order. In the period 1997-2000 the state through the Croatian Ministry of Maritime Affairs, Transport and Communications directly conducted the large investments, especially damage rehabilitation. The total amount of investments was around 5.5 million Euros. However, after the rehabilitation of the basic infrastructure facilities, it is realised that the competitiveness of the Port of Vukovar, as always – leading river Part in the Croatia (former Socialist Federal Republic of Yugoslavia) in international terms, will not be able to survive within the existing space and capacities.

Educational science
170
An interesting phenomenon occurred during the absence from the market. Participation of the general cargo increased significantly in the total transhipment. Today, the port of Vukovar, tranship a large quantity of general cargo. The 80s were record breaking years. Unfortunately, as the Port of Vukovar was the preferential port of the northern, industrialized parts of neighbouring Bosnia and Herzegovina, and this area was extremely difficult damaged during the war in that country. For this reasons, there is a lack of large quantities of coal, coke and steel that once brought up to one tranship million tons, every year. It was necessary to carry out in-dept market research and make a good Master plan for the port development, so that unhappen spontaneous investment in capacity. After that, started the production of study feasibility of individual terminals. A new Port facilities plan include 2 areas, so called – Part “East”, which continues to present – day cargo part. The part “West” is one the part of area “Borovo” whose performance will be related to the business of the free economic zones of town of Vukovar.
It is certain that such a plan includes terminals for transhipment of fertilizers bulk cargo (iron ore, coal, coke, bauxite, etc.) with an additional 2 portal cranes with the capacity of 16-32 tons (one of them was installed in October 2007). And a new indoor storage facilities construction for the general, as well as hygroscopic bulk cargo and container terminal.
3.2 The Port of Slavonski Brod
The project of the port area of Slavonski Brod was made in the “engineering office” in Zagreb. The ultimate goal of the Port Authority is visible from the conceptual design. It is necessary to take into account the effect of the future Danube-Sava Canal (from Vukovar to Slavonski Šamac in a distance of approximately 61.4 km). Its construction is a part of the Government strategy for transport. It is complete construction of the port area with the all necessary objects that will ultimately have a river part with the hinterland and the annual trans-shipment of goods one million and 500 thousand tons.
The future free zone has an area of one million and 2 hundred and eighty-six thousand square meters, and has already covered with the road and railway infrastructure, and with the existing current, drainage systems, water and telephone. Also, it is important to mention the construction of a 120 meters of vertical waterside for mooring all types of river nave and the trans-shipment of all types of cargo. Slavonski Brod is located at the intersection of the highway and a railway function routes which connect the Mediterranean and the East Europe, and represents the intersection of routes which connect the Central Europe and the south of the European continent. Convenient location on the river Sava and way out on the river Danube provides river traffic with the Central and Southern Europe as the most cost-effective form of goods and cargo transport. Zagreb and Osijek airports are close to Slavonski Brod, and it is an additional convenience for goods and services transport for this kind of business. The whole area is physically surrounded by lights and guarded by authorized persons. All vehicles and persons entering the port area are automatically insured. Realization of project of the port area Slavonski Brod would come to the inflow of foreign capital and launch new business capacity. Port area will have a duty free zone with its advantages in business. Projected area of the port area is 1.286.000m². The planned annual container transhipment of goods would be 1.5 million tons. Started construction of a 120m of vertical waterside will provide berthing the largest types of river boats and transhipment of all types of cargo, regardless of weather conditions. The whole area will be covered with highway and railway traffic, and with a fully supported infrastructure (power, telephone, water and sanitation). The port area will have an
Educational science
171
open storage space, and 30.000m² of the closed type, suitable for tranship and storage of containerized goods.
4 Conclusion
The construction of the multifunctional canal Danube- Sava is strategically the most important question of further river transport development in Croatia. It is therefore necessary to proceed with the preparation of construction works. Considering the multifunctional strategic facilities for the purpose of traffic (navigation), Agriculture and water management, it is necessary, its construction, to solve with the various sources of funding. Multipurpose canal is building in the length of 61.5km and follows the river waterways: Vuka, Bosut, Biñ, Konjsko. There are also 2 water stairs and a new port of Vukovar and 2 smaller parts in the Cerna and Vinkovci. The Canal construction will create real prerequisites for the development of the river and combined transport in Croatia on a transport corridor Danube-Adriatic. Specifically, the construction of the Danube-Sava and the proposed channelling the river Sava and Drava are generated extremely important assumptions in rational linking the Danube and Adriatic, and also internal waterway network in Croatia. The construction of river ports with concessions and co-financing, apropos, building and organising waterways, the state can attract domestic and foreign investors, or bank loans and investment funds for the construction and equipping the river ports.
References
[1] Zelenika, Ratko: Prometni sustavi (tehnologija, organizacija, ekonomika, logistika, menadžment), Ekonomski fakultet u Rijeci (2001). [2] Prostorni plan područja posebnih obilježja višenamjenskog kanala Dunav-Sava, Zavod za prostorno planiranje d.d. Osijek, Zagreb-Osijek, travanj 2007. [3] Odluka o donošenju Programa prostornog ureñenja Republike Hrvatske, Narodne novine br. 50/1999. [4] Zakon o prostornom ureñenju, Narodne novine br. 30/94., 68/98., 61/00., 32/02., 100/04. [5] Pravilnika o sadržaju, mjerilima kartografskih prikaza, obveznim prostornim pokazateljima i standardu elaborata prostornih planova, Narodne novine br. 106/98., 39/04., 45/04., 163/04.
Author data
Anita Kulaš: Management, University of Applied Sciences of Slavonski Brod. Dr. Mile Budaka 1, Slavonski Brod, Croatia. E-mail: [email protected]. Maja Vretenar: Management, University of Applied Sciences of Slavonski Brod. Dr. Mile Budaka 1, Slavonski Brod, Croatia. E-mail: [email protected]. Sanja Knežević: Management, University of Applied Sciences of Slavonski Brod. Dr. Mile Budaka 1, Slavonski Brod, Croatia. E-mail: [email protected].
Educational science
172
Az etikus globalizáció – mint pedagógiai probléma
Lesku Katalin Kecskeméti Főiskola Tanítóképző Főiskolai Kar
Környezeti és Testi Nevelési Intézet Összefoglalás: A korunkat jellemző globalizációs folyamatok határozott változást hoztak világszerte és hazánkban egyaránt. Az egyre jobban felgyorsuló élettempót az újabb és újabb technológiák szüntelen fejlődése, és a fejlődés hatására bekövetkező gazdasági és társadalmi változás okozza. Ebben az összetett társadalmi, sokszínű politikai világban az embereknek egyre nagyobb az igénye arra, hogy naprakész információkhoz, tudáshoz jussanak. A társadalom szerkezetét a tudásáramlás, -eloszlás és -feldolgozás határozza majd meg. Ebben a folyamatban átalakulnak a kulturális és társadalmi fogalmaink. Ez az átalakulás pedig egy pedagógiai paradigmaváltás alapjait kell, hogy jelentse. Előadásomban azt mutatom be, hogyan tud alkalmazkodni a pedagógiai módszertan a korunkat jellemző globalizációs folyamatok hatására bekövetkező társadalmi, gazdasági problémák értelmezéséhez, az információrobbanás következményeihez. Abstract: The globalization processes lead to a new kind of society both in Hungary and all over the World. The appearance of this new kind of society is caused by the development of new communication technologies and the economic and social changes that are rooted in the new communication culture. The borders of this society are drown by the efficiency of the providing of information, of the flow of communication, i.e. the society appears as some kind of information community. The idea of this new, so called information society can be regarded as a basis of the idea of so called ethical globalization. The aim of this paper is to show how we can harmonize the methodology of pedagogy with the new ethical interpretation of social and economic problems rooted in the globalization processes of the age of electronic media. Kulcsszavak: globalizációs folyamatok, fenntartható fejlődés, új embertudomány Keywords: globalization processes, sustainable development, new human science 1. Bevezetés
Az utóbbi évtizedekben lejátszódó globalizációs folyamatok hatására bekövetkező technológiai fejlődés, és a fejlődést kísérő gazdasági, társadalmi változások következményeként megszületett az emberiség jövőjét megkérdőjelező gondolat, amely arra hívja fel a figyelmet, hogy a természeti környezet és a megnövekedett szükségletek kielégítése közötti ellentmondás hosszú távon nem fenntartható. Ez a felismerés vezetett el a fenntarthatóság fogalomrendszerének kialakulásához.
Bár a fenntarthatóság vagy megengedőbb formában fenntartható fejlődés fogalma napjainkra a mindennapi nyelvhasználatban is igen széles körben elterjedt, a kutatási eredmények [1] mégis azt mutatják, hogy konkrét fizikai jelentéstartalommal párosul. Ez azonban azzal a következménnyel jár, hogy a tényleges döntési, cselekvési helyzetekben kevésbé érvényesülnek a „fenntartható szempontok”.
A szakirodalomban [2] olvasható definíciók alapján elmondhatjuk, hogy a fenntarthatóság gondolata többet jelent a természeti környezet megóvásánál. Olyan életvitelt, a szükségletek olyan mértékű kielégítését értjük alatta, amely nem veszélyezteti az utánunk jövő nemzedékek életfeltételeit. Értelmezésénél tehát társadalmi szempontokat is figyelembe kell venni. Ebből
Educational science
173
az következik, hogy a fenntarthatóság fogalma magában hordozza még a szükségletek és korlátozások fogalmát is. Legfőbb célja az emberek szükségleteinek kielégítése, amelyhez meglévő anyag-, és energiaforrások takarékos felhasználására; a megújuló energiaforrások használatának előtérbe helyezésére; a hulladékképződés; a környezetszennyezés mértékének csökkentésére; valamint ezeknek a környezeti szempontoknak az országhatárokon is túlnyúló alkalmazására van szükség. Mint ahogy a Brundtland jelentés szerzői is írták, a fenntarthatóság alapvetően tehát etikai probléma. [3] 2. Peter Singer és az etikai globalizáció megalapozása
A ’60-as, ’70-es években nemcsak a bennünket körülvevő környezettel kapcsolatos gondolkodásmód változott meg, hanem a filozófusok érdeklődése is alapvetően a gyakorlati, elsősorban etikai kérdések felé fordult. Ez az új attitűd új gondolkodásmód, az alkalmazott filozófia kialakulásához vezetett, amely a mindennapi életben előforduló problémákkal – etikai kérdések, környezeti tudatosság, a társadalmi igazságosságra való fokozottabb érzékenység – foglalkozik. Olyan ismeretek forrása, amelyek segítségével képesek vagyunk életmódunk tudatosabb alakítására, döntéseink, cselekvéseink meghatározására. Az irányzat legfőbb jellemzője, hogy az érvelésben gondolatkísérleteket használ. [4]
Ilyen gondolatkísérlet olvasható Peter Singer Famine, Affluence, and Morality [5] című munkájában. Ebben a tanulmányban a szerző a fizikai távolságnak az etikai döntéseinkben játszott szerepét kérdőjelezi meg. Érvelése kiterjeszthető, általános érvényű minden (gazdasági, társadalmi, környezeti) problémára. A tanulmány egyik fő gondolata az, hogy ha az egyén a saját vagyonát a szenvedés csökkentésére (éhínség leküzdésére) tudja használni, erkölcstelen nem megtennie azt. Singer gondolatkísérletében arra hívja fel a figyelmet, ugyanolyan erkölcstelen nem megmenteni egy sekély tóban fuldokló embert, aki a szemünk láttára fuldoklik, mint tőlünk a nagyobb földrajzi távolságra élőkön nem segíteni. [6] Érvelését a következő gondolatmenettel támasztja alá:
− „Azzal a feltételezéssel kezdem, hogy az élelmiszerhiányból, a hajléktalanságból és
az orvosi kezelés hiányából eredő szenvedés és halál rossz.
− Amennyiben hatalmunkban áll, hogy valami rossz megtörténtét megakadályozzuk,
anélkül, hogy ezzel valami morálisan összevethető fontosságút föl kellene
áldoznunk, akkor morálisan meg kell tennünk.” [7]
Singer szavai azt közvetítik, hogy az embereknek úgy kell viselkedniük, hogy megakadályozzák a rossz bekövetkezését, illetve elősegítsék a jó dolgok megvalósulását. Ugyanakkor hangsúlyozza, mindezt olyan mértékben kell megtenniük, hogy közben nem mondanak le morális szempontból valami hasonlóan fontos dologról.
Első olvasásra úgy tűnik, mintha a filozófus gondolatmenete két ponton hiányosságra utalna. Egyrészt nem tesz különbséget a közelség és távolság között. Véleménye szerint a tapasztalat azt mutatja, hogy a közelünkben élőknek hamarabb segítünk, de ez nem ment fel bennünket az alól, hogy ha módunkban áll, a messzebb lakóknak is segítsünk.
Másrészt Singer azt is megfogalmazza, hogy nincs különbség azon esetek között, amikor az egyén az egyedüli, aki segíthet, vagy ő csak egy a sok embertársa közül. Ebből az következik, hogy a megelőzhető rossztól való távolságunk, és ehhez a rosszhoz képest a hozzánk hasonló helyzetben lévő emberek száma sem csökkenti a felelősségünket, a kötelességünket a rossz bekövetkezésének megelőzésében, hatásainak enyhítésében. [8]
A fenti okfejtés eljuttat a tanulmány kulcsmondatához, amely szerint: „A morális
szempont megköveteli, hogy saját társadalmunk érdekein túl tekintsünk. … Morális
szempontból, a társadalmunkon kívüli milliók megmentése az éhhaláltól olyan norma, amelyet
Educational science
174
társadalmunkban legalább olyan kényszerítőnek kell tartani, mint a magántulajdon
védelmét.” [9] Ezen a ponton válik általános érvényűvé Singer üzenete, hiszen kimondja, hogy minden
egyéni cselekvésnek hosszú távon, az individuumon túlmutató, globális következményei vannak, azaz a „Gondolkodj globálisan, cselekedj lokálisan!” elv etikai megfelelőjét fogalmazza meg.
Napjaink fogyasztói társadalmát azonban még nem ez a gondolkodásmód jellemzi. Túlzott fogyasztásra, nem pedig az alapvető szükségleteink kielégítésére vagyunk ráhangolva. Gyakran előfordul, hogy felesleges dolgokat, új ruhát, új autót, a kényelmünket növelő árucikkeket vásárolunk meg, mert divatosak. Azért járunk autóval, mert az gyors és kényelmes, nem úgy, mint a zsúfolt tömegközlekedési eszközök. Nem gyűjtjük szelektíven a hulladékot, mert azt a messzebb lévő gyűjtőkbe kell elvinni. A legnagyobb problémát az okozza, hogy ezek mind-mind olyan cselekedetek, amelyeket jó megtenni, de semmilyen törvény, szabályozás nem bünteti, ha nem tesszük meg. Általában két kérdés jut ilyenkor az eszünkbe. Először is tehetünk-e egyéni szinten valamit, hogy a globális környezeti problémák bekövetkezését megelőzzük, hatásait mérsékeljük, vagy csak a „sok kis rossz” adódhat össze egy nagy problémává? Másodszor, miért kíméljük cselekedeteinkkel a bennünket körülvevő környezetet, ha embertársaink sem teszik ezt? Ez a fajta érvelés jó magyarázat a cselekvés elmulasztására, pedig legtöbb globális probléma, mint a szegénység, a túlnépesedés, vagy akár a környezetszennyezés, olyan, amelyben szinte mindenki egyenlően érintett. Ha ezt elfogadnánk, és ennek megfelelően cselekednénk, életünk, társadalmunk, világunk alapvetően megváltozna. A környezetért érzett aggodalom, a környezeti katasztrófák bekövetkezésétől való félelem nem hozná felszínre azt a gondolatot, hogy az ember jelenléte a Földön szükségszerűen saját életfeltételeinek elpusztítását jelenti. [10]
Az emberek többsége azonban ma még közömbösen viselkedik az önmagán, saját szűkebb környezetén túlmutató, s talán az emberiség fizikai túlélését is veszélyeztető globális problémák iránt. Ezt nehezíti az is, hogy olyan mértékű változásokról beszélünk, amelyeket még azok sem vállalnak fel, akik felismerik a jelenlegi életmódjukban rejlő veszélyeket, illetve ha eljutnak a felismerésig, cselekvésük szembeütközik a korlátlan gazdasági növekedést támogató társadalmi rendszerrel.
Ahhoz, hogy az emberek döntéseikkel, tevékenységeikkel megakadályozzák a jövőbeli természeti katasztrófák bekövetkezését, hatásait csökkentsék, szokásaikat, jelenlegi életvitelüket, illetve alapvetően gondolkodásmódjukat kell átalakítaniuk. A környezeti problémákat morális ügyként kell értelmezniük, és a maguk globális teljességében kell látniuk. Felül kell írniuk a politikai cselekvések által kijelölt határokat, az egyes régiók problémáit kiemelni a lokális kulturális közegükből, hogy azután globális összefüggések rendszerében lássák azok lényegi elemeit. [11] Nem azért kell bizonyos cselekedeteket megtenniük, mert ez elvárás, hanem azért mert felelősséggel tartoznak a jövő generációi iránt. 3. Új embertudomány, mint megoldási lehetőség
A XXI. században megfigyelhető globalizáció nemcsak a gazdaságra, és a társadalomra
fejt ki negatív hatásokat, hanem – mint ahogy a fentiekben olvasható – a környezeti egyensúlyt is megbontja. Gondoljunk csak az emberiség olyan nagymértékű termelő- és fogyasztó tevékenységére, amely egyrészt környezetszennyező, másrészt meg nem újuló nyersanyagforrások kimerüléséhez, az erdők pusztulásához, a hőmérséklet emelkedéséhez, a víz tartalékok apadásához vezet.
Az egyes előrejelzések is „arra utalnak, hogy a természet erőforrásainak és
szolgáltatásainak jelenlegi használata máris meghaladja a Föld hosszú távú eltartó-
képességének kapacitását. … Ha a Földön mindenki ugyanolyan ökológiai színvonalon élne,
Educational science
175
mint az észak-amerikaiak, akkor a műszaki fejlettség mai adottságai mellett három Földre
lenne szükségünk, hogy kielégítsük a teljes anyagigényt.” [12] Az ökológiai lábnyom kiszámítása, a biológiai kapacitással való összehasonlítása azt
mutatja, hogy a gazdasági fejlődés fenntarthatóságának küszöbét már a XX. században átléptük. Az életmódunk következményeként jelentkező környezetszennyezés, a környezet pusztítása végső soron a Föld életképességét veszélyezteti. A XXI. század elejére tehát bizonyossá vált, hogy a világméretű katasztrófát csak egy, az egész világot átfogó gazdasági, társadalmi és technológiai változás akadályozhatja meg. Erre pedig csak akkor van lehetőség, ha az emberi alapértékek és attitűdök új etikai normák jegyében átalakulnak, gyökeresen új alapokra helyezve az ember és természet viszonyát. [13]
„Nemcsak arra van tehát szükség, hogy a problémákkal foglalkozzunk, de ennél sokkal
fontosabb, hogy gondolkodásunkat fordítsuk helyes irányba: lássuk (a problémák)
összefüggéseit, és felismerjük egy új, a fenntarthatóság értékrendjében gyökerező irány
kifejlesztésének alapvető szükségességét.” [14] De vajon megszülethet-e egy olyan új etikai gondolkodás, amelynek jegyében a
globalizálódó világ embere képes saját természeti és társadalmi környezetével kialakított kapcsolatát, és azáltal a gazdasági fejlődés fenntarthatóságát megkérdőjelező életmódját alapjaiban megváltoztatni? McLuhan [15] „globális falu” eszméje támogatja az említett etikai gondolkodás kialakulását. A kommunikációs forradalom eredményeként létrejövő „globális falu” ugyanis a határvonalakat megszünteti, és egyetlen információs közösségként működve segíti a globalizáció folyamatát kísérő negatív fejlemények kiküszöbölését. Ezt a globális párbeszédre épülő tudományközi megközelítési módot a szakirodalom [16] embertudománynak nevezi.
Fromm [17] szerint ez az embertudomány a globális problémák értelmezését, a globalizáció negatív hatását csökkentő alternatív életmód kialakítását, valamint a korunkat jellemző fogyasztói magatartás emberi létünket pusztító, káros következményeinek a felszámolását segíti. Az alábbi kérdéseket vizsgálja:
− Hogyan válthatja fel a végtelen gazdasági növekedés napjainkban is uralkodó szemléletét a korlátozott növekedés elve?
− Hogyan tehető olyan mértékűvé a technikai fejlődés, hogy az ne veszélyeztesse az ember létét?
− Hogyan teremthetők meg annak a jó minőségű életformának a feltételei, amely nem a minden határon túl növő fogyasztásra, az egyre növekvő komfortigények maximális kielégítésére ösztönzi az embereket?
− Hogyan terjeszthető ki az egyéni kezdeményezés lehetősége a gazdaság területéről az élet más területeire?
Az ilyen és az ezekhez hasonló problémák egyértelmű megfogalmazásával válik Fromm
szerint az új embertudomány egy új etika, az etikus globalizáció alapjává. Egy olyan alkalmazott filozófia, amely a XXI. század emberének létét érintő kérdésekkel általános fogalmi keretek között foglalkozik, és a filozófiai mélységű embermagyarázatból kiindulva egyúttal a mindennapi gyakorlatot érintő útmutatást ad a globalizálódó világ viszonyai közötti eligazodáshoz.
Fromm gondolatait megpróbálja a közvetlen és közvetett társadalmi, természeti környezetükre alkalmazni, ezért az általa embertudománynak nevezett alkalmazott filozófiai kutatások alkalmasak a globalizáció problematikájának, a globalizálódást kísérő gazdasági, társadalmi, környezeti, politikai és etikai kérdéseknek, a tudományos és technológiai változások társadalmi következményeinek vizsgálatára. A filozófiai kutatások azonban csak
Educational science
176
az elméleti alapját teremtik meg gondolkodásmódunk, szokásaink, életvitelünk átalakításának. A tényleges változáshoz ennél többre, gondolatainak, döntéseink gyakorlatban való alkalmazására is szükség van.
Mivel általános tényként fogadható el a „mindig tanítunk, mindig tanulunk” elv, így minden felnőttnek, de különösen nekünk, pedagógusoknak jelentős szerepünk van abban, hogy a felnövekvő generációt úgy neveljük, szokásait úgy alakítsuk, hogy mindennapi döntéseiket a meglévő környezeti/ökológiai ismereteik mellett az etikai szempontok is befolyásolják. E célok megvalósítását a konstruktív ismeretelmélet és a rá épülő tanulási-tanítási stratégiák azáltal segítik, hogy a tanulási folyamatban a megismerő, azaz a tanuló aktív befogadóként jelenik meg. Nemcsak reprodukálja, hanem meg is teremti az ismereteket, illetve ezzel egyidejűleg egy életformát, viselkedési formát sajátít el. Mivel a környezetvédelem, az ebből kinövő környezeti nevelés, fenntarthatóságra nevelés olyan fogalomkört jelent, ahol az alapfogalmak, az ismeretek megszerzése mellett ugyanolyan fontos az ezekre épülő attitűd, magatartás-, és viselkedésforma, az aktív részvételnek, a cselekvésnek kiemelkedő a szerepe. 4. Befejezés
Az emberiség évezredek óta tartó fejlődését napjainkban egy megtorpanás jellemzi. Először érezzük úgy, hogy a technikai fejlődés, a gazdaság, a környezet és a társadalom szerkezetében bekövetkező változások hosszú távon nem alkalmasak megnövekedett szükségleteink kielégítésére. Gondoljunk csak arra, hogy olyan mértékben használjuk a rendelkezésre álló nyersanyag-, és energiaforrásokat, amely tartalékaink elfogyasztását, felélését eredményezi. Eközben a rohanó életmódunkkal együtt járó tevékenységeink globális környezeti problémák kialakulásához vezetnek. Ennek elkerülése érdekében került bevezetésre a fenntarthatóság, a fenntartható fejlődés fogalma.
Napjainkban a fenntarthatóság egyik közismert szlogenje a „Gondolkodj globálisan, cselekedj lokálisan!” mondat, amely azt a jelentéstartalmat hordozza magában, hogy a konkrét, közvetlen környezetünkben végzett cselekvéseink hatással vannak a tőlünk földrajzilag és időben egyaránt távol lévő globális környezetünkre.
Ennek az elvnek az etikai megfelelőjét fogalmazza meg Peter Singer Famine, Affluence,
and Morality című munkájában, ahol arra hívja fel a figyelmet, hogy sem a távolság, sem az, hogy mások is vannak a környezetünkben nem ment fel bennünket bizonyos cselekvések elvégzése alól. Az emberiség saját társadalmi érdekein való túllépés erkölcsi fontosságát hangsúlyozza, amit az egyéni cselekvések hosszú távú, az individuumon túlmutató, globális következményeivel magyaráz.
Mivel az emberek fogyasztói magatartásának hatására a természet az értékmentes emberi manipuláció tárgyává vált, [18] elkerülhetetlen az emberek gondolkodásmódjának, életvitelének megváltoztatása, az etika kiterjesztése, életfeltételeink, környezetünk, Földünk megvédése érdekében. Erich Fromm embertudománynak nevezi azt az új humanista tudományt, amely egy alternatív életformát, felfogást kínál a globalizáció eredményeként létrejövő gazdasági, társadalmi problémák értelmezésére, negatív hatásainak kiküszöbölésére. Ebben a folyamatban szerepet játszanak a szülők, a pedagógusok, a megfelelő értékeket képviselő média és a cselekvési teret meghatározó politika résztvevői egyaránt. Különösen nagy szerep hárul felnőttekre, (kiemelten) a pedagógusokra, mert ők a jövő generációk neveléséért felelősek.
Educational science
177
Irodalomjegyzék [1] Havas P.: A fenntarthatóság pedagógiai elemei. In: Új Pedagógiai Szemle, 2001/09. 3.
15. o. Lesku K.: A fenntarthatóság mint nevelésfilozófiai probléma, ME Kiadó, Miskolc, 2010.
[2] Our Common Future. WCED. Oxford University Press.Oxford – New York, 1987. Daly, H.: Steady-state Economics. Island Press, Washington D.C. 1991.
Transition to Sustainability. Világ Tudományos Akadémiáinak Nyilatkozata, Tokió, 2000. Kindler J.: Jóléti válság, szegénység és globalizáció. In: Pálvölgyi T. – Nemes Cs. – Tamás Zs. (szerk.): Vissza vagy hova. Útkeresés a fenntarthatóság felé Magyarországon. Tertia Kiadó, Budapest, 2002. 46-53. o. Fleiser T.: Innováció, növekedés, kockázat. In: Bulla M. – Tamás P. (szerk.): Fenntartható fejlődés Magyarországon: Jövőképek és forgatókönyvek. Stratégiai kutatások – Magyarország 2015. Új Mandátum Kiadó, Budapest, 275-284. o.
[3] Our Common Future, Id. kiad., 308. [4] Nemes L.: A bioetika három fajtája. In: Fundamentum. 2006/1. szám, 5-22. o. [5] Singer, P.: Famine, Affluence, and Morality. Philosophy and Public Affairs, Spring,
1972. 229-243. o. [6] Singer, P. honlapja, http://www.princeton.edu/~psinger/ [7] Singer, P.: Éhség, bőség, moralitás. In: Iskolakultúra. 2007/3. szám, 74. o. [8] Uo., 73.-83. o. [9] Uo., 77. o. [10] Lesku K.: A környezeti nevelés gyakorlata a Kecskeméti Főiskola Tanítóképző
Főiskolai Karán. In: Acta Beregsasiensis, 2009/1. 171-182. o. [11] Ferenczy von J. – Szécsi G.: Dialógus. Az emberiség anyanyelve. Kecskemét-
Budapest Axel-Springer Kiadó, 2004. [12] Meadows, D. – Randers, J. – Meadows, D.: A növekedés határai harminc év múltán.
Kossuth Kiadó, Budapest, 2005. [13] Ferenczy von J. – Szécsi G.: Dialógus. Az emberiség anyanyelve. Id. kiad. [14] Wheeler, K. A. – Bijur A. P. (szerk.) A fenntarthatóság pedagógiája. A remény
paradigmája a XXI. század számára. Körlánc Egyesület, Kecskemét, 2001. [15] Molinaro, M. – McLuhen, C. – Toye, W. (szerk.): The Letters of Marshall McLuhan.
New York, Oxford University Press, 1987. [16] Fromm, E.: To Have or to Be? A new Blueprint for Mankind. Id. kiad.
Ferenczy von J. – Szécsi G.: Dialógus. Az emberiség anyanyelve. Id. kiad. [17] Fromm, E.: To Have or to Be? A new Blueprint for Mankind. Id. kiad. [18] Aldo, L.: A Sand County Almanac, Id. kiad. Szerző Lesku Katalin: Környezeti és Testi Nevelési Intézet, Tanítóképző Főiskolai Kar, Kecskeméti Főiskola. 6000 Kecskemét, Kaszap u. 6-14, Magyarország. E-mail: [email protected]

Educational science
178
Teachers Sharing and Creating Knowledge on the Internet
Fruzsina Lukács1, Lilla Koltói
2
1Faculty of Psychology, Szent István University, Hungary 2Kecskemét College Teacher Training Faculty, Hungary
Abstract: The issue of teachers sharing and creating knowledge on the Internet is a new field
in the research of knowledge management (KM). This study reviews the current literature
about teachers sharing and creating knowledge on the Internet. As one of the most important
factors of knowledge- sharing is the propensity to do so, the study also gives a detailed review
on the role of interpersonal trust among teachers using the Internet, as well as, the different
motivations that can lead to teachers sharing their expertise and knowledge with each other
using the Internet. Practical implications for increasing the effectiveness of the Internet in
teachers’ knowledge management are included.
Keywords: teachers’ knowledge-sharing, online professional community, motivation factors
1 Introduction
Teachers are often regarded as the source of knowledge and therefore they are often viewed as
experts of knowledge management. Knowledge management (KM) is an established
discipline since 1991 [8]. The research of KM can be linked to different areas of discipline;
with a broad range of topics. Knowledge is not just a transfer of information but also a social
phenomenon which is affected by a lot of factors, therefore knowledge management deals
with both individual knowledge and ‘social’ knowledge that is embedded in organizational
practice or processes. Schools work a bit like
enterprises: they develop knowledge from their operation, and they also face the difficulties of
organisational knowledge management, e.g.: distribution, storing and reuse of knowledge [6].
Sharing and creating online knowledge, however, have some advantages for teachers: they
have the freedom of evaluating the sources they want to use, they can have access to
colleagues’ opinions and they can develop some important competency, e.g.: analysis,
providing and accepting feedback [6].
The promotion of information technology does not necessarily lead to the success of
KM practice. Although extracting and storing knowledge might be the most frequently carried
out tasks with computers, these are only ‘basic’ methods while information technology can
cope with applications, that are much more complex and interactive (e.g. intranets, chat
rooms, blogs, etc.). On the other hand even the later and more complex applications are bound
to fail in the service of KM, if the teachers are impaired in or not willing to use them. This is
why the following sections deal with what is needed on the part of the teachers for engaging
in knowledge-sharing via Internet and what can be said about the practice of Internet-based
knowledge management based on research so far.
2 Professional Virtual Communities for Teachers
To sustain continuous professional development teachers have to engage in both
formal and informal knowledge sharing. Formal knowledge sharing has been criticized for
having the potential to result in codified learning, while participating in an informal
knowledge sharing community can be helpful to have positive changes in teachers’ attitudes,
skills, behaviour [3].
Educational science
179
The online professional communities are mostly informal in the sense of the anonimity
and voluntary participation of their users. The members of professional communities share
common values and norms, reflect critically to each other, discuss professional topics, have
common interests and work collaboratively to achieve common aims. The characteristics of
an online virtual community is described by Lee: the community works in the cyberspace, the
activities of the community are enabled by IT tools, the topics of the community are
suggested by the participants, the participants build up their relationship by communication
and interaction [7].
3 Online interpersonal trust formations among teachers
Rotter [9] defines interpersonal trust as expectancy held by an individual that “the
word, promise, verbal or written statement of another individual can be relied upon”. If
another individual is being recognized as reliable, people will be more willing to engage in
social exchange in general and cooperative interactions in particular. Interpersonal trust
traditionally is formed in face-to-face interactions. In physical settings we have several factors
guiding us about the other persons’ reliability such as: predictability, dependability, faith,
ability, benevolence, and integrity of community members [2]. The virtual setting however
gives no social clues and creates a sense of social distance which makes building trust
towards one another harder. Some researchers argue that Internet users do not live in a virtual
reality but they rather build links to their everyday life and practices in the physical setting.
Others suggest creating some presence of the physical context (e.g. annual meetings) to help
the formation of trust among fellow online community members. It is also a known fact that
existing organizational norms, the quality of relationship with colleagues, and institutional
mechanisms usually have a major effect on online activity and performance. On the other
hand this effect is not one-sided. The opinions and resources provided by online community
members can have an impact on organizational behaviour, as well.
Teachers are expected to constantly improve their technical skills as well as being up-
to-date in their subject area. Zahner, therefore, argues that online KM fulfils teachers’ needs
by giving opportunity to share resources, ideas, expertise and experience in online
discussions. At the same time Vance sheds light on a mechanism that can hinder online
knowledge-sharing: in individual teaching practice teachers have a sense of autonomy and
because of this notion they feel both reluctant to intrude upon someone else and sensitive to
the risk of rejection by other teachers. Little’s research gives further evidence that teachers in
communities of practice usually protect their boundaries by only giving advice when directly
asked to do so and by preferring to read passively rather then engaging in a discussion. [11]
Some other studies suggest that the difficulties of online knowledge management may
involve poor understanding of new organisational and cultural issues [12], lack of time [6],
negative attitudes to new IT tools [1], little experience using IT tools [5] and teachers’ selfish
attitude [3].
Young and Cheng [12] investigated the interplay between the physical and virtual
social contexts during a 6-months period among elementary and junior high school teachers
who used a Web-based knowledge management system (KMS) to share their knowledge. The
participants were 49 teachers from Taiwan, aged 25 to 55 years (M=35 years), with a history
of using SCTNet- the largest KMS for the professional teacher community in Taiwan
supported by the Education Administration Department- for 1 to 5 years, with the mean
duration of 3 years. The main problem concerning their usage was that only 2 percent of the
total registered members accessed daily, and fewer than 5 percent of those who accessed
SCTNet routinely contributed more than 80 percent of the overall knowledge posting.

Educational science
180
To explore this “syndrome” the researchers conducted phenomenological interviews
and the interpretative analysis of those interviews resulted in revealing three important facets
of the interpersonal trust formation process in using the Web-based KMS: a.) the social role
of the teachers, b.) the rigid and tight professional community and c.) the keys to breaking
through. In their bottom-up data analysis process they identified 400 non-overlapping
meaning units that related to interpersonal trust and could be labelled with proper concept
names. They assigned twenty-eight concepts/labels to these meaning units and finally
clustered them into the three themes listed above.
One of the general findings of the interviews was that teachers were afraid of losing
their privacy in the public platform given that one had to be registered through an e-mail
address to access the site and there was no special protection provided. Researches argue that
members of SCTNet relied heavily on text as the medium for self-presentation and
communication. The absence of cues from face-to-face interactions resulted in some cases
that they feared disapproval and shame attached to not acting as a ‘professional’ and thus
losing the social position of a teacher.
The social role of teachers in Taiwan consists of a strong sense of superiority based on
the systematic academic training they have undergone and the abilities that are culturally
granted to them by the public, such as wisdom, excellence, knowledge and perfection. These
high expectations obviously make teachers want to maintain this position by looking
extremely knowledgeable, so when making comments in a professional forum they are extra
cautious not to harm this culturally assigned social role by getting something ‘wrong’.
Young and Cheng [11] argue that another facet of explaining teachers’ behavior
regarding Web-based KM is the tight and rigid professional community they live in. Usually
teachers share their problems and failures only with their closest colleagues and best friends,
one of the underlying reasons being that they want to retain their professional status in the eye
of ‘strangers’. Apart from evading the embarrassment they would have to face when being
caught making a mistake, they also avoid interfering with the professional territory of others,
since every teacher is supposed to be excellent.
4 Motivation for Teachers’ Knowledge Sharing
Ling [3] claims that only 4 – 10% of the members in online communities produce the
50 – 80% of the messages and resources shared, while the others are inactive (Hur, Brush,
2009). These results highlight the important question of the motivators and barriers of online
knowledge sharing.
Hew and Hara [2] explored what motivates the teachers to share their knowledge in
online professional communities. They based their study on online observations and
interviews. Seven motivators were revealed in the study: collectivism (teachers share
knowledge to improve the welfare of community members), reciprocity (teachers want to
share knowledge because they have recieved help from others and want to compensate),
personal gain (knowledge sharing helps teachers to gain new knowledge, reputation or
support), altruism (teachers feel empathy for other teachers’ struggles and want to help them),
anonymity (it motivates the individuals to be more open), respectful environment (it helps to
reduce the possibility of being attacked for one’s views), interest of the seeker (teachers share
knowledge for the sake of the seeker, and not for the whole community).
Hur and Brush’s 2009 research [3] based on online observations and interviews shows
a somewhat different picture in this field. In their study the emotional side of knowledge
sharing got into focus. They identified five reasons why teachers share knowledge:
1. sharing emotions (not just because of the number of postings, but also because of the
Educational science
181
great attention they got from the community, which encouraged other teachers to share
their own porblems)
2. utilizing the adventage of online environments (teachers could safely share issues they
could not with local colleagues, the environment provided them with opportunities to
communicate with a large audience)
3. combating teacher isolation (isolated school environment or lack of understanding
people, lack of time)
4. exploring ideas (teachers searched for unique ideas, they had special needs which were
often met in online communities)
5. experiencing a sense of camaraderie (it developed during the participation, these
friendships encouraged them to participate more in discussions).
Lin and Chen in their 2009 study [6] introduce three theories explaining knowledge-
sharing motivation. The first one is Kankanhalli’s social exchange theory, which states that
knowledge self-efficacy and enjoyment in helping others have great impact on online
knowledge sharing. He points out that external motivators like reciprocity and organisational
reward are affected by context, while internal motivators like self efficacy and helping others
are context free. Next they write about the social cognitive theory, which refers to the benefits
and costs of performing a behavior, making the individual’s outcome expectations affect the
motivation at a large scale. There are three forms of outcome expectations: physical
expectations (feelings of pleasantness, uncomfortableness, etc.), social expectations (social
recognitions, financial rewards, power, praise, etc.) and self-evaluative expectations (self-
satisfaction, self-devaluation, etc.), all of which can be the reason behind the sharing
behaviour. The third used theory is about identification-based trust. According to it, for
members to want participate in the knowledge-sharing process via Internet, they have to
understand, agree and identify with each others’ needs and to believe that their interests will
be protected. Bishop indicates that the actions and behaviours of the online community
members are motivated by their desires and not by their needs and that the extent of the
participatory behaviours is influenced by their own goals, plans, values, beliefs and interests.
5 The keys to breaking through
In the sections above we shed light on many problems that can arise when one wants
to motivate teachers to share their knowledge on the Web. In this section we want to revise
some of the “good practice” of breaking through these problems and give some practical
implications mostly based on Young and Cheng’s article [11]. As we stated before there is a
strong desire in teachers to be perceived and to feel knowledgeable, but they cannot reach
their goal simply by their classroom work or sharing their thoughts with best friends. They
need frequent interaction with other professionals and this is where information technology
can be at their service. Once some members take the plunge and admit their shortcomings to
the virtual community, not only can they inspire others to do so as well, but they help the
formation of trust, which will result in further sharing of knowledge and experiences. The
initially silent users become ‘insiders’ as they are influenced by other members. One way of
this change is when they realize that they are not the only ones facing problems in teaching,
which creates a common social identity. The other way is when others’ comments or shared
thoughts help them in their practice which results in appreciation for them and a greater will
to interact with them. For those who shared their problems or failures, emotional reassurance
or practical advice will make up for the ‘shame’ they might experience in the beginning when
they harm their own ‘face’ as a teacher. We believe that Young and Cheng made a useful
statement when suggesting combining face-to-face meetings and virtual work. These
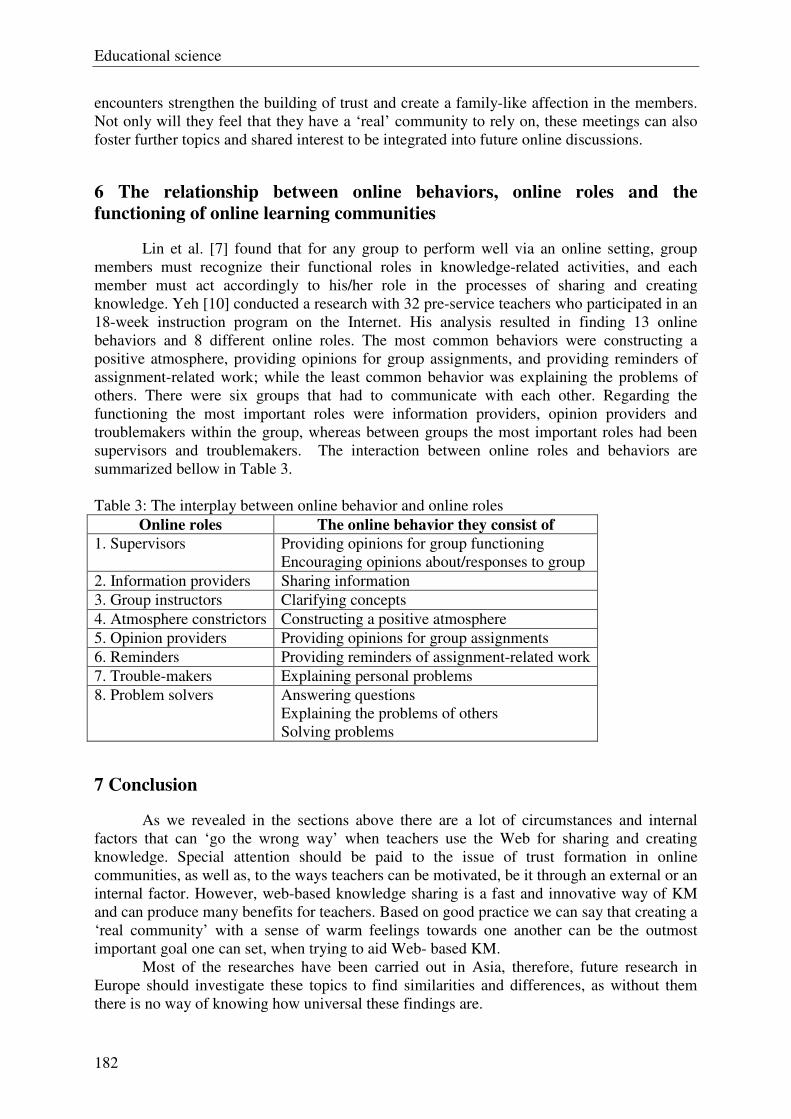
Educational science
182
encounters strengthen the building of trust and create a family-like affection in the members.
Not only will they feel that they have a ‘real’ community to rely on, these meetings can also
foster further topics and shared interest to be integrated into future online discussions.
6 The relationship between online behaviors, online roles and the
functioning of online learning communities
Lin et al. [7] found that for any group to perform well via an online setting, group
members must recognize their functional roles in knowledge-related activities, and each
member must act accordingly to his/her role in the processes of sharing and creating
knowledge. Yeh [10] conducted a research with 32 pre-service teachers who participated in an
18-week instruction program on the Internet. His analysis resulted in finding 13 online
behaviors and 8 different online roles. The most common behaviors were constructing a
positive atmosphere, providing opinions for group assignments, and providing reminders of
assignment-related work; while the least common behavior was explaining the problems of
others. There were six groups that had to communicate with each other. Regarding the
functioning the most important roles were information providers, opinion providers and
troublemakers within the group, whereas between groups the most important roles had been
supervisors and troublemakers. The interaction between online roles and behaviors are
summarized bellow in Table 3.
Table 3: The interplay between online behavior and online roles
Online roles The online behavior they consist of
1. Supervisors Providing opinions for group functioning
Encouraging opinions about/responses to group
2. Information providers Sharing information
3. Group instructors Clarifying concepts
4. Atmosphere constrictors Constructing a positive atmosphere
5. Opinion providers Providing opinions for group assignments
6. Reminders Providing reminders of assignment-related work
7. Trouble-makers Explaining personal problems
8. Problem solvers Answering questions
Explaining the problems of others
Solving problems
7 Conclusion
As we revealed in the sections above there are a lot of circumstances and internal
factors that can ‘go the wrong way’ when teachers use the Web for sharing and creating
knowledge. Special attention should be paid to the issue of trust formation in online
communities, as well as, to the ways teachers can be motivated, be it through an external or an
internal factor. However, web-based knowledge sharing is a fast and innovative way of KM
and can produce many benefits for teachers. Based on good practice we can say that creating a
‘real community’ with a sense of warm feelings towards one another can be the outmost
important goal one can set, when trying to aid Web- based KM.
Most of the researches have been carried out in Asia, therefore, future research in
Europe should investigate these topics to find similarities and differences, as without them
there is no way of knowing how universal these findings are.
Educational science
183
References
[1] Brazelton, J., Gorry, A. (2003): Creating a Knowledge-Sharing Community: If You
Bulid It, Will They Come? ACM, Vol.46 No.2. 22-25p.
[2] Goleman (1995) A new scale for the measurement of interpersonal trust. Journal of
Personality, 35:651–665.
[3] Hew, K.F., Hara, N. (2007): Empirical study of motivators and barriers of teacher
online knowledge sharing. Education Tech Research Dev (2007) 55: 573-595.
[4] Hur, J.W., Brush, T.A. (2009): Teacher Participation in Online Communities: Why Do
Teachers Want to Paricipate in Self-generated Online Communities of K-12
Teachers? Journal of Research on Technology in Education, 41(3), 279-303.
[5] Kao, C.P., Tsai, C.C. (2009): Teachers’ attitudes toward web-based professional
development, with relation to Internet sel-efficacy and beliefs about web-based
learning. Computers & Education 53, 66-73.
[6] Lin, C., Chen, M. (2009): Factors Affecting Teachers’ Knowledge Sharing Behaviors
and Motivation: System Functions that Work. eLac
http://120.107.180.177/1832/9802/98-2-14pa.pdf
[7] Lin, F., Lin, S., Huang, T. (2008): Knowledge sharing and creation in a teachers’
professional virtual community. Computers & Education 50, 742-756.
[8] Nonaka, I. (1991): “The knowledge creating company”. Harvard Business Review 69,
96-104.
[9] Rotter J. B. (1967): A new scale for the measurement of interpersonal trust. Journal of
Personality, 35:651–65.
[10] Yeh Y.- C.(2010): Analyzing online behaviors, roles, and learning communities via
online discussion. Educational Technology & Society, 13(1), 140-151.
[11] Young, M-L., Cheng, F-C.(2008): Interplay between physical and virtual settings for
online interpersonal trust formation in knowledge-sharing practice. CyberPsychology
& Behavior, Vol 11 (1), 55- 64.
[12] Yuen, A.J.K. & Ma, W.W.K. (2004): Knowledge sharing and teacher acceptance of
web-based learning system. In.: R. Atkinson, C. McBeath, D. Jonas-Dwyer & R.
Phillips (Eds), Beyond the comfort zone: Proceedings of the 21st ASCILITE
Conference (pp. 975-983). Perth, 5-8. December.
http://www.ascilite.org.au/conferences/perth04/procs/yuen.html
Acknowledgement Special thanks to our professor, János Gordon Győri, who suggested we choose this field and
helped with his useful comments.
Author data
Fruzsina Lukács: Faculty of Psychology, Szent István University. Gödöllő, Hungary. E-mail:
Lilla Koltói: Kecskemét College Teacher Training Faculty, Kaszap u. 6-14., Kecskemét,
Hungary, 6000, e-mail: [email protected]
Educational science
184
The comparative analysis of the first year full time and
correspondence students’ studying motivations at Kecskemét
College Faculty of Mechanical Engineering and Automation
Dr. Müller, Rudolf1, Dr. Pap, István2, Tóth, Ákos3 1Department of Business Administration/Institute of Economics and Social Sciences,
Kecskemét College, HUNGARY 2Department of Business Administration/Institute of Economics and Social Sciences,
Kecskemét College, HUNGARY 3Department of Business Administration/Institute of Economics and Social Sciences,
Kecskemét College, HUNGARY
Abstract: The research activity has developed in two ways since our book being published last year. We extended the research population with the correspondence students of our faculty, and the János Selye University from Slovakia joined to the research with using our questionnaire. With these improvements we have the possibility to make comparative analysis from more aspects. In this article we check if the 15-year trend continues on the 2009 first year full-time students’ motivations. We also try to demonstrate the similarities and differences among the first year full-time and correspondence students’ motivations in the academic year 2009/2010. We also examine if the results and trends of the 16 year research on the full-time students’ motivations are the similar on the correspondence students’ motivations.
Keywords: motivation, studying, full-time students, correspondence students.
1 Introduction
In the academic year 2008/2009 the research on student motivation ended its 15 year period. After writing a book on the 15 year results the authors and the members of the research group decided to continue the work. So the questionnaire made in 2002 was used to get data from the students of the academic year 2009/2010. We asked 227 full-time and 70 correspondence first-year students coming from all the three main courses, the mechanical engineering, the information technology and the management. The answerers cover the 50 % of the full-time and 35% of the correspondence students. The examination of the correspondence students is a new area of the research as this population has never been asked in this research before. With extending the research we would like to prove our assumption that the correspondence students are more motivated than the full-time students and their motivation is more concentrated on the fields of getting a diploma and knowledge.
2 Why did the students choose to attend a higher education institution?
The most important motivating factor for the students is to get a diploma. The full-time students’ data show that comparing to the previous years there is a decrease in this factor as a goal. The option “I need a diploma” was very important for 80 % in the previous years sometimes the level was above 85 %. In the last year it decreased under 80 %, (78 %). The decreasing tendency of the option “Nowadays nobody can get bye without a diploma” continues. 10 years ago this option was motivating for more than 90 % of the answerers, while this level was in 2008 only 65 % and 50 % in 2009. 32 % gave the answer, that it is
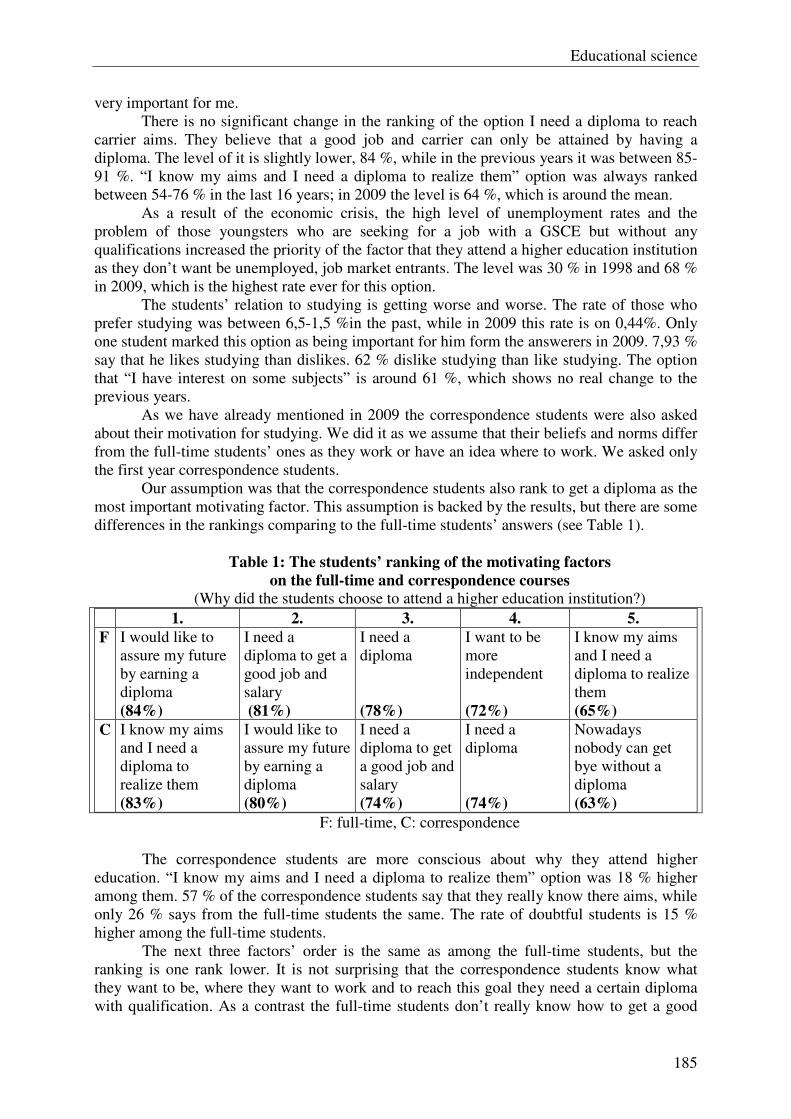
Educational science
185
very important for me. There is no significant change in the ranking of the option I need a diploma to reach
carrier aims. They believe that a good job and carrier can only be attained by having a diploma. The level of it is slightly lower, 84 %, while in the previous years it was between 85-91 %. “I know my aims and I need a diploma to realize them” option was always ranked between 54-76 % in the last 16 years; in 2009 the level is 64 %, which is around the mean.
As a result of the economic crisis, the high level of unemployment rates and the problem of those youngsters who are seeking for a job with a GSCE but without any qualifications increased the priority of the factor that they attend a higher education institution as they don’t want be unemployed, job market entrants. The level was 30 % in 1998 and 68 % in 2009, which is the highest rate ever for this option.
The students’ relation to studying is getting worse and worse. The rate of those who prefer studying was between 6,5-1,5 %in the past, while in 2009 this rate is on 0,44%. Only one student marked this option as being important for him form the answerers in 2009. 7,93 % say that he likes studying than dislikes. 62 % dislike studying than like studying. The option that “I have interest on some subjects” is around 61 %, which shows no real change to the previous years.
As we have already mentioned in 2009 the correspondence students were also asked about their motivation for studying. We did it as we assume that their beliefs and norms differ from the full-time students’ ones as they work or have an idea where to work. We asked only the first year correspondence students.
Our assumption was that the correspondence students also rank to get a diploma as the most important motivating factor. This assumption is backed by the results, but there are some differences in the rankings comparing to the full-time students’ answers (see Table 1).
Table 1: The students’ ranking of the motivating factors
on the full-time and correspondence courses (Why did the students choose to attend a higher education institution?)
1. 2. 3. 4. 5.
F I would like to assure my future by earning a diploma
(84%)
I need a diploma to get a good job and salary (81%)
I need a diploma (78%)
I want to be more independent (72%)
I know my aims and I need a diploma to realize them (65%)
C I know my aims and I need a diploma to realize them
(83%)
I would like to assure my future by earning a diploma
(80%)
I need a diploma to get a good job and salary (74%)
I need a diploma (74%)
Nowadays nobody can get bye without a diploma (63%)
F: full-time, C: correspondence The correspondence students are more conscious about why they attend higher
education. “I know my aims and I need a diploma to realize them” option was 18 % higher among them. 57 % of the correspondence students say that they really know there aims, while only 26 % says from the full-time students the same. The rate of doubtful students is 15 % higher among the full-time students.
The next three factors’ order is the same as among the full-time students, but the ranking is one rank lower. It is not surprising that the correspondence students know what they want to be, where they want to work and to reach this goal they need a certain diploma with qualification. As a contrast the full-time students don’t really know how to get a good

Educational science
186
job, but they want a diploma. Their motivation to be more independent is stronger than knowing their aims.
Not only the carrier aims but the relation to studying show differences. 8,57 % of the correspondence students really like studying, while this rate is 0,44 % among the full-time students. 14,29 % like studying, which is double the full-time students’ the rate (7,93 %). 12 % more correspondence students say that they like studying than dislike doing it. 30 % correspondence student more dislike than like, while 60 % full-time students dislike than like.
The option to avoid being unemployed is only 22 % among the correspondence students, while this rate is more than 3 times higher among the full-time ones (68 %). The reason can be that more correspondence students have a job when they come to higher education than the full-time ones.
It is also a significant difference, that 13 % more correspondence students think about having a second diploma after absolving the first one.
3 Why had our students chosen to enrol at the GAMF Faculty?
Most of the students choose the GAMF Faculty as they are interested in the course and the profession, which can be learnt here. They also find it motivating that they want that kind of knowledge which they can get at this faculty and they are interested in their major as they believe that the chosen profession gives them perspective for the future. The full-time and correspondence students share these beliefs and there can be seen no major differences.
The correspondence students show no significant difference in the ranking of the factors, but the importance of each factor is slightly different from the full-time students’ beliefs and norms (see Table 2).
The data demonstrate that the correspondence students’ results are higher in all factors. The option “I am interested in this profession” is 14 % higher if compare the answers, which mark this factor as being very important for them. The level is still 9 % higher, if we analyse the very important and important answers together. The difference is bigger for the option “I want that kind of knowledge which I can get at this faculty” (22 % for very important, 16 % for very important and important). 15 % more correspondence students think that their chosen profession has a future than full-time ones.
Table 2: The students’ ranking of the motivating factors
on the full-time and correspondence courses (Why had our students chosen to enrol at the GAMF Faculty?)
2009 Full-time Correspondence
1. 43 57 “I am interested in this
profession” 1-2. 82 91 1. 24 46 “I want that kind of knowledge
which I can get at this faculty” 1-2. 69 85 1. 25 40 “This profession has a future” 1-2. 62 63 1. 19 24 “The subjects I want to study
are offered by this major” 1-2. 45 60
Educational science
187
4 What kind of achievements do the students target?
First we are comparing the full-time students’ norms and beliefs. The first year students rank first the option “To become a qualified expert”. It was the tendency in the previous years too. There is a new motivating factor in the top ranking. It is important for the students not to be embarrassed because of bad results. Here we have to admit, that this option is ranked second mostly by the IT students, but also a priority for the mechanical engineer and manager students as well. The third highly motivating factor is “To earn a diploma as soon as possible”. The sooner they complete their studies, the less they have to pay. Respect for their parents has a strong influence as this option is ranked fourth and so a majority of the asked students studies to make their family proud through the attainment of good grades.
When comparing the answers of the correspondence students we realize that their norms and beliefs are different in many ways comparing to the full-time students. The first year correspondence students gave the following ranking: the most important for them is the parents’ honour. They try to finish school as soon as possible, in order to reach this goal they work hard to get the best out of them. The decrease of study expenses is not ranked in the front, but to want to get as much from the teachers on the intellectual level as they can.
5 What spurs on GAMF students to achieve their stated goals?
Among the most inspiring reasons are “To have a grasp of everything in this profession” and “To earn much money” for the full-time students. They rank 3 “To learn to have good recommendations once they start the job-search” option. After these options they emphasize the importance of not getting into financial trouble because of unsuccessful exams and their extra costs. The intellectual improvement comes only after these factors.
The correspondence students show differences. They want to have a grasp of everything in their chosen profession, they also study to prove for themselves that they are able getting a diploma form a higher education institution. Money comes the third place and the importance of the improvement of their skills and knowledge is ranked in the forth place.
The main difference among the full-time and the correspondence students is that the correspondence students rank those goals as being important, which make them a better expert with higher knowledge and skills, while the full-time students are more oriented to financial benefits.
From the rankings and tendencies we can state that the correspondence students are more profession oriented and they are more self-conscious about why they are willing to get a diploma. We can also see that the answers for these questions areas support the results of the first two ones.
6 The development of the factors/influences that hinder the achievement of the study-goals of GAMF students
When examining the data and results of the 2009 survey we can realize some changes. Most students delay attendance as they are easily tempted and so they get involved in more interesting activities than studying. The students give the first rank for this option among the negative factors (85%). In the previous years this option was the second or third but in 2009 it is top priority.

Educational science
188
The students say that they don’t study because there was always something more interesting to do than studying for them. 21-22 % of the answerers ranked this option very typical for them, the level is 52-53 % if we analyse the very typical and typical options together. If this is extended with the hesitant ones the result is around 85 %.
The negative influence appears differently among the correspondence students. We assume that as they have a job they are more tired. As most of them have a family they have other things to do after work than studying for the lectures held at the weekend. Some hobbies also have stronger influence on them than studying (see Table 3).
Table 3: The students’ ranking of the motivating factors
on the full-time and correspondence courses (factors that hinder the achievement of the study-goals)
2009 Full-time Correspondence
1. 6 56 1-2. 12 77
“I work beside studying, so I am tired”
1-3 26 100 1. 21 16
1-2. 52 43 “I am easily tempted and so I get involved in more
interesting activities than studying”
1-3 84 66 1. 21 14
1-2. 47 33 “There are compulsory subjects who are
unnecessary in my case and there is too much
emphasis put on them in the light of what I shall
need to master in my chosen specialization” 1-3 79 67
1. 22 13 1-2. 53 33
“I tend to delay work”
1-3 85 59 1. 21 11
1-2. 42 24 “Some compulsory subjects are unimportant in
my case”
1-3 76 51 1. 7 24
1-2. 22 43 “My personal problems hinder me in studying”
1-3 57 67 1. 10 27
1-2. 38 54 “There are other activities, which hinder me in
studying”
1-3 76 81
The correspondence students rank the option “I work beside studying, so I am tired” for the first place. Then comes the option “There are other activities, which hinder me in studying” in their norms. While only 26 % of the full-time students say that being tired has a negative influence on their studying motivations, all of the correspondence students mark this option. The other activities are always ranked higher among the correspondence students too.
84 % of the full-time students say that the option “I am easily tempted and so I get involved in more interesting activities than studying” is the top hindering factor for them. This level is 66 % among the correspondence students.
Almost the same negative influence caused by the personal problems with its 67 % rate.
When we analyse the answers we can see that more full-time students think that some compulsory subjects are unimportant in their case so they don’t really want to study them.
Educational science
189
Summarizing the results we can state that the correspondence students are more studying oriented than the full-time students. They believe that to reach the carrier goals they have to widen their knowledge, develop their skills and chose the best course. They are also self-conscious when choosing a higher educational institution.
7 Conclusions
In this article our main aim was to compare the previous years’ results to the 2009 ones. We also made a comparative analysis between the full-time and correspondence students. The results show that there is a decline in the importance of getting a diploma as a target. While in 1990 90 % of the answerers said that this is their main goal, now only 50 % share this belief. To avoid being unemployed is getting stronger in the last few years and the tendency continues in 2009 too. When examining the hindering factors we can see that the students tend to delay work and this influence is again the strongest after many years.
When comparing the full-time and correspondence students’ norms and beliefs the results show that the correspondence students know their aims, and also have a concept how to reach these goals.
The GAMF Faculty is chosen by the correspondence students under consideration, they show more willingness to study to reach their aims and goals and become a qualified expert. As a summary we can state that there only slight changes in the full-time students’ perspectives comparing to the previous years, and the correspondence students are more motivated for studying than the full-time ones.
References
[1] Deese, James és Deese, Ellin K.: Hogyan tanuljunk? Panem – McGraw – Hill, (1992) [2] Horányi Katalin: Tanuljunk tanulni. Magyar Könyvklub, Budapest (2002) [3] Dr. Müller Rudolf, Dr. Pap István, Tóth Ákos: A hallgatók tanulással kapcsolatos
motivációi a Kecskeméti Főiskola GAMF Karán. Kecskeméti Főiskola, Kecskemét (2009)
[4] Polónyi István, Tímár János: Tudásgyár vagy papírgyár. Budapest, Új Mandátum. (2001)
[5] Réthy Endréné: Motiváció, tanulás, tanítás. Miért tanulunk jól vagy rosszul? Nemzeti Tankönyvkiadó, Budapest (2003)
Authors data
Dr. Müller, Rudolf: Department of Business Administration/Institute of Economics and Social Sciences, Kecskemét College. H-6000, Kecskemét, Izsáki út 10., Hungary. E-mail: [email protected] Dr. Pap, István: H-6000, Kecskemét, Nagyváradi u. 7., Hungary. E-mail: [email protected] Tóth, Ákos: Department of Business Administration/Institute of Economics and Social Sciences, Kecskemét College. H-6000, Kecskemét, Izsáki út 10., Hungary. E-mail: [email protected]

Educational science
190
Management ICT in teaching accounting
I., Opačak1, S. Bilić2, D., Misirača3 M., Tokić4 1High School Matija Antun Reljković, Slavonski Brod, CROATIA
2University College of Applied Sciences of Slavonski Brod, CROATIA 3College Primus, Gradiška, BOSNIA AND HERZEGOVINA
4University College of Applied Sciences of Slavonski Brod, CROATIA
Abstract: The question we ask today is not shall we use new technology in the classroom, the questions is how to use it? Implementing information and communication technologies in the classroom requires strategic planning from teachers to be supported with adequate tools and resources. Using computing in teaching and learning process involves students in learning accounting and helps implementation of the accounting theory. ICT in classroom is a resource which helps students to learn how to use the accounting software and the learning may have taken place through employment.
Keywords: teaching accounting, ICT, classroom, learning process.
1 Introduction
Continual technological change and demands for new knowledge takes temporal component of life in the foreground. Education thus becomes a lifelong process. Needs for operational knowledge and skills of their application are growing. In this context, it recognizes a variety of cognitive, affective, social and work-have competencies that have never been so important as today. It develops teamwork, control emotions, and nonviolent communication skills such as communication and computer literacy, desire to improve performance, to improve the quality of work and responsibility. Education adapts to economic development and helps individuals to integrate into a social function. As such, it becomes an instrument of socialization.[1] In order to accommodate changes in education, there is a greater need to constantly modernize teaching process and to introduce new technologies and new teaching methods.
2 Modernization of the teaching process
Learning is by definition a complex psychological process which includes the adoption of habits, information, knowledge, skills and abilities.[2] Learning is influenced by a number of factors, physiological and psychological. Questioning the results of the educational process in recent years increasingly attracted the society. Traditional schools based on memorizing and reproduction of facts can not meet modern society, which requires ability to make quick and effective decision-making, will to deal with the risk, correction of the load, action without hesitation and loss of valuable time, and not to lose their jobs and destroy projects, too. Several decades after the accounting practices applied computer as an indispensable basic tool in classrooms to introduce new technologies that require new teaching methods. Teaching methods are forms and procedures that teachers and students under the terms of the institutional framework adopted by the natural and social reality that surrounds them.[3] In the teaching methods, it appears different strategies of teaching and learning which are systematically planned combination of learning activities and teaching for cognitive structuring of teaching. The strategy determines the way of preparation and teaching process

Educational science
191
for acquiring knowledge, skills and attitudes. Teachers must be prepared for the appropriate type of instruction, supported by appropriate technology, materials and equipment, materials and equipment, and educational activities appropriate to the active mode of realization of the educational process. For this purpose, it develops appropriate and active methods. In teaching, it can implement various combinations of different active methods. Active methods are purposeful for reasons other than knowledge and develop skills and attitudes. Using computers in teaching, the school will come to an accountant who will not have to attend secondary education, training or vocational IT training [4].
3 Application of computers in teaching
By organizing students, teachers, equipment and resources it will achieve information system that enables memorization and retrieval of data, processing, transfer and issue to the data used in the required time and the requested site.[5] With the creation of integrated information systems, the focus shifts from teaching to the students and teachers tends to individualization of instruction aimed to develop students’ abilities, preferences and interests. In doing so, students practically apply the acquired knowledge. Beside the fact that teaching is tailored educational goal, it allows students to discover the meaning of items for their future profession. The school is due to the rapid scientific and technical and technological development activities implemented to prepare students for future challenges and it will be facing your work soon, too.[6] Students are introduced in the education process so that they are approaching to the chosen profession and developing the competencies to perform specific occupation. In doing so, you have to keep on your mind the substantial time and linking theoretical and practical training. When students have theoretical knowledge, may lead to difficulties in the accounting of certain business changes.[7] Through the classes they are trained to logically connect all knowledge necessary for future interest and solving problems.[6]
4 Requirements use of computers in teaching
To use applications of computers in teaching accounting it takes to achieve the specific requirements. With the cabinet equipped with computers, it is necessary to have developed software, accounting applications and professors who will work through the link theory with practice. Without accurate and clear procedure it is impossible to do business books keeping.[8] With the support of teachers, it can prevent many behavioural disturbances of students by changing the environment. Teachers know from experience that most classrooms were built and equipped so that it is hard to keep their students' motivation and involvement in learning process. When the environment in the classroom is boring or unfocusing, then their behaviour is usually transformed into one that is unacceptable and professors that they interfere in the process of teaching. With the analysis of our way of talking to students in schools and children at home, we are able to see how much students and children can tolerate, and not to be destructive with their daily aggression to their surroundings.[9] Application of computers in teaching accounting provides guidance on the teaching objectives, better organization of work and objective control of success in teaching. Students have the option of self-evaluation, ongoing relationships at work and high level of individualization of the work process, from the feedback, control of the students’ activity to the objective evaluation and knowledge during and on the end of studying. Using computers in teaching accountings opens the possibility of distance learning, too. It allows students to be professional, regardless of improvement in the time and place they choose, going through the learning materials at the
Educational science
192
speed they feel comfortable with and as many times as they wish. With a multitude of benefits, the problem is a lack of mutual contact of students, loss of motivation and inability to obtain direct answers for questions that appear through the studying.
5 Conclusion
The task of the educational institutions is to follow all changes and updates and implement a new quality in teaching, especially in communication, in order to get students closer to the real needs of the economy. Teaching students is the strongest link in the chain and the strength can be achieved by proper access to the student and the subject problems using appropriate methods and forms of work. To be able to use the mentioned activities, it is desirable that they get involved as soon as possible and to be a part of interpersonal communication through the work of the round tables for group discussions, tables for learning in couples, social space, such as board games, comfortable furniture for social gathering. It is essential that educational outcome is determined by competence and qualifications that would meet the personal and professional needs. Without the application of appropriate modern information and communication technologies it will not be possible to achieve tasks. Using information and communication technology achieves the quality of the educational process and students, besides linking theory with practice, become motivated and trained for lifelong learning and work.
References
[1] Misirača, D., Bilić, S., Bojić, B., Bakić, R., Menadžment ljudskih resursa, Primus, Gradiška, 2010.
[2] http://hr.wikipedia.org/wiki/U%C4%8Denje (02. 06. 2010.) [3] Meyer, H., L., Unterrichtsmethoden. I, Theorieband, II: Praxisband.
Frankfurt:Scriptor, 1987. [4] Crnković, L., Martinović, J., Računovodstvo na računalu: priručnik za računalnu
tehniku knjiženja, Pentium, Vinkovci, 1999. [5] Majdandžić, N., Lujić, R., Matičević, G., Šimunović, G., Majdandžić, I., Upravljanje
proizvodnjom, Strojarski fakultet, Slavonski Brod, 2001. [6] Petričević, D., Metodika strukovno teorijske nastave, Pučko otvoreno učilište zagreb,
Zagreb, 2007. [7] Ušaj Hvalić, T., Blaznek, G., Narakas, I., Vidovič, D., Učno podjetje, DZS, Ljubljana,
2006. [8] Nitz, W., Rechnungswesen fur Buroberufe, Verlag Europa Lehrmittel, HaanGruiten,
1994 [9] Brajša, P., Umijeće svañanja: svañam se, dakle postojim, C.A.S.H., Pula, 1996.
Author data
Opačak Ivica: High School Matija Antun Reljković, Bunar bb, Dolac, 35000 Slavonski Brod, Croatia, E-mail: [email protected] Bilić Siniša: University College of Applied Sciences of Slavonski Brod, Ul. dr. Mile Budaka 1, 35000 Slavonski Brod, Croatia, E-mail: [email protected] Misirača Dalibor: College Primus, Dositejeva b.b., 78400 Gradiska, Bosnia and Herzegovina, E-mail: [email protected]

Educational science
193
Tokić Marija: University College of Applied Sciences of Slavonski Brod, Ul. dr. Mile Budaka 1, 35000 Slavonski Brod, Croatia, E-mail: [email protected]
Educational science
194
Educational training session for developing repetitive strength
Hrvoje Sivrić1, Mario Keškić2, Damir Rukavina3 1Management, University of Applied sciences of Slavonski Brod, CROATIA
2Faculty of Agriculture in Vinkovci, CROATIA 3Elementary school Ljudevit Gaj in Lužani, CROATIA
Abstract: The improvement of motor ability, such as repetitive strength, is an important link in contemporary health directed lifestyle and should present an important goal in physical education and physical exercising. The students of the University of Applied sciences of Slavonski Brod are provided with conditions and programs to affect development of repetitive strength through regular classes in the fitness center. Besides defining the aim directed to individual students’ characteristics and professional guidance, maximum functionality of the exercising and emotional contentment of effects and results of the exercising are ensured. Repetitive strength is the ability of long-lasting labor upon exterior weight not higher than 75% of the maximum [1]. It can be developed through entire life in different material and spatial conditions and has a very wide scope of usage in real life as well as in higher education institutions. It includes almost all muscle groups thus, through training sessions, enabling the body easier achievement from inactivity to complete intensive physical activity. The tasks of the educational training session in the function of repetitive strength development are: a) anthropological: the influence on subcutaneous adipose tissue reduction and activated muscle weight strengthening; b) motor: the relative and absolute repetitive strength development; c) functional abilities: the activating of the lactate component of anaerobic process, the synchronization of the nervous, muscular and energetic system, the increase of the enzyme quantities which take part in anaerobic energetic processes; d) educational: the introducing to basic kinesiology terminology, the influence on moral values of the students and the acquiring of self-initiative lifelong exercising habit. The model of the educational training session which is conducted at the University of Applied sciences of Slavonski Brod will be presented based on aforesaid tasks.
Keywords: repetitive strength, training session, education
1 Introduction
At the University of Applied sciences of Slavonski Brod the session of Physical education (Phys. Ed.) is a basic organizational working form which provides methodic and systematic effect on anthropological status of a pupil [2]. The basic aim of Phys. Ed. is maintenance and improvement of students’ health, first of all physical, but also psycho-social. A course is held on both first and second year and is of compulsory character. To fulfill their task, Phys. Ed. sessions must be organized and conducted in a way that students are completely involved in every session, both in physical and mental aspect [2]. According to the expressed interests of students, they are provided with conditions, program and educational training sessions so they can, through regular classes, among other things affect the development of motor abilities, such as repetitive strength. Thereby, with the defining of the aim directed at individual characteristics, students’ interests and professional guidance, maximum functionality of exercising and emotional content of the effects and exercising results are ensured. Phys. Ed. educational training session focused on the repetitive strength development is conducted within the conditional training of the students. That kind of the training session in teaching differs from the conditional training of the athletes through its aims, modalities, intensity and scope. By its shape and aims it is much more similar to recreational exercising and fitness, but
Educational science
195
there are also analogies with the general conditional preparation of athletes. At the same time, it enables the influence on the regulation of some morphological features of the students, e.g. body mass, subcutaneous adipose tissue, or aesthetic body remodeling [3]. Educational training session of the repetitive strength development is conducted in the exercise room where the students perform the exercises without exterior physical exertion and with exterior physical exertion. The structure and duration of the educational training session are: preliminary part (7 min), preparatory part (10 min), main A part (40 min), main B part (15 min) and closing part (8 min). Methodical organizational way of exercising is work in stations. During the training session, the students are subjected to the set exertion which can be defined as a total influence on the student’s organism that is achieved through the overall educational work at the session [2, 4]. The optimal exertion usage results in a more proper development of the adaptation processes and is extremely important for the students’ anthropological features transformation. At the beginning of the semester, during the initial measurement, the students are determined with RMs (repetition maximum), which are then the bases for determining the exertion on individual exercises in later training sessions during the semester.
2 Preliminary part of the session
At the beginning of every training session, except the organizational steps and giving the information about the training session, we apply training exercises of the global character for achieving particular work ability and uplifting the functional level of the organism in the duration of 5-10 min. Students in the exercise room are arranged in a free formation. To uplift the functional level, use cardio machines, bicycles and stepper. If unable to use the trainers at the same time, other students perform 5 – 6 functional exercises standing up. The exercises are performed continuously in the duration of 25 - 30 seconds without disruption and rest. Example of the functional exercises: low skipping, high skipping, vertical jumping (back-forth), vertical jumping (left-right), jumping rope, front cross stepping to the left and right [4].
3 Preparatory part of the session
The students are still arranged in a free formation. In the preparatory part of the training session, complex of general preparatory exercises without apparatuses is used. Due to their characteristics and motor structure, they have a wide usage in teaching, as well as in fitness. The complex development of entire anthropological status of the student, especially the development of his motor abilities, can be successfully influenced on. It is necessary to reduce the energy consumption by a working unit, i.e. to enhance the efficiency level of the certain organic systems [1]. The training activities, which are meant to establish the stereotypes of motion and moving coordination, are conducted. It is necessary to adjust the locomotor apparatus to different types of muscle straining, i.e. muscle contractions. Since the task of the training session is the development of repetitive strength, we use general preparatory exercises which activate main responsible muscle groups with which we want to enhance the effect of muscle strength. Basic characteristics and objectives of those exercises are: relaxation exercises and muscle loosening, muscle stretching exercises, and muscle strengthening exercises. Thus the muscles gain proper muscle vigor and tone required to continue the training session. The students perform 8 exercises minimum in the duration of 10 min. They perform the exercises while standing in place in standing, lying, kneeling, and squatting positions. Combinations of jumps, hops, lunges, turns, thrusts, bends, lifts, rotations, and other motions are used [4].

Educational science
196
4 Main part of the session
Main A part of the session
In the main A part of the training session, the students perform 6 exercises for developing of absolute–repetitive strength, i.e. the mastering of exterior exertion. The achievement of set aims and tasks is in accordance with the state of the students’ abilities and knowledge. The duration and intensity of this part of the training depend on the specificity of the training activities and the size of the training exertion in total. The students are arranged in pairs according to similar anthropological characteristics and motor abilities.
TRAINING PARAMETERS TRAINING CHARACTERISTICS
Exterior exertion – barbell measures 40 – 80% of 1 RM Repetition number 12 – 14 repetitions
Number of sets 2 – 4 series on every weight
10 – 20 series altogether
Rest interval
1 - 2 minutes between the series 2 - 3 minutes between the weights 3 – 4 minutes between the exercise
Rest activity Stretching and relaxation exercises Performance rate Medium
Number of exercises in training 2 – 6 Supercompensation 48 hours
Table. 1. Training dosage in repetitive strength development. [1]
Congruently with the Table 1., the students perform 3 sets on each exercise with 12-14 repetitions in each set. The rest between the sets is 60-70 seconds, while the rest between the exercises is 180 seconds. The exterior exertion is 40-50% of 1RM of each student, i.e. every student doses his/her exertion. The tempo of performing is medium. The students in pairs take turns on the task; while one student is exercising, the other rests actively with stretching and relaxation. The students perform all 6 exercises on the training machines. This way we provide bigger security during the performance, diversity of movement and usage simplicity. Exercise examples in the main A part of the session. 1) Exercise – Lying Machine Leg Curls routine
Type of exercise: isolating, single-joint, bilateral, leg curl Muscle groups: agonists – m. biceps femoris
synergists – m. gastrocnemius, m. gracilis stabilizers – m. gluteus medius
Exercise description: an exercise on the training machine for hamstring muscles. Inhaling during eccentric contraction, exhaling during concentric contraction. The exercise is performed with maximum amplitude of movement consistent with motion allowed by training machine [5]. 2) Exercise – Seated Barbell Deltoid Military Press routine
Type of exercise: isolating, multi-joint, press Muscle groups: agonists – m. deltoideus (anterior portion)
synergists – m. pectoralis major, m. triceps brachii, m. deltoideus (middle portion), m. trapezius (posterior portion) stabilizers – m. trapezius (upper part), m. levator scapulae
Exercise description: an exercise on the training machine for shoulder muscles. Inhaling during eccentric contraction, exhaling during concentric contraction. The initial and final position is sitting on the training machine with one’s feet flat on the ground. The training machine is gripped shoulder width apart. The torso is vertical on the ground. The exercise is

Educational science
197
performed with maximum amplitude of movement consistent with motion allowed by training machine [5]. 3) Exercise – Smith Machine Flat Bench Press routine
Type of exercise: compound, multi-joint, press Muscle groups: agonists – m. pectoralis major (sternal head)
synergists – m. pectoralis major (clavicular head), m. deltoideus (anterior head), m. triceps brachii stabilizers – m. latissimus dorsi, m. deltoideus (posterior head)
Exercise description: an exercise on the training machine for chest. Inhaling during eccentric contraction, exhaling during concentric contraction. The performing position is lying on the bench. The body is supported on five contact points with the ground: feet, buttocks, shoulders and occiput. The forearm and upper arm in the initial position are at 90 degrees. The torso is bent and the shoulders shouldn’t be allowed to move in the direction of the movement. The exercise is performed with maximum amplitude of movement consistent with motion allowed by training machine [5]. 4) Exercise – Standing Cable Triceps Extension routine
Type of exercise: isolating, single-joint, extension Muscle groups: agonists – m. triceps brachii / synergists – none
stabilizers – m. pectoralis major, m. teres major, m. deltoideus, m. latissimus dorsi, m. erector spine
Exercise description: an exercise on the training machine for triceps. Inhaling during eccentric contraction, exhaling during concentric contraction. The feet are shoulder width apart, stable position. The legs are not entirely outstretched; keep both elbows in fixed position. The torso is bent. Fully extend the forearm [5]. 5) Exercise – Close-Grip Front Lat Pull-down routine
Type of exercise: isolating, multi-joint, pull-down Muscle groups: agonists – m. latissimus dorsi
synergists – m. brachialis, m. bicepsbrachii, m. teres major, m. pectoralis major et minor, m. deltoideus, m. levator scapulae, m. trapezius / stabilizers – none
Exercise description: an exercise on the training machine for back muscles. Inhaling during eccentric contraction, exhaling during concentric contraction. Make sure to secure safe and stable position. Pull the bar onto the upper chest in a way to pull it with your shoulders first and then with your arms [5]. 6) Exercise – Bent Knee Leg Raise on a Chin/Dip Station With Dumbbells routine Type of exercise: isolating, single-joint, bend Muscle groups: agonists – m.iliopsoas
synergists – m. tensor fasciae latae, m. pectineus, m. sartorius, m. adductor longus et brevis stabilizers – m. obliquus externus (internus) abdominis, m. rectus femoris, m. latissimus dorsi, m. pectoralis major, m. trapezius, m. rectus abdominis
Exercise description: an exercise for abdominal muscles. Inhaling during lowering the legs, exhaling during raising the legs. The back is fixed on the station, supporting yourself with the arms. The legs are bent in the knee, dumbbell held between the feet. Do not swing your legs [5]. Main B part of the session In the main B part of the training session, the students are arranged in a free formation and perform 4-5 exercises for developing of relative–repetitive strength, i.e. repeatedly mastering

Educational science
198
of one’s own body weight exertion. To make this part of the session more interesting, we add the competitive character to the exercise performing. We apply those exercises which contribute to the bigger emotional satisfaction and students’ excitement, which can be achieved through competition, whether individually, in pairs or in groups. With the proper performing of each exercise, the task is to make as much repetitions as possible. This way on each exercise we get the winner of every given exercise, i.e. the student who made the most regular repetitions [4]. Exercise examples in the main B part of the session. 1) Lifting the torso and legs from lying on the back. Initial position: lying on the ground, stretching the arms up above your head. Task: lift the torso and squat the legs (placing the knees between the arms) and return to the initial position. 2) Lifting the torso and legs from lying on the chest. Initial position: lying with the chest on the ground, stretching the arms up above your head. Task: bend the body backwards simultaneously lifting the arms and legs from the ground, return to the initial position. 3) Leg turns while lying on the back. Initial position: lying with the back on the ground, arms open, legs bent in the knee joint at 90 degrees. Task: leg turns to one then the other side, return to the initial position. 4) Narrow grip knee push-ups. Initial position: support on the arms, palms are shoulder width apart on the ground, knees and feet on the ground. Task: push-up lying on the arms, return to the initial position.
5 Closing part of the session
This part of the session is distinctive by a significant decrease of the activity intensity and the reduction of the training exertion so that the organism can be brought in a convenient state of functional-motor and biochemical functions, i.e. suitable conditions for a quality recovery of the students are created. In this model of the training session we can use the exercises of static-active flexibility, i.e. abilities of achieving and maintaining of the stretched position in the certain joint (or several) using only the work of the agonists and synergists, while the antagonistic muscle groups are stretched. The movement amplitude is achieved by the strength of one’s own muscles [6]. 1) Squatting position, stretching the arms up above your head. Cross your fingers while
palms pointing up, stretch the torso and arms. Keep the position. 2) Squatting position, stretching the arms up above your head. Swing to the left, then to the
right. Keep each position 20 seconds. 3) Support on the arms. The palms and feet are on the ground. Bend the body, looking up to
the ceiling. Keep the position. 4) Support on the knees. Round the back into a hump. Keep the position. 5) Squatting support, stretching the arms up above your head. The head and arms relaxed.
Keep the position. 6) Feet apart sitting, deep forward bend. Keep the position.
6 Conclusion
In the aims and tasks of the Physical Education contemporary university teaching, a student subject in the class is needed, with his active and creative habits, rather than a student object in the class whose characteristic is passive observer. With respecting students’ wishes, emotions, interests, we achieve a healthy partner communication directed at the individualization of teaching [7]. Caring about the individualization, among other things,
Educational science
199
means to provide for each student subject who participates in the class to participate in the work which will be conducted in accordance with the current state of his anthropological status [8]. Phys. Ed. class should primly serve as theoretic and practical knowledge transfer whose further implementation can follow outside of and after finishing education. Motor ability, such as repetitive strength, with its tasks – anthropologic, motor, functional and educational – can be developed throughout life in different material and spatial conditions and has a very wide possibility of application in real life. Educational training sessions of repetitive strength within class provide for the interested students acquisition of those tasks and satisfying their aims, wishes and needs for physical exercising. It enables an educational affect on students (acquisition of theoretical knowledge on impact and importance of exercising, on dosing the exertion, on exercising methods which have a healthy value and can be applied throughout a lifetime) on one hand, whereas on the other hand they train the students to realize based on their personal experience the need and usefulness of physical exercising (acquisition of desirable habits, attitudes and emotions towards physical exercising, satisfying the need for moving, playing and friendship). It also enables the acquisition of motor knowledge (proper techniques of performing conditional exercises) and development of conditional abilities (strength, stamina, vigor, flexibility, etc.). Effectiveness of the educational training session of the repetitive strength development is completely efficient that way.
References
[1] D. Milanović: Teorija treninga, Kineziološki fakultet Sveučilišta u Zagrebu (2005). [2] D. Novak, Z. Šafarić, M. Štedul: Intenzitet opterećenja vježbanja tijekom provedbe
jednog složenijeg metodičko-organizacijskog oblika rada, Zbornik radova, 18. Ljetna škola kineziologa Republike Hrvatske (Poreč, 2009), 441 - 446.
[3] T. Maršić, P. Paradžik: Kondicijski trening u tjelesnoj i zdravstvenoj kulturi, Kondicijski trening, Broj 1 Volumen 3 (2005), 7-16.
[4] V. Findak: Metodika tjelesne i zdravstvene kulture, Školska knjiga, (2001) [5] I. Jukić, G. Marković: Kondicijske vježbe s utezima, Kineziološki fakultet Sveučilišta
u Zagrebu, (2005). [6] J. Nakić: Metodika treninga fleksibilnosti, Zbornik radova, Kondicijska priprema
sportaša (Zagreb, 2003), 256-263 [7] A. Redžić, M. Redžić, N. Prelec: Primjer poticanja individualizacije rada sa
studentima, Zbornik radova, 19. Ljetna škola kineziologa Republike Hrvatske (Poreč, 2010), 368 - 372.
[8] V. Findak: Kineziološki model individualiziranog rada u područjima edukacije, sporta, sportske rekreacije i kineziterapije, Zbornik radova, 17. Ljetna škola kineziologa Republike Hrvatske (Poreč, 2008), 280 - 282.
Author data
Hrvoje Sivrić: Management, University of Applied sciences of Slavonski Brod. Dr. Mile Budaka 1, 35000 Slavonski Brod, Croatia, [email protected] Mario Keškić: University J.J.Strossmayer in Osijek, Faculty of Agriculture in Osijek-Professional study Vinkovci, H. D. Genschera 16 D, 32100 Vinkovci, Croatia, [email protected] Damir Rukavina: Elementary school Ljudevit Gaj in Lužani, Vladimira Nazora 59, 35257 Lužani, Croatia, [email protected]
Educational science
200
The System of Values in a Biblical Upbringing
I. Vrbat Pejić1, R. Gorkić
2, I. Gusak
3
1Deputy Mayoress of Slavonski Brod, Vukovarska 1, HR-35000 Slavonski Brod, Croatia 2Primary School „A. Mihanović“, A. Mihanovića 5, HR-35000 Slavonski Brod, Croatia
Abstract: The system of values in the Biblical upbringing has been shown in this work. The
human being has been undoubtedly created as a social being. Through communication and
interaction with the environment, he looks for the truth and discovers it, resolves himself and
is being confronted with different opinions and attitudes. Throughout the centuries of
research, numerous interpretations about the upbringing have been developed. It is very hard
to name all the components of upbringing since it is a very complex process. To express it in
a simple way, the upbringing would be an intentionally oriented activity of a human being in
which the educator and the student are in constant communication, aiming at development of
the personality of another human being. Throughout the history, taking all the socio-historical
circumstances into consideration, the priorities of the upbringing actions have been changing.
The upbringing is a real function of a man. The constant social, intentional and interacting
process in the upbringing demands a multidisciplined approach. Therefore, such an approach
is impossible without an analysis of the system of values in biblical upbringing. The
upbringing, to which an individual and the society today belong, is an inseparable part of all
biblical texts. Every nation has its notion and meaning of the word upbringing and the process
of upbringing.The word upbringing has been derived from the verb to bring up in the croatian
language. The word to bring up means to let somebody live and grow and it is always related
to a human being. It involves in its contents both the physical and the spiritual life as a
complete approach to a human being. The plan and the programme of catholic religious
teaching has been defined in the Croatian National Educational Standard (Croatian
abbreviation HNOS) as a complete religious curriculum with the main didactic varieties for
each school age. The topics, didactic guides, correlation between the subjects and the
elements of evaluation have been defined.The catholic school catechism has been involved
into the general educational aims of the contemporary croatian democratic school.The biblical
upbringing has a complementary relation with other school subjects in promoting a complete
and systematic upbringing of a human being on the principles of related and integrated
learning. The upbringing in biblical values through religious contents as a subject has its
epistemology, aiming at systematic introduction, preserving and development of personal
religious identity as well as promoting the dialogue and ecumenism on the principles of
tolerance as far as the difference between people is concerned.The presentation of the survey,
conducted with the pupils from the 1st to the 4th grade of primary school, has been given in
this work in relation to the contents of the system of values in the biblical upbringing.
Keywords: education, biblical upbringing
1 Introduction (Header style)
The contemporary european phenomenon of diminishing the role of the church and
christianity is directly connected with the process of secularisation. Such a situation has deep
roots in legal democratic and social state communities. Therefore, there are differences in the
phenomenon of secularisation in Europe, which is in the process of integration. The present
differences could set an example of mutual connecting and learning, based on the experience
of differences in the present situation. It is necessary to pay equal attention to the historical
context of some countries as well as structural factors , according to which a comparison
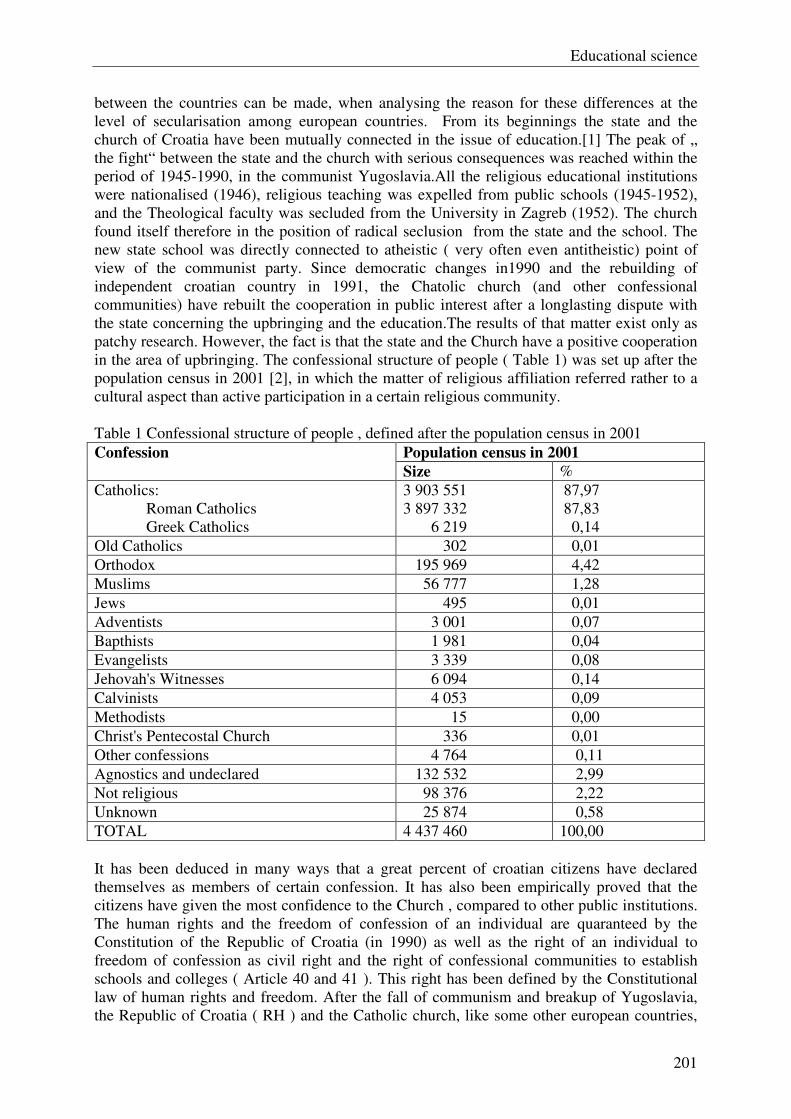
Educational science
201
between the countries can be made, when analysing the reason for these differences at the
level of secularisation among european countries. From its beginnings the state and the
church of Croatia have been mutually connected in the issue of education.[1] The peak of „
the fight“ between the state and the church with serious consequences was reached within the
period of 1945-1990, in the communist Yugoslavia.All the religious educational institutions
were nationalised (1946), religious teaching was expelled from public schools (1945-1952),
and the Theological faculty was secluded from the University in Zagreb (1952). The church
found itself therefore in the position of radical seclusion from the state and the school. The
new state school was directly connected to atheistic ( very often even antitheistic) point of
view of the communist party. Since democratic changes in1990 and the rebuilding of
independent croatian country in 1991, the Chatolic church (and other confessional
communities) have rebuilt the cooperation in public interest after a longlasting dispute with
the state concerning the upbringing and the education.The results of that matter exist only as
patchy research. However, the fact is that the state and the Church have a positive cooperation
in the area of upbringing. The confessional structure of people ( Table 1) was set up after the
population census in 2001 [2], in which the matter of religious affiliation referred rather to a
cultural aspect than active participation in a certain religious community.
Table 1 Confessional structure of people , defined after the population census in 2001
Population census in 2001 Confession
Size %
Catholics:
Roman Catholics
Greek Catholics
3 903 551
3 897 332
6 219
87,97
87,83
0,14
Old Catholics 302 0,01
Orthodox 195 969 4,42
Muslims 56 777 1,28
Jews 495 0,01
Adventists 3 001 0,07
Bapthists 1 981 0,04
Evangelists 3 339 0,08
Jehovah's Witnesses 6 094 0,14
Calvinists 4 053 0,09
Methodists 15 0,00
Christ's Pentecostal Church 336 0,01
Other confessions 4 764 0,11
Agnostics and undeclared 132 532 2,99
Not religious 98 376 2,22
Unknown 25 874 0,58
TOTAL 4 437 460 100,00
It has been deduced in many ways that a great percent of croatian citizens have declared
themselves as members of certain confession. It has also been empirically proved that the
citizens have given the most confidence to the Church , compared to other public institutions.
The human rights and the freedom of confession of an individual are quaranteed by the
Constitution of the Republic of Croatia (in 1990) as well as the right of an individual to
freedom of confession as civil right and the right of confessional communities to establish
schools and colleges ( Article 40 and 41 ). This right has been defined by the Constitutional
law of human rights and freedom. After the fall of communism and breakup of Yugoslavia,
the Republic of Croatia ( RH ) and the Catholic church, like some other european countries,
Educational science
202
have started bilateral regulation of their mutual relations. According to the professional and
public debate which was conducted during the school year 1990/1991, and on the basis of
proposal of the Croatian bishop's conference (HBK), the Ministry of education and culture
made a decision to introduce the confessional religious upbringing and education into primary
and secondary schools, beginning with the school year 1991/1992. The introduction of
religious teaching into public schools at the beginning found its legitimacy in the Law of
public education (1991). It can be said that Croatia got quite a good law because the law took
into consideration the respecting of the signed (international ) agreements with the Holy See
and also enabled all the religious communities the same rights as the Catholic church had.The
confessional model of religious teaching has ben developed by taking into consideration all
the relevant norms of international right about the human rights, which include the religious
rights, too. There are also the parents' rights which make possible for their children to have
the upbringing and the education in christian values in the public school which is plural and
value oriented. The decision about attending the religious teaching for the students till the age
of 15 makes the parent or the guardian and for the students who are older than 15 years , the
decision is made by the student himself and the parent or the guardian. The Catholic church
has the capacity of assigning the catechism teacher ( but to dismiss him as well ) for teaching
the catechism. HBK takes care of the education and acquiring the catechism degree at high
church colleges. The church also makes programmes (curriculums ) for catholic catechism
and religious upbringing and then the proposed programmes are passed by the minister of
education and sport. The schoolbooks for catechism are completely equal to all other
schoolbooks, but they have to be approved by the HBK. Therefore, the HBK has established
the National cathetic office , which has been allocated with a certain number of duties:
permanent professional education of catechism teachers, the development of cathetic
curriculums and student books; promoting the catechicm teacher – trainer and teacher –
councellor; developing regular cooperation with the bishop's catechetic offices; starting and
conducting scientific and other research: publishing the professional literature and other.
2 Catechism and biblical upbringing in primary school
There is no science in a contemporary way in the biblical texts. When we talk about
epistemology, we can say that it always has a practical role. The science as a breakthrough
into the secret relations of reality and happenings slipped away to the writer of the Bible. The
God is the only one who posesses it. The answers to some general questions such as where the
pain comes from, suffering and death, as well as how they are connected to God, had been
looked for long time ago by the Jewish scientists. The God is immensly good, and such
attitudes were accepted in the times of Jesus. [3] If we start with the system of values in
biblical upbringing , as far as the circumstances of today's system of values and influences
upon young people , especially children and students, are concerned, we can say that the
difficulties do not happen because of the methodic but they present an existential problem of
the time we live in. Such a dilemna lies in the diminished interest of today's young people for
the Bible. It can be said that a very frequent reason hides in wrong understanding and
interpretation on one hand and spiritual indifference of young people on the other hand. Right
after the second world war the catechism had been tolerated in schools for some time by the
state government. It was completely expelled from schools in the school year 1951/1952. Due
to impossibility of teaching catechism at school, the parish catechism integrated both the
dimension of parish catechism and the school catechism.It went through its revival especially
after the Second Vatican Council [4]. Favourable conditions have been made, along with the
democratic changes in croatian society, to introduce catechism into all the primary and
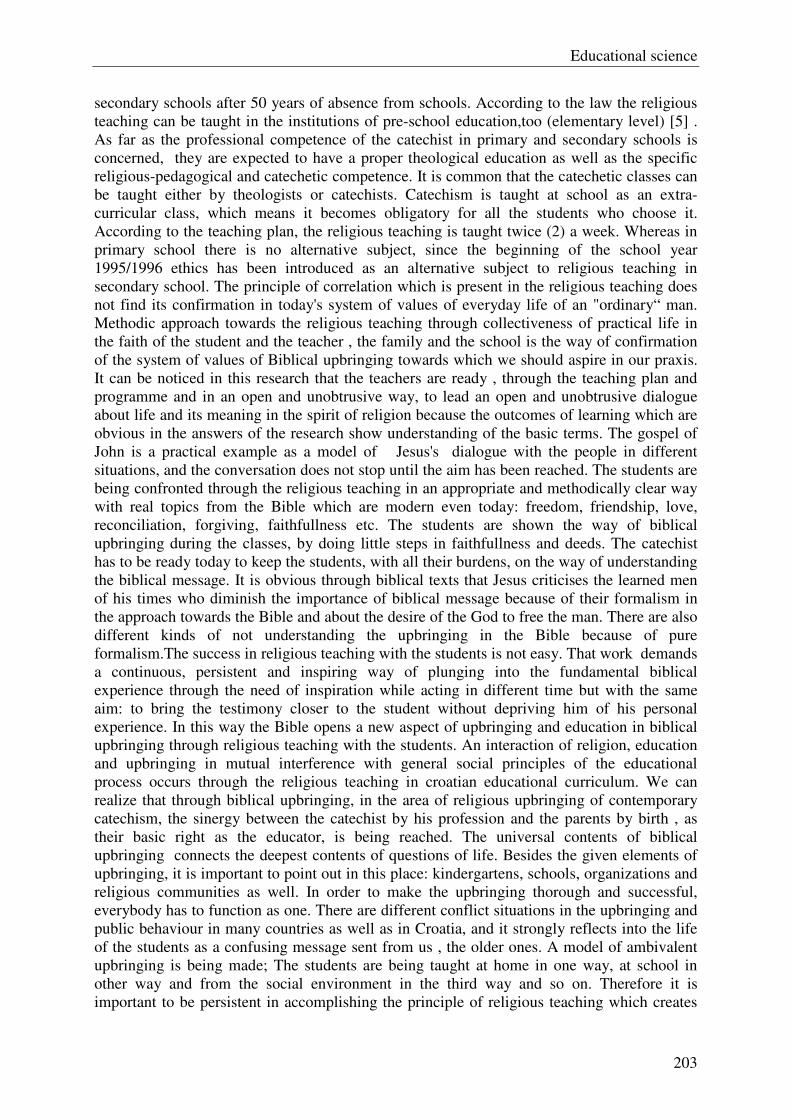
Educational science
203
secondary schools after 50 years of absence from schools. According to the law the religious
teaching can be taught in the institutions of pre-school education,too (elementary level) [5] .
As far as the professional competence of the catechist in primary and secondary schools is
concerned, they are expected to have a proper theological education as well as the specific
religious-pedagogical and catechetic competence. It is common that the catechetic classes can
be taught either by theologists or catechists. Catechism is taught at school as an extra-
curricular class, which means it becomes obligatory for all the students who choose it.
According to the teaching plan, the religious teaching is taught twice (2) a week. Whereas in
primary school there is no alternative subject, since the beginning of the school year
1995/1996 ethics has been introduced as an alternative subject to religious teaching in
secondary school. The principle of correlation which is present in the religious teaching does
not find its confirmation in today's system of values of everyday life of an "ordinary“ man.
Methodic approach towards the religious teaching through collectiveness of practical life in
the faith of the student and the teacher , the family and the school is the way of confirmation
of the system of values of Biblical upbringing towards which we should aspire in our praxis.
It can be noticed in this research that the teachers are ready , through the teaching plan and
programme and in an open and unobtrusive way, to lead an open and unobtrusive dialogue
about life and its meaning in the spirit of religion because the outcomes of learning which are
obvious in the answers of the research show understanding of the basic terms. The gospel of
John is a practical example as a model of Jesus's dialogue with the people in different
situations, and the conversation does not stop until the aim has been reached. The students are
being confronted through the religious teaching in an appropriate and methodically clear way
with real topics from the Bible which are modern even today: freedom, friendship, love,
reconciliation, forgiving, faithfullness etc. The students are shown the way of biblical
upbringing during the classes, by doing little steps in faithfullness and deeds. The catechist
has to be ready today to keep the students, with all their burdens, on the way of understanding
the biblical message. It is obvious through biblical texts that Jesus criticises the learned men
of his times who diminish the importance of biblical message because of their formalism in
the approach towards the Bible and about the desire of the God to free the man. There are also
different kinds of not understanding the upbringing in the Bible because of pure
formalism.The success in religious teaching with the students is not easy. That work demands
a continuous, persistent and inspiring way of plunging into the fundamental biblical
experience through the need of inspiration while acting in different time but with the same
aim: to bring the testimony closer to the student without depriving him of his personal
experience. In this way the Bible opens a new aspect of upbringing and education in biblical
upbringing through religious teaching with the students. An interaction of religion, education
and upbringing in mutual interference with general social principles of the educational
process occurs through the religious teaching in croatian educational curriculum. We can
realize that through biblical upbringing, in the area of religious upbringing of contemporary
catechism, the sinergy between the catechist by his profession and the parents by birth , as
their basic right as the educator, is being reached. The universal contents of biblical
upbringing connects the deepest contents of questions of life. Besides the given elements of
upbringing, it is important to point out in this place: kindergartens, schools, organizations and
religious communities as well. In order to make the upbringing thorough and successful,
everybody has to function as one. There are different conflict situations in the upbringing and
public behaviour in many countries as well as in Croatia, and it strongly reflects into the life
of the students as a confusing message sent from us , the older ones. A model of ambivalent
upbringing is being made; The students are being taught at home in one way, at school in
other way and from the social environment in the third way and so on. Therefore it is
important to be persistent in accomplishing the principle of religious teaching which creates
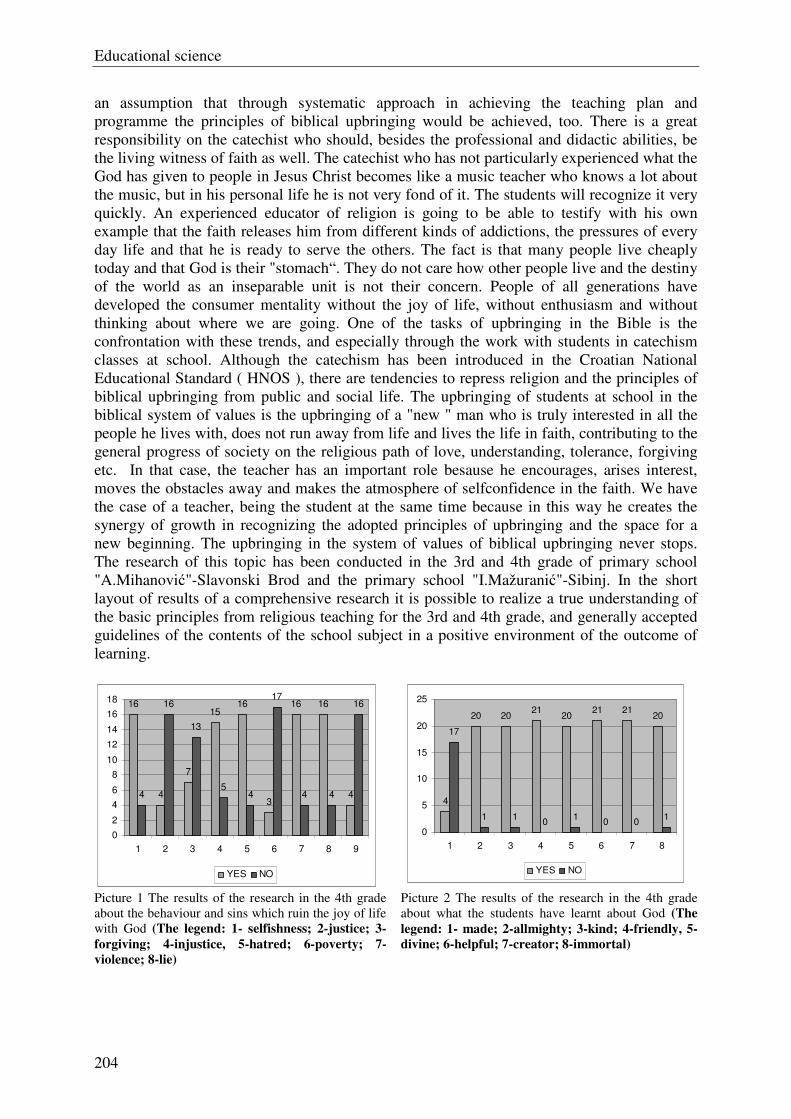
Educational science
204
an assumption that through systematic approach in achieving the teaching plan and
programme the principles of biblical upbringing would be achieved, too. There is a great
responsibility on the catechist who should, besides the professional and didactic abilities, be
the living witness of faith as well. The catechist who has not particularly experienced what the
God has given to people in Jesus Christ becomes like a music teacher who knows a lot about
the music, but in his personal life he is not very fond of it. The students will recognize it very
quickly. An experienced educator of religion is going to be able to testify with his own
example that the faith releases him from different kinds of addictions, the pressures of every
day life and that he is ready to serve the others. The fact is that many people live cheaply
today and that God is their "stomach“. They do not care how other people live and the destiny
of the world as an inseparable unit is not their concern. People of all generations have
developed the consumer mentality without the joy of life, without enthusiasm and without
thinking about where we are going. One of the tasks of upbringing in the Bible is the
confrontation with these trends, and especially through the work with students in catechism
classes at school. Although the catechism has been introduced in the Croatian National
Educational Standard ( HNOS ), there are tendencies to repress religion and the principles of
biblical upbringing from public and social life. The upbringing of students at school in the
biblical system of values is the upbringing of a "new " man who is truly interested in all the
people he lives with, does not run away from life and lives the life in faith, contributing to the
general progress of society on the religious path of love, understanding, tolerance, forgiving
etc. In that case, the teacher has an important role besause he encourages, arises interest,
moves the obstacles away and makes the atmosphere of selfconfidence in the faith. We have
the case of a teacher, being the student at the same time because in this way he creates the
synergy of growth in recognizing the adopted principles of upbringing and the space for a
new beginning. The upbringing in the system of values of biblical upbringing never stops.
The research of this topic has been conducted in the 3rd and 4th grade of primary school
"A.Mihanović"-Slavonski Brod and the primary school "I.Mažuranić"-Sibinj. In the short
layout of results of a comprehensive research it is possible to realize a true understanding of
the basic principles from religious teaching for the 3rd and 4th grade, and generally accepted
guidelines of the contents of the school subject in a positive environment of the outcome of
learning.
16
4
7
1516
3
16 16
44
16
13
54
17
4 4
16
0
2
4
6
8
10
12
14
16
18
1 2 3 4 5 6 7 8 9
YES NO
4
20 2021
2021 21
20
17
1 10
10 0
1
0
5
10
15
20
25
1 2 3 4 5 6 7 8
YES NO
Picture 1 The results of the research in the 4th grade
about the behaviour and sins which ruin the joy of life
with God (The legend: 1- selfishness; 2-justice; 3-
forgiving; 4-injustice, 5-hatred; 6-poverty; 7-
violence; 8-lie)
Picture 2 The results of the research in the 4th grade
about what the students have learnt about God (The
legend: 1- made; 2-allmighty; 3-kind; 4-friendly, 5-
divine; 6-helpful; 7-creator; 8-immortal)
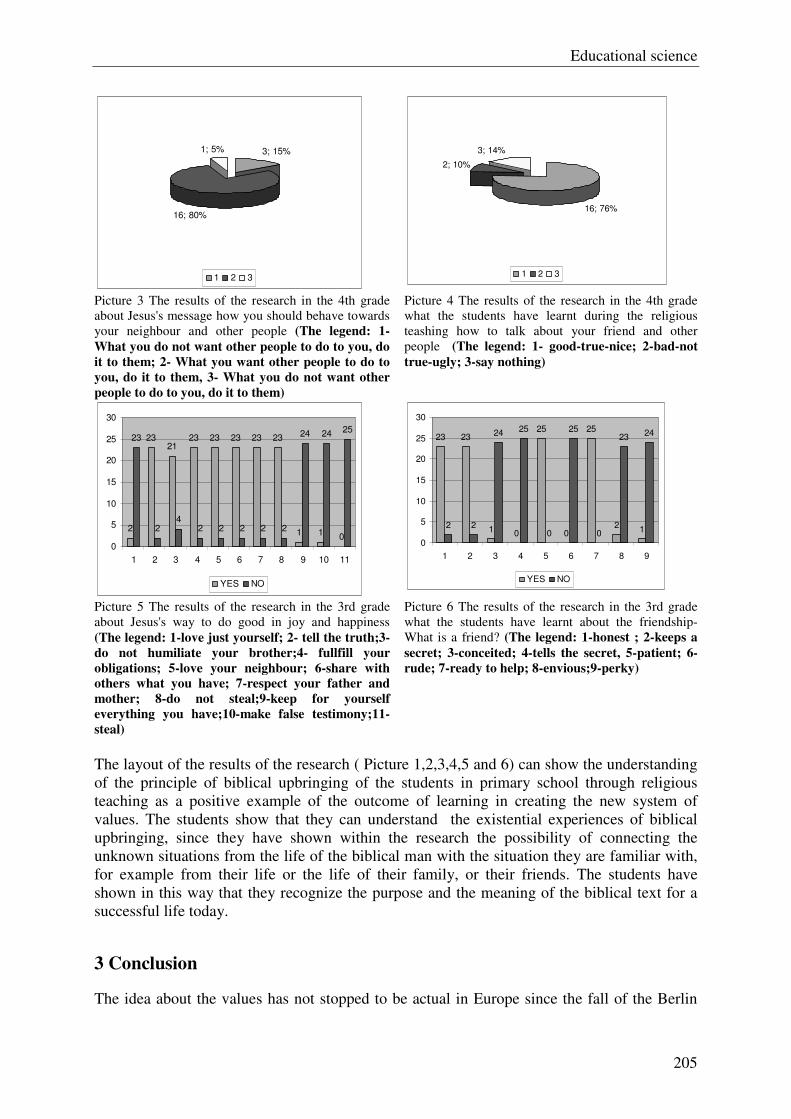
Educational science
205
3; 15%
16; 80%
1; 5%
1 2 3
16; 76%
2; 10%
3; 14%
1 2 3
Picture 3 The results of the research in the 4th grade
about Jesus's message how you should behave towards
your neighbour and other people (The legend: 1-
What you do not want other people to do to you, do
it to them; 2- What you want other people to do to
you, do it to them, 3- What you do not want other
people to do to you, do it to them)
Picture 4 The results of the research in the 4th grade
what the students have learnt during the religious
teashing how to talk about your friend and other
people (The legend: 1- good-true-nice; 2-bad-not
true-ugly; 3-say nothing)
2
2321
23 23 23 23 23
1 10
23
24
2 2 2 2 2
24 2425
0
5
10
15
20
25
30
1 2 3 4 5 6 7 8 9 10 11
YES NO
23 23
10
25
0
25
21
2 2
2425
0
25
0
2324
0
5
10
15
20
25
30
1 2 3 4 5 6 7 8 9
YES NO
Picture 5 The results of the research in the 3rd grade
about Jesus's way to do good in joy and happiness
(The legend: 1-love just yourself; 2- tell the truth;3-
do not humiliate your brother;4- fullfill your
obligations; 5-love your neighbour; 6-share with
others what you have; 7-respect your father and
mother; 8-do not steal;9-keep for yourself
everything you have;10-make false testimony;11-
steal)
Picture 6 The results of the research in the 3rd grade
what the students have learnt about the friendship-
What is a friend? (The legend: 1-honest ; 2-keeps a
secret; 3-conceited; 4-tells the secret, 5-patient; 6-
rude; 7-ready to help; 8-envious;9-perky)
The layout of the results of the research ( Picture 1,2,3,4,5 and 6) can show the understanding
of the principle of biblical upbringing of the students in primary school through religious
teaching as a positive example of the outcome of learning in creating the new system of
values. The students show that they can understand the existential experiences of biblical
upbringing, since they have shown within the research the possibility of connecting the
unknown situations from the life of the biblical man with the situation they are familiar with,
for example from their life or the life of their family, or their friends. The students have
shown in this way that they recognize the purpose and the meaning of the biblical text for a
successful life today.
3 Conclusion
The idea about the values has not stopped to be actual in Europe since the fall of the Berlin
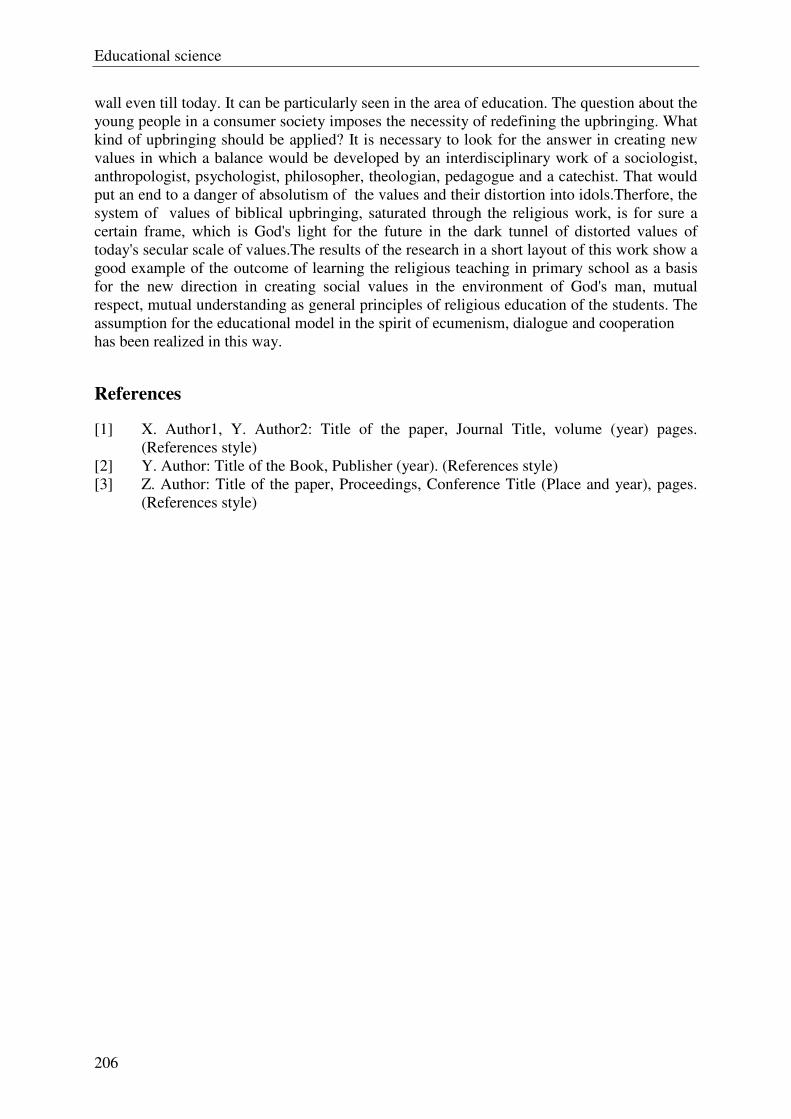
Educational science
206
wall even till today. It can be particularly seen in the area of education. The question about the
young people in a consumer society imposes the necessity of redefining the upbringing. What
kind of upbringing should be applied? It is necessary to look for the answer in creating new
values in which a balance would be developed by an interdisciplinary work of a sociologist,
anthropologist, psychologist, philosopher, theologian, pedagogue and a catechist. That would
put an end to a danger of absolutism of the values and their distortion into idols.Therfore, the
system of values of biblical upbringing, saturated through the religious work, is for sure a
certain frame, which is God's light for the future in the dark tunnel of distorted values of
today's secular scale of values.The results of the research in a short layout of this work show a
good example of the outcome of learning the religious teaching in primary school as a basis
for the new direction in creating social values in the environment of God's man, mutual
respect, mutual understanding as general principles of religious education of the students. The
assumption for the educational model in the spirit of ecumenism, dialogue and cooperation
has been realized in this way.
References
[1] X. Author1, Y. Author2: Title of the paper, Journal Title, volume (year) pages.
(References style)
[2] Y. Author: Title of the Book, Publisher (year). (References style)
[3] Z. Author: Title of the paper, Proceedings, Conference Title (Place and year), pages.
(References style)

207
Engineering and Technology
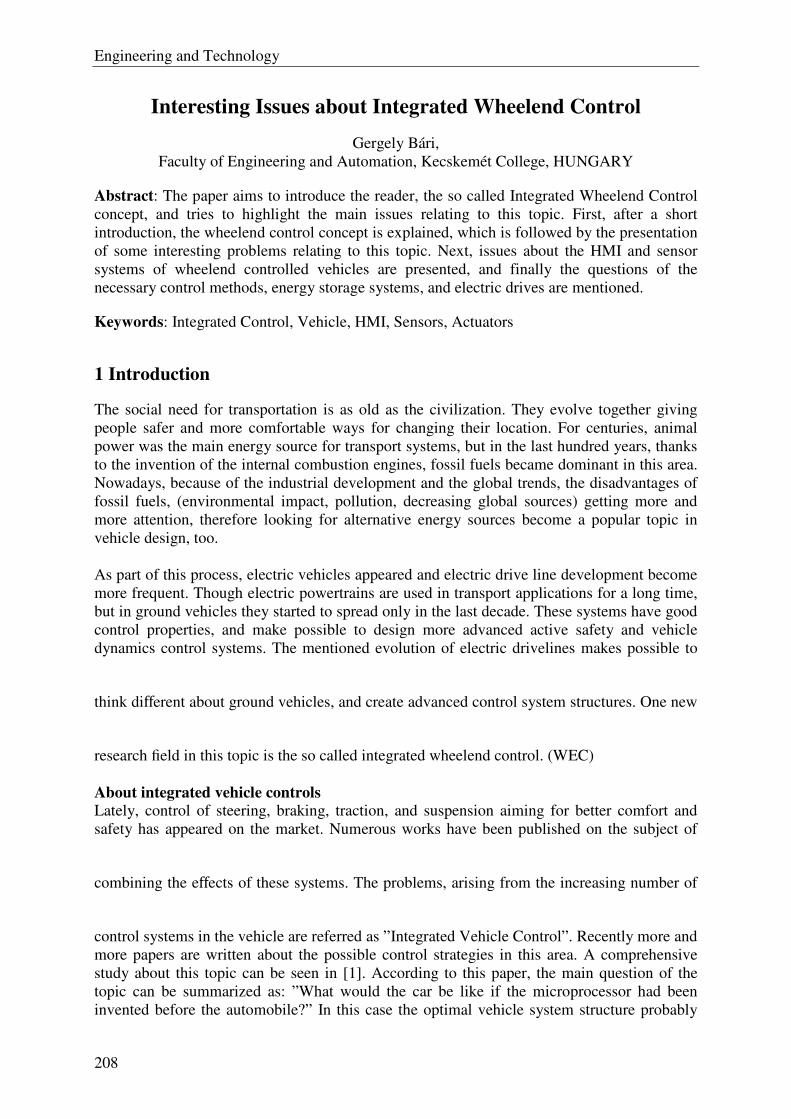
Engineering and Technology
208
Interesting Issues about Integrated Wheelend Control
Gergely Bári,
Faculty of Engineering and Automation, Kecskemét College, HUNGARY
Abstract: The paper aims to introduce the reader, the so called Integrated Wheelend Control
concept, and tries to highlight the main issues relating to this topic. First, after a short
introduction, the wheelend control concept is explained, which is followed by the presentation
of some interesting problems relating to this topic. Next, issues about the HMI and sensor
systems of wheelend controlled vehicles are presented, and finally the questions of the
necessary control methods, energy storage systems, and electric drives are mentioned.
Keywords: Integrated Control, Vehicle, HMI, Sensors, Actuators
1 Introduction
The social need for transportation is as old as the civilization. They evolve together giving
people safer and more comfortable ways for changing their location. For centuries, animal
power was the main energy source for transport systems, but in the last hundred years, thanks
to the invention of the internal combustion engines, fossil fuels became dominant in this area.
Nowadays, because of the industrial development and the global trends, the disadvantages of
fossil fuels, (environmental impact, pollution, decreasing global sources) getting more and
more attention, therefore looking for alternative energy sources become a popular topic in
vehicle design, too.
As part of this process, electric vehicles appeared and electric drive line development become
more frequent. Though electric powertrains are used in transport applications for a long time,
but in ground vehicles they started to spread only in the last decade. These systems have good
control properties, and make possible to design more advanced active safety and vehicle
dynamics control systems. The mentioned evolution of electric drivelines makes possible to
think different about ground vehicles, and create advanced control system structures. One new
research field in this topic is the so called integrated wheelend control. (WEC)
About integrated vehicle controls
Lately, control of steering, braking, traction, and suspension aiming for better comfort and
safety has appeared on the market. Numerous works have been published on the subject of
combining the effects of these systems. The problems, arising from the increasing number of
control systems in the vehicle are referred as ”Integrated Vehicle Control”. Recently more and
more papers are written about the possible control strategies in this area. A comprehensive
study about this topic can be seen in [1]. According to this paper, the main question of the
topic can be summarized as: ”What would the car be like if the microprocessor had been
invented before the automobile?” In this case the optimal vehicle system structure probably
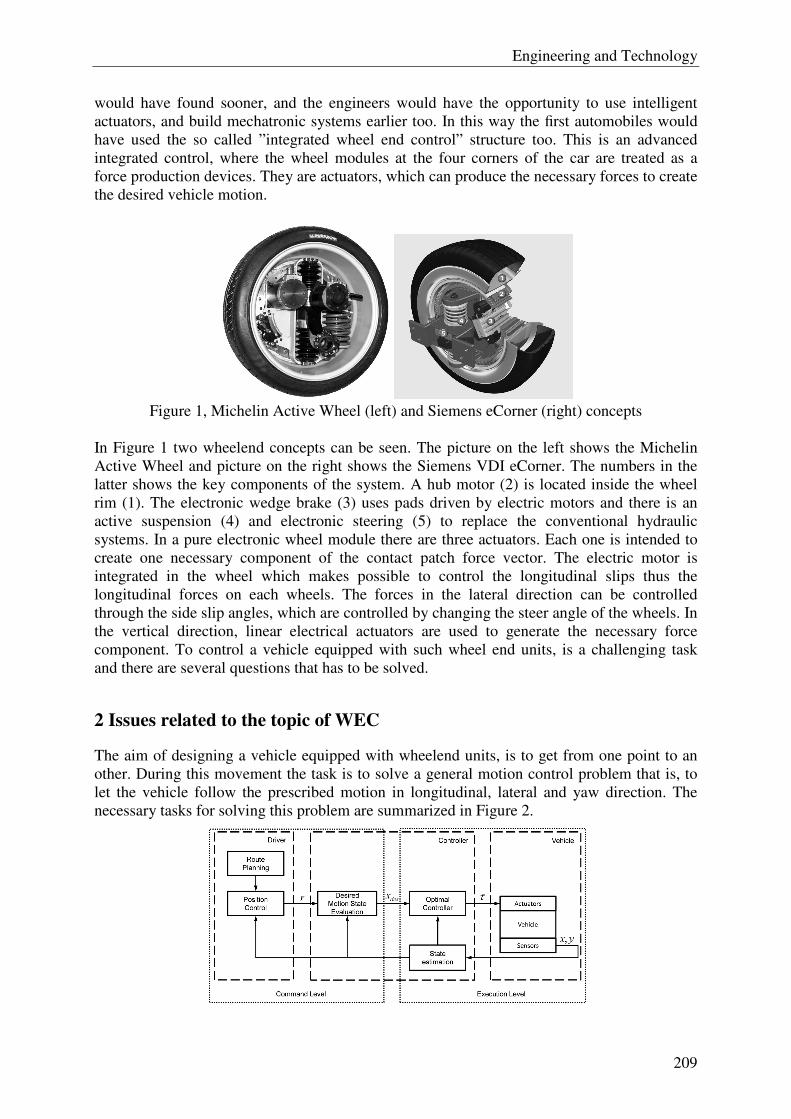
Engineering and Technology
209
would have found sooner, and the engineers would have the opportunity to use intelligent
actuators, and build mechatronic systems earlier too. In this way the first automobiles would
have used the so called ”integrated wheel end control” structure too. This is an advanced
integrated control, where the wheel modules at the four corners of the car are treated as a
force production devices. They are actuators, which can produce the necessary forces to create
the desired vehicle motion.
Figure 1, Michelin Active Wheel (left) and Siemens eCorner (right) concepts
In Figure 1 two wheelend concepts can be seen. The picture on the left shows the Michelin
Active Wheel and picture on the right shows the Siemens VDI eCorner. The numbers in the
latter shows the key components of the system. A hub motor (2) is located inside the wheel
rim (1). The electronic wedge brake (3) uses pads driven by electric motors and there is an
active suspension (4) and electronic steering (5) to replace the conventional hydraulic
systems. In a pure electronic wheel module there are three actuators. Each one is intended to
create one necessary component of the contact patch force vector. The electric motor is
integrated in the wheel which makes possible to control the longitudinal slips thus the
longitudinal forces on each wheels. The forces in the lateral direction can be controlled
through the side slip angles, which are controlled by changing the steer angle of the wheels. In
the vertical direction, linear electrical actuators are used to generate the necessary force
component. To control a vehicle equipped with such wheel end units, is a challenging task
and there are several questions that has to be solved.
2 Issues related to the topic of WEC
The aim of designing a vehicle equipped with wheelend units, is to get from one point to an
other. During this movement the task is to solve a general motion control problem that is, to
let the vehicle follow the prescribed motion in longitudinal, lateral and yaw direction. The
necessary tasks for solving this problem are summarized in Figure 2.

Engineering and Technology
210
Figure 2: Possible control architecture for solving the motion control problem
The first step is the route planning. In this level the discrete keypoints of the desired vehicle
motion path are calculated, which can be done according to GPS, traffic, or road map
information too. For example if the motion objective is to go to the workplace from home,
these keypoints can be the turnouts, street corners, etc. which defines the route to the
workplace.
In the position control level a continuous trajectory connecting the points of the route is
calculated. Note, that according to the WEC problem it is indifferent if these tasks are done
automatically or by the driver, since this level is far from the point where the necessary
wheelend actuator forces are defined. If the vehicle is controlled autonomously, the
information about the whole trajectory is available, so the desired motion state can be
calculated relatively easy, according to this planned trajectory.
If the vehicle is controlled by a driver then all of the mentioned tasks are done by the driver.
In this case to define the desired motion state of the vehicle is not so simple, since there is no
adequate information about the future inputs of the driver, and the desired future trajectory is
not known. After the desired motion state is known, the task is reach this state, by controlling
the actuators properly. This is represented by the controller box in Figure 2. For this control
not only the desired, but also the actual motion state is necessary. Since it is not always
possible to measure these variables directly, it is important to create an algorithm that
calculates the necessary information based on the available sensor signals, as shown by the
state estimation box. A different breakdown structure can be seen in Figure 3, where the
physically separable units can be seen.
Figure 3: Subsystems of a WEC system
The main functions of the subsystems numbered 1-5 in Figure 1.3 are the followings: (1) is
for gathering information about the vehicle. On the one part, the driver defines the required
motion through the Human-Machine Interface (HMI) and the on the other part sensors give
important information about the vehicle itself. The control unit (2) has a very complicated
task. Based on the available information (driver inputs, sensor signals, etc.), it calculates the

Engineering and Technology
211
desired and the actual vehicle motion, and controls the actuators in the wheelend modules to
minimize the difference between them. The aim of the energy management system (3), to
provide the necessary energy flow for the movement at every time. In the four corners of the
vehicle there are four wheelend modules (4). As mentioned earlier, these devices produce the
necessary forces that create the desired rigid body motion of the vehicle body. In the
followings the problems in the field of WEC will be presented.
Human-Machine Interface
The human-machine interface (HMI) is where people and technology meet. This people-
technology intercept can be as simple as the grip on a hand tool or as complex as the flight
deck of a jumbo jet. In case of passenger cars the most important control interfaces are the
steering wheel and pedals, since the driver indicates the desired motion through these
controls.
There are several problems according the HMI in a WEC system. Usually the first question is,
if it necessary to use steering and pedal layout anyway? Since there is no mechanical
connection between the controlled actuators and the control devices, it is possible to use any
other way for control, e.g. joysticks. There are several opinions about this question and further
investigation is necessary.
It is also an interesting question, that how many control inputs should be used? The main
motion of the vehicle is the in plane motion which means 3 state variables (the yaw rate, the
lateral and longitudinal velocities), while with the common steering & pedals layout, the
driver has only two inputs. With the usual front wheel steered vehicles, the lateral and yaw
motion are coupled, so they can be controlled together with the steering, and the longitudinal
motion can be controlled with the pedals. In a WEC system, defining the desired motion state
variables based on these inputs is not trivial. This task is performed by the Desired motion
state evaluation function as shown in Figure 2. This algorithm is part of the control logic, so
some considerations about it, will be given later.
If it is supposed that the vehicle is controlled by a conventional steering & pedals layout, the
other interesting topic is how to give feedback to the driver through the HMI. As mentioned
earlier, there is no mechanical connection between the steered wheels and the control
interfaces in case of a WEC system. This is the reason why investigating the role of the
steering torque that is felt by the driver is so important.
Historically to make the steering torque smaller was the aim of the first power steering
applications. This meant that a certain torque was added to the driver torque, and thus the
steering became easier. Though this solved the problem of the too big desired driver torque,
but also introduced the problem of ”steering feel”, which meant that the big assist torque
blurred the ”feeling” of the tyre forces, and gave lack of feedback to the driver. As the
steering systems evolved, and more sophisticated control systems were designed, the problem
of steering feel became more critical.
One of the main questions of this topic is, whether the primary control input of the driver is
the steering torque or the steering angle. This question is easier to answer in case of
longitudinal acceleration since it is known that the driver uses position control for the
accelerator pedal. In case of braking there is a difference between commercial vehicles, where
the brake pedal position is the key input, and passenger cars where rather the pedal force is
the relevant, but it is also quite simple to decide this. In case of steering, the answer for this

Engineering and Technology
212
question is not so trivial.
In [2] a detailed analysis can be found about this topic. The experiments showed that the
drivers basically use position (angle) control for steering, but as they are getting used to the
car, as they learning more and more about the vehicle, they are changing to force (torque)
control, as it is less demanding for the muscles.
Another important role of the steering torque is that it gives the driver information about the
state of the vehicle, which helps him to control and stabilize the vehicle system. This
statement is also supported by the fact that the ”steering feel” (the adequate steering torque
feedback) is mostly important in sport cars and race cars, where the drivers often have to
stabilize the car and manoeuvre at the tyre grip limit, and it is not so critical in case of
commercial vehicles and comfortable passenger cars, where the drivers do not reach the limits
of their vehicles. In latter cases the advantage of controlling the steering torque is, that it
makes possible to give better and faster feedback about what is happening on the tyre-road
contact patch, and the appropriate steering input can be suggested to the driver.
Usually the main advantage of electric control systems is that they have faster response, and
usually they can work based on measurements that are not “felt” by the driver directly (eg.:
wheel speeds) On the other hand it is also a fact that the human brain can control very
complex systems too if it has proper feedback information. This is shown by the fact that
controlling the human body, and reproducing the humanoid motion is quite a challenging
task, but every human being can perform this task. In a WEC system there are twelve possible
control inputs. (Steering torque, Driving/Braking torque and Normal force, at each wheel) It is
an interesting question, that what would happen, if a driver were put into a vehicle in which
such an HMI would be installed that would make possible to control each actuator, and would
give proper feedback about all the necessary information (wheel slips, forces, accelerations,
etc.) The learning process of the driver, and the way he controls such a vehicle could provide
valuable information for the design of other WEC vehicles.
Sensors
As it was mentioned in previous sections the proper feedback information about the vehicle
state is very important, not only for the driver, but also for any kind of closed loop control.
From this point of view more and more sensors would be desired on a vehicle, while on the
other hand the necessary sensors can be very expensive. In serial production these expenses
are not allowed, so there is a need for placing less sensors on the vehicle. This motivates very
intensive research in the field of state estimation, which means that the necessary information
are not measured directly, rather calculated, estimated from other, cheaper sensor signals.
The most important information are the following:
1. Motion state of the vehicle: Longitudinal velocity, Lateral velocity (Body slip angle),
Yaw rate.
2. Wheel forces: Longitudinal, Lateral, Vertical.
3. Vehicle parameters: Mass, Inertia, Center of Gravity (CoG) position, Wheel rolling
radius.
4. Environment parameters: Road friction coefficient, Road bank angle.
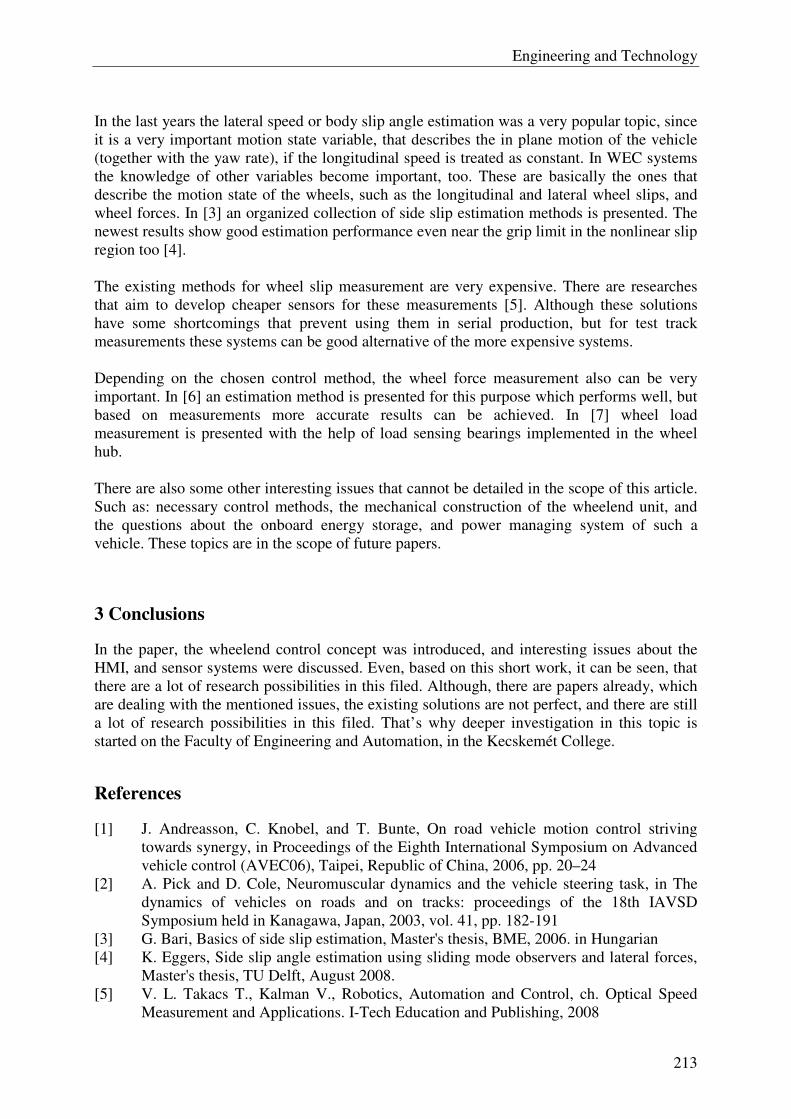
Engineering and Technology
213
In the last years the lateral speed or body slip angle estimation was a very popular topic, since
it is a very important motion state variable, that describes the in plane motion of the vehicle
(together with the yaw rate), if the longitudinal speed is treated as constant. In WEC systems
the knowledge of other variables become important, too. These are basically the ones that
describe the motion state of the wheels, such as the longitudinal and lateral wheel slips, and
wheel forces. In [3] an organized collection of side slip estimation methods is presented. The
newest results show good estimation performance even near the grip limit in the nonlinear slip
region too [4].
The existing methods for wheel slip measurement are very expensive. There are researches
that aim to develop cheaper sensors for these measurements [5]. Although these solutions
have some shortcomings that prevent using them in serial production, but for test track
measurements these systems can be good alternative of the more expensive systems.
Depending on the chosen control method, the wheel force measurement also can be very
important. In [6] an estimation method is presented for this purpose which performs well, but
based on measurements more accurate results can be achieved. In [7] wheel load
measurement is presented with the help of load sensing bearings implemented in the wheel
hub.
There are also some other interesting issues that cannot be detailed in the scope of this article.
Such as: necessary control methods, the mechanical construction of the wheelend unit, and
the questions about the onboard energy storage, and power managing system of such a
vehicle. These topics are in the scope of future papers.
3 Conclusions
In the paper, the wheelend control concept was introduced, and interesting issues about the
HMI, and sensor systems were discussed. Even, based on this short work, it can be seen, that
there are a lot of research possibilities in this filed. Although, there are papers already, which
are dealing with the mentioned issues, the existing solutions are not perfect, and there are still
a lot of research possibilities in this filed. That’s why deeper investigation in this topic is
started on the Faculty of Engineering and Automation, in the Kecskemét College.
References
[1] J. Andreasson, C. Knobel, and T. Bunte, On road vehicle motion control striving
towards synergy, in Proceedings of the Eighth International Symposium on Advanced
vehicle control (AVEC06), Taipei, Republic of China, 2006, pp. 20–24
[2] A. Pick and D. Cole, Neuromuscular dynamics and the vehicle steering task, in The
dynamics of vehicles on roads and on tracks: proceedings of the 18th IAVSD
Symposium held in Kanagawa, Japan, 2003, vol. 41, pp. 182-191
[3] G. Bari, Basics of side slip estimation, Master's thesis, BME, 2006. in Hungarian
[4] K. Eggers, Side slip angle estimation using sliding mode observers and lateral forces,
Master's thesis, TU Delft, August 2008.
[5] V. L. Takacs T., Kalman V., Robotics, Automation and Control, ch. Optical Speed
Measurement and Applications. I-Tech Education and Publishing, 2008

Engineering and Technology
214
[6] J. Boot, Atv control regulating a 4wd/4ws autonomus guided vehicle, Master's thesis,
TU/e, 2004-2005.
[7] E. Holweg, Load sensing and vehicle dynamics control, Annual ATC Congress, 2008.
Author data
Gergely Bari: Faculty of Engineering and Automation, Kecskemét College. Postal Addresse:
6000 Kecskemét, Izsáki road 10, Hungary. E-mail: [email protected].

Engineering and Technology
215
Stress analysis of thick-walled tubes with different degrees of
plasticization
Tomislav Baskaric, Darko Damjanovic, Franjo Matejicek, Drazan Kozak, Zeljko Ivandic
Mechanical Engineering Faculty, J. J. Strossmayer University of Osijek, CROATIA
Abstract: The paper presents analytical analysis for the linear elastic-ideal plastic behaviour
of thick-walled tubes under internal pressure. A plasticity theory is used to describe circular,
radial and axial stresses in tube wall. Analysis was made for varying degrees of plasticization.
According to von Mises yield criterion the pressure in the thick-walled tube was calculated
depending on the degree of plasticization. Some of the analytical solutions are verified
numerically. The numerical model is defined as a plane, and the material is defined as a linear
elastic-ideal plastic.
Keywords: plasticity theory, thick-walled tube, internal pressure, stress, degree of
plasticization.
1 Introduction
In order to determine the pressure in the pipes for some degree of plasticization is necessary
to pre-compute circular, radial and axial stresses in the pipe. Figure 1 shows the stresses in
differential element of thick-walled tube.
Figure 1: Stresses in differential element of thick-walled tube [1]
2 Circular stresses
To determine the stresses in thick-walled tube which is partially plastically deformed must
separately consider the stresses in the plasticized wall section, and separately the part that is
elastically deformed.
For a given tube the following degrees of plasticization are considered regarding circular
component of stress:
5,1 4,1 3,1 2,1 1,1 1111111
======r
r
r
r
r
r
r
r
r
r
r
r TTTTTT

Engineering and Technology
216
where r1 is inner radius of the tube and rT is the radius which divides elastic and plastic
region. For some degree of plasticization the distribution of circular stresses in area of plastic
deformation was calculated by using equation (1). For the same levels of plasticization
distribution of circular stresses in area of elastic deformation was calculated by equation (2).
Circular stresses in area of plastic deformation T1 rrr ≤≤ :
+
+= 1
rln2
3
2
2
T
T
T r
r
rpl σσ ϕ (1)
Circular stresses in area of elastic deformation 2T rrr ≤≤ :
+
=
2
2
2
2
TT
r1
r3
rrel σσϕ (2)
Dimensions of considered tube are the following:
r1 = 100 mm, r2 = 150 mm
Yield stress of the thick-walled tube is:
MPa500T =σ
Table (1) shows the amount of circular stresses for different degrees of plasticization.
r 100 105 110 115 120 125 130 135 140 145 150
rT/r1 rT r/r1 1,00 1,05 1,10 1,15 1,20 1,25 1,30 1,35 1,40 1,45 1,50
1 100 σϕ 416,98 390,14 366,87 346,58 328,77 313,05 299,11 286,70 275,58 265,60 256,60
1,1 110 σϕ 388,89 417,06 443,92 419,36 397,81 378,79 361,93 346,90 333,46 321,38 310,49
1,2 120 σϕ 368,16 396,33 423,19 448,86 473,43 450,80 430,72 412,84 396,84 382,47 369,50
1,3 130 σϕ 354,03 382,20 409,05 434,72 459,29 482,86 505,50 484,51 465,74 448,87 433,65
1,4 140 σϕ 345,88 374,05 400,91 426,57 451,14 474,71 497,36 519,15 540,14 520,58 502,94
1,5 150 σϕ 343,25 371,42 398,28 423,95 448,52 472,09 494,73 516,52 537,52 557,78 577,35 E
LA
ST
ICA
LLY
DE
FO
RM
ED
AR
EA
PLASTICALLLY DEFORMED AREA
Table 1: Circular stresses in thick-walled tube
The amounts of circular stresses in Table (1) are divided with yield strength. The results are
given in Table (2).
r 100 105 110 115 120 125 130 135 140 145 150
rT/r1 rT r/r1 1,00 1,05 1,10 1,15 1,20 1,25 1,30 1,35 1,40 1,45 1,50
1 100 σϕ/σΤ 0,83 0,78 0,73 0,69 0,66 0,63 0,60 0,57 0,55 0,53 0,51
1,1 110 σϕ/σΤ 0,78 0,83 0,89 0,84 0,80 0,76 0,72 0,69 0,67 0,64 0,62
1,2 120 σϕ/σΤ 0,74 0,79 0,85 0,90 0,95 0,90 0,86 0,83 0,79 0,76 0,74
1,3 130 σϕ/σΤ 0,71 0,76 0,82 0,87 0,92 0,97 1,01 0,97 0,93 0,90 0,87
1,4 140 σϕ/σΤ 0,69 0,75 0,80 0,85 0,90 0,95 0,99 1,04 1,08 1,04 1,01
1,5 150 σϕ/σΤ 0,69 0,74 0,80 0,85 0,90 0,94 0,99 1,03 1,08 1,12 1,15
ELA
ST
ICA
LLY
DE
FO
RM
ED
AR
EA
PLASTICALLLY DEFORMED AREA
Table 2: Ratio σϕ /σΤ depending on the degree of plasticization
Based on the table (2) it is drawn a diagram of distribution of circular stresses for different
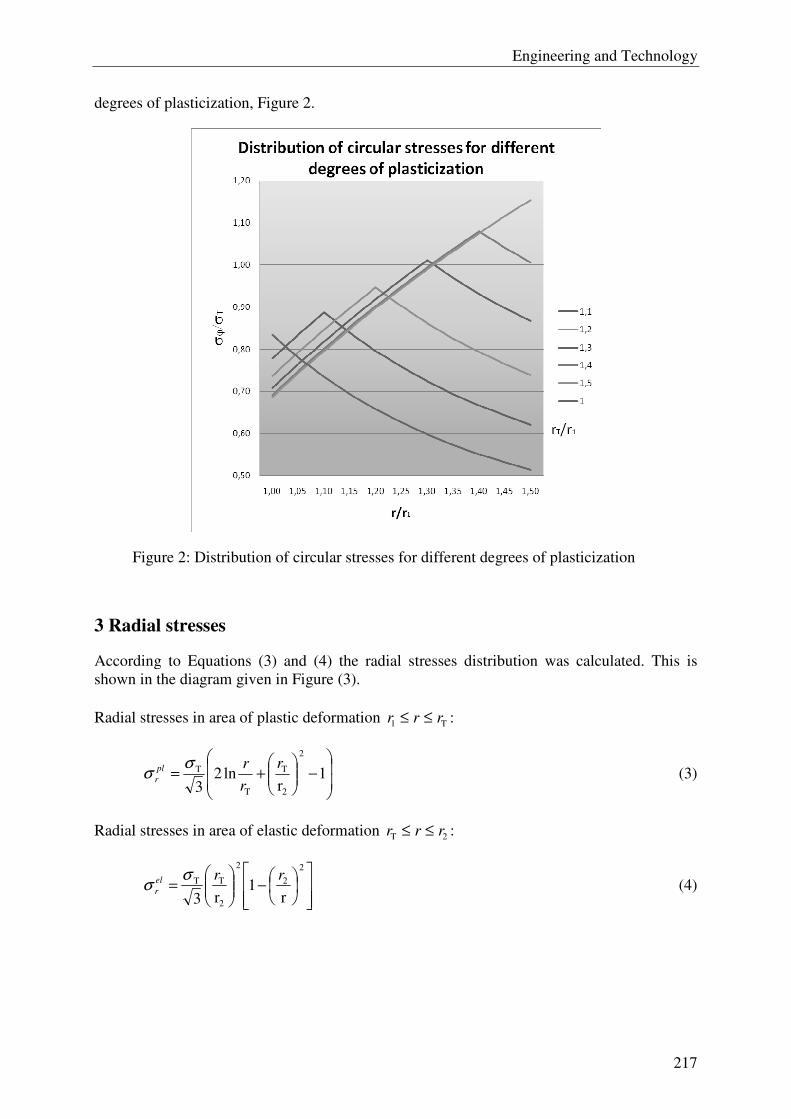
Engineering and Technology
217
degrees of plasticization, Figure 2.
Figure 2: Distribution of circular stresses for different degrees of plasticization
3 Radial stresses
According to Equations (3) and (4) the radial stresses distribution was calculated. This is
shown in the diagram given in Figure (3).
Radial stresses in area of plastic deformation T1 rrr ≤≤ :
−
+= 1
rln2
3
2
2
T
T
T r
r
rpl
r
σσ (3)
Radial stresses in area of elastic deformation 2T rrr ≤≤ :
−
=
2
2
2
2
TT
r1
r3
rrel
r
σσ (4)
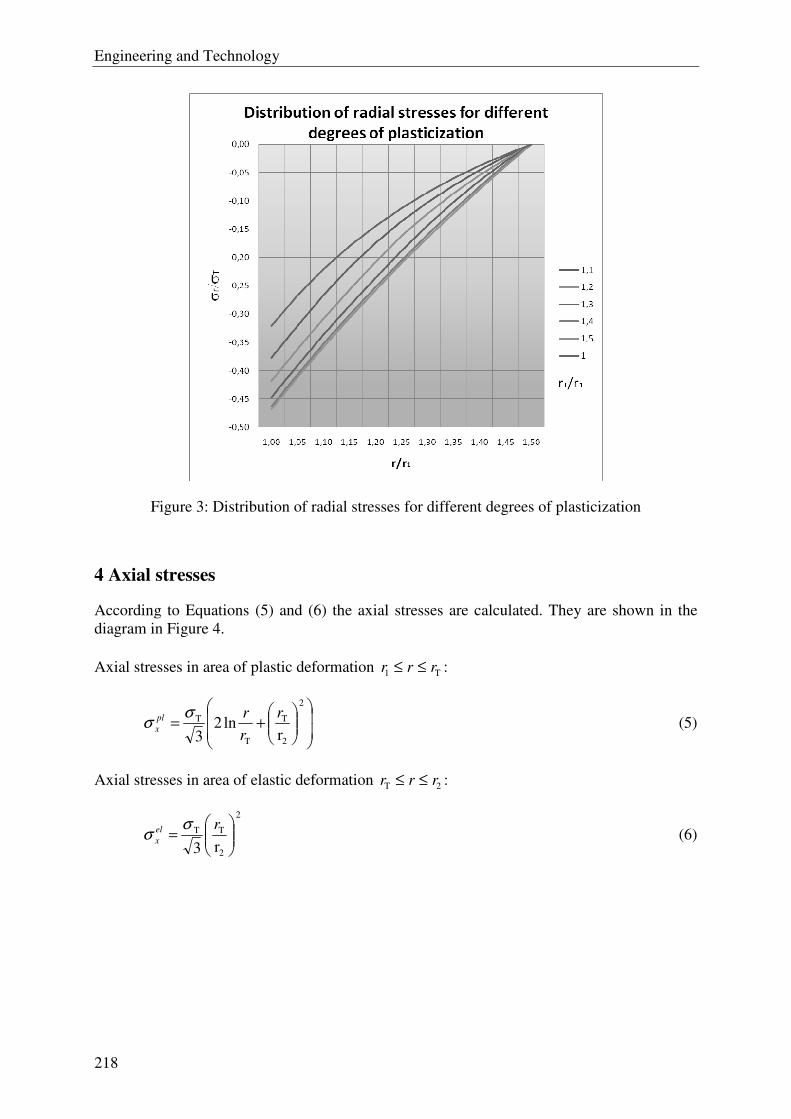
Engineering and Technology
218
Figure 3: Distribution of radial stresses for different degrees of plasticization
4 Axial stresses
According to Equations (5) and (6) the axial stresses are calculated. They are shown in the
diagram in Figure 4.
Axial stresses in area of plastic deformation T1 rrr ≤≤ :
+=
2
2
T
T
T
rln2
3
r
r
rpl
x
σσ (5)
Axial stresses in area of elastic deformation 2T rrr ≤≤ :
2
2
TT
r3
=
rel
x
σσ (6)
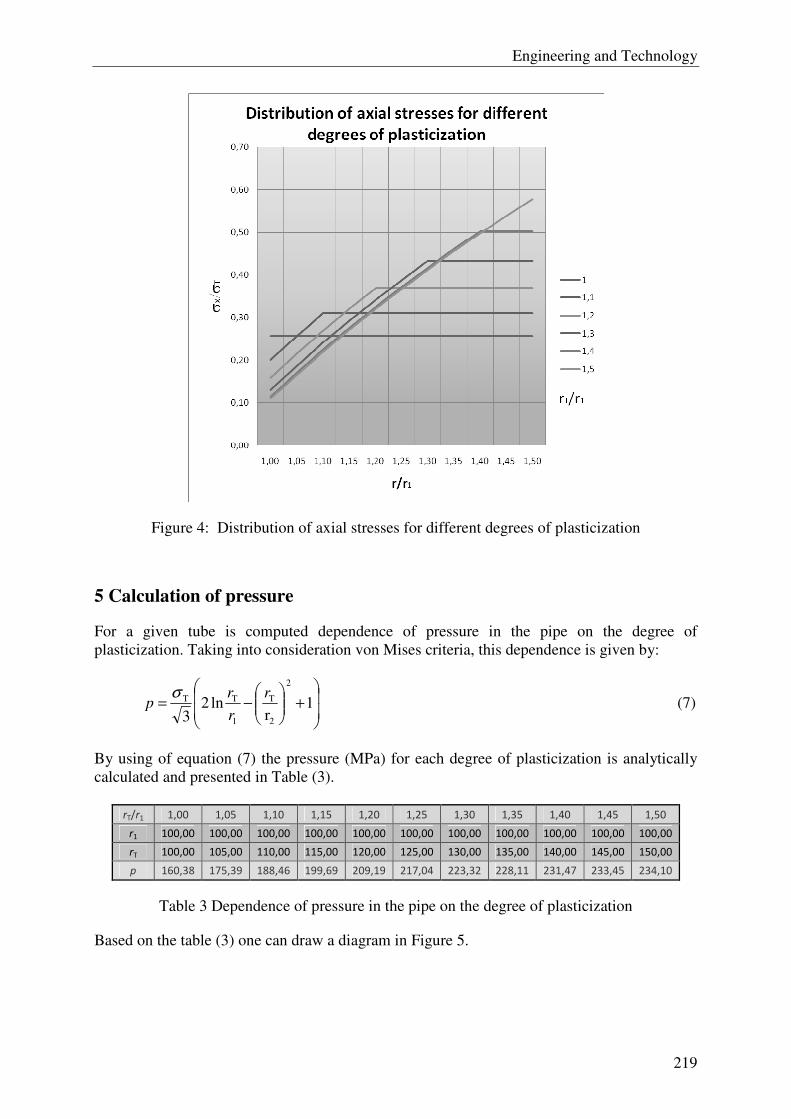
Engineering and Technology
219
Figure 4: Distribution of axial stresses for different degrees of plasticization
5 Calculation of pressure
For a given tube is computed dependence of pressure in the pipe on the degree of
plasticization. Taking into consideration von Mises criteria, this dependence is given by:
+
−= 1
rln2
3
2
2
T
1
TT r
r
rp
σ (7)
By using of equation (7) the pressure (MPa) for each degree of plasticization is analytically
calculated and presented in Table (3).
rT/r1 1,00 1,05 1,10 1,15 1,20 1,25 1,30 1,35 1,40 1,45 1,50
r1 100,00 100,00 100,00 100,00 100,00 100,00 100,00 100,00 100,00 100,00 100,00
rT 100,00 105,00 110,00 115,00 120,00 125,00 130,00 135,00 140,00 145,00 150,00
p 160,38 175,39 188,46 199,69 209,19 217,04 223,32 228,11 231,47 233,45 234,10
Table 3 Dependence of pressure in the pipe on the degree of plasticization
Based on the table (3) one can draw a diagram in Figure 5.
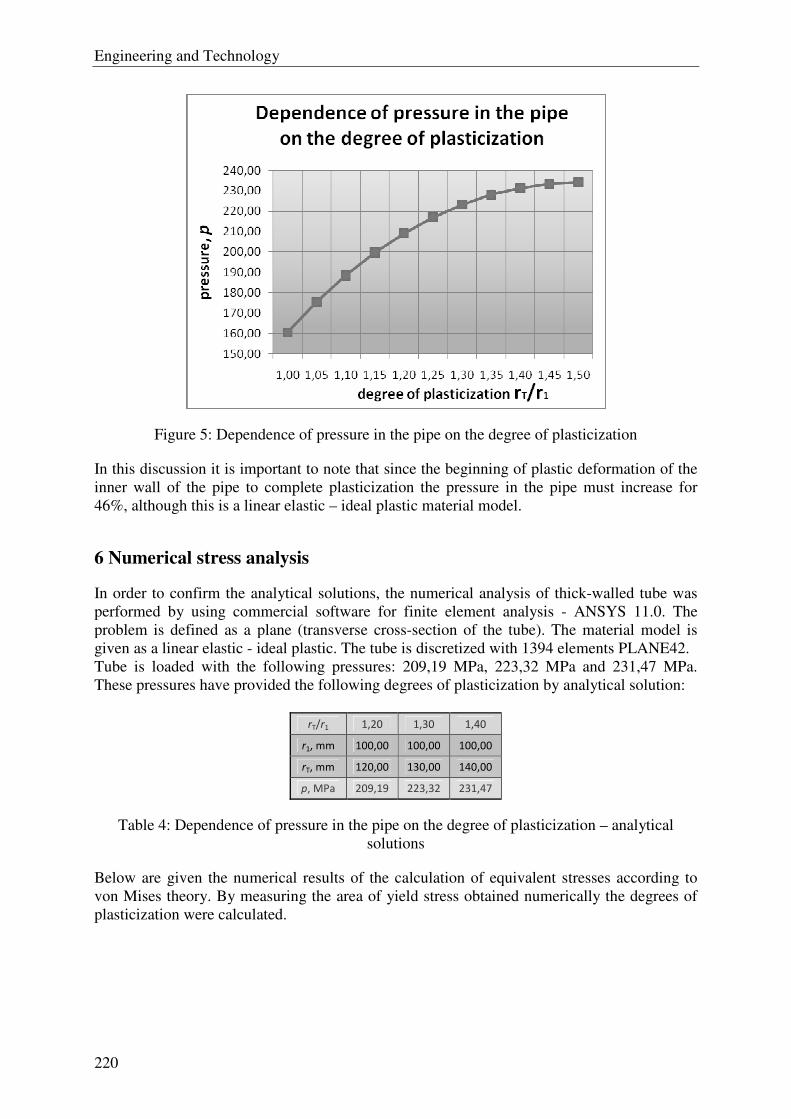
Engineering and Technology
220
Figure 5: Dependence of pressure in the pipe on the degree of plasticization
In this discussion it is important to note that since the beginning of plastic deformation of the
inner wall of the pipe to complete plasticization the pressure in the pipe must increase for
46%, although this is a linear elastic – ideal plastic material model.
6 Numerical stress analysis
In order to confirm the analytical solutions, the numerical analysis of thick-walled tube was
performed by using commercial software for finite element analysis - ANSYS 11.0. The
problem is defined as a plane (transverse cross-section of the tube). The material model is
given as a linear elastic - ideal plastic. The tube is discretized with 1394 elements PLANE42.
Tube is loaded with the following pressures: 209,19 MPa, 223,32 MPa and 231,47 MPa.
These pressures have provided the following degrees of plasticization by analytical solution:
rT/r1 1,20 1,30 1,40
r1, mm 100,00 100,00 100,00
rT, mm 120,00 130,00 140,00
p, MPa 209,19 223,32 231,47
Table 4: Dependence of pressure in the pipe on the degree of plasticization – analytical
solutions
Below are given the numerical results of the calculation of equivalent stresses according to
von Mises theory. By measuring the area of yield stress obtained numerically the degrees of
plasticization were calculated.
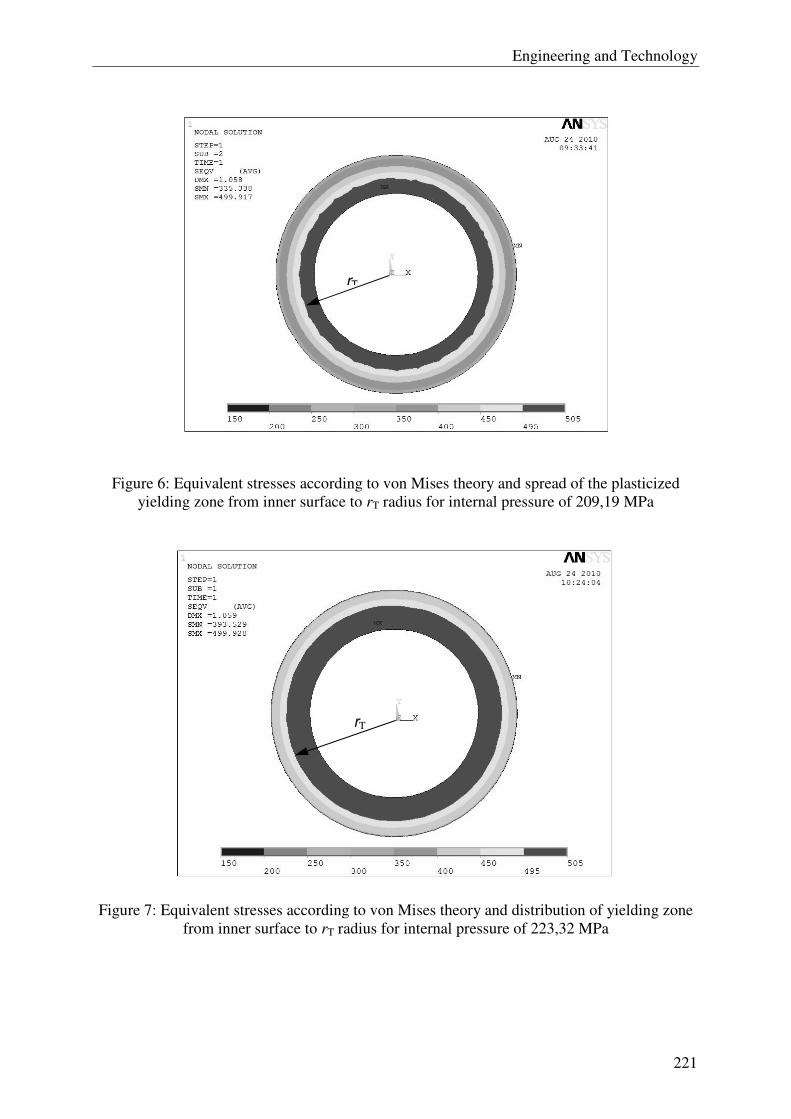
Engineering and Technology
221
Figure 6: Equivalent stresses according to von Mises theory and spread of the plasticized
yielding zone from inner surface to rT radius for internal pressure of 209,19 MPa
Figure 7: Equivalent stresses according to von Mises theory and distribution of yielding zone
from inner surface to rT radius for internal pressure of 223,32 MPa
rT
rT
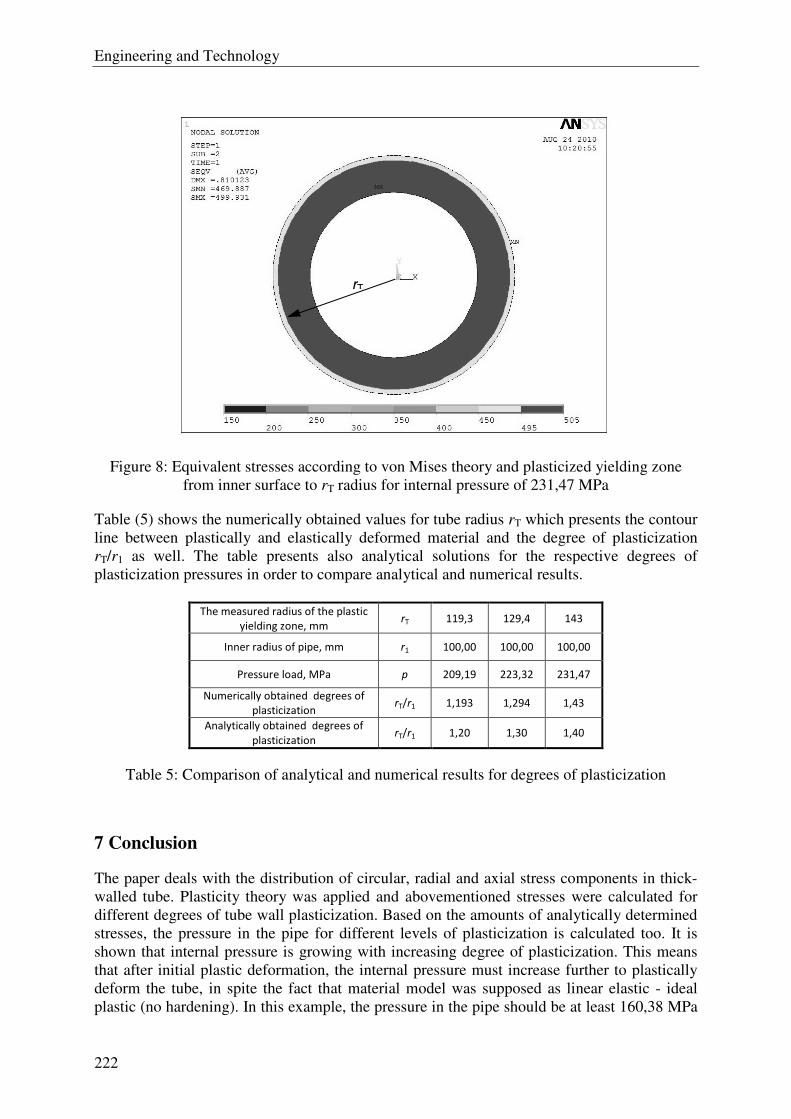
Engineering and Technology
222
Figure 8: Equivalent stresses according to von Mises theory and plasticized yielding zone
from inner surface to rT radius for internal pressure of 231,47 MPa
Table (5) shows the numerically obtained values for tube radius rT which presents the contour
line between plastically and elastically deformed material and the degree of plasticization
rT/r1 as well. The table presents also analytical solutions for the respective degrees of
plasticization pressures in order to compare analytical and numerical results.
The measured radius of the plastic
yielding zone, mm rT 119,3 129,4 143
Inner radius of pipe, mm r1 100,00 100,00 100,00
Pressure load, MPa p 209,19 223,32 231,47
Numerically obtained degrees of
plasticization rT/r1 1,193 1,294 1,43
Analytically obtained degrees of
plasticization rT/r1 1,20 1,30 1,40
Table 5: Comparison of analytical and numerical results for degrees of plasticization
7 Conclusion
The paper deals with the distribution of circular, radial and axial stress components in thick-
walled tube. Plasticity theory was applied and abovementioned stresses were calculated for
different degrees of tube wall plasticization. Based on the amounts of analytically determined
stresses, the pressure in the pipe for different levels of plasticization is calculated too. It is
shown that internal pressure is growing with increasing degree of plasticization. This means
that after initial plastic deformation, the internal pressure must increase further to plastically
deform the tube, in spite the fact that material model was supposed as linear elastic - ideal
plastic (no hardening). In this example, the pressure in the pipe should be at least 160,38 MPa
rT
Engineering and Technology
223
to initiate the plastic deformation, and has to be increased to 234,1 MPa (for about 46%) to
ensure that whole cross section of the tube will be plastically deformed.
References
[1] J. Brnic: Elastomehanika i plastomehanika, Sveuciliste u Rijeci (1996)
[2] I. Alfirevic: Mehanika elastoplasticnih tijela, FSB Zagreb
[3] ANSYS, Release 11.0, Help Topics
Author data
Tomislav Baskaric, Darko Damjanovic, Franjo Matejicek, Drazan Kozak, Zeljko Ivandic:
Mechanical Engineering Faculty, J. J. University of Osijek, Trg I. B. Mazuranic 2, HR-35000
Slavonski Brod, Croatia.
E-mail: [email protected], [email protected], [email protected],
Engineering and Technology
224
A töltőfeszültség és az agyagminőség hatásának vizsgálata a csúcsgyújtásos csaphegesztéssel készült kötések tulajdonságaira
Bernáth Mihály Mechanikai Technológiai Szakcsoport/Fém- és Műanyagfeldolgozó Technológiai Intézet,
Kecskeméti Főiskola/GAMF Kar
Összefoglalás: Sokszor szükségessé válik lemezekre, csövekre, különböző profilokra csapokat, menetes csapokat, egyéb csatlakozó füleket felerősíteni. Az ilyen alkatrészek rögzítésére többféle „hagyományos” eljárás létezik (pl.: csavarozás, szegecselés, ponthegesztés stb.). A legtöbb eljárás alkalmazásának gyakran határt szab a hozzáférhetőség, a kis termelékenység, a nem megfelelő szilárdság, korróziós hajlam stb. Ezek a problémák általában kiküszöbölhetők a csaphegesztés valamely változatával. Jelen dolgozat a kondenzátor-kisüléses (csúcsgyújtásos) alkalmazásánál vizsgálja a paraméterek hatását a kötés tulajdonságaira.
Abstract: There is often need for mounting handles, pins, or screw by welding on different surfaces such as sheet metals, pipes or different profiles. There are several traditional technologies for mounting these fittings (screwing, riveting, spot-welding, etc.). There are many limitations when using these technologies: low productivity, low strength properties, corrosion, bad accessibility of the surfaces. These problems can be eliminated by using one of the pin welding technologies. This paper deals with the effect of the capacitor discharge stud welding parameters on the weld properties.
Kulcsszavak: Csúcsgyújtás, csaphegesztés
Keywords: Capacitor discharge stud welding, pin welding
1. Hegesztés
A hegesztés és a forrasztás, mint anyagegyesítési technológiák, az oldhatatlan kötések közé tartoznak. A két eljárás között az a legfontosabb különbség, hogy a hegesztésnél az atomok között kohéziós kapcsolat alakul ki, forrasztásnál viszont csak adhéziós. A kohéziós kapcsolat létrejöttéhez az szükséges, hogy az összekötendő alkatrészek atomjai kellő közelségbe kerüljenek egymással. A legelterjedtebb hegesztési eljárásoknál a kohéziós kapcsolatot hő és/vagy nyomás segítségével hozzák létre. A kondenzátor kisüléses csaphegesztésnél a felületek megolvasztásához szükséges energiát egy nagy kapacitású kondenzátor kisülése szolgáltatja. A kötés mechanikai tulajdonságát (jóságát) számos tényező befolyásolja, pl.: a hegesztendő alkatrészek anyagminősége, hőtani jellemzői, villamos paraméterek, sajtoló erő stb.. Jelen cikk ezek közül a tényezők közül vizsgál meg néhányat.
2. Főbb paraméterek
A hő közlésével járó (ömlesztő, ömlesztve sajtoló) hegesztéseknél mindig számítani kell a hőhatás övezetben bekövetkező változásokra. Ezek a változások a kötés szempontjából lehetnek kedvezőek, vagy éppen kedvezőtlenek. A hőmérséklet növekedés hatására a szemcsék eldurvulhatnak, vagy szerencsésebb estben finomodhatnak, a hidegen alakított fémeknél pedig megtörténhet az újrakristályosodást követő nagymértékű szemcsedurvulás. Az acélok hegesztésénél nagy veszélyt jelenthet a beedződés, ami nagyobb széntartalomnál
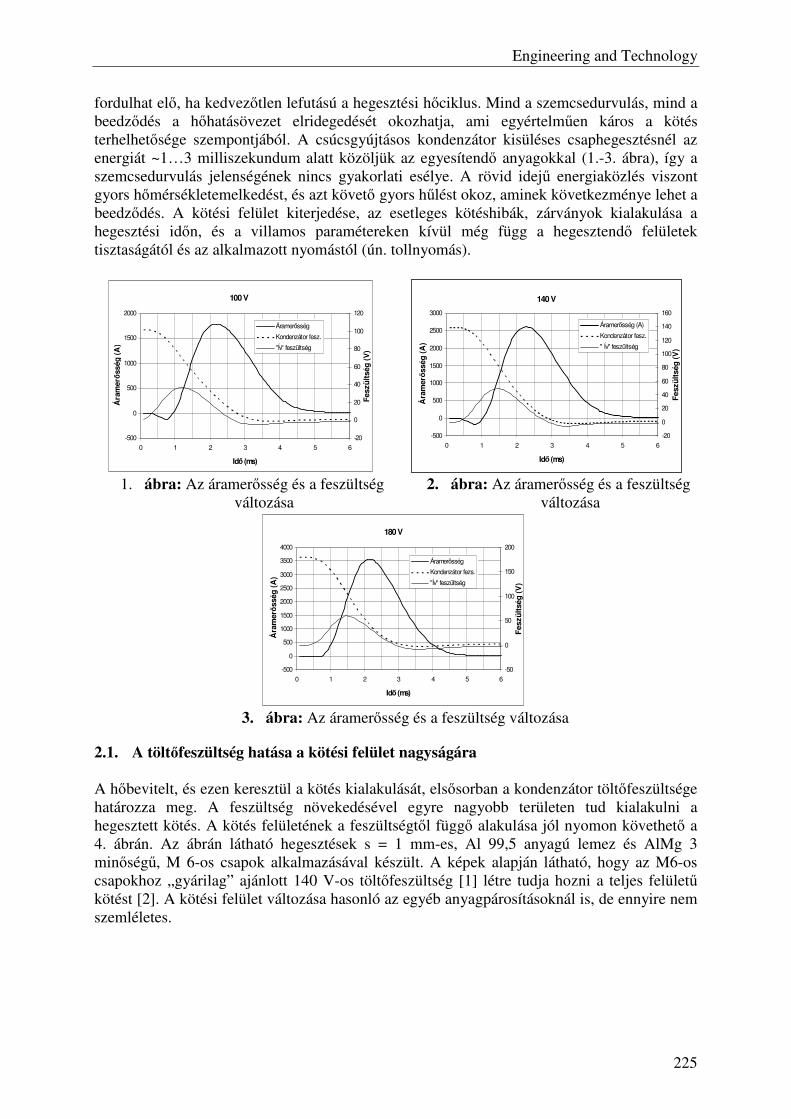
Engineering and Technology
225
fordulhat elő, ha kedvezőtlen lefutású a hegesztési hőciklus. Mind a szemcsedurvulás, mind a beedződés a hőhatásövezet elridegedését okozhatja, ami egyértelműen káros a kötés terhelhetősége szempontjából. A csúcsgyújtásos kondenzátor kisüléses csaphegesztésnél az energiát ~1…3 milliszekundum alatt közöljük az egyesítendő anyagokkal (1.-3. ábra), így a szemcsedurvulás jelenségének nincs gyakorlati esélye. A rövid idejű energiaközlés viszont gyors hőmérsékletemelkedést, és azt követő gyors hűlést okoz, aminek következménye lehet a beedződés. A kötési felület kiterjedése, az esetleges kötéshibák, zárványok kialakulása a hegesztési időn, és a villamos paramétereken kívül még függ a hegesztendő felületek tisztaságától és az alkalmazott nyomástól (ún. tollnyomás).
100 V
-500
0
500
1000
1500
2000
0 1 2 3 4 5 6
Idő (ms)
Ára
merő
sség
(A
)
-20
0
20
40
60
80
100
120
Fes
zült
ség
(V
)
Áramerősség
Kondenzátor fesz.
"Ív" feszültség
140 V
-500
0
500
1000
1500
2000
2500
3000
0 1 2 3 4 5 6
Idő (ms)
Ára
merő
sség
(A
)
-20
0
20
40
60
80
100
120
140
160
Fes
zült
ség
(V
)
Áramerősség (A)
Kondenzátor fesz.
" Ív" feszültség
1. ábra: Az áramerősség és a feszültség
változása 2. ábra: Az áramerősség és a feszültség
változása
180 V
-500
0
500
1000
1500
2000
2500
3000
3500
4000
0 1 2 3 4 5 6
Idő (ms)
Ára
merő
sség
(A
)
-50
0
50
100
150
200
Fes
zült
ség
(V
)
Áramerősség
Kondenzátor fezs.
"Ív" feszültség
3. ábra: Az áramerősség és a feszültség változása
2.1. A töltőfeszültség hatása a kötési felület nagyságára
A hőbevitelt, és ezen keresztül a kötés kialakulását, elsősorban a kondenzátor töltőfeszültsége határozza meg. A feszültség növekedésével egyre nagyobb területen tud kialakulni a hegesztett kötés. A kötés felületének a feszültségtől függő alakulása jól nyomon követhető a 4. ábrán. Az ábrán látható hegesztések s = 1 mm-es, Al 99,5 anyagú lemez és AlMg 3 minőségű, M 6-os csapok alkalmazásával készült. A képek alapján látható, hogy az M6-os csapokhoz „gyárilag” ajánlott 140 V-os töltőfeszültség [1] létre tudja hozni a teljes felületű kötést [2]. A kötési felület változása hasonló az egyéb anyagpárosításoknál is, de ennyire nem szemléletes.
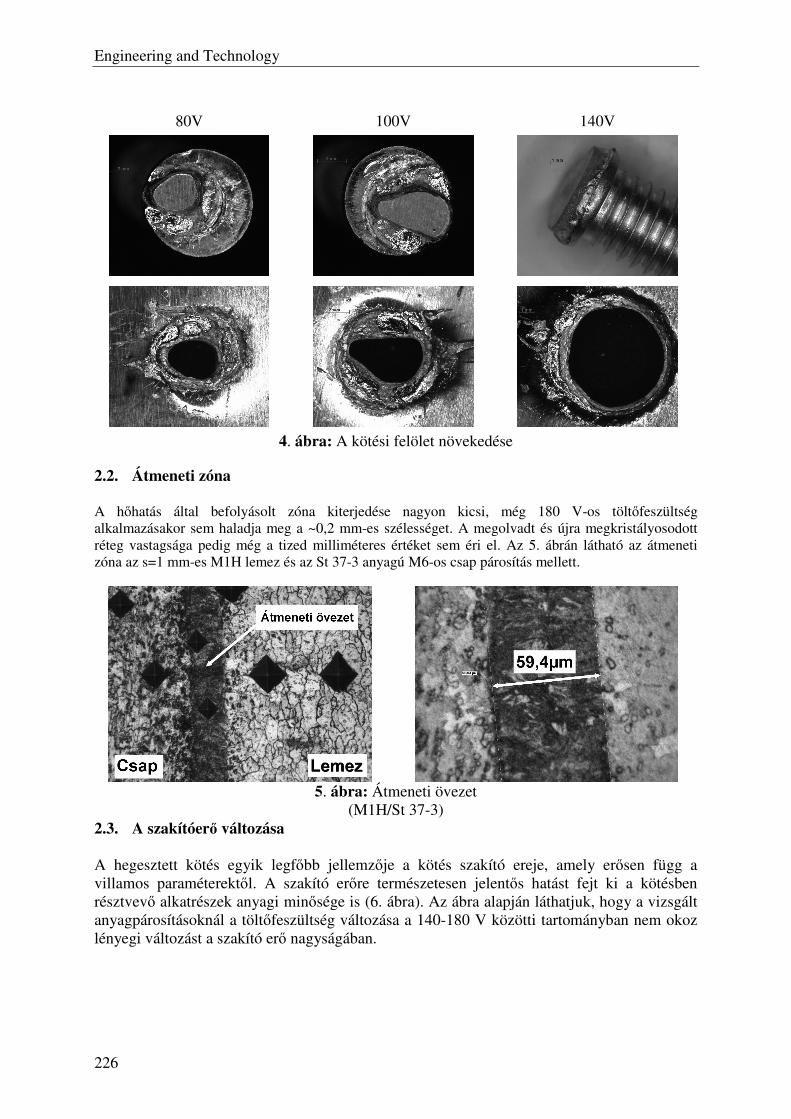
Engineering and Technology
226
80V 100V 140V
4. ábra: A kötési felölet növekedése
2.2. Átmeneti zóna A hőhatás által befolyásolt zóna kiterjedése nagyon kicsi, még 180 V-os töltőfeszültség alkalmazásakor sem haladja meg a ~0,2 mm-es szélességet. A megolvadt és újra megkristályosodott réteg vastagsága pedig még a tized milliméteres értéket sem éri el. Az 5. ábrán látható az átmeneti zóna az s=1 mm-es M1H lemez és az St 37-3 anyagú M6-os csap párosítás mellett.
5. ábra: Átmeneti övezet
(M1H/St 37-3) 2.3. A szakítóerő változása A hegesztett kötés egyik legfőbb jellemzője a kötés szakító ereje, amely erősen függ a villamos paraméterektől. A szakító erőre természetesen jelentős hatást fejt ki a kötésben résztvevő alkatrészek anyagi minősége is (6. ábra). Az ábra alapján láthatjuk, hogy a vizsgált anyagpárosításoknál a töltőfeszültség változása a 140-180 V közötti tartományban nem okoz lényegi változást a szakító erő nagyságában.
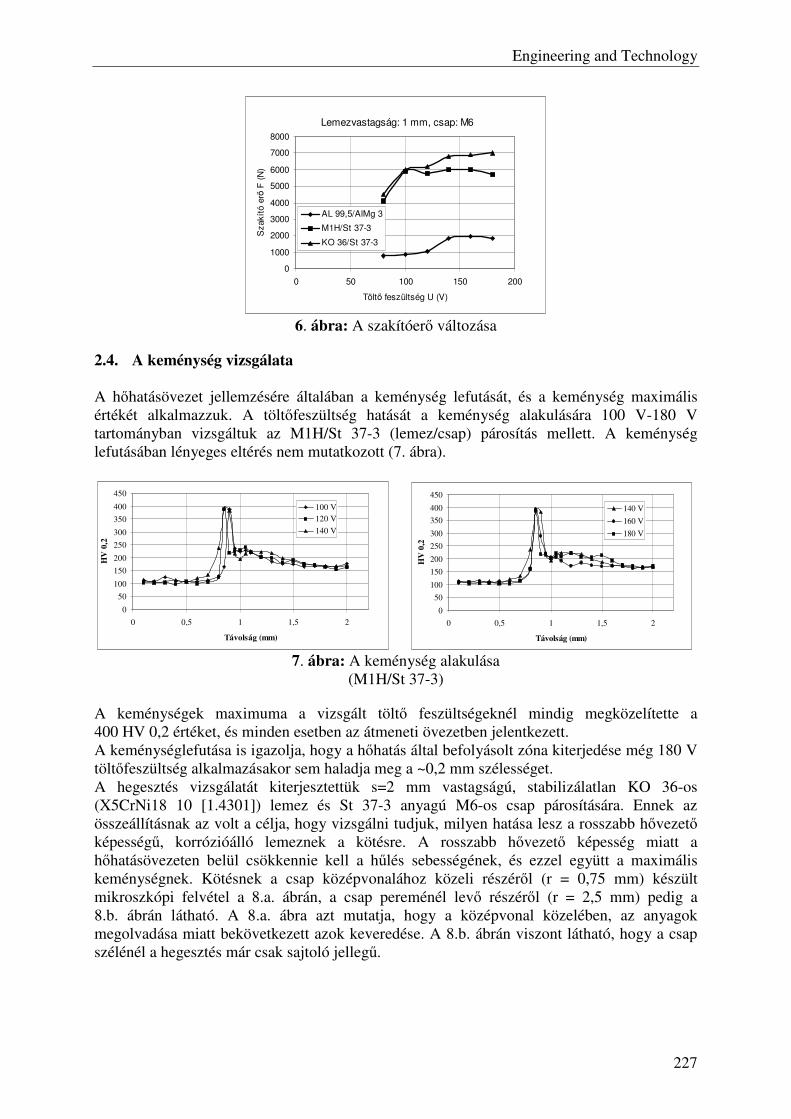
Engineering and Technology
227
Lemezvastagság: 1 mm, csap: M6
0
1000
2000
3000
4000
5000
6000
7000
8000
0 50 100 150 200
Töltő feszültség U (V)
Sza
kító
erő
F (
N)
AL 99,5/AlMg 3
M1H/St 37-3
KO 36/St 37-3
6. ábra: A szakítóerő változása
2.4. A keménység vizsgálata A hőhatásövezet jellemzésére általában a keménység lefutását, és a keménység maximális értékét alkalmazzuk. A töltőfeszültség hatását a keménység alakulására 100 V-180 V tartományban vizsgáltuk az M1H/St 37-3 (lemez/csap) párosítás mellett. A keménység lefutásában lényeges eltérés nem mutatkozott (7. ábra).
0
50
100
150
200
250
300
350
400
450
0 0,5 1 1,5 2
Távolság (mm)
HV
0,2
100 V120 V
140 V
0
50
100
150
200
250
300
350
400
450
0 0,5 1 1,5 2
Távolság (mm)
HV
0,2
140 V
160 V
180 V
7. ábra: A keménység alakulása
(M1H/St 37-3)
A keménységek maximuma a vizsgált töltő feszültségeknél mindig megközelítette a 400 HV 0,2 értéket, és minden esetben az átmeneti övezetben jelentkezett. A keménységlefutása is igazolja, hogy a hőhatás által befolyásolt zóna kiterjedése még 180 V töltőfeszültség alkalmazásakor sem haladja meg a ~0,2 mm szélességet. A hegesztés vizsgálatát kiterjesztettük s=2 mm vastagságú, stabilizálatlan KO 36-os (X5CrNi18 10 [1.4301]) lemez és St 37-3 anyagú M6-os csap párosítására. Ennek az összeállításnak az volt a célja, hogy vizsgálni tudjuk, milyen hatása lesz a rosszabb hővezető képességű, korrózióálló lemeznek a kötésre. A rosszabb hővezető képesség miatt a hőhatásövezeten belül csökkennie kell a hűlés sebességének, és ezzel együtt a maximális keménységnek. Kötésnek a csap középvonalához közeli részéről (r = 0,75 mm) készült mikroszkópi felvétel a 8.a. ábrán, a csap pereménél levő részéről (r = 2,5 mm) pedig a 8.b. ábrán látható. A 8.a. ábra azt mutatja, hogy a középvonal közelében, az anyagok megolvadása miatt bekövetkezett azok keveredése. A 8.b. ábrán viszont látható, hogy a csap szélénél a hegesztés már csak sajtoló jellegű.
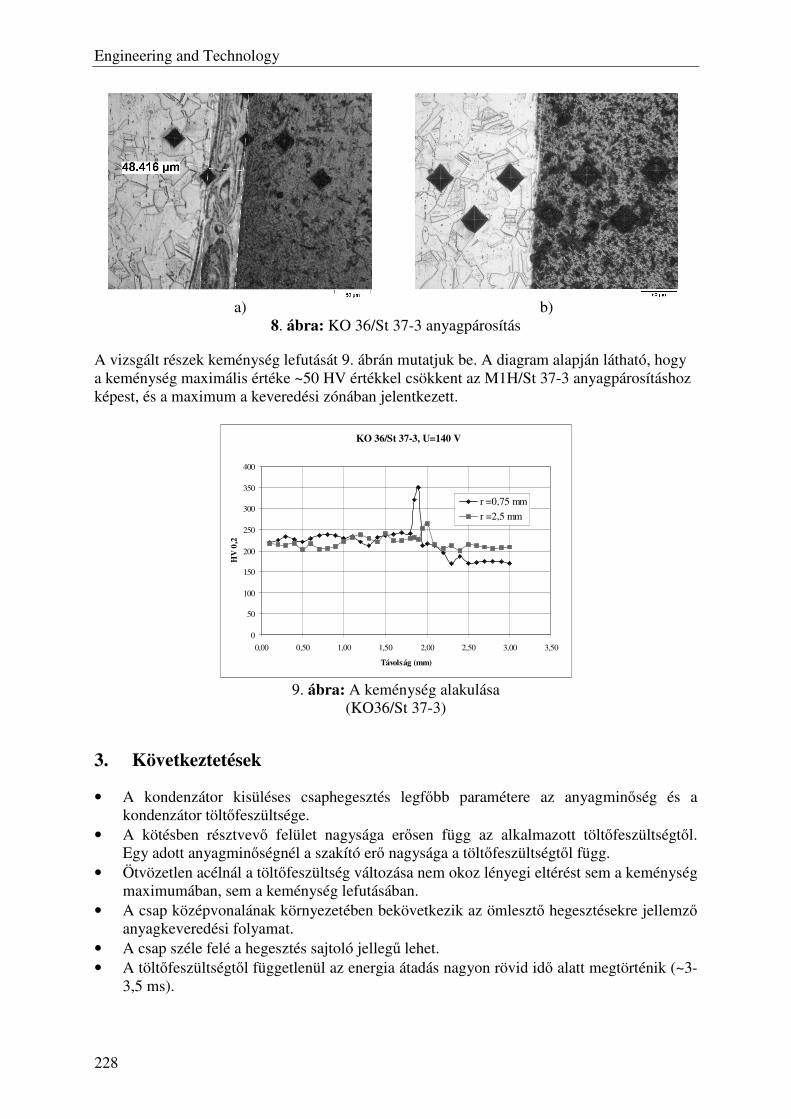
Engineering and Technology
228
a) b)
8. ábra: KO 36/St 37-3 anyagpárosítás
A vizsgált részek keménység lefutását 9. ábrán mutatjuk be. A diagram alapján látható, hogy a keménység maximális értéke ~50 HV értékkel csökkent az M1H/St 37-3 anyagpárosításhoz képest, és a maximum a keveredési zónában jelentkezett.
KO 36/St 37-3, U=140 V
0
50
100
150
200
250
300
350
400
0,00 0,50 1,00 1,50 2,00 2,50 3,00 3,50
Távolság (mm)
HV
0,2
r =0,75 mm
r =2,5 mm
9. ábra: A keménység alakulása
(KO36/St 37-3)
3. Következtetések
• A kondenzátor kisüléses csaphegesztés legfőbb paramétere az anyagminőség és a kondenzátor töltőfeszültsége.
• A kötésben résztvevő felület nagysága erősen függ az alkalmazott töltőfeszültségtől. Egy adott anyagminőségnél a szakító erő nagysága a töltőfeszültségtől függ.
• Ötvözetlen acélnál a töltőfeszültség változása nem okoz lényegi eltérést sem a keménység maximumában, sem a keménység lefutásában.
• A csap középvonalának környezetében bekövetkezik az ömlesztő hegesztésekre jellemző anyagkeveredési folyamat.
• A csap széle felé a hegesztés sajtoló jellegű lehet. • A töltőfeszültségtől függetlenül az energia átadás nagyon rövid idő alatt megtörténik (~3-
3,5 ms).

Engineering and Technology
229
Irodalomjegyzék
[1] SOYER, BMS-8N és BMS-8NV Csaphegesztő-berendezés (Használati utasítás) [2] Dr. Bernáth Mihály: Alumínium alkatrészek csaphegesztése
Műszaki szemle Különszám, 2009 p. 60-64, ISSN: 1454-0746. XVII. Országos Gépész Találkozó OGÉT’2009 Románia, Gyergyószentmiklós, 2009. 04. 23.-26.
Szerző
Dr. Bernáth Mihály főiskolai docens, Mechanikai Technológiai Szakcsoport/Fém- és Műanyagfeldolgozó Technológiai Intézet, Kecskeméti Főiskola/GAMF Kar. 6000. Kecskemét, Izsáki u. 10. E-mail: [email protected]
Engineering and Technology
230
Presenting of students learning outcomes on the example of course "Structural product development" on Mechanical Engineering
Faculty in Slavonski Brod
D. Damjanović, T. Baškarić, M. Holik, A. Koljenik, I. Krpan, M. Karakašić, M. Kokanović, M. Kljajin, Ž. Ivandić
Mechanical Engineering Faculty in Slavonski Brod, J. J. Strossmayer University of Osijek, Trg I. B. Mažuranić 2, HR-35000 Slavonski Brod, Croatia
Abstract: This paper represents a brief overview of student projects as learning outcomes of the course ''Structural product development'' on Mechanical Engineering Faculty in Slavonski Brod, University of Osijek. Course is intended to methodically and systematically introduce students to the concept of a multidisciplinary product development. Through analysis of the product as a technical system, students through the project entirely perform the functional analysis of structural features on a concrete example. By acquiring the necessary knowledge and experience through analysis of examples in lectures and exercises, and preparation of task students have to apply the acquired knowledge and develop skills necessary for the solution set of design task with structural elaboration in all phases of the design process. The project task has been developed the ability by students in the analytical access of solving of constructional problems. The acquired experience through the project enables: integration of knowledge of study program, application software systems for the analysis, drawing and modeling of constructional elements; use of professional literature and information technology in the collection information about contents of courses and analyses of quoted course. In this way, students have achieved the expected learning outcomes: knowledge, understanding, concluding, applicability and development of original ideas, integration of knowledge and ability to the presentation of personal work results.
Keywords: learning outcomes, structural product development, study of mechanical engineering
1 Introduction
During teaching course ''Structural product development'' students were divided into two groups. One of the goals of this teaching course is to show students how teamwork works in a enterprise. Students were being allowed to choose their project assignments where they will apply all their acquired knowledge and skills gained during the previous completion of the course. In this paper is given a summary presentation of two students' works: ''Automated production line for making pizza'' and ''Different versions of mounting rails for the threshold''. Each group or team, had to make a techno-economic evaluation, to select the optimal variant of design solution and elaborate in the detail the top rated version of their project task. Since our students have gained enviable knowledge and skills from modeling in software Autodesk Inventor to FEM analysis in Autodesk Inventor and ANSYS; we provide below a summarize project tasks two students works, in a way that we from one group singled out structural modeling of parts, while we from another group singled out FEM analysis of the optimal design solution.
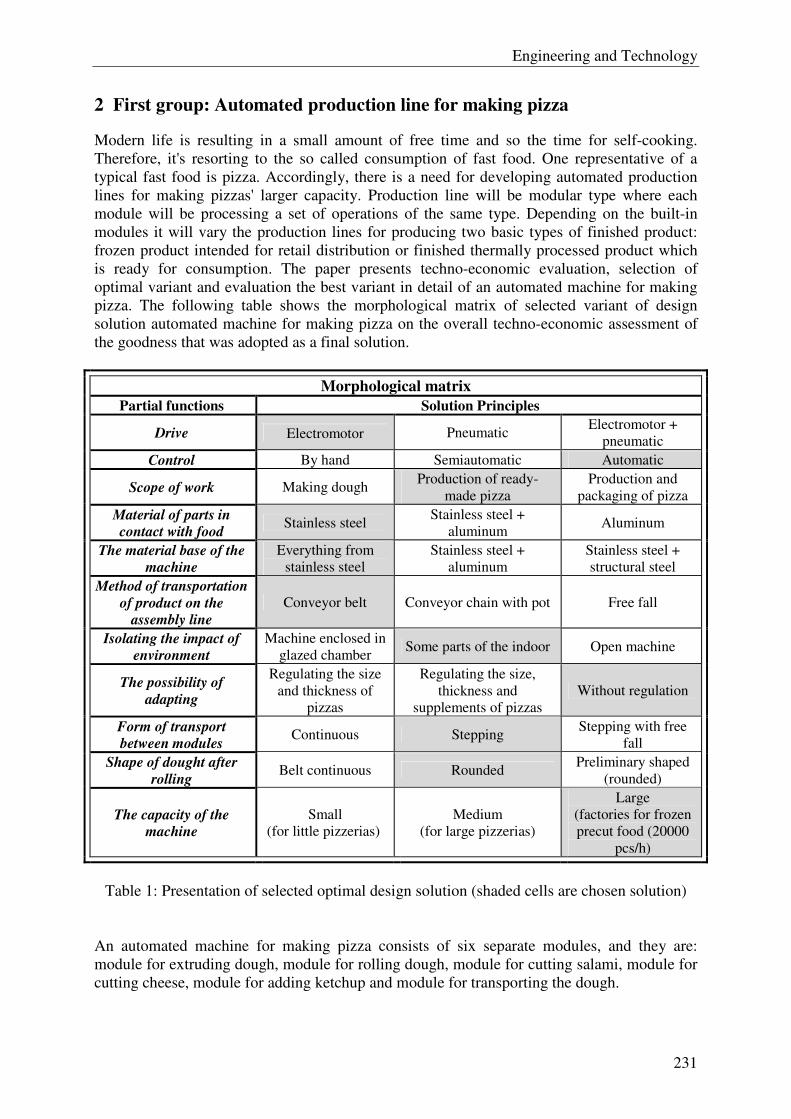
Engineering and Technology
231
2 First group: Automated production line for making pizza
Modern life is resulting in a small amount of free time and so the time for self-cooking. Therefore, it's resorting to the so called consumption of fast food. One representative of a typical fast food is pizza. Accordingly, there is a need for developing automated production lines for making pizzas' larger capacity. Production line will be modular type where each module will be processing a set of operations of the same type. Depending on the built-in modules it will vary the production lines for producing two basic types of finished product: frozen product intended for retail distribution or finished thermally processed product which is ready for consumption. The paper presents techno-economic evaluation, selection of optimal variant and evaluation the best variant in detail of an automated machine for making pizza. The following table shows the morphological matrix of selected variant of design solution automated machine for making pizza on the overall techno-economic assessment of the goodness that was adopted as a final solution.
Table 1: Presentation of selected optimal design solution (shaded cells are chosen solution)
An automated machine for making pizza consists of six separate modules, and they are: module for extruding dough, module for rolling dough, module for cutting salami, module for cutting cheese, module for adding ketchup and module for transporting the dough.
Morphological matrix Partial functions Solution Principles
Drive
Electromotor Pneumatic Electromotor +
pneumatic Control By hand Semiautomatic Automatic
Scope of work Making dough Production of ready-
made pizza Production and
packaging of pizza Material of parts in
contact with food Stainless steel
Stainless steel + aluminum
Aluminum
The material base of the
machine
Everything from stainless steel
Stainless steel + aluminum
Stainless steel + structural steel
Method of transportation
of product on the
assembly line
Conveyor belt Conveyor chain with pot Free fall
Isolating the impact of
environment
Machine enclosed in glazed chamber
Some parts of the indoor Open machine
The possibility of
adapting
Regulating the size and thickness of
pizzas
Regulating the size, thickness and
supplements of pizzas Without regulation
Form of transport
between modules Continuous Stepping
Stepping with free fall
Shape of dought after
rolling Belt continuous Rounded
Preliminary shaped (rounded)
The capacity of the
machine
Small (for little pizzerias)
Medium (for large pizzerias)
Large (factories for frozen precut food (20000
pcs/h)
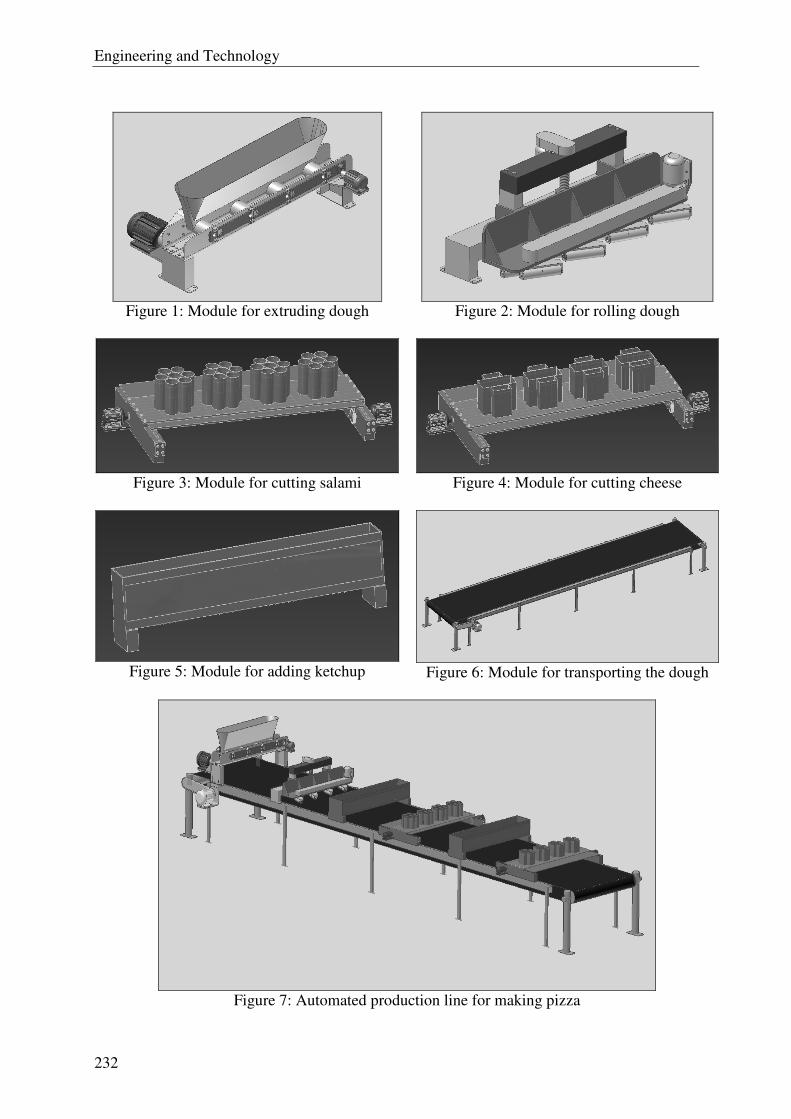
Engineering and Technology
232
Figure 1: Module for extruding dough
Figure 2: Module for rolling dough
Figure 3: Module for cutting salami
Figure 4: Module for cutting cheese
Figure 5: Module for adding ketchup
Figure 6: Module for transporting the dough
Figure 7: Automated production line for making pizza

Engineering and Technology
233
3 Second group: Different versions of mounting rail for the threshold
The term of reference should be devolop constructed device for mounting rail for the thereshold, in terms of optimization of geometrical features of individual parts, and improve calculation. Gadget must be as simple structure and have less number of parts. Also, the constuction of gadget must be such as to allow easier mounting gadget for thereshold and the mounting rail in the device. Using the optimal solution for gadget, simplifies the mounting, reduces the use of auxiliary machinery in the mounting rail and the cost of installation and it is possible in shortest possible time to make a larger selection of rail. Also, using the optimal solution of gadget it is reducing need for human labor during mounting. Restraint should provide:
- safe, durable and reliable operation, - such fastening force that guarantees the security of fasten against the axial movement
of rails and turning in the rail grid node - persistence of wide gauge within the limits prescribed tolerance, - fast and ease of mounting or replacement, - human labor is reduced to a minimum, - minimal wear on the contact joints because it affects on the fastening force - resistance on the corrosion which guarantees the durability of fastening, - minimum inspection and maintenance, - smaller number of structural elements, - possibility of production in our country and it is inexpensive, - preferably it is unified for wooden and concrete threshold.
Figure 8: Presentation of fasten gadget model for fastening rail to threshold
3.1 Presentation the numerical solution of the project task
Numerical solution of the given problem is performed in the software package Autodesk Inventor, in the module Stress Analysis. Material of spring is defined according to standard DIN 17221 and it has the following characteristics:
- Module of elasticity: E = 205 000 MPa - Poisson's factor: υ = 0,3 - Tensile strength: σm = 1450 N/mm2
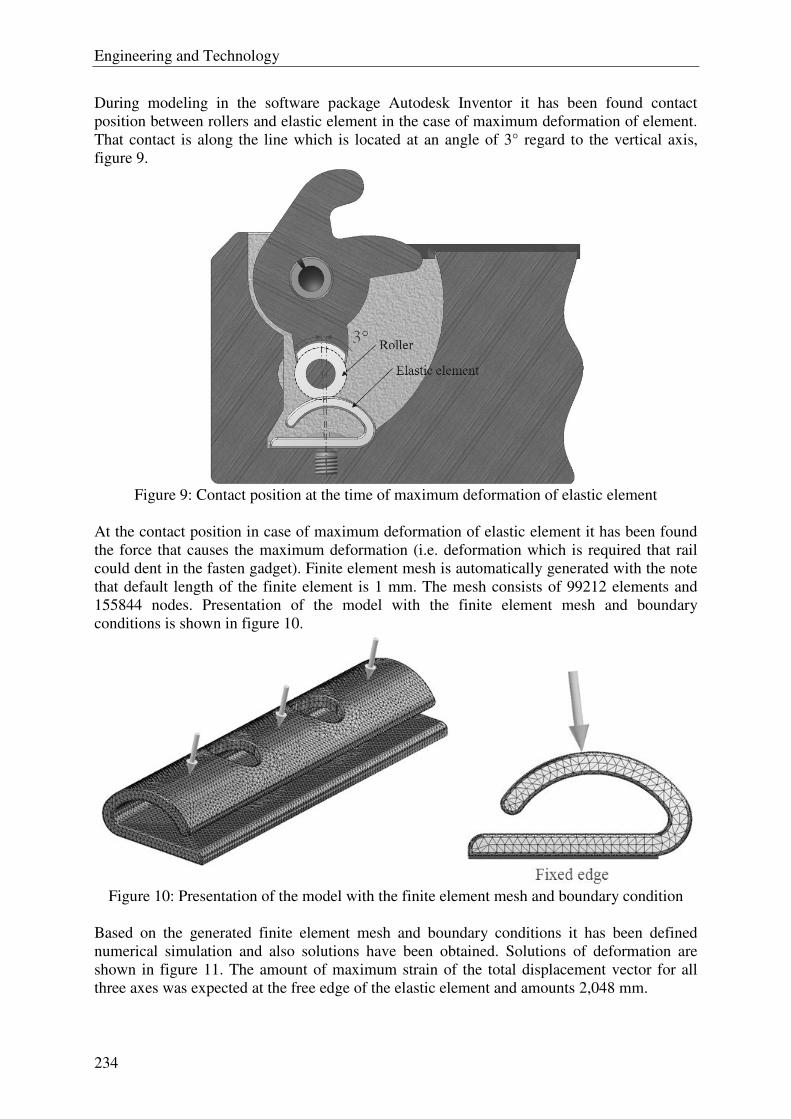
Engineering and Technology
234
During modeling in the software package Autodesk Inventor it has been found contact position between rollers and elastic element in the case of maximum deformation of element. That contact is along the line which is located at an angle of 3° regard to the vertical axis, figure 9.
Figure 9: Contact position at the time of maximum deformation of elastic element
At the contact position in case of maximum deformation of elastic element it has been found the force that causes the maximum deformation (i.e. deformation which is required that rail could dent in the fasten gadget). Finite element mesh is automatically generated with the note that default length of the finite element is 1 mm. The mesh consists of 99212 elements and 155844 nodes. Presentation of the model with the finite element mesh and boundary conditions is shown in figure 10.
Figure 10: Presentation of the model with the finite element mesh and boundary condition
Based on the generated finite element mesh and boundary conditions it has been defined numerical simulation and also solutions have been obtained. Solutions of deformation are shown in figure 11. The amount of maximum strain of the total displacement vector for all three axes was expected at the free edge of the elastic element and amounts 2,048 mm.
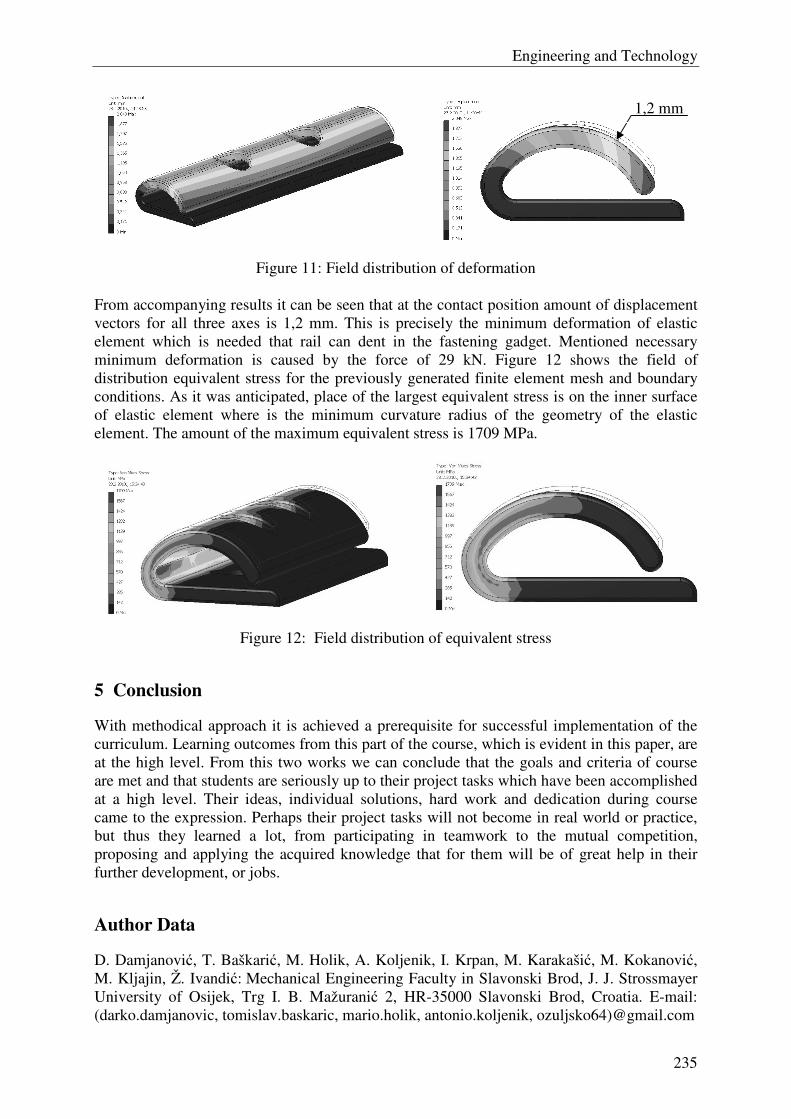
Engineering and Technology
235
Figure 11: Field distribution of deformation From accompanying results it can be seen that at the contact position amount of displacement vectors for all three axes is 1,2 mm. This is precisely the minimum deformation of elastic element which is needed that rail can dent in the fastening gadget. Mentioned necessary minimum deformation is caused by the force of 29 kN. Figure 12 shows the field of distribution equivalent stress for the previously generated finite element mesh and boundary conditions. As it was anticipated, place of the largest equivalent stress is on the inner surface of elastic element where is the minimum curvature radius of the geometry of the elastic element. The amount of the maximum equivalent stress is 1709 MPa.
Figure 12: Field distribution of equivalent stress
5 Conclusion
With methodical approach it is achieved a prerequisite for successful implementation of the curriculum. Learning outcomes from this part of the course, which is evident in this paper, are at the high level. From this two works we can conclude that the goals and criteria of course are met and that students are seriously up to their project tasks which have been accomplished at a high level. Their ideas, individual solutions, hard work and dedication during course came to the expression. Perhaps their project tasks will not become in real world or practice, but thus they learned a lot, from participating in teamwork to the mutual competition, proposing and applying the acquired knowledge that for them will be of great help in their further development, or jobs.
Author Data
D. Damjanović, T. Baškarić, M. Holik, A. Koljenik, I. Krpan, M. Karakašić, M. Kokanović, M. Kljajin, Ž. Ivandić: Mechanical Engineering Faculty in Slavonski Brod, J. J. Strossmayer University of Osijek, Trg I. B. Mažuranić 2, HR-35000 Slavonski Brod, Croatia. E-mail: (darko.damjanovic, tomislav.baskaric, mario.holik, antonio.koljenik, ozuljsko64)@gmail.com
1,2 mm
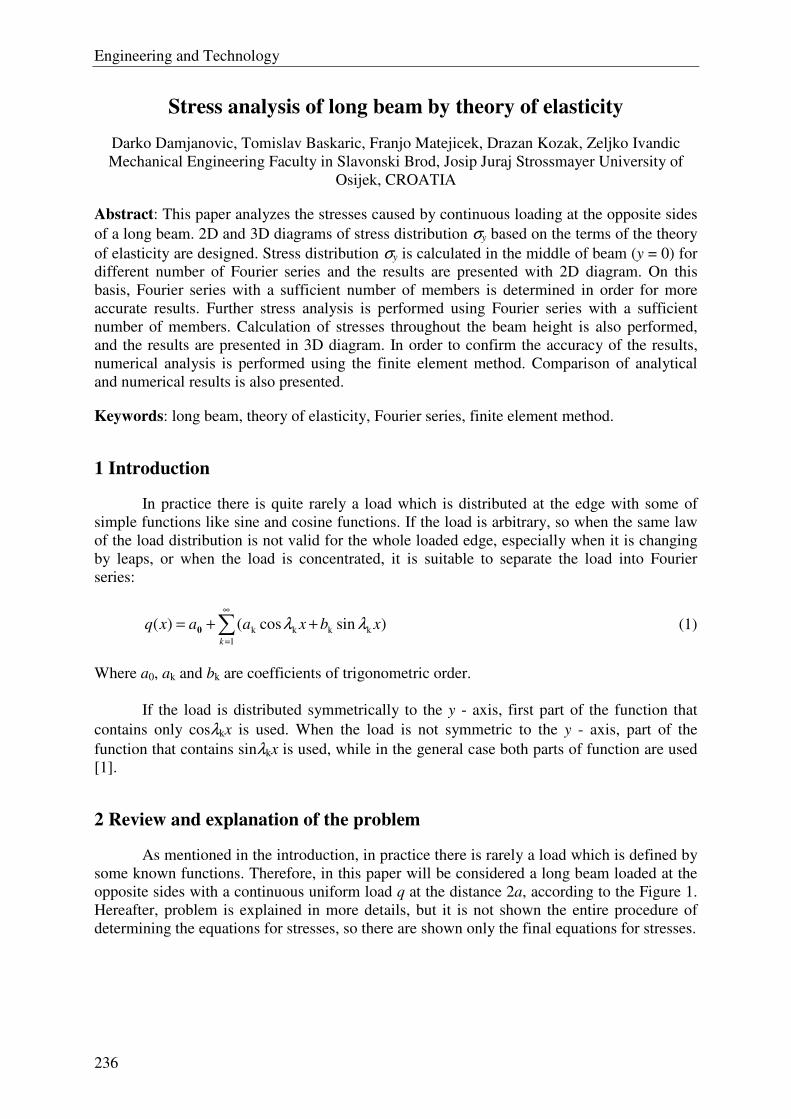
Engineering and Technology
236
Stress analysis of long beam by theory of elasticity
Darko Damjanovic, Tomislav Baskaric, Franjo Matejicek, Drazan Kozak, Zeljko Ivandic
Mechanical Engineering Faculty in Slavonski Brod, Josip Juraj Strossmayer University of
Osijek, CROATIA
Abstract: This paper analyzes the stresses caused by continuous loading at the opposite sides
of a long beam. 2D and 3D diagrams of stress distribution σy based on the terms of the theory
of elasticity are designed. Stress distribution σy is calculated in the middle of beam (y = 0) for
different number of Fourier series and the results are presented with 2D diagram. On this
basis, Fourier series with a sufficient number of members is determined in order for more
accurate results. Further stress analysis is performed using Fourier series with a sufficient
number of members. Calculation of stresses throughout the beam height is also performed,
and the results are presented in 3D diagram. In order to confirm the accuracy of the results,
numerical analysis is performed using the finite element method. Comparison of analytical
and numerical results is also presented.
Keywords: long beam, theory of elasticity, Fourier series, finite element method.
1 Introduction
In practice there is quite rarely a load which is distributed at the edge with some of
simple functions like sine and cosine functions. If the load is arbitrary, so when the same law
of the load distribution is not valid for the whole loaded edge, especially when it is changing
by leaps, or when the load is concentrated, it is suitable to separate the load into Fourier
series:
)sincos()(1
kkkk∑∞
=
++=k
xbxaaxq λλ0 (1)
Where a0, ak and bk are coefficients of trigonometric order.
If the load is distributed symmetrically to the y - axis, first part of the function that
contains only cosλkx is used. When the load is not symmetric to the y - axis, part of the
function that contains sinλkx is used, while in the general case both parts of function are used
[1].
2 Review and explanation of the problem
As mentioned in the introduction, in practice there is rarely a load which is defined by
some known functions. Therefore, in this paper will be considered a long beam loaded at the
opposite sides with a continuous uniform load q at the distance 2a, according to the Figure 1.
Hereafter, problem is explained in more details, but it is not shown the entire procedure of
determining the equations for stresses, so there are shown only the final equations for stresses.

Engineering and Technology
237
Figure 1: Long beam loaded on opposite sides with continuous load
Since the load is symmetric with regard to the y – axis, symmetric part of the function
that contains only cosλkx is used. Development of load q into Fourier series will also contain
only symmetrical members, as follows:
( ) 0 k k
k=1
cosq x a a λ x∞
= +∑ (2)
Coefficients of trigonometric order are:
l
qaa =0
(3)
al
qa k
k
k sin2
λλ
= (4)
After that, load separates to the load evenly distributed at the upper and lower edge,
and to the variable load. The first part of the load causes a homogeneous compressive stress
state. With the analysis of boundary conditions and further calculations it is possible to
determine the necessary constants of integration and then the equation for stresses too.
However, as already mentioned, only the final equations for stresses are presented:
( )x k k k k k k k k k
k=1
4 cosh cosh sinh cosh sinh cosa
σ q K λ c λ c λ y λ c λ y λ y λ y λ xl
∞
= − + ∑
(5)
( )y k k k k k k k k k
k=1
1 4 cosh cosh sinh cosh cos cosa
σ q K λ c λ c λ y λ c λ y λ y λ y λ xl
∞ = − + − +
∑ (6)
( )xy k k k k k k k
k=1
4 cosh sinh sinh cosh cosa
τ q K λ c λ c λ y λ c λ y λ xl
∞
= −∑
(7)

Engineering and Technology
238
Where:
( )k
k
k k k
sin
sinh 2 2
λ aK
λ a λ c λ c=
+
(8)
According to Figure 1, in case when a << l, continuous load q can be replaced by a
concentrated force F = 2qa [1].
3 Stress analysis of long beam
For stress analysis of the problem considered in this paper, stress distribution σy is
calculated for the different number of Fourier series to determine sufficient number of
members in order to obtain satisfactory accuracy of results. In this case stresses are calculated
in the middle of the beam, so for y = 0. For both, Fourier analysis and to generate a 3D
diagram, Microsoft Excel software is used. For making a program to automatic generation of
diagrams in the mentioned software, following equations are required:
Wavelength: l
kπλ =k , k = 0, 1, 2, 3... (9)
Coefficient of trigonometric order: al
qa k
k
k sin2
λλ
= (10)
Constant Kk: )22(sinh
sin
kkk
kk
cca
aK
λλλ
λ
+= (11)
Stress σy:
( )y k k k k k k k k k
k=1
1 4 cosh cosh sinh cosh cos cosa
σ q K λ c λ c λ y λ c λ y λ y λ y λ xl
∞ = − + − +
∑
(12)
Variables which can be modified in the program, and which are also given for a
particular case to be considered in this paper are presented in Table 1 (variables according to
the Figure 1):
Half - length of beam l = 100 mm
Half - length of continuous loading on beam a = 1 mm
Amount of continuous loading q = 1000 N/mm
Half - length of beam height c = 20 mm
Table 1: The values of given variables
First of all, a sufficient number of members for the Fourier series is determined
considering the middle of the beam (y = 0). Figure 2 shows the diagrams of stress distribution
σy for different number of Fourier series.
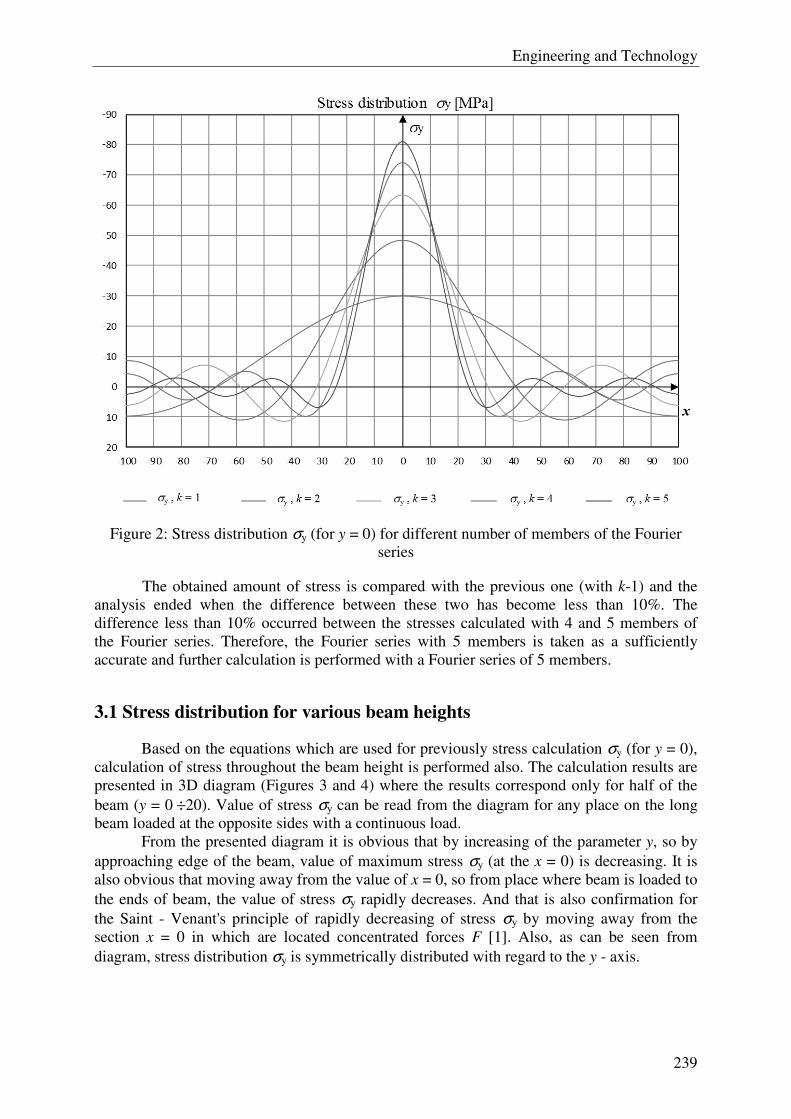
Engineering and Technology
239
Figure 2: Stress distribution σy (for y = 0) for different number of members of the Fourier
series
The obtained amount of stress is compared with the previous one (with k-1) and the
analysis ended when the difference between these two has become less than 10%. The
difference less than 10% occurred between the stresses calculated with 4 and 5 members of
the Fourier series. Therefore, the Fourier series with 5 members is taken as a sufficiently
accurate and further calculation is performed with a Fourier series of 5 members.
3.1 Stress distribution for various beam heights
Based on the equations which are used for previously stress calculation σy (for y = 0),
calculation of stress throughout the beam height is performed also. The calculation results are
presented in 3D diagram (Figures 3 and 4) where the results correspond only for half of the
beam (y = 0 ÷20). Value of stress σy can be read from the diagram for any place on the long
beam loaded at the opposite sides with a continuous load.
From the presented diagram it is obvious that by increasing of the parameter y, so by
approaching edge of the beam, value of maximum stress σy (at the x = 0) is decreasing. It is
also obvious that moving away from the value of x = 0, so from place where beam is loaded to
the ends of beam, the value of stress σy rapidly decreases. And that is also confirmation for
the Saint - Venant's principle of rapidly decreasing of stress σy by moving away from the
section x = 0 in which are located concentrated forces F [1]. Also, as can be seen from
diagram, stress distribution σy is symmetrically distributed with regard to the y - axis.
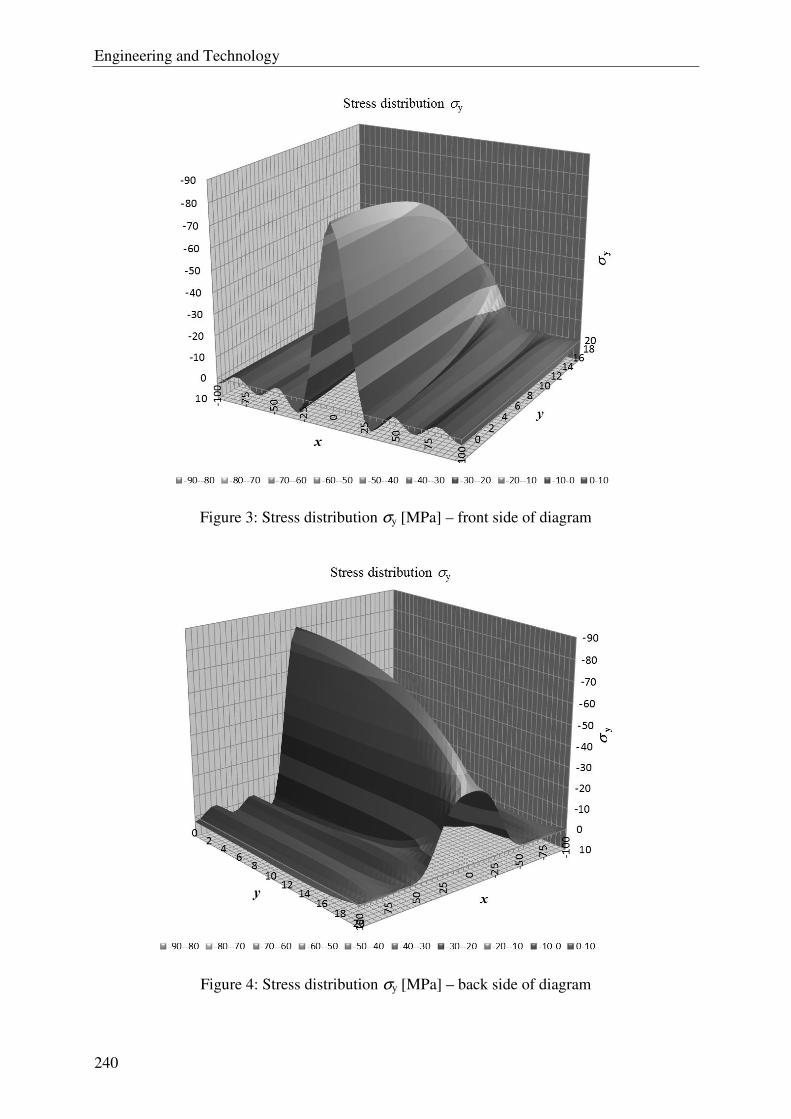
Engineering and Technology
240
Figure 3: Stress distribution σy [MPa] – front side of diagram
Figure 4: Stress distribution σy [MPa] – back side of diagram
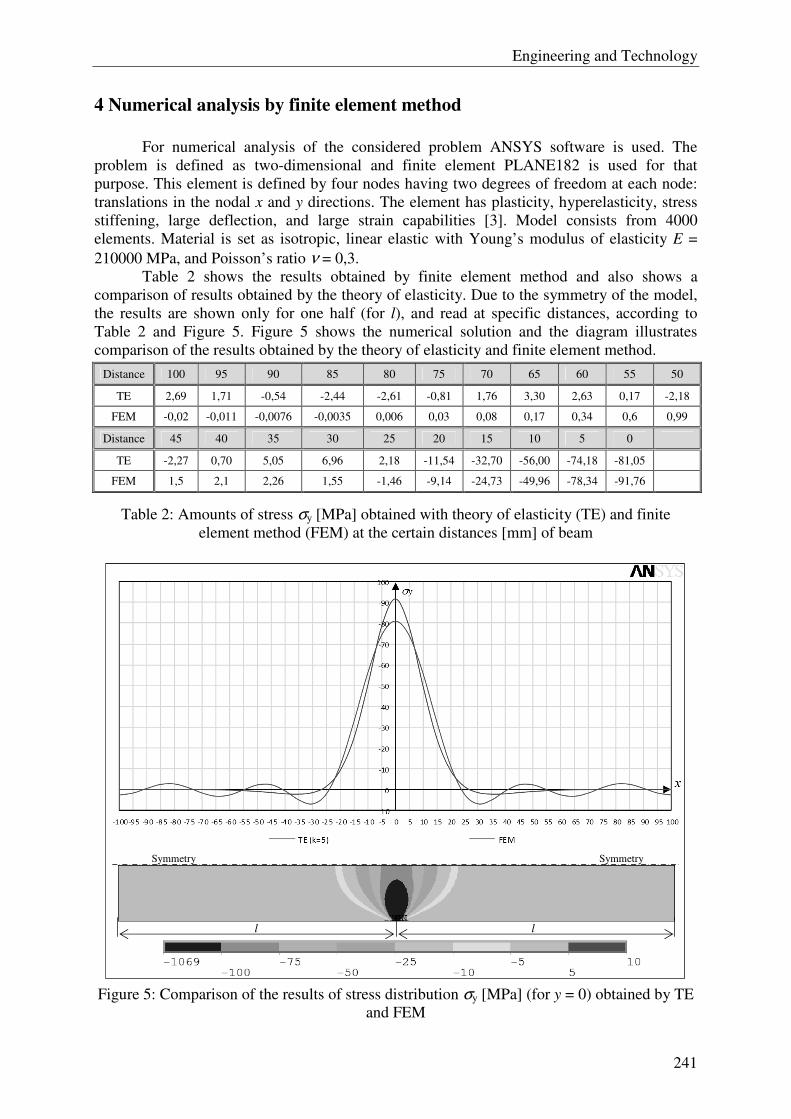
Engineering and Technology
241
4 Numerical analysis by finite element method
For numerical analysis of the considered problem ANSYS software is used. The
problem is defined as two-dimensional and finite element PLANE182 is used for that
purpose. This element is defined by four nodes having two degrees of freedom at each node:
translations in the nodal x and y directions. The element has plasticity, hyperelasticity, stress
stiffening, large deflection, and large strain capabilities [3]. Model consists from 4000
elements. Material is set as isotropic, linear elastic with Young’s modulus of elasticity E =
210000 MPa, and Poisson’s ratio ν = 0,3.
Table 2 shows the results obtained by finite element method and also shows a
comparison of results obtained by the theory of elasticity. Due to the symmetry of the model,
the results are shown only for one half (for l), and read at specific distances, according to
Table 2 and Figure 5. Figure 5 shows the numerical solution and the diagram illustrates
comparison of the results obtained by the theory of elasticity and finite element method.
Distance 100 95 90 85 80 75 70 65 60 55 50
TE 2,69 1,71 -0,54 -2,44 -2,61 -0,81 1,76 3,30 2,63 0,17 -2,18
FEM -0,02 -0,011 -0,0076 -0,0035 0,006 0,03 0,08 0,17 0,34 0,6 0,99
Distance 45 40 35 30 25 20 15 10 5 0
TE -2,27 0,70 5,05 6,96 2,18 -11,54 -32,70 -56,00 -74,18 -81,05
FEM 1,5 2,1 2,26 1,55 -1,46 -9,14 -24,73 -49,96 -78,34 -91,76
Table 2: Amounts of stress σy [MPa] obtained with theory of elasticity (TE) and finite
element method (FEM) at the certain distances [mm] of beam
Figure 5: Comparison of the results of stress distribution σy [MPa] (for y = 0) obtained by TE
and FEM
Symmetry Symmetry
l l

Engineering and Technology
242
5 Conclusions
From this paper program is developed which automatically generates 2D and 3D
diagrams of stress distribution σy of beam loaded on opposite sides with the continuous load.
When developing load q into Fourier series, Fourier series with 5 members is accepted as
sufficient, because the difference in the results using first lower number of members is in the
set limit of 10%. It is accepted also to simplify the creation of the program. Furthermore,
diagrams of stress distribution σy are obtained using equations from the theory of elasticity.
Obtained results were checked by finite element method, and there is some deviations noted.
It is assumed that the deviations occur because of an insufficient number of members of the
Fourier series. The above is also obvious from Figure 6 where in the approach of the theory of
elasticity Fourier series with 10 members is used, and the results are almost completely
identical to the numerical approach by finite element method.
Figure 6: Comparison of the results of stress distribution σy [MPa] (for y = 0) obtained by TE
with 10 members of Fourier series (k = 10) and results obtained by FEM
References
[1] I. Alfirević: Linearna analiza konstrukcija, Sveučilište u Zagrebu, Fakultet strojarstva i
brodogradnje, Zagreb 2003.
[2] S. Timoshenko, J. N. Goodier: Theory of Elasticity, McGraw-Hill Book Company,
Inc., New York, Toronto, London, 1951
[3] ANSYS, Release 12.0, Help Topics
Author data
Darko Damjanovic, Tomislav Baskaric, Franjo Matejicek, Drazan Kozak, Zeljko Ivandic
Mechanical Engineering Faculty in Slavonski Brod, Josip Juraj Strossmayer University of
Osijek. Trg Ivane Brlić Mažuranić 2, 35000 Slavonski Brod, Croatia.
E-mail: [email protected], [email protected], [email protected],
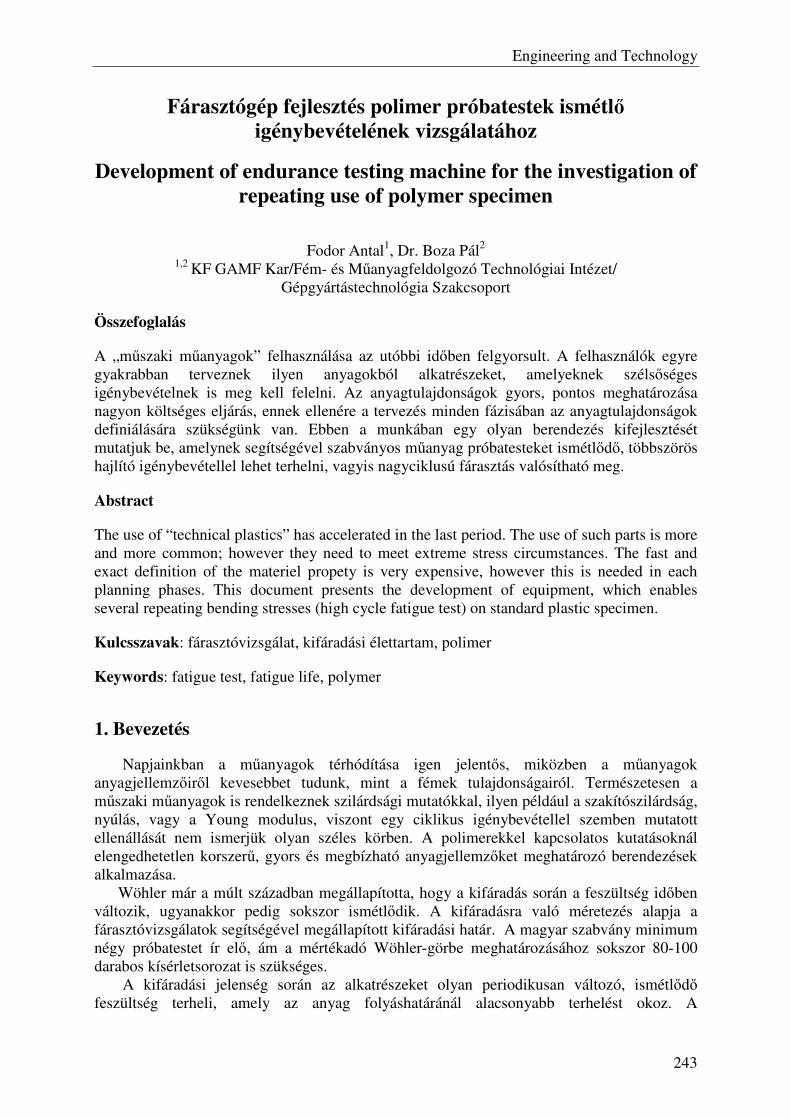
Engineering and Technology
243
Fárasztógép fejlesztés polimer próbatestek ismétlő igénybevételének vizsgálatához
Development of endurance testing machine for the investigation of repeating use of polymer specimen
Fodor Antal1, Dr. Boza Pál2
1,2 KF GAMF Kar/Fém- és Műanyagfeldolgozó Technológiai Intézet/ Gépgyártástechnológia Szakcsoport
Összefoglalás
A „műszaki műanyagok” felhasználása az utóbbi időben felgyorsult. A felhasználók egyre gyakrabban terveznek ilyen anyagokból alkatrészeket, amelyeknek szélsőséges igénybevételnek is meg kell felelni. Az anyagtulajdonságok gyors, pontos meghatározása nagyon költséges eljárás, ennek ellenére a tervezés minden fázisában az anyagtulajdonságok definiálására szükségünk van. Ebben a munkában egy olyan berendezés kifejlesztését mutatjuk be, amelynek segítségével szabványos műanyag próbatesteket ismétlődő, többszörös hajlító igénybevétellel lehet terhelni, vagyis nagyciklusú fárasztás valósítható meg.
Abstract
The use of “technical plastics” has accelerated in the last period. The use of such parts is more and more common; however they need to meet extreme stress circumstances. The fast and exact definition of the materiel propety is very expensive, however this is needed in each planning phases. This document presents the development of equipment, which enables several repeating bending stresses (high cycle fatigue test) on standard plastic specimen.
Kulcsszavak: fárasztóvizsgálat, kifáradási élettartam, polimer
Keywords: fatigue test, fatigue life, polymer
1. Bevezetés
Napjainkban a műanyagok térhódítása igen jelentős, miközben a műanyagok anyagjellemzőiről kevesebbet tudunk, mint a fémek tulajdonságairól. Természetesen a műszaki műanyagok is rendelkeznek szilárdsági mutatókkal, ilyen például a szakítószilárdság, nyúlás, vagy a Young modulus, viszont egy ciklikus igénybevétellel szemben mutatott ellenállását nem ismerjük olyan széles körben. A polimerekkel kapcsolatos kutatásoknál elengedhetetlen korszerű, gyors és megbízható anyagjellemzőket meghatározó berendezések alkalmazása.
Wöhler már a múlt században megállapította, hogy a kifáradás során a feszültség időben változik, ugyanakkor pedig sokszor ismétlődik. A kifáradásra való méretezés alapja a fárasztóvizsgálatok segítségével megállapított kifáradási határ. A magyar szabvány minimum négy próbatestet ír elő, ám a mértékadó Wöhler-görbe meghatározásához sokszor 80-100 darabos kísérletsorozat is szükséges.
A kifáradási jelenség során az alkatrészeket olyan periodikusan változó, ismétlődő feszültség terheli, amely az anyag folyáshatáránál alacsonyabb terhelést okoz. A
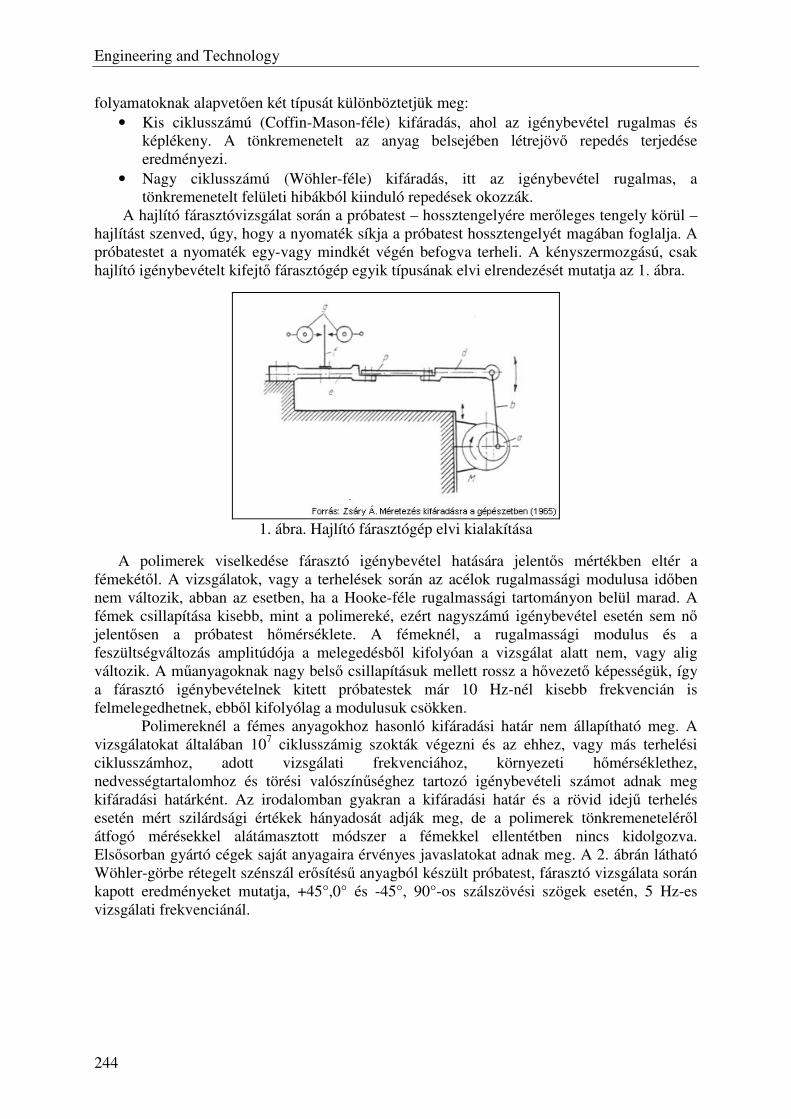
Engineering and Technology
244
folyamatoknak alapvetően két típusát különböztetjük meg: • Kis ciklusszámú (Coffin-Mason-féle) kifáradás, ahol az igénybevétel rugalmas és
képlékeny. A tönkremenetelt az anyag belsejében létrejövő repedés terjedése eredményezi.
• Nagy ciklusszámú (Wöhler-féle) kifáradás, itt az igénybevétel rugalmas, a tönkremenetelt felületi hibákból kiinduló repedések okozzák.
A hajlító fárasztóvizsgálat során a próbatest – hossztengelyére merőleges tengely körül – hajlítást szenved, úgy, hogy a nyomaték síkja a próbatest hossztengelyét magában foglalja. A próbatestet a nyomaték egy-vagy mindkét végén befogva terheli. A kényszermozgású, csak hajlító igénybevételt kifejtő fárasztógép egyik típusának elvi elrendezését mutatja az 1. ábra.
A polimerek viselkedése fárasztó igénybevétel hatására jelentős mértékben eltér a
fémekétől. A vizsgálatok, vagy a terhelések során az acélok rugalmassági modulusa időben nem változik, abban az esetben, ha a Hooke-féle rugalmassági tartományon belül marad. A fémek csillapítása kisebb, mint a polimereké, ezért nagyszámú igénybevétel esetén sem nő jelentősen a próbatest hőmérséklete. A fémeknél, a rugalmassági modulus és a feszültségváltozás amplitúdója a melegedésből kifolyóan a vizsgálat alatt nem, vagy alig változik. A műanyagoknak nagy belső csillapításuk mellett rossz a hővezető képességük, így a fárasztó igénybevételnek kitett próbatestek már 10 Hz-nél kisebb frekvencián is felmelegedhetnek, ebből kifolyólag a modulusuk csökken.
Polimereknél a fémes anyagokhoz hasonló kifáradási határ nem állapítható meg. A vizsgálatokat általában 107 ciklusszámig szokták végezni és az ehhez, vagy más terhelési ciklusszámhoz, adott vizsgálati frekvenciához, környezeti hőmérséklethez, nedvességtartalomhoz és törési valószínűséghez tartozó igénybevételi számot adnak meg kifáradási határként. Az irodalomban gyakran a kifáradási határ és a rövid idejű terhelés esetén mért szilárdsági értékek hányadosát adják meg, de a polimerek tönkremeneteléről átfogó mérésekkel alátámasztott módszer a fémekkel ellentétben nincs kidolgozva. Elsősorban gyártó cégek saját anyagaira érvényes javaslatokat adnak meg. A 2. ábrán látható Wöhler-görbe rétegelt szénszál erősítésű anyagból készült próbatest, fárasztó vizsgálata során kapott eredményeket mutatja, +45°,0° és -45°, 90°-os szálszövési szögek esetén, 5 Hz-es vizsgálati frekvenciánál.
1. ábra. Hajlító fárasztógép elvi kialakítása
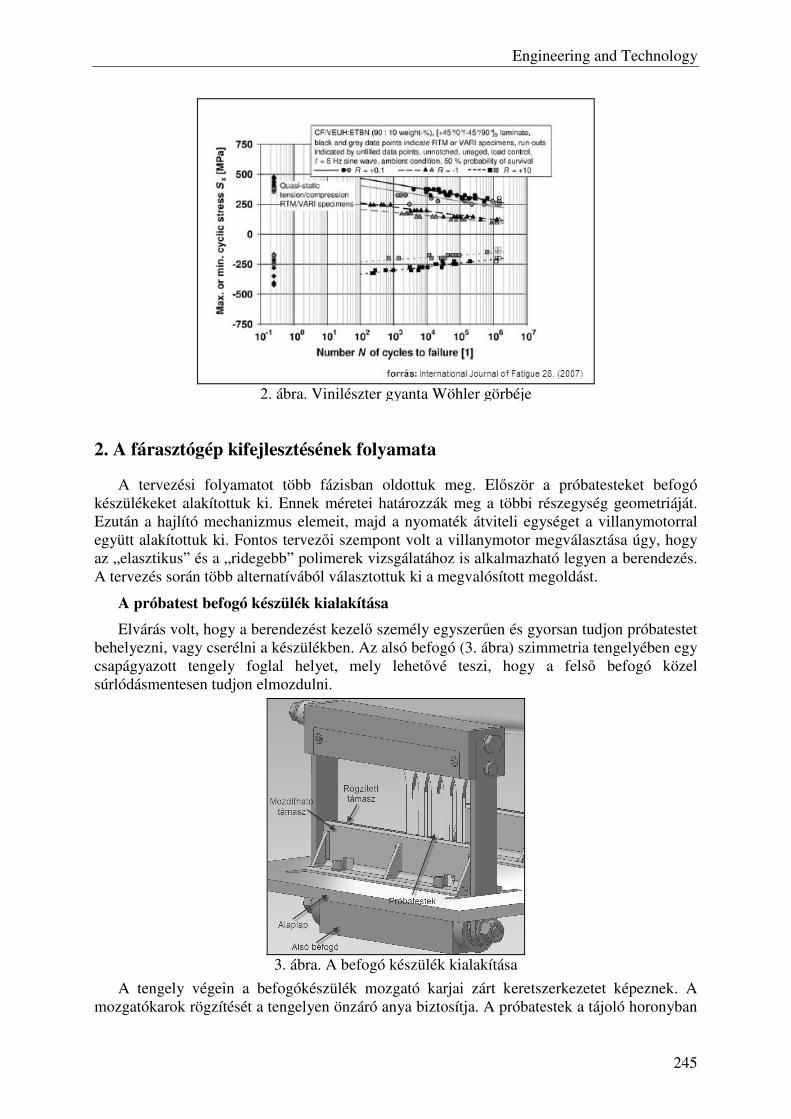
Engineering and Technology
245
2. A fárasztógép kifejlesztésének folyamata
A tervezési folyamatot több fázisban oldottuk meg. Először a próbatesteket befogó készülékeket alakítottuk ki. Ennek méretei határozzák meg a többi részegység geometriáját. Ezután a hajlító mechanizmus elemeit, majd a nyomaték átviteli egységet a villanymotorral együtt alakítottuk ki. Fontos tervezői szempont volt a villanymotor megválasztása úgy, hogy az „elasztikus” és a „ridegebb” polimerek vizsgálatához is alkalmazható legyen a berendezés. A tervezés során több alternatívából választottuk ki a megvalósított megoldást.
A próbatest befogó készülék kialakítása
Elvárás volt, hogy a berendezést kezelő személy egyszerűen és gyorsan tudjon próbatestet behelyezni, vagy cserélni a készülékben. Az alsó befogó (3. ábra) szimmetria tengelyében egy csapágyazott tengely foglal helyet, mely lehetővé teszi, hogy a felső befogó közel súrlódásmentesen tudjon elmozdulni.
A tengely végein a befogókészülék mozgató karjai zárt keretszerkezetet képeznek. A
mozgatókarok rögzítését a tengelyen önzáró anya biztosítja. A próbatestek a tájoló horonyban
3. ábra. A befogó készülék kialakítása
2. ábra. Vinilészter gyanta Wöhler görbéje
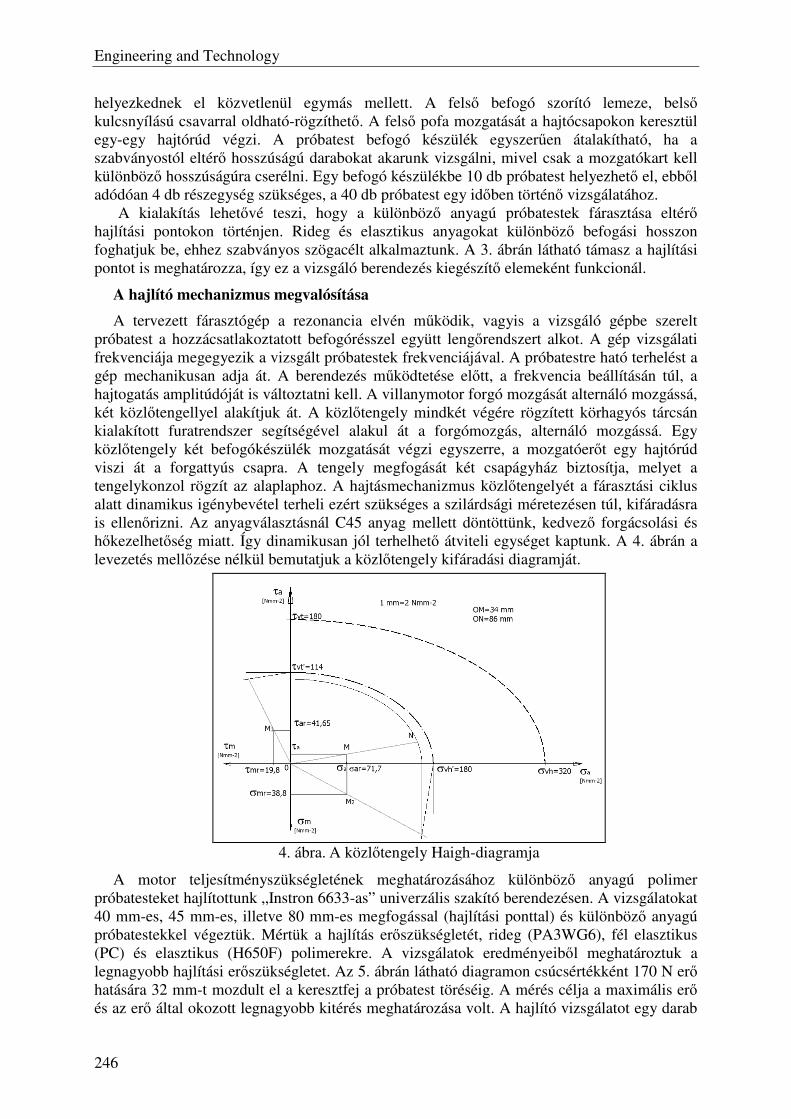
Engineering and Technology
246
helyezkednek el közvetlenül egymás mellett. A felső befogó szorító lemeze, belső kulcsnyílású csavarral oldható-rögzíthető. A felső pofa mozgatását a hajtócsapokon keresztül egy-egy hajtórúd végzi. A próbatest befogó készülék egyszerűen átalakítható, ha a szabványostól eltérő hosszúságú darabokat akarunk vizsgálni, mivel csak a mozgatókart kell különböző hosszúságúra cserélni. Egy befogó készülékbe 10 db próbatest helyezhető el, ebből adódóan 4 db részegység szükséges, a 40 db próbatest egy időben történő vizsgálatához.
A kialakítás lehetővé teszi, hogy a különböző anyagú próbatestek fárasztása eltérő hajlítási pontokon történjen. Rideg és elasztikus anyagokat különböző befogási hosszon foghatjuk be, ehhez szabványos szögacélt alkalmaztunk. A 3. ábrán látható támasz a hajlítási pontot is meghatározza, így ez a vizsgáló berendezés kiegészítő elemeként funkcionál.
A hajlító mechanizmus megvalósítása
A tervezett fárasztógép a rezonancia elvén működik, vagyis a vizsgáló gépbe szerelt próbatest a hozzácsatlakoztatott befogórésszel együtt lengőrendszert alkot. A gép vizsgálati frekvenciája megegyezik a vizsgált próbatestek frekvenciájával. A próbatestre ható terhelést a gép mechanikusan adja át. A berendezés működtetése előtt, a frekvencia beállításán túl, a hajtogatás amplitúdóját is változtatni kell. A villanymotor forgó mozgását alternáló mozgássá, két közlőtengellyel alakítjuk át. A közlőtengely mindkét végére rögzített körhagyós tárcsán kialakított furatrendszer segítségével alakul át a forgómozgás, alternáló mozgássá. Egy közlőtengely két befogókészülék mozgatását végzi egyszerre, a mozgatóerőt egy hajtórúd viszi át a forgattyús csapra. A tengely megfogását két csapágyház biztosítja, melyet a tengelykonzol rögzít az alaplaphoz. A hajtásmechanizmus közlőtengelyét a fárasztási ciklus alatt dinamikus igénybevétel terheli ezért szükséges a szilárdsági méretezésen túl, kifáradásra is ellenőrizni. Az anyagválasztásnál C45 anyag mellett döntöttünk, kedvező forgácsolási és hőkezelhetőség miatt. Így dinamikusan jól terhelhető átviteli egységet kaptunk. A 4. ábrán a levezetés mellőzése nélkül bemutatjuk a közlőtengely kifáradási diagramját.
A motor teljesítményszükségletének meghatározásához különböző anyagú polimer
próbatesteket hajlítottunk „Instron 6633-as” univerzális szakító berendezésen. A vizsgálatokat 40 mm-es, 45 mm-es, illetve 80 mm-es megfogással (hajlítási ponttal) és különböző anyagú próbatestekkel végeztük. Mértük a hajlítás erőszükségletét, rideg (PA3WG6), fél elasztikus (PC) és elasztikus (H650F) polimerekre. A vizsgálatok eredményeiből meghatároztuk a legnagyobb hajlítási erőszükségletet. Az 5. ábrán látható diagramon csúcsértékként 170 N erő hatására 32 mm-t mozdult el a keresztfej a próbatest töréséig. A mérés célja a maximális erő és az erő által okozott legnagyobb kitérés meghatározása volt. A hajlító vizsgálatot egy darab
4. ábra. A közlőtengely Haigh-diagramja
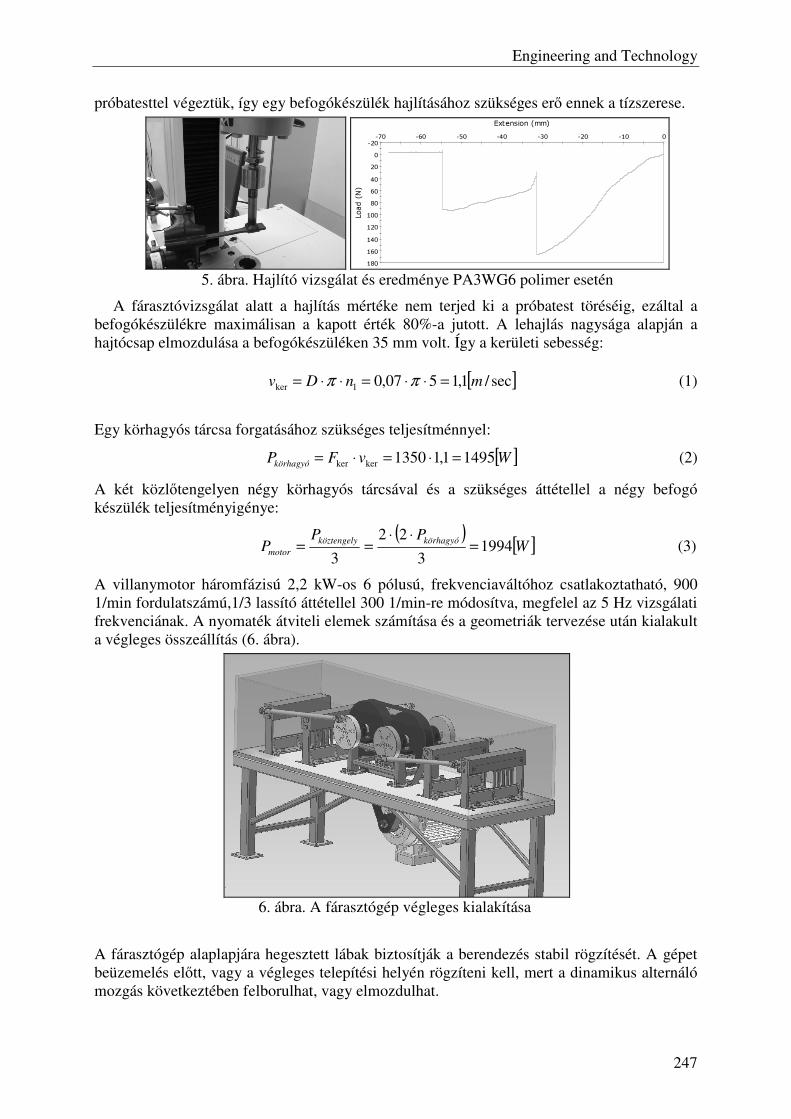
Engineering and Technology
247
próbatesttel végeztük, így egy befogókészülék hajlításához szükséges erő ennek a tízszerese.
A fárasztóvizsgálat alatt a hajlítás mértéke nem terjed ki a próbatest töréséig, ezáltal a
befogókészülékre maximálisan a kapott érték 80%-a jutott. A lehajlás nagysága alapján a hajtócsap elmozdulása a befogókészüléken 35 mm volt. Így a kerületi sebesség:
[ ]sec/1,1507,01ker mnDv =⋅⋅=⋅⋅= ππ (1)
Egy körhagyós tárcsa forgatásához szükséges teljesítménnyel:
[ ]WvFPkörhagyó 14951,11350kerker =⋅=⋅= (2)
A két közlőtengelyen négy körhagyós tárcsával és a szükséges áttétellel a négy befogó készülék teljesítményigénye:
( )
[ ]WPP
Pkörhagyóköztengely
motor 19943
22
3=
⋅⋅== (3)
A villanymotor háromfázisú 2,2 kW-os 6 pólusú, frekvenciaváltóhoz csatlakoztatható, 900 1/min fordulatszámú,1/3 lassító áttétellel 300 1/min-re módosítva, megfelel az 5 Hz vizsgálati frekvenciának. A nyomaték átviteli elemek számítása és a geometriák tervezése után kialakult a végleges összeállítás (6. ábra).
A fárasztógép alaplapjára hegesztett lábak biztosítják a berendezés stabil rögzítését. A gépet beüzemelés előtt, vagy a végleges telepítési helyén rögzíteni kell, mert a dinamikus alternáló mozgás következtében felborulhat, vagy elmozdulhat.
-20
0
20
40
60
80
100
120
140
160
180
-70 -60 -50 -40 -30 -20 -10 0
Load (
N)
Extension (mm)
5. ábra. Hajlító vizsgálat és eredménye PA3WG6 polimer esetén
6. ábra. A fárasztógép végleges kialakítása
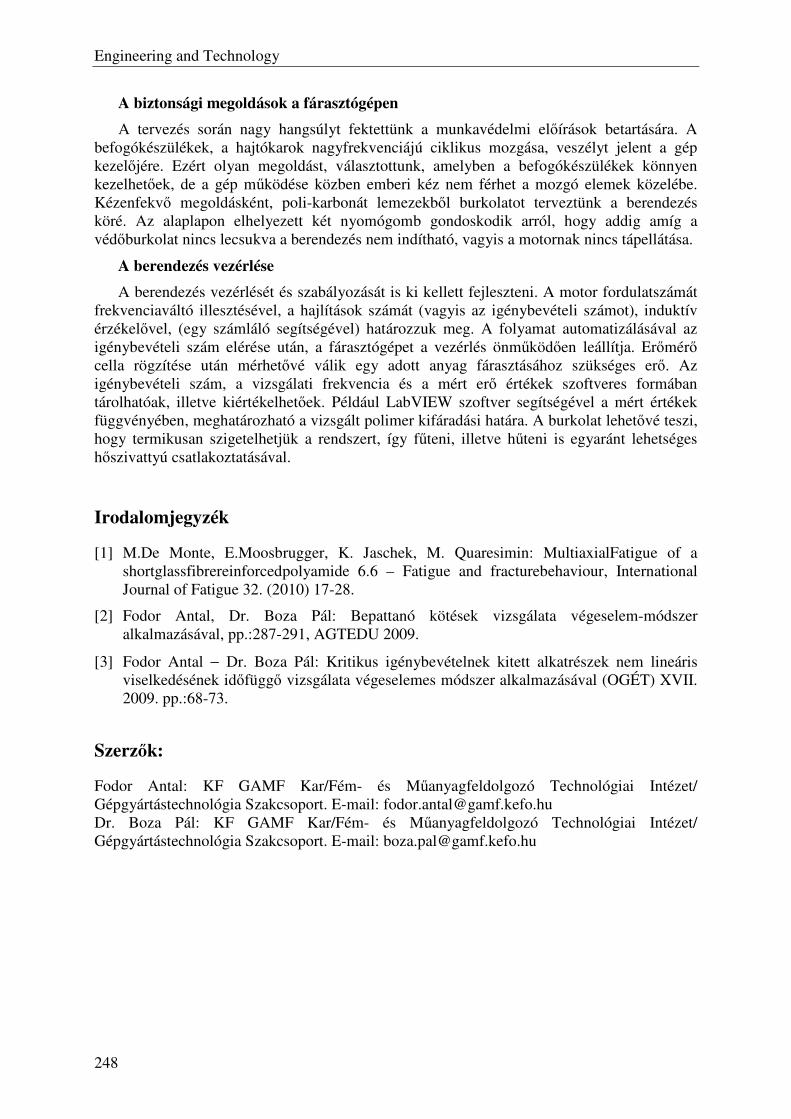
Engineering and Technology
248
A biztonsági megoldások a fárasztógépen
A tervezés során nagy hangsúlyt fektettünk a munkavédelmi előírások betartására. A befogókészülékek, a hajtókarok nagyfrekvenciájú ciklikus mozgása, veszélyt jelent a gép kezelőjére. Ezért olyan megoldást, választottunk, amelyben a befogókészülékek könnyen kezelhetőek, de a gép működése közben emberi kéz nem férhet a mozgó elemek közelébe. Kézenfekvő megoldásként, poli-karbonát lemezekből burkolatot terveztünk a berendezés köré. Az alaplapon elhelyezett két nyomógomb gondoskodik arról, hogy addig amíg a védőburkolat nincs lecsukva a berendezés nem indítható, vagyis a motornak nincs tápellátása.
A berendezés vezérlése
A berendezés vezérlését és szabályozását is ki kellett fejleszteni. A motor fordulatszámát frekvenciaváltó illesztésével, a hajlítások számát (vagyis az igénybevételi számot), induktív érzékelővel, (egy számláló segítségével) határozzuk meg. A folyamat automatizálásával az igénybevételi szám elérése után, a fárasztógépet a vezérlés önműködően leállítja. Erőmérő cella rögzítése után mérhetővé válik egy adott anyag fárasztásához szükséges erő. Az igénybevételi szám, a vizsgálati frekvencia és a mért erő értékek szoftveres formában tárolhatóak, illetve kiértékelhetőek. Például LabVIEW szoftver segítségével a mért értékek függvényében, meghatározható a vizsgált polimer kifáradási határa. A burkolat lehetővé teszi, hogy termikusan szigetelhetjük a rendszert, így fűteni, illetve hűteni is egyaránt lehetséges hőszivattyú csatlakoztatásával.
Irodalomjegyzék
[1] M.De Monte, E.Moosbrugger, K. Jaschek, M. Quaresimin: MultiaxialFatigue of a shortglassfibrereinforcedpolyamide 6.6 – Fatigue and fracturebehaviour, International Journal of Fatigue 32. (2010) 17-28.
[2] Fodor Antal, Dr. Boza Pál: Bepattanó kötések vizsgálata végeselem-módszer alkalmazásával, pp.:287-291, AGTEDU 2009.
[3] Fodor Antal − Dr. Boza Pál: Kritikus igénybevételnek kitett alkatrészek nem lineáris viselkedésének időfüggő vizsgálata végeselemes módszer alkalmazásával (OGÉT) XVII. 2009. pp.:68-73.
Szerzők:
Fodor Antal: KF GAMF Kar/Fém- és Műanyagfeldolgozó Technológiai Intézet/ Gépgyártástechnológia Szakcsoport. E-mail: [email protected] Dr. Boza Pál: KF GAMF Kar/Fém- és Műanyagfeldolgozó Technológiai Intézet/ Gépgyártástechnológia Szakcsoport. E-mail: [email protected]
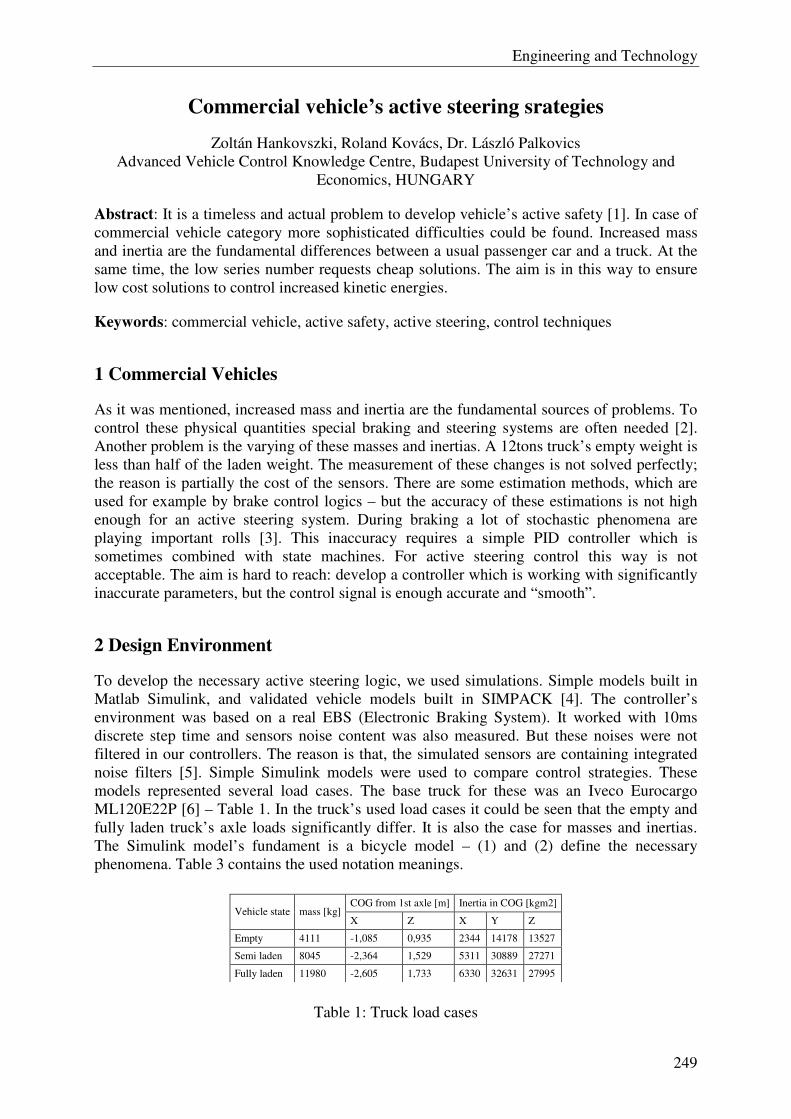
Engineering and Technology
249
Commercial vehicle’s active steering srategies
Zoltán Hankovszki, Roland Kovács, Dr. László Palkovics
Advanced Vehicle Control Knowledge Centre, Budapest University of Technology and
Economics, HUNGARY
Abstract: It is a timeless and actual problem to develop vehicle’s active safety [1]. In case of
commercial vehicle category more sophisticated difficulties could be found. Increased mass
and inertia are the fundamental differences between a usual passenger car and a truck. At the
same time, the low series number requests cheap solutions. The aim is in this way to ensure
low cost solutions to control increased kinetic energies.
Keywords: commercial vehicle, active safety, active steering, control techniques
1 Commercial Vehicles
As it was mentioned, increased mass and inertia are the fundamental sources of problems. To
control these physical quantities special braking and steering systems are often needed [2].
Another problem is the varying of these masses and inertias. A 12tons truck’s empty weight is
less than half of the laden weight. The measurement of these changes is not solved perfectly;
the reason is partially the cost of the sensors. There are some estimation methods, which are
used for example by brake control logics – but the accuracy of these estimations is not high
enough for an active steering system. During braking a lot of stochastic phenomena are
playing important rolls [3]. This inaccuracy requires a simple PID controller which is
sometimes combined with state machines. For active steering control this way is not
acceptable. The aim is hard to reach: develop a controller which is working with significantly
inaccurate parameters, but the control signal is enough accurate and “smooth”.
2 Design Environment
To develop the necessary active steering logic, we used simulations. Simple models built in
Matlab Simulink, and validated vehicle models built in SIMPACK [4]. The controller’s
environment was based on a real EBS (Electronic Braking System). It worked with 10ms
discrete step time and sensors noise content was also measured. But these noises were not
filtered in our controllers. The reason is that, the simulated sensors are containing integrated
noise filters [5]. Simple Simulink models were used to compare control strategies. These
models represented several load cases. The base truck for these was an Iveco Eurocargo
ML120E22P [6] – Table 1. In the truck’s used load cases it could be seen that the empty and
fully laden truck’s axle loads significantly differ. It is also the case for masses and inertias.
The Simulink model’s fundament is a bicycle model – (1) and (2) define the necessary
phenomena. Table 3 contains the used notation meanings.
Table 1: Truck load cases
COG from 1st axle [m] Inertia in COG [kgm2] Vehicle state mass [kg]
X Z X Y Z
Empty 4111 -1,085 0,935 2344 14178 13527
Semi laden 8045 -2,364 1,529 5311 30889 27271
Fully laden 11980 -2,605 1,733 6330 32631 27995

Engineering and Technology
250
X
Y21XY
v
vwhereFFv
dt
d
dt
dmam ≈β+=⋅
ψ+
β⋅=⋅ (1)
ψ⋅⋅−+δ+β−⋅=α⋅=+⋅−⋅=
ψ⋅ &
&
X
ii
iiiii2211v
l)1(ccFwhereMlFlF
dt
dJ (2)
In (2), cornering stiffness is a constant. For this simple model a linearized tire model was
used. In this, the 90% of tire normal force was the maximum lateral force, which was reached
at 0,08rad lateral slip. Over this slip value no further lateral force increasing was taken. The
developed final controller was also tested with validated tractor model. This was based on
measurements of an MAN TGA tractor. Another investigation option was tire wear
conditions. A new set of truck tires costs more than 4000€, so the owners use the tires as long
as it possible. But in case of any other happenings which cause tire grip loss, it is a
requirement to ensure the highest safety. We investigated tires with 30% gripping ability.
3 The Strategies
To figure out which one control strategy is the best, five techniques were investigated:
- PID control, LQ regulation (LQR) and Neuro-Fuzzy approach
- H∞ control
- Adaptive Reference Model (ARM)
With this list we tried to select simple empirical strategies (PID and Neuro-Fuzzy) and some
in theoretical ways optimized strategies (LQR and H∞). The fifth strategy (ARM) is working
with special solutions which are only valid for this model.
The controller’s aim was to ensure the best reference yaw rate following property. In case of
comparisons the control signal was equation (2)’s external control torque – M. This input is
acting around the vehicle’s vertical axle. The design was based every time on a semi laden
truck’s parameters, which is running with new tires. Reference yaw rate was originated from a
semi laden truck model, which’s steering behaviour was neutral. We represent only PID, H∞
and ARM results, because LQR and Neuro-Fuzzy results are very similar to PID.
3.1 PID Control
The control signal was only yaw rate difference from the ideal vehicle state. For the tuning of
this controller, some physical calculations were made. Redefining (2) to a steady state (yaw
rate is constant), left side of (3) is given. From this with the neglecting of steering angles and
sideslip angle the right side of (3) could be written. It says that the yaw rate is proportional to
the external torque in a steady state case where velocity and cornering stiffness parameters are
constants.
( )x
2
11
2
221122v
lclcMlFlFMψ
⋅⋅+⋅=⇒⋅−⋅=&
(3)
So, (3) provided a proportional gain value, but that wasn’t enough accurate. To reach a good
reference signal following property, another integrator part was needed, and we didn’t use
derivative part for this control logic. As it was mentioned increased mass (relative to
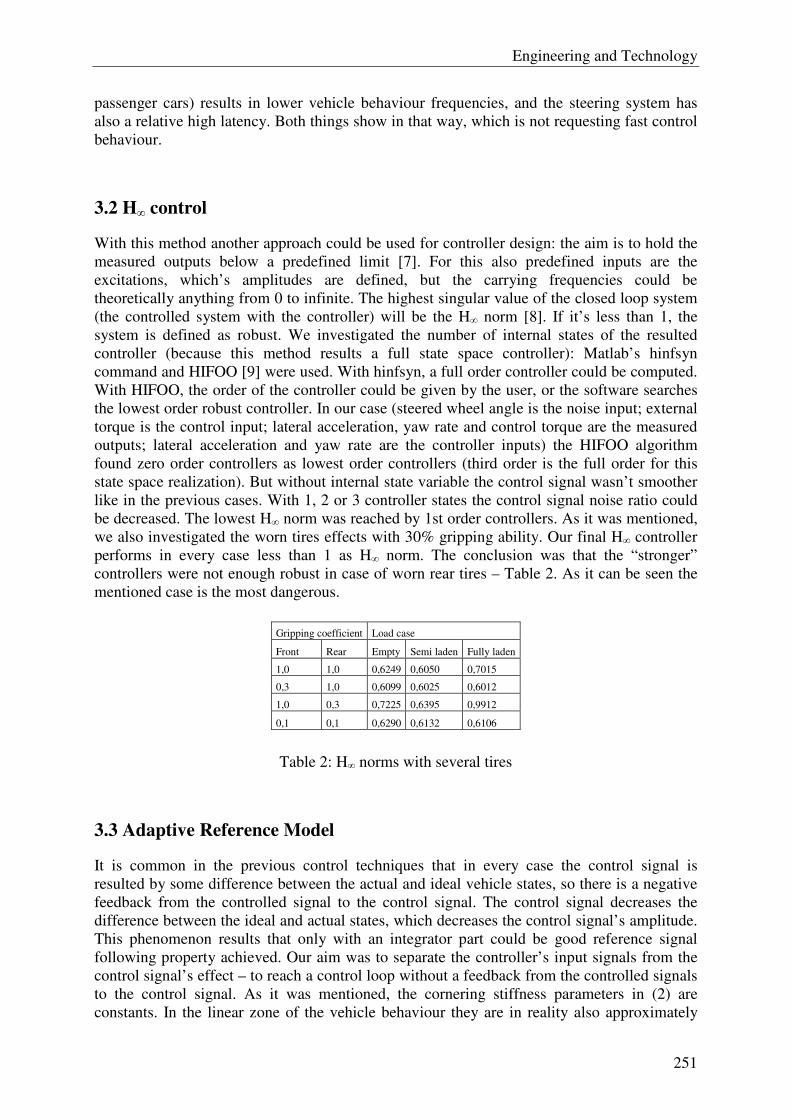
Engineering and Technology
251
passenger cars) results in lower vehicle behaviour frequencies, and the steering system has
also a relative high latency. Both things show in that way, which is not requesting fast control
behaviour.
3.2 H∞ control
With this method another approach could be used for controller design: the aim is to hold the
measured outputs below a predefined limit [7]. For this also predefined inputs are the
excitations, which’s amplitudes are defined, but the carrying frequencies could be
theoretically anything from 0 to infinite. The highest singular value of the closed loop system
(the controlled system with the controller) will be the H∞ norm [8]. If it’s less than 1, the
system is defined as robust. We investigated the number of internal states of the resulted
controller (because this method results a full state space controller): Matlab’s hinfsyn
command and HIFOO [9] were used. With hinfsyn, a full order controller could be computed.
With HIFOO, the order of the controller could be given by the user, or the software searches
the lowest order robust controller. In our case (steered wheel angle is the noise input; external
torque is the control input; lateral acceleration, yaw rate and control torque are the measured
outputs; lateral acceleration and yaw rate are the controller inputs) the HIFOO algorithm
found zero order controllers as lowest order controllers (third order is the full order for this
state space realization). But without internal state variable the control signal wasn’t smoother
like in the previous cases. With 1, 2 or 3 controller states the control signal noise ratio could
be decreased. The lowest H∞ norm was reached by 1st order controllers. As it was mentioned,
we also investigated the worn tires effects with 30% gripping ability. Our final H∞ controller
performs in every case less than 1 as H∞ norm. The conclusion was that the “stronger”
controllers were not enough robust in case of worn rear tires – Table 2. As it can be seen the
mentioned case is the most dangerous.
Table 2: H∞ norms with several tires
3.3 Adaptive Reference Model
It is common in the previous control techniques that in every case the control signal is
resulted by some difference between the actual and ideal vehicle states, so there is a negative
feedback from the controlled signal to the control signal. The control signal decreases the
difference between the ideal and actual states, which decreases the control signal’s amplitude.
This phenomenon results that only with an integrator part could be good reference signal
following property achieved. Our aim was to separate the controller’s input signals from the
control signal’s effect – to reach a control loop without a feedback from the controlled signals
to the control signal. As it was mentioned, the cornering stiffness parameters in (2) are
constants. In the linear zone of the vehicle behaviour they are in reality also approximately
Gripping coefficient Load case
Front Rear Empty Semi laden Fully laden
1,0 1,0 0,6249 0,6050 0,7015
0,3 1,0 0,6099 0,6025 0,6012
1,0 0,3 0,7225 0,6395 0,9912
0,1 0,1 0,6290 0,6132 0,6106
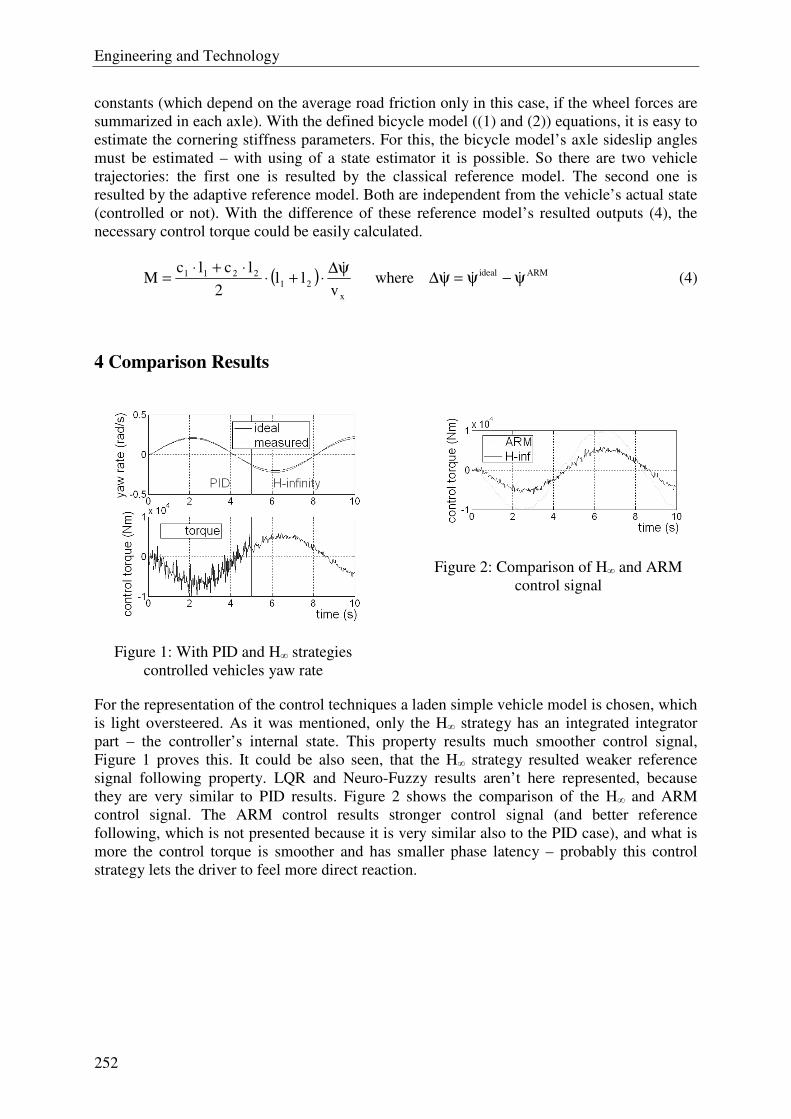
Engineering and Technology
252
constants (which depend on the average road friction only in this case, if the wheel forces are
summarized in each axle). With the defined bicycle model ((1) and (2)) equations, it is easy to
estimate the cornering stiffness parameters. For this, the bicycle model’s axle sideslip angles
must be estimated – with using of a state estimator it is possible. So there are two vehicle
trajectories: the first one is resulted by the classical reference model. The second one is
resulted by the adaptive reference model. Both are independent from the vehicle’s actual state
(controlled or not). With the difference of these reference model’s resulted outputs (4), the
necessary control torque could be easily calculated.
( ) ARMideal
x
21
2211 wherev
ll2
lclcM ψ−ψ=ψ∆
ψ∆⋅+⋅
⋅+⋅= &&&
& (4)
4 Comparison Results
Figure 1: With PID and H∞ strategies
controlled vehicles yaw rate
Figure 2: Comparison of H∞ and ARM
control signal
For the representation of the control techniques a laden simple vehicle model is chosen, which
is light oversteered. As it was mentioned, only the H∞ strategy has an integrated integrator
part – the controller’s internal state. This property results much smoother control signal,
Figure 1 proves this. It could be also seen, that the H∞ strategy resulted weaker reference
signal following property. LQR and Neuro-Fuzzy results aren’t here represented, because
they are very similar to PID results. Figure 2 shows the comparison of the H∞ and ARM
control signal. The ARM control results stronger control signal (and better reference
following, which is not presented because it is very similar also to the PID case), and what is
more the control torque is smoother and has smaller phase latency – probably this control
strategy lets the driver to feel more direct reaction.
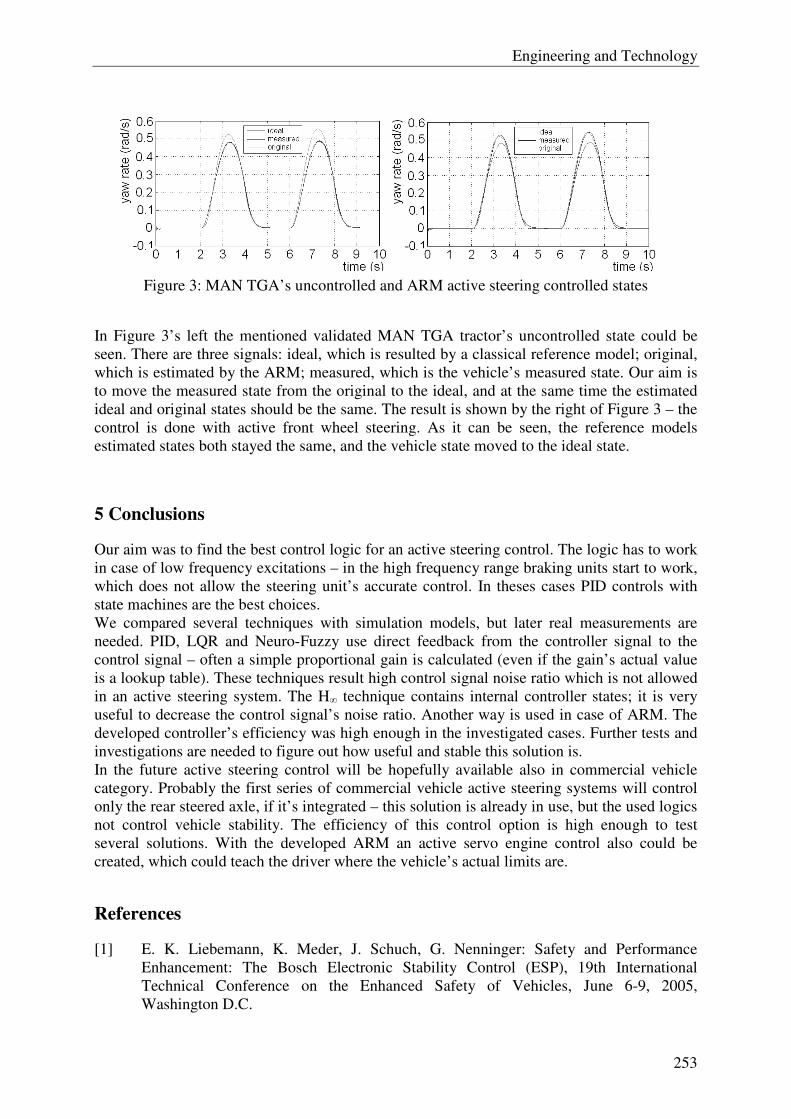
Engineering and Technology
253
Figure 3: MAN TGA’s uncontrolled and ARM active steering controlled states
In Figure 3’s left the mentioned validated MAN TGA tractor’s uncontrolled state could be
seen. There are three signals: ideal, which is resulted by a classical reference model; original,
which is estimated by the ARM; measured, which is the vehicle’s measured state. Our aim is
to move the measured state from the original to the ideal, and at the same time the estimated
ideal and original states should be the same. The result is shown by the right of Figure 3 – the
control is done with active front wheel steering. As it can be seen, the reference models
estimated states both stayed the same, and the vehicle state moved to the ideal state.
5 Conclusions
Our aim was to find the best control logic for an active steering control. The logic has to work
in case of low frequency excitations – in the high frequency range braking units start to work,
which does not allow the steering unit’s accurate control. In theses cases PID controls with
state machines are the best choices.
We compared several techniques with simulation models, but later real measurements are
needed. PID, LQR and Neuro-Fuzzy use direct feedback from the controller signal to the
control signal – often a simple proportional gain is calculated (even if the gain’s actual value
is a lookup table). These techniques result high control signal noise ratio which is not allowed
in an active steering system. The H∞ technique contains internal controller states; it is very
useful to decrease the control signal’s noise ratio. Another way is used in case of ARM. The
developed controller’s efficiency was high enough in the investigated cases. Further tests and
investigations are needed to figure out how useful and stable this solution is.
In the future active steering control will be hopefully available also in commercial vehicle
category. Probably the first series of commercial vehicle active steering systems will control
only the rear steered axle, if it’s integrated – this solution is already in use, but the used logics
not control vehicle stability. The efficiency of this control option is high enough to test
several solutions. With the developed ARM an active servo engine control also could be
created, which could teach the driver where the vehicle’s actual limits are.
References
[1] E. K. Liebemann, K. Meder, J. Schuch, G. Nenninger: Safety and Performance
Enhancement: The Bosch Electronic Stability Control (ESP), 19th International
Technical Conference on the Enhanced Safety of Vehicles, June 6-9, 2005,
Washington D.C.
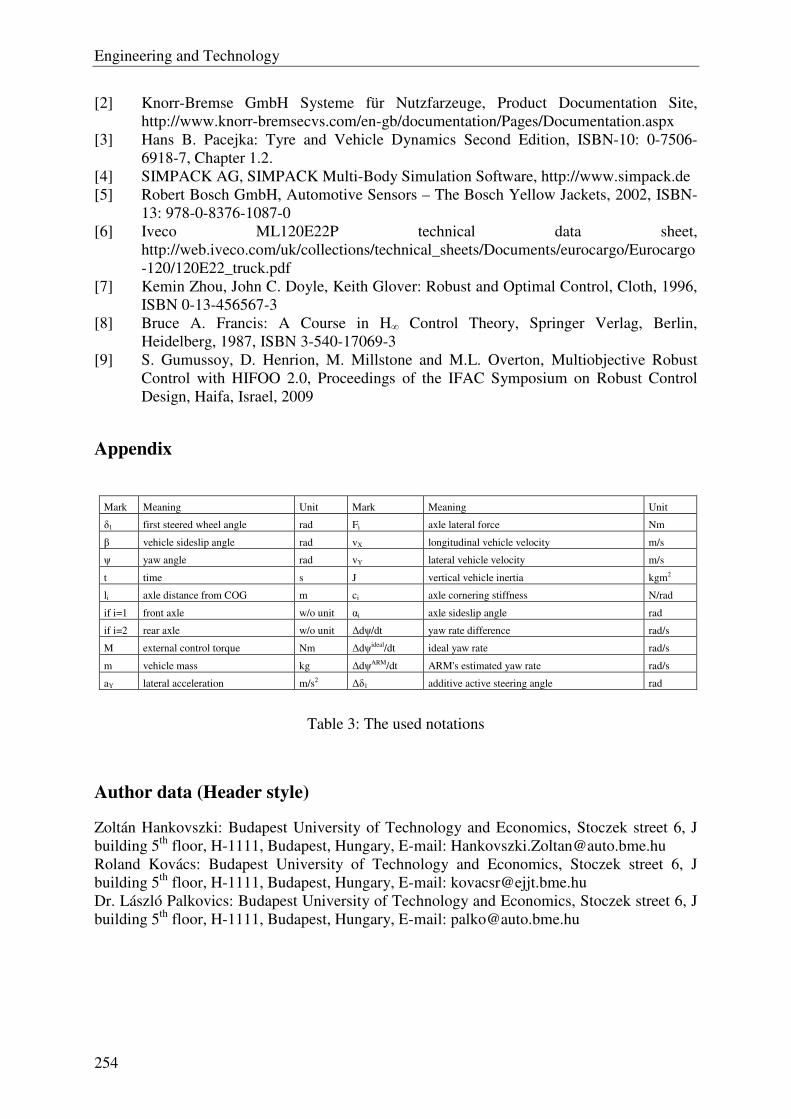
Engineering and Technology
254
[2] Knorr-Bremse GmbH Systeme für Nutzfarzeuge, Product Documentation Site,
http://www.knorr-bremsecvs.com/en-gb/documentation/Pages/Documentation.aspx
[3] Hans B. Pacejka: Tyre and Vehicle Dynamics Second Edition, ISBN-10: 0-7506-
6918-7, Chapter 1.2.
[4] SIMPACK AG, SIMPACK Multi-Body Simulation Software, http://www.simpack.de
[5] Robert Bosch GmbH, Automotive Sensors – The Bosch Yellow Jackets, 2002, ISBN-
13: 978-0-8376-1087-0
[6] Iveco ML120E22P technical data sheet,
http://web.iveco.com/uk/collections/technical_sheets/Documents/eurocargo/Eurocargo
-120/120E22_truck.pdf
[7] Kemin Zhou, John C. Doyle, Keith Glover: Robust and Optimal Control, Cloth, 1996,
ISBN 0-13-456567-3
[8] Bruce A. Francis: A Course in H∞ Control Theory, Springer Verlag, Berlin,
Heidelberg, 1987, ISBN 3-540-17069-3
[9] S. Gumussoy, D. Henrion, M. Millstone and M.L. Overton, Multiobjective Robust
Control with HIFOO 2.0, Proceedings of the IFAC Symposium on Robust Control
Design, Haifa, Israel, 2009
Appendix
Table 3: The used notations
Author data (Header style)
Zoltán Hankovszki: Budapest University of Technology and Economics, Stoczek street 6, J
building 5th
floor, H-1111, Budapest, Hungary, E-mail: [email protected]
Roland Kovács: Budapest University of Technology and Economics, Stoczek street 6, J
building 5th
floor, H-1111, Budapest, Hungary, E-mail: [email protected]
Dr. László Palkovics: Budapest University of Technology and Economics, Stoczek street 6, J
building 5th
floor, H-1111, Budapest, Hungary, E-mail: [email protected]
Mark Meaning Unit Mark Meaning Unit
δ1 first steered wheel angle rad Fi axle lateral force Nm
β vehicle sideslip angle rad vX longitudinal vehicle velocity m/s
ψ yaw angle rad vY lateral vehicle velocity m/s
t time s J vertical vehicle inertia kgm2
li axle distance from COG m ci axle cornering stiffness N/rad
if i=1 front axle w/o unit αi axle sideslip angle rad
if i=2 rear axle w/o unit ∆dψ/dt yaw rate difference rad/s
M external control torque Nm ∆dψideal/dt ideal yaw rate rad/s
m vehicle mass kg ∆dψARM/dt ARM's estimated yaw rate rad/s
aY lateral acceleration m/s2 ∆δ1 additive active steering angle rad
Engineering and Technology
255
Stress analysis of eave framework
M. Holik, D. Kozak, P. Konjatić, Ž. Ivandić, D. Damjanović
Mechanical Engineering Faculty in Slavonski Brod, Josip Juraj Strossmayer University of Osijek, CROATIA
Abstract: This paper analyzes structure of eave framework made according to the existing technical documentation. In process of parts and profiles joining, MMA (manual-arc) welding process was used. Eave framework is loaded by wind and snow, where self weight of structural parts is also taken into consideration. Finite element method and ANSYS 11.0 software was used for numerical analysis. A beam element from the ANSYS element library, called BEAM 3-D ELASTIC 4 was used. Numerical analysis showed that the structure fulfill all requirements related to the specified loading. Although maximum deflection exceeds the engineer codex for constructions (1/200 of total span), the axial stresses in beams remain in allowed limits. So one can conclude that construction satisfy given criteria.
Keywords: eave framework, numerical calculation, finite element method, beam, boundary conditions, ANSYS.
1 Introduction
Steel structures are used as supporting systems in civil and mechanical engineering and they are mostly made of rolled steel products. Their use covers a wide range of applications like in buildings, bridges, pipelines, transportation facilities, repositories, mining and metallurgical plants, columns for various purposes (lighting, power lines), etc.
Use of steel as a material for supporting structures, as compared to other building materials (wood, concrete, natural and artificial stone, plastic materials...), is based on the properties that it possess as a metal. Beside steel, aluminum alloys are also used for the same purpose. These light-weight metal constructions have very similar problematics in disposition solutions, treatment in sizing, structural design methods and processes of making compared to steel structures. Therefore joined application of these metals together, forms a whole field in designing of metal structures [1].
2 Model of eave
The entire eave is modeled from one part (Part model) with all sections of individual carriers as it is given in technical documentation, while the side and roof trapezoidal sheet (T40.1) is modeled in "Sheet Metal" part of Autodesk Inventor. The eave is “leaned” on the building, which is also modeled but not completely. Only one part (wall) of building is modeled just to give more insight in total situation. Eave model with building wall and side and roof trapezoidal metal sheet is shown on Figure 1.
Based on the eave 3D model a certain simplification was done to obtain less finite elements and nodes in finite element analysis. Therefore eave model is transformed into wired model shown on the Figure 2.
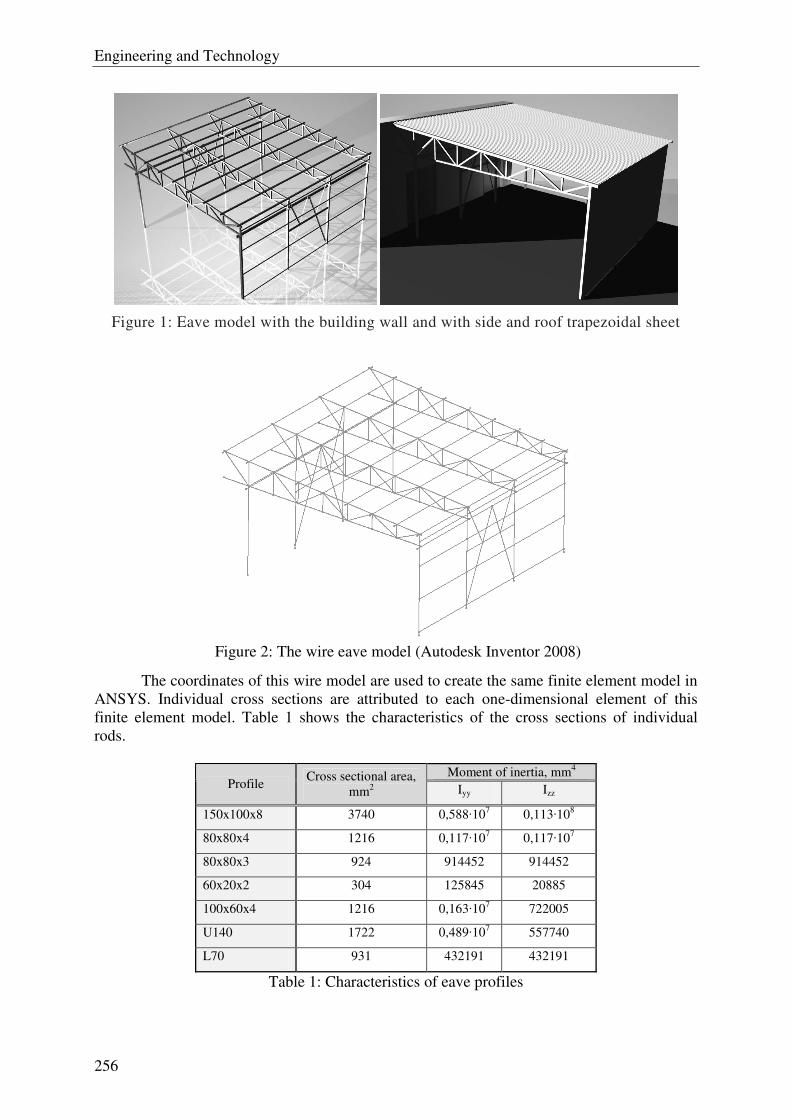
Engineering and Technology
256
Figure 1: Eave model with the building wall and with side and roof trapezoidal sheet
Figure 2: The wire eave model (Autodesk Inventor 2008)
The coordinates of this wire model are used to create the same finite element model in ANSYS. Individual cross sections are attributed to each one-dimensional element of this finite element model. Table 1 shows the characteristics of the cross sections of individual rods.
Moment of inertia, mm4 Profile
Cross sectional area, mm2 Iyy Izz
150x100x8 3740 0,588·107 0,113·108
80x80x4 1216 0,117·107 0,117·107
80x80x3 924 914452 914452
60x20x2 304 125845 20885
100x60x4 1216 0,163·107 722005
U140 1722 0,489·107 557740
L70 931 432191 432191
Table 1: Characteristics of eave profiles

Engineering and Technology
3 Material of eave beams and load on construction
As a basic material for supporting steel structures, rolled products of carbon steel up to 0.25 % of carbon are almost exclusively used. Mechanical and metallurgical properties of these steels, known as structural steels are specified in standards [1]. Beam material used in the construction of eave is Č.0361 [2], which corresponds to S235 JRG2, according to EN 10025/91. 3.1 Load on construction
Standards and codes classify different types of loadings on every kind of metal construction regarding to the actual cause of load as follows [3]:
- loads due to self weight (including the construction weight), - loads due to temperature changes, - snow, - wind, - forces caused by unplanned activity (hits of vehicle in the construction), - forces caused by earthquake, and others.
It is necessary to take into consideration the loading caused by the snow on the eave structure, wind load, and self-weight load of the structure. Snow and wind loads are obtained by perennial measurements for individual area where particular building is located. According to [4] the data for building location were taken and the load is calculated. Obtained load was 1.3 kN/m2 and with added weight of trapezoidal sheet metal covering a whole eave, load was approximately 1.8 kN/m2.
Obtained load had to be converted to the continuous load that on beam girders. Eave is divided into seven equal parts, and two end beams were loaded with continuous load of 1.352 kN/m, while the other beams in between are loaded with load of 2.705 kN/m. Construction self weight has been also taken into consideration by defining material and the Earth's gravity.
3.2. Boundary conditions
Eave supporting columns are welded on plates and tightened with screws to the concrete foundations forming a fixed support. Fixed support does not allow movement in all direction (x, y and z), but allows rotation around all three axes. Beam ends (lower parts) are also tightened with screws to the building. Upper beam has been welded to the roof beam of building. Such connections also represent fixed supports. Figure 3 shows location of fixed supports.
In order to completely set boundary conditions of problem it is necessary to set continuous loading on corresponding (Figure 4).
Figure 3: The wire eave model with fixed supports
Figure 4: Distribution of external loading on the eave construction

Engineering and Technology
258
4 The numerical calculation of deflections and stresses in construction
For the meshing of construction, considering linear-elastic analysis “Beam 3D elastic 4 element” or more briefly “Beam 4 element” from ANSYS library is used. Beam 4 is a uniaxial element with tension, compression, torsion, and bending capabilities. The element has six degrees of freedom at each node: translations in the nodal x, y, and z directions and rotations about the nodal x, y, and z axes. The element is defined by two or three nodes, the cross-sectional area, two area moments of inertia (Izz and Iyy), two thicknesses (TKY and TKZ), an angle of orientation about the element x-axis, the torsional moment of inertia (Ixx), and the material properties. If Ixx is equal to 0 or not specified, is assumed to be equal to the polar moment of inertia (Iyy + Izz) [5]. The maximal length of element used in the meshing was 10 millimeters and mesh consisted of 43076 elements and 42957 nodes.
4.1 Determination of the stresses in beams
In ANSYS, maximal stresses (Figure 5) in individual beams are determined with
NMISC command defined for all nodes. Command is “NMISC, 1” and the number “1” means that the maximum stress is determined in the first node, or “NMISC, 3” where the number “3” denotes the other node. NMISC marks a maximum and minimal stress as the sum of axial stress and bending stress. On the legend of Figure 5, stresses are marked with colors. Cold colors represent compressive stresses (from blue to green, −), and the warm colors represent tensile stresses (from yellow-green to red, +).
Figure 5: Stresses in the beams, MPa
4.2 Deformation of beams caused by loading
The largest deflection (1.093 mm) under the influence of the self weight (Figure 6) is significantly smaller than deflection caused by total loading on construction wmax = 27.34 mm shown on Figure 7. The largest deflection is on the sixth beam (looking from the building wall) and between third and fourth girder. It can be expected that the largest deflection is on

Engineering and Technology
that place, because there is the largest span between beams (span of 4000 mm compared to 3800 mm). The largest deflection on the truss is on the third beam below and it is 8.91 mm.
Figure 6: Deflections of construction caused by self weight, mm
Figure 7: Distribution of displacements due to
total loading, mm
5 The critical section of beam
The critical section of beam is on the place of tensile stresses and in this case it is on the lower beams of construction. Usually it is considered that beams with tensile load are more critical regarding the possible failure, than the beams loaded by compression. According to the Figure 5, it is obvious that the maximum stress is in the lower part of roof construction truss is in two middle beams (second and third beam from the end of eave) and it is about 68 MPa.
5.1. Influence of boundary conditions on the reaction forces
In order to see the influence of boundary conditions on reaction forces, restriction of rotation is applied on supports. Therefore such clamped supports do not allow neither translation nor rotation. Table 2 shows comparison of reaction forces in both types of supports regarding to z direction (the largest component of reaction). Columns have been marked with numbers from 1 to 8 from left to the right.
Column No.
Node num.
Reaction force in z axis for fixed
support, N
Reaction force in z axis for clamped
support, N 1 1 31045 31109 2 436 17631 17717 3 871 62697 103610 4 1306 34850 36952 5 1741 64765 106430 6 2176 35840 38205 7 2611 32471 53883 8 3046 18398 19632
Table 2: Comparison of reaction forces in supports
When support rotation is restricted an increase of reaction forces in supports can be noted compared to reaction forces of fixed supports with possibilities of rotation. It is easy to conclude that the rigidity of construction increases, what negatively influences on the whole
Engineering and Technology
260
construction. Greatest increase of reaction force can be noted on third and fifth column for almost 60 %.
6 Conclusion
Real construction of eave structure has been analyzed in this paper. 3D model is crated with defined geometry from the technical documentation. Finite element analysis is performed using ANSYS software. It is important to calculate carrying capacity of construction, and deflections in due to maximum load of construction. Axial and bending stresses in beams are also calculated.
From obtained results it is obvious that the maximum deflection for a small amount exceeds a construction code of 1/200 of the span of the beam, but the stresses in beams are significantly lower than allowable stress. Because beams, where the deflection is observed, are mainly used for fixing of trapezoidal sheet metal, and because all stresses are within the allowed limits, one can conclude that this construction, with load increased by 22% (according actual measurements) is safe for operation.
Using software for the finite element analysis, graphic representation of deformations under the load can be obtained. Deformations shown on figures is a few times enlarged in order to easily note deformations, since deflections are very small compared to the size of construction (12x12 meter).
Literature
[1] Tehnička enciklopedija 3 i 8. Zagreb, Jugoslavenski leksikografski zavod, 1988, 42–
43, pp 391 – 419 [2] Kraut Bojan: Strojarski priručnik. Zagreb, Tehnička knjiga, 1976, pp 304 – 305 [3] Andrić, B.; Dumović, D.; Džeba I.; Metalne konstrukcije I. Zagreb, Institut
greñevinarstva Hrvatske, 1994, pp 33 – 35 [4] HRN ENV 1991-1 Eurocode 1: Basis of design and influence on structures - Part 1:
Design basis, National Institute for Standards and Measurements [5] ANSYS 11.0, Manual Documentation, 2007 [6] Alfirević Ivo: Nauka o čvrstoći I, Zagreb, ITP Tehnička knjiga d.d., 1995, pp 271–
273
Author data Mario Holik, Dražan Kozak, Pejo Konjatić, Željko Ivandić, Darko Damjanović: Mechanical Engineering Faculty in Slavonski Brod, Josip Juraj Strossmayer University of Osijek. Trg Ivane Brlić Mažuranić 2, 35000 Slavonski Brod, Croatia. E-mail: [email protected] [email protected] [email protected] [email protected] [email protected]
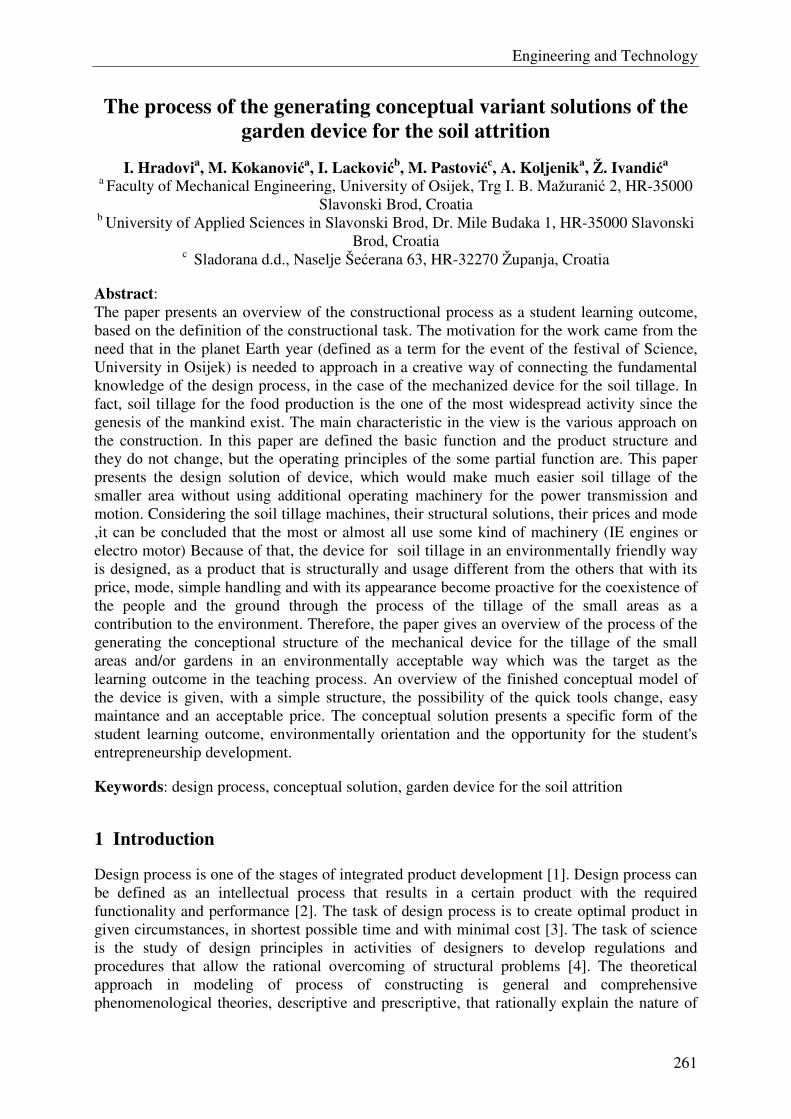
Engineering and Technology
261
The process of the generating conceptual variant solutions of the garden device for the soil attrition
I. Hradovia, M. Kokanovića, I. Lackovićb, M. Pastovićc, A. Koljenika, Ž. Ivandića
a Faculty of Mechanical Engineering, University of Osijek, Trg I. B. Mažuranić 2, HR-35000 Slavonski Brod, Croatia
b University of Applied Sciences in Slavonski Brod, Dr. Mile Budaka 1, HR-35000 Slavonski Brod, Croatia
c Sladorana d.d., Naselje Šećerana 63, HR-32270 Županja, Croatia
Abstract: The paper presents an overview of the constructional process as a student learning outcome, based on the definition of the constructional task. The motivation for the work came from the need that in the planet Earth year (defined as a term for the event of the festival of Science, University in Osijek) is needed to approach in a creative way of connecting the fundamental knowledge of the design process, in the case of the mechanized device for the soil tillage. In fact, soil tillage for the food production is the one of the most widespread activity since the genesis of the mankind exist. The main characteristic in the view is the various approach on the construction. In this paper are defined the basic function and the product structure and they do not change, but the operating principles of the some partial function are. This paper presents the design solution of device, which would make much easier soil tillage of the smaller area without using additional operating machinery for the power transmission and motion. Considering the soil tillage machines, their structural solutions, their prices and mode ,it can be concluded that the most or almost all use some kind of machinery (IE engines or electro motor) Because of that, the device for soil tillage in an environmentally friendly way is designed, as a product that is structurally and usage different from the others that with its price, mode, simple handling and with its appearance become proactive for the coexistence of the people and the ground through the process of the tillage of the small areas as a contribution to the environment. Therefore, the paper gives an overview of the process of the generating the conceptional structure of the mechanical device for the tillage of the small areas and/or gardens in an environmentally acceptable way which was the target as the learning outcome in the teaching process. An overview of the finished conceptual model of the device is given, with a simple structure, the possibility of the quick tools change, easy maintance and an acceptable price. The conceptual solution presents a specific form of the student learning outcome, environmentally orientation and the opportunity for the student's entrepreneurship development.
Keywords: design process, conceptual solution, garden device for the soil attrition
1 Introduction
Design process is one of the stages of integrated product development [1]. Design process can be defined as an intellectual process that results in a certain product with the required functionality and performance [2]. The task of design process is to create optimal product in given circumstances, in shortest possible time and with minimal cost [3]. The task of science is the study of design principles in activities of designers to develop regulations and procedures that allow the rational overcoming of structural problems [4]. The theoretical approach in modeling of process of constructing is general and comprehensive phenomenological theories, descriptive and prescriptive, that rationally explain the nature of

Engineering and Technology
262
the design process. Design process can be described from different viewpoints, such as planning, organization, methods, and activities. From the point of activity, design process can be model through four levels:
− Product planning, − Product development, − Product synthesis, − Generalized Troubleshooting.
Product planning is focused on determining of the business strategy, searching for potential jobs, adoption of technological development, selection and coordination of possible projects. Product development includes all activities necessary for product realization, from definition of requirements, through determination of the principles of individual solutions, detailed elaboration to prepare for production. Product synthesis has a mechanical product, as an object of interest, and it determines the activities needed to define the product characteristics. Generalized problem solving is defined with activities that are based on observations and theories to describe the way of human thinking and solving of problem.
2 The concept of alternative solutions of the garden device for the soil attrition
The authors of this paper have set the following objectives in designing of the device for garden soil attrition:
− Protecting the environment due to not using of IC engines − Simple construction − Making easier processing of smaller land area − Easy and simple use of the devices − Easy Maintenance − Enable multiple applications − Acceptable final price of the devices
The following table gives us the lists of requirements and desire as the construction needs for further product development.
Table 1: List of requirements and desires
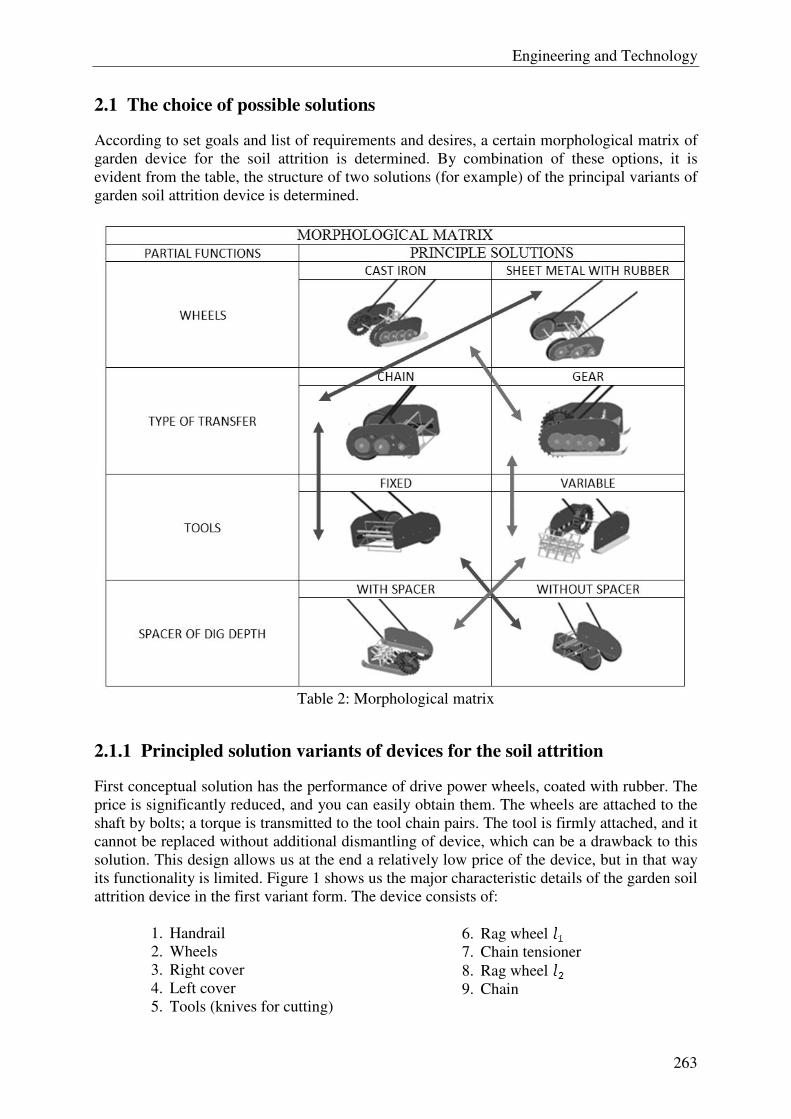
Engineering and Technology
263
2.1 The choice of possible solutions
According to set goals and list of requirements and desires, a certain morphological matrix of garden device for the soil attrition is determined. By combination of these options, it is evident from the table, the structure of two solutions (for example) of the principal variants of garden soil attrition device is determined.
Table 2: Morphological matrix
2.1.1 Principled solution variants of devices for the soil attrition
First conceptual solution has the performance of drive power wheels, coated with rubber. The price is significantly reduced, and you can easily obtain them. The wheels are attached to the shaft by bolts; a torque is transmitted to the tool chain pairs. The tool is firmly attached, and it cannot be replaced without additional dismantling of device, which can be a drawback to this solution. This design allows us at the end a relatively low price of the device, but in that way its functionality is limited. Figure 1 shows us the major characteristic details of the garden soil attrition device in the first variant form. The device consists of:
1. Handrail 2. Wheels 3. Right cover 4. Left cover 5. Tools (knives for cutting)
6. Rag wheel 7. Chain tensioner 8. Rag wheel 9. Chain
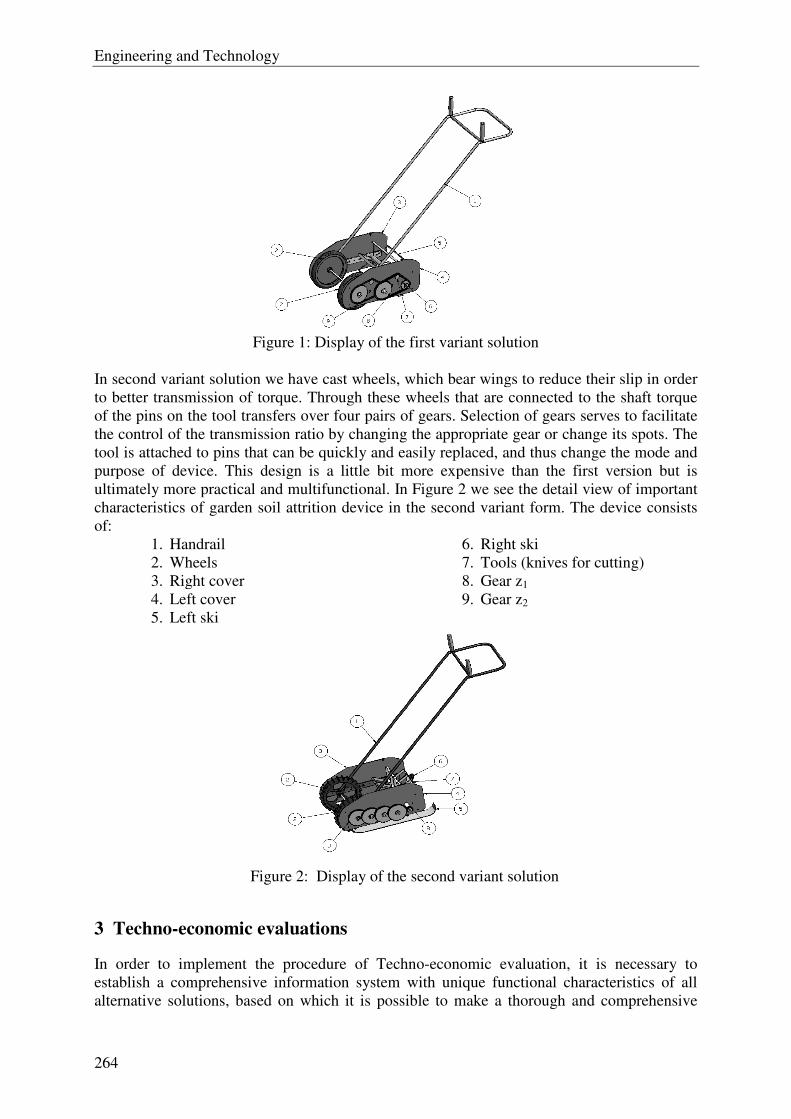
Engineering and Technology
264
Figure 1: Display of the first variant solution
In second variant solution we have cast wheels, which bear wings to reduce their slip in order to better transmission of torque. Through these wheels that are connected to the shaft torque of the pins on the tool transfers over four pairs of gears. Selection of gears serves to facilitate the control of the transmission ratio by changing the appropriate gear or change its spots. The tool is attached to pins that can be quickly and easily replaced, and thus change the mode and purpose of device. This design is a little bit more expensive than the first version but is ultimately more practical and multifunctional. In Figure 2 we see the detail view of important characteristics of garden soil attrition device in the second variant form. The device consists of:
1. Handrail 2. Wheels 3. Right cover 4. Left cover 5. Left ski
6. Right ski 7. Tools (knives for cutting) 8. Gear z1 9. Gear z2
Figure 2: Display of the second variant solution
3 Techno-economic evaluations
In order to implement the procedure of Techno-economic evaluation, it is necessary to establish a comprehensive information system with unique functional characteristics of all alternative solutions, based on which it is possible to make a thorough and comprehensive
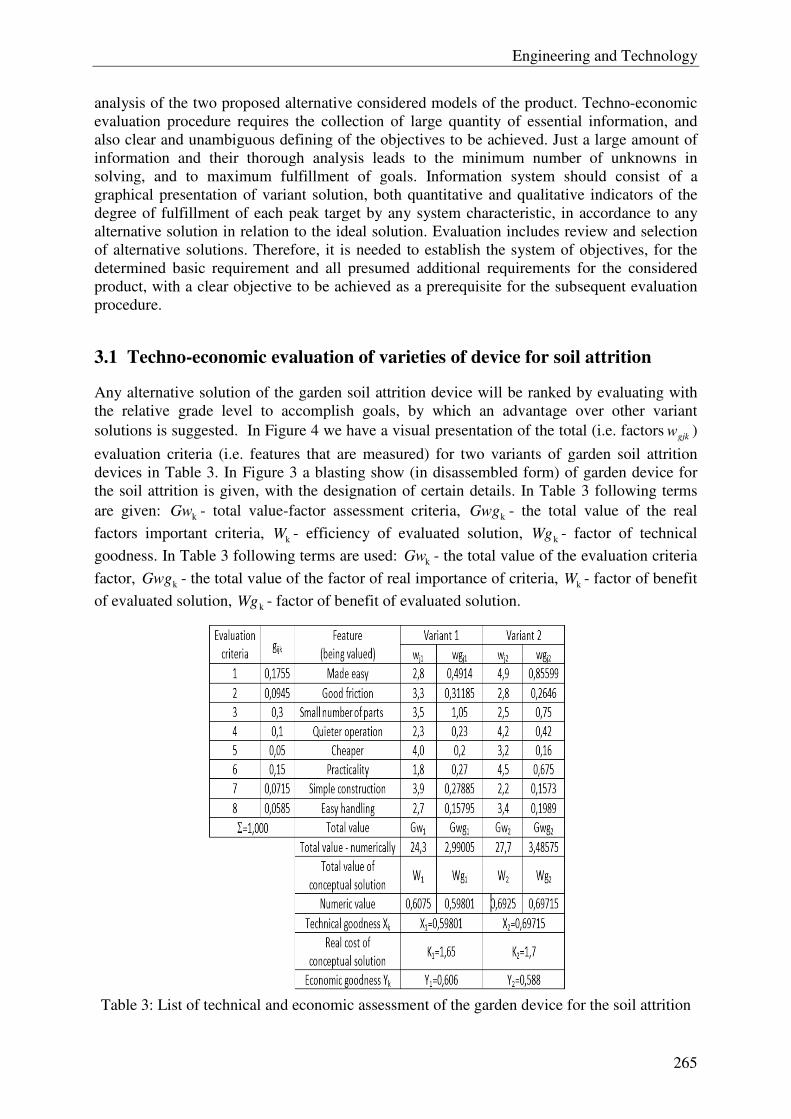
Engineering and Technology
265
analysis of the two proposed alternative considered models of the product. Techno-economic evaluation procedure requires the collection of large quantity of essential information, and also clear and unambiguous defining of the objectives to be achieved. Just a large amount of information and their thorough analysis leads to the minimum number of unknowns in solving, and to maximum fulfillment of goals. Information system should consist of a graphical presentation of variant solution, both quantitative and qualitative indicators of the degree of fulfillment of each peak target by any system characteristic, in accordance to any alternative solution in relation to the ideal solution. Evaluation includes review and selection of alternative solutions. Therefore, it is needed to establish the system of objectives, for the determined basic requirement and all presumed additional requirements for the considered product, with a clear objective to be achieved as a prerequisite for the subsequent evaluation procedure.
3.1 Techno-economic evaluation of varieties of device for soil attrition
Any alternative solution of the garden soil attrition device will be ranked by evaluating with the relative grade level to accomplish goals, by which an advantage over other variant solutions is suggested. In Figure 4 we have a visual presentation of the total (i.e. factors gjkw )
evaluation criteria (i.e. features that are measured) for two variants of garden soil attrition devices in Table 3. In Figure 3 a blasting show (in disassembled form) of garden device for the soil attrition is given, with the designation of certain details. In Table 3 following terms are given: kGw - total value-factor assessment criteria, kGwg - the total value of the real
factors important criteria, kW - efficiency of evaluated solution, kWg - factor of technical
goodness. In Table 3 following terms are used: kGw - the total value of the evaluation criteria
factor, kGwg - the total value of the factor of real importance of criteria, kW - factor of benefit
of evaluated solution, kWg - factor of benefit of evaluated solution.
Table 3: List of technical and economic assessment of the garden device for the soil attrition
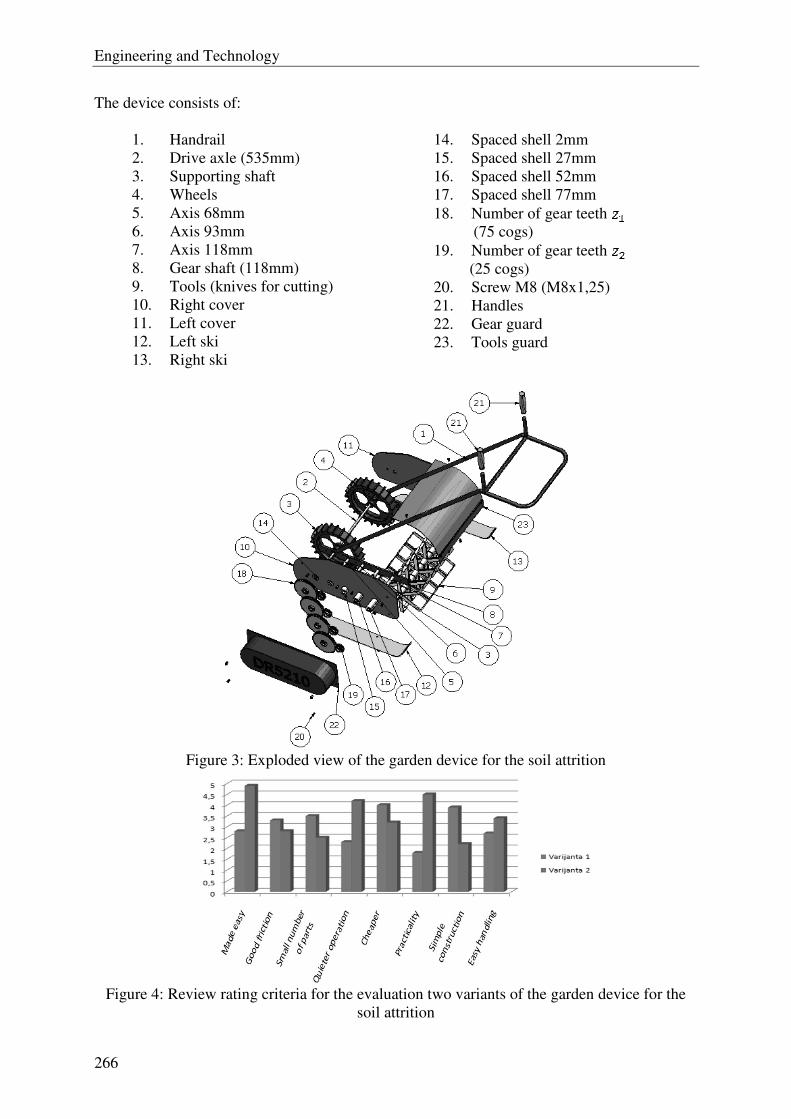
Engineering and Technology
266
The device consists of:
1. Handrail 2. Drive axle (535mm) 3. Supporting shaft 4. Wheels 5. Axis 68mm 6. Axis 93mm 7. Axis 118mm 8. Gear shaft (118mm) 9. Tools (knives for cutting) 10. Right cover 11. Left cover 12. Left ski 13. Right ski
14. Spaced shell 2mm 15. Spaced shell 27mm 16. Spaced shell 52mm 17. Spaced shell 77mm 18. Number of gear teeth (75 cogs) 19. Number of gear teeth (25 cogs) 20. Screw M8 (M8x1,25) 21. Handles 22. Gear guard 23. Tools guard
Figure 3: Exploded view of the garden device for the soil attrition
Figure 4: Review rating criteria for the evaluation two variants of the garden device for the
soil attrition
Engineering and Technology
267
4 Conclusion
Soil treatment for the purpose of food production is one of the most widespread activities since the formation of mankind. The aim of this paper is to present structural solution of mechanical device that facilitates processing of small land areas. Considering machines for treating of soil, their structural solutions, their price and way of function, it can be seen that most or almost all use some kind of motive power (IE engines or motors). According to goals set, two design solutions have been constructed, and by a computer model of the garden soil attrition device the geometric and functional presentation is made, under which it is possible to develop prototypes of these devices. Selection of the best variants of these two was carried out by a techno-economic evaluation of the goodness of the decision where it was shown that the technical goodness of the first version equals to 0,59801, and of other variant equals to 0,69715, while the economic bounty of the first variant equals to 0,606, and of other variant equals to 0,588. From this it is evident that the second alternative has better technical goodness, while economic goodness is a little bit better in the first version. Regarding the results of evaluating, structural solution of the second variant was selected for further elaboration. Specifically, this design solution has better feature functionality of the wheels, of the model of power and motion transmission, and beam tools. The benefit of this garden device for soil attrition is in the simple change of tools, and in connection with it, in the working regime change. Tool changing changes also tool function, e.g. it is possible with the same device, instead of tillage and fragmentation of the soil, to do grass-cutting.
6 References
[1] Miltenović V., Razvoj proizvoda, strategija, metode, primjena – Niš: Mašinski Fakultet, 2003.
[2] Mortensen, N.H.: Design Modelling in a Designer’s Workbench – Contribution to a
Design Grammar. Doctoral Thesis, Department of Control and Engineering Design, Technical University of Denmark, 1999.
[3] Hubka V., Eder W.E., Engineering Design - General Procedural Model of Engineering
Design, Edition HEURISTA, Zürich, 1992. [4] Herold Z.: Struktuiranje baze znanja u procesu konstruiranja; Disertacija, Zagreb
1997.[5] Andreasen, M.M., Hein, L., Integrated Product Development; IFS Publications Ltd; Springer – Verlag; London, 1987.
Author Data
Ivica Lacković: University of Applied Sciences in Slavonski Brod, Dr. Mile Budaka 1, HR-35000 Slavonski Brod, Croatia. E-mail: [email protected]
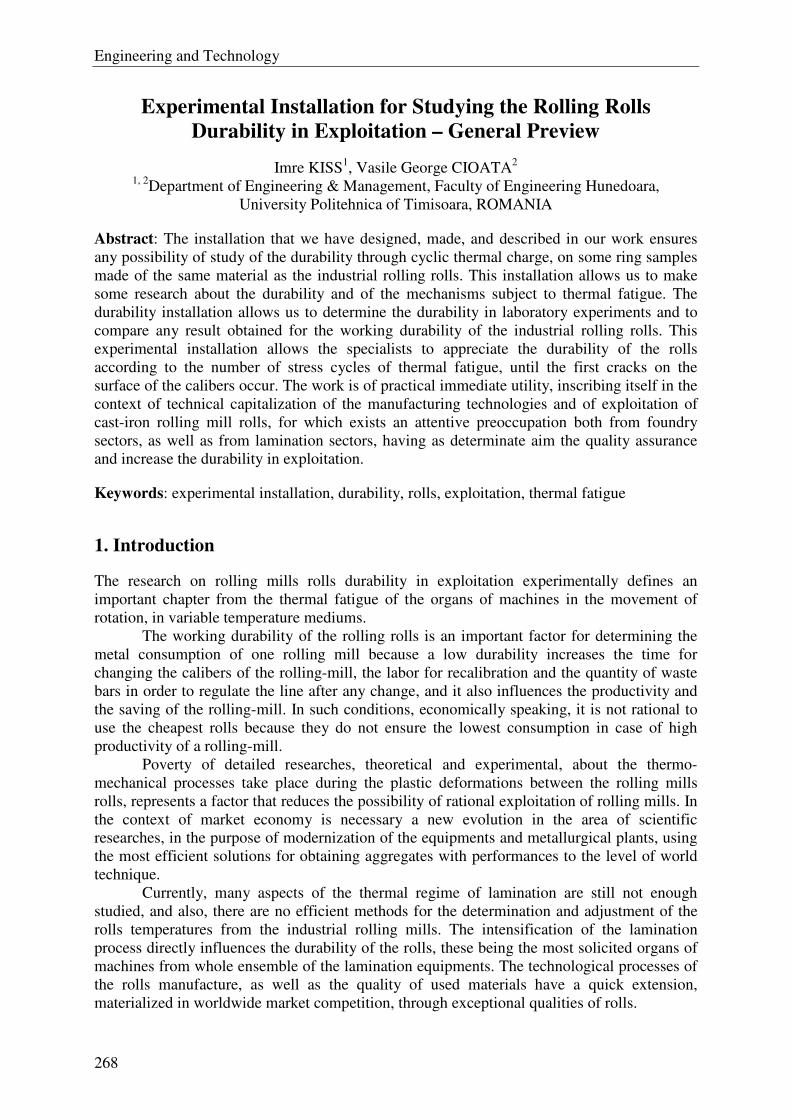
Engineering and Technology
268
Experimental Installation for Studying the Rolling Rolls
Durability in Exploitation – General Preview
Imre KISS1, Vasile George CIOATA
2
1, 2Department of Engineering & Management, Faculty of Engineering Hunedoara,
University Politehnica of Timisoara, ROMANIA
Abstract: The installation that we have designed, made, and described in our work ensures
any possibility of study of the durability through cyclic thermal charge, on some ring samples
made of the same material as the industrial rolling rolls. This installation allows us to make
some research about the durability and of the mechanisms subject to thermal fatigue. The
durability installation allows us to determine the durability in laboratory experiments and to
compare any result obtained for the working durability of the industrial rolling rolls. This
experimental installation allows the specialists to appreciate the durability of the rolls
according to the number of stress cycles of thermal fatigue, until the first cracks on the
surface of the calibers occur. The work is of practical immediate utility, inscribing itself in the
context of technical capitalization of the manufacturing technologies and of exploitation of
cast-iron rolling mill rolls, for which exists an attentive preoccupation both from foundry
sectors, as well as from lamination sectors, having as determinate aim the quality assurance
and increase the durability in exploitation.
Keywords: experimental installation, durability, rolls, exploitation, thermal fatigue
1. Introduction
The research on rolling mills rolls durability in exploitation experimentally defines an
important chapter from the thermal fatigue of the organs of machines in the movement of
rotation, in variable temperature mediums.
The working durability of the rolling rolls is an important factor for determining the
metal consumption of one rolling mill because a low durability increases the time for
changing the calibers of the rolling-mill, the labor for recalibration and the quantity of waste
bars in order to regulate the line after any change, and it also influences the productivity and
the saving of the rolling-mill. In such conditions, economically speaking, it is not rational to
use the cheapest rolls because they do not ensure the lowest consumption in case of high
productivity of a rolling-mill.
Poverty of detailed researches, theoretical and experimental, about the thermo-
mechanical processes take place during the plastic deformations between the rolling mills
rolls, represents a factor that reduces the possibility of rational exploitation of rolling mills. In
the context of market economy is necessary a new evolution in the area of scientific
researches, in the purpose of modernization of the equipments and metallurgical plants, using
the most efficient solutions for obtaining aggregates with performances to the level of world
technique.
Currently, many aspects of the thermal regime of lamination are still not enough
studied, and also, there are no efficient methods for the determination and adjustment of the
rolls temperatures from the industrial rolling mills. The intensification of the lamination
process directly influences the durability of the rolls, these being the most solicited organs of
machines from whole ensemble of the lamination equipments. The technological processes of
the rolls manufacture, as well as the quality of used materials have a quick extension,
materialized in worldwide market competition, through exceptional qualities of rolls.
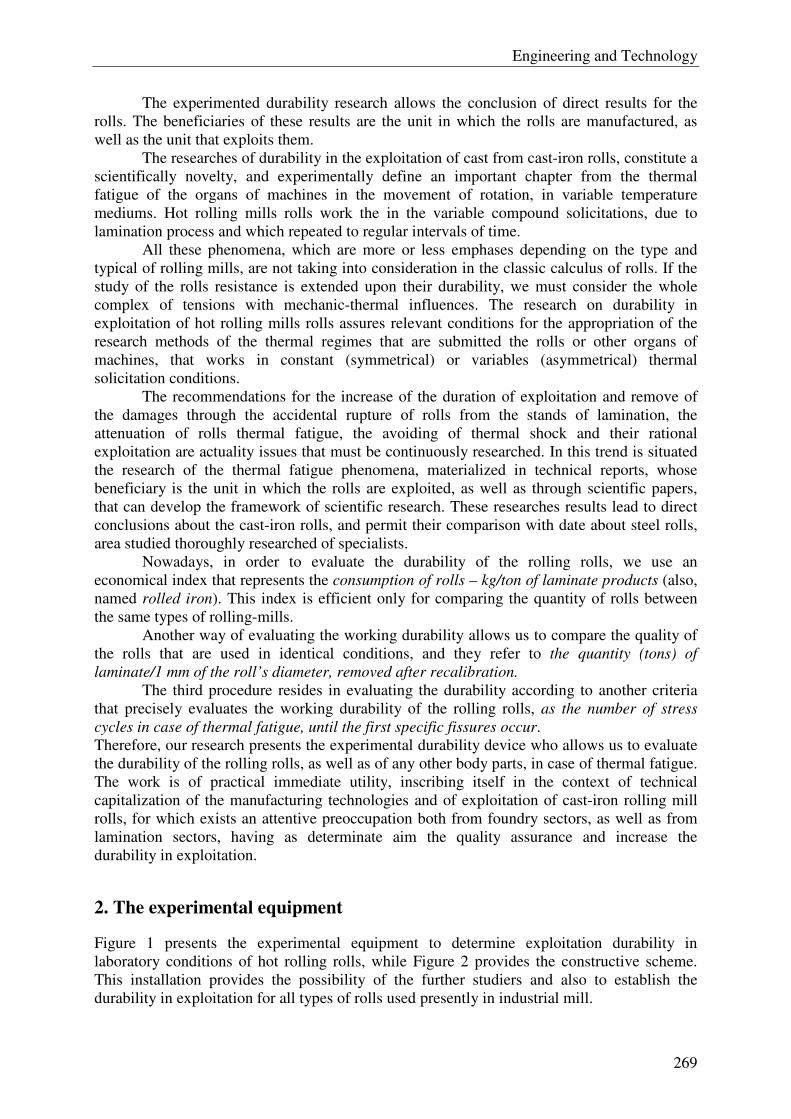
Engineering and Technology
269
The experimented durability research allows the conclusion of direct results for the
rolls. The beneficiaries of these results are the unit in which the rolls are manufactured, as
well as the unit that exploits them.
The researches of durability in the exploitation of cast from cast-iron rolls, constitute a
scientifically novelty, and experimentally define an important chapter from the thermal
fatigue of the organs of machines in the movement of rotation, in variable temperature
mediums. Hot rolling mills rolls work the in the variable compound solicitations, due to
lamination process and which repeated to regular intervals of time.
All these phenomena, which are more or less emphases depending on the type and
typical of rolling mills, are not taking into consideration in the classic calculus of rolls. If the
study of the rolls resistance is extended upon their durability, we must consider the whole
complex of tensions with mechanic-thermal influences. The research on durability in
exploitation of hot rolling mills rolls assures relevant conditions for the appropriation of the
research methods of the thermal regimes that are submitted the rolls or other organs of
machines, that works in constant (symmetrical) or variables (asymmetrical) thermal
solicitation conditions.
The recommendations for the increase of the duration of exploitation and remove of
the damages through the accidental rupture of rolls from the stands of lamination, the
attenuation of rolls thermal fatigue, the avoiding of thermal shock and their rational
exploitation are actuality issues that must be continuously researched. In this trend is situated
the research of the thermal fatigue phenomena, materialized in technical reports, whose
beneficiary is the unit in which the rolls are exploited, as well as through scientific papers,
that can develop the framework of scientific research. These researches results lead to direct
conclusions about the cast-iron rolls, and permit their comparison with date about steel rolls,
area studied thoroughly researched of specialists.
Nowadays, in order to evaluate the durability of the rolling rolls, we use an
economical index that represents the consumption of rolls – kg/ton of laminate products (also,
named rolled iron). This index is efficient only for comparing the quantity of rolls between
the same types of rolling-mills.
Another way of evaluating the working durability allows us to compare the quality of
the rolls that are used in identical conditions, and they refer to the quantity (tons) of
laminate/1 mm of the roll’s diameter, removed after recalibration.
The third procedure resides in evaluating the durability according to another criteria
that precisely evaluates the working durability of the rolling rolls, as the number of stress
cycles in case of thermal fatigue, until the first specific fissures occur.
Therefore, our research presents the experimental durability device who allows us to evaluate
the durability of the rolling rolls, as well as of any other body parts, in case of thermal fatigue.
The work is of practical immediate utility, inscribing itself in the context of technical
capitalization of the manufacturing technologies and of exploitation of cast-iron rolling mill
rolls, for which exists an attentive preoccupation both from foundry sectors, as well as from
lamination sectors, having as determinate aim the quality assurance and increase the
durability in exploitation.
2. The experimental equipment
Figure 1 presents the experimental equipment to determine exploitation durability in
laboratory conditions of hot rolling rolls, while Figure 2 provides the constructive scheme.
This installation provides the possibility of the further studiers and also to establish the
durability in exploitation for all types of rolls used presently in industrial mill.
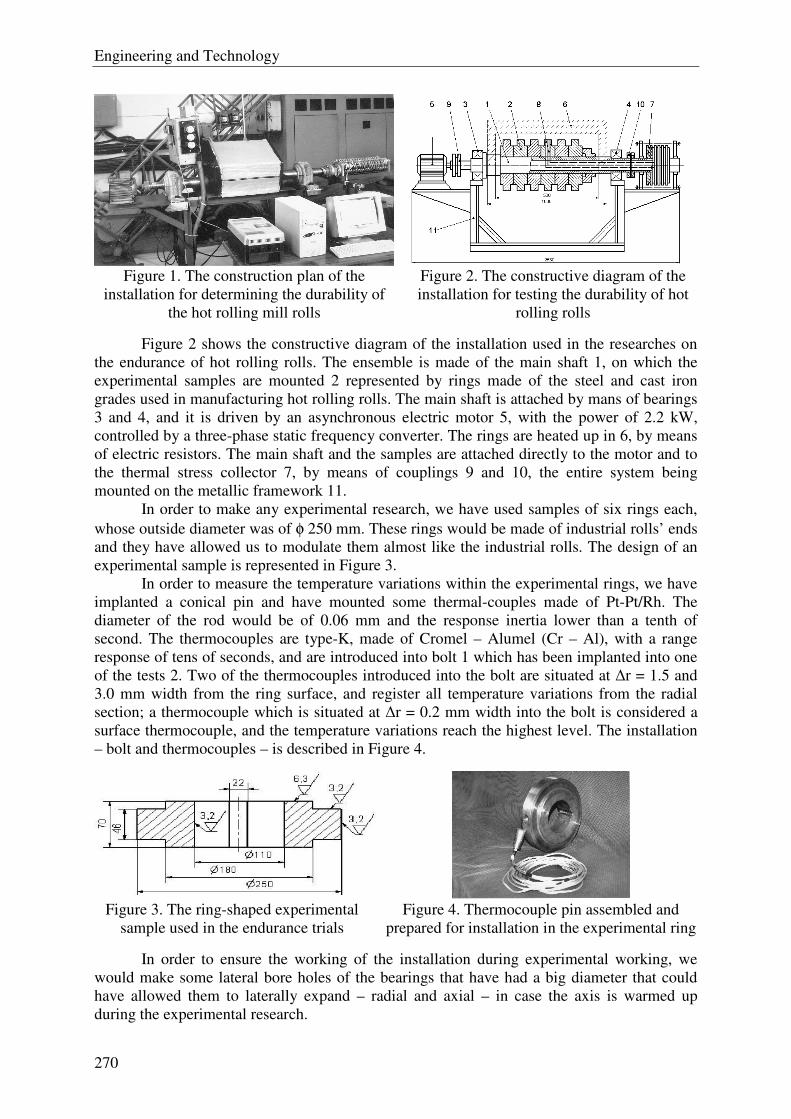
Engineering and Technology
270
Figure 1. The construction plan of the
installation for determining the durability of
the hot rolling mill rolls
Figure 2. The constructive diagram of the
installation for testing the durability of hot
rolling rolls
Figure 2 shows the constructive diagram of the installation used in the researches on
the endurance of hot rolling rolls. The ensemble is made of the main shaft 1, on which the
experimental samples are mounted 2 represented by rings made of the steel and cast iron
grades used in manufacturing hot rolling rolls. The main shaft is attached by mans of bearings
3 and 4, and it is driven by an asynchronous electric motor 5, with the power of 2.2 kW,
controlled by a three-phase static frequency converter. The rings are heated up in 6, by means
of electric resistors. The main shaft and the samples are attached directly to the motor and to
the thermal stress collector 7, by means of couplings 9 and 10, the entire system being
mounted on the metallic framework 11.
In order to make any experimental research, we have used samples of six rings each,
whose outside diameter was of φ 250 mm. These rings would be made of industrial rolls’ ends
and they have allowed us to modulate them almost like the industrial rolls. The design of an
experimental sample is represented in Figure 3.
In order to measure the temperature variations within the experimental rings, we have
implanted a conical pin and have mounted some thermal-couples made of Pt-Pt/Rh. The
diameter of the rod would be of 0.06 mm and the response inertia lower than a tenth of
second. The thermocouples are type-K, made of Cromel – Alumel (Cr – Al), with a range
response of tens of seconds, and are introduced into bolt 1 which has been implanted into one
of the tests 2. Two of the thermocouples introduced into the bolt are situated at ∆r = 1.5 and
3.0 mm width from the ring surface, and register all temperature variations from the radial
section; a thermocouple which is situated at ∆r = 0.2 mm width into the bolt is considered a
surface thermocouple, and the temperature variations reach the highest level. The installation
– bolt and thermocouples – is described in Figure 4.
Figure 3. The ring-shaped experimental
sample used in the endurance trials
Figure 4. Thermocouple pin assembled and
prepared for installation in the experimental ring
In order to ensure the working of the installation during experimental working, we
would make some lateral bore holes of the bearings that have had a big diameter that could
have allowed them to laterally expand – radial and axial – in case the axis is warmed up
during the experimental research.
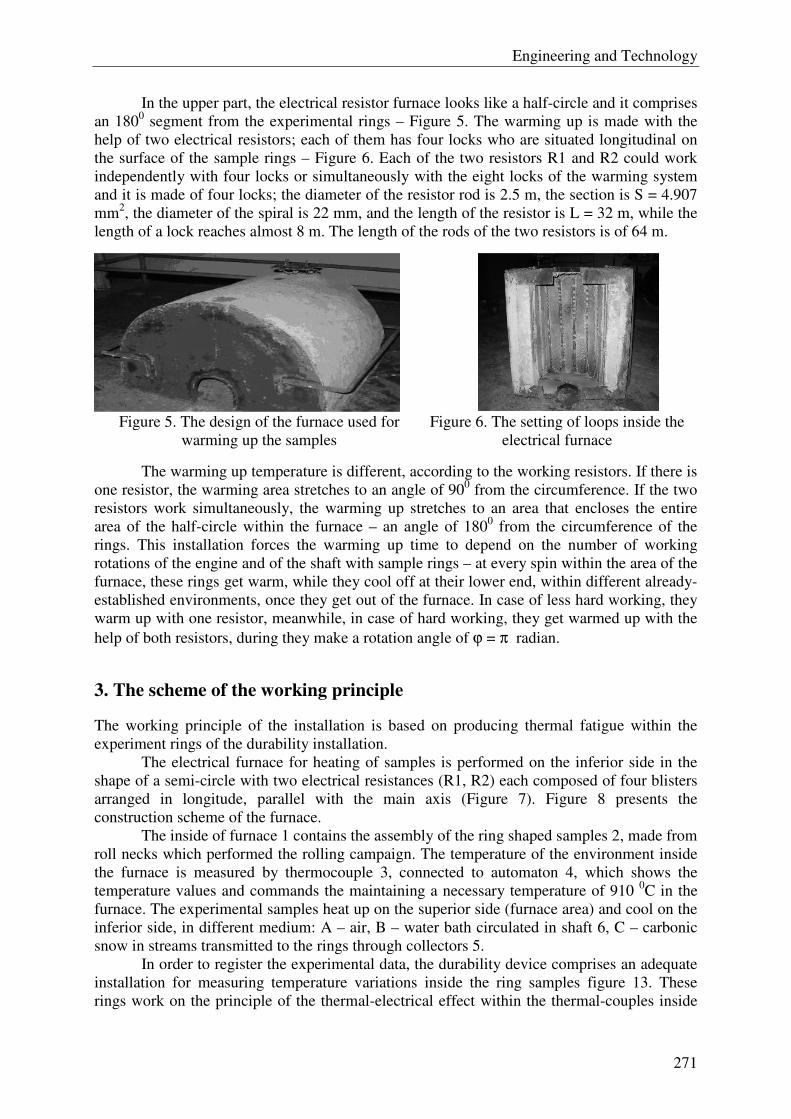
Engineering and Technology
271
In the upper part, the electrical resistor furnace looks like a half-circle and it comprises
an 1800 segment from the experimental rings – Figure 5. The warming up is made with the
help of two electrical resistors; each of them has four locks who are situated longitudinal on
the surface of the sample rings – Figure 6. Each of the two resistors R1 and R2 could work
independently with four locks or simultaneously with the eight locks of the warming system
and it is made of four locks; the diameter of the resistor rod is 2.5 m, the section is S = 4.907
mm2, the diameter of the spiral is 22 mm, and the length of the resistor is L = 32 m, while the
length of a lock reaches almost 8 m. The length of the rods of the two resistors is of 64 m.
Figure 5. The design of the furnace used for
warming up the samples
Figure 6. The setting of loops inside the
electrical furnace
The warming up temperature is different, according to the working resistors. If there is
one resistor, the warming area stretches to an angle of 900 from the circumference. If the two
resistors work simultaneously, the warming up stretches to an area that encloses the entire
area of the half-circle within the furnace – an angle of 1800 from the circumference of the
rings. This installation forces the warming up time to depend on the number of working
rotations of the engine and of the shaft with sample rings – at every spin within the area of the
furnace, these rings get warm, while they cool off at their lower end, within different already-
established environments, once they get out of the furnace. In case of less hard working, they
warm up with one resistor, meanwhile, in case of hard working, they get warmed up with the
help of both resistors, during they make a rotation angle of ϕ = π radian.
3. The scheme of the working principle
The working principle of the installation is based on producing thermal fatigue within the
experiment rings of the durability installation.
The electrical furnace for heating of samples is performed on the inferior side in the
shape of a semi-circle with two electrical resistances (R1, R2) each composed of four blisters
arranged in longitude, parallel with the main axis (Figure 7). Figure 8 presents the
construction scheme of the furnace.
The inside of furnace 1 contains the assembly of the ring shaped samples 2, made from
roll necks which performed the rolling campaign. The temperature of the environment inside
the furnace is measured by thermocouple 3, connected to automaton 4, which shows the
temperature values and commands the maintaining a necessary temperature of 910 0C in the
furnace. The experimental samples heat up on the superior side (furnace area) and cool on the
inferior side, in different medium: A – air, B – water bath circulated in shaft 6, C – carbonic
snow in streams transmitted to the rings through collectors 5.
In order to register the experimental data, the durability device comprises an adequate
installation for measuring temperature variations inside the ring samples figure 13. These
rings work on the principle of the thermal-electrical effect within the thermal-couples inside
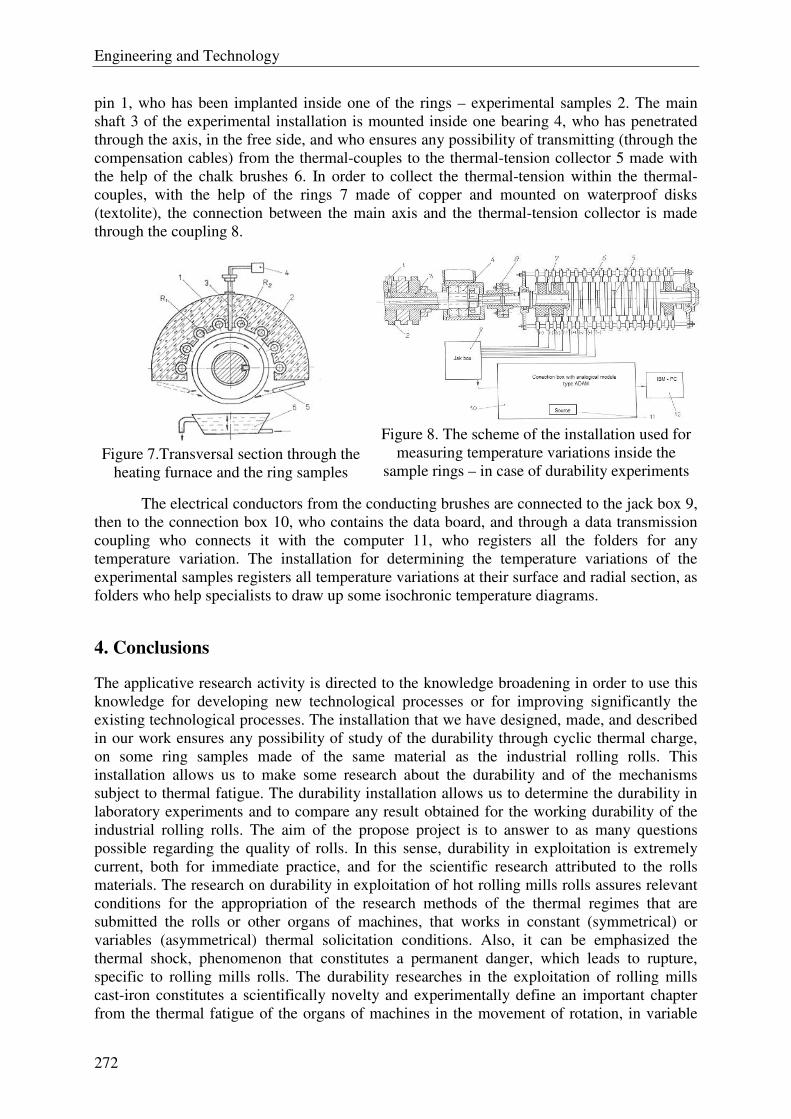
Engineering and Technology
272
pin 1, who has been implanted inside one of the rings – experimental samples 2. The main
shaft 3 of the experimental installation is mounted inside one bearing 4, who has penetrated
through the axis, in the free side, and who ensures any possibility of transmitting (through the
compensation cables) from the thermal-couples to the thermal-tension collector 5 made with
the help of the chalk brushes 6. In order to collect the thermal-tension within the thermal-
couples, with the help of the rings 7 made of copper and mounted on waterproof disks
(textolite), the connection between the main axis and the thermal-tension collector is made
through the coupling 8.
Figure 7.Transversal section through the
heating furnace and the ring samples
Figure 8. The scheme of the installation used for
measuring temperature variations inside the
sample rings – in case of durability experiments
The electrical conductors from the conducting brushes are connected to the jack box 9,
then to the connection box 10, who contains the data board, and through a data transmission
coupling who connects it with the computer 11, who registers all the folders for any
temperature variation. The installation for determining the temperature variations of the
experimental samples registers all temperature variations at their surface and radial section, as
folders who help specialists to draw up some isochronic temperature diagrams.
4. Conclusions
The applicative research activity is directed to the knowledge broadening in order to use this
knowledge for developing new technological processes or for improving significantly the
existing technological processes. The installation that we have designed, made, and described
in our work ensures any possibility of study of the durability through cyclic thermal charge,
on some ring samples made of the same material as the industrial rolling rolls. This
installation allows us to make some research about the durability and of the mechanisms
subject to thermal fatigue. The durability installation allows us to determine the durability in
laboratory experiments and to compare any result obtained for the working durability of the
industrial rolling rolls. The aim of the propose project is to answer to as many questions
possible regarding the quality of rolls. In this sense, durability in exploitation is extremely
current, both for immediate practice, and for the scientific research attributed to the rolls
materials. The research on durability in exploitation of hot rolling mills rolls assures relevant
conditions for the appropriation of the research methods of the thermal regimes that are
submitted the rolls or other organs of machines, that works in constant (symmetrical) or
variables (asymmetrical) thermal solicitation conditions. Also, it can be emphasized the
thermal shock, phenomenon that constitutes a permanent danger, which leads to rupture,
specific to rolling mills rolls. The durability researches in the exploitation of rolling mills
cast-iron constitutes a scientifically novelty and experimentally define an important chapter
from the thermal fatigue of the organs of machines in the movement of rotation, in variable
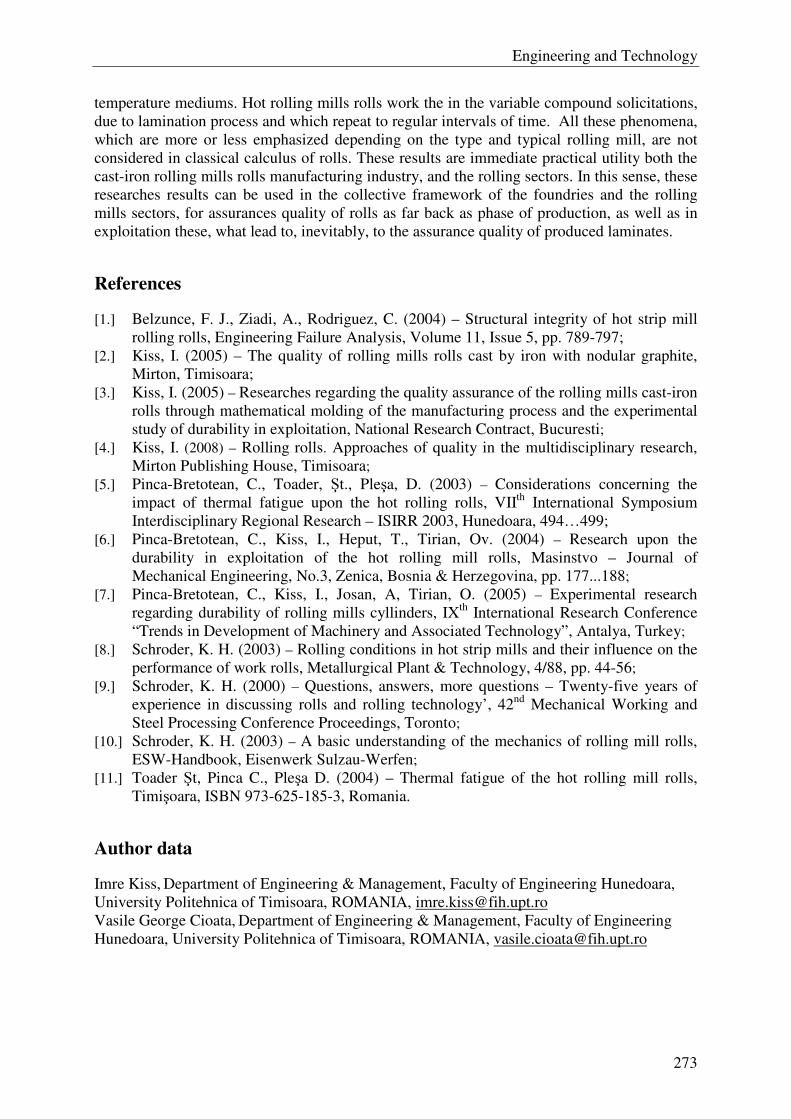
Engineering and Technology
273
temperature mediums. Hot rolling mills rolls work the in the variable compound solicitations,
due to lamination process and which repeat to regular intervals of time. All these phenomena,
which are more or less emphasized depending on the type and typical rolling mill, are not
considered in classical calculus of rolls. These results are immediate practical utility both the
cast-iron rolling mills rolls manufacturing industry, and the rolling sectors. In this sense, these
researches results can be used in the collective framework of the foundries and the rolling
mills sectors, for assurances quality of rolls as far back as phase of production, as well as in
exploitation these, what lead to, inevitably, to the assurance quality of produced laminates.
References
[1.] Belzunce, F. J., Ziadi, A., Rodriguez, C. (2004) – Structural integrity of hot strip mill
rolling rolls, Engineering Failure Analysis, Volume 11, Issue 5, pp. 789-797;
[2.] Kiss, I. (2005) – The quality of rolling mills rolls cast by iron with nodular graphite,
Mirton, Timisoara;
[3.] Kiss, I. (2005) – Researches regarding the quality assurance of the rolling mills cast-iron
rolls through mathematical molding of the manufacturing process and the experimental
study of durability in exploitation, National Research Contract, Bucuresti;
[4.] Kiss, I. (2008) – Rolling rolls. Approaches of quality in the multidisciplinary research,
Mirton Publishing House, Timisoara;
[5.] Pinca-Bretotean, C., Toader, Şt., Pleşa, D. (2003) – Considerations concerning the
impact of thermal fatigue upon the hot rolling rolls, VIIth
International Symposium
Interdisciplinary Regional Research – ISIRR 2003, Hunedoara, 494…499;
[6.] Pinca-Bretotean, C., Kiss, I., Heput, T., Tirian, Ov. (2004) – Research upon the
durability in exploitation of the hot rolling mill rolls, Masinstvo – Journal of
Mechanical Engineering, No.3, Zenica, Bosnia & Herzegovina, pp. 177...188;
[7.] Pinca-Bretotean, C., Kiss, I., Josan, A, Tirian, O. (2005) – Experimental research
regarding durability of rolling mills cyllinders, IXth
International Research Conference
“Trends in Development of Machinery and Associated Technology”, Antalya, Turkey;
[8.] Schroder, K. H. (2003) – Rolling conditions in hot strip mills and their influence on the
performance of work rolls, Metallurgical Plant & Technology, 4/88, pp. 44-56;
[9.] Schroder, K. H. (2000) – Questions, answers, more questions – Twenty-five years of
experience in discussing rolls and rolling technology’, 42nd
Mechanical Working and
Steel Processing Conference Proceedings, Toronto;
[10.] Schroder, K. H. (2003) – A basic understanding of the mechanics of rolling mill rolls,
ESW-Handbook, Eisenwerk Sulzau-Werfen;
[11.] Toader Şt, Pinca C., Pleşa D. (2004) – Thermal fatigue of the hot rolling mill rolls,
Timişoara, ISBN 973-625-185-3, Romania.
Author data
Imre Kiss, Department of Engineering & Management, Faculty of Engineering Hunedoara,
University Politehnica of Timisoara, ROMANIA, [email protected]
Vasile George Cioata, Department of Engineering & Management, Faculty of Engineering
Hunedoara, University Politehnica of Timisoara, ROMANIA, [email protected]
Engineering and Technology
274
Graphical Addenda in the Cast Iron Rolls Production
Imre KISS1, Vasile ALEXA
2
1, 2 Department of Engineering & Management, Faculty of Engineering Hunedoara,
University Politehnica of Timisoara, ROMANIA
Abstract: The technical conditions, which are imposed to the cast iron rolls in the exploitation
period, are very different and often contradictory. The obtaining of various physical and mechanical
properties in the different points of the same foundry product meets difficult technological problems in
the industrial condition. One of the parameters, which determine the structure of the irons destined for
rolls casting, is the chemical composition. If we not respect this composition, which guaranties the
exploitation properties of the each roll in the stand of rolling mill, it will lead to rejection. Alloying
elements have in principle the same influence on structure and properties. This paper suggest a
mathematical interpretation of the influence of the main alloy elements over the mechanical
characteristics (the hardness on the crust and on the necks of the rolls) of this nodular irons, resulting
the average values and average square aberration of the variables HB, and the main alloying elements
(Cr, Ni, Mo), the equations of the hyper surface in the four dimensional space. For the statistical and
mathematical analysis, there were used 23 industrial cases. The resulted surfaces, belonging to the
three-dimensional space, can be represented and, therefore, interpreted by technologists. Knowing
these level curves allows the correlation of the values of the twos independent variables so that the
hardness can be obtained in between the requested limits. The paper presents the results of some
researches regarding the chemical composition of the nodular irons destined for casting half-hard rolls.
It is presented, in graphical form, used the Matlab area, the influence of the main alloying elements
upon the hardness, and measured on the necks and the core of the rolls, respectively on the working
surface (body) of these very important rolling mill components.
Keywords: iron rolls, alloying elements, hardness, modelling, graphical addenda
1. Introduction
The rolls must present high hardness at the crust of rolls and lower hardness in the core and
on the necks, adequate with the mechanical resistance and in the high work temperatures. If in
the crust the hardness is assured by the quantities of cementite from the structure of the irons,
the core of the rolls must contain graphite to assure these properties. One of the parameters,
which are determined the structure of the irons destined for rolls casting, is the chemical
composition. If we do not respect this composition, which are guarantied the exploitation
properties of the each roll in the stand of rolling mill, leads to rejection of this. All FNS type
rolls are alloyed especially with chrome, nickel and molybdenum, in different percentages.
The irons destined to these cast rolls belong to the class of low-alloyed irons, with reduced
content of these elements. The technological instructions firmly state the elements required to
rise the quality of rolls. In this case, the contents of these elements stand between large limits.
Also, the contents of these alloying elements can be reduced due to the strong effect of the
magnesium from the nodulising agent, upon the structure and the form of the graphite.
This study analyses iron rolls cast in the simplex procedure, in combined forms (iron
chill, for the crust and moulding sand, for the necks of the rolls). The research included rolls
from the half-hard class, with hardness, between 33…59 Shore units (219…347 Brinell units)
for the 0 and 1 hardness class, measured on the crust, respectively 59…75 Shore units
(347…550 Brinell units), for the class 2 of hardness. This study is required because of the
numerous defects, which cause rejection, since the phase of elaboration of these irons,
destined to cast rolls. According to the previous presentation, it results that one of the most

Engineering and Technology
275
important reject categories is due to the inadequate hardness of the rolls. The research
includes half-hard cast rolls, from nodular graphite irons (type FNS), hardness class 1 and 2,
with the half-hard crust of 40…150 mm depth. All these types of rolls have high strength,
excellent thermal properties and resistance to accidents and there is very little hardness drops
in the surface work layer.
2. Interpretation and simulation
Therefore, we suggest a mathematical interpretation of the influence of the main alloy
elements over the mechanical characteristics (the hardness on the crust of the rolls) of this
nodular irons, resulting the average values and average square aberration of the variables HB,
and the main alloying elements (Cr, Ni, Mo), the equations of the hyper surface in the four
dimensional space. For the statistical and mathematical analysis, there were used 23 industrial
cases. The variables variation limits are: Ni = 1.49…2.24; Cr = 0.36…0.72; Mo = 0.18…0.28,
and the hardness variation limits are HB(necks) = 219…276 and HB(body) = 282…352.
Therefore, the graphical representation limits, for this molding case, are:
lim Niinf = 1.61; lim Nisup = 2.11;
lim Crinf = 0.40; lim Crsup = 0.67;
lim Moinf = 0.19; lim Mosup = 0.27.
The middle values for the three variables (Ni, Cr, Mo) and the hardness (HB),
necessary for the calculation of the optimal form of molding are:
Nimed = 1.86, Crmed = 0.52, Momed = 0.23 respectively
HB(necks)med = 251.52, HB(body)med = 308.32
Next, there are shown the results of the multidimensional processing of experimental
data. For that purpose, we searched for a method of molding the dependent variables u
depending on the independent variables x, y, z:
u = c1·x2
+ c2·y2
+ c3·z2
+ c4·x·y + c5·y·z + c6·z·x + c7·x + c8·y + c9·z + c10 (1)
The optimal molding’s form is given by the equations:
HB(body) = – 69.2668 Ni2 – 843.9321 Cr
2 – 13082.6971 Mo
2 + 258.4342 Ni⋅Cr – 3258.4415 Cr⋅Mo
+ 757.2487 Mo⋅Ni – 45.2572 Ni + 1278.2053 Cr + 6349.4428 Mo – 739.6223 (2)
HB(necks) = – 77.1259 Ni2 – 678.1307 Cr
2 – 4915.8057 Mo
2 + 384.4321 Ni⋅Cr – 1990.8226 Cr⋅Mo
+ 646.2006 Mo⋅Ni – 39.5771 Ni + 471.3705 Cr + 2131.6892 Mo – 101.7176 (3)
where the correlation coefficients are:
rf HB(body) = f(Ni, Cr, Mo) = 0.77; and rf HB(necks) = f(Ni, Cr, Mo) = 0.76
and the aberrations from the regression surface are:
sf HB(body) = f(Ni, Cr, Mo) = 13.96; and sf HB(necks) = f(Ni, Cr, Mo) = 8.73
3. Presentation the obtained results and the graphical addenda
In the technological field, the behaviour of these hyper surfaces in the vicinity of the saddle
point, or of the point where three independent variables take their average value, can be
studied only tabular, which means that the independent variables are attributed values on
spheres concentric to the studied point. Because these surfaces cannot be represented in the
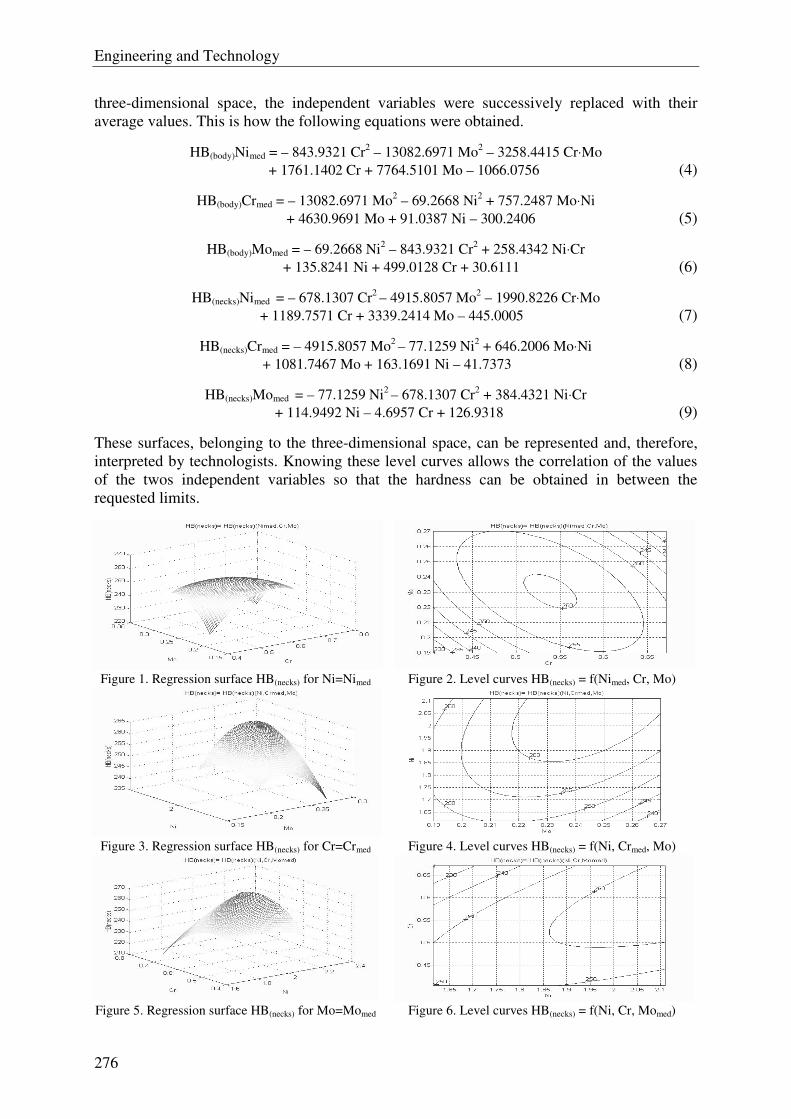
Engineering and Technology
276
three-dimensional space, the independent variables were successively replaced with their
average values. This is how the following equations were obtained.
HB(body)Nimed = – 843.9321 Cr2 – 13082.6971 Mo
2 – 3258.4415 Cr⋅Mo
+ 1761.1402 Cr + 7764.5101 Mo – 1066.0756 (4)
HB(body)Crmed = – 13082.6971 Mo2 – 69.2668 Ni
2 + 757.2487 Mo⋅Ni
+ 4630.9691 Mo + 91.0387 Ni – 300.2406 (5)
HB(body)Momed = – 69.2668 Ni2 – 843.9321 Cr
2 + 258.4342 Ni⋅Cr
+ 135.8241 Ni + 499.0128 Cr + 30.6111 (6)
HB(necks)Nimed = – 678.1307 Cr2 – 4915.8057 Mo
2 – 1990.8226 Cr⋅Mo
+ 1189.7571 Cr + 3339.2414 Mo – 445.0005 (7)
HB(necks)Crmed = – 4915.8057 Mo2 – 77.1259 Ni
2 + 646.2006 Mo⋅Ni
+ 1081.7467 Mo + 163.1691 Ni – 41.7373 (8)
HB(necks)Momed = – 77.1259 Ni2 – 678.1307 Cr
2 + 384.4321 Ni⋅Cr
+ 114.9492 Ni – 4.6957 Cr + 126.9318 (9)
These surfaces, belonging to the three-dimensional space, can be represented and, therefore,
interpreted by technologists. Knowing these level curves allows the correlation of the values
of the twos independent variables so that the hardness can be obtained in between the
requested limits.
Figure 1. Regression surface HB(necks) for Ni=Nimed Figure 2. Level curves HB(necks) = f(Nimed, Cr, Mo)
Figure 3. Regression surface HB(necks) for Cr=Crmed Figure 4. Level curves HB(necks) = f(Ni, Crmed, Mo)
Figure 5. Regression surface HB(necks) for Mo=Momed Figure 6. Level curves HB(necks) = f(Ni, Cr, Momed)
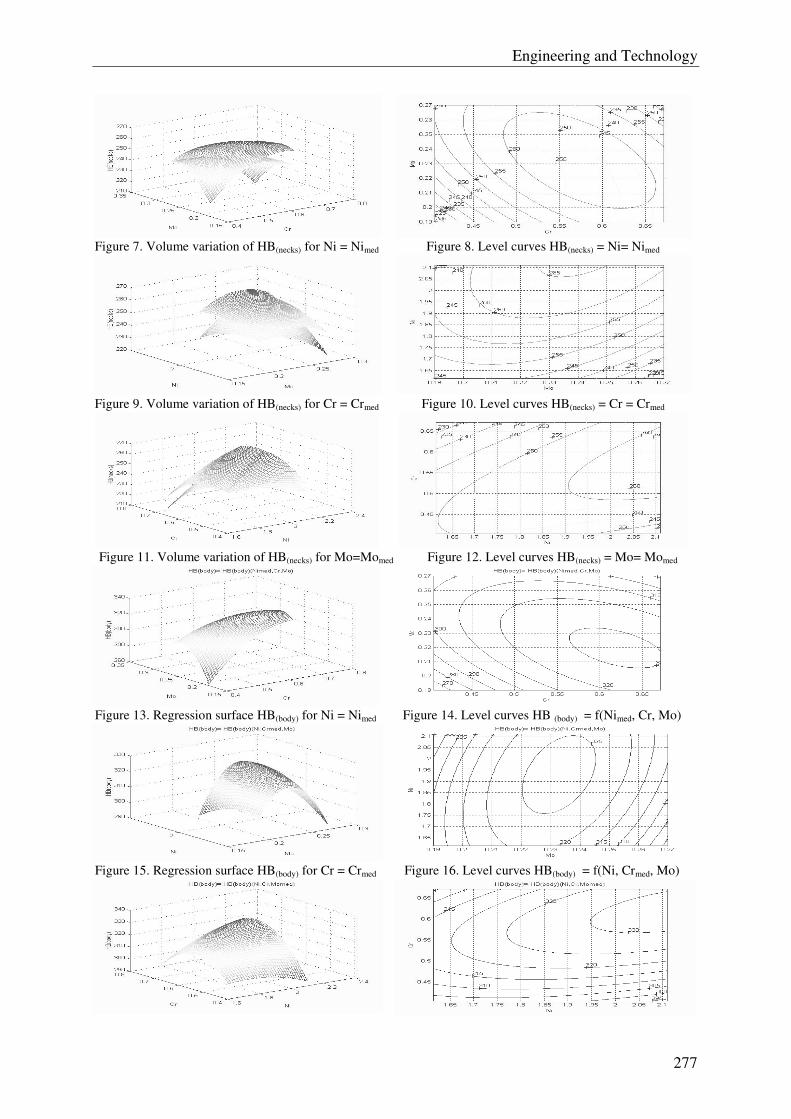
Engineering and Technology
277
Figure 7. Volume variation of HB(necks) for Ni = Nimed Figure 8. Level curves HB(necks) = Ni= Nimed
Figure 9. Volume variation of HB(necks) for Cr = Crmed Figure 10. Level curves HB(necks) = Cr = Crmed
Figure 11. Volume variation of HB(necks) for Mo=Momed Figure 12. Level curves HB(necks) = Mo= Momed
Figure 13. Regression surface HB(body) for Ni = Nimed Figure 14. Level curves HB (body) = f(Nimed, Cr, Mo)
Figure 15. Regression surface HB(body) for Cr = Crmed Figure 16. Level curves HB(body) = f(Ni, Crmed, Mo)
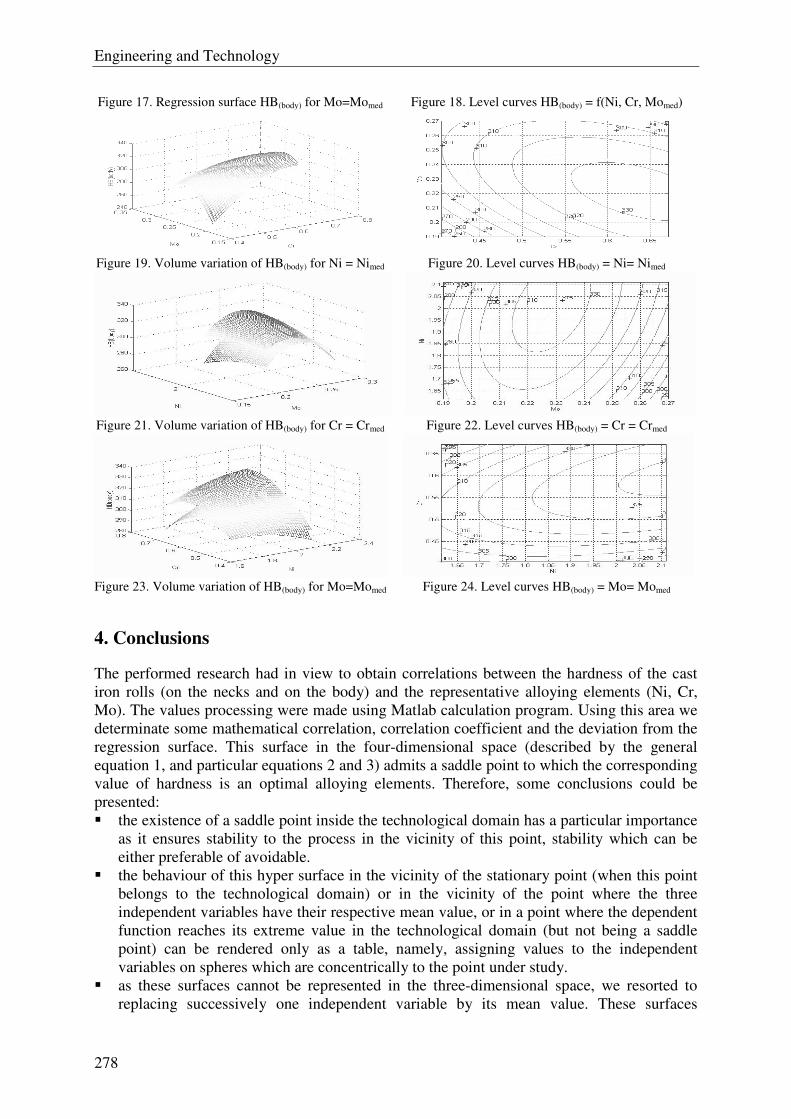
Engineering and Technology
278
Figure 17. Regression surface HB(body) for Mo=Momed Figure 18. Level curves HB(body) = f(Ni, Cr, Momed)
Figure 19. Volume variation of HB(body) for Ni = Nimed Figure 20. Level curves HB(body) = Ni= Nimed
Figure 21. Volume variation of HB(body) for Cr = Crmed Figure 22. Level curves HB(body) = Cr = Crmed
Figure 23. Volume variation of HB(body) for Mo=Momed Figure 24. Level curves HB(body) = Mo= Momed
4. Conclusions
The performed research had in view to obtain correlations between the hardness of the cast
iron rolls (on the necks and on the body) and the representative alloying elements (Ni, Cr,
Mo). The values processing were made using Matlab calculation program. Using this area we
determinate some mathematical correlation, correlation coefficient and the deviation from the
regression surface. This surface in the four-dimensional space (described by the general
equation 1, and particular equations 2 and 3) admits a saddle point to which the corresponding
value of hardness is an optimal alloying elements. Therefore, some conclusions could be
presented:
the existence of a saddle point inside the technological domain has a particular importance
as it ensures stability to the process in the vicinity of this point, stability which can be
either preferable of avoidable.
the behaviour of this hyper surface in the vicinity of the stationary point (when this point
belongs to the technological domain) or in the vicinity of the point where the three
independent variables have their respective mean value, or in a point where the dependent
function reaches its extreme value in the technological domain (but not being a saddle
point) can be rendered only as a table, namely, assigning values to the independent
variables on spheres which are concentrically to the point under study.
as these surfaces cannot be represented in the three-dimensional space, we resorted to
replacing successively one independent variable by its mean value. These surfaces
Engineering and Technology
279
(described by the equation 4…9), belonging to the three-dimensional space can be
reproduced and therefore interpreted by technological engineers (Figures 1, 3, 5,
respectively Figures 13, 15, 17). Knowing these level curves (Figures 2, 4, 6, respectively
Figures 14, 16, 18) allows the correlation of the values of the two independent variables
so that we can obtain the hardness within the required limits.
the Figures 7, 9, 11, respectively Figures 19, 21, 23 presented the volume variation of the
regression surfaces HB(necks) and HB(body) for one of the middle value of the variables Ni,
Cr, Mo.
in the Figures 8, 10, 12, respectively Figures 20, 22, 24, the level curves for the volume
variation of the regression surfaces HB(necks) and HB(body), for the Nimed, Crmed and Momed,
are presented in the graphical addenda;
the usage of the Matlab area, can also be extended to the study of influences other
chemical components (C, Si, Mn, S, P, Mg), and this influences upon the necks and the
body of the rolling mills;
References
[1] Maksay, St. – Special Mathematics, vol. I & II, Politehnica House, Timisoara, 2001.
[2] Taloi, F., Bratu, C., Florian, E., Berceanu, E. – The optimization of the metallurgical
process, Didactical and Pedagogical Publishing House, Bucuresti, 1983
[3] Kiss, I. – Rolling rolls. Approaches of quality in the multidisciplinary research, Mirton
Publishing House, Timisoara, 2008
[4] Kiss, I., Heput, T. – Mechanical properties of the cast iron rolls, assured by the chemical
composition, in: Scientific Bulletin of the University Politehnica of Timisoara,
Transactions on Mechanics, Tome 47, Fascicule 2, pp. 175…181, 2002
[5] Kiss, I., Heput, T. – The hardness of the cast iron rolls, assured by the alloy elements and
the modification treatment of the graphite nodularity, in: Scientific Bulletin of the
University Politehnica of Timişoara, Transactions on Mechanics, Tome 47, Fascicule 2,
pp. 169…174, 2002
[6] Kiss, I., Heput, T., Raţiu, S. – The hardness of the cast iron rolls, assured by the alloyed
elements and the modification treatment of the graphite nodularity, in: Masinstvo –
Journal of Mechanical Engineering, No.1, Zenica, Bosnia & Herzegovina, pp. 3…12,
2003
[7] Kiss, I. – The mechanical properties of the half-hard cast iron rolls assured by the basic
elements, in: Masinstvo – Journal of Mechanical Engineering, No.1, Zenica, Bosnia &
Herzegovina, pp. 5…16, 2004
[8] Kiss, I., Ratiu, S. – The basic chemical composition influences upon the nodular cast
iron rolls hardness, in: Annals of the Faculty of Engineering Hunedoara, 2003, Tom II,
Fascicola 2, pp. 137...144
[9] Kiss I., Cioată V.G., Alexa V. – The main alloyed elements influences upon the nodular
cast iron half-hard rolls hardness in: Annals of the Faculty of Engineering Hunedoara,
2003, Tom II, Fascicola 2, pp. 145...150
Authors data
Imre Kiss, Department of Engineering & Management, Faculty of Engineering Hunedoara,
University Politehnica of Timisoara, ROMANIA, [email protected]
Vasile Alexa, Department of Engineering & Management, Faculty of Engineering Hunedoara,
University Politehnica of Timisoara, ROMANIA, [email protected]
Engineering and Technology
280
CUTTING TEMPERATURES AND THE TOOL WEAR
János Kodácsy1, Viktor Molnár
2
1Department of Manufacturing Engineering/ Institute of Metal and Polymer Processing
Technology/Kecskemét College 2Department of Production Engineering/University of Miskolc
Összefoglalás: A Kecskeméti Főiskola GAMF Karán több éve foglalkozunk a forgácsoló
szerszámok felügyeletével, különösen a forgácsolási hőmérséklet és a szerszámkopás
kapcsolatával. A téma része kutatási programunknak, melynek eredményeit tartalmazza ez a
dolgozat.
Kulcsszavak: szerszámkopás, forgácsolási hőmérséklet, infrasugárzás, infrakamera, optikai
kábel.
Abstract: On the Department of Manufacturing Engineering of Kecskemét College, we have
been researching the monitoring of the cutting processes for several years. We investigate
especially the change of the temperature regarding the tool wear. The theme is the part of our
scientific research program. This article gives the results of this research.
Key words: tool wear, cutting temperature, infrared radiation, infrared camera, fibre-optic.
1. INTRODUCTION Regarding the monitoring systems and the high speed machining the investigation on
thermal phenomena of cutting processes is very important nowadays [1], [2].
There are cutting temperature measuring methods that use thermocouples and infrared
measuring systems. But measuring the cutting temperature by thermocouples is rather
complex. The infrared radiation is coming from the tool-chip interface and it can be relatively
easily detected without direct contact. The temperature which is in direct proportion with the
infrared radiation can be measured by fibre-optic thermometer [3] [4] or infrared camera [5].
2. TEMPERATURE MEASUREMENT BY FIBRE-OPTICS A special fibre-optical temperature measuring system has been developed on our
department (Figure 1).
The lapped end of the fibre is positioned near the heat source. As the fibre is not sensible
for mechanical and thermal effects and its diameter is small (0,3…1,0 mm) the protection is
not difficult, but in certain cases effective dirt protection has to be applied by using
compressed air.
From the fibre the radiation is transmitted to a sensible diode, and the analogue voltage
signals induced by the heat are transmitted to the computer through a digital voltmeter and
analogue-digital converter. The digital signals are evaluated by the computer (the evaluating
program is read from the hard disc unit), and the results are plotted on the display or printer.
The changes during the cutting process can be followed by the infrared measuring. The
fibre-optic is placed on the tool (acc. to Figure 2 a and b) as it could measure the temperature
of the interface of the leaving tool-chips. The tip of the fibre-optic is 12 mm far from the tool-
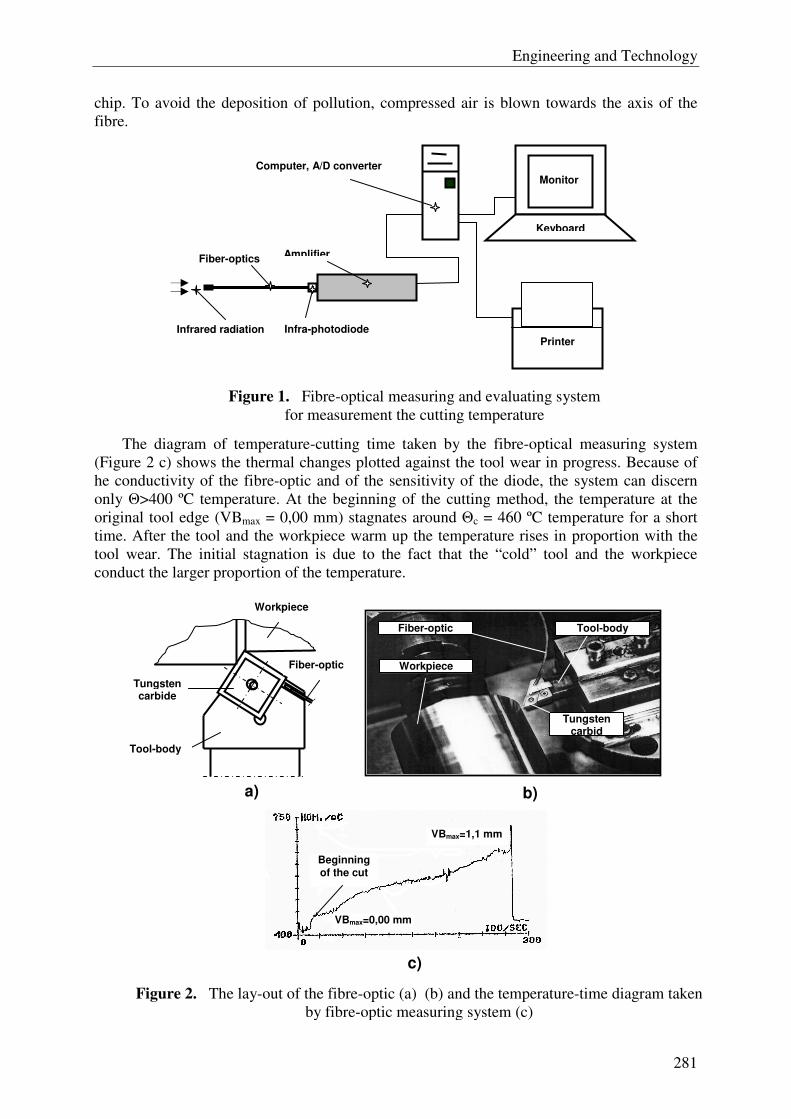
Engineering and Technology
281
chip. To avoid the deposition of pollution, compressed air is blown towards the axis of the
fibre.
The diagram of temperature-cutting time taken by the fibre-optical measuring system
(Figure 2 c) shows the thermal changes plotted against the tool wear in progress. Because of
he conductivity of the fibre-optic and of the sensitivity of the diode, the system can discern
only Θ>400 ºC temperature. At the beginning of the cutting method, the temperature at the
original tool edge (VBmax = 0,00 mm) stagnates around Θc = 460 ºC temperature for a short
time. After the tool and the workpiece warm up the temperature rises in proportion with the
tool wear. The initial stagnation is due to the fact that the “cold” tool and the workpiece
conduct the larger proportion of the temperature.
Infrared radiation Infra-photodiode
Fiber-optics
Computer, A/D converter Monitor
Amplifier
Keyboard
Printer
Figure 1. Fibre-optical measuring and evaluating system
for measurement the cutting temperature
Figure 2. The lay-out of the fibre-optic (a) (b) and the temperature-time diagram taken
by fibre-optic measuring system (c)
Tool-body
Tungsten carbide
Fiber-optic
Workpiece
b) a)
VBmax=1,1 mm
VBmax=0,00 mm
Beginning of the cut
c)
Workpiece
Fiber-optic Tool-body
Tungsten carbid

Engineering and Technology
282
3. TEMPERATURE MEASUREMENT BY INFRARED CAMERA
In Figure 3, the positioning of the FLIR T360 infrared camera, the 2D thermo-map and
the 3D thermo-map on the designated part can be seen. The 3D thermo-map is taken by FLIR
QuickReport 2.1. software.
Experiments are carried out on a turret-lathe, on ∅ 76 x 600 big and of KO36Ti
(X10CrNiTi1810) substance quality shaft. The workpiece is held in chuck and leaned with the
lathe-centre. We applied no lubrication or minimal quantity lubrication (MQL). The body of
the roughing-tool is PSBNR 2525 M12, the plate is signed by SNMM 120408 FN. The
substance of the plate is P20 tungsten carbide, the tool wear is VB = 0,1 mm. Technological
parameters: cutting speed vc ≈ 147 m/min; feed f = 0,25 mm/rev; deep of cut a = 1 mm.
The 2D thermo-map shows that the maximal temperature of the cutting zone is Θmax =
514,4 °C, while the thermo distribution can be well seen on the 3D thermo-map.
On the Figure 4 can be seen a tool wear-temperatures diagram with dry machining and
on the Figure 5 with MQL taken by infrared camera.
Figure 3. Cutting temperature measuring system with infrared camera
2D thermo-map
1 5 9
13
17
S1
S110
100
200
300
400
500
600
Hőmérséklet
Z
X
KO36 hőtérkép (n900;f0,25;a1;d76)
0-100 100-200 200-300 300-400 400-500 500-600
3D thermo-map on the tool-nib
Pixels
Θmax
Tool
Infrared camera
Workpiece
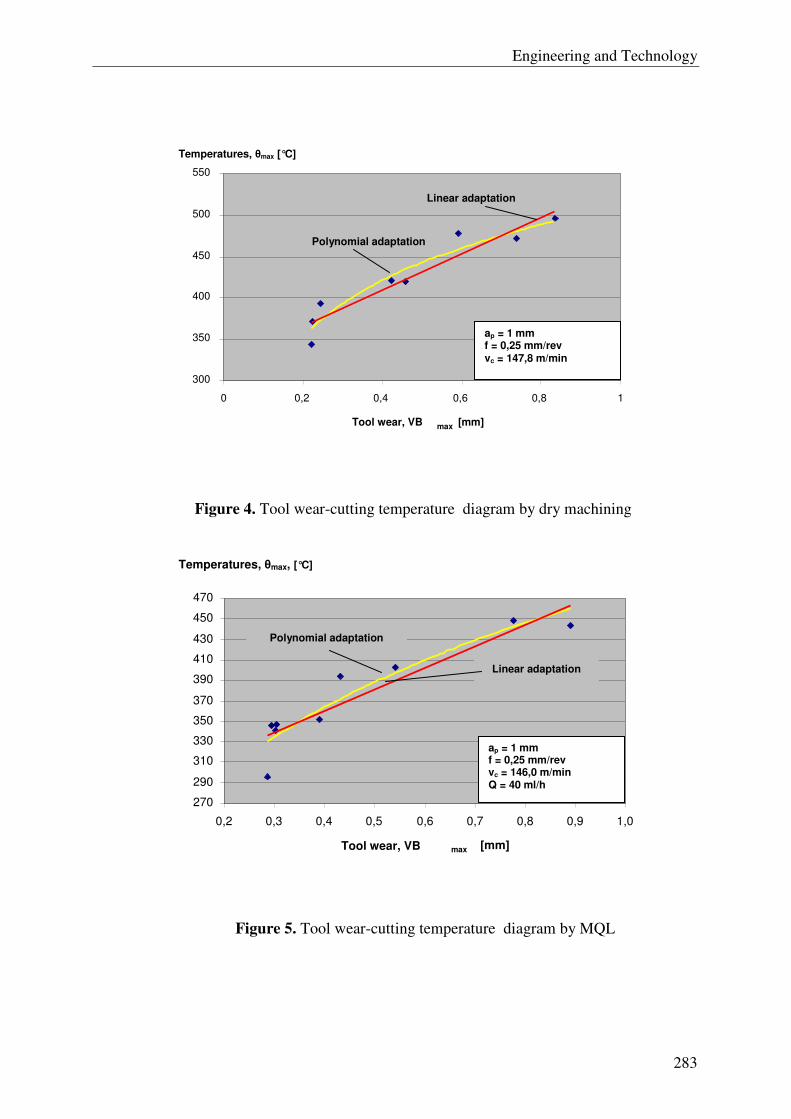
Engineering and Technology
283
Figure 4. Tool wear-cutting temperature diagram by dry machining
Figure 5. Tool wear-cutting temperature diagram by MQL
Tool wear, VB max [mm]
270
290
310
330
350
370
390
410
430
450
470
0,2 0,3 0,4 0,5 0,6 0,7 0,8 0,9 1,0
Temperatures, θmax, [°C]
Linear adaptation
Polynomial adaptation
ap = 1 mm f = 0,25 mm/rev vc = 146,0 m/min Q = 40 ml/h
300
350
400
450
500
550
0 0,2 0,4 0,6 0,8 1
Tool wear, VB max [mm]
Temperatures, θmax [°C]
Polynomial adaptation
Linear adaptation
ap = 1 mm f = 0,25 mm/rev vc = 147,8 m/min
Engineering and Technology
284
4. CONCLUDING REMARKS With the demonstrated infrared measuring systems, the temperature of the tool-chips can
be measured. Results received by the infrared camera well correspond with the results of the
fibre-optic measuring system: the thermal changes plotted against the tool wear in progress.
The measuring of infrared camera is preferably used for cutting experiments and
diagnostical purposes. Application of the infrared camera is especially suitable in the area of
High Speed Cutting (HSC), but not suitable for continuous measuring and monitoring.
The fibre-optical measuring and evaluating system used for the tests can be made suitable
for monitoring the cutting process. This system could prevent the burning of cutting edges of
expensive tools – especially on CNC tool machines.
5. REFERENCES [1] H. Tönshoff, B. Dankena: Spanen (Grundlagen). Sringer Verlag, ISBN 3-540-00588-
9, Berlin, 2004.
[2] M. C. Shaw: Metal Cutting Principles. Clarendon Press Oxford, ISBN 0 19 859020 2,
1997.
[3] Kodácsy J., Szabó A.: A New Temperature Measuring System in Dry Grinding. 3.
Seminar „Moderne Schleiftechnologie” Villingen-Schwenningen (D), 2000, pp.: 105-
108.
[4] Kodácsy J.: A forgácsolási folyamat hőjelenségeinek vizsgálata. Gépgyártás, 2006/4.
pp.: 4-7.
[5] J. Kodacsy : Investigation on the Thermal Phenomena of Cutting Processes. Academic
Journal of Manufacturing Engineering, Volume 7 ISSUE 3, 2009. pp.: 30-35.
Authors 1Kecskemét College, Faculty of Mechanical Engineering and Automation, Izsáki út 10.
Kecskemét, H-6000, [email protected] 2University of Miskolc, Faculty of Mechanical Engineering and Informatics, Miskolc-
Egyetemváros H-3515, [email protected]
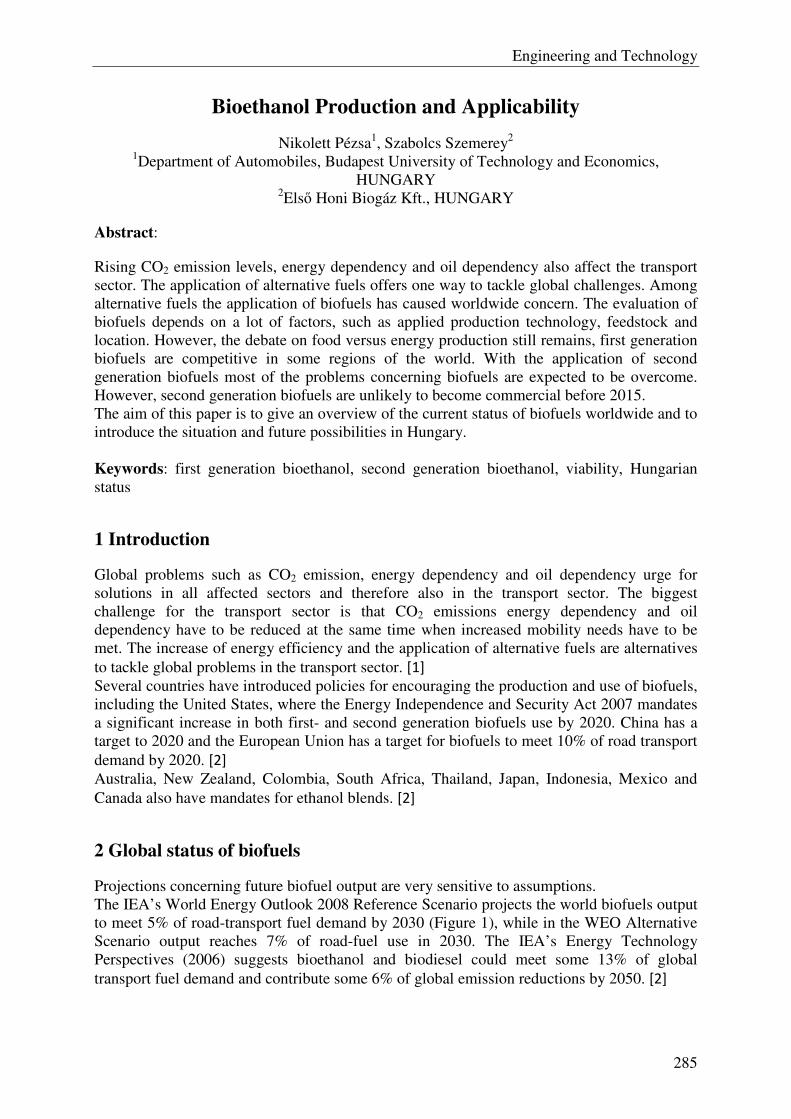
Engineering and Technology
285
Bioethanol Production and Applicability
Nikolett Pézsa1, Szabolcs Szemerey2 1Department of Automobiles, Budapest University of Technology and Economics,
HUNGARY 2Első Honi Biogáz Kft., HUNGARY
Abstract:
Rising CO2 emission levels, energy dependency and oil dependency also affect the transport sector. The application of alternative fuels offers one way to tackle global challenges. Among alternative fuels the application of biofuels has caused worldwide concern. The evaluation of biofuels depends on a lot of factors, such as applied production technology, feedstock and location. However, the debate on food versus energy production still remains, first generation biofuels are competitive in some regions of the world. With the application of second generation biofuels most of the problems concerning biofuels are expected to be overcome. However, second generation biofuels are unlikely to become commercial before 2015. The aim of this paper is to give an overview of the current status of biofuels worldwide and to introduce the situation and future possibilities in Hungary. Keywords: first generation bioethanol, second generation bioethanol, viability, Hungarian status
1 Introduction
Global problems such as CO2 emission, energy dependency and oil dependency urge for solutions in all affected sectors and therefore also in the transport sector. The biggest challenge for the transport sector is that CO2 emissions energy dependency and oil dependency have to be reduced at the same time when increased mobility needs have to be met. The increase of energy efficiency and the application of alternative fuels are alternatives
to tackle global problems in the transport sector. [1] Several countries have introduced policies for encouraging the production and use of biofuels, including the United States, where the Energy Independence and Security Act 2007 mandates a significant increase in both first- and second generation biofuels use by 2020. China has a target to 2020 and the European Union has a target for biofuels to meet 10% of road transport
demand by 2020. [2] Australia, New Zealand, Colombia, South Africa, Thailand, Japan, Indonesia, Mexico and
Canada also have mandates for ethanol blends. [2]
2 Global status of biofuels
Projections concerning future biofuel output are very sensitive to assumptions. The IEA’s World Energy Outlook 2008 Reference Scenario projects the world biofuels output to meet 5% of road-transport fuel demand by 2030 (Figure 1), while in the WEO Alternative Scenario output reaches 7% of road-fuel use in 2030. The IEA’s Energy Technology Perspectives (2006) suggests bioethanol and biodiesel could meet some 13% of global
transport fuel demand and contribute some 6% of global emission reductions by 2050. [2]
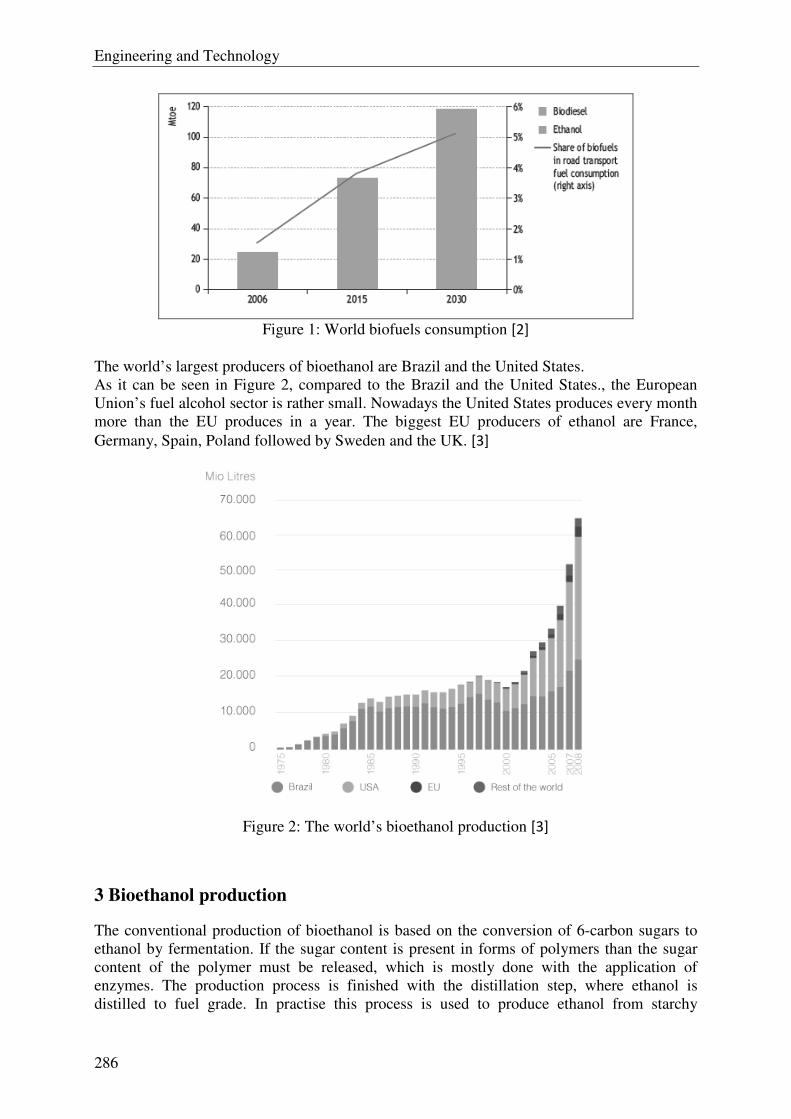
Engineering and Technology
286
Figure 1: World biofuels consumption [2]
The world’s largest producers of bioethanol are Brazil and the United States. As it can be seen in Figure 2, compared to the Brazil and the United States., the European Union’s fuel alcohol sector is rather small. Nowadays the United States produces every month more than the EU produces in a year. The biggest EU producers of ethanol are France,
Germany, Spain, Poland followed by Sweden and the UK. [3]
Figure 2: The world’s bioethanol production [3]
3 Bioethanol production
The conventional production of bioethanol is based on the conversion of 6-carbon sugars to ethanol by fermentation. If the sugar content is present in forms of polymers than the sugar content of the polymer must be released, which is mostly done with the application of enzymes. The production process is finished with the distillation step, where ethanol is distilled to fuel grade. In practise this process is used to produce ethanol from starchy

Engineering and Technology
287
biomass. A wide range of available feedstocks exist for conventional ethanol production:
cereal crops, corn (maize), sugar cane, sugar beet, potatoes, sorghum, cassava. [4] The world’s largest producers of bioethanol are Brazil and the United States. In Brazil bioethanol production is based on sugar cane, while in the United States it is based on corn. While conventional bioethanol production only uses sugar and starch components, advanced bioethanol production processes may utilize all available cellulosic materials, such as energy crops, agricultural residues (straw, corn stover), waste streams (MSW, food waste) and
forestry resources. [4] Lignocellulosic feedstocks are heterogeneous both in structure and chemical composition.
This heterogeneity has a strong influence on the production process design. [5] Ethanol production of lignocellulosic feedstocks composes of pretreatment, hydrolysis, fermentation, separation and distillations steps. The role of pretreatment to release the cellulose and hemicellulose become more relevant. In some feedstocks 5-carbon sugars might
also be present. [4] The possible presence of 5 carbon sugars influences the hydrolysis and fermentation steps, since appropriate enzymes have to be chosen to hydrolyse the 5 carbon sugar containing polymers and in the fermentation step appropriate microorganisms have to be selected, which
are capable of the co-fermentation of both 6 and 5 carbon sugars. [5]
4 Energy requirement and emissions
Fossil energy input and emission levels from biofuel production depend on a lot of factors, such as the applied process, the feedstock and local conditions. In Brazil the production of bioethanol from sugar cane is energy efficient, due to the fact that sugar can be easily extracted and crop yield per hectare is high. If bagasse is used for providing heat and power to the process than the fossil energy input required for each ethanol energy unit can be very low. This results in a low well-to-wheel CO2 emission, 0.2-0.3 kg CO2/litre ethanol. Compared to 2.8 kg CO2/litre for conventional gasoline this means a 90% reduction. In the case of sugar beet more energy input is needed and therefore only 50-60% emission reduction can be
reached compared to gasoline. [4] Ethanol production based on cereal and corn feedstock can be even more energy intensive, since fossil energy input can reach 60-80 % of the energy contained in the final fuel. As a
result CO2 reductions compared to gasoline are around 15-20 %. [4] CO2 emission reductions from ligno-cellulosic feedstock can be 70% compared to gasoline and there is a further possibility of improvement with the application of electricity cogeneration.
5 Production costs
Ethanol energy content by volume is two-thirds that of gasoline, so in the literature costs mostly refer to litre of gasoline equivalent (lge) Main factors contributing to the cost of biofuels are feedstock types, applied production processes, labour costs, credit for by-products, agricultural subsidies, food and oil markets. In Brazil ethanol made from sugar cane ($0.30/lge) is cost competitive with gasoline ($0.3- $0.4/lge). However in other regions, costs can be more than $0.40-$0.50/lge. Ethanol made from maize, sugar beet and wheat costs $0.6-$0.8/lge, with a potential to be reduced to $0.4-$0.6/lge. Ethanol made from ligno-cellulosic feedstock cost around $1.0/lge at the pilot scale. The costs of ligno-cellulosic ethanol are projected to decrease in the future, due to process improvement, the application of low-cost waste feedstock and co-production of other by-
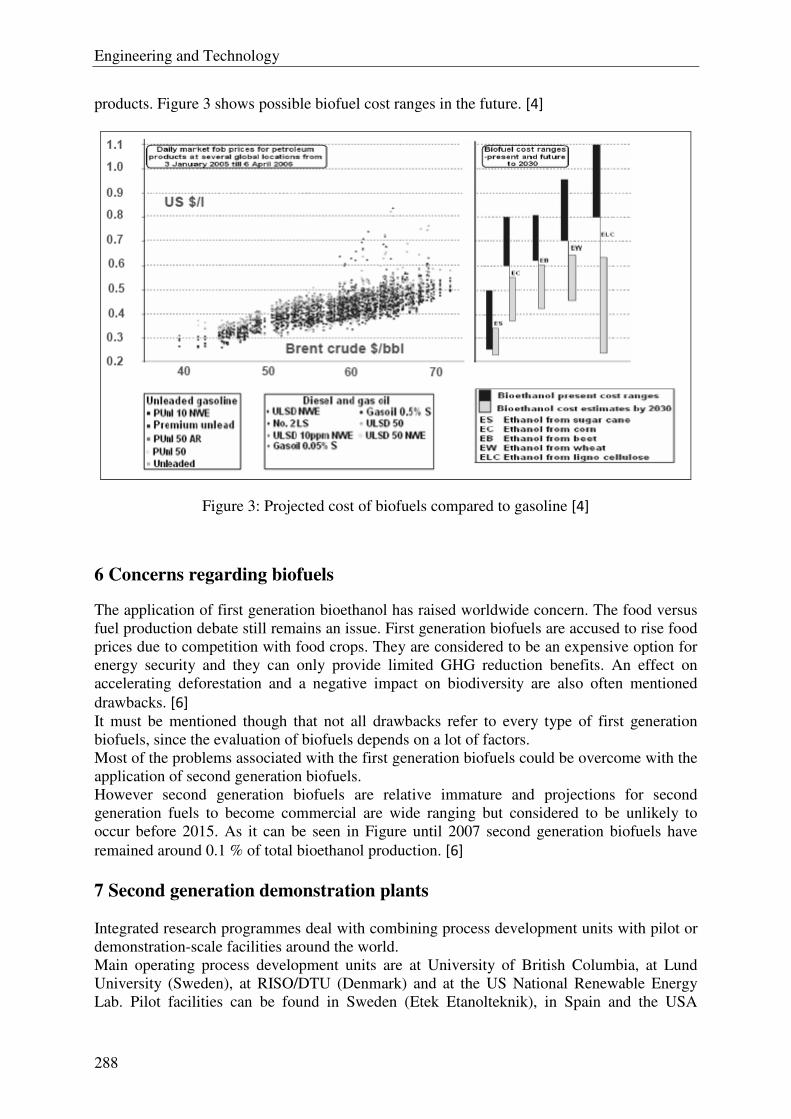
Engineering and Technology
288
products. Figure 3 shows possible biofuel cost ranges in the future. [4]
Figure 3: Projected cost of biofuels compared to gasoline [4]
6 Concerns regarding biofuels
The application of first generation bioethanol has raised worldwide concern. The food versus fuel production debate still remains an issue. First generation biofuels are accused to rise food prices due to competition with food crops. They are considered to be an expensive option for energy security and they can only provide limited GHG reduction benefits. An effect on accelerating deforestation and a negative impact on biodiversity are also often mentioned
drawbacks. [6] It must be mentioned though that not all drawbacks refer to every type of first generation biofuels, since the evaluation of biofuels depends on a lot of factors. Most of the problems associated with the first generation biofuels could be overcome with the application of second generation biofuels. However second generation biofuels are relative immature and projections for second generation fuels to become commercial are wide ranging but considered to be unlikely to occur before 2015. As it can be seen in Figure until 2007 second generation biofuels have
remained around 0.1 % of total bioethanol production. [6]
7 Second generation demonstration plants Integrated research programmes deal with combining process development units with pilot or demonstration-scale facilities around the world. Main operating process development units are at University of British Columbia, at Lund University (Sweden), at RISO/DTU (Denmark) and at the US National Renewable Energy Lab. Pilot facilities can be found in Sweden (Etek Etanolteknik), in Spain and the USA
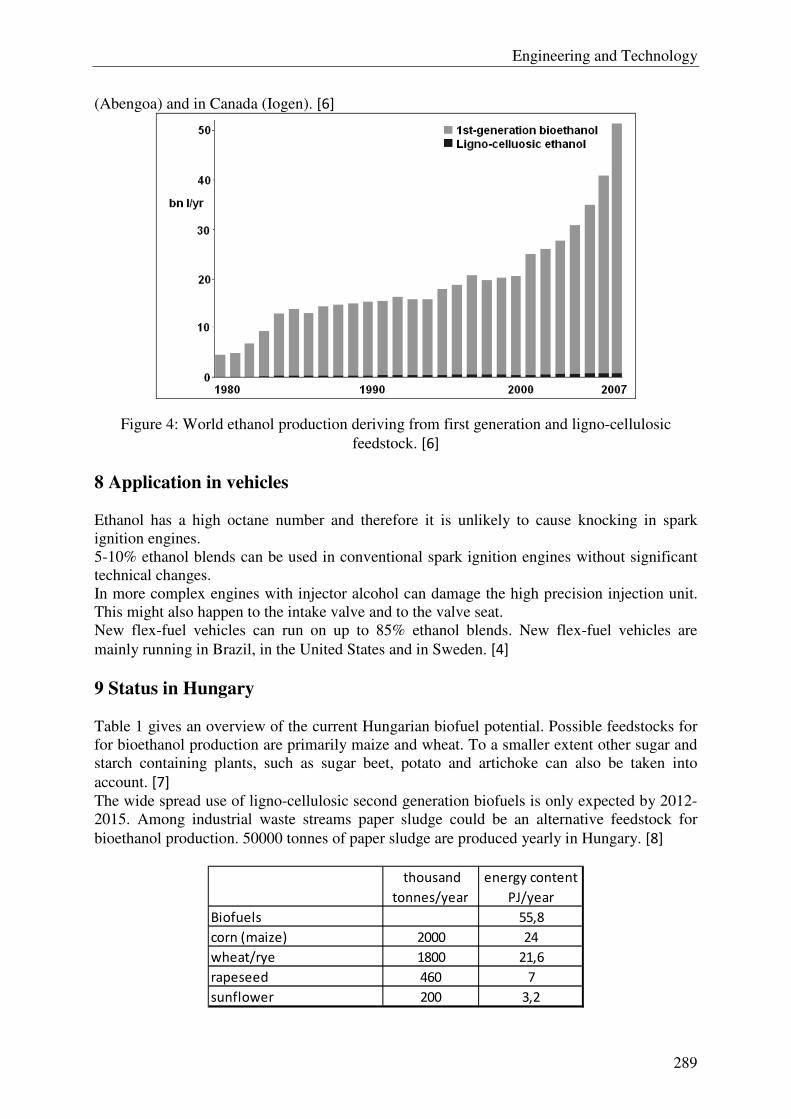
Engineering and Technology
289
(Abengoa) and in Canada (Iogen). [6]
Figure 4: World ethanol production deriving from first generation and ligno-cellulosic
feedstock. [6]
8 Application in vehicles Ethanol has a high octane number and therefore it is unlikely to cause knocking in spark ignition engines. 5-10% ethanol blends can be used in conventional spark ignition engines without significant technical changes. In more complex engines with injector alcohol can damage the high precision injection unit. This might also happen to the intake valve and to the valve seat. New flex-fuel vehicles can run on up to 85% ethanol blends. New flex-fuel vehicles are
mainly running in Brazil, in the United States and in Sweden. [4]
9 Status in Hungary Table 1 gives an overview of the current Hungarian biofuel potential. Possible feedstocks for for bioethanol production are primarily maize and wheat. To a smaller extent other sugar and starch containing plants, such as sugar beet, potato and artichoke can also be taken into
account. [7] The wide spread use of ligno-cellulosic second generation biofuels is only expected by 2012-2015. Among industrial waste streams paper sludge could be an alternative feedstock for
bioethanol production. 50000 tonnes of paper sludge are produced yearly in Hungary. [8]
thousand
tonnes/year
energy content
PJ/year
Biofuels 55,8
corn (maize) 2000 24
wheat/rye 1800 21,6
rapeseed 460 7
sunflower 200 3,2
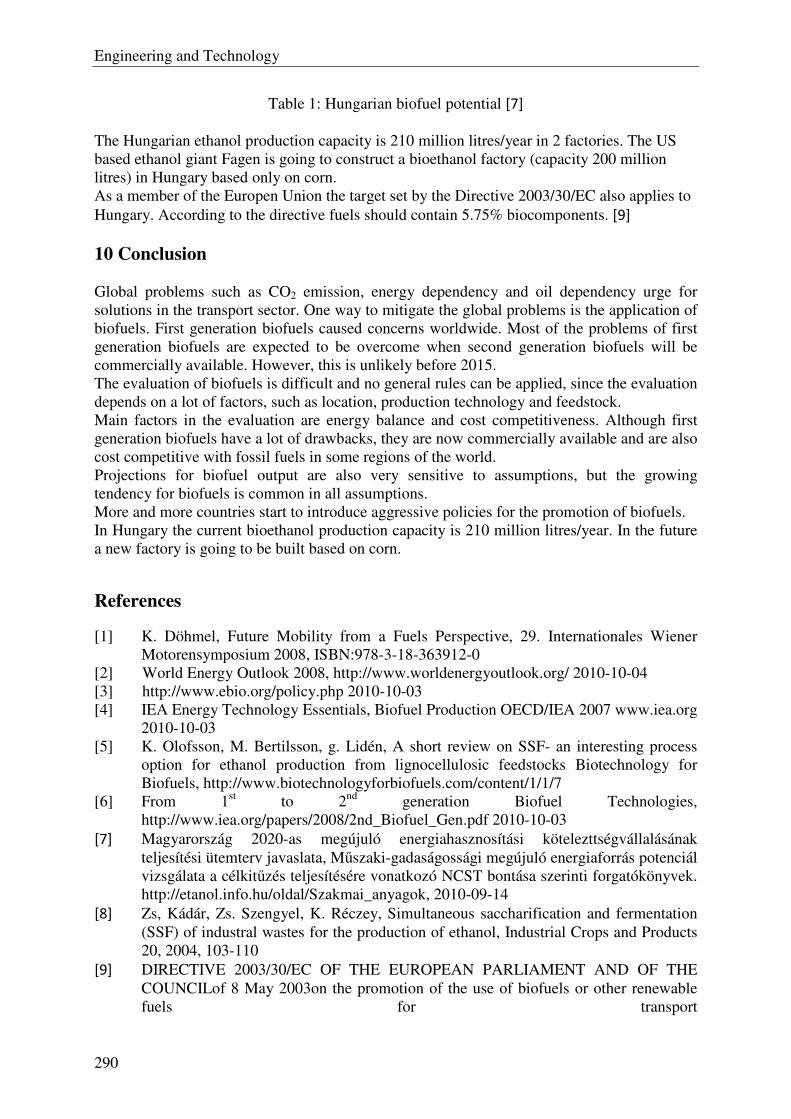
Engineering and Technology
290
Table 1: Hungarian biofuel potential [7] The Hungarian ethanol production capacity is 210 million litres/year in 2 factories. The US based ethanol giant Fagen is going to construct a bioethanol factory (capacity 200 million litres) in Hungary based only on corn. As a member of the Europen Union the target set by the Directive 2003/30/EC also applies to
Hungary. According to the directive fuels should contain 5.75% biocomponents. [9]
10 Conclusion Global problems such as CO2 emission, energy dependency and oil dependency urge for solutions in the transport sector. One way to mitigate the global problems is the application of biofuels. First generation biofuels caused concerns worldwide. Most of the problems of first generation biofuels are expected to be overcome when second generation biofuels will be commercially available. However, this is unlikely before 2015. The evaluation of biofuels is difficult and no general rules can be applied, since the evaluation depends on a lot of factors, such as location, production technology and feedstock. Main factors in the evaluation are energy balance and cost competitiveness. Although first generation biofuels have a lot of drawbacks, they are now commercially available and are also cost competitive with fossil fuels in some regions of the world. Projections for biofuel output are also very sensitive to assumptions, but the growing tendency for biofuels is common in all assumptions. More and more countries start to introduce aggressive policies for the promotion of biofuels. In Hungary the current bioethanol production capacity is 210 million litres/year. In the future a new factory is going to be built based on corn.
References
[1] K. Döhmel, Future Mobility from a Fuels Perspective, 29. Internationales Wiener Motorensymposium 2008, ISBN:978-3-18-363912-0
[2] World Energy Outlook 2008, http://www.worldenergyoutlook.org/ 2010-10-04 [3] http://www.ebio.org/policy.php 2010-10-03 [4] IEA Energy Technology Essentials, Biofuel Production OECD/IEA 2007 www.iea.org
2010-10-03 [5] K. Olofsson, M. Bertilsson, g. Lidén, A short review on SSF- an interesting process
option for ethanol production from lignocellulosic feedstocks Biotechnology for Biofuels, http://www.biotechnologyforbiofuels.com/content/1/1/7
[6] From 1st to 2nd generation Biofuel Technologies, http://www.iea.org/papers/2008/2nd_Biofuel_Gen.pdf 2010-10-03
[7] Magyarország 2020-as megújuló energiahasznosítási kötelezttségvállalásának teljesítési ütemterv javaslata, Műszaki-gadaságossági megújuló energiaforrás potenciál vizsgálata a célkitűzés teljesítésére vonatkozó NCST bontása szerinti forgatókönyvek. http://etanol.info.hu/oldal/Szakmai_anyagok, 2010-09-14
[8] Zs, Kádár, Zs. Szengyel, K. Réczey, Simultaneous saccharification and fermentation (SSF) of industral wastes for the production of ethanol, Industrial Crops and Products 20, 2004, 103-110
[9] DIRECTIVE 2003/30/EC OF THE EUROPEAN PARLIAMENT AND OF THE COUNCILof 8 May 2003on the promotion of the use of biofuels or other renewable fuels for transport

Engineering and Technology
291
http://eurlex.europa.eu/LexUriServ/LexUriServ.do?uri=CELEX:32003L0030:EN:NOT 2010-09-14
Author data
First Author: Department of Automobiles, Faculty of Transportation Engineering, Budapest University of Technology and Economics. 1111 Budapest Stoczek street. 6. J bld., Hungary. E-mail: [email protected] Second Author: Első Honi Biogáz Kft, 6000 Kecskemét Vízmű street 9, Hungary. E-mail: [email protected]
Engineering and Technology
292
Influence of the composition of structural steels on notch
toughness translation temperature
Željko Rosandić1, Slavica Kladarić2, Radojka Marković1, Ivica Kladarić1 , Darko Samardžija1 1Mechanical Engineering Faculty in Slavonski Brod, Josip Juraj Strossmayer University of
Osijek, Slavonski Brod, Croatia. 2University of Applied Sciences of Slavonski Brod, Slavonski Brod, Croatia
Abstract: Due to the numerous applications of structural steels, the different mechanical properties are required. The most important required mechanical properties are the high yield strength, high strength and high impact energy at 20 °C and the lowest possible toughness transition temperature.
In this paper, the effect of testing temperature on the impact energy on three different structural steels was researched.
The testing was done on structural steels S355J0, P265GH and 13 CrMo4-5 at following temperatures 20 oC, -10 oC and -40 oC.
To determine the applicability of specific types of structural steels, the dependence curves of impact energy and testing temperatures were used.
Keywords: structural steel, impact energy, toughness transition temperature
1 Introduction
Due to numerous applications and new manufacturing and processing procedures, the steels must have improved strength, toughness and processing characteristics. The main aim is to find economic solution, because the manufacturing costs play an important role in the use of non-alloyed and low alloyed structural steels. Savings in the weight of a structure was achieved by using less material, while this problem is addressed in a different way today, i.e. the goal is to minimize the total costs of steel structures. Therefore, the costs of designing, manufacturing, and assembling of structure are becoming more important. Horizontal and vertical supporting steel elements have better characteristics compared to elements made of other materials. The manufacturing procedure is simple, and the assembly time on construction site is short. Due to the all these positive characteristics, steel is the most suitable material for construction. Modern structural steels must resistant to cold brittle fracture which includes high toughness at lower transition temperatures [1]. With all metals with BCC lattice there is certain temperature where notch toughness decreases. Sudden toughness drops, as well as the transition temperature depend on the grain size of secondary phases in the microstructure, on micro and macro non-homogeneity, as well as the composition of specially critical elements in the crystal. Sudden brittle fracture can appear in the steel structure due to low temperature and high load, improper structure design and inadequate material
2 Notch toughness transition temperature
The curve of dependence of impact energy on the temperature for alloys with BCC lattice of the parent metal, as well as ceramics and polymers is characteristic. Most of the structural
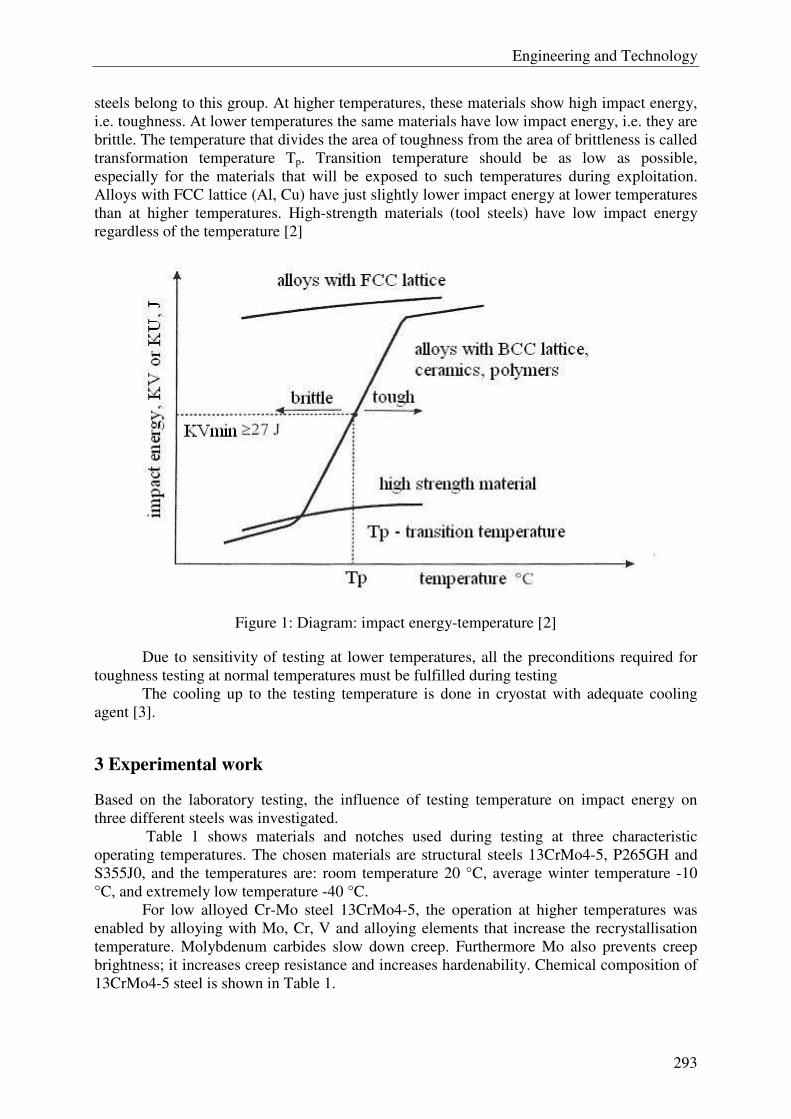
Engineering and Technology
293
steels belong to this group. At higher temperatures, these materials show high impact energy, i.e. toughness. At lower temperatures the same materials have low impact energy, i.e. they are brittle. The temperature that divides the area of toughness from the area of brittleness is called transformation temperature Tp. Transition temperature should be as low as possible, especially for the materials that will be exposed to such temperatures during exploitation. Alloys with FCC lattice (Al, Cu) have just slightly lower impact energy at lower temperatures than at higher temperatures. High-strength materials (tool steels) have low impact energy regardless of the temperature [2]
Figure 1: Diagram: impact energy-temperature [2]
Due to sensitivity of testing at lower temperatures, all the preconditions required for toughness testing at normal temperatures must be fulfilled during testing The cooling up to the testing temperature is done in cryostat with adequate cooling agent [3].
3 Experimental work
Based on the laboratory testing, the influence of testing temperature on impact energy on three different steels was investigated. Table 1 shows materials and notches used during testing at three characteristic operating temperatures. The chosen materials are structural steels 13CrMo4-5, P265GH and S355J0, and the temperatures are: room temperature 20 °C, average winter temperature -10 °C, and extremely low temperature -40 °C. For low alloyed Cr-Mo steel 13CrMo4-5, the operation at higher temperatures was enabled by alloying with Mo, Cr, V and alloying elements that increase the recrystallisation temperature. Molybdenum carbides slow down creep. Furthermore Mo also prevents creep brightness; it increases creep resistance and increases hardenability. Chemical composition of 13CrMo4-5 steel is shown in Table 1.
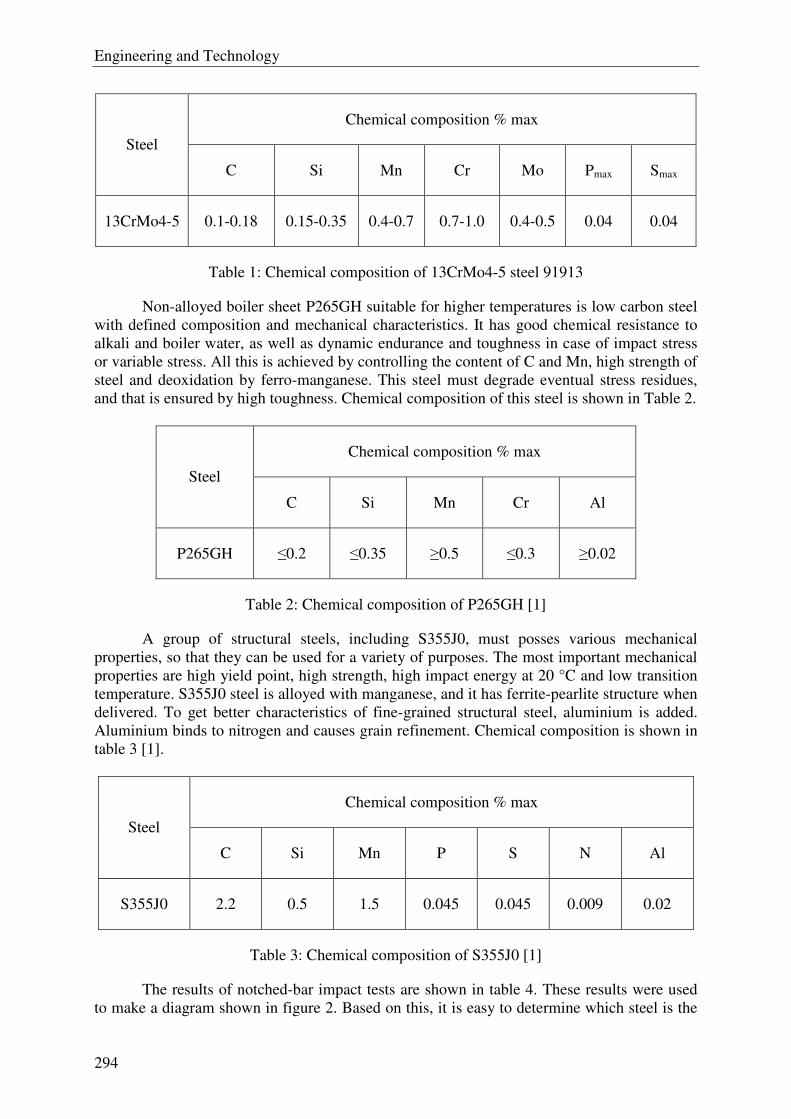
Engineering and Technology
294
Chemical composition % max
Steel
C Si Mn Cr Mo Pmax Smax
13CrMo4-5 0.1-0.18 0.15-0.35 0.4-0.7 0.7-1.0 0.4-0.5 0.04 0.04
Table 1: Chemical composition of 13CrMo4-5 steel 91913
Non-alloyed boiler sheet P265GH suitable for higher temperatures is low carbon steel with defined composition and mechanical characteristics. It has good chemical resistance to alkali and boiler water, as well as dynamic endurance and toughness in case of impact stress or variable stress. All this is achieved by controlling the content of C and Mn, high strength of steel and deoxidation by ferro-manganese. This steel must degrade eventual stress residues, and that is ensured by high toughness. Chemical composition of this steel is shown in Table 2.
Chemical composition % max
Steel
C Si Mn Cr Al
P265GH ≤0.2 ≤0.35 ≥0.5 ≤0.3 ≥0.02
Table 2: Chemical composition of P265GH [1]
A group of structural steels, including S355J0, must posses various mechanical properties, so that they can be used for a variety of purposes. The most important mechanical properties are high yield point, high strength, high impact energy at 20 °C and low transition temperature. S355J0 steel is alloyed with manganese, and it has ferrite-pearlite structure when delivered. To get better characteristics of fine-grained structural steel, aluminium is added. Aluminium binds to nitrogen and causes grain refinement. Chemical composition is shown in table 3 [1].
Chemical composition % max
Steel
C Si Mn P S N Al
S355J0 2.2 0.5 1.5 0.045 0.045 0.009 0.02
Table 3: Chemical composition of S355J0 [1]
The results of notched-bar impact tests are shown in table 4. These results were used to make a diagram shown in figure 2. Based on this, it is easy to determine which steel is the
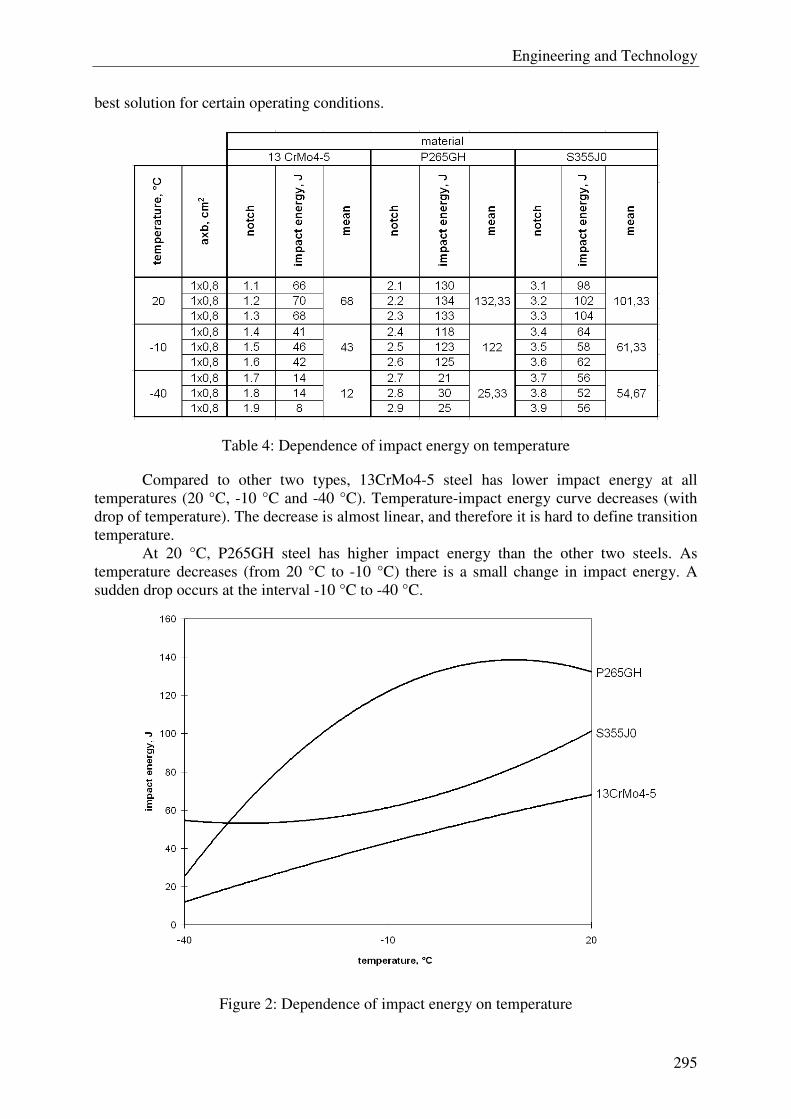
Engineering and Technology
295
best solution for certain operating conditions.
Table 4: Dependence of impact energy on temperature
Compared to other two types, 13CrMo4-5 steel has lower impact energy at all temperatures (20 °C, -10 °C and -40 °C). Temperature-impact energy curve decreases (with drop of temperature). The decrease is almost linear, and therefore it is hard to define transition temperature.
At 20 °C, P265GH steel has higher impact energy than the other two steels. As temperature decreases (from 20 °C to -10 °C) there is a small change in impact energy. A sudden drop occurs at the interval -10 °C to -40 °C.
Figure 2: Dependence of impact energy on temperature
Engineering and Technology
296
4 Conclusions
Transition temperature for structural steels must be determined if exploitation at lower temperatures is expected.
Based on the laboratory testing, the influence of temperature on the impact energy was tested on three different structural steels.
Depending on the composition and state of the tested steels, transition temperature varies from 0 to -30 °C.
At -40 °C, S355J0 steel has higher impact energy than the other two steels. At this temperature, S355J0 steel can be used for more complicated structures than P265GH and 13CrMo4-5 steels.
In order to determine transition temperature more precisely, the testing must be done on a larger number of specimens and at smaller temperature intervals.
References
[1] M. Novosel, D. Krumes: Željezni materijali II dio: Konstrukcijski čelici, Strojarski fakultet u Slavonskom Brodu, 1995, pages 1-21, 53, 183-187
[2] M. Franz: Materijali I – 3.dio Autorizirana predavanja 2005/2006 [3] V. Đukić, A. Majstorović: Mašinski materijali, Naučna knjiga Beograd, str 87-93
Author data
Željko Rosandić: Mechanical Engineering Faculty in Slavonski Brod, Josip Juraj Strossmayer University in Osijek, Trg Ivane Brlić Mažuranić 2, Slavonski Brod, Croatia, [email protected] Slavica Kladarić: University of Applied Sciences of Slavonski Brod, dr. Mile Budaka 1, Slavonski Brod, Croatia, [email protected] Note
The responsible translator for English language is: B.A. Željka Rosandić (Lecturer), J. J. Strossmayer University of Osijek, Mechanical Engineering Faculty in Slavonski Brod, Trg Ivane Brlić-Mažuranić 2, HR-35000 Slavonski Brod, Croatia, Tel. +385 35 493 436, Fax: +385 35 446 446, E-mail: [email protected]
Engineering and Technology
297
CAM stratégiák hatásai a felületek alakpontosságára és méretpontosságára
Siket Katalin Gépgyártástechnológiai Szakcsoport, Kecskeméti Főiskola
Összefoglalás: A gépgyártás automatizálása az egyik alap, amellyel a gyártás sokrétűsége miatt felvetődő problémák megoldódnak, és ez jelenti egyben a rugalmas reagálást a fogyasztók szükségleteire is. A termékek megújulási ciklusa egyre rövidül. A CAM-et úgy értékelhetjük, mint egy összetett irányító rendszert a gyártás támogatására és az egyes műveletek irányítására a konkrét munkahelyeken. De a CAM olyan szoftvert is jelent, amely segítségével generáljuk és feldolgozzuk az NC-programokat a szerszámgépek számára. Erre legtöbbször olyan geometriai adatokat használunk, amelyek a CAD-rendszer outputjai [1].
Abstract: Paper focuses on the precision of components produced by CAM strategies. On the present almost all sector of industry are founded on the development of new products and CAD technologies, engineering calculations and software simulations CAE and production management CAM, by the help of computers. Today by the computer support are designed all resources and technologies for the component producing, their measuring, control and creates bigger requirements for the precision of products, quality and of course, price. This paper deals with the influence of CAM finishing strategies for the shape and dimension accuracy of surfaces.
Kulcsszavak: CAM-rendszerek, simítási stratégiák, bonyolult felületek, alakpontosság, méretpontosság.
Keywords: CAM systems, finishing strategies, complicated surfaces, shape accuracy, dimension accuracy.
1. Bevezetés
A CAM-rendszerek (computer aided manufacturing = számítógéppel támogatott gyártás) napjainkban folyamatos fejlődésben vannak. A CAM-rendszereket két alapcsoportba sorolhatjuk:
• technológiai folyamatot segítő rendszer, • kezelői, irányító és szállítói folyamatot segítő rendszer [1].
A számítógéppel támogatott gyártásra alkalmas jelenlegi rendszereket a terjedelmük és rendeltetésük szerint következőképpen osztjuk fel:
• kis CAM szoftverek – ezek egyszerű alkalmazások az NC-programok generálására, rendszerint egy konkrét megmunkálási technológián belül;
• közepes CAM szoftverek – képesek bizonyos igényes számításokat és szimulációkat professzionális szinten megoldani, közepesen költségigényesek;
• nagy CAM szoftverek – nagyon hatékonyak és könnyen megoldják a 3-dimenziós, bonyolult, összetett felületek 3…5D-s megmunkálását: technológiai lehetőségek egész halmazát tartalmazzák széles háttértámogatással [1].
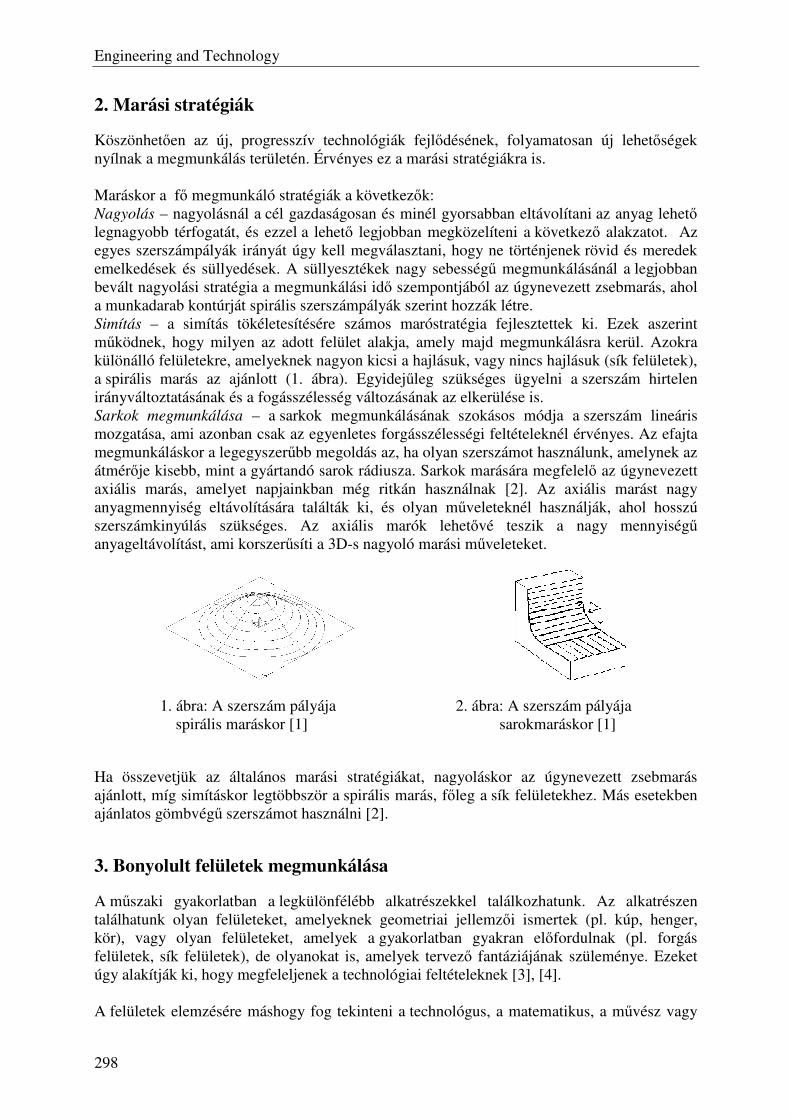
Engineering and Technology
298
2. Marási stratégiák
Köszönhetően az új, progresszív technológiák fejlődésének, folyamatosan új lehetőségek nyílnak a megmunkálás területén. Érvényes ez a marási stratégiákra is. Maráskor a fő megmunkáló stratégiák a következők: Nagyolás – nagyolásnál a cél gazdaságosan és minél gyorsabban eltávolítani az anyag lehető legnagyobb térfogatát, és ezzel a lehető legjobban megközelíteni a következő alakzatot. Az egyes szerszámpályák irányát úgy kell megválasztani, hogy ne történjenek rövid és meredek emelkedések és süllyedések. A süllyesztékek nagy sebességű megmunkálásánál a legjobban bevált nagyolási stratégia a megmunkálási idő szempontjából az úgynevezett zsebmarás, ahol a munkadarab kontúrját spirális szerszámpályák szerint hozzák létre. Simítás – a simítás tökéletesítésére számos maróstratégia fejlesztettek ki. Ezek aszerint működnek, hogy milyen az adott felület alakja, amely majd megmunkálásra kerül. Azokra különálló felületekre, amelyeknek nagyon kicsi a hajlásuk, vagy nincs hajlásuk (sík felületek), a spirális marás az ajánlott (1. ábra). Egyidejűleg szükséges ügyelni a szerszám hirtelen irányváltoztatásának és a fogásszélesség változásának az elkerülése is. Sarkok megmunkálása – a sarkok megmunkálásának szokásos módja a szerszám lineáris mozgatása, ami azonban csak az egyenletes forgásszélességi feltételeknél érvényes. Az efajta megmunkáláskor a legegyszerűbb megoldás az, ha olyan szerszámot használunk, amelynek az átmérője kisebb, mint a gyártandó sarok rádiusza. Sarkok marására megfelelő az úgynevezett axiális marás, amelyet napjainkban még ritkán használnak [2]. Az axiális marást nagy anyagmennyiség eltávolítására találták ki, és olyan műveleteknél használják, ahol hosszú szerszámkinyúlás szükséges. Az axiális marók lehetővé teszik a nagy mennyiségű anyageltávolítást, ami korszerűsíti a 3D-s nagyoló marási műveleteket.
1. ábra: A szerszám pályája 2. ábra: A szerszám pályája spirális maráskor [1] sarokmaráskor [1]
Ha összevetjük az általános marási stratégiákat, nagyoláskor az úgynevezett zsebmarás ajánlott, míg simításkor legtöbbször a spirális marás, főleg a sík felületekhez. Más esetekben ajánlatos gömbvégű szerszámot használni [2].
3. Bonyolult felületek megmunkálása
A műszaki gyakorlatban a legkülönfélébb alkatrészekkel találkozhatunk. Az alkatrészen találhatunk olyan felületeket, amelyeknek geometriai jellemzői ismertek (pl. kúp, henger, kör), vagy olyan felületeket, amelyek a gyakorlatban gyakran előfordulnak (pl. forgás felületek, sík felületek), de olyanokat is, amelyek tervező fantáziájának szüleménye. Ezeket úgy alakítják ki, hogy megfeleljenek a technológiai feltételeknek [3], [4]. A felületek elemzésére máshogy fog tekinteni a technológus, a matematikus, a művész vagy
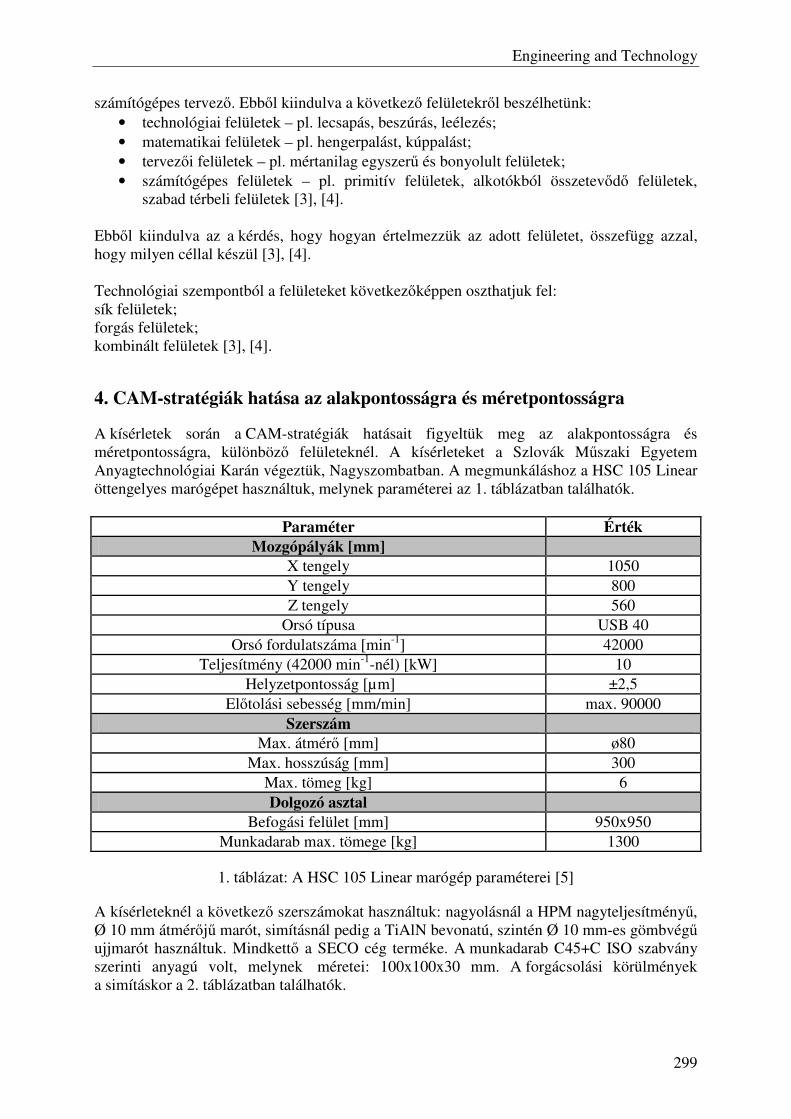
Engineering and Technology
299
számítógépes tervező. Ebből kiindulva a következő felületekről beszélhetünk: • technológiai felületek – pl. lecsapás, beszúrás, leélezés; • matematikai felületek – pl. hengerpalást, kúppalást; • tervezői felületek – pl. mértanilag egyszerű és bonyolult felületek; • számítógépes felületek – pl. primitív felületek, alkotókból összetevődő felületek,
szabad térbeli felületek [3], [4]. Ebből kiindulva az a kérdés, hogy hogyan értelmezzük az adott felületet, összefügg azzal, hogy milyen céllal készül [3], [4]. Technológiai szempontból a felületeket következőképpen oszthatjuk fel: sík felületek; forgás felületek; kombinált felületek [3], [4].
4. CAM-stratégiák hatása az alakpontosságra és méretpontosságra
A kísérletek során a CAM-stratégiák hatásait figyeltük meg az alakpontosságra és méretpontosságra, különböző felületeknél. A kísérleteket a Szlovák Műszaki Egyetem Anyagtechnológiai Karán végeztük, Nagyszombatban. A megmunkáláshoz a HSC 105 Linear öttengelyes marógépet használtuk, melynek paraméterei az 1. táblázatban találhatók.
Paraméter Érték Mozgópályák [mm]
X tengely 1050 Y tengely 800 Z tengely 560
Orsó típusa USB 40 Orsó fordulatszáma [min-1] 42000
Teljesítmény (42000 min-1-nél) [kW] 10 Helyzetpontosság [µm] ±2,5
Előtolási sebesség [mm/min] max. 90000 Szerszám
Max. átmérő [mm] ø80 Max. hosszúság [mm] 300
Max. tömeg [kg] 6 Dolgozó asztal
Befogási felület [mm] 950x950 Munkadarab max. tömege [kg] 1300
1. táblázat: A HSC 105 Linear marógép paraméterei [5]
A kísérleteknél a következő szerszámokat használtuk: nagyolásnál a HPM nagyteljesítményű, Ø 10 mm átmérőjű marót, simításnál pedig a TiAlN bevonatú, szintén Ø 10 mm-es gömbvégű ujjmarót használtuk. Mindkettő a SECO cég terméke. A munkadarab C45+C ISO szabvány szerinti anyagú volt, melynek méretei: 100x100x30 mm. A forgácsolási körülmények a simításkor a 2. táblázatban találhatók.
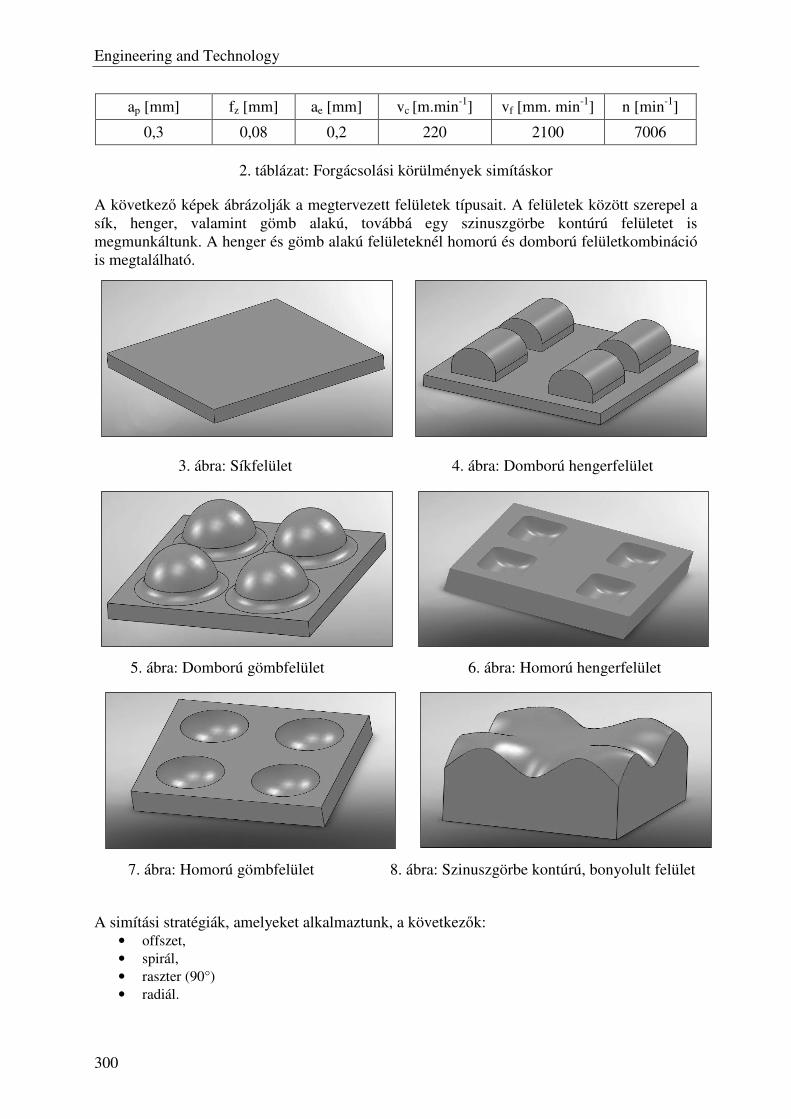
Engineering and Technology
300
ap [mm] fz [mm] ae [mm] vc [m.min-1] vf [mm. min-1] n [min-1]
0,3 0,08 0,2 220 2100 7006
2. táblázat: Forgácsolási körülmények simításkor
A következő képek ábrázolják a megtervezett felületek típusait. A felületek között szerepel a sík, henger, valamint gömb alakú, továbbá egy szinuszgörbe kontúrú felületet is megmunkáltunk. A henger és gömb alakú felületeknél homorú és domború felületkombináció is megtalálható.
3. ábra: Síkfelület 4. ábra: Domború hengerfelület
5. ábra: Domború gömbfelület 6. ábra: Homorú hengerfelület
7. ábra: Homorú gömbfelület 8. ábra: Szinuszgörbe kontúrú, bonyolult felület
A simítási stratégiák, amelyeket alkalmaztunk, a következők:
• offszet, • spirál, • raszter (90°) • radiál.

Engineering and Technology
301
Ezek a simítási stratégiák a PowerMill CAM-rendszer elnevezései. Szerszámpályáik a következő ábrákon láthatók:
9. ábra: Az offszet simítási stratégia 10. ábra: A spirál simítási stratégia szerszámpályája szerszámpályája
11. ábra: A raszter simítási stratégia 12. ábra: A radiál simítási stratégia szerszámpályája szerszámpályája
A megtervezett felületek megmunkálása után következett az alakpontosság és méretpontosság mérése. Ezekre a mérésekre a Duramax koordináta mérőrendszert használtuk, a Carl Zeiss cégtől. A mérőrendszer a 13. ábrán látható. A mérőrendszer pontossági jellemzői a következők: Mérési hiba az ISO 10360-2 számú szabvány szerint: 18.22˚C MPE-E=(2,4+L/300)µm Mérésterjedelem: X=500mm 18.26˚C MPE-E=(2,7+L/250)µm Y=500mm 18.30˚C MPE-E=(2,9+L/200)µm Z=500mm MPE-P=1,8µm [6]
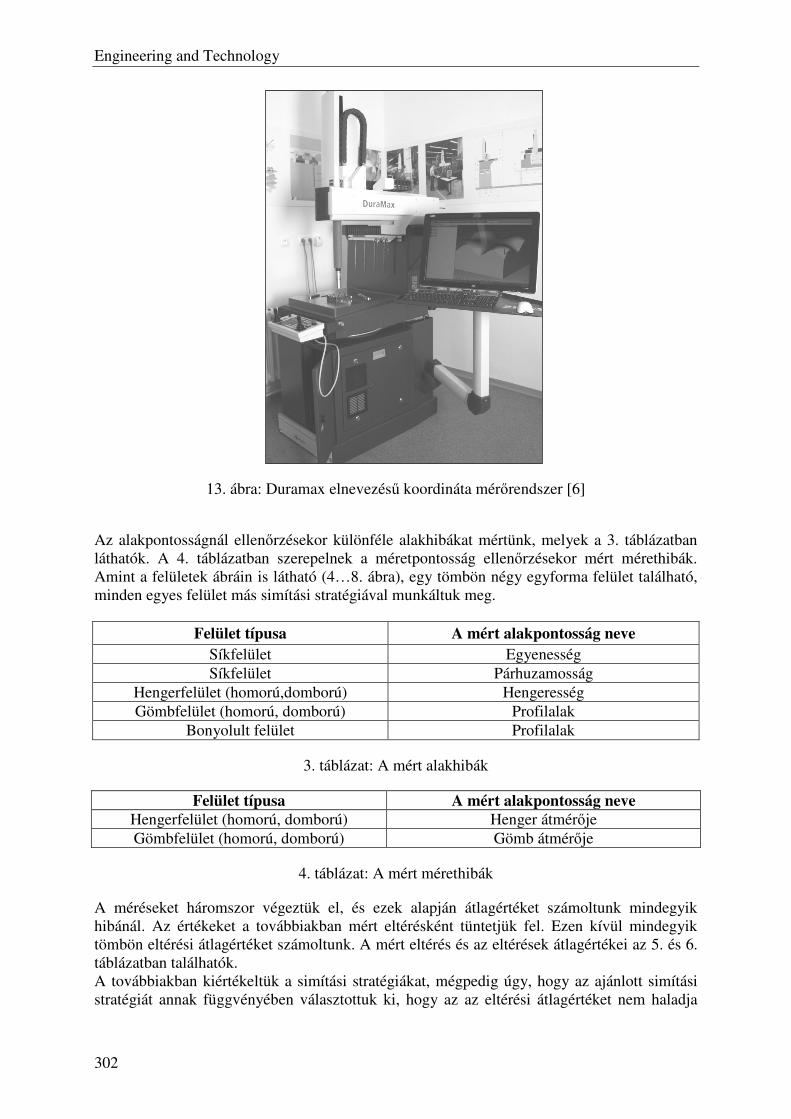
Engineering and Technology
302
13. ábra: Duramax elnevezésű koordináta mérőrendszer [6]
Az alakpontosságnál ellenőrzésekor különféle alakhibákat mértünk, melyek a 3. táblázatban láthatók. A 4. táblázatban szerepelnek a méretpontosság ellenőrzésekor mért mérethibák. Amint a felületek ábráin is látható (4…8. ábra), egy tömbön négy egyforma felület található, minden egyes felület más simítási stratégiával munkáltuk meg.
Felület típusa A mért alakpontosság neve Síkfelület Egyenesség Síkfelület Párhuzamosság
Hengerfelület (homorú,domború) Hengeresség Gömbfelület (homorú, domború) Profilalak
Bonyolult felület Profilalak
3. táblázat: A mért alakhibák
Felület típusa A mért alakpontosság neve Hengerfelület (homorú, domború) Henger átmérője Gömbfelület (homorú, domború) Gömb átmérője
4. táblázat: A mért mérethibák
A méréseket háromszor végeztük el, és ezek alapján átlagértéket számoltunk mindegyik hibánál. Az értékeket a továbbiakban mért eltérésként tüntetjük fel. Ezen kívül mindegyik tömbön eltérési átlagértéket számoltunk. A mért eltérés és az eltérések átlagértékei az 5. és 6. táblázatban találhatók. A továbbiakban kiértékeltük a simítási stratégiákat, mégpedig úgy, hogy az ajánlott simítási stratégiát annak függvényében választottuk ki, hogy az az eltérési átlagértéket nem haladja
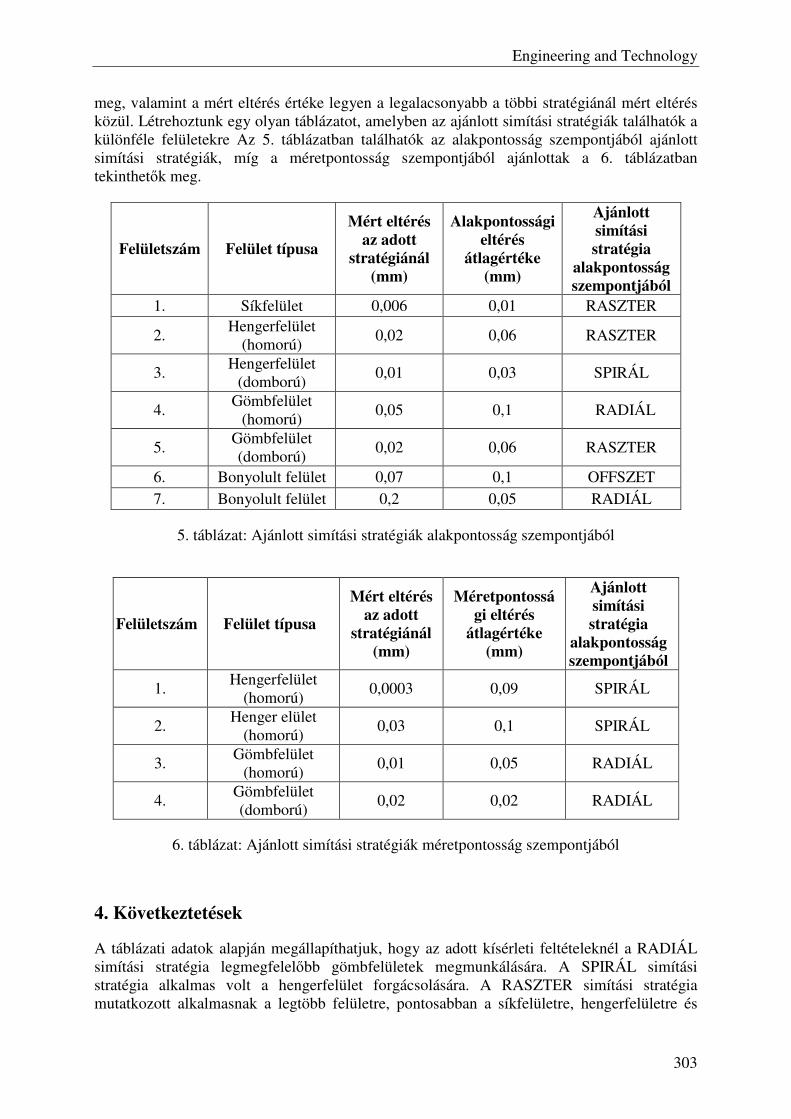
Engineering and Technology
303
meg, valamint a mért eltérés értéke legyen a legalacsonyabb a többi stratégiánál mért eltérés közül. Létrehoztunk egy olyan táblázatot, amelyben az ajánlott simítási stratégiák találhatók a különféle felületekre Az 5. táblázatban találhatók az alakpontosság szempontjából ajánlott simítási stratégiák, míg a méretpontosság szempontjából ajánlottak a 6. táblázatban tekinthetők meg.
Felületszám Felület típusa
Mért eltérés az adott
stratégiánál (mm)
Alakpontossági eltérés
átlagértéke (mm)
Ajánlott simítási stratégia
alakpontosság szempontjából
1. Síkfelület 0,006 0,01 RASZTER
2. Hengerfelület
(homorú) 0,02 0,06 RASZTER
3. Hengerfelület
(domború) 0,01 0,03 SPIRÁL
4. Gömbfelület
(homorú) 0,05 0,1 RADIÁL
5. Gömbfelület (domború)
0,02 0,06 RASZTER
6. Bonyolult felület 0,07 0,1 OFFSZET 7. Bonyolult felület 0,2 0,05 RADIÁL
5. táblázat: Ajánlott simítási stratégiák alakpontosság szempontjából
Felületszám Felület típusa
Mért eltérés az adott
stratégiánál (mm)
Méretpontossági eltérés
átlagértéke (mm)
Ajánlott simítási stratégia
alakpontosság szempontjából
1. Hengerfelület
(homorú) 0,0003 0,09 SPIRÁL
2. Henger elület
(homorú) 0,03 0,1 SPIRÁL
3. Gömbfelület
(homorú) 0,01 0,05 RADIÁL
4. Gömbfelület (domború)
0,02 0,02 RADIÁL
6. táblázat: Ajánlott simítási stratégiák méretpontosság szempontjából
4. Következtetések
A táblázati adatok alapján megállapíthatjuk, hogy az adott kísérleti feltételeknél a RADIÁL simítási stratégia legmegfelelőbb gömbfelületek megmunkálására. A SPIRÁL simítási stratégia alkalmas volt a hengerfelület forgácsolására. A RASZTER simítási stratégia mutatkozott alkalmasnak a legtöbb felületre, pontosabban a síkfelületre, hengerfelületre és

Engineering and Technology
304
gömbfelületre is. Az OFFSZET simítási stratégia tűnt a legkevésbé alkalmasnak a vizsgált felületek megmunkálására.
Irodalomjegyzék
[1] KURIC, I. et. al. „Počítačom podporované systémy v strojárstve“. Žilina: EDIS ŽU, 2002, 16 s., 26 s., s. 148 - 149, s.152 - 153. ISBN 80-7100-948-2. [2] SKOPEČEK, T. et. al.“Frézovací strategie při výrobě forem a zápustek.
Ln MM Prumyslové spektrum 5/2005. [3] ZÁMOŽÍK, J. et al.: Základy počítačovej grafiky. Bratislava: STU, 1996. [4] LIPTÁK, O. et al.: Technológia výroby. Obrábanie. Bratislava: Alfa, 1979. [5] http://www.gildemeister.com/home,us. [6] http://www.zeiss.sk.
Szerző
Siket Katalin: Gépgyártástechnológiai Szakcsoport, Fém- és Műanyagfeldolgozó Technológiai Intézet, GAMF Kar, Kecskeméti Főiskola. Izsáki út 10, 6000 Kecskemét, Magyarország. E-mail: [email protected].
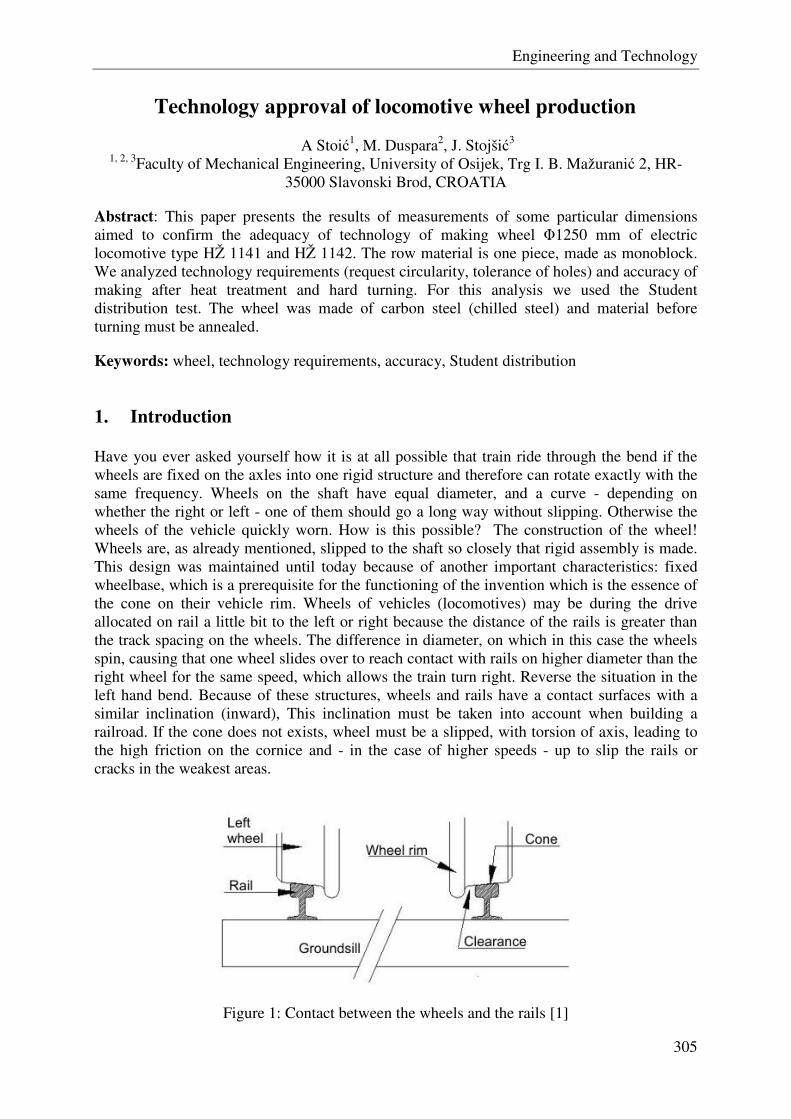
Engineering and Technology
305
Technology approval of locomotive wheel production
A Stoić1, M. Duspara2, J. Stojšić3 1, 2, 3Faculty of Mechanical Engineering, University of Osijek, Trg I. B. Mažuranić 2, HR-
35000 Slavonski Brod, CROATIA
Abstract: This paper presents the results of measurements of some particular dimensions aimed to confirm the adequacy of technology of making wheel Φ1250 mm of electric locomotive type HŽ 1141 and HŽ 1142. The row material is one piece, made as monoblock. We analyzed technology requirements (request circularity, tolerance of holes) and accuracy of making after heat treatment and hard turning. For this analysis we used the Student distribution test. The wheel was made of carbon steel (chilled steel) and material before turning must be annealed.
Keywords: wheel, technology requirements, accuracy, Student distribution
1. Introduction
Have you ever asked yourself how it is at all possible that train ride through the bend if the wheels are fixed on the axles into one rigid structure and therefore can rotate exactly with the same frequency. Wheels on the shaft have equal diameter, and a curve - depending on whether the right or left - one of them should go a long way without slipping. Otherwise the wheels of the vehicle quickly worn. How is this possible? The construction of the wheel! Wheels are, as already mentioned, slipped to the shaft so closely that rigid assembly is made. This design was maintained until today because of another important characteristics: fixed wheelbase, which is a prerequisite for the functioning of the invention which is the essence of the cone on their vehicle rim. Wheels of vehicles (locomotives) may be during the drive allocated on rail a little bit to the left or right because the distance of the rails is greater than the track spacing on the wheels. The difference in diameter, on which in this case the wheels spin, causing that one wheel slides over to reach contact with rails on higher diameter than the right wheel for the same speed, which allows the train turn right. Reverse the situation in the left hand bend. Because of these structures, wheels and rails have a contact surfaces with a similar inclination (inward), This inclination must be taken into account when building a railroad. If the cone does not exists, wheel must be a slipped, with torsion of axis, leading to the high friction on the cornice and - in the case of higher speeds - up to slip the rails or cracks in the weakest areas.
Figure 1: Contact between the wheels and the rails [1]
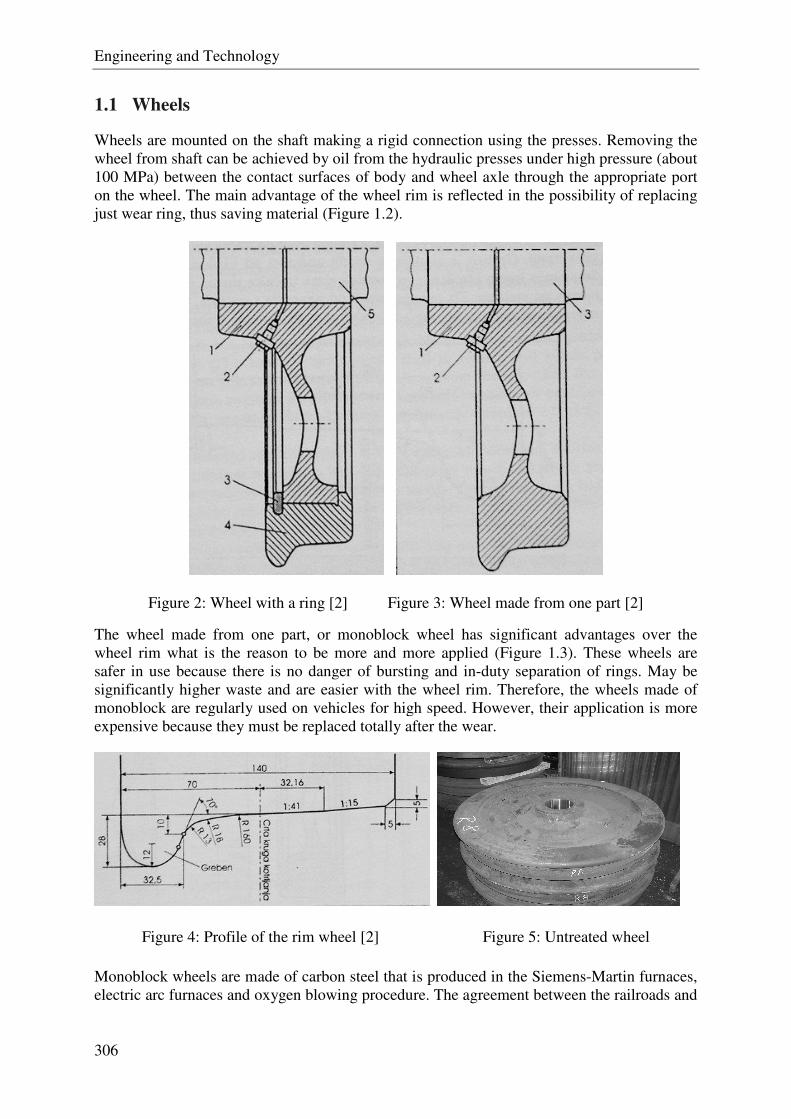
Engineering and Technology
306
1.1 Wheels
Wheels are mounted on the shaft making a rigid connection using the presses. Removing the wheel from shaft can be achieved by oil from the hydraulic presses under high pressure (about 100 MPa) between the contact surfaces of body and wheel axle through the appropriate port on the wheel. The main advantage of the wheel rim is reflected in the possibility of replacing just wear ring, thus saving material (Figure 1.2).
Figure 2: Wheel with a ring [2] Figure 3: Wheel made from one part [2]
The wheel made from one part, or monoblock wheel has significant advantages over the wheel rim what is the reason to be more and more applied (Figure 1.3). These wheels are safer in use because there is no danger of bursting and in-duty separation of rings. May be significantly higher waste and are easier with the wheel rim. Therefore, the wheels made of monoblock are regularly used on vehicles for high speed. However, their application is more expensive because they must be replaced totally after the wear.
Figure 4: Profile of the rim wheel [2] Figure 5: Untreated wheel
Monoblock wheels are made of carbon steel that is produced in the Siemens-Martin furnaces, electric arc furnaces and oxygen blowing procedure. The agreement between the railroads and
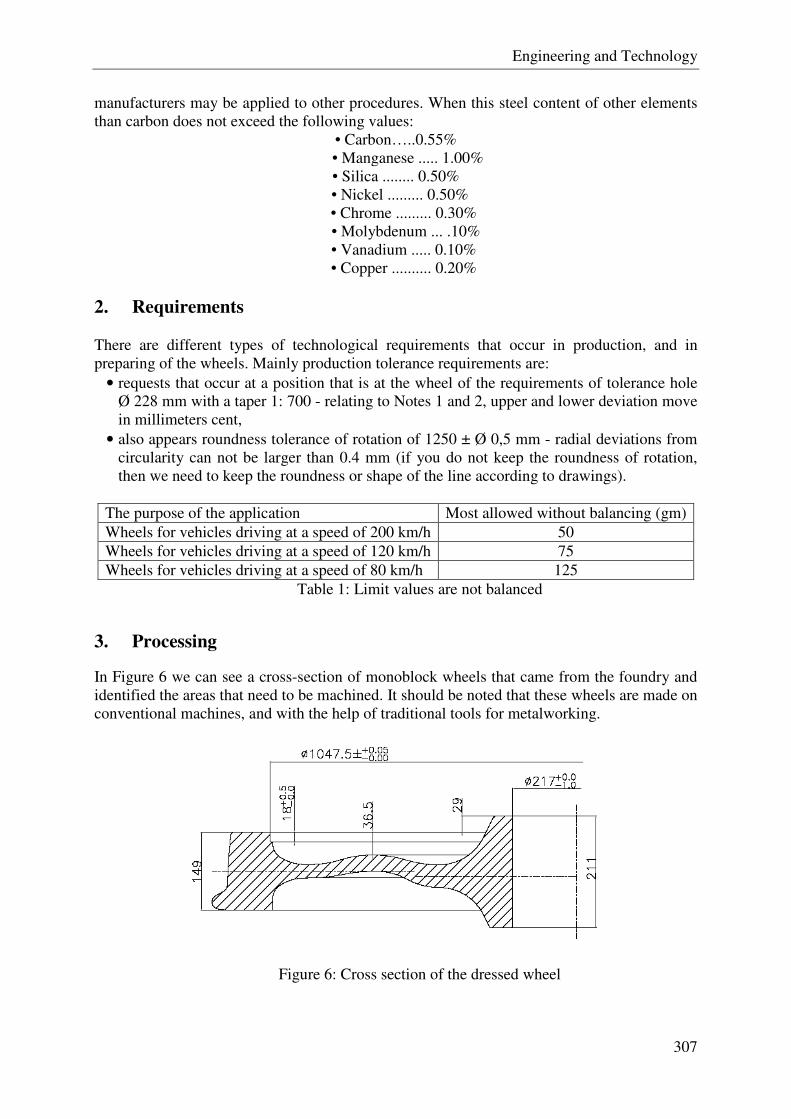
Engineering and Technology
307
manufacturers may be applied to other procedures. When this steel content of other elements than carbon does not exceed the following values:
• Carbon…..0.55% • Manganese ..... 1.00%
• Silica ........ 0.50% • Nickel ......... 0.50%
• Chrome ......... 0.30% • Molybdenum ... .10% • Vanadium ..... 0.10% • Copper .......... 0.20%
2. Requirements
There are different types of technological requirements that occur in production, and in preparing of the wheels. Mainly production tolerance requirements are:
• requests that occur at a position that is at the wheel of the requirements of tolerance hole Ø 228 mm with a taper 1: 700 - relating to Notes 1 and 2, upper and lower deviation move in millimeters cent,
• also appears roundness tolerance of rotation of 1250 ± Ø 0,5 mm - radial deviations from circularity can not be larger than 0.4 mm (if you do not keep the roundness of rotation, then we need to keep the roundness or shape of the line according to drawings).
The purpose of the application Most allowed without balancing (gm) Wheels for vehicles driving at a speed of 200 km/h 50 Wheels for vehicles driving at a speed of 120 km/h 75 Wheels for vehicles driving at a speed of 80 km/h 125
Table 1: Limit values are not balanced
3. Processing
In Figure 6 we can see a cross-section of monoblock wheels that came from the foundry and identified the areas that need to be machined. It should be noted that these wheels are made on conventional machines, and with the help of traditional tools for metalworking.
Figure 6: Cross section of the dressed wheel
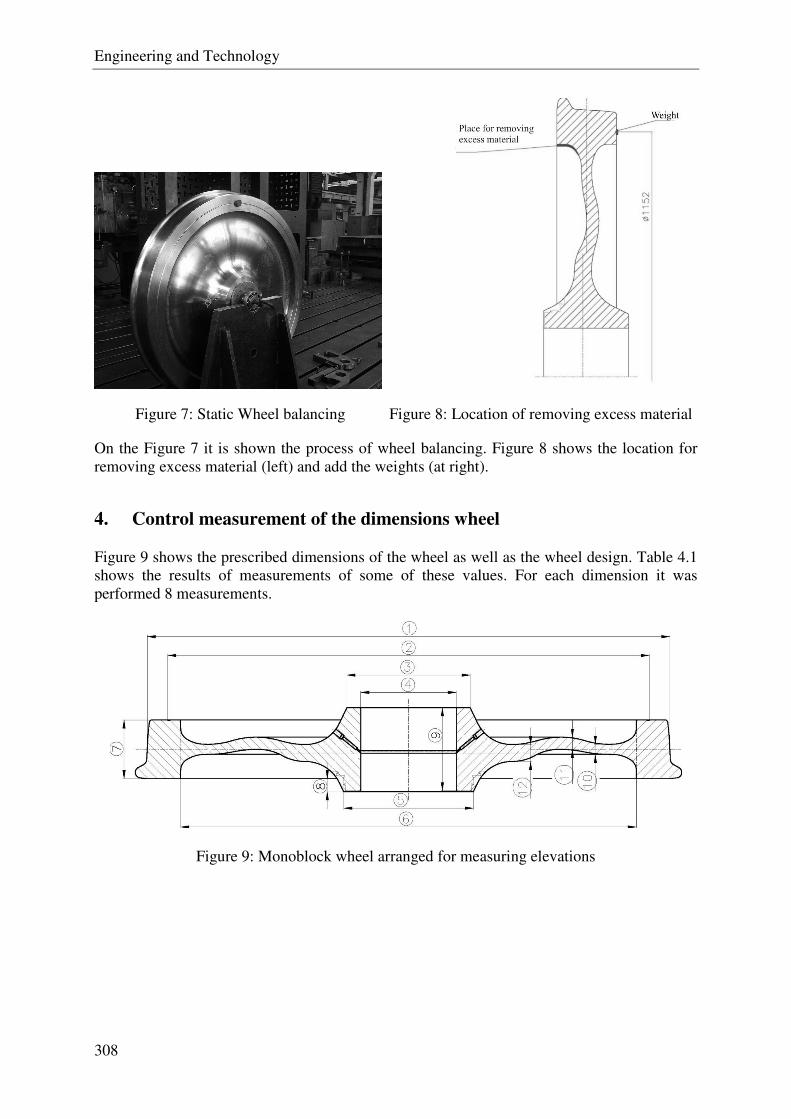
Engineering and Technology
308
Figure 7: Static Wheel balancing Figure 8: Location of removing excess material
On the Figure 7 it is shown the process of wheel balancing. Figure 8 shows the location for removing excess material (left) and add the weights (at right).
4. Control measurement of the dimensions wheel
Figure 9 shows the prescribed dimensions of the wheel as well as the wheel design. Table 4.1 shows the results of measurements of some of these values. For each dimension it was performed 8 measurements.
Figure 9: Monoblock wheel arranged for measuring elevations

Engineering and Technology
309
Ordinal number of measurements/Measured size (mm) Prescribed dimensions
Tol. 1 2 3 4 5 6 7 8
φ1250
1253,9 1253,8 1254 1254 1253,9 1254,1 1253,95 1254,15
φ1152
1152 1152 1152 1152 1152 1152 1152 1152
φ295
296 296 296 296 296 296 296 296
φ219
218,5 218,5 218,5 218,5 218,5 218,5 218,5 218,5
φ310
311 311 311 311 311 311 311 311
φ1050
1048 1048 1048 1048 1048 1048 1048 1048
140 ±2 140 140 140 140,1 140,2 140,1 140 140 31 ±0,5 31,2 31 31 31,2 31 31,2 31 31,2
Table 2: The prescribed dimensions and their survey
4.1 Student distribution test
Student distribution test is a statistical method for testing the accuracy of the process of making wheels. In a small number n of repeated measurements to estimate the standard deviation of the normal distribution is not sufficiently secure, and in metrology (with n <30) for determining the uncertainty in C mean using Student distribution. [4] At low C n unreliability can be determined from the expression:
C = (4.1)
x = ± C = ± (4.2)
Here is the estimate of standard deviation, at t = (n, P) is a factor in students' distribution, and for various values of P are given in Table 4.2
n 2 3 4 5 6 7 8 9 t 12,71 4,3 3,18 2,78 2,57 2,46 2,37 2,31
Table 3: Factor student's distribution with P = 0.95
When presenting the results of repeated measurements of the relative unreliability c by student's distribution is calculated from the equation:
c = = · (4.3)
x = · (1 ± c) (4.4)
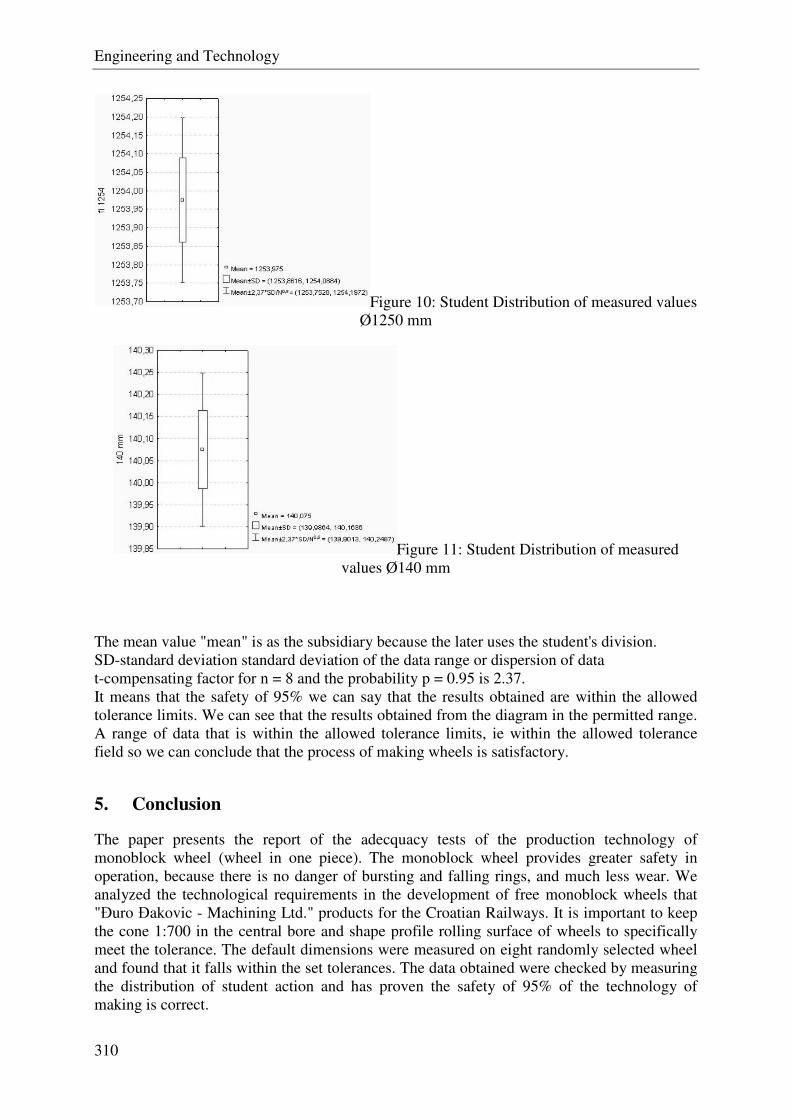
Engineering and Technology
310
Figure 10: Student Distribution of measured values Ø1250 mm
Figure 11: Student Distribution of measured values Ø140 mm
The mean value "mean" is as the subsidiary because the later uses the student's division. SD-standard deviation standard deviation of the data range or dispersion of data t-compensating factor for n = 8 and the probability p = 0.95 is 2.37. It means that the safety of 95% we can say that the results obtained are within the allowed tolerance limits. We can see that the results obtained from the diagram in the permitted range. A range of data that is within the allowed tolerance limits, ie within the allowed tolerance field so we can conclude that the process of making wheels is satisfactory.
5. Conclusion
The paper presents the report of the adecquacy tests of the production technology of monoblock wheel (wheel in one piece). The monoblock wheel provides greater safety in operation, because there is no danger of bursting and falling rings, and much less wear. We analyzed the technological requirements in the development of free monoblock wheels that "Đuro Đakovic - Machining Ltd." products for the Croatian Railways. It is important to keep the cone 1:700 in the central bore and shape profile rolling surface of wheels to specifically meet the tolerance. The default dimensions were measured on eight randomly selected wheel and found that it falls within the set tolerances. The data obtained were checked by measuring the distribution of student action and has proven the safety of 95% of the technology of making is correct.
Engineering and Technology
311
6. Literature
[1] http://www.zeljeznice.net/forum/priča o kotaču. (16.08.2009.). [2] http://www.prometna-zona.com/zeljeznicki-005kolni_slogovi.html (16.08.2009.). [3] Toma Miljković; Gornji ustroj željeznica. Beograd; Zavod za novinsko-izdavačku i
propagandnu djelatnost JŽ, 1986. [4] Zdravko Vnučec; Repetitorij 1 Tehnička mjerenja 1. dio. Slavonski Brod; Strojarski
fakultet u Slavonskom Brodu, 1998
7. Author data
Prof. dr. sc Antun Stoić: Chair of Chip removal and polymer processing at Mechanical Engineering Faculty University of Osijek, Trg I.B. Mazuranic 2, 35000 Slavonski Brod, Croatia E-mail: [email protected]
Dipl. Ing. Miroslav Duspara: Assistant at the department of Chip removal and polymer processing at Mechanical Engineering Faculty University of Osijek, Trg I.B. Mazuranic 2, 35000 Slavonski Brod, Croatia E-mail: [email protected]
Dipl. Ing. Josip Stojšić: Assistant at the department of Chip removal and polymer processing at Mechanical Engineering Faculty University of Osijek, Trg I.B. Mazuranic 2, 35000 Slavonski Brod, Croatia E-mail: [email protected]

Engineering and Technology
312
Analysis of resilient mounting of the river-marine cargo vessel’s main engine to interior noise on the vessel
Ing. Sztankay Juraj, PhD1, Ing. Németh Jozef
2,
1, 2 Detached Workplace in Komárno, Faculty of Materials Science and Technology in Trnava,
Slovak University of Technology in Bratislava, Slovak republic
Összefoglalás: A cikk ismerteti a LEDA folyami-tengeri teherhajók hang - és rezgés-
forrásait, terjedésük módjait, valamint a főmotor rugalmas elhelyzesének kedvező hatásait a
hajó beltéri hangszintjére. A főmotor rugalmas beépítésének pozitív hatása 3-8 dB(A)
hangszint csökkenéshez vezet a hajó egyes helyiségeiben, ami az IMO – A 468 nemzetközi
norma hangszintre vonatkozó értékek, betartását teszi lehetővé.
Abstract: The paper presents fundamental information about realized experimental measured
values reducing noise level in the premises of riverine-marine multipurpose cargo vessel type
Leda with rigid mounting and resilient mounting of main engine to the base.
The results quantify the positive effect of flexible imposition on noise level in each premise of
the vessel. Considerable noise level decrease by 3 - 8 dB (A) means that the flexible
imposition of main engine ensures fulfillment of noise level based on norm IMO A 468
(XII) “Noise levels on board ships“ in every premise of the vessel.
Kulcsszavak : folyami és tengerjáró teherhajó LEDA, zajszint, mechanikai rezgések,
főmotor rugalmas elhelyezése
Keywords : riverine-marine multipurpose cargo vessel type Leda, noise level, mechanical
vibration resilient mounting of main engine
1. Introduction
By increasing discharges of main engines and lifting capacities of the crafts also the noise
level and mechanical vibrations on crafts are increasing. The parameters of noise and
mechanical vibrations are guaranteed by manufacturer. These are the preferred criteria in the
process of evaluation crafts in term of health protection, comfort and personnel comfort
feeling. These values are strictly followed according to international norms ISO, IMO, DIN
classification organizations Germanischer Lloyd, UVV See - BG, etc.
2. Sources of noise and mechanical vibration on crafts.
Every source of noise and mechanical vibration on crafts is:
- Source of noise spreading through the air,
- source of mechanical vibration – spreading through structure of the ship.
The most intense sources of vibro-acoustic energy on ships are:
- Screw propeller – mechanical vibration – 0,94% mechanical power of the main engine,
- main engine of the traction system - 1100 - 2550 kW – SLKB,
- gensets - 150 – 200 kW,
- compressors, pumps, fans , 5 – 20 kW .

Engineering and Technology
313
The noise which is spreading through air from the source on the crafts spreads through isolated
constructional walls, cross walls, floors, constructions dome, through air system equipment, air
conditioning equipment, scuttles, etc.
Mechanical vibrations /vibrations, structural noise/ are excited by two ways:
a.) straight – mechanical vibrations, that are spreading from the source /main engine,
generators, compressors, pumps, fans/ through foundations and construction of the
craft throughout the craft
b.) by secondary element, that is generated by direct sound wave which is falling on
some cross wall in which it generates mechanical vibrations and this secondary
element is also spreading throughout the crafts construction
3. The measures against the noise
Reducing the level of noise and mechanical vibrations in the cabins on the cargo ships, where
the superstructure with cabins, canteen, offices is situated nearly above the machine room,
where in room with volume 300 - 500 m3
takes 1100 – 5000 kW mechanical energy and
where level of the noise around the main source reaches values 105 – 107 dB (A) ( Figure 1.)
(Table 1.) is extremely complicated.
It is needful to reach that this massive vibro-acoustic energy will be at full blast absorbed,
damped, rebounted in machine rooms of the crafts, where are main engines, gensets and other
mechanical equipment automatically remote controlled is allowed max. noise level 110 dB
(A), NR 105 and where entry is allowed just with earmuffs.
In order to observe the highest allowable equivalent noise levels in crafts space and NR
curves in individual rooms is necessary to accept effective antinoise and antivibrational
measures, which reduce vibro-acoustic energy of the sources.
Mechanical vibrations /vibrations, structural noise/ are excited by two ways:
1. active approach to reduce acoustic and vibrational energy of sources – function and
competence manufacturer of engines, gensets, compressors, etc.
2. passive approach to reduce acoustic and vibrational energy of sources – realized by
ship manufacturer.
Figure 1: river-marine cargo ship
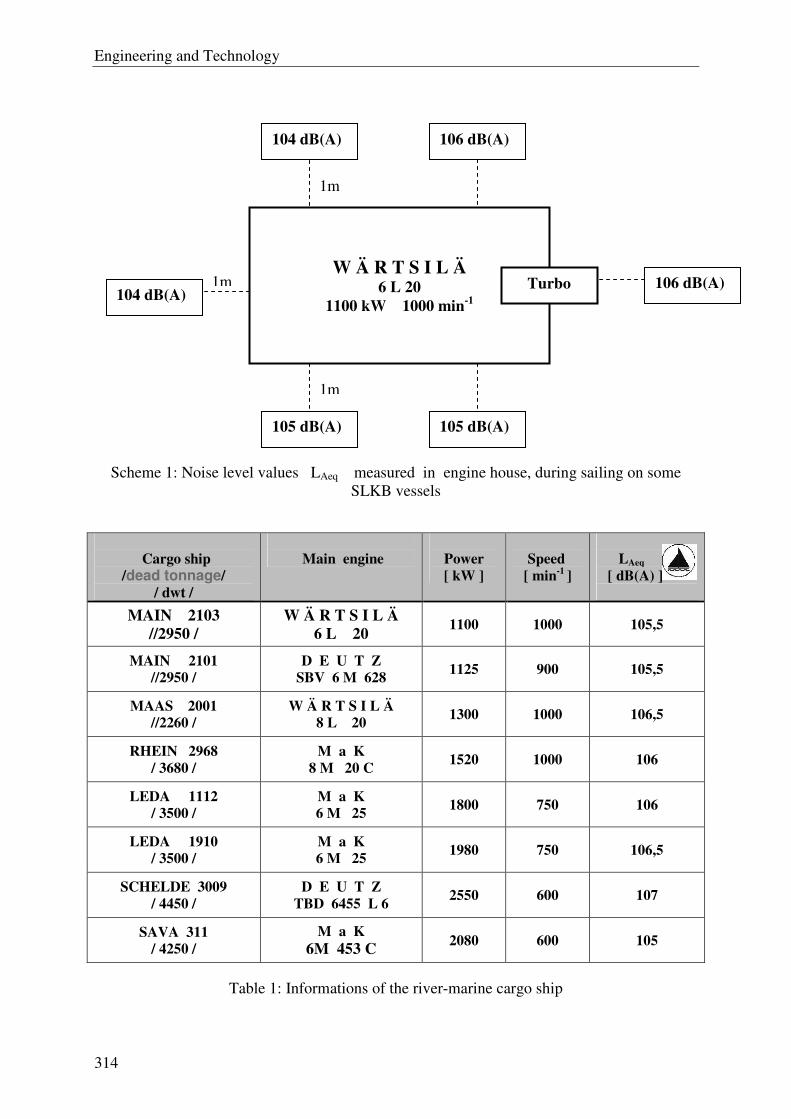
Engineering and Technology
314
Scheme 1: Noise level values LAeq measured in engine house, during sailing on some
SLKB vessels
Cargo ship /dead tonnage/
/ dwt /
Main engine
Power
[ kW ]
Speed
[ min-1 ]
LAeq
[ dB(A) ]
MAIN 2103 //2950 /
W Ä R T S I L Ä 6 L 20
1100 1000 105,5
MAIN 2101 //2950 /
D E U T Z SBV 6 M 628
1125 900 105,5
MAAS 2001 //2260 /
W Ä R T S I L Ä 8 L 20
1300 1000 106,5
RHEIN 2968 / 3680 /
M a K 8 M 20 C
1520 1000 106
LEDA 1112 / 3500 /
M a K 6 M 25
1800 750 106
LEDA 1910 / 3500 /
M a K 6 M 25
1980 750 106,5
SCHELDE 3009 / 4450 /
D E U T Z TBD 6455 L 6
2550 600 107
SAVA 311 / 4250 /
M a K 6M 453 C 2080 600 105
Table 1: Informations of the river-marine cargo ship
1m
1m
1m
104 dB(A)
104 dB(A) 106 dB(A)
105 dB(A) 105 dB(A)
106 dB(A)
W Ä R T S I L Ä 6 L 20
1100 kW 1000 min-1
Turbo
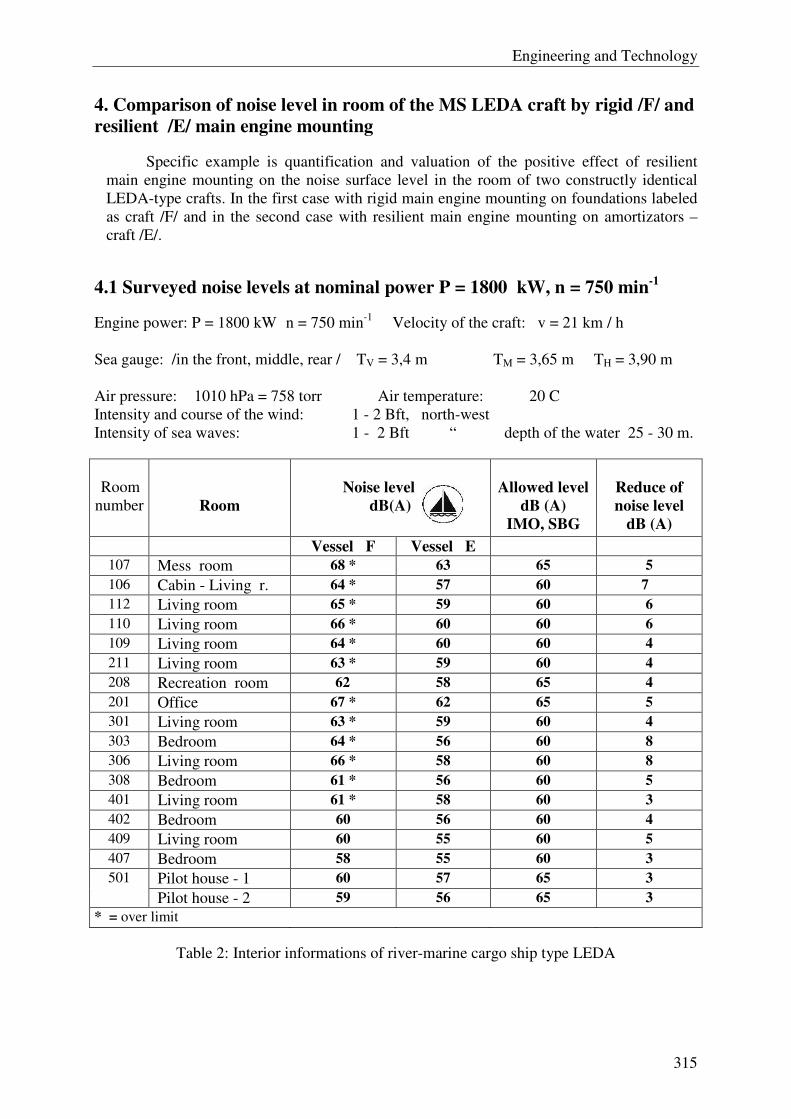
Engineering and Technology
315
4. Comparison of noise level in room of the MS LEDA craft by rigid /F/ and resilient /E/ main engine mounting
Specific example is quantification and valuation of the positive effect of resilient
main engine mounting on the noise surface level in the room of two constructly identical
LEDA-type crafts. In the first case with rigid main engine mounting on foundations labeled
as craft /F/ and in the second case with resilient main engine mounting on amortizators –
craft /E/.
4.1 Surveyed noise levels at nominal power P = 1800 kW, n = 750 min-1
Engine power: P = 1800 kW n = 750 min-1
Velocity of the craft: v = 21 km / h
Sea gauge: /in the front, middle, rear / TV = 3,4 m TM = 3,65 m TH = 3,90 m
Air pressure: 1010 hPa = 758 torr Air temperature: 20 C
Intensity and course of the wind: 1 - 2 Bft, north-west
Intensity of sea waves: 1 - 2 Bft “ depth of the water 25 - 30 m.
Room
number
Room
Noise level
dB(A)
Allowed level
dB (A) IMO, SBG
Reduce of noise level
dB (A) Vessel F Vessel E
107 Mess room 68 * 63 65 5 106 Cabin - Living r. 64 * 57 60 7 112 Living room 65 * 59 60 6 110 Living room 66 * 60 60 6 109 Living room 64 * 60 60 4 211 Living room 63 * 59 60 4 208 Recreation room 62 58 65 4 201 Office 67 * 62 65 5 301 Living room 63 * 59 60 4 303 Bedroom 64 * 56 60 8 306 Living room 66 * 58 60 8 308 Bedroom 61 * 56 60 5 401 Living room 61 * 58 60 3 402 Bedroom 60 56 60 4 409 Living room 60 55 60 5 407 Bedroom 58 55 60 3
Pilot house - 1 60 57 65 3 501
Pilot house - 2 59 56 65 3 * = over limit
Table 2: Interior informations of river-marine cargo ship type LEDA
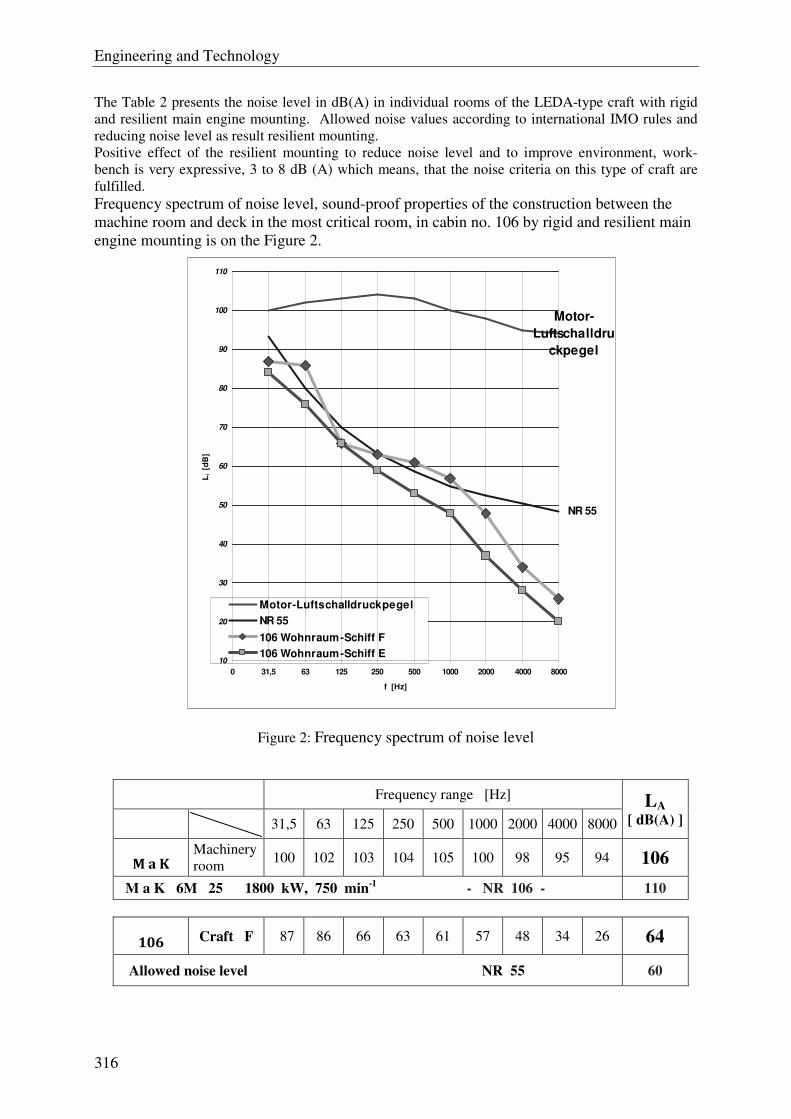
Engineering and Technology
316
The Table 2 presents the noise level in dB(A) in individual rooms of the LEDA-type craft with rigid
and resilient main engine mounting. Allowed noise values according to international IMO rules and
reducing noise level as result resilient mounting.
Positive effect of the resilient mounting to reduce noise level and to improve environment, work-
bench is very expressive, 3 to 8 dB (A) which means, that the noise criteria on this type of craft are
fulfilled.
Frequency spectrum of noise level, sound-proof properties of the construction between the
machine room and deck in the most critical room, in cabin no. 106 by rigid and resilient main
engine mounting is on the Figure 2.
Figure 2: Frequency spectrum of noise level
Frequency range [Hz]
31,5 63 125 250 500 1000 2000 4000 8000
LA [ dB(A) ]
M a K
Machinery
room 100 102 103 104 105 100 98 95 94 106
M a K 6M 25 1800 kW, 750 min-1 - NR 106 - 110
106 Craft F 87 86 66 63 61 57 48 34 26 64
Allowed noise level NR 55 60
D(F) = 43 D (E) = 52
Motor-
Luftschalldru
ckpegel
NR 55
10
20
30
40
50
60
70
80
90
100
110
0 31,5 63 125 250 500 1000 2000 4000 8000
f [Hz]
Li
[dB
]
Motor-Luftschalldruckpegel
NR 55
106 Wohnraum-Schiff F
106 Wohnraum-Schiff E
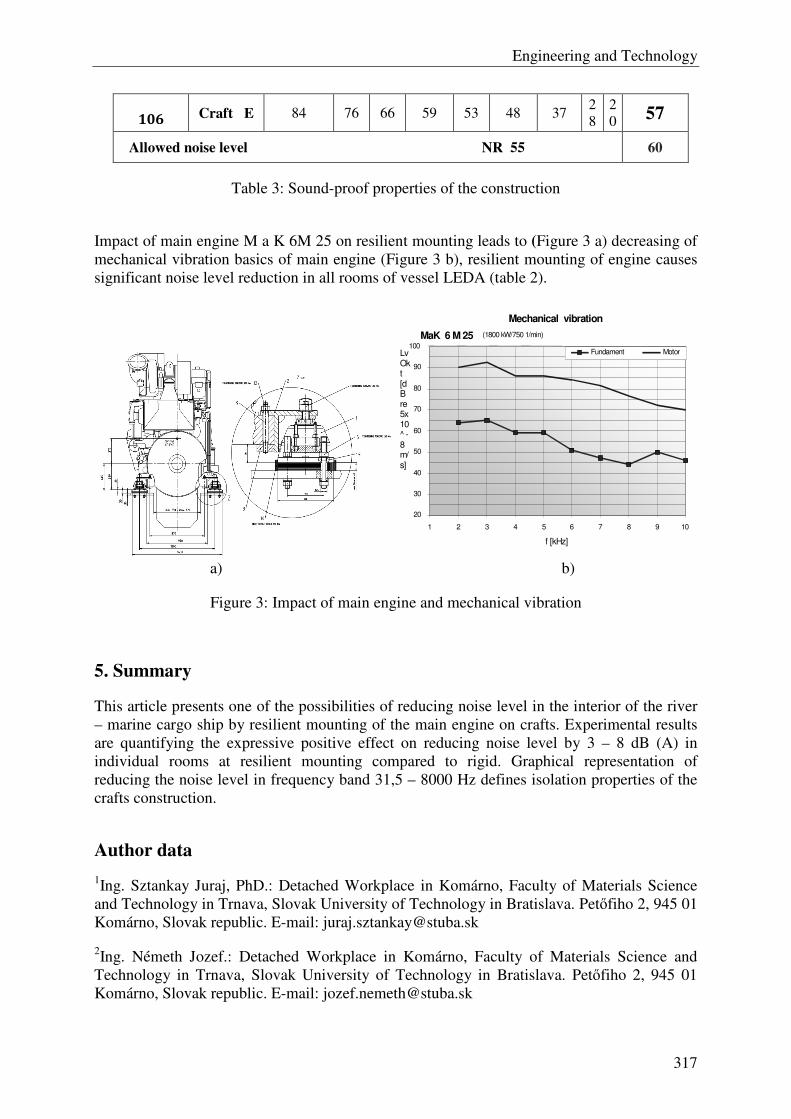
Engineering and Technology
317
106 Craft E 84 76 66 59 53 48 37
2
8
2
0 57
Allowed noise level NR 55 60
Table 3: Sound-proof properties of the construction
Impact of main engine M a K 6M 25 on resilient mounting leads to (Figure 3 a) decreasing of
mechanical vibration basics of main engine (Figure 3 b), resilient mounting of engine causes
significant noise level reduction in all rooms of vessel LEDA (table 2).
Mechanical vibration
20
30
40
50
60
70
80
90
100
1 2 3 4 5 6 7 8 9 10 f [kHz]
LvOkt [dB re 5x10 -
8 m/s]
Fundament Motor MaK 6 M 25 (1800 kW/750 1/min)
a) b)
Figure 3: Impact of main engine and mechanical vibration
5. Summary
This article presents one of the possibilities of reducing noise level in the interior of the river
– marine cargo ship by resilient mounting of the main engine on crafts. Experimental results
are quantifying the expressive positive effect on reducing noise level by 3 – 8 dB (A) in
individual rooms at resilient mounting compared to rigid. Graphical representation of
reducing the noise level in frequency band 31,5 – 8000 Hz defines isolation properties of the
crafts construction.
Author data
1Ing. Sztankay Juraj, PhD.: Detached Workplace in Komárno, Faculty of Materials Science
and Technology in Trnava, Slovak University of Technology in Bratislava. Petőfiho 2, 945 01
Komárno, Slovak republic. E-mail: [email protected]
2Ing. Németh Jozef.: Detached Workplace in Komárno, Faculty of Materials Science and
Technology in Trnava, Slovak University of Technology in Bratislava. Petőfiho 2, 945 01
Komárno, Slovak republic. E-mail: [email protected]
Engineering and Technology
318
Analysis of the Reliability of Threaded Joints Sealed with
Anaerobic Polymeric Sealants in Gas Pipeline Installations
Zlatko Tonković1, Pero Raos
2, Marija Somolanji
1
1HEP-Plin Ltd. Osijek, Croatian Electrical Company (cr. HEP), CROATIA
2Faculty of Mechanical Engineering, University of Osijek, CROATIA
Abstract: Contemporary approaches regarded to infrastructure are more over directed to new
materials development. The most recent development and application of the new materials
pertain to sealant materials for sealing threaded joints in gas pipeline installations and
installations for other medium. Based on provided analysis, gas leakage on threaded joints
sealed with hemp was affirmed. The aim of this paper is to analyze the reliability of anaerobic
polymeric sealants usage. Therefore the experimental work is provided on three different
anaerobic sealing compounds with three material combinations in threaded pipe joints (steel -
brass, brass - brass and brass -aluminium) at three different temperatures (-20 °C, 25 °C and
100 °C).
Keywords: anaerobic polymeric sealants, threaded joints, gas pipeline installation
1. Introduction
Application of hemp and non-curing sealing compounds is quite common in developing
countries for different installation types, especially in natural gas installations. In spite of
careful assembling, industry is faced with leakage problems of such joints after few years of
exploitation. Nowadays, most of the countries and especially industrial developed countries
devote great care to development and application of sealing materials for sealing of threaded
joints in gas pipeline installations and installations for other media.
With growth of natural gas usage, possibilities of risk are also increasing, and for that reason,
it is necessary to direct all attention to the tightness of sealed joints in gas installations.
According to [1] non-curing sealing compounds, polytetrafluorethylene (PTFE) tapes and
anaerobic polymer sealants can be used for sealing threaded joints in gas pipeline
installations.
The most recent development in sealants is polymeric (methacrylate) anaerobic sealants,
which cure to insoluble, tough, plastic thread fillers that prevent leakage regardless of the
pressure or torque applied. Some of the most important advantages of these anaerobic jointing
compounds are that they lubricate during assembling, seal regardless of assembly torque, seal
to the burst rating of the pipe, provide controlled disassembly torque years later, do not cure
outside joint (easy clean-up) and by that prevent corrosion on threads, give the lowest cost per
sealed fitting [2-3].
Some earlier researches [3,4] have proved that the leaking of the gas from commercial
pipelines was not a safety problem, only; it should also be considered as direct loss of
financial resources for gas distributors. Therefore, it is necessary to determine positions and
frequency of the gas leaking as well as to analyze the possible causes of leaking and to give
the eventual solutions to improve sealing.
Engineering and Technology
319
2. Reliability of Traditional Sealing Methods
Main task of thread sealants is to prevent leakage of gases and liquids from pipe joints. All
such joints consider being dynamic due to vibrations, changing pressures or changing
temperatures, which makes special requests on them. Improperly assembled joins are most often the reason of leakage that can lead to life danger
situations, therefore sealing of threaded joins is particularly important.
The ideal sealing method is to achieve join with tight thread connection. Theoretically, in
doing so there is no need for application of sealing material. It is possible to achieve absolute
tightness of join with precisely compiled thread.
In praxis, on the other hand high costs of fitting and problems with fulfilling tolerances
usually demand application of sealing methods with additional various sealing materials.
There are many factors influencing the reliability of sealing threaded joints in gas pipeline
installations. It might be the thread length, uncorrected cutting tool, sealing material or man
work.
The analysis in [4,5] has shown that one of the most important factors is the applied sealing
method. According to available references [1] and corresponding standards and producer's
recommendations as well as based on own experience a significant improvement could be the
application of anaerobic-curing jointing compounds instead of traditional sealing method
using hemp and non-curing compounds.
The experiences in application of anaerobic jointing Sealants for natural and commercial gas
installations in Europe vary from country to country. Their application standardizes DIN EN
751-1 (DIN 30 661), BS 6956-7 and some company-internal standards (e.g. Italgas, Gaz de
France etc.).
There is no large-scale application of anaerobic sealants in commercial gas installation pipe
works in Croatia. However, the previous analyses [4,5] have shown an excessive leakage in
some parts of the analyzed commercial gas installation, traditionally sealed with non-curing
sealants in combination with hemp.
Therefore, the authors have conducted an experimental investigation in which have been
applied anaerobic sealants in some positions of the commercial gas pipelines and compared
them with the same positions on pipe work sealed traditionally.
3. Experimental Investigations on Anaerobic Polymeric Sealants
According to preliminary investigations [4-8] there are three main factors influencing the
sealing performances of the threaded pipe joints. They are sealing compound, working
temperatures and fitting material combination.
3.1. Design and Course of the Experiment
In the investigations an experimental design, which includes 3 factors at 3 levels in 5 runs
giving a total of 135 experimental runs have been applied. Summarized, all factors and level
values are shown in Table 1.
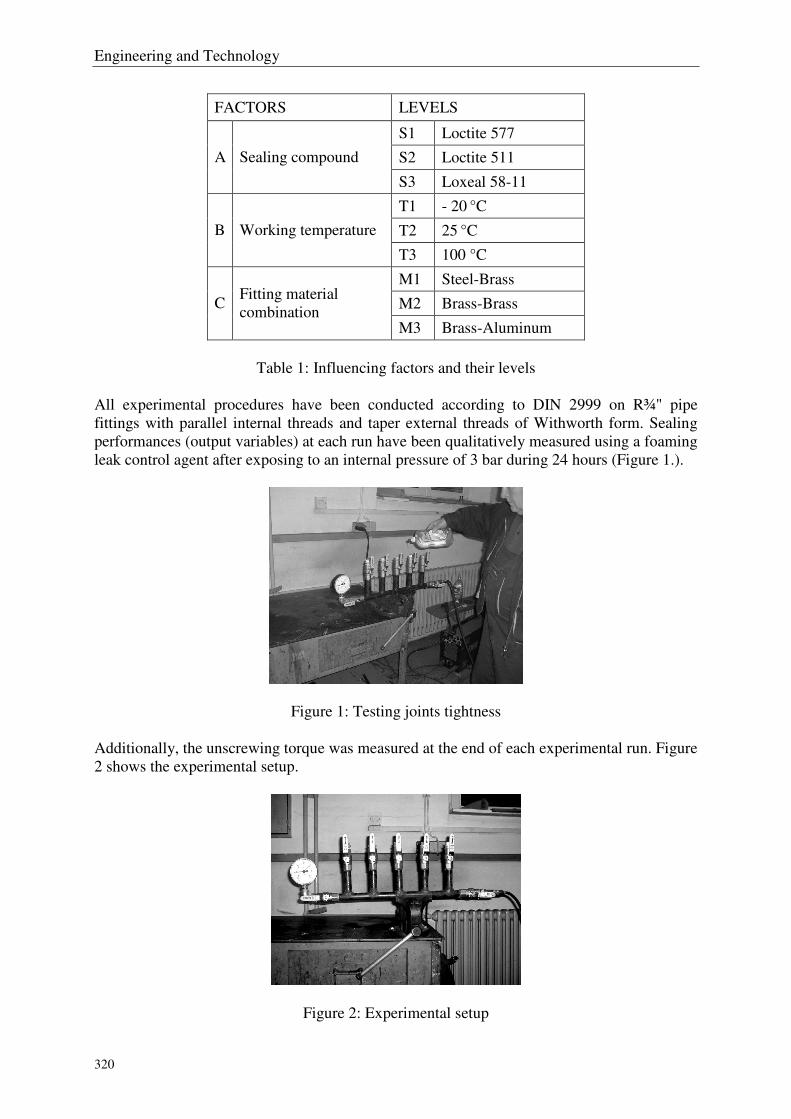
Engineering and Technology
320
FACTORS LEVELS
S1 Loctite 577
S2 Loctite 511 A Sealing compound
S3 Loxeal 58-11
T1 - 20 °C
T2 25 °C B Working temperature
T3 100 °C
M1 Steel-Brass
M2 Brass-Brass C Fitting material
combination M3 Brass-Aluminum
Table 1: Influencing factors and their levels
All experimental procedures have been conducted according to DIN 2999 on R¾" pipe
fittings with parallel internal threads and taper external threads of Withworth form. Sealing
performances (output variables) at each run have been qualitatively measured using a foaming
leak control agent after exposing to an internal pressure of 3 bar during 24 hours (Figure 1.).
Figure 1: Testing joints tightness
Additionally, the unscrewing torque was measured at the end of each experimental run. Figure
2 shows the experimental setup.
Figure 2: Experimental setup
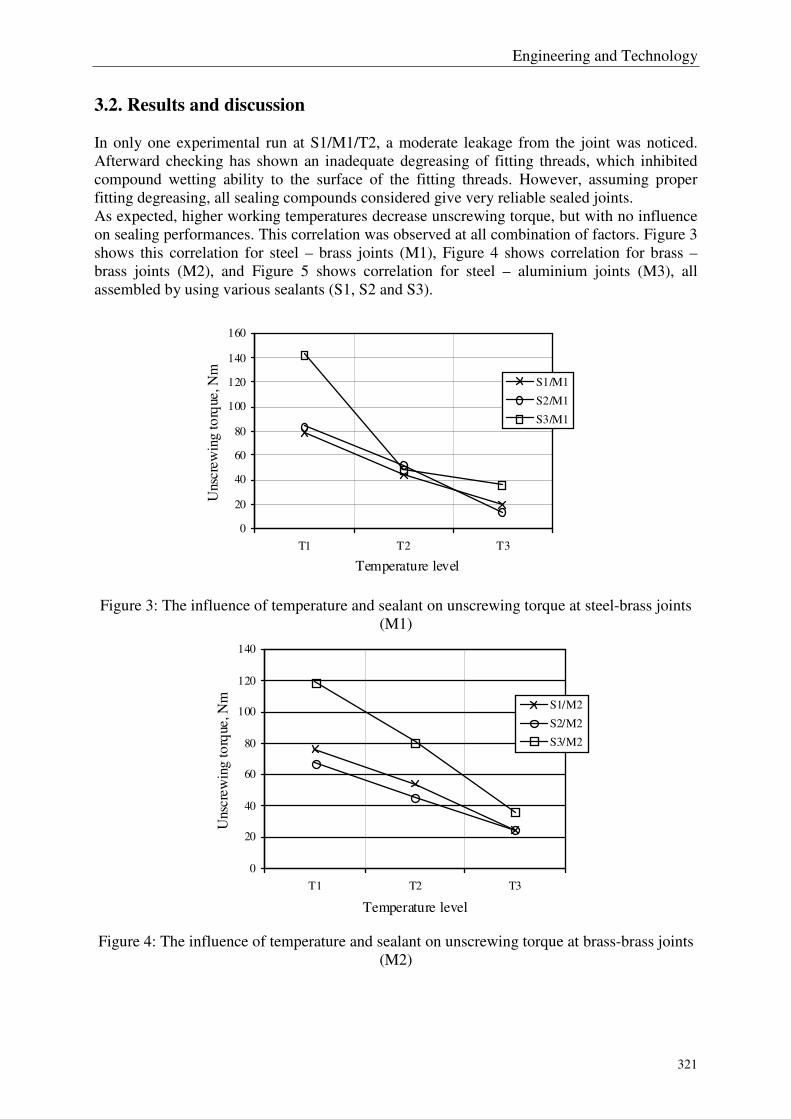
Engineering and Technology
321
3.2. Results and discussion
In only one experimental run at S1/M1/T2, a moderate leakage from the joint was noticed.
Afterward checking has shown an inadequate degreasing of fitting threads, which inhibited
compound wetting ability to the surface of the fitting threads. However, assuming proper
fitting degreasing, all sealing compounds considered give very reliable sealed joints.
As expected, higher working temperatures decrease unscrewing torque, but with no influence
on sealing performances. This correlation was observed at all combination of factors. Figure 3
shows this correlation for steel – brass joints (M1), Figure 4 shows correlation for brass –
brass joints (M2), and Figure 5 shows correlation for steel – aluminium joints (M3), all
assembled by using various sealants (S1, S2 and S3).
0
20
40
60
80
100
120
140
160
T1 T2 T3
Temperature level
Unsc
rew
ing
to
rque
, N
m
S1/M1
S2/M1
S3/M1
Figure 3: The influence of temperature and sealant on unscrewing torque at steel-brass joints
(M1)
0
20
40
60
80
100
120
140
T1 T2 T3
Temperature level
Unsc
rew
ing
to
rque
, N
m S1/M2
S2/M2
S3/M2
Figure 4: The influence of temperature and sealant on unscrewing torque at brass-brass joints
(M2)
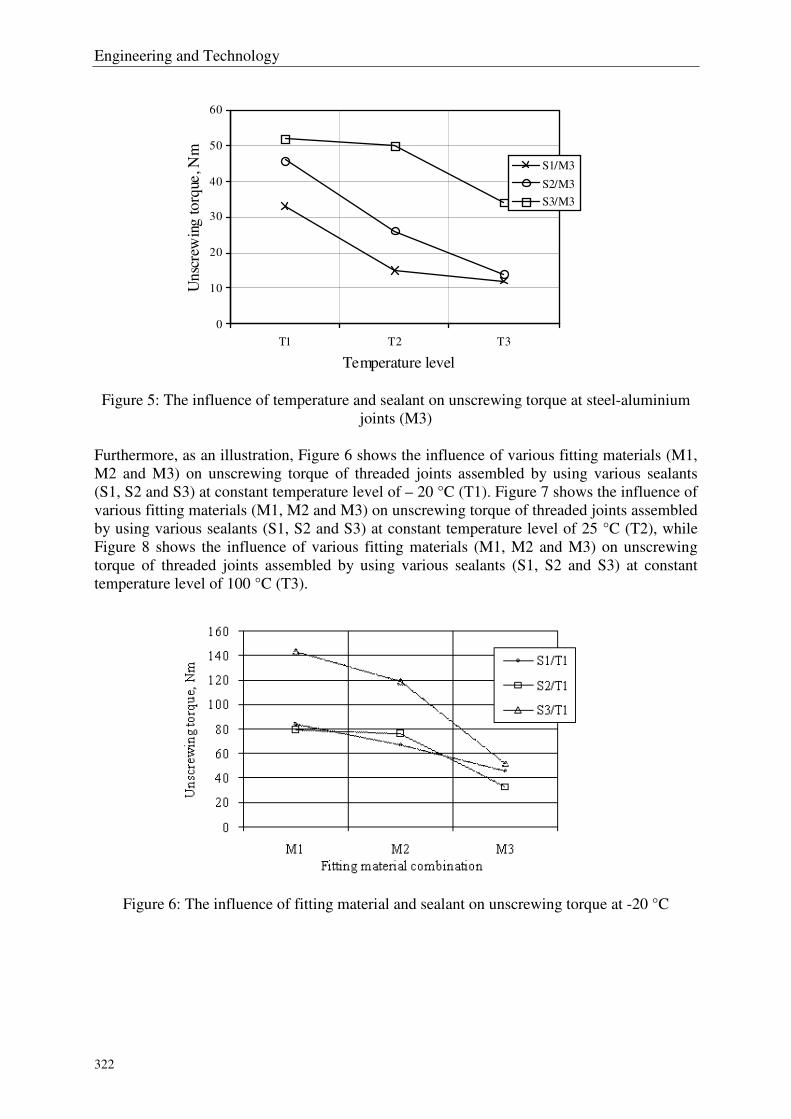
Engineering and Technology
322
0
10
20
30
40
50
60
T1 T2 T3
Temperature level
Unsc
rew
ing torq
ue, N
m
S1/M3
S2/M3
S3/M3
Figure 5: The influence of temperature and sealant on unscrewing torque at steel-aluminium
joints (M3)
Furthermore, as an illustration, Figure 6 shows the influence of various fitting materials (M1,
M2 and M3) on unscrewing torque of threaded joints assembled by using various sealants
(S1, S2 and S3) at constant temperature level of – 20 °C (T1). Figure 7 shows the influence of
various fitting materials (M1, M2 and M3) on unscrewing torque of threaded joints assembled
by using various sealants (S1, S2 and S3) at constant temperature level of 25 °C (T2), while
Figure 8 shows the influence of various fitting materials (M1, M2 and M3) on unscrewing
torque of threaded joints assembled by using various sealants (S1, S2 and S3) at constant
temperature level of 100 °C (T3).
Figure 6: The influence of fitting material and sealant on unscrewing torque at -20 °C
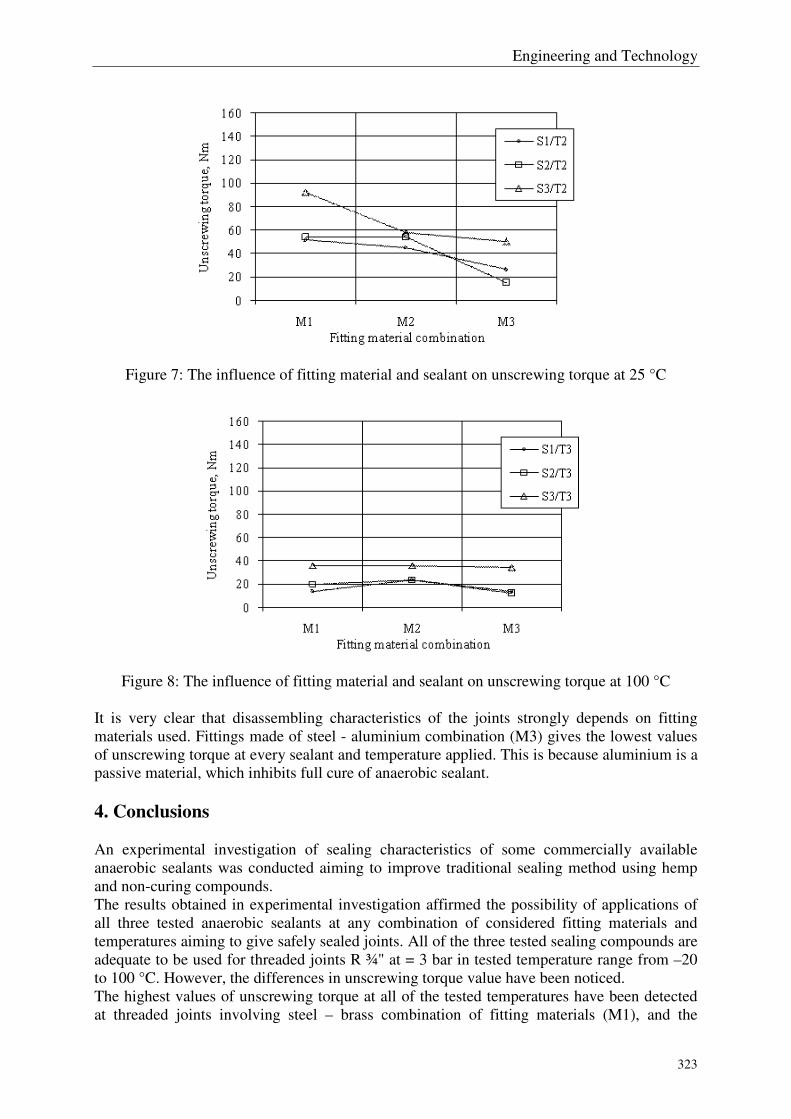
Engineering and Technology
323
Figure 7: The influence of fitting material and sealant on unscrewing torque at 25 °C
Figure 8: The influence of fitting material and sealant on unscrewing torque at 100 °C
It is very clear that disassembling characteristics of the joints strongly depends on fitting
materials used. Fittings made of steel - aluminium combination (M3) gives the lowest values
of unscrewing torque at every sealant and temperature applied. This is because aluminium is a
passive material, which inhibits full cure of anaerobic sealant.
4. Conclusions
An experimental investigation of sealing characteristics of some commercially available
anaerobic sealants was conducted aiming to improve traditional sealing method using hemp
and non-curing compounds.
The results obtained in experimental investigation affirmed the possibility of applications of
all three tested anaerobic sealants at any combination of considered fitting materials and
temperatures aiming to give safely sealed joints. All of the three tested sealing compounds are
adequate to be used for threaded joints R ¾" at = 3 bar in tested temperature range from –20
to 100 °C. However, the differences in unscrewing torque value have been noticed.
The highest values of unscrewing torque at all of the tested temperatures have been detected
at threaded joints involving steel – brass combination of fitting materials (M1), and the
Engineering and Technology
324
smallest values at brass – aluminium combination (M3). From the practical point of view a
possible limitation for application is a relatively high unscrewing torque, which is achieved by
using some compounds and/or large fitting diameters. In this case disassembling the joints
using standard manual tools could possibly be problematic.
From mentioned above can be concluded that it is more reliable to use other technical
possibilities for sealing threaded joints, such as anaerobic polymeric sealants, then hemp and
non-curing compounds. It is also necessary to follow up development and new achievements
in sealing area, try them on models and in praxis so that sealing of threaded joints in gas
pipeline installations become more reliable and permanent.
References
[1] N.N.: EN 751 - Sealing materials for metallic threaded joints in contact with 1st, 2
nd and
3rd
family gases and hot water, 1997
[2] Raos, Pero: Contemporary methods of adhesive bonding and sealing in maintenance, 2nd
International meeting: Maintenance 95, Croatian Maintenance Association, Opatija, 1995
[3] Raos, Pero. Contemporary sealing compounds in threaded pipe fittings // EGE
3(1996)13,58-59.
[4] Tonković, Zlatko: Contribution to investigation on sealing threaded joints of the city gas
pipelines with anaerobic sealing compounds, Master thesis, Mechanical Engineering
faculty in Slavonski Brod, University of Osijek, 2002
[5] Raos, Pero; Tonković, Zlatko. Sealing of threaded pipe joints in natural gas distributive
pipeline systems // EGE 11(2004)1,2-4.
[6] Tonković, Z.; Raos, P.; Stojšić, J.: Application of Anaerobic Thread Sealants in Natural
Gas Pipelines. Tehnički vjesnik, 16, 1(2009), 11-14, ISSN: 1330-3651
[7] Tonković, Zlatko; Zekić-Sušac, Marijana; Somolanji, Marija. Predicting Natural Gas
Consumption by Neural Networks. // Tehnički Vjesnik. 16 (2009), 3; 51-61, ISSN: 1330-
3651
[8] Tonković, Zlatko; Knežević, Pero; Somolanji, Marija. Sealing of Threaded Joints in Gas
Pipeline Installations // Proceedings of the 1st International Scientific and Expert
Conference TEAM 2009 / Stoić, Antun (ur.). Slavonski Brod: University of Applied
Sciences of Slavonski Brod, 2009. 137-141.
Author data
Zlatko Tonković: HEP-Plin Ltd. Osijek, Croatian Electrical Company (cr. HEP), Cara
Hadrijana 7, HR-31000 Osijek, Croatia, [email protected]
Pero Raos: Mechanical Engineering Faculty in Slavonski Brod, J. J. Strossmayer University
of Osijek, Trg I. B. Mažuranić 2, HR-35000 Slavonski Brod, Croatia, [email protected]
Marija Somolanji: HEP-Plin Ltd. Osijek, Croatian Electrical Company (cr. HEP), Cara
Hadrijana 7, HR-31000 Osijek, Croatia, [email protected]
Engineering and Technology
325
Mathematical Model for Life Prediction of Damaged PE 80 Gas-
Pipes
Zlatko Tonković1, Pero Raos2, Josip Stojšić2 1HEP-Plin Ltd. Osijek, Croatian Electrical Company (cr. HEP), CROATIA
2Faculty of Mechanical Engineering, University of Osijek, CROATIA
Abstract: This paper deals with new approach to the problem of predicting lifetime of damaged thick-walled gas pipes made of high-density polyethylene (PE-HD 80). Gas pipeline system condition affects on reliability and safety of the gas use. At the same time the quality of pipelines imposes itself as the economy and the safety imperative. Investigations based on long-term experiments involving three parameters: pressure, length and depth of initial axially notch type crack gave empirical mathematical model for life prediction of PE 80 gas pipes presented in the paper. Keywords: polyethylene gas-pipes, mathematical model, life prediction
1. Introduction Increased application of polymer materials for installing various industrial and communal pipelines puts up the question of system durability before distributors. Therefore, several methods for life prediction of polymer pipes were developed mostly based on methods of fracture mechanics, which involve experimentally defined stress intensity factor. However, in such methods stress intensity factor is determined on standardized specimens neglecting the influence of real pipe geometry and processing method (e.g. properties anisotropy as a consequence of an extrusion process) [1-3]. Major disadvantage is the fact that methods of fracture mechanics are based on observations of crack developing all over specimen intersection, what cannot be directly applied on damaged polyethylene pipes because when it comes to breaking pipe wall, the pipe becomes useless [4]. Furthermore, information on stress intensity factor is usually unknown to distributors. The only information that distributor really has access to, when perceiving damages on polyethylene pipes, are length and depth of initial notch type crack and gas pressure in pipes. Due to mentioned, and first of all for practical reasons, obtaining empirical mathematical model and by that new approach based on available and measurable data (length and depth of initial notch type crack and pressure in pipes) for life prediction of damaged polyethylene gas pipes seemed reasonable. Design and course of the experiment as well as results of investigation on PE 80 gas pipes with axial notches are considered further in text. 2. Experimental investigation on PE 80 pipes with axial notches Aiming to obtain an empirical mathematical model for life prediction of PE 80 gas pipes, with axial notches, experimental investigation was carried out. The influence of initial notch geometry and internal pressure on time to get pipes failed (burst due to internal pressure) was tested in experiment. In such a way, real situation when some accidental cuttings or notch type damages on pipe surface could occur during their mounting into the ground was simulated.
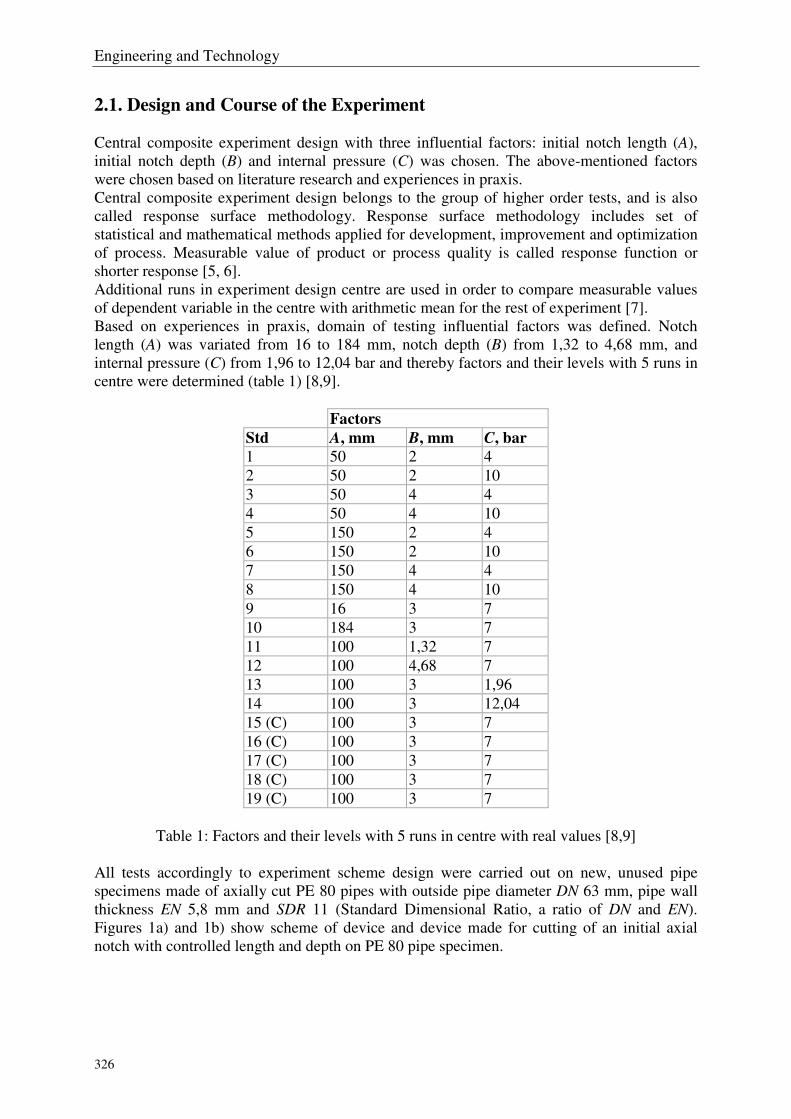
Engineering and Technology
326
2.1. Design and Course of the Experiment Central composite experiment design with three influential factors: initial notch length (A), initial notch depth (B) and internal pressure (C) was chosen. The above-mentioned factors were chosen based on literature research and experiences in praxis. Central composite experiment design belongs to the group of higher order tests, and is also called response surface methodology. Response surface methodology includes set of statistical and mathematical methods applied for development, improvement and optimization of process. Measurable value of product or process quality is called response function or shorter response [5, 6]. Additional runs in experiment design centre are used in order to compare measurable values of dependent variable in the centre with arithmetic mean for the rest of experiment [7]. Based on experiences in praxis, domain of testing influential factors was defined. Notch length (A) was variated from 16 to 184 mm, notch depth (B) from 1,32 to 4,68 mm, and internal pressure (C) from 1,96 to 12,04 bar and thereby factors and their levels with 5 runs in centre were determined (table 1) [8,9].
Factors
Std A, mm B, mm C, bar
1 50 2 4 2 50 2 10 3 50 4 4 4 50 4 10 5 150 2 4 6 150 2 10 7 150 4 4 8 150 4 10 9 16 3 7 10 184 3 7 11 100 1,32 7 12 100 4,68 7 13 100 3 1,96 14 100 3 12,04 15 (C) 100 3 7 16 (C) 100 3 7 17 (C) 100 3 7 18 (C) 100 3 7 19 (C) 100 3 7
Table 1: Factors and their levels with 5 runs in centre with real values [8,9]
All tests accordingly to experiment scheme design were carried out on new, unused pipe specimens made of axially cut PE 80 pipes with outside pipe diameter DN 63 mm, pipe wall thickness EN 5,8 mm and SDR 11 (Standard Dimensional Ratio, a ratio of DN and EN). Figures 1a) and 1b) show scheme of device and device made for cutting of an initial axial notch with controlled length and depth on PE 80 pipe specimen.
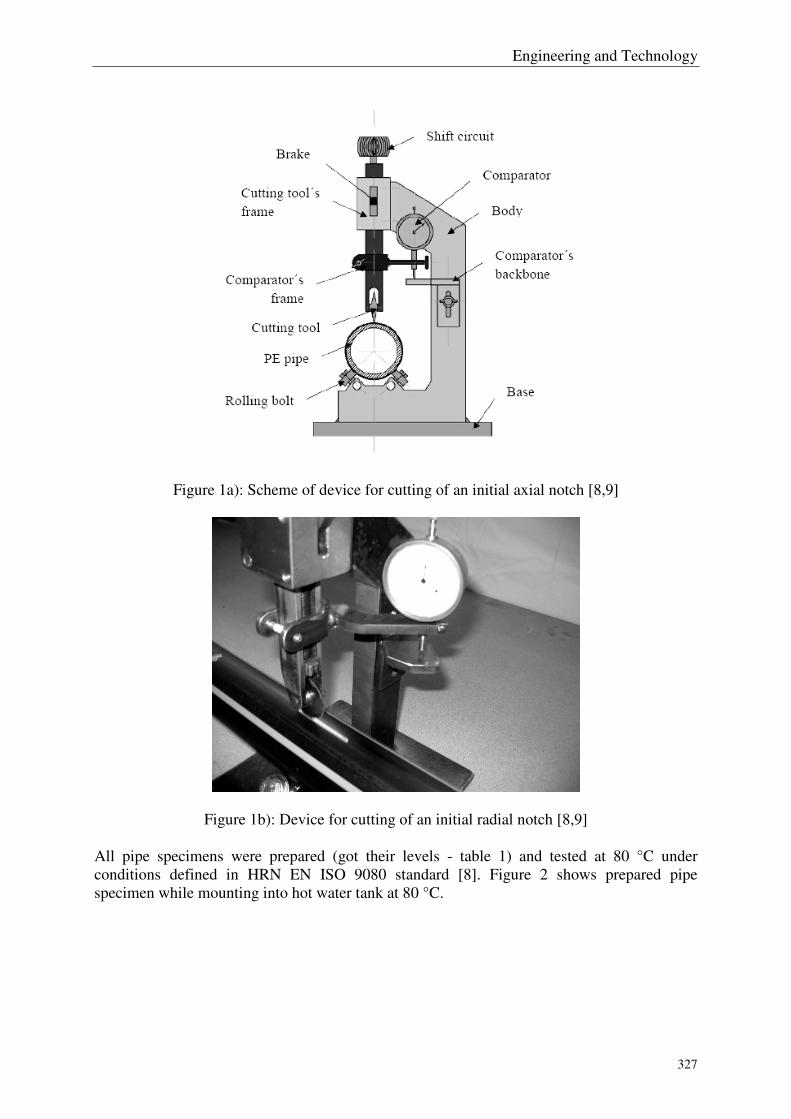
Engineering and Technology
327
Figure 1a): Scheme of device for cutting of an initial axial notch [8,9]
Figure 1b): Device for cutting of an initial radial notch [8,9] All pipe specimens were prepared (got their levels - table 1) and tested at 80 °C under conditions defined in HRN EN ISO 9080 standard [8]. Figure 2 shows prepared pipe specimen while mounting into hot water tank at 80 °C.
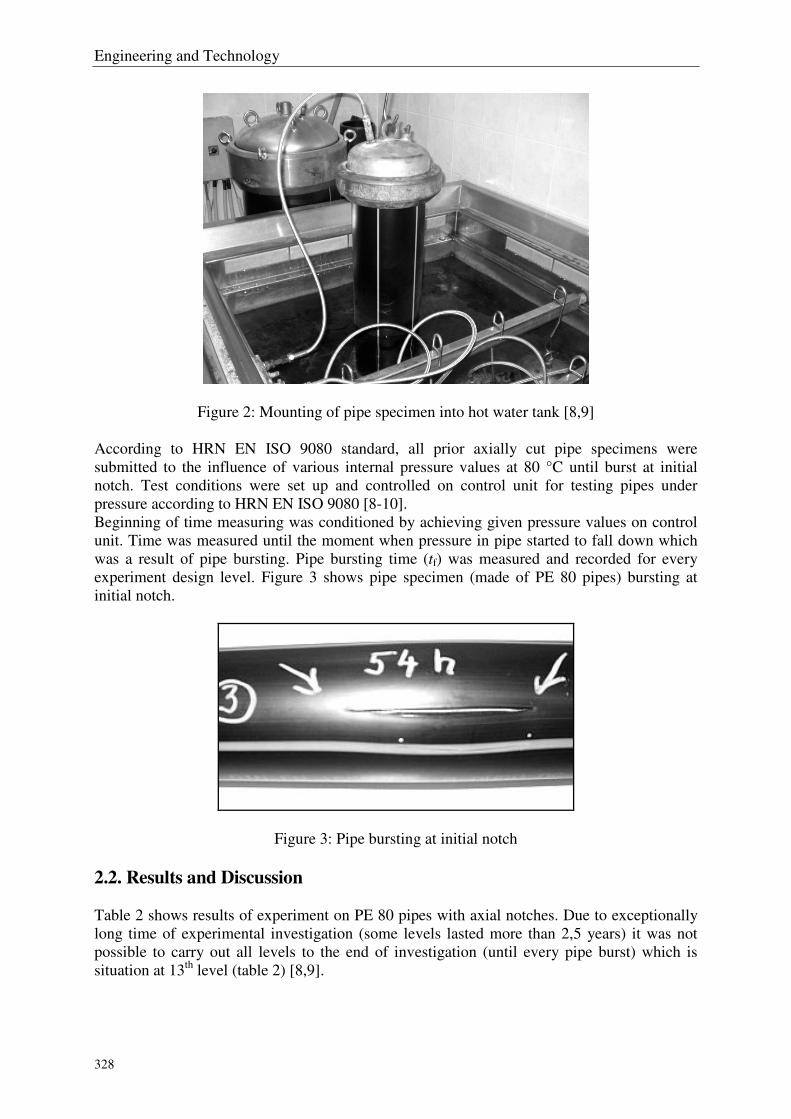
Engineering and Technology
328
Figure 2: Mounting of pipe specimen into hot water tank [8,9] According to HRN EN ISO 9080 standard, all prior axially cut pipe specimens were submitted to the influence of various internal pressure values at 80 °C until burst at initial notch. Test conditions were set up and controlled on control unit for testing pipes under pressure according to HRN EN ISO 9080 [8-10]. Beginning of time measuring was conditioned by achieving given pressure values on control unit. Time was measured until the moment when pressure in pipe started to fall down which was a result of pipe bursting. Pipe bursting time (tf) was measured and recorded for every experiment design level. Figure 3 shows pipe specimen (made of PE 80 pipes) bursting at initial notch.
Figure 3: Pipe bursting at initial notch 2.2. Results and Discussion Table 2 shows results of experiment on PE 80 pipes with axial notches. Due to exceptionally long time of experimental investigation (some levels lasted more than 2,5 years) it was not possible to carry out all levels to the end of investigation (until every pipe burst) which is situation at 13th level (table 2) [8,9].
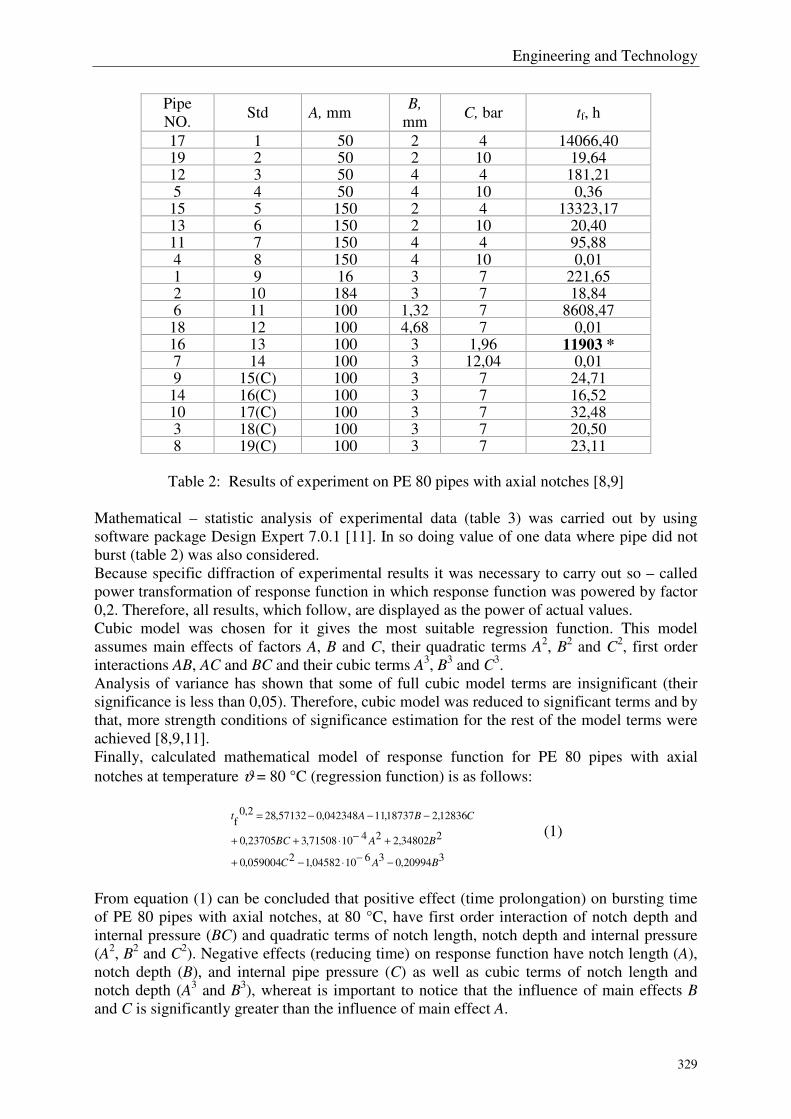
Engineering and Technology
329
Pipe NO.
Std A, mm B,
mm C, bar tf, h
17 1 50 2 4 14066,40 19 2 50 2 10 19,64 12 3 50 4 4 181,21 5 4 50 4 10 0,36
15 5 150 2 4 13323,17 13 6 150 2 10 20,40 11 7 150 4 4 95,88 4 8 150 4 10 0,01 1 9 16 3 7 221,65 2 10 184 3 7 18,84 6 11 100 1,32 7 8608,47
18 12 100 4,68 7 0,01 16 13 100 3 1,96 11903 * 7 14 100 3 12,04 0,01 9 15(C) 100 3 7 24,71
14 16(C) 100 3 7 16,52 10 17(C) 100 3 7 32,48 3 18(C) 100 3 7 20,50 8 19(C) 100 3 7 23,11
Table 2: Results of experiment on PE 80 pipes with axial notches [8,9]
Mathematical – statistic analysis of experimental data (table 3) was carried out by using software package Design Expert 7.0.1 [11]. In so doing value of one data where pipe did not burst (table 2) was also considered. Because specific diffraction of experimental results it was necessary to carry out so – called power transformation of response function in which response function was powered by factor 0,2. Therefore, all results, which follow, are displayed as the power of actual values. Cubic model was chosen for it gives the most suitable regression function. This model assumes main effects of factors A, B and C, their quadratic terms A2, B2 and C2, first order interactions AB, AC and BC and their cubic terms A3, B3 and C3. Analysis of variance has shown that some of full cubic model terms are insignificant (their significance is less than 0,05). Therefore, cubic model was reduced to significant terms and by that, more strength conditions of significance estimation for the rest of the model terms were achieved [8,9,11]. Finally, calculated mathematical model of response function for PE 80 pipes with axial notches at temperature ϑ = 80 °C (regression function) is as follows:
320994,0361004582,12059004,0
234802,2241071508,323705,0
12836,218737,11042348,057132,282,0f
BAC
BABC
CBAt
−−
⋅−+
+−
⋅++
−−−=
(1)
From equation (1) can be concluded that positive effect (time prolongation) on bursting time of PE 80 pipes with axial notches, at 80 °C, have first order interaction of notch depth and internal pressure (BC) and quadratic terms of notch length, notch depth and internal pressure (A2, B2 and C2). Negative effects (reducing time) on response function have notch length (A), notch depth (B), and internal pipe pressure (C) as well as cubic terms of notch length and notch depth (A3 and B3), whereat is important to notice that the influence of main effects B and C is significantly greater than the influence of main effect A.
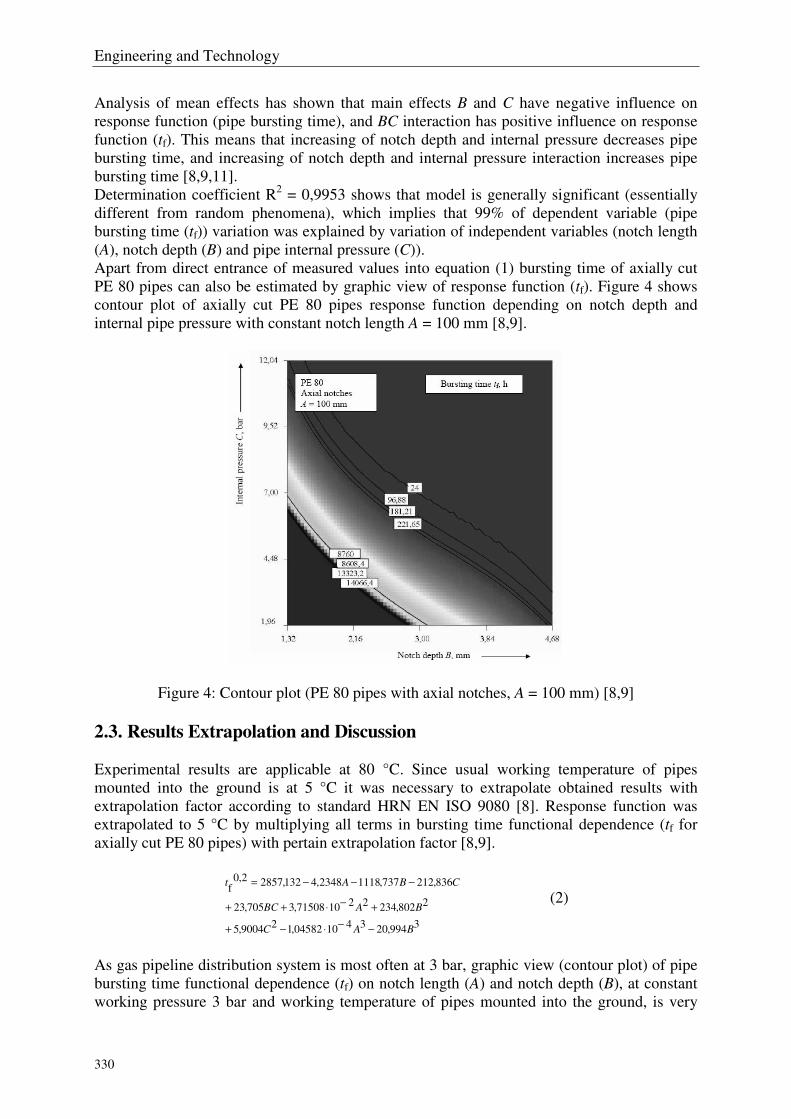
Engineering and Technology
330
Analysis of mean effects has shown that main effects B and C have negative influence on response function (pipe bursting time), and BC interaction has positive influence on response function (tf). This means that increasing of notch depth and internal pressure decreases pipe bursting time, and increasing of notch depth and internal pressure interaction increases pipe bursting time [8,9,11]. Determination coefficient R2 = 0,9953 shows that model is generally significant (essentially different from random phenomena), which implies that 99% of dependent variable (pipe bursting time (tf)) variation was explained by variation of independent variables (notch length (A), notch depth (B) and pipe internal pressure (C)). Apart from direct entrance of measured values into equation (1) bursting time of axially cut PE 80 pipes can also be estimated by graphic view of response function (tf). Figure 4 shows contour plot of axially cut PE 80 pipes response function depending on notch depth and internal pipe pressure with constant notch length A = 100 mm [8,9].
Figure 4: Contour plot (PE 80 pipes with axial notches, A = 100 mm) [8,9]
2.3. Results Extrapolation and Discussion Experimental results are applicable at 80 °C. Since usual working temperature of pipes mounted into the ground is at 5 °C it was necessary to extrapolate obtained results with extrapolation factor according to standard HRN EN ISO 9080 [8]. Response function was extrapolated to 5 °C by multiplying all terms in bursting time functional dependence (tf for axially cut PE 80 pipes) with pertain extrapolation factor [8,9].
3994,20341004582,129004,5
2802,234221071508,3705,23
836,212737,11182348,4132,28572,0f
BAC
BABC
CBAt
−−
⋅−+
+−
⋅++
−−−=
(2)
As gas pipeline distribution system is most often at 3 bar, graphic view (contour plot) of pipe bursting time functional dependence (tf) on notch length (A) and notch depth (B), at constant working pressure 3 bar and working temperature of pipes mounted into the ground, is very
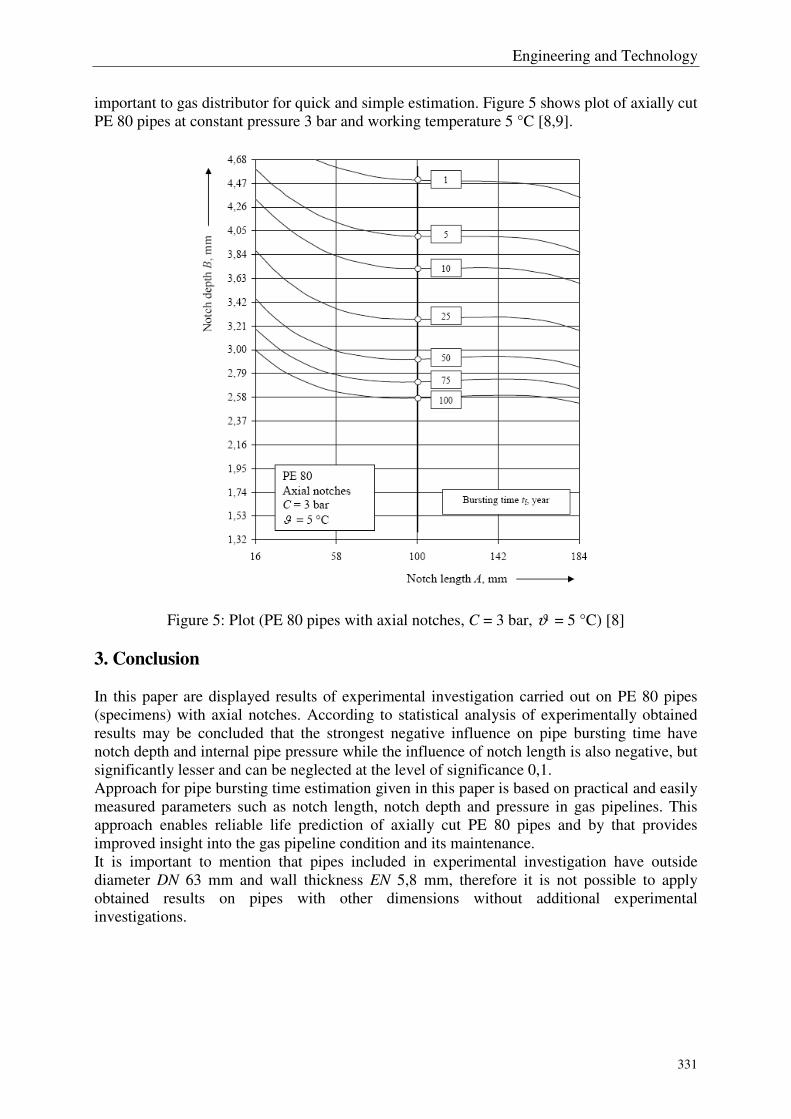
Engineering and Technology
331
important to gas distributor for quick and simple estimation. Figure 5 shows plot of axially cut PE 80 pipes at constant pressure 3 bar and working temperature 5 °C [8,9].
Figure 5: Plot (PE 80 pipes with axial notches, C = 3 bar, ϑ = 5 °C) [8]
3. Conclusion In this paper are displayed results of experimental investigation carried out on PE 80 pipes (specimens) with axial notches. According to statistical analysis of experimentally obtained results may be concluded that the strongest negative influence on pipe bursting time have notch depth and internal pipe pressure while the influence of notch length is also negative, but significantly lesser and can be neglected at the level of significance 0,1. Approach for pipe bursting time estimation given in this paper is based on practical and easily measured parameters such as notch length, notch depth and pressure in gas pipelines. This approach enables reliable life prediction of axially cut PE 80 pipes and by that provides improved insight into the gas pipeline condition and its maintenance. It is important to mention that pipes included in experimental investigation have outside diameter DN 63 mm and wall thickness EN 5,8 mm, therefore it is not possible to apply obtained results on pipes with other dimensions without additional experimental investigations.

Engineering and Technology
332
References [1] Šercer, Mladen; Raos, Pero; Tonković, Zlatko: Life prediction of polyethylene gas pipes,
Proc. 2nd Natural gas Symposium, Osijek, 2004, CD-ROM [2] Šercer, Mladen; Raos, Pero; Tonković, Zlatko: Characteristics of PE gas pipes, Proc. 3rd
Natural gas Symposium, Osijek, 2005, CD-ROM [3] Tonković, Z.; Raos, P.; Stojšić, J.: Application of Anaerobic Thread Sealants in Natural
Gas Pipelines. Tehnički vjesnik, 16, 1(2009), 11-14, ISSN: 1330-3651 [4] Pinter, G.; Lang, R. W.: Creep Crack Growth in High Density Polyethylene. In: Moore, R.
(ed.) The Application of Fracture Mechanics to Polymers, Adhesives and Composites. ESIS Publication, 2003
[5] Rujnić-Sokele, M.; Šercer, M.; Vlašić, N.: Influence of packing pressure phase on ABS moulded part properties. Tehnički vjesnik, 16, 2(2009), 67-72, ISSN: 1330-3651
[6] Myers, R. H.; Montgomery, D. C.: Response Surface Methodology: Process and Product Optimization Using Designed Experiments, John Wiley & Sons, Inc., 1995.
[7] Alvarez, L. F.: Design optimization based on genetic programming, University of Bradford, UK, 2000.
[8] Tonković, Zlatko: Life prediction of damaged polyethylene gas - pipes, Doctor´s thesis, Mechanical Engineering faculty in Slavonski Brod, University of Osijek, 2008
[9] Tonković, Zlatko; Somolanji, Marija; Stojšić, Josip. Life Prediction of Damaged PE 80 Gas Pipes. //Tehnički Vjesnik. 16 (2009), 3; 33-37, ISSN: 1330-3651
[10] Technical Report HRN EN ISO 9080: Thermoplastic Pipes for the Transport of Fluids, Methods of Extrapolation of Hydrostatic Stress Rupture Data to Determine the Long-term Hydrostatic Strength of Thermoplastics Pipe Materials, 2004
[11] Stat - Ease, Inc.: Design Expert, Version 7.0.1, Minneapolis, March 2006
Author data
Zlatko Tonković: HEP-Plin Ltd. Osijek, Croatian Electrical Company (cr. HEP), Cara Hadrijana 7, HR-31000 Osijek, Croatia, [email protected] Pero Raos: Mechanical Engineering Faculty in Slavonski Brod, J. J. Strossmayer University of Osijek, Trg I. B. Mažuranić 2, HR-35000 Slavonski Brod, Croatia, [email protected] Josip Stojšić: Mechanical Engineering Faculty in Slavonski Brod, J. J. Strossmayer University of Osijek, Trg I. B. Mažuranić 2, HR-35000 Slavonski Brod, Croatia, [email protected]
Engineering and Technology
333
Ötvözés hatása acélok edzéshez való felmelegítésére
Végvári Ferenc – Bata Attila - Kecskés Bertalan Mechanikai Technológiai Szakcsoport,
Fém- és Műanyagfeldolgozó Technológiai Intézet Kecskeméti Főiskola GAMF Kar
Összefoglalás: A gépgyártás területén igen gyakran alkalmazott eljárás az edzés. Edzést alkalmazunk szerkezeti és szerszámacélok esetén is. A hőkezelés energiaigényes eljárás, így nagyon fontos, hogy csak a minimálisan szükséges energiamennyiséget használjuk fel. Egyik nagy energiaigényű részfolyamat a felhevítés szakasza. A szükségesnél hosszabb idejű melegítési időtartam növeli az energiafelhasználást és kedvezőtlenül hat a hőkezelt alkatrész mechanikai tulajdonságaira. Mérésekkel meghatároztuk különböző átmérőjű és ötvözöttségű acélok edzési hőmérsékletre való felhevítési idejét. A mért eredményeket összehasonlítottuk az irodalmi adatokkal.
Abstract: Quenching is an often used technology in the field of mechanical engineering. Hardening by quenching is applied to structural steels and tool steels as well. The heat treatment of steels is high energy consumptive technology, therefore is important to focus on using only the minimum necessary energy. One of the high energy consumptive part of the technology is the heating process. A longer heating time than the necessary one, increases the energy consumption and can have negative effect on the mechanical properties of the heat treated components. We where carried out measurements to determine the heating time to austenitizing temperature of steels with different compositions and diameters. The measured values where compared with values from related literatures.
Kulcsszavak: edzés, felhevítés edzési hőmérsékletre, ötvözött acélok felhevítése
Keywords: Hardening by quenching, heating to austenitizing temperature, heating of alloyed steels
1. Bevezetés
Az utóbbi évtizedekben a magyarországi autóipari beszállítók egyre nagyobb részt vállalnak az autóipari alkatrészgyártásban. Ezekkel az alkatrészekkel szemben sok esetben szilárdsági elvárásokat írnak elő. Ezen elvárások biztosítására az alkatrészeket hőkezelni kell. A szerszámgyártás területén is elvárt a hőkezelés. A hőkezelés energiaigényes eljárás, így nagyon fontos, hogy az adott műveletet lehetőleg a minimális energiafelhasználással valósítsuk meg. A hőkezelés műveleti idejének csökkentésével csökkenthető az energiafelhasználás, illetve a gyártási költség. A műveleti idő csökkentésére csak a felhevítési, hőntartási idők csökkentése jöhet szóba. Az adott átalakulások végbemenetelére egy bizonyos hőmérsékletre szükség van, az nem változtatható. A hőntartási időt is a lehető legrövidebbre kell megválasztani, egy bizonyos idő után már nem csökkenthető. A felmelegítési idő csökkentésének egyik lehetősége a felhevítés sebességének növelése. A felhevítés sebességének növelése egyre nagyobb hőmérsékletkülönbségeket hoz létre a hevítendő darabban. A hevítendő darabban keletkező hőmérsékletkülönbségek hőfeszültségeket gerjesztenek, aminek a következménye lehet a munkadarab vetemedése, súlyosabb esetekben a repedése. Ezt minden körülmények közt el kell kerülni. A munkadarabban ébredő feszültségek erősen függnek a munkadarab méreteitől, a felületi hőátadás mértékétől és a munkadarab ötvözésének mértékétől. Minél erősebben ötvözött
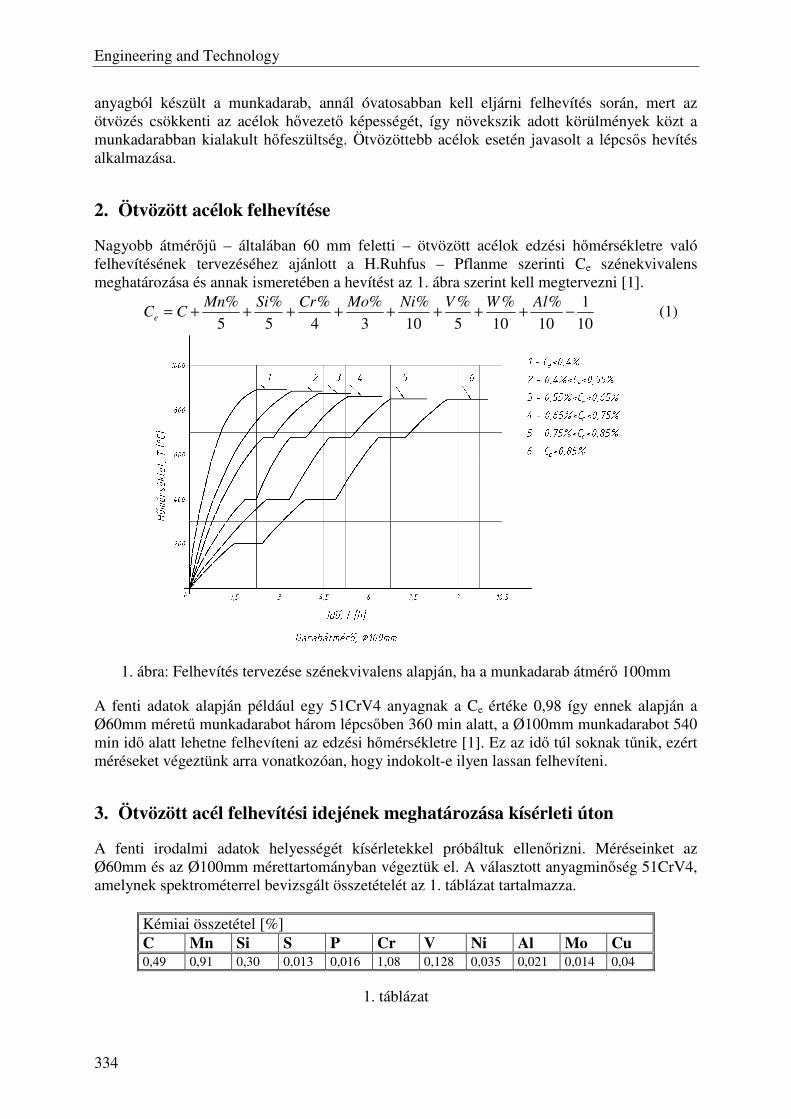
Engineering and Technology
334
anyagból készült a munkadarab, annál óvatosabban kell eljárni felhevítés során, mert az ötvözés csökkenti az acélok hővezető képességét, így növekszik adott körülmények közt a munkadarabban kialakult hőfeszültség. Ötvözöttebb acélok esetén javasolt a lépcsős hevítés alkalmazása.
2. Ötvözött acélok felhevítése
Nagyobb átmérőjű – általában 60 mm feletti – ötvözött acélok edzési hőmérsékletre való felhevítésének tervezéséhez ajánlott a H.Ruhfus – Pflanme szerinti Ce szénekvivalens meghatározása és annak ismeretében a hevítést az 1. ábra szerint kell megtervezni [1].
10
1
10
%
10
%
5
%
10
%
3
%
4
%
5
%
5
%−++++++++=
AlWVNiMoCrSiMnCC
e (1)
1. ábra: Felhevítés tervezése szénekvivalens alapján, ha a munkadarab átmérő 100mm
A fenti adatok alapján például egy 51CrV4 anyagnak a Ce értéke 0,98 így ennek alapján a Ø60mm méretű munkadarabot három lépcsőben 360 min alatt, a Ø100mm munkadarabot 540 min idő alatt lehetne felhevíteni az edzési hőmérsékletre [1]. Ez az idő túl soknak tűnik, ezért méréseket végeztünk arra vonatkozóan, hogy indokolt-e ilyen lassan felhevíteni.
3. Ötvözött acél felhevítési idejének meghatározása kísérleti úton
A fenti irodalmi adatok helyességét kísérletekkel próbáltuk ellenőrizni. Méréseinket az Ø60mm és az Ø100mm mérettartományban végeztük el. A választott anyagminőség 51CrV4, amelynek spektrométerrel bevizsgált összetételét az 1. táblázat tartalmazza.
Kémiai összetétel [%] C Mn Si S P Cr V Ni Al Mo Cu 0,49 0,91 0,30 0,013 0,016 1,08 0,128 0,035 0,021 0,014 0,04
1. táblázat
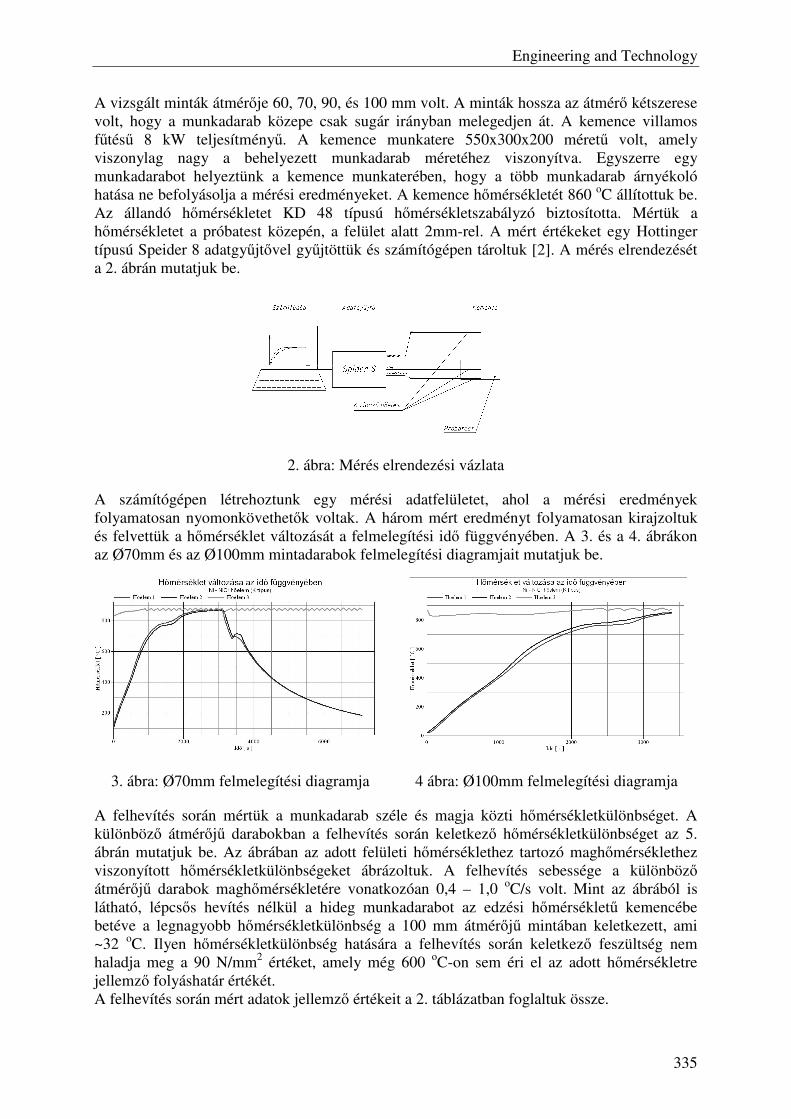
Engineering and Technology
335
A vizsgált minták átmérője 60, 70, 90, és 100 mm volt. A minták hossza az átmérő kétszerese volt, hogy a munkadarab közepe csak sugár irányban melegedjen át. A kemence villamos fűtésű 8 kW teljesítményű. A kemence munkatere 550x300x200 méretű volt, amely viszonylag nagy a behelyezett munkadarab méretéhez viszonyítva. Egyszerre egy munkadarabot helyeztünk a kemence munkaterében, hogy a több munkadarab árnyékoló hatása ne befolyásolja a mérési eredményeket. A kemence hőmérsékletét 860 oC állítottuk be. Az állandó hőmérsékletet KD 48 típusú hőmérsékletszabályzó biztosította. Mértük a hőmérsékletet a próbatest közepén, a felület alatt 2mm-rel. A mért értékeket egy Hottinger típusú Speider 8 adatgyűjtővel gyűjtöttük és számítógépen tároltuk [2]. A mérés elrendezését a 2. ábrán mutatjuk be.
2. ábra: Mérés elrendezési vázlata
A számítógépen létrehoztunk egy mérési adatfelületet, ahol a mérési eredmények folyamatosan nyomonkövethetők voltak. A három mért eredményt folyamatosan kirajzoltuk és felvettük a hőmérséklet változását a felmelegítési idő függvényében. A 3. és a 4. ábrákon az Ø70mm és az Ø100mm mintadarabok felmelegítési diagramjait mutatjuk be.
A felhevítés során mértük a munkadarab széle és magja közti hőmérsékletkülönbséget. A különböző átmérőjű darabokban a felhevítés során keletkező hőmérsékletkülönbséget az 5. ábrán mutatjuk be. Az ábrában az adott felületi hőmérséklethez tartozó maghőmérséklethez viszonyított hőmérsékletkülönbségeket ábrázoltuk. A felhevítés sebessége a különböző átmérőjű darabok maghőmérsékletére vonatkozóan 0,4 – 1,0 oC/s volt. Mint az ábrából is látható, lépcsős hevítés nélkül a hideg munkadarabot az edzési hőmérsékletű kemencébe betéve a legnagyobb hőmérsékletkülönbség a 100 mm átmérőjű mintában keletkezett, ami ~32 oC. Ilyen hőmérsékletkülönbség hatására a felhevítés során keletkező feszültség nem haladja meg a 90 N/mm2 értéket, amely még 600 oC-on sem éri el az adott hőmérsékletre jellemző folyáshatár értékét. A felhevítés során mért adatok jellemző értékeit a 2. táblázatban foglaltuk össze.
3. ábra: Ø70mm felmelegítési diagramja 4 ábra: Ø100mm felmelegítési diagramja
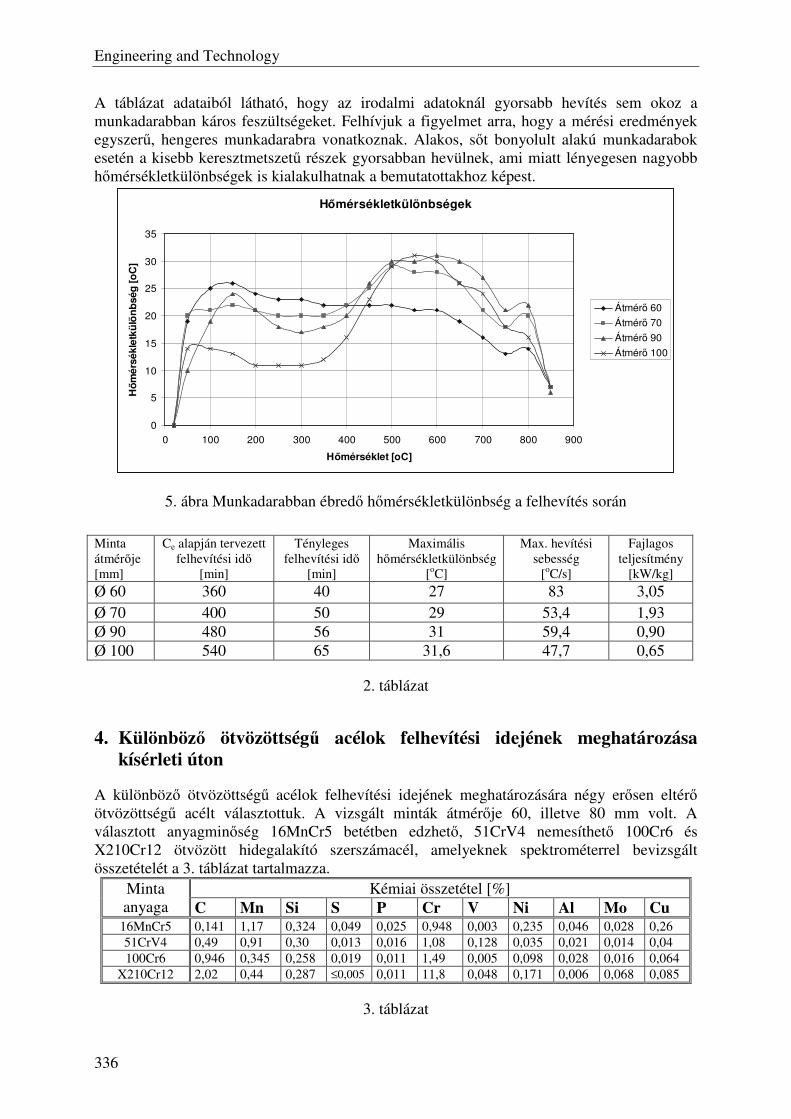
Engineering and Technology
336
A táblázat adataiból látható, hogy az irodalmi adatoknál gyorsabb hevítés sem okoz a munkadarabban káros feszültségeket. Felhívjuk a figyelmet arra, hogy a mérési eredmények egyszerű, hengeres munkadarabra vonatkoznak. Alakos, sőt bonyolult alakú munkadarabok esetén a kisebb keresztmetszetű részek gyorsabban hevülnek, ami miatt lényegesen nagyobb hőmérsékletkülönbségek is kialakulhatnak a bemutatottakhoz képest.
Hőmérsékletkülönbségek
0
5
10
15
20
25
30
35
0 100 200 300 400 500 600 700 800 900
Hőmérséklet [oC]
Hő
mé
rsé
kle
tkü
lön
bség
[o
C]
Átmérő 60
Átmérő 70
Átmérő 90
Átmérő 100
5. ábra Munkadarabban ébredő hőmérsékletkülönbség a felhevítés során
2. táblázat
4. Különböző ötvözöttségű acélok felhevítési idejének meghatározása kísérleti úton
A különböző ötvözöttségű acélok felhevítési idejének meghatározására négy erősen eltérő ötvözöttségű acélt választottuk. A vizsgált minták átmérője 60, illetve 80 mm volt. A választott anyagminőség 16MnCr5 betétben edzhető, 51CrV4 nemesíthető 100Cr6 és X210Cr12 ötvözött hidegalakító szerszámacél, amelyeknek spektrométerrel bevizsgált összetételét a 3. táblázat tartalmazza.
Kémiai összetétel [%] Minta anyaga C Mn Si S P Cr V Ni Al Mo Cu
16MnCr5 0,141 1,17 0,324 0,049 0,025 0,948 0,003 0,235 0,046 0,028 0,26 51CrV4 0,49 0,91 0,30 0,013 0,016 1,08 0,128 0,035 0,021 0,014 0,04 100Cr6 0,946 0,345 0,258 0,019 0,011 1,49 0,005 0,098 0,028 0,016 0,064
X210Cr12 2,02 0,44 0,287 ≤0,005 0,011 11,8 0,048 0,171 0,006 0,068 0,085
3. táblázat
Minta átmérője [mm]
Ce alapján tervezett felhevítési idő
[min]
Tényleges felhevítési idő
[min]
Maximális hőmérsékletkülönbség
[oC]
Max. hevítési sebesség
[oC/s]
Fajlagos teljesítmény
[kW/kg]
Ø 60 360 40 27 83 3,05 Ø 70 400 50 29 53,4 1,93 Ø 90 480 56 31 59,4 0,90 Ø 100 540 65 31,6 47,7 0,65
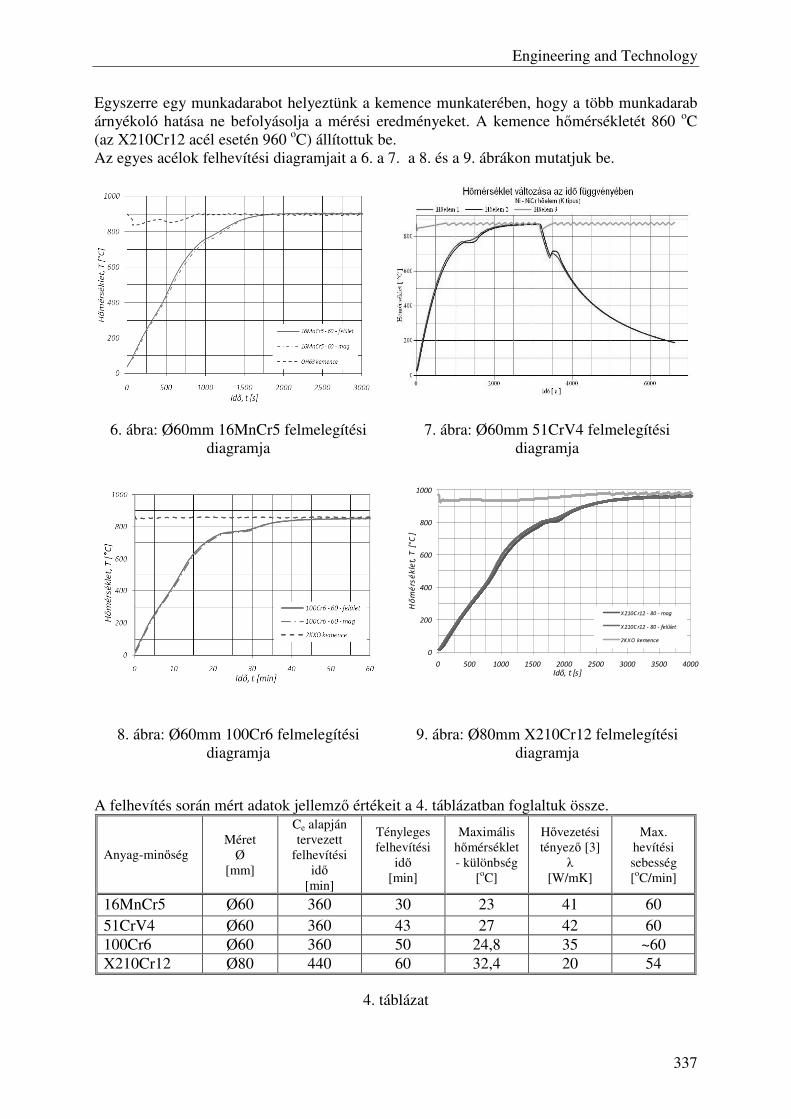
Engineering and Technology
337
Egyszerre egy munkadarabot helyeztünk a kemence munkaterében, hogy a több munkadarab árnyékoló hatása ne befolyásolja a mérési eredményeket. A kemence hőmérsékletét 860 oC (az X210Cr12 acél esetén 960 oC) állítottuk be. Az egyes acélok felhevítési diagramjait a 6. a 7. a 8. és a 9. ábrákon mutatjuk be.
6. ábra: Ø60mm 16MnCr5 felmelegítési diagramja
7. ábra: Ø60mm 51CrV4 felmelegítési diagramja
8. ábra: Ø60mm 100Cr6 felmelegítési diagramja
9. ábra: Ø80mm X210Cr12 felmelegítési diagramja
A felhevítés során mért adatok jellemző értékeit a 4. táblázatban foglaltuk össze.
Anyag-minőség Méret
Ø [mm]
Ce alapján tervezett
felhevítési idő
[min]
Tényleges felhevítési
idő [min]
Maximális hőmérséklet- különbség
[oC]
Hővezetési tényező [3]
λ [W/mK]
Max. hevítési sebesség [oC/min]
16MnCr5 Ø60 360 30 23 41 60 51CrV4 Ø60 360 43 27 42 60 100Cr6 Ø60 360 50 24,8 35 ~60 X210Cr12 Ø80 440 60 32,4 20 54
4. táblázat
0
200
400
600
800
1000
0 500 1000 1500 2000 2500 3000 3500 4000
Idő, t [s]
Hő
mé
rsé
kle
t, T
[°C
]
X210C r12 - 80 - mag
X210C r12 - 80 - felület
2KXO kemence

Engineering and Technology
338
Ha a különböző összetételű és hővezető képességű acélokat vizsgáljuk, látható, hogy a hővezető képesség csökkenésével az azonos átmérőjű minták esetén egyre nagyobb felmelegítési időre van szükség. Az X210Cr12 anyag mintája nagyobb átmérőjű volt ugyan, de a magasabb kemencehőmérséklet miatt a sugárzással átadott hőmennyiség megnőtt. A felmelegedési idők az irodalmi adatokhoz lényegesen kisebbek, tehát a felhevítés sebessége növelhető, de figyelembe kell venni, hogy egyszerű alakú, hengeres mintákat vizsgáltunk. Alakos darabok esetén az egyenlőtlen keresztmetszetű részek hevítése során jelentősebb hőmérsékletkülönbségek is kialakulhatnak a munkadarabban. Több munkadarab egyidejű hevítése során a felhevítése a munkadaraboknak jóval több időt vesz igénybe. Ezt az elhelyezéstől függő szorzófaktorokkal szokás figyelembe venni. Ilyen jellegű mérési eredményeket korábban publikáltunk [2].
4. Következtetések
Az elvégzett kísérleteink alapján az alábbi megállapításokat tehetjük: • A szénegyenérték alapján megállapított felhevítési időnél jóval rövidebb idő alatt is
felhevíthető egyszerű geometriai alakú munkadarab. • A gyors felhevítés következtében sem alakult ki káros mértékű hőmérsékletkülönbség
egyszerű geometriai alakú munkadarabok esetén a minták felülete és a magja közt. A maximális hőmérsékletkülönbség az erősen ötvözött X210Cr12 acél esetén volt mérhető, de ez is csak 32,4 oC.
• Méréseink igazolták azt a várható eredményt, hogy a rosszabb hővezetőjű erősen ötvözött X210Cr12 szerszámacél magja hevült a leglassabban.
• Méréseink alapján az egyszerű geometriájú, hengeres munkadarabok a H.Ruhfus – Pflanme szerinti Ce szénekvivalens segítségével meghatározott idők egyötöde, egy hatoda alatt is károsodás nélkül felhevíthetők az edzési hőmérsékletre.
Irodalomjegyzék
[1] Szombatfalvy Árpád: A Hőkezelés technológiája Műszaki Könyvkiadó Bp. 1985 [2] Végvári Ferenc: Felmelegítési idő meghatározása méréssel Országos Gépész
Találkozó, OGÉT 2009 április23-26, Gyergyószentmiklós, Románia Műszaki Szemle (Technical Review) XVII. Gyergyószentmiklós, Románia p.405-408
Szerzők
Dr. Végvári Ferenc főiskolai tanár Mechanikai Technológiai Szakcsoport Fém- és Műanyagfeldolgozó Technológiai Intézet, Kecskeméti Főiskola GAMF Kar Magyarország, Kecskemét, Izsáki út 10 [email protected]
Bata Attila műszaki ügyintéző Mechanikai Technológiai Szakcsoport Fém- és Műanyagfeldolgozó Technológiai Intézet, Kecskeméti Főiskola GAMF Kar Magyarország, Kecskemét, Izsáki út 10 [email protected]
Kecskés Bertalan tanszéki mérnök Mechanikai Technológiai Szakcsoport Fém- és Műanyagfeldolgozó Technológiai Intézet, Kecskeméti Főiskola GAMF Kar Magyarország, Kecskemét, Izsáki út 10 [email protected]
Engineering and Technology
339
The Effect of the Cooling Media’s Temperature on the Quenching
Efficiency
Ferenc Végvári– Edit Johanyák - Bertalan Kecskés Department of Mechanical Technologies
Institute of Metal and Polymer Processing Technology Kecskemét College, Faculty of Mechanical Engineering and Automation (GAMF)
Abstract: During heat treatment of steels the cooling process must be carefully designed. Recently comes into general use the synthetic cooling media, which substitutes the traditionally used quenching oil. AQUACOOL is a type of synthetic coolant its cooling severity can be adjusted between of water’s and oil’s by water dilution. The temperature of this plastic material based synthetic coolant has effect on the cooling severity too. In our work we tried to determine the effect of the coolant’s temperature on its cooling severity and on the quenching efficiency of different steels.
Keywords: synthetic cooling medium, AQUACOOL, cooling severity, hardening by quenching
1. Introduction
Hardening by quenching followed by high temperature tempering is the most important heat treatment technology of steels that ensures high strength and toughness. These properties can be set by choosing the adequate tempering parameters only if it was produced the necessary amount of martensite during quenching. In case of hardening by quenching in the whole crossection it must be ensured at least 50% martensite in the core of the components. The effectiveness of the through hardening of a steel component depends not only on the right composition (alloying elements) and heat treatment parameters (time, temperature, etc.) but on the cooling medium as well. When choosing the cooling medium (quenchant) one must consider that the higher the cooling severity of the coolant is, the higher the amount of martensite will be achieved. The cooling severity of the quenchant in a given temperature interval must be of the extent that ensures the avoidance of the apparition of the pearlite during cooling. However, a very fast cooling also can be dangerous because the high temperature differences in the component can produce high thermal stresses. The optimal cooling rate during quenching was found to be between that of water and oil. For this reason are applied synthetic coolants. Their cooling severity can be adjusted by water dilution to the optimal value. The temperature of the quenchant during its usage is not constant. It’s temperature is increases in course of the operation; e.g. in summer-time after a continuous usage it can reach even 80 – 100 °C and it can decrease after a closing down at the weekends in winter-time to even 5 – 10 °C. The composition of the synthetic material based coolants changes in course of its usage as well. The amount of additive is decreasing because one of the components sticks to the steels’ surfaces. This phenomena also changes the cooling severity of the cooling medium. For this reason is important to verify time – to time the cooling severity of quenchants. Our experiments focused on the determination of the influence of cooling medium’s temperature and concentration on the cooling rate of a steel with a given composition. We measured the cooling severity of the synthetic coolant AQUACOOL at different temperatures
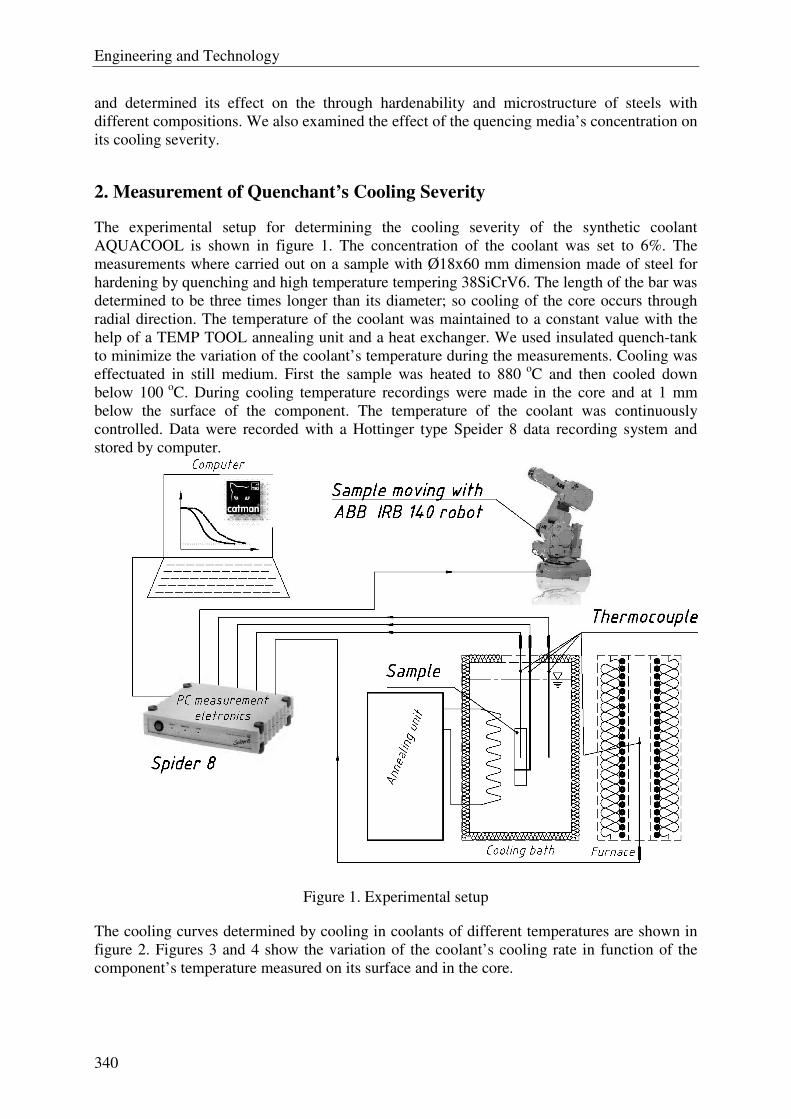
Engineering and Technology
340
and determined its effect on the through hardenability and microstructure of steels with different compositions. We also examined the effect of the quencing media’s concentration on its cooling severity.
2. Measurement of Quenchant’s Cooling Severity
The experimental setup for determining the cooling severity of the synthetic coolant AQUACOOL is shown in figure 1. The concentration of the coolant was set to 6%. The measurements where carried out on a sample with Ø18x60 mm dimension made of steel for hardening by quenching and high temperature tempering 38SiCrV6. The length of the bar was determined to be three times longer than its diameter; so cooling of the core occurs through radial direction. The temperature of the coolant was maintained to a constant value with the help of a TEMP TOOL annealing unit and a heat exchanger. We used insulated quench-tank to minimize the variation of the coolant’s temperature during the measurements. Cooling was effectuated in still medium. First the sample was heated to 880 oC and then cooled down below 100 oC. During cooling temperature recordings were made in the core and at 1 mm below the surface of the component. The temperature of the coolant was continuously controlled. Data were recorded with a Hottinger type Speider 8 data recording system and stored by computer.
Figure 1. Experimental setup
The cooling curves determined by cooling in coolants of different temperatures are shown in figure 2. Figures 3 and 4 show the variation of the coolant’s cooling rate in function of the component’s temperature measured on its surface and in the core.
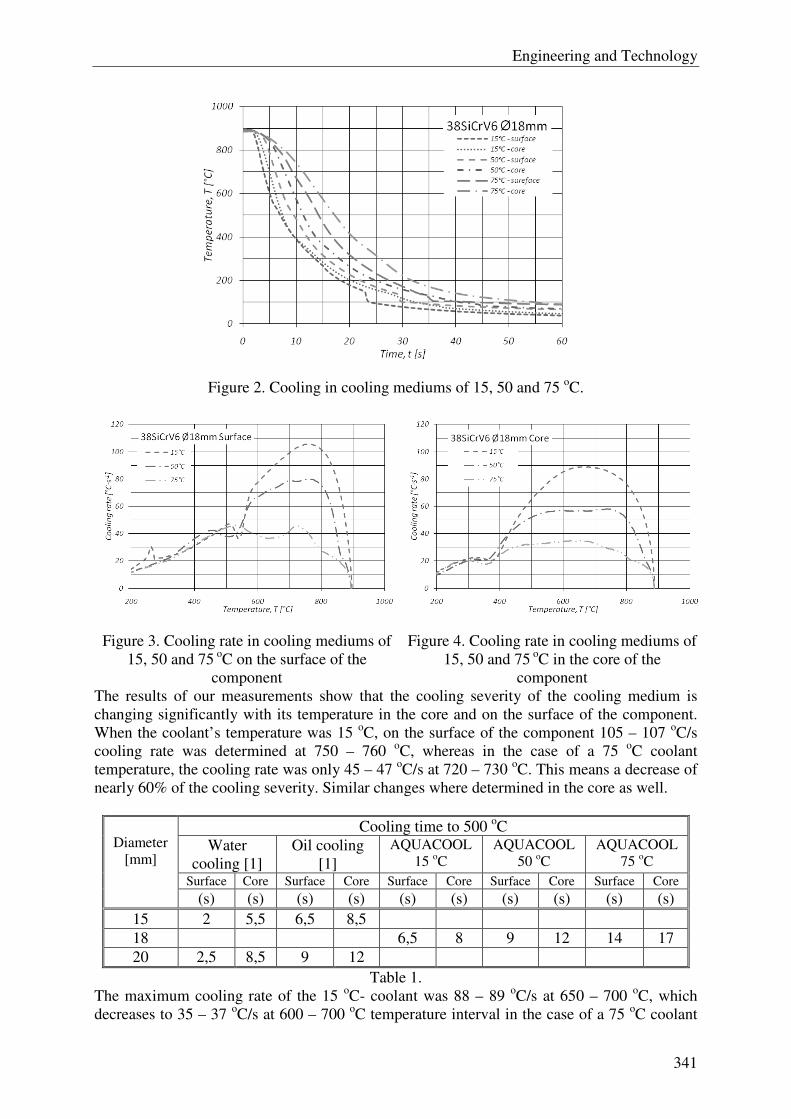
Engineering and Technology
341
Figure 2. Cooling in cooling mediums of 15, 50 and 75 oC.
Figure 3. Cooling rate in cooling mediums of 15, 50 and 75 oC on the surface of the
component
Figure 4. Cooling rate in cooling mediums of 15, 50 and 75 oC in the core of the
component The results of our measurements show that the cooling severity of the cooling medium is changing significantly with its temperature in the core and on the surface of the component. When the coolant’s temperature was 15 oC, on the surface of the component 105 – 107 oC/s cooling rate was determined at 750 – 760 oC, whereas in the case of a 75 oC coolant temperature, the cooling rate was only 45 – 47 oC/s at 720 – 730 oC. This means a decrease of nearly 60% of the cooling severity. Similar changes where determined in the core as well.
Cooling time to 500 oC Water
cooling [1] Oil cooling
[1] AQUACOOL
15 oC AQUACOOL
50 oC AQUACOOL
75 oC Surface Core Surface Core Surface Core Surface Core Surface Core
Diameter
[mm]
(s) (s) (s) (s) (s) (s) (s) (s) (s) (s) 15 2 5,5 6,5 8,5 18 6,5 8 9 12 14 17 20 2,5 8,5 9 12
Table 1. The maximum cooling rate of the 15 oC- coolant was 88 – 89 oC/s at 650 – 700 oC, which decreases to 35 – 37 oC/s at 600 – 700 oC temperature interval in the case of a 75 oC coolant
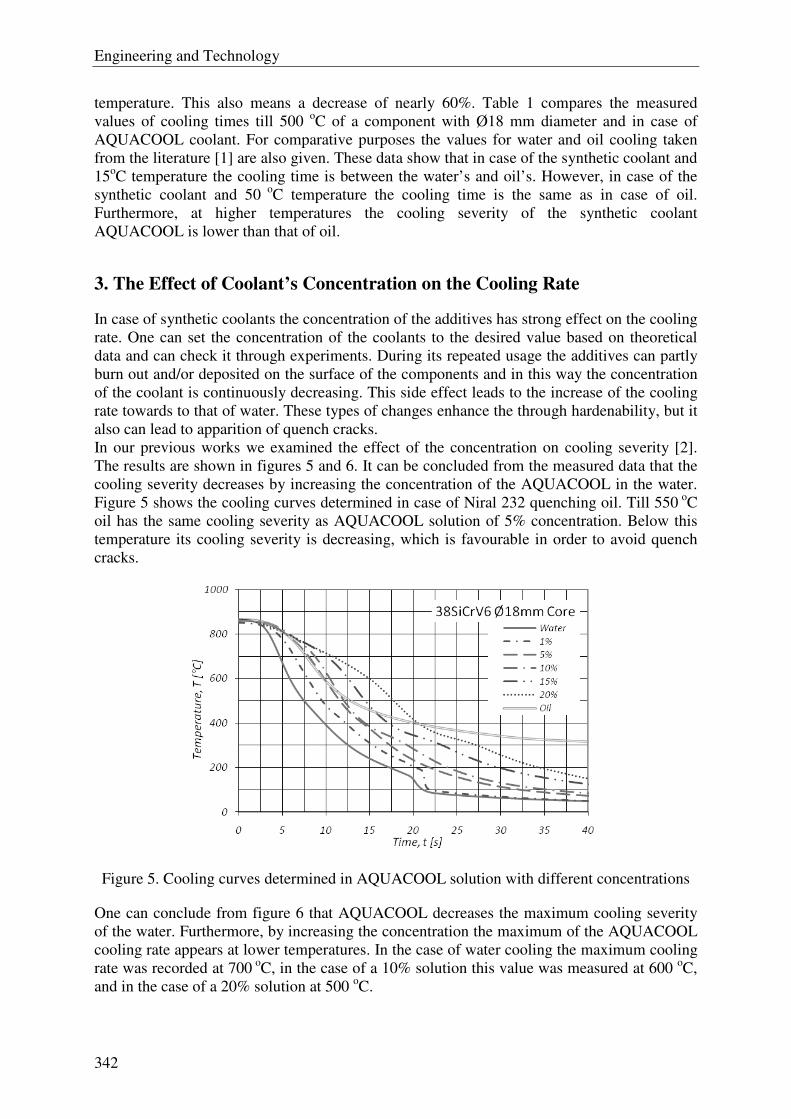
Engineering and Technology
342
temperature. This also means a decrease of nearly 60%. Table 1 compares the measured values of cooling times till 500 oC of a component with Ø18 mm diameter and in case of AQUACOOL coolant. For comparative purposes the values for water and oil cooling taken from the literature [1] are also given. These data show that in case of the synthetic coolant and 15oC temperature the cooling time is between the water’s and oil’s. However, in case of the synthetic coolant and 50 oC temperature the cooling time is the same as in case of oil. Furthermore, at higher temperatures the cooling severity of the synthetic coolant AQUACOOL is lower than that of oil.
3. The Effect of Coolant’s Concentration on the Cooling Rate
In case of synthetic coolants the concentration of the additives has strong effect on the cooling rate. One can set the concentration of the coolants to the desired value based on theoretical data and can check it through experiments. During its repeated usage the additives can partly burn out and/or deposited on the surface of the components and in this way the concentration of the coolant is continuously decreasing. This side effect leads to the increase of the cooling rate towards to that of water. These types of changes enhance the through hardenability, but it also can lead to apparition of quench cracks. In our previous works we examined the effect of the concentration on cooling severity [2]. The results are shown in figures 5 and 6. It can be concluded from the measured data that the cooling severity decreases by increasing the concentration of the AQUACOOL in the water. Figure 5 shows the cooling curves determined in case of Niral 232 quenching oil. Till 550 oC oil has the same cooling severity as AQUACOOL solution of 5% concentration. Below this temperature its cooling severity is decreasing, which is favourable in order to avoid quench cracks.
Figure 5. Cooling curves determined in AQUACOOL solution with different concentrations
One can conclude from figure 6 that AQUACOOL decreases the maximum cooling severity of the water. Furthermore, by increasing the concentration the maximum of the AQUACOOL cooling rate appears at lower temperatures. In the case of water cooling the maximum cooling rate was recorded at 700 oC, in the case of a 10% solution this value was measured at 600 oC, and in the case of a 20% solution at 500 oC.
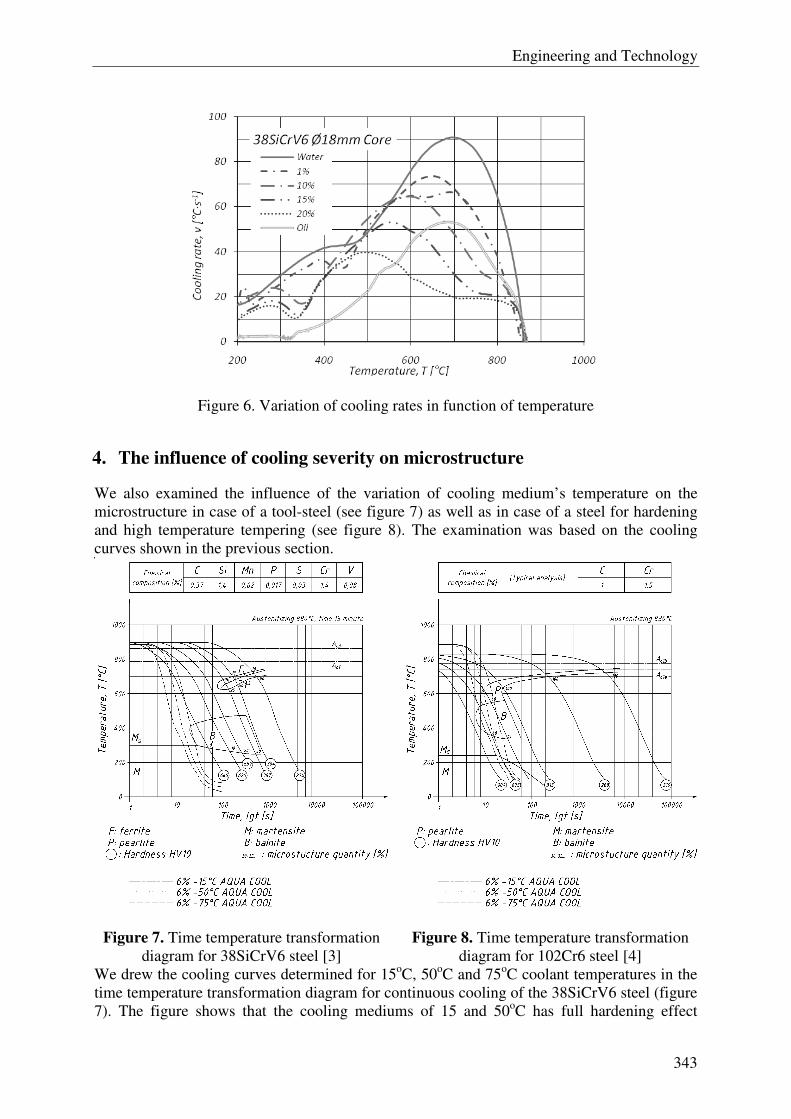
Engineering and Technology
343
Figure 6. Variation of cooling rates in function of temperature
4. The influence of cooling severity on microstructure
We also examined the influence of the variation of cooling medium’s temperature on the microstructure in case of a tool-steel (see figure 7) as well as in case of a steel for hardening and high temperature tempering (see figure 8). The examination was based on the cooling curves shown in the previous section.
Figure 7. Time temperature transformation diagram for 38SiCrV6 steel [3]
Figure 8. Time temperature transformation diagram for 102Cr6 steel [4]
We drew the cooling curves determined for 15oC, 50oC and 75oC coolant temperatures in the time temperature transformation diagram for continuous cooling of the 38SiCrV6 steel (figure 7). The figure shows that the cooling mediums of 15 and 50oC has full hardening effect
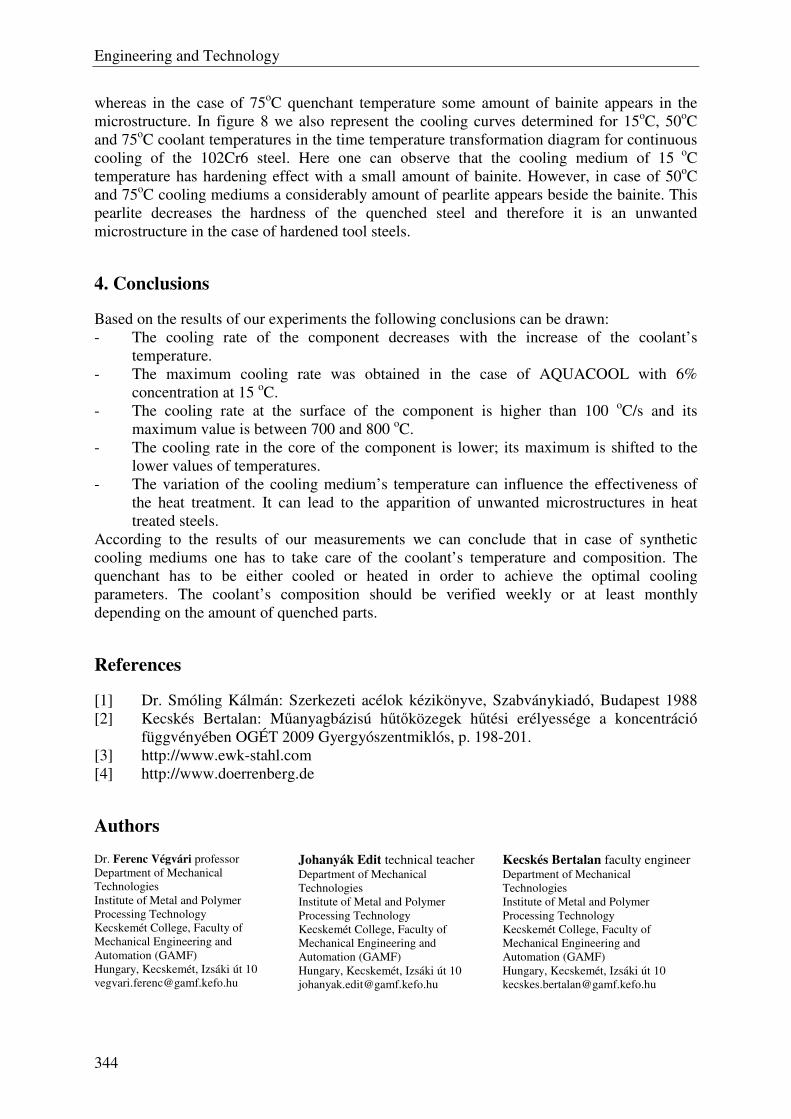
Engineering and Technology
344
whereas in the case of 75oC quenchant temperature some amount of bainite appears in the microstructure. In figure 8 we also represent the cooling curves determined for 15oC, 50oC and 75oC coolant temperatures in the time temperature transformation diagram for continuous cooling of the 102Cr6 steel. Here one can observe that the cooling medium of 15 oC temperature has hardening effect with a small amount of bainite. However, in case of 50oC and 75oC cooling mediums a considerably amount of pearlite appears beside the bainite. This pearlite decreases the hardness of the quenched steel and therefore it is an unwanted microstructure in the case of hardened tool steels.
4. Conclusions
Based on the results of our experiments the following conclusions can be drawn: - The cooling rate of the component decreases with the increase of the coolant’s
temperature. - The maximum cooling rate was obtained in the case of AQUACOOL with 6%
concentration at 15 oC. - The cooling rate at the surface of the component is higher than 100 oC/s and its
maximum value is between 700 and 800 oC. - The cooling rate in the core of the component is lower; its maximum is shifted to the
lower values of temperatures. - The variation of the cooling medium’s temperature can influence the effectiveness of
the heat treatment. It can lead to the apparition of unwanted microstructures in heat treated steels.
According to the results of our measurements we can conclude that in case of synthetic cooling mediums one has to take care of the coolant’s temperature and composition. The quenchant has to be either cooled or heated in order to achieve the optimal cooling parameters. The coolant’s composition should be verified weekly or at least monthly depending on the amount of quenched parts.
References
[1] Dr. Smóling Kálmán: Szerkezeti acélok kézikönyve, Szabványkiadó, Budapest 1988 [2] Kecskés Bertalan: Műanyagbázisú hűtőközegek hűtési erélyessége a koncentráció függvényében OGÉT 2009 Gyergyószentmiklós, p. 198-201. [3] http://www.ewk-stahl.com [4] http://www.doerrenberg.de
Authors
Dr. Ferenc Végvári professor Department of Mechanical Technologies Institute of Metal and Polymer Processing Technology Kecskemét College, Faculty of Mechanical Engineering and Automation (GAMF) Hungary, Kecskemét, Izsáki út 10 [email protected]
Johanyák Edit technical teacher Department of Mechanical Technologies Institute of Metal and Polymer Processing Technology Kecskemét College, Faculty of Mechanical Engineering and Automation (GAMF) Hungary, Kecskemét, Izsáki út 10 [email protected]
Kecskés Bertalan faculty engineer Department of Mechanical Technologies Institute of Metal and Polymer Processing Technology Kecskemét College, Faculty of Mechanical Engineering and Automation (GAMF) Hungary, Kecskemét, Izsáki út 10 [email protected]