Fifty years of marine tag recoveries from Atlantic salmon - ICES
128
#343 SEPTEMBER 2018 ICES COOPERATIVE RESEARCH REPORT RAPPORT DES RECHERCHES COLLECTIVES ICES INTERNATIONAL COUNCIL FOR THE EXPLORATION OF THE SEA CIEM CONSEIL INTERNATIONAL POUR L’EXPLORATION DE LA MER Fifty years of marine tag recoveries from Atlantic salmon
-
Upload
khangminh22 -
Category
Documents
-
view
0 -
download
0
Transcript of Fifty years of marine tag recoveries from Atlantic salmon - ICES

#343 SEPTEMBER 2018
ICES COOPERATIVE RESEARCH REPORT
RAPPORT DES RECHERCHESCOLLECTIVES
ICES INTERNATIONAL COUNCIL FOR THE EXPLORATION OF THE SEA CIEM CONSEIL INTERNATIONAL POUR L’EXPLORATION DE LA MER
Fifty years of marine tag recoveriesfrom Atlantic salmon
ICES COOPERATIVE RESEARCH REPORT RAPPORT DES RECHERCHES COLLECTIVES
NO. 343
SEPTEMBER 2018
Fifty years of marine tag recoveries
from Atlantic salmon
Editors
Niall Ó Maoiléidigh • Jonathan White • Lars P. Hansen
Jan Arge Jacobsen • Ted Potter • Ian Russell • Dave Reddin • Tim Sheehan

International Council for the Exploration of the Sea
Conseil International pour l’Exploration de la Mer
H. C. Andersens Boulevard 44–46
DK-1553 Copenhagen V
Denmark
Telephone (+45) 33 38 67 00
Telefax (+45) 33 93 42 15
www.ices.dk
Recommended format for purposes of citation:
Ó Maoiléidigh, N., White, J., Hansen, L. P., Jacobsen, J. A., Potter, T., Russell, I., Reddin,
D., et al. 2018. Fifty years of marine tag recoveries from Atlantic salmon. ICES Coopera-
tive Research Report No. 343. 121 pp. http://doi.org/10.17895/ices.pub.4542
Series Editor: Emory D. Anderson
The material in this report may be reused for non-commercial purposes using the rec-
ommended citation. ICES may only grant usage rights of information, data, images,
graphs, etc. of which it has ownership. For other third-party material cited in this re-
port, you must contact the original copyright holder for permission. For citation of da-
tasets or use of data to be included in other databases, please refer to the latest ICES
data policy on ICES website. All extracts must be acknowledged. For other reproduc-
tion requests, please contact the General Secretary.
This document is the product of an Expert Group under the auspices of the International
Council for the Exploration of the Sea and does not necessarily represent the view of the
Council.
Cover image: © OCEANA/Carlos Suárez
DOI http://doi.org/10.17895/ices.pub.4542ISBN 978-87-7482-219-6
ISSN 2707-7144
© 2018 International Council for the Exploration of the Sea

Contents
1 Background ..................................................................................................................... 1
2 Introduction .................................................................................................................... 3
2.1 Faroes fishery ....................................................................................................... 5
2.2 Greenland fishery ................................................................................................ 5
2.3 Norwegian Sea fishery ........................................................................................ 6
3 Tagging programmes by country ................................................................................ 8
3.1 Canada .................................................................................................................. 8
3.1.1 Newfoundland and Labrador Region ................................................... 8
3.1.2 Gulf Region ............................................................................................... 9
3.1.3 Maritimes Region: Atlantic coast of Nova Scotia to the US
border ....................................................................................................... 11
3.2 Denmark ............................................................................................................. 12
3.3 Iceland ................................................................................................................. 12
3.4 Ireland ................................................................................................................. 14
3.5 Norway ............................................................................................................... 17
3.6 Russian Federation ............................................................................................ 18
3.7 UK (England and Wales) .................................................................................. 19
3.8 UK (Northern Ireland) ...................................................................................... 21
3.9 UK (Scotland) ..................................................................................................... 22
3.10 USA ...................................................................................................................... 23
3.10.1 Carlin tags ............................................................................................... 23
3.10.2 Coded wire tags (CWT) ......................................................................... 23
3.10.3 Visible implant Elastomer (VIE) tags ................................................... 24
3.11 Faroes .................................................................................................................. 24
3.12 Greenland ........................................................................................................... 24
4 Tag recovery databases ............................................................................................... 26
4.1 Structure and format of the NASTR database ............................................... 26
4.2 Permissions and restrictions on data use ....................................................... 29
5 Faroes tag-recovery database ..................................................................................... 30
5.1 Scanning programmes for tags at the Faroes ................................................. 30
5.1.1 Carlin tags ............................................................................................... 30
5.1.2 Coded wire tags (CWTs) ....................................................................... 30
5.2 Summary descriptions of tagging data ........................................................... 32
5.3 Faroese adult tagging programmes ................................................................ 36
6 West Greenland tag-recovery database .................................................................... 37

6.1 Scanning programmes for tags around West Greenland ............................. 37
6.1.1 CWT recoveries (all countries) from West Greenland scanning
programme .............................................................................................. 37
6.1.2 Tag detection in catch ............................................................................ 37
6.1.3 Carlin tags ............................................................................................... 39
6.2 Summary descriptions of data ......................................................................... 39
6.2.1 Canada ..................................................................................................... 42
6.2.2 Faroes ....................................................................................................... 43
6.2.3 Iceland ...................................................................................................... 43
6.2.4 Ireland ...................................................................................................... 43
6.2.5 Norway .................................................................................................... 43
6.2.6 Spain ......................................................................................................... 43
6.2.7 UK (England and Wales) ....................................................................... 43
6.2.8 UK (Northern Ireland) ........................................................................... 43
6.2.9 UK (Scotland) .......................................................................................... 43
6.2.10 USA .......................................................................................................... 44
6.3 Origin of salmon sampled from West Greenland fishery ............................ 44
6.4 East Greenland tag recaptures ......................................................................... 45
6.5 Greenlandic adult tagging programmes ........................................................ 46
7 Distribution of salmon at sea: initial analyses of salmon tag recoveries .......... 48
7.1 Questions and hypotheses ................................................................................ 48
7.2 Analyses of the Faroes tag-recovery database ............................................... 50
7.2.1 Spatial distribution of Faroes tag recoveries ...................................... 50
7.2.2 Recaptures of salmon tagged as smolts ............................................... 56
7.2.3 Faroes tag recoveries by countries of origin and ICES statistical
rectangles – multivariate analyses ....................................................... 60
7.2.4 Faroes tag recoveries in association with location, weight, sea
age, season, and year of recapture ....................................................... 63
7.2.5 Faroes tag recoveries and climate ........................................................ 65
7.2.6 Spatial densities of recoveries in the Faroes fishery .......................... 70
7.3 Analyses of the Greenland tag-recovery database ........................................ 78
7.3.1 Spatial distribution of Greenland recaptures ..................................... 78
7.3.2 Greenland tag recoveries by countries of origin and NAFO
areas – multivariate analyses ................................................................ 78
7.3.3 Greenland tag recoveries and climate ................................................. 80
7.3.4 Greenland tag recoveries – temporal variation .................................. 82
Release and recapture dates of European-origin salmon ............................. 82
Release and recapture dates of North American-origin salmon ................. 83
Weights, lengths, and swim speeds of Greenland-caught, European-
origin, and North American-origin salmon ........................................ 85
7.4 Adult tagging in the Norwegian Sea .............................................................. 88
7.4.1 Multivariate analyses of the Norwegian adult tagging dataset ....... 89
7.5 Adult tagging at Greenland ............................................................................. 90
7.6 Overview of the Salmon at Sea: Scientific Advances and their
Implications for Management symposium .................................................... 92

8 Conclusions ................................................................................................................... 97
9 References ..................................................................................................................... 99
Annex 1: Participants in meetings ................................................................................... 104
Annex 2: Supplementary literature considered during ICES workshops
WKDUHSTI, WKSHINI, WKLUSTRE, and WKSTAR ...................................... 105
Annex 3: Contact information for editors and contributors ....................................... 115
Annex 4: Participants in tag-recovery activities ............................................................ 117
Annex 5: National tag clearing houses to which Atlantic salmon tags should
be returned .................................................................................................................. 118
Annex 6: Glossary of acronyms used in this report ..................................................... 119


Fifty years of marine tag recoveries from Atlantic salmon | 1
1 Background
The number of wild Atlantic salmon (Salmo salar L.) has periodically declined through-
out their native range (Chaput, 2012; ICES, 2015). This has been offset to some degree
by historical management initiatives such as habitat protection and restoration, harvest
restrictions, and fish health actions which have mitigated some declines. For at least
two decades, however, declines in abundance have continued (ICES, 2015) and mitiga-
tion options are limited (Parrish et al., 1998), which has led to the call for more focused
marine research to assess the reasons for this persistent decline. The status of the wild
salmon populations in both North America and Europe has shown a clear geographical
pattern over the past 30 years, with most populations in the southern extent of their
range in decline, with more northerly populations being generally stable, while popu-
lations at intermediate latitudes have been more variable (e.g. Parrish et al., 1998; ICES,
2002). While some of the problems can be attributed to the construction of dams, pol-
lution (including acid rain), water abstraction, overfishing, changing ocean conditions,
and intensive aquaculture, many declines cannot be fully explained.
Most countries bordering the North Atlantic have had extensive tagging programmes
for salmon at different life stages over the past 50 years, with large numbers of tagged
salmon recaptured in oceanic fisheries throughout the North Atlantic. While the objec-
tives of these tagging programmes varied widely, they have provided valuable infor-
mation about marine migration and survival of Atlantic salmon during that period.
Despite consistent recoveries in distant waters, until recently, no attempt was made to
collate and analyse the recovery data or combine the information covering all years
and tagging methods.
There have also been tagging programmes at sea, both at Greenland and in the Nor-
wegian Sea, with tagged adults recovered in home-water countries providing infor-
mation on adult migration routes and timing of returns from high seas fisheries. Ini-
tially, results from these studies had only been reported as single experiments and not
analysed as a whole.
Several initiatives have been undertaken by the North Atlantic Salmon Conservation
Organization (NASCO) and the International Council for the Exploration of the Sea
(ICES) to improve our understanding of the distribution and migration of salmon at
sea and the underlying causes of marine mortality of salmon. In support of these ef-
forts, ICES organized a series of four workshops (2006–2012) to compile and analyse
the available historic Atlantic salmon marine tag data:
Workshop on the Development and Use of Historical Tagging Information
from Oceanic Areas (WKDUHSTI; ICES, 2007),
Workshop on Salmon Historical Information – New Investigations from Old
Tagging Data (WKSHINI; ICES, 2008a),
Workshop on Learning from Salmon Tagging Records (WKLUSTRE; ICES,
2009),
Workshop on Salmon Tagging Archive (WKSTAR; ICES, 2012).
The first three workshops (WHDUHSTI, WHSHINI, and WKLUSTRE) reviewed pub-
lished information on tagging studies, including the grey literature, evaluated release
and recapture data (quantity and quality) available from different countries, compiled
an inventory of available databases, and evaluated metadata for georeferencing. These
workshops also made significant progress with preparing historical tag-recovery data
in a standardized format and modelling the results using a GIS approach. The final
workshop (WKSTAR) ensured that the data compiled by the previous groups would

2 | ICES Cooperative Research Report No. 343
be fully archived and documented to make it accessible for future studies, and pro-
duced an outline for this CRR and two peer-reviewed publications which were subse-
quently published in the proceedings of the ICES/NASCO symposium “Salmon at Sea:
Scientific Advances and their Implications for Management” (Hutchinson, 2012), held
in La Rochelle, France in October 2011 (Jacobsen et al., 2012; Reddin et al., 2012). Annex
1 contains a complete list of workshop participants, while Annex 2 provides a list of
the literature considered at the workshops.
This CRR compiles information from the four workshops and key results from the rel-
evant papers presented at the ICES/NASCO salmon symposium to assess the distribu-
tion of the tagged fish in space and time. It provides a compilation of information from
salmon tagged in home waters and subsequently recaptured in the oceanic salmon
fisheries around the Faroe Islands, Greenland, and in the Norwegian Sea, as well as
information from adults tagged in oceanic areas around the Faroes and West Green-
land and subsequently recaptured in home waters. The data are arranged according to
an agreed framework recommended at the 2007 workshop (WKDUHSTI; ICES, 2007)
and stored for easy access and retrieval as four datasets: (i) Faroese recaptures, (ii)
Greenland recaptures, (iii) adult tagging in Norwegian waters, and (iv) adult tagging
in Faroese waters. The datasets together are referred to as the North Atlantic Salmon
Tag Recovery database (NASTR) in this report and will be maintained by ICES Data
Centre. Each country’s dataset has been thoroughly examined to remove duplicates
and correct errors and inconsistencies, as far as possible.
The following people contributed to the NASTR database or CRR analyses through
active workshop participation or correspondence: Peter G. Amiro, Vegar Bakkestuen,
Gerald Chaput, J. Brian Dempson, Gilles Euzenat, Jeronimo de la Hoz, Mark Fowler,
Arni Isaksson, Richard Kennedy, Oleg Lapshin, Kjell Arne Mork, Terry Nicholls,
Sumarlidi Oskarsson, Stig Pedersen, Gordon W. Smith, and Fred Whoriskey. Contact
information for these individuals as well as the editors of this CRR is contained in An-
nex 3.
Fifty years of marine tag recoveries from Atlantic salmon | 3
2 Introduction
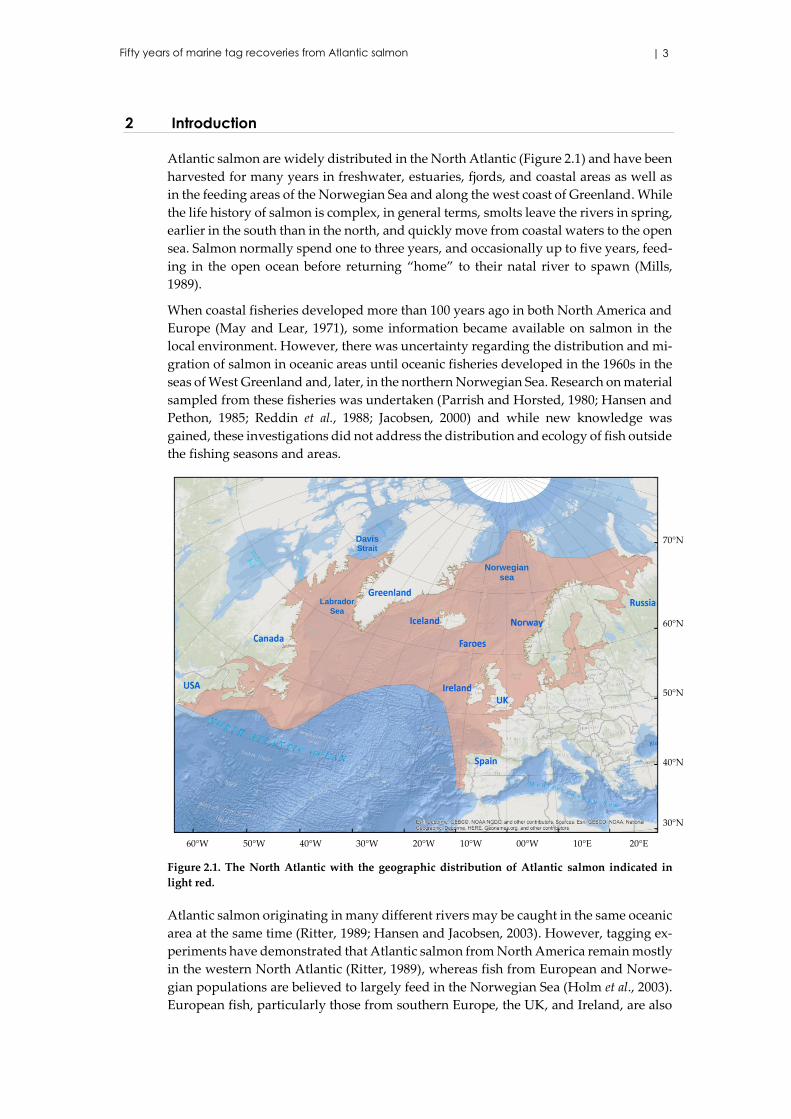
Atlantic salmon are widely distributed in the North Atlantic (Figure 2.1) and have been
harvested for many years in freshwater, estuaries, fjords, and coastal areas as well as
in the feeding areas of the Norwegian Sea and along the west coast of Greenland. While
the life history of salmon is complex, in general terms, smolts leave the rivers in spring,
earlier in the south than in the north, and quickly move from coastal waters to the open
sea. Salmon normally spend one to three years, and occasionally up to five years, feed-
ing in the open ocean before returning “home” to their natal river to spawn (Mills,
1989).
When coastal fisheries developed more than 100 years ago in both North America and
Europe (May and Lear, 1971), some information became available on salmon in the
local environment. However, there was uncertainty regarding the distribution and mi-
gration of salmon in oceanic areas until oceanic fisheries developed in the 1960s in the
seas of West Greenland and, later, in the northern Norwegian Sea. Research on material
sampled from these fisheries was undertaken (Parrish and Horsted, 1980; Hansen and
Pethon, 1985; Reddin et al., 1988; Jacobsen, 2000) and while new knowledge was
gained, these investigations did not address the distribution and ecology of fish outside
the fishing seasons and areas.
Figure 2.1. The North Atlantic with the geographic distribution of Atlantic salmon indicated in
light red.
Atlantic salmon originating in many different rivers may be caught in the same oceanic
area at the same time (Ritter, 1989; Hansen and Jacobsen, 2003). However, tagging ex-
periments have demonstrated that Atlantic salmon from North America remain mostly
in the western North Atlantic (Ritter, 1989), whereas fish from European and Norwe-
gian populations are believed to largely feed in the Norwegian Sea (Holm et al., 2003).
European fish, particularly those from southern Europe, the UK, and Ireland, are also
60°W 50°W 40°W 30°W 20°W 10°W 00°W 10°E 20°E
70°N
60°N
50°N
40°N
30°N
Labrador
Sea
Davis Strait
Norwegian sea

4 | ICES Cooperative Research Report No. 343
abundant around West Greenland (Swain, 1980). There is evidence that some migra-
tion of Atlantic salmon occurs between North America and Europe (Reddin et al., 1984;
Reddin and Friedland, 1999; Hansen and Jacobsen, 2003). Based on analyses of cae-
sium-137 in tissues of salmon from the Northwest Atlantic, it has been suggested that
some of those fish may move into the Northeast Atlantic area (Tucker et al., 1999; Spares
et al., 2007). Recent genetic investigations of scale samples have confirmed this (Gilbey
et al., 2017; ICES, 2015). DNA analysis of scales taken from salmon caught in the
1993/1994 and 1994/1995 Faroese research fisheries indicated that 5.7% of the one-sea-
winter (1SW) salmon and 20.5% of the multisea-winter (MSW) salmon sampled were
of North American origin.
The status of the salmon populations in both North America and Europe shows a clear
geographical pattern, i.e. most populations in southern areas appear to be in severe
decline, the populations in the north are generally stable, and populations at interme-
diate latitudes are in variable states (Parrish et al., 1998; ICES, 2002). Although there are
numerous identified stressors to Atlantic salmon, such as affects associated with the
construction of dams, pollution (including acid rain), water abstraction, overfishing,
changing ocean conditions, and intensive aquaculture, the causes of declines and var-
iation in trends in abundance across the species range cannot be fully explained.
It is well known that there are large variations in survival of salmon among different
smolt year classes (Porter and Ritter, 1984; Friedland et al., 1998). Although there is a
lack of direct evidence, it has been suggested that the heaviest mortality of salmon in
the sea may take place during the first months after smolts leave freshwater (Double-
day et al., 1979; Ritter, 1989). Many factors affect smolt survival and consequently the
return of adult salmon, although these factors are poorly documented (Dempson et al.,
1998). While research on this subject has been strongly recommended by a number of
organizations, only recently has there been systematic efforts to sample salmon, and
especially post-smolts, at sea (Lear, 1976; Reddin, 1985; Reddin and Short, 1991; Holst
et al., 1993; Shelton et al., 1997; Holm et al., 2000; Sheehan et al., 2012). Results from these
studies, together with the development of new techniques to analyse life-history sig-
nals from scales, bones, and tissue of salmon (e.g. Friedland et al., 1993), have improved
our understanding of the biology of salmon post-smolts but there are still major
knowledge gaps.
Over the past 10–15 years, a number of post-smolts have been caught in oceanic areas
of the Northeast Atlantic during pelagic trawl surveys in the Norwegian Sea in July
and August (Holm et al., 2000) and north of the UK (Scotland) in May and June (Holm
et al., 1998; Holst et al., 1996; Shelton et al., 1997). Based on the distribution of catches
north of Scotland, the fish appeared to move northwards with the shelf edge current
(Shelton et al., 1997). Farther north in the Norwegian Sea, post-smolts were caught be-
yond 70N in July. Analysis of growth and smolt age distribution strongly suggested
that most of the post-smolts originated from rivers in southern Europe (Holst et al.,
1996). This was supported by the recapture of salmon that had been tagged in April
1995 in western Ireland and southern UK (England and Wales) and recovered up to
2000 km farther north three months later, demonstrating post-smolts capacity for rapid
travel.
There is evidence that the marine distribution of Atlantic salmon is related to temper-
ature (Reddin and Shearer, 1987), but whether this is a direct causal relationship, or
whether the distribution of prey items is an important factor influencing distribution
is yet to be determined. The biomass of Atlantic salmon in the ocean relative to other
pelagic oceanic fish species is extremely small. During its marine phase, salmon is

Fifty years of marine tag recoveries from Atlantic salmon | 5
thought to be an opportunistic pelagic predator, supporting a rapid growth rate by
exploiting a wide range of invertebrates and fish prey.
When Atlantic salmon have reached catchable size, their capture in fisheries provides
indications of their marine distribution, although there are very large areas where no
salmon fisheries operate. Many countries have run major tagging programmes on
smolts and adults, and some of these fish have been recaptured in distant-water fish-
eries.
It is difficult to know the true distribution of salmon at sea, as recoveries depend on
the distribution of the fishery and fishing effort. However, it is likely that salmon fish-
eries developed in areas of high abundance of fish and that tag recoveries, therefore,
reflect the distribution of a substantial proportion of the catchable fish during specific
periods. However, Atlantic salmon have been documented over large areas in the Nor-
wegian Sea (Holm et al., 1982, Holm et al., 1998, Holm et al., 2000, Holm et al., 2003,
Holm et al., 2004). This report primarily focuses on tags recovered in the distant-water
fisheries around the Faroes and Greenland, which operate in a limited spatial and tem-
poral part of the salmon marine life stage.
2.1 Faroes fishery
The fishery in the Faroes area commenced in the late 1960s and operated up to 70 miles
north of the Faroes; catches increased slowly up to 40 t in 1977. Danish vessels partici-
pated in the fishery between 1978 and 1982, during which time catches increased rap-
idly owing to an extension of the fishing season, more vessels entering the fishery, and
a shift in activities northward. Catches peaked at 1025 t in 1981 (Jacobsen et al., 2012).
The Faroese Government agreed to a voluntary quota system beginning in 1982. A total
catch of 750 t was introduced in 1982, with 625 t in 1983. Following the establishment
of NASCO, agreed reductions in allowable catches were implemented following de-
clines in forecasts of abundance, and the fishery has since been restricted to the Faroes
EEZ. Although a small research fishery continued in some subsequent years until 2000,
there has been no commercial salmon fishery around the Faroes since the early 1990s.
The fishery operated over winter, mainly November–May. Salmon caught here were
thought to have originated almost entirely from Europe, although small numbers of
tagged fish originating in North America were also recaptured. Genetic analysis of
scales from salmon caught in the 1980s and 1990s, however, suggest that North Amer-
ican fish may have made up a larger contribution to the Faroes fishery than originally
indicated (ICES, 2015). Further studies of archival and contemporary material are re-
quired to estimate the historical and current extent of this contribution.
For the Faroese fishery, catch data are available by numbers and weight, usually
grouped into weight classes. Salmon were landed and sold in seven weight classes,
with the highest prices paid for the largest salmon. Landings were monitored on shore
and recorded in a landings file. Vessels were obliged to use a logbook to record fisher-
ies information from the daily sets (i.e. number of hooks used and number of salmon
caught along with the time and position when the longline was hauled). A database of
the fishery data is held by the Faroe Marine Research Institute (Laksabasa) and covers
the fishery from the late 1970s until 1991, and the research fishery thereafter until 2000.
2.2 Greenland fishery
Limited salmon fishing around West Greenland was reported as far back as the early
1900s. The present fishery dates from 1959, with a rapid expansion along the coast. The
mid-1960s saw the introduction of offshore driftnets, operating up to 40 km offshore.

6 | ICES Cooperative Research Report No. 343
Because of improvements in gear, catches rose quickly to a peak of almost 2700 t in
1971. Fishing by non-Greenlandic vessels was phased out from 1972 to 1975; however,
the total catch remained at around 2000 t until 1976 when a TAC of 1190 t was set. The
fishery has been regulated since. In June 1998, in response to declining stocks, NASCO
agreed that the West Greenland catch should be restricted to, “that amount used for
internal consumption in Greenland, which in the past has been estimated at 20 tonnes.”
Since then, the export of salmon from Greenland has been banned. From 2002 to 2011,
only the sale of salmon to hotels, institutions, and local markets by licensed fishers was
permitted together with an unlicensed fishery for private consumption.
Small catches of salmon have also been made on the east coast of Greenland, although
these are sporadic and restricted by the small number of communities in this area and
by drifting polar ice. This fishery mainly operates August–October and catches salmon
from both North America and Europe. Regulatory measures have been agreed for most
years since the establishment of NASCO, resulting in greatly reduced allowable catches
that reflect the declining abundance of the contributing stocks.
For the West Greenland fishery, Swain (1980) analysed a time-series of smolt tagging
programmes in European rivers in relation to recaptures off West Greenland, as did
Ruggles and Ritter (1980) for North American smolt tagging programmes. Jensen
(1980a) used tag recoveries from West Greenland in 1972 to assess the distribution
along the West Greenland coast of salmon originating in North America and Europe.
These investigations demonstrated that Atlantic salmon from a number of different
rivers in North America and Europe were present in the area. Furthermore, based on
much more comprehensive material, Reddin (1988) and Reddin et al. (1988) used dis-
criminate analysis of scale characteristics and concluded that catches of salmon in the
West Greenland fishery comprised equal proportions of salmon from North America
and Europe. It was more difficult to determine the country of origin, but Canada was
thought to account for most of the North American component and the UK (Scotland)
for most of the European fish (Jensen, 1980a). In recent years, the proportion of salmon
originating in Europe has decreased (Reddin and Friedland, 1999; ICES, 2015). Of 5756
recoveries in West Greenland waters of salmon tagged as smolts in home waters, 2552
originated from the United States, 1847 from Canada, 403 from the UK (Scotland), 393
from UK (England and Wales), 148 from Norway, 146 from Ireland, 24 from Iceland, 3
each from Spain and Northern Ireland, and 1 from the Faroe Islands. Recaptures do
not necessarily represent contribution to the fishery as the number of tag recoveries is
also highly influenced by the number of tags released.
2.3 Norwegian Sea fishery
In the Northeast Atlantic, salmon are found in large areas of the Norwegian Sea. In the
1970s, there was an important commercial longline fishery in the far north of the Nor-
wegian Sea from February until May. International concerns about the effects on
salmon stocks caused by this fishery resulted in recommendations from ICES to collect
information on stock composition as well as to estimate effects on home-water stocks.
Recoveries of fish in this fishery that had been tagged as smolts, and recaptures in
coastal and freshwater fisheries of salmon tagged in the Norwegian Sea suggested that
Norwegian salmon were most abundant, although fish from the UK, Sweden, and Rus-
sian Federation were also present. Most of the fish were recaptured in home waters the
same year they were tagged, suggesting that they were maturing (Rosseland, 1971).
Towards the end of the 1970s, salmon fishing was banned in the northern Norwegian
Sea and limited to the area within the Faroese Exclusive Economic Zone (EEZ).

Fifty years of marine tag recoveries from Atlantic salmon | 7
With increasing salmon farming activity in recent years, the abundance of escapees
from aquaculture facilities has become relatively high in some areas. In the Norwegian
Sea, large numbers of escaped farmed salmon are present, and, it has been estimated
that up to 40% of the salmon in the commercial catches at the Faroes were of farmed
origin (Hansen et al., 1999). In North America, escapes from Maine, New Brunswick,
and Newfoundland fish-farming facilities are known to occur but the fish do not seem
to range as widely in the ocean or around Greenland as they do on the eastern side of
the Atlantic (Hansen et al., 1997).
In 2008, an EU project (SALSEA Merge) was funded for a period between 2008 and
2011. This was a merging of ecological sampling and genetic stock identification of
salmon post-smolts and adults at sea on both sides of the Atlantic. Genetic baselines
for salmon, collected in hundreds of rivers in home-water countries and sampled mul-
tiple times, have allowed the areas of origin (and even natal rivers in some cases) of
salmon caught at sea to be identified using DNA profiling. The results from this project
have provided much new information on salmon migration and distribution and have
allowed the formulation of a hypothetical model of migration for many different stocks
(Mork et al., 2012).
Recently, the results of genetic analysis of archival and contemporary scale samples
collected at the Faroes and Greenland have provided new information on the stock
composition of salmon catches in the areas (ICES, 2015; Bradbury et al., 2016; Gilbey et
al. 2017). Summary results are provided for comparison with tag recovery information
in sections 5.2 (Faroes) and 6.2 (Greenland).
The objectives of this work have been to:
produce a permanent record of historic tag recoveries,
make such data available for future analyses,
undertake initial analysis to provide summary statistics and descriptions of
tag recoveries and implied salmon distributions, and,
demonstrate the basis and concepts for future analysis of these tag-recovery
data.

8 | ICES Cooperative Research Report No. 343
3 Tagging programmes by country
Systematic tagging studies have been carried out by countries around the North Atlan-
tic from as early as 1935 (Figure 3.1). The largest of these programmes are described
here to provide an overview of tagging in each country, including information on the
objectives, the periods involved, numbers of fish tagged where available, river
(smolt/kelt) or marine (adult) fish tagging, and whether the tagging was of hatchery,
wild fish, or both. The specific tagging programmes that have contributed to the cur-
rent North Atlantic Salmon Tag Recovery database (NASTR) and the analyses in this
CRR are indicated. Any specific issues relating to data or its use have been highlighted
where possible. Not all of the national tagging efforts have resulted in tag recoveries
in the Faroes or Greenland fisheries or entry into the NASTR database.
Figure 3.1. Juvenile tagging locations of salmon recovered around the Faroes (●) and Greenland (●)
and adult tagging locations in the Norwegian Sea (●) and Davis Strait/ Labrador Sea ( ).
3.1 Canada
3.1.1 Newfoundland and Labrador Region
There has been tagging within the Newfoundland and Labrador Region since the
1940s. Data from the following studies have been included within the NASTR database
(Figure 3.2):
1. Sand Hill tagging. Wild salmon smolts/kelts from the Sand Hill River were
tagged from a counting fence between 1969 and 1973, and returns were recorded
from various fisheries from 1969 to 1976 (Anderson, 1985). This is the only tag-
ging dataset available that describes the distribution at sea of any Labrador
salmon stock. In total, 1035 recaptures of salmon at various ages are available.
2. Marine data. Wild adult salmon were tagged in coastal areas in the Newfound-
land and Labrador Region between 1940 and the early 1980s. In total, 3495
salmon of various sea ages were tagged with Carlin tags and released back into
the sea. Of these, 892 (26%) were recaptured at various locations in the sea and
freshwater (Reddin and Lear, 1990). Recaptures were reported from North
America, Greenland, and Europe (Scotland).
-75 -70 -60 -50 -40 -30 -20 -10 0 10 20 30
35
40
45
50
55
60
65
70
75

Fifty years of marine tag recoveries from Atlantic salmon | 9
Figure 3.2. Canadian tagging locations of salmon recovered around the Faroe Islands (●) and Green-
land (●).
3. Offshore distribution/tagging of adult fish. Distributional/tagging studies took
place in the Labrador Sea and Greenland area in 1965 mainly in response to the
expanding Greenland commercial fishery (Templeman, 1967, 1968). While there
were not many recaptures from this tagging programme, the location of recap-
ture is available for each salmon and provides the best information on distribu-
tion at sea based on tagging. In total, 2241 salmon were tagged at sea in the
Greenland and Irminger Sea areas.
3.1.2 Gulf Region
There are three sources of data on tagging and recoveries in the North Atlantic Salmon
Tag Recovery (NASTR) database.
Fisheries Research Board1 of Canada historical data
The Fisheries Research Board has records for 17 370 tagged salmon (adults and smolts)
dating from 1957 to 1975. Overall, 13 378 records have complete tagging and recovery
dates. Most of the tag recoveries were from smolt tagging programmes, followed by
1 Until its transfer into the Department of the Environment (1973–1979), the Fisheries Research
Board was the principal federal research organization working on aquatic science and fisheries
in Canada.

10 | ICES Cooperative Research Report No. 343
adult salmon tagging, with the majority of the tagged fish being wild. A large percent-
age (72%) of the recoveries were made in freshwater, primarily in the Miramichi River,
which was the primary location of study during those years. The majority of marine
recoveries were obtained from smolt tagging programmes. Adult grilse and salmon
tagging programmes were carried out as fish were returning to the river to spawn, with
the majority of the recoveries occurring in the same year and generally in the river of
tagging. Freshwater recovery areas were defined as the recapture locations and were
specified to a river, a tributary, and, in some instances, a location on a river. Estuary
recoveries were defined on the basis of the name of the recapture location. Coastal re-
coveries were those that were not specific to a river or a known embayment.
Within the salmon tag recovery records, 851 recaptures were recorded from West
Greenland and are included in the NASTR database. Of these, 428 records include com-
plete information. Based on rough geographic groupings, 9 recoveries came from Lab-
rador, 487 from Newfoundland, and 37 from Quebec.
Most of the codes relate to statistical districts within the Maritimes, Quebec, and New-
foundland provinces. Recoveries in the high seas relate to the International Commis-
sion for the Northwest Atlantic Fisheries (ICNAF) subareas and divisions.
Information from TAGRET – Oracle database held at Bedford Institute of Oceanography,
Dartmouth, NS
There are 8233 records of tag recoveries for the tagging years 1966–1983 from pro-
grammes in the Gulf Region. Recaptures were evenly split between smolt and adult
tagging programmes, with recaptures as fresh-run adult returns and silvering kelts,
respectively. Within the adult programmes, most of the fish tagged were of wild origin,
whereas for smolts, ca. two-thirds were of hatchery origin. The majority of the tagged
fish were released in the Miramichi River, with lesser amounts in the Restigouche
River.
Most recaptures were reported from locations within the Gulf Region, with the vast
majority of these from freshwater locations. More than 2500 recoveries were in non-
Gulf Region waters, with just under 1000 from West Greenland. Based on the recap-
tures which occurred within three years post-tagging, the West Greenland recoveries
were primarily of reconditioned kelts from adult salmon tagged the previous year and
as non-maturing 1SW salmon one year post-tagging at the smolt stage. Most recoveries
were made from August to October. The single reported tag recovery from the Faroes
was a smolt tagged in 1974, but did not include recovery date information.
From adult tagging in Labrador, most recoveries were kelts. Recoveries of salmon orig-
inally tagged as smolts occurred as 1SW, two-sea-winter (2SW), and three-sea-winter
(3SW) adults.
Adult salmon tagged in Newfoundland were recovered on their return over the fol-
lowing two years as kelts, presumably as repeat spawners. Recaptures of smolts tagged
in Newfoundland occurred as 1SW, 2SW, and 3SW adults.
Department of Fisheries and Oceans (DFO) Canada: Science Branch Gulf Region Adult
and Smolt Tagging Programmes, 1985–present
Since 1985, fresh-run adult salmon have been tagged at several locations within Gulf
Region rivers as part of assessment programmes to evaluate adult returns. Since 1998,
smolt assessment programmes in the three main rivers of the Gulf Region (Res-
tigouche, Miramichi, and Margaree) have tagged upwards of 10 000 wild smolts annu-
ally using individually numbered streamer tags. Recaptures of post-spawned adult
Fifty years of marine tag recoveries from Atlantic salmon | 11
salmon and post-smolts were reported from numerous locations in the North Atlantic
including Quebec, Newfoundland, Labrador, and West Greenland.
The recapture data have not been assembled and reported in any previous publication.
Tag recoveries from West Greenland have been reported by ICES Working Group on
North Atlantic Salmon when they occurred.
3.1.3 Maritimes Region: Atlantic coast of Nova Scotia to the US border
Data describing the application, distribution, and recovery of individually identifiable
tags applied externally to Atlantic salmon initiating mostly, but not exclusively, from
Canadian government-funded research in the years prior to 1985 were registered with
the Atlantic Salmon Tag Clearing House of the Department of Fisheries and Oceans,
Science Branch, Maritimes Region. The data for this region are held in an Oracle data-
base at the Bedford Institute of Oceanography, Dartmouth, Nova Scotia, Canada. The
majority of tags applied were plastic Carlin tags in two sizes, with the size of the tag
depending on the size of the fish. The dataset comprises tag recoveries made in the
Maritimes Region between 1964 and 1985.
Information is available on tag code, recovery dates and locations, biological measure-
ments, fish taken for broodstock, and re-release. Release information for 2 613 919 tags
is available, with specific recovery data on 36 069 reported recaptures.

12 | ICES Cooperative Research Report No. 343
Figure 3.3. Danish tagging locations of salmon recovered around the Faroe Islands (●).
3.2 Denmark
Information is available from recaptures of salmon tagged with Carlin tags from 13
different Danish streams (Figure 3.3). The majority of smolts were released between
1965 and 1979, with some more recent releases (1991–1993) in one river. In total, ca.
56 000 smolts were tagged and released. The released fish originated from different
strains including many hatchery and Swedish strains. Approximately 160 recaptures
were reported from waters outside Denmark, with the majority of these in Norwegian
waters, followed by recaptures in Swedish waters. All recaptures near the Faroe Is-
lands have been included in the NASTR database. Tags were also reported from West
Greenland, but have not been included in the database owing to a lack of detail. A
small number of tags were recovered in Irish coastal fisheries and south of Denmark,
in German and Dutch coastal waters.
3.3 Iceland
External tagging of Icelandic salmon smolts with Floy and Carlin tags started at Kol-
lafjörður Experimental Fish Farm in the early 1960s. Microtagging with coded wire tags
(CWTs) started in 1974 and peaked in the mid-1990s when a number of commercial
ranching operations were releasing CWT tagged salmon. From 1982 to 1995, > 3 million

Fifty years of marine tag recoveries from Atlantic salmon | 13
smolts were tagged with CWTs and released in Iceland. Annual releases of smolts with
CWTs decreased considerably after those operations closed in the late 1990s and have
averaged 150 000 smolts annually since 1997.Fifty-five salmon of Icelandic origin were
caught in distant areas from 1967 to 1995 (Figure 3.4). Forty-four of these were tagged
with CWTs and were found in systematic surveys in the marine fisheries. The remain-
ing 11 salmon, mostly from the 1960s and 1970s, were carrying Carlin or Floy anchor
tags. Out of the 55 salmon caught in distant areas, 26 were recaptured in the Faroese
fishery and 24 in the Greenland fishery. In addition to the area and date of recapture,
information was also included on the type of tag, year of release, sex, length, and
weight when available. The exact location of recapture is not given for most of the
Greenland recaptures (location of landing is specified); however, more precise location
data are provided for the recoveries in the Faroese fishery.
Out of 2.2 million smolts tagged with CWTs and released in southern and western Ice-
land between 1987 and 1994, 14 were recovered in sampling programmes in the West
Greenland fishery and 1 in the Faroes. Out of 0.8 million smolts released in northern
and northeastern Iceland, 22 were recovered around the Faroe Islands and 4 in the
West Greenland fishery. In total, 1.4 CWT tagged smolts per 100 000 released from Ice-
land have been caught in distant fisheries from 1982 to 1995.
Icelandic ranched salmon released from west coast ranching stations have been recap-
tured in western Norway (1), a Faroese lake (1), a Faroese ranching operation (1), the
River Don in the UK (Scotland) (1), and off the east coast of England (1).
Figure 3.4. Icelandic tagging locations of salmon recovered around the Faroe Islands (●) and Green-
land (●).
Recoveries in Icelandic home-water fisheries of five fish tagged in other countries com-
prised salmon tagged as smolts in the River Screebe, Ireland (1) and a Faroese ranching
station (1), and adult salmon tagged in West Greenland (1), the Faroes (1) and a salmon
possibly tagged in the Russian Federation (1).
In summer 1985, there was a joint Icelandic–Greenlandic fish-finding survey east of
Greenland in two locations: Skjoldungen and Angmagsasalik. At Skjoldungen, 398
salmon were caught, including 5 without adipose fins. Of these, two were tagged with
CWTs, one from Iceland and one from Ireland. At Angmagsasalik, three salmon were
landed. Of these, one had been tagged in Ireland. A Norwegian-origin Carlin tag was
also recovered by a local fisher in this area.

14 | ICES Cooperative Research Report No. 343
In 2010, the Icelandic Directorate of Fisheries (IDF) started a screening programme to
investigate the incidence of salmon bycatch in mackerel (Scomber scombrus) and herring
(Clupea harengus) fisheries. Four tagged salmon were caught in 2010, three from Nor-
way and one from Ireland. In 2011, one Norwegian and one Irish tagged salmon were
caught. In these two years, no Icelandic tags were recovered. For each tagged salmon,
information was recorded on the date and place (coordinates) of capture, along with
the length, weight, and sex of the fish. In 2011, additional samples were taken for sex
and maturity determination, tissue for DNA analyses, and stomachs for diet examina-
tion; the head of the fish was also retained to permit CWT recovery.
3.4 Ireland
Salmon tagging has been reported in Ireland since the late 1800s. While initially re-
stricted to hatchery kelts using external tags, more consistent and extensive tagging
programmes commenced in 1948 (Went, 1964). Few external tags were recovered in
waters outside Ireland and the UK from these programmes. The main tag recovery
data derive from the National Coded Wire Tagging and Tag Recovery Programme,
which was initiated in 1980 (Browne, 1982), and include tag recoveries from West
Greenland and the Faroes (Figure 3.5).
Figure 3.5. Ireland tagging locations of salmon recovered around the Faroe Islands (●) and Green-
land (●).
The objectives of the national programme remain as originally proposed, i.e. to:
estimate the fishing exploitation rate on local salmon stocks in the Irish fish-
eries and on Irish salmon stocks in high seas fisheries;
investigate changes in marine and freshwater survival rates over time;
provide information on coastal and oceanic migrations of Irish salmon stocks;
investigate the potential for a sea ranching industry; and
Fifty years of marine tag recoveries from Atlantic salmon | 15
provide the basis for research on factors affecting salmon migration and sur-
vival using tagged experimental release groups of salmon.
Salmon smolts have been tagged and released annually from eight rivers in Ireland
since 1984 (Browne et al. 1994; Ó Maoiléidigh et al., 1994a). Apart from 1991, when over
500 000 salmon smolts were released in an effort to increase tag recovery from the fish-
eries of Greenland and the Faroes, tag output was generally more than 150 000 salmon
smolts annually until 2000 and between 250 000 and 300 000 thereafter. The hatchery
fish are generally one year old on release. The total release of coded wire tagged salmon
between 1980 and 2012 was over 8 million.
While the vast majority of tagged smolts were of hatchery origin, over 3000 wild smolts
have also been tagged annually from one river on the west coast of Ireland, with more
sporadic tagging on another two west coast rivers and one east coast river. The river
age of tagged wild smolts has been predominantly two years old. The total number of
wild fish tagged between 1980 and 2012 was close to 100 000. More than 177 000 tags
from hatchery-reared fish and more than 3000 tags of wild fish were recovered between
1980 and 2012, with the vast majority of these recovered in Irish rivers and home waters
as part of a systematic home-water catch-scanning programme. Since 2007, the coastal
mixed-stock driftnet fishery and some inshore draft (local specialized seine nets) fish-
eries have been closed for conservation reasons, resulting in a significant decline in tag
recoveries in fisheries, but an increase in the recovery of tags in hatchery broodstocks.
Although low in number, there have also been consistent recoveries in Greenland (ca.
140 tags) and the Faroes (ca. 158 tags) during the time of the commercial distant-water
fisheries and also in subsequent marine research fisheries in the Norwegian Sea, Ice-
landic waters, and East Greenland. Details of all the recoveries of Irish-origin coded-
wire tags have been placed in the NASTR database.
The majority of Faroes recaptures derive from 1SW fish which were <60 cm in length
(normally discarded), although some MSW salmon (35) have also been taken (Browne
et al., 1994; Jacobsen et al., 2012). In the early 1990s, investigations (Browne et al., 1994;
Ó Maoiléidigh et al., 1994b) of exploitation rates of Irish stocks suggested that while
exploitation of 1SW stocks was low at the Faroes, ca. 18% of an Irish-tagged hatchery
stock was taken as 1SW salmon in the West Greenland fishery. These fish would have
been destined to return as 2SW fish to Ireland.
The vast majority of tagged post-smolt salmon captured in experimental post-smolt
salmon trawling operations in the Norwegian Sea since the early 1990s, (Holm et al.,
2003) and more recently during the SALSEA Merge project (Anon., 2011), were derived
from the CWT marking programme in Ireland. These provide valuable information on
the distribution and timing of the migration of salmon from NASCO’s southern North
East Atlantic Commission (NEAC) area. In addition, owing to the nature of the coastal
net fishery, significant recoveries of tagged salmon originating in other countries were
made while this fishery operated until 2006 (Table 3.1). With the closure of the coastal
mixed-stock driftnet fishery, there have been no further recoveries of foreign tags in
the tag recovery programmes in Ireland. Note that tag recoveries by the Irish coastal
fishery have not been incorporated in the NASTR database.

16 | ICES Cooperative Research Report No. 343
Table 3.1. Recaptures of salmon in Irish marine salmon fisheries that were tagged in other countries.
Fishing year UK (NI) UK (EW) UK (Sc) France Spain Norway Denmark Germany Faroe Is
1985 7 129
1986 22 114
1987 143 66 65
1988 122 128 78
1989 101 68 17 6
1990 33 111 81 2
1991 221 57 57 1
1992 429 107 5 5
1993 172 101 2 1 8 1
1994 86 80 3 4 1
1995 51 147 4 62 3 23
1996 98 77 10 1 3 1
1997 168 44 2
1998 51 34 7 16 14
1999 46 118 2 7 35 1
2000 153 113 2 1 17 1
2001 198 54 8
2002 86 41 2 6 1 1
2003 58 27 17 1
2004 32 8 2 2 2
2005 28 10 7 1 5
2006
Total 2276 1420 578 80 100 2 77 9 1

Fifty years of marine tag recoveries from Atlantic salmon | 17
3.5 Norway
In Norway, there has been systematic tagging of Atlantic salmon since 1935, and nu-
merous experiments have been carried out to investigate life history, behaviour, and
exploitation. Salmon have been tagged and released at different life stages, mainly us-
ing external tags. Both wild and hatchery-reared smolts have been tagged and subse-
quently released in a number of rivers and fjords and in some fjord areas, with 1760
caught in the Faroese fishery and 148 caught in the Greenland fishery between 1968
and 2009 (Figure 3.6). Furthermore, salmon have been caught with longlines in the
Norwegian Sea, tagged, and released back into the sea, with many recaptured later.
These results are detailed in Section 7.4. Similarly, a large number of adult salmon have
been captured in Norwegian coastal bag nets, tagged, and released.
From April to June in the period 1969–1972, 4225 salmon were caught with longlines
in the Norwegian Sea, tagged, and released; the position of capture (latitude and lon-
gitude) was recorded. A total of 520 of these tagged salmon were recaptured. These
recapture sites have been made available for the NASTR database at three levels of
geographical precision, defined as high, medium, or low. High-precision data are those
with exact information on both tagging and recapture sites (latitude and longitude are
known). Medium-precision data are those where recapture sites can be related to a
specific geographical site (e.g. 50 nautical miles northwest of Andenes). In such cases,
the longitude and latitude can be estimated. Finally, low-precision data are those
where the recapture site is related to a large but defined geographical area (e.g. north
of the Faroes, or northern Norwegian Sea). Data on dates of release and recapture and
size of the fish at release and recapture have also been provided when available.
Similarly, information from the last 35 years has been digitized in spreadsheets and
databases, representing the recapture details of ca. 2.5 million smolts that have been
tagged and released. These data have been made available for the NASTR database.
Salmon tagged in Norway and recaptured in other oceanic areas, particularly in West
Greenland and Ireland, were also made available. These are significant, owing to their
number and recapture locations, indicating feeding grounds and migratory ranges of
northern European-origin salmon. While relatively few of these recapture data include
latitude and longitude, they can be linked to a specific site or area. The numbers of
recaptures in areas outside Norway, including those from coastal areas and freshwater
in Sweden, Denmark, the Russian Federation, and the UK are show in Figure 3.7.

18 | ICES Cooperative Research Report No. 343
Figure 3.6. Norwegian tagging locations of salmon recovered around the Faroe Islands (●) and
Greenland (●).
Figure 3.7. Number of Norwegian-origin salmon tags recovered in countries outside Norway.
3.6 Russian Federation
Between 1969 and 1974, 13 606 smolts from various rivers and hatcheries of the former
USSR were tagged with external tags. By early 1975, 120 salmon had been recaptured
(Bakshtansky and Yakovenko, 1976), including 12 tags returned from abroad. Seven
Sweden Denmark Greenland Russian Ireland UK Federation
Country

Fifty years of marine tag recoveries from Atlantic salmon | 19
tagged salmon were caught in the Norwegian Sea and five other salmon were also caught
in the territorial waters of Norway, closer to shore.
The first adult Atlantic salmon tagging experiments conducted in the coastal zone of
Norway (near Breivik, Finnmark) showed that Atlantic salmon from Russian rivers
made their feeding migrations in the Norwegian Sea and returned to their native rivers
through Norwegian coastal waters (Bakshtansky, 1970). The first salmon with a Nor-
wegian tag caught in the USSR was in the Vyg River, White Sea Basin in 1935 (Berg,
1948). This salmon had been tagged in nearby Trondheim. In 1936, 18 salmon tagged
in Norwegian coastal waters were caught (Danilchenko, 1938) in different rivers and
coastal areas of the USSR.
Bakshtansky and Nesterov (1973), in their work on the impact of foreign fisheries on
Atlantic salmon from Russian rivers, presented some data on tagged Atlantic salmon
recaptured in Russian home waters. Over a period of 11 years (1962–1972), 240 tagged
salmon were recaptured. Information on location and date of tagging was available for
only 38 of those fish. Most of them were tagged near Breivik, Finnmark and recaptured
between 9 and 97 days after tagging (mean = 59). Two fish were recaptured in the Pe-
chora River more than one year after tagging, suggesting that some salmon from Rus-
sian rivers may have been on their outward migration to feeding areas, while others
were on their homeward spawning migration (Bakshtansky and Nesterov, 1973).
Antonova and Chuksina (1987), with reference to the report by the Direktoratet for
Jakt, Viltstell og Ferskvannsfiske (Anon., 1974), analysed data on the recapture rate of
Pechora salmon tagged among other Atlantic salmon in different areas of the Norwe-
gian Sea between 1962 and 1973. In that period, 5228 salmon, taken from bendnet and
bagnet catches near Breivik, Finnmark and from catches by driftnets at Sørøy, Norwe-
gian Sea, were tagged. Of these, 162 salmon were recaptured in Russian home waters,
including 14 fish caught in the Pechora River. Also, between 1968 and 1972, 4899
salmon from longline catches were tagged in different areas of the Norwegian Sea. Of
these, 71 were recaptured in Russian home waters, including 25 fish in the Pechora
River (Antonova and Chuksina, 1987).
According to Bakshtansky and Yakovenko (1976), 1923 kelts were tagged with external
tags in the Varzuga River from 1968 to 1971, with 72 fish subsequently recaptured. Of
these, 37 were repeat spawners recaptured in the Varzuga River and 35 were caught in
different saltwater areas, including two in the Norwegian Sea. One of these (tagged in
1969) was caught by a Danish fishing vessel northeast of Vesteraalen on 18 February
1970. The other (tagged in 1971) was caught by a Norwegian fishing vessel near Nord-
kapp on 15 June 1972 (Bakshtansky and Yakovenko, 1976).
There are no reports in the NASTR database of salmon tagged in the Russian Federa-
tion and recovered in the Faroese or Greenland fisheries.
3.7 UK (England and Wales)
Salmon tagging programmes in the UK (England and Wales) have been carried out
since the late 1950s. Most of the tagging focused on juveniles (mainly smolts, but also
some parr), and both wild and hatchery-reared fish have been tagged. Small numbers
of fish have also been tagged as adults and as kelts. The UK (England and Wales) also
holds certain international tagging and tag recovery data derived from previous inter-
national collaborative programmes.
In earlier years (1958–1984), juvenile salmon from a variety of catchments were tagged
with external tags (Carlin tags and predecessors). In total, around 250 000 fish were

20 | ICES Cooperative Research Report No. 343
tagged over this period. Wild smolts were tagged in 11 catchments, although some of
these programmes were only carried out for 1 year, caught few fish, and resulted in no
recaptures outside home waters. Hatchery parr/smolts were tagged and released in ten
catchments.
The NASTR database holds records of 52 fish tagged in the UK and caught in the Far-
oese fishery and 393 caught in the Greenland fishery between 1961 and 2009 (Figure
3.8). Details of each tag recovery have been extracted from paper records and are now
held in the NASTR database. Information on release location is available for all recov-
eries, and origin of the fish (wild or hatchery) is available for many fish. For most en-
tries, the date of tagging is also available, although in some cases this is only reported
as month, season, and/or year. For the high seas recoveries (West Greenland and Fa-
roes), the precision of the recapture information varies considerably. Of the 308 fish
recovered from West Greenland, precise position (latitude and longitude) is only avail-
able for 68 fish (22%). For other West Greenland recoveries, the recapture position is
either reported as a specific place (in many cases the port of landing) or simply as West
Greenland. All the tags recovered in the Faroes fishery over the period are simply re-
ported as Faroes area. The information for Greenland and the Faroes is available in the
NASTR database. Recoveries in other countries are usually given for a particular fish-
ery area or port. For all fisheries, there is considerable variation in the precision with
which date of recovery is reported (day, month, season, or year). A range of other in-
formation may also be associated with recovered tags, e.g. fish length and weight.
Figure 3.8. UK (England and Wales) tagging locations of salmon recovered around the Faroe Islands
(●) and Greenland (●).
There has been limited tagging of adult fish and kelts in the UK (England and Wales)
and some studies have focused on relatively local issues (e.g. adult fish tagged in the
English northeast coast fishery and recovered in the northeast of England and eastern
Scotland). These latter data have not been included in this report or in the NASTR da-
tabase. However, 979 kelts were tagged on the River Axe in Devon between 1960 and

Fifty years of marine tag recoveries from Atlantic salmon | 21
1965, resulting in 8 recaptures in the West Greenland fishery. Tagging and recapture
information is as for the externally tagged smolts. Precise recovery locations (latitude
and longitude) are available for two of these fish.
Coded wire microtagging programmes started in the UK (England and Wales) in 1983
and continue to the present time. To date, > 3.3 million hatchery fish and ca. 200 000
wild smolts have been tagged. Fish have been released into 40 different catchments.
Recoveries of CWTs require targeted screening programmes, and these have operated
in the high seas fisheries at the Faroes and Greenland for many years, in the net and
angling fisheries and broodstock collections in Ireland, the net fisheries in the UK
(Northern Ireland), and in the net fisheries along part of the east coast of the UK (Scot-
land). Information on recoveries in Greenland and the Faroes is included in the NASTR
database.
3.8 UK (Northern Ireland)
A CWT programme was initiated in the UK (Northern Ireland) in 1983. The tagging
has focused on juveniles (mainly smolts) and both wild and hatchery-reared fish have
been tagged. Distinct age groups of hatchery smolts (1+ and 2+) have been tagged an-
nually. Around 900 000 salmon smolts have been tagged through the tagging pro-
gramme conducted on the River Bush on the north coast of County Antrim.
Figure 3.9. UK (Northern Ireland) tagging locations of salmon recovered around the Faroe Islands
(●) and Greenland (●).
A CWT screening programme was operated around the coastal fisheries in the UK
(Northern Ireland) whenever the commercial net fishery was operational. Details of
each tag recovery have been digitized and held in spreadsheet form. The vast bulk of

22 | ICES Cooperative Research Report No. 343
the recoveries were associated with local coastal fisheries and river returns. Relatively
few fish tagged in the UK (Northern Ireland) were detected in either the Greenland
(three) or Faroese (eight) fisheries (Figure 3.9), but recovery information for these
tagged fish is included in the NASTR database.
3.9 UK (Scotland)
Tagging programmes in the UK (Scotland) have primarily focused on juvenile salmon
(parr and emigrating smolts) from three areas: the North Esk, the Tay system, and the
River Dee (specifically the Girnock and Baddoch tributaries). Information on release
date and location, origin of the fish (wild or hatchery), and fork length are generally
available from these studies as are, for a subsample of tagged fish, weight and river
age from scale samples. Where available, these data have been collated with tag re-
turns.
Figure 3.10. UK (Scotland) tagging locations of salmon recovered around the Faroe Islands (●) and
Greenland (●).
A range of information may be associated with each recovered tag, including when
and where recovered, fish length, and weight. As noted in previous sections, there is
considerable variation in the precision with which date recovered (either day, month,
season, year, or even decade) and location (country, NAFO division caught, grid refer-
ence caught, port landed, location where tag was recovered during fish processing) are
recorded.

Fifty years of marine tag recoveries from Atlantic salmon | 23
Tagging and recovery data for 135 external and CWT tagged salmon of Scottish origin,
recovered between 1967 and 1993, are detailed in the NASTR database. Data are also
available for recoveries of 77 Scottish tagged salmon in the Greenland fishery from 1980
to the present. A small number of records from earlier years are included where these
were reported (Figure 3.10). Approximately 580 Scottish CWTs have also been recov-
ered in the Irish coastal net fishery, mainly between 1985 and 1991 but these are not
incorporated into the NASTR database. Relatively few were recaptured after this pe-
riod as the CWT programme was considerably reduced. Since 2006, when the Irish
mixed-stock coastal driftnet fishery was closed, there have been no recoveries of Scot-
tish tagged fish. Details of release location and date, landing location, length, and date
of capture are generally available.
3.10 USA
A detailed discussion and summary of the historical US Atlantic salmon tagging pro-
grammes (Carlin and CWT tag releases and recaptures) has been provided by Miller et
al. (2012a, b).
3.10.1 Carlin tags
Over 1.5 million Carlin-tagged fish were released between 1962 and 1996. There are ca.
4000 records of high seas recaptures and 4500 home-water recaptures. Home-water re-
captures were not considered further within the framework of this report. Less than
one-third of the high seas recapture data have reliable latitude and longitude coordi-
nates associated with them. The records without reliable recapture location have a
community name, community code, NAFO Division, state/province, or country asso-
ciated with each recapture. A standardized set of locations was developed so that all
tag recaptures could be associated with a general recovery location according to the
level of information available. The majority of the releases were of 1+ hatchery-reared
smolts (64%) and 35% were of 2+ hatchery-reared smolts. Approximately 50% of the
high seas recoveries came from Greenland, while eastern Canada (Maritimes, Quebec,
Newfoundland, and Labrador) accounts for the majority of the rest. The Faroese and
Saint Pierre et Miquelon fisheries each produced a single tag recovery, and a small
number were returned from US territorial waters. Most of the recaptures came from
Penobscot River releases (85%), with a few other river releases dispersed through the
dataset. All Greenland recaptures were included within the NASTR database.
3.10.2 Coded wire tags (CWT)
A total of 6.4 million CWT tagged fish were released between 1982 and 1994. There are
420 records of high seas recaptures. None of the high seas recaptures have latitude and
longitude coordinates associated with them, but they all have either a community
name or a community code. A standardized location was assigned to each recapture as
detailed above.
Overall, 92% of the releases were of hatchery-reared smolts, of which the majority
(75%) were 1+ smolts. Over 77% of the recaptures came from Greenland, with the re-
mainder coming from Canada (Newfoundland/Labrador). The largest number of
tagged fish releases came from the Connecticut River; however, distant-water recover-
ies were dominated by fish originating in the Penobscot River (71%). Similar to the
Carlin recoveries, the percentage of Penobscot River recoveries increased as fish pro-
gressed along their migration towards Greenland. Tagging locations of fish tagged in
the US and recovered in the Faroes and Greenland fisheries are shown in Figure 3.11.

24 | ICES Cooperative Research Report No. 343
Figure 3.11. USA tagging locations of salmon recovered around the Faroe Islands (●) and Greenland
(●).
3.10.3 Visible implant Elastomer (VIE) tags
A total of 1.5 million VIE tagged fish have been released since 2000. There have been
only 11 recoveries recorded to date. None of the high seas recapture data have latitude
and longitude coordinates associated with them but they all have an associated com-
munity name which has been assigned a standardized location as detailed above.
All of the releases were of 1+ hatchery-reared smolts, and the majority of them (75%)
were in the Penobscot River. All of the recaptures came from Greenland, having been
released from either the Penobscot or Dennys rivers.
3.11 Faroes
Two adult tagging programmes have been undertaken in the Faroese area in addition
to limited tagging in Faroese rivers. Exact tagging and recapture positions along with
other relevant information are available for the most recent tagging programme un-
dertaken from 1992 to 1995. The recapture by country from this experiment is shown
in Figure 5.4, adjusted for home-water exploitation rates and tag reporting rates.
3.12 Greenland
An international ICES/ICNAF (International Commission for the Northwest Atlantic
Fisheries) adult salmon tagging programme was undertaken in the West Greenland
fishery between 1965 and 1972. In total, 4632 adult fish were tagged, just over 50% of
these in 1972. Jensen (1980b) provides a summary of the recovery data. Detailed tag-
ging and recapture information for 1972 is held by the UK (England and Wales) and

Fifty years of marine tag recoveries from Atlantic salmon | 25
has been entered into spreadsheet form; it is unclear whether detailed recapture infor-
mation is available for the earlier years (1965–1971). These data include place of tag-
ging, with a high level of precision (tagging carried out by research vessels), with 236
entries in the NASTR database. The precision of the recapture information is more var-
iable. The majority of tag recoveries occurred within the West Greenland fishery (164)
and just over half of these have position (latitude and longitude) recorded. Most of the
others have either a place of recapture or port of landing given, although some are only
reported as West Greenland. There are also 52 recoveries in home-water fisheries; for
these, their home-water recovery locations are given as place of recapture, but they do
not have associated latitude and longitude coordinates.
26 | ICES Cooperative Research Report No. 343
4 Tag recovery databases
4.1 Structure and format of the NASTR database
The tag-recovery databases comprise four Excel workbooks relating to Greenland
salmon tag recoveries, Faroes salmon tag recoveries, Faroes tagged adult tag recoveries
and Norwegian tagged adult tag recoveries which provide details of the recaptures of
individual tagged salmon around the coast of Greenland and within the Faroes EEZ,
and adult salmon captured, tagged, and released around the Faroe Islands, respec-
tively. Also included in these data files are details of tag recoveries in home waters
from the adult tagging experiments in Greenland and the Faroes. Each entry includes
three groups of information related to: (i) the tag, (ii) the tagging and release (Tagging)
event, and (iii) the recovery (Reporting) event. Annex 4 lists the individuals who par-
ticipated in the collection and collation of tag recoveries.
The databases were largely compiled during two ICES workshops (WKDUHSTI; ICES,
2007 and WKSHINI; ICES, 2008a) by representatives from various countries. Further
tag records were incorporated during subsequent workshops (WKLUSTRE; ICES, 2009
and WKSTAR; ICES, 2012), with some extra validation during the intervening periods.
Table 4.1 lists the fields included in the database and their descriptors. For Tagging,
information is categorized into when (to refer to date), where (to refer to location), and
what (to indicate the life stage, size (weight and or length), origin (wild or hatchery),
and river age. Likewise, Reporting also details when (the date of recovery), where (the
catch location), and what (details of the fish when caught, including size (weight
and/or length) life stage, river and sea ages, sex, catch method, and if scales were col-
lected).
For both sets of information (Tagging and Reporting), clear descriptions have been
provided. Formats were standardized, and predefined entries were set where possible
to limit variations between entries (Table 4.1). Weight and length measurements were
set to metric units (g and cm, respectively), all dates were modified to dd/mm/yyyy
format, and latitude and longitude were converted to decimal degrees, with west indi-
cated by negative values. Drop-down lists were provided, giving standardized options
for tag type, life-history stage, sex, recovery operation, how reported, and whether a
scale sample was taken, and location-related entries were standardized to the greatest
extent possible.
In most instances, not all details are available. Omissions in entries include release
dates, districts, length and weights, hatchery or wild origin, river and sea ages, and
sex. Incomplete records have been maintained in the database provided that the infor-
mation includes release and recovery locations and years. Recovery data are grouped
by tagging and release country/district/programme as appropriate, comprising 13
worksheets, as detailed in Section 6.

Fifty years of marine tag recoveries from Atlantic salmon | 27
Table 4.1. The agreed data fields for recording tag recoveries from the oceanic areas frequented by salmon.
Attribute table fields Description Format
Tag
information
Tag
details
Tag # Number/code physically associated
with the tag
alphanumeric
Trace var Information which, together with tag #,
uniquely identifies individual tag
free format
Tag type Description of type of tag applied dropdown list: CWT Carlin T-Bar Lea PIT Other
Taggingagency Agency responsible for holding data free format
Tagging:
Details of
tagging oc-
currence
When Day
dd
Month
mm
Year
yyyy
Where Description General description of tag site free format or custom codes
Country 3 fields which allow the recovery site to
be filtered to 3 levels of precision from
the widest geographic range (country)
to the narrowest (location)
free format
District free format
Location free format
NAFO NAFO division code
ICES ICES area code
ICES square ICES statistical rectangle code
Lat Latitude decimal
degrees
Long Longitude, west indicated by -ve values decimal
degrees
What Fork length (cm) length in cm
Weight (g)
weight in
grams
Wild/hatchery etc drop down list: Wild Hatchery Mixed Unknown
Life-history stage drop down list: Parr Smolt Post-smolt Adult Kelt Other
River age River age of fish in years
Reporting:
Details
of tag
When Day
dd
Month
mm
Year
yyyy
Where Description Comments field:
general description of recovery site
free format

28 | ICES Cooperative Research Report No. 343
Attribute table fields Description Format
recovery
occurrence Country 3 fields which allow the recovery site to
be filtered to 3 levels of precision from
the widest geographic range (country)
to the narrowest (location)
free format
District free format
Location free format
NAFO NAFO division code
ICES area ICES area code
ICES square ICES statistical rectangle code
Lat Latitude decimal
degrees
Long Longitude, west indicated by -ve values decimal
degrees
What Fork length (cm) length in cm
Round weight (kg) weight in kg
Gutted weight (kg) weight in kg
Life-history stage drop down list: Parr Smolt Post-smolt Adult Kelt Other
River age River age of fish in years free format
Sea age Sea age of fish in years free format
Sex
drop down list: Male Female Unknown
Recovery
operation
Code to indicate tag recovery process drop down list: Fishing Landing Processing Tag
found
Unknown
How reported Was report part of a directed screening
programme?
drop down list: Report Screen Unknown
Gear type Type of catch method free format
Scale sample Are scale samples available? drop down list: Yes No
General
comments
Comments field which allows any other
useful comments
free format
Fifty years of marine tag recoveries from Atlantic salmon | 29
4.2 Permissions and restrictions on data use
The NASTR database is held at ICES Data Centre and documented throughout this
report. The data will be accessible on ICES website (http://ices.dk/marine-data/) subse-
quent to this report being published.
Annex 5 lists the national tag clearing houses to which Atlantic salmon tags should be
returned.
Access to the database will be restricted to the agencies and institutes that contributed
the original data for three years from the date of publication of this report. After that
time, the data will be freely available to all legitimate researchers, although the follow-
ing acknowledgement should be included in any papers or reports:
We are grateful to all data providers for access to the tag recovery data used in this paper/report.
These data are available through ICES Data Centre: www.ices.dk/marine-data.
There are several issues that need to be taken into account when using these data:
The distribution of tag returns depends on the distribution of fishing effort,
both temporally and spatially. Catch-per-unit-effort (CPUE) data from the
Faroese longline fishery are available at the Faroe Marine Research Institute
(formerly the Faroese Fisheries Laboratory) for the period since the late
1970s. The CPUE data are required to separate potential changes in the dis-
tribution of tag-recapture rates in various areas from changes in the fishery.
Only very limited effort data are available for the West Greenland fishery.
Alternative approaches may be used to take account of this in any analysis,
such as considering proportions of tag recoveries.
The Faroese and West Greenland fisheries have been subject to various man-
agement measures over the period, e.g. shortening of the fishing season and
introduction of quotas and quota buyouts.
The tag recaptures have not been adjusted by the number of fish released as
this information was not available for all countries and years for the work-
shops and was not adjusted for the relative production of salmon in each
country. Thus, for countries which tag only a small proportion of their pro-
duction, the number of tags in the database may be very low, but could rep-
resent a large contribution of salmon from that population to the fishery.
Data on the actual numbers of tags that were released from respective areas
have been collated by ICES since 1985, and some earlier data on numbers of
fish tagged by countries were included in the reports of ICES Working Group
on North Atlantic Salmon prior to the closure of the Faroese fishery. Further
information may be available from the national laboratories/agencies respon-
sible for the tagging efforts.
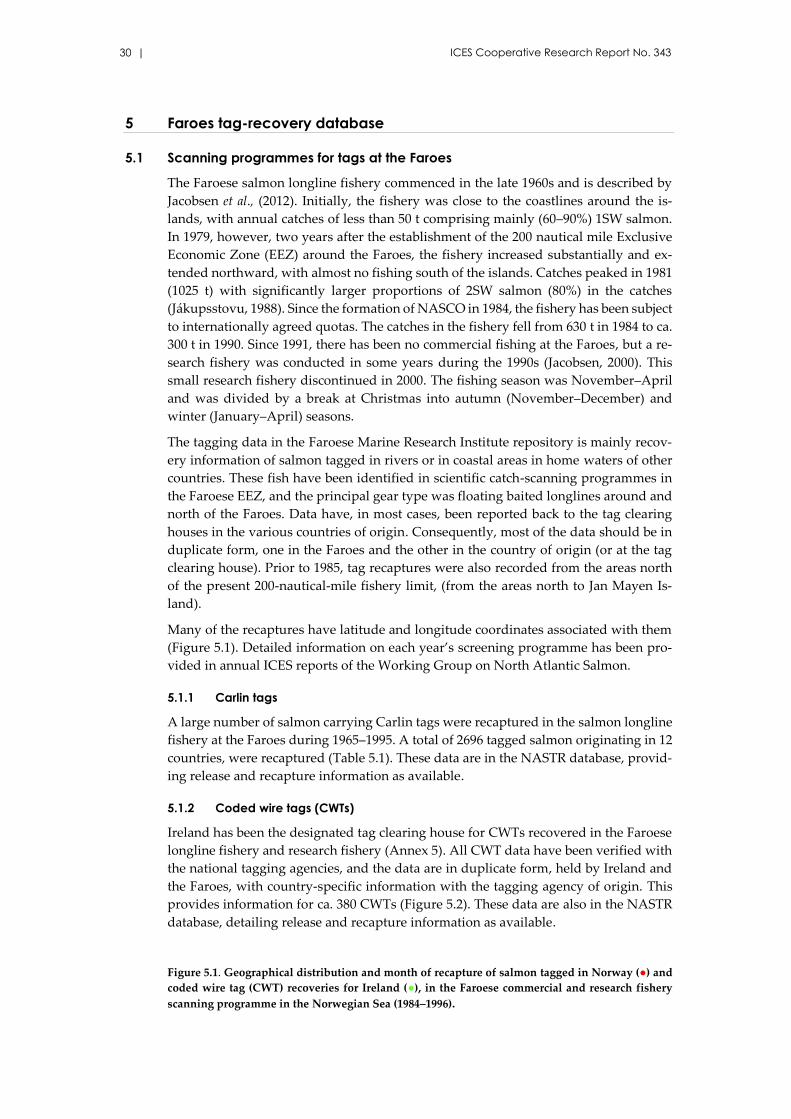
30 | ICES Cooperative Research Report No. 343
5 Faroes tag-recovery database
5.1 Scanning programmes for tags at the Faroes
The Faroese salmon longline fishery commenced in the late 1960s and is described by
Jacobsen et al., (2012). Initially, the fishery was close to the coastlines around the is-
lands, with annual catches of less than 50 t comprising mainly (60–90%) 1SW salmon.
In 1979, however, two years after the establishment of the 200 nautical mile Exclusive
Economic Zone (EEZ) around the Faroes, the fishery increased substantially and ex-
tended northward, with almost no fishing south of the islands. Catches peaked in 1981
(1025 t) with significantly larger proportions of 2SW salmon (80%) in the catches
(Jákupsstovu, 1988). Since the formation of NASCO in 1984, the fishery has been subject
to internationally agreed quotas. The catches in the fishery fell from 630 t in 1984 to ca.
300 t in 1990. Since 1991, there has been no commercial fishing at the Faroes, but a re-
search fishery was conducted in some years during the 1990s (Jacobsen, 2000). This
small research fishery discontinued in 2000. The fishing season was November–April
and was divided by a break at Christmas into autumn (November–December) and
winter (January–April) seasons.
The tagging data in the Faroese Marine Research Institute repository is mainly recov-
ery information of salmon tagged in rivers or in coastal areas in home waters of other
countries. These fish have been identified in scientific catch-scanning programmes in
the Faroese EEZ, and the principal gear type was floating baited longlines around and
north of the Faroes. Data have, in most cases, been reported back to the tag clearing
houses in the various countries of origin. Consequently, most of the data should be in
duplicate form, one in the Faroes and the other in the country of origin (or at the tag
clearing house). Prior to 1985, tag recaptures were also recorded from the areas north
of the present 200-nautical-mile fishery limit, (from the areas north to Jan Mayen Is-
land).
Many of the recaptures have latitude and longitude coordinates associated with them
(Figure 5.1). Detailed information on each year’s screening programme has been pro-
vided in annual ICES reports of the Working Group on North Atlantic Salmon.
5.1.1 Carlin tags
A large number of salmon carrying Carlin tags were recaptured in the salmon longline
fishery at the Faroes during 1965–1995. A total of 2696 tagged salmon originating in 12
countries, were recaptured (Table 5.1). These data are in the NASTR database, provid-
ing release and recapture information as available.
5.1.2 Coded wire tags (CWTs)
Ireland has been the designated tag clearing house for CWTs recovered in the Faroese
longline fishery and research fishery (Annex 5). All CWT data have been verified with
the national tagging agencies, and the data are in duplicate form, held by Ireland and
the Faroes, with country-specific information with the tagging agency of origin. This
provides information for ca. 380 CWTs (Figure 5.2). These data are also in the NASTR
database, detailing release and recapture information as available.
Figure 5.1. Geographical distribution and month of recapture of salmon tagged in Norway (●) and
coded wire tag (CWT) recoveries for Ireland (●), in the Faroese commercial and research fishery
scanning programme in the Norwegian Sea (1984–1996).

Fifty years of marine tag recoveries from Atlantic salmon | 31
-25 -20° -15° -10° -5° 0° 5° 10° 15° East
-25 -20° -15° -10° -5° 0° 5° 10° 15° East
50
°
5
5°
60°
No
rth
50°
55°
60
° N
ort
h
50°
55°
60
° N
ort
h
5
0°
5
5°
60°
No
rth
October
November
January
February
March
April
May
June
Figure 5.2. Geographical distribution and month of recapture of salmon tagged in Norway (●) and coded wire tag
(CWT) recoveries for Ireland (●), in the Faroese commercial and research fishery scanning programme in the Norwe-
gian Sea (1984–1996).

32 | ICES Cooperative Research Report No. 343
Table 5.1. Total number of external tags recaptured in the Faroes longline fishery, by country of
origin, with indication of the accuracy of the recapture location. Recovery positions are detailed as
Exact, with corresponding latitude and longitude, or regional as North of Faroes.
Country Recovery position Total
Exact North of Faroes
Canada 3 - 3
Denmark 2 - 2
Faroe Is 175 5 180
France 2 - 2
Iceland 3 1 4
Ireland 1 1 2
Norway 1 267 739 2 006
Russian Federation 1 4 5
Sweden 228 168 396
UK (EW) 6 7 13
UK (Sc) 46 35 81
USA 1 - 1
Unknown 1 - 1
Total 1 736 960 2 696
Figure 5.3. Coded wire tag recoveries in the Faroes longline fishery, 1984–1996.
5.2 Summary descriptions of tagging data
During the period 1968–2000, 2646 tags were recovered from the salmon fishery: 2258
individually numbered Carlin tags (Carlin, 1955), 383 batch-numbered CWTs, and 4 T-
bar externals. These tags had been applied to salmon in 13 countries or jurisdictions
0
20
40
60
80
100
120
140
160
Irela
nd
Fa
roe
s
UK
(Engla
nd
& W
ale
s)
Icela
nd
UK
(Sco
tland
)
Norw
ay
UK
(No
rthe
rn Ire
lan
d)
US
A
Cana
da
Fra
nce
Spa
in
Denm
ark
Sw
ede
n
Nu
mb
er
of
reco
ve
rie
s
Country of origin

Fifty years of marine tag recoveries from Atlantic salmon | 33
(hereinafter countries): Canada, Denmark, Iceland, Ireland, Faroes, France, Norway,
Spain, Sweden, the United States, and the UK (England and Wales, Northern Ireland,
and Scotland). While information on tag recoveries is available for the Russian Feder-
ation, it was not sufficiently detailed for inclusion in the NASTR tag database.
The recovery data obtained from the fishery included tag number, recovery position,
origin (country), date of tag recovery, and size of tagged salmon (Table 5.2). Of the 2646
tags, the tag-recovery location was known for 2551 salmon, while in other cases, loca-
tion was coded to be inside the Faroese EEZ (north of the Faroes).
Sea ages of the salmon were calculated from the release dates to the dates of tag recov-
ery. Salmon in their first winter at sea were termed 1SW salmon, irrespective of
whether they were recovered before or after 1 January (i.e. November–December or
January–May, respectively). The same rule was applied for 2SW and 3SW salmon,
which were collectively termed MSW salmon. The implications of the sea-winter defi-
nition are that the sea age was considered to change by the end of October and not at
the beginning of the year. Hence, salmon were assumed to have the same sea age
throughout autumn and the following winter fishing seasons, i.e. from November in
year i to October in year i + 1.
The Faroes tag database is compiled into one file comprising all of the tag recaptures
from the various release countries and including the following (ordered by number
recovered):
Norway: 1760 tag recoveries derived from external tagging of smolts.
Sweden: 376 tag recoveries derived from external tagging of smolts on the
west coast of Sweden.
Ireland: 158 tag recoveries derived from CWT tagging of smolts.
UK (Scotland): 135 tag recoveries derived mainly from external tagging of
smolts.
Faroes: 99 tag recoveries derived from external tagging of salmon smolts re-
leased in the Faroes used in ocean ranching in the 1980s and early 1990s. The
smolts were originally introduced from Norway (Sundalsøra, northwest
Norway) for salmon farming.
UK (England and Wales): 69 tag recoveries derived mainly from CWT tag-
ging of smolts.
Iceland: 27 tag recoveries derived mainly from CWT tagging of smolts.
UK (Northern Ireland): Eight tag recoveries derived from CWT tagging of
smolts on the River Bush.
Canada: Six tag recoveries derived from five external and one CWT tagged
smolts in Maritime Canada.
Denmark: Four tag recoveries derived from Carlin-tagged smolts in west and
north Jutland in the mid-1970s.
USA: Two tag recoveries derived from one external and one CWT tagged
smolts from the Penobscot River in 1987.
Spain: One tag recovery derived from a CWT smolt tagged in the Eo River
in 1993.
France: One tag recovery derived from a CWT smolt tagged in a river in Brit-
tany in 1990.

34 | ICES Cooperative Research Report No. 343
Table 5.2. Summary of the numbers of tagging entries by country in the Faroes tag-recovery database and a description of the information associated with the tag recoveries.
Tagging
country
No. of
recaptures
No. with
known GIS
position
Fork
length
Round
weight
Gutted
weight
Origin Sea age Life stage when tagged
Unknown Hatchery Wild Unknown 1SW 2SW 3SW Unknown Adult Kelt Parr Smolt
USA 2 2 1 0 1 1 1 0 0 1 1 0 1 0 0 0 1
Canada 6 5 2 1 1 1 4 1 3 0 1 2 1 0 0 0 5
Denmark 4 1 4 1 0 0 4 0 0 2 1 1 0 0 0 0 4
Faroes 99 77 95 0 95 99 0 0 15 2 78 4 99 0 0 0 0
France 1 1 1 0 1 1 0 0 0 0 1 0 1 0 0 0 0
Iceland 27 22 25 0 24 22 5 0 0 5 20 2 22 0 0 0 5
Ireland 158 133 156 0 146 0 158 0 0 123 35 0 0 0 0 0 158
Norway 1 760 1 760 1 471 0 1 208 1 760 0 0 1 227 1 360 172 19 0 0 0 1 741
Spain 1 1 1 0 1 1 0 0 0 1 0 0 1 0 0 0 0
Sweden 376 370 53 45 189 0 376 0 3 73 258 42 0 0 0 0 376
UK (EW) 69 58 61 0 53 0 37 32 1 15 47 6 12 0 0 18 39
UK (NI) 8 8 8 0 8 7 1 0 0 5 2 1 7 0 0 0 1
UK (Sc) 135 113 33 0 62 14 9 112 18 25 73 19 15 2 2 0 116
Total 2 646 2 551 1 911 47 1 789 1 906 595 145 41 479 1 877 249 178 2 2 18 2 446

Fifty years of marine tag recoveries from Atlantic salmon | 35
In addition to this report, the information contained in the Faroes recovery database
was examined to describe the distribution of salmon of different origins and sea ages
in the sea around the Faroe Islands for the ICES/NASCO Salmon Symposium held in
La Rochelle, France in October 2011, and a range of analyses have subsequently been
published (Jacobsen et al., 2012).
Tag recapture per country per year (Figure 5.3) demonstrated that the largest tag re-
coveries occurred for fish originating from Norway, Sweden, the UK (Scotland), and
Ireland, with smaller numbers of recoveries of fish tagged in the UK (England and
Wales), the Faroes, Iceland, Denmark, and Canada. Differences in annual recaptures
were evident and linked in some years to the number of fish actually tagged in these
countries. Tagging in the UK (Scotland) was much reduced, particularly after 1985.
Similar reductions in the number of fish being tagged occurred in other countries over
the years. Tagging programmes in Ireland and the UK (England and Wales) and the
UK (Northern Ireland) remained relatively consistent for most of the period. Salmon
tagged in USA, France, and Spain were also caught off the Faroes during the time-
series. Most catches were recorded during the 1980s, peaking in 1983 at 454 tagged fish
around the time when catches in the Faroes fishery peaked. Of the 2646 records, 56%
were recovered between 1981 and 1986, 81% between 1981 and 1990, and 95% between
1978 and 1994.
Figure 5.4. Tag recaptures at the Faroes by country of origin 1968–2000 (excluding countries with
fewer than three tags: USA, Spain, and France).
While conventional tagging provides information on the distribution of national or re-
gional stocks within a fishery temporally and geographically, it may not provide an
accurate reflection of the proportion of fish from each country or region of origin as the
tag recoveries have not been scaled to the total tag output. Recent genetic assignments
reported to ICES (ICES, 2015) were made possible based on DNA extracted from 656
scale samples (87 1SW and 487 MSW non-farm-origin fish and 82 farmed escapees)
collected during the 1993/1994 and 1994/1995 research fisheries and analysed against
the genetic baseline of European salmon developed during the EU SALSEA-Merge
0
50
100
150
200
250
300
350
400
19
66
19
67
19
68
19
69
19
70
19
71
19
72
19
73
19
74
19
75
19
76
19
77
19
78
19
79
19
80
19
81
19
82
19
83
19
84
19
85
19
86
19
87
19
88
19
89
19
90
19
91
19
92
19
93
19
94
19
95
19
96
19
98
No
. Tag
s re
cove
red
Year
Denmark Canada N.Ireland Iceland England&Wales Faroes Scotland Ireland Sweden Norway

36 | ICES Cooperative Research Report No. 343
project (Anon., 2011). These assignments were combined to give an overall 1SW stock
composition of 84.2% southern European, 9% northern Europe, 1.2% Icelandic, and
5.7% North American and an overall composition of the MSW catch of 20.9% southern
European, 58% northern Europe, 0.6% Icelandic, and 20.5% North American. A clear
outcome from the genetic study was the higher prevalence of North American fish in
the catches relative to the small number of tag recoveries recorded in the NASTR data-
base from an extensive salmon tagging programme in North America. The new genetic
results are thought to provide the best available data on the contribution of North
American salmon to the Faroes fishery. However, a number of possible limitations to
the study have been outlined including the age of the scale sample, the presence of
significant numbers of farmed fish in the catches, the samples being provided from a
research fishery as distinct from a full commercial fishery, and the restricted period
from which the scales were derived (ICES, 2015).
5.3 Faroese adult tagging programmes
Two adult (subadult) tagging programmes have been carried out in the sea around the
Faroes. The first took place 1969–1976 and the second 1992–1995 (Table 5.3).
Table 5.3. Tagging programmes around the Faroe Islands.
Area Period No. tagged No. recaptured
Faroes 1969–1976 1 946 90
1992–1995 5 448 106
Exact tagging and recapture positions along with other relevant information are avail-
able for the most recent tagging programme only in the NASTR database. The recap-
tures by country from this experiment are shown in Figure 5.4, adjusted for home-wa-
ter exploitation and tag-reporting rates.
Figure 5.5. Estimated percentages of subadult salmon tagged off the Faroes while returning to dif-
ferent countries and caught in home waters. Recoveries were adjusted for home-water exploitation
and tag-reporting rates. Data are from the tagging programme in 1992–1995. Error bars are 95% con-
fidence limits.
No
rway
Sco
tlan
d
Ru
ssia
n
Fed
era
tio
n
Can
ad
a
Irela
nd
Den
mark
En
gla
nd
Sw
ed
en
Sp
ain
Icela
nd

Fifty years of marine tag recoveries from Atlantic salmon | 37
6 West Greenland tag-recovery database
6.1 Scanning programmes for tags around West Greenland
6.1.1 CWT recoveries (all countries) from West Greenland scanning programme
Targeted screening of catches in the West Greenland fishery between 1985 and 1992
resulted in the recovery of 631 CWTs, 407 from USA and Canada and 224 from NEAC
countries. These data are included in the NASTR database and provide information on
release location and origin of the fish for most recoveries. The recapture location relates
to the port in which the screening was carried out, and the recorded date to the date
when the tag was detected at the landing facility. Recovery data are summarized in
Table 6.1.
Table 6.1. Summary of CWT recoveries by country and year from the West Greenland catch screen-
ing programme, 1985–1992.
Year of
recovery
NAC NEAC
Canada USA Iceland UK (Sc) UK (EW) UK (NI) Ireland
1985 - - 1 2 - - 31
1986 19 7 2 2 22 - 18
1987 21 84 - 2 17 - 24
1988 22 61 3 1 8 - 17
1989 2 73 - 2 12 1 12
1990 9 37 3 - 2 - 3
1991 2 26 2 1 3 1 2
1992 15 36 5 1 4 - 20
Total 90 324 16 11 68 2 127
6.1.2 Tag detection in catch
CWTs were identified and recovered by scientific sampling efforts at fish processing
centres with appropriate tag-detection equipment. This commenced in West Green-
land in 1985, initially with Canadian and Danish scientists (Potter et al., 1986), with
support from US scientists from 1986 (Potter et al., 1987). Subsequently, samplers from
Ireland, UK (England and Wales), and UK (Scotland) were also involved.
Scanning took place in three fish processing plants on the west coast of Greenland:
Sisimiut (NAFO Division 1B), Nuuk (NAFO Division 1D), and Paamiut (NAFO Divi-
sion 1E), expanding to include Narssaq (NAFO Division 1F) in 1986. Other communi-
ties (Kangaamuit, (1C), Maniitsoq (1C), Qassimiut (1F), and Qeqertarssuarq (1A) were
also intermittently sampled. Detailed information on each year’s catch-screening pro-
gramme and recoveries was provided annually to ICES. Recoveries in NAFO divisions
1C, D, E, and F showed two periods of heightened recoveries: between the late 1960s
and mid-1970s and between the mid-1980s and early 1990s (Figure 6.1). A similar but
less pronounced increase in recoveries in the mid-1980s and early 1990s was seen in
divisions 1A and 9A, and for recaptures where NAFO division was not reported. The
UK (England and Wales) is the designated tag-clearing house for CWTs recovered in
the West Greenland fishery (Annex 5).

38 | ICES Cooperative Research Report No. 343
Figure 6.1. Stacked area plots of numbers of tag recoveries by NAFO area (1A, etc.), country of tagging, and year of recapture (see Figure 6.2 for map of NAFO areas and percentage recaptures).

Fifty years of marine tag recoveries from Atlantic salmon | 39
The programme expanded over time with larger numbers of fish sampled at more lo-
cations, typically scanned between August and October. Although the recovery of
CWTs through sampling programmes removes some reporting biases associated with
external tags that rely on voluntary reporting, the scanning of selected catches was not
consistent among years and fish processing plants, which may have caused a bias in
sample collection (Miller et al., 2012a). Ideally, the annual recoveries should be scaled
up according to the specifics of the annual sampling programmes.
6.1.3 Carlin tags
The NASTR database contains details of Carlin tag recoveries. Between 1961 and 2009,
4749 Carlin tags were recovered from the Greenland fisheries (Table 6.2). Of these, the
majority were released from the USA (2218) between 1963 and 1988, and from Canada
(1732) between 1970 and 2009. Most of the USA tags were released into the Machias
and Penobscot rivers, with others released into the Union, Merrimack, Connecticut,
Dennys, and Narragansett rivers. Release information for Canadian releases tend to be
limited to fisheries locations or districts.
6.2 Summary descriptions of data
The West Greenland tag database comprises 13 separate country/jurisdiction/pro-
gramme worksheets of tag-recovery data, together with three information worksheets
(a sheet containing latitude and longitude values for locations at Greenland, a sheet
providing descriptors of all the fields in the database, and a ’read me’ sheet). These
data were subject to earlier validation by national scientists and are understood to be
as complete as possible. Summaries of the tagging and recovery information in the da-
tabase are given in tables 6.3 and 6.4 and Figure 6.2.
Table 6.2. Greenland Carlin tag recoveries.
Country No. tags First year Last year
USA 2 218 1963 1988
Canada 1 732 1970 2009
Norway 148 1969 2009
Iceland 4 1973 1981
Ireland - - -
UK (NI) - - -
UK (Sc) 384 1972 2003
UK (EW) 263 1961 1982
Spain - - -
Faroe Islands - - -
Total 4 749

40 | ICES Cooperative Research Report No. 343
Table 6.3. Summary of tagging entries in the Greenland tag recovery database.
Origin Life stage when tagged River age when tagged
Country Tagging
agency
No. of
entries Years
No.
of
years
No. with
GIS
locations
No.
fork
lengths
No.
weights
Un-
known Wild Hatchery
Un-
known Adult Kelt Parr Smolt
Un-
known 1+ 1 2 3
USA NOAA 2 545 1962–2006 33 8 0 0 31 0 2 521 45 32 0 3 2 472 38 2 1 185 1 314 13
Canada (Sand Hill River) DFO 86 1969–1973 5 1 80 12 0 86 0 0 0 0 0 86 81 0 0 0 5
Canada (Maritimes) Canada 1 643 1967–1998 31 45 741 761 25 194 1 424 1 643 0 0 0 0 404 0 406 833 0
Canada
(CWT and recent external) Canada 118 2001–2008 7 18 0 0 9 23 86 95 8 0 0 15 118 0 0 0 0
Norway NINA 148 1977–2008 29 3 145 70 0 25 123 0 0 0 0 148 148 0 0 0 0
Iceland Directorate of
Fisheries Iceland 24 1966–1985 7 13 1 0 0 1 23 16 1 0 0 7 23 0 0 1 0
Ireland Ireland 146 1963–2008 6 37 4 2 37 4 105 136 0 1 1 8 146 0 0 0 0
UK (NI) UK (NI) 3 1988–1990 2 1 0 0 1 1 1 1 0 0 0 2 3 0 0 0 0
UK (Scotland) FRS 403 1968–2007 27 10 376 0 5 376 22 12 0 0 4 387 403 0 0 0 0
UK (EW) UK (EW) 393 1960–2008 22 21 131 0 43 249 101 68 0 8 1 316 392 1 0 0 0
Spain Spain 3 2003–2006 3 3 0 0 0 0 3 0 0 0 2 1 3 0 0 0 0
Faroe Islands Faroe Islands 1 – 0 1 0 0 1 0 0 1 0 0 0 0 1 0 0 0 0
Intl. West Greenland
tagging experiment DFO 236 1969–1972 3 0 18 0 236 0 0 18 218 0 0 0 221 0 1 8 6
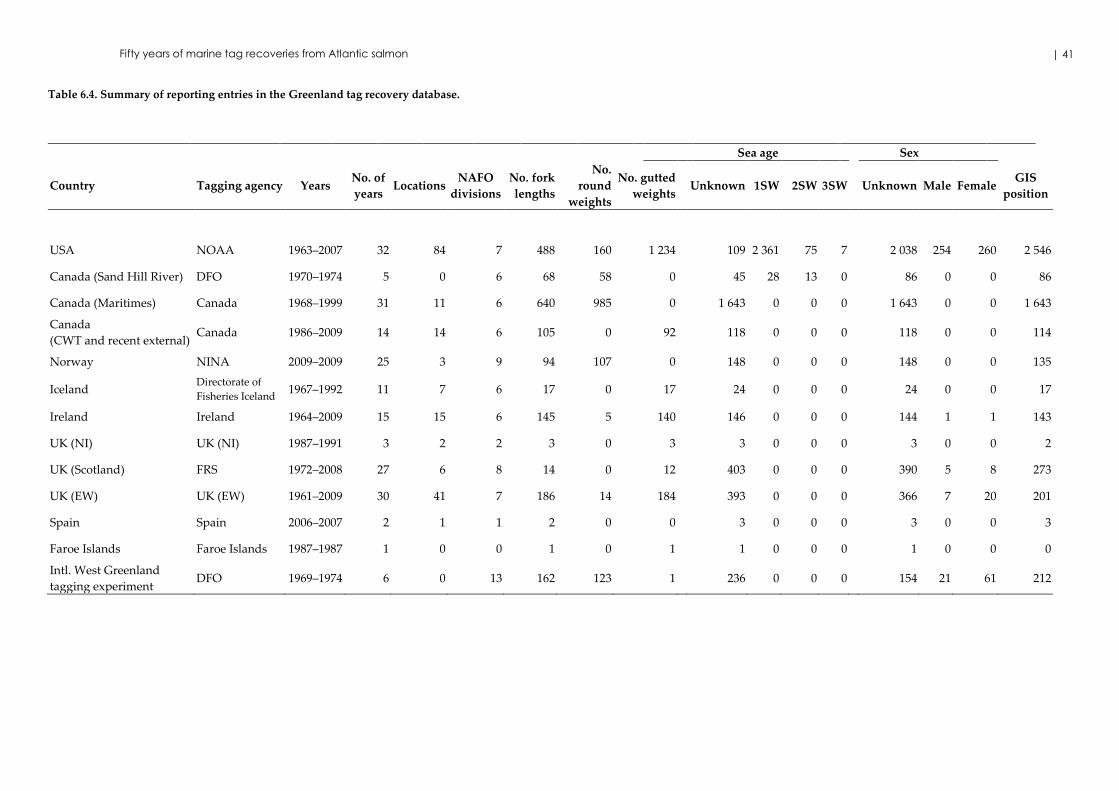
Fifty years of marine tag recoveries from Atlantic salmon | 41
Table 6.4. Summary of reporting entries in the Greenland tag recovery database.
Sea age Sex
Country Tagging agency Years No. of
years Locations
NAFO
divisions
No. fork
lengths
No.
round
weights
No. gutted
weights Unknown 1SW 2SW 3SW Unknown Male Female
GIS
position
USA NOAA 1963–2007 32 84 7 488 160 1 234 109 2 361 75 7 2 038 254 260 2 546
Canada (Sand Hill River) DFO 1970–1974 5 0 6 68 58 0 45 28 13 0 86 0 0 86
Canada (Maritimes) Canada 1968–1999 31 11 6 640 985 0 1 643 0 0 0 1 643 0 0 1 643
Canada
(CWT and recent external) Canada 1986–2009 14 14 6 105 0 92 118 0 0 0 118 0 0 114
Norway NINA 2009–2009 25 3 9 94 107 0 148 0 0 0 148 0 0 135
Iceland Directorate of
Fisheries Iceland 1967–1992 11 7 6 17 0 17 24 0 0 0 24 0 0 17
Ireland Ireland 1964–2009 15 15 6 145 5 140 146 0 0 0 144 1 1 143
UK (NI) UK (NI) 1987–1991 3 2 2 3 0 3 3 0 0 0 3 0 0 2
UK (Scotland) FRS 1972–2008 27 6 8 14 0 12 403 0 0 0 390 5 8 273
UK (EW) UK (EW) 1961–2009 30 41 7 186 14 184 393 0 0 0 366 7 20 201
Spain Spain 2006–2007 2 1 1 2 0 0 3 0 0 0 3 0 0 3
Faroe Islands Faroe Islands 1987–1987 1 0 0 1 0 1 1 0 0 0 1 0 0 0
Intl. West Greenland
tagging experiment DFO 1969–1974 6 0 13 162 123 1 236 0 0 0 154 21 61 212

42 | ICES Cooperative Research Report No. 343
Figure 6.2. Map showing the percentage of recaptures by country from each NAFO division, West
Greenland (Greenland recoveries indicate adult fish tagged and subsequently recaptured again in
the West Greenland fishery).
6.2.1 Canada
Sand Hill River
This consists of 86 individual records all arising from external tagging of smolts be-
tween 1969 and 1973. Of the recoveries, 68 fork lengths and 58 round weights are rec-
orded.
Maritimes
A total of 1643 tag recoveries are recorded, derived from external tagging primarily of
smolts tagged between 1967 and 1998. Fork lengths of 741 salmon and weights of 761
salmon released were recorded. Fork lengths of 640 salmon and round weights of 985
recaptured fish are included. These come from 11 recovery locations over 6 NAFO di-
visions.
CWT and recent external
A total of 118 tag recoveries are recorded, mainly derived from CWT programmes be-
tween the 1980s and 1990s and external tags recovered until 2009. Tagging details (date
and for some records location) are not currently provided in respect of the CWT recov-
eries. A total of 92 gutted weights of recovered fish are reported. A small number of
Canadian-origin tags recovered from fish caught around West Greenland but imported
into Ireland were added to the database during the validation exercise.

Fifty years of marine tag recoveries from Atlantic salmon | 43
6.2.2 Faroes
A single tag derived from CWT tagging was recovered in 1987. The tag was recovered
from a fish that was imported into Ireland from Greenland.
6.2.3 Iceland
Twenty-four tag recoveries are recorded, derived mainly from external and CWT tag-
ging of hatchery smolts. 17 weights and 17 lengths of recovered fish were recorded.
6.2.4 Ireland
A total of 146 tag recoveries derived mainly from CWT tagging of smolts are recorded.
Releases are recorded between 1963 and 2008 and recoveries between 1964 and 2009
across 15 locations. Of the recoveries, 145 fork lengths and 140 gutted weights are rec-
orded. A small number of Irish-origin tags recovered from fish caught around West
Greenland but imported into Ireland were added to the database during the validation
exercise.
6.2.5 Norway
A total of 148 tag recoveries of externally tagged smolts between 1977 and 2008 are
recorded. A total of 145 fork lengths and 70 weights were recorded at the time of tag-
ging and 94 fork lengths and 107 round weights recorded at recovery.
6.2.6 Spain
Details of two tags from salmon released between 2003 and 2006 and recovered be-
tween 2006 and 2007 are provided.
6.2.7 UK (England and Wales)
This provides 393 tag recoveries, derived largely from external and CWT tagging of
smolts released between 1960 and 2008. Releases took place across 21 locations. Fork
lengths were measured for 131 of the released smolts. For these, 249 are recorded as
wild and 101 as hatchery origin. Recoveries are recorded between 1961 and 2009 at 41
locations over 7 NAFO divisions. A total of 186 measurements of fork length are given,
14 round weights, and 184 gutted weights.
6.2.8 UK (Northern Ireland)
From UK (Northern Ireland), three tag recoveries are included. These come from CWT
tagging of smolts on the River Bush. The data include a single tag recovered from a
fish caught around West Greenland but imported into Ireland.
6.2.9 UK (Scotland)
A total of 403 tag recoveries were derived from both external and CWT tagging of
smolts released between 1968 and 2007. Releases were made in 10 locations, and 376
fork lengths were recorded. Recoveries are recorded between 1972 and 2008 in six lo-
cations with 14 fork lengths and 12 gutted weights.
A small number of Scottish tags, recovered from fish caught around West Greenland
but imported into Ireland, were added to the database during the validation exercise.

44 | ICES Cooperative Research Report No. 343
6.2.10 USA
A total of 2545 tag recoveries are recorded, mainly external Carlin tags and CWTs re-
sulting from tagging programmes operated by NOAA. Tagging primarily took place
in the state of Maine (2473 recoveries), but also in Connecticut (37 recoveries), Massa-
chusetts (38 recoveries), New Hampshire (3 recoveries), and Rhode Island (one recov-
ery) across 8 rivers. Tagging events took place between 1962 and 2008, though not in
all sequential years. The life stages tagged were primarily smolts (2472), but recoveries
were also recovered for 32 adults, 3 parr, and 45 undifferentiated smolt/parr releases.
Recoveries occurred between 1963 and 2007, though not in all concurrent years, across
84 locations in 7 NAFO divisions. Fork length was recorded for 488 of the recoveries,
round weight for 160, and gutted weight for 1234. A small number of US-origin tags
recovered from fish caught around West Greenland but imported into Ireland were
added to the database during the validation exercise.
6.3 Origin of salmon sampled from West Greenland fishery
While conventional tagging provides information on the distribution of national or re-
gional stocks within a fishery temporally and geographically, it may not provide an
accurate reflection of the proportion of fish from each country or region of origin as the
tag recoveries have not been scaled to the total tag output. Recent genetic stock identi-
fication efforts provide an opportunity to identify the origin of North American and
European Atlantic salmon sampled from the West Greenland fishery (ICES, 2015; Brad-
bury et al., 2016). Twelve regional groups in eastern North America and 14 in Europe
can be reliably identified. Tissue samples from salmon sampled from the West Green-
land fishery were genetically typed to continent of origin and the 2011–2014 North
American-origin samples and the 2002 and 2004–2012 European-origin samples were
assessed against regional baselines.
Three regional groups in North America contribute the majority (almost 90%) of the
North American-origin salmon in the West Greenland fishery in these recent samples:
Québec at 40%, Gulf of Saint Lawrence at 29%, and Labrador at 24%. Smaller contribu-
tions are from Newfoundland at 4.5%, Scotia-Fundy at 1%, and USA at 1%.
For the NEAC area, > 90% of the harvested European fish were assigned to three re-
gions in these recent samples: (i) northern UK (Scotland) and northern and western
Ireland; (ii) Irish Sea; and (iii) southern and eastern UK (Scotland). The regional cate-
gorization used in the analyses for southern and eastern UK (Scotland) also includes
some of the east coast of England, and was by far the largest contributor to the West
Greenland fishery, representing almost 40% of the European fish caught. Substantial
numbers of fish were also assigned to the Irish Sea (26.6%), which are principally fish
originating from the large rivers of Ireland’s south and east coast, the English west
coast, and Welsh, Scottish, and Solway rivers (the Solway estuary marks the border
between England and Scotland on the west coast of the UK, therefore Solway rivers
include rivers from northwest England and southwest Scotland). The region delineated
on the basis of the west and north coasts of Ireland and UK (Scotland) represents an

Fifty years of marine tag recoveries from Atlantic salmon | 45
additional 25.2% of the total. Overall, UK (Scotland) appears to be a major contributor
to the fishery, with possibly up to 70% of the fish being assigned.
6.4 East Greenland tag recaptures
In order to further explore the distribution of tag recoveries from both West (NAFO
Divisions 1A–F) and East Greenland (NAFO Division 9A) for different countries, tag
recovery data (external tags and CWTs) were extracted from the NASTR database.
Over the entire time-series, 4739 tags were recovered at Greenland and also assigned
to a recapture location (i.e. NAFO division). Of these, 4683 (98.8%) were recovered
along the West Greenland coast and just 56 along the East Greenland coast. This is
consistent with relatively low reported fishing effort and landings at East Greenland
(ICES, 2015). The recaptures at East Greenland occurred on an intermittent basis be-
tween 1970 and 1999, with a period of above-average recaptures in the mid-1980s (Fig-
ure 6.1). With the exception of one CWT, all the recoveries consisted of external tags.
Table 6.5 summarizes the distribution of tag recoveries at both West and East Green-
land, by country of origin. Recoveries from East Greenland comprised 1.2% of the rec-
ords for which recapture location was available. The proportional distribution of re-
coveries was, however, significantly different between countries (2 test, p < 0.01). The
proportion of tags recovered from East Greenland was particularly low for fish origi-
nating in Canada and Ireland. In contrast, the proportion from East Greenland was
well above average for Norwegian and Icelandic fish, although the sample size for Ice-
land was very small. The European-origin MSW salmon exploited from West Green-
land mainly originate from southern Europe (Reddin and Friedland, 1999; ICES, 2009).
The relatively large proportion of Norwegian fish from East Greenland suggests that
MSW salmon from northern Europe have a more easterly distribution than those from
southern Europe.
Table 6.5. Numbers of tags recovered at Greenland for which recapture location (NAFO division)
was specified, by country of origin, and the percentage of all recoveries for each country reported
from East Greenland.
Country of origin West Greenland (%) East
Greenland
(%) Total
USA 2 128 98.6 30 1.4 2 158
Canada 1 814 99.9 2 0.1 1 816
Iceland 16 94.1 1 5.9 17
Norway 116 89.2 14 10.8 130
Ireland 139 100.0 0 0.0 139
UK (Scotland) 273 97.8 6 2.2 279
UK (E and W) 195 98.5 3 1.5 198
UK (N.I.) 2 100.0 0 0.0 2
Total 4 683 98.8 56 1.2 4 739

46 | ICES Cooperative Research Report No. 343
6.5 Greenlandic adult tagging programmes
A collaborative international tagging investigation involving ICES and ICNAF was
conducted in the seas off West Greenland between 1969 and 1972. The adult fish re-
leased with tags contributed 236 tag recoveries, many of which were recaptured in the
Greenland area. Others were recaptured in various home-water fisheries. The majority
of tag-recovery data derive from a single year (1972), the main tagging year. In the
NASTR database, fork lengths of 162 fish and round weights of 123 were recorded,
although fork lengths of only 18 were recorded during both tagging and release. Full
tagging and recovery details for earlier years could not be found, and only a few rec-
ords based on fish tagged by Canadian scientists were included. The whereabouts of
the other data are unclear, despite efforts to locate them. In the NASTR database, 18
fish were recaptured in North America (all in Canada) and 51 in Europe. The European
tags were reported from the UK (Scotland, 25), Ireland (11), the UK (England and
Wales, 11), Spain (2), and France (2). All others (167) were recaptured in Greenland.
These values differ somewhat from the numbers reported by Jensen (1980b), which are
shown in Table 6.6 for information.
Taking into account the higher production of salmon in northern European countries
and Russia and the absence of any returns to these areas, the data indicated that the
proportion of salmon from more southern areas of Europe present at Greenland is
higher than the proportion of salmon from more northerly areas.
Table 6.6. Summary of adult salmon tagged around West Greenland as part of the ICES/ICNAF
collaborative tagging programme and which were subsequently recaptured (summarized from Jen-
sen, 1980b).
Year
Nu
mb
er of
salmo
n tag
ged
Number of recaptures Totals
Green
land
Can
ada
Ireland
UK
(Sc)
UK
Fran
ce
Sp
ain
N. A
merica
Eu
rop
e
1965 227 3 1 1 0
1966 729 28 1 3 1 3
1967 375 6 1 2 1 1 3
1968 47 4 1 1 0
1969 444 18 7 2 1 3 1 7 7
1970 224 3 1 1 1 1 2
1971 247 6 4 3 2 1 4 6
1972 2 364 164 12 8 24 9 2 1 12 44
Total 4 657 232 28 16 30 14 2 3 28 65
Most of the fish recaptured within the West Greenland fishery were caught in the same
year they were tagged (Jensen, 1980b). A small proportion were caught in subsequent
years. Of the fish tagged in 1972, 164 were subsequently recaptured at West Greenland,
156 in 1972, 7 in 1973, and 1 in 1974. The data indicated that some fish spent two suc-
cessive seasons in waters around West Greenland, possibly overwintering in the area.

Fifty years of marine tag recoveries from Atlantic salmon | 47
No scale samples were available for the one fish recaptured in 1974, and so it is unclear
whether this was a virgin fish or had returned to home waters to spawn in 1973.
The pattern of recovery of adult salmon recaptured within the Greenland fishery area
indicated that fish moved both north and south from the tagging and release area (Jen-
sen, 1980b). For fish tagged in 1972 and recaptured the same year, 71 (46%) were caught
south of the tagging site, 45 (29%) north, with the remainder unknown (no recovery
location available).
The 1972 entries in the NASTR database were re-examined with GIS software to derive
fish swimming speeds from the latitude and longitude of the tagging and recovery
locations and the number of days elapsed between release and recapture. This was
completed only for the fish recovered within the West Greenland fishery in the same
year in which they were tagged. The median speed for fish recovered south of the tag-
ging location was estimated at 0.13 body lengths sec−1 (mean = 0.27 body lengths sec−1,
maximum = 2.4 body lengths sec−1). The median speed for fish recovered north of the
tagging location was 0.08 body lengths sec−1 (mean = 0.21 body lengths sec−1, maxi-
mum = 1.3 body lengths sec−1). Further information is provided in subsequent analyses
in Section 7.
48 | ICES Cooperative Research Report No. 343
7 Distribution of salmon at sea: initial analyses of salmon tag recoveries
The natal rivers of Atlantic salmon range from as far south on the European seaboard
as Spain and Portugal to the Pechora Sea off the northwest Russian coast, from the
rivers of New England on the northern US coastline to Ungava Bay and Hudson Strait
in northern Quebec, Canada. The distribution of Atlantic salmon at sea has been of
interest for decades, with the introduction of tagging programmes revealing the ranges
of their sea migrations. Tagging studies have reported recaptures from the Faroes, the
northern Norwegian Sea, East and West Greenland, around the Labrador Sea, and into
Davis Strait (Figure 2.1). Migrations from home rivers to feeding grounds north of the
Faroes and Greenland coastal waters and the return to home waters are known to take
from one to multiple years. However, the biological cues regulating the timing of sea-
ward migrations, residence periods on feeding grounds, and onward or return migra-
tion timings are still not well understood. The tag-recovery databases offer the oppor-
tunity to investigate some of these unknowns.
7.1 Questions and hypotheses
The ocean distribution and migration of Atlantic salmon may be influenced by numer-
ous factors including stock origin, life history, environment, and interception fisheries.
Compilation of national tag-recovery datasets into a standard format provided a means
by which various questions and hypotheses could be explored in the context of larger
meta-analyses of available data. ICES WKSHINI workshop (ICES, 2008a) developed a
set of hypotheses that could be tested against the compiled datasets. Elucidating the
distribution and migration of salmon at sea in time and space and clarifying or updat-
ing beliefs regarding ocean migration routes improves current knowledge regarding
the ocean life history of salmon. Analyses may also provide insight into how migration
and subsequent distribution of salmon at sea could be influenced by changing biolog-
ical and physical conditions in the North Atlantic. To this end, descriptive models that
hindcast or predict the migration of salmon at sea could be formulated and tested using
the tag-recovery observations.
Examples of questions and hypotheses are provided (Table 7.1). They are divided into
migratory, life history, physical, biological, and fisheries categories and are intended
as a guide to initiate potential analyses of the data, to stimulate additional thought, and
should not be considered exclusive.
The analyses which follow go some of the way in investigating these hypotheses. While
they represent some detailed analysis, they are not intended as a complete synthesis of
the listed hypotheses.

Fifty years of marine tag recoveries from Atlantic salmon | 49
Table 7.1. Potential hypotheses and questions to investigate with the NASTR database.
Summary of testable hypotheses Checked1
Migration and distribution
The distribution of salmon at sea is not random.
(Given the large number of river stocks from both sides of the Atlantic and the extent of the
ocean area being investigated, some geographic clustering would be expected.)
Yes
The migration of salmon to marine feeding areas is not consistent over time (years, months) and
space (route).
(Changes in oceanic conditions over time have been recorded and would be expected to
infuence these distributions.)
Yes
Life history
The distribution and migration of salmon at sea depends on sea age.
(Older fish stay at sea longer than younger fish, which mature earlier and return to home waters
after their first winter at sea.)
Yes
The distribution and migration of salmon at sea is independent of rearing origin (hatchery vs.
wild).
(If behaviour of hatchery and wild fish is similar, migration behaviour can be inferred from
either.)
–
The distribution and migration of salmon at sea depends on river (smolt) age.
(Larger post-smolts may behave differently than smaller post-smolts, i.e. leave rivers at different
times and under different conditions.)
–
The distribution and migration of salmon at sea depends on rate of growth.
(Rate of growth may influence timing of maturity, avoidance of predators, and migratory
distance.)
Yes
The distribution and migration of salmon at sea depends on spawning history (maiden vs. MSW
vs. repeat and alternate spawning2 salmon).
(Previous migration to feeding grounds may influence return to those feeding grounds.)
–
The distribution and migration of salmon at sea depends on geographical origin of stocks (e.g.
northern vs. southern stocks).
(Northern or southern origin influences the timing of migration and entry to the ocean.)
Yes
The distribution and migration of salmon at sea depends on salmon run type (early vs. late spring
vs. autumn runs).
(These traits influence the oceanographic conditions encountered during migration.)
–
The distribution of European and North American salmon around West Greenland has changed
over time.
(There have been large recorded temporal changes in oceanic conditions which would be
expected to influence these distributions.)
Yes
The distribution of North American salmon caught around West Greenland depends on stock
origin (US, Quebec, Maritime, Newfoundland–Labrador, etc.).
(Northern or southern origin would influence distribution in the ocean owing to timing and
distance.)
Yes
The distribution of European salmon caught at the Faroe Islands depends on country of origin
(Norway, Sweden, Finland, Denmark, Ireland, Iceland, UK, Russia, etc.).
(Country origin would influence distribution in the ocean owing to timing and distance.)
Yes
Physical environment
The distribution of salmon at sea depends on optimal temperature requirements.
(Salmon are known to prefer a specifc temperature range during oceanic migrations.)
–
The distribution of salmon at sea depends on sea surface temperature.
(Salmon are known to prefer a specifc temperature range during oceanic migrations.)
Yes
The distribution of salmon at sea depends on salinity.
(Salmon are known to prefer a specifc salinity range during oceanic migrations.)
Yes
The distribution and migration of salmon at sea depends on the extent of pack ice in the Labrador
Sea.
(Ice melt influences oceanic conditions in this area, thus influencing salmon distribution.)
–
The distribution of salmon at sea depends on ocean current patterns and/or areas of potential
upwelling.
(These features are known to influence marine productivity.)
–
50 | ICES Cooperative Research Report No. 343
The distribution of salmon at sea depends on photoperiod.
(Increased photoperiod during winter in Arctic and Subarctic areas may influence winter
growth.)
–
Biological environment
The distribution of salmon at sea depends on availability and abundance of prey species.
(Distribution of prey species will not be random.)
–
The distribution of salmon at sea depends on predator abundance and distribution.
(Distribution of predators will not be random.)
–
The distribution of salmon at sea is influenced by competition from other pelagic fish species.
(There is overlap in food requirements of pelagic species including salmon.)
–
The distribution of salmon at sea is influenced by productivity of individual stocks.
(Generally, salmon stocks are in low productivity, so this would not be expected.)
–
The distribution and migration of salmon at sea depends on local or distant-water salmonid
aquaculture operations.
(This may occur if aquaculture affects local stocks.)
–
The distribution and migration of salmon at sea depends on the abundance and distribution of
escaped farmed salmon.
(Distribution of locally escaped farmed salmon is probably not influencing oceanic migration
and distribution of wild salmon on feeding grounds.)
–
Fisheries
The distribution and migration of salmon at sea depends on local, home-water directed fisheries.
(Only in the case of adult tagging at sea and subsequent recovery in home-water fisheries.)
–
The distribution and migration of salmon at sea depends on local, home-water bycatch fisheries.
(Only in the case of adult tagging at sea and subsequent recovery in home-water fisheries.)
–
The distribution and migration of salmon at sea is influenced by distant-water interception
fisheries.
(This depends on the extent of the fishery and the prevailing stock size).
–
The distribution and migration of salmon at sea is independent of fishing season.
(This depends on the extent of the fishery and the prevailing stock size).
–
1 Hypotheses or questions that have been investigated to some degree within this report.
2 A repeat spawning salmon spawns in more than one year, in either consecutive or alternate years.
7.2 Analyses of the Faroes tag-recovery database
The salmon fishery that began around the Faroe Islands in the 1960s, and extended
farther north in the 1970s, indicated the distribution of salmon north of the islands.Fol-
lowing the establishment of NASCO in 1984, the commercial fishery was regulated and
subsequently closed in 1991, after which only limited scientific fishing was continued
in some subsequent years through to 2000. The database, covering the period 1968–
2000 and comprising over 2000 tag recoveries from 13 countries or jurisdictions, was
reviewed for spatial, temporal, and spatial distribution patterns in the recovery data.
Using ESRI ArcGIS software, potential ways of displaying and analysing positions of
release and recapture were explored. The outputs were overlaid on a map of the North
Atlantic incorporating ICES fishing areas, ICES statistical rectangles, and NAFO fish-
ing areas.
7.2.1 Spatial distribution of Faroes tag recoveries

Fifty years of marine tag recoveries from Atlantic salmon | 51
Data for salmon tagged in Norway and Ireland in the 1970s and 1980s as well as recap-
tures at known geographic locations in the fishery in the Northwest Atlantic between
1965 and 2003 were used to visualize the distribution of stocks in that period (Figure
7.1). These migration trajectories indicate considerable overlap in both time and space
in the occurrence of Norwegian- and Irish-tagged fish from several rivers. There is also
some indication that the more northerly Norwegian stocks were recaptured in the more
northerly areas of the fishery. The number of recovered tags illustrates potential mi-
gration distances and distributions. However, the number of tags recovered is also af-
fected by the number of tagged smolts (or other life stages) released, the fishing effort,
and the effort extended in detecting tags in the catch. Therefore, any conclusions drawn
need to be viewed in the context of these caveats. What is clear is that large numbers
of tags from Norway and Ireland were recovered in the Faroes fishery, spanning an
area generally between 60–70°N and 10–20°W. This area showed a high density of
salmon over the autumn and winter fishing periods (October–December and January–
April, respectively).

52 | ICES Cooperative Research Report No. 343
Figure 7.1. An example of geographical positions of salmon tagged in Norway (green) and Ireland (blue) during the 1970s and 1980s and recaptured around the Faroe Islands and
Greenland (●) Lines are descriptive to link tag and recovery locations and do not represent known swim paths.

Fifty years of marine tag recoveries from Atlantic salmon | 53
Where the position of recapture was known with less precision (only to ICES statistical
rectangles), densities can be illustrated as categories with colours, shading, or patterns
reflecting the number of tags recovered from within each area (Figure 7.2). This allows
more data to be incorporated in a geographic framework, although with less overall
precision. Figure 7.2 shows the high density of tag recoveries in the Faroes fishery,
indicating two particularly high-density recapture areas. These two approaches can
also be combined to show densities within defined spatial areas and indicate exact lo-
cations of recapture where known. This combined approach better discerns the two
areas of higher density of recaptures and can also be used to visualize the spatial dis-
tribution of tags recovered by countries of origin (Figure 7.3). Investigating sea age in
a similar way indicates that the majority of recaptures were 2SW, with the proportion
varying from 94.2% for those fish tagged in the Faroes to 65–80% of those from Sweden,
Iceland, Norway, UK (England and Wales), and UK (Scotland), to only 21% of the Irish
recaptures (Figure 7.4 and Table 7.2).
Figure 7.2. Number of tags recaptured inside ICES statistical rectangles. Darker colours indicate
larger numbers of recaptures.
For Norwegian- and Irish-tagged salmon (Figure 7.1) as well as for records of all tagged
salmon recovered in the Faroes fishery (Figure 7.2), the density of recaptures was dis-
played as density traces after spatial analysis with kernel polygons. The plots indicated
a slightly more southern distribution pattern of salmon from Ireland than for those
from Norway. The plots also revealed that catches of the tagged fish in certain months
were very spatially concentrated (see Section 7.2.6).

54 | ICES Cooperative Research Report No. 343
Figure 7.3. Spatial distribution of salmon recaptures around the Faroe Islands and associated densities per ICES rectangles, with hypothesized clusters indicated by dashed ovals.

Fifty years of marine tag recoveries from Atlantic salmon | 55
Table 7.2. Summary of tag recoveries from the Faroes fishery by country of origin and sea age (percentages relate to subsequent totals).
Country No. data points Total Autumn
Winter
All Location 1SW 2SW 3SW Total 1SW 2SW 3SW Total
1SW 2SW 3SW Total
United
States
1 – – – – –
– – – –
– – – –
Canada 6 – – – – –
– – – –
– – – –
Den-
mark
10 – – – – –
– – – –
– – – –
France 1 – – – – –
– – – –
– – – –
Spain 1 – – – – –
– – – –
– – – –
Ireland 166 128 100 (78%) 27 (21%) 1 (< 1%) 128 (6%)
73 (79%) 18 (20%) 1 (1%) 92 (4%)
27 (75%) 9 (25%) 0 (0%) 36 (2%)
UK (Eng-
land and
Wales)
69 47 11 (23%) 32 (68%) 4 (9%) 47 (2%)
9 (31%) 18 (62%) 2 (7%) 29 (1%)
2 (11%) 14 (78%) 2 (11%) 18 (< 1%)
UK
(Scot-
land)
135 51 9 (18%) 33 (65%) 9 (18%) 51 (2%)
3 (14%) 13 (59%) 6 (27%) 22 (1%)
6 (21%) 20 (69%) 3 (10%) 29 (1%)
Iceland 27 18 2 (11%) 14 (78%) 2 (11%) 18 (< 1%)
1 (7%) 12 (80%) 2 (13%) 15 (< 1%)
1 (33%) 2 (667%) 0 (0%) 3 (< 1%)
Norway 1 760 1 183 147 (12%) 914 (77%) 122 (10%) 1 153 (57%)
33 (9%) 323 (87%) 15 (4%) 371 (18%)
114 (14%) 591 (73%) 107 (13%) 812 (39%)
Sweden 376 182 22 (12%) 145 (80%) 15 (8%) 182 (9%)
8 (13%) 55 (87%) 0 (0%) 63 (3%)
14 (12%) 90 (76%) 15 (13%) 119 (6%)
Faroes 99 69 1 (1%) 65 (94%) 3 (4%) 69 (3%)
0 (0%) 40 (95%) 2 (5%) 42 (2%)
1 (4%) 25 (93%) 1 (4%) 27 (1%)
Total 2 651 1 678 292 (17%) 1 230 (73%) 156 (9%) 1 678
127 (20%) 479 (76%) 28 (4%) 634 (38%)
165 (16%) 751 (72%) 128 (12%) 1 044 (62%)

56 | ICES Cooperative Research Report No. 343
Figure 7.4. Spatial distribution and sea ages of salmon recaptures around the Faroes with associated
densities per ICES rectangles.
7.2.2 Recaptures of salmon tagged as smolts
Fork length
Fork lengths of salmon in the Faroes tag-recovery database were extracted. In total,
1812 entries were recorded for 1966–1998. Of the fork lengths, 345 were for 1SW fish,
1305 for 2SW fish, and 162 for 3SW fish. Catches were divided by sea age and catch
season, classified as autumn (October–December) and winter (January–April) and
compared against catch year to examine variation with time.
Comparing recaptures from all countries together, autumn- and winter-caught 1SW
and 2SW fish showed a very slight reduction in length over years. While only one of
these correlations was significant (winter catch of 1SW fish), 1SW and 2SW age classes
caught in autumn and winter showed significant differences in lengths over the years
according to ANOVA tests of mean lengths (Figure 7.5, tables 7.3 and 7.4).
For 3SW autumn fish, a slightly positive trend was suggested by the data, although
neither the correlation nor differences in length with years were significant. Winter-
caught 3SW fish exhibited no apparent change in length over time.
A similar mix of results was shown when the data were split by country of origin. In
many instances, there were too few data for meaningful analysis, and tests were not
appropriate. Those tests where sufficient data existed are summarized in Table 7.4. In
the majority of cases, fork length showed a reduction with time, with a number of in-
stances where ANOVA results were found to be significant: winter-caught 2SW fish
returning to Sweden, and winter-caught 1SW from Scotland. Norway showed several
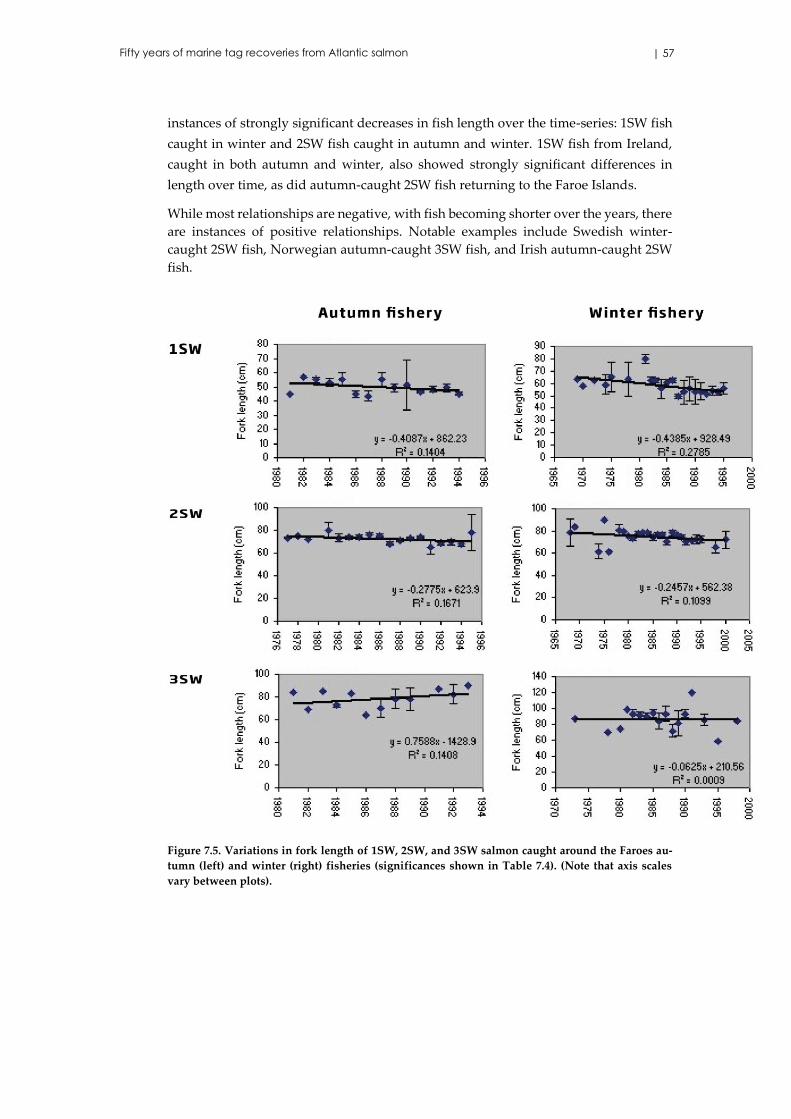
Fifty years of marine tag recoveries from Atlantic salmon | 57
instances of strongly significant decreases in fish length over the time-series: 1SW fish
caught in winter and 2SW fish caught in autumn and winter. 1SW fish from Ireland,
caught in both autumn and winter, also showed strongly significant differences in
length over time, as did autumn-caught 2SW fish returning to the Faroe Islands.
While most relationships are negative, with fish becoming shorter over the years, there
are instances of positive relationships. Notable examples include Swedish winter-
caught 2SW fish, Norwegian autumn-caught 3SW fish, and Irish autumn-caught 2SW
fish.
Figure 7.5. Variations in fork length of 1SW, 2SW, and 3SW salmon caught around the Faroes au-
tumn (left) and winter (right) fisheries (significances shown in Table 7.4). (Note that axis scales
vary between plots).
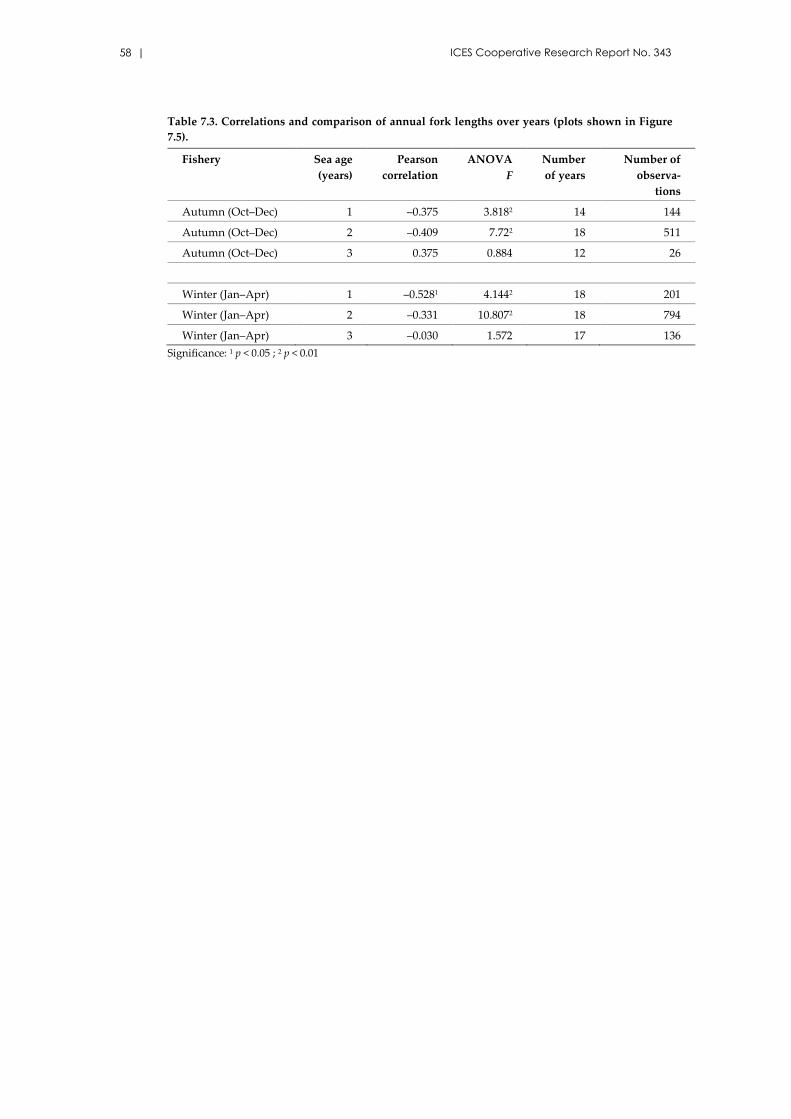
58 | ICES Cooperative Research Report No. 343
Table 7.3. Correlations and comparison of annual fork lengths over years (plots shown in Figure
7.5).
Fishery Sea age
(years)
Pearson
correlation
ANOVA
F
Number
of years
Number of
observa-
tions
Autumn (Oct–Dec) 1 –0.375 3.8182 14 144
Autumn (Oct–Dec) 2 –0.409 7.722 18 511
Autumn (Oct–Dec) 3 0.375 0.884 12 26
Winter (Jan–Apr) 1 –0.5281 4.1442 18 201
Winter (Jan–Apr) 2 –0.331 10.8072 18 794
Winter (Jan–Apr) 3 –0.030 1.572 17 136
Significance: 1 p < 0.05 ; 2 p < 0.01

Fifty years of marine tag recoveries from Atlantic salmon | 59
Table 7.4. Summary correlation and ANOVA statistics comparing fork length with year by country
of origin and sea age at recapture.
Country Catch
season
Sea age
(years)
Correlation
(Pearson’s r)
ANOVA
F
Number
of years
Number of
observations
Sweden Autumn 1 –0.721 3.188 3 4
Sweden Winter 1 –0.399 0.725 6 7
Sweden Autumn 2 –0.876 2.738 5 21
Sweden Winter 2 0.761 3.4151 9 20
Scotland Autumn 1 –0.871 12.167 3 4
Scotland Winter 1 –0.896 70.4721 4 6
Scotland Autumn 2 –0.358 3.905 5 10
Norway Autumn 1 0.004 1.365 12 45
Norway Winter 1 –0.5031 3.2183 18 153
Norway Autumn 2 –0.5931 5.1953 17 384
Norway Winter 2 –0.226 8.6383 18 717
Norway Autumn 3 0.535 0.404 11 16
Norway Winter 3 –0.027 1.49 17 129
Ireland Autumn 1 –0.414 6.553 11 77
Ireland Winter 1 –0.395 7.1523 8 25
Ireland Autumn 2 0.475 2.318 9 18
Ireland Winter 2 –0.283 0.294 7 11
Iceland Autumn 2 0.004 2.712 5 13
Iceland Winter 2 –0.973 N/A 3 3
Faroes Autumn 2 0.254 14.7743 4.0 40.0
Faroes Winter 2 0.330 1.382 5.0 25.0
UK (EW) Autumn 1 0.534 0.528 5 10
UK (EW) Winter 1 –0.854 1.833 3 4
UK (EW) Autumn 2 –0.585 2.493 9 21
UK (EW) Winter 2 –0.501 0.684 8 14
UK (EW) Autumn 3 0.923 N/A 3 3
Significance: 1 p < 0.05; 2 p < 0.01; 3 p < 0.001
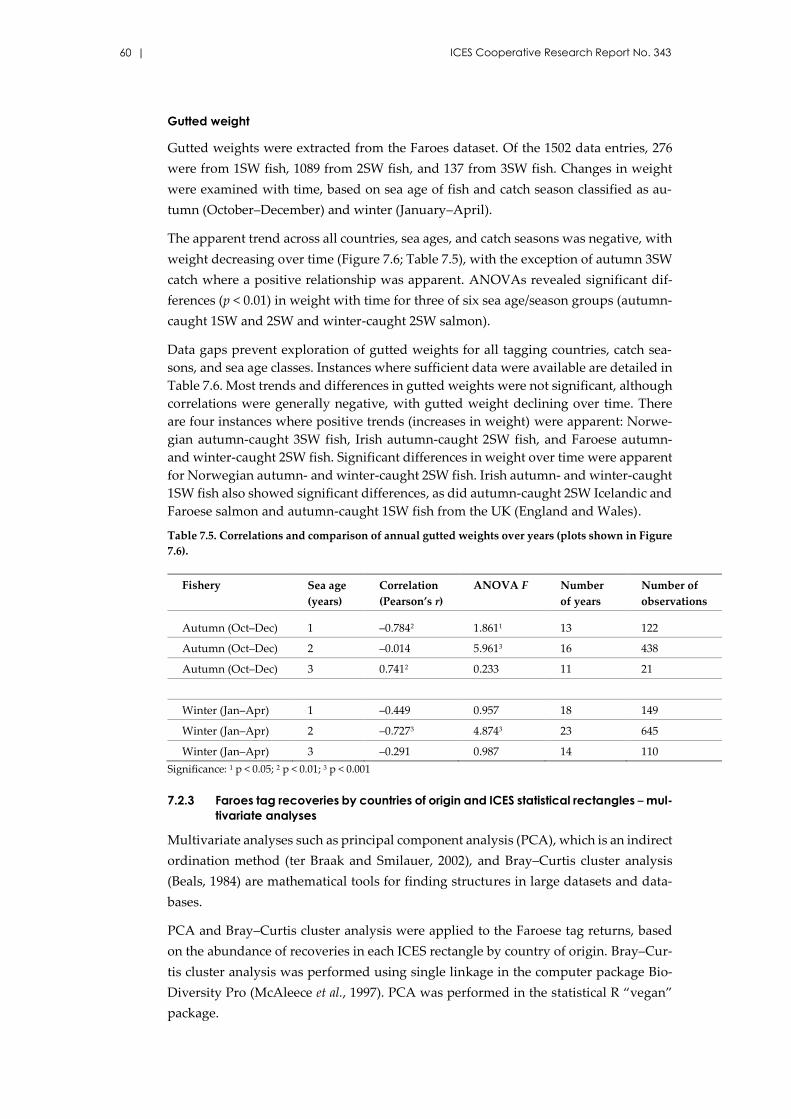
60 | ICES Cooperative Research Report No. 343
Gutted weight
Gutted weights were extracted from the Faroes dataset. Of the 1502 data entries, 276
were from 1SW fish, 1089 from 2SW fish, and 137 from 3SW fish. Changes in weight
were examined with time, based on sea age of fish and catch season classified as au-
tumn (October–December) and winter (January–April).
The apparent trend across all countries, sea ages, and catch seasons was negative, with
weight decreasing over time (Figure 7.6; Table 7.5), with the exception of autumn 3SW
catch where a positive relationship was apparent. ANOVAs revealed significant dif-
ferences (p < 0.01) in weight with time for three of six sea age/season groups (autumn-
caught 1SW and 2SW and winter-caught 2SW salmon).
Data gaps prevent exploration of gutted weights for all tagging countries, catch sea-
sons, and sea age classes. Instances where sufficient data were available are detailed in
Table 7.6. Most trends and differences in gutted weights were not significant, although
correlations were generally negative, with gutted weight declining over time. There
are four instances where positive trends (increases in weight) were apparent: Norwe-
gian autumn-caught 3SW fish, Irish autumn-caught 2SW fish, and Faroese autumn-
and winter-caught 2SW fish. Significant differences in weight over time were apparent
for Norwegian autumn- and winter-caught 2SW fish. Irish autumn- and winter-caught
1SW fish also showed significant differences, as did autumn-caught 2SW Icelandic and
Faroese salmon and autumn-caught 1SW fish from the UK (England and Wales).
Table 7.5. Correlations and comparison of annual gutted weights over years (plots shown in Figure
7.6).
Fishery Sea age
(years)
Correlation
(Pearson’s r)
ANOVA F Number
of years
Number of
observations
Autumn (Oct–Dec) 1 –0.7842 1.8611 13 122
Autumn (Oct–Dec) 2 –0.014 5.9613 16 438
Autumn (Oct–Dec) 3 0.7412 0.233 11 21
Winter (Jan–Apr) 1 –0.449 0.957 18 149
Winter (Jan–Apr) 2 –0.7273 4.8743 23 645
Winter (Jan–Apr) 3 –0.291 0.987 14 110
Significance: 1 p < 0.05; 2 p < 0.01; 3 p < 0.001
7.2.3 Faroes tag recoveries by countries of origin and ICES statistical rectangles – mul-
tivariate analyses
Multivariate analyses such as principal component analysis (PCA), which is an indirect
ordination method (ter Braak and Smilauer, 2002), and Bray–Curtis cluster analysis
(Beals, 1984) are mathematical tools for finding structures in large datasets and data-
bases.
PCA and Bray–Curtis cluster analysis were applied to the Faroese tag returns, based
on the abundance of recoveries in each ICES rectangle by country of origin. Bray–Cur-
tis cluster analysis was performed using single linkage in the computer package Bio-
Diversity Pro (McAleece et al., 1997). PCA was performed in the statistical R “vegan”
package.
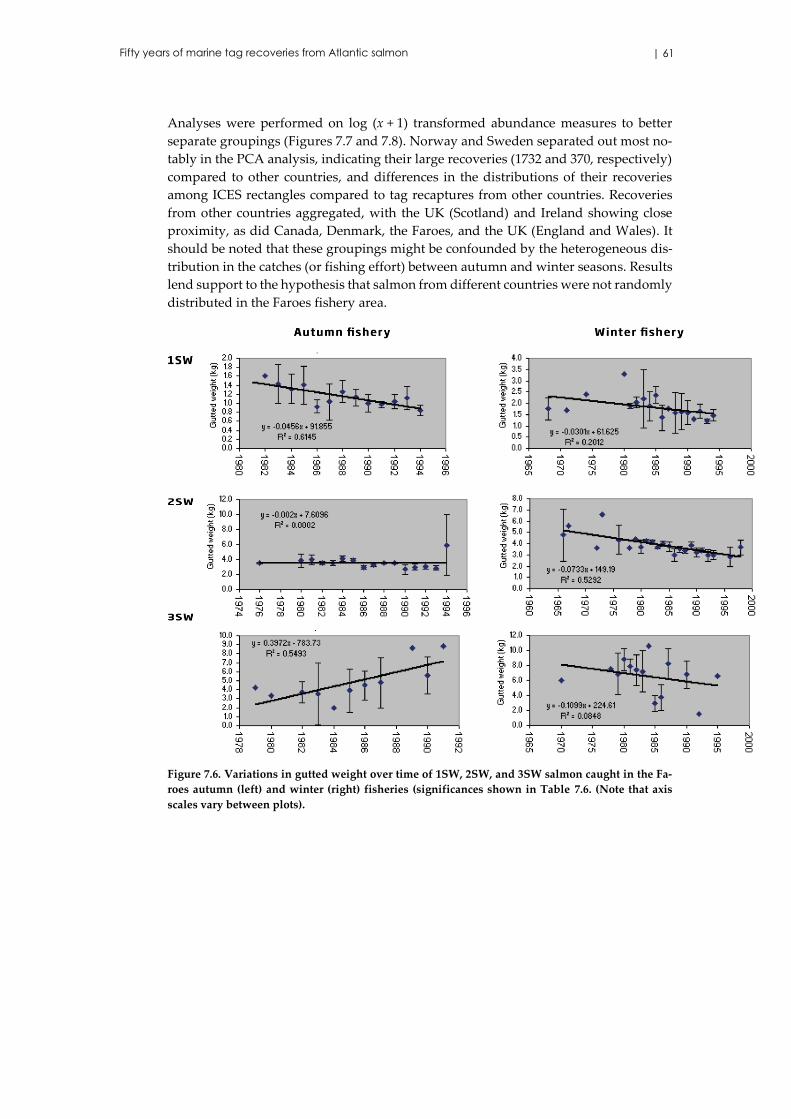
Fifty years of marine tag recoveries from Atlantic salmon | 61
Analyses were performed on log (x + 1) transformed abundance measures to better
separate groupings (Figures 7.7 and 7.8). Norway and Sweden separated out most no-
tably in the PCA analysis, indicating their large recoveries (1732 and 370, respectively)
compared to other countries, and differences in the distributions of their recoveries
among ICES rectangles compared to tag recaptures from other countries. Recoveries
from other countries aggregated, with the UK (Scotland) and Ireland showing close
proximity, as did Canada, Denmark, the Faroes, and the UK (England and Wales). It
should be noted that these groupings might be confounded by the heterogeneous dis-
tribution in the catches (or fishing effort) between autumn and winter seasons. Results
lend support to the hypothesis that salmon from different countries were not randomly
distributed in the Faroes fishery area.
Figure 7.6. Variations in gutted weight over time of 1SW, 2SW, and 3SW salmon caught in the Fa-
roes autumn (left) and winter (right) fisheries (significances shown in Table 7.6. (Note that axis
scales vary between plots).

62 | ICES Cooperative Research Report No. 343
Figure 7.7. Principal component analysis of salmon recaptures in ICES statistical rectangles from
tagging countries (as log (x+1) transformed abundance measures).
Figure 7.8. Bray–Curtis cluster analysis of salmon recaptures in ICES statistical rectangles from tag-
ging countries (as log (x+1) transformed abundance measures).
-1 0 1 2 3 4
-2-1
01
2
PC1
PC
2
CanadaDenmark
England&Wales
Faroes
Iceland
Ireland
N.Ireland
Norway
Scotland
Sweden

Fifty years of marine tag recoveries from Atlantic salmon | 63
Table 7.6. Summary correlation and ANOVA statistics comparing gutted weight with year, by coun-
try of origin and sea age at recapture.
Country Catch
season
Sea age
(years)
Correlation
(Pearson’s r)
ANOVA F Number
of years
Number of
observations
Sweden Autumn 1 0.500 4.500 3 4
Sweden Autumn 2 –0.616 2.265 5 20
Sweden Winter 2 –0.235 0.359 7 15
UK (Sc) Winter 1 –0.910 N/A 4 4
UK (Sc) Autumn 2 –0.142 2.654 5 8
Norway Autumn 1 –0.290 0.209 11 30
Norway Winter 1 –0.199 0.729 17 109
Norway Autumn 2 –0.460 3.6923 15 319
Norway Winter 2 –0.7003 4.6193 23 576
Norway Autumn 3 0.8733 0.364 10 13
Norway Winter 3 –0.289 0.868 14 104
Ireland Autumn 1 –0.529 5.9723 11 69
Ireland Winter 1 –0.442 6.9673 8 24
Ireland Autumn 2 0.501 2.328 8 15
Ireland Winter 2 –0.375 0.128 6 9
Iceland Autumn 2 –0.058 6.9551 5 11
Faroes Autumn 2 0.346 6.9913 4 38
Faroes Winter 2 0.49 1.475 5 24
UK (EW) Autumn 1 –0.418 12.4341 5 9
UK (EW) Autumn 2 –0.382 1.707 7 18
UK (EW) Winter 2 0.023 1.213 7 13
7.2.4 Faroes tag recoveries in association with location, weight, sea age, season, and
year of recapture
Faroes recoveries were used for this analysis, classed by the country of origin as
“dummy variables” and consisting of recapture latitude and longitude, gutted weight
(kg), sea age, season (autumn: October–December, winter: January–April), and year.
The original dataset, consisting of 2646 recaptures, was reduced to 1650 owing to poor
or missing values for some variables.
Redundancy analysis (RDA) was performed in the statistical package R using the ve-
gan library and based on the algorithm of Legendre and Legendre (1998). A permuta-
tion test showed the analysis to be significant (F = 22.449; p < 0.001; d.f. = 6).
The first RDA axis accounted for 79.1% of the observed variance and the second axis
accounted for 15.6% (Figure 7.9). The variables “recovery year” and “recovery season

64 | ICES Cooperative Research Report No. 343
autumn” gave high negative loadings along the RDA axis 1, while the other variables
showed positive correlation with this axis (length of vectors indicates correlation
strength to the axis). The vectors of “sea age” and “gutted weight” point in the same
direction indicating, as may be expected, that age and size are intercorrelated. Tagging
countries with similar RDA scores indicate that their recovery details were closely re-
lated, specifically the UK (England and Wales), the UK (Northern Ireland), the Faroes,
Iceland, and Sweden. Recoveries of fish tagged in the UK (Scotland) and in Norway
differed mostly from each other and the other recoveries. Permutation tests showed
that RDA axes 1–3 were significant (Table 7.7) as were all of the terms in-
cluded in the analysis (Table 7.8).
Figure 7.9. Faroes tag-recovery RDA, axes 1 and 2 biplot of tagging (prefixed by T) countries: UK
(Scotland), Faroes, Sweden, Iceland, UK (England and Wales), UK (Northern Ireland), Norway, and
Ireland (red) and vectors for constraining variables of recapture (prefixed by R) year, latitude, lon-
gitude, gutted weight (kg), sea age, and capture season: autumn and spring (blue).
Table 7.7. Permutation test: significance of RDA axes 1–6. Number of permutations: 999.
Axis d.f. Variance F
RDA1 1 0.0294 106.6051
RDA2 1 0.0058 20.9981
RDA3 1 0.0014 5.0572
RDA4 1 0.0004 1.411
RDA5 1 0.0002 0.599
RDA6 1 0.0001 0.023
Residual 1 640 0.4527
Significance:1 p <0.001; 2 p <0.01
-0.3 -0.2 -0.1 0.0 0.1 0.2 0.3
-0.3
-0.2
-0.1
0.0
0.1
0.2
0.3
RDA1
RD
A2
TEngland.Wales
TFaroes
TIceland
TIreland
TN.Ireland
TNorway
TScotland
TSweden
RYear
RLat
RLon
RGuttedWeightkg
RSeaage
RAutumn
RSpring

Fifty years of marine tag recoveries from Atlantic salmon | 65
Table 7.8. Permutation test: significance of individual terms. Number of permutations: 999.
Term d.f. Variance F
RYear 1 0.0044 15.8571
RLat 1 0.0055 19.7401
RLon 1 0.0031 11.3181
RGuttedWeightkg 1 0.0153 55.4621
RSea age 1 0.0063 22.6341
RAutumn 1 0.0027 9.6821
RSpring 0 0.0000
Residual 1 640 0.4527
Significance:1 p <0.001
The vectors for recoveries in autumn (October–December) and winter (January–April)
point in opposite directions, along RDA axis 1, indicating an inverse relationship. The
spring recovery vector points in the same general direction, increasing along axis 1, as
sea age, weight, longitude, and latitude, indicating that larger individuals with higher
sea ages are more commonly recovered during spring, and that these recoveries tended
to occur at higher latitudes and longitudes (to the northeast), while the opposite situa-
tion occurs in autumn.
The pattern of Norwegian fish recovery was the most distinct from those originating
in other countries, in alignment along axis 1 to the spring vector. This indicated that a
larger proportion of Norwegian fish were recovered in spring, at higher latitudes and
longitudes, that they weighed more, and had spent a longer time at sea. This conclusion
may also have been influenced by the relatively large number of Norwegian recaptures
relative to other countries of origin.
Irish recoveries, located to the lower end of axis 1, aligned more with autumn recover-
ies and the vector of recovery year, indicating greater recoveries in the later years of
the time-series. Vectors suggest that the Irish recoveries tended to be smaller, having
spent less time at sea, and were mainly caught at lower latitudes and longitudes (to the
southwest) and in autumn. Other countries tended towards the middle of the RDA,
thus showing less clear trends. Norwegian and Irish fish showed the most dissimilar
patterns, although this conclusion will have been influenced by the sample sizes of
both these and other countries of origin.
7.2.5 Faroes tag recoveries and climate
It should be expected that observed changes in the environment from around the 1990s
may have influenced the distribution of salmon north of the Faroes. Sea surface tem-
peratures (SSTs) were interpolated (temporally and spatially) for each salmon recap-
ture location. Figure 7.10 shows the years and months of the recaptured salmon with
associated SST. Warm periods (the end of the 1980s) and cold periods (1982–1983, 1992–
1995) are apparent, although this may well be a result of the different recovery loca-
tions.
Figure 7.11 shows the distribution of fish for autumn (November–December), winter
(February–March), and spring (May–June), along with the long-term mean SST for the

66 | ICES Cooperative Research Report No. 343
same period. In February and March, fish were caught over a greater north–south
range and generally in colder water than in the other two periods (Figure 7.10).
At each location with recaptured fish, an SST anomaly was calculated as the difference
between the ambient SST and the long-term mean SST for that month and location. In
this way, the effects of both location and time of year are removed. The time-series of
the individual SST anomalies together with the yearly and five-year averages are plot-
ted in Figure 7.12. Salmon recaptures were found in relatively colder waters in 1981–
1984 and 1993–1996, and in relatively warmer water in 1985–1988. There is similar SST
variability found north of the Faroes (Figure 7.13).
Figure 7.14 shows recaptured fish locations for autumn (November–December) and
winter (February–March) over three periods (1981–1984, 1985–1988, and 1993–1996). In
the 1981–1984 winter fishery, a few fish were recaptured farther north of the central
catch grouping, thus in colder waters, compared to autumn. Over the winters of 1985–
1988, all fish were found in water with average temperatures >4°C. During 1993–1996,
salmon were not recaptured farther to the north but were found in colder water closer
to the Faroes. This may have been a result of increased southwesterly winds (associated
with a high North Atlantic Oscillation index) over several years, which increased
transport of Arctic waters to the area. A more southerly recapture location was also
found in autumn (1993–1996) compared to the other two periods.
Figure 7.10. SST at locations where fish were recaptured as a function of year and month.
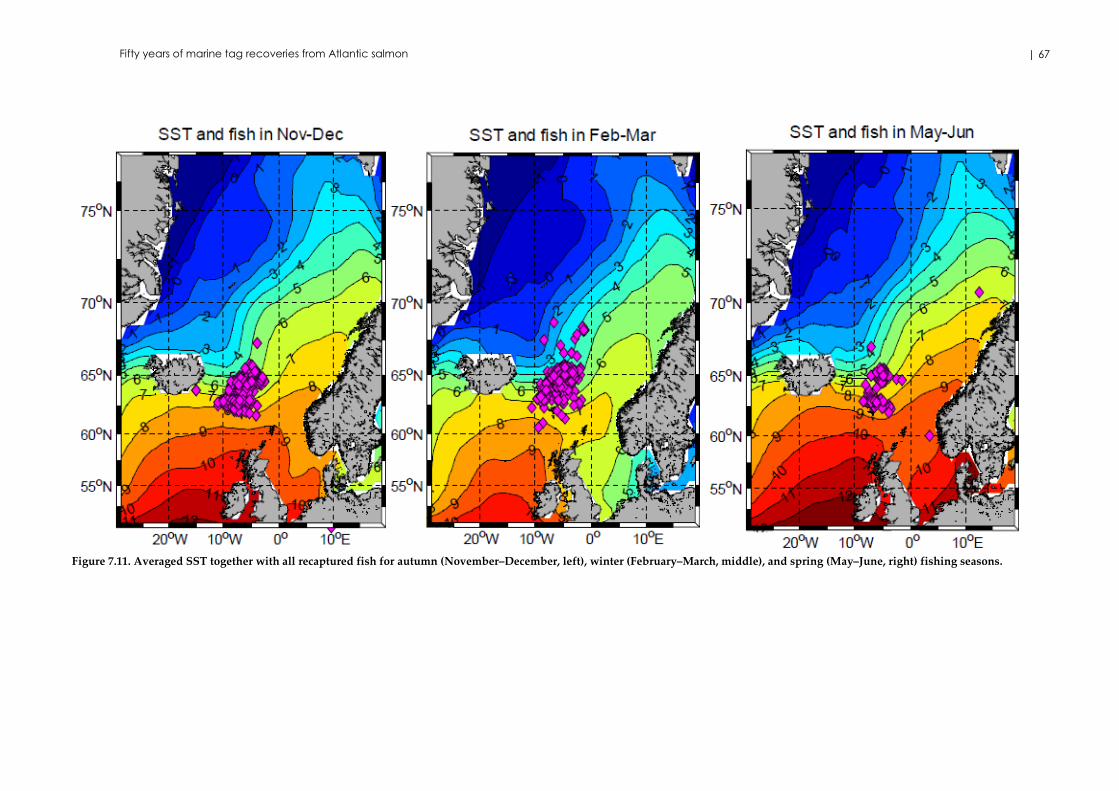
Fifty years of marine tag recoveries from Atlantic salmon | 67
Figure 7.11. Averaged SST together with all recaptured fish for autumn (November–December, left), winter (February–March, middle), and spring (May–June, right) fishing seasons.
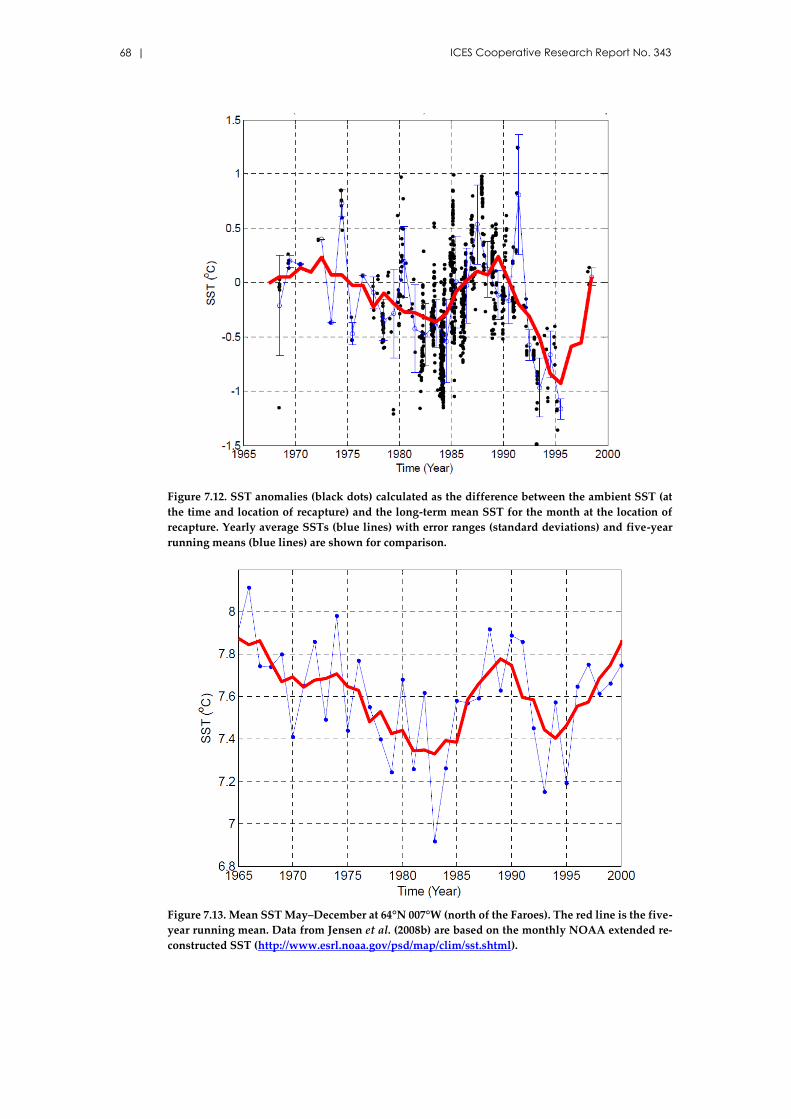
68 | ICES Cooperative Research Report No. 343
Figure 7.12. SST anomalies (black dots) calculated as the difference between the ambient SST (at
the time and location of recapture) and the long-term mean SST for the month at the location of
recapture. Yearly average SSTs (blue lines) with error ranges (standard deviations) and five-year
running means (blue lines) are shown for comparison.
Figure 7.13. Mean SST May–December at 64°N 007°W (north of the Faroes). The red line is the five-
year running mean. Data from Jensen et al. (2008b) are based on the monthly NOAA extended re-
constructed SST (http://www.esrl.noaa.gov/psd/map/clim/sst.shtml).

Fifty years of marine tag recoveries from Atlantic salmon | 69
Figure 7.14. Averaged SST and location of recaptured fish for autumn (November–December, left)
and winter (February–March, right) in 1981–1984 (upper panels), 1985–1988 (middle panels), and
1993–1996 (lower panels). Diamonds in each figure represent the centroid of catch locations.
The hypothesis that distribution and migration of salmon at sea is independent of (fish-
ing) season was not tested in the present report, as tag recovery data are fisheries de-
pendent. Previous studies however, have revealed that the country of origin of the

70 | ICES Cooperative Research Report No. 343
salmon caught in autumn differs from the composition in winter (Jacobsen et al., 2001),
supporting a rejection of this hypothesis.
Preliminary analysis indicates that there are discernible patterns in the compiled da-
taset pertaining to spatial and temporal salmon distributions around the Faroes alt-
hough fishing and tagging efforts may also influence any observed patterns. It should
also be noted that in the analyses of a single parameter, for instance sea age or country
of origin, it is possible that any result may be confounded by heterogeneous distribu-
tion in the catches (or fishing effort) over time as effort is probably not randomly dis-
tributed during the autumn and winter season fisheries. This requires further analyses
to include a time parameter such as season or month in the tests.
7.2.6 Spatial densities of recoveries in the Faroes fishery
Combined tag recoveries in catches from the Faroes salmon fishery are presented as
the autumn (November–December) fishery and late season (winter: February–March)
fishery recovery densities (kernel plots) of tagged salmon by 1SW and 2SW age groups
(Figure 7.15). Tag recoveries in the fishery were distributed more to the west and south
during the autumn season than in the winter season. Recoveries of 2SW tagged fish
appeared to have been more prevalent in the northeast in winter (Figure 7.15). Alt-
hough sea age distributions may be confounded by differences in the spatial distribu-
tion of the fishery in each period, results suggest rejecting the hypothesis that distribu-
tion is independent of sea age and that different sea ages are not randomly distributed,
but clustered.
Figures 7.16–7.22 show kernel plots of the recovery distributions around the Faroes for
fish tagged as smolts by country. Plots show the autumn fishery and winter fishery
recovery densities of tagged salmon by nation of tagging and sea age (with the excep-
tion of the Faroes and Iceland, where this breakdown is not possible). Although densi-
ties and distributions of the different national sea ages overlapped, distinct differences
were noted for recoveries from each country of origin and between autumn and winter
fishing season catches for each sea age.
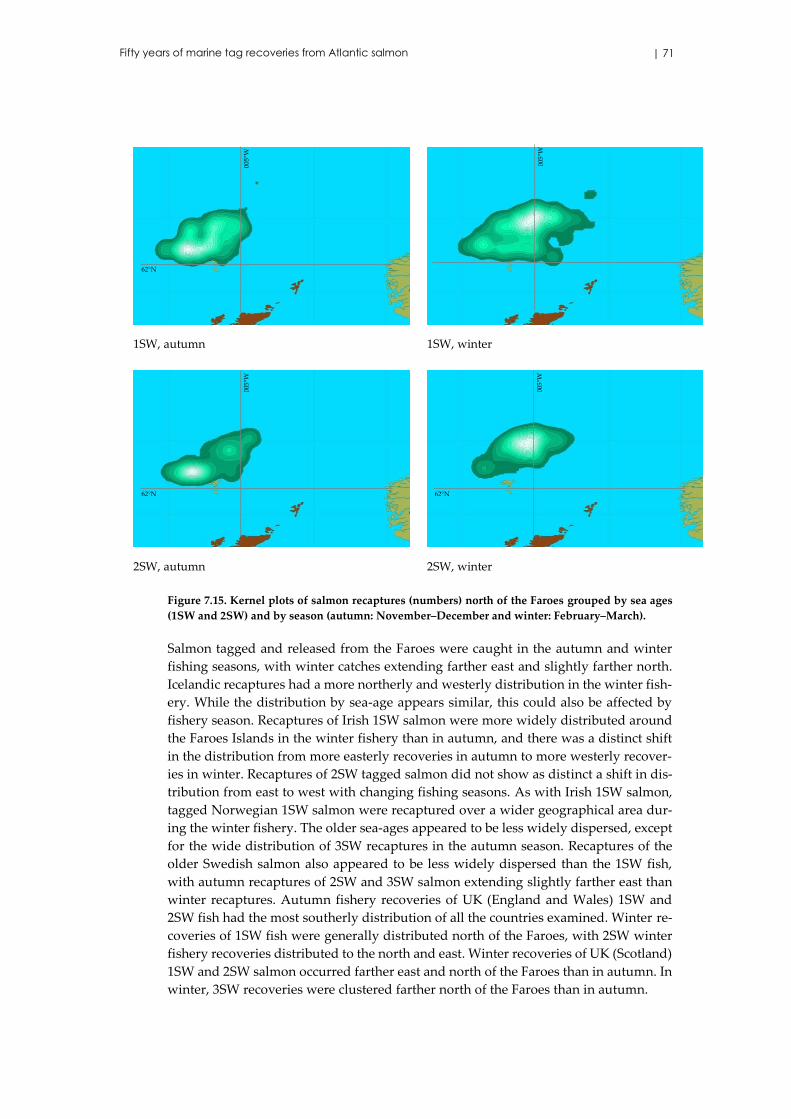
Fifty years of marine tag recoveries from Atlantic salmon | 71
1SW, autumn
1SW, winter
2SW, autumn
2SW, winter
Figure 7.15. Kernel plots of salmon recaptures (numbers) north of the Faroes grouped by sea ages
(1SW and 2SW) and by season (autumn: November–December and winter: February–March).
Salmon tagged and released from the Faroes were caught in the autumn and winter
fishing seasons, with winter catches extending farther east and slightly farther north.
Icelandic recaptures had a more northerly and westerly distribution in the winter fish-
ery. While the distribution by sea-age appears similar, this could also be affected by
fishery season. Recaptures of Irish 1SW salmon were more widely distributed around
the Faroes Islands in the winter fishery than in autumn, and there was a distinct shift
in the distribution from more easterly recoveries in autumn to more westerly recover-
ies in winter. Recaptures of 2SW tagged salmon did not show as distinct a shift in dis-
tribution from east to west with changing fishing seasons. As with Irish 1SW salmon,
tagged Norwegian 1SW salmon were recaptured over a wider geographical area dur-
ing the winter fishery. The older sea-ages appeared to be less widely dispersed, except
for the wide distribution of 3SW recaptures in the autumn season. Recaptures of the
older Swedish salmon also appeared to be less widely dispersed than the 1SW fish,
with autumn recaptures of 2SW and 3SW salmon extending slightly farther east than
winter recaptures. Autumn fishery recoveries of UK (England and Wales) 1SW and
2SW fish had the most southerly distribution of all the countries examined. Winter re-
coveries of 1SW fish were generally distributed north of the Faroes, with 2SW winter
fishery recoveries distributed to the north and east. Winter recoveries of UK (Scotland)
1SW and 2SW salmon occurred farther east and north of the Faroes than in autumn. In
winter, 3SW recoveries were clustered farther north of the Faroes than in autumn.
005°
W
62°N
005°
W
005°
W
62°N
005°
W
62°N
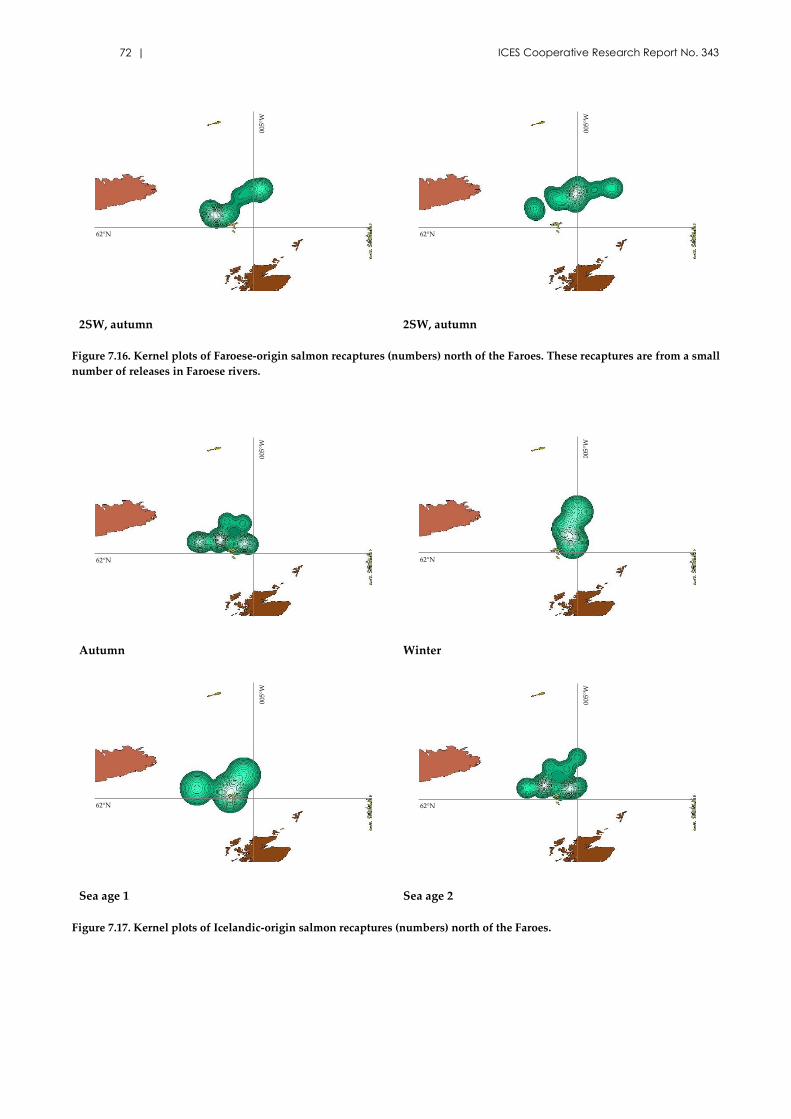
72 | ICES Cooperative Research Report No. 343
2SW, autumn 2SW, autumn
Figure 7.16. Kernel plots of Faroese-origin salmon recaptures (numbers) north of the Faroes. These recaptures are from a small
number of releases in Faroese rivers.
Autumn Winter
Sea age 1 Sea age 2
Figure 7.17. Kernel plots of Icelandic-origin salmon recaptures (numbers) north of the Faroes.
005°
W
62°N
005°
W
62°N
005°
W
62°N
005°
W
62°N
005°
W
62°N
005°
W
62°N

Fifty years of marine tag recoveries from Atlantic salmon | 73
1SW, autumn 1SW, winter
2SW, autumn 2SW, winter
Figure 7.18. Kernel plots of Irish-origin salmon recaptures (numbers) north of the Faroes.
005°
W
62°N
005°
W
62°N
005°
W
62°N
005°
W
62°N

74 | ICES Cooperative Research Report No. 343
1SW, autumn 1SW, winter
2SW, autumn 2SW, winter
3SW, autumn 3SW, winter
Figure 7.19. Kernel plots of Norwegian-origin salmon recaptures (numbers) north of the Faroes.
005°
W
62°N
005°
W
62°N
005°
W
62°N
005°
W
62°N
005°
W
62°N
005°
W
62°N

Fifty years of marine tag recoveries from Atlantic salmon | 75
1SW, autumn 1SW, winter
2SW, autumn 2SW, winter
3SW, autumn 3SW, winter
Figure 7.20. Kernel plots of Swedish-origin salmon recaptures (numbers) north of the Faroes.
005°
W
62°N
005°
W
62°N
005°
W
62°N
005°
W
62°N
005°
W
62°N
005°
W
62°N

76 | ICES Cooperative Research Report No. 343
1SW, autumn 1SW, winter
2SW, autumn 2SW, winter
Figure 7.21. Kernel plots of UK-origin (England and Wales) salmon recaptures (numbers) north of the Faroes.
005°
W
62°N
005°
W
62°N
005°
W
62°N
005°
W
62°N

Fifty years of marine tag recoveries from Atlantic salmon | 77
1SW, autumn 1SW, winter
2SW, autumn 2SW, winter
3SW, autumn 3SW, winter
Figure 7.22. Kernel plots of UK-origin (Scotland) salmon recaptures (numbers) north of the Faroes.
005°
W
62°N
005°
W
62°N
005°
W
62°N
005°
W
62°N
005°
W
62°N
005°
W
62°N

78 | ICES Cooperative Research Report No. 343
7.3 Analyses of the Greenland tag-recovery database
The West Greenland fishery operates in late summer and early autumn (August–Octo-
ber) and primarily catches potential MSW salmon (Idler et al., 1979). Younger salmon
(i.e. post-smolts) may be present in the Greenland area but are rarely caught there,
perhaps owing to the size of the mesh used in this fishery, which is generally too large
to retain post-smolts.
7.3.1 Spatial distribution of Greenland recaptures
Information from the entire West Greenland tag recoveries (external tags and CWTs)
time-series was initially examined to determine whether the distribution of tag recov-
eries was equal among three different regions: Northwest Greenland (NAFO divisions
1A–C), Southwest Greenland (NAFO divisions 1D–F), and East Greenland. Results for
Canada, USA, Norway, the UK (Scotland), and the UK (England and Wales) were con-
sistent in that tag recoveries for all countries were not uniformly distributed (all X2
tests, p < 0.0001). However, given that these results are likely related to the varying
distribution of fishing effort among these regions (there is very little salmon fishing at
East Greenland), a reanalysis of the data was carried out for West Greenland only to
test whether tag recoveries were uniformly distributed among the NAFO divisions.
Reanalysis of tag recoveries from West Greenland demonstrated similar results. For all
countries of origin, salmon tag recoveries were not uniformly distributed across the
respective NAFO divisions (all X2 tests, p < 0.0001). Canadian and US tagged salmon
were more commonly captured in northern locations (NAFO divisions 1B and C),
while European-origin salmon tended to be caught farther south in NAFO Divisions
1E and F. As expected, the recovery of North American-origin salmon differed signifi-
cantly from that of European salmon around West Greenland (likelihood ratio G-
test = 1044.88, p < 0.0001). Collectively, 35% of North American tag recoveries occurred
in NAFO divisions 1A and B compared with only 17% of European tag recoveries. In
contrast, 56% of the European-origin tag recoveries were from NAFO divisions 1E and
F compared with only 17% of North American recoveries (Figure 6.2).
7.3.2 Greenland tag recoveries by countries of origin and NAFO areas – multivariate
analyses
PCA and Bray–Curtis cluster analysis were applied to the Greenland tag recaptures,
based on abundance of tags by country of tagging and by NAFO area. Bray–Curtis
cluster analysis was performed using single linkage in the computer package BioDi-
versity Pro (McAleece et al., 1997). PCA was performed in the statistical package R us-
ing the vegan library.
Analyses were performed on log(x+1) transformed abundance measures to better sep-
arate groupings and reduce the influence in the data of very high abundance measures
from Canada and the USA (Figure 7.23). In the resulting cluster, the USA, Canada, and
Ireland clustered separately from other countries. Norway and Iceland clustered clos-
est to each other, with the UK (England and Wales), the UK (Scotland), and the UK
(Northern Ireland) also close, showing similarity in abundance and recovery in NAFO
areas.
The PCA positioned the UK (Scotland) and the UK (England and Wales) in close prox-
imity, and this was reflected in the Bray–Curtis clustering (Figure 7.24) showing them

Fifty years of marine tag recoveries from Atlantic salmon | 79
to have had the highest percentage similarity, followed by the USA–Canada cluster.
Norway separated from the UK (England and Wales) and UK (Scotland) grouping, and
Ireland separated from these and the USA–Canada group. While PCA clustered Nor-
way, the UK (Northern Ireland), Iceland, and Scotland in proximity, Bray–Curtis sep-
arated UK (Northern Ireland) and Iceland early, indicating their dissimilarity in abun-
dance and in NAFO recapture areas shown by salmon from other countries.
Figure 7.23. Principal component analysis of salmon recaptures in NAFO areas from tagging coun-
tries (as log (x+1) transformed abundance measures).
Figure 7.24. Bray–Curtis cluster analysis of salmon recaptures in NAFO areas from tagging coun-
tries (as log (x+1) transformed abundance measures).
Within North America, the distribution of Canadian and USA tag recaptures around
West Greenland was also found to differ (likelihood ratio G-test = 81.61, p < 0.001). Ca-
nadian salmon were recaptured further north more often than US fish. A comparison
of European salmon from Norway, Ireland, the UK (Scotland), and the UK (England
and Wales) also showed differences (likelihood ratio G-test = 53.51, p < 0.001): salmon
-1.5 -1.0 -0.5 0.0 0.5 1.0 1.5
-1.5
-1.0
-0.5
0.0
0.5
1.0
1.5
PC1
PC
2
Canada
Iceland
Ireland
N_Ireland
Norway
Scotland
England_and_Wales
USA

80 | ICES Cooperative Research Report No. 343
from Norway and UK (Scotland) were recovered more in northern areas, while salmon
from Ireland and UK (England and Wales) were likely to be recaptured in southwest
Greenland.
7.3.3 Greenland tag recoveries and climate
Time-series of SST averaged over the different NAFO areas (near the coast) are shown
in Figure 7.25. The data are 5-year averages using only the month of August. Several
cold periods can be seen in the time-series for all areas, especially around 1970 and
1983. Around the mid-1990s, a drop in temperature was also observed for nearly all
areas, except the southern area. The most significant cold period around 1970 occurred
at a similar time to the Great Salinity Anomaly (Dickson et al., 1988), which was a result
of increased ice transport flowing out of Fram Strait southward with the East Green-
land Current. Figure 7.26 shows the averaged August SST for 1965–1985 and 1986–
2006, with the difference between the two periods shown in Figure 7.27. The latter pe-
riod was warmer than the former over the whole region (typically 0.5–1.5°C warmer,
depending on the area). These differences in SST may have influenced salmon distri-
bution, and hence the recaptures in different areas shown in Sections 7.3.2 and 7.3.4.
Associations between changes in SST and tag recoveries require further investigation.
Figure 7.25. August SST averaged over the different NAFO areas along and close to the West Green-
land coast. The data are 5-year averages. The different areas where the SSTs are averaged over are
shown in Figures 7.26 and 7.27.

Fifty years of marine tag recoveries from Atlantic salmon | 81
Figure 7.26. SST for August averaged over 1965–1985 (left) and 1986–2006 (right).
Figure 7.27. SST difference between the two periods (1965–1985 and 1986–2006) for August.

82 | ICES Cooperative Research Report No. 343
7.3.4 Greenland tag recoveries – temporal variation
Studies have demonstrated that environmental changes around the late 1980s have had
a significant influence on the productivity of Atlantic salmon in the Northwest Atlantic
(Chaput et al., 2005; Mills et al., 2013). Analysis of the annual midpoint estimates of
“pre-fisheries abundance” (the estimated salmon abundance prior to any fisheries tak-
ing place) relative to the “lagged spawners” (the number of spawners lagged forward
on the basis of expected smolt age distributions and recruitment; Rago, 2001), indicated
a temporal split in the time-series of productivity: a high productivity period in 1979–
1989 and a low productivity period from 1990 to the end of the time-series (2006; ICES,
2008b).
It was hypothesized that these environmental and abrupt productivity changes indi-
cated non-stationarity, which may have also influenced the distribution of North
American and European salmon at Greenland. Thus, 1989 was used to establish two
periods for analysis: Period 1 data up to 1989 and Period 2 data for 1989 and later. For
both North American salmon (likelihood ratio G-test = 122.90, p < 0.001) and European
salmon (likelihood ratio G-test = 88.33, p < 0.001), the distributions between periods
were found to differ among NAFO divisions. In both cases, North American and Eu-
ropean salmon were found farther south at Greenland in the latter period than in the
former. This may have been temperature-related as Period 2 was cooler than Period 1.
It may also be related to changes over time in fishery management measures or the
distribution of fishing effort (e.g. fishing times may have been more extensive in earlier
years, or fishing effort different in different NAFO divisions).
The Greenland database includes information relating to locations of tag release and
recovery, fork length, and gutted weight of recaptured fish. These data allow investi-
gation of temporal trends in putative maximum mean swimming speeds (based on
time elapsed and distance travelled between tagging and recovery locations), mean
length, and mean weight over the period 1960–2000.
The time-series covers 50 years, and during this time, there have been management
changes in both the timing of the fishery and the timing of salmon-tagging pro-
grammes. Such changes will affect release and capture dates of North American- and
European-origin salmon and calculated swimming speeds.
Release and recapture dates of European-origin salmon
Release dates ranged from March to June, with annual 95th percentiles generally over-
lapping. Capture dates in the 1960s were later in the year than for the rest of the da-
taseries, taking place between September and November. Catch dates from the 1970s
onward generally occurred in September, though they ranged from June to November
(95th percentiles overlap). There was a notable reduction in the number of salmon be-
ing recaptured in the late 1970s to mid-1980s and from the mid-1990s to 2010, reflecting,
in part at least, reduced levels of tagging. In general, among-year variations were not
notably different from within-year variations, with the exception of the 1960s capture
dates (Figure 7.28). An ANOVA comparing dates of release in each year by decade
showed that significant differences did occur (F4,351 = 10.398, p <0.0001), and a post hoc
least significant difference (LSD) test indicated that this difference was specific to re-
lease dates in the 2000s (Table 7.9), with no significant differences between other dec-

Fifty years of marine tag recoveries from Atlantic salmon | 83
ades. Similar comparisons for decadal recaptures also showed that significant differ-
ences occurred (F4,351 = 22.568, p < 0.0001) and that they were specific to dates in the
1960s (Table 7.10).
Figure 7.28. Release dates of European-origin tagged salmon (red) and capture dates (blue).
Table 7.9. Post hoc LSD test results detailing decadal differences in the release dates of European
tagged salmon.
Decadal comparison Difference (days) s.e. p
1970–1960 4.22 4.00 0.892
1980–1960 10.19 4.21 0.212
1980–1970 5.97 2.15 0.105
1990–1960 14.13 4.93 0.086
1990–1970 9.91 3.34 0.069
1990–1980 3.94 3.59 0.877
2000–1960 −15.97 5.83 0.114
2000–1970 −20.19 4.57 0.0011
2000–1980 −26.16 4.75 < 0.0012
2000–1990 −30.10 5.40 < 0.0012
1 p < 0.01; 2 p < 0.001
Release and recapture dates of North American-origin salmon
Release dates for North American hatchery-origin salmon were more varied than Eu-
ropean release dates, tending to occur between April and August. A period in the early
1970s had a large range in release dates, and releases were recorded as late as Novem-
ber throughout the 1970s. In the first half of the 1980s, releases were focused around
May and June, becoming wider ranging (March–July) into the early-1990s, at which
time numbers of recaptured tagged fish declined markedly. From the mid-2000s, small
numbers of tag recoveries were recorded, and this was associated with the wide range
of release dates (April–September). Generally, median release dates from 1970 to 2000
were between March and April, with comparable inter 95th percentile ranges overlap-
ping (Figure 7.29). Statistical comparison of decadal release dates using ANOVA did,
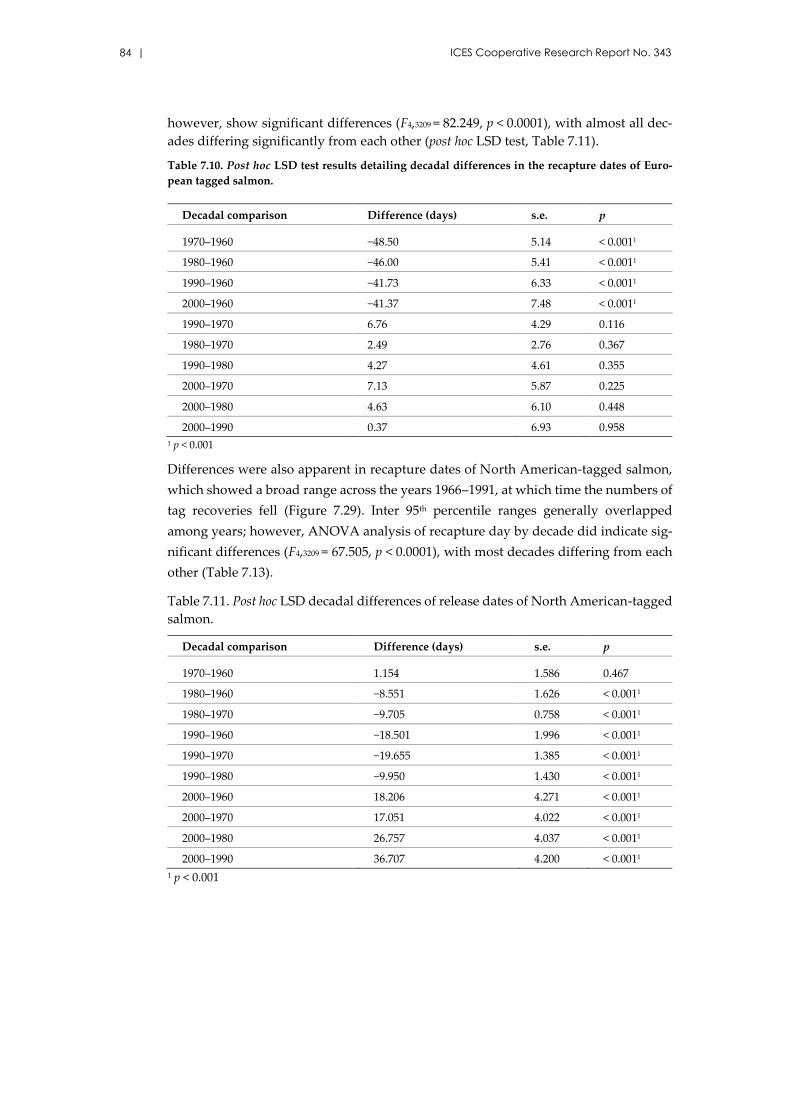
84 | ICES Cooperative Research Report No. 343
however, show significant differences (F4,3209 = 82.249, p < 0.0001), with almost all dec-
ades differing significantly from each other (post hoc LSD test, Table 7.11).
Table 7.10. Post hoc LSD test results detailing decadal differences in the recapture dates of Euro-
pean tagged salmon.
Decadal comparison Difference (days) s.e. p
1970–1960 −48.50 5.14 < 0.0011
1980–1960 −46.00 5.41 < 0.0011
1990–1960 −41.73 6.33 < 0.0011
2000–1960 −41.37 7.48 < 0.0011
1990–1970 6.76 4.29 0.116
1980–1970 2.49 2.76 0.367
1990–1980 4.27 4.61 0.355
2000–1970 7.13 5.87 0.225
2000–1980 4.63 6.10 0.448
2000–1990 0.37 6.93 0.958
1 p < 0.001
Differences were also apparent in recapture dates of North American-tagged salmon,
which showed a broad range across the years 1966–1991, at which time the numbers of
tag recoveries fell (Figure 7.29). Inter 95th percentile ranges generally overlapped
among years; however, ANOVA analysis of recapture day by decade did indicate sig-
nificant differences (F4,3209 = 67.505, p < 0.0001), with most decades differing from each
other (Table 7.13).
Table 7.11. Post hoc LSD decadal differences of release dates of North American-tagged
salmon.
Decadal comparison Difference (days) s.e. p
1970–1960 1.154 1.586 0.467
1980–1960 −8.551 1.626 < 0.0011
1980–1970 −9.705 0.758 < 0.0011
1990–1960 −18.501 1.996 < 0.0011
1990–1970 −19.655 1.385 < 0.0011
1990–1980 −9.950 1.430 < 0.0011
2000–1960 18.206 4.271 < 0.0011
2000–1970 17.051 4.022 < 0.0011
2000–1980 26.757 4.037 < 0.0011
2000–1990 36.707 4.200 < 0.0011
1 p < 0.001

Fifty years of marine tag recoveries from Atlantic salmon | 85
Figure 7.29. Release dates of North American-origin tagged salmon (red) and capture dates (blue).
Table 7.12. Post hoc LSD decadal differences of recapture dates of North American-tagged salmon.
Decadal comparison Difference (days) s.e. p
1970–1960 −28.932 1.88 < 0.0011
1980–1960 −29.200 1.926 < 0.0011
1980–1970 −0.268 0.899 0.765
1990–1960 −34.093 2.366 < 0.0011
1990–1970 −5.161 1.641 0.0022
1990–1980 −4.893 1.694 0.0042
2000–1960 −16.995 5.061 < 0.0011
2000–1970 11.936 4.766 0.0123
2000–1980 12.205 4.784 0.0113
2000–1990 17.098 4.977 < 0.0011
1 p < 0.001, 2 p < 0.01, 3p < 0.05
Weights, lengths, and swim speeds of Greenland-caught, European-origin, and North
American-origin salmon
Recorded gutted weights and lengths of tagged salmon captured in the Greenland fish-
ery provide an opportunity to examine how these changed between 1960 and 2010. The
mean gutted weight of European salmon showed a slight decline from 3.3 kg in 1961
to 2.8 kg in 2010 (p >0.05, n = 79, Figure 7.30). This was similar for North American-
origin salmon, which fell from 2.6 kg in 1967 to 2.4 kg in 2007 (p >0.05, n = 508, Figure
7.31). Neither decline was statistically significant.
Fork lengths did not show the same pattern in European- and North American-origin
1SW salmon. Those from Europe showed an apparent reduction in average length (Fig-
ure 7.32, n = 152), while North American-origin 1SW fish showed an apparent increase
in length at capture (Figure 7.33, n = 154). The regression of fork length over year was
significant at p < 0.05 for both European- and North American-origin 1SW salmon. It
should be noted that the data were not corrected for changes in the spatial and tem-
poral distribution of the sampling of the fishery, which has been shown to influence

86 | ICES Cooperative Research Report No. 343
annual estimates of length and weight of sampled salmon (ICES, 2015) and could in-
fluence tag recoveries.
Figure 7.30. Gutted weights of tagged 1SW European-origin salmon captured off Greenland 1960–
2010 (n = 79).
Figure 7.31. Gutted weights of tagged 1SW North American-origin salmon captured off Greenland
1960–2010 (n = 508).
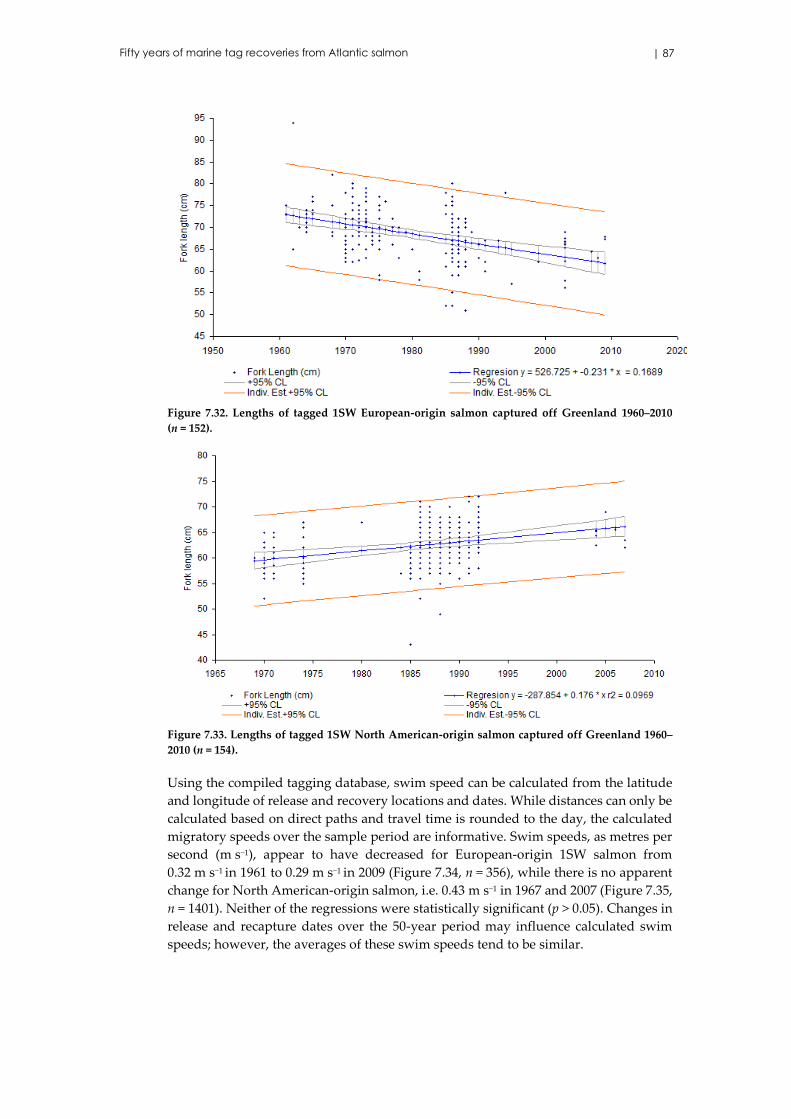
Fifty years of marine tag recoveries from Atlantic salmon | 87
Figure 7.32. Lengths of tagged 1SW European-origin salmon captured off Greenland 1960–2010
(n = 152).
Figure 7.33. Lengths of tagged 1SW North American-origin salmon captured off Greenland 1960–
2010 (n = 154).
Using the compiled tagging database, swim speed can be calculated from the latitude
and longitude of release and recovery locations and dates. While distances can only be
calculated based on direct paths and travel time is rounded to the day, the calculated
migratory speeds over the sample period are informative. Swim speeds, as metres per
second (m s−1), appear to have decreased for European-origin 1SW salmon from
0.32 m s−1 in 1961 to 0.29 m s−1 in 2009 (Figure 7.34, n = 356), while there is no apparent
change for North American-origin salmon, i.e. 0.43 m s−1 in 1967 and 2007 (Figure 7.35,
n = 1401). Neither of the regressions were statistically significant (p > 0.05). Changes in
release and recapture dates over the 50-year period may influence calculated swim
speeds; however, the averages of these swim speeds tend to be similar.

88 | ICES Cooperative Research Report No. 343
Figure 7.34. Swim speeds of tagged 1SW European-origin salmon captured off Greenland 1960–
2010 (n = 356).
Figure 7.35. Swim speeds of tagged 1SW North American-origin salmon captured off Greenland in
1960–2010 (n = 1401).
7.4 Adult tagging in the Norwegian Sea
Several programmes involving tagging of adults in the Norwegian Sea and off the Nor-
wegian coast were carried out in 1970. Figure 7.36 illustrates the returns of salmon
tagged in different months and in different areas. A few of the fish tagged early (April)
in the northern Norwegian Sea were recovered later in rivers in Russia, while fish sub-
sequently tagged through May and June were recovered mainly in mid- and southern
Norway.

Fifty years of marine tag recoveries from Atlantic salmon | 89
Figure 7.36. Recaptures of adult Atlantic salmon tagged and released in the Norwegian Sea in
spring 1970. Red lines and dots represent fish tagged in April, blue are May, and green are June.
Dots represent recovery locations. Lines are descriptive to link tag and recovery locations and do
not represent putative swim paths.
7.4.1 Multivariate analyses of the Norwegian adult tagging dataset
The PCA of the adult tagging dataset from Norway, performed on 280 z-score trans-
formed variables (Figure 7.37, reduced from 513 owing to missing values), showed that
adult fish with longer residence times (the time between tagging and release, and re-
covery) generally showed more growth (seen as an increase in length) and higher re-
covery weight (round weight). Fish released below 69°N were generally released later
in the year and displayed faster swim speeds (as calculated through straight lines be-
tween mark and recapture locations). Fish released above 69°N tended to have longer
residence times, were larger, and weighed more at recapture, and those that were re-
leased later in the time-series (in years) tended to weigh more at release and moved
south.

90 | ICES Cooperative Research Report No. 343
Figure 7.37. PCA variable loadings of recovered salmon tagged as adults in the Norwegian Sea (per-
formed on z-score transformed variables).
7.5 Adult tagging at Greenland
Adult salmon were tagged with Carlin tags between 1969 and 1972 around Greenland
(in Davis Strait and Labrador Sea, Figure 3.1). Figure 7.38 shows that while these were
predominantly recaptured along the west coast of Greenland (167 of 236 recoveries),
there were also recoveries around the UK (England and Wales) (11), UK (Scotland) (25),
Ireland (11), France (2), Spain (2), and Canada (18). Using the latitudes and longitudes
of fish tagging and recovery locations to calculate direct distances between the two
gives minimum distances travelled. Pairing these with the number of days between
tagging and recapture dates allowed estimation of salmon swim speeds by country of
recapture (Figure 7.39). ANOVA on log-transformed values (not including recaptures
in France and Spain, for which only two recaptures in each country were made) indi-
cated that significant differences existed between swim speeds by country of recapture
(F4,165 = 3.43, p < 0.05). The largest differences in estimated swim speeds (Table 7.13)
were between recaptures in Ireland and Greenland (p < 0.05), followed by Ireland and
Canada, the UK (England and Wales) and Greenland (p < 0.05), the UK (England and
Wales) and Canada, and Scotland and Greenland (p < 0. 05).
-1.0 -0.5 0.0 0.5
-0.5
0.0
0.5
PC1
PC
2
Year
Moved_North
Moved_South
Released_below _69_deg_N
Released_above_69_deg_N
Weight_release
Round_Weight_recovery
Release_month
Speed_km_hr
Residence
Grow th_cm
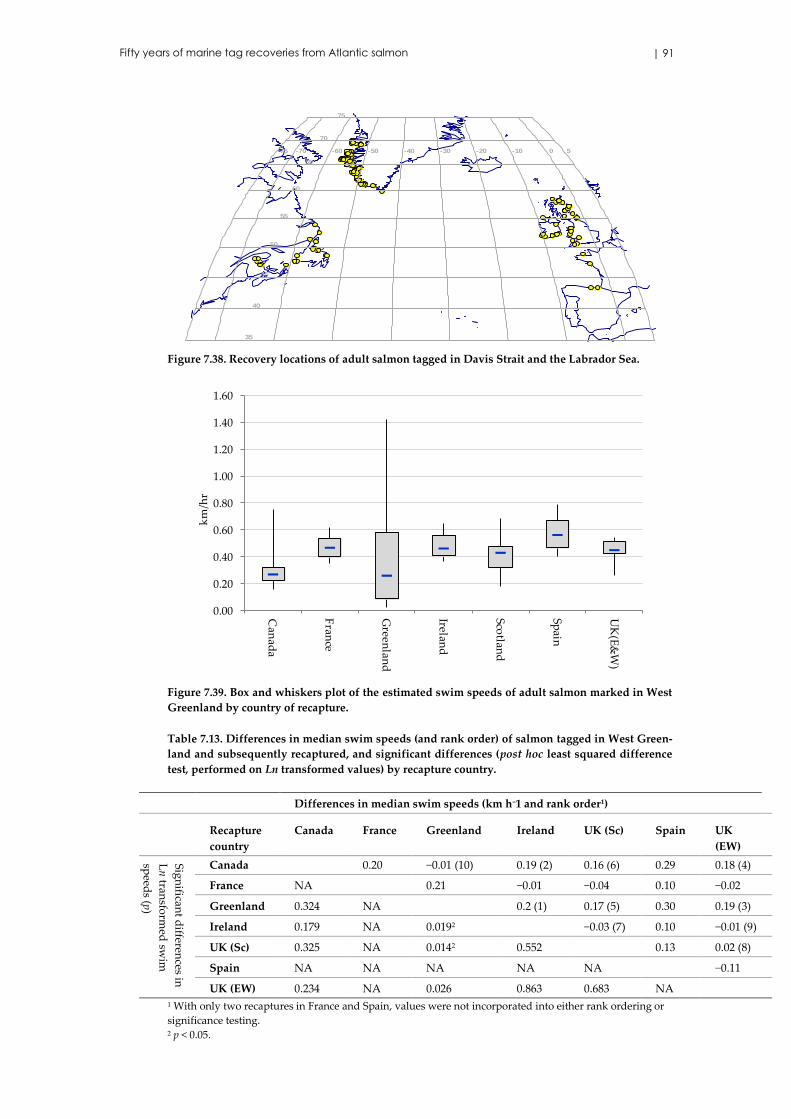
Fifty years of marine tag recoveries from Atlantic salmon | 91
Figure 7.38. Recovery locations of adult salmon tagged in Davis Strait and the Labrador Sea.
Figure 7.39. Box and whiskers plot of the estimated swim speeds of adult salmon marked in West
Greenland by country of recapture.
Table 7.13. Differences in median swim speeds (and rank order) of salmon tagged in West Green-
land and subsequently recaptured, and significant differences (post hoc least squared difference
test, performed on Ln transformed values) by recapture country.
Differences in median swim speeds (km h−1 and rank order1)
Recapture
country
Canada France Greenland Ireland UK (Sc) Spain UK
(EW)
Sig
nifican
t differen
ces in
Ln
transfo
rmed
swim
speed
s (p)
Canada 0.20 −0.01 (10) 0.19 (2) 0.16 (6) 0.29 0.18 (4)
France NA 0.21 −0.01 −0.04 0.10 −0.02
Greenland 0.324 NA 0.2 (1) 0.17 (5) 0.30 0.19 (3)
Ireland 0.179 NA 0.0192 −0.03 (7) 0.10 −0.01 (9)
UK (Sc) 0.325 NA 0.0142 0.552 0.13 0.02 (8)
Spain NA NA NA NA NA −0.11
UK (EW) 0.234 NA 0.026 0.863 0.683 NA
1 With only two recaptures in France and Spain, values were not incorporated into either rank ordering or
significance testing. 2 p < 0.05.
-75 -70 -60 -50 -40 -30 -20 -10 0 5
35
40
45
50
55
60
65
70
75
0.00
0.20
0.40
0.60
0.80
1.00
1.20
1.40
1.60
Can
ada
Fran
ce
Green
land
Ireland
Scotlan
d
Spain
UK
(E&
W)
km
/hr

92 | ICES Cooperative Research Report No. 343
7.6 Overview of the Salmon at Sea: Scientific Advances and their Implications for
Management symposium
Organized by NASCO and ICES, the Salmon at Sea: Scientific Advances and their Im-
plications for Management symposium was held in La Rochelle, France 11–13 October
2011. Three of the papers presented at the symposium detailed investigations based on
the national and international salmon tagging and recovery programmes detailed in
the databases covered in this report.
Miller et al. (2012b) reported on a US tagging programme that began in 1962 following
the development of an Atlantic salmon fishery off West Greenland, with over 1.5 mil-
lion smolts tagged with Carlin tags by 1996. A recovery rate of around 0.55% was
achieved: 23.2% of these in Canada, 26% in Greenland, and 50.8% in the US (Figure
7.40). Marine survival, based on returns of tagged salmon to the Penobscot River, was
analysed using a generalized additive model to investigate the possible effects of
month and year of release, sea age, smolt age, North Atlantic Oscillation (NAO), At-
lantic Multidecadal Oscillation (AMO) indices, and local sea surface temperatures.
Findings showed that AMO and NAO indices, SST, sea age, and date affected survival.
US-origin salmon are believed to overwinter in the Labrador Sea and are expected to
arrive along the West Greenland coast after spending a full winter at sea. The earliest
tag recoveries indicate that US-origin salmon had spent 14 months at sea before their
capture in the West Greenland fishery. Because of the timing of the Greenland fishery
and the fact that recaptures of tagged salmon are dependent on the fishery, it is possible
that 1SW salmon arrived in Greenlandic waters before the fishery commenced and
were thus undetected. Monthly patterns of tag recoveries at Greenland are also likely
to reflect the dynamics of the fishery and/or the response of fishers to the arrival of
salmon (Figure 7.41).
Salmon arriving in Greenlandic waters become susceptible to fishing in the south one
or two months earlier than in the north. The Canadian and Greenland fisheries proba-
bly harvested mainly 1SW salmon (as indicated by the high percentage of 1SW tags
recovered in the fisheries, Figure 7.40) that would otherwise have returned to home
rivers the following spring as 2SW adults. 2SW salmon in the Gulf of Maine ac-
counted for > 50% of tag recoveries in that area (Figure 7.40). Post-smolts were the
second largest source of tag recoveries in the Gulf of Maine. Tags were recovered
from post-smolts as late as July, many from the Bay of Fundy (NAFO Division 4X),
indicating a different migration pattern from that seen in post-smolts from other ar-
eas which are believed to be heading directly for Greenland. Miller et al. (2012b)
stated that the results provide information to support fisheries management of Atlan-
tic salmon stocks spatially and temporally in US rivers and the West Greenland fish-
ery.

Fifty years of marine tag recoveries from Atlantic salmon | 93
Figure 7.40. Geographic distribution of Carlin tag recoveries of US-origin salmon by sea age (a) in
US and Canadian waters and (b) at Greenland. Areas shown are NAFO divisions and ICES Statis-
tical Area XIV east of Greenland. Circle size indicates the number of tags recovered. For scale, the
smallest sample size (n = 2) came from NAFO Division 4T in the Gulf of St Lawrence and the largest
sample size (n = 712) from NAFO Division 3K off Newfoundland (Figure 2 in Miller et al., 2012b).
Figure 7.41. Geographic distribution of Carlin tag recoveries of US-origin Atlantic salmon by month
of the year (a) in US and Canadian waters and (b) at Greenland. Areas shown are NAFO divisions
and ICES Statistical Area 14 east of Greenland. For scale, the smallest sample size (n = 2) came from
NAFO Division 4T in the Gulf of St Lawrence and the largest sample size (n = 712) from NAFO
Division 3K off Newfoundland (Figure 3 in Miller et al., 2012b).
Jacobsen et al. (2012) investigated tag recoveries from international releases recovered
in the Faroes high seas longline fisheries between 1968 and 2000. A total of 2651 tags
were recovered from tagging programmes in 13 countries or jurisdictions. Geographic
distribution and origin of the salmon captured with respect to differences in sea age,
fishery season, and hydrographic features in the Faroes area were examined in both
the autumn and winter fisheries approximating the position of the Iceland–Faroe Front

94 | ICES Cooperative Research Report No. 343
(Figure 7.42). Results indicated that salmon were not distributed randomly in the Fa-
roes area by fishing season, sea age, or country of origin (Figure 7.43). Distributions
were found to be partially dependent on their geographic origin. Salmon from coun-
tries in the northern European stock complex were distributed significantly farther
northeast than those from countries in the southern European stock complex. Addi-
tionally, the proportion of tag recoveries from southern European countries was higher
in autumn, and the proportion recovered from northern European countries was
higher in winter.
The median recapture distance from a dividing line splitting the southwest fishery
from the northeast fishery (Figure 7.42) was positive (i.e. indicating a distribution
northeast of the dividing line) for the UK (Scotland), Norway, Sweden, and the Faroes,
and negative for Ireland, the UK (England and Wales), and Iceland (indicating a distri-
bution southwest of the dividing line). For Norway and Sweden, the majority of data
(above the 25th percentile) were greater than zero, being located exclusively northeast
of the dividing line. The median distance was also positive for all sea ages. For 3SW
salmon and salmon recovered during winter, the location was almost exclusively
northeast of the dividing line (Figure 7.43). Jacobsen et al. (2012) hypothesized that the
apparent temporal and spatial segregation of stocks of different origin indicates differ-
ential exploitation, and that this could inform fisheries management with regard to
temporal and spatial fishing options for the Faroes commercial salmon fishery should
it recommence in future. Reddin et al. (2012) examined 5481 tags recovered at Green-
land from salmon released in Canada, France, the Faroes, Greenland, Iceland, Ireland,
Norway, Spain, the UK (Northern Ireland), the UK (Scotland), the UK (England and
Wales), and the US from the early 1960s to 2009. For 4806 tags, recovery latitude and
longitude information were available, describing, to varying degrees of accuracy, the
location of recovery of tagged fish. Release and recovery dates were variable, though
no significant differences over time were apparent.

Fifty years of marine tag recoveries from Atlantic salmon | 95
Figure 7.42. Average geographic locations of recapture of salmon during the Faroese longline fish-
ery indicated by crosses representing 95% confidence intervals for latitude and longitude directions
by (a) sea age (1SW green, 2SW red, and 3SW blue crosses) during autumn (November–December)
and winter (January–April), and (b) from the southern (green crosses) and northern (red crosses)
European stock complexes during autumn and winter for 2SW salmon. The 500‐m (dashed line),
1000‐m (broken line), and 2000‐m (solid line) depth contours and national EEZs (solid thin lines)
and the dividing line is also shown (Modified from Figure 4 in Jacobsen et al., 2012).
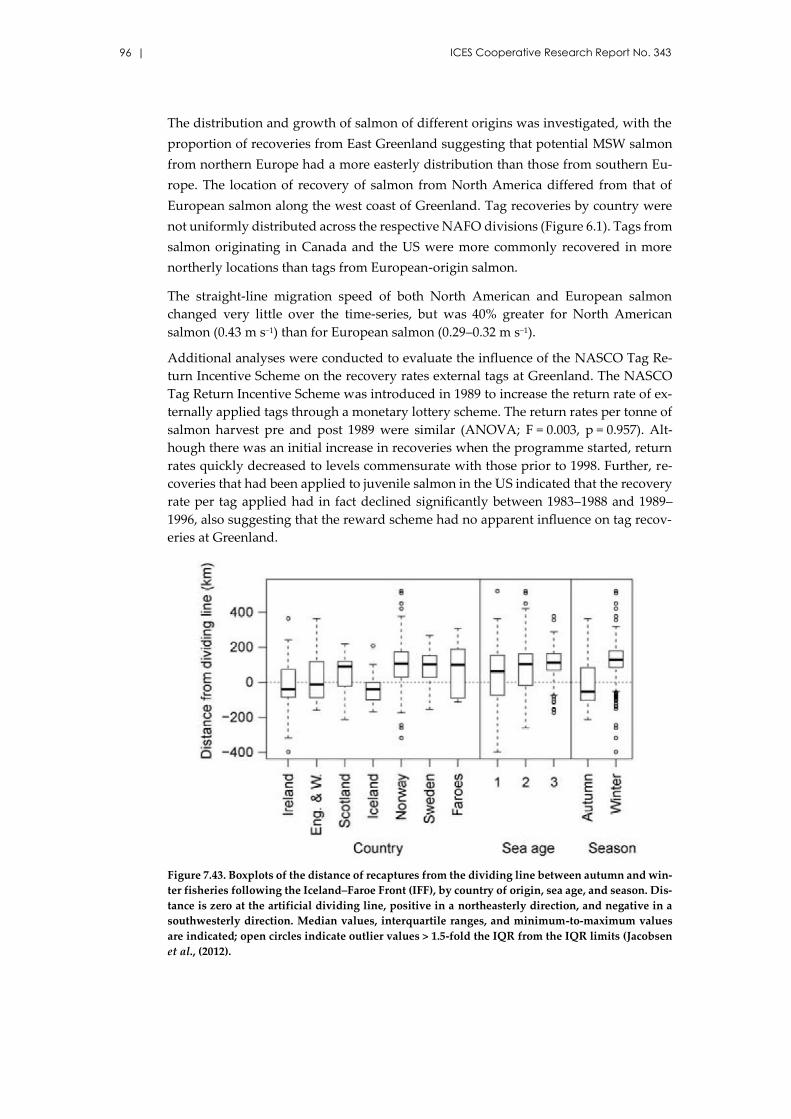
96 | ICES Cooperative Research Report No. 343
The distribution and growth of salmon of different origins was investigated, with the
proportion of recoveries from East Greenland suggesting that potential MSW salmon
from northern Europe had a more easterly distribution than those from southern Eu-
rope. The location of recovery of salmon from North America differed from that of
European salmon along the west coast of Greenland. Tag recoveries by country were
not uniformly distributed across the respective NAFO divisions (Figure 6.1). Tags from
salmon originating in Canada and the US were more commonly recovered in more
northerly locations than tags from European-origin salmon.
The straight-line migration speed of both North American and European salmon
changed very little over the time-series, but was 40% greater for North American
salmon (0.43 m s−1) than for European salmon (0.29–0.32 m s−1).
Additional analyses were conducted to evaluate the influence of the NASCO Tag Re-
turn Incentive Scheme on the recovery rates external tags at Greenland. The NASCO
Tag Return Incentive Scheme was introduced in 1989 to increase the return rate of ex-
ternally applied tags through a monetary lottery scheme. The return rates per tonne of
salmon harvest pre and post 1989 were similar (ANOVA; F = 0.003, p = 0.957). Alt-
hough there was an initial increase in recoveries when the programme started, return
rates quickly decreased to levels commensurate with those prior to 1998. Further, re-
coveries that had been applied to juvenile salmon in the US indicated that the recovery
rate per tag applied had in fact declined significantly between 1983–1988 and 1989–
1996, also suggesting that the reward scheme had no apparent influence on tag recov-
eries at Greenland.
Figure 7.43. Boxplots of the distance of recaptures from the dividing line between autumn and win-
ter fisheries following the Iceland–Faroe Front (IFF), by country of origin, sea age, and season. Dis-
tance is zero at the artificial dividing line, positive in a northeasterly direction, and negative in a
southwesterly direction. Median values, interquartile ranges, and minimum-to-maximum values
are indicated; open circles indicate outlier values > 1.5-fold the IQR from the IQR limits (Jacobsen
et al., (2012).

Fifty years of marine tag recoveries from Atlantic salmon | 97
8 Conclusions
The efforts and resources expended across the North Atlantic over the last 50 years in
tagging migrating juvenile and adult salmon and recovering tagged fish have been im-
mense. International tagging operations have tagged and released millions of salmon
over the period. Recoveries totalling 5508 tags from the seas around Greenland be-
tween 1963 and 2009, and 2646 tags from Faroes waters between 1966 and 1998 have
been recorded in the North Atlantic Salmon Tag Recovery databases (NASTR) to date
and the number of records continues to rise with additional catches and tag detections
in Greenland. The NASTR database, therefore, contains the most comprehensive col-
lection of data on tagging and recovery locations available and is the only such compi-
lation of international tagging and recovery programmes for Atlantic salmon. It repre-
sents an historic advance in the compilation of tag-recapture data and for the first time
allows international tag recoveries to be analysed jointly.
The analyses presented here are based on preliminary investigations undertaken dur-
ing the ICES workshops WKDUHSTI (ICES, 2007), WKSHINI (ICES, 2008a), WKLUS-
TRE (ICES, 2009), and WKSTAR (ICES, 2012) as well as a series of research articles
published on the recent analyses of the data. These give a comprehensive overview of
salmon migration to the recognized feeding grounds around Greenland and the Faroes
and information on the time and distances of migrations and changes in biological
characteristics over time.
Through review of catch densities and locations around the Faroes, patterns of total,
national, and age-specific recovery hot spots suggested significant differences in dis-
tributions of fish between the autumn and winter fisheries, with a general shifting of
the distribution of recovery east and north of the Faroe Islands. Associations between
catch areas and countries of origin have shown an eastern Atlantic/western Atlantic
country-of-origin split, generally followed by splits of countries within these large re-
gional groupings. This may represent differences in the migration destinies of salmon
from different locations and differences in the timings of migrations of salmon from
different locations along migration routes, although such conclusions need to be tem-
pered against possible differences in the timing of fishing at different locations. Multi-
variate analyses of the Faroes tag-recovery data showed similar temporal relationships
between weight, length, age, and season of catch over the time-series. Greater recovery
weights, sea ages, higher latitudes and longitudes, and spring catches were primarily
exhibited by Norwegian-origin salmon compared to salmon originating in Ireland, UK
(England and Wales) and UK (Northern Ireland), while salmon from UK (Scotland),
Sweden, the Faroes, and Iceland overlapped these characteristics with the other coun-
tries.
Sea surface temperature associations with catches suggest a change in location relative
to a 4°C cut-off, possibly owing to prevailing winds and a high North Atlantic Oscilla-
tion index.
Similar conclusions can be drawn from analysis of the Greenland tag-recovery data-
base, with catches on the west coast of Greenland showing different proportions of

98 | ICES Cooperative Research Report No. 343
country of origin with progression northwards, and countries of origin with close prox-
imity showing generally similar tag-recapture distributions in different areas. Investi-
gations into temperature influences indicate notable differences over the earlier and
latter parts of the time-series. With reported temperature effects upon salinity, it may
be hypothesized that such changes would influence temporal shifts in distribu-
tion/catch, migration timings, and weights and lengths of Greenland-caught salmon.
While these findings are interesting and valuable in dissecting the historic and more
recent sea migrations of Atlantic salmon, they should be seen as initial investigations.
The compiled NASTR database represents the combined, extensive efforts of sixteen
nations, initially collected and subsequently collated through collaborative activities at
considerable cost. All parties are encouraged to explore these data and use them to
further our understanding of salmon migrations, with the aim of discerning changes
that may have coincided with population declines over the same period.
Researchers who further explore these data are encouraged to take into account the
various caveats detailed throughout this report that affect the conclusions drawn from
reanalysis of these data. As an example, including the number of tagged fish released
and/or more detailed fishery dynamics would enhance conclusions drawn here about
temporal or spatial trends in the recapture data. These data are available in some agen-
cies, and researchers are encouraged to contact them for specific information. In addi-
tion, researchers using the data are requested to acknowledge ICES, this report, the
NASTR database, and all the data providers in any subsequent papers or reports.

Fifty years of marine tag recoveries from Atlantic salmon | 99
9 References
Anderson, T. C. 1985. The rivers of Labrador. Canadian Special Publication of Fisheries and
Aquatic Sciences, 81. 389 pp.
Anonymous. 1974. Om virksomheten til Direktoratet for jakt, viltstell og ferskvannsfiske i 1970
og 1971. Meldinger til Stortinget, 69, 1973–74.
Anonymous. 2011. SALSEA-Merge (Advancing Understanding of Atlantic Salmon at Sea: Merg-
ing Genetics and Ecology to Resolve Stock Specific Migration and Distribution Patterns).
Final Report of Project 212529 EU/FP7. 79 pp.
Antonova, V. P., and Chuksina, N. A. 1987. The impact of foreign fisheries on spawning stocks
of salmon in the Pechora River. Studies of Salmonids in the European North, Petrozavodsk:
20–26 (in Russian).
Bakshtansky, E. L. 1970. The development of sea fishery for Atlantic salmon. Trudy PINRO, 74:
156–176 (in Russian).
Bakshtansky, E. L., and Nesterov, V. D. 1973. Some data to evaluate the impact of foreign fisher-
ies on Atlantic salmon stocks. Journal "Rybnoe khozjaistvo", 7: 18–21 (in Russian).
Bakshtansky, E. L., and Yakovenko, M. Ya. 1976. Migration of Atlantic salmon kelts from Var-
zuga River. Trudy VNIRO, CXIII: 33–38 (in Russian).
Beals, E. W. 1984. Bray–Curtis ordination: an effective strategy for analysis of multivariate eco-
logical data. Advances in Ecological Research, 14: 1–55. https://doi.org/10.1016/S0065-
2504(08)60168-3
Berg, L. S. 1948. Fishes of Freshwaters in the USSR and Neighbouring Countries. USSR Academy
of Sciences Press, Moscow. 466 pp (in Russian).
Browne, J. 1981. First results from a new method of tagging – the coded wire tag. Department of
the Marine, Ireland. Fishery Leaflet, 114.
Browne, J., Ó Maoiléidigh, N., McDermott, T., Cullen, A., Bond, N., McEvoy, B., Ó Farrell, M., et
al. 1994. High seas and homewater exploitation of an Irish reared salmon stock. ICES Docu-
ment CM 1994/M: 10.
Carlin, B. 1955. Tagging of salmon smolts in the River Lagan. Report of the Institute of Freshwa-
ter Research, Drottningholm, 36: 57–74.
Chaput, G. 2012. Overview of the status of Atlantic salmon (Salmo salar) in the North Atlantic
and trends in marine mortality. ICES Journal of Marine Science, 69: 1538–1548.
https://doi.org/10.1093/icesjms/fss013
Chaput, G., Legault, C. M., Reddin, D. G., Caron, F., and Amiro, P. G. 2005. Provision of catch
advice taking account of non-stationarity in productivity of Atlantic salmon (Salmo salar L.)
in the Northwest Atlantic. ICES Journal of Marine Science, 62: 131–143.
https://doi.org/10.1016/j.icesjms.2004.10.006
Danilchenko, P. G. 1938. On sea migration of Atlantic salmon. Journal “Priroda”, 7–8: 138–140
(in Russian).
Dempson, J. B., Reddin, D. G., O’Connell, M. F., Helbig, J., Bourgeois, C. E., Mullins, C., Porter,
T. R., et al. 1998. Spatial and temporal variation in Atlantic salmon abundance in the New-
foundland-Labrador region with emphasis on factors that may have contributed to low re-
turns in 1997. DFO Atlantic Fisheries Research Document, 98/114. 161 pp.
Dickson, R. R., Meincke, J., Malmberg, S-A., and Lee, A. J. 1988. The "great salinity anomaly" in
the Northern North Atlantic, 1968–1982. Progress in Oceanography, 20(2), 103–151
https://doi.org/10.1016/0079-6611(88)90049-3
Doubleday, W. G., Rivard, D. R., Ritter, J. A., and Vickers, K. U. 1979. Natural mortality rate
estimates for North Atlantic salmon in the sea. ICES Document CM 1979/M: 26.

100 | ICES Cooperative Research Report No. 343
Friedland, K. D., Hansen, L. P., and Dunkley, D. A. 1998. Marine temperature experienced by
postsmolts and the survival of Atlantic salmon, Salmo salar L. in the North Sea area. Fisheries
Oceanography, 7: 22–34. https://doi.org/10.1046/j.1365-2419.1998.00047.x
Friedland, K. D., Reddin, D. G., and Kocik, J. F. 1993. Marine survival of North American and
European salmon: effects of growth and environment. ICES Journal of Marine Science, 50:
481–492. https://doi.org/10.1006/jmsc.1993.1051
Hansen, L. P., and Jacobsen, J. A. 2003. Origin and migration of wild and escaped farmed Atlantic
salmon, Salmo salar L., in oceanic areas north of the Faroe Islands. ICES Journal of Marine
Science, 60: 110–119. https://doi.org/10.1006/jmsc.2002.1324
Hansen, L. P., Jacobsen, J. A., and Lund, R. A. 1999. The incidence of escaped farmed Atlantic
salmon, Salmo salar L., in the Faroese fishery and estimates of catches of wild salmon. ICES
Journal of Marine Science, 56: 200–208. https://doi.org/10.1006/jmsc.1998.0437
Hansen, L. P., and Pethon, P. 1985. The food of Atlantic salmon, Salmo salar L. caught by long-
line in northern Norwegian waters. Journal of Fish Biology, 26: 553–562.
https://doi.org/10.1111/j.1095-8649.1985.tb04296.x
Hansen, L. P., Reddin, D. J., and Lund, R. A. 1997: The incidence of reared Atlantic salmon (Salmo
salar L.) of fish farm origin at West-Greenland. ICES Journal of Marine Science, 54: 152–155.
https://doi.org/10.1006/jmsc.1996.0178
Holm, M., Hansen, L. P., Holst, J. C., and Jacobsen, J. A. 2004. Atlantic salmon. In The Norwegian
Sea Ecosystem, pp. 315–356. Ed. by H. R. Skjoldal. Tapir Academic Press, Trondheim. 559
pp.
Holm, M., Holst, J. C., and Hansen, L. P. 1998. Spatial and temporal distribution of Atlantic
salmon postsmolts in the Norwegian Sea and adjacent areas – origin of fish, age structure
and relation to hydrographical conditions in the sea. ICES Document CM 1998/N: 15. 8 pp.
Holm, M., Holst, J. C., and Hansen, L. P. 2000. Spatial and temporal distribution of post-smolts
of Atlantic salmon (Salmo salar L.) in the Norwegian Sea and adjacent areas. ICES Journal of
Marine Science, 57: 955–964. https://doi.org/10.1006/jmsc.2000.0700
Holm, M., Holst, J. C., Hansen, L. P., Jacobsen, J. A., Ó Maoiléidigh, N., and Moore, A. 2003.
Migration and distribution of Atlantic salmon post-smolts in the North Sea area and North
East Atlantic. In Salmon at the Edge, pp. 7–23. Ed. by D. Mills. Blackwell Science, Oxford.
307 pp. https://doi.org/10.1002/9780470995495
Holm, M., Huse, I., Waatevik, E., Døving, K. B., and Aure, J. 1982. Behaviour of Atlantic salmon
smolts during the seaward migration. I. Preliminary report on ultrasonic tracking in a Nor-
wegian fjord system. ICES Document CM 1982/M: 7. 10 pp.
Holst, J. C., Hansen, L. P., and Holm, M. 1996. Preliminary observations of abundance, stock
composition, body size and food of post-smolts of Atlantic salmon caught with pelagic
trawls in the NE Atlantic in the summers 1991 and 1995. ICES Document CM 1996/M: 4. 8
pp.
Holst, J. C., Nilsen, F., Hodneland, K., and Nylund, A. 1993. Observations of the biology and
parasites of postsmolt Atlantic salmon, Salmo salar, from the Norwegian Sea. Journal of Fish
Biology, 42: 962–966. https://doi.org/10.1111/j.1095-8649.1993.tb00402.x
Hutchinson, P. (Ed). 2012. International Symposium on Salmon at Sea: Scientific Advances and
their Implications for Management. ICES Journal of Marine Science, 69: 1533–1698.
ICES. 2002. Report of the Working Group on North Atlantic Salmon. ICES Document CM
2002/ACFM: 14. 297 pp.
ICES. 2007. Report of the Workshop on the Development and Usea of Historical Salmon Tagging
Information from Oceanic Areas (WKDUHSTI). ICES Document CM 2007/DFC: 02. 60 pp.
ICES. 2008a. Report of the Workshop on Salmon Historical Information – New Investigations
from old Tagging Data (WKSHINI). ICES Document CM 2008/DFC: 02. 51 pp.

Fifty years of marine tag recoveries from Atlantic salmon | 101
ICES. 2008b. Report of the Working Group on North Atlantic Salmon (WGNAS), 1–10 April 2008,
Galway, Ireland. ICES Document CM 2008/ACOM: 18. 233 pp.
ICES. 2009. Report of the Workshop on Learning from Salmon Tagging Records (WKLUSTRE).
ICES Document CM 2009/DFC: 05. 39 pp.
ICES. 2012. Report of the Workshop on Salmon Tagging Archive (WKSTAR), 19–21 June 2012,
ICES Headquarters, Copenhagen, Denmark. ICES Document CM 2012/SSGEF: 16. 19 pp.
ICES. 2015. Report of the Working Group on North Atlantic Salmon (WGNAS), 17–26 March,
Moncton, Canada. ICES Document CM 2015/ACOM: 09. 461 pp.
Idler, D. R., Hwang, S. J., Crim, L. W., and Reddin, D. G. 1981. Determination of maturation
stages of Atlantic salmon (Salmo salar) captured at sea. Canadian Journal of Fisheries and
Aquatic Sciences, 38: 405–413. https://doi.org/10.1139/f81-057.
Jacobsen, J. A. 2000. Aspects of the marine ecology of Atlantic salmon (Salmo salar L.). PhD thesis.
University of Bergen, Norway.
Jacobsen, J. A., Hansen, L. P., Bakkestuen, V., Halvorsen, R., Reddin, D. G., White, J., Ó Maoiléi-
digh, N., et al. 2012. Distribution by origin and sea age of Atlantic salmon (Salmo salar) in the
sea around the Faroe Islands based on analysis of historical tag recoveries. ICES Journal of
Marine Science, 69: 1598–1608. https://doi.org/10.1093/icesjms/fss115
Jacobsen, J. A., Lund, R. A. L., Hansen, L. P., and Ó Maoiléidigh, N. 2001. Seasonal differences in
the origin of Atlantic salmon (Salmo salar L.) in the Norwegian Sea based on estimates from
age structures and tag recaptures. Fisheries Research, 52: 169–177.
https://doi.org/10.1016/S0165-7836(00)00255-1
Jákupsstovu, S. H. 1988. Exploitation and migration of salmon in Faroese waters. In Atlantic
Salmon: Planning for the Future, pp. 458–482. Ed. by D. H. Mills, and D. J. Piggins. Proceed-
ings of the Third International Atlantic Salmon Symposium, Biarritz, France, October 21–23,
1986. Croom Helm, London. https://doi.org/10.1007/978-94-009-1235-9
Jensen, J. M. 1980a. Recaptures of salmon at West Greenland tagged as smolts outside Greenland
waters. Rapport de Procès-Verbal de la Réunion Conseil International Exploration du Mer,
176: 114–121.
Jensen, J. M. 1980b. Recaptures from international tagging experiments at West Greenland. Rap-
ports et Procès-Verbaux des Réunions du Conseil International pour l’Exploration de la Mer,
176: 122–135.
Lear, W. H. 1976. Migrating Atlantic salmon (Salmo salar) caught by otter trawl on the New-
foundland continental shelf. Journal of the Fisheries Research Board of Canada, 33: 1202–
1205. https://doi.org/10.1139/f76-154
Legendre, P., and Legendre, L. 1998. Numerical Ecology, Volume 24, (Developments in Environ-
mental Modelling). Elsevier Science, Amsterdam. 852 pp. https://doi.org/10.1016/B978-0-
444-53868-0.50016-2
May, A. W., and Lear, W. H. 1971. Digest of Canadian Atlantic salmon catch statistics. Fisheries
Research Board of Canada, Technical Report, 270. 106 pp.
McAleece, N., Gage, J. D. G., Lambshead, P. J. D., and Paterson, G. L. J. 1997. BioDiversity Pro-
fessional statistics analysis software. http://www.sams.ac.uk/peter-lamont/biodiversity-
pro#sthash.V9H0whyz.dpuf
Miller, A. S., Sheehan, T. F., Renkawitz, M. D., Meister, A. L., and Miller, T. J. 2012b. Revisiting
the marine migration of US Atlantic salmon using historical Carlin tag data. ICES Journal of
Marine Science, 69: 1609–1615. https://doi.org/10.1093/icesjms/fss039
Miller, A. S., Sheehan, T. F., Spencer, R. C., Renkawitz, M. D., Friedland K. D., and Meister, A. L.
2012a. Description of the historic US Atlantic salmon (Salmo salar L.) tagging programs and
subsequent databases. U.S. Department of Commerce, National Marine Fisheries Service,
Northeast Fisheries Science Center Reference Document, 12–13. 51 pp.

102 | ICES Cooperative Research Report No. 343
Mills, D. 1989. Ecology and Management of Atlantic Salmon. Chapman and Hall Ltd., London.
351 pp.
Mills, K. E., Pershing, A., Sheehan, T. F., and Mountain, D. 2013. Climate and ecosystem linkages
explain the widespread decline in North American Atlantic salmon populations. Global
Change Biology, 19: 3046−3061. https://doi.org/10.1111/gcb.12298
Mork, K. A, Gilbey, J., Hansen, L. P. H, Jensen, A., Jacobsen, J. A., Holm, M., Holst, J. C., et al.
2012. Modelling the migration of post-smolt Atlantic salmon (Salmo salar) in the Northeast
Atlantic. ICES Journal of Marine Science, 69(9): 1616−1624.
https://doi.org/10.1093/icesjms/fss108
Ó Maoiléidigh, N., Browne, J., Cullen, A., McDermott, T., and Keatinge, M. 1994a. Exploitation
of reared salmon released into the Burrishoole River system. ICES Document CM 1994/M:
9.
Ó Maoiléidigh, N., Browne, J., McDermott, T., Cullen, A., Bond, N., McEvoy, B., O' Farrell, M.,
et al. 1994b. Exploitation and survival of River Shannon reared salmon. Department of the
Marine, Ireland, Fishery Leaflet, 164.
Parrish, B. B., and Horsted, S. Aa. (Eds). 1980. ICES/ICNAF Joint Investigation on North Atlantic
Salmon. Rapports et Procès-Verbaux des Réunions du Conseil International pour l’Explora-
tion de la Mer, 176. 146 pp.
Parrish, D. L., Behnke, R. J., Gephard, S. R., McCormick, S. D., and Reeves, G. H. 1998. Why aren't
there more Atlantic salmon (Salmo salar)? Canadian Journal of Fisheries and Aquatic Sci-
ences, 51 (Suppl. 1): 281–287. https://doi.org/10.1139/d98-012
Porter, T. R., and Ritter, J. A. 1984. Possible causes of low abundance of Atlantic salmon in Can-
ada – 1983. ICES CM Document 1984/M: 28. 27 pp.
Potter, E. C. E., Reddin, D. G., and Browne, J. 1986. Recoveries of coded wire microtags from
salmon (Salmo salar L.) caught at West Greenland in 1985. ICES Document CM 1986/M: 7. 10
pp.
Potter, E. C. E., Reddin, D. G., Friedland, K. D., and Russell, I. C. 1987. Recoveries of coded wire
microtags from salmon (Salmo salar L.) caught at West Greenland in 1986. ICES Document
CM 1987/M: 20.
Rago, P. J. 2001. Index measures and stock assessment of Atlantic salmon. In Stock, Recruitment
and Reference Points: Assessment and Management of Atlantic Salmon, pp. 137–176. Ed. by
E. Prévost, and G. Chaput. INRA Editions.
Reddin, D. G. 1985. Atlantic salmon (Salmo salar) on and east of the Grand Bank. Journal of North-
west Atlantic Fishery Science, 6: 157–164.
Reddin, D. G. 1988. Ocean life of Atlantic salmon (Salmo salar L.) in the Northwest Atlantic. In
Atlantic Salmon: Planning for The future, pp. 483–511. Ed. by D. H. Mills, and D. Piggins.
Proceedings of the Third International Atlantic salmon Symposium, Biarritz, France, Octo-
ber 21–23 1986. Croom Helm, London and Sydney; Timber Press, Portland, Oregon, USA.
587 pp.
Reddin, D. G., and Friedland, K. D. 1999. A history of identification to continent of origin of
Atlantic salmon (Salmo salar L.) at west Greenland. Fisheries Research, 43: 221–235.
https://doi.org/10.1016/S0165-7836(99)00074-0
Reddin, D. G., Hansen, L. P., Bakkestuen, V., Russell, I., White, J., Potter, E. C. E., Dempson, J. B.,
et al. 2012. Distribution and biological characteristics of Atlantic salmon (Salmo salar L.) at
Greenland based on the analysis of historical tag recoveries. ICES Journal of Marine Science,
69: 1589–1597. https://doi.org/10.1093/icesjms/fst069
Reddin, D. G., and Lear, W. H. 1990. Summary of marine tagging studies of Atlantic salmon
(Salmo salar L.) in the northwest Atlantic area. Canadian Technical Report of Fisheries and
Aquatic Sciences, 1737. 115 pp.

Fifty years of marine tag recoveries from Atlantic salmon | 103
Reddin, D. G., and Shearer, W. M. 1987. Sea-surface temperature and distribution of Atlantic
salmon in the Northwest Atlantic Ocean. American Fisheries Society Symposium, 1: 262–
275.
Reddin, D. G., Shearer, W. M., and Burfitt, R. F. 1984. Inter-continental migrations of Atlantic
salmon (Salmo salar L.). ICES Document CM 1984/M: 11. 9 pp.
Reddin, D. G., and Short, P. B. 1991. Postsmolt Atlantic salmon (Salmo salar) in the Labrador Sea.
Canadian Journal of Fisheries and Aquatic Sciences, 48:1, 2–6. https://doi.org/10.1139/f91-
001
Reddin, D. J., Stansbury, D. E., and Short, P. B. 1988. Continent of origin of Atlantic salmon (Salmo
salar L.) caught at West Greenland. Journal du Conseil International pour l’Exploration de
la Mer, 44: 180–188.
Ritter, J. A. 1989. Marine migration and natural mortality of North American Atlantic salmon
(Salmo salar L.). Canadian Manuscript Reports of Fisheries and Aquatic Sciences, 2041. 136
pp.
Rosseland, L. 1971. Fiske av atlantisk laks i internasjonalt farvann (Atlantic salmon fishing in
international waters). Jakt-Fiske-Friluftsliv, 100: 190–195, 238–242 (in Norwegian).
Ruggles, C. P., and Ritter, J. A. 1980. Review of North American salmon to assess the Atlantic
salmon fishery off West Greenland. Rapports et Procès-Verbaux des Réunions du Conseil
International pour l’Exploration de la Mer, 176: 82–92.
Shelton, R. G. J., Turrell, W. R., MacDonald, A., McLaren, I. S., and Nicoll, N. T. 1997. Records of
post-smolt Atlantic salmon, Salmo salar L., in the Faroe-Shetland Channel in June 1996. Fish-
eries Research, 31: 159–162. https://doi.org/10.1016/S0165-7836(97)00014-3
Spares, A. D., Reader, J. M., Stokesbury, M. J. W., McDermott , T., Zikovsky, L., Avery, T. S., and
Dadswell, M. J. 2007. Inferring marine distribution of Canadian and Irish Atlantic salmon
(Salmo salar L.) in the North Atlantic from tissue concentrations of bio-accumulated caesium
137. ICES Journal of Marine Science, 64: 394–404. https://doi.org/10.1093/icesjms/fsl040
Swain, A. 1980. Tagging of salmon smolts in European rivers with special reference to recaptures
off West Greenland in 1972 and earlier years. Rapports et Procès-Verbaux des Réunions du
Conseil International pour l’Exploration de la Mer, 176: 93–113.
Templeman, W. 1967. Atlantic salmon from the Labrador Sea and off West Greenland taken dur-
ing A.T. Cameron Cruise, July-August 1965. ICNAF Research Bulletin, 4: 5–40.
Templeman, W. 1968. Distribution and characteristics of Atlantic salmon over oceanic depths
and on the banks and shelf slope areas off Newfoundland. ICNAF Research Bulletin, 5: 62–
65.
Ter Braak, C. J. F., and Smilauer, P. 2002. CANOCO Reference manual and CanoDraw for Win-
dows User’s guide: Software for Canonical Community Ordination (version 4.5). Microcom-
puter Power, Ithaca, NY. 500 pp.
Tucker, S., Pazzia, I., Rowan, D., and Rasmussen, J. B. 1999. Detecting panmigration in Atlantic
salmon (Salmo salar) using 137Cs. Canadian Journal of Fisheries and Aquatic Sciences, 56:
2235–2239. https://doi.org/10.1139/f99-267
Went, A. E. 1964. Irish salmon: A review of investigations up to 1963. The Scientific proceedings
of the Royal Dublin Society, A–1: 365–412.

104 | ICES Cooperative Research Report No. 343
Annex 1: Participants in meetings
Name Address Phone Fax e-mail WKDUHSTI WKSHINI WKLUSTRE WKSTAR
Peter G. Amiro Bedford Institute of Oceanography, PO Box 1006, Dartmouth, NS Canada, B2Y 4A2 +1 902 426 8104 +1 902 426 6814 [email protected] mpo.gc.ca X X
Vegar Bakkestuen NINA, Gaustadalleen 21, N 0349 Oslo, Norway +47 73 801773 +47 22600424 [email protected] X X X X
J. Brian Dempson Bedford Institute of Oceanography, PO Box 1006, Dartmouth NS Canada B2Y 4A2 1 902 426 5722 dempsonb@dfo mpo.gc.ca X X
Mark Fowler Bedford Institute of Oceanography, PO Box 1006, Dartmouth, NS Canada, B2Y 4A2 +1 902 426 3529 +1 902 426 1506 [email protected] mpo.gc.ca X X
Lars P. Hansen NINA, Gaustadalleen 21, N 0349 Oslo, Norway +47 905 16 376 [email protected] X X X X
Arni Isaksson Head of Salmonid Division, Directorate of Fisheries, Dalshrauni 1,
220 Hafnarfjörður, Iceland [email protected] X
Jan Arge Jacobsen Faroe Marine Research Institute, PO Box 3051, FO 110 Torshavn, Faroe Islands +298 353 900 +298 353 901 [email protected] X X X
Oleg Lapshin 5 Dm. Donskoy str., Kaliningrad 236022, Russian Federation +7 0952649721 [email protected] X
Kjell Arne Mork Institute of Marine Research, PO Box 1870, Nordnes, N 5024, Bergen, Norway +47 5523 8500 +47 5523 6379 [email protected] X
Terry Nicholls DFO, Box 5667, St. John’s, NL, Canada A1C5X1 +1 709 772 4514 +1 709 772 5315 nichollst@dfo mpo.gc.ca X
Niall Ó Maoiléidigh The Marine Institute, Newport, Co. Mayo, Ireland +353 98 42300 +353 98 42340 [email protected] X X X
Sumarlidi Oskarsson Agriculture Authority of Iceland, Austurvegur 64, 800 Selfoss, Iceland +354 5304800 +354 5304801 [email protected] X
Stig Pedersen DTU, DFU, Vejlsøvej 39, DK 8600 Silkeborg, Denmark +45 35883141 +45 89213150 [email protected] X
Ted Potter c/o Cefas, Pakefield Road, Lowestoft, Suffolk, NR33 0HT, UK ++44 (0) 1502
524260 [email protected] X X X
Dave Reddin DFO, Box 5667, St. John’s, NL, Canada A1C5X1 +1 709 772 4484 +1 709 772 3578 [email protected] X X X
Ian Russell Cefas, Pakefield Road, Lowestoft, Suffolk, NR33 0HT, UK +44 (0)1502 524330 +44 (0)1502 513865 [email protected] X X X X
Tim Sheehan Northeast Fisheries Science Center, 166 Water Street, Woods Hole, MA 02543, USA +1 508 495 2215 +1 508 495 2393 [email protected] X X X
Gordon W. Smith FRS Freshwater Lab, Field Station, Inchbraoch House, South Quay Ferryden, Mont-
rose, DD10 9SL, UK +44 (0)1674 677070 +44 (0) 1674 672604 [email protected] X X
Jonathan White The Marine Institute, Oranmore, Co. Galway, Ireland +353 91 387361 +353 91 387201 [email protected] X X X
Fred Whoriskey Atlantic Salmon Federation, PO Box 5200, St. Andrews, NB, Canada +1 506 529 1039 +1 506 529 4985 [email protected] X

Fifty years of marine tag recoveries from Atlantic salmon | 105
Annex 2: Supplementary l i terature considered during ICES work-
shops WKDUHSTI, WKSHINI, WKLUSTRE, and WKSTAR
Allan, I. R. H., and Ritter, J. A. 1977. Salmonid terminology. Journal du Conseil International
pour l’Exploration de la Mer, 37: 293–299.
Allen, K. R., and Saunders, R. L. 1967. A preliminary study of the influence of the Greenland
salmon fishery on the salmon stocks of the Miramichi River system, New Brunswick, Can-
ada. ICNAF Redbook, 1966, Part III: 159–180.
Bakshtansky, E. L., Zaguraeva, L. F., and Nesterov, V. D. 1976. Results of Atlantic salmon juve-
nile tagging in 1969–1974. Trudy VNIRO, CXIII: 19–23 (in Russian).
Belding, D. L. 1939. Migration of the Atlantic salmon (Salmo salar) in the Gulf of St. Lawrence as
determined by tagging experiments. Transactions of the American Fisheries Society, 69:
290–295. https://doi.org/10.1577/1548-8659(1939)69[290:MOTASS]2.0.CO;2
Belding, D. L., and Prefontaine, G. 1938. Studies on the Atlantic salmon – II. Report on the salmon
of the 1937 Port aux Basques (Newfoundland) drift net fishery. Contributions de l’Institut
de Zoologie de L’Universite de Montreal, 3. 58 pp.
Bisbal, G. A., and McConnaha, W. E. 1998. Consideration of ocean conditions in the management
of salmon. Canadian Journal of Fisheries and Aquatic Sciences, 55: 2178–2186.
https://doi.org/10.1139/f98-108
Blackbourn, D. J. 1993. Sea surface temperature and the subsequent freshwater survival rate of
some salmon stocks: a surprising link between the climate of land and sea. In Proceedings
of the 9th Annual Pacific Climate (PACLIM) Workshop, 21–24 April 1992, pp. 23–32. Ed. by
K. T. Redmond, and V. L. Tharp. Technical Report 34, California Department of Water Re-
sources, Interagency Ecological Studies Program, Pacific Grove, CA.
Booker, D. J., Wells, N. C., and Smith, I. P. 2008. Modelling trajectories of migrating Atlantic
salmon (Salmo salar). Canadian Journal of Fisheries and Aquatic Sciences, 65: 352–361.
https://doi.org/10.1139/f07-173
Boylan, P., and Adams, C. E. 2006. The influence of broad scale climatic phenomena on long term
trends in Atlantic salmon population size: an example from the River Foyle, Ireland. Journal
of Fish Biology, 68(1): 276–283. https://doi.org/10.1111/j.0022-1112.2006.00893.x
Caron, F. 1983. Migration vers l'Atlantique des post-saumoneaux (Salmo salar) du Golfe du Saint-
Laurent. Le Naturaliste Canadien, 110: 223–227.
Chaput, G., Hardie, P., Hayward, J., Moore, D., and Shaesgreen, J. 2002. Migrations and biolog-
ical characteristics of Atlantic salmon (Salmo salar) smolts from the northwest Miramichi
River, 1998 to 2000. Canadian Technical Report of Fisheries and Aquatic Sciences, 2415. 70
pp.
Chaput, G., Legault, C. M., Reddin, D. G., Caron, F., and Amiro, P. G. 2005. Provision of catch
advice taking account of non-stationarity in productivity of Atlantic salmon (Salmo salar L.)
in the Northwest Atlantic. ICES Journal of Marine Science, 62: 131–143.
https://doi.org/10.1016/j.icesjms.2004.10.006
Christensen, O. 1979. Status over forsøgsudsætning af laks i vestjyske vandløb. (In Danish)
Sportsfiskeren, 54(5) 16–18.
Christensen, O. 1990. Status for den nordatlantiske laks (Salmo salar) i Danmark. (In Danish)
DFH-rapport Nr 379 – 1990. 14 pp.
Christensen, O., and Lear, W. H. 1980. Distribution and abundance of Atlantic salmon at West
Greenland. Rapports et Procès-Verbaux des Réunions du Conseil International pour l’Ex-
ploration de la Mer, 176: 22–35.

106 | ICES Cooperative Research Report No. 343
Colbourne, E. 2003. Physical oceanographic conditions on the Newfoundland and Labrador
Shelf during 2002. DFO Canadian Science Advisory Secretariat Research Document,
2003/020. 57 pp.
Dempson, J. B., and Kristofferson, A. H. 1987. Spatial and temporal aspects of the ocean migra-
tion of anadromous Arctic char. American Fisheries Society Symposium, 1: 340–357.
Dempson, J. B., O’Connell, M. F., and Schwarz, C. J. 2004. Spatial and temporal trends in abun-
dance of Atlantic salmon, Salmo salar, in Newfoundland with emphasis on impacts of the
1992 closure of the commercial fishery. Fisheries Management and Ecology, 11: 387–402.
https://doi.org/10.1111/j.1365-2400.2004.00407.x
DFO. 2005. Assessment of Newfoundland and Labrador Atlantic Salmon. DFO Canadian Science
Advisory Secretariat Science Advisory Report, 2005/052.
Dillane, E., Cross, M. C., McGinnity, P., Coughlan, J. P., Galvin, P. T., Wilkins, N. P., and Cross,
T. F. 2007. Spatial and temporal patterns in microsatelite DNA variation of wild Atlantic
salmon, Salmo salar, in Irish rivers. Fisheries Management and Ecology, 14: 209–220.
https://doi.org/10.1111/j.1365-2400.2007.00544.x
Downton, M. W., and Miller, K. A. 1998. Relationships between Alaskan salmon catch and North
Pacific climate on interannual and interdecadal time scales. Canadian Journal of Fisheries
and Aquatic Sciences, 55: 2255-2265, https://doi.org/10.1139/f98-106
Dunbar, M. J., and Thomson, D. H. 1979. West Greenland salmon and climatic change.
Meddelelser om Gronland, 202: 1–19.
Dutil, J. D., and Coutu, J. M. 1988. Early marine life of Atlantic salmon, Salmo salar, postsmolts in
the northern Gulf of St. Lawrence. Fishery Bulletin US, 86: 197–211.
Eisner, R. A., and Ritter, J. A. 1979. The Canadian Atlantic salmon (Salmo salar) smolt tag and its
recovery system: a review. ICES Document CM 1979/M: 24. 12 pp.
Elliott, J. M. 1977. Some Methods for the Statistical Analysis of Samples of Benthic Invertebrates.
2nd edn. Freshwater Biological Association Scientific Publication, 25. Freshwater Biological
Association, Ambleside. 156 pp.
Elson, P. F. 1966. Tag returns from plantings of hatchery-reared smolts of known early and late-
run parentage. Annual Report and Investigators’ Summaries of the Fisheries Research
Board of Canada, Biological Station, St. Andrews, NB, E: 14–16.
Elson, P. F. 1968. Utilization of recaptured Canadian tagged salmon, 1964–1967. ICES/ICNAF
Salmon Document, 68/14. 4 pp.
Elson, P. F. 1970. Canadian tagging and recapture data for Atlantic salmon, updated to February
26, 1970. ICES/ICNAF Salmon Document, 70/9, 31 pp.
Elson, P. F. 1971. Some aspects of Canadian Atlantic salmon fisheries in relation to the new
Greenland and high seas fisheries. ICES/ICNAF Salmon Document, 71/17. 6 pp.
Farmer, G. J. 1986. Some factors that influence the survival, age at maturity and distribution of
Atlantic salmon smolts. In Proceedings of the 1985 Northeast Atlantic Salmon Workshop,
Moncton, NB, April 22–24, 1985, pp. 141–143. Atlantic Salmon Federation, Box 429, St. An-
drews, NB, Canada.
Finstad, B., Okland, F., Thorstad, E. B., Bjørn, P. A., and McKinley, R. S. 2005. Migration of hatch-
ery-reared Atlantic salmon and wild anadromous brown trout post-smolts in a Norwegian
fjord system. Journal of Fish Biology, 66: 86–96. https://doi.org/10.1111/j.0022-
1112.2005.00581.x
Fletcher, G. L., Kao, M. H., and Dempson, J. B. 1988. Lethal freezing temperatures of Arctic char
and other salmonids in the presence of ice. Aquaculture, 71: 369–378.
https://doi.org/10.1016/0044-8486(88)90206-2

Fifty years of marine tag recoveries from Atlantic salmon | 107
Frantsi, C., Ritter, J. A., and Elson, P. F. 1977. Effect of Corynebacterial kidney disease on ocean
survival and return of Atlantic salmon (Salmo salar). 1977. ICES CM Document 1977/M: 29.
6 pp.
Fried, S. M., McCleave, J. D., and LaBar, G. W. 1978. Seaward migration of hatchery-reared At-
lantic salmon, Salmo salar, smolts in the Penobscot River estuary, Maine: riverine move-
ments. Journal of the Fisheries Research Board of Canada, 35: 76–87.
https://doi.org/10.1139/f78-011
Friedland, K. D. 1998. Ocean climate influences on critical Atlantic salmon (Salmo salar) life his-
tory events. Canadian Journal of Fisheries and Aquatic Sciences, 55: 119–130.
https://doi.org/10.1139/d98-003
Friedland, K. D., Dutil, J. D., and Sadusky, T. 1999. Growth patterns in postsmolts and the nature
of the marine juvenile nursery for Atlantic salmon, Salmo salar. Fishery Bulletin US, 97: 472–
481.
Friedland, K. D., Hansen, L. P., Dunkley, D. A., and MacLean, J. C. 2000. Linkage between ocean
climate, post-smolt growth and survival of Atlantic salmon (Salmo salar L.) in the North Sea
area. ICES Journal of Marine Science, 57: 419–429. https://doi.org/10.1006/jmsc.1999.0639
Friedland, K. D., and Reddin, D. G. 1993. Marine survival of Atlantic salmon from indices of
post-smolt growth and sea temperature. In: Salmon in the Sea and New Enhancement Strat-
egies, pp. 119-138. Ed. by D. Mills. Fishing News Books. 424 pp.
Friedland, K. D., Reddin, D. G., and Castonguay, M. 2003b. Ocean thermal conditions in the post-
smolt nursery of North American Atlantic salmon. ICES Journal of Marine Science, 60: 343–
355. https://doi.org/10.1016/S1054-3139(03)00022-5
Friedland, K. D., Reddin, D. G., McMenemy, J. R., and Drinkwater, K. F. 2003a. Multidecadal
trends in North American Atlantic salmon (Salmo salar) stocks and climate trends relevant
to juvenile survival. Canadian Journal of Fisheries and Aquatic Sciences, 60: 563–583.
https://doi.org/10.1139/f03-047
Gilbey, J., Wennevik, V., Bradbury, I.R., Fiske, P., Hansen, L. P., Jacobsen, J. A, and Potter, T.
2017. Genetic stock identification of Atlantic salmon caught in the Faroese fishery. Fisheries
Research, 187: 110–119. https://doi.org/10.1016/j.fishres.2016.11.020
Guðjónsson Þ. 1985. Recapture of tagged salmon outside Iceland in 1984 and 1985. ICES Docu-
ment CM 1985/M: XX.
Guðjónsson, Þ. 1973. Smolt rearing, stocking and tagged adult salmon recaptures in Iceland. In-
ternational Atlantic Salmon Foundation, Special Publication Series, 4 (1): 227–235.
Hansen, L. P. 1993: Movement and migration of salmon at sea. In Salmon in the Sea and New
Enhancement Strategies, pp. 26–39. Ed. by D. Mills. Fishing News Books.
Hansen, L. P., Holm, M., Holst, J. C., and Jacobsen, J. A. 2003. The ecology of Atlantic salmon
post-smolts. In Salmon on the Edge, pp. 25–39. Ed. by D. Mills. Blackwell Science, Oxford.
Hansen, L. P., and Jacobsen, J. A. 2000. Distribution and migration of Atlantic salmon, Salmo salar
L., in the sea. In The Ocean Life of Atlantic Salmon: Environmental and Biological Factors
Influencing Survival, pp. 75–87. Ed. by D. Mills. Fishing News Books, Blackwell Science.
Hansen, L. P, and Jacobsen, J. A. 2002. Atlantic salmon: the ocean traveller. ICES Marine Science
Symposia, 215: 371–381.
Hansen, L. P., and Jonsson, B. 1991. Evidence of a genetic component in the seasonal return pat-
tern of Atlantic salmon (Salmo salar L.). Journal of Fish Biology, 38: 251–258.
https://doi.org/10.1111/j.1095-8649.1991.tb03111.x
Hansen, L. P., and Jonsson, B. 1994. Homing of Atlantic salmon: effects of juvenile learning on
transplanted post-spawners. Animal Behaviour, 47: 220–222.
https://doi.org/10.1006/anbe.1994.1027

108 | ICES Cooperative Research Report No. 343
Hansen, L. P., Jonsson, B., and Andersen, R. 1989. Salmon ranching experiments in the River
Imsa: Is homing dependent on sequential imprinting of the smolts? In Proceedings of the
Salmon Migration and Distribution Symposium. School of Fisheries, University of Wash-
ington, Seattle, USA, pp. 19–29. Ed. by E. Brannon and B. Jonsson. NINA, Trondheim, Nor-
way.
Hansen, L. P., Jonsson, N., and Jonsson, B. 1993. Oceanic migration of homing Atlantic salmon.
Animal Behaviour, 45: 927–941. https://doi.org//10.1006/anbe.1993.1112
Hansen, L. P., and Quinn, T. P. 1998. The marine phase of Atlantic salmon (Salmo salar)life cycle,
with comparisons to Pacific salmon. Canadian Journal of Fisheries and Aquatic Sciences, 55:
104–118. https://doi.org/10.1139/d98-010
Hardy, Sir Alister. 1965. The Open Sea. It’s Natural History. Houghton Mifflin Company., Bos-
ton. 322 pp.
Haugland, M., Holst, J. C., Holm, M., and Hansen, L. P. 2006: Feeding of Atlantic salmon (Salmo
salar L.) post-smolts in the Northeast Atlantic. ICES Journal of Marine Science, 63: 1488–1500.
https://doi.org/10.1016/j.icesjms.2006.06.004
Holst, J. C., Shelton, R., Holm, M., and Hansen, L. P. 2000. Distribution and possible migration
routes of postsmolt Atlantic salmon in the North-east Atlantic, In The Ocean Life of Atlantic
Salmon: Environmental and Biological Factors Influencing Survival, pp. 65–74. Ed. by D.
Mills. Proceedings of a Workshop Held at the Freshwater Fisheries Laboratory, Pitlochry,
on 18 and 19 November 1998. Blackwell Scientific, Fishing News Books. 228 pp.
Huntsman, A. G. 1931. The maritime salmon of Canada. Bulletin of the Biological Board of Can-
ada, 21. 99 pp.
Hutchinson, P. (Ed). 1997. Interactions between salmon culture and wild stocks of Atlantic
salmon: the scientific and management issues. ICES Journal of Marine Science, 54: 963–1225.
Hutchinson, P. (Ed). 2006. Interactions between aquaculture and wild stocks of Atlantic salmon
and other diadromous fish species: science and management, challenges and solutions. ICES
Journal of Marine Science, 63: 1159–1372.
ICES. 1969. Report of the ICES/ICNAF Joint Working Party on North Atlantic Salmon, May 1968.
ICES Cooperative Research Report, Series A, No. 12. 18 pp.
ICES. 1971. Third Report of the ICES/ICNAF Joint Working Party on North Atlantic Salmon,
December 1970. ICES Cooperative Research Report, Series A, No. 24. 36 pp.
ICES. 1973. Fourth Report of the ICES/ICNAF Joint Working Party on North Atlantic Salmon.
ICES Cooperative Research Report No. 35. 37 pp.
ICES. 1981 Reports of the ICES Working Group on North Atlantic Salmon, 1979 and 1980. ICES
Cooperative Research Report No. 104. 46 pp.
ICES. 1990. Inconsistencies in tag release data base. ICES Working Paper 90/15.
ICES. 1994. Report of the North Atlantic Salmon Working Group, Reykjavík, 6–15 April 1994.
ICES Document CM 1994/Assess: 16. 182 pp.
ICES. 1999. Report of the North Atlantic Salmon Working Group, Québec City, Canada, April
12–22 1999. ICES Document CM 1999/ACFM: 14. 288 pp.
ICES. 2001. Report of the Working Group on North Atlantic Salmon Aberdeen, 2–11April 2001.
ICES Document CM/ACFM: 15. 290 pp.
ICES. 2002. Report of the Working Group on North Atlantic Salmon, ICES Headquarters, Co-
penhagen, 3–13 April 2002. ICES Document CM 2002/ACFM: 14. 299 pp.
ICES. 2005. Report of the Working Group on North Atlantic Salmon (WGNAS), 5–14 April 2005,
Nuuk, Greenland. ICES Document CM 2005/ACFM: 17. 290 pp.
ICES. 2009. Report of the Working Group on North Atlantic Salmon (WGNAS), 30 March–8
April, Copenhagen, Denmark. ICES Document CM 2009/ACOM: 06. 282 pp.

Fifty years of marine tag recoveries from Atlantic salmon | 109
ICNAF. 1968. Canadian tagging data for Atlantic salmon to 29 March 1968. ICES/ICNAF Salmon
Document 68/7; Research Document 68/44. 13 pp.
Idler, D. R., Hwang, S. J., Crim L. W., and Reddin, D. G. 1981. Determination of sexual maturation
stages of Atlantic salmon (Salmo salar) captured at sea. Canadian Journal of Fisheries and
Aquatic Sciences, 38: 405–413. https://doi.org/10.1139/f81-057
Ísaksson Á., and Bergman, P. 1978. An evaluation of two tagging methods and survival rates of
different age and treatment groups of hatchery-reared Atlantic salmon smolts. Journal of
Agricultural Research in Iceland, 10: 74–99.
Ísaksson Á., Óskarsson, S., Einarsson, S. M., and Jónasson, J. 1997. Atlantic salmon ranching: past
problems and future management. ICES Journal of Marine Science, 54: 1188–1199.
https://doi.org/10.1016/S1054-3139(97)80026-4
Jakupsstovu, S. H. 1988. Exploitation and migration of salmon in Faroese waters. In Atlantic
salmon: planning for the future, pp. 458–482. Ed. by D. H. Mills, and D. J. Piggins. Proceed-
ings of the Third International Atlantic Salmon Symposium, Biarritz, France, October 21–23,
1986. Croom Helm, London.
Jensen, J. M., and Lear, W. H. 1980. Atlantic salmon caught in the Irminger Sea and at East Green-
land. Journal of Northwest Atlantic Fishery Science, 1: 55–64.
Jessop, B. M. 1975. Investigation of the salmon (Salmo salar) smolt migration of the Big Salmon
River, New Brunswick, 1966–72. Environment Canada, Fisheries and Marine Service, Re-
source Development Branch, Technical Report Series No. MAR/T-75-1. 57 pp.
Jessop, B. M. 1976. Distribution and timing of tag recoveries from native and non-native Atlantic
salmon (Salmo salar) released into the Big Salmon River, New Brunswick. Journal of the Fish-
eries Research Board of Canada, 33: 829–833. https://doi.org/10.1139/f76-102
Jones, P. D., Jónsson, T., and Wheeler, D. 1997. Extension to the North Atlantic Oscillation using
early instrumental pressure observations from Gibraltar and south-west Iceland. Interna-
tional Journal of Climatology, 17: 1433–1450. https://doi.org/10.1002/(SICI)1097-
0088(19971115)17:13<1433::AID-JOC203>3.0.CO;2-P
Jonsson, B., and Jonsson, N. 2004b. Factors affecting marine production of Atlantic salmon (Salmo
salar). Canadian Journal of Fisheries and Aquatic Sciences, 61: 2369–2383.
https://doi.org/10.1139/f04-215
Jonsson, N., Hansen, L. P., and Jonsson, B. 1993. Migratiory behaviour and growth of hatchery-
reared post-smolt Atlantic salmon Salmo salar. Journal of Fish Biology, 42: 435–443.
https://doi.org/10.1111/j.1095-8649.1993.tb00346.x
Jonsson, N., and Jonsson, B. 2004a. Size and age of maturity of Atlantic salmon correlate with the
North Atlantic Oscillation Index (NAOI). Journal of Fish Biology, 64: 241–247.
https://doi.org/10.1111/j.1095-8649.2004.00269.x
Jonsson, N., Jonsson, B., and Hansen, L. P. 1998. The relative role of density-dependent and den-
sity-independent survival in the life cycle of Atlantic salmon. Journal of Animal Ecology, 67:
751–762. https://doi.org/10.1046/j.1365-2656.1998.00237.x
Jonsson, N., Jonsson, B., and Hansen, L. P. 2003. The marine survival and growth of wild and
hatchery-reared Atlantic salmon. Journal of Applied Ecology, 40: 900–911. DOI:
10.1046/j.1365-2664.2003.00851.x
Jutila, E., Jokikokko, E., Kallio-Nyberg, I., Saloniemi, I., and Pasanen, P. 2003. Differences in sea
migration between wild and reared Atlantic salmon (Salmo salar L.) in the Baltic Sea. Fisher-
ies Research, 60: 333–343. DOI: 10.1016/S0165-7836(02)00169-8
Kallio-Nyberg, I., Koljonen, M. L., and Saloniemi, I. 2000. Effect of maternal and parental line on
spatial and temporal marine distribution in Atlantic salmon. Animal Behaviour, 60: 377–
384. https://doi.org/10.1006/anbe.2000.1465
110 | ICES Cooperative Research Report No. 343
Karlsson, L., Ikonen, E., Westerberg, H., and Sturlaugsson, J. 1996. Use of data storage tags to
study the spawning migration of Baltic salmon (Salmo salar L.) in the Gulf of Bothnia. ICES
Document CM 1996/M: 9. 15 pp.
Kerswill, C. J. 1961. Investigation and management of Atlantic salmon. Part I. The research pro-
gramme. Canada, Department of Fisheries, Trade News, 14(1): 3–10.
Lacroix, G. L., and Knox, D. 2005. Distribution of Atlantic salmon (Salmo salar) postsmolts of
different origins in the Bay of Fundy and Gulf of Maine and evaluation of factors affecting
migration, growth and survival. Canadian Journal of Fisheries and Aquatic Sciences, 62:
1363–1376. https://doi.org/10.1139/f05-055
Lacroix, G. L., and McCurdy, P. 1996. Migratory behaviour of post-smolt Atlantic salmon during
initial stages of seaward migration. Journal of Fish Biology, 49: 1086–1101.
https://doi.org/10.1111/j.1095-8649.1996.tb01780.x
Lacroix, G. L., Knox, D., and Stokesbury, M. J. W. . 2005. Survival and behaviour of post-smolt
Atlantic salmon in coastal habitat with extreme tides. Journal of Fish Biology, 66: 485–498.
https://doi.org/10.1111/j.0022-1112.2005.00616.
Lacroix, G. L., McCurdy, P., and Knox, D. 2004. Migration of Atlantic salmon postsmolts in rela-
tion to habitat use in a coastal system. Transactions of the American Fisheries Society, 133:
1455–1471. https://doi.org/10.1577/T03-032.1
Lear, W. H. 1973. Distribution and relative abundance of Atlantic salmon at West Greenland and
Labrador Sea during August-October, 1972. ICES/ICNAF Salmon Document, 73/10. 10 pp.
Lear, W. H., and Misra, R. K. 1978. Clinical variation in scale characters of Atlantic salmon (Salmo
salar) based on discriminant function analysis. Journal of the Fisheries Research Board of
Canada, 35: 43–47. https://doi.org/10.1139/f78-006
Lear, W. H., and Sandeman, S. J. 1980. Use of scale characters and discriminant functions for
identifying continental origin of Atlantic salmon. Rapports et Procès-Verbaux des Réunions
du Conseil International pour l'Exploration de la Mer, 176: 68–75.
Levings, C. D. 1994. Feeding behaviour of juvenile salmon and significance of habitat during
estuary and early sea phase. Nordic Journal of Freshwater Research, 69: 7–16.
Lister, D. B., and Ritter, J. A. 1972. Preliminary observations on differences in fishery contribu-
tions of hatchery-reared Atlantic salmon (Salmo salar) smolts related to stock selections and
release location. ICNAF Research Document, 72/70. 8 pp.
Ludwig, J. A., and Reynolds. J. F. 1988. Statistical Ecology: A Primer on Methods and Computing.
John Wiley & Sons, Chichester. 368 pp.
MacPhail, D. K. 1975. Evidence of homing among transplanted Atlantic salmon (Salmo salar L.)
kelts. Environment Canada, Fisheries and Marine Service, Resource Development Branch,
Technical Report Series No. MAR/T-75-11. 5 pp.
Marshall, T. L. 1982. Interception in Nova Scotian coastal waters of Nova Scotia salmon returning
to home rivers. ICES Document CM 1982/M: 24. 17 pp.
Martin J. H. A., and Mitchell, K. A. 1985. Influence of sea temperature upon the numbers of grilse
and multi-sea winter Atlantic salmon (Salmo salar) caught in the vicinity of the River Dee
(Aberdeenshire). Canadian Journal of Fisheries and Aquatic Sciences, 42: 1513–1521.
https://doi.org/10.1139/f85-189
May, A. W. 1971. Canadian tagging and recapture data for Atlantic salmon, 1959 through 1970.
ICES/ICNAF Salmon Document 71/26. 74 pp.
May, A. W. 1973. Distribution and migration of salmon in the Northwest Atlantic. International
Atlantic Salmon Foundation Special Publication, Series 4: 373–382.
McCormick, S. D., Hansen, L. P., Quinn, T. P., and Saunders, R. L. 1998. Movement, migration,
and smolting of Atlantic salmon (Salmo salar). Canadian Journal of Fisheries and Aquatic
Sciences (Suppl. 1), 55: 77–92. https://doi.org/10.1139/d98-011

Fifty years of marine tag recoveries from Atlantic salmon | 111
McCormick, S. D., and Saunders, R. L. 1987. Preparatory physiological adoptions for marine life
in salmonids: Osmoregulation, growth, and metabolism. American Fisheries Society Sym-
posium, 1: 211–229.
Meerburg, D. J. (Ed). 1986. Salmonid age at maturity. Canadian Special Publication of Fisheries
and Aquatic Sciences, 89. 118 pp.
Meister, A. L. 1984. The marine migrations of tagged Atlantic salmon (Salmo salar L.) of USA
origin. ICES Document CM 1984/M: 27. 28 pp.
Montevecchi, W. A., Cairns, D. K., and Birt, V. L. 1988. Migration of Postsmolt Atlantic salmon,
Salmo salar, off Northeastern Newfoundland, As Inferred By Tag Recoveries In A Seabird
Colony. Canadian Journal of Fisheries and Aquatic Sciences, 45: 568–571.
https://doi.org/10.1139/f88-068
Montevecchi, W. A., Cairns, D. K., and Myers, R. A. 2002. Predation on marine-phase Atlantic
salmon (Salmo salar) by gannets (Morus bassanus) in the Northwest Atlantic. Canadian Jour-
nal of Fisheries and Aquatic Sciences, 59: 602–612. https://doi.org/10.1139/f02-033
Moore, A., Potter, E. C. E., Milner, N. J., and Bamber, S. 1995. The migratory behaviour of wild
Atlantic salmon (Salmo salar L.) smolts in the estuary of the River Conwy, North Wales. Ca-
nadian Journal of Fisheries and Aquatic Sciences, 52: 1923–1935. https://doi.org/10.1139/f95-
784
Moore, A., Lacroix, G. L.. and Sturlaugsson, J. 2000. Tracking Atlantic salmon post-smolts in the
sea. In The Ocean Life of Atlantic salmon – Environmental and Biological Factors Influenc-
ing Survival, pp. 49–64. Ed. by D. Mills. Fishing News Books, Oxford.
Narayanan, S., Carscadden, J., Dempson, J. B., O’Connell, M. F., Prinsenberg, S., Reddin, D. G.,
and Shackell, N. 1995. Marine climate off Newfoundland and its influence on Atlantic
salmon (Salmo salar) and capelin (Mallotus villosus). In Climate Change and Northern Fish
Populations, pp. 461–474. Ed. by R. J. Beamish. Canadian Special Publications in Fisheries
and Aquatic Sciences. 739 pp.
Newbould, K. 1976. Summary of fish tagging Maritimes Region – 1967-1975. Canadian Data Rec-
ord Series No. MAR/D-76-1. 94 pp.
Newbould, K. A. 1989. North American Atlantic salmon tagging programs 1974–1985. Canadian
Data Report of Fisheries and Aquatic Sciences, 730. 66 pp.
O'Connell, M. F., Dempson, J. B., Porter, T. R., Reddin, D. G., Ash, E. G. M., and Cochrane, N. M.
1992. Status of Atlantic salmon (Salmo salar L.) stocks of the Newfoundland Region, 1991.
CAFSAC Research Document, 92/22. 56 pp.
Osborn, T. J. 2004. Simulating the winter North Atlantic Oscillation: the roles of internal varia-
bility and greenhouse gas forcing. Climate Dynamics, 22: 605–623.
https://doi.org/10.1007/s00382-004-0405-1
Otterstrøm, C. V. 1938. 125 salmon from West Jutland. Meddelelser fra Kommissionen Danmarks
Fiskeri- og Havundersøgelser. Serie: Fiskeri Bind X, 6.
Paloheimo, J. E., and Elson, P. F. 1974. Reduction of Atlantic salmon (Salmo salar) catches in Can-
ada attributed to the Greenland fishery. Journal of the Fisheries Research Board of Canada,
31(9): 1467–1480. https://doi.org/10.1139/f74-176
Paloheimo, J. E., and Elson, P. F. 1974. Effects of the Greenland fishery for Atlantic salmon on
Canadian stocks. Special Publication Series International Atlantic Salmon Foundation, 5(1):
1–34.
Parker, R. R., Black, E. C., and Larkin, P. A. 1963. Some aspects of fish-marking mortality. North
Atlantic Fish Marking Symposium, ICNAF Special Publication, 4:117–122.
Peet, R. F., and Pratt, J. D. 1972. Distant and local exploitation of a Labrador Atlantic salmon
population by commercial fisheries. ICNAF Redbook, 1972, Part III: 65–71.

112 | ICES Cooperative Research Report No. 343
Penney, G. H. 1983. Recaptures of Atlantic salmon tagged and released in the Bay of Fundy near
the Saint John River, New Brunswick, 1970-73. Canadian Manuscript Reports of Fisheries
and Aquatic Sciences, 1737. 12 pp.
Peterman, R. M. 1981. Form of random variation in salmon smolt-to-adult numbers relations and
its influence on production estimates. Canadian Journal of Fisheries and Aquatic Sciences,
38: 1113–1119. https://doi.org/10.1139/f81-151
Pippy, J. 1982. Report on the Working Group on the Interception of Mainland Salmon in New-
foundland. Canadian Manuscript Report of Fisheries and Aquatic Sciences, 1654. 196 pp.
Potter, E. C. E., Russell, I. C., Reddin, D. G., and Friedland, K. D. 1988. Recoveries of coded wire
microtags from salmon (Salmo salar L.) caught at West Greenland in 1987. ICES Document
CM 1988/M :8.
Power, G., Power, M. V., Dumas, R., and Gordon, A. 1987. Marine migrations of Atlantic salmon
from rivers in Ungava Bay, Québec. American Fisheries Society Symposium on Common
Strategies in Anadromous/Catadromous Fishes, 1: 364–376.
Pratt, J. D., Hare, G. M., and Murphy, G. M. 1974. Investigations of production and harvest of an
Atlantic salmon population, Sand Hill River, Labrador. Environment Canada, Fisheries and
Marine Service, Fisheries Operations Directorate, Newfoundland Region, Technical Report
Series, NEW/T-74-1. 27 pp.
Price, M. 1974. Experimental fish tagging Maritimes Region. Environment Canada, Fisheries and
Marine Service, Resource Development Branch, Data Record Series, MAR/D-74-1. 73 pp.
Price, M. 1975. Summary of fish tagging, Maritimes Region, 1967–1974. Environment Canada,
Fisheries and Marine Service, Resource Development Branch, Data Record Series, MAR/D-
75-3. 87 pp.
Rago, P. J., Reddin, D. G., Porter, T. R., Meerburg, D. J., Friedland, K. D., and Potter, E. C. E.
1993a. A continental run reconstruction model for the non-maturing component of North
American Atlantic salmon: analysis of fisheries in Greenland and Newfoundland-Labrador,
1974–1991. ICES Document CM 1993/M: 25.
Rago, P. J., Meerburg, D. J., Reddin, D. G, Chaput, G. J., Marshall, T. L., Dempson, B., Caron, F.,
et al. 1993b. Estimation and analysis of pre-fishery abundance of the two-sea-winter popu-
lation of North American Atlantic salmon (Salmo salar), 1974–1991. ICES Document CM
1993/M: 24.
Reddin, D. G. 1986. Discrimination between Atlantic salmon (Salmo salar L.) of North American
and European origin. ICES Journal of Marine Science, 43: 50–58.
https://doi.org/10.1093/icesjms/43.1.50
Reddin, D.G. 1987. Contribution of North American salmon (Salmo salar L.) to the Faroese fish-
ery. Le Naturaliste Canadien, 114: 211–218.
Reddin, D. G. 2006. Perspectives on the marine ecology of Atlantic salmon (Salmo salar L.) in the
Northwest Atlantic. Canadian Science Advisory Secretariat Research Document, 2006/018.
45 pp.
Reddin, D. G., and Dempson, J. B. 1986. Origin of Atlantic salmon (Salmo salar L.) caught at sea
near Nain, Labrador. Le Naturaliste Canadien, 113: 211–218.
Reddin, D. G., and Friedland, K. D. 1998. A history of identification to continent of origin of
Atlantic salmon (Salmo salar L.) at west Greenland, 1969–1997. Fisheries Research, 43: 221–
235. https://doi.org/10.1016/S0165-7836(99)00074-0
Reddin, D. G., Friedland, K. D., and Downton, P. 2006. Early marine use of thermal habitat by
Atlantic salmon smolts (Salmo salar L.). Fishery Bulletin US, 104: 415–428.
Reddin, D. G., Friedland, K. D., Downton, P., Dempson, J. B., and Mullins, C. C. 2004. Thermal
habitat experienced by Atlantic salmon kelts (Salmo salar L.) in coastal Newfoundland wa-
ters. Fisheries Oceanography, 13: 24–35. https://doi.org/10.1111/j.1365-2419.2004.00237.x
Fifty years of marine tag recoveries from Atlantic salmon | 113
Reddin, D. G., Helbig, J., Thomas, A., Whitehouse, B. G., and Friedland, K. D. 2000. Survival of
Atlantic salmon (Salmo salar l.) related to marine climate. In The Ocean Life of Atlantic
Salmon: Environmental and Biological Factors Influencing Survival, pp. 88–91. Ed. by D.
Mills. Fishing News Books, Oxford.
Rice, A. L., and Lambshead, P. J. D. 1994. Patch dynamics in the deep-sea benthos: the role of a
heterogeneous supply of organic matter. In Aquatic Ecology: Scale, Pattern and Process. 34th
Symposium of the British Ecological Society, pp. 469–499. Ed. by P. S. Giller, A. G. Hildrew,
and D. G. Raffaelli. Blackwell Scientific Publications, Oxford.
Rikardsen, A. H., Haugland, M., Bjorn, P. A., Finstad, B., Knudsen, R., Dempson, J. B., Holst, J.
C., et al. 2004. Geographical differences in marine feeding of Atlantic salmon post-smolts in
Norwegian fjords. Journal of Fish Biology, 64: 1655–1679. https://doi.org/10.1111/j.0022-
1112.2004.00425.x
Ritter, J. A. 1977. Relationship between smolt size and tag return rate for hatchery-reared Atlantic
salmon (Salmo salar). ICES Document CM 1977/M: 27. 6 pp.
Ritter, J. A., Marshall, T. L., Reddin, D. G., and Doubleday, W. G. 1980. Assessment of the impact
of the West Greenland Atlantic salmon, Salmo salar, fishery on stocks and catches in North
America. ICES Document CM 1980/M: 38. 10 pp.
Rossby, T. 1996. The North Atlantic Current and surrounding waters: At the crossroads. Reviews
of Geophysics, 34, 463–481. https://doi.org/10.1029/96RG02214
Ruggles, C. P., Ritter, J., and Harger, R. 1974. Some preliminary tables and graphs summarizing
North American smolt tagging experiments, prepared for the March 1974 meeting of the
ICES-ICNAF Joint Working Party on North Atlantic Salmon. ICNAF Research Document,
74/38. 10 pp.
Russell, I. C., Potter, E. C. E., Reddin, D. G., and Friedland, K. D. 1989. Recoveries of coded wire
microtags from salmon (Salmo salar L.) caught at West Greenland in 1988. ICES Document
CM 1989/M: 24.
Russell, I. C., Potter, E. C. E., Reddin, D. G., and Friedland, K. D. 1990. Recoveries of coded wire
microtags from salmon (Salmo salar L.) caught at West Greenland in 1989. ICES Document
CM 1990/M: 20.
Russell, I. C., Potter, E. C. E., Reddin, D. G., and Friedland, K. D. 1991. Recoveries of coded wire
microtags from salmon (Salmo salar L.) caught at West Greenland in 1990. ICES Document
CM 1991/M: 11.
Russell, I. C., Potter, E. C. E., Reddin, D. G., and Friedland, K. D. 1992. Recoveries of coded wire
microtags from salmon (Salmo salar L.) caught at West Greenland in 1991. ICES Document
CM 1992/M: 30.
Russell, I. C., Potter, E. C. E., Reddin, D. G., and Friedland, K. D. 1993. Recoveries of coded wire
microtags from salmon (Salmo salar L.) caught at West Greenland in 1992. ICES Document
CM 1993/M: 19.
Saunders, R. L. 1969. Contributions of salmon from the Northwest Miramichi River, New Bruns-
wick, to various fisheries. Journal of the Fisheries Research Board of Canada, 26: 269–278.
https://doi.org/10.1139/f69-028
Saunders, R. L. 1986. The thermal biology of Atlantic salmon: influence of temperature on salmon
culture with particular reference to constraints imposed by low temperature. Institute of
Freshwater Research, Drottningholm, Report, 63: 68–81.
Saunders, R. L., Henderson, E. B., Glebe, B. D., and Loundenslager, E. J. 1983. Evidence of a major
environmental component in determination of the grilse: larger salmon ratio in Atlantic
salmon (Salmo salar). Aquaculture, 33: 107–118. https://doi.org/10.1016/0044-8486(83)90391-
5

114 | ICES Cooperative Research Report No. 343
Scarnecchia, D. L. 1983. Age at sexual maturity in Icelandic stocks of Atlantic salmon (Salmo
salar). Canadian Journal of Fisheries and Aquatic Sciences, 40: 1456–1468.
https://doi.org/10.1139/f83-168
Smed, J. 1980. Temperature of the waters off southwest and south Greenland during the ICES/IC-
NAF experiment in 1972. Rapports et Procès-Verbaux des Réunions du Conseil Interna-
tional pour l'Exploration de la Mer, 176: 18–21.
Sigholt, T., and B. Finstad. 1990. Effect of low temperature on seawater tolerance in Atlantic
salmon (Salmo salar) smolts. Aquaculture, 84: 167–172. https://doi.org/10.1016/0044-
8486(90)90346-O
Stasko, A. B., Sutterlin, A. M., Rommel, S. A., and Elson, P. F. 1973. Migration-orientation of
Atlantic salmon (Salmo salar L.). In International Atlantic Salmon Symposium, St. Andrews,
pp. 119–137. Ed. by M. W. Smith, and W. M. Carter. International Atlantic Salmon Founda-
tion, Special Publication Series 4 (1). 504 pp.
Thorpe, J. E. 1988. Salmon migration. Science Progress, 72: 345–370.
Þorsteinsson, G., and Guðjónsson, Þ. 1986. Experimental salmon fishing at East Greenland in
summer 1985 and recaptures of tagged fish. ICES Document CM 1986/M: 25.
Steele, J. H. 2004. Regime shifts in the ocean: reconciling observations and theory. Progress in
Oceanography, 60: 135–141. https://doi.org/10.1016/j.pocean.2004.02.004
Sturlaugsson, J. 1995. Migration studies of homing of Atlantic salmon (Salmo salar L.) in coastal
waters W. Iceland - Depth movements and sea temperatures recorded at migration routes
by data storage tags. ICES Document CM 1995/M: 17. 13 pp.
Sutterlin, A. M., Saunders, R. L., Henderson, E. B., and Harmon, P. R. 1982. The homing of At-
lantic salmon to a marine site. Canadian Technical Report of Fisheries and Aquatic Sciences,
1058: 1–6.
Turner, G. E. 1975. Migration route and timing of Miramichi River salmon (Salmo salar) as indi-
cated from recaptures of tagged smolts and adults. Environment Canada, Fisheries and Ma-
rine Service, Resource Development Branch, Technical Report Series, MAR/T-75-7. 11 pp.
Turner, G. E. 1975. Exploitation of Miramichi Atlantic salmon based on smolts tagged in 1968,
1969 and 1970. Environment Canada, Fisheries and Marine Service, Resource Development
Branch, Maritimes Region, Technical Report Series, MAR/T-75-3. 11 pp.
Turner, G. E. 1976. Exploitation of Atlantic salmon (Salmo salar) in the Miramichi River system,
including the bay and estuary, as revealed by wild smolt and adult salmon tagging. ICES
Document CM 1976/M: 16. 11 pp.
Zubchenko, A. V., Loenko, A. A., and Popov, N. G. 1995. Salmon rivers of the Kola Peninsula.
Some data on salmon migrations and estimation of marine fishery influence. ICES Docu-
ment CM 1995/M: 37.

Fifty years of marine tag recoveries from Atlantic salmon | 115
Annex 3: Contact information for editors and contributors
Editors
Niall Ó Maoiléidigh
Fisheries Ecosystem Advisory Services
Farran Laboratory
Furnace, Newport
Co Mayo
Ireland
Lars P. Hansen
Norwegian Institute for
Nature Research
Gaustadalléen 21
NO-0349 Oslo
Norway
Ted Potter
c/o Centre for Environment, Fisheries
and Aquaculture Science (Cefas)
Lowestoft Laboratory
Pakefield Road, Lowestoft
Suffolk NR33 0HT
UK
Ian Russell
Centre for Environment, Fisheries and
Aquaculture Science (Cefas)
Lowestoft Laboratory
Pakefield Road, Lowestoft
Suffolk NR33 0HT
UK
Jonathan White
Marine Institute
Rinville
Oranmore
Co Galway
Ireland
Dave Reddin
Department of Fisheries and Oceans
Northwest Atlantic Fisheries Centre
PO Box 5667
St John's, NL A1C 5X1
Canada
Tim Sheehan
NOAA Fisheries
Northeast Fisheries Science Center
166 Water Street
Woods Hole, MA 02543
USA
Jan Arge Jacobsen
Faroes Marine Research Institute
PO Box 3051
FO-110 Tórshavn
Faroe Islands
Contributors
Peter G. Amiro
Department of Fisheries and Oceans
Bedford Institute of Oceanography
PO Box 1006
Dartmouth, NS B2Y 4A2
Canada
Vegar Bakkestuen
NINA
Gaustadalleen 21
N-0349 Oslo
Norway

116 | ICES Cooperative Research Report No. 343
Gerald Chaput
Fisheries and Oceans Canada
DFO Moncton
PO Box 5030
Moncton NB E1C 9B6
Canada
J. Brian Dempson
Department of Fisheries and Oceans
Northwest Atlantic Fisheries Centre
PO Box 5667
St John's, NL A1C 5X1
Canada
Gilles Euzenat
ONEMA DAST
Station d’Ecologie Piscicole
Rue des fontaines, 76260 Eu
France
Mark Fowler
Bedford Institute of Oceanography
PO Box 1006
Dartmouth NS B2Y 4A2
Canada
Arni Isaksson
Freshwater Fisheries and Salmonid
Management Division
Directorate of Fisheries
Dalshrauni 1, 220 Hafnarfjörður
Iceland
Jeronimo de la Hoz
Servicio Caza y Pesca
Principado de Asturias, Oviedo
Spain
Richard Kennedy
River Bush Salmon Station
21 Church Street
BT57 8QJ Bushmills Co
Antrim
UK
Oleg Lapshin
Federal Research Institute of Fisheries
and Oceanography (VNIRO)
V. Krasnoselskaya Street 17
Moscow 107140
Russia
Kjell Arne Mork
Institute of Marine Research
PO Box 1870 Nordnes
N-5024 Bergen
Norway
Terry Nicholls
Department of Fisheries and Oceans
Northwest Atlantic Fisheries Centre
PO Box 5667
St John's, NL A1C 5X1
Canada
Sumarliði Óskarsso
Agriculture Authority of Iceland
Austurvegur 64
800 Selfoss
Iceland
Stig Pedersen
DTU, DFU
Vejlsøvej 39
DK-8600 Silkeborg
Denmark
Gordon W. Smith
Marine Scotland Science
Inchbraoch House South Quay
Ferryden Montrose
Angus DD10 9SL
UK
Fred Whoriskey
Atlantic Salmon Federation
PO Box 5200
St Andrews, NB E5B3AP
Canada

Fifty years of marine tag recoveries from Atlantic salmon | 117
Annex 4: Participants in tag-recovery activities
The editors would like to acknowledge the following individuals for their efforts in
collecting and collating tag recoveries:
Faroe Islands
Rógvi Mouritsen, Andrias Reinert, Arnold Hendriksen, Súni Lamhauge, Jón Jakob
Høisted, Osmud Justinussen, Hans Høghamar, Marius Østerø, Ólavur Olsen, Hjalti í
Jákupsstovu, and Jan Arge Jacobsen.
Ireland
Arthur Went, Eileen Twomey, John Brown, Anne Cullen, Barney Doolin, Tom McDer-
mott, Nigel Bond, Desmond McCarthy, Niall Ó Maoiléidigh, Paddy Gargan, Deirdre
Cotter, Ger Rogan, Jonathan White, and Mary Dillane.

118 | ICES Cooperative Research Report No. 343
Annex 5: National tag clearing houses to which Atlantic salmon tags
should be returned
Country Institution Address
Canada Fisheries and Oceans Canada
Attention: Scott Douglas
343 Université Avenue, Moncton
NB E1C 9B6, Canada
Scott.Douglas@dfo‐mpo.gc.ca
Denmark DTU Aqua
National Institute of Aquatic Resources
Department of Inland Fisheries
Attention: Gorm Rasmussen
Vejlsøvej 39, DK-8600 Silkeborg, Denmark
France ONEMA
The French National Agency for Water
and Aquatic Environments
Attention: Gilles Euzenat
5, square Félix Nadar,"Le Nadar" Hall C,
94300 Vincennes, France
Iceland Directorate of Fisheries
Attention: Sumarliði Óskarsson
Dalshrauni 1, 220 Hafnarfjordur, Iceland
Ireland
(Also tag clearing for Fa-
roes tag recoveries)
Marine Institute Fisheries
Ecosystem Advisory Services
Attention: Niall Ó Maoiléidigh
Farran Laboratory, Furnace,
Newport Co. Mayo, Ireland
Norway Institute of Marine Research
Attention: Vidar Wennevik
PO Box 1870, Nordnes, 5817 Bergen, Norway
Russian Federation Knipovitch Polar Research Institute
of Marine Fisheries and Oceanogra-
phy
Attention: Sergey Prusov
6 Knipovitch Street, 183763 Murmansk, Russia
[email protected]/[email protected]
Spain (Asturias) Seccion de Pesca,
Gobierno del Principado de Asturias
Attention: Jeronimo de la Hoz Regules
Sección de Pesca fluvial
C/ Coronel Aranda, 3 3º, 33005, Oviedo Spain
Spain (Navarra, Gipuzkoa,
Cantabria)
Calle Albert Einstein and Polígono
Parque Científico y Tecnológico
Attention: Enrique Merino Gallo
39011 Santander Cantabria, Spain
Sweden Swedish Board of Fisheries
Institute of Freshwater Research
Attention: Erik Degerman
Pappersbruksallen 22,
SE-702 15 Örebro, Sweden
UK (England and Wales)
(Also tag clearance for West
Greenland tag recoveries)
Cefas
Lowestoft Laboratory
Attention: Ian Russell
Pakefield Road, Lowestoft,
Suffolk NR33 OHT, UK
UK (Scotland) Marine Scotland Science,
Freshwater Laboratory Field Station
Attention: Helen Downie
Inchbraoch House South Quay, Ferryden
Montrose DD10 9SL Scotland, UK
UK (N Ireland) Agri-Food and Biosciences Institute
Attention: Dennis Ensing
18a Newforge Lane, BT9 5PX Belfast, UK
USA NOAA National Marine Fisheries Service,
Northeast Fisheries Science Center
Attention: Tim Sheehan
166 Water Street,Woods Hole, MA 02453, USA

Fifty years of marine tag recoveries from Atlantic salmon | 119
Annex 6: Glossary of acronyms used in this report
1SW (one-sea-winter). Maiden adult salmon that has spent one winter at sea.
2SW (two-sea-winter). Maiden adult salmon that has spent two winters at sea.
3SW (three-sea-winter). Maiden adult salmon that has spent two winters at sea.
AMO (Atlantic Multidecadal Oscillation). A mode of natural variability occurring in the
North Atlantic which has its principle expression in the sea surface temperature (SST)
field.
ANOVA (analysis of variance). Statistical models used to analyse the differences among
group means.
CPUE (catch per unit of effort). A derived quantity obtained from the independent values
of catch and effort.
CRR (Cooperative Research Report)
CWT (coded wire tag). The CWT is a length of magnetized stainless steel wire 0.25 mm
in diameter. The tag is marked with rows of numbers denoting specific batch or indi-
vidual codes. Tags are cut from rolls of wire by an injector that hypodermically im-
plants them into suitable tissue. The standard length of a tag is 1.1 mm.
DFO (Department of Fisheries and Oceans). DFO and its Special Operating Agency, the
Canadian Coast Guard, deliver programs and services that support sustainable use
and development of Canada’s waterways and aquatic resources.
Distant-water fisheries. Fisheries which take place away from the home coastal wa-
ters of the fishing fleet, usually classed as waters outside their home country 200nm
zone.
DNA (deoxyribonucleic acid). DNA is a nucleic acid that contains the genetic instructions
used in the development and functioning of all known living organisms (with the ex-
ception of RNA- ribonucleic acid viruses). The main role of DNA molecules is the long-
term storage of information. DNA is often compared to a set of blueprints, like a recipe
or a code, since it contains the instructions needed to construct other components of
cells, such as proteins and RNA molecules.
EEZ (exclusive economic zone). An area of sea designated under the United Nations Con-
vention on the Law of the Sea which a state has rights regarding the exploration and
use of marine resources, stretching out 200 nautical miles from the coastal baseline.
ICNAF (International Commission for the Northwest Atlantic Fisheries). An international
fisheries organization established in 1949 that was the precursor of the Northwest At-
lantic Fisheries Organization (NAFO) which succeeded it in 1979.
IDF (Icelandic Directorate of Fisheries). An agency of the Ministry of Industries and In-
novation, Iceland. The Directorate's task is monitoring fisheries and the daily admin-
istration of the fisheries management system in Iceland.
LSD (least significant difference). Fishers LSD test is a post hoc analysis applied follow-
ing a one-way or two-way ANOVA to compare mean values of test groups.
MSW (multisea-winter). A MSW salmon is an adult salmon which has spent two or
more winters at sea and may be a repeat spawner.
NAFO (Northwest Atlantic Fisheries Organization). NAFO is an intergovernmental fish-
eries science and management organization that ensures the long-term conservation
and sustainable use of the fishery resources in the Northwest Atlantic.

120 | ICES Cooperative Research Report No. 343
NAO (North Atlantic Oscillation). A weather phenomenon of fluctuating sea surface at-
mospheric pressure between the Icelandic Low and the Azores High defined as sea-
sonal average air pressure difference between meteographic stations.
NASCO (North Atlantic Salmon Conservation Organization).
NASTR (North Atlantic Salmon Tag Recovery database). Database developed by the ICES
Working Group on Effectiveness of Recovery Actions for Atlantic Salmon (WGER-
AAS).
NEAC (North East Atlantic Commission). A commission of NASCO. Members include
Denmark (in respect of the Faroe Islands and Greenland), the European Union, Nor-
way, and the Russian Federation. Canada and the United States of America may also
submit and vote on proposals for regulatory measures for salmon stocks originating in
their rivers and occurring off East Greenland.
NINA (Norwegian Institute for Nature Research). Norway’s institution for applied eco‐
logical research.
NOAA (National Oceanic and Atmospheric Administration). An American scientific
agency within the United States Department of Commerce focused on the conditions
of the oceans and the atmosphere.
PCA (principal components analysis). A multivariate statistical procedure that uses an
orthogonal transformation to convert a set of observations of possibly correlated vari-
ables into a set of values of linearly uncorrelated variables called principal components.
RDA (redundancy analysis). A multivariate statistical procedure that examines how
much variation in one set of variables explains the variation in another set of variables.
A multivariate analogue of simple linear regression.
SALSEA-Merge (Salmon at Sea Merge). SALSEA-Merge is an international programme
of cooperative research designed to improve understanding of the migration and dis-
tribution of salmon at sea in relation to feeding opportunities and predation. It differ-
entiates between tasks which can be achieved through enhanced coordination of exist-
ing ongoing research and those involving new research for which funding is required.
SST (sea surface temperature). SST is the water temperature close to the surface. In prac-
tical terms, the exact meaning of surface varies according to the measurement method
used. A satellite infrared radiometer indirectly measures the temperature of a very thin
layer of about 10 micrometres thick of the ocean which leads to the phrase “skin tem-
perature”. A microwave instrument measures subskin temperature at about 1 mm. A
thermometer attached to a moored or drifting buoy in the ocean would measure the
temperature at a specific depth, (e.g. at one meter below the sea surface). The measure-
ments routinely made from ships are often from the engine water in-takes and may be
at various depths in the upper 20 m of the ocean. In fact, this temperature is often called
sea surface temperature, or foundation temperature.
UK (Sc) (United Kingdom – Scotland). A jurisdiction in the UK.
UK (EW) (United Kingdom – England and Wales). A jurisdiction in the UK.
UK (NI) (United Kingdom – Northern Ireland). A jurisdiction in the UK.
USSR (Union of Soviet Socialist Republics). The USSR was a socialist state on the Eurasian
continent existing between 1922 and 1991 as a union of multiple subnational Soviet
republics.

Fifty years of marine tag recoveries from Atlantic salmon | 121
VIE (Visible implant Elastomer). VIE is a coloured elastomer that can be injected as a
liquid under the skin of a fish. It the cures to a pliable solid, marking the fish. Colours
are bright and can be fluorescent, lighting up under ultra violet light.
WGERAAS (Working Group on the Effectiveness of Recovery Actions for Atlantic salmon).
An ICES expert group that last met in 2015.
WKDUHSTI (Workshop on the Development and Use of Historical Tagging Information from
Oceanic Areas). An ICES workshop held in 2007.
WKSHINI (Workshop on Salmon Historical Information – New Investigations from Old Tag-
ging Data). An ICES workshop held in 2008.
WKLUSTRE (Workshop on Learning from Salmon Tagging Records). An ICES workshop
held in 2009.
WKSTAR (Workshop on Salmon Tagging Archive). An ICES workshop held in ICES 2012.