BUBBLE CBAMBFtt STUDIES OF NUCLEAR STRUCTURE
290
BUBBLE CBAMBFtt STUDIES OF NUCLEAR STRUCTURE A dissertation submitted tor fat* degree of Doctor of Philosophy in the Uaivarsity of Oxford A. R. BOWDSN The Queea's College Osford
-
Upload
khangminh22 -
Category
Documents
-
view
0 -
download
0
Transcript of BUBBLE CBAMBFtt STUDIES OF NUCLEAR STRUCTURE

BUBBLE CBAMBFtt STUDIES OF NUCLEAR STRUCTURE
A dissertation submitted tor fat* degree of Doctor of Philosophy
in the Uaivarsity of Oxford
A. R. BOWDSN
The Queea's College
Osford

This is not tii£ eaa. It & no* even the De&iiJiu&g ol
ihe eud. iju* it *«, perhaps, tiic end of die t
Win«ton Churchill,

CONTENTS
Preface
Abstract
PART I INTEODUCI'ORY
Char r l - torrsui^iion to the jftysics and mgthods
1 1 The experiment 1
1.2 Interpretation of Ugb energy nucleon-nucieus reactions 3
1.3 fc'ante Carlo calculations 7
19 1114 The quasi-elastic C ""{p,2p)B reaction 15
1. 3 Limitations of the apparatus
PART £ EXPEKI::. ;"K'L\ q.^Ar:.-. AND THE DATA
r- ' : DUG TION PHO
2 ..*.... The twelve iin?h p. v»
2.1 Bubble chambers 24
2.2 Th£ chamber body 25
2.3 Temperature control 26
2 4 Expansion mechanism ?g
2 5 Optical design 3
2 6 Frame isioibering counter 33
2 7 The bbaaaia 35
2.8 ilecironic c<Kiti'oi umt 35
2, - Pr«i»ratioa and operation of tha bubble chamber 10

Chapter 3 - Ifre Harwell fiy^hroc^cigtron. the tarotop beam,
anU the eanposura of the bubble chamber
3.1 The aynchrocyclotroa 38
3. 2 The external proton beam 3
). 3 £xperim*ni* with the bc^ani 43
3. 4 Tb$ bubble chamber ax pendent 46
Chapter 4 - SxtracUoQ of information from the film
4.1 Introdttcticai 4,'
4.2 Scanning 5 *
4.3 Cdmparia^i of the two indepeodent scans 54
4.4 Measuremeat of event*
Chapter 5 - From m&asuren.enU to
5 1 Introduction
5. 2 Reconstruction of an event fro&i mgadurem&nis on two
stereoscopic views
3. 3 The computer program for the analysis o.f tl*e 2-prong events
5. 4 Cornjaiter programs for the analysis of the 3-proag and
4-pro»g events 7u
5.5 Bulxile chamber cooBtanu 71

PAKT 3 THE ANALYSIS OF THE W
Chapter 6 Introduction to ffce eacperimeata] iosuiu<?
6,1 The incident energy spectra for the analysed events 77
6. t Eeactions represented by the 2 -prong, --prong and 4-prong events 78
6. 3 llie eoergy-loas distribution for &e 2-prong events SO
6.4 Hie energy-loss distributions for the 3~prong and 4-prong events 84
6. 5 Hie experimental resolution 84
Chapter 7 - The ero$s~sectloas
?, 1 The measurable croes-aec lions 86
?. 2 Tiie calculation of cross-sectiona 88
7. 3 The elastic proton-proton cross-section ; 1
12 11 7.1 The cros3*6cction for the reaction C (p»2p)B g. s. S4
12 117.5 Dwussion of the C (p,?p)B g. s. croas-sectloR . t>
7. fc Other cross -sections 100
If 1, !Chapter 8 « T^ C (p,2b)3^ . ..i^tionjor -era and low
ior. cn-ei---.^3 of B
8, 1 Nomenclature If 2
S. a The quasi-elastic nature of the reaction 102
S 3 A suiranary of the experimental results 1< C
8.4 Events In the energy-loss region of 21 ItfeV to 3«.i MeV
8. 5 Conclusion

9 - NucleoR cascade model
1 Introduction 122
2 The model 123
3 Some sample results 127
Chapter l|* - A atudy.. of .fog .jHPfogg eventtf and some
OB the 4-proaff events and hi%h a .? ,- ̂ y-loaa 2~i>roi*g
1.1 Introduction 130
10.2 Some experimental results from the 3-prong events 131
12 1010.3 The reaction C (p, 3p)Be and the events with energy-losses
below 40 MeV 132
10.1 Reactions involving heavy particles
10. 5 The nucleon cascade and evaporation mechanism
10. 6 Knock-out of correlated pairs of protoaa 145
10.7 Summary and conclusions concerning the S*proag events 14$
1^.8 The 2-pronf events and neutron producing reactions 152
1K9 The 4-prong events 155
Chapter 11 * Concluding remarks 15?

JH>J
JO
ptm e- rod &mp®ods3.uoo jo
|o
91 49H3 at p»p«a9p BT ii
in

Preface
Hie research work reported in tins thesis is &e result of an experiment
performed at A EKE, Harwell and at the Nuclear Physios Laboratory, Oxford
in collaboration with Dr. M.K. Bowman and under the supervision of
Professor D. H. WUiunson FRS. Or. J. ItoKeaKie and Dr. D. W. Anderaon
were responsible lor the construction of the bubble chamber that has been
used, and i& many ways the experiment is a continuation of the work started
by them with an experiment using a a mailer bubble chamber.
Hie main aim of the present work has been an attempt ;o improve our
understanding erf the reaction mechanisms that determine the interaction of
protons with C in the energy interval of 50 MeV to ISO MeV.
It has been a very great pleasure to work in collaboration with
Martin Bowman from whom I have learned a great deal and with whom I
have had many helpful discussions. Much of the work discussed in section
two of this thesis is the result of our Joint efforts, but the remainder of
the work was performed solely by me.
I should like to thank Professor Wilkiaton for the opportunity to work
at the Nuclear Physics Laboratory and for his support and encouragement
on the many occasions when It has been needed. & has been particularly
interesting to watch the development of the laboratory from its inception
with a small nucleus of people to the very large and active organisation
that it is now.

A bubble chamber experiment cannot be conducted without a great deal
of support from many sources. I am greatly indebted to very many people
for their generous help, and f should particularly Ilka to thank:
Mr. S.A. Tolan and other members of the workshop staff for their
very substantial work on the apparatus;
Mr. B. Rose for the facilities made available to us by the Cyclotron
Division at A ERE. Harwell, and the crew of the cyclotron whose efforts
were responsible for the smooth running of our proton source;
Mr. Cyril Band for his continued willingness to produce photographs
and reproduction* at short notice;
the large number of physicists and assistants who made possible the
use of the semi-automatic measuring and scanning machines, and In particular
krs. J^net Warae for her v«ry conscientious and hard work at all states of
the data reduction process;
Professor 1. Fo&, for the use of the fc'ercury computer and later the
KDF9 computer, and Or. C. Phelps for advice and assistance concerning these
machines,
I am very grateful to Professor A. B. Clegg and to Mile. T. Yuasa of
Orsay for the many helpful discussions that I had with them concerning the
analysis and interpretation of the experimental results.
! shall always be grateful to my future wife, Jill, for her immense
patience, her very hard work in the data reduction stages of the analysis,
and her assistance in the compilation of the

I should lik to thantt RiJss Gill Wyi&er, my typist, for her patience
with me and lor her careful presentation of th« thesis in its present form.
My thanka are also tluc to th# Oepartn ent of Scieatii'ic and Industrial
Research, the University of Oxford, and the iSaglish Electric Conipany, lor
suj^ori Curing the |>eria1 of research.
i.e

Abe tract
12Tha proton- ' interaction has been investigated using a twelve-inch
propane bubble chamber and the fall energy proton beam from the Harwell
synchrocyclotron.
A series of experiments on the external proton beam led to the estab
lishment of a beam with an energy spread of less than 0. § &eV; this enabled
the bubble chamber to be used at the limn of its resolving power which was
then deterniindd by straggling.
2-prong, 3-prong and i-prong events have been analysed. Hie quasi-
l^ 11 elastic nature of the reaction C ~(p,3p)B g, n. has been confirmed ami its
cross-section has been seen to be independent of the proton energy from
5 'it MeV to ISO r^eV and equal to 16^1.5 mb. ihe energy independence of
the cross-section Is shown to be explained by the operation of the Paul!
principle within the nucleus.
The (p. 2p) reaction leading to Hie low excitod states of B , the
?-prong events w'th high energy-losses (when reconstructed cm the
assumption that they arc (p, 2p) reactions^ the 3-prong events, and the
4-prong events have been analysed with a view to establishing the reactions
and the reaction mechanisms giving rise to them. Hie analysis was
facihtated by setting up a reaction model, of the fc'onie Carlo type, to
calculate the energies of final reaction products from various hypothesized
reactions. The conclusion reached is that multiple scattering of nucleons

within the nucleus is the key to tht production of the above-cited events;
intranuclear nucieon cascades are set up which lead to reactions of the type
C 12(pt 2pKn)BU~x f Cl2{pt 3pom)Bel'~x and C(»9 4jnDU" , where x»l,2t .
With the exception ol the quasi-elastic (p, 2p) reaction the reactions with
;.-.= ) contribute only a small part of the total cross-sections.
8 There is evidence that the production of Be , or two a-par tides, as
the final products of cascade and evaporation mechanisms is highly favoured
and as an interpretation of this it is suggested that a-particle substructures
12 in C are important in .r.uu-.. jscing the course of the proton-C reaction.
There is no evidence for a significant proportion of o-particles amongst the
reaction products but this coitld well be due to the fact that the probability
of observing an or-particta is zero for a^particiea below 16 MeV and only
reaches unity at an energy of 4C K'eV.

Pan 1 Introductory Remarks

CHAPTEH 1
INTRODUCTION TO THE PHYSICS AND METHODS
1.1 The exi; .-
In the experiment, C "" nuclei are bombarded with protons of energy
between 50 McV and 130 &'e V, with a view to obtaining a better understanding
of the reaction mechanisms that are important in this energy region for tiwj
light nuclei.
Because the internueleon law of force la still not completely understood
there is no fundamental theory of nuclear matter as there is a theory to
account for atomic electron structure, and the advancement of our understanding
of the nucleus is based upon the models put forward to interpret experimental
results. These models can be divided into two classes: those concerned with
the structure and stationary states of nuclei, and those concerned with reacucn
mechanisms and so with the behaviour of nuclear matter under perturbation.
To study the structure of the nucleus it is necessary to perturb the stable
configuration of its nucleons, so the two types of models are interrelated and
tend to develop together. It has been found to date that dU'i'jror.r models are
needed to describe different aspects of nuclear :>chaviour and no single model
has been found that can encompass all in, experimental results. Thus, for
example, the Independent Particle Models, which can account for a wide range
of experimental information such as pick-up reactions, knock-out reactions,

the giant resonance, etc. , fail by up to two orders of magnitude to predict the
qttadrupole momenta of nuclei with VU < N < 114 or Z > 88 (the ^axinmin
<£iadrupole moment calculated on the basis of the deformation of one nucleon 25 9 orbital* is ~ 3 x 10 cm , whereas typical treasured values in the above
mages are * 10* cm2). However, the Collective Jriodel, which can account
for these quadrupoie mooi^nts, fails to yield any detailed information about the
single particle aspects of nuclear behaviour.
A summary of the interpretive framework relevant to the experiment &
given in the next section.
A propane bubble chamber has been used for the study and this provides
both the target nuclei aixi the means oi detecting the charged particles resulting
from the ^rotaa-carjca reaction. Xfc-» li^utauous oi' the apparatus are
discussed in section l.j.
The reactions that have been studied are those in which one or more
charged particles are knocked out of the nucleus. Details have been accu
mulated by careful measurement for all the reactions leading to two or more
observable bubble chamber tracks. '.< ii. 2 -prong events have been unambiguously
divided into those originating from interactions between incident protons and
target hydrogen nuclei (henceforth referred to as hydrogen events), and those
originating from interactions oi the incident protons and target C " nuclei
12 11 (carbon e vests). The events representing the reaction C (p,2p)B £. a. , in
which OIK? proton from a p-staia in the nucleus Is cleanly knocked out (p-shell
evant), have been well separated trom the other carbon events.

3
Of the events with more than 2 prongs, 39% are 3-prong events and 11 6
are 4-proag events (one 5-prong event was seen). Because of the small
number of 4-prong events (55 of the 84 detected were measurable) and the
poor accuracy of the information obtained from them aue to nx>us«ren,e n
uncertainties on very abort tracks, ihe«e events are dealt with only briefly.
The Sprang events have been the subject of a more detailed analysis and it
19, 10la seen that most of them cannot be attributed to the C (p,3p)Be reaction.
The complex nature of these evests explains the difficulty experienced by
ANDERSON (1 U C 0 in drawing any conclusions from the analysis of die twenty-
seven 3-prong events observed in the four inch propane bubble chamoer.
i.f Interpretation el feign energy nucleon-nucleus reactions
The present tbeoretieal framework for the interpretation of the nucleon-
nucleus reaction mechanism in the energy range relevant to Hie current experi
ment is based upon the 'direct interaction' concept established by 3ERBER
(1 '47). It was at this time that the first high energy nucleon beams became
available and it was the experimental work of COOK et ai. (14), on the
reactions oi ^0 MeV neutrons with a wide range of target nuclei, that provided
the first experimental evidence for the mhdity of the model.
Until this Unie the predoi nrtat theory for the interpretation of low energy
cxperin\ental lafornxation had been based upon the 'compound nucleus" theory
of BOHB (1*37), At energies oi a lew MeV and below, the nucleon ^ Broglie
-12 wavelengtb <^l r ' cm) is much larger than the typical Ug^it nucleus radius

( *- 4 x 1)" cms), and iis mean free path in nuclear matter (^ 1>> cms) is
rruch leas than the nuclear radius. The Incidem nucieon, on entering the
nucleus. 1* caught up in the gas-like motions of the raicleofis, and the energy
it carries in w th it Is rapidly shar amongst nil the nucleotw. Ow« this
has happened a relatively long time will elapse before sulfic-cat energy is
concentrated in any one nutrleoa to enable it to sscap* from the ays ten'; th©
narrow resonance widths measured in slow neutron ( <: 100 eV) absorption
-15 experiments indicate a lifetime of the order o* lu sacs and even at several
-1£VeV excitation the lifetime is still very long (^ 3.) sees) compared vlth the
-21 ur e it would take the incident ouek-on to cross the nucleus (- 1 sees).
At erufcrgriea ai>ove 1 ' MeV the, do Broghs wavtkngth of the Incident
aucl^on -;^5^ K- x *cm^> is much scalier tlian tbfe nuclear radius aa-J, also,
tht; reduction in the Bueleofi-ouclx?OD cross-sootlon with StKTua^ed «?n^rgy
increases the mean tree path >i Usa incident wicieon <^5 K in cma) to a
size comparable with the nuclear si*e. T^e relatively small aire of the
acldent nuclron and the nuclear transparency thus make it jx^sible to visuali
the nucleus as a colled urn uf individual micleons, anti the incident aucioon-
larget nucl«ou collisions within H as class? eal billiard-ball type collisions or
'direct interactions' The ftwidc-nt nucleori, which crosses the nucleus m a
n^uch shorter time than th«; URA .j^twei'ii collisiofw of the nuclear imcleons,
no longer becomes trapped in the nucleus, and the characteristic reaction U/
O9xs of tho order of 1 " »ec» Allhoufrh the relevant conditions are not fully
met at energies R uch ^>elow 1 '* ft^eV. considersJDl« success has been

by applying the direct interaction concept down to energies as low as 5
(LANE ft WANDEL 1^5).
Th« description of the complete reaction induced by a high energy aucleon
& usually separated into two parts.
In ths iirst, an intranuclear nuelecm cascade, cfaaracu*riy,ed by a series
of two-body direct interactions* is assumed to develop within the imcleiis; the
latter manifests itself through:
(a) sh© Pauli principle (forbidding low eitergy transfer scatters),
(b) the momentum distribution oft the struck mideous, aati
(c) the change in the kinetic energy of raicleoas as they cross
th«j nuclear boundary.
Bearing in mind these nucleus effect®, the two-body colHsiona are assumed to
he characterised by the free aiicleon-nueiean interaction. This premiss, known
as the Impulse ApproxuiiaUoa, las been formalised by CHEW & WICK (1J52)
under the following aasuir,pt'.oaa:
(a) the iiic-jdent particle inleracts with ooly one out!eon at a tin e f
(b) Hie binding forces between the coostitueata of the system are
negligible during thu decisive phase of the colliaion, when the incident
particle interacts strongly, and
(c) the aBipi.Uk!-.> oi the lncr,k:!!it nucieou wave is aot appreciably
diminished n crossing the sucietts, I.e. the nucleus is virtu:,!;v
transparent to the incident miclooD.
The cascade Is visualised as continuing until each unclean involved wither has

6
escaped from the nucleus or has had ita energy reduced below the minimum
required for it to e*cape direct from the nucleus (in this caae the regaining
energy Is assumed to be shared amongst the remaining nucieons). The whole•22eascade develops very rapidly and is over in a time less than 10 sees.
Generally speaking, the residual nucleus Is left in an excited state and can
be compared with the excited compound nucleus of the Bohr low energy model,
although the excitation energies are normally much larger.
In the second part of the reaction, we are concerned with the de-excitation,
by particle emission, of the nucleus resulting from the tascade stage. Thia
particle evaporation is usually treated by the statistical model of the nucleus
and the WEBSKOPF (1-37) evaporation theory and th@ decay modes are
sensitive to parameters such a» binding energy and the Coulomb barrier.
For a nucleus with excitation U, the probability per unit time that a
particle of type i with binding energy B and spin 8, is emitted in the energy
interval ce at e, is:' ' 28. +1
whereyD(U) * density of energy levels in the original nucleus at itaexcitation energy U - usually obtained from the statistical model
/> V(U~B~£) * density of energy levels in the residual nucleus A « reduced mas* of the system after ©mission
d*Ae) • crossHvection for the exact inverse of the emission process * this term contains the Coulomb effect explicitly.
The usual method of reconstructing the evaporation part of the reaction is to
follow an evaporation cascade stochastically, applying the above equation

successively «atil the nucleus has been reduced to some melons of lower mass
with an excitation energy leas than the threshold for particle emission.
Characteristic times for this part of the reaction are lets well defined
than for the direct interaction cascade due to the large variety of ways in-21 which de-excitation may occur, but the lower limit ia 10 gee.
MILLEK £ HUDU (1 ."4 write the cross -flection for the complete
reaction in terms of the two separate phases aa shown;
6 (A, Z | A°. Z°, q, £) - Z <^A% 2 ', U% I |A°, Z°, q, E) X
o o where (A ,£ ) characterise the target nucleus,(A',?') t the intermediate(A, 7), the final nucleus, andq , the incident particle.^,7 f f U'.l.|A ,2°,<|f E) is the differential cross-section for theformation, in the first stage, of the nucleus A'Z with spin I and excitation energy m the interval dU at U, and
i}(A, Z|A\7',U ,1) is the probability that the product nucleus A,Z remains after the de-excitation of A'Z .
Both stages of the reaction lend themselves to analysis by the Monte
Carlo method of calculation. For the light nuclei, several calculations have
been reported for the cascade stage of the reaction and one particularly
successful calculation has been reported for the complete reaction for protoxisIf with C . SoJite of these results are su?Tmmrixed below.
1.3 V ante Carlo calculations
GOLDBERGLYv (U48) was the first to use the -Monte Carlo method to
simulate an fntraaacl«ar nacleon cascade. His calculation was for neutrons
8
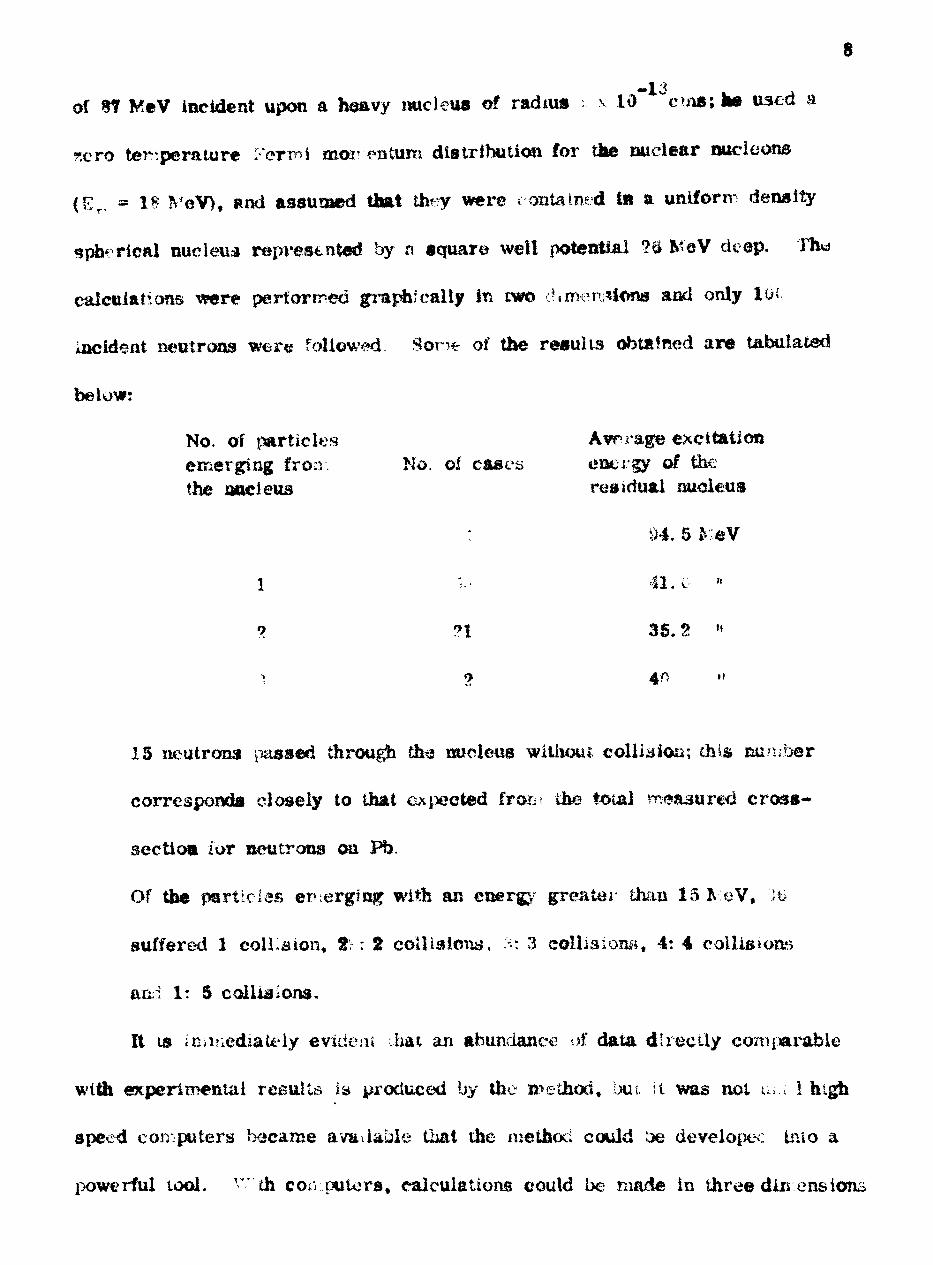
-13 . . of #t MeV incident upon a hsavy nucleus of radms v 10 cms; he used a
temperature Fermi mor-entum distribution for tiu» nuclear oucleons
- 18 VeV), »nd assumed that th^y were contained in a uniform density
spherical nucleus represented by n square well potential ?tt MeV de@p, Th«>
calculations were performed graphically in two dimensions ami only luc
incident n«utr(Mis were followed Sor>e of tJbe resulus obtafned are tabulated
below:
No. of particles emerging fron
uocleusNo. of case;
Average excitation energy ol the residual aucleus
94. 5 fr
41.
36.
15 neutrons passed through th^j nucleus witlioui collision; this ttuniber
corresponds closely to that ej*peeted fror^ the total measured cross*
sectioa for neutrons on Pb.
Of the particles erherging with an euerg)r greater than 15 ft eV, 'it?
suffered 1 collision, t : 2 coHisicms. * : 3 collision^i, 4: 4 collisions
i It 5 collisions.
It is iciirtediately evident .hat art abundance of data directly comparable
with experimental results is* produced by the irethod, but it was not u* ! high
speed computers became available tlmt the method could be developec into a
powerful tool, v; th con putors, calculations could be made in three dimensions

for a wide range of nuclear parameters, and enough cases could be followed
to make statistical variations in the results insignificant.
Essentially, the Monte Carlo method for sirutdating nudeon cascade
reaction results consists of following, for a large number of cases, the
progress of a aucleon, and the products of any of its collisions, through a
target nucleus until all the particles of the cascade either have escaped from
the nucleus or have been absorbed by it. Hie complete reaction is split up
into a series of basic parts, and for each part a random selection is made
from a choice of equally probable occurrences; the following steps are usually
taken in reconstructing each cascade:
1. ihe point oi entry otto the nucleus is chosen;
2. the distance ol travel to a collision position is chosen;
3. the position of the collision is examined to see whether or not it, lies
within the nucleus; if it does not, the complete history of the particle
has been followed and its angle and energy aie stored. If it does lie
within the nucleus,then;
4. the nature of the struck particle is chosen (he, n or p, or in more
sophisticated calculations d, t, or etc) together with its vector
momentum;
5. the dynamics of the collision are calculated in the centre of mass
frame of reference and transformed to the laboratory frame;
6. the Paul! principle is applied to see whether or not the collision
constructed in step 5 is "allowed 4 ; both particles must have energies

10
aix>v« the Fermi energy for ih* collision to be allowed. If the
collision Is forbidden, the calculation Is reconrusneed at step 2
and a new distance (iron the collision point) ia chosen, etc;
7. for an allowed collision the histories of the two product particles
are followed;
§, the cascade is followed until all the particles either have escaped
from the nucleus or have been absorbed by it;
K the residual nucleus excitation energy and the case history of the
cascade are stored and the next incident nuclaon ia followed from
step 1.
METROPOLIS et al. (1088), using the Los Alamos "Jtfantoc" computer
ade extensive calculations for cascade reactions for mid eons in the energy
27 J238 range 10f -4C>Q £:eV on nuclei ranging between Al and u . The results
presented were in good agreement with *:tp&runeatal results from photographic
;-»iaic experiments by BEBRVIDIN1 et al. (1&5?) and FRIUDMAN (1456) for Uk
distribution of the number of knocked-out proloiv- and for their angular distri
butions. The excitation energy of the residual nuci ai:, was found to be not
$4 very sensitive to the bombarding energy; for example, for Cu the average
excitation energy of the residual nucleus changes by only 18 MeV for an
incident energy change from 00 MoV to 330 MeV, and the dependence of the
excitation energy on the incident energy also decreases as the mass vm »i>cr
of the target nucleus decreases. Extrapolating the results to a mass number
of 12 gives an excitation energy change of approximately 4 MeV over vir; same

11M , .
energy rang? as quoted for Cu . Total inelastic cross-sections were
found to be independent of tike incident energy for all the nuclei suidied; this
independence was attributed to the eou iXjnaaUBg effects, as the incident energy
increases, of (a) the decreasing Importance of the Pauli principle and hence
the reduction of the mean free path of the nuclcoits in the nucleus, and of
(b) the decreasing nuch on-nttcleon cross-&«&uun. Another interesting result,
64; ^resented for u , was th difference between the excitation energy distributions
for Ihi* residual nuclei left after the knock-out of 0, 1, 2 and :i
respectively. All ih-i distributions were found to im tfaA'weUitt in
except for the case of the single nucleon knock-out reactions for which the
distribution was peaked at *ero excitation energy* The calculated equitation
energy spectra for the reactions (p.p'K (P»2p)» (P»3p) a*** (Pt*P)» initiated by
04 £86 J^eV protons on Cu , ar© reproduced in figure 1.1.
ABATE et al. (1361), following the initial suggestion of COMBE et al,
(1-58, li?55) found that for calculations for ,TM) MtV protons incident on ,
the agreement between calculated results and published resuHs for cascade
reactions could be markedly improved if each cascade nueleon was given a
3 '-4 : ? probability of colliding with an ^-cluster instantaneously formed Inside
the nucleus. The relative strengths of cascades producing different numbers
of charged particles were found to be sensitive to the presence of substructures.
BERTIN1 (16") made several reflnetr eats to the model u;5<d by &~etropoUs
and in particular investigated the effect of non-uniform nucicon density; he used
the nucleon density 4i*trU*ut!on ol>taiaei by KOFSTAOTSH (1 '&) frona electron

0 50
(P,P f )
100 150 200 E* MeV
(P. 2p)
0 50 100 150 200 E* MeV
(p, 3 nucleon)
200 E* MeV
(p,4 nucleon)
50 100 150 200 E* MeV
Fig. 1. 1 Distributions of residual nucleus excitation energies (E*)calculated by Metropolis et al. for various nucleon cascades in Cu64 initiated by 286 MeV protons.

12
scattering experiments, sad found that the main effect in going from a uniform
to a non-uniform nucleon density was doe to the increase la nuclear size when
a diffuse edge is used. Generally, the results were similar to those of
Metropolis. BEBTQVI (13*4) has also calculated the following crocs-sections
for the various cascades in C (Intranuclear clusters were not Included In
the calculations);
Incident proton energy
SO MeV 100 UeV 150 M»V
p.*/P,2pn
P,*J*2a
pt 2p3n
p,2p4n
P.3P
P*3j»
p, 3p2a
p 3p3n
41.2
13.0
0.9
-
-
2. S
0.3
-
«.
mb
mb
mb
mb
mb
48,
27.
4.
0.
'••'.
4.
3.
0.
<
3
8
0
6
3
3
4
6
»
mb
mb
nib
mb
mb
mb
mb
mb
42.7
26.3
10.8
i?. 3
X3
7.4<& *f? + Vf
2.2
6.3
nib
mb
mb
mb
mb
mb
mb
i:t:/L
mb
The probability of the residual nucleus being left with an excitation energy of less than 10 MeV was approximately 37 . for the three incident energies considered.
Monte Carlo calculations on the residual nucleus decay stage of the
12react!ons have been reported in detail only for nuclei much heavier than C
(DO8THOVBK7 et al.l 58) and because of the importance of the Coulomb
barrier effect on the evaporation of particles, the results cannot be loosely
applied to the lighter nuclei. However the general fact did emerge that decay

rs
modes depend upon the nearness of the numbers of neutrons ajiu protons i ht-
residual nuclei to the closed-shell imi jers. Also, the relationship between
the nuiobcr of evaporated articles and the mas" number of the bor,<uar i.t'
nucleus was seen to be very closely Unear from A=*4 to A*23 ; if the imor-
tratzon is extrapolated to A»12, a value is obtained ol between 2 and 3 evaporated
nueleons per reaction.
7HDANOV & FEOOTOV (1 : t>' , U62t 1 t-4) have reported a very inter estuiE
invedUgaiion of the proton-carbon reaction at u.--" ?. .oV. A nuclear emulsion
was loaded with diamond dust (particles of 5-ijji In diameter) and by analysing
those events oecurr iig within the diamond particles a pure sample of proton-
carbon reactions was obta.n- d; thus two of the usual unsa siaciory aspects of
envision expcjrirnents w«iie elindaated, i.e. (a) the profefe of separating tlw
events froiv. heavy and light nuclei and (b) the fact that events from the light
emulsion ancle) (C. K, O) are inseparable aad are presented together. The12 M disiniegratloaa of C were attributed to the various reaction modes m the
proportions shown in the second column of U^ table below.
The t! ole shows that the most probable typt; of disintegration is that
12involving the break up of OEWJ a-parUcle substructure in C (i.e. modes
p, ;jp2a and p, 3pBe).
reaction was analysed using a r'onte Carlo n.otliod for the direci
cascade part of the interaction and a statistical ii,odel calculation
ior the decay oi th*.» residual nucleus. IV c-uscada ealculation was based upon
that oi Abate and -t provided the distribution of residua.1, nuclei, ihe cascade
products and ttie residual nuclei excitation energies.

PC roeniage of total no. of disintegrations
Type of d is integration">: pe r Lnio aud Theore u cal
(P»pa) <H,%/W* IX:,* 1.0 1
1 12.2+1. 11M
T TX V+X-:; 2B
15
11
10
5
4
1
p, 5per
p,p3of
p,2paLip, 3pBep, 2p3ofT*
P, ?Pp, 4pLi
p, Cp«r"
12.
7.
T.
*.
3.
2.1.
' ,
t -f !> 2& * /..••'
04^ 2.0•'• + 2. 0
5 + «.n2+1.0
4 £ n. 8
7 1 0. 7
6 + 0. 5
Protona are detected to energ-ies below 1 !-TeV
The decay part oi the calculation, made analyticftily, was bm»t\i upon
tiiat thf- energy released within tlie aucleus is statiftticaily
amoiag the particles, so tJiat the possible final states appear \%iih frequ«nc!"~
proportional to their statistical weighu. it was found that the prooafrilitics tor
£ I'akea by the authors lro. s other authors' work
/ live .outruns froiu th« ^r^ak«u^ uiv not shown, Tb& p is statcci to a coiieciively for thr »jirt;: -;ly charged j*rticl*»a p,cl,t and T , >ait from the di in thr- 1 64 puj.\;r it -.uve^s ihat tbu oaly >i »ortant contriijutiuft eoincui fror. the
; however ilu> point is iwt macte clear.

u
different decay erodes were very sensitive to the excitation energy off the
residual nucleus and to the Ending energy corresponding to the given decay,
and that the stability of the rc-ijartcJo played a dominant role IB determining
the pattern of the decay (of. >o3irovsky'» results). By combining the cascade
calculation results with the decay mode results to form cross-sections of the
type shown n the last section, the relative yields for the various overall reaction
types were obtained; these are shown in the third eoluirn of the table. The
agreement with Uie exper rccntal results Is very good and in particular the
experimentally determined dominance of the p, 3p£cr (and p, 3pBe) reactions is
accounted for.M
The weak dependence of ih* residual nucleus excitation energy on t&e
energy of the incident nucleens (Metropolis results) suggests that he results 01
Zhdanov & Fedotov should be applicable, at least qualitatively, to the experi-
mental results at 5 >-l30 ^eV of the present
12 111.4 The quasi^cla&tic C (p.?p)B reacUoa
This reaction is an example of tbe sitrplefit possible type of cascade
reaction; the Incoming nucleon collides with one target nucleon only and both
nucleate leave the nucleus Without any further interactions. This picture of
the interaction has befin i'ormalr-'cd in the Impulse Apura; < lajUiozi, and
to the Independent Particle Shell Model of the nucleus, in which each nuci on is
pictured as moving independently m the average f oi ! created by the presence?
of ail the other nuctoons, the momentum oi the recoiling residual nucleus will

16
be equal and opposite to the momentum that the target proton possesses when
it is struck, Ifei* follows from the fact that the target nucleus a* a whole la
at rest. Therefore the recoil nucleus moms mm distribution, when corrected
for kinematics! phase space affects ahouid yield the nucieon moa*,-muiu distri
bution lor the large! nucleus. Also, following from the Independent Pamela
lecture, each aucleon of the nucleus lies in a discrete energy suue in the
nuclear potential well BO that the energy loss in the reaction reflects the
occupation of &e various energy--suues oi the nucleus.
That these sa^vifr nouona of the nucleus and *h>: iuicieon^auoleus later*
actions are broadly correct has been shown by ; xany experimenters. For
^vample, ia the work of TTOEN et al.(l&58) at 185 MeV, GOODING Si PUGH
(L>6 >) at 150 MeV, and GARRON et al. (1^62) at 153 J5eV, the energy loss
T Id distributions obtained from (p. 2p) reactions on ancle! from LI lo Ca showed
^piite distinctly the presence of discrete energy levels within the nucleus. It is
found that the experimental peaks can be understood very well In terms of the
extreru1 Jj-coupllng shell rv»odel ; the peakf for nuclei of mass nunirjers (A)
less than 12 correapood to the knockout oi s-sheli oucleons and p y -shell•J/Z
nucieons, and for nuclei v,ith A> 12, the knockout of s , , p.%/ and p x*/•* -»/ ~ 1/2
nucleons. Also, the nocleon iv,o,n.t»nUim d^iributiowi derived \\--i^ the recoil
CLFGG (1 i> ) has shown that, although a state of intermediate ASPI ns midwayn the jj-couirilng T .odei and the l^S-coupling r,oi_i preva'i ? m ih* Ip-oh&H, prvf-vrties ol ibu. nucleus can ue ccns^^nijy clo:>e to wUu U» exj>ecU?d
fror one of the extreme coaling «<-h

17
nucleus data by maay authors, e.g. WATTENBERG at al. (Iv56). CLAOLS et ml.
(135*), MeEWEN etal. U *7). AZHGIEEI at al. (IftSb), DOWELLatal. U? ̂ 0),
ANDER3ON It We KENZIE <iy«>0) are approximately the same as those expected
from oucieoas ia a potential well of the harmonic oscillator type (in general,
Gausaian momentum distributions with l/e valuaa corresponding to nucieon
energies in the range 10*20 MeV ware reported).
At first sight U is difficult to reconcile the success of the
Part.cle I'odol, which suggests the e^isu^c of weak ioag-raitga
forces, with the well known experimental fact that the forces between are vary atroi^ ahort-range fareea/ BRUECKN::! and co-workc-r« (1,55) have
greatly clarified this paradox by showing that, starting from the 2-body inter-
nucleon poiamtiala, it is possible to introduce a mathematical tranafornation
that allows a nuclear po&ntial to be derived by self-consistent methods similar
to those used for atomic electrons by HABTREE (1-28), TTie derive! potential
is very similar to the refined shell model potentials, the parts of the inter-
nucleon potentials not incorporated into the nuclear potential representation
give rise to second-order "reaidual nieractioa; ri . Hie result ts that the
independent ''particlesn deacribed by the model are very nucieon-like for a
wide range of observations.
^ The evidence for ibe persistence of the strong internueleon forces when the nucleons art within nttclear ti&iter co :,ea frotx* ueuunan pick-Hip reactions, fror.. nieson capture from low Bohr orbits in the ato^., from the nuclear effcct at high energies <rfrom aucleoii-r,uci«jon hueractioma (ae« Bu

18
Because of the presence of the residual interactions in the nucleus itself,
the quasi-elastic reactions do not lead exclusively to single-particle shell model
states in the product nucleus: they also lead to other states close to the single-
particle states. la th« energy-loss distribution studies, the presence of these
secondary transitions is usually masked by the resolution width of the dominant
single-particle peak. However, CLEGGetal. (1361) and AUSTIN et si. (1962)
have
12
radiation from their decays. Tney found that die ground state of the residual
nucleus was produced only 80% of the time and that states of spin 3/2", 5/2"
and 7/2~ were also produced; the cross-sections found for the feeding of these
states m B are shown below:
the relative feeding of excited states of the residual nuclei from
11 12 11&*»d C (p,pn)C reactions at 15o &-&V by observing the gamma-
l/2~ at 2. 14 MeV
5/2" at 4. 46 MeV
3/2* at 5. 04 MeV
7/2*, l/2*t 3/2* at
6.48 and 6.34 MeV
5/2* at 7.3
Cross-section (ni relative to 1/2* state
0. 98
0. 54 + 0. 11
0. 49 + 0. 13
0,36 + 0.12
* 0. 3
higher bound states v . 15
According to calculations by GOSWAMI & PAL (1 63), admixtures into the pure
shell12 ground state of C from f particle-? hole configurations might account
for as much as 35 of the intensity of the state.

13
the branching ratios to states ol BU t fed in the quasi-elastic C (p,2p)B
reaction, give information about the details of the C12 ground state waveftmetioa.
Using the fractional parenfege concept as proposed by LAN8 & WILKINSON (1
the C ground state waveftroetton can be written in terms of the states of the
parent nucleus (B in this case) and the knocked-out particle. When a proton
12 11 Is cleanly knocked oat ol C , the various states of B will be produced
12 according to the extent to which they contribute to the C g. s. waveftascUoa
expansion.
However, the Interpretation of experimental results in terms of the
parentage concept is beset with difficul ties. For, example, the excited states
ol the residual nucleus can also be produced via initial and final ataic later -
12actions: in aa initial state interaction, for example, an excited state of C
could first be produced, and £h@ subsequent feeding 01 the B excited states
by the Knock-out oi' ana proton fro., the- excited system will reflect the
1? 12expansion of the C excited state ami not the C g. s., These difficulties have
been encountered in the present experiment and they are discussed in chapter 8
in relation to the experimental results.
The limitations of the Impulse Approximation are also met in the analysis
ol chapter 8. The high momentum component in the nucieon momentum distri
bution, associated with correlations within the nucleus, cannot be properly probed
by the nttcleon knock-out type ol experiment (at least, not by an Impulse Apj.rox-
imation analysis of the results). The inadequacy of the Approximation has been
discussed by GOTTFHIED (1 t>3). In a qualitative approach he visualised the

20
nudeon motion within the nucleus aa being something like that shown in the
full-line trajectory below.
For most of the tiiae the nucleon Shaves according to the shell model picture
and receives only small momentum transfers from the other nucleus: its
trajectory is therefore smooth. Occasionally» however, the nucleon approaches
another oueleon closely ami undergoes a strong acceleration to a high momentum,
these correlation effects are represented by the kinks on the trajectory drawn,
la the shell model, the eucleon trajectory would be represented by the dotted
curve, which la a good approximation to the slowly varying parts of the actual
trajectory but a very poor approximation indeed to the kinked parts. The
Impulse Approximation for a collision amounts to the replacement of the actual
trajectory by its tangent at the time 01 collision, but in fact, because of iht
finite extent of the incident particle's ci« Broglui wavelength, the average
>>ehavlour of the- target nudeon o/er the tin e of the reaction is observed.
The difference between the nwcleon motion represented by the tangent to th«
track and die motion represented by the average behaviour of the nucleon over

21
a finite path length is sraall for the smooth (shell model) parts of the trajectory
bat is burg* and arbitrary for the kinked parts of the trajectory. Th& Impulse
Approximation analysis therefore ceases to be of use In probing the higher
momentum components of the nuoleon momentum distribution. However, it is
to be expected that as the energy of the incident nucleon increases and its
de Broglie wavelength decreases* it should be possible to detect more of any
high momentum component present than at the lower Incident energies. In the
current experiment with an Incident energy spread of 53-13'' MeV this effect
might be detectable.
1. S I imitations of the apparatus
There are several important implications in the use of a propane bubble
chamber for nuclear structure experiments; those relevant to the present study
are summarised below.
1. The energy of the incident proton beam when it enters the illuminated
region of the ohamber is approximately 130 MeY, and when it leaves is
approximately 25 MeV; the events recorded are therefore for this range
of incident proton energies. Events in any energy range within these
lindts can be selected for analysis by considering events in the relevant
part of the chamber. Ideally, seta of tnforrr ation should be collected for
unique energies or at least for very limited ranges of energy, However,
because the requirement for a limited energy range conflicts with the
requirement for good statistics, it is necessary to analyse the data in as

nlarge an energy slice as possible. This is determined by the range over
which the mechanism being studied can be assumed not to undergo any
radical change.
2. Tile uncertainty in the measured energy of the beam increases as the beam
traverses the propai^e and loses energy. This arises from:
(a) the statistical nature of tfct slowing down process, and
(b) the magnification of any energy spread present in the original beam.
The former process is uncontrollable, but the effect of the latter can be
minimised by giv ng careful attention to the optics of the proton beam between
the cyclotron and the bubble chamber.
123. Although there are more neutrons than protons ejected from the C nucleus
whoa it is bombarded with high energy protons, the bubble chamber does not
detect the uncharged neutrons. The loss of information because of this is the
major source of difficulty in the analysis of the non p-shell 2-proag carbon
events and of all the 3-prong and 4-prong events.
4. A further concealing factor is that particles of different charge do not give
rise to dlstinguishahly different tracks in the propane. However the range-
energy reiatioaship Cor die particles in propaoo does depend upon their mass
and their charge. Hie presence of deuterons, «-partides etc., can therefore
oaiy be inferred from kinsniatlcal filUng procedures, which are always compli
cated by the possible presence of neutrons.
5. Ifee lowest energy particle that can be detected U that which produces cme
bubble in the propane, and even these particles will be difficult to detect because
23
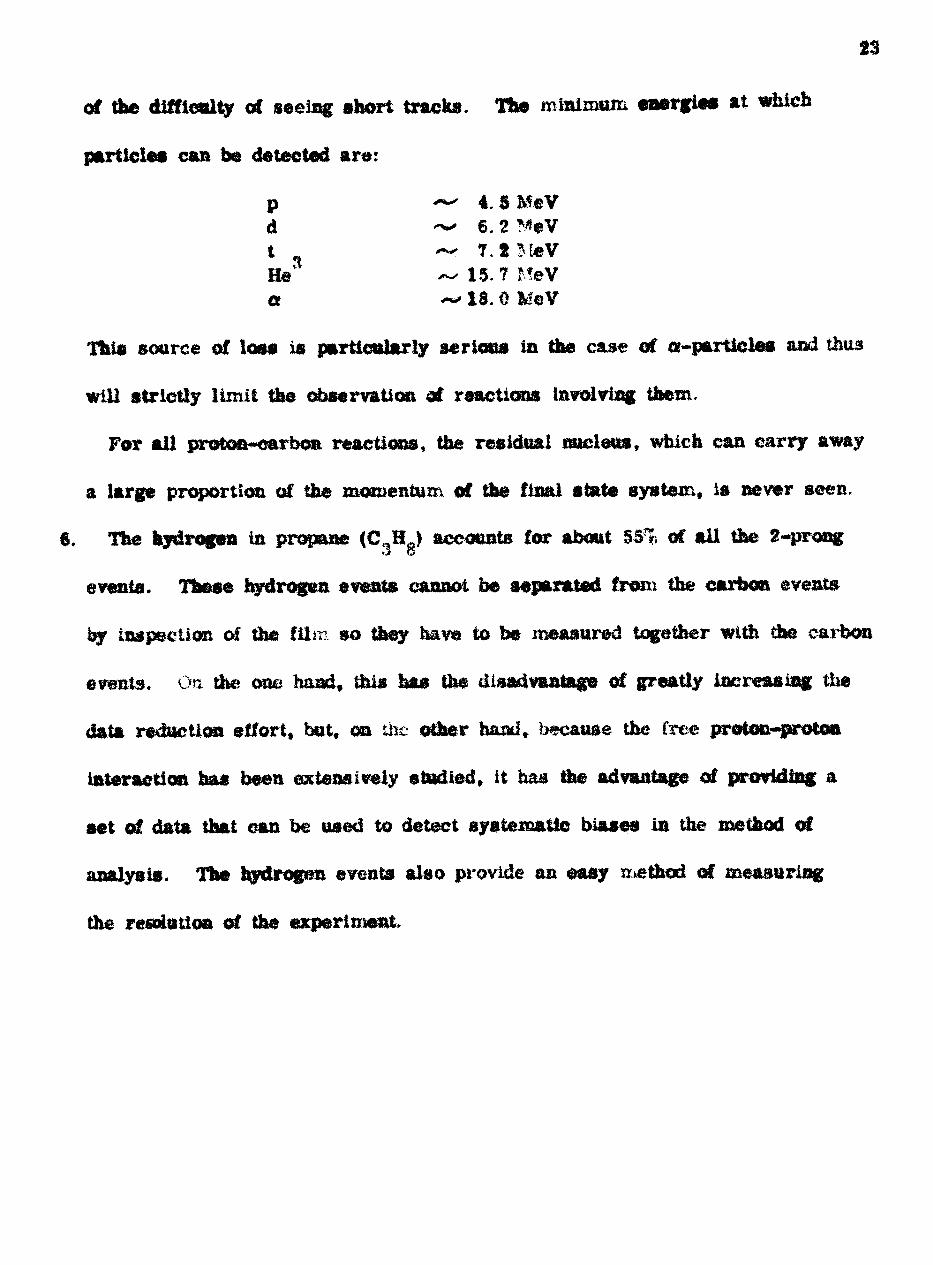
of the difficulty of seeing short tracks. The minimum energies at which
particle* can be detected are:
pd *** 6. 2 t . He* ~ 15. 7 MeVa ^ 18. 0 MeV
tills scarce of loss is particularly serious in the case of a-partielea and thus
will strictly limit the observation of reactions Involving them.
For ai! proton-carbon reactions, the residual nucleus, which can carry away
a large proportion of the momentum of the final state system, is never seen.
$, The hydrogen in propane (C-.HJ accounts for about §5% of ail the 2-prong 3 o
events. These hydrogen events cannot be separated from the carbon events
by inspection of the film so they have to be measured together with die carbon
events. On the oae hand, this has the disadvantage of greatly increasing the
data reduction effort, but, on the other hand, because the tree proton-proton
interaction has beea extensively studied, it has the advantage of providing a
set of data that can be used to detect systematic biases la the method of
analysis. The hydrogon events also provide OB easy n ethod of measuring
the resolution of the experiment

Part 2 Experimental details and
data reduction processes
14
CHAPTER 2
THE TWEI-VE-mCH PROPANE BUBBLE CHAMBER
2.1 Bubble chambers
Development work on babble chambers progressed very rapidly after
the observation &y GLASEB (1952) that superheated liquids were sensitive
to the passage of ionizing radiation. The chambers with dimensions of
several metres, which are now being used for elementary partieie physics,
have been developed from the early chambers with dimensions of the order
of centimetres only. A 12-inch propane chamber is large enough for nuclear
structure experiments at ICO M«V. Gluser's own work, together with that of
later developers, is now wall documented in review articles, e.g. PKETTEH
(1955), DODD (1J5£), BUGG (Iu5,) and HRADNEIl (1900).
In the present experiment the propane chamber provides both the carbon
target and the means of detecting the charged reaction products. The des
cription of the 12-inch chamber given in this chapter is not exhaustive, bet
emphasis has been placed on those aspects of the design that differ from the
4-iach chamber described by Me KENZZE (I960) and ANDKRSQN (1060), and
also on those aspects that gave rise to difficulties.
A general view of the chamber, from the beam-entry side, is shown
in plate I, and a view of the optical system from the other side of the
chamber can be seen in plate HI.

Plate I
A general view of the bubble chamber,
The gas bottles in the background are not part of the
apparatus.


25
2.2 Hie chamber body
The proton energy of the beam extracted from the Harwell synehro-
cyclotron is approximately 153 MeV; alter the protons have passed through
the durai beam entry window of the chamber their energy is 1-7 MeV. The
window-volume of the chamber (12 x sr x «r) was designed to allow all the
charged reaction products from (p,H) and (p,C ) reactions to be stopped
by the propane.*1
Figure 2.1 shows a section through the chamber body parallel to the
wall containing the beam entry window. The latter, placed centrally in one
of the 3* x 9" sides of the chamber, was made by machining down an area
V x 2" from the nominal wall thickness of 3" to 4*. To discourage turbulence
and local boding during the expansion of the chamber, the internal faces are
polished and all edges smoothly rounded-off.f
The windows are of lj* 'armourplate' glass and are located in recesses
in the 12 & §" sides of the body, each window is clamped to the body by a
2 thick dural frame secured with 36 S/16 higb tensile non-magnetic steel
bolts* Sealing is effected by Gftco K>' rings and the glass is further protected
against any contact with metal by 1/16" neoprene strips* From the approx
imate design formula, quoted by Btigg, for toughened glass;-
84,000 t * p.A.f
All asterisks In this chapter refer to appendix I, where more technical details are given.

no
a
^isodiaoo dG
jo ooniffod j-
!'"> CO! 1'- ^O'.i ?T • ' t T 4 V*
D
,fl M
X
H
01

EXHAUST-
TO HP RESERVOIRI
V
TO CHAMBER
POSNA
TOHJ? RESERVOIR I
EXHAUST ^f»-oL. T~-
J~V
TO'CHAMBER
I
POSN B
FIG.2J CROSS-SECTIONAL VIEW OF CHAMBER BODY

26
Where t - glass thickness (ins)
p » pressure difference across window (Ibe/sq.ia)
A * area over which pressure acts (aq. ins)
and t * factor of safety
it is seen that the design allows for a faetar of safety of approximately 4.
Clamped into one of the window frames and sealed with aa 'O' ring is
a piaao-coavex polished parspex condensing lens. The apace between the lens
and the window is filled with paraffin, which, with a refractive index of 1.43
at 6-? c, reduces optical discontinuities and leads to more efficient chamber
illumination.
In the opposite wall from the beam entry window there is a hole
mounted on the outside by a doubly sealing tap* this serves as a filling and
evacuating line.
Twenty-four screws anchor the block to the baseplate which is, in turn,
held rigidly to the mounting framework. Between the two, held by an 'O'
ring seal, is the impervious membrane that isolates the propane from the
high pressure air of the expansion system.
The total volume of propane in the chamber is 1$ litres and the visible
volume is 16 litres.
2.3 Temperature control
Sensitivity of superheated propane to ionising radiation occurs at
temperatures in the region of 60°C. To maintain the chamber at a fixed
temperature in this region a surface of electrical heating elements is clamped

27
to three outside faces of the block (see plates I * HI). To counterbalance
the greater heat loss from the lower part of the chamber, caused by losses
to the unheated base plates and the supporting framework, the lower elements
of the side healers are designed to dissipate more power than the upper
elements.
The power to the heaters is supplied in two parts. A steady base-load
power slightly less than that required to balance the heat lost to the air is
supplied from the mains via a variac, and the remainder is supplied through
a control unit operated by an A.C. bridge. A thermistor, located on the top
of the chamber forms one arm of the bridge and the circuit is designed to
switch the extra power to the heaters whenever the temperature at the
thermistor drops below the predetermined control value.
To guard against any fault leading to overheating of the propane and
consequent dangerous rise in pressure, a modified Bourdon pressure gauge
is connected to the propane *a the filling tap. This gauge is supplied with
an electrical circuit designed to blow the heater fuses and give an audible
alarm if the propane pressure rises above 550p.a.i.g.
Comment on, the performance _Qf the heating;_ unit
During the experimental run this part of the apparatus gave a consid
erable amount of trouble. Temperature oscillation* were occasionally set
up in the propane and these were sometimes large enough to cause a loss
of sensitivity and a temporary halt in photography. These were usually
initiated by large ambient temperature changes in the experimental area when,

28
due to the surface heating and control of the babble chamber temperature,
the propane conditions got oat of phase with the surface conditions. Hate H
shows an example of the phenomenon of foaming which occurred in one of
these extreme oscillations*
A better method of temperature coatroi for a chamber of this sice has
been indicated recently by the very successful scheme designed for the Oxford
Frcon Chamber. This used a water circuit within the walls of the chamber
fed from a thermostatically controlled reservoir.
2.4 Expansion mechanism
Ytith a chamber of the present dimensions an expansion mechanism of
very an,all intrinsic inertia is required to ensure the rapid expansion and
recompression of the propane. Rapid expansion is required to prevent the
chamber from partially reeompressiag itself by gasket boiling etc. which
would prevent the achievement of sensitivity. Rapid recompression is
needed to squash-out all the gas bubbles formed, before they have time to
coalesce and collect at the top of the chamber. A large bubble at the top
takes a few seconds to condense due to the absence of an efficient thermal
sink and it also leads to a concentration of heat at the top of the chamber;
these effects would result in an interruption of the continuous operation of
the chamber. A piston-operated expansion mechanism of the type used in
the r chamber has too high an inertia.
3y using a strong membrane to seal off the propane and by connecting
a high pressure sir supply through a rapid action 3-port valve to a supply port

Ftate I!
An example of foaming in the chamber.
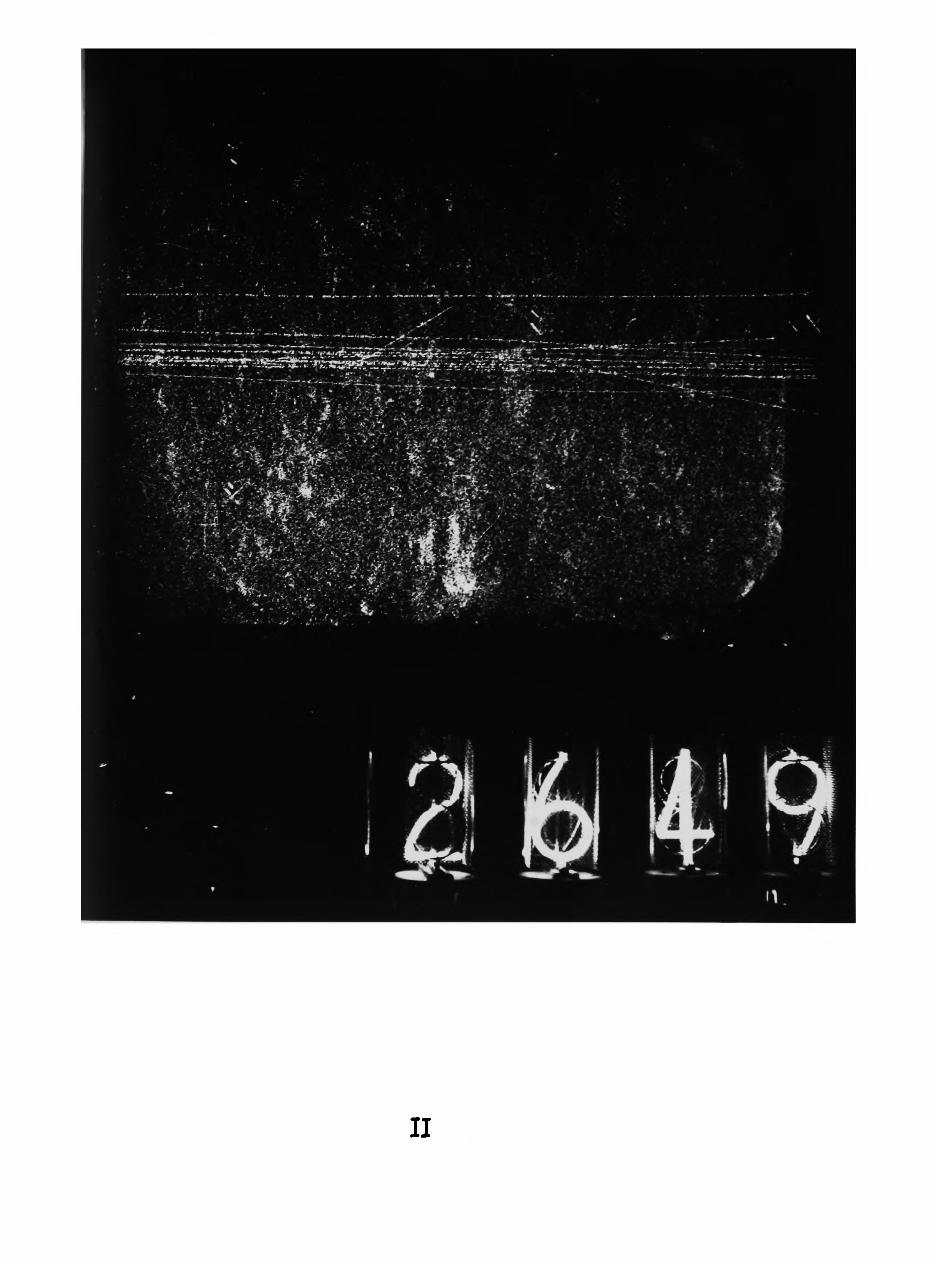
II

29
beneath the membrane, a very low inertia system is obtained. The two
positions of the valve are shown ai the bottom of figure 2.1. The normal
de-energised state of the valve (position B) keeps the propane at the air
reservoir pressure (about lOOp. s.i. above its a.v.p.). For 8*® duration
of the expansion pulse the fmlve is energised and switched to position A
which isolates the fas reservoir and releases the high pressure air pocket
trader the diaphragm to the atmosphere. The propane expansion speed Is
limited only by the inertia of the propane-membrane-air system which is
negligible; the membrane very rapidly hits the baseplate and the expanded
propane is in its superheated sensitive state* After about 5 msecs the
chamber starts to recompress itself, relatively slowly, by gasket boiling ete.
until the valve is de-energised to position B again and the propane is very
rapidly recompressed to the air reservoir pressure. The total sensitive
time can be controlled very easily from zero up to appro*. 10 msecs by
varying a resistor in the expansion pulse-width control unit (see section 2.8).*2
Gompregagd air lit supplied by ft two-stage heavy-duty compressor
fitted with a blow-off valve which is operated by a pressure controlling
device connected to the air reservoir on the bubble chamber assembly.
To vary the overpressure in the chamber it is only necessary to change the
setting of the control meter. Because of the extremely loud report made by
the expanding gas when it escapes freely from the valve, die exhaust port of
the valve is connected to a silencing system comprising a gas bottle and a
lorry silencer.
30
The valve used is a magnetic Barksdale valve . In order to obtain
a very rapid action from this valve, which has a specified running voltage
of 250 volts, an initial power surge of 860 volts is used for the switching
operation.
The membrane consists of two parts: a 5 thou melinex sheet and a
1/8 doubly rayon reinforced butyl rubber sheet. In Hie first design this
v/as clamped between the body of the chamber and a flat base-plat* (BP1 in
fig. ?.l) but during a prolonged test oi the chamber the membrane fractured
after so^ne lu,000 expansions. The probable cause for this was the inelasticity
of the melinex; thus, after the first few expansions it maintained its bowed -up
surface area so that on each subsequent expansion it folded up on hitting the
baa e -plate (when the chamber was dismantled the membrane was found to be
split along a very pronounced crease). To increase this un&cceptably short
maintenance-free running tin*e the base-plate was modified by the addition of
a hollowed-out slab of dural (BP2 in fig. 2.1) with a surface area equal
approximately to the bowed-tip area oi the membrane. On expansion oi the
chamber the membrane then lay smoothly in contact with the base-plate.
This system underwent some 60,000 expansions without showing any sign of
deterioration.
2.5 Otical
Following the successful photography of the 4" chamber, a similar but
acaied-up version of its dark field illumination system was designed for the
12' chairiber. Plate III shows the components of the optical system and

Plate
Component ol the optical system

lighsource
bubble chamber
camera
Fig 2.2

o

31 figure 3.2 shows diagrams atieally the marginal rays from the light source
to the camera front The position of the camera assembly is dictated by the need for a demagnificatioa of approximately 1$ from die object space to the film. The position of the flash box on the principal axis of the condensing lens is determined by the need to illuminate as much of the window volume
of the chamber as possible and yet to Inhibit the entry of stray light into
the cameras. With an ideal optical system the image of the fiash could lie only J« t within the lenses on the camera front, but because of the distortion in the very thick condensing lens and reflection from the cut-away skies of the lens it was found that the maximum permissible image radius was 2" compared with tile Ideal radius of 6.3'. Under these conditions the central plane of the chamber, parallel to the windows, has an unilluminated peripheral region of t" wide at the top and bottom and 3/1' wide at the two sides. The condensing
lens was highly polished and the windows were kept clean and free ol abrasions. On the outside faces of the windows sets of fiducial marks were etched with hydrofluoric acid: Andrew Crosses on the window nearest to the cameras and
George Crosses on the other window. The relative positions of these were carefully measured when the chamber was assembled and their images are used in the geometrical reconstruction of the events phctographed in the
chamber (see chapter 5).
There are no shutters on the cameras and during operation an intense flash of light is timed to occur shortly after the nucieation of boiling along the paths of the charged particles; the time delay between the pulse of protons
32
from the cyclotron and the flash is variable so that optimum quality tracks
can be obtained and maintained* ideally, the cameras should record only
die images of the bubble tracks and the fiducial marks both of which scatter
ligM out of the main cone of light shown in figure 2.2, but a certain amount
of stray light also enters the cameras. It was discovered that much of this
stray light was due to double reflection from the camera front and the bubble
chamber window. Liberal use of black non-reflecting paint reduced the back
ground light to an acceptably low value.*7
Tfe light source used is a G.E.C. high duty flash tube which gives
a good paint source of light and is mounted at the centre of curvature of a
small concave mirror. To obtain a sufficiently intense beam of light from
this arrangement it is found necessary to discharge through the tube a 60yuF
capacitance charged to 2.5 KV. At this rating the use&l life of each tube is
10,600 cycles. The condensers making up the COyuF cannot be mounted with
the remainder of the flash tube circuitry because the voltage drop in the
connecting cable then dissipates most of the available power; they are mounted
behind the flash tube in the box that can be seen in plate in. The Hash is
produced by the breakdown of the tube resistance, effected by a 100 KV pulse
fed from a pulse transformer onto a tickler electrode coiled around the tube.
Tne earner^ is mounted on a supporting framework (see plate I) and is
provided with thfee levelling screws to allow the front of it to be set*8accurately parallel to the windows of the bubble chamber. Three lenses
are carried on the front plate which can be moved with respect to the main

33
assembly for focossing purposes. Behind each lens is mounted a cassette*§ which can hold a 100 ft reel of 35 mm film , enough for 2,400 exposures.
A mechanism is provided for winding-on the film and for clamping it In the
local plane of the lens before each exposure. The operation of the camera
is controlled by a square wave pulse from a relay ID the control unit.
Approximate focuaaing was performed by viewing the chamber through
the back of a dummy cassette aol more accurate focussing was then achieved
by a series of photographs. The focus condition ehosen was that with back
and front fiducial marks out of focus to approximately the same degree.
The leas aperture was set at ffO; this was determined Joy the usual
process of compromise between depth of focus limitations and diffraction
limitations. The calculation is shown IB Appendix 0.
1.6 Frame numbering counter
tile use of an illuminated post office counter mourned adjacent *o the
frost window of the chamber proved unsuccessful in giving discernible images
oa the films. Since the camera had not bees designed for a back projection
svstem in which the image of a small counter is projected directly onto the
films through the backs of the cassettes, it was decided to build a self-
illuminating electrical counter with a separable display unit of large digits
which could be mounted immediately above the chamber window.*lo The basic unit of the display panel is a digltrom tube . Five tabes
are shown mounted in the display unit in plate IVa. Each tube has ten
separately Insulated one-inch high wire cathodes in the shape of the digits

Hate IV
The frame numbering counter
(a) die display panel
(b) the uniselector counting circuit

IVb
IVa Fig. 2.3

34
0 to 8 surrounded by a wire mesh anode. The cathodes are connected via
two 26-eored cables to the counting unit and the anodes are supplied from
an unsmoothed 250 volt power pack. An earthed cathode glows red due to
a cold discharge in the tube. Figure t.S shows dtagraminaticaliy how one
unit can be made to count' from 0 to $,
The counting circuit itself comprises five 25-way, 4«feank uniselectors,
each operated through two parallel 3? ohm coils from an unsmoothed 30 volt
supply. It is shown in plate IVb. The circuit diagram is shown in
figure 2.4.
A square-wave pulse from the camera coincides exactly with the film
wind-on. The leading edge of this pulge closes relay R, disconnecting the
digitron cathodes from earth (via bank 1 - the outside bank in diagram), and
the illumination ceases. When die film has wound-on the trailing edge of the
pulse moves on the first uniselector arm by one position and simultaneously
re-earths the cathodes; the display is now re*illuminated and shows the new
aumber. On receipt of each tenth pulse, the arms sweep around to the zero
position due to the action through the second banks as they do this a pulse is
fed, via bank 3, to the next uniselector, which then moves on one position.
On receipt of every hundredth pulse, both the first and second selectors
return to tero and the third moves on one position; and so on. The con
tinuous bank (number 4) allows for the manual reset of each decade to xero.
The quality of the tniage can be seen in plate HI; it facilitates quick
recognition of frames and in this respect is superior to any other frame
numbering seen by the author.

FIG
.24
UN
ISE
LELE
CTO
R
DE
CA
DE
CO
UN
TE
R

2.7 fhe chassis
All the components described, with the exception of the compressed air
supply and control units, are mounted on a welded steel trolley, which also
carries the pipe and tap system necessary for the various air and propane
transfer operation*. It is 39" high, has base dimensions of 30' x 63'
tapering to top dimensions of I$" x 5T and is constructed from 3/8", 4" x 3'
angled steel. It can <gnite easily be lifted in and oat of the experimental area
by crane,,which enables all preparatory work to be done in a radiation-iree
tone while the cyclotron is in operation.
2.8 Electronic control unit
For the successHtl operation of the babble chamber assembly, the
propane must be in a superheated state at the precise time that a proton
pulse is delivered from the cyclotron, the illuminating flash (which acts as
the earner a shutter) must occur when the hubbies of the proton tracks are at
a suitable site, the propane must then be reea;»pres@€d before much aparious
boiling can take place» the cameras must wind-on the films ready for the next
exposure, and finally the frame numbering device must be advanced by one
unit. The organisation of iais cycle of operations is carried out by the
transistorised control unit, which consists essentially of a collection of pulse
generating circuits and variable delay circuits. Figure 2.5 shows a block
diagram of the unit aad figure 2.6 shows the timt sequence of the more
important pulses from the unit in relation to the sensitive period of the
chamber.

JUUUCYCLOTRON RF. PULSES
GATEu.v.
M.V.**
±r
R.F.AMP
4
B-PHASEDA-UNPHASED\ \ C-SINGLE
REPETITION RATE CONTROL
'x, SINGLEPULSEUNIT
Xu.v.
DELAY Xu.v. DELAY
FIRST DELAY
-TL
Xu.v.J~L
-f-vt PULSE SELECTOR
OSCILLOSCOPETRIGGER
PULSE
JL
EXPANSIONPULSE WIDTH
CONTROL
CYC. R.E PULSES
TO EXPANSION VfcLVE CONTROL
FINE DELAY
UNPHASED \ /
•t-V* PULSE SELECTOR
POWER PULSE TO CAMERA WIND-ON
MECHANISMTO FLASH
CONTROL UNIT
represent* a1 variable delay
FIG. 2 5 BLOCK DIAGRAM OF CONTROL UNIT

r
A
Jl
1
KEY
A Cyclotron R. F. pulses B Gate to accept a pulse
to initiate B.C. cycle C Accepted and amplified
pulseD First delay E Trigger to expansion
pulse-width circuit F Pulse to expansion valve G Propane pressure pulse
H I
K L M
N
A
B
C DE
G
H I
JK L M
N
Flash gate delayGate in the sensitiveperiod of B. C.Pulse coincident with therequired proton pulseFlashdelayTrigger to flash control unitFixed delay to camera-controlrelayCamera wind-on pulse
Fig. 2. 6 Schematic sequence of pulses and delays for operating the bubble chamber in the proton beam.

36
There are three possible mod** of operation of the unit, corresponding
to the positions A, B and C of the switch shown above the first delay unit in
figure 2. 5. For operation in phase with the cyclotron, ui$es from the latter**
radio frequency generator, in phase with the proton poises, are accepted
position B* For testing purposes it is possible to cycle the trait
either continuously with pulses fidm ihz pulse generating nautiyibrator unit
through position A, or singly by push-button in an uni vibrato* circuit through
position C. For both phased and unphased continuous operation the repetition
rate of the cycle is controlled by a setting on the multivibrator circuit.
Because of the Instabilities in the propane temperature (discussed in
section 2.3) the bubble growth rate tended to vary during the experimental
run and in order to photograph the tracks at their optimum quality, the time
deiay between the proton pulse and the light flash (delay (K) in fig. 2.6) had
to be adjusted occasionally.
2.9 Preparation and operation of the bubble chamber
On assembling the chamber body, great care was taken to clean
thorou^Uy aii internal surfaces. Any dust and grease left in the chamber
would give rise to scattered light, which would decrease the quality of the
photographs. Before fiiiing the chamber with propane, a water pressure test
was performed up to 80, p. $. i. , twice the pressure to be applied to the
projaane. This tested the safety of the apparatus wd the sealing at all of
the '€>* rings.
Propane reacts with water to form the insoluble hydride, the presence

37
of this would destroy, or at least reduce, the transparency of the liquid.
Therefore when the chamber had been dra.ncu after the pressure test it was
vaeuun.~pun.ped to remove ail traces of water. When the chamber was dry,
a propane reservoir was connected to Hie tilling tap via a drying bottle
containing silica gel; the chamber was kept at room temperature and the
reservoir was heated to distil the propane into the chamber. The filling tap
was closed when the liquid level was within 1" of the top of the chamber and
the propane was heated to its controlling temperature
The optimum running conditions were found to be:
temperature 62°C (S. V. P. 330 p. s. i.)
overpressure 90 p. s. i.
volume expansion ratio *- 3%
repetition rate 15 expansions/min.
expansion pulse width 30 msecs.
flash delay time 1 msec.
A bebble density of ? to 25 bubbles/cm was obtained under these
conditions.

38
HARWELL SYNggHQCYCI QTOON. THE FEQTON BEAM, AND
THE EXPOSURE OF THE BTJBB1 E CHAKBEK
3.1 The
The Harwell synchrocyclotron, built in 1M£, la of conventional dea.gn;
tt has been described ia detail by ADAMS & EDMUNDS (1 50) and by
PICKAVANCE & CASSELS (1 52). Protons, produced by a pulsed hydrogen
gas discharge at the centre of the dees, are accelerated by a & kv radio
frequency voltage until they strike a tungsten target at a radius of 4.? inches.
The extracted beam comprises those protons that scatter from the target into
file magnetically shielded extraction channel.
At the extraction radius the circulating beam has 1 inch radial oscillations
about its stable orbit, and therefore the energy of the protons that strike the
target ia the cyclotron energy corresponding to a stable orbit radius of 43
inches,
This is given byf 9 * 2 tT * ?E T - e H r c * I' o
where r U; the radius of extraction
H is the magnetic field at this radius
£ is the rest mass energy of the proton
and T is the kiaetic energy of the protons at the radius r.
At a radius of 48 inches the cyclotron magnetic field i& 15, SCO gauss

39
giving the energy of the circulating proton beam as 164 &eV. The tungsten
target degrades the energy to 134 MeV and a further 0. 5 MeV is lost along
the transport system because of the presence of mylar windows and air gaps.
A beam energy in the region of 153. 6 MeV is therefore expected at the bubble
chamber. la fact, a value of XSJ+o. 1 MeV was deduced from the range tele
scope measurement, reported in section .. , and a value of 132*1. 5 MeV
was dedaced from the measurements on stopping tracks, reported in section
5.5,
1!? The internal beam strength of 6 x 10 protons/sec (U»A) is reduced toa
10 protons/sec by the extraction process. This full beam strength was used
for all the experiments on the beam, but for the bubble chamber run the
beam strength was reduced to approximately 10 protons/sec (-€ protons/poise).
3.2 The external proton beam
There are four important conditions that the beam most meet.
1, The proton flux must be stable at a level giving to 10 protons per pulse.
?. The proton pulses must be short compared with the growth time of the
bubbles in the propane.
3. At the entry plane to the bubble chamber the beam must be coliimated
so that the protons are well spread out in the plane parallel to the
chamber windows. This makes it possible to see from the photographs
exactly what happens to each proton as it traverses the chamber.
4. There mast be a smaU energy spread in the beam.
Condition £ is dealt with n the next section, and conditions 1 and 2 in

40
section 3.4. Here the requirements on the spread of proton energies in the
beam are discussed,
The beam energy spread
The successful separation of the events representing proton~&ydrogen
interactions from those representing proton-carbon interactions, and the
subsequent separation of carbon events representing the direct knock-out of
a p~sheli proton from the other carbon events is of extreme importance.
For •atampliu even a small contamination of the p-shell events by hydrogen
events would seriously distort the measured p~aheii nacleon momentum
distribution.
The classification of an event into one of the various reaction hypotheses
is baatd upon the en$rgy-4os# (E ) measured for the reaction. Thin ia given
by;
= £ «•» 4* E« - ]£..L
where Eo is the energy of the incoming proton
Ej ia the energy of the i^ outgoing proton
and E£ ia the energy carried away by the residual nucleus
(calculated from the momentum unbalance in the reaction)
Th* energies EO and Ej are calculated from the measured residual ranges
of the particles; the uncertainties in these energies determine the resolution
obtainable for E^. There in an intrinsic limit to the accuracy of energy
measurement by this method, due to the statistical nature of the slowing-down
process, and this determines the best possible resolution that can be obtained

41
for E T . Added quadraticaJiy Into the Intrinsic uncertainty in E is theit O
uncertainty arising from the spread of energies in the incident beam; it is
desirable that this be small enough to imke an insignificant contribution to
the overall energy resolution* Errors of measurement on the film contribute,
ia most cases, only very sniaii errors to E^.
Let us now consider the precise beam energy spread requirements.
As a consequence of the non*4ia@ar relationship between the energy ofHa proton and its residual range (E - AH ; B - '. 3), an energy spread in the
proton beam delivered lo the bubble chamber by the beam transport system
is magnified as the protons traverse the chamber. It is shown In appendix III
that for a proton beam of energy £ and HMS energy spread d£, the RMS
energy spread in the beam after the protons have traversed a thickness L is
given, to a first apfvroKiniftttoa, by
d£oi A/B-1
where A is the range constant
and R is the range of a proton of energy E
STERNHEXftER (1360) has determined the stra^Ie In the residual range
due to the statistical nature of the Rowing-down process for protons of various
energies. From this information an estimate can be obtained for the intrinsic•K
energy uncertainty In the proton beam at each point along its path. In appendix
IV the energy spread doe to straggling in the beam at a depth L is shown to
be, to a first approximation,

dE **of 2 V R-L
where k is the straggle coefficient as determined by Steraheimer
R and A are as before.
These two first order equations can be used to obtain some idea of the
requirements on the incident beam energy spread. If, for example, we make
the specification that the beam spread must contribute an energy uncertainty
in 1 less than that contributed by the straggle spread at, say, a distance of
12 cms ia the chamber (where the energy is appro*. 100 MeV) we get from
MEdE . kA J SRL-X/
02
with
that the RMS energy spread in the incident beam (dE) must be iess than
0. 6 MeV.
In figure 3.1 the energy uncertainty in £T for a 2-proag event arisingJL
from the combined straggling effects on the incident proton and the two
product protons is shown as a function of the distance traversed by the
incident proton before it interacts. Also shown are the independent energy
BueertainUea that would be produced by incident beams with initial RHS
energy spreads of ' . 5 MeV, 1.0 MeV and 1.5 MeV.
In figure *. 2 the energy resolution in E ] , for E -100 MeV, is shown
as a function of the incident beam energy spread. Since the straggling error
cannot be removed, undue effort to reduce the incident beam energy spread below
0.5 MeV pays very little dividend.

Initial RMS beam spread 1.5 MeV
2.0 -
1.0 MeV
Straggling only
0. 5 MeV
1.0 -
130 115 100 80 50
cms
MeV
Fig. 3.1 Uncertainty in the measured energy-loss at various depths in the chamber, produced by straggling and by energy spread in the incident beam.
RMS energy resolution in E MeV
3.0
2.0
1.0
L
0. 5 1.0 1.5 2.0 MeV
Energy spread
Fig. 3.2 Total RMS energy resolution for various incident energy spreads, produced at a depth of penetration of 12 cms (E ~ 100 MeV).

43
3.3 E^pcrimems with the beam
The proton beam that emerges froiu the cyclotron extraction channel
has aa energy spread of approximately ^ & MeV. The beam transport system
has to reduce this to leas than o. s MeV and at the $aine time produce a
geometrical beam profile at the bubble chamber that is well spread-out in
the vertical direction aad closely confined la the horizontal direction. There
was little experience of setting-up a beam of this type aad it was necessary
to experiment with the beam transport system before performing the bubble
chamber experiment.
Three measuring techniques were ttsed in these experiments:
(1) The beam flux levels were measured with an ionization chamber.
(2) Geometries! profiles were recorded OB X-ray plates inserted in the full
flux beam. Plata V shows a selection from the beam profiles obtained
durinf the evolution of the repaired form.
(3) Energy measurements were made with a range telescope. This consisted
of three scintillation counters lined up along the beam path, and a set of
aiurrunium plates of uniform and accurately known thicknesses - see
figure 3.3.
To determine the spread of energies in the beam, the ratio of coin*
cidences for counter* 1, 2 and 3 to the coincidences for counters 1 and 2 only
is measured lor various thicknesses of aluminium between counters 2 and ';.
When allowance is made for nuclear scattering in the aluminium this ratio
five* the number of protons stopped by each thickness of aluminium and

44
hence the number of protons In the beam of energy greater than E, given byE - ABB
where E is the thickness of aluminium
A and B are the range constants for aluminium.
Very small increments in the aluminium thicknesses are made when
the coincidence ratio begins to fail off rapidly* i.e. as the thickness corres
ponding to the mean energy of the beam is approached.
A typical range curve from such a measurement is shown in figure >. 4.
Hie measured energy spread is obtained from this by eliminating the
nuclear scattering component* which can be determined from the slope of the
curve at the low aluminium thicknesses, and differentiating the resultant carve.
An energy spread is introduced by the aluminium itself because of
straggling effects and it is the spread doe to the combination of the incident
beam energy and tne straggling spread that is actually measured. To separate
them it is essential to have an accurately measured range curve.
The curves of figure 3. § show the differentiated range curves which
would be obtained from measurements on beama of various initial RMS energy
spreads. Hie straggling component for these curves was obtained from the
results of Sternheimer who showed that for a mono-energetic beam die
probability of a proton stopping within the distance H to IHdR is given
?(B)dE - —*- —— *R-
where H is the mean range of the
is the KM8 spread of ranges.

Beam
Al
Fig. 3.3 Range telescope.
Ratio of coincidences
1.0
0.75
0.5
0.25
123 1?
0.25I______I______I______I
20.0 20.5 21.0 Thickness of Al. gms/sq cm
21.5
Fig. 3.4 A typical range curve.
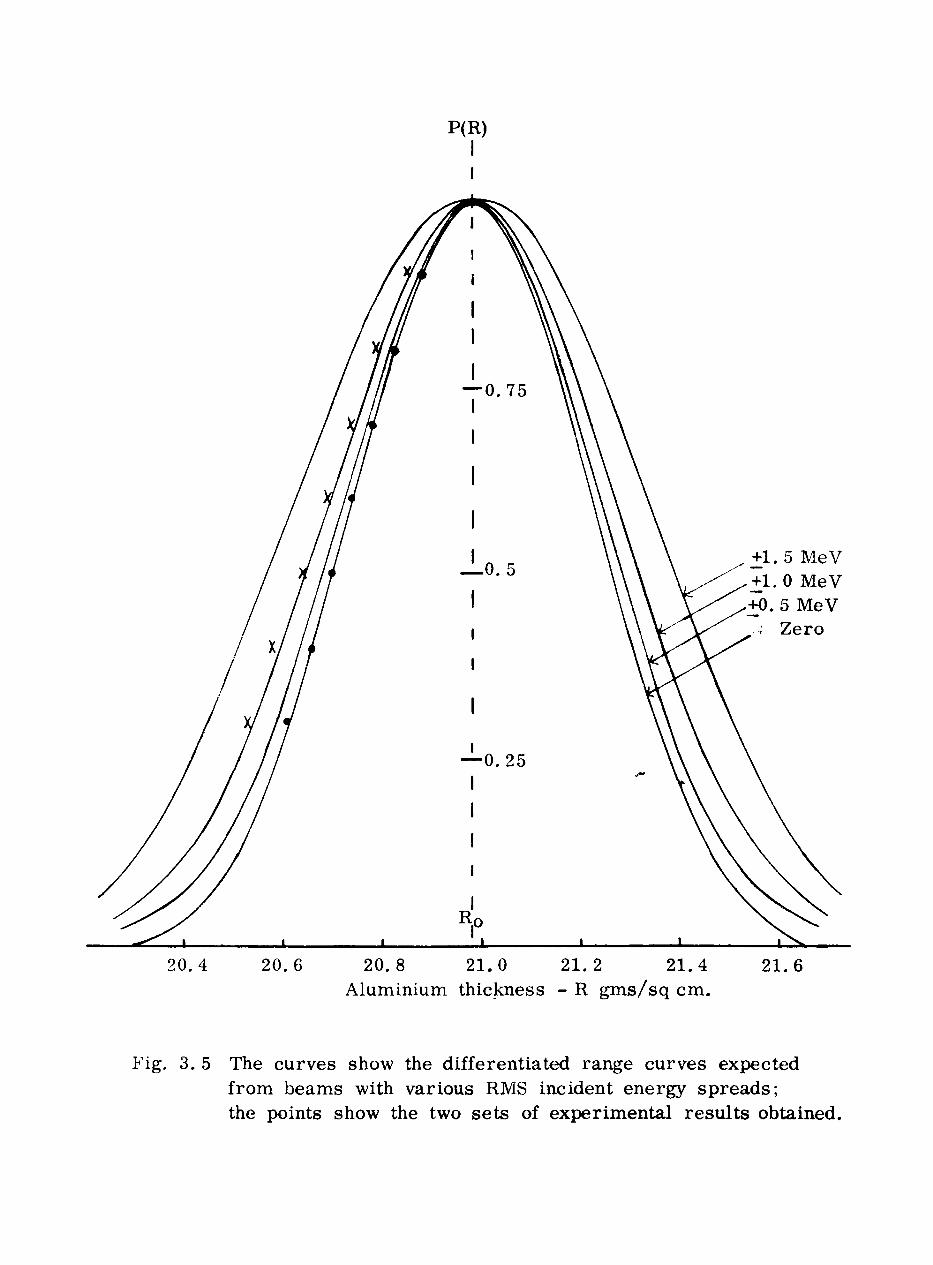
P(R) I
+1.5 MeV +1.0 MeV +0. 5 MeV
Zero
20.4 20.6 20.8 21.0 21.2 21.4Aluminium thickness - R gms/sq cm.
21.6
Fig. 3. 5 The curves show the differentiated range curves expected from beams with various RMS incident energy spreads; the points show the two sets of experimental results obtained.
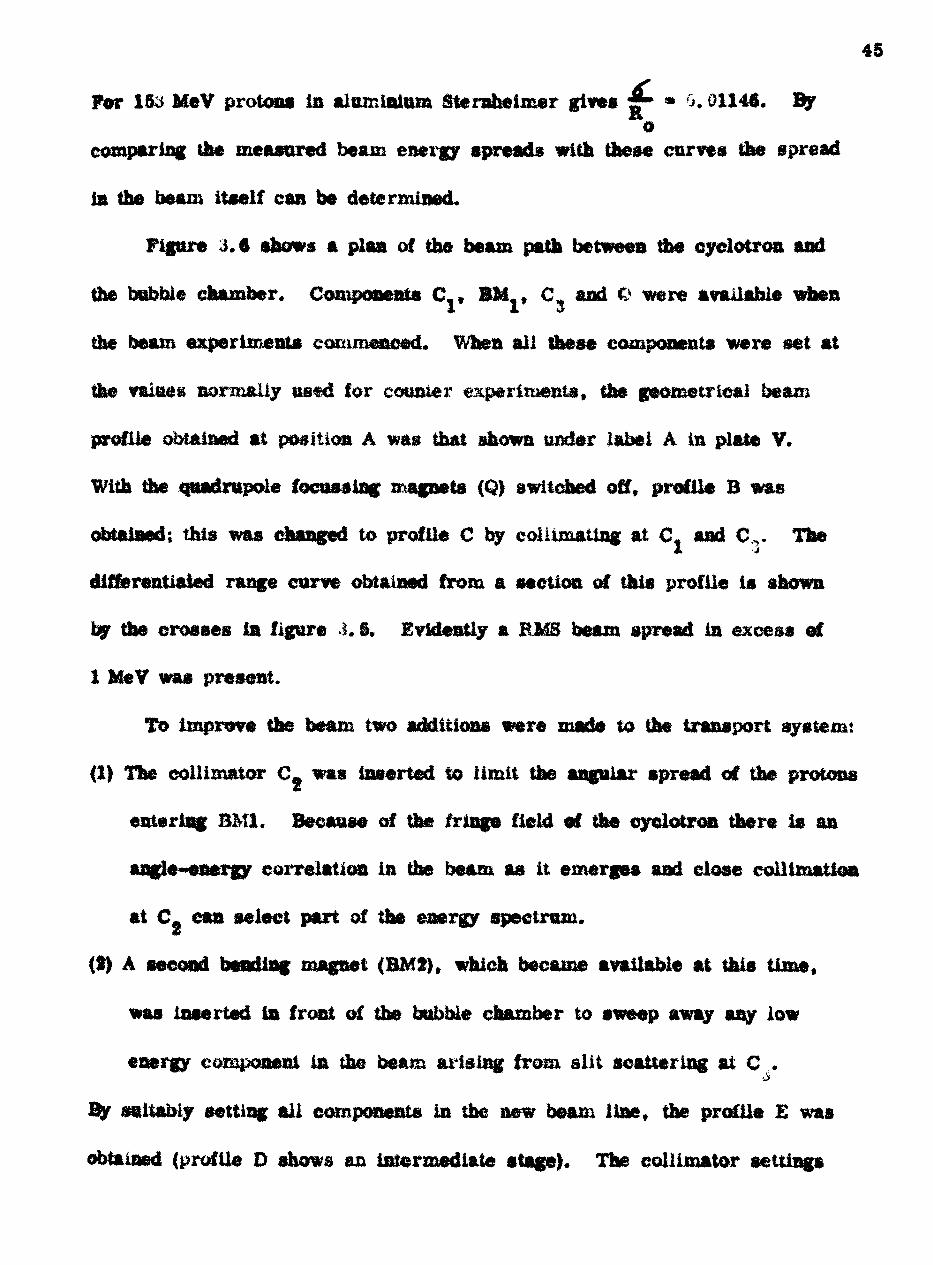
45
For 153 MeV protona In aluminium Sternheimer gives • * 0.01146. Byo
comparing the measured beam energy spreads with those curves the spread
in the beam itself can be determined.
Figure 3.6 show* a plan of the beam path between the cyclotron and
the bobble chamber. Components C., BM,, C and O were available when* 13
the beam experiments commenced. When all these components were set at
the value* normally used for counter experiments, the geometrical beam
profile obtained at position A was that shown under label A in plate V.
With the qoadrupole focassing magnets (Q) switched off, profile B was
obtained; this was changed to profile C by eoiiimaUng at C. and C,. The
differentiated range curve obtained from a section of this profile is shown
by the crosses In figure 3, 5. Evidently a EMS beam spread in excess of
1 MeV was present.
To improve the beam two addition* were made to the transport system:
(1) The eoliimator C_ was inserted to limit the angular spread of the protonsZ
entering BM1. Because of the fringe field el the cyclotron there Is an
angle-energy correlation In the beam as it emerges and close colHmatioa
at C. can select part of the energy spectrum, z(2) A second bending magnet (BM$), which became available at this time,
was inserted in front of the bubble chamber to sweep away any low
energy component in the beam arising from slit scattering at C .j»
By suitably setting all components in the new beam line, the profile £ was
obtained (profile D shows an intermediate stage). Hie eoliimator settings
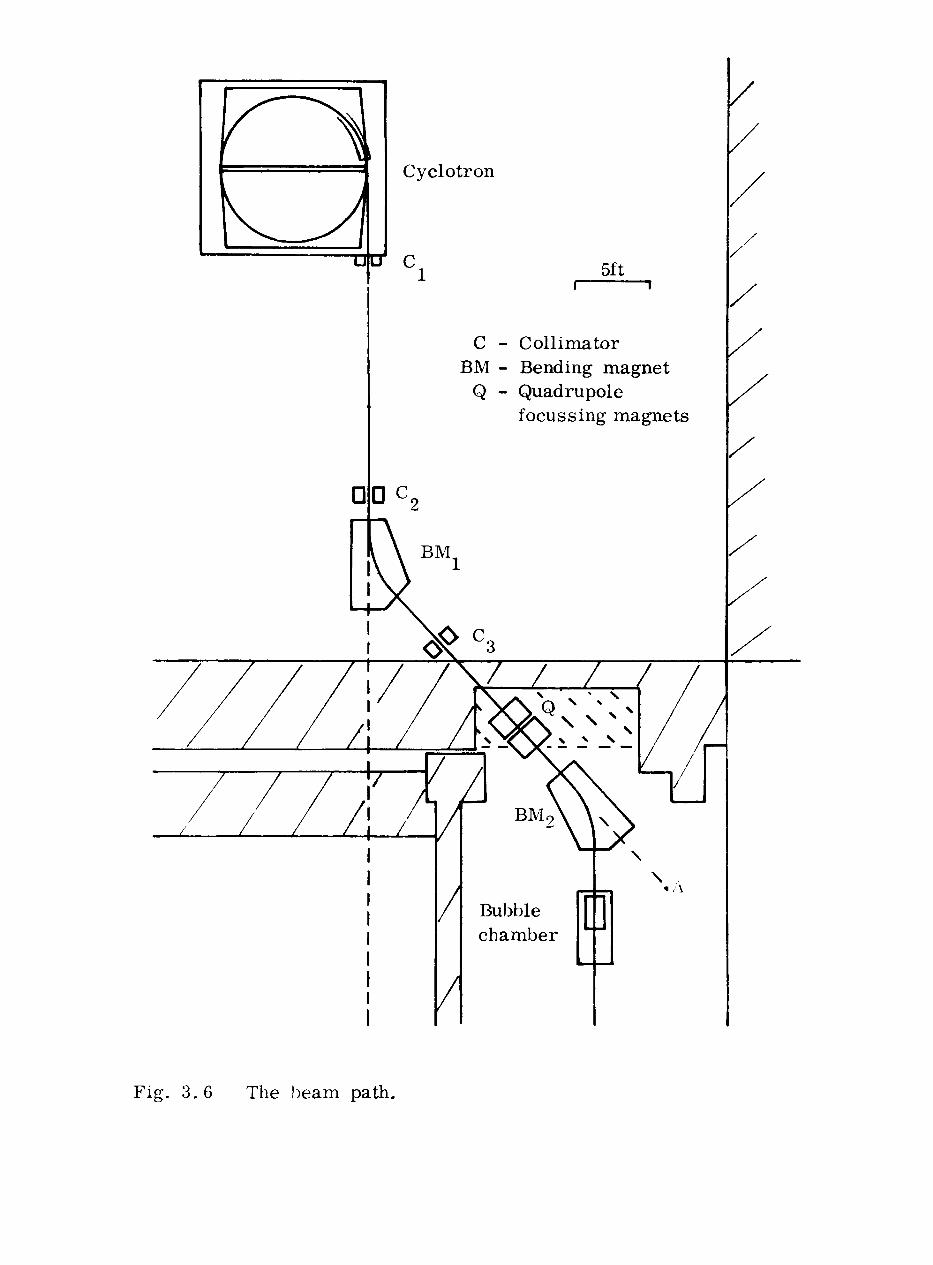
Cyclotron
tr c 5ft
CBM
Q
Collimator Bending magnet Quadrupole focussing magnets
DD
\/ / /
Bubble chamber
\
Fig. 3.6 The beam path.

Plate V
X-ray exposures Uiiien at various stages during the
seltimg-up of &o heara; they show tba beam profiles
at the position oi the oubble chamber ?»eam entry
window.

B

46 for this beam were as follows:
x ~ 1.1 4- 0. $ emsC!
y no caihmation provided
x * 1.45 4- 0.15 cmsC2
y * 0 + I* •*»
X * -0. 7 * 0.c,
y « y + > cms
sense of the co-ordinates can be seen from the sketch.
Looking ap the beam tube
towards the cyclotron
Hie differentiated range curve obtained from profile E is shown by the
circles in figure 3.5 (the range carve itself is the one shown in figure 5.4).
Therefore this beam has a HMS energy spread consistent with zero and
certainly below 0. 5 MeV. The resolution in the energy loss spectrum for
the p-hydrogen events, discussed in section 6.6, confirms this result.
The mean thickness of aluminium required in the beam to stop the
protons was 2C*. j& + -. 01 gins; this corresponds to a mean beam energy of
1SX 04 + ( . 05 MeV,
•'.*. 4 The bubble chamber extjeriment
The preliminary testing and liiiing operations were made as described
ia section 2. &. The chassis was lowered into th& experimental area and
lined up with the beam path in the position shown in figure *.*, so that the
beam profile £ (plate V) was in the centre of the beam entry window.

47
Beam eoadUioa 2 of section 2 was automatically satisfied because the
proton pulse supplied by the cyclotron is of only 6 yasecs duration.
However, the magnitude of the flax had to be reduced to the extremely low
level of 5 to 10 protons per pulse; this was done by inserting the chopper
(a block of lead) into the eircuiating beam within the cyclotron tank.
Because the chopper had to be almost fully inserted to reduce the flux
sufficiently, it tended to give rise to seriously varying flux levels when the
cyciotroa was not completely stable. For example, whenever the cyclotron
tripped off, the chopper would cool and contract and on the subsequent
restart of the machine would allow too much beam to pass. The beam flux
was therefore continuously monitored by an observe* with binoculars situated
at a vantage |x>int ia a radiation-fret s?one above the experimental area. It
was found that, despite the very short durcu;jn of the illuminating flash* aa
experienced observer was able to detect serious fluctuations in both the flux
level and th@ quality of the tracks. When each cassette was changed, a strip
of film from the end of the roll was developed to check directly the flux level
and quality of the tracks.
For the last hundred frames of each roll, aluminium absorber was
placed in the beam path; 2.04 gms lor 5') frame a and 8.22 gms for 50 frames.
The protons stopped approximately two-thirds the way across the visible
region for the first set of frames and approximately half-way across for the
second set. From these, the range constants for the propane under the
operating conditions could be found and also a meeusuremeai of the beam

48
energy could be made (see section o. 5).
28,000 photographs were taken and these yielded approximately 3,500
8-prong evems; this was the limit to the number that could be analysed on
the n:eaauriag-rr;aehiaes in the machine uiae made amiable for this experi
ment. It had been hoped that another 10,000 photographs would he taken to
obtain better statistics for the .i-prong events, die analysis ol which required
mainly scanning-machine time, on which there was no limit of availability.
However, the run was brought to an end before these additional photographs
co&id be taken because of the temperature controlling difficulties discussed
in section f.3.
Plate VI shows a typical frame.
Plate VI
A typical exposure showing a 2-prong event and
the fiducial marks on the windows of the bubble
chamber.


49
CHAPTER 4
EXTRACTION OF INFORMATION 3FHOM THE FILM
4.1 Introduciion
The collection of the experimental data was completed in approximately
two weeks but the subsequent extraction of this data from the film took almost
eighteen months. Some 27, $03 expansions with the full energy proton beam
were recorded but, for various reasons, such as Hash tube failure aad foaming,
l,2>) frames were unusable.
The film was first scanned, when ail the relevant information on each
frame was no.ed. and then each 2-prong, 3-proag aad 4-prong event was
measured; the measurement consolidated , In a coded form on punched paper
tape, nil the information needed for the geometrical reconstruction of each
*vent. The paper tape was processed by a Ferranti "Mercury" computer to
give all the relevant geometrical and kinematics! quantities for each event
Appendix V gives the actual instructions followed in the routine analysis
work. The remaining sections of this chapter are concerned with some of the
details of the procedures followed, the discussion of which highlights the
difficulties encountered ill the collection of data by the bobble chamber method.
Scanning and measuring were kepi quite independent of each other and
they were, in fact, performed on different types of machines. The explanation
for this is that the measurement of events on the film requires much more
complex equipment than the basic projection aad wind-on mechanisms required

50
for the scanning of the frames. It is therefore not an economieal proposition
to use more time on the measuring machine than is essential for the actual
measurement of the events.
Because of the repetitive nature of the scanning process and because of
the difficulties of the interpretation of the scanning instructions in border-line
cases, the data collected depends to sozne extent upon the person scanning
and also upon his or her mental alertness at the time of the scan. For this
reason two completely independent scans were made of all the frames and
from them a master-list was compiled. This master-list was used to find
the events at the measuring stage of the analysis and whenever the list
showed a discrepancy between the two scans an adjudicating decision was
made by the measurer or, in cases of difficulty, by a physicist.
4.2 Scanning
This was performed on 'British National Scanning Machines" with a
magnification from film to projected image of 20; a description of these
machines has been given by CHENNELL (1^6 >).
Scanning is essentially a process of finding and tabulating all the events
of interest on the Him, in this case, the events with two or more prongs.
However, to prevent inaccuracies in the cross-sect ions and the various
angular and energy distributions obtained from the analysis, it is important
that as much systematic bias as possible is avoided in the collection of the
data.
Systematic biases arise because some classes of events are more easily

overlooked than others. Thus, for example, those 2-prong events with one
very short prong are more likely to be overlootoed than those with two long
prongs, and since the proton energies decrease as the beam traverses the
bubble chamber, the effect becomes more marked. Figure 4.1 shows a good
example of such a loss. The distribution of proton energies is shown for all
proton-hydrogen Interactions for which the interacting proton energy is greater
than §o &teV. In the absence of any lo#s of events the known tsotropy of the
(p,H) cross-section in the centre of mass of the system dictates that the»
distribution should be uniform from rero up to S3 MeVt in fact, it is seen
that there is a complete loss of events that have one proton of energy less
than 4 MeV, and a gradually decreasing loss for events that have one proton
energy between 4 MeV and If MeV (one bubble diameter corresponds to an
energy of approximately 4.8 MeV).
A big reduction can be made in scanning biases if those frames on
which it is very difficult or impossible to follow right through the bubble
chamber the path of each incident proton are excluded from the analysis.
Tims, for example, a frame was excluded from the analysis if:
(a) all the beam protons entered very close to each other
or (b) there was a very large number of tracks on the frame
or (c) the tracks were too faint for efficient detection; this occurred
occasionally when the flash tube deteriorated more quickly than
expected or when the propane drifted from its ideal working
temperature.

N _
75
50
25 If0 20 40 60
E MeV P
80 100
Fig. 4.1 Distribution of prong lengths for hydrogen events.E > 50 MeV ; -5 MeV < E T < 5 MeV o L

§2
Because very strict acceptance criteria were imposed, approximately 25% of
the original frames were rejected (see chapter 7 and the table on page £5
for details)
Although all 2-prong events on rejected frames were completely ignored,
i was decided that 3-prong and 4-prong events seen on these frames would be
included m the hats - bui their or .gin was noted so that they could be excluded
from absolute cross-section measurements These events were included for
two reasons: firstly, because of the failure to accumulate, as planned, extra
exposures to improve the statistics of the >-prong and 4-prong events, aad
secondly, because, due to the large loss of *?-prong and 4*-prong events even
under ideal conditions (because of the a- very short prongs), any additional bias
introduced by including the events on rejected frames would be small in any
case.
When a frame was accepted, it was systematically examined for the
presence of events with two or more prongs. All three views were examined
because sometimes an event is clearly visible on one view only. Events with
rriore than two prongs are confined to the i rst hall of the chamber where the
energy of the interacting protons is high. Also ihay proved to be easy to
detect because they are characterized by the absence of long prongs. For
these reasons the scanning of the rejected frames for the ivulM-prong events
was not as difficult as might have been expected. This faci, reported in the
next section, is reflected in the high scanning efficiencies achieved for these
events.

53
There are several reasons for not recording some events which at first
sight misjat appear quite acceptable. The application of the following tests
removed some of the unwanted events before the measuring stage was reached.
(a) If die angle of entry of the incident proton, as seen on any of the
views, was more than 3° from the mean entry angle, the event was not
accepted. Protons entering at large angles must have scattered either
in the beam entry window or in the unilluminated part of the propane,
and, since nothing is known about these scatters, the protons have
undeterminable energies.
Figure 4.2 shows the distribution of the angle between the incident
proton direction projected on to the front window of the chamber and
tile horizontal.
(b) If the incident proton track, when projected backwards, fell outside
the vertical limits of the beam entry window the event was again not
accepted. The beam entry window limits drawn on the teat template
lie Just within the actual window limits to allow for the Founding off of
the corners of the window. Any proton outside these limits will have
been degraded by an unknown amount.
Figure 4.3 shows the vertical distribution of the tracks entering the
chamber.
(c) The incident proton track of an event was carefully examined and if
it had a scatter on it the event was ignored. In this case the incident
proton must be considered to have given rise to a one-prong event and

N Fig. 4.2Fig. 4.3
•+. ^
250
200
150
100
50
N
250
200
150
100
50
-
-
-
-
-
-
-2
-
-
-
-
— i
mMM
1
u
_
HJ--\J i
Fig
H••••Ml
|
_J
j. i
150
125
100
75
H4
r
50
25
4 degreesN
.4 250
200
150
— 100
50
M»
M»
-.
-
_^^
- |-^
1 1 1 1 1 1 1 * —— 1
-3-2-10 1 2 cms
Fig. 4. 5
- -^~
^
i^ — TTi i i i i i i i nrv-n10 11 12 13 14 cms 80 84 88 92 96 degrees
Fig. 4. 2 Angle between incident track and a line normal to beamentry window projected onto vertical plane
Fig. 4. 3 Vertical distribution of incident tracks at point of entryto bubble chamber
Fig. 4. 4 Distribution in depth of incident tracks at point of entryto bubble chamber
Fig. 4. 5 Angle between incident track and a line normal to thebeam entry window projected onto horizontal plane.

54
so contributes to the elastic or (p,p ) cross-section and not to the
multi-prong cross -section. (A multi- prong event with a further later-
action on one of its prongs must. of course, be Deluded; although a
lull analysis cannot be made of such events, they must be allowed for
in the calculation of cros8*>*ections. )
These criteria were also applied when the number of tracks on the frame
was counted this was done on every tenth frame.
The three tests given above eliminate most of the unwanted events, but,
due to the fact that a two dimensional projection of the bubble chamber space
is observed on the films, large angles and displacements in a direction away
from ihf camera plane cannot he detected on the projected images. Another
test was therefore made fa the reconstruction program to remove any such
Figure 4.4 shows the distribution in depth of the apices of events and
figure 4. 5 shows the distribution of the angle, projected on to a horizontalnormal plane, between the me dent proton direction and a horizontal iiae^to the plane
of the beam entry w ndow.
4, 3 CpjviparisQp of the .two jndte pendent., scans
The table below 4u*Tjm*rir*tt the data obtained from the two scans. The
miir.'.)er of frame* examined was 37,6^4

Seats on 1st aoan but not Sad
No. of rejected frames
No. w 2-proiig events
No. of *»*prong events
No. of 4-prong events
1?39 * 771R
4 t4B
IB
Seen on 2nd scan »ut not 1st
Seen on both scans6^37
966 > 980B
3S 4- 18R
23
R denotes the even is seen on one scan which fell on frames rejected on the other scan.*1 653 include* 135 events on frames rejected on troth scans*2 2,5 include K 8 events ou Irajm-es reacted oa both scans The number of 4~prong events is considerably less than the total number of 4*pnxag event* actually measured because a comparatively iarg© mirnber erf 4-prong events was discovered when ta* classified .l-prong event® were examined eloae.lv under a ciieroscope at the measuring stage.
Scanning efficiencies can be deduced from the figures in the table.
To obtain an expression for the efficiencies of the two scans and of the
eomb-ned scan, it IB assumed that the events not seen on each scan form
a random sample of the events actually present.
Therefore if
N * sambe** of events seen on both scan® oN no of events »een on the 1st scan bat not on the
N. no of events seen on the fad scan but not on the 1st
N » the unknown total number of events present
e. « the efficiency of the 1st scan
© » the efficiency of the tnd scan
the efficiency of the combined «ean

S6
then
Ho, of events seen on the 1st scan « e^N
No. of events seen on the 2nd scan that were not seen on the first scan
* a x the no, of events not aren on the first scan
,The total no, of events seen by both scans is therefore
eN * ejN + e^N - e-e^N
e - •1 *.f - Vf (1)
and the iad'vfdeal efficiencies are
* <No * *N o
t*«t Jk™ ' * »^ * m ™ ^.o 1 8
Equations (1), (2) anfc (?) can be solved for e , e9 and e .JL 2
It p-iusl be renumbered that these expressions do not include systematic
losses.
Using the equations and the values given for the 2-proag events in the
table (and ignoring those events on rejected frames), the efficiencies derived
are
e. * SS. 1%

57
These figures give a lower-limit estimate for the efficiencies because
the firat two columns of figures in the table for the ?-prong events reflect,
to a large extent, those cases where a scanner was in doubt as to whether
or not an observed phenomenon was a 2~prong event. Different decisions
on the two scans for the same phenomena therefore give rise to a large pro
portion of the events in these columns. It can be seen in appendix VII that
about a half of these phenomena proved not to he 2~prong events when studied
more closely at the rceastiring stage. This reflects a tendency on the part of
scanners, especially when tired, to record a doubtful phenomenon rather than
to examine it carefully on all three views. This is inclined to make the
scanning efficiencies, as defined appear rather low.
An upper limit for the efficiencies can be obtained by analysing those
f-prong events that have both prongs of length greater than, say, f. 5 mms
(corresponding to a proton energy of appro*. 10 MeV). This category of
events excludes most of the doubtful phenomena described above, although St
also excludes the event types particularly prone to loss at the scanning stage.
From these events the following upper-limit efficiencies were obtained
e- « 95.6%
e. - 95.1%A
e « 99.8%
It is interesting to note that, despite the short prongs always associated
with 3-prong events, the detection efficiencies for these events are of approx
imately toe same magnitude as those for the 3-prong events. From the

figures in the table (excluding the events on rejected frames), the efficiencies
are calculated as
«t * 93,
e. • 91.3se »
4.4 Measurement of events
The 2-prong events were measured on a machine constructed at the
Nuclear Physics Laboratory by the bubble chamber analysis group. On this
machine (which differed in this respect from most of the n&chines in use at
the laboratory), the measurements were performed on the projected image
and act on the film itself. A co-ordinate measuring apparatus, previously
used and described by HOPKINS (1961), was provided with an automatic
digitizer, coupled to a paper-tape punch* and set over the horizontal screen
on tc which the image of the film was projected with a magnification of
approximately to. To record the co-ordinates of a point a reference cross*
wire, carried on the co-ordinate arms, was get in coincidence with the
relevant point and a foot-pedal switch was operated to transfer the x and y
co-ordinates of the point on to 5-hole paper tape. The sequence of points
measured and the facilities for correcting errors are shown in detail on the
"Measuring Procedure" given in appendix V. The measurement of fiducials
on the chamber window provides the link between die co-ordinate system of
the measuring machine and that of the bubble chamber.
Accuracy of measurement was checked In the geometrical reconstruction

program and all events that failed to meet the tight tolerances imposed on the
measured points were separated oat. These events, with certain exceptions,
were remeasured until they were accepted by the program. The exceptions
referred to were those events that only just failed to meet the accuracy
requirements and whjteh were recognised from the computer output to be due,
unambiguously, to proton-hydrogen interactions. Because no detailed analysis
of these interactions was to be made, a set of less accurately measured events
was quite acceptable.
The S-prong events were measured on a "Cooke series 4 r> ft uicroscope
at a magnification of ISO. The need for a microscope measurement was
clearly indicated whsa an initial measure raent showed that only 50% of the
events could be measured on the measuring machine because of the small
relative si^e of the event compared with the reference fiducial. With the
microscope $5% of the events were measured. Also, with the microscope
a much more accurate setting could be made on end points and apices, and
this is important In the case of 3-prong events because of the large number
of associated short tracks. Hate VTIgives a good indication of the improve
ment obtained by using the microscope; the two photographs show the same* 1-prong event as it appeared on the measuring machine and imdar the
microscope.
* The frame shown was actually rejected on the criteria set out in section 4.*.

VII
A 3-prong event as it appeared oa a r.ieasui ,ng machine
and as it appeared uipjer the microscope

VII

eoWhenever possible the events were measured on all three view* and the
reconstruction was performed for all pairs of views that met the accuracy
toleranceat the results fron these reconstructions were then averaged. The
presence of distortions or of other tracks sometimes prevented measurement
on one or more views. An ?-ample of distortion is shown in plate VITX in
which view B is undistorted and view A has a distortion on one prong,
Because the microscope was not supplied with an automatic digitizer,
the following operations were necessary to transfer the information from the
microscope to paper-tape:
(a) x and y co-ordinates were read from the micrometer screw gauges on
the rate rose or*.
(b) the numbers we it written on specially prepared forms
(c) the numbers were teleprinted on to 5-hole paper-tap^i.
Each operation involved 42 numbers per event and the cumulative errors
of the three manual processes were such that 5 % of the events were found
to have errors \vh**n they were checked in the reconstruction program. This
meant that, on average, each event had to be measured twice.
About 1>% of the l*prong events recorded in the scanning process were
found to be 4-prong events when they were examined under the microscope.
These and the other 4-proag events were also measured on the microscope.

Plate Vlil
Two views of a 4-prong event under the microscope,
indicating the type of difficulty that occurred as a
result of optical distortions in the propane.

IIIA

61
CHAPTER 5
F!?OM MEASUREMENTS TO PHYSICS
5.1 Introduction
Th^ paper-mpe output from the measuring n achine contains all the
information necessary for the identification and reconstruction of each event.
It was processed on f '?.*ercuryt7 computers at A£RE, Harwell and at the
Computing Laboratory of the University. The program for the analysis of the
events was written mainly In "Autocode" and Its main functions were to read
and decode the co-ordinates of the measured points, to check on the accuracy
of the measurements, to reconstruct the events in three dimensions from the
information provided by two stereoscopic views, and finally to calculate the
necessary geometrical and kinematical quantities.
This chapter
(a) shows the derivation of the equations used for the reconstruction,
with emphasis upon their use in practice;
(b) describes in detail the program written for the analysis of the
$~prong events;
(c) indicates the modifications to the basic program necessary for the
analysis of the 3-prong and 4-prong events;
and (d) deals in some detail with the determination of the parameters*
for the analysis.

62
5. 2 Reconstruction of an event from measurements on two stereoscopic views
For the sake of die discuss ion, f-prong events are considered.
For all 2*proag events the points x v to x_y,. were measured and for11 5^ 5
some events either or both of the points x^y and x y were also measured
(see appendix V). These latter two points, when measured, were used only
for measurement accuracy checks.
fUTjF-j- j.-~r-~-/*.
The apex and the end points of the two prongs could be unambiguously identified
and measured on the two separate views* but the point of entry of the incident
proton to the illuminated region of ihv chamber was usually indistinct because
of a slight diffuseness at the edge of the illuminating light-cone: non-corres
ponding points were measured therefore on the incident track. Because of
this, the method used for reconstructing the two prongs was different from
that used for reconstructing the incident track; these two methods are discussed
below.
The co-ordJaalc axes (XY?) f (x'yV) and (x*yV) all refer to a system
using the base line of the cameras, projected on to the bubble chamber window,
as the abscissa ft is assumed that the transformations through the co-ordinate
systems defined by the measuring machine and by the fiducfals etched on the
bubble chamber window have been made. The co-ordinate axes are shown in
appendix VI and the series of co-ordinate transformations made in the analysis

63
program can be seen in figures 5. 1 and 5. ?.
Reconstruction of the correspond ing points of the prongs
fa appendix VI the equations are derived which relate the spatial co
ordinates (XT7) to the filir? eo-ordinattfs of a corresponding point;
they are:
(y'V-y'x")
fry<y*V - y V)
7," > 9 9, 9 99jnV-Kx'V Z)(n 2-l)
wherex"yf are the co-ordinates of the point on ona view, scaled-up to bubble
chamber dimensions x'VM are the co-ordinates of the same point on the other view, also
scaled -upI is the distance between the cameras d is the perpendicular distance between the camera lenses and the
front window of the chamberf is the distance between the lens and the film within the cameras 6 is the thickness of the front window n* is the refractive ind«x of the front window n is the refractive index of the propane.
Because the co-ordinate system is tied to the two camera positions, as
described above, y* Is approxirs ately eqtial to y" (see appendix VI). This
property is used as a check on the accuracy of the measurement of corres
ponding points.
If the co-ordinate* y and y" are replaced by y the above
expiations reduce to1/2x'-x"

64
y -x
x"-*'
It is shown below that the errors arising from this approximation are
very small and that, paradoxically, it la essential to use the "approximate'
equations la order to achieve accurate reconstruction.
The approximation y'.% y*
It can be shown, by • amputating the equations of appendix VI, that
y"- y
where r ( * (x
and the other symbols are the before.
If the worst combination possible within the bubble chamber for the
values of Y, £, r and rf ' is used,
y*' - y' -w 0.15 mm
this is of , the same orct«r aa the r?\easur;ng errors, la general, therefore,
the error arising fro;n the approximation is naich smaller than die
error and it can be
Because of the preaenco of m^asurinfj errors, the emct equations can,
under certain circumstance* v lead to very large error* in the reconstructed
points. For example, consider the first term in the exact equation for 7.
The error in this due to measurement errors in y' and y" is

*x'Ay' IE Ay"
The re fore for points close to the camera base line (y and y" •* ), the
error In 2 can become very large.
The reconstruction of the fiducials OB the back window of the bubble
chamber illustrates this point very well, because for each view pair two
fiducial* lie close to the camera base lice, as can be seen from the
following
The circles show the intersections of the optic axes of the cameras
with the window, and the crosses show the approximate positions of the
fidttcials me&attred.
The 7 co~ord f nates of the fidnciata, as reconstructed from the
and approximate , are shown in the table (in centimetres)
E "l X F A *C *•T
i Fls ?;°
>/i.3wa 1 and 3
13. 9
18.9
25.8
views 2 and 3
«>*? QJt^ -ti; • J
26.8
n.i
2:1 0
views 1 and 1
27.4
25. 223.9
2X2
21.6

Hie measured depth of the chamber Is ft. «7 ems. *
It is seen that In each case the two fiducial 3 lying close to the base
line were very badly reconstructed by the exact equations, The "approximate '
equations were, therefore* used throughout the analysis,
of ti lucldffnt track
A reconstruction method batscd 012 the const ruction of corresponding
points OD the incident tracks was found to lead to errors of up to 2 to 3 MeV
in ths calculated incident energy The following c cthod, using the angles of
the track, as measured on the Iwo views, gave an order of magnitude im
provement in acceracy.
It Is shown In appendix VI that the spatial angles of ihe iuc;deat track
(a and £) are related to the angles of the track measured on the film
»"> through the equations
^ « taa" 1
4 or » taa
(Y Hl/2) ts»r' - <Y where tan § « -
o
(2o o
X Y 7 are the co-ordinates o! the apex, 000
* Th<> dtserttpaacies betw^^n this mltt$ ^d tho^e given in the table are due rnufnly to the fact that these numbers v&re obtaiai^d before the camera positions had been finally

From or, & X , Y . and 2., the point of intersection of the incident o o otrack with the inside of the beam entry window was calculated.
The angles $' and 0" were obtained from least squares fits to the three
points measured on the incident track.
5.3 The ..computer, ^rojyam for the analysis of the |-proag events
This was written mainly In ''Autocode*', Nit basic machine language was
used for decoding the co-ordinates punched out by the measuring machine.
Figures 5,1 to 5.1 show, together, a macroscopic flow diagram for the whole
program, which can conveniently be divided into three sections. The first
section, shown la figure 5.1 and the upper part of figure $. t, deals with the
reading of the measuring machine tape; the checking for format errors on the
tape and for inaccurate measure meat*; the decoding of the co-ordinates to
decimal form, and the transformation into the camera-co-ordinate system of
all ih<? ev©ni coordinates The second section, shown in the lower part of
figure 5 °, deals with: the reconstruction of corresponding points and the
incident track: ihe transformation of points and angles back to die fiducial
co-ordinate system; and checking that die tracks do not leave the illuminated
region of the propane or pans through th<? babble chamber windows. Finally,
In she third section, shown in figure $.3, the geometrical and kiaematical
quantities arc calculated and printed on to the output tape.
Vori* details concerning gome of the operations anil calculations >hown
in the flow diagrams ara set owl in the following notes:
1. The polat measured first and last on each view was the fU&cial at the

ENTER CH.O, SET CONSTANTS AND HALT FOR DATA TAPE
I-MANUAL RESTART
no
READ TAPE ROW AND TEST IF L.F. lyes
-TEST IF ->
yes
.print f - no "
READ NEXT TAPE ROW AND TEST IF ->
| yes PRINT CH.O REF. NO.
IREAD, STORE AND PRINT 12 TAPE ROWS - I.D
I • CHECK IF VIEWS ARE IN CORRECT ORDER
yes
SELECT FROM CH.O CONSTANTS THOSE APPROPRIATE FOR THE VIEW NOS. READ
READ TAPE ROW
_prin t f. no.
< X es TEST IF +
( no
TEST IF ' 9 Xes >
TES
cancel co-ords. of last view read
no rno
IF L.S
no
TEST IF (
.read nexr tnpo es
row and test if
— print. f. no.
no t yes
check if 6th no "consecutive l.f. ^
halt-end of data tape
print fault no..
.cancel last co-ord. pair measured
-READ 9 ROWS AND TEST IF 9th IS )
I xesDECODE X ANDY CO-ORDS.& P1ACE IN KNOWN LOCATIONS
ICHECK IF ALL POINTS REQUIRED FOR np_____ ________THE TYPE NO. HAVE BEEN READ *
yes READ NEXT TAPE ROW
TES' IF
no
yes
TEST IF 9.
no
TEST IF L.S.
I no
.cancel co-ords. of both views
• cancel last view ————————
PROCEED TO CHECKING & RECONSTRUCTION ROUTINE
v
FIG.5-1 INPUT ROUTINE

REPEAT FOR 2nd. VIEW
A
REPEAT FOR 2nd.VIEW
FROM INPUT ROUTINE
CHECK IF FID. REPEAT IS WITHIN TOLERANCE -print fault no.
CHECK IFSEPARATION BETWEEN CENTRAL AND noEND FIDUCIAL IS WITHIN TOLERANCE
, 1st. time
.print fault no.
yes
EXPRESS CAMERA CO-ORDS.IN MEAS. MACHINE CO-ORD. SYSTEM
EXPRESS ALL CO-ORDS. IN CAMERA SYSTEM ^ 1st. time
CHECK IF y'. y " FOR ALLCORR. PTS. IS WITHIN TOL. yes
no
FIT STRAIGHT LINE TO INC. TRACK AND ANY LONG TRACKS
• print fault no.
CHECK IFR.M.S. DEVIATION OF POINTS no _______ FROM FITTED LINE LIES WITHIN TOL. ——————————
yes| ————————————————————— < ———————
RECONSTRUCT CORR. PTS. AND CALCULATE ERRORS
RECONSTRUCT @ AND JE FOR INC.TRACK,& CALC.
CALC. FROM CORR. PTS. ® AND £ & HENCE OC AND A FOR OUTGOING TRACKS
yes
CHECK THAT Z(end point) LIES WITHIN CHAMBER £2. yes
CHECK THAT END POINTS LIE no WITHIN ILLUMINATED REGION ———
yes
TO STAGE 3
•print fault no.
TRANSFORM PTS. AND ANGLES TO FID. CO-ORD. SYSTEM
CHECK IF Z(apex) IS WITHIN TOLERA NCE————————>————print fault no.
CHECK IFot AND A OF INC. TR. ARE WITHIN TOLS. ££-£————print fault no. *'• ^ _______ I
.print fault no.
print fault no.
FIG. 5T.Z CHECKING AND RECONSTRUCTIONROUTINE

CALCULATE AZIMUTHAL ANGLE
CALCULATE COPLANARITY
CALCULATE e 1 ,e2 ,03
'0
I4 beam entry plane
CALCULATE loJi J2' AND HENCE E Q/ E 1/ E 2
CALCULATE MOMENTUM & ENERGY OF RECOIL NUCLEUS
CHECK IF > 5 Mev ——22.
lyes
SUBTRACT E R
PRINT ROUTINE ««•
'2
JUMP TO INPUT ROUTINE AND PROCEED TO NEXT EVENT
FIG. 5-3 EVENT KINEMATICS
ALL 2-PRONG EVENTS^-
EVENTS WITH
SCATTERED PRONGS
CARBON EVENTS
REMEASURED/,
POORLY MEASURED
& SPURIOUS EVENTS
HYDROGEN EVENTS
P-SHELL EVENTS^OTHER CARBON EVENTS
FIG.5-4 2-PRONG EVENT SORTING

centre of the front window of thff chamber. Any inconsistent behaviour of
the measuring machine can be detected by comparing these measurements.
2. The parameters of the straight line fitted to the incident track on each
view are given \yyi
3
' V
**m and c *
*l
i * 1 -* 3.
3. Hie iUuJiunaled region oC the propane i.y conical, with a cross-section of
the same shape as the eosdmi»tng lens (see plate III), A set of equation*
four planes and four conic segments g&ve a good lit to surface oof
the region, The digi&nee of each {joint from the surface was calculated and
It waa found that, with the exception of those points associated with events
at the very end of the chamber, all the end points lay well within the
illuminated region, Vhe same result applied for Hie distances of the end
points from the windows of the chamber Since events ai the very end of
the chamber were excluded from the analyst* (see section 6. 1), ail reaction
products of interest stop within the visible region of &e chamber.
4 The azimuthai angle {*) is defined aa the angle between the plane of the
front window of the bubble chamber and the plane? containing the incident
track and the longer oi the cue prongs, la the program it was calculated

69
from
I is the incident track length vector"O
L is the length vector of the longer prong
% i» the un t vector perpendicular to the chamber window
and f 1 is tb<; angle between the incident track and the longer prong.
The coplanarity (^) erf the e-.'eni Is defined as the volume of the parallelepiped
whose sidt« are tike unit vectors along the incident track and the two prongs,
6. Energies were calculated from the ranges of the particles (or, in the ease
of tht- incident proton, ihe residual rai^|iR>, For protoas the range-enargy
used v/as:
log E « ;5. Q440 4 0. S427 log R + 0. 0^ -'45 (log B) ?
(E in KeV and R In
7. In the initial analysis all the obsor ted tracks were assumed to represent
protons and the t-prong events were analysed either a® (p, H) reactions ar1? II C (P«£|j|B reactions. To establish the energy loss in each reaction the
quantity E •£--£, was first calculatedo J. *
wher<» E is the energy of th< interacting proton
and K and E^ air the energies of the two "protons"
produced by the interaction

70
If £ -E - r̂ is in the rang® O^SMeV the event must represent a (p,H)
reaction, but 11 it is greater than 5 MoV the event almost certainly
represents a (p, C ) reaction. The good energy resolution obtained for
the energy -loss distribution for the ?-prong events, as shown in chapter 6,
makes tills unambiguous reparation possible.
Tor hy<lroc»:eR events E -E - ••: was printed as the energy loss, but forO A *
carbon events the energy of the recoiling nucleus (EL) was calculated
19 11 from the momentum balance, assuming a C ~(p,2p)B reaction, and
E -E -S0-E^ was printed as the energy loss in the reaction.
A subsidiary program was written for reconstructing the carbon events
on the assumption that they represented various reactions involving heavy
particles, for example (p, pa), (f»*pd) etc.
A book-keeping program was used to sort out the events into various
categories. The operations of this program are summarized in figure 5.4.
S, 4 ComEjttter_ programg^for,_^ sjaalyqla of tltg 3*pronir and 4*prong eventa
These programs were* basically the same as the 2-prong program. The
main differences were aa follows:
1 Tht decimal co-ordinaUs from th^ microscope measurements were read
into the computer by && standard "Autocode" fast rend routing and th?y
required no decoding.
?. Measurement from either cwo or three views could be r©ad In; fch*
relevant directive wai? stored In the event identification nuaber.
3. For the 3-prong events the initial analysis was made hi terms of the

7112 1 ^ x C (p, 3p)Be reaction, and for the 4-prong events in terms of toeIS 9 C <p.4$Li reaction. Later, .1 whole range of reaction hypotheses,
3 4 involving one or two of the particles d, t( He" or Ho . were investi
gated for the 3~prong events, and the reaction hypothesis C (p, p3o?)
was ia*e*Ugated for the 4-prong event*.
The rang® t»fieffy relstt onsh p naed for the h nvy particles wast<? $ ^ <>F 7 * Z V log (-=H - n, 0446 + 0. 542? log (^-R> * 0, 00345 ' log (-^-RH « m ^© fn em /
wher& H is the range in centimetres
r.. is the mass of the partick in units of the proton mass
7 is the charge of the particle.
4. When thre« views lia * been measured for an event, flte event was
reeoasirueWi on each $i cbc three poasfl/le '/tew pairs in turn.
5. After all events had bee& n^&^&r^d, and, where accessary, re
the r- 5U1-:--; from all ,h- ai>ceptabk recant troctiorm for each event were
5 Bubble chamber .
Numerical values for several parameters of the apparatus were quired
for the analysts of &» ev«aia lt»e methods that were imad to ^ -r-.^,ii, these
arc disnutaed b®low:
1 Thickness and re fr active 'n(,-.^ of the front window of foe chamber.
These were determined by direct meayur«*rient on the window
thicknee^ » 1, 89 cms
refractive Index » I, 53,

2. Co-ordinates of the camera principal axes in the fiducial co-ordinate system.
A standard program, written by B$CK(1&60) was available for the
determination of the camera co-ordinates. It assumes that the two
windows ol the bubble chamber and the plane in which the camera lenses
lie are parallel to each other, and it requires the following input infor
mation:
(i) Refractive index and thickness of the front window
(li) Depth of the chamber and the refractive index of its contents;
the former was obtained directly with a copper spacer-bar
(«23.97 cms), and the latter was unity because the measurements
were made on photographs of an empty chamber,
(ill) Distance between the camera plane and the chamber window;
found by direct measurement (*$$. 13 cms),
(i?) Co-ordinates ol the fiducial marks on the front and back windows,
found by theodolite measurement during the assembly of the chamber,
(r) Approximate co-ordinates of the cameras ia the fiducial co-ordinate
system. Found by direct measurement.
(vl) Distances between the three pairs of camera lenses. Found by
direct measurement.
(vU) Measurements on the film from each camera, taken in the same
order as in (v), ol each of the fiducial marks, taken in the same
order as in (iv).

73
Hie co-ordinates of the camera principal axes calculated by the
program were:
camera 1 ca/oera 2 camera 3
x(cnie) -13.64 14.55 14.73
y(cms) * 0.61 -10.66 8.6S
3. Refractive index of the propane under operating conditions.
An iterative method was used to determine the refractive index.
Its value in the analysis program was varied until the reconstructed
vataes of the Z co-ordinate* of the fiducial marks on the back window of the
chamber beat fitted the known depth of the chamber. The best fit was
obtained for a refractive index of 1.22£.01.
4. Hie position of the beam-entry plane in the fiducial co-ordinate system.
This waa found, by theodolite measurement, to be in the y* plane
at x « IS. 45 cms.
$. Parameters of the range-energy relationship in propane and the incident
proton energy.
Hie range-energy relationship was determined by numerical integration
from the encrgy-ioas formula of UVfNGSTONE and BETHE (1£37), which
for protons is:
. Jil , NZ lot () . Iog ox nxv* v e I e
where e is the electronic chargem is the mass of title electronv is the velocity of the incident protonNZ is the electron density in the target£ - v/c

and I la the n&an excitation potential; the values used were * 17. 5 eV and I « 3d eV.
On integration the above equation has the form,4
and a quadratic function ol the lorm
log E « A + B log B + C<k* H)2e e ewas found to fit the tabulated values of £ and H to within .15 UeV over the energy range I MeV to UO MeV.
Because the density of propane under the operating conditions was not precisely known, an approximate value (0.434 gma/cc) was used to determine B and C (it can be seen from the equations above that the density, which determines NZ, is contained in the parameter A only)* v\ith the approximate density the parameter values were A • 3.0848, B • 0.5427, and C ^ 0.00345. Information from protons slopped in the propane by known thicknesses of aluminium was then used to determine the correct value of A, as indicated below:
Let £ » energy of the protons delivered toy the beam transport system E, * energy ol the protons after passage through L gms of Al absorberA*
E * energy ol the protons alter passage through M gms of Al absorber r_ ** residual range in propane of protons of energy E rM ** residual range in propane ol protons of energy E. r .. <* range in aluminium of protons ol energy E
Assuming a mage-energy relationship for protons in aluminium of the lorm:

75
E - AAJ -
the energies E and E^ can be expressed in terms of ranges In aluminiumJL> •*«>
as
TJ* en A
EL AAi
EM * AA1
From the measured ranges in propane r t and r.. (see section 3.4)JL OH
OE, * A •»•
Using tiie
sl * 26.82J B,, = 0.5715 RICH awl MADE V (1954) Al
r * 26. 1 cias rM » 15. 5 cmsJL< **T
B « 0.5427 C « 0.00345
1 2 I, « 5. 47 gms/cm M « 11. 65 gms/cm
and solving for A and E (hence E ) the following values are obtained
A * 3. 0446
EO
The range-energy relationship lor protons la the bubble chamber Is,
therefore
log E » 3. 0446 + 0. 5427 log R + 0. 00345 (iog^R)2
6. Deraagnlfloation from bubble chamber to film.
This was slightly dtHenmt *****& vtew to vtew aad

ft it tl
because of inconsistent positioning of the cassettes in the camera
housing. For each roll of film the demagnification was obtained by
eomjaring the measured separation of a given pair ol fiducial marks
with the mean value obtaiaed from all the measurements available
from the film. The deumgnmcations were all within about 1% ol 13.0.

Part 3 Tht; analysis of the results

7?
CHAPTER 6
INTHQDUCTION TO THE EXPERIMENTAL RESULTS
6 1 The tnci.deni eatlfpr ipftptrj,. for the analysed events
The incident protons enter the :nominated region ol the propane with an
energy of approximately 13? MeV and leave it with approximately 25 ItfeV.
Figure 6 1 shows the distribution In incident energy of the measured 2-prong,
3-prong7 and 4-prong events
The propane bubble chamber method is not very suitable for investigating
proton-carbon reactions for low energy protons In figure 6 2 the measured
angular correlation bc-iween $*<••• two prong;-:-, of a random selection of hydrogen
events U- shown plotted against the energy of the shorter prong*, it can be seen
that the reconstruction errors become very large for events with a prong energy
below about 15 MeV All carbon events with Incident proton energies less than
5> MeV have one prong of proton energy less than 15 MeV Also, as wasX
pointed out in section 4 2, then* is a serious loss of events in which iow energy
protons are produced Furthermore, in tfc® present experiment, the energy
errors due to straggling and spread of any in>ti«l beam energy spread increase
rapidly at She low proios energies, ih s was shown in figure 3 1. Tti«refore t
events Initiated by protons of energy less than 53 MeV ar© excluded from the
analysis
i © the energy calculated for the particle assure lag it to be a proton

N
150
100
50
N
800
600
400
200
20
3-prong events
100
2-prong events
60 100
N
20
15
10
5-
140 E MeV o
4-prong events
j_L140 E MeV o 60 100 140 E MeV o
Fig. 6.1 Distribution in incident energy of the measured events.E MeV
60
50
40
30
20 -
10 -
• •• • •• ».•• .. * *•*•.. ,* . •. •
' * • •* •:!*•." **V • ••• •!. • •••••»•• . •**•• ••*.« » ••.'.*• •
1.3 1.4 1.5
12
1.6 radians
1.7 1.8 1.9
Fig. 6. 2 Effect of prong length on resolution.

78
{>. ? Ite actions ratirgacntftd i?y the g-monff. 3-proni% and 4-pronjp events
The 2-prong events can represent proto&*iqrdrog*ii reactions or proton*
carbon reactions, but tL.e Sprang and 4-prong events must represent proton-
carbon reactions For a hydrogen event the incident track and the two prongs
slum the complete reaction, but for a carbon event the reeling residual nucleus
is never seen However, when the residua) nucleus s in* only unobserved
product from a proton-carbon reaction, the latter is still completely kinematieally
data?'.-? by the momentum and energy balances for the system
Hydrogen events can be eoaaftetely separated from carbon events, and
ihey can he analysed wtfcoat any difficolty But for carbon events, there are
two factors that complicate the deterrt inatl >n of the nature of the causal reactions
Firstly, the prongs of an *veat can represem |>rotons or heavier particles such* 4 as d, t, He and He , and il is sot po$8*M3 to dintingulsh between these by
looking at iht tracks Secondly, an event does not always show all the product
particles of the reaction; there can be neutrons present or charged per tides
with insufficient energy to prodtwe tifee minlrr;tirfi ob«erv»ble prong length of one
hub^ile 4-!isrr?.eter; th<* latter JOSH i«t particularly serious in die case of or-partlcles .
VarloMs reactions that cnn contrit«te to t-proag, 3*proag and 4-prong
events arc listed below:
events t n (p, p)H
12A *(
\ 3,

Ti
3-preag e ygtUi ; C (p,3p)Be19 919 819 ^ 8 1 *» 7
C <p,tpti)B* ; C (p.2p$Be ; C (p,2pHe )Li tC (i <,2pa)U
C ~(p,pSd)B6v ; ctuI? 10-NC (p, DpxrtBe x » 1,2,;;,
12 9C (p, 4p)Li
C <p,p3«)
decays oC low-lying excited states of rwdual auciei
not repr^«ented an<i tht? res ; due I nuclei shown are not mM/f^aarHy *n t
ground stales Al^o, becau3« oi tiu aeeood cao»© of eoiiipl • A -on
above, aay of the reactions l.sted under 3-pro»g events caa contr>)>uie to .ho
2-prcmg e veats if one ot tlie charged particles has too low an energy to be
detected Similarly, any of ifce react ons listi^l under 4-proag events can
coatr.bute to ill*:- 3-prong ^ vents or to the 2-proog events.
A i rst picture of the importaace of th@ various contributing reactions can
be obtained by examining the- energyioss distribtttioaa that ar«s« by hypothesising
that all of the e/?nt» are of the a^mpl^si poa.»!bie ;oir , c., that protona only
are produced and that all th« i -fu aon products (except ihs reaidual nuclei) are
observed Thus, for exanxple, if ih*- hypotheses w^re a correct on« w? could/
expect 10 Had v^ry «mipl«> eaergy-loas dJgtributions with peaks at, or just above,
the energies corresponding to the Q-valufcS for the (p,^p) reactions f:x«l,?,3, . .)
'iliv energy *io$s (E, ) for a reaction caa >/ obiaijaed from the n,oir<>n?:iin%j.<
a.nd energy balanet^ cqtuOjr.* foi-

II £.k B incident proton energy an^ rr,or,ueutu:nt
^j»lL * energy and j» orrentum of the i** product proton,4 >
"R'-^R * eBsr8y &nd momentum of the uaaedci recoUing nucleus,
and ^ • anergy-lo&s m Uto mteract.on « binding energy of thei4
koockad-out particles + the res :• dual sucUm excitation energy
(tf the correct react; on hyjx)thesis i« used),
tbeii th« jYiOir.enfiuw Glance equal 'ona give the momeEHiiP of the recoil- ng
nuclcms:
g.vcs *;_, and then the energy balance ^nation g-.ws the -r, rgy-lo«s
- E - E,O T i
The energies E and E. , and th@ /ocior momenta K and k are fullyo 1 -" — •
from th$ ev^nt r.rcoastnict on procedure
6. 3 ijtc qBergy«iQsa distribution ..for thg ^*
The energy -loss distr.btxuoo for all the 2*prong aveaia with incident
energies a&ove 3C> MeV, Stained on th« ftssumptloa that the events represent
either C *{p, Sp>B reactioats or HT (p,p)H reactions (hereafter referred to aa
the (p, 2p) eaergy-lGfis diatributioa), is «ho <̂n IB figure 6 S
It ta »e<m that the energy r««olut;oii >.n g^ood ^noo^i to isolate completely
the hydrogen ©vents, wfoch ar« ela«t?c ancJ so lio m th*> p^ak centred »t rero,
A systemmUc error of approximately 0. 5 VeV is present IB all inc'dent en^rgie* eaiculatod for ihe 2-prong events Th;u i ;f not a serious error but it accounts for the fact that both the hydrogen peak and the p-»hell peak are not centred exactly at the expected

Hyd
roge
n ev
ents
Car
bon
even
ts
-5
Fig.
6.
3 Th
e (p
, 2p)
en
ergy
-los
s di
stri
butio
n.

81
'rons the carbon events The width of the hydrogen peak gives a measure of
the energy resolution achieved; this is ^scusaed in aeetioa £ $ Two peaks
can he reoogni^od ,n the distribution for the carbon events, one at 16 IVeV with
a w d£h close to the resolution width, and a mueh broader one centred at about
3$ I'eV. Ifce distrlbttucm is wry similar to those obiaine:4 from th« copiaiwr
carbon events analysed by several experimenter* with counter telescope r!H>
section 1.4). The peak at 16 5>;eV is r.5«agaJ?e^ as 1^tag due to the
12 quasi -elastic knock-out of p-shall protons from C , and the fit i ir at 38 fc!t»V
occur* at an energy-loss close to that predicted for the quits. -e last 'c knock-out
of «-»hell protons; it has ttsttally been attributed to such interactions by other
authors
The p*aheU peak is fairly sharply defined at tta lower limit but t
nto a general baok^rowad of events at iis upp«r*r limit; it la also asymmetric
Because of the energy resolution I- mil, ^ius<?d mainly by atragghog, it la not
possible to see directly whether or not the low excited siar^s i» B (at
excitation energies of ? 14 MeV; 4 4$ M«V 5 14 MeV, etc) are being f©df but
it is evident that the predominant interaction in feeding the B ground slate
(the C (p.SpJB11 O-valttt. ts li * * eV). OT the other reacttoas that can
contr-lxile to the 'N prong eventa f only fe« (p.por) reaotios can give events in
the region of th® peaki th>3 can be seen from the third column of the U* >}c
ahovm below:

energy at Reaction Q-value which events can *
appear in fig e 3
M*V
3 (p, pHe )
(p.tpttl
35.9
i5. 2 MeV
2T.4
«6. 3
7.4
«7.4
">?
30
sa
si28
The events catming tha asymmetry of the peak and the events in th*? enorgy-loss
region below ? fcjeV must, tlien, b^ due either to (p, pa) reactions or to Ctoe
production of ffee cxefted ^;ia ?a of B by (p,?j>> reactioitel fe section 8 4, it
wjl 1» seeu that the (p. por) reaction do^s not (rontribote n any events, and that
some information ca» be o'^ia-ncc from the asymmetry about £he roaettoa
leading to the B e^elff-d states
? arc^ two intrinsic nuclear effects -that ma!-.e it more d.ff'cult to
the- 8-sheil roartiona than it is to observe the p-'ih^ll reactiona in
type of expemr^m, thea^ are?
The dtfferences ijctwe^rt colun.ns ? and -1 are Ui* direct rv-MU^i of treating all part cles as protons For example, the mtnlmmv observable energy of an *~partk>k< *i» IS McV (section 1 r.) ami if the track of such a particle ^ asstimed to be a proton its calculateti energy become 4. SMeV 13, > Tv?eV of ©nci^y is 'lost" in Uw r&co& umi ou; this ia the between the Q-vaJue for the react on and the mm-.mut:•» energy at whch it can bs observed on the <n,2p) on*;•

83
(a) that the a-shsil nucleons he mor -•» deeply m the uncivil* than the
p-eh&ll nuclcons; the spatial wawfunetion for the statute perajca at
*ero radios while ibe p-stato wavrefonction falls to roro at sero
radios Nuclear absorption effects will therefor© reduce the prob~
ability of quasi tissue a-shell reactions,
and (b) that .h ' s-et&te has a natural width of 5-7 fc -«V: the consequent
broadening of the peak makes it merge more into the background ofA
the aoiHptty) evenia tha. art? preaent Ui this region ot energy-loss
These factors i ; ghi account lor ib« fact that the e -shell peak is only just
observed However, in section l r?. 8, evidence is presdntsd which points to the
fact that ev@n the observed peak might not be due to a -shell events but doe to12 10events from tlia r^ac, oa C <p»?pn)B .
No analysis of the s-shell t-vynln it possible, ihere(ort- f and there r.;u^t
be some doubt am to whether *fc', quaai-<jlasilc Knoeu-Kjut of s-«hell protcjas is
being observed at all in this experiment
Although at ?fr«t sight it might be thought that a third effect, enters because th^re arc only half as many s-shell pioums vn C1S as |>-3he!J protocol, CLEOG (19€3> has pointed out that, »'nce tike coll ^.on cross^neetion is d^termln^sd by amatrix element whou- yalu-t s partly dependent on thy form of the target nuch-oa wawfunction. tha relative croas-s«etiotis fot' th^» tcnoek^nur of nmcAeons fr<M?< different nuclear suites is not Jiec^ssartly proportional to the number of nuc» ons *a these states In fact, evidence is presoatml from the Ca4 '(\\ ^?p) r.^cUon to soggeat that, for this tmcir>us at least, reaction; in tfee s-state are considerably enhanced owr those in the p-siate

C 4 The energy-logs attributions for lha 3-proag and 4-pr
The most noticeable feauira of the (p, 3p) and (p, 4p) energy-loss dlstri-
but' ons, which are shown m »igttr -Jt *. 4 and 6. 5 respectively, i* the complete
absence of peaks at energy -losses corresponding to the threshold energies (orIf 1 >low residual nucleus excited state energies) for the reactions C <p,3p)B«
and C "(Pf^P) 1^ • h* *h^s respect they differ from the (p,2p)
diatributlOD shown in figure G. 3, but in their general foruvs they are very
sin tlar to that part of the (p, 2p) diatrtLmuon which lies above the p*ahell peak.
It is evident that the simple (p,xp) descriptiona cannot apply to these
events bat the similarities of the three diatribuUona does suggest that the three
sets of events are produced by similar reaction mechanisms. It is interesting
to note that the distributions are similar to the excitation functions obtained by
Metropolis (see section 1 3) from his calculations for intranuclear cascade64 reactions on Oi at 286 fc*eV.
6. 5 The experimental re solution
The events in the hydrogen peak of figure 6. 3 provide an excellent means
of determining the purely e?;porimemal resolution for the various measurement
made on the events. The events represent elastie proton-proton interactions•I
wMcb have the following unique pro^rties:
(a) no energy i& lost in the u&racUon; a; - £, - S * 0,o 1 t(b) the sumjij^d momenta of the prodttet protons is equal to the inc dent
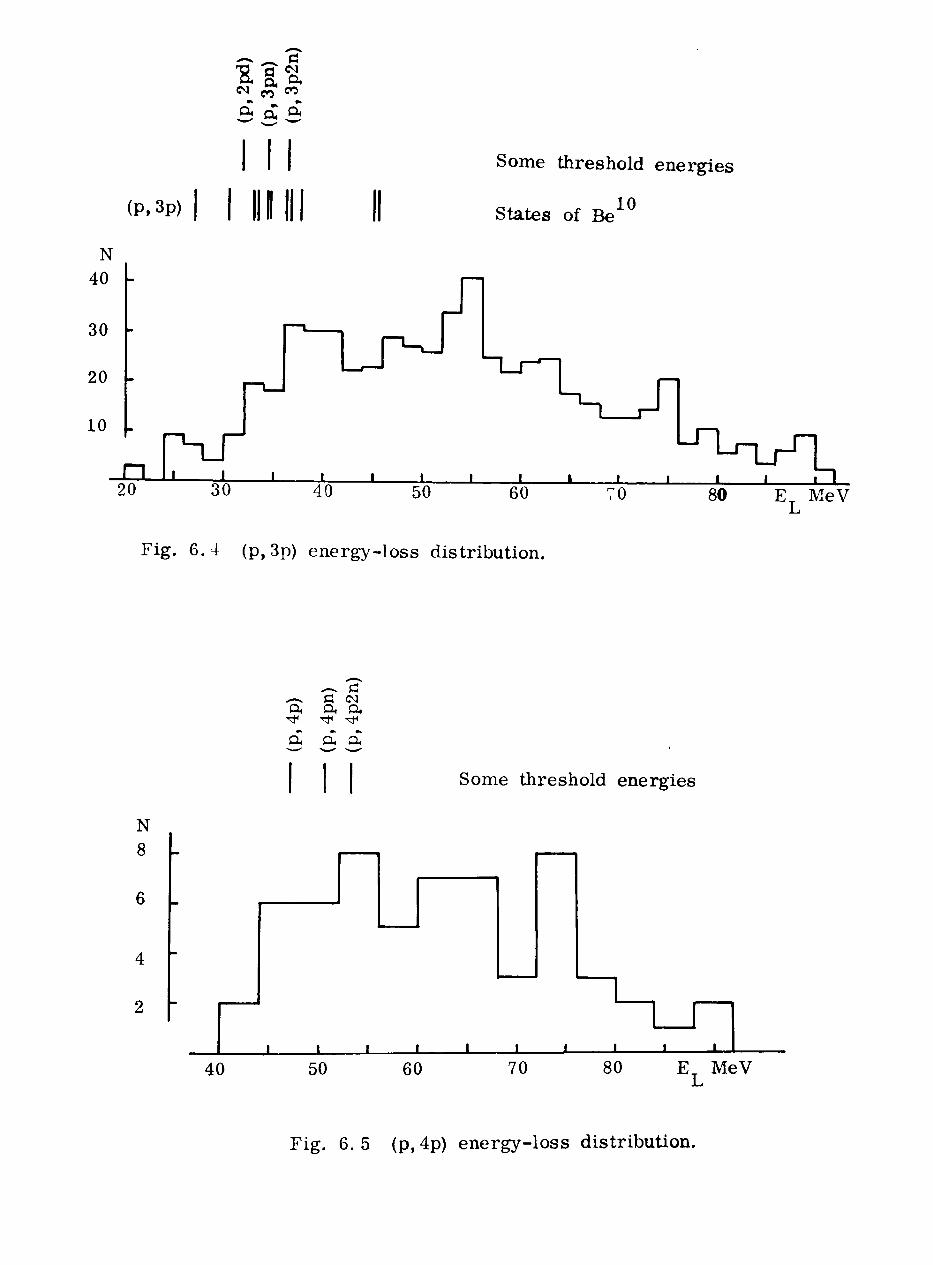
(P,3p)
N 40
30
20
10
n
•> CU Q. Q,
Some threshold energies
States of Be 10
-I——I——I——' ' I ' I I I20 30 40 50 60 70 80
Fig. 6.4 (p, 3p) energy-loss distribution.
E MeV
N 8
4
2
rt <Ma a,a
Some threshold energies
i i I I————I————I————L
40 50 60 70 80 E MeV
Fig. 6.5 (p, 4p) energy-loss distribution.

85
: k - k~ lc» 0,
(c) the angle between die two protons is always between $3° ando{•90 m the noa«relaf*visuc limit),
and (d) the incident proton and the product protons lio in the same plane;
v> « &>*& • Jt> * 0 koklk2
The width of the experimental distribution for each quantity, shown in figures
C 6 to 6. 9 t gives directly its experimental resolution.
Of particular interest are the distributions of the energy --losses; for
events with incident energies below 100 MeV (m«an E - 8-> B eV), Uia RMSodeviation is 5. 0 MeV and for events with incident energies above 100 MeV
(mean £ - 115 MeV), the RMS deviation is 1. 2 MeV, & chapter 3 the calculated
BBSS «n$rgy spreads produced by dtraggjUng a>^ by energy spreads in the
beam wore shown. Inferring to figure 3. 1 it can be seen that the RMS deviations
quoted above are consistent with an RM$ energy spread of leas than 3. 5 MeV
in the beam incident upon the chamber. This result confirms the result obtained
by the range-telescope method of measurement ;; ade before the co? meneement
of the bubble chamber run (see section 3. 0). It was pointed out in chapter 3
that once the beam energy spread has been reduced to about 0. 5 MeV, further
reduction nmk&s vtry little difference to the energy resolution obtained In the
bubble chamber measurement* It follows, therefore, that in this experiment
the bubble chamber Is being used at the limit of Its resolving power.
The RMS errors in quantities (b), (c) and (d) are very nmeh smaller than
any structural features in the distributions for these quantities for the carbon events
(ae* «*h«nt«r RI. no that the errors place no it^iit on the analysis.

N
600
400
200
E > 100 MeV oE - 115 MeV
E < 100 MeV oE ~ 80 MeV
0
1 J 160
120-
80» »
4ft
' 1
t 1 *
11
1 «i ' 1 ' ' .i i 1 i i i i i 1 i i i*
-4-2024 -4-20246E -E -£„ MeV E -E -£„ MeVrt o 1 2 rt o 1 2
Fig. 6. 6 Energy-loss distributions for hydrogen events.
N
400
300
200
100
0 40 80 120 k -k -kn MeV/c
Fig. 6.7 Momentum unbalance for hydrogen events.
N
800
600
400
200
1.4 1.6 1.8 0 radians
j_ &
Fig. 6. 8 Angular correlation for hydrogen events.
0 0.1 0.2 0.3 V*
Fig. 6. 9 Coplanarity for hydrogen events.

CHAPTER 7
THE CBO3S-SSCT1ON3
7.1 The meaaurable cross-gections
In chapter 10, evidence is given to show that events from the reaction12 10C (p, 3p)Be can be separated, at least approximately, from the other J-prong
events. This categorization of events is the only improvement siade upon that
which is given in chapter 6 on the basis of the (p,*:p) energy-loos distributions.
Six categories of events can therefore be recognized:
events
hydrogen events
other 2-prong events
(p, 3p) events
other 3-proag events
4-pTong events.
If the cross-sect ions for the production of the ground state and of each11of the excited states of B could be i?i«asured f information could be obtained
12 11on the parentage coefficients of the C g. a., in terms of B states (see
section 1. 4). However, ft was aeen in chapter S that the energy resolution in
the experiment* coupled with the fact that none of the B excited states is
produced very strongly, makes it impossible to resolve individual states.12 Despite this, the extent to which the C g. s. wavefunction deviates from a pure
shell model wavetonction could be Treasured by comparing the frequency of
87
production of the B g. s. with that of all the excited states taken together.
Unfortunately, the B excited states can b© produced by mechanisms
other than the direct knock-out of a nucleon; lor exan ;>le:
(a) by initial and final state interactions; these reflect the parentage of1 O *l 1 |K fk
some intermediate state of C or B and not that of the C g. a.
(see section 1. 4), Hie final state interactions, in which outgoing
protons suffer inelastic scattering off other nueleoos or groups of
aueleoas in the nucleus, are likely to be more important than the
initial state interactions because there are, alter the knock-out
reaction, two product protons both with energies much lower thanEe-16
the incident energy (—~~, on average), and the nueleon-tmcieonA-
cross-section increases rapidly with decreasing energy below 100 MeV.11 12 and (b) by the decay to B of a C excited state produced in the reaction
19 19*C (P,P')C . GBOVER 6 CARETTO (1^64) have pointed out that
12 for 93 MeV protons, the production of the C states with excitation
energies between 19 IV eV and 30 MeV (those likely to decay by the
emussion of at single nucleon) is 2C mb and that the branching ratio
for proton eiuission is somewhere in the region of 0.3 to 0.4.
U is not possible to disent&agle the events due to these other r eehanisn^
from those due to the clean knock-out n-iechanie/.i and so to obtain the ground
state to excited state parentage ratio. An analysts of the events Just above
the ground state peak is given m chapter 8. Here the cross-section deter-12 11 ruination has been limited to the reaction C (P.*P)B g.s. (p*sheU events).

88
Several incident -energy-dependent correction factors enter into the
calculation of the (p, 2p) croes-ftectioa and also, because of difficulties in
determining the total incident proton flax, there is an uncertainty in the
absolute value of the calculated cross-section of about 10%. Hie proton-proton
interaction cross-section is, however, well known and strongly energy dependent
in the energy interval S* MeV<E <133 &eV; a summary of the published
experimental results U given by HESS (1;?58). Therefore, by first calculating
this cross -sect on from the hydrogen events (which are subject io very o milar
correction factors to those used tor th# p-sheli events), it is possible to check,
from the energy dependeiwe, the validity of th« correcifon lacwrs, and to obtain,
from the absolute <' a^aiiude, the flux iiormaiitauoa factor required to give an1? 11 absolute value to the cross-section for the C (p, 2p)B g. s. reaction.
Cross-sections for the observation in the bubble chamber (i.e. imeor reeled)
of the other categories ol events are also calculated.
calculation of
To calculate from the bubble chamber data the cross-sec! ion for a reaction
of the type E at energy E, the following relationship is used:
Wnmillibarns
E
where M * Avogadro s Number * 6. 00--J. x 10" 'W » the molecular weight of propane * 44.0')x * 3 for carbon crpss-afctlons and S for the hydrogen crose-section
path length in centimetres corresponding to the degradation in the beam energy from E-*&E to E-&E

(AE) * the number 01 reactions of the type R in the energy interval** l -- . 4 <-
« the density of propane at the operating conditions » the proton flux at the energy E.
A summary is given below of the methods used to obtain the propane
density and the proton flu>.
Propane density• In section 5 5 the range-energy relationship was obtained
for protons in propane under the operating conditions of the experiment, w thout
use of the exact proton density. A density of 0. 4^4 gms/ec was assumed and
the computed range-energy data was fitted with a quadratic equation of the type:
log E » a + ft log R + /(iog^R) .•3 Kg
Using the values of " and if so obtained, the parameter a was optimised to fit
the data available from the measure i&ant of the tracks of protons stored n
the chairber. The density can be determined from this value of a.2 If R is measured in gms/cm , the relationship is independent of the
density of the propane. For measurements taken in centimetres it becoo.es:
Jog E » or + /? log Rd -»• Y (log Rd)Se e y ewhere d is the propane density and H ;, is cms.
An error of less than 0. 1 * arises if tht^ laji two terms m the expansion of the
are omitted, so the relationship can be written to a good approximation as:0
log E « a + flog d * * log R +Yttog H)f . "e e e U cIt was shown in section 5. 5 that Hie constant term, (or «• £log d), is 3. 0446efor the operating conditions of the propane. It was also seen that for a propane
density of 0. 434 gais/ec, the relevant constant term is 3. 0848. Since ft and V

are independent of changes in density (see section 5. 5) the density corres
ponding to fh« operating conditions of the propane can be determined from the
two equations:
3. 0446 » a + £ log d
3. 0848 « Of * ft log 0, 434
using $ * t). 542? and solving for d
d . y .....(?. 414 . gnyi/cc«
Proton fHjts f In order that the cross-section may be correctly determined
the proton flux in each energy interval and the number of events in this same
interval most be consistent with each other. This is not an easy specification
to meet and. as soon as frame aad event acceptance criteria oi the type discussed
in section 4. 2 are introduced into the analysis, different biases tend to operate
when the film is scanned for different information. It wiil, in fact, be seen m
section ».. 3 that the cross-sec liona calculated are systematically high and in
retrospect it is possible? to recogn^e the origin of the error? this is doue below
for the factors that make up the total proton flux, F .St
F_ « (no. of frames included in the analysis) x (average no. of tracks/frame)E
where t is the attenuation of the .ucident beam flux at the energy E.£
(i) Number of frqr. <•*-; Ine total nurober of frames examined was 27, 384
and of these '-, 03? were rejectee on both scans (see section 4. 3).
Of the Ira, as that were accepted on one scan but not on the other,
734 were rejected at the £ >«3&unng stage. The nu/^er of f ran e 3
consistent with the events measured m, Iher, 'ore, 2 ,^13.

91
Source of error: there i* some evidence to show that a bad fraine
was less likely to be eliminated if it had a very clear event on it.
This bias would increase the calculated cross-section.
(ii) Number of tracks per frame At the scanning stage the number of
protons entering the chamber was counted on every tenth frame.
Figure f, 1 shows the frequency distribution obtained; the mean value
with its statistical error is 6. 56 + fh $6.
Source of error: a systematic bias operated here similar to that of
(i) above, A frame with a large number of tracks was more likely
to be rejected if the tracks on it had to be counted than if they had
not to be. This bias again would increase the calculated cross-section.
^'^ Attenuation. Thia was determined by scanning the best frames of
several rolls of film. The G f l,2,3 and 4-prong events were recorded
in intervals corresponding to 5 *VeV incident energy steps. Th<*
attenuation at any point in the chamber la the fraction of the incident
beam lost up to that point. The result Is shown in figure 7.2.
proton flux at an energy £ is, therefore: 136533.28 (1-fJ.
7.3 The elastic protoa^roton cross-section
Not all of the S-prong events listed at the scanning stage could be straight
forwardly measured aod categorized by energy-loss into hydrogen events etc.
For example: some events could not be measured at all; some had scatters on
their prongs etc. In appendix VU the categorization accomplished at the treasuring

N Mean = 6. 56 + 0. 06
300
200
100
4 8 12 16 No. of tracks per frame
f
0.3
0.2
0.1
i^. 7.1 Number of incident protons per frame.
130 110 90 70 50 E MeVo
Fig. 7. 2 Beam attenuation.

nstage of the analysis for all the 2-prong events that appeared in the combined
seaming list (see chapter 4) is given; this ( s the starting point for the calcu
lation of the p-«hell cross-section and hydrogen cross-sections.H
Column of table A shows, for each 5 MeV incident energy interval, the
results collected from the following categories (see appendix VII): the success
fully treasured hydrogen events; the hydrogen events not re measured; and that
component of die eveata not measured that were classed as hydrogen events.
The first correction factor is applied to these events to allow for the events
not observed because of the azimuth effect
The ayJBmthal correction. For taqpolarized protons and an tmpolarized target,
the plane ol an elastic event is arbitrarily oriented with respect to any fixed
plane containing the incident track. However, \t the plane of the event passes
through, or close to, the camera through which the event is being observed,
the event image will appear as a straight line only and it will not be recorded.
The distribution of the anmuthal angle, measured with respect to a plane
parallel to the glass windows ol the chamber, is shown in figure r<."' for the
hydrogen events in the various incident energy regions of the chamber. To
avoid any overlap with the abort-prong correction, only events with both protons
of energy greater than If fceV are included. From the distributions of figure
7.3, an energy dependent correction factor is determined; this u sshown in figure
''.4. Cokcin ni of ta/'jle A shows ihe corrected numbers of events.
The correction is not applied to the events with scatters because a scatter
on one of two nearly coincident tracks immediately resolvaa thorn. The hydrogen

N
60
40
20
110 < E < 130 o
0
N
60
40
20
90 < E < 110 o
30 60 90 degrees 0 30
11
60 90 degrees
70 < E < 90 50 ^ EN
60
40
20
o N
" M 1 !--l-l- .. ..... 40
.
1 I 1
t-»V - J_i — 1 V
O
-
. .Ill
1 ' ' f f' ' 11 1 1
0 30 60 90 degrees 0 30 60 90 degrees
Fig. 7.3 Distribution with azimuthal angle of the hydrogen events.
No. of events lost No. of events recorded
0.4
0.3
0.2
0.1
130 110 90E MeV o
70 50
Fig. 7. 4 Azimuthal correction factor.

93
•rents with scatters are added in column IV; these numbers must BOW be
corrected for the events lost in the analysis because of their very short prongs.
The sbort~proag correction Events in which the incident energy is shared
very unequally between the two protons can easily be overlooked; the small
angle of scatter of the high eaergy proton and the very short (or nan-existent)
track of the low energy proton make it difficult (or impossible) to detect such
events. The distribution of the energies of the protons from aH the events
with E > §C MeV is shown in figure 7. 5; there is a noticeable absence of low oeaergy protons.
The proton-proton cross-section is closely isotropic in tht centre of mass
system and it follows from this that in the laboratory frame of reference the
distribution of the energies of the scattered protons (irom a nia&o-e&ergeti*
beam of E MeV) is uniform from rero to K MeV. If all protons with an o oeaergy less than x &ieV are not detected, the ratio
eveals last m tx.events recorded K * 2x&
From die distribution of figure 7.5, which without loss would be uniform from
tero to 50 &eV, the equivalent complete cut-off energy is taken as 6 lueV; the
correction factor for the hydrogen events is, therefore:
16£ -16 o
Column V of table A shows th$ numbers of events alter this correction factor
has been applied These ntunbors are used to calculate the proton-proton
cross~0eotion.

N
80
60
40
20 r0 10 20 30 40 50
Fig. 7. 5 Distribution of proton energies for hydrogen events.
60 E MeV P
I~T—\
Jl,o
52.557.562.567.572.577.582.587.592.597.5
102. 5107.5112.5117.5122.5127. 5
II
No. without scatter
100126105137156134140153135139151177150166170179
III
Corrected Az. Loss
145178141175193163167179155158172200170186190200
IV
Plus events with scatter
170189156193221195206217215194220260247260287293
V
Corrected for sh. pr.
244262210253283246256266260232261305288301320335
VI
6mb
58.857.743.146.248.338.437.636.533.828.530.533.430.029.831.530.7
VU
0mb
51.4
40.2
31.5
30. 5
Table A - The hydrogen events.
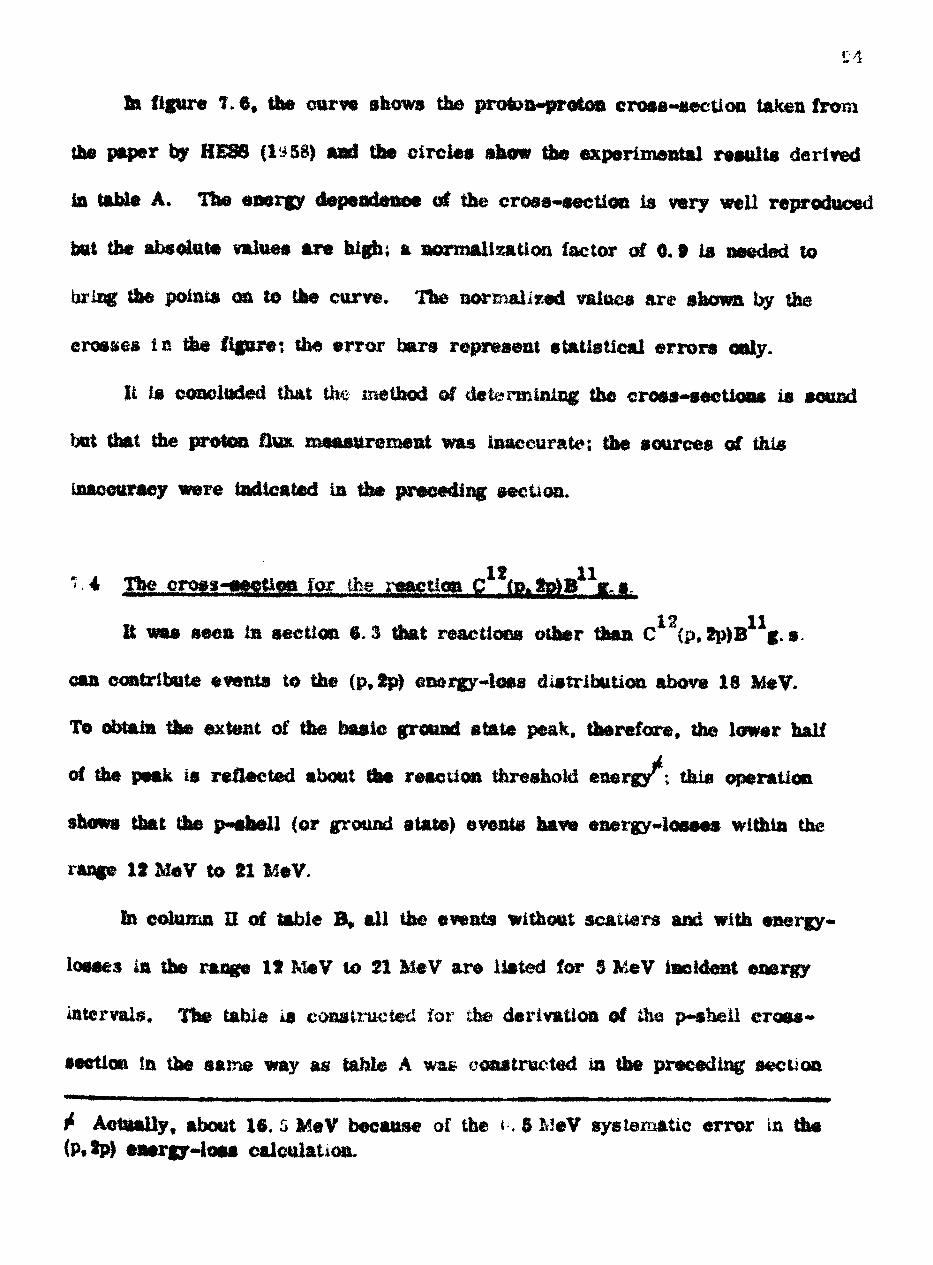
la figure 7. 6* the curve shows the proton-proton cross-section taken from
the paper by HESS (1^58) and the circles show the experimental results derived
In table A. Tfce energy dependence ol the cross«secUo& is very well reproduced
but the absolute values are high; a normalization factor of 0. 9 is needed to
bring the points oa to the curve. The normalised values are shown by the
crosses in the: figure; the error bars represent statistical errors only.
It is concluded that the method of determining the cross-sections is sound
but that the proton fto measurement was inaccurate; the sources of this
inaccuracy were indicated in the preceding section.
It 11 for fa® j-eactloa C te12 11 ft was seen in section $.3 (hat reactions other than C (p, 2p)B g. ».
can contribute events to the (p, 2p) energy-Ices distribution above 18
To obtain the extent of the basic ground state peak, therefore, the lower hall
of the peak is reflected about the reaction threshold energy ; this operation
shows that the p-shell (or ground state) events have energy-losses within the
range 12 M«V to 21 McV.
In column H of table B, all the events without scai&rs and with energy*
losses in the range If M«V to 21 MeV are listed for 5 MeV incident energy
intervals. The table is constructed for iht- derivatioa of th@ p-sheil cross*
section in the same way as table A wat oonstructed m the preceding section
J* Actually, about 16, S MeV because of the t . 5 MeV systematic error in the (Pf2p) eaergy-loss calculation.

50
45
40
30
25 h
50
The established p, p cross-section
Experimental results
Experimental results after normalization
70 90E MeV o
110 130
Fig. 7. 6 The elastic proton-proton cross-section.

95
for the hydrogen events. Three correction factors are applied: a correction
to allow for the non-ground-atate events included in column H; the azimuthal
correction, and the short prong correction; these are discussed below.
Non-ground-state correct;OP. If there are a events, from any given Incident
energy interval, in the lower half of the p-shell peak (12 <E < 16.5), and Ni*events, from the same incident energy interval, in the region covered by the
complete peak (12<£L< 21), the aormaliKatiOB factor to be applied to the total
number N lo obtain the number of p-sheli events is ^ff. However, this
perfect symmetry in the fundamental peak and this will only apply if the recon
struction procedure is completely free of any incident energy dependent bias.
An easy way of allowing Cor the possible presence of such a bias to to weight
the above correction factor by a term isjPj, which measure* the asymmetry of
the hydrogen peak.
From a breakdown of the hydrogen, and p-shell, events, the two quotients,«n **»•*• and ™% were obtained as functions of the incident energy. These are shown w zn..-in figure 7.7, together with thmr product, which is the correction factor applied
to column II of table B to allow for the presence of the non-ground-state events.
Tiie ft?irr.uthal corroction Although p-shell events are not, in general, eoplanar,
the reconstruction program calculates the azimuth of the plane containing the
incident proton and the longer of the two prongs of each event, so that the same*
method of correction can be used for the p-shell events as was used for the
hydrogen events. The relatively small number of p-shell events prevents the
determinattua of the aKinmthal correction as a function of incident energy, but

II III IV V VI VIIE No. without
scattero Non-g. s. Corrected Plus events corrected Az. Loss with scatter
Corrected for sh. pr.
52. 557.562.567.572.571.582.587.592.597.5102.5107.5112.5117.5122. 5127.5
11202018292327282329554743354053
11202018282226272127504338313546
14242321312428292329534540333748
14242322342730322834635653505368
24393532473740423542786864606280
^ normalized to the hydrogen cross-section
Table B - The p-shell events.
16.4
15.6
15.8
15.5
1.0
0.9
0.8
0.7
H Asymmetry of hydrogen peak
Correction factor (=product)
2n Asymmetry of N p-shell peak
50 70 90 110 130 E.
Fig. Correction factor to allow for non-ground state events.

an average correction factor (i.e. no. ol events lost/no, of events recorded)
of 0.09 is obtained by taking together all the events with both proton energies
greater than 12 MeV; the distribution of the azimuthal angles is shown in
figure 7.8. The corresponding average correction factor for the hydrogen
events is 0. IS. The p*ehell axismthal correction factor is, therefore, assumed
to have the same energy dependence as (but half the value of) the correction
factor calculated for the hydrogen events.
short-prong correction Figure 7.9 shows (he distribution of proton
energies for all the events with £ > 50 MeV and 12 MeV<ET <rn MeV. Theo 1,1
equivalent complete cut-off energy is at 8 Me V, as it was for the hydrogen
events. Assuming, on the strength of the quasi-elastic hypothesis, that the
distribution should be uniform from zero up to the total available energy
(E -16 M«V in this case), the snort-prong correction factor is: 7~T .O Jb —32
OColumn VH of table B shows the eras a-sections alter they have been
normalized to allow for the incident flux discrepancy detected by calculating
the proton-proton cross~aection. The values are shown graphically in figure
'.10, the error bars represent the statistical errors only.
12 117 ' 5 PJ^cusaion of the C (p.2p)B g.s. cross-section
To within the statistical errors, the measured cross-section is independent
of the incident energy from SO MeV to 130 P.'eV.
YUASA ft POULET (1#63) have measured the C p-sheli cross-section
with a propane bubble chamber but they used different energy-loss limits to

N
50
40
30
20
10
0 30 60 90 degrees
Fig. 7. 8 Distribution with azimuthal angle of p-shell events,
N
50
40
30
20
10
0 10 20 30 40 50
Fig. 7.9 Distribution of proton energies for p-shell events.
60 E MeV P

define the p-shell events; their results are summarised below. In the last
ooluma, the cross~«ectlons from the present experiment, calculated for the
same esergy*loss limits, are shown.
incident energy Energy-loss
70 <£ < o
12 ̂ K <-28
doss-section Comparable firon* present results (tab)
17.4 +1.9
24. S + S
IS, 3 + 3.9
25.9 + $. <J
15.9 •»• 3.0 17.6+1.
23.7 + 3.0 23.0 + 1.7
There is excellent agreement between the two sets of results.
OOODING & PUGH (1960) measured the C12 P-shell cross«seeUon at
1S3 MsV using the counter telescope method and they obtained a value of
16 + 4 mb; th« energy-ioaa limits used were 8 MeV and 27 MeV. The
correspondiug result from the present experiment is 18. 5 ^ 2 J^eV, which
agrees wthff* the statistical errors with the quoted result. This i* a more
interesting agreement than the one above because the bubble chamber method,
and the counter telescope method* ot measuring erosa-secUona involve different
experimental difficulties, 90 that undetected systematic biases would be more
likely to show in a comparison of these result* than in a comparison of results
from two bubble chamber experiments*
Energy-loss limits of 10 &eV and 27 MeV were used because the events below 10 MeV in the energy-loss distribution (fig. 6. 3) are hydrogen <. vents. The experimental results were extrapolated to 153

MOH1U3OH ft CARETTO (19*S), in radiochemlcal experiments, nave also
found that (p,2p) cross-sections are approximately energy Independent; theyfifi l 'liftmeasured the cross-eections for 81 , Zn and W in tne incident proton
energy range 1*0 MeV to 450 MeV.
Assuming that tne nucleon-aucieon interactions within nuclear matter
resemble interactions between free nucleons (i.e. accepting the Impulse Approximation), the energy independence of the (p,2p) cross-aection can, in
fact, he accounted for.
OOL0BERGER (I IS) has shown thai, within nuclear matter, free oucleon-
otscleon cross-sections are decreased by the operation of the Paul! principle; he showed that the intranuclear ao«leoB*nuoteoo cross-sections are related to
free nucieon-ttaeleon cross-gecUona by the following formula:
+ V )' o o
where <fl « nucleon-nucleon cross-section within the nucleus0~ * free nuelton-nucleoa cross-section at the energy (£ +V )E_ * Fermi energyE = incident nucleon energyV •* depth of the aaelear potential well
Hie energy dependence of the quasi-clastic (p, 2p) reaction depends upon:(a) the intranuclear proton-proton cross-section for the incident protons, and
(b) the intranuclear protoa-nucleoa cross-section for the protons produced by
the initial quasi-elastic reaction (because a final state interaction destroys
the quasi-elastic nature of the reaction).

99
Using the values: £ * 30 MeV; V - 40 MeV; and values of 6 fromJF O
HESS (IS 58). 6" for the incident protons is found to be independent of the
incident energy in the range 50 MeV<£ <!'><» MeVv and equal to 17 tub.
For incident proton energies of 50 MeV and 130 MeV, the average proton
eutrgtes Hi the final state within the B11 nucleus, <E+v ), are 65 MeV ando05 MeV respectively. Using these values for <E +V ), and an appropriately
weighted average proton-nucleon cross-section (£* 5<5~pp/ll + 66"pn/ll) t la
the Oofalberger formula, the cross-section for proton interactions in the final
state is found to be approximately energy Independent: (5^(50 MeV) * 23. 5 mb
and 6^130 MeV) « 25 mb.
The energy independence of the two factors affecting the quasi-clastic
(p,ip) reaction can account for the energy independence of the measured cross-
section. The agreement also lends support to the validity of the Impulse
Approximation picture of nuclear reactions.
The above effects are implicit in Moste Carlo calculations, in which
they receive a more detailed treatment, and the I-.'ionte Carlo calculated cross*
sections do, in fact, turn out to be energy independent. For example, it was12 11 seen In section 1. 3 that the C (p, 2p)B cross-section calculated t>y Berlin!
is approximately constant from 50 MeV to 150 MeV. Although the value of the
cross-section quoted is approximately 44 mb, it refers to reactions leaving the11 B nucleus with all possible excitation energies, and if the cross-section for
the production of B with an excitation energy of less than 10 MeV is taken,
I* The Monte Carlo calculation does not produce a body of ground state events because the shell structure of th& nucleus is not built into the nuclear model used.

100 it is found to be equal to 16mb. , i.e. in good agreement with the value
measured in the present experiment.
Another example from Monte Carlo calculations comes from the calculation
of the cross-section for the reaction Cu (p.pn)Cu by &ETBOPO1& etal (1858).
Hwy showed that the experimentally measured strong energy dependence for this
cross-section. In the incident energy range 50 MeV <S < 160 MeV, is due entirely66 flS* 65*to the composite reaction: p * Cu •* p 1 + Cu ; Cu -* Cu + n,
t
and that the cross-section for the direct knock-out of a neutron is approximately
energy Independent, It seems probable that the experimental results of
CRANDALL et al (USS) for C12:
<T{pf pii) at 130 MeV » 51 mb
f (PtS») at IW foeV * 87 oab i*.
can also be explained by the same composite reaction and that the cross -section
for the quasi-elastic (p.pn) reaction is energy independent like that of the quasi-
elastic (p, 2p) reaction.
7.6 Other croaa-aeciiona
Figure 7.11 shows the cross-sections corresponding to the numbers of
events actually observed in the bubble chamber for all the 2 -prong events with
energy-losses above 30 MeV, for all the S-prong events, and for ail the 4-prong
events. No correction factors have been applied to the results except for the
fhtx ttorniaUEaUon; the error bars show the statistical errors only. The ;* -.ost
events on rejected frames (see section 1.2) were excluded from the cross-section determination.

rf'mb
18
16
14
12
50 r<0 90E MeV o
110 130
12 11 Fig. 7.10 The cross-section for the reaction C (p, 2p)B g. s,
/mb
35
30
25
20
15
10
5
50 70 90E MeV o
110
2-prong events above p-shell
I 3-prong events
4-prong events __i__
130
Fig. 7.11 Cross-sections for the categories of events shown.

101
U&portant correction would be lor the non-observation of short prongs, but
because the contributions to the events from the various reaction mecUuuarrs
are not fully understood, especially for those events with short prongs (i.e.
reactions lor which nucleon evaporation and heavy particle ejection are
important) r no meaningful oorrecUon can be given.
It Is interesting to note that even the uncorreeted cross-section lor the
3-prong events is 501 above the value for the micieon cascade reactions
£{p,3pxn) given by Bertmi (see section 1.3).*
In chapter 10, it is shown that there is evidence to support the hypothesis
that a large proportion of the events with (p,3p) energy-losses below 40 MeV
are consistent with the reaction C (p,3p)Be . The uncorrected cross^seotioa
for these events is independent oi the incident energy and is equal to 2.6+0.5 tub.

102
CHAPTRB 8
THE C12(p.%p)Bn REACTION FOR ZERO AND LOW
EXCITATION ENEBOUSS OF BU
8.1 Nomenclature
The diagram shows the nomenclature used in describing the (p,2p)
reaction.
t Of K* S\ ®< <taf*<V
^r»
V5 or
*
8.2 The guaai^elaa tig nature of the rgagtion
The recod nucleus momentum distribution data for events with energy-
losses in the range of It &*eV to 21 McV, shown in figure 8. i, g*ve direct
evidence in support of the quas i-elaatic reaction hypothesis
If the reaction were due to a compound nucleus mechanism, the distribution
of the recoil nucleus mom»nttii^ would be deterir ined only by the available phase
apace (including the energy and momentum conservation laws for the system)
This phase space factor has been determined tor incident protons of energy

w
40
30
20
10
(
N
40
30
20
10
-100 (
N 60
40
20£-1 V/
N50 < E < 100 o
40
r- r~~ 30- ~~T _ "— 1 20
— L_, 10
iiii — i i ——— ̂) 200 400 600
kR MeV/c
N
50
40
30i *
20' — iI— r~ 10
^-ni i i i i3 200 400 -100 (
k/x MeV/c
N 60
- _ |—| 401I 90
100 < E < 130O
In[
i i i i 1 —— .0 200 400 600
k_ MeV/crl
r*
^,
. , ^-i) 200 400
k,x MeV/c
I — .
, ^-n0 200 400
j_ MeV/c0 200 400
L MeV/c
Fig. 8.1 Recoil nucleus momentum distributions.
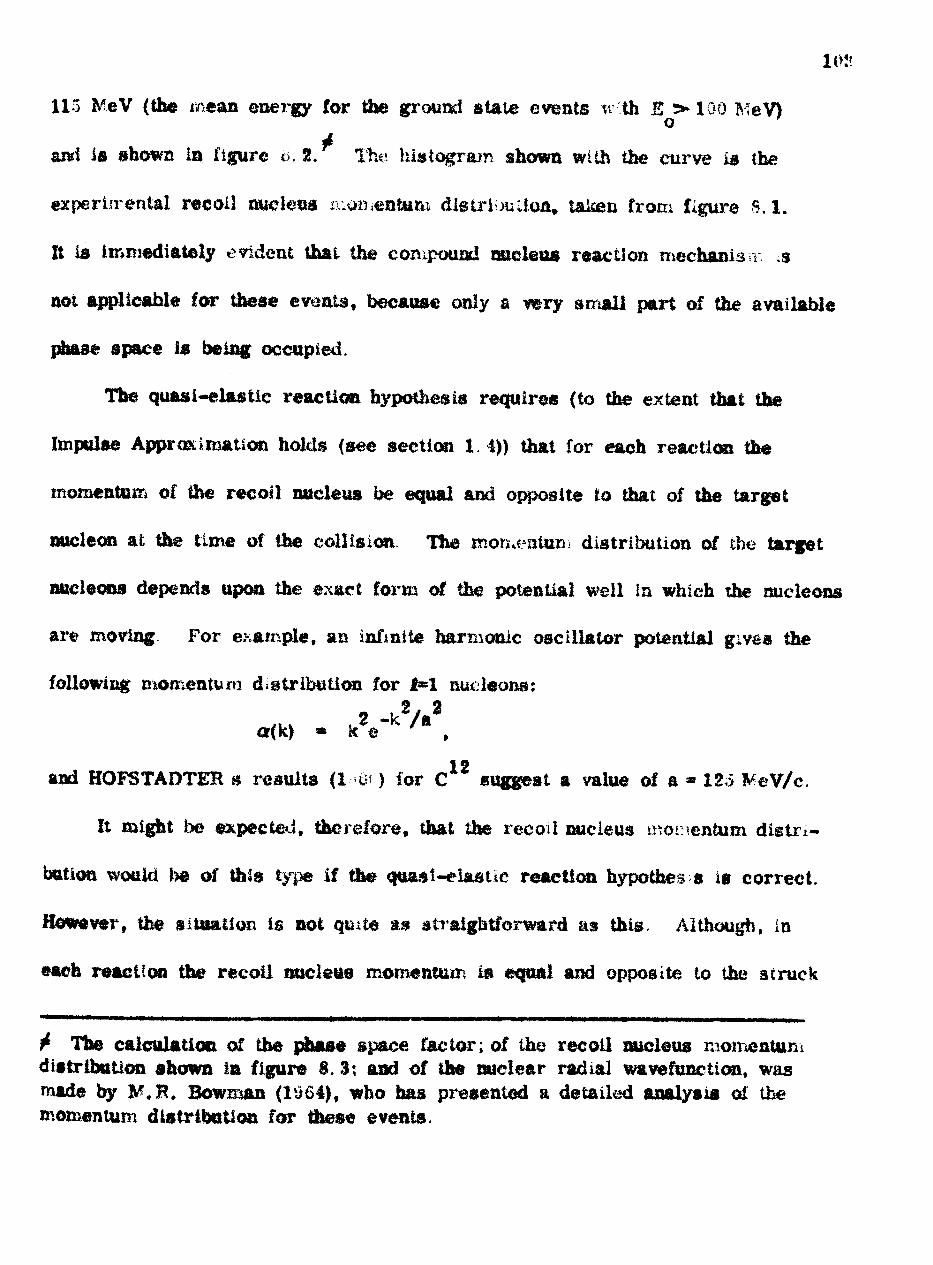
115 MeV (the mean energy for the ground atate events w th E >-100 MeV)
and ia shown la figure <*. 2. The histogram shown with the curve is the
experimental recoil nucleus zno»>«Qtym dtetriijutloA, taken from figure S.I.
It la Immediately evident that the compound nucleus reaction rnechanis v .3
aot applicable for these events, because only a very a mall part of the available
phase space i* being occupied.
Tfce quasi-elastic reaction hypothesis requires (to the extent that the
Impylae Approximation holds (see section 1. 4)) that for each reaction the
momentum of the recoil nucleus be equal and opposite to that of the target
nucleon at the time of the collision. The momentum distribution of the target
aucleoBs depends upon the exact form of the potential well in which the nucleons
are moving. For e; ample, an infinite harmonic oscillator potential g.ve* the
following momentum distribution for 1=1 nucleons:* ,2, 2 .. v .2 -k /a a(k) • k e ,
12and HOFSTADTEB s results (10') for C suggest a value of a * 12<> l^eV/c.
It might be expected, therefore, that the recoil nucleus momentum distri
bution would be of this type if the quast-elaauc reaction hypothec a ie correct.
However, the situation is not quite as straightforward as this. Although, in
each reaction the recoil nucleus momentum in equal and opposite to the struck
The calculation of the phase space factor; of the recoil nucleus momentum distribution ahowa in figure S. 3; and of the nuclear radial wavefunction, was made by A'.R. Bowman (1^64), who has presented a detailed analysis of the momentum distribution for these events.

104
nocleoa momentum, the probability of a collision with a nucleon of a given
momentum depends not oaly upon the frequency with which this mom en tun
occurs within the nucleus, but also upon the phase space available for (he
relevant final state and upon the cross-sec lion for the nucleon-nucVeon collision
at the appropriate relative momentum Thus, for example, the conservation
laws forbid certain reactions; it can easily be shown that for an incident proton
energy of 15' 1'eV, the maximum observable momentum for nucleons moving ia
directions at angles of 0, 45 , 90 , 135 and Vm , with the inc dent proton
direction, are 184* VcV/c, 22i MeV/e, 450 tteV/c, 880 IV'eV/c and 1100 MeV/c
respectively.
The factors ragntioned above, however, can be allowed for and, assuming
a nucieon momentum distribution of the type or{k), the expected recoil nucleus
momentum distribution will be:
N(k) « <f(P»P), tt(k) /Wk
where:
i, is the elastic proton-proton cross-section at the relative
t>:ott..£nua,> fe (i.e. the In |iulse Approximation holds), a»d
is the phase si&ce factor.
The results calculated for E =115 fc.-eV ai-e shown in Hgure 8. 3, togethero
with die experimental results for the events with E >U*3 MeV. There Js, ,n
contrast with the compound mteleus hypothesis, an excellent order of magnitude
between these two sets of results, and this points very deimitely to
the correctness of the quasi-elastic hypothesis. Although there are discrepancies

200 400 600kR MeV/c
800
Fig. 8.2 Phase space factor (E =115 MeV).
N(k)
0 100 200 300MeV/c
400 500
Fig. 8. 3 The recoil nucleus momentum distribution and themomentum distribution calculated on the assumption of an oscillator potential.

10S
between the experimental results and the theoretical results both at high
momenta and at low momenta, this is perhaps not surprising m view of the
idealised nuclear potential used in the calculation
The tall of high momentum events is observed consistently n experiments
of this sort and it can be attributed either to the effect of final state interactions,
which make the momentum distribution 'leak out" into the available phase space,11or to the presence of nucleon correlation effects in the C and B ground
states (although, in general, interactions involving the knock out of one of a
correlated pair of aue.sonu might be expected to lead to B excited states).
If the high momentum tali is subtracted from the experimental results
and the resulting distribution used for N(k), then by inverting the calculation
process mentioned above, the unclear radial wavefunction corns is tent with N(k)
can be obtained. IV. B. Bowman iound thai when this was done the wave function
obtained was very similar to the infinite oscillator wavefunction up to about
4 fermis, bat that it possessed a tall extending 3 ferrais beyond the oscillator
wavefunction cat-off radius (which is at appro?. 4. 5 fermis). JOHANS3ON &6 78AKAMOTO (lf;63) ,n an analysis of the (p, 2p) reaction in 14 and Li found a
similar high radius component of the wavefunction; ihey reconciled the change
of the p-state radial wavefunction and the charge distribution of the whole nucleus
(determined from electron scattering experiments) by reducing the radial extent
of the a-shell wavcfunctioa (they supposed thai the s-sbell protons moved in a
square w«U potential). BILEY et al. (1 Ji/1 ) proposed that the low momentum
events rjght arise from surface localisation 01 ihs reaction, but on thi«

ireassumption the agreement between the calculated and the experimental
momentum distributions (figure 8.3) is improved at low momenta only at the
expense of increasing the discrepancy at high momenta, with no improvement
in the overall agreement.
8. 3 A summary of the experimental results
The quasi-elastic nature of the reaction characterises all the features of
the experimental results, these results are summarized in figures 8.4 to 8.9
for the events with energy-losses between 12 &eV and 21 ItfeV. and some
interpretive comjuents are given below
Figures §.4 and 8 5? Correlation between proton energies and angles.
For elastic proton-proton reactions, all the points would lie on the line2f? /E « cos ^.. However, for quasi-elastic reactions the binding energy of
the nucleons and the nucleoa momentum distribution lead to the more complex
relationship?
When %~JE - O f this expression reduces to:
E - Ei oTile larger ^/H be<jome«, the weaker becomes the correlation (assuming a
given spread in E_) This is well illustrated in figures 8. 4 and 8. 5, which
show the distributions of points for two ranges of incident energies The two
curves show the correlation for the special cases:
- k^ - 92 MeV/c (figure 8 4)
k// » 151 MeV/c (figure 8 3)

E -16 o
0.8
0.6
0.4
0.2
E > 100 MeV o12 MeV<E <21 MeV
0 0.4 0.8 1.2 1.6 2.0 2.4 2.8 0;
0.6
0.4
0.2
Fig. 8.4 Proton angle-energy correlations for p-shell events.
E.
E -16 o o. aE < 100 MeV o12 MeV< E < 21 MeV
0 0.4 0.8 1.2 1.6 2.0 2.4 2.8 0.
Fig. 8. 5 Proton angle-energy correlations for p-shell events.

107
Figures 8.6 and S 7: Angle between the product protons
This angle, which is always oloae to 90 for elastic proton-proton
reactions (equal to 90 in the noo-relativistic liirut), depends markedly on
the momentum of the target nucleon in the case oi the quasi-elastic reaction:$ $
- tk k,,________________L
12
A marked correlation is seen in figure 8.6 between * and U. . The curve*
shows the special case: k A * 0; £ « B • EJL <£ O
115 MeV.
Although the distributions of £ , shown in figure 8. 7 for the two incident
energy ranges, nave ^ean values very close to 90 , it is evident, from figure
0.6 that this Is a somewhat fortuitous result caused by the balance, on average,
of tiie reduction of ».. due to the nucleon binding energy and the increase in
due to the fact that the majority of collisions occur with nucleons moving
towards the incident proton,
Figure 8 8: Correlation between the angles of emergence of the product protons
and the angle between them
The crosses, which shew the mean value of *._ for each Interval of 4* ,
indicate a marked correlation effect; this correlation has been noted previously
\yy GODDING 6 PUGH (W0), and by WcXENZIE (1900) and ANDERSON (1S«0).
It i» directly attributable to the u.cm.entum distribution of the struck nucloons,
and the latter authors showed that a classical calculation, using any reasonable
nucleon momentum distribution, reproduced the correlation extremely well.

0 radians
2.4
2.2
2.0
1.8
1.6
1.4
1.2
1.0
0.8
0.6
0.4
0.2
12 MeV<E < 21 MeV
E > 100 MeV o
-100 0 100 200 300 400 kx/ MeV/c
Fig. 8. 6 Relationship between the angle between the product protons and the parallel component of the recoil nucleus momentum,
0
E < 100 MeV o
Ji &=1. 53 radians
nJ
N ..40
.30
20
10
1.6 3.2 '12 0
TE > 100 MeV-°e12=l. 54 radians
1.6 3.2 '12
Fig. 8. 7 Distributions of the angular correlation for p-shell events.

E > 100 MeV o0£2 radians
2.8
2.6
2.4
2.2
2.0
1.8
1.6
1.2
1.0
0.8
0.6
0.4
0.2
• • • • • • -• Tk» * •-. •• . ..• • :.- •* X . •. •• •• y-«: •.:"• . :•' V'-V. . .
1.4 - ' . . -;X..'; . ' - . .• •. \s ••"•" .:••*.
. . X • X../...•. --. _ .•• •.• • •••• - • '.
0 0.4 0.8 1.2 1.6 2.0 2.4 2.80 & 0 radians
JL £
Fig. 8. 8 Relationship between the angle of emergence of protonsand the angle between the two protons, for p-shell events.

108
Figure 8.1- Coplanarity.
For elastic proton-proton reactions, ths eoplanariiy is always zero.
For the quasi-elastic reactions, the coplanarity is destroyed by the nueleon
momentum distribution and the reactions will be less coplanar, on average,
as the difference between k and fe_ becomes smaller. The figure shows, asO K
expected, that the reactions are less coplanar for the lower incident proton
energies
8.4 ffvents in the energy -loss region of 21 MeV to 30 MeV
Apart from a small contribution from background events, the only12 11*
oon-C (p,2p)B reactions that can contribute events between 21 MeV and
3a % eV in the (p,2p) energy-loss distribution are: (p,pd), (p.por), and (p,2pn),
From the observed number of background events appearing above the
hydrogen peak in the (p, 2p) energy-loss distribution, the number of background
events above the p~shell peak was estimated to I* approximately three per VeV
interval,
Heavy particle reactions were assumed to account for all those events
that had energy-losses in the region of, or above, 7 MeV and 25 MeV when
they were reconstructed on the reaction hypotheses (p»pd) and {p,por> respectively.
This gives an upper limit estimate, because (p,?p) reactions producing very low
energy protons also come into this category A negligible number of the events
below an energy-loss of 2< MeV eoc.e from the cascade (p,2pn) reaction
It is possible that Oiere is a contribution from (p,2p) reactions, where the residual B*1 decays by neutron eirdssion. For the present purpose such reactions are treated as (p>2p) reactions.

N
80
60
40
20
E ^ 100 IVieV o
J_____L0 0.2 0.4 0.6 0.8 1.0
coplanarity
N
50
40
30
9Q
10
-
-
-
~
-
E < 100 MeV0
——— 1 ' 1
\.0 0.2 0.4 0. G 0.8 1.0
coplanarity
Fig. 8.9 Distribution of coplanarity for the p-shell events.

(see chapter 1", figure 33). Figure 8.13 shows the estimated number of
background events and heavy particle events and figure S. 11 shows the
relevant part of the (p, 2p) energy-loss distribution after the events of
figure 8. lo have been subtracted from it.
AUSTIN ei al.(l;62) have measured the cross-seen one for the production
of the low-lying excited states of B by th<? clean proton knock-out process; the details of the results have been given in section 1.4. Because the reaction mechanism leading to these states is the same as that for the production of the B ground state and since it has been shown in chapter 7 that the cross- section for the production of the ground state is approximately independent of the incident energy from 53 MeV to 130 MeV, it is assumed that the cross- sections quoted are also applicable throughout the energy range.
Using the figures tabulated in section 1 4, the numbers of events to b* expected in ftgure 8,11 from the direct knock-out excited state reactions have been calculated. Figure S, 12 shows the resultant distribution when the events are smeared out to the measured resolution width of the ground state peak.
These events ware subtracted from the distribution ol figure §.11 and then the ovccta in the ground state peak, constructed by reflecting the lower half of the peak about its median value,were also subtracted. The resulting distribution
is shorn in figure £.13; evidently there Is a large residue of events unaccounted for by the reactions already considered. The production cross-section is, on
*
average, approximately half tike cross-section for the production of the B g s ,
but is much more dependent upon the incident energy, hi the incident energy

N
10
0 L14 18
(a)
22 26 E MeVt j
N
10
0 I____I14 18
(b)
22 26 E MeV
Fi 8 10 Number °f background events. (b) Number of heavy particle events.
80
70
60
50
40
30
20
10
I '—————L
10J—————I—————I—————L
14 18 22 26 30 E_ MeVL
Fig. 8.11 The (p, 2p) energy-loss distribution after thesubtraction of the events shown in figure 8.10.

N
20
10
N
30
20
10
15 20 25 E MeV 20 25 30
Fig. 8.12 Distribution of events expected from direct knock-out reactions; from the results of AUSTIN et al.
Fig. 8.13 The residue of excited state events.
0
E < 100 MeV o
0.8 1.6 2.4 0. radians i
N
30
20
io
0 0.8
E > 100 MeV o
1.6 2.40 radians i
Fig. 8.14 Distributions of the product proton angles for the excited state events compared with those for the ground state events (curves).

110
region $» JdeV to 130 MeV the Gross-section is ^. § + 1 mb. and in the incident
energy region 1 MeV to 130 MeV it is 5 + , $5 mb
To account lor these events several possible reaction mechanisms, not
already considered, can be envisaged; these are:If 12* 12(i) AC <p.p')C reaction, leaving a highly excited state of C which
subsequently evaporates a proton,
(ii) A (p, 2p) reaction with either an initial state interaction or a final state
interaction.
(ii ) A direct knock-out reaction uavolving a nuclear proton that is not in an
independent particle state; such protons are usually associated **&
correlated melton pairs and have mojiien& larger than typical independent
nucleon momenta.
The characteristics of events arising from such reacuon mechanisms will
differ from those arising from the quasi-elastic reaction mechanism that is
responsible for the ground state events. An attempt is made to aases the
differences between the experimental results for the ground state events and
those lor the e&cited state events, m terms of the relative importance of the
three reaction mechanisms listed. The experm.eruai s&UsUcs are not good
and the differences m the two sets of results are not very great; consequently
only a semi-qualitative approach is possible.
gomaarison of the experlmcoUil results
Histograms were first plotted for the various kuneirai cal distributions of
all the events with eoergy-losaes between 21 MeV and 3 MeV. To correct ior
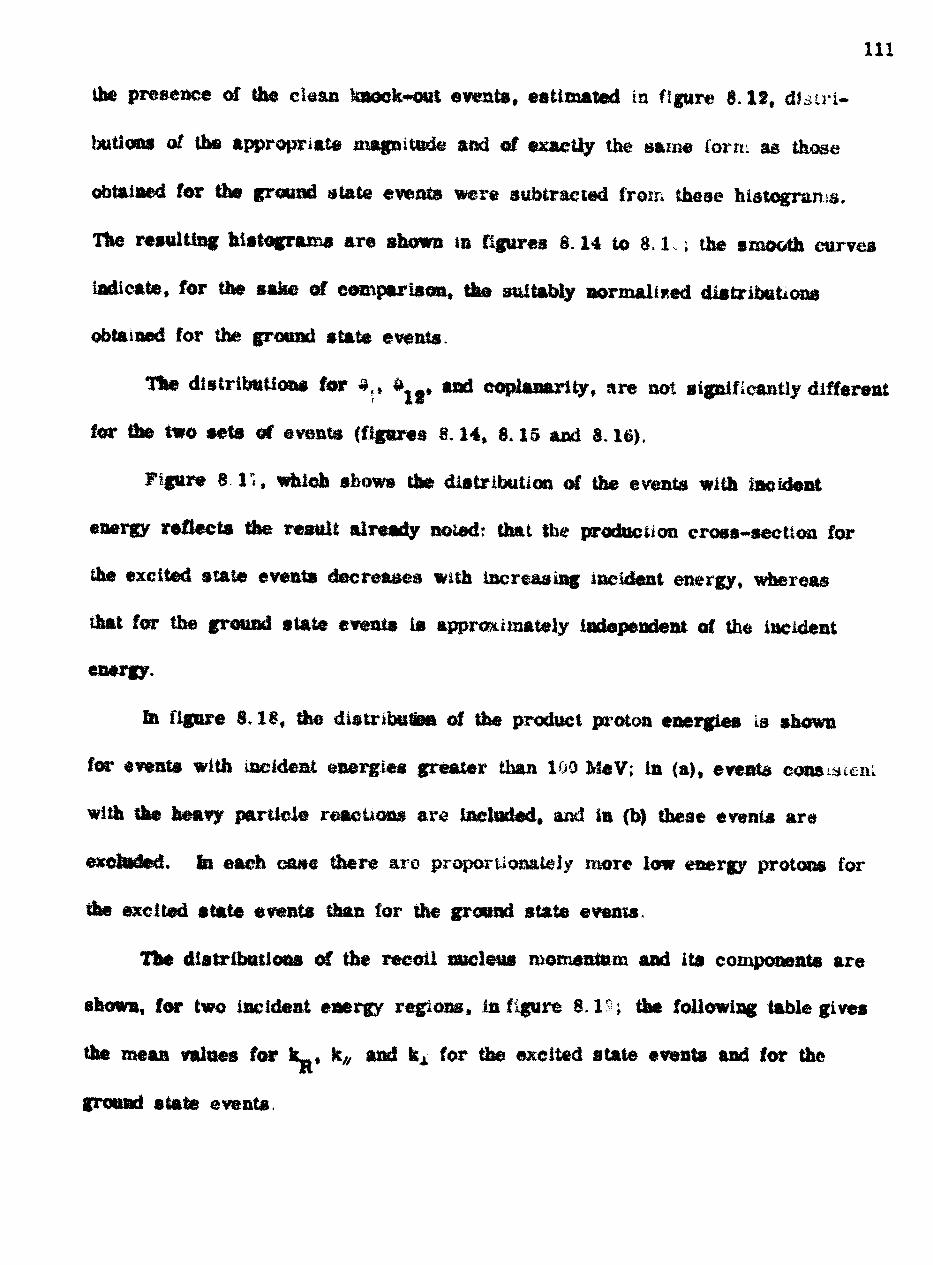
Illthe presence of the cloan knock-out events, estimated in figure 8.12, distri
butions ol the appropriate magnitude and el exactly the same lorn, as those
obtained for the ground slate events were subtracted from these histograms.
The resulting histograms are shown m figures 8.14 to 8.1 ; the smooth curves
indicate, for the sake of comparison, the suitably normalised distributions
obtained for the ground state events.
The distributions for £,, £ , and copiaaarity, are not significantly different
for the two sets of ©vents (figures 8. 14, 8.15 and 8.16).
Figure 8 17, which shows the distribution of the events with incident
energy reflects the result already noied: that the production cross-section for
the excited stale events decreased with Increasing incident energy, whereas
that for the ground state events is approximately independent of the incident
energy.
In figure 8,18, (fee distrtbiiiea of the product proton energies is shown
for events with incident energies greater than 100 MeV; in (a) t events consilient
with the heavy particle reactions are Included, and in (b) these events ar«
excluded. In each catte there are proportionately more low energy protons for
the excited state events than for the ground state events.
The distributions of the recoil nucleus momentum and its components are
shown, for two incident energy regions, in figure 8. IS; the following table gives
the mean values for k., k/, and kA for the excited state events and for the
ground slate events.

E < 100 MeV o
2.4 3.2 0 j-adians
E > 100 MeV o
3. 2 6 radians
Fig. 8.15 Distributions of the angle between the two product protons for the excited state events compared with those for the ground state events(curves).
0 0.4 0.8 coplanarity
0 0.4 0.8 coplanarity
Fig. 8.16 Distributions of the coplanarity ior the excited state events compared with those for the ground state events (curves).
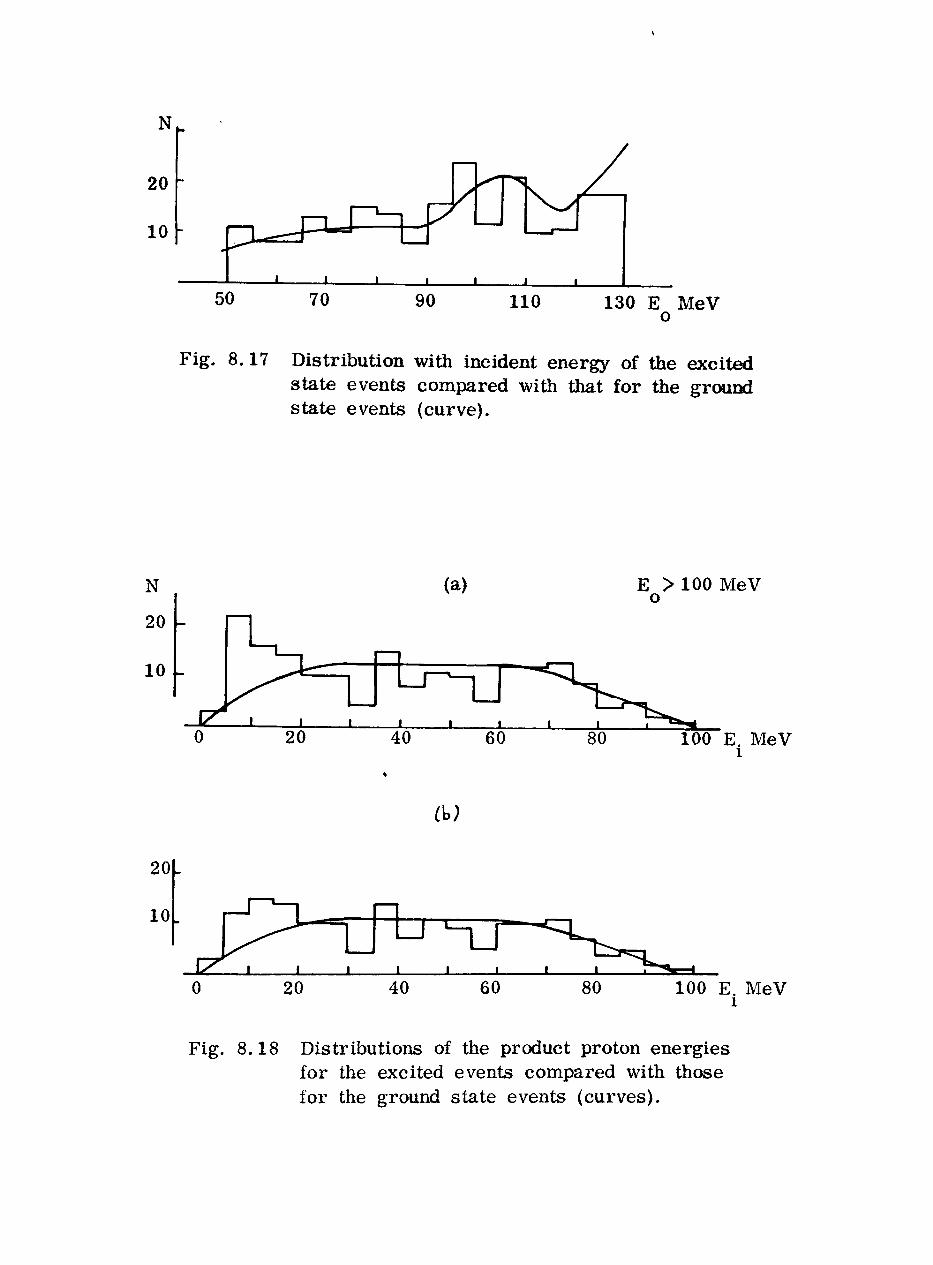
110 130 E MeV o
Fig. 8.17 Distribution with incident energy of the excited state events compared with that for the ground state events (curve).
N
20
10
0 20
(a)
40 60
E > 100 MeV o
80 100 E. MeV i
t\>)
20
10
0 20J_____L
40 60 80 100 E. MeVi
Fig. 8.18 Distributions of the product proton energies for the excited events compared with those for the ground state events (curves).

E < 100 MeV o E > 100 MeV o
N
200 400 kR MeV/c
600
N
20
10
0 200 400kR MeV/c
600
-100 0 200 400 k/7 MeV/c
30
20
1!
600 -100 0 200 400kx/ MeV/c
600
0 200 400 kx MeV/c
200 400
Fig. 8.19 The distributions of the recoil nucleus momentum and its components for the excited state events compared with those for the ground state events (curves).
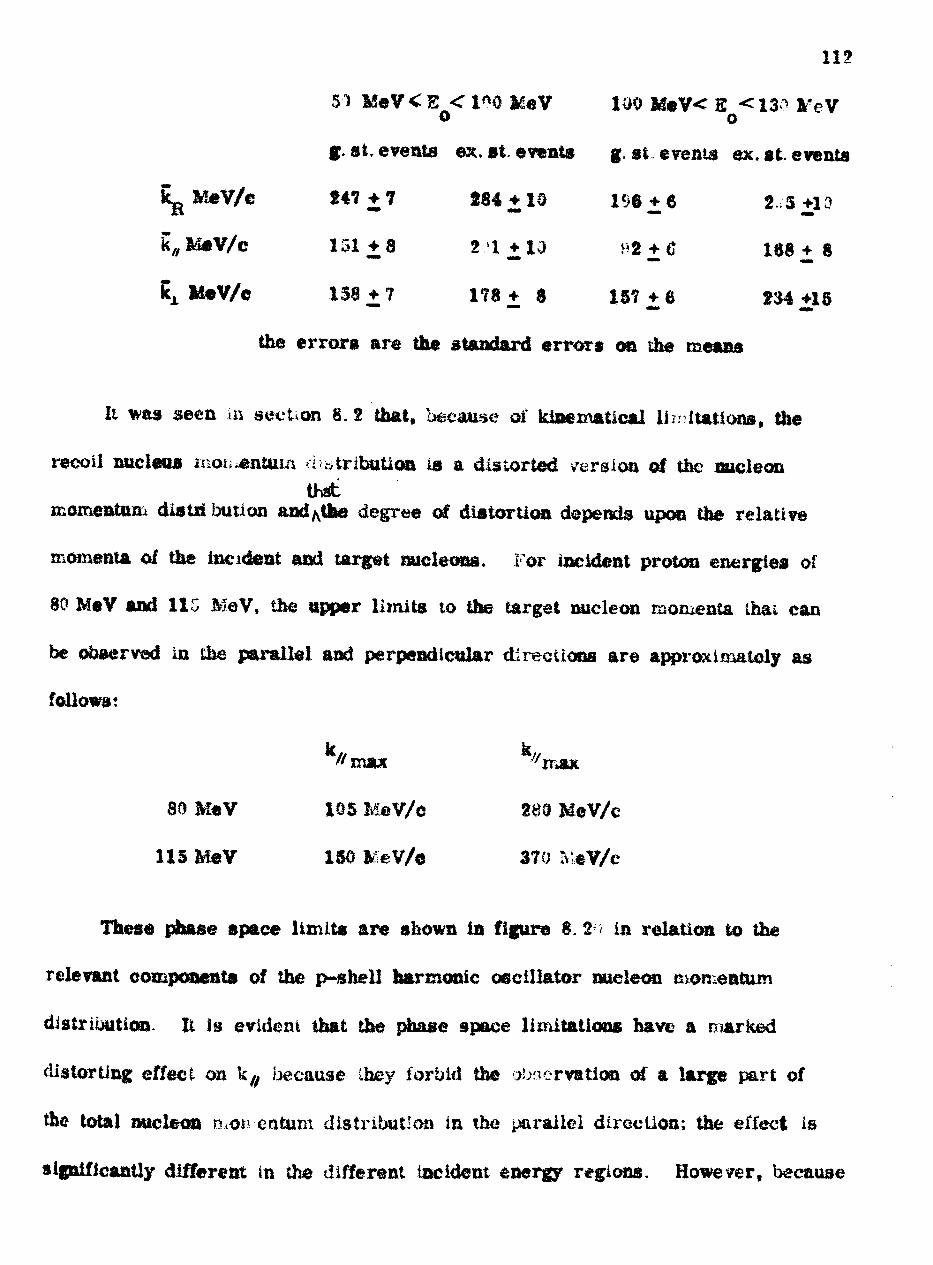
11?51 M«V<£ < 1*0 UeV 100 M*V< E o og, st. events ex. 01 events g.st. evens* ex. at. events
8L M«V/e $47 + 7 £84 + 10 1S§ * 6 2. 3 +10it «•»«•«••«•
ky/ M«V/c 131*8 2 v l+ia "2 ±tf 168+8
x M«V/c 158+7 178+ 8 137^0 2S4+15
the errors are Hie standard errors on the means
it was seen in sect, on 8. $ that, because of kinematical limitations, the
recoil nucleus K.O; .entuu; r.,tnbution 19 a distorted version of the nucleonML
momentum distribution and A the degree of distortion depends upon the relative
momenta of the incident and target nucieons. For incident proton energies of
80 MeY and 11 5 MeV, the upper limits to the target nucleon momenta thai can
be obaerved in the parallel and perpendicular directions are approximately as
follows:
80 M*V 105 MoV/e 283 MeV/c
US MeV ISO &eV/e 370 M
These phase apace limits are shown in figure 8. 2 in relation to the
relevant components of the p-shell harmonic oscillator nueleon momentum
distribution. It is evident that the phase space limitations have a marked
distorting effect oa k^ because they forbid the observation of a large part of
the total nucleon n.ot1 eatum distribution in ihe parallel direction; the etiect is
significantly different in the different incident energy regions. However, because

Arbitrary units
-k2/1252
-300 -200 -100 0 100 k ;/ MeV/c
200 300
Arbitrary units
ke9̂
115 MeV
0 100 200 300 400 kj_ MeV/c
Fig. 8. 20 The curves show the two components of an oscillator potential momentum distribution and the arrows show the upper limits of the available phase space for reactions initiated by 80 MeV protons and 115 MeV protons.

113
the phase space limitations on k . lie above the- highest mome&a that occur in
the perpendicular nucleon motrtentos distribution, the distorting effects for kx
are likely to be very inuoh teas than those for k^. In fact, referring to the
figures for the ground state events given in the table, it can be seen that there
is no difference In kA for the two regions of incident energy. It is concluded
that phase space effects do not Introduce significant energy-dependent effects
for this component of the reeoil nucleus
From the table it can be seen that kx is significantly larger for the
excited state events than it is for the ground state events and thai Uw? difference
increases as the incident energy increases; the energy dependence is shown in
more detail in figure 3. 21, title results from the ground state events are shown
for comparison in figure 8, 22. It follows, therefore, that, quite apart from
phase space effects* reactions leading to B melted states involve, on average,
a larger transfer of momentum to die residual nucleus than reactions leading
to &s B g. a. Jo flg&re 8.23, the mean energy-loas for the events in the
energy-loss range 21 M©V to S ) MeV is shown as a Inaction of the incidente§^^ ^»
energy. There is no systematic change in EL with £ , indicating that theLJ O
E ,i, correlation of figure 8. 21 does not reflect any change in the relative o Afeeding of excited states as the incident energy changes,
In summary, th* experimental results for the excited stale events and
for the ground state events are different in three ways:

k* JMeV/c
250
200
150
100t
I
50 70 90 110 130 E MeV oFig. 8. 21 Dependence of the perpendicular component of the
recoil nucleus momentum on the incident proton energy for the excited state events.
kj. MeV/c
200
150
100\ * t t t
50 70 90 110
and Fig. 8.22, for the ground state events.
130 E MeV o
27
26
25
24
MeV
i f t
50 70 110 130 i:o
"ig. 8. 23 Tuean energy-loss for the excited state events as a function of the incident energy.
114
(a) in the spectrum of emitted protons,
(b) in the energy dependence of the production eroas-section, and
(c) IB the recoil nucleus momentum distribution.
The compatibility of these results with each of the three possible reaction
mechanisms listed on page 110 is investigated below,,.„ J*< ^l%* ~12* JU (i) C (P.P)C ; C -* B +p
The energy distribution of evaporated protons from light nuclei is sharply
peaked at low energies Typically, the results of ZHDANOV £ FEDOTOV <l*eo)12 show that for protons evaporated from C (and lighter cascade products) the
energy distribution peaks in the region of 2 MeV and then falls off rapidly,
reaching less than 10% of the peak probability at !•> MeV. Because of the very
low detection efficiency for protons of energies below 10 MeV in the present
experiment, only a very small proportion of events from the hypothesized
mechanism would be seen. However, ft se*t, s likely that the low energy protons
observed for the excited state ©vents in excess of those effected from tbe
quasi elastic reaction are due to this reaction,
If these low energy protons arise from evaporation, they must be iso-12 tropically distributed with res|>ect to the centre of mass of the recoiling C
nucleus. To test this, the component of the centre of mass proton moxnentuxr
iz 12* 12 Only C (p,p*)C reactions leading to C- 1 excited states above approx*8 MeV can contribute to the production of B excited states above 7 MeV: binding energy « IS MeV; excitation energy * 7 MeV; proton energy ̂ 5 &eV. (The giant dipole excitation m the region of 20 ! eV cannot contribute.)

OK o
I fc> »- v^r fnf

115
in the direction of the incident proton was calculated for all protons of energy
less than 2 MeV (including those for events that also fit a heavy particle reaction hypothesis).
"«.«. " V"*! -subindex 1 refers to the low energy proton
The results for various proton energy ranges are shown in figure 8. 24. The
forward io backward ratios (F/B),
i f are 11/11, 14/14, and IS/lu, for protons of
energies less than 10 MeV, 13 MeV, and 20 MeV respectively. Although the
statistics are poor, the results definitely point to the isotropy of the low energy
protons and, assuming that the same result applies for the events with £ < 100
MeV, it is concluded that approximately 13% of he excited state events arc
consistent with the hypothesised reaction.
The momentum result is not significantly altered by the removal of the
events with low proton energies.
(1:) Initial and final,stalf iafceracaoas
Inelastic proton scattering reactions involving energy transfers to the
nucleus of up to 14 MeV will give rise to excited state events in the region
under examination. Since (p,p) reactions have cross-sections chat increase
^ith decreasing energy &&! siiicc ghere are twice as Biany product protons as
incident protons, final state interaction will be much more important than initial
state intersctions. SQUIRES (I;/58) has given evidence from nautron polarization
experiments to support the existence of such final state Interactions. The

E > 100 MeV o
-200 200 Jfc. v. Mev/c
20-t
10
-200
E.< 15 MeV
I I
E.< 20 MeV i
-200 200 k//C.M. MeV/C
Fig. 8. 24 The parallel component of the momentum of the lower energy proton in the centre of mass ofthe recoilin nucleus.
f _ o»C ^«
200
150
100
50
n i
k x MeV/c
1 * •< i: t f- t15 , 25 35 , 45 55 E MeV
- -|— 1 ———— | ——————— f— i ———— i ——————— \— p50 1 70 90 ' 110 130 Ert MeV
Fig. S. 25 The average additional perpendicular momentum transfer for the excited state events compared with the ground state events.

116
average energies of product proton* from (p, 2p) reaction* produced by 115 MeV
and 80 MeV incident protons are approximately 4 < MeV and 30 fc*eV respectively.
Typically, DICKENS et al. (1^63) report total <p,p ) cross-sections at these
energies for the production of the states at 4. 4 MeV, 7. 7 MeV, 9. * fcieV, and1212, 7 MeV in C , taken together, a* approximately 25 rab and 1 mb It is to
be expected, therefore, that final state interactions that feed the low lying excited
states of the residual B nucleus will be much more important for the events
with £ <130 MeV than for those with £ >!•>-'• MeV. The measured production o ocross-flections for the excited state events are therefore in qualitative agreement
with the final state interaction hypothesis.
With reference to the momentum distribution result, the second interaction
will, on average, transfer additional momentum to the nucleus and the distri
bution will "leak out into the available phase space. The final stale interaction
hypothesis the re fore leads to the expectation of a recoil nucleus momentum
distribution shifted to hi^er momenta than those of the distribution due to the
clean knock-out (p, Sp) reactions. The shift should increase as the incident
energy increases. The observed results (figures 8.1; and 8. SI) are in
qualitative agreement with the hypothesis.
Quantitatively, however, there is a difficulty. If the average additional-*Z rl i momentum transfer in each incident energy region is taken to he <kx - 10.
where kA is the mean momentum transfer for the excited state events, then
The result quoted for 4" ? cV was obtained fay extrapolating from i2 MeV.

117
taking the values from figures 8.31 and 8. 22 it appears that the additional
momentum transfer approaches zero at 50 &-eY incident energy; ,.e. at an
average final state energy of 15 MeV (see figure 8. 25). If this is the cast
(and points below 5* £ieV would be necessary to verily the result with the
present statistics), it is not easy to understand this result in terms of final
state interactions,
(Hi) Direct knock-out reactions involving correlated nuciecms
ft Is more difficult to assess the results in terms of this mechanisn
because very little is known about aucleoa correlations in nuclear matter;
CLEGO (19i3) and OOTTFBIE0 (1 ,<C13) have pointed out some of the difficulties
associated with gaining such information
A brief discussion on die departure of nuclear ground states from pure
shell made! configurations has been given in section 1.4. GOSWAMl & PAL
(1 63) (referred to below as OP) have suggested that 35% of the C ground
state intensity can be accounted for by 2 particle * 2 hole configurations other
than the intermediate coupling configurations, and AUSTIN et al.(l:,62) proposed71 62 admixtures of the configurations (Ip) (H3p) and (Ip) (Id2s) into the pure shell
g model configuration dp) as a possible explanation for trie production of &e
low lying bound excited states ol B observed by them (see action 1.4).
From the present experimental results*
no of excited state events with £*< 14 Bier _ . A ft ,"•""""•• ' •"'" "'"""• •""*• •"•'•«"'• "•• —•""'""••i"""' - -• • •'-'''•" "" v, 5 •*• v. 1no, of ground state events —
12 12* 12* 11 F excluding the events consistent with the mechanism C (p,p')C ; C - B +p.

118
From OP's result:
intensity ol admbced states ^ n intensity of pure shell model state
8 nee, in the p + C reaction, the admixed states can be responsible for higher
ex cited states of B than those Included above and also for two nucleon knock*
out reactions etc , the exper mental ratio of excited state events to ground
state events is probably larger than can be explained by the GP admixture alone.
This is not surprising m view of the fact that final state interactions must
account for some events. Nevertheless, if the Gl result Is valid, it is evident
that a large proportion of the excHsci state event-: could be produced by the
direct reaction mechanism.
BBUECKNEPt et al (15;) laid emphasis upon the fact that the departure8 of tlte ground state from the (lp) configuration Introduced a high momentum
component Into the nueleon momentum distribution within the nucleus. It was
pointed out by GQTTFIUED (see section 1.4) that in order to observe the high
momenta experimentally, the incoming nucleon must have a suitably short wave
length and that the maximum observable u:oxr.entum Increases as the wavelength
decreases.
If the de Brogiie wavelength ol the incident proton is A . the interaction
between the incident proton and the target proton is localized to the extent of
this wavelength and it follows from the Uncertainty Principle that momenta up
to a maximum of fi/X can be observed Absolute values of the maximum
momentum observable at a given energy cannot be obtained reliably in this way

50 MeV^E < 70 MeV o
20
10
0 200 400
XT 70 MeV < E < 90 MeV N o
20
10
0 200 400 k, MeV/c
20
10
90 MeV<E < 110 MeV o20
10
110 MeV<E <130 MeV o
0 200 400 k x MeV/c 0 200 400 k L MeV/c
The curves show the fits to the points.
k^max) MeV/c
500
400
300
50 70 90 110 130 E MeV o
Fig. 8. 26 Dependence of the maximum recoil nucleus momentumon the incident proton energy for the excited state events.

120
section; tills could account lor the experimental result*. However, it could
also be argued that since the mean recoil nucleus momentum is no different
for the excited state events sad the ground state events in the region of 50
MeV, then the operation of the Psttli principle will have the same effect lor
the excited state events and the ground state events at lower incident energies,
but will have less effect at higher energies i this could lead to a cross-section
Increasing with incident energy in disagreement with the experimental results,
Secondly, it might be argued that as the incident energy increases there is a
greater tendency for both of the aucleons of the hypochesifted correlated pair
to be knocked out; this would suggest a redaction In the excited state cross-
section as the incident energy increases, in agreement with the experimental
result. On the other hand it is possible that a completely different part of
the nuclear wave function is responsible for one nude on knock-out and two
nueUon knock-OUL
fe the present state of kmwiedge about these processes the necessary
quantitative analysis is not possible and it must be concluded that the cross*
section result yields no information on the validity of the hypothesized direct
reaction mechanism.
i5 Conclusion
Approximately 15 / of the excited state events can be attributed to the
inelastic proton scattering reaction The remainder of the events have been
shown to have properties consistent with two other reaction mechanisms and

121
it is not possible on the evidence available fron the events analysed to
determine their relative importance. However, the analysis of the 3-prong
events throws some light onto the problem: the extent to which the 3-prong
events can be explained by unclean cascade reactions will reflect tt*e portance
ol final state interaction® and the extent to which they can be explained by the
knock-out ol correlated nucieon pairs will reflect the importance of the presence
of nucieon correlations* with associated high momentum nucleoas, within Hie
nucleus, to chapter 10 it is shown that the 3-prong events are very well
explained by nucieon cascade reactions but not by nucieon correlation reactions;
it is therefore concluded that final state interactions are probably responsible
for the majority of tne excited state events

122
CHAPTSH 9
mJCLEQN CASCADE ^
3. 1 Introduction
Monte Carlo method* have been amongst the most useful tools -n the
analysis of reactions involving the knock-out of several nucleons from a nucleus.
Some of the results from such calculations that are relevant to the present
experiment have been presented in section 1.3.
However, none of the published results can be used to compare with tho
present experimental results, partly because they apply to nuclei of very
different masses or they apply to Incident nueldons of discrete and veiy
different energies, but mainly because no distinction has been drawn between
neutrons and protons; thus, for example, no (p,3p) energy -loss distributions
are available,
It has been shown in section 6. 4 that over 90% of the 3-prong events
appear in the (p,3p) eaergy*loss distribution above the threshold energy (or
particle emission from Be - mostly well above this threshold energy. It is
evident, therefore, thai. C (p,3p)Be cannot be the correct, or at least the12 1 -^ complete, description for the reaction. Reactions of the type C (p,3pxn)Be
(x«l,2, . . .) give a possible explanation for these events and, in order to assess
the characteristics of the proton parts of such reactions, a cascade reaction
mechanism model has been set up along the lines of the Monte Carlo methods,
The purpose of the model is to calculate the (p,3p) energy-losses and the

123
distribution of proton energies arising .Ho;- classical cascade reactions of the12 types (pt 3pxa) w.tbm the C *" nucleus.
The model is set out ;a detail in this chapter anu the results from it
are used in the next chapter.
9.2 The model
Ho attempt has been t><ade to calculate the relative probabilities for the
various reactions i.e. (p,3pn), (p,3p2n), (p,3p3n) etc. Even in the most
sophisticated Monte Carlo methods the calculation of cross-sections is parti*
cularly unsatisfactory. Each reaction is dealt with in turn and then, by
comparing the calculated distributions with the experimental distributions, an
upper limit can be assessed for the contribution froj each reaction to the
class of events under consideration.12 & For the purpose of this description, the reaction C (p,3pn)Be will be
taken as an example. In general, the reaction comprises a cascade part and
an evaporation part. However, the simplifying assumption is made that the
whole process oaa bo describe by a cascade .odel and it is set up in such
a way as to amke allowance iar evaporation effects.
In the extreme classical limit, the cascade can be pictured as a aeries
of nuclean-nucleon collisions with the nucleons having straight line trajectories
between collisions and with all energy losses and transfers occurring at the
collision apices Several configuration modes for the cascade are possible lor
each reaction. For the (nucieon, 4 nucleon) reaction the following two modes
are possible:

124
mode I mode n
incident ^^^ incidentproton \ proton
U .« assumed that each collision baa the properties of the free raucleon-
nucleon interaction ana therefore, that if an energy £ *s available for the two
nucleons after collision, the probability p(e)de ai either iiucleon having an
energy between e and e+de is constant in the range 0<«^T. The momentum
of the struck nuclaon Is neglected when the energy sharing at each apex is
considered, but an allowance is made in Use energy balance lor the recoiling
nucleus momentum (it would not be possible to make this simplification for
calculations Involving angles). By choosing the total energy-loss in the cascade
to be equal to the Q-ralue of the reaction plus the recoiling nucleus energy,
the assumption is made that after all the particles have been emitted, the
nucleus is left in its ground state.
A mode is chosen and the cascade is followed until tho energy of each
of the four product nucleons xs obtained. Hie only restriction placed upon
the energies of the nucieons participating in the cascade is thai cascades
producing protons of less than 5 &?eV are disallowed since proton energies of
fl than 5 IvieV are not observed in tn experiment because of the limitations

125
of the apparatus. Although, in fact, low energy nucleons do not play an
Important part m the cascade phase of the reaction, by including them and
also by differentiating between neutrons and protons at energies below about
5 MeV, the model cascade qualitatively simulates the complete reaction (i.e.
cascade + evaporation). It will be seen in figures 9.3 and o. 4 that the
calculated proton spectra are, at the low energies, characteristic of evaporation
spectra.
A mode n (p. 3pn) reaction will now be followed through step by step
using the nomenclature of figure 5.1
At the first collision apex, the separation energy of the lirat target
nttcleoa and an energy to allow for the recoiling nucleus are subtracted from
the incident energy. The recoil nucleus energy is chosen randomly from the
experimental recoil nucleus energy distribution which is shown in figure d. 2
(only a very small and insignificant bias is introduced by subtracting the total
EL at the first apex). E ~ B -~ IL is. than, the energy available for the twoH O Si it
nucleons leaving the apex and E is obtained by choosing a number at random
from the ra&gd OtoB-E«-IL. B represents the first of the requiredo si II a
As the energy of a cascade nucieon Calls towards the energies of the nuclear nucleons, there is a rapidly increasing probability that it will be absorbed by the system to form a compound nucleus. Also, any low energy nucleona produced In die cascade cannot escape very easily through the nuclear surface; ELTON It GOMES (1£57) have shown that total internal reflection severely restricts the escape of nucleon* that have energies within ID to 2^ MeV of the average nuclear nucieon energy.

E
Eo
Energy available at apices:I E - E - E_ o si R
II E - E 0 b s2IH E - E Q d s3
E, = E - 2 - E - Eb o si RE = E. - E - Ed b s2 c
E - incident energyE_. - energy of recoil of the residual nucleusJtv
E - separation energy of 1st nucleon s j.a E - separation energy of 2nd nucleon
E - separation energy of 3rd nucleonSo
Fig. 9.1 A (p,3pn) cascade.Arbitrary
uiits
12 ER l\IeV
ijr. -9. 2 Distribution of recoil nucleus energy.

12*
aucleon energie* beoatise m &e mode under discussion this Bueleoa escapes
from the nucleus without further interaction.
E. is now given by:
K m £ - £ - E , £o o si K a
and the energy available after iha nueleon with this energy has collided ia
E, - R ^. If this is negative, the cascade is abandoned and a new one is startedO Sc
with the incident nucleon of energy £ . If it ia not negative, then the cascade
ie coatiaued and E is chosen randomly from ihe rare® o to EL - £ «» K isc ^ " D s2 c
the second of the required atujlsar energies.
E is BOW given by:
jg. * E, ~£ tt- E d b »2 c
and the energy available after the third collusion is S.- £ 4 . Again, if this« S3
Is asgative the cascade is abandoned and a new 003 is started with the incident
socleon. U II is not, the nucleon energy E is choeen randomly from dm rangeeQ to IS,- B „ and the aucleon energy Ef is given by:
£ wm W* B" _ IP ^ «K» »** Jtg *fc ** *
E and E are the two remaining iwpired rmcleon energies.e i
The energies of the lour product nuclsoas are now known and it remains
to associate one of these with the neutron; this Is done by choosing one of them
at random to be the neutron energy. The other three energies are Inspected
and if a»y oae Is below tfce chosen observational eui~e£t energy (appresdxnateiy
S MeV) then tile event is once again abandoned ami restarted with the incident
nucleon. IT all three proton ea^rgtas are above the cat-off value, the event is
finally accepted and noted.

127
To obtain distributions that can be compared with those obtained from
the experiment a program was written for die Mercury computer to construct
a large number of events by the procedure outlined above. Since the value of
the Incident energy has a direct effect on the results (e. g. the maximum (p, 3p)
energy-loss possible is approx (E -15) MeV), the program was made to generate
events from the sauae distribution of incident energies as was observed to give
rise to those events In the (p,3p) encrgy-loso distribution above the threshold
emrgy for the reaction. After successfully following through a predetermined
number of events (usually approximately twice the experimental statistics) and
storing the results, histograms were printed for the following quantities in the
incident energy regions E > 100 MeV and E < 100 &'eV:
(i) the proton energies; £pi(ti) the (p,3p) energy-loss, JS - Z£ 4- E^
(iii) the ratio EpMAX , and
(iv) the ratio
where E _.__ is the lowest of the proton energies for the event, and £P&ilN p
Is the highest.
Throughout the program, random numbers were generated from the standard
"Autocode ' random number routine.
9.3 Some sample results
to figure 9.3 the distributions of the above mentioned quantities, obtained

12812 9 for the reaction C (p,3pn)Be , are shown for incident energy protons above
100 MeV. The following details apply to these results:
(i) Configuration mode X;
(ii) E» 16 MeV, E- 7 MeV, and &« 11 JseV. giving, together, the
C12<p,3pn)!3e 9 Q-valoe of 34 MeV,
(iii) a proton cut-off energy of 5 MeV; and
(ir) approximately 1000 events.
A series of calculations was made to assess the effect of changes in the
details of the specification given above. In figure 9.4 the (p,3p) energy-loss
distributions refer to the following speeifications:
(a) (i) to (iv), as above;
(b) (i), (Mi) and (iv) as above, and E « £ » E = 11 MeV;81 S£ S3
(c) Configuration mode II. and (ii) to (iv) as above;
(d) a new series of random numbers, otherwise as for (a).
The results are not greatly different for all these variants of the initial
specification. Itte calculated distributions for the other quantities Us ted in
section 9. 2 show the same small range of variation as the energy-loss results.
Tbe method outlined in section 9. 2 can quite easily be adapted for cascades
of any number of neutrons and protons. For each reaction reconstructed in this
way the distribution of incident energies used is that for the events above the
appropriate threshold energy in the experimental energy-loss distribution. In
figure 9. 5 the results for the (p,3p) energy-loss distributions calculated for the
reaction* (p,3pu), (p,3p2a) and (p,3p3n) are shown for events of all incident

N
60
40
20
30
N
150
100
50
0
40
20
50
Proton energiesfor E > 100 MeV o
40 60 80 E. MeV i
(p,3p) energy lossfor E > 100 MeV o
60 70 80 90 E MeV
E > 100 MeV o
0.4 0.6
""plMA^y «- ^pi0.8
N
200
150
100
50..
E > 100 MeV o
0.1v
pMIN/
0.3
-E . Pi
Fig. 9.3 Sample results for a (p,3pn) cascade.

N All E
(a)
90 E MeVJL»
80
40
(c)
40 50 60 70 80 90 E_ MeV JL
70 80 90 E MeV
Fig. 9.4 (p,3p) energy-loss distributions for different model specifications for the (p,3pn) cascade.

N
80
60
40
20
All Eo
12 9 C (p,3pn)Be
40 50 60 70 80 90 E_ MeV
N
60
40
20
12 8 C (p,3p2n)Be
40 50 60 70 80 90 E MeV
N
20
10
C 12(p,3p3n)Be ?
Fig. 9.5 (p,3p) energy-loss distributions for different reactions.

energies. It is interesting to note that the results are quite different for the
three reactions.
Therefore, whilst it must be emphasised that the treatment is based upon
a simple model, the fact that the calculated results are sensitive to the type of
reaction but insensitive to the details of the model means that they can be used
usefully for a qualitative analysis of the expennieat&l results.
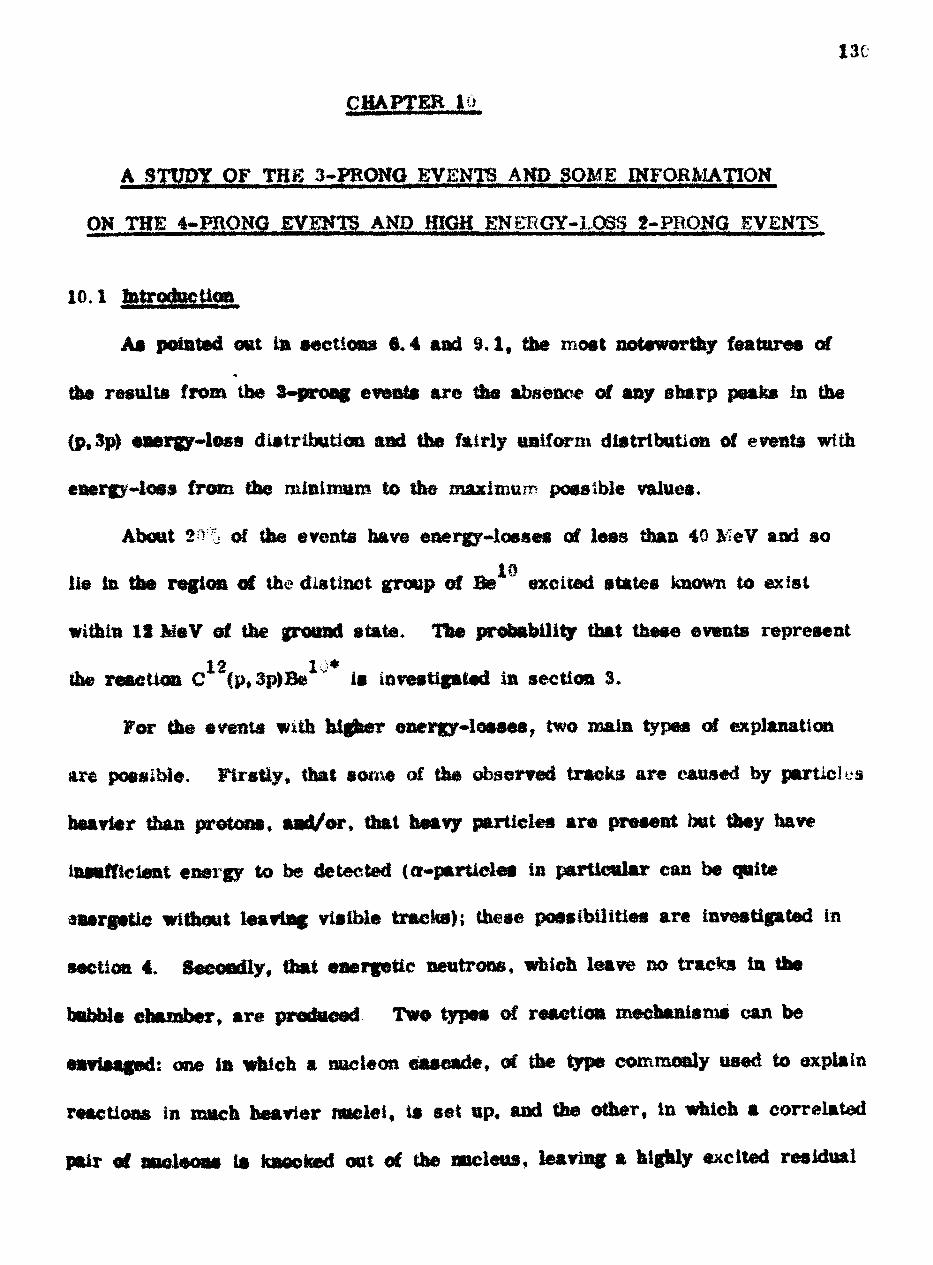
130
CHAPTER |0
A STUDY OF THE 3-yRONO EVENTS AKD SOME INFORAIATION
OK THE 4-PRONG EVENTS ANOD HIGH ENERGY-LOSS 2-PROKG EVENTS
10.1 Introduction
As pointed out In sections 6.4 and 9,1, the most noteworthy features of*
the results from the 3-proag events are the absence- of any sharp peaks in the
<p,Sp) energy-loss distribution aad the fairly uniform distribution of events with
energy-loss from the minimum to the maximum possible values.
About 2^% of the events have energy~iosses of less than 40 MeV and so
lie in the region of the distinct group of Be excited states known to exist
within 12 MeV of the ground state. The probability that these events represent12 1 5 *
the reaction C (p»3p)Be " is investigated in section 3.
For the events with higher energy*!osses, two main types of explanation
are possible. Firstly, that some of the observed tracks are caused by particles
heavier than protons, and/or, that heavy particles are present but they have
insufficient energy to be detected (a~partieles in particular can be quite
aaergetic without leaving visible tracks); these possibilities are investigated in
section 4. Secondly, that energetic neutrons, which leave no tracks in the
bobble chamber, are produced Two types of reaction mechanisms can be
envisage*!: one in which a nucieon cascade, of the type commonly used to explain
reactions in natch heavier nuclei, is set up, and the other, in whieh a correlated
pair of nocleoas is knocked out of the nucleus, tearing a highly excited residual

131
nucleus which decays by further particle emission. The first mechanism is
examined in section 5 and the second tn section 6.
When the eleaa knock-out (p,2p) p-shell events are excluded from the
(pt*P) energy-loss distribution for the 2-prong events, the resultant distribution
is similar in form to that of the (p,$p) energy-loss distribution for the 3-prong
events. The applicability of the conclusions concerning the 3-prong events to
the results of the 2-proag events is considered in section 8.
Finally, in section 0, the results from (fee small number of 4-proag events
observed are presented.
10.2 Some experimental results from jfee 3-prong events
Several aspects of (fee experimental results are presented in the subsequent
sections of this chapter. Her®, figures 1®. 1 lo 10.6 are presented as a general
Introduction to the mam features of the results. Figure 10.1 shows the corre
lation between the incident proton energies and the (p,3p) energy-losses; it
indicates the need for care in interpreting the data to account for the effects
of the range of incident proton energies present. Figures 10.2 to 13.6 show
that the events with different energy-losses do not have very different character
istics; this suggest* that the same reaction mechanism, or at least very similar
reaction mechanisms, account for all events. The small variations with energy-
loss in the distribution of energy amongst the product particles (assumed to be
protons), shown in figures 10.3 and 10.4, can oe completely accounted for by
the presence of the cut-oft at approximately 5 f'eV for the detection of protons.

E MeV L92
84
76
68
60
52
44
36
28
20
• * •
50 70 90 110 130 E MeV o
Fig. 10.1 Correlation between the incident proton energies and the (p, 3p) energy-losses.

F/B
4.0
3.0
2.0I f
Fig. 10.2
20 40 60—i___i—70 E_ MeV JL
Ratio of number of protons emitted in the forward hemisphere to the number emitted in the backward hemisphere.
EMIN/? Ei
0.2
0.1
20
« , «« .* * * * '
40 60 80 E MeV
Fig. 10. 3
0.7
0. G
0.5
0.4
Mean ratio of the minimum proton energy to the sum of the proton energies as a function of the incident proton energy.
Fig. 10.4
20 40 60 80 E MeV
Mean ratio of the maximum proton energy to the sum of the proton energies as a function of the incident proton energy.

E MeV
92
84
* X
76
68
60
52
X
:•-• v- . .»• • « •• • •
• ••
..X
44
36
28
I •
10 30 50 70 90 110 130 0. degrees
Fig. 10. 5 Angles of the product protons for events of various (p,3p) energy-losses.

E_ MeV
92
84
76
68
60
44
36
* •
52 - - . . '...... ' * :- . • • " • •/••'
» •••• .... .*««
••*• ».«•••*<
<>• • . •- ••• • • ... •
•
28
• "•' -.X
10 30 50 70 90 110 130 0.. degreesJ
Fig. 10.6 Angles between the product protons for events of various (P»3p) energy-losses.

In figured 10. 5 and 10. 6, the crosses show the near* angles for all events in
each 1^ MeV i-e^ton of energy-loss.
It is not a practical proposition to present all aspects of the experimental
results, bat because there is very little experimental information available for
these types of reaction m any published work, the basic information for each
3-prong event that was measured *s recorded In appendix VIII; from this
information each event can be reconstructed It would be interesting to
compare the predictions of a sophisticated Monte Carlo calculation with the
detailed experimental results.
12 ID 10. 3 Ttie reaction C (p. 3p)Be and the events with energy-losses below 40
Three possible reaction mechanic ms can be envisaged for the <p,3p)
reaction; these are:12 (i) an inelastic scatter of the incident proton, leaving the C nucleus
with sufficient excitation energy for it to evaporate two protons,
(ii) a quasi-elastic (p, 2p) reaction, leaving the B nucleus with
sufficient excitation energy for it to evaporate one proton, and
(iii) a cascade reaction involving only three protons
The evidence for each of these mechanisms is examined below for the
events below 40 MeV in the (p,3p) energy-loss distribution. The possibility
of events arising from the direct knock-out of a correlated pair of protons
is considered separately in section 10. 5,

133
W
For this reaction one of the protons will have an energy much greater
than the other two. For example, for an incident proton with an energy of
100 MeV (which is approximately the mean incident energy for the events with
energy-losses less than 40 MeV) there is approximately C>) I eV available for
th« kinetic energy of the three protons, after the binding energy and the energy
of the recoiling nucleus have been allowed for, Assuming an upper limit of
about IS MeV for the sum of the energies of the two evaporated protons, a
minimum ratio for E^.^/^E of 0.75 is obtained. The experimental valueft'iAJT i
for this ratio for events with energy-losses below 1 < MeV is o.$9 £0. 02 (see
figure 10.4). It is concluded from this evidence that the double evaporation
reaction mechanism is not an important contributor to the low energy-loss events.12 11* 11* < 1!> C foErtB** ; B - Be
For this reaction the incident proton and the two protons from the initial
stage of the reaction will be geometrically related to each other in a very
similar way to the protons from a quasi-«laatic (p,2p) reaction of the type
discussed in chapter 3. Since the proton evaporated from the excited residual
nucleus will, in almost all cases, have the lowest energy of the three protons,
it is possible to pick out the direct knock-out part of the reaction.
In figure 10. 7 the his tog, -am shows the distribution of the angle between
the two longer prongs Cor all the events with EJ <40 MeV, and the curve, which
is normalized to the number of events in the histogram, shows the results
obtained for this distribution from the quasi-elastic events. The coplanarity

134
of the incident proton and the two longer prongs has been calculated for each
event with B_< 40 MeV and its distribution is shown in the histogram of £4figure 10.8; again the curve shows the result obtained from the quasi-elastic
reaction.
In neither case does £h@ curve give a good fit to the histogram and it is
concluded that the single evaporation process is also unimportant.12 1 (*) (Hi) C (p»3p)Be by a proton cascade mgebanlsm
This mechanism can be pictured as follows: the incident proton interacts
quaai-elasticaliy with one of the nuclear protons and one of the product protons
then interacts quasi-eUatlcally with a second nuclear proton.
It is difficult to establish criteria by which evidence for or against this
mechanism can be Judged. For example, it is not possible to pick out for
each event which of the protons has undergone only one collision and which two
come from the second collision. However, by using a model for the reaction
it is possible to derive the spectrum of proton energies to be expected from
a three proton cascade reaction. The model is the analytical equivalent of the
statistical model outlined in chapter 0 for calculations on the more complex
cascades Involving neutrons; the approximations are the same*
The diagram below illustrates the (p,3p) cascade:
E o

N
20
10
Fig. 10. 7 The histogram shows the angles between the two longer prongs for events with E < 40 MeV and the curve is the distribution of tne angles between the product protons for the quasi-elastic 2-prong events.
EL <
0.8 1.0 coplanarity
Fig. 10. 8 The histogram shows the coplanarities calculated from the incident track and the two longer prongs for 3-prong events and the curve is the distribution oi coplanarities for the quasi-elastic 2-prong events.

135
£ Ui the incident energy,
El f & 3 are the final proton energies* and
E T is the energy of the Intermediate proton.
IT the total binding energy is £ and the recoiling nucleus has an energy
f then there la an energy E - S ~ a^ f say E A , available to be shared betweenO L rt A
the three protons that come from the nucleus. £ is replaced by £. and itO A
is assumed that each collision has the properties of an elastic nucleon-nucleon
collision; in particular it is assumed that either proton has a constant probability
of taking any energy between srero and the total energy available at the inter
action apex.
The probability of proton 1 having an energy between £ and E + dJS is
dS/E,, and the probability of proton 2 having an energy in the same range isA
the prodnet of the probability that the intermediate proton has an energy £'
greater than £ and of the probability that proton 2 takes an energy between £
and E +d£ from the available energy E'; this is equal tot
E
The same expression applies for proton 3.
Therefore, for the observation of a large number of events, the distri
bution of protons from the hypothesised reaction is;.<,.9* The same result is obtained if the total energy-loss is shared betweea the collision apices.
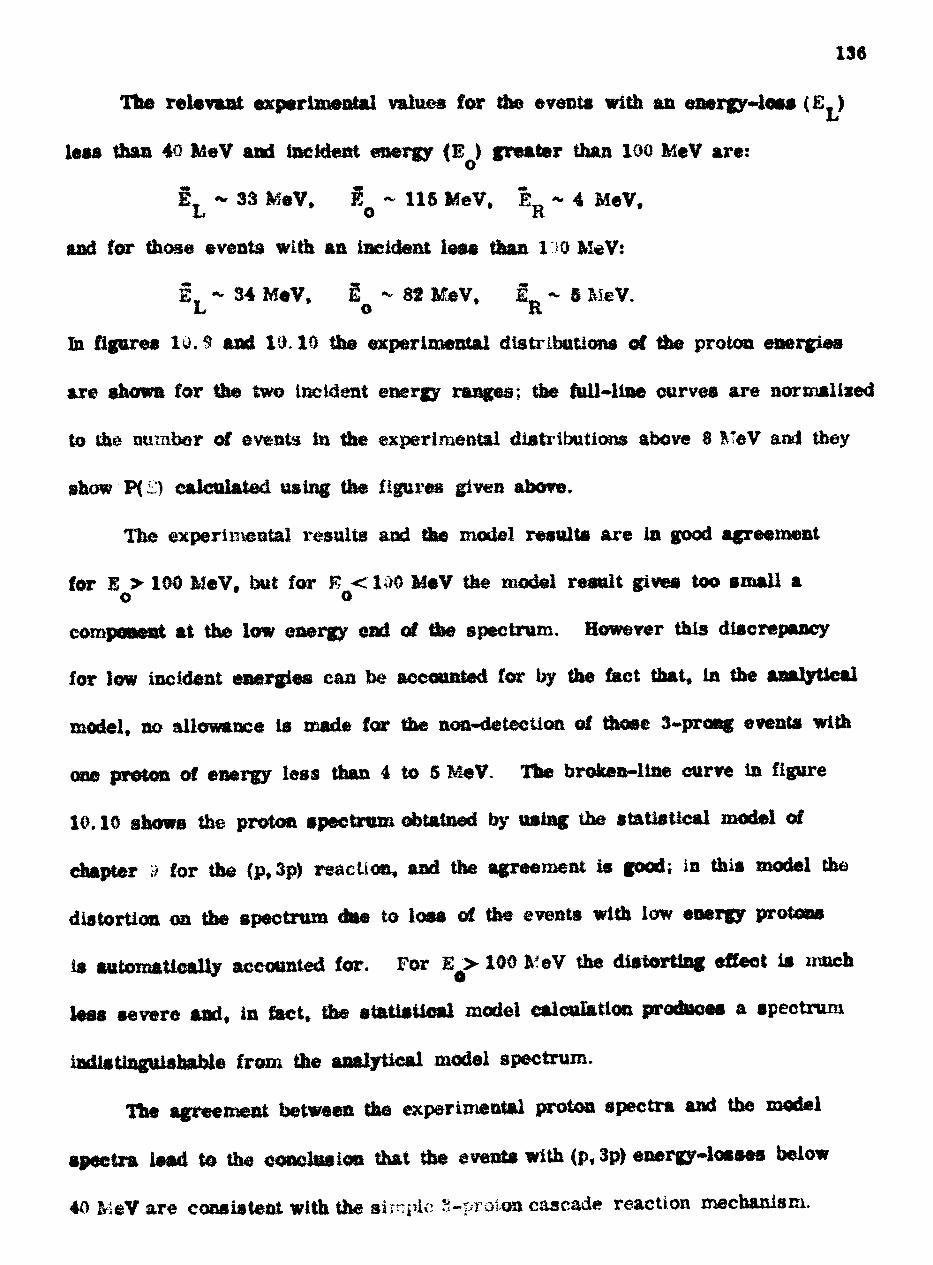
136
relevant experimental values for the events with an energy-loss (£_)LIless than 40 MeV and incident energy (E ) greater than 100 MeV are:
I. - 33 MeV, fi - 115 MeV, 1-4 MeV,*•* O K
and for those events with an incident less than 10 MeV:
E. •*• 34 MeV, g - 82 MeV, f - 5 MeV.JL O R
In figures 10. § and 10.10 the experimental distributions of the proton energies
are shown for the two incident energy ranges; the foil-line curves are normalised
to £h$ number of events in the experimental distributions above 8 KeV and they
show P< ) calculated using the figures given above.
The experimental results and Hie model results are in good agreement
for E > 100 MeV. but for E < 100 MeV the model result gives too small a o ocomponent at the low energy end of the spectrum. However this discrepancy
for low incident energies can be accounted for by the fact that, in the analytical
model, no allowance is made for Hie non-detection of those 3-prong events with
one proton of energy less than 4 to 5 MeV. Hie broken-line curve in figure
10.10 shows the proton spectrum obtained by using the statistical model of
chapter :/ for the (p,3p) reaction, and the agreement is good; in this model the
distortion on the spectrum due to loss of the events with low energy protons
is automatically accounted for. For E^> 100 RfeV the distorting effect is much
less severe and, in fact, the statistical model calculation produces a spectrum
indistinguishable from the analytical model spectrum,
Itte agreement between the experimental proton spectra and the model
spectra lead to the conclusion that the events with (p, 3p) energy-losses below
40 &5eV ar« consistent with the simple Si-proton cascade reaction mechanism.

The points show the experimental proton energy distributions and the full line curves are the analytically predicted distributions. The broken line curve of Fig. 10.10 shows the statistical model result.
N
50
40
30
20
10
E T < 40 MeV JL/
E > 100 MeV o
0 16 32 48
Fig. 10.9
64 E.
E < 40 MeV
E < 100 MeV o
Fig. 10.10

137
involving heavy particlea
Heavy particles haw been observed amongst the particles emitted from
light raclei whan they are bombarded with high energy protons and they have
been aftributed to:
(a) the direct knock-out of preformed clusters in the nucleus,12 ^
e.g. the quasi-elastic C (p. pa) Be reactions at 150 2. eV reported
by JAMES it PUGH {l:H>j) ; or, d aod t knock-out from the light
emulsion nuclei at 340 MeV reported by 3AMMAH, CUER t COMBE
et al, (1954, 11 35, 1^5$, 1 :->$8) and at 661 &eV t*y QSTROUMOV &
FILOV (lv>6u), a-particles being the most frequenUy observed particles;
(b) evaporation of preformed clusters from excited residual nuclei,
e.g. ZHDANOV IE FEDOTOV (IS60) and PSEFILOV 6 SEREBRENNIKOV
found a large ratio of o>partieiea to protons amongst the
prociucus from refiidual light en.ulsion nuclei;
(c) pick-«p reactions by nucieoos as th«y move through the nucleus,
e.g. BADVANYI 6 GENIN (1 60) attributed U,a deutarons and tritooa
12 observed by them in p •*• C reactions at ISO MeV to pick-up reactions.
There are several theoretical papers which show that the clustering of
mtcleona within the nucleus is 00! teonftistent with an independent particle
model for the nucleus sad that the quasi -a cluster is particularly favoured
(e.g. BAZ(12S6), BI^KHINTSEV (1958), SHEUNE ft WHJDEHMUTH (I960) and
BUNAKOV (1-63), but the theoretical understaodmg of the production of heavy
particles In nucleon-nucleus interactions is not yet very well developed.

138
It seems possible, therefore, that heavy particle reactions could account
for some of the 3-prong events. The large (p,3p) energy-losses could be
accounted for in two ways. Firstly, If the particles have sufficient energy to
leave observable tracks in the bubble chamber, their calculated energies
(assuming them to be protons) will be below their true energies; for example,
a 40 MeV a-particl® would appear to be a 10 MeV proton. Secondly, if they
have insufficient energy to b*j detected then ^ey are obviously omitted from th.j
energy balance for the reaction; up to 16 MeV can be accounted for in this way
by one a-particle. TMdeac& for these two sources of energy-loss will be
considered separately,
(i) Observed heavy particles If the three prongs of each event represent
the sole reaction products, apart from the recoiling nucleus, it is possible toIS 12 calculate the energy-loos for any reaction of the type C (p.pAB) or C (p, 2pA),
« where A and B represent particles such as d, t, He and a. The energy-loss
calculated with a correct reaction hypothesis for an event will be equal to, or
Just above, the threshold energy for that reaction. Peaks at these energies in
the energy-loss distributions would therefore point to the presence of heavy
particle reactions
For a given reaction, three possible energy-losses can be calculated, due
to the different ways in which the hypotheaiaad product particles can ba assigned
to the three prongs. la figures K 11 to 10. IS, the distributions of energy-loss
calculated for various hypotheses (including the three possibilities for each event)
are shown with the appropriate threshold energies. Only for the reactionB

40
N J Eth <p,2pd)
160
120
80- i ( , Fig. 10.11 f t I
, •1 Mi'
40-| {
f ———i———l———i———' ' i < ' i
14 30 46 62 78 E^ MeV
180 1 n -,120 - [,ll
11 ' » .80 ., t Fig. 10.12
40f
t14 30 46 62 78 L\ MeV
160
120 1- ,' ' f M i,80 . | f FiS- 10 - 13
40
J______I_____I—————I—————I—————I
14 30 46 62 78 E MeV
I E (p, P2t) 120 h i ' ' ™
80 . , f f,' ' Fig. 10.14
14 30 46 62 78 E MeVL
Energy-loss distributions obtained for various reaction hypotheses.

Energy-loss distributions obtained for various reaction hypotheses.N
80
40
I »
J____L
II, 1 ", (p,2pHe)
I, Fig. 10.15
4- t
I____i » *22 38 54 70 E MeV
JL
80
40'',.'
-22 -G
(p, p2He
t 4 f
104
26 42 E MeV
Fig. 10.16
80
40I f | I » ( '
(p- 2pa)
Fig. 10.17
I I
-12 20 36 52 E MeV
80
40 I f »»«,
th
''»*»',,
-42 -26 -10
f
I_______I_______I
22 MeV
Fig. 10.18
88 E MeV
Fig. 10.19 (p, 3p) energy-loss distribution for events with incident energies greater than 120 MeV.

139
*, CU(p,2pt)Be\ and Cl2(p, p*d)Bea is there any Indication of
peaking at the threshold energies, and furthermore it is found that, broadly
speaking, the same body of events is responsible for each of the peaks.
It is estimated from the distributions that up to 10% of the total number
of 3-prong events can be attributed to reactions involving heavy particles.
00 Unobserved toiyy particlef Only an indirect assessment can be made
of th* importance of these reactions. It has been noted that results from
emulsion experiments. La which heavy particles can be detected to energies
below 1 fcieV, show that, of the heavy particles emitted from light nuclei,
or-particles predominate. Two assumptions will be made; firstly that the
observed particles are protons, and secondly that any unobserved heavy particles12 are or-particles. The break up of the C nucleus must therefore be as follows:
C -*ap + a + af+8n,6because once one or-parHcle is emitted with 3 protons, the residual He is
6 unstable against the decay: He •* er + 2&.
ZHDANOV 6 FEDOTQV (16) showed that, for the reaction p + C12 at
8$0 3£eV, the ratio of the number of a-partieles knocked out of the nucleus to
the number of protons knocked out is 0.2, and a similar result was reported
byPERFILOV ft SEREBRENNHCOV (1S81) for the nuclei C, N, O taken together.
If this result is assumed to apply at energies in the region of 100 Me\r , the
This is not an unreasonable assumption since Ostroumov 6 Filov have shown that the cross-section for the knock-out of high energy a-particles from the light emulsion nuclei is constant for Incident energies between ion MeV and 700 MeV.

14012 hypothesized C break up will, in four cases out of ten, involve one knocked -
out a-particle. The energies of the various particles can be estimated as:
kiiocfeed-ottt a < U MeV
evaporated a < 6 MeV
two evaporated neutrons < $ HeV
and &e total Ending energy- is 36 l^eV.
When a knock-out o-partlcle is involved, the maximum energy unaccounted
for will therefore be 66 MeV, and when both or-partlcles are evaporated the
maximum unobserved energy will be 5S MeV. If the hypothesised process is
important, U la to be expected that tins (p, 3p) energy-loss distribution will have
a strttcturc reflecting the presence of the above two components.
& figure 10.1% the (p,3p) energy-loss distr&utloa is shown lor events
with £ > 13o £?eV (to eliminate most of the effect on the distribution of the ospread ol incident e&ergios (see figure 10.1)). The distribution shows no
marked structure and in particular shows no discontinuities in the region of
$6 MeV and 66 AeV. Furthermore, It was shown la section 10.2 that all the
other characteristics of the 3-prong events are (juite independent ol energy-los3
rl^it «p to ths niaximum enorgy-loases observed (- IS BrleV).
Hie evidence for the pr^.,ence of energetic heavy particles shows that
an upper limit of 10% ol the 3-proog events could be explained by reactions
Perfilov & Sbrebrentti&ov showed that, for the decay of r««idaal light nuclei, the ratio ol or-particles to protons Is approximately 1.7 and that the energy spectrum of the or-fxirtieles 10 peaked at 3 MeV and falls off rapidly above
energy.

141
involving heavy particles. The indirect evidence for the presence of low
energy heavy particles lends no support at all to their importance. Therefore,
subject to the limitation* of the analysis, it is concluded that the presence of
heavy particle reaction products cannot account for the main body of the
3-prong events.
5 Thi nuclcon cascade and evaporation E.:.cchaattai
Traditionally, this mechanism has been used to interpret nucloon-nucleus
interactions for heavy nuclei and for hi|fr energy incident sneleons, bet the
work of ZHDANOV 6 FEDOTOV (l;*0 t l^0t, 1804), ABATE (1961). and BERTINI
(1963, 1 64) has shown that it is also applicable for nuclei as light as carbon
and for energies as low as 50 MeV; sonic of their results were reported in
section 1. 3.12 l'*-x If i-h-e reactions C (pf ^pai>Bt , x»l f $,..., are important contributors
to the 3-proag events it is easily seen that they can produce very low and very
high <p,3p) energy-losses. Low energy-losses would result from interactions
in which the neutrons take away a small proportion of the available energy*
as they would, Cor example, if they were produced in the evaporation phase of
the reaction - and high energy-losses would result, for example, from reactions
in which high energy neutrons produced in the first stages of the cascade
reaction escaped from the nucleus without further Interaction, To assess the
relative importance of these various possibilities, the model, described in
detail in the preceding chapter, was set up. As pointed out in that chapter,

142
each reaction of the type (p,3pxn) is assumed, in turn, to account for all of the observed ©vents and, by comparing the results from each calculation with the experimental results, an assessment of their relative importances can be made,
The results predicted by the model for the (p,3p) energy-losses, the
proton energy spectra, and the energy sharing between product protons lor the& 12 8 reactions C (p,3po)Be and C (pt r>p!?n)n« are presented in figures 1C.30 to
12 7 l'\28. One energy-loss distribution Is also shown for the reaction C (p,3p3a)Be .
The model results have been smoothed out to curves and the experimental distri
butions are shown by the points. The first observation is that the model
predictions do indeed produce distributions very similar to the experimental
distributions
An examination of figure 10. ?0 shows that the contribution to the events12 7 from the C (p,3p3n)Be reaction, with its high threshold energy, is likely to
be minimal. Firstly because it can contribute events only in the tail of the
energy-loss distribution, and secondly because if it were Important in this
region, the contribution from the reactions (p,3pn) and (p,3p2n) would have to
be very small to retain a good fit for the high energy-loss end of the distri
bution; this would leave a large proportion of the main body of the events, at
lower energy-losses, unexplained. The unimportance of the (p, 3p3n) reaction
can easily be explained by the fact that this reaction would require the breaking
up of two a subgroups in the nucleus compared with the breaking up of only
one for file (p,3pn) and (p,3p2n) reactions.
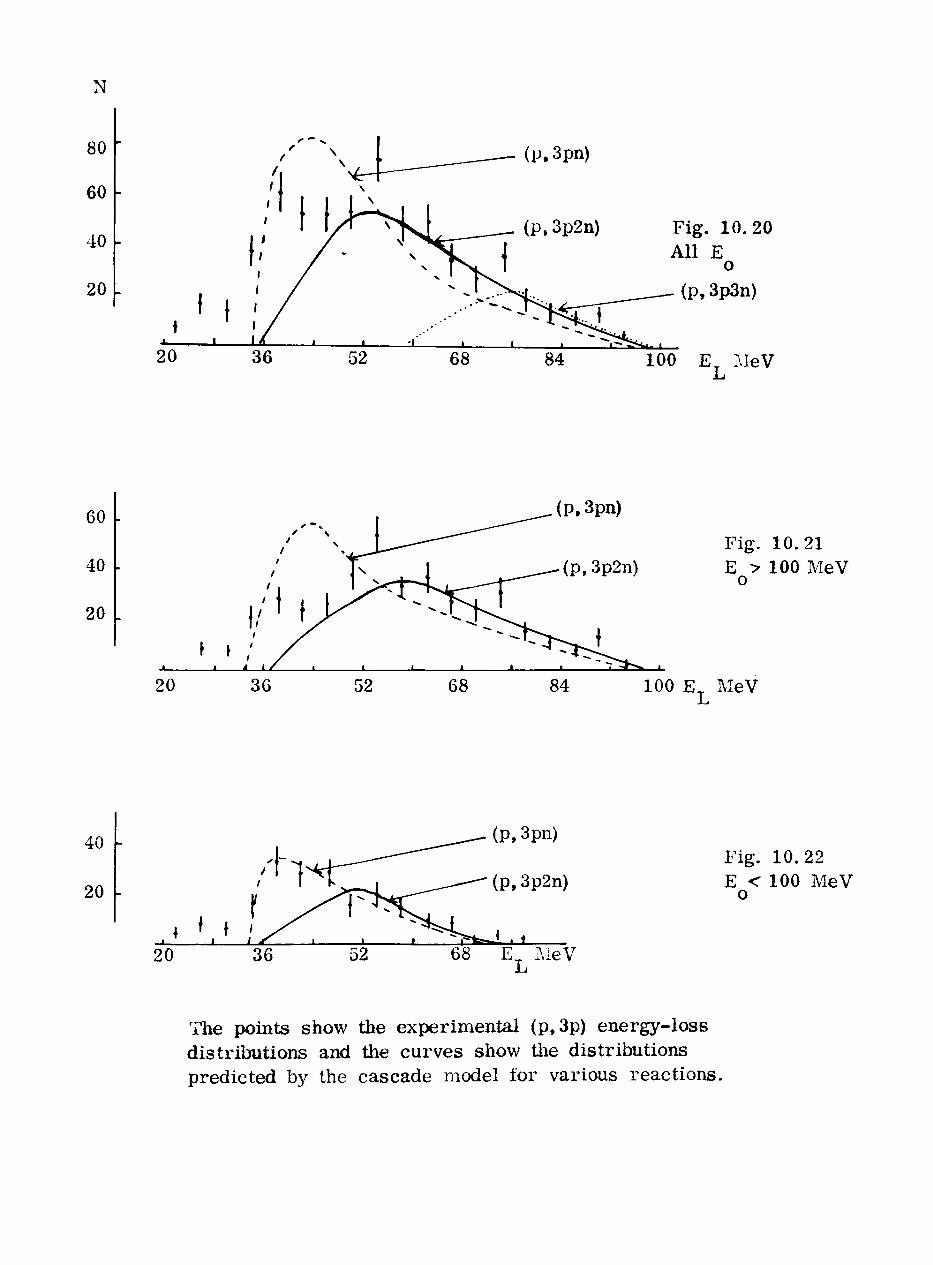
N
80
60
40
20
(P.Spn)
84
Fig. 10.20All E o
(P, 3p3n)
100 E MeV
60
40
20
Fig. 10.21E > 100 MeV o
84 100 E MeV
40
20
(P, 3pn)
(p,3p2n)
68 E MeV L
Fig. 10.22E < 100 MeV o
The points show the experimental (p,3p) energy-loss distributions and the curves show the distributions predicted by the cascade model for various reactions.

N
100-
80-
60
40
20
0
\(P.3p2n)
(P,3pn)
8 16 24_L
32 E. MeV i
Fig. 10.24 E < 100 MeV E_°>36 MeV
20 •
(P, 3p2n)
(P, 3pn)
Fig. 10.23
E >100 MeV oE > 36 MeV
48 E. MeV i
The points show the experimental proton energy distributions and the curves show the distributions predicted by the cascade model for various reactions.

N
N
80
60
40
20
0.3
(p,3p2n)
<P.3pn)
Fig. 10. 25
0. 5 0. 7
Fig. 10.26
E >100 MeV oE, ? 36 MeV
0.9 EMAXSEE.L I
N
50
40
30
20
10
0.1 0. 3 EMEN
Fig. 10.27L 1
N
40
30
20
10
E < 100 MeV oE > 36 MeV
0.3 0.5 0. 7 EMAX
Fig. 10.28<- i
Characteristics of the energy-sharing between the three product protons. The points show the experimental results and the curves show the results predicted by the cascade model for various reactions.

143
No sueh clear-cat observations can be made concerning (lie relative
importances of the (p»3pn) and (p,3pfa) reactions. Tfee table below summarizes
the good&ess of fit between the model predictions and the experimental results
shown by figures to 10.28.
Incident rgy
resultE > 100 MeV o
(p. 3p) energy-loss
proton energy spectrum
energy ratios
(p.3p£a) better
(p, 3p2n) better
both fit equally well
E < 100 MeVo'
both fit over different ranges
(j',3p2n)
(p,3p2n) better
better
Hie experimental proton energy spectra seem to have more low energy
protons than is predicted by the model for either reaction. Tb's could well
be Uue to the very pheriomcnologicai manner in which evaporation has been
included in tha model, because the proton contribution from evaporation begins
to be important at the lowest proton energies observed in the experiment.
The general conclusion to emerge from the table is that the model
predictions for the (p, Spin) reaction give a better fit to the experimental
distributions than tile (p,3pn) predictions do. Let us examine further the
energy-loss distributions to see to what extent the dominance of the (p,3p2n)
reaction can be substantiated
Firstly, what are the implications of hypothe&ixiztg that there is BO
contribution at all from file (p, 3po) reaction? IB figart KK 23 the histograms
show the differences between the predicted (p,3p2n) distributions

144
And the experimental energy -loss distributions; also shown are the energy levels10 corresponding to the production ol the known low-lying excited states ol Be .
ft can be seen that the (p,3p2n) reaction can account for All of the events with
E vlOO &?cV and E_>56 M«V, and for All those with £ <1'0 MeV AndO X* O
*V* ^** remaining events all occur in the region ol energy-loss
corresponding to tho low-lying excited states ol Be and so they could be
attributed to the (p, Sp) reaction; it has Already been shown (section 1 <. 3) that
these events have proton spectra consistent with a (p.Sp) cascade reaction
. It seems quite possible, therefore, that the (p, 3pn) reaction is
unimportant and that all of die observed ©vents are produced by the two12 8 12 10 reactions: C (p, 3p2n)Be and C (p,3p)Be ,
Having established that the possible minimum contribution from the (p,3pa)
reaction is *ero, it will now be Interesting to see whether an upper limit can
be set to the (p, 3pn) contribution. In the first place it can be seen from
figures 10, 21 and 10, ?2 that there is a small residue of low energy-loss events
that CAnoot possibly be accounted for by tha (p, 3pn) reaction because they are
below the threshold energy tor the reaction; these nutst be attributed to the
(p,3p) reaction. Apart from these, however, many of the events shown in
figure 10. 23 can be accounted for if contributions to the events from the (p, 3pn)
reaction are hypothesised. or Incident energies below 190 PieV, it can be
seen from figure IXff that the contribution from the (p,3pn) reaction could
be almost AS high as IAO% without producing significant discrepancies between
the predicted and the experimental distributions, but the energy sharing results

N
60
40
20
20
40
20
20
36
36
Excited states of Be10
All Eo
52 E MeVJu
E > 100 MeV o
52 E MeV
36
E < 100 MeV o
52 E_ MeV Ju
Fig. 10. 29 The difference between the experimental energy-loss distributions and the predicted (p,3p2n) (p, 3p) energy- loss distributions.
N
60
40
20
: i 1*
,
'i1
|, *
E >:0
1 * I
0 8 16 24 E MIN MeV
Fig. 10.30 Distribution of the lowest energy proton for the high incident energy 3-prong events.

145
of figures 10.2? and 10.28 would be in disagreement with the experimental
results if very large contributions were hypothesised. On the other hand, for incident energies above 100 M*V large contributions from the (p,3pn) reaction
would produce a distribution with more events in the energy-loss region of
36 MeV to 46 MeV than are observed ax pen mentally. In figure 10.31 the
experimental distribution is shown along with tha distributions predicted for
various combinations of contributions from the (p, 3pn) and (p,3p2n) reactions.
Certainly, (p,3pn) contributions of 507? and above imply an excess of events
in the 30 MeV - 46 HeV region but a eoatrU>ution of up to approximately 40% would give a distribution consistent with the experimental one. It most be
borne in mind, though, that the lower the hypothesised contribution from the
(p,3pn) reaction, ihe better will be the agreement between the ejiperli^nial
aad the theoretical distribution for the other results summarised in the table.
To summarise: all the events can be accounted for by tb« two reactionsCl2(p,3#Be10 and C12(p«3p2n)Be S <30% aad 70% respectively), but up to 40%
IS & of the events could be due to the reaction C (p, 3pn)Be , although the evidencepoints to the fact that the contribution from this reaction is probably well
below 49?..
10.6 Knock-out of correlated pairs of protons
It would be extremely interesting if a body of events attributable to the
direct knock-out of a correlated pair of protons could be recognized, because
very little is known about such correlations. Although the 3-prong events

E > 100 MeV o
N
60
40
20
25% (p,3pn) 75% (P,3p2n)
100 E MeV
60
40
20
20 36 52 68 84
50% (p,3pn) 50% (p,3p2n)
100 E MeV
60
40
20
20 84
75% (p,3pn) 25% (p,3p2n)
100 E MeV JL
Fig. 10. 31 The experimental energy-loss distribution compared with the results predicted by the cascade model for various combinations of the reactions (p,3pn) and (p,3p2n) (curves).

146
have been shown to be consistent with nuckun cascade inactions, the evidence
is not conclusive and the possibility that the three protons emerging from the
nucleus arise from a proton-diproton collision within the nucleus remains open.
If such reactions were present, the spectrum of excited states produced
in the residual Be nucleus would reflect the parentage coefficients for the
expansion of the C ground state -n terms of two protons and Be . Since
the evidence from the results, presented in section 10. 2, shows that the event
characteristics are no different* on average, throughout the energy-loss range,
it is presumed that if the protoa-diproton mechanism is important it contributes
events at all energy-losses, and it was seen in figure 10. li> that, for a given
incident energy, events are distributed uniformly with energy-loss up to the
maximum possible level. This implies that the sunis of the parentage10 coefficients for equal intervals oi Be excitation energies are constant at
least up to the ntaximum excitation gi&rgiea observable. However, BALA3HOV
12ft BOYAEKINA (li 44) showed that the e pans ion of the C wavefunction in
terms of a proton-neutron pair and B involved finite parentage coefficients10
for only the very low-lying excited states in the residual C nucleus and it
seems likely that the result would not be greatly different if the expansion1$ were for a proton-proton pair and Be . This evidence suggests that the clean
knock-out proton-diproton reaction mechanism is not an important contributor
to the observed 3*prong eveata.
In figure 10, 30 the spectrum of the lowest energy protons from each
event is shown for all events with EQ^120 MeVj bearing in li.ivd the loss of

147
low energy protons, the spectrum is characteristic of an evaporation spectrum
(see, for example, ZHDANOV & FEDOTOV (I a6^>). This further suggests that
diprotoa direct knock-oat is not important because in such a reaction there are
no evaporated protons.
Finally, there is the question of how the visaing energy is accounted for.
I! the measured energy-loss represents the excitation energy of the Be J nucleus
before it breaks up, as it would for a clean diproton knock-out reaction, then as10 tha incident energy increases and the highest energy-losses increase, so the Jk
break-up products (let + 2n) take away, on average, more energy. For ,0 » l?f)
MeV and E.f « 80 MeV, the four particles must take away approximately W RicV.
A» the incident energy Increases, this value will be at least as large as thai,
but if the present results are extrapolated they suggest that higher incident
energies would give rise to higher (p,3p) energy-losaes and consequently that
even more energy must be accounted for by the o>partieies and neutrons.
However, ZHDANOV 6 FEDOTOV (l^Q) showed that, even at an incident
energy of 66 * MeV, the energy spectrum of the cr-partieles is peaked at 4 MeV
and drops exponentially to 1 >% of the peak value ai 20 MeV. This is a typical
evaporation spectrum and it certainly suggests that the average a-parUcle
energy does not increase as the incident energy increases. To account for
the high energy~to9se«, therefore, neutron energies above these encountered in
evaporation spectra are required. The presence of high energy neutrons but
Over half of th« cr-particles Uv?y observed came fror» the reactions involving the knock-out of two protons from

148
not high energy or-particles cannot easily be accounted for by a model involving
the spontaneous break up of highly excited Be10 nuclei.
Only an indirect approach to the problem has been possible, but from the
separate bits of evidence, which all show that a proton-diprotou reaction
mechanism could not easily account for the results obtained from the 3-prong
events, it is concluded that the mechanism is not responsible for a significant
proportion of the observed events.
The analysis does not rule out the possibility of a proton-diproton inter
action followed by final state interactions, which have the effect of establishing
a nucleon cascade; nor does It rule out the possibility of a proton-quasi deuteron
interaction, because in the case a large amount of energy could be carried away
by a neutron. But these possibilities are not susceptible to analysis.
There are no difficulties of the type discussed in this section if nucleon
cascade and evaporation reactions are admitted.
10.7 Summary and conclusions concerning the 3-prong events
Several possible reaction mechanisms for the production of the observed
3-prong events have been investigated,
Nueleon cascade and evaporation mechanisms leading to reactions of the
type C (pt Spent)Be *, when interpreted with a relatively elementary model,
accurately predict the various experimental energy distributions for all of the
3-prong events. The evidence suggests that Use (p, 3p2n) reaction is the
dominant one but at least some contribution, at low energy-losses, must come

from the (p, 3p) reaction. Although no contribution from the (p,3pn) reaction
is needed to explain the experimental results* a contribution of up to 40% can
be admitted before the agreement with these results is violated; however, the
lower the hypothesised proportion, the better is the agreement.
Apart from the micleon cascade reactions, the analysis shows that up to
1C**, of the events eouki be due to one, or to a mixture, of the reactions
Cl2(p,frpd)B*i# , Cl2(p, 2pt)Be8 , and CW(p, p2d)Be8. No evidence was found for
reactions involving the clean knock-out of a correlated pair of protons. However
more complex reactions cannot be ruled out because it is not possible to test
for their presence; this category includes, for example: a cascade reaction
involving correlated pair interactions 5 and participation of heavy particles in
a cascade, nevertheless, the excellent agreement between the experimental
results and the results predicted for the nucleon cascade reactions does stand
out a* the most striking feature of the analysis.12 8At first sight, the conclusion that the reaction C (p,3p2a)Be is the most
important single contributor to the 3-prong events, seems contrary to the
predictions of the detailed Monte Carlo calculations performed by other authors.
For example, the results of Bertini reported in section 1. 3, predict that
<T(p,3p)> 6fp,3pn»dtp,$p8n); the results of ABATE et al. (1^61) and
OHADSTEJfN (11*62) also show the same feature. If the cross-section of
8.6^0.5 mb, calculated in section r«. « for the events with energy-losses less
than 40 MeV and incident energies greater than 160 MeV is very approximately
corrected for the loss of low energy protons, by assuming that the number of

ISO
protons missing from the spectrum of figure 10. £ ig equal to the number of
missing events, a value of 4, 4 £ 1 mb is obtained; this applies to the mean
incident energy of 117 &2eV. An interpolation of Berlin! 's result* gives a
eroes-sccuon of & 1 rob for the (p,3p) reaction at this energy which is in
agreement with the experimental result. The Monte Carlo results for the
(p.Spn) cross-section - largeat in BertinTa results where it Is approximately
equal to the (p,3p) cross-section - implies a contribution of 10% from this
reaction la the present instance and thia is well within the possible upper limit
of 40% suggested In section 10. 5. Thia leaves a very large contribution from
the (p,3p2c) reaction which cannot be accounted for by the Monte Carlo cascade
model predictions.
There are two possible explanation*.
Firstly, if <s substructures in C play an important part in the proton*
nucleus reaction then it seems likely that the interaction of the incident proton
with a nucleoa when it is participating in a sub-a correlation (not necessarily
a spatial correlation - see BA7 (1956)) could result m the ejection of all four
of the correlated aucleona. Since thia nuclear structure effect has not been
allowed for in any of the Monte Carlo calculations this could account for the
fact that the predicted cross-section ia very much smaller than the expert-8 mentally deduced cross-section for the reaction G (p,$pSa)Be .
Secondly* since the cascade calculations make no allowance for evaporation
from the ancle! remaining after die cascade stage of the reaction, it is possible
that the evaporation part of the reaction greatly reinforces the (p,3p2n) reaction

151
but not the other reactions, It can be seen from the results of Metropolis
(aee section 1. 3) that, for medium weight nuclei at least, (nucleon, x nucleon)
oaacatta r&actions leave the residual nuclei with considerable amounts of
excitation energy which will be dissipated by particle evaporation. ZHDANOV
ft FEDOTOV (1^64) investigated thia poaaibility for their experimental conditions12 of 640 MeV protons on C , because their experimental result* alao indicated
a predominance of the reaction (p,3p2n). As reported in section 1.3, they
did in fact find that a very sUong reinforcement of the cross-section for the8 production of the final nucleus Be (or two low energy a-pertieles) waa predicted
if a conventional nucleon cascade calculation waa followed by a decay mode
calculation. They showed that the effect waa due to the stability of the aa
grouping within the nucleus which makes Be (or 2a) a highly favoured final
product
Therefore both explanations depend upon c*~particle aubatructure. It la
interesting to recall (aee section 1.3) that the Monte Carlo calculations of
ether authors gave better agreement with experimental reaulta if the presence12 of cr-particlea in C was admitted, although in these calculations the cr-parcicles
were treated as aubparuelea which do not break up.
On the basis of the evidence presented, it is concluded that cc-particle
substructures play an important role in determining the course of nucleon12 Interactions With the C nucleus and that the 3-prong events arise from
reactions of the type C (pt 3pocn)3e "X ; with x«2 predominating.
60% of all the non-meaonic reactions with three or more charged products (excluding the residual nucleus) were attributed to the (p, 3p2n) reaction,

162 * Ifct >-propg events and neutron prodticing reactiopa
the 2-prong events that have (p,2p) energy-losses ia the region of 16 MeV have been explained by the quasi-elastic (p,2p) reaction, but die majority of the events have energy-losses well above that corresponding to the mostsimple knock-out reaction. There is no evidence for a dominant contribution
a to the event* from the heavy particle reactions (p.pd), (p,pt), (p.pHe ) and(p,por), as can be seen from the eaergy-loss distributions obtained by eon* structing the events according to these hypotheses * shown in figure 10. 32. Following the conclusions drawn from the 1-prong events, it was interesting to tnvetUgate to what extent the high enargy-loes 2-proag events could be attributed to reactions of the type C1 (pf 2pcn)Bll~X ; to do this die reaction
»model described in chapter 9 was modified to calculate the various energy-loss distributions. The results are ahown In figure 1". 33 together with the xperi- mental
12 8 It can be seen from figure 10. 33athat die reaction C (p, 2p3n)B la olno importance for explaining the experimental results.
+ Because the 2-proag events were not measured with a microscope, as were the 3-prong events, a large number of events with one or two very short prongs were not measured (aee appendix VID. This means that there are events missing from the high energy-lose end of the energy-loss distributions and consequently it is not possible to make a very accurate normal imtton of the distributions predicted by the model to die experimental distributions. The normalizations ahown in figure 10.33 are, therefore, somewhat arbitrary.

N(P, Pa)
80
40
-12
80
40
8
240
160
80
8
160
80
12
24 40
Eth
24
Eth
40
(P, Pt)
56
56
J_____L
28 44 60
68 E_ MeV L
72 E MeVJ—*
72 E MeV L
76 E MeV
Fig. 10.32 Energy-loss distributions for 2-prong events according to several different reaction hypotheses.

•(P,2pn) (P, 2p2n)
(P, 3p2n)
(P, 2p3n)
(a) all E
100 E MeV
80
60
40
20
(b) E > 100 MeV
20 36 52 68 84 100 E_ MeV
100
80
60
40
20
(c) E < 100 MeV
36 52 68 84 E MeV JL
Fig. 10. 33 Experimental energy-loss distributions and the cascade model results for various reactions.

103
If. as deduced from the 3-prong events, the a-particle substructure of12C is important, and the (p, 3p2n) reaction has a very high cross -section,
a large number of 2-prong events will be produced by (p, 3p2n) reactions ID
which one proton has insufficient energy to be detected. As well as the
cascade model calculations for the (p, 2pxn) reactions, therefore, (p, 3p2n)
reactions with one proton of energy below 5 MeV have also been simulated
and the resulting predicted (p. 2p) energy-loss distributions are also shown
in figure 10. *<3.
Several points emerge from an examination of figure IX 33. Firstly,
the {p, 2pn) reaction along could be responsible for all of the events observed
at the lower incident proton energies and for a large proportion of the events12 8 at the higher incident energies. Secondly, either the reaction C (p, 3p2n)Be
or the reaction C ~(p,2p2n)Bw can account for all of the high energy-loss
events (above 8 - 50 MeV for the (p,3p2n) reaction and above £ - 60I, JL
for the (p, 2p2n) reaction) for both incident energy regions. Taking the curve
normalisations given in figure 10. 33 for these two reactions in turn, the residues
of events that they leave unaccounted for are obtained by subtracting the curves
from the experimental distributions; these are shown in figures 10.34 to81\37. In the case of the reactions C (p,3p2n)3e , the residual events for
both incident energy regions all lie in the region of energy-loss expected for
the quasi-elastic <p,2p) reaction involving the knock-out of an s-shell proton
(E T * 34 M«V. AE T » ± 5 MeV (TYREN et al. 1965)). In the case of the' •> I* "" '
(p,2pfn) reaction at the higher incident energies, there are residual events

N
Eo?100 MeV
140--
120
1001
80
60
40--
20 •
20 36 52 68 E MeV
E >100 MeV o
20 36 52
Fig. 10.34 Residual (p, 2p) energy- loss distribution after the subtraction of the (p, 2p2n) curve.
Fig. 10.35 Residual (p, 2p) energy- loss distribution after the subtraction of the (p,3p2n) curve.
N
EQ<100 MeV 10(K
I
n-i"-nJ•— ' 60.
40 .
20.
I 1 1 I I
E <T100 MeV o1
' 1 ^B^^HW
k
»
»
ill 1
20 36 52 E MeV 20 36 52
Fig, 10.36 Residual (p, 2p) energy-loss distribution after tlie subtract ion of the (p, 2p2n) curve.
Fig. 10.37. Residual (p,2p) energy-loss distribution after the subtraction of the (p,3p2n) curve.

154
in the region of the quaai~eliuuic g -shell binding energy and alec so^oe abo/t
th« range of energy-losses covered by the quasi-elastic reaction.
Unfortunately, a very wide range of suitably normalized coc:b (nations of contributions from the reactions C12<p,2p) BU , C12(p.3p2n)Be8, Cl2(pt ^pn)B1 .
9Mand C (p.3pSn)B will give (p,2$ energy-loss distributions that fit the exper
imentally observed distribution so that, whilst it is established that the experi
mental results for the high (p,2p) energy-lo83 events are consistent with the
results to be expected from oucleon cascade reactions, it is noi possible to
determine Hie relative importances of the various reactions However, the
following points can be made
FirgUy, one way of fitting the experimental results is by a combination of12 11 12 8two reaction* C <p,2p) B and C (p.3p2n)Be (one proton energy < 5 Me V).
Taking the extreme ease of no contributions from the (p,2pn) and (p, 2p2n)
reactions, and accepting the normalization of the predicted (p, 3p?n) energy-loss
curve shown in figure 10. 33b for the events with £0 >1<M> &eV, the residua of
events, shown in figure 10. 35, represents the quaal-elantie (p, 2p) reaction and
the background of unclean knock-out (p,2p) reactions only. Ait order ofHide determination of ihe <n»»i-ela*tlc (p, 2p) reaction in the energy range 1 ;0
to 130 MeV caa be mad* from these events. Th* dotted curves show two
alternative estimates for the background events and oa subtracting these from
die histogram, the two estuuates obtained for the iwnsber of s-sheil events are
100 and 1*0. Taking the average of these and assuming that the events are
to exactly die same corrections as the p-sheil events (see section 7.4),

155
the estoated s-shell eroaa-aecUon for lui> &eV< £ < 1£0 J*!eV is ^ 8 nib;ois approximately half of the cross-section calculated for the quasi-elastic
knock-out of p-shall protons. Since there are half as many a-shell protons in
C as p~ehell protons, this value is probably of the correct order of magni
tude for the cross-section, This result shows that it is not unreasonable to12 8 hypothesise thai the reaction C <p,3p2n)B< is the dominant contributor to the
high energy-loss 2-prong events and it is therefor* concluded that the results
from the 2-prong events are consistent with the conclusions reached in the
previous section, i.e. that the a-particla substructure in C12 plays an important
part in determining the course of the nucleon-nueleus reaction,
Secondly, admitting the fallibility of the above deductions and looking at
the results in another way, the fact that the <p,2pa) reaction gives rise to an
energy-loss distribution with a pronounced peak m the same region as the
energy-loss for quasi-alastic (p,2p) reactions shows that it is not nec^ssariiyncorrect to attribute the experimentally observed peak to she quasi-elastic
reaction, as has been the custom of previtm* authors.
10.9 The 4«prong events
Sixty-<w» 4-prong events were measured. The experimental iaforniaUon
on the difltribuUon of thes* event* with incident energy and (p,4p) €tnergy-loss
is shown in figure 10.38. hi figure 1$. §t* the spectrum of the energies of the
prongs, treated as protons, is given.
See the comments in the footnote on page 83

E MeV o
130
120
110
100!
90
80
40 50 60 70 E T , . , MeV L(p,4p)N
10
0
Fig. 10. 38 Distribution of the 4-prong events with incident energy and with (p,4p) energy-loss.
N
50
40
30
20 -
10 .
r
i_32 E. MeVi
0 8 16 24
Fig. 10.39 Distribution of proton energies for the 4-prong events.

15612presence of the reaction p + C -> p + 3« was tested for, but in
the eusrgy-Ioes diatribotioo obtained when &e events were reconstructed
according to this hypothesis there was no evidence of a peak at zero; this
reaction l», therefore, not being observed.
Th* (p,4p) eaergHtoftS distribution is of the same nature as the 3-procg
(p,3p) energy-loss distribatioa and th@ 2-proiag <p, 2p) eiwrgy-loss
above the p»sh«n peak. It ieems likely, therefore, that tha 4*prong•I <3>
are also caused by reaction 0! the type C (p,

157
CHAPTER 11
CONCLUDING REMARKS
The work reported has provided the author uuh interesting aDd valuable
in the fields of experimental techaqucs, data processing, computer
programming and nianipulation, aad the interpretation of experimental results
in terms ol the physics ol the nucleus.12The quasi-elastic nature of the C (p,2p) reaction leaving the residual
B nucleus in its ground state, previously established by other experimenters,
has been confirmed, and the energy dependence of the cross-section between
50 MeV and 130 MeV has been seen to be consistent with the effect of the Pauli
principle, operating within the nucleus, on the free proton-proton cross-section.
For the higher incident energies the measured cross-section ?s in agreement
with the results ol other experimenters.
It has not been possible to study the quasi-elastic reaction in voting
s-shell protons nor to measure its cross-section, because events from this
reaction were not separable from the events from other reactions.12 Multiple scattering ol nucleons within the C nucleus, leading to the
establishment of intranuclear micieon cascades has be@a &hown to b$ exti^ .uuely
important; nucleon cascades and evaporation reactions can account for the
majority of the 2-prong events and lor ali the 3-prong events and 4-prong
events, the production of the low excited states of B has also been seen to
be consistent with multiple scattering of the protons produced in the qui -
elastic reaction.

158
It seems surprising that raieleon cascade ami evaporation reactions are
so important in a nucleus of only twelve godsons. A possible explanation for
this, deduced from the observation that the experimental evidence points to a12 3 very large cross-section for the reaction C (p,Sp2n)Be Is that cr-particl*
substructure effects tit the nucleus are frequently responsible for the ejection
of four mteleons from the nucleus when it is disturbed by the incidence of a
high energy nucleon.
By setting up a proton beam with very little energy spread in it, the
propane bubble chamber has been used at the limit of its resolution (deter
mined ty straggling). The main disadvantages of the apparatus have proved
to be its inability (a) to differentiate between protons and other charged particles,
(b> to detect protons with energies below 5 to 10 &_i*V, and (c), in common with
most other detector*, to detect neutrons. The first two disadvantages could be
alleviated by using for the study a diamond loaded emulsion or a cloud chamber;
bath of these methods have their own disadvantages but the former has been
used successfully &y Zhdanov & Fedotov for €69 MeV protons.
Perhaps She most useful next step would be to compare the experimental
result with predictions of sophisticated Monte Carlo calculations, it would be
particularly interesting if the effects of or-particle substructures in the nucleus
could be simulated in such calculations.


Appendix I
Technical Notes
1. The chamber body wsu* machined from a solid dural block
15|' x 18] ' a. «j". Sullied and aeat treated by 'Ifortfcern
Aluminium Co. Ltd. *
2. f Heaveli' Compressor able to supply J litre of air/ace ai SS aixnos.
j. f Foxboro' N^edie Valve
4. ' Foxboro M/4u Stabiii^g Pressure Contt oiier
$. ' Barksdale' Crescent Serins Valve. Model A1038
6. Supplied by ' Marston E^cellsioi Ltd.' (I.C.I.) MM J41
7. 'O.E.C.' FT2SO
8. Dallineyer' Series F/$. 5. Wide angle, asiigniaiic and coated.
Focal length 2 3/8 ,
j. ' Jiford' 33 mm perforated Paa F film
10. "Iricsoa' OR IOG
11. 99% pure propane from 'Calor Go* .

160
Apendix U
Choice of APtrwre Cainerm Leases
The diagram allows the image space of a camera lens, It is assumed
that Uic bubbles in the chamber act as point sources and for simplicity,
only points on the principal axis of the lens are considered.
L U the image point lor a point in the centre of the chamber
i ia the image point for a point on the babbie chamber window
M is the plane of the
The rad.ua (r) at W of the light cone of I? U given by
v+l
and since I «
Thus, to reduce the loss of resolution due to this geometrical effect,
the aperture radius a should be as •mall a* po*0ibl«. However, as a is
reduced, diffraction effects beeoiue important.

161
Using the Rayleigh cr.ierion, the diffraction radius for the image L
can be written as
The optimum. resolution over the whole chamber wUl be achieved when
r *- r ; that i* when
I. tgXv la""""""""""^** ** «•"«* f 51a v l '
if D i* the depth of field in the object space and m is the
the babble chamber to the Mm
2mand equation (3) gives _______i """"^"""^"^
a * v / ..!.¥. ft ( 5)Since u - 13f, v - f. the focal length of the leas.
-fore There, the stop number (F) of the leas is given
f 1
Using the relevant values
ro * 14
» 5 x 10 "'cms
D * 3Q cms
F * 19
The number of bubbles <n) resolved per eeatimetre ia the object apace
(*lmr) is given from equations (1) and (4)teF
B " D
m

From microscope observations cm the film it i& found that at
2i* to 2S btib&es/cij* are resolved - In good ftgree£aea& uith the
fiom the apyro:.linate treatment givea above. A more detailed treatn^eat
l» not jusiificsd becatise of tfe* somei^iat arbiti-ary nature of the Hayleigh
criterion.

163
Apendix
Tne magnification of an energy apread In a proton beam as it la degraded
in energy
In the diagram
R is las residual range in propane of a proton ef energy E
dE is tto Initial RMS energy spread in the beam
R-KlR ia the residual range of a proton of energy £ + dE
and E0 is the energy of the protons at the plane A
U<-. _ . l~- — ^ — - -
A It is required to find the energy spread at the plane A when energies are
measured by the method of residual ranges.8 A range-energy relationship of the form £ * AE is assumed; this
introduces an error of less than 1 .
Using this, the difference in ranges of the two protons is
The energy difference (dE J at plane A t measured by the method of
residual ranges is
dE , • A(R4dR-L) - A<R-L) (2) 01

164dR For |~» <<: 1 which apptteft for all but the laat centimetre or so
of the path in propane
dE(R-L)
The expression can be presented more concisely if the approximation••^
B =- 0. 5 is made (B - 0. M). Using this apprcocimaaoa and substituting for
dE
01 A JR-L

165
Appendix IV
The energy spread in a proton beam aa it is degraded in energy due to
the statistical nature of the slowing down process
STERNHEIMER (1960) has calculated the RMS percentage straggle in
the range of a stopped proton beam (the straggle coefficient) for a series
of elements and incident energies.
Consider the energy uncertainty du«? to this effect at a depth of
penetration I where the average beam energy is o
E O
E
For protons of a given energy E at the depth L, the straggle in the
range produced by stopping them is
where k is the straggle coefficient for protons oi energy £ .
The total range straggle produced by stopping the incident protons is
kR
where k is the straggle coefficient lor protons of energy E. The range
straggle produced up to the plane A can therefore be expressed as/1 9 9 9dL «kV- kz (H-n (1)

166
The equivalent RMS spread in energies al A is obtained from the range-
relationship
E * A(R-L) oB
heac© AB(R-L)B-l
and substituting for dL
_ O™
taking the
assuming that k * k -
B 1 / 9 **-L) / k R«k" (R-l y O
B * 0. 5, as in the previous appendix, and
(true to \v*thm equation (3) can be
(2)
o2 R-L (4)

167
Appendix V
A. Scanning Procedure
Use, cm view 1, the template provided. CD defines the beam entry window;AB defines the edge of the illuminated region; tracks should be visible
from here on.A xI x
I
III XIB
The chamber is divided into ten regions, labelled 1 to 10 on the template.
1. Selection of a frameFirstly, decide whether or not the frame is to be 'accepted". To do
this, ask the following question; Can I see, quite clearly, everything that happens on this frame? If the answer to this question is 'no', the frame is to be rejected and noted on a separate scanning sheet.
S. Selection of an eventHaving accepted a frame, scan it for 2-prong, 3-proag and 4-prong
events.If an event is seen:
(a) Check on view 1 that the incident proton has entered through the beam window; the track, when projected backwards, should intersect the line CD. If it does not, ignore the event.
(b) Check on view 1 that the angle made by the incident track with thereference line is less than 3° (the incident track is to be considered only over the first f" or so). If the angle is larger than 3°, ignore the event.
(c) Check ON ALL VIEWS that there is no scatter on the incident track. The diagram below shows such a scatter and indicates that unless care is taken the scatter may ue overlooked.
If A scatter is detected, ignore the event.

Heeordlnf of an eventFill ta the first four columns on the scantling sheet.S<mie events are very clearly S-, S-, or 4-prong events, but sometime*
events may be wrongly classed If care is not taken, (a) Apparent 0~proag events may have very short stubs,
* g.
For such events, write "stubfs)" in the comment column of the scanning sheet. Record any uncertainty about the number of prongs. (b) Apparent l~prong events often have a short second proag,
..__iRecord, where necessary, a® above.
(c) If a 1-proag •«y*iit with iwo short prongs ia seen, look very carefully for the presence of a third prong, especially if the event occurs in the first hall of the chamber. This Is important as nearly all 3-prong events are of this
e.g.
\Generallyf for cteclding on the number of prongs, all three views
should be looked at. 4. Comments
Under the scanning sheet column headed "Comments", record, whan relevant, the following features: (a) Short stubsfig An event that Is visible on one or two views only, (c) A scatter or event on one of the prongs of an event,
(d) Anything that appears unusual.

5. Beam TracksOn every tenth frame count the number of "acceptable 1 beam tracks
(see sections SSa and tb> and record with the frame number.6. Stopping Tracks^
At the end of most of the rolls of filtr? there are about 5; > frames with true?fs stopping at the end of the chamber, followed by some frames with trackn stopping halfway across the chamber.
r>o not scan the^e ;rames for evxmts hue merely record the frame ournVrs.
B. Measuring Procedure for 2-proag Events
Set op the fiin, on the measuring machine so that the tracks enter at the end close to you, and the frame number is on your right. The relevant views can be recognired by the fiducial positions; the position where the "George" and "Andrew" crosses are close together indicates the view number.
_V|EW 1 VIEW/ VIEW 3___
Firstly, look at the three views and decide upon which two the event srncd can most easily be measured; the appropriate view numbers will
be included in the event identification number (I.D.)Decide what type-number to associate with the event; the type-number
determines ths measuring procedure which has to be used. If the event has two long prongs (longer than about 1| ems on the screen), it la a type 3 event; one long prong and on** short prong characterise a type ? event and two short prongs a type 1 event..
The following I. D. mast be typed out imir cchaicly before each event measured:
SignificanceEvent commencesFrame numberEvent number, Bveata on each frair-c arenumbered from the beam entry end of thechamber.View numbers used; in increasing orderEvent type-number
Characters typed«* -*S digits 1 digit
2 digits I digit

170
Then * For an event without complicationsor * h there is any uncertainty (e.g. about position
of end point or presence of a scatter etc.) O£ > If thare is a very abort stub
Then, taking the prongs clockwise, or in the case of a type 2 event, takingthe shorter prong ft rat, punch:
F.S. If neither prong scatters 2£ * If the first prong scatters ojr 2 If the second prong scatters or 3 If both prongs scatter
For a prong that has a scatter, take the scattering point as the end of thetrack.
For frames with more than one event, a new I. D. mujt before each event.
punched
Chooae the lower number view of the two selected and measure as indicated below:(a) 7 ©TO the machine on the central fiducial mark - the fiducial s to be used are the "Andrew' crosses. Punch out this co-ordinate and then proceed to treasure Hdueials $ and 3 in order.
(b) Set the machine on the incident track close to the beginning of the trackand punch out the co-ord<nat£. Hepe&i for a second point halfway along thetrack, and also for the ap©#Then,For a,type 1 ev^nt:
Measure the two end points, taking them in the order of a clockwise movement. Take great care to get an accurate setting.

For a typt gthe end poliu of tho short track first, then measure a point
about 1 M fro.ni the apex on the long track, and finally, treasure the end point of the long track.
32 •*•
For a type 3 event:Measure the prongs in a clockwise direction
When all the point* on h event have been measured, set the machine on fiducial - again and punch out..
Now return to the centre fiducial and check that the counters return to wo (within 3 to 5 counts on each axis). TX) NOT punch out this point.
Tile measurement on the first view ia now complete.Switch to the second view and repeat the measuring procedure given
above. When the second view has been finished (with the rero check), type out the symbol + on the data tape and run out so: e blank tape.
Cancellation SymbolsThe following cancellation symbols are available for error removal:
(a) V an incorrect point is measured, type out the characters LS and * onthe tape immediately after the erroneous measurement and re measure the point.(b) If several consecutive points are to be cancelled, type IS followed by thesame number of *-» as there an? points to be cancelled.fe) If x complete vic-w Is Incorrect, then, AT THE END OF TK^ VIEW, typea coirtr.a.(d) I! after completing the measurement of an event it is to be cancelled, typea full stop and start again WfH A NEW I.D.
Cancellation symbols haw no effect after the symbol + has been typed. In the case of discovering sorco error after typing +, either remove the event from the tape or cover the * and type the relevant cancellation symbol.
Before removing a data ape froxr the tape punching machine, terminate it with tf n Urn -feeds.

172
Appendix VI
reconstruction of correa.oriding potato aad incident track angles
The points measured on the meaauring machine or on the microscope
are in an arbitrarily oriented cartesian co-ordinate system (the machine ayatem).
Camera positions and the varioua bubble chamber parameters are beat
expresaed in a co-ordinate ayatem linked to the ftdaciala etched on to the front
face of the front window of the bubble chamber (the fiducial syetezn).
For reconatrucUon, the roost suitable co-ordinate ayatem is linked to the
line joining the intersections of the principal a&ea of the two views with the
front ol the chamber window (the camera ayatem * aee figure VW).
It is aaaumed in this appendix, aa in chapter 5, that all co-ordinates
are expre*«ed in the camera ayatem. The various transformation* before
and after the reconstruction ol the event are performed in the analysis
computer-program.
Consider the point P in the bubble chamber. Assuming no distortions
la the camera lenses, it can be seen from figure VT-1 that similar triangles
in the bubble chamber and on the left-hand view give
X+I/S x'
and -f- « rr (2)yFor the right-hand view
(3)

Enlargement of one of the image planes
FIG. YI-1 BUBBLE CHAMBER OPTICS

173
From (i) and (3)
-X
X
y « ii* J Mi. lt| (§)
From figure VI-2
rf « ~ d 1 + £tanb * Ztana
jp* gin c ain c and, tanc » ^r ; *•*•? * a* ; **** * n (7)* W«** fcr ^MkMp **
therefore
sin c *
tanb
ytana * T .
/ Q !
Thtrefore, from e^piatioa (i)
II « i + da**** •f^n*2*!)) * Z|a*f* 4/^*(a*-l)| (8) A * L J LFrom (2) and (5)
. . £1
/>'
»»

Film Camera lens
I IB.C.
Window Propane
i
Fig. VI-2. Object to image ray in the normal plane.
Fig. VI-3 Relationship between the various angles,

(9) PUTS (9)
(It)
(01)
—
.
(o tq t
pens q '9
«(n)
aq
ptre (9)
Iq f
JOJ *
jo
pro g pox 10
J <t-3«Mg»%»*)
ant
Z

175
Inserting y' « y'Mf f
and from (4) and (5)
l/f fr* '
_,«Y ~
The errors arising from the approximation are about 1% la Z and about 0. ** in X and Y.
From equations (13) to (15)-afY
DiflereaUatlng (16) and (17) and
St. . .' - Y-(Z+nd*iiVii*)tan© - «
where tan and tan have been substituted for rr and 7^ respectivelyd/; Q^ .
XYZ is a point on the incident track;
similarlyY - (2 ->• nd ^ n/n*) tan 6
Soiling (18) and
(Z + ad + n6/a*)(tan « -tan «')
Y Itaa^*(Z ^ ad * nVn*) (Z * nd

176
Fronr, figure VI-4 it can be **een that, finally,
tail (t&u £/tan
a * tan (tan

177
Appendix Vn
A break-down of the %-prong events
Figure VH-1 gives a detailed break-down of the events, listed at the
scanning stage, into the various categories established during the measuring
stage of the analysis. The following explanatory notes refer to the superscripts
in the table.
(1) On average, an event had to be measured twice before its geometrical
reconstruction passed the acceptance tolerances set In the program. To
minimise measuring effort, those events that failed to pass the tolerances but
were unquestionably hydrogen events were not rexneasured. The establishment,
in this way, of a set of events of Inferior accuracy was permissible because
accurate data was not required for all the hydrogen events.
(2) Events that fell outside the acceptance limits set on the beatn angle and
the Z co-ordinate of the event apex.
(3) The event* with an energy-loss, E ** 0 ± 5 MeV, were classed asLJ "**
hydrogen events.
(4) Because events with a scatter on one or both prongs are not completely
determined by measurement, their identity oould not be determined by the
&&ergy~los& criterion. However, the hydrogen events could be recognized by
a combination of their idnematical properties, and the incident energy distri
butions of the separated hydrogen and carbon co< poaents of the scatter events
are shown in figure VH-U. A method of assessing the p-sheil component of
the carbon events follows from the following reasoning: the probability of a

178
scatter on a prong is a function of its energy, and the distribution of prong
energies for p«*heU events (£. » 16 MeV) at an incident energy of E is veryJL O
similar to that for hydrogen events at an incident energy of (E -16) MeV.
Therefore, if:*N* * no. of p-ehell events in the incident energy interval £ 4dEP ** o—
with a scatter
N * no* of p-shell events without a scatter in the same energy interval,
N* « no. of hydrogen events in the incident energy interval (£ ~16)£
with a scatter, and
N_. » no. of hydrogen events without a scatter in the same energy interval fitN' (E -
* (E ) » M " _, ' fl , . N (E ),* 7 p' o7
NH The ratio rr- and the derived scattering component for p-sheli events areNH shown in figure VH~XL,
(5) For example: events with scatters on the incident track; events with a
third, very short, prong; misleading scratch marks on the film.
($) About 501) of these had one prong too short to be measured, 20 - had
both prongs too short, and 30% had end points or apices hidden by scratches,
spurious tracks, distortions, etc. Hie first two sets will be accounted for by
the short prong correction factor and are excluded from the analysis; the third
set was approximately categorised by making ruler measurements on Hie projected
images.

s i
g3
"* GQ
<*> 179irt
1Is
I•s
1 S«
Ifc
13P
§

N
40
20
N
100
80
60
40
20
NH'NH0.6
0.4
0.2
70
70
Carbon
90 110 130 E MeVo
90 110 130 E MeVo
Function used to determine p-shell component
50 70 90 110 130 E MeV o
N
20
10
90 110 130 E Mev o
Fig. VII-IL Breakdown of the events with scatters.

f
A
4or
;* vm3-/ian*u
o
f
palitt j)
t* U
^^^tiAS/ avv coJttulflJti<

181
E0
12073
1291319991
131131111879010810298
12310988
10410912412284
12964
11210882
11297
10287
11813197
11890
1251131161281319498
10811310693
12812612711610597
107119128125125103
El E2
8 1415 66 55
23 55 9* 168 11
20 518 10
15 815 207 26
17 55 39
37 277 9
10 55 21
15 718 97 8
12 514 278 8
21 1510 1022 1613 1233 2811 1513 1511 2354 833 166 374 356 6
49 74 54
66 1615 6722 179 164 15
10 1714 68 406 48 155 399 178 115 337 139 4422 1034 716 115 33
E3
331188
30244111202299
26187
2212109
12427
325
3056
51122910101465
1756554559
295
101131494
1124966
459
4813
365253616590
132887167
10778
105107256665634342
110236611288857076579745
1167676514197337451
1439156
12399656163
15480286676619886516065
110323636676050248235475724562457437720353842423138191556394875
100513165545933293071513032505127371815235650125734596152
1061431201169163696092
10197756236
1118783
1281319026
1471482
11692
12557
10325
11540
11076
101123319098
11766505763967377
11314
1048773
108627613757893
1047477957396
10689
10710212586
1048616
11547856369816367
102539685318798
117967798296270429872
1055765
12452
1164367
140693868
1126294589092
104
13613315117211163
114147112746199
15095
13014312113315513011215874
13114815711913115911714887
17014811414612511717313610811811313912593
12111115914683
13911884999112010880
110114968443
1061196117
1171431166188
13530
11390
1147042
1065571
15389
11710672594513211151
10190807675
114124705683
10970
10413527
1136783
11367
12639808393
Eo
121115107628660
1191018695
13084
1309497103120958386
12396
109548994
12011211110513110810190
11912012311991
11811913299
107131125105110129118847183
12713013211186
107
El
3410198
1912977
122787
1717192817168699688569
111210146
2585
247
24303312266
36623338257
171778
1375
13
E2
1031136
106
17696
15196
164
21106
133
13746
30177430261414338
io>68
4058
172339669
23111525231087
2513311086
E3
112610657
178
164
135
3110339
4659
101323276865
11217
318
38158
32182416249
201112611484
107
106
1212165
12415
43836186938684
12472
106649566
117742278
1549885
101575859747987
102126114376579
1066076613772196620
10278
12639315745
1456275
127593689519690
§2
2015475454376447
107354360439
24693731585
335760113172303922795239294045463474852327185026542226404952524110437
10935527264
*3
6179398959643782
133763496833587
11344
1014111366
10115710130
1078497388618
1337759923945
153877381
11666698
3614456533677986276
14831
1265167
'12
4990695879664294
1228992
11439
120816154
1388082
133947755453661112137966174599848
11588
109127389333869496594618929539642657
121627184
124
*13
1031419715612416412013182
12686
11612214113912312299
13714711691
14012690
10513213515113154
12314214714510899
15212770
12913215611313474
13911382
14612815016910714511910513166
'23
636650
128106121908770805499972985
147779778
11452
1391221025374
10863295259
1129569
110403388388462
10171635818
130952982
11711616011256589553
129

182
"o
1211251151191249091
12512210313199
13111810111768
12510510511611311411711011312012774
12510810412112511112012510012211112011197
128112118837276
12512174
11094103781058390
1
74411421010226
142391011768
105719369
15171110128
11668
10108
236
10112612215
121014315
1074
141957787
1615
2
4516165
3698
15197
508
224116145997
529
2010134641241426117
212129318
238
124695
2626121055
58126
301746
111413
3
815581715321433129
1510136
38187335
248
211918243252171715162014111264198
177
1819131210307
1714307
117
3315231016
1
1124494
1721028942915423979085
10411074
10111411355
1085263
138765286
118117809890218818
1151219520238187
1257993
12995
15713162
147507373
151101782142
2
5961647652483135397139713146323251244934346918836852657112444549213824298819372919525352332076396250195445537071553538
3
9847319
8091
1259898
140787276485268
1116067
12445
130975524424640676988
128785760493635
14814196716257
128463770488973
1117870323041
11277
12
1158347
10253
1194793628360326497
11310657
127708675
121569113
1014388
11073534635754189498644409359
13241
10814011913187
1051458329699131
1095579
13
11682
1251769616514410911516213416213515214713910075
14497
1401031501367835
1291531511291095469
12769
15310611415815515510815413297
16412811413713910415013070
12912910112785
23
1058393837371
146906480
105132106666738
1008488
13475
11797996789
1089278639681788857696231
11411781
10054
1071463958877944817141
1018899578683
o130105108
v, 10611185
12112381
11912311212610012389
11712912112112812312911588
11811310910311712213081
12970
12313066
12298
10112411110812412112712812580
112123126131116101114117130
1
301832273678
27133736218
36265
12343099
35145
29111285
2711116
264
19696
24169
34365
421075
226
107689
27386
2
78
207
206
1234887
1511215077
14233014259
156
40431920203976
505
23206
391146521697
266329331218195761141785
12
3
12108
231816995
128
2797
1098889
451253425
161412151132189
206
14657
125
135
11187
12381366
417
102617257
40
1
122546396749558
1054780
106124502693
109121462684
17048
13894
1395642
1091149752984170
109878671975
47886578
13211510764683982
10313612010653824880
6459449
80 6737 11962 9856 6113 9930 10641 7053 7973 11440 8241 5047 4047 13735 40
70276950
37 11853 7862 2843 10025 2566 5535 7519 774 117
25 2116 5259 5030 7446 11210 11450 6950 5833 6626 9573 10354 5090 14020 13731 11748 724755135732
6324613326
56 11819 8252 6217 11427 6936184759
56285048
64 13123 48
97 12485 16337 15856 11961 13371 5245 12687 12591 14592 16172 94
158 11158 15832 6283 15755 132
105 15651 8619 144
119 79116 14388 139
122 161136 127130 13239 7842 114
128 130115 8690 13970 8893 14045 9068 137
109 13287 131
120 175143 154119 9085 13661 14459 14038 136
115 139125 144127 17368 13358 78
123 13522 118
124 9496 136
121 8886 161
108 12198 9656 13175 14894 125
7796
13011110981875282743675
12473
102839742
144123807543729070
11816596292
12110871909062459864
1381411062659487658669671
1137489231590
10544

133
*<>13111512012511479
1087884
11980
11896
12367
12812512012080
12812384
11011271
12313098
13311598
1158595
10388
11711388
1281181049076
11795
127129131122113108105122129125125122
*1
510107
22196056
1922139
414
12758
101513113378
2129658
1296
177
1377
10129
20119
4565
3313172667
3919191611
*2
7689
2210966
2456
147
1187
132012452716157
108
133927418766
186597
186
12255
127
1813349
295
226
5253147
*3
8266
115
137
196
2775
23315
43427
281540127495
14216
10175
466
25101357146
367
1268
126
1097
6011131513117
116
"l
927479
10633
145729898319765
118738272
1076185463885
1295796964789776559
10914148
1514371
11732
1461256645
114487744566291
13410665992747
11314066
*2
276343407747335914225853582513204677527051495940582345324835614082396834483452436434412468575518533223229
233363535230
"*3
2078798098297979
10835878468
147148102358161839838655660
1031059082
1107766239527
10579431001862562864
1288798
1021101111569
14063
117717176
114
12722958
143105118849710632
10575619380726471739328
1021001881855
116679679
10910179
11840739578
107677744
13785
1346565
103115132128629159
10915511861
1311173
11268
130147107935452
12714112214012399
12513013291
12811013011310913664
13613014512616216111614312414015012715114511870
10013714791
133141117148153101127143117164126135
23414594
108436947
135104156184
10112614112263
1324749
14973429568
1036459
125935257869593
13870624851
1015448716342458798813050
1318287194091
107
"o
1181268679
1241101261231211199393
11911890
12012283
12499
11812177
1291121311161311151161251328262
13211292
12613310978
13212613061
12312613293
1211221291011231121257763
109
"1
189
141621378
107
17101311208
1595
35186
15172289
1258
227738
37757
3510121211869
271116235414587
425
1010
^2
9595
16137
479
2114221740321127448
1217318
1050124
523322369
1777
14202332228
19134
19229
221732195
5019112319144
60
*3
8157
10194
1412111017134
312239101096
34356
10311686
35141952585677867
1917155
3340158
141235
21125
14117
wl
741521285829638658893887625781748562
10910765
11713210681
13491538941411081218781825988835092
12499966761
105170416614472958097484472
15477
23122648060493443365232222765484041613928546736343749632659275115686861371915595074833353446030311435545358552917212731
3648877
1015666
1393163
13737
1428949214350647080483935638187
1148343100473779
11510111177
132956525867286725820896820
11886
12883
1199458
14285
1298
15965
1344438
11657
1043897755488635493
153915471
1381188498
11399809362
15011110824
131567389486954
137129397757
1407179
1358061
11375545184
136107
1313011161
15079
11010957
13110394
14570808865
10715980
1281001321251201241491397573
13485
15016559
11815313313213810313513814013310815716278431401431361041511271255556
156
233477252193
1031121565897
13462
1135915
•91
43707775875687988448
10469928943705499
11795
1251401088684519577
11437
105745592
13874
1051438779
15156

Eo El
111 38110 8101 24100 32116 37132 3765 897 594 8
100 10102 43123 1269 597 18
118 2196 13
120 19105 11114 1168 6
109 11113 10120 39122 2384 6
126 2489 998 892 13
128 16130 5102 3785 5
124 9128 16113 26102 892 8
101 8125 8127 3376 1091 11
119 2473 6
124 20112 27125 8111 9119 15102 17121 5131 21119 5172 26
107 10131 14132 699 6
E2 E3
9 427 2512 1212 515 1915 423 77 477 10
10 2815 67 78 169 7
12 67 175 8
32 79 437 184 58 414 115 27
10 1127 738 725 1619 737 69 15
15 913 717 3235 2241 123 67 106 3
43 846 810 911 83 4
16 1754 1110 1011 2010 326 309 7
24 5447 2035 47 8
11 299 6
42 1131 29
0 0 1 265 5554 2055 2993 2174 5698 8172 3997 3635 44
106 3387 2545 3659 46
109 39129 5890 41
130 28110 2478 1942 58114 13136 7384 4764 4859 8046 6352 17
110 4050 7689 3995 3447 3348 1452 4161 4935 33
119 36110 4578 8
118 2159 2235 69109 1564 1464 5167 3766 6019 7739 30
112 72146 3095 2880 2122 3094 2995 2182 7288 44
128 45
*3
11076517750638660
1021083
104767727
1326874
130110864081
1181536894
13689954474
1387713876573648685
1244793887744
1486730623739769451477256
•12117573275
10820
110975889
1094263997377
126966462
1061066883
1098168982755
1156055572728987086
1054695108689459628658
1051641186511927915
116121
°13
13312810110397
13313315211511114599
1161281351338353
12712312814315014414410796
11285
14312699
12211565
10914398
13511910414311315787
11597
13610197
1201189492
16910912712876
°23
8374737189
11652749030718864"
6376
1177077
1451069899
109101836396
13776
1092244
1339258
119989157
1041051014989
11311192
1086899703237918969
1197584
E o87
^11182
12510611711812112210089
13274
11110612410589
12710913313010010593
11011811410611711611711111411312690
1181061211068612810912611612966
120117125121110104121130124102131
El E2
12 2110 129 138 61
12 48 35
22 269 249 55 6
13 1124 1438 716 2116 46 14
17 1510 86 44
30 710 639 274 12
27 1910 298 215 67 34
12 822 5316 229 44 205 21
17 106 69
10 284 177 187 20
12 1113 917 2611 1551 1943 56 688 77 8
34 1043 96 14
21 67 10
22 239 19
16 257 86 31
E3 \6 784 539 1358 668 47
38 878 126
13 6047 1346 47
14 7216 746 57
10 378 1676 535 156 118
13 4015 725 764 94
22 846 459 82
41 7363 11822 13011 556 51
33 4751 895 60
16 6724 11010 384 75-
17 8434 1117 49
14 737 746 47
20 96 657 689 595 99
18 10232 4410 1307 88
10 1228 76
30 685 106
30 5923 6124 45
2 372 10122 9257 9927 11943 12746 3231 6759 7335 5033 9933 12236 4350 9632 6246 3144 1329 81
24 5728 12849 8833 8935 9533 11165 10436 11919 7134 4367 5435 5217 8231 7526 10560 9985 11553 6722 12146 5125 8846 3871 9664 5062 9844 11560 5050 5036 11281 8429 9119 7336 5933 3628 7738 5431 10550 7727 10736 11127 5861 70
126158
1658380
11314811213056
102518558
1292717
128643147639873
11671
114105635934647978925564
1066589
1151138864769843
1068952
12264
12287
107122566783
13 23101 4676 11085 85
172 100160 107119 36113 7999 62
149 73127 92132 10578 67
125 5087 75
156 62167 14988 78
151 39153 100151 133104 94151 117139 112111 116126 89105 71153 49150 100105 47103 67108 106166 129157 94158 123125 114155 106101 84109 90143 83117 3651 115
116 118120 8558 6859 97
158 85137 15680 68
158 84102 61149 30127 99165 59131 107140 34108 87155 13088 66
112 40

185
Eo
1301301291027889
129129131124112116101128103125909491
1091118990
1207899
1121271321021101071061301248072
11179
13012983
12292
12810611310991
10610411480
127121131112123132
El
17689
10162756
44208
279
12365
107
1522228
115
246
212827377
3116166
141964
2329289235102167
34126
19313927283327
E2
165399
18162360468
2629595120193278
151715186
193110298
26131824367
1498
41134115357
262317128
18154
185
533320
E3
765
4215211198
149
1788596
113116168
15127
153216657
4117265
306
217
328757
11228
1394
173910428
214
2343
'l
71837689
128395283
1311006459
15172
144121111809164633390585981773459963199436391
10457
10059794234
1193116816067
10352288272
13961
1131116053
°2
42593018522640645332459
4631469117505749592557434722601841262470243024666669642744304449397950765232631761385591213139
°3
8312610449545356665892
20710171
1414462965379416455
11757
1377570
1508666965374849043
10650
1135192
12386
1161491091001305759
1036725514948812978
'l2
1081166990
11879669880
1069055
11966
10431
1231014654924146694471
1322241
1189
51638867143413279
1038229
1205554
10693
14012972816716
1043160926176
'l3
12615115013114511393
125170165111143138102147154138115133949980
1391141371511461701091391255157
14817511215814214210513114510914415913714812315010712610680
17050
1339981
125
'23
5281
1084983668789
1107888
10989
11167
142808294478
4712269
1369118
16610557
118249861
11386
122114683862
144120115117117907339628580688620778925
• 54
Eo
73108799887971108392
10111411198
12910787
1281241139599
) 651099586
12374
10412412211713012110512711195
11249
11712212412082
123116102111799693
10311512012592
106108120
El
57969
26265
197
308
32366
107
53224186
15105
236
124
3312161074
128
256
231024133725137
1624267
159
11376
141212
E2
86
126
259
22266
117
12188
379
2920369
205496
1375
418
20251066
271478
21235
406
247
15667
292416121720485
E3
7576
155
115
1111239
1175
162715126
1969
181423117
4614102620188
202223866
3727135
1328114553
138
144
17161118
'l
745479
114101675865
10584
15450599627
12832489481
16396
1031189255481178593
1043278
141604190797787
11974
10684
12479
1341371611131004255
15850
1297555
139
•27161386517673627494744224826405149634034444622304746315147172138325033363239454051414144151966681639182045481755285064
'3
7610911266608788
136764725
1218445
12411
13376717140
104123248679
1434140345475
11145
11295438199975638
1277067109641719737750523586
104487988
•1210282926690
1323673974211544498146804710312610212259
105101827257746085
1144998959156867682567278
14747118647381
12697
1065555
14336776982
104
°13
12815484
13113914211813110410413614485
12812912413911266
1131488956
12714912116113911911314310115012916013391
14013913816511212795
1521601511471511731252092
124112124109111119
•2310810011975744596
139696732
1151136295529615
1064060
117143396887
12389844241948172807975
11578
116107548678791231238462876455565692
13774
10484

186
E o
11810510310810711886
13182
11298
1101151021209189
121
El
107
1794
1075
14131564
136
11127
E2
11199
1213535
224
119
38312867424
E3
5117101218121147121010586
626
1128
*1
8367
110808820886850
111668678
1013487
15562
'2
586083641467211438463019211843415759
'3
35102659586743428
112102140847
41109651767
*12
6312270
120988182727368867299
1124577
11063
°13
1031049382
15991
1198880
13993
13914013914214315297
923
4868255979724026
118140128919134
114777024
Eo
988395
1011311119694
11310712111612212510310172
El
2389
29395
18141765
20357
59198
E2
2176
31253512155
1617103832888
E3
6768
1519174
2517548
138
1519
•i1065
16066458922713060
1239573
13643
12142
°2
514617521254818364330236045326853
*3
748249
119384830
106797754
10557498447
117
"12
1559
11513664
10665625889
118105131130577182
•u7735
14013280
11749
13910912415915173
15496
156141
•23
75703683193241
118553853877234629365

Reference®
187
REFERENCES
Abate B. , Bclhn Q. , Fior'n" E. , Batii S. , (1961) U Nuovo Cimento 25, Adaja* & Edmunds (ly&o) AERE - G/R - 56S Anderson D.W. (1360) Ph.D. thesis Cambridge
Austin S.M. , Salmon O. I. , Clegg A.B. . Foley,K.J. t & Newton D, Proc. Ptys. Soc. 80, 383
i I..:i. t Vssorov I.K., Zrelov V. P. , RTescheryakov M.G. , Neganov B.S. t Pynd.nR.L-., & SixaJjUuiji A.F. (1959) N. P. 1". 25S
Bala^hov V. V. Ir Bc^urluiM A.N. (19G4) Bull, Acad. \5c. USSR, Phya.SeT.PS,
Rue A. I. (1966) J. . T. P. 4 (31) ?04
Bernard ai G. , Booth E. T. , & lindenbaum S.I. (1952) Phys. Rev. 85,Bcrtini H.W. (1963) Phya. Hc-v. HI. 1801Bertim H.W. (1964) Private con^ruunieauotiBiokhimsev D.I. (1 ;58) J. E. T. P. 6 (33) 995
B8ck B. (196«| CERN Beport 60-7
Bohr N (1937) Scsesce 86, 161Down an M.R. (1964) D. Phil thesis Oxford
Bradner H (1^60) Aa Hev Noel. Sc 1 ,103
Brwekner K.A. & Levinson C.A. (195S) Phya Rev 97, 1344Brueckner K.A. (1355) Pbys K^v. 97, 1353
Bruecl^ner K.A. , .Cden R.J. & Francis N.C. (1965) Fays. Itev. 97,(195S) Phys Rev. d8, 1445
Bugg D.V. (1959) Prog. Nuel Pfeys. 7, 2 Bunakov V. E. (1963) Phya lett. 7, 140 Chew O.F. 6 WickG.C. (1952) Phys. Rev 35. 6:l« Cladis J. B. , H«»« W.N. I? Rfoyer B.J. (19S2) Phys. R«v. 8", 425
Clegg A. B. , Foky K.J. , Salmon O.I. ftSeftl^.E. (1061) Proc. Phys. Soc. 7E, 681Clegg A.B. (1963) Proceeding® of the Interaationai Conlerence on High
Physics anxi Hocloar Stiiicture C£:iN 6.3-28

186
J. (1955) J. de Fhya. 16, 445 Combe J, (1956) Stipp. Nu. Cim. 3, 182; Ctter P. t Samman A. & Combe J.
(1955) Compt. Read. 240,Cook t.J. , MeKillan E. M. , Pteterson J. M. & Sewell D.C.
Phys, Rev, V5, 7Crandall E.W. , MUibum G. F. , Pyle R.V. & Birnbatim W.
Ptiys. Rev. 101, 329Creaatll D.J. (1963) D. Phil, thesis OxfordC8er P. & Combe J. (1954) Compt Read 239, 351Ctter P. , Combe J & Samman A (195$) Compt Rend. 240, 73Ctter P , Samman A & Combe J (1955) Compt, Rend 240 15T<Oickens J.K.. Haner D.A. & Waddeli C.N. (1963) Pbys. R«v 132, 2159Dodd C (1956) Prog, Nttcl. Pbys. 5, 142
OontrovsJqr t, Babinowite P., BivHas B. (19S8) Phys Itev. Ill, 1659Dowell J. D. , Frlsken W.B. r Martelli Q. & Musgrave B. (1960)
Proc Fhys. Soc. 75, 24
£ItOD L.R.B. &Oones L.C. (1957) Phys. Rev. 1^5, 1027 ;vltoii I.F.B. (19«l) 'Haclear S&«M" O.U.P. ^, 6S Fretter W. B. (19S5) Ann. R«v. Nocl.Se. 5, 145 Friedrmn J, (19§6) reported by Metropolis et al. p. 13dGar r on J. P. , Jackmort J.C. , Hiou M. , Buhla G. , Reillac J. & Strauch K.
(1962) N. P. 37, 12$Olaaer £>.A. (1^62) Pliys. 1 «v. 87, 665Goldberger M. L. (1^48) Biys, Rev. 52, 295
Gooding T.J. & Pttgli H.G. (I960) N.P. 18, 4<i
Goswmmi A. £ Pal M. K. (1963) N. P. 44, 294Gottfrled K. (1963) Ann. of Flqra. 21, 29Gradstejn (1962) Private communicationGrover J.R. ftCarettoA.A. (18<j4) Ann Rev Nuci So 14, 51Herman & Hofatadter (I960) ^Hi^i Energy Electron Scattering Tables'
Stanford U. P. 1960

!!artree D.R. (1928) Proe. Camb Phil. Soc. ? . 89Hess W.N. (195S) Rev. Rfod. Pby*. SU, 368Hofstadler R. (195 ) Ami, Rev. Nuel. Sc. 7, 231HopkJBs H.Vv.K, (19ii) D. Phil, thesis OxfordJunes A.N. & Pugh H.G. (1963) N. P. 42, HIJoha&ft&oa A. fcSakamoto Y. (1S£3) N. P. 42. 625Lane A.?,:, ft Wandcl C.F. (135$) Phys. lev. 9&, 1524LaiHiA. M. &Wi!kinscHi D.H. (19S3) f%ys. Bev. Sr/,Living»tonc M.S. fc Bethe ILA. (1937) Rev. H, od. Phys. 9, Kl&cKenzte J. (l^ruO) Pit, O thesis, Cambridge
J.O. , Gib«caj W.M. & Duke P.J. (19St) Ptoi. Mag. 5th aeries 2,?. e ropolis N. , Bivlns B, . Storm r . , Turkevidb A., MUier J. & : . 6 Friedlander G.
(1958) Pfays. Rev. 110, 1S5MlUer J. M. & fitodis J. (imty Ann, Rev. NucL Sc. 9, Morriscm D. L, & Carelto A.A. (1962) Ffeiys, Rev. 127, 1731 OsuouiROV V.I. & Filov R.A. (I960) J. E. T. P. 10 (37) 459 Perftlov N.A. & S«rebrenaikov Yu. I. (19«1) J. J. T. P. 13 (40) 274 Pickavance T. G. It Cassel® J. M. (1952) Nature 169, 520Ifadvanyi P. & Geam J. (1MO) J.dc Pby* 21,MtK H, 4- M*l\j R. (iHTif) Utt^U 2LSOI '•• u; - s Riley K.F. , Pogh H.G. 6 Good lag T.J. (1^60) N. P. 18,Samman A. (1956) Compt. Read 242, 2232 Samman A. (1950) Compt. Rend 212, 3062Sammaa A. & Otter O, (1S5S) J, cte Phya 19.1 , see also under Ctier
and under CombeServer R« (1^47) Phys. Rev. 72, 111 i
K. <196») N.P. ?l iroc. l%y». Soc. 72, 413
Stemheimer R.M. (19iO) Pliys. Eev. 117, 487

£n H. , IMbnan P. & Maria T.A.J. (195&) N. P. 7. 1 Tyren H. , Kullander S , Sundberg O , Ramacha&dran IL , laacsson P. &
T. VBAT Grant NoWatteaberg A , Odiaa A.C. , Stein P. C. , Wilson H. 6 Wejpsieln R. Pfays. Kev 194, 1710W©isskopf V (1937) Phys Rev. "i?, 2 >5Yuasa T. & Poulei ? . (1$63) J. de Phys. 24, 1<HI2 and pnvai«Tbdasiov A. P. & Xedotov P. I. (I9t=0) J. E.T. P. 1 (3?) 280
(1SCS) J.E.T.P. 11(41) i33D(1964) J. E. T. P. 13(45) ."i!3