The Development of the Baltic Sea Basin During the Last 130 ka
23
Chapter 4 The Development of the Baltic Sea Basin During the Last 130 ka Thomas Andrén, Svante Björck, Elinor Andrén, Daniel Conley, Lovisa Zillén, and Johanna Anjar Abstract During the Eemian interglacial 130–115 ka BP, the hydrology of the Baltic Sea was significantly different from the Holocene. A pathway between the Baltic basin and the Barents Sea through Karelia existed during the first ca. 2.5 ka of the interglacial. Both sea surface temperature and salinity of the SW Eemian Baltic Sea were much higher, ca. 6 ◦ C and 15‰, respectively, than at present. A first early Weichselian Scandinavian ice advance is recorded in NW Finland during marine isotope stage (MIS) 4 and the first Baltic ice lobe advance into SE Denmark is dated to 55–50 ka BP. From the last glacial maximum that was reached ca. 22 ka BP, the ice sheet retreated northward with a few still-stands and readvances; however, by ca. 10 ka BP the entire basin was deglaciated. Weak inflows of saline water were regis- tered in the southern and central Baltic Sea ca. 9.8 ka BP with full brackish marine conditions reached at ca. 8 ka BP and the maximum Holocene salinity was recorded between 6 and 4 ka BP. The present Baltic Sea is characterized by a marked halo- cline preventing the vertical water exchange resulting in hypoxic bottom conditions in the deeper part of the basin. Keywords Baltic Sea · Eemian · Scandinavian ice sheet · Weichselian · Baltic Ice Lake · Yoldia Sea · Ancylus Lake · Littorina Sea · Hypoxia 4.1 Introduction During the last decade, significant efforts have been focused on the recent develop- ment of the Baltic Sea. This has resulted in different explanatory mechanisms for its present state and different possible remedies to change its present eutrophication status (Conley et al. 2009). The increased knowledge about the array of processes influencing the Baltic has meant that it has gradually become more common to place T. Andrén (B ) School of Life Sciences, Södertörn University, SE-141 89 Huddinge, Sweden e-mail: [email protected] 75 J. Harff et al. (eds.), The Baltic Sea Basin, Central and Eastern European Development Studies (CEEDES), DOI 10.1007/978-3-642-17220-5_4, C Springer-Verlag Berlin Heidelberg 2011
-
Upload
independent -
Category
Documents
-
view
1 -
download
0
Transcript of The Development of the Baltic Sea Basin During the Last 130 ka

Chapter 4The Development of the Baltic Sea Basin Duringthe Last 130 ka
Thomas Andrén, Svante Björck, Elinor Andrén, Daniel Conley,Lovisa Zillén, and Johanna Anjar
Abstract During the Eemian interglacial 130–115 ka BP, the hydrology of theBaltic Sea was significantly different from the Holocene. A pathway between theBaltic basin and the Barents Sea through Karelia existed during the first ca. 2.5 ka ofthe interglacial. Both sea surface temperature and salinity of the SW Eemian BalticSea were much higher, ca. 6◦C and 15‰, respectively, than at present. A first earlyWeichselian Scandinavian ice advance is recorded in NW Finland during marineisotope stage (MIS) 4 and the first Baltic ice lobe advance into SE Denmark is datedto 55–50 ka BP. From the last glacial maximum that was reached ca. 22 ka BP, theice sheet retreated northward with a few still-stands and readvances; however, by ca.10 ka BP the entire basin was deglaciated. Weak inflows of saline water were regis-tered in the southern and central Baltic Sea ca. 9.8 ka BP with full brackish marineconditions reached at ca. 8 ka BP and the maximum Holocene salinity was recordedbetween 6 and 4 ka BP. The present Baltic Sea is characterized by a marked halo-cline preventing the vertical water exchange resulting in hypoxic bottom conditionsin the deeper part of the basin.
Keywords Baltic Sea · Eemian · Scandinavian ice sheet · Weichselian · Baltic IceLake · Yoldia Sea · Ancylus Lake · Littorina Sea · Hypoxia
4.1 Introduction
During the last decade, significant efforts have been focused on the recent develop-ment of the Baltic Sea. This has resulted in different explanatory mechanisms forits present state and different possible remedies to change its present eutrophicationstatus (Conley et al. 2009). The increased knowledge about the array of processesinfluencing the Baltic has meant that it has gradually become more common to place
T. Andrén (B)School of Life Sciences, Södertörn University, SE-141 89 Huddinge, Swedene-mail: [email protected]
75J. Harff et al. (eds.), The Baltic Sea Basin, Central and Eastern EuropeanDevelopment Studies (CEEDES), DOI 10.1007/978-3-642-17220-5_4,C© Springer-Verlag Berlin Heidelberg 2011
76 T. Andrén et al.
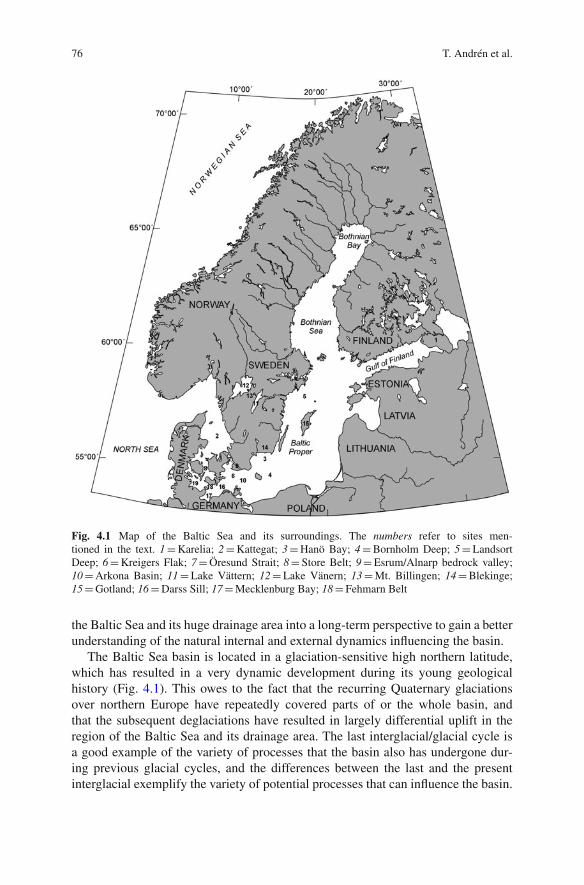
Fig. 4.1 Map of the Baltic Sea and its surroundings. The numbers refer to sites men-tioned in the text. 1 = Karelia; 2 = Kattegat; 3 = Hanö Bay; 4 = Bornholm Deep; 5 = LandsortDeep; 6 = Kreigers Flak; 7 = Öresund Strait; 8 = Store Belt; 9 = Esrum/Alnarp bedrock valley;10 = Arkona Basin; 11 = Lake Vättern; 12 = Lake Vänern; 13 = Mt. Billingen; 14 = Blekinge;15 = Gotland; 16 = Darss Sill; 17 = Mecklenburg Bay; 18 = Fehmarn Belt
the Baltic Sea and its huge drainage area into a long-term perspective to gain a betterunderstanding of the natural internal and external dynamics influencing the basin.
The Baltic Sea basin is located in a glaciation-sensitive high northern latitude,which has resulted in a very dynamic development during its young geologicalhistory (Fig. 4.1). This owes to the fact that the recurring Quaternary glaciationsover northern Europe have repeatedly covered parts of or the whole basin, andthat the subsequent deglaciations have resulted in largely differential uplift in theregion of the Baltic Sea and its drainage area. The last interglacial/glacial cycle isa good example of the variety of processes that the basin also has undergone dur-ing previous glacial cycles, and the differences between the last and the presentinterglacial exemplify the variety of potential processes that can influence the basin.

4 The Development of the Baltic Sea Basin During the Last 130 ka 77
The geologic deposits in the Baltic basin, as well as in the surrounding region, arethus archives of its history. If these can be retrieved and “read” by geologists, wewill understand the background on which we shall base our interpretations of themost recent history on, as well as plan for the future in a continuously changingworld. Therefore, we think it is appropriate to summarize some important, and forthe Baltic basin history decisive, aspects of its youngest geologic history. It shouldbe noted that this summary is from a slightly south Scandinavian perspective andfrom the wealth of papers published on the subject we have chosen those consideredthe most appropriate, i.e., with high quality of data and with a proper chronologicalcontrol.
The interglacial/glacial cycles and their recurring glaciations have had differ-ent types of impacts on the Baltic basin and can be summarized into some maincategories:
• Glacial and glaciofluvial erosion of the basin and its catchment, resulting in dis-placement of clastic sediments (ground bedrock) from the surrounding land areasto the basin floor.
• Repeated cycles of downwarping of the lithosphere, as an effect of the glacialexpansion and loading, and uplift/unloading during phases of deglaciation orthinning of the ice sheet.
• Varying ice thicknesses during more or less extensive glaciations of theScandinavian ice sheet have resulted in highly different uplift rates (high in thenorth and low in the south) during subsequent deglaciations.
• The combination of glacially forced global sea level changes and regional iso-static movements has resulted in changing water levels (depths) – in both timeand space – of the basin and of the critical threshold areas.
• The above-mentioned processes have been the main salinity regulator for theBaltic basin, allowing more or less saline water to enter the basin through moreor less broad and deep straits.
• The setting of the Baltic Sea basin at the rim of the northeastern Atlantic meansthat it is sensitive to changes in atmospheric and marine circulation patterns ofthe region. These have caused large changes in both temperature and precipita-tion/evaporation ratios. These have had a direct and also indirect impact on theBaltic Sea; the latter through changing river and surface run-off from the hugecatchment area, four times as large as the basin itself.
4.2 History of the Baltic Sea Prior to the LastGlacial Maximum (LGM)
4.2.1 130–70 ka BP
Deposits from the Last Interglacial, the Eemian (basically corresponding to MarineOxygen Isotope Substage (MIS) 5e) ca. 130–115 ka BP, have been described

78 T. Andrén et al.
from a number of marine and terrestrial sites in the North Atlantic region, but isonly partly documented in the NGRIP (North Greenland Ice Core Project mem-bers 2004) ice core. A delay between the beginning of MIS 5e and that ofthe European terrestrial Eemian was demonstrated for the first time by SánchezGoñi et al. (1999) based on a land–sea correlation between the European pollenzones and the marine isotope stages (discussed by Kukla et al. 2002). High-resolution Eemian marine shelf records (here correlated with MIS 5e) from northernEurope are, however, very scarce and usually only contain fragmentary paleoen-vironmental information. The same is valid for the early Weichselian stadialsand interstadials (MIS 5d to 5a), which were, however, fully recovered in the,e.g., NorthGRIP ice core. Data from marine sediments in the Nordic Seas showthree substantial sea surface temperature fluctuations during MIS 5e (Fronvaland Jansen 1996). These results imply that the Last Interglacial at high north-ern latitudes was characterized by rapid changes in the polar front movement,ocean circulation, and oceanic heat fluxes. This may have resulted in notice-able temperature changes in neighboring land areas, which is different from theHolocene climate development, with only minor fluctuations on a general coolingtrend.
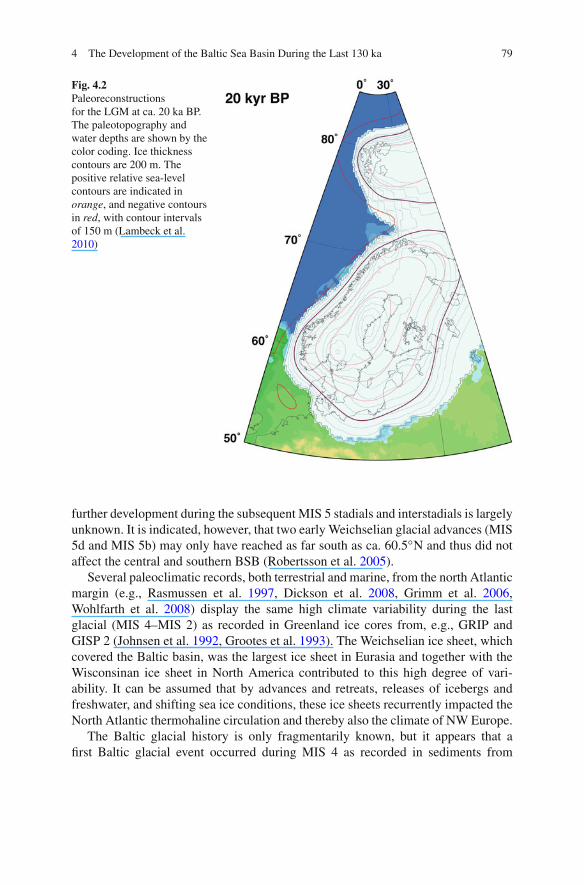
Records from Eemian lacustrine and marine sediments (MIS 5e), presently sit-uated on shore, show that the Eemian in the Baltic Sea Basin (BSB) began with alacustrine phase during ca. 300 years before marine conditions were established(Kristensen and Knudsen 2006). A pathway existed between the BSB and theBarents Sea through Karelia during the first ca. 2–2.5 ka of the interglacial dueto the large isostatic depression as a result of the extensive Saalian ice sheet whichprobably was much thicker than the Weichselian ice sheet (Fig. 4.2). It is debatableas to what degree this pathway was of importance for the general circulation in theBSB and the climate of north Europe (Funder et al. 2002). It did, however, havesignificant effect on oceanography during the first ca. 4 ka of the Eemian BalticSea, and possibly also on the surrounding terrestrial climate (Björck et al. 2000),resulting in a strong W–E temperature and salinity gradient with a winter sea sur-face water temperature ca. 6◦ higher and a salinity ca. 15‰ higher than today inthe Belt Sea and western BSB. At the same time, lower salinity and colder bottomwater (ca. 2.5◦C) conditions prevailed in the eastern BSB. This circulation patternwith high salinities may have created strong salinity stratification and the develop-ment of a permanent halocline resulting in hypoxic bottom conditions during a greatpart of the Eemian. These conditions resemble in many ways the development ofthe Baltic Sea during the last 8,000 years and today’s situation. Also, the differencebetween the warm and well-ventilated southwestern Eemian BSB and the cold, stag-nant conditions of its easternmost parts implies that the ocean–continental climategradient from the west to the east in N Europe was steeper than during the Holocene(Funder et al. 2002). After ca. 6 ka into the interglacial, the Eemian Baltic Seawas characterized by a falling sea level and decreased salinity seen in diatom andforaminifera records (Eiríksson et al. 2006, Kristensen and Knudsen 2006), but its
4 The Development of the Baltic Sea Basin During the Last 130 ka 79
Fig. 4.2Paleoreconstructionsfor the LGM at ca. 20 ka BP.The paleotopography andwater depths are shown by thecolor coding. Ice thicknesscontours are 200 m. Thepositive relative sea-levelcontours are indicated inorange, and negative contoursin red, with contour intervalsof 150 m (Lambeck et al.2010)
further development during the subsequent MIS 5 stadials and interstadials is largelyunknown. It is indicated, however, that two early Weichselian glacial advances (MIS5d and MIS 5b) may only have reached as far south as ca. 60.5◦N and thus did notaffect the central and southern BSB (Robertsson et al. 2005).
Several paleoclimatic records, both terrestrial and marine, from the north Atlanticmargin (e.g., Rasmussen et al. 1997, Dickson et al. 2008, Grimm et al. 2006,Wohlfarth et al. 2008) display the same high climate variability during the lastglacial (MIS 4–MIS 2) as recorded in Greenland ice cores from, e.g., GRIP andGISP 2 (Johnsen et al. 1992, Grootes et al. 1993). The Weichselian ice sheet, whichcovered the Baltic basin, was the largest ice sheet in Eurasia and together with theWisconsinan ice sheet in North America contributed to this high degree of vari-ability. It can be assumed that by advances and retreats, releases of icebergs andfreshwater, and shifting sea ice conditions, these ice sheets recurrently impacted theNorth Atlantic thermohaline circulation and thereby also the climate of NW Europe.
The Baltic glacial history is only fragmentarily known, but it appears that afirst Baltic glacial event occurred during MIS 4 as recorded in sediments from

80 T. Andrén et al.
NW Finland at ca. 64◦N (Salonen et al. 2007), the first advance into northernDenmark at 65–60 ka BP blocking any Baltic outlets through Kattegat (Larsen et al.2009), while the first Baltic ice lobe advance into southeastern Denmark is datedto ca. 55–50 ka BP (Houmark-Nielsen 2007). It is likely that freshwater lakes cov-ered the deeper subbasins of the central and southern BSB until at least 60 ka BPwhen sea level was >50 m lower than today (Lambeck and Chappell 2001, Siddallet al. 2003). In the Hanö Bay, Bornholm and Landsort Deep basins were probablysediments deposited during several tens of millennia through the first half of the lastglacial.
Based on detailed correlations and dating of the southwestern Baltic glacial strati-graphies, Houmark-Nielsen and Kjær (2003) and Houmark-Nielsen (2007, 2008)conclude that the SW Baltic may have experienced two major ice advances duringMIS 3, at ca. 50 and 30 ka BP. The latter is being vividly discussed (Wohlfarth 2010)as well as the general asynchroneity of MIS 3 ice advances at the western marginof the Scandinavian ice sheet (SIS) (Mangerud 2004) compared to the ice marginsin the south (Houmark-Nielsen et al. 2005). This less well-known period betweenca. 50 and 25 ka BP with its partly incompatible records is followed by a complexglaciation in the southern BSB (Houmark-Nielsen and Kjær 2003) leading up to theLGM. Previous off-shore studies in the southern Baltic have documented the pres-ence of marine brackish sediments, dated to MIS 3 or older, that were overridden bya glacier (Klingberg 1998) at Kriegers Flak and, e.g., two varved clay sequences –the upper one dates from the last deglaciation – separated by an organic-rich layerdated to >35 ka 14C BP (bulk date) in Hanö Bay (Björck et al. 1990).
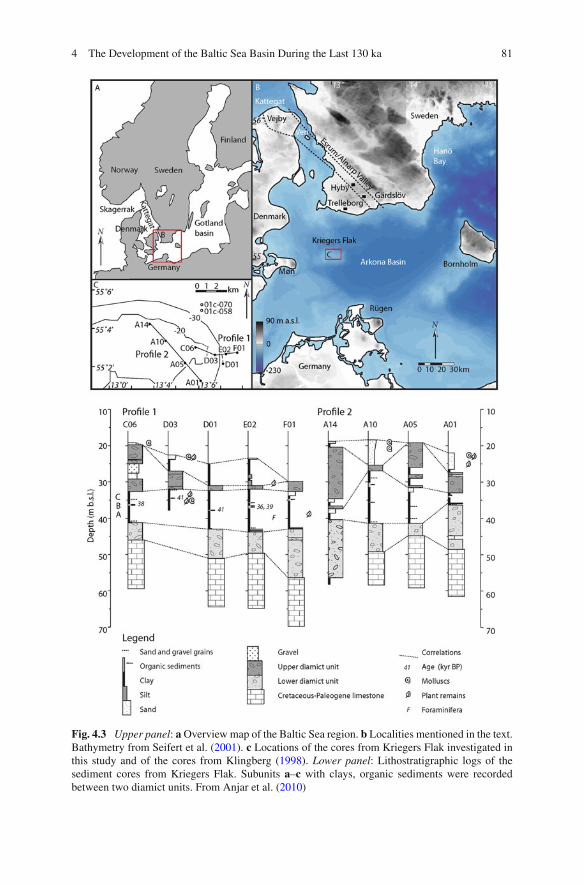
Recently, 40 cores were obtained from drillings for the planning of the KriegersFlak wind-mill park, of which 9 indicate that complex yet incomplete stratigraphiesoccur in this shallow part of the BSB. The shallow Kriegers Flak area shows a sur-prisingly complex stratigraphy with a variety of lithologic units, gravel–sand–silt,clays of glaciolacustrine and brackish origin, interstadial lacustrine, and terres-trial organic sediments with five 14C dates between 36 and 41 ka BP, sandwichedbetween several glacial diamicts (Fig. 4.3) (Anjar et al. 2010).
The geographic location and altitude (in relation to sea level) of the criticalthreshold, or “gateway,” between the open ocean and the BSB are a key factor forthe BSB history, as it controls if, and how much, water can flow in or out of theBSB. Presently, the two main thresholds are the Öresund Strait (–7 m) and the StoreBelt (ca. –20 m).
However, during earlier stages in the history of the BSB, a bedrock thresholdsituated 60 m below sea level, the buried Esrum/Alnarp bedrock valley runningthrough SW Skåne in Sweden and northernmost Sjaelland in Denmark, 120 kmlong and 6 km wide, has been suggested as a possible connection to the oceans(Lagerlund 1987, Andrén and Wannäs 1988). Deep corings in the 1970s of thismain aquifer recovered fluvial and lacustrine sediment units with an organic carboncontent that made radiocarbon dating possible. The ages presented by Miller (1977)indicate that the valley was sediment-filled during the later part of MIS 3. The valleymay thus have served as the outlet route for the entire BSB until it later was filledup by sediments.
4 The Development of the Baltic Sea Basin During the Last 130 ka 81
Fig. 4.3 Upper panel: a Overview map of the Baltic Sea region. b Localities mentioned in the text.Bathymetry from Seifert et al. (2001). c Locations of the cores from Kriegers Flak investigated inthis study and of the cores from Klingberg (1998). Lower panel: Lithostratigraphic logs of thesediment cores from Kriegers Flak. Subunits a–c with clays, organic sediments were recordedbetween two diamict units. From Anjar et al. (2010)
82 T. Andrén et al.
4.3 Late and Postglacial History of the Baltic Sea
4.3.1 16,0–11,7 ka BP
While the development of the Baltic Sea during the last glacial period is only frag-mentarily known, its history since the last deglaciation is better understood. It isbased on studies of numerous sediment cores from different parts of the basin as wellas on analyses of the mechanisms behind the geodynamic history of the Baltic Sea(Björck 1995, 2008). The latter can be evaluated from the many curves displayingthe water level changes in different parts of the Baltic basin and with comparisonsto the relative sea level changes seen in parts of Denmark and on the Swedish westcoast.
The complexities of the post-LGM history of the southern parts of theScandinavian ice sheet (SIS) have been summarized by Houmark-Nielsen and Kjær(2003). They conclude that a first embryo of a final deglacial lake basin, the BalticIce Lake (BIL), should have an age of ca. 16 ka BP. Lower valleys in Denmark aswell as the Öresund area between Sweden and Denmark were possibly the maindrainage pathways for the glacial melt water, and the Store Belt and Öresund straitswere most likely formed as a consequence of gradual erosion by these rivers as thearea rebounded above base level (sea level). While the southernmost parts of thebasin were filled up with glacial deposits formed at the margin of the ice sheet, thedeeper parts, such as the Arkona Basin and Bornholm Basin, later on constituted aglacial lake as the deglaciation continued.
During the initial stage of the BIL, it was most likely at level with the sea.However, as the isostatic rebound of the outlet in the Öresund threshold areabetween Copenhagen and Malmö – made up by glacial deposits on top of chalkbedrock – was greater than the sea level rise, the Öresund outlet river eroded its bedin pace with the emerging land. In fact, the island of Ven with its complex glacialstratigraphy (Adrielsson 1984) is a remnant of this eroded glacial landscape. Whenthe fluvial downcutting reached the flint-rich chalk bedrock, the erosion must haveceased more or less completely. This is possibly an important turning point in theBIL development: the uplift of the threshold lifted the BIL above sea level and theupdamming (ponding) of this large glacial lake started. Based on the apparent sud-den changing rate of shore displacement in Blekinge this seems to have occurred atca. 14 ka BP.
The deglaciation of the central Baltic led to the formation of the so-called highestshoreline since the deglaciation of the coastal areas was followed by rapid isostaticrebound. Because of the deglaciation, the sedimentation in the BIL was predomi-nantly of a glaciolacustrine character resulting in either glacial varved clay or morehomogenous glacial clay: as the ice sheet retreated north the BIL grew in size withvarved clay forming in proximal areas of the ice sheet, while homogeneous clay wasdeposited in more distal areas. Organic productivity was very low and even diatomswere rare.
Due to the fact that the isostatic uplift of the outlet area in Öresund was morerapid than the eustatic sea level rise, the altitudinal difference between the level

4 The Development of the Baltic Sea Basin During the Last 130 ka 83
of the BIL and the sea gradually rose. It has been estimated that this difference at13 ka BP was in the order of 10 m (Björck 2008), and around this time there arestrong indications that a first drainage of the BIL occurred (Björck 1981, 1995).This is thought to have been the consequence of ice recession north of the southSwedish highlands and Mt. Billingen, situated between Lake Vättern and LakeVänern (Björck and Digerfeldt 1984). This deglaciation uncovered parts of themiddle Swedish lowlands and opened up a contact between the sea in the west,occupying, e.g., Lake Vänern, and the BIL. Due to a later ice readvance and erosionof the deglaciated terrain, the proofs for this drainage are more of circumstantialcharacter, though the circumstantial evidences are many (cf. Björck 1995), thanconcrete drainage deposits. It may have been recorded in the Arkona basin as basin-wide sandy layer (Moros et al. 2002). There is, however, no evidence that marinewater entered the Baltic basin.
When the Younger Dryas cooling set in at ca. 12.8 ka BP, the ice sheet advancedsouth over the previously deglaciated areas and once again blocked the northerndrainage of the BIL at Mt. Billingen. This ponding effect might have been a gradualprocess but must have led to a more or less rapid transgression, depending on howlong the updamming took, until the Öresund outlet functioned again. ComplexYounger Dryas sediment lithologies in lakes in Blekinge (Björck 1981), in more orless contact with the BIL during Younger Dryas, imply that the BIL experienced acomplex water level history during this time period. It has been shown that duringthis phase the BIL reached as far southwest as into the Kiel Bay (Jensen et al. 1997,2002).
Fig. 4.4 Paleogeographicmap showing the Baltic IceLake just prior to themaximum extension and finaldrainage at ca. 11.7 ka BP

84 T. Andrén et al.
The uplift of Öresund continued to be greater than the sea level rise, which meantthat the altitudinal difference increased further between the closed-in BIL and theopen sea (Fig. 4.4). At the end of Younger Dryas, we have ample evidence for milderconditions in NW Europe (e.g., Bakke et al. 2009), which triggered a retreat of theice sheet even before the Younger Dryas cold period ceased (Björck and Digerfeldt1984, Johnson and Ståhl 2010). Although we do not know the details about the finaldrainage of the BIL, we know from many independent evidence that there was a sud-den lowering of the Baltic level of ca. 25 m down to sea level, and it occurred over atime period of 1–2 years just prior to the onset of the Holocene (Björck et al. 1996,Jakobsson et al. 2007), which dates it to ca. 11.7 ka BP (Walker et al. 2009). Theeffects both inside and outside the Baltic basin have been described in more detailby Björck (1995), but it must have had a huge impact on the whole circum-Balticenvironment, with large coastal areas suddenly subaerially exposed, large changesin fluvial systems, considerable reworking of previously laid down sediments aswell as the establishment of a large land-bridge between Denmark and Sweden.
4.3.2 11.7–10.7 ka BP
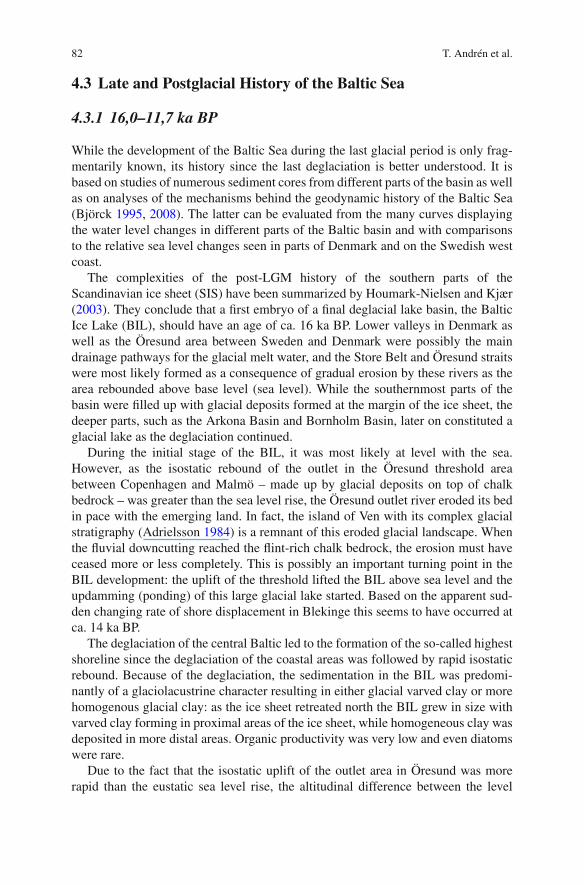
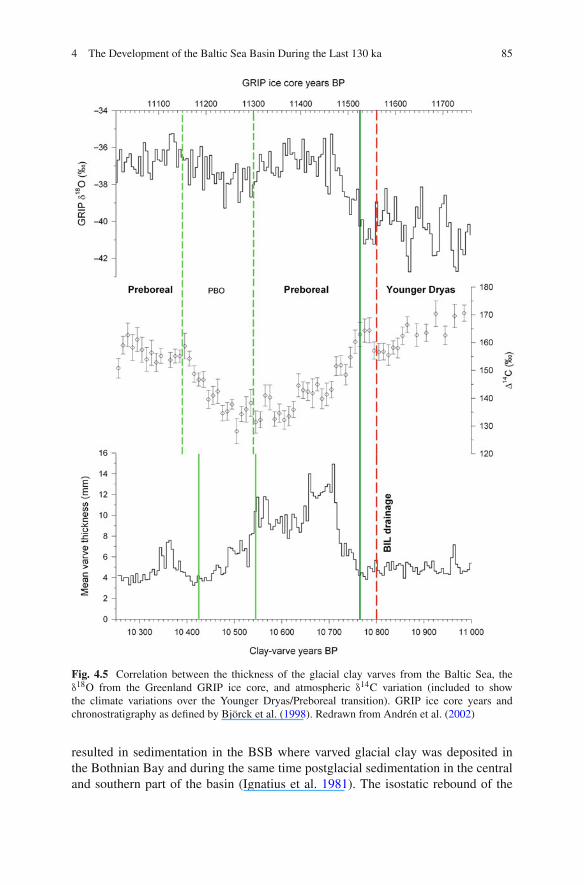
Hence, the onset of the next Baltic Sea stage, the Yoldia Sea (YS), coincides moreor less exactly with the base/start of the Holocene Series/Epoch (Walker et al. 2009)and the rapid warming connected with that. In fact, varved clay thicknesses in north-western Baltic Proper and δ18O values in the GRIP ice core display a strikinglysimilar pattern over a 150 year long Younger Dryas–Preboreal transition period(Andrén et al. 1999, 2002), showing a distinct increase in sedimentation rate as theice sheet began to melt and rapidly retreat (Fig. 4.5). Apart from being characterizedby the rapid deglaciation of the Scandinavian ice sheet, the relative sea level changesof the YS played an important role and were a combination of rapid regression inthe recently deglaciated regions and normal regression rates in southern Sweden(1.5–2 m/100 years).
Although the YS were at level with the sea, it would take ca. 300 years beforesaline water could enter through the fairly narrow straits of the southcentral Swedishlowland. This brackish phase has been documented by the varve lithology, geochem-istry, and marine/brackish fossils, such as Portlandia (Yoldia) arctica. Occasionallythis phase shows up as sulfide banding, implying a halocline, and the maximumduration of this brackish phase has been estimated to 350 years (Andrén et al.2007), although some records indicate it only lasted some 70–120 years (Andrénand Sohlenius 1995, Wastegård et al. 1995). Due to the high uplift rate in south-central Sweden, the strait area shallowed up rapidly, which together with the largeoutflow prevented saline water to enter the Baltic (Fig. 4.6). This turned the YoldiaSea into a freshwater basin again although there was an open contact with the sea inthe west through Lake Vänern and valley systems further west.
At the end of this stage the ice sheet had receded far north and most of today’sBaltic Sea basin was deglaciated, with the exception of the Bothnian Bay. This
4 The Development of the Baltic Sea Basin During the Last 130 ka 85
Fig. 4.5 Correlation between the thickness of the glacial clay varves from the Baltic Sea, theδ18O from the Greenland GRIP ice core, and atmospheric δ14C variation (included to showthe climate variations over the Younger Dryas/Preboreal transition). GRIP ice core years andchronostratigraphy as defined by Björck et al. (1998). Redrawn from Andrén et al. (2002)
resulted in sedimentation in the BSB where varved glacial clay was deposited inthe Bothnian Bay and during the same time postglacial sedimentation in the centraland southern part of the basin (Ignatius et al. 1981). The isostatic rebound of the

86 T. Andrén et al.
Fig. 4.6 Paleogeographicmap showing the Yoldia Seaat the end of the brackishphase ca. 11.1 ka BP
areas around Lake Vänern led to a situation where the outlets west of Vänern shal-lowed up and could not “swallow” all outflowing water from the Baltic. This marksthe end of the Yoldia Sea.
4.3.3 10.7–9.8 ka BP
When the shallowing up of the outlets west of Lake Vänern forced the water levelinside the Baltic to rise, the next stage, the Ancylus Lake (AL), began. The sedi-ments of this large freshwater lake are usually poor in organic material, which ispartly a consequence of the melt water input to the Baltic from the final deglacia-tion of the Scandinavian ice sheet and the fairly pristine soils of the mainly recentlydeglaciated drainage area. Together, this resulted in an aquatic environment withlow nutrient input and hence low productivity. The absence of a halocline in the ALled to a well-mixed oxygenated water body and the fairly common sulfide-bandedsediments of this stage can probably be explained by H2S diffusion from youngersediments (Sohlenius et al. 2001).
The onset of the AL is displayed by a simultaneous switch in relative waterlevel change in the areas south of Stockholm–Helsinki (corresponding to the meanisobase of the outlets west of Lake Vänern), which had previously experiencedregression since deglaciation: transgression now took over. This is documented notonly by an array of shore displacement curves, but also by simultaneous flooding
4 The Development of the Baltic Sea Basin During the Last 130 ka 87
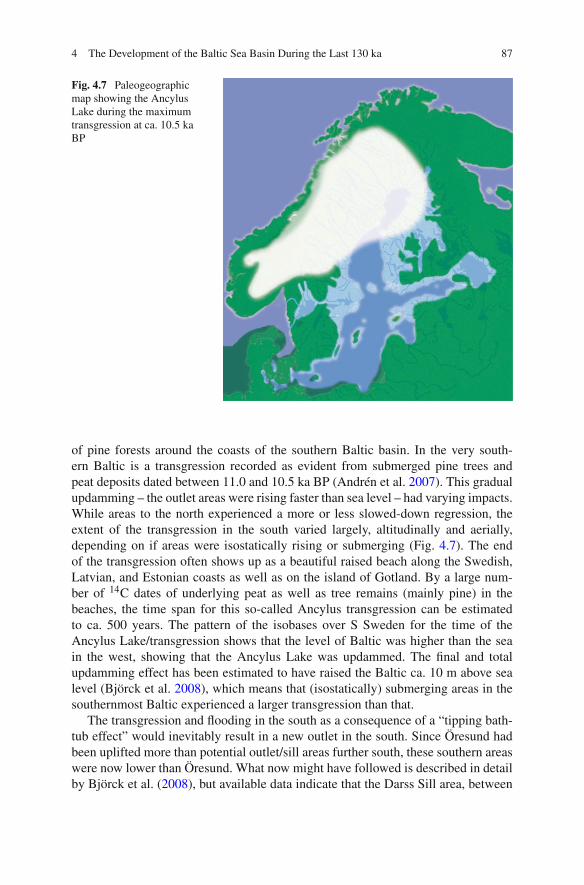
Fig. 4.7 Paleogeographicmap showing the AncylusLake during the maximumtransgression at ca. 10.5 kaBP
of pine forests around the coasts of the southern Baltic basin. In the very south-ern Baltic is a transgression recorded as evident from submerged pine trees andpeat deposits dated between 11.0 and 10.5 ka BP (Andrén et al. 2007). This gradualupdamming – the outlet areas were rising faster than sea level – had varying impacts.While areas to the north experienced a more or less slowed-down regression, theextent of the transgression in the south varied largely, altitudinally and aerially,depending on if areas were isostatically rising or submerging (Fig. 4.7). The endof the transgression often shows up as a beautiful raised beach along the Swedish,Latvian, and Estonian coasts as well as on the island of Gotland. By a large num-ber of 14C dates of underlying peat as well as tree remains (mainly pine) in thebeaches, the time span for this so-called Ancylus transgression can be estimatedto ca. 500 years. The pattern of the isobases over S Sweden for the time of theAncylus Lake/transgression shows that the level of Baltic was higher than the seain the west, showing that the Ancylus Lake was updammed. The final and totalupdamming effect has been estimated to have raised the Baltic ca. 10 m above sealevel (Björck et al. 2008), which means that (isostatically) submerging areas in thesouthernmost Baltic experienced a larger transgression than that.
The transgression and flooding in the south as a consequence of a “tipping bath-tub effect” would inevitably result in a new outlet in the south. Since Öresund hadbeen uplifted more than potential outlet/sill areas further south, these southern areaswere now lower than Öresund. What now might have followed is described in detailby Björck et al. (2008), but available data indicate that the Darss Sill area, between

88 T. Andrén et al.
Darss and Møn, was inundated by Ancylus waters. Through Mecklenburg Bay andFehmarn Belt, along the eastern side of Langeland and out through the Great Beltto Kattegat, a large river was established through Denmark, i.e., the Dana river (vonPost 1929). The idea of a sudden and large drainage of AL was proven impossibleby Lemke et al. (2001) but due to initial erosion of the riverbed of soft Quaternarydeposits this might have caused an initial lowering of the AL in the order of 5 m,followed by a period of rising base level, i.e., the sea in the north. This resultedin a complex river system through Denmark with river channels, levées, and lakes(Bennike et al. 2004) with a gradually smaller fall-gradient as the sea level wasrising. When sea level in Kattegat had reached the level of the AL inside the Balticbasin we think it is possible that saltwater could penetrate all the way through thelong river system into the Baltic, at least during periods when the Baltic regionhad been under influence of a long-lasting high-pressure suddenly followed by deeplow pressure systems and strong westerly winds. We therefore place the end of theAncylus Lake when it was at approximate level with the sea and we see the firstsigns of marine influence since the YS.
4.3.4 9.8–8.5 (8) ka BP
According to independent evidence in the Blekinge archipelago (Berglund et al.2005) and from the Bornholm basin (Andrén et al. 2000b), the first, though weak,signs of saline water entering the Baltic basin after the AL have been 14C dated to9.8 ka BP. Also in the eastern Gotland basin is an increase in brackish freshwaterdiatom taxa recorded at ca. 9.8 ka BP (Andrén et al. 2000a). This period with verylow saline influence has been named the Initial Littorina Sea (Andrén et al. 2000b),which is very appropriate considering the fact that the Baltic was at level with thesea. The Scandinavian ice sheet finally melted during the early part of this stage,and although most of the Baltic Sea coastline still experienced regression due tothe rebound, the “0-line,” i.e., the areas where eustasy and isostatic uplift balanced,moved north. The 0-line during the first part of this stage was possibly along aline from SE Sweden to Estonia, i.e., all areas south of such a line would haveexperienced a transgression.
In comparison with the AL sediments the organic content often rises gradu-ally throughout this stage. In the coastal zone, a diverse brackish diatom flora, theso-called Mastogloia flora, was established (Miettinen 2002). In the open basin,however, a very low diatom abundance characterizes the Initial Littorina Sea (e.g.,Andrén et al. 2000a, b, Paabo 1985, Sohlenius et al. 1996, 2001, Thulin et al. 1992,Westman and Sohlenius 1999). Pigment biomarkers indicate that cyanobacteriawere abundant during the Initial Littorina Sea (Bianchi et al. 2000, Borgendahl andWestman 2007). Stable nitrogen isotopes which are indicative of the origin of nitro-gen have been used to show that these early blooming cyanobacteria were actuallynitrogen fixers (Borgendahl and Westman 2007, Voss et al. 2001).

4 The Development of the Baltic Sea Basin During the Last 130 ka 89
How long this period of almost freshwater character lasted is not known in detailsince the age of the onset of the next stage is not unequivocal, but it certainly lastedmore than a millennium. The reasons behind the age uncertainty are many: differenttypes of material have been dated with different types of dating methods, the 14Creservoir effect in the Baltic is poorly known, and the simultaneousness in the Balticof this shift is debated. Bulk sediments, shells, and terrestrial macrofossils havebeen 14C dated and fine sand quartz samples have been OSL dated with the SARprocedure (Kortekaas et al. 2007).
4.3.5 8.5 (8) ka BP–Present
The onset of the next stage, the Littorina Sea, is seen as a marked lithological changein Baltic Sea cores. It shows up as a very distinct increase in organic content as wellas increasing abundance of brackish marine diatoms (e.g., Sohlenius et al. 2001). Ithas been discussed if this sudden increase in organic carbon content is exclusivelycoupled to changes in primary production or if it is partly due to better preservationof carbon during anoxic conditions (Sohlenius et al. 1996). It has also been pro-posed that an increase in the secchi depth due to flocculation of clay particles andsubsequent rapid sedimentation could attribute to an increased primary production(Winterhalter 1992). Distribution of trace elements in sediments, especially enrich-ment of barium and vanadium, is linked to the cycling of organic carbon and implythat increased productivity in the basin caused the rise in organic carbon content(Sternbeck et al. 2000).
Due to dating problems it has not been possible to absolutely date the transitionfrom fresh to brackish water. In general, 14C dates between 8.5 and 8 ka BP arevery common for the onset of this important shift (Sohlenius et al. 1996, Sohleniusand Westman 1998, Andrén et al. 2000a), while the OSL-based age-depth modelof Kortekaas et al. (2007) suggests an age of 6.5 ka BP for the same shift in theArkona Basin. Both 14C ages of bulk sediment and bivalves from the very samecore give older ages than the OSL ages, but younger than the expected age of 8.5–8 ka BP. This discrepancy is difficult to explain unless the shift was not the same asdetermined in other studies; diatom analysis was not carried out by Kortekaas et al.(2007).
Rising sea level and flooding of the Öresund Strait is believed to be the mainmechanism behind the onset of the Littorina Sea; melting of the Laurentide andAntarctic ice sheets over couple of millennia caused a 30-m rise in the absolute sealevel (Lambeck and Chappell 2001). Episodic melting events of these ice sheetsmay explain the so-called Littorina transgressions in the Baltic Sea (e.g., Berglundet al. 2005), which are found in areas south of Stockholm. For example, the rapidsea level rise (4.5 m in a few hundred years) in Blekinge centered at 7.6 ka BP hasbeen ascribed to the final decay of the Labrador sector of the Laurentide ice sheet(Yu et al. 2007).
90 T. Andrén et al.
4.3.6 Salinity
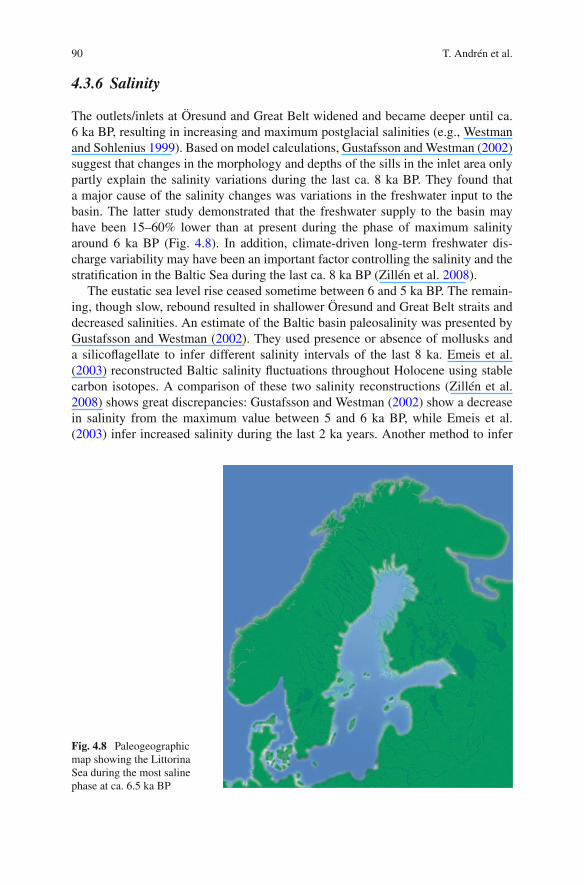
The outlets/inlets at Öresund and Great Belt widened and became deeper until ca.6 ka BP, resulting in increasing and maximum postglacial salinities (e.g., Westmanand Sohlenius 1999). Based on model calculations, Gustafsson and Westman (2002)suggest that changes in the morphology and depths of the sills in the inlet area onlypartly explain the salinity variations during the last ca. 8 ka BP. They found thata major cause of the salinity changes was variations in the freshwater input to thebasin. The latter study demonstrated that the freshwater supply to the basin mayhave been 15–60% lower than at present during the phase of maximum salinityaround 6 ka BP (Fig. 4.8). In addition, climate-driven long-term freshwater dis-charge variability may have been an important factor controlling the salinity and thestratification in the Baltic Sea during the last ca. 8 ka BP (Zillén et al. 2008).
The eustatic sea level rise ceased sometime between 6 and 5 ka BP. The remain-ing, though slow, rebound resulted in shallower Öresund and Great Belt straits anddecreased salinities. An estimate of the Baltic basin paleosalinity was presented byGustafsson and Westman (2002). They used presence or absence of mollusks anda silicoflagellate to infer different salinity intervals of the last 8 ka. Emeis et al.(2003) reconstructed Baltic salinity fluctuations throughout Holocene using stablecarbon isotopes. A comparison of these two salinity reconstructions (Zillén et al.2008) shows great discrepancies: Gustafsson and Westman (2002) show a decreasein salinity from the maximum value between 5 and 6 ka BP, while Emeis et al.(2003) infer increased salinity during the last 2 ka years. Another method to infer
Fig. 4.8 Paleogeographicmap showing the LittorinaSea during the most salinephase at ca. 6.5 ka BP
4 The Development of the Baltic Sea Basin During the Last 130 ka 91
paleosalinity of the Baltic Sea is to use the strontium isotopic ratio in carbonatemollusk shells (Widerlund and Andersson 2006) and quantify salinity with a preci-sion better than ±5%. However, this method can only be used when carbonate shellsare present/preserved in the sediments. Donner et al. (1999) suggest a salinity ca.4‰ higher than present at the coastal areas of the Gulf of Finland and the Gulf ofBothnia between ca. 7.5 and 4.5 ka BP based on the 18O/16O ratio in mollusk shells.
4.3.7 Nutrient Conditions and Hypoxia
The inflowing marine water in the Baltic Sea 8–7 ka BP probably caused the releaseof phosphorus from sediments, enhancing the growth of cyanobacteria (Bianchiet al. 2000, Borgendahl and Westman 2007, Kunzendorf et al. 2001). The salin-ity stratification together with increased primary production initiated periods ofdeepwater hypoxia in the open Baltic basin, evident in the sediment record asextended periods of laminated sediments (Sohlenius and Westman 1998, Zillénet al. 2008). Increased upward transport of nutrients from the anoxic bottom waterhas been suggested as an explanation of the enhanced primary productivity atthe Ancylus/Littorina transition (Sohlenius et al. 1996). Between 8 and 4 ka BP,the Littorina Sea experienced a long sustained period of hypoxia (Zillén et al.2008). Oxygen conditions improved considerably after ca. 4 ka BP, also as salin-ity decreased (Gustafsson and Westman 2002). This coincided with the onset of theneoglaciation in N Europe with a more humid and cold climate (Snowball et al.2004). The shift to colder and wetter conditions probably increased the net precip-itation in the watershed leading to increased freshwater supplies to the basin anddecreased salinities (Gustafsson and Westman 2002). Such a freshening, in combi-nation with increased wind stress over the Baltic Sea, would result in a weakenedhalocline and enhanced vertical mixing allowing more efficient exchange of oxygenacross the halocline (Conley et al. 2002). This scenario would promote more oxicbottom water conditions and explain the diminishing of the hypoxic zone around4 ka BP (Zillén et al. 2008).
Hypoxia occurred again during the middle-late Littorina Sea (ca. 2–0.8 ka BP).In contrast to the period of oxygen deficiency during the early and more salinephase of the Littorina Sea, hypoxia during the late Littorina Sea does not show arelationship to any known changes in salinity. During this time, the surface salin-ity in the Baltic Proper probably ranged between 7 and 8‰, i.e., similar to thelast ca. 4–3 ka (Gustafsson and Westman 2002). Hypoxia between 2 and 0.8 kaBP overlaps with a climate anomaly known as the Medieval Warm Period (Lamb1965) when atmospheric temperatures in NW Europe were ca. 0.5–0.8◦ warmer thantoday (Snowball et al. 2004). However, temperatures have no proven effects on theoxygen conditions in the Baltic Sea and the relationship between primary produc-tion and climate change is not straightforward (Richardson and Schoeman 2004).Furthermore, the link between phytoplankton abundance and sea surface temper-ature is only indirectly coupled to temperature. The ecological response to NAO
92 T. Andrén et al.
(North Atlantic Oscillation) has been reviewed and several correlations between cli-mate and ecological changes have been observed, although the mechanism is notunderstood (e.g., Ottersen et al. 2001). At the Swedish west coast, a strong corre-lation between phytoplankton biomass and NAO has been found, possibly causedby an increased stratification in Skagerrak (Belgrano et al. 1999). In the North Sea,there has been an increase in phytoplankton season length and abundance since themid-1980s, interpreted as a response to climatic forcing (Reid et al. 1998). AlthoughNAO is well known to influence climate conditions in the Baltic Sea, no direct linksbetween NAO, hypoxia, and inflow of saline water have been established.
The causes of hypoxia during the middle-late Littorina Sea are not fully under-stood. An alternative trigging mechanism to widespread hypoxia during this timeperiod is increased anthropogenic forcing via eutrophication. It has been proposedthat hypoxia correlates with population growth and large-scale changes in landuse that occurred in the Baltic Sea watershed during the early Medieval expansionbetween AD 750 and 1300 (Zillén et al. 2008, Zillén and Conley 2010). The largeland use changes increased soil nutrient leakage significantly in the Baltic Sea water-shed, leading to high nutrient variability in the basin and associated hypoxia (Zillénand Conley 2010). The late Littorina Sea record of hypoxia in the Baltic Sea maythus be due to multiple stressors, where both climate and human impacts may haveinteracted. It is known that human activities have affected the Baltic Sea already AD200 which is recorded as a change in the lead composition in the sediments from theEastern Gotland basin. This change coincides with a geographic shift in the Romanlead mining from the Iberian Peninsula to other areas, e.g., Germany and the BritishIsles during the first to third centuries AD (Bindler et al. 2009).
Hypoxia again appeared in the Baltic Sea around the turn of the last centurywith all sediments below 150 m in the Gotland Deep laminated (Hille et al. 2006).This period corresponds to a climate amelioration, which has lasted over most ofthe twentieth century as well as the onset of the Industrial Revolution when theEuropean population increased rapidly (about six times since AD 1800) and techno-logical advances in agriculture and forestry exploded (Zillén and Conley 2010). Theeutrophication we now experience (e.g., Elmgren 2001) is caused by the increaseddischarge of nutrients with a growing population and the use of synthetic fertilizerson arable land after World War II (Elmgren 1989), but these effects are also super-imposed on effects caused by the ongoing climate warming (Andrén et al. 2000a;Leipe et al. 2008). Revealing the relative importance between climate and anthro-pogenic forcing on the Baltic Sea ecosystem is one of the major scientific challengesfor the future.
References
Adrielsson L (1984) Weichselian lithostratigraphy and glacial environments in the Ven-Glumslövarea, southern Sweden. LUNDQUA Thesis 16
Andrén E, Shimmield G, Brand T (1999) Changes in the environment during the last centurieson the basis of siliceous microfossil records from the southwestern Baltic Sea. The Holocene9:25–38
4 The Development of the Baltic Sea Basin During the Last 130 ka 93
Andrén E, Andrén T, Kunzendorf H (2000a) Holocene history of the Baltic Sea as a backgroundfor assessing records of human impact in the sediments of the Gotland Basin. The Holocene10:687–702
Andrén E, Andrén T, Sohlenius G (2000b) The Holocene history of the southwestern Baltic Sea asreflected in a sediment core from the Bornholm Basin. Boreas 29:233–250
Andrén E, Clarke A, Telford R, Weckström K, Vilbaste S, Aigars J, Conley D, Johnsen T, Juggins S,Korhola A (2007) Defining reference conditions for coastal areas in the Baltic Sea. TemaNord2007:583
Andrén T, Wannäs K (1988) Late Quaternary development of the Bornholm Gatt. GeologicalSurvey of Finland, Special Paper 6:23–29
Andrén T, Sohlenius G (1995) Late Quaternary development in the north-western Baltic Proper –result from the clay-varve investigation. Quaternary International 27:5–10
Andrén T, Björck J, Johnsen S (1999) Correlation of Swedish glacial varves with the Greenland(GRIP) oxygen isotope record. Journal of Quaternary Science 14:361–371
Andrén T, Lindeberg G, Andrén E (2002) Evidence of the final drainage of the Baltic Ice Lake andthe brackish phase of the Yoldia Sea in glacial varves from the Baltic Sea. Boreas 31:226–238
Anjar J, Larsen NK, Björck S, Adrielsson L, Filipsson HL (2010) MIS 3 marine and lacustrinesediments at Kriegers Flak, southwestern Baltic Sea. Boreas 10:360–366
Bakke J, Lie Ø, Heegaard E, Dokken T, Haug GH, BirksHH, Dulski P, Nilsen T (2009) Rapidoceanic and atmospheric changes during the Younger Dryas cold period. Nature Geoscience2:202–205
Belgrano A, Lindahl O, Hernroth B (1999) North Atlantic Oscillation primary productivity andtoxic phytoplankton in the Gullmar Fjord, Sweden (1985–1996). Proceedings Royal SocietyLondon B 266:425–430
Bennike O, Jensen JB, Lemke W, Kuijpers A, Lomholt S (2004) Late- and postglacial history ofthe Great Belt, Denmark. Boreas 33:18–33
Berglund BE, Sandgren P, Barnekow L, Hannon G, Jiang H, Skog G, Yu S (2005) Early Holocenehistory of the Baltic Sea, as reflected in coastal sediments in Blekinge, southeastern Sweden.Quaternary International 130:111–139
Bianchi TS, Westman P, Rolff C, Engelhaupt E, Andrén T, Elmgren R (2000) Cyanobacterialblooms in the Baltic Sea: natural or human-induced? Limnology and Oceanography45:716–726
Bindler R, Renberg I, Rydberg J, Andrén T (2009) Widespread waterborne pollution in centralSwedish lakes and the Baltic Sea from pre-industrial mining and metallurgy. EnvironmentalPollution 157:2132–2141
Björck S (1981) A stratigraphic study of Late Weichselian deglaciation, shore displacement andvegetation history in south-eastern Sweden. Fossils and Strata 14:1–93
Björck S, Digerfeldt G (1984) Climatic changes at Pleistocene/Holocene boundary in the MiddleSwedish endmoraine zone, mainly inferred from stratigraphic indications. In: Mörner NA,Karlén W (eds) Climatic changes on a yearly to millennial basis. Reidel, Dordrecht
Björck S, Dennegård B, Sandgren P (1990) The marine stratigraphy of the Hanö Bay, SE Sweden,based on different sediment stratigraphic methods. GFF 112:265–280
Björck S (1995) A review of the history of the Baltic Sea, 13.0–8.0 ka BP. Quaternary International27:19–40
Björck S, Kromer B, Jonsen S, Bennike O, Hammarlund D, Lemdahl G, Possnert G, RamussenTL, Wohlfarth B, Hammer CU, Spurk M (1996) Synchronized terrestrial-atmospheric deglacialrecords around the North Atlantic. Science 274:1155–1160
Björck S, Walker MJC, Cwynar LC, Johnsen S, Knudsen KL, Lowe JJ, Wohlfarth B, INTIMATEMembers (1998) An event stratigraphy for the Last Termination in the North Atlantic regionbased on the Greenland ice-core record: a proposal by the INTIMATE group. Journal ofQuaternary Science 13:283–292
Björck S, Noe-Nygaard N, Wolin J, Houmark-Nielsen M, Hansen HJ, Snowball I (2000) Eemianlake development, hydrology and climate – a multistratigraphic study of the Hollerup site inDenmark. Quaternary Science Reviews 19:509–536

94 T. Andrén et al.
Björck S (2008) The late Quaternary development of the Baltic Sea basin. In: The BACC AuthorTeam (eds) Assessment of climate change for the Baltic Sea Basin. Springer, Berlin, Heidelberg
Björck S, Andrén T, Jensen JB (2008) An attempt to resolve the partly conflicting data and ideason the Ancylus-Litorina transition. Polish Geological Institute Special Papers 23:21–25
Borgendahl J, Westman P (2007) Cyanobacteria as a trigger for increased primary productivityduring sapropel formation in the Baltic Sea – a study of the Ancylus/Litorina transition. Journalof Paleolimnology 38:1–12
Conley DJ, Humborg C, Rahm L, Savchuk OP, Wulff F (2002) Hypoxia in the Baltic Sea andbasin-scale changes in phosphorus biogeochemistry. Environmental Science and Technology36:5315–5320
Conley DJ, Bonsdorff E, Carstensen J, Destouni G, Gustafsson BG, Hansson LA, Rabalais NN,Voss M, Zillén L (2009) Viewpoint: tackling hypoxia in the Baltic Sea: is engineering asolution? Environmental Science and Technology 43:3407–3411
Dickson AJ, Austin WEN, Hall IR, Maslin M, Kucera M (2008) Centennial-scale evolution ofDansgaard-Oeschger events in the northeast Atlantic Ocean between 39.5 and 56.5 ka BP.Paleoceanography 23:PA3206
Donner J, Kankainen T, Karhu JA (1999) Radiocarbon ages and stable isotope composition ofHolocene shells in Finland. Quaternaria Ser A 7:31–38
Eiríksson J, Kristensen PH, Lykke-Andersen H, Brooks K, Murray A, Knudsen KL, Glaister C(2006) A sedimentary record from a deep Quaternary valley in the southern Lillebælt area:Eemian and Early Weichselian lithology and chronology at Mommark. Boreas 35:320–331
Elmgren R (1989) Man’s impact on the ecosystem of the Baltic Sea: energy flows today and at theturn of the century. Ambio 18:326–332
Elmgren R (2001) Understanding human impact on the Baltic ecosystem: changing views in recentdecades. Ambio 30:222–231
Emeis KC, Struck U, Blanz T, Kohly A, Voss M (2003) Salinity changes in the central Baltic Sea(NW Europe) over the last 10 000 years. The Holocene 13:411–421
Fronval T, Jansen E (1996) Rapid changes in ocean circulation and heat flux in the Nordic seasduring the last interglacial period. Nature 383:806–810
Funder S, Demidov I, Yelovicheva Y (2002) Hydrography and mollusc faunas of the Balticand the White Sea-North Sea seaway in the Eemian. Palaeogeography, Palaeoclimatology,Palaeoecology 184:275–304
Grimm EC, Watts WA, Jacobson GL Jr, Hansen BCS, Almquist HR, Dieffenbacher-Krall AC(2006) Evidence for warm wet Heinrich events in Florida. Quaternary Science Reviews25:2197–2211
Grootes PM, Stuvier M, White JWC, Johnsen S, Jouzel J (1993) Comparison of oxygen isotoperecords from the GISP2 and GRIP Greenland ice cores. Nature 366:552–554
Gustafsson BG, Westman P (2002) On the causes for salinity variations in the Baltic Sea for thelast 8500 years. Paleoceanography 17:1–14
Hille S, Leipe T, Seifert T (2006) Spatial variability of recent sedimentation rates in the EasternGotland Basin (Baltic Sea). Oceanologia 48:297–317
Houmark-Nielsen M, Kjær KH (2003) Southwest Scandinavia, 40–15 ka BP: palaeogeography andenvironmental change. Journal of Quaternary Science 18:769–786
Houmark-Nielsen M, Krüger J, Kjær KH (2005) De senaste 150.000 år i Danmark. Istidsladskabetog naturens udvikling. Geoviden – Geologi og Geografi 2:2–19
Houmark-Nielsen M (2007) Extent and age of Middle and Late Pleistocene glaciations andperiglacial episodes in southern Jylland, Denmark. Bulletin of the Geological Society ofDenmark 55:9–35
Houmark-Nielsen M (2008) Testing OSL failures against a regional Weichselian glaciationschronology from southern Scandinavia. Boreas 37:660–677
Ignatius H, Axberg S, Niemistö L, Winterhalter B (1981) Quaternary geology of the Baltic Sea. In:Voipio A (ed) The Baltic Sea. Elsevier Oceanography Series 30, Elsevier, Amsterdam
4 The Development of the Baltic Sea Basin During the Last 130 ka 95
Jakobsson M, Björck S, Alm G, Andrén T, Lindeberg G, Svensson NO (2007) Reconstructing theYounger Dryas ice dammed lake in the Baltic Basin: Bathymetry, area and volume. Global andPlanetary Change 57:355–370
Jensen JB, Bennike O, Witkowski A, Lemke W, Kuijpers A (1997) The Baltic Ice Lake in thesouthwestern Baltic: sequence-, chrono- and biostratigraphy. Boreas 26:217–236
Jensen JB, Kuijpers A, Bennike O, Laier T, Werner F (2002) New geological aspects for fresh-water seepage and formation in Eckernf.orde Bay, western Baltic. Continental Shelf Research22:2159–2173
Johnsen SJ, Clausen HB, Dansgaard W, Fuhrer K, Gundestrup N, Hammer CU, Iversen P, JouzelJ, Stauffer B, Steffensen JP (1992) Irregular glacial interstadials recorded in a new Greenlandice core. Nature 359:311–313
Johnson MD, Ståhl Y (2010) Stratigraphy, sedimentology, age and paleoenvironment of marinevarved clay in the Middle Swedish end-moraine zone. Boreas 39:199–214
Klingberg F (1998) A late Pleistocene marine clay succession at Kriegers Flak, westernmost Baltic,southern Scandinavia. Boreas 13:245–253
Kortekaas M, Murray AS, Sandgren P, Björck S (2007) OSL chronology for a sediment corefrom the southern Baltic Sea: a continuous sedimentation record since deglaciation. QuaternaryGeochronology 2:95–101
Kristensen P, Knudsen KL (2006) Palaeoenvironments of the Eemian deposits at Mommark, SouthDenmark: foraminifera, ostracods and stable isotopes. Boreas 35:349–366
Kukla G, Bender MD, de Beaulieu JL, Bond G, Broecker WS, Cleveringa P, Gavin JE, HerbertTD, Imbrie J, Jouzel J, Keigwin LD, Knudsen KL, McManus J, Merkt J, Muhs DR, Müller H,Poore RZ, Porter SC, Seret G, Shackleton NJ, Turner C, Tzedakis PC, Winograd IJ (2002) Lastinterglacial climates. Quaternary Research 57:2–13
Kunzendorf H, Voss M, Brenner W, Andrén T, Vallius H (2001) Molybdenum in sediments of thecentral Baltic Sea as an indicator for algal blooms. Baltica 14:123–130
Lagerlund E (1987) An alternative Weichselian glaciation model, with special reference to theglacial history of Skåne, South Sweden. Boreas 16:433–459
Lamb HH (1965) Climate, history and the modern world, 2nd edn. Routledge, LondonLambeck K, Chappell J (2001) Sea level change through the Last Glacial cycle. Science
292:679–686Lambeck K, Purcell A, Zhao J, Svensson NO (2010) The Scandinavian ice sheet: from MIS 4 to
the end of the Last Glacial Maximum. Boreas 39:410–435Larsen NK, Knudsen KL, Krohn CF, Kronborg C, Murray AS, Nielsen OB (2009) Late Quaternary
ice sheet, lake and sea history of southwest Scandinavia – a synthesis. Boreas 38:732–759Leipe T, Dippner JW, Hille S, Voss M, Christiansen C, Bartholdy J (2008) Environmental changes
in the central Baltic Sea during the last 1000 years: inferences from sedimentary records,hydrography and climate. Oceanologia 50:23–41
Lemke W, Jensen JB, Bennike O, Endler R, Witkowski A, Kuijpers A (2001) Hydrographicthresholds in the western Baltic Sea: Quaternary geology and the Dana River concept. MarineGeology 176:191–201
Mangerud J (2004) Ice sheet limits on Norway and the Norwegian continental shelf. In: Ehlers J,Gibbard P (eds) Quaternary glaciations – extent and chronology. Elsevier, Amsterdam
Miettinen A (2002) Relative sea level changes in the Eastern part of the Gulf of Finland during thelast 8000 years. Annales Academiae Scientarum Fennicae Geologica-Geographica 162
Miller U (1977) Pleistocene deposits of the Alnarp Valley, southern Sweden – microfossils andtheir stratigraphical applications. University of Lund, Department of Quaternary Geology,Thesis 4
Moros M, Lemke W, Kuijpers A, Endler R, Jensen JB, Bennike O, Gingele F (2002) Regressionsand transgressions of the Baltic basin reflected by a new high-resolution deglacial andpostglacial lithostratigraphy for Arkona Basin sediments (western Baltic Sea). Boreas 31:151–162
96 T. Andrén et al.
North Greenland Ice Core Members (2004) High-resolution record of Northern Hemisphereclimate extending into the last interglacial period. Nature 431:147–151
Ottersen G, Planque B, Belgrano A, Post E, Reid PC, Stenseth NC (2001) Ecological effects of theNorth Atlantic Oscillation. Oecologia 128:1–14
Paabo K (1985) Diatomological studies of two cores from the western Baltic. Striae 23:83–91Rasmussen TL, VanWeering TCE, Labeyrie L (1997) Climatic instability, ice sheets and ocean
dynamics at high northern latitudes during the last glacial period (58–10 ka BP). QuaternaryScience Reviews 16:71–80
Reid PC, Edwards M, Hunt HG, Warner AJ (1998) Phytoplankton change in the North Atlantic.Nature 391:546
Richardson AJ, Schoeman DS (2004) Climate impact on plankton ecosystems in the NortheastAtlantic. Science 305:1609–1612
Robertsson A-M, Lundqvist J, Brunnberg L (2005) Dark clayey till in central and northernSweden microfossil content and stratigraphical importance. GFF 127:169–178. http://www.gff-online.se/site/article.asp?articleID=833
Salonen VP, Kaakinen A, Kultti S, Miettinen A, Eskola KO, Lunkka JP (2007) Middle Weichselianglacial event in the central part of the Scandinavian Ice Sheet recorded in the Hitura pit,Ostrobothnia, Finland. Boreas 37:38–54
Sánchez Goñi MF, Eynaud F, Turon JL, Shackleton NJ (1999) High resolution palynological recordoff the Iberian margin: direct land-sea correlation for the Last Interglacial complex. Earth andPlanetary Science Letters 17:123–137
Seifert T, Tauber F, Kayser B (2001) A high resolution spherical grid topography of the Baltic Sea.Proceedings of the Baltic Sea Science Congress 25–29 November 2001, poster 147. Stockholm,Sweden
Siddall M, Rohling EJ, Almogi-Labin A, Hemleben Ch, Meischner D, Schmelzer I, Smeed DA(2003) Sea-level fluctuations during the last glacial cycle. Nature 423:853–858
Snowball IF, Korhola A, Briffa KR, KoçN (2004) Holocene climate dynamics in Fennoscandiaand the North Atlantic. In: Battarbee RW, Gasse F, Stickley CE (eds) Past climate variabilitythrough Europe and Africa. Springer, Dordrecht
Sohlenius G, Sternbeck J, Andrén E, Westman P (1996) Holocene history of the Baltic Sea asrecorded in a sediment core from the Gotland Deep. Marine Geology 134:183–201
Sohlenius G, Westman P (1998) Salinity and redox alternations in the northwestern Baltic properduring the late Holocene. Boreas 27:101–114
Sohlenius G, Emeis KC, Andrén E, Andrén T, Kohly A (2001) Development of anoxia during thefresh–brackish water transition in the Baltic Sea. Marine Geology 177:221–242
Sternbeck J, Sohlenius G, Hallberg RO (2000) Sedimentary trace elements as proxies to deposi-tional changes induced by a Holocene fresh-brackish water transition. Aquatic Geochemistry6:325–345
Thulin B, Possnert G, Vuorela I (1992) Stratigraphy and age of two postglacial sediment coresfrom the Baltic Sea. Geologiska Föreningen i Stockholm Förhandlingar 114:165–179
von Post L (1929) Svea, Göta och Dana älvar. Ymer 49:1–33Voss M, Kowalewska G, Brenner W (2001) Microfossil and biochemical indicators of environ-
mental changes in the Gotland Deep during the last 10,000 years. Baltica 14:131–140Walker M, Johnsen S, Rasmussen S, Popp T, Steffensen JP, Gibbard P, Hoek W, Lowe J, Andrews J,
Björck S, Cwynar L, Hughen K, Kershaw P, Kromer B, Litt T, Lowe D, Nakagawa T, NewnhamR, Schwander J (2009) Formal definition and dating of the GSSP (Global Stratotype Sectionand Point) for the base of the Holocene using the Greenland NGRIP ice core, and selectedauxiliary records. Journal of Quaternary Science 24:3–17
Wastegård S, Andren T, Sohlenius G, Sandgren P (1995) Different phases of the Yoldia Sea in thenorth-western Baltic Proper. Quaternary International 27:121–129
Westman P, Sohlenius G (1999) Diatom stratigraphy in five off-shore sediment cores from thenorth-western Baltic implying large scale circulation changes during the last c. 8500 years.Journal of Paleolimnology 22:53–69
4 The Development of the Baltic Sea Basin During the Last 130 ka 97
Widerlund A, Andersson PS (2006) Strontium isotopic composition of modern and Holocenemollusc shells as a palaeosalinity indicator for the Baltic Sea. Chemical Geology 232:54–66
Winterhalter B (1992) Late-Quaternary stratigraphy of Baltic Sea basins – a review. Bulletin of theGeological Society of Finland 64:189–194
Wohlfarth B, Veres D, Ampel L, Lacourse T, Blaauw M, Preusser F, Andrieu-Ponel V, KéravisD, Lallier-Vergès E, Björck S, Davies S, de Beaulieu JL, Risberg J, Hormes A, Kasper HU,Possnert G, Reille M, Thouveny N, Zander A (2008) Rapid ecosystem response to abruptclimate changes during the last glacial period in Western Europe, 40–16 kyr BP. Geology36:407–410
Wohlfarth B (2010) Simulated climate conditions in Fennoscandia during a MIS 3 stadial. Boreas39:436–456
Yu S, Berglund B, Sandgren P, Lambeck K (2007) Evidence for a rapid sea-level rise 7600 yr ago.Geology 35:891–894
Zillén L, Conley DJ, Andrén T, Andrén E, Björck S (2008) Past occurrences of hypoxia in theBaltic Sea and the role of climate variability, environmental change and human impact. EarthScience Reviews 91:77–92
Zillén L, Conley DJ (2010) Hypoxia and cyanobacterial blooms are not natural features of theBaltic Sea. Biogeoscience 7:2567–2580