better science, better fish, better life proceedings of the ninth ...
409
1 BETTER SCIENCE, BETTER FISH, BETTER LIFE PROCEEDINGS OF THE NINTH INTERNATIONAL SYMPOSIUM ON TILAPIA IN AQUACULTURE Editors Liu Liping and Kevin Fitzsimmons Shanghai Ocean University, Shanghai, China 22-24 April 2011 Published by the AquaFish Collaborative Research Support Program AquaFish CRSP is funded in part by United States Agency for International Development (USAID) Cooperative Agreement No. EPP-A-00-06-00012-00 and by US and Host Country partners. ISBN 978-1-888807-19-6
-
Upload
khangminh22 -
Category
Documents
-
view
1 -
download
0
Transcript of better science, better fish, better life proceedings of the ninth ...

11
BETTER SCIENCE, BETTER FISH, BETTER LIFE
PROCEEDINGS OF THE NINTH INTERNATIONAL SYMPOSIUM ON
TILAPIA IN AQUACULTURE
Editors
Liu Liping and Kevin Fitzsimmons
Shanghai Ocean University, Shanghai, China
22-24 April 2011
Published by the AquaFish Collaborative Research Support Program
AquaFish CRSP is funded in part by United States Agency for International Development (USAID)
Cooperative Agreement No. EPP-A-00-06-00012-00 and by US and Host Country partners.
ISBN 978-1-888807-19-6

22
Dedication:
These proceedings are dedicated in honor Of our dear friend
Yang Yi
It was Dr. Yang Yi who first suggested having this ISTA at Shanghai Ocean University to celebrate SHOU’s move
to the new Lingang Campus. It was through his hard work and constant attention with his many friends and colleagues that
the entire 9AFAF and ISTA9 came together, despite the terrible illness that eventually took his life at such a young age.
Acknowledgements:
The editors wish to thank the many people who contributed to the collection and review and editing of these proceedings, especially
Mary Riina, Pamila Ramotar, Sidrotun Naim and Zhou TingTing
33
Table of Contents Page KEYNOTE ADDRESS
WHY TILAPIA IS BECOMING THE MOST IMPORTANT FOOD FISH ON THE PLANET Kevin Fitzsimmons, Rafael Martinez-Garcia and Pablo Gonzalez-Alanis 8
SECTION I. HEALTH and DISEASE
LIVE ATTENUATED BACTERIAL VACCINES IN AQUACULTURE 18 Phillip Klesius and Julia Pridgeon ISOLATION AND CHARACTERIZATION OF Streptococcus agalactiae FROM RED TILAPIA 27 CULTURED IN THE MEKONG DELTA OF VIETNAM Dang Thi Hoang Oanh and Nguyen Thanh Phuong ECO-PHYSIOLOGICAL IMPACT OF COMMERCIAL PETROLEUM FUELS ON NILE TILAPIA, 28 Oreochromis niloticus (L.) Safaa M. Sharaf and Mohsen Abdel-Tawwab ACUTE TOXICITY OF WATER-BORN ZINC IN NILE TILAPIA, Oreochromis niloticus (L.) 39 FINGERLINGS Mohsen Abdel-Tawwab*, Gamal O. El-Sayed, and Sherien H.H.H. Shady FIVE STAR CERTIFICATION PROGRAM AGAINST OFF-FLAVOR IN TILAPIA FILLETS 45 Tomi HONG ACUTE TOXICITY OF AQUEOUS Morinda lucida LEAF EXTRACTS TO NILE TILAPIA, 46 Oreochromis niloticus (LINNAEUS 1857) Oyedapo FAGBENRO and Iyabo AKINDUYITE HAEMATOLOGICAL RESPONSE OF NILE TILAPIA (Oreochromis niloticus) JUVENILES 52 EXPOSED TO TOBACCO (Nicotiana tobaccum) LEAF DUST M.O. OLUFAYO AND I.A. JATTO COMPARATIVE ASSESSMENT OF PARASITE INFESTATION OF TILAPIA IN NATURAL AND 56 CULTURED ENVIRONMENTS ABIDEMI-IROMINI A.O and R.N EZE OXYTETRACYCLINE MARKING STUDIES OF TILAPIA Oreochromis niloticus 60 Yasser Mohammed ABDEL-HADI
SECTION II. ACCELERATING AQUACULTURE DEVELOPMENT IN POORER COUNTRIES
INTENSITY OF FRESHWATER USE FOR AQUACULTURE IN DIFFERENT COUNTRIES 68 Claude E. BOYD* and LI Li IMPACTS OF THE INTRODUCTION OF ALIEN TILAPIAS (Oreochromis spp.) ON 75 THE FISHERIES AND BIODIVERSITY OF INDIGENOUS SPECIES IN TRI AN RESERVOIR, VIETNAM Le Thanh Hung, Vu Cam Luong, Nguyen Phu Hoa, James Diana DURATION OF APPETITE INHIBITION PREDICTS SOCIAL DOMINANCE IN NILE TILAPIA, 86 Oreochromis niloticus L. Emmanuel M. Vera Cruz, Madelin B. Valdez, Remedios B. Bolivar, and Russell J. Borski
44
FISHMEAL-FREE DIETS IMPROVE THE COST EFFECTIVENESS OF CULTURING NILE 95 TILAPIA (Oreochromis niloticus L.) IN PONDS UNDER AN ALTERNATE DAY FEEDING STRATEGY Russell J. Borski, Remedios B. Bolivar, Eddie Boy T. Jimenez, Roberto Miguel V. Sayco, Reginor Lyzza B. Arueza, Charles R. Stark, and Peter R. Ferket HEAT-INDUCED GERM CELL LOSS IN SUB-ADULT NILE TILAPIA Oreochromis niloticus 102 Narayan P. Pandit, Madhav K. Shrestha and Masaru Nakamura EFFECTS OF STOCKING DENSITY ON THE GROWTH, SURVIVAL AND YIELD 103 PERFORMANCE OF NILE TILAPIA (Oreochromis niloticus, Linn. 1858) IN AN INTEGRATED CAGE-CUM-POND CULTURE SYSTEM C. C. Ngugi, G. Kuria, K. Quagrainie, and S. Macharia FOOD SAFETY STUDY OF LEAFY GREENS IRRIGATED WITH TILAPIA FARM 104 EFFLUENTS IN TAMAULIPAS P. González-Alanis* J. I. Gutierrez-Olguín, H. Ezqueda-Palacios, H. H. Gojon-Báez, G. Aguirre-Guzmán, F. M. Guzmán-Saénz, K. M. Fitzsimmons. MASCULINIZATION OF NILE TILAPIA (Oreochromis niloticus L.) USING LYOPHILIZED 105 TESTES FROM CARABAO (Bubalus bubalis carabanesis L.), BULL (Bos indicus L.) AND BOAR (Sus domesticus L.) Ramjie Y. Odin and Remedios B. Bolivar POTENTIAL USE OF BACTERIAL DEGRADATION TO ELIMINATE 121 METHYLTESTOSTERONE FROM INTESIVE TILAPIA MASCULINIZATION SYSTEMS Rosa M. Padrón-López, Lucero Vázquez-Cruz, Ulises Hernández-Vidal, W. M. Contreras-Sánchez* and K. Fitzsimmons HOW TO PRODUCE BILLIONS OF HIGH QUALITY TILAPIA FRY 123 Ram C. Bhujel IMPROVING THE SUPPLY CHAIN OF TILAPIA INDUSTRY IN THE PHILIPPINES 132 Wilfred E. Jamandre, Upton Hatch, Remedios B. Bolivar, Russell Borski DEVELOPMENT OF SUSTAINABLE AQUACULTURE PRACTICES IN TABASCO, 157 MEXICO USING NOVEL IAA TECHNOLOGY R. Martínez- García*, M. F. Cifuentes-Alonso, M. A. Estrada Botello, A. S. Lopez Torres, M. de Jesús Contreras-García, A. Macdonal-Vera, E. González-Arévalo, W. M. Contreras-Sánchez, K. Fitzsimmons CONSTRAINTS AND OPPORTUNITIES IN CAGE AQUACULTURE IN GHANA 158 Gifty Anane-Taabeah, Emmanuel A. Frimpong, Stephen Amisah, and Nelson Agbo GEOSPATIAL MODELING OF SITE SUITABILITY FOR POND BASED TILAPIA AND 166 CLARIAS FARMING IN UGANDA Herbert Ssegane, E.W.Tollner, and Karen Veverica WHAT INFLUENCES THE SUCCESS OF AQUACULTURAL RESEARCH PROJECTS? 167 Steven Buccola, Lin Qin and Rolf Fare METHODS FOR ASSESSING ECONOMIC, ENVIRONMENTAL AND SOCIAL IMPACTS 174 OF AQUACULTURE TECHNOLOGIES: ADOPTION OF INTEGRATED AGRICULTURE-AQUACULTURE IN MALAWI John Antle and Roberto Valdivia VALUE CHAIN OF CULTURED SNAKEHEAD FISH IN THE MEKONG DELTA 184 Le Xuan Sinh*, Robert S. Pomeroy & Do Minh Chung

55
USE OF GONADOTROPIN RELEASING HORMONE ANALOGS ON THE INDUCED 187 REPRODUCTION OF CHAME Dormitator latifrons Gustavo A. Rodriguez M. de O.*, Eva A. Medina H., Jeniffer Velazquez S., V. Lopez L., C. Roman R., K. Dabrowski, E. Gaxiola Camacho, and M.C. Haws
SECTION III. GENETICS and REPRODUCTION
IMPROVING SALINITY TOLERANCE IN TILAPIAS: PAST EXPERIENCE AND FUTURE 193 PROSPECTS Avner CNAANI, Ariel VELAN, Gideon HULATA* COMPARISON BETWEEN GREEN WATER AND CLEAR WATER SYSTEMS DURING THE 202 MASCULINIZATION PROCESS OF SILVER TILAPIA, Oreochromis niloticus Ryan S. Mohammed and Indar W. Ramnarine OSMOREGULATORY CAPACITY OF THE NILE TILAPIA (Oreochromis niloticus (L. )) 203 DURING EARLY LIFE STAGES. Fridman, S., Bron, J.E. and Rana, K.J. TILAPIA GERMPLASM IN CHINA: CHANCE AND CHALLENGE 217 Zhao Jinliang EFFECTS OF Aloe vera (Liliaceae) ON THE GONAD DEVELOPMENT IN NILE TILAPIA, 222 Oreochromis niloticus (Linnaeus 1758) Temitope JEGEDE MORPHOMETRIC AND MERISTIC CHARACTERISTICS AND THEIR VARIATIONS 228 BETWEEN TWO DIFFERENT STRAINS (GIFT & GIFU) OF NILE TILAPIA, Oreochromis niloticus (Linnaeus, 1758) A.-Al Mamun, K. M. Shahriar Nazrul*, B. S. Sarker, Md. Mofizur Rahman and U. S. Tonny GENETIC STOCK IMPROVEMENT OF THE GIFT STRAIN IN BANGLADESH 236 M.G. Hussain, A.H.M. Kohinoor, N.H. Nguyen and R.W. Ponzoni PRODUCTIVE PERFORMANCE AND MUSCLE GROWTH OF THREE DIFFERENT 243 STRAINS OF NILE TILAPIA, Oreochromis niloticus, DURING THE INITIAL DEVELOPMENT T. M. de Freitas, J. T. Kojima, N. de J. Leitão, C. Nebo, F. Carani, M. D. Pai-Silva and M. Célia Portella*
SECTION IV. NUTRITION and FEEDS
EFFECTS OF SAPONIN FRACTIONS FROM Trigonella foenum-graecum AND 245 Balanites aegyptiaca ON GENE EXPRESSION OF GH, IGF-1 AND THEIR RESPECTIVE RECEPTORS, GROWTH, NUTRIENT UTILIZATION, BODY COMPOSITION OXYGEN CONSUMPTION AND PLASMA IGF-1 IN NILE TILAPIA (Oreochromis niloticus, L.). T. Stadtlander, W. K. B. Khalil,, B. Levavi-Sivan, H. Dweik5, M. Qutob, S. Abu-Lafi, Z. Kerem, U. Focken, and K. Becker BROODSTOCK DIETS WITH ADDED CRUDE PALM OIL RESULTED IN IMPROVED 260 REPRODUCTIVE PERFORMANCE, EGG HATCHABILITY AND LARVAL QUALITY OF NILE TILAPIA Oreochromis niloticus Wing-Keong Ng and Yan Wang DISTILLERS DRIED GRAINS WITH SOLUBLES AS ALTERNATIVE PROTEIN SOURCES IN 261 DIETS OF TILAPIA, Oreochromis niloticus LIM, Chhorn, Erchao LI and Phillip H. KLESIUS ECONOMICALLY FEASIBLE FISH FEED FOR GIFT TILAPIA (Oreochromis niloticus) FOOD 262 FISH CULTURE IN SRI LANKA M.H.S. Ariyaratne
66
SUPPLEMENTAL FEEDING OF NILE TILAPIA (Oreochromis niloticus L.) IN FERTILIZED 268 PONDS USING COMBINED FEED REDUCTION STRATEGIES R. B. Bolivar, E. Boy T. Jimenez, R. Miguel V. Sayco, and R. J. Borski THE USE OF ROASTED COFFEE PULP AS A FEED SUPPLEMENT IN PRACTICAL DIETS 275 FOR NILE TILAPIA, Oreochromis niloticus (L.) Mohsen ABDEL-TAWWAB PARTIAL AND TOTAL REPLACEMENT OF FISHMEAL WITH CHEESE PROCESSING 283 BY-PRODUCT MEAL IN PRACTICAL DIETS FOR NILE TILAPIA, Oreochromis niloticus (L.): A PRELIMINARY STUDY Mohsen ABDEL-TAWWAB*, Fayza E. ABBASS, and Medhat E.A. SEDEN
SECTION V. ECONOMICS and COUNTRY - REGIONAL REPORTS
TILAPIA CULTURE IN TRINIDAD AND TOBAGO: YET ANOTHER UPDATE 294 Indar W. Ramnarine and Capildeo Barrath TECHNOLOGY TRAINING AND SHARING ON TILAPIA FARMING: AN EXPERIENCE 299 FROM THE ICDF WORKSHOP ON TILAPIA CULTURE IN HONDURAS Fu-Sung Frank Chiang, Kelvin Chen, Tien-Tsai Tsai, and Cathy Chen 60 YEARS OF TILAPIA AQUACULTURE IN NIGERIA 300 O. A. FAGBENRO, O. S. FASASI, T. JEGEDE and O. O. OLAWUSI-PETERS BEST AQUACULTURE PRACTICES STANDARDS FOR THE TILAPIA INDUSTRY 310 Darryl JORY A HANDS-ON TRAINING HELPED PROLIFERATION OF TILAPIA CULTURE 311 IN BANGLADESH BAQUI*, M. A. AND BHUJEL, R. C. STATUS AND SUSTAINABILITY ANALYSIS OF THE TILAPIA AQUACULTURE IN CHINA 323 LIU Liping*, ZHANG Wenbo, Francis MURRAY, David LITTLE TILAPIA: THE SEARCH FOR A SUSTAINABLE MODEL TO BALANCE BETWEEN 324 ENVIRONMENT, PEOPLE AND ECONOMY. SNIR, Israel and SNIR, Yedod TILAPIA - THE HISTORICAL PROMISE FOR TODAY, SOCIAL JUSTICE AND SECURITY 326 SNIR, Israel and SNIR, Yedod
SECTION VI. GROWOUT SYSTEMS
THE INTERNATIONAL TILAPIA AND AQUAPONICS COURSE AT THE UNIVERSITY 329 OF THE VIRGIN ISLANDS James E. Rakocy, Donald S. Bailey, R. Charlie Shultz and Jason J. Danaher A COMMERCIAL-SCALE AQUAPONIC SYSTEM DEVELOPED AT THE UNIVERSITY 336 OF THE VIRGIN ISLANDS James E. Rakocy, Donald S Bailey, R. Charlie Shultz, and Jason J. Danaher DEVELOPMENT OF A BIOFLOC SYSTEM FOR THE PRODUCTION OF TILAPIA 344 James E. Rakocy, Jason J. Danaher, Donald S. Bailey and R. Charlie Shultz BIO-FLOC TECHNOLOGY (BFT):A BRIEF SUMMARY 359 Yoram AVNIMELECH TILAPIA PRODUCTION USING BIO-FLOC TECHNOLOGY (BFT) 362 Yoram Avnimelech
77
LENGTH-WEIGHT RELATIONSHIP OF Oreochromis niloticus IN CONCRETE 367 POND OF HABIB ADM, HUB, BALOCHISTAN M. Y. Laghari, B. A. Dars, and N. T. Narejo, *Baoping Xin SCALING UP OF CAGE-CUM-POND CULTURE SYSTEM OF CATFISH AND TILAPIA 372 IN CAGES IN CARP POLYCULTURE PONDS Ram B. MANDAL, Madhav K. SHRESTHA, Dilip K. JHA and Narayan P. PANDIT BRACKISHWATER POLYCULTURE OF TILAPIA WITH MILKFISH IN ACEH, 381 INDONESIA Hasan Hasanuddin and Michael Rimmer POLYCULTURE OF TILAPIA AND SEAWEEDS IN SOFT-SHELL CRAB PONDS IN 382 INDONESIA AND THAILAND May Myat Noe LWIN STOCKING TILAPIA IN SHRIMP CULTURE RESERVOIR: FIELD TRIAL IN ACEH, 383 INDONESIA Sidrotun NAIM POSTERS
THE DEVELOPMENT OF CORRELATIVE MICROSCOPY TECHNIQUES TO DEFINE 387 MORPHOLOGY AND ULTRASTRUCTURE IN CHLORIDE CELLS OF NILE TILAPIA (Oreochromis niloticus (L.)) YOLK-SAC LARVAE. FRIDMAN, S., Bron, J.E. and Rana, K.J. ADDRESSING THE GOALS AND OBJECTIVES OF THE FEED THE FUTURE INITIATIVE: 388 ENHANCING THE PROFITABILITY OF SMALL AQUACULTURE OPERATIONS IN GHANA, KENYA, AND TANZANIA Stephanie ICHIEN* and Hillary EGNA AQUAFISH CRSP: MITIGATING THE NEGATIVE ENVIRONMENTAL IMPACTS OF 389 AQUACULTURE PRACTICES THROUGH DEVELOPING SUSTAINABLE FEED TECHNOLOGIES Stephanie ICHIEN*, Ford EVANS, and Hillary EGNA PROMOTING SUSTAINABLE AQUACULTURE AND FISHERIES DEVELOPMENT THROUGH 390 CAPACITY BUILDING: A SYNOPSIS OF SHORT- AND LONG-TERM TRAINING CONDUCTED BY THE AQUAFISH CRSP Ford EVANS*, James BOWMAN, Lisa REIFKE, and Hillary EGNA PROMOTING SUSTAINABLE RICE-FISH AQUACULTURE IN IRRIGATED SYSTEMS 391 IN MALI Coulibaly, H., L. Liping, D. Yuan, A.S. Toure, J.R. Bowman, and H.S. Egna* TILAPIA: SILENT BOOMING IN BANGLADESH 393 Sk. AHMAD-AL-NAHID*, M. Mahfujul HAQUE, Md. Abdul WAHAB, David C. LITTLE and Francis MURRAY PRELIMINARY STUDY ON MICROBIAL ACTIVITY ASSOCIATED WITH TILAPIA 394 CULTURE AGAINST Vibrio harveyi Sidrotun NAIM THE EFFECTS OF PLANKTON ON TILAPIA GROWTH USING ORGANIC AND 395 INORGANIC FERTILIZERS AND WHAT CAUSES PHYTOPLANKTON BLOOM TO "CRASH" Pamila RAMOTAR
88
WHY TILAPIA IS BECOMING THE MOST IMPORTANT FOOD FISH ON THE PLANET
Kevin Fitzsimmons, Rafael Martinez-Garcia, Pablo Gonzalez-Alanis University of Arizona
Tucson, AZ, USA [email protected]
ABSTRACT Tilapia has become the shining star of aquaculture with farms starting and expanding
across the globe while consumption races ahead of even the most ambitious farm building plans. 2010 saw farmed tilapia exceed 3.2 million metric tons per annum, surging further ahead of the salmon and catfish industries. We are also seeing an explosion of product forms in the grocery stores that is only matched by the variety of preparations we see in the restaurant trade. The global adoption of tilapia as a substitute for all kinds of wild-caught fish has driven demand higher every year, even through the global recession of recent years. The description of tilapia as an “aquatic chicken” becomes more accurate every day. It’s wide acceptance across all cultural, religious, and economic groups is similar to chicken. A variety of breeds and strains have been developed and by most measures, tilapia is now the most highly domesticated of farmed fishes. Unique amongst the major farmed fishes, tilapia maintains a key role in rural aquaculture improving the welfare of the poorest farmers while at the same time, it is reared in the most high tech production systems and is sold into international markets for up-scale markets. Tilapia is still the darling of the environmental community and the industry continues to polish its “green” credentials.
Three or four closely related species of tilapias readily hybridize in captivity and produce fecund F1 progeny. This has provided a huge genetic base for the geneticists to perform basic selective breeding. The domestication of tilapias has been a great driver of productivity during the 1990’s and 2000’s. There is also a concerted effort to describe the tilapia genome. When these genetic maps are distributed we can expect a second wave of genetic research that should further improve productivity. All of this will have been accomplished without the need of transgenics or genetically modified organisms. The basic biology of the fish along with the skill of traditional breeders has provided all of the progress to this point and much more in the near future.
Tilapia continues its march towards eventually overtaking carp as the most important farmed fish crop. With a much wider distribution of production and consumption and a huge base of value added product forms, it is almost certain that tilapia production will someday eclipse that of carp. As tilapia production and consumption grows globally, it is likely to become the foundation product for all farmed fishes, just as chicken is the base for the poultry industry. So someday soon instead of referring to tilapia as the aquatic chicken we may be referring to chicken as the “terrestrial tilapia”.
INTRODUCTION Tilapia holds a somewhat unique position amongst the major aquaculture fishes as a
key product in international trade produced in large vertically integrated farming operations, while at the same still being produced in large amounts as a subsistence crop by some of the world’s poorest farmers. The tilapias, with their unique mouth-brooding form of reproduction and extreme hardiness, allow farmers with the most meager resources an opportunity to rear the fish. Some farmers have even been known to rear tilapia in cisterns or 200 liter barrels. To an even greater extent than carps, farmers do not need access to hatcheries, or specialized information to rear tilapia in captivity. And similar to the oft used comparison to chickens, small farmers who spawn their own tilapia, will frequently end up with problems of in-breeding and reduced yields. But for a subsistence farmer, this may be a minor problem compared to keeping a family fed. At the same time, cooperatives of small-scale fish farmers in Asia and Latin America have collaborated with live haulers and processing plants to produce large amounts of fish for domestic and international markets. Cage culture has proven to be a key technique for people with limited resources and experience to get into aquaculture and generate significant quantities of fish for household and ex-household consumption. Cages can be constructed of
99
locally available materials with minimal investment and placed in small ponds or in public waters. Many countries will provide access to reservoirs, irrigation systems and public waters to farmers and fishers with limited resources or who partner with government sanctioned processors. Tilapia aquaculture has also attracted multi-national firms who grow fish in multiple countries vertically integrating feedmills, hatcheries, production, processing, packaging, transportation, and marketing. These firms employ thousands of farmers, feeedmillers, processing plant staff, drivers, office staff and sales forces. In many cases these employees are the prime recipients of the foreign exchange generated by these operations (Fitzsimmons and Watanabe, 2010). Finally, as mentioned above, much of the global tilapia aquaculture has been integrated into irrigation systems. By rearing fish in reservoirs, canals and farm ponds, the effluents from tilapia farming are contributing to the fertilizer value in the water delivered to irrigated crops. This contributes to tilapias “green” reputation with the environmental community while saving on chemical fertilizer costs for resource poor farmers. So tilapia truly are a key contributor to global food security on several levels.
GENETICS One of the key reasons for tilapia’s continued expansion of production in future years is based on the genetic diversity available from which to build. The farmed tilapias are derived from several species in the genus Oreochromis. The fact that several of the species easily hybridize and produce large numbers of fecund young has allowed fish breeders to cross several species and develop strains that incorporate various traits from each of the parent species. This further supports the contention that the tilapia have been selectively bred and domesticated to an even greater extent than the edible carps. In fact they may be even more domesticated and differentiated than koi are from wild carps.
Size and body shape – Some of the primary morphological characteristics that breeders wanted to improve were the average size of the tilapia and the body shape, especially reducing the proportion of head to fillet. In both cases the ultimate goal is to have more edible fillet product. Most of the intensive breeding programs have focused on O. niloticus (Nile tilapia). The Nile tilapia strains that have been developed in recent years include: 1. The Genetically Improved Farmed Tilapia (GIFT), originally developed in the Philippines
from eight farmed and wild strains collected from around the world. The breeding program continues under the auspices of the WorldFish Centre at Jitra, Malaysia.
2. The Genomar strain was developed by a partnership of biologists from Brazil and Norway. It also included a large hatchery project in China, the Trapia project in Malaysia www.trapia.com.my/ and a hatchery in the Philippines. www.genomar.com
3. The Chitralada strain was developed in Thailand, and actually was started from the stocks of tilapia given to the King of Thailand who kept them in ponds at the Chitralada Palace. Breeders in Thailand continued to work with this strain and eventually developed the line that still bears the Chitralada name. It has also been used as an important line in some of the other breeding programs.
4. The TabTim line was developed in Thailand by the CP Group as their branded tilapia strain. The line is derived from several salt tolerant red tilapia lines, including some from Thailand, the Bahamas and the University of Arizona. Tab Tim has been successfully branded as a premium tilapia which receives an increased price and now is produced and marketed in Indonesia and Malaysia as well as Thailand.
5. The GIFT Excell line is derived from some of the GIFT tilapia that were left behind in the Philippines, when the GIFT program proper was moved to Malaysia. Some of the original GIFT biologists have worked in the original location and have partnered with various hatcheries to improve the strain.

1010
6. The GIFT Bangladesh strain is another derivation from the GIFT tilapia. In this case, Bangladeshi scientists continued a selective breeding program with the GIFT fish sent to Bangladesh. These fish have been bred to thrive under the climatic and cultural conditions found at the local farms.
YY Supermale – This novel program was envisioned by biologists at University of Wales Swansea and then put into practical operation at the Central Luzon State University in the Philippines (Mair et al, 1997). The commercial entity arising from the project is called FishGen. http://www.fishgen.com The technique produces all male progeny for stocking on farm by manipulating the reproductive morphology of the grandparent fish. By treating the juvenile grandparent fish with estrogen, breeders can produce fish with a genetically female “father”. This results in 25% YY fish in the F1 which can be crossed to normal females to produce virtually all XY (normal) male progeny in the F2 generation. In 2008 and 2009 groups in Egypt and Indonesia, respectively have reported that they have developed their own YY stocks. Color morphs – There have been several strains of red tilapia developed. These include populations from Florida, Hawaii, Taiwan and Israel. Several have arisen from random mutations in O. mossambicus and another one in O. niloticus. Diligent breeding managed to “fix” these traits and develop marketable strains. In certain Asian communities the fish fetch a premium as it is the color of “good luck”. In other communities, red tilapia resemblance to red snapper or red sea bream gains a premium price. Salinity resistance – There are several populations of O. mossambicus that are recognized for their tolerance for extreme levels of salinity. These populations, especially from Lakes Bardawil and Manzala in Egypt, have been used as broodlines with Red strains and other species crosses to impart the salinity tolerance. This is another major advantage that the tilapias have over several other farmed species including the carps. Salinity tolerance opens up so many more options for farming opportunities in marine and brackish coastal water, inland brackish waters, agricultural and industrial waste water, and even hydroponic solutions used for lettuce and other vegetable production (Watanabe et al. 2006). Genome project – An international group of geneticists is rapidly working through the O. niloticus genome (Kocher et al., 1998; Lee et al., 2005). http://www.broadinstitute.org/ftp/pub/assemblies/fish/tilapia/Orenil1/ The project has benefited from several allied groups sequencing parts of the genetic make-up. Recently large parts have been cataloged and are now being compared to previously described portions from other cichlids and the zebrafish (Danio rerio). A grass carp genome project in 2010 provided the first linkage map, many years behind the work done with tilapia (Xia et al., 2010). Again this further definition and available information will likely benefit the genetic knowledge for the tilapia sooner, and to a more full extent that that available for the various carps.
NUTRITION
Omnivores – Herbivores – One of the qualities that continues to make tilapia popular with the “green movement” is the fact that they feed primarily on a very low trophic level. In nature, the tilapias feed upon algae, fresh and decaying plant material and periphyton. In domesticated settings the various tilapias still are fed a formulated diet that consists of grains and agricultural by-products that serve to keep tilapia diets below the average for most other farmed fishes. While many of the carps have similar feeding and nutritional patterns, the fact that tilapia in general are smaller and have smaller teeth and mouths, they tend to be even more efficient at scraping off the finest biofilms and periphyton colonies. BioFlocs - The ability of tilapia to thrive in biofloc systems is yet another benefit that tilapia have over many of the other common aquaculture species. Avnimelech (2009; and this volume) describes how tilapia are uniquely adapted to thrive under biofloc conditions that would stress most other fish. This relatively low cost system for producing healthy fish and reducing formulated feed costs could be an additional benefit that should keep tilapia prices competitive with other wild and farmed species.

1111
Agricultural plant wastes – Tilapia have proven to be one of the most important fishes used in alternative ingredient studies. The most common goal is to replace fish meal and fish oils. While these tend to be very minor ingredients in tilapia diets, the farmers and researcher still want to further reduce fish products in the diet and utilize locally available ingredients (Zerai et al. 2008). There are many studies available, including several more in this volume.
PRODUCTION SYSTEMS and LOCATIONS
Variety of production modes – Tilapia are unique in the array systems used to rear them in captivity. Commercial operations include: ponds, cages, raceways, tanks, net pens, lake ranching, seawater, brackish water, freshwater, aquaponics, plastic drums and computer controlled intensive recirculation systems. This variety of production exceeds that of any other farmed fish. Tilapia’s usage with recirculating systems has allowed their production in urban areas, high latitude locations and even on the international space station (Fitzsimmons 2005; 2000). Geographic distribution – FAO reports tilapia production from over 100 nations. This vast base of production and interest in the fish vastly exceeds any other farmed fish. The consumer demand is equally widespread. There are not any reports of cultural or religious restrictions on consuming tilapia. The major producing countries produced just over 3,200,000 metric tons of tilapia in 2010 (Fig. 1).
Figure 1. World Tilapia Production of 3,200,000 mt in 2010 Low cost production costs - Tilapia with their grain and vegetable based diets and ability to gather significant nutrition from grazing on algae and biofilms, have some of the lowest feed costs of any farmed fishes. With the high densities achieved on many farms, the infrastructure costs are therefore spread across a larger volume of fish. Finally, hatchery technology is relatively simple, allowing for fewer hatchery workers.
Hatchery technology – The high level of parental care provided by the female mouth brooders, simplify the activities of the tilapia hatchery manager. If the fry are left with the mother, the primary activity is to collect fry as they leave the female and start foraging. If the eggs are flushed from the mother’s mouth and reared in a hatchery settling, the technology is only slightly more sophisticated; requiring hatching jars (or recycled plastic bottles) or open trays. With the hatching jars, the sick and dead eggs flow out, while trays do require maintenance to remove infected or unfertile eggs.
China
EgyptPhilippines
Mexico
Thailand
Taiwan
Brasil
Indonesia
BangladeshColombiaCuba
EcuadorVietnamCosta Rica
Honduras MalaysiaUnited StatesSaudi Arabia
Others

1212
POLYCULTURE
An additional area in which tilapia production is rapidly increasing is polyculture. Many carp farmers in China, Vietnam and Indonesia have now incorporated tilapia into their traditional carp ponds and cages. In many cases this is for the better market price that tilapia sometimes gets and in others they appreciate the different niches (feeding and physical) that the tilapia occupy compared to their carps. Integration of tilapia and shrimp has been found to be beneficial for shrimp health and for economic return (Yuan et al 2010; Cruz et al. 2008). Across most shrimp farming regions, tilapia are increasingly being produced in cages or hapas inside shrimp ponds, or are produced in supply channels or head ponds. The increasing interest in integrated multi-trophic aquaculture systems for tropical production is certain to further contribute to overall tilapia production as most systems consider tilapia to be a key component to the systems.
Strong domestic markets – In many of the biggest producing countries, domestic demand is so strong, there are virtually no exports from countries including the Philippines, Mexico, Brazil, and Bangladesh. Even China, with the world’s biggest production, consumes more than half of all its production. In fact, Ecuador, Costa Rica and Honduras are probably the only countries which export a majority of the tilapia produced. This is a testament to the strong demand across all socio-economic groups for tilapia products.
Stronger international markets – The United States continues to be the single largest market for tilapia products. Increasing demand for all forms of tilapia products and more market share in restaurants, food-service, club stores, hypermarkets and groceries is encouraging live and on-ice tilapia sales from US farms and a flood of imports from Asia and Latin America.
Table 1. US imports of tilapia products in 2009 and 2010 (values in US$)
Product Country 2009 Kilos 2009 Value 2010 Kilos 2010 Value
TILAPIA FILLET FRESH BELIZE 9,304 76,620 0 0
TILAPIA FILLET FRESH BRAZIL 264,232 1,892,361 332,471 2,445,064
TILAPIA FILLET FRESH CHILE 643 3,589 3,218 29,250
TILAPIA FILLET FRESH CHINA 20,769 109,200 0 0
TILAPIA FILLET FRESH CHINA - TAIPEI 207,949 1,348,949 220,166 1,250,038
TILAPIA FILLET FRESH COLOMBIA 1,627,884 12,655,428 1,796,060 13,549,639
TILAPIA FILLET FRESH COSTA RICA 5,720,984 41,979,201 5,825,430 39,803,789
TILAPIA FILLET FRESH ECUADOR 9,059,973 57,594,646 7,852,974 49,715,847
TILAPIA FILLET FRESH EL SALVADOR 480,827 3,720,300 332,289 2,447,784
TILAPIA FILLET FRESH FAROE IS. 0 0 3,283 25,384
TILAPIA FILLET FRESH GUATEMALA 0 0 1,361 9,000
TILAPIA FILLET FRESH HONDURAS 6,511,715 51,607,530 7,245,304 56,201,338
TILAPIA FILLET FRESH NICARAGUA 430,635 3,424,958 46,428 342,391
TILAPIA FILLET FRESH PANAMA 1,362 10,117 3,808 28,268
TILAPIA FILLET FRESH PERU 4,009 31,199 55,044 431,899
TILAPIA FILLET FRESH THAILAND 17,654 84,472 0 0
Subtotal 24,357,940 174,538,570 23,717,836 166,279,691
TILAPIA FILLET FROZEN CHINA 100,691,098 363,266,149 135,522,960 517,771,039
TILAPIA FILLET FROZEN CHINA - HONG KONG 0 0 73,935 228,090
TILAPIA FILLET FROZEN CHINA - TAIPEI 2,332,494 12,483,161 2,248,666 10,093,980
TILAPIA FILLET FROZEN COLOMBIA 0 0 3,832 12,128
TILAPIA FILLET FROZEN COSTA RICA 95,838 662,839 152,776 936,587
TILAPIA FILLET FROZEN ECUADOR 1,118,103 7,391,980 638,368 4,181,009

1313
TILAPIA FILLET FROZEN FIJI 0 0 16,393 63,880
TILAPIA FILLET FROZEN HONDURAS 604,502 4,345,036 108,289 673,853
TILAPIA FILLET FROZEN INDONESIA 8,757,932 56,464,317 10,201,574 68,590,604
TILAPIA FILLET FROZEN MALAYSIA 0 0 319,912 1,434,481
TILAPIA FILLET FROZEN NEW ZEALAND 51,710 579,039 0 0
TILAPIA FILLET FROZEN NORWAY 726 4,247 0 0
TILAPIA FILLET FROZEN PANAMA 273,499 1,250,091 193,789 871,642
TILAPIA FILLET FROZEN PHILIPPINES 1,701 10,500 9,232 21,887
TILAPIA FILLET FROZEN THAILAND 678,831 3,792,956 1,055,543 5,488,994
TILAPIA FILLET FROZEN VIET NAM 156,028 555,401 224,847 705,939
Subtotal 114,762,462 450,805,716 150,770,116 611,074,113
TILAPIA FROZEN BANGLADESH 490 2,537 1,207 2,230
TILAPIA FROZEN CAMEROON 19,958 24,080 0 0
TILAPIA FROZEN CANADA 2,268 10,000 0 0
TILAPIA FROZEN CHINA 29,671,564 44,185,702 22,938,041 37,337,832
TILAPIA FROZEN CHINA - TAIPEI 13,179,606 23,915,366 16,296,367 25,434,922
TILAPIA FROZEN COLOMBIA 97,202 277,719 44,712 132,462
TILAPIA FROZEN ECUADOR 5 5,162 2,000 4,551
TILAPIA FROZEN INDIA 0 0 2,790 2,715
TILAPIA FROZEN INDONESIA 11,026 14,431 22,401 44,939
TILAPIA FROZEN MALAYSIA 18,144 27,550 0 0
TILAPIA FROZEN NICARAGUA 6,037 16,395 5,527 14,520
TILAPIA FROZEN PANAMA 65,136 121,933 158,159 242,112
TILAPIA FROZEN PERU 42,203 78,650 0 0
TILAPIA FROZEN PHILIPPINES 23,871 55,079 114,430 212,596
TILAPIA FROZEN THAILAND 904,663 1,676,321 1,185,152 1,782,752
TILAPIA FROZEN UNITED ARAB EMIRATES 0 0 7,000 11,700
TILAPIA FROZEN VIET NAM 132,266 330,770 112,068 288,871
Subtotal 44,174,439 70,741,695 40,889,854 65,512,202
Grand Total 183,294,841 696,085,981 215,377,806 842,866,006
PROCESSING and VALUE ADDING One of the primary constraints on the tilapia industry has been the problem off-flavor. Most often the off-flavor is caused by cyanobacteria (blue-green algae) blooming in production ponds. The industry has made a concerted effort to train farmers, custom harvesters and processing plant operators to recognize the presence of both the algae and the off-flavor odors coming from the geosmin and methyl-isoborneol imparted to the fish by the cyanobacteria. Many farms and processors have developed depuration systems and procedures to ensure that any off-flavor fish are treated before processing. More sophisticated testing and testing labs are also available to assist farmers and processors to ensure that off-flavor products do not reach consumers (Fitzsimmons 2006). It should be noted that sometimes these fish are processed and sold as lower grade product to lower price markets, especially in Russia and sub-Saharan Africa. A second constraint is the relatively low percent recovery for tilapia fillets compared to other fishes with a more beneficial body form. This has become even more of an issue as processors implement additional trims and deeper skinning at the request of some customers. Breeders are attempting to overcome this constraint by selecting fish with a better body conformation to increase fillet yield. A second aspect is the development of co-products from the processing industry. One of the co-products has been the increase in a variety of

1414
leather goods derived from tilapia skins. This technique first appeared in Brazil, which still has the most diverse selection of products. But we are seeing additional products including tilapia skin swimwear from Thailand.
Figure 2. Tilapia skin leather goods
Sophisticated equipment and low labor costs – processing companies are continuing to utilize a mix of high technology and low skill labor to prepare the variety of tilapia goods in the market. High capital investment equipment including freezers, scalers, packaging, and computer aided weight checkers is mixed with hand fillet lines and manual packing of boxes. The low cost labor countries with tropical growing conditions will continue to be the industry leaders. Explosion of product forms – More than any other factor, the plethora of tilapia products hitting the market is encouraging demand and will be the ultimate reason that tilapia will eventually surpass carps to become the most popular farm raised food fish. Breaded fillets, tilapia loins, stuffed fillet, ready to bake or microwave tilapia with sauces and side-dishes are flooding the markets in the US, Europe and the East Asia countries. As young women in Asia continue to join the work force, the idea of purchasing a whole fish (especially carp) and preparing it for smaller families is declining. Women shopping after a work day in the office want the convenience of a packaged fillet product that will be easy to prepare with minimal waste for disposal. Smoked and sashimi forms are also becoming more popular. The consumption of tilapia in the US market continues to increase and Europe and East Asia are likely to follow the trend of more value added tilapia forms making up an increasing share of the market demand. Tilapia may become the fourth most popular seafood in the US by 2012.
Table 2. United States per capita consumption of seafood products in pounds per person.
VERTICAL INTEGRATION
Another huge reason for the rapid expansion of tilapia products and consumption has been the vertical integration in the industry that has been especially beneficial for production in developing countries and market expansion in the US and European Union. RainForest, Regal Springs, Tropical Tilapia and HQ Sustainable Maritime are multi-national firms. Some source
2000 2001 2002 2003 2004 2005 2006 2007 2008 2009Tuna 3.5 Shrimp 3.4 Shrimp 3.7 Shrimp 4.0 Shrimp 4.2 Shrimp 4.1 Shrimp 4.4 Shrimp 4.1 Shrimp 4.1 Shrimp 4.1Shrimp 3.2 Tuna 2.9 Tuna 3.1 Tuna 3.4 Tuna 3.4 Tuna 3.1 Tuna 2.9 Tuna 2.7 Tuna 2.8 Tuna 2.5Pollock 1.6 Salmon 2.0 Salmon 2.0 Salmon 2.2 Salmon 2.2 Salmon 2.4 Salmon 2.0 Salmon 2.4 Salmon 1.8 Salmon 2.0Salmon 1.5 Pollock 1.2 Pollock 1.1 Pollock 1.7 Pollock 1.7 Pollock 1.5 Pollock 1.6 Pollock 1.7 Pollock 1.34 Pollock 1.45Catfish 1.1 Catfish 1.1 Catfish 1.1 Catfish 1.1 Catfish 1.1 Catfish 1.0 T ilapia 1.0 T ilapia 1.14 Tilapia 1.19 Tilapia 1.21Cod 0.8 Cod 0.6 Cod 0.7 Cod 0.6 Tilapia 0.7 Tilapia 0.8 Catfish 0.97 Catfish 0.90 Catfish 0.92 Catfish 0.85Clams 0.5 Clams 0.5 Crabs 0.6 Crabs 0.6 Cod 0.6 Crabs 0.6 Crabs 0.7 Crabs 0.68 Crabs 0.61 Crabs 0.59Crabs 0.4 Crabs 0.4 Clams 0.5 Tilapia 0.5 Crabs 0.6 Cod 0.6 Cod 0.5 Cod 0.47 Cod 0.44 Cod 0.42Flatfish 0.4 Flatfish 0.4 Tilapia 0.4 Clams 0.5 Clams 0.5 Clams 0.4 Clams 0.4 Clams 0.45 Flatfish 0.43 Clams 0.41Scallops 0.3 Tilapia 0.4 Flatfish 0.3 Scallops 0.3 Scallops 0.3 Scallops 0.3 Scallops 0.3 Flatfish 0.32 Clams 0.42 Pangasius 0.35
Tilapia 0.3

1515
from multiple farms in several countries and each sells to multiple countries. The application of technology across borders and multi-national, multi-lingual employees have provided these companies the ability to rapidly adjust techniques and feed formulations, genetics, processing and marketing. Brand recognition and specialized packaging have further improved the tilapia markets.
Figure 3. Packaging and brand development
CONCLUSIONS Global farmed tilapia production has already surpassed that of the salmon and the various catfishes. New producing countries continue to enter the markets producing and consuming large volumes of tilapia. For example, Bangladesh has increased tilapia production from virtually zero in 2000 to 100,000 mt tons in 2010.
Figure 4. Production of tilapia in Bangladesh (2002 – 2011 est.) On a global basis, while tilapia production is still far behind the carps, the convergence of stronger potential for increased production and the much wider base of consumption leads to the logical conclusion that tilapia will continue to increase production until it surpasses the carps as the most important farmed fish on the planet.
0
20,000
40,000
60,000
80,000
100,000
120,000
2002
2003
2004
2005
2006
2007
2008
2009
2010
(est
)
2011
(est
)
Met
ric
tons

1616
References
Avnimelech, Y. (2009). Biofloc Technology—A Practical Guide Book. The World Aquaculture Society.
Cruz, P., Andalecio, M., Bolivar, R. and Fitzsimmons, K. 2008. Tilapia – shrimp polyculture in Negros Island, Philippines: A Review. Journal of the World Aquaculture Society 39(6):713-725.
FAO (2010). The State of World Fisheries and Aquaculture - 2010 (SOFIA). Rome. Fitzsimmons, K. and Watanabe, W. (2010). Chapter 17 (Family: Cichlidae) pp. 375-397. In:
N.R. Le François, M. Jobling, C. Carter and P.U. Blier eds. Finfish Aquaculture Diversification. C.A.B. International 640 pp.
Fitzsimmons, K. (2006). Harvest, Handling, and Processing. pp. 607-618. In: Lim, C and Webster, C., eds. Tilapia: Biology, Culture, and Nutrition. Hawthorn Press.
Fitzsimmons, K. Tilapia culture. (2005) pp. 563-590. In: Kelly A.M. and Silverstein, J. eds. Aquaculture in the 21st Century. American Fisheries Society, Symposium 46, Bethesda, Maryland.
Fitzsimmons, K. 2000. Tilapia aquaculture in Mexico. Pp. 171-183 In: Costa-Pierce, B.A. and J.E. Rakocy, eds. Tilapia Aquaculture in the Americas, Vol. 2. The World Aquaculture Society, Baton Rouge, Louisiana, United States.
Fitzsimmons, K. 2000. Future Trends of Tilapia Aquaculture in the Americas. Pp. 252-264 In: Costa-Pierce, B.A. and J.E. Rakocy, eds. Tilapia Aquaculture in the Americas, Vol. 2. The World Aquaculture Society, Baton Rouge, Louisiana, United States.
Kocher, T.D., Lee, W.J., Sobolewska, H., Penman, D., McAndrew, B. (1998) A genetic linkage map of a cichlid fish, the tilapia (Oreochromis niloticus). Genetics, 148(3):1225-1232.
Lee, B.Y., Lee, W.J., Streelman, J.T., Carleton, K.L., Howe ,A.E., Hulata, G., Slettan, A., Stern, J.E., Terai, Y., Kocher, T.D. (2005) A second-generation genetic linkage map of tilapia (Oreochromis spp.). Genetics 2005, 70(1):237-244.
Mair, G.C., Abucay, J.S., Skibinski, D.O.F., Abella, T.A., Beardmore, J.A. (1997) Genetic manipulation of sex ratio for the large scale production of all-male tilapia Oreochromis niloticus L. Canadian Journal of Fisheries and Aquatic Sciences, 54(2): 396-404.
Watanabe, W. Fitzsimmons, K. and Yang Yi. (2006) Farming Tilapia in Saline Waters. pp. 347-447. In: Lim, C and Webster, C., eds. Tilapia: Biology, Culture, and Nutrition. Hawthorn Press.
Xia ,J. H., Feng Liu, Ze Yuan Zhu, Jianjun Fu, Jianbin Feng, Jiale Li, Gen Hua Yue. (2010) A consensus linkage map of the grass carp (Ctenopharyngodon idella) based on microsatellites and SNPs. BMC Genomics 2010 11:135.
Yuan, D. Yi, Y. Yakupitiyage, A., Fitzimmons, K. and Diana, J. 2010. Effects of addition of red tilapia (Oreochromis spp.) at different densities and sizes on production, water quality and nutrient recovery of intensive culture of white shrimp (Litopenaeus vannamei) in cement tanks. Aquaculture 298: 226–238.
Zerai, D.B., Fitzsimmons, K.M., Collier, R.J. and Duff, G.C. 2008. Evaluation of brewers waste as partial replacement of fish meal protein in Nile Tilapia (Oreochromis niloticus) diets. Journal of the World Aquaculture Society 39(4):556.564.
Zimmerman, S. and Fitzsimmons, K. (2004) Tilapia Intensiva. Pp. 239-266. In: Cyrino, J.E.P., Urbinati, E.C., Fracalossi, D.M. and Castagnolli, N. (Eds.) Topicos Especiais em Piscicultura de Agua Doce Tropical Intensiva. Sociedade Brasileira de Aquicultura e Biología Aquatica. TecArt, Sao Paulo.

1717
SECTION I HEALTH AND DISEASE
Chair: Professor Phillip Klesius
United States Department of Agriculture Auburn, Alabama, USA

1818
Live Attenuated Bacterial Vaccines in Aquaculture
Phillip Klesius and Julia Pridgeon
U.S. Department of Agriculture, Agricultural Research Service, Aquatic Animal Health Research Laboratory, 990 Wire Road, Auburn, Alabama 36832
水产养殖中的活性弱毒疫苗 Phillip Klesius Julia Pridgeon
美国农业部农业研究服务中心水生动物病害研究实验室 地址:990 Wire Road, Auburn, Alabama 36832
目前,在世界范围内,水产养殖业已经成为农业经济中的一个重要的组成部分。阻碍水产养殖业增长的一个最重要的因素就是传染性疾病,它给水产养殖业带来了巨大的经济损失。目前,已报道的致病菌种类已经多达20多个属。细菌性传染病爆发的几率是相当高的,特别是在高密度和循环水养殖系统中。预防这类疾病发生的最有效的方法是接种疫苗。这是保证养殖经济鱼类健康的一种不可或缺的重要措施。活性弱毒疫苗已经非常成功的广泛应用于预防动物与人类的多种疾病。活性弱毒疫苗能天然的模仿宿主与病原菌之间的相互作用,这就可以有效的激活宿主相应的免疫系统。因此最有效的预防鱼类细菌性传染疾病爆发的措施就是接种活性弱毒疫苗。此外,
这种疫苗还具有生产成本低,运输简捷以及保护性长久等优点。下面将会讨论这类疫苗的生物安全性,保护性的强弱,经济价值,生产和运输方法,以及一些潜在的活性弱毒疫苗。
Biosecurity
Aquaculture is emerging as an important economical agribusiness, worldwide. Disease outbreaks cause severe economic losses in aquaculture production and trade. Currently, it is not possible to properly quantify the dollars losses, but disease loss estimates in Asian countries amount to more than $3 billion annually1. Furthermore, disease is being recognized as a primary constraint on the economic development of some countries. In addition to mortality and morbidity, disease causes reduced slaughter value, growth performance and feed conversion in fish. Other costs associated with disease are money spent to purchase chemicals and drugs to combat diseases.
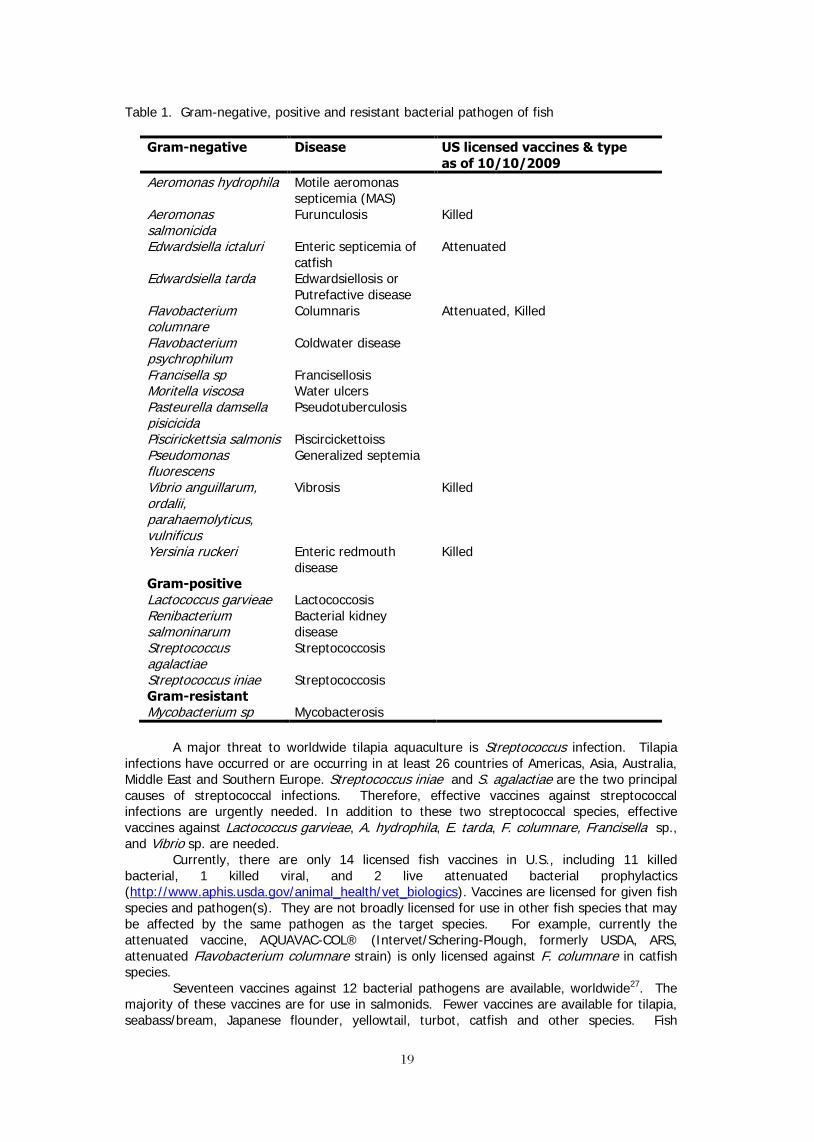
A variety of pathogens are responsible for infectious diseases including viruses, parasites, fungi and bacteria. Among them, bacteria pathogens account for majority of diseases in warm water aquaculture. Bacterial species of more than 20 genera have been reported as causes of diseases. Prominent Gram negative pathogens include species of Aeromonas, Edwardsiella, Flavobacterium, Francisella, Pasteurella, Piscirickettsia, Pseudomonas, Vibrio and Yersinia. Species of Lactococcus, Reinbacterium, Streptococcus are examples of Gram positive pathogens while Mycobacterium is a Gram resistant pathogen. Diseases caused by pathogen genus, species, and available U.S. licensed vaccines are summarized in Table 1.
水
美国
地址
目前 水
运
生 以及一些潜在的活性弱毒疫苗。
它 已
特多个属。
有效的方法是接
在世界范
1919
Table 1. Gram-negative, positive and resistant bacterial pathogen of fish
Gram-negative Disease US licensed vaccines & type as of 10/10/2009
Aeromonas hydrophila Motile aeromonas septicemia (MAS)
Aeromonas salmonicida
Furunculosis Killed
Edwardsiella ictaluri Enteric septicemia of catfish
Attenuated
Edwardsiella tarda Edwardsiellosis or Putrefactive disease
Flavobacterium columnare
Columnaris Attenuated, Killed
Flavobacterium psychrophilum
Coldwater disease
Francisella sp Francisellosis Moritella viscosa Water ulcers Pasteurella damsella pisicicida
Pseudotuberculosis
Piscirickettsia salmonis Piscircickettoiss Pseudomonas fluorescens
Generalized septemia
Vibrio anguillarum, ordalii, parahaemolyticus, vulnificus
Vibrosis Killed
Yersinia ruckeri Enteric redmouth disease
Killed
Gram-positive Lactococcus garvieae Lactococcosis Renibacterium salmoninarum
Bacterial kidney disease
Streptococcus agalactiae
Streptococcosis
Streptococcus iniae Streptococcosis Gram-resistant Mycobacterium sp Mycobacterosis
A major threat to worldwide tilapia aquaculture is Streptococcus infection. Tilapia
infections have occurred or are occurring in at least 26 countries of Americas, Asia, Australia, Middle East and Southern Europe. Streptococcus iniae and S. agalactiae are the two principal causes of streptococcal infections. Therefore, effective vaccines against streptococcal infections are urgently needed. In addition to these two streptococcal species, effective vaccines against Lactococcus garvieae, A. hydrophila, E. tarda, F. columnare, Francisella sp., and Vibrio sp. are needed.
Currently, there are only 14 licensed fish vaccines in U.S., including 11 killed bacterial, 1 killed viral, and 2 live attenuated bacterial prophylactics (http://www.aphis.usda.gov/animal_health/vet_biologics). Vaccines are licensed for given fish species and pathogen(s). They are not broadly licensed for use in other fish species that may be affected by the same pathogen as the target species. For example, currently the attenuated vaccine, AQUAVAC-COL® (Intervet/Schering-Plough, formerly USDA, ARS, attenuated Flavobacterium columnare strain) is only licensed against F. columnare in catfish species.
Seventeen vaccines against 12 bacterial pathogens are available, worldwide27. The majority of these vaccines are for use in salmonids. Fewer vaccines are available for tilapia, seabass/bream, Japanese flounder, yellowtail, turbot, catfish and other species. Fish
2020
producers have considerably fewer vaccines available than producers in poultry and livestock industries with a ratio of about 1 to 10. There is a recognized need to develop new vaccines as well as to improve efficacy of existing vaccines.
A hallmark of bacterial disease is its rapid spread within a farm, between farms in a locality, nationally and internationally by a variety of means. Treatment of diseased fish is often done by the use of antibiotics or chemicals. Some drugs and chemicals may be harmful to the consumer and the environment. The use of drugs and chemicals in aquaculture is a major issue in international trade and many countries have limited detectable quantities of these substances in fish products.
Vaccine disease prevention
The best disease prevention method is vaccination. Vaccines are an integral tool in any health management strategy applicable to economically reared fish. Vaccines greatly reduce the need for drugs and chemicals. Live attenuated vaccines contain weakened or less virulent form of the pathogen that causes the disease. The concept behind such vaccines is that the pathogens are efficacious to stimulate immunity, but too weak to cause diseases. Live attenuated vaccines have been extensively and very successfully used against a number of animal and human diseases, over an extensive span of years, whereas killed vaccines were often poorly efficacious. Therefore, we believe that the most valid preventative strategy to combat infectious disease of fish is through the use of live attenuated vaccines. Aspects of biosafety, efficacy, economic benefits, methods of production, delivery of two available licensed vaccines, and some novel live attenuated bacterial vaccines will be discussed.
Vaccines types
Six types of bacterial vaccines include killed, recombinant, DNA, subunit, vector and
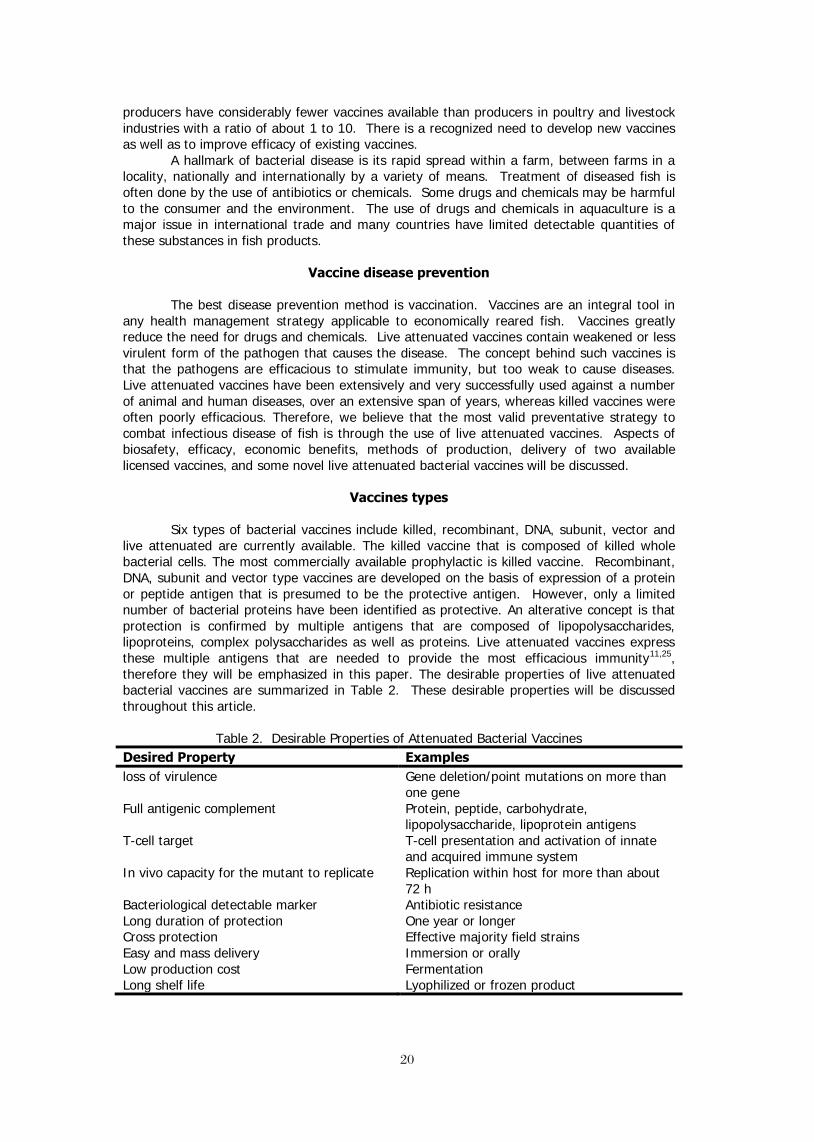
live attenuated are currently available. The killed vaccine that is composed of killed whole bacterial cells. The most commercially available prophylactic is killed vaccine. Recombinant, DNA, subunit and vector type vaccines are developed on the basis of expression of a protein or peptide antigen that is presumed to be the protective antigen. However, only a limited number of bacterial proteins have been identified as protective. An alterative concept is that protection is confirmed by multiple antigens that are composed of lipopolysaccharides, lipoproteins, complex polysaccharides as well as proteins. Live attenuated vaccines express these multiple antigens that are needed to provide the most efficacious immunity11,25, therefore they will be emphasized in this paper. The desirable properties of live attenuated bacterial vaccines are summarized in Table 2. These desirable properties will be discussed throughout this article.
Table 2. Desirable Properties of Attenuated Bacterial Vaccines Desired Property Examples loss of virulence Gene deletion/point mutations on more than
one gene Full antigenic complement Protein, peptide, carbohydrate,
lipopolysaccharide, lipoprotein antigens T-cell target T-cell presentation and activation of innate
and acquired immune system In vivo capacity for the mutant to replicate Replication within host for more than about
72 h Bacteriological detectable marker Antibiotic resistance Long duration of protection One year or longer Cross protection Effective majority field strains Easy and mass delivery Immersion or orally Low production cost Fermentation Long shelf life Lyophilized or frozen product

2121
Biosafety The development and use of live attenuated bacterial vaccines is becoming more
attractive due to their many advantages, despite concerns raised by some about their biosafety. The principal reason behind the concern that attenuated vaccines are considered more risky than killed vaccines is their possible reversion from the weakened state to virulent state. However, this risk appears to be unfounded as no reversion has been documented for the AQUAVAC-ESC® attenuated vaccine (formerly USDA, ARS, RE-33) which has been used in U.S. catfish industry for more than 10 years.
Development and biosafety evaluation of vaccines is regulated by the USDA, Animal and Plant Inspection Service, Center for Veterinary Biologics in the U.S. Acceptance of vaccines requires comprehensive assessments of all criteria of vaccine development. This assessment includes biological safety to both aquatic animals and environment. The assessment also includes purity and efficacy of the vaccine. U.S. protocols for studies of host animal immunogenicity/efficacy, safety, backpassage, shed/spread, immunological interference, and other areas can be found at http://www.aphis.usda.gov/animal_health/vet_biologics. U.S. environmental release- risk assessment comply with the regulations of the National Environmental Protection Act (NEPA), applies to products not exempted by categorical exclusion by 7 CFR 372.5(c). This requirement applies to conventionally derived modified live vaccine products and those derived by recombinant DNA technology.
In general, attenuated vaccines should be both safe and efficacious to achieve the desirable features of a live vaccine. Phenotypic and genotypic stability, pathogenicity to other organisms, and the potential effects to non-target organisms are major biosafety-related properties to be examined for any attenuated vaccine and its wild type parent. A risk/benefit analysis on the use of live attenuated bacterial vaccines may reveal the potential preventive benefits that outweigh the decision to preclude these vaccines from the market. Favre and Viret8 have provided a framework on European regulations for biosafety assessment of human oral attenuated vaccines that provides valuable insight to the assessment of veterinary attenuated vaccines. Incorporation of specific genetic markers such synthetic antibiotic resistance into the attenuated vaccine strain will allow the wild type parent strain to be distinguished from the attenuated vaccine strain by appropriate bacteriological methods. This is important for monitoring the biosafety of the attenuated vaccine in the field.
Licensed attenuated vaccines
Currently two licensed attenuated bacterial vaccines are available for use in U.S. catfish. These commercially available vaccines include E. ictulari (AQUAVAC-ESC®) and F. columnare AQUAVAC-COL®9,26. These two vaccines were successfully developed by the USDA, ARS Aquatic Animal Health Research Laboratory and licensed from the USDA to Intervet/Schering-Plough for manufacture and distribution. The two attenuated vaccines mentioned above were developed by serial passages of the virulence wild type parent bacteria on increasing concentrations of the synthetic antibiotic, rifampicin. These mutants were demonstrated to be both safe and effective vaccines9,26,14,32,33. The loss of virulence was associated with alterations in their LPS2,9,26,34.
Delivery
Attenuated bacterial vaccines, such as E. ictaluri vaccine, are deliverable to large numbers of fish by immersion with minimum stress10,15. The vaccine was licensed to be used in 7-10 post-hatched or older catfish by immersion9. Further, attenuated vaccines such as F. columnare are efficacious when delivered in 10 d post-hatched fry by immersion26. The relative percent survival (RPS) was 57 to 94% between 10 to 48 d post-hatch. Eyed catfish eggs were also successfully vaccinated using the E. ictaluri RE-33 attenuated vaccine. The RPS was 57.9% when the immunized fingerlings were challenge at 60 d post-immunization22,24. However, when the immunized fry were booster by immersion at 7 d post-hatch the RPS declined to 27.3%. These results indicated that the additional antigen load from the booster immunization compromised the immune protection of the attenuated vaccine. Attenuated vaccines that stimulate a strong cellular immune response have been reported to lead to immunosuppression17. It was believed that the persistence of the
2222
attenuated vaccine strain in the egg and fry resulted in the successful immunization of eyed eggs and their fry. The results also showed that eyed catfish eggs were safely immunized with no adverse mortality.
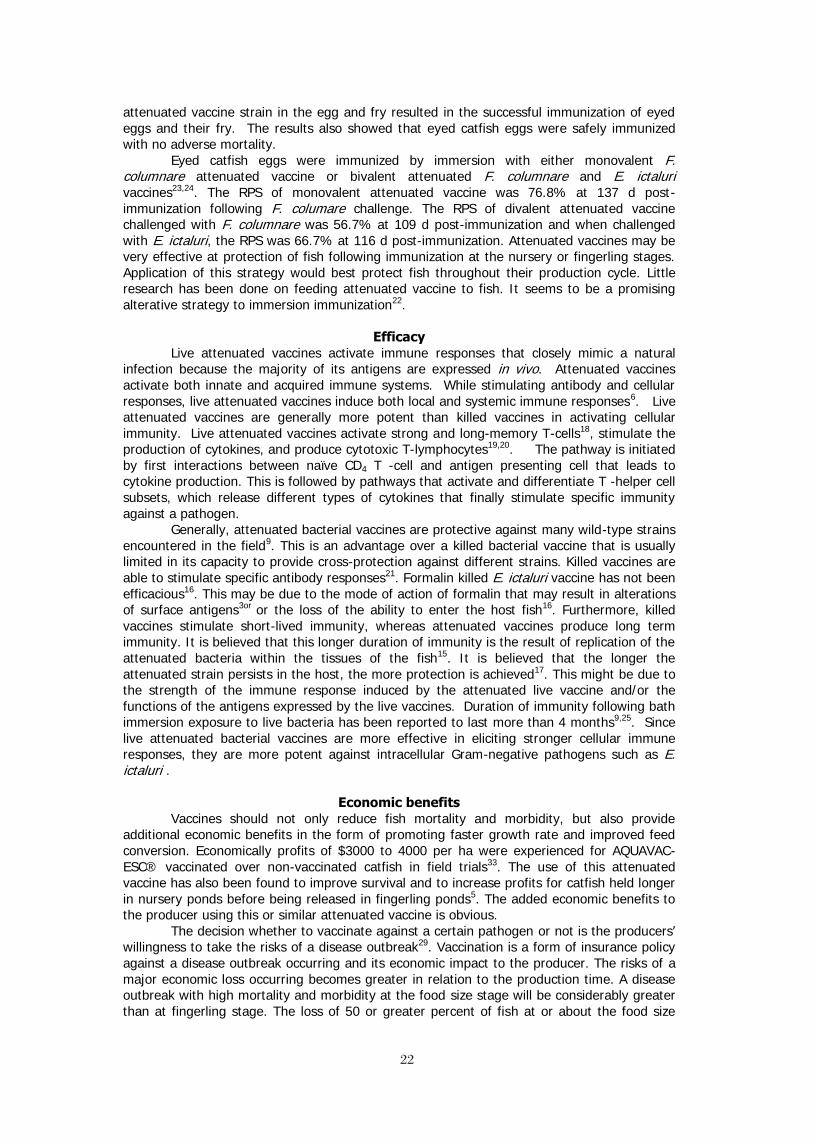
Eyed catfish eggs were immunized by immersion with either monovalent F. columnare attenuated vaccine or bivalent attenuated F. columnare and E. ictaluri vaccines23,24. The RPS of monovalent attenuated vaccine was 76.8% at 137 d post-immunization following F. columare challenge. The RPS of divalent attenuated vaccine challenged with F. columnare was 56.7% at 109 d post-immunization and when challenged with E. ictaluri, the RPS was 66.7% at 116 d post-immunization. Attenuated vaccines may be very effective at protection of fish following immunization at the nursery or fingerling stages. Application of this strategy would best protect fish throughout their production cycle. Little research has been done on feeding attenuated vaccine to fish. It seems to be a promising alterative strategy to immersion immunization22.
Efficacy Live attenuated vaccines activate immune responses that closely mimic a natural
infection because the majority of its antigens are expressed in vivo. Attenuated vaccines activate both innate and acquired immune systems. While stimulating antibody and cellular responses, live attenuated vaccines induce both local and systemic immune responses6. Live attenuated vaccines are generally more potent than killed vaccines in activating cellular immunity. Live attenuated vaccines activate strong and long-memory T-cells18, stimulate the production of cytokines, and produce cytotoxic T-lymphocytes19,20. The pathway is initiated by first interactions between naïve CD4 T -cell and antigen presenting cell that leads to cytokine production. This is followed by pathways that activate and differentiate T -helper cell subsets, which release different types of cytokines that finally stimulate specific immunity against a pathogen.
Generally, attenuated bacterial vaccines are protective against many wild-type strains encountered in the field9. This is an advantage over a killed bacterial vaccine that is usually limited in its capacity to provide cross-protection against different strains. Killed vaccines are able to stimulate specific antibody responses21. Formalin killed E. ictaluri vaccine has not been efficacious16. This may be due to the mode of action of formalin that may result in alterations of surface antigens3or or the loss of the ability to enter the host fish16. Furthermore, killed vaccines stimulate short-lived immunity, whereas attenuated vaccines produce long term immunity. It is believed that this longer duration of immunity is the result of replication of the attenuated bacteria within the tissues of the fish15. It is believed that the longer the attenuated strain persists in the host, the more protection is achieved17. This might be due to the strength of the immune response induced by the attenuated live vaccine and/or the functions of the antigens expressed by the live vaccines. Duration of immunity following bath immersion exposure to live bacteria has been reported to last more than 4 months9,25. Since live attenuated bacterial vaccines are more effective in eliciting stronger cellular immune responses, they are more potent against intracellular Gram-negative pathogens such as E. ictaluri .
Economic benefits Vaccines should not only reduce fish mortality and morbidity, but also provide additional economic benefits in the form of promoting faster growth rate and improved feed conversion. Economically profits of $3000 to 4000 per ha were experienced for AQUAVAC-ESC® vaccinated over non-vaccinated catfish in field trials33. The use of this attenuated vaccine has also been found to improve survival and to increase profits for catfish held longer in nursery ponds before being released in fingerling ponds5. The added economic benefits to the producer using this or similar attenuated vaccine is obvious. The decision whether to vaccinate against a certain pathogen or not is the producers’ willingness to take the risks of a disease outbreak29. Vaccination is a form of insurance policy against a disease outbreak occurring and its economic impact to the producer. The risks of a major economic loss occurring becomes greater in relation to the production time. A disease outbreak with high mortality and morbidity at the food size stage will be considerably greater than at fingerling stage. The loss of 50 or greater percent of fish at or about the food size
2323
stage may lead to farm closure. Vaccination with attenuated vaccines would reduce the disease risk and provide additional profits that may offset the cost of vaccination. If a particular disease occurs with some frequency on a farm, a decision against vaccination is the highest form of risk taking. A good vaccination strategy that is applied on a regular basis will result in a reduction of disease outbreaks overtime and consequently result in greater profits. Treating disease outbreak with drugs generally do not achieve this beneficial outcome. In a study of vaccine usage in the Chilean salmon industry during the period of 1999-2003, it was reported that usage by immersion increased from 97 million to 200 million doses and by injection from 2 thousand to 16.5 thousand doses4. The Chilean salmon industry accounts for a fish harvest at 585 thousand tons and netting an income of $1.721 million in 2005 (http:salmonchile.cl). More than 20 different vaccines are used or have been used in the Chilean salmon industry4.
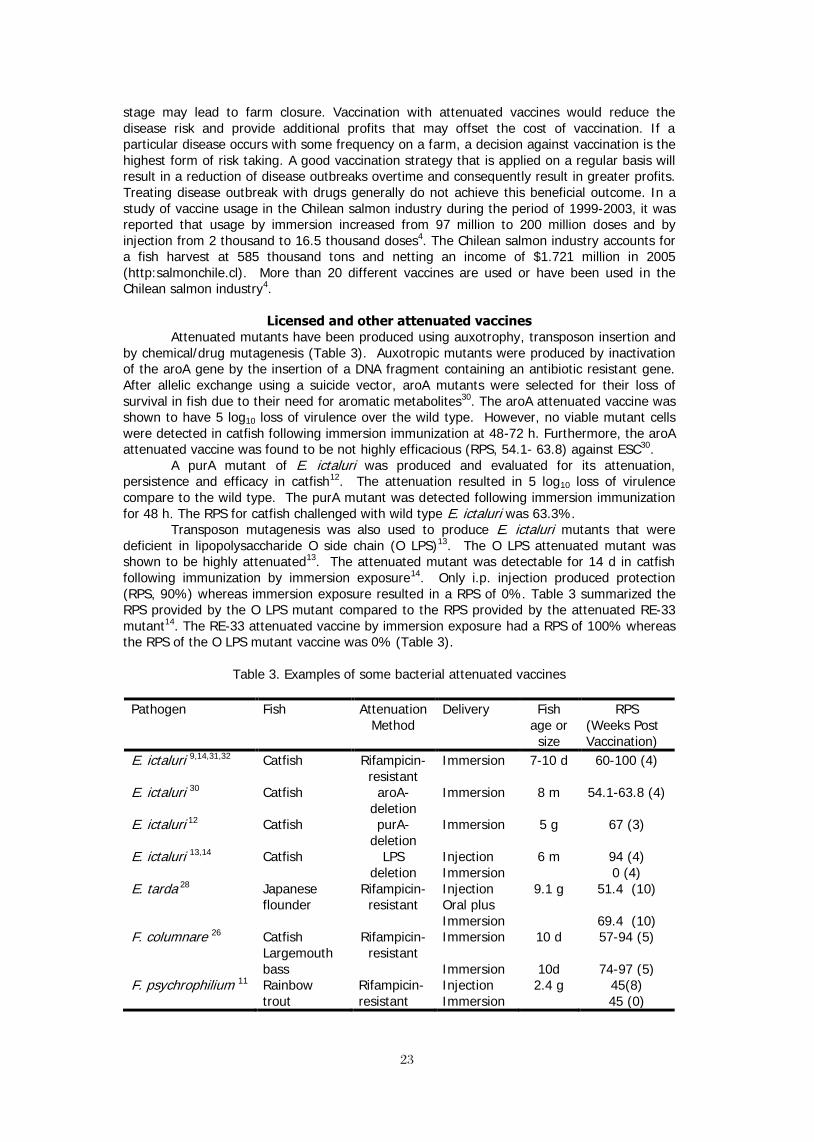
Licensed and other attenuated vaccines Attenuated mutants have been produced using auxotrophy, transposon insertion and
by chemical/drug mutagenesis (Table 3). Auxotropic mutants were produced by inactivation of the aroA gene by the insertion of a DNA fragment containing an antibiotic resistant gene. After allelic exchange using a suicide vector, aroA mutants were selected for their loss of survival in fish due to their need for aromatic metabolites30. The aroA attenuated vaccine was shown to have 5 log10 loss of virulence over the wild type. However, no viable mutant cells were detected in catfish following immersion immunization at 48-72 h. Furthermore, the aroA attenuated vaccine was found to be not highly efficacious (RPS, 54.1- 63.8) against ESC30.
A purA mutant of E. ictaluri was produced and evaluated for its attenuation, persistence and efficacy in catfish12. The attenuation resulted in 5 log10 loss of virulence compare to the wild type. The purA mutant was detected following immersion immunization for 48 h. The RPS for catfish challenged with wild type E. ictaluri was 63.3%.
Transposon mutagenesis was also used to produce E. ictaluri mutants that were deficient in lipopolysaccharide O side chain (O LPS)13. The O LPS attenuated mutant was shown to be highly attenuated13. The attenuated mutant was detectable for 14 d in catfish following immunization by immersion exposure14. Only i.p. injection produced protection (RPS, 90%) whereas immersion exposure resulted in a RPS of 0%. Table 3 summarized the RPS provided by the O LPS mutant compared to the RPS provided by the attenuated RE-33 mutant14. The RE-33 attenuated vaccine by immersion exposure had a RPS of 100% whereas the RPS of the O LPS mutant vaccine was 0% (Table 3).
Table 3. Examples of some bacterial attenuated vaccines
Pathogen Fish Attenuation Method
Delivery Fish age or size
RPS (Weeks Post Vaccination)
E. ictaluri 9,14,31,32 Catfish Rifampicin- resistant
Immersion
7-10 d 60-100 (4)
E. ictaluri 30 Catfish aroA-deletion
Immersion 8 m 54.1-63.8 (4)
E. ictaluri 12 Catfish purA-deletion
Immersion 5 g 67 (3)
E. ictaluri 13,14 Catfish LPS deletion
Injection Immersion
6 m 94 (4) 0 (4)
E. tarda 28 Japanese flounder
Rifampicin-resistant
Injection Oral plus Immersion
9.1 g 51.4 (10)
69.4 (10) F. columnare 26 Catfish
Largemouth bass
Rifampicin-resistant
Immersion Immersion
10 d
10d
57-94 (5)
74-97 (5) F. psychrophilium 11 Rainbow
trout Rifampicin-resistant
Injection Immersion
2.4 g 45(8) 45 (0)
2424
The rifampicin strategy was used to produce an attenuated vaccine against F. psychrophilium, the cause of coldwater disease in salmonids11. The rifampicin resistant mutant was demonstrated to be highly attenuated and efficacious in rainbow trout. The same strategy was used to produce an attenuated vaccine against E. tarda, an important pathogen of marine and freshwater fish28. The rifampicin-resistant mutant was produced by multiple passages on growth medium containing the antibiotic rifampicin. This attenuated vaccine was shown to be safe and efficacious in Japanese flounder by injection, immersion and oral delivery28. Feeding plus immersion booster was shown to produce the highest RPS levels of 80.6 and 69.4% at 5 and 8 weeks, respectively. The mutant was demonstrated to survive in intestine, liver and spleen of fish for 1-10 d post vaccine feeding28. When administrated by immersion, the spleen, liver, kidney and blood were positive for the live attenuated vaccine at 1-14 d post immunization28.
Conclusion
The development and use of attenuated bacterial vaccines in the U.S. has provided very promising benefits and advantages over other types of vaccines in the last 10 years in the catfish industry. The use of attenuated vaccines in world aquaculture will grow to a stage as much as they are used in livestock, poultry and humans to prevent diseases. The further development and use of attenuated vaccine in disease endemic areas is expected in the future, especially where no efficacious vaccines are available.
Acknowledgements
We thank Drs Victor Panangala and Dehai Xu for making helpful suggestions to this manuscript. We also thank Xingjiang Mu for translating the abstract to Chinese. This study was supported by the USDA/ARS CRIS project #6420-32000-024-00D. The use of trade, firm, or corporate names in this publication is for the information and convenience of the reader. Such use does not constitute an official endorsement or approval by the United States Department of Agriculture or the Agricultural Research Service of any product or service to the exclusion of others that may be suitable.
Literature cited
1. ADB/NACA. Final Report on the Regional Study and Workshop on Aquaculture Sustainability and the Environment (RETA). Manila, Asian Development Bank and Bangkok, Network of Aquaculture Centers in Asia-Pacific. In Press
2. Arias, C.R., C.A. Shoemaker, J.J,.Evans and P.H. Klesius. 2003. A comparative study of Edwardsiella ictaluri parent (EILO) and E. ictaluri rifampicin-mutant (RE-33) isolates using lipopolysacharide outer membrane fatty acids, Biolog, API 20E and genomic analysis. J Fish Dis. 26:415-421.
3. Bader, J.A., S. Vinitnantharat and P. H. Klesius. 1997. Comparison of whole cell antigens of pressure- and formalin–killed Flexibacter columnare from channel catfish (Ictalurus punctutus) Am. J. Vet Res 58:985-988.
4. Bravo, S. and P.J. Midtlying. 2007. The use of fish vaccines in the Chilean salmon industry 1999-2003. Aquacult 279:36-42.
5. Carrias, A.A., J.S. Terhune, C.A. Sayles and J.A. Chappel. 2008. Effects of an extended hatchery phase and vaccination against enteric septicemia of catfish on the production of channel catfish, Ictalurus punctatus fingerlings. J World Aqua Soc. 39:259-266.
6. Clark, T.R. and D, Cassidy-Hanely. 2005. Recombinant subunit vaccines, potentials and constrains. Progress in Fish Vaccinology. Development in Biological Standardization, 121: 153-163. Karger, Basel, Switerland.
7. Favre, D. and J-F Viret. 2006. Biosafety evaluation of recombinant live oral bacterial vaccines in the context of European regulation. Vaccine 24: 3856-3864.
2525
8. Klesius, P.H. and C.A. Shoemaker. 1997. Heterlogous isolate challenge of channel catfish, Ictulurus punctus, immune to Edwardsiella ictaluri. Aquacult. 157:147-157.
9. Klesius, P.H. and C.A. Shoemaker. 1999. Development and use of modified live Edwardsiella ictaluri vaccine against enteric septicemia of catfish. Pages 523-537 in R.D. Schultz, editor Advances in veterinary medicine, 41, Academic Press San Diego, CA USA.
10. Klesius, P.H., J.J. Evans and C.A. Shoemaker. 2004. Warmwater fish vaccinology in catfish production. Anim Health Res Rev. 5:305-311.
11. LaFrentz, B.R., S.E. LaPatra, D.R. Call and K.D. Cain. 2008. Isolation of rifampicin resistant Flavobacterium psychrophilum strains and their potential as live attenuated vaccine candidates. Vaccine 26:5582-5589
12. Lawrence, M.L., R.K. Copper and R.L. Thune. 1997. Attenuation, persistence and vaccine potential of an Edwardsiella ictaluri purA mutant. Infect and Immun 65:4642-4751.
13. Lawrence, M.L., M.M. Banes and M.L. Williams. 2001. Phenotype and virulence of a transposon derived lipopolysaccharide O side chain mutant strain of Edwardsiella ictaluri. J Aqua Anm Health 13:291-299.
14. Lawrence, M.L. and M.M. Barnes. 2005. Tissue persistence and vaccine efficacy of an O side chain mutant strain of Edwardsiella ictaluri. J Aqua Anm Health 17:228-232.
15. Norqvist, A., A. Hagstrom and H. Wolf-Watz. 1989. Protection of rainbow trout against vibriosis and furunculosis by use of attenuated strains of Vibrio anguillarum. App Environ Microbiol 55:1400-1405.
16. Nusbaum, K.E. and E.F. Morrison. 1996. Entry of 35 S-labeled Edwardsiella ictaluri into channel catfish (Ictalutus punctatus) J Aqua Anim Health 8:146-149.
17. Salmbandamurthy, V.K. and W. R. Jocobs, Jr. 2005. Live attenuated mutants of Mycobacterium tuberculosis as candidate vaccines against tuberculosis. Microb and Infect &:955-961.
18. Salerno-Goncalves, R.and M.B. Sztein. 2006. Cell-mediated immunity and challenges for vaccine development. Trends Microbiol. 2006:536-542.
19. Savan, R, and M. Sakai. 2006. Geomonics of fish cytokines. Comp. Biochem. Physiol D. 1:89-101.
20. Secombes, C. 2008. Will advances in fish immunology change vaccination strategies? Fish & Shellfish Immunol. 25:409-416.
21. Seder, R.A. and A.V.S. Hill. 2000. Vaccines against intracellular infectious requiring cellular immunity. Nature. 406:793-797
22. Shoemaker, C.A., P.H. Klesius and J.M. Bricker. 1999. Efficacy of a modified live Edwardsiella ictaluri vaccine in channel catfish as young as seven days post hatch. Aquacult. 176:189-193.
23. Shoemaker, C.A., P.H. Klesius and J.J. Evans. 2002. In ovo method for utilizing modified live Edwardsiella ictaluri vaccine against enteric septicemia in channel catfish. Aquacult. 203:221-222.
24. Shoemaker, C.A., P.H. Klesius and J.J. Evans. 2007. Immunization of eyed channel catfish, Ictalurus punctatus, eggs with monovalent Flavobacterium columnare and bivalent F. columnare and Edwardsiella ictaluri vaccine. Vaccine 25:1126-1131.
25. Shoemaker, C.A., P.H. Klesius, J.J. Evans and C.R. Arias. 2009. Use of modified live vaccines in aquaculture. J World Aquacult Soc 40:573-585.
26. Shoemaker, C.A., P.H. Klesius, J.D. Drennan and J.J. Evans. 2011. Efficacy of a modified live Flavobacterium columnare vaccine in fish. Fish & Shellfish Immunol 30:304-308.

2626
27. Sommerset, I, B. Krossøy, E. Biering and P. Frost. 2005. Vaccines for fish in aquaculture. Expert Rev Vaccines 4:89-101.
28. Sun, Y., C-S. Liu and L. Sun. 2010. Isolation and analysis of the vaccine potential of an attenuated Edwardsiella tarda strain. Vaccine 28:6344-6350.
29. Thorarinsson, R. and D.B. Powell. 2006. Effects of disease risk, vaccine efficacy and market price on the economics of fish vaccination. 256:42-49.
30. Thune, R.L., D.H. Fernandez and J.R. Battista. 1999. An aroA mutant of Edwardsiella ictaluri is safe and efficacious as a live, attenuated vaccine. J Aqua Anm Health 11:358-372.
31. Wise, D. J., P.H. Klesius, C.A. Shoemaker and W. R. Wolters. 2000. Vaccination of mixed and full-sib families of channel catfish Ictalarus punctatus against enteric septicemia of catfish with live attenuated Edwardsiella ictaluri isolate (RE-33). J World Aquacult Soc 31:206-212.
32. Wise, D. J. and J. Terhune. 2001. The relationship between vaccine dose and efficacy in channel catfish Ictalurus punctutus vaccinated with live attenuated strain of Edwardsiella ictaluri (RE-33). J World Aquacult Soc 32:177-183.
33. Wise, D.J. 2006. Vaccination shown to improve production efficiencies. The Catfish J. 6-7.
34. Zhang, Y., C.R. Arias, C. A. Shoemaker and P. H. Klesius. 2006. Comparsion of lipopolysaccharide and protein profiles between Flavobacterium columnare strains using different genomovars. J Fish Dis. 29:657-663.

2727
ISOLATION AND CHARACTERIZATION OF Streptococcus agalactiae FROM RED TILAPIA CULUTURED IN THE MEKONG DELTA OF
VIETNAM
Dang Thi Hoang Oanh and Nguyen Thanh Phuong
ABSTRACT Bacterial diseases have been one of significant problem in red tilapia (Oreochromis sp) cage culture in the Mekong delta of Vietnam. Usual clinical signs of Streptocococcis include opacified eyes, popeye, small skin haemorrhage or petechias and skin ulcers. These clinical signs are easy to spot for the layman. However, the observation of the clinical signs from a macroscopic perspective is insufficient to determine the species of bacteria responsible for the disease as well as the biotype. These pieces of information are crucial to be collected in order to anticipate the utilization of a treatment or vaccine program. Therefore, diseased specimens were collected at a farm practicing intensive cage culture of red tilapia in Tien Giang province in 2010. Microscopic observation of fresh smear of blood, liver, kidney and spleen from these specimens revealed small cocci, gram positive bacterial cells. Bacteria isolates from brain and head kidney were recovered on brain heart agar and were analyzed as Gram positive, non-motile and oxidase negative and they were identified as Streptococus agalactiae biotype 2 using a combination of conventional biochemical test, API 20 strep system. Histopathological examination of diseased specimens showed a typical sign of bacterial necrosis in kidney, spleen and liver. Challenge experiments using injection method showed that they can cause the observed disease signs with the LD50 value of about 4.89 x 10⁴ CFU/m. It is the first report of Streptococcus agalactiae biotype 2 outbreak in tilapia in Vietnam. Keywords:Red tilapia, Streptococcus agalactiae, histopathology, pathogenicity

2828
ECO-PHYSIOLOGICAL IMPACT OF COMMERCIAL PETROLEUM FUELS ON NILE TILAPIA, OREOCHROMIS NILOTICUS (L.)
Safaa M. Sharaf 1 and Mohsen Abdel-Tawwab 2*
1 Department of Animal Production and Fish Wealth, Faculty of Agriculture, Suez Canal University, Ismailia, Egypt.
2Department of Fish Biology and Ecology, Central Laboratory for Aquaculture Research,
Abbassa, Abo-Hammad, Sharqia 44662, Egypt.
* Corresponding author email: [email protected] Abstract
The pollution of commercial petroleum fuels (CPF) is one of the environmental constrains that produces aqua-toxicological effects, which are deleterious to aquatic life. Therefore, this study was conducted to explore the effect of some CPF; kerosene, gasoline or diesel, on the performance of Nile tilapia, Oreochromis niloticus (L.). Healthy fish (49.5±1.3 g) were distributed into glass aquaria and 12 ml of kerosene, gasoline, or diesel were separately added to 6 120-L aquaria. Fish were stocked into the aquaria containing kerosene, diesel, or gasoline for 5 minutes. Signs of poisoning in fish exposed to each fuel type included air gulping, increased opercular movement, and dyspnea. Fish lost their balance, meanwhile no poisoning signs were observed in control fish. At 0, 1, 2, 3, and 4 weeks of the recovery, blood samples were taken to measure the different physiological variables. At the end of this experiment, fish were collected, counted and weighed. Fish in control group grew up gradually to the end of the experiment, meanwhile fish exposed to kerosene, diesel, or gasoline lost their weights for 2 weeks and started to grow again. Moreover, weight gain and SGR of fish exposed to diesel and gasoline were less than that exposed to kerosene. Feed intake, FCR, and survival rate of the exposed fish were poor. RBC count and Hb in fish exposed to kerosene, diesel, or gasoline increased by time and the maximum count was obtained at the 1st week; their values decreased up gradually to the 4th week. Glucose level was maximized after the exposure to kerosene, diesel, or gasoline and decreased up gradually to the end of the experiment. Plasma lipids increased significantly by time at the treated fish groups. Plasma protein in fish increased suddenly after the exposure to kerosene, diesel, or gasoline and it decreased by time to be close to that of control group. AST and ALT activities in fish increased gradually after their exposure to CPF and the maximum values were obtained after 3-4 weeks. The lowest cortisol value was obtained at control, which was insignificantly changed throughout the experimental period. This study has demonstrated that the acute exposure to CPF had a highly significant effect on reducing the growth performance of Nile tilapia and affected their physiological status.
INTRODUCTION The majority of studies examining the toxicity of petroleum hydrocarbons have
focused on marine species, thus the toxic effects of petroleum hydrocarbons on freshwater species are relatively unknown. The main source of freshwater environments contamination by commercial petroleum fuel (CPF) is runoff from urban, industrial, and agricultural industries. The mining of oil shale reserves may also pose a risk to freshwater ecosystems. Currently, leakage of oil transport pipelines, storage tanks, and accidents involving petroleum transport vehicles are contributors to hydrocarbon pollution in the freshwater ecosystem.
Oil pollution is one of the environmental constrains that produces aqua-toxicological effects, which are deleterious to aquatic life (Kori-Siakpere 2000; Agbogidi et al. 2005). A variety of pollutants including crude oil and its products are known to induce stress conditions, which impair the health of fish (FEPA 1991). Ekweozor (1989) reported that frequent spillages of crude oil and its products in creeks and rivers may have resulted in a marked reduction in the number of both freshwater and marine creatures. Earlier reports have also shown that oil pollution impact negatively on fishery resources (Kilnhold 1980; Afolabi et al. 1985). Ajoa et al. (1981) and Azad (2005) observed that eggs and young stages
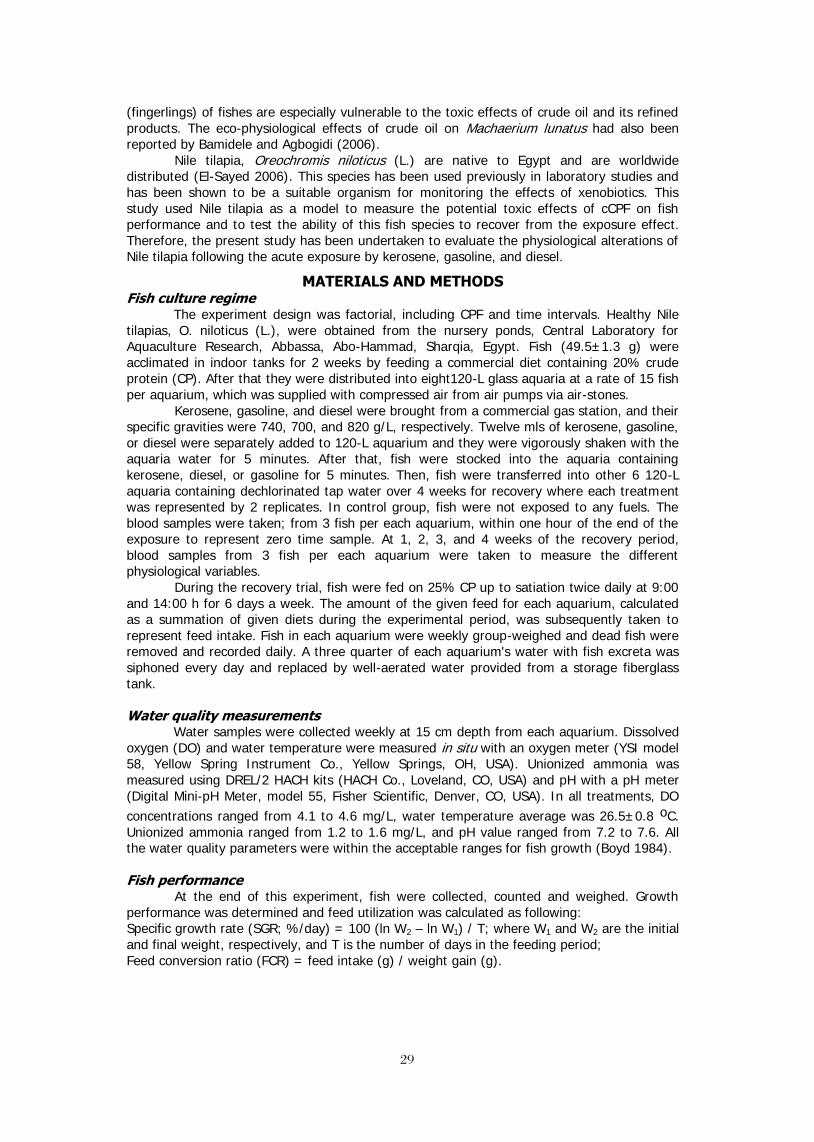
2929
(fingerlings) of fishes are especially vulnerable to the toxic effects of crude oil and its refined products. The eco-physiological effects of crude oil on Machaerium lunatus had also been reported by Bamidele and Agbogidi (2006).
Nile tilapia, Oreochromis niloticus (L.) are native to Egypt and are worldwide distributed (El-Sayed 2006). This species has been used previously in laboratory studies and has been shown to be a suitable organism for monitoring the effects of xenobiotics. This study used Nile tilapia as a model to measure the potential toxic effects of cCPF on fish performance and to test the ability of this fish species to recover from the exposure effect. Therefore, the present study has been undertaken to evaluate the physiological alterations of Nile tilapia following the acute exposure by kerosene, gasoline, and diesel.
MATERIALS AND METHODS Fish culture regime
The experiment design was factorial, including CPF and time intervals. Healthy Nile tilapias, O. niloticus (L.), were obtained from the nursery ponds, Central Laboratory for Aquaculture Research, Abbassa, Abo-Hammad, Sharqia, Egypt. Fish (49.5±1.3 g) were acclimated in indoor tanks for 2 weeks by feeding a commercial diet containing 20% crude protein (CP). After that they were distributed into eight120-L glass aquaria at a rate of 15 fish per aquarium, which was supplied with compressed air from air pumps via air-stones.
Kerosene, gasoline, and diesel were brought from a commercial gas station, and their specific gravities were 740, 700, and 820 g/L, respectively. Twelve mls of kerosene, gasoline, or diesel were separately added to 120-L aquarium and they were vigorously shaken with the aquaria water for 5 minutes. After that, fish were stocked into the aquaria containing kerosene, diesel, or gasoline for 5 minutes. Then, fish were transferred into other 6 120-L aquaria containing dechlorinated tap water over 4 weeks for recovery where each treatment was represented by 2 replicates. In control group, fish were not exposed to any fuels. The blood samples were taken; from 3 fish per each aquarium, within one hour of the end of the exposure to represent zero time sample. At 1, 2, 3, and 4 weeks of the recovery period, blood samples from 3 fish per each aquarium were taken to measure the different physiological variables.
During the recovery trial, fish were fed on 25% CP up to satiation twice daily at 9:00 and 14:00 h for 6 days a week. The amount of the given feed for each aquarium, calculated as a summation of given diets during the experimental period, was subsequently taken to represent feed intake. Fish in each aquarium were weekly group-weighed and dead fish were removed and recorded daily. A three quarter of each aquarium's water with fish excreta was siphoned every day and replaced by well-aerated water provided from a storage fiberglass tank. Water quality measurements
Water samples were collected weekly at 15 cm depth from each aquarium. Dissolved oxygen (DO) and water temperature were measured in situ with an oxygen meter (YSI model 58, Yellow Spring Instrument Co., Yellow Springs, OH, USA). Unionized ammonia was measured using DREL/2 HACH kits (HACH Co., Loveland, CO, USA) and pH with a pH meter (Digital Mini-pH Meter, model 55, Fisher Scientific, Denver, CO, USA). In all treatments, DO concentrations ranged from 4.1 to 4.6 mg/L, water temperature average was 26.5±0.8 oC. Unionized ammonia ranged from 1.2 to 1.6 mg/L, and pH value ranged from 7.2 to 7.6. All the water quality parameters were within the acceptable ranges for fish growth (Boyd 1984).
Fish performance
At the end of this experiment, fish were collected, counted and weighed. Growth performance was determined and feed utilization was calculated as following: Specific growth rate (SGR; %/day) = 100 (ln W2 – ln W1) / T; where W1 and W2 are the initial and final weight, respectively, and T is the number of days in the feeding period; Feed conversion ratio (FCR) = feed intake (g) / weight gain (g).
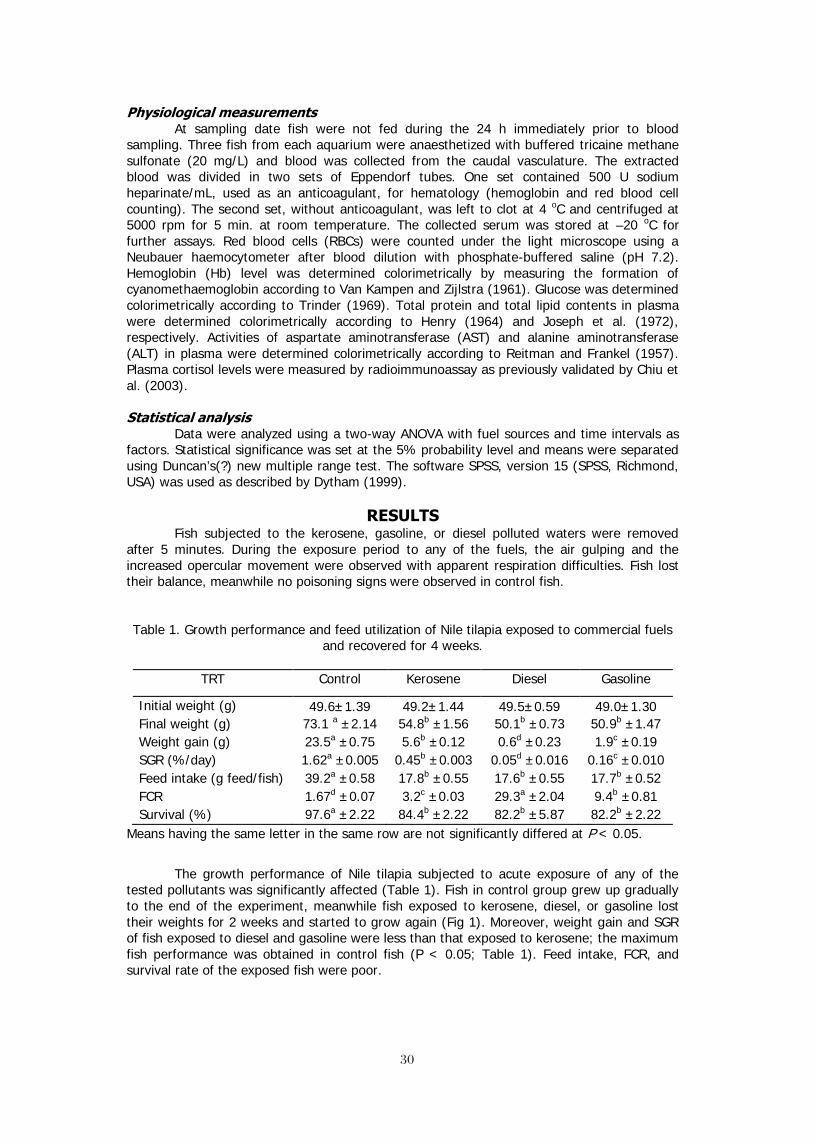
3030
Physiological measurements At sampling date fish were not fed during the 24 h immediately prior to blood
sampling. Three fish from each aquarium were anaesthetized with buffered tricaine methane sulfonate (20 mg/L) and blood was collected from the caudal vasculature. The extracted blood was divided in two sets of Eppendorf tubes. One set contained 500 U sodium heparinate/mL, used as an anticoagulant, for hematology (hemoglobin and red blood cell counting). The second set, without anticoagulant, was left to clot at 4 oC and centrifuged at 5000 rpm for 5 min. at room temperature. The collected serum was stored at –20 oC for further assays. Red blood cells (RBCs) were counted under the light microscope using a Neubauer haemocytometer after blood dilution with phosphate-buffered saline (pH 7.2). Hemoglobin (Hb) level was determined colorimetrically by measuring the formation of cyanomethaemoglobin according to Van Kampen and Zijlstra (1961). Glucose was determined colorimetrically according to Trinder (1969). Total protein and total lipid contents in plasma were determined colorimetrically according to Henry (1964) and Joseph et al. (1972), respectively. Activities of aspartate aminotransferase (AST) and alanine aminotransferase (ALT) in plasma were determined colorimetrically according to Reitman and Frankel (1957). Plasma cortisol levels were measured by radioimmunoassay as previously validated by Chiu et al. (2003).
Statistical analysis
Data were analyzed using a two-way ANOVA with fuel sources and time intervals as factors. Statistical significance was set at the 5% probability level and means were separated using Duncan’s(?) new multiple range test. The software SPSS, version 15 (SPSS, Richmond, USA) was used as described by Dytham (1999).
RESULTS
Fish subjected to the kerosene, gasoline, or diesel polluted waters were removed after 5 minutes. During the exposure period to any of the fuels, the air gulping and the increased opercular movement were observed with apparent respiration difficulties. Fish lost their balance, meanwhile no poisoning signs were observed in control fish.
Table 1. Growth performance and feed utilization of Nile tilapia exposed to commercial fuels and recovered for 4 weeks.
TRT Control Kerosene Diesel Gasoline
Initial weight (g) 49.6±1.39 49.2±1.44 49.5±0.59 49.0±1.30 Final weight (g) 73.1 a ±2.14 54.8b ±1.56 50.1b ±0.73 50.9b ±1.47 Weight gain (g) 23.5a ±0.75 5.6b ±0.12 0.6d ±0.23 1.9c ±0.19 SGR (%/day) 1.62a ±0.005 0.45b ±0.003 0.05d ±0.016 0.16c ±0.010 Feed intake (g feed/fish) 39.2a ±0.58 17.8b ±0.55 17.6b ±0.55 17.7b ±0.52 FCR 1.67d ±0.07 3.2c ±0.03 29.3a ±2.04 9.4b ±0.81 Survival (%) 97.6a ±2.22 84.4b ±2.22 82.2b ±5.87 82.2b ±2.22
Means having the same letter in the same row are not significantly differed at P < 0.05.
The growth performance of Nile tilapia subjected to acute exposure of any of the
tested pollutants was significantly affected (Table 1). Fish in control group grew up gradually to the end of the experiment, meanwhile fish exposed to kerosene, diesel, or gasoline lost their weights for 2 weeks and started to grow again (Fig 1). Moreover, weight gain and SGR of fish exposed to diesel and gasoline were less than that exposed to kerosene; the maximum fish performance was obtained in control fish (P < 0.05; Table 1). Feed intake, FCR, and survival rate of the exposed fish were poor.
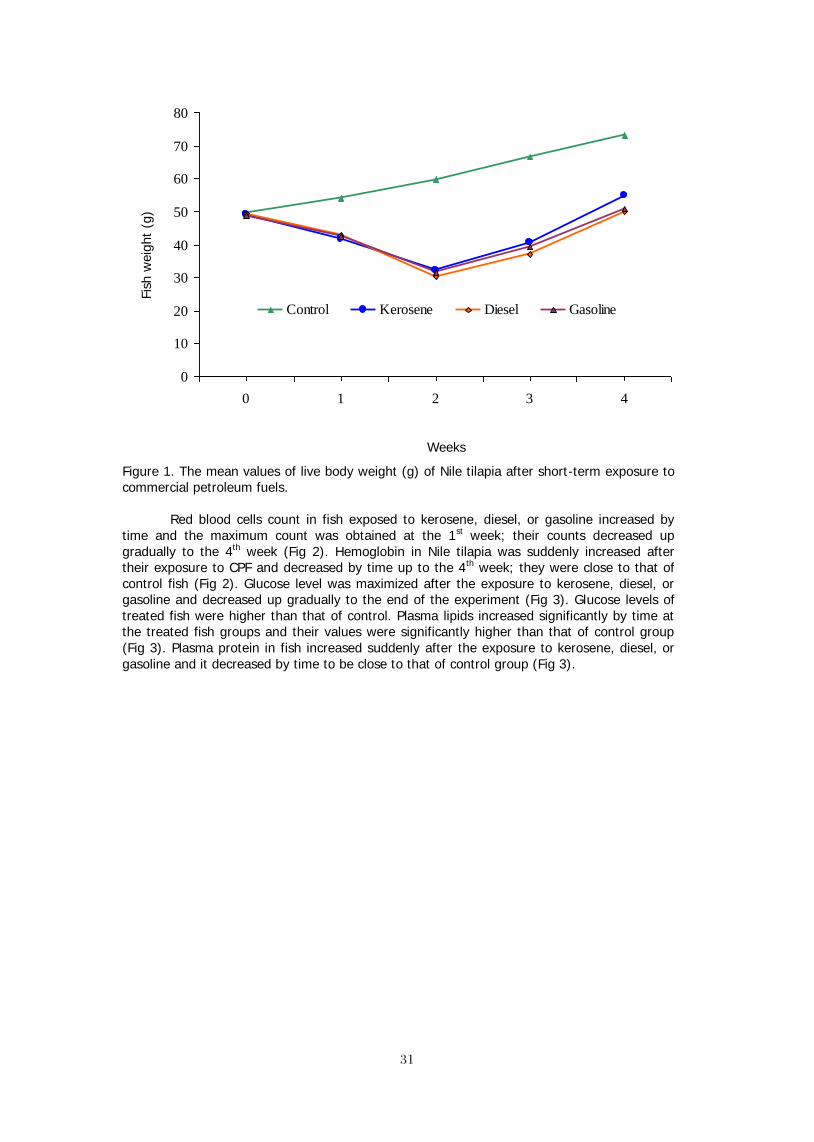
3131
Fish
wei
ght
(g)
0
10
20
30
40
50
60
70
80
0 1 2 3 4
Control Kerosene Diesel Gasoline
Weeks
Figure 1. The mean values of live body weight (g) of Nile tilapia after short-term exposure to commercial petroleum fuels.
Red blood cells count in fish exposed to kerosene, diesel, or gasoline increased by time and the maximum count was obtained at the 1st week; their counts decreased up gradually to the 4th week (Fig 2). Hemoglobin in Nile tilapia was suddenly increased after their exposure to CPF and decreased by time up to the 4th week; they were close to that of control fish (Fig 2). Glucose level was maximized after the exposure to kerosene, diesel, or gasoline and decreased up gradually to the end of the experiment (Fig 3). Glucose levels of treated fish were higher than that of control. Plasma lipids increased significantly by time at the treated fish groups and their values were significantly higher than that of control group (Fig 3). Plasma protein in fish increased suddenly after the exposure to kerosene, diesel, or gasoline and it decreased by time to be close to that of control group (Fig 3).
3232
RBC
(/N
o/m
m)
0.9
1
1.1
1.2
1.3
1.4
1.5
1.6
0 1 2 3 4
Control Kerosene Diesel Gasoline
Hem
oglo
bin
(mg/
dL)
2
2.5
3
3.5
4
4.5
5
0 1 2 3 4
Weeks
Figure 2. The mean values of RBCs count (No/mm) and hemoglobin (mg/dL) in Nile tilapia after short-term exposure to commercial petroleum fuels and recovered for 4 weeks.

3333
Glu
cose
(m
g/dL
)
50
70
90
110
130
150
170
190
0 1 2 3 4
Control Kerosene Diesel Gasoline
Plas
ma
lipid
s (m
g/dL
)
150
200
250
300
350
400
0 1 2 3 4
Plas
ma
prot
ein
(mg/
dL)
2
2.5
3
3.5
4
4.5
0 1 2 3 4
Weeks
Figure 3. The mean values of glucose, lipids, and protein (mg/L) in Nile tilapia after short-term exposure to commercial petroleum fuels.

3434
Plas
ma
AST
(mg/
dL)
0
50
100
150
200
250
0 1 2 3 4
Control Kerosene Diesel Gasoline
Plas
ma
ALT
(mg/
dL)
10
20
30
40
50
60
0 1 2 3 4
Weeks
Figure 4. The mean values of AST and ALT activities (mg/dL) in Nile tilapia after short-term exposure to commercial petroleum fuels.
Activities AST and ALT increased gradually after their exposure to kerosene, diesel, or
gasoline and the maximum values were obtained after 3-4 weeks (Fig 4). The lowest values of AST and ALT were obtained at control group, which did not significantly differ throughout the experimental period.
Plasma cortisol in fish was suddenly increased after their exposure to kerosene, diesel, or gasoline (Fig 5); cortisol value was significantly differed by fuel source (kerosene > gasoline > diesel). The lowest cortisol value was obtained at control which was insignificantly changed throughout the experimental period.

3535
Plas
ma
cort
isol
(µg
/L)
50
70
90
110
130
150
170
190
210
230
0 1 2 3 4
Control Kerosene Diesel Gasoline
Weeks
Figure 5. The mean values of plasma cortisol (µg/L) in Nile tilapia after short-term exposure to commercial petroleum fuels.
DISCUSSION
The results obtained herein indicated that CPF had negative impacts on the growth performance and survival of Nile tilapia. However, the exposure of fish to these pollutants resulted in reduced feed intake and thus lowered body weight. These results indicate that the exposure to CPF may lead to a reduction in fish appetite or complete fish fasting resulting in lower retention rate of nutrients into fish body and so growth was reduced. The findings of this study agreed with Kicheniuk and Khan (1981) and Kori-Siakpere (2000) who noted that exposure of fish to water soluble fractions (WSF) of crude oil can result in reduced feeding and lower body weight. Dede and Kaglo (2001) reported that the survival of Nile tilapia decreased by increasing concentration of diesel fuel. Ofojekwu and Onah (2002) stated that fish are known to increase their metabolic rates to metabolize and excrete aromatic hydrocarbons and consequently allocate more energy to homeostatic maintenance than storage exhibiting growth retardation. Additionally, delayed growth and reduced survival of pink salmon (Onchorhynchys gorbuscha) embryos has been observed following exposure to crude oil (Heintz et al. 2000). In juvenile turbot study, fish exposed to higher concentrations of the fuel exhibited reduced growth and feed consumption (Saborido-Rey et al. 2007).
Fish hypoxia and the increased respiration of fish were observed within few minutes after their exposure to CPF. This result may be because these pollutants have been reported to cause structural damage to the respiratory lamellae of the gills (Poirier et al. 1986; Correa and Garcia 1990; Prasad 1991), as well as to have narcotic actions (Correa and Garcia 1990). Such effects would be predicted to impede gas exchange, and result in hypoxaemia (Perry et al. 1989; Ristori and Laurent 1989; Randall and Perry 1992). Other studies using flounder (Platichtys flesus) found that exposure to the WSF of crude oil caused declines in the plasma oxygen content, suggesting fish were experiencing respiratory problems (Alkindi et al. 1996). In addition, fusion of secondary lamellae, gill hyperplasia, and oedema have been reported in fish exposed to petroleum hydrocarbons (Correa and Garcia 1990; Prasad 1991; Dede and Kaglo 2001).
The increase of RBC, Hb, glucose, and cortisol were observed in fish following their exposure to CPF. In this regard, the study of Alkindi et al. (1996) observed that after 3 h exposure of flounder to 50% WSF of crude oil, RBC and Hb increased significantly. Kita and
3636
Itazawa (1990), Pearson et al. (1992), and Alkindi et al. (1996) reported that the exposure of fish to petroleum hydrocarbons stimulates the release of catecholamines, which could have a number of potentially beneficial effects, including stimulation of splenic release of erythrocytes to aid O2 carrying capacity, stimulation of Na+/H+ exchange in erythrocytes, and resultant increases in haemoglobin-oxygen affinity. The rise in plasma glucose concentrations indicates a stress-induced mobilization of energy reserves. Some studies suggest that fish exposed to petroleum hydrocarbons have elevated concentrations of plasma cortisol indicating a corticosteroid stress response. In this regard, Alkindi et al. (1996) found that the exposure of flounders to a 50% dilution of the WSF of Omani crude oil, a mix of aromatic hydrocarbons (benzenes, toluene, and xylenes and lower amounts of naphthalenes), resulted in a progressive increase in plasma cortisol concentrations continuing over the 48-h exposure period. Moreover, cortisol has a direct effect on carbohydrate metabolism, stimulating glycogenolysis and gluconeogenesis, but that it also interacts with catecholamines which may exert dominant effects in the immediate stages of stress (Wright et al. 1989; Vijayan and Moon 1994; Vijayan et al. 1994).
The fluctuation in plasma lipids, protein, AST, and ALT may be due the disturbance of metabolic pathways. In addition, the increase in AST and ALT activities are indicatives to liver damage, which might have occurred due to the exposure to CPF and hence leading to the leakage of these enzymes into the blood. In this regard, Martin-Skilton et al. (2008) demonstrated that acute exposure of juvenile turbot, Scophthalmus maximus to the Prestige fuel oil elicits alterations in some hepatic biotransformation enzymes with different sensitivities, and leads to decreased levels of testosterone in plasma of juvenile turbot which might threaten reproductive capability of exposed individuals.
It is noticed that all variables were declined to be close to those of control group after 2 weeks, except lipids and AST, and ALT need time over 4 weeks to be near those of control group. These results may be because CPF not bioaccumulate in exposed fish, but they are rapidly metabolized to form epoxy- and hydroxyl-derivatives during phase I metabolism and subsequently converted into highly water-soluble conjugates (e.g., glucuronides or sulfates) that are excreted through the bile (Varanasi et al. 1985). Pollino and Holdway (2003) reported that the short-term exposures of petroleum hydrocarbons to rainbowfish at realistic concentrations potentially alter metabolic and detoxification enzymes, with metabolic enzymes recovering after depuration (17 days).
Conclusively, this study has demonstrated that the acute exposure to CPF significantly reduced the growth performance of Nile tilapia. The study has also showed that Nile tilapia can serve as a bio-indicator of CPF toxicity. Particular attention should also be given to CPF process aimed at minimizing their toxicity to the aquatic ecosystem.
REFERENCES
Afolabi, O.A., S.A. Adeyemi, and M.A. Imebore. 1985. Studies on toxicity of some Nigerian crude oils on some aquatic organisms. In: Proceedings of 1985 International Seminar on Petroleum industry and the Nigerian environment, Lagos, pp 269-273
Agbogidi, O.M., B.C. Okonta, and D.E. Dolor. 2005. Socio-economic and environmental impact of crude oil exploration and production on agricultural production: a case study of Edjeba and Kokori communities in Delta in Nigeria. Global Journal of Environmental Sciences 4: 171-176
Ajoa, E.A., E.O. Oyewo, and T. Orekoya. 1981. The effect of oil formation water on some marine organisms. In: Proceedings of an International Seminar on Petroleum Industry and the Nigerian Environment, NNPC, Warri Delta State, pp 80-82.
Alkindi, A., J. Brown, C. Waring, and J. Collins. 1996. Endocrine, osmoregulatory, respiratory and hematological parameters in flounder exposed to the water soluble fraction of crude oil. Journal of Fish Biology 49: 1291-1305
Azad, M. 2005. Toxicity of water-soluble fractions of four fuels on Metamysidopsis insularis, an indigenous tropical mysid species. Environmental Monitoring and Assessment 104:37-44
3737
Bamidele, J.F. and O.M. Agbogidi. 2006. The effects of soil pollution by crude oil on seedling growth of Machaerium lunatus (L) G.F.W. (MEG). Discovery and Innovation 18: 104-108
Boyd, C.E. 1984. Water Quality in Warm water Fishponds. Auburn University Agriculture Experimental Station, Auburn, Alabama, USA.
Chiu, S.K., C.P. Collier, A.F. Clark, and K.E. Wynn-Edwards. 2003. Salivary cortisol on ROCHE Elecsys immunoassay system: Pilot biological variation studies. Clinical Biochemistry 36: 211–214.
Correa, M. and H.I. Garcia. 1990. Physiological responses of juvenile white mullet, Mugil curema, exposed to benzene. Bulletin of Environmental Contamination and Toxicology 44: 428–434
Dede, E.B. and H.O. Kaglo. 2001. Aqua-toxicological effects of water soluble fraction (WSF) of diesel fuel on Oreochromis niloticus fingerlings. Journal of Applied Sciences and Environmental Management 5: 93-96.
Dytham, C. 1999. Choosing and using statistics: A Biologist’s guide. Blackwell Science Ltd., London, United Kingdom.
Ekweozor IKE (1989) A review of the effects of oil pollution in West African environment. Discov Innov 1: 27-37
El-Sayed A-FM (2006) Tilapia Culture. CABI publishing, CABI International Willingford, Oxfordshire, United Kingdom.
FEPA (1991) Guidelines and standards for environmental pollution control in Nigeria. The Federal Environmental Protection Agency, 238p.
Heintz, R.A., S.D. Rice, A.C. Wertheimer, R.F. Bradshaw, F.P. Thrower, J.E. Joyce et al. 2000. Delayed effects on growth and marine survival of pink salmon Oncorhynchus gorbuscha after exposure to crude oil during embryonic development. Marine Ecology Progress Series 208: 205–216
Henry, R.J. 1964. Colorimetric determination of total protein. In: Clinical Chemistry. Harper and Row Publ., New York, USA, p 181.
Joseph, A., M. Knight, S. Anderson, M. James, and H. Rawie. 1972. Chemical basis of the sulfophospho-vanillin reaction for estimating total serum lipid. Clinical Chemistry 18: 198-201
Kicheniuk JW, Khan RA (1981) Effect of petroleum hydrocarbons on Atlantic cod Gardus following chronic exposure. Can J Zool 65:490-494
Kilnhold, W.W. 1980. Some aspects of the impact of aquatic oil pollution on fisheries resources. FAO/UNDP South China sea. Fisheries, Development and Co-ordinary Progm, Manila, Philippines. pp 1-26.
Kita, J. and Y. Itazawa. 1990 Effects of adrenaline on the blood flow through the spleen of rainbow trout (Salmo gairdneri). Comparative Biochemistry and Physiology 95(A): 591–595.
Kori-Siakpere, O. 2000. Petroleum induced alterations in the African catfish, Clarias gariepinus (Teugels 1984): II. Growth factors. Nigerian Journal of Science and Environment 2: 87-92
Martin-Skiltona, R., F. Saborido-Rey, and C. Portea. 2008. Endocrine alteration and other biochemical responses in juvenile turbot exposed to the Prestige fuel oil. Science of the Total Environment 404: 68 – 76
Ofojekwu, P.C. and J.A. Onah. 2002 Effects of water-soluble fractions of crude oil on growth of the catfish, Clarias gariepinus (Burchell, 1822). African Journal of Environmental Pollution and Health 1(2): 1-7
Pearson, M., G. Kraak, and E.D. Stevens. 1992. In vivo pharmacology of spleen contraction in rainbow trout. Canadian Journal of Zoology 70: 625–627
Perry, S. F., R. Kinkead, P. Gallaugher, and D.J. Randall. 1989. Evidence that hypoxemia promotes catecholamine release during hypercapnic acidosis in rainbow trout (Salmo gairdneri). Respiratory Physiology 77: 351–364.
Poirier, A., F.B. Laurencin, G. Bodennec, and C. Quentel. 1986. Intoxication experimentale de la truite arc-en ciel Salmo gairdneri Richardson, par du gas-oil moteur: modifications haematologiques, histologie. Aquaculture 55: 115–137

3838
Pollino, C.A. and D.A. Holdway. 2003. Hydrocarbon-induced changes to metabolic and detoxification enzymes of the Australian crimson-spotted rainbowfish (Melanotaenia fluviatilis). Environmental Toxicology 18: 21–28.
Prasad, M.S. 1991. SEM study on the effects of crude oil on the gills and airbreathing organs of climbing perch Anabas testudineus. Bulletin of Environmental Contamination and Toxicology 47: 882–889
Randall, D.J. and S.F. Perry. 1992. Catecholamines. In: Fish Physiology. The cardiovascular system. Vol. XII, Part B (Hoar, W. S. and Randall, D. J., eds), Academic Press, London, pp 255–300.
Reitman, S. and S. Frankel. 1957. Colorimetric determination of glutamic oxaloacetic and glutamic pyruvic transaminases. American Journal of Clinical Pathology 28: 53-56
Ristori, M. and P. Laurent. 1989. Plasma catecholamines in rainbow trout, Salmo gairdneri, during hypoxia. Journal of Experimental Biology 48: 285–290.
Saborido-Rey, F., R. Domínguez-Petit, J. Tomás, B. Morales-Nin, and A. Alonso-Fernández. 2007. Growth of juvenile turbot in response to food pellets contaminated by fuel oil from the tanker ‘Prestige’. Marine Ecology Progress Series 345: 271–279
Trinder, P. 1969. Determination of glucose concentration in the blood. Annual Clinical Biochemistry 6: 24-27
Van Kampen, E.J. and N.C. Zijlstra. 1961. Determination of haemoglobin. Clinica Chimica Acta 5: 719-720
Varanasi, U., W.L. Reichert, J.E. Stein, D.W. Brown, and H.R. Sanborn. 1985. Bioavailability and biotransformation of aromatic hydrocarbons in benthic organisms exposed to sediment from an urban estuary. Environmental Science and Technology 19: 836–41
Vijayan, M.M. and T.W. Moon. 1994. The stress response and the plasma disappearance of corticosteroid and glucose in a marine teleost the sea raven. Canadian Journal of Zoology 72: 379–386
Vijayan, M.M., P.K. Reddy, J.F. Leatherland, and T.W. Moon. 1994. The effect of cortisol on hepatocyte metabolism in rainbow trout: a study using the steroid analogue RU486. General and Comparative Endocrinology 96: 75–84
Wright, P.A., S.F. Perry, and T.W. Moon. 1989. Regulation of hepatic gluconeogenesis and glycogenolysis by catecholamines in rainbow trout during environmental hypoxia. Journal of Experimental Biology 147: 169–188

3939
ACUTE TOXICITY OF WATER-BORN ZINC IN NILE TILAPIA, Oreochromis niloticus (L.) FINGERLINGS
Mohsen Abdel-Tawwab1*, Gamal O. El-Sayed2, and Sherien H.H.H. Shady1
1 Department of Fish Ecology and Biology, Central Laboratory for Aquaculture Research, Abbassa, Abo-Hammad, Sharqia, Egypt
2 Chemistry Department, Faculty of Science, Benha University, Benha, Egypt *Corresponding author email: [email protected]
Abstract
Zinc (Zn) is an essential trace element for most organisms including fish, but above certain limit Zn will be toxic. The present study was conducted to evaluate the toxic effect of water-born Zn on Nile tilapia, Oreochromis niloticus (L.) via estimating the acute 96-h median lethal concentration (LC50) value and behavioral changes. A total 140 of Nile tilapia fingerlings was subjected to 14 20-L aquaria. Fish were exposed to 0.0, 10, 40, 70, 100,130, or 160 mg Zn/L for 4 days. Each Zn dose was represented by two aquaria. Fish was daily observed and dead fish were removed immediately. The data obtained were statistically evaluated using Finney’s Probit Analysis Method and Behrens–Karber’s Method. The 96 h LC50 value for Nile tilapia was found to be 63.984 mg/L with 95% confidence limits of 48.029 – 78.372 mg/L. This value was calculated to be 70.0 mg/L with Behrens–Karber’s Method. The behavioral changes of Nile tilapia were primarily observed as nervous and respiratory manifestations. It could be concluded that Nile tilapia is a species slightly sensitive to Zn and the two methods were relatively comparable.
INTRODUCTION Pollution of the aquatic environment with heavy metals has become a serious health
concern in recent years. These metals are introduced into the aquatic ecosystem through various routes such as industrial effluents and wastes, agricultural pesticide runoff, domestic garbage dumps and mining activities (Merian, 1991). Increased discharge of heavy metals into natural aquatic ecosystems can expose aquatic organisms to unnaturally high levels of these metals (van Dyk et al., 2007). Among aquatic organisms, fish cannot escape from the detrimental effects of these pollutants, and are therefore generally considered to be the most relevant organisms for pollution monitoring in aquatic ecosystems (van der Oost et al., 2003).
It has been reported that heavy metals had a negative impact on all relevant parameters and caused histo-pathological changes in fish. Some heavy metals are essential elements, while others are non-essential. Zinc (Zn) is one of the most important trace metals in the body, and participates in the biological function of several proteins and enzymes (Maity et al., 2008). Despite being an essential trace element, Zn is toxic to most organisms above certain concentrations (Ho, 2004). Since the range-finding acute test is conducted to pinpoint exposure concentrations; the definitive acute test is firstly conducted to estimate LC50 of the chemical to which organisms are exposed (Rand, 2008). Nile tilapia, Oreochromis niloticus (L.) is an important commercial fish in Egypt and worldwide (El-Sayed, 2006) and it could be used as test organism for evaluation the impact of heavy metals. Consequently, the objective of this study is to assess the responsiveness of Nile tilapia to Zn through determination of acute 96-h LC50 value and behavioral responses induced from exposure to different Zn concentrations.
MATERIALS AND METHODS Fish management:
Apparently healthy Nile tilapia, O. niloticus (L.) (4.6 ± 0.2 g) were obtained from fish hatchery, Central Laboratory for Aquaculture Research, Abbassa, Abo-Hammad, Sharqia, Egypt. Prior to the experiment, fish were acclimatized for 2 weeks in 14 40-L glass aquaria under laboratory conditions (natural photoperiod 11.58–12.38 h); 10 fish per each aquarium. The continuous aeration was maintained in each aquarium using an electric air pumping compressors. Fish were fed daily on commercial fish diet containing 25% crude protein provided for satiation twice daily at 9:00 and 14:00 h.

4040
Analysis of the water physico-chemical variables: Water samples were collected from each aquarium prior to Zn exposure. Dissolved
oxygen and temperature were measured on site with an oxygen meter (YSI model 58, Yellow Spring Instrument Co., Yellow Springs, Ohio, USA). pH value was measured using a pH-meter (Digital Mini-pH Meter, model 55, Fisher Scientific, Denver, USA). Total alkalinity and total hardness were measured according to Boyd (1984). The mean values for test water variables were as follows: dissolved oxygen 5.84±0.72 mg/L, pH 7.5±0.1, water temperature 25.5± 0.1 oC, total alkalinity 153.7±4.8 mg/L as CaCO3, and total hardness 222.5±2.9 mg/L as CaCO3. Experimental procedures:
The heavy metal Zn in the form of zinc sulfate anhydrous (Analar grade, Merck, Readington Township, New Jersey, USA) was used in the present study. The acute toxicity test was performed for 4 days in which two replicates of seven different Zn concentrations (0, 10, 40, 70, 100, 130, and 160 mg/L) were used (10 fish for each aquarium). At 24, 48, 72, and 96 h, fish dead were counted in the different Zn concentrations along with the control group. In this study, the acute toxic effects of Zn on Nile tilapia were determined by the use of Finney’s Probit Analysis LC50 Determination Method (Finney, 1971). The computer model (Probit Program Version 1.5 software) was developed by Environmental Protection Agency (EPA, 1999). It was designed for the analysis of mortality data from acute toxicity tests with fish and other aquatic life, performed with reference toxicants by regulatory agencies and permittees under the National Pollutant Discharge Elimination System (NPDES). In addition, the data were also assessed according to Behrens–Karber’s method using the following formula (Klassen, 1991):
LC50 = LC100 ∑A x B / N as mg/L;
where LC50 and LC100 indicate the lethal doses for 50% and 100% of the tested fish. Value ‘‘A” gives the differences between the two consecutive doses, ‘‘B” the arithmetic mean of the mortality caused by two consecutive doses and ‘‘N” the number of tested fish in each group. The dead fish were removed immediately. Behavioral changes, clinical toxic signs and postmortem lesions of tested fish were closely followed up and recorded daily.
RESULTS
The data obtained from the acute toxicity test of water-born Zn for Nile tilapia revealed that the Zn toxicity increased with increasing concentration and/or exposure time. The number of dead fish in relation to the Zn concentrations (40, 70, 100, 130 and160 mg/L) were assessed and counted during the exposure time at 24, 48, 72 and 96 h then they were removed immediately. No mortality was observed during the 96 h at control (0.0 mg Zn/L) and 100% mortality rate was achieved only at 130 and 160 mg Zn/L (Table 1).
Table 1. The cumulative mortalities and acute 96 h LC50 of water-born Zn in Nile tilapia
fingerlings according to Behrens-Karber's method (Klassen, 1991).
Zn dose (mg/L)
No. of exposed fish
No of dead fish Overall deaths within 96 h
A B AB D1 D2 D3 D4
0 10 0 0 0 0 0 0 0 0 10 10 0 0 0 0 0 10 0 0 40 10 0 1 2 2 2 30 1.0 30 70 10 2 3 4 4 4 30 3.0 90 100 10 8 9 9 9 9 30 6.5 195 130 10 8 10 10 10 10 30 9.5 285 ∑AB =600
Where A = differences between the two consecutive doses and B = arithmetic mean of the mortality caused by two consecutive doses. 96 h LC50 = LC100 - ∑ (A x B)/N = 130 – 600/10 = 70.0 ppm.
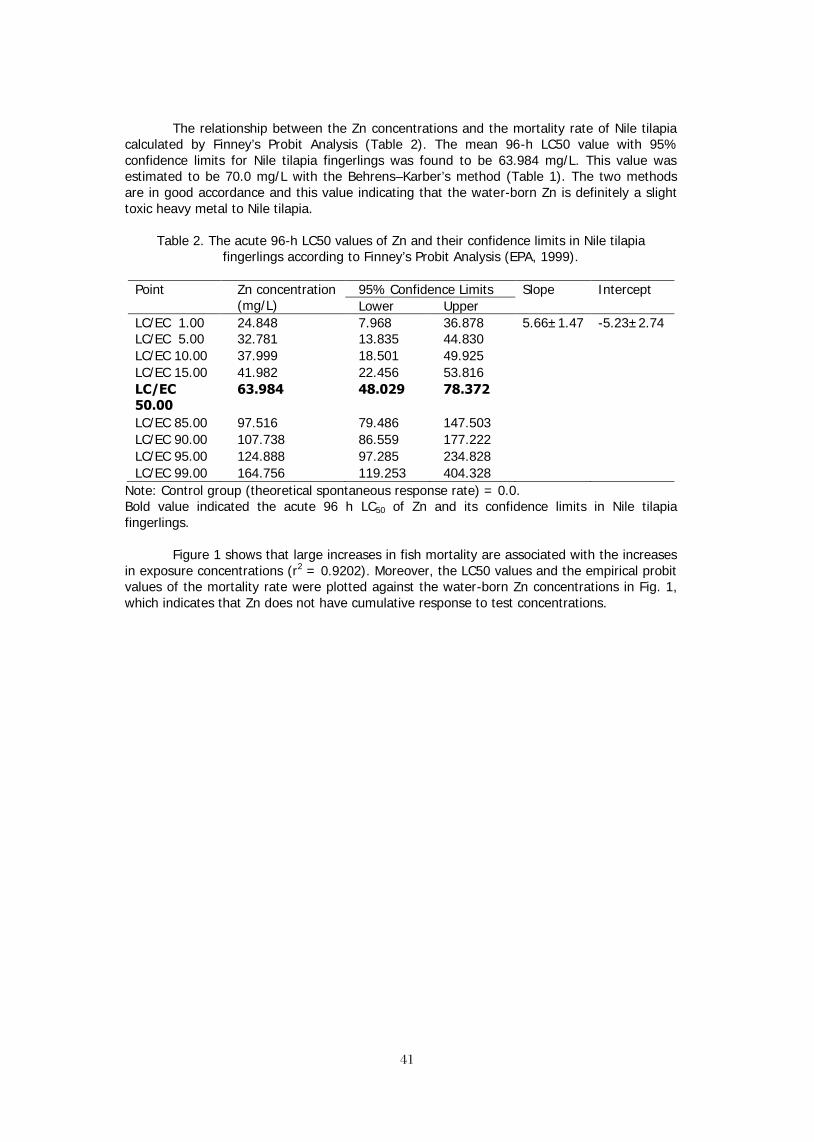
4141
The relationship between the Zn concentrations and the mortality rate of Nile tilapia
calculated by Finney’s Probit Analysis (Table 2). The mean 96-h LC50 value with 95% confidence limits for Nile tilapia fingerlings was found to be 63.984 mg/L. This value was estimated to be 70.0 mg/L with the Behrens–Karber’s method (Table 1). The two methods are in good accordance and this value indicating that the water-born Zn is definitely a slight toxic heavy metal to Nile tilapia.
Table 2. The acute 96-h LC50 values of Zn and their confidence limits in Nile tilapia fingerlings according to Finney’s Probit Analysis (EPA, 1999).
Point Zn concentration
(mg/L) 95% Confidence Limits Slope Intercept Lower Upper
LC/EC 1.00 24.848 7.968 36.878 5.66±1.47 -5.23±2.74 LC/EC 5.00 32.781 13.835 44.830 LC/EC 10.00 37.999 18.501 49.925 LC/EC 15.00 41.982 22.456 53.816 LC/EC 50.00
63.984 48.029 78.372
LC/EC 85.00 97.516 79.486 147.503 LC/EC 90.00 107.738 86.559 177.222 LC/EC 95.00 124.888 97.285 234.828 LC/EC 99.00 164.756 119.253 404.328
Note: Control group (theoretical spontaneous response rate) = 0.0. Bold value indicated the acute 96 h LC50 of Zn and its confidence limits in Nile tilapia fingerlings.
Figure 1 shows that large increases in fish mortality are associated with the increases
in exposure concentrations (r2 = 0.9202). Moreover, the LC50 values and the empirical probit values of the mortality rate were plotted against the water-born Zn concentrations in Fig. 1, which indicates that Zn does not have cumulative response to test concentrations.

4242
Fig 1. Plot of adjusted probits and predicted regression line.
It was observed that Nile tilapia individuals exhibited a variety of behavioral changes when subjected to different Zn concentrations. The behavioral and swimming patterns in the control group were normal and there were no deaths during the experimental period. The behavioral changes and clinical toxic symptoms in Nile tilapia subjected to different Zn concentrations are the following: sluggish movement, loss of equilibrium, and rapid operculum movement as respiratory manifestations. Variable degrees of fin erosions were seen. Fish died during the experiment were immediately removed from the aquaria and subjected to a necropsy. The necropsy revealed that there were general congestion of the kidneys and gills, and spots of congestion on the periphery of the liver at macroscopic scale.
DISCUSSION
In the present study, Zn toxicity was indicated by fish mortality. Shetty Akhila et al. (2007) reported that the determination of acute toxicity is usually an initial screening step in the assessment and evaluation of the toxic characteristics of all compounds. Likewise, De Schamphelaere and Janssen (2004) reported that fish mortality might be a more sensitive endpoint for assessing effect of Zn exposure. The acute 96-h LC50 value of water-born Zn for Nile tilapia having an average weight 4.6 g was calculated as 63.984 mg/L by using Finney’s Probit Analysis and 70.0 mg/L by the use of Behrens–Karber’s method. The 96-h LC50 values obtained for both methods were found to be relatively comparable. Similar results were

4343
obtained El-Sayed et al. (2009) who used both methods to evaluate the acute toxicity of ochratoxin-A in sea bass (Dicentrarchus labrax L.).
Bengeri and Patil (1986) found that the 96-h LC50 of Zn for Labeo rohita was 65.0
mg/L. Hilmy et al. (1987) found that the 96-h LC50 of Zn for Tilapia zillii and Clarias lazera at summer (25.0 oC) was 13.0 and 26.0 mg/L, respectively. Senthil Murugan et al. (2008) found that the 96-h LC50 concentration of Zn for snakehead, Channa punctatus was 48.68 mg/L. The variation in LC50 values among the different studies may be due to the variations in kinetic variables that may play a role in explaining these differences. Moreover, the alkaline and hard water in the present study could be responsible for being the LC50 herein higher than the other studies. In this regard, Weatherley et al. (1980) and Wood (2001) stated that Zn bioavailability and toxicity to aquatic organisms are affected by pH, alkalinity, dissolved oxygen, and temperatures. Alabaster and Lloyd (1982) and Everall et al. (1989) stated that Zn toxicity to fish can be greatly influenced by both water hardness and pH. Hilmy et al. (1987) found that 96-h LC50 for both fishes increased with the decrease in water temperature. Eisler (1993) reported that the acute 96-h LC50 values for fish were between 66 and 40,900 µg Zn/L depending on many factors including pH, alkalinity, dissolved oxygen, and temperatures.
Previous studies have shown that Zn accumulation in fathead minnow, Piinphales
promelus, and common carp, Cyprinus carpio, was reduced in hard water compared with soft waters (Everall et al., 1989). However, Bradley and Sprague (1985) found that in hard water, Zn accumulation in the gills of rainbow trout, Salmo gairdneri, was reduced and suggested that water hardness may protect fish by altering the dynamics of Zn exchange mechanisms. Moreover, the process of metal uptake may be dependent upon the metal exposure level, its local availability at the sites of uptake and the duration of exposure. Immediate levels of Zn exposure have been shown to affect the pattern and rate of metal uptake (Everall, 1987). It is possible that previous metal acclimation may also affect the pattern and rates of Zn uptake, dependent upon prior tissue loading and depuration (Bradley et al., 1985).
The loss of positive rheotaxis is a good indication of any toxic response, but in the case of Zn it takes place when poisoning is already irreversible. Signs of poisoning before loss of positive rheotaxis are not the same at high and lower concentrations; the air gulping and the increased opercular movement observed at high concentrations contrast with the general apathy and ataxia, but without apparent respiration difficulties observed at low concentrations. A comparable behaviour was reported by Matthiessen (1974) for Sarotherodon mossambicus and Hilmy et al. (1987) for Tilapia zillii and Clariaz lazera. An interpretation of the toxicity data is that two poisoning mechanism may take place, one occurring at high concentrations and provoking a rapid suffocation by destruction of the gill epithelium, the other prevailing at low concentrations and consisting of an inhibition of the main metabolic pathways.
In conclusion, Nile tilapia is a slightly susceptible species to water-born Zn and the two methods were relatively comparable and useful. The useful experimental models could be widely used to assess the aquatic toxicology of heavy metals.
REFERENCES Alabaster, J.S. and R. Lloyd. 1982. Water Quality Criteria for Freshwater Fish. London:
Butterworth, pp 361. Bengeri, K.V. and H.S. Patil. 1986. Respiration, liver glycogen and bioaccumulation in Labeo
rohita exposed to zinc. Ind. J. Comp. Anim. Physiol. 4: 79-84. Boyd, C.E. 1984. Water Quality in Warmwater Fishponds. Auburn University Agriculture
Experimental Station, Auburn, Alabama, USA. Bradley, R.W. and J.B. Sprague. 1985. The influence of pH, water hardness and alkalinity on
the acute lethality of zinc to rainbow trout (Salmogairdneri). Can. J. Fish. Aquat. Sci. 42, 731-736.
4444
Bradley, R.W., C. Duquesnay, and B. Sprague. 1985. Acclimation of rainbow trout, Salmo gairdneri Richardson, to zinc: kinetics and mechanism of enhanced tolerance induction. J. Fish Biol. 27: 367-379.
De Schamphelaere, K.A., Janssen, C.R., 2004. Bioavailability and chronic toxicity of zinc to juvenile rainbow trout (Oncorhynchus mykiss): comparison with other fish species and development of a biotic ligand model. Environ. Sci. Technol. 38: 6201–6209.
Eisler, R. 1993. Zinc Hazards to Fish, Wildlife, and Invertebrates: A Synoptic Review. U.S. Fish and Wildlife Service, Biological Report 10.
El-Sayed, A.-F.M. 2006. Tilapia Culture. CABI publishing, CABI International Wallingford, Oxfordshire, UK.
El-Sayed, Y.S., R.H. Khalil, and T.T. Saad. 2009. Acute toxicity of ochratoxin-A in marine water-reared sea bass (Dicentrarchus labrax L.). Chemosphere 75: 878–882.
EPA 1999. LC50 Software Program, Version 1.50. Ecological Monitoring Research Division, Environmental Monitoring Systems Laboratory, EPA, Cincinnati, Ohio 45268, USA. <http://www.epa.gov/nerleerd/stat2.htm>.
Everall, N.C., 1987. The effects of water hardness and pH upon the toxicity of zinc to the brown trout Salmo trutta. Ph.D. thesis, Trent Polytechnic, Nottingham, UK, pp 242.
Everall, N.C., N.A.A. Macfarlane, and R.W. Sedgwi. 1989. The effects of water hardness upon the uptake, accumulation and excretion of zinc in the brown trout, Salmo trutta L. J. Fish Biol. 5: 881-892.
Finney, D.J. 1971. Probit Analysis. Cambridge University Press, New York, USA, pp 337. Hilmy, A.M., N.A. El-Domiaty, A.Y. Daabees, and H.A. Abdel Latife. 1987. Toxicity in Tilapia
zillii and Clarias lazera (Pisces) induced zinc, seasonally. Camp. Biochem. Physiol. 86C: 263-265.
Ho, E. 2004. Zinc deficiency, DNA damage and cancer risk. J. Nutr. Biochem. 15: 572–578. Klassen, C.D. 1991. Principles of toxicology. In: Gilman, A.G., Tall, T.W., Nies, A.S., Taylor, P.
(Eds.), Pharmacological Basis of Therapeutics, eighth ed. McGraw-Hill, Berlin, pp. 49–61.
Maity, S., S. Roy, S. Chaudhury, and S. Bhattacharya. 2008. Antioxidant responses of the earthworm Lampito mauritii exposed to Pb and Zn contaminated soil. Environ. Pollut. 151: 1–7.
Matthiessen, P. 1974. Some effects of slow release bis(tri-n-butyltin) oxide on the tropical food fish, Tilapia mossambica (Peters). In: Controlled Release Pesticide Symposium, Report No. 25, The University of Akron, Ohio, USA.
Merian, E. 1991. Metals and their Compounds in the Environment. Occurrence, Analysis and Biological Relevance. VCH: Weinheim.
Rand, G.M. 2008. Fish toxicity studies. In: Di Giulio, R.T., Hinton, D.E. (Eds.), The Toxicology of Fishes. CRC Press, New York, USA, pp. 659–682.
Senthil Murugan, S., R. Karuppasamy, K. Poongodi, and S. Puvaneswari. 2008. Bioaccumulation pattern of zinc in freshwater fish Channa punctatus (Bloch.) after chronic exposure. Turk. J. Fish. Aquat. Sci. 8: 55-59.
Shetty Akhila, J., Deepa, S., Alwar, M.C., 2007. Acute toxicity studies and determination of median lethal dose. Current Science 93(7): 917 – 920.
van der Oost, R., J. Beyer, and N.P.E. Vermeulen. 2003. Fish bioaccumulation and biomarkers in environmental risk assessment: a review. Environ. Toxicol. Pharmacol. 13: 57–149.
van Dyk, J.C., G.M. Pieterse, and J.H.J. van Vuren. 2007. Histological changes in the liver of Oreochromis mossambicus (Cichlidae) after exposure to cadmium and zinc. Ecotoxicol. Environ. Safety 66: 432–440.
Weatherley, A.H., P.S. Lake, and S.C. Rogers. 1980. Zinc pollution and the ecology of the freshwater environment. In: J. O. Nriagu (ed.), Zinc in the environment. Part I: Ecological Cycling. John Wiley, New York, USA, pp 337-417.
Wood, C.M. 2001. Toxic responses of the gill. In: Schlenck, D., Benson, W.H. (Eds.), Target Organ Toxicity in Marine and Freshwater Teleosts Vol. 1, Organs. Taylor and Francis, London, New York, pp. 1–89.

4545
FIVE STAR CERTIFICATION PROGRAM AGAINST OFF-FLAVOR IN
TILAPIA FILLETS
Tomi Hong
4646
ACUTE TOXICITY OF AQUEOUS Morinda lucida LEAF EXTRACTS TO NILE TILAPIA, Oreochromis niloticus (LINNAEUS 1857)
Oyedapo FAGBENRO and Iyabo AKINDUYITE
Department of Fisheries and Aquaculture Technology, Federal University of Technology, Akure, Nigeria
ABSTRACT
Acute toxicity tests (range finding and definitive) using aqueous extracts of Morinda lucida on Oreochromis niloticus fingerlings (mean wt., 6.2g ± 1.2g) were conducted in a static bioassay inside plastic tanks. In the range-finding test, the concentration range tested was 20, 40, 60, 80 and100g M. lucida/L of water while 70, 72, 74, 76 and 78 M. lucida/L of water was used in the definitive test. The LC50 at 24 hours was 1.869g M. lucida g/L of water. There were five concentrations with control and each treatment was replicated twice. For each test, 15 O. niloticus fingerlings were used in each plastic tank. The responses exhibited by O. niloticus fingerlings subjected to the toxicant include erratic swimming, loss of reflex, colour change, weakened motion and vertical swimming. These were enhanced by the increase in concentration of the toxicant and the duration of exposure. During the 24 hours of range finding test, no mortality occurred at concentrations 20, 40, 60, 80 and 100 g M. lucida/L. No mortality was recorded in the 96 hours at concentration 20.0g M.lucida/L. Histological changes occurred in the gills and liver of the fish in the definitive test as gill alterations (hydropic degeneration of the gill rays, degeneration of the gill lamellae and necrosis) which were usually related to gills function disorders. Liver shows hepato-cellular architecture, hydropic degeneration, vacuolation of the liver cells and spaces within the cell protoplasm filled with fluid. This effect intensified with increasing M. lucida concentration.
INTRODUCTION
The Nile tilapia, Oreochromis niloticus, is an important cultured fish species in Nigeria. The main advantage of tilapia is relatively low cost of production, mainly for fry and seed, and the quality of its flesh. The attributes that make Nile tilapia so suitable for fish farming, are its resistance against harsh conditions, ease of breeding, rapid growth rate, ability of efficiently convert organic and domestic wastes into high quality protein, and good taste (de Graaf et al., 1999). Other advantages are its herbivorous nature and its mouth brooding habits, tolerance of poor water quality and fast growth at warm temperature.
Morinda lucida is a species yielding dyes, timber, fuel and traditional medicines. The leaves are use as the remedies against different type of fever. M. lucida known as ‘Oruwo’ in south-western Nigeria, it is a medium-sized tree at maturity. The stem bark infusion is used as an anti-malarial and antidiabetic (Burkill, 1997), anti-malarial activity (Tona et al., 1999; Agomo et al., 1992; Asuzu and Chineme, 1990); Makinde and Obih, 1985; Koumaglo et al., 1992), anti-Salmonella typhi activity (Akinyemi et al.,2005),effect on contractivity of isolated uterine smooth muscle of pregnant and non pregnant mice(Elias et al.,2007),toxicity and mutagenic studies (Sowemimo et al., 2007; Akinboro and Bakare, 2007; Koumaglo et al., 1992; Raji et al., 2005); and anti-diabetic property(Olajide et al., 1999) of Morinda lucida extracts have all been reported
M. lucida is a multipurpose species yielding dyes, timber, fuel and traditional medicines (Abbiw, 1990). The useful parts of M. lucida are mostly collected from wild plants. Only occasionally are plants grown in home gardens. Propagation is possible by seed and cuttings. The genus Morinda comprises about 80 species and occurs throughout the tropics. In Africa five species are found. The comparatively small flowering and fruiting heads on long
4747
slender peduncles are distinctive characteristics of M. lucida. The growth and development of M. lucida is from February to May, fruiting from April to June. M. lucida grows in grassland, exposed hillsides, thickest, forests, often on termite mounds, sometimes in areas which are regularly flooded, from sea-level up to 1300m altitude. In West Africa, M. lucida is an important plant in traditional medicine. Morinda lucida is an important plant used in traditional medicine. Decoctions and infusions or plasters of root, bark and leaves are recognized remedies against different types of fever. M. lucida is one of the four most used traditional medicines against fever. M. lucida grows in grassland, exposed hill sides, thickest forest often on the mite mounds. The useful parts of M. lucida are mostly collected from wild plants only occasionally are they grown in home gardens (Adesida and Adesogan, 1972). In West Africa, the roots of M. lucida are sold in load shops and markets, both as dyestuff and medicine. Leaves and twigs are sold in markets as a medicinal tonic for young children in Africa.
Aquatic toxicity tests are used to detect and evaluate the potential toxicological effects of chemicals or toxicants which exhibit changes in the aquatic environment. Studies have revealed that organisms exposed to chemical or toxicants usually exhibit changes in opercula rate and may cause physical damages to fish particularly on the gill surfaces (Davis, 1973). Toxic substances may be introduced deliberately or accidentally into the aquatic ecosystem, impairing the quality of water and making it unsuitable for aquatic life. When the concentration of the toxic substance is higher than what the homeostasis of the fish can control, it results in death or cause damages in the fish opercula and may also cause physical damages to fish particularly on the skin, liver and gill surface.
The objectives of this study are to determine the lethal concentration (LC50) value of O. niloticus fingerlings exposed to varying concentrations of M. lucida leaf extract (dry) and determine the effects of acute and sub-lethal concentrations of M. lucida extract on histopathology of gills and liver tissues of O. niloticus fingerlings.
MATERIALS AND METHODS O. niloticus fingerlings, (mean weight 6.2g ± 1.2g) were purchased and were acclimated for 48 hours prior to toxicity tests inside plastic tanks (30 L capacity). Each tank was filled with 15 litres of water obtained from the borehole. Fish were fed to satiation daily with a commercial 35% crude protein pelleted feed. Feeding was discontinued 24 hours prior to the commencement of the tests. Individual weights of the fingerlings were measured with a top-loading mettler balance and distributed randomly in duplicate treatments at 15 fingerlings/tank. Leaves of M. lucida were collected around the Federal University of Technology, Akure and sun-dried at ambient temperature, and milled into powder.
A range finding test served as a preliminary test which was followed by definitive test. In the range finding test, five triplicate treatments using five test concentrations of 20.0, 40.0, 60.0, 80.0, 100.0g M. lucida /L of spring water were used. O. niloticus fingerlings were stocked into each tank for 24 hours prior to the introduction of M. lucida leaf extract (dry) to the water. The range finding test lasted for 96 hours and was checked initially at four hours intervals followed by 12 hours intervals. Mortality of the fingerlings was routinely monitored and recorded. The failure to respond to external stimuli was used as an index of death. LC50 is the concentration of M. lucida extract estimated to the lethal to 50 of the test organism after 96 hours of exposure using probit analysis and by graphical method. Five concentrations of M. lucida used in the definitive test were 70.0 72.0, 74.0, 76.0g and 78.0g M. lucida/L. The concentrations were prepared arithmetically and followed the results obtained from the range-finding test. The test lasted for 96 hours and O. niloticus fingerlings mortality was monitored at 3 hours followed by 12 hours intervals. The dissolved oxygen concentration, pH and temperature were determined every 24 hours. The behaviour and mortality of the fish were observed and recorded after 24 hours.
The 96 hour LC50 was estimated by probit analysis as described by Wardlaw (1985) and by graphical method. At the end of the definitive test, O. niloticus fingerlings were

4848
dissected to remove the gills and liver. The organs were fixed in 10% formalin for 72 hours, dehydrated in graded level, alcohol (50, 70, 90, 100%) after which they were cleared in 50/50 mixture of alcohol and xylene for 3 hours, then 100% xylene for three hours and impregnated in molten wax, oven-dried for 6 hours after which they were embedded in Petri dishes with wax. The specimens were mounted and sectioned 8µ thickness prior to staining in haematocylin and eosin. Photomicrographs were taken with Leitz (Ortholux) microscope fitted with camera.
RESULTS During the range finding test, O. niloticus exhibited various reactions which included, erratic movement, vertical swimming position, colour change to dark brown, weakened swimming motions, sudden jerky swimming movement, and changes in opercula rate. All fish in the control treatment survived throughout the 96 hours duration of the experiment. Fish mortality in the varying concentrations (Table 1) increased with increasing concentration of the M. lucida used. In the definitive test, fish swam weakly, settling at the bottom of the tank. They showed less movement with increase in duration of the exposure, and showed increased weakness, remaining motionless most of the time. The LC50 aws determined as 1.87 mg/L. The summary of histological observations in the gills and liver of O. niloticus exposed to varying concentrations of M. lucida are presented in Tables 1 and 2, respectively.
Table 1: Histological changes in gills of O. niloticus fingerlings. Concentration
(g/L) Histological observation
0 No visible alteration on the gill ray 70 normal gill architecture 72 inflammation of the gill lamella 74 degeneration of the gill architecture 76 hydropic degeneration in the gill lamellae and disintegration of the gill
aarchitecture 78 erosion of the gill filaments and gill rakers
Table 2: Histological changes in liver of O. niloticus fingerlings.
Concentration (g/L)
Histological Observation
0 Normal hepato-cellular architecture 70 normal liver architecture. 72 Normal heptocellular architecture of the liver cells. 74 Hydropic degeneration in the hepatic parenchyma of the liver cells
76 Severe alteration in the liver architecture 78 vacuolation within the cell protoplasm field with fluid
DISCUSSION
Different behaviour shown demonstrated to be sensitive indicator of the physiological stress in fish subjected to sub lethal concentrations of pollutant (Davis, 1973) when the pollutant was introduced into the water containing the test fish, the fish at first displayed attempt to jump out. After being stressed, they resorted to settling at the bottom of the plastic tank and became motionless with slow opercula movement. The abnormal behaviour displayed by the fish subjected to M. lucida increased with increasing concentration of the pollutant used. The observation of fish response in this experiment agreed with Akinbulumo (2005) who reported that fish showed toxic reactions to Derris elliptica root powder by surfacing jaws and becoming stupefied. Also, according to Pascual et al., (1994) fish staying at the bottom of the plastic tank is a sign of stress or weakness.
The fish in the M. lucida solution showed erratic swimming, loss of reflex, vertical swimming position, colour changes (discolouration) and weakened swimming motion (Table1and 2). Fish response observed in the study agreed with similar observation made by
4949
White (1980) in Atlantic herring, Clupea harengus, exposed to dinoflagallate toxins. The abnormal swimming and changes in colour are indicative of stress which might lead to mortality (Chan, 1982). The test fish showed abnormal swimming and subsequently erratic movement and they finally settled to the bottom, showing signs of exhaustion, stress after which they move along the tank bottom and finally die off. This was in accordance with Liong et al., 1988, moreover according to Pascual et al. (1994) suspected that fish staying at the bottom of the rubber tank is a sign of weakness.
O. niloticus fingerlings survived in low concentration of Morinda lucida and died at higher concentration (table 1and 2). In this study, the replicates gave different fish mortality values. This agrees with the observation of Chen and Lei (1990) who observed that juveniles of penaeus monodon showed differences in the tolerance to ammonia and nitrate solutions.
There were significant difference in the treated water in range finding test and also there were significant difference between the central medium and treated water in definitive test in terms of physico-chemical measurement (Table 4).
The results of physico-chemical parameters of the experimental water at the end of the experiment, 96 hours of introduction of toxicant are given in (table 4).Water temperature in the experimental tanks was affected by the concentration of Morinda lucida, also the dissolve 02 content of the samples were within the range desirable (>3ppm) for the optimum growth of Orechromis niloticus (Alex Bocek et al, 1991).
Water temperature was within the range desirable (24-280C) for the optimum growth of O.niloticus (Alex Bocek et al., 1991). The pH of the test media obtained from the experiment indicated that the addition of M.lucida increased the pH.
Histological changes
Histological examinations of O. niloticus gave significant indication of toxicity of M. lucida (Table 5 and 6). The effects include gill alterations such as: hydropic degeneration in the gill lamellae, inflammation of the gill, and disintegration of the gill architecture and fusion which denotes gill functional disorders which may affect the fish physiology or cause death of the fish. In this study, observations showed that the damage of the liver cells increased with increasing concentration and duration of exposure to the toxicant. Liver alteration such as, normal hepato-cellular of the liver cells, hydropic degeneration in the hepatic parenchyma of the liver cells, which are usually related to liver functional disorder, which may affect the physiology and caused death and spaces within the cell protoplasm filled with fluid.
The histopathological changes detected seem to have been caused by the toxicant M. lucida, while the mortality recorded could be due to the malfunctioning of the gills and the disorder of the liver. The results showed that M. lucida is toxic to O. niloticus fingerlings. The results of this study showed that the survival of O. niloticus was directly related to the concentration of M. lucida in solution. The water quality parameters increased concentration of M. lucida with time. There was a visible effect of M. lucida concentration on histopathological alterations/changes in the gills of the O. niloticus fingerlings these include; degeneration of gill architecture, disintegration of the gill and erosion of the gill filaments and gill rakes. Histopathological evidence of the gill damaged caused by M. lucida toxicity was evident resulting from malfunctioning of the gill.
The liver is an important centre of metabolism of various substances and supporting the stability of intra-circumstances of organism, therefore the changes that occur in the liver would interfere with the normal metabolic function of the liver cells. Mortality may be as a result of the disorder of the liver. Changes that occur in the liver include: degeneration in hepatic parenchyma, hydropic degeneration and hepato-cellular of the liver cells and necrosis. The 96 hours LC50 of M. lucida dry extract to O. niloticus was at 1.869g M. lucida/L of water at 24 hours.

5050
REFERENCES
Abbiw, D.K., (1990). Useful plants of Ghana: West African uses of wild and cultivated plants. Intermediate Technology Publications, London and Royal Botanic Gardens, Kew, Richmond, United Kingdom, xii +377pp.
Adamassu D. (1996): The breeding season of tilapia. Oreochromis niloticus L in lake Awassa (Ethiopian rift valley). Hydro biological 337: 77 – 83.
Adesida, G.A. and Adesogan, E.K., (1972): Oruwal, a novel dihydroanthraquinone pigment from morinda lucida Benth journal of the Chemical Society. Chemical Communications 1:405 – 406.
Agomo, P.U., J.C. ldigo and B.M. Afolabi., (1992). Antimalarial’’medicinal plants and their impact on cell populations in various organs of mice. Afr. J.Med. Sci., 21(2):39-46.
Akinyemi, K.O U.E. Mendie, S.T. Smith, A.O. Oyefolu and Coker, (2005).Screening of some medicinal plants used in south-west Nigerian traditional medicine for anti-salmonella typhi activity. J. Herb pharmacother., 5(1):45-60.
Alex Bocek, (1991): Editor International Centre for Aquaculture and Aquatic Environments. Swingle Hall Auburu University Alabama 368495419. U.S.A.
Asuzu, I.U. and Chineme, C.N., (1990): Effects of Morinda lucida leaf extract on Trypanosoma bruceibrucei infection in mice. Journal of Ehtnopharmacology 30 (3): 307 – 313.
Bowen, S.H. (1982): Feeding, digestion and growth qualitative consideration. In the biology and culture of Tilapia Pullin, R.S.V. and lowe McConnell, R.H (eds). ICLARM(Manila). Proc. Int. Conf. on the biology and culture of Tilapias (1980).
Buikema, A.l., Neidertchner, R.R. and cairns, J. (1982): Biological monitoring part 1v, toxicity testing. Water resources 16: 239-262.
Burkill, H.M. (1997): The useful plants of West Tropicl Africa. 2nd Edition, volume 4, families M – R. Royal Botanic Gardens, Kew, Richmond, United Kingdom. 969pp.
Coward, R. and N.R. Bromage (1998): Histological classification of oocyte growth and the dynamics of ovarian recrudescence in Tilapia zillii. J fish. Biol. 53: 285 – 302.
Chan, W.L. (1982): Management of Nursery of Sea bass fry. Development coordinating programme (Workshop Reports) South China fisheries Development and co-ordinating programme P. 34-37.
Chen, J. and S. Lei (1990): Toxicity of ammonia and nitrate Penaeus monodon juveniles. Journal of the World Aquacultural Society. 21:300-306.
Chimits, P.(1955): Tilapia and its culture: A preliminary bibliography. FAO. Fish. Bull., 8 :( 1):1-33.
Davis, J.C. (1973).Sub-lethal effects of bleached draft pump mill effluent on respiration and circulation in stock eye salmon (Oncorhyncus mykiss).J. Fish Res, Board .30, 346-348.
De Graf G.J, F, Galemoni and E.A. Huisman, (1999): Reproductive biology of pond reared Nile tilapia, Oreochromis niloticus L. Aquaculture Research 30:25 – 23.
Dupree, K.H. and J.V. Hunnr (1984): The status of warm water fish farming and progress in fish farming research. U.S. Fish and Wildlife Service, Washington D.C. U.S.A.
Elias, S.O., C.O. Ladipo, B.P.Oduwole, P.M. Emeka, P.D.Ojobor and O.A. Sofola, (2007).Morinda lucida reduces contractility of isolated uterine smooth muscle of pregnant and non-pregnant mice.Niger j.Physiol. Sci., 22(1-2):129-34.
Kayode, B.A. (1997): Proximity of two pollutants (Eramoxone and Detergent to nile (Oreochromis niloticus) fingerlings and its effects on target organs. M. Tech. Thesis. Federal University of Technology, Akure, 76pp.

5151
Koumaglo, K, Gbeassor, M, Nikabu, O, de Souza, C. and Wermer, W., (1992): Effects of the three compounds extracted from Morinda lucida on Plasmodium falciparum. planta medica 58 (6): 533 – 534.
Liong, P.C. Hamzah, P.W. and Murugan, V. (1988): Toxicity of some pesticides towards fresh water fishes Jabatan Perikana (eds). Ministry Agriculture, Malaysia, Bulletin Perikana No. 57:13pp.
Makinde, J.M. and Obih P.O, (1985): Screening of morinda lucida leaf extract for antimalarial action on plasmodium berghei in mice. African journal of medicine and medical sciences 14 (1 – 2); 59 – 63.
Moriarty, D.J W.(1973): The physiology of digestion of blue green algae in T. nilotica.J. 2001. Lond 171;25-39.
Morales, D.A. (1991): 1a Tilapiaen Mexico. Biologia, Cultivoy pesquerias. AG. Mexico, D.F. 170 pp.
Olajide, O.A., S.O. Awe, J.M. Makinde and O. Morebise, (1999). Evaluation of the anti-biabetic property O. Morinda lucida leaves in streptozotocin-diabetic rats. J Pharm Pharmacol., 51(11): 1321-4.
Pascual, F.C. Tayo G.T.Cruz-lacierda E.R.(1994). Acute toxicity of formalin to sea bass (Lates calcarified) fry pp 346-348. In : The third Asian fisheries forum chou L.M, A.D. Munro, T.J. Lam. T.W. Chen, L.K.K, Cheong, J.K. Ding, K.K.Hool, H.W. Khoo, O.P.E. Phang, K.F. Shim and C.H. Tan(editors)Asian fisheries society . Manila, Phillipine.
Raji, Y., O.S. Akinsomisoye andT.M .Salman, (2005). Antispermatogenic activity of Morinda lucida extract in male rats. Asian J Androl., 7(4): 405-10.
Rand, G.M and Petrocelli, S.R. editors. (1985) fundamentals of Aquatic Toxology. Hemisphere Publishing corporation, New York. 666pp.
Reyes, R.A. (1984): philippine (BFAR) Freshwater Aquaculture Extension Training Manual, vol. iii PP. 3-9. Southern Regional Aquaculture centre SRAC Publication No. 283, March, 1999. United States department of Agricultural, Cooperative States Research, Education and Extension Services.
Robert, C., Peterson Jr and Peterson. M. (1988). Compensatory mortality in aquatic populations: Its importance for interpretation of toxicant effects pp 318-82.
Sowemimo, A.A., F.A. Fakoya, I. Awopetu, O.R. Omobuwajo and S.a. Adesanya, (2007): Toxicity and mutagenic activity of some selected Nigeria plants. J. Ethnopharmcol, 113 (3): 427-32.
Wardlaw, A.C.(1985). Pratical statistics for Experimental Biologists.John Wiley and Sons. New York 290pp.

5252
HAEMATOLOGICAL RESPONSE OF NILE TILAPIA (Oreochromis niloticus) JUVENILES EXPOSED TO TOBACCO (Nicotiana tobaccum)
LEAF DUST
M.O. OLUFAYO AND I.A. JATTO Department Of Fisheries and Aquaculture Technology, Federal University of Technology,
Akure
ABSTRACT
Tobacco (Nicotiana tobaccum) leaf dust has piscicidal properties thus there is a need to study its haematological effects on Nile tilapia juveniles. A 96hour bioassay was conducted on Oreochromis niloticus juveniles (mean wt., 30g) to determine the median lethal concentrations (LC50) .The fish were exposed to various concentrations of tobacco leaf dust (0.5g-2.5g/l).Water quality parameters and physiological parameters were monitored/determined according to standard procedures. Water quality parameters were monitored after 96hours. The LC50 at the end of 96hours was 1.35g/l. The monitored water quality parameters such as temperature, pH and dissolved oxygen were significantly decreased while total alkalinity and conductivity increased significantly in the exposed media, compared to the control test. The fish showed hypeventilation, erratic swimming, loss of reflex during the period of exposure and this increased with increase concentrations of tobacco leaf dust. Haematological analysis of the blood revealed significant haematological changes, the intensity of haematology damages increased with increasing concentrations and exposure to tobacco leaf dust. The reduction in blood parameters could be as a result of destruction of erythrocyte or haemodilution. However, the monitored water quality parameters revealed that the plant dust has effects on the blood parameters of the test fish and consequently the biodiversity of the organisms. The result provided baseline information and established safe limits of using tobacco leaf dust in fish ponds, hence 1.0g/l concentration of tobacco leaf dust is recommended for the use on O. niloticus juveniles
INTRODUCTION
Aquaculture is increasingly becoming one of the fastest growing aspect of the agricultural industry worldwide (FAO, 2004). Fish farmers often use tobacco leaf in controlling these unwanted organisms/pests (Konar, 1970; Tobor, 1990). According to Aleem (1987), the use of tobacco leaf dust is due to its inexpensiveness, local availability and easier degradability. Despite, the effective use of this plant material, eco-toxicologists are interested in the ecotoxic properties of plant origin pesticides/piscicides, such that plant origin pesticides/piscicides cannot be used directly in freshwater bodies unless their toxicity and sub-lethal long term effect have been studied on non-target animals, sharing the habitat with the target animals.
The active ingredient of the plant used, is the nicotine (Hassal, 1982), It is soluble in water, alcohol, chloroform, ether, kerosene and some fixed oils (Vogue, 1984). Tobacco leaf dust has been used in Nigeria as an effective insecticides and treatment of predators/pest in water (pond) since it is completely biodegradable (Aleem, 1987; Nile tilapia is of the commercially important species of fish for rapid aquaculture expansion in Nigeria. The choice of the test fish is attributed to the report of Rand et al., (1995) that in order to extrapolate meaningful, relevant and ecological significant results from aquatic toxicity tests, not only appropriate test but also appropriate organism should be used, whenever possible, species should be studied or representative of the ecosystem that may be impacted; thus the choice of the Oreochromis niloticus which is of economic importance in Nigeria as an abundant cultural fish species in Nigeria and is very popular with fish farmers and consumers. The knowledge of sub-lethal effects of tobacco is very important to delineate the health of fish status and to provide a future understanding of ecological impacts (Radhaiah et al., 1987). The aim of this research is to ascertain the assumption whether tobacco leaf dust (Nicotina tobaccum) in a sub-lethal concentration and in a medium exposure time can influence changes in the blood of O. niloticus after the 96 hours exposure period.
5353
MATERIALS AND METHODS
Juvenile O. niloticus of the same brood stock (30.01±0.34g) were obtained from the Federal University of Technology, Akure fish farm. They were acclimatized in a glass tank for 24 hours. The mortality and later transferred to the experimental plastic aquaria 10 fish/48L aquaria). The leaves of tobacco were sun-dried for 10 days and milled into powder, sieved and stored in a sealed plastic container until required. The concentrations of tobacco used were calculated as 50% 96h LC
50 (96h LC
50 of tobacco leaf dust on O. niloticus obtained from
preliminary investigation). Thus 100 mg of tobacco leaf dust were measured and mixed in 1 litre of water to give 100 mg/L concentration of the tobacco leaf dust. These concentrations were introduced into 12 sets of aquaria with one replication.
Forty (48) liters capacity aquaria were maintained throughout the exposure period. Ten (10) juveniles each were placed in the 48L plastic aquarium. Bore-hole water was used during the acclimatization and exposure period. In order to monitor the toxicant strength, level of dissolved oxygen, the effects of evaporation; ammonia concentration and reduce stress during experimentation, the test media were replaced by 50% prepared – concentrations of the same quantity after removing its equivalent along with defaecation every 6 hours to maintain the requisite level and potency of the concentration. The exposure period lasted for 96hours during which some water quality parameters were monitored daily using APHA (1998) methods. After 96 hours, 60 fishes were sacrificed and analyzed for the haematological examination. Blood was obtained from randomly selected fish from the control and the exposed test after the 96hours, using 2.0ml plastic syringe, as described by Kori-Siakpere (1998). The blood was transferred into a lithium heparin anticoagulant tube at room temperature for 30-40 minutes (Mahoba, 1987) and stored at refrigerator until analyses.
Fish mortality data were analyzed using complete randomized design with equal replication (one-way ANOVA test) at 5% level probability. All data were presented as means ± standard error, the data from the 96hours tobacco leaf dust exposure was first analyzed using a one-way ANOVA test, after which individual means were compared, using Bonferoni multi-sample correction/test.
RESULTS AND DISCUSSION
Mean values of water quality parameters of the different sub-lethal concentrations of tobacco leaf dust and control media to which the test fish O. niloticus were exposed over the 96hours exposure period is as presented in Table1. The value of temperature, pH and dissolved oxygen were found to significantly (p<0.05) and (p<0.01) decreased as the concentrations of tobacco leaf dust increased. However, the values of total alkalinity and conductivity in the exposed media were significantly (p<0.01) increased as the concentrations of tobacco leaf dust increased, compared to the control test. Exposure of O. niloticus juveniles to tobacco leaf dust solution clearly disrupted haematological parameters. Haematocrit, haemoglobin values, erythrocyte and leucocyte counts, total protein and albumin of the fish exposed to different concentrations of tobacco leaf dust revealed significant haematological alteration and changes (Table 2). Erythrocyte reduces from mean value of 1.67 – 1.0mm3 with increase in concentration of tobacco leaf dust, the decrease in these values were also observed to be both a factor of time and concentration of tobacco.

5454
Table 1. Water quality parameters of the sub-lethal concentrations of tobacco leaf dust after 96 hours
Concentration (g/l)
Temperature (0C)
Dissolved oxygen (mg/l)
pH Conductivity
0.0 24.20 ±0.00 6.20±0.10 6.80±0.05 117.9±0.40 0.5 24.30 ±0.00 5.90±0.20 6.50±0.00 134.3±1.10 1.0 24.30 ±0.00 4.10±0.10 6.40±0.00 1.5 24.30 ±0.00 3.80±0.10 6.40±0.05 141.0±1.20 2.0 24.30 ±0.00 3.30±0.00 6.30±0.05 145.8±2.05 2.5 24.30 ±0.00 3.10±0.10 6.20±0.00 150.1±1.05
*mean ± Standard Error (SE).
Table 2: Blood parameters of O. niloticus exposed to tobacco leaf dust concentrations for 96 hours.
Concentrations (mg/l)
Haematological Parameters PCV (%)
RBC (mm3)
WBC (mm3)
HB (g/dl)
Total protein (mg/dl)
Albumin (mg/dl)
0.0 15.00 (1.00)
1.67 (0.27)
3.88 (0.10)
6.93 (2.57)
5.13 (0.12)
3.43 (0.21)
0.5 14.00 (1.00)
1.73 (0.06)
3.82 (0.10)
4.67 (0.31)
4.80 (0.20)
2.93 (0.12)
1.0 11.7 (0.58)
1.21 (0.04)
5.12 (0.10)
4.00 (0.00)
3.43 (0.21)
2.73 (0.12)
1.5 10.7 (0.58)
1.21 (0.01)
5.00 (0.10)
2.20 (0.35)
2.80 (0.20)
2.37 (0.32)
2.0 9.33 (1.16)
1.10 (0.03)
5.12 (0.08)
1.33 (0.35)
2.20 (0.20)
2.00 (0.20)
2.5
9.00 (1.00)
1.00 (0.03)
5.27 (0.76)
0.70 (0.10)
1.97 (0.15)
1.87 (0.23)
*Mean ± Standard Error (SE).
Haemoglobin values reduced from 6.93-0.70g/dl with increase in concentration from 0.0g /l control - 2.5g/ l (Table2). The erythrocyte and leucocyte counts showed intra- concentration variations, the number of the leucocytes increased as the concentration of the toxicants increases while erythrocytes deceased with increasing concentrations of tobacco leaf dust , In different concentrations of tobacco leaf dust (0.0, 0.5, 1.0, 1.5, 2.0, and 2.5g/l), PCV values varied from 15.0 ,14.00, 11.67 ,10.67, 9.33 and 9.0%, respectively, at concentrations 0.5 and 2.5g/l, and the PCV values reduced with increase in concentration of test dye and this is traceable to different fishes having different blood parameters unlike human blood that is constant (Baker and Silverton, 1982). Total protein (g/L) varied with different concentrations of tobacco leaf dust, the mean value for total protein varies from 1.97-4.80mg/dl and 1.87-3.43mg/dl in albumin, this shows that total protein decreases with increase in concentration of tobacco leaf dust when compared with the control (0.0) with mean value of 5.13mg/dl (Table2). The 96-h LC50 was 1.35 g/L tobacco leaf extract, compared to other synthetic pesticides used in fish farming, such as carbamates and organophosphates, tobacco based products are certainly less toxic to fish (Wan et al., 1996). Results indicated that tilapia is more sensitive to tobacco leaf water extract than other fishes (Mamdouh et al., 2008). Changes in the water quality parameters showed that the concentrations affected the water quality, but the values were within tolerance range (Table 1).
Houston et al. (1971) reported changes in the blood parameters of fresh water fish exposed to various handling procedure before experiment and the effect of stress on the fish. The disrupted haematological parameters observed in this experiment also agreed with

5555
Akinbulumo (2005) who reported that fish showed toxic reaction to Derris elliptica root powder by surfacing jaws and becoming stupefied. Reduction in oxygen level in this study is in line with Lloyd (1961) who reported that toxicity of several poison on rainbow trout increased inversely to the oxygen concentrations of water .A number of poisons become more toxic at low oxygen concentrations because of an increasing respiratory rate, increasing the amount of poison to which the animal is exposed.
Haematological examination revealed adverse effect of tobacco leaf dust on the blood of O. niloticus, and this is similar to Mason et al. (1994) who had earlier reported similar observations when subjected O. niloticus to sub-lethal concentration of formalin. The result from statistical analysis shows that there is reduction in some of the blood parameters, this is an indication of anemia which is a condition characterized by a deficiency of haemoglobin, packed cell volume and erythrocytes.
REFERENCES Akinbulumo, M .O (2005) : Derris elliptica as anaesthetic agent on Nile Tilapia,Oreochromis
niloticus ( Linne, 1758), Applied Tropical Agriculture, 10, special issue: 24 -27. Aleem, SO. 1987. An assessment of tobacco waste for control of the gastropod Tympandomus
fuscavis (Linnaeus) in brackish water fish pond. Aquaculture 73: 19-25. Baker, F.J. and Silverton R.E.(1982): Introduction to Medical Lab Tech., 5th Ed. Butterworth
Scientific London. FAO. 2004. FAO Fisheries circular 886. Rev.25-29 June Gill R Foster A and Woodruff G. 1988.
MK – 801 is neuroprotective in gerbils when administered during the post-ischemic period. Neuroscience 25: 847 – 855.
Hassal KA. 1982. The chemistry of pesticides; Macmillan press, London, 372p. Hill AB. 1995. The environment and disease, Association or Causation? Proceedings of the Royal Society of Medicine pp.295-300
Houston, A.M., Madden, J.A. Wood, R.J. and Miles, H.M.(1971) Variation in the blood and tissue chemistry of Brook trout, Salvelinus fontinalis subsequent. Journal of the Fisheries Research Board of Canada, 28 (5): 635-642:
Konar SK. 1970. Nicotine as a fish poison. Te Progressive Fish Culturist, 32: 103-104 Kori-Siakpere O. 1998. Petroleum induced alterations in the haematological parameters of
Clarias gariepinus. Nigerian Journal of Science and Environmental, 1:87-92 Mahoba GP. 1987. Studies on Indian Cichlids Ph.D thesis, University of Science and
Technology, Cochin, India Lloyd, R. (1961): Effect of dissolved oxygen concentration on the toxicity of several poison of
Exp. Bio. 38: 447-455. Mamdouh, A. A. Mousa, Ahmed, M. M. EL-Asham, and Mona Hamed. 2008. Effect of Neem
leaf extact on freshwater fishes and zooplankton community. 8th International symposium on Tilapia Aquaculture. 2008, Pp11 ElGhobashy, H. and Fitzsimmons, K., eds.
Mason, C.F. (1998): Biology of Freshwater pollution,Third edition, Longman, England. 356pp Radhaiah V Girija M and Rao KJ. 1987. Changes in selected biochemical parameters In the
kidney and blood of the fish, Tilapia mossambicus (Peters), exposed to heptachlor. Bulletin of Environmental Contamination and Toxicology, 39: 1006-1011.
Rand GM Wells PG. and McCarthy LS. 1995. Introduction to aquatic toxicology. In: G.M. Rand (ed), Fundamental of aquatic Toxicology: effects environmental fate and risk assessment. 2nd ed. Taylor and Francis, Washington, D.C
Tobor JG. 1990. The Fishing Industry in Nigeria: Status and potential for self sufficiency in fishing production, NIOMR, Technical Paper, No.54 Nigeria Institute for Oceanography Research, Lagos, Nigeria, 26pp.
Vogue E. 1984. Tobacco Encylopaedia, Tobacco Journal International Federal Republic of Germany.
Wan, M.T., R.G. Watts, M.B. Isman and R. Strub. 1996. Evaluation of the acute toxicity to juvenile pacific northwest salmon of azadirachtin, neem extract, and neem based products. Bull. Environ. Contam. Toxicol., 56: 432–439.

5656
COMPARATIVE ASSESSMENT OF PARASITE INFESTATION OF TILAPIA
IN NATURAL AND CULTURED ENVIRONMENTS
ABIDEMI-IROMINI A.O & R.N EZE
DEPARTMENT OF FISHERIES AND AQUACULTURE TECHNOLOGY FEDERAL UNIVERSITY OF TECHNOLOGY, AKURE, NIGERIA
ABSTRACT
The study identified and compared the prevalence and intensity of parasites of Tilapia zillii and Oreochromis niloticus from natural and culture environments. 145 samples were collected from both environments and gross observations were carried out to check for physical abnormalities and presence and identification of parasites. The samples were dissected and the skin, gills, stomach and intestine were examined for parasites presence, prevalence and intensity. Four classes of parasites comprising 410 parasites were recovered namely 106 protozoans, 148 nematodes, 7 crustaceans, 132 trematodes and 17 parasites cysts. Cultured tilapia had higher parasitic infections than the wild tilapia and the parasite intensity and prevalence; and the parasite were significantly different in the tissues and organs.
INTRODUCTION
Tilapia is now one of the most widely distributed exotic fish in the world, second only to common carp, as their introduced range now stretches to nearly every continent and include 90 different countries. Tilapias are widespread in the tropics and sub-tropics (Intervet, 2006). They are highly adaptable and easily cultured. The fish are reared in ponds, cages, or pens and they grow well in fresh water and brackish waters. The high fecundity of the fish; its few disease problems; and the availability of its fry have resulted in intensification of production (Seafood Watch, 2006). Under the original extensive or semi-intensive culture systems, Tilapias were more resistant to disease than many other fish species (Roberts and Sommerville, 1982). However the intensification of culture systems and resultant deterioration in the environment has been associated with an increase in parasitic and infections disease problems. Infections diseases are caused by parasites, but host and environmental factors also play a role in their occurrence (Thrusfield, 1997).
A parasite could be harmless, harmful or beneficial to the host. The number of parasites necessary to cause harm to a host varies considerably with species and size of the host and its health status (Carpenter et. al., 2001) Parasite infections in fish causes production and economic losses through direct fish mortality; reduction in fish growth; reproduction and energy loss; increase in the susceptibility of fish to disease and predation; and through the high cost of treatment (Cowx, 1992). Information about the mode of transmission and potential intermediate hosts is often crucial to select the most appropriate management action to reduce or eliminate the problem (Aken’ova, 2000). The aim of this study is to identify the parasites in T. zillii and O. niloticus, and compare the prevalence and intensity of parasites from the wild and cultured environments in south-western Nigeria.
METHODOLOGY
A total of 145 live fish samples comprising of two species of wild and cultured tilapia: T. zillii and O. niloticus were collected from fresh water rivers: Owena reservoir, Ogbese river, and two fish farms in Akure, South Western Nigeria. Gross physical examination of the external features of the samples were done for abnormalities (if any); and the fish were transported in a 25 liters plastic containers to the laboratory. The specimens were kept in glass tanks (72 x 30 x 35 cm) filled with freshwater. The samples were separated into species, total length (cm) measured using a measuring board; and weighed (g).

5757
The outer layer of the skin were then scraped from the right and left sides of the back and posterior of the fish body, transferred to a slide, diluted with a drop of sterilized water, cover-slipped and examined under a microscope (Olympus CX40). Large parasites were expressed by their absolute numbers, while the microscopic parasites were expressed by decanting serially and determining their minimum, maximum and average numbers in each field of view of microscope at a definite magnification. The intestines of samples were removed and separated into stomach and intestine sections. Parasite cysts located on their surfaces were located and examined microscopically. The parasites wre transferred by a dissection needle to a slide containing sterilized water after getting rid of their slime and examined at high magnification (400 X). Smears were made from the samples of the skin, gills, stomach and intestine. These specimens were dissolved in petri dishes with few drops of 9% saline solution which kept the parasites alive. Smear was place on sterilized slide and viewed under low and high power (400 X) magnification.
Descriptive analysis was used to evaluate the data obtained. Level of significance of the mean difference on prevalence and intensity of parasites on T. zillii and O. niloticus were carried out using T-test (SPSS version 15.0).
RESULTS AND DISCUSSION
The prevalent parasite identified in O. niloticus and T. zillii samples examined from the natural and induced environments wee Camallanus sp. Tricodina acuta, Dactylogyrus sp, Gyrodactylus sp, Echthyophithrins mutifilies, leech and parasite cysts. Table 1 represent the prevalence parasites in the intestine of the wild and cultured Tilapia fish samples. Camallanus sp was highest (74.00±33.94) while leech was the least (3.50±0.95). Infection rate and intensity of the parasites were higher in culture than in the wild tilapia. 27% of males were infected while 80% of females were infected, and it agrees with the report of Ibiwoye et al. (2004) who reported more infection in female fish; and that they are more liable to infection with nematodes and acanthocephalan which were among the group reported in these studies. 35% of T. zillii were paratized while 48% of O. niloticus were infected, resulting that O. niloticus were highly infected than T. zillii
Among the wild species of O. niloticus and T. zillii collected (96 fish samples), 40 (42%) were infested, while 33 (67%) were infested from a total of 49 fishes from the different cultured sites. This is in line with Martin, et. al. 2009, which reported that higher infections levels in cultured tilapia than in wild tilapia are attributed to higher fish densities in the cultured systems and lack of adequate management techniques. And that high stocking densities favour increased parasite populations (Karvonen et al. 2006). Parasite located in the stomach organ indicated that 83% of the fish samples had parasites infestation in the stomach; while 34% is from the wild and 49% from the cultured samples. About half of the samples (51%) from the cultured habitat harbored parasites in the intestine, while 29% from the wild were infested in the intestine. Parasites infestation on gills examination indicated 45% from the cultured and 13% from the wild samples and 14% of the female O. niloticus from the cultured samples were paratized on the skin with leeches. Camallanus sp has the highest prevalence (80%). Parasitic prevalence was found highest in the following order: stomach (83%), intestine (80%), gills (58%), and skin (14%).
Fish sample with weights ranging between 20.5 – 30.5g and 110.3 -130.4g recorded the highest percentage of infection (44%) while fish with weights range of 40.7g – 60.8g and 130.5g and 190.9g recorded very low level of infection (4%). Fish samples with between 11.6cm – 18.1cm recorded the highest percentage of infection (23%) while fish with length ranging from 18.2cm – 24.7cm recorded a low percentage infection (10%). This is in-view with Goselle et al. (2008) who reported low level of infection in larger sizes of fishes in Lamingo reservoir, Jos, Nigeria. Total parasitic load of the fish samples (from the wild) decreased from the first sampling during March (early rainy season) to the eight sampling during June (peak rainy season). This can be due to high rain influx during the rainy season and low rain influx during the dry season. It is also supported according to Morenikeji and
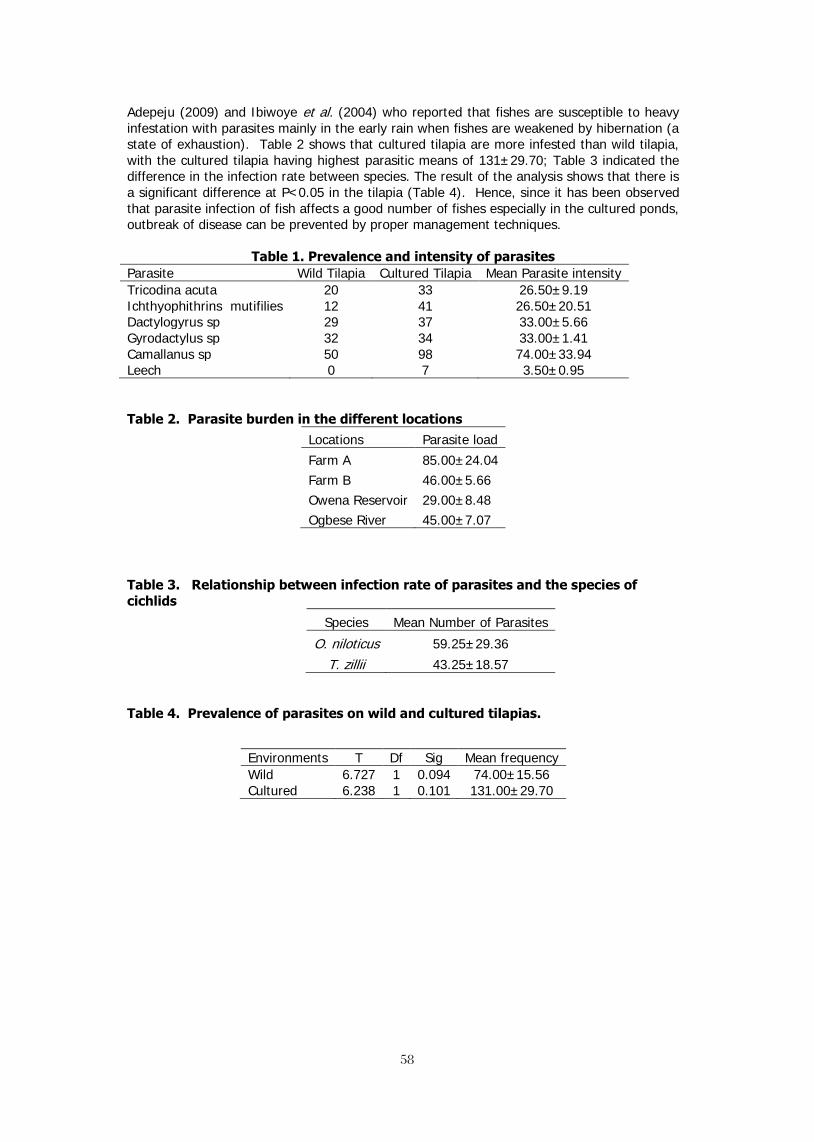
5858
Adepeju (2009) and Ibiwoye et al. (2004) who reported that fishes are susceptible to heavy infestation with parasites mainly in the early rain when fishes are weakened by hibernation (a state of exhaustion). Table 2 shows that cultured tilapia are more infested than wild tilapia, with the cultured tilapia having highest parasitic means of 131±29.70; Table 3 indicated the difference in the infection rate between species. The result of the analysis shows that there is a significant difference at P<0.05 in the tilapia (Table 4). Hence, since it has been observed that parasite infection of fish affects a good number of fishes especially in the cultured ponds, outbreak of disease can be prevented by proper management techniques.
Table 1. Prevalence and intensity of parasites Parasite Wild Tilapia Cultured Tilapia Mean Parasite intensity Tricodina acuta 20 33 26.50±9.19 Ichthyophithrins mutifilies 12 41 26.50±20.51 Dactylogyrus sp 29 37 33.00±5.66 Gyrodactylus sp 32 34 33.00±1.41 Camallanus sp 50 98 74.00±33.94 Leech 0 7 3.50±0.95
Table 2. Parasite burden in the different locations Locations Parasite load Farm A 85.00±24.04 Farm B 46.00±5.66 Owena Reservoir 29.00±8.48 Ogbese River 45.00±7.07
Table 3. Relationship between infection rate of parasites and the species of cichlids
Table 4. Prevalence of parasites on wild and cultured tilapias.
Species Mean Number of Parasites
O. niloticus 59.25±29.36
T. zillii 43.25±18.57
Environments T Df Sig Mean frequency Wild 6.727 1 0.094 74.00±15.56 Cultured 6.238 1 0.101 131.00±29.70

5959
REFERENCES
Aken’ova A.F. (2000) Fish mortalities associated with Goezia sp. (Nematoda: in Ascarididae) Central Florida. Proc. 25th Ann. Conf. Southeast. Assoc. Game Fish Comm., pp. 496- 497.
Carpenter, J.W., Mashima T.Y. and Rupiper, D.J. (2001). Exotic animal formulary. Second ed. W.B. saunders Company. 423pp.
Cowx, I.G. (1992). Aquaculture development in Africa, training and reference manual forl aquaculture extensionists. Food production and rural development. Common wealth secretariat London, pp 246-295.
Goselle, N., Shir, G.I., Udeh, E.O., Abelau, M. and Imandeh, G.N. (2008). Helminth parasites of Clarias gariepinus and Tilapia zillii at Lamingo dam, Jos, Nigeria. Science world journal vol 3 (4)
Ibiwoye, T.I.I., Balogun, A.m., Ogunsusi, R.A. and Agbontale, J.J. (2004). Determination of theinfection densities of nematode Eustrongylides in mud fish Clarias gariepinus and Clarias angullaris from Bida flood plain of Nigeria. Journal of Applied Science and Environmental Management. 8(2):39 44.
Intervet, (2006). Diseases of Tilapia. Digenectic Trematodes parts I and II. Inter-sciences publishers Inc. New York, pp 1575.
Karvonen A., Savolainen M., and Seppala O. (2006). Dynamics’ of Diplostomum spathaceum infection in Snail Host. Parasites; warnell school of forest resources, University of Georgia. Parasitol 99: 341-345.
Martin G.V, Juan V.G. Augustin R, a. and Salvador G.G. (2009). Diplostomiasis in cultured and wild tilapia (Oreochromis niloticus) in Guerrero State, Mexico.
Morenikeji, A.K and Adepeju, G.S (2009). Diurnal variations of physic-chemical factors and Planktonic organism in Jos Plateau (W. Africa) water reservoir. Japanese journal of Limnology, 44 (1): 65-71.
Roberts, R.J. and Somerville, C., (1982). Diseases of tilapias. In: pullin, R.s.V. and lowemcconnell, R.H. (Eds). The biology and culture of tilapias. ICLARM conference proceedings, 7, manila, Philippines. Pp. 247-263.
Seafood Watch, (2006). Farmed Tilapia Oreochromis, Sarotherodon, Tilapia., Seafood Report, Fisheries Global Information System.
Thrusfield, B. (1997). Studies on some parasitic affection in fresh water fishes in Beni- Suef Governorate. P.D.V. Sc. Thesis, Cairo University.

6060
OXYTETRACYCLINE MARKING STUDIES OF TILAPIA; Oreochromis niloticus
Y. M. Abdel-Hadi 1, 2, J. F. Craig 3, J. A. Babaluk 4 and R. Wassle 4
1 Aquaculture Dept., Faculty of Agriculture, University of Putra Malaysia (UPM), 43400, Serdang, Selangor, Malaysia. Tel. 603-89464248, Fax: 89464102.
2 Central Laboratory for Aquaculture Research, Abbassa, 44662, Egypt. E.mail address: [email protected]
3 Whiteside, Dunscore, Dumfries, DG2 0UU, Scotland, U.K. 4 Freshwater Institute, 501 University Crescent, Winnipeg, Manitoba, Canada.
Abstract
Oxytetracycline (OTC) was intraperitoneally injected into tilapia, Oreochromis niloticus to validate aging of this fish, to determine suitable marking dosages of OTC, to assess OTC-induced mortality and to determine the rate of OTC incorporation into 4 bony structures including scales, opercula, otoliths and pelvic fin rays' sections. The OTC was used in 3 doses; 12.5, 25 and 50 mg/kg of fish body weight. A total of 1200 fish with an average body weight of 60 grams were used for the experiment (300 fish per OTC dose and another 300 fish were injected with sterile saline solution as a control group). The fish of the 4 groups were released in the water of 4 raceways at the World Fish Centre, Abbassa, Egypt and were kept for an entire year. The results revealed that 1 annulus was laid down after the OTC mark on all bony structures. OTC was incorporated into all examined bony structures. The clearest OTC marks with minimal mortality were induced by the 25 mg OTC dosage. No significant mortalities were noticed among the injected fish with OTC. Key words: Oxytetracycline, tilapia, annulus, scale, operculum, otolith, fin rays.
Introduction Until the 1970s, tetracycline had been used extensively in the field of aquaculture as an antibacterial drug (Schnick, Meyer & Walsh 1986). OTC was found markedly effective in vitro and in vivo against Aeromonas hydrophila micro-organism and the highest concentrations of the drug were found in liver and bone tissues of the treated Oreochromis niloticus (Soliman 1994). Since it is incorporated into newly forming calcified tissue and is visible under ultraviolet light as a fluorescent band (Bavelander & Goss 1962), it had been used periodically by fisheries researchers as a marking tool (Emery & Wydoski 1987). Since that time, tetracycline has been used widely as a means of marking fish (Babaluk & Craig 1990). Applied at a known date, tetracycline has been used to validate methods of fish age determination (Casselman 1974; Babaluk & Campbell 1987; McFarlane & Beamish 1987a). Since tetracycline is incorporated relatively quickly into calcified structures (Campana & Neilson 1982; Nagiec, Dabrowski, Nagiec & Murawska 1988), it can been used to verify the existence of daily growth increments (Campana & Neilson 1982; Laurs, Nishimioto & Wetherall 1985). High dosages of tetracycline will cause mortality so it is necessary to determine a dosage that produces a suitable mark on calcified structures of a fish species while causing minimal mortality (Kobayashi, Yuki, Furui & Kosugiyama 1964; McFarlane & Beamish 1987b). In this study, tetracycline was injected into tilapia, Oreochromis niloticus to validate 4 age determination methods (scales, opercula, otoliths' and pelvic fin rays' sections) to assess tetracycline-induced mortality, to determine how quickly it was incorporated into calcifying tissues in fresh water and to determine the suitable marking dosage of tetracycline for this species.
Materials and methods Fish: A number of 1200 fingerlings of monosex Oreochromis niloticus were used for the study. The fish were acclimatized first and then were distributed into 4 raceways (300 per each raceway). After that the fish were kept for 4 months before launching the experiment to reach bigger sizes. The fish were fed on artificial ration of 25% protein in the rate of 3% of
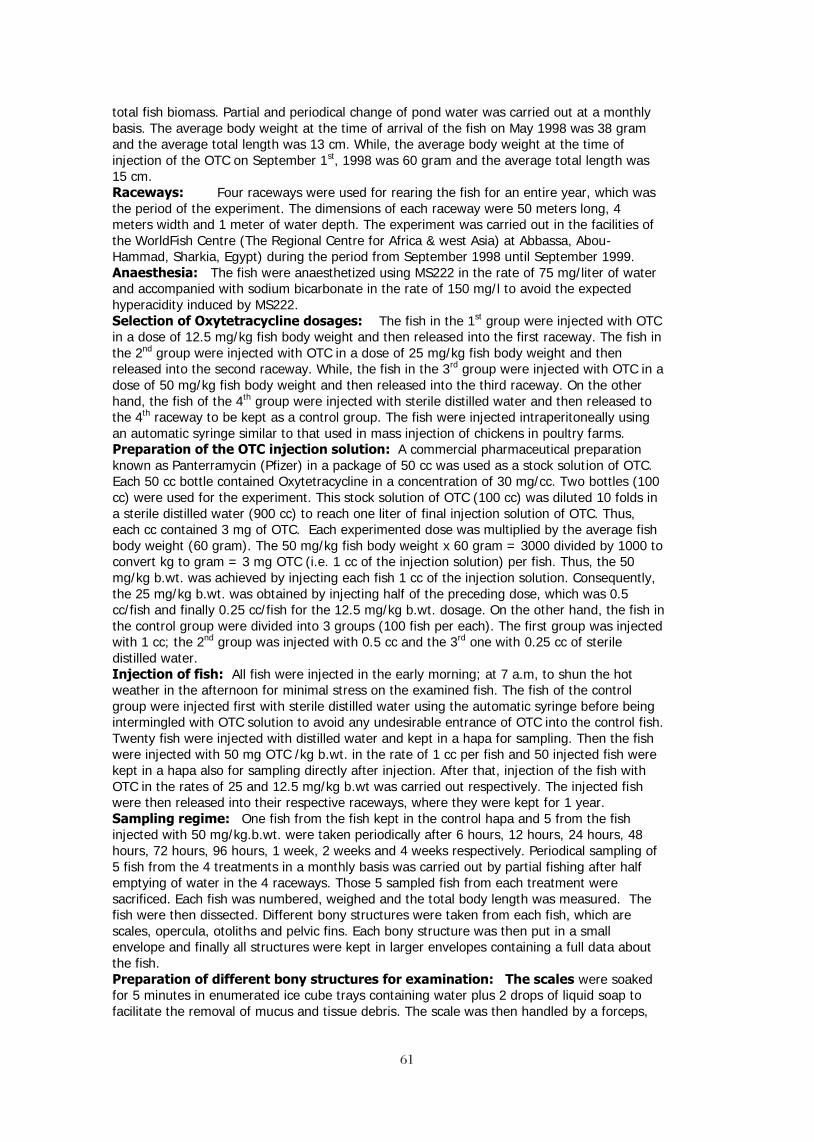
6161
total fish biomass. Partial and periodical change of pond water was carried out at a monthly basis. The average body weight at the time of arrival of the fish on May 1998 was 38 gram and the average total length was 13 cm. While, the average body weight at the time of injection of the OTC on September 1st, 1998 was 60 gram and the average total length was 15 cm. Raceways: Four raceways were used for rearing the fish for an entire year, which was the period of the experiment. The dimensions of each raceway were 50 meters long, 4 meters width and 1 meter of water depth. The experiment was carried out in the facilities of the WorldFish Centre (The Regional Centre for Africa & west Asia) at Abbassa, Abou-Hammad, Sharkia, Egypt) during the period from September 1998 until September 1999. Anaesthesia: The fish were anaesthetized using MS222 in the rate of 75 mg/liter of water and accompanied with sodium bicarbonate in the rate of 150 mg/l to avoid the expected hyperacidity induced by MS222. Selection of Oxytetracycline dosages: The fish in the 1st group were injected with OTC in a dose of 12.5 mg/kg fish body weight and then released into the first raceway. The fish in the 2nd group were injected with OTC in a dose of 25 mg/kg fish body weight and then released into the second raceway. While, the fish in the 3rd group were injected with OTC in a dose of 50 mg/kg fish body weight and then released into the third raceway. On the other hand, the fish of the 4th group were injected with sterile distilled water and then released to the 4th raceway to be kept as a control group. The fish were injected intraperitoneally using an automatic syringe similar to that used in mass injection of chickens in poultry farms. Preparation of the OTC injection solution: A commercial pharmaceutical preparation known as Panterramycin (Pfizer) in a package of 50 cc was used as a stock solution of OTC. Each 50 cc bottle contained Oxytetracycline in a concentration of 30 mg/cc. Two bottles (100 cc) were used for the experiment. This stock solution of OTC (100 cc) was diluted 10 folds in a sterile distilled water (900 cc) to reach one liter of final injection solution of OTC. Thus, each cc contained 3 mg of OTC. Each experimented dose was multiplied by the average fish body weight (60 gram). The 50 mg/kg fish body weight x 60 gram = 3000 divided by 1000 to convert kg to gram = 3 mg OTC (i.e. 1 cc of the injection solution) per fish. Thus, the 50 mg/kg b.wt. was achieved by injecting each fish 1 cc of the injection solution. Consequently, the 25 mg/kg b.wt. was obtained by injecting half of the preceding dose, which was 0.5 cc/fish and finally 0.25 cc/fish for the 12.5 mg/kg b.wt. dosage. On the other hand, the fish in the control group were divided into 3 groups (100 fish per each). The first group was injected with 1 cc; the 2nd group was injected with 0.5 cc and the 3rd one with 0.25 cc of sterile distilled water. Injection of fish: All fish were injected in the early morning; at 7 a.m, to shun the hot weather in the afternoon for minimal stress on the examined fish. The fish of the control group were injected first with sterile distilled water using the automatic syringe before being intermingled with OTC solution to avoid any undesirable entrance of OTC into the control fish. Twenty fish were injected with distilled water and kept in a hapa for sampling. Then the fish were injected with 50 mg OTC /kg b.wt. in the rate of 1 cc per fish and 50 injected fish were kept in a hapa also for sampling directly after injection. After that, injection of the fish with OTC in the rates of 25 and 12.5 mg/kg b.wt was carried out respectively. The injected fish were then released into their respective raceways, where they were kept for 1 year. Sampling regime: One fish from the fish kept in the control hapa and 5 from the fish injected with 50 mg/kg.b.wt. were taken periodically after 6 hours, 12 hours, 24 hours, 48 hours, 72 hours, 96 hours, 1 week, 2 weeks and 4 weeks respectively. Periodical sampling of 5 fish from the 4 treatments in a monthly basis was carried out by partial fishing after half emptying of water in the 4 raceways. Those 5 sampled fish from each treatment were sacrificed. Each fish was numbered, weighed and the total body length was measured. The fish were then dissected. Different bony structures were taken from each fish, which are scales, opercula, otoliths and pelvic fins. Each bony structure was then put in a small envelope and finally all structures were kept in larger envelopes containing a full data about the fish. Preparation of different bony structures for examination: The scales were soaked for 5 minutes in enumerated ice cube trays containing water plus 2 drops of liquid soap to facilitate the removal of mucus and tissue debris. The scale was then handled by a forceps,
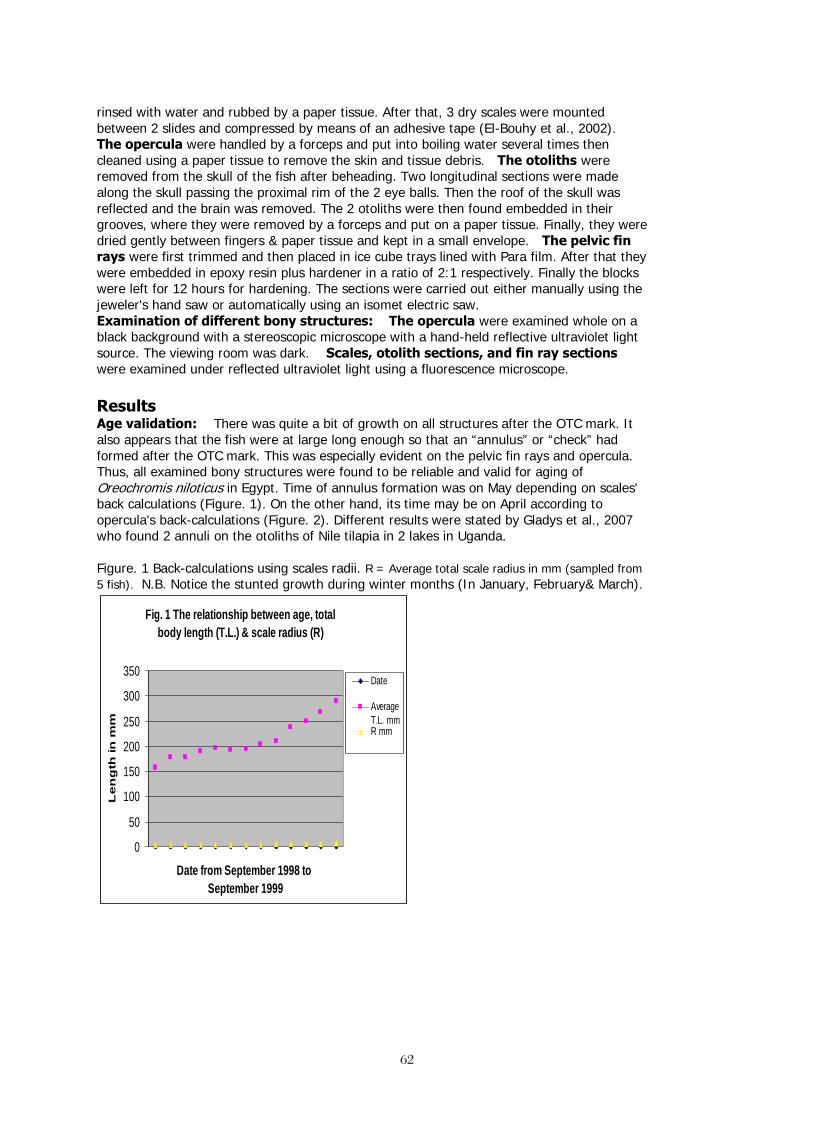
6262
rinsed with water and rubbed by a paper tissue. After that, 3 dry scales were mounted between 2 slides and compressed by means of an adhesive tape (El-Bouhy et al., 2002). The opercula were handled by a forceps and put into boiling water several times then cleaned using a paper tissue to remove the skin and tissue debris. The otoliths were removed from the skull of the fish after beheading. Two longitudinal sections were made along the skull passing the proximal rim of the 2 eye balls. Then the roof of the skull was reflected and the brain was removed. The 2 otoliths were then found embedded in their grooves, where they were removed by a forceps and put on a paper tissue. Finally, they were dried gently between fingers & paper tissue and kept in a small envelope. The pelvic fin rays were first trimmed and then placed in ice cube trays lined with Para film. After that they were embedded in epoxy resin plus hardener in a ratio of 2:1 respectively. Finally the blocks were left for 12 hours for hardening. The sections were carried out either manually using the jeweler's hand saw or automatically using an isomet electric saw. Examination of different bony structures: The opercula were examined whole on a black background with a stereoscopic microscope with a hand-held reflective ultraviolet light source. The viewing room was dark. Scales, otolith sections, and fin ray sections were examined under reflected ultraviolet light using a fluorescence microscope. Results Age validation: There was quite a bit of growth on all structures after the OTC mark. It also appears that the fish were at large long enough so that an “annulus” or “check” had formed after the OTC mark. This was especially evident on the pelvic fin rays and opercula. Thus, all examined bony structures were found to be reliable and valid for aging of Oreochromis niloticus in Egypt. Time of annulus formation was on May depending on scales' back calculations (Figure. 1). On the other hand, its time may be on April according to opercula's back-calculations (Figure. 2). Different results were stated by Gladys et al., 2007 who found 2 annuli on the otoliths of Nile tilapia in 2 lakes in Uganda. Figure. 1 Back-calculations using scales radii. R = Average total scale radius in mm (sampled from 5 fish). N.B. Notice the stunted growth during winter months (In January, February& March).
Fig. 1 The relationship between age, total body length (T.L.) & scale radius (R)
0
50
100
150
200
250
300
350
Date from September 1998 to September 1999
Le
ng
th in
mm
Date
AverageT.L. mmR mm
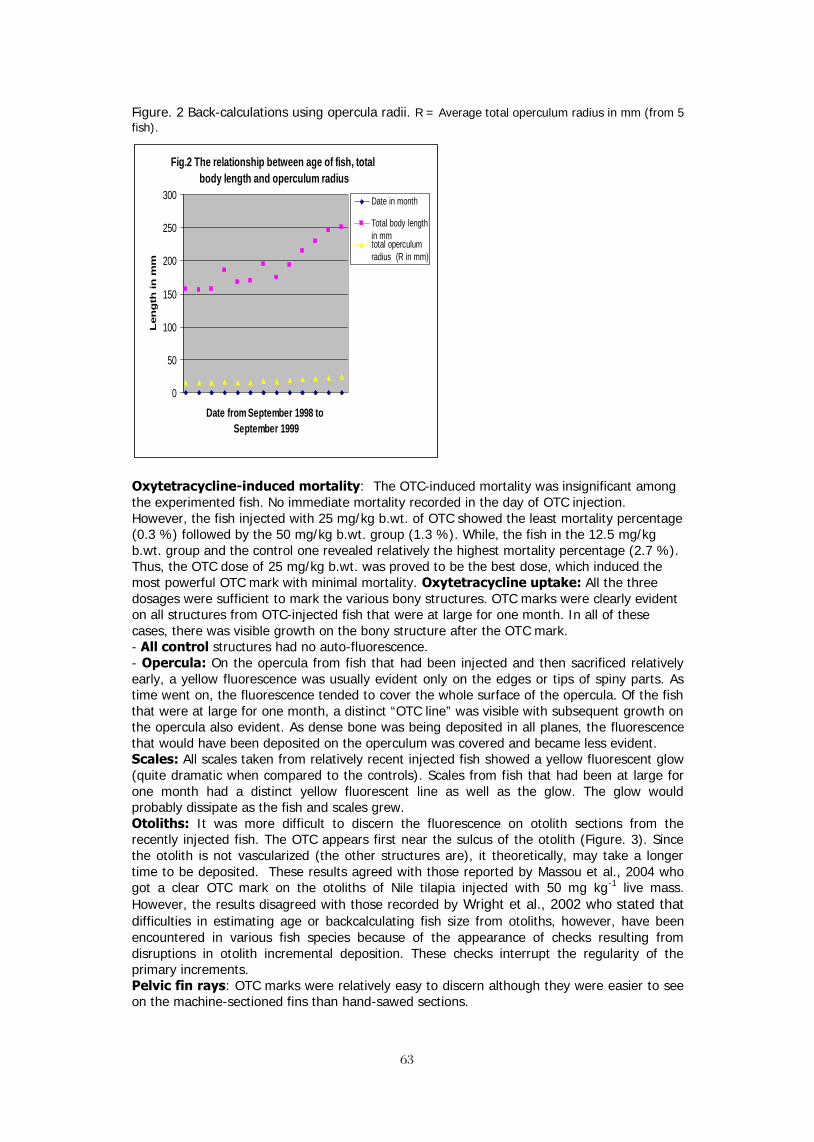
6363
Figure. 2 Back-calculations using opercula radii. R = Average total operculum radius in mm (from 5 fish).
Fig.2 The relationship between age of fish, total body length and operculum radius
0
50
100
150
200
250
300
Date from September 1998 to September 1999
Len
gth
in
mm
Date in month
Total body lengthin mmtotal operculumradius (R in mm)
Oxytetracycline-induced mortality: The OTC-induced mortality was insignificant among the experimented fish. No immediate mortality recorded in the day of OTC injection. However, the fish injected with 25 mg/kg b.wt. of OTC showed the least mortality percentage (0.3 %) followed by the 50 mg/kg b.wt. group (1.3 %). While, the fish in the 12.5 mg/kg b.wt. group and the control one revealed relatively the highest mortality percentage (2.7 %). Thus, the OTC dose of 25 mg/kg b.wt. was proved to be the best dose, which induced the most powerful OTC mark with minimal mortality. Oxytetracycline uptake: All the three dosages were sufficient to mark the various bony structures. OTC marks were clearly evident on all structures from OTC-injected fish that were at large for one month. In all of these cases, there was visible growth on the bony structure after the OTC mark. - All control structures had no auto-fluorescence. - Opercula: On the opercula from fish that had been injected and then sacrificed relatively early, a yellow fluorescence was usually evident only on the edges or tips of spiny parts. As time went on, the fluorescence tended to cover the whole surface of the opercula. Of the fish that were at large for one month, a distinct “OTC line” was visible with subsequent growth on the opercula also evident. As dense bone was being deposited in all planes, the fluorescence that would have been deposited on the operculum was covered and became less evident. Scales: All scales taken from relatively recent injected fish showed a yellow fluorescent glow (quite dramatic when compared to the controls). Scales from fish that had been at large for one month had a distinct yellow fluorescent line as well as the glow. The glow would probably dissipate as the fish and scales grew. Otoliths: It was more difficult to discern the fluorescence on otolith sections from the recently injected fish. The OTC appears first near the sulcus of the otolith (Figure. 3). Since the otolith is not vascularized (the other structures are), it theoretically, may take a longer time to be deposited. These results agreed with those reported by Massou et al., 2004 who got a clear OTC mark on the otoliths of Nile tilapia injected with 50 mg kg-1 live mass. However, the results disagreed with those recorded by Wright et al., 2002 who stated that difficulties in estimating age or backcalculating fish size from otoliths, however, have been encountered in various fish species because of the appearance of checks resulting from disruptions in otolith incremental deposition. These checks interrupt the regularity of the primary increments. Pelvic fin rays: OTC marks were relatively easy to discern although they were easier to see on the machine-sectioned fins than hand-sawed sections.

6464
The fact that the fish had been at large for a lengthy period of time (nine months) made it easier the discern of the OTC marks. The optimum Oxytetracycline dosage: The 50 mg/kg dosage produced the “strongest” mark on all structures although on the scales a relatively faint line was observed. The scales had a florescent “glow” inside the OTC mark. The 25 mg/kg dosage produced “good” marks on all structures (Figure. 3) although the marks were relatively faint on the opercula and scales. The 12.5 mg/kg dosage produced faint marks on most of the structures. All that was discernable on the opercula was a florescent glow (perhaps) on the inner area of the bone.
Figure. 3 Transverse section of an otolith from a tilapia injected with 25 mg oxytetracycline/kg body weight on 1 September 1998 and recaptured on 2 September 1999 under (a) reflected ultraviolet light and b) transmitted white light. Annuli are indicated by dots. Oxytetracycline mark (OTC) is also indicated. Bar = 0.5 mm.
Conclusion: It could be concluded that tilapia fish aging is reliable in Egypt as a subtropical country and can be used as a basis for stock assessment and other fisheries management applications. The dose of 25 mg OTC/kg body weight for marking of tilapia is recommended in subsequent work & future studies. Acknowledgment The authors are very grateful to the WorldFish Centre and its entire staff (Regional Center for Africa and West Asia, Abbassa, Egypt), where the experiment was carried out. Special thanks to Dr. Roger Row (the former deputy director general), Engineer Rezk Hara and his team. The authors also appreciate the kind support of Dr. Ismail Radwan who granted the fish of the experiment as a gift from his own hatchery in Kafr El-Sheikh, Egypt.

65 65
References 1. Babaluk J.A. & Campbell J.S. (1987): "Preliminary results of tetracycline labeling for
validating annual growth increments in opercula of walleyes". North American Journal of Fisheries Management 7, 138-141.
2. Babaluk J.A. & Craig J.F. (1990): "Tetracycline marking studies with pike, Esox lucius L.". Aquaculture and Fisheries Management 21, 307-315.
3. Beamish R.J. & McFarlane G.A. (1983): "The forgotten requirement for age validation in fisheries biology". Transactions of the American Fisheries Society 112, 735-743.
4. Bevelander G. & Goss R.J. (1962): "Influence of tetracycline on calcification in normal and regenerating teleost scales". Nature 193, 1098-1099.
5. Campana S.E. & Neilson J.D. (1982): "Daily growth increments in otoliths of starry flounder (Platichthys stellatus) and the influence of some environmental variables in their
production". Canadian Journal of Fisherieas and Aquatic Sciences 39, 937-942. 6. Campbell J.S. & Babaluk J.A. (1979): "Age determination of walleye, Stizostedion vitreum vitreum (Mitchill), based on the examination of eight different structures".Canada
Fisheries and Marine Service Technical Report 849. 7. Casselman J.M. (1974): "Analysis of hard tissue of pike, Esox lucius L., with special
reference to age and growth. In: The Ageing of Fish – The Proceedings of an International Symposium (ed. By T.B. Bagenal), pp. 13-27. Gresham Press, Surrey.
8. El-Bouhy Z.M., Diab A.S. AND Abdel-Hadi Y.M. (2002):"Studies on the scales of some fresh water fishes". 6th Vet. Med. Zag. Conference (7-9 Sept. 2002), Hurgada, Egypt.
9. Emery L. & Wydoski R. (1987): "Marking and tagging of aquatic animals: an indexed bibliography". United States Fish and Wildlife Service Resource Publication 165.
10. Gladys N. Bwanika; Debra J. Murie and Lauren J. Chapman (2007): “Comparative age and growth of Nile tilapia (Oreochromis niloticus L.) in lakes Nabugabo and Wamala, Uganda”. Hydrobiologia (2007) 589:287–301.
11. Harrison E.J. & Handley W.F. (1979): "A comparison of the use of cleithra to the use of scales for age and growth studies". Transactions of the American Fisheries Society 102, 452-456.
12. Holden M.J. & Vince M.R. (1973): "Age validation studies on the centra of Raja clavata using tetracycline". Journal du Conseil International pour l'Exploration de la Mer 35, 13-17.
13. Johnson L.D. (1971): "Growth of known age muskellunge in Wisconsin and validation of age and growth determination methods". Wisconsin Department of Natural Resources Technical Bulletin 49. 14. Kipling C. & LeCren E.D. (1984): "Mark-recapture experiments on fish in Windermere,
1943-1982". Journal of Fish Biology 24, 395-414. 15. Kobayashi S., Yuki R., Furui T. & Kosugiyama T. (1964): "Calcification in fish and shell-
fish: I. Tetracycline labeling patterns on scales, centrum and otolith in young goldfish". Bulletin of the Japanese Society of Scientific Fisheries 30, 6-13.
16. Laurs R.M., Nishimoto R. & Wetherall J.A. (1985): "Frequency of increment formation on sagittae of North pacific albacore (Thunnus alalunga)". Canadian Journal of Fisheries
and Aquatic Sciences 42, 1552-1555. 17. Massou A. M., P.-Y. Le bail J. Panfili, R. Lae, J. F. Baroiller, O. Mikolasek, G. Fontenelle
and B. Auperin (2004): “Effects of confinement stress of variable duration on the growth and microincrement deposition in the otoliths of Oreochromis niloticus (Cichlidae)”. Journal of Fish Biology (2004) 65, 1253–1269.
18. McFarlane G.A & Beamish R.J. (1987a): "Validation of the dorsal spine method of age determination for spiny dogfish". In: The Age and Growth of Fish (ed. By R.C. Summerfelt & G.E. Hall), pp. 287-300. Iowa State University Press, Ames. 19. McFarlane G.A & Beamish R.J. (1987b): "Selection of dosages of Oxytetracycline for age validation studies". Canadian Journal of Fisherieas and Aquatic Sciences 44, 905-909. 20. Nagiec M., Dabrowski K., Nagiec C. & Murawska E. (1988): "Mass-marking of coregonid
larvae and fry by tetracycline tagging of otoliths". Aquaculture & Fisheries Management 19,171-178.

6666
21. Occhi de Forrati R.N. (1971): "Application of tetracyclines to the study of growth in fresh water fish". Journal of Dental Research 50, 1156 (abst).
22. Schnick R.A., Meyer F.P. & Walsh D.F. (1986): "Status of fishery chemicals in 1985". Progressive Fish-Culturist 48, 1-17.
23. Soliman Z.I. (1994): "Some Pharmacological Studies of Oxytetracycline in Fish". A Ph.D thesis submitted to Depart. of Pharmacology, Fac. of Vet. Med., Zagazig Univ., Egypt.
24. Siegel S. (1956): "Nonparametric Statistics for the Behavioral Sciences". 25. Weber D.D & Ridgway G.J. (1962): "The deposition of tetracycline drugs in bones and scales of
fish and its possible use for marking". Progressive Fish-Culturist 24, 150-155. 26. Wild A. & Foreman T.J. (1980): "The relationship between otolith increments and time for
yellowfin and skipjack tuna marked with tetracycline". Inter-American Tropical Tuna Commission Bulletin 17, 509-560.
6767
SECTION II ACCELERATING AQUACULTURE DEVELOPMENT
IN POORER COUNTRIES
Chair: Dr. Hillary Egna Oregon State University, USA
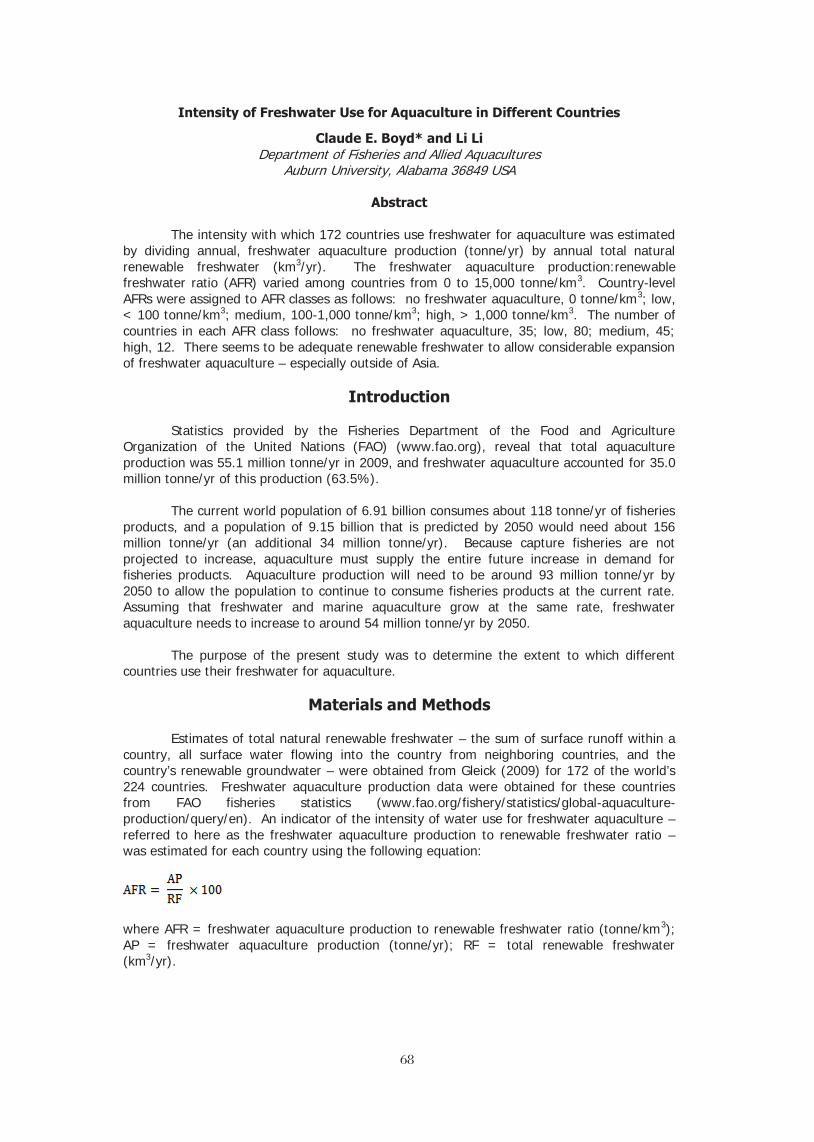
6868
Intensity of Freshwater Use for Aquaculture in Different Countries
Claude E. Boyd* and Li Li Department of Fisheries and Allied Aquacultures
Auburn University, Alabama 36849 USA
Abstract The intensity with which 172 countries use freshwater for aquaculture was estimated by dividing annual, freshwater aquaculture production (tonne/yr) by annual total natural renewable freshwater (km3/yr). The freshwater aquaculture production:renewable freshwater ratio (AFR) varied among countries from 0 to 15,000 tonne/km3. Country-level AFRs were assigned to AFR classes as follows: no freshwater aquaculture, 0 tonne/km3; low, < 100 tonne/km3; medium, 100-1,000 tonne/km3; high, > 1,000 tonne/km3. The number of countries in each AFR class follows: no freshwater aquaculture, 35; low, 80; medium, 45; high, 12. There seems to be adequate renewable freshwater to allow considerable expansion of freshwater aquaculture – especially outside of Asia.
Introduction
Statistics provided by the Fisheries Department of the Food and Agriculture Organization of the United Nations (FAO) (www.fao.org), reveal that total aquaculture production was 55.1 million tonne/yr in 2009, and freshwater aquaculture accounted for 35.0 million tonne/yr of this production (63.5%).
The current world population of 6.91 billion consumes about 118 tonne/yr of fisheries products, and a population of 9.15 billion that is predicted by 2050 would need about 156 million tonne/yr (an additional 34 million tonne/yr). Because capture fisheries are not projected to increase, aquaculture must supply the entire future increase in demand for fisheries products. Aquaculture production will need to be around 93 million tonne/yr by 2050 to allow the population to continue to consume fisheries products at the current rate. Assuming that freshwater and marine aquaculture grow at the same rate, freshwater aquaculture needs to increase to around 54 million tonne/yr by 2050.
The purpose of the present study was to determine the extent to which different countries use their freshwater for aquaculture.
Materials and Methods Estimates of total natural renewable freshwater – the sum of surface runoff within a country, all surface water flowing into the country from neighboring countries, and the country’s renewable groundwater – were obtained from Gleick (2009) for 172 of the world’s 224 countries. Freshwater aquaculture production data were obtained for these countries from FAO fisheries statistics (www.fao.org/fishery/statistics/global-aquaculture-production/query/en). An indicator of the intensity of water use for freshwater aquaculture – referred to here as the freshwater aquaculture production to renewable freshwater ratio – was estimated for each country using the following equation:
where AFR = freshwater aquaculture production to renewable freshwater ratio (tonne/km3); AP = freshwater aquaculture production (tonne/yr); RF = total renewable freshwater (km3/yr).

6969
Results and Discussion
Of the 172 countries for which renewable freshwater data were available, 35 had no freshwater aquaculture production, or if they did, it was not reported. For the 137 countries reporting freshwater aquaculture production, AFR ranged from < 1 tonne/km3 in several countries to 7,344 tonne/km3 in China, 11,324 tonne/m3 in Israel, and 15,000 tonne/km3 in Kuwait (Table 1). Notice that the two highest AFR values were for small, water-restricted countries.
The AFR values were initially placed in five classes as follows: countries with AFR = 0 (no freshwater aquaculture); 80 countries with AFR < 100 tonne/km3; 45 countries with AFR > 100 tonne/km3 but < 800 tonne/km3, ten countries with AFR > 1,000 tonne/km3 but < 10,000 tonne/km3; two countries with AFR > 10,000 tonne/km3. However, it did not seem appropriate to assign the two countries – Israel and Kuwait – with AFR > 10,000 tonne/km3 to a separate class, because they represent an insignificant proportion of world freshwater aquaculture production (19,546 tonne/yr or 0.062%). Thus, countries were placed into four AFR classes: no reported aquaculture (AFR = 0 tonne/km3); low (AFR < 100 tonne/km3); medium (AFR = 101-1,000 tonne/km3); high (AFR > 1,000 tonne/km3).
Many of the countries in the no aquaculture and low AFR classes (Table 1) need additional protein that could be obtained by increasing the amount of aquaculture. There also are countries in the medium and high AFR classes that need more protein. An example of the effect of increasing freshwater aquaculture on AFR in a country with a low FCR will be provided. Guatemala has a rapidly growing population that is expected to increase from 14,362,000 in 2010 to 22,995,000 in 2050. Suppose that Guatemala increased its freshwater aquaculture production from 3,000 tonne/yr at present to 10,000 tonne in 2050. The renewable freshwater in Guatemala is estimated at 111.3 km3/yr (Gleick 2009); thus, AFR would rise from 27.0 tonne/km3 to 89.8 tonne/km3 – the country would still have a low AFR. In many Asian countries, and especially in China, increasing the amount of aquaculture will result in higher AFRs in a region where values are already much greater than in the rest of the world. Nevertheless, the data provided in Table 1 suggest that many countries could greatly increase aquaculture production without increasing AFR values to the levels found in Asia.
The main negative issues related to a large amount of freshwater aquaculture production (high AFR) at the country level are competition with other water uses and water pollution resulting from aquaculture (Pillay 2004; Boyd et al. 2007; Tucker and Hargreaves 2008). However, there are no studies revealing the extent to which aquaculture interferes with other water uses or contributes to water pollution at the country level. Based on regional studies of individual aquaculture industries such as channel catfish, (Ictalurus punctatus), in the southeastern United States (Boyd et al. 2000; Tucker and Hargreaves 2008), and Pangasius catfish in Vietnam (Bosma et al. 2009), aquaculture does not appear to be of as much concern related to water use conflicts and water pollution as many other activities. Thus, there should be opportunity to greatly increase aquaculture production in many countries, and especially those outside Asia, without resulting in major water use competition or causing serious water pollution. Nevertheless, aquaculture producers should strive to increase production per unit of water use – Verdegem and Bosma (2009) suggested that productivity could be tripled without increasing current freshwater use. Moreover, governments should pay more attention to the effects of aquaculture on the environment and require producers to comply with either discharge standards, best management practices, or both.
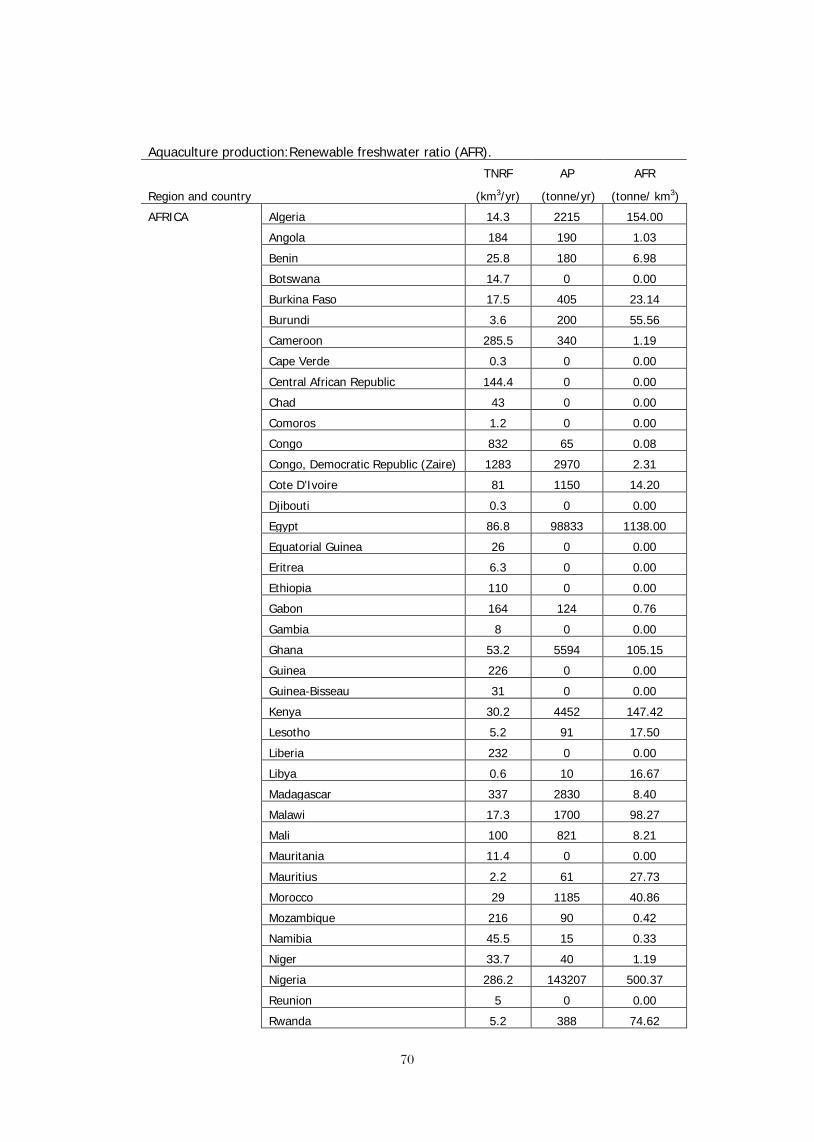
7070
Aquaculture production:Renewable freshwater ratio (AFR). TNRF AP AFR
Region and country
(km3/yr) (tonne/yr) (tonne/ km3)
AFRICA Algeria 14.3 2215 154.00
Angola 184 190 1.03
Benin 25.8 180 6.98
Botswana 14.7 0 0.00
Burkina Faso 17.5 405 23.14
Burundi 3.6 200 55.56
Cameroon 285.5 340 1.19
Cape Verde 0.3 0 0.00
Central African Republic 144.4 0 0.00
Chad 43 0 0.00
Comoros 1.2 0 0.00
Congo 832 65 0.08
Congo, Democratic Republic (Zaire) 1283 2970 2.31
Cote D'Ivoire 81 1150 14.20
Djibouti 0.3 0 0.00
Egypt 86.8 98833 1138.00
Equatorial Guinea 26 0 0.00
Eritrea 6.3 0 0.00
Ethiopia 110 0 0.00
Gabon 164 124 0.76
Gambia 8 0 0.00
Ghana 53.2 5594 105.15
Guinea 226 0 0.00
Guinea-Bisseau 31 0 0.00
Kenya 30.2 4452 147.42
Lesotho 5.2 91 17.50
Liberia 232 0 0.00
Libya 0.6 10 16.67
Madagascar 337 2830 8.40
Malawi 17.3 1700 98.27
Mali 100 821 8.21
Mauritania 11.4 0 0.00
Mauritius 2.2 61 27.73
Morocco 29 1185 40.86
Mozambique 216 90 0.42
Namibia 45.5 15 0.33
Niger 33.7 40 1.19
Nigeria 286.2 143207 500.37
Reunion 5 0 0.00
Rwanda 5.2 388 74.62

7171
Senegal 39.4 160 4.06
Sierra Leone 160 0 0.00
Somalia 15.7 0 0.00
South Africa 50 1202 24.04
Sudan 154 2000 12.99
Swaziland 4.5 0 0.00
Tanzania 91 12 0.13
Togo 14.7 126 8.57
Tunisia 4.6 1117 242.83
Uganda 66 52250 791.67
Zambia 105.2 5640 53.61
Zimbabwe 20 2450 122.50
N & C AMERICA
Antigua and Barbuda 0.1 0 0.00
Bahamas nd 0 0.00
Barbados 0.1 0 0.00
Belize 18.6 1865 100.27
Canada 3300 9314 2.82
Costa Rica 112.4 21768 193.67
Cuba 38.1 27771 728.90
Dominica nd 0 0.00
Dominican Republic 21 140 6.67
El Salvador 25.2 3606 143.10
Guatemala 111.3 3000 26.95
Haiti 14 0 0.00
Honduras 95.2 20494 215.27
Jamaica 9.4 5812 618.30
Mexico 457.2 10618 23.22
Nicaragua 196.7 1388 7.06
Panama 148 462 3.12
St. Kits and Nevis 0.02 0 0.00
Trinidad and Tobago 3.8 0 0.00
United States of America 3069 323905 105.54
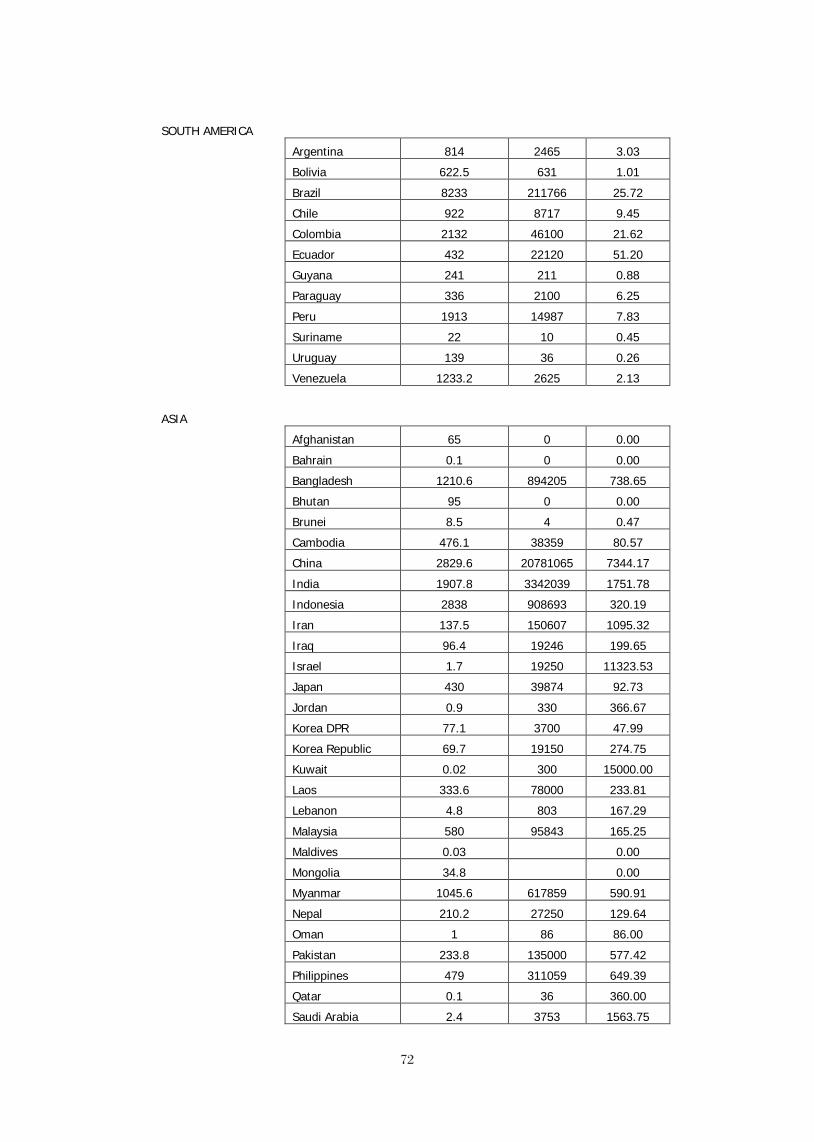
72 72
SOUTH AMERICA
Argentina 814 2465 3.03
Bolivia 622.5 631 1.01
Brazil 8233 211766 25.72
Chile 922 8717 9.45
Colombia 2132 46100 21.62
Ecuador 432 22120 51.20
Guyana 241 211 0.88
Paraguay 336 2100 6.25
Peru 1913 14987 7.83
Suriname 22 10 0.45
Uruguay 139 36 0.26
Venezuela 1233.2 2625 2.13
ASIA
Afghanistan 65 0 0.00
Bahrain 0.1 0 0.00
Bangladesh 1210.6 894205 738.65
Bhutan 95 0 0.00
Brunei 8.5 4 0.47
Cambodia 476.1 38359 80.57
China 2829.6 20781065 7344.17
India 1907.8 3342039 1751.78
Indonesia 2838 908693 320.19
Iran 137.5 150607 1095.32
Iraq 96.4 19246 199.65
Israel 1.7 19250 11323.53
Japan 430 39874 92.73
Jordan 0.9 330 366.67
Korea DPR 77.1 3700 47.99
Korea Republic 69.7 19150 274.75
Kuwait 0.02 300 15000.00
Laos 333.6 78000 233.81
Lebanon 4.8 803 167.29
Malaysia 580 95843 165.25
Maldives 0.03 0.00
Mongolia 34.8 0.00
Myanmar 1045.6 617859 590.91
Nepal 210.2 27250 129.64
Oman 1 86 86.00
Pakistan 233.8 135000 577.42
Philippines 479 311059 649.39
Qatar 0.1 36 360.00
Saudi Arabia 2.4 3753 1563.75

73 73
Singapore 0.6 283 471.67
Sri Lanka 50 5172 103.44
Syria 46.1 8595 186.44
Taiwan 67 161027 2403.39
Thailand 409.9 516405 1259.83
Turkey 234 66557 284.43
United Arab Emirates 0.2 0.00
Vietnam 891.2 1771000 1987.21
Yemen 4.1
EUROPE
Albania 41.7 558 13.38
Austria 84 2087 24.85
Belgium 20.8 126 6.06
Bosnia and Herzegovina 37.5 7360 196.27
Bulgaria 19.4 4562 235.15
Croatia 105.5 4458 42.26
Cyprus 0.4 57 142.50
Czech Republic 16 20395 1274.69
Denmark 6.1 22661 3714.92
Estonia 21.1 813 38.53
Finland 110 2159 19.63
France 189 41340 218.73
Germany 188 36973 196.66
Greece 72 3991 55.43
Hungary 120 15687 130.73
Iceland 170 381 2.24
Ireland 46.8 850 18.16
Italy 175 39916 228.09
Luxembourg 1.6 0.00
Macedonia 6.4 1331 207.97
Malta 0.07 0.00
Netherlands 89.7 8575 95.60
Norway 381.4 90 0.24
Poland 63.1 36813 583.41
Portugal 73.6 941 12.79
Romania 211.9 12532 59.14
Slovakia 80.3 1071 13.34
Slovenia 32.1 1041 32.43
Spain 111.1 22281 200.55
Sweden 179 4016 22.44
Switzerland 53.3 1214 22.78
United Kingdom 160.6 10563 65.77
Serbia-Montenegro 208.5 0 0.00

7474
(Yugoslavia)
Russia 4498 115234 25.62
Armenia 10.5 2001 190.57
Azerbaijan 30.3 89 2.94
Belarus 58 4150 71.55
Estonia 12.8 813 63.52
Georgia 63.3 180 2.84
Kazakhstan 109.6 321 2.93
Kyrgyzstan 46.5 92 1.98
Latvia 49.9 584 11.70
Lithuania 24.5 3008 122.78
Moldova 11.7 4700 401.71
Tajikistan 99.7 26 0.26
Turkmenistan 60.9 16 0.26
Ukraine 139.5 15027 107.72
Uzbekistan 72.2 3418 47.34
OCEANIA
Australia 398 1127 2.83
Fiji 28.6 217 7.59
New Zealand 397 0 0.00
Papua New Guinea 801 80 0.10
Solomon Islands 44.7 0.00
Literature Cited
Bosma, R. H., C. T. T. Hanh, and J. Potting, editors. 2009. Environmental impact
assessment of the pangasius sector in the Mekong Delta.
Boyd, C. E., C. Tucker, A. McNevin, K. Bostick, and J. Clay. 2007. Indicators of resource use efficiency and environmental performance in fish and crustacean culture. Reviews in Fisheries Science 15:327-360.
Boyd, C. E., J. Queiroz, J. Lee, M. Rowan, G. N. Whitis, and A. Gross. 2000. Environmental assessment of channel catfish, Ictalurus punctatus, farming in Alabama. Journal of the World Aquaculture Society 31:511-544.
Gleick, P. H. 2009. The world’s water 2008-2009. Island Press, Washington, D.C., USA.
Pillay, T. V. R. 2004. Aquaculture and the environment, 2nd edition. Blackwell Publishing, Oxford, United Kingdom.
Tucker, C. S. and J. A. Hargreaves, editors. 2008. Environmental best management practices for aquaculture. Wiley-Blackwell, Ames, Iowa, USA.
Verdegem, M. C. J. and R. H. Bosma. 2009. Water withdrawal for brackish and inland aquaculture, and options to produce more fish in ponds with present water use. Water Policy 11 (Supplement 1):52-68.
7575
IMPACTS OF THE INTRODUCTION OF ALIEN TILAPIAS (Oreochromis spp.) ON THE FISHERIES AND BIODIVERSITY OF INDIGENOUS SPECIES IN TRI AN RESERVOIR,
VIETNAM
Le Thanh Hung, Vu Cam Luong, Nguyen Phu Hoa, James Diana
Abstract
This study was conducted at Tri An Reservoir of Vietnam from November 2007 to June 2009 to determine the impact of tilapias (Oreochromis spp.) on the fisheries and biodiversity of indigenous species in the reservoir. Historical and currently data on fish caught and fish species composition was collected. There are currently 19 different types of fishing gears in use at the reservoir, of which 14 fishing gears caught tilapias. Of the five fishing gears with highest total catches, only two caught tilapias. There were only 4.62% and 5.09% of tilapias in fishermen harvest and landing point records, repectively. However, tilapias (Oreochromis spp.) were 6th of 40 fish species caught from fishermen data, indicating the rather low productivity of most other fish species in the reservoir. Among the six species with highest biomass, the only economically valuable species recorded were the silver barb (Barbonymus gonionotus) and tilapias. The species with little or no economic value that are abundant in the reservoir (glass fish Parambassis siamensis, river sprat Corica soborna, repassan Cyclocheilichthys repasson and wrestling halfbeak Dermogenys pusillus), accounted for 64% of estimated total fish harvest (3823 tons) in the reservoir in 2008. The high production of low value species is also evidenced by their abundance at landing points, with glass fish and river sprat accounting for 355.91 and 243.68 of the total of 1661 tons landed in 2008. These indicated that the abundance of low economic value fishes may affect fisheries and fish biodiversity much more than the impact of alien tilapias species.
By using gill nets instead of seining, fish species composition was composed of more species with high economic value. Estimated tilapia catches and landing records show that tilapia species are abundant (84.62 of the total 1661 tons at landing points), second most only to silver barb (147.59 of 1661 total tons). This pattern holds despite the fact that tilapia haven’t been stocked regularly as silver barb and other cultured fish species, indicating a favorable development of tilapia species in the reservoir. During the peak catches of tilapias in August in 2008, the other top five most commonly caught fishes are not at their peak catches, indicating a likely impact of tilapias on other economically important fish species such as silver barb, common carp (Cyprinus carpio), repassan and Labiobarbus spilopleura.
Key words: Alien tilapias, biodiversity, fisheries, Tri An Reservoir
INTRODUCTION
Tilapias (Oreochromis spp.) support an enormous market throughout Asia. Additionally, tilapias have been promoted as a food supply for poor farmers, as they provide food security. Tilapias were introduced into Vietnam several times from 1951 to 1997, and have been widely cultured in various systems, including ponds, cages, and rice-fields (Tu 2003). There were 700 tilapia hatcheries in Ho Chi Minh City in 2003, resulting in a seed production of 400 MT per year (Tu, 2003). According to MOFI (2006), the production of tilapia in Vietnam was 54,000 MT in 2005, with total culture area of 2,148 ha in 2004. Such rapid development of tilapia culture resulted in fish escapes to natural environments, a serious concern that deserves research a great caution. The rapid expansion of tilapia populations in Vietnam’s natural waters indicates that the ecosystems are able to support the invasion. Restocking tilapia in reservoirs was generally aimed at increased fish catch production (FAO-SEAFDEC, 1985).
Escaped tilapias from aquaculture have established populations in reservoirs (Tu 2003 2006). For example, tilapias accounted for about 4% and 20% of the total catch in Tri An and Thac Mo Reservoirs, respectively (Tu 2003, 2006). Some regard tilapia as beneficial to

7676
local fisheries (and sometimes for control of mosquitoes or aquatic plants); some consider them pests with stunted populations that compete with indigenous fish species; and some consider their presence to be both, with benefits and negative effects, depending on geographical area (Lowe-McConnell 2000).
The purpose of this study is to investigate the impacts of tilapias on fisheries and biodiversity of indigenous fish species in the Tri An reservoirs of Vietnam. Information on the impacts of the introduced alien species on fisheries and biodiversity of indigenous fish species will allow governmental agencies to establish policies, plans and mechanisms for the management of the introduction of alien species.
MATERIALS AND METHODS
This study was conducted at Tri An Reservoir from November 2007 to June 2009. Tri An Reservoir was constructed in 1984 for the main purpose of providing hydroelectric power to southern Vietnam, which it has been doing since 1988. It was formed as a result of a dam constructed on the upper Dongnai River. The Tri An Reservoir is the largest reservoir in Vietnam, with a surface area of 324 km2 and 15.05 km3 of water storage capacity. It has an electric capacity of 420 MW, generating an average of 1,700 GW hour-1 year-1.
Tri An Reservoir is located at 10 through 1220’N and 107 through 10830’E. The watershed of Tri An Reservoir is around 15,400 km2, with a mean reservoir length of 43.5 km, mean reservoir width of 7.5 km, maximum depth of 28 m, total volume of 2.76 km3, and mean area of 323.4 km2.
The primary data on fish catch and fish species composition was collected during a one-year study period through interviews and field sampling.
(1) Collecting data during the annual harvest by the fisheries management companies;
(2) Collecting data at fish landing points such as Ap 1, Phu Cuong and La Nga;
(3) Investigation of fishermen for their fish catch and species composition;
(4) Field sampling to investigate seasonal fish species composition.
The secondary data of historical fish catch and fish species composition in Tri An Reservoir was collected from relevant reservoir management agencies such as the Dong Nai Fisheries Company, Dong Nai Department of Agriculture and Rural Development, Dong Nai Bureau of Fisheries Resources Protection and Management, and Dong Nai Fisheries Extension Center.
Interviews with fisherman for catch and species composition
Interviews with fishermen consisted of two main themes: the type of fishing gear used and the fish catches for each fishing gear. There were 151 fishermen interviewed at upstream, midstream and downstream of the reservoir, accounting around 15% of total fishermen in the reservoir. At the upstream area, 49 of the interviewed fishermen belonged to La Nga and Thanh Son Communes. At the midstream area, 57 of the interviewed fishermen belonged to Phu Cuong and Gia Tan Communes. At the downstream area, 45 of the interviewed fishermen belonged to Ma Da and Vinh An Communes.
The total number of each type of fishing gear was recorded from Dong Nai Fisheries Company. Detailed information that was not available at Dong Nai Fisheries Company such as catch per unit effort (CPUE), fishing times and duration, and fish species composition was investigated directly from fishermen. CPUE was defined as the daily average catch (kg/day) for each type of fishing gear.
Field sampling to investigate seasonal fish species composition

7777
Seasonal fish species composition in Tri An Reservoir was estimated by seining fish at 4, 5 and 4 locations at upstream, midstream and downstream of the reservoir four times per year. Field sampling was also carried out using gillnets with mesh size of 40-60 mm, the net length and width were 1,000m and 5m, respectively. The gillnet was fixed by floats for whole day per location. Seasonal sampling times were November 2007, February 2008, May 2008 and August 2008 representing the dry season (November and February) and rainy season (May and August).
Data analyses
The secondary and primary data from Tri An Reservoir were calculated in the percentage changes of fish catch and fish species composition over time using Microsoft Excel software. The linear relationship was also calculated for fish catch and effort.
RESULTS
The state of fish catches over time in Tri An Reservoir
Yearly fingerling stocking, fish catch and number of fishermen are presented in Table 1. The linear relationship between fish catch and effort found an R2 of 35, so only 35% of the variation is explained by fishing effort. The fishermen population reached highs in 1998 and 2000 and then has essentially leveled off. If CPUE was defined as dividing of catch by number of fisherman, the linear relationship between CPUE and year show an increase across all years in CPUE and explains R2= 55% of the variation.
Table 1. Stocking and catch over time in Tri An Reservoir
Year Fingerling stocking (no.
of fish) Annual fish catch
(MT/year) No. of
fishermen
1993 0 800 300 1994 0 833 400 1995 1,300,000 1126 550 1996 1,900,000 1475 748 1997 5,006,000 1825 800 1998 0 1840 1234 1999 1,317,000 2269 1136 2000 1,200,000 2301 1470 2001 1,501,000 2786 1237 2002 1,170,000 3118 892 2003 868,000 3080 978 2004 0 2835 884 2005 0 2589 872 2006 500 2600 721 2007 1,000,000 2837 747 2008* 0 3823 1115
Source: Dong Nai Fisheries Company (1993-2007), * 2008 data were collected by this study.
Fishing gears and species composition in Tri An Reservoir
There were 19 main types of fishing gears used in Tri An Reservoir, with mean daily catch (CPUE) for each fishing gear ranging from 3.4 to 71.4 kg/day (Table 2). CPUEs of each fishing gear changed by seasons. The most productive gears in terms of CPUE were seine nets, magine scoop nets, lift nets with a light and lift nets without a light. In terms of quantity of fishing gears operation, gill nets, magine scoop nets, lift nets with a light and long lines were the most popular (Table 3). Seasonal fish catch of each fishing gear was also presented

7878
at Table 3 in order to combine a yearly fish catch. The five fishing gears with highest yearly catches were magine scoop nets (1 lights), lift net with a light, gillnets (mesh size 40-60 mm), seine nets and magine scoop nets (18 lights). The fish catch of top five fishing gears make up 81.7% total catch of the reservoir, with total of 3,124 tons/year.
Table 2. CPUE of fishing gears during dry and rainy seasons
No.
Fishing gears
CPUE in dry season
(kg/day) CPUE in rainy
season (kg/day)
1 Seine net (2 boats) 70.7 ± 4.14 45.3 ± 3.83
2 Machine scoop net (18 light) 70.42 ± 7.65 59.28 ± 6.46
3 Machine scoop net (1 lights) 56.96 ± 5.33 38.64 ± 4.68
4 Lift net (no lights) 53.52 ± 10.9 22.48 ± 3.73
5 Mobile cast net 49.84 ± 4.92 0
6 Seine net (1 boat) 48.8 ± 4.49 40.3 ± 3.0
7 Encircle surrounding net 42 ± 8.0 0
8 Viet trawl net 31.2 ± 6.03 12.64 ± 2.16
9 Mussel trawl net 15.24 ± 1.16 0
10 Gillnet (mesh size 40-60 mm) 14.84 ± 1.2 11.82 ± 0.94
11 Cast net 14 ± 0.98 0
12 Gillnet (mesh size 70-140 mm) 10.1 ± 1.45 8.51 ± 0.73
13 Surface gillnet station 9.68 ± 1.69 7.2 ± 0.44
14 Horizontal cylinder basket trap for marble goby 8.48 ± 1.18 7.04 ± 0.84
15 Horizontal cylinder basket trap for shrimp 6.28 ± 0.58 3.4 ± 0.46
16 Long line 5.76 ± 0.44 4.32 ± 0.5
17 Lift net with light 0 71.44 ± 7.56
18 Horizontal cylinder basket trap for tilapia 0 8.08 ± 1.36
19 Trammel net 0 6.8 ± 1.16

7979
Table 3. Fishing gears and total catches in Tri An Reservoir No. Fishing gears No. fishing
gears Fish catch (MT) Total
catch (MT) Dry
season Rainy
season Dry
season Rainy
season 1 Magine scoop net (1 light) 104 63 889 219 1108 2 Lift net with a light 0 80 0 686 686 3 Gillnet (mesh size 40-60 mm) 228 178 406 189 595 4 Seine net (2 boat) 42 30 356 61 417 5 Magine scoop net (18 light) 25 20 211 107 318 6 Lift net 18 22 101 52 153 7 Mussel trawl net 70 0 128 0 128 8 Seine net (1 boat) 10 20 73 29 102 9 Viet trawl net 22 31 62 35 97 10 Long line 52 108 9 56 65 11 Horizontal cylinder basket trap
for marble goby 25 29 25 18 44
12 Horizontal cylinder basket trap for shrimp
39 48 22 20 42
13 Mobile cast net 11 0 33 0 33 14 Surface gillnet station 6 8 5 5 10 15 Gillnet (mesh size 70-140 mm) 2 11 1 6 7 16 Horizontal cylinder basker trap
for tilapia 0 12 0 6 6
17 Encircle surrounding net 2 0 5 0 5 18 Trammel net 0 6 0 4 4 19 Cast net 2 0 3 0 3
Total 658 666 2329 1493 3823
Proportions of tilapias catch in various fishing gears were presented in Table 4. Gill net with various mesh size (40-140 mm) was the main fishing gear for tilapia catching. Other fishing gears with high rate of tilapias catch were horizontal cylinder basket traps and cash net. There was 14 fishing gears (73.7%) having tilapias within their catches, in which 8 fishing gears (42.1%) having tilapias catch for whole year round.

80 80
Table 4. Proportion of tilapias in various fishing gears No. Fishing gears % tilapias
in dry season
% tilapias in rainy season
1 Gillnet (mesh size 70-140 mm) 21.34 ± 8.01 26.63 ± 12.16 2 Gillnet (mesh size 40-60 mm) 18.81 ± 5.24 7.82 ± 2.88 3 Horizontal cylinder basket trap for
marble goby 7.67 ± 3.27 25.68 ± 5.13
4 Long line 1.99 ± 0.91 15.57 ± 6.45 5 Lift net 8.07 ± 2.19 8.9 ± 3,99 6 Seine net (1 boat) 5.23 ± 1.57 6.88 ± 1.32 7 Seine net (2 boats) 5.96 ± 1.59 3.12 ± 3,22 8 Surface gillnet station 1.62 ± 1.62 3.47 ± 2.95 9 Horizontal cylinder basker trap for
tilapia 0 37.46 ± 8.17
10 Trammel net 0 19.0 ± 4.4 11 Cast net 26.07 ± 2.13 0 12 Encircle surrounding net 15.95 ± 2.27 0 13 Mobile cast net 4.01 ± 2.63 0 14 Magine scoop net (1 light) 2.62 ± 1.27 0 15 Viet trawl net 0 0 16 Mussel trawl net 0 0 17 Magine scoop net (18 lights) 0 0 18 Horizontal cylinder basker trap for
shrimp 0 0
19 Lift net with light 0 0

8181
Table 5 presents the most common 40 fish species caught by the 19 fishing gears. Most abundant species such as glass fish Parambassis siamensis, river sprat Corica soborna, repassan Cyclocheilichthys repasson and wrestling halfbeak Dermogenys pusillus accounted for 64% of estimated total fish harvest (3823 tons) in the reservoir in 2008.
Table 5. Fish species composition from 19 fishing gears in Tri An Reservoir
No. Fish species Fish catch (ton) % 1 Parambassis siamensis 727.1 19.02 2 Corica sorbona 666.2 17.43 3 Cyclocheilichthys repasson 566.1 14.81 4 Dermogenys pusillus 448.4 11.73 5 Barbonymus gonionotus 278.8 7.29 6 Oreochromis spp. 176.5 4.62 7 Kryptopterus cryptopterus 167.7 4.39 8 Labiobarbus spilopleura 155.2 4.06 9 Mystus spp. 147.3 3.85 10 Glossogobius giuris 119.0 3.11 11 Cyprinus carpio 92.1 2.41 12 Oxyeleotris marmoratus 69.4 1.81 13 Hemibagrus wyckii 47.1 1.23 14 Hypostomus plecostomus 32.9 0.86 15 Cichla ocellaris 20.1 0.52
16 Wallago attu 16.9 0.44
17 Mystus nemurus 14.8 0.39 18 Cirrhinus jullieni 13.1 0.34 19 Henicorhynchus siamensis 12.5 0.33 20 Mystus wyckii 10.7 0.28 21 Micronema bleekeri 6.2 0.16 22 Osteochilus hasseltii 5.0 0.13 23 Clarias batrachus 4.9 0.13 24 Macrognathus taeniagaster 4.9 0.13 25 Hampala macrolepidota 4.0 0.11 26 Labeo chrysophekadion 3.6 0.09 27 Ompok bimaculatus 3.0 0.08 28 Channa striatus 1.9 0.05 29 Hypophthalmichthys molitrix 1.7 0.05 30 Notopterus notopterus 1.7 0.05 31 Mastacembelus armatus 1.5 0.04 32 Ctenopharyngodon idellus 0.6 0.02 33 Labeo rohita 0.4 0.01 34 Clarias macrocephalus 0.4 0.01 35 Anguilla marmorata 0.2 0.01 36 Macrognathus siamensis 0.2 0.01 37 Macrobrachium rosenbergii 0.2 0.01 38 Pangasius hypophthalmus 0.2 0.01 39 Hypophthalmichthys nobilis 0.06 0.002 40 Paralaubuca barroni 0.01 0.0002

8282
Fluctuations of fishing seasons and locations
Fish species composition by season in seine surveys was presented in Table 6. Tilapias (Oreochromis spp.) were also abundant, ranking second in catch after silver barb (Barbonymus gonionotus). Both tilapias and silver barb catches have high fluctuations by season, with peak catches in August and February, respectively. The other fish species at high catch rate were common carp (Cyprinus carpio) and repassan (Cyclocheilichthys repasson), accounting for 16.9 and 13.6%, respectively. Within the top five fish species with highest fish catches, the peak catch season of tilapias (in August) was different with others.
Table 6. Fish species composition by season in seine surveys
No. Species Proportion of catch by weight (%)
Nov 07
Feb 08 May 08 Aug 08
All year
1 Barbonymus gonionotus 25.5 36.5 33.2 27.2 30.6
2 Oreochromis spp. 12.3 12.5 17.6 36.6 19.7
3 Cyprinus carpio 16.9 18.9 19.5 12.4 16.9
4 Cyclocheilichthys repasson 22.9 16.7 4.8 9.9 13.6
5 Labiobarbus spilopleura 8.6 8.5 5.8 1.1 6.0
6 Mystus spp. 1.9 0.8 0.8 6.8 2.6
7 Cichla ocellaris 0 1.5 4.3 2.3 2.0
8 Hypostomus plecostomus 4.1 0.4 1.7 0 1.6
9 Mystus nemurus 0 1.8 3.3 0 1.3
10 Anguilla marmorata 3.4 0 1.6 0 1.3
11 Hypophthalmichthys nobilis 0 0.7 3.5 0 1.0
12 Oxyeleotris marmoratus 2.7 0.3 0 0.7 0.9
13 Hampala macrolepidota 1.4 1.4 0.2 0 0.8
14 Kryptopterus cryptopterus 0 0 0 2.0 0.5
15 Ompok bimaculatus 0.3 0 0.7 0.3 0.3
16 Hemibagrus wyckii 0 0 1.1 0 0.3
17 Wallago attu 0 0 1.1 0 0.3
18 Labeo chrysophekadion 0 0 0.5 0.4 0.2
19 Notopterus notopterus 0 0 0.4 0.1 0.1
20 Channa striatus 0 0 0 0.2 0.1 Fish species composition by locations in seine surveys was presented in Table 7. Most of fish species have fluctuations in fish catch between upstream, midstream and downstream. At the upstream area, tilapias were the most abundant catch species (26.3% in catch weight), but it was less abundant at the downstream sites. Silver barb (Barbonymus gonionotus) occupied abundant at the midle and downstream of the reservoir.

8383
Table 7. Fish species composition by locations in seine surveys
No. Species Percent in weight (%)
Upstream Midstream Downstream Reservoir
1 Barbonymus gonionotus 25.2 33.7 32.8 30.6
2 Oreochromis spp. 26.3 19.1 13.9 19.7
3 Cyprinus carpio 14.4 16.5 19.9 16.9 4 Cyclocheilichthys repasson 17.9 10.3 12.5 13.6
5 Labiobarbus spilopleura 5.8 6.0 6.1 6.0
6 Mystus spp. 0 4.4 3.3 2.6
7 Cichla ocellaris 1.7 1.7 2.7 2.0
8 Hypostomus plecostomus 1.7 0.5 2.5 1.6
9 Mystus nemurus 0 1.2 2.7 1.3
10 Anguilla marmorata 1.8 0 2.0 1.3 11 Hypophthalmichthys nobilis 1.4 1.2 0.5 1.0
12 Oxyeleotris marmoratus 1.2 1.5 0 0.9
13 Hampala macrolepidota 0 1.1 1.2 0.8
14 Kryptopterus cryptopterus 0 1.5 0 0.5
15 Ompok bimaculatus 0.8 0.3 0 0.3
16 Hemibagrus wyckii 0.4 0.4 0 0.3
17 Wallago attu 0.8 0 0 0.3
18 Labeo chrysophekadion 0 0.7 0 0.2
19 Notopterus notopterus 0.4 0 0 0.1
20 Channa striatus 0.2 0 0 0.1
DISCUSSIONS
Recently in Tri An Reservoir, fingerling stocking has not been continuous, especially for tilapias, which have not been stocked for the last 10 years. Thus, current tilapia populations in the reservoir exist due to natural reproduction, while other traditional herbivorous fish are stocked continuously such as silver carp, bighead carp, common carp, etc. The fluctuations in annual fish catch showed unstable management practices at the reservoir, based mostly on fluctuations of fishermen and fishing gears. Yearly fluctuations of fish catch and CPUE indicated that fisheries resources of Tri An Reservoir are affected by multiple factors such as environment, time and seasons, etc…
As CPUEs of each fishing gear changed by seasons, recording and understanding such changes were necessary for estimating the yearly average CPUE of each fishing gear. However, most of the previous historical fish catch data from Tri An Reservoir did not record this information, making it difficult to estimate yearly total catch exactly.
The data of seasonal fish catch and total catch for each fishing gear were not contributed directly to assess of tilapias impacts, but it provides a whole picture of fishing gear diversity and activities at the reservoir. Among the top fishing gears with highest catches, magine scoop nets, lift net and seine net were the one to catch all size of fish, indicating an uncontrol fishing situation at the reservoir.
8484
Within the top five fishing gears with highest total catch, lift nets with a light and magine scoop nets (18 lights) were not used to catch tilapia, and magine scoop nets (1 light) tilapias didn’t focus on tilapia. That was probably why tilapia only accounts for 4.62% of fish species composition caught in the reservoir. However, 14 of the 19 fishing gears operating in the reservoir caught tilapia. This finding suggests a wide distribution and production of tilapias across the reservoir. When tilapias were catched mainly by gill net with its mesh size lesser than 60 mm, it indicates an overfishing situation of tilapias in the reservoir.
According to Tung and Trong (2005), there were 109 fish species in Tri An Reservoir. Although this study’s effort was not similar to Tung and Trong (2005), the low number of species caught in the present study suggest a decline in biodiversity since the Tung and Trong report. However, there was no data to prove that such a decrease was caused by the impacts of fishing activity or alien species. Sy (2008) implies some negative impacts of alien carnivorous species in the reservoir, such as Cichla ocellaris, but not tilapias.
Among the top six species with the highest catches, only two economically valuable species were recorded: silver barb and tilapias. The fish of low economic value abundant in the reservoir were as Parambassis siamensis, Corica sorbona, Cyclocheilichthys repasson and Dermogenys pusillus. These fish represented 64% of total catch by biomass in the reservoir. This indicates over-fishing for economically valuable species in the reservoir (Li and Xu, 1995), a situation that has strongly affected fisheries and fish biodiversity much more than the impact of alien species.
By using gill nets (mesh size 40-60 mm) to seine fish at 4, 5 and 4 locations upstream, midstream and downstream of the reservoir four times per year, the data showed that fish species composition was concentrated more economically species. Tilapias were also abundant, ranking second in catch after silver barb, indicating a favorable development of such species in the reservoir as well as their strongly reproduction during a year cycle. In August, when tilapia was in their highest total catch, the other top five fish catch species does not fall into that peak catch, indicating the interaction of tilapia and other main economically fish species such as silver barb (Barbonymus gonionotus), common carp (Cyprinus carpio), repassan (Cyclocheilichthys repasson) and Labiobarbus spilopleura.
Most of fish species have fluctuations in fish catch between upstream, midstream and downstream indicating the habitat and environmental factors play an important role for fish distribution in the reservoir. The upstream area has more favorable conditions for fish growth and reproduction because of more food source and nutrients from Dong Nai and La Nga Rivers, indicating that tilapias were among dominant economically valuable species successfully occupying this area. Luong et al. (2002) indicated rather low primary and secondary productions at Tri An Reservoir (phytoplankton and zooplankton of 0.36 - 0.82 g DW/m2), resulting less abundant of tilapias at the downstream area. On the other hand, the limitted plankton food source had also been competed by many herbivorous fish. To manage the fish species composition at Tri An Reservoir, Luong et al. (2005) suggested to stock indigenous mable goby (Oxyeleotris marmorata) to feed on the prawns (Macrobrachium spp.) and other low economic small fish species (glass fish Parambassis siamensis, river sprat Corica soborna, repassan Cyclocheilichthys repasson, etc.). In terms of natural food web management, reducing of low economic small fish species may allow quick development of economically herbivorous fish such as tilapias, silver carp, bighead carp, etc.
ANTICIPATED BENEFITS
Information on the impacts of the introduced alien species on fisheries and biodiversity of indigenous fish species will allow governmental agencies to establish policies, plans and mechanisms for the management of the introduction of alien species.
As reservoirs are widely distributed throughout Asian countries and tilapias have been introduced into many reservoirs either intentionally or unintentionally, these results from this

8585
study may allow to stocking continuously of tilapias without much concerning of its negative impacts.
REFERENCES
FAO-SEAFDEC, 1985. Fisheries planning, management and development. FAO-SEAFDEC, Bangkok, Thailand, 31 pp.
Li, S. and Xu, S. 1995. Culture and capture of fish in Chinese Reservoirs. IDRC, Ottawa, Canada and Southbound Sdn. Bhd. Penang, Malaysia, 128 pp.
Lowe-McConnell, R. H. 2000. The roles of tilapias in ecosystems. In: M. C. M. Beveridge, B. J. McAndrew (eds.), Tilapias: Biology and Exploitation. Kluwer Academic Publishers, The Netherland, pp.129-162.
Luong, V.C., Kwei Lin, C. and Yakupitiyage, A. 2002. A trophic box model of cove aquaculture in Tri An Reservoir, Vietnam. Verh. Internat. Verein. Limnol. 28: 1381-1384. Stuttgart.
Luong, V.C., Yang Yi, Kwei Lin, C., 2005. Cove culture of marble goby (Oxyeleotris marmorata Bleeker) and carps in Tri An Reservoir of Vietnam. Aquaculture 244: 97-107.
Ministry of Fisheries (MOFI), 2006. Fisheries in Vietnam, researches and development (in Vietnamese). A Workshop Report in Nha Trang on 17 Dec, 2006. 93 pp.
Sy, P.C., 2008. Management of fishing, fisheries resources and aquaculture for sustainable development in Tri An Reservoir. Dong Nai Department of Science and Technology, 250 p.
Tu, N. V. 2003. Role and effects of tilapia in Vietnam. Oral presentation in a Workshop on Impact Assessment of Alien Species in Vietnam. May 2005, Can Tho University (in Vietnamese).
Tu, N. V. 2006. Solutions for Fisheries Development in Tri An Reservoir. Report on Reservoir Fisheries Management and Development. RIA1, RIA3 and UAF, 65 pp. (in Vietnamese).
Tung, N.T., Lam, P.T. 2002. Assessment of fisheries resources protection and management at Tri An Reservoir during last 5 years. Research Institute for Aquaculture No. 2.
Tung, N.T., Trong, N.V. 2005. Assessment of fisheries resources in Tri An Reservoir. Research Institute for Aquaculture No. 2.

8686
DURATION OF APPETITE INHIBITION PREDICTS SOCIAL DOMINANCE IN NILE TILAPIA, Oreochromis niloticus L.
Emmanuel M. Vera Cruz1, Madelin B. Valdez1, Remedios B. Bolivar1, and Russell J. Borski2
1College of Fisheries and Freshwater Aquaculture Center Central Luzon State University, Science City of Muñoz, Nueva Ecija, Philippines
2North Carolina State University, Raleigh, North Carolina 27695, USA
Abstract
This study investigated whether the result of contest for social dominance among
individuals in Oreochromis niloticus can be predicted by assessing the duration of appetite inhibition (DAI) during the isolation period. Fifty all-male juvenile O. niloticus of similar size were isolated for 10 days and were used in a social pair study. The DAI of each fish was observed when fish was transferred to the isolation unit. Body weight of dominant and subordinate individuals was recorded before and after the encounter. Eye color pattern (ECP) was also observed during the social encounter. The study revealed that tilapia with shorter DAI during the isolation had a greater possibility to win the fight for social dominance. Formation of stable dominant-subordinate relationship was observed in 24 of the 25 tested pairs. A total of seventeen fishes (70.93%) out of the 24 fishes that became dominant have shorter DAI compared to that of their conspecifics (Binomial test, P = 0.03). This indicates that social dominance can be predicted using the DAI of the fish during isolation. Reduced growth rate of both dominant and subordinate fish and a well-described physiological end result of social stress were observed one day after the social interaction. The significantly greater weight loss (P < 0.01) in subordinate fish (2.88 ± 0.21 g) compared to dominant fish (2.11 ± 0.19 g) a day after the establishment of social hierarchy was mainly attributed to behavioral differences such as appetite rather than to differences in physical activities. Death, which is the most overwhelming effect of stress, was observed in the subordinate individuals. All subordinate fish died within a week after the social interaction.
Key words: Appetite inhibition, Behavioral stress response, Growth, Oreochromis niloticus, Social dominance, Social interaction
INTRODUCTION
Cultured fish live in a diverse and complex environment. Social stress has a crucial role to play in the growth of the fish. A well-characterized physiological consequence of social stress is a reduced growth rate (Sloman et al., 2000). Stressful conditions can also affect fish health and welfare (Barton, 2000; Barton and Iwama, 1991). Environmental and husbandry stressors weaken both the innate and adaptive immune responses of the fish against pathogens (Klesius et al., 2001). Due to these, stress coping style or “the coherent set of behavioral and physiological stress responses, which is consistent over time and a characteristic of a certain species” (Koolhaas et al., 1999), is of fundamental importance to the quality of life of a cultured species. This study investigated whether the outcome of contests for dominance among individuals in an unselected population can be predicted from observations made before interactions on stress coping style or behavioral stress response such as the duration of appetite inhibition (DAI) after transfer for isolation to the new environment. This behavioral stress response has a potential to be used in the breeding programs of the experimental fish to select individuals that will produce offspring that can adjust their behavior to stressful conditions.
8787
MATERIALS AND METHODS
Experimental fish
One hundred size #20 genetically male Nile tilapia (Oreochromis niloticus), with average weight of 0.60 g, were obtained from the Phil-Fishgen, Central Luzon State University, Science City of Muñoz, Philippines. They were maintained in a rectangular tank (2m x 1m x 1m) receiving continuous flow of water. The fish were fed three times a day at 3% of the body weight. Prior to isolation weight of each fish was determined.
Isolation and monitoring of the DAI
Fifty fish (mean weight of 26.02 ±0.98 g) were isolated at random in glass aquarium (30cm x 15cm x 30cm) for 10 days. Each isolation unit was aerated to ensure sufficient dissolved oxygen available for the fish. Three sides of the aquarium were covered to prevent the fish seeing other fish isolated in the nearby aquaria. Upon introduction of each fish in the isolation unit, it was immediately hand fed with three pieces of floating feeds placed in a feeding ring. The duration from the time of feed introduction to the time of feed consumption was regarded as the duration of appetite inhibition (DAI). The DAI and the weight of the fish served as the bases for pairing the fish for social interaction; fish with shorter DAI against those with longer DAI; with both fish having similar weight. Fish were then fed daily at 1% of the body weight except two days prior to interaction. Water exchange was done every other day to maintain good water quality.
Fish marking for identification
After establishing the competing fish for social interaction, each fish in a pair was individually marked by a small cut on the upper or lower part of the tail fin for the purpose of identifying the fish with shorter and longer DAI. The fish in a pair with longer DAI was cut on the lower portion of the caudal fin and vice versa.
Social interaction
After marking, the pair of fish was introduced into a new environment (30cm x 15cm x 30cm aquarium) to prevent the effect of place familiarity. The period from the time of introduction to the time of first agonistic attack was recorded. The number of attacks in ten minute-time from the first agonistic attack was separately recorded from the total number of attacks during the entire interaction. Change in eye color pattern (ECP) of the competing fish was monitored at the start, during and after the competitive social interaction. Eye color was quantified as darken area of both iris and sclera (Volpato et al., 2003). The circular area of the eye was divided into eight equal parts using four imaginary diagonal lines (Fig. 1). Eye color pattern value ranged from zero to eight. At the end of the interaction, social rank (dominant or subordinate) was identified by the characteristics displayed by each fish such as proactive and reactive, pursuing and retreating, erected and not erected dorsal fin and as well as changes in skin color and ECP. Canon power shot A650IS image stabilizer AIAF digital camera with resolution of 12.1 megapixels was used to document the social interaction which in turn was used in checking the observations made during the interaction.

8888
Figure 1. Eye color pattern of the fish. Picture with blue arrow shows darkening of 5 out of 8 divisions of the iris and sclera of the fish
Growth rate observation
Paired fish after the interaction were transferred to the dominant fish’s aquarium to support its dominancy status. They were maintained for a week and fed once a day at 3% of their total body weight. Every aquarium was aerated and to maintain good water quality. Exchange of water was done every other day. The weight of fish was recorded a day after the fight.
Statistical analyses
Frequency difference was analyzed using Binomial test. Mean DAIs of the two groups, and mean decrease in weight a day after the social encounter between dominant and subordinate fish were compared using paired sample T-test. Linear relationship of DAI and aggression was assessed using linear regression and Pearson correlation coefficient. Statistical analyses were carried out by using the SPSS software version 16.0.
RESULTS
DAI after transfer to isolation units
The mean DAI for all isolated fish was 83.55 (±14.29) minutes. The shortest DAI was 0.31 minute and the longest was 570.76 minutes. After the matching pairs for later pairing had been established, short DAI group had a mean DAI of 33.55 (±10.15) minutes, which was significantly shorter (P < 0.01) than that of the long DAI group (133.54±22.86 minutes; Fig. 2).
Social interaction
During the introduction of competing individuals in the aquarium, both fish displayed pale body coloration with dark stripes. The mean duration before observance of first attack was 10.86 (±2.13) minutes. The fastest individual to adapt to the social condition and

8989
attacked the opponent took less than a minute (6.0 seconds), while the longest duration before observance of first attack was 33.66 minutes. However, at the beginning of the social encounter, it was not always the fish with shorter DAI that initiated the fight. Thirteen (52.00%) of the 25 fish with shorter DAI (compared to their respective opponents) initiated the fight while 11 social interactions were initiated by fish with longer DAI. One pair did not show any interaction.
During the social encounter, the dorsal fins of both fish were raised and both swam towards each other indicating their preparedness to fight. Then they begun aggressive interaction which involved chasing, rapid circling and biting directed against the mouth, fins and all other body parts of the opponent. During this period of intensive interaction, both fish exhibited pale body stripe coloration. However, during the later part of the interaction, challenged fish mostly rebuffed attacks and at this period, one of the fish chased and bit the flanks of the other fish that was fleeing. At this point, aggressive behaviour becomes unidirectional, and an aggressive dominant individual and a retreating subordinate fish were clearly identified. It was also observed that subordination increased the body- and eye-darkening color of the fish while dominance decreased it.
Figure 2. Mean (±S.E.) duration of appetite inhibition (minute) of the two competing groups. S-DAI: short DAI group; L-DAI: long DAI group. Mean DAI were significantly different at P < 0.01.
Formation of a stable dominant-subordinate relationship was observed in 24 out of the 25 tested pairs for social dominance. Seventeen dominant fish (70.83%) of the 24 had shorter DAI during isolation compared to their opponents (Fig. 3). This frequency difference on DAI of the dominant individuals was significant (Binomial test, P = 0.03). However, as previously mentioned, social encounter was not always initiated by the earlier eaters (i.e. shorter DAI), but eleven (64.70%) of the 17 dominant earlier eaters initiated the fight and the remaining six individuals did not start up attacking the opponent yet won the fight. On the other hand, five later eaters that became dominant begun the fight, while the remain ning two did not.
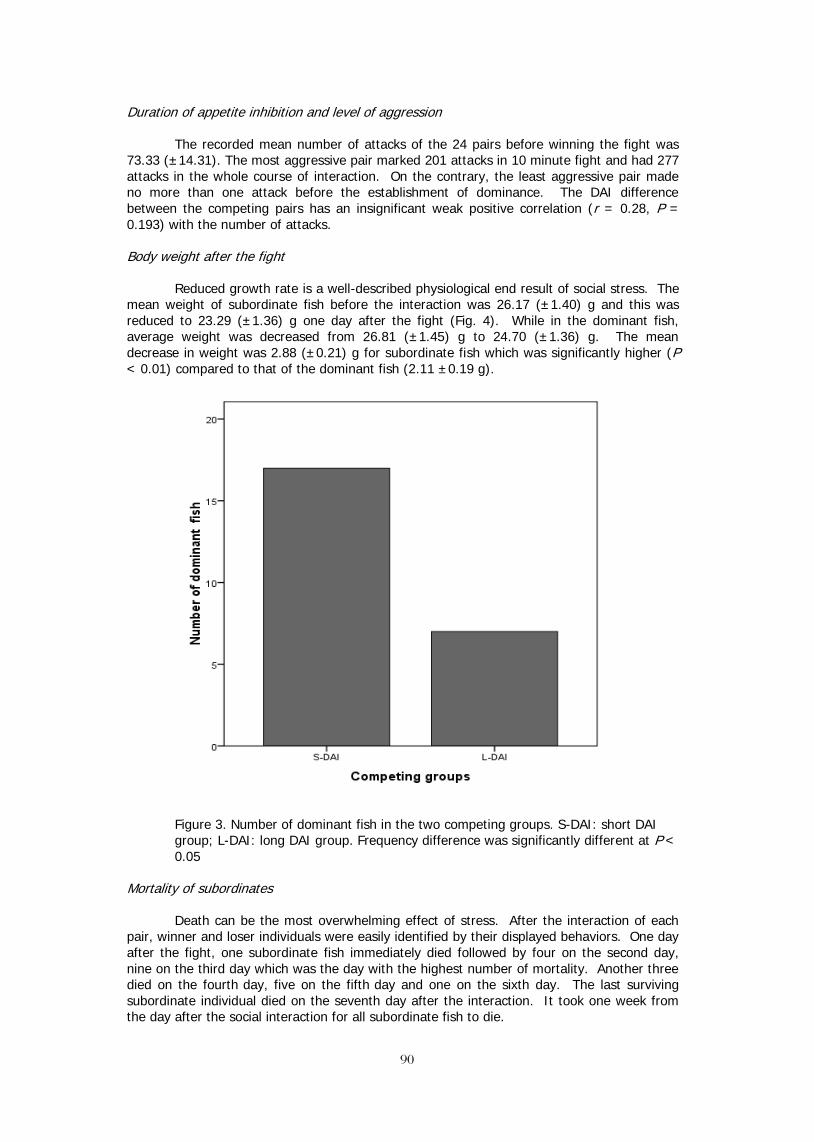
9090
Duration of appetite inhibition and level of aggression
The recorded mean number of attacks of the 24 pairs before winning the fight was 73.33 (±14.31). The most aggressive pair marked 201 attacks in 10 minute fight and had 277 attacks in the whole course of interaction. On the contrary, the least aggressive pair made no more than one attack before the establishment of dominance. The DAI difference between the competing pairs has an insignificant weak positive correlation (r = 0.28, P = 0.193) with the number of attacks.
Body weight after the fight
Reduced growth rate is a well-described physiological end result of social stress. The mean weight of subordinate fish before the interaction was 26.17 (±1.40) g and this was reduced to 23.29 (±1.36) g one day after the fight (Fig. 4). While in the dominant fish, average weight was decreased from 26.81 (±1.45) g to 24.70 (±1.36) g. The mean decrease in weight was 2.88 (±0.21) g for subordinate fish which was significantly higher (P < 0.01) compared to that of the dominant fish (2.11 ±0.19 g).
Figure 3. Number of dominant fish in the two competing groups. S-DAI: short DAI group; L-DAI: long DAI group. Frequency difference was significantly different at P < 0.05
Mortality of subordinates
Death can be the most overwhelming effect of stress. After the interaction of each pair, winner and loser individuals were easily identified by their displayed behaviors. One day after the fight, one subordinate fish immediately died followed by four on the second day, nine on the third day which was the day with the highest number of mortality. Another three died on the fourth day, five on the fifth day and one on the sixth day. The last surviving subordinate individual died on the seventh day after the interaction. It took one week from the day after the social interaction for all subordinate fish to die.

9191
Figure 4. Mean weight (±S.E.) of dominant and subordinate fish before and after the social interaction. BI. Dom: dominant - before the interaction; AI. Dom: dominant – after the interaction; BI. Sub: Subordinate – before the interaction; AI. Sub: Subordinate - after the interaction
DISCUSSION
Behavioral stress response can be used to predict outcome of contest for social dominance. Results of the present study indicate that tilapia with shorter DAI after its transfer for isolation to a new environment before a fight is most likely or has a greater chance to become dominant. These results draw parallel with the findings of Korzan et al. (2006), Øverli et al. (2004) and Pottinger and Carrick (2001) that fish with low behavioral stress response became dominant in majority of the social pairing. The time variation of resumption of food intake (ranging from seconds to hours) of fish after being transferred to new environment most likely reflects some aspects of the physiological stress responses to confinement, which could also affect the outcome of the social interaction (Øverli et al., 2004). According to Bernier (2006), stress induced inhibition of food intake in fish is in part mediated by corticotrophin-releasing factor (CRF) system which plays a key role in controlling the neuroendocrine, autonomic, immune, and behavioural responses to stressors. On the other hand, the fish resumption of feeding after they have coped-up with the stressful condition is likely to reflect a down regulation of the physiological stress response (Øverli et al., 1998).
The results that not all fish with shorter DAI won the fight calls for a need to refine the method of assessing the behavioral stress response in this species of fish. In a review, Øverli et al. (2007) described how feeding behavior can be used as indicator of stress coping style. Feeding behaviour can be assessed using point system based on the feeding behavior of the fish when fed daily for one week during isolation. This grading of fish behavior should also be tried in O. niloticus.
Social encounter is potentially costly and risky to the fighting opponents. The cost of fighting includes energy, time and physical injuries. The individuals engaged in social fight are integrating the costs and benefits associated with the contest and adjust their behavior
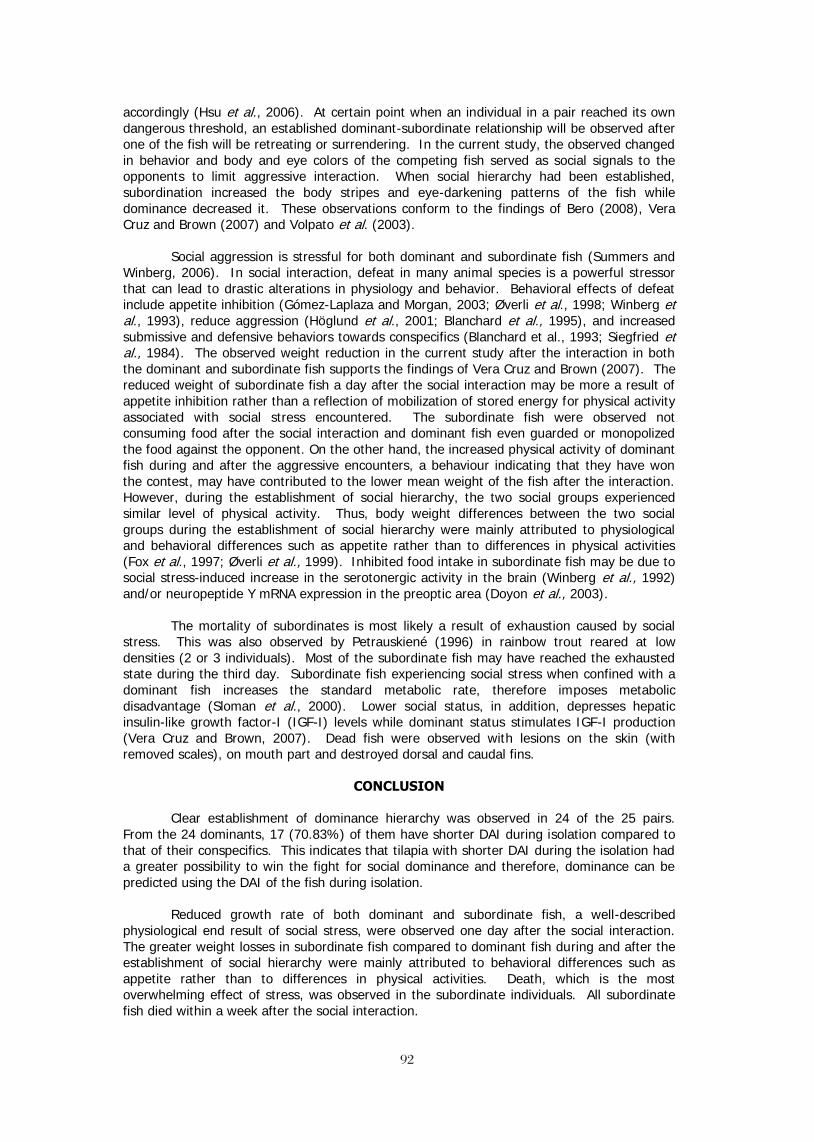
9292
accordingly (Hsu et al., 2006). At certain point when an individual in a pair reached its own dangerous threshold, an established dominant-subordinate relationship will be observed after one of the fish will be retreating or surrendering. In the current study, the observed changed in behavior and body and eye colors of the competing fish served as social signals to the opponents to limit aggressive interaction. When social hierarchy had been established, subordination increased the body stripes and eye-darkening patterns of the fish while dominance decreased it. These observations conform to the findings of Bero (2008), Vera Cruz and Brown (2007) and Volpato et al. (2003).
Social aggression is stressful for both dominant and subordinate fish (Summers and Winberg, 2006). In social interaction, defeat in many animal species is a powerful stressor that can lead to drastic alterations in physiology and behavior. Behavioral effects of defeat include appetite inhibition (Gómez-Laplaza and Morgan, 2003; Øverli et al., 1998; Winberg et al., 1993), reduce aggression (Höglund et al., 2001; Blanchard et al., 1995), and increased submissive and defensive behaviors towards conspecifics (Blanchard et al., 1993; Siegfried et al., 1984). The observed weight reduction in the current study after the interaction in both the dominant and subordinate fish supports the findings of Vera Cruz and Brown (2007). The reduced weight of subordinate fish a day after the social interaction may be more a result of appetite inhibition rather than a reflection of mobilization of stored energy for physical activity associated with social stress encountered. The subordinate fish were observed not consuming food after the social interaction and dominant fish even guarded or monopolized the food against the opponent. On the other hand, the increased physical activity of dominant fish during and after the aggressive encounters, a behaviour indicating that they have won the contest, may have contributed to the lower mean weight of the fish after the interaction. However, during the establishment of social hierarchy, the two social groups experienced similar level of physical activity. Thus, body weight differences between the two social groups during the establishment of social hierarchy were mainly attributed to physiological and behavioral differences such as appetite rather than to differences in physical activities (Fox et al., 1997; Øverli et al., 1999). Inhibited food intake in subordinate fish may be due to social stress-induced increase in the serotonergic activity in the brain (Winberg et al., 1992) and/or neuropeptide Y mRNA expression in the preoptic area (Doyon et al., 2003).
The mortality of subordinates is most likely a result of exhaustion caused by social stress. This was also observed by Petrauskiené (1996) in rainbow trout reared at low densities (2 or 3 individuals). Most of the subordinate fish may have reached the exhausted state during the third day. Subordinate fish experiencing social stress when confined with a dominant fish increases the standard metabolic rate, therefore imposes metabolic disadvantage (Sloman et al., 2000). Lower social status, in addition, depresses hepatic insulin-like growth factor-I (IGF-I) levels while dominant status stimulates IGF-I production (Vera Cruz and Brown, 2007). Dead fish were observed with lesions on the skin (with removed scales), on mouth part and destroyed dorsal and caudal fins.
CONCLUSION
Clear establishment of dominance hierarchy was observed in 24 of the 25 pairs. From the 24 dominants, 17 (70.83%) of them have shorter DAI during isolation compared to that of their conspecifics. This indicates that tilapia with shorter DAI during the isolation had a greater possibility to win the fight for social dominance and therefore, dominance can be predicted using the DAI of the fish during isolation.
Reduced growth rate of both dominant and subordinate fish, a well-described physiological end result of social stress, were observed one day after the social interaction. The greater weight losses in subordinate fish compared to dominant fish during and after the establishment of social hierarchy were mainly attributed to behavioral differences such as appetite rather than to differences in physical activities. Death, which is the most overwhelming effect of stress, was observed in the subordinate individuals. All subordinate fish died within a week after the social interaction.

9393
ACKNOWLEDGMENTS
This work resulted from joint efforts between Central Luzon State University and the Aquaculture and Fisheries Collaborative Research Support Program (AquaFish CRSP). The opinions expressed herein are those of the authors and do not necessary reflect the views of these agencies. Data presented here are part of the undergraduate research of M.B. Valdez.
REFERENCES Barton, B. A. 2000. Stress. In: Stickney, R.R. (Ed.). Encyclopedia of Aquaculture. Wiley,
New York. 892-898 pp.
Barton, B. A. and G.K. Iwama. 1991. Physiological changes in fish from stress in aquaculture with emphasis on the response and effects of corticosteroids. Annual Review of Fish Diseases, 1: 3-26.
Bernier, N.J. 2006. The corticotropin-releasing factor system as a mediator of the appetite-suppressing effects of stress in fish. General and Comparative Endocrinology, 146: 45-55
Bero, R.M.L., 2008. Eye color as a predictor of social dominance in Nile tilapia (Oreochromis niloticus L.). Undergraduate Thesis. Central Luzon State University. 53 pp.
Blanchard, D.C., R.L. Spencer, S.M. Weiss, R.J. Blanchard, B. McEwen and R.R. Sakai. 1995. Visible burrow system as a model of chronic social stress: behavioral and neuroendocrine correlates. Psychoneuroendocrinology, 20: 117- 134.
Blanchard, D.C., R.R. Sakai, B. McEwen, S.M. Weiss and R.J. Blanchard. 1993. Subordination stress: behavioural, brain and neuroendocrine correlates. Behavioral Brain Research, 58: 113-121.
Doyon, C., Gilmour, K.M., Trudeau, V.L., Moon, T.W., 2003. Corticotropin-releasing factor and neuropeptide Y mRNA levels are elevated in the preoptic area of socially subordinate rainbow trout. General and Comparative Endocrinology, 133: 260-271.
Fox, H.E., White, S.A., Kao, M.H.F., Fernald, R.D., 1997. Stress and dominance in a social fish. Journal of Neuroscience, 17: 6463-6469.
Gómez-Laplaza, L.M. and E. Morgan, 2003. Theinfluence of social rank in angelfish, Pterophyllum scalare, on locomotor and feeding activities in a novel environment. Laboratory Animals, 37: 108-120.
Höglund, E., N. Kolm and S. Winberg. 2001. Stress-induced changes in brain serotonergic activity, plasma cortisol and aggressive behavior in Arctic charr (Salvelinus alpinus) is counteracted by L-DOPA. Physiological Behavior, 74: 381-389.
Hsu, Y.Y., Earley, R.L., and L.L. Wolf. 2006. Modulation of aggressive behaviour by fighting experience: mechanisms and contest outcomes. Biological Reviews, 81: 33-74.
Klesius, P.H., J.J. Evans and C.A. Shoemaker. 2001. Stress control for healthy fish. Abstracts of 6th Ecuadorian Aquaculture Conference.
Koolhaas, J.M., S.M. Korte, S.F. De Boer, B.J. Van Der Vegt, C.G. Van Reenen, H. Hopster, I.C. De Jong, M.A.W. Ruis, and H.J. Blokhuis. 1999. Coping styles in animals: current status in behavior and stress- physiology. Neuroscience Biobehavioral Reviews, 23: 925-935.
Korzan, W.J., Ø. Øverli, and C.H. Summers. 2006. Future social rank: Forecasting status in the green anole (Anolis carolinensis). Acta Ethology, 9: 48-57.
Øverli, Ø., C.A. Harris and S. Winberg, S., 1999. Short-term effects of fights for social dominance and the establishment of dominant-subordinate relationship on brain monomines and cortisol in rainbow trout. Brain Behavior and Evolution, 54: 263-275.

9494
Øverli, Ø., W.L. Korzan, E. Höglund, S. Winberg, H. Bollig, M. Watt, G.L. Forster, B.A. Barton, E. Øverli, K.J. Renner and C.H. Summers. 2004. Stress coping style predicts aggression and social dominance in rainbow trout. Hormones and Behavior, 45: 235- 243.
Øverli, Ø., C. Sorensen, K.G.T. Pulman, T.G. Pottinger, W. Korzan, C.H. Summers and G.E. Nilsson. 2007. Evolutionary background for stress-coping styles: relationships between physiological, behavioural, and cognitive traits in non-mammalian vertebrates.neuroscience and Biobehavioral Reviews, 31: 396-412.
Øverli, Ø., S. Winberg, B. Damsgard and M. Jobling. 1998. Food intake and spontaneous swimming activity in Arctic charr (Salvelinus alpinus): role of brain serotonergic activity and social interactions. Canadian Journal of Zoology, 76: 1366-1370.
Petrauskiené, L. 1996. Effects of social stress in rainbow trout at different stocking densities. (www-heb:pac.dfo-mpo.gc.ca/congress/1996/Applied/Petrauskiene1.pdf.)
Pottinger, T.G. and T.R. Carrick. 2001. Stress responsiveness affects dominant-subordinate relationships in rainbow trout. Hormones and Behavior, 40: 419-427.
Siegfried, B., H.R. Frischknecht and P.G. Waser. 1984. Defeat, learned submissiveness, and analgesia in mice: effects of genotype. Behaviour of Neural Biology, 421: 91-97.
Sloman, K. A., G. Motherwell, K.I. O’Connor and A.C. Taylor. 2000. The effect of social stress on the standard metabolic rate (SMR) brown trout, Salmo trutta. Fish Physiology and Biochemistry, 23: 49- 53.
Summers, C.H. and S. Winberg. 2006. Interactions between neural regulation of stress and aggression. Journal of Experimental Biology, 209:4581-4589.
Vera Cruz, E.M. and C.L. Brown. 2007. The influence of social status on the rate of growth, eye color pattern and Insulin-like Growth Factor-I gene expression in Nile tilapia, Orechromis niloticus. Hormones and Behavior, 51: 611-619.
Volpato, G.L., A.C. Luchiari, C.R.A. Duarte, R.A. Barreto, and G.C. Ramanzini. 2003. Eye color as an indicator of social rank in the fish Nile tilapia. Brazilian Journal of Medical and Biological Research, 36: 1659-1663.
Winberg, S., C.G. Carter, I.D. McCarthy, Z.-Y. He, G.E. Nilsson and D.F. Houlihan. 1993. Feeding rank and brain serotonergic activity in rainbow trout Oncorhynchus mykiss. Journal of Experimental Biology, 179: 197-211.
Winberg, S., G.E. Nilsson and K. H. Olsén, 1992. Changes in brain serotonergic activity during hierarchic behavior in artic charr (Salvelinus alpinus L.) are socially induced. Journal of Comparative Physiology, 170, 93-99.

9595
FISHMEAL-FREE DIETS IMPROVE THE COST EFFECTIVENESS OF CULTURING NILE TILAPIA (Oreochromis niloticus L.) IN PONDS UNDER AN ALTERNATE DAY
FEEDING STRATEGY
Russell J. Borski1, Remedios B. Bolivar2, Eddie Boy T. Jimenez2, Roberto Miguel V. Sayco2, Reginor Lyzza B. Arueza2, Charles R. Stark3, and Peter R. Ferket3
1Department of Biology, North Carolina State University, Raleigh, NC, USA 2Freshwater Aquaculture Center-College of Fisheries, Central Luzon State University,
Science City of Muñoz, Nueva Ecija, Philippines 3Department of Poultry Science, North Carolina State University, Raleigh, NC USA
ABSTRACT
Feed constitutes 60-70% of total production costs of tilapia (Oreochromis spp.). Reductions in quantity of feed used for fish growout and in the cost of formulated feeds are two approaches to containing feed costs. Our previous studies show that alternate day feeding at full ration produces Nile tilapia (O. niloticus) of comparable body size and harvest yield as those fed daily at full ration. The reduced feed consumption and 100% improved feed conversion with fish on the alternative day feeding strategy provided a significant cost savings to the semi-intensive growout of Nile tilapia in ponds in the Philippines. The cost of commercial fish feeds are rising sharply as the demand for fishmeal increases and its supply declines. We evaluated the growth performance of tilapia fed on alternate days with diets that incorporated plant ingredients widely available in the Philippines or other semi-tropical or tropical regions (cassava meal, copra meal, coconut oil, rice bran) and that contained porkmeal to replace fishmeal. Fish were grown out in ponds for 120 days with isocaloric-balanced, 0% and 6% fishmeal diets contained 31% crude protein and 6% crude fat. Fish showed similar performance on diets containing 0% and 6% fishmeal. Final body weight, total length, specific growth rate were virtually identical in fish on the two diets. Survival rates were 84% and 89% for fish on the 0% and 6% fishmeal diets, respectively. Feed consumption and feed conversion were also similar among the two groups. Total extrapolated yield at harvest was 3062 and 3080 kg fish/hectare for the 0% and 6% fishmeal groups, respectively. A marginal budget analysis showed an 8% improved return on fish fed the cheaper diet lacking fishmeal. This along with the alternative day feeding strategy previously shown to be as effective as daily feeding protocols has the potential of reducing overall feed costs for growing marketable size tilapia by > 60%. Collectively, the results show that substitution of diets containing fishmeal with cheaper and more sustainable sources of protein are effective options for reducing the costs without negatively impacting the production of tilapia.
INTRODUCTION
Feed is widely recognized as the most costly component of fish farming. A cost-farm budget analysis shows that feed constitutes 60-70% of total production costs of tilapia (Oreochromis niloticus) for small-scale, rural farmers in the Philippines (ADB 2005). Because of this, any reductions of feed costs can effectively increase income for Philippine farmers. Reductions in both the amount of feed used for growout of marketable fish and in the cost of formulated feeds are two approaches to containing feed costs. Our previous studies show that 1) delaying the onset of supplemental feeding to either 45-days or 75-days in fertilized ponds reduces the amount of feed consumed without any negative impact on the production of marketable tilapia, 2) feeding at a sub-satiation level of 67% did not reduce measurable production of marketable fish relative to fish fed at 100% satiation level, and 3) feeding only on alternate days saved approximately half of feed cost without a significant reduction in growth, survival, or market yield of Nile tilapia in growout ponds (Brown et al. 2000, Bolivar et al. 2003, Bolivar et al. 2006).

9696
The cost of commercial fish feeds are rising sharply as the market demand increases to supply growing aquaculture and the availability of fishmeal declines. About 40% of feed costs are attributable to fishmeal, which constitutes 15-20% of the feed formulation. Much of the fishmeal used for tilapia in the Philippines is imported, and costs are expected to rise in the future as global supplies become constrained by increasing demands from other aquaculture and declines in commercial bait fisheries. Because tilapia are omnivorous fish, which naturally feed on plankton, diatoms, small crustaceans, algae, higher plants and decomposing vegetable matter, they do not require fish in their diet and they are an ideal group of species to recycle food by-products into high quality food protein for humans (Brown 1983). Unlike carnivorous fishes, tilapia can digest high levels of carbohydrate in their diet (Anderson et al. 1984; National Research Council 1993), and they can effectively utilize human food by-products as feed ingredients, such as rice bran, cocoa, various flowers, soya, nut oil, milling waste, brewer’s wastage, poultry by-product meal, pork meal, feather meal, cassava, and ipal-ipal leaf (Jackson et al. 1982). All of these lower-cost ingredients are readily available in the Philippines to completely replace or significantly reduce the inclusion of fishmeal in tilapia diets. Indeed, various animal protein meals (meat and bone meal, poultry by-product meal, feather meal, and blood meal) and plant proteins (soya, copra, cottonseed and others) have been shown to be either partially or completely replace fishmeal in tilapia diets (El-Sayed 1998; for reviews see Lim and Webster 2006 and El-Sayed 2006). Few studies have addressed the combinations of animal and plant protein types that might suffice in replacing or significantly reducing fishmeal in tilapia feed. Also, most investigations focus on the performance and nutritional characteristics of different protein sources rather than their ability to improve profit margins in tilapia production (see El-Sayed 2006). We examined the use of pork by-product meal as a replacement for fishmeal in diets formulated with plant and animal ingredients widely available in the Philippines on the grow out performance of Nile tilapia fed on alternate days in earthen ponds.
MATERIALS AND METHODS
In this study we evaluated the utility of using pork meal, a source of animal protein substantially lower in cost than fishmeal and widely available in the Phillipines, as a replacement of fishmeal in diets of tilapia grown in ponds. Alternate day feeding was previously shown to reduce production costs of tilapia without significantly altering final yield as almost 50% less feed could be used to grow fish than that incorporating standard daily feeding practices. Hence, this study evaluated if replacement of fishmeal with pork meal is as effective in producing tilapia under an alternate-day feed reduction strategy, as those diets containing standard levels of fishmeal.
This study was composed of two (2) treatment groups with four replicates per treatment. Groups were as follows: treatment I – formulated feeds with 6% fishmeal and treatment II – formulated feeds lacking fishmeal and containing pork meal. The constitution of the formulated tilapia grower floating feeds is shown in Table 1. The grow-out phase of this study were done in eight 500 m2 earthen ponds at the Freshwater Aquaculture Center, Central Luzon State University, Science City of Muñoz, Nueva Ecija, Philippines.

9797
Table 1. Composition of caloric balanced grower test diets with 6% fishmeal and 0% fishmeal (fishmeal substituted with porkmeal). Inclusion rate of ingredients are kg ton-1 of feed.
RAW MATERIALS Grower – 6% Fishmeal Grower – 0% Fishmeal Soybean Meal (HP) 45% 422.00 400.00 Corn Gluten 50.00 53.00 Hydrolyzed Animal Protein 30.00 30.00 Fishmeal Tuna 55% 60.00 0.00 Pork Meat Meal 55% 0.00 74.00 Copra Cake 73.00 76.00 Rice Bran 178.20 182.90 Cassava Meal 150.00 150.00 Fish Oil (Local) 5.50 5.00 Coconut Oil 5.00 5.00 Mono dicalcium phosphate 12.00 10.00 Salt 5.00 5.00 Mineral Premix 3.00 3.00 Vitamin Premix 6.30 6.10 TOTAL WEIGHT 1000.00 1000.00 DE Fish (kcal/kg) 2477.92 2484.50 Crude Protein (%) 30.99 31.07 Crude Fat (%) 6.21 6.23 Crude Fiber (%) 4.41 4.29 Starch (%) 17.36 17.40 Ash (%) 8.20 9.05 Ca (%) 0.96 0.91 Avail. Phosphorus (%) 0.67 0.66 Lysine (%) 1.51 1.50 Methionine (%) 0.54 0.50 Methionine + Cysteine (%) 0.97 0.96 Threonine (%) 1.06 1.07 Tryptophan (%) 0.33 0.42
Size 20 (weight range = 0.35- 0.37 g) sex reversed fingerlings of the GIFT strain were stocked in each pond at 4 fish m-2. Fish were initially fed on alternate days with prestarter (36% crude protein) for 30 days and then starter feeds for 30 days. Following this 60-day period, animals were fed formulated grower feeds with and without fishmeal on alternate days until the end of the experiment. The feed ration was based on the average fish biomass amd ranging from 10% down to 3% body weight per day.
Fish sampling was done every two weeks using cast net method to monitor fish growth and for feed adjustment. Estimated survival were as follow: first month – 100%, second month – 95%, third month – 90% and fourth month – 85%. Ponds were fertilized weekly with ammonium phosphate (16-20-0) and urea (46-0-0) at the rate of 28 kg N and 5.6 kg P ha-1 week-1, respectively to enhance the growth of natural foods in pond water. Water quality parameters (dissolved oxygen concentration, water temperature and Secchi disc visibility) were monitored weekly between 9 to 10 o’clock in the morning. Water depth was maintained at 1 m in each pond. The total numbers of fish were counted and bulk weighed at the end of the 120 days culture period. Final mean weight, daily weight gain, gross yield and survival rates were calculated. A simple cost and return analysis were computed to compare the cost benefits between the two treatments. Data (mean ± standard deviation) were analyzed using paired t-Test.
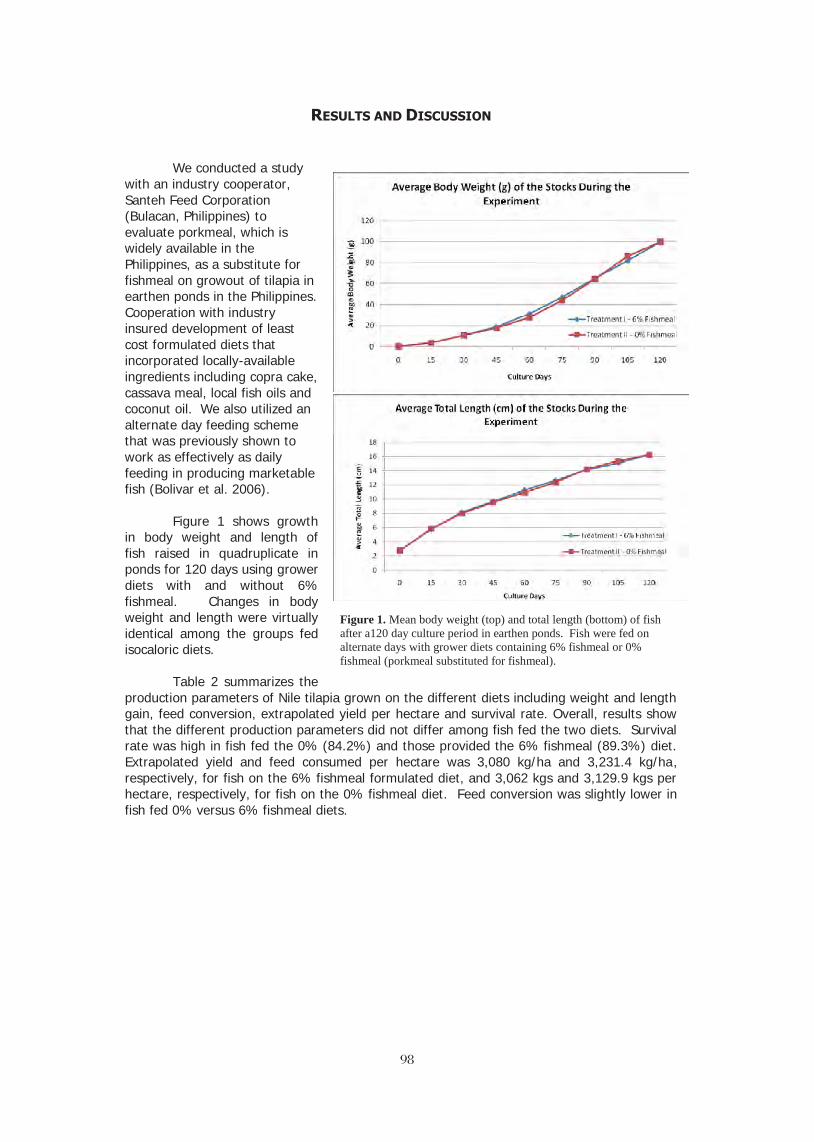
9898
RESULTS AND DISCUSSION
We conducted a study with an industry cooperator, Santeh Feed Corporation (Bulacan, Philippines) to evaluate porkmeal, which is widely available in the Philippines, as a substitute for fishmeal on growout of tilapia in earthen ponds in the Philippines. Cooperation with industry insured development of least cost formulated diets that incorporated locally-available ingredients including copra cake, cassava meal, local fish oils and coconut oil. We also utilized an alternate day feeding scheme that was previously shown to work as effectively as daily feeding in producing marketable fish (Bolivar et al. 2006).
Figure 1 shows growth in body weight and length of fish raised in quadruplicate in ponds for 120 days using grower diets with and without 6% fishmeal. Changes in body weight and length were virtually identical among the groups fed isocaloric diets.
Table 2 summarizes the production parameters of Nile tilapia grown on the different diets including weight and length gain, feed conversion, extrapolated yield per hectare and survival rate. Overall, results show that the different production parameters did not differ among fish fed the two diets. Survival rate was high in fish fed the 0% (84.2%) and those provided the 6% fishmeal (89.3%) diet. Extrapolated yield and feed consumed per hectare was 3,080 kg/ha and 3,231.4 kg/ha, respectively, for fish on the 6% fishmeal formulated diet, and 3,062 kgs and 3,129.9 kgs per hectare, respectively, for fish on the 0% fishmeal diet. Feed conversion was slightly lower in fish fed 0% versus 6% fishmeal diets.
Figure 1. Mean body weight (top) and total length (bottom) of fish after a120 day culture period in earthen ponds. Fish were fed on alternate days with grower diets containing 6% fishmeal or 0% fishmeal (porkmeal substituted for fishmeal).
9999
Table 2. Production parameters (mean ± standard deviation) of fish fed on alternate days with grower diets with 6% fishmeal or 0% fishmeal (porkmeal substituted for fishmeal). Fish were grown in ponds for 120 days.
Parameters Treatment I (6% Fish Meal)
Treatment II (0% Fish Meal)
Initial Average Weight (g) 0.372 + 0.049a 0.356 + 0.028a Final Average Weight (g) 99.531 + 19.190a 99.746 + 14.331a Average Gain in Weight (g) 99.159 + 19.175a 99.390 + 14.355a Average Daily Gain in Weight (g/day)
0.826 + 0.160a 0.828 + 0.120a
Specific Growth Rate (%) 4.652 + 0.172a 4.693 + 0.176a Initial Average Total Length (cm)
2.8 + 0.12a 2.8 + 0.06a
Final Average Total length (cm)
16.261 + 1.116a 16.241 + 0.823a
Average Gain in Length (cm) 13.467 + 1.107a 13.491 + 0.880a Average Daily Gain in Length (cm/day)
0.112 + 0.009a 0.112 + 0.007a
Survival Rate (%) 89.3 + 5.3a 84.2 + 3.1a Extrapolated Feed Consumed per Hectare (kg/hectare)
3231.4 + 711.5a 3129.9 + 425.7a
Extrapolated Yield per Hectare (kg/hectare)
3080.0 + 598.9a 3062.0 + 520.8a
Feed Conversion Ratio 1.05 + 0.05a 1.03 + 0.05b Treatment means within the same row with different superscript letters are significantly different (P < 0.05).
Water quality parameters including dissolved oxygen, water temperature and secchi disc visibility were similar among the two groups and fell within the range tolerable for tilapia growout. However, dissolved oxygen levels declined in ponds during the last month of growout for both groups of fish. This may have resulted in reduced feeding activity and overall growth of both groups of fish.
We conducted a simple cost and return analysis using current prices for all inputs and the value of marketable tilapia (Table 3). We found an approximate 8% higher net return for production of fish on the 0% fishmeal formulated diets (PhP 55,944.42) had than those grown on the 6% fishmeal diet (PhP 51,742.76).
Table 3. Simple cost and return analysis per hectare of production of fish grown on diets with 6% fishmeal and 0% fishmeal (porkmeal substitution of fishmeal) over a 120-day culture period. Values are shown in Philippine pesos (~44 PhP = $1 USD)
Descriptions Treatment I – 6% Fishmeal Treatment II – 0% Fishmeal Gross Return PhP 169,400.00 PhP 168,410.00 Costs (PhP, Philippines peso): Fingerlings 17,200.00 17,200.00 Commercial Feeds 99,043.44 93,497.46 Fertilizers 16-20-0 526.40 658.00 46-0-0 887.40 1,110.12 Total Cost: 117,657.24 112,465.58 NET RETURN PhP 51,742.76 PhP 55,944.42

100100
Assumptions: Price of Fingerling: P 0.43 piece-1 Price of Commercial Feeds: Pre-starter: P35.00 kg-1 Starter: P28.25 kg-1 Formulated Feeds with 6% Fishmeal: P31.00 kg-1
Formulated Feeds with 0% Fishmeal: P30.00 kg-1 Price of marketable Tilapia: P55.00 kg-1 Price of Fertilizers: 16-20-0: P18.80 kg-1 46-0-0: P17.40 kg-1
CONCLUSION
It is estimated that 60-80% of total variable costs for growing tilapia is attributable to feeds.
We previously show that alternate day feeding resulted in significant cost-savings relative to daily feeding at full ration (Bolivar et al. 2006). Using this more cost-effective alternate day feeding strategy, we assessed whether elimination of fishmeal from diets and its replacement with a cheaper animal protein (porkmeal) might provide additional cost savings to tilapia production. The diets were produced by a local feeds company and incorporated locally available Philippine ingredients where possible. We show that fish fed formulated feeds lacking fishmeal had similar daily weight gain, specific growth rate, and survivorship as fish fed fishmeal diets. Feed consumption, gross harvest yield and feed conversion were also similar among fish on the experimental diets. A cost-return analysis shows that incorporation of a diet lacking fishmeal produced an 8% or almost $100 in cost savings in feed for each hectare of tilapia farmed. This along with the alternative day feeding strategy has the potential of reduce overall feed costs for growing marketable size tilapia by 60% relative to the typical practice of applying fishmeal formulated diets on a daily basis. A future study directly comparing daily and alternative day feeding strategies with diets formulated with and without fishmeal througout the entire production cycle of tilapia is warranted to establish the actual cost savings farmers are likely to have. Collectively the results show that substitution of diets containing fishmeal with a cheaper and more sustainable source of protein, i.e. pork meal, is an effective option for reducing the costs without negatively impacting the production of tilapia.
ACKNOWLEDGEMENTS
We are greatful for the cooperation of Santeh Feed Corporation (Bulacan, Philippines) including Ning Pascual for cooperating on the formulation and production of feeds used in this study. This research was supported by the Aquaculture & Fisheries Collaborative Research Support Program (AquaFish CRSP; grant number EPP-A-00-06-00012-00) of the U.S. Agency for International Development (USAID) and by contributions from the participating institutions. The opinions expressed herein are those of the authors and do not necessarily reflect the views of USAID.
LITERATURE CITED ADB (Asian Development Bank). 2005. An evaluation of small-scale freshwater rural
aquaculture development for poverty reduction. 163 pp
Anderson, J. A.J. Jackson, A.J. Matty, and B.S. Capper. 1984. Effects of dietary carbohydrate and fibre on the tilapia Oreochromis niloticus (Linn.). Aquaculture 37:303-314.
Bolivar, R.B., Jimenez, E.B.J. and Brown, C.L. 2006. Alternate day feeding strategy for Nile tilapia grow out in the Philippines: Marginal cost-revenue analysis. North American Journal of Aquaculture, 68: 192-197.
101101
Bolivar, R.B., C.L. Brown and E.T. Jimenez. 2003. Feeding Strategies to Optimize Tilapia Production in Ponds. Book of Abstract. Aquaculture 2003. Louisville, Kentucky, USA. p. 26.
Brown, C.L., Bolivar, R.B., Jimenez, E. T., and Szyper, J.P. 2000. Timing of the onset of supplemental feeding of Nile tilapia (Oreochromis niloticus) in ponds. p. 237-240. In: Fitzsimmons, K. and Filho, J.C. (eds.). Tilapia Aquaculture in the 21st Century. Proceedings from the Fifth International Symposium on Tilapia Aquaculture. September 3-7. Rio de Janeiro, Brazil. 682 p.
Brown, E.E. 1983. World Fish Farming: Cultivation and Economics. 2nd edn. AVI Publishing, Westport, CT. 397 pp.
El-Sayed, A.F.M. 1998. Total replacement of fishmeal with animal protein sources in Nile tilapia, Oreochromis niloticus. Aquaculture Research. 29-275-280.
El-Sayed, A.F.M. 2006. Nutrition and Feeding. In: Tilapia Culture. CABI Publishing, Oxford, U.K. 277 pp.
Li, M.H., Lim, C.E., and Webster, C.D. 2006. Feed Formulation and Manufacture. In: Tilapia: Biology, culture and nutrition. C.E. Lim and C.D. Webster (Eds). The Haworth Press, Inc., New York. 517-559.
Lim, C.E. and Webster,C.D. 2006. Nutrient Requirement. In: Tilapia: Biology, culture and nutrition. C.E. Lim and C.D. Webster (Eds). The Haworth Press, Inc., New York. 469-501.
National Research Council. 1993. Nutrient Requirements of Fish. National Academic Press, Washington, DC.

102102
HEAT-INDUCED GERM CELL LOSS IN SUB-ADULT NILE TILAPIA Oreochromis niloticus
Narayan P. Pandit,1,2 Madhav K. Shrestha1 and Masaru Nakamura2
1Institute of Agriculture and Animal Science (IAAS), Rampur, Chitwan, Nepal
2Sesoko Station, Tropical Biosphere Research Center, University of the Ryukyus, 3422 Sesoko, Motobu, Okinawa 905-0227, Japan
Abstract
Reproductive failure associated with heat-stress is a well known phenomenon in higher vertebrates. To examine the effect of high temperature on ovarian development and function of fish, an experiment was conducted using immature Nile tilapia, Oreochromis niloticus as a model fish species. All-female Nile tilapia of 100 day after hatching (dah) were reared at 27 oC and 37 oC water temperatures for 60 days. After temperature treatment, fish were cultured in normal temperature (25-30 oC) for 3 months. The gonadal structure of fish were examined initially, and at 30, 45 and 60 days after the onset of the experiment by histological and immunohistochemical methods. Results showed the complete loss of germ cells in the gonads of fish exposed at 37 oC for 60 days, and these individuals did not recover from this condition after transfer to normal temperature for 3 months. Gonads of fish treated at both 27 oC and 37 oC temperatures for 60 days of treatment period showed strong immunopositive reactions against the major steroidogenic enzymes; P450scc, 3β-HSD, and P450arom. Plasma E2, 11-KT and T levels were significantly lower in the 37 oC fish. The survival was significantly reduced at 37 oC (80%) than those of 27 oC (95%) during treatment period. These results suggest that exposure of Nile tilapia at 37 oC temperatures for 60 days induces complete and permanent gonadal sterility. This technique might be an easy and eco-friendly method for sex control in aquaculture. Key words: Nile tilapia; high temperature; germ cells; gonadal sterility.
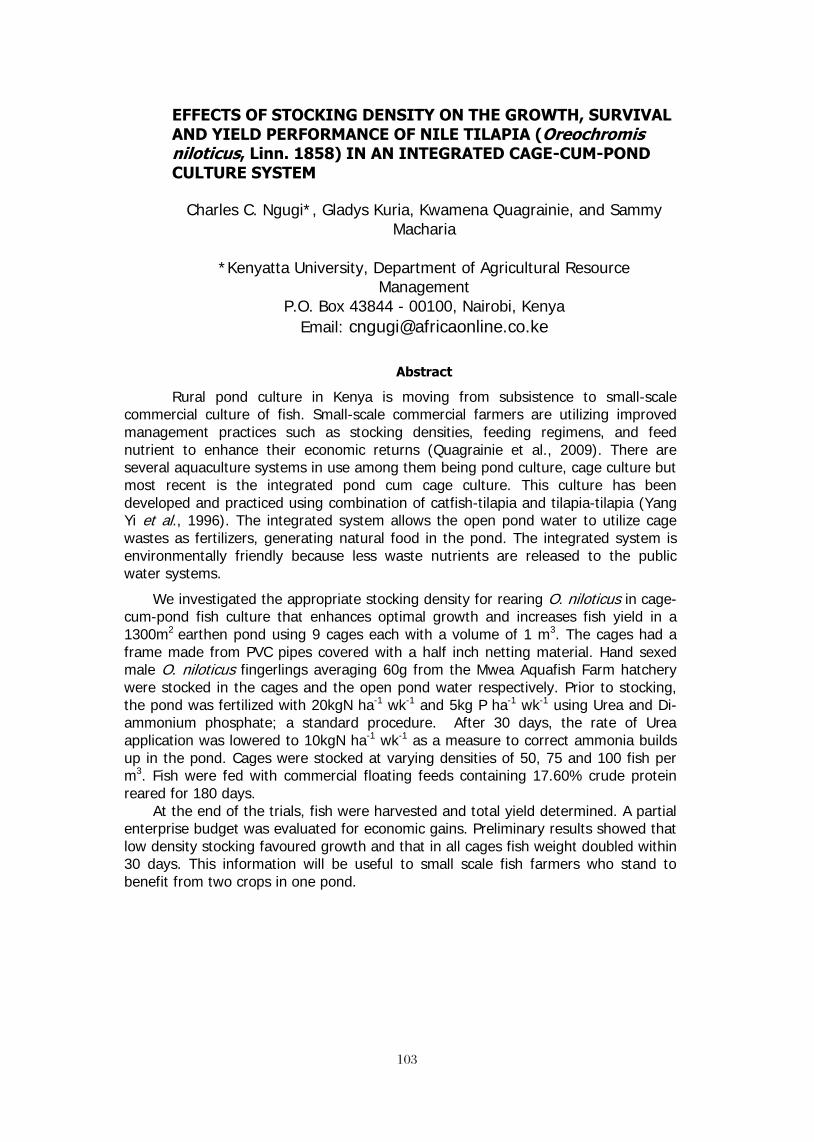
103103
EFFECTS OF STOCKING DENSITY ON THE GROWTH, SURVIVAL AND YIELD PERFORMANCE OF NILE TILAPIA (Oreochromis niloticus, Linn. 1858) IN AN INTEGRATED CAGE-CUM-POND CULTURE SYSTEM
Charles C. Ngugi*, Gladys Kuria, Kwamena Quagrainie, and Sammy Macharia
*Kenyatta University, Department of Agricultural Resource
Management P.O. Box 43844 - 00100, Nairobi, Kenya
Email: [email protected]
Abstract
Rural pond culture in Kenya is moving from subsistence to small-scale commercial culture of fish. Small-scale commercial farmers are utilizing improved management practices such as stocking densities, feeding regimens, and feed nutrient to enhance their economic returns (Quagrainie et al., 2009). There are several aquaculture systems in use among them being pond culture, cage culture but most recent is the integrated pond cum cage culture. This culture has been developed and practiced using combination of catfish-tilapia and tilapia-tilapia (Yang Yi et al., 1996). The integrated system allows the open pond water to utilize cage wastes as fertilizers, generating natural food in the pond. The integrated system is environmentally friendly because less waste nutrients are released to the public water systems.
We investigated the appropriate stocking density for rearing O. niloticus in cage-cum-pond fish culture that enhances optimal growth and increases fish yield in a 1300m2 earthen pond using 9 cages each with a volume of 1 m3. The cages had a frame made from PVC pipes covered with a half inch netting material. Hand sexed male O. niloticus fingerlings averaging 60g from the Mwea Aquafish Farm hatchery were stocked in the cages and the open pond water respectively. Prior to stocking, the pond was fertilized with 20kgN ha-1 wk-1 and 5kg P ha-1 wk-1 using Urea and Di-ammonium phosphate; a standard procedure. After 30 days, the rate of Urea application was lowered to 10kgN ha-1 wk-1 as a measure to correct ammonia builds up in the pond. Cages were stocked at varying densities of 50, 75 and 100 fish per m3. Fish were fed with commercial floating feeds containing 17.60% crude protein reared for 180 days. At the end of the trials, fish were harvested and total yield determined. A partial enterprise budget was evaluated for economic gains. Preliminary results showed that low density stocking favoured growth and that in all cages fish weight doubled within 30 days. This information will be useful to small scale fish farmers who stand to benefit from two crops in one pond.
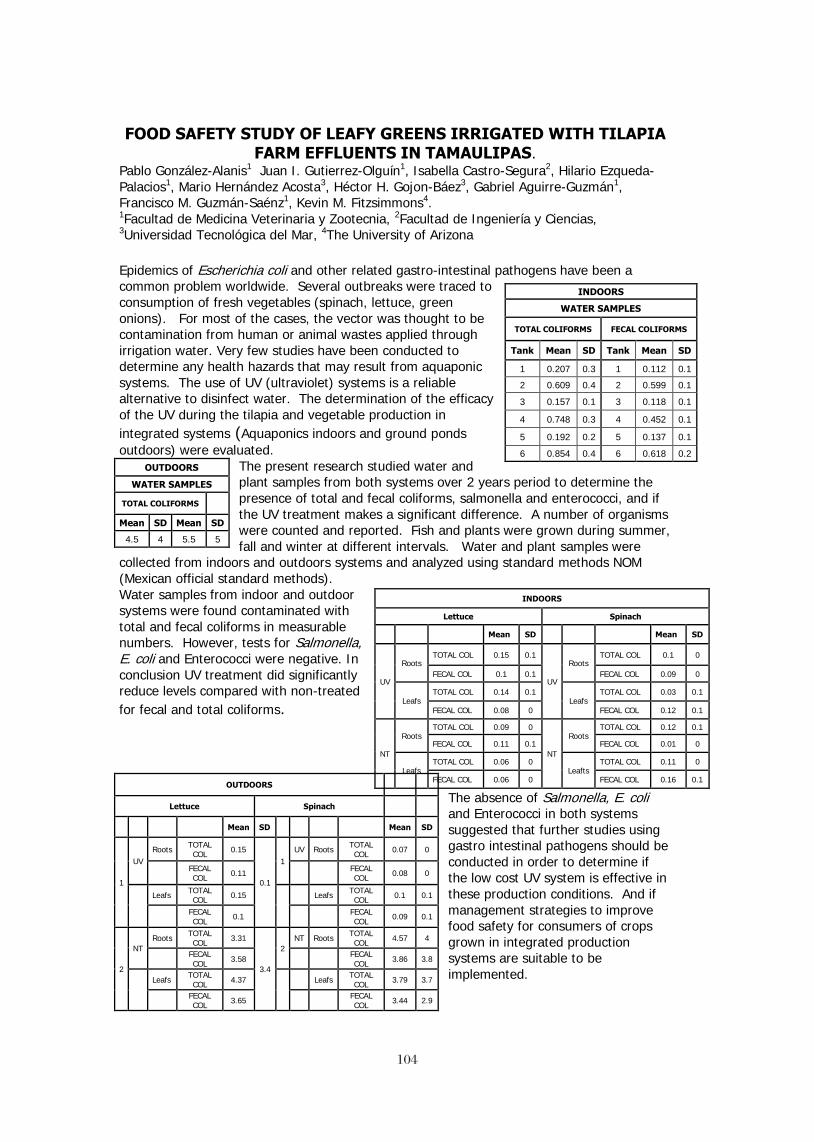
104104
FOOD SAFETY STUDY OF LEAFY GREENS IRRIGATED WITH TILAPIA
FARM EFFLUENTS IN TAMAULIPAS. Pablo González-Alanis1 Juan I. Gutierrez-Olguín1, Isabella Castro-Segura2, Hilario Ezqueda-Palacios1, Mario Hernández Acosta3, Héctor H. Gojon-Báez3, Gabriel Aguirre-Guzmán1, Francisco M. Guzmán-Saénz1, Kevin M. Fitzsimmons4. 1Facultad de Medicina Veterinaria y Zootecnia, 2Facultad de Ingeniería y Ciencias, 3Universidad Tecnológica del Mar, 4The University of Arizona Epidemics of Escherichia coli and other related gastro-intestinal pathogens have been a common problem worldwide. Several outbreaks were traced to consumption of fresh vegetables (spinach, lettuce, green onions). For most of the cases, the vector was thought to be contamination from human or animal wastes applied through irrigation water. Very few studies have been conducted to determine any health hazards that may result from aquaponic systems. The use of UV (ultraviolet) systems is a reliable alternative to disinfect water. The determination of the efficacy of the UV during the tilapia and vegetable production in integrated systems (Aquaponics indoors and ground ponds outdoors) were evaluated.
The present research studied water and plant samples from both systems over 2 years period to determine the presence of total and fecal coliforms, salmonella and enterococci, and if the UV treatment makes a significant difference. A number of organisms were counted and reported. Fish and plants were grown during summer, fall and winter at different intervals. Water and plant samples were
collected from indoors and outdoors systems and analyzed using standard methods NOM (Mexican official standard methods). Water samples from indoor and outdoor systems were found contaminated with total and fecal coliforms in measurable numbers. However, tests for Salmonella, E. coli and Enterococci were negative. In conclusion UV treatment did significantly reduce levels compared with non-treated for fecal and total coliforms.
The absence of Salmonella, E. coli and Enterococci in both systems suggested that further studies using gastro intestinal pathogens should be conducted in order to determine if the low cost UV system is effective in these production conditions. And if management strategies to improve food safety for consumers of crops grown in integrated production systems are suitable to be implemented.
INDOORS
WATER SAMPLES
TOTAL COLIFORMS FECAL COLIFORMS
Tank Mean SD Tank Mean SD
1 0.207 0.3 1 0.112 0.1
2 0.609 0.4 2 0.599 0.1
3 0.157 0.1 3 0.118 0.1
4 0.748 0.3 4 0.452 0.1
5 0.192 0.2 5 0.137 0.1
6 0.854 0.4 6 0.618 0.2 OUTDOORS
WATER SAMPLES
TOTAL COLIFORMS
Mean SD Mean SD
4.5 4 5.5 5
INDOORS
Lettuce Spinach
Mean SD Mean SD
UV
Roots TOTAL COL 0.15 0.1
UV
Roots TOTAL COL 0.1 0
FECAL COL 0.1 0.1 FECAL COL 0.09 0
Leafs TOTAL COL 0.14 0.1
Leafs TOTAL COL 0.03 0.1
FECAL COL 0.08 0 FECAL COL 0.12 0.1
NT
Roots TOTAL COL 0.09 0
NT
Roots TOTAL COL 0.12 0.1
FECAL COL 0.11 0.1 FECAL COL 0.01 0
Leafs TOTAL COL 0.06 0
Leafts TOTAL COL 0.11 0
FECAL COL 0.06 0 FECAL COL 0.16 0.1 OUTDOORS
Lettuce Spinach
Mean SD Mean SD
1
UV Roots TOTAL
COL 0.15
0.1
1 UV Roots TOTAL
COL 0.07 0
FECAL COL 0.11 FECAL
COL 0.08 0
Leafs TOTAL
COL 0.15
Leafs TOTAL COL 0.1 0.1
FECAL COL 0.1 FECAL
COL 0.09 0.1
2
NT Roots TOTAL
COL 3.31
3.4
2 NT Roots TOTAL
COL 4.57 4
FECAL COL 3.58 FECAL
COL 3.86 3.8
Leafs TOTAL
COL 4.37
Leafs TOTAL COL 3.79 3.7
FECAL COL 3.65 FECAL
COL 3.44 2.9
105105
MASCULINIZATION OF NILE TILAPIA (Oreochromis niloticus L.) USING LYOPHILIZED TESTES FROM CARABAO (Bubalus bubalis
carabanesis L.), BULL (Bos indicus L.) AND BOAR (Sus domesticus L.)
Ramjie Y. Odin1 and Remedios B. Bolivar2
1College of Fisheries, Mindanao State University – Maguindanao, Datu Odin Sinsuat,
Maguindanao, Philippines 2Freshwater Aquaculture Center, College of Fisheries, Central Luzon State University, Muñoz,
Nueva Ecija, Philippines
Abstract
The study was conducted to evaluate the use of lyophilized testes from carabao (B. b. carabanesis), bull (B. indicus) and boar (S. domesticus) in the masculinization of Nile tilapia (O. niloticus) fry, specifically, their efficacy in producing phenotypic males and their influence on the growth and survival rate of Nile tilapia fry on a 28-day treatment period in outdoor tanks.
The experimental treatments evaluated were: Treatment I- lyophilized testes from carabao, Treatment II- lyophilized testes from bull, Treatment III- lyophilized testes from boar, Control I- methyltestosterone (MT)- treated diet and Control II- untreated diet. Percent phenotypic males, specific growth rate and survival rate were determined after 28 days of treatment in outdoor tanks.
Results revealed that Nile tilapia fry fed with MT-treated diet gave the highest percent phenotypic males with a mean of 96.67%. Those fry fed with lyophilized testes from bull, boar and carabao gave means 80.67, 79.33 and 72.67%, respectively. There was a significant difference (P<0.05) among the treatments. Based on the Chi-square test (α ≤ 0.05), the higher percentages of males produced from androgen-treated fry which are significantly different from that of untreated fry showed that lyophilized testes diets and MT-treated diet were effective in masculinizing Nile tilapia fry.
Lyophilized testes from bull, carabao and boar gave higher specific growth rate of tilapia fry with means 15.85, 15.29 and 14.82%, respectively. Tilapia fry fed with lyophilized testes from carabao and boar did not differ significantly (P>0.05) from MT-treated fry but differed significantly (P<0.05) from those untreated fry. Those fry fed with lyophilized testes from bull were found to be significantly different (P<0.05) from the two controls. All the experimental treatments gave relatively high survival rate of the tilapia fry with no significant differences (P>0.05).
INTRODUCTION
Tilapia (Oreochromis niloticus L.) has been regarded as one of the major produced and consumed aquaculture commodities in Asia. The tilapia world production has grown rapidly at 2,515,908 metric tons in 2007 (Fitzsimmons, 2008). One of the developed management aspects considered to contribute to this growth is the production technology of monosex fingerlings through sex reversal. The production of all-male tilapia through hormone manipulation became a common methodology in the aquaculture of tilapia. Male tilapia is preferred over the female one because of its fast growth. Oral administration of sex hormones is employed to control the sexual development of this species and produce monosex fish. Various natural and synthetic hormones have been used to sex-reverse tilapia fry. At present, successful production of masculinized tilapia is done through oral administration of synthetic androgen hormone-treated feed at 30-60mg/kg of diet for about three to four-week period (Shelton et al., 1978; Guerrero and Guerrero, 1988; Jo et al., 1988; Vera Cruz and Mair, 1994). The dosage of hormones incorporated in diets for sex reversal of tilapia varies widely from 10-70 mg of hormone/kg of diet (Abucay and Mair, 1997; Mateen and Ahmed, 2007). The use of 17α-methyltestosterone is by far the most common practice for many aquaculturists since it has been proven both effective and relatively inexpensive
106106
means of masculinizing fry of at least 95% for various tilapia species (reviewed by Macintosh and Little, 1995; Green et al., 1997; Phelps and Popma, 2000; and El-Sayed, 2006). However, some concerns have been raised on the consumption of steroid-treated tilapia in the advent of this culture practice. The use of synthetic hormones has been under increasing public criticism due to their possible health and environmental impacts. As a result, the use of methyltestosterone for sex reversal of food fish is either licensed by the U.S. Food and Drug Administration or prohibited in Europe (Penman and McAndrew, 2000). Potential disadvantage of synthetic hormone treatment is the increased risks of long term exposure of workers handling MT during food preparation and feeding which may cause adverse effects on their health (Green et al., 1997). There have been reports that hormones in the form of either active metabolites excreted by the treated fish or leachates from uneaten food can build up in a closed water system (Abucay and Mair, 1997). Hence, the waste water from the culture system with MT treatment for sex reversal can have unknown effects on the untargeted elements of the pond ecosystem.
The rapidly increasing demand for organic food in the world market has become a consideration in the aquaculture of tilapia. The demand for organic fish is rapidly increasing, while the supply is very inadequate (Aquaculture Production Technology Ltd., 2006). Most consumers want tilapia to be organically produced and with reduced or eliminated use of synthetic hormones. The idea is no antibiotics and chemicals, reduced environmental repercussions and recycled water and waste products. In Israel, organic aquaculture started at kibbutz Geva fish farm in 2000 with blue tilapia (O. aureus) as main species of the polyculture (Milstein and Lev, 2004). Similarly, Premier Organic Farms Group, Inc. in the US is now able to produce a superior farm-raised organic tilapia to supply the ever expanding organic market.
Among the alternatives which can be considered to mitigate the problem on using synthetic steroid for sex reversal of tilapia is the use of testes from animals which can be a potential substitute to synthetic MT. The testes from farmed animals like carabao, bull and boar which are readily available from any local market and abattoir in the country can be a good source of natural testosterone. Haylor and Pascual (1991) reported successful tilapia sex reversal using ram’s testes. Phelps et al. (1996) also obtained a 65% male population using bull testes. Meyer et al. (2008) reported successful use of bull and hog testes in sex reversal of Nile tilapia fry. White (2008) also obtained high percent male of tilapia fry after sex reversal treatment using frozen bull testes. The animal testes coming from carabao, bull and boar can be potential sources of dietary testosterone. There are only few studies conducted evaluating the use of animal testes in masculinizing tilapia fry. Hence, these natural sources of testosterone can therefore be investigated for sex reversal of Nile tilapia fry.
This study was conducted at the Freshwater Aquaculture Center, Central Luzon State University, Science City Muñoz, Nueva Ecija, Philippines. The Nile tilapia fry in this study were treated with lyophilized testes for 28 days in outdoor tanks.
The general objective of this study was to evaluate the use of lyophilized testes from carabao (B. b. carabanesis), bull (B. indicus) and boar (S. domesticus) in the masculinization of Nile tilapia (O. niloticus) fry. Specifically, the study determined the efficacy of lyophilized testes from carabao, bull and boar in producing phenotypic males of O. niloticus fry and their influence on the growth and survival rate of O. niloticus fry. A simple cost and return analysis was also considered in this study.
MATERIALS AND METHODS
Fifteen net enclosures (1 x 1 x 1 m) with 1.6 mm mesh size were set in 15 outdoor
tanks (3 m3) following the Complete Randomized Design (CRD) for three treatments and two controls. The experimental treatments evaluated were: Treatment I- lyophilized testes from carabao, Treatment II- lyophilized testes from bull, Treatment III- lyophilized testes from boar, Control I- methyltestosterone (MT)- treated diet and Control II- untreated diet. These were replicated three times.
Each net enclosure was stocked with 500 fry. The net enclosures were extended at least 20 cm above the water surface to prevent the fry from escaping and were moored into
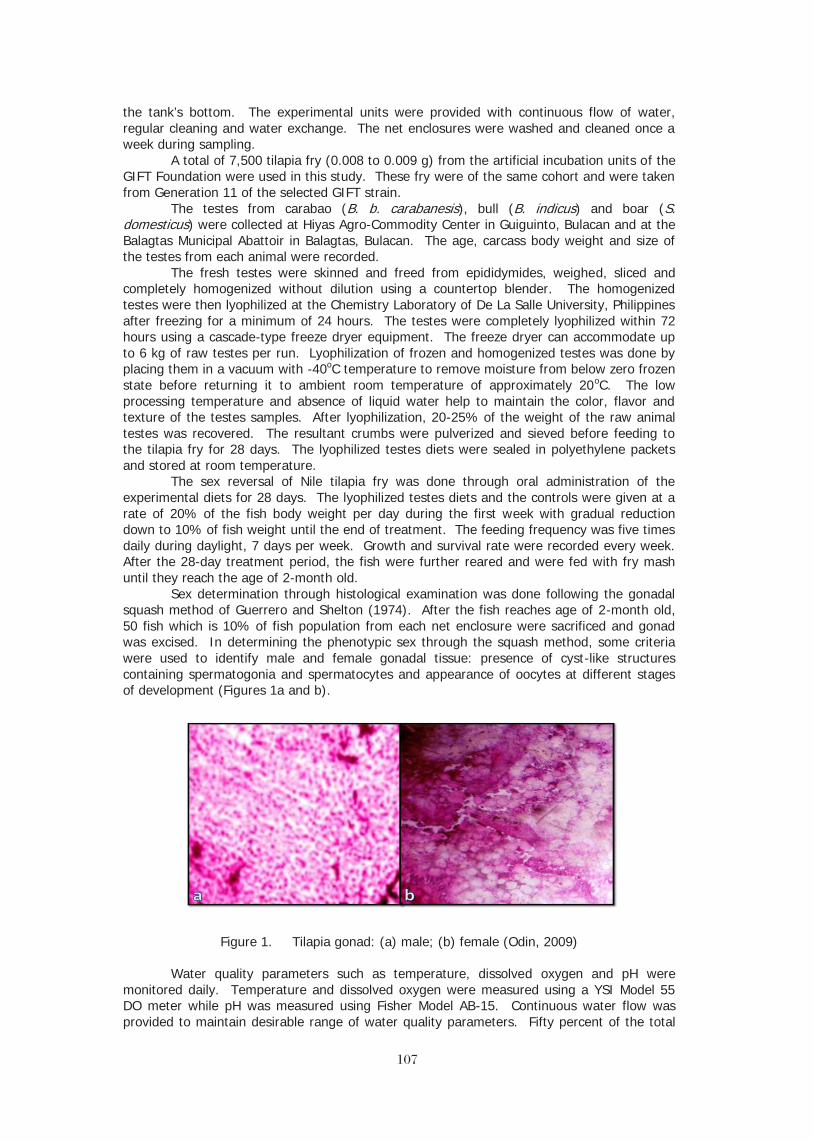
107107
the tank’s bottom. The experimental units were provided with continuous flow of water, regular cleaning and water exchange. The net enclosures were washed and cleaned once a week during sampling.
A total of 7,500 tilapia fry (0.008 to 0.009 g) from the artificial incubation units of the GIFT Foundation were used in this study. These fry were of the same cohort and were taken from Generation 11 of the selected GIFT strain.
The testes from carabao (B. b. carabanesis), bull (B. indicus) and boar (S. domesticus) were collected at Hiyas Agro-Commodity Center in Guiguinto, Bulacan and at the Balagtas Municipal Abattoir in Balagtas, Bulacan. The age, carcass body weight and size of the testes from each animal were recorded.
The fresh testes were skinned and freed from epididymides, weighed, sliced and completely homogenized without dilution using a countertop blender. The homogenized testes were then lyophilized at the Chemistry Laboratory of De La Salle University, Philippines after freezing for a minimum of 24 hours. The testes were completely lyophilized within 72 hours using a cascade-type freeze dryer equipment. The freeze dryer can accommodate up to 6 kg of raw testes per run. Lyophilization of frozen and homogenized testes was done by placing them in a vacuum with -40oC temperature to remove moisture from below zero frozen state before returning it to ambient room temperature of approximately 20oC. The low processing temperature and absence of liquid water help to maintain the color, flavor and texture of the testes samples. After lyophilization, 20-25% of the weight of the raw animal testes was recovered. The resultant crumbs were pulverized and sieved before feeding to the tilapia fry for 28 days. The lyophilized testes diets were sealed in polyethylene packets and stored at room temperature.
The sex reversal of Nile tilapia fry was done through oral administration of the experimental diets for 28 days. The lyophilized testes diets and the controls were given at a rate of 20% of the fish body weight per day during the first week with gradual reduction down to 10% of fish weight until the end of treatment. The feeding frequency was five times daily during daylight, 7 days per week. Growth and survival rate were recorded every week. After the 28-day treatment period, the fish were further reared and were fed with fry mash until they reach the age of 2-month old.
Sex determination through histological examination was done following the gonadal squash method of Guerrero and Shelton (1974). After the fish reaches age of 2-month old, 50 fish which is 10% of fish population from each net enclosure were sacrificed and gonad was excised. In determining the phenotypic sex through the squash method, some criteria were used to identify male and female gonadal tissue: presence of cyst-like structures containing spermatogonia and spermatocytes and appearance of oocytes at different stages of development (Figures 1a and b).
Figure 1. Tilapia gonad: (a) male; (b) female (Odin, 2009)
Water quality parameters such as temperature, dissolved oxygen and pH were monitored daily. Temperature and dissolved oxygen were measured using a YSI Model 55 DO meter while pH was measured using Fisher Model AB-15. Continuous water flow was provided to maintain desirable range of water quality parameters. Fifty percent of the total
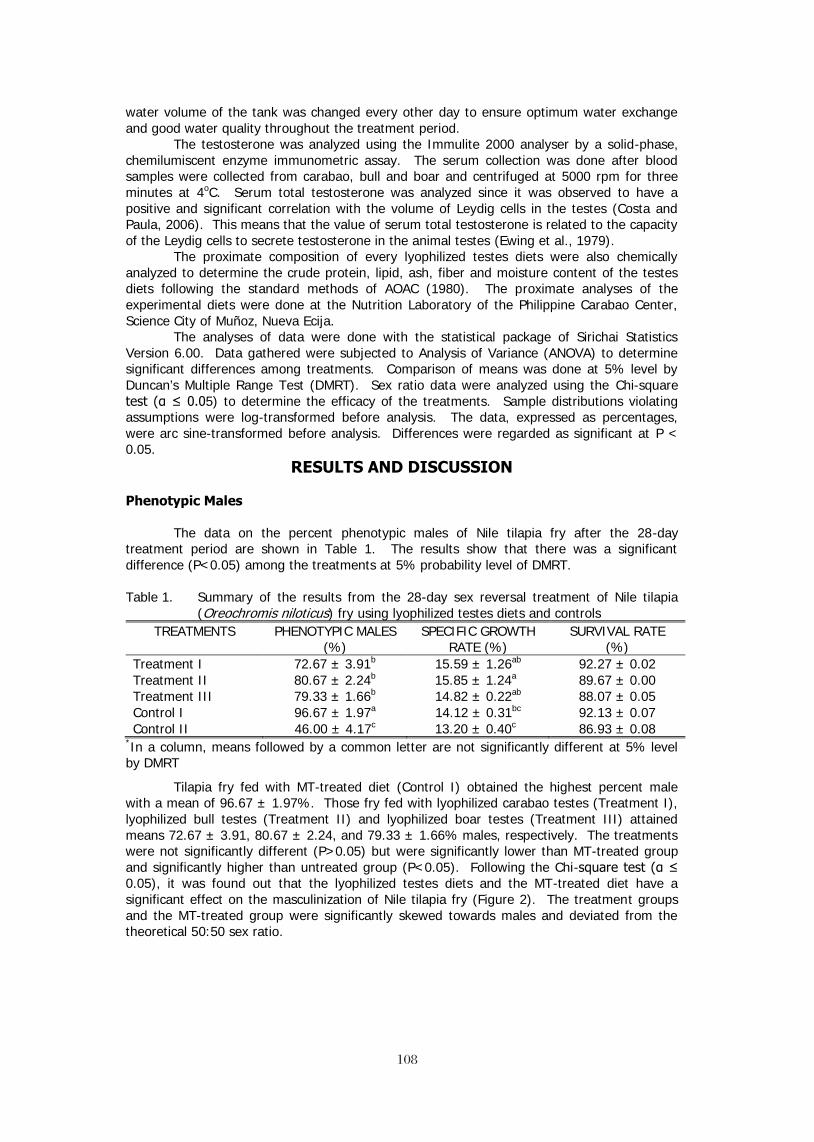
108108
water volume of the tank was changed every other day to ensure optimum water exchange and good water quality throughout the treatment period.
The testosterone was analyzed using the Immulite 2000 analyser by a solid-phase, chemilumiscent enzyme immunometric assay. The serum collection was done after blood samples were collected from carabao, bull and boar and centrifuged at 5000 rpm for three minutes at 4oC. Serum total testosterone was analyzed since it was observed to have a positive and significant correlation with the volume of Leydig cells in the testes (Costa and Paula, 2006). This means that the value of serum total testosterone is related to the capacity of the Leydig cells to secrete testosterone in the animal testes (Ewing et al., 1979).
The proximate composition of every lyophilized testes diets were also chemically analyzed to determine the crude protein, lipid, ash, fiber and moisture content of the testes diets following the standard methods of AOAC (1980). The proximate analyses of the experimental diets were done at the Nutrition Laboratory of the Philippine Carabao Center, Science City of Muñoz, Nueva Ecija.
The analyses of data were done with the statistical package of Sirichai Statistics Version 6.00. Data gathered were subjected to Analysis of Variance (ANOVA) to determine significant differences among treatments. Comparison of means was done at 5% level by Duncan’s Multiple Range Test (DMRT). Sex ratio data were analyzed using the Chi-square test (α ≤ 0.05) to determine the efficacy of the treatments. Sample distributions violating assumptions were log-transformed before analysis. The data, expressed as percentages, were arc sine-transformed before analysis. Differences were regarded as significant at P < 0.05.
RESULTS AND DISCUSSION
Phenotypic Males
The data on the percent phenotypic males of Nile tilapia fry after the 28-day treatment period are shown in Table 1. The results show that there was a significant difference (P<0.05) among the treatments at 5% probability level of DMRT.
Table 1. Summary of the results from the 28-day sex reversal treatment of Nile tilapia
(Oreochromis niloticus) fry using lyophilized testes diets and controls TREATMENTS PHENOTYPIC MALES
(%) SPECIFIC GROWTH
RATE (%) SURVIVAL RATE
(%) Treatment I 72.67 ± 3.91b 15.59 ± 1.26ab 92.27 ± 0.02 Treatment II 80.67 ± 2.24b 15.85 ± 1.24a 89.67 ± 0.00 Treatment III 79.33 ± 1.66b 14.82 ± 0.22ab 88.07 ± 0.05 Control I 96.67 ± 1.97a 14.12 ± 0.31bc 92.13 ± 0.07 Control II 46.00 ± 4.17c 13.20 ± 0.40c 86.93 ± 0.08
*In a column, means followed by a common letter are not significantly different at 5% level by DMRT
Tilapia fry fed with MT-treated diet (Control I) obtained the highest percent male with a mean of 96.67 ± 1.97%. Those fry fed with lyophilized carabao testes (Treatment I), lyophilized bull testes (Treatment II) and lyophilized boar testes (Treatment III) attained means 72.67 ± 3.91, 80.67 ± 2.24, and 79.33 ± 1.66% males, respectively. The treatments were not significantly different (P>0.05) but were significantly lower than MT-treated group and significantly higher than untreated group (P<0.05). Following the Chi-square test (α ≤ 0.05), it was found out that the lyophilized testes diets and the MT-treated diet have a significant effect on the masculinization of Nile tilapia fry (Figure 2). The treatment groups and the MT-treated group were significantly skewed towards males and deviated from the theoretical 50:50 sex ratio.

109109
Figure 2. Percentage of Nile tilapia (O. niloticus) fry classified as male and female under the lyophilized testes treatments and the controls after the 28-day treatment period. Note: Asterisks indicate significant differences in proportion of males from the untreated control (from Chi-square test; α ≤ 0.05)
One of the factors that may be considered to contribute to the percent males produced from the 28-day sex reversal treatment using lyophilized testes is the presence of testosterone in the animal testes. The total testosterone from serum of each animal was analyzed using chemilumiscent enzyme immunometric assay to determine the levels of testosterone (Table 2).
Table 2. Total testosterone from serum of carabao, bull and boar
TREATMENTS NO. OF SAMPLES CONCENTRATION (ppb)
Treatment I (carabao) 2 2.57
Treatment II (bull) 3 9.83
Treatment III (boar) 3 13.61
As reported by Costa and Paula (2006), there is a positive and significant correlation between the serum total testosterone and the volume of Leydig cells in the testes. The values of serum total testosterone signify the capacity of the Leydig cells to secrete testosterone hormones in the animal testes (Ewing et al., 1979). Hence, the animal testes might contain concentrations of testosterone. The levels of total testosterone observed on the serum attested the presence of the androgen hormone in the testes of the animals. The testosterone in the testes is assumed to be preserved using lyophilization process which in turn promote sex reversal of tilapia fry after the 28-day lyophilized testes treatment. Furthermore, the animals from which the testes were collected were all characterized as sexually matured (Roth and Myers, 2004; Dewey and Ng, 2001; The University of Tennessee Health Science Center, 2009). Researchers have reported that mature animals have increased levels of testosterone (Becker and Snipes, 1968; Costa and Paula, 2006; Lindner, 1959; Lindner and Mann, 1960). During the age of sexual maturity of animals, testosterone level and potency is assumed to increase significantly. This idea explains the possible sex reversal of tilapia fry when treated with lyophilized testes from animals which contained concentration of potent testosterone.
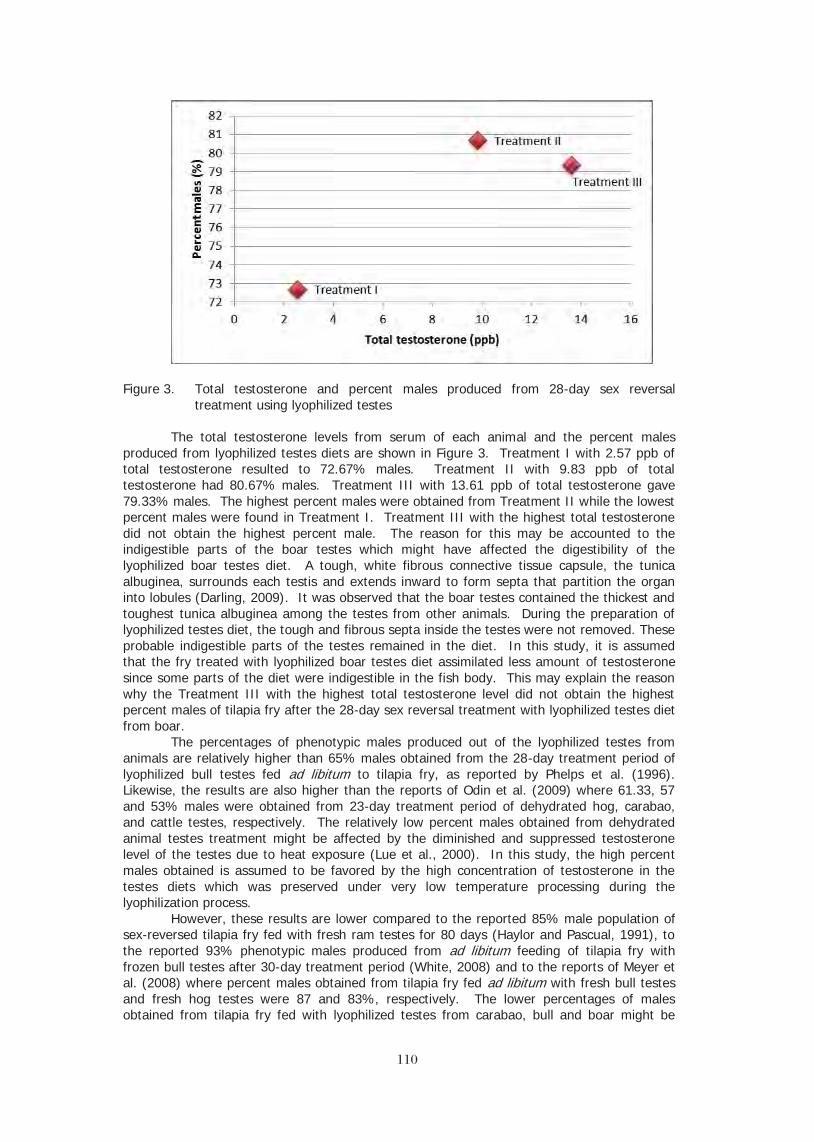
110110
Figure 3. Total testosterone and percent males produced from 28-day sex reversal treatment using lyophilized testes
The total testosterone levels from serum of each animal and the percent males produced from lyophilized testes diets are shown in Figure 3. Treatment I with 2.57 ppb of total testosterone resulted to 72.67% males. Treatment II with 9.83 ppb of total testosterone had 80.67% males. Treatment III with 13.61 ppb of total testosterone gave 79.33% males. The highest percent males were obtained from Treatment II while the lowest percent males were found in Treatment I. Treatment III with the highest total testosterone did not obtain the highest percent male. The reason for this may be accounted to the indigestible parts of the boar testes which might have affected the digestibility of the lyophilized boar testes diet. A tough, white fibrous connective tissue capsule, the tunica albuginea, surrounds each testis and extends inward to form septa that partition the organ into lobules (Darling, 2009). It was observed that the boar testes contained the thickest and toughest tunica albuginea among the testes from other animals. During the preparation of lyophilized testes diet, the tough and fibrous septa inside the testes were not removed. These probable indigestible parts of the testes remained in the diet. In this study, it is assumed that the fry treated with lyophilized boar testes diet assimilated less amount of testosterone since some parts of the diet were indigestible in the fish body. This may explain the reason why the Treatment III with the highest total testosterone level did not obtain the highest percent males of tilapia fry after the 28-day sex reversal treatment with lyophilized testes diet from boar.
The percentages of phenotypic males produced out of the lyophilized testes from animals are relatively higher than 65% males obtained from the 28-day treatment period of lyophilized bull testes fed ad libitum to tilapia fry, as reported by Phelps et al. (1996). Likewise, the results are also higher than the reports of Odin et al. (2009) where 61.33, 57 and 53% males were obtained from 23-day treatment period of dehydrated hog, carabao, and cattle testes, respectively. The relatively low percent males obtained from dehydrated animal testes treatment might be affected by the diminished and suppressed testosterone level of the testes due to heat exposure (Lue et al., 2000). In this study, the high percent males obtained is assumed to be favored by the high concentration of testosterone in the testes diets which was preserved under very low temperature processing during the lyophilization process.
However, these results are lower compared to the reported 85% male population of sex-reversed tilapia fry fed with fresh ram testes for 80 days (Haylor and Pascual, 1991), to the reported 93% phenotypic males produced from ad libitum feeding of tilapia fry with frozen bull testes after 30-day treatment period (White, 2008) and to the reports of Meyer et al. (2008) where percent males obtained from tilapia fry fed ad libitum with fresh bull testes and fresh hog testes were 87 and 83%, respectively. The lower percentages of males obtained from tilapia fry fed with lyophilized testes from carabao, bull and boar might be

111111
attributed to the restricted feeding of tilapia fry with testes diets at 20% feeding rate in this study. Hence, it is assumed that fry which were not masculinized consumed fewer hormones than the required minimum amount for sex reversal during the gonadal differentiation period.
According to Phelps and Popma (2000), the age and size of the fry and the environmental factors such as temperature can impact growth and affect gonadal differentiation and in turn the treatment duration needed. In this study, the first feeding fry with less than 9 mm initial length were used. Apparently, the ample amount of high protein from lyophilized testes diets fed to the fry and the high temperature during the treatment period might have contributed to the fast growth of the tilapia fry, reaching a length greater than 18 mm on the 14th day of the treatment period. This length is greater than the minimum harvestable size recommended for effective sex reversal of tilapia (Phelps and Popma, 2000; and Phelps, 2006). Hence, since growth was too fast, it may be necessary to reduce the quantity or quality of diet to reduce the growth rate and obtain effective sex reversal.
Another factor which may be considered to affect the percentages of males produced from the treatments is the flow-through system maintained throughout the experiment period. It is well established that hormones administered for sex reversal are metabolized and eliminated from the body of fish (Lone and Matty, 1981; Gomelsky et al., 1994). Abucay and Mair (1997) observed sex reversal of untreated fish reared within a system previously used with hormone treatment. He also mentioned that sex reversal treatments are more successful in closed water systems where metabolites and leachates can build up. In this study, the active metabolites of the testosterone excreted by treated fry during sex reversal and the hormones which leak from the uneaten food might have been prevented to build-up, diminished and lost from the system since continuous flow of water and regular water exchange were maintained during the treatment period. The shortened exposure of the treated fry to active metabolites of testosterone due to its loss in turn, may have affected the percentages of males produced in this study.
The percent males obtained from MT-treated group were found to be highest among the groups. This result conformed to the reports of Shelton et al. (1978), Guerrero and Guerrero (1988), Jo et al. (1988), Vera Cruz and Mair (1994) that oral administration of testosterone-treated feed (30-60mg/kg feed) to tilapia fry during a three to four-week period yields populations composed of ≥ 95% males.
The significant difference of phenotypic males in Treatments I, II, and III from that of the untreated group showed that lyophilized testes diets from bull, boar and carabao and the MT-treated diet were effective in masculinizing Nile tilapia fry. However, the higher percentage of males obtained in MT-treated group compared to those treated groups with lyophilized testes showed the greater potency of the synthetic androgen under the condition of this study. This might be due to the fact that 17α- methyltestosterone contained concentrated form of synthetic androgen. Synthetic androgens are generally more potent than natural androgens for masculinizing fish (Yamamoto, 1969). Growth Rate
Data on the specific growth rate of Nile tilapia fry after the 28-day treatment period are shown in Table 1. The analysis of variance shows a significant difference (P<0.05) among the treatments at 5% probability level of DMRT (Figure 4).
112112
Figure 4. Specific growth rate of Nile tilapia (Oreochromis niloticus) fry after the 28-day treatment period. Note: Treatments with different letter superscripts indicate mean values that are significantly different at 5% level by DMRT
After the 28-day treatment period, results revealed that Nile tilapia fry fed with lyophilized carabao testes (Treatment I), lyophilized bull testes (Treatment II) and lyophilized boar testes (Treatment III) obtained the highest specific growth rate among other treatments with means 15.59 ± 1.26, 15.85 ± 1.24 and 14.82 ± 0.22%, respectively. There was no significant difference (P>0.05) found among the treatments using lyophilized testes. Tilapia fry fed with MT-treated diet (Control I) obtained a mean of 14.12 ± 0.31% with no significant difference from Treatments I, III and untreated fry. The untreated group (Control II) with a mean of 13.20 ± 0.40% significantly differed from the groups treated with lyophilized testes diets.
These results may be attributed to the fact that animal meal contains higher protein content which in turn results to apparent high specific growth rate of Nile tilapia fry fed with lyophilized testes diets from carabao, bull and boar. The proximate analysis evaluated on the lyophilized testes from such animals revealed their high crude protein (CP) content (Table 3). Consequently, those tilapia fry fed with lyophilized testes had the highest specific growth rate since these diets contain the high crude protein content of about 64.85 to 71.69%. Table 3. Chemical composition of the experimental diets
TREATMENTS
CRUDE PROTEIN
(%)
MOISTURE CONTENT
(%)
CRUDE FAT (%)
CRUDE FIBER (%)
ASH (%)
Treatment I* 64.85 2.89 13.59 0.43 10.24 Treatment II* 71.69 1.97 13.16 0.25 10.17 Treatment III* 70.20 2.98 12.33 0.27 9.84 Control I** 33.00 12.00 6.00 5.00 12.00 Control II** 33.00 12.00 6.00 5.00 12.00
*Analyzed using AOAC (1980) method **Guaranteed proximate analysis of TATEH Aquafeeds, SANTEH, Feeds Corp
The results on the specific growth rate of the tilapia fry fed with lyophilized testes diets conformed to the results of the study conducted by Phelps et al. (1996) who reported that growth increase of tilapia fed ad libitum with trout chow feed containing lyophilized bull testes may range from 0.7 to 2.0 g after 28-day treatment period in outdoor tanks. Likewise, White (2008), reported that tilapia fry fed with frozen bull testes and oven-dried bull testes
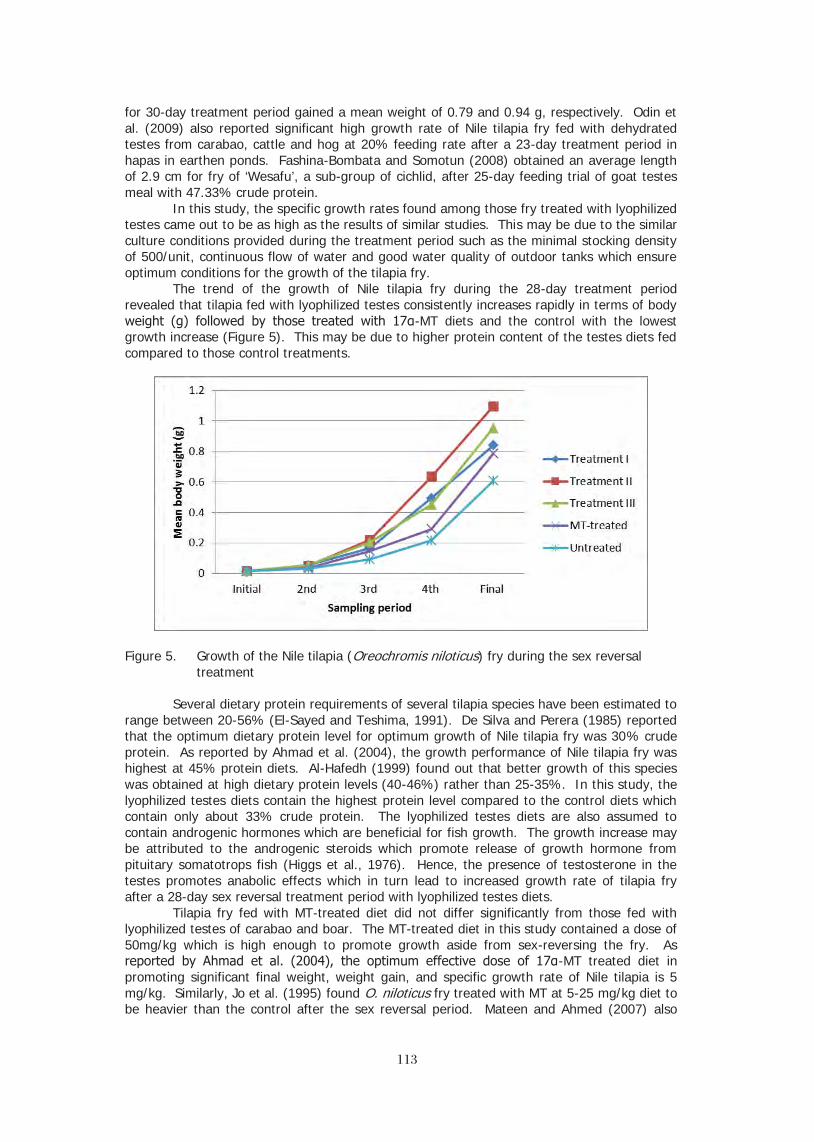
113113
for 30-day treatment period gained a mean weight of 0.79 and 0.94 g, respectively. Odin et al. (2009) also reported significant high growth rate of Nile tilapia fry fed with dehydrated testes from carabao, cattle and hog at 20% feeding rate after a 23-day treatment period in hapas in earthen ponds. Fashina-Bombata and Somotun (2008) obtained an average length of 2.9 cm for fry of ‘Wesafu’, a sub-group of cichlid, after 25-day feeding trial of goat testes meal with 47.33% crude protein.
In this study, the specific growth rates found among those fry treated with lyophilized testes came out to be as high as the results of similar studies. This may be due to the similar culture conditions provided during the treatment period such as the minimal stocking density of 500/unit, continuous flow of water and good water quality of outdoor tanks which ensure optimum conditions for the growth of the tilapia fry.
The trend of the growth of Nile tilapia fry during the 28-day treatment period revealed that tilapia fed with lyophilized testes consistently increases rapidly in terms of body weight (g) followed by those treated with 17α-MT diets and the control with the lowest growth increase (Figure 5). This may be due to higher protein content of the testes diets fed compared to those control treatments.
Figure 5. Growth of the Nile tilapia (Oreochromis niloticus) fry during the sex reversal treatment
Several dietary protein requirements of several tilapia species have been estimated to range between 20-56% (El-Sayed and Teshima, 1991). De Silva and Perera (1985) reported that the optimum dietary protein level for optimum growth of Nile tilapia fry was 30% crude protein. As reported by Ahmad et al. (2004), the growth performance of Nile tilapia fry was highest at 45% protein diets. Al-Hafedh (1999) found out that better growth of this species was obtained at high dietary protein levels (40-46%) rather than 25-35%. In this study, the lyophilized testes diets contain the highest protein level compared to the control diets which contain only about 33% crude protein. The lyophilized testes diets are also assumed to contain androgenic hormones which are beneficial for fish growth. The growth increase may be attributed to the androgenic steroids which promote release of growth hormone from pituitary somatotrops fish (Higgs et al., 1976). Hence, the presence of testosterone in the testes promotes anabolic effects which in turn lead to increased growth rate of tilapia fry after a 28-day sex reversal treatment period with lyophilized testes diets.
Tilapia fry fed with MT-treated diet did not differ significantly from those fed with lyophilized testes of carabao and boar. The MT-treated diet in this study contained a dose of 50mg/kg which is high enough to promote growth aside from sex-reversing the fry. As reported by Ahmad et al. (2004), the optimum effective dose of 17α-MT treated diet in promoting significant final weight, weight gain, and specific growth rate of Nile tilapia is 5 mg/kg. Similarly, Jo et al. (1995) found O. niloticus fry treated with MT at 5-25 mg/kg diet to be heavier than the control after the sex reversal period. Mateen and Ahmed (2007) also

114114
reported that different dose rates of MT significantly increased the growth of Nile tilapia fry than the control. However, in this study, it was found out that fry fed with MT-treated diet had no significant difference from untreated fry. Vera Cruz and Mair (1994) did not find significant effect of MT on the growth and survival of Nile tilapia fry during the treatment period with MT at 40 mg/kg diet.
The high growth of tilapia confirmed the findings of earlier studies regarding animal protein meal. El-Sayed (2006) stated that terrestrial animal by-products have been widely and successfully used as protein sources for tilapia due to their high protein content and essential amino acids.
Survival Rate
The data on the survival rate of Nile tilapia fry after the 28-day treatment period are shown in Table 1. Analysis of variance shows no significant difference (P>0.05) among treatments (Figure 6).
Figure 6. Survival rate of Nile tilapia (Oreochromis niloticus) fry after the 28-day treatment period
Results show that the survival rate among treatments did not differ significantly (P>0.05) after the 28-day treatment period. Tilapia fry fed with lyophilized testes from carabao (Treatment I) obtained the highest survival rate with a mean of 92.27 ± 0.02%. This was followed by those fry fed with MT-treated diet (Control I), lyophilized testes from bull (Treatment II), lyophilized testes from boar (Treatment III) and untreated diet (Control II) with means 92.13 ± 0.07, 89.67 ± 0.00, 88.07 ± 0.05 and 86.93 ± 0.08%, respectively.
The high survival rate of Nile tilapia fry obtained in this study confirmed the findings of White (2008) who obtained high survival rates (88-95%) of fry fed with animal testes and stocked in outdoor tanks with green water during a 30-day treatment period. The survival of fry during the sex reversal treatment are dependent on factors such as stocking density, feeding, temperature and other environmental conditions (Bocek et al., 1992). Vera Cruz (1991) stated that the sex reversal treatment unit influences the quality of fingerlings produced. In this study, the experimental units were set with continuous flow of water to ensure optimum water exchange and good water quality throughout the treatment period. Vera Cruz and Mair (1994) obtained >70% survival rate of tilapia fry utilizing outdoor tanks having at least once/day water exchange rate during the hormone treatment period. Vera Cruz and Mair (1994) also reported insignificant effect on the survival of O. niloticus fry during the treatment period of 40 mg/kg diet. The minimal stocking density of 500 fish per unit in outdoor tanks in this study might have favored the high number of fish surviving throughout the treatment period (Figure 7).

115115
Figure 7. Number of fry surviving based on the original 500 fish per experimental unit during the 28-day treatment period
Apparently, the survival rates obtained in this experiment were higher compared to the results of earlier studies conducted on the use of animal testes in masculinizing Nile tilapia fry (Haylor and Pascual, 1991; Phelps, 1996; Meyer et al., 2008. In this study, the high survival rate of fry is assumed to be attributed to the continuous water flow and regular cleaning of the tanks and enclosure nets which in turn promoted optimum culture and environment conditions for the experimental fish during the treatment period.
Simple Cost and Return Analysis
The simple cost and return analysis of Nile tilapia fry treated with lyophilized testes on a 28-day treatment period is shown in Table 4. Treatments III and II with no significant difference (P>0.05) gave the highest gross income of PhP 306.58 and PhP 294.45, respectively. MT-treated diet (Control I) and Treatment I followed with a gross income of PhP 271.15 and PhP 263.17, respectively. The MT-treated group differed significantly (P<0.05) from Treatment III but did not differ significantly (P>0.05) from Treatments I and II in terms of gross income. The untreated fry (Control II) with the lowest gross income of PhP 167.42 differed significantly (P<0.05) from other groups.
In terms of cost, Treatment I, II and III gave the highest operating cost of Php 238.97, PhP 260.83 and PhP 197.78, respectively. The control treatments, MT-treated diet and untreated diet, obtained costs of PhP 136.02 and PhP 131.98, respectively. The cost for lyophilized testes diets significantly differed (P<0.05) from the control groups.

116116
Table 4. Simple cost and return analysis of Nile tilapia (Oreochromis niloticus) fry fed with lyophilized testes vs controls
ITEMS
TREATMENTS I II III MT-
treated Untreated
Gross Income (PhP) 263.17c 294.45ab 306.58a 271.15bc 167.42d Operating Cost (PhP)
a. Fry 100 100 100 100 100 b. Lyophilized testes diet 111.37 133.23 70.18 0 0 c. MT-treated diet 0 0 0 8.42 0 d. Fry-mash 0 0 0 0 4.38 e. Labor 23 23 23 23 23 f. Electricity 4.60 4.60 4.60 4.60 4.60
Total Cost 238.97b 260.83a 197.78c 136.02d 131.98d
Net Returns (PhP) 23.20b 33.62b 108.80a 135.13a 35.44b
*In a column, means followed by a common letter are not significantly different at 5% level by DMRT
In terms of net returns, those fry fed with MT-treated diet gave the highest significant net return of PhP 135.13 and this was followed by those in Treatment III with Php 108.80 net returns. There was no significant difference (P>0.05) found between the MT-treated group and Treatment III. Treatment I and II obtained a net return of PhP 23.20 and PhP 33.62, respectively. The untreated group with PhP 35.44 net return did not differ significantly (P>0.05) from those in Treatments II and I.
The low value of net returns in Treatments I and II was assumed to be greatly affected by the high cost incurred for the production and processing of lyophilized testes diets. Treatment III, on the other hand, obtained a high net return because of the low price of raw boar testes in the market. In order to determine the market price of the sex-reversed fingerlings produced from lyophilized testes, the cost of diet preparation of the lyophilized testes must be reduced.
The result of the simple cost and return analysis revealed that it is more economical to use synthetic MT-treated diet than lyophilized testes diet in masculinizing Nile tilapia fry. The MT hormone is synthetic product and more potent in masculinizing Nile tilapia fry. This product is also a concentrated form of androgen which can be easily stored and can be easily administered to the fish. On the other hand, the testes of carabao, bull and boar are readily available from any market and local abattoirs in the country. However, the preparation and processing of these animal testes into lyophilized form to ensure prolonged shelf-life and potency for sex reversal requires a complicated, sophisticated and extensive methodology. The use of lyophilized testes can be of great relevance to the production of organic tilapia. Water Quality
Water quality parameters such as temperature, pH and dissolved oxygen were all found to be within the desirable optimum range. Statistical analysis revealed that there were no significant differences (P>0.05) found among the treatments in terms of the water quality parameters monitored during the 28-day treatment period (Table 5).
Table 5. Water quality parameters monitored during the 28-day treatment period
TREATMENTS
TEMPERATURE (oC) DO (mg/L) pH
AM PM AM PM AM PM Treatment I 27.95 29.46 5.3 8.0 8.2 8.3 Treatment II 27.97 29.38 5.4 7.7 8.1 8.3 Treatment III 27.94 29.40 5.3 8.2 8.2 8.3 MT-treated 27.96 29.39 5.3 7.8 8.1 8.3 Untreated 27.97 29.36 5.1 7.5 8.2 8.3
117117
The readings on the water quality parameters during the experimental period demonstrated desirable levels suitable for sex reversal of Nile tilapia fry. The average temperature was recorded to be optimal at an average of 27oC in the morning. However, it was also found to be relatively high during afternoon with an average of 29oC. Phelps and Popma (2000) stated that optimum temperature suitable for sex reversal of tilapia fry falls between 26-28oC. In this study, high temperature readings which fell out of the maximum optimum range were recorded during the first to third week of the treatment period where the weather was sunny. The temperature readings started to drop to its optimum range on the last days of the treatment period where rainy weather was observed. The readings on dissolved oxygen (5.1 - 8.2 mg/l) and pH (8.1 - 8.3) recorded were all within the favorable conditions appropriate for sex reversal. Phelps and Popma (2000) suggested that dissolved oxygen concentrations should remain above 4 mg/l to ensure a strong feeding response. In terms of pH, it was mentioned that tilapia can best survive in pH of 6.0-9.0 (Popma and Masser, 1999).
CONCLUSIONS Based on the results of this study, it can therefore be concluded that the objectives
of this study were met. (1) Lyophilized testes from bull, boar and carabao were possible in masculinizing Nile tilapia fry after a 28-day treatment period in outdoor tanks but the percent phenotypic males produced is not as high as the synthetic MT. The sex reversal rates of tilapia fry using lyophilized testes were found to be significantly higher than the untreated fry. (2) Lyophilized testes from bull, carabao and boar gave higher specific growth rate of Nile tilapia fry after a 28-day treatment period in outdoor tanks. High survival rate of Nile tilapia fry fed with lyophilized testes from carabao, bull and boar were obtained after a 28-day treatment period in outdoor tanks. (3) The simple cost and return analysis revealed that it is more economical to use the synthetic MT-treated diet in masculinizing Nile tilapia fry rather than the lyophilized testes from carabao, bull and boar.
RECOMMENDATIONS
Based on the results of this study, the following recommendations are considered for future investigation: (1)Consider the influence of controlled and uncontrolled feeding in using lyophilized testes diets for sex reversal of Nile tilapia fry to come up with effective dose; (2) Consider the use of lyophilized testes diets for sex reversal of Nile tilapia fry in hapas in earthen pond; (3) Develop a procedure for the use of liquid nitrogen instead of lyophilization in the preparation method of freeze-drying the testes to reduce the cost of testes diets.
ACKNOWLEDGEMENT
We wish to acknowledge the Department of Science and Technology through the Philippine Council for Aquatic and Marine Research and Development (DOST-PCAMRD), the Commission on Higher Education (CHED) Thesis Grant, the MSU-Maguindanao and CRSP-AquaFish for the financial support. The authors are thankful to the GIFT Foundation International and the CLSU/FAC.
REFERENCES
A.O.A.C. 1980. Official Methods of Analyses. 13th edition. In: K. Helrich (ed.). Association of Official Analytical Chemists, Inc., Washington D.C., USA. pp. 288-290.
Abucay, J.S. and G.C. Mair. 1997. Hormonal sex reversal of tilapias: Implications of hormone treatment application in closed water systems. Aquaculture Research, 28:841-845.
Ahmad, M.H., M. Abdel-Tawwab and Y.A.E. Khattab. 2004. Effect of dietary protein levels on growth performance and protein utilization in Nile tilapia (Oreochromis niloticus L.) with different initial body weights. pp. 249-258. In: R.B. Bolivar, G. Mair and K. Fitzsimmons (eds.). New Dimensions in FarmTilapia. Proceedings of the 6th International Symposium on Tilapia in Aquaculture. Philippines. p. 805.
Al-Hafedh, Y.S. 1999. Effects of dietary protein on growth and body composition of Nile tilapia, Oreochromis niloticus L. Aquaculture Research, 30(5):385-393.
118118
Aquaculture Production Technology Ltd. 2006. Organic tilapia: organic fish farming. Retrieved on October 27, 2008 from http://www.aquaculture.co.il/Technology/organic_Tilapia.html.
Becker, W.G. and C.A.Snipes. 1968. Shift with age in steady-state concentrations of androstenedione and testosterone in incubations of Guinea-pig testis. Biochemistry Journal, 107:35-40.
Bocek, A., R.P. Phelps and T.J. Popma. 1992. Effect of feeding frequency on sex-reversal and on growth of Nile tilapia, Oreochromis niloticus, Journal of Applied Aquaculture, 1(3):97-103.
Costa, D.S. and T.A.R. Paula. 2006. Testosterone level, nasal gland volume and Leydig cell morphometry in capybaras (Hydrochoerus hydrochaeris). Arquivo Brasileiro de Medicina Veterinária e Zootecnia. Vol. 58(6). Print version ISSN 0102-0935. Retrieved on March 04, 2009 from http://www.scielo.br/scielo.php?pid=S0102- 09352006000600017&script=sci_arttext.
Darling, d. 2009. Testes. The Internet Encyclopedia of Science. Retrieved on October 2, 2009 from http://www.daviddarling.info/encyclopedia/T/testes.html.
De Silva, S.S. and M.K. Perera. 1985. Effects of dietary protein levels on growth, food conversion and protein use in young Tilapia nilotica at four salinities. Transaction of the American Fisheries Society, 114:584-589.
Dewey, T. and J. Ng. 2001. Bos taurus. Animal Diversity Web. Retrieved on October 06, 2009 from http://animaldiversity.ummz.umich.edu/site/accounts/information/Bos_taurus.html.
El-Sayed, A.-F.M. 2006. Tilapia Culture. United Kingdom. CABI Publishing. p. 277.
El-Sayed, A.-F.M. and S. Teshima. 1991. Tilapia Nutrition in Aquaculture. Reviews in Aquatic Sciences, 5:247-265.
Ewing, L.L., B.R. Zirkin, R.C. Cochran, N. Kromann, C. Peters and N. Ruiz-Bravo. 1979. Testosterone secretion by rat, rabbit, guinea pig, dog and hamster testes perfused in vitro: correlation with Leydig cell mass. Endocrinology, 105(5):1135-1142.
Fashina-Bombata, H.A. and A.O. Somotun. 2008. The effect of lyophilized goat testes meal as first feed on the growth of ‘Wesafu’: An ecotype cichlid of Epe-Lagoon, in Lagos State, Nigeria. Asian Network for Scientific Information. Pakistan Journal of Nutrition, 7(5):686-88.
Fitzsimmon, K. 2008. Review - Global advances in tilapia production and marketing. Paper presented at the World Aquaculture 2008, The Annual International Conference and Exposition of World Aquaculture Society and Korean Aquaculture Society. Busan, Korea.
Gomelsky, B., N.B. Cherfas, Y. Peretz, N. Ben-Dom and G. Hulata. 1994. Hormonal sex inversion in the common carp (Cyprinus carpio L.). Aquaculture, 126:265-270.
Green, B.W., K.L. Veverica and M.S. Fitzpatrick. 1997. Chapter 10: Fry and Fingerling Production. pp. 227-33. In: H.S. Egna and C.E. Boyd (eds.). Dynamics of Pond Aquaculture. USA. CRC Press LLC. p. 437.
Guerrero, R.D.III and L.A. Guerrero. 1988. Feasibility of commercial production of sex-reversed Nile tilapia fingerlings in the Philippines. pp. 183-86. In: R.S.V. Pullin, T. Bhukasawan, K. Tonguthai and J.C. Maclean (eds.). 2nd International Symposium in Aquaculture. ICLARM Conference Proc.15. Department of Fisheries, Bangkok, Thailand and ICLARM, Manila, Philippines. p. 623.
Guerrero, R.D.III and W.I. Shelton. 1974. An aceto-carmine squash method for sexing juvenile fishes. The Progressive Fish-Culturist, 36:56.
Haylor, G.S. and A.B. Pascual. 1991. Effect of using ram testis in a fry diet for

119119
Oreochromis niloticus (L.) on growth, survival and resultant phenotypic sex ratio. Aquaculture and Fisheries Management, 22:265-68.
Higgs, D.A., E.M. Donaldson, H. Dye and J.R. McBride. 1976. Influence of bovine growth hormone and L thyroxin on growth, muscle composition and histological structure of the gonads, thyroid, pancreas, and pituitary of coho almon (Oncorhynhus kisutch). Journal of the Fisheries Research Board of Canada, 33: 1585-1603.
Jo, J.Y., R.O. Smitherman and L.L. Behrends. 1988. Effects of dietary 17-α
methyltestosterone on sex reversal and growth of Oreochromis aureus. pp. 203-07. In: R.S.V. Pullin, T. Bhukaswan, K. Tonguthai and J.L. Maclean (eds.). The Second International Symposium on Tilapia in Aquaculture. ICLARM Conference Proc. 15. Department of Fisheries, Bangkok, Thailand and ICLARM, Manila, Philippines. p. 623.
Jo, J.Y., R.O. Smitherman and D. Tave. 1995. Effects of six levels of dietary 17α-methyltestoterone on sex-reversal and growth of Oreochromis aureus (Steindachner) and O. niloticus (Linnaeus). Journal of Aquaculture, 8(2):77-83.
Lindner, H. R. 1959. Androgens in the bovine testes and spermatic vein blood. Nature, London, 183:1605.
Lindner, H. R. and T. Mann. 1960. Relation between the content of androgenic steroids in the testes and secretory activity of seminal vesicles in the bull. Journal of Endocrinology, 21:341.
Lone, K.P. and A.J. Matty. 1981. Uptake and disappearance of radio-activity in blood and tissues of carp (Cyprinus carpio) after feeding H-testosterone. Aquaculture, 24:315-326.
Lue, Y., A.P. Sinha-Hikim, C. Wang, M. Im, A. Leung and R.S. Swerdloff. 2000. Testicular heat exposure enhances the suppression of spermatogenesis by testosterone in rats: the “two-hit” approach to male contraceptive development. The Endocronology Society. USA. 141(4):1414-1424.
Mateen A. and I. Ahmed. 2007. Effect of androgen on sex-reversal and growth of Nile tilapia (Oreochromis niloticus). Pakistan Journal of Agricultural Sciences, 44(2):272-276.
Macintosh, D.J. and D.C. Little. 1995. Nile Tilapia (Oreochromis niloticus). pp. 277-320. In: N.R. Bromage, and R.J. Roberts (eds.). Broodstock Management and Egg and Larval Quality. Blackwell Science, Oxford, UK. p. 432.
Meyer, D., M. Guevara, W. Chan and C. Castillo. 2008. Use of fresh bull and hog testis in the sex reversal of Nile tilapia fry. Paper presented at the World Aquaculture 2008, The Annual International Conference and Exposition of World Aquaculture Society and Korean Aquaculture Society. Busan, Korea.
Milstein, A. and O. Lev. 2004. Organic Tilapia Culture in Israel. pp. 657-660. In: R.B. Bolivar, G. Mair and K. Fitzsimmons (eds.). New Dimensions in Farmed Tilapia. Proceedings 6th International Symposium on Tilapia in Aquaculture. Philippines. p. 805.
Odin, R.Y., L.S. Germino, L.D. Noscal, J.R.A. Sugue, R.L.B. Argueza and T.A. Abella. 2009. Masculinization of Nile tilapia (Oreochromis niloticus L.) using testes from carabao (Bubalus bubalis L.), cattle (Bos taurus L.), and Hog (Sus domesticus E.). pp. 151. In: C.C. Deocaris, H.M. Dejarme, A.M. Guidote Jr., L.P. Guidote, R.S. Julian and N.H. Tan Gana (eds.). Book of Abstracts 29th Annual PAASE Meeting and Symposium Linking Science and Engineering to Development. The Philippine-American Academy of Science and Engineering (PAASE). Quezon City, Philippines.
Penman, D.J. and B.J. McAndrew. 2000. Genetics for the management and improvement of cultured tilapia. pp. 227-66. In: M.C.M. Beveridge and B.J. McAndrew (eds.). Tilapias: Biology and Exploitation. Dordrecht. Kluener Academic Publishers. p. 505.

120120
Phelps, R.P. 2006. Chapter 6: Hormone Manipulation of Sex. pp. 211-252. In: C.E. Lim and C.D. Webster (eds.). Tilapia: Biology, Culture, and Nutrition. New York. The Haworth Press, Inc. p. 678.
Phelps, R.P., L.L. Lovshin and B.W. Green. 1996. Sex Reversal of Tilapia: 17-α Methyltestosterone Dose Rate by Enviromental, and Efficacy of Bull Testes. Progress Report, Honduras Special Study 1. Pond Dynamics/Aquaculture Collaborative Research Support Program. Oregon State University, Corvallis, Oregon, USA. p 4.
Phelps, R.P. and T.J. Popma. 2000. Sex reversal of tilapia. In: B.A. Costa-Pierce and J.E. Rakocy (eds.). Tilapia Aquaculture in the Americas. The World Aquaculture Society, Baton Rouge, Louisiana, United States. 2:34–59.
Popma, T.J., and M. Masser. 1999. Tilapia: Life History and Biology. Southern Regional Aquaculture Center Publication No. 283.
Premier Organic Farms Group, Inc. 2009. Premier Organic Farms and U.S. Power Systems Announce Merger. Retrieved on October 12, 2009 from http://www.premierorganicfarms.com/.
Roth, J. and P. Myers. 2004. Bubalus bubalis. Animal Diversity Web. Retrieved on March 04, 2009 from http://animaldiversity.ummz.umich.edu/site/accounts/information/Bubalus_bubalis.html.
Shelton, W.L., K.D. Hopkins and G.L. Jensen. 1978. Use of hormone to produce monosex tilapia for aquaculture. pp. 10-33. In: R. O. Smitherman, W. L. Shelton and J. H. Grover (eds.). Culture Exotic Fishes Symposium Proceedings. Fish Culture Section, American Fisheries Society, Auburn, Alabama, USA.
Vera Cruz, E.M. 1991. Growth and gonadal maturation of androgen-treated Nile tilapia (Oreochromis niloticus L.). Master’s thesis. Central Luzon State University, Nueva Ecija, Philippines. p. 112.
Vera Cruz, E.M. and G.C. Mair. 1994. Conditions for effective androgen sex reversal in Oreochromis niloticus (L.). Aquaculture, 122:237-48.
White, E.M. 2008. Evaluación del testículo de toro como fuente de testosterona en la reversion sexual de alevines de tilapia Oreochromis niloticus en agua con algas. Proyecto Especial de Graduación para Ing. Agr. Escuela Agrícola Panamericana, Tegucigalpa, Honduras. p. 20.
Yamamoto, T. 1969. Sex Differentiation. In: W.J. Hoar and D.J. Randall (eds.). Fish Physiology. New York. Academic Press. 3:117-175.
121121
POTENTIAL USE OF BACTERIAL DEGRADATION TO ELIMINATE METHYLTESTOSTERONE FROM INTESIVE TILAPIA
MASCULINIZATION SYSTEMS
Rosa M. Padrón-López1, Lucero Vázquez-Cruz1, Ulises Hernández-Vidal2, Wilfrido M. Contreras-Sánchez*2 and Kevin Fitzsimmons.
1Laboratorio de Microbiología. e-mail: [email protected]; 2Laboratorio de Acuicultura Tropical. División Académica de Ciencias Biológicas, Universidad Juárez Autónoma de Tabasco, km 0.5 carret. Villahermosa–Cárdenas, Col.
Bosques de Saloya, 86039, Villahermosa, Tabasco, México
To reduce the potential contamination of effluents with Methyltestosterone (MT) used in Tilapia hatcheries, we have proposed the use of bacteria isolated from filters that trap MT in activated charcoal. MT is commonly used in tilapia aquaculture to produce all-male populations and certain concerns have been raised regarding the potential risks to the environment and farmers. The filters we use to retain MT have a biofiltration component where microbial populations are easily formed. We hypothesized that some of the MT degradation occurs in the biofilter due to the active use of MT as carbon source. Based on this we isolated and characterized heterotrophic bacteria obtained from biofilms formed in a filtration system used for tilapia (Oreochromis niloticus) masculinization. We also determined the capacity of adaptation of isolated bacteria in a culture media enriched with MT as the only source of carbon. Primary isolates were obtained from biofilms collected at 7, 11, 20 and 28 days of the masculinization trial. Isolates were inoculated in nutritious agar and eosin-methylene blue agar. Identification was conducted using API WEB and dichotomic keys (Koneman et al.,1999). Adaptation trials were conducted in flasks containing mineral medium enriched with MT (45 mg/100 ml) as the only carbon source. Each flask was inoculated with 2ml of a bacterial suspension (0.5 in the McFarland scale) and incubated at 30 ºC with agitation at 175 rpm for 26 days. Adaptation was measured by counting bacteria daily using the plate counting method.
We isolated and characterized Bacillus ceresus, Bacillus subtilis, Pseudomonas aeruginosa, Pseudomonas fluorescens and Serratia marcescens. All of them were able of using MT as source of carbon and energy. P. aeruginosa was the species with the fastest adaptation; initial growth was perceived at 48 hours and reached the highest number of microorganisms. B. subtilis y P. fluorescens showed initial growth at 72 hours while B. ceresus y S. marcescens initiated growth later (96 and 198 hours, respectively (Fig. 1). P. aeruginosa seems to be a species capable of utilizing a large amount of organic compounds as substrate to grow. This capability allows it to colonize niches and inhospitable environments where nutrients are scarce. Our results indicate that the bacteria we isolated are potential MT biodegraders.

122122
1
10
100
1000
10000
100000
1000000
10000000
24 48 72 96 120 144 168 192 216 150 174 198 222 246 270 294 318 342 366 390 414 438 462 486 510
UFC
/ml
Horas
P.a B.c B.s P.f S.m
Figure 1. Growth kinetics of bacteria in mineral medium enriched with MT. P. aeruginosa; B. ceresus; B. subtilis, P. fluorescens; S. marcescens. Funding for this research was provided by F&A CRSP. Project 07MNE06UA under Grant No. EPP-A-00-06-00012-00 from the United States Agency for International Development (USAID)

123123
HOW TO PRODUCE BILLIONS OF HIGH QUALITY TILAPIA FRY
Ram C. Bhujel
Aquaculture and Aquatic Resources Management (AARM) Asian Institute of Technology (AIT)
PO Box 4, Klong Luang, Pathumthani 12120, Thailand Email: [email protected] or [email protected]
Abstract
Tilapia has now become a popular protein source to the poor, and also increasingly to middle class people. It serves as a typical model of a success story of farming outside its native area. Annual tilapia production was only 1.5 tons in 1950 which surpassed 1.5 million tons in 2002; increased by 1 million fold. Now it has surpassed even 3 million tons in 2010. Its production will still continue to grow exponentially, if high quality fry are readily available especially in countries like China where fry demand is in billions. How to produce and supply such a huge quantity of high quality tilapia fry has been a question for the countries which have potential to expand tilapia farming for domestic consumption and export markets. In Thailand, shortage of premium quality tilaia fry was realized as early as 1980s as the main constraint to the growth of commercial farming. Therefore, Asian Institute of Technology (AIT) developed a practical technique of mass-scale fry production through a series of on-station experimentation over a decade. The technology is basically to produce all-male fry by maintaining a large number of broodfish in hapas, collecting eggs, incubating them artificially in clean and controlled system and feeding with methyl-testosterone (MT) mixed with high quality feed as early as possible to ensure over 99% males in the fry population.
In addition to developing the production technology, AIT also successfully disseminated it applying all sorts of strategies involving public as well as private sector. However, a key turning occurred only after the success of a private hatchery in Thailand that triggering mushrooming of many others. There are over 100 hatcheries of such type in Thailand alone. Now the same trend can be seen in Bangladesh. The technology has now been adopted by many farmers and entrepreneurs of many countries especially in Asia and Latin America. However, in China where about half of the global tilapia is produced, most farmers use hybridization technique to produce mono-sex fry. In Thailand, three hatcheries annually produce 200 million fry each. This means, establishing about five such hatcheries could easily produce 1 billion high quality fry per year. A hatchery in Hainan island of China has been already established by a foreign company which has claimed to achieve the same level of production. However, this technology has not been widely adopted. Adoption of this technology could boost tilapia farming further increasing many folds as the demand for fish for local consumption is huge, and so the export market. Exploring potential and promoting this technology could bring a big leap in tilapia industry in China from its current level. With a view to assisting the industry, establishing functional linkages between China and Thailand and other countries that facilitate cooperation among the researchers / scholars in sharing information and organizing study visits or trainings to government officials and farm/hatchery managers could serve as solutions. This paper describes the techniques and approaches applied by AIT hoping that it provokes policy makers, extension workers, researchers and educators working especially in China, and also other countries to find various ways of collaborations.

124124
Introduction
Background Tilapias are natives of African continent. Nile tilapia (Oreochromis niloticus) was
introduced to Thailand as gift to the King of Thailand from the Japanese Emperor in 1965. They were kept in Chitralada Palace. After seeing a large number of fry produced naturally in the pond, HM the King provided 10,000 fingerlings to the Department of Fisheries (DoF) requesting to produce more and distribute to the poor people perceiving the tilapia as a cheap protein source (Pullin, 1988; Bhujel and Stewart, 2007). Tilapia in Thailand is considered as precious fish because it is thought to be ‘Royal Fish’. In addition to its historical background, the fish itself possess special biological characteristics i.e. caring of its eggs and young ones in the mouth by females. It also can use planktons as feed which can be produced simply by applying manures and chemical fertilizers in ponds. At the same time, agriculture byproducts such as rice / wheat bran, oil cakes and others can be used as feeds to enhance its growth thereby productivity. It can be cultured in systems ranging from backyard ponds to intensively managed tanks/ponds. It resembles with chicken in terms of farming as well as its consumption; therefore, it has been often dubbed as ‘aquatic chicken’ (Little, 1998). Due to its easiness of breeding and farming, it became the species of interest among the resource poor especially in rural areas. In Thailand, it became number one specie since mid-90s over-taking the hybrid catfish. More importantly, Nile tilapia has gained its popularity in China, Bangladesh, Indonesia Laos, Malaysia, Taiwan, the Philippines and Vietnam. People do not treat it as exotic fish, instead regard as a very important source of high quality animal protein and income.
Perception of the Potential and the Problem
Natural breeding without the need of any hormone injection was considered the main advantage of tilapia over other species but as the farming became more commercial, demand for large and uniform fish increased. This created high demand for good quality mono-sex fry. It was almost impossible for the traditional hatcheries to produce and supply a large quantity of fry using traditional methods. For example, production of millions of fry was almost impossible using the existing method. Therefore, the low number of eggs (approx. 1,000 per spawn) and asynchronous spawning became the constraint for mass fry production. Therefore, producing sufficiently large quantity of good quality seed was a big challenge in early 1980s (Little et al., 1997; Bhujel et al., 2000). The potential of tilapia in Thailand and lack of high quality seed was perceived as problem in advance. As a result, it provoked a research program at AIT that aimed at developing mass-scale mono-sex fry production technique. Recently, farmed tilapia has been regarded as green and good species for consumption. Demand is steadily increasing. More and more super markets and retailers are having various types of tilapia items around the globe. Some airlines in US have already started serving tilapia meal. Similarly, fast food chains such as McDonalds’ and others have also tried. Indications are already there that tilapia is becoming ‘Aquatic Chicken’ in true sense. When it becomes everyone’s meal, demand could be unimaginably higher. As the seed is one of the most components of the aquaculture development, availability of good quality seed whenever needed accelerates the industry growth. Therefore, in order to support the maximum potential growth of tilapia industry, policy makers, researchers and other involved should emphasize the seed production technology and its dissemination. Applying the method and disseminating it as a campaign is likely to solve the high demand of fry such as in PR China.
Solution to the problem
Any problem once identified, can be solved through research and development. AIT started research conducting a series of trials establishing a parental stock of Nile tilapia in 1984. Comparisons of breeding in earthen ponds, hapas-in-ponds and tanks within a recirculation system were the beginning of the research. Then trials were on developing methods of egg collection and artificial incubation systems (Little, 1989; Macintosh and Little, 1995). One of the major challenges was to explore or develop the best system or method, and container or jar for artificial incubation of eggs that could ensure high hatching rate and

125125
survival of eggs and yolk-sac larvae to swim-up fry consistently. Use of conical vessels and shaking tables (Macintosh and Little, 1995), various containers were tried such as simple coke bottles and white water bottles. However, semi-transparent fiber-glass jars (Fig. 1: left) locally made was found to be the best. They have been designed in two sizes; 4-litre and 6-litre. The larger sized incubators (Fig. 1, left) can accommodate about 0.2-0.3 million eggs. Attempts are still on-going to explore possibility of using new containers for the improvement in hatching and survival of eggs/larvae. Recently, simple plastic jars (Fig. 1: left) or jugs have been used. As they are cheap, easily available and more transparent so that the hatchery operators can see the egg movement easily and they are also lighter and easier to handle, most hatchery operators like them. However, relatively rough wall of the fiberglass jars facilitate egg hatching accelerating the process of removing egg’s hulls. As tilapia eggs are heavy and remain at the bottom, they needed to be moved gently so that they would not get injured and stay at the bottom without getting adequate oxygen. For this, up- and down-welling water flows into the jars were compared and the downward water flow has been found to be better. It is commonly used by most hatchery operators.
Fig. 1 Tilapia egg incubation jar made of fiberglass (left); and a series of incubators
(right) in well-designed large tilapia hatchery in Thailand.
Shallow aluminum or plastic (Fig. 2) trays are use for the rearing of yolk-sac fry after they hatch. A large number of fry (up to 40,000 fry) can be accommodated in a tray with shallow water oxygenated by its gentle movement. Several trials studied the effects of factors such as fry density and water flow on the fry survival, showed higher densities are even better.

126126
Fig. 2 Larval rearing in aluminum tray (left), feeding hormone mixed feed (middle, in Bangladesh) and fry packed in plastic bags (right) ready for transport.
Attempts were also made to maintain high survival and increase percentage of males in the fry populations. These included determining the optimum dose of methyl-testosterone in feed, frequency and length of feeding period and so on. As a result high percent of males (100% or close to) have been consistently achieved. As demand for fry is seasonal, a method of advanced nursing (Little et al., 2003) has also been developed which can be applied when they needed to keep longer period.
With a gradual improvement in each step of the whole process, a complete package of mass-scale fry production technology has been developed. Research is still on-going especially to make it more adaptable to the environmental conditions and for the manipulation of fry production and supply demand (e.g. Bhujel et al., 2001; 2007). Many research projects secured/launched, and also the student research, were either only on tilapia or in combination with other species. More than 100 student theses (M.Sc. and PhD) have been produced related to tilapia. Research areas covered varies. Initially, tilapia was used as means for waste recycling (AIT, 1994; Edwards and Pullin, 1990), its fry as feed to other species e.g. snakehead (Kaewpaitoon, 1992) and dominant species with others in polyculture e.g. carps, catfish and prawn/shrimp from semi to intensive production systems (Little, 1998). Over 150 peer reviewed journal articles have been published in tilapia alone (Bart, 2004). Significant numbers of popular articles have also been appeared in several magazines and newsletters. They served as main information outlets to the outside world and have contributed significantly to the adoption, culture tilapia technologies and overall development of aquaculture in Asia and beyond (Bhujel, 2009). For an example, Brazilian aquaculture has grown significantly as a result of Chitralada broodstock and the technology they took from Thailand.
Technology Dissemination Any technology package after its development, it has to be disseminated. A variety of
ways can be applied depending upon the local contexts keeping the benefit of end-users or farmers in mind. Some of the means applied or occurred in Thailand (Fig. 1) and around the globe are briefly discussed in this section.
Education and Training
Tilapia culture and breeding techniques were well incorporated into the post-graduate curriculum in both in theory and practicum, at AIT. In the course, all the students are assigned to conduct tilapia breeding and grow-out trials. Many of these students are lecturers at the Universities in their home countries. They do the same when they go back to teaching.
127127
Emphasis on tilapia farming is reflected in their curricula as well as. More importantly, after acquiring knowledge and skills many graduates or alumni and staff are directly or indirectly involved in tilapia farming and its promotion. Many of them are successfully running tilapia hatcheries and farms by themselves in Thailand while few others in other countries e.g. Bangladesh, Ghana and so on.
Successful launching of aquaculture program and its activities in the region increased demand not only for formal education but also created the interest in short-term, need-based skill development training. As a result, AIT has trained over 1,000 personnel so far from about 30 countries. ‘Techniques for Mass Fry Production and Grow-out’ was one of the most attractive courses. Interestingly, the course on tilapia attracted more participants than by Integrated Aquaculture probably because it was completely different and about new techniques developed as compared to the traditional techniques of aquaculture dominated by carps. This training course has a significant role in promoting tilapia not only in Asia but also in Africa and Americas. In addition there were several participants for hands-on work experience in tilapia hatchery. One of the remarkable examples is that some private companies (e.g. Chareon Pokhaphand) sent their staff for training and they have established tilapia hatcheries. It served as the base for the company’s tilapia business that also involves fillet export to US now. In a decade’s time (1989-1999), out of 843 people trained, 26% were from Bangladesh, 22% from Vietnam and 12% Cambodia; mostly for tilapia only or in combination with other species. Many officials of the governments, research institutions have also got this training where they have established and run tilapia hatcheries in their countries, specifically e.g. Bangladesh, Thailand and Vietnam.
Demonstration and outreach
AIT has been keeping a prototype hatchery and runs as a commercial unit within the not-for-profit organization. Many visitors from abroad and students of Thai Universities, colleges visit tilapia hatchery. It has been an interesting place also for distinguished guests of AIT e.g. Thai Princess Mahachakri Sirindhorn, and the King of Sweden in 2003. When there are visits graciously paid by Royal families, the hatchery technology is additionally highlighted including live TV coverage. Many farmers also come with pick-up trucks to AIT directly to purchase fry also to farmers. In doing so, they see the system and spread the words from mouth to mouth. Interestingly, Thai fisheries stations use tilapia hatcheries as a means to generate income unlike distributing fry at free of cost in many countries. Using the funds generated further research and technology dissemination is done in the long-run. AIT engaged farmers as part of research team for field testing also called participatory research. They feel proud being a part of the scientific research. AIT continued to focus on the production of quality mixed sex tilapia in the early 1990s even when AIT was commercializing the monosex approach. This was because it was perceived that even though there was a rapidly increasing demand in the commercial sector for monosex, poor rural households needed quality tilapia to be available locally and centralized commercial monosex operations were unlikely to meet their needs in the short to medium term. Hence, AIT also focused studying on decentralized seed production resulting in large impacts in some marginal agricultural areas such as in Bangladesh. Benoy Barman’s work for PhD at AIT, showed fry could be produced cheaply in rice-fish fields. There was number of research work in this aspect on-campus funded by DFID and then through various mechanisms e.g. DFID’s support in Bangladesh and subsequently supports from SIDA/DANIDA in Vietnam and elsewhere in Indochina.
Aqua outreach played a considerable role in building regional institutional capacity in aquaculture and aquatic resources management and related fields through innovative approaches. It established a network of partners which included vocational colleges, research institutes, universities and department of fisheries (provincial or national levels) under the ministries. AARM assisted to establish tilapia hatcheries under outreach activities. For example, Department of Fisheries in Udonthani Province of Thailand, a tilapia hatchery was established with a view to supplying fry to the farmers of the province. Similarly, a hatchery in an Agricultural college, which is managed by one of the AIT graduates, also serves the same purpose. More interestingly, various non-profit organizations in the same province and also in Chiang Mai established and have run tilapia hatcheries e.g. Udonpatana Foundation,
128128
as a means to serve the poor families providing an evidence for earlier the notion that tilapia is poor men’s fish. Table 1 is a list of hatcheries in Thailand established with direct and indirect assistance of AIT and its partners.
Learning lessons from the promotion of tilapia culture in SE Asia, similar activities have been expanded to Nepal. A project called “Women in Aquaculture” has been launched jointly with the Institute of Agriculture and Animal Sciences (IAAS), Nepal. Tilapia culture was tested or compared with carps at the beginning. After getting positive responses, tilapia has been promoted among ethnic groups and also attempts have been made to expand further with a view to solving the problem of protein malnutrition in the rural areas (Bhujel et al., 2008).
Private-Public Partnership (P-PP)
A number of attempts were made to disseminate the technology through public / government organization with the aim of supplying large number of high quality mono-sex tilapia fry. However, the success was not up the expectation and shortage of high quality fry was still at large. It was probably due to the lack of realization on the potential of tilapia farming by those organizations and their aims were to serve as extension agents rather than doing business by themselves. However, the most obvious reason has been the lack of performance based incentives or rewards for and control over the staff in public organization. Fortunately, these problems were identified well in advance and attempts were also made to quickly shift to partnership with private sector. Unique contractual agreements were made realizing the importance of strict imposition of technological procedures or protocol was necessary in the production of high quality tilapia fry production at every step of the process that involves careful management of brood stocks, collection of eggs, artificial incubation of delicate fry and hormonal sex-reversal. A breakthrough occurred when a private company picked-up the technology in supplying large number of quality seed was possibly. Although, the technology was thought to be cumbersome but private sector adopted quickly due to its profitability and increasing demand. More importantly, after the successes in the private sector, public sector has re-focused on this technology. As a result, tilapia became number one species in Thailand in mid-90s due mainly to these reasons. Sooner or later tilapia industry may take off other countries too. Bangladesh, Malaysia and Vietnam, governments are aggressively promoting tilapia. Tilapia has been officially allowed to culture in commercial scale.
CP Food Co. Ltd., which runs five tilapia hatcheries using the AIT technology, has also played a significant role in promoting tilapia further especially red variety. The company created demand by giving “Thapthim” as a brand name which means “ruby” giving the impression to the common people that it is something special and completely different food item. The company promoted it by producing and distributing an attractive picture of a food item of red-tilapia to almost all the restaurants in Thailand in order to boost domestic demand. The company now has several tilapia growers in groups in various pocket areas under contract farming. Under the agreement, farmers get a complete package of technology, inputs such as fingerlings and feed. They also buy back the fish so that farmers would not need to worry about market. This is a very good lesson strategy to learn from CP, while promoting any new species like tilapia.
Other companies e.g. GenoMar, a Norwegian company has also made remarkable contribution hiring a consultant who was successful in establishing tilapia farming in Brazil after bringing a group of farmers to study the system and purchase broodfish in Thailand. He was initially hired by GenoMar for setting up AIT style hatcheries in the Philippines and subsequently China as well as Latin America. GenoMar also has established a hatchery in Singapore. In early 80s, David Little, who was the main researcher behind developing the technology, has worked with Regal Springs when they first started tilapia production in Java to introduce the AIT approach. More recently, many groups from Bangladesh have been supported by AIT. A large hatchery plan has also been implemented with a company in India for the transfer of tilapia farming technology in bio-secure way, where previously tilapias were not officially approved for culture. Many groups from various countries have showed interests for the establishment of AIT style hatcheries and quality control/certification systems.

129129
Aqua Internship: on-the-job work experience AIT and its partners in Thailand as well as in other countries offer internship programs
to students from within the same country or abroad to provide on-the-job work experience at the tilapia hatchery alone so far in the past. Students, normally enrolled in their universities in their countries do not need any aquaculture background to join internship. Biology background would be sufficient as it is more in hands on work with hatchery staff and learn by doing the work as regular staff. Tilapia hatcheries have been considered as one of the best internship placements where students spend 2-3 months and understand the real field situation and also identify problems faced by the industry which can be research areas for their thesis with the aim of solving those problems faced by the industry. These hatcheries also provide opportunities to students to carry out their research afterwards and even employ in some cases. Internship program runs on cost-sharing basis. Interns or their Universities provide airfares, interns bear food costs by themselves and Asian partner institutions provide free or accommodation or with discounted fees either in their student dormitories/hostels, guest houses or arrangement to live with staff families in communities.
Source: Belton et al., 2009
≈ 1986
Bor Charoen
Prasit
Wiboon
Boonholme
Wanida
Uthai Jam Nong
Pung Thai
DOF
Chiang Mai
Patana
Udorn Patana
Nam Sai Branch
Manit
Nam Sai
Rom Sai
CP
AIT
Fig 1. Technology dissemination pathways in Thailand (Belton et al., 2009)
CONCLUSIONS
Realization of the potential of tilapia as a candidate species, because of its benefits over others, identification of shortage of quality fry as the main constraint of its expansion and continuous research carried out to find the solutions served as foundation for developing a practical technology package, for the transfer of knowledge and technology. Incorporation of the hatchery technique and its farming in post-graduate education, short-term training courses, outreach and internship programs accelerate in the promotion of tilapia culture.
Several individuals who were formally educated from, trained by and/or exposed to AIT have contributed tremendously in promoting the tilapia farming technology developed at AIT. However, the major breakthrough occurred when private sector took up the technology, successfully implemented it and success story started to spread through various means. Countries wanting to promote tilapia may need to think about establishing such hatchery either their own or encouraging and facilitating the private sector. Results have showed that five large hatcheries managed using the set of guidelines or protocol developed could easily produce over a billion high quality fry within 3-5 years period. Further promotion and expansion can be augmented through education, training, farm visits and other media means where the demand is such high e.g. PR China.
Several individuals and groups from abroad were attracted to see the operation and understand it in-depth. Many of them started by themselves and many others established their farms by making contractual arrangements. As a result, several hatcheries emerged in Thailand followed by Bangladesh where most people rely on fish for protein. Again, global expansion has occurred due mainly to the up-take of the technology by the private sector. A lot of adaptations in the technology, modifications and/or improvements have been made in different parts of the world by various groups depending upon the availability of materials and equipment. Nevertheless, ideas of several individuals have contributed in further

130130
advancing the technology. Due to which millions of people have and going to have direct or indirect benefits from tilapia research and technology transfer.
Aquaculture program of AIT has established itself in international arena because of these activities carried out over two decades. It has contributed significantly in the improvement of indigenous capacity for education, research and development in the region and beyond. Therefore, approaches/strategies used and role played by AIT in the promotion of tilapia should serve as a model for other organizations which have similar goal of contributing to food security and poverty reduction. However, there is always a room for improvement. No technology can be 100% perfect. More research is still necessary to improve the technology as well as strain itself. For examples, improvement in survival of fry, development of cold and salinity tolerance in various strains, solution to heat stress during summer and its drastic drop in egg production in some cases, various new and emerging diseases, and minimization of cost of production. One of the researchable issues has been always raised is the impacts of MT (methyl-testosterone), a steroid hormone, on the health of technicians who handle the MT on daily basis while preparing feed and feeding the fry, and the impacts on the environment.
REFERENCES
AIT, 1994, Partners in Development: The Promotion of Sustainable Aquaculture. Asian Institute of Technology, Bangkok, Thailand, 98 p.
Belton, B., Turongruang, D. Bhujel, R. and Little, D.C. 2009. The History, status, and future prospects of mono-sex tilapia culture in Thailand. Aquaculture Asia Magazine April-June 2009, 16-19 pages.
Bhujel, R.C. 2000. A review of strategies for the management of Nile tilapia (Oreochromis niloticus) broodfish in seed production systems, especially hapa-based systems. Aquaculture 181:37-59.
Bhujel, R.C., W.A. Turner, A. Yakupitiyage, D.C. Little, 2001. Impacts of environmental manipulation on the reproductive performance of Nile tilapia (Oreochromis niloticus). Journal of Aquaculture in the Tropics 16(3): 197-209.
Bhujel, R. and J. Stewart, 2007. Sustainable tilapia culture in Thailand. Fish Farmer, Nov./Dec. 2007, pages 38-39.
Bhujel, R.C., D.C. Little, A. Hossain, 2007. Reproductive performance and the growth of stunted and normal Nile tilapia (Oreochromis niloticus) broodfish at varying feeding rates. Aquaculture 273:71-79.
Bhujel, R.C., M.K Shrestha, J. Pant, S. Buranrom, 2008. Ethnic Women in Aquaculture in Nepal. Development, 51: 259-264.
Bhujel, R.C. 2009. Artificial incubation, hormonal sex-reversal promoted tilapia boom. Global Advocate, Sept/Oct 2009: 73-75.
Bart, A. 2004. Contribution of Aquaculture and Aquatic Resources Management (AARM) program of the Asian Institute of Technology (AIT) to tilapia research. Proceedings of ISTA6, Sept 12-16, 2004, the Philippines. Pages 711-722.
Edwards, P. and R.S.V. Pullin, (eds.), 1990. Wastewater-fed Aquaculture. Proceedings of the International Seminar on Wastewater Reclamation and Reuse for Aquaculture, Calcutta, India, December 6-9, 1988. Asian Institute of Technology, Bangkok, Thailand. 296 pages.
Macintosh D.J. and D.C. Little, 1995. Nile tilapia (Oreochromis niloticus) In Broodstock management and egg and larval quality, N. R. Bromage and R.J. Roberts (eds). Blackwell Science, 424 p.
Kaewpaitoon, K. 1992. Utilization of septage-raised tilapia (Oreochromis niloticus) as feed for snakehead (Channa striata). Dissertation AE 92-2. Asian Institute of Technology, Bangkok, Thailand.
Little, D.C. 1989. An evaluation of strategies for production of Nile tilapia (Oreochromis niloticus) egg and fry suitable for hormonal treatment. PhD thesis. Institute of Aquaculture, University of Stirling, Scotland, UK.
Little, D. 1998. Options in the development of the aquatic chicken. Fish Farmer, July/August 1998, pages 35-37.

131131
Little, D.C., D. Sikawa, and J. Juntana, 1994. Commercial production and marketing of Nile tilapia (Oreochromis niloticus) fry in Chonburi and Chachoengsao Provinces, Thailand. The NAGA ICLARM Quarterly, April 1994, pages 14-17.
Little, D.C. W.A. Turner and R.C. Bhujel, 1997. Commercialization of a hatchery process to produce MT-treated Nile tilapia in Thailand. p. 108-118. In D.E. Alston, B.W. Green and H.C. Clifford (Eds.), IV Symposium on aquaculture in Central America: focusing on shrimp and tilapia, 22-24 April 1997, Tegucigalpa, Honduras, Asociacion Nacional de Acucultores de Honduras and the Latin American Chapter of World Aquaculture Society, 237 p.
Little, D.C., R.C. Bhujel, and T.A. Pham, 2003. Advanced nursing of mixed sex and MT-treated tilapia (Oreochromis niloticus) fry, and its impact on subsequent growth in fertilized ponds. Aquaculture, 221 (1-4): 265-276.
Pullin, R.S.V. 1988. Tilapia genetic resources for Aquaculture. Proceedings of the Workshop on Tilapia genetic resources for aquaculture March 23-24, 1987. ICLARM. 108 pages.
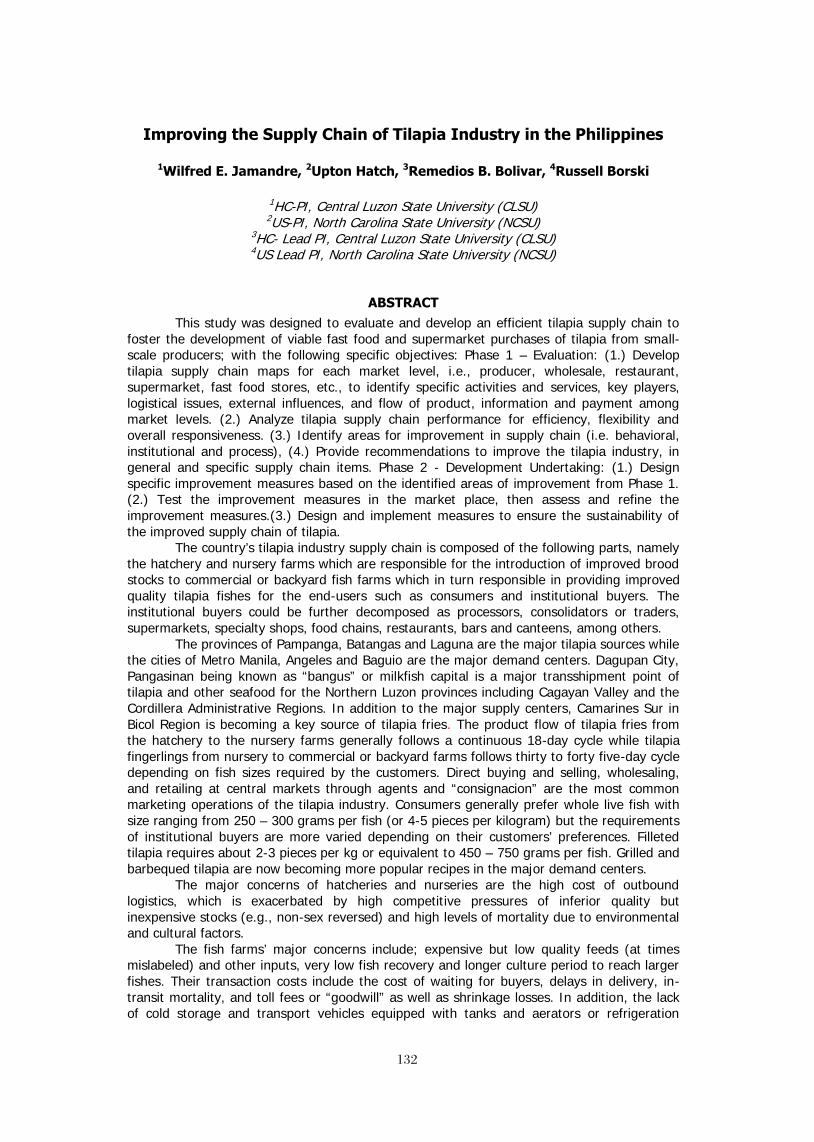
132132
Improving the Supply Chain of Tilapia Industry in the Philippines
1Wilfred E. Jamandre, 2Upton Hatch, 3Remedios B. Bolivar, 4Russell Borski
1HC-PI, Central Luzon State University (CLSU)
2US-PI, North Carolina State University (NCSU) 3HC- Lead PI, Central Luzon State University (CLSU) 4US Lead PI, North Carolina State University (NCSU)
ABSTRACT This study was designed to evaluate and develop an efficient tilapia supply chain to
foster the development of viable fast food and supermarket purchases of tilapia from small-scale producers; with the following specific objectives: Phase 1 – Evaluation: (1.) Develop tilapia supply chain maps for each market level, i.e., producer, wholesale, restaurant, supermarket, fast food stores, etc., to identify specific activities and services, key players, logistical issues, external influences, and flow of product, information and payment among market levels. (2.) Analyze tilapia supply chain performance for efficiency, flexibility and overall responsiveness. (3.) Identify areas for improvement in supply chain (i.e. behavioral, institutional and process), (4.) Provide recommendations to improve the tilapia industry, in general and specific supply chain items. Phase 2 - Development Undertaking: (1.) Design specific improvement measures based on the identified areas of improvement from Phase 1. (2.) Test the improvement measures in the market place, then assess and refine the improvement measures.(3.) Design and implement measures to ensure the sustainability of the improved supply chain of tilapia.
The country’s tilapia industry supply chain is composed of the following parts, namely the hatchery and nursery farms which are responsible for the introduction of improved brood stocks to commercial or backyard fish farms which in turn responsible in providing improved quality tilapia fishes for the end-users such as consumers and institutional buyers. The institutional buyers could be further decomposed as processors, consolidators or traders, supermarkets, specialty shops, food chains, restaurants, bars and canteens, among others.
The provinces of Pampanga, Batangas and Laguna are the major tilapia sources while the cities of Metro Manila, Angeles and Baguio are the major demand centers. Dagupan City, Pangasinan being known as “bangus” or milkfish capital is a major transshipment point of tilapia and other seafood for the Northern Luzon provinces including Cagayan Valley and the Cordillera Administrative Regions. In addition to the major supply centers, Camarines Sur in Bicol Region is becoming a key source of tilapia fries. The product flow of tilapia fries from the hatchery to the nursery farms generally follows a continuous 18-day cycle while tilapia fingerlings from nursery to commercial or backyard farms follows thirty to forty five-day cycle depending on fish sizes required by the customers. Direct buying and selling, wholesaling, and retailing at central markets through agents and “consignacion” are the most common marketing operations of the tilapia industry. Consumers generally prefer whole live fish with size ranging from 250 – 300 grams per fish (or 4-5 pieces per kilogram) but the requirements of institutional buyers are more varied depending on their customers’ preferences. Filleted tilapia requires about 2-3 pieces per kg or equivalent to 450 – 750 grams per fish. Grilled and barbequed tilapia are now becoming more popular recipes in the major demand centers.
The major concerns of hatcheries and nurseries are the high cost of outbound logistics, which is exacerbated by high competitive pressures of inferior quality but inexpensive stocks (e.g., non-sex reversed) and high levels of mortality due to environmental and cultural factors.
The fish farms’ major concerns include; expensive but low quality feeds (at times mislabeled) and other inputs, very low fish recovery and longer culture period to reach larger fishes. Their transaction costs include the cost of waiting for buyers, delays in delivery, in-transit mortality, and toll fees or “goodwill” as well as shrinkage losses. In addition, the lack of cold storage and transport vehicles equipped with tanks and aerators or refrigeration

133133
facilities delimits them to take market opportunities. Interestingly, many farmers adapted a “circuitous” production technique to take advantage of markets preference on tilapia with darker skin.
The major concerns of processors are too few farms that could supply regularly the desired quality and volume of tilapia, the lack of capital for market expansion, and competition with cheaper imported counterparts.
The concerns of traders including “consignacion”, suppliers or consolidators are the following; (a) meeting the product quality and quantity orders on schedule (b) high logistics and transaction costs of consolidating and distributing fishes from sources to destinations (c) absence of product grades and standards.
The following are some recommendations to address the various issues and concerns namely of the various chain players: (1) encourage the establishment of more nursery farms for better quality brood stocks while intensifying technology transfer to farmers for better health and management of tilapia (2) conduct market promotion activities highlighting the various niche opportunities of tilapia among growers and consumers (3) motivate the participation of small farmers in supply chains by setting up an incentive scheme through a mix of patronage refund and profit sharing (4) institutionalize an accreditation program for feed manufacturers, hatcheries, processors and the like to improve the quality assurance of products and services (5) provide capital windows to improve facilities and reduce logistics and transaction costs in the entire supply chains of tilapia.
IMPROVING SUPPLY CHAIN FOR TILAPIA
IN THE PHILIPPINES (On-going)
INTRODUCTION
Tilapia (Oreochromis niloticus) became one of the most popular and important farmed fish commodities in the Philippines. It contributed around 12% of the gross domestic production to the aquaculture sector. It also provided a source of income and livelihood of around 1.4 million workforce and fish producers (BAS, 2010). Likewise, tilapia is an important source of food and animal protein. In 2009, the per capita consumption of tilapia was 3.81 kgs and it grew at an average annual rate of about 10% from 2005-2008. Moreover, fish accounted for about 14% of the total food expenditure of the country (Rodriguez, et.al. 2009).
Tilapia culture is widely undertaken in the country with regions III and IV as the major production areas. Due to the product attributes and factors productivity of tilapia as offshoots of research and development (R & D) efforts and programs from the mid 80’s until recently, tilapia production has been a dynamic aquaculture enterprise in the country. Furthermore, markets for tilapia remains vibrant with encouraging growth potentials. All major demand areas such as cities of Metro Manila, Baguio, Angeles, among others, are now preferring other product forms and shopping venues for reasons of convenience and availability than the traditional marketing mode.
In the recent past, efforts to sustain the industry’s growth momentum have been focused on the improvement of the broodstock through genetic improvement by cross-breeding strains. Likewise, improved stock management and cultural practices have been developed to decrease mortality and maintain growth vigor.
However, in the midst of the global economy, the tilapia industry remains sluggish to serve new market niches such as supermarkets, food chains and exports since it is dominated by smallhold producers that are scattered all over the country. High mortality, small marketable body size and slow growth performance are still prevalent in the industry.
Thus, this existing condition of the tilapia industry amidst pressures brought about by global competition necessitates a development framework that views the industry in a holistic manner that would bring about visible and concrete improvements in production, handling and distribution processes or activities. It is of utmost consideration that the various players of the industry are coordinated to achieve a more efficient, cost-effective, profitable and sustainable industry that thrives in an environment of increased competition due to liberalized markets.

134134
Objectives This study was designed to evaluate and develop an efficient tilapia supply chain to
foster the development of viable fast food and supermarket purchases of tilapia from small-scale producers; with the following specific objectives:
Phase 1 – Evaluation: 1) Develop tilapia supply chain maps for each market level, i.e., producer, wholesale,
restaurant, supermarket, fast food stores, etc., to identify specific activities and services, key players, logistical issues, external influences, and flow of product, information and payment among market levels.
2) Analyze tilapia supply chain performance for efficiency, flexibility and overall responsiveness.
3) Identify areas for improvement in supply chain (i.e. behavioral, institutional and process),
4) Provide recommendations to improve the tilapia industry, in general and specific supply chain items. Phase 2 - Development Undertaking:
1) Design specific improvement measures based on the identified areas of improvement from Phase 1.
2) Test the improvement measures in the market place, then assess and refine the improvement measures.
3) Design and implement measures to ensure the sustainability of the improved supply chain of tilapia.
REVIEW OF LITERATURE Supply Chain Management
The management of multiple relationships across the supply chain is being referred to as supply chain management (SCM). It is a network of multiple businesses and relationships and is defined as the integration of key business processes that add value to products, services and information as they move from the original suppliers to the end-users (Lambert, D. et.al., 1998). Alternatively, SCM is a process of planning, implementing and controlling the operations of supply chain as efficiently as possible, hence, the application of total systems approach to minimize the cost of flow of information, materials, and services from raw materials suppliers through factories and warehouses to the end consumer.
SCM entails the identification of the different players and how they are connected (both within and outside a particular organization) in bringing a product or in providing a service from the source to the end-users. With SCM, the exchange of information, movement of supplies and transformation of products are facilitated through open collaboration and cooperation among these players.
One key element of managing the supply chain is to have an explicit knowledge and understanding of how the supply chain network structure is configured. In determining the network structure, it is necessary to identify who the members of the supply chain are. To integrate and manage all process links with all members across the supply chain, the key is to identify the basis for determining which members are critical to the success of the company and the supply chain, and thus should be all allocated managerial attention and resources (Lambert, D. et.al., 1998).
The value chain framework in Porter, M. (1985) is a model that helps to analyze specific activities through which firms can create value and competitive advantage. There are two sets of activities involved. The first set of activities are the primary activities (line functions) that include (a) inbound logistics - receiving, storing, inventory control, and transportation planning (b) operations - machining, packaging, assembly, equipment maintenance, testing and all other value-creating activities that transform the inputs into final product (c) outbound logistics - activities required to get the finished product at the customers: warehousing, order fulfillment, transportation, distribution management (d) marketing and sales - activities associated with getting buyers to purchase the product, including: channel selection, advertising, promotion, selling, pricing retail management, etc. and (e) service - activities that maintain and enhance the product’s value. The second set of activities in a supply chain includes (a) procurement, (b) technology development to support value chain activities, (c) human resource management associated with recruiting, retention

135135
and compensation of employees and managers and (d) firm structure - general management, planning management, etc.
Three main paths are identified in the process of SCM, namely: (1) product flow that includes the movement of goods from a supplier to a customer,
as well as customer returns, (2) information flow that involves transmitting orders and updating the status of
delivery; and (3) financial flow that consists of credit terms, payments and payment schedules,
plus consignment and title/ownership.
Supply Chain Management in the Food Sector Food sectors such as agriculture and aquaculture involve a diverse range of distinct
enterprises (producers, processors, marketers and distributors) and rely on inputs from various sources, often at distinct geographical locations (Hobbs, 1996; Williamson, 1979).
In developing countries these sectors are mostly composed of smallhold producers. These producers are information-poor and usually viewed as being the least powerful in the marketplace. On the other hand, traders are generally information-rich and are usually seen as yielding much of the power and doing so at the expense of producers. However, this is not always the case but rather there are instances that traders act as “supply chain champions”. As the number of supply chains rise in developing countries, traders will have an important role in management (Ramasamy, 2007).
Smallholders operate in critical supply chains, thus, value chain becomes necessary for sustaining smallholder growth. A primary driver of the growing focus of the food sector on SCM is the changing competitive environment. Supply chain management provides one conceptual approach to build the capacity of domestic producers to match the products that exporting countries will be aiming to put into world markets. Thus, SCM in the food sector is an essential tool for integrating each step in the entire production and distribution process (from the farming of basic raw materials to delivery of final products to the consumer) so that the end product meets the value expectations of the consumers or end-users. This “biological manufacturing” is necessary to meet consumer expectations (Tveteras and Kvaloy, 2004).
For the consumers and other stakeholders, SCM focuses on improving the performance of the supply chain through the delivery of guaranteed safe, desirable, accessible and good quality food in a cost-effective manner. SCM, therefore, represents the management of the entire set of production, manufacturing/transformations, distribution and marketing activities by which a consumer is supplied with a desired product (Woods, 1999).
Benefits of Supply Chain Management
Supply chain improvement not only benefits the private sector but also creates spin-offs that stimulate social, economic, environmental and sustainable development in the country (employment generation, added value, minimization of product losses, etc.). Effective supply chain management improves data accuracy and reduces complexity in operations including supplier selection, purchasing, warehousing and distribution. Other benefits are greater productivity and lower costs, reduced inventory throughout the chain, improved forecasting precision, fewer suppliers and shorter planning cycles.
Specific gains in supply chain management include; reduction of product losses in transportation and storage, increase in sales, foster dissemination of technology and advanced techniques, provision of capital and knowledge among the chain partners, better information about the flow of products, markets and technologies, greater transparency in the supply chain, accurate tracking and tracing of product flows, better control of product safety and quality and large investments and risks are shared among partners in the chain. Efforts of targeting such potential gains were demonstrated for the Mexican tilapia (Vivanco-Aranda, et.al. 2010).
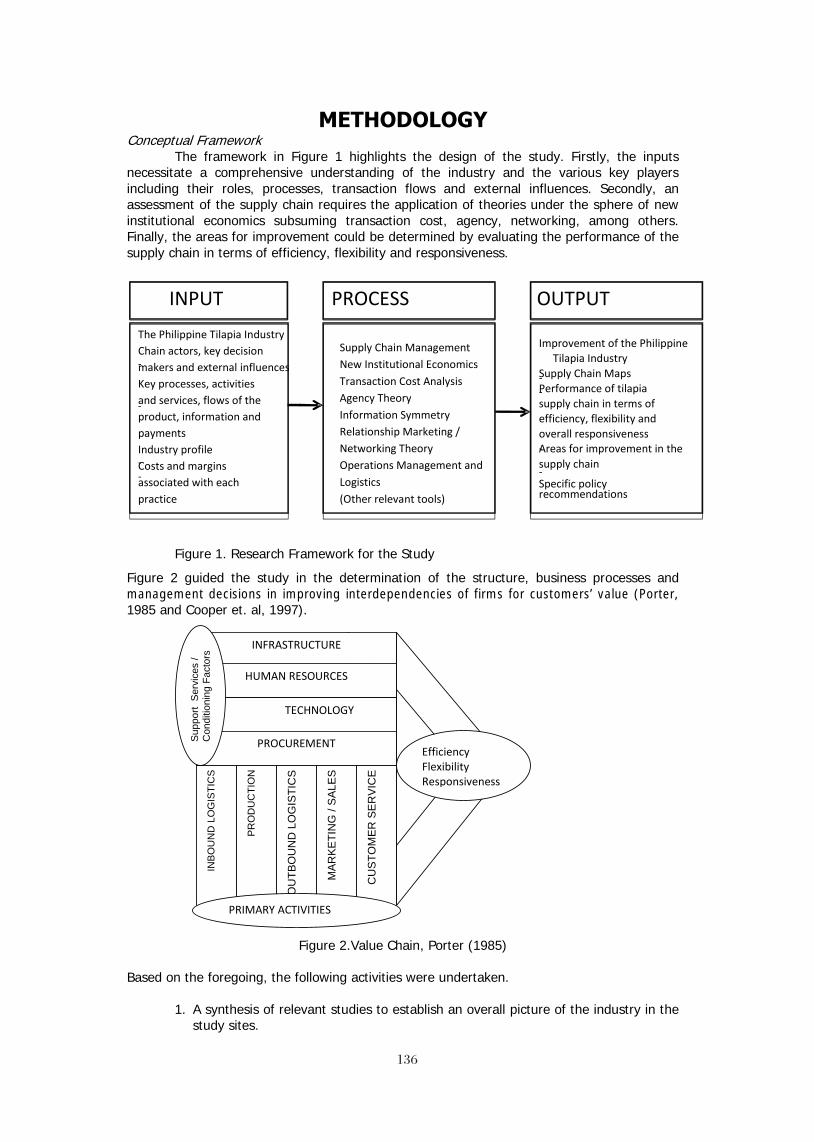
136136
METHODOLOGY Conceptual Framework
The framework in Figure 1 highlights the design of the study. Firstly, the inputs necessitate a comprehensive understanding of the industry and the various key players including their roles, processes, transaction flows and external influences. Secondly, an assessment of the supply chain requires the application of theories under the sphere of new institutional economics subsuming transaction cost, agency, networking, among others. Finally, the areas for improvement could be determined by evaluating the performance of the supply chain in terms of efficiency, flexibility and responsiveness.
Figure 1. Research Framework for the Study
Figure 2 guided the study in the determination of the structure, business processes and management decisions in improving interdependencies of firms for customers’ value (Porter, 1985 and Cooper et. al, 1997).
Efficiency Flexibility Responsiveness
INBO
UN
D L
OG
ISTI
CS
PRO
DU
CTI
ON
OU
TBO
UN
D L
OG
ISTI
CS
MAR
KETI
NG
/ S
ALE
S
CU
STO
MER
SER
VIC
E
HUMAN RESOURCES
TECHNOLOGY
PROCUREMENT
INFRASTRUCTURE
Supp
ort
Serv
ices
/ C
ondi
tioni
ng F
acto
rs
PRIMARY ACTIVITIES
Figure 2.Value Chain, Porter (1985)
Based on the foregoing, the following activities were undertaken.
1. A synthesis of relevant studies to establish an overall picture of the industry in the study sites.
- -
-
Specific policy
-
-
- -
PROCESS INPUT
Supply Chain Management New Institutional Economics Transaction Cost Analysis Agency Theory Information Symmetry Relationship Marketing / Networking Theory Operations Management and Logistics (Other relevant tools)
OUTPUT
Improvement of the Philippine Tilapia Industry
Supply Chain Maps Performance of tilapia supply chain in terms of efficiency, flexibility and overall responsiveness Areas for improvement in the supply chain - recommendations
The Philippine Tilapia Industry Chain actors, key decision makers and external influences Key processes, activities and services, flows of the product, information and payments Industry profile Costs and margins associated with each practice

137137
2. Identification of the members of the supply chain, key processes that required coordination (flows of the product, information and payments), activities and services conducted by supply chain members, critical logistics issues, key decision makers and external influences.
3. For each supply chain, at least one shipment from the product source to the ultimate destination was traced to: validate/verify all information in the supply chain drawn; document all practices at each stage of the chain; determine and quantify costs and margins associated with such practices; and determine and quantify the changes in product volume and quality along the chain.
After the supply chain has been validated and the impact of various practices along the chain was established, the next step was to identify areas for improvement of the supply chain. This was done through a participatory approach involving the supply chain members. Among others, identification of supply chain champions, the structure of power along the chain and the relative interest of members with regards to improvement in the chain were considered.
Study Areas and Coverage
The study covered Regions III, IV and NCR. In order to draw the major tilapia routes, at least one shipment in each of these regions, from the supply center to the ultimate end-user was traced.
Table 1 shows the total number of respondents covered, for each of the supply chains mapped. There are five chain players that perform either one process or a combination of processes depending on the degree of coordination in the chain, decomposed as follows: 5 hatchery and nursery operators, 28 farmers, 4 processors, 24 traders/consolidators/shippers and 11 institutional buyers.
Data Collection and Requirements
Primary data were obtained through survey, key informant interview and focus group discussions (FGD). FGD was also conducted to validate secondary information and to answer more specific questions related to supply chain mapping. A questionnaire was designed to answer key questions, among others: Who are the key costumers and what are their product requirements (especially quality standards)?; Who are the key players and what are their respective roles?;How do product, information and money flow through the supply chain?;What are the activities and services provided at each level in the supply chain?;What are the critical logistics issues?; and What are the external influences?
Table 1. Number of respondents covered in the tilapia supply chains Routes of SC mapped Supply Chain Players Number of Respondents
Bicol-Laguna-Batangas-Manila-Baguio (Chain 1):
Hatchery and Nursery Operators 3 Fish farmers 15 Processors 2 Traders/consolidators 8 Institutional buyers 5
Pampanga-Pangasinan-Ilocos and Isabela - Baguio and Manila (Chain 2):
Hatchery and Nursery Operators 2 Fish farmers 13 Processors 2 Traders/consolidators 16 Institutional buyers 6
Secondary data series on tilapia statistics was obtained from various agencies such as the Bureau of Agricultural Statistics (BAS), Bureau of Fisheries and Aquatic Resources (BFAR) and other relevant agencies of the Department of Agriculture (DA). Previous studies on the
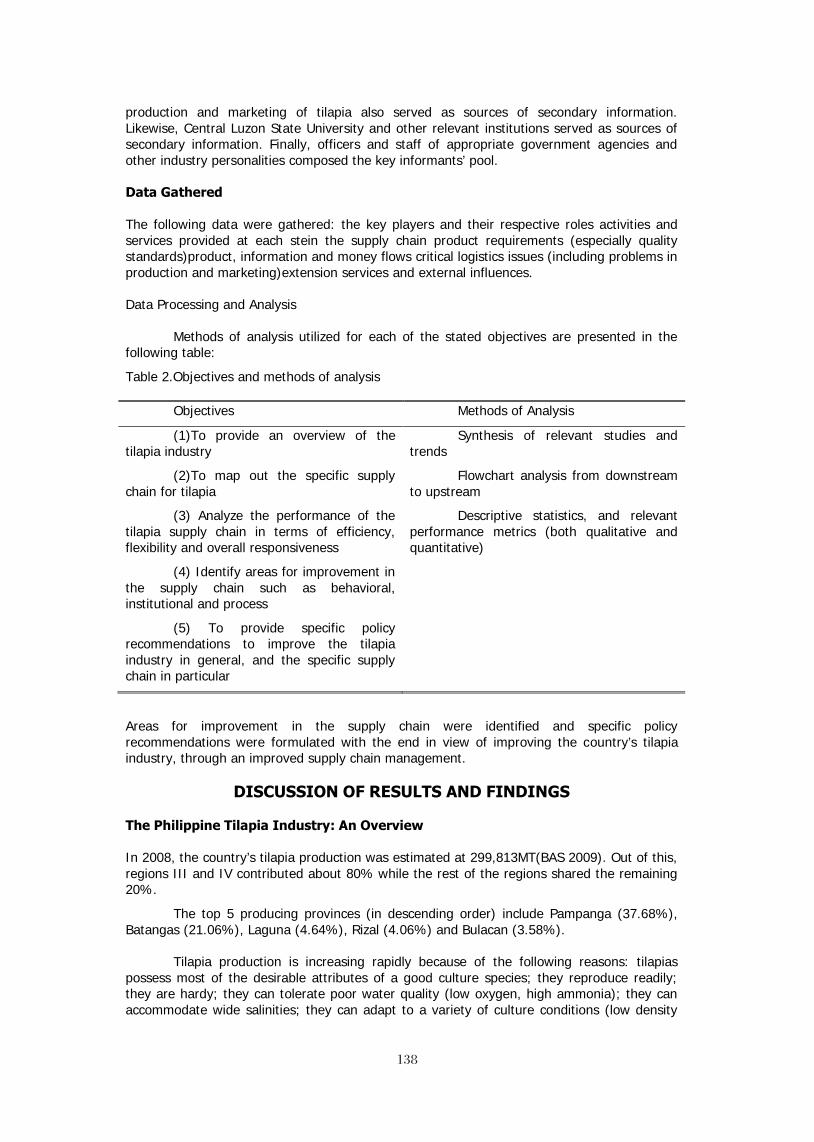
138138
production and marketing of tilapia also served as sources of secondary information. Likewise, Central Luzon State University and other relevant institutions served as sources of secondary information. Finally, officers and staff of appropriate government agencies and other industry personalities composed the key informants’ pool.
Data Gathered
The following data were gathered: the key players and their respective roles activities and services provided at each stein the supply chain product requirements (especially quality standards)product, information and money flows critical logistics issues (including problems in production and marketing)extension services and external influences.
Data Processing and Analysis
Methods of analysis utilized for each of the stated objectives are presented in the following table:
Table 2.Objectives and methods of analysis
Objectives Methods of Analysis
(1)To provide an overview of the tilapia industry
Synthesis of relevant studies and trends
(2)To map out the specific supply chain for tilapia
Flowchart analysis from downstream to upstream
(3) Analyze the performance of the tilapia supply chain in terms of efficiency, flexibility and overall responsiveness
Descriptive statistics, and relevant performance metrics (both qualitative and quantitative)
(4) Identify areas for improvement in the supply chain such as behavioral, institutional and process
(5) To provide specific policy recommendations to improve the tilapia industry in general, and the specific supply chain in particular
Areas for improvement in the supply chain were identified and specific policy recommendations were formulated with the end in view of improving the country’s tilapia industry, through an improved supply chain management.
DISCUSSION OF RESULTS AND FINDINGS
The Philippine Tilapia Industry: An Overview
In 2008, the country’s tilapia production was estimated at 299,813MT(BAS 2009). Out of this, regions III and IV contributed about 80% while the rest of the regions shared the remaining 20%.
The top 5 producing provinces (in descending order) include Pampanga (37.68%), Batangas (21.06%), Laguna (4.64%), Rizal (4.06%) and Bulacan (3.58%).
Tilapia production is increasing rapidly because of the following reasons: tilapias possess most of the desirable attributes of a good culture species; they reproduce readily; they are hardy; they can tolerate poor water quality (low oxygen, high ammonia); they can accommodate wide salinities; they can adapt to a variety of culture conditions (low density

139139
pond to very intensive systems; mono- to polyculture; they have versatile food habits; and they are highly marketable (Shelton,2002).
In the Philippines, tilapia is produced in freshwater fishponds, freshwater fish cages, brackishwater fishpond and freshwater fishpen with extensive to intensive culture systems. In 2002, 57% of the total tilapia production in the country came from freshwater fishponds, 38% from freshwater fish cages, 7% from brackishwater fishpond and 1% freshwater fishpen (BFAR, 2004).
There are three types of tilapia in the country: Nile, Red and Javanese (BAR digest, 2010). Nile breed of tilapia is the main species cultured in the country at freshwater ponds and cages in Central and Southern Luzon which contributed 87% to total tilapia production in 2000 (BFAR, 2001). The other important species are the Mozambique tilapia and its hybrids with O. Niloticus and O. Hornorum which are produced in brackishwater ponds.
The most popular tilapia strains adopted by the small-scale tilapia farmers in Central Luzon were the BFAR Genetically Enhanced Tilapia (GET), strain (GET Excel Tilapia) and Genomar Supreme Tilapia (GST) because of their growth performance.
Some barriers in starting tilapia farming venture include: lack of capital for financing pond construction and operating expenses; high input prices, particularly of feeds; unsuitable farm location, i.e., flood prone and no access road lack of technical expertise; unreliable water supply; low farm gate price of tilapia.
In addition, the most common problems experienced by the tilapia farmers were: high feed prices; high fertilizer prices; declining net profits; high cost of pond construction; and presence of tilapia predators, such as Channastriata (snakehead), Clarias spp. (catfish), and bullfrogs.
Important inputs to tilapia culture are the quality of seeds and broodstocks. With the efforts of Research and Development (R&D) agencies such as CLSU, BFAR, GIFT foundation among others, many hatchery farms were established across the country. However, despite the combined production outputs of the same the demand for fries and fingerlings cannot be filled up. Many producers adopt direct and indirect stocking due to high mortality rates and longer culture periods (Tan, et.al. 2009). Those who stock directly have a higher density per m2 than their counterparts. Those who stock indirectly require larger-sized fingerlings from 17-14, hence, offering opportunities for nursery operations.
Other inputs consist of capital investments such as the land, water supply system, drainage system, pump and equipment/paraphernalia (seine net, weighing scales, tubs/buckets). It also includes the operating capital – fingerlings, fertilizer (chicken manure and ammonium phosphate), supplemental feeding (fry mash, fish starter, fish grower, fish finisher), labor, fuel/lubricant and electricity. Each item affects the operation of the tilapia industry particularly on feeds which accounts for about 73% of the operating capital (BFAR, 2010).
Marketing system of tilapia in the Philippines is as varied as the locations of the supply source. The traditional marketing of tilapia in some places was relatively simple. Traders normally picked up the harvested tilapia at the farms. Most tilapia farmers sold it to wholesalers-assemblers. Some sold the tilapia produced to retailers, consumers, and brokers. In Central Luzon, some distributors and retailers procure tilapia in “pakyaw” or (bulk and assorted) basis and these are hauled from the supply area. Moreover, there are also some traders that take charge in harvesting the produce and pay all the expenses during the activity. This practice is very common in the province of Pampanga (BFAR, 2002). Some traders, particularly wholesalers, finance small-scale farmers in order to be assured of a steady supply of fish. Under this arrangement, the farmer is mandated to sell exclusively to the trader at a pre-agreed price. Major marketing issues for tilapia include fluctuating prices, irregular supply, nonpayment of debts by traders, informal levies (particularly when transporting the product), and seasonal off-flavors that render the fish less marketable.
Moreover, the supermarket phenomenon and more liberalized trading environment have induced the emergence of market niches such as the fillet, smoked, dried and other

140140
processed forms. Links with these new markets and increased participation of small-scale producers requires a new approach to tilapia marketing.
Key Customers and Product Requirements
The tilapia chain key customers are classified into two types: the institutional buyers (hypermarkets or restaurants/specialty food shops) and the household-level/end-users or consumers.
Product Form
Generally, household customers prefer live whole tilapia with firm meat and with the size of 4-5 pieces per kg(200 - 250 g per fish).Also, regular tilapia consumers in Manila and Southern Luzon are indifferent relative to the source and skin color of tilapia. However, consumers in the Northern Luzon markets such as Pangasinan and Baguio exhibit similar product requirements except they prefer darker skinned tilapia because of more belly fats and tastier as perceived by them. The common food recipes for tilapia are charcoal grilled, fried, boiled and “paksiw”. Most of these customers buy tilapia from fish vendors at local public markets or stalls. Regular customers in Laguna require daily volume of about 1,700 kgs while Manila customers require 2,500 kgs a day.
Institutional buyers such as specialty shops, hypermarkets or malls, restaurants and food chains cater to relative affluent customers with varied product requirements. Hypermarkets normally require live whole fish with size from 3-4 pieces per kg (250 – 350 g per fish).Institutional buyers of this sort are indifferent to the source of tilapia as long as suppliers meet the fish size, volume and delivery requirements as stipulated in the marketing contract. Hypermarkets in Manila and Laguna normally require 500 – 1000 kgs of tilapia per day while Pangasinan and Baguio require a daily volume of 65-70 kgs, respectively.
In the case of specialty shops and food chains such as Monterey shops and SM South Mall, Central Barbeque Plaza in Parañaque and Ineng’s Barbeque shop in Global City, tilapia fillet and whole frozen fish are more preferred than whole live fish. By-products of filleting are absorbed by specialty restaurants selling fish soups, tilapia belly and deep fried tilapia skin. The specialty shops require consistent fillet size and volume. The total volume requirements of these institutional buyers is 1000 kgs daily with a fish size of 1-2 pieces per kg (450- 600 g per fish).
Volume requirement
The total volume requirements of the supply chains serving major customers in Luzon average about 5,335 kgs daily or approximately 1, 947,275 kgs (or ~ 1,947.28MT) yearly. With the per capita consumption of around 3.81 kg (or 323,850 MT), these chains could barely meet 1% of the consumption requirement of the country.
Major Players and Their Activities
The major players and their activities are highlighted in Figure 3. The hatchery and nursery operators supply the fries and fingerlings as well as provide techno-guides to fish producer - customers. Both operators are closely linked and coordinated with each other. The hatchery operator handles about 3,000 breeders (Genomar crossed with IDRC strain from BFAR and CLSU) that produce 1.5 million sex-reversed fries every 18 days. The hatchery farm is located in Ligao City, Camarines Sur which is around 600 kms south of the nursery operator in Cabuyao, Laguna. Due to the travel distance, 33 plastic bags(i.e. imported from Taiwan) with no bottom corners each containing 400,000 fries were used to reduce stress and minimize fries mortality while being transported in 4 rented trucks each with 6-ton capacity. Oftentimes, the hatchery operator pays “goodwill fees” to traffic enforcers on top of the regular toll fees charged by the superhighways in Manila. The operator maintains also
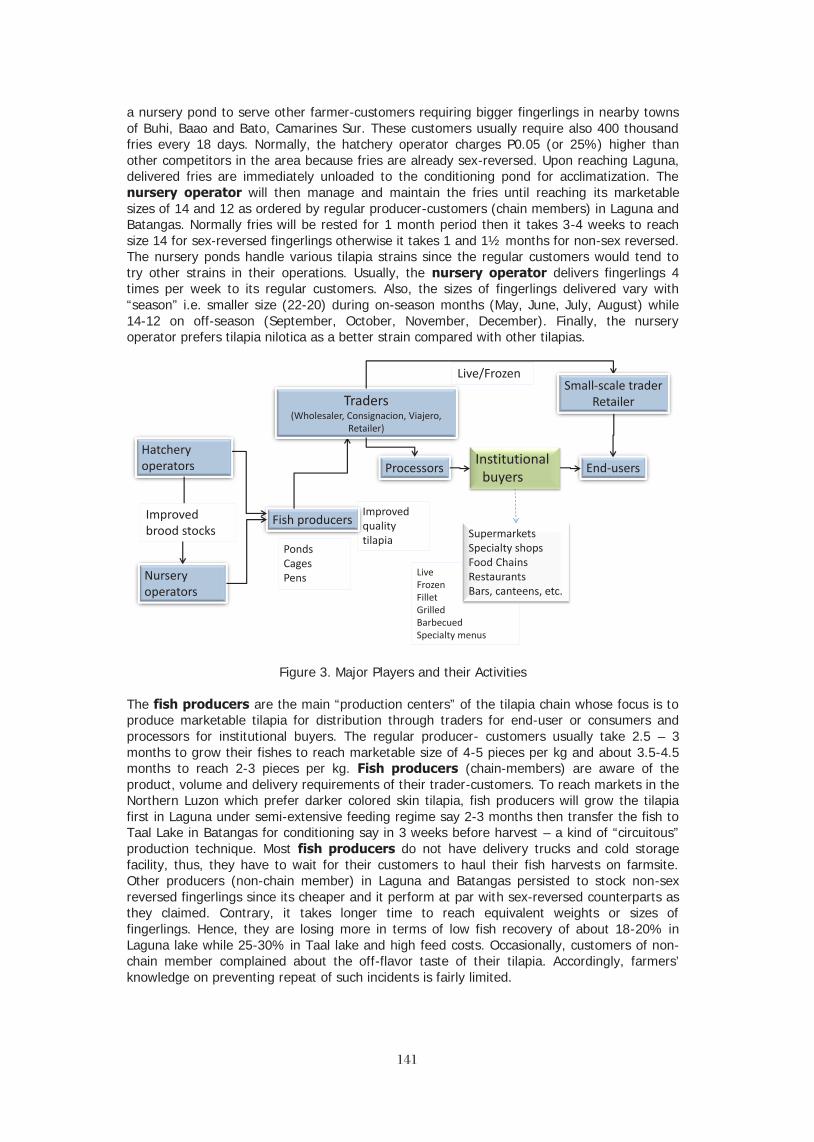
141141
a nursery pond to serve other farmer-customers requiring bigger fingerlings in nearby towns of Buhi, Baao and Bato, Camarines Sur. These customers usually require also 400 thousand fries every 18 days. Normally, the hatchery operator charges P0.05 (or 25%) higher than other competitors in the area because fries are already sex-reversed. Upon reaching Laguna, delivered fries are immediately unloaded to the conditioning pond for acclimatization. The nursery operator will then manage and maintain the fries until reaching its marketable sizes of 14 and 12 as ordered by regular producer-customers (chain members) in Laguna and Batangas. Normally fries will be rested for 1 month period then it takes 3-4 weeks to reach size 14 for sex-reversed fingerlings otherwise it takes 1 and 1½ months for non-sex reversed. The nursery ponds handle various tilapia strains since the regular customers would tend to try other strains in their operations. Usually, the nursery operator delivers fingerlings 4 times per week to its regular customers. Also, the sizes of fingerlings delivered vary with “season” i.e. smaller size (22-20) during on-season months (May, June, July, August) while 14-12 on off-season (September, October, November, December). Finally, the nursery operator prefers tilapia nilotica as a better strain compared with other tilapias.
Hatchery operators
Nursery operators
Fish producers
End-users
Improved quality tilapia
Institutional buyers
Supermarkets Specialty shops Food Chains Restaurants Bars, canteens, etc.
Live Frozen Fillet Grilled Barbecued Specialty menus
Traders (Wholesaler, Consignacion, Viajero,
Retailer)
Ponds Cages Pens
Live/Frozen
Improved brood stocks
Processors
Small-scale trader Retailer
Figure 3. Major Players and their Activities
The fish producers are the main “production centers” of the tilapia chain whose focus is to produce marketable tilapia for distribution through traders for end-user or consumers and processors for institutional buyers. The regular producer- customers usually take 2.5 – 3 months to grow their fishes to reach marketable size of 4-5 pieces per kg and about 3.5-4.5 months to reach 2-3 pieces per kg. Fish producers (chain-members) are aware of the product, volume and delivery requirements of their trader-customers. To reach markets in the Northern Luzon which prefer darker colored skin tilapia, fish producers will grow the tilapia first in Laguna under semi-extensive feeding regime say 2-3 months then transfer the fish to Taal Lake in Batangas for conditioning say in 3 weeks before harvest – a kind of “circuitous” production technique. Most fish producers do not have delivery trucks and cold storage facility, thus, they have to wait for their customers to haul their fish harvests on farmsite. Other producers (non-chain member) in Laguna and Batangas persisted to stock non-sex reversed fingerlings since its cheaper and it perform at par with sex-reversed counterparts as they claimed. Contrary, it takes longer time to reach equivalent weights or sizes of fingerlings. Hence, they are losing more in terms of low fish recovery of about 18-20% in Laguna lake while 25-30% in Taal lake and high feed costs. Occasionally, customers of non-chain member complained about the off-flavor taste of their tilapia. Accordingly, farmers’ knowledge on preventing repeat of such incidents is fairly limited.
142142
Traders generally subsume the terms consolidators/wholesalers/retailers and brokers or agents a.k.a. consignacion since they are all engaged in the buying, selling and distribution of tilapia from sources to various destinations depending on which market level they operate. The consolidators are the big traders who supply regularly supermarkets and bulk buyers in major fish terminal markets (or transshipment points). At the terminal markets, the consignacion facilitates the transactions between the traders (shippers or viajeros) and bulk buyers (provincial traders) for a “commission fee”. Since they own a stall at the terminal market, they also act as gatekeeper of the traders and key player in the price discovery process, thus, they also perform price monitoring and occasional small-scale trading. The wholesalers are themselves shippers or viajeros who buys tilapia from the terminal markets in bulk and ship them to other bulkbuyers serving other geographical markets. Strategically, some wholesalers resort to backward integration by self-producing tilapia and contracting other farmers to meet market commitments and reduce supply risks. The retailers are the smallest traders in the market chain which finally caters to the end-users. They owned stalls at public markets and small delivery vehicles such as tricycles and owner jeeps with aerators. Their sales volume depends on the deliveries by local traders. Since they compete with many retailers, they handle about 100-150 kg of live fish (with average size of 5-6 pieces per kg) for easier disposal and minimize unsold products for each transaction day.
Processors are those who supply regularly the specific product forms such as the fillet, cubes, whole frozen and choice portions or trimmings by institutional buyers(either as supermarket, specialty food shop, food chain, bar and restaurants, canteens, among others. It had been operating and registered in 1995 as Fishda Enterprises. Now it is incorporated and named as Unavis. Its operation is accredited by Department of Food and Drugs. Product forms, volumes and deliveries depend on the arrangements with the various customers. Presently, the customers include Monterey specialty shops, SM Southmall, Metro Bank canteens, Central Barbeque Plaza in Parañaque, Ineng’s Barbeque at Global city, Setton Golf Club, etc. To maintain customers, the processor should ensure that raw materials meet the size, volume and meat quality requirements needed for processing. The processing plant has 1.5-2 ton capacity (processing-in -demand) with 6 – ton cold storage capacity of filleted tilapia at one time. The plant maintains a “comfort” or safety stock level of 5 tons. The filleting process for a per kilogram raw tilapia (2-3 pieces per kg) yields the following: 30-35% fillet, 18% belly, 25% innards, 21% head and 1% skin. Because the cost of filleting is about P35 per pack (1 pack = 300 grams), cost recovery has to be taken from the sales of the by-products. The processor could not raise the price of tilapia fillet due to cheaper import alternatives like the pangasius and dowry fillets. To increase the shelf-life and maintain quality of products, quick or blast freezing is necessary. Increasing the present capacity of cold storage and blast freezers entails additional cost which is unaffordable at the moment. Finally, only few tilapia producers can meet and assure volume, size and quality of raw materials, the processor cannot expand market coverage. Many orders and inquiries from potential high-end customers including Philippine Airlines, Cathay Pacific, five star hotels and restaurants, etc. were turned down.
Major Routes of Products
Figure 4 shows the tilapia supply chain’s major routes in Luzon. The cities of Malabon in Manila, Angeles in Pampanga and Dagupan are the major transshipment points of tilapia in Luzon; with cities in Metro Manila, Angeles and Baguio; La Union and Ilocos provinces, Isabela and Cagayan Valley provinces and the Cordillera Administrative Region, being the major demand centers. Pampanga, Batangas and Laguna provinces are the major production centers while Pampanga, Laguna and Camarines Sur are the major hatcheries concentration.

143143
Marketable fish
Pampanga
Laguna
Batangas
Metro Manila
Angeles
Baguio City
Dagupan City
Cagayan Valley
Cordillera Administrative Region
MAJOR SUPPLY CENTERS
MAJOR TRANSSHIPMENT
POINT
MAJOR DEMAND CENTERS
Camarines Sur
Tilapia Fries
Isabela Ilagan
La Union & Ilocos Provinces
Fries Hatcheries
Malabon
Marketable fish
Figure 4. Major Routes of Products
The geographical locations of the major routes are depicted in Figure 5. There are two major routes traced namely: (1) Laguna/Batangas – Manila/Baguio; (2) Pampanga – Pangasinan/Baguio. These routes normally take from 1 to 3 days to distribute from source to final destination points. The time period used to assemble the required volume of tilapia with consistent size is the bottle neck for meeting the entire delivery schedule of tilapia in the supply chain.
Camarines Sur
Tilapia Fries
Batangas
Laguna
Metro Manila Marketable
fish
Pampanga
Tilapia Fries Marketable fish
Dagupan City Cagayan Valley
La Union & Ilocos Provinces
Malabon
Angeles Baguio City
Figure 5. Major Routes of the TilapiaSupply Chain
Figure 6 describes the product flow of route 1. Eighteen-day old tilapia fries from Camarines

144144
Sur hatchery are brought to the nursery operators in Cabuyao, Laguna, for conditioning and growth in about 45 days to reach fingerling size of 14-12. It will then be delivered to grow-out operators in Laguna and Batangas for 2-3 months before harvest. Fish sizes range from 4-5, 3-4 and 2-3 pieces per kg. Small fishes will be sold to local markets inLos Baños and Pila, Laguna. The larger fishes will be delivered to supermarkets in Calamba and Sta. Cruz, Laguna. Largest fishes will be delivered to the processors in Los Baños, Laguna and Parañaque. Fishes intended for the Northern Luzon supermarkets such as Rosales, Pangasinan and Baguio City will be transferred and conditioned in Taal Lake for a period of 3-4 weeks to ensure that fishes will have dark colored skin before marketing.
In the case of Batangas, fries with size 22-20 from Calauan, Laguna hatcheries are brought to grow-out operators in Tanauan, Talisay and other towns along the Taal lake. Large fish producers (with 500 cages) in Batangas usually stock 200/m3. Their fish recovery in Taal lake ranges from 25%-30%. Furthermore, their FCR on the average is 1.5:1 while Laguna producers have lesser. After 6-8 months culture period, marketable tilapias are picked up by wholesalers and brought to Malabon, in Manila being the major transshipment point for seafood to the rest of the markets in Metro Manila and the rest of Luzon. Smaller traders and other provincial traders will both source their fishes from wholesalers through a consignacion in Malabon market. Fishes are then packed in ice boxes for distribution to supermarkets and far-flung markets.
Tilapia supply chain: Product Flow (Laguna/Batangas-Manila/Baguio Route)
(frozen)
(live)
FRIES
FRIES
(live) (frozen)
Hatchery/Nursery Batangas
Hatchery Nursery Laguna
Hatchery Camarines Sur
Fingerlngs
Cage operator Batangas/Taal
Grow-out pond Semi-intensive Laguna/Rizal
Processors
3 months conditioning
Consolidator/Trader
Trader Local market (live)
Specialty shop - Monteray (Manila, Tuguegarao)
Fastfood shop
Supermarket
Trader
Wholesale shipper “viajero”
Local market (live)
Central fish market
(Malabon)
Local market
Supermarket
Manila Pangasinan Baguio
Marketable size (live)
(live/frozen)
(live)
(frozen)
Marketable size tilapia (live)
Figure 6. Product Flow (Laguna/Batangas-Manila/Baguio-Route 1)
The flow of products in route 2 is shown in Figure 7. Pampanga fish producers usually source their fries from nearby hatcheries and stock them directly in their grow-out ponds. After 6-8 months culture period, tilapia are harvested using mesh nets since ponds sizes range from 2-12 hectares on the average. Some larger farms have about 25-100 hectares surface areas. Most farmers do not have trucks equipped with tanks and aerators, thus, they have to wait for traders through an agent to pick up their harvest and bring it to the fish terminal market in Pampang, Angeles City as the major transshipment point of Pampanga.
Wholesalers and local traders including consolidators source their live tilapia at this market. Wholesalers then bring their tilapia to consignacion market in Dagupan City, Pangasinan serving as transshipment point to the rest of the Northern Luzon markets. Fishes usually reach this market alive which is preferred by most if not all customers. However, once passed on to other provincial traders whose markets are farther, fishes must be stacked with ice to retain freshness upon reaching destination points. Normally it takes around 1-2 days to reach some markets in Ilocos and Isabela provinces together with Cagayan Valley and Cordillera

145145
Administrative regions. Tilapia supply chain: Product Flow (Pampanga-Pangasinan-Baguio Route)
FRIES - Direct stocking
Grow-out pond Pampanga
Central fish market Dagupan
Marketable size (live)
Consolidator/Trader
Local market
Baguio
Supermarket Pampanga Manila
(live) Ilocos
Isabela
Trader
(live)
Figure 7. Product Flow (Pampanga-Pangasinan/Baguio-Route 2)
Payment Flow
In general, payments are made on spot cash and cash-on-delivery (COD) between the local consumers and retailers; wholesaler and trader/consolidators; processor and producers; small-scale traders and producers. However, bank payments through 7 day post-dated checks are made among hatchery/nursery operators and producers; supermarket and processors/traders or consolidators (Figure 8).
Hatchery
Nursery
Producers
Processor
Trader/Consolidator Wholesaler/”Viajero”
Specialty Shop
Supermarket
Local market
Wholesaler-Retailer Terminal Market
(e.g. Malabon “consignacion”)
Cash payment, net after deducting feed loan
1-2 days
COD
Producers (non feed-borrowers)
Trader/Retailer (small-scale)
Sales remittances to pay trading capital, cash
COD
Cash payment in 1-2 days with contract
Post-dated checks, 7 days
Post-dated checks,7 days
Retailer
Cash after net sales
COD
Cash
Cash
COD
Post-dated checks,7 days
Post-dated checks,7 days
Figure 8. Payment Flow of the Supply Chains
Only the specialty shops advance payments for about 1-2 days before product delivery to the processor as stipulated in a contract. On the other, the trader/consolidator who loan out feeds to producers and trading capital to small-scale traders depict a different arrangement. The small scale-traders will check on the exact harvesting dates of the farmer-borrowers.

146146
Upon harvest, these traders will weight, transport and consign the tilapia harvest to the local retailers at an agreed price. After each transaction day, the retailers remit the net sales proceeds to the small-scale traders who will in turn remit the same plus the trading capital equivalent to the fish volume purchases from the producer-borrowers to the trader/consolidator. After deducting the cost of feeds, the trader will pay the producers the net sales value of their tilapia.
Information Flow
Figure 9 shows the flow of information among the supply chain members. Information exchange between and among the chain members and the mode of contact are done through face-to-face and mobile or telephones which are concluded in a short period of time. The price, sources, quality, availability and delivery schedules of tilapia are the major information required by the chain members. Farm gate prices are low and more unstable than those in the wholesale and retail levels. Such behavior is prevalent because institutional buyers are slow to react with price changes. Another, the processor maintains a price level that was two years ago for fear of losing customers with or without contracts. Retail prices tend to be sticky upwards but faster to adjust downwards.
FRIES -Volume -Delivery schedule -Size -price
Hatchery
Nursery
Producers
FINGERLINGS -Quantity -Delivery schedule -Cost -price
Processor
Trader/Consolidator Wholesaler/”Viajero”
MARKETABLE SIZE -Volume -Delivery schedule -Size -price
Specialty Shop
MARKETABLE SIZE -Volume -Price -Weight -Quality (“firmness”)
Supermarket
Local market
-Source of fish -Volume -Delivery schedule -Size
Wholesaler-Retailer Terminal Market (e.g.
Malabon “consignacion”)
Information Needs of Network Players
Figure 9.Information Flow of the Supply Chains
External Influences
(1) Production and market support programs of the government
Recognizing the vital importance of tilapia to address poverty alleviation and development of the country side, the government had embarked on tilapia upgrading program through genetic improvement projects espoused by CLSU, GIFT, BFAR and other international R&D agencies. This program had effected the participation and entry of many tilapia industry players. Additionally, the establishment of hatcheries and dispersal programs of BFAR had facilitated the extension of broodstock quality improvement of tilapia into the countryside. Likewise, training and capacity building activities among tilapia farmers in terms of improved
147147
technologies in management, nutrition and health aspects of tilapia growing. The continuing improvement of broodstock and dispersal program will help foster the growth of the industry. On the other, the market support program of the GOP is limited to market matching and participation in aqua fairs.
(2) Food safety through permits and accreditation
In preparation towards globalization, BFAR had instituted an accreditation protocol for quality assurance of meeting export standards. However, many found it to be very rigid hence restricts the potential exporters to qualify. Unfortunately, fish imports continually to flood the domestic market which dampens further the competitiveness of the local industry.
(3) Presence of “rent-seeking” behavior of law enforcers
In addition to the toll fees in superhighways paid by traders or viajeros including hatchery operators, unreceipted fees are charged that serve as goodwill to rent-seeking law enforcers at check points. Such expense is usually passed on to the final consumer.
Issues and Concerns
The major concerns of hatcheries and nurseries are the high cost of outbound logistics, which is exacerbated by high competitive pressures of inferior quality but inexpensive stocks (e.g., non-sex reversed) and high levels of mortality due to environmental and cultural factors.
The fish farms’ major concern, on the other hand, is the expensive but low quality feeds (at times mislabeled) and other inputs coupled by very low fish recovery of about 25% in lakes’ cages or pens and about 60% in ponds system. In addition, the more pronounced variability in climate pattern had induced more variability in production volume hence, overstocking became a “recouping mechanism” among fish growers. Moreover, the grow-out period ranges from 6-8 months to reach a marketable size of 250-400 grams per fish across production systems. Their transaction costs include the cost of waiting for buyers, delays in delivery, in-transit mortality, and toll fees or “goodwill” as well as shrinkage losses. In addition, the lack of cold storage and transport vehicles equipped with tanks and aerators or refrigeration facilities delimits farmers to take market opportunities in terms of value-adding and processing activities. Interestingly, due to the high consumers’ preference on “darker tilapia”, many farmers adapted a “circuitous” production technique i.e. fries from the hatcheries say in Bicol (pond based) were transferred to nurseries’ pond in Cabuyao, Laguna then moved and raised in a semi-intensive grow-out environments in Laguna lake then finally transferred and conditioned as “dark tilapia” within 3 weeks in another place like Taal, Batangas to take advantage of such marketing premium.
The major concerns of processors are too few farms that could supply regularly the desired quality and volume of tilapia at each process-in-demand period, likewise, the lack of blast freezers to maintain higher quality products while maintaining longer shelf-life of products and other derivatives. Moreover, due to high cost of filleting and low dressing recovery, processors’ could hardly compete with the influx of cheaper imported alternative fillets like pangasius, sea bass and others, saved by the revenues derived from by-products such as heads, bellies and skin. Demand for choice portions and trimmings by high-end institutional buyers like Philippine Airlines and Cathay Pacific remained untapped. Also, other test markets that showed bright prospects are the tilapia nuggets and fingers.
The concerns of traders including “consignacion”, suppliers or consolidators are the following; (a) regularly meeting the quantity and delivery schedules of their customers is undermined by their defaulting “contract tilapia farmers” (b) high logistics and transaction costs of searching, locating, assembling and distributing fishes from sources to destinations (c) lag responses in unexpected price movements and the absence of product grades and standards contribute to the difficulty of maintaining a “profitable” volume of operation.

148148
RECOMMENDATIONS The following are some recommendations to address the various issues and concerns namely of the various chain players: (1) encourage the establishment of more nursery farms of better quality brood stocks while intensifying technology transfer to farmers for better health and management of tilapia (2) conduct market promotion activities highlighting the various niche opportunities of tilapia among growers and consumers (3) motivate the participation of small farmers in supply chains by setting up an incentive scheme through a mix of patronage refund and profit sharing (4) institutionalize an accreditation program for feed manufacturers, hatcheries, processors and the like to improve the quality assurance of products and services (5) provide capital windows to improve facilities and reduce logistics and transaction costs in the entire supply chains of tilapia.
LITERATURE CITED Bureau of Agricultural Research (BAR) Research and Development Digest. 2010. Excel: The
Hybrid Tilapia. http://www.bar.gov.ph
Bureau of Fisheries and Aquatic Resources (BFAR, various issues).Tilapia: Overview of the Industry. http://www.bfar.da.gov.ph
Bureau of Agricultural Statistics (BAS, various issues). http://www.bas.gov.ph
Cooper, M.C., Lambert, D.M. and Pagh J.D. 1997. Supply Chain Management: More than a New Name in Logistics. The International Journal of Logistics Management.8 (1).
Hobbs, J.E. 1996. A transaction cost approach to supply chain management. Supply Chain Mgt 1(2): 15-17.
Lambert, D.M., Cooper, M.C. and Pagh, J.D. 1998. Supply Chain Management: Implementation Issues and Research Opportunities. The International Journal of Logistics Management.9 (2).
Porter, Michael. 1985. Competitive Advantage: Creating and Sustaining Superior Performance. p33. The Free Press.
Ramasamy, C. 2007. Supply Chain Management in Agriculture: Trends, Status and Initiatives taken uin Tamil Nadu Agricultural University. Tamil Nadu Agricultural University, Coimbatore 641 003.4-5pp.
Rodriguez, U., Garcia, Y. and Dator, M. 2009. Seasonal Integration and Co-integration in Selected Philippine Fish Prices. Philippine Agricultural Economics and Development Association (PAEDA) Biennial Convention at the Bureau of Soils and Water Management Convention Hall, 22-23 October 2009.
Shelton, William L. 2002. Tilapia Culture in the 21st Century. International Forum on Tilapia Farming in the 21st Century. February 25-27, 2002. Los Banos, Laguna, Philippines
Tan, R., Garcia, Y. and Tan,I.2008. Technical efficiency and profitability of tilapia and milkfish growout cage operations in Taal Lake, Talisay, Batangas, Philippines, 20th DA-BAR National Research Symposium, October 2-3, 2008, Quezon City, Philippines.
Tveras, Ragnar and Kvaloy, Ola.2004 Vertical Integration in the Salmon Supply Chain, Institute of Research in Economics and Business Administration, Bergen
Vivanco-Aranda, M., et al.,2010.Foresight analysis of tilapia supply chains (SistemaProducto) in four statesin Mexico: Scenarios and strategies for 2018, Technol. Forecast. Soc. Change.
Williamson, O. 1979. Transaction-cost economics: the governance contractual relations. J. Law and Econ. 22: 233-261.
Woods, E. 1999. Supply chain management. ACIAR Postharvest Technology Internal Workshop No. 20, Canberra, 1-2 December.6 p.
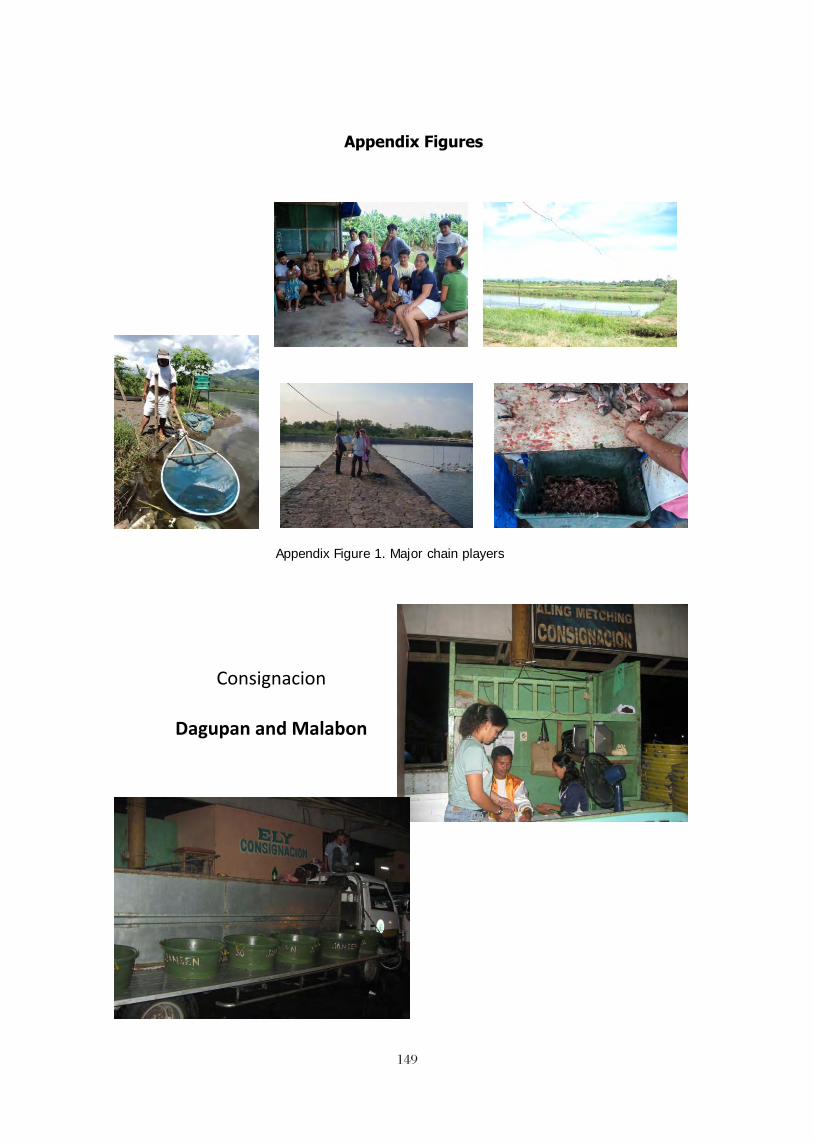
149149
Appendix Figures
Appendix Figure 1. Major chain players
Consignacion
Dagupan and Malabon
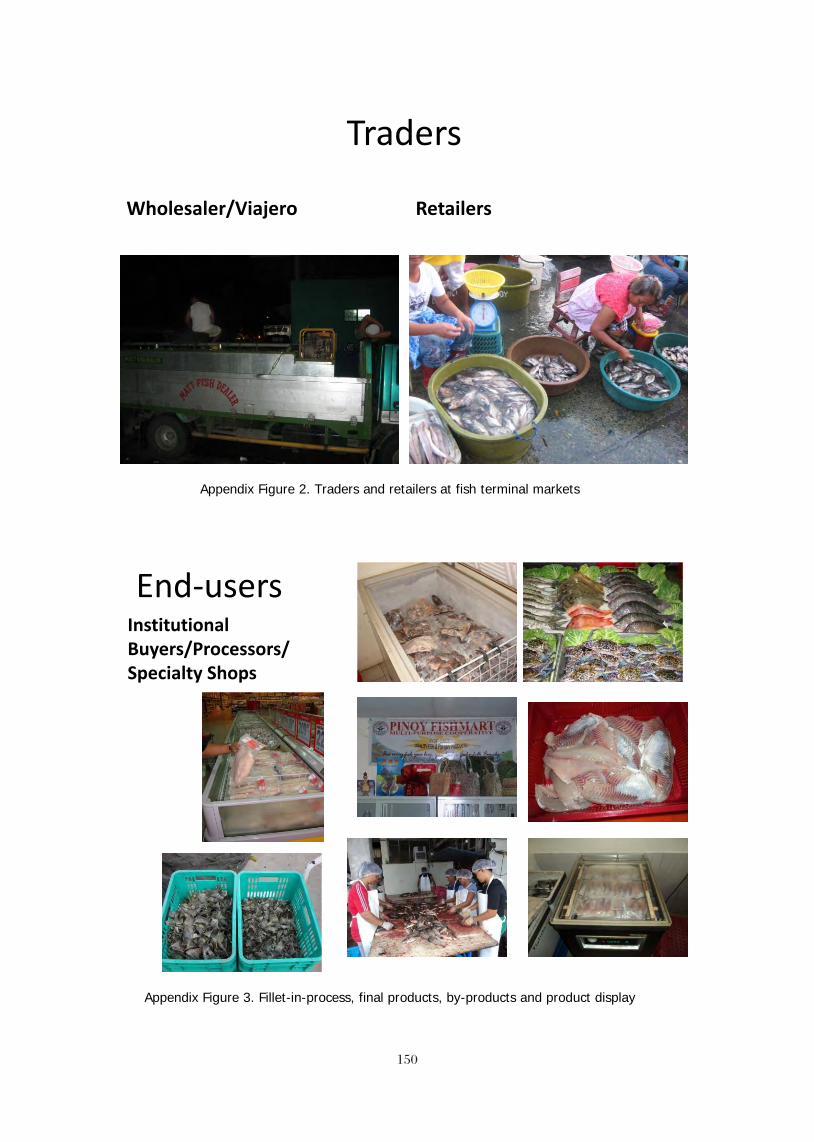
150150
Traders
Wholesaler/Viajero Retailers
Appendix Figure 2. Traders and retailers at fish terminal markets
End-users Institutional Buyers/Processors/Specialty Shops
Appendix Figure 3. Fillet-in-process, final products, by-products and product display

151151
DEVELOPMENT OF SUSTAINABLE AQUACULTURE PRACTICES IN TABASCO, MEXICO USING NOVEL IAA TECHNOLOGY
Rafael Martínez- García1, María Fernanda Cifuentes-Alonso1, Maximiano Antonio Estrada Botello2, Abel Santiago Lopez1 Torres, María de Jesús Contreras-García1, Alejandro Macdonal-Vera1, Estuardo González-Arévalo1, Wilfrido Miguel Contreras-Sánchez1, Kevin Fitzsimmons3
1Laboratorio de Acuicultura Tropical, División Académica de Ciencias Biológicas, Universidad
Juárez Autónoma de Tabasco, México 2Division Académica de Ciencias Agropecuarias, Universidad Juárez Autónoma de Tabasco,
México 3University of Arizona, 2601 E. Airport Drive, Tucson, Arizona 85706, USA
Abstract The treatment and discharge of aquaculture effluent and resulting negative impacts
on the environment remains a critical issue that is threatening the sustainable growth of the aquaculture industry. Three optimal sites has been selected to carry out IAA systems in order to deplete eutrophication, two indigenous communities, one from the highlands and other one from the wetlands were selected to produce agro and aqua products with the same amount of energy, also a demonstration system is building at UJAT. Part of our progress so far is: two workshops; the first one on integrated systems and the second one on bioflocs systems with more than 60 attendants among farmers, students and technicians. In Caridad Guerrero the highland indigenous community we have a 90% progress for the setting up phase, habanero pepper will be growth with Tilapia water effluents. In the wetland community there is a progress of 40% the group is already organize and training is given, the demonstration system at UJAT has a 30% progress, materials and instruments have been already purchased and the design was made. In overall the project suffered a delayed due to major flooding events in the region. Introduction
The treatment and discharge of aquaculture effluent and resulting negative impacts on the environment remains a critical issue that is threatening the sustainable growth of the aquaculture industry. Even the discharge of effluent that has been treated to levels acceptable under limitation guidelines (ELGs) through the use of dilutions, may pose long-term environmental risks. The resulting negative impacts will continue to intensify in the future if sustainable practices are not developed in commercial scale.
The first phase of a two phase project focused on the development and testing of sustainable aquaculture systems—specifically, the development of technology that combined agriculture and aquaculture technology. Such systems are often referred to as aquaponic systems as the water in which the fish are living in is used as a nutrient rich water source to stimulate plant growth. The technologies in the current research program were a novel variation from existing concepts, however, as they were developed as re-circulating systems and the plants were imbedded in soil and supplied with irrigation water from surface drip systems. Subsequently, the water migrates through the soil profile, collects in sub-surface collecting drainage canals built at negative slopes, and migrates down the canals and collects in a terminal basin. From this basin, the water is pumped back into the aquaculture tanks. Alternatively, plants in many aquaponic systems are grown in styrofoam trays that float on top of a water medium. Roots from the plants are allowed to grow submerged in the water which is infused with the nutrient rich aquaculture effluent, thus eliminating the need for using soil mediums. While hydroponic and aquaponic technologies have proven to be highly productive and efficient in commercial scale, the technologies developed in phase I of this program allow for a more diverse number of crops to be generated. Moreover, these systems are relatively simple and were developed with the goal of implementation in Tabasco, Mexico. Because more plants can be grown in soil based mediums compared to

152152
hydroponics systems, RIAA technology offers the advantage of diversifying the product for improved income as well as providing a more diverse diet to local communities.
Approach The approach towards implementing novel agriculture technology in Tabasco is being
carried out, through the training of local farmers, demonstration of concept through development and support, and longer term monitoring. The project team was formed through an existing strong partnership between the University of Arizona’s College of Agriculture and Life Sciences (CALS) and the Universidad Juarez Autonoma de Tabasco (UJAT). Business management practices were also supported by Arizona’s Eller College of Business Management.
Firstly, our student led team held a training program at UJAT for rural and commercial farmers in the nearby regions. This training seminar was given by Dr. Kevin Fitzsimmons, Dr. Dennis McIntosh and Dr. Rafael Martinez-Garcia, which were designed to engage nearby farmers and to describe to them the techniques and practices of RIAA systems including technical aspects, animal and plant management, and essential simplified business practices. The second component of this project was to build demonstration systems in two small indigenous communities in Tabasco. Along with the demonstrations, our student led team will provide workshops in the indigenous languages (with collaboration with the Universidad Intercultural del Estado de Tabasco; an Indigenous University) (Fig. 1) describing the benefits of the integrated farms and how best to manage the farm to increase income and reduce chemical costs.
Figure 1. Training on site of IAAS systems and hands on practical activities
Summary of Findings: The project suffered a major delay in its development due to severe flooding events that impact the three selected sites. Fig. 2.

153153
a) b)
Figure 2. a) Flooded State highway Villahermosa-Teapa. b) Before and after flooding event, massive erosion and damage
All the progress in Caridad Guerrero site suffered severe impacts. Agricultural beds were destroyed with heavy sediments and water erosion, the whole project had to be rebuild. The other two sites also suffered flooding impacts for more than three months. The Villages were abandoned and people stayed in emergency shelters. All the activities programmed at these sites were delayed; at UJAT a portion of land was filled with sand to raise the land level. We have rescheduled our activities in both sides for January 2011. Workshop 1: Integrated Agriculture-Aquaculture From August 12 - 19, students from the P3 award team along with Drs. Dennis McIntosh, Kevin Fitzsimmons and Rafael Martinez from the Universities of Delaware and Arizona

154154
respectively, presented an overview of integrated agriculture aquaculture systems (IAAS) at the Universidad Juárez Autónoma de Tabasco (UJAT) to 34 participants. This workshop provided an opportunity to introduce project group members to other members of the University, to indigenous community farmers, extension agents, Professors and also participating members of nearby farming cooperatives attending the workshop. In conjunction with educational training, the workshop included several visits to nearby communities where development of small-scale integrated farming operations were either being planned or currently being developed. Workshop 2: Bio-Floc From September 6 – 10, a second workshop was held at UJAT to discuss the many aspects of maintaining bio-floc in integrated systems. Several of these more advanced themes attracted approximately 30 participants each, representing farmers, hatchery staff, professors and students. Maintaining bio-floc material in aquaculture systems is appropriate in regions like Tabasco, Mexico where high protein diets may be prohibitively expensive, but power for aeration is subsidized and reliable. Bio-flocs are characterized by a mixture of nitrifying , autotrophic and heterotrophic bacteria along with several kinds of algae, and have been shown to be a very nutritious for several kinds of filter feeding juvenile fish (such as those used in our proposed technology) as well as crustaceans including shrimp. Originally, a large component of this workshop was dedicated to visiting a number of aquaculture facilities in nearby rural regions, where on-the-ground training would occur. Unfortunately, our group was unable to make these visits due to massive flooding caused by substantial rainfall and high intensity storms. Support visit 1: Kelly Green From March 18 – 28, 2011, support visit was held in order to support P3 projects, Kelly Green designated from the Farmer to Farmer program to collaborate in the duties of the project. The first part of the collaboration was to visit the site project in Tacotalpa, where Kelly help with sampling activities, she stayed for over 3 days in the Tacotalpa area and could observed the situation of the population. After this she visited the second work site in a Chontal indigenous community in Nacajuca municipality, where he had a training talk and a water sampling activity. The rest of her visit she expended collaborating in other Aquafish CRSP projects. Early Phase IAA Implementation. The P3 project has identified several regions with indigenous communities that have connections to the University Juarez de Tabasco in collaboration with an Indigenous University ( Universidad Intercultural del Estado de Tabasco). The P3 team has already begun to implement the integrated agriculture-aquaculture technology in (Caridad Guerrero) Lacandon village in Tacolapla, (Fig. 3A) where a farmer’s cooperative has already formed and there is existing aquaculture infrastructure (Fig. 3B). The farmers have identified a suitable location (Fig. 4A) where they would like to produce vegetables, though currently do not have the knowledge to set-up an integrated agriculture-aquaculture system (IAAS). The intent is to produce a variety of crops both for their own use, but also for generating income, in this phase they will grow habanero pepper, which has a very high demand and price. The proposed site needed to be selectively cleared to make planting space for the IAAS; however, most of the larger trees were retained.
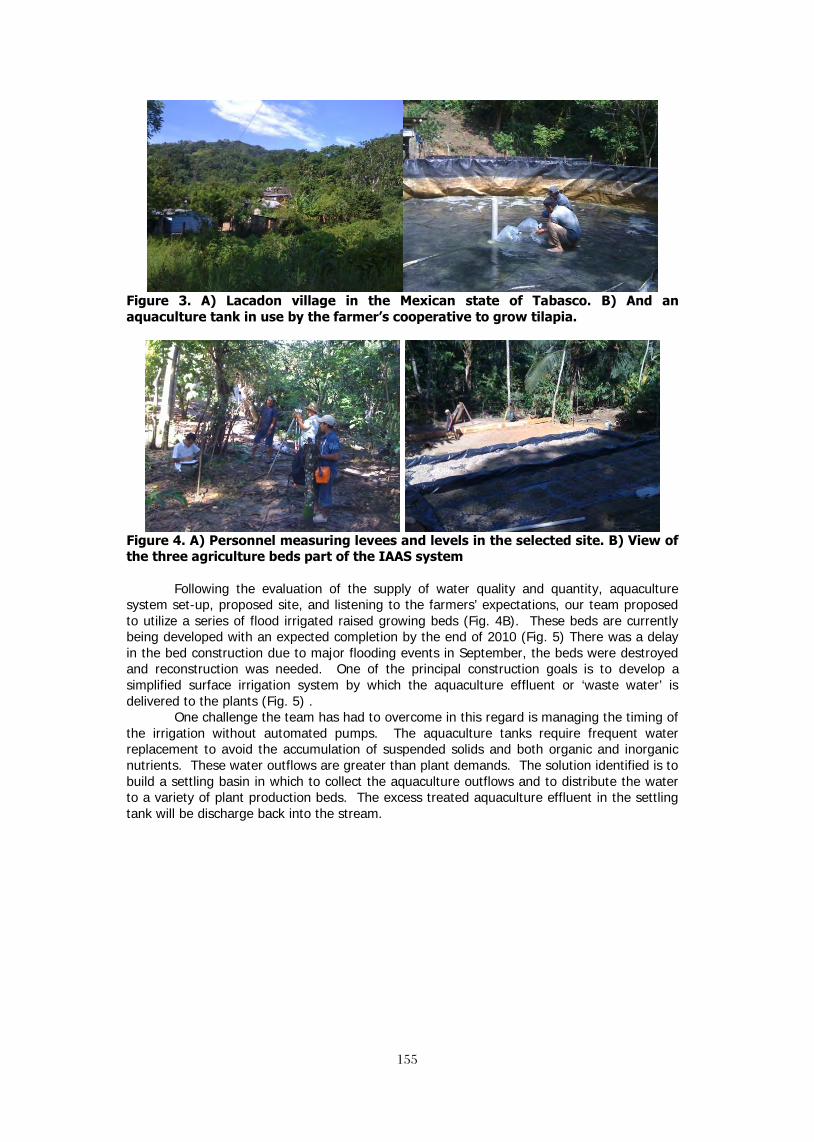
155155
Figure 3. A) Lacadon village in the Mexican state of Tabasco. B) And an aquaculture tank in use by the farmer’s cooperative to grow tilapia.
Figure 4. A) Personnel measuring levees and levels in the selected site. B) View of the three agriculture beds part of the IAAS system
Following the evaluation of the supply of water quality and quantity, aquaculture system set-up, proposed site, and listening to the farmers’ expectations, our team proposed to utilize a series of flood irrigated raised growing beds (Fig. 4B). These beds are currently being developed with an expected completion by the end of 2010 (Fig. 5) There was a delay in the bed construction due to major flooding events in September, the beds were destroyed and reconstruction was needed. One of the principal construction goals is to develop a simplified surface irrigation system by which the aquaculture effluent or ‘waste water’ is delivered to the plants (Fig. 5) .
One challenge the team has had to overcome in this regard is managing the timing of the irrigation without automated pumps. The aquaculture tanks require frequent water replacement to avoid the accumulation of suspended solids and both organic and inorganic nutrients. These water outflows are greater than plant demands. The solution identified is to build a settling basin in which to collect the aquaculture outflows and to distribute the water to a variety of plant production beds. The excess treated aquaculture effluent in the settling tank will be discharge back into the stream.
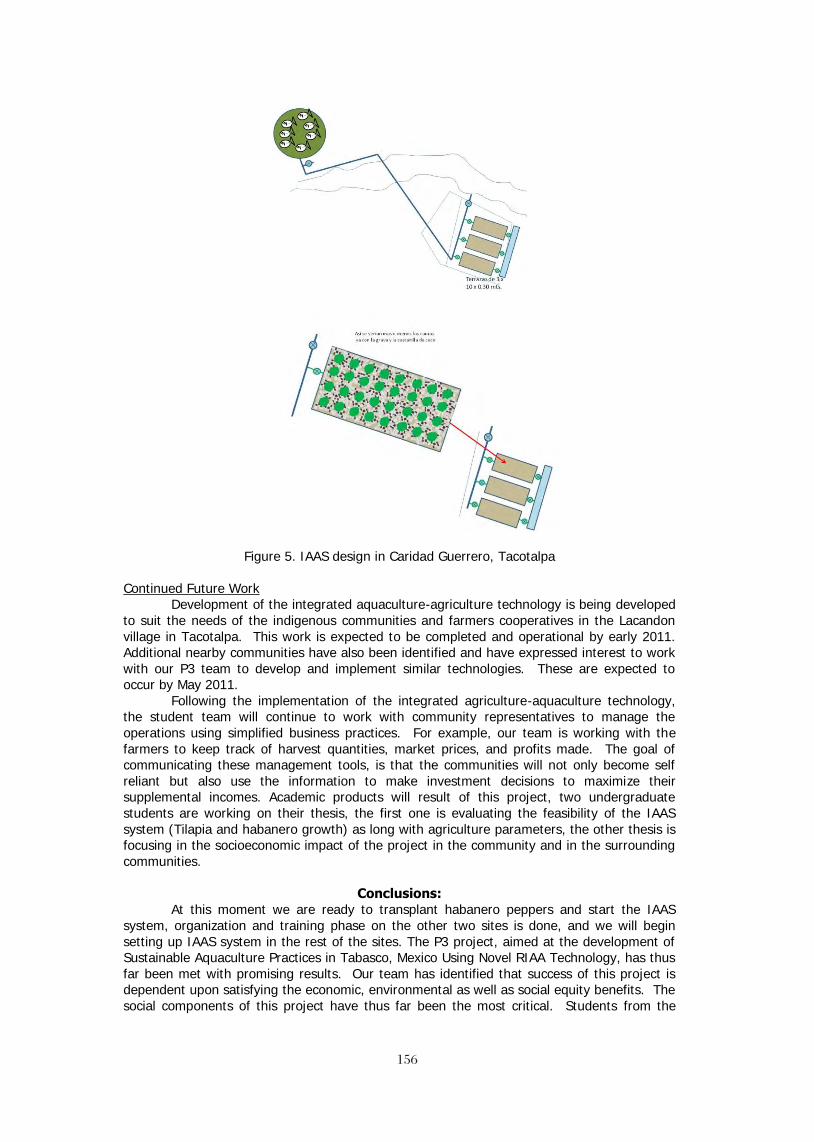
156156
Figure 5. IAAS design in Caridad Guerrero, Tacotalpa
Continued Future Work Development of the integrated aquaculture-agriculture technology is being developed
to suit the needs of the indigenous communities and farmers cooperatives in the Lacandon village in Tacotalpa. This work is expected to be completed and operational by early 2011. Additional nearby communities have also been identified and have expressed interest to work with our P3 team to develop and implement similar technologies. These are expected to occur by May 2011.
Following the implementation of the integrated agriculture-aquaculture technology, the student team will continue to work with community representatives to manage the operations using simplified business practices. For example, our team is working with the farmers to keep track of harvest quantities, market prices, and profits made. The goal of communicating these management tools, is that the communities will not only become self reliant but also use the information to make investment decisions to maximize their supplemental incomes. Academic products will result of this project, two undergraduate students are working on their thesis, the first one is evaluating the feasibility of the IAAS system (Tilapia and habanero growth) as long with agriculture parameters, the other thesis is focusing in the socioeconomic impact of the project in the community and in the surrounding communities.
Conclusions: At this moment we are ready to transplant habanero peppers and start the IAAS
system, organization and training phase on the other two sites is done, and we will begin setting up IAAS system in the rest of the sites. The P3 project, aimed at the development of Sustainable Aquaculture Practices in Tabasco, Mexico Using Novel RIAA Technology, has thus far been met with promising results. Our team has identified that success of this project is dependent upon satisfying the economic, environmental as well as social equity benefits. The social components of this project have thus far been the most critical. Students from the

157157
team have worked with indigenous community leaders as well as farmers from local communities to better understand their needs and to modify the technologies developed in the early phases of this project to maximize the economics and environmental benefits. In less than a year from the start of the project, the team has helped educate and train more than 200 participants, technologies to enhance the livelihood of local level farmers are being developed in one site with anticipation of development in two additional sites, and critical relationships have been developed which will extend the life of the project beyond the completion of the P3 component. Utilization of the technologies will have low impact on the environment, generate sufficient revenues to cover both long and short terms costs, and the communities are being supplied with the knowledge and tools to administer farming production effectively. Thus, the farming technologies implemented through this project are expected to remain operationally sustainable beyond the life of the P3 project.
Figure 6. Habanero pepper plants ready for transplant

158158
CONSTRAINTS AND OPPORTUNITIES IN
CAGE AQUACULTURE IN GHANA
Gifty Anane-Taabeah1, Emmanuel A. Frimpong1*, Stephen Amisah2, and Nelson
Agbo2
1. Virginia Polytechnic Institute and State University Department of Fisheries and Wildlife Sciences
Blacksburg VA 24061 2. Kwame Nkrumah University of Science and Technology Department of Fisheries and Watershed Management
Ghana Corresponding author: [email protected]
Abstract
This study was conducted to identify why the overall contribution of the aquaculture industry to local fish production in Ghana is low (<1%) although cage aquaculture has a potential to increase production. We administered 106 questionnaires to six respondent groups (current cage fish farmers, potential adopters of cage aquaculture, farmers who have abandoned cage aquaculture, Fisheries Commission, regional and district fisheries officers, and financial institutions) to obtain insight into the constraints in cage aquaculture as well as opportunities that can be exploited to promote cage aquaculture adoption. For the purpose of this study, potential adopters are individuals who have fish-related livelihoods including fishermen, pond-based fish farmers and fish traders. We also interviewed key informants in relevant government institutions. Preliminary results indicate that lack of funds and lack of government extension services are the main constraints in cage aquaculture in Ghana. Lack of funds manifests in farmers’ inability to afford quality floating feed and could explain low production levels of current cage farmers, although most (95%) suggested they could market their fish if they increased production. Lack of funds also accounted for the inability of potential adopters and farmers who have abandoned cage aquaculture to start or continue cage aquaculture respectively. Major opportunities identified include 1) a high interest among potential adopters (97%) to start cage aquaculture and farmers who have abandoned cage aquaculture (100%) to resume if constraints are removed, 2) development of a feed production plant in Ghana by a private enterprise, 3) willingness of some financial institutions to provide loans for cage farmers, and 4) a number of government initiatives to promote cage aquaculture. Our preliminary recommendations are that the Fisheries Commission should work with the financial institutions to help determine farmers’ ability to repay loans and guarantee loans made by the financial institutions. Also, there is a need for a more specialized aquaculture extension service accessible to farmers to help with technical issues built on the model of agricultural extension services in Ghana.
Key words: Tilapia; Cage aquaculture; Adoption constraints; finance; extension; Ghana
Introduction
Aquaculture in Ghana has been predominantly land-based since its inception in the 1950’s. There are currently about 4,500 ponds operated by more than 2,800 fish farmers in Ashanti, Brong Ahafo, Central and Western Regions of Ghana (Lionel Awity, unpublished data). Despite these numbers the contribution of aquaculture to local fish production is still insignificant. Available data suggests that the output from aquaculture in 2006 was estimated to be less than 1% of local fish production (Abban et al. 2006). Increasing aquaculture production will be a major step towards food security in Ghana and a further step in achieving 20% of local production, similar to the global mean, which the government seeks (Abban et al. 2006). In order to achieve this goal in addition to meeting the estimated annual

159159
deficit of 400, 000 mt (Asmah 2008), cage aquaculture must be given serious consideration since land-based aquaculture in Ghana is mostly extensive and the land is finite.
The country offers considerable opportunity for small-holder and commercial-scale development of freshwater cage aquaculture, especially in the Volta Lake. Utilizing only 1% of the area of Volta Lake (approximately 8502 km2) (ILEC 1999) corresponds to about 8500 hectares of water. This quantity of water is more than 10 times the area used for land-based aquaculture, about 468 hectares, estimated with 1,300 farms with mean size of 0.36 hectares (Asmah 2008). The culture of other desirable species such as the catfishes can also be expanded through cage aquaculture in addition to Nile tilapia (Oreochromis niloticus) which is currently the only species cultured in cages in Ghana (Blow and Leonard 2007). There is no doubt that cage aquaculture has the potential to make significant contribution to total fish production and food security in Ghana. China is a good example of a country where cage aquaculture has played an important role in inland fish yields. During1978 to1993, production from cage aquaculture accounted for 67.5% of total fish production of inland water bodies (Baotong and Yeping 1997). Even in Ghana, a single commercial cage farm contributed about 21% (200 tons out of 950 tons) to total aquaculture production in 2004 (Awity 2005). It has been suggested that if cage farmers in Ghana can produce yields of 50-150 kg/m3/9 months as done elsewhere in Africa, less than 100 hectares of fish cages can produce yields matching the current capture fisheries production of 90,000 mt (Ofori et al. 2010).
Evidently cage aquaculture is not without negative environmental impacts. However, most impacts can be avoided if appropriate policies are implemented to limit the area of water allocated for cage aquaculture, which is currently being considered (Lionel Awity, pers. comm.). Existing irrigation reservoirs also have the potential to be used for cage aquaculture since they are less likely to raise major concerns.
Obviously, having significant national water resources for cage aquaculture is an important first step, but national development policy for cage aquaculture should be cognizant of other complex and interacting constraints to cage aquaculture development as have already been documented elsewhere (Hambrey 2006). Cage aquaculture has been developing in Ghana consistently in the last decade but there have been no significant reflection in the overall aquaculture production figures. Major constraints to aquaculture development suggested for Sub-Saharan Africa are feed and seed quality and availability, cost of cage design and construction, and financing (Ridler and Hishamunda 2001; Halwart and Moehl 2006; Moehl et al. 2006; Blow and Leonard 2007; Asmah 2008). Other constraints identified include lack of technical know-how (Ridler and Hishamunda 2001; Halwart and Moehl 2006; Blow and Leonard 2007; Asmah 2008), lack of market (Hambrey 2006; Moehl et al. 2006), lack of processing (Blow and Leonard 2007), lack of access to information and support (Ridler and Hishamunda 2001; Moehl et al. 2006; Asmah 2008), conflict over water use (Halwart and Moehl 2006) among others.
Many of the constraint suggested have been attributed to aquaculture in general and are likely to be constraints facing cage farmers but because they are mostly described for the entire sub-Saharan Africa, it becomes difficult to develop policy strategies and solutions targeting specific constraints. It is imperative that each country identifies its specific set of constraints and prioritize development interventions accordingly.
Our goal was to identify why the overall contribution of the aquaculture industry to local fish production in Ghana is low although cage aquaculture has a potential to increase production, and make necessary recommendation to the Fisheries Commission aimed at developing interventions for expanding cage aquaculture. Our specific objective was to identify the main constraints to cage aquaculture in Ghana. We also sought to identify any opportunities that could be exploited to increase the contribution of cage aquaculture to fish production in Ghana.
Description of the study area The study was conducted in communities around the Volta Lake where there are
present or past cage aquaculture activities. Lake Volta is currently the main inland water body used for cage aquaculture in Ghana. It presents enormous opportunities for aquaculture expansion. Communities around the lake are mainly engaged in fishing and farming employing mostly men with the women focusing on fish processing and trading. Lake Volta

160160
and its tributaries drain 70% of the entire area of Ghana (FAO 2005) covering mostly Northern, Volta, Eastern and Brong Ahafo regions. The Eastern and Volta regions were the focus of this study. We selected the respondent groups from several districts in these regions based on the recommendations from the Fisheries Commission.
Methods
Sample selection and data collection The surveys were done with three main respondents including current cage fish
farmers (Adopters), cage fish farmers who have abandoned the trade (Abandoned), and Potential Adopters represented by people with fish-related livelihoods such as pond aquaculture and trading in fish. The other respondents were the Fisheries Commission, regional and district Fisheries Officers, and representatives of financial institutions. The group consisted of people already employed in fish activities including fishermen, pond and pen-based fish farmers and fish traders. Regional and district Fisheries Officers of the Fisheries Commission function as extension officers to fish farmers in addition to their prescribed duties. Therefore we included this respondent group to learn about their perspectives of what the constraints in cage aquaculture in Ghana were.
With the exception of Potential Adopters and financial institutions, all respondents identified for this study had small populations which were easily accessed through census. We obtained a list of Adopters and Abandoned from the Fisheries Officers and contacted as many as were available. Where we could not contact farmers directly, we employed opinion leaders to help access them. We also interviewed financial institutions based on their availability and preparedness to voluntarily answer questions.
The field studies were conducted between June and August 2010. We employed both surveys and interviews in this study. We administered most of the questionnaires in person to ensure answers provided were directed to exact questions asked. A total of 106 questionnaires were administered. Questionnaires were structured to suit respondent groups but we incorporated similar questions in some questionnaires to aid comparison among groups. We interviewed 43 Adopters, 20 Abandoned (including 10 individuals who had abandoned pen fish farming), and 31 Potential Adopters. We also administered 1 questionnaire to the Fisheries Commission, 5 questionnaires to regional and district Fisheries Officers, and 5 financial institutions identified in the two regions used in this study. We further interviewed key informants in relevant government institutions. Questionnaire design
Based on the information available in the literature about constraints in aquaculture in general and cage aquaculture in specific we developed nine items representing constraints that could be evaluated by Adopters, Abandoned and Potential Adopters. The nine items were presented and scored on a four-point interval scale ranging from “not important” to “very important” modified from Vagias (2006) level of problem type-scale. Respondents were to rank the constraints according to how important they were in their cage aquaculture operations, their decision to abandon or adopt the business. Additionally we presented the same set of constraints to the Fisheries Commission and the regional and district Fisheries Officers. We also provided an open-ended option for respondents to state other constraints that thought were very important.
Adopters, Abandoned and Potential Adopters were asked to indicate (yes/no) whether they had had specific cage aquaculture training. We followed up with an open ended question of the type of training, where and when they had the training. We used these multiple measures of training as a way of assessing the level of knowledge of respondents in cage aquaculture.
We also wanted to evaluate the market availability for products, the profitability of cage aquaculture from the respondents’ perspective, and interest in the business. To do this we developed a series of binary response questions which were presented to the appropriate respondent groups. We asked Adopters to indicate (yes/no) whether they thought they would be able to sell more fish if they could expand production above their current level. Then we asked them if they would recommend cage aquaculture to potential farmers. To evaluate the level of interest, we asked Potential Adopters to indicate (yes/no) whether they were

161161
interested in starting cage aquaculture on the Volta Lake. We further asked both Abandoned and Potential Adopters to indicate (yes/no) if they were interested in resuming or starting cage aquaculture if constraints are removed, and to provide reasons for their responses.
Opportunities available for farmers to access loans from banks and financial institutions were explored through both close-ended and open-ended questions. Financial institutions were asked to indicate (yes/no) if they had given loans to fish farmers in the past. When the response was yes, they were further asked to indicate the percentages of farmers who paid the loan at the appointed time, sometime after the appointed time or never repaid the loan. Future opportunities for loans were explored by asking financial institutions to indicate (yes/no) whether they had some form of budget for fish farmers currently. For those that responded in the affirmative, we asked them to provide specific requirements that farmers needed to meet in order to access a loan. Interviews
We used select questions from the questionnaires as an interview guide in conducting the interviews with the key informants in government research institutions. We asked interviewees their opinions about the constraints in cage aquaculture in Ghana and opportunities they knew existed which could improve the industry. We took notes in all interviews but recorded none of the interviews to avoid making interviewees uncomfortable.
In this preliminary analysis, the quantitative questions in the surveys were analyzed using descriptive statistics such as arithmetic means, percentages and proportions and the qualitative questions were either coded and analyzed using descriptive statistics or analyzed qualitatively. All interviews were transcribed and stored to await analysis with the surveys.
Results and Discussion
Constraints in cage fish farming Overall, the three main respondents groups (Adopters, Abandoned and Potential
Adopters), the Fisheries Commission, and regional and district fisheries officers ranked lack of funds high on a 4-point scale. Mean ranking of lack of funds was 3.58 for Adopters (Figure 1). Abandoned and Potential Adopters had mean rankings of 3.25 and 3.81 respectively. Due to the small sample size of the Fisheries Commission, and regional and district fisheries officers (n = 1 and 5 respectively), their means were not included in the comparisons but it is worth mentioning that the Fisheries Commission ranked lack of funds as very important (4) whiles the regional and district officers had a mean ranking of 4 for the same constraint.
Figure 1.- Mean rankings of nine constraints for Adopters, Abandoned and Potential Adopters.
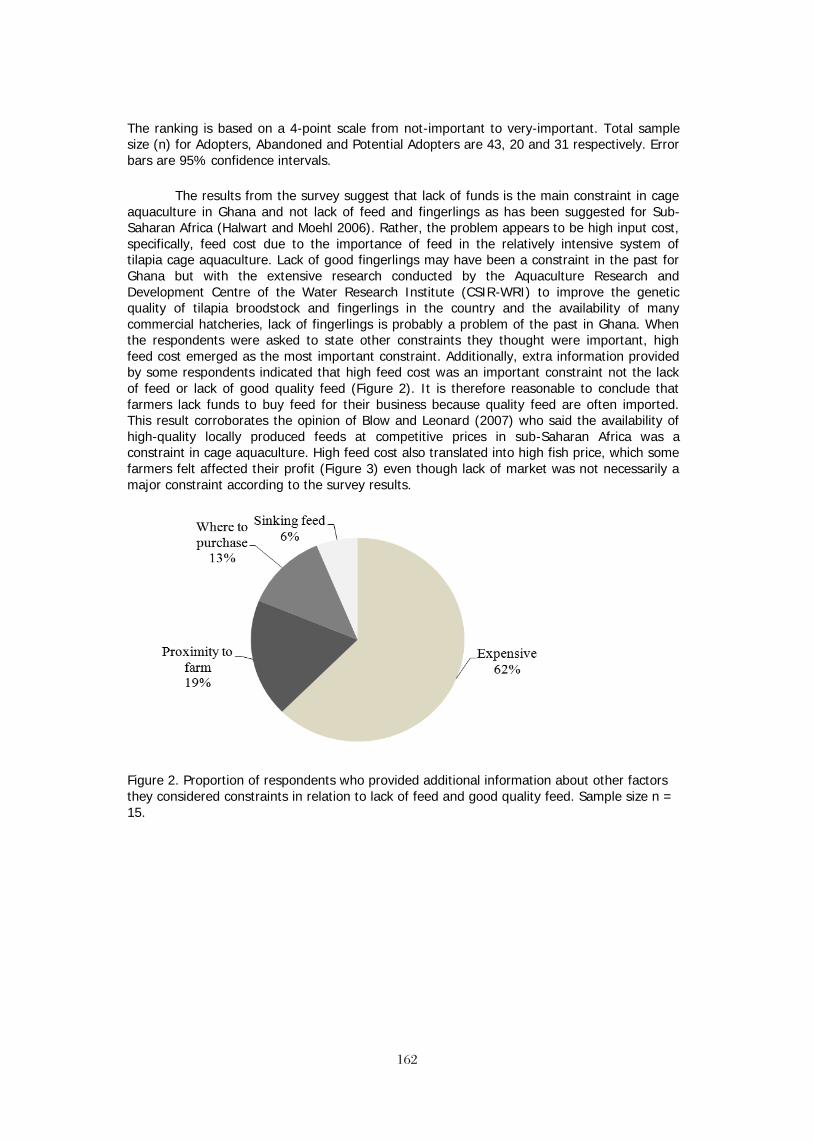
162162
The ranking is based on a 4-point scale from not-important to very-important. Total sample size (n) for Adopters, Abandoned and Potential Adopters are 43, 20 and 31 respectively. Error bars are 95% confidence intervals.
The results from the survey suggest that lack of funds is the main constraint in cage aquaculture in Ghana and not lack of feed and fingerlings as has been suggested for Sub-Saharan Africa (Halwart and Moehl 2006). Rather, the problem appears to be high input cost, specifically, feed cost due to the importance of feed in the relatively intensive system of tilapia cage aquaculture. Lack of good fingerlings may have been a constraint in the past for Ghana but with the extensive research conducted by the Aquaculture Research and Development Centre of the Water Research Institute (CSIR-WRI) to improve the genetic quality of tilapia broodstock and fingerlings in the country and the availability of many commercial hatcheries, lack of fingerlings is probably a problem of the past in Ghana. When the respondents were asked to state other constraints they thought were important, high feed cost emerged as the most important constraint. Additionally, extra information provided by some respondents indicated that high feed cost was an important constraint not the lack of feed or lack of good quality feed (Figure 2). It is therefore reasonable to conclude that farmers lack funds to buy feed for their business because quality feed are often imported. This result corroborates the opinion of Blow and Leonard (2007) who said the availability of high-quality locally produced feeds at competitive prices in sub-Saharan Africa was a constraint in cage aquaculture. High feed cost also translated into high fish price, which some farmers felt affected their profit (Figure 3) even though lack of market was not necessarily a major constraint according to the survey results.
Figure 2. Proportion of respondents who provided additional information about other factors they considered constraints in relation to lack of feed and good quality feed. Sample size n = 15.

163163
Figure 3. Proportion of respondents (n = 7).who provided additional information about other factors they considered constraints in relation to lack of market.
For the Abandoned and Potential Adopters, lack of funds could explain why they are not currently practicing cage aquaculture. When asked if they were interested in resuming the business, all 20 respondents (100%) in the Abandoned group (including 10 farmers who have abandoned pen fish farming) were interested in resuming cage aquaculture if they had capital. The pen farmers were interested in adopting cage aquaculture but not pen farming because they had received some training in cage aquaculture and found it more desirable than pen aquaculture
Lack of extension was ranked as the second most important constraint by Adopters with a mean of 2.93 (Figure 1). The Fisheries Commission ranked lack of extension as very important (4), however, both the Abandoned and Potential Adopters rated lack of extension or lack of information (for Potential Adopters) as a slightly unimportant constraint. In contrast, the regional and district fisheries officers ranked lack of extension quiet low with a mean of 1.6. This is probably because the regional and district fisheries officers felt they were doing their best doubling as extension officers in addition to their assigned duties.
Apart from lack of funds and lack of extension, respondents ranked all other constraint as slightly unimportant (mean rank of 2.3 or lower). The only exceptions are cage destruction by storms which was ranked higher by Abandoned (mean rank of 2.67) and theft which was ranked 4 and 3.4 by the Fisheries Commission, and regional and district fisheries officers respectively. Cage destruction by storms was ranked as slightly important because 50% of the cage farmers who had quit the business did so because their cages had been destroyed by storms. Theft was probably ranked high by the Fisheries Commission, and the regional and district fisheries officers because of individual reports by some farmers but it appears that once funds are available to hire security personnel on farms, the problem of theft is easily dealt with.
Interview results shared some similarities with survey result in terms of lack of extension being a major constraint in cage fish farming. Whereas all three interviewees mentioned lack of extension specifically, only one mentioned lack of funds as a constraint. Interestingly, all three interviewees stated lack of knowledge in cage aquaculture as the main constraint. However, this was not evident in the survey because when asked if they had specific training in cage aquaculture, we had yes response of 72%, 85% and 55% for Adopters, Abandoned and Potential Adopters respectively. Opportunities that can be exploited
In response to whether they would be able to market their produce if they could expand their production above current level, 95% of Adopters responded yes, suggesting a potential to expand the aquaculture industry through cage fish farming. Farmers also appear to be making profits judging from the fact that 93% of all Adopters said they would

164164
recommend cage aquaculture to potential farmers, with 65% of them recommending cage aquaculture on the basis of its profitability.
Another opportunity that can be exploited to expand production was evident when 90% of Potential Adopters said they were interested in starting cage aquaculture on the Volta Lake. Some fisher folk in the group indicated they could hardly wait to start due to the advantage of getting fish all year round compared to the seasonality of fishing. Additionally, 97% and 100% of Potential Adopters and Abandoned respectively, responded yes when asked whether they were interested to start or resume cage farming if constraints are removed. The prospects of making profit was a strong indication why both Abandoned and Potential Adopters were interested in cage aquaculture but they also indicated that they found management of cages relatively easy.
We also learned through the interviews that a private enterprise has started producing floating feed for fish farmers in Ghana. Hopefully, this should ease the burden of high feed cost on farmers especially if local ingredients are used. We expect locally produced floating feed to be cheaper but the price and quality of locally produced floating feed will need to be verified in future studies before a definite advantage for cage aquaculture development can be ascribed.
In exploring the possibility of cage fish farmers being able to access loans from banks and other financial institution, we learned that some banks have had unpleasant experiences with fish farmers in the past and indeed were skeptical about future loans to fish farmers. Nevertheless, some institutions were willing to provide loans to fish farmers if they had guarantors, mortgage collateral, and the institution had sufficient knowledge about the entire project. There were also opportunities for groups to access micro-finance with relatively less stringent criteria. Our findings are consistent with that of another study by Hishamunda and Manning (2002) who investigated the role of banks in aquaculture development in six countries in Sub-Saharan Africa (Cote d’Ivoire, Madagascar, Malawi, Mozambique, Nigeria, and Zambia) and found that banks were skeptic about giving fish farmers loans because of past failures but there still existed opportunities for acquiring loans if farmers had a convincing proof of success.
Certain government initiatives were also identified as avenues to improve to cage fish farming in Ghana. Results from the survey revealed that some interested individuals had received training in cage fish farming organized by the government and were awaiting inputs from the government to commence business. This is probably a part of a “Youth in Agriculture” proposal by the Ministry of Agriculture which we learned about during the interviews. Finally, our study also revealed that limited government supported microfinance and small loans centers were in operation in Ghana and could be accessed by fish farmers.
Conclusions and Recommendations
Our study suggests that the main constraint in cage aquaculture in Ghana is the lack of funds to purchase input such as feed. While lack of funds prevented farmers who have abandoned cage farming from resuming, the constraint also barred potential adopters from starting cage aquaculture even though they showed a high interest in the business. In addition, farmers appeared to have knowledge in their operations but it seems the knowledge is inadequate and they could use more extension services.
In light of these results, our preliminary recommendations are that the Fisheries Commission should work with the financial institutions to help determine farmers’ ability to repay loans and guarantee loans made by the financial institutions. In the long run, aquaculture could be made more attractive and competitive by subsidizing feed cost for small-holders, especially if quality floating feed is produced locally. It would seem appropriate to provide subsidies for some of the most expensive inputs for aquaculture since farmers in crop production receive similar subsidies on fertilizers and inputs. Also, there is a need for a more specialized aquaculture extension service accessible to farmers to help with technical issues built on the model of agricultural extension services in Ghana. Farmers who cannot afford private extension services would greatly benefit from such a program especially if this is a cheaper alternative.

165165
Acknowledgement This study was funded by the United States Agency for International Development
Aquaculture and Fisheries Collaborative Research Support Program (AquaFish CRSP) with in-kind support from Virginia Tech University. Collaboration with the Fisheries Commission and Water Research Institute of Ghana ensured the integrity of data collected and the cooperation of participants. We are grateful to Yaw Ansah for his assistance with questionnaire administration.
Literature Cited Asmah, R. 2008. Development potential and financial viability of fish farming in Ghana. PhD
Thesis. University of Stirling, Stirling,UK. Abban, E. K., J. Moehl, L. K. Awity, M. Kalende, J. K. Ofori, and A. Tetebo. 2006. Aquaculture
Strategic Framework. Ministry of Fisheries. 33p. Awity, L. 2005. National Aquaculture Sector Overview-Ghana. National Aquaculture Sector
Overview Fact Sheets. In: FAO Fisheries and Aquaculture Department [online]. Rome. Accessed March 20, 2010.
Baotong, H., and Y. Lui. 1998. The development of cage culture and its role in fishery enhancement in China. In T. Petr (ed). Inland fishery enhancement. Papers presented at the FAO/DFID expert consultation on inland fishery enhancement. Dhaka, Bangladesh, 7-11 April. FAO Fisheries Technical Paper. No. 374. Rome. 463p.
Blow, P. and S. Leonard. 2007. A review of cage aquaculture: sub-Saharan Africa. Pages 188–207 in M. Halwart, D. Soto and J.R. Arthur, editors. Cage aquaculture – Regionalreviews and global overview, FAO Fisheries Technical Paper. No. 498. Rome, 241p.
FAO. 2005. Irrigation in Africa figures. Aquastat survey. FAO Water Reports No. 9. Rome, 74p.
Halwart, M., and J. F., Moehl (eds). 2006. FAO Regional Technical Expert Workshop on cage culture in Africa. Entebbe, Uganda, 20-23 October 2004. FAO Fisheries Proceedings. No.6. Rome. 113p.
Hambrey, J. 2006. Cage culture - the challenges. Page 73 in M. Halwart, and J. F., Moehl (eds). FAO Regional Technical Expert Workshop on cage culture in Africa. Entebbe, Uganda, 20-23 October 2004. FAO Fisheries Proceedings. No.6. Rome.
Hishamunda, N. and P. Manning. 2002. Promotion of sustainable commercial aquaculture in sub-Saharan Africa: Investment and economic feasibility. FAO Fisheries Technical Paper. No. 408/2. Rome. 54p.
ILEC (International Lake Environment Committee Foundation) 1999. World Lake Database. Accessed: March 26, 2010 at http://www.ilec.or.jp/database/afr/afr-16.html.
Moehl, J., R. Brummet, M. K. Boniface, and A. Coche. 2006. Guiding principles for promoting Aquaculture in Africa: benchmarks for sustainable development. CIFA Occasional Paper No. 28, Accra. 122p.
Ofori, J. K., E. K. Abban, A. Y. KariKari, and R. E. Brummett. 2010. Production parameters and economics of small-scale tilapia cage aquaculture in the Volta Lake, Ghana. Journal of Applied Aquaculture. 22:337-351.
Ridler, N. and N. Hishamunda. 2001. Promotion of sustainable commercial aquaculture in sub-Saharan Africa: Policy framework. FAO Fisheries Technical Paper. No. 408/1. Rome. 67p.
Vagias, W. M. 2006. Likert-type scale response anchors. Clemson International Institute for Tourism & Research Development, Department of Parks, Recreation and Tourism Management. Clemson University. 1p.

166166
GEOSPATIAL MODELING OF SITE SUITABILITY FOR POND BASED TILAPIA AND CLARIAS FARMING IN UGANDA
Herbert Sseganea, E.W.Tollnera, and Karen Vevericab
a Department of Biological and Agricultural Engineering, University of Georgia,
Athens, GA, 30602. b Department of Fisheries and Allied Aquacultures; International Center for Aquaculture and Aquatic Environments, Auburn University, Alabama, USA
Abstract
The study set out to implement geospatial modeling of site suitability for
Tilapia and Clarias farming for Uganda. Seven criteria of water requirement, water
temperature, soil texture, terrain slope, potential farm gate sales, availability of farm
inputs, and access to local and regional markets were analyzed. The crisp and fuzzy
approaches of criterion classification were implemented and the results compared.
The weighted linear aggregation method was used to generate the overall suitability
maps. There was a statistically significant difference between suitability values
generated by crisp and fuzzy approaches. For both the crisp and the fuzzy
approaches, over 99 % of the land was classified as moderately suitable or as
suitable. However, the distributions of the suitable and moderately suitable
classifications varied between the two approaches. The differences were more
dominant in the Northeastern part of the country and areas around the shores of the
major Lakes. For the same location, the fuzzy method gave slightly higher suitability
values at the lower extreme (unsuitable) and gave slightly lower suitability values at
the upper extreme (very suitable). Overall, the crisp method classified 59,203 ha
(0.34 %) as very suitable for Tilapia and Clarias farming compared to 230 ha (0 %)
by the fuzzy method. Simultaneously, the crisp method gave 10,794 ha (0.06) as
unsuitable compared to 7,150 ha (0.04 %) by the fuzzy method. Of the 138 fish
ponds with operational pond status, the crisp method classified 71 % as suitable
while 29 % as moderately suitable while the fuzzy method classified 71.7 % as
suitable while 28.3 % as moderately suitable. The paper provides a nice template for
duplicating this assessment in other regions of the world.
Keywords: GIS, fish farming, fuzzy logic, crisp sets, multicriterion evaluation, and pairwise
comparisons

167167
WHAT INFLUENCES THE SUCCESS OF AQUACULTURAL RESEARCH PROJECTS?
Steven Buccola, Lin Qin, and Rolf Fare
Paper delivered at the 9th Asian Fisheries & Aquaculture Forum and
9th International Symposium of Tilapia Aquaculture Shanghai Ocean University, Shanghai, China, April 21 – 25, 2011
Steven Buccola and Lin Qin are respectively professor and graduate research assistant in the Department of Agricultural and Resource Economics, and Rolf Fare is professor in the Departments of Economics and Agricultural and Resource Economics, Oregon State University, Corvallis, Oregon, USA, 97331. [email protected].
This study is supported by the USDAID-sponsored AquaFish Collaborative Research Support Program (AquaFish CRSP), http://www.aquafishcrsp.oregonstate.edu. We thank the AquaFish CRSP staff at Oregon State University for their strong administrative support.
Introduction No research program can enjoy long-run success without a periodic assessment of
how it is performing and what factors influence success and failure. While most such assessments are informal and specific to a particular study, formal evaluations eventually become important at the program level. A formal analysis the same as an informal one in the sense of comparing research outputs with the inputs or efforts expended to achieve them (a “knowledge production function”). Approaches to research assessment thus differ only in how such outputs and inputs are to be understood, measured, and compared.
Assessment methods can be either quantitative – typically statistical – or the kinds of institutional evaluation one sees in a case study. In biological disciplines, at least, most statistical analyses of the factors affecting research success employ the scientists’ publication counts, citations, or intellectual property as measures of research output. Methods are parametric or non-parametric, dynamic or static. In the parametric approach, the bibliographic output measures are regressed against current and lagged research expenditures, against other inputs or conditions poorly represented by expenditures, and sometimes against a time trend.
Adams and Griliches (1996), for example, examine U.S. university research performance in eight scientific fields during the 1980s. They find at the level of a particular university or field that diminishing returns to scale prevail in academic research. That is, increases in study size bring less-than-proportionate increases in the study’s publication output. At the aggregate level, however, there appears to be approximate equality between research expenditure and publication (or citation) performance, possibly because aggregate data incorporate cross-study knowledge spillovers that are not captured in more disaggregated data. These methods have more recently been applied to life-science research by Smith (1998), Xia and Buccola (2005), Groot and Garcia-Valderrama (2006), Buccola, Ervin, and Yang (2009).
The bibliometric approach is, despite its widespread use, inadequate in a number of respects. The first and probably most important difficulty is that publication, patent, and journal citation rates mask much of the detail of a study’s findings and thus only grossly reflect the findings’ nature, magnitude, and importance. Much published output also becomes available only years after the study has been completed. Finally, the bibliometric approach is poorly suited to an exact matching of a study’s outputs and inputs.
To help solve these difficulties, we examine here a new approach to research assessment. The new method focuses directly on the information a research study has generated, enabling a more exact and more contemporaneous matching of that information to the skills, expenditures, and capital devoted to the study. We apply the approach to the
168168
55 past and on-going aquacultural research investigations which AquaFish CRSP is pursuing in eleven countries.
Conceptual Framework To place this approach in its broadest context, let K represent the knowledge an
aquacultural study has generated; E the study’s expenditures; M the research management policies, such as choice between control and survey methods; C the human capital devoted to the study (and which can be only imperfectly captured in expenditures); I the institutional, cultural, and environmental conditions under which the study is pursued; and the unexplained variation. We then can relate the magnitude K of the study outcome to the inputs affecting that magnitude:
(1) ( , , , , )K f E M C I and in this way individually examine the impacts of factors E, M, C, and I on knowledge output K. For example, we can estimate the effectiveness of research management policies while holding expenditure, such human-capital dimensions as researcher education and experience, and environmental conditions statistically constant. Difficulties in Measuring Research Output
Relationship (1) is best characterized with disaggregated data, that is with observations on many individual studies. With disaggregate data, information about research expenditures, the composition of the research team, research management practices, and the institutional environment will be available if enough effort is made to collect it. The more difficult task, even in disaggregate settings, is to characterize and measure research output magnitude K. Output measurement difficulties arise from several sources.
First, an aquacultural research study typically focuses not only on a variety of research treatments but on a variety of outcomes per treatment. An examination of alternative fish feed rations, for instance, typically is interested in the survival rate, feed conversion, final body weight, and flesh quality associated with each ration. The reason is that all such outcomes affect profitability in a separate way. Yet these outcomes are incommensurable with one another unless expressed in terms of their impact on profit, an impact that varies with market conditions and hence is unknown to the investigator at the time the project is initiated. Even greater outcome incommensurability is encountered from one study to another. For example, one study in our AquaFish dataset may be seeking to boost tilapia exports, while another seeks to improve pond water quality.
Second, an aquacultural research study's contribution is information rather than something tangible like per-hectare fish yield or pond oxygen content. Because information is intangible, we cannot measure its magnitude by counting tons or hectares.
Third, research studies in our dataset frequently will be found to have started on different dates and to have progressed at different rates. Our assessment procedures must therefore account for differences in the stages at which a given study will be encountered. That is possible only if our assessment method is updatable, permitting us to evaluate progress as a study proceeds as well as when it is completed.
Fourth, some research projects fail in the sense that the hypothesized improvement – enhanced oyster management practices, say – does not materialize. Such failures do not necessarily imply that the study expenditures have been wasted, since the experimental disappointment can be valuable in pointing to more fruitful directions in subsequent research (CGIAR Science Council 2009).
The first or incommensurability problem can be solved by expressing study output units in terms of percentage changes, relative either to the originally anticipated improvement, the improvement the study manages to obtain, or the outcome levels already achieved before the study was inaugurated. Percentage changes in, say, one study's per-hectare yields are directly comparable to percentage changes in another study's water quality index. However, such proportional measurement makes no progress in solving the remaining three measurement difficulties.
169169
Bayesian Approach to Research Output Measurement An approach that does solve the second through fourth problem is to take advantage
of Bayesian statistics, which are complementary to the classical statistics employed in most aquacultural research (Robert 2001; Schimmelpfennig and Norton 2003; Carlin and Louis 1996; Press 1989; Winkler 1972). In contrast to classical statistics' focus on estimating a population parameter like a water-quality improvement rate, Bayesian statistics concentrates on the new information the water-quality study provides. The old information can be either the results from earlier experiments or surveys or the aquaculturalist's subjective, pre-experiment hunches about how the experiment will turn out.
More particularly, the Bayesian method regards any new information as the difference between the study outcome probabilities (e.g. fish mortality rate or feed/gain ratio) that the researcher had surmised before the study began and the probabilities she encountered during or as a result of the study. Provided those outcomes are expressible in frequency terms, they can never generate less information than what the researcher originally had possessed, since the least the new outcomes can do is to exactly confirm the researcher’s prior expectations. For example, early success of a proposed new Tilapia seed production method may boost the pond yield rates relative to those farmers presently achieve or to those the investigators had anticipated. If, on the other hand, the study fails to boost yields, its success is reflected instead in the experimental lesson learned, which in turn is expressed as the narrowing of the probability distribution of possible yield outcomes. To summarize the Bayesian approach, let Y be the percentage improvement in a particular study outcome such as pond water quality. Let Z be the performance of the new technology the researchers are examining and which is intended to improve pond water quality. The probability the investigator initially assigns to a particular level of water-quality improvement is, in light of the study’s current progress, updated as
(2) ( | ) ( )( | ) = ( )
p Z Y p Yp Y Zp Z
where ( )p is the probability of the first term in each parenthesis, and | indicates that the following term is held constant. That is, after the researchers have observed performance Z of the new technology, the probability of a particular pond improvement level equals the probability that experimental outcome Z will occur given that the new technology improves pond quality by a stated amount, times the prior probability of pond improvement and divided by the prior probability of experimental outcome Z.
The likelihood that experimental outcome Z will occur depends in turn on study expenditures and other inputs X such as the investigators’ human capital. We may represent this dependence as ( , )Z Z X , where are unanticipated research findings.
Furthermore, once the experiment is complete, ( )p Z is a known constant. Combining these two considerations gives, at the end of the experiment, (3) [ | ( , )] [ ( , ) | ] ( )p Y Z p Z Y p Y X X in which signifies “is proportionate to.” That is, the probability of the given pond improvement once experimental results have been obtained is proportionate to the probability that experimental outcome Z (a function of research inputs X) will be obtained assuming the new technology will be pond-enhancing at a stated level, times the pond enhancement originally expected. Expression ( )p Y in equation (2) is the investigator’s prior (baseline) pond quality probability. In contrast, [Z( , ) | ]p YX is the posterior improvement expectation elicited at a midpoint – then at the termination – of the research process, reflecting the intervening experimental or other study results. Well-developed methods are available for eliciting the prior probabilities (Stael von Holstein 1970). They involve casting the probability questions in the context of the study’s institutional and technical environment and employ the researcher's judgment about the situation at hand, a judgment that will partly be based on the previous literature.

170170
The value to a decision maker of basing her decisions on the prior probability distribution ( )p Y rather than on posterior distribution ( | ) p Y Z , that is the value the aquacultural study has provided her, is reflected in the “loss” difference (4) ( , , ) ( ) ( ( ) , )L d Z U d U d Z X
where is the prior information available to the decision maker. This loss is the difference between the utility of acting in the absence of the study results and the (higher) utility of acting after knowing those results. Thus also, it is the disutility a fish farmer, buyer, supplier, or other interested party suffers if deprived of the research study. Function (4) can be specified in a variety of functional forms (Robert 2001).
For example suppose an oyster producer’s decision d is that he promises, on the basis of his present management practices X, to deliver oysters at a particular quality grade A. If he delivers the oysters at lower than the promised grade, his quality reputation suffers; if at a higher grade, he sells at a price lower than he could have achieved had he predicted the quality more accurately. His profit, that is, rises with his accuracy in predicting quality grade. By improving our understanding of the true quality probabilities related to a particular management practice, oyster management research is precisely what improves such prediction accuracy. The negative of Loss (4) thus reflects the value of the oyster study's contribution to the improvement in prediction accuracy. A measure of the study's knowledge output K that solves all four of the research-output measurement difficulties listed above is therefore (5) [ , ( ), ]K L d Z X the negative of the Bayesian Loss value (4). If we consider decision d to be a function of sample information Z itself, and prior information to be unobserved error , we get (6) [ ( ) , ( )] ( ) ( , , , , )K L d Z Z f f E M C I X X namely, knowledge production function (1).
Characterizing the Knowledge Production Relationship
In order to characterize how the magnitude of such new research knowledge responds to the type and quantity of research inputs, namely in order to depict relationship K ( , , , , )f E M C I , we treat each AquaFish research study as a production unit
employing research inputs ( , , , )E M C I -- such as money and personnel – to produce knowledge outputs. Most AquaFish studies are designed to examine a variety of experimental or survey dimensions, and they involve a variety of alternative treatments for a given dimension. For example, a controlled-experiment investigation focusing on feed rations can examine both the weight-gain and fish mortality effects of a given ration. A variety of rations are examined in each study – each constituting a separate research treatment – for their weight-gain and mortality effects. Considering instead a non-controlled-experiment situation, a survey investigation focusing on fish export opportunities can examine a marketing program’s implications for both fresh and dried fish.
If the investigator employs m alternative feed-ration or marketing-program treatments, and examines the implications of each of them for such n outcome dimensions as mortality, weight gain, or dried exports, she will generate mn utilities (3), that is mn items of utility-enhancing new knowledge. Because p AquaFish investigations have been pursued over t years, we thus have N = mnpt observations for estimating equation (1). The result is to reveal, for each of a group of investigations, how much research output K has been achieved for each given set of research inputs and each scenario of institutional, management, and environmental conditions. Importantly, our method can be used to examine research performance not only at its conclusion, but at earlier project stages; that is relative not only to other studies but to its own earlier efforts.

171171
Research Inputs We Are Examining We examine in knowledge production function (1) the research impacts of the following study inputs and conditions: Expenditures (E) At U.S. Project University In Host Country Research Management (M) Controlled Experiment versus Statistical Survey
Sample Size Investigator and Collaborator FTE and Human Capital (C)
Scientist and Collaborator Age Distributions Distributions of Highest Degrees Position Rank Distributions
Institutional and Environmental Conditions (I) On-Station versus Off-Station research Transportation Modes Road Conditions and Distances
Climate and other Environmental Conditions Knowledge production function (1) or, equivalently, (6) can be estimated with
distance-function methods (Fare and Primont 1995). Attention to unexplained variation in equation (1) is useful. If we consider to be the sum two independent random variables,
u v , the latter may be used to represent frontier or best-research-practice performance, and the former to represent negative deviations from that frontier. Error u thus provides the basis for conducting cross-study comparisons of the efficiency with which research resources are used to achieve knowledge.
Utility Computation Example
An example from Investigation 07MNE04UM, a University of Michigan AquaFish study conducted in China, will illustrate the method we are using to compute an AquaFish study’s knowledge contribution. The purpose of 07MNE04UM is to examine ways of reducing effluent and settling-pond pollution from Chinese shrimp production. Fish yield is compared in that study with water quality as measured by settling-pond chemical content. Statistical-survey rather than experimental-control methods are used. Relevant data in one of its treatments are:
Outcome Level Prior probability Posterior mean Posterior standard deviation
Fish yield (kg/ha) Low 7000 0.10
8255.06 1438.05 Medium 8000 0.60
High 9000 0.30 Dissolved oxygen
(mg/L) Low 6 0.20
6.74 1.05 Medium 7 0.70 High 8 0.10
Total suspended solids (mg/L)
Low 20 0.10 47.12 12.33 Medium 30 0.70
High 40 0.20
One thing that is clear from this table is that an econometric model in which several dimensions of outcome – such as fish yield, dissolved oxygen, and suspended solids – are pooled, we first must normalize the outputs in a way permitting comparisons among them. Kilograms per hectare and micrograms per liter are not directly comparable. A natural way to do so is to divide each outcome level by the sum of its Low, Medium, and High levels, so that outcome levels are expressed essentially as percentage differences from their mean. Thus,

172172
for example, we can restate the three alternative fish yield levels as 7/24, 8/24, and 9/24, where 24 = 7+8+9. Loss function values are invariant to this normalization.
The prior probabilities in the table are elicited from the scientists on the basis of their best understanding, prior to conducting the research, of what the yield and chemical readings would be in response to the particular treatment or set of management practices. The posterior mean and standard deviation are, in contrast, taken from the statistical survey’s ANOVA results. To demonstrate the value of this research, we compare the advantage of using these posterior rather than prior distributions of when making shrimp production management decisions.
The mean of the shrimp producer’s prior distribution is (7) PR L M HMean P L P M P H
where L, M, and H are the low, medium, and high levels shown in the table, and the P’s are the associated prior probabilities. This is what, prior to the research study, the producer expects his yields or dissolved oxygen levels to be. To derive the mean of the posterior distribution – namely what the producer expects, by virtue of the new study, the yields or dissolved oxygen to be, we first generate the normal density function corresponding to the posterior mean and posterior standard deviation shown. We then compute from that density function the low, medium, and high outcomes ( 'L , 'M , 'H ) whose cumulative probabilities would – to keep our results comparable to the prior distribution – equal to those in the prior. The result is the mean outcome as corrected by the research results, namely by the information in the posterior distribution:
(8) 0P L M HMean P L P M P H We next use these two respective means in (7) and (8) to compute two important
measures of random variation in the producer’s shrimp yield or pond dissolved-oxygen content. The first is the variation the producer anticipates around his naïve (pre-research) outcome expectation PRMean , but evaluated in terms of the outcome probabilities estimated from the new research. This models the risk which the new study shows the producer actually was facing when she used the pre-research outcome expectation. It is the post-study view of the producer’s pre-study thinking. The relevant measure of this variation is the outcome variance expressed in terms of the outcome deviations from the pre-study mean but in which the outcome levels ( 'L , 'M , 'H ) are those the study indicates are associated with the given probability levels – that is, essentially in terms of the posterior probability distribution:
(9) 2 2 2( ) ( ) ( )PO
PR L PR M PR H PRVar P L Mean P M Mean P H Mean
The appropriate variance of the posterior distribution is based on the respective distances between the posterior mean and the same three outcomes predicted. This of course is the posterior variance itself:
(10) 2 2 2( ) ( ) ( )PO L PO M PO H POVar P L Mean P M Mean P H Mean
The knowledge or utility gained from the research is the difference between this prior and posterior variance:
(11) ( , , ) ( , ) ( ) POPO PRK L d Z U d Z U d Var Var
It is easy to show that this difference is non-negative, so that the knowledge gained from properly conducted research can never be negative.

173173
Data on AquaFish research treatments, probabilities, and inputs were provided by the host-country AquaFish investigators. Coordinators were (by US university base of respective project): Steven Amisah (Purdue U), Gertrude Atukunda (Auburn U), Remedios Bolivar (North Carolina Stat U), Wilfrido Contreras (U Arizona), Eladio Gaxiola (U of Hawaii), So Nam (U of Connecticut), and Gao Zexia (U of Michigan). Our study covers 55 aquacultural research studies conducted during AquaFish’s 2007 – 2009 and 2009 – 2011 phases. Twenty-seven of these were conducted during the 2007 – 2009 phase and 28 in the 2009 – 2011 phase.
References Adams, and Griliches. 1996. “Research Productivity in a System of Universities.” NBER
Working Paper No. 5833. Buccola, S.T., D. Ervin, and H. Yang. “Research Choice and Finance in University Bioscience.”
Southern Economic Journal 75 (April 2009): 1238 - 1255. Carlin, B.P., and T.A. Louis. 1996. Bayes and Empirical Bayes Methods for Empirical
Analysis. London: Chapman and Hall. CGIAR Science Council. 2009. Defining and Refining Good Practice in Ex-Post Impact
Assessment – Synthesis Report. CGIAR Science Council Secretariat: Rome, Italy. Fare, R., and D. Primont. 1995. Multi-Output and Duality: Theory and Application. Boston:
Kluwer-Nijhiff. Groot, T. and T. Garcia-Valderrama. 2006. “Research Quality and Efficiency: An Analysis of
Assessments and Management Issues in Dutch Economics and Business Research Programs.” Research Policy 35: 1362 - 1376.
Robert, C.P. 2001. The Bayesian Choice, 2nd Ed. New York: Springer-Verlag. Press, S.J. 1989. Bayesian Statistics: Principles, Models, and Applications. New York: John Wiley and Sons.
Schimmelpfennig, D. E. and G.W. Norton. 2003. “What is the Value of Agricultural Economics Research?” American Journal of Agricultural Economics. 85: 81 – 94.
Stael von Holstein, C.A. 1970. Assessment and Evaluation of Subjective Probability Distributions. The Economics Research Institute, Stockholm School of Economics
Smith, V. H. 1998. “Measuring the Benefits of Social Science Research.” Impact Assessment Discussion Paper No. 2, International Food Policy Research Institute.
Winkler, R.L. 1972. An Introduction to Bayesian Inference and Decision. New York: Holt, Rinehart, Winston.
Xia, Y., and S.T. Buccola. 2005. “University Life Science Programs and Agricultural Biotechnology.” American Journal of Agricultural Economics 87: 229 – 243.

174174
METHODS FOR ASSESSING ECONOMIC, ENVIRONMENTAL AND SOCIAL IMPACTS OF AQUACULTURE TECHNOLOGIES: ADOPTION OF
INTEGRATED AGRICULTURE-AQUACULTURE IN MALAWI
John Antle Dept. of Agricultural and Resource Economics
Oregon State University, Corvallis OR 97331 USA [email protected]
Roberto Valdivia
Dept. of Agricultural Economics and Economics Montana State University, Bozeman MT 59716 USA
Abstract
There is a growing demand for assessment of economic, environmental and social impacts of new food-related technologies, including the impacts of new methods for aquaculture management. This paper presents a new “minimum-data Tradeoff Analysis” (TOA-MD) model that can be applied to assess economic, environmental and social impacts in a wide array of agricultural systems that incorporate aquaculture, crops, and livestock (Antle 2011; Antle and Valdivia 2010). This model is widely applicable to assess impacts because it utilizes a generic model structure that can be parameterized with data available from a variety of sources, including farm surveys, experimental data, simulated data from bio-physical simulation models, and expert judgment. A key feature of this model is that it takes into account the fact that farmers systematically selected themselves into adopting and non-adopting groups. Analysis shows that this selection must be taken into account to obtain accurate estimates of impact.
To illustrate the use of the TOA-MD model, we use it to implement an impact assessment of integrated agriculture-aquaculture (IAA) systems in southern Malawi developed by the World Fish Center, using a WorldFish farm survey data collected in 2004, together with data from other public sources. We use the TOA-MD model to demonstrate how it is possible to use available data to move a conventional economic impact assessment “along the impact assessment pathway” to estimate adoption rates in the relevant populations, and to quantify impacts on distributional outcomes such as poverty, environmental impacts such as soil and water quality, and social and health-related outcomes such as nutrition or gender impacts. The analysis predicts an adoption rate of about 44%. In two districts, there is a substantial increase in protein consumption associated with the adoption of IAA and substantial reductions in poverty, whereas in others the effects are smaller.
Introduction
One of the great challenges in impact assessment is to “move assessment along the impact pathway” to quantify distributional, environmental impacts, and social impacts of agricultural technologies being developed and disseminated. As noted in a recent report sponsored by the Standing Panel on Impact Assessment of the CGIAR (Walker et al. 2008), a major impediment to meeting the growing demand for broader impact assessments is their cost in time and other resources, particularly when donors expect impact assessments to be carried out as part of a technology-related project. As Walker et al. (2008) observe, “In terms of both budgetary support and human capital, a disaggregated multi-dimensional impact study can be quite demanding and costly. The supply of these studies is more likely to be constrained by lack of funding than the other types. (p. 7). Nevertheless, Walker et al. (2008) conclude, “The desirability of moving along the impact pathway is unquestioned. As donors want to see ever more comprehensive impact assessments, so ways have to be found to accommodate their wishes… even when resources for carrying out these studies are not forthcoming.” (p. 14).

175175
A recent development in impact assessment methodology is the use of a “parsimonious” approach that moves the focus from site-specific, processes based models and data, to the use of simulation models parameterized with population data (Antle 2011). This approach has been implemented in the form of a generic “minimum-data Tradeoff Analysis” (TOA-MD) model that can be applied to assess impacts in a wide array of agricultural systems that incorporate crops, livestock and aquaculture (Antle and Valdivia 2010). The TOA-MD model is a unique simulation tool that uses a statistical description of a heterogeneous farm population to simulate the proportion of farms that utilizes a baseline system (in this case, farms not using integrated agriculture-aquaculture, or IAA) and the proportion of farms that would adopt an alternative system (in this case, farms using IAA) within defined strata of the population. We apply this model using those data from the World Fish impact assessment of IAA in Malawi made public by Dey et al (2010), together with data from other public sources such as the national agricultural census. We use the TOA-MD model to demonstrate how it is possible to move a conventional economic impact assessment “along the impact assessment pathway” to estimate adoption rates in the relevant populations, and to quantify impacts on distributional outcomes such as poverty, environmental impacts such as soil and water quality, and social and health-related outcomes such as nutrition or gender impacts.
The adoption and impacts of World Fish Center research on integrated agriculture-aquaculture (IAA) systems in Malawi has been studied and publicized by Dey et al. (2006, 2010), Russell et al. (2008), Government of Malawi, (2005), NSO-GoM (2010), FAO (2008) and related sources. The impact assessment that was carried out by World Fish Center analyzed factors influencing adoption, and using an assumed adoption rate, evaluated aggregate economic impacts and estimated a rate of return on investment. While the study collected some data on outcomes such as nutrition, this was done for a stratified random sample of a small number of farms not using and using aquaculture. Thus, while it was possible to conclude that if farms adopted IAA they would be better off in terms of income and nutrition, it was not possible to estimate an overall adoption rate or make statements about the overall impacts of IAA in the relevant population of farms that potentially could adopt the IAA technology. Moreover, the assessment also did not provide estimates of environmental impacts (CGIAR Science Council 2007). In this report we show how the TOA-MD approach can utilize data that was collected in the original impact assessment surveys, along with other publicly available data, to carry out a disaggregated, multi-dimensional impact assessment. The TOA-MD approach also provides the basis for carrying out sensitivity analysis to parameters that cannot be estimated with the available data, thus providing guidance about the types of data that should be collected in future impact assessments. Impact Assessment using TOA-MD
The TOA-MD model is a unique simulation tool that uses a statistical description of a heterogeneous farm population to simulate the proportion of farms that utilizes a baseline system (in this case, farms with small ponds and low integration) and the proportion of farms that would adopt an alternative system (in this case, farms with larger ponds, higher integration, and vegetable production) within defined strata of the population. Based on the predicted adoption rate of the alternative system, the TOA-MD model simulates associated economic, environmental and social impacts on adopters, non-adopters and the entire population. The version of the model used for the analysis presented here is a new version developed for impact assessment (Antle 2011). It is based on the earlier version developed for ecosystem service analysis (Antle and Valdivia 2006, 2010).
One unique feature of the TOA-MD model is its capability to exploit statistical relationships between technology adoption and the environmental, economic and social outcomes associated with adoption. Economic research shows that taking these inter-relationships between adoption and outcomes is critical to obtain accurate estimates of impact. This fact also has important implications for data collection that we discuss in the conclusions of this study.
Another unique feature of the TOA-MD model is its parsimonious, generic structure, which means that it can be used to simulate virtually any farm system. One virtue of this model design is that, unlike many large, complex simulation models, it is easy to relate

176176
results to particular features of the system. TOA-MD is also well-suited to address the uncertainty in impact assessments, by using sensitivity analysis to explore how results change with different assumptions. The TOA-MD model is programmed in Excel, and is easy to learn and use. The model utilizes the following types of data: population means and variances of production, output price and cost of production, by
crop, aquaculture and livestock activity
population means and variances of environmental and social outcomes associated with each system
correlations between system returns and environmental and social outcomes
population means and variances of farm household characteristics (farm size, pond size, household size, off-farm income).
Population and Strata
The population represented is farms in southern Malawi that could adopt aquaculture, or that have aquaculture operating at a low level of integration that could be improved. The strata are 5 districts where survey data were collected : Zomba East and West (pop. 670500), Mulanje (pop. 428322), Mwanza (pop. 138000), Thyolo (pop. 458000), and Mangochi (pop. 610000), see Figure 1.
Brooks (1992) estimated the potential areas for aquaculture in Malawi based on some physiographic factors (land formations, altitude, temperature, precipitation, run-off and soils). Brooks estimated that the areas under or that have potential for aquaculture in Malawi was about 11,650 km2 and about 7,200km2 corresponded to the southern regions of Malawi. More recently, the project “Determination of High-Potential Aquaculture Development Areas and Impact in Africa and Asia (funded by the Federal ministry of Economic Cooperation and Development of Germany and in coordination with the WorldFish and other partner institutions) developed a decision-support package that can be used to identify areas where aquaculture is feasible. One of the studies of this project was carried out in southern Malawi where they identified areas with existing and potential aquaculture adoption. They used biophysical (e.g. water availability, land conditions) and socio-economic (market, knowledge and inputs, labor and finance) criteria to evaluate the suitability of the area. The overall area suitable for Southern Malawi estimated was about 35,400km2 (Kam et al., 2008; Kam and Teoh, 2008).
Agriculture in Southern Malawi is characterized by small farms (average 0.89 ha)1 growing mixed crop systems of maize, beans and some vegetables. Poverty rates are very high, approximately 70% based on the Malawi poverty line of about $0.41/person/day. Some farms have non-agricultural income. Various NGOs have been involved for several years in encouraging adoption of more highly integrated agriculture-aquaculture (IAA) systems. Adopters of IAA tend to be larger farms growing irrigated vegetables and have higher incomes and lower poverty. Integrated Aquaculture-Agriculture (IAA) Farming Systems
The IAA farming system is based on the utilization of organic wastes and by-products, such as crop residues, as feed inputs to the fish pond, and the recycling of pond mud and water containing nutrient wastes back to cropland. In Southern Malawi, maize bran is the most common pond input. (Dey et al. 2007).
The Malawi data differentiate the farms according to a) the adoption or non-adoption of IAA, and b) the level of integration of IAA. Based on this data we defined the systems for our analysis as:
1 Average farm size in Dey et al. (2010) survey data was about 1.4ha because it
included dambo areas used for IAA
177177
System 1: Crop-based system of maize, beans and some other crops, with the addition of small ponds with a low level of integration with agriculture. The level of integration is defined by the number of bio-resource flows in the farm, where 2 or less bio-resources is considered to be the low integration case.
System 2: more highly integrated system with larger ponds and irrigated vegetables that utilize water from ponds. Impact Indicators Mean farm income and per-capita income
The mean farm income in the study area is about $420/yr while the per-capita income is about $160/yr. Fish culture contributes in average between 8% and 10% to the annual farm income (Dey et al., 2007, 2010) Poverty rate
Poverty rates are high in the region, several sources indicate poverty rates ranging from 65% to 78% (NSO-GoM, 1998, IFAD, 2006). According to the survey data, using the official poverty line of 16,165 Malawi Kwacha/year and an exchange rate of 108 Kwacha per US dollar, the poverty rate of the farms in the survey is about 90 percent. Human nutrition
A survey performed by the GoM’s National Nutrition in December 2005 for the rural Malawian population, concluded that the national average number of meals per day for an adult was 2.0; 45% of adults had two meals the day before the survey, roughly one-third of adults had three meals and 19% had only one meal the day before the survey. The percentage of households reporting at least one member regularly reducing the amount of food they consumed at mealtimes was 82% and 49% of households reported that at least one member did not eat during a whole day in the last month due to lack of food (GoM and UNICEF, 2005). An important component of diet is protein consumption.
Data
The TOA-MD model utilizes statistics (means, variances, correlations) estimated from the data. The model set-up with all of the data used for the analysis is available from the authors. Farm Data
The average farm size in the population is about 1.9 ha, with an average household size of 5 people. The low integrated farms is characterized by having small ponds averaging 150m2 (0.015 ha), while high integrated farms own larger ponds with an average of 300m2. Non-agricultural income per farm varies across strata and ranges from $44 to about $100, with an average of $76/farm. Economic Data
Maize is the main staple crop in this region, but farmers also grow a combination of other crops (e.g. beans, pigeon peas, cowpeas, etc.). For this analysis we use maize and beans to represent the crop activities in the farms with low integration. Farmers with high integration of IAA grow vegetables in addition to maize and beans. Data on yields as well as production costs and prices were obtained from GoM (2005), Chilongo (2005) and NoS (2010). Nutrition
Using the survey data, the protein consumption in each household (kg/person/month) was calculated. The data showed that the average for non-IAA farms was about 1.32 kg/person/month, whereas the average for IAA farms was about 1.64.
Results
Results of the analysis are presented in Figures 2, 3 and 4, and summarized in Table
1. Figure 2 presents curves showing the simulated adoption rate of IAA as a function of the opportunity cost of changing from System 1 to System 2. The rate that would occur if farmers are behaving economically rationally and maximizing expected returns to their farms,

178178
is the point where the curves cross the horizontal axis. This rate ranges from 38 to 49 percent.
Figure 3 presents the predicted poverty rates in relation to the adoption rate of IAA. The baseline poverty rates are at the zero adoption rate, and as noted above, average about 90 percent, and range from 74 to 99 percent. At the economically-efficient rates of adoption (the rates where the adoption curves cross the horizontal axis in Figure 2), the poverty rates decline by 8 to 14 percent, when averaged over the entire population of adopting and non-adopting farms. However, when only adopting farms are considered, the poverty rates decline for adopters by 19 to 35 percent (Table 1).
Figure 4. shows the impacts on protein consumption. The baseline (the rate at zero adoption) shows that protein consumption varies substantially across the regions. Adoption of IAA has relatively small impacts on those areas where consumption is relatively high, but has substantial impacts in Mulange and Mangochi, the two districts with the lowest protein consumption. In those areas, protein consumption among adopters increases from less than 1 kg/person/month to over 2 kg/person/month.
Conclusions
This paper demonstrates the use of the TOA-MD model to carry out an integrated
impact assessment of technology adoption, using the case of integrated agriculture-aquaculture in Malawi. Using TOA-MD, it is possible to implement an integrated assessment of economic, environmental and social impacts at low cost relative to methods that rely on case-specific, complex bio-economic simulation models. Cost is reduced in two ways. First, by using a generic model that can be applied to virtually any system, the time and resources needed to design a new model for each case are largely eliminated. Second, by identifying in advance the indicators that need to be quantified, any data collection activities can be focused on the relevant information, thus eliminating the cost and respondent burden caused by the “kitchen sink” approach to survey design. Moreover, the TOA-MD approach shows that correlations between economic, environmental and social data are often needed to obtain accurate estimates of impact. By recognizing this need in advance, the cost of collecting data can be reduced, and the quality of impact assessment can be enhanced.
References Antle, J.M. 2011. “Parsimonious Technology Impact Assessment.” American Journal of
Agricultural Economics, submitted (revised). Antle, J.M. and R.O. Valdivia. 2010. TOA-MD Version 4: Minimum-Data Tradeoff Analysis
Model. www.tradeoffs.oregonstate.edu. Antle, J.M., Valdivia, R. 2006. “Modelling the Supply of Ecosystem Services from Agriculture:
A Minimum-Data Approach.” Australian Journal of Agricultural and Resource Economics 50: 1–15.
Brooks, A.C., 1992. Viability of commercial fish farming in Malawi - a short study. Central and Northern Regions Fish Farming Project, Mzuzu, Malawi
Chilongo, T. (2005) An Assessment of Smallholder Farmers' Access to Produce Markets in Malawi: The Case of Kasungu RDP. In: Tsutomo Takane (Ed) “Agricultural and Rural Development in Malawi: Macro and Micro Perspectives”.
Dey, M.M., P. Kambewa, M. Prein, D. Jamu, F. J. Paraguas, D. E. Pemsl and R. M. Briones. Impact of Development and Dissemination of Integrated Aquaculture-Agriculture (IAA) Technologies in Malawi, NAGA, WorldFish Center Quarterly Vol. 29 No. 1 & 2 Jan-Jun 2006
Dey, Madan M.; Paraguas, F.; Kambewa, P.; Pemsl, D. 2010. The Impact of integrated aquaculture-agriculture on small-scale farms in Southern Malawi. Agricultural Economics 41: 67-69
Dey, M.M., Kambewa, P., Prein, M., Jamu, D., Paraguas, F.J., Briones, R., Pemsl, D.E., 2007. Impact of the development and dissemination of integrated aquaculture-agriculture (IAA) technologies in Malawi. In: Waibel H., Zilberman, D. (Eds.), International

179179
Research on Natural Resources Management: Advances in Impact Assessment. CAB International, Oxfordshire, UK, pp. 118–14
FAO, 2008. Malawi Nutrition Profile: Nutrition and Consumer protection Division, FAO. IFAD (2006) Enabling the rural poor to overcome poverty in Malawi. Rome, November 2006. GoM(Government of Malawi), 2005. Integrated Household Survey 2004–2005. National
Statistical Office, Zomba Kam SP, Barth H, Pemsl DE, Kriesemer SK, Teoh SJ, and Bose ML. 2008. Recommendation
Domains for Pond Aquaculture. WorldFish Center Studies and Reviews 1848. The WorldFish Center, Penang, Malaysia. 40 pp.
Kam, S.P. and S.J. Teoh (2008). Suitability Analysis & Query for Aquaculture (SAQUA). Tutorial Guide. The WorldFish Center.
National Statistics Office (NSO), Government of Malawi (2010) – Online statistics. http://www.nso.malawi.net/
Russell, A.; Grotz, P.; Kriesemer, S.; Pemsl, D. (2008). Recommendation Domains for pond Aquaculture: Country Case Study: Development and status of freshwater Aquaculture in Malawi. WorldFish Center Studies & Reviews No. 1869. The WorldFish Center, Penang, Malasya. 52p.
UNICEF. 2005. The State of World’s Children 2005. United Nations Children’s Fund. New York. USA.
Walker T., Maredia M., Kelley T., La Rovere R., Templeton D., Thiele G., and Douthwaite B. 2008. Strategic Guidance for Ex Post Impact Assessment of Agricultural Research. Report prepared for the Standing Panel on Impact Assessment, CGIAR Science Council. Science Council Secretariat: Rome, Italy.

180180
Mangochi
Zomba
Mulanje
Thyolo
Mwanza
Figure 1. Study area: Map of Malawi
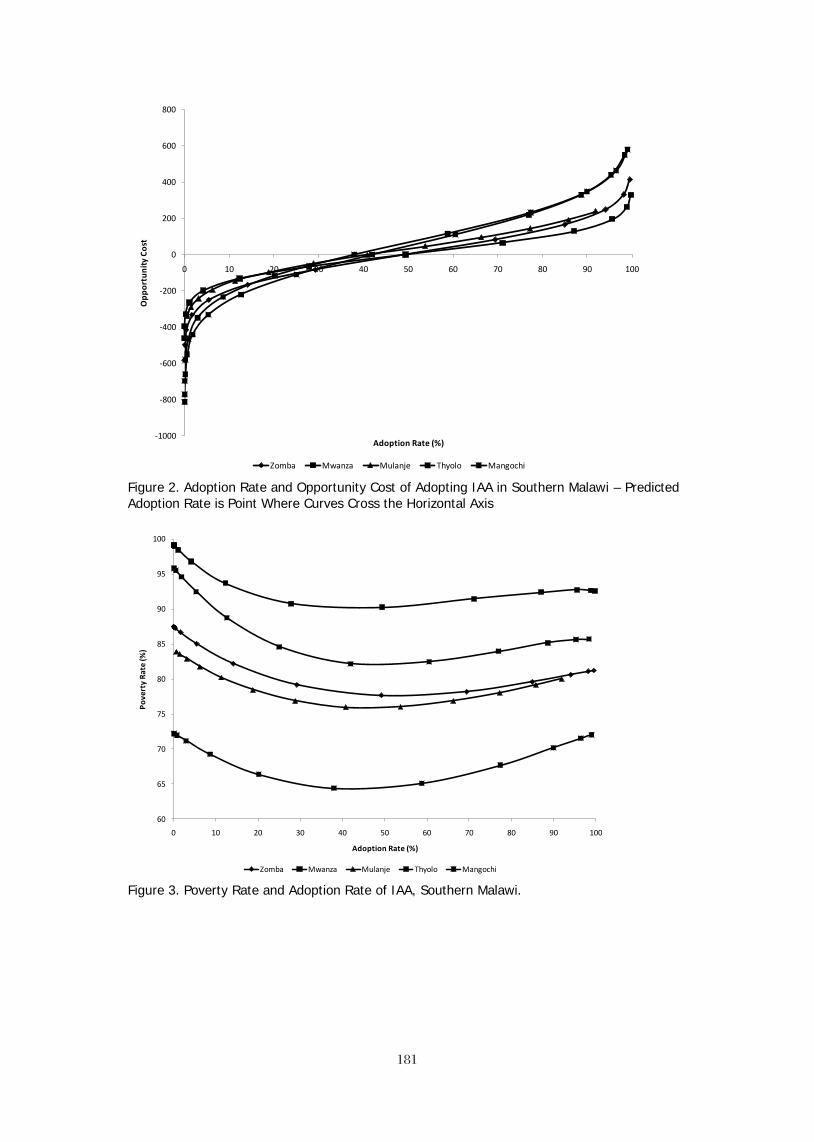
181181
-1000
-800
-600
-400
-200
0
200
400
600
800
0 10 20 30 40 50 60 70 80 90 100
Opp
ortu
nity
Cos
t
Adoption Rate (%)
Zomba Mwanza Mulanje Thyolo Mangochi
Figure 2. Adoption Rate and Opportunity Cost of Adopting IAA in Southern Malawi – Predicted Adoption Rate is Point Where Curves Cross the Horizontal Axis
60
65
70
75
80
85
90
95
100
0 10 20 30 40 50 60 70 80 90 100
Pove
rty
Rate
(%)
Adoption Rate (%)
Zomba Mwanza Mulanje Thyolo Mangochi Figure 3. Poverty Rate and Adoption Rate of IAA, Southern Malawi.

182182
0
0.5
1
1.5
2
2.5
0 10 20 30 40 50 60 70 80 90 100
Mea
n M
onth
ly P
rote
in C
onsu
mpt
ion
per p
erso
n (k
g)
Adoption Rate (%)
Zomba Mwanza Mulanje Thyolo Mangochi Figure 4. Mean Monthly Protein Consumption and Adoption of IAA, Southern Malawi.

183183
Table 1. Summary results
Ave.
farm
inco
me
($/y
ear)
Po
vert
y ra
te (%
) M
ean
Mon
thly
Pro
tein
Con
sum
ptio
n (k
g/pe
rson
)
Stra
ta
Adop
tion
rate
(%)
base
(no
adop
tion)
% C
hang
e on
po
pula
tion
%
Cha
nge
on
adop
ters
ba
se (n
o ad
optio
n)
% C
hang
e on
po
pula
tion
%
Cha
nge
on
adop
ters
ba
se (n
o ad
optio
n)
% C
hang
e on
po
pula
tion
%
Cha
nge
on
adop
ters
ZO
MBA
49
.22
112.
47
54.6
0%
135.
62%
87
.50
-15.
81%
-4
2.48
%
1.41
12
.86%
38
.95%
M
WAN
ZA
49.4
0 89
.01
50.7
7%
137.
61%
99
.16
-16.
01%
-5
1.88
%
1.94
0.
30%
10
.64%
M
ULA
NJE
40
.81
81.0
1 54
.46%
17
9.51
%
84.3
0 -1
1.38
%
-44.
26%
0.
65
53.1
0%
191.
35%
TH
YOLO
41
.92
170.
85
41.8
5%
116.
92%
95
.93
-16.
48%
-5
6.11
%
1.75
-0
.49%
28
.63%
M
ANGO
CHI
37.9
5 18
8.62
30
.77%
11
6.63
%
72.2
4 -1
0.53
%
-53.
66%
0.
77
56.4
2%
178.
33%
RE
GIO
N
44.4
9 12
3.90
45
.23%
13
2.70
%
87.1
1 -1
1.25
%
-30.
45%
1.
29
15.3
2%
59.0
0%

184
184
VALUE CHAIN OF CULTURED SNAKEHEAD FISH IN THE MEKONG DELTA OF VIETNAM
Le Xuan Sinh2; R. S. Pomeroy3 & Do Minh Chung1
Email: [email protected]
ABSTRACT
Snakehead fish is the fish species which is mostly preferred by consumers in the Mekong Delta of Vietnam. However, it is difficult to develop this industry due to a number of reasons. This study was carried out with the aims to describe the value chain of cultured snakeheads and to analyze the distribution of cost-benefit among the chain actors in the delta. Among 10 common market channels, two most important ones in term of total production were Channel 3 (Fish farmers – Wholesalers – Retailers – End consumers in the Mekong Delta), and Channel 9 (Fish farmers – Wholesalers – Wholesalers in Ho Chi Minh City). Profit was unbalant distributed among the chain actors, mainly for the wholesalers (87.9-93.4% of total profit of the whole chain). In order to have an appropriate development of snakehead industry, to improve profit of the whole chain and to have a better competition power, the followings should be given more consideration: (i) more proper planning of cultured area and technological supports, and marketing of fish products; (ii) To encourage the application of pelette feed in order to reduce the pressure on fresh water wild fish stocks; and (iii) To have incentive policies/regulations that help to encourage the processors to export, especially processed products for a long-term market expansion in terms of higher production, more export value, and stable price of snakehead products.
Key words: chain actor, cost, profit, snakehead fish, value added, value chain, yield.
INTRODUCTION The cage culture of giant snakehead (Channa micropeltes) was started in Vietnam in
the 1960s, while the farming of common snakehead fish (Channa striatus) was begun in the 1990s and spread by different farming systems in the flood-prone areas of the Mekong Delta. However, the development of snakehead fish culture was unstable and said to contribute to the depletion of wild fish resources, more water pollution, and unsustainable development. This study was carried out over a one year period beginning in September 2009. It covers four main provinces of snakehead farming in the Mekong Delta (An Giang, Dong Thap, Can Tho and Hau Giang). The study aims to describe the value chain of cultured snakeheads and the distribution of cost-benefit among the chain actors in the study area. Five main groups of actors of snakehead value chain (farmers, traders, processors, retailers and end consumers) were interviewed. In addition, two chain supporters, including market managers and government officers were also interviewed.
Reports from provinces in the Mekong Delta in 2010 revealed that estimated total production of snakehead fish in the Delta was about 40,000 tons, increasing about 1,000 tons compared to that of the previous year, of which giant snakeheads made up approximately 20% of the total production. The average stocking duration was 4-6 months/crop depending on cultured species and selling price at the harvest. Average stocking density was 204 fish/m3 (or 114 fish/m3) with the average survival rate of 53.2% and the average yield was 41.9 kg/m3/crop. Production cost was VND 29,700 per kg and if the cost of self-captured trash fish was not taken into account, this cost was reduced to about VND 24,400 per kg. Most of local traders bought snakeheads directly from the grow-out farmers (54.7%) and resold the fish to bigger traders in Ho Chi Minh City (58.8%). All retailers in the local markets sold their fish to local consumers.
For dried snakehead processors, the average amount of raw fish bought was 8.2 tons/processor/year, of which 84.4% was bought from fish traders. Approximately 60% sold
2 Cantho University, Vietnam. 3 University of Connecticut, USA.
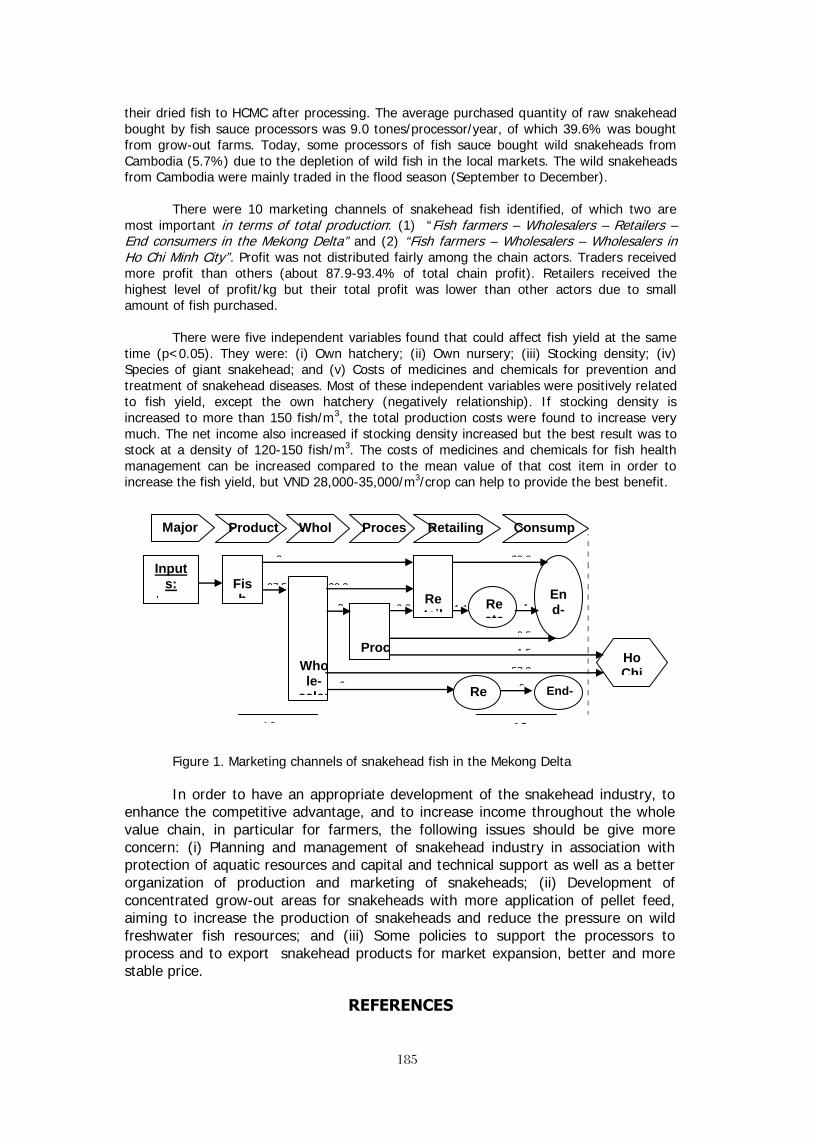
185
185
their dried fish to HCMC after processing. The average purchased quantity of raw snakehead bought by fish sauce processors was 9.0 tones/processor/year, of which 39.6% was bought from grow-out farms. Today, some processors of fish sauce bought wild snakeheads from Cambodia (5.7%) due to the depletion of wild fish in the local markets. The wild snakeheads from Cambodia were mainly traded in the flood season (September to December).
There were 10 marketing channels of snakehead fish identified, of which two are most important in terms of total production: (1) “Fish farmers – Wholesalers – Retailers – End consumers in the Mekong Delta” and (2) “Fish farmers – Wholesalers – Wholesalers in Ho Chi Minh City”. Profit was not distributed fairly among the chain actors. Traders received more profit than others (about 87.9-93.4% of total chain profit). Retailers received the highest level of profit/kg but their total profit was lower than other actors due to small amount of fish purchased.
There were five independent variables found that could affect fish yield at the same time (p<0.05). They were: (i) Own hatchery; (ii) Own nursery; (iii) Stocking density; (iv) Species of giant snakehead; and (v) Costs of medicines and chemicals for prevention and treatment of snakehead diseases. Most of these independent variables were positively related to fish yield, except the own hatchery (negatively relationship). If stocking density is increased to more than 150 fish/m3, the total production costs were found to increase very much. The net income also increased if stocking density increased but the best result was to stock at a density of 120-150 fish/m3. The costs of medicines and chemicals for fish health management can be increased compared to the mean value of that cost item in order to increase the fish yield, but VND 28,000-35,000/m3/crop can help to provide the best benefit.
Figure 1. Marketing channels of snakehead fish in the Mekong Delta
In order to have an appropriate development of the snakehead industry, to enhance the competitive advantage, and to increase income throughout the whole value chain, in particular for farmers, the following issues should be give more concern: (i) Planning and management of snakehead industry in association with protection of aquatic resources and capital and technical support as well as a better organization of production and marketing of snakeheads; (ii) Development of concentrated grow-out areas for snakeheads with more application of pellet feed, aiming to increase the production of snakeheads and reduce the pressure on wild freshwater fish resources; and (iii) Some policies to support the processors to process and to export snakehead products for market expansion, better and more stable price.
REFERENCES
100%
100%
1.1%
0.8%
6.6%
1.5%
0.5%
1.1
%
33.0%
6.6%
57.3%
2.7
%
30.8%
97.5%
2.5
%
Fish
farme-rs
Inputs:
+ Seed + Feed + Drugs
Whole-
salers
Proces-
sors
Retail-
ers
End-consu-mers
Resta-
rants Ho
Chi Minh City
Resta-
rants
End-cons-umers
Retailing
Whole
saling
Processing
Production
Consumption
Major input
s

186
186
Sinh, L. X., and D. M. Chung (2009). Survey of farming systems of snakeheads (Channa micropeltes and Channa striatus) in the Mekong Delta. Report of AquaFish-CRSP.
Departments of Agriculture & Rural Development (2010). Annual report of provinces in the Mekong Delta.
Making markets work better for the poor-M4P, 2007. Making value chains work better for the poor – A toolbook for practitioners of Value chain analysis.

187
187
USE OF GONADOTROPIN RELEASING HORMONE ANALOGS ON THE INDUCED REPRODUCTION OF CHAME Dormitator latifrons
Gustavo A. Rodriguez M. de O.1*, Eva A. Medina H1., Jeniffer Velazquez S1., Vanesa Lopez L1., Cristobal Roman R1., Konrad Dabrowski2, Eladio Gaxiola Camacho1, Maria C. Haws3. 1Facultad de Ciencias del Mar, Universidad Autónoma de Sinaloa, AP 187 Mazatlán, Sin México
CP 82000 2School of Environment and Natural Resources, Ohio State University, Columbus OH
3Pacific Aquaculture and Coastal Resources Center, University of Hawaii at Hilo, Hilo, Hawaii, USA
*Corresponding author: [email protected]
Abstract
Chame (Pacific Fat Sleeper) is considered a relevant upcoming fish species for aquaculture; particularly in Ecuador and some preliminary trials in Mexico. Nevertheless, the reported production for the last 15 to 20 years in culture has been dependant of wild-caught juveniles. Thus, we are conducting research focused on the achievement of controlled reproduction and larvae production as well as to get relevant information on the reproductive biology of the fish. At this moment we have successfully induced gamete release in both genders using the following procedures: An experiment was conducted with 16 females divided into the following groups: control group (0.5 ml/kg 0.9% saline solution), Desgly10-Ala6 LHRHa injected at 40 µg/kg (priming dosage) and 80 µg/kg (resolving dose), 2 injections of Ovaprim® at 0.5 ml/kg or a single implant 75 µg (Ovaplant®). Spawning results showed 100% success within 24h and 48h for the Ovaplant group, and 25% for the LHRHa treatment but 0% for Ovaprim group within 48-72h. Only one natural spawn was observed. Obtained data establishes oocyte size as 300 µm and a relative fecundity of 80,000 to 100,000 cells per gram. All delivery treatments were effective to induce spermiation in volumes from 0.5 to 10 ml per male (LHRHa injected at 40 µg/kg, Ovaprim® at 0.5 ml/kg or a single implant 75 µg (Ovaplant®); however several males released sperm naturally up to 1 ml throughout the reproductive season. Obtained data indicates that sperm activation time is close to 4 minutes, and overall concentration is within the range of 1 to 2X10⁹ cells per milliliter. Increased sperm motility is achieved after predilution on a 1:10-1:40 ratio in Ringer´s solution. As optimal salinity values, both for fertilization and egg incubation, our results indicate that there is no sperm activation above 5‰ of salinity; similar data were recorded for optimal incubation salinity as no hatching was observed above 5‰ salinity. These findings are relevant due to the differences with other spawning protocols previously used, given that other trials reported the need of repeated injections of Human chorionic gonadotropin (HcG) up to 10,000 UI per fish. Another difference with previous studies was the observance of only partial spawns. We conclude that these protocols allow to successfully obtaining viable gametes for chame larvae production.
Introduction
At present, medium-scale commercial aquaculture in Ecuador, as well as initial experiences of chame culture in Mexico, are conducted with wild caught juvenile fish. There is also interest in this fish in Nicaragua, where freshwater fishes such as tilapia are currently fetching higher prices than cultured shrimp. Therefore, the goal of this work is the production of juveniles under laboratory conditions and minimize the dependency on wild fish supply. Available information indicates that in Ecuador, chame aquaculture has continuously decreased over the last eight years due to the shortage of juvenile fish since controlled propagation has not been achieved. Research in this area was largely abandoned over ten years ago. For Mexico, there is a steadily demand on the central and the southern Pacific Coast. Also, as surveyed by the authors, there are already fish farmers interested in
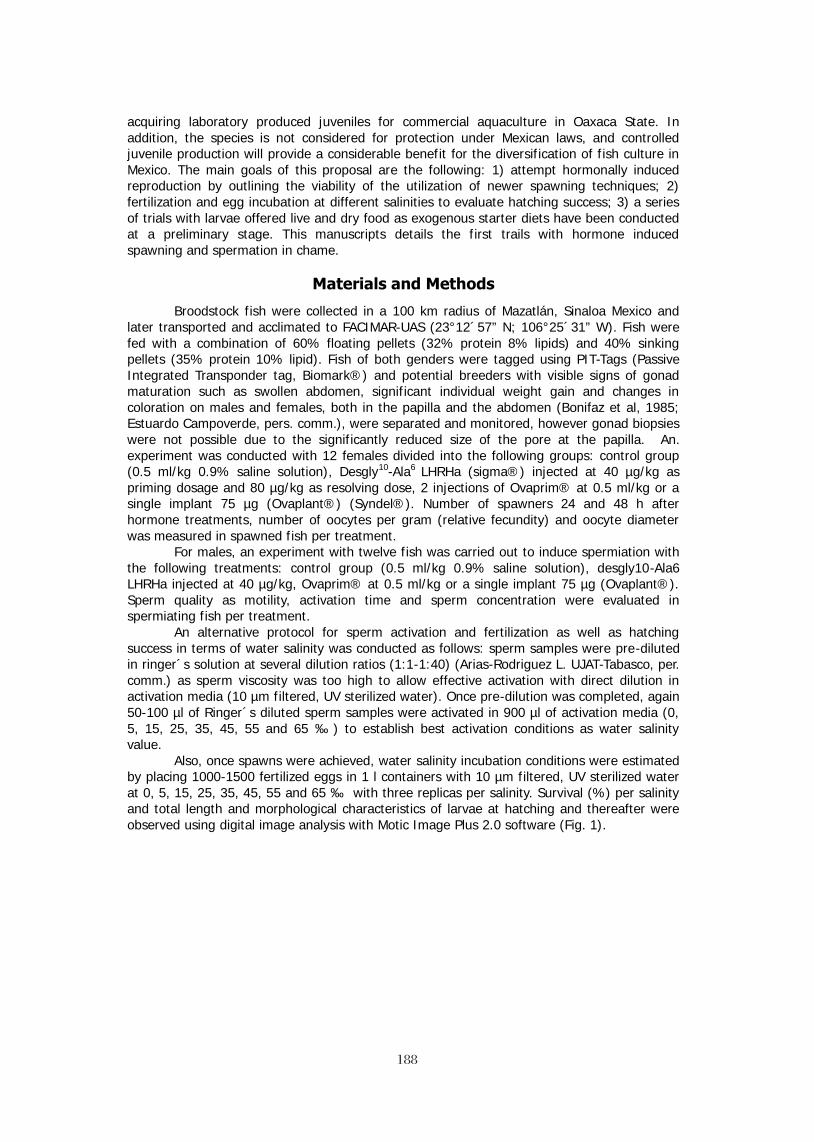
188
188
acquiring laboratory produced juveniles for commercial aquaculture in Oaxaca State. In addition, the species is not considered for protection under Mexican laws, and controlled juvenile production will provide a considerable benefit for the diversification of fish culture in Mexico. The main goals of this proposal are the following: 1) attempt hormonally induced reproduction by outlining the viability of the utilization of newer spawning techniques; 2) fertilization and egg incubation at different salinities to evaluate hatching success; 3) a series of trials with larvae offered live and dry food as exogenous starter diets have been conducted at a preliminary stage. This manuscripts details the first trails with hormone induced spawning and spermation in chame.
Materials and Methods
Broodstock fish were collected in a 100 km radius of Mazatlán, Sinaloa Mexico and later transported and acclimated to FACIMAR-UAS (23°12´57” N; 106°25´31” W). Fish were fed with a combination of 60% floating pellets (32% protein 8% lipids) and 40% sinking pellets (35% protein 10% lipid). Fish of both genders were tagged using PIT-Tags (Passive Integrated Transponder tag, Biomark®) and potential breeders with visible signs of gonad maturation such as swollen abdomen, significant individual weight gain and changes in coloration on males and females, both in the papilla and the abdomen (Bonifaz et al, 1985; Estuardo Campoverde, pers. comm.), were separated and monitored, however gonad biopsies were not possible due to the significantly reduced size of the pore at the papilla. An. experiment was conducted with 12 females divided into the following groups: control group (0.5 ml/kg 0.9% saline solution), Desgly10-Ala6 LHRHa (sigma®) injected at 40 µg/kg as priming dosage and 80 µg/kg as resolving dose, 2 injections of Ovaprim® at 0.5 ml/kg or a single implant 75 µg (Ovaplant®) (Syndel®). Number of spawners 24 and 48 h after hormone treatments, number of oocytes per gram (relative fecundity) and oocyte diameter was measured in spawned fish per treatment.
For males, an experiment with twelve fish was carried out to induce spermiation with the following treatments: control group (0.5 ml/kg 0.9% saline solution), desgly10-Ala6 LHRHa injected at 40 µg/kg, Ovaprim® at 0.5 ml/kg or a single implant 75 µg (Ovaplant®). Sperm quality as motility, activation time and sperm concentration were evaluated in spermiating fish per treatment.
An alternative protocol for sperm activation and fertilization as well as hatching success in terms of water salinity was conducted as follows: sperm samples were pre-diluted in ringer´s solution at several dilution ratios (1:1-1:40) (Arias-Rodriguez L. UJAT-Tabasco, per. comm.) as sperm viscosity was too high to allow effective activation with direct dilution in activation media (10 µm filtered, UV sterilized water). Once pre-dilution was completed, again 50-100 µl of Ringer´s diluted sperm samples were activated in 900 µl of activation media (0, 5, 15, 25, 35, 45, 55 and 65 ‰) to establish best activation conditions as water salinity value.
Also, once spawns were achieved, water salinity incubation conditions were estimated by placing 1000-1500 fertilized eggs in 1 l containers with 10 µm filtered, UV sterilized water at 0, 5, 15, 25, 35, 45, 55 and 65 ‰ with three replicas per salinity. Survival (%) per salinity and total length and morphological characteristics of larvae at hatching and thereafter were observed using digital image analysis with Motic Image Plus 2.0 software (Fig. 1).
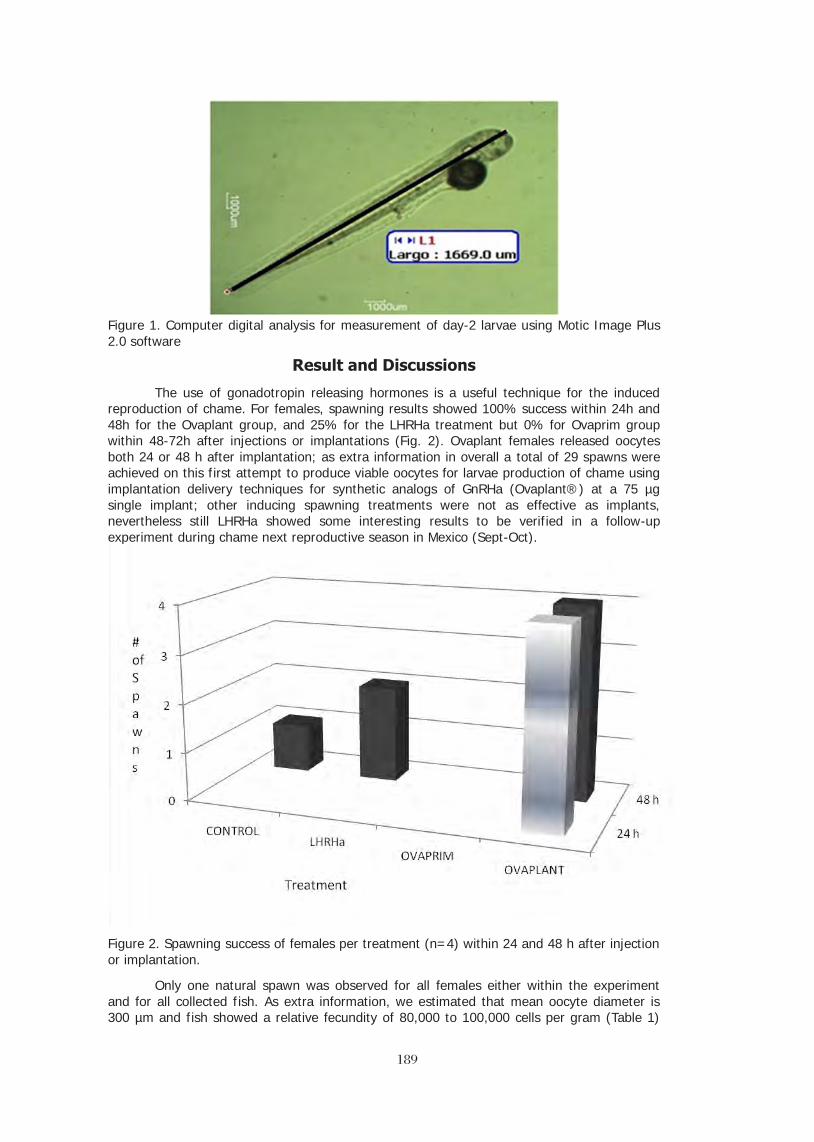
189
189
Figure 1. Computer digital analysis for measurement of day-2 larvae using Motic Image Plus 2.0 software
Result and Discussions
The use of gonadotropin releasing hormones is a useful technique for the induced reproduction of chame. For females, spawning results showed 100% success within 24h and 48h for the Ovaplant group, and 25% for the LHRHa treatment but 0% for Ovaprim group within 48-72h after injections or implantations (Fig. 2). Ovaplant females released oocytes both 24 or 48 h after implantation; as extra information in overall a total of 29 spawns were achieved on this first attempt to produce viable oocytes for larvae production of chame using implantation delivery techniques for synthetic analogs of GnRHa (Ovaplant®) at a 75 µg single implant; other inducing spawning treatments were not as effective as implants, nevertheless still LHRHa showed some interesting results to be verified in a follow-up experiment during chame next reproductive season in Mexico (Sept-Oct).
Figure 2. Spawning success of females per treatment (n=4) within 24 and 48 h after injection or implantation.
Only one natural spawn was observed for all females either within the experiment and for all collected fish. As extra information, we estimated that mean oocyte diameter is 300 µm and fish showed a relative fecundity of 80,000 to 100,000 cells per gram (Table 1)

190
190
Apparently, only partial spawns were recorded for all observed spawns. Thus, we were able to validate GnRH analogs as valuable tools to achieve controlled spawning of chame, in a similar fashion to bullseye puffer Sphoeroides annulatus (Duncan et al., 2003) and with better results that previous trials in Ecuador (several per comm.) were large amounts of HcG had to be injected (up to 10,000 UI) to obtain viable oocytes or no spawn achieved as tested with fatsleeper Dormitator maculatus using HcG, LHRHa and Ovaprim (Gaude et al, 2010).
Table 1. Estimated values of spawning females for all experimental treatmens within the experiment.
Variable Control LHRHa Ovaprim Ovaplant
Weight (g) 393.3±185.1 486.15±205.2 388.9±151.6 388.6±216.1
% of spawning fish 25% 50% 0% 100%*
Relative fecundity (cell g-1) 83000 59000 n/a 50000±10000**
Oocyte diameter (µm) 392.6±51.8 327.7±18.5 n/a 353.8±106.6**
*n=4 **Pooled from 4 females
For males, sperm quality issues are noticeable given that in most cases, milt collected can show very low sperm motility; either after hormone injection or with testicle removal and maceration from fish (Estuardo Campoverde, pers. comm.). We were able to induce spermiation in all hormone treatments with minimal changes in estimated sperm quality variables (Table 2). As main difference, both and Ovaprim and Ovaplant groups released as significantly higher amount of milt, with noticeable sperm fluid mixed with sperm fluid; however it did not affect motility or sperm concentration (Table 2). LHRHa was an effective spermiation inducing agent as proved with many other fish such as bullseye puffer Sphoeroides annulatus (Rodriguez, 2001). Several males released sperm naturally up to 1 ml throughout the reproductive season as observed in this experiment. Obtained data indicates that sperm activation time is close to 4 minutes, and overall concentration is within the range of 1 to 2X10⁹ cells per milliliter (table 2). No spermatocrit values were recorded as chame sperm viscosity probed to high in undiluted sperm. Therefore, GnRHa can be used to induce sperm release in chame, result that in our knowledge is the first report of similar findings.
Predilution of sperm in Ringer´s solution on a 1:10 ratio was determined to be the most favorable ratio, both for sperm activation and fertilization. As optimal salinity values, both for fertilization and egg incubation, our results indicate that there is no sperm activation above 5‰ of salinity; similar data were recorded for optimal incubation salinity as no hatching was observed above the same salinity value. Therefore all fertilization and incubation trials were conducted in 1 µm filtered, UV sterilized fresh water.
Table 2. Estimated values of sperm quality for all experimental treatments
Variable Control LHRHa Ovaprim Ovaplant
Weight (g) 622.7±54.7 434.7±139.4 538.75±187.4 540.6±202.1
# of spermiating fish 3 4 3 4
Mean volume ml 0.5 2.3 4.3 8.2
Motility (%) 93.3±11.5 83.3±11.5 80.0±26.4 93.3±5.77
Activation time (Min) 4:24±0:22 4:57±1:91 2:47±1:37 2:90±1:02
Concentration (cell ml-1) 1.96E+09±
1.29E+09
2.29E+09±
7.8E+08
1.26E+09±
2.37E+08
2.31E+09±
7.84E+08
Eggs are demersal and have an adhesive layer, transparent and spherical with a 300 µm average diameter (Fig. 3a). Hatching occurs at 14-17 hours at 26°C, larvae length is close to 1288.2±137.2 µm, yolk sack diameter is around 171.2±10.6 µm with a single lipid droplet, no eyes or mouth are visible and show a vertical floating position with no active movement (Fig. 3b). At 24 h (1 day posthatching DPH), yolk sack diameter reduces to 137.1±8.3 µm,
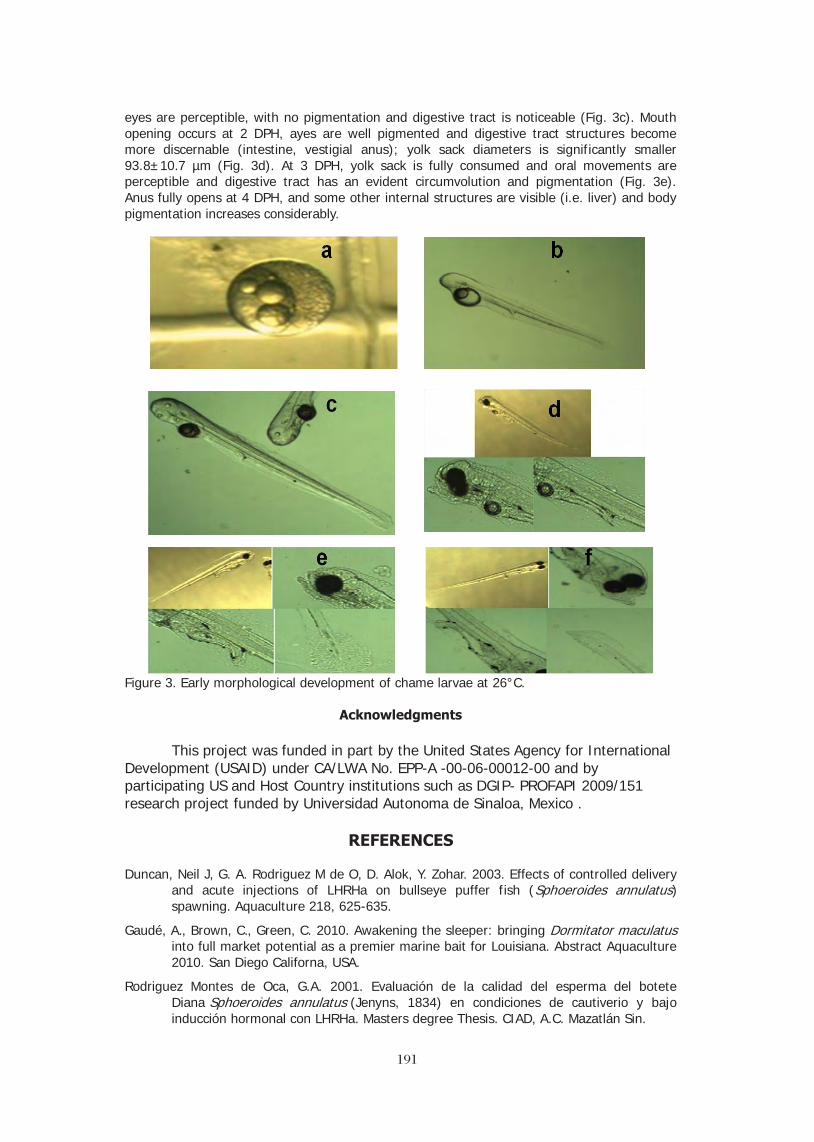
191
191
eyes are perceptible, with no pigmentation and digestive tract is noticeable (Fig. 3c). Mouth opening occurs at 2 DPH, ayes are well pigmented and digestive tract structures become more discernable (intestine, vestigial anus); yolk sack diameters is significantly smaller 93.8±10.7 µm (Fig. 3d). At 3 DPH, yolk sack is fully consumed and oral movements are perceptible and digestive tract has an evident circumvolution and pigmentation (Fig. 3e). Anus fully opens at 4 DPH, and some other internal structures are visible (i.e. liver) and body pigmentation increases considerably.
Figure 3. Early morphological development of chame larvae at 26°C.
Acknowledgments
This project was funded in part by the United States Agency for International Development (USAID) under CA/LWA No. EPP-A -00-06-00012-00 and by participating US and Host Country institutions such as DGIP- PROFAPI 2009/151 research project funded by Universidad Autonoma de Sinaloa, Mexico .
REFERENCES
Duncan, Neil J, G. A. Rodriguez M de O, D. Alok, Y. Zohar. 2003. Effects of controlled delivery and acute injections of LHRHa on bullseye puffer fish (Sphoeroides annulatus) spawning. Aquaculture 218, 625-635.
Gaudé, A., Brown, C., Green, C. 2010. Awakening the sleeper: bringing Dormitator maculatus into full market potential as a premier marine bait for Louisiana. Abstract Aquaculture 2010. San Diego Californa, USA.
Rodriguez Montes de Oca, G.A. 2001. Evaluación de la calidad del esperma del botete Diana Sphoeroides annulatus (Jenyns, 1834) en condiciones de cautiverio y bajo inducción hormonal con LHRHa. Masters degree Thesis. CIAD, A.C. Mazatlán Sin.

192
192
SECTION III GENETICS and REPRODUCTION
Chair: Professor Gideon Hulata
The Volcani Center, Israel

193
193
IMPROVING SALINITY TOLERANCE IN TILAPIAS: A REVIEW
Avner Cnaani, Ariel Velan, Gideon Hulata*
Institute of Animal Science, Agricultural Research Organization, Volcani Center
PO Box 6, Bet Dagan 50250, Israel
*Corresponding author. Tel.: +972-3-9683020, Fax: +972-3-9605667, e-mail: [email protected]
Abstract
With increasing scarcity of fresh water available for aquaculture, especially in arid regions, development of tilapias that tolerate high salinity would increase fish (and hence, animal protein) production. We review culture practices, nutrition, physiology and genetics, and propose approaches to improving salinity tolerance in tilapias. Dietary supplementation with NaCl and optimized acclimation protocols are immediate and practical ways to improve salt tolerance. Inter-specific variation in salinity tolerance may be used to select salt-tolerant species and develop salt-tolerant hybrids. Physiological studies of biochemical pathways underlying phenotypic differences in salt tolerance can lead to genetic studies of intra- and inter-specific variation. Molecular technology can lead to studies on osmoregulation-related biochemical pathways, for which the euryhaline tilapia is an attractive model. Functional genomics and proteomics are powerful tools for studying the molecular bases of environmental adaptation and metabolic connections to osmoregulatory physiology. Both provide avenues for discovering novel pathways related to osmoregulation with relevance to aquaculture. In the long term, quantitative trait loci associated with, or genes involved in saltwater tolerance may facilitate marker-assisted or gene-assisted selection for this trait in tilapia.
We recently examined the possible interrelationships between the allelic polymorphism of the tilapia Prolactin gene and growth performance in brackish water. Comparative sequencing revealed one amino-acid substitution at a highly conserved site adjacent to the receptor binding site, where the conserved leucine in O. mossambicus is replaced by phenylalanine in O. niloticus. We also studied allelic variation in a microsatellite marker at the promoter region of the Prolactin 1 gene. Two distinct alleles in O. niloticus as well as two additional alleles in O. mossambicus were detected. Parental crossing was performed between O. mossambicus and O. niloticus in search for correlations between the allelic composition and growth performance of F2 families in brackish water. Correlation between genotypes (allelic composition) and growth performance was found in some but not all families. One allele appears to be associated with good growth in brackish water.
INTRODUCTION
With the increasing scarcity of freshwater available for aquaculture in general, and for tilapia culture in arid regions (like Israel) in particular, tilapias tolerating high salinity would increase global tilapia production (and hence, animal protein production) by expanding the range of production in many regions of the world. Cnaani and Hulata (2011) have recently reviewed the subject, aiming to show what can be learned from the past experience in areas of culture management practices and nutrition as well as physiology and genetics, and to propose the best approaches for improvement of salinity tolerance in tilapias. The present paper brings the highlights from that review, focusing on the more recent findings, and some results of additional work carried out recently in our laboratory.
PHYSIOLOGICAL STUDIES Control of salt and water balance within a narrow limit is critical to life in all
multicellular organisms, including teleost fishes. Salt tolerance is a term describing the overall fitness, or productivity, of the fish in a saline environment. It is a combination of different quantitative traits, such as metabolism, growth, osmoregulation, immunocompetence and fecundity.
Inter-specific variation in salinity tolerance may be used to select salt-tolerant species and develop salt-tolerant hybrids. Growth of O. niloticus at high salinity is significantly lower than that in freshwater (Fineman Kalio, 1988), whereas survival is not affected by salinity.

194
194
High salinity does seem to suppress, or at least delay, onset of reproduction in O. niloticus, thus presenting a practical method of population control.
Chloride cells (known also as Mitochondrion Rich Cells - MRC) in the gill epithelium are important osmoregulatory sites in all fish species. Their large surface area at both sides, the apical and basolateral, is a placement of ion transporting proteins such as sodium-potassium ATPase (Na+/K+-ATPase) and Na+/K+/2Cl− co-transporter (NKCC). Studies on changes in chloride cells characteristics and function in response to salinity challenges, mostly in O. mossambicus, revealed a significant increase in the abundance of chloride cells and in ion transporters activity in the gills (Fiess et al., 2007). Differences in ion transporters type and membrane location on the chloride cells were also found between fresh- and salt-water challenged fish.
Hormones of the neuroendocrine system are essential players in the control of osmoregulatory mechanisms, and extensive studies on endocrine pathways involved in osmoregulation clarified the role of prolactin (PRL) and growth hormone (GH) in osmoregulation. PRL and GH are closely related and thought to be derived from the same ancestral gene. They exhibit a variety of functions in growth, development, osmoregulation and reproduction that are variously distinct, overlapping or opposing (Sakamoto and McCormick, 2006; Mancera and McCormick, 2007). Tilapias possess two PRLs that are encoded by separate genes (Specker et al., 1985). One form of PRL, PRL177, binds to the GH receptor and has somatotropic actions of stimulating growth and cell proliferation (Shepherd et al., 1997). GH is produced and secreted from the anterior pituitary gland and has been shown to have an osmoregulatory role in seawater, where it promotes ion regulation by stimulating chloride cell proliferation and up-regulating ion transporters tied to extrusion pathways (Sakamoto and McCormick, 2006; Mancera and McCormick, 2007). Several isoforms of the PRL receptor exist in tilapia, with unique intracellular signaling pathways (Fiol et al., 2009). It is becoming increasingly apparent that the existence of an array of receptor subtypes has a major role in the pleiotropic nature of GH and PRL.
Osmoregulation, somatic growth, and reproduction are among the most energetically costly metabolic activities engaged by teleost fishes. Boeuf and Payan (2001) discussed four possible pathways of interaction between osmoregulation and growth: (1) difference in standard metabolic rate, (2) increase in food intake, (3) increase in digestibility, and (4) hormonal stimulation. These four pathways can interact, and none can be considered as a unique route connecting osmoregulation and growth.
Growth and development are directed by an integration of environmental, physiological and genetic factors. The high energetic cost of osmoregulation, usually estimated as 25-50% of metabolic output, means that there is a link between osmoregulatory and growth capacities. This might explain the observation that growth and osmoregulation are governed by many of the same hormones, notably PRL and GH. It has been demonstrated that genetic variation in the tilapia PRL gene is associated with differential gene expression and growth rate in saline water (Streelman and Kocher, 2002).
Functional genomics (i.e., the field of molecular biology that attempts to answer questions about the function of DNA at the levels of genes, RNA transcripts, and protein products) and proteomic (i.e. the study of the entire complement of proteins, particularly their structures and functions) approaches represent powerful tools for gaining insight into the molecular bases of environmental adaptation. Gene transcripts for ion transporters, enzymes, hormones and components of cellular stress signaling were characterized in the brain, gill, gut and kidney of Mozambique tilapia (Fiol et al., 2006) and black-chinned tilapia (D’Cotta et al., 2006; Tine et al., 2008). The transcriptional response to tilapias salinity challenge was studied for the immediate and long term response in two highly salinity tolerant species. In the Mozambique tilapia genes involved in the immediate hyperosmotic stress response were analyzed in gill epithelial cells. Most genes show an immediate response with peak levels observed between 2 and 8 h after seawater transfer. Pathway analysis of the newly identified genes revealed that more than half of the identified immediate hyperosmotic stress genes interact closely within a cellular stress response signaling network. The genes cluster together in six molecular processes that are rapidly activated in tilapia gills upon salinity transfer: (1) stress response signal transduction, (2) compatible organic osmolyte accumulation, (3) energy metabolism, (4) lipid transport and cell membrane protection, (5)

195
195
actin-based cytoskeleton dynamics, and (6) protein and mRNA stability (Fiol et al., 2006). In the black-chinned tilapia genes whose transcription is induced by 45 days acclimation to either hyper-saline waters or to fresh water were analyzed in the gills. The suppression subtractive hybridization (SSH) resulted in the isolation of a wide spectrum of differentially expressed genes, classified according to functional annotations. These genes were clustered into 14 functional categories of biological processes. Cellular processes, metabolic processes, and localization were the most abundant categories in the high salinity library (D’Cotta et al., 2006; Tine et al., 2008).
APPROACHES TO IMPROVING SALT TOLERANCE IN TILAPIAS
Adding salt to feed: Saltwater survival of O. mossambicus improved by 84% after two weeks of feeding the salt diet, and that of the O. aureus x O. niloticus hybrids by 62%. Three weeks of feeding the salt diet were required to improve survival of O. spilurus by 50%. Contrary to the sudden increase in plasma osmotic concentration recorded in the fish transferred directly from freshwater to 60% sea water, feeding the high-salt diet prior to the transfer resulted in only a slight increase in the plasma osmotic concentration in sea water (Al-Amoudi, 1987). In all-male tilapia hybrids (O. aureus X O. niloticus) fed with feed that did not contain fish meal, 3% dietary salt supplementation resulted in about 20% improvement in specific growth rate and feed conversion ratio while cultured in freshwater for two months (Cnaani et al., 2010).
Acclimation: O. mossambicus can be acclimated in a single step (intermediate salinity directly to final full sea water salinity) and requires only one day at the intermediate salinity for sea water acclimation with no mortality, O. aureus requires four days and O. niloticus eight days for acclimation (Perschbacher, 1992). Yao et al. (2008) investigated the best conditions for transfer of Nile tilapia (O. niloticus) from freshwater to salt water. Fingerlings (8 to 12 g) were transferred, either directly or gradually, from freshwater to water of variable salinities, and survival was monitored after 3 weeks. Survival of fish transferred directly to saline water was high (84.3% to 96.8%) until 17 ppt, but mortalities were significant (60-70%) above that salinity. High rate of survival (78 to 81%) was, however, achieved by gradual acclimation to salinity of 30 ppt over two days.
These management practices are useful, yet genetic approaches may be more sustainable.
Variation among species and hybrids: Villegas (1990) found that O. niloticus was significantly less saline-tolerant than O. mossambicus and their reciprocal F1 hybrids. Similarly, Kamal and Mair (2005) evaluated O. niloticus, O. mossambicus and O. mossambicus x O. niloticus hybrids over a series of salinities. O. niloticus exhibited faster growth at low salinity and O. mossambicus at the higher salinities; the hybrid was superior to O. mossambicus at all salinities and to O. niloticus at salinities above 10 ppt.
Several red tilapias, such as the Taiwanese (Cheong et al., 1987), Florida (e.g., Thourad et al., 1990; Watanabe et al., 1990; Ernst et al., 1991; Head et al., 1996), Philippine (Romana-Eguia and Eguia, 1999) and Thai (Yi et al., 2002) strains, originating by hybridization of either O. niloticus or O. mossambicus, are also considered saline-tolerant. Significant differences in the growth among five strains of Asian red tilapia (O. mossambicus or O. mossambicus-hornorum hybrid crossed with O. niloticus) were found when grown in fresh, brackish and salt water (Romana-Eguia and Eguia, 1999) using O. mossambicus as a reference strain. However, they also observed a significant interaction between strain and rearing condition. Ignoring the interaction effects, their results suggested that overall growth in length was more rapid in brackish water (17 ppt) than in either freshwater or salt water (34 ppt).
Variation within species: To the best of our knowledge, there is not much divergence for salt tolerance within Nile tilapia (O. niloticus). Selection of more salt-tolerant strain(s)/population(s) of O. niloticus would be based on documenting the salinity tolerance of various wild stocks in their native waters, and comparing them under standard conditions. Basiao et al. (2005) evaluated three commercial strains of O. niloticus for growth rate in freshwater and saline water (32 ppt) relative to an 'internal reference' population and found

196
196
significant strain effects on specific growth in standard length in both saline and freshwater environments.
Hybridization: A saline-tolerant hybrid, produced by crossing the salt-tolerant O. mossambicus with a commercial ND9 line is characterized by good growth rate and high salinity tolerance. Males of this F3 hybrid were crossed with orange-colored females of the ND5 commercial line, resulting in a mostly homogenous red tilapia with good growth rate and salinity tolerance, termed ND60. The good performance qualities were confirmed in growth trials in tanks (compared to a commercially-cultured hybrid of O. niloticus x O. aureus) and in commercial sea-cages. Consequently, this hybrid was introduced into a brackish water farm in Surinam and a marine farm in Guatemala (Lahav and Ra'anan, 1997). A synthetic strain of fast-growing tilapia with high salinity tolerance that breeds naturally in brackish water was developed in the Philippines starting in 1999 through a series of repeated backcrosses of the saline-tolerant O. mossambicus to the hybrids, coupled with selection for growth rate, and was named "molobicus". The first stage of the project produced a hybrid population that was 1/3 O. niloticus, 2/3 O. mossambicus with a good salinity tolerance (Mateo et al., 2004; Rosario et al., 2004). Another inter-generic hybrid of interest regarding salinity tolerance was produced by artificial propagation - the two reciprocal hybrids between the fast-growing O. niloticus and the highly euryhaline S. melanotheron (Toguyeni et al., 1997; Baroiller et al., 2000). Both hybrids were viable and fertile, and their growth rate was intermediate to that of the two parental species, but their relative salinity tolerance was not reported.
Selective breeding: Four Oreochromis species were used in an evaluation of salinity tolerance conducted by Tayamen et al. (2002) in the Philippines. A diallel cross of the different species/strains was carried out involving O. spilurus, O. aureus, O. mossambicus and three genetically improved strains of O. niloticus, namely: sixth-generation improved GIFT strain, FAC selected line (FaST), and all-male YY tilapia. Progenies from the 27 cross combinations (5 purebreds and 22 crossbreds) were evaluated in 10 environments with different salinity levels and agro-climatic conditions using a communal rearing design. Among the different cross combinations reared across environments, O. aureus x O. spilurus gave the highest body weight and O. mossambicus x O. spilurus, the highest survival rate. Tayamen et al. (2004) continued the selection program by breeding the selected fish and testing the progeny in different culture systems. Salinity tolerance in terms of growth and survival was positively influenced by having O. spilurus as sires, while O. niloticus FaST dams contributed most to increased growth rate. Different rankings in terms of growth and survival were obtained across environments. The second stage of the "molobicus" project was initiated in 2003 with selection process based on a simple within-family selective breeding scheme in a saline environment (Rosario et al., 2004). Fish of the first selected generation of "molobicus" currently are used on a small scale in the Philippines, while the selection process is going on (P. Morissens, CIRAD, France, and W. Rosario, BFAR-NIFTDC, Philippines, pers. comm.).
Armas-Rosales (2006) took a quantitative genetics approach to evaluate genetic effects influencing tilapia salinity tolerance using a diallel mating design. Six parental strains were used [O. aureus, O. mossambicus, O. niloticus, Stirling red O. niloticus, Florida red tilapia (originated from an O. urolepis hornorum x O. mossambicus male hybrid) and a commercial hybrid (originated from the Rocky Mountain White® tilapia)], resulting in 36 genetic groups. Twenty-four salinity levels were used in the growth trial. Salinity tolerance was determined for all strains and crosses, and genetic effects influencing salinity tolerance were estimated. Several lines exhibited highly significant line and maternal effects. Several crosses exhibited highly significant heterosis effects. The results suggest that improvement in salinity tolerance could be accomplished by developing a breeding program combining selection, hybridization and backcrossing among O. aureus, O. mossambicus and Florida red tilapia. Experiments were conducted at the Research Institute for Aquaculture No.1 (RIA1), northern Vietnam, to evaluate the growth and survival of the GIFT and Vietnamese strains of Nile tilapia in fresh and brackish water earthen ponds. The heritability estimates for harvest weight in both test environments were moderate (~0.2) for both brackish and fresh water. The genetic correlations of harvest body weight and survival were relatively low (>0.4) between the two test environments. The results suggest a substantial additive genetics variance for the traits that can be further exploited through a selective breeding program.

197
197
However, in view of the strong genotype by environment interaction for harvest weight and survival traits observed, separate breeding programs should be considered for Nile tilapia in fresh and brackish water farming (Luan et al., 2008).
Genomic approaches: Genomic approaches may offer contribution to aquaculture over a longer term. With the application of modern molecular biology techniques, it may be possible to identify genes encoding specific proteins active in salt-tolerant species that are lacking or are less active in less-tolerant species, or specific proteins that are induced under salt stress. One such gene is prolactin1 (prl1); this gene has a central role in adaptation of marine species to freshwater by reducing Na+/K+-ATPase activity and consequently increasing the osmotic level of the plasma (e.g., Sakamoto et al., 1997). Streelman and Kocher (2002) reported that microsatellite polymorphism in the tilapia prl1 promoter is associated with differences in prl1 gene expression and growth response of salt-challenged fishes. They crossed females of the salt-tolerant O. mossambicus (homozygous for long alleles) with a freshwater-adapted O. niloticus male heterozygous for microsatellite alleles that differed by 17 repeat units (CA31 vs. CA14). Fish homozygous for the long allele grew more slowly at 16 ppt and their weight was only half those of the other two genotypes, while in freshwater growth rate did not differ significantly among the three genotypes.
We have recently re-examined this association in nine F2 families of O. mossambicus X O. niloticus hybrids (Velan et al., 2011). Both parental fish were heterozygous for different alleles (CA33 and CA38 in O. mossambicus, CA30 and CA35 in O. niloticus, resulting with PCR products of 253, 263, 247 and 257 bp, respectively). The association reported earlier by Streelman and Kocher (2002) was observed in only three of the nine families. In two of those three families, full-sibs were also grown in freshwater where no correlation between the genetic polymorphism and growth was found. In these two families, fish carrying the allelic combination 247/253 grew better in saline water and worst in fresh water (Figure 1).
Figure 1. Weight of the four genotypes of offspring in one family, grown in salt water (dark bars) and fresh water (light bars). Groups sharing the same letter are not significantly different (α = 0.05).
We concluded that this variation is probably not a major contributor to the total genetic variation in salinity tolerance, and that there may be a large environmental influence underlying the differential growth in saline water. We have sequenced the prl1 gene in the parental species and discovered one point mutation, within a conserved motif, that cause substitution of phenylalanine with leucine and forming two isoforms of the tilapia prl1 (Figure 2).
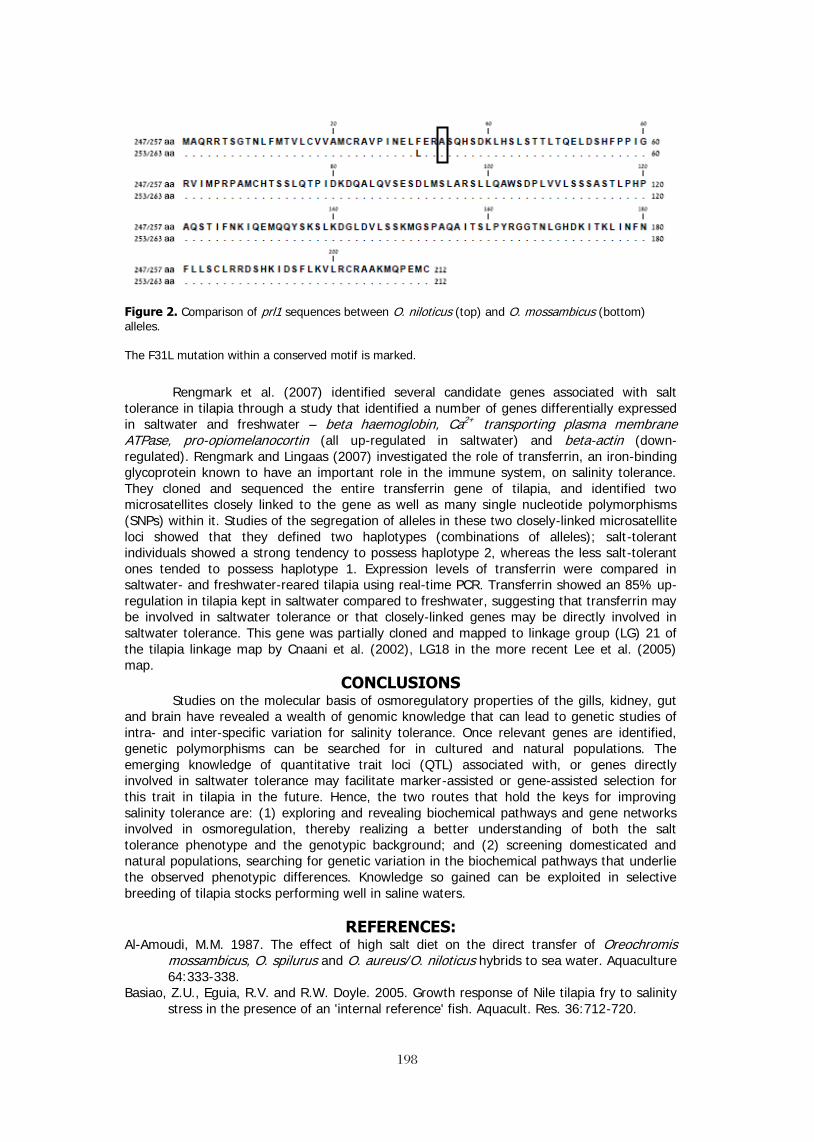
198
198
Figure 2. Comparison of prl1 sequences between O. niloticus (top) and O. mossambicus (bottom) alleles. The F31L mutation within a conserved motif is marked.
Rengmark et al. (2007) identified several candidate genes associated with salt
tolerance in tilapia through a study that identified a number of genes differentially expressed in saltwater and freshwater – beta haemoglobin, Ca2+ transporting plasma membrane ATPase, pro-opiomelanocortin (all up-regulated in saltwater) and beta-actin (down-regulated). Rengmark and Lingaas (2007) investigated the role of transferrin, an iron-binding glycoprotein known to have an important role in the immune system, on salinity tolerance. They cloned and sequenced the entire transferrin gene of tilapia, and identified two microsatellites closely linked to the gene as well as many single nucleotide polymorphisms (SNPs) within it. Studies of the segregation of alleles in these two closely-linked microsatellite loci showed that they defined two haplotypes (combinations of alleles); salt-tolerant individuals showed a strong tendency to possess haplotype 2, whereas the less salt-tolerant ones tended to possess haplotype 1. Expression levels of transferrin were compared in saltwater- and freshwater-reared tilapia using real-time PCR. Transferrin showed an 85% up-regulation in tilapia kept in saltwater compared to freshwater, suggesting that transferrin may be involved in saltwater tolerance or that closely-linked genes may be directly involved in saltwater tolerance. This gene was partially cloned and mapped to linkage group (LG) 21 of the tilapia linkage map by Cnaani et al. (2002), LG18 in the more recent Lee et al. (2005) map.
CONCLUSIONS Studies on the molecular basis of osmoregulatory properties of the gills, kidney, gut
and brain have revealed a wealth of genomic knowledge that can lead to genetic studies of intra- and inter-specific variation for salinity tolerance. Once relevant genes are identified, genetic polymorphisms can be searched for in cultured and natural populations. The emerging knowledge of quantitative trait loci (QTL) associated with, or genes directly involved in saltwater tolerance may facilitate marker-assisted or gene-assisted selection for this trait in tilapia in the future. Hence, the two routes that hold the keys for improving salinity tolerance are: (1) exploring and revealing biochemical pathways and gene networks involved in osmoregulation, thereby realizing a better understanding of both the salt tolerance phenotype and the genotypic background; and (2) screening domesticated and natural populations, searching for genetic variation in the biochemical pathways that underlie the observed phenotypic differences. Knowledge so gained can be exploited in selective breeding of tilapia stocks performing well in saline waters.
REFERENCES:
Al-Amoudi, M.M. 1987. The effect of high salt diet on the direct transfer of Oreochromis mossambicus, O. spilurus and O. aureus/O. niloticus hybrids to sea water. Aquaculture 64:333-338.
Basiao, Z.U., Eguia, R.V. and R.W. Doyle. 2005. Growth response of Nile tilapia fry to salinity stress in the presence of an 'internal reference' fish. Aquacult. Res. 36:712-720.
199
199
Boeuf, G. and P. Payan. 2001. How should salinity influence fish growth? Comp. Biochem. Physiol. C 130:411–423.
Baroiller, J.F., Bezault, E., Bonnet, S., Clota, F., Derivaz, M., D'Hont, A., Fauconneau, B., Lazard, J., Ozout-Costaz, C., Rognon, X., Toguyeni, A. and A. Vergent. 2000. Production of two reciprocal intergeneric hybrids between Oreochromis niloticus and Sarotherodon melanotheron. P. 366, In: K. Fitzsimmons and J. Carvalho Filho (eds.), Tilapia in the 21st Century: Proc. 5th International Symposium on Tilapia Aquaculture. Rio de Janeiro, Brazil.
Cnaani, A. and G. Hulata. 2011. Improving salinity tolerance in tilapias: Past experience and future prospects. Isr. J. Aquacult. - Bamidgeh 63, IIC.63.2011.533, 21 pages.
Cnaani, A., Barki, A., Slossman, T., Scharcanski, A., Milstein, A. and S. Harpaz. 2010. Dietary salt supplementation increases the growth rate in freshwater cultured tilapia hybrids. Aquacult. Res. 41:1545-1548.
Cnaani, A., Ron, M., Lee, B.-Y., Hulata, G., Kocher, T.D. and E. Seroussi. 2002. Mapping the transferrin gene in tilapia. Anim. Genet. 33:78-80.
Cheong, L., Chan, F.K., Wong, F.J. and R. Chou. 1987. Observations on the culture of red tilapia (Oreochromis niloticus hybrid) in seawater under intensive tank conditions using a biodrum. Singapore J. Prim. Ind. 15:42-56.
D'Cotta, H., Pepey, E., Tine, M., Ouattara, N., Baroiller, J.-F., Bezault, E., Durand, J.-D., Bonhomme, F., Charmantier, G., Morissens, P., Poivey, J.-P. and B. Chevassus. 2006. Adaptation to extreme salinity variations in tilapias. Paper presented at Symposium COA/INRA Scientific Cooperation in Agriculture, Tainan (Taiwan, R.O.C.).
Ernst, D.H., Watanabe, W.O., Ellingson, L.J., Wicklund, R.I. and B.L. Olla. 1991. Commercial-scale production of Florida red tilapia seed in low- and brackish-salinity tanks. J. World Aquacult. Soc. 22:36-44.
Head, W.D., Zerbi, A. and W.O. Watanabe. 1996. Economic evaluation of commercial-scale, saltwater pond production of Florida red tilapia in Puerto Rico. J. World Aquaculture Soc. 27:275-289.
Fiess, J.C., Kunkel-Patterson, A., Mathias, L., Riley, L.G., Yancey, P.H., Hirano, T. and E.G. Grau. 2007. Effects of environmental salinity and temperature on osmoregulatory ability, organic osmolytes, and plasma hormone profiles in the Mozambique tilapia (Oreochromis mossambicus). Comp. Biochem. Physiol. A Mol. Integr. Physiol. 146:252-264.
Fineman Kalio, A.S. 1988. Preliminary observations on the effect of salinity on the reproduction and growth of freshwater Nile tilapia, Oreochromis niloticus (L.), cultured in brackishwater ponds. Aquacult. Fish. Manage. 19:313-320.
Fiol, D.F., Chan, S.Y. and D. Kültz. 2006. Identification and pathway analysis of immediate hyperosmotic stress responsive molecular mechanisms in tilapia (Oreochromis mossambicus) gill. Comp. Biochem. Physiol. D 1:344-356.
Fiol, D.F., Sanmarti, E., Sacchi, R. and D. Kültz. 2009. A novel tilapia prolactin receptor is functionally distinct from its paralog. J. Exp. Biol. 212:2007-2015.
Kamal, A.H.M.M. and G.C. Mair. 2005. Salinity tolerance in superior genotypes of tilapia, Oreochromis niloticus, Oreochromis mossambicus and their hybrids. Aquaculture 247:189-201.
Lahav, E. and Z. Ra'anan. 1997. Salinity tolerance of genetically produced tilapia (Oreochromis) hybrids. Isr. J. Aquaculture - Bamidgeh 49:160-165.
Lee, B.-Y., Lee, W.-J., Streelman, J.T., Carleton, K.L., Howe, A., Hulata, G., Slettan, A., Terai, Y. and T.D. Kocher. 2005. A second generation genetic linkage map of tilapia (Oreochromis spp.). Genetics 170:237–244.
Luan, T.D., Olesen, I., Ødegård, J., Kolstad, K. and N.C. Dan. 2008. Genotype by environment interaction for harvest body weight and survival of Nile tilapia (Oreochromis niloticus) in brackish and fresh water ponds. In: H. Elghobashy, K. Fitzsimmons, A.S. Diab (Eds.). Proc. 8th International Symposium on Tilapia in Aquaculture. Cairo, Egypt. Vol. 1, p.231-240. http://ag.arizona.edu/azaqua/ ista/ISTA8/Abstracts_Papers/

200
200
Mancera, J.M. and S.D. McCormick. 2007. Role of prolactin, growth hormone, insulin-like growth factor I and cortisol in teleost osmoregulation. pp. 497-515. In: B. Baldisserotto, J.M. Mancera & B.G. Kapoor (Editors). Fish Osmoregulation, Science Publishers, Enfield, NH.
Mateo, D., Aguilar, R., Campos, W., Katalbas, M.S.F., Sanares, R., Edra, R., Chevassus, B., Lazard, J., Morrisens, P., Baroiller, J.F. and X. Rogñon. 2004. Salinity tolerance of Oreochromis niloticus and O. mossambicus F1 hybrids and their successive backcross. pp. 426-438. In: R.B. Bolivar, G.C. Mair, K. Fitzsimmons (eds.), Proc. of the 6th International Symposium on Tilapia in Aquaculture (Philippine International Convention Center, Manila, Philippines). Available at: http://ag.arizona.edu/azaqua/ ista/ista6/ista6web/pdf/426.pdf
Perschbacher, P.W. 1992. A review of seawater acclimation procedures for commercially important euryhaline tilapias. Asian Fish. Sci. 5:241-248.
Rengmark, A.H. and F. Lingaas. 2007. Genomic structure of the Nile tilapia (Oreochromis niloticus) transferrin gene and a haplotype associated with saltwater tolerance. Aquaculture, 272:146–155.
Rengmark, A.H., Slettan, A., Lee, W.J., Lie, Ø. and F. Lingaas. 2007. Identification and mapping of genes associated with salt tolerance in tilapia. J. Fish Biol. 71 (Suppl. C):409 – 422.
Romana-Eguia, M.R.R. and R.V. Eguia. 1999. Growth of five Asian red tilapia strains in saline environments. Aquaculture 173:161-170.
Rosario, W.R., Georget, C., Chevassus-Au-Louis, B., Morissens, P., Muyalde, N.C., de la Cruz, A.E., de Vera, E. and J.-P. Poivey. 2004. Selection from an interspecific hybrid population of two strains of fast growing and salinity tolerant tilapia. p. 73. In: R.B. Bolivar, G.C. Mair, K. Fitzsimmons (eds.), Proc. of the 6th Internat. Symp. on Tilapia in Aquaculture (Manila, Philippines). Abstract and presentation available at: http://ag.arizona.edu/azaqua/ista/ista6/ista6web/ (click Genetics)
Sakamoto, T. and S.D. McCormick. 2006. Prolactin and growth hormone in fish osmoregulation. Gen. Comp. Endocrinol. 147:24-30.
Sakamoto, T., Shepherd, B.S., Madsen, S.S., Nishioka, R.S., Siharath, K., Richman, N.H. III, Bern, H.A. and E.G. Grau. 1997. Osmoregulatory actions of growth hormone and prolactin in an advanced teleost. Gen. Comp. Endocrinol. 106:95–101.
Shepherd, B.S., T. Sakamoto, R.S. Nishioka, N.H. Richman, III, I. Mori, S.S. Madsen, T.T. Chen, T. Hirano, H.A. Bern and E.G. Grau. 1997. Somatotropic actions of the homologous growth hormone and prolactins in the euryhaline teleost, the tilapia, Oreochromis mossambicus. Proc. Nat. Acad. Sci. (USA) 94:2068-2072.
Specker, J.L., King, D.S., Nishioka, R.S., Shirahata, K., Yamaguchi, K. and H.A. Bern. 1985. Isolation and partial characterization of a pair of prolactins released in vitro by the pituitary of cichlid fish, Oreochromis mossambicus. Proc. Nat. Acad. Sci. (USA) 82:7490-7494.
Streelman, J.T. and T.D. Kocher. 2002. Microsatellite variation associated with prolactin expression and growth of salt-challenged tilapia. Physiol. Genom. 9:1–4.
Tayamen, M.M., Reyes, R.A., Danting, Ma.J., Mendoza, A.M., Marquez, E.B., Salguet, A.C., Gonzales, R.C., Abella, T.A. and E.M. Vera-Cruz. 2002. Tilapia broodstock development for saline waters in the Philippines. NAGA-ICLARM Quarterly 25:32– 36.
Tayamen, M.M., Abella, T.A., Reyes, R.A., Danting, Ma.J.C., Mendoza, A.M., Marquez, E.B., Salguet, A.C., Apaga, M.M. and R.C. Gonzales. 2004. Development of tilapia for salinity waters in the Philippines. pp. 463-478. In: R.B. Bolivar, G.C. Mair, K. Fitzsimmons (eds.), Proc. 6th Internat. Symp. on Tilapia in Aquaculture (Philippine International Convention Center, Manila, Philippines). Available at: http://ag.arizona.edu/azaqua/ ista/ista6/ista6web/pdf/463.pdf
Thouard, E., Soletchnik, P. and J.-P. Marion. 1990. Selection of finfish species for aquaculture development in Martinique (F.W.I.). Aquaculture 89:193-197.
Tine, M., de Lorgeril, J., D'Cotta, H., Pepey, E., Bonhomme, F., Baroiller, J.-F. and J.-D. Durand. 2008. Transcriptional responses of the black-chinned tilapia Sarotherodon melanotheron to salinity extremes. Mar. Genom. 1:37–46.
201
201
Toguyeni, A., Fauconneau, B., Mélard, C., Fostier, A., Lazard, J., Baras, E., Kühn, E.R., Van Der Guyten, S. and J.-F. Baroiller. 1997. Sexual dimorphism studies in tilapias, using two pure species, Oreochormis niloticus and Sarotherodon melanotheron, and their intergeneric hybrids (O. niloticus x S. melanotheron and S. malanotheron x O. niloticus). pp. 200-212, In: K. Fitzsimmons (ed.), Proc. 4th International Symposium on Tilapia in Aquaculture. Orlando, USA.
Vellan, A., Hulata, G., Ron M. and A. Cnaani. 2011. On the association between genetic variation in the prolactin 1 gene and differential growth of salt-water cultured tilapia. In preparation.
Villegas, T.C. 1990. Evaluation of the salinity tolerance of Oreochromis mossambicus, O. niloticus and their F1 hybrids. Aquaculture 85:281-292.
Watanabe, W.O., Ellingson, L.J., Olla, S.L., Ernst, D.H. and R.I. Wicklund. 1990. Salinity tolerance and seawater survival vary ontogenetically in Florida red tilapia. Aquaculture 87:311-321.
Yao, K., Ouattara, M. and A.F.A. Ahoussi. 2008. Survie du Tilapia du Nil (Oreochromis niloticus) en eaux salées durant un transfert direct et progressif [Survival of the Nile Tilapia (Oreochromis niloticus) in salt water during a direct and progressive transfer]. Livest. Res. Rural Develop. 20: Article #72. (http://www.lrrd.org/lrrd20/5/yao20072.htm; in French with English abstract).
Yi, Y., Lin, C.K. and J.S. Diana. 2002. Semi-intensive culture of red tilapia in brackishwater ponds. PD/A CRSP Nineteenth Annual Technical Report. Available at http://pdacrsp.oregonstate.edu/pubs/ technical/19tch/9NS4.pdf.

202
202
COMPARISON BETWEEN GREEN WATER AND CLEAR WATER SYSTEMS DURING THE MASCULINIZATION PROCESS OF
SILVER TILAPIA, Oreochromis niloticus
Ryan S. Mohammed, Department of Life Sciences, University of the West
Indies Indar W. Ramnarine, Department of Life Sciences, University of the West
Indies
Key words: Oreochromis niloticus, masculization, 17 alpha methyltestosterone, sex reversal, green water.
ABSTRACT
The growth and survival of Silver or Nile Tilapia (Oreochromis niloticus) was compared between green water systems (containing green algae) and clear water systems (no algae). Both treatments (green and clear water treatments) were replicated four times using 45.72cm x 20.32cm x 20.32cm tanks, stocked with 100 fry each. The hormone 17 alpha methyl testosterone was administered four times per day for twenty eight days, in an attempt to obtain an all male stock. Water chemistry including pH, ammonia and nitrite levels was monitored weekly and temperature was monitored daily. An algal count and species identification was done to estimate the composition and density of green algae culture. The fish length, wet mass and mortality of the fish were monitored on the 14th and 29th day. It was found that compared to clear water fish raised in green water were significantly larger and heavier (F1, 575 = 1028.28: p<0.001 for length and F1, 575 = 566.48 for mass). In addition there was a significantly higher survivorship in the green water system (mean of 85% survival in green water and mean survival of 61% in clear water respectfully, χ2 =67.18, p< 0.001). There were also significantly higher levels of nitrite and ammonia in the clear water tanks. Green water systems were found to be overall superior for producing sex reversed or masculinized male Silver tilapia fingerlings, than clear water systems.
203
203
OSMOREGULATORY CAPACITY OF THE NILE TILAPIA (Oreochromis niloticus (L. )) DURING EARLY LIFE STAGES.
Fridman, S.1, Bron, J.E.1 and Rana, K.J.1,2
1 Institute of Aquaculture, University of Stirling, Scotland. 2 Aquaculture Division, University of Stellenbosch, South Africa.
ABSTRACT Although not considered to be amongst the most tolerant of the cultured tilapia
species, the Nile tilapia still offers considerable potential for culture in low-salinity water. The ontogeny of osmoregulation in the Nile tilapia was studied from spawning to yolk-sac absorption after exposure to different experimental conditions ranging from freshwater to 25 ppt. Eggs were able to withstand elevated rearing salinities up to 20 ppt, but transfer to 25 ppt induced 100% mortality by 48 h post-fertilisation. At all stages embryos and larvae hyper-regulated at lower salinities and hypo-regulated at higher salinities. Osmoregulatory capacity increased during development and from 2 days post-hatch onwards remained constant until yolk-sac absorption. Adjustments to larval osmolality, following abrupt transfer from freshwater to experimental salinities (12.5 and 20 ppt), appeared to follow a pattern of crisis and regulation, with values for larvae stabilising at c. 48 h post-transfer for all treatments, regardless of age at time of transfer. Age at transfer to experimental salinities (7.5 – 25 ppt) had a significant positive effect on larval ability to osmoregulate; larvae transferred at 8 dph maintained a more constant range of whole body osmolality over the experimental salinities tested than larvae at hatch. Concomitantly, survival following transfer to experimental salinities increased with age. There was a significant effect (GLM; p < 0.05) of salinity of incubation and rearing media on the incidence of gross larval malformation that was seen to decline over the developmental period studied.
INTRODUCTION
In recent times, diminishing freshwater resources, due to the rapidly increasing drain of urban, industrial and agricultural activities in combination with the impact of climate change, has called for an urgent need to manage marine and brackish water environments more efficiently. Therefore the diversification of aquacultural practices, either by the introduction of new candidate species or by the adaptation of culture methods for existing species is vital at a time when innovation and adaptability of the aquaculture industry is fundamental in order to maintain its sustainability.
The Nile tilapia (Oreochromis niloticus, Linnaeus 1758), which has now extended well beyond its natural range, dominates tilapia aquaculture because of its adaptability and fast growth rate. Although not considered to be amongst the most tolerant of the cultured tilapia species, the Nile tilapia still offers considerable potential for culture in low-salinity water. An increase in knowledge of the limits of salinity tolerance of this species during the sensitive early life stages and the ability to predict responses of critical life-history stages to environmental change could prove invaluable in improving larval rearing techniques and extend the scope of this globally important fish species. It is well established that measurement of osmolality provides a valid route for the evaluation of the osmoregulatory status of fishes (Alderdice, 1988). Recent reports on ontogenic changes in osmoregulatory capacity during early life stage have been mainly confined to marine teleost species in an attempt to explain species and developmental stage-specific distribution i.e. turbot (Scophthalmus maximus) (Brown and Tytler, 1993), chum salmon (Oncorhynchus keta) (Kaneko et al., 1995), sea bass (Dicentrachus labrax) (Varsamos et al., 2001), Japanese eel (Anquilla japonica) (Unuma et al., 2005; Okamoto et al., 2009), Mozambique tilapia (Oreochromis mossambicus) (Yanagie et al., 2009) and the gilt-head sea bream (Spaurus aurata) (Bodinier et al., 2010).
In the present study, the responses and physiological effects of osmotic challenge during ontogeny in the Nile tilapia were assessed through the measurement of embryo and larval osmolality and the resulting osmoregulatory capacity. In addition, the short-term
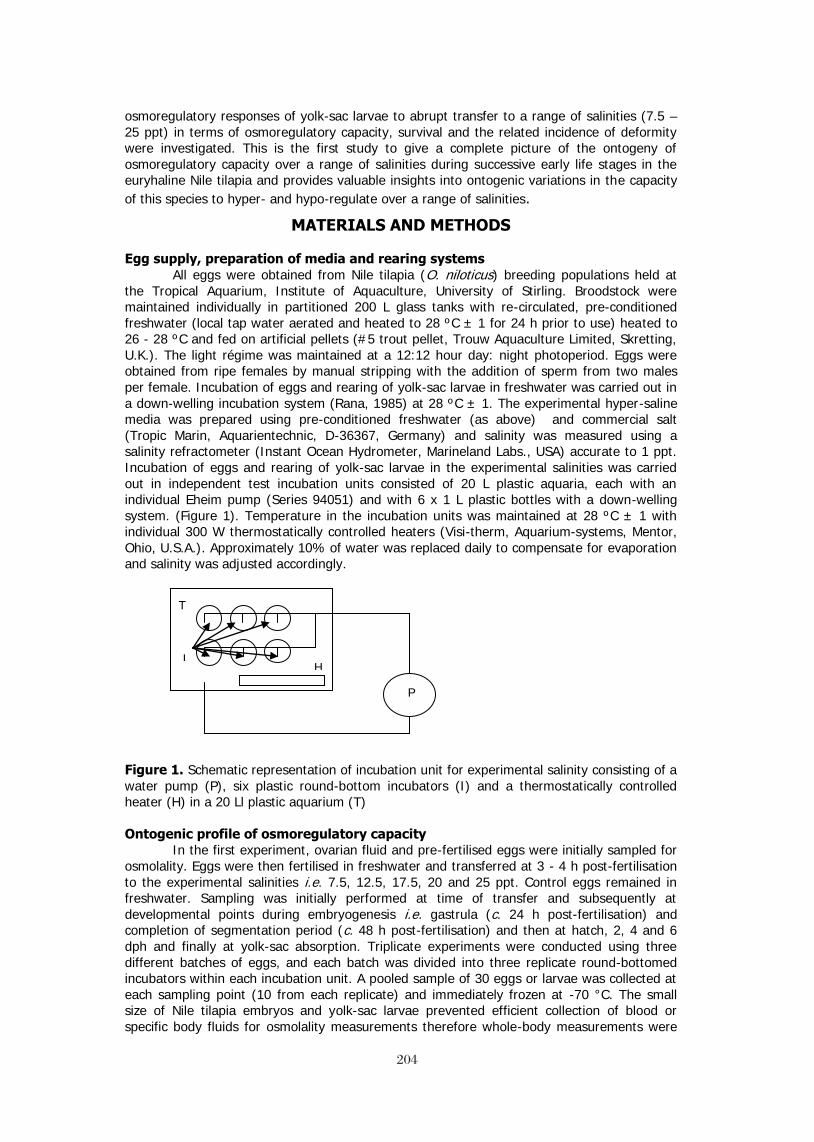
204
204
osmoregulatory responses of yolk-sac larvae to abrupt transfer to a range of salinities (7.5 – 25 ppt) in terms of osmoregulatory capacity, survival and the related incidence of deformity were investigated. This is the first study to give a complete picture of the ontogeny of osmoregulatory capacity over a range of salinities during successive early life stages in the euryhaline Nile tilapia and provides valuable insights into ontogenic variations in the capacity of this species to hyper- and hypo-regulate over a range of salinities.
MATERIALS AND METHODS
Egg supply, preparation of media and rearing systems All eggs were obtained from Nile tilapia (O. niloticus) breeding populations held at
the Tropical Aquarium, Institute of Aquaculture, University of Stirling. Broodstock were maintained individually in partitioned 200 L glass tanks with re-circulated, pre-conditioned freshwater (local tap water aerated and heated to 28 ºC ± 1 for 24 h prior to use) heated to 26 - 28 ºC and fed on artificial pellets (#5 trout pellet, Trouw Aquaculture Limited, Skretting, U.K.). The light régime was maintained at a 12:12 hour day: night photoperiod. Eggs were obtained from ripe females by manual stripping with the addition of sperm from two males per female. Incubation of eggs and rearing of yolk-sac larvae in freshwater was carried out in a down-welling incubation system (Rana, 1985) at 28 ºC ± 1. The experimental hyper-saline media was prepared using pre-conditioned freshwater (as above) and commercial salt (Tropic Marin, Aquarientechnic, D-36367, Germany) and salinity was measured using a salinity refractometer (Instant Ocean Hydrometer, Marineland Labs., USA) accurate to 1 ppt. Incubation of eggs and rearing of yolk-sac larvae in the experimental salinities was carried out in independent test incubation units consisted of 20 L plastic aquaria, each with an individual Eheim pump (Series 94051) and with 6 x 1 L plastic bottles with a down-welling system. (Figure 1). Temperature in the incubation units was maintained at 28 ºC ± 1 with individual 300 W thermostatically controlled heaters (Visi-therm, Aquarium-systems, Mentor, Ohio, U.S.A.). Approximately 10% of water was replaced daily to compensate for evaporation and salinity was adjusted accordingly.
Figure 1. Schematic representation of incubation unit for experimental salinity consisting of a water pump (P), six plastic round-bottom incubators (I) and a thermostatically controlled heater (H) in a 20 Ll plastic aquarium (T)
Ontogenic profile of osmoregulatory capacity In the first experiment, ovarian fluid and pre-fertilised eggs were initially sampled for
osmolality. Eggs were then fertilised in freshwater and transferred at 3 - 4 h post-fertilisation to the experimental salinities i.e. 7.5, 12.5, 17.5, 20 and 25 ppt. Control eggs remained in freshwater. Sampling was initially performed at time of transfer and subsequently at developmental points during embryogenesis i.e. gastrula (c. 24 h post-fertilisation) and completion of segmentation period (c. 48 h post-fertilisation) and then at hatch, 2, 4 and 6 dph and finally at yolk-sac absorption. Triplicate experiments were conducted using three different batches of eggs, and each batch was divided into three replicate round-bottomed incubators within each incubation unit. A pooled sample of 30 eggs or larvae was collected at each sampling point (10 from each replicate) and immediately frozen at -70 °C. The small size of Nile tilapia embryos and yolk-sac larvae prevented efficient collection of blood or specific body fluids for osmolality measurements therefore whole-body measurements were
H
P
T
I

205
205
used for osmolality measurements; the pools of whole larvae were thawed on ice, homogenised with a motorised Teflon pestle (Pellet Pestle® Motor, Kontes) and the homogenate centrifuged at 10 °C for 10 min at 14 000 g (Eppendorf centrifuge 5417R). The supernatant overlying the pellet was carefully removed into a single well of a 96-well plate and thoroughly mixed with a pipette to ensure homogeneity of each sample. Osmolality was determined using an Advanced 3MO Plus MicroOsmometer (Advanced Instruments, MA, U.S.A.) using three replicates of 20 μl aliquots of supernatant from each pool and accuracy of the machine was regularly checked against calibration standards of 50 and 850 mOsm kg-1. Osmolality was expressed either as whole body osmolality (mOsmol kg-1) or as osmoregulatory capacity (OC; mOsmol kg-1), defined as the difference between the mean osmolality of the pooled larvae to that of the osmolality of their corresponding incubation or rearing media. Adaptation time
In the second experiment, the acclimation time of yolk-sac larvae either at hatch, 3 and 6 days post-hatch (dph) to abrupt salinity challenge was carried out to determine the time necessary for whole-body osmolality to reach a steady-state after abrupt transfer from the rearing medium (freshwater) to two experimental salinities (12.5 and 20 ppt). Triplicate experiments were conducted using three different batches of eggs. Pooled samples, consisting of 30 whole larvae collected at 1.5, 3, 6, 12, 24, 48 and 72 hours after transfer were immediately frozen at -70 °C. Whole body osmolality (mOsmol kg-1) was determined as described above. Osmoregulation and survival following abrupt salinity challenge
In a third experiment, healthy yolk-sac larvae were transferred directly from freshwater to 7.5, 12.5, 17.5 or 25 ppt at hatch, 2, 4, 6 and 8 dph. Larvae were exposed to their experimental salinity for 48 h prior to sampling. Control larvae remained in freshwater. Triplicate experiments were conducted using three different batches of eggs. Pooled samples, consisting of 30 whole larvae (10 from each replicate), were immediately frozen at -70 °C. Osmolality was determined as described above and expressed either as whole body osmolality (mOsmol kg-1) or as osmoregulatory capacity (OC; mOsmol kg-1).
Incidence of larval malformation Thirty newly-hatched larvae from each of the three batches from the first experiment
were selected at random from freshwater, 12.5 and 20 ppt and examined under a dissecting microscope and type and incidence of malformations were noted. Thereafter, thirty live larvae were selected at regular time points during yolk-sac absorption i.e. 2, 4, 6 dph and yolk-sac absorption and malformations were assessed as before. The percentage of abnormality was calculated, based on the numbers of normal and malformed larvae as follows: percentage of malformed larvae (%) = 100 x number of malformed larvae/number of normal larvae. Statistics
Statistical analyses were carried out with Minitab 16 using a General Linear Model (GLM) or One-way analysis of variance (ANOVA) with Tukey’s post-hoc pair-wise comparisons (p < 0.05). Homogeneity of variance was tested using Levene’s test and normality was tested using the Anderson-Darling test. Where data failed these assumptions, they were transformed using an appropriate transformation i.e. squareroot. All percentage data were normalised by arcsine square transformation prior to statistical analyses to homogenise the variation and data are presented as back-transformed mean and upper and lower 95% confidence limits. Significance was accepted when p < 0.05 and results were expressed as mean ± SE.

206
206
RESULTS
Ontogenic profile of osmoregulatory capacity Osmolality of unfertilised eggs (358.2 ± 4.95 mOsmol kg-1) was similar to that of
ovarian fluid (370.7 ± 2.30 mOsmol kg-1) but was seen to drop significantly (One-way ANOVA; p < 0.05) to 216.9 ± 8.89 mOsmol kg-1 after 3 - 4 hours post-fertilisation in freshwater (Figure 2). There was always a significantly higher whole body osmolality in eggs and larvae maintained in elevated salinities as compared to those in freshwater. Osmolality during embryogenesis in freshwater dropped further to a low of 174.6 ± 4.15 mOsmol kg-1 at completion of segmentation period at c. 48 h post-fertilisation, and then was seen to increase significantly (GLM with Tukey’s post-hoc pair-wise comparisons; p < 0.05) by hatching to 230.3 ± 2.53 mOsmol kg-1. Osmolality of larvae in freshwater was then seen to rise again significantly (GLM; p < 0.05) by 4 dph and, thereafter, maintained a relatively constant level of 319.5 ± 4.91 – 324.8 ± 7.41 mOsmol kg-1 until yolk-sac absorption (Figure 2.). In contrast, the osmolality of eggs transferred to elevated salinities at 3 - 4 h post-fertilisation increased with increasing salinity immediately upon transfer. Transfer to 25 ppt induced 100% mortality by 48 h post-fertilisation. In the higher salinities of 17.5 and 20 ppt, osmolality was seen, after the initial abrupt rise, to steadily increase, reaching a maximal value of 434.0 ± 2.07 mOsmol kg-1 and 497.8 ± 2.79 mOsmol kg-1 at hatch for larvae maintained in 17.5 and 20 ppt respectively, declining significantly (GLM; p < 0.05) at 2 dph and thereafter maintaining a relatively constant level until yolk-sac absorption (Figure 2.). For the lower salinities of 7.5 and 15 ppt, following a similar, abrupt rise at transfer, osmolality appears to drop slightly at c. 48 h post-fertilisation and then rise significantly (GLM; p < 0.05) by 4 dph, similarly maintaining a relatively constant level thereafter until yolk-sac absorption.
Figure 2. Ontogenic changes in whole body osmolality of Nile tilapia larvae. Mean ± S.E. x axis (Stage): a; pre-fertilised eggs; b: 3 – 4 h post-fertilisation; c: 24 h post-fertilisation-f; d: 48 h post-fertilisation; e: hatch; f: 2 dph; g: 4 dph; h: 6 dph; i: yolk-sac absorption. Different numerals indicate significant difference between pre-fertilised eggs and those at 3 - 4 h post-fertilisation (One-way ANOVA with Tukey’s post-hoc pair-wise comparisons; p < 0.05).
Stage
a b c d e f g h i
Who
le-b
ody
osm
olal
ity (m
Osm
kg
-1)
150
200
250
300
350
400
450
500
550
Freshwater7.5 ppt12.5 ppt17.5 ppt20 ppt25 ppt

207
207
The ability to osmoregulate increased throughout the developmental period studied, as evidenced by variations in osmoregulatory capacity (OC; defined as the difference between the mean osmolality of the pooled larvae to that of the osmolality of their corresponding incubation or rearing media) (Figure 3.).
Hyper-OC in freshwater increased progressively in absolute value from 176.1 ± 3.66 mOsmol kg-1 at 24 h post-fertilisation to 321.2 ± 4.99 mOsmol kg-1 until yolk-sac absorption; OC values during embryogenesis remained similar but rose significantly (GLM; p< 0.05) at hatch. Osmoregulatory capacity was again seen to increase significantly (GLM; p< 0.05) by 4 dph to 316.4 ± 2.92 with levels remaining constant thereafter until yolk-sac absorption. A similar pattern was observed for embryos and yolk-sac larvae adapted to 7.5 ppt, although OC levels were significantly (GLM; p < 0.05) lower throughout ontogeny than corresponding freshwater values Figure 3.). Whilst at the elevated salinities of 17.5 and 20 ppt, OC levels remained constant during embryogenesis with no significant change in absolute value from 24 hours post-fertilisation until yolk-sac absorption, a significant drop (GLM; p < 0.05) in OC was observed at hatch (Figure 3.), but which then rose again by 2 dph. In the iso-osmotic salinity of 12.5, embryos hypo-regulated until hatch, and thereafter were either iso-osmotic to the environmental salinity or slightly hyper-regulated (Figure 3.).
Figure 3. Variations in osmoregulatory capacity (OC) during ontogeny in comparisons
Figure 3. Variations in osmoregulatory capacity (OC) during ontogeny in relation to the osmolality of the medium. Mean ± S.E; different letters represent significant differences between sampling points (General Linear Model with Tukey’s post-hoc pairwise comparisons; p < 0.05).
Salinity (ppt)
Freshwater 7.5 12.5 17.5 20 25
OC (m
Osmo
l kg -1
)
-300
-200
-100
0
100
200
300
400
24 h post-fertilisation48 h post-fertilisationHatch2 dph4 dph6 dphYolk-sac absorption
a
a
b
a
c c c
c
a
b
b c c c
ab a
b c c
d d
b a a a a a a
a a b a a a a

208
208
Salinity tolerance
The time required for whole-body osmolality to stabilise following an abrupt transfer to an elevated salinity did not appear to vary according to age at transfer (Figure 4.). In general, the changes in osmolality appeared to follow a pattern of crisis and regulation, with values for larvae stabilising at c. 48 h for all treatments, regardless of age at time of transfer, and subsequently remaining the same with no significant change (One-way ANOVA; p < 0.05) until 72 h post-transfer. According to these results, the subsequent experiments on osmolality and osmoregulatory capacity were made on larvae having reached a steady-state osmolality following 48 h exposure to experimental salinities.
Figure 4. Time-course of whole body osmolality in Nile tilapia yolk-sac larvae following direct transfer from freshwater to 12.5 and 20 ppt at hatch, 3 dph and 6 dph. Mean ± S.E.
Ontogeny had a significant (GLM with Tukey’s post-hoc pair-wise comparisons; p < 0.05) effect on larval ability to withstand abrupt osmotic challenge; larvae at 8 dph maintained a more constant osmolality over the experimental salinities tested (range 341.4 ± 11.06 to 427.0 ± 2.34 mOsmol kg-1) than larvae transferred at hatch (360.9 ± 3.33 to 487.7 ± 4.92 mOsmol kg-1) (Figure 5.). Similarly, a statistical comparison of OC values showed a clear pattern of age at transfer positively influencing osmoregulatory status. However, there was no significant (GLM; p < 0.05) effect of age of transfer on osmoregulatory capacity (OC) to 7.5 ppt (Figure 6.).
Time after transfer (h)
1.5 h 3 h 6 h 12 h 24 h 48 h 72 h
Who
le b
ody
osm
olal
ity (m
Osm
ol k
g -1
)
200
250
300
350
400
450
500
550
Transfer at hatch to 12.5 pptTransfer at hatch to 20 pptTransfer at 3 dph to 12.5 pptTransfer at 3 dph to 20 pptTransfer at 6 dph to 12.5 pptTransfer at 6 dph to 20 ppt
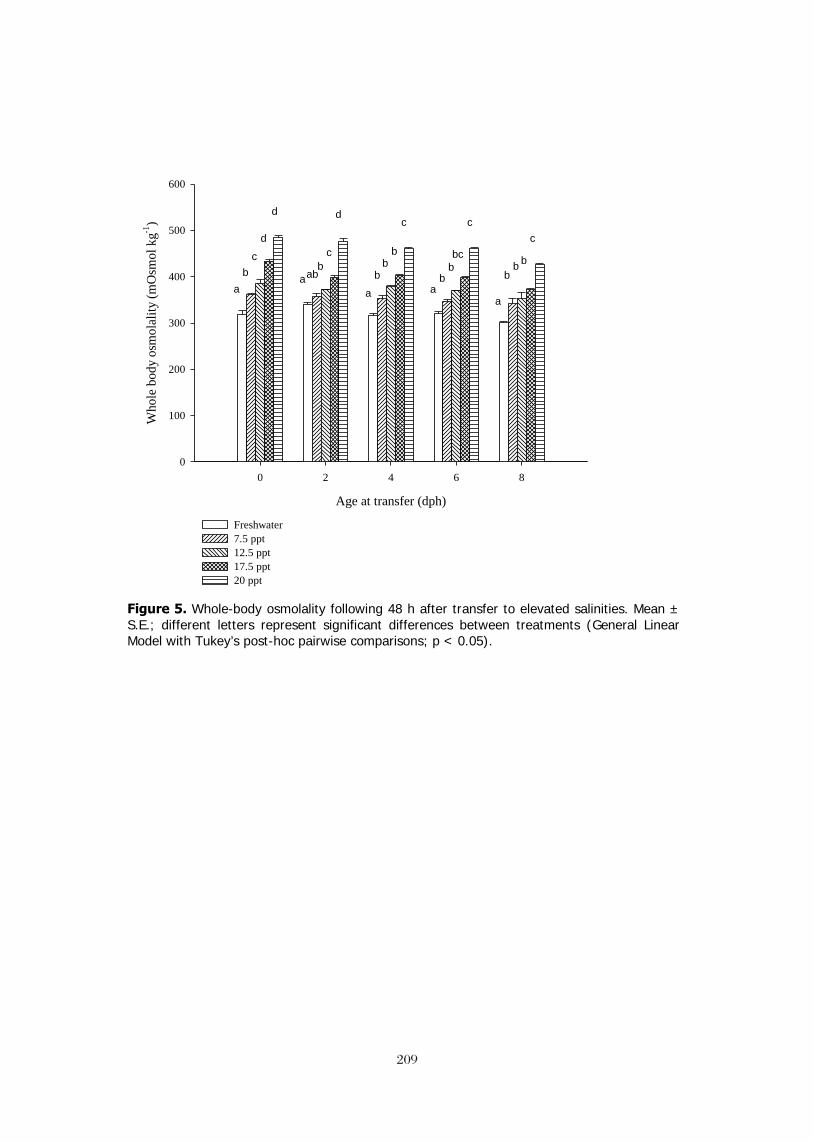
209
209
Figure 5. Whole-body osmolality following 48 h after transfer to elevated salinities. Mean ± S.E.; different letters represent significant differences between treatments (General Linear Model with Tukey’s post-hoc pairwise comparisons; p < 0.05).
Age at transfer (dph)
0 2 4 6 8
Who
le b
ody
osm
olal
ity (m
Osm
ol k
g-1)
0
100
200
300
400
500
600
Freshwater7.5 ppt12.5 ppt17.5 ppt20 ppt
d
b a
d
c
a
d
ab b
a
c
b
c
b b
a b
b bc
c
a
b b
c
b

210
210
Figure 6. Variations in osmoregulatory capacity (OC) at different post-embryonic stages in relation to the osmolality of the medium following 48 h exposure to experimental salinities. Mean ± S.E.; different letters represent significant differences between time of transfer (General Linear Model with Tukey’s post-hoc pairwise comparisons; p < 0.05).
Survival generally decreased with increasing salinity but increased with successive developmental stages (Table 1.). Survival rates of 98 % were recorded for larvae maintained in freshwater at hatch yet lower survival rates, in the range of 83 - 92 %, were recorded for those transferred, at hatch, to elevated salinities. Larvae transferred to salinities of 7.5 – 17.5 ppt at 2 and 4 dph exhibited an improved survival rate than at hatch, yet larvae transferred to 20 ppt still displayed a significantly lower survival rate (GLM; p < 0.05) than other salinities. From 6 dph onwards, no significant differences were observed between survival rates amongst salinities (GLM; p < 0.05) (Table 1.).
Salinity (ppt)
Freshwater 7.5 12.5 17.5 20
OC
(mO
smol
kg-1
)
-200
-100
0
100
200
300
400
Transfer at hatch Transfer at 2 dph Transfer at 4 dpjh Transfer at 6 dph Transfer at 8 dph
a b
a
a a c
a a a a a
a b b b
c
a b b
c b b ab
b c c

211
211
Table 1. Effect of various salinities on larval survival (%) at 48 h post-transfer at various developmental stages during yolk-sac period. Mean and 95% confidence limits. Different superscript letters represent significant differences between treatments; different subscript letters represent significant differences between age at transfer (General Linear Model with Tukey’s post-hoc pairwise comparisons; p < 0.05). Larval survival (%) Salinity Freshwater 7.5 ppt 12.5 ppt 17.5 ppt 20 ppt
Time of transfer: Hatch
98
(94.4–9.9) aba
86
(70.6–96.4) ba
92
(82.9–97.8) aba
83
(73.7 – 90.2) ca
85
(70.7 – 95.6) bca
2 dph
98 (95.4–99.9) a
a 98
(94.5–99.9) ab
95
(79.5–99.9) aa
97 (93.5–99.6) a
b
85 (69.4–95.9) b
a
4 dph
99 (98.4–99.9) aa
96 (90.7–99.5) ab
92 (86.2–96.9) aa
95 (90.1–98.8) ab
77 (69.6–84.2) ba
6 dph
99 (95.1–99.8) aa
98 (94.8–99.9) ab
96 (87.1–99.9) aa
95 (85.1–99.7) ab
99 (95.5–99.3) ab
8 dph
99 (96.8–99.9) aa
99 (94.8–99.9) ab
97 ( 90.8–99.9) aa
99 (96.8–99.9) ab
99 (96.8–99.9) ab
Incidence of malformation Gross larval malformation was defined as pericardial oedema, sub-epithelial oedema of the yolk-sac, non-specific haemorrhaging of blood vessels associated with the yolk-sac syncytium and body or abnormal neurocranium (Figure 7.). Incidence of malformation of yolk-sac larvae was always significantly higher in salinities than in freshwater at all stages (GLM; p < 0.05). Incidence of malformation was seen to decline significantly (GLM; p < 0.05) from hatch until yolk-sac absorption (Table 2.). Table 2. Effect of salinity on larval malformation during yolk-sac period. Mean and 95% confidence limits were calculated on arcsine square transformed data. Different superscript letters represent significant differences between treatments; different subscript letters represent significant differences between days (General Linear Model with Tukey’s post-hoc pairwise comparisons; p < 0.05).
Incidence of malformation (%)
Salinity Freshwater 12.5 ppt
20 ppt
Time of transfer: Hatch
14
(12-59.6) aa
22
(20.6-41.9) ba
23
(19.9-32) ba
2 dph
2
(0.5-17.6) ab
8
(6.2-34.8) bab
29
(22.6-35.6) ca
4 dph 2
(0.4-4.7) ab
8
(2.23-18.1) bab
10
(2.4-23.6) bb
6 dph
1
(0.1-15.1) ab
2
(0.1-15.1) ab
6
(1.9-13.6) bb
Yolk-sac absorption
1
(0.5-6.0) ab
7
(5.6-8.5) bab
9
(7.5-11.7) bb

212
212
Figure 7. Malformation during yolk-sac absorption period in Nile tilapia. A) Normal larvae at hatch in freshwater showing network of blood vessels associated with yolk-sac syncytium, B) Malformed larvae at hatch maintained in 17.5 ppt showing curvature of stunted tail and pericardial haemorrhaging (arrowhead), C) 2 dph larvae maintained in 20 ppt showing pericardial oedema (arrow) and haemorrhaging of blood vessels associated with the yolk-sac syncytium (arrowhead), D) 2 dph larvae maintained in 20 ppt with pericardial oedema, enlarged heart (arrow) and sub-epithelium oedema of the yolk-sac (arrowhead), E) Normally developing larvae at yolk-sac absorption maintained in freshwater, F) 8 dph larvae maintained in 20 ppt showing distortion of neurocranium (arrowhead) and pooling of blood along spine (arrow).
DISCUSSION
Ontogenic pattern of osmoregulatory capacity and salinity tolerance
This study confirms that newly extruded Nile tilapia eggs, prior to fertilisation, have the same osmo-concentration to that of the ovarian fluid, which has been confirmed in a number of marine teleost species e.g. herring (Clupea harengus) (Holliday and Blaxter, 1960; Alderdice et al., 1979), plaice (Pleuronectes platessa) (Holliday and Jones, 1967), long rough dab (Hippoglossoides platessoides limandoides) (Lonning and Davenport, 1980), cod (Gadus morhua) (Davenport et al., 1981; Mangor-Jensen, 1987), lumpsucker (Cydopterus lumpus) (Kjorsvik et al., 1984) and Atlantic halibut (Hippoglossus hippoglossus) (Østby et al., 2000).
B
C D
E F
A

213
213
Indeed, it has been recognised that marine teleost eggs, prior to ovulation take up a large amount of water leading to swelling of 4 - 7 times resulting in a relative water content on 90 -92 % (Craik and Harvey, 1987; Østby et al., 2000). Indeed, both prior to and post ovulation, the plasma membrane of eggs are relatively permeable to water and respond to changes in the ovarian fluid (Sower et al., 1982) and they are therefore assumed to be iso-osmotic with maternal blood. After spawning, fertilisation and activation of the egg results in cortical alveolar exocytosis, a process that causes imbibition of water from the external environment across the chorion to form the perivitelline fluid (PVF), blocking the micropyle and therefore preventing polyspermy (Yamamoto, 1944). Lonning and Davenport, (1980) report swelling to be complete at 24 h post-fertilisation, but may have ceased between 4 – 24 h in the eggs of the long rough dab (H. platessoides limandoides). Similarly, Shanklin (1959) comments that the PVF of the egg, upon spawning, rapidly establishes equilibrium with the external media, and this is confirmed by Lasker and Theilacker (1962) in the developing eggs of the Pacific sardine (Sardinops caerulea). Similarly, a rapid increase in osmolality after spawning into sea water is reported in newly extruded eggs in the Atlantic herring (C. harengus) (Holliday and Jones, (1965), the cod (G. morhua) (Davenport et al., 1981), the long rough dab (H. platessoides limandoides) (Lonning and Davenport, 1980) and the lumpsucker (C. lumpus) (Kjorsvik et al., 1984). This could explain the abrupt decline in osmolality of eggs at 3 - 4 h post fertilisation into hypo-osmotic freshwater that is reported in this study.
It has been demonstrated in this study that, during embryogenesis, a constant osmolality is maintained regardless of the external media until hatch. Therefore the question arises, how do embryos maintain some sort of osmoregulatory control during these early stages of embryogenesis. At spawning the yolk is enclosed by a double membrane enclosing a thin layer of cytoplasm which concentrates on the animal pole forming a blastodisc. During gastrulation the peripheral cells of the morula begin to cover the yolk sac coinciding with the appearance of cutaneous mitochondria-rich cells (MRCs) i.e. on the epithelium of the body surface and yolk-sac of the developing embryo, thus marking the start of the selective restriction of ions and water transfer or active ionoregulation (Guggino, 1980). The first appearance of MRCs on the yolk-sac epithelium of dechorionated freshwater maintained tilapia (Oreochromis mossambicus) embryos was reported at 26 h post-fertilization but no apical crypt was found until 48 h post-fertilization (Lin et al., 1999). Similarly, Ayson et al. (1994) observed MRCs on the yolk-sac epithelium of the tilapia (O. mossambicus) embryos at 30 h post-fertilization in both freshwater and seawater, but apical openings of MRCs were first observed at a low density at 48 h post-fertilization or half-way to hatching. The presence of functional MRCs, therefore, may offer an explanation for the ability of embryos, as demonstrated in this study, to maintain osmotic control i.e. to hyper-regulate in low salinity waters (i.e. freshwater and 7.5 ppt) and to hypo-regulate in elevated salinities (i.e. 12.5 – 20 ppt) at 48 h post-fertilisation following completion of epiboly. Whilst osmolality levels of embryos initially showed a rapid rise following transfer to hyper-osmotic environments, embryos still displayed some sort of regulative control, with the exception of embryos transferred to 25 ppt, who were unable to survive.
Ontogenic changes in salinity tolerance appear, in this study, to be related to developmental stage. Results suggest that abrupt osmotic challenge gave rise to different osmoregulatory responses which were dependant on the ontogenic stage of the larvae and, moreover, a gradual improvement in ability to osmoregulate occurs during ontogeny. Indeed this ability to maintain osmotic homeostasis is reflected in survival patterns of larvae following transfer; from 6 dph onwards, no significant difference is evident in survival between salinities. The study by Watanabe et al. (1985) on the ontogeny of salinity tolerance in various tilapiine spp. (e.g. Oreochromis aureus, O. niloticus and O. mossambicus x O. niloticus hybrid) spawned and reared in freshwater but transferred to elevated salinities (0 – 32 ppt) from 7 – 120 dph suggested that changes in salinity tolerance were more closely related to body size than chronological age, and was probably related to maturational events such as the functional development of the osmoregulatory system. Although the fish in that study were older than those used in the present study, it is still interesting to note that ontogenic physiological changes may confer osmoregulatory ability and salinity tolerance.
214
214
Larval malformation In the present study, haemorrhaging and pooling of blood appears to be linked to
oedematous build up during yolk-sac stages of the Nile tilapia. It is possible that oedema may compress the delicate blood capillary network on the yolk-sac syncytium, and have a damaging, systemic effect on whole larvae by impairing circulation. Hill et al. (2003) examined the negative impacts of the contaminant Polychlorinated dibenzo-p-dioxins (PCDDs) on the epithelium of zebrafish during early life stages and reported a build-up of oedema and ensuing organ compression that led to decreased kidney and circulatory function. They concluded that this model also predicts that many different types of stresses, within which salinity must be included, might lead to the same outcome, and this therefore offers a possible explanation to what is happening in this study.
In this study, there was a significant negative effect (GLM; p < 0.05) of increasing salinity on the occurrence of larval malformations during the yolk-sac period. A high incidence of larval abnormalities has been previously reported during early life stages of marine teleosts, when challenged with variations in salinity. Larvae of the navaga (Eleginus nava), polar cod (Boreofadus saida ) and Arctic flounder (Liopsetta glacialis) exhibited a high incidence of malformation in low salinities (Doroshev and Aronovich, 1974), as did the Atlantic halibut (H. hippoglossus) (Bolla and Ottensen, 1998). A lower percentage of abnormalities in the newly hatched larvae of the pomfret (Pampus punctatissimus) was reported at 29 – 30 ppt than either at < 25 ppt or > 40 ppt (Shi et al., 2008) and, similarly, the percentage of deformities was significantly lower at 36 ppt than at either lower (24 – 33 ppt) or higher (36 - 42 ppt) salinities in the Japanese eel (A. japonica) (Okamoto et al., 2009). These results would therefore seem to suggest that, once the incubation and rearing salinity moves away from that which is encountered in nature, detrimental effects become more pronounced, a trend that is apparent in the current study.
It is clear from this study that there also exists a significant effect of ontogeny on the incidence of malformation during the yolk-sac period. The development of the branchial system and an ontogenic shift in location of active MRCs from extrabranchial to branchial sites is widely accepted and has been reported in the Mozambique tilapia (O. mossambicus) by Li et al. (1995) and van der Heijden et al. (1999) and in the Nile tilapia (O. niloticus) (Fridman et al. in press) which would appear to confer an increasing osmoregulatory capacity which is apparent in the reported pattern of survival in elevated salinities following hatch. This observed reduction of pericardial and sub-epithelial oedema as yolk-sac larvae develop appears to reflect an increasing ability to maintain ionic and osmotic balance throughout the yolk-sac period. In agreement, oedema is not observed in zebrafish larvae after exposure to contaminants if exposure is delayed during ontogeny suggesting that larvae are particularly vulnerable shortly after hatching (Belair et al., 2001).
To conclude, assessment of whole body osmolality has provided a method that has allowed an evaluation of the osmoregulatory status during the early life stages of the Nile tilapia; these measurements appear to offer valuable insight into the emerging pattern of the adaptive capacity to hypo- and hyper-regulate during ontogeny. Osmolality levels of embryos immediately post-transfer to elevated salinities appear to be proportional to and directly related to the osmolality of the external media, but then drop to a more steady state during embryogenesis and yolk-sac period, suggesting that an ontogenic regulatory control is evident which is, in turn, reflected in larval ability to withstand transfer to elevated salinities and decrease in the incidence of larval deformity.
REFERENCES
Alderdice, D. F., Rosenthal, H. and Velsen, F. P. J. 1979. Influence of salinity and cadmium on capsule strength in Pacific herring eggs. Helgolander wiss. Meeresunters. 32: 149-162.
Ayson, F.G., Kaneko, T., Hasegawa, S. and Hirano, T. 1994. Development of mitochondria-rich cells in the yolk-sac membrane of embryos and larvae of tilapia, Oreochromis mossambicus, in fresh water and seawater. J. Exp. Zool. 270: 129-135.
Brown, J.A. and Tytler, P. 1993. Hypoosmoregulation of larvae of the turbot, Scophthalmus maximus, drinking and gut function in relation to environmental salinity. Fish Physiol. Biochem. 10: 475– 483.

215
215
Bolla, S. and Ottesen O. H. 1998. The influence of salinity on the morphological development of yolk-sac larvae of Atlantic halibut, Hippoglossus hippoglossus (L.) Aquaculture Research 29: 203-209.
Bodinier, C., Sucré, E., Lecurieux-Belford, L., Blondeau-Bidet, E. and Charmantier, G. 2010. Ontogeny of osmoregulation and salinity tolerance in the gilthead sea bream Sparus aurata. Comp. Biochem. Physiol. Part A. 157: 220-228.
Craik, J.C.A. and Harvey, S.M. 1987. A biochemical method for distinguishing between wild and farmed salmonid fishes by their carotenoid pigmentation. J. Forensic Science Society 27: 47-55.
Davenport, J., Lønning, S. and Kjørsvik, E. 1981. Osmotic and structural changes during early development of eggs and larvae of the cod, Gadus morhua L. J. Fish Biol. 19: 317–331.
Doroshev, S.I. and Aronovich, T.M. 1974. The effects of salinity on embryonic and larvaldevelopment of Eleginus navaga (Pallas), Boreogadus saida (Lepechin) and Liopsettaglacialis (Pallas). Aquaculture 4: 353–362.
Fridman, S., Bron, J.E. and Rana, K.J. 2011. Ontogenetic changes in location and morphology of chloride cells during early life stages of the Nile tilapia (Oreochromis niloticus (L.)) adapted to freshwater and brackish water. J. Fish Biol. Accepted.
Guggino, W.B. 1980. Water balance in embryos of Fundulus heteroclitus and F. bermudae in seawater. Am. Jour. Physiol. 238: 36–41.
Hill, A., Howard, C. V., Strahle, U., and Cossins, A. 2003. Neurodevelopmental defects in zebrafish (Danio rerio) at environmentally relevant dioxin (TCDD) concentrations. Toxicol. Sci. 76: 392-399.
Holliday, F. G. T., Blaxter, J. H. S. 1960. The effects of salinity on the developing eggs and larvae of the herring. J. Mar. Biol. Assoc. U. K. 39: 591-603.
Holliday, F. G. T. and P. M. Jones. 1965. Osmotic regulation in the embryo of the herring (Clupea harengus). J. Mar. Biol. Assoc. U.K. 45: 305-311.
Holliday, F, G. T., Jones, M. P. 1967. Some effects of salinity on the developing eggs and larvae of the plaice (Pleuronectes platessa). J. Mar. Biol. Assoc. U. K. 47: 39-48.
Kaneko, T., Hasegawa, S., Takagi, Y., Tagawa, M. and Hirano, T. 1995. Hypoosmoregulatory ability of eyed-stage embryos of chum salmon. Mar. Biol. 122: 165– 170.
Kjorsvik, E., Davenport, J. and Lonning, S. 1984. Osmotic changes during the development of eggs and larvae of the lumpsucker Cydopterus lumpus L. J. Fish Biol. 24: 311-321.
Lasker, R. and Theilacker, G.H. 1962. Oxygen consumption and osmoregulation by single Pacific sardine eggs and larvae (Sardinops caeurlea Griard). J. Cons. Perm int. Explor. Mer. 27: 25-33.
Li, J., Eygensteyn, J., Lock, R.A.C., Verbost, P.M., van der Heijden, A.J.H., Wendelaar Bonga, S.E. and Flik, G. 1995. Branchial chloride cells in larvae and juveniles of freshwater tilapia Oreochromis mossambicus. J. Exp. Biol. 198: 2177–2184.
Lin, L.Y., Weng, C.F. and Hwang, P.P., 1999. Effects of cortisol on ion regulation in developing tilapia (Oreochromis mossambicus). Physiol. Biochem. Zool. 72: 397– 404.
Lonning, S. and Davenport, J. 1980. The swelling egg of the long rough dab, Hippoglossoides platessoides limandoides (Bloch) J. Fish. Biol. 17: 359-378.
Mangor-Jensen, A. 1987. Water balance in developing eggs of the cod Gadus morhua L. Fish Physiol. Biochem. 3: 17–24.
Okamoto, T., Kurokawa, T., Gen, K., Murashita, K., Nomura, K., Shibahara, H., Kim, S.K.,Matsubara, H., Ohta, H. and Tanaka, H. 2009. Influence of salinity on morphologicaldeformities in cultured larvae of Japanese eel, Anguilla japonica, at completion ofyolk resorption. Aquaculture 293: 113–118.
Østby, G.C., Finn, R.N., Norberg, B. andFyhn, H.J. 1999. Osmotic aspects offinal oocyte maturation in Atlantic halibut. Proc. 6th Int. Symp. Reprod. Physiol. Fish. (2000) pp 289-291Norberg B, Kjesbu OS., Taranger GL, Anderson E, Stefansson SO (eds). Inst Mar Res & Univ Bergen
Rana, K.J. 1988. Reproductive biology and the hatchery rearing of tilapia eggs and fry. In: J.F. Muir and R.J. Roberts (Editors), Recent Advances in Aquaculture, London, pp. 343-406.
Shanklin, D.R. 1959 Studies on the Fundulus chorion. J. Cell. Comp. Physiol. 43: 1-11.

216
216
Shi Z., Huang, X., Fu, R., Wang, H. Luo H., Chen, B. Liu M. and Zhang, D. 2008. Ssalinity stress on embryos and early larval stages of the pomfret Pampus punctatissimus Aquaculture 275: 306-310.
Sower, S.A., Schreck, C.B. and Donaldson, E.M. 1982. Hormone-induced ovulation of coho salmon (Onchorhynchus kisutch) held in seawater and fresh water. Can. J. Fish. Aquat. Sci. 39: 627-632.
Unuma, T., Kondo, S., Tanaka, H., Kagawa, K., Nomura, K. and Ohta, H., 2005. Relationship between egg specific gravity and egg quality in the Japanese eel, Anguilla japonica. Aquaculture 246: 493–500.
Varsamos, S., Connes, R., Diaz, J.P., Barnabé, G. and Charmantier, G. 2001. Ontogeny ofosmoregulation in the European sea bass Dicentrarchus labrax L. Mar. Biol. 138: 909–915.
van der Heijden, A.J.H., Verbost, P.M. Eygensteyn, J., Li, J., Wendelaar Bonga, S.E. and Flik, G. 1997. Mitochondria-rich cells in gills of tilapia (Oreochromis mossambicus) adapted to fresh water or sea water: quantification by confocal scanning laser microscopy. J. Exp. Biol. 200: 55-64.
Watanabe W.O. Kuo, C.M. and Huang, M.C. 1985. The ontogeny of salinity tolerance in the tilapias Oreochromis aureus, O. niloticus and an O. mossambicus x O. niloticus hybrid, spawned and reared in freshwater. Aquaculture 47: 353-367.
Yanagie, R., Lee, K. M., Watanabe, S. and Kaneko, T. 2009. Ontogenic change in tissue osmolality and developmental sequence of mitochondria-rich cells in Mozambique tilapia developing in freshwater. Comp. Biochem. Physiol. (Part A) 154: 263-269
Yamamoto,T. 1944. On the excitation-conduction gradient in the unfertilized egg of thelamprey, Lampetra planeri. Proc. Imp. Acad. Japan. 20.

217
217
Tilapia Germplasm in China: Chance and Challenge
Zhao Jinliang
Key Laboratory of Aquatic Genetic Resources and Utilization, Ministry of Agriculture, Shanghai Ocean University, Shanghai, 201306 P. R. China
Email: [email protected]
Abstract Tilapia aquaculture has experienced rapid development in China in recent years, which has become the largest tilapia producing country in the world. Tilapias are actually several exotic species and have been introduced repeatedly to China since 50 years ago. The major species are Oreochromis niloticus and O. aurea. The superior strain of introduced Nile tilapia is the Genetically Improved Farmed Tilapia (GIFT). Now, a further bred GIFT is widely used in practice for its high growth rate, another is the hybrid of O. niloticus × O. aurea for its high male percentage. Genetic breeding and biotechnology are extensively being applied to improve tilapia performance such as sality tolerance, resistance to lower temperature and some diseases. However, it may not be rational and healthy for rapid development of Chinese tilapia industry. Rapid development driven by profits may not be the best indicator for the tilapia industry. An environmentally and economically sustainable industry should be the goal for development in China. The largest production of tilapia in China is mainly relying on international market, local market for acceptance and consumption is less developed. Tilapia germplasms in China are mainly from international introduction, our capacity of germplasm creation and genetic breeding is still at a low level, which could constrain our development in long run. Much attention has been given to the total production but less on fish quality. Strong renovation technologies for improving limited tilapia germplasm are expected to support the largest Chinese tilapia industry. Keywords: Tilapia, germplasm, chance, challenge
Outlines
A. The largest tilapia industry in China is totally depended on some limited introductions Tilapias are exotic species and originated from African countries. Since 1950s, nine species (O. mossambicus, O. niloticus, O. aurea etc) have been introduced to China, which formed the founder of Chinese tilapia industry (Table 1) After 40 years experiment and exploration, China successfully became the biggest tilapia producer in the world. Table 1 The introduction of tilapia in China Species Year Source Introducing institute O. mossambicus 1956 Vietnam Guangdong Fisheries Institute O. niloticus 1978
1978 1988 1992 1994 1998 2005
Sudan Thailand Egypt America Philippine Egypt Malaysia
Yangtze Fisheries Institute Zhujiang Fisheries Institute Hunan Fisheries Institute Freshwater Fisheries Research Center Shanghai Fisheries University Shanghai Fisheries University Freshwater Fisheries Research Center
O. aurea 1981 1983 1998
Taiwan America Egypt
Guangzhou Fisheries Institute Freshwater Fisheries Research Center Shanghai Fisheries University
O. hornorum 2000 America Zhujiang Fisheries Institute S. melanotheron 2002 America Shanghai Fisheries University

218
218
The actual introductions should be bigger than the above table. However, the most introductions were in-directed, second-handed or more, a few introduction was from the original rivers. Thus, these germplasm now supporting Chinese tilapia industry is relatively smaller. Through many species and many times introductions, GIFT strain and the hybrid O. niloticus×O. aurea are two commonly cultured species in inland fisheries (Table 2). The NEW GIFT strain is famous for its high growth rate, the hybrid of O. niloticus × O. aurea for its high male percentage, other speices or strain are not extensively used due to laking of superior performance. Meantime, Red tilapia, GILI (O. niloticus× S. melanotheron) and Mohe (O. mossambica×O. hornorum) are partially applied in some seawater.
Table 2. The major strains and species cultured in China Common name Species/strain/variety GIFT NEW GIFT Genomar GIFT Baolu GIFT Ni ao Gili Red tilapia Mo he
Selected from a mixed population of 4 native and 4 domesticated of O. niloticus Selected from GIFT strain of O. niloticus O. niloticus O. niloticus O. niloticus× O. aurea O. niloticus× S. melanotheron F2 O. niloticus× O. mossambica variety O. mossambica×O.hornorum
Due to warm climate requirement, the major tilapia production area is in south China (>90%), it also be cultured in the north China using waste heat generation (Table 3).
Table 3. The major production areas in China Area Production percentage Guangdong Hainan Guangxi Fujian Other
47% 20% 15% 8% 10%
Good strain, huge human labors, large amount of water area, new markets, together with the aquaculture experience promote the tilapia production quickly. Chinese tilapia production is about one-third of total tilapia production in the world (Table 4).

219
219
Table 4. Tilapia production in recent year in China
Year Production (×104 tons) 2000 2001 2002 2003 2004 2005 2006 2007 2008 2009 2010
63 67 71 81 90 98 99 113 95 115 100
In those years, the export production also keeps a strong increase and export to many other countries (Table 5).
Table 5. Tilapia export production
Year Production (×104 tons) 2007 2008 2009 2010
21.5 22.4 25.9 26.0
Problems on introduction
(1) Unorganized introduction The purposes of tilapia introduction were for research or commercial use, fish
introduction was never organized by the government. These tilapias are kept in some separated institutes or fish farms, their genetic variation may not be fully utilized. Introducing source, number and their characters are less considered for industry view. (2) Small population
The population size is determined by the actual mating parent’s numbers rather than the total parental numbers. Because of long-distance transplantation, only few individuals could survive at last. Therefore, the effective population is much smaller than its original amount; the genetic variation of introduced population was rather small. (3) Loss of genetic variation
Under the circumstance of small population size, genetic drift happened and severely changed their genetic variation generation by generation. In depth, low genetic diversity is the ultimate limitation for its future genetic improving. (4) Poor management
Inbreeding is easily happened for tilapia because they are from the common ancestor, especially from some small population (Table 6). Meantime, unjust mating scheme are another source of inbreeding during generation transition.
Table 6. The estimated inbreeding coefficient for introduced tilapia in China
Species Survival No. Effective size Coefficient index N78-1 N78-2 N85 N95 N98
10♀,12♂ 30 9♀,1♂ 24♀,29♂ 3000
21.8 30 3.6 52 3000
0.00965 0.03333 0.01389 0.00952 0.00017
(5) Hybridization
Because of easy interspecific hybridization, more than two kinds of species kept in the same fish farms would produce interspecific hybrid, these hybrids were often mixed with the
220
220
brooder stocks. Genetic introgression was found in tilapia fish farm. In respect of the germplasm, low genetic variation, inbreeding of these introduced population further limited and constrained their long term utilization. B Genetic improvements is still on development Growth Rate
Growth rate is the first demand for a good variety. GIFT strain was selected from the combined base populations of four African strains and four Asian strains in Philippines. It was introduced to China in 1994, and showed some superior performances (growth, capture) than that of the extant strains in China, thus became a superior introduced variety. New GIFT was developed from the introduced GIFT strain by Shanghai Ocean University. After eight generations of mass selection on growth rate and morphology, the NEW GIFT possessed higher growth rate than the control group (>30%), it now become the most popular cultured species in China.
Although there are many introductions for different tilapia species, the small effective population size resulted in the genetic drift or genetic bottle, the loss of genetic variation made its selection are not effective in most strain. Male percentage
Sexual maturation ahead of the commercial size is also perplexing tilapia aquaculture. The hormone administration was easily applied at the fingerling stage to increase male percentage, however, its safety is still on debated. Another practical method for producing male-offspring is interspecific hybridization. The best hybridization combination for high male percentage is O. niloticus× O. aurea, which claimed to more than 95% male percentage. In fact, some other factors (genetic and environmental) also affected the male percentage. YY-male tilapia The sexual chromosome type of Nile tilapia is XY for male and XX female, after sexual reversal XY(♂)→XY (△♀), then identified the YY(♂) among XY(△♀)×XY(♂) progeny, In genetics, XX(♀)×YY(♂) will produce 100% male percentage. Development and application of super male tilapia natural breeding system are carried out in Guangzhou Luye Fisheries Co. Ltd Salt-tolerance O. niloticus grow fast but low sality tolerance (<5), S. melanotheron grow slowly but high sality tolerance (0-100). It is easy for interspecific hybridization among some tilapia species, far interspecific hybridization of O niloticus and S. melanotheron are less successfully probably due to their different genera. Secondly, the mouth hatching parent is female in O. niloticus, while mouth hatching parent is male in S. melanotheron. The growth and sality of O. niloticus× S. melanotheron was better than that of the reciprocal hybrid S. melanotheron× O. niloticus. The difficulty to get enough F1 greatly confined their application.
In contrast, the F2 generation could easily be obtained by the natural mating among F1, and kept sality tolerance and growth as F1. They could be largely propagated in practical. Now, they have been cultured in seawater ponds (15) or polycultured with shrimp. Meantime, the meat quality also was improved under salinity culture. Also brackish-alkaline water tolerance tilapia is expected in north China. Disease resistance
Disease is another problem perplexing the industry. A Tilapia epidemic has broken out in main producing area, South China since 2009, it mostly attacked tilapia at 200g, with 20-30% morbidity and 95% mortality, thus greatly decrease the total production. Recently, Streptococcicosis agalactiae was isolated and identified as the main pathogen in Guangdong and Hainan. A new program has been initiated to prevent and control this disease during the whole production process, also disease resistance strain is expected urgently to adjust the aquacultural environmental.

221
221
Cold tolerance Naturally, these temperate species couldn’t survive the winter in most part China. The
lethal temperature for O. niloticus is 10℃, 8℃ for O. aurea. In north China, tilapia was only cultured under circulated warm water supplied by electricity power plant. In south China, they could survive the winter in the simple plastic-roof rooms, the warm climate also provide a long growth period for tilapias. Therefore, the major production area is south China. Since 2008, the bad cold climate often intruded south China. The low temperature killed the adult fish and decreased the total production; it also killed tilapia breeders and caused the shortage of the next year seed supply.
The best resolution for safe winter is providing some warm-keeping apparatus, it is effective way to escaping from the cold, but would add some cost to producer. Improving their cold tolerance is put forward in recent years; however, it may be a long way to conquer their biological ability and climate change.
References
Cao J L, Chen J J Yang H, et al. 2010. Study on selection effects in Egyptian strain of Nile tilapia, Oreochromis niloticus. Aata Hydrobiologica Sinica, 34(4): 866-871.
China Aquatic Products Processing and Marketing Association, 2010. The 7th International Tilapia Industry Development Forum. Nanning.
Chen S Z and Ye W. 1994. The tilapia species in China. Chinese Journal of Zoology, 29(3):18-23.
Hu G C, Li S F, He X J. et al. 2005. Selective effects of growth from 6th to 8th generation of GIFT strain Oreochromis niloticus. Journal of Shanghai Fisheries University, 14(3):327-331
Ke J, Zhao F, Luo L, et al. Isolation, identification and pathogenicity of pathogenic bacteria of fulminant disease of tilapia in Guangdong Province. Journal of Zhanjiang Ocean University, 2010, 30(3):22-27.
Li J L and Zhou Z J. 2000. Introduction and research of blue tilapia in China mainland. Journal of Zhejiang Ocean University (Natural Science), 19(3): 261-265.
Li S F. 2001. Introduction of GIFT strain of Nile tilapia. China Fisheries, (10): 52-53. Li J L and Li S F. 2001. Introduction and research advances of Oreochromis niloticus in China
Mainland. Journal of Fisheries of China, 25(1):90-95. Li X J, Li A J, Peng X L, et al. 2007. Introduction of tilapias and conservation of their genetic
resource. Henan Fisheries, (1):3-6. Li Q Y,Liu H N,Wu K. 2010. Export analysis and strategies of Chinese tilapia to the
European Union. Hunan Agricultural Sciences, (8):137-139. Lin Y, Yang L H, Tang Z Y, et al. Evaluation on culture performance of cold-tolerance tilapia
strain. China Fisheries, (9): 95-96. Lu M X. 2010. Review of research on streptococcosis in tilapia. South China Fisheries Science,
(1):75-79. Luo Y J, Cao J L, Chen J J, et al, 2010. Selection effects in American strain of Nile tilapia,
Oreochromis niloticus. Journal of Fishery Sciences of China, 17(5): 951-959. Xie X Y, Zhong J X, Li S F, et al. 2009. Comparison of growth performance of F6, F7 and F8 of
GIFT strain Oreochromis niloticus. South China Fisheries Science, 5(1):48-53. Yang H. 2010. The status of Chinese tilapia industry and construction of industry and
technology system. China Fisheries, (9): 6-10. Zhao J L, Li S F, He X J, et al. 2003. Selection evaluation of sixth generation of GIFT strain of
Oreochromis niloticus. Journal of Shanghai Fisheries University, 12(3):201-204. Zhong J X, Xie X Y, Li S F, et al. 2008. Comparison of growth performance of F6, F7 and F8 of
GIFT strain Oreochromis niloticus at the second year. Ocean and Fisheries, (12):23-25. Zhu H P, Lu M X, Huang Z H, 2008. Evaluation of selective breeding effect of Oreochromis
mossambicus and O. hornorum at fourth generation. South China Fisheries Science, 4(3):1-6

222
222
EFFECTS OF Aloe vera (Liliaceae) ON THE GONAD DEVELOPMENT IN NILE TILAPIA, Oreochromis niloticus (Linnaeus 1758)
Temitope JEGEDE
Department of Forestry, Wildlife & Fisheries Management, University of Ado Ekiti, Ekiti State, Nigeria.
ABSTRACT
There is need to control undesirable tilapia recruitment in ponds using natural reproductive inhibitory agents in plants because they are less expensive and constitutes appropriate technology in developing countries. Aloe vera latex (AL) was added to a basal diet (350g crude protein and 18.5MJ gross energy/kg diet) at 0, 0.5, 1.0, 1.5 or 2.0 ml/kg diets and fed to mixed-sex Oreochromis niloticus for 60 days to evaluate the effects on growth and feed utilization, reproduction traits, and histology of gonads. There were no significant difference (p >0.05) in the growth parameters and food conversion ratio. Indices of reproduction traits decreased with increasing dietary A. vera latex (AL) levels. Fish fed with the control diet and 0.5ml AL/kg diet had significantly higher and better indices of reproduction traits (P<0.05) than the other fish fed with 1.0,1.5 and 2.0ml AL/kg diets respectively. Fish fed 0ml AL/kg diet (control) showed normal testicular and ovarian tissues architecture, typical bilateral lobes of the ovaries were evident, normal olive green colour was maintained; and no pathological lesions occurred. Fish fed 0.5ml AL/kg diet showed no visible alteration in the ovaries, testicular architecture and cystic seminiferous tubules. Fish fed 1.0ml AL/kg diet showed testicular atrophy. Fish fed 1.5ml AL/kg diet exhibited cystic seminiferous tubule and atrophy of tissues. Fish fed 2.0ml AL/kg diet showed severe tissue atrophy, sperm cells disintegration and necrosis. Also, in fish fed 2.0ml AL/kg diet, ovirectomy revealed a change in the colour of ovaries, histology showed ruptured follicle, granulomatous inflammation in the insterstitium and necrosis of the ovaries. Reproduction traits and histological observations of gonads in O. niloticus fed high dietary levels of AL revealed that A. vera latex may be effective as reproduction inhibitory agent.
INTRODUCTION
Aloe vera is a succulent, almost sessile perennial herb. Its leaves 30–50 cm long and 10cm broad at the base; colour is pea-green (when young they are spotted with white) and has bright yellow tubular flowers, 25–35 cm in length arranged in a slender loose spike. It contains a colourless mucilaginous gel called A. vera gel (Bruneton 1995). A. vera is grown commercially, especially in the Netherlands Antilles, for the latex which is used medicinally (Christman 2005). It is frequently used in herbal medicine and can be grown as an ornamental plant. Preliminary evidences have shown that A. vera extracts (bitter yellow A. vera latex) are useful in the treatment of fungi and bacterial infections in humans and as laxative (Boudreau and Beland 2006). Compounds extracted from A. vera have been used as an immunostimulant that aids in fighting cancers in cats and dogs (King et al 1995). King et al. (1995) and Eshun and He (2004) reported that the active compounds in A. vera include polysaccharides, mannans, anthraquinones, lectins, salicyclic acid, urea, nitrogen, cinnamic acid, phenol and sulfur. It also contains amino acids, lipids, sterols tannin and enzyme.
Though many scientific studies on the use of A. vera have been undertaken, some of them are said to be conflicting (Ernst 2000 and Vogler and Ernst 1999) and this include the fact that the bitter yellow latex from A. vera leaf (which active ingredients are aloe-emodin, aloin and barbaloin)can cause abdominal cramps,impair fertility or cause miscarriage in humans and animals during overdose or misuse. Active ingredients from A. vera latex are used extensively in commercial laxative preparation, though its use has been banned.
Tilapias constitute one of the most productive and internationally traded food fish in the world (Modadugu and Belen 2004). They are a major protein source in many of the

223
223
developing countries. The commodity is not only the second most important farmed fish globally (next to carp) but also described as the most important aquaculture species of the 21st century (Shelton 2002). (FAO 2006) reported that farmed Nile tilapia (O. niloticus) production reached 1,703,125mt, which is about 84% of total farmed tilapia production in 2006. However, tilapias are yet to reach their full aquaculture potential because of the problem of precocious maturity and uncontrolled reproduction, which often results in the overpopulation of production ponds with young (stunted) fish. Population control in farmed tilapias has been reviewed (Guerrero, 1982; Mair and Little, 1991); such control methods include monosex culture, sex reversal by androgenic hormones, cage culture, tank culture, the use of predators, high density stocking, sterilization, intermittent/selective harvesting, and the use of slow maturing tilapia species, among others. However, these population control methods have their limitations; e.g. the use of reproductive inhibitors, such as irradiation, chemosterilants has disadvantages which are: expensive technology, hatchery facilities and skilled labour are required and hormones are expensive and difficult to obtain. Hence there is need to examine less expensive and appropriate technology to control tilapia recruitment in ponds using natural reproductive inhibitory agents in some plants.
O. niloticus is a maternal mouth brooder and becomes sexually matured in 4-5 months at small size (10 cm; 20-50 g) in ponds; each female lays about 1,500-2,000 eggs/spawning and 3 spawnings/year (Balarin and Hatton, 1979). The objective of this study was to investigate the effects of varying dietary inclusion levels A. vera latex on some reproduction traits (gonad development stages, fecundity, egg size (length and diameter), histology of gonads) in O. niloticus fed for 60 days.
MATERIALS AND METHODS
A. vera leaves were cut with a sharp, clean knife and the bitter yellow latex were collected and stored in a dry, clean, air-tight transparent plastic container, labelled and refrigerated at -200. Feedstuffs were purchased from a local feedstuff market and were separately milled to small particle size (< 250 µm). A basal diet (D1, 350g crude protein and 18.5MJ gross energy/kg diet) was prepared as formulated in Table 1. Four test diets (D2, D3, D4, D5) were formulated by adding 0.5, 1.0, 1.5, or 2.0ml of A. vera latex (AL) to 1 kg of basal diet, respectively. The feedstuffs were thoroughly mixed in a Hobart A-200T mixer. Hot water was added at intervals to gelatinize starch. The five diets were pelletized using a die of 8 mm diameter and air-dried at ambient temperature for 72 hours; broken, sieved into small pellet sizes, packed in air-tight containers, labelled and stored.
Table 1: Ingredient composition of basal diet
g/kg diet
Menhaden fish meal 280 Soybean meal 370 Corn meal 250 Cod liver oil 30 Corn oil 20 Vitamin-mineral mix 30 Corn starch 20
O. niloticus fingerlings, obtained from a single spawn, were acclimated for 14 days in concrete tanks during which they were fed with a commercial diet. After acclimation, 5 male and 5 female O. niloticus (mean wt., 30.38 +0.16g) were stocked in each of 15 glass tanks (75cm x 40cm x 40cm) supplied with 60 litres of fresh water (water temperature, 27 oC; pH, 7.3; alkalinity, 50 ppm; dissolved oxygen, 7.6-7.9 mg/L). Continuous aeration was provided using a blower and air stones (Tecas air pump AP-3,000; 2 ways). The treatments were replicated thrice. Fish were fed at 4% body weight/day of the basal diet in two instalments at

224
224
0900-0930 h and 1700-1730 h for 60 days; after which they were removed, sorted by sex and weighed. Sex determination was done through visual examination of the gonad. Fish mortality was monitored daily.
Six male and six female O. niloticus samples were randomly taken from each treatment, dissected, and the testes and ovaries removed and weighed. Gonad development stages in male and female O. niloticus were classified according to Kronert et al. (1989) and Oldorf et al. (1989), respectively. Fecundity was estimated from gonads of six fish from each treatment in the final maturation stage from a sample representing at least 50% of ovary weight then reported to the total weight of the ovary. Thirty (30) eggs were measured using a microscope eye-piece graticule for length (L) and width (H) (Rana, 1985). Short and long axis of two egg samples from each spawn (treatment) were measured using light microscope containing a calibrated eye piece graticule.
Mean egg diameter was calculated from each spawn (treatment) as follows:
Mean egg diameter (mm) = length of long axis + length of short axis
The gonads were sectioned, fixed for 24 hours in formalin-saline solution made of equal volumes of 10% formalin and 0.9% NaCl solution. Histological sections of 8µ thickness were prepared following standard procedures. Photomicrographs were taken with Leitz (Ortholux) microscope and camera.
Statistical comparisons of the results were made using the one-way Analysis of Variance (ANOVA) test. Duncan’s New Multiple Range Test was used to evaluate the differences between means for treatments at the 0.05 significance level (Zar, 1996).
RESULTS AND DISCUSSION Reproduction traits and histology of testes in O. niloticus fed varying inclusion levels
of Aloe vera Latex (AL) diets. In fish fed with the control diet, milt motility from its initial level of 84.84% for O. niloticus dropped to 17.88%, for those fed with 2.0ml AL/kg diet for 60 days. In a similar study, Lohiya and Goyal (1992), Lohiya et al. (1999a, 1999b) reported that the chloroform extract, the benzene chromatographic fraction of the chloroform extract and its methanol and ethyl acetate sub-factions and the isolated compounds of Carica papaya showed significant effects on sperm parameters by oral administration in rats and rabbits. Also, milt count dropped from its initial level of 163,600 to 138,000 in O. niloticus fed with 2.0ml AL/kg diet for 60 days. This was corroborated by Sadre et al. (1983) who studied male antifertility activity of neem on mice, rats, rabbits, and guinea pigs by daily oral administration of a cold-water extract of fresh green neem leaves and reported infertility effect in treated male rats, as there was a 66.7% reduction in fertility after six weeks, 80% after nine weeks, and 100% after 11 weeks. There were no inhibition of spermatogenesis, no decrease in body weight and no manifestation of toxicity, but there was a marked decrease in the motility of spermatozoa. The infertility in rats was reported not to be associated with loss of libido and that the animals maintained normal mating behavior.
Milt morphology was also evaluated using the evaluation criteria suggested by World Health Organization (WHO) (1999) and examined under Olympus microscope model CX 40. The milt showed normal milt morphology; the oval head and distinctive and well defined tail. At low treatment dosage i.e. 0.5ml or 1.0ml AL/kg basal diet, no appreciable visible changes was noticed in the milt morphology, while at high treatment dosage 1.5ml or 2.0ml AL/kg basal diet, deleterious changes in the plasma membrane of the head was observed, consequently suggesting that the milt were infertile (Farnsworth and Waller, 1982).
Histological sections of testes in O. niloticus fed 0ml AL/kg diet (basal diet) showed normal tissue architecture and spermatids distribution (Table 2). Fish fed 0.5ml AL/kg diet showed no visible alterations in the testicular architecture and cystic seminiferous tubules. In fish fed 1.0ml AL/kg diet, there was atrophy, while fish fed 1.5ml AL/kg diet showed cystic
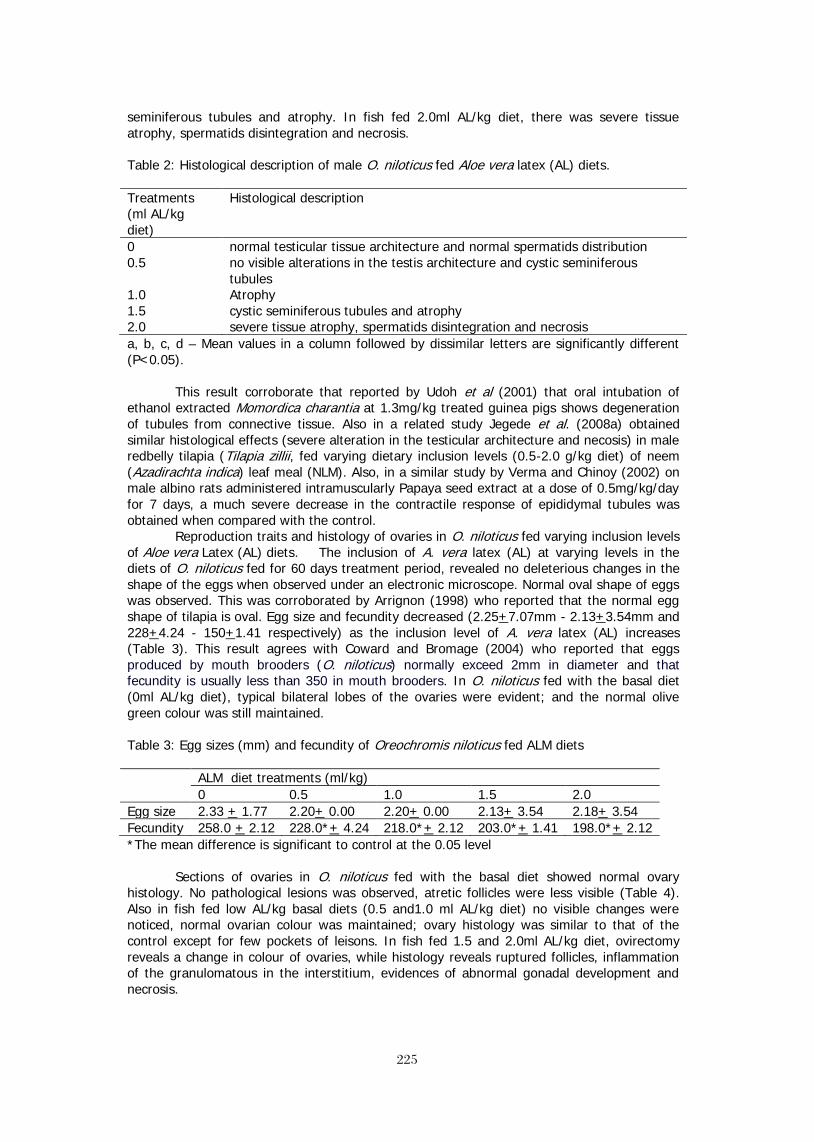
225
225
seminiferous tubules and atrophy. In fish fed 2.0ml AL/kg diet, there was severe tissue atrophy, spermatids disintegration and necrosis.
Table 2: Histological description of male O. niloticus fed Aloe vera latex (AL) diets.
Treatments (ml AL/kg diet)
Histological description
0 normal testicular tissue architecture and normal spermatids distribution 0.5 no visible alterations in the testis architecture and cystic seminiferous
tubules 1.0 Atrophy 1.5 cystic seminiferous tubules and atrophy 2.0 severe tissue atrophy, spermatids disintegration and necrosis a, b, c, d – Mean values in a column followed by dissimilar letters are significantly different (P<0.05).
This result corroborate that reported by Udoh et al (2001) that oral intubation of ethanol extracted Momordica charantia at 1.3mg/kg treated guinea pigs shows degeneration of tubules from connective tissue. Also in a related study Jegede et al. (2008a) obtained similar histological effects (severe alteration in the testicular architecture and necosis) in male redbelly tilapia (Tilapia zillii, fed varying dietary inclusion levels (0.5-2.0 g/kg diet) of neem (Azadirachta indica) leaf meal (NLM). Also, in a similar study by Verma and Chinoy (2002) on male albino rats administered intramuscularly Papaya seed extract at a dose of 0.5mg/kg/day for 7 days, a much severe decrease in the contractile response of epididymal tubules was obtained when compared with the control.
Reproduction traits and histology of ovaries in O. niloticus fed varying inclusion levels of Aloe vera Latex (AL) diets. The inclusion of A. vera latex (AL) at varying levels in the diets of O. niloticus fed for 60 days treatment period, revealed no deleterious changes in the shape of the eggs when observed under an electronic microscope. Normal oval shape of eggs was observed. This was corroborated by Arrignon (1998) who reported that the normal egg shape of tilapia is oval. Egg size and fecundity decreased (2.25+7.07mm - 2.13+3.54mm and 228+4.24 - 150+1.41 respectively) as the inclusion level of A. vera latex (AL) increases (Table 3). This result agrees with Coward and Bromage (2004) who reported that eggs produced by mouth brooders (O. niloticus) normally exceed 2mm in diameter and that fecundity is usually less than 350 in mouth brooders. In O. niloticus fed with the basal diet (0ml AL/kg diet), typical bilateral lobes of the ovaries were evident; and the normal olive green colour was still maintained.
Table 3: Egg sizes (mm) and fecundity of Oreochromis niloticus fed ALM diets
ALM diet treatments (ml/kg) 0 0.5 1.0 1.5 2.0
Egg size 2.33 + 1.77 2.20+ 0.00 2.20+ 0.00 2.13+ 3.54 2.18+ 3.54 Fecundity 258.0 + 2.12 228.0*+ 4.24 218.0*+ 2.12 203.0*+ 1.41 198.0*+ 2.12 *The mean difference is significant to control at the 0.05 level
Sections of ovaries in O. niloticus fed with the basal diet showed normal ovary histology. No pathological lesions was observed, atretic follicles were less visible (Table 4). Also in fish fed low AL/kg basal diets (0.5 and1.0 ml AL/kg diet) no visible changes were noticed, normal ovarian colour was maintained; ovary histology was similar to that of the control except for few pockets of leisons. In fish fed 1.5 and 2.0ml AL/kg diet, ovirectomy reveals a change in colour of ovaries, while histology reveals ruptured follicles, inflammation of the granulomatous in the interstitium, evidences of abnormal gonadal development and necrosis.

226
226
Table 4: Histological description of female Oreochromis niloticus fed Aloe vera latex (AL) diets.
Treatments (ml AL/kg diet)
Histological description
0 normal histology and less visible atretic follicles
1.0 ovary histology was similar to that of the control except for few pockets of lesions; normal ovarian colour was maintained;
2.0 change in colour of ovaries was noticed, ruptured follicles, inflammation of the granulomatous in the interstitium, evidences of abnormal gonadal development and necrosis.
a, b - Mean values in a column followed by dissimilar letters are significantly different (P<0.05)
Similar histological effect was reported by Jegede (2010) where the damage done to tissues of the testes and ovaries were minimal at lower dietary Hibiscus rosa sinensis leaf meal (HLM) levels (1.0 or 2.0 g/kg diet), and at higher dietary HLM levels (3.0 or 4.0 g/kg diet), it caused disintegration of many more cells, rendering the testes and ovaries devoid of spermatids and oocytes, respectively.
Although A. vera gel had been reported to provide evidence of anti-genotoxic against mutagenicity induced by alkylating agent ethyl methanesulfonate (Stanić 2007), nothing of such had been reported on A. vera latex. This indicates that A. vera latex at high levels of concentration causes histological damage to the gonads of both male and female O. niloticus, thereby potentially impairing reproduction.
REFERENCES
Arrignon, J. C. V. (1998) Tilapia. The Tropical Agriculturalist. Editor: René Coste. Published by Macmallian Education Ltd, London. pp 16-19.
Balarin J. D. and Hatton J. P. (1979) Tilapia: a guide to their biology and culture in Africa. Institute of Aquaculture, University of Stirling, Stirling, Scotland. 173pp.
Boudreau M. D. and Beland F. A. (2006). "An evaluation of the biological and toxicological properties of Aloe barbadensis (miller), Aloe vera". Journal of environmental science and health. Part C, Environmental carcinogenesis & ecotoxicology reviews 24 (1): 103–54.
Bruneton J. (1995) Pharmacognosy, phytochemistry, medicinal plants. Paris, Lavoisier, Christman S. (2005)http://www.floridata.com.
Coward, K. and Bromage, N. R. (2004) Reproductive physiology of female tilapia broodstock. Fish Biology and Fisheries. Spinger Nertherlands.Vol 10.No. 1, pp 1-25.
Eshun K. and He Q. (2004). "Aloe vera: a valuable ingredient for the food, pharmaceutical and cosmetic industries--a review". Critical reviews in food science and nutrition 44 (2): 91–6.
Ernst E. (2000). "Adverse effects of herbal drugs in dermatology". The British journal of dermatology 143 (5): 923–929.
FAO.FishStat Plus- Universal software for fishery statistical time series (2006). http:// www.fao.org/fishery/topic/16073. Date accessed: 17-7- 2006.
Farnsworth, N.R. and Waller, D.P. (1982) Current status of plant products reported to inhibit sperm. Research Frontiers in Fertility Regulation 2: 1-16.
Guerrero, R. D. (1982) Control of tilapia reproduction. Pp. 309-316, in R.S.V. Pullin and R.H. Lowe-McConnell (eds.) The Biology and Culture of Tilapias. ICLARM Conference Proceedings 7, Manila, Philippines.
King G. K., Yates K. M. and Greenlee P. G. (1995). "The effect of Acemannan Immunostimulant in combination with surgery and radiation therapy on spontaneous canine and feline fibrosarcomas". Journal of the American Animal Hospital Association 31 (5): 439–47.
227
227
Jegede T. (2010) Control of reproduction in Oreochromis niloticus (Linnaeus 1758) using Hibiscus rosa-sinensis (Linn.) leaf meal as reproduction inhibitor. Journal of Agricultural Science. Vol.2. No 4. 149 – 154.
Jegede T., Fagbenro O. A. and Nwanna, L. C. (2008a) Histology of testes in redbelly tilapia Tilapia zillii Gervais 1848) fed pawpaw (Carica papaya) seed meal diets or neem (Azadirachta indica) leaf meal. Applied Tropical Agriculture 13 (2): 14-19.
Kronert U., Horstgen-Schwark G. and Langholz H. J. (1989) Prospects for selecting on late maturity in Oreochromis niloticus. 1. Family studies under laboratory conditions. Aquaculture 77: 113-121.
Lohiya, N.K. and Goyal, R.B. (1992) Antifertility investigations on the crude chloroform extract of tropical plants in male rats. International Journal of Experimental Biology 30: 1051-1055.
Lohiya, N.K., Pathak, N., Mishra, P.K. and Manivannan, B. (1999a) Reversible contraception with chloroform extract of tropical plants in male rabbits. Reproductive Toxicology 13: 59-66.
Lohiya, N. K., Pathak, N., Mishra, P.K., Manivannan, B. and Jain, S.C. (1999b) Reversible azoospermia by oral administration of benzene chromatographic fraction of the chloroform extract of the seeds of tropical plants in rabbits. Advances in Contraception 15: 141-61.
Linnaeus C. (1758). Systema Naturae, Ed. X.; Systema naturae per regna tria naturae, secundum classes, ordines, genera, species, cum characteribus, differentiis, synonymis, locis. Tomus I. Editio decima, reformata; 10 i-ii + pp. 1-824.
Mair G. C. and Little D. C. (1991) Population control in farmed tilapia. NAGA, ICLARM Quarterly 14: 8-13.
Modadugu V. G. and Belen O. A. (2004) A review of global tilapia farming practices. Aquaculture Asia Vol. IX. No 1. pp 1- 16.
Oldorf W., Kronert U., Balarin J., Haller R., Horstgen-Schwark G. and Langholz H. J. (1989) Prospects for selecting on late maturity in tilapia (Oreochromis niloticus). 2. Strain comparison under laboratory and field conditions. Aquaculture 77: 123-133.
Rana K. T. (1985) Influence of egg size on the growth, onset of feeding, point-of-no-return, and survival of unfed Oreochromis niloticus fry. Aquaculture 46: 119-131.
Sadre, N.L., Vibnavaii, Y., Deznpande, K.N., Mendukar and Nabal, D.H. (1983) Male antifertility activity of Azadirachta indica in different species. pp.473-482 in H. Schmutterer and K.R.S. Ascher (eds.) 1984. Natural pesticides from the neem tree and other tropical plants. Dutsche Gesellschaft fur Technische zusammenarbeit (GTZ), Eschborn Germany.
Shelton W. L. (2002) Tilapia culture in the 21st century p. 1-20. In Gurrero R. D. III and M. R.Guerrero-del Castillo (eds.) Proceedings of the International Forum on Tilapia Farming in the 21st Century (Tilapia Forum 2002), 184p. Philippine Fisheries Association Inc. Los Bonos, Laguna, Philippines.
Stanić S. (2007) Anti-genotoxic effect of Aloe vera gel on the mutagenic action of ethyl methanesulfonate. Arch.Biol. Sci., Belgrade, 59 (3), 223-226.
Udoh P., Ojenikoh C. and Udoh F. (2001) Antifertility effects of Momordica charantia(Bitter Gourd) fruit on the gonads on male Guinea pigs. Global Journal of Pure and Applied Science. Vol 7. No.4. pp 627 – 631.
Verma R. J. and Chinoy N. J. (2002) Effects of papaya seed extract on contractile response of cauda epididymal Tubules. Asian Journal of Andrology. 4 (1): 77 – 78.
Vogler B. K. and Ernst E. (1999). "Aloe vera: a systematic review of its clinical effectiveness." Br J Gen Prac. 49:823-828
World Health Organization (WHO) (1999) Laboratory manual for the examination of human semen and sperm-cervical mucus interaction. 4thedn. Cambridge: Cambridge University Press.
Zar J. H. (1996) Biostatistical analysis 3rd Edition. Prentice-Hall, Upper Saddle River, New Jersey, USA. 383pp.
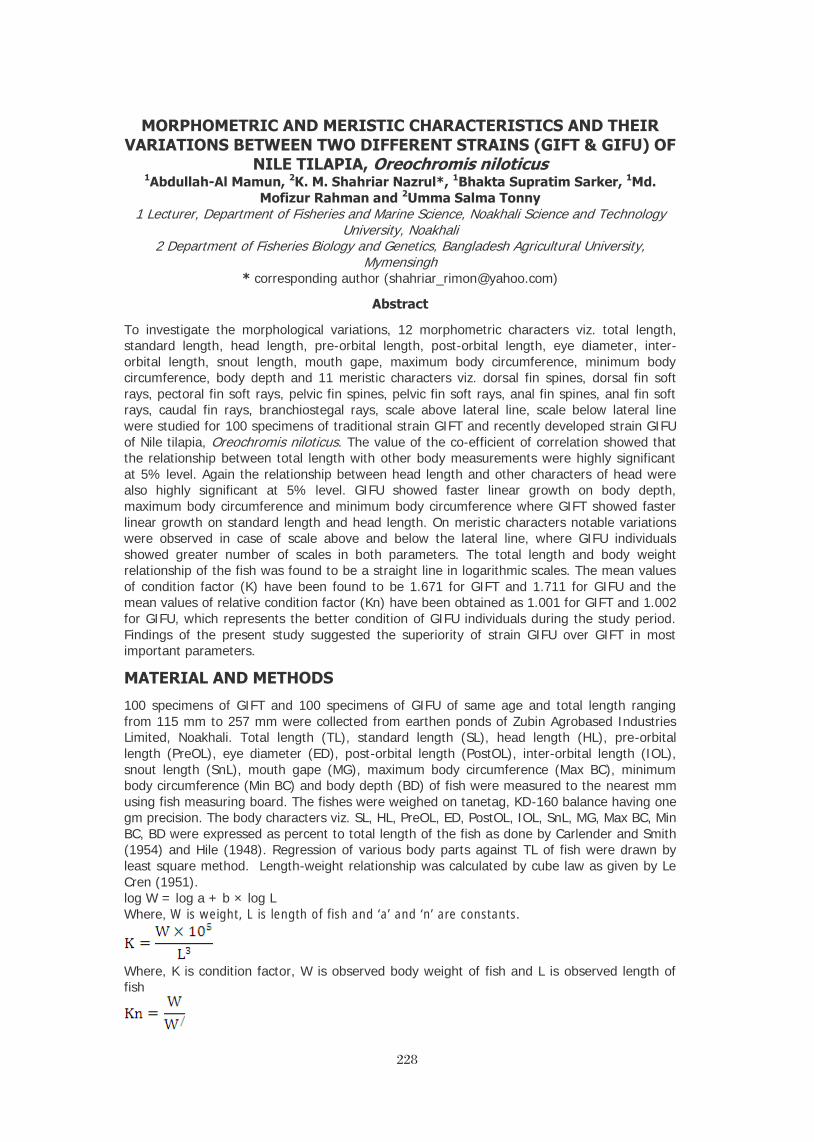
228
228
MORPHOMETRIC AND MERISTIC CHARACTERISTICS AND THEIR VARIATIONS BETWEEN TWO DIFFERENT STRAINS (GIFT & GIFU) OF
NILE TILAPIA, Oreochromis niloticus 1Abdullah-Al Mamun, 2K. M. Shahriar Nazrul*, 1Bhakta Supratim Sarker, 1Md.
Mofizur Rahman and 2Umma Salma Tonny 1 Lecturer, Department of Fisheries and Marine Science, Noakhali Science and Technology
University, Noakhali 2 Department of Fisheries Biology and Genetics, Bangladesh Agricultural University,
Mymensingh * corresponding author ([email protected])
Abstract
To investigate the morphological variations, 12 morphometric characters viz. total length, standard length, head length, pre-orbital length, post-orbital length, eye diameter, inter-orbital length, snout length, mouth gape, maximum body circumference, minimum body circumference, body depth and 11 meristic characters viz. dorsal fin spines, dorsal fin soft rays, pectoral fin soft rays, pelvic fin spines, pelvic fin soft rays, anal fin spines, anal fin soft rays, caudal fin rays, branchiostegal rays, scale above lateral line, scale below lateral line were studied for 100 specimens of traditional strain GIFT and recently developed strain GIFU of Nile tilapia, Oreochromis niloticus. The value of the co-efficient of correlation showed that the relationship between total length with other body measurements were highly significant at 5% level. Again the relationship between head length and other characters of head were also highly significant at 5% level. GIFU showed faster linear growth on body depth, maximum body circumference and minimum body circumference where GIFT showed faster linear growth on standard length and head length. On meristic characters notable variations were observed in case of scale above and below the lateral line, where GIFU individuals showed greater number of scales in both parameters. The total length and body weight relationship of the fish was found to be a straight line in logarithmic scales. The mean values of condition factor (K) have been found to be 1.671 for GIFT and 1.711 for GIFU and the mean values of relative condition factor (Kn) have been obtained as 1.001 for GIFT and 1.002 for GIFU, which represents the better condition of GIFU individuals during the study period. Findings of the present study suggested the superiority of strain GIFU over GIFT in most important parameters.
MATERIAL AND METHODS
100 specimens of GIFT and 100 specimens of GIFU of same age and total length ranging from 115 mm to 257 mm were collected from earthen ponds of Zubin Agrobased Industries Limited, Noakhali. Total length (TL), standard length (SL), head length (HL), pre-orbital length (PreOL), eye diameter (ED), post-orbital length (PostOL), inter-orbital length (IOL), snout length (SnL), mouth gape (MG), maximum body circumference (Max BC), minimum body circumference (Min BC) and body depth (BD) of fish were measured to the nearest mm using fish measuring board. The fishes were weighed on tanetag, KD-160 balance having one gm precision. The body characters viz. SL, HL, PreOL, ED, PostOL, IOL, SnL, MG, Max BC, Min BC, BD were expressed as percent to total length of the fish as done by Carlender and Smith (1954) and Hile (1948). Regression of various body parts against TL of fish were drawn by least square method. Length-weight relationship was calculated by cube law as given by Le Cren (1951). log W = log a + b × log L Where, W is weight, L is length of fish and ‘a’ and ‘n’ are constants.
Where, K is condition factor, W is observed body weight of fish and L is observed length of fish
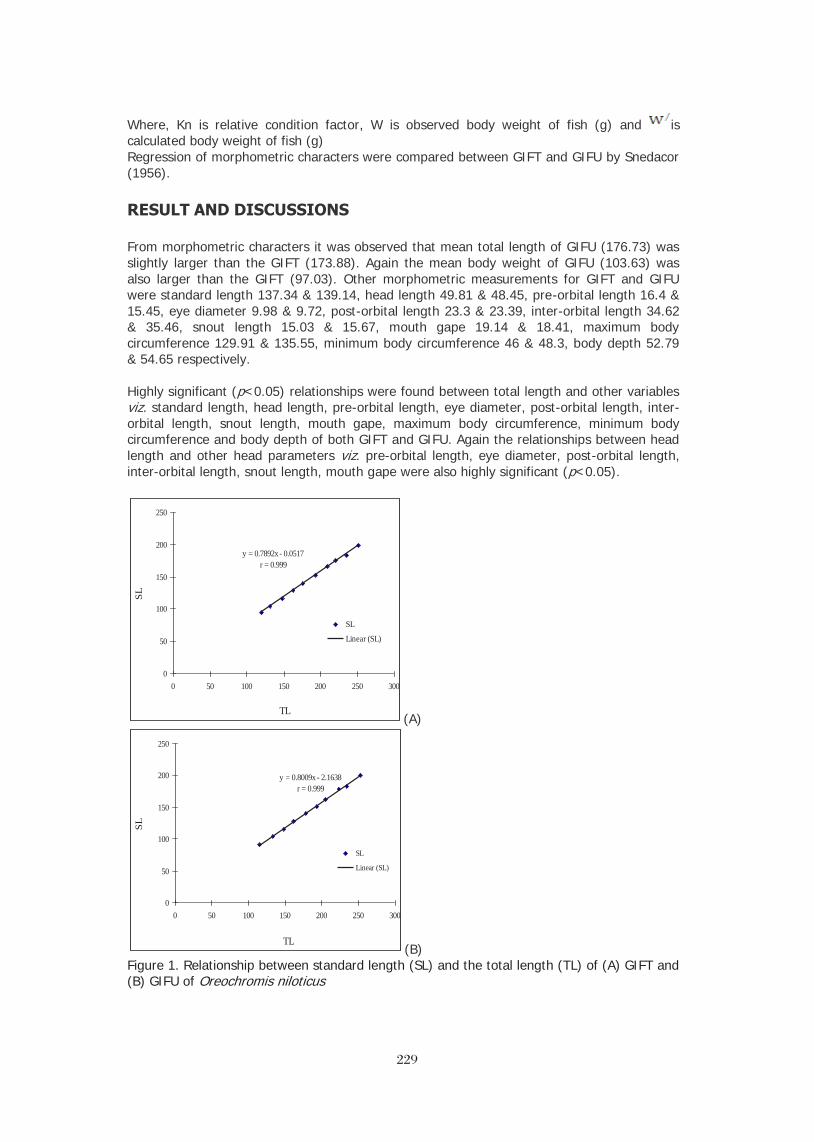
229
229
Where, Kn is relative condition factor, W is observed body weight of fish (g) and is calculated body weight of fish (g) Regression of morphometric characters were compared between GIFT and GIFU by Snedacor (1956). RESULT AND DISCUSSIONS From morphometric characters it was observed that mean total length of GIFU (176.73) was slightly larger than the GIFT (173.88). Again the mean body weight of GIFU (103.63) was also larger than the GIFT (97.03). Other morphometric measurements for GIFT and GIFU were standard length 137.34 & 139.14, head length 49.81 & 48.45, pre-orbital length 16.4 & 15.45, eye diameter 9.98 & 9.72, post-orbital length 23.3 & 23.39, inter-orbital length 34.62 & 35.46, snout length 15.03 & 15.67, mouth gape 19.14 & 18.41, maximum body circumference 129.91 & 135.55, minimum body circumference 46 & 48.3, body depth 52.79 & 54.65 respectively. Highly significant (p<0.05) relationships were found between total length and other variables viz. standard length, head length, pre-orbital length, eye diameter, post-orbital length, inter-orbital length, snout length, mouth gape, maximum body circumference, minimum body circumference and body depth of both GIFT and GIFU. Again the relationships between head length and other head parameters viz. pre-orbital length, eye diameter, post-orbital length, inter-orbital length, snout length, mouth gape were also highly significant (p<0.05).
y = 0.7892x - 0.0517r = 0.999
0
50
100
150
200
250
0 50 100 150 200 250 300
TL
SL
SL
Linear (SL)
(A)
y = 0.8009x - 2.1638r = 0.999
0
50
100
150
200
250
0 50 100 150 200 250 300
TL
SL
SL
Linear (SL)
(B) Figure 1. Relationship between standard length (SL) and the total length (TL) of (A) GIFT and (B) GIFU of Oreochromis niloticus

230
230
y = 0.3038x - 2.9727r = 0.998
0
10
20
30
40
50
60
70
80
0 50 100 150 200 250 300
TL
HL
HL
Linear (HL)
(A)
y = 0.247x + 4.765r = 0.997
0
10
20
30
40
50
60
70
80
0 50 100 150 200 250 300
TL
HL
HL
Linear (HL)
(B) Figure 2. Relationship between head length (HL) and the total length (TL) of (A) GIFT and (B) GIFU of Oreochromis niloticus
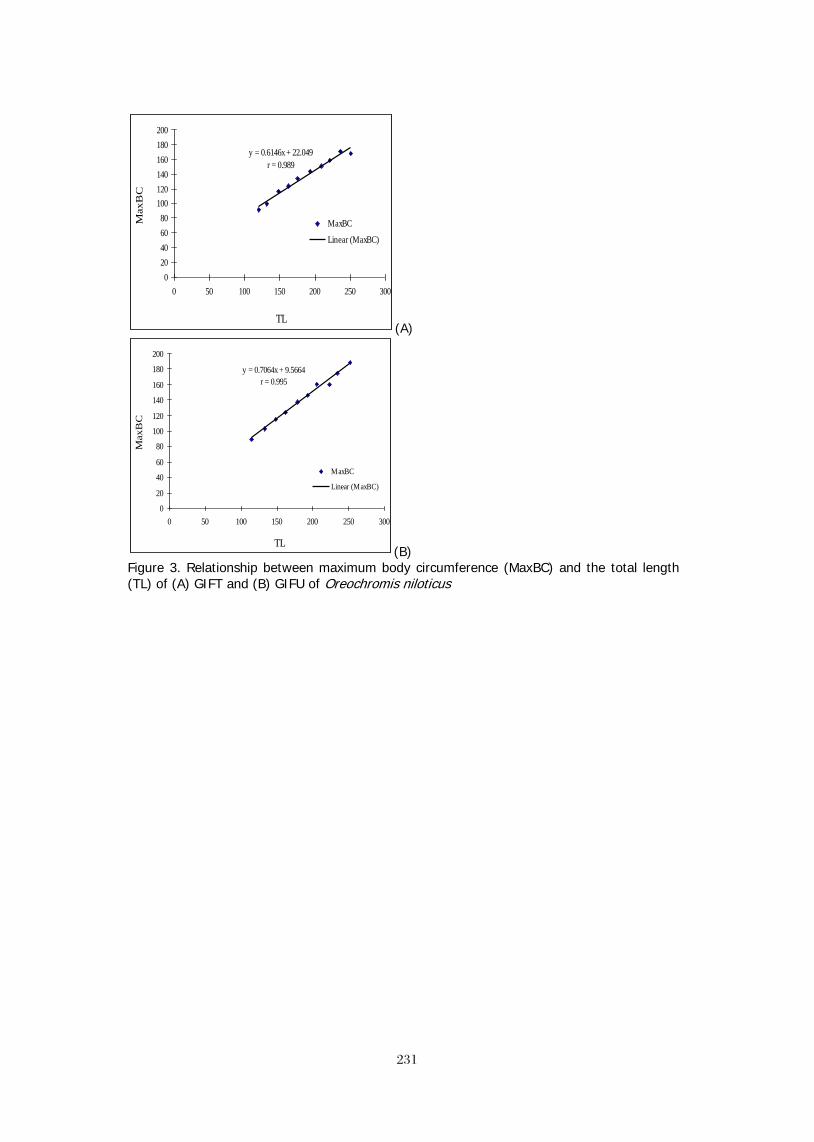
231
231
y = 0.6146x + 22.049r = 0.989
020406080
100120140160180200
0 50 100 150 200 250 300
TL
Max
BC
MaxBC
Linear (MaxBC)
(A)
y = 0.7064x + 9.5664r = 0.995
0
20
40
60
80
100
120
140
160
180
200
0 50 100 150 200 250 300
TL
Max
BC
MaxBC
Linear (MaxBC)
(B) Figure 3. Relationship between maximum body circumference (MaxBC) and the total length (TL) of (A) GIFT and (B) GIFU of Oreochromis niloticus
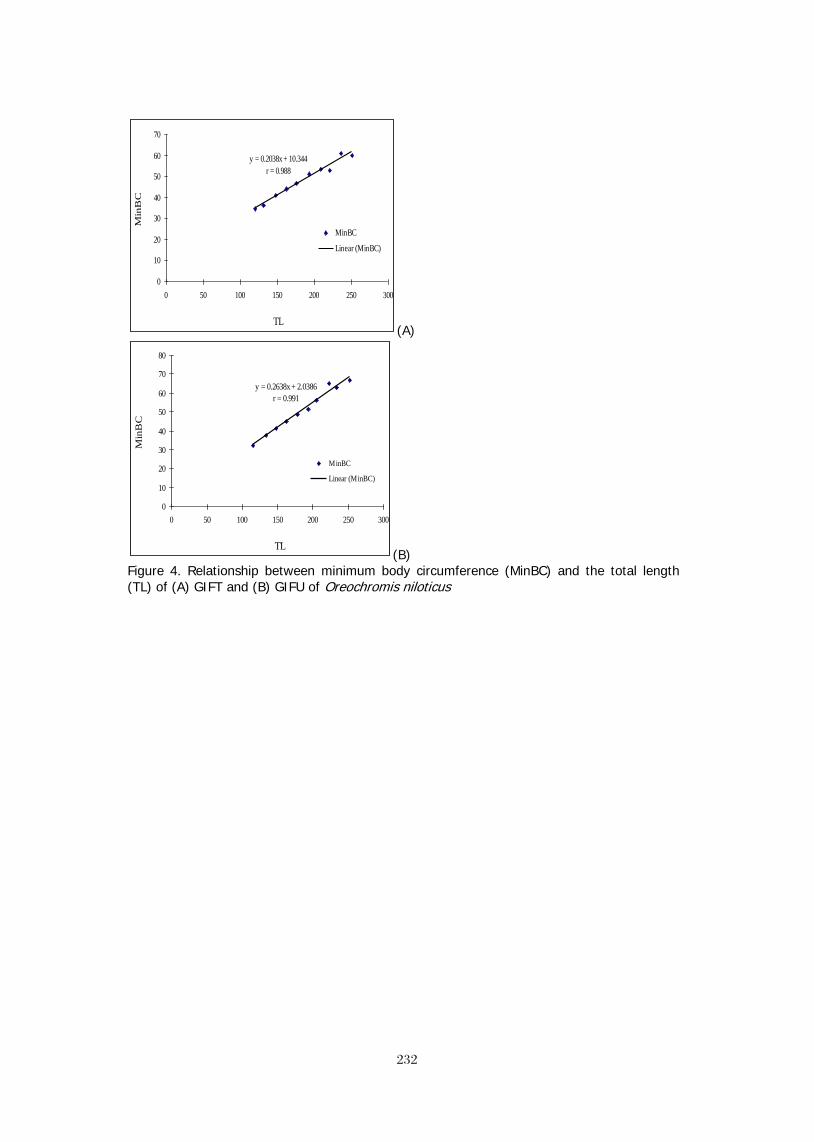
232
232
y = 0.2038x + 10.344r = 0.988
0
10
20
30
40
50
60
70
0 50 100 150 200 250 300
TL
Min
BC
MinBC
Linear (MinBC)
(A)
y = 0.2638x + 2.0386r = 0.991
0
10
20
30
40
50
60
70
80
0 50 100 150 200 250 300
TL
Min
BC
MinBC
Linear (MinBC)
(B) Figure 4. Relationship between minimum body circumference (MinBC) and the total length (TL) of (A) GIFT and (B) GIFU of Oreochromis niloticus

233
233
y = 0.2387x + 10.978r = 0.982
0
10
20
30
40
50
60
70
80
0 50 100 150 200 250 300
TL
BD
BD
Linear (BD)
(A)
y = 0.2826x + 4.3061r = 0.998
0
10
20
30
40
50
60
70
80
0 50 100 150 200 250 300
TL
BD
BD
Linear (BD)
(B) Figure 5. Relationship between body depth (BD) and the total length (TL) of (A) GIFT and (B) GIFU of Oreochromis niloticus
Figure 6. Growth of different morphometric body parts of GIFT & GIFU in relation to the total length (TL) of the fish on a percentage basis Percentage values (Figure 6) of standard length (78.99) of GIFT was slightly higher than the standard length (78.73) of GIFU. Again, the value of body depth at pectoral fin-base in GIFU (30.92) was higher than that of GIFT (30.36). A close examination of values of the characters revealed a strong heterogeneity between GIFT and GIFU. The GIFU were broader in anterior part of the body at pectoral fin than the GIFT where GIFT (28.65) having longer head than

234
234
the GIFU (27.41). The maximum body circumference and minimum body circumference of GIFU (76.7 & 27.33 respectively) are higher than that of GIFT (74.71 & 26.46 respectively). Regarding other characteristic like standard length of GIFT was longer than that of GIFU. Thus it may be inferred that GIFU shows faster linear growth on body depth, maximum body circumference and minimum body circumference where GIFT shows faster linear growth on standard length and head length. Simply it may be said that GIFU is fatter or heavier than GIFT which allows more flesh. Devi et al. (1991) reported the value of head length (24.91) of males to be higher than that of females (22.91) and the value of depth of body at pectoral fin-base in females (21.09) to be higher than that of males (19.50) in Rita rita. This finding is similar to the present study, only the difference is that the variation here is conducted within two different strains. This heterogeneity of body characters may be due to their strain variation. Such phenomenon was also reported by Khumar (1985). In case of dorsal fin spines (16-17), dorsal fin soft rays (11-13), pectoral fin soft rays (13-14), pelvic fin spines (1), pelvic fin soft rays (5), anal fin spines (3), anal fin soft rays (9-11), caudal fin rays (16) and branchiostegal rays (3) the meristic variations were observed merely. Siddique et al. (2007) found the number of dorsal fin spines ranged from 16 to 17, dorsal fin soft rays from 11 to 15, pectoral fin soft rays 15, pelvic fin spines 1, pelvic fin soft rays 5, anal fin spines 3 and anal fin soft rays from 8-11 which is almost similar to the present findings. Only the notable variation in the present study was observed in case of scale above and below the lateral line. The range of the scales above lateral line is 4.5-5.5 in both GIFT and GIFU but greater number of individuals of GIFU obtained 5.5. In case of scale below lateral line the range of GIFU (11.5-15.5) was greater than the range o f GIFT (10.5-11.5). This variation may be due to that GIFU individuals showed greater body depth and body circumference which allowed more scales than the GIFT individuals. The length weight relationship of GIFT and GIFU were not significantly different. The regression equation is expressed as:
LogBW (GIFT) = 2.6932 LogTL - 4.0895 LogBW (GIFU) = 2.7221 LogTL - 4.1421 The value of coefficient of correlation showed that the relationship between length and weight of the fish was highly significant (P<0.05). The value of exponential in the length-
weight equation ( ) was found to be 2.6932 and 2.7221 for GIFT and GIFU respectively which were within the range from 2.0 to 4.0 mentioned by LeCren, 1951. Various workers calculated the values of regression coefficient (b) in different fish species and found the value of b>3. Narejo et al. (1999) from Pakistan and Al-Baz and Grove (1995) from Kuwait calculated value of regression coefficient b in Tenualosa ilisha (3.0246 for males and 3.0345 for females) and (2.68 for males and 3.16 for females) respectively. Azadi and Naser (1996) reported the values of regression coefficient to be 3.16 for males and 3.20 for females in Labeo bata and Quddus (1993) reported value of regression coefficient to be 3.40 in Gudusia chapra from Bangladesh. Hile (1936) and Martin (1949) observed that the value of regression coefficient (b) usually lies between 2.5 and 4.0 in cisco, Leochthys artedi. However, a variation in ‘b’ value may occur due to species variation, strain variation, stock variation, differences in environmental factors, sex variation etc. The values of condition factor (K) were found to vary from 1.343-1.871 for GIFT and 1.385-1.825 for GIFU and the mean values were 1.671 and 1.711 for GIFT and GIFU respectively. The values of relative condition factor (Kn) ranged from 0.897-1.06 for GIFT and 0.876-1.097 for GIFU and the mean values were 1.001 for GIFT and 1.002 for GIFU. From this finding it can be stated that the higher value of condition factor (K) and relative condition factor (Kn) of GIFU expresses the better condition of GIFU individuals over GIFT individuals during study period.

235
235
REFERENCES
Al-Baz, A. F. and Grove, D. J. 1995. Population biology of Sbour, Tenualosa ilisha (Hamilton-Buchanan) in Kuwait. Asian Fish. Sci., 8: 239-259.
Azadi, M. A. and Naser, A. 1996. Morphometry of Labeo bata (Ham.) from Kaptai reservoir, Bangladesh. Chittagong. Univ. Stud. Part И: Sci., 20 (2): 133-136.
Begum, M., Mamun Abdullah-Al, Islam, M.L. and Alam, M.J. 2008. Morphometric characters and their relationship in estuarine catfish. J. Bangladesh Agril. Univ. 6 (2): 349-353.
Carlander, K.D. and Smith, L.L., 1954. Some factor to consider in choice between standard, fork or total length in fishery invertigations. Copeia, 3: 7-12.
De Silva, S. S. and Gunasekera, R. M. 1991. An evaluation of the growth of Indian and Chinese major carps in relation to the dietary protein content. Aquaculture, 92 (2/3): 237-241.
Hile, R. 1936. Age and growth of cisco. Leuchthys artedi Le suer in lake of north-eastern high lands. Bull. U. S. Bur. Fish., 48: 211-317.
Hile, R. 1948. Standardization of methods expressing length and weight of fish. Trans. Amer. Fish. Soc., 75: 157-164.
Khumar, F. 1985. The biology of Puntius sarana (Ham.) and Labeo calbasu (Ham.) of some freshwater ecosystems in north Ph. D. Thesis Aligarh Muslim University, Aligarh.
Kohinoor, A.H.M., Saha, N.C., Akhteruzzaman, M., Shah, M.S. and Mahata, S.C. 1995. Morphometric characters and their relationship in red tilapia (mutant Oreochromis mossambicus × Oreochromis niloticus). Bangladesh J. Fish., 15-18 (1-2): 19-24.
LeCren, E. D. 1951. The length weight relationship and seasonal cycle in gonad weight and condition in the perch (Perca fluviatilis). J. Anim. Acol., 20: 201-219.
Martin, W.R. 1949. The mechanics of environmental control of body form in fishes. Univ. Toronto Stud. Biol., 56:1-91.
Narejo, N.T., Ali, S.S., Jafri, S.I.H. and Hussain, S. M. 1999. A study on the age and growth of Palla, Tenualosa ilisha from the River Indus. Pakistan J. Zool., 31(1): 25-29.
Quddus, M.M.A. 1993. Observation on some aspects of biology of Gudusia chapra (Hamilton-Buchanan, 1822) in a Lake. Bangladesh J. Sci. Res., 11(1): 83-88.
Rahman A.K.A. 2005. Freshwater fishes of Bangladesh. 2nd ed. Zool Soc of Bangladesh, Dhaka, Bangladesh; ХVШ + 394 pp.
Siddique, K.U., M.A. Islam, S.M.H. Kabir, M. Ahmed, A.T.A. Ahmed, A.K.A. Rahman, E.U. Haque, Z.U. Ahmed, Z.N.T. Begum, M.A. Hassan, M. Khondker and M.M. Rahman (eds.). 2007. Encyclopedia of flora and fauna of Bangladesh. Volume 23. Freshwater fishes, Asiatic Society of Bangladesh. 300 pp.
Snedecor, G.W. 1956. Statistical Methods. The lowa College Press, Ames, lowa, U.S.A., 534p.
236
236
GENETIC STOCK IMPROVEMENT OF THE GIFT STRAIN IN BANGLADESH
M.G. Hussain1, A.H.M. Kohinoor1 N.H. Nguyen2 and R.W. Ponzoni2
1Bangladesh Fisheries Research Institute, Mymensingh 2201, Bangladesh 2WorldFish Center, Jalan Batu Maung, 11960 Bayan Lepas, Penang, Malaysia
Abstract
Tilapia is globally recognized as one of the most important aquaculture species of the 21st century. Culture of tilapias has expanded rapidly under a wide range of farming environments from extensive to intensive scale in both fresh and brackish water in Asia and many other countries of the world including Bangladesh. The world’s total tilapia production was forecasted that it would be reached 3.70 million tones by the end 2010. In case of Bangladesh, it is estimated that the tilapia production in 2010 would be more than 1.00 million tones. Tilapias will be the prime culture species in different water ecosystems at various production scales (small, medium and commercial scales) in Bangladesh. This has led to a great demand in terms of both quantity and quality of tilapia seeds in the country. To meet this growing demand, Bangladesh Fisheries Research Institute (BFRI) has undertaken research work to further improve performance of the GIFT strain (Genetically Improved Farmed Tilapia) through combined family selection with the technical assistance of The WorldFish Center, Malaysia.
In the present study, we report growth performance of the GIFT strain after four generations of selection for increased body weight at BFRI, Bangladesh. Founder stock comprising 300 individuals from 30 families of the GIFT strain were introduced from The WorldFish Center, Malaysia, in March 2005. They were reared in 100 m2 hapa for three months, and then individually tagged using Passive Integrated Transponder (PIT) tags at a mean weight between 30 and 40g. After tagging, all the fish were communally grown out in pond until harvest. Breeding values (EBVs) for body weight were estimated using SAS and ASREML. Based on EBV ranking, the best 40 females and 40 males from the founder stock were then selected to produce progeny of the first generation (G1) in 2007. From each family 25 female and 25 male fingerlings were sampled and tagged using Passive Integrated Transponder (PIT). A total of 2,000 tagged fish from 40 families were stocked in a pond (1000 m2) for a continuation of the selection program. The same production and selection procedures were practiced in subsequent generations in 2008, 2009 and 2010 (corresponding to generations G2, G3 and G4). In addition to the mainstream selection program, surplus fish after tagging were also reared together with progeny of the founder stock in cisterns (G1) and in earthen ponds (G2 to G4) for growth evaluation. Our preliminary analysis showed that the upgraded fish had 7.2, 13.1, 23.2 and 30.3% greater harvest weight than that of the founder population (non selected population) in G1, G2, G3 and G4 generations, respectively. Due to fast growth of GIFT, the strain is widely sought and cultured in Bangladesh. To date BFRI has supplied seed to about 100 hatcheries, which in turn multiply and distribute GIFT fry to fish farmers throughout the country. The paper also discusses strategies for future expansion of GIFT culture in Bangladesh.
Key words: Stock Improvement, Genetic selection, GIFT strain.
INTRODUCTION
The last three decades have seen significant developments in farming of tilapias worldwide. In view of the increasing commercialization and continuing growth of tilapia industry, the commodity is not only the second most important farmed fish globally, next to carps but is also described as the most important aquaculture species of the 21st century (Shelton 2002). The fish is being farmed in about 85 countries worldwide, and about 98% of tilapia produced in these countries is grown outside their original habitats (FAO 2002). In
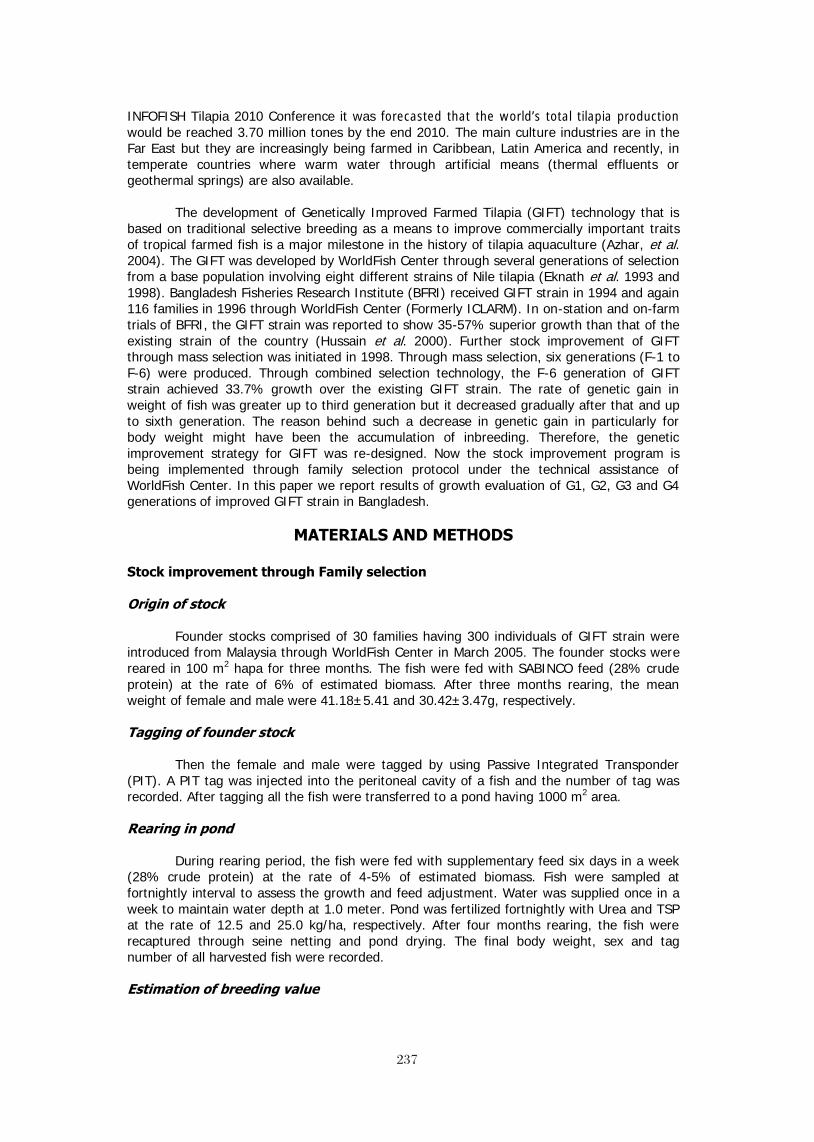
237
237
INFOFISH Tilapia 2010 Conference it was forecasted that the world’s total tilapia production would be reached 3.70 million tones by the end 2010. The main culture industries are in the Far East but they are increasingly being farmed in Caribbean, Latin America and recently, in temperate countries where warm water through artificial means (thermal effluents or geothermal springs) are also available.
The development of Genetically Improved Farmed Tilapia (GIFT) technology that is based on traditional selective breeding as a means to improve commercially important traits of tropical farmed fish is a major milestone in the history of tilapia aquaculture (Azhar, et al. 2004). The GIFT was developed by WorldFish Center through several generations of selection from a base population involving eight different strains of Nile tilapia (Eknath et al. 1993 and 1998). Bangladesh Fisheries Research Institute (BFRI) received GIFT strain in 1994 and again 116 families in 1996 through WorldFish Center (Formerly ICLARM). In on-station and on-farm trials of BFRI, the GIFT strain was reported to show 35-57% superior growth than that of the existing strain of the country (Hussain et al. 2000). Further stock improvement of GIFT through mass selection was initiated in 1998. Through mass selection, six generations (F-1 to F-6) were produced. Through combined selection technology, the F-6 generation of GIFT strain achieved 33.7% growth over the existing GIFT strain. The rate of genetic gain in weight of fish was greater up to third generation but it decreased gradually after that and up to sixth generation. The reason behind such a decrease in genetic gain in particularly for body weight might have been the accumulation of inbreeding. Therefore, the genetic improvement strategy for GIFT was re-designed. Now the stock improvement program is being implemented through family selection protocol under the technical assistance of WorldFish Center. In this paper we report results of growth evaluation of G1, G2, G3 and G4 generations of improved GIFT strain in Bangladesh.
MATERIALS AND METHODS
Stock improvement through Family selection
Origin of stock
Founder stocks comprised of 30 families having 300 individuals of GIFT strain were introduced from Malaysia through WorldFish Center in March 2005. The founder stocks were reared in 100 m2 hapa for three months. The fish were fed with SABINCO feed (28% crude protein) at the rate of 6% of estimated biomass. After three months rearing, the mean weight of female and male were 41.18±5.41 and 30.42±3.47g, respectively.
Tagging of founder stock
Then the female and male were tagged by using Passive Integrated Transponder (PIT). A PIT tag was injected into the peritoneal cavity of a fish and the number of tag was recorded. After tagging all the fish were transferred to a pond having 1000 m2 area.
Rearing in pond
During rearing period, the fish were fed with supplementary feed six days in a week (28% crude protein) at the rate of 4-5% of estimated biomass. Fish were sampled at fortnightly interval to assess the growth and feed adjustment. Water was supplied once in a week to maintain water depth at 1.0 meter. Pond was fertilized fortnightly with Urea and TSP at the rate of 12.5 and 25.0 kg/ha, respectively. After four months rearing, the fish were recaptured through seine netting and pond drying. The final body weight, sex and tag number of all harvested fish were recorded.
Estimation of breeding value

238
238
Breeding value was estimated for individual fish in a full pedigree, using SAS (SAS Inc, 1997) and ASREML (Gilmour et al. 1999).
Breeding in hapa for G1 (Generation 1) production
On the basis of breeding values of the founder stock, the best 40 males from 30 families were crossed with 40 best females (from 30 families) for the production of F-1 generation. For breeding, 40 breeding hapas (1.0m3) were set up in a pond with bamboo poles. A pair of female and male breeders (1:1) was stocked in each breeding hapa. After 12 days of stocking, fertilized eggs were collected from brooding females. After that, collected eggs were transferred to the hatchery for incubation. Immediately after hatching, the larvae were shifted to a series of trays and were kept until their yolk sac resorption stage.
Nursing in hapa
After resorption stage, 300 fry from each family were transferred to 40 individual fine mesh nursery hapas (2.0 m3) in pond. The progeny were fed with nursery feed containing 30% protein at the rate of 30% of estimated body weight. After 45 days nursing, the mean weight of the fry was 2.80±0.42g.
Rearing in hapa
Subsequently, 150 fry from each progeny group were transferred to 40 individual rearing hapa (2.0 m3 in size). Supplementary feed (Nursery feed) was applied in all the hapas at the rate of 15% of estimated biomass. After two months of rearing, the weight range of male and female were 36-43 and 28-32g, respectively.
Tagging
From each progeny group 25 male and 25 female fish were selected and tagged using Passive Integrated Transponder (PIT). Tagged fish from 40 families (2000 fishes) were stocked in a pond having 1000m2 area for communal rearing. Supplementary feed (25% crude protein) was supplied regularly at the rate of 6% of estimated biomass. After six months of grow-out in pond, the fish were harvested, and tag number, weight, sex, body depth were recorded. After harvesting, breeding values of G1 generation were estimated from the complete data set, tracing back to the foundation population (F0).
Evaluation of Growth performances G1 generation of GIFT strain
This trial was conducted to compare growth performance between G1 progeny of the selected fish and progeny of the non-selected population (founder stock) in cisterns (2.0 m3)
for a period of four months during April to July 2007. Progeny of the selected fish were produced from 40 single pair matings in separate hapas. Family rearing of the selection progeny was as described above. After tagging, surplus fish were sampled for this experiment. By contrast, the non-selected population (200 breeders) was stocked in a 300 m2
pond for mass breeding. After 40 days of stocking, 6,000 fry were collected and reared in a 10m3 hapa for a period of 3 weeks. From this population, fry samples were taken for growth evaluation. The initial mean weight of the selected fish and of the founder population (non selected population) was 2.95±0.65 and 2.65±0.82g, respectively. There were two treatments with three replicates. Before stocking the cisterns were cleaned and filled up with deep tube well water at the depth of 1.0 meter. Fry of GIFT strain were stocked at a density of 5 fish/m3.
The fry of both treatments were fed twice a day in six days in a week with supplementary feed (28% crude protein) at 5-8% body weight. During grow out period, first and second months, feed was given at the rate of 8% and 7% of body weight, respectively, Then subsequently, 6% and 5% feed were given to the fish in the 3rd and 4th month,

239
239
respectively. Fish sampling was done at monthly interval to assess the growth, and feeding ratio was adjusted on the basis of estimated weight of fish biomass. In every week cisterns were cleaned through siphoning and 80% water changed with deep tube well water. Average water depth was maintained in all the cisterns at 1.0 m during the experimental period. After five months rearing, all the fishes were harvested. After harvest, body weight was measured on individual fish. Statistical analysis was carried out to test significant differences in growth between the F1 generation fish and the founder stock.
Production of G2 (Generation 2) generation of GIFT strain
On the basis of breeding values of G1 generation, the best 60 males were crossed with 60 females. For breeding, 60 breeding hapas (1x1x1m3) were set up in a pond. The range of breeding values of selected males were 8.23 to 16.13, while in case of females, the values were 5.01 to 14.47. A pair of female and male breeders (1:1) was stocked in each breeding hapa. After 21 days of stocking, 300 larvae from each progeny group were shifted to a series of hapas in a pond. The progeny were fed with nursery feed containing 30% protein at the rate of 30% of estimated body weight. After 30 days nursing, the mean weight of the fry was 2.46±0.81g. Each progeny group, 150 fry were transferred to 70 individual 2.0 m3 size rearing hapa. Supplementary feed (Nursery feed) was applied in all the hapas at the rate of 10-15% of estimated biomass. After 1.5 months of rearing, the weight ranges of fingerlings were 15-22g.
Tagging and communal rearing
From each progeny group 20 male and 20 female fish were tagged them by using Passive Integrated Transponder (PIT). Tagged fishes from 60 families (2400 fishes) were stocked in a pond (1000m2) for communal rearing in 1 July 2008. The tagged fishes were reared in the pond. Supplementary feed (25% crude protein) were supplied regularly at the rate of 6-8% of estimated biomass. After four months rearing, fish were harvested and tag number, weight, sex, body depth were recorded. Then data were analyzed through statistical analysis for breeding value estimation.
The same production and selection procedures were followed in subsequent generations G3 and G4.
Evaluation of growth performances between upgraded GIFT strain (G2) and founder population in pond
This trial was conducted to evaluate the growth performances of upgraded GIFT strain (G2) and founder population of GIFT strain in a pond for a period of five months during June to November 2008. A pond having an area of 1000m2 were selected for growth performances evaluation. Prior to the evaluation, the pond was cleaned and limed at the rate of 250 kg/ha. After three days of liming, pond was fertilized with urea and TSP at the rate of 12.50 and 25.0 kg/ha, respectively.
Fry of upgraded GIFT strain generation (G2) were stocked together with the progeny of the founder stock in a pond for communal rearing. In each group, 600 hundred fry were stocked. The initial mean weight of upgraded GIFT strain (G2) and founder Population were 4.81±0.65 and 4.72±0.82g, respectively. Fry of founder population of GIFT strain were marked through cauterization of pelvic fin. After stocking fry were fed with nursery feed contained 28% crude protein at the rate 5-10% of estimated body weight. Fry were sampled at fortnightly interval to know the growth as well as feed adjustment. In the first month, fry were fed at the rate of 10% of estimated body weight and the consecutive months feed ration was reduced to 8, 6 and 4% in the 2nd, 3rd and 4th month, respectively. After four months of rearing, fish were harvested through repeated netting followed by pond drying. The same protocol was practiced in subsequent generations in 2009 and 2010 (corresponding to generations G3 and G4) for growth evaluation.

240
240
RESULTS AND DISCUSSIONS
A total of 2000 fish (1000 males and 1000 females) of the first generation were harvested and measured of body weight in June 2007. General linear model analysis indicated that there was significant difference (P< 0.001) in body weight between the two sexes, where the males were substantially heavier than the females (278 vs. 156 g) (Table 1). The effect of sex on size and growth is often found in aquaculture species (Ponzoni et al. 2005, Nguyen et al. 2007).
Table 1: Body weight of male and female Sex Number of records Weight (g) Male 1000 277.76±29.77
Female 1000 156.05±30.26
Therefore, the statistical model included sex as the fixed effect and the additive genetics of individual fish as the random term to estimate breeding values (EBV) of all animals in the pedigree. Based on EBV ranking, the best 60 females and 60 males from 40 families were selected to produce progeny for the second generation (G2). The EBV range for the selected males and females were 4.17- 9.70 g and 4.24-9.36 g, respectively (Table 2).
Table 2: Breeding values of selected male and female breeders Sex Number of animals Breeding Values Male 60 4.17 - 9.70
Female 60 4.24 - 9.36
The body weight data of the upgraded (selected) and founder stock (non selected population) were measured at different months. The initial mean weight was 30.23±0.41 and 31.70±0.60g for the upgraded (selected GIFT) and founder stock, respectively. Month wise sampling data showed that growth rate of the upgraded GIFT strain was always higher than the founder stock. After four months rearing, the final cumulative mean weights were recorded at 168.67±3.51 and 157.33±2.52g for the selected and founder stock, respectively.
Table 3 also presents net gain and daily gain for the F1 and founder stocks. The net gains for weight estimated for the selected GIFT was significantly (P< 0.05) higher than that of the founder stock (138.4 vs. 125.6 g). The final weight of the selected GIFT was 7.20% higher than that of the founder stock. In regard to survival rate, hundred percent survivals were obtained in both the stocks.
Table 3: Growth rate of the GIFT strain tested in cistern ecology at BFRI Population No of records Net gain (g) Daily gain (g) Selected GIFT 30 138.43±3.40 1.15±0.03 Founder stock 30 125.50±3.30 1.04±0.02
Evaluation of growth performances of upgraded GIFT strain (G2, G3 and G4)
The harvesting mean weight of upgraded GIFT strain (G2) and founder GIFT strain were 142±4.18 and 125±3.97g, respectively. During sampling, the upgraded GIFT strain (G2) showed higher growth rate than founder GIFT strain in all the events. The mean weight of the upgraded GIFT was 13.60% higher than that of the average GIFT strain. The upgraded GIFT strain showed higher survival rate than founder GIFT which were 91 and 88%, respectively.
Table 4 presents the weight gain for the generations of G2, G3 and G4 and founder stocks. The upgraded GIFT of G3 and G4 were found 23.21 and 30.30% higher growth over founder generation (Fig. 1). The G2, G3 and G4 upgraded groups attained 7%, 8% and 7%
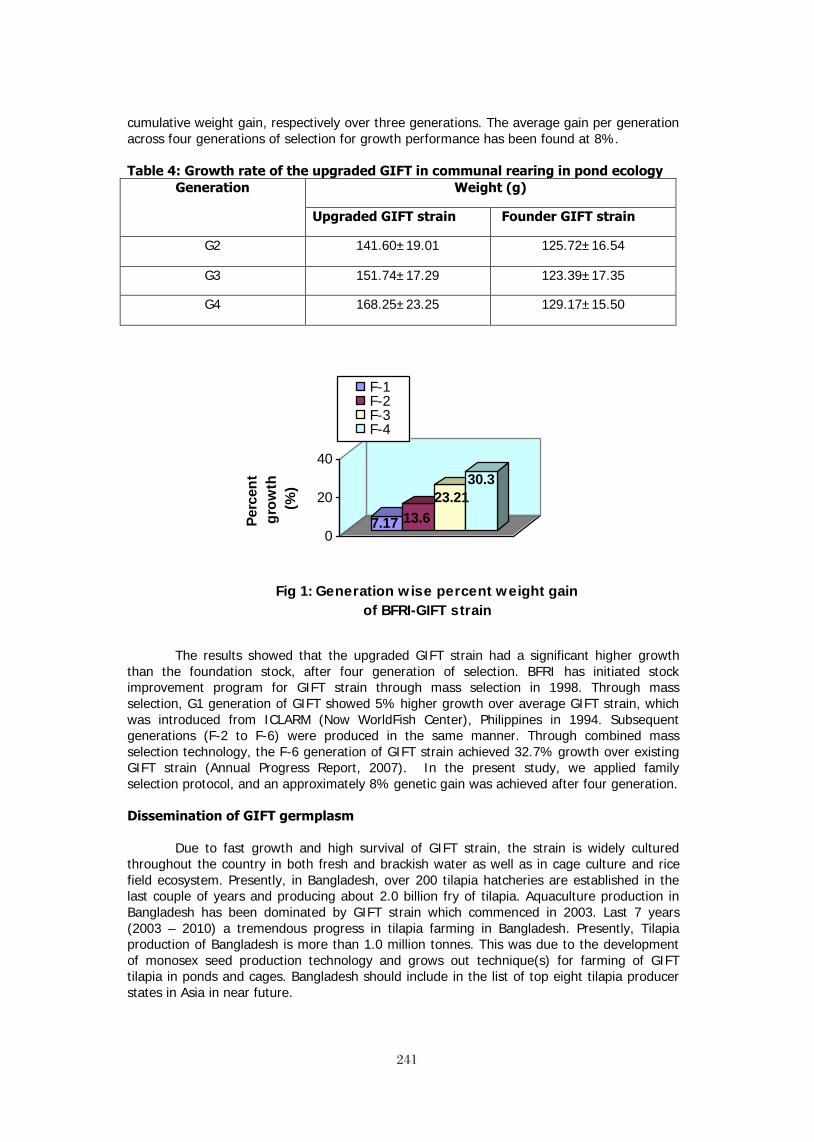
241
241
cumulative weight gain, respectively over three generations. The average gain per generation across four generations of selection for growth performance has been found at 8%. Table 4: Growth rate of the upgraded GIFT in communal rearing in pond ecology
Generation Weight (g)
Upgraded GIFT strain Founder GIFT strain
G2 141.60±19.01 125.72±16.54
G3 151.74±17.29 123.39±17.35
G4 168.25±23.25 129.17±15.50
The results showed that the upgraded GIFT strain had a significant higher growth than the foundation stock, after four generation of selection. BFRI has initiated stock improvement program for GIFT strain through mass selection in 1998. Through mass selection, G1 generation of GIFT showed 5% higher growth over average GIFT strain, which was introduced from ICLARM (Now WorldFish Center), Philippines in 1994. Subsequent generations (F-2 to F-6) were produced in the same manner. Through combined mass selection technology, the F-6 generation of GIFT strain achieved 32.7% growth over existing GIFT strain (Annual Progress Report, 2007). In the present study, we applied family selection protocol, and an approximately 8% genetic gain was achieved after four generation.
Dissemination of GIFT germplasm
Due to fast growth and high survival of GIFT strain, the strain is widely cultured throughout the country in both fresh and brackish water as well as in cage culture and rice field ecosystem. Presently, in Bangladesh, over 200 tilapia hatcheries are established in the last couple of years and producing about 2.0 billion fry of tilapia. Aquaculture production in Bangladesh has been dominated by GIFT strain which commenced in 2003. Last 7 years (2003 – 2010) a tremendous progress in tilapia farming in Bangladesh. Presently, Tilapia production of Bangladesh is more than 1.0 million tonnes. This was due to the development of monosex seed production technology and grows out technique(s) for farming of GIFT tilapia in ponds and cages. Bangladesh should include in the list of top eight tilapia producer states in Asia in near future.
7.17 13.623.21
30.3
0
20
40
Perc
ent
grow
th
(%)
Fig 1: Generation wise percent weight gain of BFRI-GIFT strain
F-1F-2F-3F-4
242
242
But it is alarming that, a large number of hatchery operators are not producing quality fry due to unavailability of good quality brood fish. So farmers are not getting expected production rather sometimes they become frustrated. Bangladesh Fisheries Research Institute (BFRI) as a center of excellence has given thrust to produce quality seeds as well as stock improvement program of GIFT strain. In the last year (2010), BFRI distributed 0.60 million fry to 100 tilapia hatcheries. When these GIFT fry attaining maturity, the hatchery operators producing millions of monosex fry and sale to the farmers for the production of table size fish. It is expected that in near future, generically improved GIFT strain will be the prime culture species next to riverine cat fish ie. Pangasius spp. and carp spp. in Bangladesh.
Dissemination Strategy:
The demand of GIFT strain is increasing day by day. In every year 40-50 tilapia hatchery have been established in this country. It is not possible at all to meet up the nation wide demand of quality GIFT fry from Freshwater Station of BFRI. Bangladesh Fisheries Research Institute (BFRI) authority is thinking to produce mass scale quality germplasm production through applying rotational breeding program in the satellite breeding station and sub stations. Moreover, improved germplasm of GIFT strain will be also handed over to the live gene banks of Department of Fisheries (DoF). These gene banks will take initiative to produce quality seed of GIFT strain and distribute to the hatcheries and farmers.
REFERENCES
Annual Progress Report, 2007. Annual Report 2003-04 and 2004-2005. Bangladesh Fisheries Research Institute, Mymensingh 2001. 136p.
Azhar, H., R. Ponzoni, K. Nurhidayat, A.R. Masazurah and A.N. Roslina. 2004. Genetic selection of Farmed tilapia: the performance of the 9th generation of the GIFT strain in different farm environments. Malaysian Fisheries Journal, 3(2):74-80.
Eknath, A.E., M.M. Dey, M. Rye, B. Gjedre, T.A. Abella, R.C Sevillega, M.M Tayamen, R.A Reyes, H.B Bensten, 1998. Selective breeding of Nile tilapia in Asia. Paper presented in the 6th World Congress on Genetics Applied to Livestock Production, 11-16 January, 1998, University of New England, Armidale, Australia. 10 pp.
Eknath, A.E., Tayamen, M.M., Palada-de-Vera, M.S., Danting, J.C., Reyes, R.A., Dionisio, E.E., Capili, J.B., Bolivar, H.L., Abella, T.A., Circa A.V., Bensten, H.B., Gjedre, B., Gjedrem, T., Rye, M., Pullin, R.S.V., 1993. Genetic improvement of farmed tilapias: the growth performance of eight strains of Oreochromis niloticus tested in different farm environments. Aquaculture 111, 171-188.
FAO. 2002. Fishery Statistics. Aquaculture production. 90 (2).
Gilmour, A.R, B.R. Cullis, S.J. Welham, R. Thompson, 2002. Asreml reference manual. NSW Agriculture Biometric Bulletin No.3. Orange Agricultural Institute, Forest Road, Orange 2800 NSW Australia.
243
243
PRODUCTIVE PERFORMANCE AND MUSCLE GROWTH OF THREE DIFFERENT STRAINS OF NILE TILAPIA, Oreochromis niloticus,
DURING THE INITIAL DEVELOPMENT
Thiago M. de Freitas, Juliana T. Kojima, Natalia de J. Leitão, Caroline Nebo, Fernanda R. Carani, Maeli Dal Pai-Silva and Maria Célia Portella*
The aim of this study was to compare the productive performance and muscle growth (fiber hyperplasia and hypertrophy, and gene expression of the myogenic regulatory factors) of three strains of Nile tilapia (GIFT, Supreme and Thai), fed commercial diet containing or not the hormone 17α-methyltestosterone (MT), during the phase of sexual differentiation. The experiment was conducted in a factorial scheme (3x2), making up six treatments with four replicates each. Fish growth was evaluated along the experiment, as well as the survival rates, masculinization rates and homogeneity of the animals at the end (29 days). For the morphometric analysis of the muscle fibers, samples (n = 8 per treatment) were taken at 4, 19 and 33 days post-hatching (dph) and transversal sections of the epiaxial muscle were obtained. The diameter (d) and the area of 200 muscle fibers were measured in each sample, and the diameters were classified as follow: class 10 = d ≤ 10 μm, class 20 = 10 < d ≤ 20 μm, class 30 = 20 < d ≤ 30 μm, class 40 = 30 < d ≤ 40 μm, and class 50 = d > 40μm. The analysis of gene expression of MyoD and Myogenin were performed by real time PCR (sampling at 4 and 33 dph). The "Supreme" strain showed better growth performance, survival rates, and size homogeneity. All strains displayed masculinization rates above 97%. The use of MT affected the productive performance of Nile tilapia larvae, and the effects were different among the strains. The development of the muscle fibers of the juvenile of Supreme strain that did not receive MT was characterized by more intense hyperplasia of the muscle fibers than the Thai strain. Preliminary results on the expression of MyoD and myogenin showed no effect of MT in juveniles of the Thai strain. In general, tilapia juveniles that received the hormone showed higher frequency of fibers of higher diameter classes, indicating intense participation of hypertrophy. However, this trend did not accompany increasing in weight, suggesting possible adverse effects on fish’s physiology. Financial Support: CNPq, Brazil.

244
244
SECTION IV NUTRITION and FEEDS
Chair: Professor Wing-Keong Ng
Universiti Sains, Malaysia

245
245
Effects of saponin fractions from Trigonella foenum-graecum and Balanites aegyptiaca on gene expression of GH, IGF-1 and their
respective receptors, growth, nutrient utilization, body composition, oxygen consumption and plasma IGF-1 in Nile tilapia (Oreochromis
niloticus, L.).
T. Stadtlander1, W. K. B. Khalil1,2, B. Levavi-Sivan3, H. Dweik5, M. Qutob5, S. Abu-Lafi5, Z. Kerem4, U. Focken1,6 and K. Becker1
1Department of Aquaculture Systems and Animal Nutrition in the Tropics and Subtropics, University of Hohenheim (480B), 70593 Stuttgart, Germany
2Cell Biology Department, Genetic Engineering and Biotechnology Division, National Research Centre, Giza, Egypt
3Department of Animal Sciences, and 4Institute of Biochemistry, Food Science and Nutrition, Faculty of Agricultural, Food and Environmental Quality Sciences, The Hebrew University, PO
Box 12, Rehovot 76100, Israel 5Faculty of Science and Technology, Al-Quds University, PO Box 20002, Abu Dis, Palestinian
Authority, 20939 Jerusalem 6Johann Heinrich von Thünen Institute, Institute of Fisheries Ecology, 22926 Ahrensburg,
Germany
Abstract Saponins in aquaculture feedstuffs are generally considered anti-nutritional. However, in several experiments it was shown that low level (150 ppm) supplementation with saponins from Quillaja saponaria, the South American soap bark tree, yielded several beneficial effects. Among them were improved growth rates, feed conversion efficiency, protein utilization and reduced oxygen consumption per unit body mass gain in common carp (Cyprinus carpio). In Nile tilapia, Oreochromis niloticus, supplementation levels of 300 ppm showed similar beneficial effects as the 150 ppm inclusion in carp diets. Based on the above mentioned results an experiment was conducted in which saponin fractions (eluated with 60% or 80% methanol) from two different saponin rich plants, fenugreek (Trigonella foenum-graecum L.) and a methanol extract from the Egyptian desert date (Balanites aegyptiaca L.) were fed at different concentrations to 15 individually stocked Nile tilapia (19.1 ± 0.6 g, mean ± SD) in a respirometer system. Five treatments, namely a control diet (no saponin), three fenugreek saponin diets and one desert date saponin diet were fed to three replicates each. Every week the fish were weighed and feed allowance was calculated accordingly. At the end of the eight week experiment the fish were anaesthetized and killed. IGF-1 levels in plasma were determined using a radio-immuno-assay, expression of genes encoding for IGF-1, GH and their receptors were determined using semi-quantitative reverse transcriptase real time PCR and proximate composition determined. Fish fed with 60% T. foenum-graecum saponins at a concentration of 300 mg kg-1 showed the highest performance. Their expression levels of GH and IGF-1 genes were highest followed by control. The other groups had a significantly lower expression of GH and IGF-1. These results were also reflected in the numerically best growth and feed utilization parameters and the lowest oxygen consumption. On the contrary, all other saponin supplementations resulted in reduced performance with considerably higher oxygen consumptions for fish fed 600 mg kg-1 60% fenugreek saponins. Results of gene expression levels strongly correlated with other performance parameters.The obtained results suggest that the 60% MeOH eluated Trigonella foenum-graecum saponin fraction has a potential as natural growth promoter depending on applied concentration. Key Words: Saponin, Nile tilapia, growth promoter, GH and IGF-1 gene expression

246
246
Introduction
With the rapidly growing aquaculture industry the demand for high quality fish feeds is increasing. At current and expected aquaculture growth rates the demand will eventually outgrow the availability of fish meal as highly digestible protein source (Hardy 2010). As a consequence the inclusion levels of plant derived proteins are increasing for formulated fish and crustacean feeds. However these plant derived ingredients have, in comparison to fish meal, a serious drawback since they always contain one or more anti-nutrients like protease inhibitors, lectins, gossypol, phytic acid, tannins or saponins (Francis et al. 2001a). While saponins are generally considered as anti-nutrient, it has been shown in several experiments that low concentrations of Quillaja saponaria (South American soap-bark tree) saponins in the diet are improving the oxygen consumption, nutrient utilization and growth performance of carp, Cyprinus carpio and Nile tilapia, Oreochromis niloticus, respectively. When fed to common carp (Cyprinus carpio) at 150 mg kg-1 in the diet, Quillaja saponaria saponin supplementation resulted in significantly increased final body mass, reduced the oxygen uptake per unit body mass gain and improved the protein and energy utilizations compared to the control (Francis et al. 2002a, b). Nile tilapia fed with 300 ppm Q. saponaria saponins in their diet showed a significantly higher body mass gain and increased energy retention when compared to the control fish (Francis et al. 2001b). Saponins are glycosidic compounds mainly produced by plants that are often activated after tissue damage and act for instance as antimicrobial defense substances (Gus-Mayer et al. 1994). Saponins can be found in a great variety of different plants, including many cultured plants like soybean which is the most common plant protein source for aquaculture. Some marine invertebrates like starfish also produce saponins most likely as a chemical defense against predators (Rio et al. 1965). Saponins consist of a steroidal or triterpenoidal core structure called aglycone or sapogenin and one or more sugar side chains. Due to the large variations in either the aglycone or the sugar moiety they produce very diverse biological effects in animals. A detailed review of the biological actions of saponins is given by Francis et al. (2002c). Saponin fractions were derived from two different plants, one being Fenugreek, Trigonella foenum-graecum, the other one being the Egyptian desert date, Balanites aegyptiaca. Both are frequently occurring and cultivated in the Middle East and are rich in different saponins (Marker et al. 1947, Dawidar and Fayez 1969, Hosny et al. 1992, Kamel 1998, Murakami et al. 2000). Both plants are commonly used in traditional folk medicine in the Middle East. Ethanol extract of T. foenum-graecum was considered an excellent alternative to a well known anti-diabetic drug as tested in artificially induced diabetic rats (Eidi et al. 2007). Diosgenin, a sapogenin present in fenugreek, did stimulate ion transport in human cortical neuronal cells (Wang et al. 2006). The desert date is traditionally used as an anti-diabetic drug in folk medicine in Egypt and other parts of northern Africa and the Middle East. Kamel et al. (1991) were able to show that aqueous extracts of the desert date mesocarps and its fractions reduced the blood glucose levels significantly. A totally different application of the desert date was demonstrated by Chapagain et al. (2008) who used saponins extracted from a root derived callus as a larvicidal agent against the mosquito Aedes aegypti, the major vector for dengue fever and dengue hemorrhagic fever. The saponins were added in low concentrations to the diets of Nile tilapia. To test whether saponin fractions derived from Fenugreek and the desert date yield similar results as obtained for carp and tilapia by Francis et al. (2001b, 2002a, b), an eight week feeding experiment with Nile tilapia was conducted. Based on previous trials two eluates from fenugreek (one in two concentrations) and a methanol extract from the desert date were chosen and tested for their effects on gene expression of GH, IGF-1 and their receptors, IGF-1 plasma levels, growth performance, oxygen consumption, nutrient utilization and chemical composition.

247
247
Material and Methods Experimental set-up A total of 20 male Nile tilapia, O. niloticus, with a body mass of 19.0 ± 0.5 g (mean ± SD) were divided in two groups. At the start of the experiment five fish were killed by a sharp blow on the head and immediately frozen at -20°C for subsequent analysis of chemical composition. The fish were obtained from the University of Göttingen, Department of Aquaculture and Water Ecology. The other 15 fish were individually stocked in 12-L chambers of a fully computer controlled respirometric system (Focken et al. 1994). The flow rates were adjusted to 0.3 L min-1 and the temperature was kept at 27°C. The light cycle was set to 12/12 light/dark and water quality was analyzed once per week. Once weekly the fish were weighed to the nearest 0.1 g and the feed ration adjusted accordingly. After the individual weighing the fish were kept for 5 to 10 minutes in a bucket with well aerated water while the respective respirometer chamber was cleaned. The feed rations were calculated as four times (14 g kg-0.8 day-1) the daily energy maintenance requirement (3.5 g kg-0.8 day-1) on metabolic body mass basis. A standard diet was prepared according to Table 1 which also served as control diet. The different saponin fractions were added to the standard diet in different concentrations (Table 1) resulting in four saponin supplemented diets termed according to the included fraction and its concentration, for example 60TS600 refers to the 60% methanol extracted Trigonella saponin eluate or fraction included at 600 ppm while BA stands for Balanites saponin. The five diets were randomly assigned to the 15 chambers in triplicates. At the end of the eight week feeding period all experimental fish were anaesthetized with 200 ppm MS 222, weighed, blood drawn from the caudal vein and killed with a sharp blow to the head. Afterwards, brain, liver and muscle samples were taken and stored on liquid nitrogen for later gene expression analysis while the carcasses were kept at -20°C for later proximate composition analysis. For the chemical analysis the fish were chopped while still frozen, autoclaved for 30 minutes at 120°C, homogenized with an Ultra-Turrax T25 (IKA-Labortechnik, Staufen, Germany), refrozen and freeze dried. Water content was calculated by difference from body mass at slaughter and dry matter mass after freeze drying. Basically the chemical analysis was conducted according to AOAC (1990) on each individual fish. In brief, dry matter was determined by drying over night to constant mass at 105 °C, ash was determined by ashing over night at 500°C, crude lipid (CL) was determined by a modified Smedes method (Smedes 1999, Schlechtriem et al. 2003). Crude protein (CP) was determined using a C/N-analyzer (C/N VarioMAX, Elementar Analysensysteme GmbH, Germany) and N x 6.25 = CP. Saponins were extracted from fenugreek seeds (T. foenum-graecum L.) seeds generally according to Marston and Oleszek (2000). Ethanol extracts were fractionated using a reversed phase HPLC and different consecutive methanol/water solutions (v/v, 40/60, 60/40, 80/20) resulting in three saponin eluates or fractions (40, 60 and 80%) of which the 40% eluate was discarded. An 80% methanol extract of Balanites aegyptiaca was produced by grinding 5 g of seeds to a fine powder and mixing with 80% methanol over night. Afterwards the extract was centrifuged (5 minutes at 2400 g) and the supernatant collected and evaporated in a rotary evaporator at 40°C. After another MeOH washing step with 80% MeOH and subsequent centrifugation the extract was washed with 10 ml butanol, centrifuged, butanol phase incubated over night at 6°C and next morning evaporated at 45°C. The material was dissolved in aqua dest. and freeze dried before use.

248
248
Calculations The following parameters were calculated as shown: Metabolic Body Mass (MBM (kg0.8) (Live body mass (g) / 1000)0.8
Metabolic Growth Rate (MGR (g kg-0.8 day-1) Live body mass gain (g) / average
metabolic live body mass (kg0.8) /
experimental period (Dabrowski et al.
1986)
Specific Growth Rate (SGR (% day-1)) 100 x [(ln final mass - ln initial mass) /
days of experiment]
Routine Metabolic Rate (RMR) mean oxygen consumption in 24 h (mg)
/ metabolic body mass (kg0.8) x 24
Energy Expenditure (EE (kJ)) Oxygen uptake (g) x 14.86 (kJ g-1 O2,
Huisman 1976)
Energy Retention (ER (kJ)) Final gross energy (kJ) of fish – initial
gross energy (kJ) of fish
Metabolizable Energy (ME), (kJ) ER (kJ) + EE (kJ)
EE (% of GE fed) EE (kJ) x 100 / Feed energy intake (kJ)
ER (% of GE fed) ER (kJ) x 100 / Feed energy intake (kJ)
ME (% of GE fed) ER (kJ) + EE (kJ) x 100 / Feed energy
intake (kJ)
AUE (% of GE fed) 100 - EE (%) - ER(%)
O2 consumption (g) / protein gain (g) Total oxygen consumption (g) / total
protein gain (g)
EE (kJ) / protein gain (g) Total EE (kJ) / total protein gain (g)
Protein Efficiency Ratio (PER) Live body mass gain (g) / feed protein
intake (g)
Protein Productive Value (PPV (%)) Total protein gain (g) x 100 / total
protein fed (g)
Apparent lipid conversion (%) Total lipid gain (g) x 100 / total lipid fed
(g)
Feed Conversion Ratio (FCR) Feed consumption (dry matter) / live
body mass gain (g)
Radio-Immuno-Assay Blood was drawn from each fish with a heparinized 1 ml syringe from the caudal vein after anaesthetizing the fish with 200 ppm MS 222. The blood was centrifuged at 4°C and 2,500 g for 5 minutes and the plasma was frozen at -20°C. For the determination of the plasma levels of IGF-1 a fish IGF-1 RIA kit from GroPep [including Anti Barramundi IGF-1 Polyclonal Antiserum (Rabbit) and Recombinant Barramundi IGF-1 (Lates calcarifer)] (catalogue nos. PAF1 and YU100 respectively) was used following the basic methodology of Claus and Weiler (1996) with some minor changes.

249
249
Isolation of total RNA Extraction of total RNA from brain (including pituitary), liver and muscle tissues of Nile tilapia was carried out using TRIzol® Reagent (cat#15596-026, Invitrogen, Germany) according to the manufacturer’s instructions with minor modifications. Tissue samples were homogenized in 1 ml of TRIzol® Reagent per 50 mg of the tissue. RNA was dissolved in diethylpyrocarbonate (DEPC)-treated water.
Total RNA was treated with 1 unit of RQ1 RNAse-free DNAse I (Invitrogen, Germany) to digest DNA residues, re-suspended in DEPC-treated water and quantified photospectrometrically at 260 nm. Purity of total RNA was assessed by the 260/280 nm ratio which was between 1.8 and 2.1. Additionally, integrity was assured with ethidium bromide-stain analysis of 28S and 18S bands by formaldehyde-containing agarose gel electrophoresis. Aliquots were used immediately for reverse transcription (RT) otherwise they were stored at -80°C. Reverse transcription (RT) reaction The complete Poly(A)+ RNA isolated from Nile tilapia tissues was reverse transcribed into cDNA with a total volume of 20 µl using RevertAidTM First Strand cDNA Synthesis Kit (MBI Fermentas, Germany) according to manufacturers instructions. The RT reaction was carried out at 25°C for 10 min, followed by 1 h at 42°C, and finished with a denaturation step at 99°C for 5 min. Afterwards the reaction tubes containing RT preparations were flash-cooled in an ice chamber until subjected to DNA amplification using the quantitative Real Time polymerase chain reaction (RT-qPCR). Quantitative Real Time-Polymerase Chain Reaction (RT-qPCR) An iQ5-BIO-RAD Cycler (Hercules, CA, USA) was used to determine the Nile tilapia cDNA copy number. PCR reactions were set up in 25 L reaction mixtures containing 12.5 L 1× SYBR® Premix Ex TaqTM (TaKaRa, Biotech. Co. Ltd.), 0.5 L 0.2 M sense and antisense primers, 6.5 L distilled water, and 5 L of cDNA template. The reaction program was allocated to 3 steps. First step was at 95.0°C for 3 min. Second step consisted of 50 cycles in which each cycle divided to 3 sub-steps: (a) at 95.0°C for 15 sec; (b) at 60°C for 30 sec; and (c) at 72.0°C for 30 sec. The third step consisted of 71 cycles which started at 60.0°C and then increased about 0.5°C every 10 sec up to 95.0°C. At the end of each RT-qPCR a melting curve analysis was performed at 95.0°C to check the quality of the used primers. Each analysis included a non template control. The sequences of specific primers of the genes used and sequence references are listed in Table 2. The quantitative values of RT-qPCR of GH, IGF-1 and their receptor genes
-actin gene expression. Statistical Analysis
All data was analyzed using SPSS version 10.0 (IBM SPSS, Chicago, IL, USA). All data is presented as mean ± SEM if not stated otherwise. To test for homogeneity of variance a Levene test was applied while the test for normal distribution was conducted with a Kolmogorov-Smirnov test. To test for significant differences between the groups all data was subjected to an ANOVA with a subsequent Scheffé post-hoc test. Pearson’s correlation coefficient was used to check for correlations among parameters. Statistical significance level was p < 0.05.
Results Observations, growth performance, oxygen consumption and nutrient utilization
All fish accepted the respective diets and ate the provided feed during the first two minutes. No abnormal behavior or signs of stress were observed.
Over the experimental period all groups gained similarly in protein, lipids and subsequently in energy (Table 3). Fish fed with either control or 60TS300 feed showed a numerically higher apparent lipid conversion compared to the other saponin fed groups (Table 4).
Fish fed with 60TS300 grew numerically best in terms of body mass gain and final body mass compared to all other groups. The other saponin fed groups showed the lowest growth response while the control fed fish grew close to the 60TS300 group (Table 4).
The same results can be observed in all measured and calculated growth performance and nutrient utilization parameters. Fish fed with 60TS300 always showed better or equal numerical values compared to the control group while the 60TS600 group exhibited

250
250
the lowest performance. Strong positive correlations were found between feed utilization (FCR, PER and PPV) and growth performance (MGR, SGR, FBM and BMG) (p < 0.01).
Somewhat different to the growth and nutrient utilization performances was the oxygen consumption. It was highest for fish fed with 600 mg kg-1 of the 60% Trigonella fraction fed fish while it was lowest in fish fed with only 300 mg kg-1 of the same fraction. It can be seen from Fig. 1 that the oxygen consumption in the 60TS600 treatment increases from week 4 onwards together with a dramatically increasing standard error of mean. This is caused by a dramatically increasing oxygen consumption of one replicate in the respective treatment. The control and the other two saponin fed groups had an oxygen consumption between those two groups (Fig. 1). The oxygen consumption per gram of protein gain was lowest for fish fed with 60TS300 followed by control fed fish, while it was highest for fish fed with 60TS600 (Table 5). Logically, a similar result is gained for the heat dissipation (energy expenditure) since it is calculated from the oxygen consumption (Huisman 1976). Negative correlations were found for the energy expenditure per unit of protein gain and growth performance (MGR, SGR, FBM and BMG) showing that lower oxygen consumptions resulted in higher growth performance (p < 0.05). Gene expression and IGF-1 plasma level
Expression of GH in brain and pituitary was highest for fish fed 60TS300 followed by control while the other saponin fed groups showed a significantly reduced expression of GH. A similar result was obtained for the expression of GHR-2 expression in brain and pituitary but not in liver and muscle tissue. IGF-1 expression was significantly lower for all saponin treated groups compared to control except 60TS300 which was numerically even higher than control. No differences were found between groups and tissues in expression of GHR-1, IGF-1 Ra and IGF-1 Rb. and between plasma levels of IGF-1. Expression levels of GH did strongly correlate to growth related parameters like BMG (r = 0.99, p < 0.01), MGR (r = 0.99, p < 0.01), SGR (r = 0.99, p < 0.001), nutrient utilization parameters like FCR (r = -0.98, p < 0.005), PER (r = 0.98, p < 0.005), PPV (r = 0.97, p < 0.01) and ER (r = 0.96, p < 0.01). Similar correlations but not as strongly pronounced were found between expression of IGF-1 and performance related parameters (see Table 6).
Discussion
To our knowledge, this is the first experiment where a traditional growth trial has been combined with proximate composition analysis, respirometry and gene expression to evaluate the effects of supplementation with saponin fractions in Nile tilapia. Furthermore this is the first time that saponin extracts have been fractionated to be tested as possible natural growth promoters.
While the observed differences between growth, oxygen consumption and proximate composition between control and treatments were not statistically significant due to low number of replicates (which is limited by the number of boxes of the respirometer system), the expression of GH, GHR-2 and IGF-1 showed significant differences between treatments. The expression of GH in the pituitary and brain and the expression of IGF-1 in the liver were significantly reduced for all saponin treatments except 60TS300 which had numerically even higher expressions of these genes than the control. In our experiment the expressions of GH and IGF-1 genes directly reflected the overall performance including the growth rates and the various evaluated feed utilization and metabolic parameters of the respective treatments. All results point towards a performance depression in all saponin supplemented treatments except the 300 ppm supplementation with the 60% methanol fractionated saponin eluated from T. foenum-graecum seeds. High expression levels of GH and IGF-1 genes resulted in numerically highest growth rates and best nutrient utilization while significantly reduced gene expressions of GH and IGF-1 resulted in numerically lowest growth and inferior nutrient utilization.
Generally an over-expression of GH in transgenic fish results in significantly higher growth rates as reported for coho salmon (Devlin et al. 2004), Atlantic salmon (Du et al. 1992), Arctic charr (Pitkänen et al. 1999), rohu (Venugopal et al. 2004), common carp (Hinits and Moav 1999), channel catfish (Dunham et al. 1999) and Nile tilapia (Rahman and Maclean 1999).

251
251
In an in vitro study it has been shown that saponins extracted from Fenugreek significantly stimulated GH release in rat pituitary cells. The most potent substance proved to be a crude methanol extract of T. foenum-graecum (~ 22-fold higher GH release compared to control) while dioscin (~18-fold) and fenugreek saponin I (~13-fold) where also highly potent (Shim et al. 2008). Although no direct growth promotion was observed in GH transgenic tilapia, a significantly improved feed utilization was reported by Martínez et al. (2000). The differences between the different treatments compared to control, although we did not measure GH release, were far less pronounced as the above mentioned results. Feeding common carp with 150 mg per kg diet for eight weeks with crude Quillaja saponaria saponins resulted in significantly increased final body mass and improved oxygen consumption while a similar effect was yielded in tilapia when the saponin inclusion level was raised to 300 mg kg-1 diet (Francis et al. 2001b, 2002 a, b). The two main differences between those experiments and our experiment where the nature of the saponins on one side and the degree of saponin fractionation on the other side. Q. saponaria saponins are of triterpenoid nature (Guo & Kenne 2000) while T. foenum-graecum (Marker et al. 1947, Murakami et al. 2000) and B. aegyptiaca (Marker et al. 1947, Dawidar and Fayez 1969) saponins are of steroidal nature. The goal of this experiment was to test if saponins derived from two common and widespread Middle Eastern plants can be used as environmentally friendly growth promoters. To do so a fractionation was conducted with the future goal in mind to identify and purify a single compound responsible for a growth promoting effect as experienced in the experiments of Francis and his colleagues. However, evidence exists that the biological activity of saponins is not the consequence of one single biologically active saponin or sapogenin which can be extracted and purified but rather that saponin mixtures exhibit the highest biological activity. As mentioned above, the highest release of GH in rat pituitary cells was measured after stimulation with crude methanol extract derived from fenugreek (Shim et al. 2008) and Kamel et al. (1991) showed that single saponins derived from B. aegyptiaca showed no anti-diabetic activity while different mixtures of single extracted saponins showed significant anti-diabetic activity. Also Francis et al. (2001b, 2002a, b) used crude Quillaja saponin mixtures yielding far more pronounced effects than we observed in our experiment. Nevertheless we found a tendency that certain saponin fractions were less detrimental for growth and nutrient utilization (60% methanol fraction) while another fraction of the same plant seemed to exhibit stronger anti-nutritional activity (80% methanol fraction) when applied in the same concentration of the diet. Furthermore the concentration of the saponin matters since 600 ppm of the 60% MeOH extract from Fenugreek in the diet yielded similar bad results as 300 ppm of the 80% MeOH extract from Fenugreek. The variance in the oxygen consumption experienced in the 600 ppm treatment of the 60% Fenugreek methanol fraction is starting to increase from the 4th week onwards. The cause is a strongly increasing oxygen consumption of a single fish while the other two fish’s metabolic rates only increase slightly which could be explained by increasing body mass. That might point towards a rising inability of the fish’s metabolism to cope with higher amounts of this specific saponin fraction.
Despite a potential application of saponins as growth promoter in aquaculture they might also be used to influence the sex ratio in vivo. This is especially interesting for tilapia since the commercial tilapia production depends on male monosex cultures which are at the moment mainly produced by application of a synthetic androgen, 17- -methyletestosterone.
Commercial extracts of Tribulus terrestris, known as Gokshura, had a significant effect on sex ratio and in the highest dose also on growth of the African catfish, Clarias gariepinus (Turan and Çek 2007). Furthermore, the same extract was able to increase the sex ratio of male convict cichlids (Cichlasoma nigrofasciatum) (Çek et al. 2007).
Gokshura is reported to be rich in steroidal saponins but with varying compositions depending on origin (Dinchev et al. 2008).
Up to now only very little attention has been paid to effects and potential of saponins as feed additives in aquaculture feeds. While saponins are in use in terrestrial livestock feeds for example to control ammonia and odor (Cheeke 1999) they are generally still considered anti-nutrients for aquatic animals.
We conclude that the saponin fractions derived from Fenugreek and the desert date in the applied concentrations are no possible alternative for prohibited antibiotics as growth
252
252
promoters in Nile tilapia production. However, a certain potential as growth promoter might be found in the 60% MeOH saponin fraction from Fenugreek or in crude saponin extracts and that the effects of the saponins are likely to be concentration depending.
More studies are needed to test a possible optimum dietary concentration of that saponin fraction (60TS). Furthermore, the decreased performance of other saponin treated fish, including the higher concentration of 60TS, points toward anti-nutritional effects. The combined results are in good coherence since high expression levels of GH and IGF-1 genes positively correlated with parameters related to growth, nutrient digestion and metabolic efficiency.
References
Ber R., Daniel V., 1992. Structure and sequence of the growth hormone-encoding gene from Tilapia nilotica. Gene, 113: 245-250.
Chapagain B.P., Saharan V. and Wiesman Z., 2008. Larvicidal activity from Balanites aegyptiaca callus agains Aedes aegypti mosquito. Bioresource Technology 99, 1165-1168.
Çek S., Turan F. and Atik E., 2007. Masculinization of convict cichlid (Cichlasoma nigrofasciatum) by immersion in Tribulus terrestris extract. Aquaculture International 15, 109-119
Claus R. and Weiler U., 1996. Relationships between IGF-I, cortisol, and osteocalcin in peripheral plasma of growing pigs. Exp Clin Endocrinol Diabetes 104 (4), 344-349
Dabrowski, K., Murai, T., Becker, K., 1986. Physiological and nutritional aspects of intensive feeding of carp. In: Billard, R., Mercel, J. (Eds.), Aquaculture of Cyprinids. INRA, Paris, pp. 55–70.
Dawidar A.A.M. and Fayez M.B.E., 1969. Steroid sapogenins-XIII. The constituents of Balanites aegyptiaca. Phytochemistry 8, 261-265
Devlin R.H., Biagi C.H. and Yesaki T.Y., 2004. Growth, viability and genetic characteristics of GH transgenic coho salmon strains. Aquaculture 236, 607-632
Dinchev D., Janda B., Evstatieva L., Oleszek W., Aslani M.R. and Kostova I., 2008. Distribution of steroidal saponins in Tribulus terrestris from different geographical regions. Phytochemistry 69, 176-186
Du S.J., Gong Z., Fletcher G.L., Shears M.A., King M.J., Idler D.R. and Hew C.L., 1992. Growth enhancement in transgenic Atlantic salmon by the use of an “all fish” chimeric growth hormone gene construct. Bio/Technology 10, 176-181
Dunham R.A., Chitmanat C., Nichols A., Argue B., Powers D.A. and Chen T.T., 1999. Predator avoidance of transgenic channel catfish containing salmonid growth hormone genes. Marine Biotechnology 1, 545-551
Focken U., Schiller M., Becker K., 1994. A computer-controlled system for the continuous determination of metabolic rates of fish. In: Kestemont, P., Muir, J., Sevilla, F., Willot, P. (Eds). Measures of Success: Contributions presented at the International Conference Bordeaux Aquaculture 1994. CEMAGREF edition, Antony, France, pp. 167–171.
Francis G., Makkar H.P.S. and Becker K., 2001a. Antinutritional factors present in plant-derived alternate fish feed ingredients and their effects in fish. Aquaculture 199, 197-227
Francis G., Makkar H.P.S. and Becker K., 2001b. Effects of Quillaja saponins on growth, metabolism, egg production and muscle cholesterol in individually reared Nile tilapia (Oreochromis niloticus (L.)). Comparative Biochemistry and Physiology (C) 129 (2), 105-114
Francis G., Makkar H.P.S. and Becker K., 2002a. Dietary supplementation with a Quillaja saponin mixture improves growth performance and metabolic efficiency in common carp
(Cyprinus carpio L.). Aquaculture 203, 311-320 Francis G., Makkar H.P.S. and Becker K., 2002b. Effects of cyclic and regular feeding of a
Quillaja saponin supplemented diet on growth and metabolism of common carp (Cyprinus carpio L.). Fish Physiology and Biochemistry 24, 343-350
Francis G., Kerem Z., Makkar H.P.S. and Becker K., 2002c. The biological action of saponins in animal systems: a review. British Journal of Nutrition 88, 587-605
253
253
Gaye-Siessegger J., Focken U., Muetzel S., Abel H., Becker K., 2004. Feeding level and individual metabolic rate affect δ13C and δ15N values in carp: implications for food web studies. Oecologia 138, 175-183
Greene M.W. and Chen T.T., 1999. Characterization of teleost insulin receptor family members. II. Developmental expression of insulin-like growth factor type I receptor messenger RNAs in rainbow trout. General and Comparative Endocrinology 115, 270-281.
Guo S. and Kenne L., 2000. Characterization of some O-acetylated saponins from Quillaja saponaria Molina. Phytochemistry 54, 615-623
Gus-Mayer S., Brunner H., Schneider-Poetsch H.A., Rudiger W., 1994. Avenacosidase from oat: purification, sequence analysis and biochemical characterization of a new
-glucosidases. Plant Molecular Biology 26 (3), 909-921 Hardy R.W., 2010. Utilization of plant proteins in fish diets: effects of global demand and
supplies of fishmeal. Aquaculture Research 41, 770-776 Hinits Y. and Moav B., 1999. Growth performance studies in transgenic Cyprinus carpio.
Aquaculture 173, 285-296. Hosny M., Khalifa T., Çaliş İ., Wright A.D. and Sticher O., 1992. Balanitoside, a furostanol
glycoside, and 6-methyl-diosgenin from Balanites aegyptiaca. Phytochemistry 31 (10), 3565-3569.
Huisman E.A., 1976. Food conversion efficiencies at maintenance and production levels for carp, Cyprinus carpio L. and rainbow trout, Salmo gairdneri Richardson. Aquaculture 9: 259-273
Hwang G.L., Azizur Rahman M., Abdul Razak S., Sohm F., Farahmand H., Smith A., Brooks C. and Maclean N., 2003. Isolation and characterisation of tilapia beta-actin promoter and comparison of its activity with carp beta-actin promoter. Biochim Biophys Acta 1625, 11-18.
Jiao B., Huang X., Chan C.B., Zhang L., Wang D. and Cheng C.H., 2006. The co-existence of two growth hormone receptors in teleost fish and their differential signal transduction, tissue distribution and hormonal regulation of expression in seabream. Journal of Molecular Endocrinology 36, 23-40.
Kajimura S., Kawaguchi N., Kaneko T., Kawazoe I., Hirano T., Visitacion N., Grau E.G. and Aida K., 2004. Identification of the growth hormone receptor in an advanced teleost, the tilapia (Oreochromis mossambicus) with special reference to its distinct expression pattern in the ovary. Journal of Endocrinology 181, 65-76.
Kamel M.S., 1998. A furostanol saponin from fruits of Balanites aegyptiaca. Phytochemistry 48 (4), 755-757
Kamel M.S., Ohtani K., Kurokawa T., Assaf M.H., El-Shanawany M.A., Ali A.A., Kasai R., Ishibashi S. and Tanaka O.,1991. Studies on Balanites aegyptiaca fruits, an antidiabetic Egyptian folk medicine. Chemical & Pharmaceutical Bulletin 39 (5), 1229-1233
Livak K.J. and Schmittgen T.D., 2001. Analysis of relative gene expression data using real-time quantitative PCR and the 2- Methods 25 (4), 402-408
Marker R.E., Wagner R.B., Ulshafer P.R., Wittbecker E.L., Goldsmith D.P.J. and Ruof C.H., 1947. New sources for sapogenins. Journal of the American Chemical Society 69 (9), 2242
Marston A. and Oleszek W. (Eds.), 2000: Saponins in food, feedstuffs and medicinal plants. Springer, Netherlands
Martínez R., Juncal J., Zaldívar C., Arenal A., Guillén I., Morera V., Carillo O., Estrada M., Morales A. and Estrada M.P., 2000. Growth efficiency in transgenic tilapia (Oreochromis sp.) carrying a single copy of an homologous cDNA growth hormone. Biochemical and Biophysical Research Communications 267, 466-472
Murakami T., Hishi A., Matsuda H., Yoshikawa M., 2000. Medicinal Foodstuffs XVII. Fenugreek Seed. (3): Structures of new furostanol-type steroid saponins, Trigoneosides Xa, Xb, Xib, XII a, XIIb and XIIIa from the seeds of Egyptian Trigonella foenum-graecum L. Chemical & Pharmaceutical Bulletin 48 (7), 994-1000

254
254
Pitkänen T.I., Krasnov A., Teerijoki H. and Mölsä H., 1999. Transfer of growth hormone (GH) transgenes into Arctic charr (Salvelinus alpinus L.) I. Growth response to various GH constructs. Genetic Analysis: Biomolecular Engineering 15, 91-98
Rahman M.A. and Maclean N., 1999. Growth performance of transgenic tilapia containing an exogenous piscine growth hormone gene. Aquaculture 173, 333-346
Rio G.J., Stempien M.F. Jr., Nigrelli R.F. and RuggieriG.D.; 1965: Echinoderm toxins – I. Some biochemical and physiological properties of toxins from several species of Asteroidea. Toxicon 3, 147-155
Shim S.H., Lee E.J., Kim J.S., Kang S.S., Ha H., Lee H.Y., Kim C., Lee J.-H. and Son K.H., 2008. Rat growth-hormone release stimulators from Fenugreek seeds. Chemistry & Biodiversity 5, 1753-1761
Schlechtriem C., Focken U. and Becker K., 2003. Effect of different lipid extraction methods on d13C of lipid and lipid-free fractions of fish and different fish feeds. Isotopes Environ. Health Stud. 39 (2), 135-140
Schmid, A.C., Lutz, I., Kloas, W., Reinecke, M., 2003. Thyroid hormone stimulates hepatic IGF-I mRNA expression in a bony fish, the tilapia Oreochromis mossambicus, in vitro and in vivo. General and Comparative Endocrinology 130, 129-134
Smedes F., 1999. Determination of total lipid using non-chlorinated solvents. The Analyst 124, 1711-1718
Turan F. and Çek S, 2007. Masculinization of African catfish (Clarias gariepinus) with Gkshura (Tribulus terrestris). The Israeli Journal of Aquaculture – Bamidgeh 59 (4), 224-229
Venugopal T., Anathy V., Kirankumar S. and Pandian T.J., 2004. Growth enhancement and food conversion efficiency of transgenic fish Labeo rohita. Journal of Experimental Zoology 301A, 477-497
Figures and Tables
Figure 1: Average weekly routine metabolic rate over the experimental period. Values are presented as mean ± SEM, n = 3
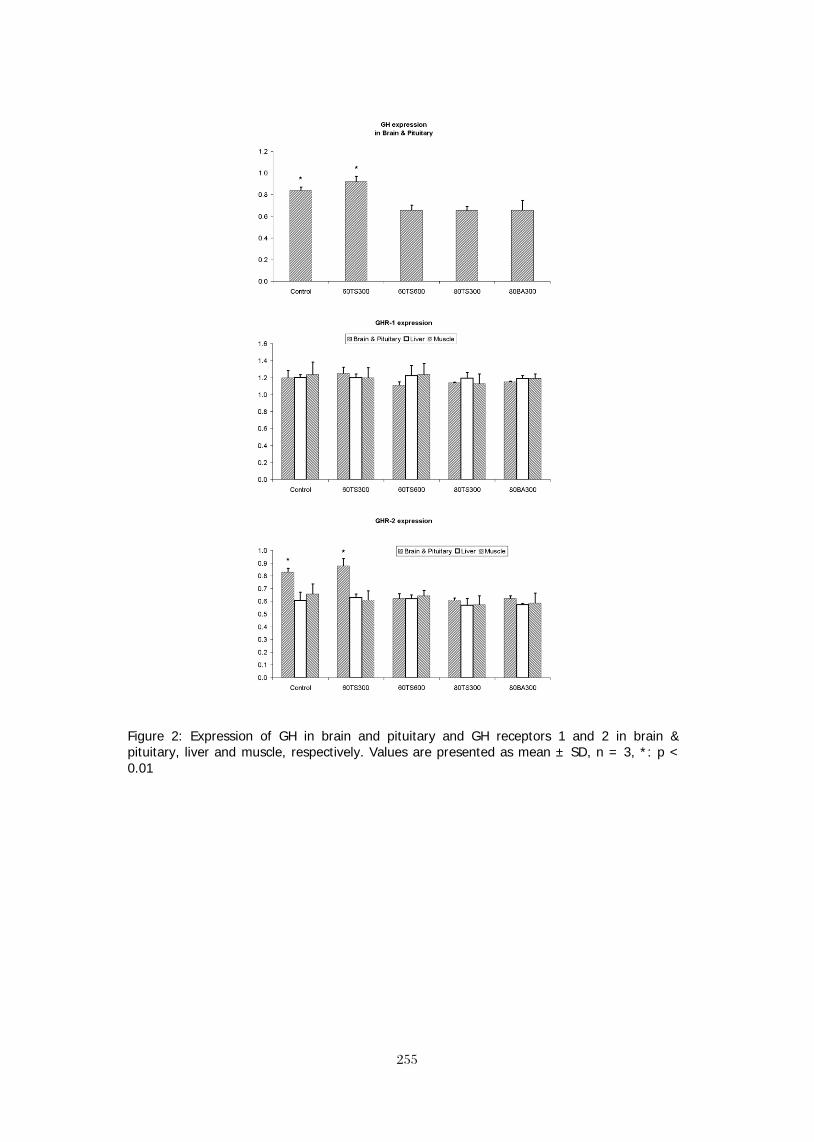
255
255
Figure 2: Expression of GH in brain and pituitary and GH receptors 1 and 2 in brain & pituitary, liver and muscle, respectively. Values are presented as mean ± SD, n = 3, *: p < 0.01

256
256
Figure 3: Gene expression of IGF-1 in liver and IGF-1 receptors a and b in brain & pituitary, liver and muscle, respectively. Values are presented as mean ± SD, n = 3, *: p < 0.01 Table 1: Ingredients of the basal and experimental diets and chemical composition of the standard diet
DM = dry matter, CA = crude ash, CP = crude protein, CL = crude lipids, GE = gross energy aNorwegian fish meal obtained from Wuerttembergische Zentralgenossenschaft, Germany. bPrepared after Gaye-Siessegger et al. (2004).
Diet Ingredient Control 60TS300 60TS600 80TS300 80BA300 Trigonella 60% Fraction (mg kg-1) 300 600 Trigonella 80% Fraction (mg kg-1) 300 Balanites 80% Fraction (mg kg-1) 300 Fish meala (g kg-1) 500 500 500 500 500 Whole wheat meal (g kg-1) 420 420 420 420 420 Sunflower oil (g kg-1) 40 40 40 40 40 Vitamin premixb (g kg-1) 20 20 20 20 20 Mineral premixb (g kg-1) 20 20 20 20 20 Standard diet DM
(%) CA (g kg-1 DM)
CP (g kg-1 DM)
CL (g kg-1 DM)
GE (kJ g-1 DM)
93.2 11.9 41.9 12.6 20.8

257
257
Table 2. Primer sequences used for RT-qPCR
Gene Primer sequence (5’–3’)a Sequence references
GH F: GAA CTG ATG CCA GCC ATG A
Ber and Daniel (1992)
R: AGC TAC AGA GTG CAG TTT G
GHR-1 F: CCA TCA GAT GAG CAA CTT CTG AAA AGT
Jiao et al. (2006)
R: ACT TCC TGG TGA ATC AGC CTT A
GHR-2 F: CAC AGA CTT CTA CGC TCA GGT CA
Kajimura et al. (2004)
R: TGA GTT GCT GTC CAG GAG ACA
IGF-1 F: GTC TGT GGA GAG CGA GGC TTT
Schmid et al. (2003)
R: AAC CTT GGG TGC TCT TGG CAT G
IGF-1 Ra F: CTAAGGGCGTGGTTAAGCAC
Greene and Chen (1999)
R: TTGTTGGCGTTGAGGTATGC
IGF-1 Rb F: AGG GAC GAG CCA GAG ACG
Greene and Chen (1999)
R:TTC AGA GGA GGG AGG TTG
-actin F: GTG ATG TGA CGC TGG ACC AAT C
Hwang et al. (2003)
R: CCA TGT CAT CCC AGT TGG TCA CAA T a F: forward primer; R: reverse primer.
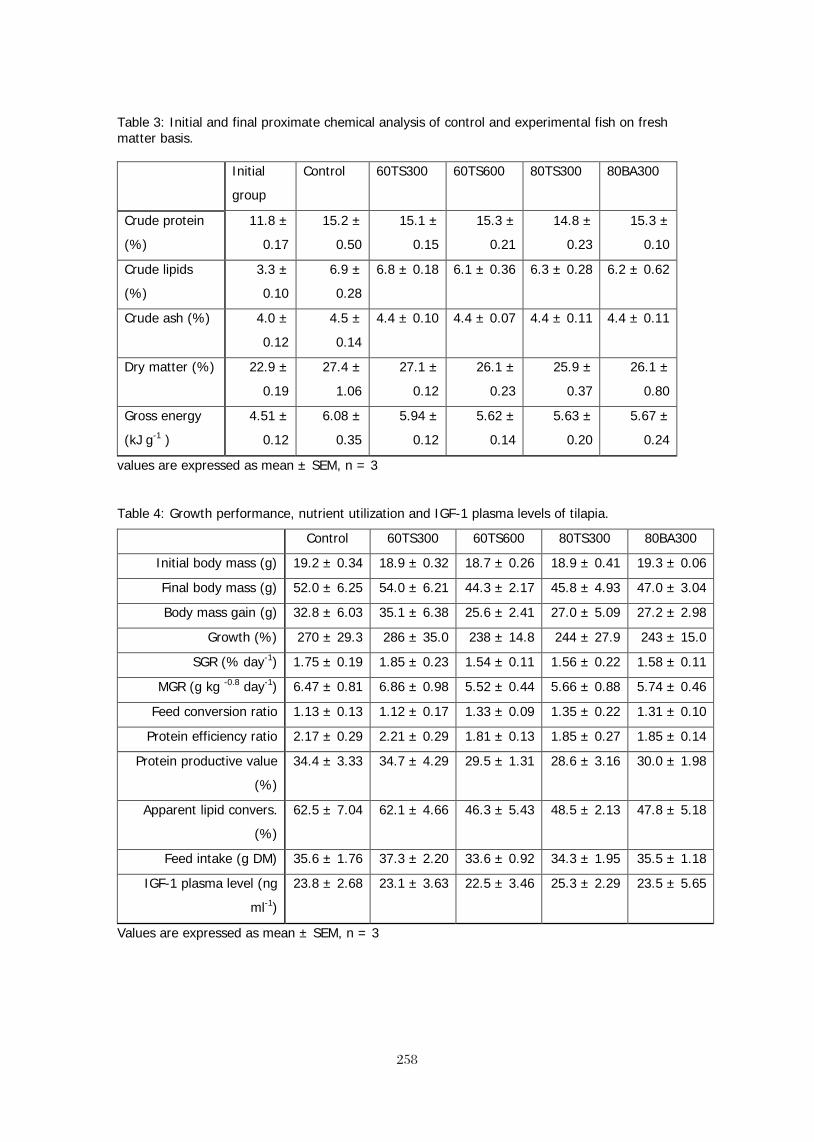
258
258
Table 3: Initial and final proximate chemical analysis of control and experimental fish on fresh matter basis. Initial
group
Control 60TS300 60TS600 80TS300 80BA300
Crude protein
(%)
11.8 ±
0.17
15.2 ±
0.50
15.1 ±
0.15
15.3 ±
0.21
14.8 ±
0.23
15.3 ±
0.10
Crude lipids
(%)
3.3 ±
0.10
6.9 ±
0.28
6.8 ± 0.18 6.1 ± 0.36 6.3 ± 0.28 6.2 ± 0.62
Crude ash (%) 4.0 ±
0.12
4.5 ±
0.14
4.4 ± 0.10 4.4 ± 0.07 4.4 ± 0.11 4.4 ± 0.11
Dry matter (%) 22.9 ±
0.19
27.4 ±
1.06
27.1 ±
0.12
26.1 ±
0.23
25.9 ±
0.37
26.1 ±
0.80
Gross energy
(kJ g-1 )
4.51 ±
0.12
6.08 ±
0.35
5.94 ±
0.12
5.62 ±
0.14
5.63 ±
0.20
5.67 ±
0.24
values are expressed as mean ± SEM, n = 3
Table 4: Growth performance, nutrient utilization and IGF-1 plasma levels of tilapia.
Control 60TS300 60TS600 80TS300 80BA300
Initial body mass (g) 19.2 ± 0.34 18.9 ± 0.32 18.7 ± 0.26 18.9 ± 0.41 19.3 ± 0.06
Final body mass (g) 52.0 ± 6.25 54.0 ± 6.21 44.3 ± 2.17 45.8 ± 4.93 47.0 ± 3.04
Body mass gain (g) 32.8 ± 6.03 35.1 ± 6.38 25.6 ± 2.41 27.0 ± 5.09 27.2 ± 2.98
Growth (%) 270 ± 29.3 286 ± 35.0 238 ± 14.8 244 ± 27.9 243 ± 15.0
SGR (% day-1) 1.75 ± 0.19 1.85 ± 0.23 1.54 ± 0.11 1.56 ± 0.22 1.58 ± 0.11
MGR (g kg -0.8 day-1) 6.47 ± 0.81 6.86 ± 0.98 5.52 ± 0.44 5.66 ± 0.88 5.74 ± 0.46
Feed conversion ratio 1.13 ± 0.13 1.12 ± 0.17 1.33 ± 0.09 1.35 ± 0.22 1.31 ± 0.10
Protein efficiency ratio 2.17 ± 0.29 2.21 ± 0.29 1.81 ± 0.13 1.85 ± 0.27 1.85 ± 0.14
Protein productive value
(%)
34.4 ± 3.33 34.7 ± 4.29 29.5 ± 1.31 28.6 ± 3.16 30.0 ± 1.98
Apparent lipid convers.
(%)
62.5 ± 7.04 62.1 ± 4.66 46.3 ± 5.43 48.5 ± 2.13 47.8 ± 5.18
Feed intake (g DM) 35.6 ± 1.76 37.3 ± 2.20 33.6 ± 0.92 34.3 ± 1.95 35.5 ± 1.18
IGF-1 plasma level (ng
ml-1)
23.8 ± 2.68 23.1 ± 3.63 22.5 ± 3.46 25.3 ± 2.29 23.5 ± 5.65
Values are expressed as mean ± SEM, n = 3
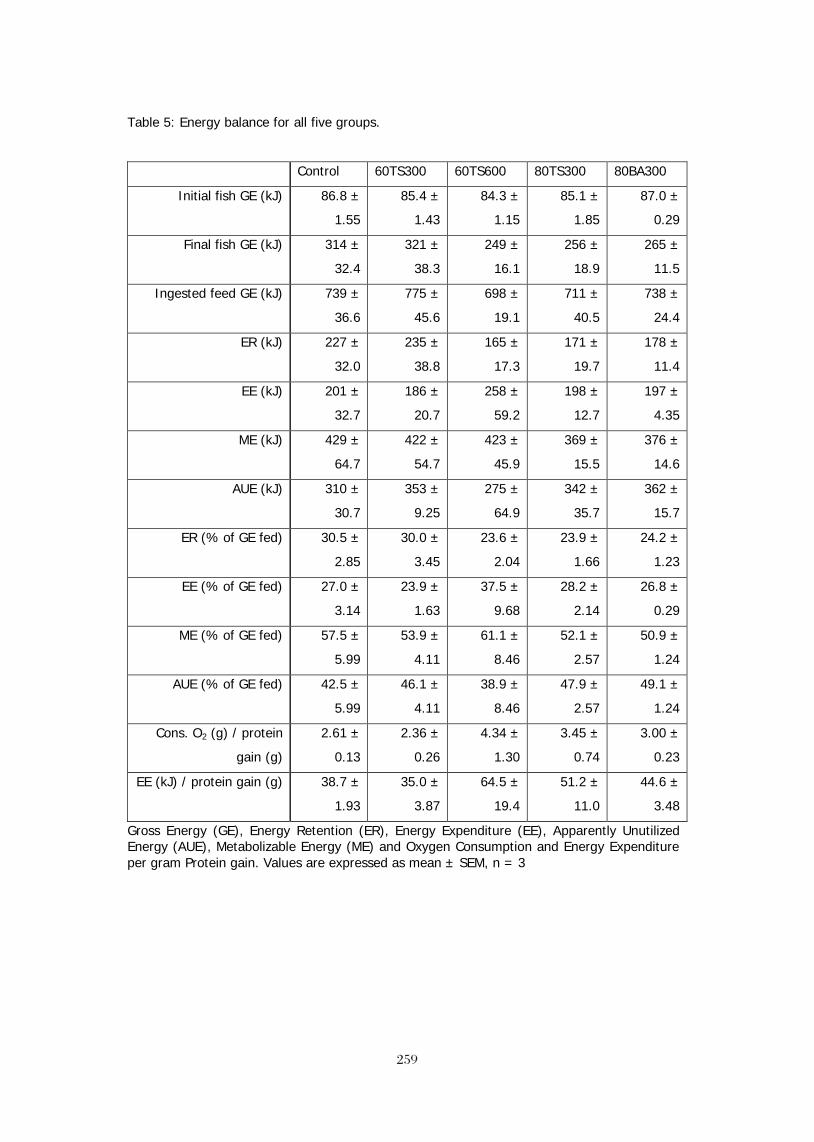
259
259
Table 5: Energy balance for all five groups.
Control 60TS300 60TS600 80TS300 80BA300
Initial fish GE (kJ) 86.8 ±
1.55
85.4 ±
1.43
84.3 ±
1.15
85.1 ±
1.85
87.0 ±
0.29
Final fish GE (kJ) 314 ±
32.4
321 ±
38.3
249 ±
16.1
256 ±
18.9
265 ±
11.5
Ingested feed GE (kJ) 739 ±
36.6
775 ±
45.6
698 ±
19.1
711 ±
40.5
738 ±
24.4
ER (kJ) 227 ±
32.0
235 ±
38.8
165 ±
17.3
171 ±
19.7
178 ±
11.4
EE (kJ) 201 ±
32.7
186 ±
20.7
258 ±
59.2
198 ±
12.7
197 ±
4.35
ME (kJ) 429 ±
64.7
422 ±
54.7
423 ±
45.9
369 ±
15.5
376 ±
14.6
AUE (kJ) 310 ±
30.7
353 ±
9.25
275 ±
64.9
342 ±
35.7
362 ±
15.7
ER (% of GE fed) 30.5 ±
2.85
30.0 ±
3.45
23.6 ±
2.04
23.9 ±
1.66
24.2 ±
1.23
EE (% of GE fed) 27.0 ±
3.14
23.9 ±
1.63
37.5 ±
9.68
28.2 ±
2.14
26.8 ±
0.29
ME (% of GE fed) 57.5 ±
5.99
53.9 ±
4.11
61.1 ±
8.46
52.1 ±
2.57
50.9 ±
1.24
AUE (% of GE fed) 42.5 ±
5.99
46.1 ±
4.11
38.9 ±
8.46
47.9 ±
2.57
49.1 ±
1.24
Cons. O2 (g) / protein
gain (g)
2.61 ±
0.13
2.36 ±
0.26
4.34 ±
1.30
3.45 ±
0.74
3.00 ±
0.23
EE (kJ) / protein gain (g) 38.7 ±
1.93
35.0 ±
3.87
64.5 ±
19.4
51.2 ±
11.0
44.6 ±
3.48
Gross Energy (GE), Energy Retention (ER), Energy Expenditure (EE), Apparently Unutilized Energy (AUE), Metabolizable Energy (ME) and Oxygen Consumption and Energy Expenditure per gram Protein gain. Values are expressed as mean ± SEM, n = 3
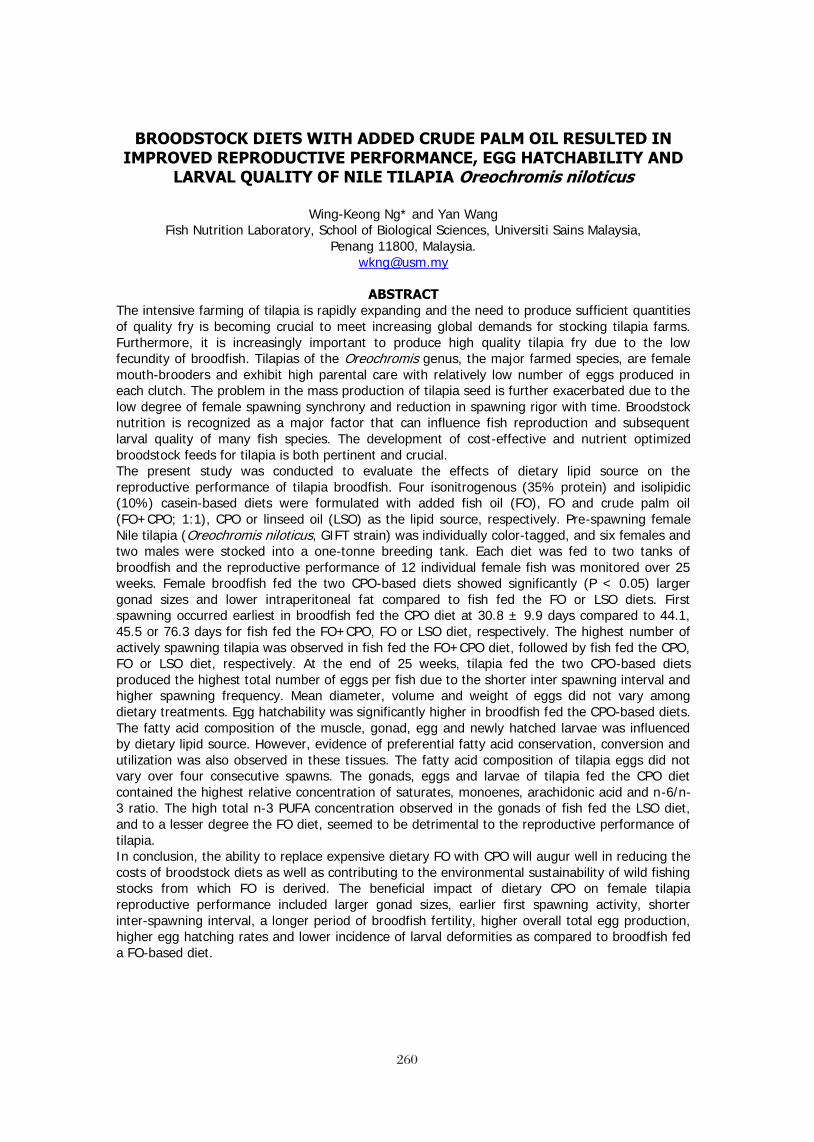
260
260
BROODSTOCK DIETS WITH ADDED CRUDE PALM OIL RESULTED IN IMPROVED REPRODUCTIVE PERFORMANCE, EGG HATCHABILITY AND
LARVAL QUALITY OF NILE TILAPIA Oreochromis niloticus
Wing-Keong Ng* and Yan Wang Fish Nutrition Laboratory, School of Biological Sciences, Universiti Sains Malaysia,
Penang 11800, Malaysia. [email protected]
ABSTRACT
The intensive farming of tilapia is rapidly expanding and the need to produce sufficient quantities of quality fry is becoming crucial to meet increasing global demands for stocking tilapia farms. Furthermore, it is increasingly important to produce high quality tilapia fry due to the low fecundity of broodfish. Tilapias of the Oreochromis genus, the major farmed species, are female mouth-brooders and exhibit high parental care with relatively low number of eggs produced in each clutch. The problem in the mass production of tilapia seed is further exacerbated due to the low degree of female spawning synchrony and reduction in spawning rigor with time. Broodstock nutrition is recognized as a major factor that can influence fish reproduction and subsequent larval quality of many fish species. The development of cost-effective and nutrient optimized broodstock feeds for tilapia is both pertinent and crucial. The present study was conducted to evaluate the effects of dietary lipid source on the reproductive performance of tilapia broodfish. Four isonitrogenous (35% protein) and isolipidic (10%) casein-based diets were formulated with added fish oil (FO), FO and crude palm oil (FO+CPO; 1:1), CPO or linseed oil (LSO) as the lipid source, respectively. Pre-spawning female Nile tilapia (Oreochromis niloticus, GIFT strain) was individually color-tagged, and six females and two males were stocked into a one-tonne breeding tank. Each diet was fed to two tanks of broodfish and the reproductive performance of 12 individual female fish was monitored over 25 weeks. Female broodfish fed the two CPO-based diets showed significantly (P < 0.05) larger gonad sizes and lower intraperitoneal fat compared to fish fed the FO or LSO diets. First spawning occurred earliest in broodfish fed the CPO diet at 30.8 ± 9.9 days compared to 44.1, 45.5 or 76.3 days for fish fed the FO+CPO, FO or LSO diet, respectively. The highest number of actively spawning tilapia was observed in fish fed the FO+CPO diet, followed by fish fed the CPO, FO or LSO diet, respectively. At the end of 25 weeks, tilapia fed the two CPO-based diets produced the highest total number of eggs per fish due to the shorter inter spawning interval and higher spawning frequency. Mean diameter, volume and weight of eggs did not vary among dietary treatments. Egg hatchability was significantly higher in broodfish fed the CPO-based diets. The fatty acid composition of the muscle, gonad, egg and newly hatched larvae was influenced by dietary lipid source. However, evidence of preferential fatty acid conservation, conversion and utilization was also observed in these tissues. The fatty acid composition of tilapia eggs did not vary over four consecutive spawns. The gonads, eggs and larvae of tilapia fed the CPO diet contained the highest relative concentration of saturates, monoenes, arachidonic acid and n-6/n-3 ratio. The high total n-3 PUFA concentration observed in the gonads of fish fed the LSO diet, and to a lesser degree the FO diet, seemed to be detrimental to the reproductive performance of tilapia. In conclusion, the ability to replace expensive dietary FO with CPO will augur well in reducing the costs of broodstock diets as well as contributing to the environmental sustainability of wild fishing stocks from which FO is derived. The beneficial impact of dietary CPO on female tilapia reproductive performance included larger gonad sizes, earlier first spawning activity, shorter inter-spawning interval, a longer period of broodfish fertility, higher overall total egg production, higher egg hatching rates and lower incidence of larval deformities as compared to broodfish fed a FO-based diet.
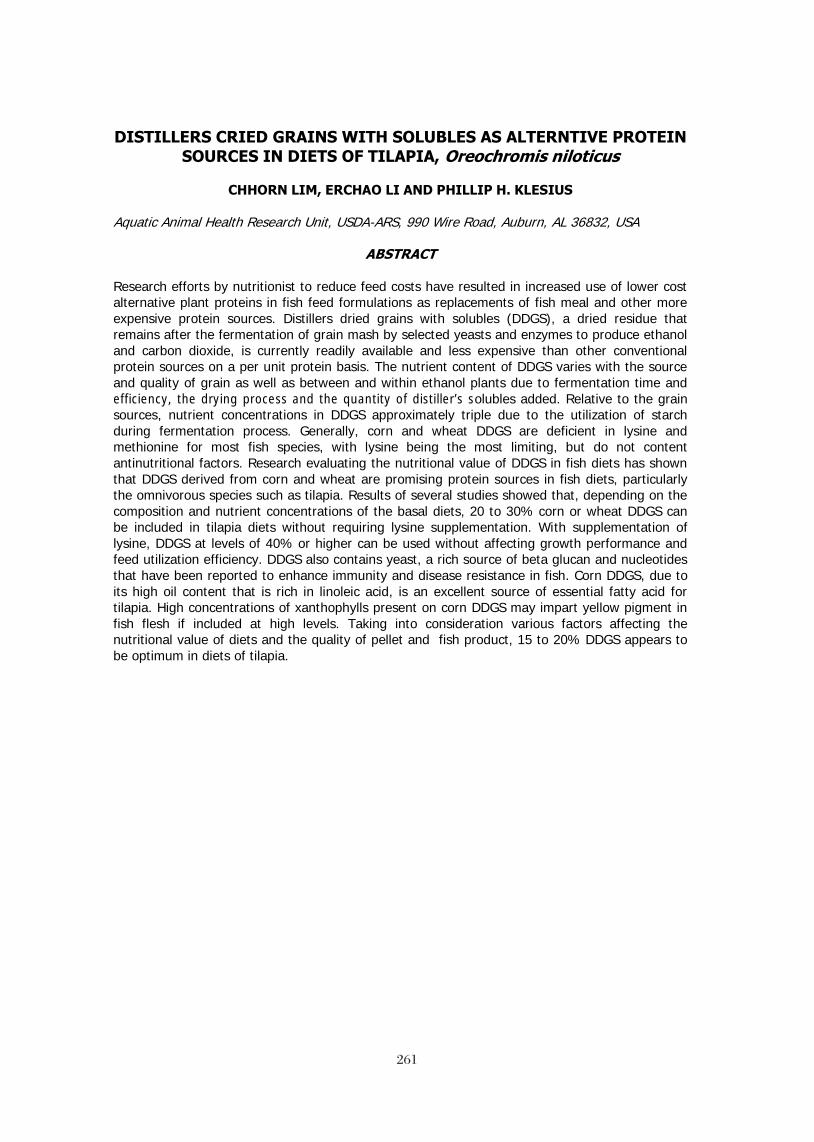
261
261
DISTILLERS CRIED GRAINS WITH SOLUBLES AS ALTERNTIVE PROTEIN SOURCES IN DIETS OF TILAPIA, Oreochromis niloticus
CHHORN LIM, ERCHAO LI AND PHILLIP H. KLESIUS
Aquatic Animal Health Research Unit, USDA-ARS, 990 Wire Road, Auburn, AL 36832, USA
ABSTRACT Research efforts by nutritionist to reduce feed costs have resulted in increased use of lower cost alternative plant proteins in fish feed formulations as replacements of fish meal and other more expensive protein sources. Distillers dried grains with solubles (DDGS), a dried residue that remains after the fermentation of grain mash by selected yeasts and enzymes to produce ethanol and carbon dioxide, is currently readily available and less expensive than other conventional protein sources on a per unit protein basis. The nutrient content of DDGS varies with the source and quality of grain as well as between and within ethanol plants due to fermentation time and efficiency, the drying process and the quantity of distiller’s solubles added. Relative to the grain sources, nutrient concentrations in DDGS approximately triple due to the utilization of starch during fermentation process. Generally, corn and wheat DDGS are deficient in lysine and methionine for most fish species, with lysine being the most limiting, but do not content antinutritional factors. Research evaluating the nutritional value of DDGS in fish diets has shown that DDGS derived from corn and wheat are promising protein sources in fish diets, particularly the omnivorous species such as tilapia. Results of several studies showed that, depending on the composition and nutrient concentrations of the basal diets, 20 to 30% corn or wheat DDGS can be included in tilapia diets without requiring lysine supplementation. With supplementation of lysine, DDGS at levels of 40% or higher can be used without affecting growth performance and feed utilization efficiency. DDGS also contains yeast, a rich source of beta glucan and nucleotides that have been reported to enhance immunity and disease resistance in fish. Corn DDGS, due to its high oil content that is rich in linoleic acid, is an excellent source of essential fatty acid for tilapia. High concentrations of xanthophylls present on corn DDGS may impart yellow pigment in fish flesh if included at high levels. Taking into consideration various factors affecting the nutritional value of diets and the quality of pellet and fish product, 15 to 20% DDGS appears to be optimum in diets of tilapia.
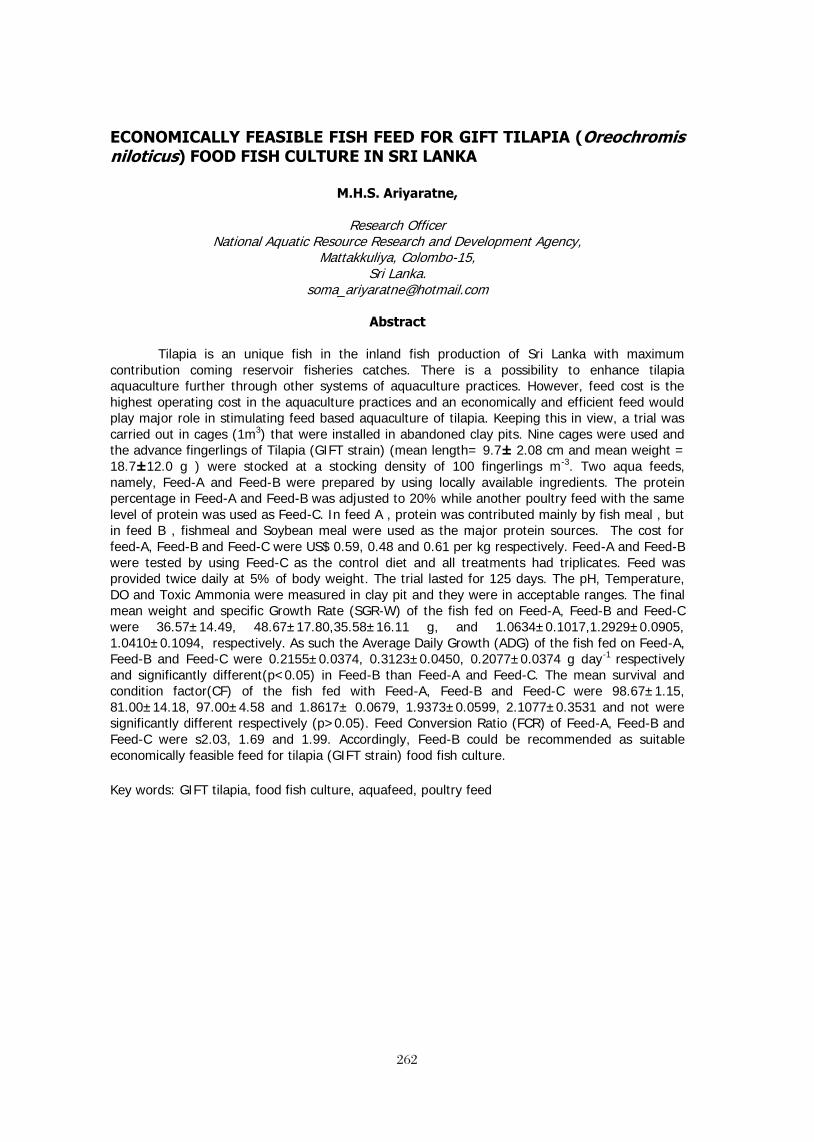
262
262
ECONOMICALLY FEASIBLE FISH FEED FOR GIFT TILAPIA (Oreochromis niloticus) FOOD FISH CULTURE IN SRI LANKA
M.H.S. Ariyaratne,
Research Officer
National Aquatic Resource Research and Development Agency, Mattakkuliya, Colombo-15,
Sri Lanka. [email protected]
Abstract
Tilapia is an unique fish in the inland fish production of Sri Lanka with maximum
contribution coming reservoir fisheries catches. There is a possibility to enhance tilapia aquaculture further through other systems of aquaculture practices. However, feed cost is the highest operating cost in the aquaculture practices and an economically and efficient feed would play major role in stimulating feed based aquaculture of tilapia. Keeping this in view, a trial was carried out in cages (1m3) that were installed in abandoned clay pits. Nine cages were used and the advance fingerlings of Tilapia (GIFT strain) (mean length= 9.7± 2.08 cm and mean weight = 18.7±12.0 g ) were stocked at a stocking density of 100 fingerlings m-3. Two aqua feeds, namely, Feed-A and Feed-B were prepared by using locally available ingredients. The protein percentage in Feed-A and Feed-B was adjusted to 20% while another poultry feed with the same level of protein was used as Feed-C. In feed A , protein was contributed mainly by fish meal , but in feed B , fishmeal and Soybean meal were used as the major protein sources. The cost for feed-A, Feed-B and Feed-C were US$ 0.59, 0.48 and 0.61 per kg respectively. Feed-A and Feed-B were tested by using Feed-C as the control diet and all treatments had triplicates. Feed was provided twice daily at 5% of body weight. The trial lasted for 125 days. The pH, Temperature, DO and Toxic Ammonia were measured in clay pit and they were in acceptable ranges. The final mean weight and specific Growth Rate (SGR-W) of the fish fed on Feed-A, Feed-B and Feed-C were 36.57±14.49, 48.67±17.80,35.58±16.11 g, and 1.0634±0.1017,1.2929±0.0905, 1.0410±0.1094, respectively. As such the Average Daily Growth (ADG) of the fish fed on Feed-A, Feed-B and Feed-C were 0.2155±0.0374, 0.3123±0.0450, 0.2077±0.0374 g day-1 respectively and significantly different(p<0.05) in Feed-B than Feed-A and Feed-C. The mean survival and condition factor(CF) of the fish fed with Feed-A, Feed-B and Feed-C were 98.67±1.15, 81.00±14.18, 97.00±4.58 and 1.8617± 0.0679, 1.9373±0.0599, 2.1077±0.3531 and not were significantly different respectively (p>0.05). Feed Conversion Ratio (FCR) of Feed-A, Feed-B and Feed-C were s2.03, 1.69 and 1.99. Accordingly, Feed-B could be recommended as suitable economically feasible feed for tilapia (GIFT strain) food fish culture. Key words: GIFT tilapia, food fish culture, aquafeed, poultry feed
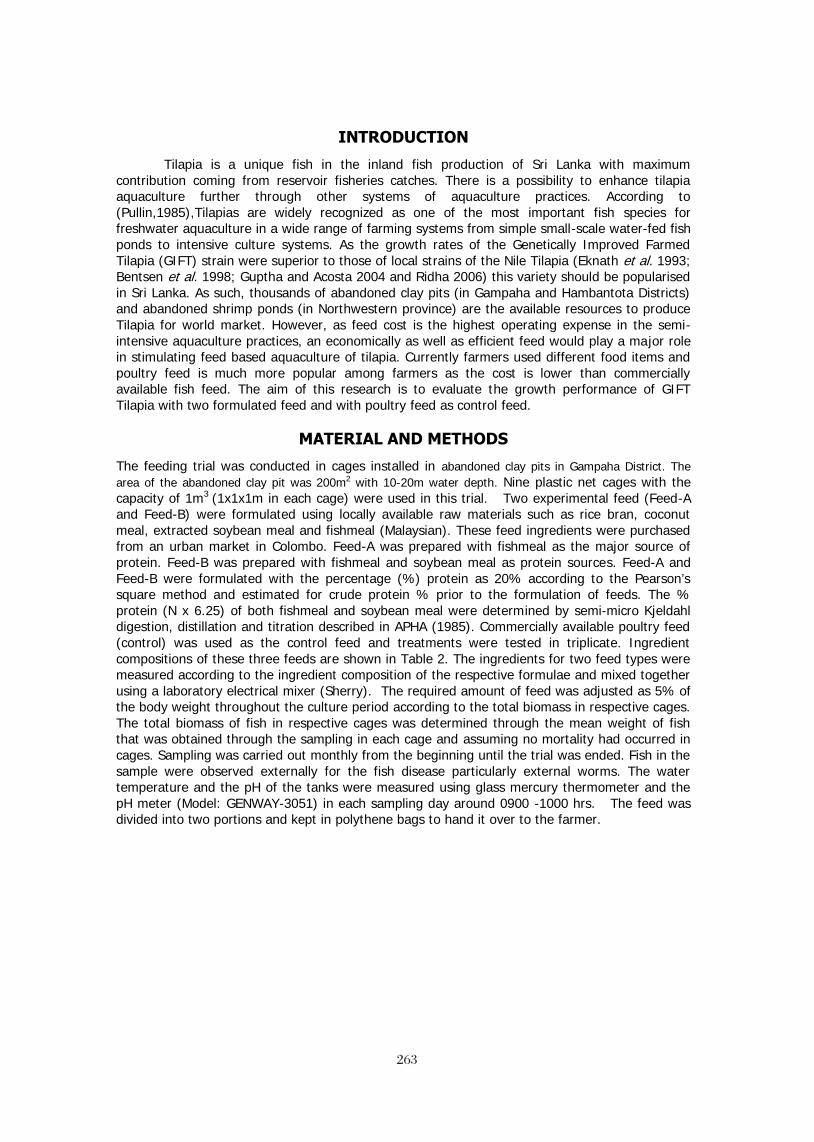
263
263
INTRODUCTION
Tilapia is a unique fish in the inland fish production of Sri Lanka with maximum contribution coming from reservoir fisheries catches. There is a possibility to enhance tilapia aquaculture further through other systems of aquaculture practices. According to (Pullin,1985),Tilapias are widely recognized as one of the most important fish species for freshwater aquaculture in a wide range of farming systems from simple small-scale water-fed fish ponds to intensive culture systems. As the growth rates of the Genetically Improved Farmed Tilapia (GIFT) strain were superior to those of local strains of the Nile Tilapia (Eknath et al. 1993; Bentsen et al. 1998; Guptha and Acosta 2004 and Ridha 2006) this variety should be popularised in Sri Lanka. As such, thousands of abandoned clay pits (in Gampaha and Hambantota Districts) and abandoned shrimp ponds (in Northwestern province) are the available resources to produce Tilapia for world market. However, as feed cost is the highest operating expense in the semi-intensive aquaculture practices, an economically as well as efficient feed would play a major role in stimulating feed based aquaculture of tilapia. Currently farmers used different food items and poultry feed is much more popular among farmers as the cost is lower than commercially available fish feed. The aim of this research is to evaluate the growth performance of GIFT Tilapia with two formulated feed and with poultry feed as control feed.
MATERIAL AND METHODS
The feeding trial was conducted in cages installed in abandoned clay pits in Gampaha District. The area of the abandoned clay pit was 200m2 with 10-20m water depth. Nine plastic net cages with the capacity of 1m3 (1x1x1m in each cage) were used in this trial. Two experimental feed (Feed-A and Feed-B) were formulated using locally available raw materials such as rice bran, coconut meal, extracted soybean meal and fishmeal (Malaysian). These feed ingredients were purchased from an urban market in Colombo. Feed-A was prepared with fishmeal as the major source of protein. Feed-B was prepared with fishmeal and soybean meal as protein sources. Feed-A and Feed-B were formulated with the percentage (%) protein as 20% according to the Pearson’s square method and estimated for crude protein % prior to the formulation of feeds. The % protein (N x 6.25) of both fishmeal and soybean meal were determined by semi-micro Kjeldahl digestion, distillation and titration described in APHA (1985). Commercially available poultry feed (control) was used as the control feed and treatments were tested in triplicate. Ingredient compositions of these three feeds are shown in Table 2. The ingredients for two feed types were measured according to the ingredient composition of the respective formulae and mixed together using a laboratory electrical mixer (Sherry). The required amount of feed was adjusted as 5% of the body weight throughout the culture period according to the total biomass in respective cages. The total biomass of fish in respective cages was determined through the mean weight of fish that was obtained through the sampling in each cage and assuming no mortality had occurred in cages. Sampling was carried out monthly from the beginning until the trial was ended. Fish in the sample were observed externally for the fish disease particularly external worms. The water temperature and the pH of the tanks were measured using glass mercury thermometer and the pH meter (Model: GENWAY-3051) in each sampling day around 0900 -1000 hrs. The feed was divided into two portions and kept in polythene bags to hand it over to the farmer.
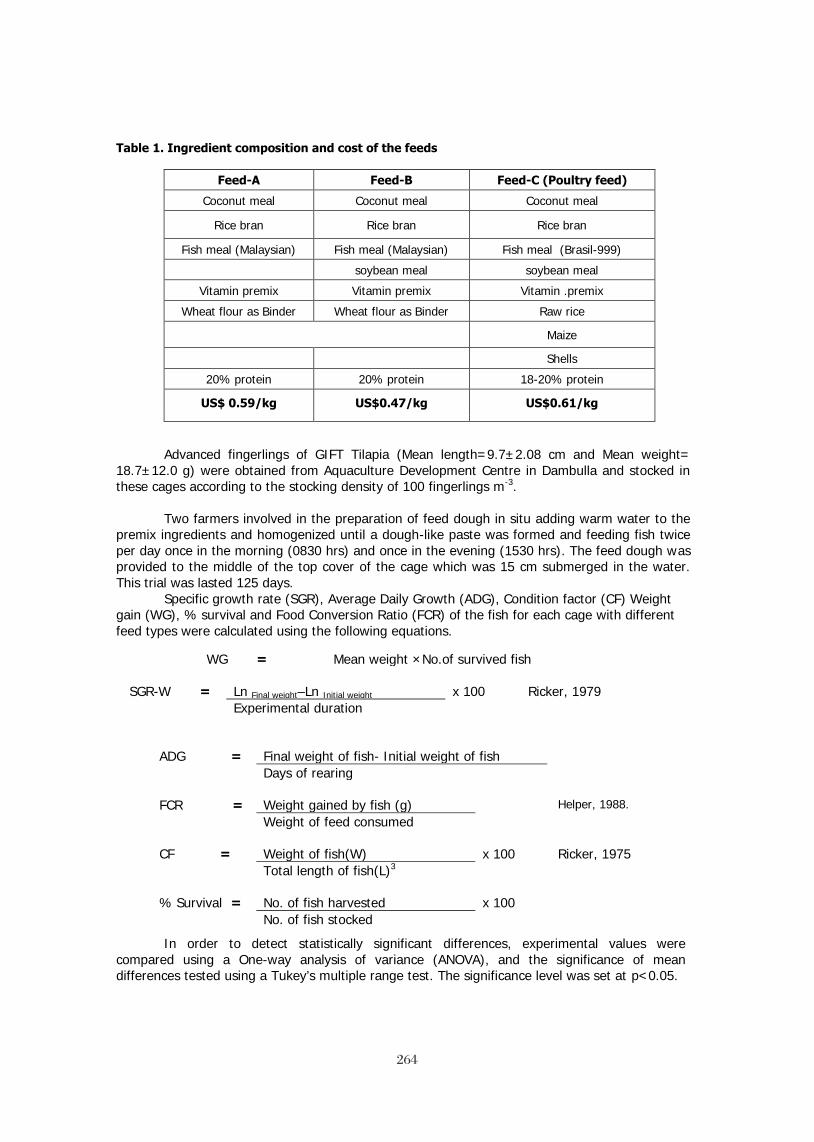
264
264
Table 1. Ingredient composition and cost of the feeds
Feed-A Feed-B Feed-C (Poultry feed)
Coconut meal Coconut meal Coconut meal
Rice bran Rice bran Rice bran
Fish meal (Malaysian) Fish meal (Malaysian) Fish meal (Brasil-999)
soybean meal soybean meal
Vitamin premix Vitamin premix Vitamin .premix
Wheat flour as Binder Wheat flour as Binder Raw rice
Maize
Shells
20% protein 20% protein 18-20% protein
US$ 0.59/kg US$0.47/kg US$0.61/kg
Advanced fingerlings of GIFT Tilapia (Mean length=9.7±2.08 cm and Mean weight= 18.7±12.0 g) were obtained from Aquaculture Development Centre in Dambulla and stocked in these cages according to the stocking density of 100 fingerlings m-3.
Two farmers involved in the preparation of feed dough in situ adding warm water to the premix ingredients and homogenized until a dough-like paste was formed and feeding fish twice per day once in the morning (0830 hrs) and once in the evening (1530 hrs). The feed dough was provided to the middle of the top cover of the cage which was 15 cm submerged in the water. This trial was lasted 125 days.
Specific growth rate (SGR), Average Daily Growth (ADG), Condition factor (CF) Weight gain (WG), % survival and Food Conversion Ratio (FCR) of the fish for each cage with different feed types were calculated using the following equations.
ADG = Final weight of fish- Initial weight of fish Days of rearing
FCR = Weight gained by fish (g) Helper, 1988.
Weight of feed consumed
CF = Weight of fish(W) x 100 Ricker, 1975 Total length of fish(L)3
% Survival = No. of fish harvested x 100
No. of fish stocked
In order to detect statistically significant differences, experimental values were compared using a One-way analysis of variance (ANOVA), and the significance of mean differences tested using a Tukey’s multiple range test. The significance level was set at p<0.05.
WG = Mean weight ×No.of survived fish
SGR-W = Ln Final weight–Ln Initial weight x 100 Ricker, 1979 Experimental duration

265
265
RESULT AND DISCUSSIONS
The crude protein level of fish meal (Malaysia) was 50.14±1.21 and soybean meal was 34.19±2.25. These two components were used in a 1:1 ratio in Feed-B. There were not significant differences (p>0.05) in the survival rate of fish fed on Feed-A, Feed-B and Feed-C (Table 2). As such, the condition factor (CF) of the fish that fed on these 3 feed types was not significantly different (p>0.05) too. However, further growth performance of fish should be considered to select one or more feed types for the culture of GIFT Tilapia. Table 2. Growth performance of Tilapia (GIFT strain) food fish with two different aquafeed (Feed-A & Feed-B) and with poultry feed (control feed) within 125 days culture period. Growth Indices Feed-A Feed-B Feed-C MW final 36.57a
±4.6758
48.67b ±5.6255
35.74 a ±4.8569
Weight Gain (g) 2.6547a ±0.4373
3.9147b ±0.5594
2.5177a ±0.4698
CFfinal 1.8617a ±0.679
1.9373 a ±0.0597
2.1077 a ±0.3531
% Survival 98.67a ±1.15
81.00a ±14.18
97.00a ±4.58
SGR-final 1.06a ±0.10
1.29b ±0.09
1.04a ±0.11
ADGfinal 0.2155a ±0.0374
0.3123b ±0.0450
0.2077a ±0.0374
FCR 2.03 1.695 1.988 Figures in the same row having similar superscripts are not significantly different at p>0.05
Accordingly, these three feed types help to keep the health and well-being of the fish and provide more or less similar survival. Accordingly these three feed types could be considered in GIFT Tilapia food fish culture. The weight gain of the fish fed on Feed-B has shown the significantly highest value while Feed-C has shown the poorest value. As such, the ADG of the fish fed on Feed-B was significantly higher and different from the ADG of the fish fed on Feed-A and the control feed, Feed-C. As such the higher ADG of the fish fed on Feed-B could be seen through out the culture period (Figure 1).

266
266
Figure 1. Average Daily Growth (% ADG) of GIFT Tilapia in day 22, day 63 and 125 day in the culture period
Accordingly it was revealed that the growth of fish enhances with Feed-B than Feed-A and Feed-C. As such the final mean body weight of the fish fed on Feed-B was significantly different (p<0.05) and higher than the fish fed on Feed-A and Feed-C (Table 3). It also revealed that the importance of Feed-B in GIFT tilapia food fish culture than Feed-A and Feed-C.
Furthermore the SGR of the fish fed on Feed-B has shown significantly higher value (1.29±0.09) than Feed-A (1.06±0.1) and Feed-C (1.04±0.11) Table 3). The higher value of SGR could be seen in the fish feed on Feed-B through out the culture period than the fish fed on Feed-A and Feed-C (Figure 2).
Figure 2. The Specific Growth Rate (SGR) of GIFT Tilapia in day 22, day 63 and 125 day in the culture
period
Wannigama et al. (1985) have observed no significant difference in the growth of Tilapia when fed 29% protein diet or a 19% protein diet in the cages in perennial reservoirs in Sri Lanka. These three feed types were in 20% protein and have shown significantly difference ADG in Feed-B than Feed-A and Feed-C. It may be due to other reason such as (i) palatability,

267
267
(ii)digestibility or (iii) more or less acceptability of the Feed-A. The remaining big grain particles in Feed-C could be observed in the top cover of the cage where feed provided but it was not observed in Feed-A and Feed-B provided cages as the ingredients were used in fine powder form. Accordingly the better ADG, SGR and Weight gain of the fish with Feed-B could be happen due to the presence of soybean meal with fish meal together as protein provider.
Then according to the growth performance (ADG, SGR, CF, Weight gain) of the fish, Feed-B could be recommended for GIFT Tilapia food fish culture in Sri Lanka. However the FCR and production cost of the three feed types should be considered.
The better FCR has observed in Feed-B=1.695, then in Feed-C=1.9886 and finally in Feed-A=2.03. Accordingly, it has shown the efficiency of Feed-B is higher than the other 2 feed types used. As such the cost of feed should be considered as we need the economically feasible feed. The production cost of Feed-B was lesser than the production cost of Feed-A (Table 1). It was due to the replacement of the part of the fishmeal (the expensive component of fish feed) through soybean meal.
Considering all the facts shown above, Feed-B could be considered as economically feasible feed for GIFT Tilapia food fish culture in Sri Lanka. Further research is needed to improve this feed as commercial feed. De Silva (1989) has shown, in developing countries where labour costs are comparatively low, a significant saving in feed costs can be made by feeding diets with a lower protein content than that which is thought to be the optimal dietary protein requirement, without significant loss in growth or yield. In this study it has clearly shown this less protein amount could be provided through the mixture of fishmeal and soybean meal.
Recommendations
Promotion of oil extracted soybean meal instead of import it as already produce big quantities of soybean seeds in dry zone in Sri Lanka.
Production of fishmeal component through the minor cyprinid fauna, the unexploited fishery resources in reservoirs to reduce the production cost of Feed-B further more (future research are needed).
Feed-B should be developed up to commercial level to promote Tilapia Aquaculture in the country (future research are needed).
REFERENCES APHA (American Public Health Association). 1985. Standard Methods for the Examination of
water and wastewater. American Water Works Association and Water Pollution Control Federation, 16th ed, Washington D.C.
Bentsen,H.B., A.E. Eknath, M.S. Palada-de Vera, J.C. Danting, H.L. Boliver, R.A. Reyes, E.E.Dionisio, F.M. Longalong, A.V. Circa, M.M.Taymen and B.Gjerde. 1998.”Genetic improvement of farmed tilapias: growth performances in a complete diallel cross experiment with eight strains of Oreochromis niloticus. Aquaculture 160:145-173
Eknath, A.E. and B. Acosta. 1968. Genetic improvement of farmed tilapias(GIFT) Project Final Report Part 1. International Centre for Living Aquatic Resources Management, pp. 75.
Guptha, M.V. and B.O. Acosta 2004. From drawing board to dining table: The success story of the GIFT project. NAGA. July/September:4-14
Hepher, B. 1988. Nutrition of Pond Fishes. Cambridge University Press. UK, pp.388. Pullin, R.S.V., 1985. Tilapia: Everyman’s Fish. Biologist 32 (22), 84-88. Ricker, W.E. 1979.Growth rate and models. W.S.Hoar, D.J.Randall and J.R. Brett, Ridha, M.T. 2006. Evaluation of growth performance of nonimproved and improved strains of the Nile
Tilapia Oreochromis niloticus (L). Journal of the World Aquaculture Society 37:218-223. Wannigama, N.D., Weerakoon, D.E.M. and Muthukumarana, G. 1985. Cage culture of
Sarotherodon niloticus in Sri Lanka: effect of stocking density and dietary crude protein levels on growth. C.Y. Cho, C.B. Cowey and T. Watanabe (Ed.). Finfish nutrition in Asia: methodological approaches to research and development. International Development Research Centre, Ottawa, Ontario. pp.113-117

268
268
SUPPLEMENTAL FEEDING OF NILE TILAPIA (Oreochromis niloticus L.) IN FERTILIZED PONDS USING COMBINED FEED REDUCTION
STRATEGIES
Remedios B. Bolivar1, Eddie Boy T. Jimenez1, Roberto Miguel V. Sayco1, and Russell J. Borski2
1Freshwater Aquaculture Center-College of Fisheries, Central Luzon State University, Science City of Muñoz, Nueva Ecija, Philippines
2Department of Zoology, North Carolina State University, Raleigh, NC, USA 27695-7617
Abstract
The study was conducted in nine 500-m2 earthen ponds at the Freshwater Aquaculture Center, Central Luzon State University, Science City of Muñoz, Nueva Ecija, Philippines, to determine the effect of using combined feed reduction strategies on the grow-out culture of Nile tilapia in fertilized earthen ponds. There were three treatments with three replicates: (I) 67% daily feeding until harvest; (II) 67% daily feeding for 60 days, 50% daily feeding until harvest; (III) 67% daily feeding for 60 days, 100% alternate day feeding until harvest. Ponds were stocked with sex-reversed GIFT tilapia fingerlings at 4 fish m-2.
The study showed that Nile tilapia cultured in fertilized earthen ponds using different combined feed reduction strategy had no significant difference in terms of growth performance. Final mean weight and length of Nile tilapia in Treatment I were 183.1 + 77.1 g and 20.1 + 2.9 cm, Treatment II had 168.5 + 39.9 g and 19.9 + 1.4 cm and Treatment III had 183.1 + 16.0 g and 20.5 + 0.6 cm. Yield after harvest in Treatments I, II and III were 2,968.7 + 439.6, 1,980.7 + 541.8 and 2,024.7 + 329.0 kg ha-1, respectively. Net tilapia yield in Treatment I was significantly higher compared to the other treatments considering the higher survival of the treatment.
Treatment I gave the highest net return among treatments with a mean value of US$705.90 followed by Treatment III with a mean value of US$6.41 then Treatment II with a mean value of US$-36.12. Net return was low among treatments because of the low survival after the study. Numerically, Treatment I showed the most profitable reduction strategy with the obtained survival, however, analysis of variance showed no significant differences in net return among treatments.
With this result, Treatment I seemed to have the best result for tilapia culture, however, previous studies also shows feasibililty of the use of other feed reduction strategies if more viable survival is attained leading to better FCR and net return.
Introduction
Grow-out culture of tilapia has been modified with several technologies including feeding option that promotes cost-saving strategies; however, the determination of feeding strategies based on mathematical and economic models can be rather complex (Cacho, 1993). It is not known whether the reduction of food costs without a net reduction in fish yield is a result of more efficient food consumption (i.e. lack of waste), better food utilization (increased food conversion ratio) or both.
Previous Aquafish CRSP studies introduced the different feeding strategies with the aim of reducing the total cost of tilapia production that can increase the profit of the farmers while limiting the degradation of the environment with lesser nutrient load given to the fish. The strategies include, alternate-day feeding strategy, 45 and 75 day delayed feeding, 67% sub-satiation feeding (Brown, et al. 2004) and other modified feeding strategies like the 50% reduction of daily feed ration (Bolivar, et al. 2010) and the use of combined feed reduction (Borski, et al. 2010) which were generally developed to reduce the cost of tilapia production.
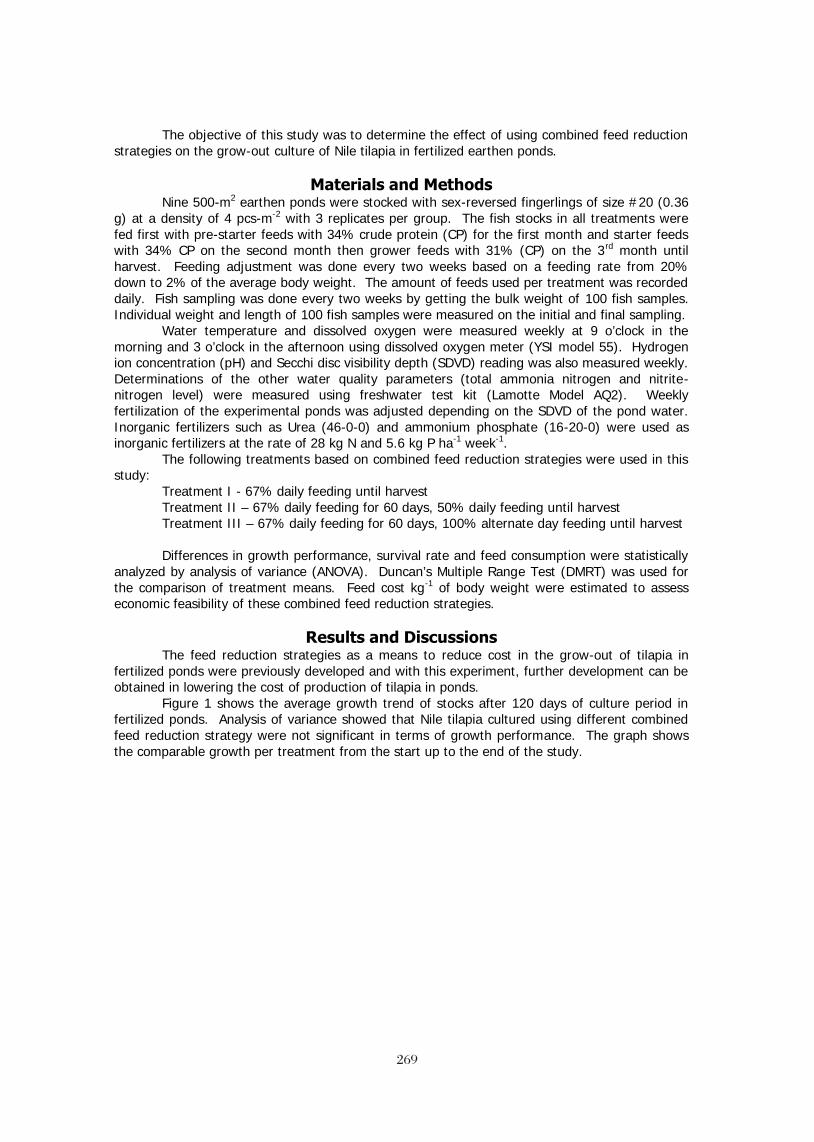
269
269
The objective of this study was to determine the effect of using combined feed reduction strategies on the grow-out culture of Nile tilapia in fertilized earthen ponds.
Materials and Methods
Nine 500-m2 earthen ponds were stocked with sex-reversed fingerlings of size #20 (0.36 g) at a density of 4 pcs-m-2 with 3 replicates per group. The fish stocks in all treatments were fed first with pre-starter feeds with 34% crude protein (CP) for the first month and starter feeds with 34% CP on the second month then grower feeds with 31% (CP) on the 3rd month until harvest. Feeding adjustment was done every two weeks based on a feeding rate from 20% down to 2% of the average body weight. The amount of feeds used per treatment was recorded daily. Fish sampling was done every two weeks by getting the bulk weight of 100 fish samples. Individual weight and length of 100 fish samples were measured on the initial and final sampling.
Water temperature and dissolved oxygen were measured weekly at 9 o’clock in the morning and 3 o’clock in the afternoon using dissolved oxygen meter (YSI model 55). Hydrogen ion concentration (pH) and Secchi disc visibility depth (SDVD) reading was also measured weekly. Determinations of the other water quality parameters (total ammonia nitrogen and nitrite-nitrogen level) were measured using freshwater test kit (Lamotte Model AQ2). Weekly fertilization of the experimental ponds was adjusted depending on the SDVD of the pond water. Inorganic fertilizers such as Urea (46-0-0) and ammonium phosphate (16-20-0) were used as inorganic fertilizers at the rate of 28 kg N and 5.6 kg P ha-1 week-1.
The following treatments based on combined feed reduction strategies were used in this study:
Treatment I - 67% daily feeding until harvest Treatment II – 67% daily feeding for 60 days, 50% daily feeding until harvest Treatment III – 67% daily feeding for 60 days, 100% alternate day feeding until harvest Differences in growth performance, survival rate and feed consumption were statistically
analyzed by analysis of variance (ANOVA). Duncan’s Multiple Range Test (DMRT) was used for the comparison of treatment means. Feed cost kg-1 of body weight were estimated to assess economic feasibility of these combined feed reduction strategies.
Results and Discussions
The feed reduction strategies as a means to reduce cost in the grow-out of tilapia in fertilized ponds were previously developed and with this experiment, further development can be obtained in lowering the cost of production of tilapia in ponds.
Figure 1 shows the average growth trend of stocks after 120 days of culture period in fertilized ponds. Analysis of variance showed that Nile tilapia cultured using different combined feed reduction strategy were not significant in terms of growth performance. The graph shows the comparable growth per treatment from the start up to the end of the study.

270
270
Figure 1. Average weight of Nile tilapia after 120 days of culture period.
In terms of fish yield, the highest yield per hectare was observed in Treatment I followed
by Treatment III then Treatment II with a mean values of 2,968.7, 2,024.7 and 1,980.7 kgs hectare-1, respectively. Having the greatest yield, analysis showed that Treatment I was significantly different compared from Treatments II and III.
For the feed conversion ratio (FCR), Treatment I with 1.8 had the best FCR compared to Treatments II and III with mean FCR values of 2.0, however, there was no significant difference among treatments at 5% level of significance.
Feed consumption per hectare of Treatment I was the highest followed by Treatment III then Treatment II with a mean values of 5,201.1, 4,045.3 and 3,965.2 kgs hectare-1, respectively. Treatment I had varying volume of feed consumed, but based on the analysis of variance, no significant differences were found on the feed consumed hectare-1. Table 1 shows the summary of growth performance, survival, feed consumption and yield of Nile tilapia cultured in earthen ponds using combined feed reduction strategies.
Aver
age
Wei
ght (
g)
Treatment I
Treatment II
Treatment III
Culture Days
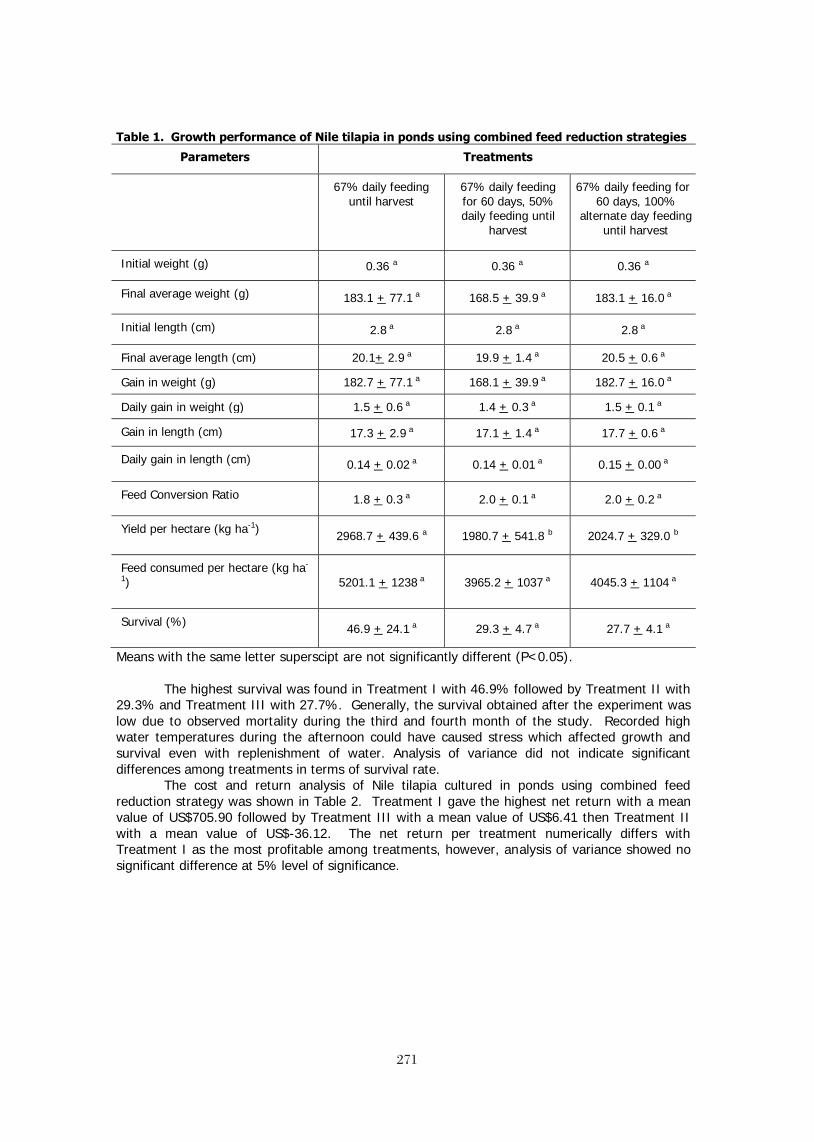
271
271
Table 1. Growth performance of Nile tilapia in ponds using combined feed reduction strategies
Parameters Treatments
67% daily feeding until harvest
67% daily feeding for 60 days, 50% daily feeding until
harvest
67% daily feeding for 60 days, 100%
alternate day feeding until harvest
Initial weight (g) 0.36 a 0.36 a 0.36 a
Final average weight (g) 183.1 + 77.1 a 168.5 + 39.9 a 183.1 + 16.0 a
Initial length (cm) 2.8 a 2.8 a 2.8 a
Final average length (cm) 20.1+ 2.9 a 19.9 + 1.4 a 20.5 + 0.6 a
Gain in weight (g) 182.7 + 77.1 a 168.1 + 39.9 a 182.7 + 16.0 a
Daily gain in weight (g) 1.5 + 0.6 a 1.4 + 0.3 a 1.5 + 0.1 a
Gain in length (cm) 17.3 + 2.9 a 17.1 + 1.4 a 17.7 + 0.6 a
Daily gain in length (cm) 0.14 + 0.02 a 0.14 + 0.01 a 0.15 + 0.00 a
Feed Conversion Ratio 1.8 + 0.3 a 2.0 + 0.1 a 2.0 + 0.2 a
Yield per hectare (kg ha-1) 2968.7 + 439.6 a 1980.7 + 541.8 b 2024.7 + 329.0 b
Feed consumed per hectare (kg ha-
1) 5201.1 + 1238 a 3965.2 + 1037 a 4045.3 + 1104 a
Survival (%) 46.9 + 24.1 a 29.3 + 4.7 a 27.7 + 4.1 a
Means with the same letter superscipt are not significantly different (P<0.05).
The highest survival was found in Treatment I with 46.9% followed by Treatment II with 29.3% and Treatment III with 27.7%. Generally, the survival obtained after the experiment was low due to observed mortality during the third and fourth month of the study. Recorded high water temperatures during the afternoon could have caused stress which affected growth and survival even with replenishment of water. Analysis of variance did not indicate significant differences among treatments in terms of survival rate.
The cost and return analysis of Nile tilapia cultured in ponds using combined feed reduction strategy was shown in Table 2. Treatment I gave the highest net return with a mean value of US$705.90 followed by Treatment III with a mean value of US$6.41 then Treatment II with a mean value of US$-36.12. The net return per treatment numerically differs with Treatment I as the most profitable among treatments, however, analysis of variance showed no significant difference at 5% level of significance.

272
272
Table 2. Cost and return analysis of Nile tilapia in ponds using combined feed reduction strategies per hectare in US dollar. 67% daily feeding
until harvest 67% daily feeding for 60 days, 50% daily feeding until harvest
67% daily feeding for 60 days, 100%
alternate day feeding until harvest
GROSS INCOME 4,487.52 2,994.03 3,060.54
Costs
Fingerlings 400.00 400.00 400.00
Feeds 3,343.42 2,572.84 2,620.71
Fertilizers 38.20 57.30 33.42
Total Costs 3,781.62 3,030.15 3,054.13
NET RETURN 705.90 -36.12 6.41
Assumptions: Price of tilapia fingerlings: US$ 0.01 piece-1 Price of commercial feeds:
Pre-starter: US$ 0.81 kg-1 Starter: US$ 0.66 kg-1 Grower: US$ 0.62 kg-1 Price of inorganic fertilizers:
Ammonium phosphate (16-20-0): US$ 0.36 kg-1 Urea (46-0-0): US$ 0.35 kg-1
Price of marketable tilapia: US$ 1.51 kg-1
Results on average minimum and maximum reading for water quality parameters during
the 120-day culture period are summarized in Table 3. Generally, the dissolved oxygen readings during the morning ranged from 0.98 and 7.78 mg-L-1 for Treatment I, 1.20 and 3.89 mg-L-1 for Treatment II and 1.39 and 6.64 mg-L-1 for Treatment III. Afternoon dissolved oxygen readings for Treatments I, II and III were 3.64 and 12.87, 4.67 and 11.41 and 5.36 and 13.67 mg-L-1, respectively. Dissolved oxygen measured during the study remained in the favourable range for tilapia (Boyd, 1990). The result supports the findings of Liti et al. (2002) that Nile tilapia can tolerate low DO levels.

273
273
Table 3. Average minimum and maximum reading for water quality parameters during the experimental period (120 days). Parameters 67% daily feeding
until harvest 67% daily feeding
for 60 days, 50% daily
feeding until harvest
67% daily feeding for 60 days, 100% alternate day
feeding until harvest
Min Max Min Max Min Max
Dissolve Oxygen (9AM) (mg-L-1)
0.98 7.78 1.20 3.89 1.39 6.64
Dissolve Oxygen (3PM) (mg-L-1)
3.64 12.87 4.67 11.41 5.36 13.67
Water Temperature (9AM) (oC)
28.43 31.90 28.53 31.77 28.50 31.97
Water Temperature (3PM) (oC)
31.70 36.37 31.57 36.27 32.00 37.50
Hydrogen-Ion (pH) 7.07 8.37 6.97 8.20 6.93 8.27
Total Ammonia Nitrogen (mg-L-1)
0.017 1.090 0.018 1.456 0.022 0.942
Nitrite-Nitrogen (mg-L-
1) 0.067 0.075 0.067 0.075 0.075 0.075
Secchi Disc Visibility (cm)
23.3 72.7 22.3 78.3 24.3 57.7
The average water temperature readings in the morning range between 28.43 and 31.90
oC for Treatment I, 28.53 and 31.77 oC for Treatment II and 28.50 and 31.97 oC for Treatment III. While afternoon water temperature readings for Treatments I, II and III were 31.70 and 36.37, 31.57 and 36.27 and 32.00 and 37.50 oC, respectively. Preffered water temperatures for tilapia growth are approximately 28.0-32.0 oC, but range varies depending on what species of tilapia is being cultured. Tilapias reportedly tolerate temperatures up to 40 oC, but stress-induced disease and mortality are problematic when temperatures are around 37.0 or 38.0 oC (Teichert-Coddington, et al., 1997). Fluctuation of the water temperature also affects growth due to the rise and fall of temperature, energy required for maintenance increases rapidly, thus decreasing the energy available for growth (Soderberg, 1997).
Average pH ranged between 7.07 and 8.37, 6.97 and 8.20 and 6.93 and 8.27 for Treatments I, II and III, respectively. Boyd (1998) reported that waters with a pH range of 6.5 – 9 are the most suitable for fish production. Readings for total ammonia nitrogen and nitrite levels during the experiment were in the desirable range for all the treatments. The European Inland Fisheries Advisory Commission (1993) reported that the toxic level of NH4 to fish is 2 mg/L. The average value of secchi disc reading were 23.3 and 72.7, 22.3 and 78.3 and 24.3 and 57.7 cm for Treatments I, II and III, respectively. Water quality parameters showed no significant difference among treatments at 5% level of significance.
274
274
Conclusion Results in this study showed that there were no significant differences observed on the
growth performance and survival of Nile tilapia after 120 days of culture period; however, significant difference was observed on the fish yield with Treatment I having the highest yield among treatments. The cost and return analysis showed that Treatment I had highest net profit among the treatments due to higher fish yield and a negative income in Treatment II having low survival after the experiment. Statistically, data showed that profit was not significantly different from the other combined feed reduction strategies. With this result, Treatment I seemed to have the best result for tilapia culture, however, previous studies also shows feasibililty of the use of the other feed reduction strategies like alternate-day feeding if more viable survival is attained leading to better FCR and net return.
References
Bolivar, R. B., Vera Cruz, E. M., Jimenez, E. B. T., Sayco, R. M. V., Argueza, R. L. B. and Borski, R. J., 2010. Reduction of Daily Feed Ration in the Grow-out Culture of Nile Tilapia (Oreochromis niloticus L.) on Farm. 22nd CLSU In-House Review of Completed and On-Going R and D Projects Book of Abstracts. Science City of Muñoz, Nueva Ecija, Philippines. p. 26
Borski, R. J., Bolivar, R. B., Jimenez, E. B. T., Sayco, R. M. V. and Argueza, R. L. B. 2010. Growth Performance of Nile Tilapia (Oreochromis niloticus L.) in Ponds in the Philippines using Combined Feed Reduction Strategies. Aquaculture 2010 Book of Abstracts. San Diego California, USA.
Boyd, C. E. 1990. Water Quality in Ponds for Aquaculture. Alabama Agriculture Experiment Station, Auburn University, Alabama, USA.
Boyd, C. E. 1998. Water Quality for Pond Aquaculture. Research and development series No. 43. pp. 37. International Centre for aquaculture and aquatic Environments. Alabama Agricultural Experiment Station. Auburn University.
Brown, C. L., Bolivar, R. B. and Jimenez, E. B. T. 2000. Philippine studies support moderate feeding in tilapia. Global Aquaculture Alliance Advocate 7:70
Cacho, O. J., 1993. Development and implementation of a fish-farm bioeconomic model: a three-stage approach. In: U. Hatch and H. Kinnucan (eds.). Aquaculture Economics. Westview Press, Boulder, CO, pp 55-74.
European Inland Fisheries Advisory Commission (1993). Water quality criteria for European fresh water fish. Report on Ammonia and Inland Fisheries. Water Res., 7: 1011.
Liti, D. M., Mac’Were, O. E. and Veverica, K. L. 2002. “Growth performance and economic benefits of Oreochromis niloticus/Clarias gariepinus polyculture fed on three supplementary feeds in fertilized tropical ponds”. In: K. McElwee, K. Lewis, M. Nidiffer, and P. Buitrago (eds.). Nineteenth Annual Technical Report. Pond Dynamics/Aquaculture CRSP, Oregon State University, Corvallis, Oregon. pp 11-16.
Soderberg, R. W. 1997. Factors affecting fish growth and production. p. 199-213. In: H. S. Egna and C. E. Boyd (eds.). Dynamics of Pond Aquaculture. CRC Press. New York, USA. 437 pp.
Teichert-Coddington, D. R., Popma, T. J. and Lovshin, L. L. 1997. Attributes of Tropical Pond-cultured Fish. p. 183-198. In: H. S. Egna and C. E. Boyd (eds.). Dynamics of Pond Aquaculture. CRC Press. New York, USA. 437 pp.

275
275
THE USE OF ROASTED COFFEE PULP AS A FEED SUPPLEMENT IN PRACTICAL DIETS FOR NILE TILAPIA, Oreochromis niloticus (L.)
Mohsen Abdel-Tawwab
Department of Fish Biology and Ecology, Central Laboratory for Aquaculture Research, Abbassa, Abo-Hammad, Sharqia 44662, Egypt.
* Corresponding author E-mail address: [email protected]
ABSTRACT
The present study was undertaken to evaluate the use of ground roasted coffee (Coffee Arabica; GRC) as a natural feed additive in practical fish diets and its impact on growth, feed utilization, biochemical variables, and body composition of Nile tilapia, Oreochromis niloticus (L.). Ground roasted coffee was added to the ingredients of tested diets to represent 0.0 (control), 0.5, 1.0, 2.0, or 5.0 g/kg diet. Fish (1.9 ± 0.03 g) were distributed to various treatments at a rate of 20 fish per 80-L aquarium and fed one of the experimental diets for 10 weeks. No growth-promoting influences of GRC were observed; however, the optimum fish growth and feed utilization were obtained at 0.0 – 1.0 g GRC/kg diet. The inclusion of GRC in fish diet over 1.0 g/kg diet reduced fish growth, feed consumption, and the protein contents in fish body. The highest lipids and ash contents were obtained at 5.0 g GRC/kg diet. Glucose, plasma protein, and plasma lipids decreased significantly, meanwhile aspartate aminotransferase (AST), alanine aminotransferase (ALT), and creatinine increased significantly in fish fed 5.0 g GRC/kg diet. Fish survival (93.3 – 97.8%) was not affect by GRC inclusion in fish diets. These results indicate that GRC supplement is not a promising growth stimulant for Nile tilapia.
Keywords: Nile tilapia, ground roasted coffee, Coffee Arabica, fish growth, feed utilization, body composition, biochemical variables, fish health.
INTRODUCTION Nile tilapia, Oreochromis niloticus (L.) is one of the most popular species in Egypt and
worldwide (El-Sayed, 2006). As the regular use of antibiotics and chemicals as preventative and curative measures for disease leads to drug-resistant bacteria and harmful effects on the environment (Teuber, 2001; Bachère, 2003; Hermann et al., 2003), alternatives to antibiotics and chemicals to improve the quality and sustainability of aquaculture production have been seen as desirable (Meunpol et al., 2003; Vaseeharan and Ramasamy, 2003; Li et al., 2006).
Medicinal plants have been used as immune-stimulants for human in China and old civilization for thousands years (Tan and Vanitha, 2004). These plants contain many types of active components such as polysaccharides, alkaloids, or flavonoids that have immuno-stimulating activities in mice, chickens, or human cell lines (Cao and Lin, 2003; Lin and Zhang, 2004). The use of medicinal plants as immuno-stimulants in fish diets has been considered (Abdel-Tawwab et al., 2010; Ahmad and Abdel-Tawwab 2011; Ahmad et al.; in press).
Many studies have been conducted on using coffee pulp in fish diets and they found adverse effects of coffee pulp on fish growth and feed utilization (Fagbenro and Arowosoge, 1991; Moreau et al., 2003; Ulloa and Verreth, 2003; Chatzifotis et al., 2008). Some other studies reported that coffee shows an antioxidant activity because it contains many substances like caffeine, cafestol, kahweol, and chlorogenic acids (Pellegrini et al., 2003; Vinson et al., 2005). Due to the abundance of antioxidant compounds in coffee, these agents must be seriously considered when elucidating potential pharmacological effects of coffee intake. Therefore, the present research aims to evaluate the effect of ground roasted coffee (GRC) supplementation on growth, feed efficiency, feed consumption, biochemical variables, and proximate composition of Nile tilapia, O. niloticus.

276
276
MATERIALS AND METHODS Fish culture and feeding regime - Ground roasted coffee (Coffee Arabica; GRC) was obtained from the local market. Five different diets containing 0.0, 0.5, 1.0, 2.0 and 5.0 g GRC/kg diet were formulated. The dietary ingredients were thoroughly mixed and moistened by the addition of 100 ml warm water per kg diet and then made into pellets by a mincing machine. The pellets were cut into shape manually, dried in an oven at 55 oC till constant weight was obtained and stored in a freezer at -2 oC until use.
Nile tilapia, O. niloticus were obtained from fish hatchery, Central Laboratory for Aquaculture Research, Abbassa, abo-Hammad, Sharqia, Egypt. Before starting the experiment, fish were acclimated and hand-fed to apparent satiation twice a day for 2 weeks. For the experiment, 15 80-L aquaria were used and oxygenated to saturation by air pumps. In each aquarium, 20 randomly distributed fish (1.9 ± 0.03 g) were stocked. The tested diets were administered to five fish groups with three replicates per each. Fish were hand-fed for satiation thrice daily 5 days a week for 10 weeks. Settled fish wastes along with three-quarter of aquarium’s water were siphoned daily. Siphoned water was replaced by clean and aerated water from a storage tank. Average weight per aquarium was assessed every 2 weeks by group-weighing all fish. Fish were starved for a day before weighing. Fish growth and feed utilization - At the end of the experiment, fish per each aquarium were harvested, counted, and weighed. Fish growth and feed utilization variables were calculated as follows: Weight gain (g) = final weight – initial weight; Specific growth rate (SGR; %/day) = 100 (Ln final weight – Ln initial weight) / days; Feed conversion ratio (FCR) = feed intake (g) / weight gain (g); Protein efficiency ratio (PER) = weight gain (g) / protein intake (g); Fat efficiency ratio (FER) = weight gain (g) / fat intake (g); Energy utilization (EU; %) = 100 x (energy gain / energy intake). Chemical analysis of diets and fish - The proximate chemical analyses of the tested diets and fish samples were done for moisture, crude protein, total lipids, and total ash according to the standard methods of AOAC (1990). Moisture content was estimated by drying the samples to constant weight at 95 oC in drying oven (GCA, model 18EM, Precision Scientific group, Chicago, Illinois, USA). Nitrogen content was measured using a microkjeldahl apparatus (Labconco, Labconco Corporation, Kansas, Missouri, USA) and crude protein was estimated by multiplying nitrogen content by 6.25. Lipid content was determined by ether extraction in multi-unit extraction Soxhlet apparatus (Lab-Line Instruments, Inc., Melrose Park, Illinois, USA) for 16 hours. Total ash was determined by combusting dry samples in a muffle furnace (Thermolyne Corporation, Dubuque, Iowa, USA) at 550 oC for 6 hours. Biochemical measurements - At the end of the 10-week feeding trial, feed was withhold 24 hour immediately prior to sampling and five fish per aquaria were randomly chosen and anesthetized with tricaine methanesulfate (20 mg/L). Blood samples were collected from the caudal vessel and the extracted blood was collected in Eppendorf tubes contained 500 U sodium heparinate/mL; used as an anticoagulant. The collected plasma was stored at –20 oC for further assays. Blood glucose, plasma total protein, plasma total lipids, and plasma creatinine were calorimetrically determined according to Trinder (1969), Henry (1964), Joseph et al. (1972), and Henry (1974), respectively. Activities of aspartate aminotransferase (AST) and alanine aminotransferase (ALT) in plasma were determined colorimetrically according to Reitman and Frankel (1957). Statistical analysis - The obtained data were subjected to one-way ANOVA to evaluate the effect of GRC supplementation. Differences between means were tested at the 5% probability

277
277
level using Duncan test. All the statistical analyses were done using SPSS program version 10 (SPSS, Richmond, VA, USA) as described by Dytham (1999).
RESULTS
In the present study, fish grow gradually by time in all treatments (Figure 1). Final fish weight, weight gain, and specific growth rate were not significantly (P < 0.05) affected with the increase in GRC levels up to 1.0 g/kg after which growth declined (Table 1). The lowest fish growth was obtained at 2.0 – 5.0 g GRC/kg diet. Moreover, fish fed on diets containing 2.0 and 5.0 g GRC/kg consumed less diet than the other treatments giving the highest FCR (1.4 and 1.5, respectively). Meanwhile, fish fed on 0.0 – 1.0 GRC/kg diet consumed approximately the same feed amount giving the same FCR (1.3; Table 2). Table 1. Growth performance and survival of Nile tilapia fed different levels of ground roasted
coffee (GRC) for 10 weeks. GRC levels (g/kg diet)
Initial weight (g)
Final weight (g)
Weight gain (g)
SGR (%/day)
Fish survival (%)
0.0
1.9±0.03 14.5±0.35 a 12.6±0.38 a 2.90±0.059 a 95.6±4.43
0.5
1.9±0.01 14.5±0.55 a 12.6±0.55 a 2.90±0.052 a 95.5±2.23
1.0
1.9±0.01 14.0±0.58 ab 12.1±0.58 ab 2.85±0.058 ab 97.8±2.23
2.0
1.9±0.03 12.5±0.55 bc 10.6±0.52 bc 2.69±0.043 bc 93.3±3.84
5.0 1.9±0.03 11.2±0.36 c 9.3±0.38 c 2.53±0.066 c 95.6±4.43 Means having the same letter in the same column are significantly differed at P < 0.05.
Fish
gro
wth
(g)
Weeks
Figure 1. The weight of Nile tilapia (g) fed different levels of ground roasted coffee (GRC) for 10 weeks.
0
2
4
6
8
10
12
14
16
0 2 4 6 8 10
0.0 (control)
0.5 GRC/kg diet
1.0 GRC/kg diet
2.0 GRC/kg diet
5.0 GRC/kg diet

278
278
Furthermore, no significant differences were observed in fat efficiency ratio, protein efficiency ratio, and energy utilization at 0.0 – 1.0 GRC/kg diet levels and the lowest values of these parameters were obtained when fish fed 2.0 – 5.0 g GRC/kg diet (Table 2). On the other hand, fish survival range was 93.3 – 97.8% with no significant difference (P > 0.05) among the different treatments.
Table 2. Feed utilization by Nile tilapia fed different levels of ground roasted coffee (GRC) for 10 weeks.
GRC levels (g/kg diet)
Feed intake (g feed/fish)
FCR Fat efficiency ratio
Protein efficiency ratio
Energy utilization (%)
0.0
16.0±0.88 a 1.3±0.033 b 10.50±0.876 a 2.86±0.238 a 32.0±1.271 ab
0.5
16.0±0.44 a 1.3±0.058 b 10.08±0.123 a 2.86±0.033 a 32.8±2.119 a
1.0
16.1±0.44 a 1.3±0.033 b 9.45±0.568 ab 2.74±0.154 ab 31.4±2.227 ab
2.0
14.7±0.78 b 1.4±0.033 ab 9.22±0.108 b 2.62±0.027 b 30.1±1.266 bc
5.0 14.0±0.58 b 1.5±0.058 a 8.38±0.390 c 2.39±0.106 c 28.5±0.203 c Means having the same letter in the same column are significantly differed at P < 0.05.
The GRC supplementation in the present study significantly affected the whole-fish body constituents except moisture content, which did not vary significantly (P > 0.05; Table 3). The protein content decreased significantly, meanwhile lipid and ash contents increased significantly by increasing GRC levels. The lowest protein (15.1%), the highest lipids (9.7%) and the highest ash (3.8%) contents were obtained at 5.0 GRC/kg diets. In addition, fish fed the control diet exhibited the highest protein (61.4%) and the lowest lipid (25.5%) contents (Table 3).
Table 3. Proximate composition of whole-body (%; on fresh weight basis) of Nile tilapia fed different levels of ground roasted coffee (GRC) for 10 weeks.
GRC levels (g/kg diet)
Moisture Crude protein Total lipid Total ash
0.0
72.3±0.31 17.2±0.29 a 7.1±0.03 c 3.2±0.09 b
0.5
71.8±0.28 16.9±0.17 a 7.7±0.19 bc 3.2±0.07 b
1.0
72.0±0.27 16.4±0.18 a 8.0±0.16 b 3.3±0.13 b
2.0
72.1±0.87 16.5±0.53 a 8.1±0.26 b 3.2±0.17 b
5.0 71.7±0.41 15.1±0.30 b 9.7±0.15 a 3.8±0.21 a Means having the same letter in the same column are significantly differed at P < 0.05.
The biochemical variables were significantly affected by GRC supplementation (P < 0.05; Tables 4 and 5). The inclusion of 0.5 – 5.0 g/kg diet of dietary GRC resulted in significant decreases in glucose, plasma protein and plasma lipids, whereas the highest values of above parameters were obtained with fish fed the control diet (Table 4). Contrarily, AST, ALT, and creatinine values increased significantly with increasing GRC levels and the highest values of these parameters were obtained with fish fed 5.0 g GRC/kg (Table 5). Fish fed on the control diets exhibited the lowest values.

279
279
Table 4. Changes in glucose, plasma protein, and plasma lipids in Nile tilapia fed different levels of ground roasted coffee (GRC) for 10 weeks.
GRC levels (g/kg diet)
Glucose (mg/dL) Protein (g/dL) Lipids (g/dL)
0.0
67.53±1.362 a 1.77±0.057 a 2.69±0.167 a
0.5
55.23±1.468 b 1.63±0.064 b 1.61±0.067 b
1.0
55.42±2.669 b 1.60±0.061 b 1.57±0.083 b
2.0
52.63±4.435 b 1.51±0.021 b 1.53±0.035 b
5.0 50.23±1.386 b 1.37±0.056 c 1.42±0.059 c Means having the same letter in the same column are significantly differed at P < 0.05. Table 5. Changes in AST, ALT, and creatinine in plasma of Nile tilapia fed different levels of ground roasted coffee (GRC) for 10 weeks.
GRC levels (g/kg diet)
AST (mg/dL) ALT (mg/dL) Creatinine (mg/dL)
0.0
52.57±2.919 d 22.60±2.023 d 0.252±0.0147 d
0.5
63.60±2.386 c 37.23±3.187 c 0.328±0.0117 c
1.0
76.90±2.312 b 45.20±4.046 bc 0.386±0.0684 b
2.0
80.13±2.440 b 48.46±5.017 b 0.393±0.0392 b
5.0 97.10±5.103 a 59.30±1.350 a 0.467±0.0304 a Means having the same letter in the same column are significantly differed at P < 0.05.
DISCUSSION The present study showed that GRC adversely affected Nile tilapia growth at a
concentration higher than 1.0 g/kg diet. These results are in concomitant with Fagbenro and Arowosoge (1991), Moreau et al. (2003), and Ulloa and Verreth (2003) who found adverse effects of coffee-containing diets on fish growth. Similarly, Chatzifotis et al. (2008) reported that sea bream, Sparus aurata did not accept the caffeine-containing diet at a 10 g/kg dose but at doses at or lower to 5 g/kg caffeine appeared not to have a deterrent effect. They also stated that the negative effect of caffeine on sea bream growth can be traced in its increased FCR. Throughout the feeding period the fish in all experimental groups were in good health and dose-related mortalities were not observed, indicating that Nile tilapia can tolerate GRC levels (up to 5 g/kg diet) albeit with reduced growth rate and increased feed conversion ratio.
It is worth mentioning that 2 - 5 g GRC/kg diet caused a significant decrease in feed consumption and a significant increase in FCR. These results suggested that GRC did influence the diet palatability, implying that the growth retardation at 2 - 5 g GRC/kg diet may be due to the low diet utilization. It has been inferred that caffeine in GRC, together with polyphenols and tannins can deter feed consumption in fish (Ulloa and Verreth, 2003); possibly because of its bitter taste usually perceived by animals (Mazzafera, 2002; Frank et al., 2004). Furthermore, Kasumyan and Døving (2003) reported that caffeine inhibited the feeding behavior of turbot, Psetta maxima.
The proximate composition of whole-fish body was significantly affected by GRC inclusion (Table 3). However, protein content decreased, meanwhile lipids contents decreased by increasing GRC levels. These results disagree with Kobayashi-Hattori et al. (2005) who reported

280
280
that caffeine induced lipolysis and thereby reduce the body fat mass and body fat percentage in Sprague–Dawley rats fed on a high fat diet. Chatzifotis et al. (2008) found that caffeine cannot reduce the lipid content of white muscle and liver in heterotherm sea bream when reared in low winter temperatures. These changes in protein and lipid contents in fish body herein could be linked with changes in their synthesis and/or deposition rate in fish body (Abdel-Tawwab et al., 2006).
Glucose, serum protein, and serum lipids decreased significantly, meanwhile AST, ALT, and creatinine increased significantly in fish fed 5.0 g GRC/kg diet. In this regard, Gagne et al. (2006) stated that in rainbow trout, Oncorhynchus mykiss, long-term exposure to caffeine could lead to lipid peroxidation. Furthermore, caffeine is an inhibitor of glycogen phosphorylase in the mantle tissue of mussel (Mytilus galloprovincialis; Serrano et al., 1995) and of lactate dehydrogenase in the muscle of rabbit (Gardiner and Whiteley, 1985). The increase in AST and ALT activities is an indicative to liver dysfunction and the increase in creatinine is an indicative to kidney dysfunction. These results suggest that GRC may contain compounds that caused some kind of stress on fish affecting these biochemical variables. Corradetti et al. (1986) found a chronic-caffeine effect on rats.
These results indicate that GRC supplement is not a promising growth stimulant for Nile tilapia and in some cases GRC should not exceed 1.0%. Further work is needed to explore the role of GRC in enhancing antioxidant activity and/or the anti-toxicity effect against water pollutants
Acknowledgment The author would like to thank Mohamed N. Monier and Nahla E.M. Ismael, Central Laboratory for Aquaculture Research (CLAR), Abbassa, Abo-Hammad, Sharqia, Egypt, for their assistance during the running of this study, and Sherien H. Shady, CLAR for doing the physiological assay.
REFERENCES Abdel-Tawwab, M., M.H. Ahmad, S.F.M. Sakr, and M.E.A. Seden. 2010. Use of green tea,
Camellia sinensis L. in practical diet for growth and protection of Nile tilapia, Oreochromis niloticus (L.) against Aeromonas hydrophila infection. J. World Aquacult. Soc., 41: 203-213.
Abdel-Tawwab, M., Y.A.E. Khattab, M.H. Ahmad, and A.M.E. Shalaby. 2006. Compensatory growth, feed utilization, whole body composition and hematological changes in starved juvenile Nile tilapia, Oreochromis niloticus (L.). J. Appl. Aquacult., 18: 17-36.
Ahmad, M.H. and M. Abdel-Tawwab. 2011.The use of caraway seeds as a natural feed additive in practical diet for Nile tilapia, Oreochromis niloticus (L.). Aquaculture 134: 110-114.
Ahmad, M.H., A.M.D. El-Mesallamy, F. Samir, and F. Zahran. Effect of different levels of cinnamon (Cinnamomum zeylanicum) on growth performance, feed utilization, whole-body composition, and entropathogenic Aeromonas hydrophila – challenge of Nile tilapia, Oreochromis niloticus L. J. Appl. Aquacult (in press).
AOAC (1990). Association of Official Analytical Chemists. The Official Methods of Analyses Association of Official Analytical Chemists International.15th edition, Arlington, VA, 2220, USA.
Bachère, E. 2003. Anti-infectious immune effectors in marine invertebrates: potential tools for disease control in larviculture. Aquaculture 227, 427–438.
Cao, L.Z. and Z.B. Lin. 2003. Regulatory effect of Ganoderma lucidum polysaccharides on cytotoxic T-lymphocytes induced by dendritic cells in vitro. Acta Pharmacologica Sinica, 24: 312–326.
Chatzifotis, S., F. Kokou, K. Ampatzis, I.E. Papadakis, P. Divanach, and C.R. Dermon. 2008. Effects of dietary caffeine on growth, body composition, somatic indexes, and cerebral distribution of acetyl-cholinesterase and nitric oxide synthase in gilthead sea bream (Sparus aurata), reared in winter temperature. Aquacult. Nut., 14: 405-415.
281
281
Corradetti, R., F. Pedata, G. Pepeu, and M.G. Vannucchi. 1986. Chronic caffeine treatment reduces caffeine but not adenosine effects on cortical acetylcholine release. Brazil. J. Pharmacol., 88: 671–676.
Dytham, C. 1999. Choosing and Using Statistics: A Biologist’s Guide. Blackwell Science Ltd., London, UK.
El-Sayed, A.-F. M. 2006. Tilapia Culture. CABI publishing, CABI International Willingford, Oxfordshire, UK.
Fagbenro, O.A. and I.A. Arowosoge. 1991. Growth response and nutrient digestibility by Clarias isheriensis (Sydenham, 1980) fed varying levels of dietary coffee pulp as replacement for maize in low-cost diets. Bioresource Technology 37, 253–258.
Frank, M.E., Bouverat, B.P., MacKinnon, B.I., Hettinger, T.P., 2004. The distinctiveness of ionic and nonionic bitter stimuli. Physiol. Behav., 80: 421–431.
Gagne, F., C. Blaise, and C. Andre. 2006. Occurrence of pharmaceutical products in a municipal effluent and toxicity to rainbow trout (Oncorhynchus mykiss) hepatocytes. Ecotoxicol. Environ. Saf., 64: 329–336.
Gardiner, N.S. and C.G. Whiteley. 1985. The interaction and inhibition of muscle lactate dehydrogenase by the alkaloid caffeine. Biochem. Biophys. Res. Com., 127: 1057–1065.
Henry, R.J. 1964. Colorimetric determination of total protein. In: Clinical Chemistry. Harper and Row Publ., New York, USA.
Henry, R.J. 1974. Clinical Chemistry Principles and Techniques. 2nd ed., Harper and Row Publ., New York, USA.
Hermann, J.R., M.S. Honeyman, J.J. Zimmerman, B.J. Thacker, P.J. Holden, and C.C. Chang. 2003. Effect of dietary Echinacea purpurea on viremia and performance in porcine reproductive and respiratory syndrome virus-infected nursery pigs. J. Anim. Sci., 81: 2139–2144.
Joseph, A., M. Knight, S. Anderson, M. James, and H. Rawie. 1972. Chemical basis of the sulfophospho-vanillin reaction for estimating total serum lipid. Clin. Chem. 18: 198-201.
Kasumyan, A.O. and K.B. Døving. 2003 Taste preferences in fishes. Fish Fish., 4: 289–347. Kobayashi-Hattori, K., A. Mogi, Y. Matsumoto, and T. Takita. 2005. Effect of caffeine on the body
fat and lipid metabolism of rats fed on a high-fat diet. Biosci., Biotech. Biochem., 69: 2219–2223.
Li, J., B. Tan, K. Mai, Q. Ai, W. Zhang, W. Xu, Z. Liufu, and H. Ma. 2006. Comparative study between probiotic bacterium Arthrobacter XE-7 and chloramphenicol on protection of Penaeus chinensis post-larvae from pathogenic vibrios. Aquaculture 253: 140–147.
Lin, Z.B. and H.N. Zhang. 2004. Anti-tumor and immunoregulatory activities of Ganoderma lucidum and its possible mechanisms. Acta Pharmacologica Sinica 25: 1387–1395.
Mazzafera, P. 2002. Degratation of caffeine by microorganisms and potential use of decaffeinated coffee husk and pulp in animal feeding. Scientia Agricola 59, 815–821.
Meunpol, O., K. Lopinyosiri, and P. Menasveta. 2003. The effects of ozone and probiotics on the survival of black tiger shrimp (Penaeus monodon). Aquaculture 220: 437–448.
Moreau, Y., J.L. Arredondo, I. Perraud-Gaime, and S. Roussos. 2003. Dietary utilisation of protein and energy from fresh and ensiled coffee pulp by the Nile tilapia Oreochromis niloticus. Brazil. Arch. Biol. Tech., 46: 223–231.
Pellegrini, N., M. Serafini, B. Colombi, D. Del Rio, S. Salvatore, M. Bianchi, and F. Brighenti. 2003. Total antioxidant capacity of plant foods, beverages and oils consumed in Italy assessed by three different in vitro assays. J. Nut., 133: 2812–2819.
Reitman, S. And S. Frankel. 1957. Colorimetric determination of glutamic oxaloacetic and glutamic pyruvic transaminases. Am. J. Clin. Path., 28: 53-56.
Serrano, F.S.J., J.L.S. Lopez, and L.O.G. Martin. 1995. Caffeine inhibition of glycogen phosphorylase from Mytilus galloprovincialis mantle tissue. Intern. J. Biochem. Cell Biol., 27: 911–916.
Tan, B.K.H. and J. Vanitha. 2004. Immunomodulatory and antimicrobial effect of some traditional Chinese medicinal plants. Cur. Med. Chem., 11: 1423–1430.

282
282
Teuber, M. 2001. Veterinary use and antibiotic resistance. Cur. Opin. Microbiol., 4: 493-499. Trinder, P. 1969. Determination of glucose concentration in the blood. Ann. Clin. Biochem., 6: 24. Ulloa, R.J.B. and J.A.J. Verreth. 2003. Growth of Oreochromis aureus fed with diets containing
graded levels of coffee pulp and reared in two culture systems. Aquaculture 217: 275–283.
Vaseeharan, B. and P. Ramasamy. 2003. Control of pathogenic Vibrio spp. by Bacillus subtilis BT23, a possible probiotic treatment for black tiger shrimp Penaeus monodon. Let. Appl. Microbiol., 36: 83–87.
Vinson, J.A., K. Patel, and G. Agbor. 2005. Polyphenols: total amounts in foods and beverages and US per capital consumption. In: ACS 230th National Meeting. Book of Abstracts (n. AGFD 10). American Chemical Society, Washington.

283
283
PARTIAL AND TOTAL REPLACEMENT OF FISHMEAL WITH CHEESE PROCESSING BY-PRODUCT MEAL IN PRACTICAL DIETS FOR NILE TILAPIA, Oreochromis niloticus (L.):
A PRELIMINARY STUDY
Mohsen Abdel-Tawwab1*, Fayza E. Abbass2, and Medhat E.A. Seden3
1Department of Fish Biology and Ecology, 2Department of Fish Production and Aquaculture
Systems, and 3Department of Fish Nutrition, Central Laboratory for Aquaculture Research,
Abbassa, Abo-Hammad, Sharqia 44662, Egypt.
* Corresponding author E-mail: [email protected]
Abstract
Aquaculture is the fastest expanding food production system in the world. This rapid development largely depends upon the increased production of aqua-feeds, which traditionally rely on fishmeal (FM) as the main protein source. The increasing demand for FM use in animal and fish diets has resulted in FM becoming difficult to obtain and more expensive. Therefore, this study was conducted as a trial to use cheese processing by-product meal (CPBM) as a substitute for FM in practical diet for Nile tilapia, Oreochromis niloticus (L.). Triplicate fish groups were fed on one of five isonitrogenous (30.0%) and isolipidic (7.5%) diets. The control diet (D1) used FM as the sole protein source. In the other four diets (D2 – D5), FM protein was substituted by 25, 50, 75, or 100% CPBM. Fish (3.5 ± 0.1 g) were stocked at a rate of 20 fish per 100-L aquarium and fed one of the tested diets for satiation twice daily, 6 days a week for 12 weeks. Fish growth, feed utilization, protein efficiency ratio, apparent protein utilization, and energy utilization for fish fed CPBM diets up to 75% of FM (D2 – D4) were all higher, but not significantly, than those for fish fed D1. No significant changes were found in whole-body moisture, crude protein, total lipid, and total ash contents. Cost–benefit analysis of the test diets herein indicated that CPBM was economically superior to FM. This study concluded that the optimal replacement level of FM by CPBM was 75%.
Keywords: Nile tilapia, fishmeal, cheese processing byproduct meal, fish growth, feed utilization, whole-body composition.
INTRODUCTION
Nowadays, aquaculture industry accounts for a massive 68% of global fishmeal (FM) consumption (Naylor et al., 2009); however, FM is a major conventional ingredient in many aqua-feeds (El-Sayed, 2004). FM is the single most expensive macro-feed ingredient and is highly sought after by other livestock industries (Tacon et al., 2000). With static or declining clupeid fish populations that are harvested for FM, any negative market disturbance, supply disruption, or availability problem, can lead to dramatic increases in the commodity price (Tacon et al., 2000). Further, the capture of wild fish used to feed cultured fish is unsustainable at current levels according to most experts (Naylor et al., 2000). Current developments in aqua-feeds production are seeking the substitution of FM by alternatives such as terrestrial plant material, rendered terrestrial animal products, krill, seafood by-products or materials of protest origin. The National Organics Standards Board (NOSB) has proposed limiting the use of FM in organically certified aquaculture products with a 12-year phase-out schedule (Board, 2008). These developments are being driven by both economic and ethical concerns.
284
284
As the tilapia industry expands, there is a need to formulate nutritious, economical diets that do not rely on FM as a major protein source. One approach to reducing FM in Nile tilapia diet is to replace it with alternative, less expensive animal or plant protein ingredients. This would alleviate the dependence on marine-derived protein, allow for continued expansion of global aquaculture, utilize renewable ingredients, and help decrease production costs. The use of environmentally friendly approach is desirable in modern aquaculture and cheese processing byproduct meal (CPBM) fulfills this objective; however it is readily available and renewable ingredient. This by-product achieves a protein content of 34% to 89% (USDEC, 2004); that nominees it to partially or totally replace FM in fish diets. Therefore, this study was conducted as a preliminary study to evaluate the use of CPBM in fish diets instead of FM and its impact on growth, survival, feed efficiency, and body composition of Nile tilapia, Oreochromis niloticus (L.).
MATERIALS AND METHODS Diet preparation
Cheese processing byproduct meal was obtained from local cheese manufacture produces Domiatta cheese from caw milk. It was centrifuged at 10,000 g for 30 min and oven dried at 55 oC for 24 hours. AOAC method (AOAC, 1990) was used to determine its proximate chemical composition. Moisture, crude protein, total lipid, and total ash contents of CPBM (on dry matter basis) were 77.1, 42.2, 14.3, and 28.4%, respectively.
Five diets were formulated to be isonitrogenous (30.0% crude protein) and isolipidic (7.5% total fat) with CPBM replacing herring FM at different levels. All diets contained a constant level of plant protein from soybean meal, corn meal and wheat bran to complete the protein requirement. These diets were formulated to contain the same protein and lipid contents (Table 1). The control diet (D1) was prepared with herring FM as the only protein source. In the remaining four diets (D2 – D5) 25, 50, 75, or 100% of herring FM protein substituted by CPBM protein. The dietary ingredients were thoroughly mixed and moistened by the addition of 100 ml warm water per kg diet and then made into pellets by a mincing machine. The pellets were cut into shape manually, dried in an oven at 55 oC till constant weight was obtained and stored in a freezer at -2 oC until use.
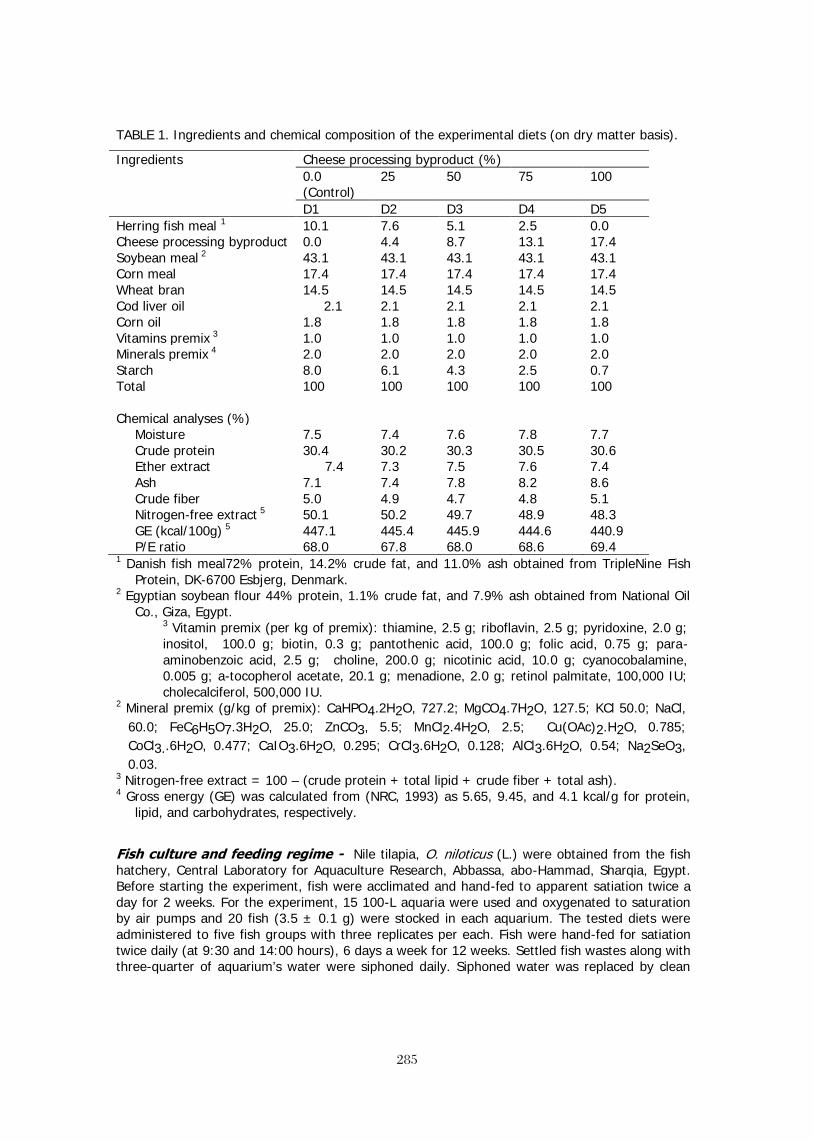
285
285
TABLE 1. Ingredients and chemical composition of the experimental diets (on dry matter basis).
Ingredients Cheese processing byproduct (%) 0.0
(Control) 25 50 75 100
D1 D2 D3 D4 D5 Herring fish meal 1 10.1 7.6 5.1 2.5 0.0 Cheese processing byproduct 0.0 4.4 8.7 13.1 17.4 Soybean meal 2 43.1 43.1 43.1 43.1 43.1 Corn meal 17.4 17.4 17.4 17.4 17.4 Wheat bran 14.5 14.5 14.5 14.5 14.5 Cod liver oil 2.1 2.1 2.1 2.1 2.1 Corn oil 1.8 1.8 1.8 1.8 1.8 Vitamins premix 3 1.0 1.0 1.0 1.0 1.0 Minerals premix 4 2.0 2.0 2.0 2.0 2.0 Starch 8.0 6.1 4.3 2.5 0.7 Total 100 100 100 100 100 Chemical analyses (%)
Moisture 7.5 7.4 7.6 7.8 7.7 Crude protein 30.4 30.2 30.3 30.5 30.6 Ether extract 7.4 7.3 7.5 7.6 7.4 Ash 7.1 7.4 7.8 8.2 8.6 Crude fiber 5.0 4.9 4.7 4.8 5.1 Nitrogen-free extract 5 50.1 50.2 49.7 48.9 48.3 GE (kcal/100g) 5 447.1 445.4 445.9 444.6 440.9 P/E ratio 68.0 67.8 68.0 68.6 69.4
1 Danish fish meal72% protein, 14.2% crude fat, and 11.0% ash obtained from TripleNine Fish Protein, DK-6700 Esbjerg, Denmark.
2 Egyptian soybean flour 44% protein, 1.1% crude fat, and 7.9% ash obtained from National Oil Co., Giza, Egypt.
3 Vitamin premix (per kg of premix): thiamine, 2.5 g; riboflavin, 2.5 g; pyridoxine, 2.0 g; inositol, 100.0 g; biotin, 0.3 g; pantothenic acid, 100.0 g; folic acid, 0.75 g; para-aminobenzoic acid, 2.5 g; choline, 200.0 g; nicotinic acid, 10.0 g; cyanocobalamine, 0.005 g; a-tocopherol acetate, 20.1 g; menadione, 2.0 g; retinol palmitate, 100,000 IU; cholecalciferol, 500,000 IU.
2 Mineral premix (g/kg of premix): CaHPO4.2H2O, 727.2; MgCO4.7H2O, 127.5; KCl 50.0; NaCl, 60.0; FeC6H5O7.3H2O, 25.0; ZnCO3, 5.5; MnCl2.4H2O, 2.5; Cu(OAc)2.H2O, 0.785; CoCl3..6H2O, 0.477; CaIO3.6H2O, 0.295; CrCl3.6H2O, 0.128; AlCl3.6H2O, 0.54; Na2SeO3, 0.03.
3 Nitrogen-free extract = 100 – (crude protein + total lipid + crude fiber + total ash). 4 Gross energy (GE) was calculated from (NRC, 1993) as 5.65, 9.45, and 4.1 kcal/g for protein,
lipid, and carbohydrates, respectively.
Fish culture and feeding regime - Nile tilapia, O. niloticus (L.) were obtained from the fish hatchery, Central Laboratory for Aquaculture Research, Abbassa, abo-Hammad, Sharqia, Egypt. Before starting the experiment, fish were acclimated and hand-fed to apparent satiation twice a day for 2 weeks. For the experiment, 15 100-L aquaria were used and oxygenated to saturation by air pumps and 20 fish (3.5 ± 0.1 g) were stocked in each aquarium. The tested diets were administered to five fish groups with three replicates per each. Fish were hand-fed for satiation twice daily (at 9:30 and 14:00 hours), 6 days a week for 12 weeks. Settled fish wastes along with three-quarter of aquarium’s water were siphoned daily. Siphoned water was replaced by clean

286
286
and aerated water from a storage tank. Every 2 weeks fish were group-weighed. Fish were starved for a day before weighing. During the experiment, the water quality was checked periodically. The water temperature ranged from 24.2 to 26.4 oC, pH from 7.4 to 7.6, dissolved oxygen was 4.9 – 5.3 mg/L, and unionized ammonia was <0.2 mg/L.
Fish growth and feed utilization - At the end of the experiment, fish per each aquarium were harvested, counted, and weighed. Fish growth and feed utilization variables were calculated as follows: Weight gain (g) = final weight – initial weight; Weight gain % = 100 x weight gain / initial weight; Specific growth rate (SGR; %/day) = 100 (Ln final weight – Ln initial weight) / days; Feed conversion ratio (FCR) = feed intake (g) / weight gain (g); Protein efficiency ratio (PER) = weight gain (g) / protein intake (g); Apparent protein utilization (APU; %) = 100 [protein gain in fish (g) / protein intake in feed (g)]; Energy utilization (EU; %) = 100 x (energy gain / energy intake). Chemical analysis of diets and fish - The proximate chemical analyses of the tested diets and fish samples were done for moisture, crude protein, total lipid, and total ash according to the standard methods of AOAC (1990). Moisture content was estimated by drying the samples to constant weight at 95 oC in drying oven (GCA, model 18EM, Precision Scientific group, Chicago, Illinois, USA). Nitrogen content was measured using a microkjeldahl apparatus (Labconco, Labconco Corporation, Kansas, Missouri, USA) and crude protein was estimated by multiplying nitrogen content by 6.25. Lipid content was determined by ether extraction in multi-unit extraction Soxhlet apparatus (Lab-Line Instruments, Inc., Melrose Park, Illinois, USA) for 16 hours. Total ash was determined by combusting dry samples in a muffle furnace (Thermolyne Corporation, Dubuque, Iowa, USA) at 550 oC for 6 hours. Economic evaluation - The cost of feed to raise unit biomass of fish was estimated by a simple economic analysis. The estimation was based on local retail sale market price of all the dietary ingredients at the time of the study. These prices (in LE/kg) were as follows: herring fish meal, 12.0; CPBM, 3.0; soybean meal, 2.5; corn meal, 1.50; wheat bran, 1.40; starch, 3.0; fish oil, 9.0; corn oil, 7.0; vitamin premix, 7.0; mineral mixture, 3.0. An additional 50.0 LE/ton manufacturing cost. Statistical analysis - The obtained data in this study are presented as means ± SD of three replicates. One-way analysis of variance was used to test the effects of the diets. Duncan’s Multiple range test was used for mean comparisons. Differences were regarded as significant when P < 0.05. Second-order polynomial regression analysis of the relationship between the fish growth and the replacement levels of protein of CPBM was used to estimate the optimal replacement level of protein of FM by CPBM in the diets for Nile tilapia. All the statistical analyses were done using SPSS program version 10 (SPSS, Richmond, VA, USA) as described by Dytham (1999).
RESULTS
Fish displayed an active feeding behavior, particularly during the morning meal. Final body weight, weight gain, weight gain %, and SGR were insignificantly (P<0.01) influenced by the dietary CPBM except that fed 100% CPBM diet, which exhibited the lowest growth performance (Table 2). No significant differences were observed in survival among the treatments since its range was 96.7 - 100 % (P > 0.05; Table 2).
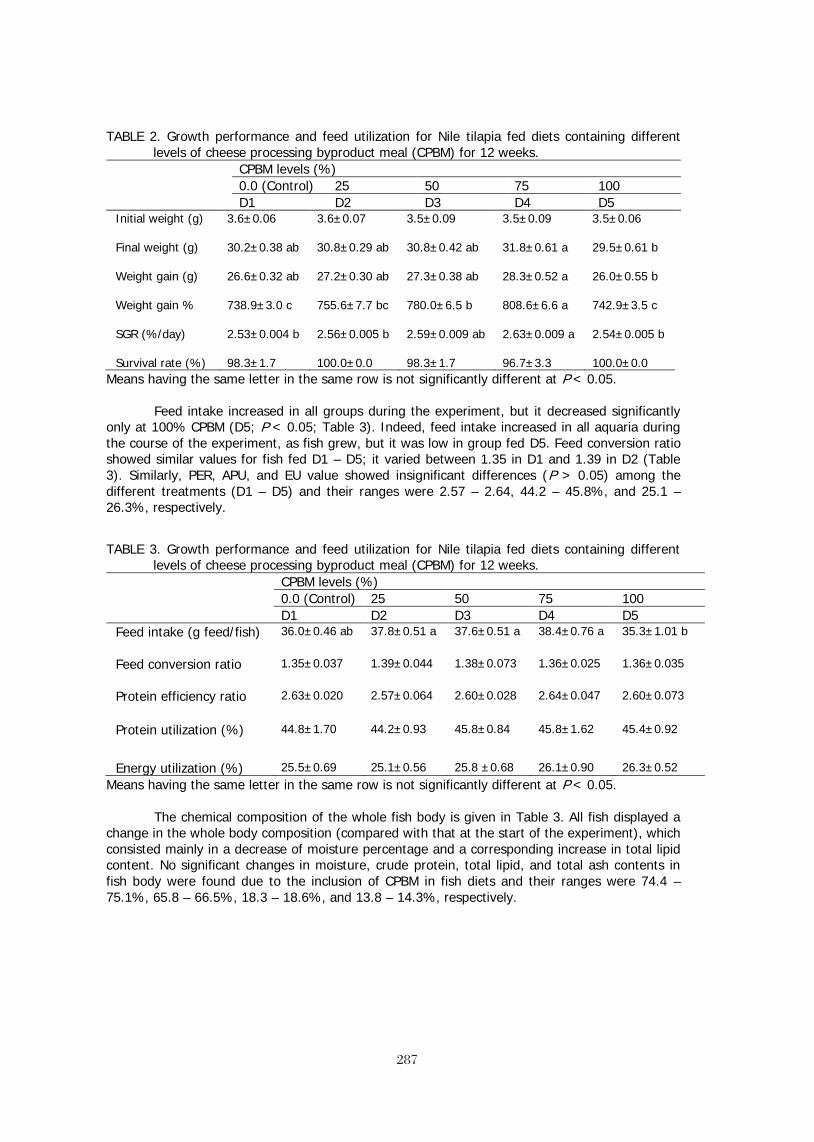
287
287
TABLE 2. Growth performance and feed utilization for Nile tilapia fed diets containing different levels of cheese processing byproduct meal (CPBM) for 12 weeks.
CPBM levels (%) 0.0 (Control) 25 50 75 100 D1 D2 D3 D4 D5 Initial weight (g)
3.6±0.06 3.6±0.07 3.5±0.09 3.5±0.09 3.5±0.06
Final weight (g)
30.2±0.38 ab 30.8±0.29 ab 30.8±0.42 ab 31.8±0.61 a 29.5±0.61 b
Weight gain (g)
26.6±0.32 ab 27.2±0.30 ab 27.3±0.38 ab 28.3±0.52 a 26.0±0.55 b
Weight gain %
738.9±3.0 c 755.6±7.7 bc 780.0±6.5 b 808.6±6.6 a 742.9±3.5 c
SGR (%/day)
2.53±0.004 b 2.56±0.005 b 2.59±0.009 ab 2.63±0.009 a 2.54±0.005 b
Survival rate (%) 98.3±1.7 100.0±0.0 98.3±1.7 96.7±3.3 100.0±0.0 Means having the same letter in the same row is not significantly different at P < 0.05.
Feed intake increased in all groups during the experiment, but it decreased significantly only at 100% CPBM (D5; P < 0.05; Table 3). Indeed, feed intake increased in all aquaria during the course of the experiment, as fish grew, but it was low in group fed D5. Feed conversion ratio showed similar values for fish fed D1 – D5; it varied between 1.35 in D1 and 1.39 in D2 (Table 3). Similarly, PER, APU, and EU value showed insignificant differences (P > 0.05) among the different treatments (D1 – D5) and their ranges were 2.57 – 2.64, 44.2 – 45.8%, and 25.1 – 26.3%, respectively.
TABLE 3. Growth performance and feed utilization for Nile tilapia fed diets containing different levels of cheese processing byproduct meal (CPBM) for 12 weeks.
CPBM levels (%) 0.0 (Control) 25 50 75 100 D1 D2 D3 D4 D5 Feed intake (g feed/fish)
36.0±0.46 ab 37.8±0.51 a 37.6±0.51 a 38.4±0.76 a 35.3±1.01 b
Feed conversion ratio
1.35±0.037 1.39±0.044 1.38±0.073 1.36±0.025 1.36±0.035
Protein efficiency ratio
2.63±0.020 2.57±0.064 2.60±0.028 2.64±0.047 2.60±0.073
Protein utilization (%)
44.8±1.70 44.2±0.93 45.8±0.84 45.8±1.62 45.4±0.92
Energy utilization (%) 25.5±0.69 25.1±0.56 25.8 ±0.68 26.1±0.90 26.3±0.52 Means having the same letter in the same row is not significantly different at P < 0.05.
The chemical composition of the whole fish body is given in Table 3. All fish displayed a change in the whole body composition (compared with that at the start of the experiment), which consisted mainly in a decrease of moisture percentage and a corresponding increase in total lipid content. No significant changes in moisture, crude protein, total lipid, and total ash contents in fish body were found due to the inclusion of CPBM in fish diets and their ranges were 74.4 – 75.1%, 65.8 – 66.5%, 18.3 – 18.6%, and 13.8 – 14.3%, respectively.

288
288
TABLE 3. Proximate chemical analyses (%; on dry weight basis) of Nile tilapia whole-body fed diets containing different levels of cheese processing byproduct meal (CPBM) for 12 weeks.
CPBM levels (%) 0.0 (Control) 25 50 75 100 D1 D2 D3 D4 D5 Moisture
75.1±0.32 74.7±0.28 74.4±0.49 74.5±0.44 74.5±0.52
Crude protein
66.1±0.71 65.8±0.50 66.5±0.67 65.8±076 66.2±1.22
Total lipid
18.5±0.68 18.3±0.17 18.4 ±0.63 18.6±0.35 18.3±0.75
Total ash 14.2±0.68 14.3±0.34 13.8±0.93 13.9±0.90 14.1±051
Means having the same letter in the same row is not significantly different at P < 0.05.
It is noticed that the incorporation of CPBM (D2 – D5) herein reduced the price of one kg diet as compared to the control group (Table 4). Average cost to produce on kg gain in weight for D1 – D5 were 4.59, 4.45, 4.14, 3.81, and 3.40 LE, respectively. However, CPBM inclusion reduced the cost to produce one kg gain by 3.1, 9.8, 17.0, and 25.9% for D2 – D5, respectively (Table 4). Table 4: Economic efficiency for production of one kg gain of Nile tilapia fed diets containing
different levels of cheese processing byproduct meal (CPBM) for 12 weeks.
CPBM levels (g/kg diet)
0.0 (Control) 25 50 75 100
D1 D2 D3 D4 D5 Feed cost (L.E./kg)
3.4 3.2 3.0 2.8 2.5
FCR (kg feed/kg gain)
1.35 1.39 1.38 1.36 1.36
Feed cost per kg gain (L.E.)
4.59 4.45 4.14 3.81 3.40
Cost reduction per kg gain (L.E.)*
0.0 0.14 0.45 0.78 1.19
Cost reduction per kg gain (%)** 0.0 3.1 9.8 17.0 25.9 * Cost reduction per kg gain (L.E.) = feed cost per kg gain of control (L.E.) - feed cost per kg
gain of CPBM treatment (L.E.); ** Cost reduction per kg gain (%) = 100 [cost reduction per kg gain (L.E.) in D2-D5 / feed cost
per kg gain of control (L.E.)].
DISCUSSION The present study indicated that the partial substitute of FM protein by CPBM protein has
no significant adverse effect on the growth response and feed utilization for Nile tilapia; meanwhile higher amounts of CPBM protein (D5) retarded fish growth and feed utilization significantly. These results suggest that it is possible to replace up to 75% of FM protein with CPBM protein without significant adverse effect on fish growth response.
This is the first time to our knowledge that CPBM has bean demonstrated to be effective in replacing FM in fish diets although other authors have demonstrated FM replacement potential for a variety of plant and animal meals. Based on diet intake, the palatability of the tested diets

289
289
(D1 – D4) appeared to be better than D5 (100% CPBM; Table 3). Palatability may be in part responsible for the significant differences in weight gain and FCR among the tested diets. The highest level of substitution, which was not significantly different from the control in growth performance, was 75% CPBM (Table 2).
Many authors reported that between 30% and 75% of dietary FM could be replaced by animal by-products. Abdelghany (2003) evaluated the use of gambusia, Gambusia affinis, fish meal (GFM) in practical diets for red tilapia, O. niloticus x O. mossambicus. He formulated six isonitrogenous diets (35%) in which GFM replaced 0.0, 10, 25, 50, 75, or 100% of the protein supplied by herring FM. He demonstrated that GFM is a suitable protein source in practical diets for Nile tilapia and could replace HFM up to 50%; however, fish growth and feed and protein utilization were retarded for diets containing 100% GFM. Furthermore, Ahmad (2008) used the same diets as Abdelghany (2003) for Nile tilapia and he found that the optimum GFM level was obtained at 75%.
The complete replacement of CPBM with FM (100% GFM) reduced the fish growth. The growth reduction in fish fed the diet containing 100% CPBM may be attributed to reduced palatability or attractiveness of the diet causing a reduced diet intake. Also, the low fish growth at 100% CPBM diet may be attributed to the low availability of certain EAA or to EAA imbalance (the data are not included here) resulting in growth retardation.
The obtained results herein are in concomitant with previous studies used animal byproducts sources to partially or totally replace FM for red tilapia, O. niloticus x O. mossambicus (Abdelghany 2003; Ahmad 2008), sunshine bass, Morone chrysops x Morone saxatilis (Muzinic et al. 2006), gibel carp, Carassius auratus gibelio (Yang et al. 2006), and black Sea turbot, Psetta maeotica (Yigit et al. 2006). On the other hand, Rodriguez-Serna et al. (1996) found that commercial defatted animal by-product meal (a combination of BM, MBM, feather meal and FM) supplemented with soybean oil completely replaced FM in the diets fed to Nile tilapia for 7 weeks, with no adverse effects on fish performance. El-Sayed (1998) totally replaced FM by shrimp meal (SM), blood meal (BM), meat and bone meal (MBM), BM+MBM mix and poultry by-product meal (PBM) in six isonitrogenous (30% crude protein), isocaloric (400 kcal GE 100/g) diets for Nile tilapia. He found that the growth of fish fed SM, PBM and MBM was not significantly different from those fed the FM-based diet, while a reduction in fish performance was noticed when BM or BM+MBM replaced FM in the control diet.
No significant changes in the proximate whole-body composition were observed because of the changes in CPBM levels in fish diets. These results suggested that fish efficiently ingested, digested, and assimilated CPBM protein. These results are in agreement with Abdelghany (2003) and Ahmad (2008) who reported that partial or complete replacement of FM with GFM did not affect body composition (protein, fat, and dry matter) of red tilapia and Nile tilapia, respectively. Takagi et al. (2002) did not find significant changes in whole-body composition of yearling red sea bream because of inclusion of low-fat poultry by-product (with 6.7% fat) in fish diets. Yang et al. (2006) found that no significant changes were observed in whole-body moisture and fat content resulted from the different replacement of FM with PBM.
Most of the works reviewed have evaluated FM replacements in tilapia feeds from biological or nutritional viewpoints. Little attention has been paid to economic analyses of these protein sources. Only a few studies have been conducted into this subject and these have indicated that those unconventional protein sources were more economical than FM because of their local availability at low prices. Cost–benefit analysis of the test diets herein indicated that CPBM was economically superior to FM. Similar results were reported by other workers. The economic evaluation of animal by-product meals replaced FM for Nile tilapia indicated that these sources were economically superior to FM, even at total replacement levels (Rodriguez-Serna et al., 1996; El-Sayed, 1998).
Small-scale fish farmers in developing countries are constrained by both the availability and the cost of pelleted fish diets produced commercially. Hence, there is a real need to encourage fish farmers to formulate their own pelleted diets using CPBM produced near their farms as far as possible. As a conclusion of this study, it is suggested that without amino acid

290
290
supplementations, CPBM could safely replace FM up to 75% in practical diets for Nile tilapia. These results may allow for formulation of less expensive diets for Nile tilapia and may reduce the diet costs for producers.
REFERENCES Abdelghany, A. E. 2003. Partial and complete replacements of fish meal with gambusia meal in
diets for red tilapia Oreochromis niloticus x O. mossambicus. Aquaculture Nutrition 8(3):1–10.
Ahmad, M.H. 2008. Evaluation of gambusia, Gambusia affinis, fish meal in practical diets for fry Nile tilapia, Oreochromis niloticus. J. World Aquacult. Soc., 39: 243 – 250.
AOAC (Association of Official Analytical Chemists). 1990. Official methods of analyses, 15th edition. Association of Official Analytical Chemist Inc., Arlington, Virginia, USA.
Board, N.O.S. 2008. Proposed organic aquaculture standards: fish feed and relative management issues. In: Board, N.O.S. (Ed.), Formal recommendation by the NOSB to the National Organic Programme. Washington, DC, USA.
Dytham, C. 1999. Choosing and using statistics: A Biologist’s guide. Blackwell Science Ltd., London, UK.
El-Sayed, A.-F. M. 1998. Total replacement of fish meal with animal protein sources in Nile tilapia, Oreochromis niloticus (L.), feeds. Aquacult. Res., 29: 275–280.
El-Sayed, A.-F. M. 1999. Alternative dietary protein sources for farmed tilapia, Oreochromis spp. Aquaculture, 179:149–168.
El-Sayed, A.-F. M. 2004. Protein nutrition of farmed Tilapia: searching for unconventional sources. In: R. Bolivar, G. Mair, K. Fitzsimmons (Editors). New dimensions in farmed tilapia: proceedings of the Sixth International Symposium on Tilapia Aquaculture 2004, Manila, Philippines, pp 364–378.
Muzinic, L. A., K. R. Thompson, L. S. Metts, S. Dasgupta, and C. D. Webster. 2006. Use of turkey meal as partial and total replacement of fish meal in practical diets for sunshine bass (Morone chrysops x Morone saxatilis) grown in tanks. Aquacult. Nut., 12:71–81.
Naylor, R.L., R.J. Goldberg, J.H. Primavera, N. Kautsky, M.C. Beveridge, J. Clay, C. Folk, J. Lubchenco, H. Mooney and M. Troell. 2000. Effect of aquaculture on world fish supplies. Nature, 405: 1017-1024.
Naylor, R.L., R.W. Hardy, D.P. Bureau, A. Chiu, A. Elliott, A.P. Farrell, I. Forster, D.M. Gatlin III, R.J. Goldburg, K. Hua, and P.D. Nichols. 2009. Feeding aquaculture in an era of finite resources. Proceedings of the National Academy of Sciences of the United States of America, 106: 15103–15110.
NRC (National Research Council). 1993. Nutrient requirements of fish. Committee on Animal Nutrition. Board on Agriculture. National Research Council. National Academy Press. Washington, DC, USA.
Rodriguez-Serna M., Olvera-Novoa M.A., Carmona-Osalde C. (1996) Nutritional value of animal by-product meal in practical diets for Nile tilapia Oreochromis niloticus (L.) fry. Aquacult. Res., 27: 67–73.
Tacon, A.G.J. and I.P. Forster. 2000. Global trends and challenges to aquaculture and aquafeed development in the new millennium. International Aquafeed–Directory and Buyers Guide 2001. pp. 4-25. Turret RAI, Uxbridge, Middlesex, UK.
Takagi, S. T., H. Hosokawa, S. Shimeno, and M. Ukawa. 2002. Utilization of poultry by-product meal in a diet for red sea bream Pagrus major. Nipponsulsan Gakkaishi, 66: 428–438.
USDEC 2004. Products definition, composition, functions. Reference Manual for U.S. Whey and Lactose Products, pp 27–40.
Yang, Y., S. Xie, Y. Cui, X. Zhu, W. Lei, and Y. Yang. 2006. Partial and total replacement of fishmeal with poultry by-product meal in diets for gibel carp, Carassius auratus gibelio Bloch. Aquacult. Res., 37:40–48.

291
291
Yigit, M., M. Erdem, S. Koshio, S. Ergün, A. Türker, and B. Karaal. 2006. Substituting fish meal with poultry by-product meal in diets for black Sea turbot Psetta maeotica. Aquacult. Nut., 12: 340–347.

293293
ECONOMICS and COUNTRY – REGIONAL REPORTS
Professor Indar Ramnarine
University of the West Indies
Trinidad and Tobago
294294
TILAPIA CULTURE IN TRINIDAD AND TOBAGO: YET ANOTHER UPDATE
Indar W. Ramnarine
Department of Life Sciences The University of the West Indies
St Augustine Trinidad and Tobago
and Capildeo Barrath
Aquaculture Association of Trinidad & Tobago
e-mail: [email protected] ABSTRACT
Production of tilapia began in Trinidad in 1951 with the culture of the Mozambique tilapia, Oreochromis mossambicus. In the years that followed, although attempts were made to commercialize its culture, tilapia production remained at a subsistence level with small earthen ponds being utilized. The Jamaica red tilapia was introduced in 1983 and during the years 1994 to 1998, commercial production was established at the state-owned company, Caroni (1975) Ltd. Production peaked at 26 tonnes in 1998. The facility was leased in 1999 but production declined until the project was terminated in 2000. There have been recent attempts at commercial culture by the Nariva Aquafarm and the Bamboo Grove Fish Farm. Production has increased since 2000 and the annual production is about 10 tonnes, with the Nile tilapia, Oreochromis niloticus, being the major species. There is again considerable interest in tilapia culture and this is being aggressively promoted by the Aquaculture Association of Trinidad & Tobago. Within the last year, there have been significant development; construction of a biofloc system by the Seafood Industry Development Company, a re-circulating system by the Institute of Marine Affairs, an Aquaponics system by a private investor, several hatcheries utilizing YY technology and several smaller enterprises. The trend is towards intensive culture in tanks. The forecast is for increased production especially as new investors continue to join the industry.
INTRODUCTION
The Republic of Trinidad and Tobago is located between 10°2' and 11°2' North Latitude and 60°30' and 61°50' West Longitude, just off the north-east coast of Venezuela, South America. Its climate is tropical, with an average temperature ranging from 21°C to 34°C. In general nighttime temperatures are usually 10°C to 15°C lower that during the day. There is a major dry season from late December to early May followed by a rainy season extending from late May to early December. The rainy season is interrupted by a short dry spell of mean duration two weeks and termed the petit careme. The average rainfall in NE Trinidad is around 3000 mm per annum while in NW and SW Trinidad, the rainfall is about 1500 mm per annum. The island of Trinidad is roughly rectangular in shape and has an area of 4760 square kilometers. There are three mountain ranges, the Northern Range (which is a continuation of the Andes), Central Range and Southern Range. The area between the Northern Range and Central Range is relatively flat and clayey in nature while the area between the Central Range and the Southern Range is gently rolling. Tobago occupies an area of 308 square kilometers and there is a single mountain range called the Main Ridge. There are several major drainages in both islands. In Trinidad, the major drainages are the Caroni, North Oropouche, Ortoire and South Oropouche whereas in Tobago, the major drainages are the Courland, Hillsborough and Goldsborough. There is therefore an ideal climate, abundant water and land resources for the development of an aquaculture industry, in particular tilapia aquaculture.
HISTORY OF TILAPIA CULTURE
The Mozambique tilapia, Oreochromis mossambicus, was first introduced to Trinidad and Tobago in 1951 via St Lucia by Hickling (Kenny, 1959). Production began in 1951 with the

295295
establishment of the Bamboo Grove Fish Farm at Valsayn as a research and demonstration unit (Ramnarine, 1996). Research was conducted on the species during the 1950s and 1960s. Although a method was developed to restrict reproduction under pond culture (Kenny, 1960), no significant commercial development took place. This was primarily the result of poor consumer acceptance of the fish due to its acquired muddy taste and dark colour. Also, most of the private farms that were established were small and subsistence culture was practised. There was very little understanding of pond management such as water quality management, predator control and feeding. In addition, monosex culture was not practised and this led to the production of numerous stunted and unmarketable fish. A red tilapia strain was imported from Jamaica in 1983 and the Nile tilapia was introduced into the country in 1986, also from Jamaica (Ramnarine, 1996).
STATUS OF TILAPIA CULTURE
There are currently 1105 food-fish farmers registered with the Ministry of Agriculture but Manwaring and Romano (1990) identified only 562 active farmers. That number has declined since 1990. These farmers operate small holdings with an average surface area of 0.07 ha and initially cultured the Mozambique tilapia. Since the mid-1980s they have shifted to culturing mainly the Jamaica red tilapia, but operate, however, at a subsistence level. Today, the number of active food-fish farmers is thought to be even less that 100 but there is growing interest in the culture of the Nile tilapia.
The major commercial aquaculture project in the country was that operated by the state-owned Caroni (1975) Limited, a sugar producing company. Their aquaculture project consisted of a hatchery, outdoor concrete tanks and 9.5 ha of earthen ponds, ranging in size from 0.25 ha to 1 ha (Ramnarine and Batchasingh, 1994). This farm, however, was leased in mid 1999 to a private farmer, although Caroni (1975) Limited has retained control of the hatchery. The project was closed soon after and although there were attempts to lease the facilities to the private sector in 2005, this was not done and as such, the project remains closed. Another government-owned facility, the Bamboo Grove Fish Farm consists of a small hatchery and 2.4 ha of ponds. This was leased in 2002 and has been brought back into production. There are two other government institutions involved in aquaculture. The Institute of Marine Affairs has an aquaculture unit that consists of a hatchery/wet laboratory and nine small earthen ponds with a of total area 0.18 ha. The Sugarcane Feeds Centre has 13 ponds with a total area of 0.88 ha and a small hatchery. There is a privately owned project at Plum Mitan consisting of about 3 ha of ponds and another farm at Penal with 1 ha of ponds.
Most projects in the country use earthen ponds but there is a tank culture operation in central Trinidad that utilizes injected oxygen in their system. The status of this project is unknown. Caroni (1975) Limited and the Sugar Cane Feeds Centre also use concrete and metal tanks, but production from tank culture is limited. At the Bamboo Grove Fish Farm, there are four octagonal concrete tanks with a solids removal system. Each tank has a capacity of 100 cubic metres and intensive mixed-sex culture is being carried out in these tanks with encouraging results (Ramnarine, 2004).
The subsistence farmers practise mixed-sex culture while the Institute of Marine Affairs, the Sugarcane Feeds Centre practise monosex culture. Manual sexing is done by the Institute of Marine Affairs and the Sugarcane Feeds Centre while Bamboo Fish Farm uses hormonal sex reversal in addition to intensive mixed-sex culture. More recently, the Institute of Marine Affairs has acquired YY males and monosex production is done using this technology.
Caroni (1975) Limited used a 24 week grow-out period and the average yield per crop ranges between 2,000 to 4,000 kg per ha. A locally manufactured tilapia feed (sinking pellets, 25% crude protein) was used and costed $US0.38 per kg. A floating pellet is also available and costs $US0.60 per kg. The average size at harvest is 250 to 450 g and the average feed conversion ratio ranges between 2 : 1 to 4 : 1. The bulk of the fish was marketed fresh, chilled on ice, while some processing was also done by Caroni (1975) Limited. Whole fish was sold at approximately $US2.00 per kg while fillets are sold at $US3.00 per 450 g package.
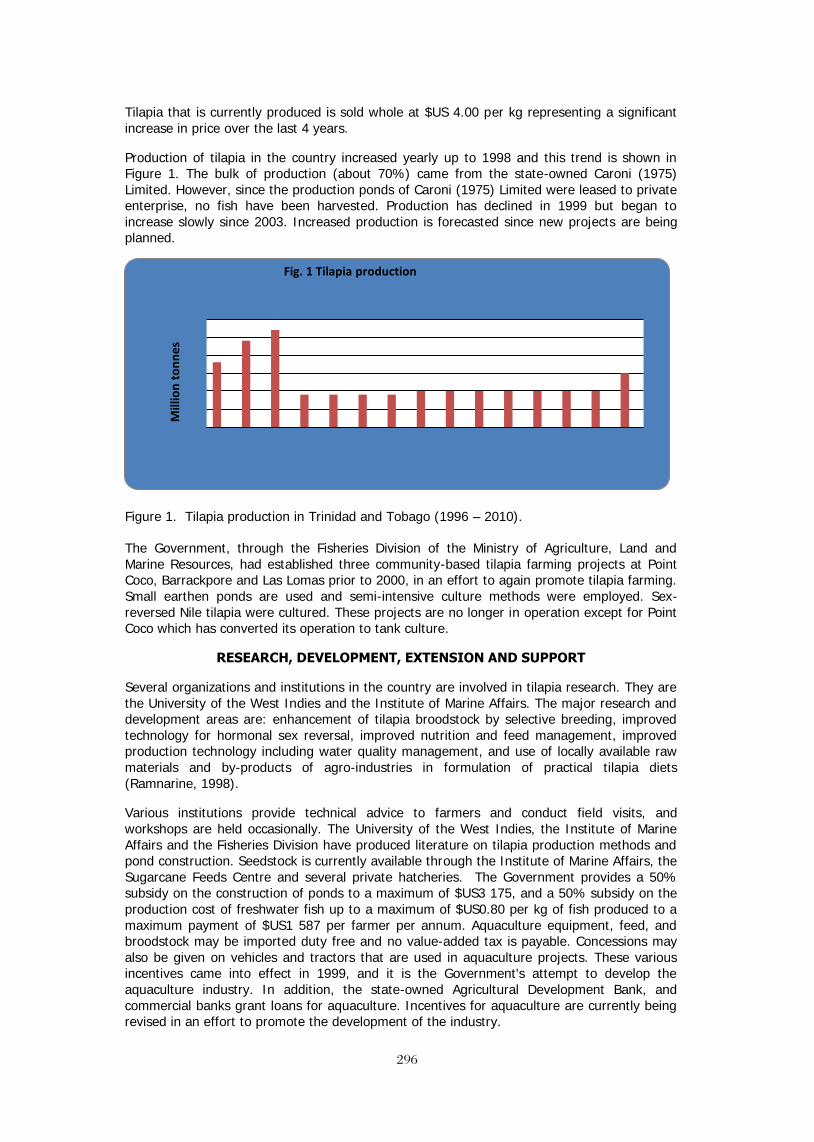
296296
Tilapia that is currently produced is sold whole at $US 4.00 per kg representing a significant increase in price over the last 4 years.
Production of tilapia in the country increased yearly up to 1998 and this trend is shown in Figure 1. The bulk of production (about 70%) came from the state-owned Caroni (1975) Limited. However, since the production ponds of Caroni (1975) Limited were leased to private enterprise, no fish have been harvested. Production has declined in 1999 but began to increase slowly since 2003. Increased production is forecasted since new projects are being planned.
Figure 1. Tilapia production in Trinidad and Tobago (1996 – 2010).
The Government, through the Fisheries Division of the Ministry of Agriculture, Land and Marine Resources, had established three community-based tilapia farming projects at Point Coco, Barrackpore and Las Lomas prior to 2000, in an effort to again promote tilapia farming. Small earthen ponds are used and semi-intensive culture methods were employed. Sex-reversed Nile tilapia were cultured. These projects are no longer in operation except for Point Coco which has converted its operation to tank culture.
RESEARCH, DEVELOPMENT, EXTENSION AND SUPPORT
Several organizations and institutions in the country are involved in tilapia research. They are the University of the West Indies and the Institute of Marine Affairs. The major research and development areas are: enhancement of tilapia broodstock by selective breeding, improved technology for hormonal sex reversal, improved nutrition and feed management, improved production technology including water quality management, and use of locally available raw materials and by-products of agro-industries in formulation of practical tilapia diets (Ramnarine, 1998).
Various institutions provide technical advice to farmers and conduct field visits, and workshops are held occasionally. The University of the West Indies, the Institute of Marine Affairs and the Fisheries Division have produced literature on tilapia production methods and pond construction. Seedstock is currently available through the Institute of Marine Affairs, the Sugarcane Feeds Centre and several private hatcheries. The Government provides a 50% subsidy on the construction of ponds to a maximum of $US3 175, and a 50% subsidy on the production cost of freshwater fish up to a maximum of $US0.80 per kg of fish produced to a maximum payment of $US1 587 per farmer per annum. Aquaculture equipment, feed, and broodstock may be imported duty free and no value-added tax is payable. Concessions may also be given on vehicles and tractors that are used in aquaculture projects. These various incentives came into effect in 1999, and it is the Government's attempt to develop the aquaculture industry. In addition, the state-owned Agricultural Development Bank, and commercial banks grant loans for aquaculture. Incentives for aquaculture are currently being revised in an effort to promote the development of the industry.
Mill
ion
tonn
es
Fig. 1 Tilapia production

297297
RECENT DEVELOPMENTS
Within the last year, there have been significant developments in the growth of the tilapia industry. There are now three private hatcheries that produce all-male tilapia using YY technology. The Institute of Marine Affairs is also producing males using this technology.
There is a functioning biofloc operation at the Seafood Industry Development Company consisting of six 6-m diameter fiberglass tanks. Technical assistance was provided by the University of the West Indies in setting up this system. The Institute of Marine Affairs has established a re-circulating system consisting of ten 6-m diameter fiberglass tanks. Both these operations are quite impressive and are functioning well. There is now considerable interest in Aquaponics in the country and the University of the West Indies recently hosted a training workshop for potential farmers and investors. This was taught by Drs J. Rakocy and I. Ramnarine. A commercial system has recently been commissioned and there are three other commercial systems that are being planned. There is also a lot of interest in tank culture using the biofloc system and two commercial operations are being planned.
CONCLUSIONS
Tilapia production was increasing at a steady rate prior to the lease of the Caroni (1975) Limited aquaculture project in 1999. Production has averaged just under 10 tonnes per annum since then but now, due to the development of two major projects: the SIDC and the IMA, production is again on the increase. There is renewed interest in intensive and semi-intensive systems using tanks in particular and also in aquaponics. The future looks very promising.
REFERENCES
Kenny, J.S. (1959) Fish culture prospects in Trinidad and Tobago. W.I. Fish Bulletin, 2: 1 - 15.
Kenny, J.S. (1960) Notes on experiments to determine methods of restricting population growth of Tilapia mossambica (Peters) under pond culture conditions. BGFF, Ministry of Agriculture, 8 pp.
Manwaring, G. and Romano, H. (1990) Aquaculture marketing; a survey of existing producers. Caribbean Marine Studies 1 No.1: 2 - 10.
Ramnarine, I.W. (1996) A brief history of aquaculture in Trinidad and Tobago and the potential for the development of an aquaculture industry. In: Proceedings of NIHERST's 7th annual seminar on agricultural research. pp 171 - 174.
Ramnarine, R.N. (1998) A situation analysis of the freshwater fish industry in Trinidad and Tobago. In: Situation Analyses of Agricultural Sub-sectors for the Priority Setting Process in Trinidad and Tobago (NIHERST) pp 130 - 138.
Ramnarine, I.W. and Batchasingh, R.N. (1994) Recent developments in aquaculture in Trinidad and Tobago. The Caribbean Aquaculturist 9 No 3, p 20.
Ramnarine, I.W. , de Souza, G., Ramnarine, R.N., Gooriesingh, K., Soomai, S., and Henry, L. (1998) A National Aquaculture Policy for Trinidad and Tobago. MALMR, 40 pp.
Ramnarine, I.W. (2004) Mixed-sex culture of tilapia in octagonal concrete tanks. Proceedings of the 6th International Symposium of Tilapia in Aquaculture. Manila, the Philippines, September 2004.


299299
Technology Training and Sharing on Tilapia Farming: An Experience from the ICDF Workshop on Tilapia Culture in Honduras
Fu-Sung Frank Chiang, Kelvin Chen, Tien-Tsai Tsai, and Cathy Chen
Abstract
Tilapia farming is becoming an important type of aquaculture in the regions of both Central and South Americas and Caribbean Sea. It also has been regarded as one of the major project fields by Taiwan’s International Cooperation and Development Fund (TaiwanICDF) under which technical missions have been dispatched to various countries. A regional tilapia culture training workshop sponsored by TaiwanICDF in Honduras was held on March 14-25, 2011. Three main courses were offered in this 2-week training workshop: (1) tilapia breeding technology; (2) aquaculture project development and management; and (3) tilapia marketing planning and farmers’ organization. Course on tilapia breeding was the core of this workshop. It included classroom lecture and field practice. The field practice was about 60% of the training hours. In addition to three courses offered above, each participant from 8 countries was required to present an in-class country report on the current status and development of aquaculture sector in the first day of the workshop to exchange and share the information on each country’s aquaculture development. In the end of the workshop, an oral presentation was also required for each participant to report their learning, progresses and accomplishments from this workshop. The goal was to help assisting the development of local tilapia farming sector, to enable local trainees to apply facilities and/or materials in tilapia farming, and to transfer the Taiwan’s tilapia farming know-how and technology.
300300
60 YEARS OF TILAPIA AQUACULTURE IN NIGERIA
O. A. FAGBENRO1, O. S. FASASI2, T. JEGEDE3 and O. O. OLAWUSI-PETERS1
1 Department of Fisheries & Aquaculture Technology, Federal University of Technology, Akure, Nigeria.
2 Department of Food Science & Technology, Federal University of Technology, Akure, Nigeria.
3 Department of Forestry, Wildlife & Fisheries, University of Ado Ekiti, Ado Ekiti, Nigeria.
INTRODUCTION
Nigeria is the second largest producer of farm-raised tilapias in Africa, after Egypt (Adesulu, 1997; Fagbenro, 2002; El-Sayed, 2006; Fagbenro et al., 2010). The first attempt at fish farming was in 1951 at a small experimental station in Onikan and various Tilapia species were used. Modern pond culture started with a pilot fish farm (20 ha) in Panyam for rearing the common/mirror carp, Cyprinus carpio, following the disappointing results with tilapias. Although the first years of Panyam fish farm's existence were hardly satisfactory, the trials nevertheless generated sufficient interest that regional governments established more fish farms. Tilapias are widely cultivated in ponds, reservoirs and cages in Nigeria (Satia, 1990; Fagbenro et al., 2004) and are suited to low-technology farming systems because of their fast growth rate, efficient use of natural aquatic foods, propensity to consume a variety of supplementary feeds, omnivorous food habits, resistance to disease and handling, ease of reproduction in captivity, and tolerance to wide ranges of environmental conditions (Fagbenro, 1987).
Tilapia culture in Nigeria remained largely a subsistence level activity until 2000, when it began to expand rapidly following the successful commercial farming of catfishes during the last decade (Alfred and Fagbenro, 2006; Afolabi et al., 2007). There are over 25 species of tilapias in Nigeria, out of which about six species are used for aquaculture, namely, Tilapia zillii, T. guineensis (substrate spawners, macro-phytophagous (generally herbivorous), Sarotherodon galilaeus, S. melanotheron (bi-parental mouth-brooders, micro-phytophagous (planktophagous), Oreochromis niloticus and O. aureus (maternal mouth-brooders, omnivorous). The natural feeding habits of cultivated tilapias in Nigeria are summarised in Table 1.
Table 1: Natural feeding ecology of tilapias used in fish culture in Nigeria.
Species Food habits
O. aureus Adults omnivorous. Fry feed initially on zooplankton. Exclusively phytoplanktivorous.
O. niloticus Omnivorous grazer. Feeds on algae but not higher plants.
S. galilaeus
S. melanotheron
Adults feed almost exclusively on phytoplankton. Juveniles feed on plankton.
T. guineensis, T. Zillii Adults feed exclusively on higher plants. Juveniles consume plankton.
Sources: Idodo-Umeh (2003), Adesulu and Sydenham (2007)
301301
TILAPIA FARMING/PRODUCTION SYSTEMS
Tilapia is cultivated in a tremendous diversity of production systems, in ponds, cages, hapas, raceways, concrete tanks, from extensive to super-intensive practices at small-scale and large-scale level, for self-consumption or marketing and even processing purposes. The technology for tilapia farming is well established and tested, ranging in production from 200 kg.ha-1.yr-1 in stocked rice paddies to over 2000 mt.ha.yr-1 in the more intensive tank culture system. Tilapia aquaculture industry produced 14,388 tonnes in 2000 and increased to 19,546 tonnes in 2005; and was based mainly on O. niloticus (Fagbenro and Adebayo, 2005; Ayinla, 2007), cultivated under intensive (commercial) and semi-intensive (artisanal) production systems. Tilapias are suited to low-technology farming systems. This is because of their fast growth rate, efficient use of natural aquatic foods, propensity to consume a variety of supplementary feeds, omnivorous food habits, resistance to disease and handling, ease of reproduction in captivity and tolerance to wide ranges of environmental conditions; and its use to control aquatic microphytes (Fagbenro, 1998, 2001; Fagbenro and Akinbode, 1988).
TILAPIA POPULATION CONTROL
Natural reproduction of cultured tilapia species occurs in one of two ways: mouth brooders or substrate brooders. The ease with which tilapias spawn and produce offspring makes them a good fish to culture. However, this trait creates problems. Survival of young is high and grow-out ponds can become crowded. Fish become stunted as the supply of natural food organisms in the pond is depleted. Fagbenro (2002) reviewed the several effective methods used to control such undesirable tilapia population and the advantages and disadvantages of these control methods were presented, of which very few have progressed from use in experimental studies or development trials to widespread adoption by farmers (Agbebi and Fagbenro, 2006). Where a thorough assessment of user (farmer and consumer) perspectives are considered, the use of local predatory fish species to control such undesirable tilapia recruitment in ponds is one of the most effective and practical methods.
Density control of tilapia populations by predators is not thoroughly researched in Nigeria as only few indigenous predators have been tested. Unlike clariid catfishes, most predators have some drawbacks (Table 2); hence the combined production of tilapia and clariid catfishes has attracted considerable attention, particularly in Nigeria (Fagbenro, 2000, 2004). The hybrid clariid catfishes, H. longifilis x C. gariepinus and H. bidorsalis x C. gariepinus, and their reciprocal crosses grow faster than their parental species and have high propensity for piscivory, suggesting that they could be used to control tilapia recruitment in ponds. Choosing an efficient predator of a specific size with a recommended optimum predator-tilapia ratio represents a constraint to the success of this technique. Apart from the proper stocking densities and ratios, the effectiveness of combined culture of tilapias with predators is determined by many interrelated factors: adequate good-quality supplementary feed for tilapias; availability of predator fingerlings for stocking; dietary habits of predator; appropriate time of introduction of predator.
302302
Table 2: Predatory fishes used to control tilapia reproduction in Nigeria. Predatory species and their qualities Clarias isheriensis (C. agboinensis) - prefers tilapia eggs to juvenile tilapia - poor market value due to small adult size - easily propagated in captivity using natural or hormone induced techniques African (sharptooth) mud catfish - Clarias gariepinus (C. lazera) - omnivorous with high propensity for carnivory - becomes inefficient, competing for food with prey - fast growth, attains large adult size - easily propagated in captivity using natural or hormone induced techniques Heterobranchus bidorsalis, H. bidorsalis/H. longifilis x Clarias gariepinus - carnivorous with high propensity for piscivory - fast growth, attains large adult size - easily propagated in captivity using natural or hormone induced techniques Snakehead - Parachanna obscura - voracious predator - difficulty in obtaining its seeds in natural waters - inability to reproduce in captivity - attains large size The jewel cichlid - Hemichromis fasciatus - voracious predator - a prolific breeder with short generation time (5-6 months) - poor market value due to small adult size Source: Fagbenro (2000, 2002, 2004)
Even with the use of predators, the main drawback to tilapia culture remains the excessive recruitment in ponds, which result in low yields of harvestable size. Presently, the use of less expensive and appropriate technology in solving the problem of uncontrolled reproduction in tilapias using biological inhibitory agents is being advocated. Plants with antifertility properties may offer solution as they are easy to obtain and can be incorporated into tilapia feeds. Plants that have been tested and proved for their antifertility properties in Nigeria include Quassia amara, Alloe vera, Hibiscus rosa-sinensis, pawpaw (Carica papaya), neem (Azadirachta indica) and morinda (Morinda lucida) (Raji and Bolarinwa, 1997; Udoh and Kehinde, 1999; Uche-Nwachi et al., 2001; Kusemiju et al., 2002; Oderinde et al., 2002; Adebiyi et al., 2002, 2003; Raji et al., 2003; Yinusa et al., 2005; Jegede, 2010; Ellah, 2011). In Nigeria, extracts of pawpaw seeds, neem leaves, had been investigated as fertility control agents in O. niloticus, and T. zillii and their contraceptive efficacies in combating the problem of tilapia overpopulation in ponds have been established (Ekanem and Okoronkwo, 2003; Jegede, 2009).
FEEDSTUFFS AND FEED/DIETS FOR TILAPIAS Both intensive and semi-intensive systems involve input of supplementary and
complete feeds, which account for up to 40 and 60% of production costs, respectively (Fagbenro, 1987; Raji, 1998; Fapohunda and Fagbenro, 2006). Two main types of feeds are produced by both sectors namely herbivorous fish (tilapia) feeds, which contain 30-35% crude protein, and carnivorous fish (catfish) feeds, which contain 45-50% crude protein. In 2000, the Nigerian aquaculture industry consumed an estimated 35,570 tonnes of feed (Fagbenro and Adebayo, 2005). The gross ingredient composition used in tilapia feeds follows the least cost formulation presented in Table 3. The various animal by-products and plant residues that have been evaluated in tilapia diets in Nigeria are shown in Table 4.

303303
Table 3. Least cost feedstuffs used for tilapia feed production in Nigeria. g/kg diet Fish meal (65% cp) 150 Soybean meal (45% cp) 450 Maize 250 Fish oil 40 Vegetable oil 60 Mineral-vitamin premix 30 Binder 20 Source: Fagbenro and Adebayo (2005)
Table 4. Practical feedstuffs used/tested in tilapia diets in Nigeria. Plant residues Animal by-products Oils African yam bean meal Roselle seed meal Fish meal Cod liver oil Kidney bean Kenaf seed meal Fish silage (dry) Palm oil Winged bean meal Mango seeds Fish silage (moist) Soybean oil Mucuna seed meal Cassava peels Blood meal Groundnut oil Lima bean meal Defatted cocoa cake Shrimp head meal Jackbean meal Cocoa pod husk Shrimp head silage Tamarind seed meal Maize meal (yellow, white) Hydrolysed feather meal Cottonseed meal Sorghum Poultry offal silage Palm kernel cake Acha seeds Poultry meat meal Macadamia presscake Cassia seed meal Poultry wastes/manure Sunflower seed cake Azolla Sesame seed meal Duckweed
Source: Jegede (2004), Fagbenro et al. (2003, 2005), Ochang (2007)
USE OF STUNTED TILAPIAS IN FISH SILAGE PRODUCTION
According to Akande (1990) and Eyo (1996), low-value freshwater fishes such as tilapias could be economically utilised to produce acceptable high-protein fishery products for human consumption, and fish meal and silage for animal feeds from the processing wastes. Large quantities of cichlids are landed from freshwaters of Africa in short periods and often glut the market, consequently much remain unsold and spoil as a result of poor handling and processing (Shimang 1992). These surplus unmarketable tilapias could be economically recycled for animal feeding, through dry meal rendering or ensilation. The two most important techniques (other than the direct production of rendered dry meals) used to preserve/upgrade the nutritional value are: (a) ensiling through chemical acidification (acid-preserved silage) or microbial fermentation (fermented fish silage), and (b) protein hydrolysis using selected exogenous enzymes (protein hydrolysate). Both procedures rely on producing unfavourable conditions for putrefactive microrganisms, but conducive conditions for proteases (low pH required in the silage; high temperature required in the hydrolysate).
The preparation of acid or fermented silage using tilapias as substrates includes trials made by Akande (1989) and Fagbenro (1994). Fermented silage was prepared from a mixture of minced tilapias (Oreochromis spp.), different carbohydrate sources (molasses, corn flour, tapioca flour) and Lactobacillus plantarum as inoculum, incubated anaerobically for 30 days at 5-35 oC. The pH and protein solubilization were temperature-dependent (Fagbenro, 1994). The source of carbohydrate did not affect non-protein nitrogen (NPN) content or proximate composition of tilapia silage (Fagbenro, 1994). During storage at 30 oC for 180 days, NPN content increased and there was 8-11% loss of tryptophan (Fagbenro 1994).
USE OF TILAPIA SILAGE IN FISH DIETS
Fish silage has been used as a feed supplement for various livestock and poultry animals and results have generally shown that it has good nutritional quality. The biological value of its protein was also comparable with that of fish meal protein. However, only recently has its potential in aquaculture diets been recognised, hence few studies have
304304
assessed their suitability. Generally, fish silage has been compared with fish meal and its suitability (or otherwise) assessed by fish growth responses, protein utilization and digestibility. Conflicting results have been reported on fish silage as fish meal replacer (either partially or totally) in fish diets. Moist acid silage has been fed to carps, salmonids, eels, catfish, sea bass and tilapias with satisfactory results but few comparable results are available for fish fed fermented silage. Fagbenro (1994) showed that O. niloticus and C. gariepinus fed with moist diets containing autolysed protein from fermented tilapia silage stored for 15-60 days showed good growth performance and protein utilization. There were no differences in body (carcass) composition and hepatosomatic index in C. gariepinus fed increasing dietary levels of autolysed protein from fermented fish silage and no morphological deformities were observed (Fagbenro, 1994).
Liquid fish silage is viscous, bulky and difficult to transport, stir or store, and can only be fed to pigs directly. There are no solids present to make into presscake; hence water removal by evaporation is necessary. Because of the low solids concentration, it is difficult to dry alone. Several methods of removing the water content of silages include spray drying, vacuum evaporation or drum drying. Alternatively, filler can be added and then dried together, after which the co-dried product can be used as protein supplement for poultry or fish. The nutrient content of the dried product is easily altered by the type and amount of filler material used, such as wheat offal, palm kernel cake, cassava flour, rice bran, maize flour, whey, potato flour, soybean-feather meal mixture, soybean meal, poultry by-product meal, meat and bone meal, feather meal (Akande, 1990; Fagbenro, 1994), the choice of which is determined by cost and local availability. Ayinla and Akande (1988) reported that dietary inclusion of acidulated tilapia silage at 410 g/kg for C. gariepinus resulted in a better weight gain than diets containing 40 g/kg fish meal. Fermented tilapia silage co-dried with soybean meal replaced up to 75% of fish meal component in dry diets for O. niloticus and C. gariepinus while total replacement gave inferior growth responses, feed conversion and protein utilization, caused by reduced palatability of diets or reduced appetite. No differences occurred in the hepatosomatic indices of O. niloticus and C. gariepinus fed increasing dietary levels of co-dried fermented fish silage: soybean blend and no morphological deformities were observed (Fagbenro, 1994).
USE OF TILAPIA IN SALTED DRIED MINCED FISH CAKE PRODUCTION
Stunted tilapias could also be introduced into the human food chain. One of such ways is the conversion to mince and cakes. Fish mince is flesh separated in a communited form from skin, bones, scales and fins of fish. Production of mince from underutilized and unused species is not only an efficient way of recovering flesh for direct human food, but also a wide range of by-products such as pet foods and livestock meal can be made from bones as well as scales, liver, swim bladder, etc. The production of mince from tilapia could be a valuable source for the production of a versatile protein-rich product acceptable to the local consumers. In the production of spiced minced fish cakes from stunted tilapias, Akande (1990) concentrated efforts on producing an inexpensive cake that would be particularly appropriate for the growing fast-food trade as “raw and ready to fry” product. No loss in quality was reported when spiced minced tilapia cake was fried immediately after preparation and assessment of the product varied from good to excellent. An advantage of this product is the convenient preparation and lack of bones, which makes it readily consumed by children. It would be particularly appropriate for the institutional trade as raw, ready to fry product and for the housewife as a ready “heat-in-the-oven” product. Similar works in Nigeria using stunted tilapias as substrates for salted minced fish cakes were conducted by Eyo (1996) and Aluko et al.(2000). The cakes produced were stored at ambient temperature (25-32 oC) for up to two months during which the microbial count (total viable count, TVC) reduced from 4.4 x 10³ to 1.5 x 10². The drop in TVC was attributed to a lowering of water activity with increasing water loss. Although no attempts were made to identify the organisms in the total plate count, halotolerant organisms were responsible. The results of a taste panel confirmed the flavour as good, without a strong “fishy” taste. Odour, texture, saltiness and colour were satisfactory and no rancid taste was detected.
305305
USE OF TILAPIA PITUITARY IN CATFISH BREEDING
African catfishes, Clarias gariepinus, C. anguillaris, Heterobranchus bidorsalis, H. longifilis, and their hybrids are cultivated for reasons of their high growth rate, disease resistance and amenability to high density culture, related to their air-breathing habits (Fagbenro et al., 1993; Atanda 2007). The genus Clarias is circumtropical, constituting a major warmwater aquaculture species in Africa and has been introduced for cultivation in Europe and southern Asia while the genus Heterobranchus is endemic to Africa. Clariid catfishes do not breed in ponds; hence artificial propagation using exogenous hormones to induce oocyte maturation, ovulation and spawning is necessary. Various synthetic or purified hormones and steroids have induced ovulation in fishes but their use in Nigeria is limited because they are expensive and are not locally available. To avoid these problems, and to encourage fish breeding programs, the use of crude piscine hypophyses was advocated.
The reluctance of fish farmers to sacrifice precious catfish brooders as donors for hypophyses coupled with seasonality of maturation in clariid catfishes (Ayinla and Nwadukwe, 1988), pose hindrances to homoplastic hypophysation in Nigeria. Although pituitary extracts from non-piscine sources such as African bullfrog (Rana adspersa), common toad (Bufo regularis) and domestic chicken (Gallus domestica) have also induced spawning in clariid catfishes in Nigeria, (Fagbenro et al., 1992; Nwadukwe, 1993; Inyang and Hettiarachchi, 1994; Salami et al., 1994), the standardization of methods dosages and concentration of hormones are often inadequate. It is generally more efficient to induce ovulation in fishes with a pituitary gland extract or a gonadotropin from a teleostean source because of the phylogenetic closeness between the donor and the recipient.
Sexually-mature tilapias are available all-rear round and could be used as alternative sources of piscine hypophyses for catfish breeding. Salami et al.(1997) investigated the effectiveness and dosage of acetone-dried pituitary extracts from tilapias (ADTPE) to induce oocyte maturation, ovulation and spawning in C. gariepinus and H. bidorsalis. Results showed that oocyte maturation and ovulation were induced in female C. gariepinus and H. bidorsalis by single intramuscular injection of 6-10 mg.kg-1 ADTPE with optimum results obtained with 8 mg.kg-1 acetone-dried tilapia pituitary extracts in both catfishes. At ambient temperature (27oC), ovulation occurred within 14-18 hours post-injection resulting in 16-20% increase in egg diameter. Fertilization and hatching percentages increased with increasing hormone dosage. Salami et al.(1997) demonstrated that optimal egg and larval quality in C. gariepinus and H. bidorsalis could also be achieved by using the tilapine pituitary hormone extracts to induce ovulation. The efficacy of ADTPE precludes the depletion of mature catfish (potential brooders) traditionally sacrificed for collection of hypophyses in fish hatcheries.
USE OF TILAPIA: CEREAL BLENDS IN HUMAN NUTRITION
Cereal grains – maize, rice, and sorghum are the staple food of people in the tropics and provide about 75% of total calorie intake and 67% of total protein (Inhekoronye and Ngoddy, 1985). Root and tuber crops (cassava, yams, cocoyams, sweet potatoes) rank next in importance in providing the major part of the daily energy needs of people in the tropics (Inhekoronye and Ngoddy, 1985). Cereal grains as well as root and tuber crops therefore provide the main dietary items for many people, resulting in food with low nutritional value as they are not adequate source of micro and macro nutrients (Brown, 1991). Efforts made to improve the nutritional value of these staples especially cereals in the past were based on fortification with legumes to boost the deficient amino acids, (Bressani and Eliaz, 1983; Egounlety and Syarief, 1992; Salami, 1988). Deficient amino acids in cassava tuber are methionine, lysine, tryptophan, phenylalanine and tyrosine while in cereals they are – lysine and tryptophan. Protein quality is therefore synergistically improved in cereal-legume blends because of the lysine contributed by the legume and methionine contributed by the cereal (Bressani, 1993), but according to Okeiyi and Futrell (1983), the resulting improved diets are of variable organoleptic properties and poor digestibility, these were attributed to the low solubility of plant protein.
306306
Fasasi et al.(2005, 2006, 2007) however replaced the legume (plant protein) in cereal – legume diet with the underutilized tilapias (animal protein), with the aim of reducing the post harvest losses incurred especially in developing countries, and resultant production of highly digestible novel food which will enhance optimal utilization of these worldwide cultured species of fish. Considering the potentials of “Cereal-fish flour” mixes, investigations were made into the properties - physicochemical, and storage stability studies so as to establish the characteristics which may affect its behaviour in food systems during processing and storage hence its usefulness and acceptability for industrial and consumption purposes.
CONCLUSIONS African aquaculture research and development are producing promising results,
despite the economic difficulties under which much of these are undertaken. The future of tilapia farming remains bright, despite the somewhat disappointing recent statistics. In Nigeria, wherever inland aquaculture flourishes, tilapias are likely to be a major, if not the major farmed fish commodity. This can be true if research is better directed towards farmers’ needs; if better breeds and farming systems are developed together; if anti-tilapia attitudes are changed where they are ill-founded; and if tilapia farming becomes a more sustainable and environmentally compatible enterprise, well-integrated with other development initiatives.
REFERENCES Adebiyi, A., Adaikan, P.G. and Prasad, R.N. 2002. Papaya (Carica papaya) consumption is
unsafe in pregnancy: fact or fable? Scientific evaluation of a common belief in some parts of Asia using a rat model. British Journal of Nutrition 88(2): 199-203.
Adebiyi, A., Adaikan, P.G. and Prasad, R.N. 2003. Tocolytic and toxic activity of papaya seed extract on isolated rat uterus. Life Sciences 74(5): 581-592.
Adesulu, E.A. 1997. Current status of tilapia in Nigerian aquaculture. Proceedings of the Fourth International Symposium on Tilapia in Aquaculture, pp.577-583 (K. Fitzsimmons, ed.). Orlando, USA.
Adesulu, E.A. and Sydenham, D.H.J. 2007. The freshwater fishes and fisheries of Nigeria.macmillan Nigeria Publishers Ltd., Ibadan. 397pp.
Afolabi, J.A., Imoudu, P.B. and Fagbenro, O.A. 2000. Peri-urban tilapia culture in homestead concrete tanks: economic and technical viability in Nigeria. Proceedings of Fifth International Symposium on Tilapia in Aquaculture (ISTA V), pp.575-581. (K. Fitzsimmons and J.C. Filho, eds.). Rio de Janeiro, Brazil.
Akande, G.R. 1989. Improved utilization of stunted Tilapia spp. Journal of Food Science and Technology 24: 567-571.
Akande, G.R. 1990. Stunted tilapias: new ideas on an old problem. Infofish International 6: 14-16.
Aluko, J.F., Onilude, A.A. and Sanni, O.A. 2000. Microbiological evaluation of spontaneously fermented tilapia fish. Journal of Fisheries Technology 2: 73-81.
Agbebi, F.O. and Fagbenro, O.A. 2006. Tilapia culture and risk management in Nigeria. Proceedings of the Seventh International Symposium on Tilapia in Aquaculture (W.M. Contreras-Sanchez and K. Fitzsimmons, eds.). Veracruz, Mexico.
Alfred, S.D.Y. and Fagbenro, O.A. 2006. Perception of tilapia farmers on information sources in the coastal region of Ondo State, Nigeria. Proceedings of the Seventh International Symposium on Tilapia in Aquaculture (W.M. Contreras-Sanchez and K. Fitzsimmons, eds.). Veracruz, Mexico.
Atanda, A.N. 2007. Freshwater fish seed resources in Nigeria. pp.361-380. In: Assessment of freshwater fish seed resources for sustainable aquaculture (Bondad-Reantaso, M.G., ed.) FAO Fisheries Technical Paper No. 501. FAO, Rome. 628pp.
Ayinla, O.A. 2007. Analysis of feeds and fertilizers for sustainable aquaculture development in Nigeria. pp.453-470. In: Study and analysis of feeds and fertilizers for sustainable aquaculture development (Hasan, M.R., Hecht, T., De Silva, S.S. and Tacon, A.G.J., eds). FAO Fisheries Technical Paper No. 497. FAO, Rome. 510 pp.

307307
Ayinla, O.A. and Akande, G.R. 1988. Growth response of Clarias gariepinus (Burchell 1822) on silage-based diets. NIOMR Technical Paper No. 37. Nigerian Institute for Oceanography and Marine Research, Lagos. 19pp.
Ayinla, O.A. and Nwadukwe, F.O. 1988. Effect of season on controlled propagation of the African catfish Clarias gariepinus (Burchell 1822). Pp.198-210, in: G.M. Bernacsek and H. Powles (eds.), Aquaculture Systems Research in Africa. IDRC, Canada.
Brown, K.H. 1991: The importance of dietary quality versus quantity of weanlings in the developed countries, a frame work of discussion. Food and Nutrition Bulletin 13: 86–93.
Bressani, R. 1993. Grain quality of beans. Food Rev. Int. 9(2): 237-297. Bressani, R. And Eliaz, E. 1983. Guideline for the development of the processed and
packaged weaning foods. Food and Nutrition Bulletin 5: 32-36. Egounlety, M. and Syarief, R. 1992. Study on supplementation of Ogi with tempe. Nigerian
Food Journal 10: 92-102. Ekanem, S.B. and Okoronkwo, T.E. 2003. Pawpaw seed as fertility control agent on male Nile
tilapia. NAGA 26 (2): 8-10. Ellah, G. 2011. Antispermatogenic activity of Morinda lucida leaf meal on male Nile tilapia,
Oreochromis niloticus. M.Tech. Thesis, Federal University of Technology, Akure. El-Sayed, A-F. 2006. Tilapia Culture CABI Publications, Wallingford, UK. 275pp. Eyo, A.A. 1996. Storage potential and utilization of tilapia mince. pp.135-143. In: A.A. Eyo
(ed.). Proceedings of the 13th Annual conference of the Fisheries Society of Nigeria (FISON), National Institute for Freshwater Fisheries Research Institute (NIFFRI), New Bussa.
Fagbenro, O.A. 1987. A review of biological and economical principles underlying commercial fish culture production in Nigeria. Journal of West African Fisheries 3: 171-177.
Fagbenro, O.A. 1994. Studies on the use of fermented fish silage in diets for juvenile tilapia (Oreochromis niloticus) and catfish (Clarias gariepinus). Ph.D. Thesis, University of Stirling, Scotland. 200pp.
Fagbenro, O.A. 1998. Apparent digestibility of various legume seed meals in Nile tilapia diets. Aquaculture International 6: 83-87.
Fagbenro, O.A. 2000. Assessment of African clariid catfishes for tilapia population control in ponds. Proceedings of the Fifth International Symposium on Tilapia in Aquaculture, pp.241-246 (K. Fitzsimmons and J.C. Filho, eds.). Rio de Janeiro, Brazil.
Fagbenro, O.A. 2001. Feedstuff digestibility in culturable freshwater fish species in Nigeria. Proceedings of the First National Symposium on Fish Nutrition and Fish Feed Technology in Nigeria, pp.26-37 (A.A. Eyo, ed.). Fisheries Society of Nigeria (FISON) and Nigerian Institute for Oceanography and Marine Research (NIOMR), Lagos, Nigeria.
Fagbenro, O.A. 2002. Tilapia: fish for thought. 32nd Inaugural Lecture, Federal University of Technology, Akure, Nigeria. 77pp
Fagbenro, O.A. 2004. Predator control of overpopulation in cultured tilapias and the alternative uses for stunted tilapias in Nigeria. Proceedings of the Sixth International Symposium on Tilapia in Aquaculture, pp.634-647. (R.B. Bolivar, G.C. Mair and K. Fitzsimmons, eds.). Manila, Philippines. September 12-16, 2004.
Fagbenro, O.A. and Adebayo, O.T. 2005. A review of the animal and aquafeed industries in Nigeria. In: A synthesis of the formulated animal and aquafeed industry in sub-Saharan Africa, pp.25-36. (John Moel and Matthias Halwart, eds.). CIFA Occasional Paper No.26, FAO, Rome. 61pp.
Fagbenro, O.A. and Akinbode, G.A. 1988. The use of Tilapia zillii (Gervais) as biological control of aquatic microphytes in ponds. Nigerian Journal of Weed Science 1: 71-75.
Fagbenro, O.A., Akinbulumo, M.O. and Ojo, S.O. 2004. Aquaculture in Nigeria - past experience, present situation and future outlook (history, status and prospects). World Aquaculture 35 (2): 23-26.
Fagbenro, O.A., Adeparusi, E.O. and Fapohunda, O.O. 2003. Feedstuffs and dietary substitution for farmed fish in Nigeria. Proceedings of the National Workshop on Fish Feed Development and Feeding Practices in Aquaculture, pp.60-72. (A.A. Eyo, ed.). Fisheries Society of Nigeria (FISON), and FAO-National Special Program on Food
308308
Security (NSPFS) and National Institute for Freshwater Fisheries Research (NIFFR). New Bussa, Nigeria. September 15-19.
Fagbenro, O.A, Jegede, T. and Fasasi. O.S. 2010. Tilapia aquaculture in Nigeria. Applied Tropical Agriculture 15: 49-55.
Fagbenro, O.A., Salami, A.A. and Sydenham, D.H.J. 1992. Induced ovulation and spawning in the catfish, Clarias isheriensis (Clariidae) using pituitary extracts from non-piscine sources. Journal of Applied Aquaculture 1(4): 15-20.
Fagbenro, O.A., Adedire, C.O., Owoseeni, E.A. and Ayotunde, E.O. 1993. Studies on the biology and aquacultural potential of feral catfish, Heterobranchus bidorsalis (Geoffroy Saint Hilaire 1809) (Clariidae). Tropical Zoology 6: 67-79.
Fagbenro, O.A., Nwanna, L.C., Adeparusi, E.O., Adebayo, O.T. and Fapohunda, O.O. 2005. An overview of the animal feed industry and dietary substitution of feedstuffs for farmed fish in Nigeria. In: Crops: Growth, Quality and Biotechnology (current status and future prospects) (Ramdane Dris, ed.). WFL Publisher, Helsinki, Finland. ISBN 952-91-8601-0, 3-1: pp.91-107.
Fapohunda, O.O. and Fagbenro, O.A. 2006. Biotechnical factors affecting tilapia culture systems in the savanna region of Nigeria. Proceedings of the Seventh International Symposium on Tilapia in Aquaculture (W.M. Contreras-Sanchez and K. Fitzsimmons, eds.). Veracruz, Mexico.
Fasasi, O.S., Adeyemi, I.A. and Fagbenro, O.A. 2005. Proximate composition and multi-enzyme in-vitro protein digestibility of maize-tilapia flour blends. Journal of Food Technology 3 (3): 342-345.
Fasasi, O.S., Adeyemi, I.A. and Fagbenro, O.A. 2006. Physicochemical properties of maize-tilapia flour blends. Proceedings of the Seventh International Symposium on Tilapia in Aquaculture (W.M. Contreras-Sanchez and K. Fitzsimmons, eds.). Veracruz, Mexico.
Fasasi, O.S., Adeyemi, I.A. and Fagbenro, O.A. 2007. Functional and pasting characteristics properties of fermented maize and Nile tilapia (Oreochromis niloticus) flour diet. Pakistan Journal of Nutrition 6 (4): 304-309.
Idodo-Umeh, G. 2003. Freshwater fishes of Nigeria (taxonomy, ecological notes, diet and utilization). 1st edition. Ldodo-Umeh Publishers Ltd, Benin City. Nigeria. 238pp.
Ihekoronye, A.I. and Ngoddy, P.O. 1985. Integrated Food Science and Technology for the Tropics. Macmillian Educational Press Limited. Lagos, Nigeria. pp. 226-336.
Inyang, N.M. and Hettiarachchi, M. 1994. Efficacy of human chorionic gonadotropin (HCG) and crude pituitary extract of fish and frog in oocyte maturation and ovulation in African catfish Clarias gariepinus Burchell 1822 and Clarias anguillaris (L.) 1762. Aquaculture and Fisheries Management 25: 245-258.
Jegede, O.T. 2004. Replacement value of Cassia fistula seed meal for soybean meal in practical diets of Nile tilapia (Oreochromis niloticus L.) fingerlings. M.Tech. Thesis, Federal University of Technology, Akure.
Jegede, T. 2009. Population control of farm-raised tilapias (Oreochromis niloticus and Tilapia zillii) using pawpaw seed and neem leaf meals as reproduction inhibitors. Ph.D. Thesis, Federal University of Technology, Akure, Nigeria. 151pp.
Jegede T. 2010. Control of reproduction in Oreochromis niloticus (Linnaeus 1758) using Hibiscus rosa-sinensis (Linn.) leaf meal as reproduction inhibitor. Journal of Agricultural Science 2(4): 149-154.
Jegede, T. and Fagbenro, O.A. 2007. Tilapia husbandry vs. midwifery: use of antifertility plants. Proceedings of the Third Annual Conference of the School of Agriculture and Agricultural Technology, pp.118-122. (G.E. Onibi, S.O. Agele, V.A.J. Adekunle and M.O. Olufayo, eds.). Federal University of Technology, Akure. April 16-19, 2007.
Jegede, T., Ellah, G. and Fagbenro, O. 2010. If overpopulation is the problem in farm-raised tilapias, the use of antifertility plants may be the solution. Paper presented at the 25th Annual Conference of the Fisheries Society of Nigeria, Lagos, Nigeria. Oct. 25-29, 2010.
Kusemiju, O., Noronha, C. and Okanlawon, A. 2002. The effect of crude extract of the bark of Carica papaya on the seminiferous tubules of male Sprague-Dawley rats. Nigerian Postgraduate Medical Journal 9(4): 205-209.

309309
Nwadukwe, F.O. 1993. Inducing oocyte maturation, ovulation and spawning in the African catfish Heterobranchus longifilis Valenciennes (Pisces: Clariidae), using frog pituitary extracts. Aquaculture and Fisheries Management 24: 625-630.
Ochang, S.N. 2007. Use of palm oil, soybean oil or groundnut oil as substitute for fish oil in diets for Nile tilapia (Oreochromis niloticus) and African catfish (Clarias gariepinus). Ph.D. Thesis, Federal University of Technology, Akure. 170pp.
Oderinde, O., Noronha, C., Oremosu, A., Kusemiju, T. and Okanlawon, O.A. 2002. Abortifacient properties of aqueous extract of Carica papaya (Linn) seeds on female Sprague-Dawley rats. Nigerian Postgraduate Medical Journal 9(2): 95-98.
Okeiyi, L.C. and Futrell, M.F. 1983. Evaluation of protein quality of formulation of sorghum grain flour and legume seeds. Nutrition Report International 28: 451-456.
Raji, A.A. 1998. A survey of aquacultural management practices in fish farms in Osun State. PGD Thesis, Federal University of Technology, Akure, Nigeria. 100pp.
Raji, Y. and Bolarinwa, A.F. 1997. Antifertility activity of Quassia amara in male rats- in vivo study. Life Science 64: 1067-1074.
Raji, Y., Udoh, U.S., Mewoyeka, O.O., Ononye, F.C. and Bolarinwa, A.F. 2003. Implication of reproductive endocrine malfunction in male antifertility efficacy of Azadirachta indica extracts in rats. African Journal of Medical Sciences 32: 159-65.
Salami, A.A., Fagbenro, O.A., Edibite, L. and Fagbemiro, S. 1994. Induced spawning of Clarias gariepinus using non-piscine pituitary extracts. Journal of the World Aquaculture Society 25: 166-168.
Salami, A.A., Bello-Olusoji, O.A., Fagbenro, O.A. and Akegbejo-Samsons, Y. 1997. Induced breeding of two clariid catfishes, Clarias gariepinus and Heterobranchus bidorsalis using tilapia pituitary extracts. Journal of the World Aquaculture Society 28: 113-117.
Salami, I.L. 1988. An assessment of the nutritional value of corn-pinto bean, Ogi-pinto porridges as food. Journal of Arid Agriculture 1: 107-119.
Satia, B.P. 1990. National reviews for aquaculture development in Africa. 29. Nigeria. FAO Fisheries Circular No.770.29. FAO, Rome. 193pp.
Shimang, G.N. 1992. Post-harvest losses in inland fisheries in Nigeria with emphasis on Lake Chad and Lake Kainji. pp.78-83. In: F. Teutscher (ed.) Proceedings of Symposium on Post-harvest Fish Technology. Cairo, Egypt. 21-22 Oct. 1990. CIFA Technical Paper No. 19. FAO, Rome. 117pp.
Uche-Nwachi, E.O., Ezeokoli, D.C., Adogwa, A.O. and Offiah, V.N. 2001. Effect of water extract of Carica papaya seed on the germinal epithelium of the seminiferous tubules of Sprague Dawley rats. Kaibogaku Zasshi 76(6): 517-521.
Udoh, P. and Kehinde, A. 1999. Studies on antifertility effects of pawpaw seeds (Carica papaya) on the gonads of male albino rats. Phytotherapeutic Research 13(3): 226-228.
Yinusa, R., Akinsomisoye, O.S. and Salman, T.M. 2005. Antispermatogenic activity of Morinda lucida extracts in male rats. Asian Journal of Andrology 7(4):405-410.

310
310
BEST AQUACULTURE PRACTICES STANDARDS FOR THE TILAPIA INDUSTRY
Darryl JORY

311311
A HANDS-ON TRAINING HELPED PROLIFERATION OF TILAPIA
CULTURE IN BANGLADESH
MD. ASADUL BAQUI1 AND RAM C.BHUJEL2
1Fisheries Training Institute, Chandpur, Department of Fisheries (DoF), Bangladesh
2Aquaculture and Aquatic Resources Management (AARM) SERD, Asian Institute of Technology (AIT) PO Box 4, Klong Luang, Pathumthani 12120, THAILAND
Abstract
Realizing the need to develop appropriate skills of extension worker, 2nd Fisheries Training and Extension Project (FTEP-II) funded by Department of International Development (DFID), UK focused to develop the skills of DOF officials as trainers. The main goal of the project was to demonstrate the direct benefits to the poor that could result in by improving the capacity of trainers and by supporting the application of this capacity in extension service delivery. Under the project, a group of selected DOF officers (extension workers) were sent to the Asian Institute of Technology (AIT) based in Thailand for training on mono-sex hatchery management and cage culture of tilapia in 2001. Thinking to apply the knowledge and skills gained through 4-week hands-on training, one of them upon his return to workplace (Fish Breeding and Training Center, Raipur) collected F6 generation of Genetically Improved Farmed Tilapia (GIFT) from Bangladesh Fisheries Research Institute (BFRI) which was originally from ICLARM, now World Fish Center. Applying selective breeding high quality seeds of GIFT were produced and 3.7 million seeds were distributed among the farmers during 2002. By motivating the private farmer and providing the technical support, a mono-sex tilapia hatchery and grow-out farm (Ambar Fisheries) was established in Laxmipur district in 2002. In the same year, cage culture was promoted among private entrepreneurs. As a result, 40 cages (6mX3mX1.5m=27m3) were set in the Dakatia River in Chandpur. Following the success, cage culture expanded to Laxmipur district in 2006 due to which demand for seed increased. Under the technical assistance of the same person, Pioneer Fisheries and hatcheries started its operation in Chandpur district in the same year. After the success of these first few hatcheries which produced several millions of high quality sex-reversed tilapia fry, many others showed interest. At least four hatcheries came into operation between 2006 and 2008 in mid-southern part of Bangladesh. After this, proliferation of mono-sex hatcheries and cage culture started in many parts of Bangladesh. About 3,500 cages are in operation now in Chandpur along the Dakatia River, 500 cages in Laxmipur along the Meghna River. Culture involves stocking of 37-40 sex-reversed tilapia fry of 20-25 g size per m3. Fish grow around 400 g in 6-7 months giving around 15kg/m3 productivity when fed floating feeds. Mortality remains <5% and FCR around 1.75. Altogether, these cages are producing at least 3,200 metric tons of tilapia annually. At least 600 people including 5% women are working in the cages. Four feed producing companies are providing 6,000 MT of floating feed annually. Probably, as a result of intensification and contamination from other countries, farmers as in other countries, are facing disease problem which is threatening the tilapia industry. A solution has to be explored.
INTRODUCTION
Background Bangladesh has the sub-tropical monsoon climate with temperature range ranging
from 11 to 340C. Bangladesh is composed of mainly the great combined delta and flood plains criss-crossed by numerous rivers and their tributaries. There are over 250 large rivers in the country. The three major rivers, the Padma, the Brahmaputra and the Meghna, drain a catchment extending over Bhutan, Nepal, India, Bangladesh and China. The total area of these river basins is about 1.5 million sq km of which 8% is in Bangladesh. Bangladesh alone

312312
has about 4 million hectares of inland open water area and 0.3 million hectares of inland closed waterbed (Banglapedia, 2003). The inland closed water bodies especially the ponds and shrimp-farms are almost on peak of utilization and losing their production potentials day-by-day. But most of the inland open water bodies including extensive floodplains are still left for capturing the natural stocks and un-utilized. Increasing pressure of population over the natural resources, siltation, and water pollution by industries and agriculture are causing decline in the natural fish stock critically while the demand is increasing rapidly. Wise use of the potential vast flowing water by promoting culture fish in cages could assist in fulfilling the demand of national protein intake as in other Asian countries. After the liberation of the country a number of NGOs (e.g. CARE-Bangladesh and others) along with the relevant government department tried for decades but unfortunately due to some factors the technology didn’t sustain in the country. However, Department of fisheries (DoF) collaborating with other governments and NGOs continue to promote cage culture. A remarkable breakthrough was achieved when some DoF field level officials had the opportunity to receive training from the Asian Institute of Technology (AIT) based near Bangkok, where the technology mono-sex seed production was developed. One of the authors of this paper serving for the DoF being based in Fisheries Training Institute was able to translate the knowledge and skill gained from the high quality training into practice in Bangladesh. Cage culture in rivers has been introduced in Bangladesh successfully to support poor communities residing in two districts; Chandpur and Laxmipur. Six large-scale mono-sex hatcheries have been established so far working with the private sector. The technology has been disseminated to other parts of the country. Gradually, a number of organizations along with the government and various social sects have also been involved. This has efforts has been a model as it brought in a huge direct and indirect benefits to the communities in a number of ways, such as, by producing high quality protein near the doors, creating employment opportunity, increasing family income and supporting economic activities through linkages with private sector. This paper highlights the approaches used hoping that it could be a model for others in Bangladesh as well as rest of the world.
Tilapia – species of choice Tilapia, especially Nile tilapia (Oreochromis niloticus), better known as aquatic-
chicken, has become the second most important fish species in world aquaculture after carps overtaking salmonids. Although native to Africa tilapia have been introduced around the globe and its farming is growing rapidly especially in Asia including Bangladesh because of their fast growth, ease of breeding and accept a wide range of feeds including planktons from natural sources, high disease-resistance and tolerance to poor water quality and low dissolved oxygen levels. Tilapia is gaining popularity in the west as well because of its white muscle with mild flavor with no intra-muscular bones. Tilapias are a good source of protein and a popular target for artisanal and commercial fisheries in Bangladesh. Although tilapia is alien species, it is considered almost like a native species in Asia. It is raised in inland ponds, lakes, reservoir, and artificial tanks and even in lowland agricultural fields. Developing the GIFT variety by ICLARM (now WorldFish Center) and development of Sex Reversed Tilapia (SRT) seed production technology by the Asian Institute of Technology (AIT) has added new dimension in tilapia aquaculture. Farmers have been well-acquainted with tilapia culture. Mozambique Tilapia (Oreochromis mossambicus) was first introduced to Bangladesh in 1954 but due to the black color, excessive breeding nature, and low productivity character of the fish it could not be well accepted by the farmers. In 1974, UNICEF arranged the introduction of Chitralada strain of Nile tilapia from Thailand (Hossain, 2005) which proved to be far better and farmers started its farming. Further introduction was in 1994 by the WorldFish Center. Tilapia farming gained importance in Bangladesh during last ten years only.
Cage culture Cage culture has been successfully practiced most Asian countries adopting which
China, Vietnam, Thailand, Taiwan and Malaysia have increased their national fish production by several folds and leading the international tilapia market and producing better sized tilapia whole frozen and fillet (Am. Tilapia Assoc., 2010). As Bangladesh has high population density and regularly loosing agricultural lands for urbanization, closed water bodies to produce fish are limited; and production has reached to high enough of its capacity. Now is the time to
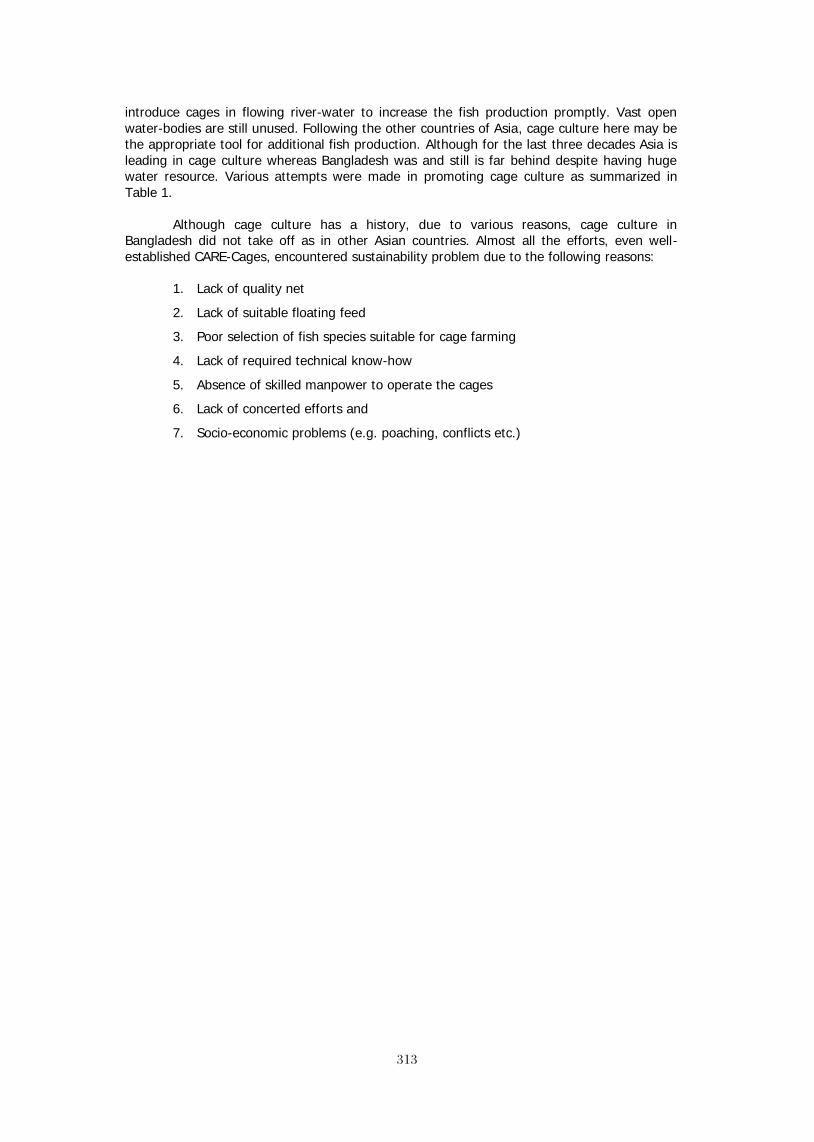
313313
introduce cages in flowing river-water to increase the fish production promptly. Vast open water-bodies are still unused. Following the other countries of Asia, cage culture here may be the appropriate tool for additional fish production. Although for the last three decades Asia is leading in cage culture whereas Bangladesh was and still is far behind despite having huge water resource. Various attempts were made in promoting cage culture as summarized in Table 1.
Although cage culture has a history, due to various reasons, cage culture in Bangladesh did not take off as in other Asian countries. Almost all the efforts, even well-established CARE-Cages, encountered sustainability problem due to the following reasons:
1. Lack of quality net
2. Lack of suitable floating feed
3. Poor selection of fish species suitable for cage farming
4. Lack of required technical know-how
5. Absence of skilled manpower to operate the cages
6. Lack of concerted efforts and
7. Socio-economic problems (e.g. poaching, conflicts etc.)
314314
Table 1: History of cage culture in Bangladesh
Duration Activities Remarks
1977 Commercial cage culture was included in the National Development Program.
Target was to promote fish production utilizing the vast open water.
1978 Department of Fisheries and Bangladesh Agricultural University introduced cage culture mainly for research of the post-graduate students of Fisheries Faculty.
These experimental cages were mainly as a part of post graduate student’s course-curriculum.
1980 Bangladesh Fisheries Development Corporation and Bangladesh Krishi Bank jointly started cage project in Kaptai Lake.
Poor management and lack of technical know-how resulted ending of project.
1986-87 Department of Fisheries introduced cage culture of Indian major carps in Kaptai lake.
Hand-made feed could not bring any good result.
1981-84 Department of Fisheries derived experimental cage culture in different places of the country; the remarkable one was the cages in Dhandmondi lake in Dhaka town.
Survival rate was good but production of O. niloticus was not up to the satisfactory level.
1983-84 In the same Dhanmondi lake cage culture of Rohu Catla, Mirgal, Bighead, Silver and Nile tilapia was trialed. Survival rate was high and production rate was poor.
The survival rate was high.
1987-1991 BFRI tried experimental cage culture in Kaptai Lake. Hand-made feed was used, no good result was obtained.
1992 CARE-Bangladesh and North-west Fishery Extension project introduced cage culture in Kakrul beel (floodplain) in Rangpur.
Leasing complexity of the beel caused stopping of the activities.
1993-95 North-west Fishery Extension project run cage culture with women groups in many places of Chirirbondor and Parbotipur.
Cutting off the nets by crabs finally became a threat.
1995 CARE-Bangladesh undertook the project “Cage Aquaculture for Greater Economic Security” (CAGES) for experimenting in Meghna-Gomti river.
The technology couldn’t be proved economically sound and therefore, was not disseminated.
1996 North-west Fishery Extension project along with RDRS started cage culture at Dimla and Aditmari.
Tilapia was found to be the best species for cage culture followed by Pangsias.
Source: DoF, Bangladesh
NEW APPROACHES OF TECHNOLOGY TRANSFER This section describes the approaches of technology transfer activities step-wise. High Quality Training
Funded by the Department of International Development (DFID), UK, Fisheries Training and Extension Project (FTEP-II) realized the need to develop appropriate skills of extension workers of DOF officials as trainers. The ultimate goal of the project was to demonstrate the direct benefits to the poor that could result in by improving the capacity of trainers and by supporting the application of this capacity in extension service delivery. Under the project, a group of 18-members DOF officers (extension workers) were selected for
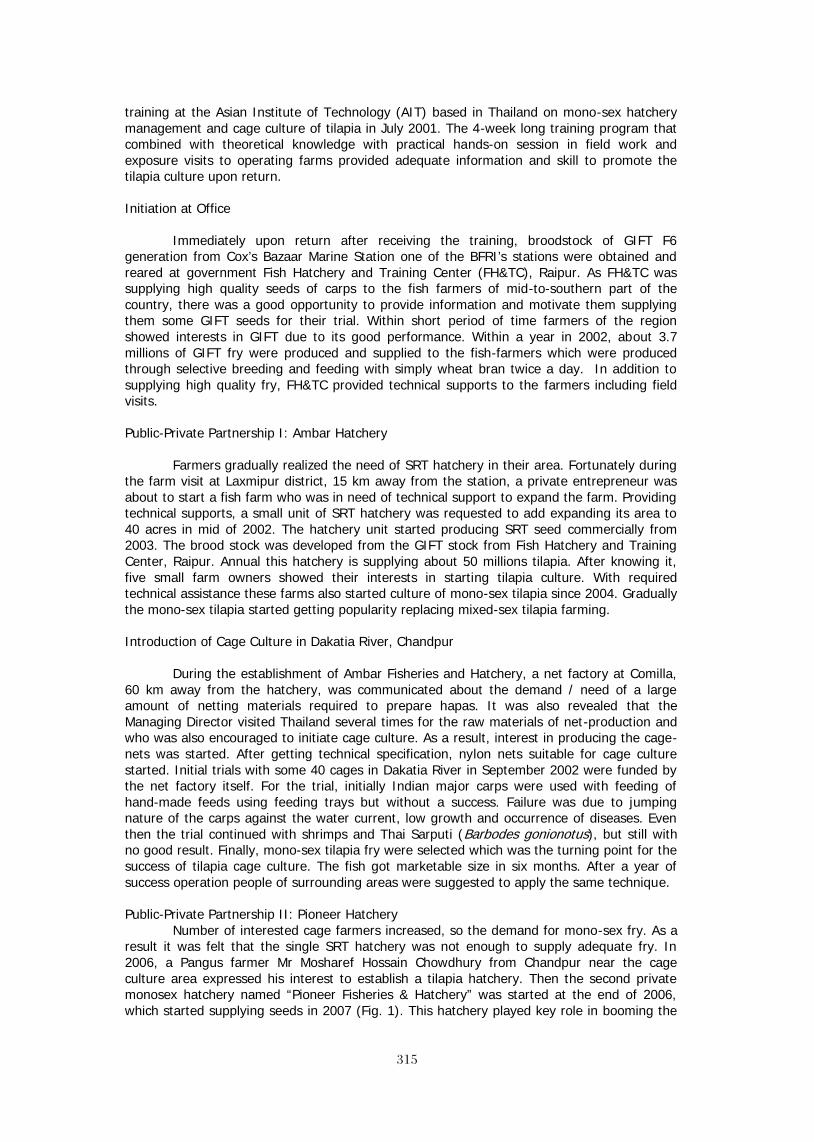
315315
training at the Asian Institute of Technology (AIT) based in Thailand on mono-sex hatchery management and cage culture of tilapia in July 2001. The 4-week long training program that combined with theoretical knowledge with practical hands-on session in field work and exposure visits to operating farms provided adequate information and skill to promote the tilapia culture upon return.
Initiation at Office
Immediately upon return after receiving the training, broodstock of GIFT F6 generation from Cox’s Bazaar Marine Station one of the BFRI’s stations were obtained and reared at government Fish Hatchery and Training Center (FH&TC), Raipur. As FH&TC was supplying high quality seeds of carps to the fish farmers of mid-to-southern part of the country, there was a good opportunity to provide information and motivate them supplying them some GIFT seeds for their trial. Within short period of time farmers of the region showed interests in GIFT due to its good performance. Within a year in 2002, about 3.7 millions of GIFT fry were produced and supplied to the fish-farmers which were produced through selective breeding and feeding with simply wheat bran twice a day. In addition to supplying high quality fry, FH&TC provided technical supports to the farmers including field visits.
Public-Private Partnership I: Ambar Hatchery
Farmers gradually realized the need of SRT hatchery in their area. Fortunately during the farm visit at Laxmipur district, 15 km away from the station, a private entrepreneur was about to start a fish farm who was in need of technical support to expand the farm. Providing technical supports, a small unit of SRT hatchery was requested to add expanding its area to 40 acres in mid of 2002. The hatchery unit started producing SRT seed commercially from 2003. The brood stock was developed from the GIFT stock from Fish Hatchery and Training Center, Raipur. Annual this hatchery is supplying about 50 millions tilapia. After knowing it, five small farm owners showed their interests in starting tilapia culture. With required technical assistance these farms also started culture of mono-sex tilapia since 2004. Gradually the mono-sex tilapia started getting popularity replacing mixed-sex tilapia farming.
Introduction of Cage Culture in Dakatia River, Chandpur
During the establishment of Ambar Fisheries and Hatchery, a net factory at Comilla, 60 km away from the hatchery, was communicated about the demand / need of a large amount of netting materials required to prepare hapas. It was also revealed that the Managing Director visited Thailand several times for the raw materials of net-production and who was also encouraged to initiate cage culture. As a result, interest in producing the cage-nets was started. After getting technical specification, nylon nets suitable for cage culture started. Initial trials with some 40 cages in Dakatia River in September 2002 were funded by the net factory itself. For the trial, initially Indian major carps were used with feeding of hand-made feeds using feeding trays but without a success. Failure was due to jumping nature of the carps against the water current, low growth and occurrence of diseases. Even then the trial continued with shrimps and Thai Sarputi (Barbodes gonionotus), but still with no good result. Finally, mono-sex tilapia fry were selected which was the turning point for the success of tilapia cage culture. The fish got marketable size in six months. After a year of success operation people of surrounding areas were suggested to apply the same technique.
Public-Private Partnership II: Pioneer Hatchery Number of interested cage farmers increased, so the demand for mono-sex fry. As a
result it was felt that the single SRT hatchery was not enough to supply adequate fry. In 2006, a Pangus farmer Mr Mosharef Hossain Chowdhury from Chandpur near the cage culture area expressed his interest to establish a tilapia hatchery. Then the second private monosex hatchery named “Pioneer Fisheries & Hatchery” was started at the end of 2006, which started supplying seeds in 2007 (Fig. 1). This hatchery played key role in booming the
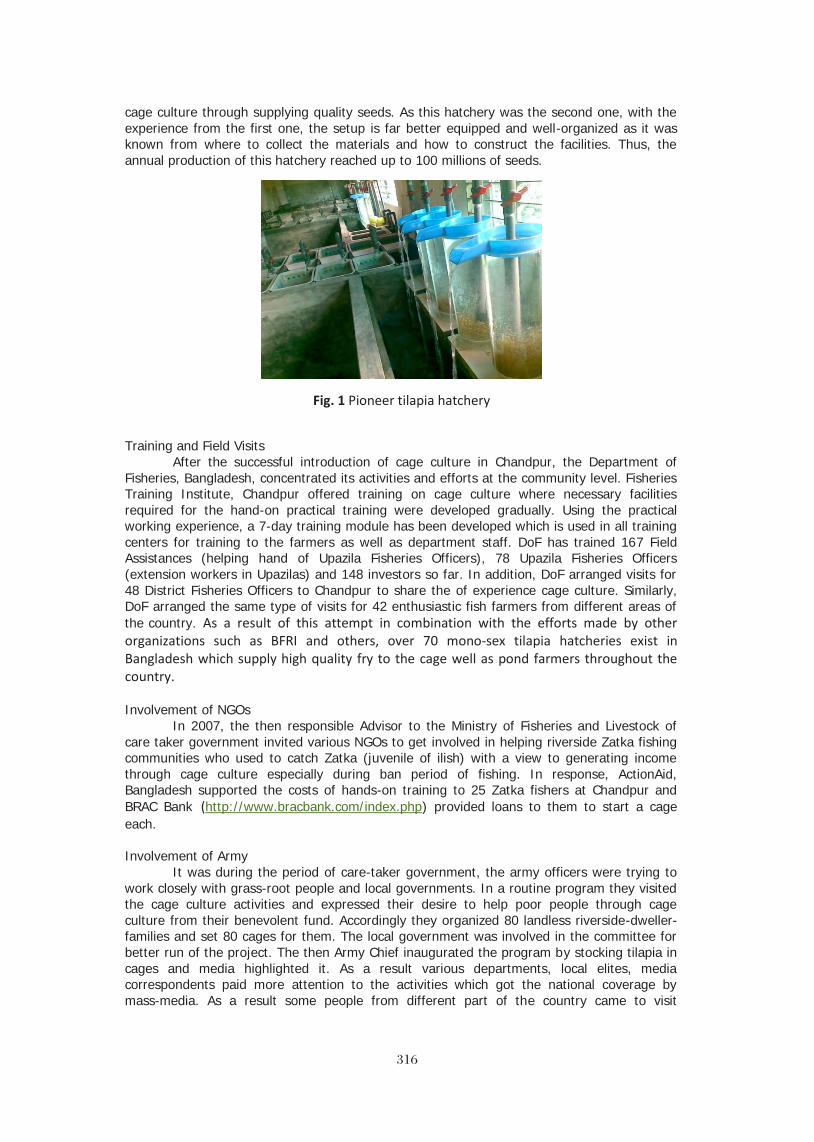
316316
Fig. 1 Pioneer tilapia hatchery
cage culture through supplying quality seeds. As this hatchery was the second one, with the experience from the first one, the setup is far better equipped and well-organized as it was known from where to collect the materials and how to construct the facilities. Thus, the annual production of this hatchery reached up to 100 millions of seeds.
Training and Field Visits After the successful introduction of cage culture in Chandpur, the Department of
Fisheries, Bangladesh, concentrated its activities and efforts at the community level. Fisheries Training Institute, Chandpur offered training on cage culture where necessary facilities required for the hand-on practical training were developed gradually. Using the practical working experience, a 7-day training module has been developed which is used in all training centers for training to the farmers as well as department staff. DoF has trained 167 Field Assistances (helping hand of Upazila Fisheries Officers), 78 Upazila Fisheries Officers (extension workers in Upazilas) and 148 investors so far. In addition, DoF arranged visits for 48 District Fisheries Officers to Chandpur to share the of experience cage culture. Similarly, DoF arranged the same type of visits for 42 enthusiastic fish farmers from different areas of the country. As a result of this attempt in combination with the efforts made by other organizations such as BFRI and others, over 70 mono-sex tilapia hatcheries exist in Bangladesh which supply high quality fry to the cage well as pond farmers throughout the country.
Involvement of NGOs In 2007, the then responsible Advisor to the Ministry of Fisheries and Livestock of
care taker government invited various NGOs to get involved in helping riverside Zatka fishing communities who used to catch Zatka (juvenile of ilish) with a view to generating income through cage culture especially during ban period of fishing. In response, ActionAid, Bangladesh supported the costs of hands-on training to 25 Zatka fishers at Chandpur and BRAC Bank (http://www.bracbank.com/index.php) provided loans to them to start a cage each.
Involvement of Army It was during the period of care-taker government, the army officers were trying to
work closely with grass-root people and local governments. In a routine program they visited the cage culture activities and expressed their desire to help poor people through cage culture from their benevolent fund. Accordingly they organized 80 landless riverside-dweller-families and set 80 cages for them. The local government was involved in the committee for better run of the project. The then Army Chief inaugurated the program by stocking tilapia in cages and media highlighted it. As a result various departments, local elites, media correspondents paid more attention to the activities which got the national coverage by mass-media. As a result some people from different part of the country came to visit
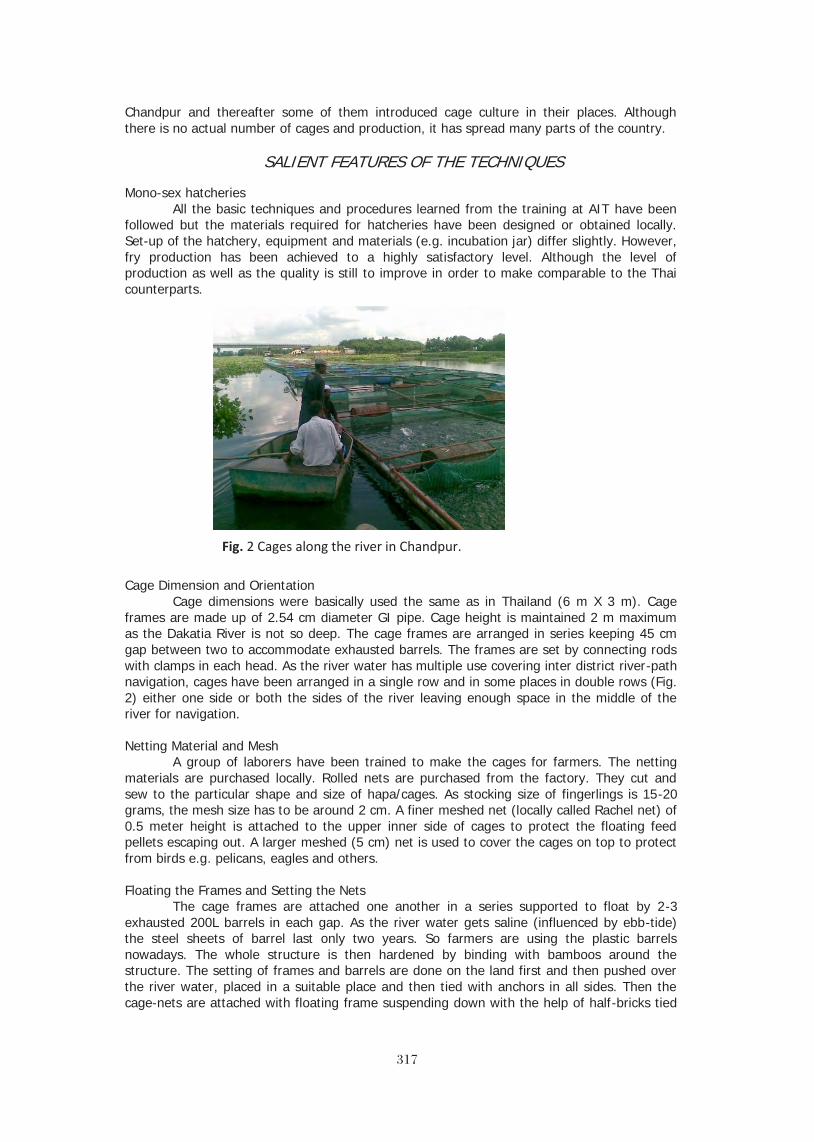
317317
Fig. 2 Cages along the river in Chandpur.
Chandpur and thereafter some of them introduced cage culture in their places. Although there is no actual number of cages and production, it has spread many parts of the country.
SALIENT FEATURES OF THE TECHNIQUES
Mono-sex hatcheries All the basic techniques and procedures learned from the training at AIT have been
followed but the materials required for hatcheries have been designed or obtained locally. Set-up of the hatchery, equipment and materials (e.g. incubation jar) differ slightly. However, fry production has been achieved to a highly satisfactory level. Although the level of production as well as the quality is still to improve in order to make comparable to the Thai counterparts.
Cage Dimension and Orientation Cage dimensions were basically used the same as in Thailand (6 m X 3 m). Cage
frames are made up of 2.54 cm diameter GI pipe. Cage height is maintained 2 m maximum as the Dakatia River is not so deep. The cage frames are arranged in series keeping 45 cm gap between two to accommodate exhausted barrels. The frames are set by connecting rods with clamps in each head. As the river water has multiple use covering inter district river-path navigation, cages have been arranged in a single row and in some places in double rows (Fig. 2) either one side or both the sides of the river leaving enough space in the middle of the river for navigation.
Netting Material and Mesh A group of laborers have been trained to make the cages for farmers. The netting
materials are purchased locally. Rolled nets are purchased from the factory. They cut and sew to the particular shape and size of hapa/cages. As stocking size of fingerlings is 15-20 grams, the mesh size has to be around 2 cm. A finer meshed net (locally called Rachel net) of 0.5 meter height is attached to the upper inner side of cages to protect the floating feed pellets escaping out. A larger meshed (5 cm) net is used to cover the cages on top to protect from birds e.g. pelicans, eagles and others.
Floating the Frames and Setting the Nets The cage frames are attached one another in a series supported to float by 2-3
exhausted 200L barrels in each gap. As the river water gets saline (influenced by ebb-tide) the steel sheets of barrel last only two years. So farmers are using the plastic barrels nowadays. The whole structure is then hardened by binding with bamboos around the structure. The setting of frames and barrels are done on the land first and then pushed over the river water, placed in a suitable place and then tied with anchors in all sides. Then the cage-nets are attached with floating frame suspending down with the help of half-bricks tied

318318
at each corner. After setting the cages, they are left exhausted for about 15 days so that the inner parts of the nets lose their roughness so that fishes would not be wounded.
Stocking Size and Stocking Density Farmers stock larger fingerlings e.g. 20 g although there is higher mortality compared
to smaller ones during transportation from hatcheries/nursery ponds. Stock of 1,000-1,100 mono-sex tilapia fingerlings per cage of 27m3 (6m X 3m X 1.5m) i.e. 37-40 per m3 is applied. Increasing the density beyond this increases the mortality.
Feeding Rate, Frequency and FCR Floating feed was first introduced by RUPSHEE fish feed in Bangladesh only in 2006.
Before 2006 feeding in cages was difficult job as it was not clear how the sinking feeds were used by the fish. Production of floating feeds assisted farmers a lot as farmers can observe and control feeding. Feeding is done twice daily to satiation level spreading over the water surface in each cage. During feeding the cages are not disturbed by any other activities. A number of companies are supplying floating feeds; the quality of them is more or less similar. Good feeding management in cages ensures the FCR remain less than 1.75, whereas, inexperienced new farmers use more feeds unnecessarily.
Sorting and Grading Depending on the feed quality, variation in fish size becomes obvious. Fishes are
graded and kept in different cages. Better the quality of feed and shorter will be the seed sorting interval. Normally, sorting is done once a month that means during the culture cycle of 6-7 months it requires 5-6 sortings. Fish are sold when they get larger than 400 gm. If smaller fish are kept further to grow. Sorting is done from late morning to noon.
Marketing Pattern Unlike pond cultured fish, marketing of caged fish is very easy. Retailers come to the
cage sites at a pre-set time, and collect on desired amount of fishes. The cage operators usually sort out the marketable sized fishes a day before selling date. Feeding is stopped 6 hours before harvest. Usually fish sellers collect two times from the cages, in the morning and in the afternoon and sell them in different markets even in neighboring village markets. In addition, some sellers collect live caged-fishes early in the morning and ferry them to the urban housing areas to sell live fishes.
RESULTS AND IMPACTS
Extension Trends of the Technology Until the end of 2005, nobody paid attention to the activities in Chandpur. Farmers
started showing interest only when it was demonstrated from trials with farmers and proved to be economically profitable at the household level. Once proved, number of families interested increased gradually and so the number of cages (Fig. 3). Various social sects such as, other businessmen, unemployed youth groups, primary school teacher, started involving in the venture. Thus at the end of 2006, a total 276 cages were functioning in Dakatia river and in 2007 the number increased to 578. Especially, after the involvement of Bangladesh Army, mass media highlighted and many more people came to learn about the activities and many people started getting involved indiscriminately and remarkable competition was observed for placing the cages in the rivers. At the end of 2008 the number raised to 1,580 and in following two years (2009 and 2010) the figure raised to 2,375 and 3,241 respectively and at the moment there are 3,510 cages in the river Dakatia alone in Chandpur.
It was also possible later in October 2006 to transfer the cage culture technology to nearby district i.e. Laxmipur only after having success in the district where training center was located. A total of 78 cages were introduced first in a canal of Meghna river near Barishal-Laxmipur steamer Ghat. In the following year the number increased to 273 and then in 2008 it reached to 550 covering 2 km canal leaving only one side for navigation. However,

319319
during the following years the numbers of cages at Laxmipur have declined because some poor farmers could not continue supporting the feeding cost (Table 1 and Fig 4).
Table 2. Number of cages by year
Year Chandpur Laxmipur
2005 40 0
2006 276 78
2007 578 273
2008 1580 550
2009 2375 523
2010 3241 475
2011 3510 475
From the very beginning well-being of the communities was highlighted as basic motive behind the investment in cage culture to avoid profit oriented rich people and their businesses. Gradually, when more people got involved, seed and feed demand increased which provide the opportunities for the larger companies to get involved. Some of the cage farmers have at least five cases in Laxmipur have sold out their cages due to shortage of funds to buy feed.
Impacts so far - A total of nearly 4,000 cages of Chandpur and Laxmipur are now producing approximately 3,200 metric tons of tilapia annually with the local market value of US$4.6 million using about 600 metric tons of floating feeds with the value of US$0.26 million. Each kilogram of tilapia is sold at US$1.75. In two districts (Chandpur and Laxmipur) cages are managed under single and multiple ownerships at least 124 units known. On an average, each unit employs at least 5 people, thus a total of 620 men have got direct employment in cage farming. About 10 feed-agents are supplying feeds with about additional 30 people are working for maintaining the feed marketing channel. In the two districts about 25 laborers are involved in making cages and 10 more people work in different places for setting up the cages in rivers. About 25 retail fish sellers are involved in marketing the caged tilapia on regular basis. Cage farming has now expanded throughout the country, especially after the involvement of Army, which was covered by the mass media. Many farmers from different part of the country paid visit to Chandpur who have introduced cage culture in their places. Although there is no actual number of cages and production, it has spread many parts of the country. Table 3 presents initial report.
0500
1000150020002500300035004000
2005 2006 2007 2008 2009 2010 2011Chandpur
Fig 3: Number of cages in Chandpur and Laxmipur districts of Bangladesh

320320
Table 3. Fish cage spots / districts
Spots No of cages Chandpur 3510 Laxmipur 475 Sunamgonj 253 Dhaka 10 Jamalpur 25 Sunamgonj 250 Pirojpur 170 Barishal 265 Feni 150 Narayongonj 270 Daudkandi 25 Munshigonj 25
Thus the cage farming has created a lot of jobs in various levels of process that links producers with consumers. Cage culture and other associated activities have developed several indirect employment opportunities. Women’s participation is limited as the activity requires working in the large volume and deep water (river) and far away from their homes. However, few women are involved in groups, especially fisher families who reside near the river. In such cases, illiterate fisher women have got donation or loan from NGOs. Even then female members often are assisted by their husbands.
More interestingly, illegal fishing and netting has drastically reduced due to the presence of cages in these two districts as they cover almost all the areas along the river side (total coverage is 84,000 square meters of river surface). Therefore, it has helped conserve the natural stock and their breeding. During feeding period small indigenous fishes from outside the cage enter and share some percentage of the same feed. Thus cages culture has ensured food for natural stock and preserved serving as fish sanctuary. Increased population of small fish species around the cages are observed clearly.
PROBLEMS ASSOCIATED
Although the cage culture technology has been introduced in Bangladesh with new approaches and new dimension, it has not been easy and without obstacles. Dense population, illiteracy, economic insolvency, rivalry and jealousy to each other, non-cooperation from many sects, social conflicts and few others are affecting its expansion. The major problems encountered are as follows:
Conflicts of Interest - Initially the river Dakatia was selected for setting up cages, due to its’ non-turbulent environment, security, easy transport of cage materials, seeds, feeds and giving suitability of marketing the fishes to surrounding numerous urban and village fish-markets. Until 2005, since the technology was not well-known to the people, it was thought that the whole Dakatia could be used for cage culture except the areas where industries and poultry farms release the effluents. However, when more and more people came to learn from one another, conflicts of interests started in the use of river. Some people marked their places with red-flags until they installed the cages; turning some cases into cruel conflicts. Concerned authorities and sects had to compromise with the riverside dwellers to solve the crisis.
Cages Damaged by Ships - The same rivers are used for inter district navigation. A good number of steamers run from Dhaka to Chandpur daily. All these steamers crossing the main
3510 500
253 10 25 250
170 265
150 270
25 25
Chandpur
Laxmipur
Sunamgonj
Dhaka
Jamalpur
Sunamgonj
Pirojpur
Barishal
Feni
Narayongonj
Daudkandi
Munshigonj
Fig 4: Expansion of Chandpur model cage culture to other districts
321321
stream of Meghna reach Chandpur. On their arrival they settle down in the secure inner ghats which are about 5-7 km inside from the Dakatia, where numerous cages have been installed on both the sides. The steamers especially in the foggy winter night sometimes run over the cages unknowingly. Thus another type of conflicts aroused between cage-owners and steamer-drivers. The strong association of steamer owners did not pay attention to the crying of cage operators. As a measure, the cage operators have installed security lights with series of bamboo poles over the cage structures. At the same time, the steamer drivers have been requested to drive their vehicles cautiously particularly around the cage culture area.
Lack of Legal Right - According to the public rule of the Bangladesh each citizen has an equal right over the river on condition that he/she doesn’t disturb others. However, nobody can set any permanent structure on the river. Sites have been selected with due consideration of these rules. Cages have been installed leaving ghats which are used by villagers for bath and collecting water for house-hold use and leaving navigation route free. Even then when the cages are great in serving people by producing rich protein, creating employment opportunities, farmers still can’t have legal right over the places in river. Considering this as a critical problem, cage farmers formally submit request to the District Collector (DC) and they have been allowed in condition that the cage structures are only temporary and would not disturb any navigation route.
Disease Problem - Since 2008, in the cages at Chandpur and Lamxipur are facing the most acute problem with disease. Like other countries in Asia, the pond tilapia aquaculture is also suffering from diseases. Last year about 30% of the cages fishes died due to disease. A particular size of fishes was affected by the diseases. Teachers and Fish disease scientists from Bangladesh Agricultural University and BFRI visited the cages during the crisis. According to them it was due to the bacterial disease caused by Streptococcus sp. However, no specific diagnosis was possible. In addition to the disease, it might have been due to the combination of factors involving water quality. Some solution is still to be explored to help the farmers.
RECOMMENDATIONS AND CONCLUSIONS
Unlike some of the other Asian countries, cage culture in Bangladesh is still in its infancy. There are still a lot to do to reach the level that cage farming would play an important role of food security to the poor people as well as earn foreign currency by export. Based on the experience of direct involvement, the followings are recommended:
Government should formulate appropriate policies and regulations for the cage farming and provide legal right over the places charging annual fees per cage or unit area. If necessary, quota system can be established for a given area/village selected based on the suitability.
Keeping in mind that tilapia can be a good source of foreign earnings as other Asian countries, technical expertise should be developed within relevant departments so that whole production process can be monitored and certified. For example, environmental condition, seed quality, stocking density, feeds and feeding practices, post harvest handling, processing and so on.
There are about 145 shrimp export companies in Bangladesh, 63 of which are approved by EU. These have the capacity of exporting 265,000 MT fish and shrimps. But these factories are getting only 50,000 MT for export which means only 18-20% of their capacity has been used so far. They do not have anything to export especially during October to late February. As tilapia is produced throughout the year, exporting tilapia fillets would be one of the best options. Therefore, production of export quality tilapia in cages in huge volume would need concerted efforts including developing national policies and promotion. In order to create export market some sorts of certification schemes for export grade tilapia production, would be necessary e.g. good aquaculture practices (GAP) and HACAP.
Since the mono-sex tilapia hatcheries are the base of tilapia industry, they should be well-equipped with technology and quality brood stocks. Some hatcheries are dealing with the
322322
broods from authentic sources through BFRI, but majority are using broods either from unknown origin or from residual seeds of some farms which are genetically inferior. International organizations, such as AIT and GIFT Foundation, should have direct involvement for periodical refreshment of the brood stocks and monitoring and certification of seed produced local hatcheries.
Floating feeds are mostly produced in the country, partially from Thailand as well, and production of quality tilapia greatly depends on feed quality. A lot of farmers are complaining about the quality of feed produced in Bangladesh. Government should monitor the production process and the quality including the levels of nutrients as mentioned in the feed-bags.
A number of issues emerged among the cage owners which were not possible to solve on individual basis. Some issues such as, moving workers from one cage-owner to another, fish poaching, conflicts with ship-owners, lack of legal right over position on river-site, became too burning ones to stop the tread. Considering all the issues the cage owners arranged a meeting on 14th August 2010 and formed an association named “Bangladesh Cage-Owners Association” and its legal registration procedure is ongoing. They have setup an association office at Chandpur, from where they do the formal communications to relevant parties and organizations in any crisis.
In conclusion, cage culture has started a new era for aquaculture history in Bangladesh. Farmers are dreaming of big success in the venture. Cage farming needs expansion throughout the country. A good training to enthusiastic staff and practical exercise to develop and test new model of technology at the center where they are based play a critical role. Once a successful model is demonstrated, farmers and other stakeholders get interested in to apply and also support. Transfer to technology is more efficient through public-private partnership. As a result of this venture, cage culture of tilapia has been expanded in Bangladesh producing quite a large volume. However, production is consumed within the country. Bangladesh may start exporting tilapia, if production further increases and if the marketing infrastructure is developed that emphasize certification of quality, processing, and storage, and exploring the market. World is looking for quality farmed fish to feed the people. Tilapia has been considered the best candidate species. When the fish is started to export, it will further boost tilapia farming in Bangladesh. Similar to Prawn / shrimp, tilapia could play greater role towards reducing poverty through generating more income to the farmers, increasing employment and supplying animal nutrition. Every relevant and interested sect, government or non-government organization needs to join in hands to make it a success.
REFERENCES American Tilapia Association, 2010. American Tilapia Association web site. Banglapedia, 2003. National Encyclopedia of Bangladesh. Vol 4, Asiatic Society of
Bangladesh. Dhaka. March, 2003. Beverage, M.C.M. 1987. Cage Culture, Fishing News Book, 351p. Department of Fisheries (DoF), Bangladesh A training Manual on Cage Culture, Dakatia model Hossain, M.G. 2005. Aquaculture of tilapia in Bangladesh, 125p. Infofish. 2007. Infofish magazine at www.infofish.org.

323323
STATUS AND SUSTAINABILITY ANALYSIS OF THE TILAPIA AQUACULTURE IN CHINA
Liu Liping*1, Zhang Wenbo1, Francis Murrary2, David Little2
1College of Fisheries and Life Science, Shanghai Ocean University, Shanghai 201306, China
2Institute of Aquaculture, University of Stirling, Stirling, FK9 4LA, Scotland, UK E-mail: [email protected]
Abstract
Global consumption of seafood and associated trade volumes have risen dramatically over the last decade due to rising population, growing affluence and changing eating habits. Today more than half of all seafood is internationally traded with net transfers from developing to developed countries.
Tilapia is a worldwide fish of great commercial importance. In China, tilapia is an important species with annual production of more than 1.2 million tons, which accounted for about 45% of the total tilapia production in the world in 2008. Guangdong, Hainan and Guangxi provinces ranked top three in annual production in China. However, with over two decades of rapid growth, tilapia aquaculture in China has been facing many challenges in the past years.
To investigate the sustainability problems, a large scale survey was carried out through integrated top–down and bottom–up approaches. Secondary statistic data were collected at national and district level, and farm data were collected by field visit. Participation and perspectives from different local stakeholders along the value chain were emphasized to contextualize and understand sustainability constraints. Through these activities, we summarized that the sustaining development of the tilapia industry depends on the market price of products, disease control, water quality, climate, seed supply and seed quality.

324324
Tilapia; The Search for a Sustainable Model to Balance Between
Environment, People and Economy.
Yedod Snir and Israel Snir
Neve Eitan Fish Farm, Israel 38885, Inversiones miel - Honduras
During the past decade, World Tilapia production has experienced impressive and continues growth mainly in Asia and mostly by China. Same years and in parallel, very meaningful production scenarios and projects developed away from the Far East, closer to the main export market in the USA, with significant impacts on the industry - beyond the numbers and statistics.
The Seafood market as a whole is evolving and we are witnessing extreme changes in the basic characteristics of the demand. The end client today is more educated, expects the story behind the product, and has more ways to channel his requirements upwards, through the retailer or wholesaler, to the grower. Today, the big Tilapia exporters must give equal emphasis on production volumes, as too adopting more of a holistic approach in an attempt to find the right balance between environmental, social, and economic impacts of their activity.
Driven by the increased USA market, Tilapia consumption per capita has made an impressive growth, however with limited impact on the overall “USA seafood consumption” per capita – which implies Tilapia is replacing other marine species. Based on this very rapid unprecedented production and market increase worldwide, FAO, public and private research institutes, potential investors, are all trying to understand and predict the tendencies and the real overall potential for the continuing development of the Tilapia industry. What are the limiting factors? How sustainable Is this growth?
Many years have passed since Tilapia was first introduced to the Boston seafood show in 1979; today it is covering half of the floor. Will the same trend continue? How much more Tilapia will be needed? Where and how will Tilapia be produced? Which products? In what cost? All those recent years the focus was on fast production growth and it took its toll. Between others the apparent “victims” are the environment, the product quality and industry wholesomeness, the people involved, communities, and unfortunately the economy. Many big projects ended bankrupted and many single small farmers and farms lost control and disappeared. On the market side Tilapia is still suffering from low image reflecting low prices and more economical constrains. To increase production and develop stable demand it takes a balanced approach which requires going through each of these seven principal components, in the order they appear and simultaneously.
1. Water & environment
2. Financing
3. Animals & Husbandry
4. People & Management
5. Facilities & Technology
6. Feed & Raw materials ingredients
7. Market the story behind the product
325325
The challenge and the mission are to find the right balance between all of these factors, or as the term is often used today, to make this industry more ´´Sustainable´´.
The question for the grower today is, how much more sustainable is your competition?
Examples - Salmon is mainly being produced by two rich countries and consumed worldwide by the richer upper-class markets; American Catfish is being produced by few farmers in Southern USA and most of it is consumed right there; The emerged Vietnam Catfish industry is producing most Pangasius sold worldwide, little is eaten locally; Shrimp is produced mainly in poor countries by poor people who can’t afford to consume this product themselves but only to satisfy rich exclusive markets…
Tilapia is a very different story;
Tilapia is being produced all over the globe, mainly by “low income food deficit countries”
Tilapia is being consumed all over the globe in various socioeconomics groups, levels, with no distinction.
Tilapia on one hand has the potential to secure food availability for the poor nations and on the other hand to improve commercial balance for better and stable developing economies.
And even more so when the entire world economy, nations, societies, are undergoing a scaring food scarce warning.
It is a unique historically dangerous combination between climatologically changes, world politics, social unrest and real shortage due to increase in demand.
Tilapia, like any other live protein domestic production is competing with human being for same plants production – maize, soya, wheat and others.
In order to fulfill its nutritional expectations and future role – Tilapia (and other animals) must be produced on byproducts conversion to high quality animal proteins from raw materials not suited anymore for human consumption.
It is only then, that Tilapia will become an indispensible food staple for the low income societies to balance their nutrition and at the same time available for the white tablecloth markets.
In my presentation I am discussing the potentials and the limits for the Tilapia industry continuous growth and market expansion. This based on one little country’s experience that should serve as a model for the potential impact on many other communities and societies.
326326
Tilapia – the historical promise for today’s social justice and security
Yedod Snir and Israel Snir –
Neve Eitan Fish Farm, Israel 38885, Inversiones miel – Honduras
Abstract
Big companies policy on social and environment responsibility is always questionable. Is this just another way to clean their guilty conscience, a deceiving strategy which aims primarily to improve their short term and immediate economical and financial results? Or is it a real understanding that taking care of people and the environment is the best investment strategy they can make for long term sustainability and profitability?
Whatever we do, as human beings, will have its impact on the environment. From the moment we born we indeed contaminate – as we breathe, as we eat, as we build, as we fight, as we live. The ever-present need to produce and to stay active, in order to sustain ourselves, our families, and our countries - the humanity – is a destructive process.
As we are all aware the globe is hosting more and more habitants – world’s population keeps growing, meanwhile the natural resources we all depend on for our basic existence are quickly depleting, because of us, and because of others.
We all understand this process is accelerated each and every day. We are all desperately searching for the right formula which will allow more mouths to depend on fewer resources, more newborn given the opportunity to a fair life. Hopefully this will be a life which could help us balance between our indispensable needs and our economical and livelihood activities.
Aquaculture as a whole is an “industry” involved in land, water, air and people; could Tilapia be the “promised” specie to offer the best reasonable potentially balanced formula which at the same time is considerably caring about peoples, the environment, and the benefit of the economy – the investor?.
This paper is describing a very small country located in Central America. It is only a two hours flight from Miami which is closer than most other major cities in America. While it is only three days boat ride, from the USA, the country is basically a different planet, different globe, light years of distance, far away from the daily routine we all familiar with. With an annual GDP of a few hundred dollars or in the best case few thousands, how can one face the enormous challenges for maintaining basic daily life and society order? Let alone when it comes for “altruistic causes” like preserving the environment or caring about others or looking for more justice.
Despite all these hardships, typical constrains in such an underdeveloped country, almost all of the aquatic products (better term than Seafood) America eats is coming from countries with a similar unfortunate circumstances around the globe and in the case of Tilapia Tropical countries. It is quite obvious to the world that those who have will do whatever they can to ensure a continuous flow from those who don’t have. Of course, these are the markets, the banks, the stomachs that can afford paying for this activity and they are those who making the rules.
327327
The recent flourishes of so many certifying organizations, mostly NGOs, are primarily aimed at “selfish” approach to assure the quality, acceptability and stability of the aquatic products supply – in the current terminology - transparency and sustainability. However, one must be very careful in making sure it is not becoming a way to express a modern colonialism…
This is exactly the point I will try to demonstrate - how a small country, remote communities, forgotten children, after so many years of traditional environmentally destructive practices – how they transformed and were able to put together a sustainable project which is changing their life, ours. How they manage to combine natural resource, water, energy, Tilapia, foresting, communities, health, education, government, private sector, investor – how they all together made the change. How local native stakeholders learn to watch their OWN long term interests, how big companies investment in people becoming a strategy, how illiterates people interpreted amorphous and theoretical terminology into day to day constructive practices for the benefit of all, their families, communities, countries, and us - the globe. It is a modest attempt to show some of the process where so many people were and are involved – and hopefully to inspire others.

328328
GROW OUT SYSTEMS
Professor Emmanuel Frimpong
Virginia Tech University
USA
329329
The International Aquaponics and Tilapia Aquaculture Course at the University of the Virgin Islands
James E. Rakocy*, Donald S. Bailey, R. Charlie Shultz and Jason J. Danaher
Agricultural Experiment Station University of the Virgin Islands
RR 1, Box 10,000, Kingshill, VI 00850, U.S. Email: [email protected]
Introduction
For nearly three decades the Aquaculture Program at the University of the Virgin Islands (UVI) has focused on the development of two intensive tilapia production systems that conserve and reuse water and recycle nutrients. Dry conditions and limited arable land in the Virgin Islands provided the impetus for this research. A commercial-sized aquaponic system was developed. This system can annually produce 5 mt of tilapia and 5-13 mt of leafy green vegetables on 0.05 ha of land. A 0.02-ha biofloc system was developed which can produce 7 mt of tilapia annually. The biofloc system could be scaled up to a larger size. Using geotextile technology, solid waste from these systems can be recovered, dewatered and used as a soil amendment for field crops, replacing the need for inorganic fertilizers.
After 19 years of research and development, the aquaculture program started to promote and teach these technologies while continuing to conduct research. In 1999, the 1st Annual Aquaponics and Tilapia Aquaculture Short Course was held and attended by 17 students. Advertising for the 1-week course was conducted mainly by sending out flyers and placing ads in aquaculture publications. As the Internet became widely used, most attendees learned of the course through the Internet and the use of flyers was discontinued. Attendance gradually increased until the capacity of the lecture room (33) was consistently reached and exceeded, resulting in the rejection of many applicants. During the last 4 years, a new conference room became available and attendance in 2007, 2008, 2009 and 2010 was 63, 73, 56 and 92 students, respectively. In 2008, the 10th anniversary of the course, its name was changed to the International Aquaponics and Tilapia Aquaculture Course. During that year students came from all seven continents, including a researcher from Antarctica.
A team of four aquaculturists teach the course which is divided into 26 hours of classroom instruction and 22 hours of hands-on field exercises. During 2007-2009, two lectures were delivered during each course by an aquaponics researcher (Dr. Wilson Lennard) from Australia over the phone while his PowerPoint slides were shown in the conference room.
Total course attendance to date has been 510 students from 45 U.S states and territories and 52 other countries (Table 1). Former students have offered their own short courses in Florida, Illinois, Oklahoma, Hawaii and Mexico and have attracted hundreds of students. The course instructors are sometimes asked to conduct aquaponics training at other locations including Virginia, Pennsylvania, Wisconsin, Hawaii, Mexico, Trinidad and Australia. As a result of the UVI course and the efforts of many others, aquaponics is becoming remarkably popular but mainly at the hobby level so far. Biofloc system adoption is slower, but its potential in tropical areas is great. Biofloc technology training should be conducted in a separate course for a different audience.

330330
Table 1. Breakdown of participants taking the “International Aquaponics and Tilapia Aquaculture Course” by state, territory and country during 13 course offerings from 1999-2010. U.S. States Student No. West Indian Countries,
Territories, Departments Student No.
Alabama 11 Arizona 6 Antigua 9 Arkansas 2 Barbados 3 California 20 British Virgin Islands 2 Colorado 8 Cayman Islands 4 Connecticut 7 Curacao 3 Florida 39 Dominican Republic 3 Georgia 16 Haiti 3 Hawaii 6 Jamaica 6 Idaho 1 Martinique 5 Illinois 5 Montserrat 1 Indiana 1 Nevis 2 Iowa 1 St. Eustatius 2 Kansas 3 St. Lucia 5 Kentucky 1 St. Maarten 7 Louisiana 11 Trinidad and Tobago 16 Maine 1 Maryland 3 Other Countries Massachusetts 3 Argentina 1 Michigan 7 Australia 3 Minnesota 2 Bahamas 3 Missouri 2 Belize 1 New Hampshire 2 Botswana 1 New Jersey 8 Bulgaria 1 New York 16 Canada 21 North Carolina 5 Colombia 4 Ohio 5 Costa Rica 2 Oklahoma 5 Cyprus 2 Oregon 4 Denmark 1 Pennsylvania 8 Ethiopia 1 Rhode Island 2 Finland 1 South Carolina 3 France 1 South Dakota 1 France (Réunion Island) 1 Tennessee 4 Guatemala 2 Texas 18 Honduras 1 Utah 3 China (Hong Kong) 3 Virginia 11 Hungary 1 Washington 4 Indonesia 2 West Virginia 1 Italy 1 Wisconsin 1 Japan 1 Lebanon 1 District of Columbia 1 Malaysia 8 Mexico 9 Nigeria 2 U.S. Virgin Islands Norway 1 St. Croix 34 Peru 2 St. John 1 Republic of Benin 1 St. Thomas 12 Saudi Arabia 1 Singapore 3 Other U.S. Territories South Africa 4 American Samoa 2 UAE (Abu Dhabi) 1 Guam 1 UK (England) 10 Puerto Rico 26 UK (Scotland) 1 Saipan 2 Venezuela 2 Zimbabwe 1 U.S. States 40 District of Colombia 1 U.S. Territories 5 Other Countries, Emirates Territories, Departments
52
Continents 7 (including Antarctica) 1 Total Students 510

331331
Background
UVI is a U.S. Land-Grant University. Land-Grant Universities typically have an agricultural experiment station, a cooperative extension service and an agricultural instruction program. UVI however could not sustain an instructional program due to lack of students from the Virgin Islands (population ~ 110,000) who wanted to pursue a degree in agriculture. Therefore, offering short courses became a feasible alternative to a formal degree program.
The U.S. Virgin Islands has a tourism-based economy of which agriculture is a very small segment. More than 95% of the food consumed in the Virgin Islands is imported, including 80% or more of the fish. There is a great need to increase the local production of fresh fish and vegetables. The UVI Agricultural Experiment Station supports the agriculture industry by conducting applied research in the areas of animal science, agronomy, horticulture, biotechnology and aquaculture. Aquaculture was the only research program which did not have a stakeholder base. The Aquaculture Program was established to create a commercial aquaculture sector by developing fish culture systems that are appropriate for the Virgin Islands and economically feasible. The Aquaculture Program has enjoyed a long period of stable funding and freedom to explore new technologies without stakeholder pressure.
The culture of freshwater fish in dug ponds is not feasible in the Virgin Islands because there is no running surface water and insufficient freshwater supplies in aquifers. Moreover, the high calcium carbonate soils (caliche) in the Virgin Islands lowlands do not retain water. Therefore, the Aquaculture Program focuses its research on high density tank systems that reuse and conserve water and recycle nutrients in vegetable crops. The program initially conducted research on aquaponic systems and later added the study of biofloc systems to its research agenda. Hydroponic herbs and vegetables were grown in aquaponic systems in conjunction with tilapia. The biofloc systems raised tilapia and recovered solid waste, using geotube technology, to fertilize field crops.
The results from a long progression of experiments on aquaponic and biofloc technology were outstanding. Both systems were scaled up to commercial sizes and evaluated for productivity. The aquaponic system can produce 5 mt of tilapia and 5 - 13 mt of hydroponic leafy green vegetables such as lettuce and basil annually on 0.05 ha of land (Figure 1) (Rakocy et al. 1997, Rakocy et al. 2004a, Rakocy et al. 2004b). Production of kangkong (Ipomoea aquatica), a nutritious aquatic plant, was 34 mt annually (unpublished data). A 0.02-ha biofloc tank can produce 7 mt of tilapia annually (unpublished data) (Figure 2) (Rakocy et al. 2004c). Dewatered solids (13% dry weight), which were collected from the biofloc system using geotube technology, produced comparable yields of vegetables when used as an organic fertilizer compared to standard applications of slow release inorganic fertilizers (Danaher 2009).
Training
By 1999 the development of the UVI aquaponic system reached a stage where it was ready for commercial application. While continuing to conduct research and refine the aquaponic and biofloc systems, the Aquaculture Program also began to promote this technology and train students by initiating the annual “Aquaponics and Tilapia Aquaculture Short Course.”
The course begins on a Sunday in the middle of June. After the instructors are introduced, the students introduce themselves, stating where they come from and what their goal is in taking the course. At this point the students are given CDs containing numerous publications and a class schedule. Students generally belong to one of the following categories: farmers, entrepreneurs, teachers, researchers, extension agents, missionaries or hobbyists.
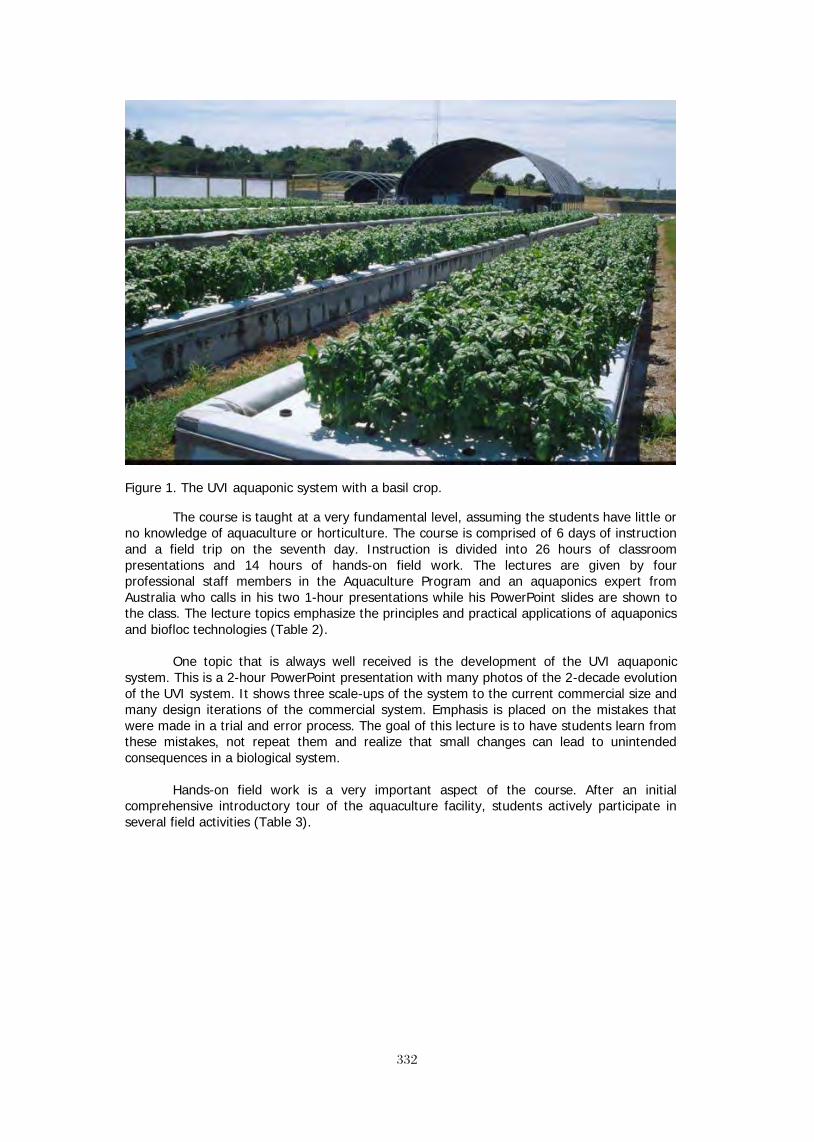
332332
Figure 1. The UVI aquaponic system with a basil crop.
The course is taught at a very fundamental level, assuming the students have little or no knowledge of aquaculture or horticulture. The course is comprised of 6 days of instruction and a field trip on the seventh day. Instruction is divided into 26 hours of classroom presentations and 14 hours of hands-on field work. The lectures are given by four professional staff members in the Aquaculture Program and an aquaponics expert from Australia who calls in his two 1-hour presentations while his PowerPoint slides are shown to the class. The lecture topics emphasize the principles and practical applications of aquaponics and biofloc technologies (Table 2).
One topic that is always well received is the development of the UVI aquaponic system. This is a 2-hour PowerPoint presentation with many photos of the 2-decade evolution of the UVI system. It shows three scale-ups of the system to the current commercial size and many design iterations of the commercial system. Emphasis is placed on the mistakes that were made in a trial and error process. The goal of this lecture is to have students learn from these mistakes, not repeat them and realize that small changes can lead to unintended consequences in a biological system.
Hands-on field work is a very important aspect of the course. After an initial comprehensive introductory tour of the aquaculture facility, students actively participate in several field activities (Table 3).

333333
Figure 2. The UVI biofloc system.
Table 2. Lecture topics in the “International Aquaponics and Tilapia Aquaculture Course.” World status of tilapia production and aquaponics systems Overview of the UVI systems Development of the UVI aquaponic system UVI aquaponic system design UVI aquaponic system construction Technical aspects of Australian aquaponics Aquaponic guidelines The UVI biofloc system Tilapia breeding, fry and fingerling production Feeding and fish nutrition The biology and diseases of tilapia Processing and marketing Water quality Plant requirements Plant production Plant pests, diseases and treatment Economics of aquaponics Business planning

334334
Table 3. Field activities in the “International Aquaponics and Tilapia Aquaculture Course.” Sort brood fish by sex Stock breeding hapas Collect and incubate eggs Estimate fry numbers Stock fry into hapas for sex reversal Grade and stock advanced fingerlings Harvest, purge and process tilapia Seed planting trays in greenhouse Fertilize and thin seedlings Transplant seedlings into aquaponic system Harvest and package vegetables Clean raft tops and net pots
The field activities in Table 3 are done by students. In addition, demonstrations are
conducted to show students the feeding of fry, fingerlings and growout fish, the addition of base, sludge removal from clarifiers and filters tanks and other miscellaneous activities.
The local media is invited during one of the field-activity sessions. Reporters from the two local newspapers and one local television station film or take photos of students working with the fish and plants and interview several students, especially students who come from distant countries. The resultant newspaper articles and TV news stories are always very positive and reflect well on the aquaculture research program and the university.
There are four social events during the week to encourage interaction among the students and the instructors in a less formal setting. On the first day of class the students are given dinner consisting of tilapia produced at the research facility and aquaponic vegetables along with some purchased items. On Wednesday, the students report to class in the field at 7:00 a.m. to harvest fish and vegetables, restock the fish tank and transplant seedling. After lunch on this day the students are given an island tour which finishes at a beach bar for drinks. On Friday night a banquet is held at a luxury resort which includes a cultural show. On Saturday the students go on a full day sailing and snorkel trip to Buck Island National Park. On the return trip the sail boat moors at a deserted beach on St. Croix for a beach barbecue.
A class photo is taken Thursday afternoon. By Friday copies of this photo are printed, laminated and distributed at the class closing ceremony. The students are given certificates of completion and T-shirts with a design signifying aquaponics. The students are also given an access code so that they may view all the PowerPoint presentations on a website called Blackboard. The students fill out and submit evaluation forms, which are used to improve the course. There is no formal method to follow up on the students after the course. The students are encouraged to call or e-mail the instructors if they want additional information or need clarification on some topic. A few students have taken the course a second time as they get closer to constructing their operation. Several students have sent photos of their aquaponic operations. The course has lead to the installation of many aquaponic systems, but the full extent of application is not known.
Students learn the principles of aquaponics during this intensive course. They see a working model of a commercial-scale aquaponic system and develop a good sense of the steps required to prepare an aquaponic business plan and to construct and operate an aquaponic system. However, it has become apparent over the years that students could benefit from an internship program where they are given full responsibility for operating an aquaponic system for a two or three-month period while having instructors available to assist them if problems develop or they are uncertain about some aspect of the operation. A trained intern would have the confidence and knowledge to start their own aquaponic business or work for someone else in a management capacity.

335335
References
Danaher, J.J. 2009. Evaluating geotextile technology to enhance sustainability of agricultural production systems in the U.S. Virgin Islands. University of the Virgin Islands, Technical Bulletin #14, 4 pp.
Rakocy, J.E., D.S. Bailey, K.A. Shultz and W.M. Cole. 1997. Evaluation of a commercial-scale aquaponic unit for the production of tilapia and lettuce. Pages 357-372 in K. Fitzsimmons, ed. Tilapia Aquaculture: Proceedings of the Fourth International Symposium on Tilapia in Aquaculture, Orlando, Florida.
Rakocy, J.E., D.S. Bailey, R.C. Shultz and E.S. Thoman. 2004a. Update on tilapia and vegetable production in the UVI aquaponic system. Pages 676-690 in R.B. Bolivar, G.C. Mair, K. Fitzsimmons, Eds. Proceedings from the Sixth International Symposium on Tilapia in Aquaculture, Manila, Philippines.
Rakocy, J.E., Shultz, R.C., Bailey D.S. and Thoman, E.S. 2004b. Aquaponic production of tilapia and basil: comparing a batch and staggered cropping system. Acta Horticulturae (ISHS) 648:63-69. (http://www.actahort.org/books/648/648_8.htm)
Rakocy, J.E., D.S. Bailey, E.S. Thoman and R.C. Shultz. 2004c. Intensive tank culture of tilapia with a suspended, bacterial-based, treatment process. Pages 584-596 in R.B. Bolivar, G.C. Mair and K. Fitzsimmons, Eds. Proceedings from the Sixth International Symposium on Tilapia in Aquaculture, Manila, Philippines.

336336
A Commercial-Scale Aquaponic System Developed at the University of the Virgin Islands
James E. Rakocy*, Donald S Bailey, R. Charlie Shultz, and Jason J. Danaher Agricultural Experiment Station University of the Virgin Islands
RR 1, Box 10,000, Kingshill, VI 00850 U.S. [email protected]
Abstract Aquaponics is the combined culture of fish and plants in recirculating systems.
Nutrients generated by the fish, either by direct excretion or microbial breakdown of organic wastes, are absorbed by plants cultured hydroponically. Fish provide most of the nutrients required for plant nutrition. As the aquaculture effluent flows through the hydroponic component of the recirculating system, fish waste metabolites are removed by nitrification and direct uptake by plants, thereby treating the water, which flows back to the fish rearing component for reuse.
The University of the Virgin Islands Aquaculture Program has developed a commercial-scale aquaponic system. The system consists of four fish rearing tanks (7.8 m3 each, water volume), two cylindro-conical clarifiers (3.8 m3 each), four filter tanks (0.7 m3 each), one degassing tank (0.7 m3), six hydroponic tanks (11.3 m3 each, 214 m2 of plant growing area), one sump (0.6 m3), and one base addition tank (0.2 m3). The system contains 110 m3 of water and occupies a land area of 0.05 ha. Major inputs are fish feed, water (1.5% of system volume daily on average), electricity (2.21 kW), base [Ca(OH)2 and KOH] and supplemental nutrients (Ca, K, Fe). The system can produce nearly 5 mt of tilapia along with 1400 cases (24-30 heads per case) of leaf lettuce or 5 mt of basil or a variety of other crops.
The UVI system represents an appropriate or intermediate technology that can be applied outdoors under suitable growing conditions or in an environmentally controlled greenhouse. The system conserves and reuses water, recycles nutrients and requires very little land. The system can be used on a subsistence level or commercial scale. Production is continuous and sustainable. The system is simple, reliable and robust. The UVI aquaponic system does require a relatively high capital investment, moderate energy inputs and skilled management, though management is easy if production guidelines are followed.
INTRODUCTION
Aquaponics is the combined culture of fish and plants in recirculating systems. Nutrients, which are excreted directly by the fish or generated by the microbial breakdown of organic wastes, are absorbed by plants cultured hydroponically (without soil). Fish feed provides most of the nutrients required for plant growth. As the aquaculture effluent flows through the hydroponic component of the recirculating system, fish waste metabolites are removed by nitrification and direct uptake by the plants, thereby treating the water, which flows back to the fish-rearing component for reuse.
Aquaponics has several advantages over other recirculating aquaculture systems and hydroponic systems that use inorganic nutrient solutions. The hydroponic component serves as a biofilter, and therefore a separate biofilter is not needed as in other recirculating systems. Aquaponic systems have the only biofilter that generates income, which is obtained from the sale of hydroponic produce such as vegetables, herbs and flowers. In the UVI system, which employs raft hydroponics, only calcium, potassium and iron are supplemented. The nutrients provided by the fish would normally be discharged and could contribute to pollution. Removal of nutrients by plants prolongs water use and minimizes discharge. Aquaponic systems require less water quality monitoring than individual recirculating systems for fish or hydroponic plant production. Aquaponics increases profit potential due to free nutrients for plants, lower water requirements, elimination of a separate biofilter, less water quality monitoring and shared costs for operation and infrastructure.

337337
Design Evolution and Operation
Aquaponic research at UVI began with six replicated systems that consisted of a rearing tank (12.8 m3), a cylindro-conical clarifier (1.9 m3), two hydroponic tanks (13.8 m2) and a sump (1.4 m3) (Rakocy 1997). The hydroponic tanks (6.1 m long by 1.22 m wide by 28 cm deep) were initially filled with gravel supported by wire mesh above a false bottom (7.6 cm). The gravel bed, which served as a biofilter, was alternately flooded with culture water and drained. Due to the difficulty of working with gravel, the gravel was removed and a raft system, consisting of floating sheets (2.44 m long x 1.22 m wide x 3.8 cm thick) of polystyrene, was installed. A rotating biological contactor (RBC) was then used for nitrification. Effluent from the clarifier was split into two flows, one going to the hydroponic tanks and the other to the RBC. These flows merged in the sump, from which the treated water was pumped back to the rearing tank.
The rearing tank in this design proved to be too large relative to the plant growing surface area of the hydroponic tanks, or, conversely, the hydroponic tanks were too small relative to the size of the rearing tank. When the rearing tank was stocked with Nile tilapia (Oreochromis niloticus) at commercial rates, nutrients rapidly accumulated to levels that exceeded the recommended upper limits for hydroponic nutrient solutions [2,000 mg/L as total dissolved solids (TDS)] (Rakocy et al. 1993). Using Bibb lettuce, the optimum ratio between the fish feeding rate and plant growing area was determined (Rakocy 1989). At this ratio (57 g of feed/m2 of plant growing area/day) the nutrient accumulation rate decreased and the hydroponic tanks were capable of providing sufficient nitrification. Therefore, the RBCs were removed and the fish stocking rates were reduced to levels that allowed feed to be administered near the optimum rate for good plant growth.
The experimental system has been scaled up three times. In the first scale-up, the length of each hydroponic tank was increased from 6.1 m to 29.6 m. The optimum design ratio was used to allow the rearing tank to be stocked with tilapia at commercial levels (for a diffused aeration system) without excessive nutrient accumulation. In the second scale-up, the number of hydroponic tanks (29.6 m in length) was increased to six; the number of fish rearing tanks was increased to four (each with a water volume of 4.4 m3); the number of clarifiers was increased to two; four filter tanks (0.7 m3 each) were added and the sump was reduced to 0.6 m3. This production unit, commercial aquaponics 1 (CA1), represented a realistic commercial scale, although there are many possible size options and tank configurations. The final scale-up, commercial aquaponics 2 (CA2), involved the enlargement of the four fish rearing tanks (each with a water volume of 7.8 m3) and the two clarifiers (each with a water volume of 3.8 m3) and the addition of a 0.7-m3 degassing tank (Figure 1). The commercial-scale units could be configured to occupy as little as 0.05 ha of land.
The rearing tanks and water treatment tanks were situated under an opaque canopy,
which inhibited algae growth, lowered water temperature, which is beneficial for hydroponic plant production, and created more natural lighting conditions for the fish.
The system used multiple fish rearing tanks to simplify stock management. Tilapia
production was staggered in four rearing tanks so that one rearing tank was harvested every 6 weeks. The fish were not moved during their 24-week growout cycle. In a 2.5-year production trial in CA 1 using sex-reversed Red tilapia, annual production was 3,096 kg, based on the last 11 harvests out of 19 harvests (Rakocy et al. 1997). Fingerlings, stocked at 182 fish/m3, grew at an average rate of 2.85 g/day to a size of 487 g. The final biomass averaged 81.1 kg/m3. This was equivalent to annual production of 175.7 kg/m3 of rearing tank space. The average feed conversion and survival were 1.76 and 91.6%
The stocking density appeared to be too high for maximum growth and efficient feed
conversion. Midway through each production cycle, ad libitum feeding leveled off at approximately 5 kg per rearing tank. As the fish grew in the last half of the production cycle, feed consumption did not increase. Therefore more of the feed was used for maintenance and less was used for growth, leading to a relatively high feed conversion ratio for 487-g fish. In CA2 the stocking rate for red tilapia has been lowered by 15% to 154 fish/ m3. The
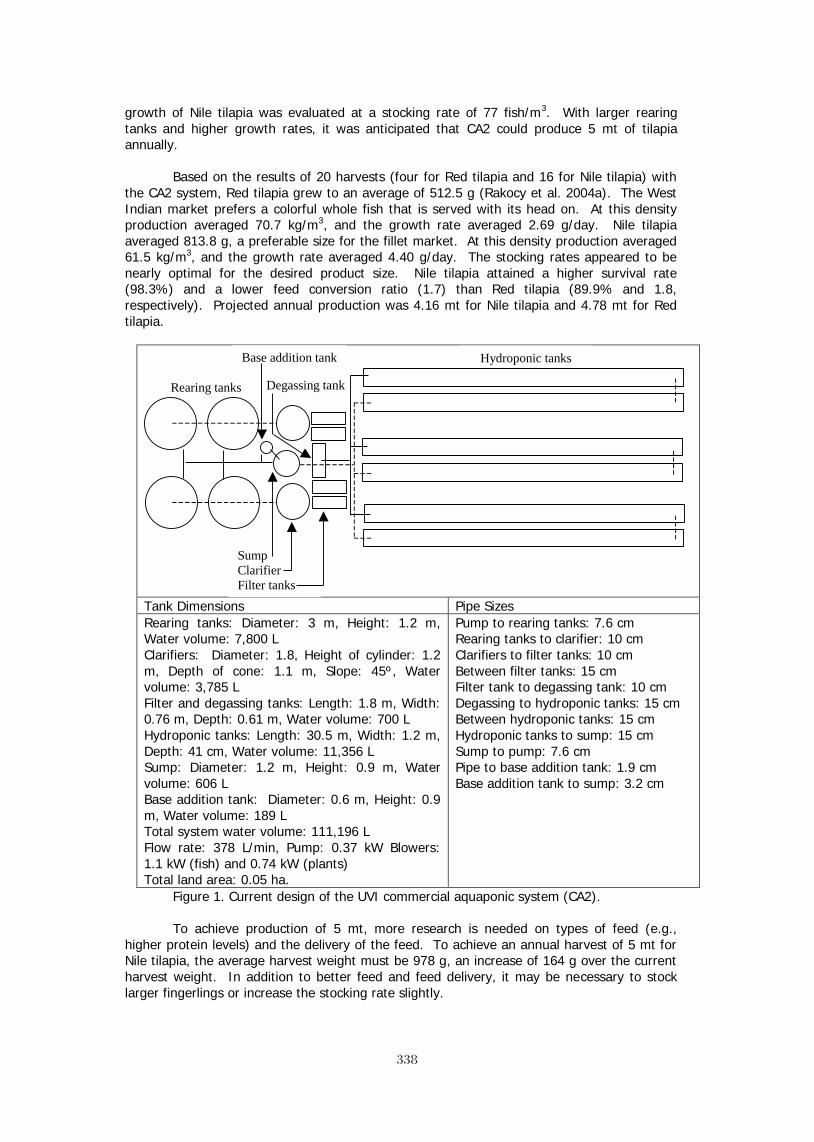
338338
growth of Nile tilapia was evaluated at a stocking rate of 77 fish/m3. With larger rearing tanks and higher growth rates, it was anticipated that CA2 could produce 5 mt of tilapia annually.
Based on the results of 20 harvests (four for Red tilapia and 16 for Nile tilapia) with
the CA2 system, Red tilapia grew to an average of 512.5 g (Rakocy et al. 2004a). The West Indian market prefers a colorful whole fish that is served with its head on. At this density production averaged 70.7 kg/m3, and the growth rate averaged 2.69 g/day. Nile tilapia averaged 813.8 g, a preferable size for the fillet market. At this density production averaged 61.5 kg/m3, and the growth rate averaged 4.40 g/day. The stocking rates appeared to be nearly optimal for the desired product size. Nile tilapia attained a higher survival rate (98.3%) and a lower feed conversion ratio (1.7) than Red tilapia (89.9% and 1.8, respectively). Projected annual production was 4.16 mt for Nile tilapia and 4.78 mt for Red tilapia.
Tank Dimensions Pipe Sizes Rearing tanks: Diameter: 3 m, Height: 1.2 m, Water volume: 7,800 L Clarifiers: Diameter: 1.8, Height of cylinder: 1.2 m, Depth of cone: 1.1 m, Slope: 45º, Water volume: 3,785 L Filter and degassing tanks: Length: 1.8 m, Width: 0.76 m, Depth: 0.61 m, Water volume: 700 L Hydroponic tanks: Length: 30.5 m, Width: 1.2 m, Depth: 41 cm, Water volume: 11,356 L Sump: Diameter: 1.2 m, Height: 0.9 m, Water volume: 606 L Base addition tank: Diameter: 0.6 m, Height: 0.9 m, Water volume: 189 L Total system water volume: 111,196 L Flow rate: 378 L/min, Pump: 0.37 kW Blowers: 1.1 kW (fish) and 0.74 kW (plants) Total land area: 0.05 ha.
Pump to rearing tanks: 7.6 cm Rearing tanks to clarifier: 10 cm Clarifiers to filter tanks: 10 cm Between filter tanks: 15 cm Filter tank to degassing tank: 10 cm Degassing to hydroponic tanks: 15 cm Between hydroponic tanks: 15 cm Hydroponic tanks to sump: 15 cm Sump to pump: 7.6 cm Pipe to base addition tank: 1.9 cm Base addition tank to sump: 3.2 cm
Figure 1. Current design of the UVI commercial aquaponic system (CA2).
To achieve production of 5 mt, more research is needed on types of feed (e.g., higher protein levels) and the delivery of the feed. To achieve an annual harvest of 5 mt for Nile tilapia, the average harvest weight must be 978 g, an increase of 164 g over the current harvest weight. In addition to better feed and feed delivery, it may be necessary to stock larger fingerlings or increase the stocking rate slightly.
Rearing tanks
Hydroponic tanks
Degassing tank
Base addition tank
Sump Clarifier Filter tanks

339339
Production trials with the CA1 system employed two methods of ad libitum feeding. A demand feeder, used initially, was replaced by belt feeders, utilizing variable quantities of feed adjusted to meet the demand. Neither method proved to be entirely satisfactory. With demand feeders, high winds would shake the feeder, which then dispensed too much feed, or clumps of feed would block the funnel opening of the demand feeder, which then delivered too little feed. The belt feeders periodically failed, not delivering any of the daily feed ration. Both devices were expensive and required support structures. In CA2 the fish were fed ad libitum by manual feeding three times daily, which proved to be much more satisfactory.
In a CA1 production trial, DO levels were maintained at a mean of 6.2 mg/L by high
DO in the incoming water and by diffused aeration with air delivered through 10 air stones (22.9 cm x 3.8 cm x 3.8 cm) around the perimeter of the tank. In the last 12 weeks of the growout period, a 40-watt vertical lift pump was placed in the center of the tank for additional aeration. The pump pushed the floating feed to the perimeter of the tank and some feed pellets were splashed out of the tank during initial feeding frenzies. Vigorous aeration vented carbon dioxide gas into the atmosphere and prevented its buildup. A high water exchange rate quickly removed suspended solids and toxic waste metabolites (ammonia and nitrite) from the rearing tank. A 0.74-kW in-line pump moved water at an average rate of 378 L/min from the sump to the rearing tanks (mean retention time, 0.8 h). Values of ammonia-nitrogen and nitrite-nitrogen in the rearing tanks averaged 1.47 and 0.52 mg/L, respectively. A pH of 7.2 was maintained by frequently adding equal amounts of calcium hydroxide and potassium hydroxide. Total alkalinity averaged 56.5 mg/L as calcium carbonate.
In CA2 the vertical lift pump was eliminated, and the number of air stones around the
rearing tank perimeter was increased to 22 (15.2 cm x 3.8 cm x 3.8 cm). The air stones pushed feed to the center of the tank and no feed was lost due to feeding frenzy splashing. With larger water volumes, the retention time increased to an average of 1.37 hours. A 1.1 kW blower provided sufficient aeration for the fish rearing tanks while a 0.74 kW blower was used for the hydroponic tanks.
Effluent from the fish rearing tanks flowed into two 1.9-m3 clarifiers in the CA1
production trial. Separate drains from two of the rearing tanks were connected to each clarifier [see Rakocy (1997) for a detailed description]. The clarifiers removed settleable solids, but the amount of solids collected was not as great with the 9.5-minute retention time in the production trial as it had been in previous trials with longer retention times (>20 minutes). Therefore, in CA2 the clarifiers were increased in size to 3.8 m3 and the retention time increased to 19 minutes. The bottom slope of the new clarifiers was 45º as compared to 60º slopes in the 1.9-m3 clarifiers. Sludge was removed from the clarifiers three times daily.
Settleable solids in the clarifiers adhered to the sides of the cones and did not slide to
the bottom where they could be removed by opening the drain line. It was necessary to stock about 20 male tilapia in the each clarifier. They were not fed. As these fish fed on organisms growing on the clarifier walls, solids rolled to the cone bottom and were easily removed by opening the drain line. The tilapia also swam into the rearing tank drain lines and kept them free of biofouling organisms. Tilapia in the clarifiers grew rapidly and needed to be replaced every 12 weeks with smaller (~ 50 g) fingerlings. If they became too large, their swimming activity stirred up the settled solids, which was counterproductive to clarification.
Suspended solids levels, which decline slightly on passage through the clarifier, were
reduced further before the effluent entered the hydroponic tanks. Excessive solids were detrimental to plant growth. Solids adhered to plant roots, created anaerobic conditions and blocked nutrient uptake. Two filter tanks in series, each with a volume of 0.7 m3 and filled with orchard netting (1.9 cm mesh), received effluent from the clarifier and removed considerable amounts of suspended solids, which adhered to the orchard netting. In the CA1 production trial, total suspended solids averaged 9.0 mg/L in the rearing tanks, 8.2 mg/L in
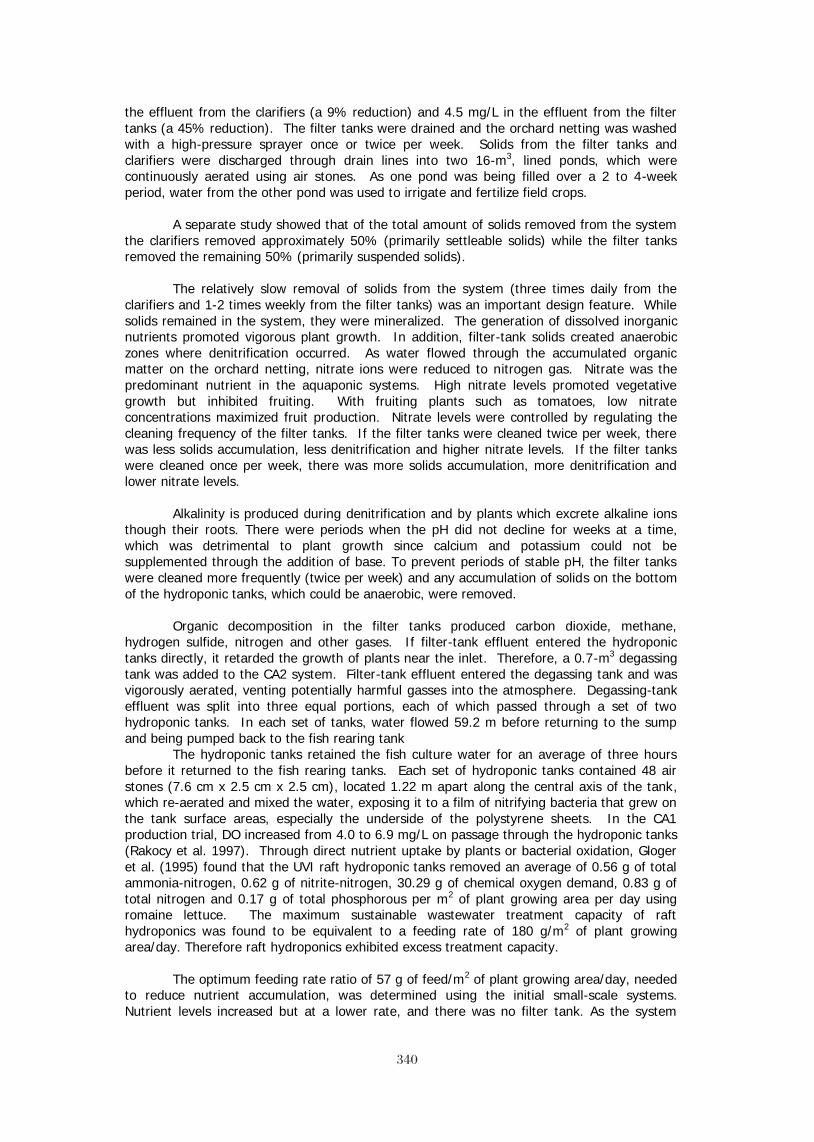
340340
the effluent from the clarifiers (a 9% reduction) and 4.5 mg/L in the effluent from the filter tanks (a 45% reduction). The filter tanks were drained and the orchard netting was washed with a high-pressure sprayer once or twice per week. Solids from the filter tanks and clarifiers were discharged through drain lines into two 16-m3, lined ponds, which were continuously aerated using air stones. As one pond was being filled over a 2 to 4-week period, water from the other pond was used to irrigate and fertilize field crops.
A separate study showed that of the total amount of solids removed from the system
the clarifiers removed approximately 50% (primarily settleable solids) while the filter tanks removed the remaining 50% (primarily suspended solids).
The relatively slow removal of solids from the system (three times daily from the
clarifiers and 1-2 times weekly from the filter tanks) was an important design feature. While solids remained in the system, they were mineralized. The generation of dissolved inorganic nutrients promoted vigorous plant growth. In addition, filter-tank solids created anaerobic zones where denitrification occurred. As water flowed through the accumulated organic matter on the orchard netting, nitrate ions were reduced to nitrogen gas. Nitrate was the predominant nutrient in the aquaponic systems. High nitrate levels promoted vegetative growth but inhibited fruiting. With fruiting plants such as tomatoes, low nitrate concentrations maximized fruit production. Nitrate levels were controlled by regulating the cleaning frequency of the filter tanks. If the filter tanks were cleaned twice per week, there was less solids accumulation, less denitrification and higher nitrate levels. If the filter tanks were cleaned once per week, there was more solids accumulation, more denitrification and lower nitrate levels.
Alkalinity is produced during denitrification and by plants which excrete alkaline ions
though their roots. There were periods when the pH did not decline for weeks at a time, which was detrimental to plant growth since calcium and potassium could not be supplemented through the addition of base. To prevent periods of stable pH, the filter tanks were cleaned more frequently (twice per week) and any accumulation of solids on the bottom of the hydroponic tanks, which could be anaerobic, were removed.
Organic decomposition in the filter tanks produced carbon dioxide, methane,
hydrogen sulfide, nitrogen and other gases. If filter-tank effluent entered the hydroponic tanks directly, it retarded the growth of plants near the inlet. Therefore, a 0.7-m3 degassing tank was added to the CA2 system. Filter-tank effluent entered the degassing tank and was vigorously aerated, venting potentially harmful gasses into the atmosphere. Degassing-tank effluent was split into three equal portions, each of which passed through a set of two hydroponic tanks. In each set of tanks, water flowed 59.2 m before returning to the sump and being pumped back to the fish rearing tank
The hydroponic tanks retained the fish culture water for an average of three hours before it returned to the fish rearing tanks. Each set of hydroponic tanks contained 48 air stones (7.6 cm x 2.5 cm x 2.5 cm), located 1.22 m apart along the central axis of the tank, which re-aerated and mixed the water, exposing it to a film of nitrifying bacteria that grew on the tank surface areas, especially the underside of the polystyrene sheets. In the CA1 production trial, DO increased from 4.0 to 6.9 mg/L on passage through the hydroponic tanks (Rakocy et al. 1997). Through direct nutrient uptake by plants or bacterial oxidation, Gloger et al. (1995) found that the UVI raft hydroponic tanks removed an average of 0.56 g of total ammonia-nitrogen, 0.62 g of nitrite-nitrogen, 30.29 g of chemical oxygen demand, 0.83 g of total nitrogen and 0.17 g of total phosphorous per m2 of plant growing area per day using romaine lettuce. The maximum sustainable wastewater treatment capacity of raft hydroponics was found to be equivalent to a feeding rate of 180 g/m2 of plant growing area/day. Therefore raft hydroponics exhibited excess treatment capacity.
The optimum feeding rate ratio of 57 g of feed/m2 of plant growing area/day, needed
to reduce nutrient accumulation, was determined using the initial small-scale systems. Nutrient levels increased but at a lower rate, and there was no filter tank. As the system
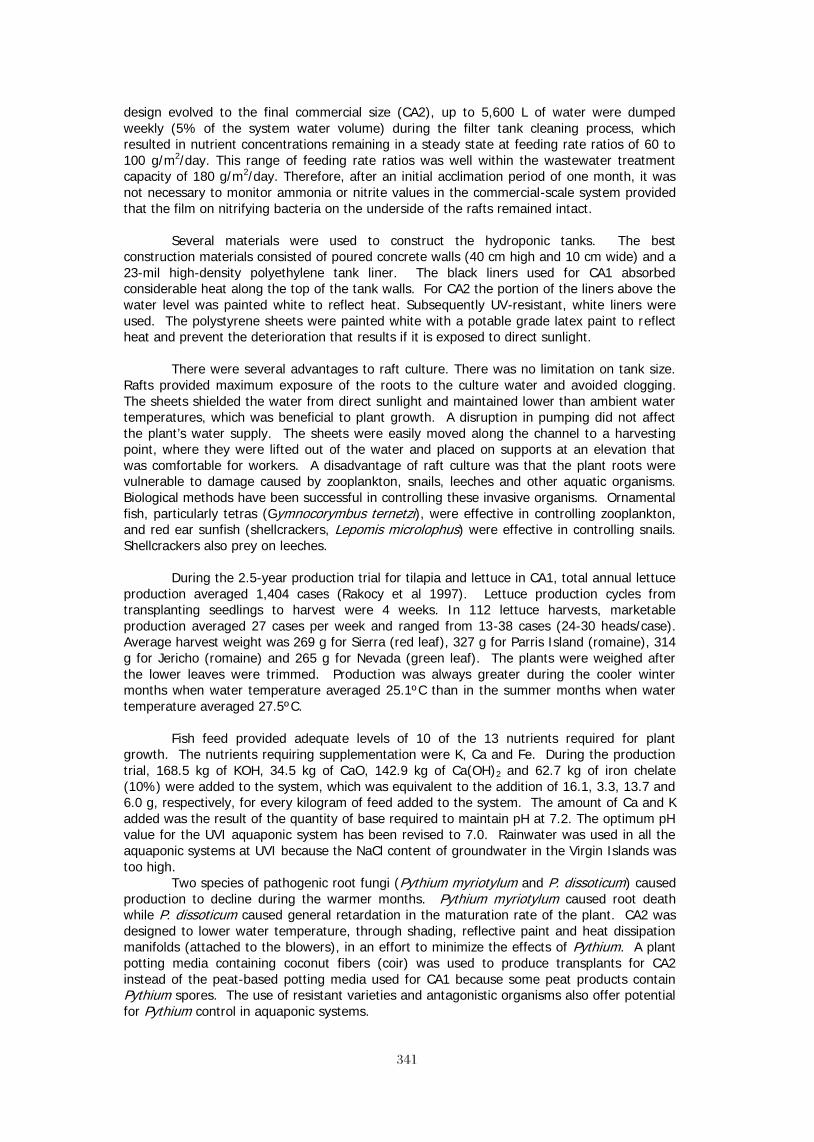
341341
design evolved to the final commercial size (CA2), up to 5,600 L of water were dumped weekly (5% of the system water volume) during the filter tank cleaning process, which resulted in nutrient concentrations remaining in a steady state at feeding rate ratios of 60 to 100 g/m2/day. This range of feeding rate ratios was well within the wastewater treatment capacity of 180 g/m2/day. Therefore, after an initial acclimation period of one month, it was not necessary to monitor ammonia or nitrite values in the commercial-scale system provided that the film on nitrifying bacteria on the underside of the rafts remained intact.
Several materials were used to construct the hydroponic tanks. The best
construction materials consisted of poured concrete walls (40 cm high and 10 cm wide) and a 23-mil high-density polyethylene tank liner. The black liners used for CA1 absorbed considerable heat along the top of the tank walls. For CA2 the portion of the liners above the water level was painted white to reflect heat. Subsequently UV-resistant, white liners were used. The polystyrene sheets were painted white with a potable grade latex paint to reflect heat and prevent the deterioration that results if it is exposed to direct sunlight.
There were several advantages to raft culture. There was no limitation on tank size.
Rafts provided maximum exposure of the roots to the culture water and avoided clogging. The sheets shielded the water from direct sunlight and maintained lower than ambient water temperatures, which was beneficial to plant growth. A disruption in pumping did not affect the plant’s water supply. The sheets were easily moved along the channel to a harvesting point, where they were lifted out of the water and placed on supports at an elevation that was comfortable for workers. A disadvantage of raft culture was that the plant roots were vulnerable to damage caused by zooplankton, snails, leeches and other aquatic organisms. Biological methods have been successful in controlling these invasive organisms. Ornamental fish, particularly tetras (Gymnocorymbus ternetzi), were effective in controlling zooplankton, and red ear sunfish (shellcrackers, Lepomis microlophus) were effective in controlling snails. Shellcrackers also prey on leeches.
During the 2.5-year production trial for tilapia and lettuce in CA1, total annual lettuce
production averaged 1,404 cases (Rakocy et al 1997). Lettuce production cycles from transplanting seedlings to harvest were 4 weeks. In 112 lettuce harvests, marketable production averaged 27 cases per week and ranged from 13-38 cases (24-30 heads/case). Average harvest weight was 269 g for Sierra (red leaf), 327 g for Parris Island (romaine), 314 g for Jericho (romaine) and 265 g for Nevada (green leaf). The plants were weighed after the lower leaves were trimmed. Production was always greater during the cooler winter months when water temperature averaged 25.1ºC than in the summer months when water temperature averaged 27.5ºC.
Fish feed provided adequate levels of 10 of the 13 nutrients required for plant
growth. The nutrients requiring supplementation were K, Ca and Fe. During the production trial, 168.5 kg of KOH, 34.5 kg of CaO, 142.9 kg of Ca(OH)2 and 62.7 kg of iron chelate (10%) were added to the system, which was equivalent to the addition of 16.1, 3.3, 13.7 and 6.0 g, respectively, for every kilogram of feed added to the system. The amount of Ca and K added was the result of the quantity of base required to maintain pH at 7.2. The optimum pH value for the UVI aquaponic system has been revised to 7.0. Rainwater was used in all the aquaponic systems at UVI because the NaCl content of groundwater in the Virgin Islands was too high.
Two species of pathogenic root fungi (Pythium myriotylum and P. dissoticum) caused production to decline during the warmer months. Pythium myriotylum caused root death while P. dissoticum caused general retardation in the maturation rate of the plant. CA2 was designed to lower water temperature, through shading, reflective paint and heat dissipation manifolds (attached to the blowers), in an effort to minimize the effects of Pythium. A plant potting media containing coconut fibers (coir) was used to produce transplants for CA2 instead of the peat-based potting media used for CA1 because some peat products contain Pythium spores. The use of resistant varieties and antagonistic organisms also offer potential for Pythium control in aquaponic systems.

342342
The only significant insect problem with lettuce was caused by caterpillars of the fall armyworm and corn earworm. These caterpillars were controlled by twice weekly sprays with Bacillus thuringiensis, a bacterial pathogen that is specific to caterpillars. Using the final design of system CA2 for production of basil was evaluated (Rakocy et al. 2004b). Annual production was projected to be 5.0 mt (Figure 2).
Figure 2. Basil production in the UVI aquaponic system (CA2).
Economics
The economics of the UVI aquaponic system is very site specific. The cost of construction materials, labor and inputs such as feed, chemicals and electricity vary widely from one country to another. In the Virgin Islands the current sales price for live tilapia is US$6.60 per kg. Assuming that a commercial scale system can produce 5 mt of tilapia annually, total annual income from fish sales will be $33,000.
The income from crop production depends on the production level and commercial value of the crop. A number of crop production trials have been conducted. Each crop requires a different planting density and length of production cycle. The greatest annual income for the commercial-scale UVI system is obtained by herbs such as chives and basil (Table 1). These production levels exceed the market size on small islands. Intermediate income levels are obtained from lettuce while fruiting crops such as cantaloupe and okra produce very low income (Table 1). It is recommended that a commercial operation consists of six production units (systems). With a total of 24 fish rearing tanks, one fish rearing tank can be harvested weekly, yielding 574 kg of fish. A consistent amount of fish on a weekly basis facilitates market development. Based on experience, this amount of tilapia can be sold weekly on a small island. The best marketing strategy is direct sales to customers either by delivering fish to restaurants and stores or by establishing a sales outlet at the production site. With the latter strategy it is important to select a location that is highly visible and convenient to customers.

343343
Table 1. Production parameters and income levels for vegetables grown in the commercial-scale UVI aquaponic system. Vegetable Planting
Density (#/m2)
Production Cycle Length (weeks)
Sales Price (US$)
Annual Income (US$/m2)
Annual System Income (US$)
Leaf lettuce 20 4 1.50 each 292 62,595 Romaine lettuce 16 4 1.50 each 234 50,076 Basil 16 4 26.40/kg 515 110,210 Okra 3.7 12 1.10/kg 15 3,210 Cantaloupe 0.67 13 2.99/kg 46 9,844 Chives 80.7 6 1.00/bunch 700 149,800
Conclusion
The UVI aquaponic system represents an appropriate or intermediate technology that can be applied outdoors under suitable growing conditions or in an environmentally controlled greenhouse. It is ideal for areas that have limited resources such as water or level land. The system is highly productive and intense but operates well within the limits of risk. It conserves and reuses water, recycles nutrients and requires very little land. With its small land requirement it is economically feasible to locate systems close to urban markets, thereby reducing transportation costs. The system can be used on a subsistence level or a commercial scale. The system is simple, reliable and robust. Production is continuous and sustainable as demonstrated by nearly 10 years of continuous operation in its current configuration. The UVI aquaponic system does require a relatively high capital investment, moderate energy inputs and skilled management, though management is easy if production guidelines are followed.
References
Gloger, K.C., J.E. Rakocy, J.B. Cotner, D.S. Bailey, W.M. Cole and K.A. Shultz. 1995. Waste treatment capacity of raft hydroponics in a closed recirculating fish culture system. World Aquaculture Society, Book of Abstracts: 126-127.
Rakocy, J.E. 1989. Hydroponic lettuce production in a recirculating fish culture system. University of the Virgin Islands, Agricultural Experiment Station, Island Perspectives 3:4-10.
Rakocy, J.E., J.A. Hargreaves and D.S. Bailey. 1993. Nutrient accumulation in a recirculating aquaculture system integrated with hydroponic vegetable production. Pages 148-158 in J.K. Wang, editor. Proceedings of the Aquaculture Engineering Conference on Techniques for Modern Aquaculture. Aquacultural Engineering Group, American Society of Agricultural Engineers.
Rakocy, J.E. 1997. Integrating tilapia culture with vegetable hydroponics in recirculating systems. Pages 163-184 in B.A. Costa-Pierce and J.E. Rakocy, Eds. Tilapia Aquaculture in the Americas, Vol. 1. 1997. World Aquaculture Society, Baton Rouge, Louisiana.
Rakocy, J.E., D.S. Bailey, K.A. Shultz and W.M. Cole. 1997. Evaluation of a commercial-scale aquaponic unit for the production of tilapia and lettuce. Pages 357-372 in K. Fitzsimmons, ed. Tilapia Aquaculture: Proceedings of the Fourth International Symposium on Tilapia in Aquaculture, Orlando, Florida.
Rakocy, J.E., D.S. Bailey, R.C. Shultz and E.S. Thoman. 2004a. Update on tilapia and vegetable production in the UVI aquaponic system. Pages 676-690 in R.B. Bolivar, G.C. Mair, K. Fitzsimmons, Eds. Proceedings from the Sixth International Symposium on Tilapia in Aquaculture, Manila, Philippines.
Rakocy, J.E., Shultz, R.C., Bailey D.S. and Thoman, E.S. 2004b. Aquaponic production of tilapia and basil: comparing a batch and staggered cropping system. Acta Horticulturae (ISHS) 648:63-69. (http://www.actahort.org/books/648/648_8.htm)

344344
Development of a Biofloc System for the Production of Tilapia
James E. Rakocy, Jason J. Danaher, Donald S. Bailey and R. Charlie Shultz
University of the Virgin Islands Agricultural Experiment Station
RR 1, Box 10,000, Kingshill, VI 00850, U.S. [email protected]
Abstract
A 200-m3 circular tank was stocked with sex-reversed Nile tilapia (Oreochromis niloticus) and evaluated in four production trials. Water treatment methods consisted of aeration, mixing, solids removal, nitrification and denitrification. The fish were fed ad libitum twice a day with a complete (32% protein), floating pellet. Ammonia and nitrite concentrations were generally acceptable for tilapia growth. During the four trials, there were two non-toxic TAN spikes (~8 mg/L) and three nitrite-nitrogen spikes (14-18 mg/L) that were prevented from being lethal by adding chloride ions (~300 mg/L) at the outset of the trials. The nitrate-nitrogen concentration increased throughout the first two trials and reached 654 and 707 mg/L in Trials 1 and 2, respectively, which indicated a high rate of nitrification in the water column and the need for a denitrification treatment process. Two external denitrification channels (15.2 m x 1.2 m x 0.6 m) were established and used in Trials 3 and 4, resulting in lower peak nitrate-nitrogen concentrations (341 and 364 mg/L, respectively). Total suspended solids (TSS) increased throughout the first two trials and reached peaks values of 1,300 and 1,960 mg/L in Trials 1 and 2, respectively. Horizontal water velocity was too high for effective sedimentation of suspended solids for removal by a 45º cone situated in the center of the tank bottom. The addition of an external clarifier (1.8 m3, 60º slope) to the system for the last 3 weeks of Trial 2 removed 360 kg of dry weight solids, resulting in the reduction of TSS levels from to 1,700 to 600 mg/L. The reduction of TSS improved other water quality parameters and fish feeding response. The use of the central cone was discontinued, and the external clarifier was used throughout Trials 3 and 4, in which TSS reached peak values of 540 and 550 mg/L and averaged 317 and 368 mg/L, respectively. In Trial 4 the entire tank was covered with bird netting in lieu of less effective bird deterrence methods. As a result, survival increased from a high of 86% in Trial 3 to 99.7% in Trial 4. For optimal performance the UVI biofloc system requires an external clarifier, a denitrification unit and complete enclosure with bird netting.
Introduction
Pond culture is the standard method of producing tilapia in the tropics. Pond culture
depends on phytoplankton to generate oxygen and absorb dissolved nitrogenous waste. The feeding rate limit for fed ponds is determined by the ability of the pond’s microbial community to assimilate fish waste products such as ammonia and solid waste, which undergoes microbial decomposition. The feeding rate limit determines a pond’s production capacity. A standard production level for a fed pond is 5,000 kg/ha. The production level can be increased with aeration and/or water exchange.
An intensive biofloc system was developed at the University of the Virgin Islands, which reduces the limitations of pond culture (Rakocy et al. 2000; Rakocy et al. 2002, Rakocy et al. 2004). The biofloc tank was continuously aerated and did not depend on phytoplankton for oxygen production. The primary component of the microbial community was shifted from phytoplankton to chemoautotrophic bacteria, which removed ammonia and nitrite. Settleable solid waste was removed daily through a sedimentation process. The culture water was mixed to suspend the microbial community and maximize contact between bacteria and waste products. The culture water contained high concentrations of phytoplankton, but the phytoplankton community did not play as dominant a role in
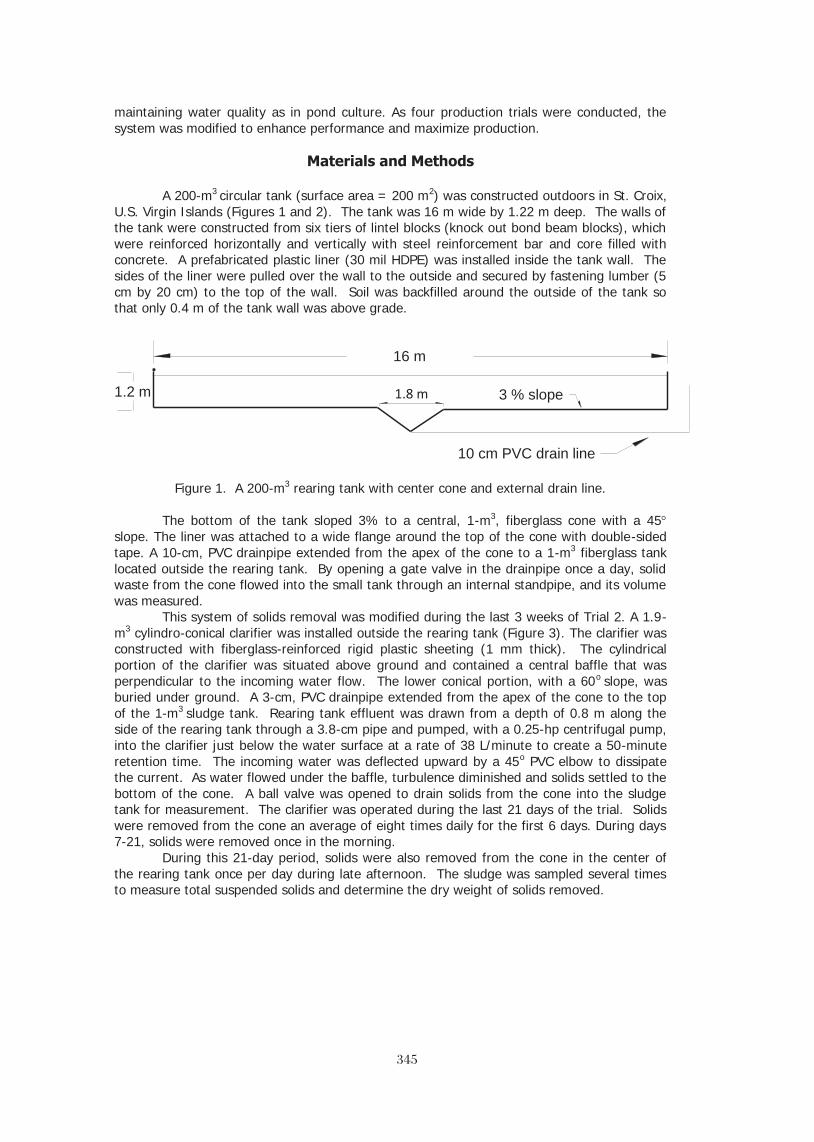
345345
maintaining water quality as in pond culture. As four production trials were conducted, the system was modified to enhance performance and maximize production.
Materials and Methods
A 200-m3 circular tank (surface area = 200 m2) was constructed outdoors in St. Croix,
U.S. Virgin Islands (Figures 1 and 2). The tank was 16 m wide by 1.22 m deep. The walls of the tank were constructed from six tiers of lintel blocks (knock out bond beam blocks), which were reinforced horizontally and vertically with steel reinforcement bar and core filled with concrete. A prefabricated plastic liner (30 mil HDPE) was installed inside the tank wall. The sides of the liner were pulled over the wall to the outside and secured by fastening lumber (5 cm by 20 cm) to the top of the wall. Soil was backfilled around the outside of the tank so that only 0.4 m of the tank wall was above grade.
Figure 1. A 200-m3 rearing tank with center cone and external drain line.
The bottom of the tank sloped 3% to a central, 1-m3, fiberglass cone with a 45
slope. The liner was attached to a wide flange around the top of the cone with double-sided tape. A 10-cm, PVC drainpipe extended from the apex of the cone to a 1-m3 fiberglass tank located outside the rearing tank. By opening a gate valve in the drainpipe once a day, solid waste from the cone flowed into the small tank through an internal standpipe, and its volume was measured.
This system of solids removal was modified during the last 3 weeks of Trial 2. A 1.9-m3 cylindro-conical clarifier was installed outside the rearing tank (Figure 3). The clarifier was constructed with fiberglass-reinforced rigid plastic sheeting (1 mm thick). The cylindrical portion of the clarifier was situated above ground and contained a central baffle that was perpendicular to the incoming water flow. The lower conical portion, with a 60o slope, was buried under ground. A 3-cm, PVC drainpipe extended from the apex of the cone to the top of the 1-m3 sludge tank. Rearing tank effluent was drawn from a depth of 0.8 m along the side of the rearing tank through a 3.8-cm pipe and pumped, with a 0.25-hp centrifugal pump, into the clarifier just below the water surface at a rate of 38 L/minute to create a 50-minute retention time. The incoming water was deflected upward by a 45o PVC elbow to dissipate the current. As water flowed under the baffle, turbulence diminished and solids settled to the bottom of the cone. A ball valve was opened to drain solids from the cone into the sludge tank for measurement. The clarifier was operated during the last 21 days of the trial. Solids were removed from the cone an average of eight times daily for the first 6 days. During days 7-21, solids were removed once in the morning.
During this 21-day period, solids were also removed from the cone in the center of the rearing tank once per day during late afternoon. The sludge was sampled several times to measure total suspended solids and determine the dry weight of solids removed.
16 m
1.2 m 3 % slope
10 cm PVC drain line
1.8 m
346346
Figure 2. View of rearing tank with three vertical lift aerators.
Figure 3. External clarifier. Figure 4. Denitrifying tanks.
The central cone was filled with sand and covered with a sealed liner for Trials 3 and 4, and only the external clarifier was used for solids removal. Two denitrification troughs (15 m x 1.2 m x 0.5 m each, water volume = 9.0 m3) were constructed adjacent to the rearing tank (Figure 4) and used in Trial 3 and 4. Water pumped from the rearing tank was diverted to these tanks at two flow rates, 6.0 and 3.1 L/min to create a retention time of approximately 1 and 2 days, respectively. Solids settled in the troughs throughout the production period and developed anaerobic zones where denitrification could occur.
At the end of Trial 1 a high voltage electrical line was installed around the perimeter of the tank by mounting it loosely about 4 cm above the board covering the side wall. A copper wire was affixed to the top board. When a bird perched on the electric wire, it sagged and touched the copper wire, giving the bird an electric shock to scare it away. This system was used through Trial 2. In Trial 3, 75-cm sections of concrete reinforcing rods were mounted vertically along the inside edge of the top board. Orchard netting (1.9-cm mesh) was fastened to the rods along the entire perimeter of the tank to remove space for birds to perch on the tank edge. In Trial 4, the entire tank was covered with 5-cm mesh, bird netting to prevent any possibility that birds could access the tank. The top of netting was suspended about 2.4 m and supported by infrastructure consisting of galvanized poles anchored into the ground and metal guywires fastened between the tops of the poles. The bottom edge of the netting was buried in the ground.
The rearing tank was aerated with three ¾-hp vertical lift pumps (Figure 2). A single aerator was used for the first two months. Two aerators were employed during months 3-4, and three aerators were used during months 5-6. In the Trial 4 the use of two and three aerators was initiated earlier. Another vertical lift pump was positioned horizontally to provide horizontal water circulation (mixing). The amount of electricity used was recorded.

347347
The biofloc tank was stocked with sex-reversed Nile tilapia (Oreochromis niloticus) fingerlings at a rate of 20 fish/m3 in Trial 1 and 25 fish/m3 in Trials 2-4. A nutritionally complete, floating pellet (32% protein) was offered twice daily ad libitum to satiation for 175, 201, 182 and 183 days in Trials 1 through 4, respectively. An initial 30-minute feeding period was eventually extended to 1 hour in Trial 1 and reduced to 30-40 minutes in Trials 2-4. Feed was restricted slightly during the first 4-6 weeks of the trials until populations of nitrifying bacteria in the water column were adequate to maintain low levels of ammonia and nitrite.
Water quality parameters were measured biweekly (DO, water temperature, NH3-N, NO2-N, NO3-N, pH, total alkalinity, chlorophyll a, COD, settleable solids, TSS, TP, PO4-P) or periodically (Cl). In Trial 3, NH3-N, NO2-N, NO3-N were measured biweekly in the influent and effluent of the denitrification tanks. Base [Ca(OH)2] was added frequently to maintain pH near 7.5. The base was added to a 0.2-m3 tank through which a small stream of water flowed so that high-pH water was gradually added to the rearing tank. Water loss due to evaporation and sludge removal was volumetrically replaced. At the end of the trials all fish were harvested, weighed and counted.
Results and Discussion
Tilapia production results are given in Table 1. The fish grew at a higher rate (4.0
g/day) and reached a large size (912 g) in Trial 1 because larger fingerlings were stocked. Therefore initial growth rates were higher. In addition, the stocking rate was higher (25 fish/m3) in Trials 3-4, which can reduce the growth rate of individual fish. The feed conversion ratios ranged from 1.8 in Trial 3 to 2.2 in Trial 1 and were higher than expected, which may have been due in part to low survival rates (78.9% to 86.0% in the first three trials) caused by bird predation. Herons perched on the side of the tank and preyed on the fish during the beginning of each production cycle in the first three trials. Fish that were too large to swallow were found on the ground or floating dead in the water. An electric wire to repel birds was strung along the top of the tank midway through the first trial. This device failed in the second trial, and bird predation was heavy again. The anti-bird orchard netting that was attached vertically above the tank wall in the third trial reduced perching sites, but predation continued. Complete enclosure of the tank by netting prevented bird predation entirely in Trial 4 and resulted in excellent survival of 99.7%. Final biomass density in Trial 4 reached the highest value (18.6 kg/m3) of all four trials. Total production in Trial 4 was 3,720 kg. However, the feed conversion ratio remained high (2.0) due in part to a 2-week period of high nitrite-nitrogen values and reduced feeding (Figures 8 and 10)
Table 1. Results of four tilapia production trials in a 200-m3 biofloc system.
Trial
Stocking Rate
(#/m3)
Initial Size (g)
Final Size (g)
Culture Period
(d)
Growth Rate (g/d)
Final Biomass (kg/m3)
FCR
Survival (%)
1 20 214 912 175 4.0 14.4 2.2 78.9 2 25 73 678 201 3.0 13.7 1.9 81.0 3 25 70 707 182 3.5 15.3 1.8 86.0 4 25 154 745 183 3.2 18.6 2.0 99.7
Another factor leading to a high feed conversion ratio appeared to result from the interaction of water quality and feed consumption. The daily feed consumption varied considerably, but there was an upward trend in consumption at the beginning of Trials 1 and 2 (Figures 5 and 6). In Trial 1, feed consumption increased initially but then leveled off during the middle of the trial and declined slightly by the end of the trial. In Trial 2, feed consumption generally increased through most of the trial but decreased near the end. The maximum feeding rate in these trials was approximately 40 kg/day. In Trial 3, feed consumption generally increased throughout the culture period except for sharp decreases near days 121 and 181 (Figure 7). The maximum feeding rate reached 45 kg/day. In Trial 4, feed consumption increased to a peak at day 79 and declined dramatically at day 92 for a 2-week period (Figure 8). Feed was restricted during this period due to high nitrite-nitrogen levels (Figure 10). After nitrite levels
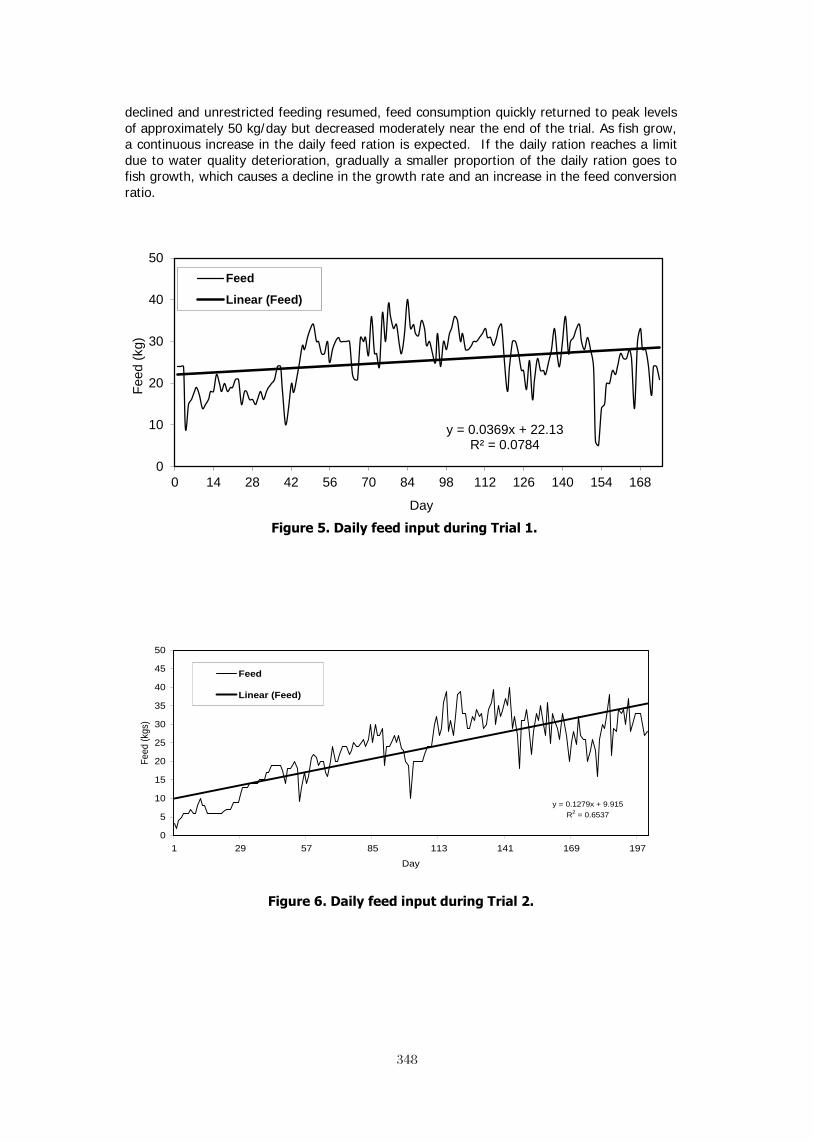
348348
declined and unrestricted feeding resumed, feed consumption quickly returned to peak levels of approximately 50 kg/day but decreased moderately near the end of the trial. As fish grow, a continuous increase in the daily feed ration is expected. If the daily ration reaches a limit due to water quality deterioration, gradually a smaller proportion of the daily ration goes to fish growth, which causes a decline in the growth rate and an increase in the feed conversion ratio.
Figure 5. Daily feed input during Trial 1.
Figure 6. Daily feed input during Trial 2.
y = 0.0369x + 22.13 R² = 0.0784
0
10
20
30
40
50
0 14 28 42 56 70 84 98 112 126 140 154 168
Feed
(kg)
Day
Feed
Linear (Feed)
y = 0.1279x + 9.915R2 = 0.6537
0
5
10
15
20
25
30
35
40
45
50
1 29 57 85 113 141 169 197
Day
Feed
(kgs
)
Feed
Linear (Feed)

349
349
Figure 7. Daily feed input during Trial 3.
Figure 8. Daily feed input during Trial 4.
Most water quality parameters were in acceptable ranges for tilapia culture (Table 2). The TAN concentration spiked once to 8.55 mg/L in Trial 2 and once to 8.75 in Trial 4 for a short period (Figure 9). There was no observed mortality during these periods. Nitrite-nitrogen concentrations spiked once in each of Trials 1, 2 and 4. There was a peak concentration of NO2-N in Trial 1 of 13.62 mg/L, but this value was not included in the average (Table 2) because it was caused by mistakenly adding chlorinated water to replace evaporative losses. The chlorine appeared to affect Nitrobacter bacteria but not Nitrosomonas, as TAN levels did not increase during this period. In Trial 2 the peak NO2-N
y = 0.1323x + 15.407 R² = 0.6453
05
101520253035404550
1 29 57 85 113 141 169
Feed
(kgs
)
Date
Feed (kgs)
Linear (Feed (kgs))
y = 0.0775x + 25.839 R² = 0.1439
05
101520253035404550
1 21 41 61 81 101 121 141 161 181
Feed
(kgs
)
Day
Feed (kgs)

350350
concentration of 18.27 followed the peak TAN concentration. In Trial 4 the peak NO2-N concentration of 13.58 mg/L coincided with the peak TAN concentration (Figures 9 and 10).
Table 2. Mean values of water quality parameters during Trials 1-4.
Trial 1 Trial 2 Trial 3 Trial 4
Dissolved Oxygen (mg/L) 5.5 7.9 5.3 5.3
pH 7.8 7.8 7.7 7.5
Alkalinity (mg/L, as CaCO3) 224 204 247 211
Temperature (oC) 28.6 28.5 26.1 26.4
Total Ammonia-N (mg/L) 1.15 1.85 2.0 2.3
Nitrite-Nitrogen (mg/L) 0.58* 2.68 1.93 5.6
Nitrate-Nitrogen (mg/L) 289 397 158 165
Total Phosphorous (mg/L) 41.9 64.5 53.7 -
Orthophosphate (mg/L) 16.9 19.2 34.5 32
COD (mg/L) 353.3 363 292.1 315
Total Suspended Solids (mg/L) 476 898 317 368
Total Settleable Solids (ml/L) 29 48 24 10
Turbidity (FTU) 328 506 304 -
Chlorophyll-a (ug/L) 1895 924 821 937
* Indicates removal of two data points for NO2-N, 10.65 and 13.62 mg/L, resulting from addition of chlorinated water
To avoid ammonia toxicity, pH was maintained near 7.5 so that most ammonia was in the ionized, nontoxic form. However, during system startup, the pH of the well water was close to 9.0 and nitrifying bacteria were not established. Therefore, pH, TAN and NO2-N were monitored frequently for 4-6 weeks, and CaCl was added as a prophylactic to prevent nitrite toxicity. The chloride concentration averaged 301 mg/L in Trial 1, 319 mg/L in Trial 2 and 95 mg/L in Trial 3. In Trial 4 additional salt was added during the period of high NO2-N concentrations. During this period the chloride concentration reached 482 mg/L.
Figure 9. Total ammonia-nitrogen concentrations during Trials 1-4.
0123456789
10
0 5 10 15 20 25 30
Con
cent
ratio
n (m
g/L)
Week
Trial 1Trial 2Trial 3Trial 4
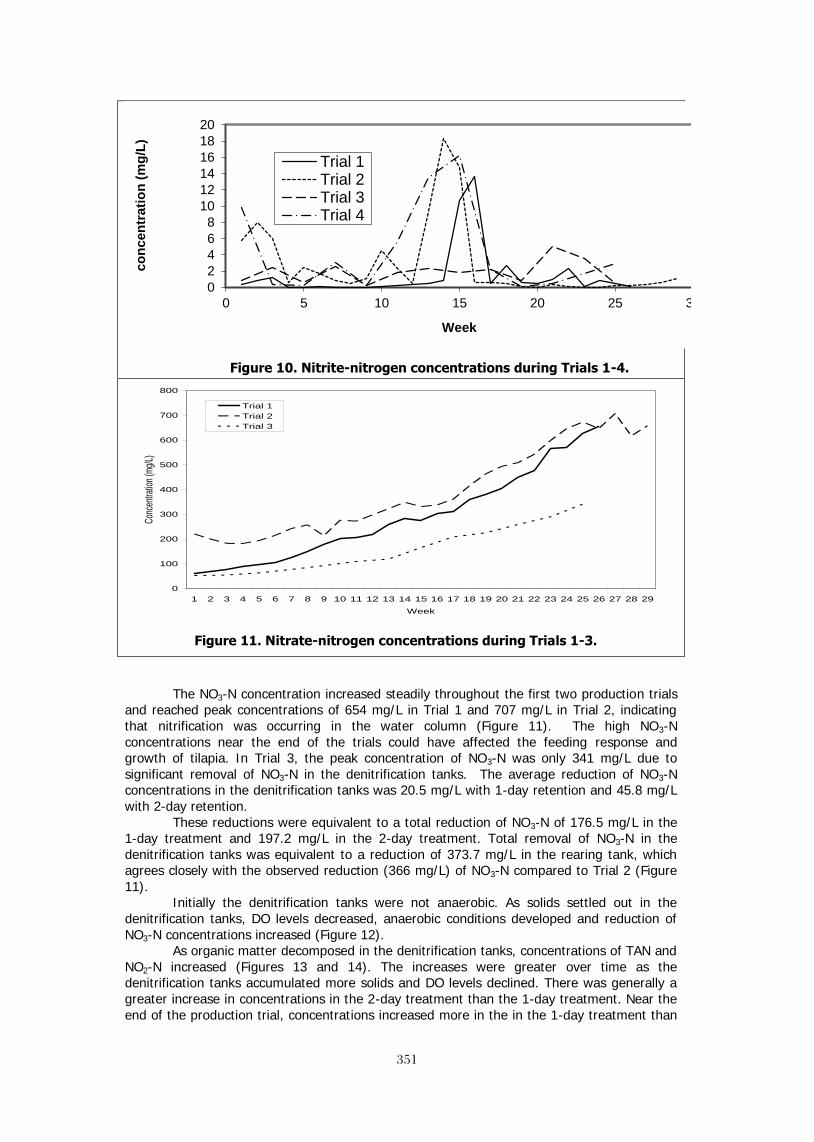
351351
Figure 10. Nitrite-nitrogen concentrations during Trials 1-4.
Figure 11. Nitrate-nitrogen concentrations during Trials 1-3.
The NO3-N concentration increased steadily throughout the first two production trials and reached peak concentrations of 654 mg/L in Trial 1 and 707 mg/L in Trial 2, indicating that nitrification was occurring in the water column (Figure 11). The high NO3-N concentrations near the end of the trials could have affected the feeding response and growth of tilapia. In Trial 3, the peak concentration of NO3-N was only 341 mg/L due to significant removal of NO3-N in the denitrification tanks. The average reduction of NO3-N concentrations in the denitrification tanks was 20.5 mg/L with 1-day retention and 45.8 mg/L with 2-day retention.
These reductions were equivalent to a total reduction of NO3-N of 176.5 mg/L in the 1-day treatment and 197.2 mg/L in the 2-day treatment. Total removal of NO3-N in the denitrification tanks was equivalent to a reduction of 373.7 mg/L in the rearing tank, which agrees closely with the observed reduction (366 mg/L) of NO3-N compared to Trial 2 (Figure 11).
Initially the denitrification tanks were not anaerobic. As solids settled out in the denitrification tanks, DO levels decreased, anaerobic conditions developed and reduction of NO3-N concentrations increased (Figure 12).
As organic matter decomposed in the denitrification tanks, concentrations of TAN and NO2-N increased (Figures 13 and 14). The increases were greater over time as the denitrification tanks accumulated more solids and DO levels declined. There was generally a greater increase in concentrations in the 2-day treatment than the 1-day treatment. Near the end of the production trial, concentrations increased more in the in the 1-day treatment than
02468
101214161820
0 5 10 15 20 25 30
conc
entr
atio
n (m
g/L)
Week
Trial 1Trial 2Trial 3Trial 4
0
100
200
300
400
500
600
700
800
1 2 3 4 5 6 7 8 9 10 11 12 13 14 15 16 17 18 19 20 21 22 23 24 25 26 27 28 29
Week
Conc
entra
tion (
mg/L)
Trial 1Trial 2Trial 3

352352
the 2-day treatment. The effect of increased TAN and NO3-N concentrations in the denitrification tank effluent on the rearing tank water quality was negligible due to the high dilution factors of 95% for the 1-day treatment and 97.5% for the 2-day treatment. Selecting the highest effluent concentrations for TAN (22.5 mg/L for the 1-day treatment and 27.0 mg/L for the 2-day treatment), the diluted concentration in the rearing tank would be 1.1 and 0.7 mg/L, respectively. Selecting the highest effluent concentrations for NO3-N (7.6 mg/L for the 1-day treatment and 4.9 mg/L for the 2-day treatment), the diluted concentration in the rearing tank would be 0.4 and 0.1 mg/L, respectively. These values are well within the treatment capacity of the biofloc.
In Trial 4 the denitrification tanks were anaerobic and full of solids from the outset. Between Trials 3 and 4 the biolfoc system continued to operate for nearly a year and considerably more solids had accumulated. At the outset of Trial 4 there was a milky white appearance to the denitrification tank effluent, which apparently affected the rearing tank water quality, which did not develop a phytoplankton bloom and appeared to be black, similar to swamp water. The experiment was stopped to remove all the solids from the denitrification tanks and change the system water. When the experiment resumed, a phytoplankton bloom immediately developed and water quality was similar to the proceeding trial.
The tank system required very little water exchange. Average daily makeup water ranged from 401 liters (0.20% of the tank volume) in Trial 2 to 880 liters (0.44% of the tank volume) in Trial 1 (Table 3). The average volume recovered as sludge ranged from 213 liters/day in trial 3 to 470 liters/day in Trial 1 (Table 3). The average net water loss per day did not exceed 0.2% of the system volume over the four production trials.
Table 3. Total inputs and outputs of the biofloc system during Trials 1-4.
Trial
Initial Water (m3)
Makeup Water (L/day)
Sludge (L/d)
Feed (kg/day)
Base Addition (kg/day)
Electricity (kWh/day)
1 200 880 470 25.4 1.5 52.8 2 200 401 366 23.0 1.7 52.8 3 200 588 213 27.3 0.9 58.9 4 200 577 240 33.0 1.3 71.7
Another variable that may have affected tilapia feeding response and growth was
total suspended solids (TSS), which steadily increased during the first two production trials and reached 1,300 mg/liter in Trial 1 and 1,960 mg/liter in Trial 2. The central settling cone removed an average of 470 liters of sludge in Trial 1 and 366 liters in Trial 2 (Table 3). Daily sludge removal was somewhat variable over Trial 1 (Figure 15). On some days large amounts of sludge were removed for an unknown reason. These were called “sludge events.” Near the end of Trial 1 daily sludge removal was consistently low (150-350 liters). In Trial 2, daily sludge removal in general was consistently low (150-300 liters) until the last 3 weeks of the trial when the external clarifier was activated (Figure 16).

353
353
Figure 12. Nitrate-nitrogen concentrations in the denitrification tanks.
Week Figure. 13. Total ammonia-nitrogen concentrations in the denitrification tanks.
Figure. 14. Nitrite-nitrogen concentrations in the denitrification tanks.
- 50
100 150 200 250 300 350 400
5 7 9 11 13 15 17 19 21 23 26
mg/
L
Week
Influent1 day retention2 day retention
5 7 9 11 13 15 17 19 21 23 26 Influent 0.86 1.02 2.69 3.53 2.14 0.95 1.46 1.12 3.58 4.37 2.42
1 dayretention 1.82 3.10 2.94 4.07 4.38 5.59 4.73 6.82 22.51 16.70 10.17
2 dayretention 3.33 4.35 5.72 5.82 6.04 6.84 6.44 13.86 26.97 11.35 5.30
- 5
10 15 20 25 30
mg/
L
Influent
1 day retention
2 day retention
5 7 9 11 13 15 17 19 21 23 26 Influent 0.64 2.56 0.29 1.90 2.31 1.89 2.19 0.88 5.07 3.54 0.52
1 dayretention 1.23 3.63 1.23 2.07 2.46 2.92 4.14 3.67 7.56 6.70 1.62
2 dayretention 1.52 4.04 2.61 2.84 2.17 3.20 4.88 4.88 3.38 3.19 0.50
- 1 2 3 4 5 6 7 8
mg/
L
Week
Influent 1 day retention 2 day retention

354354
As each trial progressed, the buildup of TSS could be observed by the appearance of the water. There were clear streaks in the culture water that looked like solids were settling as the water circulated around the perimeter. However, the current was fast and re-suspended the solids on each pass through the horizontal mixing device. Water circulated completely around the perimeter of the tank every 2.5 minutes, a horizontal velocity of 20 m/minute. This phenomenon was most apparent in the last few weeks of the production trial when TSS levels were near their peak. At the end of Trials 1 and 2 a sample of culture water was collected and sampled for TSS every 5 minutes over a 30-minute period. The settling curves show that 89% of the solids settled out in 30 minutes (Figure 17). In Trial 2, 84% of the solids settled out in 5 minutes. These results showed that the mixing was too rapid for
01000200030004000500060007000
Lite
rs (L
)
Day
Figure 16. Daily sludge removal in Trial 2
01000200030004000500060007000
1 29 57 85 113 141 169
Lite
rs (L
)
Day
Figure 15. Daily sludge removal in Trial 1.

355355
Figure 17. Total suspended solids settling curve for Trials 1 and 2.
suspended solids to settle out in the central cone for effective removal on a daily basis. As TSS increased, it likely affected the fish directly through physical irritation of the gills, exerted a high biochemical oxygen demand (BOD) and led to secondary ammonification. Paradoxically, rapid mixing and high TSS levels created an effective biofilter. An external clarifier was installed to reduce TSS levels in during the last 3 weeks of Trial 2.
The solids removal efficiency of the external clarifier was 88.5% (Table 4). The effectiveness of the external clarifier is clearly indicated in Figure 18. Sludge TSS was 26,230 mg/L, which is 2.6% dry weight solids. During the first 6 days of operation, the external clarifier removed 175.5 kg of dry weight solids from the rearing tank compared to 5.9 kg of dry weight solids removal by the central cone (Table 5). During this 6-day period, the external clarifier removed 96.7% of the total amount of solids that were collected. During days 7-21, the external clarifier removed 184.4 kg of dry weight solids compared to 4.8 kg of dry weight solids removal by the central cone. During this 15-day period, the clarifier removed 97.5% of the total amount of solids that were collected. During the 3-week period, TSS concentrations in the rearing tank declined from to 1700 mg/L to 600 mg/L, a 65% reduction (Figure 19). There were also decreases in total phosphorus from 172 to 64 mg/L (Figure 20) and chlorophyll a (Figure 21). Concentrations of ammonia and nitrite remained low, which indicates that sufficient levels of nitrifying bacteria remained in the water column (Figures 9 and 10). With substantially lower TSS levels, there would be less secondary ammonia production caused by the decomposition of suspended organic matter. Dissolved oxygen concentrations (data not shown) and the feeding response of the fish increased as TSS levels decreased.
Table 4. External clarifier efficiency at the end of Trial 2.
Parameter Concentration Influent TSS (mg/L) 1178 Effluent TSS (mg/L) 136 Sludge TSS (mg/L) 26,230
Removal (%) 88.5
0
200
400
600
800
1000
1200
1400
1600
1800
2000
0 5 10 15 20 25 30
Time (min)
Con
cent
ratio
n (m
g/L)
Trial 1Trial 2
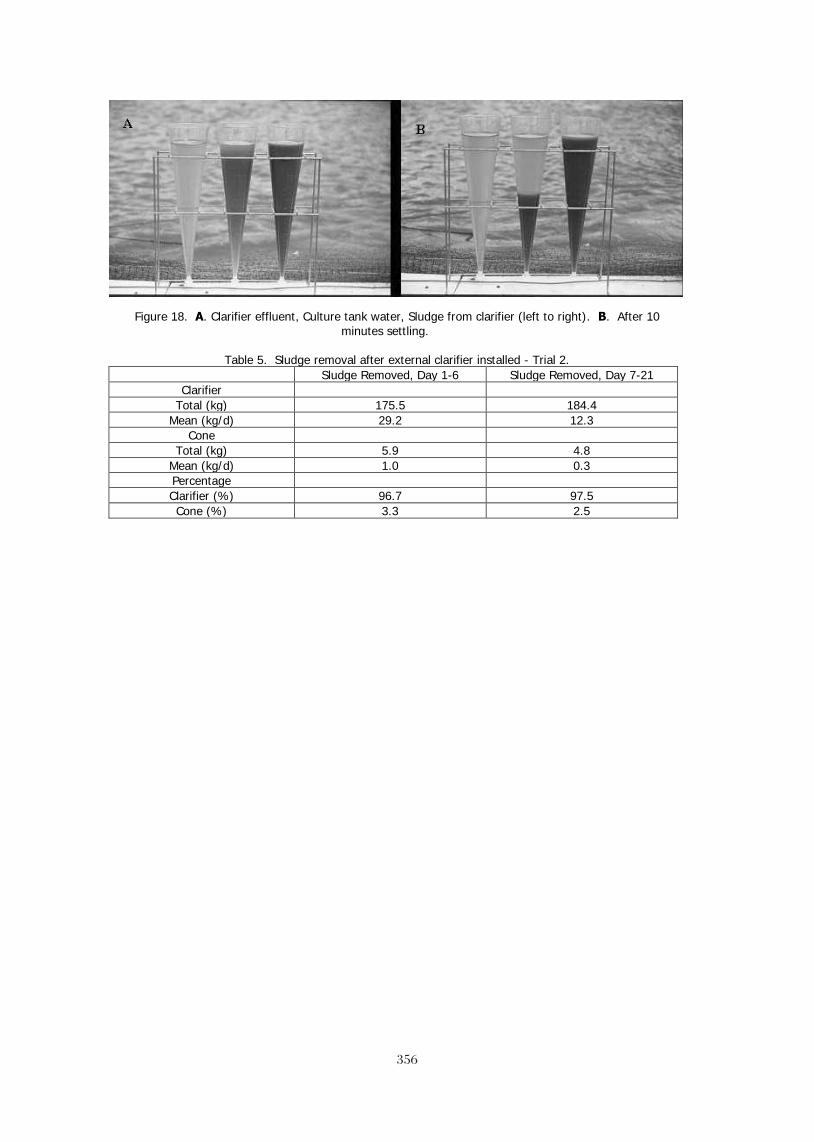
356356
Figure 18. A. Clarifier effluent, Culture tank water, Sludge from clarifier (left to right). B. After 10
minutes settling.
Table 5. Sludge removal after external clarifier installed - Trial 2. Sludge Removed, Day 1-6 Sludge Removed, Day 7-21
Clarifier Total (kg) 175.5 184.4
Mean (kg/d) 29.2 12.3 Cone
Total (kg) 5.9 4.8 Mean (kg/d) 1.0 0.3 Percentage Clarifier (%) 96.7 97.5 Cone (%) 3.3 2.5
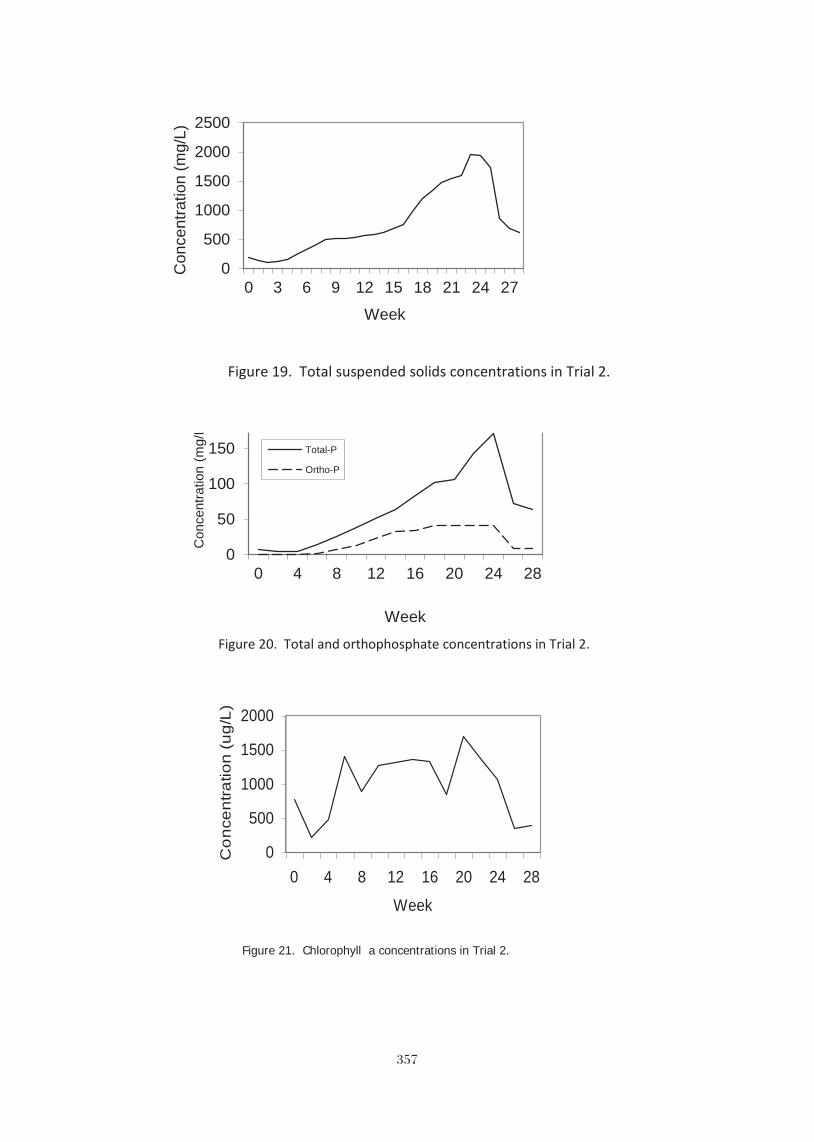
357357
Figure 20. Total and orthophosphate concentrations in Trial 2.
0
500
1000
1500
2000
2500
0 3 6 9 12 15 18 21 24 27
Con
cent
ratio
n (m
g/L)
Week
Figure 21. Chlorophyll a concentrations in Trial 2.
0
50
100
150
200
0 4 8 12 16 20 24 28
Con
cent
ratio
n (m
g/L)
Week
Total-P
Ortho-P
Figure 20. Total and orthophosphate concentrations in Trial 2.
Figure 19. Total suspended solids concentrations in Trial 2.
0
500
1000
1500
2000
0 4 8 12 16 20 24 28
Week
Co
ncen
tratio
n (u
g/L)
358358
Base and electricity were the other major inputs to the system (Table 3). Addition of Ca(OH)2 averaged 1.6 kg/day, which was 6.6% of the average daily feed input (24.4 kg) over the first two production trials. In Trial 3, base addition decreased to 0.9 kg/day as a result of denitrification, a process the produces (recovers) alkalinity. In Trial 4, base addition increased to an average of 1.3 kg/day due to higher survival (Table 1) and greater feed input (Table 3). The maximum sustainable daily feed input was approximately 32 kg/day in Trials 1 and 2 and increased to more than 40 kg/day in Trial 3 and 45 kg/day in Trial 4 (Figures 5-8. The average electrical usage ranged from 52.8 to 58.9 kWh/day in Trials 1-3 and increased to 71.7 kWh/day in Trial 4. The higher survival in Trial 4 and the increased feeding rate required that the second and third aerators had to be activated sooner.
Conclusion This biofloc tank system was easy to manage and produced high densities of fish.
Biofloc production of tilapia was 37 times higher (Trial 4) than levels typically obtained by un-aerated pond culture. High mortality resulting from bird predation was addressed by installing a framework and lightweight bird netting over the entire tank to prevent bird predation entirely.
Limiting the accumulation of nitrates is important to fish health and growth. Denitrification is an anaerobic process that reduces NO3-N to N2 and generates alkalinity. The two denitrification channels proved to be effective in reducing nitrate accumulation by half. The denitrification tanks were never fully established during Trial 3. Solids gradually accumulated, but the tanks were never totally anaerobic. However, as the beginning of Trial 4 showed, the accumulation of too much solid waste can be detrimental to water quality. Therefore it is recommended that the denitrification tanks be cleaned at the end of each production cycle. An alternative option to reduce NO3-N concentrations is increased water exchange. This approach is not feasible in the Virgin Islands and in many other areas that have limited water resources. The reuse of system water after the fish harvest is encouraged to conserve water and eliminate the acclimation period for nitrifying bacteria.
Effective management of suspended solids with an external clarifier was a major finding of this project. The central cone and the 3% bottom slope were unnecessary. Eliminating them will make future construction faster, easier and less expensive. The external clarifier provides the ability to control TSS levels. Work is now needed to determine the optimum TSS concentration for nitrification and fish growth.
The tank described in this paper is compared to ponds because it may be possible to scale it up to the size of a commercial pond and greatly increase production or substantially reduce resource requirements. For example, 100 ha of un-aerated ponds could be replaced with 2.7 ha of tanks, based on the production level in Trial 4. Research is needed to determine the effect of scale-up on inputs, management, production and cost. An economic comparison of large tanks and ponds will be required. Evaluation of risk factors and environmental benefits will be an important element of an economic comparison. Intensive tank culture of tilapia, utilizing biofloc systems, has great potential in the development of the tilapia industry.
REFERENCES
Rakocy, J.E., D.S. Bailey, J.M. Martin and R. C. Shultz. 2000. Tilapia production systems for the Lesser Antilles and other resource-limited, tropical areas. Pages 651-662 in K. Fitzsimmons and J. Carvalho Filho, Eds. Tilapia Aquaculture in the 21st Century: Proceedings from the Fifth International Symposium on Tilapia in Aquaculture, Rio de Janeiro, Brazil.
Rakocy, J.E. 2002. An integrated fish and field crop system for arid areas. p.263-285. In: Ecological aquaculture: the evolution of the blue revolution. Blackwell Science. Costs-Pierce, B.A. (Ed.). Blackwell Science, Oxford. 382.
Rakocy, J.E., D.S. Bailey, E.S. Thoman and R.C. Shultz. 2004. Intensive tank culture of tilapia with a suspended, bacterial-based, treatment process. Pages 584-596 in R.B. Bolivar, G.C. Mair and K. Fitzsimmons, Eds. Proceedings from the Sixth International Symposium on Tilapia in Aquaculture, Manila, Philippines.
359359
Tilapia Production Using BioFloc Technology (BFT)
Yoram Avnimelech Dept. of Civil & Environmental Eng.,Technion, Israel Inst. Of Technology
Haifa, 32000, Israel [email protected]
ABSTRACT Production of tilapia, for home or local consumption and for export, has been raised
tremendously in the last few decades. The tonnage of world wide tilapia production (in 2010, about 3 million tons) is second, among fish, only to carps. Global production of tilapia was estimated to be 2.5 billion US$ in 2010. The present trends indicate a continuous growth of production and expanded penetration of that fish to a variety of markets, from expensive restaurants to local households all around the world.
Higher production levels are needed and anticipated; however, increasing aquaculture production is limited, globally, by the severe limitations of water and availability of suitable land. The only feasible and environmentally acceptable way to raise aquaculture production is by the use of intensive systems. The choice of suitable intensive systems to produce commodity fish is limited due to the need to produce the fish at a cost lower than the market price. One of the systems that enable intensification at a relatively reasonable investment and running costs is biofloc technology.
Biofloc technology is based upon the running of the pond using minimal water exchange, subsequent development of dense microbial population and managing the microbial population through the adjustment of the C/N ratio so that it controls inorganic nitrogen concentration in the water. The bacteria, forming bioflocs, assimilate TAN, produce microbial proteins and enable to recycle the unused feed protein. BFT systems are widely used for shrimp production world wide. (For more details: Yoram Avnimelech, Biofloc Technology, A Practical Handbook, World Aquaculture Soc. 2010). Tilapia is ideally adapted to BFT systems. It is herbivore, essentially a filter-feeder adapted to the harvest of bioflocs suspended in the water, it can grow and flourish in dense systems and is overall a strong and stable fish. Using BFT systems for tilapia production is an obvious choice.
INTRODUCTION
An essential feature of BFT tilapia production systems, especially as compared to shrimp systems, is the very high biomass. In our experience, tilapia biomass can reach 20-30 kg/m3 (200-300 ton/ha), as compared to shrimp biomass of about 2 kg/m3 (20 tons/ha) in very good ponds. This difference is a very significant feature for minimal water exchange systems. The daily TAN release, if untreated and left in the water is high enough to lead to fish mortality. Two microbial mediated processes are acting in BFT systems to control TAN concentrations.
One microbial process taking place is nitrification that converts the toxic ammonia and nitrite to nitrate. Another process quite specific to BFT systems is the assimilation of TAN by heterotrophic bacteria into microbial protein. In systems with high levels of available carbon as compared to nitrogen (C/N ratio > 15), bacteria utilize the carbon as a building stone of new cell material, yet, since microbial cells are made of protein, they need nitrogen and take up ammonium from the water. Both experience and theory demonstrates that when C/N is higher than 15 (15-20), TAN concentration is kept low. It is important to notice that both processes can take place only if the proper microbial consortia are present in sufficient levels in the water. The heterotrophic consortia develop rather fast following the build up of organic matter in the water. Nitrifying community develops slowly and it takes about 4 weeks before it reaches its capacity, unless proper inoculum is applied.
Microbial assimilation of nitrogen has a high capacity to control nitrogen levels in the water. Microbial protein is produced concomitantly, and may serve as a high quality feed source to fish. In dense microbial systems (Bacterial density in BFT systems is 107 - 10 cells/ml); the bacteria stick together with many other organisms and organic particles, forming bioflocs that range in size from 0.1 to a few mm. Such particles are easily harvested and assimilated by tilapia. The amounts of protein stored in the bioflocs are very significant.

360360
In a typical pond, even if only 50% of the excreted TAN (i.e. 7 mg N/l) is assimilated and available as a fish feed, this process adds, in any given day, 45 mg protein/l, an amount equivalent to feeding with 30% protein pellets at a daily ration of 150 mg/l or 150 g/m3. This is a significant contribution to the feed. Moreover, unlike the applied feed, the bioflocs are harvested and utilized by the fish continuously all day long. Observing feeding behavior of tilapia growing in BFT pond with tilapia in equivalent control ponds, it could be seen that fish in the control ponds were very hungry and rushed wildly to the feed pellets that were applied twice a day, while tilapia growing at the BFT ponds ate quietly, showing that they were not starved before feeding. It is expected that the semi continuous feeding through the harvest of the bioflocs will help the smaller fish that hardly compete with larger fish in regular ponds, and thus higher uniformity is expected In BFT ponds.
Total suspended solids (TSS) accumulate in the pond at a fast rate when fish biomass is high. As to be discussed later, TSS or biofloc volume has to be monitored. The desired microbial community and reserves of feed are associated with the TSS. Thus we should not release it carelessly out of the pond. However, excessive levels of TSS are not favorable since it adds to oxygen consumption and at very high levels may clog the gills of the fish. In addition, if water mixing is not well controlled, or when TSS concentration exceeds the mixing capacity of the system, solid particles settle down and may accumulate and create anaerobic layer or pockets. The existence of anaerobic sites in the pond bottom may lead to the production of toxic reduced compounds and eventually severely hamper fish growth. TSS levels may be controlled by drainage of sludge, proper mixing of the water and good design of pond bottom. This is one of the essential controls in BFT tilapia production systems.
Feeding is an important control means. Proper feeding enables one to get the proper C/N ratio (>15) that will promote the uptake of ammonium from the water. In addition, proper feed strategy is required to utilize the recycled microbial protein, to reduce costs and to minimize residues. There is a need for more research in order to get the right feed composition and ration. Some questions are still open.
a. The recommended C/N ratio can be obtained by either feeding with pellets of low protein percentage or by augmenting the feed pellets through the application of carbonaceous material (molasses, cassava, wheat or other flour, etc.). The first option may save labor. However we rely upon the passage and excretion of the added carbohydrates through the fish to be used by the bacteria. This assumption may not hold.
b. Feed rations can be lower than the ones used in conventional tilapia ponds. With shrimp in tanks it was found that feed ration can be reduced by 30% as compared to conventional systems. It was estimated, but not proven, that feed ration in tilapia BFT systems can be lowered be at least 20% as compared with conventional systems.
Oxygen consumption in intensive BFT tilapia culture is rather high, both due to the respiration of the dense fish biomass as well as due to respiration of the microbial community that metabolize the organic residues. Oxygen consumption was estimated or modeled by several scientists however, there are a number of critical assumptions depended on specific pond conditions. The range of required aeration is 10-20 hp for a pond of 1000m2. The exact aeration rate needed for a given pond under given conditions should be adjusted following the daily determination of oxygen in the pond, normally setting a minimal level of 4 mgO2/l. One should adjust aerator usage to the size of the fish and pond's biomass. Usually, lower aeration can be applied at the start of the cycle when fish biomass is low, though it is recommended to utilize the capacity of the pond by stocking large number of fingerlings and maintain a relatively constant biomass by appropriate transfers.
Proper placement of aerators is very important. Most pond aeration deployment is made in a way to obtain a circular movement of water so as to concentrate the settled particles as close as possible to the center drain. However, there are conflicting demands in this matter. We want to be able to effectively drain out the excessive sludge, yet we want to keep bioflocs suspended in the water. To prevent a fast sedimentation of particles near the center drain, it is advised to place an aspirator type aerator or air-lifts to resuspend particles sedimenting at the center. By properly adjusting the location of these units, we can approach an optimum of resuspending the less dense bioflocs while sedimenting and eventually draining the heavier particles.

361361
An important role of the aeration system is to properly mix the water and to prevent build up of sludge piles in locations were it is not effectively drained out. In case one finds such accumulation, aerators deployment has to be adjusted as soon as possible. Placement of aerators is still an art, we lack models and we do not have appropriate aerators in the market.
A very important demand is to have a sensitive and reliable monitoring and backup system. A fault in the aeration when the fish biomass is so high may be critical if no backup is activated within less than an hour.
Intensive tilapia BFT ponds are rather small, 100 -1000m2, mostly due to the difficulty in the perfect mixing of a large water body. Most ponds are round or square with rounded corners, the floor of the pond slopes toward the center to facilitate sludge concentration in the center. A central drain is located in the center, operated using a stand pipe or a valve. The drain is opened usually twice daily, letting the dark sludge to drain out, till a point when clear pond water is exiting.
Though the BFT tilapia ponds are rather simple to operate, the system demands a careful monitoring and a fast response to defects, when ever detected. It has to be remembered that the pond is highly loaded and that any fault not responded to, may develop and become critical. Normal aquaculture monitoring is certainly needed. Of special importance are the following parameters:
a. Oxygen, if oxygen is high, you can reduce number of applied aerators to save electricity. However, if O2 is less than 4 mg/l, add aerators.
b. TAN. Low TAN concentration (<0.5 mg/l) means that the system works fine. You may consider lowering carbon addition. If TAN increases respond quickly by raising carbon addition.
c. NO2. Nitrite may negatively affect tilapia, yet the effect is limited in salty water. However, an increase in NO2 may be an indication of the build up of anaerobic sites. In case of an increase of nitrite one should carefully check the presence of sludge piles in the pond and if found change aerators deployment.
d. Floc volume (FV) determination using Imhoff cones is easy and cheap. FV should be in the range of 5-50 ml/l. If it is too low add carbohydrates and in cases it is higher than 50 raise sludge removal.
Summary
Biofloc systems enable to intensify tilapia production. The fish is adaptable to conditions in BFT systems, grows well, harvest the bioflocs and utilize them as a feed source. The recycling of feed and minimization of water exchange are important contribution to the economy of tilapia production. Understanding the system, monitoring and fast response to negative developments are essential to the success of the culture.

362362
Tilapia production using biofloc technology (BFT)
Yoram Avnimelech
Dept. of Civil & Environmental Eng. Technion, Israel Inst. Of Technology
Haifa, 32000, Israel [email protected]
ABSTRACT
Bio Floc Technology (BFT) is a new approach toward management of ponds, in most cases intensive tilapia or shrimp ponds. Water scarcity, the demand for bio-security and economy, all leads to minimizing water exchange, even down to zero. Under these conditions, a major problem is the accumulation of ammonia and nitrite, both toxic to shrimp and fish. One way to solve this is to recycle the water through a bio-filter system. Recirculating Aquaculture Systems (RAS) are known to work well, yet they have two major problems: First they are expensive in both investment and maintenance and secondly, they recycle water but do not recycle feed residues. Feed is becoming more and more expensive and its recycling is essential.
An alternative approach, the Bio Floc Technology (BFT) is based upon the activity of the microbial community within the pond. Water treatment is done within the pond, with no need for a separate water treatment compartment. Very dense microbial community develops when water exchange is limited. Typically, we find 10-1000 million microbial cells (107-109) in 1 cm3 of pond water. If we add carbonaceous material (molasses, starch, tapioca and others) to adjust the C/N ratio in feeds to 15-20, the microbes take up the ammonium from the water and create microbial protein. By the adjustment of the C/N ratio, the nitrogen problem can be easily and consistently solved as described and formulated by Avnimelech (1999).
An important feature of BFT is the ability to recycle proteins. In conventional
aquaculture, only about 20-25% of feed protein is retained by fish or shrimp. The rest is excreted to the water, mostly as ammonium. In BFT the ammonium is converted to microbial protein (through the addition of carbohydrates), that can be used as a protein source. The micro-organisms in the water tend to aggregate and form bio-flocs that can be filtered and harvested by tilapia or shrimp. It was found, using 15N tagging of bio flocs, that more that 20% of protein eaten by shrimp or fish growing in BFT systems comes from bio flocs harvesting. The amount of feed protein retained in BFT systems is double than that in traditional ponds, since the protein is practically used twice: Once when pellets are eaten by fish and then when the bio flocs are harvested. The doubled feed efficiency is a very important factor, especially now, when feed costs are rising. Both protein recycling and water quality control are achieved through the addition of carbonaceous feed and adjustment of the C/N ratio.
Extensive work had been done on the composition and nutritive value of the flocs. A
detailed work by Tacon and coworkers (2003) demonstrated the presence of more than 30% protein, containing essential amino acids in sufficient quantities. In addition, it was demonstrated that the microbial flocs contain vitamins and trace metals enabling to omit those from the feed, saving about 25% of the Protein is an expensive feed component. In addition, it is, at least partially, made of fish meal, a component that is scarce and its harvest in the ocean leads to environmental damage. Thus, the fact that protein utilization rises from 15-25% in conventional ponds to 45% in BFT is very important. The utilization of microbial flocs as a source of feed protein leads to a lower expenditure on feed. Avnimelech reported that feed cost for tilapia production was lowered from $0.84/kg fish in conventional ponds to $0.58 in BFT. McIntosh reported that feed cost using the lowered protein diet in Belize Aquaculture was about 50% as compared to conventional shrimp farming.
BFT systems are environmentally friendly, mostly due to the fact that there is almost
no release of nutrient rich drainage water to the environment. According to existing
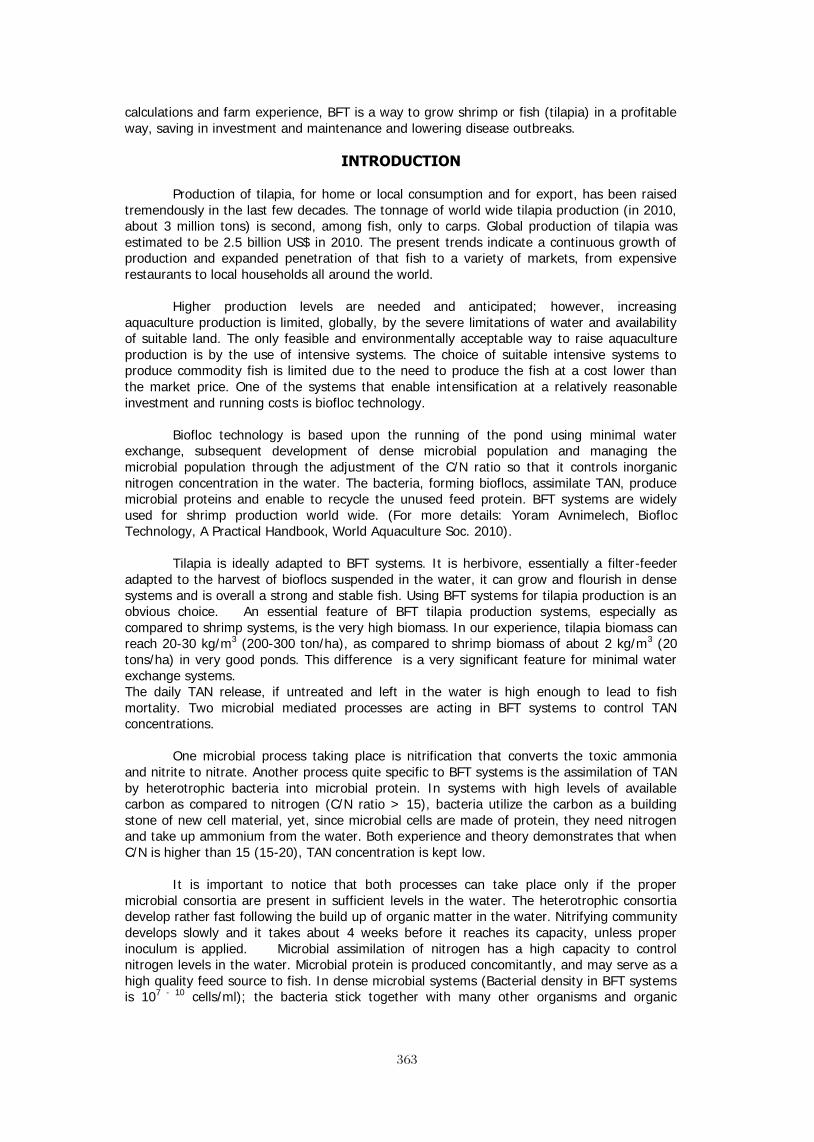
363363
calculations and farm experience, BFT is a way to grow shrimp or fish (tilapia) in a profitable way, saving in investment and maintenance and lowering disease outbreaks.
INTRODUCTION
Production of tilapia, for home or local consumption and for export, has been raised
tremendously in the last few decades. The tonnage of world wide tilapia production (in 2010, about 3 million tons) is second, among fish, only to carps. Global production of tilapia was estimated to be 2.5 billion US$ in 2010. The present trends indicate a continuous growth of production and expanded penetration of that fish to a variety of markets, from expensive restaurants to local households all around the world.
Higher production levels are needed and anticipated; however, increasing
aquaculture production is limited, globally, by the severe limitations of water and availability of suitable land. The only feasible and environmentally acceptable way to raise aquaculture production is by the use of intensive systems. The choice of suitable intensive systems to produce commodity fish is limited due to the need to produce the fish at a cost lower than the market price. One of the systems that enable intensification at a relatively reasonable investment and running costs is biofloc technology.
Biofloc technology is based upon the running of the pond using minimal water
exchange, subsequent development of dense microbial population and managing the microbial population through the adjustment of the C/N ratio so that it controls inorganic nitrogen concentration in the water. The bacteria, forming bioflocs, assimilate TAN, produce microbial proteins and enable to recycle the unused feed protein. BFT systems are widely used for shrimp production world wide. (For more details: Yoram Avnimelech, Biofloc Technology, A Practical Handbook, World Aquaculture Soc. 2010).
Tilapia is ideally adapted to BFT systems. It is herbivore, essentially a filter-feeder
adapted to the harvest of bioflocs suspended in the water, it can grow and flourish in dense systems and is overall a strong and stable fish. Using BFT systems for tilapia production is an obvious choice. An essential feature of BFT tilapia production systems, especially as compared to shrimp systems, is the very high biomass. In our experience, tilapia biomass can reach 20-30 kg/m3 (200-300 ton/ha), as compared to shrimp biomass of about 2 kg/m3 (20 tons/ha) in very good ponds. This difference is a very significant feature for minimal water exchange systems. The daily TAN release, if untreated and left in the water is high enough to lead to fish mortality. Two microbial mediated processes are acting in BFT systems to control TAN concentrations.
One microbial process taking place is nitrification that converts the toxic ammonia and nitrite to nitrate. Another process quite specific to BFT systems is the assimilation of TAN by heterotrophic bacteria into microbial protein. In systems with high levels of available carbon as compared to nitrogen (C/N ratio > 15), bacteria utilize the carbon as a building stone of new cell material, yet, since microbial cells are made of protein, they need nitrogen and take up ammonium from the water. Both experience and theory demonstrates that when C/N is higher than 15 (15-20), TAN concentration is kept low.
It is important to notice that both processes can take place only if the proper
microbial consortia are present in sufficient levels in the water. The heterotrophic consortia develop rather fast following the build up of organic matter in the water. Nitrifying community develops slowly and it takes about 4 weeks before it reaches its capacity, unless proper inoculum is applied. Microbial assimilation of nitrogen has a high capacity to control nitrogen levels in the water. Microbial protein is produced concomitantly, and may serve as a high quality feed source to fish. In dense microbial systems (Bacterial density in BFT systems is 107 - 10 cells/ml); the bacteria stick together with many other organisms and organic

364364
particles, forming bioflocs that range in size from 0.1 to a few mm. Such particles are easily harvested and assimilated by tilapia.
The amounts of protein stored in the bioflocs are very significant. In a typical pond,
even if only 50% of the excreted TAN (i.e. 7 mg N/l) is assimilated and available as a fish feed, this process adds, in any given day, 45 mg protein/l, an amount equivalent to feeding with 30% protein pellets at a daily ration of 150 mg/l or 150 g/m3. This is a significant contribution to the feed. Moreover, unlike the applied feed, the bioflocs are harvested and utilized by the fish continuously all day long. Observing feeding behavior of tilapia growing in BFT pond with tilapia in equivalent control ponds, it could be seen that fish in the control ponds were very hungry and rushed wildly to the feed pellets that were applied twice a day, while tilapia growing at the BFT ponds ate quietly, showing that they were not starved before feeding. It is expected that the semi continuous feeding through the harvest of the bioflocs will help the smaller fish that hardly compete with larger fish in regular ponds, and thus higher uniformity is expected In BFT ponds.
Total suspended solids (TSS) accumulate in the pond at a fast rate when fish biomass
is high. As to be discussed later, TSS or biofloc volume has to be monitored. The desired microbial community and reserves of feed are associated with the TSS. Thus we should not release it carelessly out of the pond. However, excessive levels of TSS are not favorable since it adds to oxygen consumption and at very high levels may clog the gills of the fish. In addition, if water mixing is not well controlled, or when TSS concentration exceeds the mixing capacity of the system, solid particles settle down and may accumulate and create anaerobic layer or pockets. The existence of anaerobic sites in the pond bottom may lead to the production of toxic reduced compounds and eventually severely hamper fish growth. TSS levels may be controlled by drainage of sludge, proper mixing of the water and good design of pond bottom. This is one of the essential controls in BFT tilapia production systems.
Feeding is an important control means. Proper feeding enables one to get the proper
C/N ratio (>15) that will promote the uptake of ammonium from the water. In addition, proper feed strategy is required to utilize the recycled microbial protein, to reduce costs and to minimize residues. There is a need for more research in order to get the right feed composition and ration. Some questions are still open.
a. The recommended C/N ratio can be obtained by either feeding with pellets of low protein percentage or by augmenting the feed pellets through the application of carbonaceous material (molasses, cassava, wheat or other flour, etc.). The first option may save labor. However we rely upon the passage and excretion of the added carbohydrates through the fish to be used by the bacteria. This assumption may not hold. b. Feed rations can be lower than the ones used in conventional tilapia ponds. With shrimp in tanks it was found that feed ration can be reduced by 30% as compared to conventional systems. It was estimated, but not proven, that feed ration in tilapia BFT systems can be lowered be at least 20% as compared with conventional systems.
Oxygen consumption in intensive BFT tilapia culture is rather high, both due to the respiration of the dense fish biomass as well as due to respiration of the microbial community that metabolize the organic residues. Oxygen consumption was estimated or modeled by several scientists however, there are a number of critical assumptions depended on specific pond conditions. The range of required aeration is 10-20 hp for a pond of 1000m2. The exact aeration rate needed for a given pond under given conditions should be adjusted following the daily determination of oxygen in the pond, normally setting a minimal level of 4 mgO2/l. One should adjust aerator usage to the size of the fish and pond's biomass. Usually, lower aeration can be applied at the start of the cycle when fish biomass is low, though it is recommended to utilize the capacity of the pond by stocking large number of fingerlings and maintain a relatively constant biomass by appropriate transfers.

365365
Proper placement of aerators is very important. Most pond aeration deployment is made in a way to obtain a circular movement of water so as to concentrate the settled particles as close as possible to the center drain. However, there are conflicting demands in this matter. We want to be able to effectively drain out the excessive sludge, yet we want to keep bioflocs suspended in the water. To prevent a fast sedimentation of particles near the center drain, it is advised to place an aspirator type aerator or air-lifts to resuspend particles sedimenting at the center. By properly adjusting the location of these units, we can approach an optimum of resuspending the less dense bioflocs while sedimenting and eventually draining the heavier particles. An important role of the aeration system is to properly mix the water and to prevent build up of sludge piles in locations were it is not effectively drained out. In case one finds such accumulation, aerators deployment has to be adjusted as soon as possible. Placement of aerators is still an art, we lack models and we do not have appropriate aerators in the market.
A very important demand is to have a sensitive and reliable monitoring and backup system. A fault in the aeration when the fish biomass is so high may be critical if no backup is activated within less than an hour. Intensive tilapia BFT ponds are rather small, 100 -1000m2, mostly due to the difficulty in the perfect mixing of a large water body. Most ponds are round or square with rounded corners, the floor of the pond slopes toward the center to facilitate sludge concentration in the center. A central drain is located in the center, operated using a stand pipe or a valve. The drain is opened usually twice daily, letting the dark sludge to drain out, till a point when clear pond water is exiting.
Though the BFT tilapia ponds are rather simple to operate, the system demands a careful monitoring and a fast response to defects, when ever detected. It has to be remembered that the pond is highly loaded and that any fault not responded to, may develop and become critical. Normal aquaculture monitoring is certainly needed. Of special importance are the following parameters:
a. Oxygen, if oxygen is high, you can reduce number of applied aerators to save
electricity. However, if O2 is less than 4 mg/l, add aerators. b. TAN. Low TAN concentration (<0.5 mg/l) means that the system works fine. You
may consider lowering carbon addition. If TAN increases respond quickly by raising carbon addition.
c. NO2. Nitrite may negatively affect tilapia, yet the effect is limited in salty water. However, an increase in NO2 may be an indication of the build up of anaerobic sites. In case of an increase of nitrite one should carefully check the presence of sludge piles in the pond and if found change aerators deployment.
d. Floc volume (FV) determination using Imhoff cones is easy and cheap. FV should be in the range of 5-50 ml/l. If it is too low add carbohydrates and in cases it is higher than 50 raise sludge removal.
Summary Biofloc systems enable to intensify tilapia production. The fish is adaptable to conditions in BFT systems, grows well, harvest the bioflocs and utilize them as a feed source. The recycling of feed and minimization of water exchange are important contribution to the economy of tilapia production. Understanding the system, monitoring and fast response to negative developments are essential to the success of the culture.
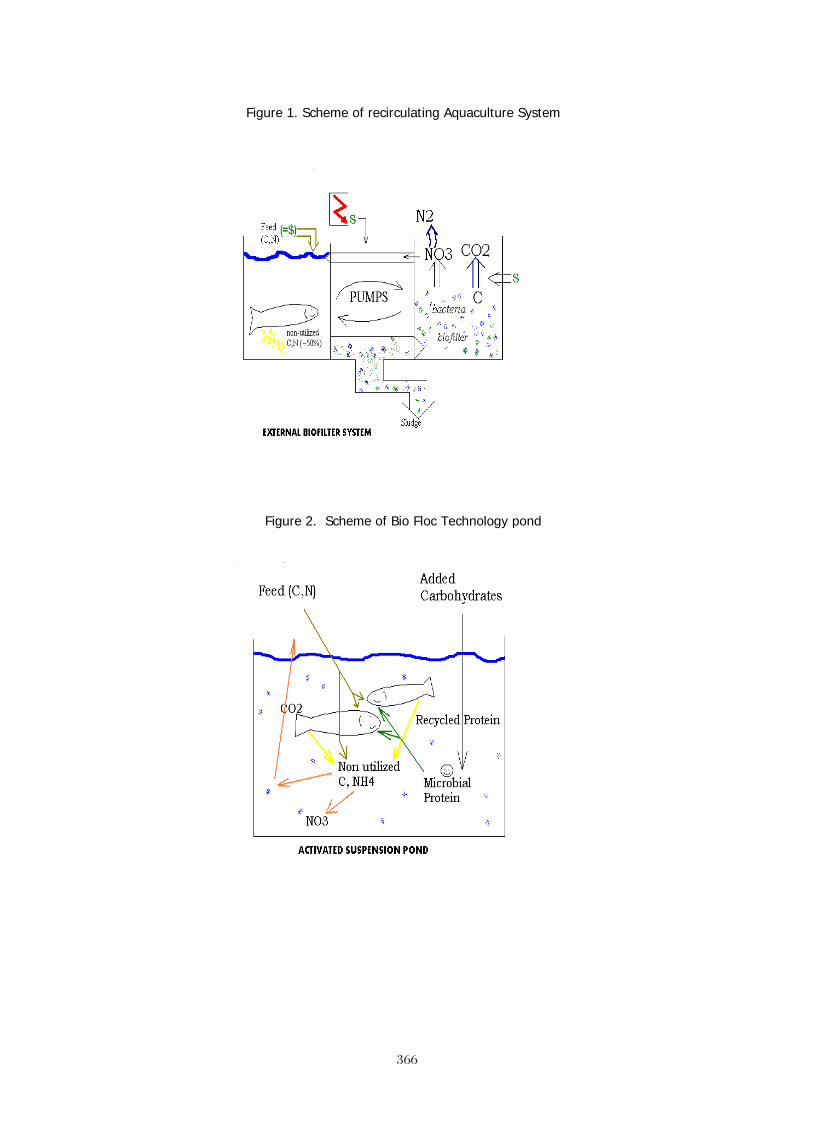
366366
Figure 1. Scheme of recirculating Aquaculture System
Figure 2. Scheme of Bio Floc Technology pond
367367
LENGTH-WEIGHT RELATIONSHIP OF Oreochromis niloticus IN A CONCRETE POND OF HABIB ADM, HUB, BALOCHISTAN
M. Y. Laghari, B. A. Dars, and N. T. Narejo, *Baoping Xin
Department of Fresh Water Biology and Fisheries, University of Sindh, Jamshoro 67080, sindh_Pakistan.
*School of Chemical Engineering and Environment, B.I.T, Beijing_China.
Abstract
The length-weight relationship and condition factor was investigated from 500 specimens of Oreochromis niloticus maintained in a concrete pond at Habib ADM Hub, Balochistan, Pakistan for six months, March to September, 2008. The experimental fish ranged from 15. 5 - 37. 8 cm and 50. 4 - 635. 4 g in length and weight respectively. The value of regression co-efficient obtained for the length-weight relationship 4.55. This suggests positive allometry growth from the entire specimens sampled. There was no significant statistical difference in the regression co-efficients. The mean values of condition factor computed for all the specimens of Oreochromis niloticus was 1.07 ± 0.45, which indicated that the specimens were healthy. The length-weight relationship of sexes combined as shown by the following equation:
Log W= -4.07 + 4.55 Log L.
Key words: Length- weight relationship, Condition factor, Oreochromis niloticus, Concrete pond, Balochistan.
Introduction Oreochromis niloticus is locally known as `Daya` belongs to the family percidae of the order perciformes. Oreochromis niloticus could be easily identified by dark bands or stripes founds on their bodies are most prominent in mature forms. They inhabit fresh water and water bodies of low salinity, as is typical of most Tilapia species Olurin and Aderibigbe 2006). Length –weight relationship give information on the condition and growth patterns of fish (Bengal and Tesch, 1978). Fish are said to exhibit isometric growth when length increases in equal proportions with body weight for constant specific gravity. The regression co-efficient for isometric growth is 3 and values greater of than 3 indicate allometric growth condition factor studies take into consideration the health and general well-being of a fish as related to its environment; hence it represents how fairly deep bodied or robust fishes are (Reynold, 1968). Pauly (1983) reported the importance of length-weight relationship in the calculation of an equation of growth in length into an equation of growth in weight. Whereas Arsalan et al (2004) stated that it is usually easier to measure length than weight and weight can be predicated later on using the length –weight relationship which helps among other fish given its definite length Olurin and Aderibigbe (2006) calculated the length-weight relationship and condition factor of pond reared Juvenile Oreochromis niloticus. But no work is available on to determine the length-weight relationship and condition factor of Oreochromis niloticus reared in concrete ponds from Pakistan. The present study aims to provide information on the length-weight relationship and condition factor of Oreochromis niloticus reared in concrete ponds of Habib ADM at Hub, Balochistan with a view to determine the suitability of stocking in concrete pond.
368368
Materials and Methods Experimental fish
Five hundred fish samples were collected from concrete pond at Habib ADM Hub, Balochistan, Pakistan, with the help of fish catching net. The specimens were transported to the laboratory in a large polythene bag with 5% formalin.
Laboratory analysis
The collected specimens were washed and mopped on filter paper to remove excess water from their body surfaces. Length of fishes was measured to the nearest cm and weight up to 0.1g by using a scale sensitive portable battery operated balance (Model No., CT, 1200-S, Made in USA ) respectively. The experimental fish were ranging from 15.5 – 37.8 (cm) in total length (TL) and 50.4-635.4 g in weight respectively.
Length–weight relationship and condition factor
The regression of weight against length was computed from the logarithmic formula: log a + b log L. Ponderal index (Kn) was observed of different length groups. It was calculated for each 5cm length interval. The smoothed mean weights W/W, for each length group has been computed from the log formula suggested by LeCren (1951) modified formulae: Kn =W/aLn has been adapted for the calculation of the relative condition factor.
Results Length-weight relationship
The length–weight relationship equations were determined for sexes combined only. The expression can be transformed logarithmically as suggested by LeCren (1951) log a + b log L. When empirical values of lengths were plotted against their respective weight on an arithmetic scale, smooth curves were obtained (Fig .1). A plot of weight against length on double logarithmic paper however yielded a straight line (Figs. 2, 3 and 4) as expected. The data of length-weight of Oreochromis niloticus is presented in (Table 1).
The regression coefficients, when calculated using the methods of least squares for samples of Oreochromis niloticus in size ranged between 15.5 – 37.8 (cm) gave the following equation:
Log W=- 4. 07 + 4.55 × Log L
As observed from the above equations values for all specimens were practically identical and followed the cube law (b= 3). The agreement between the empirical weight and computed weight from regression can be termed as ideal growth (positive allometry).
Relative condition factor
The relative condition factor (Kn) for all fish samples was determined from the average lengths and weights of 5cm interval of total length groups (Table 2). The relative condition factor (Kn) was determined for all samples in case of sexes combined only Kn values were ranging from 0.49-1.84 with mean was 1.0 ± 0.5. The values of Kn showed ideal or good growth of all specimens in all size groups of fish.
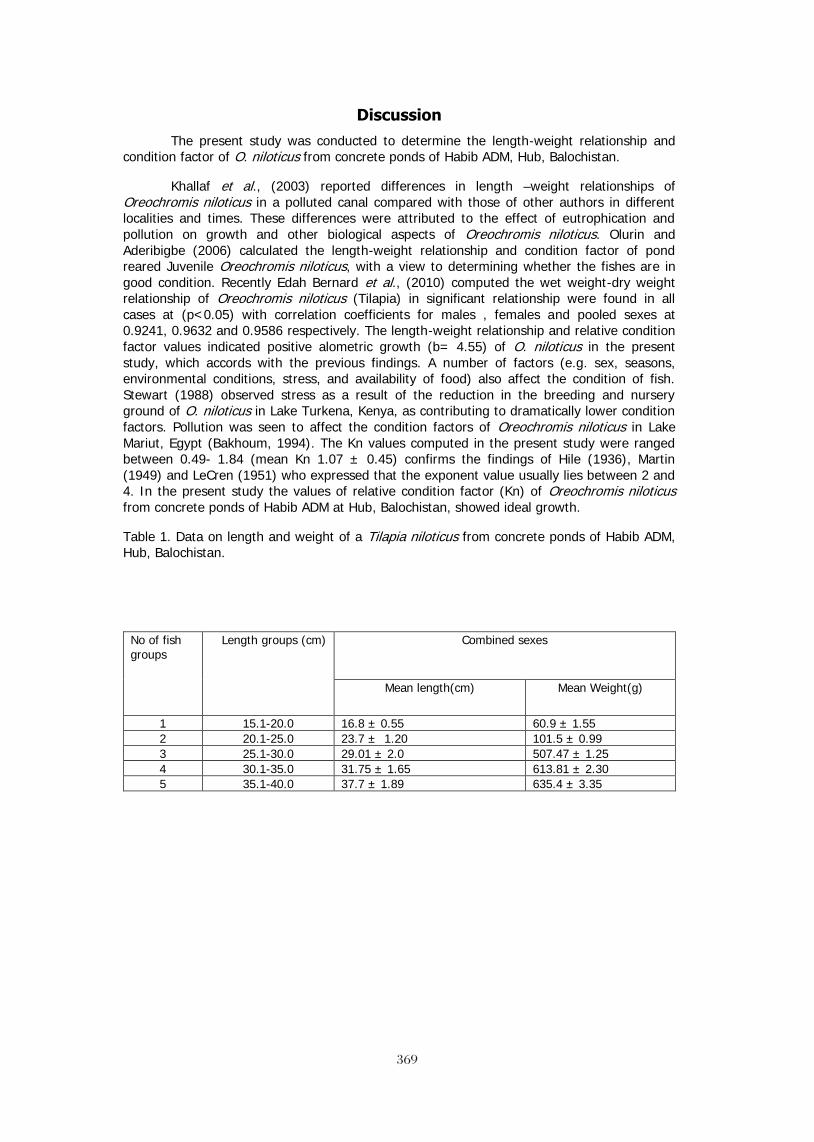
369369
Discussion The present study was conducted to determine the length-weight relationship and condition factor of O. niloticus from concrete ponds of Habib ADM, Hub, Balochistan.
Khallaf et al., (2003) reported differences in length –weight relationships of Oreochromis niloticus in a polluted canal compared with those of other authors in different localities and times. These differences were attributed to the effect of eutrophication and pollution on growth and other biological aspects of Oreochromis niloticus. Olurin and Aderibigbe (2006) calculated the length-weight relationship and condition factor of pond reared Juvenile Oreochromis niloticus, with a view to determining whether the fishes are in good condition. Recently Edah Bernard et al., (2010) computed the wet weight-dry weight relationship of Oreochromis niloticus (Tilapia) in significant relationship were found in all cases at (p<0.05) with correlation coefficients for males , females and pooled sexes at 0.9241, 0.9632 and 0.9586 respectively. The length-weight relationship and relative condition factor values indicated positive alometric growth (b= 4.55) of O. niloticus in the present study, which accords with the previous findings. A number of factors (e.g. sex, seasons, environmental conditions, stress, and availability of food) also affect the condition of fish. Stewart (1988) observed stress as a result of the reduction in the breeding and nursery ground of O. niloticus in Lake Turkena, Kenya, as contributing to dramatically lower condition factors. Pollution was seen to affect the condition factors of Oreochromis niloticus in Lake Mariut, Egypt (Bakhoum, 1994). The Kn values computed in the present study were ranged between 0.49- 1.84 (mean Kn 1.07 ± 0.45) confirms the findings of Hile (1936), Martin (1949) and LeCren (1951) who expressed that the exponent value usually lies between 2 and 4. In the present study the values of relative condition factor (Kn) of Oreochromis niloticus from concrete ponds of Habib ADM at Hub, Balochistan, showed ideal growth.
Table 1. Data on length and weight of a Tilapia niloticus from concrete ponds of Habib ADM, Hub, Balochistan.
No of fish groups
Length groups (cm) Combined sexes
Mean length(cm) Mean Weight(g)
1 15.1-20.0 16.8 ± 0.55 60.9 ± 1.55 2 20.1-25.0 23.7 ± 1.20 101.5 ± 0.99 3 25.1-30.0 29.01 ± 2.0 507.47 ± 1.25 4 30.1-35.0 31.75 ± 1.65 613.81 ± 2.30 5 35.1-40.0 37.7 ± 1.89 635.4 ± 3.35

370370
Table 2. Relative condition factor (Kn) values for combined sexes of Tilapia niloticus from concrete ponds Habib ADM, Hub, Balochistan.
Length group (cm)
Combine sexes Observed weight Calculated weight Kn
15.1-20.0 60.9 30.19 0.49 20.1-25.0 101.50 144.54 0.73 25.1-30.0 507.47 371.53 0.91 30.1-35.0 613.81 562.34 1.42 35.1-40.0 635.4 1174.89 1.84
Mean Kn = 1. 07 ± 0.45
Fig.1. Length-weight relationship of sexes combined Oreochromis niloticus from concrete pond of Habib ADM, Hub, Balochistan (Empirical values)
Fig. 2. Log-log relationship of sexes combined Oreochromis niloticus from concrete ponds of Habib ADM, Hub, Balochistan.
0200400600800
1000
0 10 20 30 40
Total Length (cm)
Tota
l Wei
ght (
g)
01234
0 0.5 1 1.5 2
Log Length (cm)
Log
Wei
ght (
g)

371371
References Bagenal, T.B. and A.T. Tesch, (1978). Conditions and growth patterns in fresh water habitats.
Blackwell Scientific Publications, Oxford. Bakhoum, S.A., (1994). Comparative study on length weight relationship and condition
factors of the Oreochromis in polluted and non-polluted parts of Lake Mariut, Egypt. Bull. Natl. Inst. Oceanogr. Fish., Egypt, 20: 201-210.
Edah, B. A., A. O. Akande, C. Ayo-Olalusi, A. Olusola. (2010) Computed the wet weight-dry weight relationship of Oreochromis niloticus (Tilapia) Internet Journal of Food Safety, 12, 2010, p. 109-
Hile, R. (1936). Age and growth of Cisco, Leuhthys artedi (Le Suer) in the lake of north-eastern high lands. Bull. US. Bur. Fish., 48:211-317.
Khallaf, E. A., M. Galal and M. Authman, (2003). The Biology of Oreochromis niloticus in a polluted canal. Ecotoxicol, 12: 405-416.
LeCren, E. D. (1951). The length- weight relationship and seasonal cycle in gonad weight and condition in the perch (Perca fluviatilis). J. Anim.Ecol., 20 (4): 201 -219.
Martin, W. R. (1949). The mechanics of environmental control of body form in fishes. Univ. Toronto Stud. Biol., 56:1-91.
Olurin, K. B. and O. A. Aderibigbe. (2006) Length-weight relationship and condition factor of pond reared juvenile Oreochromis niloticus. World Journal of Zoology 1 (2): 82-85.
Pauly, T.A., (1976). General characters for the classification of the cichlid family. Ricker, W.E. (Ed.). Blackwell, Oxford.
Reynold, T.D., (1968). The biology of the clupeids in the New Volta. In: Man-made Lakes. The Accra Symposium. Ghana University Press, Accra.
Stewart, K.M., (1988). Changes in condition and maturation of the Oreochromis niloticus L. population of Ferguson’s Gulf, Lake Turkana, Kenya. J. Fish Biol., 33: 181-188.

372372
SCALING UP OF CAGE-CUM-POND CULTURE SYSTEM OF CATFISH AND TILAPIA IN CAGES IN CARP POLYCULTURE PONDS
Ram B. Mandal1, Madhav K. Shrestha1*, Dilip K. Jha1, Jharendu Pant2 and Narayan P.
Pandit1 1Institute of Agriculture and Animal Science (IAAS), Rampur, Chitwan, Nepal
2WorldFish Center, Penang, Malaysia [email protected]
ABSTRACT
A scaling up experiment on cage-cum-pond culture system of African catfish (Clarias gariepinus) and Nile tilapia (Oreochromis niloticus) with carps, developed by AquaFish CRSP, was conducted using 20 farmers’ earthen ponds (65-370 m2) in Chitwan district of Nepal for 150 days to evaluate the production and profitability of these system. The experiment was conducted in a completely randomized design (CRD) with four treatments replicated five times. The treatments were (1) carps in ponds without cage (control), (2) tilapia at 30 fish/m3 in cage and carps in open pond, (3) catfish at 100 fish/m3 in cage and carps in open pond, (4) tilapia and catfish at 30 and 100-fish/m3, respectively, in separate cages and carps in open pond. Carps were stocked at 1 fish/m2 (silver, common, bighead, rohu, mrigal and grass carp at 4:2:1.5:1:1:0.5 ratio) in all the treatments. The cage occupied about three percent of the pond area. Caged tilapia and catfish were fed with locally prepared pellet feeds (29% crude protein), while no feed or fertilizer was added into open water of treatment ponds. The control ponds were fertilized weekly using diammonium phosphate (DAP) and urea at rates of 4 kg N and 2 kg P/ha/d.
The results showed that the combined net yields were significantly higher in tilapia-carps (3.0 t/ha/crop) and tilapia-catfish-carp integration system (3.6 t/ha/crop) than control (1.4 t/ha/crop) (p<0.05). The net yields of carps were not significantly different between control and treatments. The cage-cum-pond system increased productivity by 2-3 times. The mean temperature, dissolved oxygen, pH and transparency were not significantly different among treatments. The benefit-cost ratio was significantly higher in the tilapia-carps integration system (7.4) than control (3.3) (p<0.05). This experiment demonstrated that the cage-cum-pond integration with Nile tilapia in cage and carps in open pond is one of the best technologies to increase production and profitability for small farmers.
INTRODUCTION
Rural pond aquaculture in Nepal is typically small-scale and semi-intensive polyculture of Chinese and Indian major carps with an average production of 3.3 t/ha/yr (DoFD, 2009). Increasing fish productivity as well as total production in country is a challenging task and necessary in order to provide for increasing demand for fish as food without increasing import from neighboring countries. Nile tilapia (Oreochromis niloticus) and African catfish (Clarias gariepinus) are the well proven species for aquaculture in many countries but they are newly introduced fish species in Nepal (Shrestha and Bhujel, 1999). The major production system for Nile tilapia is semi-intensive with inorganic or organic fertilizer inputs while African catfish is generally cultured at high stocking densities with intensive feeding (Lin and Diana, 1995; Rai and Lin, 1999). One of the most problematic aspects of intensive catfish culture is its effects on the environment (Lin and Diana, 1995). In most of the countries, Nile tilapia at a size greater than 500 g fetch a much higher price than fish at 250-300 g, the size commonly produced in fertilized pond systems (Yi et al., 1996). In this context, the AquaFish CRSP has developed a high production and eco-friendly technology, so-called integrated cage-cum-pond culture system, especially for tilapia and catfish culture. Different models of integrated cage-cum-pond culture systems has been developed and practiced by AquaFish CRSP suitable for small-scale farmers.

373373
In the integrated cage-cum-pond culture system, high-valued, feed-response fish species are fed with artificial diets in cages suspended in ponds and filter-feeding fish species are stocked in such ponds to utilize natural foods in form of cage wastes. This integrated system has been developed and practiced using combinations of catfish-tilapia (Lin, 1990; Lin and Diana, 1995) and tilapia-tilapia (Yi et al., 1996; Yi, 1997; Yi and Lin, 2001) at AIT, and in mixed-sex tilapia-tilapia (Shrestha, 2002), sahar-carps (Shrestha et al., 2005) and catfish-carps (Shrestha et al., 2009). These systems have been shown to be effective to increase nutrient utilization efficiency and gross fish production. Compared to of about 25 to 30% in most of the intensive culture systems, the nutrient utilization efficiency could reach more than 50% in integrated cage-cum-pond systems, resulting in the release of lesser amount of nutrients to receiving waters (Yi, 1997). It is one of the highly successful and widely accepted fish culture systems among small scale rural farmers in Thailand, Vietnam and Cambodia (Yi, 1997). This integrated system is environment-friendly because less waste nutrients are released to the environment. The purposes of this study were to adopt the integrated cage-cum-pond culture system in local conditions in Nepal and to assess the production and profitability of different integration models of Nile tilapia and African catfish with carps.
MATERIALS AND METHODS
This experiment was conducted at 20 farmer’s earthen ponds of average 168.5m2 (65-370 m2) sizes for 5 months (12 April 2010 to 12 September 2010) in the subtropical climate of Nepal. The experiment was set up in a Completely Randomized Design (CRD) with one control and three treatments with five replicates each. The treatments were ((1) carps in ponds without cage (control), (2) tilapia at 30 fish/m3 in cage and carps in open pond, (3) catfish at 100 fish/m3 in cage and carps in open pond, (4) tilapia and catfish at 30 and 100 fish/m3, respectively, in separate cages and carps in open pond. Carps were stocked at 1 fish/m2 (silver, common, bighead, rohu, mrigal and grass carp at 4:2:1.5:1:1:0.5 ratio) in all the treatments. The cage occupied about three percent of the pond area. The ponds were completely drained and filled with canal water to 1.4 m and water was added weekly to compensate for evaporation and seepage losses. Ponds were fertilized at the rate of 4 kg N/ha/day and 2 kg P/ha/day for 7 days with diammonium phosphate (DAP) and urea. Prior to filling ponds, cages were placed at the center of the pond 15 cm above the bottom and supported by bamboo poles. A feeding tray was placed in each cage. A wooden platform was constructed to connect cages to the bank for feeding, cage monitoring, and water sampling. A wooden depth gauge was fixed in the middle of each pond to measure water depth.
Tilapia and catfish fingerlings (approximately 48.4 ± 2.5 g and 3.8 ± 0.1 g, respectively) were stocked in cages, while fingerling silver carp (Hypophthalmichthys molitrix), common carp (Cyprinus carpio), bighead carp (Aristichthys nobilis), rohu (Labeo rohita), mrigal (Cirrhinus mrigala) and grass carp (Ctenopharyngodon idella), (average weights 3.3 ± 0.8 g, 3.4 ± 0.7 g, 22.3 ± 6.2 g, 3.5 ± 0.6 g, 3.5 ± 0.5 g and 2.1 ± 0.0 g, respectively) were stocked in open ponds. Fish were stocked on 12 April 2010 and harvested on 12 September 2010. About 15% of carps and 100% of tilapia and catfish were sampled, counted and bulk weighed monthly during the experimental period.
Caged fish were fed once daily at 0900–1000 h, with a locally made pellet feed (rice bran and mustard oil cake 1:1; 29% crude protein) at rates of 3% body weight per day for tilapia and 4% body weight per day for catfish, while no feed or fertilizer was added into open water of the treatment ponds. Feed rations were adjusted based on sampling weights and observed mortality of tilapia and catfish. Control ponds were fertilized weekly using DAP and urea at rates of 4 kg N and 2 kg P/ha/day. The cages and feeding trays were cleaned fortnightly during sampling.
Weekly measurements of water quality parameters were conducted at 0800–1000 h starting from 12 April 2010. Water temperature, dissolved oxygen (DO), pH, and Secchi disk depth were measured in situ weekly using a DO meter (YSI meter model 50B), pH meter (Pocket pH meter) and Secchi disk, respectively. Simple economic analysis was conducted to
374374
determine economic returns of each treatment (Shang, 1990). The analysis was based on market prices in Nepal for harvested fish and all other items, which were expressed in local currency NRs (US$ 1 = 75 NRs). Market prices of harvested tilapia, catfish and carps were 200 NRs/kg. Market prices of tilapia, catfish and carp fingerlings were 4.0, 3.0 and 1.25 NRs/piece, respectively. The market prices of feed was 18 NRs/kg, DAP was 44 NRs/kg, urea was 25 NRs/kg, and cage depreciation was 22.32 NRs/m2cage/year. Data were analyzed statistically by analysis of variance (ANOVA) using SPSS (version 15.0) statistical software (SPSS Inc., Chicago). Arcsine transformations were performed on percent data. Differences were considered significant at the 95% confidence level (P<0.05). All means were given with ±1 standard error (S.E.).
RESULTS
The initial weight, harvest weight, weight gain, gross fish yield, net fish yield, and survival of tilapia, catfish and carps are presented in Table 1. The survivals of tilapia in cages were ranging from 75.5 - 86.1%. Tilapia grew steadily and slowly at about 0.6 g/day during the entire culture period (Figure 1). FCR was quite high, ranging from 4.8 - 5.8. Net and gross fish yields of tilapia in cage in the tilapia-carp integration system were 0.4 and 0.5 t/ha/crop, respectively. The survivals of catfish in cages were low, ranging from 29.0 to 55.3%. The growth rate of catfish was 0.8 to 1.0 g/day. The growth is steady and slow (Figure 2). FCR was quite high, ranging from 4.5-5.8. Net and gross fish yields of catfish in cage in the catfish-carp integration system were 0.6 and 0.7 t/ha/crop, respectively. The net and gross yield, and survival of carps were not significantly different among treatments (P>0.05). The combined net yields of tilapia, catfish and carps were significantly higher in tilapia-carps (3.0 t/ha/crop) and tilapia-catfish-carp integration system (3.6 t/ha/crop) than control (1.4 t/ha/crop) (p<0.05), whereas there were no significant difference between catfish-carps integration system ((2.7 t/ha/crop) and control (1.4 t/ha/crop) (P>0.05; Table 1).
The mean temperature, dissolved oxygen, pH and transparency were not significantly different (P>0.05) among treatments (Table 2). Water temperature was 28 °C during at the initial period of the experiment, increased gradually, and reached about 32 °C at the end of the experiment (Figure 3). Lower levels of morning dissolved oxygen (1.1 to 3.0 mg/L) were observed in all treatments during the entire culture period (Figure 2). Most of the water quality parameters showed seasonal and cyclic variation limiting the growth performance of cultured fish. Economic analysis showed that gross revenues were significantly higher in the tilapia-carps and tilapia-catfish-carp integration system than control (p<0.05), whereas the benefit-cost ratio was significantly higher in the tilapia-carps integration system than control (p<0.05; Table 3).
DISCUSSION
The growth of Nile tilapia in cage in the present experiment was relatively low, with daily weight gain of 0.6 g/fish/day, compared with other integrated cage-cum-pond system (1.0 g/fish/day, Yadav et al. 2007; 1.0 g/fish/day, Shrestha, 2000c; and 4.0 - 4.6 g/fish/day, Yi et al., 1996). Similarly, the daily weight gain of African catfish in the present experiment was 0.8 - 1.0 g/fish/day, which was lower than in outdoor cement tanks (1.1 - 1.7 g/fish/day, Yi et al., 2004; and 1.7 - 1.9 g/fish/day, Long and Yi, 2004), an integrated pen-cum-pond system (2.5 - 2.6 g/fish/day, Yi et al., 2003), and integrated cage-cum-pond system (2.1 - 2.2 g/fish/day, Lin and Diana, 1995; and 1.3 g/fish/day, Shrestha et al., 2009), but higher than those in two other integrated cage-cum-pond systems (0.7 g/fish/day, Uddomkarn, 1989; and 0.8 - 0.9 g/fish/day, Ye, 1991). The higher FCR of tilapia and catfish were caused by higher mortality. The possible reason for lower survival was lower early morning DO and prolonged duration of low DO levels in the case of Nile tilapia, and small stock size and cannibalism in the case of African catfish.

375375
The extrapolated carp yield in the control ponds in the present study (3.3 t/ha/year) was comparable to the yield of semi-intensive carp polyculture system of Nepal (3.3 t/ha/year, DoFD, 2009). The combined net yields of tilapia, catfish and carps in tilapia-carps (7.3 t/ha/year) and tilapia-catfish-carp integration system (8.8 t/ha/year) in the present study was lower than the production of 8 - 15 t/ha/year in other cage-cum-pond integration systems (Yi et al., 1996; Yi, 1997; Yi and Lin, 2001; Shrestha 2002).
Both the control and cage treatment produced positive net returns ranging from 292,125 NRs/ha in the control, and 586,662 to 786,135 NRs/ha in the cage treatment. There was also a significant increase in net returns for the integrated cage-cum-pond culture system as compared to the semi-intensive culture of carps alone. However, in the present study, on the basis of profitability, the tilapia-carp integration system is the best. Small farmers having a single pond can produce more fish for sale from cages and carps without feeding in ponds for home consumption as well as for sale. This increased production per unit area as well as income by 2 times than the normal pond culture of carps in Nepal.
The cage-cum-pond integrated system was developed to integrate intensive feeding in cages and semi-intensive fertilization in open ponds, with fertilizer derived from cage wastes. The similar growth rate of the carps in cage-cum-pond integration compared to the fertilized pond without cages indicated that the nutrients released by the cage are sufficient for production of carps in open pond. This experiment demonstrated that the cage-cum-pond integration with Nile tilapia in cage and carps in open pond is one of the best technologies to increase production and profitability for small farmers.
ACKNOWLEDGEMENTS
This research was the Master’s thesis work of Mr. Ram B. Mandal at the Tribhuvan University, Institute of Agriculture and Animal Science (IAAS), Rampur, Chitwan, Nepal. The authors wish to acknowledge the supports of the Nepal Agricultural Research and Development Fund (NARDF) and AquaFish CRSP for funding the research. Special thanks are extended to the participating farmers of the Kathar VDC, Chitwan, Nepal for their assistance and providing ponds for this experiment.
REFERENCES
DoFD. 2009. Annual Report . Directorate of Fisheries Development, Balaju. Department of Agriculture, Ministry of Agriculture and Co-operatives, Government of Nepal.
Lin, C.K. 1990. Integrated culture of walking catfish (Clarias macrocephalus) and tilapia (Oreochromis niloticus). In: R. Hirano and I. Hanyu (Eds.), The Second Asian Fisheries Forum, Asian Fisheries Society, Manila, Philippines. Pp. 209-212
Lin, C.K. and Diana, J.S. 1995. Co-culture of catfish (Clarias macrocephalus x C. gariepinus) and tilapia (Oreochromis niloticus) in ponds. Aquatic Living Resources 8: 449-454.
Long, N.T. and Yi, Y. 2004. Stocking ratios of hybrid catfish (Clarias macrocephalus x C. gariepinus) and Nile tilapia (Oreochromis niloticus) in an intensive polyculture. In: R. Bolivar, G. Mair and K. Fitzsimmons (Eds.), Proceedings of the 6th International Symposium on Tilapia in Aquaculture. Manila, Philippines. pp. 518-528.
Rai, S. and Lin, C.K. 1999. Effect of co-culture of hybrid catfish with carps on pond water quality and fish yield. J. Inst. Agric. Anim. Sci. 19-20: 83-89.
Shang, Y. C. 1990. Aquaculture Economics Analysis: An Introduction. World Aquaculture Society, Baton Rogue, Louisiana. 211 p.
Shrestha, M.K., Pandit, N.P., Yi, Y., Lin, C.K. and Diana, J.S. 2009. Integrated cage-cum-pond culture system with Clarias gariepinus in cages and carps in open ponds. In Y. Yang, Wu, X.Z. and Zhou, Y.Q. (Eds.), Cage Aquaculture in Asia: Proceedings of the Second International Symposium on Cage Aquaculture in Asia. Asian Fisheries Society, Manila, Philippines, and Zhejiang University, Hanzhou, China. Pp. 150-161.
Shrestha, M.K., Pandit, N.P. Yi, Y. Diana, J.S. and Lin, C.K. 2005. Integrated cage-cum-pond culture system with high-valued Sahar (Tor putitora) suspended in carp polyculture ponds. In: J. Burright, C. Flemming, and H. Egna (Eds.), Twenty-Second Annual Technical Report. Aquaculture CRSP, Oregon State University, Corvallies, Oregon. pp. 97-114.

376376
Shrestha, M.K., Shrestha, S.S. and Jha, D.K. 2000c. Cage cum pond integration system for large size Nile tilapia production: a model evaluation. In: S.M. Shrestha and N.R. Devkota (Eds.), IAAS Research Reports (1995-2000). Inst. Agric. Anim. Sci., Rampur, Chitwan, Nepal. pp. 69-77.
Shrestha, M.K. 2002. Mixed sex Nile tilapia culture model for subtropical Nepal. Paper presented in World Aquaculture 2002. 23-27 April 2002, Beijing, China.
Shrestha, M.K. and Bhujel, R.C. 1999. A preliminary study on Nile tilapia (Oreochromis niloticus) polyculture with common carp (Cyprinus carpio) fed with duck weed (Spirodella) in Nepal. Asian Fisheries Science 12: 83-89.
Uddomkarn, C. 1989. Integration of Catfish (Clarias macrocephalus) Cage Culture with Tilapia in Earthen Ponds. Unpublished M.Sc. Thesis. Asian Institute of Technology, Bangkok, Thailand.
Yadav, R.K., Shrestha, M.K. and Pandit, N.P. 2007. Introduction of sahar (Tor putitora) in cage cum pond integration system of mixed-sex Nile tilapia (Oreochromis niloticus). Our Nature 5: 52-59.
Ye, Q.F. 1991. Nutrient Budget and Water Quality in Integrated Walking Catfish – Tilapia Culture. Unpublished M.Sc. Thesis. Asian Institute of Technology, Thailand, 88 pp.
Yi, Y. and Lin, C.K. 2001. Effects of biomass of caged Nile tilapia (Oreochromis niloticus) and aeration on the growth and yields in an integrated cage-cum-pond system. Aquaculture 195: 253-267.
Yi, Y. 1997. An Integration Rotation Culture System for Fattening Large Nile Tilapia (Oreochromis niloticus) in Cages and Nursing Small Nile Tilapia in Open Ponds. Unpublished Doctoral Dissertation, Asian Institute of Technology, Bangkok, Thailand.
Yi, Y., Lin, C.K. and Diana, J.S. 1996. Influence of Nile tilapia (Oreochromis niloticus) stocking density in cages on their growth and yield in cages and in ponds containing the cages. Aquaculture 146: 205-215.
Yi, Y., Lin, C.K. and Diana, J.S. 2003 Hybrid catfish (Clarias macrocephalus X C gariepinus) and Nile tilapia (Oreochromis niloticus) culture in an integrated pen- cum-pond system: growth performance and nutrient budgets. Aquaculture 217: 395-408.
Yi, Y., Sethteethunyahan, R. and Lin, C.K. 2004. Recycling wastewater of intensive hybrid Clarias catfish culture for semi-intensive Nile tilapia culture. In: R. Bolivar, G. Mair and K. Fitzsimmons (Eds.), Proceedings of 6th International Symposium on Tilapia in Aquaculture. Manila, Philippines, pp. 755-762.

377377
Table 1. Individual and combined performance of Nile tilapia, African catfish and carps in different treatments during the 150-day culture period. Mean values with different superscript letters in the same row were significantly different (P<0.05).
Parameter
Treatments Control Tilapia-Carp Catfish-Carp Tilapia-
Catfish-Carp A. Nile tilapia Stocking Total weight (kg/ha) Mean weight (g/fish)
- -
439.9±24.7 47.9±2.4
- -
215.7±10.8 48.8±2.7
Harvesting Total weight (kg/ha) Mean weight (g/fish) Weight gain (g/f/d) Gross yield (t/ha/crop) Net yield (t/ha/crop) Survival (%) FCR
- - - - - - -
885.3±143.5 128.8±12.9 0.60±0.08
0.5±0.1 0.4±0.1
75.5±8.1 4.8±1.2
- - - - - - -
530.0±50.2 137.0±11.3 0.66±0.08
0.3±0.1 0.3±0.1
86.1±4.8 5.8±0.7
B. African catfish Stocking Total weight (kg/ha) Mean weight (g/fish)
- -
- -
110.7±3.2 3.9±0.1
58.1±1.7 3.7±0.1
Harvesting Total weight (kg/ha) Mean weight (g/fish) Weight gain (g/f/d) Gross yield (t/ha/crop) Net yield (t/ha/crop) Survival (%) FCR
- - - - - - -
- - - - - - -
746.6±213.7
86.0±4.0 0.8±0.0 0.7±0.2 0.6±0.2
29.0±7.0 5.8±0.73
509.9±141.3 100.2±17.6
1.0±0.2 0.7±0.1 0.8±0.1
55.3±7.8 4.5±1.13
C. All carps Stocking Total weight (kg/ha)
68.8±15.7a
69.0±12.6a
81.7±9.6a
29.9±3.8b Harvesting Total weight (kg/ha) Gross yield (t/ha/crop) Net yield (t/ha/crop) Survival (%)
1460.8±299.2a
1.5±0.3a 1.3±0.3a
51.1±11.4a
1959.8±291.6a
2.0±0.3a 1.9±0.3a
69.3±6.0a
2168.8±303.1a
2.2±0.3a 2.0±0.3a
61.7±5.2a
1974.0±369.0a
2.0±0.3a 1.9±0.4a
58.7±8.7a D. Combined Initial Fish Biomass (kg/ha) Final Fish Biomass(kg/ha) Gross Fish Yield (t/ha/crop) Net Fish Yield (t/ha/crop)
68.8±15.7d
1460.6±299.4b 1.5±0.3b 1.4±0.3b
509.0±19.3a
3521.3±814.9a 3.5±0.4a 3.0±0.4a
192.4±11.2c
2933.3±334.0ab 2.9±0.3ab 2.7±0.3ab
303.9±12.3b
3930.7±630.3a 3.9±0.3a 3.6±0.3a
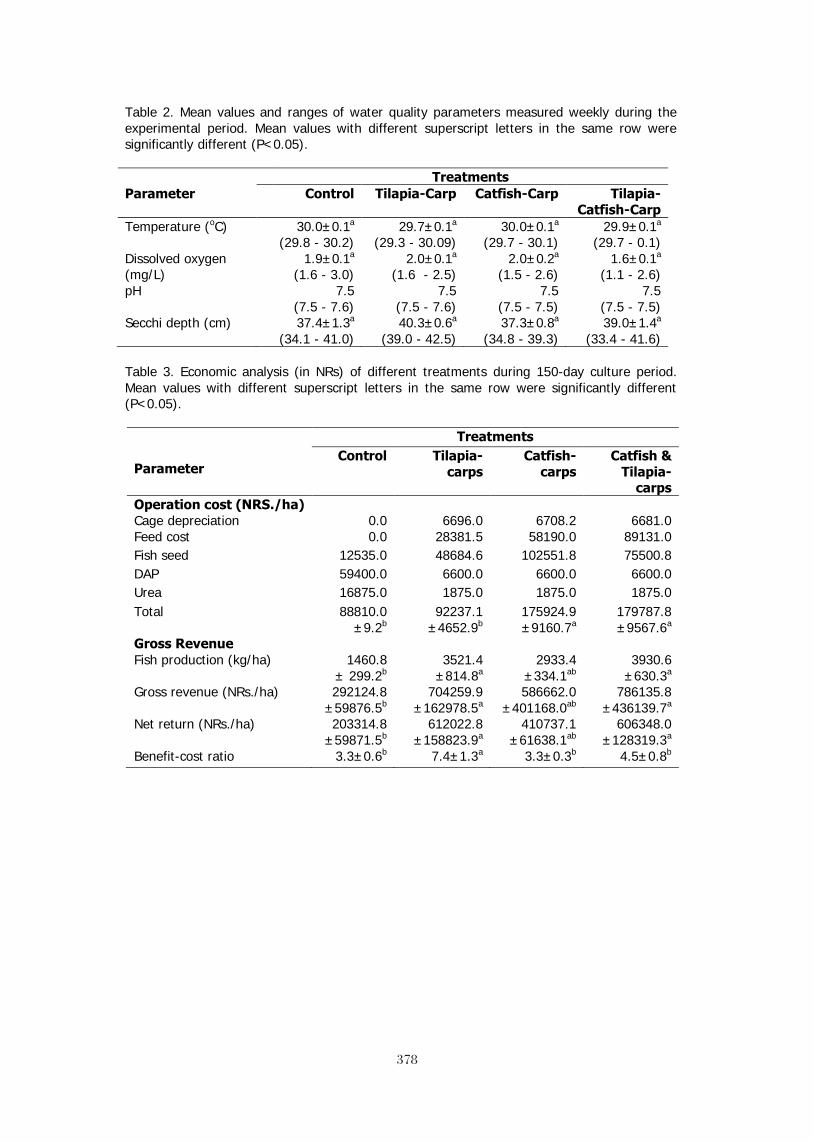
378378
Table 2. Mean values and ranges of water quality parameters measured weekly during the experimental period. Mean values with different superscript letters in the same row were significantly different (P<0.05). Treatments Parameter Control Tilapia-Carp Catfish-Carp Tilapia-
Catfish-Carp Temperature (oC) 30.0±0.1a
(29.8 - 30.2) 29.7±0.1a
(29.3 - 30.09) 30.0±0.1a
(29.7 - 30.1) 29.9±0.1a
(29.7 - 0.1) Dissolved oxygen (mg/L)
1.9±0.1a (1.6 - 3.0)
2.0±0.1a (1.6 - 2.5)
2.0±0.2a (1.5 - 2.6)
1.6±0.1a (1.1 - 2.6)
pH 7.5 (7.5 - 7.6)
7.5 (7.5 - 7.6)
7.5 (7.5 - 7.5)
7.5 (7.5 - 7.5)
Secchi depth (cm) 37.4±1.3a (34.1 - 41.0)
40.3±0.6a (39.0 - 42.5)
37.3±0.8a (34.8 - 39.3)
39.0±1.4a (33.4 - 41.6)
Table 3. Economic analysis (in NRs) of different treatments during 150-day culture period. Mean values with different superscript letters in the same row were significantly different (P<0.05).
Parameter
Treatments Control Tilapia-
carps Catfish-
carps Catfish &
Tilapia-carps
Operation cost (NRS./ha) Cage depreciation
0.0
6696.0
6708.2
6681.0
Feed cost 0.0 28381.5 58190.0 89131.0 Fish seed 12535.0 48684.6 102551.8 75500.8 DAP 59400.0 6600.0 6600.0 6600.0 Urea 16875.0 1875.0 1875.0 1875.0 Total 88810.0
±9.2b 92237.1
±4652.9b 175924.9 ±9160.7a
179787.8 ±9567.6a
Gross Revenue Fish production (kg/ha)
1460.8
± 299.2b
3521.4
±814.8a
2933.4
±334.1ab
3930.6
±630.3a Gross revenue (NRs./ha) 292124.8
±59876.5b 704259.9
±162978.5a 586662.0
±401168.0ab 786135.8
±436139.7a Net return (NRs./ha) 203314.8
±59871.5b 612022.8
±158823.9a 410737.1
±61638.1ab 606348.0
±128319.3a Benefit-cost ratio 3.3±0.6b 7.4±1.3a 3.3±0.3b 4.5±0.8b

379
379
Figure 1. Growth of Nile tilapia in cages in different treatments during the experimental period. T2 = tilapia-carps integration and T4 = tilapia-catfish-carps integration system.
Figure 2. Growth of African catfish in cages in different treatments during the experimental period. T3 = catfish-carps integration and T4 = tilapia-catfish-carps integration system.
Mea
n w
eigh
t (g)
Experimental period (days)
T2 T4
Mea
n w
eigh
t (g)
Experimental period (days)
T3 T4

380380
1
Figure 3. Fluctuations in water temperature (at dawn) in different treatments during the experimental period. T1 = control, T2 = tilapia-carps integration, T3 = catfish-carps integration, and T4 = tilapia-catfish-carps integration.
Figure 4. Fluctuations in dissolved oxygen (at dawn) in different treatments during the experimental period. T1 = control, T2 = tilapia-carps integration, T3 = catfish-carps integration, and T4 = tilapia-catfish-carps integration.

381
381
BRACKISHWATER POLYCULTURE OF TILAPIA WITH MILKFISH IN ACEH, INDONESIA
Hasan Hasanuddin and Michael Rimmer

382382
POLYCULTURE OF TILAPIA AND SEAWEEDS IN SOFT-SHELL CRAB PONDS IN INDONESIA AND THAILAND
May Myat Noe LWIN
383383
STOCKING TILAPIA IN SHRIMP CULTURE RESERVOIR: FIELD TRIAL IN ACEH, INDONESIA
Sidrotun Naim1, Cut Desyana2
1University of Arizona, Tucson, USA 2WWF – Indonesia
ABSTRACT
Shrimp culture was started in Indonesia in 1980’s and tilapia culture became popular in the last ten years. Both species are considered as the main fisheries commodities by the government. Previous research findings suggested that shrimp-tilapia polyculture may help to minimize the risks of Vibriosis and WSSV infection.The use of water from a tilapia culture pond reduced the prevalence of bacterial infections in shrimp ponds from luminous Vibriosis. Field experiment of shrimp-tilapia polyculture has been conducted in Aceh by stocking tilapia in the reservoir. After two months, the shrimps were infected with WSSV. The tilapia was able to survive and grown up to harvest time.
INTRODUCTION
Polyculture has been a long tradition in Asian countries, including Indonesia. While
milkfish culture was started in the 17th century, shrimp aquaculture was not initiated until the beginning of 1980’s. Since then, shrimp-milkfish polyculture has been practiced in extensive, semi-intensive and intensive culture systems. In most shrimp-milkfish polyculture systems, shrimp is cultured as the primary; while milkfish is cultured as the secondary species to reuse the shrimp feed wastes and to improve the water quality.
Having one of the longest coastlines in the tropical countries, the people in Indonesia are more familiar to marine fish. Only in the last five years, tilapia, one of the freshwater fish has become popular. In fact, tilapia was already present in Indonesia since 1930’s. In Indonesia, tilapia is known as ‘ikan nila’ (for Oreochromis niloticus) and ‘ikan mujair’ (for O. mossambicus). Not a native to Indonesia, but the local name ‘mujair’ for mossambicus came from the persons who found the fish in 1939 in the Serang River, Blitar, East Java. Most probably, the Dutch during the colonial era shipped the live fish from South Africa to Indonesia. This history also explains how Mossambicus is also known as the Java Tilapia, as it was already found in Java in 1930’s. As tilapia became popular, the shrimp-polyculture had already started on a small scale in some places.
The use of water from a tilapia culture pond reduced the prevalence of bacterial infections in shrimp ponds from luminous Vibriosis (Huervana, et.al., 2004; Tendencia, et.al.,2006). Vibrio harveyi is a bacterial pathogens common in shrimp culture nd is a gram negative, while waters which have been used for fish culture tend to be dominated by gram positive bacteria (Yi and Fitzsimmons, 2004).
In Indonesia, traditional extensive shrimp farms usually have a reservoir, where the water from the coast is settled before entering the pond, particularly if the farms are far away from the nearest coast. Most of the time, farmers do not stock shrimps or fish in the reservoir. The field experiment aims to investigate the stocking of tilapia in the reservoir.
MATERIAL AND METHODS
Pond preparation Infrastructure work commenced on the embankment and the sludge was removed. Standard measurements for pH, DO, and salinity were conducted periodically. The pond was fertilized, limed, and irrigated. Saponin was added before stocking with shrimps. Culture In a one hectare pond, 20,000 black tiger shrimp post larvae (12 day) were released into the pond. The post larvae came from hatcheries at Trieng Gadeng, Pidie Jaya. Feeding commenced 35 days after shrimp stocking. The amount of feed given was 0.5 kilogram

384384
every morning, afternoon, and evening. Red Tilapia from Ujung Batee Brackish Aquaculture Research Center were stocked in the reservoir simultaneously with the shrimps. The experiment for shrimps was conducted for two months (April-June 2010) and for tilapia went on for six months (April-December 2010).
RESULTS AND DISCUSSION
The survival and growth rates of both shrimps and tilapia were quite good in the first two months. As it common in a traditional extensive system, the farmer did not feed the shrimps for the first month and relied on the natural feed. After a heavy rain, which was not common in May/June, the water quality was low.
Table 1 Water quality measurements during two month culture
No Age (day) Salinity (ppt) Water pH Water colour Note
1 14 33 8.1 yellow 2 18 33 8.2 yellow 3 23 22 8.2 yellow Heavy rain 4 32 28 8.8 yellow
5 40 39 8,4 Red-brown High evaporation, 10 cm water change
6 46 39 8,2 yellow High evaporation 7 50 24 8,0 yellow
At 56 days into the culture, fifty shrimps were found dead with some lesions:
broken pleopod, some black spots on the body, and red muscle. Vitamin C (one tablet each feeding) and coconut oil were added into the feed to treat the diseases. Fifty kilogram of lime was also added into the pond. Samples of dead shrimps were sent to Ujung Batee Brackish Aquaculture research Center for analysis. PCR confirmed that the shrimps experienced WSSV. After three days, another 200 dead shrimps were found, and the farmer decided to conduct a sudden harvest. Other than the dead shrimps, it was noticed that the water color changed from yellow to brownish-red at 40 days, and again changed to yellow two weeks before the sudden harvest.
All the tilapia survived in the reservoir up to the time of harvest (after six months). The finding suggests that the tilapia was able to survive in reservoir and maintained good growth rate. Even though other findings in lab scale or field observation suggest that the tilapia has the ability to minimize the risks of Vibriosis and WSSV, the exact mechanism and under what condition are remain unclear. Another question is whether the tilapia has direct inhibition against both pathogens or indirect inhibition by stimulating microbes or microalgae to grow. Further research needs to be conducted to investigate the mechanism.
Acknowledgement
The field experiment in Indonesia was funded by the L’Oréal Indonesia For Women in Science Program. SN would like to thank the US Department of State, the Schlumberger Foundation Faculty for the Future Program, and the University of Arizona for supporting the PhD study and research component in the US.

385385
References
Huervana. F.R., J.J.Y De la Cruz, C.M.A.Caipang. 2006. Inhibition of luminous Vibrio harveyi by green water obtained from tank culture of tilapia Oreochromis mossambicus. Acta ichthyologica et piscatorial 36 (1): 17-23
Tendencia, E.A. M.R. de la Pena. C.H. Choresca. 2006. Effect of shrimp biomass and feeding on the anti-Vibrio harveyi activity of Tilapia sp. in a simulated shrimp tilapia polyculture system. Aquaculture 253 (1-4): 154-162.
Y, Yi., Fitzsimmons, K., 2004. Tilapia-shrimp polyculture in Thailand. pp. 777-790. In: Bolivar, R., Mair, G. and Fitzsimmons, K. (eds). New Dimensions in Farmed Tilapia. Proceedings of ISTA 6. Bureau of Fisheries and Aquatic Resources. Manila, Philippines.
2010. Peradaban ikan mujair air tawar. http://www.manifest-2010.co.cc/2010/12/peradaban-ikan-mujair-air-tawar.html

386386
POSTERS

387387
Abstract for Poster presentation for ISTA9:
THE DEVELOPMENT OF CORRELATIVE MICROSCOPY TECHNIQUES TO
DEFINE MORPHOLOGY AND ULTRASTRUCTURE IN CHLORIDE CELLS OF
NILE TILAPIA (Oreochromis niloticus (L.)) YOLK-SAC LARVAE.
Fridman, S.1, Bron, J.E.1 and Rana, K.J.1
1 Institute of Aquaculture, University of Stirling, Scotland.
Abstract
The Nile tilapia, the predominant farmed tilapia species worldwide, displays an ability to
thrive in low salinity waters not otherwise used for culture of conventional freshwater fish.
The ability of early life stages to osmoregulate relies initially on chloride cells which are
located on the body surface of larvae. These specialised cells are responsible for the trans-
epithelial transport of ions, this being achieved using the transport protein Na+-K+-ATPase. In
this study FluoroNanogold™ was used in combination with a Na+/K+-ATPase antibody on
yolk-sac larvae of Nile tilapia that had been incubated and reared in brackish water. Chloride
cells were detected directly by confocal scanning laser microscopy and subsequently by
transmission electron microscopy. Scanning electron microscopy confirmed the appearance of
the structure of the chloride cells on the surface of larvae. Results demonstrate that this
integrated approach - used here for the first time on whole-mount fish specimens – offers
valuable insight into the cellular localisation of Na+/K+-ATPase and morphology of chloride
cells.

388388
ADDRESSING THE GOALS AND OBJECTIVES OF THE FEED THE FUTURE INITIATIVE: ENHANCING THE PROFITABILITY OF SMALL AQUACULTURE OPERATIONS IN GHANA,
KENYA, AND TANZANIA
Stephanie Ichien* and Hillary Egna
Abstract
The Aquaculture & Fisheries Collaborative Research Support Program (AquaFish CRSP), located at Oregon State University, brings together resources from US and host country institutions to develop sustainable solutions in aquaculture and fisheries for improving health, building wealth, conserving natural environments for future generations, and strengthening poorer societies’ ability to self-govern in ways that respect the sanctity of all. In aligning strategies and goals with Feed the Future (FTF), the US government’s new global hunger and food security initiative, USAID recognizes that providing the poor with better access to well managed water resources can help eradicate poverty and improve livelihoods, health, and ecosystems. In 2010, AquaFish CRSP received funding from USAID for a three-year project to enhance small-scale aquaculture operations in Ghana, Kenya, and Tanzania. This project works toward reducing the prevalence of poverty by accelerating inclusive agriculture sector growth through improved agriculture productivity, expanded markets and trade, and increased economic resilience in vulnerable rural communities. Using three components of outreach—central media, demonstrations, and lateral diffusion—this project looks to promote the adoption of best management practices for pond aquaculture within three target technologies:
1. Effluent Management Practices: Includes guidelines on pond operations, settling ponds and vegetation ditches, draining to wetlands, top-releases for partial drainage, and water re-use (by holding or re-circulating to other ponds).
2. Nutrient Management Practices: Includes guidelines relating to fertilizing and feeding regimes that avoid wastes or, in worse cases, result in deteriorated water quality that threatens the health or condition of the fish.
3. Profitability Analysis: Appropriate stocking and feeding regimes can reduce the cost of production through reduced aeration, better water quality, higher survival, reduced use of medication and chemicals, improved feed conversions, and thereby increased profitability.
389389
AQUAFISH CRSP: MITIGATING THE NEGATIVE ENVIRONMENTAL IMPACTS OF
AQUACULTURE PRACTICES THROUGH DEVELOPING SUSTAINABLE FEED
TECHNOLOGIES
Stephanie Ichien*, Ford Evans, and Hillary Egna
Abstract
With the rapid growth in aquaculture production worldwide, negative environmental impacts are of increasing concern. Aquaculture is associated with a range of issues including dependence on fishmeal, habitat degradation, contaminated water systems, increases in the spread of fish diseases, and the introduction of alien species. Mitigation of these adverse effects is key to developing sustainable end-user level aquaculture systems. Fish feeds are a major expense for small-scale aquaculture farms. Ingredients can be costly, particularly protein sources such as fishmeal. Other costs are attributed to feed wastage due to uneaten diets or poor feed conversion efficiency. In moving away from the dependence on fishmeal, feed research is now focusing on locally available protein sources derived from plant materials and food processing by-products. Therefore, the development of nutritionally efficient diets and optimal feeding strategies will not only reduce operating costs but also minimize environmental impacts.
Funded by the United States Agency for International Development (USAID), the Aquaculture & Fisheries Research Support Program (AquaFish CRSP) strives to enrich livelihoods and promote health through international multidisciplinary partnerships that advance science, research, education, and outreach in aquatic resources. AquaFish CRSP is currently supporting research on sustainable feed technologies, as part of a larger research portfolio. The goal of this work is to lower costs and to improve feed efficiencies while reducing the ecological footprint of fish culture. AquaFish CRSP investigations in Africa, Asia, and Latin America are exploring different sustainable feed technology approaches, including:
Replacement of fishmeal and other costly protein sources in diets of omnivorous and carnivorous fish with protein from sustainable local sources;
Optimizing feeding schedules to lower feed input; Adoption of least-cost formulation and feed manufacturing technologies to
develop less expensive and more efficient feeds.
390390
PROMOTING SUSTAINABLE AQUACULTURE AND FISHERIES DEVELOPMENT
THROUGH CAPACITY BUILDING: A SYNOPSIS OF SHORT- AND LONG-TERM
TRAINING CONDUCTED BY THE AQUAFISH CRSP
Ford Evans*, James Bowman, Lisa Reifke, and Hillary Egna [email protected]
AquaFish CRSP, 418 Snell Hall, Oregon State University, Corvallis OR 97331 USA
ABSTRACT
The Aquaculture and Fisheries Collaborative Research Support Program (AquaFish CRSP) is actively engaged in aquaculture and fisheries research, training, and outreach activities in 17 countries in Africa, Asia, and the Americas. These efforts are made successful through close collaboration between researchers and educators at 16 US and 29 Host Country institutions. One of the key objectives of the AquaFish CRSP is to build and strengthen the capacities of aquaculture and fisheries institutions and personnel at all levels. Capacity building under the AquaFish CRSP largely emphasizes human resource and institutional development through training and outreach activities. Training supported by the program takes a number of forms, with the most important being short-term and long-term training programs. Short-term training is under 6 months in duration and typically includes seminars, workshops, short-courses, and internships. Long-term training is defined as formal training occurring in an academic setting lasting 6 months or longer and culminating in either an academic degree or a technical certificate. Ensuring gender-equitable access to training opportunities and resources is a high priority in all aspects of the CRSP’s capacity building activities and therefore a target for participation by women is set at 50%. During 2010 the AquaFish CRSP supported 196 long-term trainees and 25 short-term training events including 694 trainees. Since its inception in2006, the program has supported the training of 288 long-term students and conducted 115 short-term trainings involving over 4000 trainees. AquaFish CRSP capacity building efforts benefit stakeholders in the US and in participating Host Countries through the transfer of knowledge and technology and the dissemination of information about best management practices, offering increased economic opportunities that ultimately enhance the sustainability of aquaculture and fisheries in all regions.
391391
PROMOTING SUSTAINABLE RICE-FISH AQUACULTURE IN IRRIGATED SYSTEMS IN MALI
Coulibaly, H., L. Liping, D. Yuan, A.S. Toure, J.R. Bowman, and H.S. Egna*
*Hillary Egna, AquaFish CRSP, 418 Snell Hall, Oregon State University, Corvallis, OR 97331 USA [email protected]
Abstract
Through a series of hands-on trainings in Mali and China from mid-2008 to 2010, rice producers in Mali learned and applied updated techniques for producing crops of fish along with their rice crops. The AquaFish CRSP Mali project, which ended in December 2010, partnered with Mali’s Direction Nationale de la Pêche (DNP) and China’s Shanghai Ocean University on this work. Project activities involved various stakeholders in the Mali aquaculture industry, including farmers, extension and technical personnel, and members of local NGOs. In little under two years, the project identified appropriate strategies for the implementation of integrated rice and fish farming, adapted rice-fish technologies from China to Mali (2 trainees from Mali studied in China), set up and ran rice-fish demonstration plots in the Baguineda irrigation area, and conducted workshops on appropriate aquaculture technologies for Mali.
In the first workshop, “Up-to-Date Techniques for Rice-Fish Culture in China,” the Malians who had trained in China shared technical information on rice-fish culture, including options for modifying and managing rice fields, with potential farmers and interested government and NGO personnel in Mali. The second workshop, on “Appropriate Aquaculture Post-harvest Technologies,” involved fishers, fish farmers, fish traders, marketers, processors, government officers responsible for aquatic food quality and safety. The objectives were to examine the current status of post-harvest processing practices, review available technologies, identify constraints and problems in post-harvest processing, and recommend appropriate technologies for small post-harvest businesses. The third workshop, on “Training and Extension Capacity for Rice-Fish Culture,” followed immediately after the first in late November 2009 and involved 27 participants. It aimed to build training and extension capacity for government extension officers, university teachers, and others working to develop rice-fish culture techniques. The fourth short-course was a four-day stakeholder workshop on “Best Aquaculture Practices (BMPs) and Aquaculture Policy in Mali,” organized by the DNP for approximately 20 participants in early 2010. The objective was to generate recommendations regarding development and implementation of BMPs for Mali aquaculture through careful review of the current status of aquaculture practices and policies in Mali, critical examination of existing guidelines and standards, and consultation with multiple stakeholders and experts. A document on fisheries standards in use in China was translated and recommended for submission to the DNP: Le standard industriel de la poissonnerie dans la République populaire de Chine.
Four rice-fish demonstrations were started in July 2009 and the fish were harvested from the first rice field, that of farmer Mamadou Samake, in late November. His field of approximately 840 m2 (0.084 ha) in area yielded 115 kg of fish, or about 1360 kg per hectare. This result was very appealing to Mr. Samake because of the additional income he was able to receive by selling the fish. These results generated a great deal of interest among other rice producers in the Baguineda area. Local interest in rice-fish increased five-fold following the initial demonstrations, with at least 22 new farmers eager to invest their own resources in this new rice-fish enterprise based on the successes they saw their neighbors achieve. Several new designs for the layout of fish sump and access channels in the fields are

392392
being tried, and DNP technical officers have been monitoring the preparation and stocking of fields. The rice-fish farmers of the Baguineda area have formed a cooperative to better organize themselves for sharing and spreading this new technology. Also, farmers far from the original test sites have indicated their interest to DNP technicians, who plan to begin extending technologies in the next year. After many reported failures in rice-fish culture in Mali, this experience speaks to success and a way forward for small-scale farmers in Mali.

393393
Tilapia: Silent Booming in Bangladesh
Sk. Ahmad-Al-Nahid1, M. Mahfujul Haque1, Md. Abdul Wahab1, David C. Little2 and Francis Murray2
1 Corresponding author: [email protected] 1 Faculty of Fisheries, Bangladesh Agricultural University, Mymensingh, Bangladesh
2 Institute of Aquaculture, University of Stirling, Stirling FK9 4LA U.K.
Abstract This study was part of a scoping study on commercially important aquaculture species traded from Asia into Europe under an European Commission (EC) funded project ‘Sustaining Ethical Aquaculture Trade’ (SEAT). The objective was to assess the current production status and development trends of four important species, one of them is tilapia. Methods included literature review and rapid rural appraisal (RRA) exercises in Comilla (important for flood plain tilapia culture), Chandpur (for cage culture), Pabna (for monoculture), Khulna (polyculture with shrimp and prawn), Jessore (polyculture with carps), and Mymensingh (polyculture with catfish and carps) districts. During September 2009 to April 2010, 24 tilapia farms (4 per district; 2 small: farm size ≤ 0.20 ha, 1 medium: farm size 0.21 to 0.80 ha and 1 large: ≥ 0.81 ha in each instance), 6 Tilapia hatcheries (1 per district), 6 markets (1 per district) and 2 processing plants (in Khulna) were visited. For this exercise, 24 Tilapia farmers, 6 hatchery owners, 18 retailers and 18 consumers (3 retailers and 3 consumers at each market) and 2 processors were also interviewed individually.
At present there are about approximately 70 commercial tilapia hatcheries in the country, of which the first to start was a mono-sex tilapia seed production in Cox’s Bazar in 1992. It was found that the increasing availability of tilapia seed made diverse positive impacts on traditional aquaculture practices. Results demonstrated that tilapia has several encouraging attributes (e.g. suitable for culture in both fresh and brackish water, country-wide low cost seed availability, high resistant to diseases, high local market demand, comfortable price for both farmers and consumers, stable market price, two crops year-1, cash flow round the year etc.) which collectively resulted in higher adoption at the farmers’ level. It can be cultured in various densities and combinations from mono- to polyculture with carps, shrimp, prawn, or with catfish (Pangasius, Heteropneustes and Clarias), and in different containments including ponds, rice fields, gher (low lying wet lands used for shrimp and prawn), flood plains, river cages, tea garden ponds, small reservoirs etc. Moreover, tilapia has provided a strategic means for farmer households for mitigate cropping risks. Pangasius catfish farmers culture tilapia as an alternative, to compensate when catfish market price is low, while shrimp and prawn farmers stock tilapia to minimize diseases. With the expansion of tilapia production, there is a growing interest observed at the level of private entrepreneurs to explore the potentials of its export market. Understanding on the increasing trend of tilapia’s sex-reversal seed production, positive attributes at culture systems and its environmental impacts will contribute to the development of EAFI (Ethical Aquatic Food Index). The broader understanding on different issues will be contributing to the studies of other work packages (e.g. WP3-LCA) of SEAT project and policy development.
394394
PRELIMINARY STUDY ON MICROBIAL ACTIVITY ASSOCIATED WITH TILAPIA
CULTURE AGAINST Vibrio harveyi
Sidrotun Naim
The University of Arizona, Tucson, USA. [email protected] Bandung Institute of Technology, Indonesia. [email protected]
Many shrimp ponds in coastal areas have been abandoned in many parts of the world due to diseases, poor management such as overstocking, and environmental degradation. Black tiger shrimps (Penaeus monodon), whiteleg shrimps (Litopenaeus vannamei) and tilapia (Oreochromis spp.) are commonly cultured in extensive, semi-intensive, or intensive systems in tropical countries includes Indonesia. Traditional farming is typically classified as extensive system which means that shrimps are stocked at low density, feed and fertilizer inputs are generally low, and environmental impacts from nutrient release are mild. The polyculture of shrimp-tilapia at low stocking density may provide an opportunity to develop a sustainable aquaculture system to best utilize abandoned shrimp ponds. To investigate the potential of shrimp-tilapia polyculture for traditional farming setting, a preliminary study has been conducted in the field with shrimps as the main species in Aceh and East Java provinces, Indonesia. Shrimp’s survival and growth rates were increased in polyculture compared to in monoculture.
A laboratory study was conducted to describe how the presence of tilapia can help the shrimps. With continue exposure to sunlight in an aquarium system, it was obvious that tilapia stimulates microalgae growth. This green water helps maintaining the water quality. Challenge study with Vibrio harveyi, a pathogenic bacteria for shrimps, was found that the number of the Vibrio on TCBS media was lower in a polyculture system. Interestingly, the system stimulates other bacteria to grow based on Heterotrophic Plate Count on TSA media. Molecular study with PCR technique found that different bacteria attached on the fish mucus after the Vibrio injection into the water.
Follow up study in the laboratory has been conducted to find the major factor that responsible in lowering the Vibrio count. It could be the tilapia itself secreting a kind of natural antibiotics, or the microalgae which has that ability, or the other bacteria that competing and minimizing the growth of the Vibrio. Follow up in the field will include the study on freshwater shrimp-tilapia polyculture. If the system works well, polyculture would be a good model as a sustainable and profitable farming system in both freshwater and brackishwater aquaculture.
395
395
The effects of plankton on Tilapia growth using organic and inorganic fertilizers and what causes phytoplankton bloom to
“crash”
Pamila Ramotar
University of Arizona
Abstract
Plankton is also one of the main sources of food for fish. They are the most common prey for all fish larvae. Plankton has its place in the lower regions of the food chain and is the basic source of food for small aquatic animals like fish larvae. During the early stage of their life cycle fish rely on their yolk sac for nutrition. They also rely on plankton to survive during its development stage. And if the number of plankton decreases, the population of fishes will be greatly affected. This cycle clearly demonstrates the impact of plankton upon pond life. Fish farmers have increased fish yields in ponds by using inorganic or chemical fertilizers and organic fertilizers or "manures." (Bocek, 2009)
When ponds are fertilized with organic and inorganic fertilizers, nutrients stimulate the growth of microscopic plants in the water (phytoplankton). Phytoplankton is food for other organisms (zooplankton and larger animals) that are eaten by fish. Abundant growth of these microscopic plants gives water a turbid, greenish color (called a “bloom”) that can prevent light from reaching the pond bottom and reduce the growth of rooted aquatic weeds. Fish farmers and recreational farm pond owners fertilize ponds to increase fish. Aquaculture ponds are fertilized to increase the available natural food (phytoplankton and zooplankton) for fry or larval fish, or for species that are efficient filter feeders.
Some ponds have very dense algae blooms dominated by one or two species. For reasons that are not well understood, these blooms are subject to spectacular collapse, often called a “crash,” where all the algae suddenly die. This research would highlight the effects of plankton on Tilapia growth using organic and inorganic fertilizers and the causes of phytoplankton blooms to “crashes.”
It was found that when organic fertilizers are used there is a higher phytoplankton bloom and higher oxygen level in the tanks where as when inorganic fertilizers are used there is a greater zooplankton population. When organic and inorganic fertilizers are combined it provides food for fishes and the fishes in the combined tank had the highest weight gained. Brachionus pala and Daphnia pulex which are plankton-feeding animals, will decrease the numbers of the phytoplankton very rapidly when present in high numbers.
Introduction
A fishpond is a unique environment created by man. It must be managed properly to achieve good fish production. For centuries fish farmers have increased fish yields in ponds by using inorganic or chemical fertilizers and organic fertilizers or "manures." (Bocek, 2009)
The major objective of applying fertilizers in fishponds is to enhance the primary productivity of the fish ponds i.e. to assure abundance of different fish food organisms (mainly phytoplankton, benthos and periphyton) in the aquatic environment. This encourages growth and production of fishes which feed on these organisms. Improved primary productivity in a fish pond requires adequate space, moisture, light, nutrients, favorable pH, temperature and

396396
absence of toxic substances. Of these, considerable importance has been laid on the influence of nutrient concentrations of pond environment on primary productivity. Other factors remaining favorable, nutrient concentrations determine the magnitude of phytoplankton growth, which relates to total fish production. Hence for obtaining maximum fish production, it is necessary to maintain the nutrient status of the pond to an optimum range. (Brunson et al, 1999).
A well-managed fertilized recreational pond can produce 200 to 400 pounds of fish per acre annually. This is three to four times the fish production that can be obtained without fertilization. Phytoplanktons are free-floating microscopic algae. Photosynthetic activity by large plankton populations can produce enough oxygen to cause oxygen super saturation of water during mid-afternoon on bright sunlit days.
Phytoplankton growth is stimulated by addition of nitrogen, phosphorous and potassium. Populations may "bloom" 7 to 10 days after large inputs of nutrients, or "crash" when nutrients are depleted, or if toxic chemicals are added to the water. Phytoplankton respiration may be nearly 80% of oxygen consumption in water, and respiration by large phytoplankton populations may deplete oxygen in ponds during sustained periods of cloudy weather or at night.
There are two main sources of algal species used in aquaculture. These are: (1) natural populations of phytoplankton, either as they are found in nature or from cultures enriched by adding nutrients and (2) unialgal cultures. Unialgal cultures are essential when a high quality feed source with known nutritional properties is required. Most species are unicellular or filamentous freshwater forms. The best known algae, such as Chlorella, Chlamydomonas, Dunaliella and Haematococcus, belong to this group. Some species accumulate high concentrations of carotenoids under certain culture conditions.
Chlorella is spherical in shape, about 2 to 10 μm in diameter, and is without flagella. Chlorella contains the green photosynthetic pigments chlorophyll-a and -b in its chloroplast. Through photosynthesis it multiplies rapidly requiring only carbon dioxide, water, sunlight, and a small amount of minerals to reproduce.
Literature review
The natural productivity of a fish culture system depends largely on the availability of natural food organisms and on favorable environmental conditions for the fish.
Phytoplankton, the floating microscopic plants that give water its green color, are the first step in the food chain of fish ponds. Other organisms also feed on them and multiply, increasing the availability of natural food for fish stocked in the pond. In addition to carbon dioxide (C02) , water and sunlight for carbohydrate synthesis, phytoplankton need mineral elements including nitrogen, phosphorus, potassium, calcium, sulfur, iron, manganese, copper and zinc for their growth and nutrition. To promote phytoplankton growth and maintain the optimum natural productivity of ponds, the water must contain adequate amounts of these nutrients.
What are Fertilizers?
Fertilizers are natural or synthetic substances that are used in ponds to increase the production of the natural food organisms to be eaten by the fish. These organisms include phytoplankton, zooplankton and insects they are all part of a complex food web converging toward fish production. By increasing the availability of major nutrients, fertilizers promote the development of plank tonic algae, which provide food for many fish. Fertilization also leads to the development of animals which feed on algae, including some fish such as the Chinese silver carp and the Nile tilapia. (See Annex I)
397397
When a fertilizer is added to a fish pond, the chemicals it contains dissolve in the water, where a portion is usually rapidly taken up by the phytoplankton present, either to be stored, sometimes in quite large proportions, or to be assimilated and used for growth, reproduction, etc.;
Another portion is attracted by and becomes attached to the organic and mineral particles present, both in the pond water and in the upper layers of the bottom mud or soil.
This second portion may also assist the development of bacteria, responsible for the decomposition of organic matter. The decomposition of organic matter may in turn release more nutrients back into the mud or water. The chemicals attached to soil particles may also later be released back into the water slowly, over a long period of time. They may also migrate deeper into mud and soil, where they will no longer affect the water body, unless the pond bottom is dried or ploughed.
Most of these phenomena are linked with and controlled by water quality and in particular temperature, pH, alkalinity and dissolved oxygen level. (Brunson et al, 1999)
Types of Fertilizers
Brunson, (1999) indicated that pond fertilizers form two distinct groups: mineral or inorganic fertilizers, which contain only mineral nutrients and no organic matter; they are manufactured industrially to be used in agriculture for improving crop production and they can be obtained from specialized suppliers.
Organic fertilizers, contains a mixture of organic matter and mineral nutrients; which are produced locally, for example as wastes from farm animals or as agricultural wastes.
The formulation of a fertilizer tells the percent by weight of nitrogen (N), phosphorus (as P2O5), and potassium (as K2O) in the fertilizer. For example, an 11-37-0 fertilizer contains 11 percent nitrogen, 37 percent phosphorus (as P2O5), and 0 percent potassium (as K2O). Phosphorus is the most important nutrient in ponds, but nitrogen and potassium may be needed occasionally. In new ponds, some nitrogen may be beneficial, while potassium is rarely, if ever, needed.
Organic materials are not recommended for fertilizing recreational farm ponds, as excessive amounts may lower dissolved oxygen to a critical level, possibly killing fish. The fertilizers can promote the growth of undesirable filamentous algae (commonly known as “Blue green algae”, “pond moss” or “pond scum”). Fertilizers are available through any farm supply dealer and are formulated specifically for ponds, but any fertilizer formulation with the appropriate nutrient levels can be used unless the product contains other ingredients that may be harmful to fish or other aquatic organisms. For example, do not Use fertilizers intended for lawn or turf application that contain either herbicides or insecticides. (Brunson et al, 1999)
WHY FERTILIZE PONDS?
Microscopic green plants called algae or "phytoplankton" form the base of the food chain for fish. All green plants need proper temperature, light, and nutrients for growth. If sufficient light and proper temperature are present, the nutrients in chemical fertilizers (nitrogen, phosphorous and potassium) are readily assimilated by phytoplankton and their abundance increases. Manure contains the same nutrients which are released and become available to phytoplankton during and after decomposition. As phytoplankton assimilate fertilizer nutrients and reproduce to form dense communities’ pond water turns a greenish or brownish color. This is called a phytoplankton bloom.
Sudden death of phytoplankton or algal bloom, "bloom crash", may result from insufficient
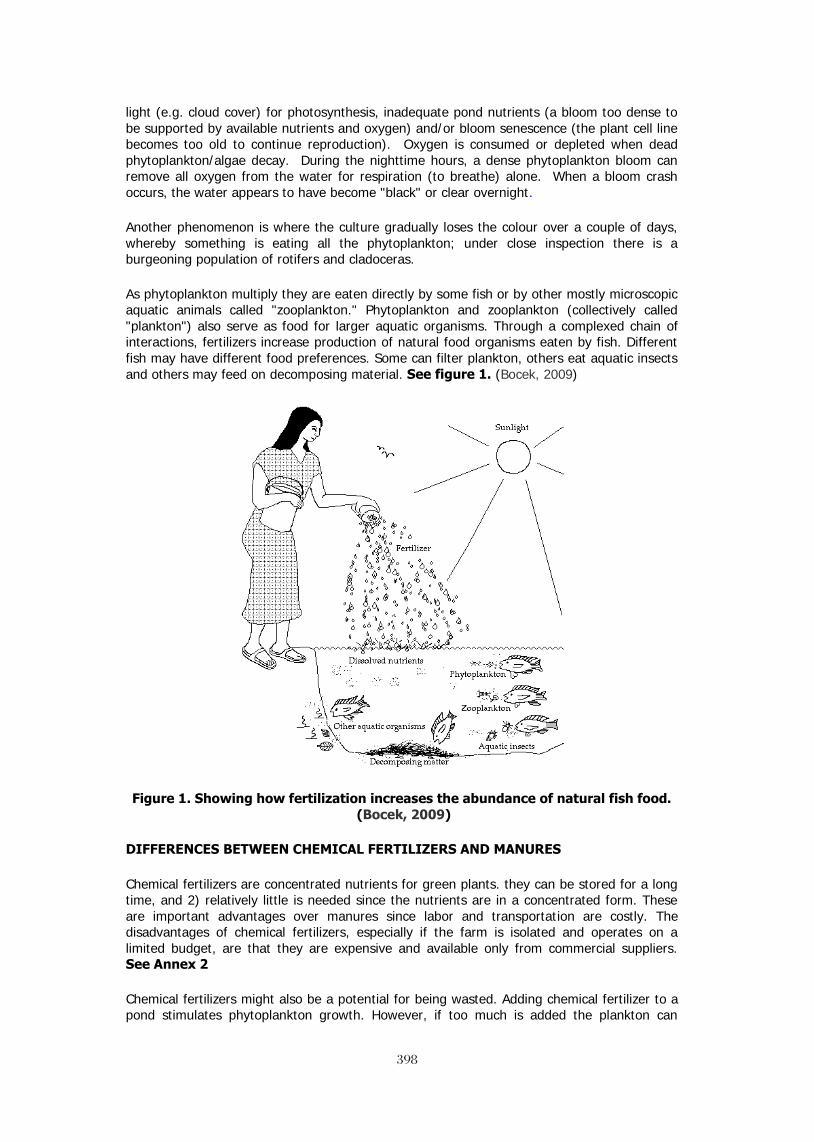
398398
light (e.g. cloud cover) for photosynthesis, inadequate pond nutrients (a bloom too dense to be supported by available nutrients and oxygen) and/or bloom senescence (the plant cell line becomes too old to continue reproduction). Oxygen is consumed or depleted when dead phytoplankton/algae decay. During the nighttime hours, a dense phytoplankton bloom can remove all oxygen from the water for respiration (to breathe) alone. When a bloom crash occurs, the water appears to have become "black" or clear overnight.
Another phenomenon is where the culture gradually loses the colour over a couple of days, whereby something is eating all the phytoplankton; under close inspection there is a burgeoning population of rotifers and cladoceras.
As phytoplankton multiply they are eaten directly by some fish or by other mostly microscopic aquatic animals called "zooplankton." Phytoplankton and zooplankton (collectively called "plankton") also serve as food for larger aquatic organisms. Through a complexed chain of interactions, fertilizers increase production of natural food organisms eaten by fish. Different fish may have different food preferences. Some can filter plankton, others eat aquatic insects and others may feed on decomposing material. See figure 1. (Bocek, 2009)
Figure 1. Showing how fertilization increases the abundance of natural fish food. (Bocek, 2009)
DIFFERENCES BETWEEN CHEMICAL FERTILIZERS AND MANURES
Chemical fertilizers are concentrated nutrients for green plants. they can be stored for a long time, and 2) relatively little is needed since the nutrients are in a concentrated form. These are important advantages over manures since labor and transportation are costly. The disadvantages of chemical fertilizers, especially if the farm is isolated and operates on a limited budget, are that they are expensive and available only from commercial suppliers. See Annex 2
Chemical fertilizers might also be a potential for being wasted. Adding chemical fertilizer to a pond stimulates phytoplankton growth. However, if too much is added the plankton can
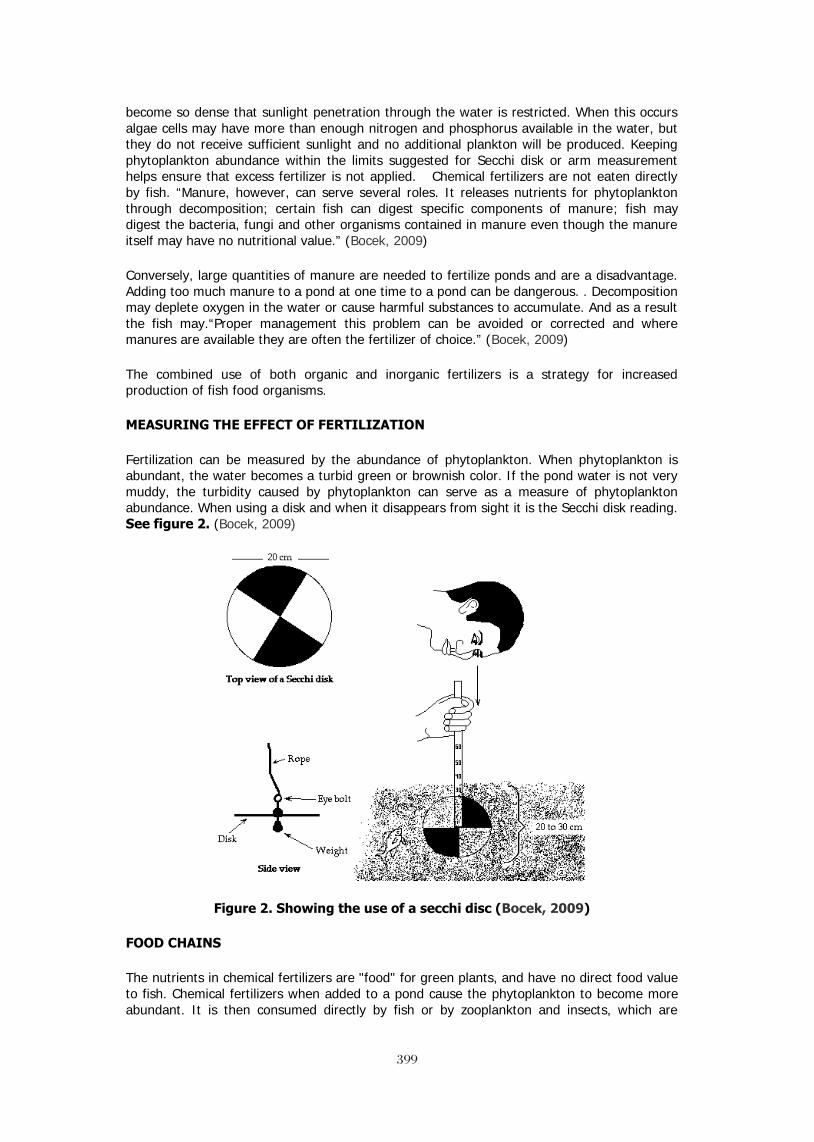
399399
become so dense that sunlight penetration through the water is restricted. When this occurs algae cells may have more than enough nitrogen and phosphorus available in the water, but they do not receive sufficient sunlight and no additional plankton will be produced. Keeping phytoplankton abundance within the limits suggested for Secchi disk or arm measurement helps ensure that excess fertilizer is not applied. Chemical fertilizers are not eaten directly by fish. “Manure, however, can serve several roles. It releases nutrients for phytoplankton through decomposition; certain fish can digest specific components of manure; fish may digest the bacteria, fungi and other organisms contained in manure even though the manure itself may have no nutritional value.” (Bocek, 2009)
Conversely, large quantities of manure are needed to fertilize ponds and are a disadvantage. Adding too much manure to a pond at one time to a pond can be dangerous. . Decomposition may deplete oxygen in the water or cause harmful substances to accumulate. And as a result the fish may.“Proper management this problem can be avoided or corrected and where manures are available they are often the fertilizer of choice.” (Bocek, 2009)
The combined use of both organic and inorganic fertilizers is a strategy for increased production of fish food organisms.
MEASURING THE EFFECT OF FERTILIZATION
Fertilization can be measured by the abundance of phytoplankton. When phytoplankton is abundant, the water becomes a turbid green or brownish color. If the pond water is not very muddy, the turbidity caused by phytoplankton can serve as a measure of phytoplankton abundance. When using a disk and when it disappears from sight it is the Secchi disk reading. See figure 2. (Bocek, 2009)
Figure 2. Showing the use of a secchi disc (Bocek, 2009)
FOOD CHAINS
The nutrients in chemical fertilizers are "food" for green plants, and have no direct food value to fish. Chemical fertilizers when added to a pond cause the phytoplankton to become more abundant. It is then consumed directly by fish or by zooplankton and insects, which are
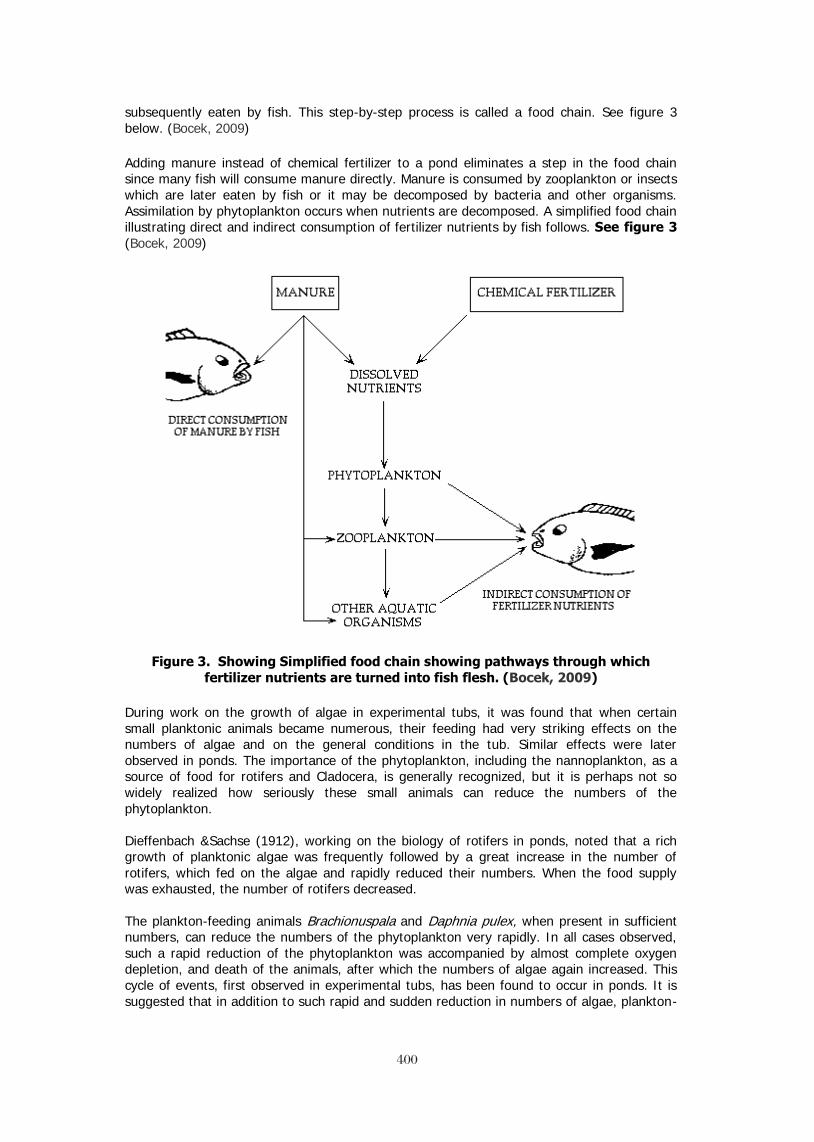
400400
subsequently eaten by fish. This step-by-step process is called a food chain. See figure 3 below. (Bocek, 2009)
Adding manure instead of chemical fertilizer to a pond eliminates a step in the food chain since many fish will consume manure directly. Manure is consumed by zooplankton or insects which are later eaten by fish or it may be decomposed by bacteria and other organisms. Assimilation by phytoplankton occurs when nutrients are decomposed. A simplified food chain illustrating direct and indirect consumption of fertilizer nutrients by fish follows. See figure 3 (Bocek, 2009)
Figure 3. Showing Simplified food chain showing pathways through which fertilizer nutrients are turned into fish flesh. (Bocek, 2009)
During work on the growth of algae in experimental tubs, it was found that when certain small planktonic animals became numerous, their feeding had very striking effects on the numbers of algae and on the general conditions in the tub. Similar effects were later observed in ponds. The importance of the phytoplankton, including the nannoplankton, as a source of food for rotifers and Cladocera, is generally recognized, but it is perhaps not so widely realized how seriously these small animals can reduce the numbers of the phytoplankton. Dieffenbach &Sachse (1912), working on the biology of rotifers in ponds, noted that a rich growth of planktonic algae was frequently followed by a great increase in the number of rotifers, which fed on the algae and rapidly reduced their numbers. When the food supply was exhausted, the number of rotifers decreased. The plankton-feeding animals Brachionuspala and Daphnia pulex, when present in sufficient numbers, can reduce the numbers of the phytoplankton very rapidly. In all cases observed, such a rapid reduction of the phytoplankton was accompanied by almost complete oxygen depletion, and death of the animals, after which the numbers of algae again increased. This cycle of events, first observed in experimental tubs, has been found to occur in ponds. It is suggested that in addition to such rapid and sudden reduction in numbers of algae, plankton-
401401
feeding animals may have important effects on the rate of increase in numbers of algae at any stage of the annual cycle (Pennington,1941).
The dominant algae of the plankton were nearly always small members of the Chlorococcales-Chlorella, Scenedesmus, or a minute alga which has been described (Pennington, 1941), under the name of Diogenes rotundus, and which, apart from its method of reproduction, resembles a small Chlorella.
At the time when the population of a tub had reached a high, more or less constant, level, Diogenes rotundus almost invariably formed the bulk of the phytoplankton, and in bright summer weather its numbers often exceeded 20,000 per cu. mm., when the water would be bright green and almost opaque (Pennington,1941).
In such a tub, it was frequently observed that in the course of a few days the colour changed from bright green to a dull olive green, and then to black, and at the same time became sufficiently clear to show the bottom of the tub.
Counts of the algae showed that their numbers had decreased very rapidly, and on examination, the water was found to contain enormous numbers of small animals-in every case either the rotifer, Brachionuspala, or the crustacean, Daphnia pulex. This sudden destruction of the algae by small invertebrate animals is here termed a 'crash'(Pennington,1941).
When the significance of the 'crash' phenomenon was appreciated, further investigations of the feeding habits of small animals from the tubs were carried out. The gut contents were examined, and those species which appeared to feed on plankton algae were kept and observed in cultures in beakers. Then closer investigations were made of their feeding habits in the tubs, and the course of a crash followed in detail. Gut contents Of all the small animals whose gut contents were investigated, it appeared that only rotifers and Daphnia were important in reducing the numbers of plankton algae. Brachionuspala and Daphnia pulex both had large numbers of the smaller plankton algae from the tubs in their stomachs-in fact, these algae appeared to be their main diet in the tub environment. Live individuals of Brachionuspala in a culture of Diogenes were observed to take in large numbers of the algae by the action of the cilia on their trochal disks. Once eaten by a rotifer, the algae fairly rapidly became unrecognizable, only the somewhat misshapen cell wall surviving digestion. In the gut of Daphnia, the algae retained their shape over a longer period. Neither of these animals appeared to show any selectivity in feeding, apart from that imposed by the relative sizes of animals and algae. Brachionus ate Chlorella as well as Diogenes rotundus, when both were present, but nothing larger. Daphnia ate any alga occurring in the cultures in which it was grown, up to the size of Pediastrum, Boryanum, small individuals of which were found in its gut (Pennington,1941).
The other animals commonly present in the tubs were not important in reducing the numbers of plankton algae. The only other plankton feeder was the larva of Culex sp., which was frequent in the summer. The guts of these were full of plankton algae, but the larvae did not occur in sufficiently large numbers to cause an appreciable reduction in the numbers of algae in the tub (Pennington,1941).
The Objectives of the experiment were as follows:
1. To determine the effects of plankton on growth rates of tilapia. 2. To compare the differences between organic fertilizers (cow manure) and inorganic
fertilizers (Triple Super Phosphate (TSP) and urea) on phytoplankton “bloom” 3. What causes phytoplankton bloom to “crash or die off”

402
402
Materials used in the experiments are:
Four tanks each measuring 7.3 m. Triple Super Phosphate (TSP) Urea Cow manure 1 Secchi disk Agricultural lime Biological microscope
Slides Digital camera pH meter DO meter Temperature meter 40 fishes, 10 fish per tank
Procedure used for conducting the experiment:
1. The tanks 1, 2, 3 and 4 at the SatyadeowSawh Aquaculture were treated with agriculture lime to kill any unwanted fish and increase the pH of the water.
2. Water sample was collected from the concrete ponds, using a microscope the samples were examine to identify the algae present; chlorella was isolated and culture in the lab. It was then used to inoculate the selective tanks.
3. Tank 1 was not fertilized nor inoculated with chlorella, tank 2 was fertilized with cow manure (0.14g/m2) and inoculated with chlorella, tank 3 was fertilized with TSP (0.014g/m2) and Urea (0.014g/m2) not inoculated with chlorella, while tank 4 was fertilized with cow manure (0.14g/m2), TSP (0.014g/m2) and Urea (0.014g/m2) and inoculated with chlorella.
4. Ten fishes between 20 – 25g were placed into each tank. 5. Every two weeks they were weighted and the figures recorded 6. The transparency of the water was checked twice weekly (Tuesday and Friday) using
a secchi disc to monitor the fertilization process. 7. The pH meter was used to check the pH daily (morning at 9 hrs and afternoon at 15
hrs). 8. The DO meter was used to check the dissolved oxygen level daily (morning at 9 hrs
and afternoon at 15 hrs). 9. The thermometer was used to check the temperature of the water daily (morning at
9 hrs and afternoon at 15 hrs). 10. Water samples were collected once a week and observed under the microscope. 11. Water exchange was conducted on Mondays and Fridays or as a need arise.

403 403
Results
Table 1 showing the types of plankton found in tanks
Table 2 Showing the weight of the fishes that consumed the plankton
Tanks # Photoplanktons Zooplanktons 1 Chlorella Cladocers (Daphnia pulex )
Rotifers (Brachionuspala),and copepods
2 Chlorella Mosquito larvae (Aedes or Culex)
3 Blue green algae Cladocers (Daphnia pulex ) Rotifers (Brachionuspala),and copepods
4 Chlorella Cladocers (Daphnia pulex ) Rotifers (Brachionuspala),and copepods
No feeding
Organic fertilizer
Inorganic fertilizer
Combined organic and inorganic fertilizer
Final average weight (grams) 38.9 42 45.8 51.2 Initial average weight (grams) 22.8 22.6 22.4 22.6 Change in weight (grams) 16.1 19.4 23.4 28.6
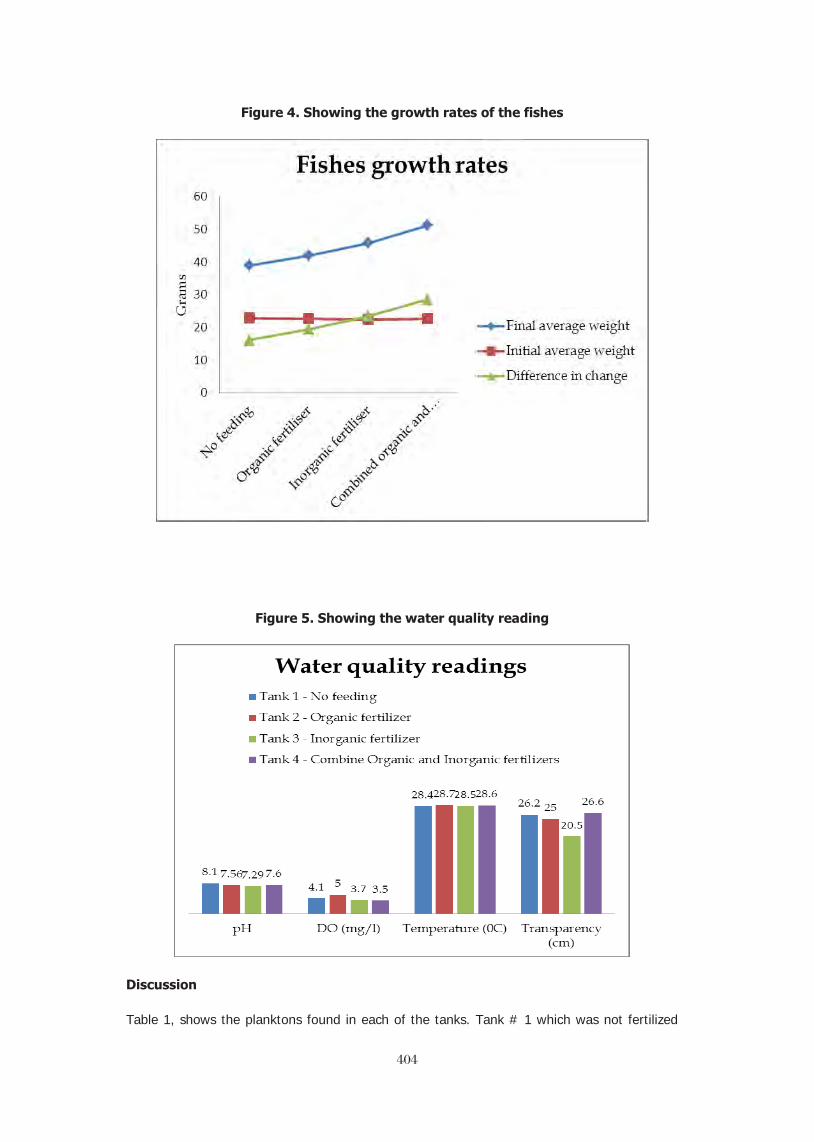
404404
Figure 4. Showing the growth rates of the fishes
Figure 5. Showing the water quality reading
Discussion
Table 1, shows the planktons found in each of the tanks. Tank # 1 which was not fertilized
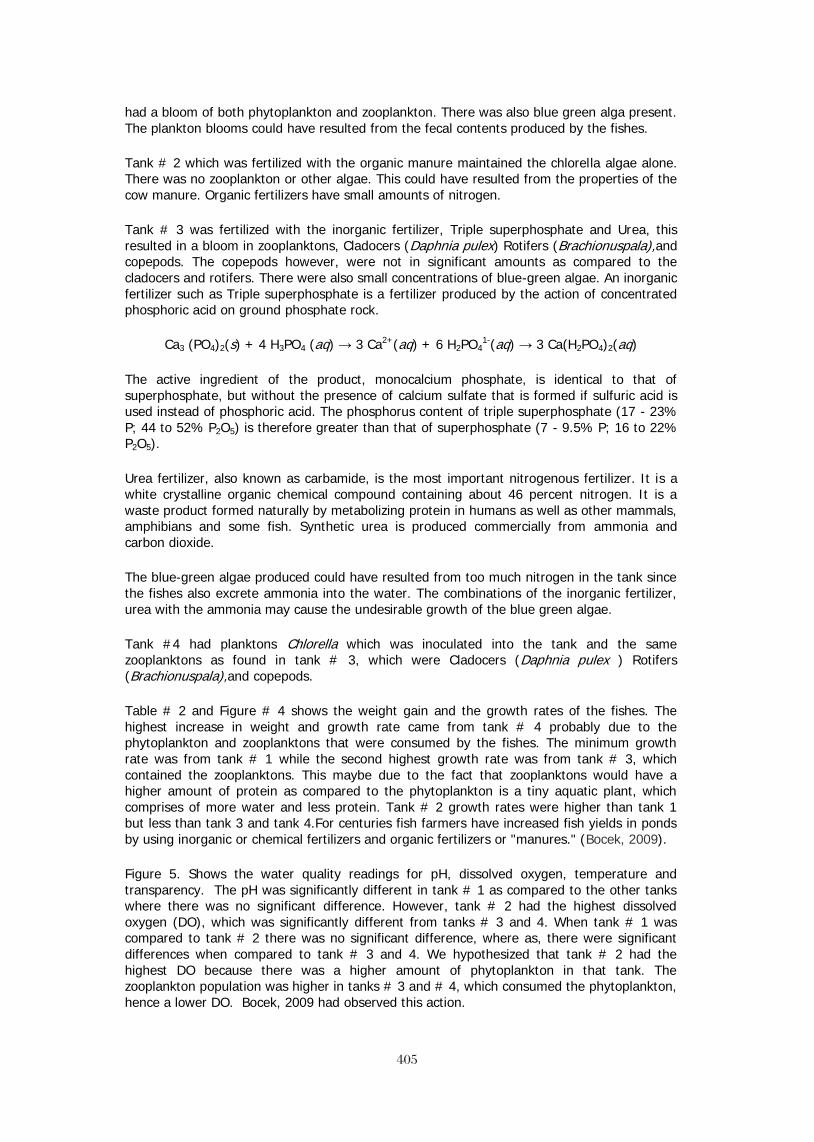
405405
had a bloom of both phytoplankton and zooplankton. There was also blue green alga present. The plankton blooms could have resulted from the fecal contents produced by the fishes.
Tank # 2 which was fertilized with the organic manure maintained the chlorella algae alone. There was no zooplankton or other algae. This could have resulted from the properties of the cow manure. Organic fertilizers have small amounts of nitrogen.
Tank # 3 was fertilized with the inorganic fertilizer, Triple superphosphate and Urea, this resulted in a bloom in zooplanktons, Cladocers (Daphnia pulex) Rotifers (Brachionuspala),and copepods. The copepods however, were not in significant amounts as compared to the cladocers and rotifers. There were also small concentrations of blue-green algae. An inorganic fertilizer such as Triple superphosphate is a fertilizer produced by the action of concentrated phosphoric acid on ground phosphate rock.
Ca3 (PO4)2(s) + 4 H3PO4 (aq) → 3 Ca2+(aq) + 6 H2PO41-(aq) → 3 Ca(H2PO4)2(aq)
The active ingredient of the product, monocalcium phosphate, is identical to that of superphosphate, but without the presence of calcium sulfate that is formed if sulfuric acid is used instead of phosphoric acid. The phosphorus content of triple superphosphate (17 - 23% P; 44 to 52% P2O5) is therefore greater than that of superphosphate (7 - 9.5% P; 16 to 22% P2O5).
Urea fertilizer, also known as carbamide, is the most important nitrogenous fertilizer. It is a white crystalline organic chemical compound containing about 46 percent nitrogen. It is a waste product formed naturally by metabolizing protein in humans as well as other mammals, amphibians and some fish. Synthetic urea is produced commercially from ammonia and carbon dioxide.
The blue-green algae produced could have resulted from too much nitrogen in the tank since the fishes also excrete ammonia into the water. The combinations of the inorganic fertilizer, urea with the ammonia may cause the undesirable growth of the blue green algae.
Tank #4 had planktons Chlorella which was inoculated into the tank and the same zooplanktons as found in tank # 3, which were Cladocers (Daphnia pulex ) Rotifers (Brachionuspala),and copepods.
Table # 2 and Figure # 4 shows the weight gain and the growth rates of the fishes. The highest increase in weight and growth rate came from tank # 4 probably due to the phytoplankton and zooplanktons that were consumed by the fishes. The minimum growth rate was from tank # 1 while the second highest growth rate was from tank # 3, which contained the zooplanktons. This maybe due to the fact that zooplanktons would have a higher amount of protein as compared to the phytoplankton is a tiny aquatic plant, which comprises of more water and less protein. Tank # 2 growth rates were higher than tank 1 but less than tank 3 and tank 4.For centuries fish farmers have increased fish yields in ponds by using inorganic or chemical fertilizers and organic fertilizers or "manures." (Bocek, 2009).
Figure 5. Shows the water quality readings for pH, dissolved oxygen, temperature and transparency. The pH was significantly different in tank # 1 as compared to the other tanks where there was no significant difference. However, tank # 2 had the highest dissolved oxygen (DO), which was significantly different from tanks # 3 and 4. When tank # 1 was compared to tank # 2 there was no significant difference, where as, there were significant differences when compared to tank # 3 and 4. We hypothesized that tank # 2 had the highest DO because there was a higher amount of phytoplankton in that tank. The zooplankton population was higher in tanks # 3 and # 4, which consumed the phytoplankton, hence a lower DO. Bocek, 2009 had observed this action.

406406
There was no significant difference in temperature between all the tanks. There was significant difference in tank # 3 as it related to the transparency, which was measured using a Secchi disc where as there were no significant differences in the other tanks. There reasons why tank # 2 had the lowest transparency is probably because the zooplankton population was higher in the tanks, which consumed the phytoplankton. This was similar to what Bocek, 2009 had observed.
Phytoplankton populations, or blooms, can grow rapidly, particularly on sunny days when the water is warm and nutrients are available. Alternatively, they can die-off quickly, especially in the spring and fall as water temperatures change rapidly with weather fronts. However, a bloom die-off can occur at any time of the year with little or no warning.
Typically during a bloom die-off, the color of the water will start to change. Leading up to a bloom die-off, the pond water may have a “streaky” appearance. Streaks of brown or gray-black through the otherwise green water of the pond is an indication that the algae are starting to die. As the die-off progresses, the whole pond will turn from green to gray, brown, or clear. The pond water will typically clear after a die-off as the dead algae settle to the bottom.
Plankton die-offs cause rapid oxygen depletions for two reasons: 1) the remaining dissolved oxygen is consumed by aerobic bacteria and fungi in the process of decaying the dead algae and 2) few live phytoplankton’s remain to produce more oxygen. Secchi disks can be used to monitor bloom densities. Any bloom that reduces visibility in the pond to 25 cm or less may cause oxygen problems. Plankton-feeding animals control the numbers of the phytoplankton and have an impact on the numbers of the phytoplankton found in the tanks. This depends on the numbers of animals and algae present. When the numbers of algae are tiny, a small number of animals may prevent any increase in algal numbers. It is believed that this occurred in the tanks in which the algal inoculum failed to grow and disappeared.
Once the algae started to increase, the sequence of events described a crash. Initially, there is a steady increase in the numbers of algae, the reproduction rate is sufficient to compensate for the numbers eaten by animals. However, as the algae reproduction rate begins to slow down, a critical stage is reached when the reproduction rate, where the numbers balances the daily increase in numbers consumed by animals. Further, an increase in the number of animals at this stage resulted in a crash, whereby the numbers of algae were rapidly reduced, until nearly all was destroyed. This produced important changes in water composition, notably almost complete oxygen depletion, as a result of this the animals are frequently destroyed. The few remaining algae are not destroyed, and after the death of the animals begin to multiply rapidly once more. This may have been the reason why tanks # 3 and #4 had the low oxygen level and tank # 3 had the lowest Secchi reading. The time at which the critical stage is reached is not the same. This is may be due to differences from one tank to another, in the respective reproduction rates of animals and algae. The factors controlling these reproduction rates are still unknown. Sometimes the critical stage was reached soon after inoculation, before the numbers of algae were very high, and there was no sudden asphyxiation, but only a gradual disappearance, apparently from starvation, following the disappearance of the algae. While no direct proof can be offered, it seems likely that the differences were due to variation in the animal population, arising from chance inoculation with animals from previous experiments.
Pennington, (1941) found a phenomenon that was similar to what was described from the experimental tubs. In the rich culture solution of the tubs, both animals and algae were present in greater concentration than is found in ponds, but there was no reason why similar crashs should not occur in eutrophic ponds. A crash was observed in a pond near Burghfield Common, Reading, in the autumn of 1938. A rich growth of algae, comprising mainly of flagellates, developed in the water, and then suddenly disappeared, the disappearance coincided with the appearance of large numbers of Cladoceran (probably Daphnia sp.) and a Copepod. The water became black and acquired a foul smell, which was typical of anaerobic
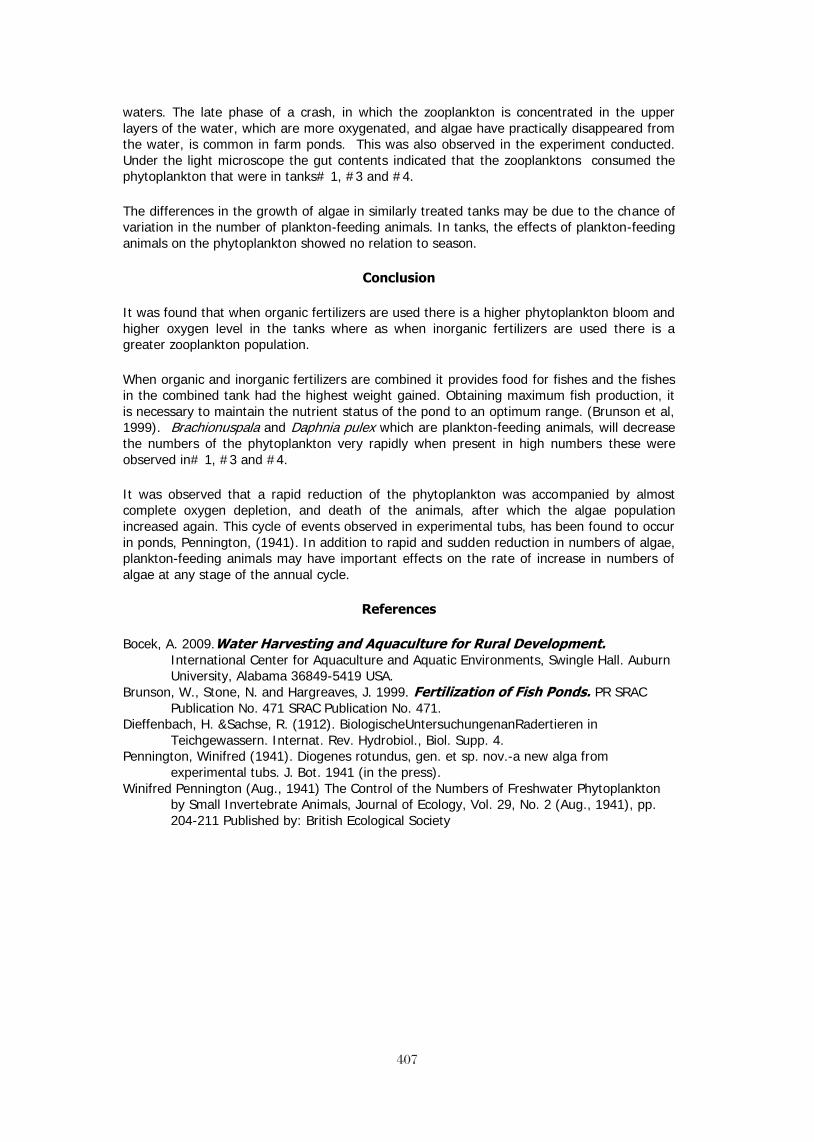
407407
waters. The late phase of a crash, in which the zooplankton is concentrated in the upper layers of the water, which are more oxygenated, and algae have practically disappeared from the water, is common in farm ponds. This was also observed in the experiment conducted. Under the light microscope the gut contents indicated that the zooplanktons consumed the phytoplankton that were in tanks# 1, #3 and #4.
The differences in the growth of algae in similarly treated tanks may be due to the chance of variation in the number of plankton-feeding animals. In tanks, the effects of plankton-feeding animals on the phytoplankton showed no relation to season.
Conclusion
It was found that when organic fertilizers are used there is a higher phytoplankton bloom and higher oxygen level in the tanks where as when inorganic fertilizers are used there is a greater zooplankton population.
When organic and inorganic fertilizers are combined it provides food for fishes and the fishes in the combined tank had the highest weight gained. Obtaining maximum fish production, it is necessary to maintain the nutrient status of the pond to an optimum range. (Brunson et al, 1999). Brachionuspala and Daphnia pulex which are plankton-feeding animals, will decrease the numbers of the phytoplankton very rapidly when present in high numbers these were observed in# 1, #3 and #4.
It was observed that a rapid reduction of the phytoplankton was accompanied by almost complete oxygen depletion, and death of the animals, after which the algae population increased again. This cycle of events observed in experimental tubs, has been found to occur in ponds, Pennington, (1941). In addition to rapid and sudden reduction in numbers of algae, plankton-feeding animals may have important effects on the rate of increase in numbers of algae at any stage of the annual cycle.
References
Bocek, A. 2009.Water Harvesting and Aquaculture for Rural Development. International Center for Aquaculture and Aquatic Environments, Swingle Hall. Auburn University, Alabama 36849-5419 USA.
Brunson, W., Stone, N. and Hargreaves, J. 1999. Fertilization of Fish Ponds. PR SRAC Publication No. 471 SRAC Publication No. 471.
Dieffenbach, H. &Sachse, R. (1912). BiologischeUntersuchungenanRadertieren in Teichgewassern. Internat. Rev. Hydrobiol., Biol. Supp. 4.
Pennington, Winifred (1941). Diogenes rotundus, gen. et sp. nov.-a new alga from experimental tubs. J. Bot. 1941 (in the press).
Winifred Pennington (Aug., 1941) The Control of the Numbers of Freshwater Phytoplankton by Small Invertebrate Animals, Journal of Ecology, Vol. 29, No. 2 (Aug., 1941), pp. 204-211 Published by: British Ecological Society
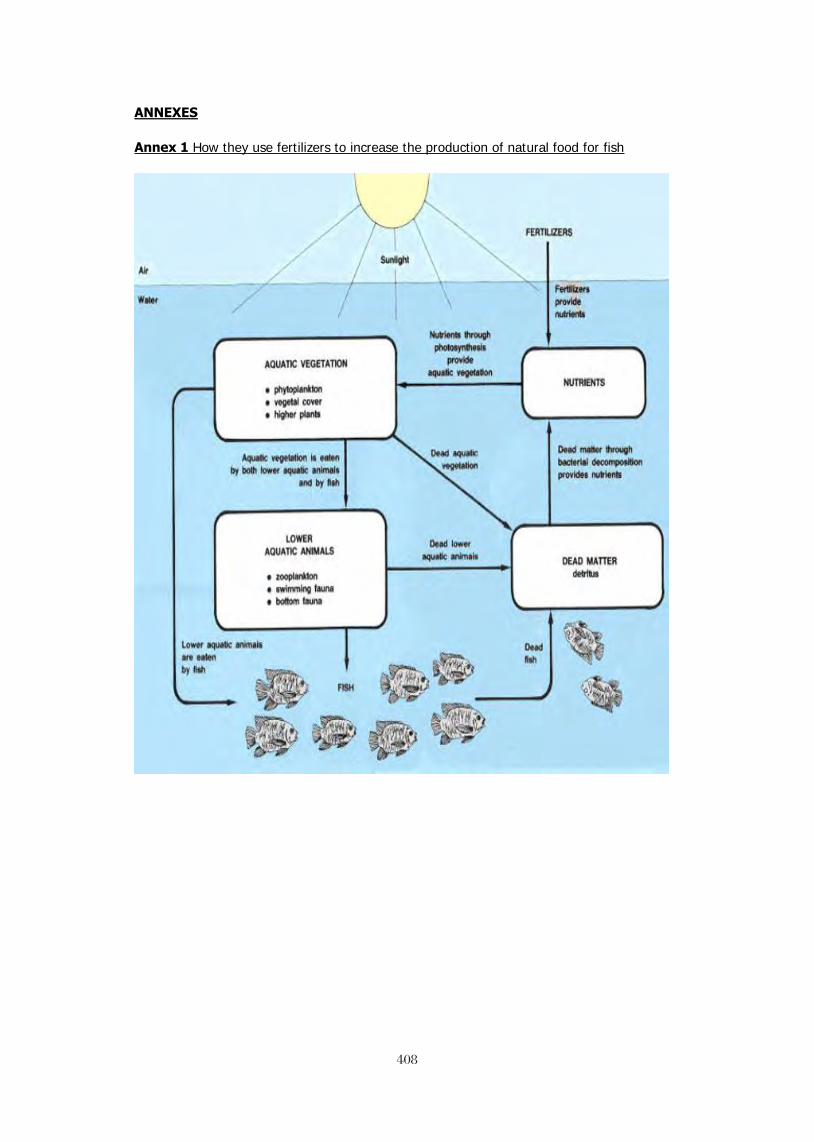
408408
ANNEXES
Annex 1 How they use fertilizers to increase the production of natural food for fish

409 409
Annex 2
Item
Organic fertilizers
Inorganic fertilizers
Storage Difficult, only short time Easy, possibly for long time
Distribution Difficult, esp. on larger scale Easy
Mineral content Variable, low Consistent, high to very high
Organic matter Present Absent
Effect on soil structure Improvement No
Direct food for fish Yes No
Decomposition process Yes, with oxygen consumption No
Price Low to medium High to very high
Cost per nutrient unit Higher Lower
Availability Possibly in neighborhood or even on own farm
Commercial suppliers only; sometimes imported
Direct pond fertilization Possible by raising animals on or near the pond Not feasible