
NINTH FIVE YEAR PLAN 1997-2002
1062
NINTH FIVE YEAR PLAN 1997-2002 VOLUME II Thematic Issues and Sectoral Programmes NIEPA DC IIP I Government of India Planning Commission New Delhi
-
Upload
khangminh22 -
Category
Documents
-
view
0 -
download
0
Transcript of NINTH FIVE YEAR PLAN 1997-2002
NINTH FIVE YEAR PLAN 1997-2002
VOLUM E II
Them atic Issues and Sectoral Programmes
NIEPA DC
I I P IGovernment of India
Planning Commission New Delhi

•JBHAHY S. mr^.-xi{-=jArnm c c iiri-Hat K ’Oi ' f 'S' ’■ !u-«t
‘ ' Skj“ * l \ .
’' ■ K»ft r I
O i - l o s i o^>.r. " ...............

Contents
S.No. Chapter
1. Overview 1
2. Poverty Alleviation Programme
2.1 Poverty Alleviation in Rural India: Programmes and 10Strategy
2.2 Urban Poverty Alleviation 542.3 Public Distribution System 63
3. Human and Social Development
3.1 Sectoral Overview 703.2 Basic Minimum Services 923.3 Education 1013.4 Health 1383.5 Family W elfare 2053.6 Indian System of Medicine and Homoeopathy 2543.7 Housing,Urban development. W ater Supply and 262
Civic Amenities3.8 Empowerment o f Women and Development O f 313
Children3.9 Empowerment o f the Socially disadvantaged 355
Groups
3.10 Social W elfare 3853.11 Labour and Labour W elfare 4073.12 Art & Culture 4203.13 Youth Affairs and Sports 426
4. Agriculture, Irrigation, Food Security and Nutrition
4.1 Agriculture 4344.2 Irrigation, Command Area Development and 476
Flood Control4.3 Food and Nutrition Security 529
5. Industry and Minerals 5836. Energy 6667. Transport and Communication
7.1 Transport 7657.2 Telecom Sector 8667.3 Postal Sector 8827.4 Information and Broadcasting 9077.5 Information Technology 9237.6 Tourism 925
8. Environment and Forest 9309. Special Area Programmes 97910. Science and Technology 1005

CHAPTER 1
OVERVIEW
11 The objectives o f the Ninth Plan have been spelt out in the Approach to the Ninth Fve Year Plan document adopted by the National Development Council. “Growth with Social Justice and Equity” is proposed to be achieved with the objectives outlined in the Aoproach Paper. Some specific areas from within the broad objectives o f the Plan as laid down by the NDC have been selected for special focus. For these areas, Special Action Plans (SAPs) have been evolved in order to provide actionable, time-bound targets Avith adequate resources Broadly, the SAPs cover specific aspects o f social and physical infrastructure, acricuhure, information technology and water policy.
1.2 Volume-I o f the Ninth Plan document covers not only the macro and economy-wide issues but also reflects on the important general aspects o f the sector specific issues, particularly the approaches to policy formulation. The main thematic areas covered in Volume-I, inter alia, include Economic infrastructure, energy, agricultural development and food security, industry and commerce, and the financial sector.
1.? Volume-II gives perspectives on how the sectoral programmes fit into realisation ofplanning themes enurr erated in Volume-I. The sectoral chapters deal with the trade-oif in objectives both for the perspective period and during the Ninth Plan, commonality in approach, policy frarnewoTk, institutional structure, delivery mechanism, possibility of synergy and convergence and major requirements i.e. labour, input and technology
1.4 In individual sectoral chapters, policies and programmes during the Eighth Plan period have been reviewed, shortcomings identified and new policy framework suggested to overcome the shortcomings and ensure sustainability o f the development process not only in economic terms but also in terms o f social and environmental factors Sectorwise overview is discussed in the succeeding paragraphs:
Agriculture, Food Security and Irrigation
15 The Strateg> o f agricultural development would be centred around achievingthe objectives o f sustainability o f employment generation, food and nutrition security, equity and poverty alleviation. Efforts will be made to achieve a growth rate o f 4.5 per cent per annum in agricultural output in order to make a significant impact on overall growth and poverty. Regionally differentiated strategies will be followed to realise the full potential o f growth in every region. The emphasis will be on raising the capabilities o f small peasants and promoting sustainable agricultural systems, while at the same time conserving and maximising the value from scarce resources, water and land. Infrastructure development wall be given the highest importance. Emphasis will be laid on minor irrigation by harnessing ground water resources. Timely and adequate availability o f inputs will receive special attention. The regional programmes will be formulated in such a manner as to ensure provision o f inputs to the farmer, particularly in the remote, hilly, backward and tribal areas. Agricultural credit is a crucial input and it will receive special attention. The programmes relating to land reforms would be strengthened to raise agricultural growth and help the poor. Efforts will be made to increase public investment during the Plan period. In every district, the Rural Infrastructure
1

Development Fund (RIDP) would be used to promote projects wiui..:; encoi.iug-ze organisations o f groups o f small farmers, artisans and landless labonicr-, iiii ^ki U up-gradation, processing, transport infrastructure, quality inipio\en.iciiito agricultural research will be enhanced and emphasis will he placed -.’n b technology, microbiology, genetic improvem.ent of crops !::cludinu iiv b ncitechnology, genetic up-gradation o f animal resources, improvement of fish iiei letiicstock and post-harvest technology, etc. Efforts will be made to accelerate tine growth rates o f allied sectors such as horticulture, including fruits and \ egetai'ii e- s. fisheries, livestock and dairy Agricultural exports will receive special attetuiinn as these have a lot o f potential for increasing farm incomes and cmplovment besii itcs earning foreign exchange. Co-operatives will be strengthened Greater pailicipa ti o)no f women in agriculture than at present will be encouraged. Linkages with niar keris will be strengthened and agro-processing and agro-industries will he encouraged
1.6 Self-sufficiency in food-grains for the country as a whole does not necess;;iriii\ imply food and nutrition security for all Making food available through the PDS at affordable prices has been a key element o f our food security system Howes e.,“i untargeted PDS has resulted in a steady rise o f budgetary food subsidy Uuring tllie Ninth Plan subsidised food grains is proposed to be targeted only to people btil o av the poverty line so as to ensure that budgetary subsidies reach the needy and bee on nc sustainable In addition to reorienting PDS, food supplementation programmes foi tlhe identified vulnerable groups such as women and children (such as ICDS Mid-ciaiy Meal, Vitamins and Iodine deficiency programmes) are proposed to be extended arnd strengthened
Industry & Minerals
1.7 The thrust o f the new industrial policy announced in July 1991 has been on substaiitiial reduction in the scope o f industrial licensing, simplification o f procedures, rules aind regulations, reforms in the Monopolies and Restrictive Trade Practices(MRTP) Acct reduction o f areas reserved exclusively for the public sector, disinvestment o f equity of selected public sector enterprises (PSEs), raising the limit of foreign equiity participation in the domestic industrial undertakings, liberalisation o f trade aind exchange rate policies, rationalisation o f duties, etc with a view to promoting grovwtli and increasing efficiency and international competitiveness Steps were also takien to bring public sector enterprises within the ambit o f Board o f Industrial and Financ:ia! Reconstruction (BIFR), providing a social security net through National Renewal Fumd (NRF), industrialisation o f backward areas through growth centres scheme, opening uip oi' mining sector to private sector, strengthening o f technological capachy etc Industrrial growth rate during the Eighth Plan was, however, lower than that achieved in tthe Seventh Plan. One o f the major constraints faced by the industrial sector is inadeqiuatc availability o f infrastructural support, which not only affected domestic productioi i Inut exports as well. However, the industry has responded well to the opening up o f ithe economy and has realised the importance o f competitiveness with the result that diuc emphasis is being given to modernisation, up-gradation, economies o f scale, qi.ialiity research and development, etc. The rate o f foreign direct investment has also s:aiited picking up in response to the improved policy environment

18 The Ninth Plan envisages an industrial growth rate o f 8.2% per annum and export growth o f 11.8% per annum. For achieving this growth, special measures have been suggested to ensure adequate availability and requisite quality of infrastructure and creating onditions conducive for unhindered growth of such industries which can produce products at internationally competitive prices. Internal aberrations in policies are proposed tc be removed and special measures envisaged to promote development o f industries in backward areas. Special emphasis has been given to the industrial and economic divelopment o f the North Eastern Region by evolving a special package which, inter alia, ircludes changes in the funding pattern of growth centres and integrated infrastructure development centres, extension o f transport subsidy scheme, strengthening o f institutions concerned with entrepreneurship and human resources development etc., various physical concessions and incentives and specific measures for development o f industrial sub-sectors like agriculture, handicrafts, handloom etc. It is also proposed to review the working of BIFR and bring about necessary changes to make it an effective instrument of reviving sick industrial units. The scheme of National Renewal Fund is also proposed to be recast through appropriate modifications to make it more effective and ichieve the objectives of providing a social safety net as originally envisaged. The ■e’.ention price-cum-subsidy scheme for fertilisers and dual pricing scheme for sugar is also oroposed to be reviewed and necessary changes vvill be made with a view to ensuring lealthy development of these industries.
The small scale sector has shown considerable resilience and in-built strength and growth rate of this sector has been about two to three percentage points higher than that o f arge and medium industries. Due emphasis would be given for making available adequate credit to the sector, and promote production and productivity through technological up- gradation.
.10 In the unorganised sector, a cluster approach will be adopted for provision o f taining, up-gradaiion of skills and improvement in tool kits, equipment and production techniques to increase production, productivity and income levels o f artisans, craft-persons, ■'v'eavers, spinners and workers etc.
Energy
1.11 The major thrust of the on-going reform process in the Energy Sector has been to nake it commercially viable and also to attract private sector participation. The Ninth flan lays emphasis on bringing about a commercial outlook among the PSUs, attracting private sector participation in the development of energy sector, encouraging a competitive environment not only between public and private sectors, but between public stctor units, need for regulatory agencies for fixation of tariff, conservation o f resources, safeguarding the interest o f consumers and protecting the environment. Energy-economy interaction, viz. the demand for energy in the economy, the sources from which this demand i; met, the changes in the pattern o f energy consumption from non-commercial to om m ercial, changes in the composition o f commercial energy use, energy-GDP elasticity aong with some policy measures have been discussed. New policies in the Ninth Plan on getting the private sector to invest in the electric power generation, transmission and d stribution, in coal mining, in petroleum exploration, production and arranging o f supply o' liquefied natural gas have been considered. Restructuring of the electricity supply system to make it commercially viable, bankable and professional, rapid increase in 0 1 and coal production by deregulating the industry in a short period o f time are some o f the a;pects which will receive due consideration.

Transport
1.12 The country's transport system which comprises o f rail, roads, sea port and!airports is facing capacity saturation. Inadequacies and imbalances in transport threaten to ) constrain economic growth and the quality o f life in both urban and rural areas A large; number o f villages lack reliable all-weather connection with nearby markets and towns Areas like North East and Jammu & Kashmir have remained physically and emotionally y' isolated because the transport system has not linked them adequately with the rest o f thee country. Environment friendly and socially cost-effective means o f transport like coastal il shipping, inland water transport and non-mechanised transport, etc also have remained d undeveloped. Distortions in the inter modal mix o f transport, environment and energyy linkages, safety and technology up-gradation have been examined The diverse issues s facing the transport sector require a comprehensive policy package Strengthening olif the Indian railways in its reach and capacity so that it effectively links the distant parts o f thee country, helps to develop economic potential o f the backward areas and carries the bulk ot)f the nation's long or medium haul traffic, is necessary. Similarly road networks need too be expanded and strengthened. There is also a need to modernise our seaports and airportss with a view to augmenting their capacity and making them o f international standard.
1 13 Policy options, each backed by adequate investment and complemented byysuitable policy changes in other sectors, have been discussed and emerging issues anad strategies visualised for development have been elaborated The pricing policy in futurce would have to be based on full recover^' o f cost Subsidies/concessions will boe direct through General Budget or sectoral budget so that the health of the transponrt enterprises is not impaired. Attempts will be made to mobilise resource from user charges i)in various ways. Non-tariff measures will also be taken for resource generation Revenutie mobilisation through tariff and non-tariff measures, stress on productivity o f human anod material assets and cost cutting will be pursued vigorously in the public sector transponrt enterprises Measures will be taken for increasing the involvement o f private capital in thne expansion and strengthening o f infrastructure in railways, road, shipping and airports Thhe private participation can take many forms like fLill or joint ownership management contracct, leasing, concessions like BOT etc.
Communications, Broadcasting and Information Technology
1.14 Information Technology (IT) is fast emerging as the technological infrastructure fcbr global integration and rapid development o f all sectors o f economy IT broadly includes aall sub-sectors dealing with the generation, transmission and utilisation o f inform ation likke telecommunications, computers, consumer electronics, m^edia infrastructure etc Recognisinng the impressive growth the country has achieved in IT since mid-eighties, its immennse potential for fijture growth and its importance as an agent o f transformation o f every facet ‘ of human life, a high priority has been accorded to the development o f this sector The Ninnth Plan would aim to make India a global IT super power and a front runner in the mformaticon revolution To help devise an appropriate policy framework towards achieving this objectivve, a National Task Force on Information Technology and Software Development has been sset up with Deputy Chairman, Planning Commission as its Chairperson Expansion o f fthe telecom network and its transformation into a modern and efficient system would be the tvwo thrust areas during the Ninth Plan Universal coverage or telephones on demand, universsal and easy accessibiHty, world standard services to consumers at affordable prices, demand

based provision o f existing value added services and introduction o f new services would be the major objectives for the Ninth Plan. To achieve the objective o f providing telephones on demand, 237 lakh new telephone connections are envisaged to be provided.
Environment & Forest
1.15 The Agenda 21 o f the Rio Summit calls for integration o f environmental aspects with development aspirations. One o f the objectives o f the Ninth Five Year Plan is to ensure environmental sustainability through social mobilisation and participation o f people at all levels. It is also based on the belief that the principal task o f planning in a federal structure is to evolve a clear vision and commitment to the national objectives and development strategy by both central. State and local governments Therefore, emphasis is being placed on reorienting the policies rather than on direct intervention so as to send proper signals and induce economic development. The strategy in the Ninth Plan for the environment sector has been drawn up in accordance with the development needs o f the nation The measures required to protect the environment will be taken in such a way as to achieve sustainable development. The strategy recognises the symbiotic relationship between tribals and the forests, and gives a special focus to the scheduled castes, the tribals and the weaker sections living in and around the forests A number o f enabling conditions have already been created for harmonising economic growth and environmental conservation These include the macroeconomic compatibility, the implementation o f the 73rd and 74th Constitutional amendments and the measures being undertaken in the implementing ministries
Human and Social Development
1 16 Human Development and improvement in the quality o f life are the uhimate objectives o f planning. This is to be achieved through policies and programmes aimed at promotion o f both equity and excellence Benefits o f national economic programmes reach the different segments o f the population through different channels and at different rates Econom ic growth improves employment opportunities and employment improves income and purchasing power. But the market mechanism may not improve access to available facilities or fully meet the essential needs o f the population with inadequate purchasing power. Social sector planning therefore ensures that appropriate policies and programmes are formulated and adequate investment provided by the State so that poor and vulnerable segments o f the population can access essential commodities and facilities based on their needs and not on the ability to pay.
1.17 Despite the fact that there has been a decline in the incidence o f poverty over the past tw o decades, millions continue to live below the poverty line, a large proportion o f whom reside in rural areas. Therefore, specifically designed anti-poverty programmes for generation o f both self-employment and wage-employment will continue in the Ninth Plan These would, however, be rationalised and re-designed in order to make them more effective as instrum ents o f poverty alleviation. Under the self-employment programme o f Integrated Rural Development Programme (IRDP) there would be a progressive shift from the individual beneficiary approach to the group and/or cluster approach A holistic approach would be adopted with an integration o f the existing sub-schemes o f Training o f Rural Youth for Self Employment (TRYSEM), Development o f Women and Children in Rural Areas (DW CRA), Supply o f Improved Toolkits to Rural Artisans (SITRA), and Ganga Kalyan Yojana (GKY) in the IRDP. Jawahar Rozgar Yojana (JRY) will be confined to the creation

of rural infrastructure according to the felt needs o f the people at the village level throiujgh panchayats. However, at the block and district level, the Employment Assurance Sche;nne (EAS) would be the single wage-employment programme Efforts would be made to brring about a greater integration between the poverty alleviation programmes and the varuoius sectoral programmes as well as the area development programmes within the umbrella o f ttlie Panchayati Raj Institutions (PRIs).
1.18 fn the area o f basic minimum services, the Ninth Plan has placed greater emphasis on primary health care, primary education and provision o f safe drinking water and shelter
1 19 Over the last five decades a massive health care infrastructure has been built up in urban and rural areas National programmes to combat major health problems have bteeii evolved and implemented through this infrastructure These have resulted in a steep fall ni mortality However there has not been any reduction in the communicable diseases aind nutrition related morbidity There has been a progressive increase in the luo i- communicable disease burden, occupational and environmental health related problem 's Focus during the Ninth Plan will be to provide integrated preventive, promotive, curativ e cand rehabilitative services for communicable, non-communicable and nutrition related heailth problems, through appropriate strengthening o f the existing health care institutions aind ensuring that they are optimally utilised. Efforts will be made to achieve substantial reductiion in morbidity and mortality rates by taking advantage o f the ongoing demographic trarsiliion and progressive increase in the population in the 15-59 age group
1.20 Over the last five decades there has been a steep decline in severe grades o f iindiei- nutrition and related heahh problem Currently major nutritional problems o f public heaihh importance are (a) chronic energy deficiency (CED) especially in pregnant women and pire- school children, (b) obesity and consequent increase in non-communicable disea;scs especially among urban affluent segments o f population, (c) micro-nutrient deficiencies o f iron, iodine and vitamin A and associated health hazards During the Ninth Plan, efforts wv.ll be made to achieve substantial reduction in CED and its health consequences throuigh universalisation o f ICDS, screening o f pregnant and lactating women, growth monitoring auid better targeting o f food supplements to those with CED. close monitoring o f pe rso n s receiving food supplements, close inter-sectoral co-ordination to ensure early detection aiiid management o f health problem leading to o r associated with under-nutntion Preventi(on early detection and effective management o f micro-nutrient deficiencies and associated heaihh hazards will receive due attention.
1.21 The technological advances and improved quality and coverage o f health c;aie resulted in a rapid fall in Crude Death Rate (CDR) from 25.1 in 1951 to 9 8 in i99 1 In contrast, the reduction in Crude Birth Rate (CBR) has been less .steep, declining fnoni40.8 in 1951 to 29.5 in 1991, As a result, the annua! exponential population growth rate lhas been over 2% in the last three decades. During the Eighth Plan period the decline in CBR lhas been steeper than that in the (CDR) and consequently, the annual population growth i ate has been around 1.9% during 1991-95. Reduction in the population growth rate has bteen recognised as one o f the priority objectives during the Ninth Plan period. This will be achieved by meeting all the felt-needs for contraception; and reducing the infant aind maternal morbidity and mortality so that there is a reduction in the desired le\ el of ie 'tiliity The efforts will be made to minimise the existing disparities between states by pro'.-idling resources fill the crucial gaps in infrastructure and manpower and im pioving the operational eftlciepxv o f health system, improving the access and quality o f reprod jct.ive

and child health services to enable the increasingly aware and literate families to attain their reproductive goals in harmony with the national goals and accelerating the rate o f reductionii) population growth rate to achieve rapid population stabilisation.
1.22 Manpower development to provide adequate labour force o f appropriate skills and quality to different sectors essential for rapid socio-economic development and elimination o f the mismatch between skills required and skills available has been a major focus o f human resource development activities during the last fifty years Employment generation in all the productive sectors is one o f the basic objectives. In this context, providing enabling environment for self employment has received special attention both in urban and rural areas. Objective is also to eliminate bonded labour, employment o f children and women in hazardous industries, and minimise occupational health hazards During the NiiUii Plan period, elimination o f such undesirable practices as child labour, bonded labour ensuring w'orkers' safety and social security, looking after labour welfare and providing o f the necessary support measures for sorting out problem relating to employment o f both men and women workers in different sectors will receive priority attention It is also envisaged that the employment exchanges will be reoriented so that they become the stiurce o f labour related information, emplovmeni opportunities and provide counselling and guidance to employment seekers
1 23 The Ninth Plan treats Education as the most crucial investment in human development with objective o f eradicating illiteracy by 2005 Special Action Plan has ideniified the expansion and improvement o f social infrastructure in education as a critical area An overriding priority will be given for providing access to schooling to children in the age group 6-11 years A special thrust will be on girls' education by providing free education up to college level including professional courses Vocational education at the secondary and under-graduate levels will be expanded and restructured so as to have strong linkages with industry and improve employability. The intake capacity o f the llTs, other reputed engineering institutions and IlMs will be doubled, particularly in high demand areas like software engineering and information technology PRIs will be empowered to serve as the nucleus in programme implementation Non-governmental organisations will be encouraged to supplement the governmental efforts, private sector will also be facilitated to grow particularly in higher and technical education Care will, however, be taken to ensure that the country does not lag behind in terms o f creative artists and scientists Accordingly, education in basic sciences and areas o f fijndamental research will be promoted and strengthened
1 24 To ensure the well-being o f the disadvantaged sections o f the society, there has been a definite shift in the approach from 'welfare' to development' and to empowerment' over the last four and a half developmental decades In line with this new approach, all the welfare and developmental measures have been directed towards empowering the Socially Disadvantaged Groups, such as women, Scheduled Castes. Scheduled Tribes, Other Backward Classes and Minorities, as the agents o f social and economic change and development. While in the case o f women, efforts are now being made to make them economically independent and self-reliant through various employment and income- generating activities, the main thrust in respect o f children is to ensure their survival, protection and development with a special focus on the girl child and the adolescent girl In the field o f social welfare, the special focus will be riow' on empowering the persons with disabilities, reforming the deviants like juvenile delinquents/vagrants, alcoholics and drug addicts; and caring for other disadvantaged, viz. street children, older persons and destitutes The main strength o f these efforts is derived from various legislations enacted for protecting

the interests o f these groups. Towards empowering the Socially Disadvantaged Groups, a three-pronged strategy o f Social Empowerment, Economic Empowerment and Social Justice, will be adopted in the Ninth Plan.
Housing, Urban Development and W ater Supply
1.25 The key urban concern is the growing gap between demand and supply o f basic services. While there has been a steady growth in the housing stock, infrastructure and basic services, the gaps between demand and supply have been growing even in terms o f conservative norms. This gap has a deteriorating impact on the urban environment, inadequacy o f urban planning, urban poverty and degradation. With a view to achieving the goal o f 'Health for all', the Government is committed to provide drinking water to every settlement in the rural and urban areas within next five years. It has also been decided to ensure that sanitation facilities are improved and expanded rapidly A new National Housing and Habitat Policy has been evolved which aims at providing Housing for All'. Towards this end the Government will facilitate construction o f 20 lakh additional housing units annually in urban and rural areas. To achieve these objectives Special Action Plans have been prepared.
1.26 The rural hinterland has played a critical role in sustaining urbanisation This is reflected in the indicators o f sources o f primary inputs, competitively priced labour for urban economic activities, primary funds as reflected in comparative urban and rural credit-deposit ratios and market for urban pockets But the unending migration o f the rural poor to the urban areas may have a destabilising effect o f urbanisation and its sustainability Income and employment opportunities will have to rise in rural areas through both the farm and non-farm sectors. The rural - urban continuum would be strengthened so that the gaps between rural and urban life styles are reduced. Effective urban strategies and programmes cannot be developed in isolation o f those living in rural areas. The Ninth Plan will take cognisance o f this ground realities, particularly in respect o f the three critical components viz drinking water, sanitation and housing.
Science and Technology
1.27 The Science and Technology policy and approach for the Ninth Plan reflects the reality o f the present day world in which nations progress along their own chosen path but in a much more closely inter-connected and inter-dependent manner. Science and Technology continues to remain the main focal point for exploring new horizons and new vistas, economic prosperity and meeting the economic, industrial, trade and societal challenges Policy initiatives have been suggested to ensure the benefits emerging from the S&T reach all sections o f the community including the weaker sections o f the society Since a strong science base is a pre-requisite for achieving technological competitiveness, efforts will be continued to build and maintain the same. Scientists with exceptional capabilities would be nurtured and supported flilly by offering them within the country facilities comparable with international standards, by creating more centres o f excellence in institutions o f higher learning for supply o f future S&T manpower and by utilising the existing infrastructure in terms o f facilities and manpower more efficiently Research programmes, particularly in some o f the chosen fields o f agriculture, export and industry would be taken up on in a mission mode through appropriate restructuring and reorientation o f many o f the scientific institutions and laboratories The emphasis will be on clean and eco-friendly technologies The major focus o f the S&T programmes will be to

encourage and strengthen interaction among R&D institutions and the users. Development o f core strength and concentration on areas where competitive strength can be built so that the technological competitiveness can be converted into commercial strength are envisaged. In the light o f the international control regime, greater awareness would be created among the scientists and technologists regarding the patents and IPR related issues for protecting the interest o f the country. Science and technology activities in the States and UTs would be geared up to take up location specific R&D programmes for S&T inputs in the key sectors o f the socio-economic development through promotion o f joint innovative programmes with industry and NGOs.
] 28 The importance o f developing S&T in a major way has been recognised since independence. The whole hearted support provided to science and technology since then has resulted in many accomplishments in a wide variety o f disciplines. Support to basic research has been receiving a rather high priority during the earlier plans Though this may continue to a considerable extent, a proper balance would be maintained between fundamental research and applied research in scientific fields. Recent developments have brought home the need to accord high priority to technology related areas, particularly the process technologies, which may be characterised as core technologies, which need to be strengthened with particular emphasis on ensuring partnership with the concerned socio-economic activities and industry wherever possible. In this process the Indian industry and the users o f technology have a crucial role to play in generation o f technology in order to sustain a competitive technological edge.

CHAPTER 2
POVERTY ALLEVIATION PROGRAMMES
2.1 Poverty Alleviatioo in Rural India : Programmes and Strategy
2.1.1 Poverty eradication is one o f the major objectives o f planned development. TTie magnitude o f the problem is still quite staggering. Thirty six per cent o f the Indian population was below poverty line (BPL) in 1993-94, the latest year for which the data are available and the absolute number o f poor was 320 million, out o f which 244 million (37 per cent o f the rural population) lived in rural areas. The incidence o f poverty declined from 54.9 per cent in 1973-74 to 36 per cent in 1993-94. But the absolute number o f poor did not decline much over this period o f 20 years. There were 321 million poor in 1973-74 and 320 million in 1993-94; in the rural areas the corresponding numbers were 261 million and 244 million.
2.1.2 The main determinants o f poverty are (i) lack o f income and purchasing power attributable to lack o f productive employment and considerable underemployment and not to lack o f employment per se; (ii) a continuous increase in the price o f food, especially foodgrains which account for 70-80 per cent o f the consumption basket; and (iii) inadequacy o f social infrastructure, affecting the quality o f life o f the people and their employability.
2.1.3 Economic growth is important. Economic growth creates more resources and has the potential o f creating more space for the involvement o f the poor. But the involvement o f the poor depends on the sources o f growth and the nature o f growth. If the growth is sourced upon those sectors o f the economy or those activities which have a natural tendency to involve thj poor in their expansion, such growth helps poverty eradication. Therefore, it is important to source a large part o f economic growth in agriculture, in rural non-agricultural activities and in productive expansion o f the informal sector which all have high employment elasticities, as well as in an export strategy based on labour intensive exports.
2.1.4 The Government recognises that high growth o f incomes is by itself not enough to improve the quality o f life o f the poor. Unless all the citizens o f the country, and m ost particularly the poor, have certain basic minimum services, their living conditions cannot improve. These minimum services include among other things literacy education, primary health care, safe drinking water cind nutritional security. The Government had convened a meeting o f Chief Ministers to identify' such basic minimum services and a list o f seven services had unanimously been agreed upon. These seven services are safe drinking water, primar)' health facilities, universal primary education, nutrition to school and pre- school children, shelter for the poor, road connectivity for all villages and habitations, and the Public Distribution System (FDS) with a focus on the poor. ITie Ninth Plan lays special emphasis on these seven basic minimum services and will make all efforts to achieve a minimum level o f satisfaction in providmg these in partnership with the State Governments and the Panchayati Raj Institutions (PRIs).
2.1.5 Direct poverty alleviation programmes are important and will ccrtm ue on an expanded scale m the Ninth Pian. But these programmes would be oriented towards strengthening the
!0

productive potential o f the economy and prov iding more opportunities for involving the poor in the economic process. Broadly, there would be schemes for income generation through supplem.entarv employment, for the welfare o f the poor in rural/urban areas and for a targeted PDS system to ensure that the poor have access to foodgrains at prices they can afford. In this chapter, both rural and urban poverty alleviation programmes besides the Targeted Public Distribution System (TPDS) will be discussed in some detail.
2.1.6 Poverty can effectively be eradicated only when the poor start contributing to the growth by their active involvement in the growth process. Implementation o f the programmes should be increasingly based on approaches and methods which involve the poor themselves in tiie process o f poverty eradication and economic grovvlh. This is possible through a process o f social mobilisation, encouraging participatory approaches and institutions and empovvermenr o f the poor. In this the PRIs, the voluntary' organisations and community based Self-Help Groups will be more closely involved.
Rural Poverty Alleviation
Self-Em ploym ent Programmes
Integrated Rural Developm ent Programme (IRDP) & Allied Programme.s
2.1.7 I'hc Integrated Rural Development Progranime (IRDP) aims at providing scU'- employment to the rural poor through acquisition of productive assets or appropriate skills which would generate additional income on a sustained basis to enable them to cross the poverty line. .Assistance is provided in the fonn o f subsidy and bank credit. The target group consists largely o f small and marginal farmers, agricultural labourers and rural artisans living below the poverty line. The pattern o f subsidy is 25 per cent for small farmers, 33-1/3 per cent for marginal famiers, agricultural labourers and rural artisans and 50 per cent for Scheduled Castes/Scheduled Tribes families and physically handicapped persons. The ceiling for subsidy is Rs.6000/- for Scheduled Castes/Scheduled Tribes families and the physically handicapped; for others, it is Rs.4000/- in non-DP.A.P/non-DDP areas and Rs.5000/- in DP.A.P and DDP areas. Within the target group, there is an assured coverage o f 50 per cent for Scheduled Castes/Scheduled Tribes, 40 per cent for women and 3 per cent for the physically handicapped. Priority in assistance is also given to the families belonging to the assignees o f ceiling surplus land. Green Card Holders covered under the Family Welfare Programme and freed bonded labourers.
2.1.8 IRDP is a Centrally Sponsored Scheme which is in operation in ail the blocks o f the country since 1980. Under this scheme Central funds are allocated to States on the basis of proportion o f rural poor in a State to the total rural poor in the country.
2.1 .9 Since the inception o f the programme till 1996-97, 50.99 million families have been covered under IRDP at an e.xpenditure o f Rs. 11434.27 crore. The total investment during this period has been Rs.28047.65 crore which includes a subsidy component o f Rs.9669.97 crore and a credit disbursement o f Rs. 18377.68 crore. O f the total families assisted under this programme 44,75 per cent were Scheduled Castes/Scheduled Tribes and 27.07 per cent women.
2.1 .10 During the Eighth Five Year Plan the total allocation (Centre and State) under IRDP was Rs 5048.29 crore and the total investment amounted to Rs. 11541.06 crore. In quantitative

numbers, 10.82 million families were covered under IRDP against the initial target o f 12.6 m illion families fixed for the entire Eighth Plan period. However, from 1995-96 physical targeting under the programme was abolished with the focus shifting to financial targets and qualitative parameters. O f the families covered 50.06 per cent were Scheduled Castes/Scheduled Tribes and 33.59 per cent women. The coverage of women was still lower than the target o f 40 per cent.
2.1.11 The IRDP has been successful in providing incremental incom e to the poor fam ilies, but in most cases the incremental income has not been adequate to enab le the beneficiaries to cross the poverty line on a sustained basis mainly because o f a lo w per fam ily investment. The results o f the last Concurrent Evaluation (Septem ber 1992 - A ugust 1993) revealed that o f the total beneficiaries assisted under the programme, 15.96 per cent o f the old beneficiary fam ilies could cross the revised poverty line o f R s .l 1,000 (at 1991-92 prices), while 54.4 per cent o f the families were able to cross the old poverty line o f R s.6,400 per annum. But, the analysis by incom e group o f fam ilies revealed that in case o f those within initial incom e o f R s.8 5 0 1 - 11,000, 48.22% o f beneficiary fam ilies could cross the poverty line o f R s.l 1,000 which is quite encouraging. The analysis o f the fam ily incom e o f the beneficiaries reveal that a large percentage (57.34% ) o f the fam ilies had annual family incom e from assets o f more than R s.2000. The annual incom e from the asset was more than R s.6000 in 29% cases.
2 .1 .12 The major constraint in the implementation o f IRDP has been sub-critical investm ents which have adversely affected the Incremental Capital Output Ratio (ICO R) levels and thereby undermined the viability o f the projects. Though the average per fam ily investment has been rising steadily in monetary terms, in real terms the increase has been inadequate and in som e cases sub-critical due to the inflationary trends and the increase in the cost o f assets.
2.1.13 At the instance o f the Ministry o f Rural Development (now renamed as M inistry of Rural Areas & Employment) , the Reserve Bank o f India appointed in 1993, a High Powered Com m ittee under the Chairmanship o f Dr. D.R. Mehta, Deputy Governor o f Reserve Bank o f India to make an indepth study o f IRDP and recommend suitable measures for its improvement. The Committee was asked to review among other factors, the process o f selection o f appropriate income generating assets, credit structure, recovery o f loans, and procedural matters in respect o f obtaining loans, and efficacy of existing administrative structures o f the D istrict Rural D evelopm ent Agencies (DRDAs). In consonance with the recommendations o f the High Powered Committee, the new initiatives taken by Government under IRDP in the E ighth Plan included (a) targeting the segment o f literate unemployed youth below the poverty line for IRDP activities by giving them subsidy upto Rs.7500 or 50 per cent o f the project cost (whichever is lower) (b) promotion o f group activities through enhancement o f ceiling on subsidy to R s .l.25 lakh or 50 per cent o f the project cost (whichever is lower) for all group ventures in\ oK ing at least 5 members (c) back-ending o f subsidy to prevent leakages in subsidy adm inistration (d) shifting the emphasis to financial targets and qualitative parameters from a perfunctor> physical coverage o f families and (e) enhancing the limit of allocation to programme infrastructure from 10 per cent to 20 per cent in all the States and 25 per cent in the North Eastem States.
12

2.1.14 Among the other steps taken to enhance the efficacy o f the programme are abolition o f the cut o f line to enable all families below the poverty line to be assisted under the programme, targeting the investment per family at progressively higher levels each year, extension o f the family credit plan to 213 districts o f the country, enhancing the ceiling limit o f collateral free loans to a uniform limit o f Rs.50,000 with a view to easing the constraints faced by poor beneficiaries while taking loans from the banks, extension o f the cash disbursement scheme to 50 per cent blocks in the country, decentralisation o f the sanctioning powers for infrastructural projects below Rs.25 lakh and entrusting the banks with the task o f identification o f beneficiaries in about 50 districts on a pilot basis. These interventions have had an impact on the average per family investment which rose from Rs.7889 in 1992-93 to Rs. 15036 in 1996-97.
2.1.15 In pursuance o f the High Powered Committee’s recommendation, for the first time in 1995-96 credit targets w'ere fixed. There has been a continuous increase in the volume o f credit mobilised by the banks during the successive years o f the Eighth Plan period. Correspondingly, the subsidy credit ratio, which averaged 1; 1.77 in the first three years o f the Eighth Plan, rose to 1:1.96 in the fourth year and further to 1:2.17 in 1996-97. However, there are genuine reasons for the inability o f the banks to meet the full credit requirements o f IRDP beneficiaries. These include poor recovery o f IRDP loans, lack o f adequate rural banking infrastructure in certain
areas and the weak financial performance o f Regional Rural Banks and Cooperative banks.
2.1.16 There has been considerable diversification o f IRDP activities since the inception of the programme. Initially, a majority o f the beneficiaries under the programme subscribed to primary sector activities. In 1980-81 the sectoral composition o f IRDP activities was heavily skewed towards the primary sector which had a sponsorship o f 93.56 per cent, while the share o f the secondary and tertiary sectors were 2.32 per cent and 4.12 per cent respectively. Over the years, the share o f the primary' sector has come down considerably and is currently around 55 per cent, while the shares o f the secondary and tertiary sectors have increased proportionately to 15 per cent and 30 per cent respectively.
2.1.17 Inadequate development o f infrastructure and insufficient forward and backward linkages and market facilities have been an area o f concem under IRDP. In an attempt at filling up the critical infrastructural gaps and strengthening the linkages and marketing facilities, the allocation under IRDP towards the development o f programme infrastructure was increased from10 per cent to 20 per cent in all the States and to 25 per cent in the North Eastern States. Decentralisation in the sanctioning powers for infrastructural projects had already been given effect to in 1994-95. However, despite this enhanced provision for programme infrastructure under IRDP and the relaxation in sanctioning norms, the actual expenditure on infrastructural development was a mere 5 per cent to 7 per cent of the total allocation under the programme at the all-India level. There is, therefore, a critical need to prepare a perspective infrastructural plan at the district and block level and to ensure that the funds earmarked for infrastructural development under IRDP are closely monitored and not diverted elsewhere.
2.1.18 The salient features o f IRDP performance during the Eighth Plan are given in Annexure-I.

2.1.19 The Scheme of TRYSEM, a facilitating component o f IRDP, aims at providing basic technical and entrepreneurial skills to the rural poor in the age group of 18 to 35 years to enable them to take up income generating activities. The Eighth Plan had emphasised the im portance o f a proper assessment of the training needs of the rural youth in relation to se lf and wage- em ploym ent opportunities, quality o f training and group training. During the Eighth Plan, 15.28 lakh youth were trained under TRYSEM, o f whom 34.16 per cent took up self-em ploym ent and15.05 per cent wage-employment; while the remaining 50.79 per cent remained unem ployed. (Perform ance details are given at Annexure-II.)
2.1.20 W ith a view to strengthening this programme, several initiatives were taken in the Eighth Plan which include, among others, an increase in the stipend and honorarium rates; em phasis on professionalised training through the established and recognised institutes like ITIs, Com m unity Polytechnics, Krishi Vigyan Kendras etc., exploring the possibilities o f setting up production groups from amongst TRYSEM trainees for undertaking ancillary activities like manufacture and assembly o f modem items o f production; utilisation o f TRYSEM infrastructure funds for the strengthening of Nimiithi Kendras (Rural Building Centres) sponsored by HUDCO for training o f youth under TRYSEM in the trades o f low cost housing and the setting up o f mini- ITIs at the block level to strengthen the training infrastructure for the rural youth. •
2.1.21 The TRYSEM progvamme was evaluated for the first time in a Quick Study (June to A ugust 1993) conducted through independent research institutes/organisations. The main findings o f the evaluation study are as under :
i ) O f the total sample districts, area skill surveys were not carried out in 92 per cent o f the districts to assess the potential skill requirements. This resulted in a mism atch o f jo b skills in53.3 per cent o f the sample districts.
ii ) O f the total number of beneficiaries, who got training under TRYSEM, roughly 47.19 per cent w ere unemployed after the training and 32.54 per cent took up self-em ploym ent after training o f whom 12.41 per cent took up em ployment in trades other than those in w hich they were trained.
iii) A majority o f the beneficiaries i.e. 66.52 per cent cited lack of funds as a m ajor reason for not taking up self-employment independently after the training.
i\ ) A m ajor proportion o f TRYSEM trainees i.e. 53.57 per cent did not apply for loan under IRDP. O f the total beneficiaries, who applied for loan, only about 50 per cent were given assistance under IRDP upon completion o f training.
v) Roughly, 73.38 per cent of the beneficiaries could derive an average monthly turnover upto Rs. 1000 as a result of self-employment taken up by them after the training.
M ) 63 per cent beneficiaries felt no improvement in their socio-economic conditions as aresult o f TRYSEM training.
2.1.22 There has been a poor convergence o f TRYSEM with IRDP which has also been reflected in the Fourth Round o f the Concurrent Evaluation of IRDP (1992-93). Onlv 3.88 oer
Training o f Rural Youth for Self-Employment (TRYSEM)
14

cent of the IRDP beneficiaries had received training under TRYSEM. It was also observed that the rural youth trained under TRYSEM were only interested in the stipendiary benefits they received during the course o f training and therefore, had not utilised the knowledge gained under the programme for furthering their self-employment prospects. In practice, therefore, such expenditure on training had become infructuous because of an absence o f linkages between the employment opportunities available and training provided. Clearly. TRYSEM has been a weak link in the overall strategy for self-employment in rural areas.
Supply o f Improved Toolkits to Rural Artisans (SITRA)
2.1.23 Launched in July 1992, as a sub-scheme o f IRDP in selected districts, this scheme has since been extended to all the districts o f the country. Under the scheme, a variety o f crafts persons, except weavers, tailors, needle workers and beedi workers, are supplied with a kit o f improved hand tools within a financial ceiling of Rs.2000, of which the artisans have to pay 10 per cent and the remaining 90 per cent is a subsidy from the Government o f India. The supply o f power driven tools, subject to a ceiling o f Rs.4500, is also permitted under this scheme. Beyond this, any additional finance required by the artisans can be provided through loans under IRDP. The rural artisans are trained under TRYSEM for which an age relaxation has been provided to them.
2.1.24 Since the inception o f this scheme in 1992-93 upto 1996-97, 6.10 lakh toolkits have been distributed to rural artisans at an expenditure of Rs.\ \6.19 croxe. (Performance details are given at Annexure-III.) Reports from the State Governments indicate that the scheme has been well received by rural artisans. The more popular crafts under this scheme are blacksmithy, carpentry, stone craft, leather work, pottery and cane & bamboo work. Prototypes o f improved tools in these crafts have been developed by the National Small Industries Corporation (NSIC), Regional D esign and Technical Development Centres under the Development Commissioner, Handicrafts and other organisations. The SITR.A, was evaluated by an independent research organisation, i.e. Development Alternatives, New Delhi, in two Districts o f Uttar Pradesh, nam ely A gra and Aligarh. The findings o f this study reaffirms the positive impact o f SITRA. It also indicates that the income level o f airal artisans have increased substantially with the use o f im proved tools.
DEVELO PM EN T OF W OM EN AND CHILDREN IN RURAL AREAS (DW CRA)
2.1.25 The special scheme for Development o f Women and Children in Rural Areas (DWCRA) aim s at strengthening the gender component o f IRDP. It was started in the year 1982-83, on a p ilo t basis, in 50 districts and has now been extended to all the districts o f the country. The details o f the performance under DWCRA during the Eighth Plan are given at .\nnexure-IV.
2.1.26 DW CRA is directed at improving the living conditions o f women and, thereby, of children through the provision o f opportunities for self-employment and access to basic social serv ices. The main strategy adopted under this programme is to facilitate access for poor women to em ploym ent, skill upgradation, training, credit and other support services so that the DWCRA w om en as a group can take up income generating activities for supplementing their incomes. It seeks to encourage collective action in the form o f group activities which are known to work better and are more sustainable than the individual effort. It encourages the habit o f thrift and

credit £imong poor rural women to make them self-reliant. The programme also envisages that this target group would be the focus for convergence o f other services like family welfare, health care, nutrition, education, child care, safe drinking water, sanitation and shelter to improve the welfare and quality o f life o f the family and the community.
2.1.27 Since the inception of the scheme till 1996-97, 1,87,918 DWCRA groups were formed at an expenditure o f Rs.248.95 crore, covering 30,39,383 rural women. It was in the Eighth Plan that DW CRA received a fillip with the Government taking several initiatives to strengthen the programme. These include, among others, extending its coverage to all the districts o f the country, increasing the revolving fund from Rs. 15,000 to Rs.25,000, permitting the formation o f smaller DWCRA groups in difficult terrain and remote areas, and permitting operation o f joint accounts by the group organiser and another member o f the group elected as treasurer o f the group rather than the Gram Sevikas and the group organiser, so as to facilitate the DWCRA groups in managing their own affairs. The Child Care Activities (CCA) component was introduced in the DWCRA programme in 1995-96 with the objective o f providing child care services for the children o f DWCRA women. Similarly the Information, Education and Communication (lEC) component was introduced to generate an awareness among rural women about the development programmes being implemented for their upliftment and welfare. The Eighth Plan also saw the extension o f the Community Based Convergent Services (CBCS), a component o f DWCRA, to 141 districts o f the country.
2.1.28 In the implementation o f DWCRA, some States like Andhra Pradesh, Kerala, Tripura and Gujarat have performed very well while in other States, theperformance and impact o fDWCRA has been relatively poor. In Andhra Pradesh, in particular,
several successful DWCRA groups have been formed and this has led to the empowerment o f women in decision making on various social aspects that impinge on their daily life. The range o f activities pursued by these groups are also fairly diverse. Some have started mini banks and have, thereby, reduced
their dependence on the money lenders. Other groups are managing lands taken on lease. Quite a few have formed mini transport companies, having acquired autos, LCVs etc. on bank loans. The success o f this programme has been attributed to two major catalysts namely, adult literacy among women and its culmination into a women's movement and close involvement of the NGOs. There is a need to evolve an institutional mechanism for replicating the successful DWCRA groups throughout the country.
DW CRA - The Case of ,\ndhva Pradesh> Strategy adopted tor formation of sustainable DWCRA groups had
the following salient features :
❖ Formation of Thrift and Credit groups to develop group dynamics, cohesion and homogeneity among the members.
❖ Savings provided the entry point for poor women to come togetherthrough a Self-Help mechanism.
Democratically managed groups with collective decision making,
<• Sustainable income generating activities with access to creditunder the Integrated Rural Development Programme (IRDP) and to training facilities.
•t* Total Literacy Campaign (TLC), Kalajatha, multimedia publicitycampaign through All India Radio (AIR). Doordarshan and print media, involvement of youth leaders, mahila mandals, voluntarv’ organisations and Government functionaries created awareness and contributed to the process of social mobilisation
16

2.1.29 Yet, in the implementation o f DWCRA several shortcomings have also surfaced which has stymied its successful and effective execution in some States. Several groups have become defunct over time. The reasons for these include, among others, (a) improper selection of groups; (b) lack o f homogeneity among the group members; (c) selection o f non-viable economic activities which are mostly traditional and yield low income; (d) the linkages for supply o f raw material and marketing o f production are either deficient or not properly planned as a result o f which DWCRA groups have become vulnerable to competition.The District Supply and Marketing Societies have been weak outlets for the sale o f DWCRA products; (e) lack o f institutional financial support, inadequate training, a nonprofessional approach and poor access to upgraded technological inputs have deprived DWCRA groups from diversifying into high value addition activities; and (f) inadequacy o f staff and their insufficient training and motivation has also affected the overall implementation o f the programme. These shortcomings would have to be suitably addressed for the successful implementation o f the programme in the Ninth Plan.
PODUPULAKSHMI - Pride of Nellore Women’- a successstory.
> As a sequel to the Total Literacy Campaign & anti-arrack agitation, PODUPULAKSHM I’ (Podupu means saving, Lakshmi - Goddess o f Wealth) was started by two lakh women organised into 7000 small thrift groups o f 20-30 members. They saved Rs.8.00 crore in four years.
> The district adm inistration provided thePODUPULAKSHM I’ movement with the initial support
and acted as a facilitator. Volunteers, animators, trainers and instructors in the Total Literacy Campaign acted as PODUPULAKSHM I organisers.
> O nce PODUPULAKSHM I groups reached a level o f maturity, they converted themselves into DW CRA groups. This enabled them to access the revolving fund under DWCRA which was used by the groups to provide working capital to set up micro enterprises. The savings fund was used to meet emergency consumption needs.
y Today a wide variety o f women centred activities are carried out by these groups. The ANM, the School Teacher, the Fair Price Shop Dealer, the Anganwadi W orker are a\\ associated whh PODU Pb'LAKSHM l - bringing about a convergence o f basic services.
W age Em ploym ent Programmes Jaw ahar Rozgar Yojana (JRY)
2.1.30 Rural poverty is inextricably linked with low productivity and unemployment. Hence, it is imperative to improve productivity and increase employment in rural areas. An employment-oriented growth strategy would achieve this goal only in the medium and long run. In the short run supplementary employment will have to be provided to the unemployed and
underemployed, during the lean agricultural season. There are two major wage employment programmes namely the Jawahar Rozgar Yojana (JRY) and the Employment Assurance Scheme (EA S) presently in operation.
2.1.31 The JRY was launched as a Centrally Sponsored Schemes (CSS) on T' April, 1989 by merging the National Rural Employment Programme (NREP) and the Rural Landless Employment Guarantee Programme (RLEGP). The main objective of the programme is the generation o f additional gainful employment for unemployed and underemployed p>ersons, both men and women, in the rural areas through the creation o f rural economic infrastructure, community and social assets with the aim o f improving the quality o f life of the rural poor.
2.1.32 The resources under this scheme are allocated to the States/UTs on the basis o f proportion o f rural poor in the States/UTs to the total rural poor in the country. From the States
17

to the districts, the allocation is made on an index o f backwardness which is based on the proportion o f rural Scheduled Castes/Scheduled Tribes population in the district to total Scheduled Castes/Scheduled Tribes population in the State and an inverse o f agricultural production per agricultural worker in that district, in equal weights. The funds are devolved to the village panchayats by giving due weightage to the Scheduled Castes/Scheduled Tribes population and the total population o f the village panchayat. Until recently, these funds were distributed between the village panchayats and the district level in the ratio o f 80:20. However, subsequent to the revitalisation o f PRIs at three levels, the JRY funds are now distributed among the village panchayats, intermediate panchayats and the district panchayats in the ratio o f 70:15:15.
2.1.33 This programme is targeted at people living below the poverty line. However, preference is given to Scheduled Castes/Scheduled Tribes and freed bonded labourers. A tleast 30 per cent o f the employment is to be provided to women under the Yojana. In practice, however, this programme is self targeting. Given that em ployment is offered at statutory minimum wages for unskilled labour and that these wage rates are generally lower than the prevailing market wage rates, only those willing to do manual work for the prescribed wage rates would seek employment on these public works. While works under the scheme can be taken up during any pan o f the year whenever the need for generating em ploym ent is felt, these should preferably be started during the lean agricultural season but may continue thereafter, if necessary.
2.1.34 After three years o f its implementation, i.e. in 1992-93, a review o f the program m e revealed that the per person employment generated was inadequate in terms o f the requirem ent and did not provide enough income to the poor. It was also perceived that the resources under JRY were too thinly spread and adequate attention was not being given to the backward areas o f the country. Accordingly, the strategy for implementation o f JRY was modified from 1993-94 with the introduction o f the Second Stream of JRY, specifically targeted at 120 identified backward districts in 12 States o f the country, characterised by a concentration o f the poor and the underemployed, with additional resources flowing to these districts. This modification in programme strategy was made to achieve the target o f providing 90-100 days o f employment per person in backw ard districts where there v\̂ as a concentration o f unemployed and underemployed persons. In addition, a Third Stream of JRY was introduced for taking up special and innovative projects aimed at preventing migration o f labour, enhancing w om en’s em ploym ent and undertaking special programmes through voluntary organisations for drought proofing etc.
2.1.35 A Concurrent Evaluation o f the JRY was conducted from June 1993 to May 1994. The study revealed that nearly 82.16 per cent of the available funds were spent on com munity development projects. Construction o f rural link roads received the highest priority. The wage and non-wage component of the expenditure of JRY works undertaken by the village panchayats wa? o f the order o f 53:47 at the all-India level against the stipulated norm o f 60:40. M uster rolls were maintained with 86.87 per cent o f the village panchayats. The average wages paid per manday o f the unskilled workers were more or less on the lines of the minimum wages stipulated under the Act. O f the assets created, 76.96 per cent were created by the village pancha\ ats and76.11 per cent o f these assets were found to be in a good condition. As many as 69.35 per cent o f the workers were satisfied with the benefits the\ received under the JRY.

2.1.36 The Evaluation Report also brought into focus certain inadequacies in the programme. It was reported that 57.44 per cent o f the elected panchayat heads had not been imparted any training for the implementation o f JRY works. The share o f women in employment generated under the programme was only 16.59 per cent and 49.47 per cent o f the works could not be completed on time on account o f shortage of funds. Other shortcomings observed were differentials in the wages paid to male and female workers, non-utilisation o f locally available material in a large number o f JRY works undertaken by panchayats and lack o f discussion o f the annual action plans in the Gram Sabha meetings etc.
2.1.37 In a com prehensive restructuring o f the wage employment programmes on 1.1.1996, JRY was further streamlined. In the revised strategy, the First Stream o f JRY was continued in its existing form but Indira Awaas Yojana (lAY) and Million Wells Scheme (MWS) which were till then sub-schemes o f JRY were made independent schemes. The Second Stream o f JRY, which was being implemented in 120 backward districts in the country, was merged with the Employment Assurance Scheme (EAS) introduced in 1775 selected backward blocks o f the country in 1993-94 in view' o f the similarit>’ in these programmes. The Third Sti'eam o f JRY with its thrust on innovative projects was continued. Accordingly, the JRY is now being implemented in two parts i.e. (i) the Jawahar Rozgar Yojana (M ain Scheme); and (ii) Special and Innovative Project.
2.1.38 Since the inception o f JRY in 1989-90 till 1996-97 a total amount o f Rs.26570.25 crore (Centre and State) was allocated to the programme. As against this total allocation, an amount of Rs.25661.70 crore was released of which Rs.25190.30 crore was utilised by the States. This utilisation is approximately 98.16 per cent of the total funds released. In terms o f physical performance, as against a target of 6581 million mandays fixed under JRY, the actual em ployment generated was 6585 million mandays which is an achievement o f 100.07 per cent. O f the total em ployment generated under the programme, the share of Scheduled
Castes/Scheduled Tribes was 3659.53 million mandays (55.57 per cent) and that o f women 1681.40 million mandays. which is 25.53 per cent.
2.1.39 The financial and physical performance under the JRY during the Eighth Plan period is given at Annexure-V.
2.1.40 From the data on mandays of employment generated under JRY it is difficult to assess the number o f workers who have actually received employment in the rural areas and on an a\ erage for how many days. To surmount this shortcoming, registration o f workers who take up em ploym ent under this programme, should be made compulsory as under the EAS.
2.1.41 Besides generating supplementary employment o f a casual manual nature, the program m e has contributed to the development of rural infrastructure through the creation o f a w ide range o f com munity and social assets in a number o f sectors. These included major irrigation works, soil conservation works, land development, drinking water wells, rural roads, construction o f school buildings, panchayat ghars, mahila mandals, houses and sanitary latrines and social forestry. In fact, assistance for construction o f class rooms under the Operation Black Board ( OBB) programme was specially provided under JRY. Of the total cost. 60 per cent w as funded from JRY and 40 per cent from the education department o f the State Go\ ernments to m eet the additional non-wage cost. Under Operation Black Board. 25576 classrooms and 21541
19

school buildings were constructed at an expenditure o f Rs. 176.11 crore from JRY funds between 1991-92 to 1994-95. Such an integration between sectoral programmes and JRY, with dovetailing o f funds, would help in the creation of better quality durable assets.
Em ploym ent Assurance Scheme (EAS)
2.1.42 The Employment Assurance Scheme was launched on 2"‘‘ October, 1993 in 1775 identified backward blocks situated in drought prone, desert, tribal and hill areas, in which the revamped public distribution system was in operation. Subsequently, the scheme was extended to additional blocks which included the newly identified Drought Prone Area Programme (DPAP)/Desert Development Programme (DDP) blocks. Modified Area Development Approach (MAD A) blocks having a larger concentration of tribals, and blocks in flood prone areas o f Uttar Pradesh, Bihar, Assam and Jammu & Kashmir. In addition, 722 non-EAS blocks previously covered under Second Stream o f Jawahar Rozgar Yojana (JRY) were also brought under the EAS. The EAS has since been universalised to cover all the rural blocks in the country with effect from 1.4.1997.
2.1.43 The main objective o f the EAS is to provide about 100 days o f assured casual manual employment during the lean agricultural season, at statutory minimum wages, to all persons above the age o f 18 years and below 60 years who need and seek employment on economically productive and labour intensive social and community works. The works are to be selected by the District Collector and implemented through the line departments in such a manner that the ratio o f wage to the non-wage component would stand at 60:40. Sectoral norms for execution o f various works are-watershed development (50 per cent) and agro-horticulture, minor irrigation works (10 per cent) in DPAP and DDP blocks or water & soil conservation including afforestation, agro-horticulture and silvipasture (40 per cent), and minor irrigation works (20 per cent) in non-DPAP/non-DDP blocks. In addition, funds are also earmarked for link roads featuring in the Master Plans developed in the respective districts for this purpose (20 per cent) and public community buildings in rural areas as per the felt needs o f the districts (20 per cent). The village panchayats are involved in the registration o f persons seeking employment and the panchayats maintain these registers. They also coordinate and monitor the works. A maximum o f two adults per family are to be provided employment under the scheme. The applicants, who register themselves for employment under the EAS, are issued family cards in which the number o f days o f employment are entered as and when such employment is given to them.
2.1.44 The EAS is a Centrally Sponsored Scheme. The scheme is demand-driven and therefore no fixed allocations are made for the districts/blocks. Instead, initial notional allocations are made to districts at the commencement of each year and thereafter depending on the demand for supplementary employment and the actual utilisation o f funds the districts can request for additional funds. For the purpose of initial release, the blocks have been classified into three categories i.e. category A, B & C and Central funds to the tune o f Rs.40 lakh, Rs.30 lakh and Rs.20 lakh are released as the first o f the two instalments to these blocks respectively. This corresponds to the notional minimum allocation o f Rs.l crore, Rs.75 lakh and Rs.50 lakh
per block per annum including the State’s matching share.
2.1.45 The financial and physical performance of EAS since its inception in 1993-94 (October 1993) to 1996-97 is given in the Annexure-VI.
20

2.1.46 Since the inception o f EAS in 1993-94 (i.e. October 1993) upto 1996-97, a total amount (Centre and State) o f Rs.6514.65 crore has been released under the programme, against which the total utilisation was Rs.5278.16 crore. This indicates a percentage utilisation o f 81.02 per cent. As many as 25.90 million persons registered themselves for employment under the EAS. The programme generated 1068.60 million mandays o f employment from 1993-94 (October 1993)to 1996-97.
2.1.47 The EAS has not been evaluated till date. Hence, it is difficult to assess the overall impact o f the programme in terms o f employment, enhancement in the purchasing power o f the poor and creation o f durable assets. However, the Programme Evaluation Organisation has recently undertaken a comprehensive evaluation study o f this Scheme.
Million Wells Scheme (MWS)
2.1.48 In India, though the small and marginal farmers, with holdings o f less than 2 hectares, account for about 78 per cent o f the total operational holdings, they only cultivate about 32.2 per cent o f the cropped area (Agricultural Census 1990-91). To increase the productivity o f these holdings they must be ensured an assured source of water supply. Ground water made available through wells is an important source specially in the remote areas o f the countryside, where canal or tank irrigation is not feasible. Though the fixed capital investment in well irrigation is fairly high, it has many advantages such as flexibility in operation, dependability o f source, timing o f water deliveries and low conveyance losses.
2.1.49 The Million Wells Scheme (MWS) was launched as a sub-scheme o f the National Rural Employment Programme (NREP) and the Rural Landless Employment Guarantee Programme (RLEGP) during the year 1988-89. After the merger o f the two programmes in April 1989 into the Jawahar Rozgar Yojana (JRY), the MWS continued as a sub-scheme o f JRY till December 1995. The MWS was delinked from JRY and made into an independent scheme with effect from 1.1.1996.
2.1.50 The scheme was primarily intended to provide open irrigation wells, free o f cost, to individual, poor, small and marginal farmers belonging to Scheduled Castes/Scheduled Tribes and freed bonded labourers with a 20 per cent earmarking o f JRY fiinds. Tubewells and borewells are not permitted under the Scheme. WTiere wells are not feasible due to geological factors, other minor irrigation works can be undertaken such as irrigation tanks, water harvesting structures as also development o f land belonging to small and marginal farmers. From the year 1993-94 the scope o f the MWS has been enlarged to cover non-Scheduled Castes/non-Scheduled Tribes small and marginal farmers who are below the poverty line and are listed in the IRDP register o f the village. The sectoral earmarking which was 20 per cent upto 1992-93 had also been raised to 30 per cent from 1993-94 with the stipulation that the benefits to non-Scheduled Castes/Scheduled Tribes would not exceed one third o f the total funds utilised during the year.
2.1.51 The MWS is also a Centrally Sponsored Scheme. The cost/area norms in regard to works under MWS are decided upon by a Committee comprising o f Chief Secretary', Secretary (RD), Secretary (Plarming). Secretary (Irrigation) and Chief Engineer (Minor Irrigation) o f the State. The beneficiarficiaries themselves are asked to undertake construction o f their wells through their own labour and local labour for which they are paid. Contractors are banned under
21

this programme. The wage to material ratio is required to be maintained at 60:40. Supplem entary material costs, if any, can be met from other private/public sources. Though lifting devices are not provided under the scheme, the beneficiaries who intend to install a lifting device, are given the preference under IRDP and other relevant programmes.
2.1.52 The MWS is being im plem ented throughout the country. Allocations are made to the States/UTs on the basis of the proportion of rural poor in the State/UTs to the total rural poor in the country. The District-wise allocations are made by the States from their allocation in relation to the unirrigated land held by the target group with a potential for well irrigation.
2.1.53 A total of 11,04 lakh wells have been constructed since the inception o f the programme till 1996-97 at an expenditure o f Rs.4003.11 crore. The financial and physical perform ance under M W S during the Eighth Plan is given at Annexure-VII.
2.1.54 There has been no evaluation or impact study conducted in the field for the MWS. Yet, on the basis o f the feedback available from certain parts o f the country, this programme achieved considerable success in the districts falling in the Chotanagpur region o f South Bihar, large parts o f Orissa, many districts o f Gujarat, besides the Eastem and Southern region o f Rajasthan. In these areas, the MWS has played a significant role in transforming single cropped dry land areas held by farmers o f the target group into double cropped lands, leading to increase in agricultural output and incomes. Yet, such successes have not been uniformly reported across the country. Many Stales have expressed difficulty in the implementation o f the programme. For instance, in Punjab and Haryana where the incidence o f tubewell irrigation is widespread and there is a wide network o f canal irrigation systems, the programme o f open dug wells is a non-viable option. Similarly, in Kerala the small size o f the land holdings o f the small and marginal farmers
•gives the scheme a limited potential. Andhra Pradesh, Goa, Madhya Pradesh, Maharashtra, and West Bengal are some o f the other States which have shown a poor performance in the construction o f wells under the MWS. These States have been permitted to utilise the allocations made under MWS for other schemes o f minor irrigation such as irrigation tanks, w ater harvesting structures and also for the development o f land belonging to the small and marginal farmers. Some States have also been permitted to divert MWS resources for the construction o f houses for the poor under the Indira Awaas Yojana.
2.1.55 Field studies in various parts o f the country have identified several factors which have posed as impediments to the effective implementation o f this scheme. These include, among others , ( a) construction of wells without proper hydro-geological surveys; (b) a declining water table and its continuous depletion by overuse o f pumping sets resulting in large tracts falling in the dark 'grey zones w'hich indicate already dangerous levels o f depletion o f ground water; (c ) non-availability o f eligible persons in the target group; (d) limited success in rocky and sandy strata; and (e) distance between wells affecting the rate of discharge.
2.1.56 The programme has also been hamstrung by inadequate linkages. There has been a I'ailure on the part of the block officers and the banks in providing lifting devices under IRDP and other programmes, thus rendering the investment in open dug wells infructuous. In some cases, though the wells have been dug and are working, their full potential has not been realised because o f a lack o f extension support from the agricultural department.
70

2.1.57 The National Social Assistance Programme (NSAP) came into effect from 15"' August, 1995, The programme represents a significant step towards the fulfilment o f the Directive Principles in Articles 41 and 42 o f the Constitution through the enunciation o f a National Policy for social assistance benefits to poor households in the case o f old age, death o f the primary breadwinner and maternity. It is a Centrally Sponsored Scheme with 100 per cent Central assistance provided to States/UTs.
2.1.58 This programme has three components : namely (i) National Old Age Pension Scheme (l^OAPS); (ii) National Family Benefit Scheme (NFBS); and (iii) National M aternity Benefit Scheme (NMBS) which are targeted at people living below the poverty line. Under the National Old Age Pension Scheme (NOAPS), old age pension o f Rs.75 per month is provided to persons o f 65 years and above who are destitutes. The National Family Benefit Scheme (NFBS) provides a lump sum family benefit o f Rs. 10,000 to the bereaved household in case o f the death o f the primary bread winner irrespective o f the cause o f death. This scheme is applicable to all the eligible persons in the age group 18 to 64. Under the National Maternity Benefit Scheme (NMBS) there is a provision for payment o f Rs.500 per pregnancy to women belonging to poor households for pre-natal and post-natal matemity care upto the first tw'o live births. This benefit is provided to eligible women o f 19 years and above.
2.1.59 In pro\ iding social assistance benefits to poor households in cases o f old age, death o f the primary bread winner and maternity, the NSAP supplements the efforts o f the State Governments with the objective o f ensuring minimum national levels o f well-being.
2.1.60 The NSAP provides opportunities for linking social assistance package to schemes for poverty alleviation and provision o f basic minimum serv ices. In fact, that old age pension can be linked to medical care and other benefits aimed at the aged beneficiaries. The Integrated Rural Development Programme/Jawahar Rozgar Yojana assistance may be provided in addition to the family benefit for the families of poor households, who suffer the loss o f the primary bread winner. Matemity assistance can be linked to other programmes o f maternal and child care.
2.1.61 The NSAP is implemented in the States/UTs through Panchayats and Municipalities. The Panchayats and M unicipalities are encouraged to involve Voluntary agencies to the extent possible for identify ing beneficiaries and persuading them to avail o f the benefits intended for them.
2.1.62 The NSAP programme has been operationalised since August 1995. No evaluation o f the programme has been conducted either by the Central Govenim ent or by any other institution/organisation so far.
2.1.63 The details o f financial and physical performance under NSAP during the years 1995-96 and 1996-97 are given at Annexure VIII.
National Social Assistance Programme (NSAP)

2.1.64 In the first year o f the programme in 1995-96, as against the total allocation o f Rs.538.93 crore, the release was Rs.380.49 crore. Of the total release, only Rs. 183.77 crore was actually utilised. Consequently, in 1996-97 there was a large opening balance o f Rs. 197.53 crore. Again, as against the total allocation o f Rs.916.21 crore, the total release in 1996-97 was Rs.548.29 crore. Thus, the total available funds in 1996-97 was Rs.745.82 crore, of which only Rs.383.50 crore was utilised ( i.e. 51.42 per cent utilisation).
2.1.65 O f these three programmes, the performance under the NOAPS has been relatively good as compared to that o f NFBS and NMBS because the administrative machinery for the implementation o f this programme was already in place in most o f the States. If we analyse the State-wise physical performance for the year 1996-97, even under NOAPS, only 10 States had covered more than 90 per cent numerical ceilings o f the target population. Of this, 5 States/UT namely Andhra Pradesh, Haryana, Karnataka, Madhya Pradesh and Pondicherry had more than 100 per cent achievement. The achievement in many States was less than 50 per cent. These States include Goa, Maharashtra, Rajasthan and North Eastern States excluding Assam.
2.1.66 The performance in the case o f NFBS and NMBS was particularly poor. Under NFBS, achievement was only 28.85 per cent o f the numerical ceiling. In only five States namely, Andhra Pradesh, Goa, Madhya Pradesh, Punjab and Tamil Nadu the coverage was above 50 per cent and in 7 States/UTs the coverage was between the national average o f 28.85 per cent and 50 per cent, while in the remaining 20 States/UTs, the coverage was below the national average.
2.1.67 Under NMBS, achievement was only 27.57 per cent o f the numerical ceiling. Except in Andhra Pradesh and Tamil Nadu where the coverage was 51.36 per cent and 60.94 per cent respectively, in all other States/UTs the coverage was below 50 per cent. In the case o f 7 States/UTs the coverage was between the national average o f 27.57 per cent and 50 per cent, while in the remaining 23 States/UTs, the coverage was below the national average.
2.1.68 Steps would be taken to simplify the procedures for the sanctioning and disbursement o f benefits under these schemes with a closer involvement o f the Gram Panchayats/Municipalities. The assistance may be sanctioned and disbursed in public meetings preferably o f Gram Sabha by either Gram Panchayat functionaries or Block functionaries or appropriate level. In the case of urban beneficiai'ies, elected local self government officials wherever available should be involved in the process o f sanctioning the assistance. The disbursement in such cases should also be preferably made in public meetings o f neighbourhood/mohalla committees. These schemes would also be given increased publicity to ensure a larger coverage o f beneficiaries.
Land Reforms
2.1.69 Despite attempts at land reforms over successive Plan periods, the basic character o f the agrarian economy has not undergone any structural change. The pattem of land distribution is highly skewed, with a high concentration o f land in the hands o f a few land owners on the one hand and the growing number of marginal and sub-marginal farmers on the other. Fragmentation of land holdings continues on a large scale and only a few States like Punjab. Har\ ana, Uttar Pradesh and parts o f Maharashtra have been able to successfully undertake a programme o f consolidation o f holdings. Agricultural tenancy, which was abolished in most o f the States by various enactments in the post-Independence era, continues unabated though it is largely
24

concealed. In the wake o f liberalisation, several State Governments have modified their land ceiling laws so as to exempt orchards, fish ponds etc., from the purview o f land ceilings. There is also a move to make suitable changes in tenancy regulations to attract private corporate investment in agriculture. Hence, it is necessary to reconsider the issue o f land reforms, particularly from the point o f view o f the poor, as access to land is still a major source o f livelihood in rural India. In fact, it has been argued that the need for poverty alleviation programmes has arisen because the land reforms have not been implemented in a systematic way. The experience o f several countries in East Asia shows that land reforms, leading to structural equity in the distribution o f land, are an essential prerequisite for economic development through agricultural transformation. In addition, the efficiency o f land use and land management, and protection o f the land rights o f the tribals and women have assumed great significance in the context o f the changes that are taking place in rural India.
2.1.70 The continued importance o f land reforms was recognised in the Eighth Plan, with the abolition o f intermediaries, redistribution o f ceiling surplus land, tenancy reforms providing security o f tenure to tenants and share croppers, consolidation o f holdings and updating o f land records as the main objectives o f the land reform policy. However, only limited success was achieved with respect to these objectives in the Eighth Plan. Given that land reforms is a State subject, the Central Government can only draw the attention o f the State Governments to the pressing needs for land reforms, which are central to any strategy o f poverty alleviation.
2 1.71 At the end o f the Seventh Plan, out o f the 72.2 lakh acres of land declared surplus, only46.5 lakh acres had been distributed. At the end o f the Eighth Plan, out o f the total 74.94 lakh acres declared surplus, 52.13 lakh acres had been distributed. In other words, during the Eighth Plan only 6-7 lakh acres were redistributed. Further, 12.4 lakh acres were under disputes pending in courts and 19.59 lakh acres were not available for distribution because they were unfit for cultivation or reserved for public purposes or for odier miscellaneous reasons. In fact, only 59.000 acres were available for redistribution. O f the Bhoodan land donated, 53 per cent was distributed, accounting for 24.52 lakh acres. In addition, 142.87 lakh acres o f wastelands were distributed among 88.5 lakh beneficiaries. But, there is still considerable scope for redistributing Government wastelands, common lands, ceiling surplus land and Bhoodan land.
2.1.72 Similarly, in the area o f tenancy reforms very little progress has been made, after the initial abolition o f ‘zamindari' and the transfer o f title to owner-cultivators in the immediate post- Independence period. The successful implementation o f tenancy laws has been confined to West Bengal, Karnataka and Kerala. In fact, in the Eighth Plan there was no progress in respect o f conferment o f rights on tenants and therefore the issue o f tenancy reforms is still illusory, but requires tackling.
2.1.73 Consolidation o f holdings has taken place in very few States. While 15 States had enacted appropriate legislation, Andhra Pradesh, Tamil Nadu, Kerala, Pondicherry and the North- Eastern States do not have any laws for consolidations o f holdings. Several States like Bihar, Maharashtra and Rajasthan have suspended the programme. In fact, only in Uttar Pradesh, 900- 1000 villages are being covered annually.
2.1.74 There is evidence o f considerable alienation o f tribals from their land. As per the latest available estimates, 4.6 lakh cases of tribal land alienation covering 9.2 lakh acres have been
25

registered. O f these 2.7 lakh cases covering 6.3 lakh acres have been disposed of in favour o f tribals but physically an estimated 4.7 lakh acres had been restored to them. In other cases, reconciliations are being effected.
2.1.75 It cannot be gainsaid that the essential prerequisite o f any land reform measure is the recording o f land rights and their updating. In recognition o f this, a Centrally Sponsored Scheme for Strengthening o f Revenue Administration and Updating o f Land Records was introduced during the later half o f the Seventh Plan and against an outlay o f Rs.20.8 crore, Rs. 14 crore were spent. In the Eighth Plan a provision of Rs. 175 crore was made against which Rs.98 crore were released and Rs.66.7 crore utilised. But, given that the funds are shared in the ratio o f 50:50 between Centre and States, several States have not been able to provide their share and hence, the utilisation has been low. Several other States have not availed o f this scheme at all. In 1995- 96, funds were released only to Bihar, Kerala, Maharashtra, Madhya Pradesh, Rajasthan, Tamil Nadu and West Bengal aggregating to only Rs.18.8 crore. The States have been requested repeatedly to expedite expenditure and to adopt new technologies for survey and settlement operations, preparation o f maps etc. Funds for infrastructure development were also sanctioned to meet the training needs o f the revenue functionaries. Some States have developed new training institutions, while a few have upgraded the existing ones.
2.1.76 In 1988-89, 8 pilot projects were taken up for computerisation o f land records with 100 per cent Central assistance. Since inception, 323 projects have been sanctioned and funds to the tune o f Rs.64.43 crore have been released. However, the utilisation was only to the extent o f 20 per cent. This shows the tardy progress made in the implementation o f this scheme on the ground.&
Ninth Plan Strategy
2.1.77 Direct poverty alleviation programmes will continue on an expanded scale in the Ninth Plan. But these programmes would be oriented towards strengthening the productive potential o f the economy and providing more opportunities for involving the poor in the economic process.
2.1.78 The Integrated Rural Development Programme (IRDP) w'ould continue to be the major self-employment programme targeted to families living below the poverty line in the rural areas o f the country. In the Ninth Plan it would be implemented through an integrated approach under which the existing schemes o f Training o f Rural Youth for Self-Employment (TRYSEM) and Supply o f Improved Toolkits to Rural Artisans (SITRA), Development o f Women and Children in Rural Areas (DWCRA) and Gcinga Kalyan Yojana (GKY) would be subsumed into the main programme.
2.1.79 To facilitate higher levels of investment under the programme, there would be a strategic shift under IRDP from an individual beneficiary approach to a group and/'or cluster approach. As part o f the group approach, the focus o f IRDP would be on the formation o f Self-Help Groups (SHGs) w'hich would be the catalyst for organising the poor. The cluster approach would focus on the identification o f a few specified viable activities based on the local resource endowment and occupational skills o f the people o f that area. The IRDP will also aim at diversifying the investments into high-value-addifion sectors and non-traditional activities which have a market potential. The financial institutions would play a more significant and dynamic role by
26

enhancing the credit tlows through a continuous line o f credit, instead o f a one-time loan and would render constructive assistance to the beneficiaries. This would help them to increase returns on their investments. The IRDP would service the beneficiaries through a package approach, wherein the beneficiary would have access to credit, training as per requirements, upgradation o f technology, delivery o f essential inputs and marketing tie-ups in an integrated manner. Presently, under the IRDP, training under TRYSEM is provided as an isolated input and there has been little attempt to make a proper assessment o f opportunities where skills could be more gainfully utilised. Hence, the new holistic approach would overcome some o f the inherent shortcomings which have undermined the success o f the programme.
2.1.80 In view o f the near complementarity in the ongoing wage employment schemes, Jawahar Rozgar Yojana (JRY) and Employment Assurance Scheme (EAS) will be rationalised. In the revised format JRY will be confined to the creation o f rural infrastructure at the village panchayat level in consonance with the felt needs o f the community. To the extent that the works undertaken under JRY would be largely labour intensive, supplementary wage employment would be generated in the process o f infrastructure creation. The EAS would be the major wage employment programme which would contribute significantly to the provision of the mandated 100 days o f casual manual work to those who register for employment under it. As the EAS has been universalised, specific measures would be taken to ensure that the benefits reach the poor and more backward districts o f the country.
2.1.81 Land reforms will continue to be an important policy instrument tor alleviating rural poverty. Access to land is still a major source of liveliood and its possession enhances the status o f people in rural society. A proper implementation o f land laws and policies would lead to a restructuring o f the agrarian economy in a way conducive to higher rates o f agricultural growth but w ith greater equity in the distribution of gains from it. While the ingredients o f the land reform policy would continue to be the same as before, the focus would shift to a few critical areas. All efforts would be made to detect and redistribute the ceiling surplus land and to enforce the ceiling laws stringently. Given that small and marginal farms are viable, both from the efficiency and equity points o f view, it is desirable that the existing ceiling limits are strictly enforced. More importantly, tenancy reforms would have to be taken up especially in States characterised by semi-feudal modes of production. The rights o f tenants and sharecroppers need to be recorded and security o f tenure provided to them. Leasing in o f land should be made permissible within the ceiling limits. The poor should be given access to wastelands and common property resources. The land rights of women must be ensured. This would require amendment o f the existing legislations in some States to ensure w om en's rights with regard to inheritance o f both land owned as also under tenancy. Updating o f land records would have to be expedited as this is a necessary prerequisite of any effective land reform policy. Since land reforms is a State subject the States would have to be persuaded to take up these measures.
2.1.82 While the implementation o f poverty alleviation programmes would be made more effective in the Ninth Plan, the extant non-monetary policies and institutional arrangements which adv ersely affect the interests of the poor would also be suitably addressed. In this context, the Ninth Plan vvill identify those laws, policies and procedures which are anti-poor and take the initiative in exploring whether some o f these could be suitably modified in favour o f the poor.
27

2.1.83 In the Ninth Plan, the poverty alleviation programmes would be more effectively integrated with area development programmes and the various sectoral programmes within the umbrella o f Panchayati Raj Institutions (PRIs). The PRIs will function as effective institutions o f local self-government. These would prepare the plans for economic development and social justice through the District Planning Committees and implement them. The State Government would have to devolve administrative and financial power to the PRIs which fall within their purview as per the Eleventh Schedule o f the 73rd Constitutional Amendment Act, 1992. In addition, the voluntary organisations (VO) will have to play a more dynamic role in empowering the poor through advocacy, awareness generation and formation o f SHGs.
Integrated Rural Developm ent Programme (IRDP)
New Initiatives under IRDP
> IRDP will be a holistic programme covering all aspects of self- employment, namely, organisation of beneficiaries and their capacity building, planning of activity clusters, infrastructure, technology, credit and marketing.
> The existing sub-schemes of TRYSEM, DWCRA, SITRA and GKY to be merged into IRDP.
> Progressive shift from the individual beneficiary approach to the group and/or cluster approach.
> To facilitate group approach SHGs will be formed and steps will be taken to nurture them.
> For cluster approach each district will identify 4 to 5 activity clusters m each block based on local resources and occupational skills of the people. The infrastructure needs for the identified activities will bemet in full.
> The Banks will be closely involved in the planning and preparation ofprojects, identification of activity clusters, infrastructure planning as well as capacity building and choice of activity of the SHGs.
> Promotion of multiple credit rather than one time credit injection.
overall implementation o f the programme.
2.1.84 The IRDP would continue to be the major self-employment programme, targeted towards families living below the poverty line in the rural areas. However, in the Ninth Plan, the focus would be on pursuing an integrated approach under IRDP bysubsuming the existing subschemes o f Training o f Rural Youth for Self-Employment (TRYSEM) and Supply o fImproved Toolkits to Rural Artisans(SITRA). Development of Women and Children in Rural Areas (DWCRA) and GangaKalyan Yojana (GKY) into the main programme. This integration of schemes is necessary to develop the appropriate forward and backward linkages to achieve a synergistic complementarity in the
Project for Linking Banks with Self-Help Groups
> N A BA RD initiated a Pilot project to link Banks with Self- Help Groups (SHGs), with the objective o f meeting the credit needs o f the poor through form al financial institutions.
> Evaluation studies show success with increase in loan volume o f SHGs, shift to income generating activities, nearly 100 per cent recovery and reduction in transaction costs,
> 85% o f the groups linked with banks were exclusively o f wom en.
^ Schem e is being expanded, and will be replicated all over the country.
2.1.85 Furthermore there would be a strategic shift from an individual beneficiary approach to a group and /or cluster approach.
a) To facilitate this process S elf Help Groups (SH G s) w ill be formed under IRDP and steps w ill be taken to nurture these groups to enable them to function effectively as w ell asto choose

their econom ic activity. Efforts would be made to involve women members in each SHG. Besides, formation o f exclusive w om en groups w ill also continue as at present under DW CRA. It is proposed that group ventures which involve at least five beneficiaries w ould be assisted by making available 50 per cent o f the project cost subject to a ceiling o f Rs. 1.25 lakh. This enhanced level o f investment would facilitate econom ies o f scale and improve recover) .
b) A ltem atively, a cluster approach would be preferred wherein a few specified activities are identified for assistance in an area. This would necessitate the formulation o f a menu o f "activity-based'" project profiles in different sectors to suit the local resource endowm ent and the occupational skills o f the local people. A ccordingly, each D R D A w ould set up four to five activity clusters. Appropriate infrastructure and technology inputs w ould be built into the project.
c) The Family Credit Plan would be extended to all the districts o f the country in a phased manner. The feedback from the States suggests that this strategy has met with reasonable success and has raised investment levels.
2.1.86 One o f the major constraints in the implementation o f IRDP has been sub-critical investments, which have adversely affected Incremental Capital Output Ratios (ICOR) and. ihereby, undennined ihe viabiVily ot' the pre')jects. Recognising that the level of investment is the most crucial \ anable in determining the incremental income generated under IRDP, the credit flows and the average level o f investment per family for the Ninth Plan would aim at achieving enhanced levels of investment in the range of Rs.25.000-Rs.50,000 depending on the estimate o f the poverty line and the poverty gap. These higher levels o f investment will give the beneficiary the necessary financial support for diversifying into high-value-addition sectors and non-traditional acxiviiies which have a market potential.
2.1.87 In this effort at achieving higher investment levels, the financial institutions would have to play a more significant and dynamic role by enhancing credit t]ows and rendering constmctive assistance to the beneficiary' making their investments viable under this programme. Adoption o f simplified procedures by financial institutions would facilitate the BPL families in accessing groups loans under IRDP.
2.1.88 To simplify procedures the regimen of subsidy administration would be suitably streamlined in the Ninth Plan. At present, there is a complex gamut o f ceiling limits on subsidy. The ceiling limit on subsidy would be fixed at 30% of the project cost subject to a maximum of Rs. 7,500. However, in the case of SC/ST it would be fixed at 50° o o f the project cost subject to a ceiling o f Rs. 10.000. Therefore, for purposes of administrative expediency the area specific differential in subsidy administration would no longer exist. For group activities, however, the subsidy would continue to be Rs.l .25 lakh or 50 per cent o f the project cost, whichever is lower.
2.1.89 The IRDP will seek to develop close linkages with the credit mechanism in such a manner as would promote repealed/multiple doses o f credit rather than a one-time loan for the beneficiary. The emphasis, therefore, would be on establishing a continuous line o f credit for the beneficiary, wherein it would be possible for the borrower to obtain need-based additional
29

credit for working capital purposes, meeting unforseeni expenditure related to proper maintenance o f assets etc. which would have a bearing on the viabiility of the project so as to sustain credible levels o f income generation.
2.1.90 E.xperience has showji that the IRDP has beem relatively more successful in land-based activities. In recognition o f this fact, purchase o f land was made a permissible activity under the programm e. For land-based activities, besides providing assistance for purchase o f inputs to enhance the productivity o f land, there exists a potential for diversifying into other allied activities, which have a high value-addition, such as sericulture, aqua-culture, horticulture and floriculture, on the existing lands o f the small and mairginal farmers as well as on land leased by the landless. In addition to these activities, SHGs w^ould be given ‘pattas’ for development o f w^astelands, social forestry, soil conservation and watershed projects. Com m on property resources would also be allocated to SHGs in the vilhages on a long-term basis for eco-sensitive resource management. There is also a potential for aillotting nurseries o f the forest department to these groups for management. In all these, inteFest o f women’s groups would have to be protected. Usufruct rights o f women on minor forest: produce would have to be ensured legally and administratively and assistance provided to them> for purchase or leasing in o f land for joint management.
2.1.91 Yet. it must be recognised that land is a limite:d resource and that the distribution o f land holdings remains highly skewed. Hence, the need f(or exploring the potential o f the non-farm sector is crucial. It, CAnnot. be gainsaid that the non-fairm sector in the rural areas has witnessed both growth and (diversification in the past few years. Around 50 per cent o f the IRDP investm ents are now made in the secondary and terttiar\’ sectors, based on local resources and local requirements. These include processing industtries, handlooms and handicrafts. Again, in most villages there is scope for tailoring and ready-imade garments, chemist shops, woodcraft, country tiles, general store etc. In addition., in villages o f a reasonable size, other business/service ventures like flour milling, motor rewinding, cycle repair etc. could also be promoted under IRDP. Greater emphasis should be p laced on developing rural industries which would catalyse the overall development o f that area.. In a situation o f an ever changing pattern o f dem and, emergence of new products and technoKogies in a dynamic and growing economy, an attem pt would be made to integrate the IRDP acctivities, particularly those in the Industry Services and Business (ISB) sector with the market. This task would be entrusted to a team o f experts/professionals, who would prepare sectoral ancd micro plans for identifying the thrust areas and activities for working out necessary linkages wiith other departments/agencies.
2.1.92 The artisans in the rural areas, despite their riich heritage and skills, largely belong to the poverty group. The scheme for Supply o f Improved Toolkits to Rural Artisans is directed to this particular target group. In the Ninth Plan, to enable the rural artisans to take advantage o f the new opportunities thrown up by the market, there h;as to be a quantum jum p in their skills and producti\ ity to make their activ ities viable and profitable. It is also necessary to support them with appropriate product designs and traming, imiproved technology on the one hand and professional management and marketing support on the other. In other words, the rural artisans should be serviced through a package approach whe;rein the distribution o f improved toolkits is supplem ented with the supply of credit and raw matierial. marketing support and upgradation o f existina technolouv.
30

2.1.93 The timely and adequate supply of tirade specific toolkits would be given added attention. While deciding the source for supply o f toolkits, quality' and cost considerations, alongwith the post-delivery services offered by the m anufacturer would be o f considerable significance. It is im portant to constantly upgrade the design o f the toolkits. For this, research and developm ent w ould be given due emphasis. States wotuld be advised to take the initiative in developing toolkits in at least two or three artisanal trades. Tlie Department o f Science and Technology, the National Small Industries Corporation, the; Small Industries Services Institutes and the IITs w ould interact with the State Govemment:s for development o f appropriate technology and designs for improved toolkits for various artisan groups. In the process of designing and m anufacturing these trade-specific toolkits, ithere would be constant consultations and dialogue w ith groups o f artisans and reputed craftsm en in that particular trade. To broadbase the source for supply o f toolkits some master craftsrmen would also be trained in the m anufacture o f im proved tools/toolkits. An effort would allso be made to develop capabilities for design and upgradation o f improved toolkits by artisans themselves. There are pockets o f rural technology which have survived the onslaught o f m odem technological innovations by virtue o f their sturdiness and locale-specific utility. These would be identified and replicated elsewhere. For the dissemination o f technology the State Gowemments, in collaboration with the manufacturing agencies, would undertake promotional activities by organising exhibitions at several locations and on im portant occasions.
2.1.94 Since the 1991 Census data on rural partisans are still not available, the States would be required to conducl a iisxricl-wise surv ey o f'the lota\ number of rural poor artisans, the number o f such artisans prrnided with improved too)lkits and the balance number to be covered. This exercise would facilitate a planned and phasecd coverage o f this target group under IRDP. While individual artisans would continue to be cove;reJ with the supply o f toolkits in traditional crafts, it is also proposed to cover the rural artisans ithrough a cluster approach and to provide/saturate each cluster with trade-.specific toolkits and rrelated inputs in a package. In the im plem entation o f this group cluster approach, due emphasis would be given to the formation o f women artisan groups.
2.1.95 Availability of infrastructure facilities is an essential prerequisite for the success o f IRDP activities. Substantial investments in program m e infrastructure would be ensured, through a larger apportionm ent of funds, in consonance with the enhanced provisions o f 20 per cent for IRDP infrastructure (and 25 per cent in the IMorth Eastern States). There would be a special em phasis on infrastructure created under ISB sector with the setting up o f service-cum-facility v\orkshops at convenient places in the rural areas. These could provide common facilities in the use o f m achines and equipments to the rural ^artisans as also for repairing electrical gadgets o f various types, agricultural implements, autonnobile parts and articles o f common use. These w orkshops would also be set up in the tribal aireas so that the process o f initial value-addition to minor forest produce could be undertaken by ithe tribals themselves. Funding for infrastructure would also include the setting up or upgradatiion o f technology resource centres.
2.1.96 Provision o f marketing facilities is an important aspect o f infrastructural development. In the Eighth Plan detailed guidelines were isssued for setting up District Supply and Marketing
Societies (DSM S) with the objective o f provicding integrated services to IRDP beneficiaries in the cottage and rural industries sector for thej supply o f raw materials, marketing o f surplus products, information on technological upgradation and extension of credit suppon. Whereas

some State Governments have taken the initiativfe in this regard, by and large the DSMS or sim ilar bodies do not have much o f a presence iin most areas. In the Ninth Plan alternative strategies would be formulated for developing a siuitable marketing infrastructure under IRDP. These would include (i) provision o f transport airrangements for carr\ ing IRDP products to rural/urban markets; (ii) introduction o f insurance c:over to mobile sellers; (iii) provision of better storage facilities; (iv) setting up and revamping o f District Supply and Marketing Societies; (v) sale o f IRDP products through Khadi & Village Imdustries Commission (KVIC) outlets. State Em poria etc., besides networking with DRDA shiowrooms/markets; (vi) setting up o f quality control centres and consultancy centres which the; beneficiaries could approach for advice for im proving the quality and standard o f their products; (vii) involvement o f private sector in marketing by adoption o f better packaging techniqiues, design, input, quality control, brand name etc.; and (viii) launching o f a suitable advertiserment campaign for IRDP products including organisation o f exhibitions, melas. Furthermore, tlhe potential of rural haats as a rural marketing outlet for IRDP products would be fully exploited.
2.1.97 There are certain areas in the country whichi have a very poor banking infrastructure. ITie areas o f North-East and parts o f Jammu & Kashmiir fall under this category. Attention would be given to evolving innovative strategies and progrrammes to take care o f the unbanked areas.
2.1.98 However, while diversifying the rural econiomies in high-productivity sectors, provision o f adequate training facilities and upgradation o f skills would be given primacy. As we have seen, the TRYSEM programme has been the weak link in the overall strategy for self- em ploym ent in rural areas. In the Ninth Plan, tlherefore, training would be made an integral com ponent o f IRDP. This integration would reduice to a great extent, the area-skill mismatch as the training would only be imparted in those tradtes/occupations which have a market potential. Yet. training would not be made compulsory as Uhere are certain trades/activities under IRDP w hich do not require this input.
2.1.99 To strengthen the content and design o f tthe training curriculum, the training institutes would have to constantly upgrade their syllabi in , tune with the rapid changes in the job market.A basic foundation course w ould be a critical ingrredient of the training curriculum which would make the trainees aware o f simple accounting procedures, book keeping techniques and procedures in financial management, informaticon on how to approach the banks and other financial institutions for loans, where to access the latest technology etc. Training would be given a sharper employment focus wherein the tiraining content would be compatible with the area-specific ground realities and would be spec:itlcally impaned in those trades and activities which have a market orientation'potential and wvhich would ensure the beneficiary sustained em ploym ent.
2.1.100 The quality o f training would be imfproved. Inadequacy o f proper infrastructural support has posed as a bottleneck in this effort. While the emphasis would continue to be on im parting training through the established aind recognised training institutes like ITls. Com m unity Polytechnics. Krishi Vigyan K endras, etc,, the training infrastructure in these professionalised training institutes would be suittably strengthened. Special thrust will be given to the creation o f training opportunities for womien via strengthening o f women ITIs, womens wings in general ITIs and women polytechnic. lit is also necessary to upgrade the training skills o f the trainers in the various government instituitions imparting training to IRDP beneficiaries.

The existing craft training centres and skilll development institutes etc. would be revamped to cater to the needs o f the changing situations. In those blocks where there is a concentration o f unem ployed youth and where there are no ireputed training institutes in the vicinity, mini-ITIs should be set up, but only very selectively. Smaller private institutions and craftsmen will be engaged only where institutional support is not available.
2.1.101 In addition, a more effective liaisson and interface between the State Governments, DRDAs and the formal/informal private sectcor/NGOs is required in order to identify the available em ploym ent opportunities in a region and dtevelop training modules accordingly. Efforts would be made to establish a direct linkage betweeen ITIs and industries in the areas where the youth could either be employed directly or could scet up ancillaries to cater to the industrial demand. A sim ilar linkage could be established betwreen ITIs and exporters/export houses on the lines similar to gem cutting training in Gujarat. Such linkages are possible in rural hinterlands o f towns/urban agglomerations. It is proposed tco develop a Management Information System (MIS) through which important training institutes o f relevance for IRDP throughout the country are identified and networked. This would giv. e some idea o f the areas deficient in the training infrastructure and would indicate where futuire investment should flow for meeting the training requirements.
2.1.102 With a view to ensuring that thte benefits under the programme reach the more vulnerable sections o f the society, the Ninthi Plan would continue with the assured coverage o f atleast 50 per cent for Scheduled Caste and Scheduled Tribe families, 40 per cent for women and3 per cent for the physically handicapped. EExperience in the implementation of IRDP suggests that program m es focussed on women, or ini which women have played a dominant role, have performed better. The DWCRA programmee has been an excellent vehicle for extending IRDP credit support for women beneficiaries in !Some States. The group strategy would, thereby, become the main plank for achieving the sttipulated reservation for women over the next few years.
2.1.103 In the Ninth Plan social mobilisattion will receive a special thrust. Initiative will be taken to build and strengthen the organisations o f the poor with the objective o f enhancing their capabilities. In this process voluntary orgamisations would have to play an important role in empowering the poor through advocacy, awaireness generation and social mobilisation. As social animators and rural organisers they would hellp the poor to form SHGs in order to take advantage o f the policies and programmes being impplemented by the Government for their economic betterment. A voluntary organisation or la technology group could lend support to group activities by ensuring training, technological! upgradation and convergence o f various schemes. In addition, the DRDAs and PRIs would porovide support for capacity building and provide access to credit, technology and markets to I SHGs. A cadre o f para professionals from within the community would be created to enhance tthe capability o f the SHGs and help the community to access the facilities and services meant ffor them.
2.1.104 The DRDAs would be restructured! in the light o f the 73"̂ Constitutional Amendment Act. which has enhanced their area o f operattion. commensurate with a larger inflow o f funds. The scope o f the activities implemented by thie DRDAs has enlarged progressively over the years from the sole implementation of rural self-em ploym ent programmes to exercising effective coordination and supervision over other Cemtrally Sponsored Schemes. In the revised format.
the DRDAs would work under the supervision an d overall control o f the Zilla Parishads. I he Chairman o f the Zilla Parishad will be the Chaimnan o f the DRDA Governing Body and will preside over their meetings. The organisational stnucture (staffing pattern) o f the DRDAs would be suitably revamped and strengthened with the imduction o f professional cadres and technical experts. The expertise v/ould have to be deve;loped in the tlelds o f credit, technology upgradation, activity-specific training and infrastructural development. To make this implementing agency effective, the staff would lhave to be given sufficient exposure to the complexities o f poverty eradication, human resourcce development, gender and related issues. The D RD A ’s agenda for operation in the Ninth Plan, \would not be limited only to the achievement o f physical targets, but also to ensure the quality o f the programme and realisation o f intended benefits for the targeted poor beneficiaries.
W age Employment Programmes
2.1.105 The thrust o f the Government policy is on assuring at least 100 days of employment per person per year by coordinating all the wage-emphoyment schemes including the State schemes iiKe the Employment Guarantee Scheme in M aharashtra. Now, with the universalisation o f the EAS, both JRY and EAS are operating in all the diistricts/blocks o f the country. At present, the JRY is being implemented through the panchay.'ats and the EAS through the administrative apparatus. However, in consonance with the Giovemment policy, the EAS would also be implemented through the Panchayati Raj Institutions (PRIs) in future. There is, therefore, a near complementarity o f objectives and there would be: a common implementing agency namely the PRIs in the case o f both JRY and EAS. The only major difference is that while, under JRY the allocations are made on the basis of a specified criiteria, the EAS is a demand-driven scheme. In the latter case, only initial notional allocations are; made and then depending on the demand for supplementary employment and actual utilisation;, requests for additional allocations are made by States/Districts. Therefore, in theory there is a jgood case for merging these two schemes into a single wage-employment programme. Though tl..^ merger o f the schemes may be operationally expedient, there would be practical constraints. Uinder the EAS works are taken up at the block level whenever v.'orkers register themselves for cas^ual manual employment. Hence, it is possible that no works are taken up in many villages, partiicularly those which are' economically better
off or where the population is sparse.W age Employment Programmes
> JRY will be confined to the creation o f rural infrastnucture according to the felt needs o f the people at the villagte level through p an ch ay a t.
The EAS would program m e.
be the major wage-em plo'ym ent
In order to make EAS effective in reaching the poior and more backward areas o f the country, it is proposeed that funds released to States should be made as per incidence o f poverty.
W orks can be taken up in blocks where thtere is concentration o f the poor and underemployed, and w. orkers have reaistered them selves for manual work.
In this case, these villages would be denied funds presently flowing to them under JRY. This would lead to contradictions as JRY has made the villages more independent in so far as they can take up small works according to the fell needs o f the community without having to look for funds from the district administration. The JRY has also been successful in taking development to the people with planning and implementation o f works accordinu to their felt needs.

2.1.106 Therefore, it is proposed that the JRY would be confined to the creation o f rural infrastructure at the village panchayat le’vel. To the extent that the works would be largeh' labour-intensive, supplementary wage-e:mployment will be generated and this would be monitored without the existing stipulation! of a wage-material ratio o f 60:40.
2.1.107 The EAS would be the major \wage-employment programme. The funds at present flowing to the block and district levels under JRY would also be rediverted to the EAS, augm enting the resources under this scheime. However, certain precautionary measures would have to be taken in order to make the sccheme effective in reaching the poor and the more backward areas o f the country, where therre is a concentration o f the poor and underemployed.Towards this end, it is proposed that fundsj released to States should be made on the basis o f the incidence o f poverty in order to prevent thte better-off States from cornering a larger share o f the funds. To elaborate, in progressive Staites characterised by higher levels o f agricultural productivity, higher per capita income ancd/or high literacy rates there is little real demand for casual manual work on public works. Yet, in these States demand is artificially created as, in the lean agricultural season, labour is willing; to work on public works at the prevailing minimum wage rates which are relatively high. In tlhis way, the State’s specific real demand is not being addressed and in fact, there is a diversion of resources from the relatively poorer States to the more progressive ones. In such a situatio)n, EAS would cease to be a genuine demand-driven scheme and. therefore, suitable measures w ould have to be taken to ensure that scarce resources reach the targeted poor and the more back'.ward areas o f the country'.
2.1.108 Hence, as a second step, the alllocations from the States to the districts will also be made on the basis o f a predetermined criteerion which reflects the relative backwardness o f the district. Below the district level, the woirks can be taken up in blocks where workers have registered themselves for casual manual w/ork. Urbanised blocks would be excluded from the purview o f this scheme. No contractors wvould be involved. This scheme would essentially be implemented by the PRIs at the block levtel, but with a specific apportionm ent o f funds to the DRDA/ZPs, for taking up inter-block and district level works.
2.1.109 Presently, under EAS the funids are earmarked for specific activities in given proportions. Fifty per cent is earmarked fcbr watershed-related activities. It is argued by man} that it may not be fair to pre-empt the bulk of the resources for watershed-related activities being implemented in a few villages to the relatiw e neglect o f other villages in a block. In the spirit ot democratic decentralised planning, the c:hoice o f activities must be left to the Panchayat Samities/Zilla Parishads which can select from the various activities/works envisaged in their block/district plans. However, at least 4C0 per cent o f the expenditure would have to be on watershed-related activities in DPAP areas> as water conservation through construction o f w'ater harvesting structures has become one o f thte priorities o f planning, particularly in the plateau and rocky areas where water tables are falling rapidly and ground water acquifers need recharging It may be worthwhile to spell out that the vA'orks should be labour-intensive with a 60:40 ratio of wages and m aterirls and should lead to thte creation o f durable assets and rural infrastructure.
2.1.110 In short, EAS will be the single 'wage-employment programme operating throughout the country, while JRY will be confined to the creation o f durable community assets at the village level. So far. under the JRY a certain quantum o f funds was eaflHiapked fogiSpecial a^y Innovative Projects. However, experiencee gained from the im plem eotation o f this companeifii . ;
3 ) - l o S S o35 '7-- ,

of JRY has indicated that most o f the projec;ts were not really innovative in nature but merely a replication o f the existing programmes on traditional lines. Hence, there is no need to continue a separate scheme for Special and Innovativ e Projects.
2.1.111 Currently, the funds for IRDP and ills allied programmes are shared between the Centre and the States in the ratio o f 50:50, whereas tdie wage-employment programmes such as the JRY and the EAS are funded by the Centre and the States in the ratio o f 80:20. It hardly needs to be em phasised that the wage-employment programmes are more popular with the State Governments on account o f this cost sharing pattern. As against this, the equal cost sharing formula for self-em ploym ent schemes seem s to have dampened the enthusiasm o f the State Governments towards IRDP and allied progirammes. States with difficult resource position find it hard to contribute their share o f the outlay. In the Ninth Plan, it is proposed to alter the funding pattern under IRDP and bring it at par with the rural wage-employment programmes. In fact, the cost sharing formula for both IRDP and the 'wage employment programmes would be revised to a uniform ratio o f 75:25 between the Centre and the States.
Million W ells Schem es (MW S)
2.1.112 In view o f its importance in provi ding a source o f irrigation to the target group, the MWS would continue in the Ninth Plan to provide for maximisation o f agricultural output. Simultaneously, the level o f ground water would have to be maintained by the adoption o f suitable recharging practices so that the smalil and marginal farmers can derive maximum benefits from their small holdings.
2.1.1 13 Until recently, the focus under the MWS was on the creation o f employment, with the secondary objective o f providing a source o f irrigation. This situation has now been modified by delinking the MWS from the JRY and repositioning it as a beneficiary-oriented scheme o f irrigation for enhancing agricultural produc:tivity levels o f the small and marginal farmers.
2.1.114 The per capita assistance under th'C MWS for providing a well on the land of the sm.all and marginal farmer ranges approximately from Rs.30,000 to Rs.35,000. though some States hav e reported a cost o f upto Rs.l lakh. S uch a well can irrigate, on an average, one or two hectares. There have been suggestions from some States to permit the construction o f field channels in conjunction with the digging of Wells. This is particularly significant in view of the fact that water lifted from the wells is conve'yed through open unlined earthem channels by most o f the farmers, leading to conveyance losse:s of about 14 to 19 per cent. Necessary control and div ersion structures for open line channels’, may be provided to avoid wastage o f water. The channels could consist o f structures of soil., cement or even prefabricated cement concrete.
National Social .\ssistance Programme ( NSAP)
2.1.115 The NSAP was introduced as a scjcial security programme for the welfare of the poor households. However, it must be recognised that it is not a poverty alleviation scheme but more in the nature o f a welfare programme and hence, has a limited role in the overall strategy o f poverty alle\ iation. Moreover, the ilnanciail assistance provided to poor households in the case o f old age. death o f primary bread winner and maternity is in the nature of transfer payments iind iheretbre. it should really form a part of non plan expenditure. Furthermore, the performance
36

under this programme indicates that it has not been effective in reaching the intended beneficiaries. Moreover, several States have their own schemes o f old age pension and maternity benefit for which provisions are made in the States Plans and this should continue to be within their purview, as it is a State subject. Yet, as this programme has now been introduced as a Centrally Sponsored Scheme it would continue in the Ninth Plan but w'ould require a review thereafter.
Land Reforms
2.1.116 In the Ninth Plan the issue o f agrarian restructuring will continue to receive the top most priority in the expectation that the States would be able to facilitate changes that would make for more efficient agriculture, leading to increases in both output and employment. This process will, in turn, contribute to the achievement o f a higher rate o f economic growth with social justice.
2.1.117 The main components o f the land reform policy are the detection o f ceiling surplus land and the distribution o f the existing surplus land, besides tenancy reform, consolidation o f holdings, providing access to the poor on common lands and wastelands, preventing the alienation o f tribal lands and providing land rights to women. However, for the successful im plementation of land reforms, updating o f the land records, both by traditional methods and through computerisation, is an essential prerequisite. Let us elaborate.
2.1.118 Ceiling on Land Holdings^ With the introduction of the Land Ceilings Act in 1972, the ceiling on land holdings was introduced in almost all the States with the exception o f some North-Eastern States, though the ceiling limit varied depending on the quality o f the land. The ceiling surplus land was to be distributed among the landless poor. In this way, land ceiling was considered an important instrument for reducing disparities in the ownership o f land and as a way o f increasing productivity through greater utilisation of labour. However, in practice, the extent o f land declared surplus was very limited. The total area declared surplus is estimated at less than 2 per cent of the total cultivated area. Further, distribution o f surplus land has been limited in several States because o f institutional and legal rigidities. There are other reasons too which have led to the poor performance v/ith regard to land ceiling. Most importantly, the ceiling surplus land continues to exist in a concealed way particularly in areas which have been covered by irrigation in the post-1972 era. Further evidence suggests that there are areas where land owners have land in excess o f ceiling limits which can be mopped up if the programm e for unearthing it is pursued vigorously. Also, in order to circumvent the ceiling laws, benami and furzi transfers are effected which need to be identified. There is clearly a need to detect the land falling within the ceiling limits and redistribute it. But detection and distribution o f ceiling surplus land require tremendous political and administrative will.
2.1.119 In the wake of the economic liberalisation in certain States like Karnataka, the industry and the large farmers are being given exemption from ceiling laws without seeking the permission of the Government o f India. This would certainly go against the interest o f the poor as it would increase landlessness and depress agricultural wages. Hence, this issue requires close examination, before such exemptions are given.

2.1.120 Small farms are efficient in terms of yields and returns per unit o f area. However, they are often not able to generate adequate income to sustaiin further investment. Therefore, there is a need for both horizontal and vertical diversitlcationi o f small farms. An analysis o f Indian Council o f Agricultural Research (ICAR's) data of natio>nal demonstrations shows that there are large technological/yield gaps, particularly in the back\ward regions, which, if fully exploited, would enable the marginal and small farmers to generate incomes well above the sustenance level, subject to crop rotation, cropping pattern, yield re;sponses o f technological adoption, etc. In fact, in irrigated areas, the small and marginal farmerrs are viable because o f their capacity to produce two or three crops a year. In the case of rainfecd agriculture, a breakthrough in dryland farming is required with respect to the traditional cerreal crop that can grow in these areas. .A.lternatively. there is a possibility o f shifting to other hiigh-value crops like fruits, vegetables, mulberry, etc. Other support systems would have to Ibe appropriately developed to provide facilities for credit, marketing, storage and transportatioin o f the perishable high-value crops. In fact^ a change in the cropping pattern away from cerceals to some high-value crops, would certainly make the small and marginal farmers viable. Allso, given the increasing market demand for certain products, sericulture, horticulture and aq]uaculture have a great potential. In Maharashtra and West Bengal a small piece of land yieldis adequate returns from horticulture and acquaculture respectively. This provides further justificattion for ensuring that ceilings are strictly enforced as small farms can be perfectly viable in the giiven context.
2.1.121 As observed in the UNDP Human Developmeint Report 1996, as land is redistributed from big to small tarms, not only the family labour per he.;ctare can increase sharply, so, can hired iabour also. For both the reasons, tlie employment situati(on improves even for those, who remain landless after the land reform. The main conclusion fnom this is that an agricultural strategy centered on small farms, rather than large, sim ultaneously increases the social efficiency of resource use in agriculture and improves social equity tthrough employment creation and more equal income distribution, that small farms generate.
2.1.122 WTiile there appears to be a rationale for reducinig the existing ceiling limits further with a view to alleviating poverty o f the growing number off rural landless poor, this is unlikely to have the support of the State Govemments. Therefore, a pragmatic approach would be to strictly enforce the existing ceiling limit without permitting amy attempt to circumvent it. Given the em ploym ent elasticity of agriculture in areas, which are; agriculturally backward, land reforms would ensure both agricultural growth and greater em ploym ent for the rural poor. It would also provide a social status to the large number of poor. A greater transparency in the method o f distribution o f surplus land is possible with a greaiter involvement o f panchayats, local com m unities and NGOs.
2.1.123 Tenancy Reforms: The policy with regard to itenancy clearly provided for conferment o f ow nership rights on tenants or for acquisition of owmership rights by them on payment o f a reasonable compensation to the landlords. The tenancy Haws o f most States abolished tenancies so as to vest ownership of land with the actual tiller. IDespite the legal provisions to abolish tenancy, it has continued to flourish with the existence' o f a large number o f tenants and subtenants without an\ protection against eviction leading tc3 insecurity among them. The continued existence o f oral and concealed tenancies has led to lo'w investments and low productivity in agriculture in several States where the implementation o f tenancy reforms has been tardy. In contrast, in West Bengal, Karnataka, and Kerala, much smccess has been achieved in this respect.
38

The success o f ‘Operation Barga’ in West Bengal is well documented. This shows that conferring occupancy rights on thie tenants has led to better investments in land and consequently, a higher rate o f return. Hence, it is desirable that States which have a high incidence o f concealed tenancy recogmise this fact and record the rights of tenants. In addition, absentee landlordism has to be restraiined. To the extent that large land owners leave their land lallow. either the State should take it C3ver and lease it out on a long-term basis or the land owners should be required to lease it out on ai long-term basis. Measures would have to be taken for the
protection o f tenants against displacem ent, eviction and other forms o f exploitation.
2.1.124 A ban on tenancy was im posed in almost all the States to encourage owner cultivation and to give security o f tenure to the shiarecroppers and the tenants. In areas characterised by semi- feudal m odes o f production, where agricultural markets are not well developed, this ban is desirable with a view to protecting tthe tenants. It has been demonstrated that in 1972-73 in Pum ea district o f Bihar 40 per cent o f the land was under sharecropping. This percentage has gone down and is probably around 215 per cent. The share of landholders is limited to 25 per cent o f the gross produce but in practiice this is perhaps illusory. Since the tenancies are oral and the sharecroppers are weak their hokd on land is tenuous and they have to give to the landlord more than half o f the produce. In thiis case, the tenants have no incentive to make long-term investments in land. The landlords allso do not look upon it as a productive asset but a store o f value and a reflection o f their social status. Both the landlord and the sharecropper would gain if the sharecropper had the rights o f ciultivation in the land as he would make greater investments which would lead to higher retums. This shows that in areas where tenancy flourishes, reforms are required together with a proper irmplementation o f laws.
2.1.125 On the other hand, in the '"Green Revolution” areas where there is greater awareness and the m arkets work, freeing the kease market for land would contribute both to equity and efficiency. In these areas where thie traditional arrangements exist, the tenants have been reduced to the status o f an agricultujral labourer with the landlord exercising considerable influence. In this case, the tenants as well as small and marginal farmers would be able to augm ent their operational holdings b}v leasing in land and, with a greater intensity o f cultivation, it would lead to greater output. Cleiarly, agricultural tenancy should be opened up and leasing in o f land perm itted subject to the c:eiling limits. This would activise the land market which would enhance the poor people's acccess to land.
2.1.126 Protection o f Tribal Landi. Despite the commitment that the tribal lands must remain with the tribals. alienation of the trib;als from their land continues on a large scale due to various legal loopholes and administrative hapses. Hence, in the Ninth Plan legal provisions must be made for the prevention of alienation o f tribal lands and for their restoration, not only in the notified scheduled tribe areas but als>o in the tribal lands in other areas. Also, the regulation o f resale o f the tribal lands should be made as stringent as possible. Given that alienation is basically a consequence of economic: depnvation and social discrimination it is felt, that for the tribal com m unities, various develop)ment programmes must be dovetailed in order to improve the income level of these people and to provide them with a basis for sustained livelihood. Even in the case o f acquisition of lands o f uhe tribals by the Government for public purposes, it should be restricted to a minimum. Encroac:hment o f land belonging to tribals should not be permitted. Even civil courts should have no juirisdiction in the proceedings involving transfer o f land o f persons belonging to scheduled tribtes.

2.1.127 Consolidation o f Holdings^ As already stated, consolidation o f holdings has been successful in a very few States though several States have enacted legislation in this regard. In some cases, there are genuine problems in the process o f consolidation including proper valuation o f land, fear of eviction o f small and marginal fanners who are tenants, inadequate availability o f staff and lack of updated land records. Despite these constraints, consolidation o f holdings makes for efficient land use and water management, leading to higher productivity and, therefore, must be enforced wherever practicable. However, in so far as there is insecurity among the tenants and small and marginal farmers, the State must ensure that their interests ai'e protected. Consolidation operations, whenever undertaken, should be integrated with survey and settlement operations in order to avoid duplication in work and harassment to the affected person. The involvement o f the Panchayati Raj Institutions should facilitate this process through a greater participation o f the village people.
2.1.128 Government Land and Common Property Resources: In rural areas every village has com mon lands as well as other common property resources. These are a source o f sustenance to the landless. Evidence suggests that considerable area o f the government land has been taken over both by the rural poor as well as by the rural elite for agricultural and housing purposes. Unluckily, due to negligence, unsustainable overuse and excessive pressure o f population on land, the productive capacity o f common lands has been diminishing. However, jo in t forest m anagem ent and watershed development programmes are schemes which can be successful in the regeneration o f these common lands. Clearly, ‘pattas’ should be given to the rural poor in order to provide them access to a means o f livelihood. There are several success stories, both in the area o f jo in t forest management as well as watershed development by groups o f people, especially women on common land, which could be replicated. These lands can also be used for providing grazing land, fodder and fuel to the poor. If the common property resources vest in the Gram Panchayat, access to it should be limited to the rural poor and the rural elite should not be allowed to encroach upon it. Similarly, the wastelands which are lying unutilised should be reclaimed and distributed among the marginal fanners and landless labourers o f the area. This would provide them a source of income as also generate greater output from a variety o f activities in the area o f agriculture, horticulture, fodder, fuelwood and other agro-forestry. Given the paucity o f ’cultivable’ land, it is necessary to redistribute the wastelands and fallow land in order to provide productive employment to the poor.
2.1.129 In the case of land vested and in possession o f the Government and/ or where a final decision is pending in a judicial court, it is suggested that such land should not be kept vacant but allotted to eligible rural poor on a short-term basis with a clear understanding that they would have to handover the land to the original landlord if the court so directs. However, legal opinion is being sought on the possibility o f taking up this measure. Again in the case o f Government wasteland and degraded forests, there is a growing opinion that such land should be allotted/leased to the corporate sector and for industrial and commercial purposes. As argued above, this too would adversely affect the rural poor. Access to such land should be restricted to the rural poor in order to provide them with employment.
2.1.130 Gender and Land Rights. So far, the strategy of land reforms has not given any cognizance to the existing gender inequalities in land inheritance laws and ceiling laws. In most regions o f the country, women constitute a disproportionate number of poor. They are also more
40

dependent on agriculture for a livelihood than men, as men shift to non-farm employment. Also, it is estimated that 20 per cent of the rural households are de facto female-headed. Yet. very few women have titles to land and even fewer control it. Hence, ensuring w om en’s effective com m and over land will be one o f the new priorities o f the Ninth Plan.
2.1.131 Traditionally, it was accepted that ajgricultural land would be inherited by sons, even though in some States the inheritance law idid not stipulate such a provision. Hence, it is necessary to implement the laws and also to record the rights o f women, where it is legally claimed by them. Further, in so far as inlieritance rights in tenancy laws are subject to specific land acts, the issues cannot be easily resolve;d. In some States the tenancy laws provide for devolution o f tenancy to male descendants and only in their absence, women can inherit, but then also to a lim ited extent. Hence, it is recomrmended that States should amend their land and inheritance laws so as to bring agricultural lamd at par with other forms o f property. There has been some progress in this direction in Southtem and Central India.
2.1.132 M any of our States have improve:d w om en’s access to land and landed property. States like Karnataka, Tamil Nadu and .Ajidhra Pradesh have amended the Hindu Succession Act, 1956 to form alise issues related to women’ s right to property including land. Some, like Rajasthan and M adhya Pradesh have provide(d that issues related to property, including landed property, would be dealt with in accordance: with the appropriate personal laws. However, serious anom alies continue to persist. A numiber o f States like U.P. Haryana, J&K, Delhi and Punjab are apparently yet to take adequate ste:ps to provide the Constitutional/legal safeguards to wom en with respect to their access to land..
2.1.133 Additionally, it is necessar> that whten ceilings are fixed in relation to a '‘family unit” , the detlnition o f a family should be uniform ac:ross States and sons and daughters should be given equal consideration, both while assessing ce;iling surplus land and in land distribution under various resettlement programmes. The pattas ;should be in the name o f women to a larger extent. W hile jo in t pattas are better than no pattas. wlhich do not provide the women control over it. In fact, groups o f poor rural women should be giiven group pattas with usufructuarv' rights, but no right to sell individually. This group approac;h would enable the women to retain control over land. They could invest in the land collectively and cooperate in sharing both labour time and the returns. There are several instances o f smch jo int m anagem ent by groups o f women which need to be replicated. However, to enable wormen to reap the benefits o f land acquisition, greater access to information, credit, inputs, m arketing and technologies must be provided to them.
2.1.134 In order to have a better data base., both the Agricultural Census and the National Sample Surveys should provide information on land ownership, land operated and land under tenancy by gender. So far. land-based statistics are recorded on a household basis. A pilot surv ey should be undertaken proceeding the inext nationwide NSS data collection exercise.
2.1.135 Updating o f Access to Land Records-^ M aintenance o f up-to-date land records is crucial for effective implementation of land reform s. In recognition o f this, during the Seventh Plan period, a Centrally Sponsored Scheme f or Strengthening o f Revenue Administration and Updating o f Land Records was introduced w ith a view to strengthening survey and settlement organisations at the grassroots level through training, equipment, staff etc. Hence, it is imperative that States should give special em phasis to resurveys and adopt appropriate modem
41

technologies for this, including aerial surv'ey, photogramettic systems, global positioning system, use o f scanners, digital computerised maps etc.
2.1.136 Further, a special drive for recording land righits o f tenants and sharecroppers, as in W est Bengal, must be undertaken by other States. As recommended by the Conference o f Revenue Ministers held in 1997 all the existing tenancy reeform legislations should be examined and a m odel legislation prepared.
2.1.137 Another Centrally Sponsored Scheme for Compmterisation of Land Records was started during 1988-89 as a pilot project. But the scheme has madde little progress. In fact, several factors including pow er shortage, lack o f trained staff and bureauicratic procedures involved at various stages, have constrained the progress o f computerisatiion o f land records. Despite these problem s, com puterisation must be given a high priority aand solutions found for the operational problems. The updating o f land records can be expedited (even without computerisation through the involvem ent o f panchayat institutions and the local rewenue functionaries. The village-level revenue functionaries should be placed under the control o f the Gram Panchayats, though the appellate jurisdiction should continue with the tehsildar. At the district level, the land revenue system m ust work under the Zilla Parishad. The 30 per ccent representation for women in PRls should help the cause o f women in so far as recording o f i rights o f women in land is concerned.
2.1.138 M oreover, steps have to be taken to bring; about greater transparency in the adm inistration o f land records, with access to informatiom regarding land holdings on demand by any individual. Copies of land records, including recorcd o f rights, field books/field map. Land Pass Books as also mutation statements, status o f lancd and jamabandi register should be accessible and copies provided on payment o f a fee.
A nti-Poor Laws and Policies
2.1.139 O ver time, the expenditure on the various poverty alleviation programmes has increased significantly. It is true that these programmes pkay a vital role in ensuring that the poor are able to sustain themselves, particularly during the lean seasons, through generation o f additional em ploym ent and incomes. However, it is becojming increasingly clear that spending money is not the only way o f ameliorating the conditions; o f the poor. Scant attention has been paid to the role o f non-monetary policies and institutionaal arrangements which affect the lives o f the com m on people, especially the poor. There are seweral laws and policies which are antipoor. The know ledge about them is scattered and often . anecdotal. However, some examples may illustrate the nature o f the problem.
2.1.140 For tribals and forest dwellers minor forest prodluce obtained from forest and common property resources is a major source of liv elihood. Howev/er, the poor tribals are facing problems in gathering this minor forest produce due to diversioni of non-timber forest produce to the industry. Bamboo forests are being readily leased to tthe paper industries regardless o f the provision in the Forest Policy 1988 which stipulates that tlhe forest dwellers have the first charge on the forest produce. Rural artisans, who make product^s out o f bamboo, face shortage o f raw material as the forest departments allot them green bambo)o in rationed quantities. This practice has been observed in Karnataka and Orissa. In some casses, forest land is leased out to private industry for long periods. This too adversely affects the poor.
42

2.1.141 The forest department also issmes licences to women for gum collection from babool trees and compels them to sell their entirre collection to the forest department at a prescribed price which is one third to one fourth o f the market price. In some States, tribals can collect hill brooms but cannot process these into a broom nor can they sell the collected items in the open market. Thus, the poor are prevented frrom making value addition through processing and are denied the right to get the best price for their produce. Licensing activities for the poor in rural areas are cumbersome and time consuiming. To set up a charcol kiln one requires four to five types o f permission.
2.1.142 The cattle flayers in UP have mo legal control over their own produce i.e. the hides they flay from the naturally fallen animals. TThe Zilla Parishads award contracts either to individuals or to cooperatives for collection and storage of hides. Hence, the flayers are not able to sell in the open market but are forced to acceipt the terms made by the contractors. Again in Bihar, auction ferry right is made in favour olf Zamindars and contractors who collect tolls and taxes from the poor who have to cross the riveir to sell their produce. In addition, those who are fishing or plying boats across the river have to p>ay taxes to the Zamindars. Normally, access to, and use of, the river should be free to farmers, laibourers, petty traders etc. In Assam, the fishery laws are such that the fishermen do not benefiit from them. A sector o f the river is leased out to “Mohildhars” who auction the fish andl only 1/3"* is given to fishermen who actually catch the fish. These are ways in which com m on property resources are being used m a way that are prejudicial to the poor.
2.1.143 The rural poor do not have: a level playing field as the market for their finished products are dominated by a single tradeir or cartel o f traders operating in the area. In the market, the terms o f trade are against them. Neiither the public nor the private sector has encouraged the growth o f poor people’s organisations but, instead, has either tried to suppress or control them.Cooperatives could have become the r<eal supporters o f the poor and needy but the process for
their formation and registration is very cumbersome. Where cooperatives o f poor people have been successftil such as womens’ beetdi cooperatives, they have been taken over by private companies. Similarly, the Govemmemt has often interfered with the independence o f the cooperatives by putting government op«erators incharge o f them.
2.1.144 Such examples abound. An eixercise has already been done to document some o f these laws and policies. In the Ninth Plan, an lattempt will be made to initiate the process o f identifying anti-poor laws/policies, Statewise. Therse would be brought to the notice o f the policy makers, local governments and NGOs so that tthese may be suitably modified and/or repealed in the interest o f the poor.
Integration o f Poverty Alleviation Program m es with Sectoral Programmes
2.1.145 It is necessary to recast the sjpecial employment programmes with a view to making them more effective in meeting not onljy the short-term objective o f providing temporary work, but also in building up the productive ciapacity o f individuals/areas which, in turn, would make for greater employment on a more sustaiinable basis. The focus would have to be on agriculture and allied activities, besides rural non-fairm sectors and services, which have a high employment elasticity. This would require a highi degree o f convergence among the various poverty
43

alleviation programmes (PAPs), area development programmes and sectoral schemes, within a district plan based on the physical and human endowments o f the area, the felt needs of the people and the total financial resources available. Using scientific methods, remote-sensing agencies at the Centre and State level would be asked to provide detailed maps showing land, water and other physical resources o f the area, with the aid o f photogrammetry and satellite imagery. The detailed maps would then be scrutinised to identify all possible watersheds. Planning along watershed lines would ensure minimum surface run-off, thus conserving water from rainfall. Viable activities in agriculture and allied sectors would have to be selected. Agroprocessing activities linked with the cropping pattern, village and small industries with growth potential and other infrastructural gaps would also have to be identified and prioritised. Within this framework, poverty alleviation programmes would be integrated with area development programm es within a developmental plan at the district level.
2.1.146 So far, there has been a complete dichotomy between various sectoral as well as poverty alleviation programmes that have been planned and implemented by the concerned line departments. The Government has recognised this dichotomy but greater efforts have to be made to effect the convergence in practice. As a start, an attempt has been made to integrate DPAP and DDP, EAS and the Integrated Wasteland Development Programme (IWDP), all being im plem ented by a single Ministry. Watersheds are to be constructed and associated works o f drainage, land development and terracing undertaken. Also, afforestation, agro-based and horticultural development, pasture development, crop demonstration for popularising new crops/varieties and upgrading o f common property resources are being taken up. Clearly, there is scope for integrating other sectoral programmes of soil and water conservation, forestry, mmor irrigation, animal husbandry, agriculture and other departments, funds from which flow from sectoral heads to the district level. Once the area plans are prepared, dovetailing of funds would not pose a problem.
Institutional M echanism for Delivery
2.1.147 Consequent to the 73'‘‘ Constitutional Amendment Act, State Governments have enacted enabling legislations providing for local bodies at the village, intermediate and district levels. In almost all the States with the exception o f Bihar the PRIs have been duly constituted. The Slate Governments are required to endow these PRIs with the requisite financial and administrative powers to enable them to function as institutions o f self-government. The PRIs would be responsible for preparing the plans for economic development and social justice through the District Planning Committee and for implementing them, in respect o f the items listed in the Eleventh Schedule o f the Constitutional Amendment. This process o f devolution is at various levels o f operafionalisation for individual States. It is expected, that in the Ninth Plan, the States would devolve funds on the panchayats both from the Consolidated Funds of the States and the allocations made by the Central Government for Centrally Sponsored Schemes. In addition, the panchayats have to be given their own revenue raising powers, as per the recommendations o f the State Finance Commissions. It is expected that village level plans would be prepared, based on the felt needs of the people as articulated in the Gram Sabha meetings. These plans would be incorporated into the intermediate level plans and finally merged into a district plan. This district plan would then enable the dovetailing o f funds from the various sectoral poverty alleviation and area development programmes. In this way. developm ent planning would begin from below reflecting the aspirations o f the people within
44

the constraints o f the available physical and financial resources.
2.1.148 Voluntary organisations would also play an enhanced role especially asfacilitators and social animators in bringing about greater awareness through advocacy. They would also help the poor to form self-help groups with the objective o f improving their economic status through concerted action. In this way the PRIs, the voluntary organisations and the community would work in tandem to bring about greater development at the local level and consequent reduction in poverty levels.
45

Financial performance under Integrated Rural Development Prograumne (IRDP) during Eighth Plan (1992-93 to 1996-97)
(Rs in Crore)
Annexure - I
Year Total Expen %ageAllocation diture E x p d .
1992-93------—
662.22 693.08 104 .. 661993-94 1093.43 956.65 87.,491994-95 1098.22 1008.32 91,.81
1995-96 1:Prov) 1097.21 1077. 16 98., 171996-97 1;Prov) 1097.21 1139.49 103., 85
Total 5048.29 4874.70 96.,56
Physical performance under IRDP during Eighth Plan (1992-93 to 1996-97)
Lakh Families
YearTarget Achievemen
%age A c h .
1992-931993-941994-95
1995-96(Prov)1996-97 (Prov)
18.75 25.70 21.15
No Targe No Targe
20 . 69 25. 39 22.15 20. 89 19.12
110.35 98 .79
104.73
Total 108 .24
46

Financial and Physical performance under Training of Rural Youth For Self Employment (TRYSEM) during
Eighth Plan (1992-93 to 1996-97) - Yearwise(No. in Lakh)
Year No.of No.of No. of No. of Total RecurringYouth to Youth to Youth Youth youth Expensesbe trained trained Self- Wage Err.ployed (Rs.in
Annexure - II
Employed Employed Crcre)
1992-93 3.00 2.76 0.99 0.42 1.41 47.501993-94 3. 50 3.04 1.08 0.43 1.51 55.021994-95 3.18 2 , 82 0.86 0.45 1.31 68 . 461995-96 (Prov) - 3.02 0. 98 0.48 1.46 98.831996-97 (Prov) - 3. 64 1.31 0.52 1. 83 100.27
Total - 15.28 5.22 2 . 30 7 . 52 37C.08
47

Financial performance under Supply of Improved Toolkits to Rural Artisauis during
Eighth Plan - Yearwise(Rs in Crore)
Annexure - III
Year TotalAllocation
Expenditure
%ageExpd.
1992-93 16.85 13.86 82.261993-94 23.22 18. 60 80.101994-95 29.00 22. 91 79.00
1995-96 (Prov) 40.00 28.69 71.731996-97 (Prov) 40.00 32.13 80.33
Total 149.07 116.19 77. 94
Physical performance xinder Supply of In^roved Toolkits to Rural Artisems during Eighth Plam - Yearwise
(Toolkits distributed in Lakhs'
Year Target Achievement %ageAch.
1992-93 0. 98 0.83 84.691993-94 1.29 1.09 84.501994-95 1. 61 1.25 77. 641995-96(Prov) 2.22 1.53 68. 921996-97(Prov) 2.22 1.40 63. 06
Total 8. 32 6.10 73.32
48

Financial and Physical performance under Development of Women and Children in Rural Area (DWCRA) during
Eighth Plan (1992-93 to 1996-97) - Yearwise
Annexure - IV
Year Target Achievement %age N o . of Utilisation(No . of (No . of Achie Women of fundsGroups) Groups vement Benefitted (Rs in
Formed) Crore)
1 9 9 2 - 9 3 7500 9029 1 2 0 . 3 9 128744 15.481 9 9 3 - 9 4 11000 15483 1 4 0 . 7 5 268525 23.651 9 9 4 - 9 5 13400 37964 2 8 3 . 3 1 592026 31.001 9 9 5 - 9 6 (Prov) 30000 37565 125 . 22 697088 63.651 9 9 6 - 9 7 (Prov) 30000 41345 137 . 82 580434 56.94
Total 9190 0 1-U3S6 153 .85 2266817 190.72
49

Financial performance under Jawahar Rozgar Yojana (JRY) during Eighth Plan (1992-93 to 1996-97) - Yearwise
Rs in Crore)
Annexure - V
Year Total Allocation(Centre+State) Total Expenditure %ageExpenditure1st Ilnd
Stream StreamTotalJRY
1stStream
Ilnd Total Stream JRY
1992-93 3169.051993-94 3181.22 378.201994-95 3498.72 878.20
1995-96(Prov) 4348.70 500.001996-97(Prov) 2236.79
3169.054059.424376.924848.702236.79
2709.59 3590.21 3359.88 3966.08 2156.93
2709.59 288.50 3878.71 908.45 4268.33 493.41 4459.49
2156.93
85.5095.5597.5291.9796.43
Total 16434.48 2256.40 18690.88 15782.69 1690.36 17473.05 93. 48
Physical performance under Jawahar Rozgar Yojana (JRY) during Eighth Plan (1992-93 to 1996-97) - Yearwise
Employment Generated in Lakh Mandays
Year Target Achievement %ageAchievement:st Ilnd
Stream StreamTotalJRY
1stStream
Ilnd Total Stream JRY
1992-931993-941994-95
1995-96(Prov1996-97(Prov
7537.95 1C383.26 7997.37 1868.08
; 8042.80 437.25 ) 4141.37
7537,95 10383.26 9865.45 8480.05 4141.37
7821.02 9523.45 7453.59 7955.89 3819.14
7821.02 734.95 10258.4
2063.48 9517.07 991.27 8947.16
3819.14
103.76 98.80 96. 47
105.51 92.22
Total 38102.75 2305.33 40408.08 36573.09 3789.70 40362.79 99.89
50

Financial and Physical performance under Employment Assurance Scheme (EAS) during Eighth Plan
(1992-93 to 1996-97) - Yearwise(Rs. in crore)
Annexure - VI
Year Total Release (Centre + State)
Expenditure
%ageExpd.
Physical Achievement (Employment in Lakh Mandays)
1992-93 - - _ _
1993-94 548.77 183.75 33.48 494.741994-95 1410.25 1235.45 87.61 2739.561995-96 (Prov) 2131.64 1720.61 80.72 3465.271996-97 (Prov) 2423.99 2138.35 88.22 3986.45
Total 6514.65 5278 .16 81. 02 10686.02
EAS is a Demand Driven scheme, therefore no prior Statewise allocations are made.
51

Financial and Physical performance under Million Wells Scheme (MWS) during Eighth Plan
(1992-93 to 1996-97) - Yearwise(Rs. in crore)
Annexure - VII
Year Total Allocation (Centre +
State)
Expenditure
%age E x p d .
Physical Achievement (Wells Constructed in Number)
1992-93 605.33 534.05 88.22 1809951993-94 954.37 639.74 67 . 03 1516731994-95 1049.62 776.18 73. 95 158780
1995-96 (Prov) 559.07 538.29 96.28 1426851996-97 (Prov) 559.07 498.77 89.21 103196
Total 3727 .46 2987.03 80. 14 737329
52

Annexure-VIII
Financial Performance under National Social Assistance Programme (NSAP) - 1995-96
(Rs.Crores)
Prog . 0.8. 33on 1.4.95
[ o t a 1
3ation
TotalRelease
T 0 r a 1 Available Fund ■Co'' 2^4 )
Total Expend.
4age Expend. w . r . t .Total
AvailableFund
1 2 3 4 5 6 7
NOAPS - 297.07 216.71 216.71 119.58 55-18
NFBS - 154.4 9 105.07 105.07 38.01 36.18
NMBS - 8"̂ . 37 58.71 58 . 71 26.18 44.59
Total - 533,93 380,49 380.49 183.77 48.30
F i n a n c i a l P e r f o r m a n c e u n d e r N S A P - 1996-97;Rs .Crores)
O.B. 33 on 1.4. 6
oar:cn
i “1 n 1
ab 1‘.' '.■’’jnci
3^4 ;
Total Expend.
"^age Expend. w . r . t .
Avallable Fund
- 2 3 4 6 7
NOAPSC'
97 . 53 507,61 373.82 4 71.35 267.31 56.71oNFBS 67 .36 2 63.80 106.89 174.25 73.88 42.40
NMBS 32 . 64 144.80 67 . 58 100.22 42 .31 42.22
Total 197.53 915.21 543.29 '.'4 5.8 2 383.50 51.42
Physical Performance 1995-96 and 1996-97
under NSAP during^In Numbers)
Prog . -995-96 1996-97
Numeri- ca 1Ceiling
Beneficiaries c c ^ r 0 d
7ageAchievement
N ume r1-calCeiling
Beneficiariescovered
lageAchievement
X 2 3 4 5 6 ~!
NCAP3 - 31190^T - 5 3'/1 60 0 4381712 81 . 57
NFBS ~ 78607 - 456800 131796 28.85
NMBS - 6 7 5 o 4 ̂ - 4 5 9 n '■ 3 3 12 674 95 2" .57
NCAPS NFBS - NM3 3 -
- Naticna; Nat i.cr;a 1
- Mationa.
o:d Ace r'.imi*'/ 3<
Pension 3; enefit Sc: -V 5enef
meme . lerr̂ e .It Scneni e .

2.2 URBAN POVERTY ALLEVIATION
2.2.1 Poverty reduction is an important goal o f the urban policy. Urban growth is a result o f (1) natural increase in population (2) net migration from rural areas to urban areas and (3) reclassification o f towns. The common notion that migration largely fuels urban growth is only partially correct. Therefore, it is necessary to view urban poverty as distinct from rural poverty and not as mere transfer o f rural poverty into urban areas.
Urban poverty leads to :
(a) proliferation o f slums and bustees; (b) fast growth o f the informal sector; (c) increasing casualisation o f labour; (d) increasing pressure on civic services; (e) increasing educational deprivation and health contingencies.
The Urban Poverty Alleviation Programmes (UPAPs) which were in operation during eighth plan are as follows:
Nehru Rozgar Yojana (NRY)
2.2.2 In order to alleviate the conditions o f urban poor, a Centrally Sponsored programme - Nehru Rozgar Yojana - was launched at the end o f the Seventh Five Year Plan (October 1989) with the objective o f providing o f employment to the urban unemployed and underemployed poor. The Central Government indicated its overall contribution while the essential task o f identifying, earmarking and coordinating the relevant sectoral inputs was undertaken by the State Govemmeuts. The NRY consisted o f three schemes namely (i) the Scheme o f Urban Micro Enterprises (SUME); (ii) the Scheme o f Urban Wage Employment (SUWE); and (iii) the Scheme o f Housing and Shelter Upgradation (SHASU). The physical and financial details o f the implementation o f these Schemes are at Annexure-I and Annexure-II respectively. During the Eighth Plan, 92% o f the available funds were utilised and but for the shortfall in the number o f dwelling units upgraded/in progress under SHASU, the targets have been achieved under all the other schemes.
Urban Basic Services for the Poor (UBSP)
2.2.3 The UBSP Programme was implemented as a Centrally Sponsored Scheme during the Eighth Five Year Plan with the specific objectives o f effective achievement o f the social sector goals; community organisation, mobilisation and empowerment; and converence through sustainable support system. The expenditure on the Programme was being shared on a 60:40 basis between the Central and the State Governments and UTs (with legislatures). Further, the per capita expenditure on any slum pocket is Rs.75/- in the first year and Rs.50/- from the second year onwards after the basic infrastructure is developed. The UBSP was targetted to cover 70 lakh urban poor beneficiaries in 500 towns during the Eighth Plan period. The Programme has achieved the physical target o f 70 lakh beneficiaries during the Eighth Plan period in 350 towns. Against the release o f the Central share o f Rs.8090 lakh, the release o f the State share was Rs.3439.64 lakh. As on 31.03.1997, 353 towns and 4993 slum pockets have been selected for coverage and 75 lakh beneficiaries have been covered.
54

Prime M inister's Integrated Urban Poverty Eradication Programme (PM lU PEP) :
2.2.4 Recognising the seriousness and complexity o f urban poverty problems,especially in the small towns where the situtation is more grave due to lack o fresources for planning their environment and development, the PMI UPEP was launched in November, 1995. The PM lUPEP was a Rs.800 crore scheme approved for theperiod up to the year 2000. Programme was applicable to all Class II urbanagglomerations with a population ranging between 50,000 and 1 lakh subject to the condition that elections to local bodies have been held. The Programme was being implemented on a wholetown/ project basis extending the coverage to all the targetted groups for recuring a visible impact. During 1995-96 and 1996-97, Rs. 176.40 crorewere released to the States/UTs. Most of the States are in the preparatory stages o f theProgramme, such as house-to-house survey, patial mapping, need assessment, developing Itemative project reports, building community structures etc., which take quite some time. The physical achievements as reported by the States are as under:
(a) House-to-house survey has been completed in 213 towns.
(b) Town-wise project reports have been prepared for 229 towns.
(c) Under the self-employment component, 20775 applications have been forwarded to banks, out o f which 3080 cases have been approved.
(d) Under the Shelter Upgradation Component, 10386 applications have beenforwarded to banks/HUDCO, out o f which 4743 cases have been approved by HUDCO.
(e) As many as 8382 Neighbourhood Groups, 1200 Neighbourhood Development Committees and 444 Thrift and Credit Societies have been formed.
2.2.5 The performance o f the UPAPs in the Eighth Five Year Plan reveals:
that although urban poverty is no less severe than rural poverty, the priorityaccorded to alleviation o f urban poverty is low as the common perception is that urban poverty is a transfer o f rural poverty into urban areas;
that UPAPs are highly fragmented and have overlapping objectives and strategies.
that integration of UPAPs with sectoral development and area developmentprogrammes has been overlooked.
- that the role o f voluntary organisations and community based organisation in planning and implementation of UPAPs is on the peripher>'.
2.2.6 The Planning Commission's (Modified Expert Group) estimates o f urbanpoverty show a decline in the percentage o f urban poor from 38 percent (1987-88) to 32.36 percent (1993-94). As per the Modified Expert Group the number o f urban poor is 763.37 lakh in 1993-94. The Hashim Committee, which was set up to review and rationalise Centrally Sponsored Schemes for poverty alleviation and employment generation, had gone into the question of rationalisation o f the existing povertyalleviation programmes and recommended that:-
55

1. the self-em ployment component o f NRY and PMIUPEP be combined into a single program m e valid for all the urban areas all over the country;
2. the urban v̂ âge employment component as well as the physical infrastructure developm ent component under the NRY and the PM IUPEP be merged and be made applicable to all the urban areas with a population less than 5 lakhs. This component may be separated from the self- em ploym ent component as a separate scheme with a distinct identity; and
3. the shelter upgradation/housing componentunder N RY and PMIUPEP be retained either as a separate scheme or merged with the Slum Developm ent/Basic Services Schemesoperating at present.
The Swarna Jayanti Shahari Rozgar Yojana (SJSRV):
2.2.7 In pursuance o f the above recom m endations, during the Ninth Plan it is proposed to launch the Swarna Jayanti Shahari Rozgar Yojana (SJSRY) and phase out NRY, PM IUPEP and UBSP. The SJSRY is to be a Centrally Sponsored Scheme applicable to all the urban areas with expenditure to be shared in ratio 75:25 between the Centre and States/UTs. The programme has become operational on December 1, 1997. This program m e would have two sub-schemes, namely, (i) UrbanSelf-Employment Prograrmne and (ii) Urban Wage Employment Programme. The self-employment and wage em ploym ent components o f the existing NRY and PM IU PEP have been reorganised under upgradation components o f both NRY and National Slum Development Programme.
The Planning Comm ission’s (modified Expert Group) estimates o f urban poverty show a decline in the percentage o f urban poor from 38 percent (1987-88) to 32.36 percent (1993-94). As per the Modified Expert Group the number o f urban poor is 763.37 lakh in 1993-94.The Hashim Committee, which was set up to review and rationalise Centrally Sponsored Schemes for poverty alleviation and employment generation, had gone into the question o f rationalisation o f the existing poverty alleviation programmes.Based on the recommendation o f the Committee the Swarna Jayanti Shahari Rozgar Yojana (SJSRY) has been launched with effect from1.12.97 and NRY, PMIUPEP and UBSP have been phased out.The programme has two sub-schemes namely, (a) Urban Self - Employment Programme and (b) Urban Wage Employment Programme. The self-employment and wage employment components o f the NRY and PMIUPEP have been re-organised under this single programme. The shelter upgradation components o f both NRY and PMIUPEP has been merged with the National Slum Development Programme.
this single programme. Further,the shelter PMIUPEP will be merged with the
2.2.8 The Swarna Jayanti Shahari Rozgar Yojana (SJSRY) seek to provide gainful em ploym ent to the urban unemployed or underemployed poor by encouraging the setting up o f self-employment ventures or provision of wage employment. This program m e will rely on the creation o f suitable community structures on the UBSP pattern and delivery o f inputs under this programme will be through the medium o f urban local bodies and similar community institutional structures.
2.2.9 The Swarna Jayanti Shahari Rozgar Yojana rests on the foundation o f community em pow ennent. Towards this end. community organisations like Neighbourhood (jroups (NHGs), Neighbourhood Committees (NHCs) and Community Developm ent
56

Societies (CDSs) will be set up in the target areas based on the UBSP pattern. The CDSs will be the focal point for purposes o f identification o f beneficiaries, preparation o f applications, monitoring o f recovery and generally providing whatever other support is necessary to the programme. The CDSs will also identify viable projects suitable for that particular area.
2.2.10 These CDSs may also set themselves up as Thrift and Credit Societies to encourage community savings, as also other group activities. A maximum expenditure at the rate o f Rs.lOO per member for the first year and Rs.75 per member for each subsequent year will be allowed for activities connected with the CDSs.
The Urban Self Employment Programme (USE?):
2.2.11 This programme will have three distinct components:-
(i) assistance to individual urban poor beneficiaries for setting up gainful self- employment ventures.
(ii) assistance to groups o f urban poor women for setting up gainful self-employment ventures. This sub-scheme may be called "1 he Scheme for Development o f Women and Children in the Urban Areas (DWCUA)".
(iii) training o f beneficiaries, potential beneficiaries and other persons associated with the urban employment programme for upgradation and acquisition o f vocational and entTepteneurial skills.
Coverage:
(i) The programme will be applicable to all urban towns in India.
(ii) The programme will be implemented on a whole town basis with special emphasis on urban poor clusters.
Target Groups:
(i) The programme will target the urban poor,i.e those living below the urban poverty line, as defined from time to time.
(ii) Special attention will be given to women, persons belonging to Scheduled Castes/Tribes, disabled persons and other such categories as may be indicated by the Government from time to time. The percentage o f women beneficiaries under this programme will not be less than 30 percent. The SCs and STs must be benefited at least to the extent o f their proportion in the local population. A special provision o f 3 percent will be reserved for the disabled under this programme.
(iii) There will not be any minimum educational qualification set for beneficiaries under this programme- However, to avoid an overlap with the PxMRY scheme, for self- employment component, this s heme will not apply to beneficiaries educated beyond the IX standard. As regards the wage employment component, there will be no restrictions o f educational qualifications whatsoever.
(iv) A house-to-house survey for identification of genuine beneficiaries will be undertaken. Non-economic parameters will also be applied to identify the urban poor in addition to the economic criteria o f the urban poverty line.
57

2.2.12 AH other conditions being equal, women beneficiaries belonging to women-headed households will be ranked higher in priority than other beneficiaries.
COM PONENTS:
(i) Self-em ploym ent through setting up Micro-enterprises and Skill development:
2.2.13 To avoid duplication with the ongoing Prime Minister's Rozgar Yojana(PMRY), this component o f SJSRY is confined to the below poverty line beneficiaries who have no education upto ninth standard, with emphasis on those accorded a higher priority on the basis o f the non-economic critera. The maximum unit costwill be Rs.50,000 and the maximum allowable subsidy will be 15 percent o f the project cost, subject to a limit o f Rs.7,500. The beneficiary is required to contribute 5 percent o f the project cost as margin money. In case a number o f beneficiaries decide to jointly set up a project, such project will be eligible for a subsidy which will be equal to the total o f the permitted subsidy per person as per the above criteria. In this case too the provision relating to 5 percent margin money per beneficiary willapply. The overall project cost, which can be permitted, will be the total o f theindividual project cost allowable per beneficiary.
2.2.14 Skill development through appropriate training is another element o f this programme. The unit cost allowed for training will be Rs.2000 per trainee, including material cost, trainers' fees, other miscellaneous expenses to be incurred by the training institution and the monthly stipend to be paid to the trainee. The total training period for skill upgradation may vary from two to six months, subject to a minimum o f 300 hours.
2.2.15 Infrastructural support may also be provided to the beneficiaries setting up micro-enterprises in relation to marketing o f their products etc.
(ii) Developm ent o f W omen and Children in Urban Areas (DWCUA):
2.2.16 This scheme is distinguished by the special incentive extended to urban poor women who decide to set up self-employment ventures as a group as opposed to individual effort. Groups o f urban poor women will take up an economic activity suited to their skill, training, aptitude and local conditions. Besides generation o f income, this group strategy will strive to empower the urban poor women by making them independent as also providing a facilitating atmosphere for self-employment. To be eligible for subsidy under this scheme, the DWCUA group should consist o f at least 10 urban poor women.
Financial Pattern
2.2.17 The DWCUA group society will be entitled to a subsidy o f Rs. 1,25,000 or50% o f the cost o f project whichever is less.
2.2.18 WTiere the DWCUA group sets itself up as a Thrift and Credit Society, inaddition to its other entrepreneurial activity, the group/Thrift and Credit society will also be entitled to a lump sum grant o f Rs.25,000 as a revolving fiind at the rate o f Rs.lOOO maximum per member. This revolving fund will be available to a simple Thrift and Credit Society also even if the society is not engaged in any project activity under DWCUA.
58

2.2.19 This programme seeks to provide wage employment to beneficiaries living below the poverty line within the jurisdiction of urban local bodies by utilising their labour for construction of socially and economically useftil public assets.
2.2.20 This programme will apply to urban local bodies, the population o f which is less than 5 lakhs as per the 1991 Census.
2.2.21 The material-labour ratio for works under this programme will be maintained at 60:40. The prevailing minimum wage rate, as notified from time to time for each area, will be paid to the beneficiaries under this programme.
2.2.22 This programme will be dovetailed with the State sector EIUS scheme aswell as the National Slum Development Programme (NSDP). This programmeis not designed to either replace or substitute the Environmental Improvement Of Urban Slums (EIUS), the NSDP, or any other State sector schemes.
Project Administration :
2.2.23 At the community level, a Community Organiser(CO) will be appointed forabout 2000 identified families. The Community Organiser should, as far as practicable, be a woman.
2.2.24 At the town level, there will be an Urban Poverty Eradication Cell under the charge of a Project Officer. The Project Officer will be responsible for coordinating the activities o f all the CDSs and COs.
2.2.25 At the district level, the State Government will constitute a District UrbanDevelopment Agency (DUDA) with an officer designated as the District Project Officer.
2.2.26 At the State level, there will be a State Urban Development Authority (SUDA), which will be headed by a full-time senior officer o f the State Government. The SUDA will be designated as the State Nodal Agency for urban anti poverty programmes.
2.2.27 At the national level, the Department of Urban Employment and Poverty Alleviation will be the nodal department. The programme will be monitored and overseen by the UPA Division.
2.2.28 The Ninth Plan, in particular, needs to focus on the effective implementation and management o f urban poverty alleviation programmes (UPAPs). Targetting o f urban poor is essential for the success o f any anti-poverty programme. Therefore, the UPAPs should be designed to accomodate flexibility in operation. The key components o f the Ninth Plan strategy would be;
effective targetting using either a self-identification system or a selection process by institutions responsible for financing and managing UPAPs as faulty targetting will enhance income inequalities.
a "bottom up" approach should be adopted for UPAPs which should be routed through community based organi- sations. There should be effective participation
The Urban Wage Employment Programme (UWEP):
59

o f community institutions for extending loans and for aiding loan recoveries made under UPAPs.
since the problem o f urban poverty is a manifestation o f the higher incidence o f marginal and low income employment in the informal sector, it is essential to upgrade informal sector occupations. Hence there is a need for emphasis on generation o f self-employment in processing and services sector, improving theacccess to technology and credit and above all improving the general legal and physical environment which governs the working o f the informal sector.
2.2.29 The policy framework adopted by the Government o f India also mentions that "a frontal attack on poverty is an important element in development policy. This is the main rationale for anti-poverty programmes".
60

Annexure-INEHRU ROZGAR YOJANA
FINANCIAL PERFORMANCE (Rs in lakh)
Scheme/Component
Funds available during VIII Plan (Central+State) 1992-93 to 1996-97
Expenditure (upto 31.3.97)
Percent
SUME(Subsidy) 15625.26 16467.40 105
SUME(T & I) 3848.48 2738.40 71
SUWE 19703.05 19618.43 99
SHASU (Subsidy) 5124.73 5090.09 99
SHASU(T & I)
A & OE
1684.46
3866.70
1206.14 72
ULBs
NGOs
2844.99
1520.33
8232.02 4683.29 57
TOTAL 54218.00 49803.75 92
61

Annexure-II
NEHRU ROZGAR YOJAMA Physical targets and achievement
(in lakha)
upto 1991-92 T A
1992-T
■93A
1993-T
■94A
1994-T
-95A
1995T
-96A
1996-T
-97A
GrandT
TotalA
No.of beneficiaries assisted to set up micro enterprises
2.87 1.42 0.92 2.37 1 .25 1.52 1.02 1,25 1.17 1.25 0.87 1,29 8,10 9,10
Parsons trained/under going training under SUME
0.68 0.48 0.32 0.41 0.42 0.31 0.34 0.38 0.40 0.46 0,30 0,46 2,46 2,50
Mandays of work generated under SUWE
257 .84 195.24 63.74 76.27 50.84 72.17 41.12 50.85 36.22 54,64 33,74 9,57 483,50 458,70
No. of dwelling units upgraded/in progress under SHASU
2.85 0.28 1.77 2.28 1.76 0.56 1.60 0.62 0.23 “ 0,87 7,98 4,80
Mandays of work generated under SHASU
246.87 18.16 94.46 64.22 91.89 51.50 65.00 13.11 38.31 * 47,46 498,22 232,00
Persons trained/under going training under SHASU
0.62 0.15 0.16 0.17 0.16 0.17 0.15 -0.05 0,15 0.21 0,16 1,24 0.81
T-Targot A^Achiovamont
62

2.3 PUBLIC DISTRIBUTION SYSTEM
Introduction
2.3.1 The Public Distribution System (PDS) is the key element o f the Government's food security system in India. It is an instrument for ensuring availability o f certain essential commodities at easily affordable prices especially for the poor. The Goverrmient, via the Food Corporation o f India (FCI), procures and stocks foodgrains which are released every month for distribution through the PDS network across the country. In addition to sugar, edible oils and kerosene, foodgrains, mainly rice and wheat, are distributed to the public via a network o f Fair Price Shops (FPS). The system o f procurement is also used by the Government o f India to provide minimum support prices to the farmers so as to stabilise farm output and income. To begin with, in the sixties efforts were made to procure rice and wheat not only for normal distribution through Fair Price Shops under the PDS but also to maintain buffer stocks, which were built in the years o f good production to tide over the periods o f lean production. In the eighties, given the increases in the foodgrains production and the resilience in the agricultural production scenario, the Government o f India decided to operate a system whereby certain norms were fixed regarding the quantities to be held by the Food Corporation o f India at different points o f time during the year, thus merging the stocks meant for normal distribution and buffer stocks.
2.3.2 The PDS, till recently, has been a general entitlement scheme to all consumers without any targetting. On an average, about 15-16 million tonnes o f foodgrains are issued by the FCI to the States at a uniform Central Issue Price (CIP) which is much less than the economic cost incurred by the Central Government by way o f procurement, storage, transport and distribution. The difference between the economic cost and the CIP. called the consumer subsidy, is borne by the Central Government through its annual non-Plan budget. In addition to this, as mentioned above, the FCI maintains a large buffer stocks o f foodgrains, which entails a substantial carrying cost. The consumer subsidy and the carrying cost o f the buffer stock together add up to the total food subsidy. The total food subsidy, which was o f the order o f Rs.2000 crore in 1987-88, has gradually increased to the level Rs.7500 crore during the year 1997-98. Despite the mounting food subsidy bills, various evaluation studies o f the PDS have shovsoi that the system has failed to translate the macro level self sufficiency in foodgrains achieved by the country into household level food security for the poor. In a system with access to all, rich and poor alike, the quantum o f PDS supply to each household formed only a small proportion o f a family's total requirement. The increases in the Minimum Support Prices (MSP) effected over the years, which were considered necessary by the Government to keep up the production o f foodgrains, led to corresponding increases in the consumer prices in the PDS, adversely affecting the economic access o f the poor to the PDS foodgrains. Another fall out o f the universal PDS has been that the States with the highest incidence o f poverty, viz Orissa, Bihar, Madhya Pradesh and Uttar Pradesh are the ones whose per capita PDS off-take has been the lowest. It thus became clear that the PDS, which existed till recently, did not serve the poor well, especially in the poorer States. In view o f the mounting food subsidy in recent years, coupled with the fact that the PDS did not reach the poor, a view has emerged that the universal coverage o f the PDS is neither sustainable nor desirable. One o f the central concerns o f the economic reform process, that was initiated in 1991, is to limit the quantum o f explicit and implicit subsidies as well as other forms o f non-Plan expenditure, while at the same time raising both tax and non tax revenues. The unbridled growth o f non- Plan expenditure in relation to the revenues during the decade o f the eighties had brought
63

about a severe fiscal imbalance, with a rapid build up o f public debt and mounting interest burdens. It is in the context o f correcting this macro economic imbalance that the view o f curbing subsidies to the barest minimum emerged. While recognising the need to curb subsidies in general, it is important to recognise the need to provide foodgrains at affordable prices to the bottom rungs of the population, whose well being ought to be at the core o f the Government's food security programme. One o f the most important determinants o f the changes in India's poverty level is the price o f foodgrains which has a major impact on the real income, especially for the relatively poorer sections whose incomes are very largely spent on foodgrains. For example, at the all- India level the people spend on an average about 63% o f their total expenditure on food in the rural areas and about 55% in the urban areas. O f the expenditure incurred on all food items the expenditure on foodgrains accounts for 45% in the rural areas and about 32% in the urban areas. The bottom 30-40% o f the population spend over 70% of the total expenditure on food. O f their expenditure on food, the bottom 30-40% o f the population spend about 50% on foodgrains in the rural areas and over 40% in the urban areas. In view o f the fact that the poor devote a substantial part o f their expenditure on foodgrains, it is essential to protect them from a continuous upward pressure on foodgrains prices, a phenomenon in-built in our system o f procurement prices which need an annual increase as an incentive for increasing production. If the poor are not protected from the impact of the ever increasing pressures on prices o f foodgrains through a subsidised PDS, the impact o f many o f the poverty alleviation measures and programmes would get neutralised. In other words, a system of food subsidy is an essential element o f food security strategy. The challenge, however, is to contain the total food subsidy to the minimum necessary by devising a system of targeting so that the subsidies benefit only those sections whom the State wants to protect. The challenge lies in the fact that by international comparison most Indians are poor and most o f them devote a substantial part o f their expenditure on foodgrains. So naturally, there is a pressure to have a subsidised PDS with an almost open ended coverage. Open ended coverage, however, cannot be continued, not only because o f its massive implication for the total volume o f food subsidy but also because o f the enormous price distortions that is implicit in an open ended, heavily subsidised PDS.
T argetting Public Distribution System:
Recom m endations o f the W orking Groups(WG)
2.3.3 The logic o f a targeted PDS described above was enunciated in the Report o f the Working Group on National Policy on Public Distribution System (June, 1996) set up in the Planning Commission in August, 1995. The Working Group after discussing various forms and experiences o f targeting, such as, through wage employment programmes (JRY,EAS etc), area-based targeting (ITDP, RPDS), exclusion o f non-poor and the system o f food stamps prevalent in some countries, suggested a scheme of allocation of foodgrains out o f the Central Pool to the States at tw'o sets o f prices, namely, a highly subsidised price for the allocations meant for the poor and near open market prices for the non-poor. The recommendations of the Working Group are given in Box.
64

Recommendations o f the W orking Group on National Policy on PublicDistribution System
* The Central G overnm ent should adopt the Planning Com m ission's estim ates o f the proportion o f population below the poverty line (BPL) available for 1987-88 as the criteria for allocating a feasible annual level o f foodgrains to States/UTs for a targeted PDS.
* Based on the levels o f procurem ent and allocations/offtake o f foodgrains in the past, the Central G overnm ent should maintain an annual allocation level o f 15 m illion tonnes.
* Earmark about 80% o f the annual allocation i,e around 12 m illion tonnes for distribution to the States/UTs on the basis o f their share o f BPL population . This will work out to an availability o f 20 kgs per month per BPL household.
* 12 million tonnes o f foodgrains m eant for the BPL population should be issued to the States at highly subsidised prices and allocations to any State over and above this at near open market prices.
♦ A ceiling limit should be imposed for each State based on the highest offtake o f foodgrains in the past ten years. The States should be allowed full freedom to decide on the mode of distribution, pricing, identification o f beneficiaries etc.
2.3.4 The Working Group also worked out the subsidy implications o f the proposed targetted PDS. Distribution o f 12 million tonnes o f foodgrains to an estimated BPL population of 250 million (based on 29.9% BPL proportion applied on 1991 population census figure) worked out to a per capita availability of 20 kgs per poor household per month. The Working Group was o f the view that the targetting exercise would be meaningless if the benefit through PDS supply was insignificant. Therefore, it suggested that the monthly savings to a beneficiary household should be at least around Rs.50.00 per month on the purchase o f 20 kgs o f foodgrains through the PDS. This worked out to an unit subsidy o f Rs.2.50 per kg. At the time of the deliberations o f the Working Group (1995-96), the weighted average Central Issue Price (CIP) o f foodgrains worked out to a little over Rs.5.00 per kg. Thus, in effect the Working Group suggested an issue price for BPL population at half the normal CIP. The subsidy requirement per armum for 12 million tonnes worked to an additional Rs.3000 crore. Since the normal CIP o f about Rs.5.00 per kg already involved an unit subsidy o f about Rs.2.00 per kg, the actual consumer subsidy would have been Rs.4.50 per kg at 1995-96 costs and prices and the total subsidy would have been Rs.5400 crore. As the non-poor were required to purchase foodgrains at near open market price which was close to the economic cost o f foodgrains to the FCI, no additional subsidy was involved on this account.
Targetted Public Distribution System (TPDS): - As Implemented
2.3.5 The principles enunciated by the Working Group were adopted by the Government while implementing the TPDS w.e.f. 1st June, 1997. How'ever, the numbers and dimensions of TPDS as implemented differ greatly from those contained in the Report o f the W'orking Group. Under the TPDS, a quantity of lOkgs of foodgrains per family per month is being issued at highly subsidised rates to the States on the basis o f the number o f BPL families as against 20 kgs recommended by the Working Group. One o f the reasons that forced the Government to reduce the scale o f the ration to BPL is that the number o f BPL families had increased tremendously following the acceptance o f the methodology of
65
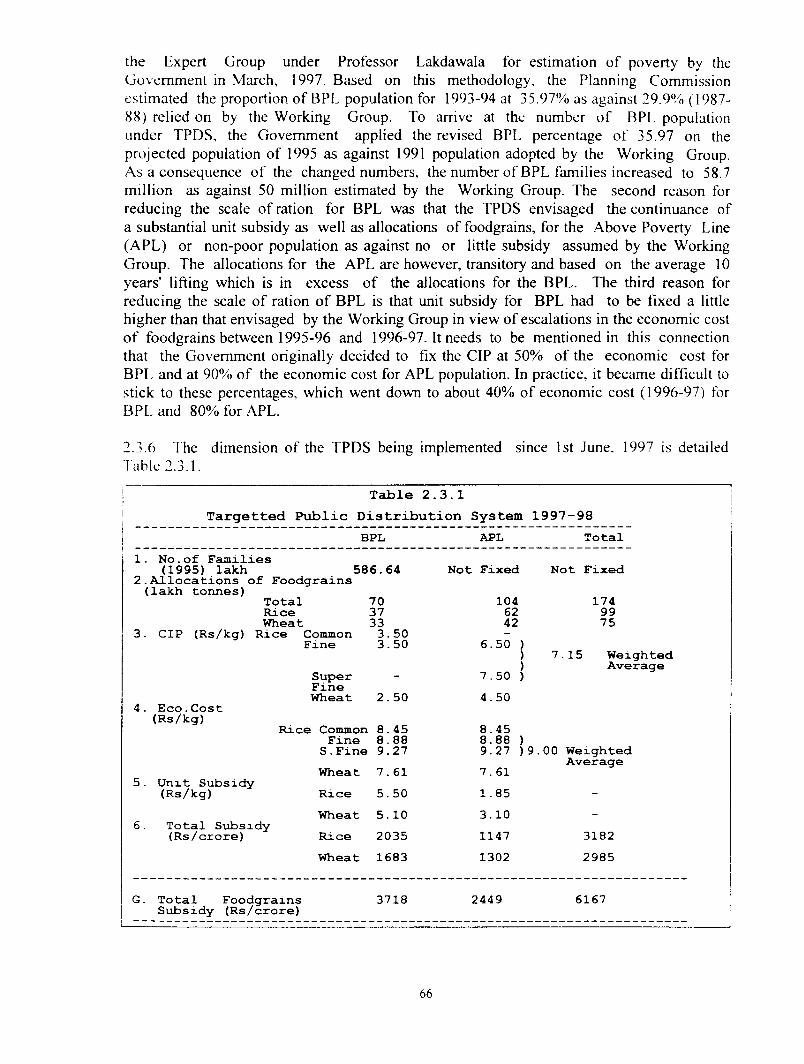
the Expert Group under Professor Lakdawala for estimation o f poverty by the Government in March, 1997. Based on this methodology, the Planning Commission estimated the proportion o f BPL population for 1993-94 at 35.97% as against 29.9% (1987- 88) relied on by the Working Group. To arrive at the number o f BPL population under TPDS, the Government applied the revised BPL percentage o f 35.97 on the projected population o f 1995 as against 1991 population adopted by the Working Group. As a consequence o f the changed numbers, the number o f BPL families increased to 58.7 m illion as against 50 million estimated by the Working Group. The second reason for reducing the scale o f ration for BPL was that the TPDS envisaged the continuance of a substantial unit subsidy as well as allocations o f foodgrains, for the Above Poverty Line (APL) or non-poor population as against no or little subsidy assumed by the Working Group. The allocations for the APL are however, transitory and based on the average 10 years' lifting which is in excess o f the allocations for the BPL. The third reason for reducing the scale o f ration o f BPL is that unit subsidy for BPL had to be fixed a little higher than that envisaged by the Working Group in view o f escalations in the economic cost o f foodgrains between 1995-96 and 1996-97. It needs to be mentioned in this connection that the Government originally decided to fix the CIP at 50% o f the economic cost for BPL and at 90% o f the economic cost for APL population. In practice, it became difficult to stick to these percentages, which went down to about 40% o f economic cost (1996-97) for BPL and 80% for APL.
2.3.6 The dimension o f the TPDS being implemented since 1st June, 1997 is detailed Table 2.3.1.
Table 2.3.1Targetted Public Distribution System 1997-98
BPL APL Total1. N o .of Families(1995) lakh 586.64 Not Fixed Not Fixed2 .Allocations of Foodgrains (lakh tonnes) Total 70 104 174
Rice 37 62 99Wheat 33 42 753. CIP (Rs/kg) Rice Common 3.50 -
Fine 3.50 6.50 )) 7 )
.15 Weighted AverageSuper - 7.50 )FineWheat 2.50 4.504. Eco.Cost (Rs/kg) Rice Common 8.45 8.45Fine 8.88 8.88 )S .Fine 9.27 9.27 )9.00 WeightedAverageWheat 7. 61 7. 615. tJnit Subsidy(Rs/kg) Rice 5.50 1. 85 -Wheat 5. 10 3.10 -
6. Total Subsidy(Rs/crore) Rice 2035 1147 3182Wheat 1683 1302 2985
G. Total Foodgrains 3718 2449 6167Siibsidy (Rs/crore)
66

2.3.7 The subsidy implication o f the TPDS at current (1997-98) costs and prices as worked out above is a little over Rs.6000 crore, roughly the same as budgeted for 1997-98. This does not include a sum of about R s.l500 crore towards the carrying cost o f a reasonable volume o f buffer stock.
2.3.8 Despite a very heavy subsidy burden, the TPDS has come in for severe criticism from various quarters including many State Governments. It has been argued that a scale o f ration o f 10 kgs per month per BPL family is grossly inadequate since the average requirement o f a family is about 30 kgs per month. An unit subsidy o f about Rs.5 per kg works to a subsidy o f only Rs. 50 per month which is not sufficient to make a significant dent on poverty. It has been suggested that the scale o f ration to BPL families should be raised to 20 kgs per month. Several State Governments have also expressed unhappiness that the quantum o f overall allocations has been restricted to 10 years' average off-take, rather than the maximum o f the allocations during the last 10 years. It has been suggested that the overall allocations to the States should be restored to the maximum level o f 25 .5 million tonnes achieved in 1996-97. Some o f the State Governments have also represented that under poverty based allocations for BPL they are being penalised instead o f being rewarded for bringing down their poverty ratios as compared to other States.
Review o f Targetted PDS
2.3.9 A review o f the TPDS is necessary in order to make it acceptable to the participant States. A system which is acceptable to the States should also be sustainable over a period o f time. Sustainability is a function o f coverage, scale o f allocations, unit economic cost o f foodgrains and unit subsidy which together determine the amount o f subsidy that the exchequer is required to bear. The key to sustainability lies in adhering to the principles o f the targetted subsidy system, in particular the need for confining the subsidies to the BPL families and reducing them, and eventually eliminating them, for the APL families, as enunciated by the Working Group o f the Planning Commission. Based on the current (1997-98) costs and prices, and other dimensions, the TPDS that may be acceptable to the States and sustainable from the point o f view o f the Central Government are outlined below.
2.3.10 The most persistent complaint against the current TPDS is the very low scale o f allocation @10kgs o f foodgrains per BPL family per month. The scale needs to be raised to 20 kgs. The annual requirement o f foodgrains @20kgs per month for an estimated58.7 million BPL families (based on Expert Group Methodology and the projected population o f 1995) comes to about 14 million tonnes, which needs to be earmarked. The second most important demand o f the States is to restore the overall annual allocations to25.5 million tonnes achieved in 1996-97. This means that about 11.5 million tonnes o f foodgrains will have to be allocated to the APL population.
2.3.11 As per the principles enunciated by the Working Group, the BPL families will have to be issued foodgrains at half the normal CIP, which should be defined as equal to economic cost o f foodgrains to the FCI. At current (1998-99) economic costs, the subsidy on 14 million tonnes o f foodgrains meant for BPL comes to about Rs.6300 crore as per the details given in Table 2.3.2.
67

Table 2.3.2Subsidy At Half Economic Costs to BPL(1998-99)
Rice Wheat
1 . Qu a n t i t y ;LMT) 0 20 kg p e r m o n t h
E c o n . C o s t (Rs/kg)
CI P ( 1 / 2 ECO. c o s t ) ( R s / k g )
U n i t s u b s i d y
T o t a l s u b s i d y ( R s / c r o r e )
Total
140
1 0 . 00
5. 00
5. 00
3700
8 . 00
4 . 00
4 . 80
2640 6340
2.3.12 If the sustainable amount o f subsidy is assumed to be Rs. 7500 crore (excluding the carrying cost o f buffer stock), as has been budgeted for 1998-99, about R s.l200 crore (7500-6300) only will be available for APL. This will be just enough to provide a subsidy o f Re 1.00 per kg for an allocation o f 11.5 million tonnes for the APL population. One fall out of the principle o f pricing foodgrains at
near economic cost for APL would be that there will be little demand from this section in normal times. With the market prices ruling at par with the economic cost, the consumers tend to rely more on the market than on the PDS. Therefore, it is expected that only afraction o f the allocation o f II.5 million tonnes will actually be lifted.
2.3.13 The second important key to sustainability is the periodic revision o f economic costfollowing changes in any of its components, such as, procurement price, procurement incidentals and distribution cost. While all attempts should be made to reduce the economic costs, especially when they exceed the market price, and the FCI's operational system be constantly reviewed and monitored for the purpose, the need for revision o f economic cost, which is inherently upwardly mobile, should not be overlooked. Otherwise, the subsidy burden, which is the gap between economic cost and CIP, will tend to rise andin no time exceed the sustainable limit.
2.3.14 In order to make the TPDS not only consistent with the principles o f TPDS but also attractive to the States, a reasonable amount o f additional subsidy of, say, Rs.500 crore, can be given to those States that succeed in reducing the level o f poverty below the national average. For this purpose, a scheme can be introduced to distribute the additional subsidy as grant to the eligible States based on their relative share o f BPL population who have been lifted out o f poverty as a result o f special efforts in bringing dowTi their poverty ratios below the national average. Other important features o f the current TPDS should be retained and strengthened. One such feature relates to issue o f subsidised foodgrains to all workers under EAS/JRY @ lkg per manday. This is in addition to the entitlement under TPDS. Under this scheme, the TPDS envisages issues o f "Food Coupons" to the beneficiaries to enable them to obtain foodgrains from the FPS, to which their normal family card is attached. Another important feature of the TPDS which should be retained and strengthened is the detailed operational scheme. In order to make the TPDS transparent and accountable and thereby plug the leakages, a number o f steps have been prescribed. These include: (a) release o f foodgrains to the States subject to satisfactory completion o f identification o f eligible families; (b) involvement of the Panchayats/Nagar Palikas in the identification exercise as well as for supervision of the work o f the FPS, (c)
68

constitution o f Vigilance Committees at FPS, Taluka, District and State levels and (d) a system of monitoring and reporting on the working o f the TPDS.
2.3.15 While the provision for food subsidy is made in the non-Plan budget o f the Central Government, for strengthening the operational machinery o f the PDS, the Planning commission provide funds under its plan programmes for the following schemes:
1) Construction o f Godown2) Purchase o f Mobile Vans/Trucks3) Training, Research and Monitoring.
2.3.16 The Godowns scheme is intended to assist the State Governments /UTs. for construction o f small godowns o f the capacity upto 2000 tormes in interior areas where it is necessary to maintain adequate stocks to ensure regular supplies under PDS. Since 1983-84 this scheme was being implemented to supplement the resources o f the State Governments, to augment the storage capacity in remote/inaccessible/hilly areas. Till 1991 the scheme was restricted to North Eastern States, Himachal Pradesh, Sikkim, J&K, Lakshadweep and Andaman & Nicobar Islands. With the launching o f RPDS in January, 1992 the scheme was further extended to cover all the identified RPDS areas. In 1998, a decision was taken to extend the scheme to all such areas in the country where the need for such facilities may exist. Funds under the scheme are released for small godowns in places where Central agencies like CWC, FCI etc. do not operate. The present pattern o f financial assistance is 50% loan and 50% subsidy. However, in the case of UTs without legislatures the entire assistance is in the form o f subsidy only. The Mobile Vans scheme is intended to provide financial assistance to the State Governments /UT adm\nist.raUons for purchase of mobile vans/trucks for distributing essential commodities in ruraLTiilly/remote and other disadvantaged areas where static/regular Fair Price Shops are not found viable/feasible. Initially, an assistance o f Rs.2.50 lakh was being provided for a delivery van/truck with 75% loan and 25% subsidy. With the liberalisation o f the scheme during 1992-93 the subsidy component o f the assistance was enhanced from 25% to 50% and the financial assistance per van/truck was also raised to Rs.4 lakh in the case o f delivery van (for 4 tonner) and Rs.8 lakh for big truck ranging from 8-10 tormes and above subject to the ceiling o f actual cost whichever is lower. Under this scheme, vehicles can be used not only as mobile Fair Price Shops but also for effecting door delivery o f PDS commodities to Fair Price Shops. The scheme is supplementary in nature as the running cost and its maintenance etc. are borne by the respective State Governments from their own budget.
2.3.17 The training scheme aims at strengthening and upgrading the skill o f persormel engaged in PDS and also to improve the management o f supplies. The efforts o f the State Govemments./UT administrations, Civil Supplies Corporations etc. are supplemented by providing financial assistance for organising training programmes on PDS. Evaluation studies, research studies on various aspects o f PDS are also sponsored under the scheme. Provision also exists for organising w'orkshops, seminars for various level officers/officials o f States as well as Central Ministries/Organisations. Generally, the maximum Central Assistance for a week's training course is limited to Rs.50,000/-. The assistance for research/studies/seminars etc. however, depends on the size, merits o f each case.
69

CHAPTER 3
HUMAN AND SOCIAL DEVELOPMENT
3.1 SECTORAL OVERVIEW
Introduction
3.1.1 Human development and improvement in quality o f life are the ultimate objectives o f ail Planning. This is to be achieved through policies and programmes aimed at promotion o f both equity and excellence. Planning takes into account the resources required for human development and human resources available for carrying out the Plan. India, the second most populous country in the world, has no more than 2.5% of global land but is the home o f l/6th o f the world's population. Living in a resource poor country with high population density, planners perceived in the figures o f 1951 census the potential threat posed by rapid population growth to the developmental activities, efforts to improve per capita income, availability o f food, clothing, education and employment, prevention o f environmental deterioration and enhancement o f the quality of life. India became the first country in the world to formulate and implement the National Family Planning Programme in 1952 with the objective o f "reducing birth rate to the extent necessary for stabilisation o f the population at a level consistent with the requirement o f the National economy".
3.1.2 The benefits o f national economic progress reach different segments o f the population through different channels at different rates. The needs o f people above the poverty line and an improvement in their standards o f living can be achieved through optimum utilisation o f existing market mechanism; but market mechanism may not improve access to available facilities or fully meet the essential needs o f the population with pxjor purchasing power. Economic growth improves the employment opportunities; employment improves purchasing power; but these alone may not Population projections
Population projections are required for planning adequate investm ents for:
□ Essential necessities such as food, shelter and clothing.
□ Essential prerequisites for human developm ent such as education, employment and health care
□ Optimal utilisation o f the available human resources for econom ic and social development.
be sufficient to improve the quality o f the life. Social sector planning ensures that appropriate policy and programme initiatives are taken and adequate investment is provided by the State in the social sector so that the poorer and vulnerable segments o f the population can access essential commodities. facilities and services based on their need and not ability to pay. It is expected that these efforts will accelerate human development and this, in turn, will ensure that the population becomes a major resource for developmental activities and acts as an important driving force for growth and development o f the economy.
70

Population projections 1996-2016
The population will increase from 934 million in 1996 to 1264 million in 2016
Between the periods 1996-2001 and 2011- 2016 there will be a decline o f :
U CBR from 24.10 to 21.41□ CDR from 8.99 to 7.48□ N G R from 1.51% to 1.39%□ IMR
Male from 63 to 38 Female from 64 to 39
Population projections
3.1.3 Right from 1958 the Planning Commission has been constituting an Expert Group on Population Projections prior to the preparation o f each of the Five Year Plans so that the information on the population status at the time o f initiation o f the Plan and population
projections for future are available during the preparation o f the Plan. The data from the population projections have been utilised not only for plarming to ensure provision o f essentials necessities such as food, shelter and clothing but also for the prerequisites for human development such as education, employment and health care. Over the years there has been considerable refinement in the methodology used for population projections and substantial improvement in the accuracy o f predictions. The projections made by the Standing
Committee on Population Projection in 1988 for the year 1991 was 843.6 million; this figure was within 0.3% of the 846.3 million reported in the Census 1991.
3.1.4 In 1996, prior to the formulation of tlie Ninth Plan, the Planning Commission had constituted a 1’echnical Group on Population Projections, under the Chairmanship of Registrar General India, lo work oul Ihe population projections for the country for the period 1996 to 2016 on the basis o f census 1991 and other available demographic data. The Group worked out the projections for the population o f the country (Table 3.1.1) and the major States for the period 1991-2016 . The age and sex-wise distribution o f the projected population is given in Table 3.1.2. Population pyramids for the period 1971 to 2016 (drawn on the basis o f census figures for 1971,1981 and 1991 and on the basis o f population projections for the period from* 1996-2016) are shown in Figure 1.
3.1.5 Demographic transition is a global phenomenon. The transition is from high fertility, high mortality, stable population scenario, to low fertility, low mortality and stable population scenario. India is currently in the second stage o f transition; the rate o f fall in birth rate exceeds fall in death rates and for the first time after three decades the population growth rate has fallen below 2%. Surveys undertaken in the country have unequivocally shown that awareness about contraception is universal; there is substantial unmet need for contraception. The short term goals during the Ninth Plan period will be to assess and meet all the felt needs for maternal and child health care and contraception; the focus will be on meeting the unmet needs for contraception and achieving reduction in the high desired level o f fertility through programmes for reduction in IMR/MMR. The medium and long term goals will be to continue this process o f enabling the couples to achieve their reproductive goals and simultaneously enable the country to accelerate the pace of demographic transition and achieve population stabilisation as early as possible. Early population stabilisation will enable the country to achieve its developmental goal of improvement in economic status and quality o f life o f the citizens. Along with the demographic transition, there is concurrent ongoing socioeconomic, educational, information technology transition. These will improve access, enhance the awareness and promote optimal utilisation of the available services. By bringing about an accelerated convergence of all these favourable factors it will be possible not only to hasten the pace of demographic transition but also impro\ cthe quality o f life.

CHANGES IN POPULATION PYRAMID -1971 TO 2016[Figure -1
41.87 39.60
94.19
M.81 37.73
55.60
6.S7
mmi.99.93
37.79
M ALE 1971 FEM ALE MALE I M l FEM ALE M ALE 1991 FEM ALE
34 00
7.00
90.40
y /////////////A '
63 60
34 90 28.40
M ALE 20ei FEM ALE MALE 2011 FFM A I.F MALE 2016 FEM ALE

Effective implementation of RCH Programme and acliievement of targets set for CBR would avert about 1 million births and 1,40,000 infant deaths in 2002 AD. If the goals o f RCH Programme are met, India could achieve TFR of 2.1 at the national level a decade earlier than current projections. A reduction in birth rate of this magnitude would prevent an otherwise inevitable increase in number of births due to rise in reproductive age population two to three decades later, lead to population stabilisation earlier and at a substantially lower figure than the current projections.
Im plications o f ongoing demographic transition to the social sector planning: Econom ic Implications
3.1.6 Population growth and its relation to economic growth has been a matter o f debate for over a century. The early Malthusian view was that population growth is likely to impede economic growth because it will put pressure on the available resources, result in reduction in per capita income and resources; this, in turn, will result in deterioration in quality o f life. Contrary to the Malthusian predictions, several o f the South East Asian countries have been able to achieve economic prosperity and improvement in quality o f life inspite o f population growth. This has been attributed to the increase in productivity due to development and utilisation o f innovative technologies by the young educated population who formed the majority o f the growing population. These countries have been able to exploit the dynamics o f demographic transition to achieve economic growth by using the human resources as the engine driving the economic development; improved employment with adequate emoluments has promoted saving and investment which in turn stimulated economic growth.
3.1.7 However, it is noteworthy that not all countries which have undergone demographic transition have been able to transform their economies. Sri Lanka in South Asia which underwent demographic transition at the same time as South East Asian countries still continues to have poor economic indices. It is likely that population growth or demographic transition can have favourable impact on economic growth only when there are optimal interventions aimed at human resource development and appropriate utilisation o f available human resources.
3.1.8 For India the current phase o f demographic transition with low dependency ratio and high working age group population represents both a challenge and an opportunity. The challenge is to utilise these human resources fully, give them appropriate jobs with adequate emoluments; if this challenge is met through well planned schemes for employment generation which are implemented effectively, there will be improved national productivity and personal savings rates; appropriate investment o f these savings will help the country to achieve the economic transition from low economic growth - low per capita income to high economic growth - high per capita income. It is imperative to make the best o f this
Econom ic implications o f dem ographic transition
The next two decades will witness:□ Increase in the 15-59 age group from 519 -
800 million□ Low dependency, ratit
Challenge is to ensure:□ Adequate investment in HRD□ Appropriate employment with adequate
emoluments
Opportunity is to:□ Utilise available abundant hum an resources
to accelerate economic developm ent

opportunity so as to enable the country and its citizens to vault to the high income- high economic growth status.
Interstate differences:
3.1.9 The projected values for the total population in different regions (Fig. 2), Total Fertility Rate (TFR) and the probable year by which the replacement level TFR o f 2 1 will be achieved by different States and India, if the pace o f decline in TFRs observed during 1Q81- 93 continues in the years ahead and expectation o f life at birth are shown in Tables 3 13, 3 1 4 & 3 15. There
Population Projections(Reqicn Wisa)
F igure-2are markeddifferences between States in size o f the population, population growth rates and the time by which TFR o f 2 1 is to be achieved If the present trend continues, most o f the Southern and the Western States are likely to achieve TFR .-)f 2 1 by 2010.Urgent energetic steps to assess and fijlly meet the unmet needs for maternal and child health (MCH) care and contraception through improvement in availability and access to family welfare services are needed in the States o f UP, MP, Rajasthan and Bihar in order to achieve a faster decline in their mortality and fertility rates. The performance o f these States would determine the year and size o f the population at which the country achieves population
stabilisation.
B N A R , M .P
R AJASTHAN
OR ISSA. U P
■ 1996 ^ 2 0 0 1Source Registrar G eneral India
Region
0 2 0 0 6 1 □ 2 0 1 6
Interstate differencesThere are m assive interstate diflFerences in population, population growth rates, tim e by w hich TFR o f 2 1 and population stabilisation will be achieved
These differences will have m ajor im pact on □ H ealth and nutritional status
Education and skill developm ent A ppropriate em ploym ent w ith adequate em oluments Rural ~ urban and interstate migrations Social and economic development.
3.1.10 There are also marked differencesbetween States in socioeconomic development Increasing investments and rapid economic development are likely to occur in the States where literacy rates are high, there is ready availability o f skilled work force and
adequate infrastructure. In these States, population growth rates are low. If equitable distribution o f the income and benefits generated by development is ensured, substantial increase in per capita income and improvement in quality o f life could occur in these States in a relatively short time
3.111 In majority o f States with high population growth rates, the performance in the social and economic sector has been poor The poor performance could be the outcome o f a variety o f factors including paucity o f natural, financial or human resources Poverty, illiteracy and
Efforts arc to provide adequate inputs to improve perform ance so that the disparities between states will be narrowed.
74

poor development co-exist and reinforce each other. In order to promote equity and reduce disparity between States, special assistance has been provided to the poorly performing States. The benefits accrued from such assistance has to a large extent depended upon :
a. the States' ability to utilise the available funds and improve services and facilities, andb. community awareness and ability to utilise the available services.
3.1.12 In spite o f the additional assistance provided, improvement in infrastnicture, agriculture and industry have been sub-optimal and the per capita income continues to be low in most o f the poorly perfonning States. These States also have high birth rates and relatively low literacy rates. It is imperative that special efforts are made during the next two decades to break this vicious self perpetuating cycle o f poor performance, poor per capita income, poverty, low literacy and high birth rate so that the further v/idening o f disparities between States in terms o f per capita income and quality o f life is prevented. In addition to the special assistance available to poorly performing States, additional Central assistance from Basic Minimum Service (BMS) programme will also be available during the Ninth Plan period for achieving these objectives.
3.1.13 The higher population growth rates and low per capita income in poorly performing States are likely to have a major impact on several social sector programmes. The health status o f the population in these States is poor; the health sector programme will require inputs not only for improving infrastructure and manpower, but also increasing efficiency and improving performance. The Family Welfare Programme has to address the massive task o f meeting all the unmet needs for MCil and contraception so that there is a rapid decline in mortality and fertility rates. Due to high birth rate, the number o f children requiring schooling will be large. The emphasis in the education sector on primary education is essential to ensure that the resource constraints do not result in an increase in either proportion or number o f illiterates. Emphasis on prevocational and vocational training in schools will enable these children to acquire skills through which they will find gainful employment later.
3.1.14 The available data from census shows that until 1991 both internal and international migration has been negligible. The Technical Group while computing the population projection upto 2016, has assumed that the component o f migration between major States and from India will be negligible. This assumption may not be valid if there is ftirther widening o f the disparity between States in terms o f economic growth and employment opportunity. Given the combination of high population growth, low literacy and lack o f employment opportunities in the poorly performing States, there may be increasing rural to urban migration as well as interstate migration especially o f unskilled workers. Such migration may in the short run assist the migrants in overcoming economic problems associated with unemployment. However, the migrant workers and their families may face problems in securing shelter, education and health care. It is essential to build up a mechanism for monitoring these changes. Steps will have to be taken to provide for the minimum essential needs o f the vulnerable migrant population.
Changes in Labour Force
3.1.15 Currently, India's population is undergoing a relatively slow but sustained demographic transition . During the next two decades, the proportion o f the population in the age-group 20-60 years m the countr}' will be very large, because o f the high birth rates during the last three decades. Increasing literacy and decreasing birth rates may result in more
75

women seeking economically productive work outside home. Planners have to ensure that there is sustained high economic growth rate, in sectors which are labour-intensive to ensure adequate employment generation for productively utilising this massive work force. This challenging task could be viewed as a major opportunity; this large group o f literate, skilled, aware men and women if utilised as human resource could trigger off a period o f rapid economic development.
3.1.16 During the next two decades, there will be a substantial reduction in birth rates and therefore a reduction in the proportion o f the dependent child population. The proportion o f the dependent population beyond 60 years is relatively small and will expand relatively slowly over the next two decades. Thus for the next two or three decades the country will have relatively low dependency ratios. If the massive work force in age-group 20-60 years get fully employed and adequately paid, the relatively low level o f dependent children and elders might result in increased savings and investments at household level; this in turn will improve the availability o f resources for accelerated economic growth.
SEX-RATIO IN INDIA
9700)^ 960
o 950 o
^ 930
920
910
900
So>
Rgurê a Ratio
3.1.17 The reported decline in the sex ratio during the current century has been a cause for concern (Figure 3). The factors responsible for this continued decline are as yet not clearly identified. However, it is well recognised that the adverse sex ratio is a reflection o f the gender disparity. Appropriate steps to correct this will be taken during the Ninth Plan period. There is an urgent need to ensure that all sectors collect and report data on
sex disaggregated basis; this will be of help in monitoring for evidences o f gender disparity; continued collection, collation, analysis and reporting o f sex disaggregated data from all social sectors will also provide a mechanism to monitor whether girls and women have equal access to these services.
1901 1911 1921 1931 1941 1951 1961
CENSUS YEAR
1971 1981 1991
Source: Registrar General India
Sex ratio at birth(1981-90)
Figure 4
SRS Estimates-Registrar General, India
3.1.18 The SRS based estimates o f average sex ratio at birth for the period 1981-90 for the major States and India are given in Figure 4. The observed sex ratio o f 110 is much higher than the internationally accepted sex ratio at birth o f 106. There had been speculations as to whether female
76

infanticide, sex determination and selective female foeticide are at least in part responsible for this. The Government o f India has enacted a legislation banning the prenatal sex determination and selective abortion. Intensive community education efforts are under way to combat these practices, especially in pockets from where female infanticide and foeticide have been reported. Higher childhood mortality in girl children is yet another facet o f the existing gender disparities and consequent adverse effect on survival. In the reproductive age- group the mortality rates among women are higher than those among men. The continued high maternal mortality is one o f the major factors responsible for this. Effective implementation o f the Reproductive and Child Health Programme is expected to result in a substantial reduction in maternal mortality. At the moment, the longevity at birth among women is only marginally higher than that among men. However over the next decade the difference in life expectancy between men and women will progressively increase. Once the reproductive age group is crossed the mortality rates among women are lower. The proportion o f women in the over- 60 age- group is expected to increase. Steps to ensure that these women do get the care they need are being taken by concerned Departments including the Departments o f Health, Family Welfare and Women and Child Development.
Increasing Longevity
Increasing, longevity:
□ The population o f elderly (>60 years) will increase from 62.3 million in 1996 to 112.9 million in 2016
□ Improved health care has added "Years to life”
□ Increased social sector investment is needed to add “Q uality o f life to years”
3 .1.19 The projected level o f expectation of life at binh 1996-2016 is shown in Table 3 .i.6 . It is obvious that over the next three decades the country will be facing a progressive increase both in the proportion and number o f persons beyond 60 years of age. Over the next 20 years, there will be a small but significant increase in number and proportion o f persons in the group over 60 years o f the age; the subsequent decades will witness massive increase in this age group. It is noteworthy that women out number men in the 65+ age group; it is expected that over the next two decades longevity in women will substantially increase. Increasing longevity w'ill inevitably bring in its wake increase in the prevalence o f noncommunicable diseases. The growing number o f senior citizens in the country poses a major challenge; the cost o f providing socio-economic security and health care to this population has to be met; currently several region and culture specific innovative interventions to provide needed care to this population are underway; among these are efforts to reverse the trend o f break up o f joint families. If these efforts succeed, it will be possible to provide necessary inputs for the care o f rapidly increasing senior citizens population in the subsequent two decades.
3.1.20 Majority o f the people in their sixties will be physically and psychologically fit and would like to participate both in economic and social activities. They should be encouraged and supported so that they do lead a productive life and also contribute to the national development. Senior citizens in their seventies and beyond and those with health problems would require assistance. So far, the families have borne major share in caring for the elderly . This will remain the ideal method; however there are growing number o f elderly without family support; for them, alternate modes for caring may have to be evolved and implemented. Improved health care has "added years to life". The social sectors have to make the necessary provisions for improving the quality o f life o f these senior citizens so that they truly " add life to years.”

Population projections and their implications for the FW program m e
Figure-5
PROJECTED POPULATION - INDIA900800700600zo 500
_ J_ I 4002 300
2001000
15-59 Y e a r e _ _ _ _ -«
< 1 5 Years------ ♦ ■ ♦ ^
60 Years & above__ ..-A----------▲-----------* -------------
1996 2001 2006 YEAR
Source:- Registrar General India
2011 2016
3.1.21 The projected populations of India in the three major age groups (less than 15, 15-59, 60 years or above) are shown in Figure 5.
3.1.22 There will be a marginal decline in the population less than 15 years o f age (352.7 million to 350.4 million). The health care infrastructure w ill therefore be not grappling with ever increasing number o f children for providing care and they will be able to concentrate on
Age group < 15 years
There will be no increase in num bers
Focus will be to improve□ quality and coverage o f health and nutrition
services at\d achieve im provem ent in health and nutrional status
□ improve access to education & skill developm ent
(a) improving quality o f care;
(b) focus on antenatal, intranatal and neonatal care aimed at reducing neonatal morbidity and mortality;
(c) improve coverage and quality o f health care to vulnerable and underserved adolescents;
(d) promote intersectoral coordination especially with ICDS programme so that there is improvement in health and nutritional status;
(e) improve coverage for immunization against vaccine preventable diseases.
3.1.23 The economic challenge is to provide needed funds so that these children have access to nutrition, education and skill development. The challenge faced by the health sector is to achieve reduction in morbidity and mortality rate in infancy and childhood, to improve nutritional status and eliminate ill-effects o f gender bias.
Age G roup 15-59 years
□ There will be an increase from 519-800 million in two decades
□ They will be requiring w ider spectrum o f health care services and im provem ent in quality o f services
□ Family Welfare program m e has to cater to :□ Maternal and child health services□ Contraceptive care□ Gynaecological problem s□ RTI /STD m anagem ent
3.1.24 There will be a massive increase of population in the 15-59 age group (from 519 million to 800 million). The RCH care has to provide the needed services for this rapidly growing clientele. The populations in this age group is more literate and has greater access to information; they will therefore have greater awareness and expectation regarding both the access to a wide spectrum o f health care related services and the quality o f these services. The Family Welfare Programme has to
78

cater to wider spectrum of health care needs o f this population - including maternal and child health care, contraceptive care, management of gynaecological problems, STD/RTI/HIV management and control; quality o f services need also be improved.
Age group 15-59
Challenge is the m assive increase in the num ber o f people in this age group. They will;□ need wider spectrum o f services□ expect better quality o f services□ expect fulfillment o f their felt needs for
MCH/FP care
Opportunity is that if their felt needs are m et through effective implementation o f RCH program m e, it is possible to accelerate dem ographic transition and achieve rapid population stabilisation.
3.1.25 There will be a substantial increase in the population more than 60 years (62.3 million to 112.9 million). In the next two decades, increasing numbers o f the population beyond 60 years would necessitate provisions for management of some o f the major health problems in this age group including early detection and management o f cancers.
3.1.26 There has been a paradigm shift in Family Welfare Programme; centrally defined method specific targets have been replaced by community based need assessment and decentralised planning and implementation o f the programme to fulfil these needs. The ongoing educational, info- technology and socio-economic transition have raised awareness and expectations o f the population. It has been recommended that a Population Policy is drawn up to provide reliable and relevant policy frame work for the programmes in the Family Welfare and the related social sectors, for mcasur\!:\g And mouiloriug the delivery of services and their demographic impact in the new milienium.
3.1.27 Any projection o f expected levels of achievement in the demographic indices by the end o f the Ninth Plan has to take into consideration the pace o f improvement in these indicators during the Eighth Plan and the additional policy and programme measures envisaged to accelerate the pace o f achievement durmg the Ninth Pian. The projections regarding expected levels o f achie\ement have been worked out at two different levels, one on the basis o f the assumption that the trend observed with regard to these parameters in the last 15 years will continue during the Ninth Plan period and the second on the assumption that the additional policy and programme mitiatives provided during the Ninth Plan period will result in the acceleration o f the pace and result in substantial improvement during the Ninth Plan period. The expected levels o f achievement under these two sets o f assumptions for CBR is 24 and 23/1000. difference in the birth rate of this magnitude would make the difference o f about one million births in 2002 .AD alone. Similarly if the Programme achieves, the accelerated decline in IMR (from 56/1000-50/1000) over 140 thousand infant deaths will be averted in 2002 .A.D. These achievements may be the beginning o f a major acceleration in pace of demographic transition and impro\ ing health status o f the population.
Health Implication of the demographic transition
3.1.28 It was earlier assumed that population growth demographic transition will lead to overcrow'ding. poverty, undernutrition, enviromnental deterioration, poor quality o f life and increase in disease burden. In recent years this view has been challenged. The period during demographic transition with increase number and proportion o f persons in the age group 15- 59 years may. if appropriate health services are made available, lead to substantial improvement in the health status of the population. The increase in population at this stage of demographic transition is mamiy among younger, better educated and healthy population with low morbidity and mortality rate. The challenge for the health sector is to promote
79

healthy life styles, improving access to and utilisation o f health care and achieve substantial reduction in mortality and morbidity Occupational health and environmental health programme need be augmented to ensure that working population remain healthy and productive. If these challenges are fully met, it is possible to accelerate reduction in morbidity and mortality rate in this age group
3 1 29 There will be a small but significant increase in the elderly in ihe next decade The impact o f growing number o f senior citizens is likely to result in substantial increase in for heahh care needs especially for management o f noncommunicable diseases in this population Increasing availability and awareness about technological advances for management o f these problems, rising expectations o f the population and the ever escalating cost o f health care are some o f the challenges that the heahh care system has to cope with Health care delivery systems will have to gear up to taking up necessary preventive, promotive, curative and rehabilitative care for this population
3.1.30 From foregoing paragraphs it is obvious that the on-going demographic transition is both a challenge and an opportunity. The challenge is to ensure human development and optimum utilisation o f human resources. The opportunity is to utilise available human resources to achieve rapid economic development, human developm.ent and improvement in quality o f life. It has to be realised that demographic transition does not occur in isolation Simultaneously, there are ongoing economic transition, education transition, health transition and reproductive health transition. All these affect human development If there is svnergy between these transitions; the transhions can be completed rapidly, there will be substantial improvement in human development and economic development The focus o f planners programme implementers and the people during the next tv/o decades will have to be in achieving the synergy so that India can achieve rapid improvement in economic and social development
Social sector Planning
3 1.31 Social sector planning ensures that appropriate policy and programme initiatives are taken and adequateinvestments are provided to the social sector so that the poorer and more vulnerable segments o f the populationhave access to essentialservices and neededfacilities The chapter on human and socialdevelopment deals with the achievements and proposed plans in social sectors and services listed in the box
B asic M in im um Services:
3 1,32 Providing integrated essential services lo the population has been an objective o f the social sector planning right from the first Plan period The community development Block was the instmment o f such development in iTira! a^eas during the first four Plan periods Ttie
80
Sectors covered in the chapter on Human and Social Developm ent
□ B asic M inim um Services□ Specia l A ction Plan□ H ealth□ Farml',' W elfare□ F.ducation. Culture, Y oulh Afl'air and Spoi l.s□ i,abour, Km ployinent and M anpow er□ Urban D evciop m en l ( including urban tiii.sic services)□ Em poweriricnl o f W om en and D evelopm ent ol Childreri□ E m p ow en n en t o f the SocialK I )isadvantaged ( irciups□ Social W elfa ic ,

initial focus was on provision o f these services to the underserved rural population during the first two decades. However, by the mid- seventies, urban migration and explosive expansion o f the urban population outstripped the existing services. It became imperative to invest in the provision o f basic services to the urban population and urban development also.
3.1.33 In an attempt to provide greater focus and ensure achievement o f objectives through careful monitoring, the Minimum Needs Programme (MNP) was formulated in the Fifth Plan. Over the last four Plans earmarked funds were provided under the MNP for establishment o f a network of facilities and services for social consumption according to national norms throughout the country. The review o f progress achieved so far indicates that the investment has brought about improvement in infrastructure and services available; however, the targets set are unlikely to be achieved within the time-frame. It is also a matter o f concern that the performance under MNP was sub optimal in states where the access to these services were poor prior to the initiation o f the programme and over years the disparities in availability o f services between States and between districts has widened.
□□
□□□□□
The Seven Basic Minimum Services are:
Primary health care services Provision o f safe-drinking water Universalisation o f primary education Housing assistance to shelterless Nutrition supportStreamlining o f PDS with a focus on the poor Connectivity o f unconnected villages.
3.1.34 Recognising that the access to basic minimum services to all in urban and rural areas is for improvement in the quality o f life of the citizens, the Conference o f Chief Ministers held in 1996, resolved that the core o f the social development plan for the seven Basic Minimum Services should be initiated in a time bound fashion. Among these Primary Health Care, Primary Education and Provision of Safe-drinking water have been accorded higher priority, with a target o f universal coverage by 2000 AD.
Special Action Plan for Social infrastructure
3.1.35 The Special Action Plan (SAP) envisages expansion and improvement o f the social infrastructure - health care, education, housing (urban and rural), water supply and sanitation (urban and rural). For some sectors eg. housing specific targets to be achieved with in a defined time frame have been set; for other sectors such as health the efforts are to achieve substantial expansion and improvement o f availability and quality o f services. The details o f the Special Action Plan goals and the strategy for achievement o f these goals is discussed under each o f the sectoral programmes.
Health
3.1.36 Increasing realisation that healthy human resource is an essential prerequisite for all developmental activities has led to interest and investment "in" and "for” health even under severe resource constraints. Over the last 5 decades India has built a massive health care infrastructure to provide access to health care in urban and rural areas. National Programmes for combating major health problem have been evolved and implemented through this health
due to
to non-
HealthMajor areas o f concern are:□ Continued high morbidity
com municable diseases□ Rising disease burden due
com municable diseases□ Escalating cost for health care
Focus during Ninth Plan will be on:□ Providing integrated preventive,
promotive, curative and rehabilitative services in primary, secondary and tertiary health care institutions with appropriate referral linkages.
81

infrastructure. These efforts have resulted in steep decline in death rate and rise in life expectancy. Some States like Kerala have health indices comparable to developed countries that have been achieved relatively at a low cost. Though there has been a steep fall in mortality rates through out the country, disease burden due to morbidity continues to remain high. Yet another cause o f concern is the continued high and rising morbidity rates due to communicable and non-communicable diseases and nutritional problems. Rapid technological improvements in health care and increasing population awareness about these have further widened the gap between what is possible and what is feasible within the resources available for the individual and in the country. The focus during the Ninth Plan is therefore, on providing integrated preventive, promotive, curative and rehabilitative services for communicable and non-communicable diseases through appropriate strengthening o f existing Primary Health Care Infrastructure by filling in the existing gaps in physical infrastructure and manpower and ensuring their optimal utilisation both in urban and in rural areas.
Family W elfare Programme
3.1.37 Technological advances, improvement in quality and coverage o f health care, implementation o f disease Control Programmes, lEC campaigns, and increasing literacy have led to increased utilisation o f available health services and resultant steep decline crude death rate from 25.1 in 1951 to 9.8 in 1991. Life expectancy rose from 32 years in 1947 to 59.4 years in 1989-93. In contrast, the reduction in Crude Birth Rate (CBR) has been less steep declining from 40.8 in 1951 to 29.5 in 1991. As a result the annual exponential population growth rate has been over 2% in the period between 1961 and 1991.
3.1.38 There is usually a lag period between fall in infant mortality rates and decline in birth rates because the population has to recognise the fall in mortality rates and respond to the change by reduction in the desired fertility level. Awareness about and access to Family Welfare services have shown substantial improvement during the last two decades. Because o f these factors there has been a steeper fall in birth rate and annual population growth rate during the Eighth Plan period. Reduction in population growth rate was one o f the major objectives o f during the Eighth Plan and continues to be a major objective during Ninth Plan. It is expected that with vigorous effective implementation o f Reproductive and Child Health Care programme the rate o f decline in population growth will be accelerated during the Ninth Plan period.
3.1.39 It is obvious that the decline in fertility and mortality rates have occurred in all States, the rate o f decline was slower in some States like U.P. and Bihar; even within the same state there are substantial differences between districts. It is imperative that efforts are made to remove or minimise inter and intra state differences in the vital indices. For this purpose the NDC Committee recommended that there should be:
1. decentralised area specific planning based on the need assessment2. emphasis on improved access and quality of services to women and children3. creation o f district level data base on quality and coverage indictors for monitoring of
the programme
3.1.40 The Dept o f Family Welfare has started implementing these recommendations. From 1.4.96 the centrally defined method specific targets for Family Planning have been replaced by:
82
1. need assessment and fulfillment through decentralised PHC based planning and implementation o f the programme.
2. improved access and quality o f comprehensive reproductive and child health services.
3.1.41 It is envisaged that this shift will enable the increasingly aware population to access available facilities so that they fulfill their reproductive goals and enable the nation to rapidly attain population stabilisation and improvement in quality o f life o f all the citizens.
3.1.42 The large size o f the population in the age group 15-50 (60%), unmet need for contraception (20%) and high wanted fertility because o f high IMR (20%) are the three major causes for the current high birth rates. During the Ninth Plan efforts will be to meet all the unmet needs for contraception by 2002 AD, and to achieve a reduction in the IMR and MMR through effective implementation of Reproductive and child health Programme .
3.1.43 If all these efforts to provide essential services to the population to meet their reproductive goals succeed, it might be possible for the country to achieve the TFR o f 2.1 by 2010; this achievement in turn will enable the country to achieve population stabilisation at a substantially lower level well head o f the projected year for population stabilisation. It should however be realised that even if all the efforts for achieving TFR of 2.1 are successful country's population will continue to grow during the next few decades. Adequate provision for meeting the minimum essential needs o f this growing population and social sector provision to enable them to access requirements for human development have to be made during the next few decades.
Education, Culture, Youth Affairs and Sports
3.1.44 Education holds the key for increasing awareness o f the population o f the methodsfor improving their quality o f life through appropriate utilisation o f available resources, opportunities and facilities. Ample data exists to clearly demonstrate that investment in primary education specially education to women and girl children can play an important role in improving and sustainable on-going developmental efforts. The commitment for universal primary education and adult literacy in the past has resulted in marked improvement in literacy rates over the last five decades; however the target o f universal primary education continues to elude achievement. In view o f this, a special thrust under BMS will be given during the Ninth Plan so that the Nation achieves full literacy by 2005. Prevocational,vocational training in school and technical training aimed at providing skilled humanresource for accelerated industrial and agrarian development is another thrust area o f the Ninth Plan. Adequate opportunities will be provided for higher education as it is necessary for meeting the human resources required for the tasks o f plarming, teaching, research and similar activities. In order that the country's requirement o f social scientists, creative artists and theoreticians is adequately catered to appropriate investment will be ensured in these areas o f higher education. Youth will be involved in the task o f nation building focussing their energies strongly in programmes o f environmental protection as well as health and family-life education. Creating widespread awareness for physical and mental fitness starting from the school stage onwards and making youth and sports activities an integral part o fevery stage of education will be the cherished goals.
83

3.1.45 India is the country with the second largest population in the world. Planned optimal utilisation o f the human resources will not only ftiel economic development but also ensure improvement in human resources o f life o f the citizens. Manpower development to provide adequate labour force, o f appropriate skills and quality to different sectors essential for rapid socioeconomic development and elimination o f the mismatch between skills required and skills available has been the major focus o f activity during the last fifty years. Employment generation in Public, private and voluntary sectors as well as providing enabling environment for both wage and self employment has received due attention both in lirban and rural areas. Attempts have also been made to eliminate bonded labour, employment o f children and women in hazardous industries and minimising occupational health hazards.
3.1.46 In addition to the attention paid for employment generation, elimination o f such undesirable practices as child labour, bonded labour, ensuring workers safety and social security, labour welfare and providing necessary support measures for sorting out problem relating to employment o f both male and female workers in different sectors will receive priority attention during the Ninth Plan period. It is also envisaged that the employment exchanges will be reoriented so that they become the source o f labour related information, employment opportunities and provide counseling and guidance to employment seekers.
Urban Development, Housing, Water Supply and Civic Amenities
3.1.47 Rapid urbanisation over the last fifty years has resulted in steep increase in urban population; urban India contributes 45-50% o f the GDP. The projections regarding urban population made by the Technical Group on Population projections is given in Table 3.1.6. Ongoing accelerated economic growth is expected to further increase growth o f urban population. In spite o f all the developmental efforts the demand for urban basic services like safe drinking water supply, sanitation including management o f solid and liquid waste, urban transport has by far outstripped the availability. The needs for improvement in the urban infrastructure have not been fully met and there has been a perceptible deterioration in urban environment. During the Ninth Plan period this challenging task o f meeting the felt needs for urban basic services and development o f urban infrastructure will be addressed through decentralisation, innovative mechanisms for funding the urban basic services programme as also devising new methodologies for dealing with sub-sectoral issues.
Empowerment o f women and development of children
3.1.48 Ample data exists mdicating that undemutrition and child mortality rates are higher in girls; to a large extent this has been attributed the existing gender disparity in feeding practices and health care seeking behaviour o f the parents. Health education efforts are underway to eliminate these. The National Plan o f Action for the Girl Child on the theme o f "survival protection and development" has been evolved and is being implemented by the concerned Departments. Efforts for universalisation o f ICDS and intersectoral cooperation between concerned sectors to improve both child survival and development are underway. These efforts will be continued and augmented in the Ninth Plan period.
3.1.49 Empowerment o f women to be the agents o f social change and development has been recognised as one o f the major objectives during the Ninth Plan. With increasing literacy,
Labour Employment and Manpower
84

awareness about opportunities, reduction in family size and time required for childbearing and child rearing, it is likely that there will be increasing number o f women who will be seeking employment on full time or part time basis. Their entry into this sphere o f economic activity and income generation will be o f considerable significance specially to small scale sector, home-based agro, agriculture and handicrafts production. While encouraging this development, it is essential to take steps to prevent economic exploitation o f women; efforts will be directed to prevent or reduce the potential adverse health impact o f dual stress o f household work and economically productive activities on women. The draft National Policy on empowering, when it comes into action, is expected to meet these goals.
Empowerment of Socially Disadvantaged Groups
3.1.50 One o f the objectives o f Planning is to ensure equitable distribution o f yields o f development among all segments o f population. In order to ensure equity social welfare, and developmental programmes have been taken up over the last five decades among the disadvantaged segments o f the population. Developmental activities had been directed towards socio-economic upliftment o f disadvantaged groups such as SCs, STs, OBCs and minorities. The initial efforts during the fifties and sixties were through designing and implementation o f programmes for the welfare o f these groups; removal o f economic and social disability prevalent amongst special groups through educational development, economic development and provision o f social justice were the focus o f efforts during the seventies and eighties. These efforts did improve the situation to some extent but large segments o f these groups still did not get covered through the ongoing programmes. The thrust during the Ninth Plan wi\l be to improve coverage, empower these groups and to provide an enabling environment for them to thrive and develop, so that they become agents o f social change and economic development.
Social Welfare:
3.1.51 Social Welfare deals with the Welfare and Development o f those vulnerable groups who fail to cope up with the rapid socioeconomic changes and started lagging behind the rest o f the society. They include - persons with disabilities, social deviants who come in conflict with law, and the other disadvantaged. Since Independence efforts were made to improve the lot o f these people through effective policies and programmes. However, a lot needs to be done to ensure their well-being. Therefore, the Ninth Plan proposes to adopt a three - fold strategy specific to each group namely, empowering the disabled, reforming the social deviants and caring for the other disadvantaged.
85

TABLE- 3.1.1
PROJECTED POPULATION OF INDIA.1996-2016
INDIAYEAR (in '000)
MALE FEMALE1996 484859 4493601997 492571 4573071998 500359 4652491999 508174 4731502000 515984 4809612001 523780 4886062002 531395 4962122003 539344 5041902004 547556 5124682005 555964 5209712006 564498 5296282007 573068 5383782008 581573 5469992009 590018 5554952010 598407 5638762011 606744 5721452012 614749 5802862013 622966 5886082014 631395 5971112015 640034 6057932016 648886 614657SOURCE:- REPORT OF THE TECHNICAL COMMITTEE
ON POPULATION PROJECTIONS CONSTITUTED
BY PLANNING COMMISSION 1996,
REGISTRAR GENERAL OF INDIA.
86
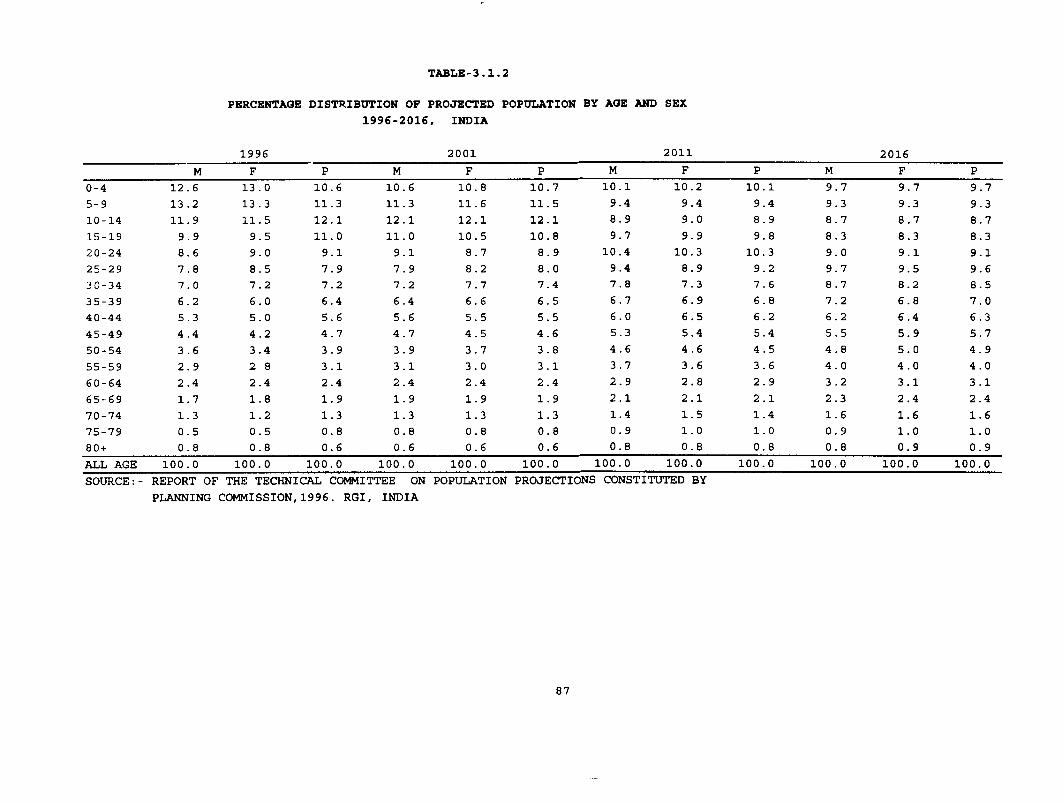
PERCENTAGE DISTRIBUTION OP PROJECTED POPULATION BY AGE AND SEX 1 9 9 6 - 2 0 1 6 , INDIA
1996 ___________________ 2001_______ ___________________ 2011___________________________ 2016____________M F P_________ M_________ F_________ P M_________ F_________ P_________ M_________ F_________ P
0-4 12.6 13.0 10.6 10.6 10.8 10.7 10.1 10.2 10.1 9.7 9.7 9.75-9 13.2 13.3 11.3 11.3 11.6 11.5 9.4 9.4 9.4 9.3 9.3 9.310-14 11.9 11.5 12.1 12.1 12.1 12.1 8.9 9.0 8.9 8.7 8.7 8.715-19 9.9 9.5 11.0 11.0 10.5 10.8 9.7 9.9 9.8 8.3 8.3 8.320-24 8.6 9.0 9.1 9.1 8.7 8.9 10.4 10.3 10.3 9.0 9.1 9.125-29 7.8 8.5 7.9 7.9 8.2 8.0 9.4 8.9 9.2 9.7 9.5 9.630-34 7.0 7.2 7.2 7.2 7.7 7.4 7.8 7.3 7.6 8.7 8.2 8.535-39 6.2 6.0 6.4 6.4 6.6 6.5 6.7 6.9 6.8 7.2 6.8 7.040-44 5.3 5.0 5.6 5.6 5.5 5.5 6.0 6.5 6.2 6.2 6.4 6.345-49 4.4 4.2 4.7 4.7 4.5 4.6 5.3 5.4 5.4 5.5 5.9 5.750-54 3.6 3.4 3.9 3.9 3.7 3.8 4.6 4.6 4.5 4.8 5.0 4.955-59 2.9 2 8 3.1 3.1 3.0 3.1 3.7 3.6 3.6 4.0 4.0 4.060-64 2.4 2.4 2.4 2.4 2.4 2.4 2.9 2.8 2.9 3.2 3.1 3.165-69 1.7 1.8 1.9 1.9 1.9 1.9 2.1 2.1 2.1 2.3 2.4 2.470-74 1.3 1.2 1.3 1.3 1.3 1.3 1.4 1.5 1.4 1.6 1.6 1.675-79 0.5 0.5 0.8 0.8 0.8 0.8 0.9 1.0 1.0 0.9 1.0 1.080+___________0^8_______ 0^8_______ 0^6_______ 0__6_______ 0^6_______ 0.6 0.8_______ 0_̂_8_______ 0_̂_8_______ 0__8_______ 0__9_______0.9ALL AGE 100.0 100.0 100.0 100.0 100.0 100.0 100.0 100.0 100.0 100.0 100.0 100.0SOURCE:- REPORT OF THE TECHNICAL COMMITTEE ON POPULATION PROJECTIONS CONSTITUTED BY
PLANNING COMMISSION,1996. RGI, INDIA
TABLE-3.1.2
87

TABLE-3.1.3
PROJECTED LEVELS OF TFRs FOR MAJOR STATES AND INDIA,,1996-2016
Major States SRS PeriodYear 1991 1996-2001 2001-2006 2006-2011 2011-2016Andhra piades 3.00 2.27 2.03 1.88 1.78Assam 3.50 2.82 2.55 2.33 2.17Bihar 4.40 2.92 2.53 3.19 2.93Gujarat 3.10 2.73 2.48 2.26 2.11Haryana 4.00 3.25 2.93 2.68 2.47Karnataka 3.10 2.54 2.31 2.14 2.01Kerala 1.80 1.62 1.61 1.60 1.60Madhya Prades 4.60 3.99 3.72 3.49 3.27Maharashtra 3.00 2.51 2.28 2.10 1.97Orissa 3.30 2.64 2.36 2.16 2.01Punjab 3.10 2.65 2.43 2.25 2.11Rajasthan 4.60 3.91 3.58 3.30 3.06Tamil Nadu 2.20 1.87 1.75 1.69 1,65Uttar Pradesh 5.10 4.75 4.50 4.27 4.05West Bengal 3.20 2.56 2.31 2.13 1.99India(Pooled) 3.64 3.13 2.88 2.68 2.52India 3.60 3.05 2.75 2.52 2.33Source;- REPORT OF THE TECHNICAL COMMITTEE ON POPULATION
CONSTITUTED BY PLANNING COMMISSION 1996,RGI,INDIA
88

TABLE -3.1.4
YEAR BY WHICH TFR OF 2.1 WILL BE ACHIEVED
YEAR BY WHICH PROJECTED TFR WILL BE 2.1
INDIA 2026
ANDHRA PRADESHASSAMBIHARGUJARATHARYANAKARNATAKAKERALAMADHYA PRADESH MAHARASHTRA ORISSA PUNJAB RAJASTHAN TAMIL NADU UTTAR PRADESH WEST BENGAL
200220152039201420252009
ACHIEVED IN 1988 BEYOND 2060
2008201020192048
ACHIEVED IN 1993 BEYOND 2100
2009* BASED ON POOLED ESTIMATES OF TFRSOURCE:- REPORT OF TECHNICAL COMMITTEE ON POPULATION PROJECTIONS
CONSTITUTED BY PLANNING COMMISSION 1996,RGI,INDIA
89

PROJECTED LEVELS OF EXPECTATION OF LIFE AT BIRTH- 1996-2016 INDIA AND MAJOR STATES
TABLE-3.1.5
MALE FEMALE1996-2001 2001-2006 2006-2011 2011-2016 1996-2001 2001-2006 2006-2011 2011-2016'
1 8ANDHRA PRADESH 61.55 62.79 63.92 64.94 63.74 65.00 66.16 67.23ASSAM 57.34 58.96 60.44 61.77 58.84 60.87 62.70 64.36BIHAR 63.55 65.66 67.46 69.98 62.07 64.79 67.09 69.05GUJARAT 61.53 63.12 64.60 65.76 62.77 64.10 65.49 66.45HARYANA 63.87 64.64 65.50 66.03 67.39 60.30 70.00 70.00KARNATAKA 61.73 62.43 63.10 63.73 65.36 66.44 67.43 68.35KERALA 70.69 71.67 72.00 72.00 75.00 75.00 75.00 75.00MADHYA PRADESH 56.83 59.19 59.20 60.70 57.21 58.01 59.80 61.40MAHARASHTRA 65.31 66.75 67.98 69.02 68.19 69.76 71.13 72.00ORISSA 58.52 60.05 61.44 62.70 58.07 59.71 61.23 62.63PUNJAB 68.39 69.78 70.88 71.74 71.40 72.00 72.00 72.00RAJASTHAN 60.32 62.17 63.79 65.21 61.36 62.80 65.22 66.84TAMIL NADU 65.21 67.00 68.45 69.64 67.58 69.75 71.54 72.00U ri AR PRADESH 61.20 63.54 65.48 67.10 61.10 64.09 66.60 68.72WEST BENGAL 64.50 66.08 67.42 68.57 67.20 69.34 71.11 72.00INDIA(Pooled) 62.30 63.87 65.65 67.04 65.27 66.91 67.67 69.18INDIA 62.36 64.11 65.63 66.93 63.39 65.43 67.22 68.80
PLANNING COMMISSION, 1996, RGI INDIA
90

TABLE-3.1.6
PROJECTED URBAN POPULATION OF INDIA AS ON 1st MARCH, 1996-2016
INDIA(IN ’000)
YEAR MALE FEMALE1996 133661 1207451997 137163 1243871998 140738 1280921999 144373 1318492000 148060 1356462001 151796 1394602002 155532 1433272003 159420 1473672004 163442 1515632005 167579 1558962006 171814 1603472007 176119 1649012008 180463 1694882009 184849 1741102010 189277 1787702011 193749 1834662012 198173 1881942013 202724 1930532014 207404 1980462015 212215 2031742016 217160 208441
Source; Report of the Technical Committee on PopulationProjections constituted by Planning Commission 1996, Registrar General of India.
91

3.2 BASIC M INIM UM SERVICES
3.2.1 The M inim um Needs Programme (MNP) was launched in the Fifth Five Year Plan. Its objective was to ensure a basic minimum standard o f life for all sections o f people living in the rural areas o f the country. The strategy was to establish a network o f facilities to attain an acceptable level o f social consumption in respect o f selected items within a stipulated tim e-tram e. The rationale was twofold. First, it was felt that the competing dem ands for greater investment in other development sectors left relatively small allocations for social services. In the face o f resource constraint, the tendency was to impose economy m easures or cuts in the allocations for social sectors. Second, there were wdde inter-State differences in the provision o f social services and infrastructure which called for governm ental intervention.
3.2.2 Initially, there were eight components o f MNP, viz., elementary education, rural health, rural w ater supply, rural electrification, rural roads, rural housing, environmental im provem ent o f urban slums and nutrition. While adult education was added to the list o f MNP com ponents in the Sixth Plan, rural domestic energy, rural sanitation and public distribution system were added during the Seventh Plan.
3.2.3 W hile in some areas o f MNP, great strides have been made since the launching o f the programm e, for certain other components of the programme, the extent o f achievement are below acceptable levels. Further, the inter-State differences in the levels o f achievem ent still remained very high.
3.2.4 Recognising the shortfall in the achievement o f the basic minimum standard o f life for all sections o f the people, a bold initiative was taken by the C hief Ministers Conference held in July, 1996 to ensure access o f all to certain Basic M inimum Services (BMS) in a tim e-bound manner.
3.2.5 The Conference endorsed the seven basic minimum services as o f paramount im portance in securing a better quality o f life for the people, especially those residing in rural areas. Further, it observed that it would be in the best interests o f the country, if tim e-bound action plans are formulated to secure ftill coverage o f the country with these seven basic services by 2000 AD. This was essential for the rapid growth o f the economy and for social justice and hence, these basic services were to constitute the core o f the social sector developm ent plan.
3.2.6 The seven basic services identified for priority attention are:
1. 100 per cent coverage o f provision o f safe drinking water in rural and urban areas;
2. 100 per cent coverage o f primary health service facilities in rural and urban areas;
3. Universalisation o f primary education;
4. Provision o f Public Housmg Assistance to all shelterless poor families;
5. Extension o f Vlid-day Meal Programme in primar\' schools, to all rural blocks and urbanslum s and disadvantaged sections;
6. Provision o f connectivity to all unconnected villages and habitations; and
^2

7. Streamlining o f the Public Distribution System with focus upon the poor.
3.2.7 The provision o f funds for items covered under the BMS are primarily part o f the Plan o f a State/UT, and are earmarked so that no diversion is possible. In addition. Centrally Sponsored Schemes were introduced in order to provide additional resources to supplem ent the resources o f the States in some critical areas e.g. the scheme o f Operation Black Board in the education sector and the Accelerated Rural Water Supply Scheme for drinking water in rural areas. In 1996-97, the Government o f India introduced a budget head for providing additional fimds for BMS in the form o f Additional Central Assistance
(ACA). Therefore, the total funds available for BMS is from the State Plans, the selected Centrally Sponsored Schemes as also the ACA. The ACA is being released monthly by the Finance Ministry to the State Governments in twelve equal instalments. The ACA is in the form o f 70 per cent loan and 30 per cent grant for the Non-Special Category States. For the Special Category States, it is in the form o f 90 per cent grant and 10 per cent loan.
Salient Features o f BIVIS Program m e
O bjective is to ensure access o f all the people living in both pjral and urban areas to the seven Basic Services in a tim e bound manner.
O ver and above the allocations being made by the States the Centre provides Additional Central Assistance (A C A ) to the States and UTs.
States and UTs have flexibility to make inter se allocation o f ACA am ong BM S Com ponents depending on their priorities.
ACA for BMS increased from Rs.2244 crore in 1996-97 to Rs.2970 crore in 1997-98 and ftjrther to R s.34!0 crore in 1998- 99.
Funds for BMS are earm arked in the Annual Plan o f the S tates/IJT s.
States and UTs are required to ensure a minimum am ount o f outlay for BMS in their Annual Plans.
Release o f ACA is contingent on satisfactory utilisation o f funds provided for the BMS.
3.2.8 During the Ninth Plan, the ACA would be distributed amongst States on the basis o f BMS infrastructural gaps. This exercise to assess the infrastructural gaps is being carried out by the Plarming Commission in consultation with State governments. In respect o f the N orth-East States, the 1996-97 allocations have so far been protected and are not based on the actual gaps in infrastructure.
3.2.9 In order to ensure that adequate investments are made for BMS sectors, the Planning Comm ission has used the notion o f M inimum Adequate Provision (M AP) to be calculated on the following basis: MAP = Actual Expenditure for 1995-96 + ACA + 15% o f ACA as States share. However, for the special category States/TJTs, the 15 per cent contribution has been waived.
3.2.10 While entire MAP will be earmarked in the Plan o f a State/UT, there will be no sector-wise earmarking. Funds allocated for BMS can be spent on any o f the BMS components and on any permissible item under each sector in accordance with the State's own priorities. The States can allocate outlays for BMS in excess o f the MAP in the initial stage. However, at the Revised Estimate stage, they could reduce their proposed outlay on BMS but under no circumstances below the MAP. Failure to allocate and utilise M AP requirements would result in a curtailment o f Central Assistance in the following year.
93

3.2.11 A brief discussion o f each o f the BMS components is given in the following paragraphs;
Primary Health Facilities
3.2.12 The primary health care infrastructure provides the integrated promotive, preventive, curative and rehabilitative services to the population close to their residence. It is estim ated that over 80 per cent o f the health care needs o f the population can be met by the primary health care infrastructure; only the rest may require referral to the secondary or tertiary health care institutions.
Rural Primary Health Care
3.2.13 During the Sixth Plan, the national norms for a three tier rural primary health care infrastructure consisting o f the Sub-Centre (SC), Primary Health Centre (PHC) and the Comm unity Health Centre (CHC) were evolved. While the Sixth and the Seventh Plan witnessed major expansion o f the rural health care infrastructure, the Eighth Plan concentrated the efforts on development, consolidation and strengthening o f the existing health care infrastructure to bring about improvement in quality and outreach o f services. The national norm for a Sub-Centre vary between 3000-5000 population depending upon terrain and location; on similar considerations the norm for a Primary Health Centre is 20,000-30,000 population; for four PHCs there should be a Commimity Health Centre. In accordance with these national norms the requirement for population o f 1991 are: SC 1,34,108, PHC 22349 and CHC 5587; as against this there are only 1,32,730 subcentres, 21854 PHCs and 2424 CHCs as of 30.6.96. There is a gap between the num ber required and the functioning centres in all the three types o f primary care institutions but the gap is widest in the CHCs which provide the critical linkage and are the First Referral Units; this gap shall be bridged during the Ninth Plan rapidly so as to provide urgently needed care for patients with complications referred from SC/PHC; the states shall during Ninth Plan restructure the existing sub-district/ taluka hospital and block level PHCs into functioning CHCs to the extent possible; similarly existing rural hospital and dispensaries have to be restructured wherever possible to meet the requirements in P H C s. Such an exercise would obviate the need for creating additional infrastructure and m anpower to the extent possible. There are wide inter and intra State disparities in health care infrastructure. This will be attended to on an urgent basis so as to improve quality o f service in poorly performing districts. An initiative in this respect was already taken during the Eighth Plan through the Social Safety Net Programme.
3.2.14 To fill the gap in physical infrastructure, 1378 SCs, 495 PHCs and 3163 CHCs are required to be established at a total cost o f approximately Rs.7000.00 crore. The total resources required for providing essential equipment for strengthening and upgradation o f rural primary health care infrastructure has been estimated to be Rs. 1600.00 crore. In addition there are substantial gaps in critical manpower required (type o f personnel and num ber indicated in the Section on Health). The estimates o f the total requirement o f funds to bridge the critical gap in manpower works out to Rs. 1400.00 crore annually. Finally for essential drugs and supplies, mobility and other recurring expenses an amount o f Rs.2000.00 crore will be required annually.
Urban Primary Health Care:
3.2.15 Nearly 30 per cent o f India's population live in urban areas. Due to urban migration and massive inflow o f population to the towns and cities, the health status o f urban slum dwellers is at times worse than the rural population. There has not been any well planned and organised efforts to provide primary health care services to the population within 2-3
94
Kms. o f their residence and to link primary, secondary and tertiary care institutions in geographically defined areas. As a result there is either a non-availability or at times underutilisation o f available primary health care facilities and consequent over-crowding at the secondary and tertiary care centres.
3.2.16 The NDC endorsed the Approach Paper to the N inth Plan emphasising the need to create a well-structured organisation o f urban primary health care aimed at providing basic health and family welfare services to the population within one-two kilometers o f their dwellings.
3.2.17 Primary health care infrastructure in urban areas should consist o f health and family welfare posts to cover 10,000 to 15,000 population manned by an ANM and one male multi-purpose worker with a helper. Urban health and family welfare centre should cater to about 1-1.5 lakh population. These centres should be provided with two Medical Officers and other required supporting staff; they will provide preventive, promotive, curative and rehabilitative services and essential maternal, child health and contraceptive care.
3.2.18 As on 30.6.1996, 871 urban health and family welfare posts and 1083 health and family welfare centres have been established. The number, type and quality o f manpower in these institutions located predominantly in urban slums vary considerably. To meet the requirement for primary health care o f the 1996 urban population, 19480 urban health and family welfare posts and 952 health and family welfare centres have to be established. In order to cover the urban population especially the slum dwellers effectively it may be necessary to redeploy the personnel in the existing centres, strengthen the centres with appropriate manpower besides providing essential equipment, mobility and drugs.
3.2.19 For providing essential physical infrastructure for urban primary health care a sum o f Rs.900.00 crores will need to be invested. The urban posts, hospitals/dispensaries were established several years ago, thus requiring strengthening and re-equipping at the cost o f Rs. 100.00 crore. For recurring cost o f critical manpower, essential drugs and supplies and providing mobility, Rs.400.00 crore would be aimual expenditure.
3.2.20 Funds for urban and rural primary health care infrastructure are provided mainly from the earmarked funds for health under the BMS in the State Plan and fimds from EAPs. The manpower costs are mainly met by the State, with some fiinding from Centrally Sponsored Family Welfare programme and national disease control programmes. Additional Central Assistance under BMS initiated during 1996-97, is yet another funding source which must be utilised for bridging critical gaps. However there is a large gap between the availability o f total funds and the minimum stated requirements.
3.2.21 While every effort shall continue to be made to provide additional financial resources for primary health care in urban and rural areas as a part o f BMS, it is imperative on the part o f the States to constantly review the essential needs so as to ensure optimum functioning and utilisation o f existing institutions. Some o f the funding for this effort will have to be intemalised within the State budget. The State will need to identify poorly performing districts and provide essential funds to meet their requirements so that existing gaps in the health and demographic indices among these districts and the rest o f the country could be minimised.
95

Universalisation o f Primary Education
3.2.22 In order to achieve universalisation o f primary education (UPE), it had been estim ated for the year 1993-94 that approximately 142 million children in the age-group 6- 11 years would have to be provided primary schooling out o f which 69 million would be girls. Therefore, UPE by the year 2000 will also have to take into account the additional children who would come into the age-group 6-11 years by that year. As against this, the total num ber o f out o f school children i.e. children who are not enrolled (44 million) and children who drop out (35 million) is estimated to be 79 million. Among these, as high as 43 m illion are girls.
3.2.23 The latest available data on drop-out rates in class 1-V for the year 1996-97 reveal that the drop-out rate for the country as a whole was 38.95 per cent. It was 39.37 % among boys and 38.35% among girls. Further, there were vsride inter-State disparities in retention and drop-out. As against the above mentioned national average, the total drop-out rates for B ihar was as high as 61.78 per cent. For boys, it was 60.85% while for girls the figure was as high as 63.44 per cent.
3.2.24 According to the Sixth All-India Education Survey, 83.4 per cent o f the habitations in the country were served by a primary school within 1 km. o f walking distance. However the habitations w ithout primary schools/ sections as per the norm o f 1 km. distance is as high as 1.76 lakh habitations. While 45.25% o f these habitations are having population less than 300, about 40000 habitations have population o f 300 or more who have to be provided primary schools.
3.2.25 Apart from availability or access to primary school within a walking distance o f habitations, there are a number o f other problems which are required to be tackled on an urgent basis. Some o f these are low enrolm ent o f girls, high drop-out rates, education o f disadvantaged groups, lack o f physical infrastructure like school buildings, teachers, teaching learning equipments and the problem o f working children, low levels o f achievem ent and regional disparities.
3.2.26 Education being a subject in the Concurrent List, both States governments and the Centre provide funds for it. The Centrally Sponsored Schemes o f Operation Blackboard, N on Formal Education, Teachers Training and the District Primary Education Project supplem ent, in large measure, the efforts o f the State government.
3.2.27 In pursuance o f the adoption o f the National Policy on Education (NPE), 1986, the Schem e o f Operation Blackboard (OB) was introduced as a Centrally Sponsored Scheme (CSS) to provide certain minimum facilities in the primary schools in order to increase enrolm ent and reduce drop out. The OB norms aimed at providing at least one additional teacher preferably a female teacher, in single teacher schools, at least two reasonably large all weather classrooms for every school and a set o f teaching/learning equipment. U nder OB, 1.74 lakh classrooms have been constructed, 1.47 lakh teachers have been appointed and 5.23 lakh primary schools have been provided with the teaching/learning m aterial. According to the available statistics, teaching/learning equipm ent have been sanctioned to almost 100% primary schools and 96% of the targetted posts o f teachers had been sanctioned for single teacher schools. Even after the implementation o f the OB Schem e for full five years, a large number o f schools were functioning without proper buildings. Selected statistics o f the Sixth All India Education Survey with the reference date
96

30th September 1993 reveal that out o f a total number o f 5.70 lakh primary schools in the country, 38,657 schools still had no buildings in rural areas.
3.2.28 In order to address the needs o f the drop-outs and the working children, the Non-Formal Education (NFE) scheme is being implemented. There are at present 2.79 lakh NFE centres in operation wherein about 70 lakh children are enrolled. However, the quality o f education being imparted in the NFE centres needs to be improved as well as mechanisms to ensure greater accountability for various functionaries in the system need to be evolved.
3.2.29 There is an urgent need to impart necessary training to primary school teachers. This can reduce drop-outs and the high attrition rate o f primary school teachers, besides enhancing the quality o f education being imparted at the primary stage. The various Centrally Sponsored Schemes for teachers training initiated in pursuance o f the NPE, 1986 need to be strengthened and implemented expeditiously.
3.2.30 The District Primary Education Programme (DPEP) aims at providing access toprimary education for all children, reducing drop-out rates to less than 10 per cent, increasing the learning achievement o f primary school students by at least 20 per cent and reducing the gap among gender and social groups to less than 5 per cent in the educationally backward districts with female literacy below the national average and districts where the Total Literacy Campaign (TLC) have been successful leading to enhanced demand for primary education. The DPEP needs to be implemented vigorously.
3.2.31 Conservative estimates o f financial implications for achieving UEE place the requirement at over Rs.40.000 crores. Assuming that atleast two third o f this amount is required for achieving UPE. about Rs.26,000 crore need to be allocated for this component o f Basic Minimum Services.
Safe Drinking Water For All
3.2.32 The existing norms for rural water supply is 40 litres o f drinking water per capita per day (LPCD) and a public standpost or a handpump for 250 persons. Further, the sources o f water supply should be within 1.6 km.horizontal distance in plains or 100 metres elevation distance in hills. For cattle in DDP areas an additional 30 LPCD is recommended. Against this, the norm for urban water supply is 125 LPCD piped water water supply with sewerage system, 70 LPCD without sewerage system and 40 LPCD in towns with spot sources. At least one source for 20 families within a maximum distance o f 100 metres has been laid down.
3.2.33 As against these norms, the studies as on 1.4.1997 reveal that there were 61724 habitations without any safe source o f drinking water ( called not covered habitation), 3.78 lakh habitations which were partially covered and 1.51 lakh habitations which had quality problems like excess flouride, salinity, iron and arsenic etc. .A.part from the provision in the state plans for water supply, there are major Centrally Sponsored Schemes called the Accelerated Rural Water Supply Programme and the Urban Water Supply Programme for small towns with population o f less than 20,000. In order to cover this backlog in rural drinking water supply, it has been estimated that approximately Rs.40000 crore will be required including the funds required for operations and maintenance and funds to tackle quality problems. Similarly, the estimates o f investment required for full coverage of urban water .supply is Rs.30734 crore.
q?

Nutrition
3.2.34 There are two major programmes which provide food supplements to the vulnerable segments o f the population; these are the Special Nutrition Programme (SNP) and the Midday Meal Programme (MDM).
3.2.35 Special Nutrition Programme is one o f the important component o f the Integrated Child Developm ent Services Programme. The target group receiving food supplem entation are children between the age o f 6 months to 6 years and pregnant and lactating mothers. Efforts are made to provide 300 calories and 10 grams o f proteins per child, 500 calories and 15 to 20 grams o f proteins for pregnant/nursing women and 600 calories and 20 gram o f proteins to severely malnourished children as food supplements at prevailing prices. The beneficiaries receive the supplements through ICDS infrastructure which is funded by the Dept o f W om en and Child Development. The cost o f food supplements is met by the State Governm ents and UTs through the State plan budget. As o f 1996, there are 4,200 ICDS blocks w ith 5,92,571 anganwadis in the country; 426.65 lakh beneficiaries are covered. By 2002, it is planned to operationalise ICDS programme in 5614 blocks with 804671 anganwadis; 579.36 lakh beneficiaries can be covered by these. Funds required for covering all these beneficiaries under SNP in the period 1997-2002 is Rs 6792.29 crore.
3.2.36 The Programme o f Nutritional Support to Primary Education popularly known as the Mid-day Meal scheme, was launched in 1995 as a fully fiinded Centrally Sponsored Scheme. Under this scheme, all school children in the primary schools in governm ent and government-aided schools are to be covered. Ideally, a hot meal is provided to the children al school but for 10 months in a year. The foodgrains are delivered directly at the district level by the Food Corporation o f India under instructions from the Department o f Education in the Government o f India. So far, the scheme has not been universalised but once it is done the annual expenditure would be o f the order o f Rs.2226 crore in 1997-98 going up each year on account o f the increase in cost.
3.2.37 In so far as nutrition is concerned, the funds required are in the nature o f recurring costs and not for the creation o f infrastructure for delivery o f this service. Hence, there cannot be any time-bound plan as there will be recurring expenditure until such time as poverty has been eradicated.
H ousing
3.2.38 According to 1991 census, there are 3.41 million rural households who are shelterless. Apart from this, about 10.31 million households live in unserviceable katcha houses. Therefore, the total housing shortage is about 13.72 million. It should be pointed out that this shortage covers both the poor and the non-poor households. In addition it has been estimated that another 10.75 million houses would be required between 1991- 2002 AD on account of an average annua! growth o f 0.89 million people without shelter. Thus around 24.5 million houses would have to be constructed by 2002 AD. However, it is estim ated that 6.8 million houses would have already been constructed under various housing schemes o f both the Centre and the States. Therefore, the total housing shortage would be approximately 17.67 million. O f this, 10.3 million would require upgradation and7.36 m illion units would have to be newly constructed. The Centrally Sponsored Scheme for providing shelter to the shelterless poor is called the Indira Awaas Yojana. wherein free houses are distributed to targetted beneficiaries belonging to the poor segments, specially those vvho belong to SCs/ STs or freed bonded labour. Under this programme the Centre
98

provides 80 per cent o f the funds and the States the remaining 20 per c e n t . This is a major initiative taken by the Central government.
3.2.39 The financial implications o f this are as under; The average unit cost o f a house is estimated at Rs.20900 and therefore construction o f 7.36 million new houses would cost Rs. 15382 crore. In addition, upgradation o f 10.3 million houses at an average unit cost o f Rs. 10,000 would amount to Rs. 10300 crore. Thus, the total fiinds required to alleviate the housing shortage would be in the region o f Rs.25700 crore. O f the total shortage, some would be financed by beneficiaries themselves particularly among those belonging to the non-poor families. Hence, the financial implications for the Government w ould be less than the estimated sum of Rs.25700 crores. There would also be some credit-linked housing schemes with part subsidy which would also reduce the financial burden o f the Government. However, it is difficult to make a proper assessment o f the fiinding required to meet the housing demand o f the shelterless poor more precisely.
Rural Connectivity
3.2.40 Under the Minimum Needs Programme, connectivity o f all villages w as the longterm objective. However, it was envisaged that villages with population o f 1500 and above and villages with population o f 1000 to 1500 would be connected by all weather roads' by the end o f the Eighth Plan. It is estimated that about 85 per cent o f such villages would have been connected by all weather roads by the end o f the Eighth Plan.
3.2.41 In the Ninth Plan, the target is to ensure that 85 percen t o f the village population (not 85 percent of the villages) are connected by all weather roads. It is estim ated that this would cost around Rs. 13000 crore (excluding black topping) over a period o f 5 years. However, if there has to be 100 per cent cormectivity it would involve an expenditure o f about Rs.65000 crore. This difference is on account o f the fact that the cost o f connecting a large number o f small villages is very high particularly in the hilly and remote areas o f the country with small population. Hence, it is suggested that 85 per cent o f the population be covered first at an estimated cost o f Rs. 13000 crore; and that villages with population o f 1000 and above be completely covered. As much as 75 per cent o f villages with population o f 500 to 1000 should also be covered on priority. However, in the hill areas and also in tribal, coastal, riverine and desert areas 100 per cent o f the villages with population 500 should be covered.
3.2.42 While there is no CSS for rural roads, approximately 20-25% o f the outlay on JRY and EAS is estimated to be spent on rural roads, amounting to approxim ately Rs.lOOO crore.
Public Distribution System
3.2.43 The Public Distribution System has been an important part o f the Government's strategy for ensuring food security. Foodgrains, mainly rice and wheat, are distributed through the network o f Fair Price Shops. The Government procures and stocks the foodgrains which are then released for distribution through the PDS network. How'ever, until recently it provided entitlement to all consumers without special focus on the poor. A fall-out o f this has been that States like Orissa, Bihar, Madhya Pradesh, and Uttar Pradesh which have the highest incidence o f poverty have the lowest per capita off-take from PDS. Consequently, a recent initiative, the targetted PDS (TPDS), was introduced w .e .f 1st June, 1997. Under this, a quantity of 10 kilograms o f foodgrains are to be issued per month to every' Below-Poverty-Line (BPL) family at highly subsidised rates. The non-BPL families would also be entitled to foodgrains but on the same pattern as the existing PDS. In
99

fact, w hile the issue prices would be about 40 per cent o f the economic cost for the BPL families it would be 80 per cent for the above-poverty-line families. The subsidy implications o f the TPDS at 1997-98 prices works out to about Rs.6000 crore and the carrying cost to an additional cost o f Rs.1500 crore. This would be the recurring cost which would increase each year as the procurement price goes up.
3.2.44 The provision for the food subsidy accrues to the non-Pian budget o f the Central Government. However, for strengthening the deliver}' system, schemes for construction of godowns, purchase o f mobile vans/trucks and manpower training are funded from the Plan. The first two schemes are largely confined to remote, inaccessible and hilly areas to augment shortage in storage capacity through construction o f small godowns and also to distribute foodgrains in these areas via mobile vans where Fair Price Shops are not found feasible. The financial implications o f these schemes are small, assessed at Rs.115 crore for the Ninth Plan period.
I 00

3.3 EDUCATION
SECTION - I
INTRODUCTION
3.3 1 Education is the most caicial investment in human development Education strongly influences improvement in health, hygiene, demographic profile, productivity and practically all that is connected with the quality o f life The policies and approach to investment in the Education sector and its development in the next decade assume critical significance from this standpoint
r- The Ninth Plan treats education as the most crucial investment in human development The Prime M inister’s Special Action Plan (SAP) has identified the expansion and improvement o f social infrastructure in education as a critical area
3 3 2 The Prime M inister’s Special .Action Plan (SAP) has stressed the need for expansion and improvement of social infrastructure in the field o f education This goal has been further elaborated in the National Agenda for Governance (NAG) which states "We are committed to a total eradication o f illiteracy We will formulate and implement plans to gradually increase the governmental and non-governmental spending on education upto 6% o f the GDP. this to provide education for all We will implement the constitutional provision of making primary education free and compulsory up to . t̂h standard Our aim is to move towards equal access to and opportunity o f educational standards upto the school-leaving stage W'e shall strive to improve the qualitv o f education at all levels - from primary schools to our universities " The approach to the ^th Plan has been formulated in the light of these objectives
Elementary Education
3 3 3 The strategy o f educational development during the next decade o f planning takes into account various emerging factors like (i) the national goal o f providing primary education as a universal basic service, (ii) the Supreme Court judgement declaring education to be a fundamental right for children upto 14 years o f age. (iii) the need to operationalise programmes through Panchayati Raj Institutions (PRls) and Urban Local Bodies (ULBs), (iv) the legal embargo on child-labour, (v) the provisions o f the Persons with Disabilities Act, 1995, and (vi) heightened awareness o f human rights violations in respect o f women, children and persons from disadvantaged sections o f society It is also realized that a large number o f out-of- school children, who figure neither in school enrolments nor in the calculations o f identifiable child-labour, are to be provided access to schooling
3 3 4 It is equally necessary that the problem o f universal elementary education and literacy is tackled through a strong social movement with clearly perceived goals and involving the State and Central Governments, Panchayati Raj Institutions. Urban Local Bodies, voluntary agencies, social action groups, the media and everv supportive element in societv
10!

Adult Education
3 3 5 Adult literacy and further education o f the literates, being as vital an area o f concern as universal elementary education, more intensive efforts will be made to spread literacy in the rural and tribal areas which are lagging behind, with special attention to women and such marginalised groups as small and marginal farmers, landless labourers and educationally neglected tribal groups For this purpose, a disaggregated and decentralised mode o f planning and implementation will be adoptedInterlinkage o f the adult education programme with income generation, better health and nutrition, women's empowerment and overall rural development will be focussed upon At the grass-roots level, people's participation will be ensured in planning and im plementation o f local programmes
Secondary Education
3 3 6 In spite o f increased enrolment in secondary and higher secondary schools, the age- cohon percentage continues to be low. More importantly, there are disparities in educational access as between the urban, rural and tribal areas Gender disparities also exist Secondary education curricula continue to be liberal and oriented to the first degree courses, in spite o f the strong advocacy in favour o f vocationalisation and investments made to divert students to vocational courses
3 3 7 The Ninth Plan will lay emphasis on the revision o f curricula so as to relate these to work opportunities Girls and members o f disadvantaged groups will be provided with scholarships, hostels and other incentives, for facilitating their participation in secondary education. Compensatory education will be provided, where necessary, for meeting the equity criteria
3 3.8 Pre-vocational training at the secondary level and employment-oriented courses at the higher secondary level, suited both to industrial and agricultural development, will be provided along with hands-on training The Open Learning system will be expanded and a wide variety o f courses offered Different types o f fijrther education will be made available In view o f the proposed changes in the educational policies and programmes at all levels, the pre-service and in-service training o f teachers will be reorganised. The use o f new educational technologies made available through Internet and com puter facilities will be emphasised for all educational activities.
University and Higher Education
3 3 9 The excellence o f our university products and professionals is well acknowledged both at home and aid Thecompetitive advantage of the country can be maintained andimproved only if the university and higher education sectorsperform well Their contribution to improving our capability tointeract effectively with the fast expanding global techno-economic systems has been significant and their potential needsto be harnessed to the full
3 3 10 A critical overview o f higher education in India has brought out a number o f issues C hief among them are the deterioration in quality, the resource crunch leading to
102

poor infrastnjcture and the serious problems o f governance brought about by the influence o f factors and forces extraneous to educational objectives
3 3 11 The priority for the Ninth Plan will be the expansion o f education mainly in the unserved areas and with a focus on improving the coverage o f women and the disadvantaged groups, using financial assistance as a leverage to secure better perform ance o f the system, updating o f syllabi to enhance their relevance, improvement in internal resource generation and implementation o f a model code o f governance to reduce non- academic influence in the higher education system
SECTIO N II
Post-Independence Achievements
3 3 12 Right from the inception o f planning, the crucial role o f education in economic and social development has been recognised and emphasised Efforts to increase people's participation in education and to diversify educational programmes in order to prom ote knowledge and skills required for nation-building have characterised successive Five Year Plans Despite a series o f problems that the country faced soon after independence, it has been possible to create a vast educational infrastructure in term s o f large enrolm ents and teaching force and massive capabilities for management, research and development
Institutions
3 3 13 In the fifty years since independence the number of institutions has increased several fold as indicated in Table 3 3 1
Table 3.3.1
Category of Institutions 1950-1951 1996-1997
Primary Schools ('000) 210 598Upper Primary Schools ('OOC) 13 177Secondary Schools (’000) NA 73Higher Secondary Schools ('000) (i9ci:5 25Pre Degree/Junior Colleges('000) - 4Universities 2 228*
103

Table 3.•A ' ^ ')Category of Insti'tutions
3'. 1 (CbncldV)1950-1951' 1996-1997
''iCollegesGeneral^ (No^.) 370^. 6753Ptofessional '{NoSv*) 2*08 1770
Teacher Training (Nos.)
Schools 782 1234Colleges 53 697* I n c l u d e s D e e m e d U n i v e r s i t i e s a n d I n s t i t u t i o n s o f N a t i o n a lI z z p o r t a n c e . , , , — - j-
Enrolment
373,.1,4 E nrolm ents-in ,. difFerenti, t54)es. o f institutions' have .̂recorded substantial growth. The primary stage enrolment increased from 19.2^,million in 1950-51 to 110!40 mjllipp jn , 1996- 97 ̂ and ):hat o f upper primary stage from 3.1 million to 41,06 million Taking these together, the enrolment in the two stages increased abbut sevenfold froM22.3 million to 151.45 million. At the high/higher secondary stage, the enrdlntent increased from 1.5 million in 1950-51 to 24.27 million in 1996-97. There has been a significant increase in the enrolment o f girls over this period.
Teachers
3.3.15 The nuriibS' of'teacherJ~'\Vorkinig *ia elementary and secondary-schools recorded ̂ six-fold .increase from 7.5_ lakh in J95) to 45.28 lakh in 1996, w t̂h female teachers
constituting 34.3 iper -cjsnt the total number in 199,6. The.budgeted ej^enditure bn education increased from Rs. 644.6 crore, in 1951-52 to Rs. 36,*529.29^crore'in 19^6-97.
5 .3.16 As a consequence o f the gi;owth that has taken plape, educational facilities are now available closer to the homes o f children. Tjie Sixth ̂All India Education Survey (1993) has indicated that 83.4 per cent o f the rural habitations had a primary education facility within the habitation or within a walking distance o f, \ ,km. In the case o f middle school education, 76.15 per cent o f the ̂ habitations had this facility within the habitation or wTthin a walking distance o f 3 kms. Table^3.3.2 sums up the data ~
Table 3.3.2Educational Facilities w4.thin tlie Rural Habitations
F a c i l i t y Habitations with facility of Percentage COOjO) Increase1986 1993
i) Primary Srage 502.3 528.0 5.1.ii't upper Primary Stag^ 129.0 147.1 14.0lii)Secondary Stage 43.5 53.2 22.3iv' Higher Secondary Stage 3.9 12.0 34.8V' Total Nximber of Habita-
caCions98 r. 9 1060.6 8.0
104

3 3 17 The increase in the availability o f educational facilities within the habitation has been particularly high in the case o f secondary and higher secondary stages considering that the number o f habitations itself had increased by 8 per cent during this period
3 3 18 Given the constitutional directive that the State should provide free, compulsorv and universal education for children upto the age o f 14, universalisation o f elementarv education has become a major goal o f educational policy and programmes The progress in the achievement o f this objective has been considerable The total enrolment at primary stage during the period 1950-51 to 1996-97 increased by 5 75 times, while for girls the increase is nine times At the upper primary stage, the increase during this period is more than 13 times, while for girls the increase is more than 32 times which is quite commendable At the secondary and senior secondary stage the total increase is 18 times and that o f eirls 49 times
Adult Literacy
3 3 19 Considerable progress has been made in making India's population literate, as indicated in Table 3 3 3
Table 3.3.3 Literacy Rates (In Percentages)
.Ru ral Urban - Otl d :
190 ̂ . T ~ T d 1 ? '•.jpL; 1 a t: onMale 19.0 45 - i — -i .
Female 4 . 9 . 3 -ATotal .2.: 3 4.6
'7 years and abcve;Male S 7 . ̂' 1 . LFemale j C . -C . ; 3 9.3Total 4 4.7 73. 1 52.2
3 3 20 -As in other cases, there are wide variations in literacy levels among the States, from a low o f 38 6 per cent to a high o f 89 8 per cent (1991 Census) The variations for sex- wise literacy rates were between 55 per cent and 93 per cent for males and 20 4 per cent and 86 1 per cent for females Within the States, there are substantia! variations according to area and sex
Universitj' and Higher Education
3 3 21 There has been a tremendous expansion o f facilities at the higher education stage At the dawn o f independence, the number o f universities and colleges o f all types stood at 27 and 370 respectively In 1996-97 there were 228 universities and 6759 atTliated colleges Besides, there is one Central open university (IGN'OU) and 3 open universities in the States, in addition to departments o f correspondence courses in different universities The total enrolment through the distance mode o f learning is about 15 lakh
10^

3 3 22 There has been a sizeable expansion in student enrolment during the last 50 years The number o f students at the university stage, which stood at 0 2 million in 1950-51rose to over 6 million by the end o f the Eighth Plan There has been a significantincrease in the proportion o f girls. From a modest 13 7 per cent in 1950-51, the percentage rose to about 34 by 1996-97 Special efforts have been made to promote the enrolm ent o f special groups, including reserved categories and the minorities
3.3.23 Various steps have been taken to improve the quality o f higher education These include regulations prescribing minimum qualifications o f teachers and schemes for enabling teachers to improve their academic and professional competencies through Academic Staff Colleges, teacher fellowships, travel grants, etc For promoting research. Special Assistance Programmes were initiated The scheme o f Centres o f Advanced Studies (CAS) was introduced in order to promote research in various university disciplines Assistance was provided to universities for major research projects. In order to improve quality, the National Assessment and Accreditation Council (NAAC) was set up to evolve a process o f systematic assessment
3 3.24 With a view to enhancing the relevance o f higher education, the University Grants Commission initiated a scheme o f career orientation for students at the first degree level by equipping them with competencies for moving into job markets and self-employment The scheme has been introduced in 31 universities and about 1000colleges covering about 40,000 students. Restructuring o f courses was also taken up in order to relate the course content to the needs o f society
3 3 25 The schemes o f Adult and Continuing Education and Women's Studies were initiated in order to promote greater involvement o f institutions o f higher education in socio-economic and cultural development As many as 104 universities have set up departments o f adult and continuing education. In addition, more than 2600 colleges have set up Adult Education Units, while 22 universities and 11 colleges have set up centres for women's studies
Open University System
3 3.26 The Open University System is offering a broad-based curricular content in humanities, social sciences, physical and natural sciences as well as in professional disciplines like agriculture, computer applications, education, engineering, management, nursing, nutrition, etc The institutes o f correspondence education o f the dual mode universities registered an enrolment o f about 7 lakhs In addition, the fouropen universities had an aggregate enrolment o f over 8 lakhs In order to providesupport to the open universities in the States, the Distance Education Council has been set up under the Indira Gandhi National Open University (IGNOU) Emphasis is laid on establishing a common pool o f programmes that can be shared by all the open universities The IGNOU has a state-of-the-art production facility in electronic media and a Staff Training and Research Institute in Distance Education (STRIDE), which constitutes a national resource for the Open Learning System
106

Technical Education
3.3 27 There has been substantial growth o f technical education during the post- Independence period. The number o f technical institutions at the first degree level increased from 49 in 1950-51 to 418 in 1996-97 The output o f technical graduates increased from a level o f 2200 in 1951 to about one lakh per annum For diploma courses, the increase was from 2480 to 1.7 lakh annually Postgraduate and Doctoral programm es in engineering are now available in 150 institutions About 60 polytechnics offer advanced and post- diploma courses, most o f them initiated during the Eighth Plan under the Technical Education Project assisted by the World Bank The four Technical Teachers Training Institutions have assisted in the development o f more than 500 polytechnics under this scheme.
3 3 28 The Indian Institutes o f Technology have been pursuing the aim o f creating excellence in academic work and research. A fifth institute was established in Assam in 1994 The 17 Regional Engineering Colleges (REC's) tended gradually to focus more on post-graduate education and research programmes. A Centrally funded scheme was initiated in all the RECs to develop them as centres o f excellence and to augment their facilities in computing, library resources and infrastructure for taking up industrial projects The number o f Community Polytechnics increased to 375 during the Eighth Plan
3 3 29 The All India Council o f Technical Education (AICTE) has been reorganised and strengthened The Council has developed an evaluation system for regulating the opening o f new institutions. The National Accreditation Board set up by the .AJCTE finalised proposals from 92 institutions covering 570 programmes The Board is also finalising the criteria for accreditation o f institutions o f management education
SECTION n i
A CH IEVTM ENTS DURING THE EIGHTH PLAN PERIOD
Elem entary Education
Thrusts
3 3 30 Elementary education, especially universalisation o f free and compulsory education up to the age o f 14, received a high priority in the Plan. The major effort was in the direction o f reducing the dispaities in access existed among various States and within States, between boys and girls and among different segments o f the population and in improving the retention and achievement o f children o f the relevant age-group A major effort was to provide alternative channels for education to children o f deprived sections and working children who, for various reasons, could not be enrolled and stay for the entire period in full-time schools. The reduction of drop-out rates, which have continued to be high, particularly among girls and children belonging to scheduled castes, scheduled tribes and other economically and socially disadvantaged communities, was an important objective o f the elementary education plan A national programme o f mid-day meals was started in August, 1995 to promote access.
107

retention and nutritional care o f primary school children Improvement in the quality o f schooling and achievement levels o f children enrolled in schools was attempted through the introduction o f minimum levels o f learning (MLL) and enhancement o f infrastructural facilities A number o f innovative programmes were implemented to improve the managem ent o f schools, with emphasis on the involvement o f people and voluntary organisations
M ajor Achievem ents
3 3 31 Between 1992-93 and 1996-97, the number o f primary schools increased from 5 73 lakh to 5 98 lakh and middle schools from 154 lakh to 177 lakh, indicating a percentage increase o f 4 5 and 14 8 respectively The growth in enrolment was significant, the increase being 4 8 per cent in the case o f grades I-V and 6.1 per cent in grades Vl-Vni There was an appreciable decline in the drop-out rates from 42 per cent to 34 5 per cent in classes I-V and from 58.7 per cent to 51 6 per cent in classes VI- VIII It is estim ated that additional enrolment in classes I - VIII would have reached 73 79 lakhs between 1992-93 and 1996-97
3 3 32 The following Centrally Sponsored Schemes were implemented
i) Operation Black Board Launched in 1987, the scheme was intended toim prove the school infrastructure by providing essential facilities like an additional teacher in single-teacher schools, construction o f classrooms and provision o f books and teaching equipment As many as 5 23lakh schools have been provided with books and teaching equipment worth Rs 10,000 each, 1 47 lakh single teacher schools a second teacher and the construction o f 174 lakh classrooms undertaken The scheme was extended to cover upper primary schools and, with Central assistance, 47,000 schools have been allow'ed to purchase teaching-learning materials worth Rs 40,000 each ( Rs 50,000 for schools in tribal areas) and 33,600 posts have been created for adding a third teacher in schools with enrolment exceeding 100 In the Eighth Plan, the expenditure on Operation Blackboard is likely to be Rs 816 26 crore against the outlay o f Rs 279 crore About 4 5 lakh teachers have undergone special orientation for the use o f teaching materialsprovided under the Operation Blackboard Scheme This training programme was called the Special Orientation o f Primary Teachers (SOPT) during the Eighth Plan
ii) National Programme o f Nutritional Support Launched in August 1995, the programm e provides three Kgs o f foodgrains per month to each primary school student. The programme is being implemented in all the States The scheme is expected to cover 5 54 crore children by 1996-97 The total expenditure is estimated to be o f the order o f Rs 1050 crore
iii) Minimum Levels o f Learning fh'lLL) The programme was introduced with the objective o f specifying competencies which all primary' school students should attain at mastery level in Language. Mathematics and Environmental studies and to develop curricula and text-books in relation
108

to these. The first phase was implemented through voluntary organisations, research institutions, SCERTs and DIETs. At present,the programme is being implemented in 12 States through 200 DIETsThe MLL approach has been introduced in 50,000 schools in differentStates It is now possible to direct effort and resources to schools where the levels o f learning have fallen below the prescribed ones.
iv) District Primary Education Programme The programme, paniallyflinded by the World Bank in the form o f a loan, was initiated inNovember, 1994 The programme aims at operationalising strategiesrequired for achieving the goal o f universal elementary education through specific planning and target setting at the district level. The intervention is based on the concept o f decentralised management, communitymobilisation and contextual and research-based inputs. The first phase was launched in 42 districts o f Assam, Haryana, Karnataka, Kerala, Maharashtra, Tamil Nadu and M adhya Pradesh. The programme was extended to 17 more districts o f Orissa, Himachal Pradesh, Andhra Pradesh and Gujarat It was planned to cover 120 districts by the end of the Eighth Plan.
v) Bihar Education Project The programme was launched in 1991 with a sharing o f costs among the IJNICEF, the Government o f India and the Government o f Bihar The project is being implemented in 7 districts for bringing about quantitative and qualitative improvement of primary education A mid-term review in 1994 recommended consolidation of the programme, establishing linkages between the project and the Education Department of Bihar Government, more emphasis on MLL and teacher training etc
vi) [/.P. Basic Education Project Assisted with a soft loan from International Development Agency the project involves construction o f classrooms and Block Resource Centres and training o f teachers About 40,000 teachers have been trained
vii) Mahila Samakhya The project aims at empowerment o f women throughtheir mobilisation and a change in their perception about themselves and society The programme was launched in 1991 in 10 districts ofU P., Gujarat and Karnataka It now covers 5000 villages in 35 districtsof seven States .An evaluation, conducted in 1993, indicated that theproject had laid the foundation for empowerment o f women at grass-roots level.
viii) Nan-formal Education In pursuance o f the National Policy onEducation 1986, the Central Government provides help for theestablishment o f non-formal education centres Assistance is given to the extent o f 60 per cent o f the expenditure incurred on Centresestablished by State Governments and 100 per cent for Centresestablished by voluntary organisations Centres run by the StateGovernment and exclusively meant for girls are eligible for 90 per cent
lov

assistance At present 2 79 lakh Centres - 2 40 lakh o f the State Governments and 39000 run by voluntary agencies are functioning The enrolment during 1996-97 is estimated to be 70 lakh The Centres provide education through condensed courses o f 2 to 2-1/2 years' duration
ix) Teacher Education The Centrally Sponsored Scheme o f reorganisation o f teacher education continued in the Eighth Plan The major programmes forwhich assistance was given included establishment of District Institutes o fEducation and Training, upgradation o f selected training colleges into Colleges o f Teacher Education/ Institutes o f Advanced Study, strengthening and establishment o f university departments o f education and strengtheningo f State Councils for Educational Research and Training. So far, 425 DLETs have been established, 108 training colleges upgraded and 5 university departments selected for assistance A special orientationprogramme covering 4 5 lakh primary teachers was organised for Operation Blackboard and introduction o f MLL A satellite-basedinteractive teacher orientation programme was implemented inKarnataka and Madhya Pradesh on an experimental basis
3 3 33 The National Council for Teacher Education was established as a statutor>'body to promote planned and coordinated development o f teacher education TheCouncil has developed norms and critena on the basis o f which applications are processed It has organised a number o f programmes and brought out usefijl publications dealing with different aspects o f teacher education
3 3 34 During the Eighth Plan, a number o f innovative projects like Lok Jumbish and Shiksha Karmi were implemented by non-govemmental organisations. Government o f India and the State Governments
Secondary Education
Thrusts
3 3 35 The thrust in the Plan was on consolidation and improvement The Plan proposed to regulate expansion, with new facilities being created for deprived sections like girls, scheduled castes and scheduled tribes and in rural areas In order to meet the educational needs of those who were unable to enrol themselves in the formal system, opportunities were provided through the National and State Open Schools, utilising m ulti-m edia packages and contact centres For those who intended to discontinue education after ten years of schooling, vocational courses with strong linkages to the world o f work were recommended Improvements in the quality o f education, particularly in science, mathematics and computer literacy, were emphasized with Central suppon being provided for the purpose
M ajor .\chievem ents:
3 3 36 Durin g the Eigh th Plan the number o f secondary stage mstitutions (Classes I X - X I l ) increased from 84.076 in 1992-93 to 1,02.183 in 1996-97 The enrolment increased over
110

the period from 20 71 million to 27 04 million Girls constituted 36 2 per cent o f the total students in 1996 97
3 3 37 There were 697 teachers'training colleges in 1996-97 with an enrolment o f 1 16 lakh Girls numbered 50,023 or about 43 per cent o f the enrolment The percentage of trained teachers was 88 in secondary schools and 89 in higher secondary schools
3 3 38 By the end o f 1995-96, the programme o f vocationalisation had been extended to 6476 schools with intake capacity o f 9 35 lakh students, indicating that 115 per cent o f the students were in vocational streams Inspite o f creating capacity for diversion o f 11 5 per cent secondary pass students to vocational courses, only 4 8 per cent students could be diverted A programme to provide pre-vocational training to students enrolled at the secondary stage was initiated in 1993-94
3 39 For the improvement o f science education, assistance was provided to 14,734 secondary/higher secondary schools for improvement o f libraries and to 15,775 schools for strengthening o f laboratories The scheme o f Computer Literacy and Studies in Schools (CLASS) continued to be implemented and an amount o f Rs 146 crore was provided for maintaining the programme in 1,598 schools and covering an additional 2,290 schools
3 3 40 The National Open School, which was set up in \979 and convened into an autonomous organisation in 1989, offered foundation courses, secondary and senior secondary level courses,vocational and life enrichment courses The number o f subjects offered included 51 foundation courses and 23 secondary courses including vocational courses m the areas of Agriculture, Commerce and Business. Technology, Para-medical and Home Science The number o f study centres increased from 161 in 1990- 91 to 666 in 1996-97 O f the latter, 105 are vocational study centres
Adult Education
Thrusts
3 3 41 The thrust in the Eighth Plan was on sustainability o f Hteracy skills and on remediation. Learning o f useful skills and their application m actual living and working situations was emphasised in the programmes The main strategv' emphasised an area- specific approach along with the campaign mode, with particular attention to women, the disadvantaged groups and backward rural areas The National Literacy Mission along w ith the State Literacy Missions, provided the main mechanisms for the implementation o f literacy and post-literacy programmes The services o f nongovernmental organisations were utilised for various literacy and post-literacy activities, including skill development among the adults
M ajor Achievements;
3 3 42 During the Eighth Plan, the organisation o f campaigns and adoption o f areas for intensive work constituted the two elements o f the strategy The strategv o f total literacy campaign was reviewed in 1993 which envisaged fijnding the Tribal .Area Sub-Plan between the Centre and the State Governments in the ratio o f 4 1, instead o f the earlier
i 11

ratio o f 2:1, launching o f an Operation R.estoration Programme in those districts where total literacy compaign had not taken o ff due to various causes During the Eighth Plan about 75 66 million have been enrolled out o f which 40 96 million are estimated to have been made literate
3.3 43 The scheme o f Shramik Vidyapeeths, which offers specially designed non- formal programmes by integrating literacy, general education and skill training for identified groups, was expanded by establishing 25 new Vidyapeeths during the Plan period The Centre provided assistance to State Governments for strengthening o f administration and to voluntary organisations for various activities
U niversity and Higher Education
Thrusts
3 3 44 The major emphasis in higher education during the Eighth Plan was on (i) integrated approach to higher education , (ii) excellence and equity, (iii) relevance o f higher education,(iv) promotion o f value education and (v) strengthening o f management system in university institutions
3 3.45 In order to provide facilities for higher education, particularly to the deprived sections of the population and neglected regions o f the country, several new universities and colleges were opened, particularly in the North-Eastern region Special efforts w ere made to provide facilities for specialised groups like SCs, STs and women The new facilities include increased intake and greater utilisation o f distance education mode Mobility o f the faculty and students has been facilitated by expanding the schemes o f staff quarters and student hostels
M ajor Achievements:
Q uality o f Higher Education
3 3 46 Several programmes were initiated to improve the quality o f higher educationThese included faculty development through Academic Staff Colleges, prescribingm inim um qualifications for teachers, teacher fellowships, travel grants and career awards Special efforts were made to enhance the library facilities and network (rNFLIBNET)
3 3 47 Research facilities were upgraded through a special assistance programme for universities The Centres o f Advanced Studies were continued in a number o f universities Major and minor research projects were continued The scheme of U niversity Science Instrumentation Centres was expanded Model curricula wereproduced in the Curriculum Development Cells in different subjects For qualityim provem ent through a systematic assessment procedure the National Assessment and A creditations Council was set up Relevance
3 3 48 Concerted efforts were made to make higher education relevant by introducingcareer-oriented courses as a part o f the first degree programme Further restructuring o fcourses was undertaken to provide an application component to university education Astudy was undertaken to examine the concept o f community colleges
3 3 49 The schemes o f adult and continuing education and women's studies were tlirther expanded At the end o f the Plan, there were 104 Centres o f Adult Education, 22 Centres o f Women's Studies in addition to 11 colleges which had Cells for Women's Studies
M anagem ent of Higher Education
3 3 50 The Gnanam Committee Report entitled "Towards New Educational M anagement" was accepted and formed the basis for action taken by the UGC
Technical Education
Thrust
3 .3.51 The thrust areas in Technical Education during the Eighth Plan were : modernisation and upgradation o f infrastructure, quality improvement, responding to new industrial policy and consequent interaction between institutions, industry and R & D organisations, resource mobilisation and institutional development
M ajor Achievements
3 3 52 The Eighth Plan concentrated on allo\v\ng the system to expand and ensuring that regulatory and support infrastructures were provided To achieve these objectives, more than 800 laboratories were modernised, about 550 projects were undertaken for strengthening the crucial technology areas, and training was imparted to more than 50,000 working professionals from industry Further, the schemes o f resource m obilisation and rationalisation o f fee-structure in technical institutions were operationalised The targets o f admissions to post-graduate courses were exceeded The IITs took up consultancies and programmes under Technology Development M issions The RECs were empowered under the scheme o f Centres o f Excellence and Indo-UK RECs' Project. At the end o f the Plan, 60 pol>l;echnics offered advanced and post-diplom a programmes under the Technician Education Project The AICTE sponsored and managed a substantial number of development programmes
M anagem ent Education
Thrusts
3.3 53 The All India Council for Technical Education (AICTE) is entrusted with the responsibility o f regulating, controlling and ensuring the quality o f Management Education in the country The formation o f a National Board o f Accreditation (N B .\) and organisation o f a number o f workshops contributed substantially to widespread awareness and concern for quality in M anagement Education For regulating the entry o f new instituions, the AICTE developed an effective and transparent evaluation system based on certain norms and standards which were developed in active collaboration with the leading management academicians The critical norms related to curriculum development, academic standards, admission process, number and quality o f faculty m em bers and the governance system.

3 3 54 Two new Indian Institutes o f Management were set up, besides the 422 institutions recognised by the AICTE The annual intake o f these institutions is 38.500, o f which 25,600 are in full-time, 6,600 in part-time and 6,300 in distance education programmes
SECTION IV
Ninth Five Year Plan
3 3 55 In view o f its significance for human resource development and economic and social transformation, education needs to be given a high priority in the allocation of resources Considering that the present share o f education in GDP is around 3 9 percent, raising it to any substantially higher level would require a substantial enhancement of expenditures on education The system's capacity to absorb financial resources of a large magnitude and use them productively and efficiently would also require careful consideration As regards the convergence o f Basic M inimum Services for contributing to educational development, emphasis will be laid on providing all primary schools with clean drinking water, sanitary facilities, better nutrition for the pupils through mid-day meals, heahh check-up and primary health-care facilities and a network o f roads for making the schools easily accessible
E arly C hildhood Education
3,3.56 Early Childhood Education (ECE) in the Ninth Plan requires attention for the following issues
(a) Strengthening the educational component o f ICDS(b) Its linkage, as pre-school education, with universalisation o f primary
education and consequential steps in that connection(c) The promotion and management o f EC.E under the decentralised system of
Panchayati Raj institutions and Urban Local Bodies(d) The role of the private sector and NGOs in ECE(e) Convergence o f health education and other ser\ices at the local level in
the interest o f ECE(f) Social mobilisation for ECE, through mass media and other activities
M ajor Achievements
The issues that will be addressed in the Ninth Plan are as follows,
(a) Combining pre-school and primary' level methodologies, along with healthand nutritional concerns, in teacher-training programmes, pre-ser\ice as well as in-service
(b) Encouraging the adaptation o f ECE to the environment and hoine- conditions of the children through innovative alternatives
(c) Orienting PRIs and ULBs to provision of communitv-supportedcreches and day-care centres attached to .\nganwadis, Primary schools
(d) Mobilisation of local women's groups to set up and m.anage ECE centres
114

(e) Production o f inexpensive play materials for children by using local materials and talents o f local artisans and school children engaged in socially useful productive work and social service actm ties according to their curriculum
(f) Strengthening resource groups for ECE at the NCERT and SCERTs as also research institutes, NGOs and other such organisations to conduct research, training, materials production and extension activities for ECE
Primary/Elementary Education
3.3 58 The Indian Constitution attaches high priority to education Article 45 declares "The State shall endeavour to provide, within a period o f 10 years from the commencement o f the Constitution, for free and compulsory education o f all children until they complete the age o f 14 years ” The Constitution also guarantees educational rights for minorities and calls for the educational development o f weaker sections o f society Through the 42nd Amendment o f the Constitution, the subject o f education has been brought to the Concurrent List in the Constitution for fulfilment of nationally accepted goals The 73rd and 74th Constitutional Amendments further empowered the Panchayati Raj Institutions (PRIs) to render their contribution to the development o f education at the grass-root level The Judgement o f the Supreme Court in Unnikrishnan J P \"s Andhra Pradesh (1993) states "The citizens o f the countr>’ have a fundamental right to education The said nght flows from Article 21 o f the Constitution This right \s, hovv'ever, not an absolute right Its contents and parameters have to be determined in the light o f Articles 45 and 41 In other words, every child/citizen o f this country has a right to free education until he completes the age o f 14 years Thereafter his right to education is subject to the limits of economic capacity and development of the State "
3 3 59 Critical Issues at Primary/Elementary Stage -
(i) Backlog of unenrolled children :
In order to achieve Universalisation o f Primary Education (UPE), it had been estimated for the year 1993-94 that approximately 142 million children in the age-group 6- 11 years would have to be provided primary schooling, out o f which 69 million would be girls
(ii) Drop-outs
The problem is fijrther accentuated by high drop-out rates Among those who are enrolled, it is estimated that large number o f children in Classes I-V drop out in between, before completing their class V The latest available data on drop-out rates for Classes I-V for the year 1996-97 reveal that the drop- out rate for the country as a whole was 38 95 per cent It was 39 37 per cent among boys and 38 35 per cent among girls Further, there were wide inter-State disparities. The major problem o f drop- outs as well as access to schooling is in the educationally backward States o f Andhra Pradesh, Arunachal Pradesh, Assam, Bihar, J&K, Madhya Pradesh, Orissa, Rajasthan, U P and West Bengal
11.̂

(iii) Unserved Habitations with Primary/Upper Primary Schools/Sections
According to the Sixth All India Educational Survey* out o f 10 60 lakh airal habitations, 8 84 lakh (83 4%) were served within the national norm o f one-km distance Thus about 16 6 per cent o f habitations were not served by primary schools within a distance o f 1 km. The survey resuhs also revealed that about 41,198 primary schools were being run in thatched huts, tents and open space In case o f upper primary schools, about 23.85 % habitations were not served within the official distance norm o f 3 km 5,638 upper primary schools were being run in thatched huts, tents and open space
(iv) Lack o f other Physical Infrastructure
A part from availability o f access to primary school \vithin a walking distance o f habitations there are other problems which have to be addressed on an urgent basis These relate to lack o f physical infrastructure like toilet facilities for girls, drinking water facilities in schools, teaching-learning equipment etc.
(v) Availability of Teachers
W ith regard to availability o f teachers, the Survey fijrther pointed out that about 4000 schools were without teachers and 115 lakh primary schools were being run by single teachers However, the position has improved since then, as additional teachers have been provided under Operation Blackboard (OB)
(vi) Low Levels o f Achievement
It is not only physical infrastructure that is inadequate to achieve UPE, there is the equally important dimension o f quality which needs attention For instance, evaluation studies on children's achievement show low levels in language and mathematics
(vii) Equity and Regional Disparities
Then, there are regional disparities Some States (like Kerala, Vlaharashtra, Gujarat, Tamil Nadu) have done well in providingphysical access to schooling facilities as well as in improving quality of education Some others (like Uttar Pradesh, Bihar,M adhya Pradesh, Orissa & Rajasthan) have still a long way to go There are equity concerns like low' enrolment o f girls, educational requirements o f special need groups, like SCs/STs, OBCs, minorities, disabled children, working children, children from disadvantaged locations like deserts, hilly, coastal and deep forest areas, children from migratory families etc
Prunarv education vsill be a m ajor thnist area during the 9'" Plan There w ill be an additioruil enrolment of 2 5 crore children at the lower primary stage and 1 6 crore children at tlie upper pnmarv level ' ’5()()0 additional rooms /buildings \m 11 be constructed al the elementary stage 2.36.0()0 teachers will be appointed additionalh at the lower primary le \e l and 1.75.000 teachers at the upper pnmary le\ el
' E.xcludmg j& K where Sur\ ey was noi done1 U)

3 3 60 Action Plan -
(i) Broad Approach The action plan needed to address the critical issues and achieve the desired objectives will be based upon ground realities It will resort to a multi-pronged strategy which is both imaginative and innovative and also carries with it the attributes o f flexibility, decentralisation, im provem ent o f quality, cost-effectiveness, result-oriented and time-bound commitment This can be achieved through micro- planning with a focus on area approach' and target population' It will also mean community involvement, monitoring, supervision and academic support at all levels The existing schemes will be examined with respect to these param eters and those found suitable will be promoted.
(ii) Phasing Under the Constitutional obligation, Government is to provide free and com pulsory education upto Class VIII G reater emphasis will naturally have to be laid on achieving UPE at the lower primary stage, in the first phase
(iii) M obilisation of Com m unity Support for School Improvement Programme
The 73rd and 74th Constitutional am endments have fiirther empowered the Panchayati Raj Institutions (PRIs) to make a positive contribution for developm ent o f education at the grass- root level Village Education Com m ittees (VECs) will be actively involved in School Improvement Programme (SIP)
Panchayati Raj Institutions w ill be empowered to serve as the nucleus in programme implementation N ongovernmental organisations will beencouraged to supplement the gov ernm ental efforts, v>hi\e the p m a te sector vv\U also be facilitated to grow particularly in higher and technical education
Traming will be imparted to VEC members wherever such committees have been constituted Arrangements for this will b e made through District Institutes o f Education and Training (DIETs), Block and C luster Resource Centres and through the Distance VIode
Areas o f concern o f VECs in the developm ent o f SIP will b e -
(a) door-to-door survey o f children o f school-going age and help in enrolment, particularly o f girls,
(b) planning and execution o f cijvil works o f school buildings,(c) mobilisation o f physical and fi nancial resources,(d) provision o f free accommodatLon to teachers, wherever possible,(e) improvement in children's attemdance,(0 institutional capacity building for sustainability o f schools;(g) Community ownership o f the S.chool Improvement Programme,(h) to help in implementation o f the Scheme o f National Nutritional Support to
Primary School Children(i) Other functions delegated by thie State Governments
i r

(a) Curriculum Development:
The draft curriculum framework developed by the National Council for Teacher Education (NCTE) will be finalised and made the basis for curriculum change in institutions for teacher education This will help to improve the quality o f Teacher Education Programme.
(b) Initiative for North-Eastern States
The North-Eastern States, which have a larger percentage o f untrained teachers in elementary schools will launch programmes to cover this gap by adopting the following measures :
A Diploma Programme for Primary Education developed by Indira Gandhi National Open University (IGNOU) will be launched in collaboration with the State Governments
NCTE will establish a Regional Committee for North- Eastern States to provide the necessary fillip to the teacher training institutions
Induction programmes o f 4 to 6 weeks' duration by DIETs will enrich the capabilities o f freshly appointed teachers.
(c) Upgradation o f Infrastructure:
The process o f strengthening Teacher Education Programme will be given a flirther impetus by upgrading the physical and academic infrastructure o f :
- State Councils o f Educational Research & Training (SCERTs)- Colleges o f Teacher Education (CTEs)- Institutes o f Advanced Studies in Education (lASEs)- District Institutes o f Education and Training (DEETs)- Block Resource Centres/Cluster Resource Centres (on a pilot basis)- National Council for Teacher Education (NCTE)- Departments o f Education in Universities
(d) Reaching out to Primary School Teachers in Remote Areas
To supplement the efforts to improve school effectiveness, an institutional mechanism will be put in place to provide on-the-spot counselling and guidance to teachers located in remote areas. This will be in the form o f Mobile Teams o f Resource Persons (M TRPs) Logistic arrangements will be location- specific, based upon felt needs and environment.
(iv) Strengthening Teacher Education Programme
118

(v) A lternative Education
In order to provide access to drop-outs, working children, girls, migratory population and other similar categories, ahernative education will be provided through institutional arrangements.
Non-formal Education centres for such categories o f children as are unable to avail them selves o f the formal system o f schooling in hilly, desert and forest areas, or due to the migratory nature o f the population will be expanded. The expansion will be based upon a cluster approach’, so as to make the scheme cost-effective
It has been found by experience that NFE centres achieve more meaningful results when these are run by NGOs Accordingly, the number o f centres run by NGOs will be enhanced significantly Where NGO participation is not forthcoming. State-run NFE centres will be established.
The scope o f the National and State Open Schools will be expanded by bringing elem entary education within their fold for the purpose o f providing a lateral entry to NFE children as well as to neo-literates for certification
Private initiative will be tapped in industrial project sites to run "project schools" Incentives like allotment o f land on a subsidised basis and other concessions under the Com panies Act or the Income Tax Act will be provided
(vi) Education of Working Children
A ccoraing to the 1991 census, there were 11 28 million working children in the country M ore than 90 per cent o f them were engaged in agricultural labour, rearing o f livestock, forestry and fisheries
M inistry o f Labour has a direct responsibility at the Centre for the following;
(a) to lay down policies and programmes for elimination o f child labour,particularly in hazardous trades,
(b) to monitor the progress o f implementation o f programmes, projects andschemes for elimination o f child labour, and
(c) to coordinate implementation o f child labour-related projects o f the varioussister Ministries o f the Government o f India in order to ensure convergence o f serv'ices for the benefit o f the families which have child labour Ministry o f HRD will extend all support to the Ministry o f Labour in the setting up of education-related projects' These will be area-specific' and focussed
particularly in States o f Andhra Pradesh, Madhya Pradesh, Maharashtra and Uttar Pradesh, where there is a large concentration o f child labour
i l9

Adult Education
3 3 61 Literacy, the key to most o f India's development programmes, is the catalyst to accelerate initiatives in health care, agriculture, primary education and in all critical areas o f developm ent
3 .3 62 In the light o f the 73rd and 74th constitutional amendments, hteracy has assum ed even greater significance If pow er for local self-governance is to devolve to the panchayats and nagar palikas, literacy is an essential prerequisite for these institutions to be effective
C ritical issues in Adult Education:
3 3 63 Despite this key role, much still needs to be done India has the largest number o f non-literate people in the world - about a third o f the world's total o f around 900 million A lthough literacy levels have increased from 16.67 per cent to 52 21 per cent since independence, unrestrained population grow th has proved to be a serious impediment
3 .3 .64 The literacy levels o f women are low - 39 .29 per cent as compared to 64 13 per cent for men The fact that female literacy is acknowledged as being one o f the most significant indicators o f development makes this all the more alarming With one third of the seats in panchayats and nagar palikas reserved for women, the need for them to become literate is vital
3.3 65 There are large regional disparities in literacy rates - between urban and ruralareas, as well as between states W hile about three quarters o f the urban population is literate, the literacy rate in rural areas is less than 45 per cent The literacy rate o f women in rural areas is even lower at 31 per cent.
3 3 66 Seven states - Uttar Pradesh, Bihar, M adhya Pradesh, Rajasthan, Andhra Pradesh,W est Bengal and M aharashtra - account for around 70% of India's non-literate population The first four o f these states alone, are home to around half o f India's non- literate people
3 3 .67 In its endeavour to achieve the goals it has set for itself in aduh education, India faces several challenges Studies by expert groups and the constant evaluation o f the programm e, indicate several principal challenges
3 3.68 The four Hindi speaking states - Uttar Pradesh, Bihar, Madhya Pradesh and R ajasthan - account for half o f India's non-litera te population The large number o f nonliterate people, and therefore the relatively small number o f educated people from whom volunteers can be drawn, as well as the overall socio- economic backwardness o f these states, combine to make the achievement o f literacy particularly difficult in these areas
3.3 69 There are large regional disparities - between states, between districts in a state,between males and females and between tribal and non-tribal areas
120
3 3 70 Cam paigns have sometimes been launched without adequate planning, and quality has suffered in certain places in the preoccupation with total literacy This preoccupation has also sometimes led to overestimation o f achievements, with some districts being prematurely declared totally literate.
3 .3 71 The vital importance o f post-literacy efforts to prevent a relapse into illiteracy hasalready been mentioned Post Literacy Campaigns have often not been implementedadequately or in time, even in districts where TLCs have been successful There have often been unnecessarily long time gaps between the completion o f a TLC and the beginning o f a PLC in a district To ensure that the gains o f TLCs are realized, post literacy needs far greater attention and emphasis, to sustain the interest o f the neo-literates, and to make them 'fiinctionally literate' in the true sense
3 3,72 G reater community involvement is required to convert literacy into a people's movement
3 3 73 Action Plan;
i) Literacy campaigns have already covered 447 districts, o f which 215 are in Total Literacy Campaigns, 173 are in Post Literacy Campaigns and 59 arein Continuing Education
Eradication of illiteracy is a top pnon iy in the National Agenda for Governance A m ajor dent would be made by m akm g 10 crore adults literate m the 9*̂ and ID* plan penods
Phase In addition, 38 districts have been covered under Rural Functional Literacy Projects Hence the total coverage comes to 485 districts Efforts would be made to bring the remaining 40 odd districts under the coverage o f literacy
ii) Gradually, all districts will be brought under the Continuing Education programme which will be further strengthened as well as linked to other socio-economic programmes such as health and hygiene, nutrition and sanitation, skill upgradation and capacity building, culture, sports, etc
iii) For such neo-literates who wish to pursue further education, an equivalency programme is being developed to enable neo-literates to enroll in courses at the national/ state open schools
iv) Efforts have been set in motion to decentralise and devolve administrative and financial powers to State Literacy Mission Authorities The sanctioning o f projects will largely be done by these authorities
v) Sensitisation and orientation workshops are proposed to be conducted for functionaries o f panchayati raj institutions so as to involve local government bodies in the literacy programme
vi) It is proposed to further strengthen and revitalise State Resource Centres and Shramik Vidyapeeths (proposed to be renamed as Jana Shiksha
121

Sansthans) This will provide additional fillip in the areas o f training, skill upgradation, capacity building and preparation o f materials
vii) The stress on awareness generation among women and their em powerment is proposed to be continued as one o f the major planks o f the programm e
Secondary Education
3 .3 74 Conceptually, secondary education is meant to prepare young persons both for thew orld o f work and entry into higher education. But traditionally, it has come to be looked upon as a bridge between the elementary and higher education stages This process has to be reversed
3 3 .75 Critical Issues in Secondary Education
(i) Revision of Curricula
A fter the formulation o f the New Policy on Education in 1986 (revised in 1992) the need for change o f curriculum has arisen. The change will take into account the areas of scientific development, environmental education, computer education and social issues in the context o f economic liberalisation.
(ii) Vocationalisation o f Education
The scheme o f Vocationalisation o f Education at 10+2 stage was introduced to regulate adm issions at College level. The purpose was to divert at least 25% students o f 10+2 stage to self-employment or wage-employment, while providing them with vocational com petence in a field o f their choice. However, the scheme has not taken o ff due to logistic and academic constraints which require streamlining and strong industry-institution linkages At present, only 4 8% students are opting for vocational stream, against a target o f 25%
(iii) Distance Education
D istance Education is an alternative approach for providing secondary education With the trem endous expansion o f elementary education in the country', the demand for secondary education is likely to grow enormously in the next decade This challenge has to be met by providing distance mode o f education through the Open Learning System (OLS) in the country
(iv) Quality Improvement of Teaching in Mathematics, Science and Com puter Education
The quality o f teaching in Science and Mathematics has deteriorated so much that it has started having adverse effects at under-graduate and post-graduate levels Further, with the fast development o f Information Technology, the need for quality education in com puters at school stage has become imperative
(v) Hostel Facilities for Girls
In remote and tribal areas, secondary schools do not have adequate hostel facilities for girls, and this results in failure to attr act girls to them
(vi) M inority Education
In spite o f adequate facilities at seciondary stage, children from minority groups are not taking full advantage o f these.
(vii) Integrated Education for the Dissabled
Afiter the enactment o f the Disabled Act 1995, the education o f the disabled upto age 18 has become a legal obligation. Though efforts have been made to provide educational facilities to this special group, these a re not commensurate with the trem endous needs
3 3 76 Action Plan
(i) Revision of Curricula
(a) National Council o f Educational Research & Training (NCERT) in collaboration with Statie Councils o f Educational Research & Training (SCERTs) will revise (curricula and a National Draft will be prepared for discussion and adoption New areas o f concern will be included in the curriculum After thie draft is adopted, the same organisations will upgrade the text-books ;so as to keep pace with international standards
(b) Simultaneously, N CERT and SCERTs will review the traming needs o f in-service teachers and ttake steps to meet the new challenges
(c) National Council for Te:acher Education will prepare a framework for preservice teacher educatioin, so that the standards are upgraded
(ii) V^ocationalisation of Education (V E)
The Scheme o f Vocationalisation o f Education at 10+2 stage will be restructured so as to provide employability to the target group An Empowered Committee representing the Government, industry and trade will be constituted to promote a meaningful partnership and better inter-departmental coiordination. Vocational courses with strong linkages w ith industrial units will be encouraged.
(iii) Distance Education
Distance Education will be broad-based by providing wider responsibilities to National Open School (NOS) and the State O pen Schools (SOSs) These will be in the areas o f elementary education, vocationalis;ation o f education for neo- literates, drop-outs, secondary students and adult populaition, including working women Special initiatives will be taken to derive fijll advantage from the state-of-art Information Technology (IT)
123

(iv) Teaching o f M athem atics, Science and Computer Education
(a) Special measures will be taken to promote teaching o f Mathematics and Science at the secondary stage by devising new popular source-books A Science Talent Research Scheme will be promoted
(b) Science & M athematics will be linked to the immediate environment o f the child. Efforts will be made to avoid the unnecessary load o f a crowded curriculum
(c) The recommendations made by the Task Force on Computer Education will be implemented in a time-bound manner
(v) Hostel Facilities for Girls
Additional hostel facilities for girls will be provided, particularly in tribal and remote areas, so that the attendance rate o f girls improves MHRD *will coordinate its programm es with those o f the M inistry o f Welfare
(vi) M inority Education
(a) The Scheme o f M odernisation o f Madsu^asas will receive all possible attention, so as to cover more Madarasas and improve the access o f Muslim children to education
(b) Area Intensive Programme for Educationally Backward Minorities will be strengthened by allocating a higher outlay A vigorous publicity drive will be undertaken to generate necessary awareness among the minority communities so that they come forward to take full advantage o f the scheme The cooperation o f the leaders o f the minority communities will be elicited for the fulfilment o f the same objective
(vii) Integrated Education for the Disabled
A com posite area approach will be adopted and additional blocks covered under the programme Training o f teachers for these special groups will be organised in universities
Technical Education
3 3,77 Despite efforts in the past, only a few technical mstitutions have managed to achieve high academic standards Major qualitative reforms are necessary to upgrade the Regional Engineering Colleges (RECs) While the Indian Institutes of Technology (IITs) have enjoyed autonomy, flexibility and responsive governance, there is an urgent need to enhance their output and quality
124

3 3 78 Critical Issues in Technical Education
(i) Quality Improvement
The areas which need specific attention are adequacy & quality o f faculty, modernisation o f institutional resources, upgradation o f educational technology, relevance and flexibility o f curricula, interaction with industry etc
(ii) Infrastructure Development and Innovations
Over the years, regional imbalances have emerged in respect o f infrastructure development Further, paradigm shifts are needed across the board from knowledge-based education to skill and competence development and from classroom learning to workplace learning,
(iii) Flexibility, Mobility, and Curricula
Economic liberalisation and industrial expansion have brought in new institutions and programmes Hi-tech programmes, curriculum development, flexibility and mobility assume special significance in this rapidly changing scenario
(vv) Governance of institutions
Governing and management structures at the Central and State levels need to be strengthened, so as to manage the manifold changes described above
(v) Excellence in Polytechnic Education
Technical staff produced through polytechnics form the backbone o f middle level management and technical manpower and demand for them is steadily growing There is need for greater flexibility and autonomy to these institutions, which have also to forge close linkages with technical institutions o f higher level on the one hand and industry on the other
j j 79 Action Plan
(i) Quality Improvement
(a) To meet the growing manpower needs as well as improve the quality o f technical education, the intake capacity ofIndian Institutes of Technology (lITs) and other reputed institutions will be doubled, particularly in high-demand areas likesoftware engineering
The intake capacm o f the IlTs. other reputed engineenng institutions and IIMs will bo doubled. paracuiarK in Ingh- deniand areas iike software engineering and infornution lecl\nolog\ Vocational education at the secondar> and undergradiuite le\els will be expanded and restncted so as to h a \e strong linkages with iridusir\ and im pro \e em plo\abilii\
(b) There will be an attempt at quality improvement in RECs & other technical institutions They will be given greater fijnctional autonomy and their

performance would be closely watched RECs will be integrated into the academic and faculty improvement programmes o f IITs
(ii) Infrastructure Development and Innovations
(a) To promote innovations and help meet gaps in infrastructure, institutions o f technical education will be encouraged to create a corpus o f fijnds by suitably remodelling and restructuring their tuition fees and development charges Necessary autonomy will be allowed to these institutions so that they can adopt innovative practices for institution building Training o f staff will be paid more attention
(iii) Flexibility, Mobility and Curricula
(a) To cope with the globalisation o f the economy and rapid industrial expansion in the country, hi-tech and new technology programmes will be promoted All possible steps will be taken to devise in-built flexibility in course structure, credit transfer and upward vertical mobility through modular design o f the curriculum.
(b) To meet the shortage o f faculty for post-graduate teaching, special incentive schemes for M tech, M Phil and Ph D programmes will be devised
(iv) Governance of Institutions
(a) Autonomy and deemed university status will be granted to identified technicalinstitutions. The style o f management will be more responsive and accountable through induction o f eminent academicians, technologists, industrialists and other men o f stature These bodies will focus on vision, goals, objectives and policies for the institutions and not meddle with issues o f micro-management
(v) Excellence in Polytechnic Education
(a) The implementation o f the Technician Education Project during the 8th Planattempted to bring Polytechnics closer to industrial establishments, other technical institutions o f higher education and industrial traininginstitutes This process will be further facilitated in the times to come
(b) The scheme o f Community Polytechnics will be brought closer to target groups' requirements by transfer of appropriate technology to the community and training m such technology to rural folk
U niversity & Higher Education
3 3 80 The country is going through major economic and technological changes The system o f higher education has to prepare its products for participation in the emerging social, economic and cultural environment Universities are witnessing a sea change in their outlook and perspective Information technology is leading to fundamental changes in the structure, management and mode o f delivery o f the entire educational system
126

3 3 81 Critical Issues
(i) Relevance and Quality
Today, the relevance and quality o f education is the most critical issue in higher education The delivery system is under tremendous pressure
(ii) Use of M edia & Educational Technology
Information technology has changed the educational systems throughout the world India is at the cross-roads and can easily use this opportunity, as she has a major potential forsupplying software to the world
(iii) Structure o f Curriculum
It is widely argued that the structural arrangement o f the curriculum is rigid and fails to respond to the emerging needs o f the student community
(iv) Access and Equity
Although there has been massive development and expansion o f University and higher education in the country, we are faced with the issue o f regional imbalances. There are numerous institutions without adequate physical infrastructure and academic climate The representation o f women is also much lower than that o f men
(v) M anagem ent of Education
M anagement o f education is being done on traditional lines with rigid structures, high wastage and low efficiency
(vi) Resource Utilisation
There is a problem o f under-utilisation o f the existing physical infrastructure due to proliferation o f institutions o f higher education
3 3.82 Action Plan
(i) Relevance & Quality
(a) Vocational Education: At the under-graduate level, vocational education will be expanded in disciplines which have strong linkages with industry and improve employability UGC, in collaboration with the universities, will re-structure the under-graduate courses and actively involve industrial houses in the development of curriculum, on-the- job training etc
r’7
(b) Higher Education Teaching in post-graduate and doctoral programmesand research will be oriented towards applied fields so as to establish relevance, need-based specialisation and market-driven skill generation
(c) Faculty Improvement Faculty improvement scheme will be strengthenedthrough incentives, self-development, sponsored research, in-service training tlirough distance mode etc Academic staff colleges will be restructured accordingly
(d) Faculty Exchange: Faculty exchange between industrial houses anduniversities will be prom oted in technical disciplines so as to enrich the content o f education
(ii) Use of Media and Educational Technology
A purposeful action plan will be formulated in consultation with the field agencies in order to impart a multi- media approach to teaching. Quality will be ensured through Internal Quality Assessment Cells and accreditation through the National Assessment and Accreditation Council
(iii) Structural Arrangement of Curriculum
Universities will be asked to develop a system o f credit and credit transfers This will help in shifting from rigid, structured, unidisciplinary programmes to the credit-based cafeteria system with core, optional and extra-developmental courses at under-graduateand post-graduate levels
(iv) Access and Equity
( a ) Unserved Areas Unserved areas will be brought into the fold by providing additional educational facilities College mapping will be done on an area-based approach so that there is optimal utilisation o f existing resources and regional imbalances are removed
(b) Distance Education Since resources for expanding physical facilities are limited. Distance Education in conventional as well as open universities will be strengthened and promoted
(v) Linkage Changes
Necessary changes will be made in the legislation pertaining to the UGC and the Universities so as to cope with newly emerging requirements and challenges
(vi) Resource Utilisation
(a) Fiscal Discipline Fiscal discipline will be strongly enforced in institutions o f higher education
12H

(b) Resource-Sharing Adoption o f a cluster approach to sharing o f resourcesby neighbouring institutions and setting up o f inter-university centres will help in achieving economies o f scale
(vii) Resource Mobilisation
Additional Resources will be mobilised by
(a) Fee Restructuring: Restructuring o f fees based upon the criteria o f Unit Cost and the socio-economic background o f the student
(b) Public Funding: Widening the public funding resource-base by attracting contributions from various departments o f the Government and the community, in order to support basic infrastructure such as laboratories, libraries and new courses
(c) Industrial Funding: Encouraging contributions from industrialestablishments for sponsored research projects
(viii) Performance and Accountability
UGC wlU vv'ovk out a concrete programme of action for ensuring better accountabilityThis will be done by
(a) Leveraging UGC Funds Using UGC's plan and non-plan financialassistance as a leverage to encourage better performance
(b) Evaluation: Utilising the UGC's evaluation machinery much morevigorously to rank universities and publicising evaluation reports as widely as possible
(c) Model Code: Developing a model code o f governance which wouldminimise political interference and improve standards
(ix) Extension Education
(a) Continuing Education: Auult and continuing education programmes will be targetted for those who have had the benefit o f university education but need to return, for updating or acquiring knowledge or skills
(b) Skill-based Courses: Extension education programmes will be aimed atthe needs o f specific groups who would not otherw ise be entrants to the university system. Such courses could be based on skills for income generation, entrepreneurship, para-legal work, etc
(c) Community Education Community education programmes will befocussed on transfer o f skills which require upgradation due totechnological progress
129
W o m en 's E m p ow erm en t
3.3.83 The National Agenda for Governance also states. "We will institute plans for providini: free education for girls up to college level, i e under-graduate le \el including professional courses would be made free". An adequate proxision will be made for the scheme for this purpose during the 9th Five Year Plan. On a long-term basis and in close collaboration with State and local governments, the financial implications o f making education free for girls upto the graduation level will be worked out, in so far as these relate to the Department o f Education.
3.3.84 Critical Issues
Free Education for Girls:
The concept o f free education has to be defined explicitly in terms o f its coverage The components could be:
(a) tuition fees,
(b) basic text books;
(c) maintenance expenditures in hostels; and
(d) library books
3.3.85 Action Plan
Free Education for Girls:
> Education will be free for girls upto college level. The contours o f the scheme are being worked out A new scheme will be launched shonlv
(a) Financial Requirements The financial requirements for implementation o f the concept o f free education to girls upto college level will be worked out by M inistry o f Human Development (MHRD)
(b) New Scheme: A new scheme called "Free Education for Girls" will be devised and implemented in a time-bound manner
M anagement Education
Critical Issues
3 .3 .8 6 In v ie w o f the emerging needs o f Indian economy, the new dimensions o f management education and research have necessitated technology upgradation to achieve quality control, use of information technology for overall improvement in output and performance as well as competitiveness. There is an imperative need for networking and linkages between leading management institutes, university departments of
130

management and centres o f management education, especially in private sector on the one hand and industrial establishments and user organisations on the other
Action Plan
3 3 87 In view o f the acute shortage o f teachers in management education, particularly in areas like marketing and finance, programmes will be restructured to meet the demands for managerial cadres for the growing infrastructural and service sectors and in areas like International Business, Environment, Technology Management, Entrepreneurship, Material Management, etc. Institutes-industry linkages will be strengthened through consultancy, faculty/professional exchange programmes
Language Development and Book Promotion
3 3 88 Language is a potent instrument o f artistic expresion and literary creativity. India has inherited a multiplicity o f languages, which are at various stages o f development. During the successive Plans, the endeavour had been to help the different languages develop to their optimum level. Emphasis was also laid on the promotion o f literature in various languages
3 3 89 Since Independence various programmes have been formulated and implemented for the promotion of Hindi, as a link language, and modern Indian Languages, as provided m the National Policy on Education besides giving equal stress to Sanskrit, Arabic, Persian, Sindhi, Urdu Fnulish and other languages, both spoken as well as written
Review of Eighth Plan
3 .3 90 During the Eighth Plan period, the schemes for the promotion of Hindi as a link language were further strengthened As many as 1521 posts o f Hindi teachers were created and assistance was provided to 19 Hindi teachers' training colleges Besides this, 160 voluntary organisations working for the promotion of Hindi were provided financial assistance for publication o f 54 Hindi manuscripts Fifty scholorships were given to foreign nationals for studying Hindi Books in Hindi were supplied to the Missions/Embassies abroad
3.3.91 The Central Hindi Directorate published 6 dictionaries and 30bilingual and trilingual dictionaries and organised 37 book exhibitions It also gave awards to 48 writers, organised 32 camps of new Hindi writers and conducted 8 study tours Twelve lakh books were distributed in non-Hindi speaking areasfree o f cost. As many as 51,932 students were enrolled in the correspondence course for teaching Hindi language and 66 personal contact programmes were organised for these students
3.3 92 The Kendriya Hindi Shikshan Mandal, Agra continued the extensionprogrammes for Hindi teachers in tribal areas and conducted training courses for them It also developed text books and infrastructural materials for teaching Hindi in Non-Hindi speaking areas The Commission for Scientific and Technical Terminology continued the job o f evolving a uniform format o f scientific and
111

technical terminology in Hindi and other Modern Indian languages It also developed G lossaries o f technical terms o f all discipline ranging from basic Sciences to Medicine, Engineering, Social Sciences and Humanities A revised enlarged edition o f a com prehensive glossary o f about 50,000 technical terms o f Medical Sciences, Pharmacology, and Physical Anthropology was published Similarly, an enlarged Com prehensive Agriculture Glossary was brought out As many as 2 5 lakh technical term s w ere keyed into the data base o f computer-based National Terminology Bank tow ards the modernisation o f lexicography and facilitating instant dissemination o f updated technical terms to the users It also organised terminology associated workshops
3 3 93 The Central Institute o f Indian Languages in Mysore assisted 40 NGOs for the developm ent and promotion o f Modern Indian Languages, besides continuing its regular programmes. It assisted in the publication o f 23 manuscripts in Modern Indian Lanugages. During 1993-94, a Centrally Sponsored Scheme o f Appointment and Training o f Modern Indian Language teachers, other than Hindi, was launched for enabling the implementation o f the three language formula Eleven State and Regional Institutes o f English were provided financial assistance, 30 District CeiAres for English were sanctioned in different States/UTs and about 4015 teachers received training at these centres Twenty five NGOs were assisted every year for promotion and development o f English language Twenty one manuscripts in English language were published and 75 books were purchased
3 3 94 The National Council for Promotion of Urdu (fornievK known as Bureau for Promotion o f Urdu) assisted 48 voluntary organisations and academic institutions for running o f Calligraphy Training Centres and for undertaking various activities tor promotion o f Urdu language Academic literature was also prepared and made available to Urdu speaking people o f the countrv' Dunng 1993-94, the Scheme ofM odernisation o f Madarsas was introduced to provide assistance to madarsas tointroduce science, mathematics, social science, Hindi and English as part o f their curriculum. The National Council for Promotion o f Sindhi Language wasestablished in 1994 to help in the development, promotion and propagation o f Sindhi language
3 3 95 Two more Kendriya Sanskrit Vidyapithas were started during the Eighth Plan, in addition to the seven already fianctioning Two new ,Adarsh Sanskrit M ahavidyalaya/Shodh Sansathan were also recognised The construction o f the building o f the headquarters o f Rashtriya Sanskrit Sansathan and Kendriya Sanskrit Vidyapitha at Trichur was also taken up during the Eighth Plan For the promotion and development o f Sanskrit language, 750 registered voluntaryorganisations were assisted and the .serv'ices o f !25 retired scholars availed o fThe Allahabad Sanskrit Vidyapitha took the work o f correction and preservation o f Sanskrit manuscripts. The Janapitha Sanskrh \'idvalava corrected and edited the Kashmir Shaiv Darshan Kosha
3.3 96 The National Book Trust increased its net sale considerably during the Eighth Plan The Nafional Centre for Children's Literature organised eight extension programmes and workshop;:, and panicipaleu ui international book fairs, besides organising 13 book exhibitions abroad The main focus o f NBT u a s onprom otion o f books for export to South Asia and ,\fncan countries

3 3 97 During the IX Plan, emphasis will be laid on enhancing access to tribal languages through various activities Schemes dealing with development o f Sanskrit education and for its promotion will be strengthened with an emphasis on promoting use o f Sanskrit in conversation. Sanskrit is also well suited for Computer-based natural language processing activities It is, therefore, proposed to give a thrust to this area under the scheme for the development o f Sanskrit language New programmes are proposed to be initiated for developing Hindi as a link language, particularly in non-Hindi States Due emphasis will be given to the promotion o f Urdu and Sindhi languages, modernisation o f madarsas and development and promotion o f English and modem Indian languages The publication programmes o f the National Book Trust will be strengthened further Special thrust will be given to the effective implementation o f the Copy Right Amendment Act by initiating new schemes
Programmes
3 3 98 For the promotion and preservation o f tribal languages, a programme o fpublication o f tribal oral literature, their translation into major Indian languages and provision o f training to people to preserve tribal oral literature, etc will be undertaken For the promotion o f Sanskrit, seminars, symposia and workshops on different topics, particularly relating to science and technology and study o f Sanskrit indology by exchange o f scholars with other centres/ universities within the country and abroad will be organised
3 3 99 For the documentation o f available Sanskrit treasures, a library with a docum entation and computer centre is proposed to be attached with RashtriyaSanskrit Sansathan. A new scheme will be initiated for the production o f suitable teaching material and for starting new correspondence courses. Activities relatingto production o f simplified Sanskrit learning material along with computer-aidedteaching o f shastras will be given due emphasis The Maharishi Sandipani Rashtriya Ved Pratishthan will be helped to expand its activities o f preservation, conservation and development o f the oral tradition o f vedic knowledge and studies
3 3 100 Schemes for promoting Hindi as an effective link language, particularly in the non-Hindi speaking States, will be expanded /extended fijrther Teaching o f Hindi will be taken up in two more regional languages, Telugu and Kannada, throughcorrespondence courses New centres o f Kendriya Hindi Shikshan Mandal will beestablished in the States o f Orissa, Gujarat and West Bengal and a computer laboratory will be established at the Kendriya Shikshan Mandal at Agra .Anaudio-visual laboratory will be established under the Commission for Promotion of Scientific and Technical Terminology Awards will be given to the users of scientific and technical terminology in Hindi In order to enable faster translation o f technical books and manuals using computers, computer assisted translation from English to Hindi o f technical books will be undertaken
Action Plan
133

3.3.101 For the promotion o f Urdu language, the activities o f the National Council for Promotion o f Urdu Language will be further extended by providing additional funds for the production and publication o f books, for conducting correspondence courses in Urdu, calligraphy etc. A Central Urdu Language and Documentation Centre will be established for conservation and preservation o f Urdu manuscripts and books.
3.3.102 The activities o f the National Council for Promotion o f Sindhi language will be promoted by initiating new schemes for the production o f technical terminology, learning through correspondence courses, preparation o f Sindhi- Hindi- English dictionaries, encyclopaedia etc.
3.3.103 The Central Institute o f Indian Languages (CIIL), Mysore will initiate new schemes for developing models for translation among Indian languages, development o f common core grammar for machine translation and for setting up a facility for information on Indian languages, etc. The Central Institute o f English and Foreign Languages (CIEFL), Hyderabad will focus on improving the standard o f teaching o f English language and translation o f literature from one language to another. For speedy translation o f technical books from English to Hindi by using computers, a new scheme will be initiated by CIEFL
3.3.104 The National Book Trust will be strengthened to give thrust to production o freference material for children. Comprehensive data base o f published books will also be prepared. For promoting books and reading habits, special programmes overthe mass media will be promoted.
3.3.105 The Copyright Amciidment Act will be enforced effectively. The Copyright Cells will also be established for documentation and information on Copyright Rules, related issues etc., besides promoting formation o f Copyright Societies in various areas.
NINTH PLAN OUT-LAY AND PHYSICAL TARGETS
3 .3 106 The basic agenda for the Ninth Plan is to fulfil the objectives o f Article 45 o f the Constitution by charting out a clear course ©f action to make primary education free and compulsory upto Vth standard, though the ultimate object is to universalise upto V lllth Standard. This phasing is necessary because o f the resource constraint on the one side and enormous complexity o f the problem on the other
3 .3 .107 Bulk o f the Plan Outlay will be spent on elementary education Physical targetsfor the education sector are at Annexure-3.3 1 The IX Plan will aim at :
a) Additional enrolment at lower primary stage - 250 lakhb) Additional enrolment at upper primary stage - 160 lakhc) Construction o f school buildings/additional - 75 thousand
rooms at the elementary staged) Appointment o f primary school teachers - 236 thousande) Appointment o f upper-primary school teachers -175 thousand
134

3.3.108 In addition, there is a target o f making 5 crore adults in the age group (15-35) literate during the plan period.
A Perspective for Education During the Next Decade
3.3.109 Since the task o f Universalisation o f Elementary Education will remain unfulfilled in States like Andhra Pradesh, Assam, Bihar, J&K, Madhya Pradesh, Orissa, Rajasthan, Uttar Pradesh and W est Bengal, particularly at upper primary stage, it is obvious that there is need for a longer time horizon. The Xth Plan will continue to lay emphasis on a higher allocation for primary education so as to complete the unfinished task
3 .3 .110 The details o f the proposed physical targets are at Annexure - 3 .3 .2. The Xth Plan will aim at :
a) Additional enrolment at lower primary stage - 300 lakhb) Additional enrolment at upper primary stage - 250 lakhc) Construction o f school buildings/additional - 125 thousand rooms at the elementary
stage.d) Appointment o f primary school teachers - 275 thousand ^e) Appointment o f upper-primary school teachers -250 thousand
The Xth plan will make another 5 crore adults population in the age-group 15-35 literate.
135

Physical T a r g e t s . IX Plan (1997-9S -- 2001-2002)
A nnexure-3.3.!
Item s 1 9 9 7 -9 8 1998-99 1999-2000 2000-2001 2 0 0 1 -2 0 0 2 T otal
1. A dd itiona l p^nrolment at Lower Pnmarv' S tage f in lakhs)
45 48 50 52 55 250
2. A dd itiona l E nro lm ent at I pper Primary' S tage ( in lakhs)
25 28 32 35 40 160
3 C iv il w orksE lem en ta ry Stage (in thousand units)
IS 15 15 15 15 75
4. SuDplv o f T each ing Lsam inE E q u ip m en t (T L E )
(a ) L o w er P rim ary S chools (in thousand units)
8 9 10 11 12 50
(b ) LTpper P rim ary Schools (in th o u san d units)
6 7 8 9 10 40
5. S ac tio n in g o f Post o f Teachers/N T E In stru c to rs
(a) L o w e r Pnm ary S tage (in thousands) 43 45 48 50 50 236
(b) t 'p p e r P rim ary Stage (m thousands)
30 32 35 38 40 r ?
6. S tren g th en in g o fT e a c h e r Education P rog ram m e
(a) I.'pg rada tion o f C olleges o fT each er E d u c a tio n (C TE s), Institu te o f A dvance S tud ies in E d u ca tio n (lA S E s) (N os)
5 5 5 5 5 25
(b ) D is tric t Institu tes o f E ducation and T ra in in g (D IE T s)
2 0 20 20 20 20 100
ic ) B lo ck R esou rce C entres - 5 10 15 20 50
(d ) C lu s te r R esou rce C entres - 10 20 30 40 KM)
7 A dult E ducation Program m es
(a) C o v erag e o f addl. D istric ts Under lite racv an d to po st-lite racv cam paigns (incl. O p e ra tio n R esto ra tion)
45 50 40 40 40 215
(b ) C o v er in g o f addl. D istricts Under cont. Edn. P rogram m e
15 40 40 40 40 175
1 c) t )p e m n g o f S hram ik V id \^peeths (Jan S ik sh an S ansthans)
s. 5 in 15 15 50
(d ) M ak ing A dult L iterate (m illions) Kli 10 10 10 10 50
116

Physical T arg e ts : X th P la n (2(M>2-((3 - 2(M»6-(t7)
Annexure-3.3.2
I tem s 2002 2003-04 2 0 0 4 -0 5 2005-06 2 0 0 6 -tr T o ta l
I A dditiona l E nro lm ent al Lx)wer P rim ar\ Stage (m lakhs)
55 58 60 62 65 300
2 A dditional E nrolm ent at L 'pper Pnm arv' Stage (in lakhs)
40 45 50 55 60 250
3. C ivil w orksE lem entarv S tage (in thousand units)
25 25 25 25 25 125
4. Supply o f Teachings Learning E yuipm ent CTLE)
ia) ix5wer P rim ars Schools (m thousand units)
10 15 20 25 3 0 100
(b ) I pper Pnm arv Schools (in thousand units)
10 10 15 20 25 xo
5- S ac tion ine o f Post o f Teachers N FE Instructors
(a) L ow er Pnm arv ' Stage (in thousands) 50 52 55 58 60 275
(b) ( pper Pnm arv Stage 40 45 50 55 601
250
6 S trcn g th en in e o f Teacher E ducation Program m e 1
(J) I ’p g rada lion o f Colleges o f T eacher Education (C 'fE s t Institute o f Advance Studies m E d u ca tio n (lA S E s) (N os)
10 10 10 10 10 i!!
(b) D istric t Institu tes o f E ducation and T raim ng (D IE T s)
10 10 10 10 10 50
(c ; B lock R esource Centres 25 25 25 25 25 125
(d) C luster R esou rce Centres 50 50 50 50 50 250
7 Adult E duca tion Program m es
(a i C overage o f addi, D istncts l.'nder literacy and to post-literacv cam paigns (incl O pera tion R estoration)
45 50 40 40 40 215
(b j C o v e n n g o f addl. D istncts C nder com Edn. P rogram m e
15 40 40 4(1 40 1 '5
(c ) O pen ing o f Shram ik V idvapeeths (Jan S ikshan S ansthans)
5 5 10 15 15 50
(d ) M aking A dult Literate (m illions) 10 10 10 10 101
50 1

3.4.1 India was one o f the pioneers in' heakh service Planning with a focus on primary health care. In 1946, the Health Survey and Development Committee, headed by Sir Joseph Bhore recommended establishment o f a well-structured and comprehensive health service with a sound primary health care infrastructure. This report not only provided a historical landmark in the development o f the public health system but also laid down the bluep'fint o f subsequent health planning and development in independent India.
3.4.2- Improvement in the health status o f the population has been one o f the-major thrust areas for the social development programmes o f the country. This was to be "achieved through improving the-access to and-utilization o f Health, Family Welfare and Nutrition Services with special focus on under served and under privileged segment* o f population. Main responsibility o f infrastructure and manpower-building rests with the State Govemrhent supplemented by funds from the Central Government and external assistance. Major disease control programmes and-the Family Welfare-Programmes are-funded-by-the-Centre (some- with assistance from external agencies) and are implemented through the State infrastructure. The food supplementation programmes-for mothers and children are funded-6y-ite State and- implemented through the ICDS infrastructure funded by the Central Government. Safe drinking water and environmental sanitation are essential pre-requisites for health. Initially these two activities were' funded, by the Health Department, but subsequently Dept, o f Urban and Rural Development and Dept, o f Envirormient ftmd these activities botffinlHe State and Centre.
3.4.3 At the time o f Independence, the country's health care infrastructure was mainly^urban and clinic based. The hospitals and clinics provided curative care to patients who came to them. Outreach o f services in the rural areas was very limited; there were very few preventive and rehabilitative services available. From the First five-year Plan, Centrd'"afid State Governments made efforts to build up primary, secondary and tertiary care institutions and to link them through appropriate referral.systems. The_private and voluntary sectgr_also med to cater .to the health care needs of, the population (Table 3.4.1). Efforts to train ̂ adequate number o f medical, dental and paramedical personnel were" also' taken *up. National Programmes for combating major public health problems were evolved 'and implemented during the last fifty years. Efforts to further improve the health status o f the population by optimising coverage and quality p f care by identifying and rectifying the critical gaps in infrastructure, manpower, equipment, essential diagnostic reagents, drugs and enhancing the efficiency o f the health system are underw®^.
3.4.4 Improvement in coverage and quality o f health care and implementation o'f disease control programmes resulted in steep decline in the crude death rate (CDR) from-25.1 in' 1951 to 9.b in 1996. Life expectancy rose from 32 years in 1947 to 61.1^7ears in 1991-9'6 Witli female life expectancy (61.7 yr.) higher than the male (60.6-yr.). However, the morbidity due to common communicable and nutrition - related diseases continue to be high. >4orbidity due to non-communicable diseases is showing a progressive increase because o f increasing longevity and alterations in life style. During the Ninth Plan efforts w ill have to be made to tackle this dual disease burden effectively so that there is sustained improvement in the health status o f the population.
3.4.5 India today has a vast network o f govemmental. voluntary and private health infrastructure manned by large number o f medical and paramedical persons.
3.4 HEALTH
138

1. Persistent gaps in manpower and infrastructure especially at the primary health care level.
2. Suboptimal functioning o f the infrastructure; poor referral services.3. Plethora o f hospitals not having appropriate manpower, diagnostic and
therapeutic services and drugs, in Govt., voluntary and private sector;4. Massive interstate/ interdistrict differences in performance as assessed by
health and demographic indices; availability and utilisation o f services arepoorest in the most needy states/districts.
5. Sub optimal intersectoral coordination6. Increasing dual disease burden o f communicable and noncommunicable
diseases because o f ongoing demographic, lifestyle and environmental transitions.
7. Technological advances which widen the spectrum of possible interv entions8. Increasing awareness and expectations o f the population regarding health care
services9. Escalating costs of health care, ever widening gaps between what is possible
and what the individual or the country can afford.
3.4.6 The Special Action Plan for Health envisages expansion and improvement o f the health services to meet the increasing health care needs o f the population; no specific targets have been set.
3.4.7 Durmg the Ninth Plan efforts will be further intensified to improve the health status o f the population by optimising coverage and quality o f care by identifying and rectifying the critical gaps in infrastructure, manpower, equipment, essential diagnostic reagents and drugs. Efforts will be directed to improve functional efficiency o f the health care system through;
a) Creation o f a functional, reliable health management information system and training and deployment of health manpower with requisite professional competence
b) Multi professional education to promote team work
c) Skill upgradation of all categories o f health personnel, as a part o f structured continuing education
d) Improving operational eftlciency through health sen. ices research.
e) Increasing awareness of the community through health education.
t) Increasing accountability and responsiveness to health needs of the people byincreasing utilisation o f the Panchayati Raj institutions in local planning and monitoring
g) Making use of available local and community resources so that operationalefficiency and quality of services improve and the services are made more responsive to user's needs.
Current problems faced by the health care serv ices include:
!39

A pproach During the Ninth Plan:
3.4.8 The approach during the Ninth Plan will be:
11.
111 .
I V .
An absolute and total commitment to improve access to, and enhance the quality of, primary health care in urban and rural areas by providing an optimally functioning primary health care system as a part o f the Basic Minimum Services;
Nerw Initiatives in the Ninth Plan
□ Horizontcal integration o f vertical programmes
□ Develop Disease Surveillance and Response mechanissm with focus on rapid recognition,report & responise at district level
□ Develop & implement integrated Non- Communiicable Disease control Programme
□ Health Impact Assessment as a part o f environmiental impact assessment in developmnental projects.
□ Implemernt appropriate management system s for emergenc:y,disaster, accident & trauma care at all levels o f I health care.
□ Improve IHMIS and logistics o f supplies
To improve the efficiency o f existing health care infrastructure at primary, secondary and tertiary care settings through appropriate institutionalstrengthening, ^ ^improvement of referral linkages rand opeiationalisation o f Health Management Information System (HMIS));
To promote the development o f humain resources for health, adequate in quantity and appropriate in quality so that access to essential health care services is available to all so that there iss improvement in the health status o f community, periodically organise progrrammes for continuing education in health sciences, update knowledge and upgrade skills o f all workers and promote cohesive team work;
To improve the effectiveness o f e?'xisting programs for control o f communicable diseases to achieve horizcontal integration o f ongoing vertical programmes at the district and below disstrict level; to strengthen the disease surveillance with the focus on rapid rec:ognition. reporting and response at district level; to promote production andi distribution o f appropriate vaccines o f assured quality at affordable costt; to improve water quality and environmental sanitation; to improve hcospital infection control and waste manaeement;
v .
\ 1.
To deve lop and im p lem en t in tegra ted n ran -com m unicab le d isease p reven tion and contro l p rog ram w ith in the ex isting htealth care infrastructure;
To undertake screening for c o m m o n niutritional defic iencies e spec ia l ly in vu lnerab le groups and initia te appropria tte remedial m easures; to evo lve and effec tively im plem ent p ro g ram m e s for irmproving nutritional s tatus, including m icronu tr ien t status o f the popu la t ion ;
140

vii. To strengthen programimes for prevention, detection and management o f iiealth consequences off the continuing deterioration o f the ecosystems; to improve Unkage betweeem data from ongoing environmental monitoring and that on health status o f ' the population residing in the area including health impact assessment as a part o f environmental impact assessment in developmental projects;
viii. To improve the safety o f the work environment and worker's health in organised and unorganisced industrial and agricultural sectors especially among vulnerable groups o f the population;
ix. To develop capabilities aat all levels for emergency and disaster prevention andmanagement; to implemie;nt appropriate management systems for emergency, disaster, accident and traiuima care at all levels o f health care;
X. To ensure effective impkeimentation o f the provisions for food and drug safety;strengthen the food andl drug administration both at the Centre and in the States;
xi. To increase the involvermient of ISM&H practitioners in meeting the healthcare needs o f the populatiion;
xii. To enhance research capcability with a view to strengthening basic, cUmcal andhealth systems research aimed at improving the quality and outreach of services at various levels o f health care;
xiii. To increase the involvennent of voluntary, private organisations and self-help groups in the provision o)f health care and ensure inter-sectoral coordination in im plementation o f health programmes and health-related activities;
xiv. To enable the Panchayati Raj Institutions (PRI) in plarming and monitoring ofhealth programmes at the; local level so that there is greater responsi\eness tohealth needs o f the peopke and greater accountability; to promote inter-sectoralcoordination and utilise lo:)cal and community resources for health care.
Health Care Infrastructure
Primary' Health Care
3.4.9 The primary health care infrastrucc ture provides the first level o f contact between the population and health care providers uprto and including primary health care physicians and forms the com m on pathway for implle;mentation o f all the health and family welfareprogram m es in the country. It providie:s integrated promotive, preventive, curative andrehabilitative services to the population c;l ose to their hearth and home. Majority o f the health care needs o f the population is taken came of by the trained health personnel at the primar}' health care level. Those requiring special! ised care are referred to secondar\- or tertiar>- care. Thus, the three-tier system consisting of Primary. Secondary and Tertiary care facilities with adequate referral linkages will provide e^ssential health and family welfare ser\ices to the entire population.
141

Rural Primary Health Care Infrastructure
3.4.10 At the time o f Independence, Health Care services were mainly urban-centered and hospital-based. Realising the importance o f creating a functional Primary Health Care infrastructure, national norms for the primary health care infrastructure were drawn up. These take into account the population, population density and terrain. Earmarked funds were provided under the Minimum Needs Program in the State Plan allocations. The funds received from the Department o f Family Welfare and through the Externally Assisted Projects (EAPs) w'ere utilised to build up the Rural Health infrastructure. The current functional status o f Primary Health Care infrastructure (Sub Centres, Primary Health Centres and the Community Health Centres), and the additional requirements, wherever necessary, to m eet the norms for population as per 1991 census are given in Table-3.4.2.
3.4.11 At the national level the total number of functional Sub centres and the PHCs nearly m eets the set norms (one sub-centre for 3000-5000 population, one Primary Health Centre for 20,000- 30,000 population; one Community Health Centre for four PHCs) for the population in 1991 (Table-3.4.2). However, there are marked disparities at the State and district level. It is a matter o f concern that many of the districts with poor health indices do not have adequate health infrastructure. There is considerable backlog in terms o f construction of the buildings for Sub Centres and PHCs. Some States have adopted innovative measures including mobilisation of local resources to clear this backlog. Taking cognizance o f the widening disparities among the States in the availability o f Basic Minimum Services (BMS), the Conference of the Chief Ministers in July 1996, recommended that A dditional Central Assistance (ACA) may be provided to the States for correcting the existing gaps in the provision o f seven Basic Minimum Services (BMS). The modalities of im plem entation of the programme are discussed in detail in the section on Basic Minimum Services. O f these, access to primary health care, safe drinking water and primary education were given higher priority with the mandate that universal access to these services is to be achieved by 2000 AD. Increasing involvement of the people's representatives, voluntary' organisations and the people themselves in these activities will be further encouraged during the N inth Plan.
Factors responsible for sub-optim al functioning of Primary Health Care Institutions:
Inappropriatem a in te n a n c e
lo c a t io n , p o o r acces.s , p o o r
3.4.12 While computing the requirements for primary health care infrastructure for the grow ing population, the fact that population increase has occurred in and around the already established centres have to be kept in mind.The already established physical infrastructure cannot be shifted and it will be difficult to add additional centres to serve the population in geographically convenient locations. It might be more feasible to increase the number of functionaries required to cater to the populations need rather than increase the num ber o f centres.
3.4,13 In some areas, the existing Primary Health Care Institutions (PHIs) are functioning sub-optimaily because o f one or more of the follovviniz factors:
G a p s in crit ical m a n p o w e r
M is m a tch b e t w e e n p e r s o n n e l & e q u ip m e n t
L,ack o f es sen t ia l d rucs . d ia s in o s t ic s
P oor referral l in k a g e s
A ppropria te rem.edial m e a s u r e s to im p r o v e
funct ional status w i l l h e in it ia ted in the \ i n i h
Plan
142

(i) Inappropriate location, po'or access, lack o f maintenance;
(ii) Lack o f professional and para-professional staff at the critical posts;
iii) Mismatch between the requirem ent and availability o f health professionals especially physicians at PH C ;
(iv) Lack o f funds for essential! drugs/diagnostics
(v) Lack o f First Referral Unitis (FRUs) for linkage o f referral services.
3.4.14 These problems need urgent reso'lution at the local level through adequate provision o f resources and mtervention o f the Panchayati Raj Institutions (PRI).
3.4.15 Unlike the SC and PHCs, the ntumber o f functioning CHCs, which form the First Referral Unit (FRU), is far below the proj'ected requirement. This gap should be filled quickly so that the PHCs and Sub Centres do hav/e a nearby referral hospital for the management o fhigh-risk patients' who are referred. In imost o f the States there are functioning sub-district
and taluk hospitals. With the restructuri;ng o f the Primary Health Care Institutions in the Seventh Plan, these institutions were to bie redesignated as CHCs and suitably strengthened. The Eighth Plan had also reiterated this st.rategy. States that had implemented this suggestion report that these FRUs are well utilised, ais they are located in towns that are well connected with villages by transport and are well known,
3.4.16 During the Ninth Plan, all the St.ates will restructure the existing sub-district, taluk hospitals and block level PHCs into functtioning CHCs (FRUs); it is expected that once this restructuring is completed, the current large gaps in functioning CHCs will be narrowed substantially. Similarly existing rural hospital and dispensaries have to be restructured wherever possible to meet the requirements in PHC. Earmarked funds under BMS could be utilised for completing the restructuring and strengtheming o f these hospitals/dispensaries.
Health M anpower in Rural Primary Heialth Care Institutions
3.4.17 Health manpower position in Primary Health Care Institutions in the last year o f the Eighth Plan period is indicated in Table-3.4.3.
Paramedical Personnel
Ninth Plan priorities for Rural Primary Health Care Institutions
□ Ensure existing SC, PHC are fiilly operational
□ Fill the gaps in CHCs through re-structuring existing block level PHC, Taluk, Sub- divisional hospital
□ Establish functional referral linkages
Provide need based manpower on the basis o f distances, difficulties and work load
3.4.18 As per the national norms, one male and one female multi-purpose worker shiould be available at the Sub-Centre catering to> the Health needs o f 3000 to 5000 population. The number o f sanctioned posts o f male m ultipurpose workers is only half the number required. This has been cited as one o f the major factors responsible for the sub-optimal per formance in health sector programmes. There are large numbers o f male-workers emploj-zed in the malaria, leprosy and TB Control programmes. These workers need be trained and redeployed as male multipurpose workers and given the responsibility o f looking aft(er health and family welfare programmes in their sub-centre area. The availability o f the fe)male multi-purpose workers in adequate number
143

has been the major factor for the near universal coverage under the immunisation Programme and improvement in ante-natal care, however the quality o f care provided needs improvement The vacancies as well as the lack o f sanctioned posts o f radiographers, lab-technicians and other para-professionals have adverse impact on ongoing Health and Family Welfare Programmes. These need be rectified as rapidly as possible and funds provided under BMS in 1996-97 have been utilised by some States to fill the critical gaps in health manpower
3 4 19 During the Ninth Plan, several o f the Centrally Sponsored Schemes including Family W elfare Programme, Revised National Tuberculosis Control Programme (RNTCP), National Malaria Eradication Programm e (NM EP) will provide flmds for recruitment o f appropriate manpower Funds provided under ACA for BMS may also be utilised to fill the critical gaps in health manpower. Every district will undertake district-level manpower survey and planning, so that funds from all these sources are optimally utilised to fill the existing gaps in vital manpower and unnecessary duplication is avoided
3 4.20 So far, the national norms for manpower requirement have been computed on the basis o f the population. During the Ninth Plan the requirement o f personnel will be computed not only on the basis o f population, but also on the basis o f workload, distance to be covered and difficulties in delivery o f Health Services A flexible approach to recruitment o f staff, if necessary on part time basis, will be adopted to ensure that the programmes do not suffer due to lack o f key personnel
Physicians in PHCs
3 4 21 The number o f PHC doctors at the national level exceeds the requirement as per the norms However, there are marked differences in their distribution About 10% of the PHCs are without doctors, while a similar number have three or more doctors The PHCs without doctors are mostly located in remote areas where health care facilities under voluntary or private sector are also limited The State Governments are taking steps to redeploy the PHC doctors so that the needs o f the population in under-served areas are met on a priority basis Some o f the innovative approaches to fill the vacancies in under-served areas currently being tried in some States include
(i) local recruitment o f doctors, if necessary on part-time basis,
(ii) adoption o f a village/PHC/district by industrial establishments, cooperatives, self-help groups and religious/charitable institutions,
iii) permitting local practitioners to pay a rental and practice in the PHCs afterOPD hours
3 4 22 During the Ninth Plan, the feasibility and usefulness o f these approaches will be evaluated and those found usefial in any area will be utilised as a part o f local area- specific micro planning for effective delivery o f essential Primary Health Care
Specialists at CHCs
3 4 23 A substantial proportion o f specialist’s posts even in the fianctioning CHCs is vacant Hence, these CHCs are unable to function as First Referral Units In view of the serious implications o f this lacuna in the establishment of referral system, as well as effective
144

provision o f health, MCH/FP care, there is an urg ent need to rectify this. Improving the service conditions and providing a conducive en\v'ironment are essential to ensure that specialists in CHCs do stay and provide the needed siervices. At the moment, there is no post o f Public Health Specialist or Anaesthetist, in the CH<Cs. Serv ices of Anaesthetist are vital because without an Anaesthetist, emergency/routine surgery in CHCs will not be possible. Efforts will be made to provide this critical manpowrer, if necessar\' on part-time basis. As a long-term measure, sufficient number o f in-ser\'ic;e candidates may be trained in this speciality. It is vital to provide inter linkage betwe;en preventive, promotive and curativeservices in the CHCs so that health and family w elfare programmes, disease surveillance andresponse mechanisms get strengthened. Until the spiecialists in public health get posted in CHCs, the existing specialists in these Centres w ho presently are mainly responsible for curative services, will have to be given Public Healtih orientation, training in Epidem iology and Health Management so that each one o f them assiumes the responsibility o f looking after the Disease Control Programme in their respecti ve specialities e.g. Imm unisation by paediatrician and FP by the obstetrician. This would also improve the linkages between the CHC and the PHCs.
T rib a l H ealth
3.4.24 The Scheduled Castes and Scheduled Tribes constitute 16.48% and 8.08% respectively of the total population of the country as per 1991 census. The highest concentration of tribal population is found in the North Eastern States and also in the UTs of Lakshadweep and Dadra and Nagar Haveli. High concentration o f tribal population is also present in the States of Madhya Pradesh,Orissa, Gujarat, Maharashtra and
High dise;ase b u rd en in T riba ls is du e to :
J Poveirty and under nutrition
□ Poor sanitation, lack of safe drinking water
□ Diseaises which are more prevalent in tribals
■J L ack o f awareness about and acce ss to health care
□ Sociail and economic barriers to utilisation
Bihar. The factors that contribute to increased disease burden in these communities include:
a. poverty and consequent undemutrition;
b. poor environmental sanitation, poor hygiene and lack o f safe drinking water, leading to increased morbidity from wat(er and vector-borne infections;
c. lack o f access to health care facilities resulting in increased severity and/or duration of illness;
d. social barriers preventing utilisation o f a vailable health care services;
e. specific diseases they are prone to such as genetic diseases (G-6 PD deficiency), infections (Yaws) etc.
3.4.25 The tribal population is not a homogeneous one. There are wide variations with regard to education and health status, access and utilisation o f health services among the tribal populations. The tribal populations in North Eas’.tem States have high literacy levels, they access available health facilities, and hence theiir health indicators and dem ographic indices are better than national level inspite o f the fact t;hat the region is endemic for malaria.
145

On the other hand, the Onges in A ndam an and Nicobar remain a primitive tribe with very little access to either education or health care. Differential area-specitlc strategies will therefore have to be developed for each o f the tribal areas to improve access and utilisation o f health services.
3.4.26 The National Health Policy ac corded a high priority to provision o f health services to those residing in the tribal, hilly and backward areas as well as to detection and treatm ent o f endem ic diseases affecting the tribal population. The strategy adopted for meeting the health care needs during the Eighth Plan period included provision of preventive, prom otive and curative services through the primary health care institutions, and at the village level through link health workers and trained Dais. Keeping in view the far-flung areas, forest land, hills and rem ote villages, where most o f the tribal habitations are concentrated, the population coverage norms for PHls is relaxed tro one PHC for every 20,000 population and one Sub Centre for 3,000 population. While choosing the villages for establishments o f sub centres the States have been advised to set up at least 15% of these in Scheduled Castes' habitations or villages having 20% or more Scheduled Caste population and 7.5% in tribal areas.
3.4.27 Till June 30, 1996 there were 20097 sub-centres functioning against a requirem ent o f28383 sub-centres for tribal areas. T he number o f functioning PHCs were 3260 against a requirem ent o f 4180 and functioning C H C s were 446 against a requirement o f 492. There are also 1122 Dispensaries and 120 H ospitals in Modem Medicine, 78 Mobile Clinics in M odem M edicine, 1106 Dispensaries and 24 Hospitals in Ayurveda, 251 Dispensaries and 28 H ospitals in Homeopathy, 42 Unani Dispensaries, 7 Siddha Dispensaries functioning in the tribal areas in the country. As many as 16,845 Sub Centres, 5987 PHCs and 373 CHCs have been established in Scheduled Caste BastiesA^illages having 20% or more Scheduled Caste population. In addition 980 Dispensaries in Modem Medicine, 1042 Ayurvedic Dispensaries, 480 Homeopathic Dispensaries, 68 Unani/Siddha Dispensaries are functioning in theScheduled Caste concentrated areas in the country. Mobile dispensaries and camps wereorganised to provide health facilities wherever feasible.
3.4.28 Even though efforts have been made to create primary health care infrastructure andsanction necessary manpower both under modem medicine and under ISM&H, there is lacko f both professional and paraprofessional manpower, mainly because the State Govt.
personnel do not prefer to work in these areas. The State Governments are trying to minimise vacancies by taking even part time staff in tribal areas. A Central Planning Committee has beenset up to review the health care activities in 39districts o f 12 States with pockets o f extremely backward tribal population. The States have been requested to restm cture the existing primary health care institutions, redeploy existing personnel and make them fiilly operational- After this is done, it will be possible to compute the gaps in manpower/infrastructure and take steps to ensure that these are filled. In addition to State Government flinds, allocation from appropriate
Strategies to improve Health Care in T riba lareas:
□ E nsuring availability o f adequate infrastructure and personnel.
□ A rea specific RCH programmes.
□ 100% central Plan funds for NM EP.
□ E ffective implementation o f the he:alth &FW program m es.
□ C lose monitoring, early detection ofproblem s in implem entation and m idcourse correction.
C entrally Sponsored Schemes will also be available for filling critical manpower gap. For exam ple, under the National M alaria Eradication Programmes 100% Central assistance is
146

being provided for filling critical manpower gaps, and for drugs and insecticides in North Eastern States many o f which have predominantly t ribal population The Tribal sub-project o f RCH will also provide funds for manpower, equip'ment, drugs and training o f staff
3 4 29 Priority was also accorded to research in diseases to which Scheduled Tribes/ Scheduled Castes are prone The Indian Council o f M edical Research has set up five regional medical centres in tribal areas in the country one each at Jabalpur, Bhuvaneshwar, Jodhpur, Dibrugarh and Port Blair to carry out research on he alth problems o f people in these regions, especially the scheduled tribes The AJl India Institute o f Hygiene and Public Health has also initiated a project "Integrated Heahh Development o f Scheduled Castes and Scheduled Tribes o f Sunderbans area o f West Bengal " The Central Council for Research in Ayurveda and Siddha has set up research projects, and conducted service- oriented survey to provide medical aid to Scheduled Tribes and Scheduled Castes
3 4 30 A review o f all these activities will be undertaken in the Ninth Plan so that information generated so far is transformed into weill-structured action programme During the Ninth Plan period priority action will be
a) norms for establishment and staffing pattern o f Sub Centres and PHCs will be specifically relaxed in the tribal areas taking into account the difficulty in terrain and problems in health care delivery,
b) implementation o f all ongoing program m es will be intensified and closelymonitored in these areas,
c) 100% assistance under NMEP to tiribal districts in other States will beprovided,
d) specific projects will be evolved to me et the requirements for RCH care o f thetribal population in the States such as M P, Bihar and Orissa
Operational strategy for the Ninth Plan
State specific strategies
3.4 31 States have to prioritise and utilise flinds available for primary health care on the basis o f the existing infrastructure and the performanc e indices as follows:
1 States such as Kerala and Tamil N adu with good infrastructure and goodperformance require only uninterrupted supply o f drugs and devices, management o f non communicable diseases should get attention in these states
2 States like Bihar and Uttar Pradesh with poor infrastructure and poorperformance provision o f additional Ainds to health sector from the states outlay to improve the infrastructure, ensure availability o f skilled manpower to effectively manage the programme are critical for improvement o f performance
147

. 3. States with below averag<e level o f infrastructure but average level o fperformance such as H im achal Pradesh and Andhra Pradesh: attempt should be made to improve infrastnucture through optimal utilisation o f funds from all the sources as this may resullt in rapid improvement in performance.
4. States like Punjab and Hary'ana with above average level o f infrastructure andbelow average perform ance in some health indices: specific efforts need be made to identify the factors responsible for the relatively poor perform ance and correct them.
Rural Primary Health Care
1. Ensure that geographically delineated rural areas are covered by the three tier primary health care institutions as jper the norms defined above through integration o f the existing hospitals/dispensaries in rural areas into the appropriate tier o f the rural primary health care infrastructure.
2. Accord high priority to filliing the reported large gap in the vital CHC/FRU by redesignating and appropriately strengthening the existing block level PHCs, subdistrict/ subdivisional hospitals., rural hospitals, subdistrict post partum centres.
j . In all FRUs-.
a) ensure that there are specialist/trained doctors in the following specialities: Medicine, surgery, 0bstetri(cs, paediatrics and anaesthesia;
b) ensure that there are no 'vacancies (if necessary by providing for part time appointments) and that referred patients and those requiring emergency care do receive the treatment ithey need; until such time that there are qualified PSM personnel to monit(or progress in ongoing national programmes, the specialist available in the CHC may be given the additional responsibility o f monitoring these program m es (e.g., paediatrician will m onitor the immunisation program m e); enable the staff to stay and provide good quality
services to the population by improving the service conditions and providing a conducive work environment to doctors (including specialists) and paramedical personnel.
Ninth Plan Strategies for improving Urbain Primary Health Care:
C reate and strengthen infrastructure through:
primary h«ealth care
□
❖ Re-organisation & restructuring o f existinginstitutions
❖ Re-deploy existing manpower to opferationalisethese institutions
Link prim ary health care infrastructure w ith existing secondary and tertiary care institutions in the same geographically delineated areas
□ Establish effective referral services
□ Involve N agar Palikas in effective inter-sectoral coordination & improving community partiicipation
4. noEnsure that there are vacancies in the critical para professional posts by skill development and redeployment o f already available manpower; where absolutely necessary manpov/er gaps may be filled through part time appointments.
5. Available funds to be utilised on priority basis for purchase o f equipment, consumables, drugs
148

required for improving quality o f services; ftmds may be provided for construction only when absolutely necessary.
6. Strengthen the referral services
Urban Health and Family W elfare Services
3.4.32 Nearly 30% o f India's population lives in urban areas. Urban m igration over the last decade has resulted in rapid growth o f people living; in urban slums. The massive inflow o f the population has also resulted in the deterioration o)f living conditions in the cities. Some o f the available data on health and related indices in urban and rural population is given in Table-3.4.4. From the data it would appear that the uirban population has better health facilities and health indices than the rural population. How^ever in many towns and cities the health status o f urban slum dwellers is worse than that o f the rural population. The urban health facilities provide health care, especially tertiary care to both the urban and rural population. The available urban health care infrastructure is insuifficient to meet the health care needs o f the growing urban population.
3.4.33 Realising this the municipalities, State Gov/emments and the Central Government have tried to provide ftmds for building up urban health care. Unlike the rural health services, there have not been any well-planned andl organised efforts to provide primary, secondary and tertiary care services in geographicall;y delineated areas in urban health care. As a result, there is either non-availability or substantiial under utilisation o f available primary care facilities along with an over-crowding at secondauy and tertiary care centres.
3.4.34 During the Ninth Plan period, efforts will be made to evolve a well-structured organisation o f urban primary health care to remed}y the existing situation. A health care delivery system aimed at providing basic health and fjamily welfare services to the popiUation w ithin 1 - 3 kms. o f their dwellings will be made availlable by establishing Urban Health and Family Welfare Centres maimed by medical and parra-medical persons. These Centres will have:
1. adequate outpatient facility;2. in-patient facility (at least 10 beds o f w/hich four v«ll be for maternity care and
the remaining beds will be for meditcal, surgical and paediatric care);3. supportive services including laboraUory and radiology facilities and
pharmacy;4. provision for referral/ transport o f patiemts.
The essential services, to be provided, will include
1. medical and surgical services including eye an d ENT care;2. obstetric care and new-born care and child htealth;3. counseling for reproductive health and contraception4. dental services;5. emergency and traum a care;6. prevention and control o f communicable antd noncommunicable diseases;
149

3 4 35 For effective integration o f healt h-related services the urban health centres will coordinate with other assigned social sector activities o f Nagar Palikas especially for provision o f safe drinking water and sanitation
3 4 36 An overview o f all the facilities available in a defined geographical area will be undertaken and appropriate linkages betvv^een primary, secondary and tertiary care centres in the area will be established so that provi sion o f basic minimum health services and optimal utilisation o f the available health care facilities for referral services will be ensured Earmarked funds under BMS and the AC A for BMS will be effectively utilised to fill the critical gaps in health manpower and infrastructure in urban areas also so that the performance o f both health and family welfare programmes improve
Operational Strategy for the Ninth Plan
States/ Nagar Palikas will:
1 create and stren^hen prim ary health care infrastructure in urban areas by reorganizing and restructuring o f the existing institutions and manpower created under various agenicies;
2 link these to the existin;g secondary and tertiary care institutions in the geographically delineated area
Involvem ent o f Local Self-Government Institutions
3 4 37 With the 73rd and 74th Constitutional amendments the Nagar Palikas and Panchayati Raj Institutions, are becoming operational in many States During the Ninth Plan period, these institutions will play increasing role in ensuring planning, implementation and monitoring o f heahh and family w elfare services at the local level They will also ensure effective coordination o f programmes a t the local level between related sectors such as sanitation, safe drinking water and w om en and child development, so that optimal benefit from all these programmes become avaiilable to the community and the vulnerable segments receive the attention that they need
M onitoring mechanism
3 4 38 The status o f primary health care infrastructure and manpower is being monitored by the Department o f Family Welfare, it is also being monitored as a part o f the MNP/20 point programme The Central Bureau o f Health Intelligence monitors the health care infrastructure, manpower and health stat us o f the population Planning Commission monitors the progress in PHC infrastructure/manpower annually during the Annual Plan discussions These existing mechanisms o f monitori ng will continue and be strengthened in the Ninth Plan
Secondary Health Care
3 4 39 The secondary health care infrastructure at the district hospitals today functions both as primary health care inirastructure fc r taking care o f the needs of the population in the city/town m which it is located and as, secondary care Centres This dual role dilutes its etTectiveness To remedv the situation, initiatives were taken during the Eighth Plan to ensure

that these hospitals are able to cope with the retferred cases. Four States - Andhra Pradesh, Karnataka, West Bengal and Punjab - have initiated Secondar> Health System Developm ent Projects with special focus on strengthening the District Hospital and the referral services. This step is expected to reduce the burden o n ' the tertiary care hospitals, besides providing a credible and effective linkage with Primary Health Care Institutions. In order to raise resources to m eet the recurring costs o f good quality diagnostic and curative services, the feasibility o f collecting user charges from patitents (except those belovv the poverty line) is also being explored. These experiences will emable the States to evolve and implement appropriate schemes for strengthening these hospiitals so that they cater to the increasing need for secondary care services during the Ninth Plain period. Increasing involvement o f private and voluntary sector in secondary health care has been reported from many states. The m echanism s by which secondary health care services could be made readily available and affordable through collaboration between Govemiment, private and voluntary sector will be explored during the Ninth Plan period.
Secom dary H ealth C are : P rio rities in the N inth P lan
□ Prfovide adequate diagnostics, consum ables anddriugs
□ Strrengthen emergency services
□ Provide care for high risic cases
□ Esitablish effective, credible linkages with primary'ancd tertiary care facilities in geographicallydeliineated areas.
O perational Strategy for the Ninth Plan
3.4.40 Nagar Palikas/ State governments will str engthen the primary health care network in urban areas so that the district hospitals act only as referral centre. This step is expected to reduce the burden on the secondary' care hospitals and result in creation o f a credible and effective linkage with Primary Health Care Institutions. In order to raise resources to meet the recurring costs o f good quality diagnostic and cuirative services, the feasibility o f collecting user charges from patients (except those below tlhe poverty line) is being explored by some States. The mechanisms, by which secondary htealth care services could be made readily available and affordable through collaboration bteUveen Government, private and voluntary sector may have to be explored.
Tertiary Health Care Problems:
□
□
□
G row ing demand for com plex, costly diagnostic & therapeutic modalitieslack o f skilled m anpower, equipm ent &consum ables to meet the dem andovercrow ding
Ninth Plan priorities
□ Provide funds for capacity building□ Levy user charges to people above poverty line□ Explore alternative modalities to meet the growmg
cost o f care
Tertiary Health Care
3.4.41 Along with the emphasis on enhancing the outreach and quality o f primary health care services and the strengthening o f linkages with secondary care institutions, there is a need to optimise the facilities available in the tertiary care centres. At this level, there is an ever-widening gap between what is possible and what is affordable either for the individual or for the country. Majority of the tertiary care institutions in governmental sector lack adequate manpower and facilities to meet the rapidly growing demand for increasingly

com plex diagnostic and therapeutic modalities. Over the last two decades these institutions have been facing increasing resource crunch and have not been able to obtain spares for equipm ent maintenance, to replace obsolete; equipment, to maintain supply o f consumables and to upgrade the infrastructure necessary to provide high technology, high quality care at affordable cost to meet the ever increasing needs and rising expectation o f the population. Several States have started levying user c;harges for the diagnostic and curative services offered in these institutions from people abo ve the poverty line, to meet some o f the recurring costs in providing such services. During the Ninth Plan, efforts will be made to provide a one time support to selected tertiary care instituttions in each State and Union Territory to update their technical capabilities and to evolve aind implement a rational user charge policy that would enable these institutions to provide hiigh quality tertiary care at affordable cost. Some o f the States are also taking up experimenital projects o f establishment o f pay clinics/ pay cabins for generating funds required by ithe institutions. Other States are exploring the feasibility o f providing land, water and eletctricity at lower cost to private entrepreneurs for setting up tertiary care/ super speciality institutions if these entrepreneurs agree to provide 30% in-patient facilities and 40% o f the out-patient /diagnostic services free o f cost for people below poverty line. Exemption frorm import duty for import o f diagnostic equipm ent has been given in the past to private/ voluntary agencies that had agreed to provide diagnostic serv ices to poor patients free o f cost. The advantages, disadvantages in these experiments need to be documented and those found usetful replicated in other settings.
O perational Strateg> for the Ninth Plan
3.4.42 Levying user charges for the diagnostic and curative services offered in these institutions from people above the poverty line, to meet some o f the recurring costs in providing such services have to be explorecd. The feasibility o f providing a one time support to selected tertiary care institutions in each State and Union Territory to update their technical capabilities and to evolve and implement a rational user charge policy that would enable these institutions to provide high quality tertiary care at affordable cost may be tested. Some o f the States are also taking up experimental projects o f establishment o f pay clinics/ pay cabins for generating funds required by thie institutions. Necessary amendments have to be made to enable these hospitals to retain thie funds generated by these activities so that they could be utilised to improve quality o f serviices available. If found successful it m ight also be possible to use the income from pay clinic:s as cross subsidy for treatment o f patients below poverty line.
Quality and Accountability in Health Ca re
3.4.43 Ensuring quality and bringing in aiccountability in health care provided is o f utm ost importance. In recent years, there has b<een increasing public concern over these issues because o f both increasing awareness o f the population and mushrooming growth o f institutions providing health care especiallly in the private sector. The Consumer Protection Act provides one mechanism for redressal o f grievances pertaining to quality o f care. Some States have attempted to provide a legal framework for the functioning o f private health care institutions on the lines o f Bombay Nursing Home Registration Act 1949. Until now these legislative measures have not been effetctively implemented mainly because o f lack o f objective cnteria for defining quality of c:are' and the possible impact o f such regulations on cost o f care. The cumulative experience g;enerated thus far will be utilised to evolve norms for quality and cost o f health care and ensure accountability in a uniform standardised manner.
152

Bio-medical and Health Care Technologies
3 4 44 Development and utilisation o f apjpropriate technologies for diagnosis and management o f patients at primary, secondary amd tertiary care is an essential pre-requisite for improvement in quality o f health services wit;hout unnecessary escalation in cost o f health care. Realising the need for an in-depth revitew o f the requirement for supportive and diagnostic services at primary, secondary and tertiary care a separate Working Group on this subject was constituted prior to the formulation olf the Ninth Plan
3 4 45 During the Ninth Plan period the recomnnendations o f the Working Group regarding diagnostic and supportive services at each level, technologies and equipment appropriate for each o f these levels and maintenance o f these will: be implemented In all major institutions, a Technical Appraisal Committee will be constitut ed to assess the essential requirements and prioritise the same according to funds available A national mechanism for total quality appraisal o f new technologies will be established! Efforts will be made for the development and testing o f appropriate inexpensive technologies for
1 measuring weight and height to fatcilitate early detection o f under nutrition in adults and children,
2 colourimeters for bio-chemical testt to improve diagnostic facilities at PHCs,
3 accurate self-recording mstruments; for measurmg arterial blood-pressure for use by ANMs/male multi-purpose w orkers,
4 hand-held electronic data entry maichines for ANM/MMPW to enable record maintenance and updating for H ealth and Family Welfare Programmes
Health Insurance
3 4 46 Surveys carried out by NSSO indicate thait high cost o f hospitalisation is one o f the factors leading to indebtedness especially among low and middle-income group population Health insurance to meet the cost o f hospitalisation for major illness will ensure that health care costs do not become a major financial burdien or cause of indebtedness among these patients or their families Over the last two decades several health insurance schemes have been introduced There are individual, family and group insurance schemes for health care, senior citizens insurance and insurance for specific diseases Some o f the currently operationalised insurance schemes include M ediclaim , Group Medical Insurance Scheme, Group Health Insurance Scheme, Bavishya A rog^a (Insurance for senior citizens). Senior Citizen Unit Plan, Cancer Insurance, Asha D eep and Jan Arogya Bima Policy The experience gained in the implementation o f thes<e schemes will provide useftil inputs for planning health insurance schemes during the Niinth Plan period The premium o f health insurance may have to be adjusted on the basis o f health status o f the person and age o f the person and his /her family at the time o f entry into health insurance Yearly no claim bonus'/ adjustment o f the premium could be made on the basis o f previous years hospitalisation cost reimbursed by the insurance scheme This would b e a mechanism through which the health education messages regarding the importance of~ remaining healthy through optimum utilisation o f the preventive and promotive services as well as adopting a healthy life style get reinforced by economic incentives Guidelines regarding what are the services for which
153

reim bursem ent o f treatment cost will be borne by the insurance company may have to be discussed, drawTi up and implemented. Appropriate mechanisms through which the insurance prem ium s for the people below the poverty line are to be met will have to be evolved, tested and implemented.
DEVELOPM ENT OF HUM AN RESOURCES FOR HEALTH
3.4.47 The outcome and impact o f any health programme depends on the competencies and skills o f the personnel who im plem ent it. Both in the State and in the Central sector, over 75% o f the fiinds provided are spent to meet the salary o f the employees. Personnel costs form a m ajor portion o f investment in health service delivery in voluntary and private sector. Unlike health service planning, health manpower plarming in India has not received adequate attention. There has been very little attem pt to assess the requirement in manpower and to m atch health manpower production with requirement. While the production o f physicians and specialists has been more than the estimated requirement, dental and para-professional m anpow er production has lagged far behind the present and projected needs. The curricula have not kept pace with the changing health care requirements o f the population or skills and attitudes required for implementation o f health and family welfare programmes. Continuous updating o f skills and knowledge have not been made an essential mandatory requisite for ail practicing health professionals. There are regional disparities both in quantity and quality o f available health care professionals. These factors constitute a major impediment to effective im plem entation of the health and family welfare programmes.
During the Ninth Plan, the objectives will be;
1. to establish an Education Commission of Health Sciences with the assignedresponsibility o f planning and producing health manpower that is appropriate in quantity to the present and projected needs o f the healthsystem;
2. to strengthen the educational process for all categories o f health professionals at all levels so that health care professionals possess necessary knowledge and have appropriate skills, health programme orientation and people orientation;
3. to ensure continuing knowledge and skill upgradation o f all health careproviders through Continuing Education Programmes with emphasis on multiprofessional problem solving learning strategies.
N ational Education Policy in Health Sciences
3.4.48 The need for National Education Policy in Health Sciences was emphasised in the reports o f Medical Education Review Committee 1983 and Expert Committee on Health M anpow er Planning, Production and Management 1986. A draft National Education Policy in Health Sciences was prepared by a Consultative Group under the Chairmanship ot M ember(Health). This draft Policy was adopted in the meeting o f the Central Council of H ealth and Family Welfare held in 1993 and its salient features shall be implemented during the Ninth Plan. The Council recommended urgent action with respect o f establishment of Education Commission in Health Sciences.
! 54

Education Com m ission in Health Sciences
3.4.49 The Com m ittee on Health Manpower Planning, Production and Management and the N inth Plan Steering Committee on Human Resource Development for Health recormnended that Education Comm ission in Health Sciences (ECHS) must be established as a Central O rganisation on the lines o f UGC to provide requisite financial and technical support for professional and para-professional education in health sciences, to provide realistic projection for national health m anpower requirement and to establish suitable mechanism to continuously review the projections based on felt needs.
3.4.50 M ajor functions o f the Education Commission to be constituted during Ninth Plan shall include ;
(1) provision o f realistic projections for national health manpower requirem ents and to recommend the establishment o f mechanism(s) through which such projections could be continuously reviewed in the context o f evolving social epidemiological and demographic requirements.
(2) creation o f educational institutions and facilities, or strengthening o f such facilities in already existing educational institutions through adequate financial and technical support so as to facilitate the production o f projected health manpower, and establishment o f one or more Universities o f Health Sciences in all States/regions.
(3) implementation o f desired changes required to be brought about in the curricular contents and training programmes o f medical and allied health professionals, at various levels of functioning, to optimise health care delivery system.
(4) planning and implementation o f appropriate changes in the educational system that would facilitate the establishment o f essential inter-linkages between health functionaries of various grades.
(5) establishment o f a continuing review mechanism for the strengthening o f health-related pedagogic communication and information technologies; development o f such health- related community educational programmes, using distance education mode that could effectively and optimally utilise these technologies.
(6) development o f in-buih mechanism o f reviewing, monitoring, and mid-course corrections through financial and technical assistance so as to ensure expeditious implementation o f recommendations and decisions.
(7) co-ordination o f intersectoral health systems research by interlinking the education o f suitable manpower with mission oriented research needs.
3.4.51 The Comm ission will in consultation with the Universities and Professional Councils concerned, take all such steps as they may deem appropriate for the promotion and coordination o f Education in Health Sciences, including medical sciences at all levels, nursing, pharmaceutical and dental sciences and other categories o f health care providers.
3.4.52 The Central Government has already initiated the process for obtaining approval for establishm ent o f the Commission as a statutory body. Due to paucity of funds only a token
155

provision o f Rs 1 crore was made for establishment o f the Commission during 1996-97 Sufficient funds shali be provided during the Ninth Plan to make the Commission fully operational
Universities o f Health Sciences
3 4 53 The Universities o f H eahh Sciences will be the implementing arm o f ECHS for production, evaluation and sustenance o f heahh manpower policy The aim o f the Universities o f Health Sciences is to create a physical and academic environment where all Faculties o f Health Sciences can interact together and provide a model for the education and training o f health care teams, through multiprofessional and inter-professional education In order to achieve this it was recommended by the Bajaj Committee that such Universities o f Health Sciences be established in the country, one in each region to begin with and subsequently one for each major State The Universities will affiliate all Medical Colleges, Dental Colleges, Para professional Colleges and Nursing Colleges, besides possibly considering grant o f affiliation to Colleges o f ISM&H, imparting graduate level education in the State. These U niversities may have one or more constituent professional colleges, and a number o f study centres and field project areas Three Universities have already been established in Andhra Pradesh, Tamil Nadu and Karnataka and another is being started in Punjab Networking o f these Universities with each other and through the ECHS shall be established Attempts will be made to establish at least one University o f Health Sciences in each region during the Ninth Plan period
Health M anpower Planning
3 4 54 The Bhore Committee was the first to recommend a population-based norm for medical (1/1500) and nursing perso n n el 1/500) The Mudaliar Committee made realistic recom m endations for progressive improvement in health manpower A comprehensive situation analysis is available in the 1987 Report o f the Expert Committee on Health M anpower, Planning Production and M anagement (Bajaj Committee). This Com m ittee suggested that for assessment o f health manpower requirement several param eters including functionary to population ratio, inter-professional ratio and manpower-mix must be considered It was fiirther emphasised that health manpower requirements would vary depending upon the income-elasticity and the public and private expenditure on health During the Ninth Plan, health manpower planning will be linked to the needs and dem ands o f health services In addition, a fine tuning will be undertaken regarding health manpower developm ent required for components o f the programme and health manpower requirements in voluntary and private sector
FIGURE - 1
CHANGES IN HEALTH MANPOWER OVER FIVE DECADESD O C T O R S (in 1000) □ENrisTS(iNioao)
T---- --------- ■■■ ■' ■■ "■ ■qy------ -------------
2 ^8 W
° mL
M
1̂ 1Year
156

Health M anpower Production
3.4.55 The changes in medical, dental and nursing personnel over the last five decade are given in Fig-1. The Eighth Plan clearly stated that "the existing facilities for training o f medical graduates has outstepped the needs. No new medical college or an increase in the admission capacity o f the existing colleges will be supported during the Eighth Plan". The
250
1 200 I 150
II 50
̂ 0
G E N E R A L N U R S E S
1
Year
AUXILIARY NURSE M ID W IVES
1961 1981
YEAR
HEALTH VISITORS
_____ 5__ m-
1961 1071 1961 1981
Indian Medical Council Act was amended m 1993. According to this amendment "no person shall establish a medical college aiid no medical college shall open a new or a higher course o f study or training including a post graduate course o f study or training or increase in its admission capacity in any course o f study or training, without the prior permission o f the Central Government". The Central Government after due clearance from the Medical Council o f India may grant permission for establishment of new Medical Colleges if there was a requirement for manpower ill ihe field of pr'A'cUC-i: of medicine and if other conditions specified in the enabling provisions o f the Act are fulfilled. A strict compliance o f these provisions is called for.
3.4.56 The current stock of medical, dental, nursing and para'-professionals in the country and the number o f training institutions for each category are given in Table-3.4.5. During the Ninth Plan, no new medical college will be opened nor will there be any expansion in the admission capacity o f existing institutions as there are adequate number o f doctors in the country. Already, over two third o f the doctors are undergoing postgraduate training. Hence there is no need for any addition to existing number o f seats in various post graduate institutions, except for identified specialities with unmet manpower needs.
3.4.57 There is an acute shortage o f dental manpower in the country. There is a need to ensure that adequate number of dental professionals o f appropriate quality is trained. The dental colleges are unevenly distributed in the country. As many as 41 out o f 96 dental colleges are in one State The quality o f dental education needs to be reviewed and appropriate remedial measures instituted.
3.4.58 Nursing education and nursing services have been given a high priority in order to bridge the large gap between requirement and availability o f nurses and ensure quality o f nursing training. These efforts will be continued during the Ninth Plan. In addition, efforts will be made to meet the increasing demand for nurses with specialised training in speciality and sub-speciality areas intensive medical and surgical care in hospitals and for public health nurses in health care system.
3.4.59 Many programmes are faltering because of lack o f critical para-professional manpower. Over the last three decades, there has been an increasing requirement o f several categories o f para-medical persons such as male multipurpose worker, laboratory technicians.
!57
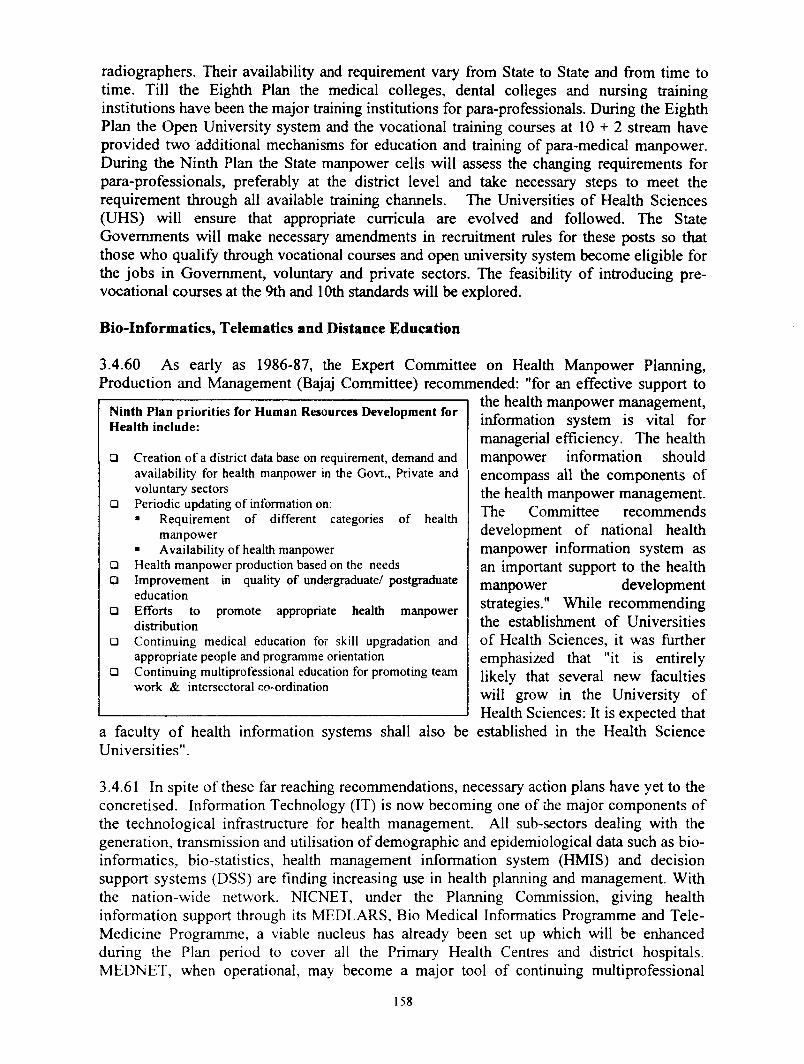
radiographers. Their availability and requirement vary from State to State and from time to time. Till the Eighth Plan the medical colleges, dental colleges and nursing training institutions have been the major training institutions for para-professionals. During the Eighth Plan the Open University system and the vocational training courses at 10 + 2 stream have provided two additional mechanisms for education and training o f para-medical manpower. During the Ninth Plan the State manpower cells will assess the changing requirements for para-professionals, preferably at the district level and take necessary steps to meet the requirement through all available training channels. The Universities o f Health Sciences (UHS) w ill ensure that appropriate curricula are evolved and followed. The State Governments will make necessary amendments in recruitment rules for these posts so that those who qualify through vocational courses and open university system become eligible for the jobs in Government, voluntary and private sectors. The feasibility o f introducing pre- vocational courses at the 9th and 10th standards will be explored.
Bio-Informatics, Telematics and Distance Education
3.4.60 As early as 1986-87, the Expert Committee on Health Manpower Planning, Production and Management (Bajaj Committee) recommended: "for an effective support to
the health manpower management, information system is vital for managerial efficiency. The health manpower information should encompass all the components of the health manpower management. The Committee recommends development o f national health manpower information system as an important support to the health manpower developmentstrategies." While recommending the establishment o f Universities o f Health Sciences, it was further emphasized that "it is entirely likely that several new facultieswill grow in the University o fHealth Sciences: It is expected that
a faculty o f health information systems shall also be established in the Health Science Universities".
3.4.61 In spite o f these far reaching recommendations, necessary action plans have yet to theconcretised. Information Technology (IT) is now becoming one o f the major components o f the technological infrastructure for health management. All sub-sectors dealing with the generation, transmission and utilisation o f demographic and epidemiological data such as bioinformatics, bio-statistics, health management information system (HMIS) and decisionsupport systems (DSS) are finding increasing use in health planning and management. Withthe nation-wide network, NICNET, under the Plarming Commission, giving health information support through its MEDLARS, Bio Medical Informatics Programme and Tele- Medicine Programme, a viable nucleus has already been set up which will be enhanced during the Plan period to cover ail the Primary Health Centres and district hospitals. MEDNET, when operational, may become a major tool o f continuing multiprofessional
Ninth Plan priorities for Human Resources Development for Health include:
C reation o f a district data base on requirem ent, dem and and availability for health m anpower in the Govt., Private and voluntary sectorsPeriodic updating o f inform ation on;■ R equirem ent o f different categories o f health
m anpow er • A vailability o f health manpower H ealth m anpow er production based on the needs Im provem ent in quality o f undergraduate/ postgraduate educationE fforts to prom ote appropriate health m anpow erdistribu tionC ontinu ing medical education for skill upgradation and appropriate people and programme orientation C ontinu ing m ultiprofessional education for prom oting team w ork & intersectoral co-ordination
□
a
158

education and distance learning. Policy initiatives shall be undertaken during the Ninth Plan with the aim o f developing clinical leadership, deciding which applications are to be supported, providing the appropriate technology, gaining clinician acceptance, setting up in Universities o f Health Sciences one or more clinician-driven academic unit(s) and network(s) that are multidisciplinary and multisite to provide support for new and existing biomedical applications.
Health M anpower Information System
3.4.62 At the moment only infrastructure and manpower at the primary health care institutions are monitored and information periodically updated. There is no mechanism for obtaining and analysing information on health care infrastructure and manpower in private and volimtary sectors in the district. Unless this information is available it will not be possible to undertake any effective area-specific microplanning so that the health manpower required to meet the local health needs o f the population is provided. This exercise becomes even more important in the current context when the population is undergoing a demographic, health and economic transition and there are marked differences in the health profile between States and districts. There is also the need for aggregating this data at the State and Central level so that appropriate policy and programme initiatives can be undertaken and adequate resources allocated.
3.4.63 During the Ninth Plan, attempts will be made to create a district data base on health manpower belonging to various categories (mcludmg the ISM&H practitioners) working in Central and State Government, voluntary, private sectors, defense services and Railways and public sector undertakings. The District Manpower Cell will assess district manpower requirement and availability and assist the State in manpower planning at district level. District-based manpower profile data will be updated at least once a year. Health manpower planning exercise at district. State and regional level by the University o f Health Sciences will be carried out utilising this data and the information on the health care needs o f the population and health facilities available. The Education Commission for Health Sciences (ECHS) will act as the nodal agency for the exercise at the national level.
3.4.64 The Health Manpower Planning,Production and Management Committee in 1987 recommended that the ECHS must be established as a central organisation on the lines o f UGC for professional and para-professional education in health sciences, inter alia to provide realistic projection for national health manpower requirement and suitable mechanism to continuously review the projections based on felt needs. During the Ninth Plan period, the ECHS will promote all educational activities for all categories o f health manpower at all levels. The UHS will develop newer faculties such as health management, health economics, social and behavioural sciences. UHS will also initiate necessary steps to enhance computer literacy among medical students and expose them to emerging technologies o f informatics and telematics which are likely to be the base and basis for 21st century mode of communication through telemedicine and distance learning by open learning system in medicine and health sciences. Health manpower cells in the States will coordinate collection o f data on manpower at district level and implement the recommendations o f UHS for health manpower production.
i59

Q uality o f Education in Health Sciences
3.4.65 One o f the im portant reasons for the sub-optimal performance o f health care institutions is the poor quality and inappropriateness o f the education and training o f health care providers, resulting in a lack o f problem-solving com petencies and skills. During the N inth Plan period, appropriate changes in syllabi, curricula, teaching methods and assessment system will be made through various professional Councils to improve the undergraduate and post-graduate training so that the medical and dental graduates as well as allied health professionals acquire necessary technical knowledge and managerial skills to solve health problem s and im plem ent ongoing major national health and family welfare programmes w ithin the existing constraints.
3.4.66 M edical colleges are periodically inspected by the M edical Council o f India (M CI) regarding both the physical facilities and training process. During the N inth Plan, inspection by the MCI will be not only for initial recognition but also for continued recognition as m edical colleges and adm issions will not be permitted imless the college is recognised. A ttem pts will be made to reorient education in health sciences so that the health care system becom es more efficient and effective. The existing professional Councils and any other Council which may be established in the future, will be responsible for ensuring the quality o f medical and para-m edical education, training and ethics o f conduct and practices as per the statutory requirements.
C ontinuing education for health professionals
3.4.67 In the context o f the rapidly evolving technology, dem ographic transition, changing lifestyles and disease patterns it is imperative that the process o f continuing education is internalised throughout the working career o f all health professionals so that their knowledge and skills are updated. Currently, in-service training courses in various institutions, thematic CM E program m es conducted by National Academy o f M edical Sciences, National Board o f Exam inations, and various professional bodies and associations have played a major role in CME. All these programm es will be expanded and intensified during the Ninth Plan. In addition. Open U niversities will play a major role in periodically updating the skills and knowledge o f various categories o f health personnel. The Open University mechanism can efficiently and cost effectively provide specific training programm es where there is a major com ponent o f didactic learning eg. epidemiology, hospital adm inistration and health management. It is also likely to be one o f the most effective, efficient and cost-effective method o f CM E involving practitioners in Government, private and voluntary sectors and hence requires increased utilisation.
3.4.68 During the Ninth Plan, a major programme o f multi-professional and interprofessional education will be initiated for training the members o f health care delivery team, so as to enable them to accomplish group tasks in providing health care in the com m unity. At the national level there will be training o f the trainers in newer technologies, national programm es on em erging diseases and their management. At the State level there will be a sim ilar training o f personnel with special reference to the State's requirement. At the district level two types o f training programmes have to be undertaken: 1) the multi- professional health team training in delivery o f integrated health and family welfare service
160

at the primary health care level; and 2) the training o f the multi-professional team for the delivery o f evolving programmes eg. the delivery o f RCH care programme.
3.4.69 In addition, there will be training of the health professionals working in the government, voluntary and the private sectors together as a team to tackle the identified health problems in the district. Inter-sectoral training o f personnel from related sectors e.g., nutrition, agriculture , water resource management and environmental sanitation will be undertaken as and when necessary.
Operational strategy for the Ninth Plan
1. Attempts will have to be made to create a district data base on healthmanpower belonging to various categories including ISM&H practitioners working for Govt., voluntary and private sectors. Based on the availability, need and demand appropriate policy and programme initiatives for manpower development have to be made at State/district level.
2. Improvement in quality o f pre-service and in-service training for medical andparamedical personnel.
3. Periodic updating o f knowledge/skill for all categories o f health manpowerthroughout their working careers so that they are able to provide appropriate quality o f health care is essential. In addition to available training programmes increasing use may have to be made o f the distance learning.
Control of Communicable Diseases
3.4.70 At the time o f independence commu- nicable diseases were the major cause o f morbidity and mortality in the country. Efforts were therefore initially directed towards their
prevention and Qontrol. Small pox, a major killer in pre-Independence era has been eradicated. In 1953, malaria affected over 75 million and killed 0.8 million people.The National Malaria ControlProgramme, which was launched in 1953, successfiilly brought down the incidence o f malaria to0.1 million cases with no death by 1965. Subsequently, there has been a resurgence o f
malaria. The Modified Plan o f Operation has, however, succeeded in keeping morbidity and mortality at relatively low levels. The use o f antibiotics has resulted in a substantial reduction in deaths due to common infections. Effective therapy for infections and vaccines forprevention o f infection were the major factors responsible for the steep fall in crude deathrate from 25.1 in 1951 to 8.9 in 1996. However, the morbidity due to communicable diseases
161
Strategies to improve performance of Disease Control Programmes during Ninth Plan:
□ Rectify identified defects in design and delivery
□ Fill critical gaps in infrastructure and manpower
□ Make service delivery responsive to user needs
□ Ensure skill upgradation, supplies, and referral services
□ Improve community awareness, peirticipation and effective utilisation o f available services

continues to be high. Deteriorating urban and rural sanitation, poor liquid and solid waste management and overcrowding have resulted in an increasing prevalence o f common communicable diseases. The re-emergence o f diseases like Kala Azar, and emergence o f new infections like HIV have added to the existing disease burden due to communicable diseases. Control o f communicable diseases is becoming more difficult because o femergence o f drug-resistant pathogens and development o f insecticide-resistant vectors.
3.4.71 Even though health is a State subject, the Central Government has over the last fortyyears provided additional fimds through Centrally Sponsored Schemes (CSS) for control o f some o f the major communicable diseases. O f these, the National Leprosy Eradication Programme is likely to achieve its objective o f reduction in leprosy prevalence to below 1 per10000 by the end o f the Ninth Plan. However, malaria, tuberculosis and HIV infectionrequire vigorous and intensified efforts for their containment and control.
3.4.72 The performance in, and shortcomings of, these National Programmes have been evaluated during the Eighth Plan period by Expert Committees. Accordingly,-- following remedial measures will be taken during the Ninth Plan period to;
1. rectify the identified defects in the design and delivery o f these programmes;
2. fill the critical gaps in infrastructure and manpower;
3. improve the operational efficiency and the quality of services;
4. make service delivery system more responsive to users needs;
5. ensure that health care providers have the necessary skills and support,including referral facilities and supplies they need;
6. improve the community .awareness o f the existing services through lEC efforts so that there is optimal utilisation o f available services.
3.4.73 External assistance has been obtained to augment available funds for implementing these programmes. These National Programmes will continue as CSS during the N inth Plan period.
New initiatives during the Ninth Plan
Horizontal Integration of Vertical Programmes:
3.4.74 Initially, when sufficient infrastructure and manpower were not available for management o f major health problems, several vertical programmes eg. National M alaria Eradication Programme (NMEP), National Leprosy Eradication Programme (NLEP) were initiated. Subsequently, over the years a three-tier health care infrastructure has been established. During the Ninth Plan period, efforts will be made to integrate the existing vertical programm es at district level and ensure that primary health care institutions will provide comprehensive health and family welfare services to the population.
3.4.75 In order to assist the PHC/ CHCs officers to effectively implement such a horizontal integration, the middle level public health programme managers who are currently heading
162

the vertical programmes at district level will be given the additional task o f ensuring coordination and implementation o f integrated Health and Family Welfare Programme at Primary Health Care institutions in defined blocks. Involvement o f the public health specialists at the subdistrict level will also improve data collection, reporting, strengthening HMIS, improving the supply of essential drugs/devices for all programmes at PHCs/CHCs and enabling operationalisation o f the disease surveillance and response at district level.
Disease Surveillance & Response
3.4.76 Given the existing conditions o f poor environmental sanitation and the weakness o f the public health system it may not be possible to completely prevent outbreaks o f communicable diseases in the near future. Delays in recognition and reporting o f focal outbreaks, absence o f functioning HMIS and disease surveillance system result in delays in implementation o f appropriate response and consequent high morbidity and even mortality. The Expert Committee on Public Health System chaired by M ember (Health), Planning Commission recommended the establishment of an epidemiological surveillance system. During the Ninth Plan, establishment o f a functioning system for early detection and prompt response for rapid containment and control of the disease outbreak will receive high priority. Disease surveillance and response will be at district level to ensure prompt, effective, efficient remedial action utilising the existing infrastructure. This system will be given the necessary back-up, laboratory and epidemiological support so that containment measures are based on sound data and scientific rationale. This back-up system will be evolved by stiengthem ng and optimal utilisation of the facilities and expertise available in the national institutions/medical colleges.
3.4.77 The regulations governing notification ot diseases vary widely between States. There is an urgent need to develop a uniform regulation for notification o f diseases in all States. The diseases that are to be covered under the notification system should consider adequately the problems o f new, emerging and re-emerging infections so that appropriate response could be generated to tackle the situation.
Hospital Infection Control and Waste Management
3.4.78 Increasing incidence of hospital-acquired infections and accidental infection in health care providers and waste disposers, renders it imperative that efforts are made to improve infection control and waste management through utilisation o f appropriate, affordable technology at all levels o f health care. During the Ninth Plan period, infection control and waste management in all health care institutions will receive due attention and adequate funding.
National Malaria Eradication Programme (NMEP)
3.4.79 In the early fifties, malaria was not only a major cause o f morbidity and mortality in the country but also one o f the constraints for ongoing developmental efforts. Illness due to malaria was a major cause o f absenteeism in agricultural and industrial labour and in irrigation and construction workers in the fifties. The National Malaria Control Programme, the first o f the Health Sector CSS, aimed at reduction of the morbidity and mortality due to malaria, was launched in 1953. It is noteworthy that even though there was no well established health infrastructure in rural areas, the number o f cases came down from 70 million in 1950 to 0.1 million by 1965. However, subsequently, there was a resurgence o f
i63

TOTAL MALARIA CASES & DEATHSFtgure-i’
M A L A R IA C A SE
D E A T H S
_P FA L C IP A R U M
malaria. In 1976 over 6.7 million cases were reported. From 1977, the NM EP started implementing a Modified Plan o f Operations for control o f malaria. After the initial success the number o f cases have remained at over 2 million (Fig-2).
3.4.80 Initially, malaria in India was mainly a rural disease. Subsequently, due to major ecological changes five more eco-types have been recognised viz., forest and forest fringe malaria; rural malaria; urban malaria; industrial malaria; border malaria and migration malaria.
Source - N M E P
3.4.81 The North Eastern (NE) States have high incidence o f P.falciparum malaria. High morbidity, mortality due to m alaria and em erging problem o f drug resistance are reported. A major initiative during the Eighth Plan (1994) was to provide 100% Central Assistance for NMEP in NE States so that financial constraints do not come in the way o f effective implementation o f the NM EP. The performance o f NMEP during the Eighth Plan period is indicated in Table-3.4.6. There has been an increase in the number o f cases o f malaria reported during the Eighth Plan period. The proportion of P f infection has increased to 40 per cent. Many o f the fever patients are not screened, diagnosed and effectively treated primarily because o f lack o f male multipurpose worker and laboratory technicians. Not all the diagnosed cases are reported to the programme authorities. Residual insecticide spraying is often not done at appropriate time. Community involvement in spray operations and the bioenvironmental measures for control o f mosquito breeding are poor. Some o f the vectors o f malaria have developed resistance to one, two or three o f the currently used insecticides. Figure-3
3.4.82 There is an urgent need to intensify the malaria control activities during the Ninth Plan period especially in the States which had been reporting large number o f m alaria cases (Fig-3). The NM EP has, therefore, drawn up a program m e for intensive and effective implementation o f the M odified Plan o f Operation (MPO) in malariogenic areas in the country during the Ninth Plan. Financial assistance has been procured from the World Bank for augm enting domestic funds available for implementation o f the programme.
PERCENTAGE DISTRIBUTION OF MALARIA CASES DURING 1995
K A R N A TA K A
9 77%
M A H A R A S H TK A 12 60%
Source:- NMEP
164

3.4.83 The criteria for selecting the areas for intensive implementation o f MPO during the Ninth Plan are:
Modined Plan of operation for NMEP during the Ninth Plan
Intensification of control activities in areas with:• API o f > 2 in the last three years• P f rate o f > 30%■ Reported deaths due to malaria■ > 25% o f the population is tribal
Components of the IVfodiried Plan of Operation• Early diagnosis and prom pt treatment■ Selective vector control & personal protection• Prediction , early detection & effective response to out breaks• lEC
Targets for 2002■ A B E R o fo v e r 10%- API <0.5%• 25% reduction in m orbidity and m ortality due to malaria
(i) annual parasite incidence o f more than 2 for the last 3 years;(ii) Pf. rate o f more than 30%;deaths due the malariareported
(iii)tribals form more than 25% o f the population.
3.4.84 The areas identified on the basis o f these criteria are the 7 North Eastern States and 100 districts spread over the States o f Andhra Pradesh, Bihar, Gujarat, Madhya
Pradesh, M aharashtra, Orissa and Rajasthan.
3.4.85 The ongoing programme with 100 percent Central assistance in the seven North- Easlem States wiU be continued dunng Ihe 'Ninth Plan. Additional inputs will be provided to the 100 hardcore and tribal districts identified on the basis o f the above criteria. Enhanced m alaria control programme will also be implemented in 19 cities/ towns which have rising slide-positivity rate and in areas where there have been focal outbreaks o f malaria in the previous year.
The main components o f MPO that will be strengthened in these areas are:
1. early diagnosis and prompt treatment, through strengthening o f active and passive surveillance and laboratory diagnosis;
2. selective vector control by integrating various vector control approaches and, promotion o f personal protection methods;
3. prediction, early detection and effective response to m alaria outbreaks;
4. intensified information, education and communication campaign.
3.4.86 In spite o f the reported increase in drug resistance, Chloroquin will remain the first line drug for presum.ptive treatment and Primaquine will be given for radical treatment. Sulpha pyrimethamine drug combination will remain as the second line o f treatment especially for P f cases in areas where drug resistance is reported and selective use o f quinine will continue for treatment o f severe and complicated malaria.
3.4.87 The village will be the unit for residual insecticide spray operations. DDT will continue to be the insecticide o f choice in areas where vector is sensitive because o f its efficacy and cost effectiveness. In areas where DDT is ineffective, M alathion may be used. Synthetic pyrethroids will be used only in areas where triple insecticide resistance is reported.
165

Personal protection through use o f insecticide impregnated bed nets will be advocated. In urban areas stringent measures to prevent stagnation o f water, ensure covering o f overhead tanks and drains and enforcing periodic cleaning will be attempted.
3.4.88 With effective implementation o f the Programme, it is expected that by the end o f the Ninth Plan the following targets will be achieved in malariogenic areas; 1. ABER o f over 10%; 2. API less than 0.5% and 3. 25% reduction in morbidity and mortality due to malaria.
K ala-azar
3.4.89 Available data indicates that Kala-azar is endemic in 36 districts in Bihar and 10 districts in West Bengal (population 75 million). Periodic outbreaks o f Kala-azar with increase in morbidity and mortality continue to occur in these States. Over 90% o f the reported cases and over 95% o f the reported deaths are from Bihar. Over two third o f the cases in Bihar are reported from 7 districts.
3.4.90 The Government o f India is implementing a GSS for control o f Kala-azar in Bihar and West Bengal. Following reported increase in the number o f cases and deaths due to Kala azar in 1989-91, an intensive programme for containment o f Kala-azar was launched in 1992.
3.4.91 The strategy for control o f infection includes interruption o f transmission through insecticidal spraying with DDT and early diagnosis and treatment o f Kala-azar cases. The Government o f India is providing insecticides and anti Kala-azar drugs. The State Governments meet the expenses involved in the diagnosis and treatment and insecticide spraying operations.
3.4.92 Effective implementation o f the programme resulted in a decline in both Kala-azar cases and deaths during 1993-95. However, there were delays and inadequacy o f the insecticidal spray operations during 1995-96 and the decline could not be maintained (Table- 3.4.7).
3.4.93 During the Ninth Plan, the focus will be on ensuring effective implementation o f the programme so as to prevent outbreaks and eventually to control infection. DDT will continue to be the mainstay for insecticide spray as the vector (Phlebotomus argentipes) is still susceptible to DDT.
O ther Vector-borne Diseases Fiiariasis
3.4.94 Fiiariasis is endemic in Southern, Eastern, Western and Central Indian States. It is estimated that about 428 million (113 urban, 315 rural) people are living in areas where fiiariasis is endemic. Reports from 13 States and UTs covering about 48 million population indicate that annually 6 million persons suffer from acute lymphangitis due to fiiariasis. Chemotherapy and vector control measures have succeeded in reducing microfilaria rate and disease rate in 94% o f towns where control programmes have been in operation for more than5 years.
166

3.4.95 During the Ninth Plan, the strategy for filariasis control would include:
(1) single dose DEC mass therapy once a year in identified 13 districts and selective DEC treatment in filariasis endemic areas;
(2) continuation of vector control measures;
(3) detection and treatment o f microfilaria carriers, treatment o f acute and chronic filariasis;
(4) lEC for ensuring community awareness and participation in vector control as well as personal protection measures.
Dengue
3.4.96 Dengue outbreaks have been reported from urban areas from all States. All the four types o f dengue virus exist in India. The vector Aedes Aegypti breeds in peridomestic fresh water collections and is found in both urban and rural areas. Analysis o f available data fi’om 54 dengue outbreaks between 1954 and 1995 indicate that:
(1) dengue outbreaks occur both in urban and rural areas; and
(2) over the years there has been an increase in reported cases o f dengue, dengue haemorrhagic fever and dengue shock syndrome.
3.4.97 Diagnostic tests for dengue virus are not readily available in most parts o f the country. At present, there is no mechanism for monitoring and surveillance for dengue. During the Ninth Plan efforts will be made to:
(1) establish an organised system of surveillance and monitoring;
(2) strengthen facilities for early diagnosis and prompt treatment;
(3) intensify lEC efforts to ensure that all households implement peridomestic measures to reduce breeding o f Aedes.
Japanese Encephalitis
3.4.98 Japanese Encephalitis (JE) has been reported in the country since mid fifties. With increasing development of irrigation projects and changing pattern o f water resource management there has been a progressive increase in number o f States reporting cases o f JE in India. Twelve States/ UTs have reported outbreaks of JE in the last decade and 378 million population is exposed to risk o f JE. The NMEP has been implementing the recommendations o f the Expert Committee on JE control. However, implementation o f the strategies for improving clinical management, vector control, disease surveillance and health education has been sub-optimal in most States. During the Ninth Plan efforts will be made to intensify all these activities.
3.4.99 Efforts to reduce morbidity and mortality due to vector-bome diseases by appropriate vector control measures aimed at reduction of disease transmission and strengthening o f
167

facilities for early diagnosis and treatment o f cases in primary and secondary care settings will be continued in the Ninth Plan. Information, education and communication (lEC) activities to ensure community awareness and cooperation, in programmes for prevention, early detection and appropriate treatment o f vector borne diseases will be intensified.
National Tuberculosis Control Programme (NTCP)
3.4.100 Tuberculosis is a major health problem in India. The aim o f the fight against tuberculosis is at individual level to cure disease, to preserve and quickly restore work capacity, to allow the person to be within the family and community and in this way to maintain their socio-economic status and at the community level, to reduce the risk o f tuberculosis infection through case finding and their appropriate management and care. Studies carried out by the Indian Council o f Medical Research (ICMR) in the fifties and sixties showed that:
1. unlike the situation in developed countries, BCG did not protect against adult TB and BCG given at/ soon after birth provided some protection against TB in infancy and early childhood.
2. domiciliary treatment with anti TB drugs was safe and effective.
3.4.101 A National Tuberculosis Control Programme was initiated in 1962 as a CSS. The programme was aimed at early case detection in symptomatic patients reporting to the health system through sputum microscopy and X-ray and effective domiciliary treatment with standard chemotherapy. BCG vaccination at birth was incorporated into the immunisation programme. The Short Course Chemotherapy (SCC) which shortened the duration o f treatment to nine months was begun in selected districts in 1983. Over the years, 293 districts were included for SCC.
3.4.102 During the last three decades, because o f low case detection, case holding and cure rates, the Programme has not succeeded in bringing down the disease burden, in spite o f availability o f effective chemotherapy. Estimates based on available limited data from small- scale epidemiological studies indicate that the prevalence o f active disease continues to be 1.4 per cent. It is estimated that there are about 14 million cases o f active tuberculosis. O f these3.5 million are highly infectious sputum positive tuberculosis cases. With the HIV-TB co- infection the incidence o f tuber-culosis may increase significantly from the current 1.8 per thousand.
3.4.103 The performance under the NTCP during the Eighth Plan period is given in Table- 3.4.8. About 1.5 million TB cases are detected and reported by the programme annually. O f these 25% are sputum positive. It is estimated that about 1.5 million cases are detected and treated by the private sector. Both under-diagnosis (missing sputum positive cases) and overdiagnosis (by X-Ray) occur. Under programme conditions completion o f therapy is only 30 per cent. Long duration o f treatment schedule (especially conventional therapy), irregular supply of. drugs, poor follow-up o f patients under treatment, lack o f coxmseling regarding adverse consequences o f incomplete therapy are some o f the major factors responsible for the low treatment completion rates.
3.4.104 A major review o f NTCP was undertaken during the Eighth Plan (1992) to identify inadequacies in the ongoing programmes and suggest remedial measures. A Revised Na
168

tional Tuberculosis Control Programme (RNTCP) was drawn up with the following aims: (1) to improve cure/ completion o f therapy rates to 85% by providing drugs for short course chemotherapy (SCC) and strengthening monitoring and supervision o f patients under treatment; and (2) to improve case detection to 70% by providing critical personnel and improving their skills through training.
3.4.105 The RNTCP has been pilot tested in 17 project sites (population o f 13.85 million) in different parts of the country during the last three years. The cure rates achieved ranged between 60 and 80%. Encouraged by the results achieved in the pilot projects, it was decided to extend the strategy in a phased manner during the Ninth Plan period. Assistance from the World Bank has augmented the resources available for the Programme during the Ninth Plan period when:
(a) RNTCP will be implemented in 102 districts;Revised N ational T uberculosis C on tro l P rogram m e
(R N TC P)
□ R N T C P w i l l be im p le m e n te d in 102 districts□ N T C P w i l l be s tren g th en ed in 2 0 3 S C C districts□ S tr e n g th e n in g o f standard r e g im e in r e m a in in g non SC C
distr icts□ S tr e n g th e n in g o f Central inst itut ions . S tate I B C e l ls & Slate
T B tra in ing Institutions
Targets u p to 2 0 0 2
□ E n h a n c e c a s e d e tec t io n to at least 7 0 % o f est im ated in c id e n c e .
□ A c h i e v e at least 8 5 % cure rate a m o n g sm ea r p o s i t iv e ca ses In 102 R N T C P districts and 6 0 % cure rate in S C C districts.
□ R e d u c e proport ion o f sm e a r n e g a t iv e d e te c te d to 5 0 % or less
o f the total c a ses .□ E nsure no. o f T B su s p e c t s t es ted for sm e a r p o s i t iv e s is not
le s s than 2 .5 % o f O P D in P H ls and no. o f sm e a r te.sted is at least 3 per su s p e c te d patient.
(b) NTCP will be strengthened in 203 Short Course Chemotherapy (SCC) districts as a transitional step to adopt the RNTCP;
(c) standard regime will be strengthened in the remaining non SCC districts, and
(d) the Central Institutions, State TB Cells, & Slate TB Training Institutions throughout the country will be strengthened.
The targets for the Ninth Plan are:
i. to enhance case detection to at least 70% of the estimated incidence.
ii. to achieve at least 85%> cure rate amongst smear positive patients ofTuberculosis in 102 districts iinplementing RNTCP and 60% cure rates in 203 SCC districts;
iii. to reduce the proportion of smear negatives detected under the programme to50%) or less of the total cases.
iv. to improve the aggregate smear positivity rate at least to 50%o.
V . to ensure that the number o f TB suspects tested for smear examination is notless than 2.5%o of the general OPD attendance o f the P ills and number o f smears examined is at least 3 per suspected patient.
I b'l

3.4.106 It is expected that with the implementation o f this Programme over the next 5 years (a) the total number o f patients cured will increase to 32.55 lakh (compared to estimated22.89 lakh who will be cured if NTCP in its original form is continued) and (b) 1.8 lakh deaths will be prevented.
N ational Leprosy Eradication Programme (NLEP):
3.4.107 Leprosy has been a major public health problem in India. In 1984 it was estimated that there were nearly four million cases o f leprosy in the country, 15% o f which were children. Recognising that leprosy was a major cause o f disability and the infected persons face social ostracism, several non-govemmental organisations and social service/volimtary agencies had taken up treatment and rehabilitation o f leprosy patients right from the pre- Independence period. However, the outreach o f these services was very limited. With the availability o f Multi Drug Therapy (MDT) it became possible to cure leprosy cases within a relatively short period (6-24 months) o f treatment. The National Leprosy Eradication Programme was launched as a 100% Centrally funded CSS in 1983 with the goal o f arresting disease transmission and bringing down the prevalence o f leprosy to 1/10000 by 2000 AD.
The strategy adopted was:
i. early detection o f leprosy cases through active surveillance by trained health workers;
ii. regular treatment o f cases with MDT administered by leprosy workers in endemic district and Mobile Leprosy Treatment Units & Primary Health Care Workers in moderate to low endemic areas/ districts;
iii. intensified health education and public awareness campaigns to remove social stigma attached to the disease.
iv. appropriate medical rehabilitation and leprosy ulcer care services.
3.4.107 The programme was initially taken up in endemic districts and was extended to all districts in the country from 1994 with World Bank assistance. The estimated number o f persons requiring treatment for leprosy has declined from four million cases in 1984 to 0.54 m illion cases in March 1996. More than 6.98 million leprosy patients have been cured by MDT and the proportion o f registered patients taking MDT treatment has increased from 10% in 1985 to 96% in 1997. The prevalence rate o f leprosy has declined from 57.3 per ten thousand population in 1981 to 5.8 per ten thousand population in 1995. However, the number o f new leprosy cases detected each year has remained about 0.45 million. The performance during the Eighth Plan is shown in Table-3.4.9.
3.4.108 The performance during the Eighth Plan has been satisfactory with respect to new case detection and treatment completion but less than optimal with respect to the reduction in total cases mainly due to treatment o f backlog o f cases. The incidence o f the disease has not shown a marked decline. Earlier 50% of cases were in Andhra Pradesh and Tamil Nadu. N ow over 50% o f the cases requiring treatment are in UP, MP, Bihar and West Bengal. The laboratory support for diagnosis and assessing the success o f treatment is sub-optimal. Available information on recurrence, relapse rates and reactions to drug therapy is
170

inadequate Even though leprosy infection has been cured, the deformities and disabilities associated with leprosy continue to require treatment and these have not been looked after.
3 4.109 During the Ninth Plan the strategy will be.
1 strengthening laboratory services in PHC/CHC, establishing surveillance system for monitoring time trends in prevalence o f the disease throughout the country
Strategies for NLEP during the Ninth Plan
□ Intensifying case detection and M DT coverage in high prevalence States and areas difficult to access
□ Strengthening laboratory services in PHC/CHC, establishing surveillance system for monitoring time trends
□ Preparing for & initiating horizontal integration of leprosy programme into primary health care system
□ Providing greater emphasis on disability prevention and treatment
□ Implementation of Modified Leprosy Elimination campaign
□ Ensuring rehabihtation of cured patients.□ Repeal of discriminatoiy provision under marriage act
where leprosy is ground for divorce
Target for Ninth Plan:□ Reduce prevalence of leprosy to 1/10000.
2. accelerating the pace o factivities, intensifying casedetection and MDT coverage in high prevalence States and areas that are difficult to access;
3. maintaining activities in the previously highly endemic areas,
4: preparing for and initiatinghorizontal integration o f the leprosy programme into the primary heahh care system
5. greater emphasis on disability prevention andmanagemeut tlwough (a) transfer o f knowledge and technology to affected persons, families, community;(b) stren^hening local treatment facilities for
ulcers/leprosy related deformities; (c) supply o f aids and appliances to prevent fijrther impairment; (d) developing trained manpower resources and improving facilities for corrective surgery for deformities
6. implementation o f Modified Leprosy Elimination campaign and bringing mass public awareness, training o f general heahh care staff and detection o f hidden cases
7 ensuring rehabilitation o f cured patients.
8 repeal o f discriminatory provision under marriage act where leprosy is one o fthe grounds o f divorce.
The target for the Ninth Plan will be to reduce prevalence o f leprosy to 1/10000 by 2002 A.D.
National AIDS Control Programme
3 4 110 Sexually transmitted diseases (STD) have been a global problem since time immemorium Fear o f STD and pregnancy had been the major deterrents against promiscuous multi-partner sex and hence, STD levels remained relatively low in general population With the ready availability o f antibiotics for treatment o f STD and contraceptives for prevention o f pregnancy, sexual mores in most countries underwent a change during the last three decades Increasing muhi partner sex and consequent increase in STD were reported from many countries Increase in STD rates did not result in rising morbidity or mortality rates because o f availability o f effective treatment. With the advent o f HTV infection the situation underwent a dramatic change because there is no effective drug for treatment or vaccine for protection against HIV infection.
171
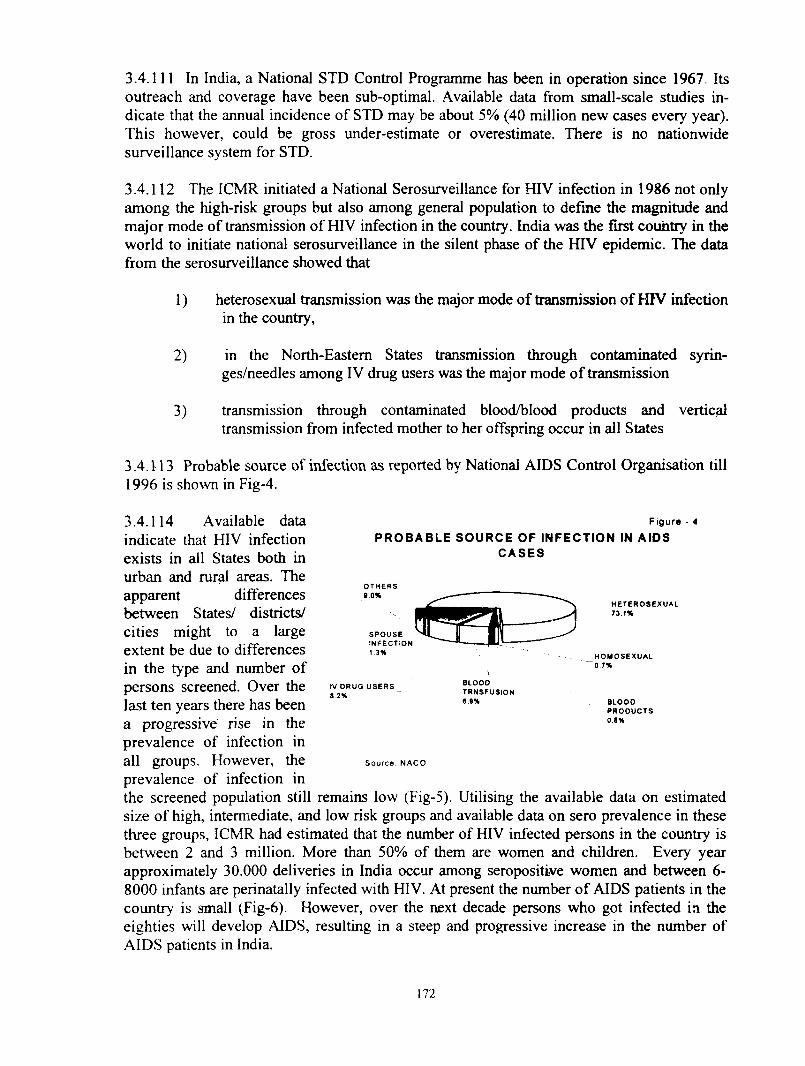
3.4.111 In India, a National STD Control Programme has been in operation since 1967. Its outreach and coverage have been sub-optimal. Available data from small-scale studies indicate that the annual incidence o f STD may be about 5% (40 million new cases every year). This however, could be gross under-estimate or overestimate. There is no nationwide surveillance system for STD.
3.4.112 The ICMR initiated a National Serosurveillance for HIV infection in 1986 not only among the high-risk groups but also among general population to define the magnitude and major mode o f transmission o f HIV infection in the country. India was the first country in the world to initiate national serosurveillance in the silent phase o f the HIV epidemic. The data from the serosurveillance showed that
1) heterosexual transmission was the major mode o f transmission o f HIV infectionin the country,
2) in the North-Eastern States transmission through contaminated syringes/needles among IV drug users was the major mode o f transmission
3) transmission through contaminated blood/blood products and vertical transmission from infected mother to her offspring occur in all States
3.4.113 Probable source of infection as reported by National AIDS Control Organisation till 1996 is shown in Fig-4.
Figure - 4
PROBABLE SOURCE OF INFECTION IN AIDS CASES
OTHE RS9.0%
SPO US E IN F E C T i O N - 1.3%
H E TE R O S E X U A L73.1%
H O M O S EX U A L0.7%
IV DRU G US ERS 8 2%
BLOOD TRNSFUSION a 9% BLOOD
- P R O D U C T S 0 8%
3.4.114 Available data indicate that HIV infection exists in all States both in urban and rural areas. The apparent differencesbetween States/ districts/ cities might to a large extent be due to differences in the type and number o f persons screened. Over the last ten years there has been a progressive rise in the prevalence o f infection in all groups. However, the prevalence o f infection inthe screened population still remains low (Fig-5). Utilising the available data on estimated size o f high, intermediate, and low risk groups and available data on sero prevalence in these three groups, ICMR had estimated that the number o f HIV infected persons in the country is between 2 and 3 million. More than 50% o f them are women and children. Every year approximately 30,000 deliveries in India occur among seropositive women and between 6- 8000 infants are perinatally infected with HIV. At present the number o f AIDS patients in the country is small (Fig-6). However, over the next decade persons who got infected in the eighties will develop AIDS, resulting in a steep and progressive increase in the number o f AIDS patients in India.
Source NACO
172
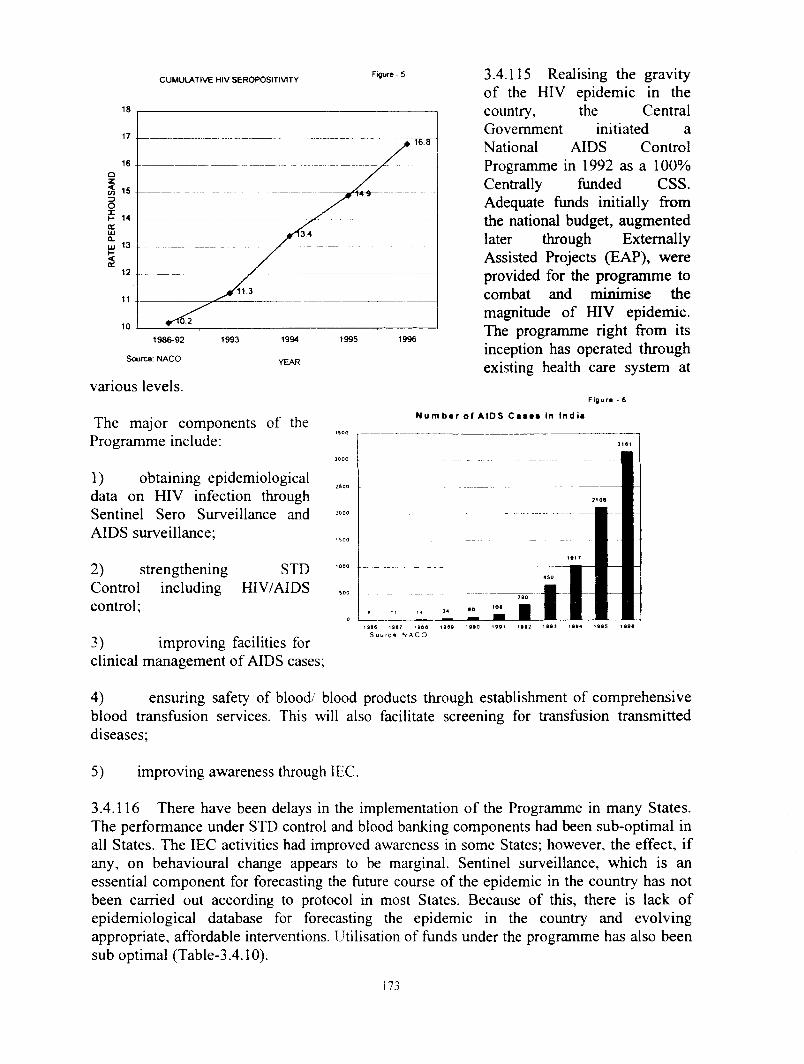
CUMULATIVE HIV SEROPOSITiVlTYFtgure - 5
Source; NACO YEAR
3.4.115 Realising the gravity o f the HIV epidemic in the country, the Central Government initiated a National AIDS Control Programme in 1992 as a 100% Centrally funded CSS. Adequate ftmds initially from the national budget, augm ented later through Externally Assisted Projects (EAP), were provided for the progranm ie to combat and minimise the magnitude o f HIV epidemic. The programme right from its inception has operated through existing health care system at
various levels.F igu r* • 6
The major components o f the Programme include:
1) obtaining epidemiological data on HIV infection through Sentinel Sero Surveillance and AIDS surveillance;
2) strengthening STDControl including HIV/AIDS control;
3) improving facilities for clinical management o f AIDS cases;
Nu m b « r o f A I D S C a s * « In I n d i a
1 S B 6 1 9 0 7 1 9 S SS o u r c i . N A C O
199g 1990 1991 1992 19 9 3 199 4 1 9 9 5 i 9 0 «
4) ensuring safety of blood/ blood products through establishment o f com prehensive blood transfusion services. This will also facilitate screening for transfusion transm itted diseases;
5) improving awareness through lEC.
3.4.116 There have been delays in the implementation o f the Programme in many States. The performance under STD control and blood banking components had been sub-optimal in all States. The lEC activities had improved awareness in some States; however, the effect, if any, on behavioural change appears to be marginal. Sentinel surveillance, which is an essential com ponent for forecasting the future course o f the epidemic in the country has not been carried out according to protocol in most States. Because o f this, there is lack o f epidemiological database for forecasting the epidemic in the country and evolving appropriate, affordable interventions. Utilisation of funds under the programme has also been sub optimal (Table-3.4.10).
i73

National AIDS Control Programme in the Ninth Plan
Priorities in the Ninth Plan:
□ More effective implementation of the Programme to ensure safety of blood/ blood products
□ Increasing the number of HIV testing network□ Augmenting STD, HIV/AIDS care facilities□ Improving hospital infection control and waste
management to reduce accidental infection□ Improving HIV/AIDS awareness, counselling and care□ Strengthening Sentinel Surveillance.
3.4.117 During the Ninth Plan the focus will be on:
1) more effectiveimplementation o f the program m e for ensuring safety o f blood/blood products;
2) increasing the num ber o fHIV testing network;
3) augmenting STD,HIV/AIDS care facilities;
4) improving hospital infectioncontrol and waste management so as to reduce accidental HIV infection
5) enhancing efforts to improve HIV/AIDS awareness, counselling and care and
6) strengthening Sentinel Surveillance.
Control o f Non-Communicable Diseases
3.4.118 Soon after Independence, the focus o f the health sector programme o f the Government was on control o f communicable diseases. However, the programmes (either Central Sector or Centrally Sponsored) for control o f some non-communicable diseases which were perceived as public health problems were also initiated. The National Goitre Control Programme initiated in 1962 is the oldest Central Sector Scheme for control o f non- communicable diseases (NCD). The National Blindness Control Programme the first CSS was initiated in 1976. Subsequently, several Central Sector Schemes for control o f non- communicable diseases, including the following were taken up:
1. National Cancer Control Programme2. Programme against micro nutrient malnutrition3. National Mental Health programme4. Diabetes Control Programme5. Cardiovascular Disease Control Programme6. Prevention o f Deafness and Hearing Impairment7. Oral Health programme8. Medical Rehabilitation
3.4.119 In addition some o f the State Governments have initiated pilot projects for district based integrated non-communicable disease control in some districts.
National Blindness Control Programme
3.4.120 It is estimated that there are 12.5 million economically blind persons in India. O f these over 80% o f blindness is due to cataract. It is estimated that every year about 2 m illion cases o f blindness occur in the country. M ost o f cataract blind individuals are in their 60s. They may not have the means for cataract surgery. These patients may also have difficulty in
174

National Blindness Control Programme
Programme Priorities during Ninth Plan:
□ To improve the quality of cataract surgery, clear the baciclog of cataract cases
□ To improve quality of care b\ skill upgradation of eye care persomiel
□ To improve service delivery through NGO and Public sector collaboration
□ Increase coverage of eye care delivery among underprivileged population.
Targets for the period 1997-2002
□ 17.5 m illion cataract operations
□ 100,000 comeal implants
accessing services, unless services are available in the vicinity o f their house. The National Blindness Control Programme was initiated in 1976 with the objective o f providing comprehensive eye care services at primary, secondary and tertiary health care level and achieving substantial reduction in prevalence o f eye disease in general and blindness in particular.
3.4.121 The long term objective is to reduce prevalence o f blindness from 1.4% to 0,3% by 2000 AD through
(a) developing institutional capacity and strengthening o f service delivery;
(b) development o f human resources for eye care;
(c) promoting outreach activities and public awareness
3.4.122 The major thrust of the programme during the seventies was to provide ready access to cataract surgery free o f charge to the blind persons so that they could regain their vision, enabling them to be independent socially and economically. There had been a gradual rise in cataract surgery from 5.5 lakh in 1981 to 11.34 lakh in 1984-85. However, subsequently there was a plateau in the performance to around 11-12 lakh per year. Surveys carried out in 1986- 89 showed that the prevalence o f blindness due to cataract and cataract backlog is high in Andhra Pradesh, Jammu and Kashmir, Madhya Pradesh, Maharashtra, Orissa, Rajasthan, Tam il Nadu and Uttar Pradesh. Therefore, a major thrust was given during the Eighth Plan to strengthen the programme in these States and in J & K and Karnataka. Funds from domestic budget as well as EAP were provided for this. District Blindness Control Societies were form ed to coordinate the activities o f Government voluntary and private sectors and to rem ove any bottlenecks in the implementation of the Programme.
The major objectives o f the Programme were :
to improve the quality o f cataract surgery, to clear the backlog o f cataract by , 11 million operations during a 7-year oeriod
1)
2)
3)
to improve tne quality or cataract surgery, to clear the I performing 11 million operations during a 7-year period
to strengthen country's capacity to provide high volume, high quality, low cost eye care by upgrading knowledge and skills of eye care personnel and improve service delivery through non-govemmental and public sector collaboration
to increase coverage o f eye care delivery among the underprivileged population including women, urban slum dwellers and tribals.
3.4.123 The performance during the Eighth Plan is given in Table3.4.11. There has been a substantial increase in the number o f cataract operation from 1.6 million in 1992-93 to 2.7 m illion in 1995-96. However, the target o f reduction in prevalence o f blindpess to 0.3% by

2000 AD is unlikely to be achieved. The quality of care especially in camp situations had been sub-optimal and needs improvement. Infections resulting in permanent blindness have occurred due to slip up in asepsis; these should be eliminated. The need to restore vision by operating on one eye in economically blind people has not been given conscious priority over operating on the cataract in the second eye. Upgradation o f medical colleges and district hospitals as well as training o f ophthalmologists for ECCE/IOL insertion is being carried both in tertiary care and district hospital setting. A comparative assessment o f ECCE/IOL in terms o f cost o f care, complication rate, and logistics o f implementation and follow up at tertiary hospital level as well as at district hospital level needs to be carried out.
3.4.124 During the Ninth Plan the Programme will be geared up to clear the backlog o f cataracts requiring extraction and also address other causes o f blindness such as glaucoma and corneal opacity. Correction of refractory errors especially in school children and treatment o f ocular infection will also be taken up. Infrastructure and manpower development and lEC will receive due attention. Attempts will be made to ensure that all available funds are optimally utilised. The target set for the Ninth Plan period is 17.5 million cataract operations and 100,000 corneal transplants.
National Cancer Control Programme
3.4.125 India has one o f the lowest cancer rates in the world. The estimated caseload is around 2 million. Every year about 7 lakh new cases are detected. Tobacco- related cancers (especially cancer o f oral cavity, lung and cancer cervix) form more than 50% of the overall cancer burden in the country. Over the next two decades it is expected that there will be a substantial increase in the prevalence o f cancers because o f increasing longevity, greater exposure to environmental carcinogens due to industrialisation, use o f fossil fuels, wide variety o f chemical agents in industry, agriculture, and continued use o f tobacco (both smoking and chewing). Thus, it is possible that the country may face the problem of increasing cancer incidence. There may also be a change in the type o f cancer seen. Increasing tobacco smoking instead o f tobacco chewing might lead to increase in incidence of lung cancer which is more difficult to detect and treat. Changing dietary patterns (high calorie, high fat intake) and lower parity may result in increasing incidence o f breast cancer.
3.4.126 The Cancer Control Programme was initiated in 1975-76 as a 100% centrally funded Central Sector project. It was renamed as National Cancer Control Programme in 1985. The objective of the programme are
(1) primary prevention of tobacco-related cancers(2) secondary prevention o f cancer cervix(3) extension and strengthening o f treatment facilities on a national scale.
3.4.127 During the last two Plan periods financial assistance has been provided for the establishment of 12 Regional Cancer Centres and oncology wings in 26 medical colleges. The District Cancer Control Programme for preventive health education, early detection and pain relief was undertaken in collaboration with Regional Cancer Centres in 32 districts. Assistance has been given to 33 voluntary organisations for undertaking health education and early detection. The estimated requirement of cobalt units in the country is 900 (1/1 million). O nh 232 cobalt machines are currently available in the country.
176
The focus during the Ninth Plan will be on
(1) intensification of lEC activities so that people seek care at the onset o f symptoms
(2) provision o f diagnostic facilities in primary and secondary care level so that cancers are detected at early stages when curative therapy can be administered
(3) filling up of the existing gaps in radiotherapy units in a phased manner so that all diagnosed cases do receive therapy without any delay as near to their residence as is feasible
(4) lEC to reduce tobacco consumption and avoid life styles which could lead to increasing risk of cancers
National Diabetes Control Programme
3.4.128 The National Diabetes Control Programme was included as a pilot programme in the Seventh Five-Year Plan. The project was initiated in two districts in Tamil Nadu and one district in Jammu & Kashmir during the Seventh Plan. Se\ eral States had initiated district diabetes control programme as a part of the State Plan scheme during the Eighth Plan period. Experience gained in implementing the district diabetes control programme during Seventh and Eighth Plans have shown that integrated treatment of diabetes mellitus, hypertension and heart disease within primary and secondary care level is possible provided functional linkages between these and tertiary care centres are developed and utilised. During the Ninth Plan period these experiences will be utilised to develop integrated programme o f non- communicable diseases prevention, detection and management programmes at primary and secondary care level in all districts.
National Mental Health Programme
3.4.129 It is estimated that 10 to 15% of the population suffer from mental health problem. Qualified professionals providing mental health carc are few and the outreach o f services in rural area is very low. The National Mental Health Programme was initiated by the Government o f India in 1982 with the objective of improving mental health services at all levels o f health care (primary, secondary and tertiary) for early recognition, adequate treatment and rehabilitation of patients with mental health problems within the community and in the hospitals. However, the Programme did not make much headway either in the Seventh or Eighth Plan. Mental Hospitals are in poor shape. The States have not provided sufficient funds for mentally ill requiring inpatient treatment. The Supreme Court has directed the Centre and the States to make necessary provision for these hospitals so that the inmates do get humane and appropriate care.
3.4.130 The Mental Health Act, 1987, which came into force with effect from April 1993, requires that each State/UT set up its own State level Mental Health Authority as a Statutory obligation. Majority of the States/ UTs have complied with this and have formed a Mental Health Authority.
3.4.131 The Central Council of Health & Family Welfare review^ed the progress and resolved that the National Mental Health Programme should be accorded due priority and full-scale operational support (including social, political, professional, administrative and financial back up).
17'

3.4.132 During the Eighth Plan, NIMHANS developed a district mental health care model in Bellary district with the following aims;
(1) to provide sustainable basic mental health services to the community and to integrate these services with health services;
(2) early detection and prompt treatment o f patients;
(3) to provide domiciliary mental health care and to reduce patient load in mentalhospital;
(4) community education to reduce the stigma attached to mental illness;
(5) to treat and rehabilitate patients with mental problems within their familysetting.
^.4.133 During the Ninth Plan period the experience gained in implementing mental health care both in Central and State Sector will be utilised to provide sustainable mental health services at primary and secondary care levels and to build up community support for domiciliary care. lEC on mental health especially prevention o f stress-related disorders through promotion o f healthy lifestyle and operational research studies for effective implementation o f preventive, promotive and curative programmes in mental health through existing health infrastructure will receive due attention.
National Iodine Deficiency Disorder Control Programme.
3.4.134 Iodine deficiency disorders (IDD) have been recognised as a public health problem in India since mid-twenties. Initially, IDD was thought to be a problem in sub-Himalayan region. However, surveys carried out subsequently showed that IDD exists even in riverine and coastal areas. No State in India is completely free from IDD. It is estimated that 61 million population are suffering from endemic goitre and about 8.8 million people have mental/motor handicap due to iodine deficiency. Universal use of iodised salt is a simple inexpensive-method o f preventing IDD.
3.4.135 The National Goitre Control Programme was initiated in 1962 as a 100% Centrally funded. Central sector programme with the aim of conducting goitre survey, and supplying good quality iodised salt to areas having high IDD, health education and resurvey after five years. The programme was renamed as the National Iodine Deficiency Disorder Control Programme in 1992. Implementation o f the Programme during the initial three decades of operation was sub-optimal and IDD prevalence had remained essentially unaltered. Inadequate production o f iodised salt, problems in transport, lack o f awareness about the need to take iodised salt are responsible for the poor performance.
3.4.136 During the Eighth Plan period there had been a substantial improvement in the production, quality and transport o f iodized salt. The annual production of iodised salt has risen from 5 lakh tonnes in 1985-86 to 40 lakh tonnes in 1996-97. By mid-1995, a ban on the sale of non-iodised edible salt has been implemented fully or partially in all States/Union Territories except Kerala, Goa and Pondicherry. Currently, it is estimated that about 80% of all edible salt is iodised and the use of iodised salt at household level has increased significantly. However, the target o f Universal lodisation of Salt is yet to be achieved.
178
3.4.137 During the Ninth Plan period the major thrust o f the Programme will be on (a) production o f adequate quantity of iodised salt o f appropriate quality; (b) appropriate packaging at the site o f production to prevent deterioration o f quality o f salt during transport and storage; (c) facilities for testing the quality of salt not only at production level but also at the retail outlets and household level so that consumers get and use good quality salt (d) lEC to ensure that people consume only good quality iodised salt and (e) survey o f IDD and setting up o f district level IDD monitoring laboratories for estimation o f iodine content o f salt and urinary iodine excretion.
3.4.138 Efforts to reduce price differentials between iodised and non-iodised salt and provide ready access to iodised salt through Targeted Public Distribution System will be considered.
Integrated Non-Communicable Disease Control Programme
3.4.139 Accelerated economic growth in the nineties does not necessarily imply improvement in health status. Increasing longevity, demographic transition resulting in rapidly rising numbers o f aged population, urbanisation, increasing pollution, change from traditional diets, sedentary life style and increase in the stress o f day-to-day living have led to an increase in lifestyle-related disorders and noncommunicable diseases. The ongoing change in disease burden is producing a major health transition; over the next two decades, non- communicable diseases are likely to contribute significantly to the total disease burden in the country. Cardio-and cerebro-vascular diseases, diabetes mellitus and malignancies are emerging as major public health problems m the country. U is essential that preventive, promotive, curative and rehabilitative services for NCD are made available throughout the country at primary, secondary and tertiary care levels so as to reduce the morbidity and mortality associated with NCD. However, vertical programmes to control individual non- communicable diseases would neither be feasible nor cost-effective.
3.4.140 Pilot projects for district-based integrated non-communicable disease control programmes carried out through the existing primary and secondary level facilities, using diabetes as a model, were initiated in the Eighth Plan. Therefore, during the Ninth Plan period an integrated non-communicable disease control programs at primary and secondary care level will be developed and implemented with emphasis on prevention o f NCD, early diagnosis, management and building up of suitable referral system. Tertiary care centres will be strengthened so that treatment facilities for complications will improve. As the anticipated increase in prevalence o f NCD over the next few decades is at least in parts due to changing lifestyles, it is imperative that health education for primary and secondary prevention as well as early diagnosis and prompt treatment of NCD receive the attention that it deserves. The increasingly literate population can then be expected to take a pro-active role and reduce morbidity and mortality due to NCD. Mobilising community action through well-structured lEC system including mass media will form an important intervention strategy for the control o f NCD. Development o f appropriate leaming resource materials for education and training o f manpower will be an essential activity.
Environment and Health
3.4.141 Environment can affect human health in many ways. Deficiency o f iodine in soil, water and foodstuffs is the cause of iodine deficiency disorders. Excessive fluoride content in the water is the cause o f fluorosis. Environmental degradation may affect air, land and water.
179

Pollutants may enter the food chain. All these may enter human body through various portals and affect the health status.
3.4.142 Rapidly growing population, urbanisation, changing agricuhural, industrial and water resource management, increasing use o f pesticides and fossil fuels have all resulted in a perceptible deterioration in the quality o f environment and attendant adverse health consequences. Environmental pollution due to developmental activities are increasingly becoming the focus o f concern. The interactive interdependence o f health, environment and sustainable development was accepted as the fulcrum o f action under Agenda 21 at the Earth Summit in Brazil in 1992. Environmental health in its broader perspective would have to address the detection, prevention and management of:
i) existing deficiencies or excesses o f certain elements in natural environment;
ii) macro environmental contamination o f air, land, water and food;
iii) disaster management
3.4.143 Following the suspected fjlague outbreak in the country during 1994 the Plaiming Commission constituted a High Power Committee on Urban Solid Waste Management in India imder the Chairmanship o f Member (Health). This Committee undertook a comprehensive review o f current situation o f urban solid waste management, specially in cities with one million or more inhabitants and made recommendations for safe methods for collection, transportation o f waste and suitable cost- effective, environmentally friendly methods for disposal o f these wastes. Pilot projects exploring the dimensions o f the problem and aimed at seeking realistic solutions were initiated during the Eighth Plan period. During the Ninth Plan period it is expected that many more cities will initiate programmes for the efficient methods o f management o f wastes generated and improve environmental sanitation.
3.4.144 So far, the major focus has been on communicable disease burden due to poor environmental sanitation in urban areas and due to improper disposal o f human excreta, garbage and waste water in rural areas and methods to tackle these. These efforts will be intensified during the Ninth Plan. In addition, efforts to reduce pollution and related non- communicable disease burden will also be strengthened. Efforts will be made to document the extent o f the problem o f environmental pollution and its impact on health status o f the population through linkages between existing environmental monitoring data and data on health status o f population living in these areas. Prevention and management o f health consequences o f environmental deterioration will receive increasing attention.
3.4.145 The Expert Committee on Public Health System had noted that major developmental activities in any field such as agriculture, industries, urban and rural development may result in environment changes which could have adverse health implications and recommended that health impact assessment may become a part of environmental impact assessment o f all large developmental projects. Efforts will be made to implement this recommendation during the Ninth Plan period. The feasibility o f making appropriate provision for health care o f people involved in developmental activities and prevention and management o f health consequences o f developmental activities on the population living in the vicinity o f the project as a part o f the project budget will be explored.
180

3.4.146 A healthy work force is an essential pre-requisite for agricultural and industrial development. Efforts to provide health care to workers through schemes such as ESI, creation o f health care facilities in industrial towns, arrange for health care services for workers and their families through existing public and private health care services have continued through the last five decades. However, both coverage and quality o f care have remained sub-optimal. There is no attempt to link existing data firom ongoing work environmental monitoring in the work place with health status o f workers and initiate appropriate intervention as and when required. Workers in the agricultural and unorganised sectors have so far not been covered under any programme. Increasing use o f mechanisation, induction o f poorly trained workers who operate machines with which they are not familiar, use o f insecticides, pesticides and chemicals by persons without appropriate knowledge o f precautions to be taken are resulting in increasing health hazards to workers in these sectors. During the Ninth Plan continuous monitoring o f safety o f work environment and workers' health status, both in the organised and unorganised sectors o f industry and in agriculture, health problems o f vulnerable groups such as women and children with focus on prevention, early detection and prompt treatment o f health problems will receive special attention. Documenting the magnitude and types o f the occupational health problems, initiating appropriate preventive and remedial measures will be developed into a structured health programme and taken up where ever possible.
Accident and Trauma Services
3.4.147 Increasing mechanisation in agriculture and industry, induction o f semi and relatively unskilled workers in various operations, rapid increase in vehicular traffic, have resulted in increase in morbidity, disability and mortality due to accident and trauma. Overcrowding, lack o f awareness and implementation o f essential safety precautions result in increasing number o f accidents of all types. Consumption o f poisonous substances accidentally or intentionally is also on the rise. Technological advances in the last twenty years have made it possible to substantially reduce mortality, morbidity and disability due to accidents, trauma and poisoning.
3.4.148 In view o f increasing morbidity and mortality due to accidents, a model accident and trauma service was proposed to be initiated in Delhi with the objective of:
(1) providing prompt services to injured person right from the site o f accident;
(2) preventing number o f deaths and extensive disabilities
(3) training medical and para-medical personnel in first aid resuscitation and treatment;
(4) establishing zonal peripheral centres and apex centre with all essentialfacilities for trauma care and appropriate networking.
3.4.149 A modest beginning was made in procuring ambulances fitted with essentiid equipment and strengthening of tertiary care hospitals in Delhi. However, a comprehensive accident and trauma services for National Capital Territory o f Delhi has not yet been established.
Occupational Health
181

3.4.150 During the Ninth Plan period efforts will be made to improve the availability and utilisation o f the emergency care services at all levels o f health care. Adequate training to medical and paramedical staff in emergency management at each level o f care, provision o f transport facilities for transfer o f patients and suitable strengthening o f emergency and casualty services in tertiary care centres so that they could handle the workload will be initiated. Rehabilitation services for those who have residual disabilities also will be strengthened. Steps to improve public awareness about available services and where and how to access them will also be taken up so that the population can fully utilise available services.
Health Management Information System (HMIS)
3.4.151 HMIS is an essential management tool for effective functioning o f the health system. Timely reporting and analysis o f data from HMIS could also serve as an early-warning o f focal outbreak o f diseases so that appropriate interventions can be initiated. The Central Bureau o f Health Intelligence (CBHI) and the States’ Bureau o f Health Intelligence are nodal agencies for HMIS. During the Eighth Plan period an attempt was made to provide a major thrust for HMIS. The CBHI in consultation with the National Informatics Centre (NIC) and State Health Departments have developed HMIS version 2.0 for sending information through NICNET on essential health indices. This system is being used by 13 States/ UTs for sending district level information. The system is still not fuUy operational in most States. During the Ninth Plan efforts will be made to ensure that the entire country is covered and all the data pertaining to the Health and Family Welfare Programmes are collected, collated and reported from all the districts through NICNET. The data from HMIS will be utilised not only for improving the efficiency and effectiveness o f the health care system but also for effective policy planning.
Comprehensive Review of Public Health System in India
3.4.152 An Expert group under the chairmanship o f Member (Health) undertook a comprehensive review o f major problems facing the public health system in the country in ensuring outreach o f appropriate services at affordable cost and maintaining quality o f services. The Committee recommended several policy and programme initiatives including administrative restructuring, health manpower planning, improving operational efficiency o f existing health care services, improving disease surveillance, epidemic control strategy, epidemiological surveillance system and development o f appropriate support services. The recommendations o f the Committee form the base and basis for the formulation o f strategies for revitalisation o f the public health system in the country during the Ninth Plan period.
Production and Quality Control of Drugs
3.4.153 Provision o f appropriate drugs o f good quality at affordable cost is essential for the success o f disease control programmes. Equally important is to restrict, and if possible, eliminate, the use o f irrational drug formulation, detect and eliminate spurious drugs. The Central Government is responsible for the control over the quality o f imported drugs, control over the manufacture and import o f new drugs into the country, amendments to the Drugs and Cosmetics (D&A) Act and Rules, coordinate the activities with the State Drug Control Authorities for uniform implementation o f D&A Act and Rules, laying down standards for drugs and updating Indian Pharmacopoeia, training o f drugs analysts anid drugs inspectors and licensing o f whole human blood and blood products, large volume parenterals, sera and
182

vaccines. Provisions for strengthening Drug Control Organisations in the States and the Centre were made in the Eighth Plan. However, the implementation of the scheme has been patchy and tardy. This task will be taken up on a priority basis during the Ninth Plan.
3.4.154 India's need for essential drugs are still not fully met. Patent laws do not cover over 95% of the essential drugs. Bulk manufacture of the generic drug and dispensing them in inexpensive packages to bulk consumers like hospitals will substantially reduce the budget needed to meet the drug cost in public health system. The possibility o f providing a dual pricing system for generic and brand drugs will be explored so that essential drugs under generic name are available at affordable cost. This approach can subsequently form the base and basis o f "drug cooperatives" as community-managed institutions.
3.4.155 Supply o f essential drugs, vaccines/devices holds the key to success in any disease control programme. Funds for drugs used for primary, secondary and tertiary care centres come partly from the State funds and partly from Central Plan funds (CSS). Procedures for procurement and distribution vary and bottlenecks in these at the national and State level have been a recurrent problem. Inefficient indenting procedures adversely affect drug procurement. Poor inventory management results in unsatisfactory drug procurement and distribution. Some States such as Tamil Nadu have attempted strengthening drug procurement and distribution through formation of a Medical Services Corporation. This Corporation has drawn up an essential drug list, improved purchase and storage o f drugs and organised efficient drug distribution within the States and brought about effective inventory control. During the Ninth Plan efforts in improving procurement and inventory control and distribution for drugs at Central and State level will receive priority.
Prevention of Food Adulteration
3.4.156 The Prevention o f Food and Drug Adulteration Act, 1954 is aimed at ensuring that consumers get pure and wholesome food of good quality and protecting them from the trade malpractice and frauds in sale of food products. The Act is implemented jointly by the Central and State Governments. During the Ninth Plan period, efforts will be made to augment food quality control both at the Central and State levels.
Bio-Medical and Health Services Research
3.4.157 The Indian Council for Medical Research is the nodal organisation for bio-medical research in India. Bio-medical and Health Systems Research is carried out by research institutions, universities, medical colleges and non-governmental organisations and are currently funded by several agencies including ICMR, DST, DBT, CSIR and concerned Ministries. Basic, clinical applied and operational research studies relevant to major health and population problems in the country have been the focus o f research programmes during the last fifty years.
3.4.158 The major thrust areas of research include existing problems o f communicable diseases, emerging problems o f non communicable diseases, improvement o f health and nutritional status o f women and children and increasing contraceptive acceptance and continuation. Indigenous development of immuno-diagnostics, research studies on improved drug regimens to combat emerging drug resistance among several bacteria, alternative
183

strategies for vector control in view o f the increasing insecticide resistance among vectors, testing innovative disease control strategies through increased community participation have been the major areas o f research in communicable diseases.
3.4.159 The ICMR has recently completed a 10-year study on health consequences o f Bhopal Gas Disaster providing data base for planning the infrastructure needed to meet the health care requirements o f the population exposed to toxic gas over the next decade. Antitobacco commuriity education, early detection and prevention o f cervical cancer in women and oral cancers in both sexes, lifestyle modification to reduce the rising morbidity due to hypertension and cardiovascular diseases, documenting the health problems associated with lifestyle changes and increasing longevity o f life are some o f the major research areas in non- communicable diseases. Evaluation o f ongoing Mid-day Meal programmes in schools, assessment o f changes in dietary intake and nutritional status o f urban and rural population in different States over the last two decades, investigating the health effects o f food contaminants and adulterants are some o f the research activities in nutrition research.
3.4.160 Keeping in view the magnitude o f the problem o f providing effective comprehensive health care to the population, the major research and developmental activities in the country during the Ninth Plan will be directed to applied, operational research for improving quality, coverage, efficiency and the cost-effectiveness o f health services. Research studies to test the operational feasibility and economic viability o f comprehensive health service schemes similar to National Health Service (NHS) o f United Kingdom suitably modified to meet the Indian milieu will be taken up. Multi-disciplinary, multi-centre operational research studies will be carried out by teams with medical scientists, social scientists, health planners and decision-makers, public health experts, health economists, and health managers.
3.4.161 During the Ninth Plan period optimal coordination o f the basic and applied research activities will be attempted by networking and if needed by multi-agency funding o f important projects.
The major thrust areas for basic research will be:
1. immunodiagnostic tests for common infections;
2. development o f newer drugs for treatment o f common infections in view o f the increasing resistance to antibiotics;
3. development o f resistance modulating agents to combat the increasing bacterial resistance to antibiotics;
4. development, testing and quality control o f newer drugs in the modem system o f medicine and ISM&H;
5. newer drug delivery systems for better targeting of drugs and reduction in side effects;
6. development o f therapeutic and prophylactic vaccines for infections utilising newer bio-technological tools so that they are thermostable , have long shelf life, free from side effects and are affordable;
!84

7. development o f newer vector control measures including testing o f biopesticides like neem;
3.4.162 Adequate operational research studies do not precede initiation o f major national programmes. There are many operational problems in these programmes, which are realised at the time o f implementation, and time is lost in rectifying these. During the Ninth Plan, development and testing o f alternative strategies for control o f communicable and non- communicable diseases will be the focus o f operational research. Funds will be made available from ongoing major disease control programmes for research aimed at improving programme implementation. Operational research for efficient implementation o f ongoing health programmes and horizontal integration o f the vertical programmes for health and family welfare at the primary health care level are some o f the major research initiatives being contemplated during the Ninth Plan period. The mechanisms by which those in the research, service and teaching cadres can move into each other's areas and participate in programme development, testing and implementation will be worked out.
Review of National Health Policy isrecommended in view of:
□ Ongoing demographic transition□ Ongoing epidemiological transition□ Expansion of health care infrastructure□ Changes in health seeking behaviour□ Availability of newer technologies for
management, rising expectations of the population, escalating cost of health care.
R eview o f the National Health Policy
3.4.163 The National Health Policy was formulated and adopted in 1983 providing comprehensive framework for planning, implementation and monitoring o f health services. Successive plans have evolved and implemented intervention programmes to achieve the goals set in the National Health Policy. The status for various Health and Family Welfare indices prior to formulation of National Health Policy, goals set in the National Health Policy for 2000 AD, the Eighth Plan goals and achievements, and the goals set for the Ninth Five Year Plan are given in Table 3.4.12.
3.4.164 2000 AD is just two years away. The time is therefore, appropriate for review o f achievements against the set goals in the National Health policy. During the last two decades there have been major changes in disease profile, health care infrastructure and health care seeking behaviour o f the population. Several newer technologies for diagnosis and management o f health problems have become available. These, in turn, have widened the gap between what is possible and what is feasible and affordable at the level o f the individual and the country. Increasing expectations o f the population, rising cost o f diagnosis and treatment and diminishing resources have brought into fore the issue o f how to meet the rising health care costs. The essential inter-linkages between health services delivery and health manpower development are still not fully understood and operationalised. Taking all these into consideration it is essential that the National Health Policy undergoes a re-appraisal and re-formulation so that it provides a reliable and relevant policy framework not only for improving health care, but also measuring and monitoring the health care delivery systems and health status o f the population during the next two decades.
O utlay and Expenditure
3.4.165 The outlay for health during the last Eight Plans is given in Table 3.4.13. Over the years there has been a substantial increase in the total Plan outlay. However, the outlay for health sector has remained less than 2% o f overall Plan outlay.
'^5
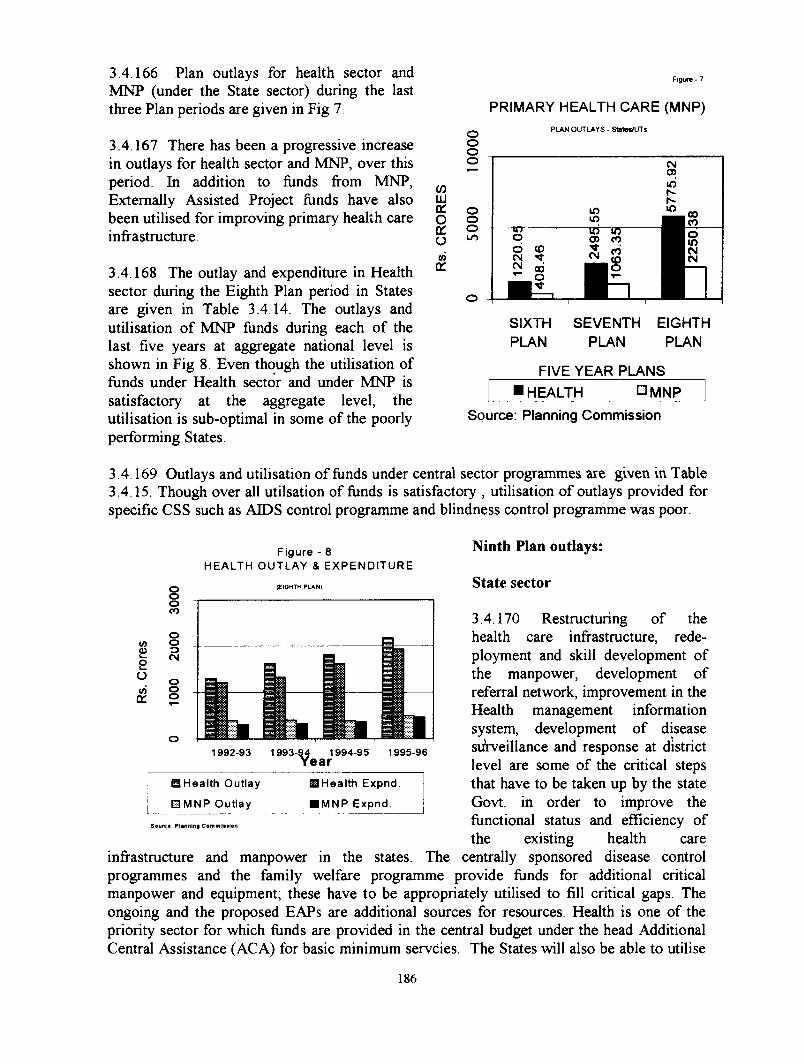
3.4.166 Plan outlays for health sector and MNP (under the State sector) during the last three Plan periods are given in Fig 7
3 .4.167 There has been a progressive increase in outlays for health sector and MNP, over this period. In addition to funds from MNP, Externally Assisted Project funds have also been utilised for improving primary health care infrastructure.
3.4.168 The outlay and expenditure in Health sector during the Eighth Plan period in States are given in Table 3.4.14. The outlays and utilisation o f MNP funds during each o f the last five years at aggregate national level is shown in Fig 8. Even though the utilisation o f funds under Health sector and under MNP is satisfactory at the aggregate level, the utilisation is sub-optimal in some o f the poorly performing States
Rgure- 7
PRIMARY HEALTH CARE (MNP)
WUJ0̂oq:oOTtr
PLAN OUTLAYS - StatesAJTs
SIXTH SEVENTH EIGHTH PLAN PLAN PLAN
FIVE YEAR PLANSI HEALTH □ MNP
Source: Planning Commission
3 .4.169 Outlays and utilisation o f funds under central sector programmes are given in Table 3 .4.15. Though over all utilsation o f funds is satisfactory , utilisation o f outlays provided for specific CSS such as AIDS control programme and blindness control programme was poor.
Figure - 8 HEALTH OUTLAY & EXPENDITURE
Ninth Plan outlays:
</)£eo</)or
oooCO
oooeg
ooo
(EIGHTH PLAN)
1 9 9 2 -9 3 1993-1 1 9 9 5 -9 6
State sector
3.4.170 Restructuring o f the health care infrastructure, redeployment and skill development o f the manpower, development o f referral network, improvement in the Health management information system, development o f disease siirveillance and response at district level are some o f the critical steps that have to be taken up by the state Govt, in order to improve the functional status and efficiency o f the existing heahh care
infrastructure and manpower in the states. The centrally sponsored disease controlprogrammes and the family welfare programme provide funds for additional criticalmanpower and equipment; these have to be appropriately utilised to fill critical gaps. The ongoing and the proposed EAPs are additional sources for resources. Health is one o f the priority sector for which funds are provided in the central budget under the head Additional Central Assistance (ACA) for basic minimum servcies. The States will also be able to utilise
1 9 9 4 -9 5ear
SHealth Outlay
E3MNP Outlay
IHealth Expnd.
IMNP Expnd.
S surca; P lann ing C e im n lt i lo n
186

these funds for meeting essential requirements for oprationalising urban and rural health care
Centre:
3 .4.171 Heahh is one o f the sectors identified under the Special Action Plan In addition to the funds available from Domestic Budgetary Support, several centrally sponsored disease control programmes are receiving funds from EAPs Taking all these factors into consideration, the Department o f Health has been provided with an outlay o f Rs. 5118.19 crores for the ninth plan period The outlay for the annual plans will be adjusted depending upon the requirements o f the department and the availability o f funds including reimbursement from EAPs
187

TABLB 3.4.1
HEALTH CARE INFRASTROCTURE
ITEMS 1 9 5 1 1 9 6 1 1 9 7 1 1 9 8 1 1 9 9 1 1 9 9 2 1 9 9 3 1 9 9 6
1 . 2 3 4 5 6 7 8 9
1 . S u b - C e n t r e s 0 0 2 8 4 8 9 5 1 4 0 6 1 3 0 9 8 4 1 3 1 3 7 8 1 3 1 5 8 6 1 3 2 7 3 0
2 . P r i m a r y H e a l t h C e n t r e s 72 5 2 5 6 5 5 1 1 2 5 7 4 0 2 0 4 5 0 2 0 7 1 9 2 1 0 3 0 2 1 8 5 4
3 . C o m m u ni t y H e a l t h C e n t r e 0 0 0 217 2071 2193 2 2 8 9 2 4 2 4
4 . D i s p e n s a r i e s 6 5 1 5 9 4 0 6 1 2 1 2 8 1 6 7 5 1 2 7 4 3 1 2 7 4 0 3 NA 2 8 2 2 5 *
5 . H o s p i t a l s 2 6 9 4 3 0 9 4 3 8 6 2 6 8 0 4 1 1 1 7 4 1 3 6 9 2 NA 1 5 0 9 7 *
6 . H o s p i t a l B e d s ( a l l t y p e s ) 1 1 7 1 9 8 2 3 0 0 0 0 3 4 8 6 5 5 5 6 9 4 9 5 8 1 0 5 4 5 8 3 4 6 5 0 NA 8 7 0 1 6 1 *
* AS o n 3 1 . 1 2 . 1 9 9 5SOURCE : - l .ECONOMIC SDRVKY,1 9 9 6 - 9 7
2 . RURAL HEALTH STATISTICS BULLETIN,JUNE 1 9 9 63 . HEALTH INFORMATION,1 9 9 5
1 8 8
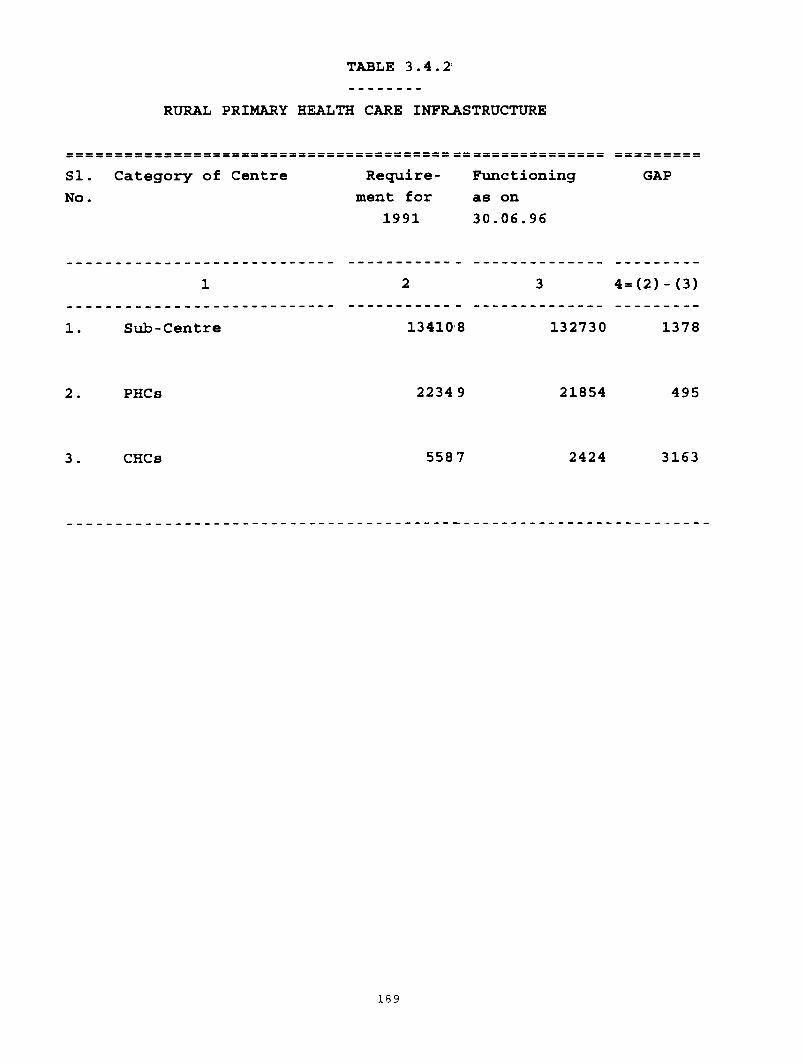
TABLE 3 . 4 . 2 :
RURAL PRIMARY HEALTH CARE INFRASTRUCTURE
SI. Category of Centre No.
Require- Functioning ment for as on
1991 30.06.96
GAP
1 2 3 4=(2)-(3)
1. Sub-Centre 13410 8 132730 1378
2. PHCs 2234 9 21854 495
3 . CHCs 5587 2424 3163
189

TABLE 3.4.3
MANPOWER REQUIREMENT IN RURALi PRIMARY HEALTH CARE INSTITXTTIONS
SI Category of manpower Require In Number Post neededNo ment for-
Census IL991Position as on 30.06.96
sanctioned1995
3-5
1. 2. 3. 4. 5. 6.
1. Specialists(4/CHC)
22348 2751 4763 17585
2. Doctors at PHCs (1/PHC)
22349 26930 32074 0
3. Block Extension Educator/Health Educator 22349 5621 6287 16062(1/PHC)
4. Pharmacist(1/CHC+l/PHC)
27.93 6 20022 21790 6146
5. Lab. Technician (1/CHC+l/PHC)
27936 9711 12371 15565
6. X-ray Technician/Radiographer 5 587 1288 1596 3991(1/CHC)
7. Nurse Midwife(7/CHC+l/PHC)
61458 12683 16754 44704
8. Health Assistant (M) (1/PHC)
22 349 15745 18323 4026
9. Health Assistant (FM) (1/PHC)
22 349 18904 21658 691
10.. Health Worker (M)(1/SC)
134108 62229 71165 62943
11.. Health Worker (FM) 156457 133773 140751 15706
TOTAL 52 5225 309657 347532 187419
Source RHS Bulletin, June, 1996 (Ministry of Health & FW)
190

TABLE 3.4..4Rural - Vrban Diflicrentiah in India
Item Rural Urban Combined
Population 1991 (crore) 63 22 85
Population 1991 (Percent) 74 26 100
Villages (198I)/Urban centres(I991) Number 557137 3.609
Crude birth rate I993(rate per 000 population per annum) 30.4 23.7 28.7
Crude death rate I993(rate per 000 population per annum) 10.6 5.8 93
Natural growth rate 1993(rate per 000 population per annum) 20.0 17J 193
Infant martality per 000 live births 1993 82 45 74
Neo-natal mortality rate 1990 57.4 30.9 52.5
Post-natal mortality rate 1990 28.9 19.5 27.2
Peri-natal mortality rate 1990 51.7 34.0 84.4
Age specific death rate 1988
(Age group 0-4) Male 35.1 18.8 31.8
Female 39.1 18.7 34.9
Person 35.7 18.7 333
Number of hospitals :1993 4310 9382 13,692
Number of hospitals beds per lakh population 1993 19.4 217.9 70.4
Number of dispensaries (1993) 11080 16323 27,403
Number of dispensary beds per lakh of persons 1993 2.1 5.6 3.0
Male literacy 1991(per cent) 58 81 64
Female literacy 1991(Per cent) 30 64 39
Combined literacy 1991(per cent) 45 73 52
Source;-!) Regisrar General of India2) Ministry of Health <& Family Welfare

TABLE 3.4.5
HEALTH MANPOWER POSITION
CATEGORY EXISTING NO TRAINING INSTTs NO
ADMISSIONCAPACITY
Medical Graduates 474270 160 15000
Dental Surgeons 19525 67 1300
Nurses
A) General 512595 487 20400B) ANMS /FHW 229304 494 12377
HEALTH WORKERS
L a b .Technicians 23617 97 2193
Dental Mechanics 1903 18 50
Dental Hyglenists 6800 17 65
Physiotherapists 6800 8 174
Occupational-Therapist 800 4 75
X-Ray Technicians 4872 33 410
Pharmacists 175000 290 16555
Ophthalmic Assistant 4390 7 134
SOURCE 1)WORKING GROUP REPORT ON MEDICAL EDUCATION - 1996 2) STEERING COMMITTEE REPORT ON DEVELOPMENT OF HUMAN
RESOURCES FOR HEALTH - 199 6
i s :

TABLE 3.4.6
NATIONAL MALARIA ERADICATION PROGRAMME
SI .NO 1992 1993 1994 1995 1996
1. BSE (IN MILLION 79.01 77.94 82.18 83.52 91.542. ABER 9.59 9 .35 9.54 9 .38 10.493.MALARIA CASES (IN MILLION)1 : 2.13 2.21 2.51 2.93 3 .044. A.P.I. 2 .58 2.65 2.91 3 .29 3.485. SPR 2.69 2.83 3.06 3.50 3 .326. PF (IN MILLION 0.88 0.85 0.99 1. 14 1.187 . SFR 1.11 1.09 1.20 1.36 1.298. NO. OF DEATHS 422 354 1122 1161 1009
FINANCIAL STATEMENT
OutlayExpenditure
(Rs. Lakhs8TH PLAN 1992-93 1993-94 1994-95 1995-96 1996-9742500.00 9700.00 11000.00 11000.00 13900.00 14500.0059106.55 9800.14 11054.28 11000.00 12864.41 14387.72
Source :- Ministry of Health & Family Welfare
193

TABLE 3 . 4 . 7
CASES AND DEATHS DUE TO KALA-AZAR
All India
(%) Increase(+) or Decrease(-) over last year's cases
Year Cases Deaths Cases Deaths
1991 61670 8381992 77102 1419 25.02 69.331993 45459 710 -41.04 -49.961994 25652 384 -43.57 -45.921995 22625 277 -11.80 -27.861996 27049 687 19.55 148 .01
PLAN FUND PROVIDED BY NMEPFOR KALA -AZAR CONTROL
Year Total Frind provided
1992-93 2000.00 Lakhs1993-94 1864.13 Lakhs1994-95 577.20 Lakhs1995-96 311.44 Lakhs1996-97 350.00 Lakhss s s s s s s S S S B ^ S S S S S5 — -------
SOURCE DEPTT. OF HEALTH
194

TABLE 348
NATIONAL T.B CONTRAL PROGRAMME
(FIGL'RES IN 000)
SIN O
lA K G K l1992-93
A? H1993-94
TA RG ET ACM T.VHGET1994-95
ACM T.Vi<GET1995 96
A c n
1996-97
TARGET
New ( as detection 1732 1539 1800 1358 1900 1249 1270 1389 1363(« /. ACH ) (88.86) (75.50) (65 74) (109 42)
Sputum exam ination P lils 3407 2752 3518 2326 3518 2241 3999 2402 4140f Vo A ('II.) (80,79) (68.29) (63.70) (6 0 0 8 )
1 INANC’IA t. SC’KNARIO
(Ks.in I.aklis)
8th plan ()uO.»v Kxp
1992 93Kxp
1993-94O utlay Kxp
1994-9?Outh.y Kxp
1995-96
Kxp1996-97
O utlay Kxp
K500.00 19442.00 2900,00 2700 66 3742 00 1719.20 4600.00 6500.00
Stiurce:- D ip tt of IK-ufth
195

LEPROSY ERADICATION PROGRAMME TABLE 3.4.9
(Figures in ‘000s)
SI .NO 1992-93 1993 -94 1594-■95 1995-96 1996-97
Target Ach. Target A c h . Target Ach. Target Ach. Target Ach.
1. Case Detection 290 548 265 494 225 430 225 424 218 461
2, Case treatment 290 541 265 487 225 424 225 420 218 455
3. Case Discharge 573 1053 525 719 425 635 425 613 425 486
LEPROSY SITUATION AT SELECTED POINTS OF TIMEINTERVAL BETWEEN 31 MARCH, 1984 AND 31 DECEMBER,1996
S. NO. PARTICULARS M A R C H , 1904 M A R C H , 1994 MAR C H , 1995 MAR C H , 1996 1.4.971 . Estimated Cases 3980000 1024000 952000 680000 680000
2 . Cases on Record 3105000 943000 740000 573000 550255
3 . M D T Coverage < 10 62 83 97 97 %
4 . Deformity Rate 10.2 % 7% 6 .4% 6 .2% 3 . 9 6 %(among new patients)
5 . M . B . % 18 % 30% 29% 27% 24.46 %(among new patients)
6 - PR/1000 0 1981 57.0
1995 5.84
ALLOCATION OF FUNDS & EXPENDITUREiRs, in CHORES.)
SI .NO 8th Plan 1992-93 1993-94 1994-95 1995-96 1996-971. Allocation 140.00 35.00 35.00 94.00 80.00 74.00
2. Expenditure 303.28 33 .38 50.94 89.10 64.53 65.33SOURCE:- DEPTT.OF HEALTH
196

TABLE 3 . 4 . 1 0
UTILISATION OF EIGHTH PLAN FUNDS UNDER NATIONAL AIDS CONTROL PROGRAMME
(Rs IN LAKHS)
8th Plan Outlay
Total 1992-93 1993-94 1994-95 1995-96 1996-97
Outlay 28000.00 44655.00 7000.00 7300.00 825S. 00 8000.00 14100.00
Expenditure 27538.00 27538.00 2971.00 3290.00 4400.00 5340.00 11537.00
Source; Ministry of Haalth k Family Nalfara* Expenditure figures for 1996-97 are based on the reimbursement claim for 100% expd. filed by various States/UTs
197

( K trcct
Operations
8ih plan TARGET ACH.
(% ACH.)
10872(110.67)
TABLE 3.4. nNATIONAL BLINDNESS CONTROL PROGRAMME
1992-93TARGET ACH.
(V. ACH.)
1993-94TARGET ACH.
(% ACH.)
2000 1604(80.20)
1<)I3(78.72)
1994-95TARGET ACH.
(% ACH.)
(FIGURES IN 000)
1995-96 TARGET ACH.
(% ACH.)
1996-97 TARGET ACH.
(% ACH.)
2165 2550(88.37)
2470(96.86)
2720(fOO.97)
FINANCIAL SCENARIO
8th plan Outlay Eip.
J992-93 Outlay Exp.
1993-94 Outlay Eip.
1994-95 Outlay Exp.
1995-96 Outlay Exp.
1996-97 Outlay Eip.
Anti.
2500.00 1970.00 3724.00 7200.00 5751.00 7500.00
Sourcf:- Dcptt. of Health
During 1994-97 an addiiionality or Rs.)3200.00 Lakhs was provided under CAP for implementation of World Bank assisted project in the country.

NATIONAL HEALTH POLICY
GOALS & ACHIEVEMENTS
Table 3.4.12
Indicator PRIOR TO NHP*Goal
EIGHTH PLAN Achievement (1996)
NHP Goal For 2000*
9th Plan Goal
1 2 3 4 5 6
IMR 125 (1978) 70 72 60 56-50CDR 12.5(1981) 9 9 9MMR 4-5(1976) 4.7(1993) Below 2 3Life Expectancy
a) Male 52.6(1976-81) 59.0 (1989-93) 64 62(1996-2001)b) Female 51.6(1976-81) 59.7(1989-93) 64 63 (1996-2001)
Babies with weightbelow 2.5 Kg. (%) 30% 30% 10%CBR/1000 35 26 27.5 21 24/23CPR % 23.6(1982) 56 45.4 60 51-60NRR 1.48(1981) IGrowth Rate % (Annual) 2.24(1971-81) 1.8 1.2 1.6/1.5TFR 4.4(1975) 3.5 2.3 2.9Z2.6ImmunizationBCG (Infants) 100 97(1996-97) 100Polio (Infants) 100 90(1996-97) 100DPT (children < 1 year) 100 89(1996-97) 100 65$Measles 100 100DT (new school entrants)
(5-6 years) 100 48(1995-96) 100T.T. (for school children)
a) 10 years 100 47(1995-96) 100b) 16 years 100 41 (1995-96) 100
Immunization by TT(%)(for Pregnant Women) 20 100 79 100 95
Pregnant mothers receivingante-natal care (%). 40-50 100 76 100 90Deliveries by trained bypersonnel (%) 30-35 13 100 45Institutional deliveries % 35Leprosy (% arrested casesamong dectected cases) 20 80Prevalance Per Thousand 57.3 (1981)** 5.8(1995) 1/10,000TB (% arrested cases 30(1995) 90 85#among dectected cases)Blindness Prevalence (%) 1.4 0.3 0.3Cataract Surgery (Yr.) 0.5 Million** 2.7 Million 17.5 Million
.(1981) (1995-96) (in 5 yrs.)* Source ; National Health Policy ‘ ♦Source : Ministry of Health & FW$ Fully immunized against 6 VPD by 1 year.# 85% cure rate in RNTCP districts
199

TXBLS 3 . 4 . 1 3
P « t t « m of Inveatiunt on Health Plan p«rlods in public sector
Family Welfare (Plan Outlays) duing Different - Centre, States and UTs (Rs in Crores)
Total Plan Health Family WelfareSI. No. Period Investiaent
/ ft 1 1 (Centre k States)(All uev.Heads) Cutlay/Rxp. \ of 3 Outlay/Exp. % of 3
1 2 3 4 5 6 7
1. Pir«t Plan (Actuals) 1960,00 65.20 3.33 0 .10 0.01(1951-56)
2. Second Plan (Actuals) 4672.00 140.80 3 .01 5 . 00 0.11(1956-61)
3. Third Plan (Actuals) 8576.50 225.90 2.63 24 . 90 0.29(1961-66)
4. Annual Plans (Actuals) 6625.40 140.20 2 . 12 70.40 1. 06(1966-69)
5. Fourth Plan (Actuals) 15778.80 335.50 2 . 13 278.00 1.76(1969-74)
6. Plfth Plan (Actuals) 39426.20 760.80 1.93 491.80 1.25(1974-79)
7. (1979-80) (Actuals) 12176.50 223.10 1.83 118.50 0.97
8. Sixth Plan (outlay) 97500.00 1821.00 1. 87 1010.00 1.04(1980-85)
Sixth Plan (Actuals) 109291.70 2025.20 1. 85 1387.00 1.27
9. Seventh Plan (Outlay) 180000.00 3392.90 1 .88 3256.30 1.81(1985-90)
Seventh Plan (Actuals) 218729.60 3688.60 1.69 3120 . 80 1.43
10. 1990-91 (Actual) 61518.10 960.90 1.56 784.90 1.28
11. 1991-92 (Actual) 65855.80 1042.20 1.58 856.SO 1. 30
12. Eighth Plan Outlay 434100.00 7582.20 1.75 6500.00 1.50(1992-97)
flOURCK :-r.R. DIVISION, PLANNINO COMMISSION

T*blt J.4.14O I TLAY FOR HEALTH IN THE STATES A UNION TtlHRITORlKS
STATES
(I)t ANDHRA PRADESH2 ARUNACHAL PRADESH i ASSAM4 BIHAR
5 GO A
i C.I JARAT7 HARYANA
8 H IM A C H A L P R A U tS H
9 J A KJO KARNATAKA !1 KERALA12 MADHYA PRADESH13 MAHARASHTRA14 MANIPUR15 MEGHALAYA16 MIZORAM17 NAGALAND l» ORISSA19 PUNJAB20 RAJASTHAN21 SIKKJM22 TAMILNADU23 TRIPURA
24 UTTAR PRADESH25 W EST BENGAL
8lh PLAN O LILA Y
H EA ITH
1992-<i3 1993-94
O liT L A \ OUTI.AV AC T.KXP.
MNP
(2 ) (3) (4)
MNP H L A l.T H
(6)HEALTH
(7) (8) (9) (JO)
18332.002802.00
15949.0067687.00
5900.0024200.0017611.0012100.0017990.0034200.0012000.00
30087.0055326.00
2100.00
4000.002550.005000.00
22323.0025475.0039095.00
5220.0076600.00
5000.00
51757.0028100.00
5360.001250.008100.00
33722.00 1222.00
11787.006768.004800.007500.00
13050.002297.00
15000.0028100.00
1015.001800.001500.00 640.00
7800.008000.00
15000.001345.006500.002000.00
26000.00 12178.00
1400.00595.00
3700.00 11431.00
1150.004093.002431.00
2200.m»
3201.5646.(H>2200.007578.008367.00
415.00790.00580.00
1140.003020.006000.004457.001340.006509.00
850.00
9058.00 4)12.50
7(K).;K)
162U.OO5715.00
:32.001650.00981.00
932.001499.002280.00
660.003000.006000.00
210.00
400.00300.00120.00
1200.00
1335.002040.00
345.00402.00424.00
4035.002245.00
~~n\oW~565.00
3866.004619.001012.00
4267.002061.00
2359.003242.005030.001491.00 534».00 718^.00
423.00857.00580.00 5W>.00
2297.002511.004346.00
629.008035.00
703.00
8547.00779.00
753.28
259.351620.002919.00
160.241492.12833.47
997.701373.182671.55
219.741762.903627.32
135.44554.34300.00
70.00681.38608.47
2040.49106.10
1380.00
4242.71400.00
2759.40
695.003920.00
12014.001232.004132.00 2591.70
2460.00
3602.0011242.002450.007644.00
10604.00545.00
1079.00720.00
1197.003040.004600.005621.001375.007158.00
580.009833.002906.00
800.00309.00
1620.0116711.00
232.001650.00925.00
975.001560.003517.00
506.002808.004741.00
60.00483.00200.00
100.001207.0((601.00
2400.00 245.00
2448.00
4̂ .003924.001292.00
2686.00626.00
4253.002370.001151.004402.002224.00
2432.003627.006990.001738.006261.009379.00
44 HW759.00770.00560.00
2318.002521.004900.001351.007259.00
§10.007778.002749.00
MNP
(11)761.83279.14
1649.00 1818.82
184.601748.17811.47
987.701574.973245.00
461.00 2277.78 4440.99
166.49483.00 454.68
72.00804.97717.00
2173.00 111.55
2554.89
450.00 3492.23
800.00
T bT A L STATES 531404.00 222734.00 92263.50 38598.00 73468.00 29556.78 104300.10 39764.00 80655.00 32520.28
U T .1 A A N ISLANDS 2251.00 945.00 314.00 216.00 436-23 252.18 574.35 240.00 557.07 263.77
2 CHANDIGARH 6682.00 75.00 825.00 27.00 60081 46.75 1072.00 55.00 1130.41 55.00
3 D A N H A V E L I 280.00 104.00 57.25 24.15 57.67 12.70 66.00 24.75 92.67 10.754 DAMAN A DIU 240.00 100.00 50.00 25.00 69 13 40.60 63.00 41.00 111.02 77.90
5 DELHI 35000.00 0.00 6500.00 0.00 6600-82 0.00 7209.00 0.00 6687.02 0.00
« LAKSHADWEEP 362.00 180.00 70.90 35.00 76.29 24.96 81.94 35.55 90.93 43.66
? PONDICHERRY 2000.00 900.00 450.00 178.00 475.18 147 70 550.00 207.00 534.00 145.96TOTAL UTi 46815.00 2304.00 8267.15 505.15 8316.13 524.89 9616.29 603.30 9203.12 597.04
GRAND TOTAL (STATES A UTi)
578219.00 225038.00 100530.65 39103.15 81784 13 30081.67 113916.39 40367.30 89858.12 33117.32
REVISED ESTIMATESOURCE I) STATE PLAN DIVISION, PLANNING COMMISSION
2) ANNUAL PLAN DOCUMENT STATE GOVERNM ENT
NA: NOT AV AILABLE

Tabic 3.4.14 (cont)(Ri. In U U u )
1094-95OUTLAY
STATES HEALTH MNP
ACT.Ejif.
HEALTH
199S-96T>UttAV *Eir
MNP HEALTH
— (16)—MNP HEALTH
(IST“MNP
(1) ( 12) (13)TANDHRA PRADESH--------J ARIINACHAL PRADESH3 ASSAM4 BIHAR5 GOA6 GUJARAT7 HARYANA8 HIMACHAL PRADESH9 J & K10 KARNATAKA11 KERALA!J MADHYA PR.-VDESH
13 MAHARASH I RA U MANIPUR15 MEGHALAYA16 MIZORAM17 NAGALAND18 ORISSA19 PUNJAB20 RAJASTHAN21 SIKKIM22 TAMILNADU23 TRIPURA24 UTTAR PRADESH25 WEST BENGAL TOTAL STATES
U T s
(14)800.00346.05
1890.002700.00
232.001718.00900.00
1257.001662.003438.00
506.003350.00
3566.00225.00500.00328.00175.00
1489.471000.00
2950.00250.00
2679.00450.00
4295.001107.00
(15)750.00339.00
1890.00996.00189.00
1718.00900.00
1344.001662.003438.00
0.003921.13
4884.80225.00535.00273.80
95.00 909.57 854.08
3296.00101.00
2679.00450.00
3976.00600.00
(17) (15)3259.40
773.004520.00
12014.001253.004841.002547.002875.003876.00
10771.003100.008450.00
10140.00485.00
1079.00720.00
1053.003940.004302.007191.00 1337.508210.00
900.0011095.00 3163.90
I1I«95.M
“ J224.00760.00
4872.003814.001018.004470.002234.003459.004301.009210.002672.00 75*5.00
8796.00492.00839.00680.00465.00
3084.003297.007766.001165.009616.00
900.00 11791.00
1795.00■17S13.52 MM4.60
4100.001069.006550.00
12014.001309.007100.003020.003479.004964.00
11472.003900.007700.00
13?3?.88678.00
1331.00787.00
2023.003769.004600.00
14153.001258.009244.001200.00
12998.00 3330.00
ijwsrwi
16M.M448.00
2048.002700.00
170.002160.001063.001400.001946.003638.00
0.002919.00 66?8.97
231.50946.00400.00175.00
1293.001100.008296.00
170.003014.00
460.005361.00
995.00
!556ir1063.00 5095.60 4191.771282.007100.003030.004238.005220.00 8994.933900.00 8528.33
15339.00
681.561331.00 896.50
1950.003769.003541.00
13230.001297.009061.00
900.0010261.003330.00
"iyi4«.j4
500.00448.00
2048.002400.00
170.002280.001069.001400.001946.00 3168.95
0.002919.007034.00
231.50946.00400.00311.00
1293.00819.00
7504.00 184.80
2831.00345.00
5098.00500.00
45846.25
1 A & N ISLANDS 800.00 372.00 531.37 372.00 1025.00 330.00 1025.00 330.002 C HANDIGARH 1387.50 90.00 1915.08 90.00 2043.84 119.56 2043.84 119.563 D & N H A V E L I 88.40 38.00 111.43 38.00 111.80 45.00 111.80 45.004 DAMAN & DIU 70.75 45.00 113.06 45.00 100.00 50.00 100.00 50.005 DELHI 9120.00 0.00 6765.65 0.00 10055.00 0.00 I0OS5.00 0.006 LAKSHADWEEP 100.00 48.32 125.48 48.32 122.00 39.35 122.00 39.357 PONDICHERRY 686.00 211.00 657.86 175.00 1245.00 214.00 1245.00 214.00TOTAI, UTi 12252.65 804.32 14702.64 • i m --------- i4Wl.<4 ■■ i m rg r a Nd Yo t a l 124148.45 168524.93 JCMIW...... 150689.64 4W».J* 46644.16(STATES & UTs)
20i

TABLE 3 4 U (Condd )
STATES
( ! ) (20) (21) (22) (23)
\ AN DHRA PRAD ESH 6111 65 800 00 3575 00 600 00
2 A R U N AC H A L PRAD ESH 2659 on 948 00 2487 00 88 1 00
3 ASSAM 6394 fK) 3073 OO 5779 00 267? 00
4 B IH AR 6612 (H) NA 7382 00 NA
5 GOA 1447 50 170 00 1048 0(1 157 00
6 G U JA R A T 9000 00 1000 00 9000 00 1000 00
7 H ARVAN A 3639 00 I50 f 12 3898 22 1761 12
8 H IM ACH A L PRAD ESH 4480.00 1713 25 4764 00 1713 25
9 J & K 5767 42 3105 00 5510 35 3105 00
10 K A R N A TA K A 19137.00 NA 11041 00 NA
1! K E R A LA 6126 26 426 00 6126 00 426 00
12 M AD H YA PRAD ESH 10709 00 NA 10816 07 5498 62
13 M A H A R A SK TR A 25265 00 9480 00 24237 00 9480 00
14 MAN IPUR 622 47 269.00 633 00 269 00
15 M EG H A LA YA 233! 00 1946 00 1731 00 1346 00
16 M IZORAM 2061 00 800 00 1877 00 780 00
17 N AGALAN D 2485 Op1003 00 2449 00 1003 00
i 8 O R ISSA 4659 55 2041 26 4439 55 1961 20
19 PUNJAB 9535.41 1575 00 5267 00 1575 00
20 RA JASTHAN 17636.00 10818 00 14979 00 9585 00
21 S IK K IM 1100 00 206 30 1100 00 206 3U
22TAM ILN A D U 13425 00 4295 00 12293 37 3163
23 TR IPU RA 1200.00 549 00 1060 00 549 00
24 U TTA R PRAD ESH 18205.00 6784 00 13718 00 l(X)66.00
25 W ES T B EN G A L 7487 00 1039 00 5182 00 1725 0(
T O TA L S TA TES 188095 26 S 1828 68 160392 56 59523.86
U T s
1 A & N IS LA N D S L370 00 455 00 1367 00 455.00
2 CHAN D IGARH 2402 50 268 40 2402 50 268 40
3 D & N H A V E L I 153 80 77 65 153 80 77 65
4 DAMAN & D IU 112.00 68 70 11200 68 70
5 D ELH I 14276.00 J 450 00 12307 50 100.00
6 LA K SH A D W EEP 175.18 87 15 175 18 87 15
7 PO N D ICH ERRY 1345.31 181.67 1345 31 181.67
T O T A L UTs 19834 79 2588.57 17863.29 1238 57
GRAN D TO T A L
(S TA T ES & UTs)
207930 05 54417.25 178255 85 60762 43

T A B L E 3 4 15
o r n A 'l ' 1 O R m - A l T H i n t h e c l m k -m S 1 -1 0 R
(K s in ( !0!C i)
P R tK iR A M M E . S C H E M E 8th
1>[ AN
O U l l A Y
1
O U T l A \ A c r i
E X P
AI
i9Q3-<^4
O U T ! A 'l ' A C T U A i
I XP
1QQ4-05
O U T L A Y A C T U A L
E X P
O U I 'L A Y A C I
E X P
J996-_9_7
o u n AY R ' \ i s r n
E ST IN L 'M L
l l ) (2 ) l-i) 16) (7) (S) (9 ) (10 ) (11 ) U 2 i
C E N T R A L L Y S P O N S O R E D S C H E M E S
1 M A L A R IA C O N T R O L ( lN C L U D lN ( i
K A L A A Z A R .E iL A R lA A JE C O N T R O i )
00 08 0■̂ 110 0(1 1 10 54 1 10 iXi ! HKV' 1 IX) 128 00 145 0'^ 14^ :)(t
2 L E P R O S Y C O N T R O L 14n no ?-i ,5 ■) 35 00 50 94 94 I'O S9 |n 8li (,)0 64 N ^ 74 00 74 ()('
7 B r O N T R O L OP '-1 3 00 17 IQ 40 Oif '-O 00 4 1 20 65 00 = . : . r
4 C O N T R O L O F B L IN D N E S S lm> (ID 1 1 ' 18 SI no iS 2(. 72 (K) 26 75 00 7-' 00
5 N A T IO N A L A ID S C O N T R O L
P R O G R A N iM E ( IN C lL fD IN G S I D A N D
B L O O D S A F E T Y M E A S U R E S ) 01) ~0 UH ■'I) ' j ()0 '3 06 s : 43 61 SO 00 5 7 (,() 141 00 |.)1 0(1
6 S I R E N G H T E N IN G O F D R U G C O N T R O L
A F O O D S T A N D A R D A D M N IN S T A T E S
20 00 I n . i K.J : 00 1 5' 2 nu 2 ' : -̂ (1 2 44 3 M* 2 (>4
P U R E L Y C E N T R .A L S C H E M E S
7 O T H E R S C H E M E ( IN C L U D IN G C SS
N E W S C H E M E S ) 7 ~ 2 i' 15 01 12 r ' 1 ' U( 1 8 06 I 90 10 <>'> 2^ 10 44 85
8 C O N T R O L O F C O M M U N IC A B L E
D IS E A S E S ]A 75 .5 82 •J ? -̂ 6 7 /^O 7 60 16 14 10 45 10 10 13 20 12 '’4
9 C O N T R O L /C O N T A fN A lE N T O F
N O N -C O M M U N IC A B L F D IS E A S E S 85 00 ) 1 ')0 : j ' m 26 18 20 ; 9 1' ̂ 10 21 25 P U 21 56 24 50 u
10 H O S P IT A L S A N D D IS P E N S A R IE S 94 00 r <>5 3 1 70 30 !4 26 DO 36 74 34 55 26 71 38 28 27 02
1 1 N IE D IC A I, E D U C A T IO N .
T R .M N IN G & R E S E A K C H 391 50 ‘’H L-5 10) K(-> 96 60 110 39 101 25 1 14 43 120 26 123 31 159 63 1 70 5 I
A ) E D U C A T IO N
B ) T R A IN IN G
C ) R E S E A K C H
2 54 25
12 25
)2 5 00
36 '35
1 70
2 0 00
74 04
1 67
2 “̂ 55
64 90
3 70
28 00
79 58
I 81
00
67 75
5 50
28 00
75 47
8 96
30 00
HI 56
9 70
29 00
91 70
I 61
30 00
1 1 8 7 2
8 91
32 00
1 '4 7S
4 06
31 70
12 N A T IO N A L IN S T IT U T E O F
B J O L O G IC A l.S , N O ID A (U P ) 4 0 00 6 4 3 1 43 5 0 0 ? 84 8 60 1 1 34 2 0 00 9 50 27 60 27 60
G R A N D T O T A L (A ^ B ) 1712 00 2>-̂ l 0 0 382 53 4 6 2 05 4 15 23 552 10 523 40 6 4 6 8 1 5 50 30 791 81 79^; 34
D E P T T O F IS M & H / H E A L T H 18 0 0 .0 0 3U2 00 3 ‘)6 ) 1 483 30 43 1 33 578 00 540 68 6 7 0 00 572 30 815 00 818 53
D E P T T O F I S M & H 88 00 1 1 00 13 58 2 i 25 I') 10 25 90 17 28 23 19 22 00 23 19 23 '9
S O U R C E ■ M IN IS T R Y O F H E A L T H A F A M IL Y W E L F A R E
204

3.5 FAMILY WELFARE
Introduction
3 5 1 Human development is the ultimate otbjective o f all planning efforts Planning takes into account the resources and pathways aivailable for human development and human resources available for carrying out the developm ental Plans India, the second most populous
country in the world, has no Figure-1 2 5% of global land
BIRTH & DEATH RATE IN INDIA 1901 to 20001 but is the home o f l/6th o f theworld's population The prevailing high maternal, infant, childhood morbidity and mortality, low life expectancy and high fertility and associated high morbidity had been a source o f concern for public heahh professionals right from the pre-independance period The Bhore Committee Report (1946) which laid the foundation for health service planning in India, gave high priority to provision o f maternal and child health services and improving their nutritional and health status It is noteworthy that this report which emphasized the
YEAR
■BIRTH RATE * DEATH RAITE
Source:- Registrar General India
importance o f providing integrated preventive, promotive and curative primary health care services preceded the Alma Ata declaration by over three decades Under the Constitution o f India elimination o f poverty, ignorance and illl health are three important goals Successive Five Year Plans have been providing the po licy frame work and flinding for planned development o f nationwide health care infrasttructure, manpower, drugs, devices and other essential items for improving health status o f miothers and their children
3 5 2 In 1951, the infant republic took stoclk o f the existing situation in the country and initiated the first Five Year Development Plan. Living in a resource poor country with high population density, the Planners recognised in the census figures o f 1951, the potential threat posed by population explosion and the meed to take steps to avert it. It was recognised that population stabilisation is an essential p>rerequisite for sustainability o f development process so that the benefits o f economic develo>pment result in enhancement o f the well being o f the people and improvement in quality o f lifTe India becam.e the first country in the world to formulate a National Family Planning Progrcamme in 1952, with the objective of “reducing birth rate to the extent necessary to stabilis<e the population at a level consistent with requirement o f national economy” Thus, the; key elements o f heahh care to women and children and provision o f contraceptive serv.dces have been the focus of India’s heahh services right from the time o f India’s indepemdence Successive FiveYear Plans have been providing the policy framework and funding fcbr planned development o f nationwide heahh care infrastructure and manpower The Centtrally Sponsored and 100% centrally funded Family W elfare Programme provides additionaal infrastructure, manpower and consumables
20:5

needed for improving health status o f women and children and to meet all the felt needs for fertility regulation
3 5.3 The technological advances and improved quality and coverage o f health care resulted in a rapid fall in Crude Death Rate (CDR) from 25 I in 1951 to 9 8 in 1991. In contrast, the reduction in Crude Birth Rate (CBR) has been less steep, declining from 40 8 in 1951 to 29 5 in 1991 As a result, the annual exponential population growth rate has been over 2% in the last three decades During the Eighth Plan period the decline in CBR has been
FigLTe-3
CRUDE BIRTH RATE (SRS 1996)
S o u n - Regsrar General In la
providing resources to fill the crucial gaps in infrastructure and manpower in primary health care in both urban and rural areas and improving the operational efficiency o f health system. The emphasis on improving the access and quality of reproductive and child health services will enable the increasingly aware and literate families to attain their reproductive goals in harmony with the national goals
POPULATION OF INDIAFigure-2
12001000
1.0 y
-0 5
<9V iTt ^ 9 9O' _— — — —
PERIOD
■p o p u l a t io n -GROW TH RATE%
Source - Registrar General IrxJia
steeper than that in the (CDR) and consequently, the annual population growth rate has been around 19% during 1991-95 (Figures 1 & 2) The rate o f decline in population growth is likely to be further accelerated during the Ninth Plan period Though the decline in CBR and CDR has occurred in all States, the rate o f decline m CBR was slower in some States like U P and Bihar (Table-3 5 I) There are substantial differences in CBR and IMR between States (Figure 3 and 4) and even within the same State there are substantial differences between districts The efforts o f the Family W elfare Programme during the Ninth Plan will be to minimise the existing disparities bv
INFANT MORTALITY RATE (S R S 1996)
S o u r c e - R e g is t r a r G e n e ra ! Ind ia
Approach during the Ninth Plan
3 5 4 Reduction in the population growth rate has been recognised as one o f the priority objectives during the Ninth Plan period The current high population growth rate is due to( I ) the large size o f the population in the reproductive age-group (estimated contribution
206

60%); (2) higher fertility due to unmet need for contraception (estimated contribution 20%); and (3) high wanted fertihty due to prevailing high IM R (^estimated contribution about 20%).
3 5.5 While the population growth contributed by the Large population in the reproductive age group will continue in the foreseeable future, the orther two factors need effective and prompt remedial action
The objectives during the Ninth Plan will be;
' i To meet all the felt-needs for contraception
To reduce the infant and maternal morbidity and mortality so that there is a reduction m the desired level of fotihty
The strategies during the Ninth Plan will be;
to assess the needs for reproductive and child health at PHC level and undertake area- specific micro plannmg
to firovide need-based, demand-driven high quahty, integrated repg-oductive and child health care.
3 5 6 The enabling objectives during the Ninth Plan period., therefore, will be to reduce the population grow th rate by
a) m eeting all the felt-needs forcontraceptiom, and
b) reduciing the infant and maternalmorbidity amd mortality so that there is a reduction in the desired level o f fertility
The strategieis during the Ninth Plan will be;
a) To assess the needs for reproductive and child health at PHC level and undertake area- specific micr o planning, and
b) To pnovide need-based, demand-driven high quality, integrated reproductive and child health care
The programmes will be directed towards
a) Bridging the gaps in essential infrastructune and manpower through a flexible approach and improving operational efficiency through investment in social, behavioural and operational research
b) Providing additional assistance to poorly perform ing districts identified on the basis o f the 1991 census to fill existing gaps, in infrastructure and manpower
c) Ensuring uninterrupted supply o f essential drugs, vaccines and contraceptives, adequate in quantity and appropriate in qualiity
d) Promoting male participation in the Planned Parenthood movement and increasing the level o f acceptance o f vasectom y
3 5 7 Efforts will be intensified to enhance the quality and coverage o f family welfare services through:
a) Increasing participation o f general medical p)ractitioners working in voluntary, private, joint sectors and the active cooperaition o f practitioners o f ISM«feH,
b) Involvement o f the Panchayati Raj Institutions for ensuring inter-sectoral coordination and community participiation in planning, monitoring and management,
c) Involvement o f the industries, organised and unorganised sectors, agriculture workers and labour representatives
207

Evolution of India’s Family Welfare Programme
The fifties
3.5.8 At the time o f Independence the health care services in India were predominantly urban, hospital based and curative. General practitioners well versed in maternal child health and paediatricians & obstetricians provided health care to women and children who came to them. They did provide comprehensive, integrated, good quality services but technology available for detection and management o f health problems was limited and out reach of services was poor. Majority o f the population especially those belonging to the poorer segment and those residing in rural areas did not have access to health care. Consequently the morbidity and morality rates in them were quite high. Many women died while seeking illegal induced abortion to get rid o f unwanted pregnancy because they did not have access to contraceptive care for preventing pregnancies. Conceptions that were too early, too close, too many and too late resulted in high maternal and infant mortality rates. Antenatal, intrapartum, postnatal and contraceptive care were not readily available to women who required these services desperately.
3.5.9 Obstetricians, who were daily witnessing maternal morbidity and mortality associated with high parity, were ready and willing to persuade their patients who had completed their families, to undergo surgical sterilisation. The fact that the technique was simple, safe and effective and could be done soon after delivery under local anaesthesia, accounted for the popularity o f postpartum tubal sterilisation. The safety, simplicity and efficacy o f vasectomy was also well recognised. For a couple who hac) completed their family, stcrilisaUon o f one partner resulted in the reduction o f maternal morbidity and mortality associated with high parity. To some extent this was responsible for the substantial drop in maternal mortality rates observed in the urban areas during the 1950s. However, these measures had no impact on the fertility rate or the population growth rate o f the country because o f poor outreach to rural population. Thus in fifties good quality integrated maternal and child health care, and family planning services were available to those who were aware, had access and could afford the services o f the physicians. There were efforts to improve the coverage o f the population and extend the services to rural areas as a part o f the block development programme; resource and manpower constraints were responsible for the slow progress in this effort.
The sixties
3.5.10 The sixties witnessed a seachange with availability of safe effective vaccines for many communicable diseases, and effective contraceptives such as Lippe’s loop for prevention o f pregnancy; programmes for providing these to the population as well as programmes for improvement o f nutritional status of vulnerable groups were initiated during this period. In order to reach the benefits of the technological innovations to the population, certain identified priority interventions were implemented by a well knit team of professionals v/ho looked after the programme requirements and implementation at the periphery was done through the limited health, care infrastructure available in rural areas. The Family Planning and the immunisation programme were among the earliest o f such programmes; subsequently several other vertical programmes were added. In an attempt to improve the out reach, camp approach was taken up for providing care to pregnant women and children; these efforts however did not result in any marked improvement in health status o f these vulnerable groups because the care was not available when needed and referral services were not available.
208

3 5 11 Rapid grow th o f the population in the previous 10 years, reported in the . 1961 census, stimulated the Government to form a Department o f Family Planning, with a modest budget The health infrastructure was still predominantly urban based During the 1960s, sterilisation remained the focus o f the National Family Planning Programme Efforts were made to popularise vasectomy and to provide vasectomy services to rural areas, using a camp approach Tubectomy services, however, remained based predominantly in urban hospitals Extension education approach to improve awareness and increase acceptance o f F P methods were also included Lippe’s loop provided the first reliable birth spacing method for women in India Following encouraging response in urban clinic attempts were made to provide this spacing method to the rural population through camp approach However, without infrastructure to provide the follow up services the device fell into disrepute It was obvious that without substantial inputs into infrastructure and manpower to provide the needed follow up services it will not be possible to achieve any substantial improvement in Maternal and Child Health indices or reduce birth rates
Seventies
3 5 12 The seventies witnessed many initiatives to improve the health and nutritional status o f women and children ■ The massive dose Vit A programme aimed at prevention o f nutritional blindness, the anaemia prophylaxis programme aimed at reducing anaemia and associated ill health and food supplementation to pregnant and lactating women and children below five years through ICDS were major initiatives to tackle under nutrition and its adverse consequences in women and children With the improvement in primary health care infrastructure access to health care improved
3 5 13 The census o f 1971 showed that population explosion was no longer a potential threat but a major problem to be tackled The government gave top priority to the Family Planning programme and provided substantial ftinds for several new initiatives Sterilisation, lUD and condoms were made available through the Primary Health Centres The hospital based Postpartum Progamme provided contraceptive care to women coming for delivery The MTP act enabled women with unwanted pregnancy to seek and obtain safe abortion services
3 5 14 Increasing concern about rapidly growing population led to the Family Planning Programme being included as a priority sector programme during the Fifth Plan The massive sterilisation drive o f 1976 did result in eight million persons undergoing sterilisation, but this did not have any perceptible impact on the birth rate as the cases were not appropriately chosen The very next year showed a steep fall in the acceptance In 1979 the Programme was renamed as Family Welfare Programme, increasing integration o f family planning services with those o f MCH and Nutrition was attempted
Eighties
3 5 15 In 1983 India formulated the National Health Policy, which provided comprehensive frame work for planning, implementation and monitoring o f Heahh care services The National Heahh Policy:
1 Reviewed the progress achieved in the delivery o f health services
2 Provided a situation analysis o f the progress achieved in heahh, family welfareand nutrition programmes
3 Identified priority areas for intervention in the next two decades
209
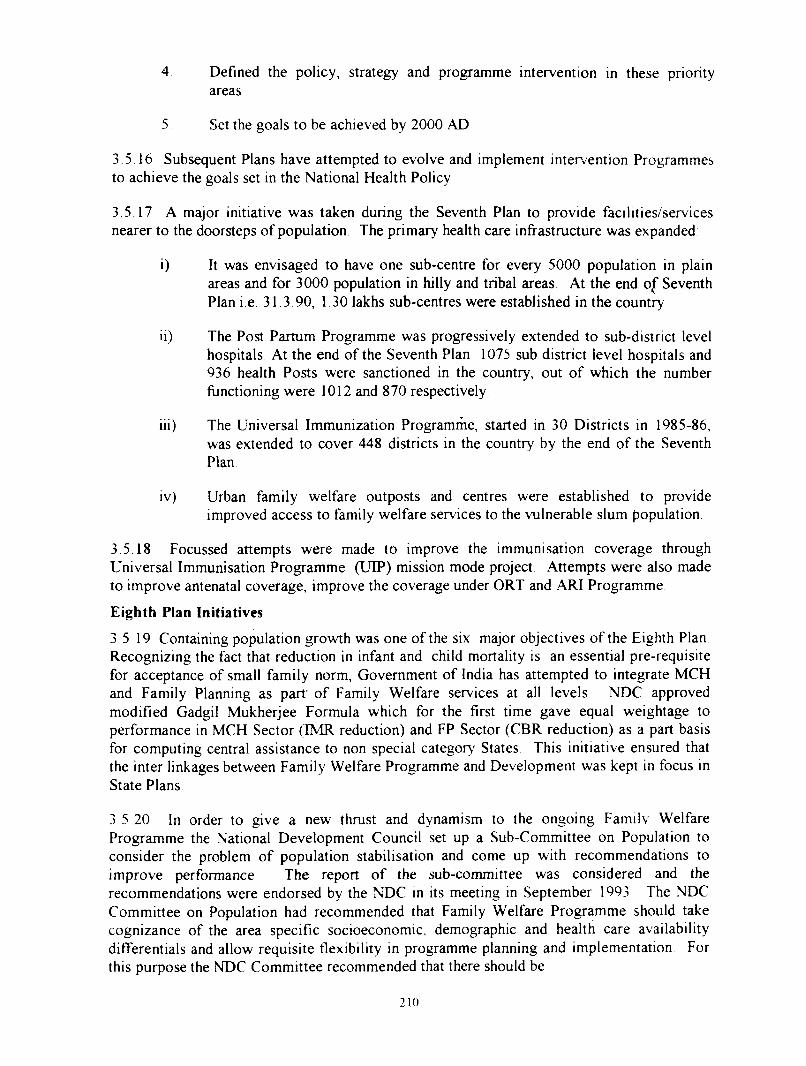
4 Defined the policy, strategy and programme intervention in these priority areas
5 Set the goals to be achieved by 2000 AD
3 5 16 Subsequent Plans have attempted to evolve and implement intep^/ention Programmes to achieve the goals set in the National Health Policy
3 5 17 A major initiative was taken during the Seventh Plan to provide facilities/services nearer to the doorsteps o f population The primary health care infrastructure was expanded
i) It was envisaged to have one sub-centre for every 5000 population in plain areas and for 3000 population in hilly and tribal areas At the end o f Seventh Plan i e 31 3 90, I 30 lakhs sub-centres were established in the country
ii) The Post Partum Programme was progressively extended to sub-district level hospitals At the end o f the Seventh Plan 1075 sub district level hospitals and 936 health Posts were sanctioned in the country, out o f which the number functioning were 1012 and 870 respectively
iii) The Universal Immunization Programrhe, started in 30 Districts in 1985-86, was extended to cover 448 districts in the country by the end o f the Seventh Plan
iv) Urban family welfare outposts and centres were established to provide improved access to family welfare services to the vulnerable slum population
3 5 18 Focussed attempts were made to improve the immunisation coverage through Universal Immunisation Programme (UTP) mission mode project Attempts were also made to improve antenatal coverage, improve the coverage under ORT and ARJ Programme
Eighth Plan Initiatives
3 5 19 Containing population growth was one o f the six major objectives o f the Eighth Plan Recognizing the fact that reduction in infant and child mortality is an essential pre-requisite for acceptance o f small family norm. Government o f India has attempted to integrate MCH and Family Planning as part o f Family Welfare services at all levels NDC approved modified Gadgil Mukherjee Formula which for the first time gave equal weightage to performance in MCH Sector (IMR reduction) and FP Sector (CBR reduction) as a part basis for computing central assistance to non special category States This initiative ensured that the inter linkages between Family Welfare Programme and Development was kept in focus in State Plans
3 5 20 In order to give a new thrust and dynamism to the ongoing Family Welfare Programme the National Development Council set up a Sub-Committee on Population to consider the problem o f population stabilisation and come up with recommendations to improve performance The report o f the sub-committee was considered and the recommendations were endorsed by the NDC in its meeting in September 1993 The NDC Committee on Population had recommended that Family Welfare Programme should take cognizance o f the area specific socioeconomic, demographic and health care availability differentials and allow requisite flexibility in programme planning and implementation For this purpose the NDC Committee recommended that there should be
210

The NDC Comm ittee on Population has recommended that there should be:
Cl D e c e n t r a l i s e d area s p e c i f i c p la n n in g based on the need a s s e s s m e n t
D E m p tia s is o n im p r o v e d a c c e s s and quality o f se r v ic e s to w o m e n a n d ch i ldren
Li P r o v id in g s p e c ia l a s s i s ta n c e to poorly perform ingsta tes /d is tr ic ts to m in im is e the inter and intra-stated i f f e r e n c e s in p e r fo r m a n c e
C rea t io n o f d istrict leve l databases on quality and c o v e r a g e and im pa c t indicators for m onitor in g the program m e
I C P D has a d v o c a te d s im i la r approach .
C o n c o r d a n c e b e tw e e n N a t io n a l ( N D C C o n n ii i t tee ) andInternational ( I C P D ) e f for ts has im proved funding and
a c c e le r a te d the p ace o f im p le m e n t io n o f the fam ily w elfare
p r o g r a m m e .
1. Decentralised areaspecific planning based on the need assessment
2. Emphasis on improvedaccess and quality o f services towomen and children
3. Providing specialassistance to poorly performing states/districts to minimise the inter and intra-state differences in performance
4. Creation o f district leveldatabases on quality and coverage and impact indicatorsfor monitoring the programme.
3.5.21 The Department of Family Welfare started
implementing the recommendations of the NDC Committee on Population during the EighthPlan period. Funds from Socul Safely Net (SSN) rrogramm e were earmarked for improvingprimary health care infrastrucuire in poorly performing districts identified on the basis ofIMR and CBR of 1981 census estimates. Implementation of Child Survival and SafeMotherhood (CSSM) Programme was initiated in the very first year o f the Eighth Plan in these districts. A project to revitalise the I’amily Welfare Programme in Uttar Pradesh was taken up with external assistance.
3.5.22 The Child Survival and Safe Motherhood Programme (CSSM) was initiated in 1992. Under the Programme efforts were made to provide integrated antenatal, intranatal and postnatal care to women; the child health care component included immunisation, diarrhoeal and acute respiratory infection prevention and management programmes. The pulse polio initiative aimed at eradication of polio by 2000 AD was initiated in 1996.
3.5.23 In response to the recommendations of the NDC that there should be decentralised area specific need assessment and microplanning to meet the local needs, the department abolished the centrally defined method specific targets for family planning in two states (Tamil Nadu and Kerala) and 18 districts in 1995-96. Encouraged by the response in these two states, Department o f Family Welfare has abolished the method specific centrally defined targets throughout the country and changed over to PHC based community need assessment, planning and implementation of Family Welfare Programme. Efforts are underway to improve access and quality of care to women and children.
3.5.24 The International Conference on Population and Development (ICPD) was held in Cairo in 1994. Major recommendations of the ICPD include:
1. Holistic reproductive health care should be made available through primary health care svstem.

2. Efforts should be made by all the states to reduce infant mortality by one-third and maternal mortality by 50% by 2000 AD.
3. Need assessment and need fulfillment as key elements for improving reproductive health.
3.5.25 India is a signatory to the ICPD; the recommendations o f the ICPD are essentially similar to the recommendations o f the NDC Committee on Population. The concordance between the National and International efforts has enabled the programme to get all the necessary political, economic and administrative support and gain further momentum to enable the individual and the country to fulfill their felt needs in reproductive health.
Achievements of the Family Welfare Programme:
Major Achievements of FW Programme are:
n Reduction in Crude Birth Rate (CBR) from 40.8 (1951 Census) to 27.4 in 1996 (SRS 96)
Reduction in Infant M ortality Rate (IMR) from 146 in 1951 to 72 in 1996 (SRS),
Increase in Couple Protection Rate (CPR) from 10.4% (1970-71) to 45.4% (31.3.1997).
□
[]
3.5.26 As a part o f the Plan exercise the Planning Commission and the Department o f Family Welfare have been laying down targets for health and family welfare activities and for demographic indicators. Over the years, there has been a progressive improvement in the achievement o f most o f these, because the targets set were realistic
and necessary inputs were provided for their achievement. The targets and achievements in the different Plan periods are given in Table 3.5.2.
3.5.27 The major achievements o f the FW Programme are given in Table 3.5.3.
These include:
1. Reduction in Crude Birth Rate (CBR) from40.8 (1951 Census) to 27.4 in 1996 (SRS 96)
2. Reduction in Infant Mortality Rate (IMR) from 146 in 1951 to 72 in 1996 (SRS),
3. Increase in Couple Protection Rate (CPR) from 10.4% (1970-71) to 45.4% (31.3.1997).
Figure-5
CO UPLE PROTECTION RATE & BIRTH RATE
-EFPECTIVE CPR
The National Family Health Survey 1992-93 showed th at:
U There is universal awareness about contraception
40.6% o f currently married women use contraceptives
L J Wanted fertility is lower than the actual fertility
Li There is a large unm et need for contraception 11.0% for birth spacing methods and 8.5% for terminal methods
the increase in couple protection rates. In the last ten years the fall in CBR has been steeper than in the earlier years.
Source :- R eg istra r G ene ra l India
Department of F am ily W elfare
The couple protection rate achieved and the birth rates since 1971 are summarised in Figure5.
3.5.28 During the initial fifteen years (1971-85) there was a relatively steep increase in the couple protection rates. The reduction in the CBR was however not commensurate with the rise in CPR is less steep, but
212

3 5.29 The relationship between couple protection rates and CBR is complex There is a time lag o f one to two years before the impact o f contraceptive acceptance is visible by way o f reduction in birth rate. The age and parity o f the acceptors o f contraception, and the continuation rates o f temporary methods o f contraception are some o f the existing factors that determine birth rates The trends in CPR and CBR over the last 25 years suggest that over the years there has been an improvement in the acceptance o f appropriate contraception at appropriate time. During the Ninth Plan the FW Programme will focus its attention on need assessment, counselling, provision o f appropriate contraceptive and good follow up services Ensuring effective implementation o f the FW programme will result in a substantial improvement in CPR and reduction in CBR
(a) 40.6% of
Figure-6
CAUSES OF MATERNAL DEATHS (1992-93)
ĴOTOASaFIABLE-15%
ivwLPosrrioNO FC H LD6%PUERPe?ALSEPSIS13%
TOX̂ MA13%ABORTION _ 12%
Source - Natioral Family Health Sun«y 1992-93
3 5.30 The National Family Health Survey indicated that in 1992-93: currently married women used contraceptives, b) awareness about contraception was universal indicating that the EEC efforts in this direction had succeeded in reaching the population, c) in all States the wanted fertility was lower than the actual fertility; d) there was an unmet need for contraception (110% for birth spacing and 8.5% for terminal methods)(Table 3 5.4) Other studies have estimated that about one sixth o f all pregnant women seek abortion because they do not want continuation o f pregnancy Illegal induced abortion continues to be a major cause o f maternal morbidity and mortality (Figure 6)
3 5.31 During the Ninth Plan period the Family Welfare Programme will be geared up to meet the unmet demand for contraception with the twin objectives o f reducing maternal morbidity and mortality and achieving rapid decline in birth rates. Data from the National
Family Health Survey indicate that apart from place o f residence education influences IMR, TFR &, CPR (Figure 7)
3.5.32 The increased awareness o f educated urban population and access to FW services are likely to be the major factors responsible for this.
Inter-State/ intra-State differences in Fertility and Mortality
3.5 33 In spite o f the uniform national norms set under the 100% Centrally Funded and Centrally Sponsored Scheme (CSS), there are substantial differences in the performance between States as
assessed by IMR and CBR (Table 3 5 1) At one end o f the spectrum is Kerala with mortality and fertility rates nearly similar to those in some o f the developed countries
F igure-7
C P R , TFR AND IMR (N FH S 1 9 9 2 -9 3 )
■ ILL IT E R A T E E3ALL INDIACDHIGH s c h o o l & A B O V E
□ < M ID D LE□ M ID D LE
S ou rce - N a tion a l F a m ily H ea lth S urvey 1992-93
21.1

At the other end, there are the four large northern States (Uttar Pradesh, Bihar, Madhya Pradesh and Rajasthan) with high Infant MortaHty Rate and Fertility Rates During the Ninth Plan special efforts will be made to achieve rapid reduction in IMR and meet all the felt needs for contraception in these four States
3 .5 34 As the availability and utilisation o f family welfare services is the critical determinant o f performance in Family Welfare Programme, achievements in terms o f reduction in IMR and CBR go hand in hand in most States However, there are exceptions, both Punjab and Tamil Nadu have good primary health care infrastructure, IMR in both the States are identical and the age at marriage in these States is similar; TFR in Tamil Nadu is 2.1 and in Punjab it is 2 9 (Table 3 5 1) In Bihar, IMR is 72 and TFR is 4 6 but Assam with IMR o f 75 has a TFR o f 3 8. During the Ninth Plan, etforts will be made to identify the factors responsible for poor achievements in terms o f IMR and TFR and area specific remedial measures will be planned and implemented in the States
3 5 36 District wise data on CBR and IMR cnm.puted on the basis o f Census 1991 show that there are marked differences in these indices not only between States but also between districts in the same State Census 1991 has confirmed that even in Kerala there are districts where IMR (Idikki) and CBR (Mallapuram) are higher than national levels. There are districts in UP with IMR (Almora) and CBR (Kanpur -Urban) lower than national levels. The Family Welfare Programme, therefore, has been re-oriented to (a) remove or minimise the inter and intra-state differences, (b) undertake realistic PHC based decentralised area- specific microplanning tailored to meet the local needs and c) involve Panchayati Rai institutions in programme development and monitoring at local level to ensure effective implementation o f the programme and effective community participation.
3 5 37 States like Kerala and Tamil Nadu have achieved low CBR and IMR at relatively low cost (Table 3 5.5) On the other hand, States like Haryana and Punjab have not achieved any substantial reduction in CBR in spite o f higher expenditure per eligible couple In States like Bihar and Uttar Pradesh the expenditure is low and performance is poor In between these extreme categories are States like Orissa and Andhra Pradesh with average or below average expenditure and average or below average performance in MCH or family planning In some States like Orissa and West Bengal the performance in family planning is better than the performance in MCH or vice versa During the Ninth Plan, the recommendation o f the NDC Committee on Population, that factors responsible for observed differences in utilisation o f funds as well as impact o f the programme should be studied and existing lacunae rectified not only at the State but also at the the district level will be implemented
3 5 38 It is noteworthy that States like Kerala and Tamil Nadu (where sterilisation is the most commonly utilised method o f contraception) have been able to achieve Total Fertility Rate (TFR) o f 2 1 even before CPR o f 60 has been achieved and that the cos! of family welfare programme per eligible couple in these States is relatively low Given the fact that most couples in India complete their family by the time they are in their mid-20s and marriage is a socially stable institution, sterilisation is the most logical, safe and cost effective contraception to protect these young couples against unwanted pregnancies

3 5 39 Over the last two decades there has been a steep fall in number of vasectomies (Figure 8) At the moment, over 97% of all sterilisations are tubectomies If, over the next decide, attempts are made to repopularise vasectomy so that this safe, simple procedure forms at least 50% of all sterilisations there will be a further substantial reduction both in the morbidity/ mortality and in the cost o f permanent methods o f contraceptive care
F ig u re -8
A C C E P T O R S OF V A S E C T O M Y & T U B E C T O M Y
- V A S E C T O M Y ' 7 U B E C T 0 M Y
S o u r c e - D e p a r t m e n t o f W e l f a r e
3 5 40 In States like Punjab where nearly half o f the acxeptors o f contraception are using temporary methods such as lUD and Condoms (CC) the cost for family welfare programme per e\igib\e couple is high In addition, m spile of the relaitively high couple protection rate (CPR), the birth rate continues to remain relatively high This is most probably because o f the low continuation rate o f lUD and low use effectiveness and continuation rates for conventional contraception In these States emphasis during the Ninth Plan will be on providing adequate counseling, offering appropriate contraceptive choices through balanced presentation o f advantages and disadvantages o f various (contraceptive methods so that the couple can make a choice o f contraceptives; these initiatives will improve continued use o f contraceptives and reduction in unwanted birthis Adequate follow up care and counselling will also be provided
3 5 41 Kerala, the first State to achieve TFR o f 2 1 did so in spite o f relatively lovv per capita income, whereas in spite o f having substantially higher per capita income Punjab and Haryana are yet to achieve TFR o f 2 1 Obviously, in Indian context, economic development and increase in per capita income are not essential prerequisites for achieving reduction in fertility Tamil Nadu was the next State to achieve TFR otf 2 1 It did so in spite o f higher IMR and lower female literacy rate than Kerala, M aharashtra, which has similar IMR, is yet to reach a substantial decline in TFR This shows that in s.ome States the decline in IMR is not also a critical determinant o f decline in fenility Andhra Pradesh is likely to achieve TFR o f 2 1 by the end o f the Ninth Plan The State has s.hown a steep decline in fertility in spite o f relatively lower age at marriage, low literacy ;and poorer outreach o f primary health care infrastructure Haryana and Punjab, which have comparatively higher age at marriage, higher literacy rate and better outreach o f primary health care infrastructure, have not succeeded in achieving a similar decline in fertility rates.
3 5 42 Both Kerala (in 1989) and Tamil Nadu (in 1993) achieved TFR o f 2 1 long before the CPR of 60 was reached In both these States sterilisation was the major mode o f contraception, suggesting that under conditions prevailing in these States the low utilization o f spacing methods was not a hindrance for the achieveme nt o f replacement level fertility

Andhra Pradesh is on the thereshold o f achieving replacement level o f fertility UT o f Goa and Pondicherry have been having less than replacement level fertility for over a decade
3 5 43 K erala’s achievement TFR 2 1 inspite o f low per capita income, disproves the theory that econom ic development is an essential prerequisite for reduction in fertility High status o f women, female literacy, age at marriage and low infant mortality were thought to be the factors behind the rapid fall in fertility in Kerala Tamil Nadu, the next state to achieve TFR o f 2.1 did so inspite o f relatively high IMR, low literacy and low per capita income Andhra Pradesh is experiencing a rapid decline in fertility inspite o f low literacy, low age at marriage, high IM R and low per capita income Studies to find out the basis o f this rapid demographic transition are underway
3 .5 .44 The experience o f these three States have clearly shown that in the Indian context it is possible to achieve replacement level o f fertility inspite o f adverse socio-economic and dem ographic indices It is noteworthy that analysis o f districtwise data clearly shows that in every State there are districts with excellent performance in MCH and FP It is in this context that the N inth Plan docum ent visualises district based de-centralised planning wherein each State can replicate in all other districts the success that some districts had achieved The NFHS has unequivocally shown that there is substantial unmet need for contraception in all States, the focus will therefore be on ensuring that these needs are fully met through m echanism s that are appropriate in the local context
3 5 45 Health professionals believe that availability and access to family welfare services is one o f the critical determinant o f decline in fertility. In the North-eastern States o f Tripura, M anipur, M izoram there is substantial difficulty in accessing primary health care facilities, but these States have achieved not only low fertility rates but low infant mortality, suggesting thereby that a literate population with awareness can successfLilly overcom e the deficiency in access to and availability of primary health care infrastructure In spite o f constraints o f infrastructure, manpower and financial resources, high illiteracy and marked diversity between States, the Family WelfareProgram m e has, during the last five decades succeeded in achieving substantial reductionin infant m ortality and fertility rates within the framework o f the democratic set-up In this process the Family Welfare Programme has shown that factors such as economic status, educational status, access to heahh services which were thought to be essential prerequisites for achieving sustained decline in birth rates are not necessarily so for reduction in birth rate in the Indian context The experience o f different States, while implementing familywelfare program m e clearly shows that the programmes can succeed despite limitations in several States The need for identifying the local problems and also methods by which these could be overcom e from within the resources available is, therefore, of paramount im portance in rapidly bringing down infant mortality and high fertility The Ninth Plan's emphasis on area-specific assessment o f the need and micro-planning is expected to provide the policy direction for achieving this goal
Perform ance during the Eighth Plan
3 5 46 During the Eighth Plan theCrude Birth Rate (CBR) and Infant M ortality Rate (IM R) declined to 27 4 and 72 against the targets o f 26 and 70
Eighth Plan Targets and Achievements
Indicator Targets Achievements
CBR 26 27 4 (SRS 1996)
IMR 70 72 (SRS 1996)
CPR 56%1
45 4% (M arch 1997)
216

respectively The Couple Protection Rate (CPR) increased to 45 4% against the target of 56% during this period The target for IMR is achievable; target for CBR may be difficult to achieve, the target for CPR has not been achieved
3 5 47 The performance o f the Family Welfare Programme in terms of achievements of targets in contraception, immunisation, anaemia and Vit A prophylaxis programmes during the Eighth Plan, is given in Table 3 5 6 Between 1992 and 1996 the number o f sterilisation has remained unaltered There has been an increase in lUD and OC use till 1995-96 and CC use till 1994-95 Whenever such a massive shift is attempted, the system requires a major preparatory effort, including sensitisation o f health care providers through intensive training and even then it may take some time to adapt to the change Comparison o f the performance between 1995-96 and 1996-97, (after the abolition o f method-specific targets) indicate that at the national level there has been a reduction in the acceptance o f different methods o f contraception The fall in condom use during 1995-96 and 1996- 97 might, at least in part, be attributable to reduction in wastage Comparison o f the performance between 1995-96 and 1996-97 shows that there are substantial differences in performance between States Tamil Nadu, Karnataka, Rajasthan have shown an improvement in acceptance o f sterilisation as well as lUD It is a matter o f concern that poorly performing States like Bihai and UP have shown a fiarther decline upto 50% in performance EfTorts to gear up the system and minimise the time lag in adopting to the decentralised planning and implementation are under way
3 5 48 The coverage under the anaemia and Vit A prophylaxis programme has shown substantial improvement but is still way below the target o f 100 per cent Adequate supply o f these drugs and continued intake at appropriate time will be attempted during the Ninth Plan
3 5.49 During the Eighth Plan, the coverage under the immunisation programme was maintained However the target o f 100% coverage by 1997 is unlikely to be achieved for all the six Vaccine Preventable Diseases (VPD). There has been a substantial improvement in the quality o f the programme but even now there are slippages in the programme resulting in occasional morbidity and rare mortality These will be eliminated during the Ninth Plan period The Pulse Polio initiative to eradicate polio by 2000 AD and special school health check up programme were taken up during the Eighth Plan period Pulse Polio programme w ill be continued until the elimination o f Polio is achieved. During the Eighth Plan there has been a progressive fall in the reported cases o f diphtheria, measles, polio, tetanus and pertussis However, under-reporting and under/ over-diagnosis continue to occur. VPD surveillance, especially for poliomyelitis, will be strengthened throughout the country during the Ninth Plan
3 5 50 Even though the targets set for IMR and CDR are likely to be achieved, it is noteworthy that maternal, perinatal, neonatal (Figures 6 and 9) mortality rates continue to remain high This is because the components o f antenatal, intrapartum and neonatal care program m es are not aimed at universal screening o f risk factors for identification and appropriate referral o f the at risk' individuals Improvement in the contents and quality o f antenatal and paediatric care at primary health care level will receive focussed attention during the Ninth Plan
217

R^e-9MORTALITY INDICATORS-ALLIIVOA
1976 1980 1985 1990 1991 19S2
-CRUDE DEA.TH RATE
- ̂ e□NATAL MDRIT«JTY (M ^
-PSaNATAL MORTAUTY (PM^
-INFAW M3RTAUrY
- POSTNATAL M3RTALfrY
-SnLLHRTHRATE
Source - Regstrar General Inda
1) the programme will provide
3 5 51 To sum up the basic premises o f the Family Welfare Programm e from inception has been that:
Basic premises of the Family Welfare Programme are:
D Acceptance of FW services is voluntary,
n FW programme will provide :
=> Integrated Maternal and Child Health (MCH) & FP services
=> EfTective E C to improve awareness
=> Ensure eas> and convenient access to FW service firee of cost
Lessons learnt during implementation of FW programme:
Governmental network provides most of the MCH and contraceptive care
/Vdequate financial inputs and health infiastnicture are essential prerequisites for the success of the programme
Providing efficient and effective integrated MCH and contraceptive care helps in building up rapport with the famihes
lEC activities are powerfiil tools for achieving the small family norm;
The population is conservative but responsible, responsive and mature; their response is slow but rational and sustained.
convenient access to family welfare services free o f cost
integrated Maternal and Child health (MCH) services and contraceptive care,
2) acceptance o f family welfare is voluntary,
3) the Government’s roleis to create a favourable environment for the people to adopt small family norm, by improving awareness throughinformation and education and ensuring easy and
3.5.52 The Family W elfare Programme has made considerable progress during the last few decades, more so during the last decade
3 5.53 The major lessons learnt during this period are:
a) In spite o f obvious constrains and inadequacies, thegovernmental network can, and does, provides most o f the MCH and contraceptive care (Figure 10),
F ig ure -10
SOURCES OF FAMILY PLANNING SERVICES
PrivateMedicalSector15%
b)S ource:- National Fam ily Health Survey 1 9 9 2 -9 3
Adequate financial inputs and health infrastructure areessential prerequisites for the success o f the programme; substantial
2 1 8

improvement in achievement o f MCH and FP targets occurred when funds were provided (Table 3 5 7 and Table 3 5 2),
c) Providing integrated MCH and contraceptive care ensures not only efficient and effective delivery o f services but also helps in building up rapport with the families and the community so essential to sustain the FW programme,
d) Counselling and education are powerful tools to overcome the barriers o f poverty, ignorance, illiteracy and conservative social mores for achieving the small family norm,
e) The population is conservative but is responsible, responsive and mature, its response to rapidly changing birth and death rates and availability o f services might be initially slow but it is rational and once developed, is sustainable
3 5 54 The task ahead o f the country during the next decade is to bring about a convergence o f all these favourable factors so that the twin goals o f small heahhy family and sustainable population growth are achieved within a decade
Population Projection for 1996 -2016 - implications to the FW Programme
3 5 55 Population projections for the period 1996-2016 have been worked out by the Technical Committee on Population Projections under the Chairmanship o f Registrar General o f India The age and sex wise distribution o f the population for the period \9 7 l - \9 9 \ based on census data and the projected population for the period from 2001 upto 2016 is shown in F i^ re 11 There will be massive increase o f population in the 15-59 age group (from 500 million to 800 million) in just twenty years (Figure 12), The RCH care has to provide the needed services for this rapidly growing clientele Along with the demographic transition, there is concurrent ongoing socioeconomic, educational, information technology transition The population in this age group will therefore have greater awareness and expectation regarding both the access to a wide spectrum o f health care related services and the quality o f these services The Family Welfare Programme has to provide the wider spectrum o f health care needs o f this population - including maternal and child heahh care, contraceptive care, management o f gynaecological problems, STD/RTI/HIV management and control, quality o f services need also be improved Increasing number o f the population beyond 60 years would necessitate provisions for management o f some o f the major heahh problems in this age group including management o f cancers
2\9

Figure-11
CHANGES IN POPULATION PYRAMID -1971 TO 2016
52.93
41.87
52.49
42.41 39.60
54.15
39.81
6.67
55.60
m a l e 1971 FEMALE MALE 1»«I FEMALEMALE 1991 FEMALE
37.79
58.90
34.00
7.00
58.40
w m m m >
34.50
8.10
63.60
28.40
70*
65-S9
55-59
50-S4
«S-«9 40-44
35-39
30-34
25-29
20-24
15-19
10-14
5-9
8.20
63.30
28.60
MALE 2001 FEMALE MALE 2011 FEMALE
63.40
27.70
9.00
iSsSi§«w m m
rm m /x m M m v /''////
W M m ///''////A W M M m V/A
27.70
MALE 2016 FEMALE
220

PROJECTED POPULATION - INDIAFigure-1 2
900
800
700
z 600 Q 500
40053UU
200
1 00
01996 2001 2006 2011
YEARS ource - R e g is tra r G e n e ra l India
2ni6
3 5 56 The number o f births will not aher substantially over the next two decades, this respite from increasing numbers should be utilised to provide improved access to high quality o f services so that there is reduction in the current high IMR and M M R This in turn might lead to a fall in the current high desired level o f fertility If the birth rate contmues to decline at the present rate, replacement ievei o f fertility will not be achieved till 202(S In view oi the serious implications o f this, efforts should be made to meet all the felt needs for contraception and achieve a more rapid decline in birth rates
Family W elfare Programme during the Ninth Plan:
3 5 57 During the Ninth Plan period atleiripis will be made to improve quality and coverage o f heahh care to women, children and adolescents, so that their felt needs for health care are fully met In addition efforts will be made to improve the participation of men in the planned parenthood movement Prevention and control o f Sexually Transmitted Disease (STD) / Reproductive Tract Infection (RTI) including emerging problem of HIV/'AIDS will also receive due attention
Components of RCH ProgrammeEfTcctiv c maternal and child health care
Increased access tc contraceptive care
Siife management of unwanted pregnancies
N utntional services to vulnerable groups
Prevention and treatm ent o f RTI/ STD
Reproductiv e health sen. ices for adolescents
Prevention and treatm ent o f gy necological problems
Screem ng and treatm ent o f cancers, especially that of u tenne cerv i \ and breast
Components of the Reproductive and Child Health Care
3 5.58 Comprehensive reproductive and child heahh care will promote the following
1) Effective maternal and child health care to ensure safe motherhood and child survival,
2) Increased access to contraceptive care to prevent unwanted pregnancies;
3) Legal abortion facilities for safe management o f unwanted pregnancies.
4) Effective nutritional services to vulnerable groups,
5) Prevention and treatment o f RTI/ STD,
6) Reproductive heahh services for adolescents,
7) Prevention and treatment of gynecological problems including infertility, menstrual disorders and prolapse uterus,
8) Screening and treatment of cancers, especially that o f utenne cervix and breast
3 5 59 While providing the package o f services, efforts will be made to improve the quality o f services, make services more responsive to users' needs, ensure that health workers and health care providers have the necessary skills and supplies they need and there is a strong and effective referral system to manage all the risk cases
Simultaneously the lEC efforts will be directed to
(1) Ensure responsible reproductive /sexual behavior,
(2) Improve awareness about reproductive health needs,
(3) Promote community participation and optimal utilisation o f available services
3 5 60 Comprehensive RCH services will be made available at all the tertiary andsecondary care institutions throughout the country.
Essential Reproductive Health Services
3 5 61 Though it is desirable that the entire package o f services indicated above is made available to all those who need it, it will not be possible to immediately implement such a comprehensive package on a nationwide basis Hence it is envisaged that improvement in quality and coverage o f services over and above the existing level will be attempted in all states in an incremental manner so that maternal and child health indices improve
3 5 62 After consultation with experts a package o f essential reproductive health services for nationwide implementation at various levels o f health care has been identified Essential components recommended for nationwide implementation include
- Prevention and management o f unwanted pregnancy.
Services to promote safe motherhood,
- Services to promote child survival,
Prevention and treatment o f RTI/STD
3 5 63 Most o f the services are already included in the Family Welfare Programme However, there are wide variations in the quality and coverage o f services not only between states but also between districts in the same state The focus is therefore on the improvement in the quality and coverage o f the services. A project preparation workshop held in Sept 1995 discussed the issues and problems in implementation o f essential RCH package and recommended reproductive and child heahh services that should be made available at community, sub-centre, PHC and FRU/ District Hospital
Maternal Care
3 .5 64 The major areas o f focus o f the Safe Motherhood Programme during the Eighth Plan were
1 Improving maternal care through early registration o f pregnant women,
2 Administration o f two doses o f Tetanus Toxoid (TT) during pregnancy,
3 Providing pregnant women with Iron and Folic Acid (IFA) tablets,
222

4 Training o f Dais for safe delivery especially in districts with high proportion o f home deliveries;
5. Provision o f Disposable Delivery Kits to thiose who plan deliveries at home;
6. Improving facilities for antenatal care and safe delivery at sub-centres and PHC; Setting up First Referral Units (FRU) for pr oviding emergency obstetric care and improving referral linkages.
3 5 65 Over the years, there has been a substantial imcrease in the proportion o f pregnant women getting registered (Table 3 .5 .6). The data report ed by Department o f Family Welfare indicate that over 70% o f pregnant women receive tw o doses o f Tetanus Toxoid (TT) and 100 tablets o f Iron and Folic Acid (IFA) during the couirse o f pregnancy. However, maternal morbidity and mortality rates (Figure 6) continue to re;main high. To achieve a reduction in these, it is essential to improve the quality o f anteinatal and intrapartum care During the Ninth Plan period efforts will be made to ensure that all pregnant women are screened for common problems such as anaemia, infections obstetriic problems and the identified ' high risk' pregnant women are referred to PHC/ CHC for aptpropriate management
3 5 66 Analysis o f service data on ANC registration and deliveries reported for the year 1995-96 from 350 districts indicate that there is an increase in the number o f hospital deliveries and deliveries attended by trained personnel (Table 3 5.8) In States like Kerala over 90% o f deliveries are in institutions and perinatal mortality rates are very \ow (Table 3.5.9). However, in States like UP, majority o f delivenies is at home and are conducted by untrained persons. Consequently, maternal and perinatal! mortality rates continue to be high. During the Ninth Plan efforts will be made to promote institutional deliveries both in urban and rural areas In States where majority o f deliveries still occur at home, efforts will be made to train Traditional Birth Attendants (TBAs)^ through Intensive Dai's Training Programme and to increase availability and access to D isposable Delivery Kits
3 5.67 Women with problems like Anaemia, malpresentations, suspected Cephalopelvic Disproportion (CPD), Hypertensive Diseases o f Pregnancy (HDP) and Gestational Diabetes Mellitus (GDM) should not deliver at horme. Screening all women during pregnancy to detect those with such problems and referriing them at appropriate time to predesignated institutions for management and safe delivery will substantially reduce maternal and perinatal morbidity and mortality. The miechanism for screening, as well as referral, will be streamlined during the Ninth Plan period and easy - to - follow protocol will be developed and made available to all health care prov/iders. In "low risk cases", if home delivery is anticipated, provision will be made for ase;ptic delivery by trained persons Unpredictable complications can arise even during apparently normal labour, rapid transportation o f these women to hospital for emergeincy obstetric care is essential to reduce morbidity and mortality during delivery Locail Panchayats, NGOs and women's organisations will play an important role in this respect In the postpartum period early detection and management o f infection, support for breaist feeding and nutrition counseling will receive due attention.
223

Multi-pronged Strategy fo r Prevention & Management of Anaemia in pregnancy include:
3 5 68 India has the dubious distinction o f being one o f the countries with the highest prevalence o f anaemia in the general population. Prevalence o f anaemia among pregnant women ranges between 50 -90% This is mainly due to low intake and poor bio-availability o f iron from the diets consumed in India. Poor intake o f folic acid and coexisting folate deficiency also contribute to the problem. Anaemia present from childhood through adolescence antedates pregnancy and it gets aggravated during pregnancy and perpetuated by blood loss during labour. Anaemia continues to be responsible for a substantial
proportion o f the perinatal and maternal morbidity and maternal mortality.
3.5 69 Realising the magnitude o f the problem, obstetricians made screening and effective management o f anaemia an essential component o f antenatal care. The National Anaemia Prophylaxis Programme o f iron and folic acid distribution to all pregnant women was initiated in 1972 The implementation and impact o f these programmes are being reviewed Available data from hospital records and information from community- based surveys on prevalence o f anaemia in urban and rural population, suggest that the prevalence and the adverse consequences o f anaemia in pregnancy have remained essentially unahered over the past three decades
National Anaemia Prophylaxis programme
nDouble fortification of salt with iron and iodine
Hemoglobin estimation of all pregnant women for detection of anaemia
Oral iron folate prophylactic therapy for non-anaemic pregnant women
all
□
IJ
Iron folate oral medication at maximum tolerated dose for all pregnant women with Hb 8-11 g/dl
Intra-muscular (IM) iron women with Hb 5-<8 g/dl
for all pregnant
Hospital admission and intensive personahsed care for women with Hb < 5 g/dl
Promoting utilisation of available facilities for antenatal and intrapartum care.
3 .5 70 Pregnant women with haemoglobin (Hb) less than 8 g/dl show functional decompensation and constitute a high-
risk group The first task is to ensure screening o f all pregnant women to identify this high-risk group. A single Hb estimation done around 20th week o f pregnancy is sufTicient to detect the high-risk anaemic pregnant women. It is essential to evolve a programme for screening all pregnant women for anaemia by Hb estimation utilising the ANM and Lab technicians in the Primary Health Centres so that anaemia in pregnancy could be detected and effectively treated Unlike the situation elsewhere in the world, oral.iron therapy is not effective in correction o f the moderate or severe anaemia in Indian pregnant women, because o f the poor bio-availability o f iron in the Indian diet Therefore pregnant women with Hb between 5-8 g/dl should be administered appropriate doses o f parenteral iron and oral folic acid.
3 5 71 During the Ninth Plan a beginning will be made to use a multi-pronged strategy for prevention and management o f anaemia in pregnancy The programme components aimed at the control o f anaemia in pregnancy will include: a) fortification o f common foods with iron to increase dietary intake o f iron and improve hemoglobin status o f the entire population including girls and women prior to pregnancy, b) screening o f all pregnant women using a reliable method o f hemoglobin estimation for detection o f anaemia, c) oral iron folate prophylactic therapy for all non-anaemic pregnant women (Hb > 11 g/dl), d)
224

iron folate oral medication at the maximum tolerable d<ose throughout pregnancy for women with Hb between 8 and 11 g/dl, e) parenteral iron therap>y for women with Hb between 5 and 8 g/dl if they do not have any obstetric or systemic complication, f) hospital admission and intensive personalised care for women with Hb < 5 g/dl, g) screening and effective m anagem ent o f obstetric and systemic problems in all anemic pregnant women and h) im provem ent in health care delivery system and healtth education to the community to prom ote utilisation o f available facilities for antenatal amd intrapartum care
Prevention of Unwanted Pregnancy
3 5 72 According to the data available with the Departmient o f Family Welfare as o f 31 3 97 45 4% o f couples in reproductive age use contraceptiwes (Table 3 5 1) The data from N ational Family Health Survey has shown that awarene:ss regarding contraception is nearly universal But there is an unmet need for contraception (8 5% for terminal methods; ,110 % for spacing methods) (Table 3 5 4) The Famiily Welfare P rogram m e'w ill gear itse lf to meet the unmet' need during the Ninth Plan period Vasectomy is safer than tubectom y and efforts will be made to increase acceptjance o f vasectomy, so that there is substantia! reduction in the morbidity associated with terminal methods o f contraception Q uality o f contraceptive care will be improved Coujples will be provided with balanced inform ation on all available methods o f contraceiption and the advantage and disadvantage o f each o f these methods so that they choose the method best suited to their needs Such a balanced presentation and counseling willl in the long run not only improve acceptance o f contraceptive care, but also improve (continuation rates o f temporary m ethods o f contraception The quality o f services will be improved through appropriate training o f service providers at all levels During the Niinth Plan efforts will be made to increase involvement o f ISM & H practitioners in Faimily Welfare Programmes The ISM & H practitioners may provide counseling for couplies about contraceptive care and to act as depot holders for OC/ condom. Social marketinjg will be increasingly utilised to im prove access to condoms and oral pills In addition toi the usual channels, the Targeted Public Distribution System (TPDS) outlets may also be ussed to improve access to condom.
M TP ServicesFigur6-13
MBQCAL TERMNAT10N OF PfCGNANCtES
Year
Source - Depottment of Fam ily W elfare
3 5 73 Over two decades have elapsed after the enactm ent o f legislation for Medical Term ination o f Pregnancy (MTP) act Over the last two decades the Government o f India has taken steps to provide trained m anpow er and equipment at secondary and prim ary health care level for safe legal abortion services The number o f MTPs reported to Department o f Family Welfare over the last 25 years is shown in Figure 13
3 5 74 It is obvious that after the initial rise, the reporte(d number o f MTPs has remained below 0 6 million for the last 15 years In spite o f efforts too improve the availability o f and access to, induced abortions services in the primary health (care set up, safe abortion services are not available to majority o f rural population in India Even today majority o f the estim ated 6 million induced abortions are not carried oiut in settings recognised for legal abortion and about 10% maternal deaths in India are due to septic abortion
22.5

3.5.75 Efforts to improve access to family planning services to reduce the number of unwanted pregnancies and cater to the request for induced abortion will continue to receive intensified attention during the Ninth Plan. In addition, efforts will be made to improve access to safe abortion services by training physicians in MTP and recognising and strengthening institutions which are capable o f providing safe abortion services for the first trimester. lEC efforts through appropriate channels o f communications to improve awareness among women about availability o f safe abortion services at affordable cost through appropriate channels of communication will be intensified. Provision for first trimester abortion will be coupled with appropriate contraceptive care so that these women do not incur the risk o f yet another unwanted pregnancy and induced abortion.
RTI AND STD
3.5.76 Sexually Transmitted Diseases (STD) and Reproductive Tract Infections (RTI) continue to be a major public health problem in India. HIV is the most recent addition to the already long list o f RTI/STD. So far, there had been no major initiative for detection and management o f STD/RTI in women. Sexually transmitted infections in women are usually asymptomatic or present with nonspecific symptoms. Even if there are symptoms, women do not go to STD clinics. They seek care in the antenatal, gynecological and family planning clinics. During the Ninth Plan, attempts will be made to provide for screening for syphilis, gonorrhea and HIV infection at PHC/CHC level wherever possible. Utilising the microscope and laboratory technician available at PHCs, vaginal/ cervical smears in women with symptoms o f RTI will be screened for identifying organisms responsible and appropriate treatment provided.
Infertility
3.5.77 It is estimated that between 5 to 10% of couples are infertile. While provision of contraceptive advice and care to all couples in reproductive age group is important, it is equally essential that couples who do not have children have access to essential clinical examination, investigation, management and counseling. The focus at the CHC level will be to identify infertile couples and undertake clinical examination to detect the obvious causes o f infertility, carry out preliminary investigations such as sperm count, diagnostic curettage and tubal patency testing. Depending upon the findings, the couples may then be referred to centres with appropriate facilities for diagnosis and management. By carrying out simple diagnostic procedures available at the primary health care institutions it is possible to reduce the number of couples requiring referral. Initial screening at primary health care level and subsequent referral is a cost-effective method for management o f infertility both for the health care system and those requiring such services.
Gynaecological Disorders
3.5.78 Women suffer from a variety of common gynaecological problems including menstrual dysfunctions at peri-menarchal and peri-mcnopausal age. I-acilities for diagnosis o f these are at the moment available at district hospitals or tertiary care centres. During the Ninth Plan period the CHCs, with a gynaecologist, will start providing requisite diagnostic and curative services. Yet another major problem in women is prolapse uterus o f varying degrees. The PHCs and CHCs will refer women requiring surgery to district hospitals or tertiary care centres.
3.5.79 Cancer Cervix is one of the most common malignancies in India and accounts for over a third of all malignancies in women. Cancer Cervix can readily be diagnosed at the PHCs and CHCs. Early diagnosis of Stage I and Stage 11 and referral to places where
226

radiotherapy is available will result in rapid declime in mortality due to Cancer Cervix in the country in the near future
Maternal Nutrition3 .5 .80 The importance o f maternal nutrition in determ ining obstetric outcome has long been recognised Continued low dietary intake and heavy manual work during pregnancy adversely affect maternal nutrition, course and outcom e o f pregnancy The association between low maternal weight, poor pregnancy weight; gain and low birth weight has been documented There is a need to clearly identify piregnant women with moderate and severe undernutrition by weighment and energetic mieasures should be taken to improve energy balance and weight gain during pregnancy tlhrough improved dietary intake, if possible through optimal utilisation o f existing food smpplementation programmes such as ICDS and through reduction in physical work
Adolescent Health3 5 81 The adolescent and youth population in the comntry is increasing There are at the moment no specific health or nutrition programmes to address the problem of this important group In the past teen age pregnancy and its attendant problem were the main focus o f attention Over the years there is a significant rise in age at marriage Efforts to educate the girl, her parents and the community to delay rmarriage will continue to receive attention during the Ninth Plan There is an urgent meed to mount programmes for early detection and effective management o f nutritional (under-nutrition, anemia) and health (infections, menstrual disorders) problem in adolescent girls Health and nutrition education to this group is essential
3 5 82 Adolescent pregnancies are still common in Ind ia Adolescent girls are at high risk o f anaemia, HDP and infections They will receive appropriate care throughout pregnancy and institutional delivery to ensure safety o f both th e mother and the baby A scheme "Planned Families by 2000 AD" is being implemented im Andaman and Nicobar islands with the objective o f improving literacy, postponing age 2at marriage and promoting small family norm through financial incentives to the girls in appropnate age groups If found effective the scheme may be replicated in other areas
Child Health3 5 83 Comprehensive, child health services including: preventive, promotive and curative services are being provided to those who seek care im secondary and tertiary health care institutions At primary health care level the spectrurm o f services available is narrower, focus is mainly on essential new bom care, essential child care including ARI and ORT programmes, immunisation, Vit A and anaemia prophylaxis Programmes Effective utilisation o f available services for prevention and detection o f undernutrition in under five population will be the aim o f ICDS programme during tlhe Ninth Plan period Efforts will be focussed on improving quality o f screening o f childrem for early detection o f health and nutntion problems and improving the referral services so that persons requiring care m secondary and tertiary level institutions receive them w ithout delay
227

M a jo r C hild H ealth C a re P ro g ram m er:
National Prophylaxis Programme against Nutritional Blindness
□ Improve the coverage o f all doses o f massive dose Vitamin A administration
□ Health education to improve consum ption o f foods rich in B-carotene & improve their availability at affordable cost
Child Survival Programme
Sustaining and strengthening the ongoing programmes of universal immunisation, ORT, m assive dose Vitamin A, Iron Folic Acid supplementation
Expanding the coverage o f Acute Respiratory Infections (ARI) Control Programme and care o f the newborn
3.5.84 In the fifties paediatricians in major ho.spilals in most of the States reported that VitA deficiency was a public health problem. Vitamin A deficiency in childhood is mainly
due to inadequate dietary intake of Vit A. Increased requirement o f the Vit. A due to repeated infectionaggravated the magnitude and severity o f the deficiency. Theassociation between measles, severe PEM and keratomalacia and high fatality in such cases was reported by many paediatricians. Prevalence of night blindness and Bitot's spot in pre-school children ranged between 5% and 10% in most States.Blindness due to Vitam.in A deficiency is one o f the major causes of blindness in children below 5 years. In view o f the serious nature o f the problem of blindness due to
Vitamin A deficiency it was felt that urgent remedial measures in the form o fspecific nutrient supplementation covering the entire population o f susceptible childrenshould be undertaken. In 1970 the National Prophylaxis Programme Against Nulrilional Blindness was initiated as a Centrally Sponsored Scheme (CSS). Under this CSS, all children between ages o f one and five years were to be administered 200,000 ID o f Vitamin A orally once in six months.
3.5.85 During the last twenty five years this programme had been implemented in all theStates and Union Territories. The major bottleneck during the seventies was lack of infrastructure at the peripheral level to ensure timely administration o f the massive dose. In the eighties there was considerable improvement in the infrastructure. The lack o f adequate doses o f Vit A came in the way o f improved coverage. Poor orientation o f the functionaries who were providing the services to the population, lack of supervision and lack o f intersectoral coordination between the health functionaries and the ICDS functionariespersisted throughout the period and has been one of the factors responsible for the continuedpoor coverage. It is a matter o f serious concern that coverage was low in high risk group o f children from poorer communities in rural areas and urban slums in poorly performing districts.
3.5.86 In an attempt to improve the coverage especially in the vulnerable 6 months to 23 n^ionths age-group. Government o f India took a decision to link up Vitamin A administration to the ongoing immunisation programme during the Eighth Plan period. Under the revised regimen a dose o f 100,000 lU o f Vit.A is to be given to all infants at 9 months along with measles vaccine and a second dose o f 200,000 lU is to be administered at 18 months of age along with booster dose of DPT and OPV. Subsequently, the children are to receive three doses of 200,000 lU o f Vitamin A every 6 months until 36 months of age. The reported coverage figures under the modified regimen indicate that there has been some improvement in coverage with the first dose (50 -75%). However, the coverage for subsequent doses is low. However, in spite o f these short comings , there has been a substantial reduction in the prevalence o f blindness due to Vitamin A deficiency from
National Prophylaxis Programme against Nutritional Blindness
228
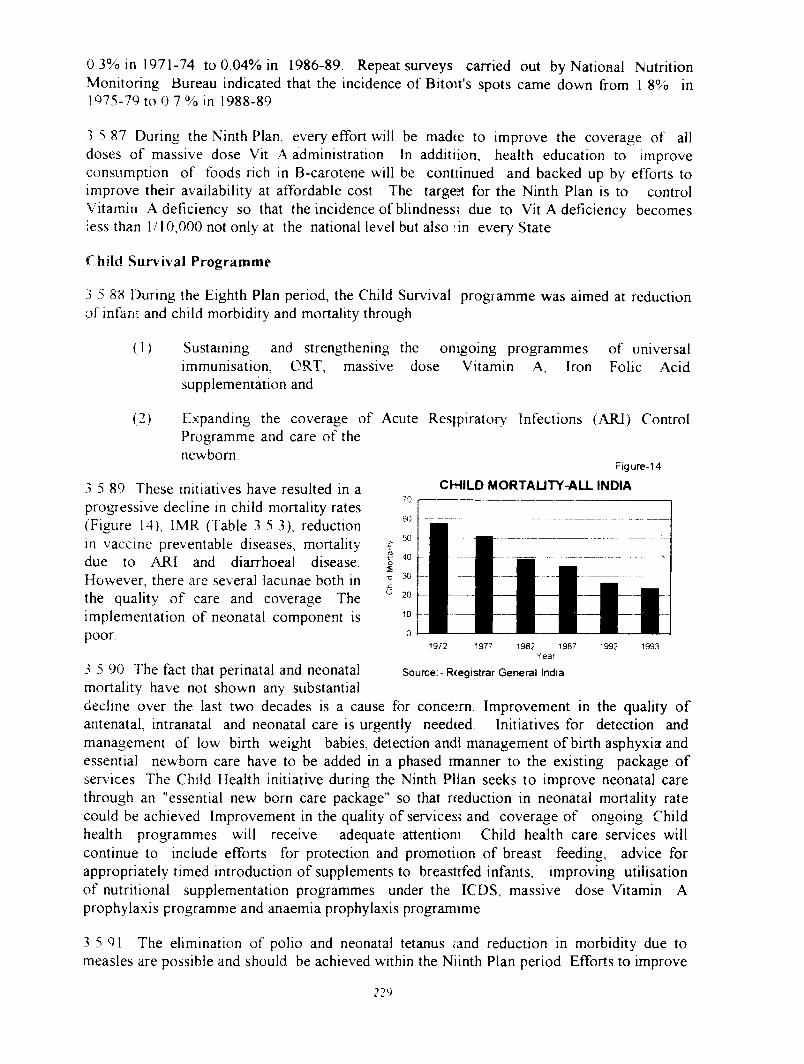
0 3% in 1971-74 to 0 04% in 1986-89 Repeat surveys carried out by National Nutrition Monitoring Bureau indicated that the incidence o f Biton's spots came down from 1 8% in1975-79 to 0 7 % in 1988-89
3 5 87 During the Ninth Plan, every effort will be madte to improve the coverage of all doses o f massive dose Vit A administration In additiion, health education to improve consumption o f foods rich in B-carotene will be conttinued and backed up by efforts to improve their availability at affordable cost The targest for the Ninth Plan is to control Vitamin A deficiency so that the incidence o f blindness; due to Vit A deficiency becomes less than 1/10,000 not only at the national level but also ;in every State
Child Survival P rogram m e
3 5 88 During the Eighth Plan period, the Child Survival programm e was aimed at reduction o f infant and child morbidity and mortality through
(I) Sustaining and strengthening the onigoing programmes o f universal immunisation, CRT, massive dose Vitamin A, Iron Folic Acid supplementation and
(2) Expanding the coverage of Programme and care o f the newborn
3 5 89 These mitiatives have resulted in a progressive decline in child mortality rates (Figure 14), IMR (Table 3 5 3), reduction in vaccine preventable diseases, mortality due to ARI and diarrhoeal disease However, there are several lacunae both in the quality o f care and coverage The implementation o f neonatal component is poor
Acute Resjpiratory Infections (ARI) Control
Figure-14CHILD MORTAUTY-ALL INDIA
1972 1977 1982 1987Year
1992 1993
3 5 90 The fact that perinatal and neonatal Source -Rcegistrar General India
mortality have not shown any substantialdecline over the last two decades is a cause for conceim. Improvement in the quality o f antenatal, intranatal and neonatal care is urgently need(ed. Initiatives for detection and management of low birth weight babies, detection and! management o f birth asphyxia and essential newborn care have to be added in a phased rmanner to the existing package o f services The Child Health initiative during the Ninth Pllan seeks to improve neonatal care through an "essential new born care package" so that rteduction in neonatal mortality rate could be achieved Improvement in the quality o f servicesj and coverage o f ongoing Child health programmes will receive adequate attention! Child health care services will continue to include efforts for protection and promotiion o f breast feeding, advice for appropriately timed introduction o f supplements to breasttfed infants, improving utilisation o f nutritional supplementation programmes under the ICDS, massive dose Vitamin A prophylaxis programme and anaemia prophylaxis programime
3 5 91 The elimination o f polio and neonatal tetanus tand reduction in morbidity due to measles are possible and should be achieved within the Niinth Plan period Efforts to improve
229
ARI and Diarrhoeal Disease Control Programmes and effective management o f infections will be the focus o f child health serviices at primary health care level These will result in a substantial reduction in IMR by 2(002 AD Linkages between primary, secondary and tertiary care institutions will enabhe rapid identification and effective management of complications o f infectious diseases ;and non- communicable disease and reduce both death and disabilities
3 5 92 There has been a substantial improvement in immunisation coverage over the lastdecade The pulse polio campaign has shown that it is possible to effectively mobilise theservice providers and the recipienits and carry out a massive campaign successfullyIntegrating these programmes in to the Child Heahh programme over the next fewyears is essential for ensuring sustaiinability o f these initiatives
Male Participation in Planned Pareinthood Movement3 5.93 Men play an important role in determining education and employment status, age at marriage, family formation pattern, access to and utilisation o f health and family welfare services for women and children Thteir active co-operation is essential for the success o f STD/RTI prevention and control In condom users, consistent and correct use are essential pre-requisites for STD as well as pregnancy prevention Vasectomy, which is safer and simpler than tubectomy, was widely ;accepted in the sixties However, after 1977 there had been a steep and continuous declime in vasectomies (Figure 8) There is a need to find out and address the needs and convenie;nces o f men seeking vasectomy and provide ready access to vasectomy services both in urban and rural areas In institutions with adequate trained expert surgeons, No-scalpeil' vasectomy might provide a useful technique for popularisation of vasectomy among; some segments o f the population During the Ninth Plan period due attention will be given to enhance men's participation in the Planned Parenthood movement
Phasing of Reproductive Health Seirvices3 5.94 There are wide variations in tthe availability and utilisation o f MCH and FP services between different States. During the . Ninth Plan, district-specific approach aimed at achieving appropriate increment in th e provision o f services will be taken up so that there is improvement in maternal and child health status and acceptance o f family planning methods in all districts and the gap between districts in terms o f performance will diminish
3 4 95 On the basis of their perform ance in the Family Welfare programme, as assessed by readily available data such as CBR^ total fertility rate, IMR, female literacy, percentage registered for ANC, percentage oif hospital deliveries, percentage o f deliveries by trained personnel, the States/ districts may be classified into three groups - good, intermediate and poorly perform ing Differential incremental additions to existing package o f services will be provide:d in these three groups In poorly performing States/ districts the major intervention will be to ensure hygienic, aseptic home-based deliveries by trained personnel, strengthening o f sub-centres for providing immunisation and MCH services, improving services available at PHCs, strengthening selected PHCs, CHCs, District Hospitals and improving referral systems In States/ districts in which majority o f deliveries are already occurring in hospitals, attempts will be made towards ensuring 100% antenatal care and institutionail deliveries In addition, comprehensive reproductive health care services including prevention and management o f RTI & STD and management o f gynaecological probbems will be made available in selected PHCs as well as CHCs In States where already m ajority o f women deliver in institutions, improvement in
2.10

availability o f MTP services in all PHCs/ CHCs, cormprehensive reproductive and child health services and strengthening referral services w ill receive attention In all States orientation training o f all health workers in PHC-bcased planning and RCH care delivery will be carried out, so that they develop appropriate skills and learn to optimally utilise available facilities to provide adequate and appropriate health care to women and children in their area
Reorganisation of Family W elfare Infrastructure
3.5 96 In the early 70s when the Family Welfaire Programme was initiated, the infrastructure for providing MCH and Family PManning Services was non-existent at primary health care level, and sub-optimal in secondarjy and tertiary care levels In order to quickly improve the situation, the Department o f Familly Welfare created and funded Postpartum Centres (A, B, and C types and subdistrict), urrban Family Welfare Centres/ health post and provided additional staff to the then existiing PHCs In addition, the ANMs in the Sub-Centres, created after the initiation off the FW Programme, were alsofunded by the Department The Department o f Faimily Welfare also created State anddistrict level infrastructure for carrying out the prograrmmes and training institutions for pre/in-service training o f personnel All these activ/ities are being funded through Plan
funds o f the Department o f Family W'elfare
3 5.97 Over the last three decades family welfare servi(ces are being provided as an integral part o f obstetric & gynaecological serv ices by seconcdary and tertiary care institutions So type A and B postpartum centres may be taken over- by the State and merged with the Departm ent o f Obstetrics and Gynaecology in the resspective hospitals during the Ninth Plan The staff whose salaries are met from the head! "Rural Family Welfare Centre" are functioning as Primary Health Centre officers in most States The sub- district postpartum centre staff may be posted in FRUs Over the next Plam period, these two categories of staff will become a pan o f State primary health care infrastru(cture
3 .5 98 It is imperative that the ANMs, who are cruc:ial for increasing the outreach of the Programme, should be available and fully funded by thie FW Programme During the Ninth Plan, efforts will be made not onK to fill the existing; gaps in the manpower but also to provide additional ANMs on the basis o f work load, oiifficuhies in delivery o f services and distances to be covered This would ensure that the Statces do employ the required number ofANMs and achieve an improved outreach and better implementation o f theProgramme
Strategies for Increasing EfTiciency
3 5 99 A v ast infrastructure for delivery o f health anid family welfare services has been created over the last three decades utilising uniform niorms for the entire country Though there has been a substantial improvement in the hejalth and demographic indices the perform ance in some respects has been sub-optimal There are marked differences in performance between the States the States with poo r demographic indices continue to remain poor performers in spite o f special efforts ito provide additional funding for m anpower and infrastructure Factors responsible for tlhe sub-optimal performance include
1 absence o f proper medical hierarchy with well defined functions;2 lack o f first line supervision and mechanism to bring about accountabilhy;3 absence o f referral system and lack of functional FRUs
3 5 100 During the Ninth Plan, efforts will be made to> improve efficiency by undertaking task analysis, assigning appropriate duties/ tasks to designated functionaries and training
23 i

them to act as a multi-professional team. In such a command chain, the last link will be provided by the village-based wor kers who will act as a liaison person between the people and health functionaries and ensure utilisation o f available facilities The Panchayati Raj Institutions will partioipate in the planning and assist in the implementation and monitoring o f the programme. The ANM will administer vaccines, screen infants, children and pregnant women, idenitify and refer the "at risk" persons to appropriate institution The medical officer at PH C will undertake PHC-based planning and monitoring o f the Health and Family Welfare programmes and provide curative services, organise and supervise preventive and prom otive health and family welfare-related activities and develop a viable, functional refe;rral systems The specialists in CHC will provide appropriate emergency care and care for referred patients, participate in the development o f the PHC based RCH programmies, monitor the activities and initiate midcourse corrections If this pattern o f fiinctioming is followed, the community, the link worker and the health functionaries will be perform ing the tasks that they are best suited to do and the im plem entation o f the programme wiill improve because o f effective functioning
Intersectoral Coordination
3 5 101 Effective implementation o f Family W elfare Programme involves a great deal o f inter-sectoral coordination The related sectors have to take steps to enhance the status o f women, particularly w om en’s literaicy and employment, to raise age at marriage, their general development, generating m ore income in rural areas
3 5 102 Concerned departments liLe Department o f Women and Child Development, Human Resources Development, /Agriculture, Rural Development, Urban Development, Labour, Railways, Industry need to
a) involve their extension w orkers in propagating reproductive and child health care,
b) include population stabilisation and RCH care in their curricula;
c) use their own funds for impro'ving awareness and access to family welfare services
3 5 103 The village-level functionaries - namely Anganwadi workers, Mahila Swasth Sangh (M SS), Traditional B irth Attendant (TBA), Krishi Vigyan Kendra (KVK) Volunteers, School teachers need to work together and achieve optimal utilisation o f available services
3 5 104 The opinion leaders at the mational. State and local levels will participate in com m unity education regarding the Family Welfare Programme so that community awareness and involvement vital to the success o f this programme is improved Simultaneously, the Ninth Plan will launch an intensive drive to promote health education so that India builds a sound foun(dation for a successful health programme lEC on basic principles o f hygiene, sanitatiion, nutrition, and prevention of illnesses and diseases will be promoted through not only the educational institutions and the adult education programm e but also through the ICDS programme, the counselling offered by the health w orkers at all levels and the mass me;dia
Involvement of Non-Governmental Organisations (NGOs) and Voluntary Organisation for Prom otion o f Family W elfare
3 5 105 The M inistr\ o f Health &: Family Welfare has initiated several programmes involvmg NGOs in efforts to improv'e Family Welfare Programme These include
232

Revam ping o f Mini Family Welfare Centre in areas where the couple protection rates are below 35 percent.
Involvem ent o f ISM & H practitioners.
A rea-specific lEC activities through NGOs,
Establishm ent o f Standing Committees for Voluntary Action (SCOVAs) to fund NGO projects promptly;
Identification o f Government/ NGO organisations for training o f NGOs in project formulation, programme management and monitoring
These activities will be continued and intensified during the Ninth Plan period
Private Sector Participation in RCH
3 5 106 It is estimated that the private sector accounts for more than three quarters o f ail health care expenditure in India Private sector provides MCH and family planning services also but to a lesser extent It is increasingly recognised that the private sector represents an untapped potential for increasing the coverage and improving the quality of reproductive and child health services in the country The challenge is to find ways and m eans to optimally utilise their potential The major limitations in the private sector include the following:
a) the focus has till now been mainly on curative services,b) the quality o f serv ices is often variable,c) as the users have to pay for the services the poorer sections o f population cannot
afford these serv'ices
3 5 107 Some o f the initiatives could be through collaboration between public and private sector in providing health care to the poorer segments o f population who cannot afford to pay for heahh services While organising the involvement o f private medical practitioners in RCH care, it is essential to provide orientation training to all and ensure utilisation o f their services in a cost-effective and sustainable basis
3 5 108 P rivate/voluntary organisations providing health care to women are relatively small in num ber but they could play an effective role in the delivery o f reproductive and child heahh care services at affordable cost, especially in certain specific locations such as urban slums Giving the private sector and voluntary organisations appropriate incentives to broaden the range o f activities and improve the quality o f reproductive and child health- related services they offer are other avenues that require exploration Continued collaboration, training and technical assistance by governmental agencies to private m edical practitioners and private/ voluntary organisations may help in strengthening reproductive and child health services in remote or under-served areas
3 5 109 The NDC Committee on Population had recommended that managerial capability o f the corporate bodies need to be harnessed for improving the social marketing o f contraceptives, streamlining o f health services and improving material and manpower m anagem ent The problem-solving approach o f the corporate sector can be o f use m im proving the operational efTiciency o f the health care infrastructure The corporate sector could participate in the delivery o f pnm ary health and family welfare care in the vicinity o f their factories They could provide tertiary care in collaboration with the

Government sector institutions, Diuring the Ninth Plan, the participation o f the organised and unorganised sectors 0)f industry, trade/ labour unions and agriculturists in family welfare programme will be further strengthened
Research and Development3 5 110 The ICMR is the nodal reseanch agency for funding basic, clinical and operational
research in contraception and MCH In addition to ICMR, CSIR, DBT and DST are some of the major agencies funding research pertaining to Family Welfare Programme, TheNational Committee for Research in HumanReproduction assists theDepartment o f Family Welfare in drawing up priority areas ofresearch and ensuring that there is no unnecessary duplication o f research activities. Some o f the major institutions carrying out research in this area include the Institute for Research inReproduction, Bombay, National Institute o f Nutrition, Hyderabad, National Institute o f Health & Family Welfare, New Delhi, Central Drug ResearchInstitute, Lucknow and the
Central Council for Research in Ayurveda and Siddha, Delhi. A network o f 18 Population Research Centres contduct studies on different aspects o f the Family Welfare Programme and undertake demographic surveys,
3 5 ,111 Basic research efforts for thee development o f newer technology for contraceptive drugs and devices currently undesr way are unlikely to lead to availability o f newer methods for use in the programme during the next decade. These efforts are needed to caterto the requirements o f the population in the decades to follow For improving thecontraceptive coverage for men and women, efforts need to be directed towards improving the quality o f care and assist men a,nd women to choose' appropriate contraceptives from those currently available. Therefore;, the emphasis must be on operational research for improving the performance o f Famdly Welfare Programme and socio-behavioural research to improve community participatiom for increased acceptance o f family welfare services. It is important that an appropriate iinstitutional mechanism is created and supported to test and ensure the quality control in pro(ducts utilised in the programme,
Basic and Clinical Research
3 5 112 Basic and clinical research studies in the priority areas identified earlier will be continued during the Ninth Plan period. These include development & testing o f
Research and Developm enit
Basic and Clinical Research
Development and testing of new contrac;eptives including contraceptives which are considered to be (effective in Indian Systems o f Medicine
Research on methods for male fertility' reguhation
Clinical tnals on newer non-surgical inethodls o f ^4TP
Post-marketing surveillance o f Centchromani,
Operational Research
□ Studies on the ongoing demographic Itransition and its consequences
□ Studies on continuation rates and usie effectiveness of contraceptives
□ Research on operationahsing integrated delivery of RCH serv ices nutrition, education!, women & child development, rural development amd family welfare services at village level
234

a) Drug delivery systems for the delivery o f c:ontraceptive steroids;
b) Vas-occlusive methods;
c) Spermicides based on plant products such ais neem oil and saponins and
d) Vaginal contraceptives including those usinig plant based substances.
e) Testing contraceptives, which are considered to be effective in Indian Systems of Medicine and/or used among tribals.
f) Research on methods for male fertility regulation including long-actingandrogens.
g) Clinical trials on newer non-surgical methods o f MTP.
h) Post-marketing surveillance for Centchrom;an.
Operational Research3.5.113 During the last year of the Eighth Plan the Dtepartment o f Family Welfare has changed over to decentralised PHC based area-specific nnicro planning and implementation of Reproductive and Child Health Care. Due to probllems inherent in such a massive shift, there had been a discernible decline in performance in terms o f contraceptive acceptance in most of the Slates. In order to rapidly rev'erse this trend it is imperative that all service providers, in the Government, voluntary an(d private sector are trained so that they understand and implement the programme and the population understands and appropriately utilises the available facilities. In ordeir to rapidly translate the written guidelines to actual implementation and remove operattional obstacles it is imperative that operational research studies on a massive scale are talken up in different settings in the States.
3.5.114 Studies on the ongoing demographic transition and its consequences will be encouraged. Studies on continuation rates and use effeictiveness o f contraceptives under the programme conditions will be undertaken so that these could be used for computing effective couple protection rates.
3.5.115 The term 'operational research' has been used to cover a wide variety o f formal research studies o f varying scale carried out by research workers belonging to different disciplines. In addition to strengthening these types o f formal research studies, it might become necessary to encourage the local population, health service providers and others who want to try innovative methods to tackle the local problems. Research is also required in operationalising integrated delivery of RCH services, nutrition, education, women and child development, rural development and family welfare services at the village level, utilising the available infrastructure under various programmes.
Monitoring of Family Welfare Services
3.5.116 Monitoring and evaluation form an essential component o f FW Programme. Indicators used for monitoring and evaluation include process indicators and impact indicators. Process indicators are used to monitor the progress o f implementation o f the programme through monthly progress reports as compared to the annual targets/ Expected Level o f Achievements (ELAs). The existing service stati;stics do provide an inbuilt rapid
235

and ready method for assessment o f performance in Family Welfare Programme in terms o f process indicators eg . Table 3 5 8 for ANC and Table 3 5 6 for immunisation and acceptance These data are used for mid-course corrections in the States that are not achieving the expected level of performance However, these indicators do not provide any information on the quality of care or appropriateness o f the ser\ ices In the Ninth Plan period, the programme will also monitor a set o f quaiitv of care'indicators During the Ninth Plan, efforts will be made to collate and analyse serv ice data collected at the district level and respond rapidly tc the evolving situations Available data from census, demographic and health surveys undertaken in the district by various agencies includuiLi; the Population Research Centres will be analysed and utilised at the local level for area- specific micro planing Efforts will be made to incorporate the district-level information from other sectors and optimally utilise the local resources including human resources in the implementation o f the Family Welfare Programme, through inter-sectoral coordination Efforts will also be made to generate district- level data on all the related sectors and utilise them for programme planning , monitoring and evaluation
3 5 117 The Department of Family Welfare has constituted regional evaluation teams which carry' out regular verifications and validate the acceptance of various contraceptives During the Ninth Plan period these evaluation teams will be used to obtain vital data on failure rates, continuation rates and complications associated with different familv planning methods
3 5 118 The Office of the Registvar General of hidia (ROM works out the annual estimates o f crude birth rate, crude death rate and infant mortality rate through their scheme o f Sample Registration System The system provides an independent evaluation o f the impact o f the Family Welfare Programme in the countrv' The vital indices and decennial growth rate estimated by the Office of the Registrar General o f India on the basis o f the census also provides indirect evaluation o f impact o f the Family Welfare programme
3 5 119 Available information with RGIs office indicates that as of mid-nineties over 90'̂ -'o of all births and deaths are registered in states like Kerala. Tamil Nadu Delhi, Punjab and Gujarat. In these States these data will be used at district-ieve! both for PHC- based planning o f RCH care as well as evaluation o f the RCH care annually In districts where vital registration is over 70%, etTorts will be stepped up to ensure that over ‘■)0” o of births and deaths are reported so that independent data base is available for planning as well as impact evaluation of PHC- based RCH care The Department of FamiK Welfare, in collaboration with RGI, has set a target o f 100% registration of births and deaths bv the end o f the Ninth Plan Steps to collect, collate and report these data at PHC/Distnct !e\el on a yearly basis have also been initiated.
Expected Levels of Achievement (ELA) for the Ninth Plan
3.5.120 The performance under the Family Welfare Programme vvsli depend upon
1) Programme initiatives during xhe Ninth Plan,
2) Financial resources available,3) Capability and effectiveness o f the infrastaicture and manpower to cam out she
programme,4) Literacv and economic status of the tamilies pariicuiarrv of the'AVimen.
5 ,1 Poiicv support by opinion leaders and the society

3.5 121 During the Ninth Plan, the FW Programme will attempt to meet the unmet need for family planning and provide MCH services so that there is a substantial reduction in IMR and under five' mortality rate In view o f the marked differences in the availability and utilisation o f family welfare services and IMR CBR and CPR between States, a differential approach to the implementation o f Family Welfare Programme is necessary Consequently, during the Ninth Plan period the ELA in terms o f process and impact indicators will be State specific
3 5 122 Any projection o f expected levels o f achievement for process and impact indicators at the end o f the Ninth Plan has to take into consideration the pace o f improvement in these indicators during the Eighth Plan and the additional policy and programme measures envisaged to accelerate the pace o f achievement during the Ninth Plan The State- specific projections have been worked out at two different levels o f achievement, one on the basis o f the assumption that the trend observed with regard to these parameters in the last 15 years will continue during the Ninth Plan period and the second on the assumption that the additional policy and programme initiatives provided during the Ninth Plan period will resuh in the acceleration o f the pace and result in more substantial improvement during the Ninth Plan period The expected levels of achievement under both these assumptions have been computed State wise and are given in Table 3 5 10 and 11
3 5 123 The expected levels of achievement by the terminal year of Ninth Plan (2002) are given below
Indicator If current trend continues If acceleration envisaged in Approach Paper to the Ninth Five Year Plan is | achieved
C B R 24/1000 23/1000
IM R 56/1000 50/1000
T F R 2.9 2.6
C P R 51% 60%
NNM R35/1000
M M R 3/1000
National Population Policy3 5 124 Population and sustainable development are key issues that have determined the improvement in quality o f life over the last five decades There have been massive changes in demographic and heahh indices o f the population India is currently in the midst o f demographic transition The next two decades will witness an unprecedented increase in the number o f persons in 15-59 age group and there is a need to meet health and contraceptive needs o f this population The number o f births may remain unaltered but there is an urgent need to reduce maternal and infant mortality so that there is a reduction in the desired level o f fertility
3 5 125 There has been a paradigm shift in Family Welfare Programme, centrally defined method specific targets have been replaced by community based need assessment and decentralised planning and implementation of the programme to fulfil these needs The
237
ongoing educational, info-technology and socio-economic transition have raised awareness and expectations o f the population Taking all these into account it is imperative that a National Population Policy is drawn up so that it provides reliable and relevant policy frame work not only for improving Family Welfare Services but also for measuring and monitoring the delivery o f family welfare services and demographic impact in the new millenium
Funding for Family Welfare Programme3 5.126 The National Family Welfare Programme is a 100% Centrally funded scheme Even after twenty five years o f initiation o f Family Welfare Programme, the Department meets the cost o f maintenance o f infrastructure, manpower, consumables and other costs for provision o f family welfare services from central Plan funds The outlays and expenditure for Family Welfare Programme during different Plan periods are shown in Table 3 5 7 Allocations for Family Welfare ranged between 1.1 to 18% o f total Plan outlays Eighth Plan outlays and expenditure is shown in Table 3 5 12. Right from the first year of the Eighth Plan, the expenditure o f the Department has been higher than the outlay provided for each year o f the plan In addition the Department has to reimburse the states for expenditure incurred as arrears
3 5 127 More than 75% o f the expenditure on the programme is committed expenditure being incurred towards staff salaries and maintenance o f infrastructure There are problems in continued plan funding o f non-plan activities under the Family Welfare Programme, but keeping in view the importance o f achieving sustainable population growth rate, the National Family Welfare Programme will continue to be centrally sponsored programme and all expenditure will continue to be made from the plan outlay o f the Department of Family Welfare during the Ninth Plan
3 5 128 It is imperative that the ANMs, who are crucial for the outreach o f the Programme should be available and her salary' fully met Family Welfare Programme During the Ninth Plan efforts will be made not only to fill the existing gaps in the manpower but also to provide additional ANMs on the basis o f workload, difficuhies in delivery o f services and distances to be covered. The Department o f Family Welfare provides fiands for the maintenance o f 97,757 sub-centres out o f 1,36,339 functioning sub-centres Planning Commission had repeatedly emphasised the need for financing all the functioning sub-centres so that the ANMs who are crucial peripheral workers for implementation o f the Family Welfare Programme are in position at all the sub-centres
3 5 129 The Department o f Family Welfare bears the costs o f maintenance o f rural family welfare subcentres, post-partum centres, urban family welfare services and training activities according to certain norms which were fixed long back There is a wide gap between the actual fijnds required to maintain the above services and the fijnds being provided according to the norms Thus, it resuks in the accumulation o f arrears payable to the states The delav in the payment o f arrears to the .states affects provision o f family welfare serv ices in the states whose financial position is not very good This is especially true for the states like Bihar, U P etc which are weak in terms o f demographic indicators Thus, there is an urgent need to review the norms for providing funds to the states for implementation o f the Family Welfare Programmes The Department o f Family Welfare has already constituted a committee to review these norms During the Ninth Five Year Plan adequate financing should be made to the states so that the programme activities are implemented without generation of anv arrears
3 5 130 The Department o f Family W'elfare has initiated multi-agencv externally funded project 'Reproductive & Child Health Care” from the year 1996-97 The project will promote

effective maternal care to ensure safe motherhood, increased access to contraceptive care, prevention and treatment o f RTI/STD, reproductive health care services for adolescents etc. The total cost o f the project which is to be implemented during the Ninth Plan period is Rs. 5112 crores out o f which Rs.3600 crores is expected to be the external assistance and the balance amount is to be provided by the Government of India for sustaining the on-going maternal and child health care activities and for counter part funding for the RCH Project. It is, therefore, imperative that sufficient funds are provided to the Department o f Family Welfare so that the department is able to absorb to external funding under the project during the Ninth Plan period.
3.5 131 During the Eighth Plan period the Central departments like Railways, Post and Telecommunications, have internalised the expenditure on family welfare services to their employees. Family welfare services are part of the welfare services like health care, pension, gratuity etc, extended to the employees by their respective departments. All departments, both o f Central and State Governments, public sector undertakings and autonomous bodies etc., should be persuaded during the Ninth Plan to internalise the family welfare expenditure within their respective budgets The modalities for such a shift have to be worked out by the concerned State and Central Departments, the Finance Ministry and the Planning Commission
3 .5 132 In view o f the importance o f lEC campaign in improving utilisation o f available services for RCH care, Doordarshan and Akashvani will be persuaded to provide specific time slots on a larger scale either free or on concessional rates for lEC efforts.
3.5 133 Over the last 40 years there has been considerable escalation in the cost o f drugs. Supply o f adequate quantities o f drugs, vaccines and contraceptives is an essential prerequisite for ensuring adequate coverage In the Eighth Plan period there has been adequate supply o f vaccine for pregnant women and vaccines to be given to infants. Contraceptive supplies have by and large been adequate However, there have been a substantial shortfall in the supply o f IFA and Vitamin A for achieving 100% coverage o f the target groups. It is imperative that the dnigs, vaccines and contraceptives to completely cover all the target groups on the basis o f the projected population is provided (Table 3 .5 13). Adequate funding for purchase of these needs to be made available so that coverage will improve. It is essential that the supply of these items are continued and provided free o f charge to all segments of population because even among the population above the poverty line, there is often considerable reluctance to meet the expenses for women and children especially for preventive programmes The services and supplies under Family Welfare Programme should continue to be provided free o f cost so that inability to pay for preventive and promotive services does not become a barrier to the acceptance o f Family Welfare Programme and the achievement o f the desired family size Taking all the above factors into consideration, the Department o f Family Welfare has been provided with an outlay o f Rs. 15120.20 crores for the Ninth Plan period. The outlay for Annual Plans will be adjusted depending upon the requirements o f the department and availability o f funds including reimbursement from EAPs
239

SINo.
Population (in 000)
1991 O nsus
Aanuiil EiponeBtiMt
1971-11
L iuracy RaU % Fenale
(7 yrs A above!
TABLt 3.51 DEMOGRAPHIC INDK ATORS
Sei RaUo
NaUral increase
(CBR-CDR) I M R .
M eaa age aleffcclivc■arriage(rcBale)
SiaguUle Mcaa age
of oiaMage(fenaie)
CPR̂ C*/*)
J l .J 97 (Prov.)
(I) (2) (3) (4) (5) (*) (7) (•) (9) (10) 01)iTym
(12)tyy^(13)
IVIl(14) (15)
% # « « » # sV*
INDIA 146303 2.14 2.22 3930 2910 927 27.4 t.9 1B.5 72 3.5 19.4 18.33 45.41. MAJOR STATES1 Aadlira Pr MSOt 2 17 2.10 32.72 24.16 972 22 7 • 3 14.4 66 2.7 1 7 J 17.26 46.92 Asia* 22414 2.17 2.12 43 03 NA 923 27.7 9.5 112 75 3.^ 19.4 NA 19.13 Bihar »6374 2.11 2.17 22.S9 1651 911 32 1 10.2 21.9 72 4.6 116 1655 21.14 C ujarat 41310 1.92 2.46 4164 3*46 934 25.5 7.6 17.9 62 3.1 20.4 19.52 57.45 llaryaM 16464 2.42 2.55 40.47 26.k •65 2SS • 1 20.7 6« 3.7 19.2 17.84 S3.9
6 K araaUka 44977 1.92 239 44.34 33.16 960 23 0 7.6 15.4 53 I t 19.4 19.21 55.67 Kerala 29091 1 34 1.77 •6.17 75.65 1036 17.« 62 11.6 13 1.7 22.3 21.S2 46.71 Madkya Pr. 661B1 231 2.27 2 l tS 11.99 931 32.4 11.1 21.3 97 4.2 1B.I 1656 47.49 M aharaiktra 7W37 2.29 2.21 S2.32 41.01 934 23.2 7.4 IS .t 4« 2.9 19.1 1177 51.0lOOriifta 31660 1.13 i . t s 34.61 25 14 971 261 10.7 16.1 9S 3 J 19.5 19.0« 39.5
11 Pwa^ab 20212 1.t9 2.16 50.41 39.64 N 2 23.5 7.5 16 52 29 20.3 21.07 76.9U RaJasUM 44006 2 50 2.17 20.44 13.99 910 32 3 9.1 23.2 •6 4.5 lt.4 16.10 32.613 TaaU Na4a 55tS» 1 43 1.63 51J 3 40.43 974 19.2 7.9 11.3 54 2.1 20.2 20.25 51.714 UlUr Pr 139112 2.27 2.29 2S.31 17.1i •79 34.0 10.2 23.1 •5 S.l 19.5 I t . 71 37.2IS W n tB M g al 6M 7I 2.21 2.10 4«.M 36.07 917 22 • r t 15 55 3.0 19.5 19.23 34.211 SMALl.ER STATES1 ATMHKlMi Pr MS 3 14 3.04 29.69 14.01 •59 21 9 56 16.3 61 NA NA NA 12.12 DHW 9421 4.15 4.29 66.99 6J.57 •27 21 2 5.4 I5.« 39 NA NA NA 33.93 0 m 1178 1 49 2.37 67.99 55.17 967 14 1 i t • J 13 NA NA NA 32.94 H iM cka) Pr. 5171 1 •> 2.15 51.13 37.72 976 23.0 • 0 15 62 2.9 2«.4 NA 55.3S JAK 7719 2.54 2.51 NA 1955 NA NA NA NA NA NA NA NA 17.6
6 M u O ^ IU 7 2.57 2.B3 47.6« 34.61 95* 194 5.7 13.7 27 NA NA NA 11 77 MegkaUya 177? 2 B4 2 N 44 tS 37 15 9SS 30 4 • 9 21.5 45 NA NA N AiJ. '4 0B MUoraH i n 334 3.99 71.60 6«.6<) 921 NA NA NA NA NA NA NA 44 I9N a|»U ad 1209 4,45 4.09 54.75 40.21 ••6 NA NA NA 6 NA NA NA 8 1
lOSlkkiM 40« 2 51 4 14 46.69 27.35 •7* 2fcO 65 13.5 47 NA NA NA 23.711 Irlpara 2757 2.95 2.79 49 65 3t.Ul 94S U 3 65 111 45 NA NA NA 26.3Ml. UNION TERRITORIES1 AAN lUaath 111 3 97 4.91 65.46 53 15 • ! • 1730 2.6 14.7 32 NA NA NA 40 92 M2 3.52 5.67 72.34 69.31 79« 169 4.1 12.^ 44 NA NA NA
wv. y
3 U*N HaxcN 131 2 B9 331 269S 20.38 952 219 9.2 19.7 7^ NA NA NAja .j\< X
4 l>a»M A Dim 102 3.52 2.32 59.4# 46 51 969 21.0 9.0 ̂ 12 36 NA NA NA^ V
a5 LalukMNccp 52 2 51 2.37 72.t9 55.32 943 23> 6.3 *17.5 36 NA NAJO.a
6 PoMttcbMTy •OB 2.9« 2.50 6563 53.03 979 U.O 6B 11.2 25 NA NA NA9.6
7Sex rario • Pe»aWi per 1000 males w.*. t
Sowce Col. 2 l o 7 - 1991 ceasiu: Col. S (u 13 - SHS EsUoMlr*: Col. 14 - Ceaftiu: Col.l5-DcHt-#. K&i'ladrt JA K Mi^urMm S: Eicliidei for 1993f i x : N*( AvallaUe M liree yeurf niovlttf a\'erage(lM3-95)
240

TABLE- 3.5.2
YEAR GOAL IN IN TERMS OF CBR*
YEAR BY WHICH ACTUAL GOAL WAS TO ACHIEVEMENT BE ACHIEVED
1962 25 1973 34.61966 25 AS EXPEDITIOUSLY1968 23 1978-79 33.31969 32 1974-75 34.5
FOURTH PLAN 25 1979-81 33.8
FIFTH PLAN 25 1984 33.8
POPULATION POLICY (JAN. 1978)
25 1983-84 33.7
NATIONAL HEALTH POLICY 312721
198519902000
32.929.9
SEVENTH PLAN 29.1 1990 29.9
EIGHTH PLAN 26.0 1997 27.4(1996)
* CRUDE BIRTH RATE
SOURCE; PLANNING COMMISSION DEPTT. OF FAMILY WELFARE
241

TABLE- 3 . 5 . 3
ACHIEVEMENT UNDER FAMILY WELFARE PROGRAMME
PARAMETER 1951 (5 1961 @ 1971 0 1981 00 1991 00 1996 00CRUDE BIRTH RATE 40.8 39.3 37.1 37.2 29. 5 27.4(PER 1000 POPL.)
DEATH RATE 25.1 18.9 17.0 19.0 9.8 8.9(PER 1000 POPL.)
NATURAL GROWTH RATE 15.7 20. 5 20.1 18.2 19 . 7 18. 5(PER 1000 POPL.)
TOTAL FERTILITY RATE 6.0 5.7 5.0 4.5 3.8 3.5(1994)
INFANT MORTALITY RATE 148 138 120 110 80 72(PER 1000 LIVE BIRTHS)
COUPLE PROTECTION RATE (%) @@@ 10.4 22.8 43.5 45.4(3/97)
CUMULATIVE NO.OF BIRTHS 0.04 44.19 155.63 210.00AVERTED (IN MILLION) @@@ (3/97)
LIFE EXPECTANCY MALE 37.2 44.2 50.9 55.4 58. 1 59.0(YEARS)
FEMALE 36.2 42.7 50.2 55.7 58.6 59. 7
COMBIN 36.7 43. 5 50.5 55.4 58.3 59.4
(1981-85 (1987-91 (1989-93)SOURCE: REGISTRAR GENERAL INDIA, DEPARTMENT OF FAMILY WELFARE
NOTE:- @ = Based on census average@@ = SRS
@@@ = Deptt. Of FW
242
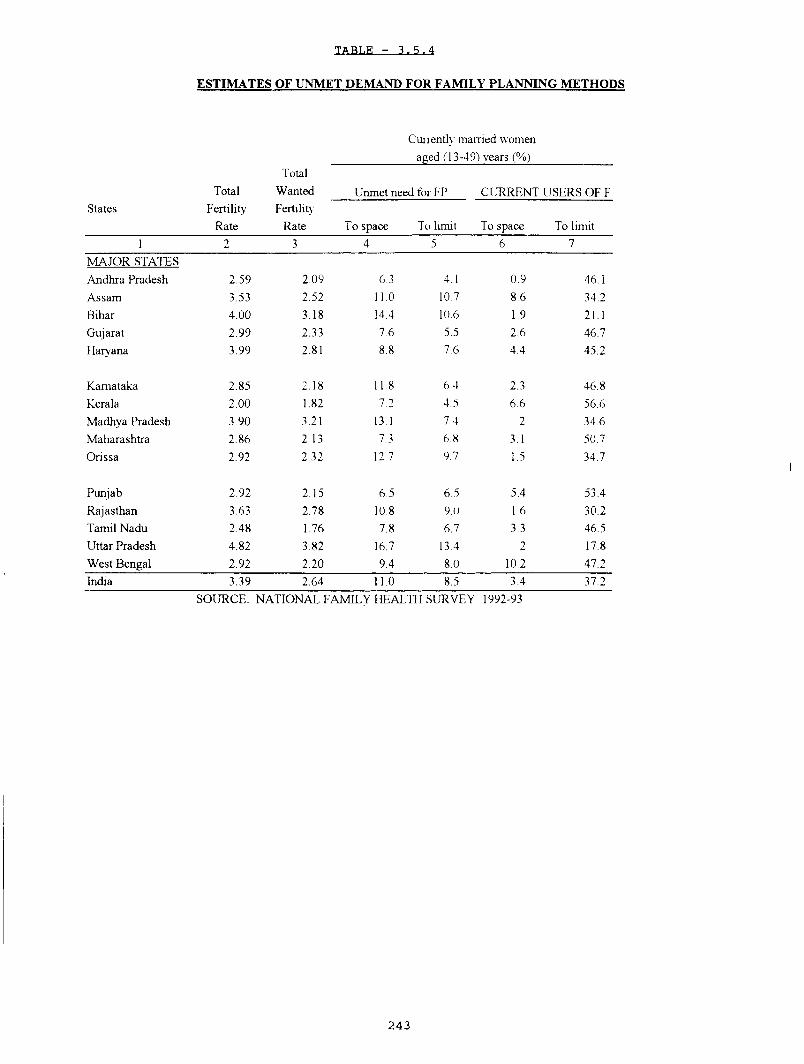
ESTIM A TES OF UNM ET DEMAND FOR FAM ILY PLA N N IN G M ETHODS
States
Currently mamed women aged (13-49) years (%)
TotalFertility
Rate
TotalWantedFertility'
Rate
Unmet need for FP CURRENT USERS OF F
To space To limit To space To limit1 2 3 4 5 6 7
MAJOR STATES Andhra Pradesh 2.59 2.09 6.3 4.1 0.9 46.1Assam 3.53 2.52 11.0 10.7 8.6 34.2Bihar 4.00 3.18 14.4 10.6 1.9 21.1Gujarat 2.99 2.33 7.6 5.5 2.6 46.7Haiyana 3.99 2.81 8.8 7.6 4.4 45.2
Karnataka 2.85 2.18 11.8 6.4 2.3 46.8Kerala 2.00 1.82 7,2 4.5 6.6 56,6Madhya Pradesh 3.90 3.21 13.1 7.4 2 34,6Maharashtra 2.86 2.13 7,3 6.8 3.1 50.7Orissa 2.92 2.32 12 7 9.7 1.5 34.7
Punjab 2.92 2.15 6.5 6,5 5.4 53.4Rajasthan 3.63 2.78 10,8 9,0 1.6 30.2Tamil Nadu 2.48 1.76 7.8 6.7 3,3 46.5Uttar Pradesh 4.82 3.82 16.7 13.4 2 17.8West Bengal 2.92 2.20 9 4 8.0 10.2 47.2India 3.39 2.64 110 8.5 3.4 37.2
SOURCE: NATIONAL FAMILY HEALTH SURVEY 1992-93
243

PLAN EXPENDITURE PER ELIGIBLE COUPLE UNDER FAMILY WELFARE PROGRAMME IN MAJOR STATES
TABLE-3 5 5
CBR I'XlGlBLIi l'XPI*M)ITURl' i;XPKND[TURl':
COI ;i>! ,F.S * * ON F. W ON FW PER
1994 (MARCH 1993) 1992-93 ELIGIBLE
COUl^LE
(MILLION) (Rs. CRORliS) (Rs.)
M in ilO D WISE COUPLE PROTECTION RATIi (EFFECTIVIi)
___________________ (31st March 1993)______________________
s t e r u is a t io n lUI.'' CC OP t o t a i .
5MAJOR STATES Andhra Pradesh 23.8 12.80 82,40 64.38 364 4,2 3.3 14 45 3Assam 30,8 3.50 21 01 60.03 22.9 1.5 0,5 0.3 25.2Bihar 32.5 16.70 75,88 45,44 21.2 2.3 0.3 0.2 24.0Gujarat 27 1 7 35 57 92 78,80 38 2 10.0 5 1 12 54 5Har>ana 30 8 2,83 27,53 97.28 33.2 10.8 7.5 1.1 52.7
Karnataka 25 0 7.73 47 19 61.05 396 5.8 1.7 11 48 2Kerala 17 4 4,47 35 03 78.37 44.5 4 9 3.2 0 8 53 4Madh\ a Pradesh 33.0 12,47 79 06 63.40 26.6 5 1 4.6 16 37.9Maharashtra 25 1 14,22 94 98 66.79 409 66 3 9 18 53.2Orissa 28 0 5,51 39 71 72.07 29 5 5 4 2.4 0 8 38 1
Punjab 25.0 3 15 37 74 119.81 37 9 23.1 8.1 19 70 9Rajasthan 33 7 8,17 59 07 72.30 22.4 42 2.4 0 6 29.3Tamil Nadu 19 2 9 91 72,21 72.87 44.9 8.4 12 10 54.5Uttar Pradesh 35 4 25,44 171 04 67.23 19 2 94 3 6 0 9 33.2West Bengal 25.2 11 65 66,60 57.17 28 6 2.6 1.6 15 34 3India 28 7 151,72 1190 40 78.46 30 3 6.3 4 9 2 0 43 5SOURCE DEPTT OF FAMILY WELFARE
AS PROJECTED BY DEPTT OF FAMILY WELFARE YEAR BOOK 1992-93
244

TABLE 3.5.6
Performance in Family Welfare Programme during Eighth Plan(Millions)
1992-93 1993-94 1994-95 1995-96 1996-97Target Achlev. %
Achlev.Target Achlev. V.
Achiev.Target Achlev. %
Achiev.Target Achiev. %
Achiev.Target Achiev. % increase/
decrease over 1995-96
Famllv PlanningSterilisation 5.28 4.29 81.2 5.18 4.50 86.8 5.33 4.58 86.0 5.03 4.42 79.20 * 3.82 -13.7lUD 6.38 4.74 74.2 7.33 6.02 82.1 7.87 6.70 85.2 7.42 6.85 85.70 * No 5.71 -16.6CC users 15.47 15.00 91.1 19.35 17.28 89.3 21.78 17.71 81.3 o T arget n . i i - Target 17.11 -1.0OP Users 4.58 3.00 65.5 5.00 4.30 86.0 5.47 4.87 89.1 5.79 5.09 83.50 * 5.17 1.5
ImmunizationTT(PW ) 27.01 21.45 79.4 27.56 22.75 82.6 27.53 23.07 83.8 27.53 22.12 80.30 28.10 22.12 78.7DPT 24.29 22.00 90.6 24.79 23.09 93.2 24.77 23.40 94.5 24.86 22.63 91.00 25.39 22.60 89.0PoUo 24.29 22.12 91.0 24.79 23.21 93.6 24.77 23.58 95.2 24.86 22.78 91.60 25.39 22.96 90.4BCG 24.29 23.46 96.6 24.79 24.09 97.2 24.77 24.70 99.8 24.86 24.13 97.10 25.39 24.57 96.8Measles 24.29 20.86 85.9 24.79 21.95 88.5 24.77 21.60 87.2 24.86 20.55 82.60 25.39 20.76 81.8
Prophylaxis (Nutritional) # Nutritional Anaemia among pregnant women 27.01 16.48 61.00 27.56 22.00 79.90 27.53 21.32 77.50 27.53 22.17 80.50 28.11 19.58 73.1 %S
Blindness in infants# (Vlt-A 1st Dose) 24.29 31.16 64.10 k 24.79 38.42 77.50 k 24.77 42.68 86.20 k 24.86 S 16.49 $ 65.10 25.40 $ 14.66 S 74.3 $$
note:- # = provisionalSS - Calculated after excluding target for States/ilTs for which achievement flgs. not received * = Calculated after excluding achievement for target free States/UTs.
k = Percentage achievement o f target were worked out by taking half of the doses given to the 1st time initiated continuded & completed dosed beneficiaries
S = Relates to 1st dose (Below lY r.+ above lY r. )
SOURCE: DEPTT. OF FAMILY WELFARE
245

Pattern of Investment on Health. Famiily ' Welfare (Plan Outlays) during Different
TABL-E 33.5.7
Pericd Total PlanHealth
(Cenitre i & States)FamiK Welfare
Investment (.All Dev. Heads) Ouutlay/Expd, %of2 Outlay E.xpd. %of2
! 2 3 4 5 61. First Plan
(1951-56)1960.00 65,20 3.33 0.10 0,01
2. Second Plan (1956-61)
4672.00 140,80 3.01 2.20 0,05
3. Third Plan(1961-66)
8576.00 225,90 2.63 24.90 0,29
4. Annual Plan: (1966-69)
6625.40 140.20 2.12 70.50 1.06
5. Fourth Plan (1969-74)
15778.80 335,50 2.13 284.40 1 80
6. Fifth Plan(1974-79)
39322.00 682,00 1.73 497 40 1.26
7. Annual Plar (1979-80)
U650 00 268,20 2.30 116.20 1.00
8. Sixth Plan (1980-85)
97500.00 1821 00 1.87 1010.00 1.04
9. Seventh Plaa (1985-90)
180000,00 3392,90 1.88 3256.30 1.81
10 Annual Plins 1990-91 & 1991-92
137033,55 2253.86 1.64 1805.52 1.32
11. Eighth Plan (1992-97)
434100.00 7582.20 1.75 6500.00 1.50
SOUtCE: PLANNING COMMISSION, DEPTT OF FAMILY WliELF.ARE
246

TABLE 3 S.8 Mid DeUveriea Ri
(Service daU for the year I99S 96 from 3S0 districts)
Deliveries Reported
staleEstimated
Pregnancies(Proportionate)
Numbers As »/. of Estimated
Preg
Total As • /. of Estimated
P regnancln
Institutional Deliveries As % of
total
By untrained personnel As “/ . of
total
By trained personnel As •/• of
total
Complicated cases
As • /. of toUl
1 2 3 4 5 ,6 7 8 9 10A P 960201 874237 90 29 600164 61 99 23 99 5665 19 76 174Arunachal 12300 4505 36 63 1977 1607 97.47 0 76 1,77 0.10A uam S9203I 406627 68.68 129995 21 96 3907 37.22 23.72 105BiharGoa
366%S Not Available
126173 3490 53668 14.60 15 36 64.49 20.15 04 9
CvJarat 314450 270909 8870 214502 68.21 35.28 57.72 7 01 4.34Haryana 27%70 246100 87.93 179381 64.09 11 11 66 03 22 86 1.47H P 92293 84481 91 54 60122 65.47 23 13 58 37 18 50 0 94
K 3809« 10683 2004 2710 7 11 99 70 23 76 1646 1.25K am aU lu 1U7675 1037968 87.39 711532 99,91 39 16 53 06 7.79 2.22Kerala 343600 253116 73.67 224113 65.22 96.64 0 79 2.57 090M P 15S4800 1351658 86.93 1016417 67.30 22.74 56 60 2066 0.82M aharashtra I607SOO 742430 46 19 1817457 113.06 6992 22.27 700 0.58M anipur 37630 59139 157 16 16436 43.68 67.04 26.30 5.87 1.01Meghalya 16350 11627 64.45 69U6 37.63 3565 29.97 3438 142Mezoram 18802 13533 71.98 12872 68 46 39 56 38 74 21 70 1.17Nagaland 15774 1284 8 14 506 3.21 71.74 19.96 8 30 0.00Orissa 643907
J'W 1 m m li.iS ̂4 4 ^ >A244730 iioi 20 76 57.92 2132 0.67
PuiOab ?!*»§• I78I0§ 7001 iii9d5 51.35 1995 6932 1073 2 46Rajasthan 597972 320076 53 53 178186 29.80 32 51 50 84 16.65 108SiUdm 1870 1135 60.70 1107 99.20 39 48 57,45 3.07 0 45rami! Nadu Iripura
110990 Not Available
1150570 103.72 967609 87.23 74 99 19 54 5.47 5.28
(1 1> 2967461 2519292 8490 2256005 76.03 12 29 80 18 7. S3 0 15W B 1596200 1019634 63 00 845804 52.92 41 62 28 74 29.59 1 09A & Nicobar 7800 3572 45.79 2605 33 41 66 58 13 32 20 11 3.68(handhifiar IV& N Havel
3193 Not Available
5306 166 19 2514 78.74 89 78 8 19 2.03 1 59
Daman & diu 2900 693 23 90 1729 99 62 23 66 50 14 26.20 0.12Delhi 253500 227447 89.72 110899 43,75 66 62 22 09 11 29 6.55l.aluuhdweep 730 729 99 86 673 94 25 48 11 46 95 4.94 4.94I'undiciurrv 5500 15666 204.04 11973 21769 91 79 4 16 4.05 0.93All India I4H587I«4 11272430 75.86 9N14962 66 05 39 87 47,53 12 58 1 42
SOI'H CK HKI'AKTMKN IO K KAMII.Y WKI.KAHK (199S 96)
247

TABLE 3.5.9
ESTIMATES OF INFANT MORTALITY AND CHILD MORTALITYCNATIONAL f a m il y h e a l t h su r v e y 1992-93)
NEONATAL PERINATAL INFANT CHILD UNDER FIVEStates MORTALITY MORTALITY MORTALITY MORTALITY MORTALITY
(NNMR) (PNMR) (IMR)1 2 3 4 5 6
MAJOR STATESAndhra Pradesh 45.3 25.0 70.4 22-4 91,2Assam 50,9 37.8 88.7 58.7 142,2Bihar 54.8 34.4 89.2 42.0 127,5Gujarat 42.3 26.4 68.7 37.9 104,0Haryana 38.4 34.9 73.3 27.4 98,7
Karnataka 45.3 20,2 65.4 32.5 87.3Kerala 15.5 8.2 23.8 8.4 32,0Madhya Pradesh 53.2 32.0 85.2 49.3 130,3Maharashtra 36.4 14.0 50.5 20.9 70,3Orissa 64.7 47.4 112.1 21.3 131,0
Punjab 31.2 22.5 53.7 15.0 68,0Rajasthan 37.2 35.4 72.6 32,3 102 6Tamil Nadu 46.2 21.5 67.7 20.1 »6 3Uttar Pradesh 59.9 40.0 999 46,0 141JWest Bengal 51.8 23.5 75.3 26,0 99.^India 48.6 29.9 78.5 33,4 109,3
NATIONAL FAMILY HEALTH SURVEY 1992-93
248

TABLE-3.5.10
EXPECTED LEVEL OF ACHIEVEMENTS BY 2002
si State/UT Infant Crude Neonatal it'k" ContraceptiveNo. Mortality Birth Mortality Prevalence
Rate* Rate* Rate Rate@ttTOIA 56-50 24-23 35 2 .9 -2 .6 51 -60
NATIONAL MATERNAL MORTALITY RATE TARGET-300 PER 100,000 LIVE BIRTHS
I. MAJOR STATES (Population 1 crore or more)1. Andhra Pradesh 60-55 20-18 35 2.3-2.1 55 -7 02. Assam 60 - 55 25-22 35 2.7 -2 .5 30 -4 03. Bihar 50-44 27-25 35 4 .0 -3 .0 30 -454. Gujarat 40 -35 2 2 -2 0 35 2 ,5 -2 .2 65 -7 55. Haryana 50-45 27-23 35 3.0-2 .5 6 0 -7 06. Karnataka 60 -5 0 21-20 35 2 .4-2 .1 6 0 -7 07. Kerala 10- 9 16-15 9 1 .7-1 .6 6 0 -7 08. Madhya Pradesh 80-70 29-25 50 3.5-2 .8 6 5 -6 59. Maharashtra 4 1 -3 6 2 0 -1 7 35 2 .5 -2 .2 6 0 -7 010. Orissa 90 -70 25-21 50 2,7 -2 .4 45 - 5511. Punjab 4 4 -4 0 21 -18 20 2 .5 -2 ,2 82-8512. Rajasthan 56-50 28-24 40 3 5 -3 ,0 40-5013. Tamil Nadu 39-35 18-16 20 1.9- 1 7 6 0 -7 014. Uttar Pradesh 7 5 -6 0 30-26 40 3 8 -3 ,4 50 -5 515. West Bengal 51 -46 24 -2 0 30 2 ,6 -2 4 4 5 -5 5
>49

EXPECTED LEVEL OF ACHIEVEMENTS BY 2002
TABLE-3.5.10 (Concld.)
SINo.
State/UT InfantMortality
Rate*
CrudeBirth
Rate*
NeonatalMortjilityRate
TFR* ContraceptivePrevalence
Rate@
INDIA 56-50 24-23 35 2 .9 -2 .6 51 - 60
NATIONAL MATERNAL MORTALITY RATE TARGET--300 PER 100,000 LIVE BIRTHS
E. SMALLER STATES/U.T.s1. Arunachal pradesh 50 -4 5 2 2 -2 0 4 .0 -3 .0 3 0 -4 02. Delhi 2 4 -2 0 18-16 2.5 -2.2 4 5 -5 03. Goa 10- 9 14-12 1,6-1.5 4 5 -5 54. Himachal Pradesh 50 -4 5 2 2 -2 0 35 2 .5 -2 .3 6 0 -7 05. Jammu & Kashmir 50 -4 5 2 7 -2 4 2 .7 -2 .5 3 0 -4 06. Man) 2 4 -2 0 18-16 2 .4-2 .1 30 -4 07. Meghalaya 4 0 -3 5 2 5 -2 3 2 .8 -2 .5 30 -4 08, Mizoram 2 4 -2 0 18- 16 2.4-2 .1 55 -6 59. Nagaland 8 - 5 16-15 2 .6 -2 .4 30 -3 510. Sikkim 4 0 -3 5 18-17 2.4-2 .1 30 -4 0n . Tripura 4 0 -3 5 18 -1 6 2.4-2.1 3 0 -4 012. A&N Islands 2 4 -2 0 16-15 2 .0 - 1.8 50 -5513. Chandigarii 4 0 -3 5 15 -14 2 .0 - 1.8 50 -5514. D&N Haveli 5 5 -5 0 2 6 -2 5 2 ,5 -2 .0 45 - 5015. Daman & Diu 2 4 -2 0 18-16 2 .0 - 1.8 4 0 -5 016. Lakshadweep 2 4 -2 0 2 2 -2 0 2 .2 -2 .0 30 -3517. Pondicherry 18-16 18-16 1.9- 1.7 7 0 -8 0Note: A minimum of 30% CPR is aimed at by all State/UTs* Lower levels indicate expected achievements with additional RCH inputs upper levels indicate expected achievemnets if current trend continues
@ Upper levels indicate expected achievements with additional RCH inputs lower levels indicate expected achievemnets if current trend continues
SOURCE: DEPTT OF FAMILY WELFARE
250

TABLE 3.5.11
EXPECTED LEVELS OF ACHIEVEMENTS IN SOME PROCESS INDICATORS B Y 20()2
SI India and
No Major States
Ante-natal
Care
(ANC %)
Institutional
Deliveries
»/n
Deliveries
Attended
by trained
personnel
Fully Immunised(%)
Children Pregnant
Woman(TT)INDL\ 90 35 45 65 95
1 Andhra Pradesh 952. Assam 753. Bihar 754. Gujarat 905. Haryana 906. Himachal Pradesh 907. Karnataka 928 Kerala 999. Madhya Pradesh 7510. Maharashtra 9211. Orissa 8512. Punjab 9513. Rajasthan 7514 TarhilNadu 9915. Uttar Pradesh 7516. West Bengal_______________90
45-5025-3017-2532-1030-3527-3548-5595-9620-2545-5017-25 20-2518-25 65-70 16-25 38^5
40-4538-4538-4550-5560-6550-5540-15
4-540-1540-1542-5060-7040-1525-3050-5535-15
72-8060-6556-6070-7560-6560-6580-8580-8570-7580-8570-7575-8060-6570-7560-6560-65
98 75 75 95 95 95 9799 85 97 90 97 75 99 85 95
SOURCE DEPTT OF FAMILY WELFARE
251

TAHLE 3.5.12
OUTLAY AND EXPENDITURE - DEPARTMENT OF FAMILY WELFARE(Rs. in CTCffe)
Scheme 8ihOutlay
1992-93Outlay Expd.
1993-94Outlay I'xpd.
1994-95 Outlay Expd.
1995-96Outlay Expd,
1996-97Outlay RE
1 2. 3. 4. 5. 6. 7. 8. 9, 10, 11, 12.1 Services and Supplies 3086.00 462.87 557.68 516.87 672.97 516.30 743.29 565,55 742,88 575,90 575.90
2 Training 59,00 8 85 9.76 8,70 8.80 9,20 9.16 9,22 13,95 9,95 9,95
3 11' C 127.(K) 19,00 18.85 25.00 22.95 30.00 22.58 33,50 29,02 43.00 43.00
4 Research & Evaluation 89,00 13,38 14.19 12.98 14,24 1655 18.20 16,52 15,71 19,50 19.50
5 M C H 1982 00 297.35 333.84 322.75 .377,83 354.10 517.88 429,10 585,52 559.10 545.10
6 Organisation 71,00 10.70 15,07 10.95 15,80 11.30 -14.29 11.61 15,25 12.60 12.60
7 VIIG Schemc 140,00 21.00 21.00 21.00 13.93 10.00 13.32 10.00 14,75 10.00 10.00
8 Area IVojects 400,00 60,00 73,66 70,00 149.08 250.00 148.81 250.00 172,42 195.00 190,00
9 SSN Scheme 34,00 - 45.00 40.00 31,01 45.00 34,32 45.00 0,00 1.00 0.00
10 USAID hi>|ccl m lir - - 1,(X) 30.00 6(KJ 30.(X) 0(X) .30,00 12,95 4000 31.(X)
11 Arrears 5t)0,(K) 1.(X).00 100.00 210.00 210.00 150.00 150,00 141,00 141 00 20.(X) 62.00
12 New Irututixcs 12.(X) 6.85 0..35 1.75 0.00 7 55 0,00 . .39,50 0.00 48.95 47,95Total 6500,(X) lOOO.tX) 1190.40 1270.00 1522.61 14,30.(X) 1671,85 1*̂ 81 (» 1743.45 1535.00 1547.00
souRci:: r o r f a m u .y w i;l f a i Î'
252

YEAR WISE ESTIMATED REQUIREMENT OF VACCINES. VTT-A' AND IFA TABLETS
TABLE 3.5. D
PROJECTEDPOPULATION
(*)
NO. OF BIRTHS
(SS)
NO. o r PREGNANT
WOMENm
CHILDREN (0-4) YRS.
REQUIREMENT OF VACCINES aX)SES)
FIGURES IN MILLIONS
PROPHYLACTIC PROGRAMMESTT
PREGNANTWOMEN
v n . A (DOSES)
NUTRITIONAL ANAEMU AMONG
WOMEN aFA Tableti)1 2 3 4 5 6 7 8 9 10 11 12 U
19W 934.22 25.60 28.16 119.55 29.44 99.83 88.31 34.56 286.91 56.31 153.59 5631.47
1997 949.88 26.03 28.63 116.13 29.93 101.50 89.79 35.14 278.70 57.26 156.16 5725.86
1998 965.61 26.46 29.10 1U.32 30.43 103.18 91.28 35.72 271.98 58.21 158.75 5820.68
1999 98U 2 26.89 29.58 111.13 30.92 104.86 92.76 36.30 266.70 59.15 161.33 5915.42
2000 996.94 27.32 30.05 109.73 31.41 106.53 94.24 .36.88 263.34 60.10 163.90 6009.58
2001 1012J9 27.74 30.51 108.49 31-90 108.18 95.70 37.45 260.39 61.03 166.44 6102.66
TOTAL (1997-2001) 154.59 524.27 463.78 181.48 1J41.11 295.74 806.57 29574.21
• BASED ON THE REPORT OF THE TECHNICAL GROUP ON POPULATION PROJECTIONS CONSTITUTED BY PLANNING COMMISSION (AUGUST 19%)
M BASED ON 1996 SRS BIRTH RATE m FEOTAL WASTEAGE ASSUMED -10%
CHILDREN (0-4) YEARS ARE AS PROJECTED IN THE REPORT OF THE TECHNICAL GROUP
REQITIBEHEMT OF VACCINES CAIXHUATED ON THE BASIS OF ESTIMATED NO. OF BIRTHS ASSUMED WASTAQCS : BCG-15%, POLI0-30«, DPT-15%, MEASLES-3S«, PPIP-20%BEQUIBEUENT OF VIT.A - 6 DOSES PER CBIIDREQUIREMENT OF IFA TABLETS - 200 TABLETS PER PREGNANT WOMMV
253

Strengths o f the system are:□ There are over 6 lakh ISM&H practitioners Q The practitioners serve
slums□ They are accepted by the community
in remote rural areas/urban
Problem s are:□ Training institutes lack well qualified teachers and
quality o f training is not o f requisite standard Lack o f essential stafT, infrastructure and diagnostic facilities in secondary/tertiary care institutions Potential o f ISM&H drugs & therapeutic modalities is not fully exploitedExisting ISM&H practitioners are not flilly utilised to improve access to health care
□
□
3.6 Indian Systems o f M edicine and Homoeopathy
3.6.1 The Indian Systems o f Medicine and Homoeopathy consist o f Ayurveda, Siddha. Hnani and f ioinoeopathy, and therapies such as Yoga and Naturopathy. Some o f these systems are indigenous and others have over the years become a part o f Indian tradition. It
I n d i i ^ y s t e m s o f M e d ic in e * Hom eopathy estimated that there are over 6 lakhISM&H practitioners in the country. Many o f them work in remote rural and urban slum areas and thus, could play an important role in improving the quality and outreacho f health care. These practitionersare close to the community, not only in the geographical sense but in terms o f cultural and social ethos. The cost o f care is affordable and hence these systems have wide acceptance among all segments o f the population. The National Health Policy visualised an important role
for the ISM&H practitioners in the delivery o f health services. Measures to popularise and develop Indian Systems o f Medicine & Homeopathy have been vigorously pursued during the Eighth Plan. In order to give focussed attention to the development andoptimal utilisation o f ISM&H for the health care o f the population, a separate Departmentfor ISM&H was set up in 1995.
Approach during the Ninth Plan
3.6.2 The Approach during the Ninth Plan period will be to:
1. improve quality o f primary, secondary and tertiary care in ISM&H;
2. invest in human resource development for ISM&H so that there is a markedimprovement in the quality o f services provided by these practitioners;
3. preserve and promote cultivation o f medicinal herbs and plants;
4. complete the Pharmacopoeia for all systems o f ISM&H; drawing up a list o f essential drugs belonging to these systems
5. encourage Good Manufacturing Practices (GMP) and ensure quality control o f drugs.
6. promote research and development (R&D) especially on new drugformulations, clinical trial o f promising drugs through strengthening o f theCentral Research Councils and coordination with other researchagencies. Special emphasis will be laid on encouraging research aimed at improving ISM&H inputs in National Health Programjnes.
254

Primary Health Care
3.6.3 Physicians belonging to ISM&H provide primary health care to vulnerable population especially those residing in urban slums, and remote rural and tribal areas. There are 21632 dispensaries in ISM&H (Table 3.6.1). In States like West Bengal and Gujarat, ISM&H practitioners are also being posted as the only Medical Officer in Primary Health Centres. In States like Kerala, ISM&H practitioners are posted in PHCs, in addition to the physicians belonging to the modem system o f medicine. They both work together and provide complementary health care under both systems in PHCs. Majority of ISM&H practitioners in urban and rural areas are private practitioners and provide primary health care. During the Ninth Plan there will be increasing utilisation of ISM&H practitioners working in Government, voluntary and private sector vu care services.
Operational strategy for the Ninth Plan
The focus w ill be on:□ Strengthening o f educational institutes o f
ISM&H to ensure improvement in the standard o f research and teaching in all the systems o f ISM&H
□ Preservation & promotion o f cultivation o f medicinal herbs and plants
□ Completion o f the pharmacopoeia for all systems o f medicine
□ Drawing up a list o f essential drugs and initiating steps to improve their availability at affordable cost
□ Ensuring quality control o f drugs used and
□ research & development o f drugs, testing and patenting them.
order to improve the outreach of primary health
Secondary Health Care3.6.4 Majority o f existing ISM&H facilities at secondary care level function as separate institutions and do not have linkages with either primary health care institutions in ISM&H or with secondary health care institutions in modem system o f medicine. Very often these institutions lack adequate diagnostic facilities and have inadequate infrastructure and manpower. During the Ninth Plan the feasibility and usefulness o f posting ISM&H practitioners in District Hospitals will be explored as pilot projects to see how' these efforts in providing complementary system o f health care to patients in these hospitals are utilised by the patients and at the same time enable patients opting for ISM&H treatment to get the benefits o f diagnostic facilities available in secondary care institutions.
Tertiary Health Care3.6.5 All the ISM&H Colleges and Institutions in private/government sector have attached tertiary health care hospitals. In addition, there are tertiajy care and/or speciality Centres attached to National Institutes. Private/voluntary sector institution also provide tertiary health care in ISM&H. Majority o f tertiary care institutions lack essential staff, infrastructure and diagnostic facilities. During the Ninth Plan, efforts will be made to improve tertiary care institutions especially those attached to ISM&H Colleges and National Institutions so that there will be simultaneous improvement in teaching, training. R&D and patient care.
D evelopm ent o f Human Resources for ISM&H
3.6.6 Physicians in ISM&H broadly belong to one o f the two categories:(l)those trained in the traditional manner in ISM&H (e.g., Vaids and Hakims) and (2) those who have gone through the educational mstitutions in ISM&H and have obtained their degrees.
25.5

3.6.7 During the last five decades there has been a progressive increase in the number o f physicians who are qualifying through educational institutions in ISM&H. At present it is reported that there are 329 ISM&H colleges in the country. It is estimated that about 11,000 health care providers graduate in the system every year (Table 3.6.1). Available information indicates that the quality o f training provided in a majority o f ISM&H colleges is sub-optimal. The training institutes often lack well qualified teachers; the quality o f education provided especially the practical training in patient management, is often not o f requisite standard because o f lack o f adequately staffed hospitals providing care to patients according to the guiding principles o f different systems o f ISM&H.
3.6.8 During the Ninth Plan period there will be efforts to improve human resource development for ISM&H through: creation o f an appropriate mechanism for quality assurance in educational process in ISM&H educational institutions; strengthening the infrastructure in ISM&H colleges and National Institutes o f ISM&H to ensure improvement in the uniformity o f standard o f teaching in all the systems o f ISM&H; creation o f appropriate mechanism for funding the Government educational institutions so as to ensure quality and relevance o f training in ISM&H colleges; promoting Continuing Medical Education for all practitioners o f ISM&H
3.6.9 During the Ninth Plan attempts will be made to ensure that ISM&H colleges are strengthened/ monitored so that the manpower produced does have essential skills to tackle health problems in urban and rural areas. The Department o f ISM&H has selected 40 institutions for organising re-orientation training for teachers and physicians o f ISM&H.
Quality Assurance in Education in ISM&H3.6.10 It is essential to have appropriate regulations and agencies for implementing these regulations in order to ensure that quality of education is maintained. The Central Council o f Indian Medicine (CCIM). a statutory body constituted in 1970 and the Central Council o f Homoeopathy (CCH) constituted in 1973 are responsible for laying down and maintaining uniform standards o f education for Courses in Ayurveda, Siddha and Unani and Homoeopathy, regulating the practice in Indian Medicine and prescribing standards o f professional conduct, etiquette and code of ethics for practitioners and advising the Central Government in matters relating to recognition o f appropriate qualifications of Indian Medicines and Homoeopathy. These Councils also maintain Central Registers for Indian medicine and Homeopathy respectively. These central professional bodies work in coordination with State Board/Councils in maintaining the standard o f medical institutions o f ISM&H in the respective States. However, the monitoring procedures and schedules are not adequate. The recommendations of CCIM and CCH are often not acted upon. A system of periodic monitoring by an accreditation committee will be worked out and implemented during the Ninth Plan. Periodic inspection and certification will later be made mandatory' for the recognition o f the institutions.
3.6.11 In order to improve the manpower development in ISM&H it is important to ensure uniformity in entr\' standards, and uniformity in the curricula. It is imperative that the condition o f hospitals where the students leam the essential clinical care are improved so that appropriate clinical training is given. The focus during the Ninth Plan will be over ensuring quality and relevance o f the undergraduate training and over improving clinical skills through a period o f internship with possible multi- professional interaction.
256

3.6.12 Under the Department o f ISM & H, some Instittutes are being developed as Centres o f Excellence such as National Institute o f Ayurvecda, Jaipur; National Institute o f Homoeopathy, Calcutta; Institute o f Post-Graduate Te:aching & Research in Ayurveda, Gujarat Ayurved University, Jamnagar.
3.6.13 These institutions will be strengthened during thie Ninth Plan so that they act as centres o f excellence in teaching, service delivery and R^&D.
Para-professionals in ISM«&H3.6.14 Currently there are no arrangements in the Depairtment for a degree or diploma in pharmacy nor is ISM&H pharmacy included as one 0)f the options in general pharmacist course. There are no nursing trainees in ISM&H. Theste areas need to be looked into and the lacunae rectified during the Ninth Plan.
Continuing Medical Education in ISM&H
3.6.15 Majority o f the ISM&H practitioners have qualiified from recognised Institutions and could be utilised for delivery o f primary health caxre. Most o f these practitioners are in the private sector and require periodic updating o f the knowledge and skills through continuing medical education courses. It is also imiportant to provide ISM&H practitioners with sufficient knowledge o f the ongoing national health programmes so that they could provide necessary counseling and act as depot holders for selected items such as condom and ORT packages. Increasing the involvejment of ISM&H practitioners in counselling and improving the utilisation of services und<er the National Health and Family Welfare programmes are envisaged during the Ninth Plan period. The ISM&H practitioners will strengthen (i) health education, (iii) drug distribution for national programmes, (iii) motivation for family welfare, (iv) mottivation for immunisation, and (v) improvement in environmental sanitation. Necessary curricular changes will be introduced in graduate and CME courses, and apprcopriate course contents will be developed so as to design learning experiences related to> expected task performance. The CME programme may be linked to a system for periodic recertification o f practitioners as a part o f efforts to ensure quality o f care.
Preservation and Promotion of Cultivation of Medicinall Herbs and Plants
3.6.16 With the new thrust for ISM&H, there will b>e an increasing demand for drugs used in these systems. Over the last two decades the ciultivation o f medicinal plants and herbs have been unable to meet the increasing demands. Several medicinal plants are no longer available at affordable cost. Some o f the speciies o f medicinal plants are also reported to be endangered because of increasing pressure o n the forests.
3.6.17 The Department has initiated a scheme for development and cultivation o f medicinal plants. The objective o f the scheme is to augmient the production o f raw herbs o f plant origin by providing Central assistance for their cultivation and development . In addition, during the Eighth Plan period several States such as Himachal Pradesh have also set up herbal gardens and linked them to production units, o f drugs for ISM&H. There is a need to create such herbal farms in public, private and jioint sector to ensure that the essential plants and herbs o f appropriate quality are produced in adequate quantity to meet the demands and the cost of drugs is maintained at affordable levels. Use o f appropriate biotechnological tools for preservation and propagation of irmportant medicinal plants have to be taken up. Inter-sectoral co-ordination with Department's o f Biotechnology, Horticulture
National Institutes in ISM&H
257

and Medicinal & Aromatic Plant Research Institutions are important for ensuring that appropriate herbs are grown taking into account agroclimatic conditions. The Department has utilised three gene banks (at Delhi, Lucknow and Trivandrum) under the Department o f Bio- technology to store 2000 species o f medicinal plants (Germ plasm) required for ISM«fcH drugs.
3.6.18 At the village level, cultivation o f medicinal plants through appropriate utilisation o f waste land will have to be undertaken with active collaboration o f agriculture Department, Krishi Vigyan Kendra and Department o f Rural Development.
Pharmacopoeial Standards3.6.19 Pharmacopoeial standardisation o f Ayurveda, Siddha and Unani Medicine, both for single and compound drugs, is essential. The Department had taken up the task o f developing Pharmacopoeial Standards through Pharmacopoeia Committees. Four Pharmacopoeial Committees are working for preparing official formularies/pharmacopoeias to maintain uniform standards in preparation o f drugs o f Ayurveda, Unani, Siddha and Homoeoapathy and to prescribe working standards for single drug as well as compound formulations. The Pharmacopoeia Committees in Ayun/eda, Siddha, Unani and Homoeopathy are headed by experts in their respective fields,
3.6.20 Pharmacopoeial Laboratory for Indian Medicine,Ghaziabad, was established in 1970 as standards setting-cum-drug testing laboratory for ISM at the National level. The standards worked out are published in the form of monographs. During the Ninth Plan period the ongoing pharmacopoeial work, development o f pharmacopoeial standards, listing essential drugs and formulations will be completed expeditiously . The work o f pharmacopoeial laboratories attached to the Department will be supplemented by laboratories o f CCRAS and university/college departments o f Chemistry and Biochemistry. Strengthening o f State Drug Testing Laboratories will also be taken up to ensure quality o f drugs used in ISM&H. In addition GMP for production o f drugs o f good quality and strengthening o f quality control laboratories will be encouraged .
Research and Development (R<&D)3.6.21 There are four Research Councils in ISM&H; these are Central Council for Research .in Ayurveda and Siddha (CCRAS); Central Council for Research in Unani Medicine (CCRUM); Central Council for Research in Homoeopathy (CCRH); and Central Council for Research in Yoga and Naturopathy (CCRYN). These Councils initiate, aid, guide, develop and coordinate basic and applied research, medico-botanical surveys, research on the cultivation o f medicinal plants and pharmacognostical studies. These Councils are the apex bodies for research in the concerned systems o f medicine and are fully financed by the Government o f India.
3.6.22 The Central Research Councils' R&D programmes will be strengthened during the Ninth Plan period, if necessary, by reorganisation and by providing adequate infrastructure and resources. These Councils will also collaborate with outside research institutions and research funding agencies as well as universities.The major focus will be on developing new drug formulations. These, as well as formulations traditionally used in ISM&H for treatment o f illnesses for which there is no effective remedy in modem system o f medicine will be tested for safety and efficacy. Clinical trials will also be undertaken in formulations traditionally used in tribal societies and reported as being effective.
258

3 6 23 Formulations found useful will be patented. The Department has established a Patent Cell to keep track o f patents being filed in India and other parts o f the world with respect to Ayurveda, Siddha, Unani drugs and to extend professional and financial assistance to Government/Private scientists in the ISM&H sector in connection with filing of patents An Expert Group has been constituted for rendering advise to the Department with regard to the Patent issues relating to ISM&H This will receive increased attention in the Ninth Plan. The potential contribution o f drugs and formulations from ISM&H to meet the national as well as global demands for safe and effective drugs will be fiilly exploited Drug safety and pharmacopoieal standards setting will receive due attention. Preventive and curative role o f Yoga and Naturopathy in life style related disorders will be fully investigated and utilised
Outlays and Expenditure
3 6 24 The outlays and expenditure during the Eighth Plan period are given in Table 3 6 2. During the initial four years there was underutilisation o f the hands provided However in the last year, after the establishment of the Department of ISM&H, utilisation of funds has markedly improved
3 6.25 The strength o f ISM&H lies in the fact that the practitioners serve in private sector even in remote rural areas and urban slums Strengthening o f undergraduate and post graduate training in ISM&H, establishment of speciality clinics in major hospitals, standardisation of drugs, enhancing availability o f raw materials, research and development and lEC are some of the major areas o f input by the Deptt o f ISM&H at the national level, they will continue to be the focus during the Ninth Plan Development o f human resources and establishment o f speciality clinics are activities that take time and have to be achieved in phases Taking all these factors into consideration an outlay o f Rs 266 35 crore has been provided to the department o f ISM&H for the Ninth Plan period The outlay for the Annual Plans will be adjusted depending upon the requirements o f the department and availability o f the ftmds The State Governments will be making necessary provisions for development of ISM&H in their budget
259

EXISTING FACILITIES UNDER THE INDIAN SYSTEMS OF MEDICINE AND HOMOEOPATHYAS ON 1.4.1996
Table 3.6.1
Sr. No. Facilities Ayurveda Unani Medicine Siddha Homoeopathy Total
1 Hospitals 21768 185 122 338 28232 Beds 30653 3596 1636 9288 451733 Dispensaries 13655 975 334 6668 216324 Reg. Practitioners 35041B 41592 12528 171298 5758345 Colleges 15(0 31 2 146 3296 Admission Capacity 594-1 1217 155 4519 11832
(2220) (2220)
Note Figures shown in the brackets are iadmission capacities in respect of Diploma Courses, otherwise the admission capacity is for Degree Courses.
Source : Department of ISM&H
260

Table 3.6.2
OUTLAY AND EXPENDITURE OF DEPARTMENT OF ISM&H(Rs. In Crores)
Programme/ 8th Plan 1992-93 1993-94 1994-95 1995-96 1996-97 8th PlanScheme Outlay Outlay Actual Exp. Outlay Actual Exp. Outlay Actual Exp. Outlay Actual Exp. Outlay Actual Exp. Allocated Released1. Medical Education Institutes 30.00 4.60 4.27 6,25 4 35 6 16 3 69 6 16 4,84 6,37 6,96 29.54 24,112 Reseach Intltutions 33.00 5.07 5.93 6.10 4.27 8.10 6,74 8 40 9,82 8,45 9.70 36.12 36,463. Statuary Institutions 1.00 0.15 0.00 0.30 0.82 0 42 0,09 0,50 0,28 0,50 0.50 1.87 1,694 Other Programme/Schemes 15.00 3.88 2.86 5.75 6.50 0.27 6 09 6,13 6,12 5,51 3.20 21.54 24,775 Strengthening Pharma. Labioratories/committees
7.50 1.30 0.42 2,80 0.16 1.15 0 25 1,37 0,33 1,62 1.10 8,24 2,26
6. Investment in Public Sector/ State Govt, Pharmacies of ISM&H
0.00 0 10 0.10 0,05 0.00 0.10 0,00 0,10 0 00 0,01 1.00 0 36 1,10
7, Strengthening of Deptt. Of ISM&H 1.50 0.00 0.00 0,00 0.00 5.00 0,03 0 53 0,61 0,73 0.73 6,26 1,378 New Schemes 0.00 0.00 0,00 0 00 000 OOC 0,00 0 00 0,00 0,00 0 00 000 0,00
Total 88.00 15.10 13.58 21.25 16.10 21 20 16,89 25,19 22,00 25 19 23.19 103,93 91,76
Source Department of ISM&H
261

3.7 HOUSING URBAN DEVELOPMENT WATER SUPPLY AND CIVIC AMENITIES
Perspective and Objectives3.7.1 The level o f urbanisation was around 11 to 12 per cent during the first three decades o f this century, increasing noticeably in the decade o f independence and rising continuously thereafter from 17.3 per cent in 1951 to 25.7 per cent in 1991. The projected scenario indicates a rising trend. The Planning Commission's Technical Group on Urban Perspectives and Policies has projected the urban population at 31.0 per cent o f the total population in 1996-97 and 38.0 percent in 2006-07. During the last four and half decades, some 5-6 million people have been added to urban India every year. The country has one o f the largest urban systems with 217.6 million people in 1991, which is projected to increase to 289 million in 2001 and around 605-618 million during 2021-2025. There will be about 40 metro cities in the country in 2001 as against 23 in 1991.
3.7.2 The slow-down in urbanisation during 1981-91 as compared to 1971-81 (36.4 per cent growth as against 46.1 per cent) and the growing concentration o f urban population in larger towns are other urban concerns, towards which the Ninth Plan strategies will be directed. The tasks are challenging, for it is mainly in the mega and metro cities that land is a major constraint for undertaking development work. A large part o f civic amenities, particularly water supply, sanitation and sewerage, are managed with assets that have outlived their operational efficiency The required massive upgradation and renovation o f these assets, is constrained by high population density and concentrated commercial activities at the locations where these service assets are installed. The lack o f comprehensive urban planning in the past to promote regular upgradation and renewal has resulted in a large backlog o f development activities.
3.7.3 The key urban concern is the growmg gap between demand and supply o f basic services. While there has been a steady growth in the housing .stock, infrastructure and services, the gaps between demand and supply have been rising, even in terms o f conservative norms. It is now well-recognised that these gaps are unlikely to be bridged over the next 5 to 10 years. Many goals o f housing, potable water and sanitation that were to be attained by 2001 AD. may require the target point fixed 10-15 years ago to be extended.
3.7 .4 In the m ids t o f g ro w in g urbanisa tion, India, nevertheless, cont inues to live in her v i l lages . A s m a n y as 629 m il l ion peop le live in som e 580,706 vil lages, w h ich w ork s out to an a v e r a g e o f 1.083 per vil lage. Rural popula t ion density is low at an ave ra ge o f 214 pe r so n s per sq .km. which br ings out the rural deve lopment chal l enges in terms o f p ro v i s io n o f h u m an se t t lements- re la ted ser\ ' ices o f potable water, sanitat ion , and access to l i \ e l i h o o d prog ram mes . Increased per capita cos t o f the services . Ope ra t ion and M ain tenance ! O & M) logistics and recove ry o f inves tment are priority concerns .
3.7.5 T h e rural h inter land has p l ayed a critical role in sus taining urbanisa t ion. This is rc t l e c ted in the indicators o f sources o f p r im ar \ inputs, compet i t ive ly priced labour for urban e c o n o m i c activities, pr im ary funds as ref lected in compara t ive urban and rural c r ed i t -d epos i t ratios and market for urban products But the unending mig ra t ion o f the rural p o o r to uriian areas m ay h a \ e a des tabi l i s ing effect on urbanisa t ion and its sus ta inabi l i ty . Income and e m p lo y m e n t oppor tuni t ies will h a \ e to rise in the rural areas, t h ro u g h both '.he farm and n o n-f a rm sectors and habi tats and basic services have to be
262

improved so that with rural development and congenial habitats, rural areas emerge as sustainable centres o f economic activities and human settlements.
3.7.6 The rural-urban continuum would be strengthened so that gaps between rural andurban lifestyles are reduced. Effective urban strategies and programmes cannot bedeveloped in isolation o f those in the rural areas. The Ninth Plan will take cognisance o f this ground reality, particularly in respect o f three critical components o f human settlements development, namely, drinking water, sanitation and housing.
3.7.7 In this perspective, the major sectoral objectives o f the Ninth Plan are;
* Development o f urban areas as economically efficient, socially equitable andenvironmentally sustainable entities;
* Accelerated development o f housing, particularly for the low income groups and other disadvantaged groups;
* Development and upgradation o f urban infrastructure services to meet the needs o f a growing population;
* Alleviation of urban poverty and unemployment;
* Promoting accessibility and affordability o f the poor to housing and basic services;
* Promoting efficient and affordable mass urban transportation systems in metropolitan cities;
* Improvement o f urban environment;
* Promoting private sector participation in the provision of public infrastructure and o f the community and NGOs in urban planning and management o f specificcomponents of urban services; and
* Democratic decentralisation and strengthening o f municipal governance.
Performance Review, Policies and Strategies
3.7.8 The total Plan outlay in the 46 years o f planning has been Rs.8,580 crore on urban development, Rs. 10,430 crore on urban housing, Rs. 15,100 crore on urban water supply and sanitation, and Rs. 19,300 crore on rural water supply and sanitation.
3.7.9 The performance review o f the Plan programmes has brought out some o f the operational problems. The activities were determined by the availability o f funds, which is a common constraint in a resource-scarce economy. This resulted in inadequate coverage o f the population and encouraged a top-down approach, with the plans being formulated at the national level on the basis o f feedback from the States, with marginal inputs from the functionaries directly working at the grass-roots level. At times, ad-hoc interventions were made, driven often by political and administrative expediencies rather than economic considerations and the ground situation. This has resulted in multiplicity o f programmes with varying components directed to the same target group and lack o f convergence or proper coordination, sequencing and linkages among them. There has also been poor feedback o f experiences from the field to provide the critical ingredients for a peoples-
263

Development o f urban areas as economically efficient, socially equitable and environmentallysustainable entities;Accelerated development o f housing, particularly for the low income groups and other disadvantaged groups;Development and upgradation o f urban infrastructure services to meet the needs o f a growing population;Alleviation o f urban poverty and unemployment;Promoting accessibility and afordability o f the poor to housing and basic services;Promoting efficient and affordable mass urban transportation systems in metropolitan cities; Improvement o f urban environment;Promoting private sector participation in the provision o f public infrastructure and o f the community and NGOs in urban planning and management o f specific component o f urban services; and Democratic decentralisation and strengthening o f municipal governance.
M ajor sectora l object ives o f the Ninth Plan :
centred and people-oriented planning. The policy framework under the Constitution (73rd and 74th Amendment) Act provides an opportunity to shift the approach in the Ninth Plan.
3.7.10 Some estimates are available on the magnitude o f work ahead. In terms o f financial indicators, the investment for urban housing has been estimated at Rs.526,170 crore and for rural housing Rs. 172,930 crore between 1997 and 2021 for new housing, upgradation and extension,Rs.70,300 crore to Rs.307,500 crore for different types o f urban drinking water systems with the investment being higher' for surface than for ground water system. A large part, in some cases, more than one-half, will be the backlog o f investm ent(l). In a shorter term perspective o f 1997-2002, urban housing investment has been estimated at Rs. 121,370 crore and for urban water supply at Rs. 26,300 crore and for rural water supply at Rs. 40,000 crore (2).
3.7.11 In terms o f reach-out indicators, new housing stock required is about 9.0 million units in urban areas and 7.7 million units in rural areas during 1997-2002 and about 77.0 million and 63.0 million units in the longer term perspective, extending upto 2021. Housing upgradation has to cover about 7.5 million units and 20.0 million units in urban and rural areas, respectively, during the Ninth Plan period. As regards drinking water, the aim is to cover the total urban and rural population with existing norm and then take up qualitative and quantitatve upgradation. Total conversion o f dry latrines into low- cost wet latrines is the immediate task in urban areas.
Water Supply and Sanitation
3.7.12 Drinking water supply and sanitation facilities are very important and crucialforachieving goal o f 'Health for AH' . The Government is committed to provide drinking water to every settlement in the countr>’ within 5 years. The Government has also decided to go all out to achieve the goal o f expansion and improvement o f sanitation facility along with other social infrastructure.
1 Government o f India (1996), Second United Nations Conference on Human Settlements (Habitat II), National Report, Ministry o f Urban Affairs & Employment.
2. Planning Commission (1996), Reports o f Ninth Plan Working Groups.
264

Performance Review
Drinking Water (Urban)
3.7.13 In the initial period of planning, from the First to the Fifth Plan, the outlay on urban drinking water was considered substantial with respect to the size o f the urban population (17.3 to 19.9 per cent) but thereafter, the thrust in the Plan programme was diverted to rural water supply and
Drinking water supply and sanitation facilities are very important and crucial for achieving goal of ‘Health for AH’. The Government is committeed to provide drinking water to every settlement in the country within five years. The Government has also decided to go ail out to achieve the goal of expansion and improvement of sanitation facility.
sanitation, inspite o f the rapidly increasing proportion o f urban population which was 23.3 per cent at the time o f the Sixth Plan and 25.7 per cent at the time o f the Eighth Plan. The proportion o f this sector's outlay to total public sector plan outlay marginally increased from1.28 percent to 1.38 per cent between the First Plan ( 1951-56) and the Eighth Plan (1992-97). The likely expenditure in the Eighth Plan was about Rs. 7,000 crore. In terms o f the Seventh Plan expenditure, the Eighth Plan expenditure was 274 per cent in nominal terms.
3.7.14 The task in the Eighth Plan was to increase the coverage of access to safe drinking water to about 94 per cent o f the urban population from 84 per cent at the end o f Seventh Plan and o f urban sanitation services to 69 per cent from 48 per cent. While the full feedback on coverage is not available, it has been estimated that in terms o f estimated 1997 population, the coverage of urban population is unlikely to increase from the level attained in the Seventh Plan. Adequate investment would be needed to meet the requirements o f incremental population for drinking water and sanitation services.
3.7.15 The programme review has brought out the concentration o f efforts on State capitals and other major cities and on augmentation and improvement, without any significant additional population coverage, resulting in the efforts being absorbed by population growth. The participation o f financial institutions and the private sector was not significant, particularly due to the absence o f cost recovery, appropriate tariff rate policies and lack o f fiscal and monetary incentives.
3.7.16 In this perspective, a new programme was launched in the Eighth Plan for urban water supply, namely the Accelerated Urban Water Supply Programme (AUWSP), which was targetted to small towns (population less than 20,000, 1991 Census) as these towns had been excluded earlier,had encountered severe problems of water scarcity and the revenue base o f the urban local bodies in these was weak. The AUWSP was launched in 1993-94 with a modest outlay of Rs.50 crore, with envisaged funding by Central and State Goverrmients in the ratio o f 50:50. Out of the 2,151 eligible towns (1991 Census), project reports were approved by the Central Ministry for 227 towns for an estimated cost o f Rs.218.50 crore and Rs. 68.62 crore was released to State Governments upto March 31, 1997. The progress was modest, partly because the scheme was launched only in March, 1994 and there were delays in the acquisition o f land, change o f water sources, procurement o f materials and equipments, submission of timely physical and financial reports by States and release o f flinds by the State Governments to the implementing agencies. These teething problems would be resolved and the activities should go on full stream in the Ninth Plan
265

3.7.17 The Plan investment diuring the eight Plans for rural water supply as a proportion o f public sector Plan, has gone up from 0.15 per cent to 2.47 per cent. The Eighth Plan outlay was Rs. 10,055 crore aind the target was to extend the coverage o f water supply facilities from an estimated 78 per cent to 100 per cent, covering all the 3,000 spill-over "problem villages" o f the 198 5 list and 1.5 lalch "partially" covered villages including hamlets. To achieve this objective, schemes were implemented under the State Sector, Centrally Sponsored Acceleratced Rural Water upply Programme (ARWSP), Sub-missions for tackling quality problem ('QP) habitations suffering from excess fluoride, salinity, iron, -irsenic, scarcity o f sources, and requiring sustainability o f the sources and the systems. The infrastructiure and the support programmes like human resource development, education, informiation and communication, research and development, science and technology, management iniformation system including computerisation o f implementing departments and field formatioms in the States and monitoring and evaluation were taken up.
3.7.18 Subsequently, the Sitate Governments undertook comprehensive surveys during 1991-94 for the Rajiv Gandhi National Drinking Water Mission, which provided the feedback that the tasks ahead wrere much more than envisaged at the begitming o f the Eighth Plan. As on April 1, 1994, tlhere were 1.41 lakh not-covered (NC) villages/habitations and 4.30 lakh partially c;overed (PC) villages/habitations, apart from 1.51 lakh villages/habitations suffering from acute water quality problems (QP). In addition, the Sundaresan Expert Committee constituted in May 1993 by the Central Department o f Rural Development has evah.iated the rural water supply programme with special reference to the Mini-Missions ;and Sub-Missions.
3.7.19 Recent provisional (data indicate that the rural water supply programmes have covered 3.40 lakh villages/habitations during the Eighth Plan. The State feedback has further suggested that during thte Eighth Plan, after the survey, 1.114 lakh NC, 1.524 lakh PC and 0.11 lakh QP villages/habitations are expected to have been covered leaving a balance o f 0.296 lakh NC, 2.776 laklh PC and 1.40 lakh QP villages/habitations as on 1-4-1997. However, keeping in view the ifield realities, Rajiv Gandhi National Drinking Water Mission in consultation with the State Govts, further revised/updated the number o f NC and PC villages/habitations and thus thie task for the Ninth Plan would be to cover 0.88 lakh NC, 3.91 lakh PC and 1.40 lakh QP villages/habitations. In terms o f population, about 86.74 per cent o f the rural population, as per 1991 Census, is expected to have been provided with an access to safe drinking wator. The Eighth Plan review has also brought out the short life span o f hand pumps, say 5-6 years due to variety o f reasons including the general depletion o f the ground water table. The Constitution (73rd Amendment) Act, an Eighth Plan initiative, has provided an institutional mechanism for effective decentralisation o f activities and the drinking water and sanitation schemes are good candidates for these, especially because community participatory efforts have to play a key role.
3.7.20 There is a need tio bring about organisational reforms in the implementation machiner>' in the Centre and thie States to equip them to work effectively in a Mission mode with guidance from the Raijiv Gandhi National Drinking Water Mission Authority and its empowered commitrtees at the Centre and similar Authorities, empowered committees and District Committees in the States to ensure the achievement o f goals and inter-sectoral integration and co-ordination.
Drinking Water (Rural)
266

3.7.21 The Eighth Plan review brings out the need to strengthen the contents o fthe ongoing Centrally Sponsored Schemes o f ARWSP, especially in the light o f the lessons learnt, suggestions o f the Sundaresan Expert Committee and thie feedback from the countrywide evaluation study conducted in 1996 by the Programme; Evaluation Organisation (PEO) as also the Comprehensive State Survey on rural water supply. The Ninth Plan strategy would, in this context, give priority to totally umcovered and poorly covered settlements (where the supply is upto 10 Ipcd) as well as the severely affected quality problem habitations and then to other habitations . There after progressively raise the present norm o f 40 Ipcd to 55 Ipcd, reduce the distance norm from 1.6 km. to 0.5 km. in plain areas and 100 mtr elevation difference in hilly areas as: recommended by the CM s’ Conference, held in July 1996 on Basic Minimum Services. Furthermore, installation o f piped water supply system should be discouraged, as it has been found to be less dependable by the PEO in their recent country-wide survey/. The villagers should be motivated to take over the routine O&M activities and ailso contribute resources for repair and maintenance.
3.7.22 In rural areas, where piped water scheme is operational or is proposed to bedeveloped, the Maharashtra model may be adopted, which is structured on the basis o fstrong community participation, through Village Panchayat Committees and Village Water Committees, whose members are directly involved during ithe construction o f different components o f the scheme, including in assisting the Maiharashtra Water Supply and Sewerage Board in deciding the location o f the village works,, such as service reservoirs, standposts, etc. and ensuring that the standposts in their jurisdiiction are maintained in good mnning conditions and are properly drained. The Village Water Committees would have at least 50 per cent women members and adequate representation for SC/ST and these local committees are entrusted with the responsibility for housie connection. Before these connections are provided, the owner has to ensure that adequate arrangements are made for disposal o f sullage water. The village committees are also responsibile for ensuring hygenic conditions o f all water sources in the villages.
3.7.23 As regards O & M of handpumps, community-based models have been developed in a number o f States, particular!} in Betul district o f Madhya Pradesh, Banda and Barabanki districts o f Uttar Pradesh and Midnapore district o f West Bengal. The Midnapore model has been recognised as a good practice and is being emulated and adopted by other States. In this model, a Water Comm ittee is established in each villlagC/liabitation, two women from the community are t.rained as caretakers, the beneficiaries raise Rs. 500 per handpump as the initial fund for maintenance and each family contributes 50 paise per month towards maintenanice. This has resulted in an optimum level o f functional handpumps on a wholly self-sustaining basis with the active participation o f the community and the local NGOs.
3.7.24 In this perspective, the Ninth Plan envisages 100 per cent coverage o f allhabitations with safe water, together with the installation o f a quality monitoring and surveillance system all over the country, evolving cost-effectave and socially acceptable O&M strategies, re-orienting the structure and functioning o f rural water supply planning and implementing agencies and taking all measures t;o ensure sustainability o f drinking water sources. Tackling the problems of drying of siources, providing a role for the beneficiaries and Panchayati Raj Institutions (PRls) in planning and implementation o f the water supply facility are other priority tasks. In view of the resource constraints, it would be necessar}' to restrict the role of external agencies to pri ority areas.

3.7.25 The Centrally Sponsored Scheme o f Urban Low-Cost Sanitation for Liberation o f Scavengers was an important Eighth Plan scheme for urban sanitation. It was first operated through the Ministry o f Home Affairs and subsequently implemented by the Ministry o f Welfare. It is being operated through the Ministry o f Urban Affairs and Employment (earlier Ministry o f Urban Development) since 1989-90. The Eighth Plan provision was Rs. 150 crore in the Central Plan, which was only about 25 percent o f the required assistance to meet the objective o f conversion o f all the existing dry latrines in urban areas o f the country numbering 50 lakh units into low-cost pour-flush sanitary latrines and 100 per cent liberation o f scavengers on "whole town" coverage basis.
3.7.26 As on March 31, 1997, 760 schemes were sanctioned in 1,155 towns with a total project cost o f Rs. 1,062.36 crore, towards which a loan o f Rs. 477..09 crore and subsidy o f Rs. 363.31 crore was sanctioned. The loan released was only 30.16 per cent (Rs. 143.87 crore) and the subsidy released was 41.23 per cent (Rs. 155.50 crore). The projects were sanctioned to construct 14.52 lakh new units and convert 19.25 lakh dry latrine units into low-cost pour-flush latrines for the individual households and 3,463 community latrines. In terms o f actual work done, 6.95 lakh units were completed upto Eighth Plan period out o f 33.77 lakh units sanctioned (20.6 per cent). It is expected that at 1991-92 prices, the expenditure during the Eighth Plan was 45.3 per cent o f the Plan outlay.
3.7.27 The impact o f the programme on the physical and financial front has not been impressive. This is due to a variety o f reasons, particularly insufficient schemes provided by the State Governments, delays in preparing documents and papers for sanction o f loan and subsidy (separately for each beneficiary), slow release o f subsidy due to inadequate physical progress, inappropriate technology, lack o f awareness and reluctance o f State Governments to give guarantee. An evaluation o f the programme in three States, sponsored by the Central Ministry o f Urban Affairs and Employment had brought out evidence to show that the objectives o f the scheme were not strictly adhered to, the recommended technology was often "unsuitable, relatively better-off families took over a substantial number o f the pour-flush latrines and funds were inadequate or not available for the superstructure.
3.7.28 Another Centrally Sponsored Scheme, the Ganga Action Plan (GAP), implemented by the Central Ministry o f Environment and Forest, has contributed to the improvement o f the sanitation facilities in 25 Class I cities along the river Ganga in the States o f Uttar Pradesh, Bihar and West Bengal. Interception, diversion and treatment o f sewage works and low-cost sanitation units were set up in GAP -I and 792 mid o f sewage has been intercepted and diverted and 596 mid o f sewage treatment facilities have been installed.
Rural Sanitation
3.7.29 The Eighth Plan outlay for rural sanitation was Rs. 674 crore to cover an additional 2-3 per cent o f the rural population, as per the 1991 Census. Recent data show that population coverage by sanitary latrines has increased from 11 percent to about 16 per cent during the Eighth Plan. This is inclusive o f the efforts o f lAY, JRY, UNICEF, CAPART and private initiatives, besides the Centrally Sponsored Rural Sanitation Programme (CRSP) and its State counterpart.
Urban Sanitation
268

3.7.30 As per the existing policy, subsidy under the: rural sanitation programme is given to people below the poverty line for construction o f individual household latrines and conversion o f dry latrines into sanitary latrines. Subsidly is extended to the Panchayats for exclusive sanitation complexes for women, in areas, 'where adequate space is not available for individual household latrines and other sanitationi facilities in the villages/habitations. Interest-free loan is also provided to entrepreneurs/Panichayats to set up sanitary marts and link them to production centres for facilitating easy aivailability o f the materials required for the sanitation programmes. Sensitisation for other sanitation facilities covers drains, soakage/ garbage pits and intensive health awareness through lEC.These activities should be further strenghtened and modified, where requirecd.
Ninth Plan Priorities and Strategies
3.7.31 While the provision o f drinking water facillities in urban areas in the country has improved over the years, the provision o f sewerage and drainage facilities has not received adequate attention. Ideally the water supp>ly and liquid waste management schemes should be integrated. The absence o f this imtegrated approach has fesulted in the degradation o f the environment, with serious health impact from water-borne and vector-borne infections. In some areas, industrial contarmination with heavy metals also leads to severe health hazards. The Ninth Plan Sub-group o f the Planning Commission on Environment and Health had concluded that the unsattisfactory progress in supply o f safe drinking water and sanitary disposal o f solid and liiquid waste has contributed to the continued high morbidity from water-borne and vectoir-bome diseases. The Expert Group on Public Health and the Working Group on Health Carte Delivery in Urban and Rviral Areas recommended that water quality monitoring and suirveillance as well as the projects for urban waste management should be taken up on a p)riority basis to achieve substantial reduction in morbidity due to water and vector-borne disseases.
Drinking Water (Urban)3.7.32 The urban drinking water supply strategies im the Ninth Plan would address the priority concerns o f universal coverage, adequacy im terms o f minimum per capita consumption norms, quality, distance from source as well as regularity o f supply, bringing in its wake the policy and operational issues o f drying and inaccessible sources o f water, recycling o f waste water and sewage for nion-domestic use, water harvesting,
among others. The strategies toThe urban drinking water supply strategies in the Ninth Plan would address the priority concerns o f universal coverage, adequacy in terms o f minimum per capita consumption norms, quality, distance from source as well as regularity o f supply, bringing in its wake the policy and operational issues o f drying and inaccessible sources of water, recycling o f waste water and sewage for non-domestic use, water harvesting, among others. The strategies to promote and strengthen decentralisation o f production and distribution systems, privatisation and participation o f the community in management and maintenance are expected to not only induct higher efficiency levels and effective reach out but also contain line leakages and wastages. Over-exploitation o f ground water must be avoided to maintain quality and to control water pumping cost. Appropriate legislation and itsa effective implementation should form an integral part o f the strategy. The modified model Bill o f the Central Ministry o f Water Resources on ground water exploitation may be considered by State Governments for adoption.
promote and strengthen decentralisation o f production and distribution systems, privatisation and participation o f the community in management and maintenance are expected to not only induct higher efficiency levels and effective reach out but also contain line leakages and wastages. Special attention will be given to strengthen the on going Centrally Sponsored Accelerated Urban Water Supply programme (AUWSP) to saturate the small towns with
269

population less than 20,000 during the Plan period.
3.7.33 The State and UT Governments should prepare long-term Master Basin RiverPlans, following the guidelines issued by the Central Ministry o f Water Resources, apart from making proper estimates o f water needs for drinking, cooking and non-consumption domestic uses like bathing, washing, toilets, gardening, etc.City water management system should have atleast a 20-25 year development perspective. Provision should be made to recycle waste water, rain water harvesting, re-use o f sewage after appropriatetreatment for flushing o f sewers and toilets, air conditioning, etc. Over-exploitation o f ground water must be avoided to maintain quality and to control water pumping cost. Appropriate legislation and its effective implementation should form an integral part o f the strategy. The modified model Bill o f the Central Ministry o f Water Resources on ground water exploitation may be considered by State Governments for adoption.
3.7.34 Financing o f drinking water supply programmes is a crucial issue in urban areas in view o f the massive investments required. These are beyond the scope o f the Plan, but nevertheless, these would have to come into the sector to meet the goals o f the Plan and maintain the sustainability o f the human settlements. Further, drinking water and sanitation activities will have to be taken up as an integrated programme, because in the absence o f such a linkage, sanitation activities tend to be overlooked. Innovative financial strategies, including alternative leasing instruments and fiscal intervention are called for. Plan funds would be used not only for direct intervention but also as a leverage instrument, a strategy already introduced during the Eighth Plan in case o f some urban infrastructure projects. This strategy has to be increasingly adopted to activate and sustain the funds flow from outside the government sector. Equally important is recovery o f full cost. N ew strategies would be gradually developed, in terms o f recovery o f O&M cost in the first instance and total capital cost later, though subsidy in pricing will continue, more sparingly than in the past.
3.7.35 The delivery and management system has to be strengthened. In the light o f the Constitution (74th Amendment) Act, while State agencies may continue to plan and implement capital works, the responsibility o f distribution may be progressively decentralised to local bodies, and where feasible, to the private sector, within the policy guidelines o f the State Governments. While this process will be initiated with distribution works, in due course capital works may be decentralised. Concerted efforts will be made to enhance the capacity o f the municipalities to bridge the gap between their resources and commitments. At the same time, city agencies may continue
in mega and metro cities.Financing o f drinking water supply programme is a cmcia! issue in urban areas in view o f the m assive investment required. These are beyond the scope o f the Plan, but nevertheless, these would have to come into the sector to meet the goals o f the Plan and maintain the sustainability o f the human settlements. Innovative financial strategies, including alternative leasing instruments and fiscal intervention are called for. Plan funds would be used not only for direct intervention but also as a leverage instrument, a strategy already introduced during the Eighth Plan in case o f some urban infrastructure projects. This strategy has to be increasingly adopted to activate and sustain the funds flow from outside the Government Sector. Equally important is recovery o f fiill cost. New strategies would be gradually developed, in terms o f recovery o f O&M cost in the first instance and total capital cost later, through subsidy in pricing will continue, more sparingly than in the past.
as long as they operate on sustainable basis.
3.7.36 In view o f the massive investmentrequired, it is obviously not possible for either the State Governments or the Central Government to go forward with thismagnitude o f funds.Institutional sources/externally aided projects.
270

private sources and community sources would all have to come forward in case we have to provide every body with safe potable water within the stipulated time frame. Alternative strategies, new technologies, cheaper methodologies as also mechanisms like rain water harvesting etc would have to go in a big way to provide alternatives to the present method o f handling the work relating to the sector. It is expected that by deferment o f some o f the less important activities, use o f low cost technology, people and private sector participation and better management, the objective of 100% population coverage in Urban area with safe drinking water supply could be achieved with an investment o f about Rs.20750 crore.
Drinking Water (Rural)3.7.37 The Ninth Plan strategies for rural water supply would seek to attain universal coverage o f drinking water through different programmes and strategies in no source villages/habitations, partially covered villages/habitations and water quality problem villages/habitations. A habitation-driven approach will be adopted in preference to a purely village-centred approach. The highest priority is to be given to all the remaining "no- source” and poorly-served "partially covered" (less than 10 Ipcd) villages/habitations as well as those facing acute water quality problems. Thereafter, priority will be given to other partially covered (11-40 !pcd) and water quality problem villages/habitations. In each category, completion o f the on-going schemes will be given priority before starting new schemes. The liberalised norms for service level o f 55 Ipcd and one HP/PSP for every 150 persons as also distance norm of 0.5 km may be adopted only after having covered all the villages/habitations with the existing norms o f 40 Ipcd, 250 persons per HP/PSP and distance norm o f 1.6 km. To cater to the drinking water requirements o f cattle in the DDP areas, an additional 30 Ipcd of water may be provided.
3.7.38 Water is perceived in the rural areas as a social good, to be provided free by the govenmient rather than as a scarce resource that should be managed as an economic asset. Supply o f water to consumers should normally be based on the principle o f effective demand which should broadly correspond to the standard o f service that the users are willing to maintain, operate and finance. There should be a capital cost recovery o f 10 per cent from the users in all the new drinking water supply projects aimed at increasing the service level beyond 40 Ipcd.
3.7.39 The present practice is that the water supply projects are designed and executed by the implementing departments and passed on to the end-users. The experience has brought out the unwillingness o f the Panchayats to take on the responsibility for operating and maintaining them.The State Governments do not have an effective machinery at the village level to maintain the assets. A radical change in the management system is required. Rather than being supply-driven, the system should be demand-driven, and should take into account user preferences, private connections and related issues. People should be aware o f the technologies and given the option to select the technology, as well as meet the expenditure on the project. People's participation at all stages o f the project implementation is likely to help get over the problems o f sub-standard materials, poor workmanship and inadequate maintenance.These problems should be addressed to in the Ninth Plan.
3.7.40 As an experiment, it may be advisable, in some places, to transfer the funds to the user communities or the panchayats, who may be induced to buy pipes and install handpumps on their own. The Panchayati Raj Institutions and the local administration should be entrusted with the responsibility for the O & M o f the installed systems. The PRIs should be given the option to levy and collect user charges for drinking water and
271

sanitation services, so that at least the O & M, if not the further development works too, may become a self-financing activity.
The rapid development in ground water -based irrigation in many States has caused ground water depletion, resulting in a reduction in the life of the drinking water supply sources. A number of steps need to be taken up to manage ground water in a more scientific manner especially in drak and grey zones and the States should bring in a legislation to control over-exploitation of ground water on the lines of the model Bill brought out by the Central Ministry of Water resources. User groups should be formed, on the pattern of the Joint Forest Management Group, to take up the monitoring of ground water and ensuring that it is managed as a common property resource rather than allowing it to be over-exploited as an open access resource.
3.7.41 The rapid development in ground water-based irrigation in many States has caused ground water depletion, resulting in a reduction in the life o f the drinking water supply sources. The highly subsidised electricity tariff for irrigation has led to an indiscriminate anddisproportionate level o f ground water extraction. Ground water depletion has aggravated water quality problems due to excess fluoride, arsenic and brackishness in certain areas forcing the engineering departments to abandon the low-cost handpump-
based systems and to opt for expensive and complicated piped water supply systems. A number o f steps need to be taken up to manage ground water in a more scientific manner, especially in dark and grey zones and the States should bring in a legislation to control overexploitation o f ground water on the lines o f the model Bill brought out by the Central Ministry o f Water Resources. User groups should be formed, on the pattern o f the Joint Forest Management Group, to take up the monitoring o f ground water and ensuring that it is managed as a common property resource rather than allowing it to be over-exploited as an open access resource.
3.7.42 As in the urban areas, integrated water supply and sanitation programmes will be increasingly implemented during the Plan in the rural areas also. The implementing machinery in the Centre and the States will require organisational restructuring to work in a Mission mode with guidance from the Rajiv Gandhi National Drinking Water Mission Authority and its empowered committees. Micro water-shed based master plans should be prepared to ensure the sustainability o f water sources by taking care o f demand and supply. The inputs o f professional institutions, NGOs and Community Based Organisations (CBOs) should be inducted into planning, development and management. At the same time, integrated water use and conservation methods should be adopted.
3.7.43 Private sector efforts in construction and maintenance o f rural water supply and environmental sanitation should be encouraged and mobilised to the maximum extent. Financing o f water supply activities in rural areas might not appear to be as attractive to the private sector as those in urban areas. Nevertheless, Sri Satya Sai Trust o f Puttaparthy has set an unparallel example o f private initiative in implementing on their own, without any State's budgetary support, a massive water supply project, with an expenditure o f Rs. 250 crore, to benefit about 730 scarcity and fluoride /salinity-affected villages and a few towns in Anantpur district o f Andhra Pradesh in a timeframe o f about 18 months. This path-breaking effort should encourage business groups, trusts and foundations. Also full cost recovery might not be a realistic approach during the Plan period. Alternative financial strategies will be evolved as the need to ensure adequate supply, in terms o f quantitative and qualitative parameters, is a national commitment.
272

3 7.44 In view o f huge requirement o f funds, we have to think o f other methodologies for raising other resources and alternative strategies to effect (economy, such as adoption o f low cost technological solutions using local materials to the textent possible and deferment o f programme for quality affected habitation, which are not o f severe nature and adoption o f liberal norms. Some economy could also be effected by taking into account the privately owned sources which yield sufTicient water and are acicessible to the common people, involvement o f community in O&M and some contribution for capital works, ensuring better sustainability to avoid early failure o f HPs etc (presentl y 15-20% HPs go defunct every year), involvement o f NGOs and private sector participaition to the extent possible. With these measures and the available outlays, it may be possibile to achieve the set objective o f providing safe drinking water facility to every settlement in rural areas whithin 5 years
Urban Sanitation3 .7 45 Inspite o f the substantial efforts made to eliminsate manual scavenging and bring in total conversion o f dry latrines into low-cost pour-flush latrines, with a target o f 100 per cent elimination o f manual scavenging during the Eighith Plan, the problem remains a challenge to planners on the eve o f the Ninth Plan Consistent with the goal o f "Heahh for All", efforts will be made to provide a reasonable level o f sanitation to a larger population in urban areas by rapid expansion and improvement o f sainitation facility during the Plan, with the specific objective o f elimination o f manual handling o f night-soil through conversion o f all dry latrines into low cost sanitary lat;rines The goal o f 100 percent conversion o f dry latrines, elimination o f manual scavengiing and total rehabilitation o f the liberated scavengers will be a permanent tribute to the Father o f the Nation. To ensure this, municipal byelaws would need to be modified to bam construction o f dry latrines and States should legislate, on the lines o f the Central legislatiton, to prohibit employment o f manual scavengers beyond a specified date in the Ninth Plain
3 7 46 Low-cost on-site sanitation will be encouraged in unsewered parts o f cities, small and medium towns and other locations where this strategy might be feasible In the larger towns and cities and congested locations, including important tourist places and centres o f pilgrimage, it would be desirable to adopt the conventional sewerage and treatment system
3 7 47 The incidence o f plague in some parts o f the country stimulated interest in solid waste management. Technological innovations to improve the re-usability o f the recycled wastes will contribute to the viability o f projects and should be encouraged This strategy would promote the segregation o f different kinds: o f wastes at the collection point to reduce the cost o f disposal Toxic wastes should foe collected and disposed o f separately The "polluter pays" principle should be applied and the proceeds may be used to finance waste disposal programmes Solid waste disposal can be privatised also. Priority will be also given to the implementation o f liqui(d and solid waste management programmes in the State capital towTis.
3.7.48 As far as sanitation is concerned, greater community participation is the most important criterian without which other activities would fail Drainage, sewerage, treatment o f wastes/effluents, sanitary land fills, location and installlation o f incinerators, low cost sanitation etc are areas o f concern, but there can be no uniform solution for the whole country and the State Governments would naturally be expectted to play their role in a manner suitable to the needs o f towns/cities where the sanitation co'verage is far below the required levels In view o f the over all resource-constraint and other competing demands, it may perhaps not be possible to make a very huge investment in the next 5 years and therefore we
273

While the elimination of manual scavenging is a mandatory requirement in urban areas, in the rural areas, a demand-driven low cost sanitation approach would be increasingloy adopted in preference to a supply -driven approach. A network of production centres and rural sanitary marts would be integral components of the new approach to reach out self sustainable and people centred sanitation programmes.
may have to restrict the target in respect o f sanitation to about 60%, which may require an investment o f around Rs.5500 crore. Besides sectoral plan outlays under State/UT Plans and Central Plan, a significant amount o f Central assistance will also be available under the Central Plan scheme o f National river conservation plan. A substantial amount is also expected to be contributed through private participation and institutional finance outside Plan.
Rural Sanitation
3.7.49 While the elimination ofmanual scavenging is a mandatory requirement in urban areas, in therural areas, a demand-driven low- cost sanitation approach would be increasingly adopted in preference to a supply-driven approach. A network o f production centres and rural sanitary marts would be integral components o f the new approach to reach out self-sustainable and people-centred sanitation programmes.lt is essential to adopt a "package" approach to rural sanitation, integrating it with rural drinking water programme and providing sufficient motivation inputs for its effective implementation.This is required in view o f the late start o f the rural sanitation programme.
3.7.50 In this perspective, rural sanitation programmes should be implemented by PRIsand NGOs, who should be directly involved in creation o f demand, lEC, training, implementation, including setting o f production centres and sanitary marts. Each State should have a nodal State NGO who would coordinate the NGO activities at , the district level. Women should be given a special role at all stages and assisted through credit, skill inputs and employment. Equally important is to mobilise the children, especiallythrough schools and anganwadis so that sanitation and hygiene practices are promoted atan early age and the demonstration effect filters within the rural society.
3.7.51 The programme should improve the technology content and also include compost toilet and latrines-based bio-mass activities. The Midnapore programme has been implemented with little or no subsidy or Government intervention, through the efforts o f Ramakrishna Mission, an NGO. The demonstrated sustainability o f this people-driven approach has stimulated its subsequent replication across West Bengal.
3.7.52 It is therefore proposed to restructure the ongoing exclusively subsidy-driven sanitation programme using valuable field experience on the low cost sanitation with extensive advocacy and people’s participation. A number o f interesting compaigns have conclusively demonstrated the weaknesses o f the subsidy-oriented, top-down sanitation programme and have extensively and successfully co-opted NGOs, Banks, Panchayats to achieve very impressive coverage levels (e.g. Midnapur in West Bengal, periyar in Tamil Nadu , Mysore in Karnataka, Allahabad in U.P). A policy note in this regard, under preparation in the Ministry, envisages the use o f the CRSP funds as “Seed Money” to propagate low-cost rural sanitation, based on felt-needs, a greater private sector involvement and using the 'Vertical upgradation” concept . A compaign approach would be developed on the lines o f the literacy/immunisation and the subsidies structure reoriented to specifically target the poorest strata. With the above approach and the available outlays, it may be possible to achieve coverage o f about 35% rural population by the end of the Ninth Plan.
274

3.7.53 For the attainment o f the set objectives/targets within the Ninth Plan, the following action points are called for :
(A) Urban Water Supply and Sanitation
(i) Larger external assistance (higher priority to Urban Water Supply and Sanitation) be provided. At present it is esttimated to be around Rs.5250 crore tor the 9"’’ Plan.
(ii) The Government o f India will play a role o f facilitator in policy framework, institutional capacity building and financial reforms so as to enable the State Governments and urban Local Bodies to aichieve the desired objective within the prescribed time frame. In addition to this, the Government o f India will also provide technical guidance in order to create proper environment for the concerned agencies to plan and formulate water supply and sanitation schemes.
Action Points for Consideration
(iii) As recommended by the Working Group, aji 'Urban Development Fund’ may be created on the lines o f the Tamil Nadu model which could be utilised for creating inftastmcture facilities in urban ar eas and such a fund should act as a catalyst to finance those schemes which are viable and with a little help from this kind o f fund local bodies can become eligible to obtain loans from commercial institutions like IDBl, ICICI, IF&LS and from the open market. The assistance from the fund can be provided to small and medium towns in the form o f soft loans cuid grants so as to enable them to take further loans from the open market as most o f these small towns otherwise might not be in a position to obtain loans from financial institutions, on their own strength.
(iv) Since it is difficult to meet the huge resourc e gap out o f State and Central Plan funds, greater emphasis would need to be given for institutional financing through HUDCO, LIC and other institutioms. Widening the equity base o f the financing institufions like HUDCO for raising the market borrowings could be encouraged.
(v) Some financial support to the ULBs to meet the expenditure towards interest differential on the loan taken from the financing institutions would encourage the ULBs to come forward to take loan even at commercial rate o f interest.
(vi) Rebate on excise and customs duties for purchase o f leak detection equipment and other such machinery needed for development and improvement o f infrastructure facilities could be o f great assistance to the State Govemments/ULBs.
(vii) As a follow up o f 74' ̂ Constitution Amiendment Act, most o f the State Governments are likely to entrust the responsibility o f operation and maintenance o f urban water supply and san itation systems to local bodies and therefore it would be necessary for the State Finance Commission to explicitly
275

indicate the norms and other financial implications make a realistic assessment o f requirement o f funds and also to make suitable recommendations for provision o f finances by different categories o f towns.
(viii) Private Sector participation in construction and maintenance o f water supply and sanitation schemes, to the extent possible be encouraged/mobilised..
(ix) Involvement o f NGOs and community be encouraged by the State Governments.
(x) Adoption o f improved low cost technology be encouraged to save cost o f construction and maintenance.
(xi) The water tariff be raised substantially to meet at least the full cost o f operation and maintenance in smaller towns and to raise some surplus also in bigger towns/cities particularly those having industrial base. This will not only make the running cost self-financing, but also enable the State Govemments/ULBs to raise institutional financing.
(xii) Improved metering systems, particularly in Class-I Cities, would not only help in actual quantification o f the water uses but also the proper billing o f the water supply, which would also improve the revenue collection.
(xiii) Each organisation at the State/ULBs level should be encouraged to have its own training plan and adequate infrastructure facilities commensurate with the work plan. Special emphasis should be given to the need for skill upgradation for the personnel responsible for O&M. The Human Resource Development Programme must endeavour to enhance user sensitivity on the part o f O&M staff and increase public awareness which will promote NGOs and consumer participation with respect top protection o f assets and improved service delivery.
(xiv) The quick and amicable solutions between States through Central intervention for sharing o f water resources would avoid delay in implementation o f the water supply projects and save the increased capital investment.
(xv) There is a need for development o f National Data Bank and creation o f Monitoring Cells at State and Central level for rigorous monitoring o f the urban water supply and sanitation system. This would help in detection o f bottlenecks and suggest mid-course corrections/reorientation o f policies at Central/State level for developmental activities o f the sector.
(xvi) Over exploitation o f ground water must be avoided to control deteoriation of its quality and reduced cost o f pumping. Regulatorv- mechanism for groundwater exploitation be brought in by the State Governments, particularly in all such urban areas which are facing acute shortage o f drinking water through out the year, for better sustainability o f the sources o f water.
(xvii) Conservation o f water by better management to reduce leakages and pilferage and re-cycling o f treated waste water for non-domestic uses be encouraged by
276

giving incentives. This will not only sa've precious fresh water but also reduces load on waste water/sewage treatmeint units.
(xviii) Rain water harvesting structures be encouraged in a big way to increase availability o f water and also increase jground-water recharge for better sustainability o f ground water sources.
(B) Rural Water Supply and Sanitation
(i) Larger external assistance (higher priority to rural water supply and sanitation)need to be provided to augment State resources.
(ii) Transfer the responsibility o f at least operation and maintenance o f Rural Water Supply to the PRIs in line with 1 '̂̂ C,kA.
(iii) Adoption o f improved low cost technolog3ŷ be encouraged to save cost of construction and maintenance.
(iv) Free supply o f water to people in rural areas; should be discouraged and some user charges collected through community participation.
(v) Private Sector participation in construction and maintenance o f water supplyand sanitation schemes to the extent possible be encouraged/mobilised.
(vi) Involvement o f NGOs and community be encouraged by the StateGovernments.
(vii) The rapid development in ground water baised irrigation in many States hascaused ground water depletion . Highly subisidised irrigation electricity tariff have led to an indiscriminate and disproportionate level o f ground water extraction. To regulate and develop grounid water resources in a scientific manner, a Model Bill was framed by the Water Resources Ministry in 1970 and was circulated to the States. The Bill hais again been recently revised and circulated to States in 1996. Except for Maharashtra, the implementation of the provision o f the legislation was not satisfactory. State Ministers’Conference held in August, 1997 resolved against any strong legal measures o f controlling ground water discharge and cropping pattern. Instead, they preferred to rely more on improving recharge and arresting run o ff through water shed programmes. Rain Water Harvesting Structure, therefore, be encouraged in a big way to increase availaibility o f water and also increase ground water recharge for better sustainabilit y o f water supply schemes.
(viii) Water supply links with watershed development programmes should be made more stronger for better sustainability o f drinJcing water sources.
Housing
Performance Review3.7.54 The dimensions and problems o f housing need to be viewed in the overall environment o f human settlements. Housing has been pirimarily a self-help activity. The housing policies and programmes, while accepting that housing is essentially a private
277

activity, has to recognise that State interv'ention is necessary to meet the housing requirements o f the vulnerable sections and to create an enabling environment in accomplishing the goals o f "shelter for all" in a self-sustainable basis.
3.7.55 An important development in the Eighth Plan was the bringing about o f a consensus in the approach to hum.an settlements development. The National Housing Policy (NHP) provided the basic approach, the economic reforms stimulated the process and the preparatory process for the Habitat II Conference brought together the key actors through the National Steering Committee, Key Groups o f human settlements managers, NGOs and CBOs, private sector and the National Human Settlement Forum, which crystalised and endorsed in the National Report.
3.7.56 The Eighth Plan outlay for urban housing wasRs.3,581.67 crore in the State Sector and Rs. 1,341.35 crore in the Central Sector (Rs.860 crore as lEBR and Rs.481.35 crore budgetary support,inclusive o f equity support). The expenditure under the Central Sector was 96 per cent and in the State sector, 112 per cent. However, there was significant interstate variations in the funds utilisation rate. In terms o f the total activities and investment requirement in the housing sector, the Plan outlay was modest.
3.7.57 The Eighth Plan target was 7.80 million new housing stock, including 6.29 million units in Economically Weaker Sections (EWS) and Low Income Group (LIG) categories. The estimated investment requirement was Rs. 5,779 crore, at 1989-90 prices. Metropolitan cities were estimated to account for as much as 2.75 million units at an investment o f Rs. 22,770 crore.The urban upgradation activity was estimated at 1.75 million units at an investment o f Rs. 1130 crore. Housing for the totally houseless population, urban and rural, would require an investment o f Rs. 610 crore. Housing has been, therefore, largely a people's activity, but constraints of finance, land, other inputs and the absence o f a stimulating environment has pushed the urban housing solutions beyond the reach o f the majority o f the people. Recent Habitat II housing and urban indicators for mega cities and secondary towns show that the cost o f a median house in terms o f the annual household income goes up sharply with the city size: 13 years income in Mumbai, 12 years in Delhi, 11 years in Bangalore and 7 years in Chennai, and it goes down to 3 to 4 years in secondary towns. This is the situation in the formal housing market, but a similar trend is seen in informal housing with 2-3 years income in mega cities and less than one year in the secondary towns. The comparative variations in housing costs in the formal and informal housing sectors and the composition o f the population in the latter also bring out a shift from formal to informal housing as costs go up. Rental housing indicator also shows market distortions as reflected in high rental to income ratio, 20-25 percent in secondary towns and 30-50 percent in the mega cities. '
3.7.58 In this perspective, public housing thrust is, most appropriately, directed towards social housing, to reach out housing solutions to the priority groups. An equally important activity is to provide a policy framework and a legislative, fiscal and financial system that would put into effect the enabling role o f the government in stimulating, supporting and promoting other actors to play direct roles in the housing delivery system. These two activities have been the pillars o f the Eighth Plan approach and would continue in the Ninth Plan.
' H ab itat 1! N a t io n a l R ep o rt that 5 0 p er cen t o f the u n its c o n str u c te d th r o u g h th e c o o p e r a t iv e s a are in the L IGc a te g o r y .
278

3.7.59 It has been estimated that during the Eighth Plan., funds flow from the formal sector was about Rs.25,000 crore, inclusive o f Central and Sttate Governments, Life Insurance Corporation (LIC), General Insurance Corporation (GIC ), National Housing Bank (NHB), Housing and Urban Development Corporation (HUD'CO), Provident Fund, commercial banks, housing finance institutions and cooperative apex federations. The State level apex cooperative housing federations had disbursed FIs. 884 crore as loan to primary
homsing cooperatives during the firstP ublic h o u sin g thrust is directed towards socia l h ou sin g to reach out housing solutions to priority groups. A n eq u a lly im portant activitv' is to provide a p o licy fram ew ork and a leg isla tive , fiscal and financial system that w ou ld put into effec t the enabling role o f the G overn m en t in stim ulating, supporting and prom otin g other actors to p lay direct roles in the h o u sin g d e liv ery system . T hese tw o activ ities have been the p illars o f the Eighth Plan approach and w ou ld con tin u e in the N inth Plan
thr-ee years o f the Eighth Plan and thi:s enabled the construction o f 2.95 lakJi units.
3.7'.60 The net flow to individuals wais about 50 per cent o f the total fumds flow from the formal sector. Thte estimation o f output 6 f housing stoick and serviced sites from the formal sector investment is difficult
because the data have to be compiled from different Centiral and State agencies. There is an element o f duplication in the data o f financial institutio>ns and housing agencies. While data on individual loans and other resources mobilised, especially for upgraded units and construction on serviced plots are often not collected, th<e physical achievements have not been monitored closely with reference to the Plari outlays for new housing stock and upgraded units.The only systematic data collection i:s undertaken for the 20 point programme in respect of EWS and LIG housing units. The;ir output in the first four years o f the Eighth Plan was 4.68 lakh EWS units and 1.87 lakh LIG units.
3.7.61 It is broadly estimated that the housing stock: provided by public agencies,cooperatives and private agencies, with the help o f instiitutional finance, budget outlays and internal resources, may be o f the order o f 7 lakh units o f EWS housing and an equal number o f slum housing units are estimated to have be;en upgraded under the Nehru Rozgar Yojana (NRY). The LIQ incremental stock may be 6 to 7 lakh units, on the assumption. The output of units for other higher categories; may not exceed 5 lakh. Thus, as against the projected physical housing output o f 30 lakh units in the urban areas during the Eighth Plan period, the contribution o f the formal sector m ay not exceed 20 lakh units.
3.7.62 In this development perspective durmg the Eighth Plan, the tasks ahead for the Ninth Plan have to be examined. Several estimates are: available o f the present housing shortage and the projected shortage at a fairly disaggregaited level. The National Buildings Organisation (NBO) has estimated the 1991 shortage at 8 .23 million, up from 7.0 million in 1981, but expects the absolute shortage to decline proigressively to 7.57 million units in 1997 and 6.64 million 2001. However, other estimates indicate that the shortage will increase to 9.4 million units in 2001 (Habitat II estimates. )
3.7.63 A major initiative was taken in the Sixth Plan, when the public sector was entrusted with a promotional role in housing in general and restrictiing its direct operations to housing for the urban poor and provision o f house sites and construction assistance for rural landless labourers. Development activities were diversifiecd in the Seventh Plan by providing for setting up an institutional financial system for housing and urban infrastructure and thrust was given to slum upgradradation in situ., development, in preference to relocation and provision o f basic services for the poor. Work on the National Housing Policy (NHP) was initiated in the mid-eighties, togethier with preparatory work to set
2 7 9

up a National Housing Bank and the process gathered momentum during the International Year o f Shelter for the Homeless (I YSH), 1987.
3.7.64 Social Housing Schemes are implemented in the State Sector with State Plan provision and loan assistance from HUDCO and other financial institutions. These include Housing Schemes for EWS; LIG; MIG/HIG; and Rental Housing Scheme for State Government Employees. HUDCO provides upto 15 per cent o f its resources for EWS housing and NHB refinances the State cooperatives and others involved in this activity. The income, cost and loan ceilings were revised in 1992 and are again under review, keeping in view the cost escalations and changes in the incomes o f the target groups.
3.7.65 In the case o f the EWS, for example, the income ceiling was raised from Rs. 700 in the Seventh Plan to Rs. 1250 in the Eighth Plan and the loan component to Rs. 19,500 for construction and Rs. 9,500 for repairs. The emphasis in the development strategy for the EWS is on sites and services and self-construction. The LIG housing scheme is primarily a loan scheme and is executed by the State Governments through Housing Boards and Housing Departments, and the budget provision is supplemented by institutional finance. The income eligibility level, which was Rs.701-1500 in the Seventh Plan, was raised to Rs. 1251-2650 in the Eighth Plan. HUDCO supplements the efforts o f State Govemments/UT Administrations and its loan component for LIG category housing is Rs.55,000 for construction and Rs.37,500 for repairs/additions. There is a need to further revise the ceilings and norms, which would be taken up in the Ninth Plan.
3.7.66 A national network of Nirmithi Kendras (Building Centres) has been established with Central assistance through HUDCO under a Central scheme. These Centres impart training to artisans in low-cost construction skills and produce building materials and components by utilising agro-industrial wastes. A Central grant o f Rs.2 lakh was provided to each Centre till 1994-95 and under a revised funding pattern, effective from 1995-96, the Central grant-in-aid ranges from Rs.3-5 lakh, depending on the level o f the activities and a HUDCO loan is also available. As on 31.12.96, 435 Centres have been identified and 239 Centres have become functional. The total Central grant has been Rs.5.75 crore and the output o f training exceeds 75,000 construction workers. The ultimate impact on the contribution o f these trained workers to new housing stock, including upgradation and renewal, has not been made and will form a part o f the Ninth Plan agenda. It is necessary to monitor the career path o f the outtums o f the centres through tracer studies and indicators.
3.7.67 The scheme o f Night Shelters/Sanitation Facility to Footpath Dwellers in Urban Areas provides night shelter and sanitation facilities to footpath dwellers. The per capita development cost provided for this is Rs.5000, 20 percent o f which is financed by Central Government and 80 per cent from implementing agencies or a HUDCO loan. The programmes overall implementing agency is HUDCO and the coverage is all urban areas, having the problem o f footpath dwellers. As on 31.12.96, HUDCO had sanctioned loan o f Rs. 10.06 crore and subsidy o f Rs.9.13 crore to 56 schemes to provide 19,366 beds, 5,258 pay-and-use toilet seats, 64 baths and 145 urinals. The total number of beneficiaries under this scheme is expected to be about 60,000, but the feedback regarding its impact in terms of actual users, coverage o f the foothpath dweller population and their satisfaction level is not available and this task will be taken up in the Ninth Plan.
280

3.7.68 The schemes for other priority groups whichi include handloom weavers and beedi workers, are implemented through Central G<ovemment subsidy released by the concerned Ministries and HUDCO loan. HUDCO als(0 provides loan for construction o f hostels for working women. The National Housing Bamk (NHB) has recently launched housing schemes for slum dwellers and households? headed by poor women with the funds mobilised under the Voluntary Deposits Scheme.
3.7.69 Under the one-time scheme o f Central Assisstance for reconstruction o f floods- damaged houses in Tam.il Nadu, Karnataka and Ke;rala, HUDCO has sanctioned construction o f 77,969 houses till the end o f December, 1996, o f which 20,318 houses have been reconstructed. The funding pattern provides for 30 percent Central subsidy, 30 percent State subsidy and 40 percent HUDCO loan.
3.7.70 Rural housing did not receive much attention diuring the first 25 years o f planning. Central The rehabilitation programmes o f the Miniistr>' o f Reftigees Rehabilitation provided, until around 1960, housing to about 5 lakh households, mainly in Northern India. A Village Housing Scheme was also launched in 1957 as part o f the community development movement, under which loans were providled to individuals and cooperatives, subject to a ceiling o f Rs. 5,000 per house and 67,000 houses were built under this scheme by the end o f the Fifth Plan (1980). The Estimates Comimittee, in its 37th Report (1972-73), expressed distress at the unsatisfactory conditions o f kuttcha housing in rural areas and the apathy o f the Government. In response to this asstsssment, the Housing Sites-cum- Construction Assistance Scheme was launched as a Cemtral Scheme in the Fourth Plan which was later transferred to the State Setctor in April, 1974. on the recommendation of the NDC.
3.7.71 Indira Awas Yojana (lAY) is the most important rural housing scheme. Its genesis can be traced to the rural employment programmes likce the National Rural Employment Programme (NREP) and Rural Landless Employment Ciuarantee Programme (RLEGP), in which construction o f houses was a major activity. There was, however, no uniform policy for rural housing. In June, 1985, a specific proportion o)f RLEGP funds was earmarked for construction o f houses for SCs/STs and freed bonded laibour. Later in April, 1989, the NREP and RLEGP were merged into the Jawahar Rozgar Yojana (JRY), and upto 1992- 93, the lAY was continued as a part o f the JRY, with a special provision o f 6 percent o f the housing units free o f cost to members o f SC/ST and freted bonded labour living below the poverty line in the rural areas. The proportion o f free homsing units was raised to 10 percent in 1993-94 and the scope was extended to cover non-SC/ST rural poor, subject to the condition that the non-SC/ST beneficiaries should not rceceive more than 40 percent o f the total allocation. Further extension o f the coverage \was made in 1995-96 to include families o f servicemen of the armed and para-military forces killed in action. In the identification o f the beneficiaries, weightage is given t(o victims o f atrocities, households headed by widows and unmarried women, households affected by natural calamities or displaced by development projects, nomadic, semi-niomadic denotified tribes, internal refugees and disabled families. After the JRY was restruictured from January 1. 1996, The lAY has become an independent Centrally Sponsored Scheme for shelter, with the resources being contributed on 80:20 basis by Centre andl States.
3.7.72 The output o f the lAY is estimated at 37.16 laikh houses during the period 1985- 86 to 1996-97 at an investment o f Rs. 5,038 crore. Thie lAY has been recognised as a positive support activity that has provided to the homeles:s poor in rural areas a feeling of security and has facilitated their integration in the emergimg social milieu. An evaluation of
28!

the lAY by the Planning Commission in 1993 brought out a high satisfaction rate, with 84 per cent o f the beneficiaries being satisfied with their houses. States have accepted it as a major activity and almost every year since its inception, the annual targets have been exceeded. The programme received a major thrust in the Eighth Plan, particularly in 1995-96, when the outlay was substantially enhanced from Rs. 437,69 crore in 1994-95 to Rs. 1368.34 crore in 1995-96. During the Eighth Plan period, the total allocation was Rs.3821.73 crore, utilisation Rs.3781.63 crore (99.0 percent), and houses constructed 26.21 lakh, which was 86.7 per cent o f the target o f 30.22 lakh.
3.7.73 The cost norms under the lAY have undergone changes during the period 1985-86 to 1996-97. The Chief Ministers Conference in July, 1996 recommended anincrease in the construction assistance under the lAY from Rs. 14,000 to 20,000 and this was followed by the Ministry o f Rural Areas and Employment enhancing the ceiling for new construction to Rs. 20,000 per unit in plain areas and Rs. 22,000 per unit in hilly and difficult areas, effective from 1.8.1996.
Implementation of Agenda 213.7.74 During the Eighth Plan period, significant activities were underatken towards theimplementation o f Agenda 21, endorsed at the Rio de Janeiro Environment Meeting o f 1992. This document had laid stress on
There is an en orm ou s shortage in the housing sector and m ajor d e f ic ie n c ie s in the h ou sin g related infrastructure. T he G overn m ent has been p rogressive ly adopting the role o f an enabler rather than a d irect provider. This has n ecessita ted a p o lic y sh ift to en cou rage private and coop era tive sector to p lay a m ajor role in housing sector, m o d ify in g the e x is tin g legal and regulatory regim e. K eep in g this fact in m ind G overn m en t has since adopted a n ew H ou sin g and Habitat Policy(approved by the C abinet in July 1998). the deteriorating situation in
human settlement conditions,assessed to be a result o f low levels o f investment because o f resource constraint andrecommended promotion and improvement of activities in eight priority areas. TheGovernment o f India has responded positively.
3.7.75 The key objective o f the National Housing Policy (NHP) 1994 is to provide access to adequate shelter for all. There is an enormous shortage in the housing sector and major deficiencies in the housing related infrastructure. The Government has been progressively adopting the role o f an enabler rather than a direct provider. However, this necessitated a policy shift to encourage private and cooperative sector to play a major role in housing sector, modifying the existing legal and regulatory regime. Keeping in view the above Government has since adopted a new Housing and Habitat Policy (approved by the Cabinet in July 1998). Efforts are also being made by the Central and State Governments to achieve the objective o f shelter for all through a number o f Centrally sponsored schemes and institutional financing through HUDCO and other institutions. Several enabling programmes have been initiated, such as. the establishment o f a housing finance system with a National Housing Bank at the apex level, amendment to the Urban Land (Ceiling and Regulation) Act to expand the supply o f land, formulation o f a model Rent Control Act. model Apartment Ownership Bill and schemes to link up housing and income generation programmes for the poor.
3.7.76 As a part o f the strategy to strengthen the human settlements management activities, the Central Government has introduced several schemes such as : Environment Improvement o f I'rban Slums, a State sector scheme; Integrated Scheme o f Low-cost Sanitation; Nehru Rozgar Yojana (NRY) with three components namely Scheme of Urban Micro Enterprises (SUME), Scheme of Urban Wage Employment (SUWE), and
282
Scheme o f Housing and Shelter Upgradation (SHASHU); Urban Basic Services for the Poor (UBSP); Scheme o f Integrated Development o f Small and Medium towns (IDSMT); Scheme of Infrastructure Development in Mega-ci ties (IDM); Integrated Rural Development Programme (IRDP); Jawahar Rozgar Yojana (JR Y); Development o f Women and Children in Rural Areas (DWCRA); Accelerated Rura.l Water Supply Programme (ARWSP); Accelerated Urban Water Supply Programme for small towns with population less than 20,000 (AUWSP) and Minimum Needs Programime (MNP)/ Basic Minimum Services (BMS).
3.7.77 In order to improve the land-use planning capabilities at the city/town level, the Central Government has launched an urban mapping scheme which utilises advanced technologies such as remote sensing and aerial photography to prepare physical and utility maps on appropriate scales. Two-third o f Indian States aind Union Territories are vulnerable to natural disasters. In order to develop policies and strategies for planning human settlements in disaster-prone areas, the Government, o f India has set up the National Centre for Disaster Management. A Vulnerability Atlas is being developed to indicate disaster-prone sites in the country.
3.7.78 The rapidly growing demand for housing anid infrastructure is exerting heavy pressures on the natural environment. To promote smstainable development o f the construction industry, Government, o f India has taken several initiatives to promote energy-efficient building materials and shift the reliance from inon-renewable resources to renewable resources. The national network o f Building Centres is disseminating information on these eco-friendly and energy-efficient building materials and construction technologies and the Building Material and Tec;hnology Promotion Council (BMTPC) is promoting large-scale utilisation o f agro-industriad wastes. The Council o f Scientific and Industrial Research (CSIR) is co-ordinating the R&D activities on the development o f new wood substitutes for use in construction aictivity. The Department o f Enviroimient, Government o f India has launched a schemte o f labelling eco-friendly building materials and the Bureau o f Indian Standards has formulated standards, specifications and code o f practice on several innovative building materials. Further capacity building programmes are being launched all over the country to improve human resource development. Sustainable energy and transport systems like Mass Rapid Transit System (M.R.T.S.) are being developed in order to tackle pollution and traffic congestion.
Ninth Plan Priorities and Strategies3.7.79 While the housingneeds o f all segments o f the population will have to be met, the Ninth Plan will focus special attention onhouseholds at the lower end of the housing market, the priority groups identified for such support, such as, for example, people below the poverty line, SC/ST, disabled, freed bonded labourers, slum dwellers and women-headed households. Minimum
While housing needs o f all seg;ments o f the population w ill have to be met, the Ninth Plan \will focus special attention on households at the lower end o f thie housing market, the priority groups identified for such supptort, such as eg. People below poverty line , SC/ST, disabled, freed bonded labourers, slum dwellers and women headed housiholds.Government will, as a facilitatoir , create an environment in which access to all the requisitce inputs will be in time, in adequate quantum and an appropriate quality and standards. There will be provision for m ore direct intervention by the Government in the case o f low/er segments o f the housing market and selected disadvantageid groups.A package o f incentives and c:oncessions to attract private sectors would be introduced to shioulder the task o f housing for the poor.
283

housing adequacy norms will be evolved that would include per capita living space, structural durability, access to drinking water with minimum quantitative and qualitative norms, sanitation facilities and connectivity. The responsibility to fix the norms will be entrusted to the States and it is expected that the State governments will further decentralise the responsibility to Urban Local Bodies (ULBs) and Panchayati Raj Institutions (PRIs), with provision for a participatory process to determine the norms. The norms would be the base for working out State and district housing action plans for both the urban and rural areas.
3.7.80 Housing has been always a people's activity and will continue to be so in the Ninth Plan, both in the urban and the rural areas. Government will, as a facilitator, create the environment in which access to all the requisite inputs will be in time, in adequate quantum and o f appropriate quality and standards. All housing delivery systems, such as the cooperatives, private sector, commimity groups, and people's se lf efforts, will be stimulated to make their contributions to new housing stock as well as upgradation and renewal o f the existing stock. In the case o f the cooperatives, the endeavour will be to encourage the formation o f cooperatives from the planning stage o f the housing programme and maintaining a high continuity rate o f the original members.
3.7.81 There will be provision for more direct intervention by the government in the case o f the lower segments o f the housing market and selected disadvantaged groups, whose needs may not be effectively or adequately met by the market-driven forces, which will, in olher cases, be a prime mover o f housing development activities, particularly in the urban areas. However, a package o f incentives and concessions to attract private sectors would be introduced to shoulder the task o f housing for the poor. Uptill now private sector has been playing an almost non-existant role in the shelter delivery for the vulnerable group. Cooperative sector and other public housing agencies could also be encouraged to share the responsibility. Subsidy would continue to be provided for some more time and the flow mechanism will be made transparent and increasingly routed outside the financial system. Government has set the goal to provide housing for all and towards this end it proposes to facilitate the construction o f 20 lakh additional housing units aimually. The focus will be on providing houses to the houseless, inadequately housed and disadvantaged groups below poverty line. Since ratio o f housing shortage betv '̂een rural and urban areas is 65:35 as per the NBO statistics derived from the 1991 census, out o f 20 lakh additional houses 13 lakh will be in the rural areas and 7 lakh will be in the urban areas.
3.7.82 Land market reforms will be undertaken through restructuring legal, planning and fiscal provisions, on which considerable work has been done during the Eighth Plan and the results incorporated in several official documents. A work agenda to implement them will be taken up. Land scarcity is one o f the key elements to development o f housing and infrastructure services. Legislative provisions like the Urban Land Ceiling and Regulation Act (ULCRA) 1976. whose basic objective is to make land available to all income segments in the urban agglomeration, has in practice, led to distortions in the land market operation. The Cabinet has since taken a decision to repeal ULCRA. To promote sustainable human settlements, the Plan will take specific initiatives to promote and adopt in human settlements programmes energy-saving, eco-friendly and environment-friendly technologies and building materials.
3.7.83 Apart from new construction, the Ninth Plan agenda will take up the massive task o f upgradation and renewal o f old and dilapidated housing stock. In the urban ,this is a major challenge in the inner city areas and in the growing slum and squatter settlements,
284

which have become an ingenious solution to get shelter perfected by the people who cannot enter the formal housing market on their own. Within this category, the Plan will look into the needs o f the households below the poverty line. Urban renewal in this direction is crucial to the health and sustainability o f the urban environment.
3.7.84 To build sustainability into the housing o f the urban poor as well as in rural housing, integrated development o f settlement should be promoted, on the principle o f stregthening the linkages and inter-dependency between shelter and income upgradation. India has made a commitment to this approach in the NHP and the Habitat II National Plan o f Action (NPA). To promote this strategy, the Ninth Plan will support the use o f composite credit instrument, modify land-use patterns and city master plans and strengthen the linkages between the farm and the non-farm sector in the rural and semi-urban areas. The NGOs and other voluntary organisations would have to play the role o f a catalyst.
3.7.85 Some special development needs have to be addressed as regards rural housing. Urbanisation has had an impact on the traditional rural housing development activities, with increased flow o f information on housing designs, new technology,and materials. The options and need to upgrade the structure, especially the roof and the wall, has been recognised in the NHP and in rural housing programmes. This would reduce the aimual maintenance inputs, including human inputs, and provide better protection against natural calamities. Rural housing is also qualitatively different from urban housing, in that the housing activity is not very much based on the cash economy but depends to a considerable extent on land rights and access to resources. Rural housing has also emerged as a major component o f rural development programmes and, as such, is considered to be an integral part o f rural development planning. Keeping in view the varied range o f geo- climatic conditions and housing typologies in rural areas, the tasks are stupendous in developing and managing rural housing programmes. One set o f materials, plans or construction techniques cannot be applicable across the country, and hence rural housing requires grass-root level feedback on housing needs, together with basic amenities like approach roads, internal roads, drainage, water supply, sanitation and work place.
3.7.86 As per 1991 census the total rural household shortage was 13.72 million. Of these3.41 million households were without shelter and 10.31 million households were living in 'Kutcha unserviceable’ houses. In addition an estimated increase o f 10.75 million households would be required on account o f population growth during the period 1991- 2002.It has also been estimated that between 1990-91 and 1996-97, about 5.7 million units would have been added to the rural housing stock through the on-going programmes o f lAY , State Governments, HUDCO and self-help system. Thus the net housing shortage between 1997 and 2002 is 18.77 millions o f which 8.46 millions are new houses and 10.31 million are kutcha/unserviceable houses. Another set o f estimates, presented in Habitat II National Report, also brings out a similar scenario with new housing requirement estimated at 7.7 million units and upgradation requirement at 11.2 million units. An additional estimate was made o f extension o f existing units, which was 8.7 million units. It is clear that large upgradation activity has to be taken up during the Ninth Plan for which realistic estimates o f net housing shortage, Statewise, will be required. The overall housing shortage does not reveal the regional dimension o f the problem. While housing shortage exist in almost all States, there is a large concentration in a few States with Bihar accounting for nearly 1/3 o f the housing shortage in the country followed by Andhra Pradesh , Assam, UttarPradesh and West Bengal, which together account for another 44.65 per cent. In each
285

o f remaining States the housing shortage is less than 5%. Therefore in the backdrop o f the total housing requirement the housing shortage in selected States is more acute.
3.7.87 Apart from the quantitative dimensions o f the rural housing requirements, the qualitative aspects are equally important, particularly those relating to per capita living space, durability and access to amenities. The 1991 Census indicated that 40.8 percent o f the 112 million rural households lived in one-room units and the pre-dominant roofing materials used were grass, straw and thatch. These rural housing activities have to be incorporated under the lAY, as a special mechanism for financing is required to facilitate the use o f market-sourced materials for increasing the durability o f structure and providing access to basic habitat services.
3.7.88 There is virtually no institutional finance in the rural housing sector except what is provided through its scheme by Housing and Urban Development Corporation . The housing finance institutions will have to overcome their reluctance to enter into the rural housing market. The access to rural housing credit, outside the Government schemes like the lAY, would require special attention during the Ninth Plan, as also fiill access to low- cost materials and appropriate technology. With the growth in the rural housing programme emphasis would also have to be placed on training and development o f skills so that skilled masons in adequate numbers are available in the rural areas to carry out construction works , particularly, using new building materials and low cost technology. The financial institutions will have to meet the credit needs o f rural housing through irmovative credit instruments and delivery systems that take into account the specificities o f rural housing, geo-climatic conditions and socio-cultural practices, besides the need to finance the habitat-related services. Multiplicity o f institutions to service the shelter and basic needs may not be very much desirable.
3.7.89 The provision o f house sites has emerged in recent years as a crucial requirement in some parts o f the coimtry, and especially for the rural poor, a large proportion o f whom do not have security o f tenure nor the right or access to land for building a house.Land should be acquired in places where public land supply may be a constraint and this strategy should take into account the ecology and environmental considerations, as also the appropriateness o f the location in terms o f the economic activities and access to basic habitat services.Under an on-going programme o f House Sites-cum-Construction Assistance, which is implemented by the tate Governments, 233.43 lakh house sites have been allotted and construction assistance provided to 77.6 lakh beneficiaries upto 1995- 96.The implementation o f this scheme has been slow, with most States not being able to keep up the desired pace vis-a-vis the extent o f the housing shortage.The lAY may be modified to include a provision for making minimum land available to such rural poor and the land would have to be acquired in the proximity o f village habitations.Tenurial arrangements to protect the nistar rights o f the rural poor and disadvantaged groups on the houses and lands occupied by them is another priority concern.
3.7.90 The I AY would be the main Government programme for achieving the objective o f shelter for all rural poor. It would continue to be a 100 per cent subsidised programme, targetted specifically towards providing shelter for the houseless, inadequately housed and disadvantaged groups. Under the lAY, the funds are allocated to the State/UT on the basis o f the proportion o f rural poor in the State/UT to the total rural poor in the country. This modality fails to take account o f the actual housing shortage and does not take into account the housing needs o f the economically weaker section who are just above poverty line.
286

There is need for modification o f present lAY. This iss;ue being discussed separately under this chapter.
3.7.91 In view o f the massive upgradation activities tot be undertaken, the lA Y may have to be modified to support these activities, initially utilising upto 20 percent o f the total lA Y fimds for upgradation o f unserviceable kutcha houses.,The Ninth Plan would also give a thrust on improving the quality o f houses under the lAY through cost-effective measures and introduction o f appropriate technologies and functional designs to suit the housing needs o f different geo-climatic conditions, cultural preferenceis and lifestyles o f the people.
3.7.92 In this effort, the focus o f research and development would be on innovative low- cost building and construction technologies, cul tural-specific housing designs and appropriate housing materials for building durable and safe houses.Apart ft’om developing new technologies, the rich stock o f appropriate techntologies will be disseminated to the rural areas.To utilise these technologies effectively a major role will be provided for development o f skills by the Nirmithi Kendras (rural biuilding centres) under the aegis o f HUDCO for dissemination of rural building techniques and for effective training to rural youth in trades related to low-cost housing.Institutional facilities already available in select rural ITIs, polytechnics and vocational training centres w ill also be strengthened.NGOs should also participate in conserving and upgrading the traditional housing architecture and should promote development oif integrated programmes for the upgradation o f artisans' skills and the deployment o f unemployed youth in various trades related to low-cost housing.
3.7.93 Integrating the financing o f rural and urban hoiusing within a single organisation might not necessarily be in the interest o f the rural housing sector. Rural housing finance requires a different type o f approach, more dev'elopment-oriented than a purely financial approach. Rural housing finance might have to take into account the financing o f habitat-related services and in the case o f housing in poorly connected areas, also economic activities. Kutcha housing units should be eligible for institutional finance and there must be a high level o f flexibility in the repayment schedule, linked more to seasonality o f income flows than to the conventional monthly repayment programme. There is also the problem of ownership o f land as in somie parts o f the country, particularly in tribal societies, land is owned by the community ratther than on an individual basis. The Ninth Plan would examine the feasibility o f special integrated rural human settlements finance and development institution, as welll as specific programmes like the lA Y that would look into the financing and developme;nt o f upgradation activities.
3.7.94 Several States/UTs are implementing theiir own housing programmes, inaddition the lAY. It is necessary to coordinate all the efforts with a view to addressing thehousing shortage in a phased manner. There should be regular and timely data onallocations, cost norms, and the number o f houses con;structed each year.Statewise. A strong data base and monitoring system is required for this purpose. The Central andState Governments, along with financial institutions would' then be able to jointly undertake the tasks o f providing a house to all, with basic habitat services, in a time bound marmer.Activities will have to be undertaken at the village level through convergence and collective action. This would necessitate the proaictive participation o f the village community who would formulate an action plan on the basis o f identified needs and priorities and in line with the resources available.
287

3.7.95 The magnitude o f the Ihousing task ahead is so great that besides the State Government's efforts at providing land and finance, making available easy access to local construction materials and dissemination o f appropriate building technologies, there has to be a more active involveiment o f several other agencies such as cooperatives, the community, voluntary orgamisations and the private sector. Public sector undertakings would also be required to participate in the programme as part o f their social obligation and commitment. The PRIs have to allso play a key role.
3.7.96 A few legislative changes are required particularly relating to tenurial arrangements, including rights to house and lantd. The"nistar rights" o f the poor to access traditional building materials and undertaking cadastral surveys are priority activities to be undertaken during the Ninth Plan. Another concern, in the case o f States with large tribal population, is to safeguard the non-alienable property rights o f the people and evolving a workable solution to the oft-identified problem o f mortgaging o f community owned land for individual home loan programm(e. It is equally important to converge all habitat-related activities presently implemented by various departments into a single programme so that planning, community mobilisation and effective monitoring and impact assessment can be taken up in a more effective marnner. The village should be made an effective planning unit, giving full recognition to the Comstitution (73rd Amendment) Act.
Special Action Plan- Urban Hcousing
3.7.97 It has already been mentrioned about the target o f construction o f 20 lakh additional houses every year under the Spec;ial Action Plan. The target of additional dwelling units has been broadly bifiarcated as 13 lakh units for rural areas and 7 lakh units for urban areas. This division o f target is stated ito be based upon the ratio o f housing shortage in the urban and rural (basis 1991 census). The Government's role is that o f an enabler than that a builder. Taking a clue fromi this approach government may provide necesary fiscal concessions, access to land, appiropriate technological support and inexpensive finance to the sector. There would be neces:sity to bring the legal reforms required for the sector particularly in respect o f rent control regulating the activities o f builders. Apartment Ownership Act Building Bye-laiws and National/Departmental Standards and Codes. Land is most critical input. An inte;grated programme for land assembly and infrastructure development to be taken up on a priority basis.
3.7.98 Keeping in view tlhe large quantum o f low cost fiinds needed, the financeMinistry would have to consider allowing substantially higher allocation o f tax fi'ee bonds for resource mobilisatiion. The banking sector would need to be directed to make available more funds for housing, both by expanding the percentage o f incremental deposits as well as earmarking dedic;ated funds under the priority sector especially forEWS/LIG housing. Fiscal incentives under the Income Tax Act for housing initiatives need to be provided. Further a;ssistance under l.T.Act to the HFIs should be continued. Tax concession under Wealth T;ax may be provided for promoting rental housing scheme. Amendments to the NHB Act need to be expedited for early foreclosure procedures.
3.7.99 Based on the average cost o f EWS and LIG o f Rs. 35000 and I lakh respectively theinvestment requirement for 7 hakh new units has been worked out to be o f the order o f around Rs. 4000 crore. The exttent o f fimding from institutional financing is proposed to be 70% and the balance 30% is proposed to be met partly as subsidy fi-omCentral/State Governments aind partly as beneficiary contribution in cash, kind and labour. This, however, is the assumption that there would not be any change in technology
288

Special Action Plan - Urban Housing
• Government has set a goal to provide housing for all and towards this end it proposes to facilitate the construction o f twenty lakh additional hiousing units annually.
• The target o f additional dwelling units has been broadly bifiircat(ed as 13 lakh units for rural areas and 7 lakh units for urban areas.
• Based on the average cost of EWSand LIG housing units o f Rls. 35000 andRs. 1 lakh respectively the investment requirement for 7 lakdi new unitswould be o f the order o f around Rs. 4000 crores.
• The extend o f funding from institutional finance is proposed to b>e 70 per centand the balance 30 per cent is proposed to be met partly as 'subsidy fromCentral/State Governments and partly as beneficiary confribuition in cash, kind and labour.
• Investment expected from the institutional financing bodies womld be o f the order o f Rs. 2800 crores.
• A package o f incentives and concessions is needed to attraclt the private sector.
leading toreduction in costs. The investment expected from the
institutional financing bodies would be o f the order o f Rs. 2800 crores. The bulk o f institutional finance for housing in the country isprovided byHUDCO, , NHB,25 HFIs andCommercial Banks for direct lending
and the LIC/GIC for supportive lending for housing sector. There is a need for all financing institutions to lend their helping hand for smpporting the additional 20 lakh houses every year.
3.7.100 One o f the key demands in the housing progiramme is active participation o fPrivate Sector. A package o f incentives and concesslonis is needed to attract the privatesector. It is proposed that shelter delivery would b>e through private sector publichousing agencies, co-operative sector and NGO/CBJOs. The implementation o f the programme would require a strong public private partnership in assembly/ development o f land provision o f infrastructure and shelter delivery.
3.7.101 While the Union government is responsible for policy formulation, the actual implementation lies with the State Governments. At the Central Government level, the Ministr>' o f Urban Affairs & Employment will be directly involved in the policy formulation on urban housing, for the techno-financing dimensions for the whole housing sector and legal and regulatory reforms in the sector. Ministry o f finance would be involved in granting various fiscal concessions so as to makce the housing sector attractive for investment and in allowing additional resource mobilisation through market borrowings and international assistance. Ministry o f Law would meed to consider reforms in the regulatory regime particularly speeding up o f foreclosure procedures and amendments required on other statutes which have impact on the housimg sector.
Requirements of Funds
3.7.102 As has been pointed above, the total imvestment requirement for the construction o f 7 lakh additional units is o f the order o f Rs. 4000 crore, annually. This consists o f institutional finance o f the order o f Rs. 2800 crores including equity support to HUDCO to be provided through central budget and the balance Rs. 1200 crores consists o f subsidy from Central/State Govts, and beneficiary contribution in cash, kind and labour. Assuming that the investment requirement remains constant over a period o f time the requirement for implementation o f PMSA during IX;th Plan works out to Rs. 16000 crores because PMSA commences from the second year oP the Ninth Plan (1997-2002).
289

Physical Targets
3.7.103 The physical targets under SAP are 7 lakh additional dwelling units annually starting from second year o f the Ninth Plan (1997-2002).
3.7.104 Assuming that physical output o f formal sector institutions in theimplementation o f SAP would be commensurate with the investment requirement o f 70%, the target for formal sector financial institutions would be 4.9 lakh dwelling units annually and the balance 2.1 lakh units would be provided by the beneficiary contribution ,subsidy. Out o f formal sector institutions HUDCO is expected to build one third o f the total target namely 2.33 lakh dwelling units annually. However since there is likely delay in the implementation o f the SAP and HUDCO is currently engaged with the task of providing roughly one lakh dwelling units annually through ongoing schemes the additional target for HUDCO has been kept at a reduced level o f 1.5 lakh dwelling units for 1998- 99 instead o f 2.33 lakh originally proposed. The shortfall in the current year(0.83 lakh dv/elling units) may be undertaken by other Formal Sector Institutions. During the remaining years o f IXth Plan (i.e. 1999-2002), HUDCO could take up one third o f the shortfall in 1998-99 (i.e. 0.83 lakh dwelling units) over and above the original target of2.33 lakh dwelling units.
3.7.105 Formal sector housing institutions would be encouraged to take up housing for the deprived sections o f the society through their various activities/progrmme.
3.7.106 Housing is a State subject. Given the wide variation in the housing needs in the States and constraint o f resources to meet the housing needs, State Govts, and UTs would have to play a critical role in formulating plans and programmes suited to local needs and conditions in consultation with the local bodies. State Governments would need to identify the specific agencies for implementation o f the Action Plan. Developmment o f housing infrastructure and services has not kept in tune with the growth o f housing. The problem o f upgradation and renewal o f basic services like potable drinking water and sanitation is serious. An integrated programme for land assembly and infrastructure development particularly water supply, sanitation, drainage and electric supply would require to be taken up on a priority basis. Action o f the State Government would need to take into account the resource flow from the private, cooperative and public sectors. The role o f the Central Government would be to guide and facilitate the implementation o f Action Plan.The synergy created with the efficiency o f private sector and experience o f the public agencies would ensure that the overall costs is kept at minimum.
Special Action Plan for Rural Housing.
Present Status Of Construction In Rural Housing
3.7.107 At present it is estimated that approx 12.3 lakh houses are being constructed annually in rural areas under various housing schemes. Based on this estimation it was projected that approx 61.50 lakh houses (i.e. 12.30 lakh x 5 years) will be added to the overall housing stock between 1997-2002 AD at the 1997-98 level o f funding. In addition, from the Additional Central Assistance (ACA) for BMS which includes rural housing as one o f the seven components, it is estimated that at least 1.70 lakh additional housing units would be constructed annually from 1998-99 to 2001-02. Therefore, a total o f 68.30 lakh units o f rural houses were to be constructed as per earlier projections.
290

be constructed annually from 1998-99 to 2001-02. The;refore, a total o f 68.30 lakh units o f rural houses were to be constructed as per earlier projecti(ons.
Special Action Plan For Social Infrastructure: Targets For Rural Housing
3.7.108 Under the Special Action Plan for Ruiral Housing, an additional 13 lakh new houses are required to be constructed annually iin the rural areas in addition to the existing 12.3 lakh units per year. Therefore, the total houses to be constructed annually would increase commensurately to 25.30 lakh.
Operational Strategy To Achieve The Targets Set Under Special Action Plan For Social Infrastructure: Portfolio O f Rural Housing Schemes Tot Be Implemented
3.7.109 The task for preparing the Action Plan o n Rural Housing has been taken up in the second year o f the Ninth Five Year Plan i.e. 1998-'99. The composite housing strategy for the Ninth Five Year Plan is multi-pronged and inclmdes proposed modifications in the existing housing schemes and certain new initiatives. These are detailed below:
i) Indira Awaas Yojana (lAY)- Main Programnne. The Indira Awaas Yojana is the most important rural housing scheme which aims; at providing dwelling units free o f cost to the rural poor living below the pove;rty line. On 1.1.1996 with the restructuring o f Jawahar Rozgar Yojana (JRY), lA.Y became an independent Centrally Sponsored Scheme (CSS) for shelter for the rural ]poor with resources being shared on a 80:20 ratio between the Centre and States. The; main objective o f the scheme is to construct dwelling units free o f cost for the target group below the poverty line which comprises SC/ST, freed bonded labourers and ailso non-SC/ST families. The cost norms under lAY have been periodically increase:d and in the latest upward revision the maximum ceiling o f assistance admissible under lA Y has been raised from Rs. 14,000 to Rs.20,000 in plain areas and froim Rs. 15,800 to Rs.22,000 in the hilly/difficult areas.
The existing scheme has a limited format ii.e. construction o f new houses. As the need for upgadation o f unserviceable kutcha Ihouses in the rural areas is acutely felt, the existing pattern o f public investment iin the rural housing sector is not necessarily the most efficient. In principle, it wouild be cost effective to provide part financing for upgradation o f existing houses as th<e field level situation supports this. Hence in its modified form it is proposed to imphement the lA Y in two components namely, (a) construction of new houses (at an av/erage weighted cost o f Rs.20,900) and (b) upgradation of kutcha and unserviceable houses (at a unit cost o f Rs. 10,000). States would be allowed to use upto 20% o f the funds allocated under lAY for the upgradation o f unserviceable kutcha houses.
To correct the regional imbalance, iimplicit in the overall housing shortage, in the country, it would be imperative: to change the existing allocation criterion under lAY from the incidence of poverty to actual housing shortages in States. Also the absorptive capacity o f the States both physical and financial in terms o f their 20 per cent share would also have to be taken note o f as problems o f implementation are acute in some States.
291

ii) Credit-cumSubsidy Scheme (CCS): There are a large number o f households in the rural areas who have not been covered under lAY, since they do not fall within the BPL category. For such households living just above the poverty line, but still constituting the segment o f economically weaker sections, a new Credit-cum-Subsidy Scheme (as a sub-scheme o f lAY) is proposed to be launched covering people upto twice the income level o f the BPL families. The Finance Minister in his budget speech for 1998-99 has also made a reference to the introduction o f such a scheme. Under this scheme it is proposed that 50% o f the assistance would be in the form o f subsidy and 50% as loan but within the lAY cost norms (presently Rs.20,000 for the plain areas and Rs.22,000 for the hilly/difficult area). The loan portion would be provided by financial institutions, commercial banks, housing boards, etc. and the refinance facility will be provided from HUDCO, National Housing Bank etc. The funding o f the subsidy portion would be shared in the ratio o f 80:20 between the Centre and the States. It is proposed to launch this scheme in 1998-99
Special Action Plan for Rural Housing• The National Housing and Habitat Policy 1998 aims at providing ‘Housing for AH’.■ 20 Lakh additional housing units proposed to be constructed annually, o f which 13 lakhs
dwelling units would be in rural areas. These would be in addition to 12 lakh units constructed per year. Therefore, a total o f 25 lakh rural houses would be constructed annually.
■ Main ingredients o f the composite housing strategy are:■ Indira Awas Yojana (lA Y) - for construction o f new houses free o f cost for the target group
below the poverty line comprising SCs/STs, freed bonded labourers and also non-SCs/STs families to continue.ln addition, a new component for upgradation o f kutcha and unserviceable houses is being introduced.
• Credit -cum-subsidy scheme to cover people upto twice the income level o f the Below Poverty Line families. Assistance in the form o f subsidy and loan on a 50:50 basis within Indira Awas Yojana(lAY) cost norms.
• Innovative Stream for Rural Housing and Habitat Development (ISRHHD) - to encourage the use o f cost effective, environment friendly, scientifically tested and appropriate indigenous and modem designs, technologies and materials.
■ National Housing Bank(NHB) - to finance 1 lakh housing units under the Swama Jayanti Housing Finance Scheme.
■ Greater equity participation to HUDCO for construction o f additional houses in rural areas,■ Rural Building Centres to facilitate technology transfer, information dissemination, skill
upgradation and production o f cost effective and environment -friendly materials.■ Basic Minimum Services(BM S) Programmes - Housing is one o f the seven components
identified under the BMS to provide housing to the shelterless poor in a time bound manner.
ni) Innovative Stream for Rural Housing and Habitat Development (ISRHHD):The Innovative Stream for Rural Housing and Habitat Development (ISRHHD) is proposed to be launched as a sub scheme o f lAY on a pilot project basis for the BPL poor. Under this scheme it is proposed to encourage the use o f cost effective, environment friendly, scientifically tested and proven indigenous and modem designs, technologies and materials to construct lAY houses suited to the particular location. The Innovative Stream for Rural Housing and Habitat Development would be launched in 1998-99, on a pilot scale.
iv) National Housing Bank/Commercial Banks Funding. The National Housing Bank (NHB) and other banks would have to enhance their performance in rural housing. The Golden Jubilee Rural Housing Finance Scheme (GJRHFS) was launched by the National Housing Bank in 1997-98 with its coverage extending to the rural areas and to small towns having a population upto 50.000. The benefits o f this
292

scheme have however been cornered mainly by the ; small towns. The total estimated contribution o f NHB and other commercial banks to rural housing annually is only 0.6 lakh units.
In the Budget speech o f the Finance Minister, the NHB has been directed to finance 1.00 lakh rural dwelling units under the Sw am a Jayanti Housing Finance Scheme (SJHFS) as against the existing 50,000 units..
v) Rural Building Centres (RBCs):To address the primary objectives o f technology transfer, information dissemination, skill upgradeation through training o f rural masons, plumbers etc. and production o f cost eflfcective and environment fiiendly materials, there is a need to establish an institutio>nal network o f RBCs in all the districts in the rural areas as has been done in the urban areas.
Rural Building Centres in the rural areas wouild be taken up initially on a pilot basis. After assessing the viability o f this scheme, iit would be extended in a phased manner to cover all the districts o f the country.
vi) Housing and Urban Development Corporeation: The Housing and Urban Development Corporation (HUDCO) is ftinctioning with equity support provided by Government o f India, as the apex national techno-ifinancing agency in the housing sector. So far its operations have been largely confimed to urban areas. However, at present HUDCO is directing 15% o f its total housing resources for fmancing housing activity in the rural areas and constructing approx. 3.(00 lakh rural houses annually. In his budget speech the Finance Minister has enhancecd the capital base o f HUDCO by Rs. 110 crore so that it may leverage more funds for Ihousing construction in the urban and rural areas.
Equity participation by the Department o f Rural Employment and Poverty Alleviation (DREPA), Ministry o f Rural Areas and Employment (MRAE) in HUDCO earmarked for rural housing would facilitate H UDCO to raise eight times o f the amount from the market for construction o f additionial houses. By way o f illustration Rs.50 crore equity participation in HUDCO would Ileverage Rs.400 crore and which would finance 1.8 lakh houses in rural areas (It imay be noted that houses to be constructed by HUDCO with equity' participaticon from Department o f Rural Employment & Poverty Alleviation in the remaining; 4 years o f Ninth Plan (1998-99 to 2001-2002) would be an additionality over their existing effort at constructing 3 lakh houses annually.
vii) Cooperative Housing: The cooperativ'e housing movement has alsocontributed to the housing sector by constructing 7.010 lakh units in the rural areas. It is expected to improve its performance in the ensuiing years o f the Ninth Five Year Plan period.
viii) Others including BMS. The Basic Minimum Services (BMS) programme was launched in pursuance o f the recommendations o f the Chief Ministers’ Conference held in July, 1996. Housing has been identified as ome o f the seven components o f the BMS to provide housing to the shelterless poor in a time boimd manner. In addition to the normal State Plan provisions for BMS being made in the States/UTs Aimual Plans and the funds routed through the Centrally [Sponsored Schemes, the Central
293

Government provided Additional Central Assistance (ACA) for BMS to the States and UTs. It is assumed that from the ACA provided to the States for BMS, at least1.70 lakh additional housinig units would be constructed annually under BMS in the rural areas. Further, it is projected that outside lAY 5.80 lakh housing units will be constructed by various finaincial institutions like NHB/Commercial Banks and State Governments rural housing programmes. It is therefore estimated that 7.50 lakh additional units would be constructed annually outside lAY by various housing agencies.
Ninth Plan : Physical targets
3.7.110 In the first year o f the Niinth Plan i.e. 1997-98 the Central outlay for rural housing (i.e. lA Y ) was Rs.l 190.00 crore. W ith this financial provision approximately 7.00 lakh lA Y houses were constructed during that year. Approx. 5.30 lakh units have been constructed outside the lA Y by various housiiug agencies and by the State Governments. Therefore the total houses constructed in 1997-98! were approx 12.30 lakh.
3.7.1 II In the financial year 1 998-99, a Central oytlay o f Rs. 1600.00 crore has been provided in the Budget for Rural Housing. Based on this Central provision it is estimated that 13.28 lakh houses can be comstructed under'the lAY and other housing schemes. In addition 7.50 lakh houses woulcd be constructed under other rural housing schemes implemented by the State Govermments, including rural houses constructed under BMS, thereby cumulating a total o f 20.78 lakh units in the current year.
3.7.112 A composite profile: o f the total houses to be constructed in eatch o f the five years o f the Ninth Plan is given in Table 3.7.1.
Table 3.7.1Lakh units
Year Houses to be constriucted Addl. Houses to be constructed TotalUnder lAY & othesr under other housing schemes houses to beSchemes with Centiral including BMS constructedContribution
1997-98 7.00 5.30 12.301998-99 13.28 7.50 20.781999-2000 17.83 7.50 25.332000-2001 18.06 7.50 25.562001-2002 18.06 7.50 25.56
Total 74.23 35.30 109.53
Note: It may be noted that the above calculation is based on the current unit cost.
3.7.113 The schematic breaik-up o f houses to be constructed during the Ninth Planperiod is detailed in Table 3.7.2.
294
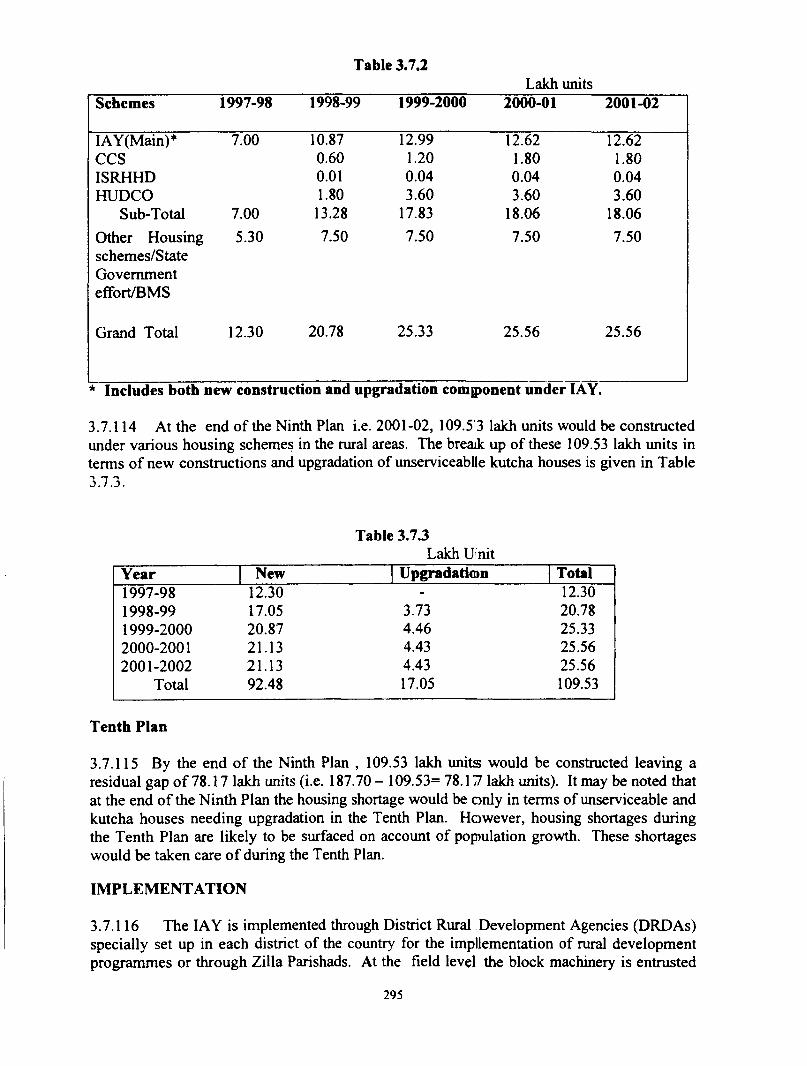
Table 3.7.2Lakh units
Schemes 1997-98 1998-99 1999-2000 2000-01 2001-02
lAY(Main)* 7.00 10.87 12.99 12.62 12.62CCS 0.60 1.20 1.80 1.80ISRHHD 0.01 0.04 0.04 0.04HUDCO 1.80 3.60 3.60 3.60
Sub-Total 7.00 13.28 17.83 18.06 18.06
Other Housing 5.30 7.50 7.50 7.50 7.50schemes/StateGovernmenteffort/BMS
Grand Total 12.30 20.78 25.33 25.56 25.56
Includes both new construction and upgradation component under lAY.
3.7.114 At the end o f the Ninth Plan i.e. 2001-02, 109.53 lakh units would be constructed under various housing schemes in the rural areas. The breaJc up o f these 109.53 lakh units in terms o f new constructions and upgradation o f unserviceablle kutcha houses is given in Table3.7.3.
Table 3.7.3Lakh U nit
Year New Upgradation Total1997-98 12.30 - 12.301998-99 17.05 3.73 20.781999-2000 20.87 4.46 25.332000-2001 21.13 4.43 25.562001-2002 21.13 4.43 25.56
Total 92.48 17.05 109.53
Tenth Plan
3.7.115 By the end o f the Ninth Plan , 109.53 lakh units would be constructed leaving a residual gap o f 78.17 lakh units (i.e. 187.70 - 109.53= 78.17 lakh units). It may be noted that at the end o f the Ninth Plan the housing shortage would be on ly in terms o f unserviceable and kutcha houses needing upgradation in the Tenth Plan. However, housing shortages during the Tenth Plan are likely to be surfaced on account o f pop>ulation growth. These shortages would be taken care o f during the Tenth Plan.
IMPLEMENTATION
3.7.116 The lA Y is implemented through District Rural Development Agencies (DRDAs) specially set up in each district o f the country for the impllementation o f rural development programmes or through Zilla Parishads. At the field level the block machinery is entrusted
295

with the responsibility o f ensuring that targets for construction o f houses under lAY are achieved. At the village level the onus is on the gram sabha to identify and select the beneficiaries. However, given that most State Governments also have their own rural housing programmes, in order to facilitate the implementation o f a composite housing plan in the States, it is proposed that the Centrally Sponsored Scheme o f Indira Awas Yojana be transferred to the State sector, to be implemented by the State Governments with Central assistance specifically earmarked for this purpose.
3.7.117 The Credit-cum-Subsidy Scheme and the Innovative Stream for Rural Housing and Habitat Development would also be implemented by the DRDAs/Zilla Parishads. The former scheme would be implemented in collaboration with financial institutions/commercial banks, housing boards with the refinance facility being provided by HUDCO and the NHB. The Iimovative Stream for Rural Housing and Habitat Development would be implemented on a project basis through HUDCO/NGOs.
3.7.118 The scheme o f Rural Building Centres would be implemented by HUDCO/well known State rural housing organisations and NGOs through the DRDAs.
3.7.119 Among the other housing schemes being implemented in the rural areas, the Golden Jubilee Housing Finance Scheme, which has a rural component, is being implemented by the NHB. The NGOs engaged in construction o f rural houses are financed through CAP ART.
MONITORING
3.7.120 The Department o f Rural Employment & Poverty Alleviation in the Minisitry o f Rural Areas & Employment is responsbile for release o f Central share o f fiinds, overall guidance, policy-making, monitoring and evaluation o f the rural housing programme at the National level.
3.7.121 The programme is continuously monitored by Department o f Rural Employment & Poverty Alleviation, on the basis o f the monthly reports received fi-om the States/UTs. Senior Officers o f the rank o f Deputy Secretary and above in the Ministry are appointed as Area Officers for different States/UTs. These Area Officers visit the allotted States/UTs from time to time and inspect among other programmes the actual implementation o f the rural housing programme in the field. They also paprticipate in the State Level Coordination Committee (SLCC) meetings providing thereby, an effective link between the policy makers (Government o f India) and the implementing agencies (State/UT Governments). The programmes are also reviewed at the meetings with the State Secretaries o f Rural Development and with the Project Directors o f DRDAs in the Workshops which are held armually.
3.7.122 The State Level Coordination Committee (SLCC) monitors the programme at the State Government level.
3.7.123 In addition to the regular monitoring o f the programmes by the Ministry, the Programme Evaluation Organisation (PEO) o f the Planning Commission also periodically evaluates programmes in the rural development sector. The PEO has carried out a quick study o f lAY in 1992-93. A system o f Concurrent Evaluation has been evolved by the Ministry o f Rural Areas & Employment under which reputed independent
296

institutions/research organisations are involved in undertaking the evaluation work. A Concurrent Evaluation o f the lAY is being undertaken on the initiative o f Department o f Rural Employment & Poverty Alleviation.
Urban Development
Performance Review3.7.124 The National Commission on Urbanisation (1988) had provided an assessment o f the urban scenario and a long-term perspective. With this document as the base, and on the feedback o f major sectoral developments and urban sector projects, the range o f economic reforms initiatives, the New Delhi Declaration o f ESCAP countries, 1994, Habitat II national report and UN Habitat Agenda, 1996, the formulation o f a National Urban Policy was taken up as a priority activity. The preparation o f State urbanisation strategy documents was another important activity, providing an insight into the future development needs in terms o f new assets required to meet the anticipated demand for urban services. These State level documents have not, however, brought out the urban renewal and upgradation requirements. The Ninth Plan will seek to incorporate this aspect in the State urbanisation strategy documents so that, if required, these activities may be given special attention in on-going and fiiture programmes, particularly relating to water supply, sanitation, sewerage and waste disposal. At the same time, the Plan would seek to strengthen the preparation and updating o f State urbanisation strategy documents, with technical assistance, where necessary. The adoption o f a commercial and market approach to infrastructure planning, development and management will be encouraged. For this purpose, suitable capacity building inputs would be provided to State and city officials. Within this macro urban agenda, various on-going schemes like the IDSMT, Mega City, UBSP, Slum Development, NRY, PMI-UPEP, Urban Mapping and any new schemes that might be introduced, will be dovetailed to attain the goals o f the State macro urban development model.
3.7.125 The two aspects o f urban development activities, namely the creation o f new assets and upgradation o f existing assets, would need to be taken up simultaneously to maintain the healthy urban environment, prevent the further process o f deterioration and reduce the inequity in access to basic civic amenities. This deteriorating urban situation is reflected most glaringly in the extension o f the "city within a city" syndrome o f vastly varying urban enviropjnent conditions in different parts o f the urban agglomerations. Action will be directed to positively contribute to the reduction o f the existing level o f these disparities and the State urban strategy will provide a valuable policy and operational framework.
3.7.126 Among the major legislative contributions o f the Eighth Plan was the Constitution (74th Amendment) Act, 1992, also known as the Nagarpalika Act,which was passed by Parliament in1992 and received the assent o f the President on April 20. 1993. Thislandmark legislation provides a common framework for the structure and mandate o f ULBs for effective democratic decentralisation. The Act
Among the major legislative contributions of the Eighth Plan was the Constitution (74"' Amendment) Act, 1992,also known as the Nagarpalika Act, which was passed by Parliament in 1992. This landmark legislation provides a common framework for the structure and mandate of Urban Local Bodies for effective democratic decentralisation. Among the major legislative contributions of the Eighth Plan was the Constitution
u c v „ c i i u a i i i a t i u i i . i i i c ---------------------------------------------- —------------------------ -
provided a period o f one year to amend or modify the existing municipal laws to bring them
297

in conformity with the provisions> o f the Nagarpalika Act. The State and UT Governments have taken measures to establisjh State Finance Commissions (SFCs) and State Election Commissions (SECs). All State;s have established the SFCs and by March 1997, 10 SFCs have submitted their reports to their respective State Govemment.There is, however, a long time lag between the submission o f the SFC Report and its placement in the State legislature. The SE(Cs have been established and have conducted elections in all ULBs except in Bihar and Orissa. In the case o f Punjab, elections have been held in only two municipalities and 29 nagair panchayats. By Januray, 1997, about 60,000 elected representatives are in municipal corporations, municipal councils and nagar panchayats in 15 major States.The responsibilities amd functions o f the elected representatives have, however, yet to be articulated and defiined by the State Govemments.The District Planning Committees have been set up in only West Bengal, Kerala and Madhya Pradesh, where separate legislations have been e;nated for this purpose. In none o f the States has the government notified an area as a imetropolitan area for the purposes o f the Amendment.
3.7.127 Major efforts were m ade during the Eighth Plan to identify the lacunae and operational constraints in the Urfban Land Ceiling and Regulation) Act, 1976 and these have been documented in thie Habitat II National Report. The feedback on the implementation indicates feilure t(o curb or prevent concentration o f urban land holdings, profiteering, and ensure equitablte distribution o f land. Out o f 4,06,282 applications filed in relation to excess vacant landl, less than two-third were dealt with by the State/UT Governments and only 7.5 per cemt o f the 220,774 hec. o f land declared surplus had been taken over. In terms o f other imdicators also, the performance has not been satisfactory. Exemption under Section 20 o f the Act was provided in 53,963 cases, which was 42.1 per cent o f the total application number submitted under this provision and only 2,984 schemes out o f 9,638 (31.0 percent) received approval under Section 21 o f the Act for construction o f dwelling units for the weaker section o f society. The approved activities are expected to result in the construction o f 4.83( lakh tenements on 5,327 hec. o f land. There has been a slow-down in housing development due to delays in acquisition and transfer o f surplus land. The Central Government should take up the rationalisation o f the Act during the NinthPlan and the thrust o f thte new approach would be guided development rather than regulation per se.
3.7.128 The NCR Planning B(oard was established with the object o f containing Delhi's population within a manageable level and developing the National Capital Region in a harmonious and plaimed manner. As a part o f its Regional Plan - 2001, the Board is finalising extensive land acquisiition and development o f physical infrastructure. It has prepared functional plans for Delhi Metropolitan Area as well as basic strategies and financial mechanism for use o f fxunds. Sub-regional plans for Uttar Pradesh and Rajasthan sub-regions were approved by the Board in June, 1992 and April, 1994 respectively, while those for Haryana sub-region amd for Delhi zire under preparation and fmalisation. An important functional plan for tranisport sector seeks to bring out a coordinated development o f transport networks and shift the modal share from road-based to rail-based transport, which is likely to be more efficiemt, economic and environment-fnendly.
3.7.129 The NCR is an irmovati’ve effort at regional planning and development is the only urban initiative to encompass several States. The approach is inter-sectoral, covering various components o f regional infrastructure like road and rail transportation, power, communication, among others, apart from local level town-specific infirastructure and civic amenities. The regional d(evelopment initiative is dependent on timely release o f
298

funds and convergence o f the various activities o f diffferent organisations and partner governments so that the requisite infrastructure can b e speedily developed and made operational. This is critical because any delay would lead to an increase in the population who may have to be deflected from Delhi and may create a situation which may be beyond the capacity o f the 6 DMA and 8 priority towns in the NCR to properly absorb in terms o f providing them adequate and affordable sheltcer, civic amenities and opportunity to take up a sustainable income-generating activity. D elay in implementation o f the programmes carries the risk o f making the regionall planning initiative a non-viable activity within a short period.
3.7.130 Recognising the potential o f the NCR sttrategy to promote and sustain effective regional development, the NCR programme will be fiirther strengthened to promote regional development in the identified hocations. Similar programmes o f developing new townships will be promoted in other pants o f the country whera regional disparities and economic backwardness are critical conce;ms and also where there is a need to develop viable townships around metropolitan cities.
3.7.131 The IDSMT scheme, an extremely valuable development instrument for small and medium towns, was initiated in the Sixth Plan in 197*9-80 to develop the infrastructure, primarily the physical components, in selected towns wiith population upto 5 lakh, that were assessed to have the potential to emerge as regionail centres o f economic growth and employment and serve as catchment centres to arrest migration to large towns and cities.The guidelines were revised in August 1995 to make its implementation more effective. A major change was in the financing strategy. Prior to the revision, the entire funding was in the form o f loan and a large proportion, 40 -70 per cent, was to be mobilised from financial institutions, which was found to be a miajor operational constraint for most o f the municipalities.The revised guidelines provide for varying levels and mix o f grant (Central and State) in the ratio o f 60:4,0 and instituti(onal finance /intemal revenues to the extent o f 20-40 percent o f the project cost. Grant-ini-aid for the preparation o f town development plans and project reports has also been provid(ed for.
3.7.132 The IDSMT scheme has covered 904 tovms upito the end o f the Eighth Plan and the the cost o f the approved schemes, as on March 31, 19*97, was Rs. 1427.38 crore and the Central assistance released was Rs. 283.96 crore. During the Eighth Plan, 387 towns were covered, with approved cost o f Rs. 890.65 crore and as nnuch as Rs. 403.68 crore was on commercial shops and stalls.The Ninth Plan would devehop mechanisms to ensure a better mix o f projects.
3.7.133 The revised scheme is expected to be a major insjtrument o f urban sector reforms in the selected growth centres, as envisaged under th<e Constitution (74th Amendment) Act, as it promotes the use o f Central and State grant (components to leverage resources internally through the project and externally from fimancial institutions. The intemal resources will develop a Revolving Fund,which would sttrengthen the municipal financial base for the future. Also, special attention is now paiid to economic analysis o f the projects, based on cost-benefits techniques.
3.7.134 The performance review brings out a concentraition o f project activities in a few areas like market complex/shopping centre, tourist faciliti(es, roads and bus terminals. There is no feedback on the impact o f these developments o>n city/town development as well as regional development. The efforts o f the implementing agencies have been to see that the number o f towns earmarked for coverage in the Plan has been largely covered, but even in
299

respect o f the numerical targets o f coverage, the annual Plan sanctions have not been as perthe provisions made in the Plan. T he release o f fiinds has not been satisfactory.
3.7.135 It is too early to get a fee;dback on the introduction o f the cost-benefit analysis in the IDSMT activities, as this co>mponent was introduced in the revised guidelines in August, 1995 and is being actuallly included in the project reports from 1996-97. The Ninth Plan would monitor the progress on this important component since the social and econom ic benefits should be higheir than the cost o f the special initiatives taken through the IDSMT at the town and regional lewel.
3.7.136 One reason for the shorttfall has been identified to be the failure o f the StateGovernments to make their co)ntribution and in some cases, the Central funds have notbeen properly utilised. This has happened because o f inadequate monitoring, as themonitoring exercise was limite;d to administrative reports from the State Government and occasional visits by Central olflFicials to the State capital and some project sites, where there was not much opportunity' for Central officials to directly interact with the beneficiairies independently.
3.7.137 The Mega City Schenne, introduced in 1993-94, covers five megacities o f Mumbai, Calcutta, Chennai, Baingalore and Hyderabad. As on April 30, 1997, 163 projects were sanctioned for an approved project cost o f Rs. 1,439.22 crore. Work has been completed in 14 projects, is iin progress in 136 projects, and is to be initiated in 13 projects. An expenditure o f Rs. 493.99 crore had been incurred, even though the Central and Slate governments had released Rs. 703.80 crore as their share. The balance is to be raised by the projects from the capiital market and financial institutions, using the Central and State government's contribuition for leverage. HUDCO had approved a loan o f Rs.383.56 crore to 20 projects ( 26.6 percent o f approved project cost), and only 31.1 percent o f this had been released (Rs. 119.16 crore). The Ninth Plan will strengthen the follow-up and monitoring functions so as to* accelerate the development o f projects at all the stages and ensure that the leverage effecit is a minimum o f 50 per cent. To facilitate the attainment o f this target, the scope o f mo>re financial institutions providing institutional finance, including from the private sector, w ill be explored.
3.7.138 The Scheme takes up three categories o f projects, namely, remunerative, user charge-based and non-remunerativ^e or service-oriented. The recommended mix is 40:30:30 among the three categories so that; the total city project is financially viable. A study o f the project mix shows under-realisattion o f the ratio o f remunerative projects in the case o f Calcutta, Bangalore and Mumbai,,, where the ratio is in the range o f 16-18 per cent and it is 35 per cent in Chenai. H ow ever, it is 51 per cent in Hyderabad. In contrast, the ratio was attained in all cities except Calcutta for the non-remunerative projects suggesting that the concern o f total city-levell project viability does not appear to have been given due attention. This aspect in project selection will be taken up in the Ninth Plan projects.
3.7.139 Project selection crite:ria should also take into account the inclusion o f only those projects which are not likely to receive funding from other accessible sources, especially under the remunerati ve projects category. Housing, truck terminal, market, shopping and office complexes may have to be given a lower priority. Some non- remunerative category projects have a good potential to be covered under user-charge category, such as flyovers, bridg(es, public conveniences. The Ninth Plan would focus on development o f urban fringes, urban renewal, sanitation, sewerage and drainage, ring roads, while other activities in tihe illustrative guidelines will have to be taken up through
300

other financial strategies. Thus, for example, city beautiification may be given for adoption by major corporates in the public and private sectors, with advertisement rights; wastes collection and disposal through commercialisation o f thie recycling o f solid wastes; slum improvement through alternate programmes; and triuck and bus terminals, housing, land development and commercial complexes through priwatisation.
3.7.140 While the period o f implementation o f the Mega City Scheme may not be adequate to assess the impact, the Ninth Plan would take up impact assessment as an activity before extension o f the programme within the selecteed cities and to other megacities that are likely to emerge in the country’. The impact asseessment inputs would also facilitate the project components to become more focussed. The iinitial flow o f projects brings out the need for a comprehensive City Urban Agenda on irnfrastructure requirements, new as well as in the renewal category', together with prop)er estimates and the cost-benefit analysis. The mega city nodal agencies should also take into account the metropolitan and regional aspects and not restrict ttheir activities to land development and housing. In this context, the state and city town pjlaiming laws, urban development authority acts, etc, should be amended to facilitate plaruning reforms and permit schemes like land adjustment, for example, to promote the use o f Isand as a resource.
3.7.141 This macro approach to mega city planning is e;ssential to decide upon the projects that may be undertaken under the Mega City Scheme aind those that may have to be marketed for implementation by other agencies and scources o f financing, including the private sector. It is also necessary to break up the massiwe activities during the Ninth Plan and thereafter into a well-defined time schedule, to emsure the completion o f the total infrastructure development on which the sustainability o f the mega city depends.
3.7.142 The project feedback brings out that the lev«erage activity has not yet become fully operational. The Plan will review the reasons foir inadequate leverage effect in the project fxmding and, in that context, consider modificatiions in the scheme and any other inputs, including fiscal instruments, and professionalisimg the financial ftmctions that may be required to make the instrument o f leverage fimds zan effective mechanism. Special attention should be paid to strengthen the monitoring o f the scheme, which presently is being done through informal reviews and reporting mecchanism. The regular monitoring and impact assessment functions may be institutionaliised in an independent agency, outside the project for the effective implementation o f tlhe scheme.
3.7.143 Cost recovery is another crucial factor for tthe success o f the scheme and forthis purpose direct as well as indirect methods will be imtroduced. The latter may include, for example, conversion charges for change o f land usee, development and bettermentcharges related to impact o f on-site and off-site activitites, Tradable Development Right (TDR) as per the Mumbai model, extra FAR/FSI surrcharge. Shelter Tax on large and luxury housing to finance low-income housing, etc. Thiese innovative strategies will be preceded by specific assessment o f the real estate market situation and potential revenue generation analysis to determine the type of instruments tco be used and the most suitable timing for mobilising resources to meet tlie cost o f the projject, and possibly for generating a surplus.
3.7.144 Slum Development is another major activity taken up to upgrade the urban environment and see that the proliferation of slum and sqiuatter settlements does not further deteriorate it. In the past, several schemes have been imtroduced to improve the living conditions in the slums, where an increasing proportion o f the urban poor and migrants live
301

and often work. Recognising the poor access to basic urban services in these settlements, the UBSP and EIUS have been provided some specific Plan support to improve the access to basic services. During the Eighth Plan, a new Centrally assisted Scheme was introduced in 1996, with an initial outlay o f Rs. 250 crore for the year and this amount was raised to Rs. 330 crore for 1996-97. The funds have been provided as additional Central assistance to the States/UTs. The Planning Commission has constituted a Working Group to examine the mechanism for determining the State allocations under this Scheme and to examine, among other issues, the possibility o f going beyond the conventional criterion o f the share o f urban population in the State for funds allocation. The NHB introduced a Slum Redevelopment Scheme during the Plan period to provide financial assistance to the implementing agencies for housing development and upgradation and provision o f habitat infrastructure like drinking water and sanitation.
3.7.145 The Environment Improvement in Urban Slums (EIUS) scheme is a high priority programme to provide seven basic amenities to slum households, namely, water supply, storm water drains, community baths and latrines, widening and paving o f existing pathways and street lighting and other community facilities. The scheme was introducted in 1972 as a Centrally sponsored scheme but was transferred to the State sector in 1974. The ceiling on per capita expenditure has now been raised to Rs.800/per slum dweller in consultation with the Planning Commission effective from1.4.1995. The programme is integrated vWth the existing urban proverty alleviation scheme and seeks the involvement o f resident associations.
3.7.146 A scheme for provision o f infrastructural facilities in the Displaced Persons (East Bengal refugees) Colonies in West Bengal is in operation. After considering a note submitted by the Ministry o f Rehabilitation in 1976, the Cabinet approved the proposal to ftind infrastructural development for 1,03,157 plots in 612 colonies at a cost o f Rs.23.85 crore. The development components included provision o f water supply, drainage, roads and pathways, sanitation and other items. A revised ceiling cost o f Rs. 17,777/per plot for development, reimbursement o f Rs.2.33 crore to the State Goverrunent and provision o f Rs.78 crore in the Central budget as grant for completing the work on the remaining 44,025 plots (originally approved in 1976) was approved by the Cabinet in January, 1995.
3.7.147 Several programmes are on stream with international assistance and cooperation. The KFW loan and grant assistance to HUDCO is for undertaking housing schemes for EWS, Building Centre Programme, low-cost housing in rural and urban areas, low-cost sanitation, slum improvement, reconstruction in Latur and to HDFC for low cost housing and urban infrastructure. The OECF (Japan) has provided assistance for city water supply project in Sholapur and New Mumbai and some other infrastructure activities. The World Bank has extended a grant o f US $ 1.0 million to HUDCO for strengthening its infrastructure-related operations, in particular, technical assistance for the preparation o f the proposed Urban Infrastructure Financing Project. The World Bank has also provided a line o f credit to the Government o f Maharashtra for reconstruction o f the housing stock and other infrastructure damaged in the Latur earthquake. According to the latest report, 15,713 houses have been completed and 9,292 houses are under construction. Under the repairs and retrofitting component 57,196 houses have been retrofitted, and 86,999 houses are under developnjent.
3.7.148 The Overseas Development Administration (ODA, UK) supports slum improvement projects in seven Indian cities, in collaboration with the Ministry
302

o f Urban Affairs & Employment, Government o f India. The Programme started in 1983 in Hyderabad, and since 1988, additional projects have been approved in Vishakapatnarn, Vijayawada, Indore, Calcutta, (Cuttack and Cochin.The project components include development o f physical infrastnucture, provision o f civic amenities, community development and provision o f social, ec:onomic and educational inputs to contribute towards raising the standard o f living o f iinhabitants in slum settlements. The Government o f Netherlands supports a pilot project. Bangalore Urban Poverty Alleviation Project (BUPP), at an estimated cost o f Rs.1.5 crore in phase -I, which commenced in November 1993 and is likely to be completed by the end o f March 1997. The second phase is likely to commence soon. The proje(ct is being executed jointly by the Central Ministry o f Urban Affairs and Employment, HUDCO and the Government o f Karnataka.
3.7.149 The Urban Mapping Scheme, a Eighth Plan pirogramme, with an outlay o f Rs. 6 crore, was undertaken for preparing, on a pilot basis, base maps for 25 identified towns, using the aerial photographing and remote sensing techmiques so that urban maps could be updated with the Geographic Information System (GIS). The Town and Country Planning Organisation (TCPO) is the national nodal agency for thiis task, which is to be undertaken by the National Remote Sensing Agency (NRSA), Hyderabaid. The task ahead is enormous, including preparation o f new maps, apart from updating some existing maps in some urban centres. This would constitute an important Ninth Plan ;activity to provide a strong base for effective implementation o f the Constitution (74th Annendment) Act provisions relating to a three-tier plaimirvg structure at the local, state and rtegional level .
3.7.150 Other Programmes include research on urlban policy, land use planning and development, municpal governance, housing, etc, with an outlay o f Rs. 1 crore per annum during the Eight Plan. Impact assessment o f the reseairch output has not been made.The Ninth Plan will review these activities and make the tfiinding o f research through this outlay as per an urban research agenda, which vsall be prepared by sectoral experts, keeping in view the priority concerns in the Ninth Plan. A trainsparent system o f funding policy and research impact assessment will be developed.
3.7.151 The World Bank and the Asian Development Bank have provided external assistance for urban sector projects, the former in Taimil Nadu and Uttar Pradesh and the latter in Karnataka. While Uttar Pradesh Urban D«evelopment Project was closed on 31.3.96, Tamil Nadu Urban Development Project is undeir implementation, with a revised project outlay o f Rs.988.50 crore. Negotiations were held with the World Bank for restructuring the existing Tamil Nadu Municiipal Urban Development Funds (MUDF) into Tamil Nadu Urban Development Pund5s (TNUDF) to be set up under the Companies Act.
3.7.152 The ADB is funding the Karnataka Urban Inifrastructiu'e Development Project, whose estimated cost is $ 132 million.The project aimis to decongest Bangalore through decentralisation o f economic activities to four projject towns o f Mysore, Tumkur, Channapatnam and Ramanagaram to be developed as counter-magnets and maintain the status o f Bangalore as a centre for high-tech indus>try, reduce the pressures on the infrastructure o f Bangalore and improve living conditiions in the city. Another ADB project in the pipeline is the Development o f West Coast Districts o f Karnataka. The Department o f Economic Affairs, Central Ministry of Finance has recommended to the ADB, the proposal with having an estimated cost o)f Rs.758 crore and an external assistance comix)nent o f Rs.430 crore.The Bank hass since approved in principle to
303
provide a Project Preparatory Technical Assistance o f US $ 800,000 during 1997. Another ADB activity is the India Urban Sector Profile (TA Study), for which an agreement was signed in Ocltober, 1994 with ADB for financial assistance o f U S $ 435,000.The project will revie'w India's Urban Sector policies and programmes and suggest areas/projects for futurfe ADB involvement in urban infrastructure in India. Another Technical Assistance t(TA) agreement has been signed between Govemm.ent o f India and ADB to determine the scope of investment in six selected towns in Rajasthan.
Ninth Plan Priorities and Strat«egies
3.7.153 Urban India presents a classic example o f a developing scenario with high concentration o f urbanisation anid economic growth in certain parts o f the country, as well as in certain parts o f a State. While the IDSMT scheme, special industrial development programmes in backward regionis and fiscal incentives have sought to reduce disparities in regional development, the regional disparities have continued.
The priority concern is not or.iiy to stop the growing deterioration in the urban envirconment, reflected in key urban indicators on housing coinditions, pollution levels, traffic congestion, informal sectior, among others, but to positively change the trend and enisure an improved, healthy and congenial environment. Thee wide gap between the demand and supply of basic aimenities will be reduced through creation of new assets, uipgradation and renewal of existing assets, attaining better operational and managerial efficiency and stimulating flow o)f resources.
3.7.154 The priority concern is not only to stop the growing deterioration in the urban environment, reflected in key urban indicators on housing conditions, pollution levels, traffic congestion, informal sector, among others, but to positively change the trend and ensure an improved, healthy and congenial environment. The
wide gap between the demand and supply o f basic civic amenities like potable water, sanitation, transport and housiing, which has shown an increasing trend over the last five decades, w ill be reduced, thr<-ough creation o f new assets, upgradation and renewal o f existing assets, attaining bettter operational and mangement efficiency and stimulating flow o f resources into all urbain development activities.
3.7.155 Regional developmient, strengthening o f the rural-urban continuum and development o f new centres o f human settlements and economic activities as an alternative to the highly congested metro and mega cities will be among the priority tasks in the Ninth Plan. An increasing projportion o f these actvities will be fmanced from outside the Plan resources.The Eighth Plam had initiated a few innovative practices, most notably the use o f Plan funds to leverajge non-Plan resources from the financial system, through leveraging fiinds from financiial institutions and the capital market. Conceptually, the strategy is well-founded; how effective it has been in the Indian urban situation has to be ascertained. The instrumenit has been effectively used in the industrial sector for a considerable period, though tihe leverage base has been the equity capital that has to be serviced and not a grant. If the impact assessment o f the urban infrastructure leverage instrument brings out a perfonmance that is lower than anticipated, the reasons should beidentified so that the Gove;mment, as a facilitator, would be in a position to takeappropriate steps to ensure the effectiveness o f the leverage strategy. Fiscal instruments, legal provisions and strengtheming ofprofessionalism in the municipalities and urban local bodies will be some illustrati've areas for suitable intervention with the aim o f formulating financially viable projects, undertaking rigorous techno-economic appraisal and facilitating efficient implementation o f projects.
304
3.7.156 The matching o f the Central Plan outlays wiith State finances was another positive particpatory endeavour. These activities will bte strengthened and the observed operational constraints would be removed. The new approaches to urban finance, initiated during the Eighth Plan, together with an integrrated approach to planning and management, should be supported by an equally strong system o f monitoring the project and periodic assessment o f its impact, to ensure the reaclnout, especially o f the subsidised non-remunerative projects to the specific target groups. The much-required sustainability in financing urban development is expected t(o be attained through this route. A composite approach to urban development that encompasses inter-dependent urban basic services will further strengthen the development p)rocess. These, indeed, are the challenges for the Ninth Plan.
3.7.157 In the context o f a regional approach to urban development, the activities o f NCR Planning Board are critical to contain deterioration of" the environment o f Delhi and the participatory efforts o f the States should be effextively mobilised. At the same time, development o f small and medium towns should gatther further momentum and there is clear need to improve the package o f remunerative aind non-remunerative projects in IDSMT scheme to go beyond the conventional activities; like shopping plaza and bus terminal to take up also activities that would bring iin sustainability to the urban environment. Critical among them are drinking water, sainitation and waste management as the sustainability o f small and medium towns has to be ensured not only in terms o f the economic viability parameter but also the environmental! sustainability parameter. The standard o f cost-benefit analysis to assess the viability of; projects, introduced during the Eighth Plan, will be improved through capacity building for inducting! a high level o f professionalism in the project contents. It is equially important to improve the composition o f the projects under the Mega City sccheme and shift the focus to development o f urban fringe, urban renewal, sanitation, se'werage and drainage, ring-roads in preference to the Eighth Plan activities like housing, truick terminal, market, shopping and office complexes, which should be given lower priority in the product mix, as they can be supported through commercial and privatisation noutes. The slow pick-up o f the Mega City scheme was to an extent due to the teethiing problems but in view o f its significant potential to become a catalyst o f infrastructure (development, the Plan will seek to accelerate project development and implementation processes. It would be desirable in the Ninth Plan to evolve the criteria for funds allocationi under the scheme and going beyond the present population criterion to give weightag'e to indicators like decadal population growth rate, performance in project implemeentation, resource mobilisation, credibility o f the nodal agency and development needs. Morre emphasis will also be given to promote integrated land use development planning with regard to mapping, use o f remote sensing and Geographic Information System (GIS) for preparation o f city maps and city/town, metropolitan and district 3-tier Development Planis, covering the armual, five year and long-term perspectives (20-25 years).
3.7.158 Planning and development o f urban infrastructiure in mega cities as well as elsewhere should be properly structured and the basic requiirement is a comprehensive city agenda which would estimate the current infrastructuri-e requirements as also the projections for the next two decades, covering new assets ais well as renewal o f existing assets. The operational plan, particularly the activities to b>e undertaken by the key actors should be formulated at the city level and participatory ap)proach should be adopted to earmark the tasks o f implementation o f tasks among the various agencies, including the private sector. The massive investment activity should be bro)ken up into a well-defined time
305

schedule so that the physical and fiinancial targets are attained and the anticipated impact realised. Cost recovery has to be a imajor concern though in certain cases, the concept may have to be gradually introduced and fsubsidy in the provision o f certain services may have to be continued during the Plan.
3.7.159 A process o f rapid urbainisation invariably places pressures on land, resuhing in an increase in land cost, and comsequent impact on cost of all land-based activities and services required for sustainiable urban development and environment. A choice has to be often made between high-rise and low-rise urban planning strategies. Within each o f the alternatives, there iss the planning option to promote high or low densities, though the tendency, a priori, is t(0 relate high density with high-rise planning and low density with low-rise planning.
3.7.160 It will not be desirable; in this perspective, to recomment a single strategy in the planning o f cities. There has to i be a different approach in urban planning in small and medium towns, where land may no>t be a scarce resource as compared to that in metro and mega cities. Several parameters should be given appropriate weightage in conceptualising and developing the city plans and tthese may include, for example, the affordability o f the people to absorb the high-rise anid low-rise housing solutions, the impact on the urban environment and quality o f life, thte implications'on energy consumption, travel time from home to workplace, recreation ftacilities, open spaces, linkage with habitat-related services, etc. Equally important is the financial implication and the cost o f ftmds that might be required for different typess o f city development programmes.
3.7.161 It was in this context, that the National Commission on Urbanisation had recommended Low-Rise High Demsity (LRHD) development to be the pre-dominant built up form in urban India. The adoptic^n o f this strategy would require a good understanding o f the socio-economic conditions o f tthe city dwellers and often modification in existing building bye-laws, zoning regulations, developments codes and land use and management systems. The advantage o f low/-rise settlements is the low cost o f construction, efficiency in energy consumption,, socially and psychologically more acceptable and environment-friendly neighbourhootds. From the operational point o f view, a high density component in low rise structures miight give rise to management challenges. Operational and financial implications o f spreaid o f essential utilities and services, including transport, have to be taken into consideration.
3.7.162 The Ninth Plan will folKow up on the progresss made during the Eighth Plan in creating an urban development-friendly planning and fiscal environment. The Constitution (74th Amendment) Act and the liberated economic policies have ensured an era o f democratic decentralisation o f the plarming and a greater degree o f involvement o f the private sector. In this changed oiperational scenario, the urban planning system in vogue should be made more dynamic andl participatory and the process o f decentralisation has to be extended from the State to the urban local government. The institutional framework for financial and other intermediatiion, including planning and project development and management, has to rcognise the k.ey role assigned to the elected urban local bodies. The Plan w ill seek to promote and stirengthen this approach. It will, for example, encourage the constitution o f the District P’lanning Committees (DPC), with an elected official as chairperson. The roles and functions o f the DPC would include the consolidation o f the plans o f the panchayats and the; municipalities to prepare the development plan for the district, coordination o f all inte;r-related activities and ftmds, and monitoring the
306
implementation o f the district plans, schemes and! projects and related activities. The Plan funds would be increasingly decided on the feedback from the DPC.
3.7.163 The Town Planning, Municipal and urban Development Authority and other State Parastatals Acts and regulations should be spteedily amended and legal framework strengthened to assign the planning and developmemt functions to the urban local bodies, facilitate planning reforms, permit schemes lik e land adjustment, for example, to promote the use o f land as a resource and include alll the emerging needs o f plaiming and development in the light o f the Consitution (74th Amendment) Act. The municipaL/ city/town development plan will form a key com ponent o f plan financing at the local level and seek to maximise the linkages between infrastrructure, land use, urban growth and economc growth.
3.7.164 The massive tasks o f development and reniewal o f housing, urban infrastructure and civic amenities requires their integration into ithe urban and metropolitan planning system as well as in the broader State and city ecconomic and financial plans.There should be complete integration o f spatial, economic aind financial planning at A e city and regional levels. This has been a weak part in the urbaan development agenda. The Ninth Plan will take positive steps in this direction.
3.7.165 Within this macro framework, an integratted urban planning approach would require integration o f planning and development t o f inter-dependent infrastructure components such as, for example, water supply, sejwerage and sanitation, and wastes collection and disposal, which in their totality, determine the quality o f the urban environment. A total package should be prepared, whiich would also facilitate the financing o f the programme as it would have a judicious mix o)f projects that have the potential to provide commercial returns, recover full-cost user charges and provide zero return on certain critical social services. While the commerciial projects would notbe eligible for any subsidy, the user-charge projects should recover O & M and debt servicing cost, though subsidy through the financial package andl other facilities may be provided on case-to-case basis, related to the extension o f the serviices to the disadvantaged groups in the urban society.
Financing o f urban infrastucture is bound to pose new challenges to the difTerenrt constituents o f the financing system. Innovative mechanisms and practices will have to be encouraged and supported to stimulate the flow of fmances such as the municipal bond system, municipal financial reforms, fiscal and monetary incentives for the creation of envirenment-friendly environment, participation of cooperatives, community groups and NGOs etc
3.7.166 The massive urban growth and the resource constraints would, together, result in a situation where the availability o f funds would not keep pace with the growing demand. The State Government's efforts would have to be supplemented with larger participation by the private
sector. Financing o f urban infrastructure is boimd to pose new challenges to the different constituents o f the financing system. Iimovative mechamisms and practices will have to be encouraged and supported to stimulate the flow o f fimances such as the municipal bond system, municipal financial reforms, fiscal and monetiary incentives for the creation o f investment-fnendly environment, specialised infrastruccture development and financial institutions, participation o f cooperatives, community groups and NGOs, and public- private partnership in the development and managemient o f urban services and social infi^tructure facilities.
307

3.7.167 The fiscal provisions at the Central, State and local level should be made investment-friendly and conducive towards the flow o f funds for urban infrastructure assets creation and renewal. Privatisation o f activities in the social service sector as well as projects with long gestation period should be stimulated through the fiscal route rather than through direct subsidy in term loans and other development inputs. This will make the subsidisation o f programmes mot only transparent but will also speed up the development work and ensure thie creation/renewal o f the assets, as the fiscal instrument is ex-post and not ex-ante. Monitoring the effective reachout and periodic impact assessment would be also facilitated.
3 7.168 The Ninth Plan will strengthen the activities relating to data base, monitoring and evaluation as the existing system has been found to be inadequate. There is no single agency that is responsible for ^compiling and maintaining data and information and undertaking regular monitoring anid evaluation work at the national, regional, state or city/town levels. Even the Plani provisions have not been fully utilised. By way o f illustration, the outlay o f Rs. 11 crore to Central Public Health Engineering and Environmental Organisation (CPHEIEO) and State/UTs during the Seventh Plan for creating a monitoring and MIS Cells was not utilised due to technical problems and procedural delays, and a similar provision in the Eighth Plan did not lead to the establishment o f these Cells. .For development o f the data base for housing and undertaking housing census, the Eighth Plan outlay was under-utilised . In the case o f the Urban and Regional Information System (URJS), the T'CPO as a nodal agency for many Centrally Sponsored Programmes like the IDSMT. has taken up the task o f developing the urban data bank. These activities will be fiirther strengthened and the scope for privatisation o f certain components o f the activity within the overall supervision o f the TCPO would be explored.
3.7.169 Apart from these activities, where the Plan provisions for data base, monitoring and MIS were provided but were not effectively utilised, in all other major urban sector programmes, the Plan will seek to develop a strong data base and monitoring and impact assessment systems. This is a key requirement for efficient urban management . Regular feedback on the reachout o f activities o f all the actors, some o f whom may not be subject to normal administrative monitoring, becomes crucial for the Government to decide when, wheje and how to inter"vene and the extent o f the intervention. An effective partnership o f the government and non-government agencies in this activity would be promoted and the UNCHS housing and urban indicators would be adopted to build up this activity.
Urban Transport
Performance Review3.7.170 Urban transport has been a sector whose development and investment requirements have been largely overlooked in tltie past. The Central Plan allocation till the Eighth Plan was a modest Rs.4.6 crore, as urban transportation system was essentially perceived in the Plans to be an appendage to initer-city rail/road transport systems.lt was not recognised that the development programmes in urban transportation were critical to the sustainability o f the urban systerms.This basic need has been acknowledged now as the rapidly deteriorating transport systtems have been jeen to affect the urban lifeline.Recent urban transport indicators have shown that the average travel time between home and work place is as much as 44.34 minutes in Delhi, 33.37 minutes in Mumbai, 21.62 minutes in Chennai and 17.60 minutes in Bangalore. The transport indicators also show that.
308
transport services utilise 13.6 per cent o f the total land area in urban agglomerations, with11.0 per cent in megacities and 20.0 per cent in metro cities and 17.1 per cent insecondary towns.
3.7.171 A review o f the mass transport modes in rmetropolitan cities has brought out that except in Mumbai, Chennai and Calcutta, whichi have suburban rail systems, the bus has been the main mode. Some metropolitan cities dio not even have an intra-city bus system. Except for mega cities, modal split in favour o f mass transport is poor and generally less than 20 per cent. Share o f walk trips and mechaniised non-motorised modes in total transport demand is quite high in metropolitan cities. Measures to promote non-motorised modes through provision o f footpaths and other pedestrian facilities, cycle tracks and priority treatment at intersections should be an integral part o f city transport plans. Land use and transport are strongly inter-related. Integrated Land Use-Transport Plans should be prepared for all metropolitan cities during the Ninth Plain period.
3.7.172 During the Eighth Plan, Central assistance wras mainly confined to support the preparation o f feasibility and other studies relating ito urban transport systems in metro cities, DPR for Delhi MRTS project and contribution towards equity capital o f Hyderabad LRT project.The total expenditure,as on March 31, 1996., was Rs. 18.32 crore and Rs. 16.80 crore was spent during the Eighth Plan period.
3.7.173 The major urban transport projects that wcere approved or proposals were initiated during the Eighth Plan are in Delhi,Mumb>ai, Calcutta,Chennai and Bangalore. The Modified Phase 1 of the Delhi MRTS project was approved by the Union Cabinet in September, 1996. It consists o f 11 kms of underground and 44.3 kms o f surface/elevated railway tracks. The total cost o f the modified Phase-T project is estimated at Rs. 4,860 crore at April, 1996 prices. The project is to be implemented by Delhi Metro Rail Corporation Limited, a joint venture o f Government otf India and Government o f National Capital Territory o f Delhi. The OECF (Japan) has agreed to provide loan assistance upto about 60 per cent o f the project cost. Initially, a loan o f Rs.478.78 crore (14.76 billion Yen)will be provided at 2.3 per cent rate o f interest per amnum.
3.7.174 The Mumbai Urban Transport Project-II consists o f construction o f fly-overs, roads,bridges, optimisation o f suburban railways, and is being plaimed by the Government o f Maharashtra and the Mumbai Metropolitan Regional! Development Authority (MMRDA) in consultation with the Ministry o f Railways. Studiies on relocation and resettlement, community environmental management plans, among others, are being conducted by the Government o f Maharashtra and further activities will be taken up by the State Government on completion o f these studies. The Calcutta Metro Rsail System, covering a length o f 16.5 kms. from Dum Dum to Tollygunge, is operational. TIhe system has been constructed by the Ministry o f Railways out o f their own budgetairy sources. Government o f West Bengal have proposed extension o f this facility by 8.4 kms., from Tollygunge to Garia. As the Central Government's budgetary resources would niot be adequate, the Government o f West Bengal has been requested to meet 50 per cent o f the project cost.
3.7.175 The Government o f Karnataka has mooted a proposal for introduction o f a Light Rail Transit System in Bangalore, covering a length o f about 90 kms. at an approximate cost o f Rs. 4,200 crore. A rail-based siurface-cum-elevated MRT system already exists in Chennai from the Beach to Chepauk (5.05 kms.) This system is being extended upto Luz (3.5 kms.)by the Ministry o f Railw/ays. A prdposal for construction o f
309

rail-based MRT system from Luz to Velacherry has also been approved and will be funded jointly by the Government o f Tamil Nadu and Government o f India (Ministry o f Railways).
Ninth Plan Priorities and Strategies3.7.176 It is now widely recognised that as cities grow in population and size, the demand for transport increases more than proportionately. A good network o f roads, coupled with an efficient mass urban transport system makes a substantial contribution to the "working efficiency" o f the cities and enables them to become catalysts o f economic, social and political development. An efficient transportation system is, thus, critical for productivity and economic growth in cities. It has been estimated that inefficient traffic and transportation system in the urban areas currently results in an annual loss o f Rs. 20,000 crore in vehicle-operating costs and travel time costs.
3.7.177 Recognising the inter-dependence between the sustainability o f urban systems and the transport network, the Ninth Plan would have a major focus on planning and development o f a viable mix o f transportation systems including road transport, MRTS and LRT, making fiill use o f all travel modes that would utilise underground,surface and elevation systems.
3.7.178 The development activities in the Ninth Plan would give a thrust to multi-modal transport programmes in order to meet the requirements o f all categories o f passengers, rather than giving priority to single modal transportation systems such as exclusive expressways which would primarily benefit only a small segment o f the population, even though, these activities may be commercially viable through the levy of high user charges. The Ninth Plan strategy would, in this context, seek to reduce the role o f private modes, owned by individuals and promote public transportation system, keeping in view the road density, pollution, travel time, parking facilities and other operational concerns.
3.7.179 There is also a need to regulate the entry o f private vehicles in the central business districts as part o f a demand management strategy. Disincentive measures may be introduced to restrict the entry o f low passenger occupancy vehicles. The operational policy instruments may include high entry and parking charges and special levies for low occupancy.This has been already demonstrated as an efficient transport management strategy in several countries.The annual registration o f new vehicles should keep in mind the holding capacity o f the cities and the availability o f the parking spaces. Proliferation o f personalised modes like cars and scooters needs to be contained by measures such as penal registration rates.
3.7.180 Equally important is the strengthen the organisational and institutional systems to provide for pleinned and efficient intra-urban transportation system in the cities. A series o f initiatives are required, such as, the setting up o f an urban transport unit in the nodal ministry and in the Planning Commission, along with similar units at the State level.
3.7.181 The financing o f transportation programmes is a critical issue.The initiatives o f the Eighth Plan in regard to financing o f urban infrastructure programmes should be made an integral part o f the financing strategy for urban transportation. Effective publio- private partnership will be promoted through appropriate fiscal and other stimulating initiatives so that the massive investment requirements, which are definitely beyond the capacity o f the Plan can be mobilised from other sources as well as the domestic and international capital markets. These financing systems may include different types of leasing fmance.
310

3.7.182 It must be recognised that the high costs, low profits and long-gestation periods o f rail-based mass urban transportation projects do not make them financially viable nor do they yield commercial returns that would be as attractive as in the surface-based/elevated urban MRT projects. The Central/State Governments would have to necessarily participate in the equity o f such projects and also consider making certain provisions for interest- free/low interest subordinate debt, incentives for property development, tax exemptions/ concessions, freedom to fix fares, etc. Budgetary and Plan support from the Central and State Governments will be required for these purpose;s.The resource mobilisation strategy that the Central and State Governments may adopt for financing these activities may include a mix o f dedicated levies and taxes on user and non-user beneficiaries o f mass transport systems, which may be in the form o f additional excise duty/sales tax on petrol/diesel, surcharge on motor vehicle tax, entry fee on motor vehicles entering metropolitan areas, passenger tenniual tax (rail, road, sea and air), surcharge on property tax and a mass transportation tax. The proceeds from these levies may be used to finance the capital costs o f MRT projects, and also to discharge part o f the long-term loan liabilities. The exploitation o f air space above and around the metro stations, depots, sheds etc, for commercial and residential purposes could generate a substantial amount towards the project cost, which can form a part o f the State Government's capital contribution to MRT projects. Keeping in view these possible develoipments, there is a need to set up a National Urban Transport Development Fund during the Ninth Plan. This Fund would provide financial assistance for mass urban transport proj ects in the country, preparation o f feasibility studies and project reports and training and R&D activities. Similar Funds at the city level may also be encouraged to meet the share o f contribution o f the State and the Urbal Local Governments in urban transport projects.
Financial Resource Mobilisation
3.7.183 The wide range o f activities that have to be undertaken in the sectoral programmes relating to urban development, housing, water supply, sanitation and transport would require not only a large quantum of financial resources but also their mobilisation on varying terms with respect to their cost and servicing conditions. The fimds should be available in such a quantum and on terms that would meet the capacity/ potential o f the user sectors in absorbing and servicing them. In some cases, such as housing development and urban transport, there is a strong case for mobilising flmds at market cost and then adopting a strategy o f cross-subsidisation through different market segments. N ew housing construction has a good potential to absorb market-sourced/cost fimds, especially for the upper market segments, as also public transport services. The lower end o f the housing market would need subsidised fimds, which shotild be provided through cross-subsidisation within the housing market. A large part o f the rental housing market is also in a position to absorb market-sourced funds. Fiscal incentives such as income tax and property tax would, o f course, be a good stimulant.
3.7.184 In the case o f other sectoral activities like those relating to water supply, some portion o f the funds may have to be mobilised at less than market cost, especially for augmentation o f capacity o f water supply, but for distribution, which generates immediate income flows, market-sourced fiinds are likely to be a feasible proposition. This is an activity suitable for privatisation and for accessing funds from thee private sector. The Ninth Plan would promote this route o f resource mobilisation.
3.7.185 Plan resources by themselves cannot be expected to meet all the requirements. The well-structured financial sector reforms during the Eighth Plan have opened up the urban sector to a wide range o f financial instruments including leasing finance and bond
311

issues, even to urban local governments. International financial institutions are now keen to provide long-term credit, including on soft terms, to urban sector programmes. The Asian Development Bank has provided this type o f assistance for the first time in India for some urban projects in Karnataka during the Eighth Plan. Specialised financial institutions have developed a range o f term assistance programmes in the areas o f housing, urban development, water supply, sanitation and urban transport. A strong financial system has been put into place which can play a significant role in providing the large quantum o f financial resources on different terms and conditions to meet the requirements o f the sector during the Ninth Plan.
3.7.186 Apart from mobilisation of funds from the domestic and global capital market, it would be necessary during the Ninth Plan for the implementing agencies to reduce the cost o f their projects through careful planning o f the details o f the project, propermonitoring o f the implementation so as to minimise, if not totally eliminate, time and cost overruns and ensuring efficiency in operational management. It is unportant to optimise the utilisation o f the assets created, eliminate operational losses and play special attention to recovery o f user charges and other tariffs, which also require a significant degree o f rationalisation in terms o f base and rate. The guiding principle should be flill-cost recovery. There is a point o f view that fiall-cost recovery in the initial period may have to be restricted in some sectors to O & M and it may be gradually extended over the Ninth and Tenth Plan periods. The important policy issues are to reduce project cost, optimise utilisation o f assets and introduce a realistic pricing policy. These major steps would generate significant amount o f internal resources, which could finance the developments in the sector, as well as reduce the total investment requirement.
3.7.187 The implementation o f the Constitution Amendment Acts that empower urban local governments and panchayati raj institutions, has to be followed up by reviewing the resource-base o f the local governments, both urban and rural, improving tax/revenue administration and rationalising some o f the major income sources that have not kept in tune with developments in their areas as well as other economic realities. Active participation o f the people in the planning and management o f the sectoral programmes is also likely to improve the financial management system and thereby contribute to generation o f intemal funds for investment.
3.7.188 In this emerging economic and financial scenario, the Plan fiinds and other subsidised ftinds should be effectively used as a leverage to mobilise fimds fi-om other sources and for very specific programmes included in the Basic Minimum Services (BMS) and those that are targetted to identified priority groups. The leverage strategy was specifically introduced during the Eighth Plan in the Megacity project and the IDSMT scheme. It would be necessary to assess its impact, and if necessary, remove the operational constraints and then extend the strategy to all other sectors.
312

3.8 EM POW ERM ENT OF WOMEN AND DEVELOPM ENT OF CHILDREN
INTRODUCTION
3.8.1 W omen and children, who represent more than two third (67.7 per cent) o f the country's total population, constitute the most important target groups in the context o f the present day developmental planning. Therefore, their concerns are placed on the priority list o f the country's developmental agenda. Needless to say, they have the strength and support o f the Constitution.
EMPOW ERMENT OF W OM EN
3.8.2 Women, as a separate target group, account for 407.8 million (including girl children) as per the 1991 census and constitute 48.1 per cent o f the country's total population. Depending upon the developmental needs o f the individual age groups, the entire female population has been categorised into five distinct sub-groups, viz. i) girl children in the age-group 0-14 years, who account for 153.85 million (37.8%) and deserve special attention because o f the gender bias and discrimination they suffer from at such a tender age; ii) adolescent girls in the age group 15-18 years, who account for 38.70 million (9.5%) and are very sensitive from the view point o f planning because o f the preparatory stage for their future productive and reproductive roles in the family and society; iii) women in the reproductive age group o f 15-44 years, numbering 183.67 million (45.1%) who need special care and attention because o f their reproductive needs; iv) women in the economically active age group o f 15-59 years, who account for 226.04 million (55.5%) and have different demands like those o f education7training, employment, income generation and participation in the developmental process, decision making etc; and v) the elderly women in the age group 60+, numbering 27.17 million (6.7%) who have limited needs mainly relating to health, emotional and financial support.
3.8.3 The principles o f gender equality and equity and protection o f women's rights have been the prime concerns in Indian thinking right from the days o f Independence. Accordingly, the country's concern in safeguarding the rights and privileges o f women found its best expression in the Constitution o f India. While Article 14 confers equal rights and opportunities on men and women in the political, economic and social spheres, Article 15 prohibits discriminatio(;i against any citizen on the grounds o f sex, religion, race, caste etc; and Article 15(3) empowers the State to make affirmative discrimination in favour o f women. Similarly, Article 16 provides for equality o f opportunities in the matter o f public appointments for all citizens. Yet, another Article 39 mentions that the State shall direct its policy towards providing to men and women equally the right to means o f livelihood and equal pay for equal work. Article 42 directs the State to make provisions for ensuring just and humane conditions o f work and maternity relief. Article 51(A) (e) imposes a fundamental duty on every citizen to renounce the practices derogatory to the dignity o f women. To make this de-jure equality into a de-facto one, special legislations have been enacted from time to time in support o f women.

3.8.4 In the earlier phase o f developmental planning, the concept o f women's development was mainly 'welfare' oriented. During the Sixties, women's education received priority along with the measures to improve maternal and child health and nutrition services. During the Seventies, there was a definite shift in the approach from 'welfare' todevelopment' which started recognising women as participants o f development. The
Eighties adopted a multi-disciplinary approach with a special thrast on the three core sectors o f health, education and employment. Accordingly, priority was given to implementation o f programmes for women under different sectors o f agriculture and its allied activities o f dairying, poultry, small animal husbandry, handlooms, handicrafts, small scale industries etc. Recognising the role and contribution o f women in development, the early Nineties made a beginning in concentrating on training-cum- employment cum-income generation programmes for women with the ultimate objective o f making them economically independent and self-reliant.
THE CURRENT SITUATION
3.8.5 Developmental policies and programmes, both in the women-specific and women- related sectors, put into action through various Five Year Plans, have brought forth a perceptible improvement in the socio-economic status o f women in the country. The following paragraphs give an account o f important achievements along with the problems and gaps that are existing and requiring attention o f the Government in the core Sectors o f health and demography, education, employment, decision-making, political participation etc.
3.8.6 In the field o f health and demography, significant gains in respect o f women's health status have been recorded. Expectation o f Life at Birth for females has risen steadily from31.7 years in 1951 to 59.7 years in 1989-93 and finally overtaken the male life expectancy o f 59.0 years during the same period, as detailed in Table 3.8.1.
Table -3.8.1
Life Expectancy at Birth (1951-1991)
(in years)
Year Female Male
1951 31.7 32.51961 40.6 48.91971 44.7 46.41981-85 55.7 55.41987-91* 58.6 58.11989-93* 59.7 59.0
* Based on the SRS Estimates Source : Census of India, 1991 - Final Population
Totals, Paper 2 of 1992, Government of India, New Delhi,1993
314

3.8.7 Similarly, the Mean Age at Marriage for females has also increased from 15.6 years in 1951 to 18.3 years in 1981, while the effective age at marriage stood at 19.4 years in1995. The Child Marriage Restraint Act of 1976 which raised the age o f marriage for girls from 15 to 18 years has helped prevent child/early marriages amongst girls and the consequent early pregnancies and birth o f premature babies. Acquiring higher/continuing education and greater employment by women has also played a role in raising their age at marriage as per the details given in Table 3.8.2.
Table -3 .8 .2 Mean Age at Marriage during 1951- 1995
(in years)
Year Female Male
1951 15.6 19.91961 15.5 21.31971 17.2 22.41981 18.3 23.31991 19.5* NA1995 19.4* NA* Mean age at effective marriageSource SRS - Fertility and Mortility Indicators for respective
years, Registrar General of India, New Delhi
3.8.8 Further, while the Crude Birth Rate (CBR) has declined from 40.8 in 1951 to 27.5 in1996, the Crude Death Rate (CDR) has gone down from 15.6 in 1970 to 8.9 in 1996. Similarly, the Total Fertility Rate (TFR) has also declined from about 6 in the early 1950's to 3.5 in 1994. For further details, refer the Chapter on 'Fam ily Welfare'. The maternal mortality which stood at a very high rate of 437 per one lakh live births in 1993, as per the National Health and Family Survey, is a matter o f great concern. This high rate of maternal mortality is attributable to the following major causes, as indicated in Table3.8.3. which are both treatable/preventable through effective health and nutrition interventions :
T ab le 3 . 8 . 3 Percentage Distribution of Cause- Specific
Maternal Deaths -1 9 9 5
Cause Percentage
- Bleeding of Pregnancy & Puerperium 28.9
- Abortion 17.6- Anaemia 17.0- Toxaemia 9.9- Puerperium Sepsis 8.5- Malposition o f Child 4.0- Non Classifiable 14.1
Total 1 0 0 . 0
Source : Survey of Causes of Death (Rural), India, Annual Report (1995), Office of the Registrar Gen.of India, New Delhi
315

3.8.9 As could be seen above, the highest number o f maternal deaths in 1995 were due to bleeding o f pregnancy and Puerperium which are preventable through better reproductive health care. Abortion which is the second high accounted for 17.6 per cent o f total maternal deaths in 1995, although abortion was legalised as early as in 1972 as a health measure through the Medical Termination o f Pregnancy (MTP) Act, 1971. Despite this special sanction, illegal abortions still continue to be performed by the unauthorised persons like the local quacks and untrained persons under unhygienic and unsafe conditions because o f the non-availability o f MTP services within the easy reach o f most o f the rural population. Further, about 47.5 per cent o f deliveries were performed by untrained persons during 1995-96. While the Reproductive Tract Infections (RTIs) and Sexually Transmitted Infections (STIs) are already very high, cases o f HIV/AIDS have also been increasing am ongst women. O f the total 3161 cases o f AIDS reported by the end o f 1996, 749 were women.
3.8.10 The Sex Ratio which illustrates the survival scene o f women, has been exceptionally unfavourable to women, besides being on a declining trend right from the beginning o f this centur;v, except for a marginal rise in 1951 and 1981. The sex ratio which was 946 females per 1000 males in 1951 has declined further to927 in 1991, as shown in Table 3.8.4.
Table - 3.8.4
Sex Ratio (1951-1991)
YEAR SEX RATIO
1951 9461961 9411971 9301981 9341991 927
Source : Census of India,1991-Final Population Totals. Paper 2 of 1992, GOI, New Delhi,1993.
3.8.11 According to the National Institute o f Nutrition, Hyderabad, 49.3 p ercen t females were suffering from varying degrees o f Chronic Energy Deficiency (CED) and87.5 per cent o f pregnant women were anaemic o f various degrees during 1989-90. These deficiencies, as stated earlier, are easily preventable by providing better nutrition to women through their adolescence period and more specifically during pregnancy. For more details, see 'Nutrition' under Chapter Tood and Nutrition Security'.
3.8.12 The gains in the women's education, has been reflected in the increase o f female literacy rate from 7.9 per cent in 1951 to 39.3 per cent in 1991, which is twice the increase over the male literacy rate during the same period, as indicated in Table 3.8.5
316

Table 3.8. 5
Literacy Rates (1951 -1991)
Year Female Male
1951 8.86 27.161961 15.34 40.401971 21.97 45.951981 29.85 56.501991 39.19 64.13
Source :: Census of India of respective years; Office of the Registrar General of India, GO!, New Delhi.
3.8.13 The enrolment o f girls at the primary level has also increased from 5.4 million in 1950-51 to 47.9 million (provisional) in 1996-97, representing a nine-fold mcrease. Correspondingly, the enrolment o f girls at the middle level has also increased from 0.5 million to 16.3 million and at the higher secondary level from 0.2 million to 9.8 million, indicating an increase by more than 32 times and 49 times, respectively during the same period, as per the details given in the later part o f this Chapter under 'Developm ent o f Children’.
3.8.14 Similarly, the number o f women/girls in the higher education which includes colleges, universities, professional colleges o f Engineering, Medicine and Technology, has also increased from 13.60 lakh (33.2%) in 1990 to 21.39 lakh (35.5%) in 1997, as per the details given in Table 3.8.6.
Table 3.8.6Enrolment of Girls at Graduate/Post Graduate/Professional
Courses during 1990-91 & 1996-97(Figures in lakhs)
1990-91 1996-97Levels Girls Total Girls Total
Graduate 11.40 32.87 18.20 48.72(B.A./B.SC./B.Com.) (34.7) (37.4)Post Graduate 1.16 3.54 1.65 5.41(M.A./M.SC./M.COM.) (32.8) (30.5)B .ED./B.T 0.40 0.92 0.50 1.16
(44.2) (43.1)B.E./B.Sc(Eng)/ 0.26 2.41 0.49 3.28
B . Arch. (10.9) (14.9)M.B.B.S. 0.28 0.84 0,43 1.21
(34.3) (35.4)Ph.D/D.Sc./D.Phil 0.10 Q.33 0.i2 0.41
(26.2) (29.2)Total 13.60 40.91 21.39 60.19
(33.2) (35 .5)Note: Figures within the parenthesis indicate percentage to total.Source: Selected Educational Statistics - 1990-91 And 1996-97
Department of Education.
317

3.8.15 The drop-out rates, which have a direct bearing on the school retention rates, have also shown a definite declining trend both in the case o f boys and girls at all levels of school education during the last decade 1986 to 1996 as per the details given in the later part o f the Chapter under 'Developm ent o f Children'. However, the drop-out rates in the case o f girls have always remained higher than those o f boys. This was further compounded by the highly pronounced regional and rural-urban differentials, besides sex differentials which continue to persist. Though the gains in the educational status o f W omen have been impressive, gender justice in education still continues to be a distant goal, with 60.7 per cent o f women being illiterate as per the 1991 Census,
3.8.16 According to the 1991 Census, the female Work Participation Rate (WPR) registered an increase from 14.2 per cent in 1971 to 22.3 per cent in 1991. But, at the same time, it was much lower than the male work participation rate with both urban and rural differentials and with much wider regional variations ranging from as high as 34 per cent to as low as 4 per cent amongst the major States. Data on the subject is given in Table 3.8.7.
Table 3.8.7
Work Participation Rates (1971-91)
Years T/R/U Females Males Persons
1971 Total 14.22 52.75 34.17Rural 5.92 53.78 35.33Urban 7.18 48.88 29.61
1981 Total 19.67 52.62 36.70Rural 23.06 53.77 38.79Urban 8.31 49.06 29.99
1991 Total 22.27 51.61 37.50Rural 26.79 52.58 40.09Urban 9.19 48.92 30.16
Note 1. Excludes Assam and J&K.2.1971 figures are totals of workers and non-workers with
secondary work whereas, 1981 and 1991 figures are totals of main and-marginal workers.
Source : Census of India, Series-1, Registrar General of India, New Delhi.
3.8.17 The Table 3.8.8 attempts to give the distribution o f women work force in the organised and unorganised sectors in comparison to their male counterparts :
Table 3.8.8Labour Force in the Organised and Unorganised Sectors in 1991
(Figures in Millions)
Female Male Total
Sector Actual % Actual % Actual %
- Organised- Unorganised
3.78 4.2 85.99 95.8
22.95 10.2 201.41 89.8
26,73 8.5 287.40 91.5
Total 89.77 100.0 224.36 100.0 314.13 100.0
Note : Computed based on the Census data and of the DGE&T, GO!, New Delhi.
318

3.8.18 O f the total women workforce o f 89.77 million ((28.6%) in 1991, their share in the organised sector is only 4.2 per cent, while the restt o f the 95.8 per cent are in the unorganised sector where there are no legislative safeguairds even to claim either minimum or equal wages along with their male counterparts, leav^e aside the other benefits that the women in the organised sector enjoy.
3.8.19 According to the Director General o f Em ploym ent and Training (DGE&T), New Delhi, women's share in the organised sector hais steadily increased from 11.0 per cent in 1971 to 15.9 per cent in 1997, but it still stands v(ery low when compared to men, as per the data given in Table 3.8.9.
Table 3.8.9
Women in Organised Sector (19'71-1997)( Figures in lal<hs)
Year Public Sector Women Men
Private Sector Women Men
Total V/Vomen Men
1971 8.6 98.7 10.8 56.8 19.3 155.6(8.0) (92.0) (16.0) (84.0) (11.0) (89.0)
1981 14.99 139.85 12.95 61.01 27.93 200.52(9.7) (90.3) (17.5) (82.5) (12.2) ( 87.8)
1991 23.47 167.1 14.34 62.43 37.81 229.52(12.3) (87.7) (18.7) (81.3) (14.1) (85.9)
1997 26.11 162.57 17.77 69.20 43.88 231.77(13.8) (86.2) (20.4) (79.6) (15.9) (84.1)
Note : Figures in parenthesis are percentages. Source: DGE&T, Ministry of Labour, GOI, New Delhi.
3.8.20 Similarly, while representation o f women in the Government account for only13.7 per cent, their representation at the decision-makinjg levels through the three Premier Services in the country viz. Indian Administrative Service (IAS), Indian Police Service (IPS) and Indian Foreign Service (IPS) has accounted for only 5.8 per cent in 1987. Although, the same has been increased marginally to 7.5 in 1997, yet it stood at a very low ebb as per the data given below, requiring both affirmative action and special interventions to help raise the number o f women at variious decision-making levels.
Table 3.8.10 Representation of Women in Premiter Services
(1987-1997)
Service 1987 1997Total Female % Total Female %
IAS 4204 339 7 .5 499)1 512 1 0 . 2IPS 2418 21 0 .9 30415 67 2 .2IFS 480 53 1 0 . 0 57'5 71 1 2 . 3
Total 7102 413 5 .8 8 6 11 650 7 . 5
Source: Ministry of Home Affairs; Ministry of External Affairs; Department of Personnel, GOI, New Delhi.
319

3.8.21 The problem o f unemployment, especially amongst the educated women, has become a matter o f great concern in the recent past. The rate o f unemployment amongst urban females which stood at 5.4 per cent in 1990-91 has become very significant when compared to 0.4 per cent amongst rural females during the same year. The same trend is visible even in the NSSO 'data based on the current weekly status o f unemployment, which stood at 5.3 per cent for urban females and 2.1 per cent for rural females in 1990- 91. While the number o f w om en on the Live Registers o f Employment Exchanges has increased from 5.5 million in 1988 to 8.4 million in 1996, the educated unemployed women (Matriculates and abov'e) in 1992 stood at 5.4 million.
3.8.22 The landmark achievement o f both 73rd and 74th Constitutional Amendments in 1993 brought forth a definite impact on the participation o f women in the grass-root democracy through the Panchayati Raj Institutions (PRIs) and Local Bodies. In the recent elections o f PRIs beld during 1993-95, women have achieved participation even beyond the mandatory requirement o f l/3rd o f total seats in States like West Bengal (35.1%), Kerala (36.4%) and Karnataka (43.4%). In fact, these amendments are expected to achieve effective participation o f women in grass-root democratic institutions and its processes, both as individuals and as representatives o f interest groups.
3.8.23 In the State Legislative Assemblies, although the number o f women has increased from 102 (2.5%) in 1977 to 162 (3.9%) in 1997, the same stands at a very low ebb. Similarly, the number o f wom en in the Lok Sabha has also increased from 22 (4.4%) in 1952 to 41 (7.5%) in 1998 as shown in Table 3.8.11, but the same continued to be very low.
Table 3.8.11
Repres entation of Women in Parliament (1952-1998)
Year Lok Sabha Females Males
1 Year1
RajyaFemales
SabhaMales
1952 22 475 1 1952 1 15 201
1980 28 51411 1984 24 209
1991 39 48611 1990 1 24 221
1996* 39 50111 1996 19 219
1998 41 54311 1998 18 218
* Provisional as on 20. 8.1996.Source: Election Comcnission of India.
3.8.24 The status-quo, referred to above, can only change when women's concerns gain political prominence and a fairly representative number of women are in position not only at grass-roots level, but also at the state and national levels to convert them into a political will. This calls for affirmative action on the part o f the Government.
320
3.8.25 Efforts o f both governmental and non-govemmentail women's organisations and women's activists to contain violence against women have not been able to meet much success, as the incidence o f atrocities against women has beejn increasing. The problems o f dowry/dowry deaths continue unabated despite the existeince o f legislation prohibiting dowry and prescribing stringent measures for violating the law. Similarly, the legislation o f Immoral Traffic (Prevention) Act, 1956 (as amended and renamed in 1986) could not curb the age-long social evil o f prostitution as it started spreading even amongst children.
3.8.26 Violence against women, both domestic and at work place, continues its existence as is evident from the increasing incidence o f rape, dowry-r elated cruelty and murders. As per the data published by the National Crimes Record Bureau, New Delhi, out o f the total 1,15,723 cases related to women and registered under IPC in 1996, rape accounted for 14,846 (12.8%), dowry deaths 5513 (4.8%) and cases o f torture 35,246 (30.5%). The media, particularly the TV and Cinema, has been perpetuarting gender stereo-types, with visuals becoming more and more sex and violence oriented. Through selective and biased messages, women's role is projected as passive and victimised wives/mothers/sisters. This, in fact, has been rendering invisibility to many aspects o f women's contribution to society.
THE STRATEGY FOR THE NINTH PLAN
3.8.27 'Empowerm ent o f Women' being one of the nine p'rimary objectives o f the Ninth Plan, every effort will be made to create an enabling environm ent where women can freely exercise their rights both within and outside home, as equal partners along with men. This will be realised through early fmalisation and adoptiom of the 'National Policy for Empowerment o f Women' which laid down definite goals, ta:rgets and policy prescriptions along with a well defined Gender Development Index to monitor the impact o f its implementation in raising the status o f women from time to time.
COMMITMENTS OF THE NINTH PLAN (1997-20102)
ObjectiveEmpowering Women As The Agents O f Social Change And Development
trategiesTo create an enabling environment for women to exercise their rights, both w'ithin and outside home, as equal
partners along with men through early fmalisation and adoption o f “Nationial Policy for Empowerment of
Women”
To expedite action to legislate reservation o f not less than 1/3 seats for wornien in the Parliament and in the
State Legislative Assemblies and thus ensure adequate representation o f womten in decision making
To adopt an integrated approach towards empowering women through efffeetive convergence o f existing
services, resources, infrastructure and manpower in both women specific andl women related sectors
To adopt a special strategy o f “Women's Component Plan” to ensure that not less than 30 percent of
funds/benefits flow to women from other developmental sectors
To organise women into Self help group and thus mark the beginning of ai major process o f empowering
women
To accord high priority to reproductive child health care
To universalise the on-going supplementary feeding programme- Special Niutrition Programme (SNP) and
M id Day Meals(MDM)
To ensure easy and equal access to education for women and girls through the commitments of the Special
Action Plan o f 1998
To initiate steps to eliminate gender bias in all educational programmes
To institute plans for free education for girls upto college level, including prof essional courses
To equip women with necessary skills in the modern upcoming trades whiich could keep them gainfully
engaged besides making them economically independent and self-reliant
To increase access to credit through setting up o f a ‘Development Bank for Women Entrepreneurs in small
and tiny sectors
321

3.8.28 An integrated approach will be adopted towards empowering women through convergence o f existing services, resources, infrastructure and manpower available in both women-specific and women-related sectors with the ultimate objective of achieving the set goal. To this effect, the Ninth Plan directs both the Centre and the States to adopt a special strategy o f 'W omen's Component Plan 'through which, not less than 30 per cent o f fiands/benefits are earmarked in all the women-related sectors. It also suggests a special vigil to be kept on the flow o f the earmarked funds/benefits through an effective mechanism to ensure that the proposed strategy brings forth a holistic approach towards empowering women.
3.8.29 While organising women into Self-Help Groups marks the beginning o f a major process o f empowering women, the institutions thus developed would provide a permanent forum for articulating their needs and contributing their perspectives to development. Recognising the fact that women have been socialised only to take a back seat in public life, affirmative action through deliberate strategies will be initiated to provide equal access to and control over factors contributing to such empowerment, particularly in the areas o f health, education, information, life-long learning for self development, vocational skills, employment and income generating opportunities, land and other forms o f property including through inheritance, common property, resources, credit, technology and markets etc. To this effect, the newly elected women members and the women Chairpersons o f Panchayats and the Local Bodies will be sensitised through the recently launched special training package to take the lead in ensuring that adequate funds/benefits flow towards the empowerment o f women and the girl child.
Health and Family Welfare
3.8.30 The Ninth Plan recognises the special health needs o f women and the girl child and the importance o f enhancing easy access to primary health care. There are many indicators to point out that the neglect o f health needs o f women especially that o f the pregnant women, adolescent girls and girl-babies, is responsible for the present high rates o f IMR/CM R/M M R. Therefore, a holistic approach with Reproductive Child Health (RCH) measures will be adopted in improving the health status o f women by focussing on their age-specific needs.
3.8.31 Taking into account their multiple roles including the physical labour that women in the lower strata o f the society living in the backward rural areas and urban slums have to carry on, efforts will be made to ensure that the health services become more responsive towards women-specific health problems. In this direction, the major strategy will be to increase women's access to appropriate, affordable and user-friendly health care services. Special attention will also be paid to occupational health hazards. The present strategy extending primary health care services for all through the Special Action Plan o f 1998 is expected to fill the critical gaps in the existing primary health care infrastructure and make it more effective to reach 'Health Care Services for AH' with a priority to the rural and urban poor living below the poverty line.
3.8.32 To achieve the expected level o f 50/1000 o f IMR and 3/1000 o f M M R by 2002 AD, if current trend continues, the Ninth Plan acpords high priority to reproductive child health care and proposes an integrated approach with ante-natal, natal and post-natal care and child health services. In this context, the Ninth Plan identifies the long-standing gap o f non-availability o f data on maternal mortality and suggests that the Office o f the Registrar
322

General and Census Commissioner, New Delhi shouild initiate action in making the data on the maternal mortality available on a regular basi;s liike that o f IMR, as the same is a pre-requisite for planning both need-based and area'-based strategies to reduce the existing high rate o f maternal mortality.
3.8.33 The other effective measures proposed in this diirection include identification and management o f high-risk mothers, appropriate mamagement o f anaemia, hyper-tension disorders and provision for emergency obstetric care. IFuirther, steps will also be taken to close the gender gaps in the existing rates of both mortality and morbidity. Also, considering the fact that more than 50 per cent o f th e deliveries and a large number o f illegal abortions are being performed by unqualified pers<ons, particularly in the rural areas, special efforts will be made to promote ready access tO) m edical termination o f pregnancy and intra-partum care at Primary Health Centres. In aireas where institutional delivery rates are low, focussed TBA training will be undertaken.
3.8.34 Prevention/control o f the misuse o f medical tec;hniologies for commercial purposes will be taken up on a priority basis as the incidence o f female foeticide has been on an increase due to misuse of the medical technolo'gy o f Amniocentesis for sex determination, which is generally followed by illegal lamd harmful practices o f female foeticide. Action in this direction will include effectiive: enforcement o f the Pre-natal Diagnostic Techniques (Regulation and Prevention o f M:isuse) Act, 1994 with stringent measures o f punishment o f both the parties. Efforts willl ailso be made to create an enabling environment for women to exercise their reproductive righ ts and choices freely, so as to contain the population growth.
3.8.35 Under RCH care, steps for prevention and treatmient o f gynaecological problems including infertility, menstrual disorders, screening a n d treatment o f cancers especially that o f breast and uterine cervix etc. will also be taken uip. Also, the traditional health care, especially practised by women, will be encouraged through programmes o f Indian Systems o f Medicine. Gender-sensitive initiatives tihat address the sexually transmitted infections/diseases (STDs), HIV/AIDS and otther sexual and reproductive health issues, will be attended to on a priority basis. The health education material, being brought out as part o f lEC material for family planning, will b e made gender sensitive for both men and women. Special efforts will be made to diisseminate information to women, especially in rural and tribal areas on the available rep>roductive health services. Efforts to promote participation o f men in planned parenthotodi in increasing acceptance o f vasectomy and active co-operation o f men in STD/RTI Prevention Control, will receive priority attention.
Nutrition
3.8.36 To tackle the problems o f micro-nutrient defiiciencies and protein energy malnutrition (PEM), the primary focus will be on the 'at-riisk groups' who are living below the poverty line and also on those who are 'nutritionialUy vulnerable', particularly, the women/mothers and children. In this direction, speciaJ e;fforts will be made through the Special Action Plan o f 1998 to universalise 'th e om-going supplementary feeding programmes viz., Special Nutrition Programme (SN P) for pre-school children and expectant and nursing mothers and Mid-Day Meals (M DM ) fo r school going children. These feeding programmes will also be reinforced with necessary support services like health check-up, immunisation, ante-natal care, health and nutritiom education and awareness etc.
323

The Ninth Plan will also incorporate a special package o f services to prevent/control the micro-nutrient deficiencies o f Vitamin A, Iron and Iodine, which are extremely important from the point o f view the health consequences on women/mothers and children. Further details are available under the Chapter on 'Food and Nutrition Security'.
Education and Training
3.8.37 Education, being the most powerful instrument for empowering women, assumes special priority in the Ninth Plan. Efforts in the Ninth Plan will, therefore, be target-oriented in fulfilling the goal o f 'Education for Women's Equality' as laid down in the National Policy on Education (NPE), 1986 and revised in 1992. Towards this, special attention will be paid to the already identified low female literacy pockets and to the women and the girl children belonging to the socially disadvantaged groups viz. SC, STs, OBCs, Minorities, Disabled, etc. as they still lag behind the rest o f the population with the lowest literacy rates ranging between 5 and 10 per cent, while the national average o f female literacy stands at 39,3 per cent in 1991.
3.8.38 While the Universal Primary Education continues to be a priority area in the Ninth Plan, all out efforts will be made to ensure both easy and equal access to education for women and girls through the commitments o f the Special Action Plan (1998) to achieve total eradication o f illiteracy. Besides, steps will be initiated to eliminate gender discrimination in the admissions; remove gender bias and stereo-types in the curricula, text books and learning material; create a gender - sensitive educational system; promote gender sensitization o f teachers on a regular basis; appoint more women teachers at primary level (at least 50%); reduce drop-out rates and increase enrolment and retention rates o f girl children through special incentives like free supply o f uniforms and text books, m idday meals, scholarships, flexible school timings and attached hostels and creches; and improve the quality o f education, facilitating life-long learning through the correspondence courses, distance learning and self-study programmes for women and girls who fall out o f the formal system o f schooHng. The special package announced for the Girl Child on 15 August, 1997 also revolves around the very same theme o f educating and empowering the girl child living below the poverty line with adequate financial support till she completes higher secondary education or gets equipped with necessary skills to earn her livelihood. More details are given in the later part o f this Chapter under the section 'Child Development'.
3.8.39 Vocafionalisation o f secondary education and vocational training for women will receive high priority as one o f the ultimate goals o f empowering women is to make them economically independent and self-reliant. In this context, the existing network o f National Vocafional Training Centre (NVTC), Regional "Vocational Training Centres (RVTCs), Pre-Vocational Training Centres (PVTCs), Industrial Training Institutes (ITIs) and Craft Training Centres (CTCs) will be fiirther strengthened with necessary improvements in the infra-structural facilities for introduction o f up-coming trades, hostels etc. Efforts will also be made to encourage eligible womea^girls with suitable incentives to join vocational education/training so that the facilities available at these exclusive Training Institutions will be utilised optimally. Introduction o f part-time and short-term courses will also be considered to meet the special needs and timings o f working women/girls. Efforts will be made to encourage women and girls with necessary incentives to opt for the emerging areas o f technical education such as electronics, computer systems and applications, bio-engineering, bio-technology, food processing, fabric designing, beauty cuhure, communications, media etc, which have high employment potential.
324

3.8.40 Further, to encourage more and more girls to en ter into the mainstream o f higher education and thus ensure fulfillment of the commitmemt o f 'Education for Women's Equality', the Ninth Plan envisages to institute plans for piroviding free education for girls upto college levels, including professional courses, so as to better empower women.
W ork and Employment
3.8.41 There is an urgent need to revive the special projject o f 'G ender Sensitization o f1991 C ensus'to capture women's work in the informal sec'.tor in a more substantial way in the comiing Census o f 2001 AD. In this regard, there is a meed to consider redefining theconcept o f work' and provide conceptual clarity to the 'defin ition o f work' by the Census
and NSSO. The Ninth Plan also envisages the preparafion o f Satellite Accounts to highlight Women's Work through appropriate m(ethodologies,consistent with the National Accounts.
3.8.42 Keeping in view the ultimate objective o f fulfillinig the 'Right to work for every citizen', special efforts will be made to generate gainful employment through promotion/expansion of both wage and self employment opportunities for women so as to make all potential women economically independent and self-reliant. In this context, the ongoing training- cum - employment ~ cum - income-gteneration programmes viz. Integrated Rural Development Programme (IRDP), Traiining o f Rural Youth for Self- Employment (TRYSEM), Nehru Rozgar Yojana (NRY), Jawahar Rozgar Yojana (JRY), Prime Minister's Rozgar Yojana (PMRY), Development o f Women and Children in Rural Areas (DWCRA), Indira Mahila Yojana (IMY), Support for Training and Employment (STEP), NORAD-assisted Training-cum-Production Cientres (popularly known as NORAD), Socio-Economic Programjne (SEP) etc. will be expanded to create more and more o f employment-cum-income generation opportunitites and cover as many women as possible living below the poverty line. In these efforts, piriority will be given to femaleheaded households and women in extreme/abject poverty
3.8.43 As in the past, there will be a special focus on womcen in agriculture and its allied sectors as they are in majority (89.5%) and form the major stock o f all the agricultural operations. The programmes for training women in soil conservation, social forestry, dairy development and other occupaitions allied to agriculture like horticulture, livestock including small animal husbandry, poultry, fisheries, etc. need to be expanded to reach the benefits to women workers im proportion to their number. Simultaneously, the extension services will be strengthenied to cover a larger number o f women, keeping in mind women's role as producers. Thie number o f women extension workers, especially the Farm Extension Workers, will be incireased to assist rural women to take advantage o f various training programmes.
3.8.44 Efforts will also be made to identify the traditional sectors that are shrinking due to advancement o f technology, market shifts and chamges in the economic policies; introduce programmes to re-train/upgrade the skills o f the diisplaced women to take up jobs in the new and expanding areas o f employment and formuilate appropriate policies and programmes to promote opportunities for wage/self-emiployment in traditional sectors like khadi and village industries, handicrafts, handlooms, sericulture, small scale and cottage industries and absorb those displaced women. Flexiibility in the labour/employment market for women will be given adequate weightage throug;h various Structural Adjustment Programmes (SAE).
325

3.8.45 Women in the Informal Sector, who account for more than 90 per cent, will receive special attention during the Ninth Plan especially with regard to their working conditions, as the same continued to be precairious without any legislative safeguards. Attempts will, therefore, be made to extend im portant labour legislations to the informal sector so as to ensure basic minimum working comditions for women. In this direction, special efforts will be made to ensure that laws relatinig to both minimum and 'equal pay for equal work' for women, shall be strictly implennented. While formulating policies and programmes for the betterment o f women in the imformal sector, the un-attended recommendations o f the National Comm ission on Self-eimployed Women and Women in the Informal Sector (1988) and also the fmding:s/results o f the Fourth Economic Census (now in progress), revealing the latest trends and patterns o f women's employment in the Informal Sector, will be taken into consideration.
3.8.46 The N inth Plan recognises the need for a conducive Credit Policy to increase the access for women to crediit through appropriate institutional mechanisms like Rashtriya M ahila Kosh (RMK), National Agricultural Bank for Rural Development (NABARD), Council for Advamcement o f People's Action and Rural Technology (CAPART), W omen Co-operative:s/SHGs and the other financial institutions. In this context, expansion o f the activities o f Rashtriya Mahila Kosh (RMK) needs special attention. Efforts will also be made to learn lessons from the success stories o f various voluntary organisations who have already established their credentials in the field o f credit and encourage them to expand their acctivities both within and outside their States. The Ninth Plan also envisages all States/UTs to be equipped with Women's Development Corporations (W DCs) to provide both 'forward' ;and 'backward' linkages o f credit and marketing facilities to women entrepreneurs, besides; being catalysts. In this context, the Ninth Plan also envisages to set up a 'Developmient Bank for Women Entrepreneurs' in the small scale and tiny sectors.
3.8.47 To increase the share o f w om en in factories and industrial establishments, efforts will be made to remove the exiisting traditional bias that women are good only in stereotype/feminine jobs and encourage women to equip themselves with necessary professional/ vocational skills and compete w ith men to make an entry into such areas. Simultaneously, efforts will be put into effect to (ensure that the employers fulfil their legal obligations towards their women workers in e:xtending child care facilities, maternity benefits, special leave, protection from occupatio>nal hazards, allowing formation o f women workers' associations/unions, legal protection / aid etc. In this context, efforts will also be made to gender sensitize the Trade U nions to play the role o f a watch-dog with regard to protection o f women's rights/intere-sts.
3.8.48 With regard to Women in Services, the Ninth Plan recognises the need to initiate affirmative action to ensure at leaist a minimum of 30 per cent o f reservation for women in services in the Public Sector as aigainst the present low representation o f 13.8 per cent in 1997. Efforts will also be made to ensure up-ward mobility for women in services. To encourage women, special concessions and relaxations, like multiple entries, enhancement o f upper age limit, need to be ejKtended to ensure adequate representation o f women in services in the public sector. For women to join the Services in a big way, support services like child care facilities viz. cr'eches/day care centres at the work places/educational institutions and homes for the age;d and the disabled will be expanded with improved facilities. Also, Hostels for W orking women will be expanded to promote their mobility in the employment market.
326

3.8.49 As the representation o f women in the deccision-making levels has a direct bearing on all the affirmative actions directed towards; their well-being and empowerment, every effort will be made to ensure that women are in adequate numbers at the decisionmaking levels. To this effect, women will be encourage<d with special coaching facilities to compete in the competitive examinations which provicde them a direct entry into the path o f decision-making levels. Similarly, there is also a need, for women to be active in public life and take part in the political decision-making proicess, as political decisions/ political will in favour o f women can influence a lot in creatimg an enabling environment for women to empower themselves. Towards this, effortjs will be made to expedite action to legislate reservation o f not less than 1/3 o f the total se<ats for women both in Parliament and State Legislative Assemblies.
3.8.50 As economic empowerment o f women is mainily related to their participation in decision-making with regard to raising and distributtion o f resources i.e. income, investments and expenditures at all levels, special efforts will be made to enhance their capacity to earn besides enlarging their access t(o and control/ ownership of family/community assets. With access to economic as'sets, women will be encouraged to take up self-employment through various entreprenieurial ventures which are more convenient and allow them to play their dual role, within and outside home, effectively.
Poverty Alleviation
3.8.51 As women are critical to the process o f movinjg their families out o f poverty, the present policies and programmes o f poverty alleviation 'will be redesigned, if called for, to make them more responsive to the special needs of women in abject/extreme poverty. As a first step in this direction, the Ninth Plan proposes to revamp TRYSEM in its design, curriculum and method o f training and thus im prove the training and employment opportunities for women in poverty. Further, a speci;al mechanism will be evolved to bring forth a closer integration amongst DWCRA, IRDP and TRYSEM to extend greater access to financial assistance and training to W om en's Groups under DWCRA. Further, as the woman's capacity to work, her health, knowledge and skill endowment are often the only resources for the poor households to fall back upon for their survival, efforts will be made to ensure that a minimum of 30 to 4 0 per cent o f the benefits flow to women from all the existing poverty alleviation pnogrammes, both rural and urban. Further, the social security programmes launched in 19'95 will give a special focus on women so that the social assistance thus received \will form the survival base for women in extreme poverty.
Care and Protection
3.8.52 Welfare and rehabilitative services will continue; to be extended for women in need o f care and protection viz. the disabled/deserted/w'idowed/destitute and women in difficult circumstances etc. Special programmes will b e designed for both social and economic rehabilitation o f Devadasis, Basavis, Jogins, sex;-workers, beggars etc. The plight o f those young women and girls, who migrate to the cities in search o f jobs and later become victims o f various circumstances and social/m oral danger, will receive special attention during the Ninth Plan.
Decision-M aking
327

3.8.53 Considering the strong impact o f environmental factors on the sustenance and hvelihood o f women, special efforts will be made to ensure/encourage participation o f women in the conservation o f environment and the control o f environmental degradation through programmes o f social forestry, afforestation and wasteland development etc. Accordingly, necessary provisions will be made to reflect women's perspectives in the policies and programmes for the management o f eco-system and natural resources. Further, emphasis will be laid on the use o f science and technology to solve environment- related problems like energy and fuel conservation along with water conservation to ease women's work in and outside the home. Efforts will also be made for gender sensitization o f forest staff and local communities to involve women's groups in the planning and management o f forest conservation and utilisation of forest produce.
Science and 1 echnology
3.8.54 Application o f Science and Technology (S&T) is vital for the advancement o f women as it reduces household drudgery and provides better working conditions for women, particularly, in rural areas. Therefore, participation o f women/women scientists in S&T activities will be encouraged in the Ninth Plan at all stages viz. - design, development/ adaptation o f alternative technologies, including upgradation o f traditional technologies and identification o f those activities for which improved technologies would be o f greater benefit. The criteria for selection o f technology for women will include relief from drudgery - associated tasks, time saving, increased output and productivity, improved hygiene, energy efficiency etc. The Ninth Plan, therefore, accords high priority to research and development (R&D) for exploitation o f locally available indigenous alternative sources o f energy for use in the women-related household activities. To undertake these types o f R&D activities, more and more girl students will be encouraged to get into science streams with attractive incentives.
Media and Communication
3.8.55 The strategy for Media in the Ninth Plan will be a combination o f efforts to confront/put an end to the negative and stereotyped portrayal and depiction o f women and girls, besides using all types o f mass media and communication resources to change the mindset o f the people and the attitudes/behavioural patterns o f people through information, advocacy and analysis. To this effect, there is an urgent need for adopting a M edia Policy with laid down prescriptions o f 'd o ’s 'an d 'don'ts' in support o f the constitutional guarantee o f upholding women's dignity.
Violence against W omen
3.8.56 To deal with the increasing problem of violence against women and the girl child within and outside the family, a comprehensive approach will be adopted through a review o f all the existing women-specific legislations and remove the weak links through necessary amendments; effective implementation o f the existing legislation with strong punitive measures; gender-sensitisation o f the enforcement machinery to be prompt and strict in handling the perpetrators o f such violence; involvement o f community and the voluntary organisations to act as the informants; and rehabilitation of, and compensation for, the victims o f such violence. Towards this, efforts will be made to
Environment
328
encourage all the States/lJTs to initiate annual reviews on the situation o f violence against women both at the State and District levels, om the lines o f the annual reviews at the national level. Setting-up/strengthening o f Womem's Cells in the approved Police Stations, family courts, mahila courts, counselling centres, legal aid centres and nyaya panchayats, will be attempted as part of the intensive e^fforts to curb violence against women. Along with these, there will be w idespread dissemination o f information on women's rights, human rights and other legal entitlemients for women, through the specially designed Legal Literacy Manuals brought out in 1992. Efforts will also be made to include legal literacy in the curriculum of schools, colleges, and other Training Institutes.
3.8.57 The other measures include strengthening o f Nati(onal/State level Commissions for Wom*en; appointment of a Commissioner for Women's IRights who would act as a Public Defender on behalf of women; mobilisation o f voluntiary action for gathering public support for the victims o f violence including counsellinig, relief and rehabilitation; and building up o f such an environment where women and giirls can come forward to report to the police about the acts of violence against them, without :any fear o f reprisal.
Gender Sensitization
3.8.58 Keeping in view the Ninth Plan commitment o>f empowering women, vigorous efforts will be made to accelerate the process o f societal reorientation towards creating a gender-just society. The focus in this regard will be on both men and w'omen within the family and within the community to change their negative attitudes and eliminate all types o f discrimination against women and the girl child. Iin this process, both governmental and non-governmental organisations are expected to play a big role in.utilising both mass media and other traditional means. Gender sensitization will be institutionalised within the government training systems through induction as welll as refresher courses. Specially designed gender sensitization programmes will be coinducted on a regular basis with special focus on the State functionaries viz. the exec'utive, legislative, judicial and enforcement wings o f all governmental agencies. Oither initiatives in this direction include generating societal awareness to gender issues; reviejw o f curriculum and educational materials leading to the removal o f all references derogatory to the dignity o f women; use o f different forms o f mass media to communicate special messages relating to women's equality and empowerment.
Legislative Support
3.8.59 Special efforts will be made to enforce the e;xisting legislations effectively to safeguard the interests o f women and girls as the Nimth Plan identifies laxity in the implementation o f various legislations, especially the wormen-specific, viz. - The Dowry Prohibition Act, 1961 (as amended upto 1986); The Immcoral Traffic Prevention Act, 1956 (as amended and retitled in 1986); Indecent Representation o f Women (Prevention) Act, 1986 etc. The findings o f the recent review of all the exiisting legislations, both women- specific and women-related, undertaken by the National (Commission for Women will be examined to plug the existing loopholes through necessairy amendments and enact new legislations, if necessary, to make the legislations as effectiwe instruments in safeguarding the rights o f women and the girl-child and ensuring gender justice.
329

POLICIES AND PROGRAM M ES : A REVIEW
3.8.60 Human development being the major thrust in the Eighth Five Year Plan (1992- 97), It sought to ensure that the flow o f benefits from other developmental sectors did not bypass women and the same was monitored with a special vigil in the three core sectors o f health, education and employment. To this effect, the special mechanism o f Monitoring the 27 Beneficiary oriented Programmes for Women was continued in the Eighth Plan. It envisaged that the women must be enabled to function as equal partners and participants in the country s developmental process. This approach o f the Eighth Plan marked a shift from development to empowerment' o f women. Achievements in both the women-related and the women-specific sectors during the Eighth Plan are listed below:
3.8.61 Improvement in the health status o f women received high priority during the Eighth Plan. The erstwhile programme o f Maternal and Child Health services was recast as the Child Survival and Safe Motherhood (CSSM) programme and launched in 72 districts during 1992-93. The same was further expanded to cover 466 districts by the end o f the Eighth Plan. Under the Universal Immunisation Programme (UIP), the TT vaccination coverage o f pregnant women increased from 40 per cent in 1985-86 to 76.4 per cent in 1996-97 and 80.93 percent in 1997-98. Under the Prophylaxis scheme, 119.59 lakh pregnant women were provided with Iron and Folic Acid (IFA) tablets during 1996-97 and83.59 lakh women during 1997-98. Around 2.11 lakh Dais were trained during 1996-97. Under CSSM training, 22715 medical officers and 92365 para medical workers were trained till September, 1996. As many as 1022 First Referral Units (FRUs) were identified for Emergency Obstetric Care in 5 States viz. - Assam, Bihar, Madhya Pradesh, Uttar Pradesh and Rajasthan till 1997. These services o f child survival and safe motherhood, as revealed by various evaluation studies, have contributed significantly to the reduction o f Infant Mortality Rate from 79 to 72; Crude Birth Rate from 29.2 to27.5 and Crude Death Rate from 10 to 9.0 during 1992 to 1996. An extensive network o f 2424 Community Health Centres, 22,962 Primary Health Centres and 1,36,815 village level Sub-Centres was in actual operation by 1997 to extend primary health care services including safe motherhood and other family planning services to women in rural areas.
3.8.62 The National Nutrition Policy (NNP), adopted in 1993, made a commitment to reduce the iron deficiency anaemia amongst pregnant women, nutritional blindness due to Vitamin 'A ' deficiency and iodine deficiency disorders. To reduce prevalence o f anaemia in pregnancy, the National Anaemia Prophylaxis programmes o f iron and folic acid tablets distribution to all the pregnant women was initiated in 1972. Alternative strategies to control anaemia in pregnancy are being taken up as part o f the RCH initiative. To combat the problem o f blindness due to Vitamin 'A ' deficiency in children, administration o f a massive dose o f Vitamin 'A ' once in 6 months to all children between 1-5 years o f age was included in the National Prophylaxis Programmes against Nutritional Blindness. In order to achieve further improvement in Vitamin 'A ' status o f children, a two-pronged initiative o f improving the coverage o f massive dose o f Vitamin 'A ' administration and nutrition education for improving the intake o f Vitamin 'A ' rich foods, is being taken.
330

3.8.63 The National Goitre Control Programme, initiated in 1962, makes available good quality iodised salt in areas o f high Iodine deficiency dis;orders (IDD). The implementation o f the programme in the initial three decades was sub-optimal and IDD prevalence remained essentially unattended to. Further, supplem entary nutrition to the expectant and nursing mothers continued through the universali;sed ICDS programme and about 3 million mothers were receiving supplementary nutritiom by the end o f the Eighth Plan. Special efforts were also made to impart nutrition education to mothers and women through the programmes o f ICDS and Integrated N utrition Education and thus create nutritional awareness amongst women/mothers. Above all, the emphasis has been on the removal o f the inequitous distribution o f food and discriiminatory feeding practices against women and the girl child.
3.8.64 In the field o f Education, emphasis was laid on increasing the participation o f women in the educational process. Accordingly, efforts were made towards Universalisation o f Elementary Education (UEE) which resulted in significant improvement in the enrolment o f girls in schools and reduction in the drop-out rates at all levels.
3.8.65 Under the Total Literacy Campaign (TLC), 422 diistricts have been covered by the end o f March, 1998 with a total coverage of 68.57 lakh beneficiaries, o f whom 41.14 lakh were women. Another programme, viz., Non-formal E(ducation (NFE), which provided education comparable to formal schooling to those w ho remained outside the formal schooling system, benefited 24,81 lakh girls at one lakh exclusive NFE Centres for girls by the end o f 1995-96. The same has increased to 29.80 lakh girls by March, 1998.
3.8.66 M ahila Samakhya, a programme for womem's equality and empowerment, operated in 35 districts o f 7 States viz Uttar Pradesih, Karnataka, Gujarat, Andhra Pradesh, Bihar, Madhya Pradesh and Assam. This program m e addressed many issues like drinking water, health services, managing non-form;al education, provision o f preschool centres/ creche facilities etc. The village w om en o f M ahila Samakhya were managing 529 NFE Centres and 241 ECCE Centres also.
3.8.67 The programme o f Nutritional Support to Primary Education which was launched in 1995 in 40 Low Female Literacy Blocks, provided a special boost to enrolment, retention and attendance o f girls besides leaving an impac t on the nutritional status o f the girl children in primary classes. To extend support for SC/ST girls to continue their education beyond the middle school level, the number and the intake capacity o f the girls' hostels were increased during the Eighth Plan by opeming 602 additional hostels for 51299 SC girls and 261 hostels for 10440 ST girls. Durimg 1997-98, 78 more SC hostels for 12857 girls and 102 ST hostels for the benefit o f 10200 girls were sanctioned.
3.8.68 In line with the Eighth Plan strategy of achieving near full employment, efforts were made to enhance employment and income generation activities for women under various sectors viz. agriculture, dairying, animal husbandry, khadi and village industries, small scale industries, handlooms, handicrafts etc. Since 89.5 per cent o f rural women were engaged in the agriculture sector, efforts were made to enhance their skills in agricultural operations and extension work.
331

3.8.69 Special programmes like 'W om en in Agriculture' were launched in 1993 to train women farmers having small and m arginal holdings in agriculture and its allied programmes like animal husbandry, dairying, horticulture, fisheries, bee-keeping etc. Since inception o f the scheme, 210 Farm Women';s Groups were constituted and training was provided to 4200 Farm W omen in 7 selected [States. Another programme called Training o f Women in Agriculture with DANIDA ancd DUTCH assistance imparted training to 1.89 lakh women. To assist women in agro-based industries, 6866 Women's Cooperatives were formed with 100 per cent fmanciali assistance from the Government. Under the programme o f Operation Flood, rural women iinvolved in dairy development on cooperative lines were given training in various activiities relating to milk production, preservation and cooperative group formation. By th e end o f the Eighth Five Year Plan, 74,300 Dairy Cooperative Societies were organisicd. The percentage o f women members has risen from about 14 per cent, a decade ago, to about 20 per cent in 1997 (approx. (19 lakh women members). By the end o f 1996, there were 8,171 exclusive Women Cooperative Societies (non-credit) with a total m em bership o f 6.93 lakh women. Women Milk Co-operatives were leading in many States esjpecially in Haryana, Punjab, Uttar Pradesh, Rajasthan and Karnataka.
3.8.70 The Khadi and Village Imdustries Commission (KVIC) took several measures to generate more employment oppo>rtunities for women and thus increase their capacity to earn. O f the total 60.75 lakh p<ersons employed under various programmes o f KVIC, 46 per cent beneficiaries were wormen. An exclusive national level Training Institute for W omen was also set up at P une during the Eighth Plan. Two schemes viz. Prime M inister's Rojgar Yojana (PMR Y) and Entrepreneurship Development Programme (EDP) in the Small Scale Industriies sector, were designed to help women to develop entrepreneurial skills and ventmres o f small scale enterprises for self-employment. Under PMRY, 85012 projects during the Eighth Plan period and 28,467 projects during 1997-98 were sanctioned exclusively for women. Under EDP, 8828 women during Eighth Plan and 3714 women during 1997-98 received training.
3.8.71 Training and upgradation o f skills for women in the most modem and upcoming trades received high priority. The National Vocational Training Institute at NOIDA (UP) and the 10 Regional VocationalTraining Institutes for women imparted basic andadvanced level vocational training with an annual turnover o f 1864 candidates. By February, 1998, there were 223 women's Industrial Training Institutes (ITIs) and
ECONOMIC EMPOWERMENT
In line with the Eight Plan Strategy of providing 'Near full - employment’, the Government has reset its priorities to accord special emphasis to keep women gainfully engaged through employment cum income generation activities. The ultimate objective of all these efforts is to make women economically independent and self-reliant. Some of the important initiatives thus undertaken in this direction include launching of programmes viz., 'Work and Wage’, ‘ Learn while you earn’, 'Credit for Entrepreneurial / Self Employment Ventures’, Employment Guaranty Schemes etc. both in rural and urban areas. While programmes like IMY (Indira Mahila Yojana), DWCRA (Development of Women and Children in Rural Areas), STEP (Support for Training and Employment), TEPC ( Training cum Employment cum Production Centres) popularly known as NORAD are some of the important women-specific employment cum training programmes, there exist a few more programmes like, IRDP (Integrated Rural Development Programme), TRYSEM ( Training of Rural Youth for Self Employment Programmes), JRY ( Jawahar Rozgar Yojana), NRY( (Nehru Rozgar Yojana), PMRY (Prime Minister’s Rozgar Yojana) which extend 30 to 40 % reservation of benefits for women.
332

235 women's wings in general/private ITIs with a to ta l sanctioned strength o f 36,114 seats. This included the expansion o f 66 women's ITLs and 102 W omen's wings in General ITIs during the Eighth Plan. Accordinglly,, the number o f women trainees also rose from 9316 in 1991 to 16,265 in 1998. During 19'97-98, 93 additional ITIs for women were sanctioned with a total capacity o f 15908 women.
3.8.72 To alle^aate extreme poverty amongst rural w/ormen, programmes like Integrated Rural Development Programme (IRDP), Jawahar R tojgar Yojana (JRY), Training o f Rural Youth for Self Employment (TRYSEM) and Dev'ehopment o f Women and Children in Rural Areas (DWCRA), expanded their activities in th(e area o f generating gainful wage and self-employment opportunities, with 30-40 per ce;nt o f benefits reserved for women. During the Eighth Plan, the coverage o f women undcer IRDP remained at 33 per cent with the number o f beneficiaries touchmg 32.57 lakh betvweten 1992 and 1997. During 1997- 98, the coverage o f women under IRDP has reached 0.06 lakhs i.e.34.3 percent o f total coverage. O f the total employment generated since imception under JRY during 1989 to1997, the share o f women was 14582.38 lakh man-dlay^s, which works out to 25.04 per cent o f the total employment generated during that p>eriod. During 1997-98, the scheme o f Women under JRY has gone up to 1116.71 lakh m ain-days representing 28.7 per cent o f total employment. About 16.30 lakh women were covered under TRYSEM since the inception o f the programme in 1979. DWCRA-an exchusiive programme for the development o f women and children in rural areas - was extendced to all the districts in the country during the Plan period with the sole objective o f brriniging about a change in the socioeconomic status o f poor women in rural areas thromg;h income generating activities and improvement o f their access to services like health, nmtrition, education, safe drinking water etc. During the Eighth Plan, 1.36 lakh Women's Self-Hlelp Groups (SHGS) were formed benefiting 21.82 lakh women. In 1997-98, 33032 addittiomal SHGS were formed.
3.8.73 In the urban areas, poverty alleviation prog;raimmes like Nehru Rojgar Yojana (NRY), Urban Basic Services for the Poor (UBSP) anid Prime M inister's Integrated Urban Poverty Eradication Programme (PMIUPEP), contriibuited a lot to improve the quality of life o f women slum dwellers. Under NRY, womein were given preferential treatment for skill upgradation and were provided assistancie for setting up micro-enterprises, wage employment through construction o f public ass<ets and shelter upgradation.
3.8.74 Sim ilarly, w om en and child beneficiaries neceived high priority under the program m e o f UBSP w hich sought to provide an imtejgrated package o f health care services for m other and child, supplem entary niutrition, non-form al/pre-school/adult education; assistance to the handicapped and the diestitute. By M arch, 1997, 5982 N eighbourhood D evelopm ent Com m ittees comprisiing; prim arily the urban poor w om en w ere set up in 360. tow ns for extending basic serv ices to 82 lakh beneficiaries. Sim ilarly, w om en also received benefits under the Prim e Mliniister's Integrated U rban Poverty Eradication Program m e (PM IU PEP) w hich e n v isag e d a holistic approach to eradicate urban poverty by creating a conducive environm em t for im proving the quality o f life o f the urban poor. D uring the E ighth Plan, 10528 c;as(es o f self-em ploym ent and 18004 cases o f shelter upgradation w ere approved, besides :settting up o f 1362 Thrift and Credit Societies; 303 Com m unity K endras, 24698 N eighbotiiring G roups; 1280 N eighbourhood C om m ittees and 208 Com m unity D evelopm ent Sociieties. This program m e was replaced by Sw am a Jayanti Shahari R ojgar Y ojana in D ecem b er, 1997.
333

3.8.75 Under the N ational Social A ssistance Program m es, special recognition was given to w om an-specific needs and! a N ational M aternity Benefit Schem e (N M BS) was launched in August, 1995. The NIMBS was exclusively aim ed at extending financial assistance o f Rs.300/- to pregnam t w om en for the first tw o live births. Likewise, under the program m e o f N ational O ld Age Pension Scheme (NOA PS), elderly w om en o f 65 years and above w ith no re g u la r m eans o f subsistence also received the benefit o f old age pension to the extent o f R ls.75 per month. Under another schem e o f N ational Fam ily Benefit, w om en could receiw e financial assistance o f Rs.5000/- to 10,000/- in the event o f the death o f the prim e brecad w inner o f the family.
3.8.76 The schem e o f S& T P ro jec ts for W omen, started in 1983, continued to prom ote Research and D evelopm em t (R&D) and adoption o f technology for reducing the household drudgery o f wom en and thus im prove their quality o f life, w orking conditions and opportunities for g a in fu l em ploym ent especially in the backw ard rural areas and urban slums. O f a totall o f 289 S&T projects, w hich received financial support during the E ighth Plan, 1137 projects were m eant for women. D uring 1997- 98, 30 additional projects w ere sainctioned exclusively for women.
3.8.77 A large number o f innovattive programmes to supplement and complement the general development programmes 'were implemented in the women and child development sector. They inclmde training-cum-employment-cum-income generation
programmes, welfare and support services and awareness generation/ gender sensitizationprogrammes. Besides, several policy initiatives were also undertaken in empowering women. Under the programme o f 'Support for Training and Employment', a total o f 44 projects receivedfinancial assistance to extend training and employment on a sustainable basis to 2.59 lakh women during the Eighth Plan and 6 more
projects during 1997-98 to benefit .53335 women in the traditional sectors o f dairying, animal husbandry, sericulture, hamdlooms, handicrafts etc. Under the programme o f Training- cum-Production Centres v/ith NORAD assistance, 693 projects during the Eighth Plan and 169 projects durin^g 1997-98 were sanctioned to train 0.78 lakh and 0,30 lakh women/girls, respectivelly in the modem and newly emerging trades. Under the scheme o f Condensed Courses o f 1 Education and Vocational Training, 5822 training courses were conducted to benefit 1. .46 lakh women and girls during the Eighth Plan and 197 courses to benefit 0.15 lakh women/girls were conducted in 1997-98. Under the Socio- Economic Programme, more than 2452 Units were set up during the Eighth Plan to
NATIONAL MACHINERY FOR lEMPONNEWNG WOMEN
The Department of Women and Cl'hild Development being the National Machinery for Empoweringg Women in the country is made responsible for mainstreamiing women into national development by raising their overall I status on par with that of men. The Department, in its ncodal capacity, formulates policies, plans and programmes,, and enacts / amends legislations affecting women and guides/co-ordinates/ streamlines the efforts of both Giovernmental and Non- Governmental Organisations worki.ing to improve the lot of women in the country. The progrcammes of the Department include - continuing education and training ; employment and income generation ; welfare and sufpport services and gender sensitisation and awareness generration. These programmes of innovative nature play the role offjje ing both supplementary and complementary to the otther general development programmes in the sectors of heallth, education, labour and employment, rural and urban develospment etc.
334
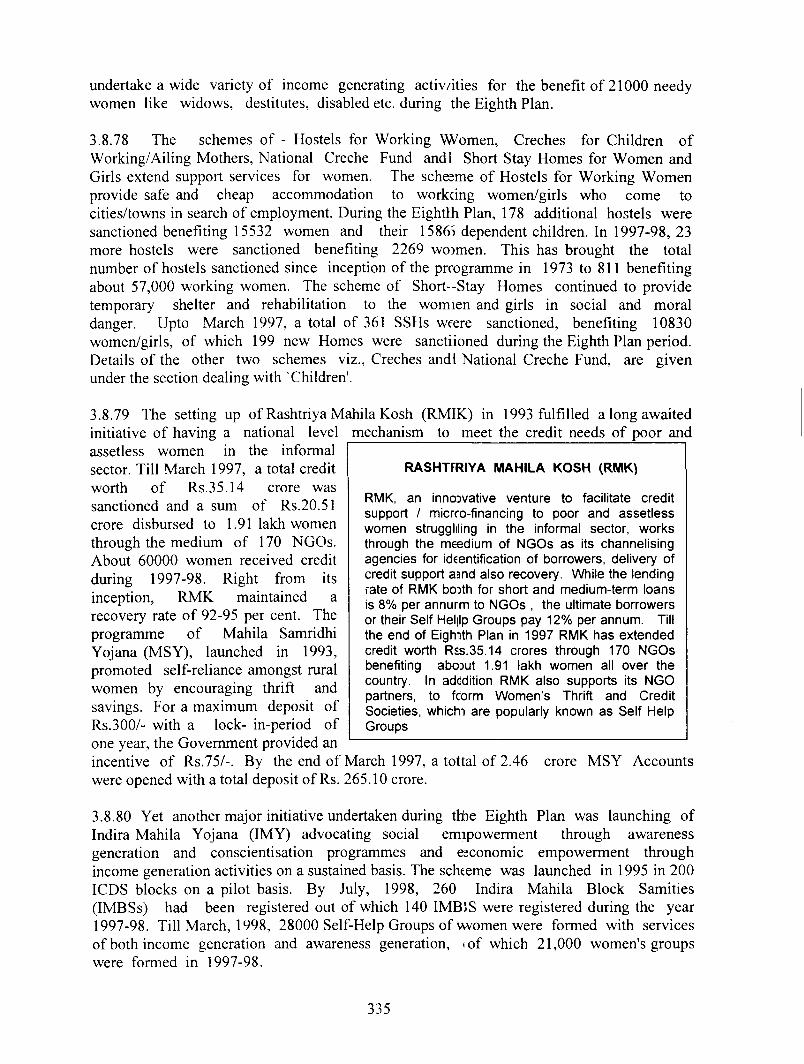
undertake a wide variety o f income generating activ/ities for the benefit o f 21000 needy women like widows, destitutes, disabled etc. during the Eighth Plan.
3.8.78 The schemes o f - Hostels for Working W om en, Creches for Children o f Working/Ailing Mothers, National Creche Fund and I Short Stay Homes for W omen and Girls extend support services for women. The sche3me o f Hostels for Working Women provide safe and cheap accommodation to workcing women/girls who come to cities/towns in search o f employment. During the Eightlh Plan, 178 additional hostels were sanctioned benefiting 15532 women and their 15865 dependent children. In 1997-98, 23 more hostels were sanctioned benefiting 2269 wo^men. This has brought the total number o f hostels sanctioned since inception o f the preogramme in 1973 to 811 benefiting about 57,000 working women. The scheme o f Short--Stay Homes continued to provide temporary shelter and rehabilitation to the womien and girls in social and moral danger. Upto March 1997, a total o f 361 SSHs weere sanctioned, benefiting 10830 women/girls, o f which 199 new Homes were sanctiioned during the Eighth Plan period. Details o f the other two schemes viz., Creches andl National Creche Fund, are given under the section dealing with 'Children'.
3.8.79 The setting up o f Rashtriya Mahila Kosh (RMIK) in 1993 fulfilled a long awaited initiative o f having a national level mechanism to meet the credit needs o f poor and assetless women in the informalsector. Till March 1997, a total credit worth o f Rs.35.14 crore was sanctioned and a sum of Rs.20.51 crore disbursed to 1.91 lakh women through the medium of 170 NGOs.About 60000 women received credit during 1997-98. Right from its inception, RMK maintained a recovery rate o f 92-95 per cent. The programme o f Mahila Samridhi Yojana (MSY), launched in 1993, promoted self-reliance amongst rural women by encouraging thrift and savings. For a maximum deposit o f Rs.300/- with a lock- in-period o f one year, the Government provided an incentive o f Rs.75/-. By the end o f March 1997, a tottal o f 2.46 were opened with a total deposit o f Rs. 265.10 crore.
RASHTFRIYA MAHILA KOSH <RMK)
RMK, an innosvative venture to facilitate credit support / micrro-financing to poor and assetless women struggliling in the informal sector, works through the meedium of NGOs as its channelising agencies for idsentification of borrowers, delivery of credit support aand also recovery. While the lending rate of RMK booth for short and medium-term loans is 8% per annurm to NGOs , the ultimate borrowers or their Self Hel|lp Groups pay 12% per annum. Till the end of Eightith Plan in 1997 RMK has extended credit worth Rss.35.14 crores through 170 NGOs benefiting aboDut 1.91 lakh women all over the country. In adcdition RMK also supports its NGO partners, to fcorm Women’s Thrift and Credit Societies, whichi are popularly known as Self Help Groups
crore MSY Accounts
3.8.80 Yet another major initiative undertaken during thbe Eighth Plan was launching o f Indira Mahila Yojana (IMY) advocating social emipowerment through awareness generation and conscientisation programmes and e;conomic empowerment through income generation activities on a sustained basis. The schteme was launched in 1995 in 200 ICDS blocks on a pilot basis. By July, 1998, 260 Indira M ahila Block Samities (IMBSs) had been registered out o f which 140 IM B’S were registered during the year 1997-98. Till March, 1998, 28000 Self-Help Groups o f vwomen were formed with services o f both income generation and awareness generation, lo f which 21,000 women's groups were formed in 1997-98,
335

3.8.81 An integrated media campaiign projecting a positive image o f both women and the girl child through electronic mediia was undertaken extensively through a large number o f TV spots, quickies, documentairy films etc. Radio programmes with positive messages about the girl child and women wfere also broadcast on a regular basis. The Central Social Welfare Board organised more tlhan 6000 Awareness Generation camps during 1992-96 to make 2.10 lakh rural womeni conscious o f their rights and privileges, besides imparting knowledge about comimunity health and hygiene, technology application, environment, etc.
3.8.82 The National Commissiom for Women, a statutory body set up in 1992 to safeguard the rights and interests o f wome;n, reviewed both women-specific and women-related legislations, investigated into thiousands o f individual complaints/ atrocities and initiated remedial action wherever possilWe. It also set up Parivarik Mahila Lok Adalats and extended speedy justice to appro)ximately 7000 women. The other issues taken up by the Commission during the Plan periiod included welfare o f women prisoners and under-trials languishing in jails; women and clhildren involved in the sex trade; reservation for women in Parliament and State Legislatmres, Anti-Arrack movements etc.
NATIONAKL COMMISSION FOR WOMEN (NCW)
NCW, set up in 1992, gained credemtials of many success stories in the areas of - offering pre-litigated counselling to aggrieved women, attendJing to / investigating into the individual complaints received from all over the country, looking into the special prroblems of services, vi/omen / child sex w/orkers, women in custody / jails, women in mental asylums, women witfh disabilities, deserted women etc. It also reviews both women-specific and women-related legislations and adwises the Government to bring forth necessary amendments from time to time. It also moves around the wholee country to enquire/investigate problems of women belonging to socially and economically disadvantaged groaips, especially those belonging to Scheduled Castes and Scheduled Tribes. Open Adalats (Public Hearirngs) is the style adopted by the Commission to hear the individual grievances and to pay personal attenti ion to the women in need. This special feature of the Commission has reached the judiciary to women at their door-step.
3.8.83 To sum up, the major pmlicy initiatives undertaken in favour o f women during the Eighth Plan included setting up o f a National Commission for Women in 1992 to safeguard the interests o f women;setting up o f Rashtriya Mahila Kosh in 1993 for women to meet the credit needs o f poor and assetless women; adoption o f the National Nutrition Policy in 1993 to fulfil the Constitutional commitment o f improving the nutritional status o f the launching o f the M ahila Samriddhi1993 which sought empower women
people; scheme of Yojana in
to by
institutionalizing their savings so that they could havegreater control over household resources;launching o f Indira Mahila
SPECIAL INITIATIVES FOR THE WELL- BEING OF WOMEN DURING THE EIGHTH PLAN (1992-1997)
• Setting up of National Commission for Women in 1992 to safeguard the interests of women
• Setting up of Rashtriya Mahila Kosh in 1993 to meet the credit needs of poor and assetless women
• Adoption of the National Nutritional Policy in 1993 to fulfil the constitutional commitment of improving the nutritional status of people in general and in particular that of the children, adolescent girls, expectant and nursing mothers
• Launching of the scheme of Mahila Samriddhi Yojana in 1993 which sought to empower women by institutionalizing their savings so that they could have greater control over household resources ( now being revamped)
• Launching of Indira Mahila Yojana in 1995, advocating an integrated approach for women’s empowerment through Self Help Groups
• Proposal for setting up of National Resource Centre of Women (in progress)
• Formulation of a draft of National Policy for the Empowerment of Women (1996)
336

Yojana in 1995 advocating an integrated approach forr women's empowerment, a proposal to set up a National Resource Centre for Women which is in progress; and the formulation o f a draft o f National Policy for the Empowerment o f Wo)men (1996)
DEVELOPMENT OF CHIILDREN
3.8.84 Children are our first priority not because the^y are the most vulnerable, but because the foundations for life-long learning and humian development are laid in the most crucial years o f early childhood. This is the time when, e 'ven a sm.all positive change yields long-term social benefits and even a temporary deprivaition inflicts life-long damage. Thus, the opportunities o f early childhood development deteermine the present and the future human resource development o f a nation.
3.8.85 The child population (0-14 years), as per the 1991 census, accounts for 319.6 million (37.8%), which include 153.85 million female children. O f the total child population, 18.9 million (5.9%) are below 1 year (infants); 38.1 million (111.9%) are in the age-group o f 1-2 years (toddlers); 73.0 million (22.8%) are in the age-gjroup o f 3-5 years (pre-school); and another 189.6 million (59.4%) are in the age group o f 6 - 14 years. While the children as a whole, require special attention o f the Government, the three age-groups viz. the infants, toddlers and pre-school children require individual attention because o f their age- specific needs.
3.8.86 Realising the fact that the children have neither ai voice nor a political constituency, the Constitution o f India laid down certain special saifeguards to ensure their welfare, protection and development. While Article 15(3) em pow ers the State to make any special provision in favour o f children. Article 24 prohibits empkoyment o f children below 14 years o f age in any factory or mine or other hazardous occuppations; Articles 39 (e) and (f) lay down that the State shall direct its policy in such a manne;r that the tender age o f children is not abused and children are given opportunities and faciliities to develop in a healthy manner and childhood is protected against exploitation and rmoral and material abandonment; and Article 45 provides for free and compulsory- educaition for all children upto the age o f 14 years.
3.8.87 The well-being o f children has been a priority and also an integral part o f the country's developmental planning, launched in 1951. In the initial years, the major responsibility o f developing child care services had priimarily rested with the voluntary sector, headed by the Central Social Welfare Board, set uip in 1953. Later, the child welfare services were concentrated in the sectors o f health, ecducation, nutrition etc. Important measures include maternal and child health serviices (MCH), primary education, supplementary feeding for pre-school and school-goin^g children etc. Just as in the case o f women, the Seventies also marked a shift in apprroach in respect o f children from 'welfare' to 'development'. It was during this period that a National Policy for Children was adopted (1974) and a programme called Integrated Child Development Services (ICDS) was launched in 1975 with an integrated approach to extendi a package o f six basic services viz. health check-up, immunisation, referral services, supplementary feeding, pre-school education and health and nutrition education for childrejn upto 6 years and expectant and nursing mothers. The Eighties saw an effective coinsolidation and expansion o f programmes started in the earlier Plans. The National Pcolicy o f Health adopted in 1983 set certain specific targets like bringing down the high rates o f infant and child mortality and Universalisation o f Immunisation etc. by the year 2002> A.D. The National Policy on
337

Education (1986) emphasised univerrsal enrolment and retention o f children, especially the girl children. The Juvenile Justice; Act (JJA) enacted in 1986 repealed the then existing Children Act, to deal effectively with the problem o f juvenile delinquents/vagrants and provide a framework for handling such children. The Child Labour Prohibition and Regulation Act, enacted in 1986, was ffollowed by the adoption o f a National Policy on Child Labour in 1987.
3.8.88 The early Nineties contimued with the major strategy o f promoting early childhood development through conwergence o f available services in different sectors and the ICDS continued as the single m ayor national programme to promote early childhood development services. Special prog^rammes were also launched for the welfare and rehabilitation o f the Working Childiren and for other children in need o f care and protection. A programme o f Universsallm m unisation was also launched to protect children from six major vaccine preventable diseases viz. Diptheria, whooping cough, tetanus, polio, measles and childhood tuberc:ulosis. The same was further strengthened and expanded to provide universal covera^ge during this period.
THE CURRENT SITUATION
3.8.89 While crucial indicators likce infant and child mortality rates, school enrolment ratios, drop-out rates and levels o f mall-nutrition have shown significant improvement in the status o f children as a result o f thie implementation o f various developmental policies and programmes since 1950's. In the field o f health, while the life expectancy at birth has gone up, as already discussed in thie first part o f this Chapter, the infant and the child mortality rates have declined sharply, with sex differentials almost bridged, as indicated in Table 3.8.12.
Table 3.8.12
Infant M ortality Rate (1978-1996)
Year Fejmales Males Persons
1978 1311 123 127
1988 93 96 94
1992* 80 79 79
1996* NA 72
* Provisional
Source : Sample Registration! System - Fertility and Mortality Indicators for respective yearsi, RG&CC, New Delhi.
338

3.8.90 Despite the significant achievements in bringimg down the female Infant Mortality Rate (IMR) from 131 in 1978 to 72 in 1996, yet therre exists inter-state variations with the highest IMR of 97 in Madhya Pradesh and the lowe;st being 13 in Kerala during 1996. Like-wise, the rural and urban differentials also contimue to be very high. While the IMR (All India) in urban areas was 46, it was 78 in rural ;areas during 1996. Similarly, the age specific death rate for 0-4 age group has declined fromi 56.2 to 23.9 between 1971 and 1994.
3.8.91 Like the IMR, the Child Mortality Rate for fermales in the age group 0-4 years, has also declined to less than half from 55.1 in 1970 to 24.2 in 1994, as compared to the decline from 51.7 to 23.6 in the case o f males, as per ■ the data given in Table 3.8.13. But, the regional variations continue to be very high eveni today, with the highest being 37 in Madhya Pradesh and the lowest 3.4 in Kerala.
Table 3.8 .13
Child Mortality Rateis by Age-Group
Year Age Group Ffemale Male
1970 0-4 yrs. 555.1 51. 7All Ages :15. 6 15.8
1985 0-4 yrs. -!40.4 36. 5All Ages 311. 8 11.8
1992 0-4 yrs. :2 8 . 2 24 . 9All Ages 110.2 10.0
1994 0-4 yrs. i24 .2 23. 6All Ages 8.9 9.6
Source: Sam ple Registration System (SRS) F<ertility and M ortalityy Indicators for respective years, RG&CC, New IDelhi.
3.8.92 The high Infant and Child Mortality Rates, re^ferred to above, can be attributable to a large extent to the following specific causes,, which are preventable/treatable, especially 'Pre-maturity' which accounts for more than 550 per c e n t :
Table 3.8.14
Percentage distribution o f Cause-Specific 1 Infant Deaths -1 9 9 5
Cause Percentage
- Pre-maturity 53.5- Respiratory Infection
of new born 17.0- Diarrhea of new born 7.4- Congenital Malformation 3.0- Birth Injury 2.0- Cord Infection 3.1- Non classifiable 14.0
Total 100.0
Source : The Survey o f the Causes o f Deeath (R u r a l: 1995) Office o f the Registrar General 0)f India, New Delhi
339

3.8.93 The ever-declining sex rratio, as already discussed in the first part o f this Chapter, has been a cause for serious concern. Except in Kerala, where the sex ratio is in favour o f females, the sex ratio maintained tthe very same declining trend in all the other States during the same period. The special stu(dies on the 'Declining Sex Ratio and the Problem of Female Infanticide’ sponsored im 1993 by the nodal Department o f Women and Child Development, New Delhi have revealed that while the practice o f Female Foeticide is a common phenomenon in urban .areas, the problem o f female infanticide is a localised phenomenon and limited only to certain communities in the States o f Tamil Nadu, Bihar, Gujarat, Punjab, Haryana, Madhyai Pradesh, Rajasthan.
3.8.94 Reports have also confirmied that the practice o f these two social evils viz. Female foeticide and female infanticide is mainly due to the strong preference for son and as such, these are responsible to a large extent for the ever-declining sex-ratio. M isuse o f the m odem technique o f Amniocente;sis for sex determination is an added dimension to this problem. In fact, the present bam on the sex determination test through the enactment of the 'Pre-Natal Diagnostic Techniques (Regulation and Prevention o f Misuse) Act, 1994’, could hardly change the situatdon. Adding to this, is the problem o f ineffective implementation o f the Act o f Com pulsory Registration o f Births and Deaths, which fails to provide information on vital statistics.
3.8.95 Malnutrition constitutes a major threat to the development potential o f young children. However, surveys coniducted by the National Nutrition M onitoring Bureau, Hyderabad (1975-79 and 1988-90) have confirmed that there has been a declining trend in severe and moderate degrees o f -malnutrition amongst children, as per the details given in Table 3.8.15.
Table 3.8.15Prevalence off Malnutrition among children(1 to 5 years)
Grade Percentage
1996-91 1988-90
- Normal (>=90)%) 5.9 9.9- Mild (75-90%)) 31.0 37.6- Moderate (60-75%) 47.5 43.8- Severe (<60%) 15.0 8.7
Source : NNMB Rreport of Repeat Surveys (1988-90), Hyderabad.
3.8.96 Further, surveys conducted by the National Institute o f Nutrition (NIN) and other agencies reveal that the m icro-nutrient deficiencies viz. Vitamin A deficiency, iron deficiency and iodine deficiemcy disorders have been affecting children in various degrees. The national data indic:ate that although the proportion o f nutritional blindness has reduced drastically, yet the smb-clinical deficiency o f vitamin A still continues to be prevalent. Similarly, Iron defuciency is also prevalent amongst pre-school and school going children. For details?, refer 'N utrition’ under the Chapter 'Food and Nutrition Security’.
340

3.8.97 On the education front, there has been a siubsstantial increase in the enrolment o f children (provisional for 1997) at all levels o f schoolinig.. While the enrolment at the primary level has increased by about 6 times i.e. from 19.2 miUiiom in 1951 to 110.4 million in 1997,it has risen by 13 times at the middle level from 3.1 miilllion in 1951 to 41.0 million in 1997,and by 18 times from 1.5 million in 1951 to 27.(0 million in 1997 at high/highersecondary level, as could be seen from the Table 3.8..16).
Table 3.8.16,School Enrolment by Stages/Classes for Booys and Girls (1951-1997)
(In Millions)
Year Primary (I-V) Middle (VI-V’Ii:i) High/H.Sec (IX-XII)Girls Boys Total Girls Boys Totcal Girls Boys Total
1950-51 5.4 13 .8 19 .2 0.5 2.6 :3. 1 0.2 1.3 1.51960-61 11.4 23.6 35.0 1.6 5.1 (6 . 7 0.7 2.7 3.41970-71 21.3 35.7 57 .0 3.9 9.4 i:3. 3 1.7 4.9 6.61980-81 28.5 45 .3 73.8 6.8 13.9 2(0. 7 3.2 7.6 10 . 81990-91 41.0 58.1 99 .1 12 .4 20.9 3!3 . 3 6 . 9 14.0 20.91992-93* 44.9 60.5 105.4 15.0 23.7 318 . 7 7.7 15.0 22.71996-97* 47 . 9 62.5 110.4 16.3 . 24.7 411. 0 9.8 17 .2 27 .0
* ProvisionalSource:Departnient of Education, lVI/HRD(GOI), New Delhi.
3.8.98 Indicative o f the positive effect of increasing rratces o f enrolment, there is a visible decline in the drop-out rates between 1981 and 1997 frfom 58.7 per cent to 38.9 per cent at the primary level, from 72.7 per cent to 52.3 per cent ait tthe middle level and from 82.5 per cent to 68.4 per cent at the high school level (I-X), as giivfen below :
Year
Table 3.8.17
Drop-out Rates Amongst Girls aindl Boys(1980-1997)
Primary (I-V) Middle (VI-VIII)
Girls Boys Total GirclES Boys Total
1980-81 62 .5 56.2 58.7 7W.<4 88.0 72 .71990-91* 46.0 40.1 42.6 6 55 . U 59.1 60.91992-93* 43 .0 40.1 41.3 6W.U 54.0 56.51996-97* 38.4 39.4 38.9 522.(8 51.9 52.3
* ProvisionalSource:Department of Education, GOI, New Delhi
3.8.99 Despite all these gains, the total female literaicy/ rate still continues to be very low at 39.3 per cent in 1991. While the slow pace o f ediucational development o f women is a cause for concern, the large inter-State variations, urbean-rural and the gender differentials, high drop-out rates, especially those o f the girls and! o ther socially disadvantaged groups like SCs, STs, OBCs and Minorities magnify the probkenn.
341

3.8.100 The problem o f child lab>our, despite effective policies, programmes and legislative support, continues to p»ersist particularly in the unorganised and home-based industries and domestic services. Thie population o f the child workers has, no doubt, come down from 13.6 million in 1981 to 11..3 million in 1991, but the magnitude o f the problem still continues to be very high as the child workers constitute 3.5 per cent o f the total child population. In certain indusstries like carpet weaving, beedi-making, match box, fireworks, bangles-making etc, chilcdren are subjected to long working hours, poor working conditions, low wages, and o«ccupational hazards which affect them adversely.
3.8.101 Child prostitution is an emierging problem with serious social consequences. According to a study on the prob)lem o f Prostitution conducted by the Central Social Welfare Board (CSW B) in 1991, thej estimated number o f prostitutes in six metropolitan cities o f Bangalore, M umbai, Cahcutta, Delhi, Hyderabad and Chermai ranged from70,000 to 1,00,000. O f this, the nvmilber o f child prostitutes has been estimated as 12 to 15 per cent. The religious practices o f offering young girls to temples in the name o f Devadasi, Basavi, Yellamma, login ettc. are prevalent in certain parts o f the country.
3.8.102 The increasing number o f Sitreet Children, who are estimated to be 4.15 lakh in 8 major cities o f Bangalore, Mumbaii, Calcutta, Delhi, Hyderabad, Indore, Kanpur and Chennai, is another serious problem.. Efforts to meet the needs o f Street Children viz. education, health, shelter, counsellinig etc. through voluntary organisations have been too recent to have any appreciable impacti on their status. Juvenile crimes, though declining, are still very high (17,203 in 1994) amd the rehabilitation o f juvei\ile delinquents/vagrants requires priority attention. More dietails on Street Children are available under the Chapter 'Social Welfare'.
THE NINTH PLAN STRATEGY'
3.8.103 As in the past; the young child will continue to be placed first on the country's developmental agenda with a special focus on the Girl Child. To this effect, the Ninth Plan reaffirms its priority for the develop)ment o f early childhood as an investment in country's human resource development. While the first six years are acknowledged as critical for the development o f children, greatter stress will be laid on reaching the younger children below 2 years.
3.8.104 The two National Plans o f A ction - one for Children and the other exclusively for the Girl Child adopted in 1992, ailso fall very much within the guiding principles underlining the importance o f 'S urv ival, Protection and Development'. Efforts in the N inth Plan will, therefore, be made Ito expedite effective implementation and achievement o f the goals set in the two Plans o f Actdon besides instituting a 'National Charter for Children' to ensure that no child remains illiteirate, hungry or lacks medical care. The UN Convention on the Rights o f the Child, ratified b>y our country in 1992, also provides a strong base for initiating necessary - legal and otherr developmental measures for protection o f the rights o f the child.
342

• To place the Young Child at the top of the Country’s Developmerntal Agenda with a Special Focus on the Girl Child
• To re-affirm its priority for the development of early childhood sesrvices as an investment in Country’s Human Resource Development
Strategy• To institute a National Charter for Children ensuring that no Chilcd remains illiterate, hungry or lacks medical
care• Acknowledge that the first six years as critical for the developmemt of children therefore, greater stress will be
laid on reaching the younger children below 2 years• To arrest the declining sex ratio and curb its related problems of fennale foeticide and female infanticide and thus
ensure 'Survival, Protection and Development of Children’• To ensure ‘Survival, Protection and Development’ through the ejffective implementation of the two National
Plans of Action -one for the Children and the other for the Girl Chilcd• To continue to lay a special thrust on the three major areas of clhild development viz., health, nutrition and
education• To bring down the IMR to less than 60 and the CMR to below 10 biy 2002 A.D. through providing feasy access
to health care services including RCH services and 100% coverag^e of immunisation in respect of all vaccine preventable diseases
• To universalise the Nutrition Supplementary Feeding Programmes to fill the existing gaps in respect of both pre-school and school children and expectant and nursing mothers? with a special focus on the Girl Child and the Adolescent Girl
• To view girl’s education as a major intervention for breaking the viccious inter-generational cycle of gender and socio-economic disadvantages ■
• To expand the support services of creche / daycare services andf to develop linkages between the primaryschools and of the child care services to promote educational opporrtunities for the Girl Child
• To widen the scope and the spectrum of child development servicces with necessary interventions related to empowerment of women and children, families and communiities through effective convergence and coordination of various sectoral efforts and services
• To universalise ICDS as the main-stay of the Ninth Plan for promcoting the over-all development of the young children especially the Girl Child and the mothers all over the countrry
• To expand the scheme of Adolescent Girls in preparation for thheir productive and re-productive roles asconfident individuals not only in family building but also in nation biruilding
• To promote the nutritional status of the mother and the child by imfproving the dietary intake through a change in the feeding practices and intra-family food distribution
• To strenghthen the early joyful peirod of play and learning in the yoiung child’s life and to ensure a harmonious transition from the family environment to the primary school.
NINTH PLAN COMMIITSObjective
3.8.105 To ensure 'survival and protection' o f children especially that o f the girl-child, themajor strategy o f the Ninth Plan will be to arrest the: declining sex ratio and curb its related problems o f female foeticide and female imfanticide. These problems will be attacked through a two-pronged strategy o f both direc:t and indirect measures. W hile the direct measures include effective implementation o f tlhe existing legislation, the indirect measures will be to change the mindset o f the people in favour o f the girl child, besides empowering w'omen to exercise their reproductive rig h ts and choices. Towards this, collaborative efforts o f all concerned to prevent/control/eradicate these twosocial evils will be initiated. In these efforts, both rmedical and para-medical staff viz. doctors, auxiliary nurse midwives/trained dais and thes front-line workers o f ICDS and the local voluntary organisations are going to play a major rrole. Special efforts will be made to ensure effective enforcement o f the Pre-natal Diajgnostic Techniques (Regulation and Prevention o f Misuse) Act, 1994 and o f the Indian P’enal Code, 1860 with a close and continuous vigil, surveillance and severe punishment for the guilty.
3.8.106 The next priority will be to fulfil the birth righU o f every child to 'developm ent', especially those belonging to the disadvantaged amd deprived groups with special needs and disabilities. In this regard, the present thruist will continue to be laid on the three major areas o f child development viz. health, nutriition and education. While the most critical period, from conception to two years o f age,, will be addressed through key interventions to promote health, nutritional and psychco- social development o f the m other and the young child through the programmes o f Reprodiuctive Child Health (RCH) and the
343

Integrated Child Development Serviices (ICDS), the pre-school age will be taken care of exclusively by the ICDS through a six-service package and the school going age through various health, nutrition anid educational programmes.
3.8.107 The Ninth Plan identifies thie urgent need to review and synthesise all the existing policies and programmes, both childl-specific and child-related. In this context, the National Policy for Children adopted in 1974 needs to be revised, in view o f various developments that have taken place between 1974 and 1997, including the ratification o f the UN Convention on the Rights o f the C h ild and the adoption o f the National Plans o f Action for Children and the Girl child (1:992). Accordingly, action will also be initiated to reconstitute the National Children"s Board. It is also time to consider instituting a mechanism both at the national and State levels to safeguard the rights and interests o f children along with the services o F a Public Defender to take up the cases on behalf o f children and to investigate/redress thte individual complaints and grievances.
Health
3.8.108 Efforts will continue in the Ninth Plan to bring down the IM R to less than 60 and the CM R to below 10 by 2002 A.ID. through effective interventions o f providing easy access to primary health care servic:es and 100 per cent coverage o f immunization in respect o f vaccine-preventable diseases viz.. Diptheria, Pertussis, Neo-natal Tetanus, Tuberculosis, Poliom yelitis and Measles. The spexial drives o f Pulse Polio launched during 1995-96 will be continued till the complete eliraiination o f the problem o f Poliomyelitis. In all these efforts, special attention will be paiid to improve the health and the nutritional status o f the girl child and the adolescent girls as; they both enjoy a lower status, when compared to their counterparts, due to vulnerability ancd discrimination.
3.8.109 Under the Reproductive ;and Child Health Care programme, attempts will be made to assess the health needs o f children, adolescents and women belonging to all age groups at the PHC level and to unidertake area-specific micro-planning to meet their needs through high quality integrated R C H services. The services for 'Child Survival' under the RCH will include universal screeming o f women during pregnancy and identification and management of'a t-risk 'ind iv id iuals to achieve reduction in the peri-natal and neo-natal mortality and morbidity. (More dletails are available under the Chapter on 'H ealth and Family Welfare').
3.8.110 In line w ith the commitmients o f the National Nutrition Policy (1993), priority will be accorded to promote the -nutritional status o f the mother and the child by improving the dietary intake thromgh a change in the feeding practices and intra-family food distribution and preventing tlhe deficiency diseases. The quality and effectiveness o f health and nutrition interventionis for mother and the child will be further strengthened with a special focuis on early diagnosis and prevention o f malnutrition during pregnancy and lactation Ifor mothers and children before and after birth with a special focus on the m ost crucial ajge o f 0-23 months.
344

3.8.111 In view o f the importance accorded to nutriition adequacy in the N inth Plan, all States/UTs will be encouraged to ensure the avaiilability o f adequate funds for supplementary nutrition component o f ICDS, by listting the same as one o f the first three priorities under Basic Minimum Services, for which additional Central assistance is being extended to States/UTs. Decentralised funding, coimmunity contribution and procurement o f local nutritious foods for the supplementary feedimg programmes will be promoted to ensure that the food distributed is adaptable^/palatable for the young children and also rich in the micro-nutrients viz. Vitamin A, Ircon and Iodine. In this context, the role o f the Food and Nutrition Board will be redeffmed and strengthened in view o f the mother and child- related commitments o f the Naticonal Nutrition Policy and its Plan o f Action. Efforts are being made for the development off new tools for Nutrition M onitoring and Surveillance to assess the nutritional status o)f children and mothers from time to time facilitating early detection o f deficiencies and (diseases and necessary interventions are taken to that effect. The specific strategies on thiss subject are detailed in the Chapter on 'Food and Nutrition Security'.
Education
3.8.112 In the Ninth Plan, the thrust will be on streingthening the early joyful period o f play and learning in the young child's life to ensuree a harmonious transition fi'om the family environment to the primary school. Towards this, special efforts will be made to develop linkages between ICDS and primary educatiion. These "operational linkages" will seek to remfoTce coordination of tim ings and lo ca tio n based on community appraisal and micro-planning at grass-roots levels. Girls' educattion will be viewed as a major intervention for breaking the vicious inter- generationall cycle o f gender and socio-economic disadvantages. The effective expansion o f day care: services and linkages o f child care services and primary schools will be a major input to fpromote developmental opportunities for the girl child for participation in primary {education and support services for women. More details are available under the Chajpter on 'Education'.
Development
3.8.113 The scope and the spectrum of child de^velopment services will be further widened with necessary interventions related to empcowerment o f women and children, families and communities through effective convergtence and co-ordination o f all sectoral efforts and services. To this effect, the ongoing apprcoach o f converging the basic services o f health, nutrition and pre-school education to p rom ote holistic development o f the young child, as embodied in ICDS, will be further strengtlhened with community participation and action to 'R each the Unreached' that is, childrren below 2 years. Thus, ICDS will continue to be the mainstay o f the Ninth Plan promioting the overall development o f the young children all over the country th rough its universalisation. For Further Syrengthening and expansion o f ICDS the Programmte has been under the Special Action Plan with additional fincnacial support o f Rs. 450 O o re s in the N inth Plan. In the expansion/universalisation o f the outreach delivery ; systems o f ICDS and RCH, emphasis will be on consolidation and enrichment o f content to) improve the quality sustenance o f services. In this process, the role o f an Angamwadi Worker will be that o f a mobiliser o f community participation and communiity contribution, apart from that o f a service provider.
345

3.8.114 The N inth Plan recognisess the impending need for the support services o f creches and day care centres for the chilldren o f working/ailing mothers in the present day situation where more and morre women, coming out for employment/in search o f employment both in the organisedl and unorganised sectors. In this context, there is an urgent need to strengthen the Nationaal Creche Fimd to develop a network o f creches all over the country.
3.8.115 The scheme for the adoleescent girls will be expanded to promote their selfdevelopment, in preparation for theirr future productive and reproductive roles as confident individuals not only in family-buiilding but also in nation-building. The programme for adolescent girls during the N intlh Plan will embrace the whole range o f activities like health, nutrition, education, health and nutrition awareness and equip them with home- based entrepreneurial skills, vocatiional training and decision-making capabilities etc. Capacity Building In the field o)f child development, the major challenge in the Ninth Plan will be to achieve increased cojmmunity ownership and qualitative improvement o f child development programmes. Towards this, efforts will be made to re-orient the ongoing training/capacity building p^rogrammes. Priority will be accorded to strengthen the knowledge, skills and capabilities o lf front- line workers as mobilisers o f convergent action. This entails a major change in th e : training process so as to equip the front- line workers to understand community perceptiorns, practices and emerging situations/demands. Thus, the major thrust would be to de^velop decentralised training strategies with innovative groimd- based approaches. In consconance with the above, new approaches for mobilising assistance both in kind and cash for the sustenance of child development programmes will be experimented with comimunity participation/contribution to ICDS. The principles enimciated above and tthe envisaged role o f the Panchayati Raj Institutions and Urban Local Bodies will have: major implications not only in planning but also in the control o f the flow o f funds for the pDrogrammes o f child development.
Elimination of Discrimination Agaainst the Girl Child
3.8.116 While taking note o f the peersistent discrimination against the girl child, concerted efforts will be put into action to esliminate all forms o f discrimination and violation o f the rights o f the girl child by undertalking strong meeisures including punitive ones. These relate to strict enforcement o f lavws against pre-natal sex selection and the practice o f harmful practices o f female foeticicde/female infanticide; child marriage; child abuse; child labour; and child prostitution etc. L^ong-term measures will also be initiated to put an end to all forms o f discrimination ageainst the girl child through providing special incentives to the mother and the girl child so tlhat the birth o f a girl child is welcomed and the family is assured o f State's support for the fiiture o f the Girl Child. To this effect, a special package for the girl children belongjing to the families living below the poverty line was laxmched on 2 October, 1997 witlh special incentives namely - Rs.5 0 0 /- to the mother on the delivery o f a girl child (limitedl to 2 girl children); an annual scholarship o f Rs.500/- for a girl child in I-V Classes; ancd Rs.lOOO/- from VI-X Classes and special permits to enjoy the benefits under all develiopment programmes till she becomes a confident and self-reliant individual. Lessons learmt from the implementation o f this Special Package for the Girl Child and similar initiattives launched by some o f the State Goverrmients viz. Haryana, Tamil Nadu, Andhra Pradiesh, Rajasthan, Punjab and M adhya Pradesh will be put to use in expanding/replicating thesse special packages throughout the country.
346
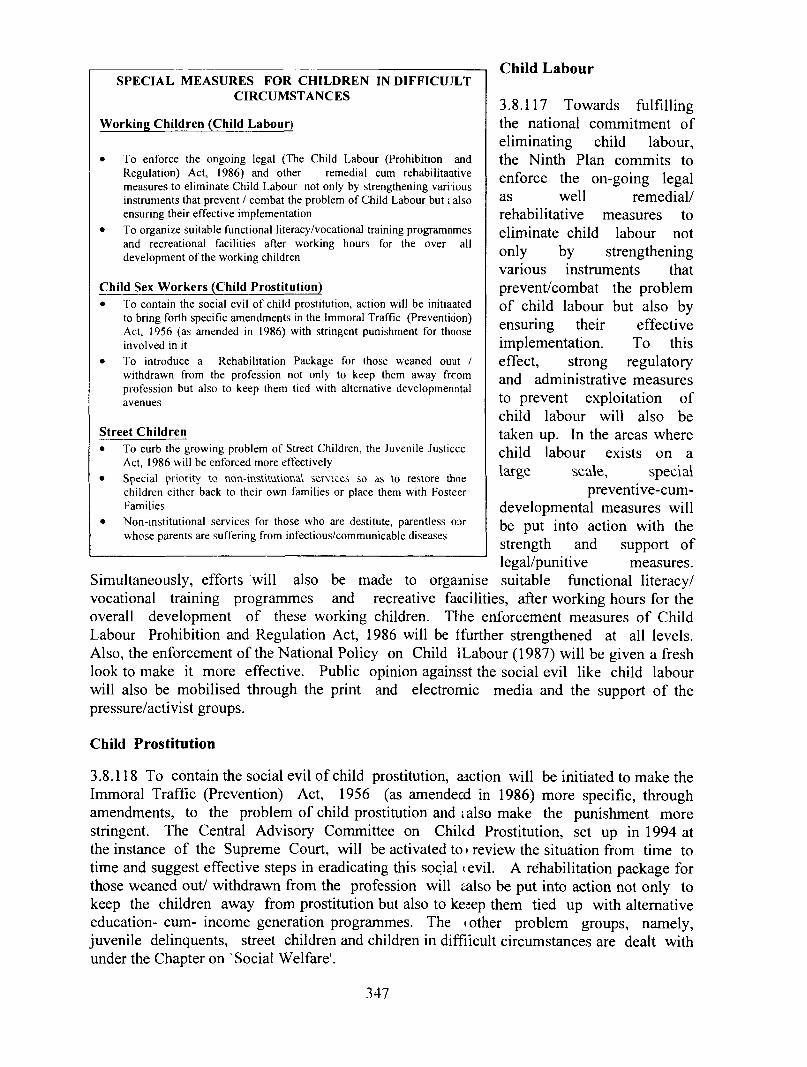
Child Labour
3.8.117 Towards fulfilling the national commitment o f eliminating child labour, the Ninth Plan commits toenforce the on-going legal as well remedial/ rehabilitative m.easures to eliminate child labour not only by strengthening various instruments that prevent/combat the problem o f child labour but also by ensuring their effectiveimplementation. To this effect, strong regulatoryand administrative measures to prevent exploitation o f child labour will also be taken up. In the areas where child labour exists on a large scale, special
preventive-cum- developmental measures will be put into action with the strength and support o f legal/punitive measures.
Simultaneously, efforts will also be made to orgaanise suitable fiinctional literacy/ vocational training programmes and recreative faacilities, after working hours for the overall development o f these working children. Tthe enforcement measures o f Child Labour Prohibition and Regulation Act, 1986 will be Ifurther strengthened at all levels. Also, the enforcement o f the National Policy on Child ILabour (1987) will be given a fresh look to make it more effective. Public opinion againsst the social evil like child labour will also be mobilised through the print and electromic media and the support o f the pressure/activist groups.
SPECIAL M EASURES FOR CH ILDREN IN DIFFICUJLT CIRCUM STANCES
W orking Children (Child Labour)
• To enforce the ongoing legal (The Child Labour (Prohibition and Regulation) Act, 1986) and other remedial cum rehabilitaative measures to eliminate Child Labour not only by strengthening vari ious instruments that prevent / combat the problem of Child Labour b u t: also ensuring their effective implementation
• To organize suitable functional literacy/vocational training programnmes and recreational facilities after working hours for the over all development of the working children
Child Sex W orkers (Child Prostitution)• To contain the social evil of child prostitution, action will be initiaated
to bring forth specific amendments in the Immoral Traffic (Preventiuon) Act, 1956 (as amended in 1986) with stringent punishment for thoose involved in it
• To introduce a Rehabilitation Package for those weaned ouut / withdrawn from the profession not only to keep them away frcom profession but also to keep them tied with alternative developmenntal avenues
Street Children• To curb the growing problem of Street Children, the Juvenile Justicce
Act, 1986 will be enforced more effectively• Special priority to non-msUt\iUoua\ sm iccs so as lo restore thne
children either back to their own families or place them with Fosteer Families
• Non-institutional services for those who are destitute, parentless oar whose parents are suffering from infectious/communicable diseases
Child Prostitution
3.8.118 To contain the social evil o f child prostitution, aaction will be initiated to make the Immoral Traffic (Prevention) Act, 1956 (as amendecd in 1986) more specific, through amendments, to the problem o f child prostitution and ;also make the punishment more stringent. The Central Advisory Committee on Chilcd Prostitution, set up in 1994 at the instance o f the Supreme Court, will be activated to » review the situation from time to time and suggest effective steps in eradicating this social (evil. A rehabilitation package for those weaned out/ withdrawn from the profession will ealso be put into action not only to keep the children away from prostitution but also to keeep them tied up with alternative education- cum- income generation programmes. The i other problem groups, namely, juvenile delinquents, street children and children in diffiicult circumstances are dealt with under the Chapter on Social Welfare'.
347

3.8.119 A thorough review of all the existing child-specific and child-related legislations will be undertaken to plug the loopholes in their implementation. Every effort will be made to protect children from all forms of exploitation through strict enforcement of the existing legislations viz. the Immoral Traiffic (Prevention) Act, 1956 to check child prostitution; the Juvenile Justice Act, 1986 to remove maladjustment and ensure rehabilitation of juvenile delinquents in the famiily and in the society; the Child Labour (Prohibition and Regulation) Act, 1986 to elirminate child labour; the Hindu Succession Act, 1956 as amended in 1993 to ensure eqqual rights to the girl child in the property of parents; Compulsory Registration of Miarriages and Minimum Age o f Marriage to avoid child marriages etc. Similarly, to pjromote breast-feeding and protect children from milk substitutes, the Infant Foods (Reegulation of Production, Supply and Distribution) Act, 1992, will need to be enforced with a ban on the promotion of milk substitutes and baby foods through media. Enforcement of the Pre-natal Diagnostic Techniques (Regulation and Prevention of Misuse) Act, 1994 and the Indian Penal Code, 1860 will receive special thrust to arrest the increasing incidenc;e o f Female Foeticide and Female Infanticide.
POLICIES AND PROGRAMIMES : A REVIEW
3.8.120 The Eighth Plan viewfed development o f children as an investment in the country'sfuture, besides improving the quallity of life o f future generations. It, therefore, accorded high priority to family/community- based preventive services in combating the problems of infant and child mortality ancd morbidity. Efforts were also made to enhance the capabilities of families, especiaWy those cof the mothers to look after the basic health, nutritional and emotional needs of children ini the age- group 0-6 years. In this process, the Eighth Planrecognised the 'Girl Child' as an important target group, demanding attention o f theGovernment for her developmtent and to fight against the prevailing gender discrimination. Development o f children, being; inter-sectoral in nature, cuts across various sectors likeHealth, Nutrition, Education, Labour, Welfare and Women and Child Development. Contribution o f these sectors toiwards the overall growth and development of children hasbeen detailed in the following; paragraphs.
3.8.121 The National Health F’olicy (1983) accords highest priority to launching o f special programmes for the improvtement o f maternal and child health. The MCH services were further strengthened !by launching the programme o f Child Survival and Safe Motherhood (CSSM) in 19‘92-93. The CSSM was being implemented in a phased manner, so as to cover all the districts in the country by 1996-97. The other ongoing interventions include expanssion o f • the programme for Control o f Acute Respiratory Infections for children below five years o f age. Special efforts to eradicate poliomyelitis were made in 1995-96 by ob)serving nation-wide immunization days on 9 December, 1995 and 20 January, 1996 when o>ver 93 million children under 3 years were given Oral Polio Vaccine (OPV) twice. Mas>s communication with two doses o f OPV vaccine per year would be continued for the mext three to four years with a view to eradicating poliomyelitis. In the case o f 'm easles, compared to the incidence in 1987, 80 per cent decline was achieved in 1995. The Government had also launched a special health check-up scheme for the p rim ary school students during 22-27 July, 1996 in the country. The school heallth programme essentially aims at screening all primary school children for commion ailments, referrals for children with problems to health institutions for full check-up and treatment and creating awareness among the community and teachers aboiut the health problems among children. To maximise the reach o f health services, the num ber o f PHCs was increased from 20,719 to 21,854 and sub-
Legislation
348

centres from 1,31,464 to 1,32,730 during the Eighth Plan, lin 1997-98, the number o f PHC's in actual operation increased to 22,962 and sub-centres to) 1,36,815.
3.8.122 In line with the policy prescriptions of the Naitional Nutrition Policy (1993) and the directions o f NPAN (1995), some impressive acchievements were made on the nutrition scene in the country during the Eighth Plan period. Blindness due to Vitamin 'A ' deficiency had come down from 0.3 to 0.04 per cent betweeen 1971 and 1989. The number o f children with 'normal' nutritional status has increased from 5.9% (1975-79) to 9.9% (1988-90) as per the NIN report titled 'National Trends in Imdia 1993'. Further, to tackle the problem of malnutrition amongst pre-school children (3--5 years), the Balwadi Nutrition Programme continued to provide nutritional supplement in a healthy environment, besides preparing children for formal schooling. At the end o f the Eighth Plan, there were 5641 Balwadis catering to 2.25 lakh children.
3.8.123 In pursuance o f the National Policy on Education ( 1986) and the Programme o f Action (1992), various steps were taken during the Eighth Plan to universalise elementary education and expand Early Child Care Education (ECCE,). This included a step-up o f various programmes such as Operation Black-board, Minimiurn Levels o f Learning and Non-forma! Education. As a distinct strategy to reduce the cdrop-out rates and improve the school retention rates, a special programme called Early Chiildhood Education (ECCE) has been in operation since 1983. It aimed at improving children 's communication and cognitive skills as a preparation for their entry into formail schooling. At the end o f the Eighth Plan period there were 4365 ECE Centres, which weire being r\m by 180 voluntary organisations benefiting about 1.09 lakh children in the age group 3-6 years in nine educationally backward States. Further, to give a boost to> universalization o f primary education, a nation-wide programme o f Nutrition Suppoirt to Primary Education was launched in 1995. By March, 1998, this programme co^vered 9.11 crore primary class children in 5440 blocks in 507 districts with a special focus; on the Low Female Literacy (LFL) Blocks.
3.8.124 In the field o f Women and Child Development, the Ilntegrated Child Development Services (ICDS) continues to be the major intervention for the overall development o f children. It caters to the pre-school children below 6 yearrs and expectant and nursing mothers with a package o f services viz. immunization, healtth check-ups, referral services, supplementary' nutrition, pre-school education and health land nutrition education. The Eighth Plan contemplated universalization o f ICDS by the e;nd o f 1995-96 by expanding the services to ail over the country. Out o f the 5614 ICDS> Projects sanctioned till 1996, 4200 became operationalised during tie Eighth Plan. Thte process o f universalisation will continue during the Ninth Plan till all the 5614 ICDS Projects become operationalised. With the operationalisation o f 4200 IC D S Projects, the total number o f beneficiaries has risen from 16.6 million in 1991-92 to 2i3.3 million in 1997-98, which included 19.8 million children and 3.5 million expectant andl nursing mothers. O f the 19.8 million child beneficiaries about 11.0 million received the services o f pre-school education. The scheme o f Adolescent Girls, an off-shoot o)f ICDS, aimed at providing a supportive environment for self-development, economic incdependence and self reliance. This scheme was in operation in 507 blocks benefiting 3.5 1 lakh beneficiaries, spread all over the country.
349

3.8.125 The ICDS Programme also receives assistance from the World Bank. The World Bank assisted Project o f ICDS - I (1990-97) has been under implementation in the predominantly tribal and drought-prone rural areas covering 110 blocks in Andhra Pradesh and 191 blocks in Orissa. Simultaneously, the World Bank Project o f ICDS-II (1993-2000) has also been under implementation in 210 blocks o f Bihar and 244 blocks o f M adhya Pradesh. The project envisaged coverage o f all the tribal blocks in both the States. To cover another five States, viz. Uttar Pradesh, Rajasthan, Tamil Nadu, Kerala and M aharashtra, the World Bank assisted ICDS- III project is under formulation. The additional inputs in the World Bank assisted ICDS Projects include - construction o f Anganwadi buildings and CDPO's office-cum-godowns; community mobilisation and v/omen's income generation activities; Women's Integrated Learning for Life (WILL); strengthening o f the health and nutrition components and experimentation for nutritional rehabilitation and enhanced inputs in the spheres o f communication, training, project management, equipment, monitoring and evaluation.
3.8.126 The programme of ICDS, which has completed 20 years o f its implementation in 1995, was evaluated by a number o f individual experts and various research organisations, since 1979. O f these, the national evaluation o f ICDS conducted by the National Institute
o f Public Co-operation and Child Development (NIPCCD), New Delhi in 1992 and the Mid-term Evaluation o f World Bank assisted ICDS need a special mention. The findings o f the Study by NIPCCD indicated a very positive impact o f ICDS on the health and nutrition status o f pre-school children. To quote the findings o f the Study, the IMR was significantly lower at 71, compared to SRS national average o f 80. The immunization coverage o f mothers and children was 46 and 49 per cent, respectively in ICDS areas, compared to 33 and 32 per cent in non- ICDS areas. The nutritional status o f children in ICDS areas was found to be better than that o f the children in non-ICDS areas. The percentage o f normal children was 35 in ICDS areas and 31 in non- ICDS areas. Non-ICDS areas also recorded 3 per cent more children in Grade III and IV malnutrition, as compared to ICDS areas (ICDS - 10.8 per cent, Non-ICDS -13.11 per cent). The prophylaxis programmes o f both vitamin A and iron had better coverage among women and children in ICDS areas, as compared
to non-ICDS areas. Higher percentage o f babies had low birth weight in non-ICDS areas as compared to ICDS areas. In tribal areas, the difference was almost double (ICDS - 43.3 per cent and Non - ICDS - 80 per cent). The support for pre-school
NETW O R K ING OF CHILD DEVELOPM ENT SERVICES TH R O UG H UNIVERSALISATION
OF ICDS
ICDS - launched in 1975 is a nation-wide single programnne for the over all development of children below 6 years and of the expectant and nursing mothers. It provides a Package of 6 services viz., Supplementary Feeding, Immunization, Health chek- ups. Referral Services, Pre-school Education and Health and Nutrition Education for its beneficiaries. The Eight Plan contemplated universalisation of ICDS by 1995-96 by expanding the services to all the 4571 CD blocks in rural areas, 733 blocks in tribal areas and 310 municipal wards in urban slums. However, the programme has been in effective operation in 4200 ICDS blocks all over the country benefiting 20 million children and 3.5 million mothers by 1997-98. Special Services for 3.51 lakh Adolescent Girls in 507 ICDS blocks are also being extended. ICDS also receives assistance from the World Bank to add some additional inputs like construction of project buildings, income generation activities for women / mothers, experimentation of nutritional rehabilitation services, training and project management, equipment, monitoring and evaluation etc.
The Programme of ICDS, which completed 20 years of its implementation in 1995, was evaluated by the National Institute of Public Co-operation and Child Development, New Delhi in 1992. The findings of the study indicated a very definite positive impact of ICDS services delivered through a single-window on the health and nutritional status of the pre-school children and of the mothers. Universalisation of ICDS is, therefore, the ultimate objective of the Ninth Plan.
350

education o f children in the age group o f 3-6 years was also significant. As much as 89 per cent o f children with pre-school education experience were found to be continuing their education in primary school as compared to 52 to 60 per cent without pre-school education in both ICDS and non-ICDS areas.
3.8.127 The M id-term evaluation o f the World Bank assisted ICDS (Project-I) conducted in Andhra Pradesh during 1995-96 revealed that the Project interventions had brought down the IM R to 62 per 1000 live births which was in consonance with the project objective o f 60 per 1000 live births. The incidence o f severe malnutrition amongst children o f 0-3 years was reduced to about 5 per cent and that o f 3-6 years to 3 per cent. The proportion o f low birth weight babies also came down to 20 per cent as against the project goal o f 24 per cent. Similarly, in Orissa, the IMR had come down to 93.6 and the incidence o f low birth weight o f babies to 23 per cent.
3.8.128 Training o f ICDS functionaries is yet another important programme funded by the Department o f Women and Child Development and implemented by the National Institute o f Public Co-operation and Child Development (NIPCCD), New Delhi with its nation-wide network o f 3 Regional Centres, 18 Middle Level Training Centres (MLTCS) and 300 Anganwadi Workers Training Centres (AWTCS). During the Eighth Plan period, 1521 CDPOs/ACDPOs, 3839 Supervisors and 153184 AW W s were trained. During 1997-98, the first year o f the Ninth Five Year Plan, 386 CDPO's, 921 Supervisors and 41,000 AW W were trained. Despite a busy schedule throughout the year, there remained a huge backlog in the training o f ICDS functionaries. To clear the backlog the special drives initiated during the Eighth Plan will continue during the Ninth Plan along with some innovative measures to improve the components o f ICDS training.
3.8.129 Creche and Day Care services for children o f working/ailing mothers, continued without any expansion during the Eighth Plan. There were 12470 creches benefiting3.12 lakh children fiinctioning under this programme by 1990-91. However, to meet the growing demand for more creches, a National Creche Fund (NCF) was set up in 1994 with a corpus o f Rs. 19.90 crore received under Social Safety Net. The NCF extended financial assistance for the opening o f creches besides conversion o f the existing Anganwadis into Anganwadi-cum-Creches. Under the NCF, 1803 creches were added benefiting about 0.44 lakh more children. A wider expansion o f creche/day-care services is envisaged during the Ninth Plan.
3.8.130 The Eighth Plan marked the adoption o f two National Plans o f Action in1992 - one for children and the other exclusively for the girl child. These Plans o f Action committed themselves to achieve the goals o f the W orld Summit viz. 'Survival, Protection and D evelopm ent'of Children. In line with these National Plans, 15 States viz. Andhra Pradesh, Bihar, Goa, Gujarat, Haryana, Karnataka, Kerala, M adhya Pradesh, Manipur, Maharashtra, Orissa, Rajasthan, Tamil Nadu, Uttar Pradesh and West Bengal had already prepared their own State Plans o f Action for Children/the Girl Child. Other States were being pursued to expedite action for finalising their draft Plans o f Action. Two separate Inter- Departmental Co-ordination Committees review the progress o f the implementation o f these two Plans o f Action at regular intervals. The first initiative under these Plans o f Action was to get gender disaggregated data from all the child- related developmental sectors to assess the progress made in improving the status o f children and the girl child since 1951.
351

3.8.131 In the State sector, most o f the States/UTs were implementing a number o f programmes for welfare and development o f women and children in addition to those being implemented by the Centre. The important programmes for women in the State sector include various developmental programmes like employment and income generation programmes, training-cum-production centres for destitute women; mahila mandals/mahila sangams; awareness generation/gender sensitization programmes; special campaigns against dowry, prostitution, child marriages etc.; rehabilitation o f women in distress; welfare services for women in need o f care and protection etc. In addition to these, they also have a major responsibility for implementing various women-specific/women- related legislations, besides setting up/maintaining the mandatory institutions under these Acts. The other major contribution o f the States and UTs relates to their coordinating role between the Centre and the NGO sector in implementing the various grant-in-aid programmes, as almost all the women development programmes in the Central sector are being implemented only through NGOs. Along with the Centre, most o f the State Governments have initiated action in formulating their own State Policies for Empowering Women. The child development programmes include supplementary nutrition feeding under ICDS, Children Homes, Bal Bhawans, Remand Homes, Observation Homes, services to destitute children and children in need o f care and protection etc. Some States have adopted State Plans o f Action for Children/Girl Child. A few States like Haryana (Apna Beti Apna Dhan), Tamil Nadu (Cradle Scheme), Andhra Pradesh (Girl Child Protection Scheme), Punjab (Kanya Jagriti Jyoti), Rajasthan (Raj Lakshmi Scheme) and M adhya Pradesh (Bhagyalakshmi) have launched specific schemes to improve the lot o f the girl child.
RESEARCH, EVALUATION AND MONITORING
3.8.132 Conducting research/action research on specific problems relating to women and children and evaluation o f the ongoing programmes for the welfare and development o f women and children leading to mid-term corrections in the content, scope and coverage o f the programmes has been a part o f the planning process in the women and child development sector. Research on the application o f science and technology for the improvement o f the quality o f life o f women will be directed to specific areas e.g. fuel, water, environm.ental degradation etc, which affect the lives o f women along with other social problems. In the recent past, the scope o f research and evaluation was widened to include special studies to assess the impact o f various programmes, being implemented for women's development and empowerment.
3.8.133 Efforts will also be made to develop a national level 'Inform ation Network System' for women and children with emphasis on collection o f gender- specific data with the objective o f preparing a Gender Development Index so as to assess the socioeconomic status o f women and children on a continuing basis. In this context, a special mention needs to be made about the action already initiated in developing an 'Integrated Monitoring System' during the Ninth Plan as a part o f the national machinery o f women and child development. In these efforts, the National Institute o f Public Cooperation and Child Development (NIPCCD), New Delhi, and the National Resource Centre for Women (NRCW), which is in the process o f being set up, along with their Regional Centres, are going to play a major role.
352

IM PLEM EN TIN G M ECH A N ISM S
CONTRIBUTIONS OF THE VOLUNTARY ORGANISATIONS
The Women and Child Development Sector has a rich tradition o f selfless voluntary action. W^ile the governmental interventions in this sector are operationalised mainly through the NGOs, the initiative that the latter have themselves developed are rich and diverse. These efforts have often demonstrated the success o f alternative models o f development and empowerment o f women - be it in the field o f providing credit for poor women or women’s health or wom en’s awareness generation or women’s literacy or running self-employment programs in traditional and non-traditional sectors o f the economy or organising women into Self- Help Groups to initiate the process o f empowering/advancing women.
3.8,134 At the Centre, the nodal Departm ent o f W om en and Child D evelopm ent acts as the national m achinery to guide, co-ordinate and review the efforts o f both governm ental and non-governm ental organisations w orking for the w elfare and developm ent o f w om en and children. The support structures to the nodal D epartm ent include the Central Social W elfare Board, an apex organisation at national level, w hich acts as an um brella organisation by netw orking through State W elfare Boards and through them thousands o f voluntary organisations w orking for the welfare and developm ent o f w om en and children in the country; the N ational Institute o f Public Cooperation and Child D evelopm ent (NIPCCD ), New Delhi w hich assists the D epartm ent in the areas o f research and training relating to w om en and children; and the National Com m ission for W om en which was set up in 1992 as the highest statutory body to safeguard and protect the wom en's rights and privileges. Sim ilarCom m issions are being set up at State level also. Rashtriya M ahila Kosh is yet another support structure at the national level for extending both 'forward' and 'backw ard' linkages for w om en in the informal sector in their entrepreneurial ventures. The W om en's Cells set up in the Central M inistries/D epartm ents o f Labour, Industry, Rural D evelopm ent and Science and Technology are expected to develop strong linkages betw een the national m achinery and the wom en- related M inistries/ Departm ents. A t the State level, developm ent o f w om en and children continues to be a part o f the D epartm ent o f Social W elfare in alm ost all the States/UTs except A ndhra Pradesh, K arnataka, Tam il Nadu, Kerala, M aharashtra, M adhya Pradesh, Rajasthan, w here exclusive D epartm ents/D irectorates have been set up to handle the program m es relating to w om en and children. Unlike the other sectors viz. - education and rural developm ent, no exclusive m achinery exists a ̂ the D istrict/Block levels for womeri and child developm ent. N on-existence o f an exclusive im plem enting m achinery at the State/D istrict/B lock levels has been affecting the im plem entation, supervision and m onitoring o f various policies and program m es for w om en and children. This situation also leads to excessive dependence on other governm ental and non- governm ental agencies. The problem is further aggravated in States where the presence o f N G O s is m inimal. Therefore, there is an urgent need to expedite the setting up o f exclusive D epartm ents/ D irectorates for w om en and child developm ent in those State G overnm ents w here no such set-up is now available. Special efforts will also need to be made to strengthen/stream line the existing institutional m echanism s both at the Central and State levels w ith adequate resources, both h u m ^ and financial, so that the system could gear up to m eet the challenging task o f em pow ering w om en and children during the N inth Plan.
353

3.8.135 W hile the govem m entalm erventions in this sector are operationalised largely through voluntary organisations, the innovative initiatives, experiments and alternative models that the latter have developed are rich and diverse. These efforts have often demonstrated the success o f alternative models o f develop-ment o f children and empowerment o f women in the areas o f credit, awareness generation, organising women into Self-Help Groups,self-employment, participatory rural appraisal etc. The Rashtriya M ahila Kosh (RMK) is another success story o f reaching credit to the poor and assetless women in the informal sector, through the medium of NGOs. The RMK has been networking with 170 NGOs to reach about 2 lakh women. It has also established the credentials o f attaining a recovery rate as high as 96 per cent. The other two important areas where the voluntary sector has been contributing their best relate to fighting against the atrocities/violence against women and girl children and creating a positive image about women and children through various awareness generation and gender sensitization programmes. The Central Social Welfare Board which is a national level Apex organisation promotes voluntary action through its country-wide network o f12,000 voluntary organisations. Besides, there are many other national and State level voluntary organisations working for the development o f children and empowerment o f women.
PLAN OUTLAYS
An outlay o f Rs. 7810.42 crore(which includes Rs. 450 crores for ICDS under Special Action Plan(SAP)) has been earmarked in the Central Sector for Women and Child Development in the N inth Five Year Plan (1997-2002). Outlays for women and child development programmes in the State Sector are included as part o f outlays for ‘Social Welfare(See Chapter 3.10)’
VOLUNTARY ACTION
354

3.9 EM POW ERM ENT OF THE SOCIALLY DISADVANTAGED GROUPS
INTRODUCTION
3.9.1 The Government has special concern and commitment for the well-being o f the Socially Disadvantaged Groups viz., the Scheduled Castes (SCs), the Scheduled Tribes (STs), the Other Backward Classes (OBCs) and the Minorities, as they still continue to lag behind the rest o f the society due to their social and economic backwardness. These Groups, which have passed through the processes o f welfare and development during the past four and a half developmental decades, will now be empowered to act as agents o f socio-economic change and development.
3.9.2 According to the 1991 Census, the Scheduled Castes account for 138.22 million, representing 16.48 per cent o f the country's total population. O f these, 81 per cent live in rural areas. There has been an increase in the percentage o f SC population to the total population from 15.28 in 1981 to 16.48 in 1991, with a decadal growth rate o f 3.20 per cent during 1981-91. They are dispersed all over the country, except in one State and two UTs viz., Nagaland, Andaman and Nicobar Islands and Lakshadweep. Uttar Pradesh alone, being the largest State, accounts for 21.05 per cent o f the total SC population. Nearly 84 per cent o f the country's total SC population live in 10 States viz., Andhra Pradesh (7.66%), Bihar (9.09%), Karnataka (5.33%), Kerala (2.09%), Madhya Pradesh (6.96%), Maharashtra (6.34%), Rajasthan (5.50%), Tamil Nadu (7.75%>), Uttar Pradesh (21.18%) and West Bengal (11.63%). In a few States, the SCs constitute more than 20 per cent o f the total o f their respective population. These include - Punjab (28.31%), Himachal Pradesh (25.34%), West Bengal (23.62%) and Uttar Pradesh (21,05%).
3.9.3. The Scheduled Tribes account for 67.76 million or 8.08 per cent o f country's total population. O f these, 1.32 million (1.95%>) are primitive tribes. The STs too, have shown a decadal growth rate o f 3.12 per cent during the period 1981-91. The actual increase in the percentage o f ST population was from 7.53 in 1981 to 8.08 in 1991. The STs inhabit in all the States except Haryana, Punjab, Chandigarh, Delhi and Pondicherry. The highest concentration o f ST population is found in the north-eastern States o f M izoram (94.75%), Nagaland (87.70%), Meghalaya (85.53%) and Arunachal Pradesh (63.66%>) and in the UTs o f Lakshadweep (93.15%)) and Dadra and Nagar Haveli (78.99%), while there are high concentrations in the States o f Madhya Pradesh (23.27%>), Orissa (22.21%>), Gujarat (14.92%), Maharashtra (9.27%) and Bihar (7.66%).
3.9.4 The Other Backward Classes, as per the Government o f India's Notification dated 8th September 1993, would comprise Castes and Communities which are found common in the List o f the Mandal Commission and in the Lists o f the individual State Governments. In the absence o f specific Census data, it is not possible to quote the exact figure o f their population. However, the Mandal Commission made a rough estimate o f OBCs constituting 52 per cent o f the country's total population.
3.9.5 The Minorities, who constitute 145.31 million (17.17%), as per 1991 Census, represent Muslim, Christian, Sikh, Buddhist and Zorastrian communities. While the M uslims are mainly concentrated in Jammu and Kashmir (J&K), Lakshadweep, West Bengal, Uttar Pradesh and Bihar, the Christians are predominantly inhabited in the north-eastern States o f Nagaland, Mizoram, Meghalaya and Manipur, besides Goa, Andaman and Nicobar Islands and Daman and Diu. The Sikhs are mainly found in the northern States/UTs o f Punjab, Haryana, Delhi and Chandigarh. The Buddhist population is mainly found in Sikkim, Maharashtra, West Bengal, Jammu and Kashmir and Himachal Pradesh. Although Zorastrians are numerically negligible, they are found in sizeable numbers in Maharashtra, Gujarat, West Bengal and Andhra Pradesh, besides Delhi and Daman and Diu.
355

CONSTITITUTION OF INDIA G UARANTEES
Social
3.9.6. Recognising the special needs o f theseweaker sections, the Constitution o f India not only guarantees them equality before the law (Article 14) but alsoenjoins the State to make special provisions o f affirmative discrimination for the advancement o f any socially and educationally backward classes or for Scheduled Castes and ScheduledTribes (Article 15(4)). It also empowers the State to make provision for reservation inappointments or posts in favour o f any backward class citizens (Article 16(4)).
3.9.7 The Constitution o f India also states categorically that untouchability' is abolished and its practice in any form is forbidden (Article 17).Further, it enjoins the State to promote with special care the educational £ind economic interests o f the weaker sections o f the people and, in particular, o f the Scheduled Castes and the Scheduled Tribes and promises to pprotect them from social injustice and all forms o f exploitation (Article 46). For prom oting thtie welfare o f STs and for raising the level o f administration o f the Scheduled Areas to thaat o f the rest o f the State (Article 244), special financial assistance is ensured under Conistititution (Article 275(1)). Reservation o f seats for the Scheduled Castes and the Schedujled Tribes in the democratic institutions (Article 330 and 332), educational instituutions and in services (Article 335) is another measure o f positive discrimination in favourr o f these Groups. It empowers the State to appoint a Commission to investigate the conoditions o f socially and educationally backward classes (Article 340) and to specify the Castess and Tribes to be deemed as Scheduled Castes and Scheduled Tribes (Articles 341 and 342)., With regard to the welfare and development o f Minorities, the Constitution incorporatecd certain safeguards to recognise their rights in conserving their culture and establish andd administer educational institutions o f their choice (Articles 29 and 30). Like-wise, a nunmber o f constitutional provisions exist for protection and promotion o f the interests o f ' these Socially Disadvantaged Groups.
3.9.8 The constitutional commitments m ade; in favour o f these Socially Disadvantaged Groups prompted the policy makers and the {plaimers to accord high priority for the welfare and development o f these groups righnt from the beginning o f the country's developmental planning, launched in 1951. During the Fifties, the general developmental programmes were so designed as to cater adecquately to the backward classes. Efforts were also made to ensure that the benefits o f eco nomic development accrued more and more to
3 56
• Equality befonre the law (Article 14)• Special provvision for the advancement o f any socially and
educationally / backward classes including SCs and STs (Article 15 (4))
• Abolition o f ' ‘u n touchab ility ’ and its practice in any form is forbidden (Ar.rticle 17)
• Appointmient t o f commission to investigate the conditions o f socially and eeducationally backward classes (Article 340)
• The right for r all minorities to establish and administer educational institution,s o f f their own choice (Article 30)
• To specify' thtie castes and tribal communities deemed to be SCs and STs (Article 2 341 and 342)
Economic• To promote with special care the educational and economic
interests o f thhe weaker sections and in particular o f SCs and STs and protect them from any social injustice and all forms o f exploitation ( (Article 46)
• Special Finanncial Assistance is charged from the Consolidated Fund o f In d ic ia each year as grant-in-aid for promoting the welfare o f the STs an d development o f Scheduled Areas. (Article 275(1))
• The Claims o f SCs and STs to appointments in services (Article 335)
Political• Administratio n and control o f the Scheduled Areas and Scheduled
Tribes in any State (Article 244 and 339)• Reservatio n ot)f seats for SCs and STs in the House o f the People and
in the Legi slatitive Assemblies o f the States (Article 330 and 332)
Like-wise a numboer o f Constitutional provisions exist for protection andpromotion o f the irinterests o f these Socially Disadvantaged Groups

the relatively less privileged classes o f the scociiety in order to reduce inequalities. Keeping in view the five principles o f the 'PPandisheel', the process o f tribal development was also initiated on the basis o f respect and unnderstanding o f tribal culture and traditions, besides appreciation o f their social, psychologgic al and economic problems. Opening of the 43 Special M ulti-Purpose Tribal Blocks duringg t.he Fifties which, were renamed later as Tribal Development Blocks, marked the be-ginnniing o f the concerted efforts in the field o f tribal development. During the Sixties, a attem pts were made to bring about greater equality o f opportunities, reduction in dispariticies in income and wealth and a more even distribution o f economic power amongst tlhe&se backward sections. The developmental programmes were gradually diverted towardis thhe basic goal o f achieving a rapid increase in the standard o f living o f these people througgh measures which promoted equality and social justice.
3.9.9 During the Seventies, the expectaticm that the general development programmes would cater to the needs o f these weaker siect^ticns and the innovative programmes of the Backward Classes Sector would provide th e i m uch needed thrust as an additive to the general efforts was belied. Further, the spoeci^al provisions for the welfare and development o f the backward classes, instead o f supplementing, began to supplant the general sector provisions. It was in this contUext that the two innovative strategies of the Tribal Sub-Plan (TSP) for STs and the Specciail Component Plan (SCP) for SCs, were launched during 1974 and 1979 respectively. These two special strategies were expected to ensure that all the general development secto irs,, both at the Central and State levels, earmark funds for SCs and STs in proportio m to their population so that adequate benefits from all the concerned sectors flow to these two disadvantaged groups.
3.9.10 In support o f these two special stratiegi es o f SCP and TSP, the Government of India has also been extending Special Centiral Assistance (SCA) to the States and the UTs, as an additive to fill up the gaps, especiailly in the family-based income generating programmes. As a result, there has been a subs stantial increase in the flow o f funds for the development o f SCs and STs besides enlargenm ent o f the share o f benefits for SCs and STs under all the development programmes,, FHowever, to ensure a focussed attention in improving the lot o f these Groups, an exclusive I M inistry o f Social Justice and Empowemient was set up in 1985. Consequently, all the hithertrto scattered programmes o f SCs, STs, OBCs and Minorities were brought under one single i um brella during the Nineties and were put into effective operation with the ultimat(e objective o f achieving the constitutional commitment o f raising the status o f these disaddvantaged groups on par with the rest of the society.
CURRENT SITUATION
3.9.11 The impact o f various developmental pplajis, policies and programmes has brought forth a perceptible improvement in the socioi-ecconomic status o f SCs and STs. A review o f the important achievements quantified throuighi various developmental Indicators and the serious gaps that exist till today under the thireee core sectors o f education, employment and economic development, projects the currennt status o f SCs and STs, as detailed in Table 3.9.1.
Educational Development
3.9.12 Although, there has been a visible inncrease in the literacy rates o f SCs and STs during the last three developmental decades, thoe gap between the literacy rates o f SCs/STs and those o f the general population still persi;ist,s. Further, the gap between the general population and STs, when compared to the gap \ betw een SCs £ind other general categories was found to be widening, decade after deicadde. Adding to this are the problems of intra and inter-State and intra and inter-comm unity a variatiohs in the literacy rates amongst SCs and STs.
357

Tahble 3.9.1Literacy Rates of SCs anod STs - The Gains and the Gaps
Category 1971 1981 1991 % age Increase of 1991 over 1971
- General Population including SC/ST)
- Scheduled Castes- Scheduled Tribes
29.4514.6711.30
36.2321.3816.35
52.2137.4129.60
77.28155.01161.95
- Gap between SCs and the General Population. 14.78 14.85 14.80 0.14
- Gap between STs and the General Population 18.15 19.88 22.61 24.57
* Excludes 0-6 age group.Source : Educational D e\ elaopment o f SCs and STs, Department o f
Education, 1995.
3.9.13 Similarly, 'Fem ale Literacy', whhich is an important indicator in the field o feducation, has also shown a progressiv’e trend in respect o f both SCs and STs, as given in Table 3.9.2.
Table 3.‘.9.2Female Literacy Rates o f SCs, ST fs and General Population
Category 19971 1981 1991*
Female Literacy Rates
All Communities including SC/ST 21.9 7 29.85 39.29
Scheduled Castes 6.44 10.93 23.76
Scheduled Tribes 4. 85 8.04 18.19
GAP
Gap between female literacy ja te o f SCs and of All communities 15. 53 18.92 15.53
Gap betweeen female literacy rate o f STs and o f All communities 17. 12 21.81 21.10
* Excludes 0-6 age group.).Source : Educational Deevelopment o f SCs and STs,
Department o f Education, 1995
358

3.9.14 The data reveals that the female lititeracy rates in respect o f SCs and STs have increased substantially from 6.44 per cent annd 4.85 per cent in 1971 to 23.76 per cent and18.19 percen t in 1991, respectively. Besiidees, the most encouraging sign was the increase in the female literacy rate amongst SCs anid STs and the reducing gap between the female literacy rates o f SCs and o f the general ;poppulation during 1981 to 1991. However, the female literacy rates o f these communitiess aas a whole continued to be very low requiring focussed attention.
3.9.15 The enrolment ratios o f SC an d ^ST girls and boys have continued to show a progressive trend along with the rest o f th(e ppopulation. The other revealing factor was the better pace o f progress maintained by S'Ts s at primary level (43.0%) over SCs (29.7%), especially that o f ST girls (49.0%) over SGC girls (37.3%) during 1981 to 1996. Above all, the overall progress made by SCs ancd SSTs in terms o f enrolment ratios at primary and middle levels between 1980-81 and 1995-9*6 lh as been impressive, as they could prove much better than the general population.
T f able 3.9.3
Gross Enrolment Ratios of f SCs & STs and General Population
Levels/ Gen. Population Schheduled Castes Scheduled Tribes
Boys Girls Total Bioys's Girls Total Boys Girls Total
1980-811-V(6-11 Yrs) 95.8 64.1 80.5 1(135.̂ 4 57.8 82.2 94.2 45.9 70.0
VI-VIII(ll-1 4 Y rs) 54.3 28.6 41.9 411.41 16.2 29.1 28.2 10.8 19.5
1990-91I-V(6-llYrs) 114.0 85.5 100.1 122.',.7 80.6 102.2 126.8 78.6 103.4
VI-VIII(ll-14Y rs) 76.6 47.0 62.1 611.41 33.3 47.7 51.3 27.5 39.7
1995-96I-V(6-11 Yrs) 114.5 93.3 104.3 1217.66 95.1 111.9 130.0 94.9 113.0
VI-VIII(11-14 Yrs) 79.5 54.9 67.6 74k9 46.8 61.3 61.6 37.6 50.0
Pace of Progress I-V 18.7 (Primary level)
29.2 23.8 2:2.22 37.3 29.7 35.8 49.0 43.0
VI-VIII 25.2 (Middle level)
26.3 25.7 33.55 30.6 32.2 33.4 26.8 30.5
Source : Selected Education Statistiics.s, 1995-96, Department of Education, New Delhi.
359

3.9.16 T he'd rop-ou t rate, which is a crucial indicator in the field o f education also reveals that there has been a steady decline in the drop-out rates o f SCs and STs as given in Table3.9.4. -
Table 3.9.4
Drop-Out Rates amongst SCs and STs at various stages of Education
Category (Classes I-V) (Classes I-VDI) (Classes I-X)
1980-81 1989-90 1980-81 1990-91__\______198ff-81 1990-91
GENERAL 58.V0 48.'08 72.70 63.40 82.46 71.34SC 60.16 49.03 76.84 72.09 86.91 80.58ST 75.66 63.8L 86:71 80.10 91.18 86.00
Source: Educational Development of SCs and STs (1995) and Unpublished Data of the Department of Education.
Note : 1. Since the latest -data on the drop-out rates* of SCs and STs is available only for 1990-91, data for General" Population was also used for the same year For effective comparison.
2. Figures for 1990-91 in respect of SCs and STs are not available for primap ̂level.
3.9.17 The problem o f drop-outs, as the above data reveal, happens to be a common feature amongst SCs, STs and other general category also. While all the three categories have been showing a decreasing trend during the decade 1981-91, the problem appears to be the worst with regard to STs with a very high drop-out rate o f 86 per cent for classes I to X during 1990-91. The gap between the general population and these two categories also appears to be on an increase, while the same is comparatively wider in respect o f STs.
3.9.18 The health and nutrition status o f the socially disadvantaged groups, especially that o f the SCs and STs continues to be one o f the major 'concerns o f the Government,,^ as th^se communities,live mostly in such areas which are neglected, remote, inaccessible and’ ^ e endemic with diseases like n ialaria ;^bercutosis. Yaws etc. Keeping their special and specific needs, the Government has been paying special attention by setting up Primary Health Care institu tions^^th relaxed pomis. However, a review o f the existing situation reveals that the health and nutrition status o f^ these ' special groups needs priority attention in the N inth Plan.-
Economic Development
3.9.19 The major ^strategy o f creating employment-cum-income generating activities to alleviate poverty amongst the SCs and ther STs has proved its impact in raigirig a large number o f SC and ST families from the level of 'Below Poverty Line' during the decade between 1983-84 and 1993-94, as quantified in Table 3.9.5.
360.

Percentage o f Population Living Below Poverty Line
Table 3.9.5
Category 1983-84 1993-94 PercentageDecrease.
General 44.48 35.97 (-) 8.51
SCs 57.60 48.37 (-) 9.23
STs 63.14 51.14 (-) 12.00 _______________
Source ; Perspective Planning Division, Planning Conynission, New Delhi.
Note : The aggregate poverty ratio of SC and ST population 1983-84 has been worked out as a weighted average of rural and urban poverty ratio using 1981 Census population of the respective Groups in rural and urban areas as weights. Ip a similar way, 1991 Census population is used to obtain aggregate poverty ratio for'these two groups in 1993-94,
3.9.20 In respect o f both SCs and STs, besides the general population, the percentage o f the number o f families living below the poverty line has shown a declining trend over the decade 1983-84 to, 1993-94. Despite a reduction in the percentage o f the population living below poverty line, the inciddrice o f poverty amongst SCs and STs continues to be very high, when compared to the general population, the reasons being that a majority o f the Scheduled Castes (77.11%) and Scheduled Tribes (90.03%) are landless with no productive assets 'and' are devoid o f sustainable employment and minimum wages, and women belonging tp these Groups who ,live not only below the poverty line, but in abj'ect/extreme f)overty, are denied o f both minimum and equal wag^s.
PajTticipation o f SCs and STs in Administration and Decision Making
3.9.21 Participation o f SCs and STs in the administration and decision-making is yet another indicator o f the positive impact o f developmental planning on the status o f SCs and STs^ The same can be seen from their representation in the ‘Government especially at the senior level o f Group A posts, where decisions are taken.
3.9.22 The total representation of'SC s in services covering A to D Groups has'risen from 13.66 per cent in 1974 to .1-6.9 per-'cent in 1994, which, in fact; is more thah 'theif legitimate share o f 16.5" per cent. 'Ipi the case o f STs, although their participation in administration has increased from Z ’iSl per cent’in 1974 to 5.48 per cent in' 1994, they are yet' to ̂ reach their proportionate representation o f 8.08 per cent:* The increasing participation o f SCs and STs in Group 'A ' Services, that is - SCs from 3.25 per cent in 1^974 to 10.25 per cent in 1994 and STs from a mere 0.57 per cent in 1974 to 2.92 per cent in1994, directly reflects the impact o f various ^firm ative measures taken in bringing them into the mainstream. At the same time," the data also reveal the gaps that need to be bridged with effective interventions, if these groups have to be b rougk on par with the general fJoJ>^ation, especiM lyin respect o f G roupA T osts, the level at which fiie decisionmaking takes'place.
361

Representation of SCs and STs in Services (1974 to 1994)
Group of Service
Table 3.9.6
Category
(As on 1.1.1974)
Total
SC
ST
(As on 1.1.84)
Total SC
ST
(As on 1.1.94)
Total
SC
ST
1094(3.25)
155(0.57)
6046(40.25)
.J727(2.92)
B D
2401(4.59)
258(0.49)
161775 230203(10.33) (18.53)
33383(2.13)
47679(3.84)
12442 37,4758(12.06) (15.73)
2902(2.81)
128228(5.38)
209423(20.46)
62945(6.15)
Total
33672 52343 1566796 1242548 2895359
395473(13.66)
81475(2.81)
3303342527573(15.97)
149391(4.52)
59016 103198 2381613 1023285 3567112
602670(16.90)
195802(5.48)
Source: Department of Administrative Reforms & Public Grievances, Annual Report, 1994.
Note : Figures in parenthesis indicate percentage of SCs and STs to the total populatiorf.
3.9.23 Affirmative discrimination through reservation for SCs and STs in the Lok Sabha and the State Legislative Assemblies evidently' establishes the "growing strength o f SCs and STs not only in terms o f their participation in the democratic processes o f the countty since independence, but also their representation in the political decision-making institutions o f Parliament, Legislative Assemblies, local bodies, Panchayats etc. In the 1996 elections, their representation in the Lok Sabha accounted for 19.52 per cent (13.01% for SCs + 6.51% for STs),
Implementation of SCP, TSP and SCA to SCP andXSPI
3.9.24 The implementation o f the special strategies o f the Special Component Plan (SCP) for SCs, Tribal Sub-Plan (TSP) for STs and the Special Central A ssist^ ce (SCA) to SCP and TSP, has been receiving special attention, since their inception, as these are effective instruments to ensure proportionate flow o f fimds for SCs and STs from the other general development sectors. In respect o f the Special Plan Component Plan(SCP), the situation at the Central level was not found to be very encouraging as the earmarking
362

SPECIAL M ECHANISM S FOR EARM ARKING OF FUNDS FOR SCs and STs
During 1970’s, the Government instituted, three special mechanisms viz., Special Component Plan (SCP) for SCs, Tribal Sub-Plan (TSP) for STs and Special Central Assistance (SCA) to SCP and TSP. While the major objective o f SCP and TSP is to ensure the much needed flow o f funds and benefits for the welfare and development o f these two categories in proportion to their population, which is now 16.5% in respect o f SCs and 8.1% in respect o f STs, as per the 1991 Census, SCA to SCP and TSP extends financial assistance to States and UTs as an additive to their SCP and TSP for filling up o f the critical gaps in the family-based employment-cum-income generation programmes. The flow o f funds during the Eighth Plan for SCP under Central and State sectors was to the tune o f 27.8 % and 10.8% respectively against the target o f 16.8%, while the fiow o f funds to TSP under Central and State sectors were 8% and 9.8%, respectively against the target o f 8.1% .
lof funds was adhered to only by 13 M inistries/Departments viz. Labour, Education, Science & Technology,Industry, Textiles, Petroleum and Natural 'Gas, Women and Child Development, H ealth and Family Welfare, Commerce, Fertilisers, Rural Development, Non- conventional Energy Sources and Agriculture and Cooperation. At the State level, 21 States viz., Andhra Pradesh, Bihar, Assam, Goa, Gujarat, Haryana, Himachal Pradesh, Jammu & Kashmir, Karnataka, Kerala, M adhya Pradesh, M aharashtra, Manipur, Orissa, Punjab, Rajasthan, Sikkim, Tamil Nadu, Tripura, U ttar Pradesh, West Bengal; and 3 UTs \dz. Chandigarh, Delhi and Pondicherry w ere earmarking funds for SCP. O f these, 18 States/UTs have been maintaining separate Budget Heads for SCP to ensure proper quantification o f funds and their effective utilisation for the p)urpose they were meant for. The rest w ere being pursued to emulate the same
system as it helps prevent the diversion o f fundds. During the Eighth Plan, the flow o f funds for SCP under the Central and State sectors by thhe end o f 1996-97 w e is estimated to be 27.8 per cent and 10.8 per cent respectively, againstt the total SC population proportion o f 16.48 per cent.
3.9.25 Under the Tribal Sub-Plan (TSP)), 17 Central M inistries/D epartm ents viz.,Agriculture, Cooperation, Education, Health, Peetroleum and Natural Gas, Food, Women and Child Development, Youth Affairs, Comnmerce, Textiles, Labour, Environment and Forest, Science and Technology, Ruraal Development, Non-conventional Energy Sources, Information and Broadcasting, 1 Industry and Communications, have been earmarking the funds. At the State level, earmaiu-ki.ng o f funds for TSP has been in operation in respect o f 18 States viz., Andhra P radesh ,/A ssam , Bihar, Gujarat, Himachal Pradesh, Jammu and Kashmir, Karnataka, Kerala, M adhhya Pradesh, Maharashtra, Manipur, Orissa, Rajasthan, Sikkim, Tamil Nadu, Tripura, Uttttar Pradesh, West Bengal; and 2 UTs viz., Andaman and Nicobar Islands and Daman and ID iu. The flow o f funds under TSP from the Central and State sectors during the Eighth Plann w as around 8.0 per cent and 9.79 per cent, respectively against the population proportion o f ̂ 8.08 per cent.
3.9.26 The Special Central Assistance (SCA)) to States/UTs, as an additive to SCP and TSP, was enhanced during the Eighth Plan so aas tio strengthen the efforts o f States in filling up the gaps under the family-based income ggeneration projects. The SCA to SCP was enhanced from Rs.930 crore in the Seventh Plaan to R s .ll2 5 crore in the Eighth Plan, indicating 21 per cent increase. Similarly, the SCA to TSP was also enhanced from Rs.756 crore in the Seventh Plan to R s.l250 croDre in the Eighth Plan, showing a rise by 65 per cent. The details o f the flow o f funds from he Central and the State Sectors to SCP for SCs, TSP for STs and the SCA to SCP and TFSP, during the Seventh and the Eighth Five Year Plans, are given in Table 3.9.7.
363

Flow o f Funds through SC P, T SP annd SCA during Seventh and E ighth P lans
(Rs. in Crore)
Table 3.9.7
SI. Item s N o.
Sevennth Plan (1 9 9 8 5 -9 0 )
Eighth Plan (1 9 9 2 -9 7 )
F low f o f funds O u tlay”' F low o f funds
Percentage over C o l.4
( 1) (2) (3 ) (4 ) ( 5) (6)
A .S p ecia l C om ponent Plan (SC P ) for SCs.
- F low from Central Plan(in respect o f 13 M in istr ies/ D epartm ents)
- F low from State Plan(in respect o f 24 S ta tes/U T s)
B .Tribal Sub-Plan (T S P ) for STs
- F low from Central Plan(in respect o f \1 M inistTies/
D epartm ents)- F low from State Plan
(in respect o f 20 S ta tes/U T s)C .S p ecia l Central A ssista n ce
(S C A ) to SCP and TSP- SC A to SCP- SC A to T SP
6 2 2 5 .0 9 3 7 687 10471.00
7 3 8 8 5 .4 2 2 0 2 8 5 0 .1 9 21921 .53
N 4 .A .
62216.76
9 9 30 .007 756 .00
6 8 9 2 4 .1 4 5 5 16 .56
174245.02 17061.93
1125.001250.00
27.78
10.81
8.00
9.79
Source ; Ministry of Soeia) Justice and Empoowerment.♦ Includes the outlays of the Eighth Plan i'in respect of only those Ministries/Departments and
States/UTs which were earmarking fundds under SCP and TSP.
3.9.27 Despite the fact that both i the strategies o f SCP and TSP have been in operation for more than fifteen years, they f could not influence all those concerned towards the right perspective. Further, lack o3f effective monitoring to ensure that all these concerned earmark fonds imder SCP and TSFP and that the funds received under SCP, TSP and SCA are utilised both effectively and ppurposefully is another area o f concern in this regard.
Crimes/Atrocities against SCs anad STs
3.9.28 Besides the IPC, the Pi'rotection o f Civil Rights (PCR) Act o f 1955 and the Scheduled Castes and Scheduleed Tribes (Prevention o f Atrocities) Act o f 1989, are the two major legal instnmients whicch help prevent/control the atrocities against SCs and STs. Under these Acts, as many as 434 : Special Courts/Mobile Courts were set up in 7 States. In addition. Special Cells/Squuads/Officers have also been appointed in 19 States to ensure effective implementation o f the Act. In accordance with the PCR Act o f 1955, special legal aid was also extendeed to the victims o f untouchability and other crimes through Special Officers who ensured effective implementation o f the Act, besides extending support for social andi economic rehabilitation o f the SC/ST victims. The crimes
364
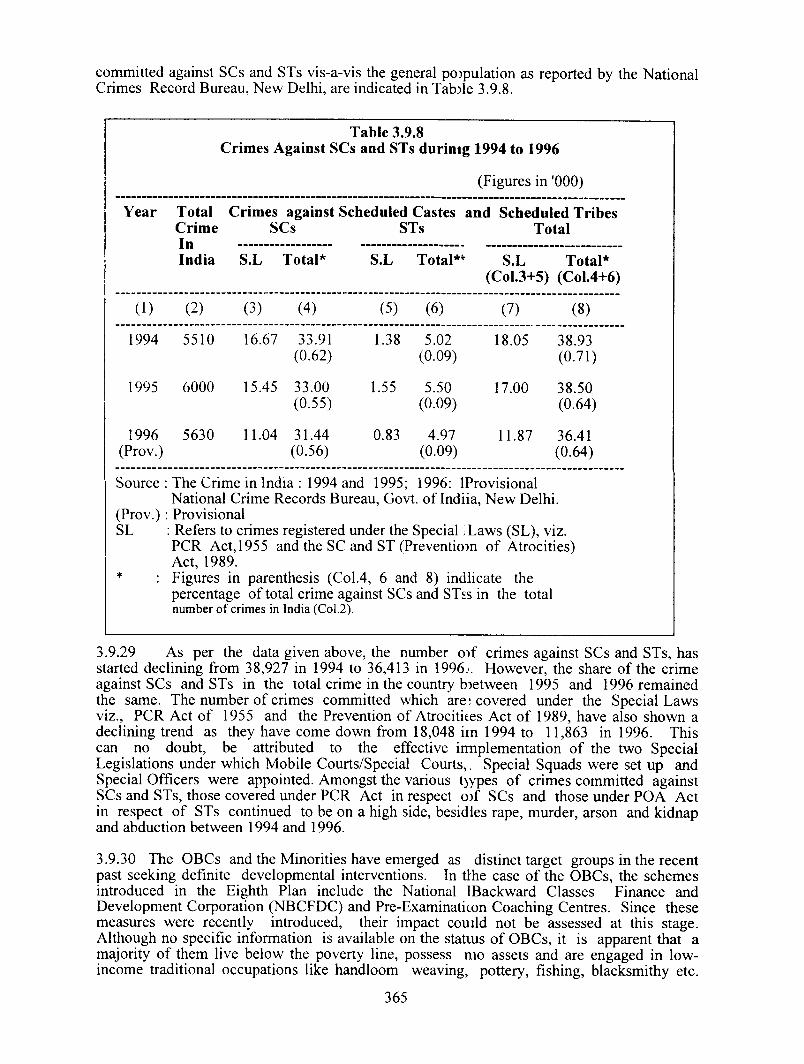
committed against SCs and STs vis-a-vis the general poDpulation as reported by the National Crimes Record Bureau, New Delhi, are indicated in Tab)le 3.9.8.
Table 3.9.8Crimes Against SCs and STs durinig 1994 to 1996
(Figures in '000)
Year Total Crimes against Scheduled Castes and Scheduled Tribes Crime SCs STs TotalIn ...............................................................................................................India S.L Total* S.L Total**' S.L Total*
(Col.3+5) (CoI.4+6)
( 1)
1994
1995
1996(Prov.)
(2 )
5510
6000
5630
(3)
16.67
(4)
33.91(0.62)
15.45 33.00 (0.55)
11.04 31.44 (0.56)
(5)
1.38
1.55
0.83
(6)
5.02(0.09)
5.50(0.09)
4.97(0.09)
(7)
18.05
17.00
11.87
(8)
38.93(0.71)
38.50(0.64)
36.41(0.64)
Source ; The Crime in India : 1994 and 1995; 1996: 1ProvisionalNational Crime Records Bureau, Govt, o f Indiia, New Delhi.
(Prov.) : ProvisionalSL : Refers to crimes registered under the S pecial; Laws (SL), viz.
PCR Act,1955 and the SC and ST (Preventiojn o f Atrocities) Act, 1989.
* : Figures in parenthesis (Col.4, 6 and 8) indiicate thepercentage o f total crime against SCs and STss in the total number o f crimes in India (Col.2).
3.9.29 As per the data given above, the number o)f crimes against SCs and STs, has started declining from 38,927 in 1994 to 36,413 in 1996.>. However, the share o f the crime against SCs and STs in the total crime in the country b^etween 1995 and 1996 remained the same. The number o f crimes committed which are; covered under the Special Laws viz., PCR Act o f 1955 and the Prevention o f Atrocitites Act o f 1989, have also shown a declining trend as they have come down from 18,048 hn 1994 to 11,863 in 1996. This can no doubt, be attributed to the effective innplementation o f the two Special Legislations under which Mobile Courts/Special Courts,, Special Squads were set up and Special Officers were appointed. Amongst the various tjypes o f crimes committed against SCs and STs, those covered under PCR Act in respect o f SCs and those under POA Act in respect o f STs continued to be on a high side, besidles rape, murder, arson and kidnap and abduction between 1994 and 1996.
3.9.30 The OBCs and the Minorities have emerged as distinct target groups in the recent past seeking definite developmental interventions. In tlhe case o f the OBCs, the schemes introduced in the Eighth Plan include the National IBackward Classes Finance and Development Corporation (^B C FD C ) and Pre-Examinaticon Coaching Centres. Since these measures were recently introduced, their impact couild not be assessed at this stage. Although no specific information is available on the statvus o f OBCs, it is apparent that a majority o f them live below the poverty line, possess mo assets and are engaged in low- income tradhional occupations like handloom weaving, pottery, fishing, blacksmithy etc.
365

Unless the harsh conditions in which i the OBCs live and work are altered, it would not be possible for them to secure economic self-reliance either in their traditional activities or in other diverse activities.
3.9.31 Just as in the case o f the OB^Cs, the impact o f various developmental measures in respect o f the M inorities also could m ot be assessed in view o f the short span that they have been in operation. However, the; general conditions reveal that the M inorities,especially the Muslims, their wormen and backward and their traditional institu tions syllabus to get integrated into the maiinstream and the OBCs continue to depend uppon the similar occupations.
girl children, remain educationally very like Madarsas are yet to adopt the m odem education. A large number o f the M inorities
low-income traditional artisanship and other
Objective
Empower the Socially Disadvantageed Groups viz., the Scheduled Castes (SCs), the Scheduleed Tribes (STs), the Other Backward Classes (OBCs) ancd Minorities as the Agents o f Social Change and Developpment
Strategies
NINTH PLAN COMMITfS TOSTRATEGY FOR THE NINTH PLAN
3.9.32 The N inth Plan commits to empower the SCs, STs, OBCs and Minorities as the agents o f socio-economic change and development. Therefore, a major shift is visualised in the approach as it envisages advancement o f these socially disadvantaged groups through a process o f 'empowerm ent’, wherein efforts will be made to create an enabling environment that is conducive for them to exercise their rights freely, enjoy their privileges and be able to lead a life o f self confidence and dignity along with the other citizens o f the country. Thus, the empowerment o f these Groups, as envisaged, will be a long-drawn process, with support policies and programmes directed towards empowering the Socially Disadvantaged Groups to be the active partners and partakers o f the country's development rather than continuing as passive recipients o f various developmental benefits.
3.9.33 The approach towards empowering these Groups in the Ninth Plan will be holistic in nature so as to accomplish all-round development o f these weaker sections with an inter-sectoral approach and inputs from both the governmental and the non
governmental agencies. In the Nintth Plan, efforts will continue to extend all assistance to SCs, STs and OBCs to ensure speeedy socio-economic development through qualitative concem and quantitative substanc:e in every measure undertaken, especially in removing the disparities, eliminating explo^itation and suppression. Thus, these vulnerable groups,
366
Create an enabling environment that ias conducive for the SCs, STs,OBCs and Minorities to exxercise their rights free\y, enjoy their privileges and be able to lead a life with confidence and dignity
Adopt a three-pronged strategy o f - i) Social Empowerment; ii) Economic Empoowerment; and iii) Social Justice, in empowering thhese disadvantaged groups
Ensure removal o f disparities; eliminaate exploitation and suppression and provide protection too the disadvantaged groups
Ensure the developmental benefitts to ‘Reach the Unreached’ through equitable distribujtion and with social justice
Ensure participation o f the Sociaally Disadvantaged Groups in the process o f planning not merely as the beneficiaries but to take part i effectively in the formulation o f the need-based program m es / projects, their implementation, supervision andl monitoring
Accelerate the on-going process o f im proving the socioeconomic status o f the disadvantagged groups through effective implementation o f varrious policies and programmes and thus bring them on i par with the rest o f the society

particularly the SCs and the STs will not only be proteected, but will be ensured o f the developmental benefits reaching the unreached, bring;ingg about equitable distribution and growth with social justice.
3.9.34 For this, the most effective instrument w hich pnrovides a special cushion for these categories in meeting their basic needs is the Special! FPlan o f Action o f 1998. In this direction, efforts are being initiated to fill the critical g;apas in providing the basic minimum services to those living below the poverty line. These speecial efforts are expected to ensure that every habitation with concentration o f these G romps will have access to potable drinJcing water, nutrition supplements with both macro amd micro nutrients, primary health care services, primary education facilities, sanitation and htousing for the shelterless poor.
3.9.35 W hile form ulating/im plem enting programnness for these G roups, the N inth Plan w ill strive to ensure 'People-C entred Developnnernt' and 'People 's Participation' w ith effective involvem ent o f Panchayati Raj Insti tuttions, in pursuance o f the recent Constitutional (73rd and 74th) Am endm ents. Im m ecdiate steps w ill also be taken for the devolution o f financial as well as adm inistrative pow eers to the local self-governm ents, so that the m arginalised groups will also get the o>pp)ortunities to participate not only in form ulating the need-based program m es but also i n their effective im plem entation, supervision and monitoring. This will not only g o a i long w ay in em pow ering these Groups but will also ensure that the im plem entatio^n o f various developm ental program m es is carried out in the true sense o f co-oper ati\ve federalism.
3.9.36 In the context o f adopting the special stra tegy / o f 'W o m e n 's C om ponent Plan in the N inth Plan, action w ill be taken by the nodal M inistry o f Social Justice and Em pow erm ent to earm ark fundsAsenefils under all ils.s program m es exclusively for w om en belonging to these socially disadvantaged gr ouips who are the w orst affected as they are generally living in extrem e poverty.
3.9.37 In the N inth Plan, the vital ongoing programnness for the advancem ent o f thesesocially disadvantaged groups will be streamlined,, strengthened and enriched to accom plish the unfinished task o f bringing these secticons on par w ith the rest o f the society. Sim ultaneously, new m easures, w'hereve:r m ecessary, w ill be initiated to accelerate the process o f em powering these w eaker se;ctions. Em pow erm ent o f these groups will, therefore, be attem pted in an iintegrated maimer, essentially encom passing the three vital and inter-reilatted com ponents viz., i) Social Em pow erm ent; ii) Econom ic Em powerm ent; and iii) S'ociial Justice.
I. Social Empowerment
Scheduled Castes and Scheduled Tribes
3.9.38 The National Agenda o f Governance clearly spelhs out the commitment o f theGovernment to safeguard adequately the interests o f SCs, STs and OBCs throughappropriate legal, executive and societal efforts arud by large scale education andempowerment.
3.9.39 Education, being the most effective iinstrument for socio-economic empowerment, high priority will be accorded to impro vinig the educational status o f SCs and STs, particularly that o f the women and the giril c;hildren. In fact, the educational backwardness, prevalent amongst these Groups, necessiitates an added thrust on their education, training and skill upgradation as it w illl bring forth not only social empowerment but also economic empowerment. Theireffore, the endeavour in the Ninth Plan will be to provide suitable education keeping in vieew, their cultural milieu, their genius eind their special needs. The need for a tim e-boum d programme to improve the educational status o f the Socially Disadvantaged Groups haas been identified as one o f the inunediate tasks to be fulfilled during the Ninth Plan as jpart o f the total commitment o f
367

Education being the most effective instrumennt of empowering the Socially Disadvantaged Groups, all-out efforts will be m ade to improve the educational status of t these Groups, especially that of the W om en and the Girl Child, through
Universalisation of primary education b'sy 2005 A.D. with a special focus on low-literacy pockets and on the educationally backward communities likes S C ,ST,O B C s and Minorities' Reaching the Unreached ’ through renmoval of the existing problem of inaccessibility by providing residential schools in the remote and the far-flung triribal areas, hostel facilities etc.Extending special concessions like freee education: free supply of books; uniforms / stationery ; scholarships / fellowships for both within and outside ccountrySpecial efforts to vocationalise educaation both at the middle / high school levels which can equip the Disadvantaged Groups either for wage / ' self-employmentEncouraging higher and technical / protifessional education amongst these, through effective implementation of Post-Matric Scholarships with an added I thrust and wider coveragePromoting education amongst children whose parents are engaged in unclean occupation and thus divert the future generation away from the practice; of scavenging through incentives like Pre-Matric Scholarships Providing more opportunities for these G3roups to appear in the competitive examinations and get into the stream of planning and decision making processs through expansion of pre-examination coaching services Complete eradication of the practice otif Untouchability and thus provide a rightful place and status for these socially disadvantaged groupsAchieving complete eradication of the ppractice of Manual Scavenging by the end of the Ninth Plan (2002) and thus liberate and rehabilitate the Scavenngers and those engaged in Unclean Occupations through a time-bound programmeDeveloping special health packages too combat diseases that are endem ic in nature and affecting the lives of the tribal populationInitiating integrated action plan towards faliround development of Primitive Tribal Groupsintroducing the concept of Mini-Anganwaadis with relaxed norms in the remote areas and thus ensure children and mothers belonging to these Groups aree taken care of with basic health and nutrition services through National Program mes like Integrated Child Devvelopment Services (iCDS), Special Nutrition Program me (S N P ) and Nutrition Support to Primary Education poopularly known as Mid-day Meals ProgrammeEncouraging the participation of the dissadvantaged groups / in the planning and developmental process at every level through ensuring their adequate i representation In various Democratic / decision making Institutions like Panchayati Raj / Local Bodies, State A^ssemblies / Parliament etc.
SOCIAXL EMPOWERMENT THROUGH
making the country fully literates by the year 2005 A.D. Efforts will, therefore, be made to fulfil this commitmernt through universalisation o f primary education with a special focus on low literacy poclkets and on the SCs, STs, OBCs and Minorities whose literacy rates are very low compaared to the rest of the population.
3.9.40 I n . view o f the low enrolmesnt/retention rates and high drop-out rates amongst these groups, special measures will be t£aken not only to strengthen the ongoing programmes but also to launch new initiatives fcbr ensuring easy access through residential schools; minimum standards with trainecd teachers, preferably local women; appropriate and adequate support services like hcostels and creches; other infra-structural facilities and special incentives to poor studesnts and their families through scholarships/financial assistance, free books, free uniforrms etc. In this context, the earlier initiative o f the Government to start creche facilitiies within the school campus or nearer to the school will be revived/intensified to ensure thiat the girl children are not deprived o f education as they have to play the role o f a mother-ssubstitute in many respects, when the mothers go out for work to supplement the family incoDme. Also, the much-needed nutritional support through the national feeding programme o f ' Mid-Day Meals (MDM) will be expanded/universalised to reach the most interior and inacc;essible rural, tribal and hill areas.
3.9.41 The spread o f literacy thrrough the efforts o f the National Literacy Mission will be ensured so as to reach the baclkward rural, tribal and urban slums where the incidence o f illiteracy especially amongst women and girl children belonging to these weaker sections is very high. Residential : schools and schools with attached hostel facilities right upto the block-level will be enco'>uraged in the Ninth Plan to solve the present problem o f inaccessibility o f schools being facted by the girls in the l^ackward rural and tribal areas. The recent launching o f Kasturba GJandhi Swatantrata Vidyalayas in 1997 is one o f such initiatives exclusively meant for thie educational improvement o f girl children belonging to SCs, STs, OBCs and Minorities.
368

3.9.42 Employment-oriented education and diiversified vocational training, which has been recognised as the need o f the day, will he giveni tcp priority. Special efforts will be made to vocationalise education both at the middle/high school levels, depending upon the need and demand. Also, job-oriented condensed course;s w'ill be accorded priority in the Ninth Plan to extend functionally viable and produictive education to these Groups, especially in tribal areas. Monitoring o f the working o f ithe se institutions will be taken up through PRIs to ensure un-interrupted and smooth irmparting o f education to the target population, especially those living below the poverty line..
3.9.43 To ensure educational development amongsst the SCs and the STs, the vital ongoing programme o f Post-Matric Scholarships, which wa;s modified in 1995-96 by lifting all the restrictive clauses during the Eighth Plan, will Ibe implemented with added thrust and wider coverage to encourage these groups to enter into higher/technical streams of education. To promote school education amongst chiildren whose parents are engaged in unclean occupations and to divert the future generatiion.s away from the practice o f scavenging, the recently revised scheme of Pre-Matric Sclholarships will be expanded to reach these facilities to all those who are in need. The scheme o f Pre-examination Coaching Centres will be further expanded to benefit the rural candidates also. Intensified efforts will be made through effective expansion o f Education Complexes in low literacy pockets for development o f SC and ST women and girls as they lag much behind their counterparts. Hostels for SC and ST Giirls and Boys will also be strengthened/expanded to ensure that the demand for thos'ie hostels is completely met as the hostels solve the problem of inaccessibility. Also, ottheir programmes like Book Banks, Merit Scholarships and Fellowships for studies abroad, w/ill be put into action effectively to act as special incentives.
3.9.44 Elimination o f the most inhuman practice o)f manual carrying o f night-soil is yet to be accomplished. During the Ninth Plan, compUete: eradication o f this practice o f manual scavenging will be achieved as a time-teound commitment by ensuring occupational mobility and breaking the nexus between the traditional occupations and social and economic disabilities. Total liberation and full rehabilitation o f the scavengers, especially focussing on the women and girl children, vvvilli be taken up intensively in the Ninth Plan after accomplishing the total identification o f the scavengers.
3.9.45 Rehabilitation programmes with vocational ttraiining for alternative jobs with sustainable income will be taken up. Loans and other fimancial and technical assistance will be extended to the scavengers to start self-employment wiith income generating activities to keep themselves gainfully engaged. Simultaneous effojrts, in close collaboration with the agencies o f Local Self Governments, will be put into ac tion to ensure that all the dry latrines are changed into wet latrines so as to wipe off thi s inhuman practice completely from the present day list o f professions. With a vie^w to freeing the future generations from the traditional occupation o f scavenging, all enc:ou)ragement for promotion of education by providing hostel facilities, scholarships, mid-day meals, free books and uniforms etc. will be given, on priority basis, to thte children belonging to these communities. To keep a close vigil on the progress (of this programme with national commitment, the term o f the National Safai Karannchari Commission has also been extended till the end o f the Ninth Plan period. The Natiomal Safai Karamcharis Finance and Development Corporation will be strengthened/activatecd to act as a catalytic agent in rehabilitating the scavengers on a time-bound basis thirough extending alternative jobs/ employment for those who want to start self-employmemt-cum-entrepreneurial ventures.
3.9.46 A large number o f families belonging to the Stociially Disadvantaged Groups live below the poverty line and dwell in the most backwarcd and inaccessible areas that are devoid o f even basic minimum services. Therefore, tthey have been always subjected to several deficiencies, diseases and disabilities dute Uo malnutrition/under-nutrition, compounded with inaccessibility /non-availability o f p rim iar/ health care and drinking water etc. While food security in the tribal areas will be ensurred through the expansion o f the
369
Revamped Public Distribution Systtem (RPDS) simultaneous efforts will also be made for raising the purchasing power o f tthe tribals through employment and income generation activities, especially under the Pov^erty Alleviation programmes. Efforts will be made to expand the scheme o f 'V illage Grramin Banks' to make sure that adequate food is available in the remote tribal villages which rremain cut-off from the mainland during the major part o f the year.
3.9.47 While the all-round devellopment o fS T s in general will be addressed through the continuing programmes bmt with added thrust and support, the Primitive Tribal Groups (PTGs), who are leading an extremely precarious life and some o f whom are on the verge o f extinction due to Ihunger, starvation and diseases, will be attended to, on a priority basis, in the TNinth Plan. As the ongoing programmes have not been able to alleviate the conditions (of the PTGs, direct programmes for the welfare and development o f PTGs will be laumched in the Ninth Plan through an integrated action plan incorporating supply o f safe drinkiing water, food and nutrition security, health coverage, educational facilities etc. The pro)posed Action Plan for PTGs will have an in-built flexibility to cater to the specific neceds o f each tribe and its environment.
3.9.48 To attend to the varied ancd specific health problems o f the tribal com.munities in different States/UTs, efforts will Ibe made to develop appropriate health infrastructure with much needed inputs so as to (enable these Groups to have easy access and availability o f services within their reach. Alsco, special health packages will be developed to combat diseases that are endemic in natuire and affecting the lives o f the tribal population. In these efforts, priority will be giv(en to the Primitive Tribal Groups as some o f them are getting extinct due to endemic cdiseases. Indigenous systems o f medicine will also be promoted with all the necessary support to cater to the needs o f the tribal population as the ingredients o f this system of meedicine are easily available at a much lower cost within the tribal areas. The tribal womien and girl children, being the deprived lot and the worst affected, will receive special attention in meeting their health and nutritional needs. The concept o f 'M ini-A ng’anwadis' with relaxed norms to bring all the remote and the neglected pockets o f the co)untry under the Universalisation o f ICDS, will be the main strategy to ensure that the children below 6 years and the expectant and nursing mothers, belonging to these communities, will receive supplementary nutrition, immunization, health-check-up etc.. The provision o f safe drinking water will be given top priority in the Ninth Plan as part o lf BMS.
3.9.49 The Ninth Plan acknowlecdges the need for a National Tribal Policy. Accordingly, efforts will be made to formulate :a comprehensive Tribal Policy during the Ninth Plan with a special focus on the primitive trribes and displaced tribals and their rehabilitation.
Other Backward Classes (OBCs)i
3.9.50 Empowerment o f the OBCs during the Ninth Plan has been visualised as an effective instrument to ensure soicial justice in the country. To make this more realistic, efforts will be made to get enumieration o f the OBC population done by the Registrar General and Census Commissionier in the forthcoming Population Census o f 2001. In the meantime, efforts will also be macde to ensure that the National and the State Commissions, in pursuance o f the directives o)f the Supreme Court, will bring out their final Lists o f OBCs.
3.9.51 Development o f the O B C s, which made a beginning in the Eighth Plan, will continue to receive more attemtion during the Ninth Plan with many new initiatives in the field o f education and eco)nomic development. The success stories related to the development o f the SCs have prrompted the Government to adopt a similar approach towards the development o f O B C s, as the needs and problems o f OBCs are more or less similar to those o f SCs. TIhus, for ensuring educational development amongst OBCs, schemes for providing scholarships for pursuing pre-matric, post-matric, and other higher
370

education, supported with hostel facilities, will boe introduced. Alternatively, children belonging to the OBCs will also be given opportuunities to enjoy the existing hostel facilities meant for SC and ST boys and girls.
3.9.52 For OBC students to participate effectively iiin the competitive examinations, Pre- Examination Coaching Centres will also be set up im the Ninth Plan. In order to provide housing and other settlement facilities to the asset;tless migratory communities amongst the OBCs, a new scheme o f Shelter for Nomadic Grooups amongst the Backward Classes, will be introduced in the Ninth Plan.
Minorities
3.9.53 The emphasis during the Ninth Plan will s be on the overall socio-economic development o f Minorities with special focus on theeir education. The existing scheme o f M aulana Azad Education Foundation, New Delhi i will be further strengthened and supported to enable the expansion o f its activities aand promotion o f education amongst women by providing additional facilities o f schoolss, colleges and hostels, offering remedial coaching, upgrading the existing institutionns and networking with vocational and technical education. In order to promote higher e and technical education amongst the Minorities, support will be extended to provide scholara-ships/ fellowships.
3.9.54 Educational backwardness, especially amnongst the M uslim women and girl children will be addressed on a priority basis in the Ninnth Plan. To this effect, efforts will be made to provide educational facilities with appropriaate infrastructural support in those areas/habitations where their population is concentitrated, facilitating easy access to educational institutions/facilities for the Muslim wonmen and the M uslim girl children. Steps will also be taken to motivate and involve panrents and community/religious leaders to play a catalytic role in promoting education amongst;t Muslim women and girl children. To tackle the educational backwardness, modemis.sation o f the existing traditional institutions like Madarsas, will be accorded a high pridority in the Ninth Plan as these have been instrumental in arresting drop-outs and inculcatinng discipline amongst their students. The modernisation o f Madarsas will be effected througgh amendments to their traditional syllabi and introduction o f subjects like Mathematics s. Sciences, General Studies, English etc. to mainstream them.
3.9.55 The other crucial areas, which will be paid sppecial attention for empowerment o f the M inorities in the Ninth Plan include special alattention to the health, nutrition and education problems o f girls and women; expansion i o f Multi Sectoral Developmental Plans and Pre-examination Coaching Centres in the NMinority concentrated Districts to extend the much-needed support to the students studyying in the secondary and post-matric classes; and conservation and promotion o f the langguages and culture o f the Minorities etc. with effective involvement o f the NGOs.
II.Economic Empowerment
Scheduled Castes and Scheduled Tribes
3.9.56 As there exists a sizeable population belongging to the Socially Disadvantaged Groups o f SCs, STs, OBCs and Minorities living unnder extreme conditions o f poverty, mobilisation o f adequate financial and social support t to free them from the clutches of poverty, will be taken up on a priority basis. To tlthis effect, economic empowerment through employment and income generation programmnes will be given special emphasis in the Ninth Plan to ensure that at least their basic needs aree met.
371

ECONOMIC EMPOWERMENT
As there exists a sizeable population belonging to the Sqcially Disadvantaged Groups o f SCs, STs, OBCs and Minorities living under extreme poverty, mobilisation o f adequate financial and social support to free them from the clutches o f poverty w ill be taken up on a priority,basis through :
SCs and STs ^• A special thrust w ill be given on employment and income generation programmes with an ultimate
objective o f making these groups economically independent ^ d self-reliant and thus raise them above the poverty line
All the 5 National and other State Level Finance and Development Corporations w ill be strengthened to play a catalytic role in promoting employment-cum-income generation activities ’ 'tKrough' ‘Backward’ and ‘Forward’ linkagesSpecial eiforts through various trainin^programmes to upgrade the tfaditional skills, equip them with m odem technology so as to meet the market demandsTo enforce special legislative measures to ensure payment o f miiiimum' wages and equal wages, with h'o gender discrimination in th,e informal/unorganised sector'The private and the corporate gectors w ill be motivated to invest on the welfare and development o f the weaker sections as they form a potential force in the country’s human resources To endow every landless SC and ST family with a minimurh'piec^ o f land; festoration / preservation o f land ownership an'd effective implementation o f protective legislationInvolvement o f NGOs in the promotion o f small and lift irrigation projects, especially in the drought prone, dry and hilly areas to ensure'food security at the village levelTo sensitise/motivate the Financial Institutions to pay special ‘attention to' these priority groups and extend loan^ on differential rates o f interestTo commercialisation o f the tribal econom y and confer ownership rights in respect o f minor forest product (MFP) to person^ who work in the forestsTo provide the much needed boost to the tribal economy, the existing supporting mechanisms o f TRIFED and its relate’d agencies will'be merged and upgraded into an Apex Body at the national-level
t ■ ^
OBCSThe NBCFDC will be activated to extend necessary support for financially viable schemes/projects and to upgrade the technical self-reliantSteps will be'taken to yipport self-employment and income generating venture;?, especially for nomadic and semi-nomadic communities with a view to settling them permanently at o,ijp, place The NBCFDC will be strengthened besides encouraging the Voluntary Organisations in the social and econom ic upliftment o f OBCs: ^Traditional weavers, who are going through hardships at present, will be supported with necessary financial and material support to revive the languishing industry as a sustainable venture The much-needed modernisation,of handloom operations throu^ appropriate apprenticeship, training, and supply o f raw materials w ilfbe ensured
MinoritiesThe National Minorities Development and Finance Corporation (NMFDC) w ill be encouraged to promote self-employm ent and income-generation activities amongst the minorities by extending financial and other technical support
3.9.57 In this direction, all the national and State level Apex bodies viz,, the National SC and the ST Finance Develop-ment Corporations (NSFDC), National M inorities-Finance and Developm ent Corporation (NMFDC) and National Backward Classes Finance ?uid Developm ent Corporation (NBCDC) and the State Scheduled Castes Developm ent Corporations (SCDCs) will be strengthened to play a leading and a catalytic role in promoting employment-cimi-income generation opportunities. As m ost o f the SCs, STs, OBCs and M inorities living in rural areas, continue to depend upon the low-inconie and less-productive informal/unorganised sectors o f agriculture, dairying, animal husbandry, fisheries, handlooms, handicrafts including other craftsmanship/artisanship, special efforts w ill be made through various training programmes to upgrade their traditional skills, equip them with m odem technology and extend both 'backward' and 'forw ard' linkages o f credit
372

and marketing facilities with the uUtirtimate objective o f making them ecommically independent and self-reliant. Special ledegislative measures will also be taken to ensure payment o f minimum wages and equail 1 wages, with no gender discrimination in the informal/unorganised sector.
3.9.58 The adoption and implememtaitation o f the New Economic Policies warrant watchful and protective attention towardls > the weaker sections so that the com nitm ent to bring about comprehensive improveemment in their living conditions does not ge: diluted and more importantly they are neither didisplaced nor marginalised. Therefore, the effons in the Ninth Plan will be to synchronise; e empowerment o f these w eaker sections \'ith the national developmental policies and progtrarammes. The private and the corporate sec ors will be motivated to invest on the welfare amd 1 development o f the weaker sections as tfcy form a potential force in the country's human rresesources.
3.9.59 Prominent amongst the various A Action Points to be taken up in the Ninth ^lan are endowing every landless SC and ST famiilyly with a minimum piece o f land, restorauon and preservation o f land ownership and effeectctive implementation o f the protective leg slation. As most o f the SC and ST families depenid d upon the cultivation o f small land holdings, steps will be taken to ensure revision o f irrrigigation facilities. Involvement o f NGOs in the promotion o f small and lift irrigation projeqects especially in the drought prone, dry aid hilly areas will go a long way in ensuring food sesecurity at the village level.
3.9.60 Special measures will also Ibe e taken to sensitise and motivate the fnancial institutions to pay special attention to tlhesese priority groups and extend loans to them on differential rates o f interest. Scnsitisattioion programmes to inculcate a positive attitude towards these disadvantaged and negllecected sections will also form part o f the economic development package. The youth and wv'ommen amongst these Groups will be given special attention as they are the most important! p potential and productive 'hum an resour;e', by setting up small scale and cottage iindidustries, village crafts, weaving ard other occupations/enterprises with effective market linkages. Exploitation o f vu nerable groups, especially the tribals, will be pre^verented with stringent measures.
3.9.61 Efforts will also be made to siimpiplify the lending and other procedures cf banks and other financial institutions as the pi procedures followed by them appear to be too complicated for the poor illiterate, ignorranant and desperate weaker sections to avail o f the loan. Since the majority o f the populaitio ion belonging to these Groups depend upon agriculture and allied activities for their li livelihood, steps will be taken to ensure thct loans are given on a priority basis to these (aroroups for agricultural purposes viz., purchase cf seeds, fertilisers, pesticides and training in n fanning and application o f advance technology.
3.9.62 With the shrinking o f the forest la land, privatisation o f common property resources and the down-trend in the forest-based siubsbsistence economy, the tribals are facing hardships leading to displacement and vulnerabiilitjity to exploitation by external forces/agencies. These problems o f the tribals are fiirtlhener compounded by land alienation and dep-ivatioa o f rights on minor forest produce, leadlingng to tribal unrest due to feeling o f insecurity. Therefore, effective .steps will be taken to to thwart the recently emerging phtse of industrialisation and commercialisation! o o f the tribal economy. The common apprcach to ownership rights in respect o f minor fo)res"est produce (MFP) to persons who work in the forests, will be realised in the Ninth Plan.
3.9.63 In order to provide the much meeceded boost to the tribal economy, the existing supporting mechanisms o f TRIFED and I i its related agencies will be merged and upgraded into an Apex Body at the national Ieve;l d during the Nirith Plan. The existing Sta;e level Tribal Development Corporations (TDCs :) v* will act as support structures to the Apex oody at the State level and are expected to involwe 'e themselves effectively in the marketing cf MFP and surplus agricultural items, both insidte a: and outside the country. The States with nzeable tribal population but without TDCs, w w ill be encouraged to set up such exclusive Corporations.
373

3.9.64 Measures will be initiated to enssurre effective implementation including earmarking and utilisation o f funds under the spoeci;ial strategies o f Special Component Plan (SCP), the Tribal Sub-Plan (TSP) both at the Ccentitral and State levels, and the Special Central Assistance (SCA) to SCP and TSP tco SStates/UTs. Special efforts will be made to impress upon those M inistries/ Departments, wl^ho are not earmarking funds, so far, under SCP and TSP in the name o f non—diivisibility o f the programmes o f their Ministries/Departments. The Centre will also puarsiiue with the State Governments for ceveloping effective mechanisms on the lines o f thoe Maharashtra Model to pool the funds of SCP/TSP from all the concerned Ministries/Dtiepoartments and authorise the State nodal Departments in charge o f the welfare o f SSCss and STs to take the responsibility in allocating the funds as per the local needs o f both thae target areas and the target population, fhis system is expected to prevent/control diverssioDn o f SCP, TSP and SCA funds and ensure effective utilisation o f the same for thes pourpose they are meant for. While a close vigil, in close collaboration with all thhe concerned, will be kept at various levels for effective monitoring o f the utilisation (o f ’ these special funds, the ongoing regular reviews at the Central level will continue to assseess as to how effective are these iistrum ents in supplem enting/ complementing thhe efforts o f the nodal Ministry o f Social Justice and Em powerm ent in empowering these 5SoocialIy Disadvantaged Groups. To this effect, efforts will be made to install an effecti:ivee monitoring mechanism with adequate manpower at various levels starting from the Centtree to the Block levels.
Other Backward Classes
3.9.65 To ensure that the OBCs are able to acchieve economic development and self- reliance through prom oting entrepreneurship amconjigst themselves in diverse fields, steps v/ill be taken to support self-employment and irncome generating ventures, especially f)r nomadic and semi-nomadic communities with i a view to settling them permanently at one place. To attend to this special task, not onHy tthe existing National Backward Classes Finance and Developm ent Corporation (NBCFDC3) >will be strengthened but a new scheme of Grant-in-aid to Voluntary Organisations will alJso) be launched to encourage the voluntary effort in the social and economic upliftment o ff O B C s. The functioning o f the existing NBCFDC will be further activated to extend rneccessary support for financially viable s;hemes/projects and to upgrade the technical anad (entrepreneurial skills o f individuals and groups belonging to OBCs to enable them innitiate self-employment/entrepreneurial \entures.
3.9.66 As majority o f OBCs has been traditiconaally engaged in the occupations like handloom weaving, pottery, metal work, artisanishiip, fishing, stone-cutting etc., a special tirust will be laid on upgrading their traditional : skdlls especially those o f women and to provide financial support and marketing facilities in i developing entreprenuership, either ii groups or as individuals. Efforts will also be ■ maade to encourage occupational mobility f jr those OBCs, especially the youth, who intend 1 tdo discontinue their traditional industries, fcy providing facilities for appropriate educationaal : and vocational training in modem and tpcom ing technologies, supplemented with finaanncial and other assistance to enable tiem to enter successfully into new ventures.
Minorities
3.9.67 Priority will be given to economic deveHoppment amongst the Minorities through srengthening the institutional set-up at various i : levels to support self-employment and iicom e generation activities, especially amonggstt women and occupational groups by &ipporting micro and small-scale enterprises. TThoe National Minorities Development and Finance Corporation will be encouraged, to promcotee self-employment activities among the ninorities and to provide upgraded entrepreneuriaal aand technical skills, specially focussing cn the development o f the backward sections w iz., women, traditional artisans and cccupational groups.
374

3.9.68 While planning for the ecoanoDmic betterment o f the Minorities, the Ninth Plan accords special recognition to the traodit tional craftsmen and artisans' skills vested in th;m for generations. A large number cof families belonging to the Minorities especially women still continue to be dependesntt upon he household/traditional industry of handicrafts such as embroidery lilikee chikan-kaari, Zari work, lace-making and tailoring, dyeing etc. In order to promnotte the handicraft sector as a viable and sustainable self-employment and income generatioDn : source for these families, efforts will be made to provide apprenticeship training, rew iw e the dying arts and crafts, extend modem technological support, upgrade the skijllss to meet the changing fashions and the m arketng demands both within and outside thae country. In fact, special efforts will be made to encourage export-oriented handicraft's in view o f the increasing demand outside ’.he country. The Minority Finance De^iveslopment Corporations both at the Central and the State levels will be encouraged tto extend financial and other technical support l;ke provision o f machinery, expertise, trainnimg, market linkages etc.
3.9.69 Handloom is another sector wlhicch has been an important traditional occupation for a large segment o f the Minorities. Tfhose traditional weavers, who are going throi.gh hardship at present, will be supporteed with necessary financial and material support to revive the languishing industry as a a sustainable venture. To this effect, the much- needed modernisation o f handloom opperations through appropriate apprenticeship aid training, will be attended to in the Ninnthi Plan. Flow o f credit and raw materials to this sector will also be ensured. To prreserve their rare traditional skills, they will be encouraged to form into self-help groDupos/co-operatives for which financial assistance v/ill be extended along with managerial andi rmarketing services.
111. Social Justice
3.9.70 Affirmative action and legislatiivee measures being the most powerful instruments to ensure social justice to the Socially / DDisadvantaged Groups, the Government commits to bring forth into action a 'National (Chaarter for Social Justice' based on the principle of social harmony, besides extending Meggal protection to existing percentages o f reservation in educational institutiom s at the State level. To this effect, implementation o f the reservation policy in both educatiornahl institutions and services for SCs and STs and for OBCs in the Services will be strictlyy < adhered to by filling up all the reserved pests promptly, arrangement will also be maade3 simultaneously for quick judicial adjudication of complaints and grievances in the maatteers related thereto.
3.9.71 To prevent/curb the persisternt problems o f social discrimination, prevalence o f social evils like untouchability, and tJthe increasing exploitation and atrocities agaiast these disadvantaged groups, collaborratiive efforts by all concerned will be made towa-ds effective imple-mentation o f the Indiaan Penal Code and the other two special legislations viz.. The Protection o f Civil Rightss /Act, 1955 and the SC and ST (Prevention o f Atrocities) Act, 1989. To rem ove: thhe last vestiges o f untouchability, special efforts with commitment will be put into aacttion to change the mind-set o f the people throtgh societal re-orientation. In this connte^xt, immediate measures will be undertaken to ensure that adequate number o f Sppeccial/Mobile Courts are set up with adequate staff in each district to provide both speedy anndl on-the-spot settlement/redressal o f grievances. As an important measure o f social justicee, ; special efforts will be made to extend timely and adequate financial support, as per tthee provisions, to compensate/rehabilitate the SC/ST victims and make them self-reliant. I In this direction, efforts will also be made to enhance the compensation through necessary aameendments in the Act. Simultaneously, efforts vail be made to develop a commuiiniity-based defence mechanism by empowering .he institutions o f local governance and WGCOs. As part o f these measures, a few selected lo;al NGOs will be identified to act as autithcorised informants to the enforcement authorities or file papers on behalf o f the victims orr asssist them in the legal proceedings.
375

To institute a ‘ National Charter fifor ' Social Justice’ for ensuring equity and social justice to tlie socially disadvantaged groups viz., SSCss, STs, OBCs and MinoritiesTo implement Reservation Policy sGtricctly in educational institutions and in services for SCs, STs and OBCsTo curb social discrimination, untoouchhability, exploitation and atrocities on these Groups through effective implementation o f :
- The Indian Penal Code- The Protection o f Civil Rights Acct, 1955- The SCs and STs (Prevention o f / Atitrocities) Act, 1989
To set up adequate number obf Special / Mobile Courts in each district for speedysettlement/redressal o f grievances o f f thae SCs/STsTo extend timely and adequate e f financial support, as a measure o f social justice, to compensate/rehabilitate the SC/ST vvict timsTo develop a community-based ddefe'ence mechanism by empowering the institutions o f local governance and NGOsTo change the mind-set and attituudess o f the people towards these Groups through awarenessgeneration campaigns and media, booth i print and electronicTo equip these Groups with necesssarry information and thus conscientise them to exercise their rights, privileges and also make thoe bbest use o f the Governmental support to overcome various social disabilitiesTo sensitise all those working for tithe well-being o f these Disadvantaged Groups through special training programmes for ensuring soociaal justice to themTo make all the three existing "Natitionnal Commissions as effective instruments to ensure that the rights and interests o f these Disadvarmtaaged Groups are well protected
T O W M R I D S S O C IA L JU S T IC E
3.>.72 Awareness generation, consccierntization and sensitization programmes are yet other m;ans to work towards social justicce.. Special efforts will be made to put this three-prongedaproach into action simultaneous sly/ for holistic effect. The first being awarenessgeieration, efforts will be made too cchange the mindset and the attitudes o f the people tovards these Groups as the same i:is very crucial in creating an enabling environment fc empowering these Groups. To > thhis effect, awareness generation programmes/special canpaigns will be taken up on a ( comtinuing basis all over the country especially in rural anas involving effectively bothi the governmental and the non-governmental organisations and the media towardds ̂erasing the long-standing social biases/stigmas like uitouchability and thus create thhe feeling o f all being equal. The second being,cascientization o f the target groupss, s simultaneous efforts will be made to make the target gnups conscious o f their own rights, ., pnrivileges and the governmental support available for th;m besides making them realises 1 their own potentials to be self-confident and self-reiant. The third being, sensitizi:ingg both officials and non-officials, special trainingpngrammes, both pre-service and irn-service, will be undertaken from time to time toseisitize all those working for thesse ' Groups so that they can work with right perspectives in meeting/handling the special neecds and problems o f these marginalised groups and thus eisure social justice. To encourag(;e/rreward those officials and non-officials, who are wirking for the good o f these depri’iveed lot by living in the most backward and difficult trbal areas, efforts will be made tco impress upon the State Governments to revive the e^lier practice o f extending incentivi^esj, both in kind and cash.
376

POLICIES AND PROGRAMMES : A REVIEW
3.9.73 The major objective o f the Eighth Plan was ; to> intensify the efforts to bridge the gap between the levels o f development o f SCs, S T s,, O B C s and Minorities and the rest o f the population so that by the turn o f the century, they aare; brought on par with the rest o f the society. The elimination o f exploitation o f SCs and S T s and the removal o f all forms o f oppression o f SCs and STs were identified as the arceats o f priority. Besides, action was taken for the complete removal o f untouchability, supppiression o f rights, usurious money lending, land alienation, non-payment of minimum VÂ a},ges and restrictions on the right to collect minor forest produce etc.
3.9.74 Education for the SCs and STs, especially wcomien and girl children belonging to these communities, received a special thrust duringg the Eighth Plan in accordance with the National Policy on Education of 1992 (revissecd). The scheme o f Post-Matric Scholarships (PMS) for SC/ST students continued t>to be the torch-bearer o f various governmental efforts in the field o f education. To emsuire better coverage, this scheme was modified in October, 1995 by incorporating provision.is for i) complete relaxation o f the restrictive clause in the number o f scholarships fo r girls and upto two males in a family; ii) increase in the rate o f scholarships fro m ; thie existing range o f Rs.65/125 to Rs.90/190 per month for the day scholars and from R.s. 115/280 to Rs. 150/425 in respect o f hostlers; iii) increase in the upper income ceililinig of parents from Rs. 18,000 to Rs.33,400 per annum for full maintenance allowancce and fees and from Rs.24,000 to Rs.44,500 with full/half maintenance allowances and ffulll fees; iv) increase in the study tour allowances from Rs.lOO to Rs.500 per annum; and vV) p^rovision o f Rs.500 per annum as allowance for books in the correspondence courses imcluding distance and continuing education. Consequently, as many as 17.12 lakh SC//STT students (piovisional) received the benefit o f PMS by the end o f the Eighth Plan (lS99f6-97), as compared to the record achievement o f 15 lakh scholarships by 1991-92 and 99.7'5 lakh scholarships by 1985-86. By the end o f 1997-98, as many as 20.88 lakh bene3fic:iaries were provided with PMSs. Guidelines for streamlining the sanction and disburssemient procedures under the Scheme were also issued to all States/UTs in April, 1995.
3.9.75 In vievv' o f the ever increasing demand andl tlhe importance o f the scheme, the financial allocations for PMS were increased from R’vS.54.05 crore in the Seventh Plan (1985-90) to Rs.300.00 crore during the Eighth Plaan.. In fact, the cumulative level of expenditure at the end o f the Eighth Plan (1992-97) vvvass as high as Rs.508.75 crore and during 1996-97 itself it was Rs. 179.93 crore. The schaerme, which made a modest begirming with the award o f 114 scholarships in 1944, reached thie level o f 21.48 lakh students by the end o f 1996-97. During 1997-98, as many as 21.777 Uakh SC/ST students were awarded with PMS. The scheme o f Pre-Matric Scholarshipps for the Children o f those who engaged in Unclean Occupations was also revised i in February, 1994 to bring about the removal o f the restrictive clause o f one child per farmihy upto Class VIII, subject to the condition that if a third child is bom after 1.4.93,, a total o f only two children in the family would be eligible for these scholarships, externsiion o f the benefits to day-scholars studying in Class III to X, removal o f the incomee cceiling o f R s.l500/- per month o f parents/guardians; and relaxation o f the restrictive clauuse on two children in Class IX and X. These positive amendments gave a boost to the < ov/erage, leading to the award o f 3.26 lakh (provisional) Pre-Matric Scholarships in 1996-977, ithe end o f the Eighth Plan and the Central assistance released also increased from Rs.6.39 i crcore in 1992-95 to Rs. 14.04 crore in 1996-97. In 1997-98, about 3.80 lakh students whosse parents were engaged in unclean occupation were provided with Pre-Matric Scholarships.;.
3.9.76 As a support service to reduce the high drop-*-ouit rates and increase the retention rates at the middle/higher level education amongst SCCs and STs, around 1503 hostels were built to benefit 1.22 laUi SC boys and girls and 553,hoDstcels to benefit 22,120 ST boys and girls by the end o f the Eighth Plan. During 1997-98, 1143 SC/ST Girls and 86 SC/ST Boys Hostels were sanctioned. To promote educatidoni amongst STs with focussed
377

attention, educational facilities like Ashram School;ls ( (residential schools) for ST students had been set up in the tribal areas in an environmennt c conducive to their learning. As many as 353 Ashram Schools in TSP Areas were envisagecd bby the end o f Eighth Plan (1996-97). During 1997-98, construction o f 101 Ashram Schooobls were taken up to accommodate 1270 ST inmates/students. The Scheme o f 'Bookk 1 Banks for SC/ST Students', envisage easy/ready availability o f text books to SC/ST stuadeents pursuing medicine, engineering, veterinary and agricultural and polytechnic courses aand around 1,27,073 SC/ST students were benefited under this scheme during the Eighth 1 Pldan. A total o f 16,482 SC/ST students were benefited through the scheme o f Book Banks, ddunring 1997-98.
3.9 77 Further, special coaching facilities for the; SSC and ST candidates were extended through Pre-Examination Coaching Centres to enahblee them compete in the Civil Services Examinations o f A and B Group o f posts o f Sttatee/Central Governments and Public Sector Undertakings. The coaching and train ing ' t to SC/ST candidates were provided through the Central assistance to 10 States viz., Avsssam, Andhra Pradesh, Bihar, Gujarat, Kamataka, Kerala, Maharashtra, Punjab and Deblhiii. Ten universities and 4 private institutions were supported during 1995-96. N'Jeaarly 30,000 SC/ST students received coaching under the scheme during the Eighth Plan. AV scheme o f 'Upgradation o f M erit Scholarships', which provides remedial coaching inn English, M athematics and Science subjects to help SC/ST students appear in medical i annd engineering examinations, is also being implemented by the Ministry o f Social Justicee annd Empowerment, since its transfer in 1993 from the Department o f Education to the M/Iinistry o f Welfare (now M inistry o f Social Justice and Empowerrnent).
3.9 78 In addition to the major programmes ddisccussed above, there are some moreeducational programmes which are under implemaenntation to provide the necessary inputs to help SC and ST students excel in the field o ff e education. These include : SpecialEducation Development Programmes to SC/ST G iirhls belonging to Low Literacy Areas; Programmes to extend financial assistance to NGCOss for setting educational complexes to promote education among SC/ST and most f primitive tribal girls; Nationalscholarships to meritorious SC/ST students to puurs'sue higher studies abroad etc. Allthese schemes, as stated earlier, supplement i the major efforts that are being implemented to improve exclusively the educatioonaal status o f SC and ST population.
3.979 The National Health Policy (1993) whilde recognising the heterogeneous tribal population and their varied health problems, accorrdeed a high priority for extending the health services to those residing in the backward rvuraal areas, with a concentration o f SCs anc to those hilly and remote tribal areas with tribal ,1 ppopulation. It laid special attention on the endemic diseases like Malaria, Tuberculosis,;, 'W aws etc. The strategy adopted forme3ting the health care needs during the Eight.th Plan period include provision o f preventive, as well as curative services through thae | primary health care institutions and at the village level through Health Guides and Trained ' D£)ais.
3.9.80 As the tribal population concentrations and 1 hakbitations are located in difficult and isoiated hill/forest areas and terrains, the Govemmoennt has adopted relaxed norms for PHCs viz., one PHC for every 20,000 population and one SSubb-Centre for every 3,000 population. In order to give focussed attention to the SCs, the Stitatite Governments were advised to set up at least 15 per cent o f the sub-centres in villages andd hhabitations having 20 per cent or more o f 5C population and to direct 7.5 per cent o f their annnual targets to tribal areas. To the sane effect. Mobile Dispensaries and Medical Ciianmps were organised to provide health facilities in States and UTs.
378

SPECIAL FINANCIA^L INSTRUMENTS
i j
3.9.81 In the sphere o f economicdevelQpment, various employment-cum- income generation programmes have been under implementation through both governmental and non-govemmental organisations with the ultimate objective o f lifting the weaker sections from the 'Below Poverty Line'. To network/coordinate various economic activities^ jspread all over the country, apex organisations viz. National SG/ST Finance.: ârid* Develop-mentCorporation (NSFDC), Tribal Cooperative Marketing Development Federation o f India Ltd. (TRIFED) and State Scheduled Castes Development Corporations (SCPCs) haye been functioning as catalytic agents, both at the-national and the State levels.. The NSFDC financed 997 self-employment projects, which were expected, to benefit 95,494 SC/ST beneficiaries during the five year period from 1992 to 1997. Jh e TRIFED continues to* offer remunerative prices for the minor forest produce and surplus agricultural items produced and collected by the tribals, besides protecting them from exploitation by middlemen. Similarly, the SCDCs were engaged in identifying eligible families and extending financial and other assistance to them to undertake income-generation projects through credit support. During the Eighth Plan, 24.42 lakh SCs were benefited with the support and assistance received from the 23 SCDCs. During 1997-98, a total o f 4.62 lakh SCs were benefited through 21 SCDCs.
3.9.82 Amongst the-various p o v e ^ alleviation ,progranynes,, the Integrated RuralDevelopment Pro^amme (IRDP) received special emphasis during the Eighth Plan period for extending the employment-cum-inconae generating activities. By the end o f the Eighth Plan (1996-97), about 36 lakh SC and'ST families, representing 98 per cent o f the target, were covered under Rural Poverty Alleviation and Employment Programme. In the year 1997-98, about 7.86 lakh SC/ST families were covered under IRDP. The'Training o f Rural Youth for Self-Employment (TRVSEM), which is a support component o f IRDP,has so far provided training to 7.20 lakh SCs and STs (46.6% o f the beneficiaries) duringthe Eighth Plan. Under Jawahar Ro:2gar Yojana. (JRY); which provides employment opportvmities to the rural poor, about 1.00 lakh man-days o f employment were gefler^t^ for SCs and STs accounting for nearly 66 per cent o f the total achievement. Similarly,, under the Employment Assurance Scheme (EAS) in 1778 blocks in ^61 districts (in 1992), about, 2940 lakh man-days o f employment were generated forvSCs and STs. Thus, by, the end o f the Eighth Plan, a total o f 24.82 lakh (96.9%) SC families, agaijjst the target.of 2^.62 lakh, and 11.07 lakh (101.0%) ST families, against the target o f 10.96 lakb, w,erq assisted under various poverty alleviation programmes.
f * .3.9.83 Besides the above, there are other schemes under 'the nodal Ministry o f ,Social Justice and Empowerment which contribute, to the economic development« o f SCs/STs. These include : Vocational Training in the Tribal Areas under which financial assistance is extended for setting up o f Vocational Training Centres in Tribal Areais and Gr^nt-in-aid to
/ State Tribal Development Cooperatives/Corporatiqns for Mmor; Forest.Produces (MFP^ to ensure remunerative prices to the tribals for MFP
379
The five National Finance Developm ent Corpo;‘ations viz., National SĈ and ST Finance and Development Corporation (NSFDC), N ew Delhi, Tribal Cooperative Market Development Federation o f India Ltd.(TRIFED), Murpbai, National Safai Karamchari Finance and Development* Corporation (NSKFDC), N ew Delhi, National 'Minorities Development and Finance Corporation(NMDFC), New' Delhf, National Backward Classes Finance and Deveropment Corporation (NBCFDC), Nfew Delhi, act as the major national-level apex agencies for networking, co-ordinating and streamlining various employment,, credit and income generation activities to better the economic i status o f th^ disadvantaged groups vi?., SCs ,STs/O BCs*and Minorities: In fact,
,they are the major catalytic agents 'which transact the business on behalf o f -the. Government. While these apex agencies work;, through their State-level Channelising Agencies which vvould help- / identify the beneficiaries; finance the projects through credit./ subsidies; extend technical advice and operate / control the activities, JRIFI^D continues to purchase the Minor Forest Produce and the Agriculturaf Surplus Produce by offering remunerative prices to the tribals and thus avoid the exploitation by middle-men.

3.9.84 The issue regarding the eradication o f the most obnoxious and inhuman practice o f carrying night-soil manually received high priority in the Eighth Plan. The National Scheme o f 'L iberation and Rehabilitation o f Scavengers and their Dependents' was launched in 1992 with the uiltimate objective o f eliminating scavenging by the end o f the Eighth Plan (1992-97) on a timie-bound programme. So far, 8.25 lakh scavengers were identified, o f whom 1.22 lakh were targeted for rehabilitation during 1995-96 and o f these, 44,000 were trained to take up alternative employment. During 1997-98, about77,000 scavengers were targete;d for rehabilitation and 43,000 were expected to be trained. In order to accelerate and intemsify the efforts, the scheme was modified in April, 1996 to provide for adopting the TRY SEM norm for training, releasing Central Assistance direct to SCDCs and introducing dustier approach for training and rehabilitation. To play the role o f a watch-dog in the elimination/rehabilitation o f scavengers, a National Commission for Safai K aram charis was set up in pursuance o f the National Commission for Safai Karmacharis Act, 1993. The National Commission for Safai Karamcharis continued to evaluate the schem es for the welfare and development o f the scavengers and recommend specific meassures for eliminating inequalities in status, facilities and opportunities, besides investigating specific grievances o f Safai Karamcharis and providing necessary guidelines for mitijgating their hardships. On the econom.ic front, an apex agency called National Safai Karamcharis Finance and Development Corporation (NSKFDC) was set up in I 997 to promote self-employment and income generating ventures by the liberated Safai Karamcharis. In all these efforts, women scavengers, being in majority, received special focus and attention.
3.9.85 The welfare and de'velopment o f the Other Backward Classes (OBCs) started receiving special attention duriing the Eighth Plan with a definite percentage o f reservation in the Government em ploym ent, besides a definite share in the assistance for both educational and economic development programmes. The setting up o f the National Backward Classes Finance aind Development Corporation (NBCFDC) in 1992 was a major achievement towards the developm ent o f OBCs. The Corporation, with a share capital o f Rs.200 crore seeks to piromote self-employment activities among socially and educationally backward c:lasses. The NBCFDC continued to promote economic development o f the OBCs by generating/extending financial assistance for viable self- employment ventures and sirmultaneously upgrading their technical and entrepreneurial skills. The Corporation has sanctioned loans to the tune o f Rs.415.30 crore during the Eighth Plan, benefiting a total o f 2,29,341 persons belonging to OBCs. O f these, about 1,46 lakh persons received wage emp)loyment through various economic development projects under agriculture, artisans and traditional occupations, small-scale and tiny industries, small business, transport serv ices etc. In the year 1997-98, through NBCFDC, a total o f 47,932 OBCs were benefited aind 17,000 were extended with wage-employment.
3.9.86 During 1993, a Naitional Commission for OBCs (NCBC), which is a permanent body at the Centre to look into the complaints and requests, besides recommending inclusion o f certain communit:ies in the lists o f OBCs, was set up. So far, on the basis o f this Commission's recommemdation, the Central list o f OBCs in respect o f 21 States and 4 UTs have been notified by the Central Government. The Government has also extended to the OBC candidates the benefi t o f the relaxed standards in respect o f written examinations and interviews, with effect fr'om October, 1994. Under the scheme o f Pre-Examination Coaching Centres for weaker sections, candidates belonging to the OBCs receive coaching to compete with other general candidates in various competitive examinations.
3.9.87 The Minorities constitute yet another target group, which has come up with various developmental demanids during the Eighth Plan. Responding to the initial demands, some developmenital measures were put into operation, not only to bring about socio-economic development amongst them but also to integrate them in the mainstream through a 15-Point Progrannme. This programme advocates protection o f life and property, adequate representattion in jobs under both Central and State Governments and programmes o f educational development. The Department o f Education has introduced
380

a scheme to extend financial assistance for modernisattion o f Madarsa education and for teaching o f Science, Mathematics, Social S tudies and languages at traditional educational institutions viz., Madarsas and Maktabs, on a voluntary basis.
3.9.88 Recognising the fact that the minority comrmunities, especially the Muslims remained educationally backward, the Maulana Azad E.ducation Foundation was set up in 1989 with a Corpus o f Rs.30.01 crore to promote eduication amongst the educationally backward minorities. To enable the Minorities to ttake part in the competitive examinations, Pre-Examination Coaching Centres were set up in 21 Universities and 32 Colleges. In order to give a focussed attention, 41 M inority Concentration Districts have been identified by the Department o f Education to extend support under the Multi-sectoral plans. An Area-intensive scheme is being imolemented at the block level in all the 41 districts to provide basic education and related infrastruc'-tural facilities. For this, 100 per cent assistance is given by the Central Government.
3.9.89 The scheme o f Pre-Examination Coaching, launcched in 1992-93, has covered 188 institutions where 9480 candidates have received comching for various competitive examinations. The Department o f Personnel made it mandatory for all the recruiting authorities o f Central Government and PSUs to have atkeast one member belonging to the Minority Communities in the Selection Boards/Committcies constituted for the recruitment o f Group C and D posts/services.
3.9.90 The 41 Minority concentrated districts have also b>een brought under the scheme of Community Polytechnics to impart technical skills to (eligible persons belonging to the minority communities. The Ministry of Labour has set up Industrial Training Institutes (ITIs) in 19 out o f the 41 districts and inlroduccd trades, relevant for the minority artisans and workers. Instructions were also issued to States/UTs tco sponsor candidates belonging to the minority communities for vocational training courses.
3.9.91 To ensure socio-economic development amo>ngst the M inorities, a National Minorities Development and Finance Corporation (N M D FC ) was set up in 1994. The activities o f NMDFC was directed towards assisting se;lf-employment ventures by the Minorities and help them through upgradation of entrepreinuerial skills. In all its ventures, the most backward people among minorities living b e lo w the poverty line or below double the poverty line received priority. To promote various economic activities that benefit the Minorities, efforts were being made to extenid credit at concessional rates o f interest, technological support, market linkages etc. Preference was also given to women's occupational groups and self-employment units. Further, to safeguard the secular interests and promote communal harmony, the erstwhile: M inority Commission, set up in 1978, was given a statutory status through the enactmentt o f the National Commission for Minorities Act, 1992 and was reconstituted in 1996.
3.9.92 Towards empowering the Socially Disadvantaged Groups, the State Governments have also been sharing the responsibility with the Centre Iby contributing their due share in terms o f both financial and human resources in line withi the guiding principles o f Cooperative Federalism'. In the area o f educational dev<elopment, the State Governments have been implementing schemes to extend scholarshiips/merit-scholarships, stipends, supply uniforms and provide hostels, residential scho)ols, coaching centres, mid-day- meals etc. Towards their economic development, special interventions, like formation o f cooperatives, cottage and small scale industries, land distribution, minor irrigation, wage/self-employment etc., have been under implementati(on in the State sector, ensuring that no one among these Groups is deprived of the benefits. The State Governments, like the Centre, have also been implementing the special strategies o f Special Component Plan (SCP) and Tribal Sub-Plan (TSP) through earmarking o f funds by various Line-Ministries / Departments concerned with the welfare and developmemt o f SCs and STs. The Special Central Assistance (SCA), provided to States/UTs as an additive to support the family- based income generation programmes, is being utilised by the State Governments in realising the economic upliftment o f SCs and STs, especiially those who are living below
381

the poverty- line . In addition to this, the State G overnm ents have been shou ldering the m o s t im portan t responsibility o f im p lem en ting the two legislations, viz., the P C R Act, 1955 and the P O A Act, 1989, to pro tec t these vulnerable G roups from the explo ita tion as well as from atrocities com m itted aga inst them and thus ensure social justice.
RESEARCH, EVALUATION AND MONITORING
3.9.93 T he ongo ing efforts in the sphere o f research and evalua tion under the schem e o f G ran ts- in -a id for R esearch and Publications at the Central level will be re -oriented tow ards d iagnostic and evalua tive studies so as to identify the p rob lem s both ex isting and em erg ing , the problem areas, the p rob lem groups, the gaps etc. Increased financial support will be ex tended to conduc t research studies on ; crucial and em erg ing p rob lem s re lated to these D isadvan taged G roups, particularly the m ost vu lnerab le viz.. the P rim itive Tribal Groups (PTG s), ind igenous m edicines, special p rob lem s re lated to fron tiers /forest dw elling tribals; m alnu tri t ion and a lchoholism am ongst SCs and STs; the em erg in g p rob lem s like the drug abuse /d rug addiction; and o ther issues re la ted to adm in is tra t ive m achinery , people 's par tic ipa tion in the process o f p lann ing and deve lopm en t etc. E v a lu a tio n studies will also be g iven adequate w e igh tage as their f indings will be o f im m en se va lue for m id-term corrections. In these activities, all the 14 exis ting Tribal R esearch Institutes (TRIs) will be fully involved.
3 .9 .94 So far as m onitor ing is concerned , action will be initiated to s tream line the exis ting m on ito r in g m echan ism s and strengthen them w herever necessary so as to develop effec tive m on ito r ing and inform ation system s both at the Centre and State levels with adequate m anpow er. Efforts will also be m ade to link up the Central and the State in lo rm a tio n sys tem s th rough the ex is ting N IC N E T and D IS N IC sys tem s o f NIC. facilita ting sm oo th flow o f in fo rm ation for effective m onitoring. T he system thus dev e lo p ed is expected to take care o f the m uch-needed m onito r ing o f ea rm ark ing /u til isa tion o f funds u nder SCP, TSP and SC A for S C P and fS P , besides m onito r ing o f o ther im portan t p rog ram m es .
IM PLEM ENTING MECHANISMS
S T .A T U T O R Y IN S T IT U T IO N S T O S A F E G U A R D
T h e three Statutor}' Ins t i tu t ion s v iz . , the N a t io n a l C o m m i s s i o n for S C s and S T s ( 1 9 9 0 ) , the N a t io n a l
C o m m i s s i o n for M in o r i t ie s ( 1 9 9 2 ) and the N a t io n a l
C o m m i s s i o n for B a c k w a r d C la s s e s ( 1 9 9 3 ) w e r e se t -u p
u n d e r the A c t s o f P ar l iam en t , w i th a s p e c i f i c
r e s p o n s ib i l i t y o f s a f e g u a r d in g the r igh ts an d the in terests
o f th e S o c i a l l y D i s a d v a n t a g e d G r o u p s v iz . , S C s , S T s , O B C s a n d M in o r i t ie s . T h e s e C o m m i s s i o n s are v e s te d
w ith the s p e c ia l p o w e r s fo r in v e s t ig a t in g the in d iv id u a l
c o m p l a in t s and g r i e v a n c e s r e c e iv e d fro m all o v e r the
c o u n tr y . T h e y a l s o r e v i e w all the re la ted l e g i s la t io n s a n d s u g g e s t n e c e s s a r y a m e n d m e n t s fro m t im e to t im e to
m e e t the e m e r g i n g s i tu a t io n s and p r o b le m s . B e s id e s
t h e s e p r im a ry r e sp o n s ib i l i t i e s , th e C o m m i s s i o n s a lso
a d v i s e the G o v e r n m e n t w i th regard to - a l lo c a t io n o f
f u n d s ; f o r m u la t io n o f n e e d - b a s e d p o l i c i e s and
p r o g r a m m e s a n d r e v i e w o f the p r o g r e s s o f their
im p le m e n t a t io n s o as to en su re that a d e q u a te a t ten t ion is p a id t o w a r d s the w e l f a r e and d e v e l o p m e n t o f t h e se
d i s a d v a n t a g e d g ro u p s .
3.9.95 The exc lusive M in istry o f Social Justice and E m p o w erm e n t (the then M inistry o f W elfare set up in 1985), at the Centre , con tinues to look after the interests o f the Socially D isadvan taged G roups. In executing this special task, the M inistry is assisted by various support structures viz.. the N a tional C o m m iss io n for SCs and STs, the N ational C o m m iss io n for B C s and the N ational C o m m iss io n for M inorities. T hese C o m m iss io n s will be further em p o w ered / encouraged to act as w a tch -d o g s and keep a close vigil on the p ro tec tion o f the rights and interests o f these d isadvan taged groups besides investigating into individualcom plaints . S im ilarly , the N ational level F inancial and D ev e lo p m en t C orpora tions along with the State level S C D C s and the Tribal D eve lopm en t C orpora tions will
382

continue to assist the M inistry with a special thrust on im p le m e n t in g various p ro g ram m es for econom ic be tte rm ent o f these G roups besides provid ing th e m bette r opportun ities to contribute to the national econom y.
3.9.96 At the State level, while 18 Stales and one U T h.ave separate D e p a r tm e n t s / D irectora tes for Schedu led C astes (SCs). Scheduled T ribes (STs) and O ther B ack w ard C lasses, the rest have Social W elfare Directorates to ta k e care o f these Socially D isadvan taged Ciroups a long with the other Social W elfare groups. A s a result o f this adm in is tra tive segregation, the focus on the developm ent o f th e s e target g roups has been getting lost. Further, m ost o f the State Directorates are not equ ipped w ith professional com petence to ensure effective im plem entation o f various policies and p rog ram m es. Therefore, the W elfare A dm in is tra tion needs to be reo r ien ted in the N in th Plan, e ither
th rough inducting professionally trained persons or b y ex ten d in g in-service train ing/professional o rien ta tion and sensitisation tow ards the up lif tm en t o f these G roups. Also, the capacity bu ild ing o f the w elfare personnel in spec if ic areas o f p lanning, pro jec t form ulation and m on ito r ing will be strengthened. Struc tural re -o rgan isa tion o f the ex isting e x c lu s i \e State le\ el Departm ents /D irec tora tes will be a ttem pted so as to ensure effective im plem entation , co-ord ination and supervision o f all the activities. At present, the w eakes t link in the entire process happens to be superv is ion . T o ov erco m e this, the responsib il i t) o f superv is ion and m onitoring will be entru.sted to the grass-root level dem ocratic institutions \ i/,.. Pancha_\ati Ra| Institutions and Loical Bodies. The setting up o f exc lusive D epartm ents and D irectorates for B ackw ard C la s se s in all the States will be con tem pla ted in the Ninth Plan as the sam e will i'urther s t ren g th en the adm in is tra tive m achinery to work effectiv ely for the em pow erm en t o f these Cnroups.
V O L U N T A R Y A C T IO N
3.9.97 Serv ices and the contribu tion o f the vo luntary sector for the w elfare and d ev e lo p m en t o f the Socially D isadvan taged G roups have been k n o w n even before Independence. They have estab lished their credentia ls as effec tive agen ts o f social change and d ev e lo p m en t by virtue o f their direct con tac ts / l inkages w ith the target g roups in the im p lem en ta t ion o f var ious deve lopm en ta l p ro g ram m es in the m o s t difficult areas occup ied by these G roups. In o rder to accom plish the N in th Plan objective -of em p o w erin g these D isadvan taged G roups, the vo luntary o rganisa tions will be p lay ing a key role in p ro m o tin g people 's initiative and partic ipa tion in the p rocess o f em p o w erin g o f these Groups.A n o th e r area w here they can p lay a sign ifican t role is to act as authorised agen ts to assist bo th the G o v ern m en t and the target G ro u p s to t'lght aga inst the social evils like untciuchability , cr im es/a trocit ies aga ins t SC s/ST s, and econom ic and social exploitation and th u s help en su re social ju s t ic e to these Groups.
IN P A R T N E R S H I P W I T H N G O s
T h e N C j O s / V O s ( V o l u n t a r y O r g a n isa t io t i s ) , b e i n g the
m ajor partners w ith the G o v e r n m e n t in e n s u r in g the
w e l l - b e i n g o f the d isa d v a n ta g e d g r o u p s , ac t a s the
m a jo r link b e t w e e n the' G o v e r n m e n t and the target
g ro u p s . In tact, th e y h a v e b e e n p l a y i n g the r o le o f
e f f e c t i v e a g e n ts to b r in g - f o r t h the m o s t d e s ir e d s o c ia l c h a n g e and d e v e l o p m e n t b y v ir tu e o f the ir d irect c o n ta c t
and l in k a g es w ith the d i sa id v a n ta g e d . B e s i d e s , t h e y are
the m a jo r con tr ib utors in h e lp r e d u c e / r e m o v e the s o c ia l
e v i l s l ike u n to u c h a b i l i ty , c r im e s /a t r o c i t i e s a g a in s t S C s /S T s and o the r f o r m s o f e c o n o m i c an d s o c ia l e x p lo i ta t io n . A b o v e all , th e y h a v e b e e n e x t e n d i n g
su p p ort to the G o v e m m e m t in f o r m u la t in g n e e d - b a s e d
p o l i c i e s , p la n s and p r o g r a m m e s for th e w e l f a r e an d
d e v e l o p m e n t o f th e se d i s a d v a n t a g e d g r o u p s b e s i d e s
im p le m e n t in g / s u p e r v i s in g an d m o n i t o r i n g th e m . T h r o u g h t h e se c o n tr ib ut i io n s , th e y b e c o m e the m o s t e f f e c t i v e partners in a c h ie v i n g the c o m m o n cause i.e. well-being of the d isad van tag ed .
383

3.9.98 Further, the voluntary (organisations will be encouraged to play the crucial role as motivators, in bringing the people and the administration to effective closeness ensuring optimum results. Thus, the NiGOs working in the grass-root level will further intensify their activities related to conscientisation and awareness generation towards health, education, nutrition, legal liteiracy etc. As the NGOs are instrumental in motivating the tribals to participate in the imiplementation o f various developmental programmes, they w'ill be encouraged not only tco mobilize individual tribal leaders but also the local institutions and organisations toiw'ards effective synchronisation o f the cultural milieu and the modern developmental p)rocess. Special thrust will be given to promote voluntary action in the low profile areas o f the country where the voluntary sector is yet to make their effective presence.
3.9.99 Constant and conltinuous interaction between the governmental and nongovernmental agencies for imp)lementing the developmental programmes and the tribals will be intensified amicably im order to minimise the feeling o f distance and alienation amongst these disadvantaged gr^oups through effective coordination and confidence building measures.
PLAN O UTLA Y S
3.9.100 While a total ou tlay /o f Rs.5399.50 crore has been earmarked for both Central and Centrally Sponsored Schem es including Special Central Assistance (SCA) to Special Component Plan (SCP) for S("s, an amount o f Rs. 9568.68 crore (Provisional) has been allocated for State Sector Schermes for empowering the Socially Disadvantaged Groups viz, SCs, STs, OBCs and Minoritie;s in the Ninth Five Year Plan (1997-2002). In addition to these. Plan allocations are a lsc earmarked through Special Central Assistance (SCA) to Tribal Sub-Plan (TSP) and undler Article 275 (1) for the development o f the Schedule I'ribes and Schedule Areas.
384

3.10 SOCIAL WELFARE
INTRODUCTION
3.10.1 The social scenario in the country has been fast changing due to rapid urbanisation and industrialisation. The unending flow o f rural population to the already crowded cities and towns in search o f employment has resulted in serious problems like overcrowding, emergence o f pavement/slum dwvellings, breakdown o f jo in t family system, unemployment, poverty etc. In this process, certain categories o f population, who failed to cope with these rapid changes,, have started lagging behind the rest o f the society due to their vulnerability. They include Persons with Disabilities viz. - locomotor, visual, hearing, speech and mental; the Social Deviants, who come in conflict with law viz. - juvenile delincquents/vagrants, drug addicts, alcoholics, sex-workers, beggars etc.; and the Other Disad>vantaged viz. - the elderly, the destitutes, the deserted, street children etc. All these categ(ories need special attention o f the State because o f the vulnerabilities and the disabilities, thiey suffer from.
3.10.2 To safeguard the interests o f the disadvantaged sections o f the Society, the Constitution o f India guarantees that no person will be dlenied 'equality' before the law (Article 14). It also promises 'right to education' and 'publitc assistance' in the old age and disablement (Article 41). To safeguard the interests of these groups, some important legislations were also enacted. They include - the Immoral Traffic (Prevention) Act, 1956 (as amended and retitled in 1986); the Probation of Offenderrs Act, 1958; Juvenile Justice Act, 1986; the Prevention o f Illicit Traffic in Narcotic Dru^gs and Psychotropic Substances Act, 1985; the Persons with Disabilities (Equal Opportunitiess, Protection o f Rights and Full Participation) Act, 1995; Prevention of Beggary Acts (States Acts) etc. Simultaneously, the Government has also undertaken many welfare-cum-developDmental measures right from the First Five Year Plan with the major objective o f extemding preventive-cum-curative- cum-rehabilitative services to meet the special needs o)f these vulnerable groups. Thus, the developmental planning has been made responsiv/e right from the beginning not only to attend to the existing problems but also to address th e situations emerging from time to time.
THE CURRENT SITUATION
Persons with Disabilities
3.10.3 No Census, except for 1981, has ever enumerated the population o f the Persons with Disabilities since Independence. However, the Natiomal Sample Survey Organisation (NSSO) conducted two country-wide Sample Surveys in 1'.981 and 1991. According to these Surveys, there were 136.74 lakh disabled persons in 1981 and 163.62 lakh in 1991 who were having at least one or the other o f the four types; o f disabilities viz. - locomotor, visual, hearing and speech. The magnitude and the siize o f various disabilities, as revealed by the two Surveys, is given in Table 3.10.1.
385

Table 3.10.1Type and INVIagnitude of various Disabilities as per the
Nation-wide; Sample Surveys of NSSO in 1981 and 1991
(Fingure in lakhs)
Type o f Disability 1981 1991
ActualNumber
% Actual % Number
1. Locomotor (with or wiithout other disability)
54.27 39.7 80.44 49.2
2. Visual (with or withouit other disability)
34.74 25.4 36.26 22.2
3. Hearing (with or witho)ut other disability - 5 yean's and above)
30.19 22.1 29.24 17.8
4. Speech (with or withoiut other disability - 5 yearrs and above)
17.54 12.8 17.68 10.8
T o t a l 136.74 100.0 163.62 100.0
- Disabled (with more tthan one o f the 4 disabilitiees mentioned above) _ 14.5% - 12.4%
Note : As the data o f Cenasus and NSSO are non-comparable, data o f NSSO for both 1981 and 1991 have been made use of for the comparison above.
3.10.4 A comparison o f the; data o f NSSO Surveys of 1981 and 1991 on the magnitude o f the problem of disability iindicates that the actual number o f the disabled has also increased from 136.74 lakhs; to 163.62 lakhs and their percentage to the total population in the correspondinig years has marginally increased from 1.8 per cent in 1981 to 1.9 per cent in 1991. Amomgst the total population o f the disabled, persons with locomotor disability had the hiighest share o f 49.2 per cent and the lowest being the victims o f speech disability. While the.; actual number o f persons with locomotor disability and visual disability have shown an increasing trend during the last decade (1981-91), persons with hearing disabiliity have shown a decreasing trend; and the persons with speech disability remained moire or less the same during the same period. But, w'hen the percentage o f their share in thie total population o f the disabled is considered, all the three categories except for the locomiotor disability, have show'n a declining trend. The high rate o f 49.2 per cent in resfpect o f the persons with locomotor disability was largely
386

attributed to the automobile and road accidents and ODther industrial hazards, indicating a greater need for strict observation o f road and imdilustrial safety measures and traffic regulations. However, the major cause o f polio-relat eed locomotor disability has been brought under control by effective nation- wide immun.izzation campaigns.
3.10.5 Although, the NSSO excluded Persons witih Mental Disabilities from both the national surveys o f 1981 and 1991, it, however, conduiccted a sample survey in 1991 on the 'Persons with Delayed Mental Development'. Accordiinag to the Survey, about 3 per cent o f the child population (1-14 years) were estimated to hnave mental retardation. Amongst the adults, rough estimates indicate that while 1 per ccent o f them were suffering from various forms o f mental disorders, 10 to 15 per cent \w ere suffering from various mental health problems.
3.10.6 The number o f leprosy affected disabled pterrsons was estimated to be about 4 million, o f whom, about one fifth were children and aiboout 15 to 20 per cent were left with deformities. The prevalence rate was more than 5 per thhousand in the 196 high endemic districts in the country.
3.10.7 As revealed by the NSSO Survey of 1991, al thhough 80 per cent o f the disabled population live in rural areas, services and institutional/iimfrastructural facilities available to them were mainly confined to urban areas, and the vi lldages remained mainly unattended to/neglected. Only 10 per cent o f villages had the priv/ili lege o f having Integrated Education Centres for the Disabled within a distance o f less thain i 10 kms. The situation was much worse in respect o f special schools, vocational traininng and other welfare institutions. Further, 97 per cent o f villages did not have the facili tyy o f having special schools within a distance o f 10 kms and about 96 per cent o f villagers did not have any facility for vocational training within that distance. Only 6 per ce;ntit o f villages received rehabilitation services through mobile vans or camps. The servi^cces available for the Spastics and persons suffering from Cerebral Palsy were not only i.naadequate but were mainly urban centred. In the rural areas, these services were virtua.lbJy absent.
3.10.8 To ensure social justice to the disabled on ecquitable terms, the Government o f India enacted in 1995 a comprehensive legislation v izz., the Persons with Disabilities (Equal Opportunity, Protection o f Rights and Full Parti icipation) Act (PDA), 1995. The Act empowers the disabled with a right to demand for- an enabling environment wherein they can enjoy protection o f rights, equal opportuniti^ess and full participation in various developmental activities o f the country. Effective i implementation o f this innovative legislation, which has made a beginning at the end o f ' the Eighth Plan, is going to be a challenge in the Ninth Plan as it promises to fulfil cierrtain rights in favour o f the persons with disabilities.
The Social Deviants
3.10.9 According to the Ministry o f Social Justice annd Empowerment, about 3.05 lakh persons were reported to have been subjected to vvarious addictions during 1996-97. Data on the prevailing situation o f addiction to t:o:)xic substances indicate that the traditional problems o f alcoholism and opium addictiotn t continue to be very high with 42 per cent and 20.5 per cent, respectively. Whilp thte problem of traditional addictions persists with a higher magnitude, the emergence aand the increasing free flow o f narcotics has become a cause for concern. The drug addiction especially in the North-
387

Eastern Region o f the country has reacched an alarming situation and continues to be unabated. The Drug abuse in this Reegion, especially in the State o f Manipur, has been contributing to a very bad spread o f HIV/AIDS due to the unsafe practices o f drug injecting. All these have become a biug threat to the society at large, as the drug addiction and HIV/AIDS got into a big ! nexus.
3.10.10 Realising the ill-effects o t f alcoholism on the family and other social institutions, a few States have enforcced Prohibition laws. Social movements like that o f the Anti-Arrack movement led by wvomen o f Andhra Pradesh, Haryana and Himachal Pradesh holds testimony to other SStates for action against alcoholism. No doubt, voluntary organisations have a significcant role to play in this direction, as they can mobilise mass movements not only to aabhor the practice o f alcoholic consumption through various preventive, curative and rehabi)ilitative services, but also by creating awareness through constant propaganda about the i ill-effects o f alcoholism and other addictions.
3.10.11 The problem o f beggary ppersists even today with its socio-cultural and economic ramifications. But, unfortunaately, there is no information about the size and magnitude o f the problem. The most t disturbing feature is begging under various kinds o f com pulsions and the worst are those \ who are inducted into begging by force by antisocial elements. Despite the enforcemnent o f Anti-Beggary legislations by 16 States and 2 Union Territories, the problem still coontinues to exist in its worst form as begging has become a profession for many, as they i find it as an easy means o f livelihood. The other problems related to begging includde : ineffective enforcement o f legislation; nonexistence/inadequate number o f Receptidon Homes/Beggars' Homes; and lack o f standards in the services provided in the mandatctory institutions owing to the existing variations in their respective legal provisions and aadministrative procedures. Presently, the approach for tackling this problem is based prim arnly on punitive devices with very little scope for any diversified programmes o f treatment al^nd rehabilitation, neither for the able-bodied nor for the disabled beggars. These problems, t therefore, need special attention in the Ninth Plan as they can leave the most damaging efffects on the otherwise healthy growth o f the society.
The O ther Disadvantaged
3.10.12 The rapid demographic changges that are taking place in the country have led to an increase in the number o f elderMy persons. According to the 1991 Census, the population o f 6 0 + was 55 million againsst 42.5 million in 1981. O f these, more than 50 per cent (27.2 million) were women. A ss per the Report o f the Technical Group on Population constituted by the Planniiing Commission in 1996, the population o f 60+ is expected to go upto 68.51 million by thae year 2000 AD.
3.10.13 Also^ a large number o f street children suffer destitution, neglect, abuse and exploitation due to various socio-eeconomic reasons. As per the jo in t survey conducted by the M inistry o f Welfare and the UJNICEF in 1988-1993 in eight metropolitan/major cities viz. Delhi, Mumbai, Calcutta, Cheennai, Bangalore, Ahmedabad, Kanpur and Indore, the estimated population o f the S tree t' Children was 4.15 lakhs. This, being an emerging problem in the recent past, the same needds to be curbed right in its infancy.
388

THE NINTH PLAN STRATEGY
3.10.14 The Ninth Plan is committed to prepare a National Charter for Social Justice to ensure allround development o f the disadvantaged sections o f the society. Therefore, approach to Social Welfare in the Ninth Plan is distinct from the earlier Plans, as it proposes to adopt the following three-fold strategy, specific to each individual group, viz. Empowering the Persons with Disabilities; Reforming the Social Deviants and Caring for the Other Disadvantaged.
Empowering the Persons with Disablilites
NINTH PLAN STRATEGIES
To prepare a National Charter for Social Justice for ensuring all round developm ent of the disadvantaged section of the society.
To adopt a three-fold strategy of Empowering the Persons with Disabilities; Reforming the Social Deviants; and Caring the Other Disadvantaged through various preventive, curative, rehabilitative and developmental policies and programmes
3.10.15 The Ninth Plan reaffirms the earlier commititment o f making as many disabled as possible active, self-rehant and productive conntributors to the national economy Accordingly, it lays special emphasis on adoptiting an integrated approach to empowering the disabled and thus mainstream them. . To this effect, systematic efforts
will be made to converge the existing services under the welfare-related sectors o f health, nutriliou, education, science and technology, rural development, urbandevelopment, women and child development,information and broadcasting etc. In these efforts, the rural disabled, who have been neglected all through, will receive special attention. To this effect, efforts will be made to reach the services to the rural disabled right upto the district level and with perspectives to extend upto the village level in a phased way starting from the Ninth Plan, through a comprehensive programme viz. 'National Programme for Rehabilitation o f persons with disablities’, being launched during the Ninth Plan, as a major effort in this direction.
EM POW ERING THE PERSONS WITH DISABILITIES
Every effort will be made towards effective enforcement o f thihe Persons with Disabilities Act (PDA), 1995‘Reaching the rural disabled’ - those who have been neglected siso far will receive special attentionContinuing efforts will be made to converge the existinmg services in welfare - specific and other welfare-related sectors t̂ to gain the optimum benefitAn enabling environment for persons with disabilities to exercisise their rights for equal opportunities and full participation will bbe put into action through joint efforts o f both Governmental anmd Non-Governmental OrganisationsA special strategy o f Family / Community-Based Rehabilitatioion (CBR) will be adopted by pooling the resources of both financiaial and manpower, o f all the concernedSpecial efforts will be made to prevent disabilities througigh supplementary nutritional feeding for both children and expectarant / nursing mothers, early detection and timely intervention Strengthening / expansion o f special schools and vocationaial training programmes with barrier-free environment Positive discrimination through earmarking not less than 3% c o f benefits under various employment cum poverty alleviatioion programmes like IRDP, m V , NRY, PMRY, EAP, DWCRA etc. Strengthening and expansion o f existing National Institutes fofor the persons with disabiltiesSpecial efforts will be made to equip the persons with disabilitieies with most suitable, simple, durable and inexpensive Aids anmd AppliancesSetting up o f a National Trust to ensure total care anmd custodianship o f those with Mental Retardation and Cerebraral Palsy.
389

3.10.16 Empowerment o f the persons w ith (diisabilities, who are differently abled, will be a continuous process wherein the joint (efforts o f both governmental and nongovernmental organisations will be put into a c tiion to create an enabling environment for the disabled to exercise their rights for equal op)p(ortunities and full participation with the strength and support o f the recently enacted Pferrsons with Disabilities(PD) Act, 1995 and the relevant support structures, mechajiiisims and services. As the envisaged empowerment o f the disabled is mainly based lupwn the PD Act o f 1995, every effort will be made towards its effective enforcement on a piriority basis.
3.10.17 Considering the size o f the populaticorn of the persons with disabilities and the slow pace o f the implementation o f policies lamd programmes, concerted efforts will be made to strengthen/expand the out-reach amd coverage o f services. Programmes catering to the needs o f the persons with disjabilities under various sectors will be reviewed and co-ordinated to converge all the reelated services in such a manner that the inter-sectoral support gets strengthened towards: e;mpowering the persons with disabilities.
3.10.18 The strategy o f the Community Eiaised Rehabilitation (CBR) will be put into action towards pooling the efforts o f the p'errscons with disabilties, their families and the communities, as well as that o f the concemie;d Ministries/Departments in a coordinated way. To fill the existing void in the rural areais., efforts will be made to promote the CBR through voluntary organisations.
3.10.19 Special efforts will be made to sttret^glhen the prevet\tive measures as the incidence o f the disability can be preventeedi through early detection and timely intervention. Therefore, priority attention willl be given to early detection and treatment by taking advantage o f the latest technologies. T o prevent certain disabilities and arrest their increase, the on-going supplementair>7 nutrition feeding programmes including prophylaxis against Vitamin A, anaemia and Iiodine deficiency as pronounced in the Special Plan o f Action o f 1998, will be strengthened and expanded. Similarly, universalization o f immunization will be; attended to on a priority basis. The frequency and coverage o f program*mes like Piuhse Polio will be continued in an expanded manner and at regular intervals, till the prro»blem is completely eradicated. National campaigns to eradicate diseases like measles aincd mumphs will be undertaken as these are the diseases which lead to various disabillities. Safety measures for prevention o f accidents on roads and at work- places includlimg the industrial and agricultural operations and road transport, will receive special atiteinttion. Along with these direct short-term measures, education and awareness generation tco the family and the community will receive priority attention as part o f the long-tcemn measures for preventing various disabilities. In this direction, the In tegratedl Child Development Services (ICDS) will be utilised to help the family, especially tthie mothers, to ensure effective health and nutrition care, early detection and timely treiattment. For this, special training will be provided to mothers, ICDS functionaries and tlhte para-medical staff associated with ICDS. Priority will also be accorded to spread the miejssages o f health and nutrition education and awareness, especially amongst the mothers to ejnsure proper dietary intake for themselves and their children.
3.10.20 To mainstream the persons w ith diisabilities, the major strategy will be to encourage more and more children with disaibiilities to join the Integrated Schools by extending special incentives like free books,, uniforms, transport and aids and appliances etc. so that the disabled children will be aibile to complete their school education in
39)0

these Integrated Schools, which are cecquipped with infrastructural facilities, support services and barrier-free environment.. Besides, the ongoing scheme o f the Integrated Education for the Disabled Children ((IIEDC) will be further expanded during the Ninth Plan to meet the growing demand fo r ' these types o f schools, especially in the context o f enacting the P.D. Act, 1995, ensuring lecqual opportunities for the disabled. In this regard, special attention will be paid to those; districts which have poor, or no, educational facilities o f Integrated Education.
3.10.21 Vocational training prograrmrmes for the persons with disabilities, which are employment-oriented, will be increase;d substantially by activating the existing Industrial Training Institutes (ITIs), Craft Trainiinig Centres (CTCs) and Vocational Rehabilitation Centres (VRCs). Simultaneously, effcorrts will also be made to set up Training-cum- Production Centres and Sheltered W o)rkshops to ensure that the trained persons with disabilities are kept gainfully engag^e;d either on wage or self-employment. While planning for the training programm.es fcbir the disabled, every effort will be made to diversify the trades, besides giving p^riiority to the up-coming trades, keeping in view the trends and the demands in the employrme;nt market.
3.10.22 Earmarking o f certain perce^mtage o f benefits for the disabled under various poverty alleviation programmes like IR ID P , DWCRA, JRY, EAP etc. will be made as the entry-points to reach the rural perrscons with disabilities. Further, income-generation activities will be initiated for the irmral disabled through Self-Help Groups called 'Sangams' on the lines o f DWCRA. Prricority will be given to impart vocational training to women and adolescent girls with disab)illit:ies. The activities o f the National Handicapped and Finance Development Corporatiiom set up in 1997 will be made functionally effective to play the role o f a catalytic argent in promoting employment opportunities, both wage and self- employme;mt, for the persons with disabilities. Besides, the Corporation will also extend 'forwarrd" and 'backward' linkages o f credit and marketing facilities to those disabled who would Hike to venture into entrepreneurial efforts.
3.10.23 The implementation o f the {policy o f 3 per cent reservation o f vacancies for the blind, deaf and orthopaedically dissalbled in Group 'A ', 'B ', 'C and 'D ' posts in Central Services and in the Public Sector Undterrtakings, will be monitored on a continuous basis and stock-taking will be done at rejgiular intervals both at the Central and State levels. The Ninth Plan recognises the need fcoir employment/placement services o f the persons with disabilities as a priority area. Theese; special needs are expected to be met through the new strategies that are being contemplattecd by the nodal M inistry o f Labour Welfare.
3.10.24 To deal effectively with piroblem s in the areas o f research, training and development o f manpower in the contextt o f providing a complete package o f preventive- cum-curative-cum- rehabilitative servictess to the persons with disabilities, all the existing National Institutes will be activatcecd and their services streamlined. The District Rehabilitation Centres meant for tthie rural persons with disabilities will be further strengthened to cater to the needs o f ailll the rural disabled in their respective districts. To ensure effective implementation o f {policies and programmes for the rehabilitation o f the disabled and to maintain a uniform/''miiiriimum standard o f training services, programmes o f the Rehabilitation Council o f India, hoccated at New Delhi will be streamlined, ^^^ile the existing National Institutes will be dte^vi;sing practical strategies to extend services to the disabled living in the backward rurrall and remote tribal areas, the Ninth Plan will programme to set up an exclusive Natiomail Institute for M ultiple Disabilities.
391

3.10.25 Also, the Ninth Plan commits to ensuire; effective integration o f the on-going efforts o f S&T with developmental pursuits so jas: to improve the quality o f life. In line with this, special endeavour will be to equip the; {persons with disabilities with simple, suitable, durable and inexpensive aids and appliancejs so as to improve their functional ability and enable them to take up various inctorme generation activities to become economically independent and self-reliant. T o this effect, the Artificial Limb M anufacturing Corporation (ALIMCO), Kanpur willl be directed to develop and produce cost-effective aids and appliances on a large scalie.. Linkages and mechanisms for effective application o f science and technology w/ould be established with all those concerned so as to tackle the rehabilitation problermss o f disabilities with right type o f aids and appliances.
3.10.26 In order to have a User-Friendly Prognarmme, the Science and Technology in M ission Mode Project will continue its Research amdl Development (R&D) activities for generating new cost- effective and easy-to-hamdlle technologies for the disabled. In addition to this, the ongoing collaborative efforts cof' the nodal Ministry o f W elfare, the Department of Science and Technology and thte Defence Research and Development Organisation, N ew Delhi will continue, during the jNfinth Plan, not only to standardise the production of polymeric composite rehabilitation laiids for the polio-affected, physically disabled but also to produce aids and appliances ifo)r rehabilitating the persons with other disabilities also.
3.10.27 To address the problems relating to botth mental disability and mental health, efforts will be made to extend convergence o f tlhte available services o f health, welfare and other related sectors, including that o f the vo>huntary sector. Special thrust will be given for the prevention, the early detection, sspeech and communication, vocational training, family and community orientation, (etcc. In all these efforts, voluntary organisations will continue to be involved very chojsely in view o f their experience and established credentials.
3.10.28 The Ninth Plan envisages the setting up o)f a National Trust to ensure total careand custodianship o f those with mental retardation sand cerebral palsy. For the welfare andcare o f the Spastics, special service centres will be scet up to cater to the urban slums and backward rural areas, undertake large-scale manip)ower development programmes, and evolve new approaches to information, dissem im ation and community awareness, rehabilitative services, like appropriate tre:attment, psychological support, day-care centres and specialised training for manpower cde;velopment, especially in the area o f cerebral palsy and mental retardation, will be expancde^d.
3.10.29 To assess the status o f women and giirlls with disabilities, needs-assessment survey will be conducted. The findings o f th e se surveys will be used in improvising/ developing educational, vocational training and (emiployment packages with necessary support services for women with the ultimate gcjail o f equipping them to become economically independent and self- reliant. In • fiulfilment o f the 'W om en's Component Plan', every effort will be made to ensure that adeqmaite fimds/benefits flow to women with disabilities from all the relevant programmes.
3.10.30 Voluntary organisations, who have Ibejen playing an important role in thedelivery o f services for the persons with disabiliitiies, will be supported to widen their
392

operations so as to reach the unreachie(d, viz. the rural disabled. They will be involved in sensitizing the rural population tow ards prevention, early detection, timely intervention, appropriate referral and follow-up ssejrv^ices, rehabilitation etc. Voluntary organisations, especially working for Spastics, memttally retarded and leprosy- cured patients, will be supported with adequate funding.
3.10.31 To ensure planning for thse welfare and development o f the disabled more meaningfully, there is an impending meed for the Office o f the Registrar General and Census Commissioner, to revive theiir practice o f 1981 Census to collect the data on the size o f the population o f persons wdtlh various types o f disabilities and to make it available through the next Populatiom Census o f 2001 AD.
R e fo r m in g th e S o c ia l D e v ia n ts
3.10.32 Keeping in view the increasing problems o f social maladjustment viz. juvenile delinquency/vagrancy, abuse,crime, and exploitation, the scope o f the Juvenile Justice Act (JJ Act), 1986 will be widened with requisite infrastructural support o f various statutory institutions in rehabilitating children, who come in conflict with law. A definite thrust will be given to developing appropriate/suitable services under juvenile justice. Necessary steps will be taken to ensure that the State Governments strictly adhere to the directives given under the JJ Act, 1986 and also set up the requirednumber o f institutions and deploythe staff, accordingly. Further, the norms and standard o f services in various institutions under the JJ Act will be reviewed to identify gaps in the existing services and initiate action to lay down the minimum standard o fservices. To initiate preventive
and rehabilitative measures, efforts will Ibes made to identify the specific areas infested with these social problems o f delinquenc'y and destitution. Further, the existing State and Central level monitoring systems will Ibe activated to ensure effective implementation o f the JJ Act o f 1986.
3.10.33 In order to arrest the growimgj problem o f alcohohsm , effective measures will be taken to restrict/reduce the piro»duction o f alcohol w ithin the country and keep aspecial check and close vigil on the f lo w o f liquor from abroad. Further, prohibition ascontemplated, will be treated as a natiional endeavour to overcome the problem o f
REFO RM ING THE SO CIAL DEV lA N T S
• To tackle the increasing problem o f malatdjjustment■ Efforts will be made in close collaborratiion with both
Governmental and Non-Governmental 0»rg'anisations for effective enforcement o f the Juvenile JIusstice Act (JJ Act), 1986
■ Ensure minimum standard o f services im the various mandatory institutions set up all over thte (country under JJ Act, 1986
■ Encourage more and more voluntary organisations to take up the responsibility o f extendintg welfare cum rehabilitative services for reforming the juvenile delinquents / juvenile vagrants and othe;r children who come in conflict with law
• To control / reduce the ever increasiin^g / em erging problem s o f alcoholism , drug addictiiom , H IV Aids etc.
■ Strict enforcement o f legislation to prohilbiit / restrict the production o f alcoholic drinks with neccesssary punitive measures
■ Expand the services o f preventive, (curative and rehabilitative services through counsellinjg running deaddiction camps / centres
■ To develop an integrated strategy inv/ollving all the concerned to curb the ever increasing inter-related problems o f drug-addiction and HIV / A I D S
■ Launching o f awareness generation prrogrammes / campaigns to educate / sensitise and miake people especially the younger generation consc:io)us o f the ill effects o f these problems
393

alcoholism and its consequences. To this effect, efforts will be made to impress upon the States to control/eradicate this serious problem o f alcoholism from-.the society. Apart from the strict enforcement o f the legislation, the role o f the rtiass media would, be . enlarged to send powerful/effective messages about the ill-effects o f the two social evils o f drug and alcoholic addiction which ruin the family and the society. The services o f counselling, de- addiction, rehabilitation, after-care and awareness generation will be expanded to reach the imreached.
3.10.34 As the problems of'alcoholism, drug addiction and HIV/AIDS are interrelated, the Ninth envisages the development o f an integrated ^approach to curbthe increasing magnitude o f these problems with.effective co-ordination amongst the concerned Ministries viz. Home Affairs, Finance, Health, Welfare, Information and Broadcasting and the voluntary sector. As a first step in this direction, action will be initiated immediately to identify those areas in the country which ^ e infested with these problems and concentrated attention will be paid to curb the nexus o f these inter-related problems. Measures for enforcement o f the Prevention o f Illicit Traffic in Narcotic Drugs and Psychotropic Substance Act, 1988 will be further tightened towards effective control over the flow o f drugs and detention o f persons trafficking in drugs. Also, ^simultaneous efforts will be made to strengthen the existing de-addiction-cum- rehabilitation Centres and expand the services to cover those areas, which are left uncovered. In all these efforts, the North Eastern Region; especially the State o f Manipur, where the menace has already taken very serious proportions will receive prioirity attention during the Ninth Plan. To make these efforts effective, Ihe local voluntary organisations will be actively involved to act as interface between the, governmental agencies and the target gr6ups.
3.10.35 For the prevention o f the age-long problem o f beggary, a three-way approach will be adopted. The first step being preventive in nature, special squads will be activated to roimd up the beggars from all &e public places especially at religious/pilgrimage Centres on a continuing basis, till no such people are visible in the public places. The second and the third are curative and rehabilitative in nature. While all those, who become beggars due to poyerty, will be dealt with by keeping them gainfully employed through various employment-cum income generation programmes/social assistance programmes, those, who opt wilfully and adopt begging as a profession, will be tackled through effective implementation o f legislation and stringent measures o f punishment.
3.10.36 The National Institute o f Social Defence (NISD), located at N ew Delhi, will be strengthened/activated with the much-needed professional staff and basic infrastructure and encouraged to d^fvelop professional linkages with the line- agencies like National Crime Records Bureau (NCRB), N ew Delhi; Police Research Bureau, New Delhi; National Academy o f Police, Hyderabad and the State Police Training Institutes, so as to meet the growing needs o f research and training in the field o f Social Defence.
394

CARING THE OTHER DISADVANTAGED
To tackle the ever increasing problem of StreetChildren through :
• More epiphasis on preventive measures through various developmental services for children like, integrated child development services, compulsory primary ' education, supplementary feeding programmed, health and referral services etc.
'• Priority for non-institutional ' services throughrestpringtthe street children.to flieirifamilies and,to Foster Families
• Review / re-orientation and expansion of the existing limited services for Street Children, botH institutional and non-institutional by "involving more and more NGOs
Policy Commitments for the well-being o f Older ̂ Persons• Direct Policy prescriptions to extend support for
financial security, health care, shelter, welfare and other needs o f older persons
• To provide protection against the dangers o f life and property; abuse and exploitation o f older persons.
• To extend opportunities for older persons to contribute their mite in various developmental activities
To curb the social evils like prostitution, beggarythrough:• Strict enforcement o f the related legislations with
rigorous punitive measures• Special programmes for economic rehabilitation o f
the disadvantaged women• Special Packages for the development o f the Girl
Child with a special focus on her educational development which would prevent the GirL Children from becoming victims of.these types o f social Qvils
• Continuous awareness generation campaigns to sensitise, the society knd change the mind-set o f the people
To strengthen the National Institute o f Social Defence,New Delhi to extend its technical advice and supportin this Area
involving them in various developmental activities.
Caring the Other Disadvantaged
\3.10.37 Programmes for the Elderly, w ill be taken up in the Ninth Plan to ensure their w ellbeing and continued participation in the community. The immediate social institutions o f family .and the community w ill be mobilised to play their catalytic role in * the effective implementation o f >the programmes for the Elderly. Priority attention will’ be paid to the Elderly, .especially in the rural areas, in extending the most wanted health care, housing, shelter, pension etc. A Isq , efforts will be made to reach/disseminate information regarding various welfare measures and special concessions being extended to the 'Senior Citizens', so that the rural Elderly can also come forward to enjoy these privileges alpng with their urban counterparts. The
jusurance sector will also be encouraged to formulate special health insurance programmes for the benefit o f the Elderly. In extending housing facilities, the concept of'Sheltered Homes’ for thei lonely/destitute Elderly will be explored with the help o f private and public agencies as well as the NGOs. In order to facilitate productive ageing, the ̂ services o f the Elderly will be made use o f by
3.10.38 The Scheme o f Old Age Pension will be reviewed and efforts will be made to rationalise the same in terms o f providing at least the barest minimum subsistence and expand its coverage, wherever possible. The Panchayati Raj institutions will be actively involved in the implementation o f various welfare schemes particularly with regard to selection o f beneficiaries and disbursement o f funds. TTie voluntary organisations will be eilcouraged to set up 'Homes for the Aged/Homes for the Destitutes/Homes for the Dying' so as to meet the increasing need for such services. Through effective advocacy, efforts will be made to promote awareness amongst the people to plan in advance for the old age. To develop greater sensitivity and better attention toward^ the needs o f the Elderly, action will be initiated to expedite the finalisation/ ^option o f the 'National Policy on Older Persons'.
395

3.10.39 Amongst the disadvantaged, the Street Ci^hildren are the most vulnerable. To tackle the growing problem o f Street Children, the existing schemes for the welfare and development o f Street ^Children will be reviewed and restructured keeping in view the Child’s Rights with perspectives for necessary expansion. Towards this end, emphasis will be given to provide adequate heal^, nutrition, education, vocational training and other related services to ensure healthy development o f these children sd as to make them productive members o f the society. The National Charter for Chilclren evisaged in the Ninth Plan promises to ensure that no child remains illiterate, hungry or lack o f medical care. In line with this ̂special efforts w ill be made to ensure that no street/destitute/orphaned child or any other child in difficult situations will be left uncovered for. The emerging threats from Drug and Psycho-tropic Substances as well as HIV/AIDS to Street Children will receive special attention. The voluntary organisations, which are already engaged in this area, w ill be further encouraged with necessary support to reach as many Street Children, as possible.
/
3.10.40 The other disadvantaged, who include the destitutes, deserted, widowed, orphaned and women and children in moral and social danger, will continue to receive priority attention in the Ninth Plan with a special focus on the child/women prostitutes. The evil o f prostitution and its diverse manifestations viz. Devadasis, Basavis, logins etc. will be tackled not only through strict enforcement o f the law but also through building strong public opinion and support along with police and community vigilance. Special programmes will be designed for economic rehabilitation o f these disadvantaged women. The special package launched for the girl-child in 1997 will act as a measure to prevent the girl children from becoming victims o f these types o f social evils. More details are available imder the Chapter on 'Empowerment o f Women and Development o f Children'. As regards the welfare o f destitute women and children, ther State governments will be encouraged to continue the ongoing programmes with further expansion so as to meet the increasing need.
3.10.41 While planning, programming and budgetting various services under Social Welfare sector, special efforts will be made to ensure that a definite percentage o f the benefits are earmarked for women and girl children under the Special Component Plan for Women as they are the most vulnerable to become easy victims o f all types o f social evils/social problems and o f the emerging situations.
POLICIES AND PROGRAMMES : A REVIEW
3.10.42 The policies and programmes relating to welfare and development o f the persons with disabilities, the destitutes and the elderly received priority within the Social Welfare sector during the Eighth Plan. Along with these, the problems o f drug abuse, prostitution, delinquency and beggary also received special attention.
Persons with Disabilities
3.10.43 The major policy thrust in the Eighth Plan was to make as many Persons with Disabilities as possible active, self-dependent and productive members o f the society by extending opportunities for education, vocation^ training and economic rehabilitation etc. Efforts were also made to integrate the services for the Persons with Disabilities covering the entire range o f activities starting from early detection, prevention, treatment, cure and rehabilitation.
396

3.10.44 The enactment o f a comprehensive legislation namely, "The Persons with Disabilities (EqualOpportunities, Protection o f Rights and FullParticipation) Act, 1995", which came into effect in1996, was a significant achievement in the history o f the welfare and development o f the Persons with Disabilities. The legislation, which is the most progressive in its thinking and approach, seeks to empower the Persons with Disabilities to demand the elimination o f any discrimination against them and creation o f a new society which can ensure protection o f their rights, equal opportunities to them, and their full participation to realise their potentials. Action on the implementation o f the Act has started in the* right earnest, as an ongoing process during the Eighth Plan period.
PERSONS WITH DISABILITIES ACT, 1995
Enactment o f ‘Persons with Disabilities (Equal Opportunities, Protection o f Rights and Full Participation), Act, 1995 * is an important landmark in the history o f social welfare 'planning to ensure equal opportunities and protection o f rights and full participation o f Persons with Disabilities in the nation-building. Some o f the special features o f the Act include :
• Prevention and Early Detection ot Disabilities• All children shall be screened once a year for identifying
‘at - risk* cases• Staff o f Primary Health Centres shall be trained to assist in
this work• Measures shall be taken for pre-natal, perinatal, and
postnatal care o f the mother and child.• Education
• Every child with disability shall have the right to free education till the age o f 18 years with free books, uniforms and scholarships/ appropriate transportation and
~ barrier-free environment.• Teacher’s Training Institutions shall be established to
develop requisite manpower.• Employment
• 3% vacancies in Government shall be reserved• Governmental Educational Institutions including those
receiving grant from the Government shall reserve at least 3% o f seats
• No employee can be sacked / demoted if they become disabled during service.
• Affirmative Action• Aids and Appliances shall be made available.• Allotment o f land shall be made at concessional rates for
housing, business, special schools etc.• Non-Discrimination
• All the places of public utilities shalf be made barrier-free to give easy access.
3.10.45 Placement o f the persons with disabilities in jobs was arranged through 50 Special Employment Exchanges and 39 Special Cells in the normal Employment Exchanges. As regards the number o f the Persons with Disabilities persons on the Live Registers, there has been an increase from 3,23,220 in 1992 to 3,53,743 in 1995. As per the information available firom the Live Registers from all over the country, 16,948 persons with various disabilities received placement during 1992-95,
3.10.46 To extend employment-cum-income generating opportunities for the Persons with Disabilities and to integrate them into the mainstream o f economic activities, a National Handicapped Finance and Development Corporation (NHFDC) was set up in 1997. The Corporation is expected to play the role o f an apex organisation and assist, coordinate and monitor the work o f the State level Corporations and other voluntary organisations working for the economic betterment o f the Persons with Disabilities. While extending, support to the Persons with Disabilities through NHFDC, preference is being given to persons with disabilities in rural areas with a specific ceiling on income.
397

3.10.47 The eleven District Rehabilitation! Centres (DRCs), functioning in the States o f Andhra Pradesh, Gujarat, Haryana, Kamataaka, M adhya Pradesh, M aharashthra, Orissa, Tamil Nadu, Uttar Pradesh, and West Beungal extended comprehensive rehabilitation services including early detection, medical inteervention, fitment o f aids and appliances etc. to the Persons with Disabilities especially in t the rural and interior areas. The DRCs also carried out special surveys o f the Persons witith Disabilities population. The four Regional Rehabilitation Training Centres (RRTC), located at Chennai, Cuttack, Lucknow and Mumbai, extended technical support to thaese eleven DRCs and conducted full-time training and management programmes to the ffield level functionaries working in the area o f rehabilitation o f the Persons with Disabililities.
3.10.48 In consonance with the policy o f providing .a complete package o f welfare and rehabilitative services to the persons with physical and mental disabilities and to deal with their multi-dimensionalproblems, the four national institutes, viz. National Institute o f Visually Handicapped (NIVH), Dehradun; National Institute o f Orthopaedically Handicapped, (NIOH), Calcutta; National Institute of Hearing Handicapped (NIHH), Mumbai; National Institute o f Mentally Handicapped, (NIMH), Hyderabad; and the other two apex level Organisations viz., the Institute o f Physically Handicapped (IPH), New Delhi and the National Institute o f Rehabilitation Training and Research (NIRTAR), Cuttack offered a wide range o f services in the field o f education, training, manpower, vocational guidance, counselling,research, rehabilitation anddevelopment o f low-cost aids and
appliances etc. They also offered a variety>' o f training courses starting from short-term Certificate and Diploma Courses to three year Degree Courses in mental retardation, physio-therapy, occupational therapy, conmmunication disorders, prosthetic and orthotic engineering, audiology, speech therapy as wf/ell as training o f teachers etc. The clinical and rehabilitation units o f these Institutes served . as in-house laboratories for both the trainers and the trainees besides providing the base foor conducting research projects and extending clinical and para- medical services to thne patients. Thus, these Institutes played a significant role in meeting the training noeeds o f the technical manpower to extend specialised services to the Persons with EDisabilities in the country. Besides the regular academic courses, the National Institutes c also conducted a large number o f short-term training courses, seminars, orientation coursess and camps etc. These provided a forusn for creating awareness amongst the communnity at large for bringing the Persons with Disabilities population closer to the organnisations working for their welfare; and
SUPPO RT INSTITUTIONS AT NATIO NAL LEVVEL
• To extend the necessary technical advice and suppport to the Government for formulating need-boased policies and programmes; experiment / demonststrate innovative projects; conduct / sponsor research i and evaluation and develop manpower with necesissary training and orientation programmes, the followiring 7 National Institutions are in effective action :
• National Institute for the Visually Handicappped,Dehradun
• National Institute for the OrthopaediccallyHandicapped, Calcutta
• All Yavar Jung National Institute for the Heaaring Handicapped, Mumbai
• Natioanal Institute for the Menntally Handicapped, Secunderabad
• National Institute for Research, Training andRehabilitation, Cuttack
• Institute for Physically Handicapped, N ew CDelhi• Rehabilitation Council o f India, New Delhi
These Institutes are the fore-runners as webll as trend-setters in their respective areas ; of specialisation. They offer a variety o f long-t term training program m es leading to degree / diploom as and also short-term Courses.
398
providing opportunities for exchange o f information, knowledge and experienci amongst the academicians, professionals, doi ctors, village/community level workers and al those associated with the disability and weelfare and development o f the Persons wit! Disabilities.
3.10.49 The scheme to provide durable, SGophisticated and scientifically manufacturec aids and appliances for the physically diisahbled, continued with a lower coverage as compared to the increasing demand for thtesee. Financial assistance was provided to 346 implementing agencies located in different parts o f the country and by the end o f 1996. more than 2.53 lakh Persons with Disabilitieis persons received benefit under this programme during the Eighth Plan period. In order to provide cost-effective aids and appliances through the application o f modem technolopgy, 58 Research and Development (R&D) Projects were identified and funded under thne scheme o f Science and Technology (S&T) Mission Mode Project. Some o f the devices; ddeveloped through the scheme include close circuit television with magnifying facilities. ; as low vision feeding aids for children with cerebral palsy, safety devices for use in aggricultural machinery, computerised Braille embosser, inter-pointing Braille writing framte, etc. Steps were also taken to start production o f these aids at reasonable prices so as to maikee them available to the needy. Among others, the projects on development o f footwear for lepprosy-cured persons and training o f visually disabled persons on Computers received assdstitance during the Plan period.
3.10.50 The Artificial Limbs Manufacturimg Corporation (ALIM CO), set up al Kanpur in 1972, continued to manufacture standard aids and appliances for the persons with disabilities. During the Eighth Five Year P'lani , the manufacturing plants o f ALIMCO were modernised so as to ensure quality control. T o r reach the limb fitting facilities to the persons with disabilities in remote areas, 6 Regional Liiimb Fitting Centres and 20 Peripheral Limb Fitting Centres were set up in the existing mtediiical colleges as part o f the Health Plan o f the State Governments. To these centres, ALUM CO extended technical know-how on fitment procedures and use o f tools and materials reqiuirred for the fabrication o f orthoses/prostheses. The ALIMCO also assisted the Governmentt oof Orissa and Uttar Pradesh for establishing Limb-Fitting Centres in their States.
3.10.51 In addition to the existing Speiciaal Schools for education o f the childern with disabilities, the Ministry o f Social Justiice3 and Empowerment initiated a Scheme o f Assistance to Voluntary Organisations for- thhe establishment and upgradation o f Special Schools in 1993-94. Under the scheme, prioirityy was given for the setting up o f schools in the districts where there were no Special School;ls. By the end o f March 1997, around 6127 disabled children have been benefited throughi 933 voluntary organisations.
3.10.52 Under the scheme o f Assistance; to Voluntary Organisations for the Persons with Disabilities, financial support was givem (upto December 1996) to 1628 voluntary organisations for extending services to 4.(00 lakh persons with disabilities through vocational training centres, special schoolls, counselling centres, training centres for the personnel and placement services etc. oMuntary organisations were also assisted to extend rehabilitation services to leprosy-cured poersons in the areas o f education, vocational training, economic rehabilitation, social integrxation and for running training courses to teachers specialised in the area o f cerebral-pals;y aand mental retardation.
3.10.53 The Rehabilitation Council o f Indiia ((RCI), New Delhi set up in 1986, has been playing an important role in ensuring the qualiity < o f services in the crucial area o f manpower
39»9

development and in enforcing uniform stamddards in training professionals in the field o f rehabilitation for the disabled. In 1993, thte RCI was converted into a statutory body through the enactment o f the RCI Act, 1992! \ which came into force in July, 1993. So far, the RCI has developed 47 training progrranmmes o f both short and long-term durations and had registered a total o f 1465 Rehalbililitation Professionals/Personnel in the Central Rehabilitation Register till March, 1997. TTo t conduct recognised training programmes, the Council has identified/recognised 91 instituttionns in the country. Besides these, the RCI also conducted jo in t entrance examinations on la lll India basis for the courses in physio therapy, occupational therapy, prosthetic aind I orthotic engineering, etc. for the National Institutes.
3.10.54 An Indian Spinal Injury Centre waas set up at New Delhi in collaboration with the Italian Government to extend comprrehoensive treatment, rehabilitation and vocational training and guidance to the spinal injury p)aticients. The Centre also conducted research in multi-dimensional aspects o f rehabilitation oof such patients. In addition to these specific programmes, there have been many othierr support programmes for persons with disabilities in other developmental :secctors like health, education, labour and employment, as listed below :
3.10.55 In the field o f health, a number 0)f oongoing programmes have a direct bearing on the prevention and reduction o f the inciideence o f the various disabilities. They include eradication o f smallpox, leprosy, contrcol o f blindness, control o f iodine deficiency disorders, national mental health programimee, universal immunization programme, child survival and safe motherhood and other rmatiternal and child health services. The National Mental Health Programme launched in 19^92 ! with the sole objective o f improving mental health services at primary, secondary amd 1 tertiary levels. Efforts were also made during the Eighth Plan to integrate mental healtth . care with primary health care. Details of various services extended under this progrramnme are given under the Chapter on 'Health and Family Welfare'. In addition to thtese.e, while the apex institutions such as the All India Institute o f Medical Sciences (AIIIMI'IS), New Delhi, Post Graduate Institute of Medical Sciences, Chandigarh and the /A ll India Institute o f Physical Medicine and Rehabilitation, Mumbai, have been extemdiiing rehabilitation services to the persons with locomotor disablility, the National Institiutae of Mental Health and Neuro Sciences, Bangalore has been contributing for tlhe ; rehabilitation o f the mentally retarded and spastics. The All India Institute of Spee;chh and Hearing, Mysore is yet another agency which has been contributing towards rehiabbilitating the persons with hearing and speech disabilities.
3.10.56 Similarly, the Defence IRessearch Development Organisation (DRDO), New Delhi, in collaboration with the; I Ministry o f Welfare, Department o f Science & Technology (DST) and Nizam Institute o f M4edical Sciences, Hyderabad, has been involved in various R&D activities to standardiise-e the production o f Polymeric Composite Rehabilitation Aids for polio-affected pjhyysically disabled. The aim o f the project was to develop different rehabilitation aiidss in standard sizes under a DST-funded programme and evolve effective prodm cttionisation techniques. The aids identified were Floor Reaction Orthosis (FRO), socket foor lower limb amputees, prosthetic foot and calipers made o f fibre reinforced plastic:s. FRO is a device meant for people having disability due to polio and having basiccall'ly a 'hand on knee' gait due to weak quadriceps. FRO made o f polymers and their compossitees developed by IIT, Bombay weigh only l/5th o f the weight o f a corresponHing metallic caaliper. DRDO has been working on standardizing
400

different sizes, limiting them to 8 sizes, wvhiich are likely to cover the majority o f the population, after doing detailed anthropometridc 'studies on about 500 polio-effected peop e, especially children. Different modules o f FRO.O are being assembled at limb fitting centres in the country, which are equipped with some boasiic facilities like heat gun etc. The District Rehabilitation Centres (DRC) o f the Ministstryy o f Welfare were also involved at the field- level trial stage. After doing the clinical triaals in 6 identified validation Centres, the sizes will be frozen to go for production. In order t<to have the trained people ready to adopt the technology, a three-week training programmne Ifor doctors has also been planned for during1997.
3.10.57 In the field o f education, the Naaticonal Policy on Education (1986) extended its support in advocating equal educatidomal opportunities for the Persons wi:h Disabilities. It envisaged universalization otif elem entary education for children with miid and moderate disabilities by 1990 and 19995 respectively and for those with severe disabilities by 2000 A.D. In the Eighth Fi'ive; Year Plan, a special thrust was laid cn providing educational services to the disaablled children in a sensitized community atmosphere with the provision o f adequattte infrastructural support. In order to provide educational opportunities for the Persons withh IDisabilities children in common schools so as to facilitate their retention in the school sjysfem, the Department o f Education has been implementing a scheme o f Integratedd Education for Disabled Children (lEDC) since 1982-83 and more than 50,000 disahbked children have been covered in 12,292 schools so far. Under the community-basedd tand innovative District Primary Education Prograinine (DPEP) launched during 1994 i;in 60 districts, integrated education for children with mild to moderate disabilitiess Awas given special emphasis. In addition, the Project 'Integrated Education for the Disabled 1 (P IE D )' initiated by the National Council for Educational Research and Training (N CERT)) wvith UNICEF assistance in 1987, continued to strengthen the implementation o f the scher;mte o f lEDC in a selected block in 10 States. An external evaluation o f this project in 19944 showed that not only the enrolment rate cf disabled children increased considerably but thhe retention rate amongst the disabled children has also increased to as high as 95 per cent ’ wlhich is much higher than that o f the nondisabled children in the same blocks. Over 6,),0(00 disabled children have been covered in 1382 schools under Project Integrated Educatioon for the Disabled (PIED).
3.10.58 The Central scheme to award Schoolairships to the Disabled students to pursue general, technical and professional courses frcom i Class IX onwards on the basis o f means- cum-merit test was transferred to the : Sttates from 1993-94. All the States implemented programmes for providing scholaarsships to the Persons with Disabilities at the elementary and secondary stages in the schools s. A few States provided free books and extended scholarship to the disabled students.s for music, vocational, technical and other professional courses.
3.10.59 Under the Em-ploym.ent sector, the vcocational training facilities for the persons with disabilities were expanded through a grannt-)in-aid programme. At present, there exis: 852 govenmient-run and 105 private-run Induustrrial Training Institutes (ITIs) in the countr} which provide 3 per cent reservation o f seats ; fcor persons with disabilities. The National Council o f Vocational Training, a non-statutorry body set up by the Ministry o f Labour, formulated a policy o f 3 per cent reservatitio^n o f seats for trainees with locomotor disability in all the ITIs in both engineering amd non-engineering trades. In order tc facilitate speedy rehabilitation o f the persons '' wiith disabilitiesd. Skill Training Workshops (STWs) have also been attached to all the eexisting seven Vocational Rehabilitation
401

Centres (VRCs) located at Mumb.baii, Ahmedabad, Bangalore, Chennai, Thiruvananthapuram, Hyderabad and Kanpur, r. Rehabilitation services to the rural Persons with Disabilities were being extended through } Mcobile Camps and 11 Rural Rehabilitation Extension Centres(RRECs) set up in 11 B lock^s and 5 VRCs located at Mumbai, Calcutta, Kanpur, Ludhiana and Chennai. By 1996, 8,8,2188 blind, 10,376 deaf and dumb, 67,656 orthopaedically disabled and 1,690 persons vw iith other disabilities were rehabilitated. To support economic activities o f the Persons with i O isabilities, the Ministry o f Rural Areas and Employment has initiated action to allocate 3 3 jper cent o f funds under all the Poverty Alleviation Programmes, except in respect o f f Eimployment Assurance Scheme and Jawahar Rozgar Yojana. Action was taken to extetemd credit facilities to the Persons with Disabilities under the Integrated Rural Developnmsent Programme.
3.10.60 Various concessions have also been i e:xtended to persons with disabilities through executive orders/notifications both by the Gov'veimment o f India and the State Governments. To illustrate, the Indian Postal Services delivverr Braille literature free o f cost to various Libraries for the Blind. Organisations working g ffor the persons with disabilities get rebate in telephone rentals. Blind persons can travel bby the Indian Railways, by paying 1/4 o f the normal fare for themselves and their escorts. Th’he; Indian Airlines give 50 per cent concession to blind people on domestic flights.
The Social Deviants
3.10.61 To tackle the problem o f social maladjustment amongst children. Central assistance was provided to States/UTs for se ettiing up Observation Homes, Juvenile Homes and upgradation o f the existing Institutions eitc. Under the scheme o f Prevention and Control o f Juvenile Social Maladjustment, aboout 280 Observation Homes, 251 Juvenile Homes, 36 Special Homes and 46 After-care Hlomes have been supported. In addition, 271 Welfare Boards and 189 Juvenile Courts were fmnctioning in the country.
3.10.62 The Probation o f Offenders Act, 19 58 provides for non-institutional treatment of offenders. This approach has been univenrsially recognised as the most scientific and economical alternative to imprisonment. According to the Act, administrative infrastructure has already been established inn more than 400 districts o f the country, thus oroviding a good base to build these services i fuirther.
3.10.63 The problem o f alcoholism/drug alabmse received priority attention in the Eighth Plan by curbing the illicit trafficking o f drugs/;s/liiquor within and across the border; and by demand reduction through building awarenesses ^ d educating people about the ill effects o f alcoholism/drug abuse. W hile the control o f f smpply o f these toxic substances was taken care o f by the Narcotic Control Bureau annd the Police, the welfare and rehabilitation aspects were attended to by the nodal M inisistry o f Welfare through a comprehensive progreunme o f 'Assistance to Voluntary Or)rgjanisations for Prohibition and Prevention o f Drug Abuse and De-addiction and Rehabilitatitiojn o f Drug and Alcoholic Addicts' launched in Eighties. To enlarge its scope and ( efffectiveness, certain modifications were brought in to reformulate the scheme in 1999^4. Voluntary organisations were assisted in creating awareness about the ill-effects alcohhollism and drug abuse, counselling services to addicts and their families, referral servi/icees for hard-core addicts to De-addiction- Cum-Rehabilitation Centres and for follow-up p scervices.
40 2

3.10.64 By March, 1997, 218 Awarenejss/t/Counselling and Assistance Centres and 123 De-addiction/Rehabilitation Centres wesre e functioning in the country. As a result o f the implementation o f the programme, the nuim hber o f drug addicts registered in these Centres started declining steadily from 3.12 lakh ini 1'1994-95 to 2.82 lakh in 1995-96 and 1.25 lakh till September 1996. During this p e rio d ,'3 .775 lakh drug addicts were detoxified in various Centres in the country. O f this, 32,819 drirug addicts were detoxified in 18 De-addiction Centres o f the North Eastern region where theie problem o f drug addiction is acute. Further, the Ministry o f Welfare, in collaborratition with United Nations Drug Control Programme(UNDCP) took up a number c o f projects which include Community Drug Rehabilitation and Work Place Prevention Pr̂ ’rogramme. Under this programme, 20 voluntary organisations were identified in different : p parts o f the country and were given extensive training in rehabilitation o f drug addicts.
3.10.65 In order to cover a wide spectrrumm o f programme/areas for tackling the social problems, the grant-in-aid scheme for 'A^ssisistance to Voluntary Organisations in the field o f Social Defence' was continued. Suppoirt v was extended to the research schemes for pilot projects in unattended and neglected areas a and social problems o f an inter-State character. Under this scheme, 17 projects havce been initiated for maintenance and rehabilitation o f the children o f prostitutess iiin Uttar Pradesh, West Bengal and Delhi. To extend support for maintenance o f the Cerntraal Office o f the voluntary organisations, the scheme o f Organisational Assistance to \ Voluntary Social Welfare Organisations was continued.
3.10.66 Efforts were continued by the Staateies to prevent, control and rehabilitate beggars as provided under their respective anti-beggary/ 1 legislations. At present, 16 State Governments and 2 Union Territory Administrations haave enacted Anti-beggary Legislations. The Ministry o f Welfare initiated a scheme 1 forir Beggary Prevention in 1992-93. Under this scheme, grant-in-aid was extended to NGO?s f fo r establishing Vocational Training Centres for the care, treatment and rehabilitation o f beggganrs. Services in this field lacked uniformity.
3.10.67 The National Institute o f So)ciaial Defence (NISD), New Delhi, functioning under the nodal Ministry o f Welfare, contimuiued to serve as the central advisory body in the field o f prevention o f crime, treatment o ftf offenders in the areas o f juvenile justice administration, welfare o f prisoners, probaiation and allied measures, suppression of immoral traffic and drug-abuse preventicon n etc. The NISD organised training courses for various categories o f personnel viz., govferrmment officials, social workers, counsellors, project managers, programme officerrs,;, prison welfare officers, enforcement machinery etc. in collaboration with SSta:ate Governments, Universities and voluntary organisations in different parts o f the ccouointry. During the Eighth Plan, the NISD organised 70 One-W eek Regional Training; CCourses, 25 Two-Week Training Courses and 4 Training Courses o f four days duration beienefitting about 3400 personnel and workers engaged in the area o f drug abuse preventiom. . The Institute being an advisory body in the field o f 'Prevention o f Crime and TreatrmeKnt o f Offenders', provided a research base for the identification and formulation o f sschhemes suitable to different regions o f the country. The Institute has contributed sifignificantly to the laying down o f a basic framework for handling and treatment o b f various categories o f juvenile and adult offenders.
40103

The Other Disadvantaged
3.10.68 Since the life expectancy in the ccouuntry has improved, the proportion o f the elderly population is on the rise. Correspoonndingly, the magnitude o f the problems o f the elderly is also increasing. To tackle the groowving problem, a new scheme o f assistance to voluntary organisations was introduced in H 9992-93 for setting up/continuance o f Day Care Centres. Old Age Homes, and Mobile Meddiccare Services. During the Eighth Plan period, voluntary organisations were assisted to estitahblish 186 Old Age Homes, 223 Day Care Centres and 28 Mobile Medicare units. Thoe < other important welfare measure for the aged was the implementation o f Old A ge; PPension Scheme under the State Sector. The rate o f monthly pension varies from State to ^Stftate and ranges between Rs.75 and Rs.200 per month. However, a majority o f the States of ffeer a minimum o f Rs. 100 per month. In August,1995, a National Social Assistance Schemoe ' was launched by the Department o f Rural Development under which the GovemmeEnt t o f India announced Central assistance to States for providing old age pension of Rs.;.755 p.m. per beneficiary to the destitute or poor elderly o f age 65 and above. While most i of f the States have adopted destitution as the criterion, some have adopted income approaachh also.
3.10.69 Due to rapid urbanisation and unabbatcted migration o f the rural poor, the population of destitutes, especially that o f the street chhilddren, in urban centres is increasing. In order to tackle this problem, a scheme for the Weblfa^re o f Street Children was launched during1992-93, to provide community-based nonn-i-institutional services for the care, protection and development o f street children. Thhe major components o f the scheme are - identification o f street children; mobilising nnutitritional support maintainance o f the requisite level of physical and mental growth offeringg facilities for education, linking facilities for the trailing o f street children in gainful vc'occations, trades and skills so as to enhance their earning capacity; promoting facililitides for shelter and hygienic living; offering counselling, guidance and referral services. 1 UrJnder this scheme, all possible efforts are also made for re-integration o f the street childnrenn with their families or their placement in a family setting and protecting the street childdreen against all forms o f abuse and exploitation. The scheme is being implemented through 8B1 voluntary organisations in 23 cities covering approximately 24000 street children under thne } guidance o f a city level Task Force composed of Seaetary, Social W elfare, Police Conmnmissioner, Municipal Commissioner, Director, Social Welfare o f the concerned State Govermrmient.
3.10.7C To streamline the adoption serrvidces, the Central Adoption Resource Agency (CARA), set up in 1988 in pursuance^bf th le ; directives o f the Supreme Court, continued 10 act as a clearing house o f information wvith regard to children available for adoption. To regoiate inter-country adoption and foDnrmulate detailed procedures with regard to the adoption o f children for foreign nationals, a revised guideline was notified in June, 1995. Around 82 national agencies and 286 foreiggn agencies were given recognition for dealing with tbs inter-country adoption cases in nmoore than 25 countries. During the Eighth Plan, an estimated niunber o f 7810 children have fouund homes through these agencies, o f whom, 4456 are intra-country and 3354 are inter- couuntry adoption. The cases o f children adopted by the foreign nationals are monitored throouggh the Embassies/High Commission o f various countries. Voluntary organisations were also assisted for setting up Homes for Infants (Shishu Griha) since 1992-93 and for promootiiing intra-country adoptiom. By 1996, 66 such Homes came into operation.
404

3.10.71 All the above listed on-going prograimnmes catering to the welfare and development o f these Groups will appropriately be stremggthened, streamlined and expanded ensuring qualitative and quantitative improvement durrinpg the Ninth Plan.
3.10.72 Most o f the programmes under So)ci;ial Welfare Sector are being implemented by the State Governments for the welfare and dlevvelopment o f the Persons with Disabilities, the deviants, and the disadvantaged. They inc ludes special schools, scholarships, hostels, aids and appliances for the Persons with Disaibi)ilities; implementation o f various social legislations like-Im m oral Traffic (Preventicon)i) Act, 1956 (amended upto 1986), Probation o f Offenders Act (1958), JJ Act (1986), Beeggary Prevention Acts (State Acts) and setting up/maintenance o f various mandatory innstitutions in the field o f Social Defence like Juvenile Homes, Childrens' Homes, Childrren i Boards, Observation Homes, Correctional Homes, Shelter Homes, Reception Homes, N-'fari Niketans, Beggar Homes etc; and other Social Welfare Institutions and services like Oi)rphanages, Old Age Homes, Homes for the Destitute and Dying; welfare ser/ices for chhildren and women in need o f care and protection etc. In running these programrmess, the central Ministry and its sub-ordinate organisations extend necessary guidance, acdvidce, support and technical know-how in respect o f the programmes for the persons wv'ithh disabilities to the States/UTs.
RESEARCH, EVALUATION AND MONI TCORING
3.10.73 The on-going efforts o f research ;anad evaluation will be oriented more towards the diagnostic and evaluative research in. idemtilifying the existing gaps, besides helping mid-term corrections in the ongoing prograimnmes. At present, as there is no systematic monitoring o f the implementation o f varriouus policies and programmes, efforts will be made to develop the required mechanisms, wl/hich would help ensure necessary feed-back for the quality o f programmes. Efforts wiill also be made to ensure the setting up o f similar mechanisms at State level.
3.10.74 The existing seven national llevvel institutes will continue to undertake specialised area-wise research to provide nec:esssary inputs to the Ministry o f Welfare in developing appropriate strategies and packatgess for the development o f the Persons with Disabilities. The National Institute o f Sociail EDefence, New Delhi will continue to serve the M inistry as an advisory body in the fi(eldd o f prevention o f drug abuse, beggary, crime and the treatment o f offenders etc.
IM PLEM ENTING MECHANISMS
3.10.75 The administrative machinery att tth e Centre for implementing the various social welfare programmes had been contimuinng without much o f a change till 1985 when a separate Ministry o f Welfare was set up. A \s part o f the Ministry, exclusive Bureaux - one for the persons with disabilities and the cothher for the social welfare and social defence, continue to handle welfare and development oof these groups. The six national institutes for the Persons with Disabilities, located ait vvarious places o f the coimtry, the Artificial Limbs Manufacturing Corporation, Kampour; National Handicapped Finance and Development Corporation, New Delhi and )thee National Institute o f Social Defence, New Delhi U nction as support structures and asssist the nodal Ministry in performing its administrative and developmental responsibiliitiees. At the State level, while majority o f the State Governments have exclusive De;panrtments/Directorates o f Social Welfare, a few States still continue to handle the sociail Wvvelfare programme in a scattered way. As
4J05 5

these State Departments/Directorates are rn o t equipped adequately v/ith technical manpower, they need to be strengthened w ithh professionally trained persons to ensure formulation o f need-based programmes annd their effective implementation At the field level, the Panchayati Raj Institutions andd the Local Bodies will be actively involved along with the voluntary sector and the community in implementing, coordinating and supervising/monitoring the welfare progranmmes Upholding the spirit of Co-operative Federalism', the Ninth Plan seeks more involvf/ement and co-operation from the States/UTs in respect o f social welfare/social defence prcogrammes whose responsibility mainly rests with the State Sector.
VOLUNTARY ACTION
3.10.76 The voluntaryorganisations, since history, have been playing a very important role in the field o f social welfare.Their role as effective motivators in bringing the local government and the people together in working towards the well-being o f the disadvantaged and the deprived as pressure groups in impressing upon the Government to extend socialsanctions in favour o f theceprived, and as an effective iTiplementing force in translating the policies and programmes o f the Government into action, has been successful in the past. Some o f the \oluntary organisations in the r3cent past have also provedfieir credentials in experimenting successful ! alternative models in providing certain specialised services for the welfare and retehabilitation o f spastics/mentally retarded, crug addicts, leprosy affected, prostitutes, ddestitutes and the dying, street children etc Another important area, where the voluntary secctor made an effective entry is to change the nind-set/attitudes o f the people to overcome ; the wrong and blind beliefs which are the causes for many present day social evils/problenms They can also be effective animators in generating awareness and thus, equip the targget groups with necessary information about fieir rights and privileges besides the governnmental efforts to improve the lot o f the ceprived and the disadvantaged groups, Th'herefore, efforts will be made to promote voluntary action especially in those areas w heree it is missing completely or weak
R O LL E OF VOLUNTARY ORGANISATIONS
Voluntary- ( Organisations have been playing a \ cr> important role for i the welfare, rehabilitation and de\elopnient of Social We^elfare Groups \iz .. Persons with Disabilities. Juvenile E Delinquents / Vagrants. Alcoholics and Dnig Addicts, SSex Workers / Cluld Se.\ Workers. Working Children, J Street Children. Destitutes / Deserted, Women and Girls i in social / moral danger. Older Persons etc who have spcci^ial problems or living in problem situations In handling / ' reforming / rehabilitating f caring these Special Groups, t the contribution of the Voluntar> Organisations which are f in direct contact with these Target Groups has been very v vital. In fact, the Social Welfare Ser\ ices in the country ha’ave been developed on the strong foundations of the Voluntatary Sector and still being continued through the country-wicide network of the Voluntary Organisations w hich are more tlthan 10.000 in number at present. Tliroiigh this medium, s< services to these Special Groups are being reached to the m osist backward, remotest and inaccessible areas of the country y.
PLAN OUTLAYS
3 10 77 While an outlay o f Rs 1208 63 croree has been earmarked for the Social Welfare Sector at the Centre in the Ninth Plan(1997-'-2002), an amount o f Rs 3348 12 crore has been earmarked (provisional) for Social Welfrfare programmes including for women and ciildren in the State Sector for the Ninth Five Ye ear Plan (1997-2002)
4-06 ,

3 111 One o f the major concerns o f the G o w em m en t has been the improvement o f labour welfare with increasing productivity and iproovision o f a reasonable level o f social security The planning process attempts to create c:onnditions for improvement in labour productivity and for provision o f social security to smppplement the operations o f the labour market The resources have been directed througlh the Plan programmes towards skill formation and development, exchange o f informati(on i on job opportunities, monitoring o f working conditions, creation o f industrial harmony thhrough an infrastructure for healthy industrial relations and insurance against disease and luneemployment for the workers and their families The achievements o f these desirable objective/es in the areas o f labour and labour welfare have been determined primarily by the kimd t o f labour market that exists The situation of surplus labour, coupled with the employrmeent o f most o f the workers in the unorganised segments o f the economy, has given rise tco i unhealthy social practices like bonded labour, child labour and adverse working condiltioons faced by the migrant labour Within the available resources, a limited effort at hanidliling these problems has been feasible
3 112 Many o f the initiatives taken by thie ( Government for labour welfare and the role o f the Plan in supplementing the efforts <of F labour, employer and the Government have to be reviewed regularly in the context o f an ewoblving economic and social background The social, economic and political conditions th a t t existed in the initial years o f planning in the country have changed The trends in deimo.ographic, social and economic developments, that have taken place, are not always the sarme 3 as expected and the Government policies have to be adjusted to the changing situation
3 11.3 The diversification o f econom'y away from agriculture, as measured by the sectoral pattern o f employment, has beem rnnuch slower than expected The Second Plan had projected a decline in the workforce emga,aged in agricultural activities from 70 per cen: in 1956 to about 60 per cent in 1976, i.e. by 10 percentage points over 20 year period but the actual decline has been much slow^er.r. Even in 1991, 64 9 per cent o f the workers were in the agriculture sector, representing a c decline by only 5 per cent from 70 per cent o f 1976.
3 .11.4 The share o f the organised sector in enmployment has continued to be b w and has been declining, accounting for 7.82 per C(entit of total employment in 1991. Within the organised sector, the private sector's sharee in employment reduced from 42 per cent ir. 1961 to 30 per cent in 1995.
3 .11.5 The proportion o f self-employed im < employment has reduced but still it accounts for 56 per cent o f those employed in 1992. TThe proportion o f casual labour has increasec from 19.7 per cent in 1972-73 to 28 per cemt in 1992 among the male employees and frorr.30.7 per cent to 36.4 per cent among the fem aale employees. The regular salaried employees constituted only 16 per cent in the case o f m aale employees and 6.8 per cent in the case of female employees.
3.11.6 Employment per enterprise, enume;ratited in -the economic census, has reduced from2.92 to 2 88 persons between 1980 and 19'90.). Nearly three-fourths o f the establishments enumerated in the 1990 economic census haid 1 less than five employees each and 90 per cent had less than 10 employees each.
3.11 Labour & Labour Welfare
4007

3 .11.7 Given the large share o f those ennpbloyed in the primary industries, outside the organised sector, in very small establishmeintsts and at casual status o f employment, the strategy for benefiting the workforce in geneiral 1 has to be based on an increase in productivity rather than on attempting labour welfare thro?uggh a frame-work o f multiple regulations
3.11.8 The labour movement in the countryy t(took shape when textiles, mines and plantation industries were the principal employers in thoe organised sector and when these industries w ere almost entirely in the private sector. AV mutually acceptable independent third party used to arbitrate in the case o f disputes b e tw eeen the employees and the employers prior to independence. After independence, the roke o o f the arbitrator has been assumed increasingly by the Government. A system o f labour trilbuunals with associated fora came into existence Such a system can be effective only in the cajse c o f labour in the organised sector
3 119 With 70 per cent o f organised em pkoyyment being in the public sector, a peculiar situation has developed in which the Govermnnment assumes the role o f an employer as also o f an arbitrator In the public sector, itheiere exist very effective, industry-specific associations o f workers, which negotiate direjctltly with the managements o f the public sector enterprises. The role o f the Government ;as ; an arbitrator in the public sector industrial disputes should, therefore, reduce drasticallly. . Both the employers and the employees can select a mutually acceptable arbitrator, indejpe endent o f the Government, on a case to case basis. The resources o f labour administrratition infrastructure should become available increasingly for studying the working conidititions o f the unorganised sector
3.11.10 In recent years, following the initiiatkion o f economic reforms in 1991, the rate o f expansion o f employment in the private seictctor has been higher than in the public sector The rate o f growth in private sector organijsectd employment during the period 1987-88 to1993-94 was 1.18 per cent as compared to 1 .000 per cent rate o f growth in the public sector employment. This is a welcome reversal <of f the relative situation that prevailed in the eighties.. The gains from economic growthi a accrue to the labour force from the expansion o f all-round employment and an increase in i the real output per worker The labour market in India, being for the most part ouitsiside the regulatory frame-work, has adjusted itself without much strain to the process o f rrefiform o f economic policies In labour disputes, the settlement can be much quicker iff the rewards are linked with productivity improvement that comes from cost reduction! annd higher output.
3.11.11 Changes in the w ork culture can sonnetetimes bring in a much larger all-round benefit than resistance to such changes. For exampplee, resistance to changes in the structure o f an industry will not benefit the workers. TThe services segment o f the organised sector covering insurance, finance, trade, comimiiunication, transport and a variety o f public services concerning health and welfare, is thie 1 largest segment o f organised workforce The benefits from the reforms in trade and fiscal p o b licy to the consumer depend very substantially on a more flexible structure o f the firms lin i these industries. During the Ninth Plan it is envisaged that the Trade Unions will contrilbutite to promoting changes in the work culture. The contribution from the Trade Unions is alsJso required for creating an environment that encourages linking o f rewards to lab o u r r with productivity improvement in a more flexible structure o f the firms that deliive^er such services. The trade unions have undertaken research studies on issues rellatiting to improvement in labour productivity in the past utilising the insights acquired by thienm through the labour movement. The forum
40?08

o f Indian Labour Conference, where theie labour representatives, employers and the Governments at States and Centre mutuallilly interact, can make useful contribu.ions by guiding research focussed at labour productivit’ity.'.
Labour Laws3.11.12 The labour laws encompass areas li Hkce industrial disputes, wages and minimum wages, security measures like Workmen's CcZormpensation Act, Equal Remuneration Act,
Maternity Benefit Act, ChildReview of Labour Laws
Benefits from existing labour laws reach a a :rminor part o f the workforce because o f adm inisisttrative difficulty in implementation. Ninth Plan w willl aim at reducing the number o f laws which deteterrmine relations between workers and em ployersrs,, with the objective that a much smaller numbibesr o f laws can reach the entire workforce
Labour Act, Factories Act, MinesAct, Contract Laboui Act,Welfare Fund related legislation etc The basic objectives o f allthese laws are to create a safework environment, pro^ide the mechanism and the procedure to settle industrial disputes and ensure minimum wages, payment of
provident fund, gratuity and bonus etc. besiaidees other statutory benefits, to the worker.
3 1113 To maintain its sanctity, any particululaar law requires to be reviewed in the context o f the changes that have occurred in the ; conditions that govern employment and industrial relations. The basic objective o f if inaitiating the process o f economic reforms was to correct certain distortions and imbalances ;s which had crept into the economy, lo overcome the crises arising out o f macro ecoroncomic imbalances and to lay the foundation of an economic regime characterised by de-lice:enising, de-regulation and de-control, besidesremoving all irritants and stumbling blocks i tco the production system in order to make itcompetitive on the one hand and to integrate t; thh.e national economy Vv-ith global economy on the other. Radical changes have been made in n tthe licensing system, in the mechanism governing import and export, in the foreign e; excchange regulations, and in the procecures for foreign direct investments It is imperative tco bring about corresponding changes in the labour laws.
3 11.14 It may be seen, however, that i ini the changed economic scenario, where displacement o f labour is inevitable and existstirng labour force is expected to get retrenched, the workers thus retrenched are not affectetedl adversely With this in mind, the National Renewal Fund has been created out o f which h poayments are made to the workers who are voluntarily retiring and funds are also prov)vicded for retraining and redeploymen: o f the retrenched workers. Steps need to be takeren so that the loss out o f reform process is minimum for the labourers.
3 .1115 The labour laws enforcement m aclchiinery in the States is under a severe strain The number o f cases pending before the coururtss is too large to be handled Any miscarriage o f justice is difficult to avoid in such a situatiitioDn. An effort to drastically reduce the number o f labour laws from the present 150 or so, andid cdevise a single labour code is necessa-y. This task is enormous. During the Ninth Plan period)d,, action will be taken to (a) identify the laws which are no longer needed and repeal them m ;; (b) identify the laws which are in harmony with the climate o f economic liberalisataticon and hence need no change, (c) amend the laws which require changes and (d) revise the e ; rules, regulations, orders and notifications etc. The M inistry o f Labour has taken the prepjpanratory steps in this direction
40W9)

3.11.16 At present, labour laws are targetted t(towards the organised labour force The unorganised sector does not get much benefit couut of the existing labour laws. Particularly vulnerable groups among the unorganised 1 sector are urban informal sector, agricultural labour, migrant labour, women anod child labour and poor landless workers who are poverty stricken. One o f the laws whhicch is widely applicable to this vulnerable groups is enforcement o f minimum wages. Thee MVIinimum Wages Act, 1948 is primarily applicable to unorganised sector/sweated sectftorr and empowers both Central and State Governments to fix/revise the minimum ratess ( o f wages in respect o f scheduled employments under their respective jurisdiction. 1 The minimum wages have been fixed at different levels by the different State Governmennts s
3.11.17 The subject o f national minimum wagt»ess has been considered by several bodies in the past. The National Commission on Labour ((H 969) was o f the view that such a wage in the sense o f uniform minimum monetary rrenmuneration for the country as a whole is neither feasible nor desirable The 28th Indian LLahbour Conference (1985) also discussed the need for national minimum wage. It was felt i thaat till such time the national minimum wage is feasible, it would be desirable to haavve regional minimum wage for which the Central Government may lay down the guideliness.
3 11 18 In the 33rd session o f the Standing Li^abour Committee, it was suggested that measures should be taken to evolve a unnifcform floor level minimum wage for all unorganised establishments. The need for so fixxinng and notifying minimum wages that no wage is fixed below Rs.35 per day was felt. It wvass also suggested to the State Governments that the existing benefits should not be reduced aanod wherever the current level o f minimum wages are more than Rs 35, they should be allcowved to continue The State Governments were also requested to take measures to reduacee inter-state and intra-state disparity in minimum wages.
3.11.19 If properly enforced, minimurm wages can offer greater potential for income transfers then special employment generratition schemes There may be opposition to this from rural oligarchy resulting in labouur substitution through mechanisation, but Government must stress on enforcing minimum! vwages at least in short term periods like sowing/harvesting season. If minimum wagess are properly enforced, it will reduce migration o f population from rural areas to urban ; arceas
Social Security
3.11.20 The present approach to providing soocial security to the population has been framed in the context o f a low recorded unemplcoyFment ( less than 3 % o f labour force) but high incidence o f poverty (more than 30% o f hoouseholds). A large number o f those employed are getting wages that do not providie them an acceptable minimum level o f living. The attempts at providing social securitty ; are targetted at the poor through special employment generation programmes on the ones hhand and provision o f free or heavily subsidised basic needs like health, nutritionn, housing and education on the other. Though 20 per cent o f the Plan and the non-Plaan expenditure o f the Governments at the Centre and the States is directed towards thhe creation and maintenance o f social infrastructure, the gap between what is needed ; anod what can be made available within the available resources o f Governments is too large.
410

3 .11.21 The other effort o f the Govemmentit t«to guarantee social security is through a set of laws, but such legal measures can tackle onnhly the symptoms o f a deeper malady underlying the economic and social situation, and thaat t too to the extent the measures are enforceable. The administrative and legalil i; infrastructure can not secure for all those m the unorganised workforce what the laws seeek c to provide for them.
3.11.22 Given the situation where the pnrovision o f social security encounters fiscal constraints and administrative limits to the tenliforcem ent o f laws, the only feasible approach to reach social security to the population is boy > creating conditions wherein the "economically active" segment o f population gets a rewanrd 1 for its labour, which affords a reasonable level o f basic needs.
3 .11.23 The working conditions o f labour • inn those parts o f the country where agricultural productivity is high and where the per capitaa i income levels, in general, are high are by and large satisfactory. In these parts, the markset t wage is well above the statutory minimum wage. At some o f the locations it is diflficuult t to find the beneficiaries eligible to get benefit under poverty alleviation schemes because i thhere are few households identifiable as below poverty line. The policies that enable high ggrowth in output do reduce the burden on the planning process o f providing social securityy.
3.11.24 However, the situation is not aas ; good in the States characterised with low productivity and high level o f poverty. ' Tl.’here are inter-State variations in the levels of M inimum wages fixed. This caWs for a {peieriodic revision o f minimum wages in all the States, which will ensure a level o f income Eaboove the poverty line
3 .11.25 The Employees State Insurance (lESSI) scheme, framed under the Employees State Insuranc' \ c t , 1948, provides for medical ( caare and treatment, cash benefit during sickness, maternity, employment injury and pensioon i for dependents on the death o f the insured worker due to employment injury, besidegs r meeting the expenditure on the funeral o f an insured person. The scheme is not applicahbleie to non-power-using factories employing less than 20 persons now but efforts will be maadde to extend it to all factories em.ploying 5 or more persons.
3.11.26 Health aspect is very important fdforr an average worker, who is poor and can not sustain him self unless work is available. UJnhless he is fit, his earnings get directly affected In these circumstances stress should be la id l oon proper heahh care arrangements for the workers in general and workers in the unnoorganised sector including urban informal sector in particular.
3.11.27 The agricultural labour which ( coonstitutes majority o f workforce, is exposed to many potential risks at the work location. IT he hospitals receive a large number o f cases o f accidents at work in the field. The heealtlth, hygiene and industrial safety set up, which has so far remained confined mainly to rm aanufacturing sector should allocate a substantial part o f its resources to providing services to > a agriculture sector.
3.11.28 The Governments o f Gujarat, KCenrala, Karnataka and Madhya Pradesh have insurance schemes for the landless agricuhltuural labourers. This needs to be extended for the entire country The Welfare Boards for r NMine Workers, Beedi and Cigar W orkers etc
4411

are financed by the cess levied o n tthese commodities A Cashew W orkers Welfare Board exists in Kerala. In the Ninth Plan, a ^strong research and development effort will be mounted to facilitate the extension o f social! pirotection to all sections o f the working population A scheme o f social security for the uinojrganised rural labour would be designed to provide for protection during the stoppage; orr diminution o f income. The existing welfare schemes o f the unorganised sector which aire widely scattered and fragmented, will be integrated properly. Institutions and arrange;mients for providing group insurance to the rural poor across the country need to be madle more effective and their coverage increased
3.11,29 Any scheme that has tco benefit the working population in the unorganised sector has to be employer-friendly/. Kdentification o f a prospective beneficiaiy is possible only with the active involvemenit o jf the employer
3 .11.30 The purpose o f the Natiiomal Scheme o f Social Security is to explore the most appropriate institutional m echainism for distributing among the working population, what has been earned by its labour, ratther than financing the flill cost o f social security
3.11.31 A scheme o f social secmriity to the working population at a particular location can be effective only if the num ber o f people who are to be reached through the scheme is manageable. The benefits o f a uinifform country-wide scheme cannot reach effectively all the locations. The requirements o f ' the working population and resources that can be pooled from the workers, the em)plo)yers and the State or national level institutions differ from place to place. Thus, the d e s ig n of the efforts for providing social security has to be promoted on a location-specific basiis
3 .11.32 Resources from the Plain can be used for demonstrating the viability o f such efforts. Certain conditions need tto Ibe fulfilled. Resources should be raised primarily by the employees and employers. T’he Government can provide a token support but cannot meet the full expenditure incurrecd con social security In the long run such location- specific schemes should invest thteir resources in, and earn from, the capital market The schemes will have to be operated <and managed jointly by the employers, employees and representatives o f the local autthority. The support from the Government, in the initial, and for a specified num ber of, years can be on a matching basis to the resources pooled by the employers and thie em ployees. The support from the Government needs to be shared by the State Govemimtent and the Central Government. The primary purpose is to test and demonstiratce the viability o f a location-specific, and largely self- financing, effort to provide soc;ial security at a rate that broadly matches the market wage rate o f an average worker at that locatiion.
3.11.33 Such a scheme, to be owvned by the local beneficiaries, has to have a strong location-specific character. The ta slk o f identification, in association with the employers, can be managed for a reasonabl«e sjize o f population unit. Hence, the formulation o f location-specific social security schejm es for a unit size o f say 20,000 households or one lakh persons, under the supervisiom (of local authority, will be encouraged
3.11.34 The social security se;t-uip as it exists among industrial countries is not applicable for India. Firstly, neairly^ half o f those employed are the self-employed , which is a very small category in thee industrial countries. M ost o f the self-employed are in the informal sector, in contrast t o tlhe industrial countries, where formal sector employs
412

bulk o f the workforce. Secondly, the incidence o f poveert;y is high here and persistent over time. It is rooted in several structural features o f the eccomomy. These include low wages, their irregular payments and irregular employment.
3 11 35 A few states in India, namely, Karmat;aka, Kerala and Tamil Nadudemonstrated the viability and potential o f old age penssio>n scheme. Some form o f social assistance is also given to the workers in the unorganisecd ;sector This could be considered by the other states. However, social security must : be targetted to particular vulnerable groups like informal urban workers, migrant workers, wvoimen and children etc However, multiple social assistance schemes will not be effective. It will be meaningftil to choose the most cost effective ones among them for application ac;ross the board Formal socialsecurity system can not be exclusively relied upon in a diev^eloping country like India It is necessary to reform and to extend their applications w here and when appropriateHowever, there is considerable scope for improvement im most o f the promotional andprotective social securities programmes in efficient utiilisation o f funds through better administration
3 1136 Urban informal sector is a sector where mostly miigrant workers are found They are landless poor who come to the cities and find them sellves in a difficult situation, staying in most unhygienic conditions. They do not have support! 0)f the trade unions Steps may be taken to improve their lot with social security measurers. The disabled workers are also in a disadvantageous position for whom special schem es; aire needed
3.11.37 An effort at providing social security to the poor was initiated in the Eighth Plan period in the form o f a National Social Aissiistance Programme (NSAP) The programme comprises (i) Old Age Pension, (ii) Matermit>y Benefit and (iii) Family Benefit for the girl child in particular This has been im plem ented mainly as a programme for the poor under the broad head 'Poverty Alleviation in Ruirail Areas'. In the Ninth Plan, an effort will be made to extend the coverage o f NSAP to ■ th e casual and the self-employed workers in informal sector both in the rural and the urbjani areas The objective will be to cover the economically active population outside the orj-gainised sector To begin v/ith, the beneficiaries will be those having income at a level bejlow the average income As discussed earlier, such a scheme will have to have requisite contribution by local authorities and the State Governments. Since the obDje(ctive is to cover economically active population, the role o f empJoyers and the local auithiorities is crucial in identification o f beneficiaries.
Employment Service
3.11.38 The employment service, set up undier the Government comprises Employment Exchanges which register the job seekerrs aand use this information for two purposes; (i) to send the names o f the job seekers to organiisations where the jobs arise and(ii) to present the data on job seekers and job plac;ennents as employment market information. Promotion o f self employment is also achiie'ved by providing information on the opportunities available. Registration o f some spec:ial groups o f job seekers like physically handicapped, professionals and executives, b)esiides the demand for labour in specific industries like the coal mines and the plantationss, i;s also attempted.
413

Towards a National Employmeint Service
* Present Employment Service set up ttook shape at a time when the public services were expanding and there was a sharp increase i urbanisation linked with expansion o f the organised services sector. There is a need for reorientation o f Empployment Service in the context o f emergmg markets.
+ Employment Exchanges should be orrganised under a local society which can raise resources from the benesficiaries -the employees and the employer in return for the information pi>rovided.
* Area specific studies to assess the mnanpower needs o f both organised and informal sectors at distriact levels to be carried out.
the
3 11 39 This set-up took shape at a time whjen the public services rendered by the Government were expanding, the supply o f educated manpower was increasing and there was a sharp increase in urbanisation linked with expansion o f the organised services sector. The legislation on compulsorynotification o f vacancies, enacted in 1959, sought to bring the information on private sector job
demands into the employment excwhange information system The function o f identifying the job seekers has been assumeed now primarily by the organisations where jobs arise The private sector does not, pracctically, use the employment service provided by the Government A number o f placcement agencies function outside the Employment Exchange set-up Within the Puablic Sector, the personnel selection function has been strengthened, reducing sharply thee reliance on Employment Exchanges The Governments now reach the job seekers directly when a sizeable job demand arises The number o f jobs that arise in the public sector has reduced sharply with the reorientation o f the role o f economic planning A number cof special employment promotion schemes in small scale industry, khadi and village industrries, animal husbandry and rural development do not have any linkage with this employmetnt service. Within the public sector, including the Government administration, the roble o f employment exchanges in personnel selection has, therefore, practically vanished
* The ability o f the existmg employmernt service set up to identify' th job seekers can be utilised for determinning those eligible to get benefits related to unemployment.
3 11 40 Some o f the State Gov/em ments have attempted to enhance the utility o f the employment service set-up. The; efforts have been made in two directions, one is in extending the reach o f the employ/ment service set-up by taking the service closer to the people with the help o f the availaible infrastructure facilities The second is in helping the identification o f the persons who arre unemployed and can be considered for support. The Government o f Gujarat has attenm ptedjo utilise the employment service set-up at the Taluka level by bringing the job seeekers and the job providers together in Bharti M elas The M aharashtra Government, in its pprogramme o f State-wide employment guarantee, intends to use the employment exchan^ges to identify the beneficiaries The West Bengal Government has provided unemplcoyment allowance to those registered, and in the process has generated some information con the number o f unemployed persons in the State, by identifying them.
3 11.41 The strength o f the presesnt employment service set-up lies in its ability to function close to the job seekers at the fieMd level It is difficuh to expect this set-up to provide "intelligence" on the labour markest as this function requires strong technical capabilities Such intelligence has to be gatherecd on "sample basis" rather than on' "enumeration basis", which is the normal approach to daata collection used by the Employment Exchanges. Most
414

job seekers, registered at the Exchanges, are thiosse looking for a change and are not necessarily unemployed. Efforts at streamlining th e (capabilities for the identification o f the actual unemployed have been made by using cormpouters to maintain and update the information on the job seekers
3 .11.42 National Employment Service in the contiextt o f newly emerging market scenario has to be reoriented The employment Service imuist accept its enhanced role and pay greater attention to compilation and disseminati(on i o f comprehensive Labour Market Information, Employment Promotion and Voc.aticonal Guidance and give up excessive reliance on traditional registration and placememt activities for the organised sector Unorganised sector needs to be covered and focu:s tco be shifted towards employment generation taking shape in the private sector, partic'.ulaarly in the services sector and not traditional manufacturing sector wherein growth o f jiob^s has moderated downwards Regular flow o f data in respect o f employment in the informaal sector o f economy needs to be generated through strengthening o f Employment Mairkeet Information Programme
3 11.43 The Employment Service needs to contribuite towards employment management by providing reliable data base generated through sujrveys on the labour market process and skill needs by assuming the role o f coordinator o f ] promotional activities undertaken by different agencies Area specific studies to assess the; mianpower needs o f both the organised and informal sectors at district levels are required to be; carried out
3 11.44 If the Employment Exchanges are to funct;iom as placement agencies meeting the needs o f the private sector, they should not function as a Department o f the Government. These should be organised under a local society, w^hicch can raise resources from the beneficiaries - the employees and the employer, iin rreturn for the information provided Wherever the management o f an existing Em ployrm ent Exchange is transferred to a local society, the State Government can consider oflfeering a subsidy, equivalent to the revenue expenditure o f the Government on rurmimg the employment exchange. The subsidy given to the society managing the employmientt promotion function, thus will be at no additional cost.
3.11.45 The ability o f the employment service set-up i to identify the job seekers can be utilised for determining those eligible to get benefits; reflated to unemployment. At present, an "unemployment allowance" is not feasible Howe^verr, any effective scheme o f social security to the working population has to be eventuailly ̂ based on an unemployment benefit, replacing the large number o f schemes through muiltipple Central and State departments, which use multiple criteria to identify the beneficiairiees namely poverty, backward class, minority status, gender, physical handicap, rural lartiisan, backward area etc Each o f these schemes seeks to benefit some one who needs lemiployment and attempts to devise its own criterion and procedure for "identification" o f thee beneficiary. In the long run, the resources o f Plan for social development will increaise. But it is not possible to fulfil the entire needs o f social infrastructure through public finaance. Ultimately, the resources for this will have to come from the purchase o f the setrvicce by the consumer in need o f the service An employment service set-up that functions (dose to a small population unit size can be an effective arm for providing social security/ bbenefits to those facing temporary spells o f unemployment. A beginning in this direction wiill be made in the Ninth Plan.
415

3 11.46 Presently, the employmemt : service mainly caters to the needs o f jobseekers and requirement o f the employer is n o t sio much looked after The Employment Service should provide quick and good quality s e rv ic e to the employers as well as employment seekers The educational and training needls ifor entry in emerging establishments o f private sector having large employment potentiial must be identified. Employment service should also cater to the needs o f the persons seeekiing to pursue avenues for self-employment
3.11 47 There is need for a coordim ated action between Centre and States for evolving an effective employment service so tihatt the existing gaps in the system are narrowed down The gaps which already exist in tine field o f vocational guidance and in terms of computerisation o f employment e^xchanges may be reduced Employment Market Information Programme run th rough 1the employment exchanges needs to be strengthened
Vocational Training
3.11.48 The National Vocatiomal Training System (NVTS) seeks to provide training for developing the skills for productioin iin those entering the labour force Two major resources tor such training are the Industrriail Training Institutes, (ITIs) and the 25000 industrial establishments that take part in A.pp)rentice Training The National Council for Vocational Training (NCVT), a tripartite bodly under the Ministry o f Labour, supervises this work Vocational education and techni(cal education are under the purview o f the Ministry o f Hvimai\ Resource Development Tine intake is 4.74 lakh trainees in the 3083 ITIs in the public and the private sector :ancd another about 2.59 lakh under the Trade Apprentice Scheme. Within the public secto>r, tthe States operate the ITIs and the Central Government trains the instructors at the Adlvamced Training Institutes (ATIs) and has a few ITIs for women. The Director General o f Emipioyment & Training (DGE&T) in the Union Ministry o f Labour co-ordinates the actriviities among the Centre and the States
3.11.49 The institutional set-ufp under DGE&T has evolved over a fifty year period with a clear definition o f funtcticons and responsibilities among different agencies for imparting training, curriculum d(evelopment, and technical approval o f the institutes Training is imparted mainly in thee engineering trades as a response to the requirements during the period o f rapid expanssiom o f engineering and capital goods industries in the manufacturing sector.
3.11.50 A few trades outside ithe; engineering field are also covered but the bulk o f the services sector, and the training meeds o f industries other than manufacturing, are handled by agencies other than D O E & T, such as the electronics establishments, agricultural institutions and medical in s titu tio n s For many o f the large services sectors, such as transport and construction, muc;h o f the training skills are acquired on job. Since the DGE&T has concentrated on th(e p>rovision o f training o f a reasonable standard, it has not been able to extend its area o f oipetration beyond engineering into the services sectors.
3.11.51 Some o f the existing diiffnculties in the system o f vocational training are uneven spread o f ITIs in different regi(on‘s, small coverage out o f the total school pass outs and drop outs, trade obsolescence, h ack o f training infrastructure, shortage o f experienced staff etc. Training programmejs being standardised on a national basis lack the desired flexibility to meet the regional anid local needs The procedural requirement for affecting
416

changes are time consuming Existing instructional pjackages in different trades need to be updated and made more attractive
3 11 52 Women constitute a significant part o f the w o rk force The National Vocational Training Institute in NOIDA (UP) and the Regional Vcocational Training Institutes for women in different parts o f India impart basic and advanice: levels o f vocational training to women Special attention is given to the modernisatiom and establishment o f women Industrial Training Institutes under the World Bank aicded Vocational Training Project A women's Ceil under the Office o f Director General o)f Em ploym ent and Training is also coordinating with the States in the matter o f Vocatiionial Training for Women The employment exchanges take special care to cater to the jcob needs o f women registered with them Proper linkage in rcspect o f women training rniay' be established between Director General o f Employment and Training (DGE&T), Minisstny o f Labour and other Ministries like Department o f Women and Child Welfare etc ancd tthe training facilities available in the Institutions created or to be created under the educcattion, health, agriculture, welfare, tourism sector plan programmes DGE&T (Women Dirrecttorate) should be provided a role in making such linkages effective
3 11,53 In the Ninth Plan, the Central Government will se;ek to strengthen the accreditation facilities for the training institutes on the pattern o f thte All India Council o f Technical Education Since the States have had the experience o f ac:tual training activity over a long period, they should also take up such ftinctions throug'h 1the State Councils for Vocational Training In the Central Plan, the DGE&T may reducej it:s role on imparting training to the trainees and the instructors and extend its institutioinall expertise to the services sector, modern as well as traditional As a leading agency ffo r training those entering labour force, the DGE&T can co-ordinate the activities for thee (development o f training courses in the fields o f health, instnjmentation, transportatiioin, agriculture, rural industries, handicrafts, etc.
3 11 54 Enrolment o f students at class X level is of thie >order o f 75 lakh The intake of the Vocational Training System is less than ten per cent off this The poshion will not be very different even if the training facilities outside thee NVTS set-up are included Proper training being an essential input for improving laibmur productivity, a comprehensive view o f the training facilities across all types o f traide;s deployed in the production of goods and services needs to be taken by one agency. It iss o>nly through such an exercise that an appropriate choice in the distribution o f public resouirce;s between academic education and training for production activities can be made. This vwilll be attempted in the Ninth Plan The DGE&T could be a suitable resource centre for this pDurpose
3.1155 In those parts o f the country like the Southern St;ates where industrialisation has taken place much earlier, the intake capacity in the nran-G overnm ental ITIs is more than twice o f those in the Government ITIs In other parts (of the country, the non-Government ITIs have less than one fourth o f the Government intakce. If the training needs o f all the entrants to the labour force are to be met, the Goveirnrment alone cannot deliver the goods. The training cost per seat has to be reduced and tthe: course pontent made responsive to the needs o f the local industry. The training instittutces, that generate resources by way o f fees, are better equipped, institutionally, to resspond to the needs o f the
417

irdustry In the Ninth Plan, the efFort will be tco increase sharply the intake in non- Covernment ITIs in the Northern and the W estenrn States Institutional set-ups, such as tie Societies, with none or only a token input o f puubllic resources will be encouraged
31156 There is a need for demonstrating to thhe younger persons the benefits in terms o' well-being and career development accruing frcrorm industrial training At present, very f(W surveys comparing the career development of f the youngsters who take to training at tie right age vis-a-vis those who continue witith academic education, are available The nistaken notion that vocational training is only 1 fo3r the 'school drop-outs' needs to be dspelled and results demonstrated widely througl^h ; applied manpower research
311.57 The existing Vocational Training syster^m is more supply oriented rather than demand oriented It is, thus, less responsive too tthe changing technological and market r;quirements. Accurate, timely and sufficient datita with regard to the absorption o f trained caftsmen and apprentices in different sectors o ff economy, is largely absent Such iiformation is necessary not only for those traineed i under the Labour sector institutions but aso for those trained under the Khadi, Village, Snmaall Industries etc institutions Without sich a database, the feedback for making changes i in the system at the policy and operational l;vel is not available and the expected outcome is i all 1 the more difficult to anticipate
n i . 5 8 In order to bring qualitative improvverment in the system, policy making tinctions on vocational training may be retained 1 boy the Director General o f Employment aid Training whereas delivery functions may be ̂ deelegated to the All India Council of '’'ocational Training by formation o f statutonry boards on trade testing, affiliation, <pprenticeship training etc. Ministry o f Labounr i is considering autonomy for some o f its iistitutes to allow flexibility in their day to day woorkc instead o f approaching the Government b r approval in routine administrative matters.
.11.59 At present, there is little linkage bet^wi'een vocational training and vocational education both at Centre and at the State level. ' There should be coordination between vocational education and vocational training imnpoarted by various departments, so that the irogramme designs, curriculum and service provvidded are in conformity with each other
.11.60 In the available ITI seats in the countryy, ithe North Eastern States have a very ow share. The employment opportunities in thoe ; government offices have shrunk due to ;onstraint o f resources faced by the State Govenrnnments. In the Ninth Plan, a special effort vill be made to expand the vocational trainniaig facilities in the North-Eastern States vith support from the Central Plan for this Sector.r, uunder Ministry o f Labour.
Thildren at work
1.11.61 The framers o f the Indian Constitituition consciously incorporated relevant )rovisions in the constitution to secure compulsoory/ universal elementary education as well IS labour protection for children. Labour Commisssicons and Committees have gone into the )roblems o f child labour and made extensisivve recommendations The existence o f :hild labour in hazardous industries is a grave prroWem in India Efforts will be taken in he Ninth Plan to modify the existing National (C Inild Labour Project. A major activity jndertaken under this scheme is the establidshiment o f special schools to provide non- 'ormal education, vocational training, supppleementary nutrition, stipend, health care
418

etc, to children withdrawn from empMoyyment. Under the existing scheme, there are 76 such projects throughout India This will ̂ heelp the working children and the children who do not have any access to the formal schocolss because of parental poverty Parental poverty and higher birth rate in 1970s were and sti;ill are responsible for a large number o f children joining work force at an early age This sccheme will partially take care o f the existing child labour problem and this will be : suupplemented by schemes like universal education etc run by other Departments Goverrnnment is also actively involved in generating awareness among the people against; eemploying a child as a labourer, especially in hazardous industries This programme wi ill ( continue in the Ninth Plan and the responsibility of education o f child labour will be takeen up by the Ministry o f Labour
Research in Employment and Manpoweer
3.1162 The Institute o f Applied M anppow er Research (IAMR) is a society carrying out training and research activities. The Insti ituute has conducted training courses for national and international participants Its infrasta'uct'-ture needs to be strengthened The Institute is supported by grants-in-aid from the ; Plrlanning Commission At present, the five theme areas for research on which the institute iss wA-orking are: i) Employment and Unemployment, ii) Human Resource Development, iii)) ! Science, Technology and Industry, iv) Social Concerns and v) Manpower Informationn s system The research capabilities o f the lAMR for carrying out research in employment . annd unemployment will be strengthened further
3 11 63 The work o f the Institute shoDuldd also contribute towards a better understandmg o f the effect o f various social sector progrramnmes on building up o f human capital Effective networking o f research efforts with Laboaunr Bureau, Labour Institutes at Centre and States, Statistical Departments at Centre and ! Staates, and the Central and State Departments responsible for social sector program m es> ccan make a significant contribution towards this objective
‘ 419

3.12. .. It is w idely recognised that there is s an integral relationship between art and cultuie on the one hand and socio-economic dievtvelopment on the other More than any other sectoi o f contemporary life, it is art and cultuire ̂ which has been the truly unifying, enduring and neaningfiilly integrating instrument o f hiarirmony and social cohesiveness It is in the realm o f culture that the Indian dynamics o f imter;rnalising change within tradition, o f bringing about consonance between modernity and tradiiticional wisdom has most effectively manifested itself
Progress Since Independence
3 12 2 Since Independence, the main conce;ntrtration was on the building up o f cultural institLtions in the field o f Archaeology, Antthrcropology, Ethnography, Archives, Libraries, Museams, Akademies etc for conservation anid f promotion o f the country’s cultural heritage Central Conservation Laboratories were set uip. , Cuhural institutions o f higher learning and research in universities and departments w ere fi further developed to promote creative talent and specialised studies through various schollar&rship schemes. Cultural relations with other count'ies were also strengthened by developiingig the Indian Council o f Cultural Relations Since 1970’s, attention has also been given tco iiincreasing the cultural awareness among the studeats by strengthening the cultural contcenint o f the curriculum at various stages of educaiion, thereby linking culture with educatiion n so that the educational system could help in buildiig up the cultural and social identity o f ttheie nation Basic infrastructural facilities have been expanded. Culture has also been reccog)gnised as one o f the basic concepts to be integrated with all development activities, panrticularly at various levels in the education sectoi for making it more relevant in the life o f f the people During the successive Plans, in order to build up cultural momentum in the comnintry, emphasis has been laid on contemporary creati/ity, preservation, documentation anid conservation o f cultural heritage through Archaeology, Archives, mural & tribal artss e etc Special attention has been given to sensit sing the Indian youth regarding the couintntry’s rich cultural heritage and for promoting com nunity participation A number o f prograimmmes for preservation o f monuments and sites o f national importance were also taken up on pririority basis While formulating programmes for welfare o f tribals and other social and ethmicic groups in different sectors, the element of cultuial development has also been taken intto > account Similarly, in the development of Indian languages and book promotion, impo)rtatant components o f our cultural policy have been ncorporated.
Progress in the Eighth Plan
3 12 .■ During the Eighth Plan the thrust vwajas on strengthening the regional and local museums, promoting tribal and folk cultmre e and their systematic documentation by institLtions like Anthropological Survey o f ' India, Indira Gandhi Rashtriya Manav Sangiahalaya, Zonal Cultural Centres (ZCCs)), T National and State Akademies o f literature, perfo ming, plastic and visual arts. State Depairtrrments o f Culture, and setting up Shilp Grams to briig the craftsmen and artisans from all coirneiers o f the country to display and market their products. People’s initiative for disseminati(on a o f knowledge about the country’s various folk, xibal and classical arts, music, dance, th(catatre etc was encouraged. Stress was also laid on improving literacy through libraries and asswociated activities
3.12 a r t a n d c u l t u r e
4:20 )

3 12.4 One important scheme emphasisisecd during the Eighth Plan was that o f financial assistance for the establishment o f mult.lti-purpose cultural complexes in States, including those for children, for creating infrastanactture like auditoria, libraries, museums etc The Archaeological Survey o f India continuiue;d the work o f conservation o f 3,562 Centrally protected monuments, including 16 WWcorld Heritage monuments As many as 450 monuments were taken up for comprorelhensive conservation work including structural conservation and environmental developmme;nt
3 12 5 The Maulana Abul Kalam Azad InlnsUitute o f Asian Studies was established at Calcutta as a research and training centre on the e Hife and works o f Maulana Azad The lnsti:ute undertakes studies on social, cultural, poioliitical and economic movements in Asia from the middle o f the nineteenth century Srimaiamta Sankaradeva Kalakshetra has been set up for protecting, preserving and promoting ) thie cultural heritage o f the people o f Assam Kalakshetra, Chennai was declared an in:nst:itute o f national importance Financial assistance was also provided through a number o f s sclhemes to dance, drama and theatre ensembles as also to persons distinguished in arts and 1 le^tters and such other disciplines for their creative work Training was imparted to a numbtbeir o f teachers and resource persons by the Certre for Cultural Resource and Training to prcrormote interlinkages between culture and education Cultural kits and audio-visual programmeses 'were distributed among students Young children were awarded cuhural talent scholarships ;
3 12.6 The Sahitya Akademy brought out it ssix volumes o f Encyclopaedia of Indian LiteratLre, an Integrated history o f Indian Literature 2 amd an Anthology o f Modern Indian Literature It published more than one thousand titles s iin various languages and launched a Translation Bureau at Bangalore. The Lalit Kala AkJcatdemi and the Sangeet Natak Akademi continued with their on-going programmes. The Nalaticonal School o f Drama opened a regional centre at Bangalore and organised exhibitions and f fe;stivals o f plays
3.12.7 The National Council o f Science e Museums executed the Science City Project at Calcutta The Convention Centre was o p p en ed on 21*̂ December 1996 and the remain ng wings were opened on July, 1997. T h e National Museum launched the scheme o f conservation o f wall paintings in 1996-97. ' T h e National Archives o f India continued with its various programmes. The Public Record J Avct was enacted in 1995 The National Archives o f India established its regional centre at t Blhubneshwar and provided financial assistance to 23 States/UTs and 178 organisations fofor the development and preservation o f archr/al repositories and preservation o f manuscripiptis. The Archives also brought out Vol III& IV of the Guide to the Sources o f Asian History. '.
3.12.8 The Anthropological Survey o f Itlncdia continued with its “People o f India” project, covering the anthropological profile o f f ^635 communities o f the country. Out of the proposed 43 volumes, it has already broujug^ht out 14 (6 in the National and 8 in the State series). Indira Gandhi Rashtriya Manav Siangrahalaya (IGRMS) organised an international meet on tribals and analogous people, attetenided by delegates from 27 countries, besided the representatives o f all the States o f India.
3 .12.9 The National Library, Calcutta init itiaited the work o f computerising its data base The Central Secretariat Library at New Delhlhi., as part o f modernisation effort, installed an automated integrated system for giving c om line public access catalogue The Raja Ram Mohan Roy Library Foundation, Calcututtai promoted library services in the country ^y providing matching financial assistance to 3 1 8 States, 2 LTs and other organisations worki.ig
421

in the field. It also extended its mobile library sserrvices to the physically and socially handicapped persons Some o f the manuscript libranriess like Thanjavur Raja Sarfoji Sarswati Mahal Library (TRSSML), Khuda Baksh Oriental PPuhblic Library, Patna and Rampur Raza Library, Ram pur continued with the work o f preser\-vatition o f the manuscript heritage o f the country The TRSSM L is also preparing micro-film i ccopies o f their manuscripts
3 12.10 The Indira Gandhi National Centre for the . Avrts continued its work through its five divisions viz. Kalakosa, Kalanidhi, K aladarshan,. Jaanapada Sampadha and Sutradhara Its building project is in progress.
3 12 II The Salaijung Museum, with its wide ranpgej o f collection o f art objects, and rare manuscripts in Persian, Arabic and Urdu, undertoookc the preservation o f more than 2000 objects by chemical treatement and restored 20 oil paainntings.
3 .12.12 The Nehru Museum and Library, engaged i in i research in modern and contemporary Indian history, brought out 19 publications. The .'A ssiatic Society, Calcutta continued its activities for the improvement o f library and museumn sservices, besides scientific preservation o f Its collection. It has introduced computerised cataalcoguing o f old books, papers, paintings by old masters, sculptures, photographs, pictures etc. .
Objectives and policy fram ework for the Ninth Pliiann
3 12.13 The activity in the culture sector will continnuue to be the preservation, conser\atioi\, dissemination and promotion o f all aspects o f anrt and culture The focus will be on comprehensive plans for conservation o f the archaecolcogical heritage and development o f the monument complexes in the country. There will tb e ; an emphasis on the development o f museum com plexes which are a hub o f activity fonr t the community and where not only the heritage is preserved and displayed but is actively linnktced to education and entertainment also. In the field o f promotion and dissemination o f cultuuree, the effort would be targeted towards documentation o f rare and vanishing art forms, proomootion o f folk and tribal arts and crafts and oral traditions which are threatened with extinocticion. Zonal Centres are the arm o f the department for this purpose and need to be strengt,lheened by providing additional financial support. A National M ission for Manuscripts is beeinag launched in three phases to identify, lis:, preserve and provide access to rare manuscripts i st^rewn all over the country which are the repository o f our ancient wisdom Networking o fC l^ en tra l and State institutions o f culture including State Governments, State Akademies anod Zonal Cultural Centres, Libraries and Museums will be a high priority item.
Implementation and Delivery System
Art and Culture
3 2.14 The Archaeological Survey o f India wouuldd take up 300 monument complexes, including 16 monuments on the World Heritage 1 lisct, for comprehensive development A scneme o f cataloguing through the establishment c o f ' a central computerised documentation centre for movable and immovable cultural propoertties is p roposal to be undertaken A scneme for site management o f monuments will boe i initiated for preserving the monuments ard reviving the historic gardens in their original s styyie. Setting up and upgradation o f Site Museums will be another important area o f work.; Computerisation and modernisation o f circle offices o f Archaeological Survey o f India will 1 aalso get attention.
422

3.12.15. Courses in M useology will be inntroduced in various institutions to overcome tae shortage o f qualified personnel for the exxis sting cuhural institutions Priority will be given :o the publication programmes o f the ASI, j NfJational Museum, Anthropological Survey o f India, National Archives and the three national /A kadem ies so as to bring out publications o f high quality Fellowships for authors and wvrititers would be provided to make the programmes attractive. Royalty could also be given as > ann incentive.
3 12 16. The scheme for conservation o ffw v a ll paintings, initiated in 1996-97, will be carried forward A scheme will be initiated to ) haave one museum in each district o f the countr.', which would be multi-disciplinary in naatuure and specific to that area for acquainting the people about the country’s heritage
3 12 17 The National School o f Drama (](NMSD), the State Akademies and the Zonal Cultural Centres have worked towards taking cultuuree to people through various schemes o f promotion and dissemination. The Zonal Centres haavee created a meaningful dialogue between artists cf different regions and the craftsmen represeennting the traditional mode o f life During the plar. Zonal centres would concentrate more on \ tnribal/folk art forms and establish documentation ô ' rare and vanishing art forms as their priordtyy area They will also increase their outreach so as to cover district headquarters and mobfliassil towns. The centres will be strengthened b’ addition to their corpus fund over the plann pperiod, as a falling interest rate regime has shrunl their incomes from the existing corpuss To provide sustenance to artists engaged ir performing arts, an increase in the scale oof s salary and production grant under ‘Guru-Shishyc Parampara’ scheme is proposed. The sccakle of assistance to artists in indigent circumstances is also proposed to be increased to covt^er r the increase in cost o f living Such financia assistance under ‘Guru Shishya Param paraa’ is currently being provided to about 2000 artists annually.
3 .12 18. The Department o f Culture will sstnrengthen the network for preservation of classical folk and tribal arts and crafts consisting o f f tithe Indira Gandhi Rashtriya Manav Sangrahalaya, the Anthropological Survey o f India, ’ thoe Zonal Cultural Centres, the three national Akademies, the NSD, the State Departmner^nts o f Culture and the State Akademies The scheme o f National Culture Fund, initiauteed in 1996-97, will be given a thrust during the Ninth Plan for promoting corporate involvt'emnent and people’s participation in preserving the cultural heritage o f the country.
3.12.19. Another area o f focus will be linkxagge between culture and education The Centre for Cultural Resources and Training would ddevvelop a programme for training o f trainers and cultural inputs for the school curriculumn. Other programmes would include a training scheme for cultural administrators in the A^cademies, Zonal Centres and Govt to improve their management skills and impart knowWeddge o f art and culture and a scheme o f assistance to State and Central institutions for developpinng cultural software
3 .12.20. There is a proposal for opening i moore Regional Resource Centres o f the National School o f Drama in other parts o f the couunntry. The NSD will also work for propagating Indian theatre through workshops, seminars s aand exchange o f troupes both within the country and abroad A theatre festival at national lew eel is also planned
4 423

3 12.21 Computerisation will be undertaken - wwith special focus on the creation o f an inventory o f archival heritage, preservation o f | puublic records and manuscripts kept in the archives and archaeological artifacts and manuscnrippts kept in the museums and libraries
Inter-Sectoral Coordination
3 12 22 Efforts will be made to bring abooutit inter-sectoral coordination among the Ministrijs/T)epartments having inter-relatcd subjtjeccts like tourism, education, information & broadcasting, etc A media policy for culture : wwill be initiated with the twin purpose o f emphasising cultural aspects within India andd f propagating Indian cuhure to the outside world
3 12 23 Special emphasis will be laid on reeggular monitoring o f the schemes o f the Department and expenditure o f autonomous orgc^annisations/institutions receiving grants under Plan and for this State Govts, and State institutioonsis will also be involved
3 12.24 To have a forward linkage with the Nautioonal Literacy Mission, it is imperative that we increase the spread o f our public libraries to ) neiew areas in rural regions o f the country A scheme for assisting and establishing libraries at t PPanchayat level is proposed in Plan with initial o v erage o f the North-East region, as theyy a already have a tradition o f village libraries Later on, the scheme will be spread to other panrts s o f the country In addition the emphasis will als3 be on old libraries with rare manusccrippts such as Khuda Baksh Oriental Public Library Patna and Thanjavur Saraswati Mahal Li^ibbrary, Thanjavur
3.12.25 To keep pace with the latest in Inforirmaation Technology the facilities in public libraries will be upgraded and latest equipment fprtfovided. A networking o f Central and State libraries is also planned.
3.12.26 Under Anthropology and Ethnology, it i is p proposed to give a thrust to up-gradation o f institut)3ns such as Indira Gandhi Rashtriya M aanaav Sangrahalaya, Bhopal and improvement cf infrastructure o f Anthropological Survey o f Ilnadia. This will be part o f the D epartm ent’s effort to preserv'e and document vanishing rare aart t-forms, with special emphasis on tribal and folk traditions and crafts.
'̂.12.21 For the optimum utilisation o f aava'ailable resources in the computer and communication technology more effectively, a porooper networking o f all libraries and resource centres will be given due emphasis. For this punrpoose, the development o f a national network of libraries is envisaged.
? . 12.2^. Efforts will be made to harness the aad^lvances made in the field o f electronics to provide better facilities to physically hanadiacapped people, especially those visually handicipped. it is proposed to have Braille Seectitions in public libraries and to extend other facilities as well.
Manptwer
3.12.2* .̂ Adequate finances will be provided 1 fonr developing expertise in terms o f trained manpo ver for both physical and chemical consserrvation o f monuments through Central/State Plans
4 2 4 4
3 12.30,In the field o f Libraries and Infornmaatics, besides formal courses o f Library Science and Information, continuing education 1 foor practising librarians, quality improvement programmes for faculty and modernisatioon of existing library schools to enable them to teach modern information technology wouldd bbe introduced.
3 12 3 1 The Centre for Cultural Resources aanod Training will devise new training programmes for programme officers o f State Akademiiiess and Directorates of Culture / Zonal Cultural Centres and National Akademies. M anagemnecnt input would be provided to achieve optimum results.
■^425

3.13 YOUTH AFFAIRS AND SPORTS
Introduction
3 13.1 Youth constitute the most creative seegi>ment o f any society. Their role and contribution are vital to all societies and more so > iiin a country like India with wide social, cultural and other demographic diversities. Y couuth constitute about 34% o f the total population o f India The need and im portancce ; o f physical education for health and physical fitness with a view to increasing individuaal j productivity, and the value o f sports as a m eans of recreation and with a potential for promnot)ting social harmony and discipline are well recognised.
YOUTH AFFAIRS : Achievements Since Indepeenndence:
3 .13 .2 The importance o f youth in national devveelopm ent has been a recurring theme in all Five Year Plans The National DDiscipline Scheme introduced in the Second Plan continued in the Third Plan Thee FFourth Plan gave special emphasis on the needs o f the youth and training o f youth i leadership Support was provided to voluntary organisations to participate in youth i ddevelopment programmes Community Service was developed as an integral part o f t theie curriculum for education, instruction and training o f all students enrolled in educational i innstitutions
3.13.3 During the Fifth Plan, expansion anod strengthening of National Service Scheme and Nehru Yuva Kendras received eem phasis National Service Volunteer Scheme was launched. In the Sixth Plan an eff(fonrt was made to effect coordination o f different programmes The services o f youth we/er«re increasingly utilized for conservation o f environment and generation o f mass a\iw<vareness and community education programmes. A National Youth Policy was fra-anmed in the Seventh Five Year Plan and accordingly a Plan o f Action was formulated in 199922
3 13 .4 The main schemes in the Seventh Plan foor f student youth related to Bharat Scouts and G tides, National Service Scheme and Natitioonal Service Volunteer Scheme At the end of the Seventh Plan enrolment in these scbheem es was: NSS - 10 lakhs. Scouts and Guides - 22 lakhs and NSVS - 3000 Consideriringg the large number o f school and college studen.s this coverage was inadequate
3.13 5 During the VII Plan for non-student youutlth the main schemes were Nehru Yuva Kendras the number o f which increased to 3998 i and Youth Clubs where the increase in number was from 25,000 to 50,000 The Prcoggramm e Evaluation Organisation o f the Planning Commission carried out an evaluatioon i o f the programmes The evaluation indicates some inadequacies such as dispoanrities in service conditions o f youth coordinators, lack o f proper linkages with devvelelopment activities o f their departments etc. St;ps were initiated to take up National In teg ra tio n Programmes, particularly in the noth-east and the border areas National Y couuth Awards were also instituted
Eighth Plan Performance Review
3 13 6 The Eighth Five Year Plan and the Nationaal 1 Youth Policy had interalia emphasized(i) organising the youth force for the promotioon o f national and cultural integration, (ii) promoting
426

awareness and involvement o f yooutith in social programmes pertaining to literacy, environment, health and family welfanre,;, and community development; (iii) fostering and developing interaction between yyouth from different parts o f the country specially the isolated border and tribal areas; (i\iv) promoting education and self-employmentcapability o f the rural youth, esppeccially o f girls and youth in backward areas; (v)developing the interest o f youth inn < adventure and other outdoor activities, and (vi)providing opportunities for leadership trraiiining.
3 13 7 The Department o f Youth Afffaiiirs & Sports made major strides during the VIII Plan period The number o f Nehru "^Yuuva Kendra went up from 398 to 499. Number o fYouth Clubs affiliated to Nehru Yuvva i Sangathan went up to 1,64,000 by the end o f the VIII Plan Period. The number o f V/olilunteers enrolled under National Service Scheme went up to 13 lakhs during the VIII PPlaan period covering 158 universities, 7,000 colleges and +2 institutions. A new schenmee for the setting up o f "Youth Development Centres" for a group o f ten villages wj^as 5 introduced during the VIII Plan period These Centres are responsible for creation c o f f facilities for information, sports, training and for taking up youth programmes for rural yvouuth. A one time financial assistance o f Rs 30,000/- is given to each Centre to cater to its recquuirements o f equipment and fiimiture etc. 340 such Centres were assisted during the V m Pl'lann period
3 13 8 The Government o f India < coonstituted a Committee for National Youth Programme (CONYP) in pursuance o t f ! National Youth Policy. National Youth Festivals (Yuva Utsav) were i organised every year since 1995. Outstanding individuals and organisations were reewA^arded Work on a new National Youth Policy was initiated during 1996-97.
3 13 9 During the Eighth Plan, the 1 fieeld operations o f Nehru Yuva Kendra Sangathan were extended to provide more oppponrtunities to the rural youth. New programmes, namely, Health Awareness Units, Pe^anchayati Raj Training, Self-Employed Workers Association Kendras etc. were introodduced Training programmes were organised by NYKS on health awareness in manny ' villages o f the country. NYKS also took up Youth Against AIDS' campaign in sseveral districts in addition to 'Mass Awareness
Generation Campaign on GATT'. Wzateershed Management and Wasteland Development Programmes were integrated into NSSS 1 progranmies under "Youth for Sustainable Development" State level adventure accaddemies were established in Gujarat and Tripura. Aerosports and Water sports were prconmoted in several states. Public trusts and NGOs provided vocational training programmaes s to promote self-employment for youth So far 50 Youth Hostels have been commissionecd a and 23 are under various stages o f construction
Ninth Plan Thrust
Harnessing Yuva Shakti
3.13.10 The National Agenda for Goveemnance states : "Our youth are the strength o f the family, village, locality and the conmnmunity, they are also the future o f our nation. We will take all necessary steps to mobbili<ise this most idealistic, inspired and energetic section o f our society in the mission obf nation- building. For this purpose, we shall build national consensus for the creation obf a National Reconstruction Corps aimed at environmental protection, ecological ttasisks, reclamation o f waste land, including
427

afforestation, and for spreading literacy. W e will have a time-bound programme for promotion o f sports "
Action Plan
N ew thrust areas o f youth programmtes w ill focus on harnessing yuva shakti by taking into consideration the followinig:
3 13 .11 A new scheme o f National jRecomstruction Corps (NRC) will be formulated aiming at environmental protection, ecolcogical tasks, reclamation o f waste land, including afforestation, spreading literacy and otiher community based nation building activities Youth volunteers to be enrolled as membjers o f NRC will be given a honorarium and will simultaneously be givenvocational and enterprise development trraining, enabling them to take up self employment ventures. A national level apex orgainisation for rendering technical and financial assistance toyouth for setting up micro enterprises fo>r self employment will be set up
3 13.12 The Department o f Youth Affiairs aind Sports as a nodal agency for extending necessary support and dissemination cof infformation to the targetted youth, will work out modalities o f networking with other JMinisJtries/Departments for effective and efficient utilization o f resources The training 0) f youith will be development-oriented in order to provide facilities to those who need ithem. Market surveys on specific skills will be conducted for specific producrt-oriemted training Self- employment and entrepreneurship development will be ermphasiized
3 13 13 Community polytechnics and N G O s will be involved extensively in vocational training programmes o f NYKS in orderr to pirovide access to rural and marginalised youth. Assistance to Voluntary Organisations and Self-Help Groups working in the field o f Youth programmes will be encouraged. Voluintary Organisations will be encouraged to work in the field o f adolescent youth.
3 13 14 The adolescent youth will recteive particular attention A concerted effort will be undertaken to build for adolescents a relatively stable place in society so as to facilitate their healthy development
3,13.15 Youth with special' needs will receive priority attention Programmes for young people with physical and mentail dis;abilities, slow learners, youth prone to social deviance, youth with drug addictioni and H IV seropositives will be further strengthened and coordinated
3 13 16 Youth Clubs will be further stxrengthiened The aim will be to have a club in each village, which will be o f multi- dinnensional character, so as to address the problems o f youth andchannelise their energy for productiv/e endeavour and good citizenship
428

3.13.17 Physical education, games and sports; and yoga in educational institutions were promoted right from the beginning o f the plamning (era. During the Second Five Year Plan, National College o f Physical Education i and National Institute o f Sports were established Facilities for coachiing o f games and rural sports were expanded. In the Sixth Plan, spotting and nurtuiring o f talent was emphasized In the Seventh Plan emphasis was givem to adventure sports. Infrastructural development was taken up for the purpose. The Sfports Authority o f India implemented a number o f programmes such as training (of aoaches, establishment o f centres for sports medicine etc. On the basis o f the >'Jatiomal Sports Policy framed during the Seventh Five Year Plan, an action plan was formulateed in 1992.
3.13.18 The Asian Games 1982 gave a new imipetus to sports and games Theimplementation o f the National Sports Policy,, 19)84 was taken up The policy empasized importance o f health and physic;al fitiness through physical education and participation in sports; to achieve thesee, the desirability o f creatinginfrastructure and facilities were emphasized. Sporrts Authority o f India implementedthe following schemes: (i) Under the Nattional Physical Fitness Scheme anational level display Bharatiyam' with 5(0,000 children participating was staged in 1989 (ii) In 1989 the Sports Projectt Deevelopment Areas Scheme was introduced to provide infrastructural ffacilitites for training, coaching and coordinating competitions. Each SPDA covers 80)-100 development blocks So far 25 SPDAs have been sanctioned, (iii) About 8000 ccoaches were trained under National Coaching Scheme through different centres off the Netaji Subhash National Institute o f Sports O f these, more than 1600 have been deploiyed. (iv) Sports talent from tribal, coastal, hilly and far-flung areas o f the countiry w?ns scouted under the Special Area Games and trained in competitive games. Archiery and Watersports centres wereestablished under the scheme.
3 13.19 The Department o f Sports continue<d to implement the schemes o f theNational Sports Organisation which included creation o f sports infrastructure in colleges and universities with assistance made available through the UGC,financial assistance to sports clubs, and scho)larships to women for promotion o f sports among them.
3.13 20 In physical education, the infrastructure consists o f Laxmibai National Institute o f Physical Education, Ghvalior, Riegionaal Centre at Tiruvananthapuram and about 200 colleges o f physical education.
Plan Performance Review
3.13.21 The thrust areas o f the VUI Plan as als<o the; Plan o f Action (POA 1992) for Sports Policy interalia emphasized (i) creaticon o f desired sports climate in the country and generating conscious responsibility ini every citizen to keep physically fit and participate in games and sports, (iii) introduction o f sports and physical education in schools, creation and improvememt o f facilities begiiming with primaryand secondary schools and ending at college level with networking between different levels; (iii) adoption o f scientific approach including sportsphysiology, sports psychology, sports miedicinie and balanced nutrition to
Sports Achievements Since Independence
429

enhance sports potential, (iv) p>articipation o f State Governments in developing comprehensive plan for development o f sports; (v) promotion o f sports and physical education among girls and marginalised populations, (vi) identifying talent and training in sports, (vii) making National Federations financially autonomous and encouraging public to invest in sports by giving them incentives like tax rebate and relaxation in import (duty etc
3 .13 .22 Creation o f lot o f sports infr astructure and laying o f synthetic tracks and surfaces have been undertaken during the Plan Many rural schools have been assisted for development o f playfields and sports equipment. Infrastructural facilities have also been created in a number o f colleges and universities. Prize money is given to winning schools at district level toumamtents Talented school children in the age group 9-12 years are identified. Special training is imparted to sports persons under Special Area Games (SAG) and Sports Project Development Area Centres (SPDA) schemes
3.13.23 Annual scholarships are disbursed to University level players through Sports Authority o f India (SAI) Scholarships are also provided to champions in the National Women Championship Evaluation o f SAI schemes has been done by Tata Consultancy Services
3 13 24 A core group on Sports Medicine was set up in 1992 which came up with several recommendations which aire being implemented by SAI SAI has developed Sports Science and Sports Meditcine facilities at Delhi, Patiala and Bangalore. Netaji Subhash National Institute o f S ports has developed a two-year course in Sports Medicine
3 13 .25 Some corporate investmients in sports have been made available for football, hockey, tennis, chess and table tennis etc.
Ninth Plan
Action Plan
3 .13.26 For promotion o f sports. National Sports Developm.ent Fund will be created where private and government contribution will be made for creating necessary infrastructure for sports, its maintenance and organising sports events.
3.13.27 It is proposed to set up spCJrts schools by suitably adopting the NavodayaVidyalaya Pattern in different States.These schools would mainly be geared to physical education disciplinesand have some academic subjects i n addition.
3.13 .28 There is also a need to take a wider perspective o f integrating sports' as part o f the educational system For that purpose. Department o f Education will earmark funds for sports promotion, upkeep o f playgrounds and physical sports infrastructure under Kendriya Vidayalayas and Navodaya Vidyalayas, training o f physical education instructors, etc.
430

3 13 29 Similarly, State Governments will also proviide additive provision' for sports' in their education budgets, so that improvement o f sports facilities could be made available to youth
3 13 30 Department o f Youth Affairs & Sports will take necessary action to prepare and update Directory o f Sports Facilities' both at tlhe Centre and State/UT level and take necessary steps for utilisation o f the existing faicilities on neighbourhood' concept. Necessary guidelines will be prepared in consultationi with the State Governments and other authorities
3 13.31 Greater integration o f the scientific facilities, the established and sound principles o f sports physiology and sports medicinie with requisite quality o f manpower relevant to the training needs o f sportspersons will be achieved in coming years. Greater importance will be given to further emhance the competencies and skills o f our coaches for training the national teams as; also for availing up seiA'ices o f world class coaches. Programmes o f continuing education o f such coaches will be established Special attention will be given to tlhe North-East region for maximum utilization o f available talent.
3 13.32 A policy for promoting the participation o f NGOs and industries for their contribution in sharing resources and sponsorecd programmes for sports and youth activities will be evolved. The private and public s<ector units will be encouraged to take up promotion and development o f sports infrastruicture Sports academies in specific disciplines will be developed under their sponsorship. The existing tax incentive in sports to the corporate houses will be simplified and publicised with a view to attracting as much investment as possible
3 13.33 The strategy adopted for greater access w;ill involve substantial investment in physical education, infrastructure development andl in creating widespread awareness for physical fitness with special focus on school chilldren The State Governments will be requested to implement the recommendations o f the Central Advisory Board on Education to make Sportsand Physical Education compulsory subjects in the cuirriculum
3 13 .34 There is a need to promote Research & Development (R&D) on sports. It is necessary to initiate research on sports medicine usiing all systems o f medicine. Deptt. o f Youth Affairs & Sports will inter-act witlh Defence Research Development Organisation (DRDO) for development o f low cost artificial turf surfaces for playing hockey IndianInstitutes o f Technology (IITs) will also be approac;hed for research on low cost surfaces.
3 13.35 Sports infrastructure will be made readily available to the public at large so that it can participate in variouis activities. Various State and nongovernmental organisations will need to be emcouraged to build infrastructural facilities The creation o f infrastructure at district and tehsil levels will be the responsibility o f the State Governments. There will be maximum utilisation o f the existing facilities. Proper coordination, joint effort and congruence o f objectives are required to get the maximum output. For this purposfe it is necessary to do a detailed analysis and prioritization o f schemes.
431

3.13.36 Special attention will bte given to the promotion o f sports and gamesamong the handicapped persons by providing specially designed equipment, playgrounds for special educatiom centres, training o f special educators andinstructors and holding o f tournaments etc A special scheme will be formulated for th epromotion o f sports and game:s among the four categories o f disabled personsnamely, (a) Blind and Visually Hiandicapped; (b) D eaf and Dumb, (c) MentallyRetarded; and (d) Physically Handicapped. The scheme will provide financialassistance for specially requiretd equipment, play-grounds for special education centres, training o f special educators, appointment o f sports teachers/coaches in special education centres, trainimg camps, holding o f tournaments etc
3.13.37 A National Programme o f Physical Fitness in schools will be taken up,which will involve the training cjf select subject teachers in the basics o f physical education through in-service trainiing programme and measuring the progress o f each individual student against a laid dowm norm
3 ,13.38 The North Eastern Region w ill be given special facilities for promotion o f sports. The work on State level Sports Complexes in the State Capitals as well asDistrict level/Sub-district level cx)mplexes/centres will continue A regional agency under the aegis o f NEC will fund., monitor and coordinate sports and youth programmes in the region. DeveUopment o f sports and youth activities in colleges and Universities, upgradation o f coaclhing standards, scholarship schemes for outstanding young athletes, promotion o f advemture activities, projects aimed at creating awareness o f environmental, mational and social issues, training o f personnel incharge o f various sports and yrauth facilities, holding o f sports tournaments, regional championships in specific disciplimes, regional sports tournaments for colleges and universities will be taken up
432

Physical targets (Ninth Plan) under various schemes of Department of Youth Afffairs & Sports
A. Youth AffairsName of the Scheme Unit Target
1. National Service Scheme
2. Nehru Yuva Kendra Sangathan 4 IDARAs (Information Development and Resource Agencies)
3. Assistance to volunteer organisations engaged in youth welfare activities
4 . National Service Volunteer Scheme
5. Commonwealth Youth Programme
6. Assistance to youth clubs
7. Training of youth8 . Special Scheme for
promotion of youth activities among backward tribes
B . Sports1. Grant for supply and
installation of synthetic surfaces
2. Sports Scholarship
3. National Physical Fitness 'Programme
No. of volunteesrs 18, 00, 000No. of Camps 15,000
No. of programmies 80, 820
No. of youths 30,000
No. of volunt.ee:rs 15,500
No. of meetings 18No. of Youth 12Exchange prograimmeNo. of youth clubs 5,000
No. of youths 7,500No. of Youths 30,000
No.of surfaces each year
No. of Scholarship each year (maximum)
No. of Schools:
4-5 (Hockey & Athletic)
State-level 2500 National level 800College/ University 400 level.Sr. Women 20Women doing Diploma 10Women doing PHD 5To cover all Sec./Sr. Sec. Schools which have the facility of physical teacher.
433
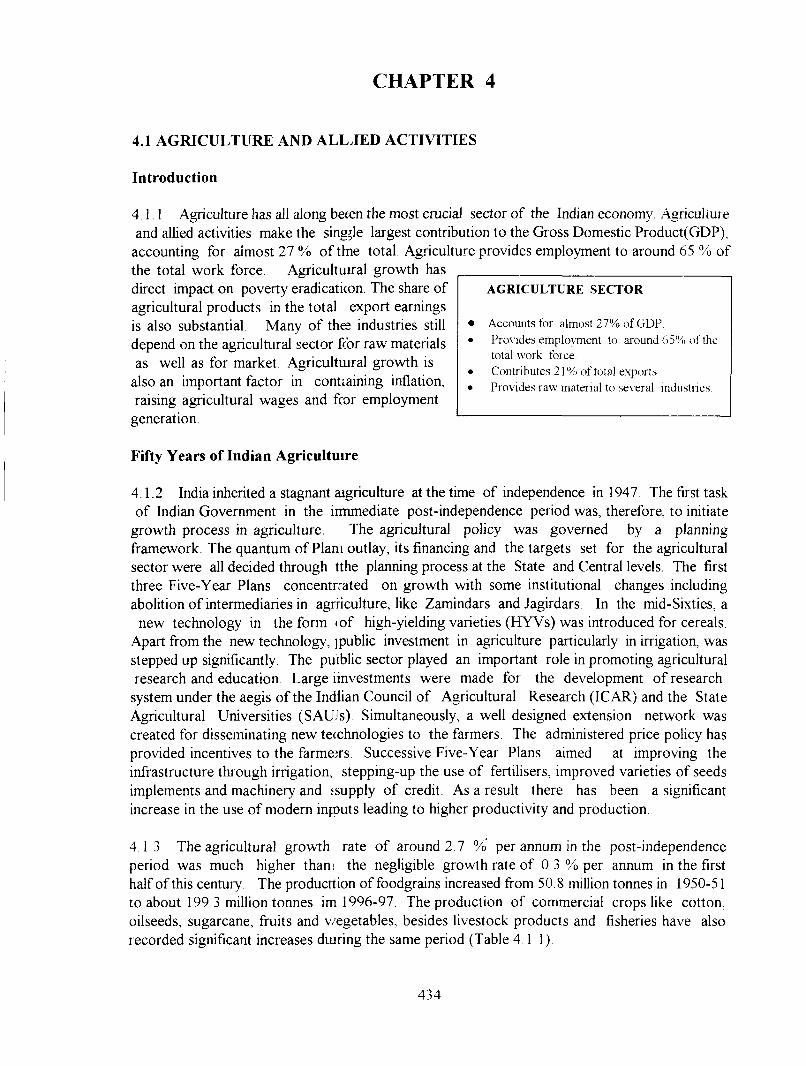
AGRICULTURE SECTOR
Accounts for almost 27% of GDP.Provides employment to around of the total work force.Contnbutes 21 % of total exports.Provides raw matenal to se\-eral industries.
CHAPTER 4
4.1 AGRICULTURE AND ALL.IED ACTIVITIES
Introduction
4.1.1 Agriculture has all along beeen the most crucial sector o f the Indian economy Agriculture and allied activities make the single largest contribution to the Gross Domestic Product(GDP),
accounting for almost 27 % o f ttne total. Agricukure provides employment to around 65 % of the total work force. Agricultuiral growth has direct impact on poverty eradicaticon. The share of agricultural products in the total export earnings is also substantial. Many o f thee industries still depend on the agricultural sector fcbr raw materials as well as for market. Agricultuiral growth is
also an important factor in contraining inflation, raising agricultural wages and fcor employment
generation.
Fifty Years of Indian Agricultuire
4.1.2 India inherited a stagnant aigriculture at the time of independence in 1947 The first task o f Indian Government in the irmmediate post-independence period was, therefore, to initiate
growth process in agriculture. The agricultural policy was governed by a planning framework. The quantum of Plani outlay, its financing and the targets set for the agricuhural sector were all decided through tthe planning process at the State and Central levels. The first three Five-Year Plans concentrrated on growth with some institutional changes including abolition o f intermediaries in agriiculture, like Zamindars and Jagirdars In the mid-Sixties, a
new technology in the form (of high-yielding varieties (HYVs) was introduced for cereals. Apart from the new technology, | public investment in agriculture particularly in irrigation, was stepped up significantly. The puiblic sector played an important role in promoting agricultural research and education. Large iinvestments were made for the development o f research
system under the aegis o f the Indiian Council o f Agricultural Research (ICAR) and the State Agricultural Universities (SAUJs). Simultaneously, a well designed extension network was created for disseminating new tecchnologies to the farmers. The administered price policy has provided incentives to the farme^rs. Successive Five-Year Plans aimed at improving the infrastructure through irrigation, stepping-up the use o f fertilisers, improved varieties o f seeds implements and machinery and ,‘supply o f credit. As a result there has been a significant increase in the use o f modern inputs leading to higher productivity and production.
4 .13 The agricultural growth rate o f around 2 7 % per annum in the post-independence period was much higher thani the negligible growth rate o f 0 3 % per annum in the first half of this century The producttion o f foodgrains increased fi-om 50 8 million tonnes in 1950-51 to about 199 3 million tonnes im 1996-97. The production o f commercial crops like cotton, oilseeds, sugarcane, fruits and v/egetables, besides livestock products and fisheries have also recorded significant increases diuring the same period (Table 4 11)
434

Table 4.1.1Production of Major Crops and Allied Activities:
(1950-51 to 199<6-97)(million tonnes)
Crops 1950-51 1970-71 1980-81! 1990-91 1996-97
Foodgrains 50,82 108,42 129 5 9 179.39 199 32Rice 20.58 42,22 53,63 74,29 8131Wheat 6,46 23,83 36 3 1 55,14 69.27C Cereals 15,38 30,55 29,0'2 32.70 34.28Pulses 8,41 11,82 10,63 14,26 14.46Sugarcane 57 05 126 37 154,2,5 241.05 277.25Cotton (m.bls) 3 .04 4,76 7 01 9.84 14 25Nine Oilseeds 5.16 9,63 9,317 18 61 24.96Milk 17,00 21,20 31 6.0 53 90 68 60Fish 0 80 1 80 2,40 3 80 5.35
Source: Agricultural Statistics at a Glaince, 1997, Min o f Agriculture
REVIEW OF EIGHTH PLAN
Investment in Agriculture
4,1 4 During the first three years o f the Eighth P’lan period, the public investment in agriculture (gross capital formation) has shown an upward trend from Rs 1002 crore in 1991 -92 to Rs 1316 crore in 1994-95. In the subsequent tw'o-year period, h declined However, there has been a steady increase in private investment from Rs 3727 crores in 1991-92 to Rs 5867 crore in 1996-97 Decelerating trends in public investment is a matter o f concern given the complementary nature o f public and private investments;.
Table 4.1.2Agricultural Investment (at 1980-81 constant prices)
(P’S. In crore)Year Total Public
GCF in Agri
(GCF)Private % share
(GCF) ---------Public Private
1991-92 4729 1002 3727 21.2 78,81992-93 5372 1061 4311 19:7 80,31993-94 5031 1153 3878 22,9 77,11994-95 6256 1316 4940 21,0 79.01995-96(Q) 6961 1268 5693 18,2 81,81996-97(Q) 6999 1132 5867 16 2 83 8
Q: Quick estimates; GCF: Gross Capital Formation; Source; CSC, National Accounts Statistics, Various Issues.
435

Growth o f Agricuiltural Sector
Foodgrains
4.1.5 The agriculttural sector has registered an average annual growth rate o f about 3 .9 percent during the E ighth Plan period. The foodgrains production, which was 168.4 million tonnes in the base; year (1991-92) o f the Eighth Plan increased to a record level o f 199.3 million tonnes in thte terminal year( 1996-97). During the first three years of the Eighth Plan, the foodgrains producticon kept on rising but unfavourable monsoon in 1995-96 brought down the production by aboiut 11 million tonnes to the level o f 180.4 million tonnes. Total foodgrains target set for Eightln Plan at 210 million tonnes was not achieved. The average annual growth rate o f foodgrains production during the period 1991-92 to 1996-97 was around 3 43% The rice output fluctuateed quite a bit during the Eighth Plan. The production declined during 1992-93 and 1995-96 over thie preceding years. In 1996-97, the production of rice stood at 81 3 million tonnes, about 9% kess than the targeted 88 million tonnes. The Eighth Plan target o f 66 million tonnes for w^heat was exceeded in the terminal year of the Eighth Plan The Eighth Plan target for coarse cerreal production was 39 million tonnes. In 1992-93 the production achieved was 36.6 million to>nnes which was the highest achieved so far. This level could not be reached subsequently. The ) production of pulses in 1991-92 was 12.0 million tonnes and in 1996-97 it was 14 5 million toinnes In between these years, excepting 1994-95 when it was 14 million tonnes, the production ranged between 12 million tonnes and 13.3 million tonnes only The country could not nnake any visible breakthrough in raising the production o f pulses during the Eighth Plan
Oilseeds
4.1.6 There has b*een a significant increase in the output of oilseeds during the Eighth Plan. It was 18 .6 million ttonnes in 1991-92, in the base year o f the Eighth Plan. It kept on increasing all through the yeairs o f the Eighth Plan except for a small decline fi'om 215 million tonnes in 1993-94 to 21.3 miillion tonnes in 1994-95. Its production in the terminal year o f the Eighth Plan was 25 millioni tonnes, an all time record. Soyabean and sunflower have, o f late, emerged as the oilseed cropss having major growth potential.
Cotton
4 .1 7 The cottoni production showed a significant increase during the Eighth Plan The cotton output, whiich was 9.7 million bales in 1991-92, increased to a record level o f 14.3
million bales in 19?96-97 This was both due to increase in area and yields
Sugarcane
4.1.8 The produ(Ction of sugarcane declined from 254 million tonnes in 1991-92 to 228 million tonnes in thie first year of the Eighth Plan. The production reached a record level of 281 1 miUion tonne;s in 1995-96 However, in 1996-97 the production declined to 277 3 million tonnes. The produc:tion target and achievement o f various crops during the Eighth Plan period are given in table 4 1.31.
436

Table 4.1.3Eighth Plan Targets and Production Performance of Crop (In Million Tonnes/Million Bales of 170 Kg.each of Cotton)
Crop 8th Plan 1992-93 1993-94 1994-95 1995-96 1996-97Targets Achiev. Achiev. Achiev. Achiev. Achiev.
Rice 88.0 72.86 80.30 81.81 76.98 8131Wheat 66.0 57.21 59.84 65.77 62.10 69 27C. Cereals 39.0 36.59 30.81 29.88 29 03 34 28Pulses 17.0 12.82 13.31 14.04 12.31 1446Foodgrains 210.0 179.48 184.26 191.50 180.42 199 32Nine-Oilseeds 23.0 20.11 21.50 21.34 22.10 24 96Sugarcane 275.0 228.03 229.66 275 54 281 10 277 25Cotton 14.0 11.40 10,74 11.89 12.86 14 25
Source: Planning Commission/Ministry o f Agriculture.
Plantation Sector
4.1.9 The production o f tea has increased from 748 million kg in 1991-92 to 775 million kg. in 1996-97. The production growth o f less than one percent has, however, not kept pace with the fast increasing demand. Production o f coffee has risen from 1 69 lakh tonnes during 1992-93 to 2.05 lakh tonnes during 1996- 97. The production o f natural rubber increased from3 .67 lakh tonnes during 1991-92 to 5 .42 lakh tonnes during 1996-97 In the traditional areas, the scope for expansion of rubber is very limited and about 95% of the existing area require replantation. India produces a wide variety o f spices like black pepper, cardamom, ginger, turmeric, chillies etc. and spices occupy an important place among the agro products exported. At present, the production o f spices in the country is around 24.7 lakh tonnes from an area o f 25 lakh ha. The development efforts put into various spices crops during the Eighth Plan period contributed significantly to the increase in their area and productivity by 5 0 % and 8.0 %, per annum, respectively. India is the third largest producer o f tobacco in the world. Export o f tobacco was as high as 1 05 lakh tonnes during 1993-94. However, it dec'ined to 0.54 lakh tonnes during 1994-95 on account o f the collapse o f the USSR market It showed some recovery during 1995-96 with export o f 0 87 lakh tonnes
Horticulture Crops
4.1.10 The growth in horticulture based activities in the last five years is due, in a large measure, to the thrust given during the Eighth Plan by the Government. The allocation in the Eighth Plan was raised to Rs. 1,000 crore from the Seventh Plan allocation o f Rs 24 crore A large number o f concessions, subsidies and incentives were given to the growers and exporters. Simultaneously, the liberalisation process introduced as a part of the New Economic Policy, eased the procedures for production, foreign collaborations and access to international
437

markets. There has been a substantial iincrease both in the. area and the production o f horticulture crops during the Eighth Plan. The are;a under horticulture crops increased from 123 lakh ha in 1991-92 to 150 lakh ha. in 1996-97 amd the production rose from 961 lakh tonnes to 1410 lakh tonnes during the same period.
Agricultural Exports Performance
4.1.11 A number o f policy chang'es were introduced during the Eighth Plan to make agricultural exports more viable. This contributed to the increase in the exports of agriculture and allied products from Rs. 8228 crore iin 1991-92 to Rs.25040 crore in 1996-97 Agriculture m allied products accounted for 21% of the total exports by the end of Eighth Plan Since 1990-91, except for 1994-95, the share o f agric:ulture exports has been steadily increasing.
Agricultural Inputs
4.1.12 A number o f significant chamges have taken place in the seeds sector durmg Eighth Plan on account o f economic libeiralisation and changes in the seed policy The distribution o f certified/quality seed increased from 60.3 lakh quintals in 1992-93 to the estimated level o f 70 lakh quintals in 1996-97 In the case of oilseeds, against the Eighth Plan target o f 7.55 lakh quintals, the achiejvement in 1995-96 was already 12 48 lakh quintals This has been mainly due to the excess ac;hievement o f 7.50 lakh quintals in groundnut against the target of 3.24 lakh quintals The aclhievement for groundnut includes quality seed/other seeds
Fertiliser
4.1.13 The consumption o f fertilisers (NPK) has been stagnant around 12 million tonnes between 1990-91 and 1993-94. Sulbsequently, it increased to reach the level of 14 3 million tonnes in 1996-97. There were chamges in the policy on fertilisers in the 1990s Phosphatic and potassic fertilisers were decontroilled in August 1992. Only urea (nitrogenous fertiliser) continued to be under the price control system and involves a heavy subsidy for keeping the farm gate prices low. Consequent to decontrol in 1992, prices o f phosphatic and potassic fertilisers rose sharply. The gap bet\ween the controlled price of urea and the decontrolled prices o f phosphatic and potassi(C fertilisers increased leading to an imbalance in their use Against the optimum N, P and K ratio of 4:2:1 and an actual ratio of 5.9 2 4 :1 just before the decontrol, the ratio during the end (of the Eighth Plan worked out to 1 0 : 2 9 : 1 It may be, however, noted that this ratio differ s from area to area.
Irrigation
4 1 14 Eighth Plan envisaged crreation of additional irrigation potential of 15 8 million ha and utihsation o f 13 6 million ha from major, medium and minor irrigation schemes As
against these, the additional potentiail created was 8.3 million ha and the incremental utilisation was only 7 9 million ha By the end o f Eighth Plan, the total potential created through major, medium and minor irrigation stood at 89.3 million ha and the cumulative utilisation at 80 7 million ha Total utilisation as a perc;entage o f total potential was 90 4
438

4.1 15 Efforts to strengthen agricultural credit agenciies have been given top priority in the Eighth Plan. Agricultural Credit is disbursed through a rmuhi-agency network consisting of Cooperatives, Commercial Banks and Regional Rurral Banks(RRBs) Agricultural loans provided by various agencies rose from Rs. 6992 crore in 1991-92 to Rs,28653 crore in 1996-97. While the short term agriculture credit from coojperative banks, RRBs and Commercial Banks increased from R^. 6611 crore to Rs. 19678 croie, tihe investment credit (medium and long term) increased from Rs. 4587 crore to Rs. 10962 crore diuring the same period As against the target o f 40 % for priority sector lending by the banks, th e sub target for agriculture has been fixed at 18 % However, the achievement during the Eighth Plan was only 13-14 %
Agricultural Credit
Watershed Management and Soil & Water Conservation
4.1 16 As about 63 per cent o f the cuhivated land falls , under the rainfed areas, watershed management is an important factor for improving agncultuiral production A holistic approach to bring about the development of integrated farming s;ystems on watershed basis is the main objective o f the National Watershed Development Project for Rainfed Areas (NWDPRA) and other externally-aided watershed development projects During the Eighth Plan, an area of 28 lakh hectare was targeted to be covered with an allocation! of Rs 1,100 crore The allocations to North Eastern States and the drought prone areas oF Orissa State were increased during 1996-97. Organising self-help groups o f beneficiaries in the micro-watersheds to institutionalise people's participation in the projects wer e stressed To make soil treatment cost-effective, the guidelines emphasised on the vegetative conservation measures with active involvement o f the beneficiaries and the non-govemmental organisations (NGOs) The All India Soil and Land Use Survey has so far covered 1155 74 lakh ha under priority delineation survey and 85.65 lakh ha. under detailed soil survey Ai new scheme entitled "Application of
Remote Sensing Technology for Soil Survey and Land U se Planning" has been launched during the Eighth Plan. The on-going Seventh Plan Centrally Sponsored Schemes o f Soil Conservation in the catchments o f River Valley Projects (RVP) and Int egrated Watershed Management in the catchments o f Flood Prone Rivers (FPR) were contimued during the Eighth Plan
Animal Husbandry and Dairying
4.1.17 There has been a considerable improvement ini the production o f major livestock products, i.e., milk, egg and wool during the Eighth P lan Period. The milk production witnessed a significant growth o f 4.5 % per annum to r each the level o f 68 6 million tonnes during 1996-97. This has increased the per capita availability o f milk from around 180 gm per day in 1991-92 to 201 gm per day in 1996-97 Thie step-up in the production o f milk has been attributed to the intensified activities particularily, in improvement of genetic-stock through cross-breeding, effective control o f diseases and Operation Flood Programmes which strengthened the cooperative institutions and infrastructuire facilities. The poultry sub- sector has also made significant progress due to research and development activities The egg production which was at the level of 22 billion nos. duriing 1991-92 increased to 28 2 billion nos. during 1996-97. The per-capita availability o f eggs iincreased from 25 to 30 per annum, for the same period. The wool production has increased from 416 lakh kg in 1991-92 to 443
439

lakh kg. at the end o f the Eighth Five; Year Plan. Though the production of major livestock products during the Eighth Plan show^ed an increasing trend but their targets have not been realised.
Fisheries
4.1.18 The country has a vast and varied fishery resources both marine and inland. The total fish production potential in the country has Ibeen estimated at 84 lakh tonnes. The total fish production has increased fi'om 41.57 lakh tonnes iin 1991-92 to 53.50 lakh tonnes in 1996-97 registering an annual average growth rate o f about 5 % during the Eighth Plan. The fish seed production has also increased from 12,203 million fiy Ito 15,700 million fiy for the same period. There has been a significant increase in the export o f miarine products both in quantity and value terms This has increased fi'om 1.39 lakh tonnes (valiued at Rs.893 crore) in 1991-92 to 3 78 lakh tonnes (Rs.4121 crore) in 1996-97.
Agricultural Research and Educatiion
4.1.19 The technological advances made during the Eighth Plan have helped to improve production o f various crops. The accelerated pace o f varietal improvement activities lead to development o f over 550 high yieldiing varieties o f different crops. A number o f them had in-built resistance to yarious biotic aind abiotic stresses, providing the much needed insulation to crop production. One o f the m ajor achievements under foodgrain crops is the release of hybrid varieties o f rice for commercial cultivation in different States. In the case o f oilseeds, hybrids have been developed, especiallly in castor seed and sunflower which helped in increasing the productivity o f these oilseeds. In lthe case o f maize, three superior hybrids having cold tolerance have been identified and for cotton, new hybrids have been released for cultivation in Punjab, Haryana and Rajasthan. In plamt protection, the All India Coordinated Research Project on Biological Control laid more eimphasis on biological control o f insect- pests. The Integrated Pests Management (IPM) approaches have been worked out for the major nematode pests in a number o f crops. During thie Eighth Plan period, a number o f improved breeds of cattle and poultry such as Frieswal amd CARI-Gold were also evolved. Research activities in the fisheries sector were also intensified. T here has also been a progress in fisheries research.
Ninth Plan Focus and Strategy
4.1.20 The agricultural developmemt strategy for the Ninth Five Year Plan is essentially based on the policy on food security annoumced by the Government to double the food prodiuction and make India hunger free in ten years. Food production will include not only fooidgrains i.e. rice, wheat, coarse cereals and pulses but also all major food items including oils, sugar, fhiits & vegetables, milk, egg & meat and fishi. The Ninth Plan accordingly, envisages operationial strategies and specific programmes/activities to ‘substantially increase the supply o f various food items so that the entire domestic demand for these items is comfortably met and some surplus for exports
STRATEGY TO ENSURE FOODSECURITY
• Doubling food production.• Increase m employmenl & incomes• Supplenientarv' /sustained empio}Tnent and
creation of rural infrastructure through poverty- allev'iation schemes.
• Distnbution of foodgrains to the people below povert}' line.
440

also become available. The development strategy to be pursued in the medium term has been consciously interwoven with the country’s food security concerns
4.1.21 Food security is to be interpreted to mean adequate availability o f basic food items particularly, foodgrains in the country as a whole and also availability o f adequate purchasing
power to meet the food requirements at the househiold level Accelerated agricuhural development based on increase in productivity and incomie would meet both these elements o f food security. Hence, a strategy for food security w ould encompass the essential components
o f availability, with a focus on those living below the pioverty line as well as the deficit and inaccessible regions o f the country.
4.1.22 A three pronged strategy will be followed to me;et the basic food requirements o f all:
i. Increase in overall employment and incomes by raiising farm productivity and through the growth o f other economic activities in the rural areas.
Provision o f gainful supplementary employment thrrough poverty alleviation schemes such as JRY, EAS. These would generate additional ermployment in the short run but would also help in the creation o f durable rural infrastructure for more sustained employment over time
iii. Distribution o f foodgrains through public distribuition system at concessional prices to those living below the poverty line.
4.1.23 In order to provide access to the poor to food at prices they can afford, a Targeted Public Distribution System (TPDS) has been introduced. Under this, 10 kg o f cereals are provided per capita per month to those living below the poverty line, at half the central issue price This too would create additional demand for cerealis
4 .1.24 Poverty eradication and generation o f productive employment in the growth process are at the top o f the Government’s agenda. It is recognised th a t greater productive employment in the growth process will take time to materialise. Lest, a large proportion o f the rural poor are left out o f growth process, there is need for continued state intcervention for poverty alleviation The resources made available under poverty alleviation prograimmes and funds provided for old age pension, maternity benefit and family benefit targeted to the poor under the National Social Assistance Programme would provide additional incomes to the poor for purchase o f essential food items.
4.1.25 The target o f new strategy is to double the food p>roduction in the next decade to meet the consumption requirement o f the growing population! and to make India hunger free However, it is neither possible nor required to double the foodgrains output o f each item or even the group o f items in the food basket. In fact, an exercise dione to estimate the food requirement suggests that production o f 300 million tonnes o f foodgraiins with an increase in horticulture, livestock and fishery production should be more than adeqiuate to meet the food and nutritional requirement and also leave an exportable surplus o f about 5 million tonnes o f foodgrains
441

4.1.26 In view o f the preponderanice o f the poor in the rural areas, household level o f food security can be achieved only through a sustained and rapid increase in productivity growth in the agriculture sector in terms o f value ad(ded per worker. The pattern of value addition in agriculture is such that this magnitude o f income growth o f the poor is unlikely to occur from the expanded output o f foodgrains only. Rapid diversification towards high value products, in both crop and non-crop sectors, is essential both to meet nutritional needs and to generate adequate incomes for the rural poor
4.1.27 A production target over 3100 million tonnes for the estimated population o f over a billion may lead to diversion o f area Ifrom other crops like oil seeds, pulses, fruits and vegetables towards cereals. The diversion may no t be desirable as demand for these items far exceeds, the supply and higher imports may meani higher prices. Further, excess production o f cereals may depress prices and lead to income Losses to farmers, large scale procurement and storage o f surplus production may also not be feasible. Therefore, the target for foodgrains production has been fixed at 300 million tonnes (Riice 130 million tonnes. Wheat 109 million tonnes; Coarse cereals including Maize 41 million tonnes; pulses 20 million tonnes) by 2007-08 Foodgrains production is expected to increase ait an annual rate o f 4 5 % per annum during the ten year period While the animal husbandry and dairy development is targeted to achieve a growth rate o f 6.2 % that o f fisheries sector is exjpected to register a growth rate of 5 .7 % per annum. With these targeted growth rates, the production o f milk and fish is expected to reach the levels o f 130 million tonnes and 9.6 million tonnes, respectively by 2007-08.
Regionally difTerentiated strategy
AGRO-CLIMATIC BASED PLANNING FOR:
High Productivity ZoneLow Productivit>'-High Potential
ZoneLow Productivity' Zone. Ecologically Fragile Regions.
4 1.28 In order to achieve the goals o f doubling the food output and alleviation o f hunger, a regionally differentiated strategy based on agro-climatic regional planning which takes into account agTonomic, climatic and environmental conditions will be adopted to realise the fiill potential o f growth in every region. The agriculture development strategy will be differentiated by broad regional characteristic o f agro-economic situation. The thrust will be on ecologically sustaiinable use o f the basic resources such as land, water and vegetation in such a way that it serves the objectives o f accelerated growth, employment and alleviation o f hunger.
High Productivity Zone (North-W est & Coastal region)
4.1.29 The high productivity zone is characterised by either high irrigation-low rainfall or low irrigation-high rainfall situation, spread over 103 districts o f the North-West and coastal areas including Andhra Pradesh and Tamil Nadu. Here, the thrust will be on diversification of agriculture towards high value crops through creation o f relevant infrastructure and establishment o f strong linkages wi th agro-processing industry and exports
4.1.30 In this Zone basic infrastructure for accelerated food production is already well developed. Some o f the districts in this region have witnessed significant productivity growth and realised 8 to 10 tonnes of paddy per ha In some of the districts where the growth of productivity
442

has reached a plateau, the requirement is for new seed warieties and better water management including large scale use o f sprinklers to avoid water log»ging and salinity problems. The latest research o f ICAR and the SAUs on production technolojgy including crop management will be implemented in the high productivity districts. The intenssity o f agricultural input will have to be increased particularly o f chemical fertilizers along with giireen manure and bio-fertilizers. Even in this zone, there are considerable variations in produictivity per ha and input use for crop
production with potential for increasing output.
4.1.31 During the next decade, efforts will be made to step up fertilizer application in all the districts where it is low to reach the level o f 200 kg/hai in a phased manner. The increased utilisation of chemical fertilizers will be accompanied by co)mplementary use of farm yard manure, compost, green manure and bio-fertilizers. A similar appiroach will be followed for augmenting
irrigation facilities. All the districts in the zone will have aissured irrigation covering over 90% of the gross cropped area (GCA). Fertilizer use is positivel^y co-related with irrigation
Low Productivity- High Potential Zone
4 1.32 In the Low Productivity - High Potential Zone; which cover about 181 districts in the country, the productivity is low despite abundant water' availability and good soil This zone would include Eastern Madhya Pradesh, Central and Eaistern Uttar Pradesh, the Bihar Plains, Assam, West Bengal and some parts o f other States IThe strategy for this region will be to achieve the productivity levels of high productivity states, of Punjab and Haryana.
4.1.33 The production strategy for this region woulld focus on flood control, drainage management, improved irrigation facilities particularly, mimor irrigation and a better input delivery system supported by extension. The fertilizer application \will have to be substantially stepped up and the gross irrigated area in this region to be increased tco cover at least 50% o f the GCA of the districts.
4.1.34 The average fertilizer consumption in the vast majjority of the districts in this zone is very low and in over 90 % o f the districts the per hectare consiumption is less than 100 kg. Here, the urgent need is to step up fertilizer consumption in the firsst category districts to the level o f the second category and in the subsequent phases these districts should catch up with those o f the high productivity zone. Along with chemical fertilisers, the use o f organic manures and bio- fertilisers will also be promoted for soil health.
4.1.35 Minor irrigation holds the key for this region andl there is considerable ground water potential. About one million tubewells will be sunk in this5 zone which would irrigate about 4.0 million ha. Large scale adoption o f drip irrigation and spriinkler irrigation will be taken up in this zone
Low Productivity Zone(Central Plateau Region)
4.1.36 In the Central Plateau region covering 79 distric:ts, the productivity is low because of water scarcity. Here, the emphasis will be on developmtent o f efficient water harvesting and conservation methods and technologies, suitable irrigation [packages on watershed approach and appropriate farming system which economise on water-us>e
443

4.1.37 The basic aim o f various land and water ddevelopment programmes in this region will be to enable the farmers to obtain at least one good ( crop in an agricultural year In the case of paddy the target should be to obtain a yield o f aboutit 3-4 tonnes/ha and for wheat about 2.5 to3.0 tonnes/ha It is possible to obtain 3.0 tonnes/ha of f maize with appropriate varieties as available in Karnataka.
4.1.38 Water harvesting structures and conservation i works are o f prime importance in watershed development. The cost eflFective indigenous method ( o f water harvesting through check dams etc. will be supplemented by the use o f drip and sprinkkler irrigation. Apart from deep tubewells, shallow tubewells, open dug-wells and tanks/ponds s which help in percolation and recharge of ground water will be emphasised. Regular desiltinng and redigging o f such tanks under rural employment programmes should be taken up. Ahbout 10 million ha. will be brought under scientific treatment for soil and water conservation ( during the Ninth Plan period.
4 139 Fertilizer consumption is very low in this reegion because o f water scarcity For higher intake o f chemical fertilizers, the urgent need is to taap ground water potential wherever available for crop production. Million wells Scheme(MWS) can make useflil contribution.
Ecologically Fragile Regions including Himalayaan & Desert Areas
4 1.40 Development strategy for the fragile Zone ; has been spun around allied sectors such as animal husbandry, fisheries, horticulture and plantaation.
4.1 41 On the basis o f existing irrigation facilitiees and the level o f fertilizer consumption in various agro-economic zones, about 212 districts hhave been identified for priority action for intensifying irrigation facilities and yield raising innputs including chemical fertilisers for the accelerated growth o f food output It is also planneed that diversification and modernisation o f various sub-sectors o f the agricultural sector wouldd gain momentum in the Ninth Plan and the dynamics o f agricultural growth would emanate fifi'om growth in non-foodgrain sectors, e.g. cotton, oilseeds, sugarcane, fhiits and vegetabless, spices, plantation crops etc. along with the development o f fisheries, animal husbandry anod dairying.
Policy Thrust and Key Elements o f Growth Straategy
THRUST AREAS
• Consen/ation of land, water and biological resources.• Rural infrastructure development• Development of Rainled agnculture.• Development of mmor irrigation.• Timely and adequate availability of inputs.• Increasing flow of credit• Enhancing public sector investment• Enhanced support for research.• Effective transfer o f technology
• Support for marketing infrastructure
• Export promotion.
4.1 42 Within the broad frame work o f Plan for doubling food production and making India hunger free the Ninth Plan will aim at achieving the specific objectives o f sustainability o f employment generation, food and nutrition security, equity and poverty alleviation. Efforts will be made to achieve a growth rate o f 4.5 % per annum in agricultural output in order to make a significant impact on overall growth and poverty alleviation. The emphasis will be
444

on raising the capabilities o f small peasants aand promoting sustainable agricultural systems, while at the same time conserving and maximisinjg the value from scarce resources, water and land Infrastructure development will be given ithe highest importance Emphasis will also be on minor irrigation by harnessing ground watcer resources. Timely and adequate availability of inputs will receive special attention. The rejgional programmes will be formulated in such a manner as to ensure provision o f inputs ito the farmer, particularly in the remote, hilly, backward and tribal areas. Agricultural crredit is a crucial input and it will receive special attention. The programmes relating to land rreforms would be strengthened to raise agricultural growth and help the poor. Efforts will be miade to increase public investment during the Plan period In every district, the Rural Infrastiructure Development Fund (RJDF) will be used to promote projects which encourage organisatiions o f small farmers, artisans and landless labourers for skill upgradation,processing, transport imfrastructure, quality improvement etc Support to agricultural research will be enhanced amd emphasis will be placed on biotechnology, micro-biology, genetic improvement o f crop>s including hybrid technology, genetic upgradation o f animal resources, improvement o f fish genetic stock and post-harvest technology, etc Efforts will be made to accelerate the grcowth rates o f allied sectors such as horticulture, including fruits and vegetables, fisheries, livfestock and dairy Agricultural exports will receive special attention as these have a lot o f potejntial for increasing farm incomes and employment,
besides earning foreign exchange. Co-operattives will be strengthened Greater participation of women in agriculture than at present willl be encouraged Linkages with markets will be strengthened and agro-processing and agro-industries will be encouraged
4.143 The Ninth Plan target is to achiieve a growth rate of about 4.5 % per annum in agricultural output and production of 2341 million tonnes of foodgrains by 2001-02 Themain elements o f the strategies to achiev/e these targets and objectives are discussed below
New Agriculture Policy
4.1.44 The Government is finalising a TiVational Agricultural Policy which is set to make some major changes in farm practices. Thee policy will focus on the optimal use o f land, water and genetic resources in a sustairnable manner It will include leasing o f land, consolidation o f land, the use o f 80 million lha. o f marginal and wastelands and community lands for agro-forestry and improvement o f rural rmarketing infrastructure The plan will be to create both cold storage and processing facilities (dose to the production centres in rural areas
Focus on Social Objectives
FOCUS ON• Raising Land Productivity in Eastern India. •Recognition of Women’s Rights in Land. •Protection of Tribals’ Rights in Land
4 .1.45 The strategies for agricultural dtevelopment will focus on the social objectives of e;mployment generation, food and nutrition
sescurity, gender equality, poverty alleviation and emvironmental sustainability. Towards these
objectives, a special thrust will be given to > raising land productivity in Eastern India and the arid-zones o f peninsular India where the pooor are largely concentrated These regions require investment in minor irrigation, watershed! development and general infrastructure as well as support to small and marginal farmers by w ay o f timely credit, availability o f inputs and seeds and market linkages. An attempt will be miade to bring about effective coordination between agricultural programmes and rural programnnes. Women's rights in land will be recognised and
445

women will be given preference in group activitities for land conservation and improvement The need for land reforms and improvement of land r records will again be brought into focus Every effort will be made to protect the tribals' rights i in land
4 .146 Technologies for integrated and apprcropriate agricultural system.s will be developed and disseminated so as to emphasise that agririculture is not only a land and water using activity but also helps to conserve and regeneerate land and water resources The cropping pattern has to be appropriate to the nature o f Hand, water and environmental resources
Agricultural Employment
4.1.47 The strategy of agricultural developmentit should be such that it should have a significant impact on the reduction o f rural poverty by thee end o f the Ninth Plan from the level o f 3 7 % in 1993-94. The focus on the development o f 5 small and marginal farmers will have a direct impact on poverty With its forward and backw/vard linkages with other sectors, the accelerated agricultural growth targeted for the Ninth Plan s should help reduce rural poverty considerably
4 1 48 The elasticity o f employment with res:spect to output in agriculture has declined over lime, if the country as a whole is taken It is gqenerally observed that during the phase when agriculture is transforming from low product;tivity to high productivity operation, labour absorption is very high, though at a highly deweloped stage additional labour absorption stops and elasticity gets reduced to almost zero The ’ Ninth Plan focuses on raising productivity in the low productivity regions o f Eastern and poeninsular India In this process, there will be considerable generation of additional employmeent The emphasis will be on high employment elasticity activities like animal husbandry, fisheriries. horticulture, fish canning and preservation, tobacco products, cotton ginning etc Increastse in cropping intensity would also lead to an increase in the employment prospects in agricultuure The strategy on employment would also encourage rural non-agricultural employment sso that the burden on agriculture would be reduced over time
Agricultural Research and Technology
4 1.49 For agricultural research and education, , the country has a strong national agricultural research system Today there is a network of 49 > research institutes, 30 national research centres, 10 Project Directorates, 28 State Agricultuural Universities, one Central Agricultural University and a large number o f All India Coonrdinated Projects involving more than 24,000 agricultural scientists and teachers The futiture economic and social development is in considerable measure dependent upon the t technological improvements in agriculture A massive application of science and technology / would enable Indian agriculture to face the serious challenges o f food security and ensuree a place for value added Indian agricultural products m the global markets There are immnense opportunities offered by technological revolutions in the field of molecular bioklogy, biochemistry', physiology. Geographical Information System, systems analysis, revolutiaon in informatics, remote sensing etc The objective is to tap the potential of science aand technology to improve the living conditions o f the poor It is increasingly difficult to obtain \ any sizeable incremental production from the conventional Green Revolution areas For the J second Green Revolution, it is necessary to make the grey areas green Hence, a major suppport for the rainfed areas, especially in Eastern and arid peninsular India would be necessary 1 Public sector research and technology missions (as for instance the mission on oilseeds) on varioous crops would play a crucial role in improving
4446

the crop production. How to reduce the yield gapp b etween the lab and the field, particularly in the case o f dryland crops is an important challenpge for agricultural research & technologies
Supportive Environment
4 150 The country has 106.6 million agricultural landholdings The holdings of small and marginal farmers together constitute around 80 % o f the total holdings and their average size is less than one hectare. A farmer takes his or her r own decisions about cropping pattern and other production activities The Government's rolee is to help build a supportive environment to increase production and productivity in the forma o f market intervention, agricultural research, public investment in irrigation and infrastructure, c credit and marketing for agricultural export besides creating and strengthening institutions liktie co-operatives which support agricultural activities.
Infrastructure Development
4.1.51 Infrastructure development in the Eighth PPlan has fallen short o f the targets This is partly due to the reliance that was placed on private; sector investment, which did not materialise inadequate measure Infrastructure includes irriggation, electricity, agricultural research, roads and communication, markets and new technology. TThe public sector investment in irrigation has been stagnant or declining since the mid-1980s. Efforts will be made to increase public investment in agricuhure The private investmennt would also increase along with public investment since there is complementarity between the two Developing roads and agricultural markets in the rural areas is important for the frfarmers to sell their products This is also important for food security because public and privvate trade cannot operate efficiently without good infrastructure. Accessibility o f remote areaas is also dependent on transport linkages
Agricultural Investment
4.1 52 Higher investment in agriculture and nrural infrastracture is a necessary'condition for increasing agricultural growth. Government has s a role in not only raising public investment but also inducing private investment. Efforts will 1 be made during the Ninth Plan to increase public investment and encourage private investmeent in agriculture
4.1.53 The public sector plays a crucial roole in providing the investment for infrastructure like irrigation, electricity, agricultuural research, roads and communications Simuhaneously, there is a need for providing inccentives for the private sector to invest in a number o f agricultural activities. Investment in miiinor irrigation by the farmers has already picked up in the eastern region during the Ninetieies. The scope exists for increasing private participation in seed industry, particularly in the noon-cereal crops. There is a need to review some o f the restrictions on storage, marketing and nmovement particularly at the State level so that the farmers can avail of better opportunities. Thhis is also important for attracting investment in many activities.
4.1.54 Irrigation development and water managqement are going to be most crucial for increasing agricultural production and productivity. . For increasing the efficiency o f irrigation projects, there is a need for institutional reforms As suggested by the Committee on Pricing o f Irrigation Water, the effective involvement o f ' farmers in management is -essential for improving the operational efficiency and financial vinability o f public irrigation systems During
447
the Ninth Plan, the Government would aim ait eencouraging greater community participation in irrigation management for bringing about gre8ate;r awareness o f the need for judicious utilisation o f water. Community participation in waterrshted development and regeneration o f land and w ater resources will have to be promoted.
Credit Availability
4.1.55 Credit is an important input for tmcireasing growth in agriculture. For achieving a growth rate o f 4 .5% , the rate o f growth im ajgricultural credit should be higher than that during the previous Plan periods A sttromg, viable and professional system o f credit disbursal is essential for meeting the emergiing credit demand on time and adequately Credit support needs to be increased for traditional secctors like minor irrigation, farm mechanisation, rainfed farming, wasteland/forestry, dairy amdl other animal husbandry activities and also for crop production. In addition, the emergirng scenario provides vast scope for diversification o f activities under horticulture, mushrooim, floriculture, fishery, animal husbandry and sericulture as well as agro-processing, storagee amd the use o f advanced technologies like tissue culture, drip irrigation, green-house etc. All thtese activities need more credit during the Ninth Plan. Efforts will be made to change the legal 1 amd administrative system in order to revitalise the co-operative credit structure and enable thee s^ystem to respond adequately and effectively to the emerging needs o f the users and the marrkerts
Land Reforms
4.1.56 A proper implementation o f land kaw/s and policies is essential in order to restructure the agrarian economy in a way conducive to hiiglher rates of agriculture growth with greater equity in the distribution o f gains from it. All possitble; efforts would be made to detect and redistribute the surplus land and to enforce the ceiling laawfs with firmness
4.1.57 Tenancy reforms would be taken ujp lin States characterised by semi-feudal modes of production. Absentee landlordism must be ellimiinated by plugging the legal loopholes, tightening the implementation machinery and providing ffor speedy adjudication of disputes in revenue courts Rights o f tenants and sharecroppers need to be recorded and security o f tenure provided to them. This alone would provide incentive forr imcreasing investment in agriculture, as experience in certain parts o f the country has shown. Prrefcerence should be given to poor, especially women
with respect to wastelands and common propoert:y resources Consolidation o f land holding should be expedited but only with the active involv/ennent o f the village people and the Panchayat Raj Institutions in order to allay fears o f small, amd marginal farmers whose lands may be under consolidation operations. Updation o f land retcord is a necessary pre-requisite o f any effective land reform policy. The rural poor, the (elected bodies and voluntary organisation should participate in the process o f ensuring agrariaan reforms
Agro-processing
4.1.58 There is a bright future for Indiaa im agro and food processing sector and for this purpose appropriate institutional arrangemaentts will have to be made. Large scale processing would have to be selectively encouraged sinc:e such activities on small scale are often not viable As the world's largest producer o f milk, amd esecond laragest producer o f fruits and vegetables, India should focus on promoting processted agricultural products for export purposes For
448

increasing agricultural trade, encouragement vwoould be given to infrastructural developments in terms o f bulk storage and handling facililitiees at rail-heads and sea-ports. For perishable commodities, fast track facilities and special c;argo terminals at major air and sea-ports are essential.
Foodgrains Self-Sufficiency at National Levvel
4.1.59 Foodgrain self-sufficiency refers only tco tthe country as a whole and there is no need for self sufficiency at the State or regional leveels.. The States would be encouraged to produce crops according to their comparative advantagee. jEach region or State should use land to its best advantage.
Towards a National Market
4.1.60 The domestic markets should be freee and there should be a free movemen: of commodities. We must proceed towards a fiililll national market by removing unnecessary restrictions. The free movement in the ddormestic markets would lead to movemenis of commodities from surplus regions to deficit repgicons.
Terms of Trade
4.1.61 In recent years terms o f trade for farm i seector has shown some improvement as a result o f various measures taken by the Government 1 likce announcing minimum support prices for the major agriculture commodities. As non-price faactcors are more important for raising the growth, the strategy should be to reduce the cost o f prcodiuction in order to make the agriculture nore remunerative
Effective Price support to farmers
4.1.62 Wide fluctuations in farm prices causee mndue fluctuations in income, more than the changes in the output. This depresses the pricees received by the farmers and discourage his investments in yield raising infrastructure. Tl'he agricultural price policy followed by the Government, over the years, has contributed siggnifficantly to the creation of a remunerative and relatively stable price environment, which haas imduced the farmers to adopt new technology and increase production. It has also helped inn tthe diversification o f cropping pattern While it is necessary to substantially improve input ddellivery system and target low intensity- high potential areas, it is also essential that farmers j aree assured o f remunerative prices that offer a fair incentive for adoption o f improved technookogy and scientific practices It is absolutely essential that Minimum Support Prices (MSP)fonr rmajor cereals should be announced well before the sowing season so that farmers are quite clear: atoout the price expectations and the price policy performs its resource allocation function effecti\tvebly
4449

4,1.63 The price support mechanism heas also not been very effective in the Eastern States and paddy prices have ruled below thhe MSP level announced by the Government, on many occasions. All efforts to improve tth e ; production, o f rice in the eastern states will be meaningless if the farmers are not assured o)f NVISP. A mechanism should be devised to monitor farm gate prices o f various agricultural procducce in all major producing Centres.
Agriculture Marketing
4.1 .t)4 The agricultural marketing infrastrruccture has not kept pace with the accelerated growth o f production in the country. This has resiulteed in significant post harvest losses o f agricultural produce. The Central Government has prowicded assistance for the creation o f infrastructural facilities for marketing and for the settings upp of rural godowns During the Ninth Plan, the Panchayats will also be encouraged to inwolve themselves actively in creating marketing infrastructure at the rural level. Marketing extension, being a key factor in bringing desirable charges in attitude, skills and behaviour of tthe j farmers, traders and consumers, the agricultural marketing extension will be strengthened. D)irect marketing will be promoted in the interests o f both the producers and the consumers
4.1.55 The functioning o f the agricultureal nmarkets particularly for fmits and vegetables will be improved to ensure fair and remunerative fpricces to the growers The wholesale markets will be modernised with all basic infrastructural fcacililities for cleaning, grading, packaging, storage and alsc with electronic auction platforms. Tlherre is a need for establishment o f cold chains, providing pre-cooling facilities to farmerss, ccold chains in the terminal markets and improving the retail marketing arrangements in thee urban areas. Schemes will be formulated for promotion o f available low cost technolojgy in the form o f fruit vending machines, expellers, grir.ders, packers, reefer vans, etc. to thie i educated rural and urban youth with appropriate paccage o f assistance.
Rationalisation of Input Prices
4.1 66 There is a school o f thought w/hicch emphasizes that the continuance o f agriculture subsidies need a re-look as these are consiidesred to be fiscally unsustainable and also encourage sub-optimal utilisation o f resources leadimg tto undesirable consequences like land degradation, wa:er-logging, depletion o f groundwater reesoDurces, etc. It is also argued that the subsidies crowd out the public investment in agriculture andl, tkherefore, a time-bound strategy for rationalizing the agnculture input pricing structure by a prropoer and transparent method is required. However, it should be recalled that agriculture subsidliess have played a very cmcial role in improving the production and productivity and have conttribouted significantly to the country’s food security All ou' efforts will be made to improve agriciultiural productivity and raise the farmers income with special emphasis on ensuring the supply off afgriculture inputs such as seeds, fertilisers, irrigation, po ver, etc. in time and in adequate quantitties.;. Efforts will also be made to targetting and selective focussing. Agricultural subsidies, where theey are focussed on raising productivity, stabilising production and supporting the small and maarginal farmers will have to be continued for some tirre
450

4.1.67 It is a known fact that there is little sscope for further expansion o f the net sown area and that land scarcity will become an accutce feature o f the rural economy Water is a precious national asset and there are severral concerns regarding water resources in the country Therefore, a judicious use o f land aancd water resources will have to be the central concern during the Ninth Plan period and boey/ond for sustainability o f agricultural growth There has been a growing concern in recent t y^ears about the deteriorating conditions o f soil health and water resources due to improper maanaagement and pollution The deterioration in land and water resources has been in the form o f flamd degradation, water logging and decline in water table There is a greater need to have aan'integrated approach in the management of agricultural nutrients, chemicals and in taking eeffeective measures to deal with the overall pollution problems
4.1.68 There are several possible technoolojgies and ahematives to reduce the use of chemicals in agriculture These altemativees are not perfect substitutes to chemicals but
adoption o f these can substantially reduce t thte adverse impact on environment Proper land and water management policies would reeduice environmental degradation Community and village institutions will be encouraged to psarticipate in protecting natural resources from
degradation Programmes for regeneration o ffhand and water resources will be strengthened
Crop Production Strategies
Foodgrains
•4.1.69 Under the accelerated growth scenarido for the Ninth Plan, with GDP growing by about 7 %, population growing by about 1 7 % anad p3er capita income by about 5 %, the demand for foodgrains is expected to grow by 3.0 % per amnum. Under this scenario, the estimated food requirements by the end o f the Ninth Phlani would be around 227 m t Against this the target for foodgrains production is fixed at 2334 million tonnes for the terminal year of the Ninth
Plan. To achieve this target, it is assumed thaat tthe area under foodgrains would be 126 million ha. The targets show that India has to incnreaase foodgrains production at least by 35 million tonnes during the Ninth Plan from the level ofif airound 199 million tonnes in 1996-97 The large part o f the incremental production will have 5 to) come from the rainfed areas
4.1.70 To supplement the efforts o f f the State Governments in increasing crop production, various crop production orienteed schemes have been implemented by the Central Government. Some special schemes for rice, \w hieat and maize were introduced during the Eighties. The Government has modified the ceeresals development schemes during the Eighth Pian by considering the overall development o f pprewailing cropping systems in different years The
modified schemes are Integrated Cereal De’evejlopment Programmes (ICDP) for rice, coarse cereals and wheat-based cropping systems a arenas
Environment and Sustainable Agriculture;
4551

4.1.71 The ICDP-Rice was being implementced 1 in the States largely following rice-based cropping system. The States covered under thhe scheme are: Andhra Pradesh, Assam, Arunachal Pradesh, Bihar, Goa, Kerala, Eastcernn Madhya Pradesh, Manipur, Meghalaya, Mizoram, Nagaland, Orissa, Tamil Nadu, Tripura^ ESastem UP, West Bengal and Union Territory o f Pondicherry. 1200 blocks were identified 1 iiin these States where the productivity of rice/cereals was less than the State/national aiveerage for implementation o f the scheme
4.1.72 The ICDP-W heat was implemented in i the States mainly following wheat-based cropping system The States covered under ithee scheme are: Haryana, Himachal Pradesh, Jammu & Kashmir, Punjab, Northern Rajasthan gandd Western Uttar Pradesh 425 blocks were identified in these States where the produc:tivvity o f wheat/cereals was less than the State/national average for implementation o f thes sccheme. During the Ninth Plan, the emphasis will be on the rainfed wheat areas particularity : in the central region Over time, wheat production has been catching up with rice produictition
4.1.73 The ICDP-Coarse Cereals was implermeented during the Eighth Plan in the States largely following coarse cereals-based croppinjg 5 system. Under the scheme, six States viz , Gujarat, Karnataka, Madhya Pradesh, Maharasshtrtra, Rajasthan and Sikkim have been covered The scheme was being implemented in 830 idemtifined blocks where the productivity of coarse cereals was less than the State/national average;.
4 174 Maize is one o f the important cereals jgrcown in the country Besides, being a food crop, maize is also important from fodder, feed aandd industries points o f view The area under maize is about 6 million hectares with a producttioon level o f nearly 10 6 m t The average yield is only 1.7 tonnes per hectare which is very low cconrmpared to the world standard at 4 1 tonnes per hectare. The area under high-yielding variety o f f maize is about 50 % However, the area under hybrid seed coverage is less than 10 %. TIhe j quality o f Indian maize compares favourably with the best in the world Keeping in view the; inmportance o f raising the yield o f maize from the present level o f 1 7 tonnes per hectare to < at 1 least 3 tonnes per hectare and to increase maize production by at least 10 million tonness, t two steps have been taken These are: (1) upgradation of the All India Coordinated Researrchi Project on Maize to Directorate of Maize Research in the ICAR and (2) introduction o f am /Accelerated Maize Development Programme under the Integrated Cereal Development Prograxmnme based on coarse cereals cropping system approach. The research component is already ;at place and the accelerated programme, in a mission mode approach, would be made functiionnal during the Ninth Plan
4 175 The production o f pulses has remainecd 5 stagnant between 10 and 12 m t during the last three decades . The productivity and produicticion o f pulses is low due to its cuhivation on rainfed, marginal and sub-marginal lands, high : suasceptibility to pest diseases and climatic aberrations, lack o f genetic breakthrough, applicaitioon o f very low level o f inputs by the farmers and diversion o f area to other remunerative crojpss as and when irrigation facilities become available In order to harness the best o f producctioon, processing and management technologies to accelerate pulses production, the prograimnme o f National Pulses Development Project (NPDP) was brought under the purview o f Te(chnnology Mission on Oilseeds in 1990. The NPDP was being implemented in 25 States and! LUnion Territory o f A & N Islands. Under this programme, emphasis is laid on increasing th e : anrea through multiple and inter-cropping and increasing the yield per unit o f area. Assistancce i under this programme is provided for key inputs. The Integrated Cereals Development Pro)gra'ammes for rice, wheat & coarse cereals and
45;2

NPDP project for pulses will be continued duirinig the Ninth Plan
Oilseeds
4.1.76 There has been a steady increase in thie production o f oilseeds after the setting up o f the Technology Mission in 1986 The aim i off the Technology Mission has been to harness the best o f production, processing and mancagejment technologies for achieving expeditiously self-reliance in oilseeds' production. Soyabe;an and sunflower have, o f late, emerged as the oilseed crops having major growth potential. W/ith a view to augmenting the availability of edible oils, the cultivation o f oil palm umdcer irrigated conditions was initiated by the Department o f Bio-technology in Andhra Pradejsh, Karnataka and Maharashtra Subsequently, it was implemented as a Technology Mission im thie name o f Oil Palm Development Programme (OPDP) in 11 states These programmes willl bee continued during the Ninth Plan
Technology Mission on Cotton
4.1.77 The productivity level o f cottom im India does not compare favourably with productivity levels attained in many o f themajjor- cotton growing countries of the world The world average o f cotton yield is well over 550 keg per hectare whereas in India, it is around 266 kg per hectare There are a number o f co>nsttraints from production to processing stages Therefore, there is a need for evolving and :apfplying technological improvements at several stages o f cotton production and processing. TThes Technology Mission on Cotton proposed in the Ninth Plan will give a major thrust to raiise; production, productivity, as well as post harvest marketing and processing o f the produice. Ministry o f Agriculture and Ministry o f Textiles are being associated for its implemejnteation, with the Department o f Agriculture as nodal agency.
Sugarcane
4 1.78 The area under sugarcane is 4 milli(on ha. and the average productivity is around 66 tonnes per ha. The production o f sugarcane iss e?xpected to increase from 277 million tonnes in 1996-97 to 336 million tonnes by the end o f thie N in th Plan at an average groAvth rate o f 3 91 % In water scarce area increase in area under sugarrcane needs to be discouraged In the State like Maharastra, sugarcane cultivation through sprim kler irrigation is taken up which is a welcome step
Targets of Crop Production
4 .1.79 The targets o f production o f foodgrainss and other crops for the terminal year o f the Ninth Plan are given in Table 4.1.4
-453

TABLE-4.1.4Targets of Production for Agriculture Commodities for 2001-02
Crops Production Annual Compound(Million Tonnes) Growth Rate (%)
1. Rice 99.0 4.022. Wheat 83.0 3.683. Coarse Cereals 35.5 0 704. Pulses 16.5 2.675 Total Foodgrains 234.0 3.266 Oilseeds 30.0 3.757. Cotton* 157.0 4.008 Sugarcane 336.0 3.91
* Lakh bales of 170 Kgs. each
Plantation Crops
4.1.80 In the plantation sector, the main emphasis during the Ninth Plan will be on increasing productivity, accelerating the replanting activities and rapid expansion of crops in the non-traditional areas, particularly the North East. The main strategy for product development will be on the adoption o f improved agricultural practices, adherence to strict phyto-sanitary norms and upgradation o f post-harvest technology These measures are aimed to bring down the unit cost of production and improving the competitive edge for our exports Strengthening o f infrastructure for value addition and quality control have been identified as the core areas in market development and export promotion. In order to establish a competitive presence in the international market, quality maintenance deserves top-most attention and quality improvement will be achieved through Research and Development intervention. Dissemination o f information will receive due importance; so also o f modern technologies for cultivation, processing and packaging to internationally accepted standards Efforts will be made to promote organically produced commodities
454

4.1.81 The North-Eastern region will receive special focus with increased flow o f resources and higher level o f subsidies under various plantation development programmes for exploiting the natural resources which this region is endowed with to their advantage This region has tremendous potential for spices besides, other plantation crops like tea, coffee and rubber The constraints o f the North-Eastern region such as lack o f skilled manpower, infrastructure, resources /credit flow and high transportation cost etc will be specifically addressed to Extension service through demonstrations and trainings to the tribal growers assume considerable importance A substantial portion o f the resources o f the various Commodity Boards will be for the North-Eastern region. During the. Ninth Plan schemes for On-Farm W ater Management for increasing production in North-East/Eastern India and schemes for increasing the consumption o f fertilisers and increased flow o f credit for the agriculture sector are being envisaged
Tea
4 1.82 Efforts will be made to increase production, improve quality and to ensure availability o f tea at a price remunerative to the producer and affordable to the cons'imer The bulk o f the incremental production during the Plan period is expected from increased productivity in the existing plantations, for which irrigation and drainage facilities will be augmented. The installed capacity o f tea factories will also be increased, besides augmenting tea processing facilities by construction o f new factories Efforts will be made to raise the productivity levels o f smaller estates where there is vast scope for improvement
Coffee
4 .183 Consequent upon liberalisation o f coffee marketing and the total withdrawal from marketing activities, the Coffee Board would shiff its emphasis towards more critical areas such as research and development, extension, training, market intelligence, promotion o f exports as well as domestic consumption and encourage coffee cultivation in the non-traditional areas. For the traditional areas, a comprehensive coffee development package will be devised to improve production, productivity and quality o f coffee produced in the small scale sector In the non-traditional areas, rapid area expansion programme will be taken up with an appropriate package o f assistance to the tribal growers. Post-harvest technology and quality upgradation, integrated pest management, free market development including creation of auction platforms, warehousing facilities, quality assurance and plant improvement activities like breeding, vegetative and clonal propagation and biotechnology are some o f the key areas for which specific programmes will be launched during the Ninth Plan
Rubber
4 1 84 There is a lot of scope for expansion of rubber plantations in the non-traditional areas like Tripura, Assam, Meghalaya, Nagaland and Karnataka In these areas, the tribal growers are financially weak and lack technical expertise The block/group planting programme launched during the Eighth Plan will be intensified Besides, the incentive package will also be made more attractive to induce investments in planting and maintenance activities Infrastructure development for processing and marketing in the North-Eastern region will be given top priority during the Ninth Plan Initiatives already taken for stimulating demand for
rubber and rubber products would be intensified
455

Spices
4.1.85 An integrated approach willl be adopted for the development of black pepper, ginger, turmeric, chillies, tree spices like clowe, cinnamon and seed spices. The identified thrust areas include increasing productivity to bring down the cost o f production, developing cultivation o f export-oriented varieties such as low fibre content ginger, chillies with bright red colour, developing cultivation o f vaniilla, saffron, herbal spices etc. and encouraging women in
cultivation o f spices and community processing o f the produce A technology mission on black pepper will be launched in Kerrala, which account for 94 % of the total production The Ninth Plan programmes will focuss their attention on post-harvest management, quality improvement through supply o f plantiing material, developing organic farming, modernisation o f processing/ manufacture, developmemt o f warehousing and mechanisation o f spices farming
Cashew
4 1.86 There is a good scope for expansion o f the area under cashew in the vast tracts o f wasteland including sandy coastlines; in both the traditional as well as non-traditional areas High density planting with 625 plantts/ha is required in these areas to control the growth o f weeds. Appropriate programmes will be devised to bring such areas under cashew plantations Cashew development and export promotion programmes will pay special attention to improving the quality o f kernels, po.'St-harvest management, packaging (consumer-packed cashew kernels) and infrastructure dievelopment Efforts will also be made to ensure that the processing o f cashew is environmentt-fiiendly Studies will be commissioned to assess the side-effects on the workers engagedi in cashew processing industries and to suggest remedial measures. Cashew apple has a comsiderable dietary importance and various edible products prepared out o f these apples will b e popularised
Tobacco
4 1.87 Efforts will be made to im prove the productivity and quality o f tobacco, grading at farmers' level and monitoring and control o f pesticides residues Strengthening o f auction facilities, promotion o f exports besi(des exploring alternate use o f tobacco will receive special attention during the Ninth Phan.
Targets for the Plantation Sector
4.1.88 The targets for production., envisaged growth rate and exports o f plantation crops for the Ninth Plan are given in Table 4.1.5.
456

TA BLE-4 .1 .5Ninth Plan Production and Export Targets for Plaintation Crops (2001-02).
Crops________ Unit________________Prnduction____ Growth rate% F.xportsl.T e a M.Kg^ 1000.0 5 0 265.02 Coffee (000 tonnes) 300.0 5 0 200 03 Spices (Lakli tonnes) 33 5 4 25 2 584 Rubber (000 tonnes) 717 3 5 5 4 05 Cashew (Lakh tonnes) 7 0 9 24
Horticulture Crops
4 1 89 The horticulture sector has established its credilbility for improving productivity o f land, generating employment, improving economic conditiions of the farmers who are mostly small and marginal and entrepreneurs, enhancing exports ;and above all providing nutritional security to the people Horticultural diversification has madie some visible impact particularly in the wake of economic liberalisation In fact, high levels of laind productivity in coastal areas can be largely attributed to the growing of high value plantation and horticultural crops However, due to various technological and infrastructural constraiints, the growth remains far from satisfactory The low productivity o f perennial fruits and phantation crops is attributed to small size of holdings, preponderance of old senile trees and poor management available to them There is also an acute shortage o f planting seed/material o f improved varieties Crop specific disorders e g various diseases o f vegetables, rootwih of coconut etc affect production and productivity Another area of concern is the post-harvest handling whichi account for 37% of the losses at different stages o f storage, grading, packaging etc Processsing infrastructure is weak and the research and development support, inadequate The marketiing is also not well organised There is a need for proper blending o f technology, credit and sciientific management for accelerated growth o f horticulture sector Horticulture sector has been brought to the forefront in the overall food production strategy o f the country and will cont'nue to be treated as an extreme focus area for provision o f strong support for its overall development
4 1 90 The development strategy would be on the basis of tlhe assessment of factor endowments and comparative advantage in propagating various horticuiltural crops Regions which have tremendous potential o f horticuhure crops including North-IEast would get top priority Special package of assistance will be devised for the NE states and thie existing schemes will be modified to meet also the requirements o f these states The specific objtectives of horticulture development during the Ninth Plan would be:
(i) to improve productivity and quality o f horticulturre crops through upgradation o f production/farming technologies,
(ii) to reduce post-harvest losses, and improve market;ability o f the produce and its availability to consumers,
457

(iii) to promote better utilisation and increased consumption of the produce to ensure higher returns to farmers/producers and better nutritional health to the people,
(iv) to promote export;
(v) to develop a strong base for supply o f inputs, transfer of technology and human resource development to support the development activities
4 191 The aim o f horticulture development in the Ninth Plan will be to consolidate the gains made in the Eighth Plan by continuing the existing schemes and implementing new schemes to bridge the identified gaps and remove the deficiencies The projection of output o f fruits and vegetables for the terminal year o f the Ninth Plan is 179 million tonnes The Ninth Plan production target o f spices is 3 36 million tonnes There is likely to be a gap between demand and supply in respect o f horticulture crops which will be met through imports Consistent efforts, however, would be made to raise productivity and reduce post-harvest losses necessary to make the country self-sufficient in horticulture crops
4 192 The targets envisaged can be achieved by promoting development o f different crops and related activities around specific thrust areas namely (i) improving productivity and quality o f produce from the existing plantations, (ii) developing infrastmcture for post-harvest handling and marketing; (iii) product diversification and improving consumption, (iv)increasing the availability o f quality seed/planting material, (v) area expansion; (vi) transfer o f technology; (vii) export enhancement, (viii) human resource development, and (ix) improving infrastructure and database for horticulture crops Productivity improvements can be achieved through the use o f high-yielding varieties, developing irrigation facilities, use of plastics, beekeeping, rejuvenation/ rehabilitation o f old orchards or plantations, uprooting o f senile/diseased plantations and adoption o f inter-cropping and bio-control measures
4 193 Intervention o f horticulture-related activities for improving the nutritional status of people in general and for preventing the disorders associated with deficiencies of \ itamins and minerals in particular will be taken up as a new initiative with greater participation of women during the Ninth Plan
4 1 94 Intensive training programmes will be devised not only for educating the farmers but also for those engaged in processing and exports activities on sanitarv and phyto-sanitar\' measures for meeting the standards of the international market Cooperative Sector will be encouraged to take up commercial horticulture with the assistance for production and post- har\est management including setting up o f grading, packing houses, pre-cooling units, cold storages, green houses, processing units, tissue culture and quality production units
4 1 95 Transfer o f technology from lab to land through demonstration and expansion services and human resource development with regard to scientific management of estates, gardens and green houses will be given specific attention with increased interaction between State Agricultural Universities, the State Departments o f Horticulture and National Horticulture Board and other Commodity Boards
458

4 1 96 Scientific cultivation of medicinal and aromatic plants on commercial basis, will receive specific attention^ Quality production and marketing would be encouraged with appropriate package o f assistance Dissemination o f information has remained a neglected area in the past Creating horticulture aw'areness through various aciivities including T&V, seminar, work shops, study tours o f farmers and demonstration will be essential comiponents o f horticulture development strategy,
4 1 97 Facilities for quarantine and cold storage at major air ports and sea ports, a process which already commenced will be expedited for expon promotion o f horticultural crops APEDA has taken the lead in sanctioning cold storage facilities in major airports like Chennai, Thiruvanthapuram, Bangalore and Hyderabad Such facilities in Delhi have already commenced operation
Agricultural Inputs
4 L98 The emphasis will be placed on adequate and timely deliver^' o f core inputs such as fertilisers, seeds, pesticides, credit and extension in different regions. Augmentation of irrigation facilities is necessary to increase the cropping intensity The implementation of the National Watershed Development Programme wi'l be intensified for the development of rainfed farming areas. Fertiliser consumption in low-use areas and crops will be stepped up I .'sides reducing imbalances in the use o f o!ant nutrients and adopting integrated pest ni.inagement approach and using biotic agents For this process to be effective, it will be necessar>' to initiate a widespread programme of soil testing across the various agroclimatic regions
4 1 99 In order to accelerate higher intake o f fertilisers and the use o f other inputs in crop production, especially in the remote areas, fertiliser and other input retailers network has to be considerably expanded Efforts are required o f stocking of fertilizer in order to create a supply push to complement the demand pull for fertilisers as a result o f extension etforts There is a need to ensure adequate movement o f fertilisers particularly, in the Fligh Potential -Low Productivity Zone with the help o f institutional agencies The State Cooperative Marketing Federation and State Agro-industries Corporation will tiave to play an effective role in input delivery system. The procedure for provision of margin money and working capital to the Federation will be streamJined by NCDC/NABARD There is also need for evolving mechanism whereby the institutional agencies are insulated from losses in the event o f the off-take of fertilizers failing below their expected level and consequent monetar\' burden due to surplus stocks.
4 1 100 Though the supply o f agricultural inputs like fertiliser, irrigation, power and credit at prices which do not fully cover the cost had substantially increased the intensity of input use but it had also encouraged misuse of the scarce resources in certain areas and has also become fiscally unsustainable Highly subsidised/free supply o f inputs like power and irrigation had also led to inappropriate cropping pattern For example, in water scarce areas, water-intensive sugarcane crop is being promoted In order to promote sustainable agricultural development and to make available resources for creation o f yield raising infrastructure, there is no alternative other than rationalising the input price structure
459

Fertilisers
4.1.101 The consumption o f fertilizers (NPK) during 1996-97 was 14.31 million tonnes The total nutrient requirement in the terminal year o f the Ninth Plan is projected at 20 0 million tonnes During the Ninth Plan greater use o f biofertilisers and bio-technological research in this direction will be encouraged To support the programme for achievement o f a target o f 234 million tonnes o f foodgrains, in the terminal year o f the Ninth Plan, a very strong network of all associated activities would be required to be created in the country This would include, inter-alia, the Integrated Plant Nutrient Management system, use o f organic sources and bio-fertilisers, use o f legumes by farmers for generating and sustaining the inherent nutrient potentiality o f soils, followed by application o f chemical fertilisers Programmes o f campaigning for making the farming community aware o f micro-nutrient deficiencies and their use would be launched. Programmes for disseminating the research results o f the ICAR for soil test crop response, trials, etc would be promoted.
Pesticides
4 .1.102 Promotion o f Integrated Pest Management (IPM) for all the crops and throughout the country would continue to remain the main thrust o f plant protection activities during Ninth Plan. Further strengthening o f eco-friendly IPM strategy to preserve and protect the environment and for maximising crop production would continue to be pursued. Computer networking o f all the IPM centres in the country, which is already in progress, would be further strengthened during the Ninth Plan for making available such reliable data on disease pest intelligence to meet the challenges in a more scientific manner. Also, work on strengthening o f existing State Bio-control Laboratories and setting up o f new ones, wherever required, would be undertaken. Promotion o f bio-pesticides like Bt, NVP, GV, Trichoderma etc , neem-based pesticides would be undertaken. Besides, programmes like involvement/ training o f women farmers as well as farmers belonging to weaker sections in respect o f IPM technology would be emphasised
Seeds
4.1.103 The target for Ninth Plan for certified seeds distribution is 109 lakh quintals for all types o f crops This would mean a quantum jump over the actual achievement during the Eighth Plan. Focus during the Ninth Plan will be more on development o f air-conditioned storage for breeder and foundation seeds, aerated storage for certified seeds, mobile facilities or common facilities for processing, drying etc. for all seed producing clusters in the country Comprehensive amendments to prevailing Seed Acts, will be required to be enacted during the Ninth Plan Another provision during the Ninth Plan would be to create a National Seed Grid Special monitoring arrangements for production and lifting o f breeder seeds by users, storage o f these seeds, scientific assessment o f seed requirements o f various varieties o f different crops for different areas and States, etc would be undertaken Distribution o f minikits under various programmes, would be enlarged and more areas will be brought under this programmes Also, frontline demonstrations would be carried out covering larger areas Emphasis will be laid on promoting higher seed replacement rate. The most important o f all would be the coverage o f drought-prone, difficult, hilly and other non-accessible areas under various programmes o f distribution o f seeds Care will also be taken so that an effective system o f import/export o f certified seeds is developed.
460

4,1,104 The public sector is primarily concentrating on seed production and supply of predominantly self pollinated varieties, while the private sector is supplying hybrids and high value and low volume seeds o f inbred varieties and hybrids Efforts will be made to have effective linkages between the public and the private sectors where both are mutually supporting and complementary in their activities The seed policy will encourage the private sector to bring its production under the purview o f certification or other accepted systems o f quality control
Agricultural Machinery and Implements
4 1 105 The Ninth Plan policy in respect of farm mechanisation will be to encourage the use of efficient tools, implements and machines which raise farm productivity and reduce cost, without large-scale replacement of human labour Thus, farm mechanisation would largely be in the nature of augmenting resources rather than replacing labour Within the framework of this policy, the Government has laid emphasis on the promotion and popularisation of improved agricuhural implements, both power-operated and animal drawn The programmes of farm mechanisation have led to the use of farm machinerv such as tractors, power tillers, combine harvesters, irrigation equipment, plant protection equipment, threshers, improved implements and hand tools The demand for agricultural equipments in respect of farm mechanisation is estimated at one percent per annum Introduction and adoption o f agricultural machinery is largely confined to the North and North-West regions of the country However, with the increase in irrigation and nvodernisation of cropping practices, the demand fov agricultural machinery has also shown an increasing trend in southern and western parts o f the country
4 1 106 During the Ninth Five Year Plan, establishment o f prototype production centres for agriculture machinery in different regions of the country is expected to be at least one each in North, South, East and West These Centres will develop power/draught/hand-driven selective mechanisation o f equipment/machinery and tools, which would be need based These centres will also be undertaking the similar activities for developing prototypes o f equipments and tools, etc. even for related activities like animal husbandry, piggery development, poultry farming, fisheries, etc, so that these activities would become more beneficial to the farmers Special attention should be paid for developing such equipments which may be more suitable to the badly felt needs to cotton growers, sugarcane growers and vegetable farmers Special focus will be made on small farm mechanisation Specific efforts will be devised for developing and popularising hand held tillers, small tractors etc with appropriate tie-up arrangements with institutional finance
4 1 107 Though the country is self-sufficient in meeting the indigenous demand for conventional agricultural implements, the quality is not up to the desired standards due to limited know-how and resource constraints faced by the small scale manufacturing units The State Agro-industries Corporation (17) are engaged in manufacture and distribution o f agricultural machinery improved implements and tools etc
Plant Protection
4,1.108 The ongoing schemes o f Plant Protection in the Eighth Plan will be continued during the Ninth Plan. The IPM strategy has become popular with the farmers during the Eighth Plan, especially in rice and cotton growing areas since it has helped to reduce the load of
461

chemical pesticides as well as incre;ase their net profits Hence, greater support in this direction will be given during the Ninthi Plan period In addition, quarantine facilities would be strengthened to more effectively pr'event the entry of exotic insects, pests, diseases and weeds. The existing network for wanning about locust attack would be geared up State Pesticide/Insecticide Laboratories \would be upgraded with infrastructure facilities for testing and quality control o f pesticides. Be;sides, setting up o f Pesticide Residues Testing Laboratories particularly in the private sector wall be encouraged in the Ninth Plan
National Agricultural Technolojgy Project
4.1.109 National Agricuhure T echnology Project (NATP), with World Bank Assistance has already started functioning in the ifield o f development of agriculture in 24 districts of 6 States The basic objective of NATP is to tdefijse the agricultural technology to the farmers and develop models o f cropping system research in association with ICAR
Crop Insurance
4 1110 The existing Comprehenisive Crop Insurance Scheme (CCIS) and Experimental Crop Insurance Scheme (ECIS), will be replaced by Modified Comprehensive Crop Insurance Scheme (MCCIS) This Scheme will progrcessively cover all the farmers (both loanee and non-loanee) and some additional cash crops suclh as sugarcane, potatoes, cotton etc depending upon the
availability o f yield-data to progre;ssively increase the extended coverage
Agricultural Credit and Co-ope;ration
4 1111 Cooperatives are an integral part of a country's agricultural system The cooperatives aim at strengthening o f peopke who have limited resources, particularly rural poor, agricultural labourers, marginal amd small farmers, etc The cooperatives have played a major role in disbursement o f credit. Neiarly 60% of the disbursement o f short term loans and 35% of investment credit were provided Iby the cooperatives. Measures have already been initiated for ensuring autonomy, democratisatiion and professionalisation o f the cooperative credit structure in the country
4. 1112 One of the major problerms faced by the cooperative credit institutions is the imbalances in agricultural loans The imbalances occur when the agricultural loans of the District Cooperative Credit Banks (DCCBjs) to Primary Agricultural Credit Societies (PACS) are not fijlly covered by corresponding loans, fo r the same purpose, outstanding against the ultimate borrower at PACS level This arises on acco)unt of poor recoveries at PACS level, diversion of recoveries to meet establishment cost of PAC'S, repayment of loans of PACS for godowns etc and also due to malpractices Accounting practtices of DCCBs, which appropriate all recoveries first towards interest and then towards principail, also tend to compound the problem The DCCBs have no prospects of recovering the outstainding amount from PACS which are not covered by the loans outstanding against the ultimate b<orrowers Consequently, the recovery of DCCBs deteriorated and the irrecoverable outstanding; amount increased Over a period o f time, the DCCBs have become ineligible for NABARD refinancing as they could not meet the stipulated recovery percentage. This in turn, had affexted the credit flow to the PACS Rectification of the balance sheet o f the cooperative sector will be attempted with one time assistance to the cooperative banks The provision of this asisistance has to be a pooled exercise by the Central, State
462

4,1.113 The cooperatives system and re-financing institutiions are the two major channels for providing agricultural credit The rural credit system is beimg restructured and it is proposed to double the flow of credit to agriculture and allied sectors T he availability of credit to the farmers particularly to the small and marginal category needs to be substantially improved The quantum of refinance to cooperatives and RRBs will be progressively imcreased The state level agricultural financial corporations established by NABARD would increaise the flow o f ground level credit, the new local area banks being established are also expectecd to increase the flow of credit to agriculture and allied sectors. In the North Eastern Region, N.ABARD's refinancing facilities to the commercial banks and other financing agencies w'ill be at 90°/o o f their ground level credit as against 50-70% applicable to rest o f the countn,-. NAB ARC) has estimated that up to 2001 -02 an amount of Rs. 1,49,400 crore. would be required for produiction purposes besides an amount o f Rs, 80,350 crore towards investment credit Thus, tine total credit fiow projected by NABARD is Rs, 2,29,750 crore up to 2001-02
W atershed M anagem ent
4 1 114 As about 63 % of the cultivated land fall under raimfed areas, watershed management is one o f the crucial areas for improving agricultural production A holistic approach for development o f integrated farming systems on watershed bassis is the main ob|ecti\ e under the National Watershed Development Project for Raitifed Areas ((NWDPR.A) and olhev exievuallv aided watershed development projects During the Ninth Plan, the implementation of the National Watershed Development Programme will be imtensified for the development of rainfed farming areas
4 1 115 Apart from the National Watershed Developmtent Project, another component of watershed management relates to externally aided projectt The World Bank aided project nam.ely Integrated Watershed Development Projects (Plaims) cover Gujarat, Rajasthan and Orissa The Integrated Watershed Development Project (Hills) was conceived to ensure integrated development o f hilly areas specially of ecologicaally degraded Shivalik ranges in Jammu and Kashmir, Himachal Pradesh, Punjab and Haryanai Similarly, there are projects assisted by Germany, Switzerland and DANIDA These projects have helped partly in increasing the area under watershed management
Governments and Cooperatives
Soil and Water Conservation
4.1 116 Various soil and water conservation programmes aim at enhancing and sustaining the productivity o f the available land stock, controlling lamd degradation , soil erosion, sedimentation, and hydrologic deterioration etc The soil c^onservation programmes like All India Soil and Land Use Survey, State Soil Survey Organisfation, National Land Use Boards, State Land Use Boards and the Soil Conservation Training Cemtres will be continued during the Ninth Plan. The on-going schemes o f Soil Conservation in the catchments o f River Valley Projects (RVP), Integrated Watershed Management in the cattchments o f Flood Prone Rivers (FPR) and the Programme of Reclamation o f Alkali Soiils, watershed development in shifting cuhivation areas in North Eastern states will also be continued in the Ninth Plan
463

4 1,117 The problem o f water logging, saline and alkaline land is required to be tackledthrough two pronged strategy, namely one which is preventive type for new irrigation projects and the other o f remedial nature of existing irrigation projects where water logging has already occurred Soil Testing facilities are grossly inadequate It is also a fact that the existing facilities are also not fully utilised to suggest remedial action to the fanners This is verv' caicial for both high productivity as well as low productivity zones Mobile Soil Testing facilities should be established in a large scale so that such facilities are available at farmer’s door-step
4 1118 Involvement of people, women’s groups, NGOs and PRIs have to be ensured on a wider scale in various land and water management programmes like tree planting, contour terracing contour bunding, construction o f innumerable small storages, leveling and reshaping of land under canal irrigation, construction o f field channels and drains and the control of grazing
Irrigation and Drainage facilities
4 1119 There are about 119 major irrigation works, 176 medium irrigation works and about 67 schemes in Extension, Renovation and Modernisation (ERM) These are spill-over schemes from the previous Plan periods These schemes have the potential of providing irrigation to an additional 12 5 million ha The SAP has drawn up a time bound programme tor completion of the spill over works with the assistance under RIDF and AIBP
4 1 120 A new Centrally Sponsored Scheme (minor irrigation) with 100° o Central assistance to the states o f Assam, Bihar, Orissa and Eastern parts o f Uttar Pradesh and Madhya Pradesh which are predominantly tribal and Northern part of West Bengal is envisaged in the Ninth Plan Given the preponderance o f small and marginal farmers in this area, very poor investment climate problems o f fragmentation holdings a massive programme for establishment of Group Irrigation system is required It is proposed that the community works/group tube wells would irrigate about4 ha and the group would consists of four or more farmers having contiguous lands The unit cost o f community tubewell may be about Rs 40,000/- About one million ha under community tubev/ell will be taken up under the programme In states like Assam, providing of the lift irrigation points are required
Rainfed Farming
4 1121 Nearly 63 % o f the cuhivated area in the country comes under the category of Rainfed' and contributes about 40 % of total output It may be noted that if the irrigation potential could be fijlly utilised, still half of the cultivated land may depend only on rain Therefore, agricultural growth in future would have to be depend on exploitation and harnessing the growth potential in rainfed areas Past experience shows that HYV technology have been adopted by the farmers in rainfed areas, particularly where there is adequate rainfall but occurrence o f flood and drought are minimal Due to low and uncertain response to new technology adoption, as well as low capital absorption capacity in rainfed areas, production remains much less compared to those o f the irrigated areas
4 1 122 The Ninth Plan strategy would largely based on the recommendations o f theReport o f the Committee on Twenty Five Years Perspective Plan for the Development of Rainfed Areas The Committee was set up by the Planning Commission under the Chairmanship of
464

Member (Agriculture) It has been estimated that development o f the vast rain-fed areas comprising o f 75 million ha. would require over Rs 37,500 crore Further the estimated cost for scientific treatment for soil and water conserx ation would be about Rs.7500 crore for 12 million ha o f arable and 3 million ha of non-arable land (at an average unit cost o f Rs 5,000 per ha) It is not possible to fijnd on this pattern to develop the entire area o f 75 million ha However, in the next ten years it may be possible to develop about 30 million ha. which would need a substantial public investment. Two-thirds o f this area will be arable and the remaining one-third non-arable
4 1123 The strategy for rainfed areas would be regionally-differentiated and broadly classified into four agro-economic zones for adoption o f diflferent technologies There will be a hierarchy o f regions in the scheme o f agro-climatic regionalisation -
(i) Agro Economic Zone ! High productive areas, high level o f irrigation or high assured rainfall and low incidence of poverty,
(ii) Agro Economic Zone 11 Relatively low productivity, high rainfall, low level o f irrigation and high incidence o f poverty:
(iii) Agro Economic zone III Areas having low productivity, low rainfall and high incidence o f poverty, and
(w) Ecologically Fragile Zone IV Agro-ecologically fragile zone, having mostly lowlevels o f productivity and serious problem of high run-off and soil erosion in the North Western Himalayan belt, shifting cultivation in north-east and shifting sand dunes, higher degree o f land degradation and inadequate water availability in desert and drought prone areas o f Rajasthan and Gujarat
4 1 124 To improve the crop productivity and production on a sustainable basis watershed development programme is being implemented with improved research technology During the Ninth Plan, 10 million hectares o f additional area has been proposed for coverage under watershed development programme funded by national or international agencies
4 1 125 The problem of waterlogging, saline and alkaline land is likely to be tackled through the proposed strategy o f preventive type o f new irrigation projects and other o f remedial nature o f existing irrigation projects where water has already occupied the land Various land and water management programmes like tree planting, contour bunding and terracing,
construction o f innumerable small storages, levelling and reshaping o f land, cleaning o f water canals, construction of field channels and drains and control o f grazing would be undertaken to prevent further deterioration o f land Measures will be taken for treatment o f alkaline and saline lands through various programmes
4 1 126 The importance o f watershed development as a strateg>'of agricultural and overall rural development in rainfed areas has been recognised in India for the past several years A number o f Government Departments as well as NGOs and external agencies are involved in promoting watershed development projects in various rainfed areas In future, watershed development programme should be truly a people's programme and the role o f Government should be limited to providing only infrastructural and technological support, wherever necessary
465
4.1.127 The gross value o f output from the livestock accounts for about 26% of the total agricultural output. Animal Husbandry & Dairying development activities will receive greater attention during the Ninth Plan as this sector plays an important role in generating employment opportunities and supplementing the incomes o f small & marginal farmers and landless labourers, especially in the rainfed and drought-prone areas Effective control o f animal diseases, declaration o f disease-free zones, scientific management o f genetic stock resources and upgradation, breeding, quality feed and fodder, extension services, enhancement of production, productivity and profitability o f livestock enterprises are the specific areas identified for immediate intervention and support. The Ninth Plan target for milk production is set at 96.49 million tonnes envisaging an annual growth rate o f 7.06 percent Egg and woolproduction targets are set at 35 billion nos. and 540 lakh kg respectively As a part of SpecialAction Plan for doubling food production new schemes envisaged in respect o f dairy sector during the Ninth Plan are; (I) New Primary Dairy Cooperatives, and (ii) Vidya Dairies
4 1.128 Some o f the critical areas requiring priority attention are improvement and expansion o f breeding services including AI services, upgradation o f health care services, strengthening o f training and research facilities. A Centrally Sponsored Scheme for upgradation o f genetic stock o f cattle and buffalo in a time bound manner will be taken up during the Plan period Systematic dissemination o f appropriate technologies in the field o f animal production/management/health care will be undertaken through extension and training programmes. Development o f human resource for
Animal Husbandry and Dairying
THRUST AREAS•Strengthening o f Health Care services.
•Upgradation ol' Genetic Slock ol'Cattle
and Buffalo,
•Quality- Feed apd Fodder.
•Revival o f Sick D a in ’ Cooperati\ es.
•H um an Resource Dex elopment
animal husbandry and dairy sector will also receive special attention
4.1.129 Fodder and feed development is also one o f the crucial areas that call for greater attention. The demand for animal feed is likely to increase at a faster rate in the next ten years and therefore promotion o f cultivation o f fodder crops, ensuring availability o f fodder seeds and also o f quality nutritious feed assume considerable importance. For poultry alone, about two million tonnes o f maize will be required and this demand would be met through the accelerated development programme for Maize.
4 1.130 Adequate credit and marketing support, modernisation and upgradation o f processing facilities including abattoir for livestock products and measures for harnessing the energies of private entrepreneurs, cooperative institutions, self-help groups and other voluntary agencies are some o f the major thrust areas in this sector Efforts will also be made to revive and rehabilitate the sick cooperatives Such a well coordinated and comprehensive approach will induce the farmers to take up improved breeding, feeding and scientific management of livestock and all these will bridge the gap between potentialities and the actual performance in this crucial sector
Fisheries
4 1.131 India is the seventh largest producer o f fish in the world and, second in inlandfish production The fishery sector provides gainfijl employment to about 3 84 million full-time 3r part-time fishermen with an equally impressive segment of the population engaged in ancillary
466

THRUST AREASE n lh an c in g ProducliM t\A iu g m cn tm g Hx]xnlC o m s e n alRin o f A quatic R eso i iiccs and ( ie inetic D n c r s iUInU-jgratcd A]iproach lor Siislainali lc De'A'clopmont o f l-’ishcrics and AqiuaculUirc
activities associated with fisheries and aquaculture. The miain objectives o f the fisheries and aquaculture development programmes during the Ninth Plain are as follows: (a) enhancing the production o f fish and the productivity of fishermen, fisherwvomen, fish farmers and the fishing industry, (b) generating employment and higher income in fisheries sector; (c) improving the socio-economic conditions o f traditional fisherfolk and fish farmers, (d) augmenting the export o f marine, brackish and freshwater fin and shell-fishies and other aquatic species, (e) increasing the per capita availability and consumption o f fiish to about 11 kg per annum, (t) adopting an integrated approach to fisheries and aquaculture,, taking into account the need for responsible and sustainable fisheries and aquaculture amd; (g) conservation o f aquatic resources and genetic diversity.
4 1 132 The total fish production in the country is5.35 million tonnes (1996-97). This is about 64 % of the existing total production potential of 8 4 million tonnes While in the case o f marine fisheries nearly
three fourth of the production potential has been exploited, that o f inland fisheries it is only around 50 % There is an enormous scope for augmentation of both production potential as well as enhancement of productivity for inland fisheries In the next ten years, fish production is projected to reach the level of 9 6 million ttonnes with special thrust on inland fisheries resources The Ninth Plan fish production ta rge t is set at 7 04 million tonnes envisaging a growth rate o f 5 64 % per annum An integrated approach for fisheries and aquaculture will be adopted for fisheries development on a siustainable basis
4 1.133 Increase in productivity and production o f fi;sh/shrimps from freshwater and brackishwater under ongoing schemes would continue during the Ninth Plan Present production level o f over two tonnes per ha achieved under ongoing program m e o f freshwater aquaculture through Fish Farmers Development Agencies (FFDAs) willl be raised by adopting advanced technologies. Programmes will also be devised for augmentinig fish production from freshwater through integrated fish farming, running water or flow -throuigh systems etc
4 1 134 The reservoirs constitute a major segment of the inlaind fishery resources of the country Emphasis will be given to adopt scientific practices in reserv'oirs to harness the potential in an optimal manner. Special attention will be given for infi-astructuire development (rearing space etc ) to have the required size of fish seed for stocking the reservo)irs
4.1 135 There is an ample scope for development o f fisherices in fallow derelict water bodies, water logged areas, lakes, beels etc. Programmes will be devi;sed to develop these resources for enhancing fish production. Programmes will also be devised for the development o f riverine fisheries through stocking, conservation and pollution abateme:nt measures Similarly programmes will also be taken up for cold water riverine and stream fisheries in the hill areas o f the ecologically fragile zone
4 1 136 Seed and feed are critical inputs required for development of fisheries and freshwater/brackishwater aquaculture and for enhancing productivity Research and Development (R & D) programmes will be taken up for production o f quality fish/shrimp seed and feed. Present level offish seed production of 16,000 milli(on fry will be raised at the rate of
467

7-8 % during the Ninth Plan R&D progranume3S will be taken for development o f freshwater prawn seed hatcheries at selected places, repgulation o f brackishwater farming and also overcoming o f the diseases in cultured shrinnpss. Steps will also be taken to overcome other constraints including the legal intervention in brrackishwater farming
4 1 137 Major emphasis will be placed o>n judicious exploitation o f the coastal fisheries resources by the traditional and small scale scecttor by protection o f the fishing rights from over exploitation o f the resources by the mechanisted and deep sea fishing fleet Measures will also be taken to conserve fisheries resources o f the; ccoastal waters Programmes will be taken up for strengthening the deep sea fishing fleet, diveirsiffication o f catch by the existing deep sea fishing fleet and introduction o f resource specific vess'ielss to exploit the deep sea fisheries resources in the Exclusive Economic Zone o f the country
4 1138 Programmes for Human Resource Devvelopment (HRD) with emphasis on training and skill development in post-harvest/processing amd marketing activities particularly for fisherwomen besides, other income generating avenues duirinig lean season will be taken up on an expanded scale Adequate attention will be given for (cre3ation o f infrastructure facilities for training of fishermen, fish processing and marketing, dewelcopment o f fishery harbours, landing centers etc with cold storages, iceplants etc
Agricultural Research Education and Extcenssion
4.1.139 Agricultural research, education amd extension forms one o f the critical inputs for accelerating the growth o f agricultural producttiorn The Indian Council o f Agricultural Research (ICAR) is the apex body in the country in rejspeect o f agricultural research and education The ICAR undertakes to promote programmes ftbr tackling problems relating to conser\/ation and management o f natural resources, productiviity,, improvement o f crops, livestock, fisheries etc
4 1 140 The major constraints that comej irn the way o f improving the production and productivity as identified by Indian Council o f A ^ c u l tu re Research ( ICAR) like inadequate and unbalanced use o f fertilizers, delayed sowing aindl also transplantation, sub-optimal plant, disease- insect pest stress, poor weed control, inadecquzate production o f HYV seeds o f long duration suited to land with zinc deficiency, salinity amd dJrainage in coastal and canal irrigated areas and soil acidity will be specifically addressed in thee Ninth Plan
4 1141 The major objectives o f the M intth Plan are
* Conservation, planned enhainccement and utilisation o f agro-biodiversity, enhancing productivity throujgh evolution o f high-yielding hybrids and varieties,
* Research on diversification, cquaality improvement, post- harvest technology, value addition and export orieinteed commodities,
* Sustaining enhanced producttivrity o f irrigated agriculture and judicious development and use o f ene;rg3y, especially renewable source o f energy, Characterisation and sustaimatole land-use models for rainfed agriculture including high-rainfall areas, Deevelopment o f Integrated Pest Management (EPM) and Integrated Nutritent Management Systems (INMS) for sustainable
46>8

agricui i re; Fostering excellennces in relevant basic and strategic research, Generating research and technoolo^gies geared to promote equity among regions, sectors o f society and genderr;
* Streng t ening social scienoce,, policy planning, agri-business, research monitoring mechanisms, adminisistrration and persormel reforms, publication and information dissemination systeemi. Promoting Agricultural Human Resource Development (AHRD); Linkings sicientists with the farmers through Institute Village Linkage Programme (TViTLP*) as an innovative technology transfer model, institutionalisation and strengtheenimg linkages/partnerships with the Consultative Group on International Agricultturre Research (CGIAR) and other national and interna j >nal agencies and retsearch and development establishments, non-gf V ^mmental organisatioons and private sectors.
4 ,1,142 Improved hi;'J yielding cultivators anod harge number o f other input technologies in the National Agricultural Research System (NARS.S) will be expanded with the missionary zeal Special focus will be on hybrid research and deveelo|pment and accelerated programmes for breeder seed production particularly o f hybrids and o f inmp>roved varieties Advent o f bio-technology as a powerful tool has opened new vistas in breakinng; genetic barriers and hence gene transfer across the board is now possible This would be capittaliised through development o f transgenics with special reference to biotic and abiotic pressures.!.
4.1.143 Seed procurement o f superior varieticies has been recommended by ICAR for each district and &rming sit’iation. Advance action forr piroviding the required quantities o f breeder and foundation seeds o f ap:ropriate varieties will be 1 takcen up. Promotion o f varietal replacement and propagation o f high yi liing varieties o f wdieat, riricei, bariey, other coarse cereals and hybrid seeds, promotion o f production o f certified seed o f H W o f crops specific to problem areas will be speeded up. Integrated Cereals Developmrait Prcogp'ammes in RiceAVheat/Coarse cereals based cropping systems areas (ICDP - Rice/Wheats/C. o ^ s e Cereals) will be intensified and all efforts will be made to rer ( ve the dysfiinctionalitiess iin implementation process and to streamline
delivery mechanisms with better extension servidcejs.
4 1 144 Arrangements will be made for monilitoiring the quality o f inputs, particularly agrochemicals, and also for increasing infi^ructure f fecnlities for soil testing On technology aspects, organisation o f breeder seed production pDro)grammes, training programmes, minikit demonstrations and technology transfer mechannisnn will be intensified.
4.1.145 The prioritie* j n respect o f research in SSoill,Agronomy & Agro-forestry in the Ninth Plan are: (i) Inventory, chaiacterisation, evaluation aandl conservation o f biophysical resources (soil, water, climate, florr. and fauna) in diflferennt agro-ecological segments, (ii) Evolving technologies for resource conservation and hanmesssing area-specific advantages o f high rainfall, rainfed areas, problem areas (flood-prone areaas, acid soils and degraded lands) and fragile ecosystems (mountainous, coastal and islands eccosjystems); (iii) Development o f sustainable land utilisation systems in fanning system frame usising modem tools and techniques for different agro-ecological regions/sub- regions/zones, conssidtering not only biophysical aspects but also socio-economic aspects; (iv) Eco-regional wvatter maiiagement planning for eflRcient use of water from various sources and o f varying quaalitry; (v) Integrated nutrient management with a focus on the use o f organics; (vi) Human resoourrce development in frontier areas o f modern
46 9

techno log ies such as G IS , rem o te sensing, siiimulation m odeling fo r nutrient and w ate r m anagem ent, c ro p -w ea th er m odel and decision siuppport system s
4 I 146 IC A R w ith its netw ork o f Institu tes, B uureaux, N ational R esearch C entres, P ro ject D irec to ra te and th rough S tate A gricultural U niverrsitties will also concen trate on im provem ent o f health o f soil th rough utilisation o f organic w astesj, f policy planning on m onitoring o f agricultural research , w ork ing o u t detail design o f netw ork fcbr N ational A gricu lture Inform ation System s B esides, it w ould also concentrate on conservattionn o f genetic resources, creation u f w orld ’s largest germ plasm banks in areas o f plants, anirmalils and fishery, conservation o f th reatened breeds, physiology and bio-technological irm prrovem ent in quality o f feed and fodders, p repara tion o f com plete feeds, etc, w ould be 'th ee o ther areas o f research on w hich the IC A R will concen tra te during the N inth Plan.
4 1 147 D esign and developm ent o f dairy p rodu ictss, processing, packaging and preservation o f m eat, eggs, etc m easures to control microbial! ccontam inants on these products, developm ent o f diagnostic techniques/m ethodologies for im pojrtaant livestock and poultry diseases, are needed and developm ent o f design fo r m onitoring am d surveillance system on animal diseases o f national and in ternational im portance w ould be ttak<en up on priority by the ICA R
Animal Sciences
4/1 .148 T he key research areas identified in re sp ie c tt o f attimal sciences are (l)G enetic resource enhancem ent o f cattle, buffalo, sheep, goat, pi|ig, camel th rough selection /cross breeding/ em bryo biotechnology for milk, m eat, draught poower, fibre, egg and broiler (ii) Im proving quality o f feeds and fodder, search fo r new er fceeeds and prepara tion o f com plete feeds, (iii) D esign and developm ent o f m echanised equipm e^ntss fo r dairy p roducts Processing, packaging and preservation o f m eat and egg fo r value addiiticon, (iv) D evelopm ent o f new er generation o f d iagnostics and diagnostic techniques/m ethodlolcogies, im m uno-biologicals against im portant livestock and pou ltry diseases.
Fisheries
4.1 .149 Im portant areas identified in fishery reseaarcbh are : (i)Technologies for semi-intensive and intensive aquacu ltu re in fresh w a te r and brackcisbhw ater ecosystem s w hich are sustainable environm entally , socially and economicall^y; (ii) R esearch support th rough studies on nutrition, rep roduction , disease con tro l and b )ro )o d stock m anagem ent w ith innovative b iotechnology, (iii) D evelopm ent o f value-addecd poroducts from low value fishes and im proved packaging techniques w ith use o f biotechncolo^gy, m icrobiology and engineering; (iv) C onservation, m anagem ent and cataloguing m f fish germ plasm resources and establishm ent o f gene bank; (v) D evelopm ent o f innovative ttecchniques such as cage culture, penculture, running w ater aquaculture, integrated fa rm in g ssystem s with recycling o f organic w astes for sustainable fish farm ing
Agricultural Engineering
4 1 150 A gricultural engineering will emphasis^e on strengthening the program m es on farm im plements and machinery, energy m anagem em t, | post-harvest engineering and technology and, irrigation and drainage engineering.
4 7 / 0

4 1151 M ajor em phasis on agricultural educcatition will be on (i) creation o f new training and laboratory infrastructure, (ii) fostering g rea tite rr in teraction betw een agricultural scientists (iii) developm ent o f lead centres for p roviding rregg ional and national level training in selected disciplines, and (iv) redefining the m an d ia ttte o f IC A R Institu tes to recognise degree and non-degree training program m es for th e ssciuentists o f the SA U s
Modernisation and Maintenance of Reseearrch Infrastructure
4 1 1 5 2 Presently , the IC A R has 80 in stittu tite s com prising 46 Central Institu tes, 4 N ational B ureaux and 30 N ational R esearch C entres It t has a netw ork o f 10 Project D irecto rates and 80 All - India C oord inated R esearch P ro jec :ts /i/ P rogram m es T here are a large num ber o f externally aided p ro jects including that o f W corldd B ank T he in frastn ic tu re facilities available at the various IC A R Institu tes are very old and o u u t-d a ted F or m eeting the fu ture challenges, it is very im portant that the basic research infraastitructure are updated and strengthened it has been estim ated that IC A R vvould need o n ee -t’tim e grant o f Rs. 500 Ct for renovation and m odern isation o f 43 institu tions which are 2C0 ■ - 50 years old The one-tim e catch-up grant is essential to upgrade and m aintain laboratoriees ; and o ther research facilities/logistics to provide a research environm ent o f in ternational s taanddards T he ca tch-up grant will provide foi replacem ent o f som e pld equipm ents and aalsc.o updating educational facilities at its prem ier institutes like Indian Agriculture R esearch In stiitu u te (LARI). H o \v e \e r , it is absolutely essenti'dl that a system o f m odern isation and m aintenance iss iiin-built in the p ro ject itself particularly in respect o f costly equipm ents and machines. The Counncilil should m ake necessary provision within the plan funds fo r m aintenance and up-keep o f researcch i in frastructu re
Agriculture Extension
4 1 153 Lack o f adequate m anpow er and eqquippm ent, the declining im portance o f Training and V isit (T & V ) system and lack o f professioD naalism have affected extension services R egular training o f extension functionaries is an integraal aand essential part o f agricultural extension system This basic responsibility lies w ith the S ta te Gcovf/ernm ents. T here are over 186 Farm ers Training U nits in the country. The m ajor task is to energgisise the extension machinery at the field level They have to play a significant positive role in disseem nination o f inform ation and upgrading o f the skills
4 .1 .154 N inth Plan will aim at consolidation ; annd quality im provem ent in the on-going projects, develop support and upgradation o f skills ( o f f s ta ff w orking in Krishi V igyan K endras (K V K s) so that they can m eet the em erging challem gqes due to globalisation and com m ercialisation o f agricu lture, technology assessm ent, re fim enm en t and transfer on partic ipatory m ode and institu tionalising the vocational train ing fo r developing en trepreneursh ip in various agricultural en terprises and rem oval o f regi^ionnal im balances by establishing new (K V K s), re-m andating the existing appropria te in s titu jtiao n s to m eet the needs o f frontline extension in backw ard, hilly, rainfed and tribal areas. In aoddiiition to the above priorities, the Ninth Plan has also program m es for the N orth E astern Regi,aonn, SC s/STs and w om en T here are tw o types o f P lan schem es during the N in th Plan. T he firirst;t one relates to the schem es w hich w ould be
m erged /in teg rated /upgraded , w hereas the secconnd one re la tes to new schem es w hich w ould be in troduced during the N inth Plan
Agricultural Education
4771

4 1 1 5 5 KVKs will be established in all the diiistricts in the country during the Ninth Five Year Plan period. Presently , there are 261 K V K s covering 253 districts Som e o f the d istricts like Jaipur, F irozpur, K urnool, D harw ar and W arTangal have tw o K VK s D unng the year 1998- 99 it is p roposed to convert 25 Z onal R esearch : S ta tions into K V K s start 25 new K V K s it is p lanned to add 78 K V K s during 1999-2000, aboou t 70 each during the subsequent tw o years so th a t by the end o f IX Plan all the d istricts in th e t countr> ' have KV K s
4 1 ] 56 T here are a num ber o f developm ent act:ti\-ities w hich do not involve m uch o f m„onetar> considerations M otiva tion and encouragem ent { p lay an effective role in developm ent activities
C lose in teraction b e tw een field officials partidcularly , those dealing w ith ex tension and the farm ing com m unity will increase the ia tte r’s > understand ing and aw areness Increasing demonstration activities on the farmers flelds î, training camps in villages, dissemination of information through various means inciudinpg mass media w ould bring tangible benefits in accelerating food p ro d u c tio n
Human Resource Development in Agriculturre
4 1 1 5 7 H um an re so u rce developm ent fo r ag riccu ltu re sec to r has rem ained a neglected area in the past T here is an increasing concern tha t if aggricultural developm ent has to proceed at a faster pace, it is essential th a t a significant qualitative u p g rad a tio n o f hum an resources in agricultural research , extension, p roduc tion system and o ther re la ted activities is achieved T he starting point o f hum an reso u rces is the agricultural educatition system The need fo r constitu tion o f an A gricu ltu ia l E ducational C ouncil is felt m o re inov/ th an ever befo re to evolve guidelines for streng then ing and achieving high standards o f a g ricu ltura l education system in the country T o begin with, IC A R should strengthen the in-house m anpow er expertise In certain new areas such as commercial horticulture, floriculture, sericuulture, establishment and maintenance of cool chains, modern post-harvest technology, estabblishment of gene bank in respect of fisheries sector, the scientific m anpow er available is g roossly inadequate T here is a need to build up a reserv o ir o f skilled m an p o w er in m odem scientifific agricultural practices
4 1 1 5 8 T he vast m ajority o f w o rk fo rce engageed in agricu lture and allied activities are w om en w orkers. Special emphasis will be placed to • encourage women to acquire scientific skillsth rough both form al and inform al education in aggricu lture and allied disciplines Besides financial assistance, o th er m easu res including m arginalilly low ering the c u t-o f m arks for entry in A gricu ltura l U niversities will be evolved fo r th e : benefit o f fem ale candidates
4 1 159 Realising the need for qualitative upgradi ation o f hum an resources with the im provem ent o f agncu ltu ra l education system in the co u n try , constitution of an Agriculture Education Council w ould be taken u p This will enable to have th e syllabi revised to include specific areas like com m ercial flo ricu ltu re , sericulture, m odeern post harvest technology, and m anagem ent, environm ent, cold sto rage technology E ducationn and training o f w on;en involved in agricultural and allied p ractices will get special a tten tio n iiin N in th Plan th rough various program m es
Women in Agriculture
4 1.160 A gricuhure and its allied secto rs w o u Id focus special atten tion on w om en w ho play a veiy m ajor role in all the agricultural operatioi n s The programmes for training women in soil conservation, dairy developm ent, social fo re str>' and o ther occupations allied to agriculture
47 '2

like sericulture, horticu ltu re and poultry' would be expanded Sim ultaneously, the extension services will be streng thened to cover a larger num ber o f w om en The num ber o f w om en extension w orkers, especially the Farm E xten sion W orkers, will be increased to assist rural w om en T he N inth Plan will aim at strength ening the conditions of female farmers andfemale labourers as it w ould also help im pro ve the food security at the household level This is because generally w om en spend m ost o f their incom e on household expenditure unlike m en and this w ould help im prove the nutrition - o f the children Efforts wil! be made to grant p roperty rights in land to w om en w herever pos?ssible and self-help groups o f w om en may be encouraged to take up activities like regeneratii.tion o f w aste lands W om en will be given preference in the allotm ent o f ceiling surplus lamnd
Agricultural Exports
M AJOR TH RI ST AREASliiii jslriicturc Dcx clopiriL'iU Qu;ilit\' and packauiiii;Value addilionI ' j ic o u r a g c i i ic n l to c x p o il - u i ic iU c il
p n jdiiL'tH)!!
4 1 161 A gricultural exports form th e e m ajor com ponent o f to tal exports N inth Plan research h on this area will keep in view the changed scenaiario o f liberalisation and em phasis on (I) developm eient and p rom otion o f m arkets and products, brand naram e and dissem ination o f inform ation am ong exportersrs, (ii) im provem ent in quality and packaging kee;eping in view the health, sanitation and international stancndards, (iii) encouragem ent to export oriented un its/100% EO U s, (iv) developm ent o f cold chaiain system , (iv) creation o f in frastructures at air po its /sea ports and, (v) integrated long term ̂ policy to im prove the production, productix i t \ . c ropping pattern , as well as processing to augm ent at the value-added p roducts etc increasing use o f bio-fertilizers and b io -pes;stic ides to ensure quality o f products, (vi) encouragem ent to private sector to invest in infrastructure which can prom ote agro-exports
4 1 1 6 2 T he m ajor constra in ts affecting agro-ex ;xports include volum e insufficiencv, quality deficiencies, stringent legislation relating to heiealth and safety standards o f the im porting countries, p rocedural bo ttlenecks, lack o f adequaia te post-harvest in frasta ic tu re like refrigerated transport, s to rage and packaging, inadequate facicilities at air ports, sea ports etc D espite these constraints, agriculture as a w hole has been an im piportant contributor to the countrv-'s exports The exports o f agricu lture p roducts contribu ted Rs. 2 25,040 C r during 1996-97 accounting for 21% o f the to tal exports In the post-liberalisatio ion period, except for 1994-95, the share o f agricultural exports has been increasing steadily /
4 1 163 A num ber o f policy changes have been h in troduced to encourage agricultural exports L ow ering o f im port duty on capital g o o d s paiarticularly for processing industry and easier availability o f credit fo r exports has been very heielpful T he m easures liberalising ag ro -exports include decanalisation, relaxation o f stock limits, ;, abolition o f M E P and extension o f benefits o f export oriented units schem e to n ee processing uninits exporting at least half o f their output W hile the export o f rice has been allow ed freely, export t o f w heat-durum as well as non-durum , coarse grains, pulses have been allow ed w ith som e ceilingigs E xports o f H PS groundnut and oilseeds like sesame, sunflow er seeds, rapeseed and m ustard ha-vave been allowed freely The export o f de-oiled cake (ex traction), de-oiled rice bran, soybean ex trtrac tio n s etc have also been allow ed freely
473

4.1 164 A gro-processing and ag ro -ex p o rts olffeer substantial non-farm em ploym ent and raise the farm incom es The rural educated youth w illl be encouraged in agri-business activitiesAgricultural Universities and IC A R institutions w /ill; give a special focus in research, education and training in com m ercial agriculture and generate a resservoir o f talents and experts in the new areas o f diversification such as h o rticu h u re , flo n cu lltu rre etc T he fact that our exports o f rice, vegetables, fruits and m arine p ro d u c ts are on thee m crease show s that w e are already price com petitive in the in ternational m arket in respe;ct o f these com m odities. The N inth Plan will adop t selective research approach to increase excpcort com petitiveness o f ag ro -p roducts
4 1 165 India is one o f the founder m em bers < o f W orld T rade O rganisation The country is under obligation to rem ove quantitative restricticonss Presently, a large num ber o f ag ro-p roducts are subject to such restrictions. Specific s t r a te g ie s ; have been devised for m eeting the situation Improving infrastructure support for post--hairvest handling and processing, export promotion and market development, fast trracck facilities and special cargo terminals at major ports for perishables, establishing linkaagees with the industry, exporters and farmers for promoting exports of commodities which haave high demand in international market, reviewing restrictions on storage, marketing anad movement of agricultural products, are all part of the agro-export strategy Larger inv/esctm ents are proposed for research & extension for yield augm entation o f cereal c rops w ith sfpeccial reference to hybrid technology Farm m echanisation particularly, suiting to the smeall farm s in the country will be developed by im proving farm im plem ents/ m achinery thereby recducing the cost o f cultivation
PLANT VARIETIES PROTECTION
4 1 166 The Government of India is in tthe; process of flnalising a legislation on a sui-generis system for Protection of Plantt 'Varieties. The Trade Related Aspects of Intellectual Property Rights (TRIPs) Agreeimeent requires that the signatory countries should establish protection for plant varieitiess either by providing a patent protection or by instituting an effective sui-generisi ssystem or by combination thereof. This requirement is to be fulfllled within a periocd 03f five years.
4 1 167 R esearch in India on breeding plant vairie tties has taken place alm ost entirely in public institu tions like A gricultural U niversities and K C A R C om m endable successes have been achieved by this set-up in the past, w ithou t ou r couuntry having been a signato iy to a system o f p ro tec tion o f breeders' rights T he focus o if Ilndian research in agriculture has to be on the requirem ents and the problem s o f a vast num lberr o f resou rce-poor, m arginal and subsistence farm ers M oreover, the research has to respond 1 to ) the varying agro-clim atic conditions and vast areas o f rainfed/dryland agricu lture The d irectiiom o f private sec to r research w orld over has been tow ards prom otiiig cash crops benefiting ressource-rich farm ers for w hom agricu lture is m ore like an industry The sam e is tru e fo r ho)rtiaculture, animal husbandry, fisheries, etc It is this m arket which assures good re tu rns for inw estm ent by the private secto r breeders and researchers Largely, the requ irem ents lo f Indian agricu lture will have to be met by research conducted by public institu tions, no t Icootking for profits
4 1 168 Equally, the low -cost diffusion o f btetteer varieties is crucial for developm ent o f Indian ag ricuhure and for p rom oting food ;seccurity. T he em ergence o f a few hundred small seed com panies w ho engage m ainly im rm ultip lication o f seeds and diffijsion o f new varieties has played a crucial role in this regardl. ' T heir rights to m ultiply im proved seeds and sell them need to be p ro tec ted and not restricctecd by creating a system o f p ro tec tion o f the so-called breeders' rights
4'74

4 1 169 Above all, the rights of farme;rs as breeders need to be protected in any 'sui-generis' system suited to our needs. Eqqu^ally, the cumulative and collective contribution of generations of farming communities in evolving a whole range of different varieties responding to the different agro-climatic comditions, needs and tastes also will have to be recognised in such a system. The system i tthat is evolved should be such that it preserves and strengthens the gains m ade by the (de^veloping countries in the negotiations on the C onvention on B iological D iversity and m ot in the opposite direction
Agro-climatic Regional Planning Approatch (ACRP)
4 1 170 T he w ork o f operationalisa tion o if tlhis new technique o f planning initiated in five A C R P experim ental pro jects will be com pltetecd during the Ninth Plan period Further, based on the resuhs o f these experim ental projeccts; the ACRP planning from district level will be popularised fo r taking up on the basis o lf tthis techn ique o f planning T he present phase o f
institutionalisation w ould thus have to com tiinue, perhaps on a w ider scale In addition, research/studies on areas having direct beairim g on developm ent planning need to be assigned priority, particularly in regions (such as the >'4orrth E ast) which have poor database The ACRP w ould also have to play a m ajor role in eniham cing the farm ers, com petitiveness to face the opening up o f the m arkets The Z onal P lan m in g T eam s (Z PT s) need to suggest and identify the best resou rce use plan for all categO)riejs o f farm ers A gro-P lanning & Inform ation Bank (A PIB ) will buildup necessary' facilities, by/ acquiring equipm ents for collecting inform ation which will be useful for line use/A C R P planniing; during the Ninth Plan The APIB will ake-up activities of resource mapping in some niiore selected States and districts during the Ninth Plan The A C R P D ocum enta tion & IDisssem ination C entre (A D D C ) will continue to function to achieve its goal o f training a large m unnber o f officers from adm inistrative dev elopm ent departm ents and g rass ro o t level w orkers for th(e adop tion o f A C R P planning
4 1171 T hrough the institu tion o f the D is ttr ic t Planning C om m ittee, the decentralised planning process has been m ade m andato ry am d has ensured people 's participation at ever}' stage T he S tate G overnm ents, how ever, w o u k d have to w ork out suitable p rocedures for integrating the hierarchical and decentralised p)lamning processes Since ACRP considers district to be the m ost operationally feasible unit fcor institu tionalisation , there exists considerable scope for dovetailing the expertise availabhe under A C R P pro ject while form ulating an integrated district plan H ow ever, A CRP w ouild have to integrate the ACRP plan with the in frastructure developm ent plan and converg im g w ith social developm ent program m es o f the S ta te and C entre F o r this purpose, the A CRIP and the S ta te governm ents w ould have to institutionalise the linkages betw een them
^ 7 f S

4.2 IRRIGATION, COMMAND ARE. A DEVELOPMENT AND FLOOD CONTROL
PROGRAMMES AND STRATEGY
4 2 1 A g ricu ltu ra l g ro w th is a p re -req u jis ite for the econom ic and social developm ent o f o u r co u n try A g ricu ltu re co n trib u tes 288% o f G N P, about 60% o f em p lo y m en t and is the p rim ary so u rce o f live lihood in ru ral a ireas w hich accoun t fo r 75% o f Ind ia 's population and 80% o f its p o o r T he irriga ted /ag ricu ltu re , con tribu tes nearly 56% o f agricultural o u tp u t A d d ressin g th e irrigation sec tto r 's curren t p erfo rm ance p ro b lem s w ill thus be a cen tra l e lem en t o f fu tu re strategy fo r a g r ic u ltu ra l deve lopm en t Ind ia has now nearly reached the ce ilm g o f av a ilab le land ssuitable for cu ltivation B etw een 1970-71 to 1993- 94, net sow n area rem ained v irtu a lly uanchanged (from 140 27 to 142.10 m .ha ). Hence, in c rease in p ro d u c tio n is a ttrib u tab le to ;an increase in y ie lds th ro u g h increase in cropping in ten sity and u tilisa tio n o f b e tte r in p u tts T he increase in irrigation in tensity has co n trib u ted to the g ro w th in th e overall 1 cropp ing in tensity ( in c lu d in g ra in fed crops) w hich in c reased from 111 07% in 1950-51 tO) 131 19% in 1993-94 T he na tu re o f irrigation d ev e lo p m en t in n o rth w est areas has had l m uch to do w ith its im pact on cropp ing intensity E x p an sio n o f tu b ew e lls and av a ilab ility o f surface w ate r from sto rage ty p e irrigation p ro jec ts has enab led th e p ro d u c tio n o f IR abi and sum m er cro p s S upp lem ental irrigation is av a ilab le via ru n -o f-th e -riv e r irrigation ! schem es as the snow m elts In th e 1950s and1960s, ex ten sio n in cu ltiv a ted area ccontributed substan tia lly to increase in ourfood g ra in p ro d u c tio n M id S ix ties o n w aird s, expansion o f irrigation as w ell as introduction o f high y ie ld in g v arie tie s o f n e e , w h ea ti and other crops b ro u g h t th e countr> ''s foodgrain p ro d u c tio n to a sa tisfac to ry level Furthher step up in foodgrain p roduction , to the extent o f its d o u b lin g in nex t 10 years, w ould m aainly depend on the availab ility and perform ance effic ien cy o f irrigation The N in th FPlan will m ake a th rust in th is d irec tion through a "Special A ction P lan", the deta ils o l f w hich are included subsequen tly T he overall s tra teg y o f irrig a tio n d ev e lo p m en t and rm anagem ent during the N in th P lan w ill have the fo llo w in g co re in g red ien ts
(a) T o im p ro v e w a te r u se effric iency by p rog ressive red u c tio n in con v ey an ce andap p lica tio n losses,
(b) T o b rid g e the gap betw eeen the potential c reated and its u tilisation bystren g th en in g the C o m im an d A rea D evelopm en t P ro g ram m e (CA D P),in s titu tio n a l re fo rm s am d prom oting farm ers ' in v o lv em en t in irrigationm an ag em en t
(c) To co m p le te all th e o n g o irn g projects, particu larly those w h ich w ere startedd urin g p re-F ifth and F ifth P lan P eriod as a tim e bound p rog ram m e to y ield b en e fits from th e in iv estm en ts already m ade
(d) T o re sto re and m o d e ;rn ise the old irrigation system s w hich w ereex ecu ted during the p rre-Independence period and 25 years ago
(e) T o in tro d u ce ra tional p ric :in g o f irrigation w ater, based in itially on O & M costand th en to en co u rag e hig^her level o f w a te r use efficiency
476

(f) To take concrete steps towards compprehensive and integrated development o f natural water resources, taking intOD account the possibility o f inter-river- basin transfer o f surplus water and,
(g) To promote adaptive research aand development to ensure more cost-effective and efficient execution and management o f irrigation systems
(h) To promote Participatory Irrig^ation Management (PIM) with flijlinvolvement o f the water user comrmunity, which will be at the centre stage o f the implementation o f above strrategies o f the Ninth Plan
(i) To encourage and implement the coDnjunctive use o f ground and surface waterstowards optimal utilisation o f waterr resource and to have its development environmentally sustainable as welll
(j) To accelerate the development ancd utilisation o f ground water, particularlyin the eastern region on sound technical, environmental and economic considerations along with proper reggulatory mechanisms.
Irrigation Development through the Plan periodls : Overview
4 2.2 Irrigation is a vital input to increase agriccultural output t'O keep pace with the food requirements of the ever-increasing population As recently reassessed by the Ministry of Water Resources the country’s ultimate irrigation )potential is tentatively estimated at 139 89 m ha comprising o f 58 46 m.ha through major 8^ medium irrigation and 81 43 m ha from minor irrigation as against pre-revised uhimate irrrigation potential o f 113 50 m ha In the post-Independence period a sum o f about Rs 919-^43 40 crore (including about Rs 13469 crore o f institutional investment) at the currrent price level (Rs 231,386 59 crore at 1996-97 constant price), has been made in major:, medium and minor irrigation projects including ground water and as a result, the ccreation o f irrigation potential increased from 22.6 million hectares(m h a ) in the prre-Independence period, to about 89 56 m.ha, at the end o f the Eighth Plan With this, Irndia has the largest irrigated area among all the countries in the world. This has greatly contributed to the increase in foodgrains production from 51 million tonnes (nmt) in 1950-51 to 198 mt in 1996-97 at a compound annual growth rate o f around 3 peer cent Broadly speaking, about 60% of the foodgrains production has come from the irrrigated area which constitutes about one- third o f the total cultivated area and the remaininpg production has come from the rainfed areas
4.2 3 Table-4 2 1 shows the magnitude and the co3mposition o f investment in irrigation and flood control projects through successive Plan pericods
477

Magnitude & Comprosition o f Investment Through Plan periods
in Irrigjation and Flood Control .Sectors
(Rs. in LTore at current p n ce level)
T able 4.2.1
Plan.s .Major & M inor Irrigation C .AD Flood I'olal at
M edium Control Current
Irrgn. Public Institutional Total
Sector F iinance
prices
First 376.24 65.62 NJeg. 65 .62 - 13.21 455.07
(1951-56 ) (7803 .42) (1360 .99) (1 3 60 .99 ) (273.98) (9438 .39)
Second 380 142.23 19.3:5 161.58 - 48.06 589.64
(19 5 6 -6 1 ) (6013 .98) (2 2 5 0 9 7 ) (306.124) (2 5 5 7 .2 1 ) (760.61) (9331 .80)
T hird 576 327.73 115.3 '7 443 .10 - 82.09 1101.19
(19 6 1 -6 6 ) (6674 .84) (3797 .82) (1 336 ..94 ) (5134.76^ (551.28) (12760 .88)
A nnual 429.81 326 .19 234.74 560.93 41.96 1032.70
(1966-69 ) (3943 .90) (2993 .10) (2153 ..96 ) (5 1 4 7 .0 6 ) (585.02) (9475 .98)
Fourth 1242.30 512.28 661.06. 1173.34 162,04 2577 48
(1969-74 ) (7976 .41) (3289 ,18) (4 2 4 3 .4 5 ) (75 3 2 .6 3 ) ( 1040 40 ) (16549 18)
Fifth 2516 18 630.83 778.7(6 1409 58 - 298.61 4224.36
(1974-78 ) (12519 .42 ) (3138 .74 ) (38741.67) (7 0 13 .41 ) (1485 .75) (21018 .59)
.Annual 2078 .58 501.50 480.4(0 981 .90 362.96* 329,96 3753.40
(1978-80 ) (7949 .67) ( 1918.02) (1837 .32) <(3755.34) (1 3 88 .16 ) (1261 .95) (14355 .15)
S ix th 7368.83 1979.26 1437 .‘56 3416 .82 743.05 786,85 12315.55
(19 8 0 -8 5 ) (19625 .50) (5271 .39) (3826..6T ) (5 1 0 0 06) (19 7 8 97 ) (209 5 .6 3 )(3 2 8 0 0 .1 6 )
Seven th 11107.29 3118.35 3060.S95 6179 .30 1447.50 941.58 19675.67
(1985-90 (21207 .15) (5953 .87 (5844 .:27 ) (1 1 7 9 8 .1 4 ) (2762 .85 (1797 .76) (37566 .77 )
A nnual 5459.15 1680.48 1349.5<9 30 3 0 .0 7 619.45 460.64 9569.31
(1990-92 ) (8125 .60) (2501 .29 ) (2 0 0 8 .7 8 ) (4 5 1 0 .0 7 ) (922 .01 ) (685.63) (14243 .32)
E ighth 21071 .87 6408 .36 5331.0(0 11739.36 2145 .92 1691.68 36648.83
(19 9 2 -9 7 ) (31057 .63 ) (9445 .22 ) (7857 .3H ) (1 7 3 0 2 .5 2 ) (3 1 62 .85 ) (2493 .35 ) (540 1 6 .3 6 )
T otal 52606.25 15692.83 I3468.7T7 2 9 161 .60 5418.88 4856,67 91943.40
(132389 .93) (39492 .89 ) (33895 .77T) (7 3 3 8 8 .6 6 ) (13385 .66 ) (12222.-39) (231386 .59 )
SOURCE : Reports of the Working Groups of Ninth Five Year Plan.Upto 3/80.Note : Figures within brackets above indicate the expenditure at constant prices at 1996-97.
4.2.4 Besides the direct investmemt shown in the above Table, there has been privateinvestments along with indirect inve.-stment by way o f subsidies to the privatedevelopment o f minor irrigation The development o f irrigation potential through thesuccessive Plans is shown in Table-4 2 2
478

TABLE 4.2.2Development of Irrigation Potential (cumulatiwe) through Plan periods
(In M illio n h a )
Plan M ajo r/M ed iu m Irrg n M inor Irrig a tio n
P o t U tl Pot U tl
T otal Irrigation
P o t Uti
G ross Irrigated A rea as per Land UtlS tatistics
1
Pre-Plan 9 70 9.70First 1220 10.98(1951-56)Second 14 33 13 05
(1956-6 D-GW Third 16 57 15 17(1961-66)Annual 18 10 16 75
(1966-69)Fourth 20.70 18.69(1969-74)Fifth 24.72 21.16(1974-78)Annua! 26.61 22.64
(1978-80)Sixth 27 70 23.57(1980-85)
Seventh 29.92 25.47(1985-90)
Annual 30 74 26 32(1990-92)Eighth 32 96 28.44(1992-97)(anticipated)
12.9014.06
12.90 14 06S
14.75 14.75*(8 28) (8.28) 17.00 1700
19.00 (12 50) 23.50 (1644)
27 30 (19.80)
30.00 (22.00)
37.52 (27.82)
4661 (35 62) 50.35 (38.89) 56.60
1900(12.50)
23.50(16.44)127.30 (19 80) 30.00
( 22 .00)
35.25 (26.24) 43.12
(33 15) 46.54
(36.25)52.31
6 7 8
22.6026.26
22.60 25 04
22 56 25.64
29.08 27 80 27 98
33 57 32 17 3090
37 10 35.75 35 48
44 20 42 19 4028
52.02 48 46 46.08
56.61 52 64 49 21
65.22 58 82 54.53
76.53 68 59 61 85
81 09 72 86 65 68
89.56 80.75 70.64
* C o m p o n en t o f g ro u n d w ater.
SOURCE : M inistn of Water Resources and Reports of Working Groiups and Ninth Five Year Plan proposals of vanous states.
Figures in Brackets indicate the potential creation by ground water development.
NOTE : Upto the Annual Plan 1978-80, the potential creation and its mtUisation for minor irrigation are shown as same. In this context, it is to be mentioned that as per procedure mpto Fifth PlaiL the utihsaUon of potential was reckoned as 100% of potential created. However, the PAC in its l-41st Report (1982-8.'^) did not accept the above practice Subsequently, the Working Group on Minor Irrigation fcor the formulation of Seventh Plan recommended that during the Sixth Plan the utilisation figure might be reported as p e r existing practice but the base line for the \ ear 1984-85 should be worked out both for potential created and utilised. .(Accordmgly. after consultation with the States the Plannmg Commission fixed the base figure for 1984-85 for potenttial created and utiUsed as 37.52 m.ha and ?5 25 m.ha. respecdveh
479

4 2 5 While the irrigation potential ccreated through major and medium irrigation projects has recorded about a four-fold inccrease, the irrigation potential created through ground water schemes, which are mostly exr.ecuted and managed by the farmers themseKes has recorded about seven-fold increase AAmong the most important 11 States, from the pomt of view o f irrigation, (Andhra Pradeslsh, Bihar, Gujarat, Haryana, Karnataka, M P , Mahararashtra, Punjab, Rajasthan, TE'amil Nadu and U P ) groundwater dominates over other sources in all except Haryana I In Gujarat, Bihar, H P , Punjab, Tamil Nadu and West Bengal, the share o f ground water in oovera!! irrigation is over 60 per cent
IRRIGATION POTENTIAL CCREATIONWhereas the im gation potential created thiirough major an medium im gation projects has recorded about a four-foid increase by the end o f Eighth Five Year PPlan over the Pre plan penod. the imgation potential createted through groun water schemes, which are mostly executed d and managed by the farmers themselves has recorded a about seven-fold increase durmg the correspondmg penod
4 2 6 A consolidated statemeni o f year-wise and State-wise financial performance during the Eighth Plan in respect o f major and medium, minor irrigation, CADP and flood control is in Annexure- 4 2 10
Utilisation of Created Potential
4 2 7 Due to rapid expansion o f ' irrigation with its emphasis on new construction, particularly till the end o f 6th Plan, tkhe performance o f irrigation and the sector's broader management have not attracted duee attention The development impact o f irrigation is much less than its potential and deficciency in implementation have accumulated over time The irrigation sector is now facing a i challenging situation and four issues are o f particular concern productivity, sustainabilityy, investment and financial discipline alongwith sector management
4 2.8 As per the latest estimates, t the gap between potential creation and utilisation is anticipated to be about 8 81 m ha aat the end o f the Eighth Plan (major and medium irrigation 4 52 m ha and minor irrrigation 4 29 m ha) This gap has been increasing from Plan to Plan But, this data doees not give a correct picture o f utilisation o f irrigation potential, mainly because o f the reastson that the criteria/norms for reporting the creation o f potential and its utilisation adoptedd by the States are not uniform For example, Maharashtra gives the utilisation as aachieved and irrigated, while U P gives the maximum area irrigated since inception durinng any rabi and kharif period This needs to be reconciled on the basis o f all the SStates following uniformly the criteria as laid down by the Planning Commission in 19733 in respect o f irrigation potential creation and its utilisation (with modification to cow er the distribution system upto 5 to 8 ha blocks) Further, a lag o f a few years betweeen the introduction o f irrigation and its full utilisation, which is less in the case o f minor iiirrigation, is obvious due to the time required for the construction o f the distribution systeem as well as for switching over from rainfed agriculture to irrigated agriculture involving major changes in agriculture techniques which the farmers take time to master r Further, the potential area, which can be irrigated in a system, depends on severaJ vvariables iilcluding, besides the availability o f distribution networks, the volume anod seasonal pattern o f water availability, the losses in conveyance, distribution and applidcation on fields, the extent to which the conjunctive use is developed and the actual crop pattrtem on ground In so far as the assumptions in respect
480

of these parameters, underlying the project design, arre not actually realised in flill, there is bound to be a divergence between the actual area irritgated and the potential created.
Gap between Potential Creation and IJJtilisation
As per the latest estimalcs. the gap between potential creation and utilisation is anticipated tobe about 8.81 in.ha. at the end of the Eighth Plan (itiajoDr and medium irrigation 4.52 m.ha. andminor imgation 4 29 m ha). Tins gap hiis been increasing frcom Plan to Plan mainly due to,
(i) A lag of few years between the introduction of irmgation and Us full utilisation (which is less in case of Minor Imgation), iso b \ ious due to tiim e required for the construction of the distribution system as u ell as for switching o \er from rainfed agriculture to irrigated agriculture m \o l\ ing major changes in agnculturaal techniques which the farmers take time to master.
(ii) The critcna/'norms for reporting crcalion of imggation potential and its utilisation adopted by the States are not uniform
(lii) The potential area which can be irrigated ini a system depends on se\eral \anables including a\ ailability of distnbution networks, thee \olum e and seasonal pattern of water a\ailability. conveyance losses, distribution and appphcation on fields, the extent to which theconjuncti\e use is developed and the actual crrop piitteni on ground. In so far as theassumptions in respcct of these parameters underrlined in the project design are not actually realised in full, there is bound to be di\ergencce between actual area irrigated and the potential created
Sectoral Priority in Funding for Irrigation
4 2.9 The funding for the irrigation sector with resfpect to total State Plan size from the Fifth Plan onwards has steadily been declining as indiccated below : -
Period Irrigation fundinig as per cent of total State Plan
I Fifth Plan (1974-78) 23.25%
2. Si.\thPlan( 1980-85) 20.85%
3 Seventh Plan( 1985-90) 11.85%
4 Eighth Plan( 1992-97) 18 48%
(Approx ed outla\)
5. I992-93(A ctualc.\pdr) 15.94%
6 1993-94(RE approved) 15.68%
7 l994-95(approved) 15 21%
8 1994-95(RE Approved) 1408%
9 1995-96( Approved outlays) 14 91%
10 1996-97( -do- ) 15 00% (anticipateed)
II EiglUh Plan 1500% -do-
For Ninth Plan agreed outlay for the State sector and thhe UTs is Rs. 55872 86 crore which works out 14 93 per cent as inter-se percentage in Sttate Plan. Besides, an outlay o f Rs. 2291 25 crore is approved for Central sector under Miniistry of Water Resources for the Ninth Plan
481

4 2 10 In the Ninth Plan, agricultural! growth at the rate o f 4.5% has been envisaged With the net sown area almost stagnant in the country at 140-141 m.ha , a further expansion o f irrigation, including additionial irrigation becoming available from the modernisation/renovation o f irrigatiom capacities, is needed as a critical input in achieving the targeted growth rate o f agricultures in the Ninth Plan
Financing for Accelerated Completiion of Projects
R ural Infrastructure D evelopm ent Funid (R ID F)
4 2 11 This was started in 1995-9(6 with a corpus o f Rs 2000 crore under the aegis o f NABARD to provide loans to the State Governments for financing rural infrastructure projects including irrigation, soil coniservation and watershed management, etc During the Annual Plans 1997-98 and 1998-99 fcbr RIDF-III and RIDF-IV Rs 2500 crore and Rs 3000 crore have been allocated As per the latest status report (January 1998) out o f RIDF-1 (closure by 1997-98), a sum o f Rs 1748 55 crore has been sanctioned to 20 States for 3517 irrigation projects/schemes (including 7 flood control schemes in Uttar Pradesh) covering total Culturabie Command A\xea o f 2.29 m ha and about 1382 27 crore has already been disbursed Similarly, out o f IRIDF-II (closure by 1998-99), a sum o f Rs 2617 88 crore has been sanctioned to M Staitesfor 3384 irrigation projects/schemes covering totalCCA o f 0 50 m ha and about 20% of'the sanctioned amount has so far been disbursed underRIDF-III a total o f 13561 schemes witth Rs 2321 27 crore have been sanctioned
Accelerated Irrigation Benefit Program m e (AIBP)
4 2 12 This programme was launchecd in 1996-97 by the Government o f India with an outlay o f Rs 900 crore, subsequently reviseed to Rs 500 crore to accelerate the completion o f selected ongoing irrigation projectts in order that the envisaged benefits from lockedinvestments in these projects are acccrued Initially, this programme had two components.The first component was designed tco include major/multipurpose projects, each with the project cost exceeding o f Rs 1000 crore and the project being beyond the resource capability of the Slates The other component 'was for irrigation projects where, with just a little additional resource, the projects co)uld be completed and farmers could get the assured water supply to the extent o f one lalkh ha in the following 4 agricultural seasons or twoagriculture years Upon the revision o f this cost criteria, now an irrigation project withits cost exceeding Rs 500 crore is eligible The funding for AIBP is in the form of loan to the States on 50% matchiing basis During the Annual Plan 1996-97, a sum o f Rs 500 crore was released to various States and, as reported by the Ministry o f Water Resources about 16180 ha o f additio)nal irrigation potential has been created so far During A P 1997-98 and A P 1998-99, thte approved outlays under AIBP are Rs 1300 crore and Rs 1 500 crore respectively
Improvement in Water Use EfTicieincy
4 2 13 Water use efficiency is p)resently estimated to be only 38 to 40% for canalirrigation and about 60% for ground water irrigation schemes On the basis o f 1991 census, our country's per capita water avaiilability per year was estimated at 2214 cubic metres agamst the global average of 9231 cuibic metres and 3020 Cub M , 3962 Cub M and 4792 Cub M per year respectively for countries like Afghanistan, Pakistan and Sudan In 1990. India was ranked at the 42ncd position among 100 countries by per capita water
482

availability. In the total water use in 1990, the shaire o f agriculture was 83%, followed by domestic use (4 5%), industrial use (2 7%) and emergy (1 8%) The remaining 8 percent was for other uses including environmental recquirements Th e projected total water demand by the year 2025 is around 1050 cubic kiilometres against the country's utilisable water resources o f 1140 cubic kilometres The sharre o f agriculture in total water demand by the year 2025 would be abou t 74 to 75 per cent Thus, ahnost the entire utili.sabic water resources o f the country would be required to bte put to use by the year 2025 A D Irrigation, being the major water user, its share in the total demand is bound to decrease from the present 83% to 74% due to more presssing and competing demands from other sectors by 2025 A D and, as such, the question o f improving the present level o f water use efficiency in general and for irrigation in particullar assumes a great significance in perspective water resource planning It is estimaited that a 10% increase in the present level o f water use efficiency in irrigation projtects, an additional 14 m ha area can be brought under irrigation from the existing irrigatioin capacities which would involve a very moderate investment as compared to the inwestment that would be required for creating equivalent potential through new schemesi Thus, there is a need to improve the water use efficiency in most o f the existing irrigaition projects through modernisation, renovation and upgradation to realise optimum beneffits on the one hand and mitigate the consequential side effects like waterlogging etc 0)n the other
Per Capita Availability of W ater in India
In \990 , India was ranked at the 42’nd position amongst 100 countries by per capita water availabilit’y On the basis o f 1991 census, the country's per capita water availability per year was estimated at 2214 cubic meters against the global average o f 9231 cubic meters
Improvement in W ater Usse Efficiency
On a rough basis, it is estimated that with a 10% increase in the present level o f water use efficiency in irrigjation systems, an additional 14m.ha area can be brought under irrigation Ifrom the existing irrigation capacities at a very moderate investment as compared to the investment that would be required for creating equivalernt potential by way o f new schemes
4.2 14 To promote the process o f improverment in water management through upgradation o f the main systems o f selected irrrigation schemes the National Water Management Project(NWMP), an externally aided p^roject (EAP), was implemented during the period 1987-95 The basic objective o f the project was to improve the irrigation coverage and agricultural productivity and thereby imcrease the income o f farmers in the command areas through a more reliable, predictjable and equitable irrigation service This project was implemented in 11 States o f A P’ , Bihar, Gujarat, Har>’ana. Karnataka, Kerala, M P , Orissa, Tamil Nadu and Utter Pradesh, covering 114 Irrigation projects with a command area o f about 3 348 m ha at a cost o f Rs 5 8 7 81 crore at current prices The IDA Credit was to finance about 73% o f the total costs aind the balance was to be met from the development budget o f the participating States Withi the implementation o f this Project an
483

overall improvement was found in terrms o f water management, productivity and farm income, etc Increase in farm income in the 9 schemes on completion as a direct result o f the Project ranged from 8% to 89%, tthe highest o f 50% and 89% w ere m the tail end reaches o f the projects which were essentially rainfed prior to NWMP Although the project outcome has not been rated as saatisfactory in terms o f achievement o f the target which was only about 15% completion o f ccommand at the time o f termination o f the schem e, this provided adequate feedback for thiie formulation o f future strategy Now, the Ministry o f Water Resources has initiated fol!o:)w-up action on NWMP-II with an estimated cost o f Rs 2880 crore for 7 years
Renovation and Modemisat:on of Pro9jects
4.2 15 Increasing the effective iirrigation area through timely renovation and modernisation o f the irrigation annd drainage systems, including reclamation o f waterlogged and salinised irrigated laands through low-cost techniques, is needed to be considered especially in the context o )f the present resource constraints It is estimated that about 21 m ha o f irrigated area frojm major and medium projects from pre-Independence period and those completed 25 years <ago, require renovation/upgradation/ restoration to a great extent o f the areas which have ggone out o f irrigation, either partly or fully, due to deterioration in the performance o ff the systems The total investment involved is estimated at Rs 20,000 - 30,000 crorre over a period o f 20 years Water Resource Consolidation Project (WRCP- 6 yearss duration) has also been ongoing in the States o f Haryana (estimated cost - Rs 1442 122 crore). Tamilnadu (Rs 807 crore) and Orissa (Rs 1409 90 crore) during the Eighthi Plan, in the post-NWMP-I period which also envisages, interalia, the completion o f some incompleted major and medium projects and strengthening o f institutions on the; lines o f Participatory Irrigation Management/ Irrigation Management Transfer (PIM/HMT) More States are expected to be covered under this programme during the- Ninth Plain Recently, an externally aided Andhra Pradesh Irrigation Project (Phase-III) has beejn taken up for modernisation/renovation o f selected irrigation projects in Andhra Pradesth. Besides the above, Punjab Irrigation and Drainage Project Phase-II (1990-98), with an esstimated cost o f US $ 165 million and closing in March, 1998 and including componentts o f all sectors o f irrigation (major/medium/minor, CAD and flood control) is also undesr implementation This is aimed primarily at better water management and* improved func:tioning to achieve optimum utilisation o f water in Punjab, as the State has almost exhaiusted the exploitation o f surface water However, a greater push for modemisation/renov?ation o f existing irrigation projects will be needed during the Ninth Plan period
Renovation amd Modernisation of Projects
It is estimated that about 21 m.i ha of irrigated area from major and medium projects from pre-Independence period and thaose completed 25years ago. requirerenoyation/upgradation/restoration to a gresat extent of the areas which have gone out of imgatioa either partly or fully, due to deterioration ) in the performance of the sy stems The total imestment mvolved is estimated at Rs.20,000 - 30.0003 CTore over a penod of 20 years In recent times, the Water Resource Consolidation Project (WRCP) haas been taken up m the States of Hanana (estimated cost - Rs. I442.I2crore). Onssa ( ^ . 1409 90 cronre) and Tanulnadu (Rs 807'crore) which also emisages. mteralia. the completion of some incoimpleted major and medium imgation projects and strengthening of institutions on the Itines of Pardcipaton Imgation Management/Imgauon Management Transfer (PIM/IMT) Such porojects are expected to be taken up m more States during the Ninth Plan period
484
4 2 16 During the Eighth Plan, the externally aiided irrigation projects, put together, accounted for 18% o f total estimated cost o f ongoing projects The share o f irrigation in the total external aid annually was around 7% to 8̂ per cent However, the expenditure incurred on the externally aided major and medium projects during the first three years of the Eighth Plan was only 31% o f the target Thujs, vigorous efforts to attract more external investments in irrigation sector as well as to i improve the level o f utilisation are the need o f the hour especially against the backdrop o f cconstraints in domestic funding Apart from provision o f inadequate level o f funding as per [provisions in the agreement, the other major reasons o f the low level o f utilisation o f extermal assistance relate to the tendering procedure and its fmalisation including insisternce on global tender for the material/machinery which may be available in Indiia, participation o f NGOs in the land evaluation committees in the States leading to dcelays in finalising land acquisition proceedings, frequent review o f R&R programme by making field visits and interrogating the oustees about their level o f satisfaction whicch at time encourages them to ask for more and more facilities which, if not fulfilled, reesults even in stoppage o f works and, sometimes, ceitain techno-economic issues requiringg change in the scope o f the project during execution ahhough the agreement has beeen signed on the basis o f detailed appraisal earlier etc
Irrigation W ater Charges
4 2 17 According to the National Water Policy (1!987), water rate should be such as to convey its scarcity value to the users and motivate tthem in favour o f efficient water uses, besides, at the same time, being adequate to coveer annual maintenance and operation charges and recover a part o f the fixed cost Avgricultural productivity per unit of water needs to be progressively increased in order tto be able to compete with other higher value uses o f water Simultaneously, sound practices for irrigation revenue recovery by the appropriate agencies, even by institutional adjustmentjs, need to be promoted Most o f the States have at present very low irrigation water rattes at substantively varying levels and have not revised these for the last 2-3 decades A ffew States had revised the water rates during 1981-86 but the revised rates in some case;s had been withheld by the States Governments Most o f the north-eastern States (exccept Assam and Manipur)do not even charge any irrigation water rate Maharashtra is thea only State where the irrigation water
International Cooperation
Irrigation Water CZhargesAccording to the National Water Polic>' (1987). wateer rates should be such as to conve> its scarcit> value to the users and motivate them ui faivour of efficient w ater uses besides at the same time, bemg adequate to cover annual mamntenance and operation charges and recover a part o f the fixed cost Agricultural productiivit> per umt of water needs to be progressivel> increased m order to be able to compete - w ith higher \ alue uses of water
Most o f the States have, at present, very low irrigation water rates at substantially varying le\ el and have not revised for the last 2-3 decades Most of the North-Eastern States (except Assam and Mampur). ddo not e\ en charge any imgation water rates Maharashtra is the only State where the ungation water rates are announced for a 5 years period at a tune with a provission for l(V'/o increase per annum so as to cover the fiill O&M cost as well as interest payabble on the public depositsraised through imgation bonds The State Governments of Andhra Pradesh. Maharashtra. Han ana and Orissa have rev ised the waMer rates recently
485

rates are announced for a 5-year period 1 at a time with provision for yearly escalation so as to cover the full O&M cost as well ass the interest payable on the public deposits raised through Irrigation Bonds The State Governments of .Ajidhra Pradesh, Maharashtra, Haryana and Orissa have revised the w/ater rates recently The position in respect of minor irrigation including ground water is also not encouraging
4 2 18 The Tenth Finance Commissi(on (! 995-2000) have suggested the norms for O&M cost o f works at the level o f Rs 300 per lha. in case o f utilised potential and Rs 100 per ha for the unutilised potential with 30% increaase for hilly areas and suitable increase for insulating inflation Accordingly, the estimated tcotal O&M cost per annum for the country would be about Rs 2500-3000 crore Against this; requirement, the O&M funds, being provided are actually less than even l/4th with wide wariation from State to State This is one o f the major reasons for the deterioration in the perfcbrmance in terms o f adequacy, timeliness and equity in the provision o f irrigation water in the; system
4 2 19 A Water Pricing Committees, an internal group was set up by the Planning Commission in October, 1991 to study tlhe pricing o f irrigation water Some o f the salient features o f the recommendations o f' this Committee are : treating water rates as user charge, the objective being ultimately tco recover cost, linking revision o f water rates with the improvement in the quality o f serrvice, revision and implementation o f water rates in phases, consolidation o f the system o f farmer group management, upgrading the system to higher levels o f efficiency in water use and productivity, switching over progressively to volumetric water rates structure, the setting up o f "High Powered" autonomous boards at State level to review the policy, estaablish norms regarding maintenance costs, assess the actual expenditure and determine thie parameters and criteria for raising water rates, mandatory review o f all matters relatted to water pricing every five years, etc Subsequently, to go into the recormmendations of the above Committee, the Planning Commission constituted a Group of:' Officials under the chairmanship o f Secretary', Planning Commission and members frcom selected States and concerned Government o f India Ministries/Departments The Grroup unanimously recommended that full O&M cost should be recovered in the phased manner i e over a 5 year period starting from 1995- 96 taking into account the inflation alsco and that subsequently after achieving O&M level the individual States might review thee status to decide on appropriate action to enhance the water rates to cover 1% o f the capitzal cost also In addition to the above, the setting up o f Irrigation and Water Pricing Boards by all the States and mandatory periodic revision of water rates atleast every 5 years with can opportunity for users to present their views were also recommended Further, the Grouip also recommended the formation o f Water Users Associations and the transfer o f the maintenance and management o f irrigation system to them so that each system may manage Its own finances both for O&M and eventually for expansion/improvement o f facilitites. During 9th Plan, all the states will have to be persuaded to implement the recomimendations o f the Group in a first phase of implementing the Water Pricing Commiittee's Report
Private Sector Participation
4 2,20 Private sector participation inwolves not only the private corporate sector but also groups like farmers' organisatiojns, voluntary bodies and the general public About 90-95% o f ground water development is by private efforts either through own financing or institutional financing or both Howeve;r in the case o f surface water, especially major
486

and medium projects, all the irrigation projects aire not equally endowed with the potential for privatisation and, as such, identification o f projects as a whole or partially (i e. planning and investigation. Construction, operation and rmanagement financing and maintenance etc ) may have to be undertaken in the light o f itts viability vis-a-vis various privatisation options as available With hydel power generation! and recreation, etc along with irrigation, the viability for privatisation o f a project improves
Private Sector Participation
Some States like Maharashtra Madhya Pradiesh and Andhra Pradesh have initiated the action for pnvatisation of imgation projects Thes«e projects are envisaged for pn\atisation on Build-Own-Op)erate (BOO), or Build-OwTi-Operaite-Transfer (BOOT) or Build-Ov\n-Lease (BOL) basis In the case of projects on BOO basis, th e! Imgation Department may buy water in bulk from the agency at mutually agreed price for disstnbution to the farmers. Apart from this. Maharashtra Krishna Valley Development Corporation (MKVDC) for Knshna Valley Projects. Sardar Sarovar Narmada Nigam Ltd (SSNNL) for Sardar Sarovar Project in Gujarat and Jal Bhagya Nigam for Upper Knshna Project, Karnataka have mobilised financial resources through issue o f Public Bonds from the onv/ate market
4 2 21 Some States like Maharashtra, Madhya Prradesh and Andhra Pradesh have inhiated the action/process for privatisation o f irrigation projects These projects are envisaged for privatisation on build-own-operate (BOO), oir build-own-operate-transfer (BOOT) or Build-Own-Lease (BOL) basis In the case o)f projects on BOO basis, the Irrigation Department may buy water in bulk from the agenc:y at mutually agreed price for distribution to the farmers Apart from this, Maharashtra KCrishna Valley Development Corporation (MKVDC) for Krishna Valley Projects, Sardar Sarovar Narmada Nirman Ltd (SSNNL) for Sardar Sarovar Project in Gujarat and Jal BIhagya Nigam for Upper Krishna Project, Karnataka have issued bonds for mopping up fundls from the private market On the basis of views expressed by the various States, in general, the following conclusions have emerged in this regard
(1) The deliberations in the Workshop indicate that private sector participation in irrigation & multipurpose projtects is feasible but selectively Some procedural and legal changes aire required to be undertaken in respect o f clearances o f projects and inv(olvement o f private sector investors in this regard More specifically, some suggestions as indicated below in brief have been offered by the partiicipants.
(2) Private sector participation could bte thought o f on BOL or BOLT basis for a specified period o f say 10-30 years
(3) While it may be more suitable for medium and minor projects, it could pose some problems in the case o f major projects
(4) Clearances such as forests, envirconment, resettlement and rehabilitation, acquisition o f land e t c , should be carried out by the Government departments
487

(5) Concessions should be offcered to private sector investors to augment their revenue These may inclucde tourism, water sports, navigation, moratorium on loans, tax concessions, etc
(6) Distribution o f water afteer bulk supply to Water Users" Associa t ions should not be handled by pjrivate sector The W U A s should be e iKouraged to be formed and they shcould manage distribution
(7) Safety and sociological asppects should be looked into by the Government departments
(8) There should be a guaranteee on the return o f investment o f the private sector
(9) In difficult terrains, there should be investment from the Government side also.
(10) While broad national policcy guidelines on private sector participation may be framed by the Centre, deetails may be worked out by the States as suited to their conditions withiin the framework o f such policy and guidelines
(11) The obligations o f the (Government departments and the private sector should be clearly spelt out iin the agreement for sucli participation It should also include penalty claauses applicable to both the parties so that slippages do not occur in implementtation
Increase in Productivity
4 2 22 Improvement in agricuhural prcoductivity from irrigated agriculture is one o f the main objectives o f the CAD Programme. An analysis o f Time series data on productivity in respect o f selected projects under CAID Programme indicated, among others, that staple crops like paddy and wheat have regisitered an increase in productivity by 50% (Pench, Maharashtra) and 85% (Gurgaon, Hary/ana) respectively Experience has shown that in most o f the Commands, the main problejms are lack o f a single window deliver^' system, poor maintenance and water managememt o f micro-networks, weak extension service for agricultural needs and near-absence o f ftarmers' participation etc As such, in most o f the CAD projects, the implementation has Ibeen limited mainly to the construction o f field channels
Environmental Concerns in Water Resoiurces Development
4 2 23 Human intervention in water resource sector is closely interlinked with the environmental issues Substantial posittive impacts o f irrigation works have been found which include socio-economic, nutritionaal and health status, benefits from higher mcome, better and more secured production ancd supply o f drinking water, etc Hydro -power generation is also one o f the imporrtant outputs through storage-based irrigation multipurpose projects, which are generjally substantially cheaper than other conventional methods o f power generation Howewer, some s ide-effects have also been noticed important among these being water logginig and salinisation, population displacement, risk of water borne diseases and loss o f landl for water development works Over-exploi tat ion o f ground water results in depletion o f watcer level and int rus ion o f saline water in coastal
488

areas Chemical pollutants from fertilizers, pesticicdes and industnal waste as also loss and change o f flora and fauna habitat etc are also otherr important side-effects, which affect the overall environmental system
4 2 24 The growing environmental concerns attracted the attention o f the world community and culminated in the United Naitions Conference on Environment and Development (UNCED) held in Rio de Janerio in June, 1992, which came out with Agenda-21 concerning the planning framework and envisaging a set o f programmes needed to ensure the objective o f economic growth with equity and environmentalsustainability
4 2 25 India is one o f the few countries in the wcorld which has been taking appropriate action to protect the environment for quite sometirme. This includes the specific reference in the Constitution to the need for environmental prrotection. The main legislations enacted so far for the prevention and control o f water pollutiion are as follows:
(i) The Water (Prevention and Control 05f Pollution) Act - 1974 and as amendedm 1988
(li) The Water (Prevention and Control o f ’Pollution) Cell Act - 1977
(lu) The Forest Conservation Act - 1980{armended in 1992)
(iv) The Environment Protection Act -- 1986 (This is an "umbrella" type enactment to ensure enforcement o f several Acts and Regulations already in existence, concerning environmentaal pollution control and safety and, interalia, includes water also as a subjtect)
(v) Environmental Impact Assessment Nottification, 1994
4 2 26 Under the Environmental (Protection) Act, 1986 and Environmental Impact Assessment Notification (EEIA) o f 1994, the Statce Governments/project authorities are required to submit Environmental Impact Asssessment Statements (EIS) and Environmental Management Plans (EMP) in the comtext o f getting environmental clearance to the projects It is also mandatory to get clearance from forest angle, if any, in addition to environmental clearance Certain environmenteal safeguards are stipulated wherever necessary and these have to b? implemented by the project authorities along with the construction activities o f the project These are:: preparation o f Master Plan for Rehabilitation o f Oustees, compensatory afforrestation, alternatives in case o f adverse effect on flora and fauna and wildlife etc, draina^ge and anti-water logging measures, identification o f critically eroded areas in the catcbhment for soil conservation works and water quality etc: The environmental impact needs to be assessed periodically i e every 5 years, during the implementation o f the project aand the project implementation agency is required to submit half yearly report to the Impsact Assessment Agency about status of implementation o f the above measures
4 2 27 The objective o f Rehabilitation & Resettlemtent is that the oustees should get similar quality o f life, if not better, as compared to the oriiginal habitation Project-wise R&R implementation plans are prepared and implemernted under strict supervision o f the Ministry o f Welfare A national policy for R&R lhas also been formulated by the
489

Government o f India in consultation w ith the various States which encompasses Water Resources Development Sector also. This is; in the process o f finalisation
Waterlogging and Drainage
4 2 28 The problem of waterlogging and so il salinity/alkalinity was noticed even during the sixties in a few major & medium irrig;ation projects The problem has grown since then The National Commission on Agriculture (1976) estimated that about 6 million ha o f land was affected by waterlogging, in both irrigated commands as well as m unirrigated lands. Out o f this, an area o f abiout 2.6 m ha. was found to be affected due to higher water-table and 3 4 m.ha. due to surface ain-ofF stagnation The Working Group constituted by the Ministry o f Wateir Resources in 1991 estimated that about 2 46 m ha in irrigated commands suffered froim waterlogging The States, where high water- table has been noticed, particularly are Punjab, U P , some parts o f Rajasthan and Maharashtra The areas with surface stagnation problem are mainly West Bengal, Orissa, Andhra Pradesh, U P , Tamil Nacdu, Kerala, Gujarat, Punjab and Haryana The Working Group also estimated that 3.30 rm. ha had been affected by salinity/alkalinity in the irrigated commands It is reportced that the spread o f conjunctive use of groundwater with that o f surface water, esjpecially in Punjab, Haryana and parts o f U P , has substantially lowered the water-tabhe and helped to contain waterlogging/salinity But there has been no systematic or comprcehensive survey undertaken so far Waterlogging and salinity/alkalinity need to be tackled jat two levels (1) There should be a sys temat ic survey to assess the extent, nature and Uocalvon o f the waterlogged and saline a lkalme lands in the existing project commands; and (2) a phased programme should be drawn up to reclaim such land in a cost-effective mamner Now, the activities related to removal o f waterlogging and restoration o f saline and alkaline areas in irrigated commands are included in the Centrally Sponsored Command Area Development Programme This measure is expected to help tackle the above problems more effectively and on a large scale
Conjunctive Use of Ground Water and Suirface Water
4 2 29 The optimum development and utilisation o f water resources can be achieved by conjunctive use o f ground water and siurface water resources The National Water Policy emphasises that both surface and grcound water should be viewed as an integrated resource and developed conjunctively in a coordinated manner and their conjunctive use should be envisaged right from the project planning stage Tubewell schemes can be integrated with canal irrigation schemess by spacing them suitably along the drainage lines in the distribution area. With a v ie w to promoting conjunctive use o f ground water and surface water resources, the Central Waiter Commission, in consultation with the Central Ground Water Board, has prepared draft guidelines for planning conjunctive use o f water resources in irrigation projects Such ttype o f conjunctive use helps considerably in preventing waterlogging and soil salinitty/ alkalinity and also in providing adequate and assured irrigation water for crops, particuljarly o f high yielding varieties
Water Quality Monitoring
4 2 30 The Central Water Commission((CWC) is maintaining a large network o f 877 hydrological observation stations in the keey locations o f the river basin systems o f India for reliable assessment o f the water resouirces o f the'Country Out o f these, 319 stations distributed over all the major river basins, <are also engaged in the water quality monitonng
490
Initially, the water quality monitoring o f CWC ^wa;s started with a limited objective of classification o f water for irrigation and other rrelaited uses but presently, it also includes monitoring the rate o f silt flows, chemical indic:es like sodium absorption ratio, sodium percentage, residual sodium carbonate and hardntess. number as well as other pollution parameters However, the monitoring does not coweir the municipal and industrial effluents The CWC is also maintaining a three-tier laboraitory sys tem for analysis of the chemical parameters o f water quality monitoring
4 2 31 The ground water quality in India is being rmonitored by the Central Ground Water Board (CGWB) through a network o f 14995 monitcoriing stations set up in different parts o f the country. Changes in water quality have b>ee;n obser\ed in major agricultural and industrial belts and urban complexes as a result o f over-use o f fertilizers, pesticides and insecticides in agriculture and disposal o f untireated waste from industries and urban cities The ground water quality has also been aflfecctetd in some parts o f the country due to salinity ingress along the coastal area o f some of' thie States like Saurashtra in Gujarat and Tamil Nadu For planning and management of gnound water system, it is necessary to set up a national data bank, where all the irmportant information, covering various facets o f ground water will be available It i:s mecessary that the data from all the concerned organisations in the States as well as at the Centre are stored on uniform formats and there should be easy access to the pnociessed data This will also help avoid duplication in efforts and investment
Regional Variations in W ater Resource and Us D>ev eiopment
4 2 32 It is grossly a misplaced conception that Hndiia is a water-rich country and water is a cost-free commodity Amongst 121 countries.! where per capita availability of annual renewable fresh water in the year 1990 was onhy more than 1695 cubic meters, India ranked at 108th position. Further, according to a niumiber o f studies conducted in India and abroad, India's per capita water availability statius is likely to move from "marginally vulnerable" (as in 1990) down to "water scarcity" in the year 2025 In fact, India is likely to experience "water stress" from the year 22007 onwards Such "water-stressed" situation will limit the growth o f our deve;lopment, besides leading to ecological degradation in our country. Unfortunately, so fear the creation o f public awareness for judicious use o f water has not received its due atttemtion and, as such, the launching o f a national awareness campaign is now necessary.
4 2 33 The availability o f surface water in variouis rregions in the country is uneven with the north zone (Indus,Ganga and Brahmputra) hawinig 77% of the country's water resource, the west-flowing rivers with 5%, the east-flowing risers with 14% and the west-flowing rivers in Kerala with 3% only. Similar is the ccasie with ground water which is quite abundant in the Indo-Gangetic Plain but scarce im the western region and in the south If the ultimate irrigation potential through the major, mtedium and minor projects/schemes in the various regions is seen in relation to the cultiwalble area (Annexure-4 2 1, col 12) it is 116 60 per cent in the eastern region, 66 97 per c:entt in the north-eastern region 84 81 per cent in the northern region, 64 37 per cent in the s<outthem region and 58 58 per cent in the western region As against this scenario, the totial creation o f irrigation potential, as percentage o f respective ultimate irrigation poteintiial in these regions as anticipated at the end o f the Eighth Plan works out to 53 24 per cent,, 2 8 65 per cent, 95 32 per cent*, 54 59
491

per cent and 39 95 per cent respectiveily with 64 per cent at the national level The above figures show that only the northern reg^ion is ahead o f the national average
Notes 1 Regions : Eastern - Bihar, O nssai,Sikkim ,W est Bengal.
North-Eastern- AnmachalPradeshj, Assam, Marupur, Meghalaya, Mizoram, Nagaland & Tripura
Northem-Hars ana, HP, J&K. Punjaib, Rajasthan & UP
Southern - Andhra Pradesh, Kamaitaka, Kerala & Tamil Nadu
W estern - Goa, Gujarat, M aharashtira, M P
2 * The ultimate potential is under re'^vision in the countrv’.
Inter-basin Transfer
4 2 34 The distribution o f water resoiurce in the country shows that as against the national per capita (based on 1991 census) amnual availability o f 2214 cubic metres o f water, the average availability in Brahmaputra riwer basin is as high as 18470 cu m while it is as low as 383 cu m in the basin o f east-fllowing rivers between Pennar and Kanya Kumari Having 8% o f the country's populaition, Rajasthan has just 1% of the country's water resource and thereby the per capita watter use in Rajasthan (1991) is estimated to be only 562 cu m , a level almost near to "absolutfc scarcity" On the other hand, about 40% o f the utilisable surface water resource is im the Ganga-Brahmaputra-Meghana system With5 9% of geographical area and 3 2% of population of the country, Brahmaputra sub-basin alone, has 29% of annual water resooirce The per capita annual availability for the rest of the country, excluding Brahmaputra biasin, works out to about 1500 cu m which falls under "water scarcity" category. The Cauvrery, the Pennar, the Sabarmati and the east-flowing rivers are some o f the basins which faill into the category o f "scarcity conditions"
4 2 35 The Ministry of Water Resoiurces (erstwhile Ministry of Irrigation) formulated a National Perspective for Water Dewelopment in 1980 comprising o f two components - (1) Himalayan Rivers Development ancd (2) Peninsular River Development The National Water Development Agency (N W D A ), set up in 1982, has the mandate to study the feasibility o f the National Perspectiv/e Plan The scheme of National Perspective for Water Development, interalia, envisages thie creation o f irrigation potential for about 35 m.ha (25 m.ha from surface water and 10 m.ha from increased use o f ground water) and hydropower generation o f about 30,00)0 MW part o f which would be in Nepal and Bhutan
4 2 36 The Himalayan rivers comp<onent envisages storage on the main Ganga and the Brahmaputra rivers and their princiipal tributaries in India and in Nepal, so as to conserve the monsoon flow for flood control, hydro-power generation and irrigation An inter-linked canal system is to be provided to transfer the surplus flow s of the Kosi, Gandak and Ghagra to the west In addition, the Brahmaputra-Ganga link is envisaged for augmenting dry weather flows to the Ganga Thte envisaged benefits of this scheme include provision o f irrigation to 22 mha in the Gang^a-Brahmaputra basin in Haryana, Rajasthan, Punjab and Gujarat besides providing 112(0 cumecs (i e . about 40,000 cusecs) to Calcutta Port and hydro-power generation o f 13000 mega-watts in Nepal and India
4 2 37 Under the peninsular rivers dsevelopment component, it is proposed to transfer the surpluses from the Mahanadi to thte Godavari and further from the Godavari to water-
492

short rivers namely the Krishna, the Pennar and the Cauvery that would provide irrigation in drought areas o f Maharashtra, Karnataka, Andhraa Pradesh and Tamil Nadu The second component o f the proposal is to divert a part o f tlhe waters of the west-flowing rivers o f Kerala to the east for irrigating the drought areas cof Tamil Nadu apart from covering new areas in Kerala Another component is to inter-linkx the small rivers flowing along the west coast north o f Bombay and south o f the Tapi andl to inter-link southern t r ibutar \ o f the Yamuna like the Ken and the Chambal, The prroposed peninsular river development is expected to provide additional irrigation benefits off over 13 m ha
National Water Policy
4.2.38 The National Water Policy (NWP) was aodopted by the National Water Resources Council, headed by the Prime Minister in its meeeting held on 09 09 1987 The NWP recognises water to be prime natural resource, : a basic human need and a precious national asset Therefore, planning and developjment o f water resources need to be governed by a national perspective The intention i o f the NWP was to mark the territory in broad terms, so as to establish the need for a, Natiaonal Water Policy, and to give a broad outline o f what the policy document needs to cover The formulation o f N'WP is not a one- ime exercise but is to be kept constantly under- review, thereby including within its purview more and more issues and areas o f concerm as they emerge For a more effective operationalisation o f the NWT* stress would have to boe placed on the following -
(i) Watershed management, rain water harvesting and water saving practicesshould be an integral part o f development and management o f water resources at the basin level and while formulating water resourcesdevelopment projects Also, Mic;ro irrigation systems need to be promoted particularly in arid re;gions where water is scarce and the topographic and soil conditions dco not permit efficient irrigation by conventional methods,
(ii) Drainage is to be an integral part o f the irrigation system, particularly, when perennial irrigation is contermplated,
(iii) The Management o f irrigation systenms by farmers should also cover water rights and the need for establishing aind regulating them
(iv) Since water markets are expanding, there is a need to develop and enforce guidelines for their operation
(v) During the Ninth Plan period, tthe pricing of water for various uses including agriculture should be ratioDnalised in a phased manner so as to at least fully recover the Operationi and Maintenance Cost
(vi) Policy framework or guidelines on the critena for inter-State river water allocation among the basin states shoiuld be evolved
(vii) Both demand and supply for waterr resources should be assessed on the basis o f agro-ecological-irrigation zojnes, cropping systems and other uses within a dynamic time- frame,
(viii) Conjunctive use o f surface and grround water should be encouraged by making adequate energy available to ffarmers,
493

(ix) The role and responsib)ility o f various agencies and organisations involved in water resources deve;lopinent and utilisation should be clearly defined Appropriate infraistructure should be developed to promote proper linkages among them,
(x) Involvement o f farmer s' organisations, such as. Water Users' Associationsshould be increased ini respect o f decisions on cropping systems, pianning and implementation o f water release schedules, collection o f waterrates, maintenance or" irrigation systems, etc Assistance o f voluntary agencies/NGOs should be enlisted in this task A gender dimension should be integrated in all decisions relating to water use The new paradigm o f water use managemient should include important parameters such as, efficiency, ecology, eqiuity and employment in addition to economics o f energy-use efficiency,
(xi) In view o f increasing demand for water, there is a need to augment the resource through inter -basin transfers, artificial recharge o f aquifers, use o f marginal quality w-ater, conjunctive use o f surface and ground water, rain water harvesting in raimfed areas, watershed development, adoption o f water saving practices etc
(xii) In order to ensure sustained availability o f ground water, average annual withdrawal should not exceed average annual recharge Ground water o f marginal quality could be used advantageously in combination with good quality o f water or foir alternate irrigations
(xiii) The existing law on water quality needs to be effectively implemented for prevention o f pollutioin o f surface and ground water Ground water pollution being more serious and hazardous, as compared to surface water pollution, wouild require special institutions for preventing and abating pollution
(xiv) The Prime Minister whiile addressing the Nation on 22"̂ March 1998 indicated that the Government would go all out to achieve five goals which include “ unveiling a National Water Policy” so that no water goes waste and our water resources are cleaned lup Appropriate action in this regard has already been initiated
High Power Commission for Integrated Water Resources Development Plan
4 2 39 The Government o f India constituted a High Power Commission in September 1996 for Integrated Water Resounces Development Plan to take a holistic view o f the overall water resources in the country and maximise the availability and its utilisation including consideration o f inter-basin transfers Presently, the Member-Secretary, Planning Commission is the Chairiman o f the Commission The terms o f reference o f the above Commission are as follows -
(a) To prepare an integratied water plan for the development o f water resources for drinking, irrigation, industrial, flood control and other uses:
(b) To suggest the modalitiies for transfer o f surplus water to water-deficit basms by inter-linking o f rive:rs for achieving the above objectives.
494

(c) To identify important ongoing projects, ais we!! as new projects, wliiclishould be completed on pnority basis, together with phasing,
(d) To identify a technological and inter-discijplinary research plan for thewater sector with a view to maximise the benefits,
(e) To suggest physical and financial resource generation strategies tor thewater sector, and
(f) .Any other related issue
High Power Commission for Integrated Water Resources Development Plan
The Government o f India constituted a High Pov\er Commission in September !996 for Integrated Water Resources Development Plan to take a holistic view o f the overall water resources in the country and maximise the availability and its utilisation includmg consideration o f mter-basin transfers Presently, the M ember-Secretar>. Planning Commission is the Chairman of the Commission The report o f the t ommiss'ion \s m ad \ancc stage of preparation
The report o f the Commission is in advanc<e stage o f preparation
Role oF Cooperatives
4 2 40 There is general consensus in favour o f the turn-over o f irrigation scheme:s on the principles o f "Irrigation Management Transfer" or "Participatory Irrigation Management" The term "tum-O'ver" means the transfer o f respons;ibi!ity and authority for irrigaticon management from the g,oven\imem agency to vrrvgators associations A number o f States have already initiated action in this regard
Cooperatives can play a vital role m sustainable dievelopment and management o f irrigation works in general and ground water resources in particular Given the small size o f the holdings in the country, cooperative ownership can help in expanding the irrigation development, including fulfilling the eligibility criterion in respect o f size o f land for institutional fijnding and management o f ground watier resources in the coming years The ground water development programme in the country is primarily (around 95%) sustained with the financial investment by the farmers themselves or though institutional finances or both The public sector outlay is limited to only such items as ground water surveys, construction o f public tubewe;lls, services provided and grants extended to small farmers etc Large public tubewells are operated and maintained by the Government agencies and corporations o f th(e State Governments Integrated Approach for Flood Management
4 2 41 Flood Management Schemes have to be planned within the framework o f an integrated long-term plan and in conjunction, where appropriate, with the plans for other areas o f water resource development such as irrigation., power and domestic water supply This will help improve the efficacy o f flood control schemes as well as their economic viability The Central Government has set up the Ganga Flood Control Commission (GFCC) and the Brahmputra Board for comprehensive planning o f flood control in the Ganges and the Brahmaputra sub-basins The GFCC and the Brahmaputra Board have prepared Master Plans for thiese sub-basins which are at prefeasibility stage Considerable follow-up action is requiired for detailed investigations o f the suggested measures and for detailed study o f the techno-economic viability, including operationalisation
495

4 2 42 T he q u estio n o f in troducing F lood P lain Z o n in g both in flood protected as well as the u n p ro tec ted areas, has been under co n sid era tio n fo r qu ite a long time. The G overnm ent o f India p rep ared a M odel B ill fo r Fhood Plain Z o n in g and c ircu lated it to all the S tates for action m the 70s So far, only M aniipur has en a c ted the legislation in Septem ber l'»''S and s ta n e d its im p lem en ta tion f ro m D ecem b er, 1985 Som e S tates I'ke M P h a \e accep ted it in p rin c ip le but the legislattion is yet to com e The legislation is also under active co n sid era tio n o f the G o v ern m en ts o f R ajasthan , W est B engal and B ihar Further, the G o v ern m en t o f Ind ia has tkaen, the in itiative in p rep arin g the survey m aps in the scale o f 1 1 5000 w ith 0 5 M co n to u r o f the flcood plain a reas th ro u g h Surv ey o f India and an area o f abou t 54740 sq km has been surveyfed up to M arch , 1991 T hese m aps are for the use by the S ta tes for p rep ara tio n o f flood risk m aips
Ninth Plan Proposals
4 2 43 B ased on the p roposa ls by the S ta tes and the M inistrv o f W ater R esources the A nnex u res-4 2 2 and 4 ,2 3 have the denails o f the financial and phs sical p rogram m es during the N in th P lan T he physical prograrm m e is su m m ed up as below -
PHYS.ICAL PROGRAM M E
Flood Plain Zoning Regulation
Item Projected Tareet for Ninth Plan
Potential Potential
(In m illion ha )
R em ark s
Creation Utilisation i!
1 i 21
i 3 4j
1 Irrigation Poten tia l
C rea tion
(a) M ajo r & M ed ium 9 81
1
8 71
1 ' The ultim ate irrigation
: potential through m inor ' surface irrigation & g round w ater w'hich w ere : 15m ha and 40 m ha respectively are u n d er revision to 17,38 m ha and 64 05m ha
(b) M inor Irrigation 7.24 4 93
Total 17.05 11
13.64 1
M AJOR & M EDIUM IRRIGATIO N PROJECTS
Status of Creation of Irrigation Potentiial at the end of 8th Plan
4 2 44 It w ou ld be seen, from the T a b le below , tha t out o f the 16 m ajor States, 3 hav e a lready ach iev ed 70% o r m ore o f the u ltim a te irrigation potential with Tam il N adu
496

reco rd ing 100% ach ievem ent, fo llow ed by Punjab and R ajasth an at 84% and 74% respec tive ly Six States, i e , H aryana, K arnata, Jam rm u & K ashm ir, and W est B engal are in the range o f 63% to 71% , w hereas in U P and M aiharash tra , the ach iev em en t w ould be 56% each The S tates o f B ihar, G ujarat, O nssa , M P aind A ssam have ach ieved less than 50% o f the u ltim ate potential T he u ltim ate potential uncder m ajor & m edium irrigation in the eastern S ta tes(e \cep t W est B engal), i e B ihar, U P , M .P and O rissa put to g e th er w orks out to about 30% o f the total u ltim ate potential o f the c(Ountry H ow ever, th e ir ach ievem ent up to the end o f the E igh th P lan is 45% o f the u ltiim ate po ten tial o f these S tates, put to g eth er The S ta te-w ise details o f irrigation poten tiia l d ev e lo p m en t v is-a-v is u ltim ate po ten tial th rough m ajor and m edium schem es are ind icatted in A n nexure-4 2 4 and have been sum m arised in T able-4 2 3 below -
TABLE 4.2.3
Major & Medium Irrigation anticipated Achievemtent upto the end of 8th Plan
(Thousand ha.)
SINo
State Ult Ach A ddl T otal % o fIrrgn to the A ch A ch DevePot end o f during to end o f at the
A/P 92-93 8th Plan 8th Plan end o f 1991-92 (.Anti) (A nti) 8th Plan
1 2 3 4 5 6 7
1 Andhra Pradesh 5000 2999 46. 10 3045.10 612 Arunachal Pradesh - - - - -3 Assam 970 176 20. 67 196.67 204 Bihar 6500 2766 36. 50 2802.50 435 Goa 62 13 0.02 13.02 21
o Gujarat 3000 ’ 1246 104.00 1350.00 457 Haryana 3000 2035 43.79 2078.79 698 Himachal Pradesh 50 8 2 .55 10. 55 229 Jammu S Kashmir 250 158 15. 70 173.70 6910 Karnataka 2500 * 1377 289.02 1666.02 6711 Kerala 1000 416 97. 31 513.31 5112 Madhya Pradesh 6000 1962 355.60 2317.60 3913 Maharashtra 4100 2030 283.00 2313.00 5614 Manipur 135 59 4.00 63.00 3815 Meghalaya 20 - - - -15 Mizoram * * - - - -17 Nagaland 10 - - - -18 Orissa 3600 1409 148.75 1557.75 4319 Punjab 3000 2367 145.85 2512.85 8420 Rajasthan 2750 * 1999 274.88 2273.88 8321 Sikkim 20 - - - -22 Tamil Nadu 1500 * 1545 0.51 1545.51 10323 Tripura 100 2 0. 30 2.30 224 Uttar Pradesh 12500 6806 253.00 7059.00 5625 West Bengal 2300 1353 91.08 1444.08 63
Union Territories 98 15 3.51 18. 51 19
Total 58465 30741 2216. 13 32956.83 56
* States ha\e indicated that the actual would be more ** included in UT
497
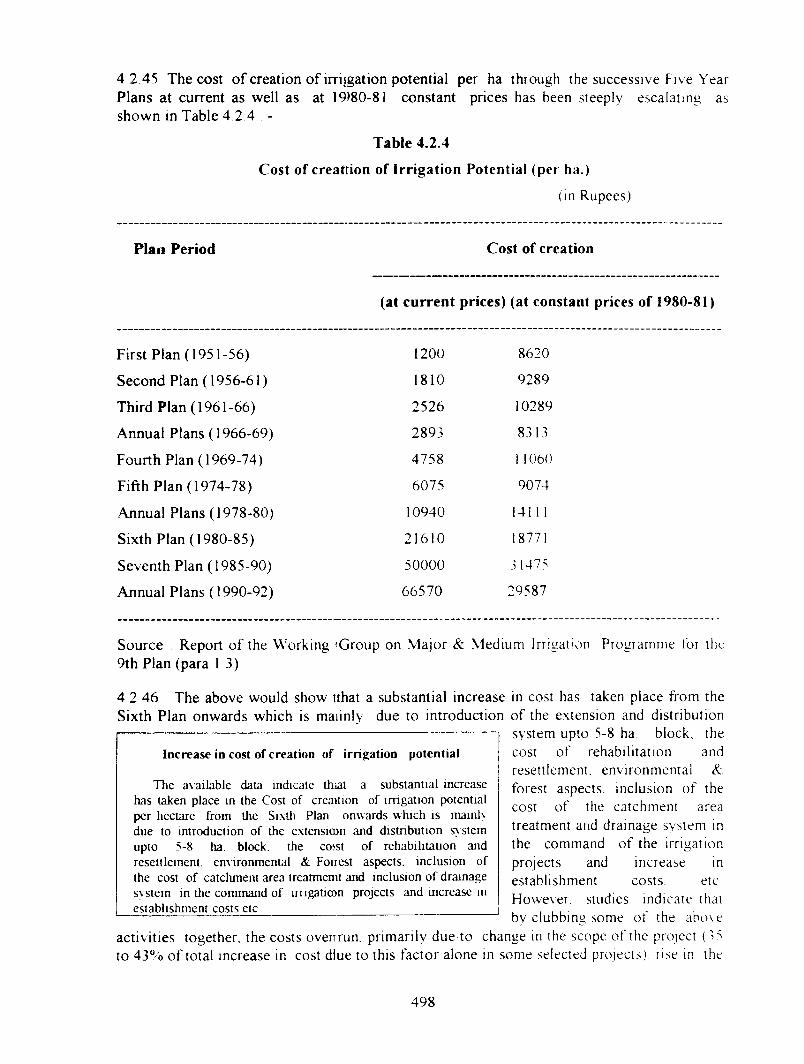
4 2 45 The cost o f creation o f irrijgation potential per ha th rough the successive F ive Y ear Plans at current as well as at 19)80-81 constant prices has been steeply esca la tin g as shown in Table 4 2 4 -
Table 4.2.4
Cost of creattion of Irrigation Potential (per ha.)
(in R upees)
Plan Period Cost of creation
(at current prices) (at constant prices of 1980-81)
First Plan (1951-56) 1200 8620
Second Plan (1956-61) 1810 9289
Third Plan (1961-66) 2526 10289
Annual Plans (1966-69) 2893 8313
Fourth Plan (1969-74) 4758 1 1060
Fifth Plan (1974-78) 6075 9074
Annual Plans (1978-80) 10940 14II 1
Sixth Plan (1980-85) 21610 18771
Seventh Plan (1985-90) 50000 3147,>
Annual Plans (1990-92) 66570 29587
S o u rce : R ep o rt o f the W ork ing 'G ro u p on M ajo r & xMedium Irrigation P rogram m e to r the 9 th P lan (p a ra 1 3 )
4 2 46 T he above w ou ld show tthat a su b stan tia l in crease in cost has taken place from the S ix th P lan o n w ard s w hich is m aiinly due to in tro d u ctio n o f the ex tension and d istribu tion
system upto 5-8 ha block, the cost o f rehab ilita tion and resettlem ent, env ironm enta l & forest aspects, inclusion o f the cost o f the catchm ent area treatm ent and dra inage system in the com m and o f the irrigation pro jects and increase in estab lishm ent costs. etc H ow ever, studies ind icate that bv clubbino som e o f the above
Increase in cost of creation of irrigation potential
The a\ailable data indicate thiat a substantial increase has taken place in the Cost of creauion of im gation potential per hectare from the Sixlli Plan onwards which is inainh due to introduction of the extension and distnbution s> stem upto 5-8 ha block, tlie co st o f rehabilitation and resettleinenL enMronmental & Foirest aspects, inclusion of the cost o f catchment area treatmenit and mclusion o f drainage s> stem in the command o f im gation projects and mcrease in establishment costs etc
ac tiv itie s toge ther, the costs oveirrun, p rim arily due to change in the scope o f the project ( to 4 3 % o f to tal increase in cost diue to this fa c to r alone m som e selected projects), rise in the
498

lumpsum provisions, which include, besides otherss, the R&R activities (40 to 47% o f total increase in the revised estimate o f some sele(Cted projects); increase due to price rise/inflation which varied from 8% to 63% o f the total increase in a period o f 2 to 20 years in the sample o f 11 projects and increase due to chanige in design (about 38% of the total increase in a selected project was due to this factor), etcc
4.2 47 The number o f major & medium schemes w hich were taken up in various Plan periods are indicated in Table-4 2.5
TABLE-4.2.5
No. of major and medium schemes taken lup in various Plan
Plan Period Major- Medium
First Plan 44 169
Second Plan 33 102
Third Plan 32 44
Annual Plans (1966-69) 11 30
Fourth Plan (1969-74) 32 73
Fifth Plan (1974-78) 70 300
Annual Plans (1978-80) 13 52
Sixth Plan (1980-85) 30 91
Seventh Plan (1985-90) 12 33
Annual Plans (1990-92) 1 -
Eighth Plan (1992-97) 14 50
Total 292! 944
Source Working Group Report for Major & Medium Iimgation Projects for Ninth Plan
4.2.48 During the Fifth Plan (1974-78), 70 new maj(or and 300 medium schemes were taken up, although 97 major and 130 medium scheme;s were already under implementation in 1974 Thereafter also, the tendency to start morre and more new projects continued unabated, which resuhed in a thin spreading o f the aivailable limited financial resources However, later on during the Seventh and the Eig'hth Plans, as a strategy, only a few new major and medium projects were taken up and greater emphasis was laid on the completion o f ongoing projects as a first charge on the ^available resources
499

4.2.49 Sedimentation o f reservoirs i;s a natural phenomenon The surveys conducted during last three decades have indic;ated that the sedimentation rates in some o f the reservoirs are higher than those envisagetd at the planning stage The variation is due to the fact that enough reliable data on Indian rceservoirs were not available earlier at the planning stage. In view o f the above, the present design practice (followed progressively since 1965) incorporates the sediment inflow ratces based on the reservoir survey data as well as actual observed sediment inflow data. 0>n the basis o f Capacity Survey data o f 46 reservoirs, it is seen that the sedimentation rate lof reservoirs vary significantly and is affected by hydrometereology, physiography and cclimate etc. Considering these factors the whole country has been classified into 7 regio>ns (viz Himalayan region, Indo-Gangetic Plains, East-flowing rivers excluding the Gangca upto the Godavari, Deccan Peninsular east- flowing rivers including Godavari, W est-flowing rivers upto Narmada, Narmada - Tapi basin and West flowing rivers) and sediimentation rates have been determined to serve as the broad guidelines
4.2.50 Oflate, there has been some appirehensions about the higher rates o f sedimentation in reservoirs and this has led to the feelinig that these may not last for their planned life. But the analysis o f data collected for various rreservoirs shows that the sedimentation rates are not so high The data also show that the sedimentation rates are higher during the initial 15-20 years o f their operation and thereafter it has fall on significantly Even some o f the reservoirs, which have completed their p>lanned life, are still continuing to serve and provide partial benefits However, better operation and management may still improve the situation for which there is a need for continuecd hydrographic surveys at regular intervals which would provided useflil feedback for betteir sedimentation planning o f future reservoirs
Financial and Physical Performance diuring Eighth Plan
4.2 51 Out o f the total outlay appro\ved for the Irrigation sector including C.AD and Flood Control, for the Eighth Plan, aibout 70% was for major and medium projects, o f which 80% was for the completion o f ongoing major and' medium projects and Extension, Renovation & Modernisation! (ERM) projects. Overall, the actual expenditure during the Eighth Plan was around the .approved outlay for the irrigation sector The State- wise break-up given in Annexure-4.2 .'5 shows that major States like Andhra Pradesh, Assam, Goa, Haryana, J&K, Karnataika, Kerala, Maharashtra, Manipur, Punjab, Tamil Nadu and West Bengal have incurred nnore expenditure than the approved outlays while in the major eastern States, which are alre;ady lagging behind the national average of 56% in terms o f creation o f irrigation potentiial, the level o f actual expenditure was quite low as compared to the approved outlays, witih Bihar at 43%, Ojissa - 40% and U P 64% of the approved outlay
4 2 52 As many as 176 major project iincluding 103 started prior to and during the Fifth Plan period and 283 medium irrigation projects were ongoing at the beginning of the Eighth Plan Against the Eighth Plan; target o f 80 major and 253 medium irrigation projects, only 44 major, 100 medium and 45 ER_M irrigation projects were expected to have been completed dunng the Eighth Plan Consequently, at the beginning o f the Ninth Five Plan, there are, in the category o f ongoing projects, as many as 119 major projects with an aggregate spillover cost o fR s 3 5300 crore, 176 medium projects with a spillover
Sedimentation in Reservoirs
500

cost o f Rs 2200 crore and 67 ERM projects with a 'spillover cost o f Rs 3800 crore, i e , with a total o f Rs 41300 crore involving an additional iirrigation potential o f about 7 2 m ha Further, the additional irrigation potential created durirng the Eighth Plan period has 195 m.ha. as against the target o f 5.088 m.ha As many ais 16 major States recorded shortfall in achieving the Eighth Plan target These are Andhra Pradesh (89%) Assam (77%), Bihar (88%), Gujarat (77%), Haryana (85%), J&K (30%), KCarnataka (28%), Kerala (57%), M P.(24%) Maharashtra (29%),Orissa (55%),Punjab (19% ), Rajasthan (86%), Tamil Nadu (44%), U P. (58%) and West Bengal (47%).
Completion of Ongoing Major and Medium Projects4 2 53 Under the "Special Action Plan", the target is tco complete such ongoing major and medium irrigation projects those are in advance stage o f (completion. These projects would be provided additional financial support under Acceleratedi Irrigation Benefit Programme and Rural Infrastructure Development Fund o f NABARD Tlhese projects would yield additional irrigation potential during Ninth Plan
MINOR IRRIGATION
Review4 2 54 The reassessed ultimate irrigation potential in thie country through minor irrigation is tentatively estimated at 81 43 million hectare (m h ai) comprising o f 17 38 m.ha from surface water schemes and 64 05 m.ha from ground water schemes (against the earlier LTP o f 55 m.ha which include IS m.ha. for minor surfacte water schemes and 40 m ha form ground water) During the Seventh Plan period the potenitial created was o f the order o f 9.09 mha (1 82 mha per annum) and utilisation was 7 87 m haa. The additional potential created and utilised under minor irrigation during the Eighth P’lan period is anticipated to be 6 25 m ha (1 25 m ha per annum) and 5 78 m ha respectiv/ely against the corresponding the Eighth Plan targets o f 10 71 mha. and 9 36 mha Thus, tthe potential created through minor irrigation at the end o f the Eighth Plan is anticipated tco be 56 60 m.hectares Hence, the balance potential available at the beginning o f the Ninthi Plan works out to 24 83 m ha which is about 30 5 per cent o f the reassessed ultimate? minor irrigation potential During the decade 1985-86 to 1994-95 the average cost (at curre;nt price) o f creation o f potential per ha has escalated from Rs.6022 in 1985-86 to IRs.11804 in 1992-93 and ftirther to Rs 13790 in 1994-95 The present cost is likely to be arouncd Rs 18000 per hectare The year- wise potential created and potential utilised during the Ei^ghth Plan period are given in Table 4 2 6.
Table 4.2.6.(in miha .)
Year Potential created Protential UtilisedTarget Achieved/Anticipated Target Acchieved/Anticipated
VIII Plan(1992-97)
10.71 9 36
1992-93 2 00 1.24 180 1 191993-94 1.98 109 1.74 0921994-95 2.05 1.35 1 63 1 301995-96 1.59 1.48 1.29 1441996-97 1.62 107 1,32 0 92
9 24 6.23 say 6 25
7.78 5.77 5 78
501

State-wise Performance
4 2 55 State-wise statistics o f physical achievement are given in Annexure-4 2 6 To the total minor irrigation potential created during the Eighth Plan period, Uttar Pradesh was the major contributor followed by West Bengal, Bihar, M P , A P & Orissa These six States together accounted for â bout 88 67 per cent o f the potential created during the Eighth Plan period, whereas the States o f Maharashtra, Punjab, Gujarat and Karnataka together contributed only about 5 per cent To the total utilisation o f irrigation potential created during the Eighth Plan per iod, the largest contributor was UP, followed Bihar, West Bengal, A P , Punjab, Maharashtra, Karnataka and Kerala
Plan Outlays and Expenditure
4 2.56 The minor irrigation schemes are funded from Plan funds, institutional finance and private investments o f user-farmeirs It is generally considered as a people's programme as the Plan funds form only a small portion o f the total investment for its development The following Table 4 2 7 indicates the outlays and actual expenditure (Central Sector and State Sector) for minor irrigation during the Eighth Plan
Table 4.2.7Outlays and Actual Expenditure on Minor Irrigation during Eighth Plan in Central
Sector and State Sector(Rs in crore)
Plan Central Sector Approved Actual/Ant Outlay Exp
StateApprovedOutlay
SectorActual/AntExp
8th Plan(92-97) 293 00 213.16 5684.26 6230621992-93 50.73 15 07 1037 50 994 601993-94 48 00 70 91 1174 63 1094 831994-95 65 38 34 30 1347 83 1185 151995-96 59 00 32 07 146115 1408.081996-97 8 2 6 4 60 81 1633 79 1547 97
4 2 57 The actual expenditure under Central sector during the Eighth Plan was 73 per cent o f the approved outlay whereas in the case o f State Sector it was 106 per cent The highest approved outlay was in the case o f Bihar (Rs 1021 crore) followed by MP (Rs 728 crore), Maharashtra (Rs.6L2 crore), U P (Rs.400 crore), Orissa (Rs 389 crore). West Bengal (Rs 370 crore) and Karna.taka (Rs 307 crore) However, the actual (antici-pated) expenditure was the highest in the case o f Maharashtra (Rs 1571 23 crore) followed by M P.(Rs 634.50 crore), Gujarat (Rs 441 22 crore), U P (Rs 351 01 crore), Andhra Pradesh (Rs 370 08 crore), Orissa (Rs 367 68 crore) and Karnataka (Rs 307 80 crore) In the case o f Andhra Pradesh, Arunachal Pradesh, Assam, Goa, Gujarat, Haryana, Himachal Pradesh, J&K, Kerala, Maharashtra, Rajasthan and U P , the anticipated total expenditure during the Eighth Plan period exceeded the approved outlay (Annexure - 4.2.7).
502
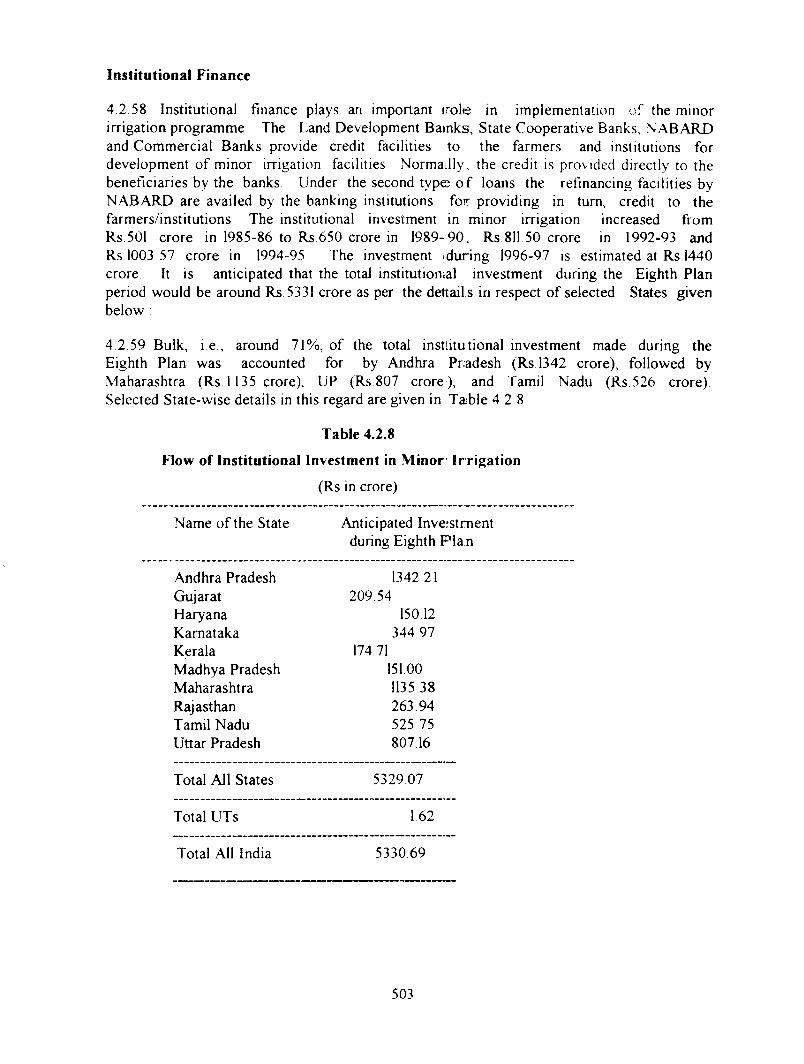
4.2 58 Institutional finance plays an important trole in implementation o f the minor irrigation programme The Land Development Bainks, State Cooperative Banks, NABARD and Commercial Banks provide credit facilities to the farmers and institutions for development o f minor irrigation facilities Normailly, the credit is provided directly to the beneficiaries by the banks Under the second type o f loans the refinancing facilities by NABARD are availed by the banking institutions foir providing in turn, credit to the farmers/institutions The institutional investment in minor irrigation increased fiom Rs 501 crore in 1985-86 to Rs 650 crore in 1989-90, Rs 811.50 crore in 1992-93 and Rs 1003 57 crore in 1994-95 The investment iduring 1996-97 is estimated at Rs 1440crore It is anticipated that the total institution;al investment during the Eighth Plan period would be around Rs 5331 crore as per the dettail s in respect o f selected States given below
4 2 59 Bulk, i e , around 71%, o f the total insttitutional investment made during theEighth Plan was accounted for by Andhra Pradesh (Rs 1342 crore), followed byMaharashtra (Rs 1135 crore), UP (Rs 807 crore ), and Tamil Nadu (Rs 526 crore)Selected State-wise details in this regard are given in Taible 4 2 8
Table 4.2.8Flow of Institutional Investment in Minor Ir rigation
(Rs in crore)
Name o f the State Anticipated Investmentduring Eighth P la n
Institutional Finance
Andhra Pradesh 1342 21Gujarat 209 54Haryana 150.12Karnataka 344 97Kerala 174 71Madhya Pradesh 15100Maharashtra 1135 38Rajasthan 263 94Tamil Nadu 525 75Uttar Pradesh 807.16
Total All States 5329 07
Total UTs 162
Total All India 533069
503

Rationalisation of Minor Irrigation Statistics
4 2 60 Minor Irrigation schemes are very large in number and scattered in locations and these are implemented by various Governmient departments/organisations and private agencies and individuals In view o f the multiplicity o f agencies involved in development o f minor irrigation programme and lacik o f proper coordination among them, reliable data on minor irrigation potential and its utilisation is necessary In order to tackle this problem, a Centrally Sponsored Scheme fcbr Rationalisation o f Minor Irrigation Statistics was launched in 1987-88, envisaging the c<onduct o f a census o f minor irrigation works on quinquennial basis The first census with ireference to 1986-87 was conducted in all the States/UTs except Rajasthan The natiional level report o f the census could be published only in November,1993 due to delay in completion o f the census work in some o f the States The second census with referemce to 1993-94 is already in progress and most o f the States have completed the fielcd work The data is likely to be available soon
Minor Irrigation Statistics
In view o f the multiplicit> o f agencies involved in development o f minor imgationprogramme in the States and lack o f adequatecoordination among them, the data on minorirrigation potential and its utilisation needs to be further improved as well as updated at regular penodicitN for its publication To address thisproblem, a Centralh Sponsored Scheme for Rationalisation o f Minor Imgation Statistics has been in operation since 1987-88, en\isaging the conduct o f a census o f minor imgation works on qumquennial basis
Minor Irrigation Tanks
4 2 61 The first census (1986-87) o f Minor Irrigation schemes showed that there were 5,07,212 minor irrigation tanks in use in the country (except Rajasthan where no census was done) Thesouthern region consisting o fAndhra Pradesh, Tamil Nadu,Karnataka and Kerala, accounted for about 60% o f the irrigated area under tanks in the country Besides these, Madhya Pradesh,Maharashtra, U P and West
Bengal also have a large number o f tanks in their resfpective States The above eight States account for about 97% o f total tank population A fresh census is needed to be made to update the data alongwith improvement both quality amd scope-wise
4 2.62 While pi ecise statistics o f tanks that have gone out o f use due to various reasons arenot presently available, the figures show that in 19(62-63, the area under tank irrigationreached an all-time high o f 47 8 lakh ha which camte down to 30 7! lakh ha in 1985-86 inspite o f addition o f thousands o f new tanks during tlhis period It clearly indicates that the upkeep o f the tanks has not been attended to properly From the planning point o f view, the estimation is o f importance that if just 3% o f total land area is used for making such tanks/ponds, it can usefully store about 10% o f ouir total rainfall, i e , about 400 billion cubic meter (BCM) o f water per year
4 2.63 The basic strategy for development and optimum utilisation o f minor irrigationworks during the Ninth Plan will be as under -
(i) Restoration and improvement o f minor irrigati<on tanks as well as the development o f new works as a part o f the integrated micro-develo»pment projects will be encouraged
504

The first census (1986-87) of Minor llrrijgation schemes showed that there were 5,07,212 minor irrigation ta i^ in use in the country (except Rajasthan where no census wais done). The southern region consisting of Ajidhra Pradesh, Tamil Nadu, Karnataka andl Kerala, accounted for about 60% of the irrigatted area under tanks in the country. Besides? these, Madhya Pradesh, Maharashtra, U P amd West Bengal also have a large number of tanks int their respective States The above eight States accoimt for about 97% of total tank popujation. A fi-esh census is needed to be made to update the data alongwith improvement both quality and scope- wise.
Minor Irrigation Tanks(ii) Priority should be accorded to the completion o f ongoing schemes and the taking up o f new irrigation schemes should be within the availability o f financial resources and with the priority for drought-prone areas
(iii) Formulation o f ground water development strategies should be based on sound technical, environmental and economic considerations Overexploitation o f ground water should be discouraged and necessary corrective measures in this regard should be implemented
(iv) Periodic evaluation o f the socio-economic and environmental impacts o f ground water deveiopmemt will be carried out to ascertain the changes between pre and post iimplementation stage o f ground water schemes
(v) Census o f ground wate;r extraction structures once in five years and a programme for rehabilitatiion o f ground water structures will be taken up
(vi) Involvement o f communiity organisations and NGOs in the management of ground water should be encouraged through legal, financial and policy backups.
(vii) The overall efficiency of' the pumping system, will be improved so as to conserve energy and optimiise water use
(viii) The installation o f sprinlklers/drip irrigation system should be emphasised, particularly, in water-scarce and drought-prone areas Necessary changes in cropping patterns, as well as crop diversification, should also be encouraged in favour o f How water consuming crops, in lieu o f waterintensive crops, particulariy in water- scarce areas
(ix) Conjunctive use o f surfac:e and ground water should be encouraged
(x) There is a need to create piublic awareness on the quality and judicious use o f ground water Such awaremess is also essential to take regulative measures for ground water developiment and management
(xi) Encouragement should be given to privately or cooperatively owned/managed tubewells; vis-a-vis public owned/managed tubewells
GROUND WATER
Overview
4.2.64 Ground water plays a crucial role in agricultural development o f our country With the advent o f high-yielding vairieties and the em phasis on spread o f m odern technology, the importance o f adequaite, timely and assured irrigation in accelerating agricultural production has been recogniised in the successive development Plans
505
The contribution o f ground water r esource to irrigated agriculture, with about 17 milHon energised wells nationwide, is now ais high as around 50 per cent The share o f ground water irrigation is nearly half o f total irrigated area in the country' and with its higher agricultural productivity, the groumd water irrigation contributes significantly to the country's total agricultural output lin addition, ground water is the primary source o f water availability in. drought years Nearlyy 80 per cent o f rural water supply and over 50 per cent o f urban and industrial water supply demand is met from ground water resource
4 2 65 As per the re-assessment irecently made by the Ministry o f Water Resources, the total annual utilisable ground water resource o f the country is tentatively placed at 43 19 million hectare metres (mhm) Besiides the provision o f 7 09 mhm (16 4%) for domestic, industrial and other uses, the groiund water resource available for irrigation comes to 36 08 mhm, o f which the utilisable quantity is 32 47 mhm, i e , about 90%, with which the total irrigation potential is» estimated at 64 05 million hectares (mha ) The stage o f creation o f irrigation potenttial through ground water development upto the Eighth Plan has been about 70 per cent o f thie uhimate irrigation potential which shows that there is considerable scope for further dev'elopment o f this resource in a judicious manner In this regard, CGWB has assessed that thejre is a feasibility o f installing 9 1 million ground water structures (6 4 million dug wells, 2 6 million shallow tiibewells and 0 1 million deep tubewells in the Eastern region o f t:he country The availability o f replenishable ground water potential in this region an»d the above structures put together can provide irrigation potential o f about 20 m ha out o f which about 14 m ha is from shallow and deep tubewells
4 2.66 During the last four decades, there has been a phenomenal increase in the growth o f ground water extraction structures in the country During the period 1951-1992, the number o f dug wells increased from 3 86 million to 10 12 million, that o f shallow tubewells from a mere 3000 to 5. 38 million and public tubewells from 2400 to 68000 Similarly, the number o f electric: pumpsets increased from 21000 to 9 34 million and diesel pumpsets from 66000 to about 4 59 million. Further, it is anticipated that 116 million dug wells, 114 million shallow tubewells and one lakh deep tubewells have been added during the Eighth Pllan period Similarly, the number o f electric pumpsets and diesel pumpsets is anticipated to have increased by 2 02 and 0 4 million respectively during this period
4.2 67 Out o f the 7063 Blocks/Maindals/TalukasAVatersheds in the country, 283 have been categorised as 'Over-exploited', whiich is also known as "Red" blocks, i e the stage o f ground water development excee(ds the annual replenishable limit and 145 are 'Dark' i e the stage o f ground water developmient is more than 85 per cent Further an analysis shows that during the period 1984-85 to 1992-93, the number o f "over exploited" and "Dark" blocks had increased from zero to 3iO in Andhra Pradesh, from 6 to 26 in Gujarat, from 3 1 to 51 in Haryana, from 3 to 18 in Karnataka, from zero to 3 in Madhya Pradesh, from 64 to 70 in in Punjab, from 21 to 56 in Rajasthan and from 61 to 97 m Tamil Nadu Whereas it decreased in Bihai from 14 to 1 aind in U P from 53 to 3 1 Thus in the above 10 States the overall increase in "over-exploited" and 'Dark' blocks during the period (19 8 4 - 9 1 ) in the country was from 253 to 383, w'fhich is about 51% and this works out to a compound growth rate o f about 5 5% per aninum If this trend and the rate o f ove r -e \p lo i ta t i on continues, it is estimated that by 2020 A D about one-third o f the total o f the 4272 blocks
506

(excluding Mandals/TalukasAVatersheds) listed as ab)ove may turn "Red" or over- exploited and "Dark" In this situation, regulation of ground water extraction has become imperative
Regulation of Ground Water Extraction
4 2.68 To avert this situation it is necessary that groumd water development is regulated on a scientific basis that permits only judicious development of the resource The control, so far being exercised, was in the form of indirect admimistrative measures by institutional finance like technical clearance of the scheme by authonised ground water Departments in various States who in turn would look into the water avail.ability aspects and some spacing criteria between two ground water structures The other methods of indirect control could be the denial of power connection for the pumpsets and/or loans fî om banks
4 2 69 To ensure regulation of ground water in a sciemtific manner, the Government of India had prepared a model bili in 1970. Subsequently, the same was revised in 1992 by incorporating the conmients fî om a few States aand circulated to all the States in June, 1996 but only a few States like Gujarat, Tamil Naidu, Madhya Pradesh and U T of Pondicherry and Karikal and Maharashtra have enacted ground water legislation and that too for a particular area or for a limited purpose in their States, whereas a few others are still contemplating. In the meanwhile, the HonTiie Sup>reme Court had passed an order in 10 12.96 disposing off an inter-locutory application wheirein the direction was issued to the Ministry of Environment & forest (MOEF), to comstitute the Central Ground Water Board(CGWB) as an authority under section 3(3) of the Environment Protection Act, 1986 who shall exercise all the powers under the Act necessaryy for the purpose of regulation land control of ground water management and developmemt In pursuance of this direction, the MOEF has issued a notification dated 14 197 constituiting the CGWB as an Authority for a period of one year. The authority shall exercise the j powers and perform the functions as follows :
(i) Exercise of powers under section 5 of thie Environment (Protection) Act, 1986 for issuing directions and taking; such measures in respect of all the matters referred to in sub-section(2) caf Section 3 of the said Act
(ii) To resort to the penal provision contained in section 15 to 21 of the said Act.(iii) To regulate indiscriminate boring and withdrawal of ground water in the
country and to issue necessary r^latory diirections with a view to preserve and protect the ground water.
The modus-operandi of the functioning of Central GJround Water Authority is being worked out
COMMAND AREA DEVELOPMENT PROGRAMME
Overview
4 2 70 The Command Area Development Programme (CAD>P) presently covers 203 projects, with CCA of about 21 m.ha in 22 States and 2 UTs. However, upto March, 1995, a total irrigation potential of 14.94 million hectares was createcd in the projects under CAD Programme and the corresponding utilisation was 11 98 mii 11 ion hectares There has been
507
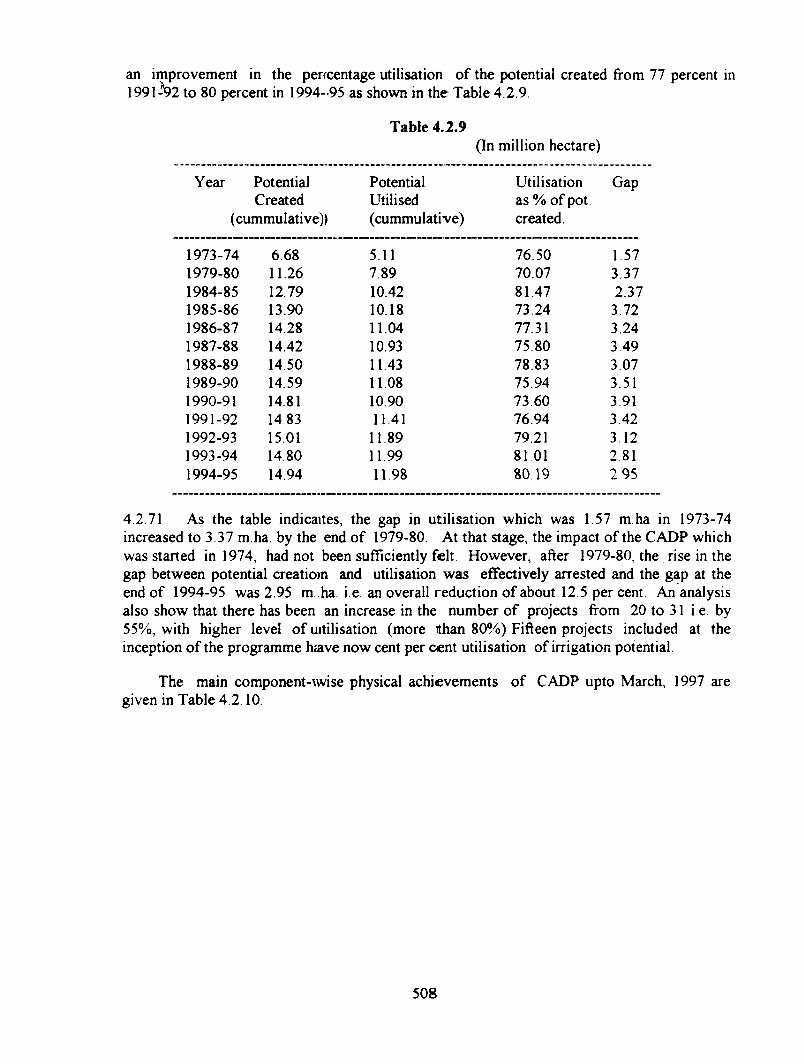
an improvement in the perfcentage utilisation of the potential created from 77 percent in 1991-^2 to 80 percent in 1994-95 as shown in the Table 4.2.9
Table 4. 2.9(In million hectare)
Year Potential Created
(cummulative))
PotentialUtilised(cummulative)
Utilisation as % of pot created.
Gap
1973-741979-801984-851985-861986-871987-881988-891989-901990-911991-921992-931993-941994-95
6.6811.2612.7913.9014.2814.4214.5014.5914.8114.8315.01148014.94
5.117.8910.42 10.18 11.04 10.9311.43 11.08 10.90 11.41
11.89 11 99 11 98
76.5070.0781.4773.2477.3175.8078.8375.94 73.6076.94 79.21 81 01 80 19
1.573.372.37 3.72 3.24 3 49 3.07 3.51 3 91 3.42 3.12 2 81 295
4 2 71 As the table indicaites, the gap in utilisation which was 1.57 m.ha in 1973-74 increased to 3.37 m.ha. by the end of 1979-80. At that stage, the impact of the CADP which was started in 1974, had not been sufficiently feh However, after 1979-80, the rise in the gap between potential creatiom and utilisation was effectively arrested and the gap at the end of 1994-95 was 2.95 m. ha. i.e. an overall reduction of about 12 5 per cent An analysis also show that there has been an increase in the number of projects f̂ om 20 to 31 i e by 55%, with higher level of uitilisation (more than 80%) Fifteen projects included at the inception of the programme have now cent per cent utilisation of irrigation potential
The main component-\wise physical achievements of CADP upto March, 1997 are given in Table 4.2.10.
508

Item
Table 4.2.10
During the period 1974-92 1992-97
(In m ha )
TTotal upto the end o f VIII Plan
1
I Physical(i) Construction of
Field Channels(ii) WARABANDI
(iii) Land levelling(iv) Field drains
II Financial( Rs. in crore )
(a) Central Sector Expd(b) State Sector Expd
12 19
6 12 1 99
0.59
1081.222091.73
1.77
2.52 Oil 0 19
607 07 1458.77
13 96
8 64 2 10 0 78
168829 3550 50
Total 3172 95 2065 84 5228.79
4.2 72 Yearwise and Statewise details of expenditure diuring 8th Plan are indicated in Annexure-4 2 8
4 2 73 The physical progress achieved in respect of constructiion of field channels has been very high but in the case of WARABANDI, it has beejn moderate viz, about 60% of the area covered by the field channels Again, the prcDgress in construction of field drains has been only 0.78 m ha (against 13 96 m ha of fiehd channels) which works out to about 5.5% only and major share of this is in the State of Maharashtra (0 28 m ha) and U P. (0 21 m ha). About 92% of the total achievement off land levelling is in Andhra Pradesh, Gujarat, Karnataka, Maharashtra and Rajasthan Due to proper levelling of land and its shaping, the cost of OFD work is reduced, besides saving of water and improvement in productivity Therefore, there is a need for co-ordinated and paripassu implementation of all the OFD activities on field so as to reallise the optimum benefits from the CAD Programme.
4 2 74 Farm roads although included in CADP package, is not a part of the Centrally Sponsored CAD Programme ̂As such, monitoring of this :activity is not being done by the Ministry of Water Resource ̂ But wherever needed, it is now being undertaken through the State sector In the case of ̂ he Chambai Project in Rajasthian, farm roads, which act as approach roads to the farmers, have been executed for transsporting inputs to the field and bringing out the produce without any difficulty The roads are being provided along the field drains with a width of 3 metres and height of 30 cm on either side of the drain raised above the surrounding terrain They are not being proAvided along the water courses because continuous weathering of farm roads/tracts due tto traffic and non-availability of earth for their maintenance near water courses and also because of the chances of earthem water course sections becoming unstable due to disjbursance of soil on account of traffic In the case of IGNP in Rajasthan, the provision of rcoad as a means of access to the vast desert area was regarded as essential and a prerequisite for the utilisation of irrigation
509

potential created and carriage o f inputs and far m produce etc Since 1974-75 till the end of Eighth Plan, about Rs 110 crore have been spent on this component Similarly, in Madhya Pradesh also, Rs 30 60 crore have been spent during the Eighth Plan for development of farm roads
4 2 75 rh e su r \ e v o f rele\ ant legal pro\ isio ns in the existing Irrigation Acts :n \arious States shows that most o f the States do not have OFD works included in their Acts For want o f this, the CADP is being implemented by o btaining willful possession of land from the concerned farmers for which no compensation is paid to them In such a situation, several issues crop up like field channels being undone after sometime without any check and also the field channels being generally aligned on field boundaries resulting in longer zig-zag length and thereby causing higher convey&'ance loss and cost o f implementation etc Consolidation o f holding is another activity whiach needs attention by the States To account for the above situations, legal back-up to CADDP is needed. For example, the North India Canal and Drainage Act, 1873, (as applicable j to the States o f Punjab, Haryana and Uttar Pradesh), the Bengal Irrigation Act 1876 appplicable to Bihar and West Bengal), the Bombay Irrigation Act 1979, the Rajasthan Inrrigation and Drainage Act, 1954 and Orissa Irrigation Act do not provide for direct/effectivve OFD works as well as involvement o f the beneficiaries in overall management and adminisistration o f irrigation systems Further some o f the State Irrigation Acts provide for peop le's participation only in a limited way Therefore, the State Irrigation Acts are requ ired to be suitably and comprehensively amended to cover OFD works and farmoer's participation through Water Users’ Associations in proper perspective
Measures for improvement
4 2 76 During Ninth Plan drainage o f wateri pgged areas which is already in CSS C.ADPwould be accelerated. In addition the moodernisation and upgradation o f old irrigationsystems would be taken up under this progr amme as both the above activities are very critical for sustenance and optimum utilisation o f created potential
4 2 77 In order to improve the implementation and performance o f the CADP, the following steps are needed :-
(i) There is a need for coordinated a and paripassu implementation o f all the OFD activities in irrigated Commanods In addition, better integration o f the engineering, agriculture and ex :tension functions in managing the system is needed
(ii) The monitoring o f CADP sho uld be done in such a manner that theevaluation, with the tangible indicators o f performance, is carried out on a continuing basis for selec ted projects preferably representative o f eachregion and corrective measurers taken accordingly from time to time
(iii) Either the existing Irrigation . Acts should be suitably amended or a special legislation should be enacted to provide for legal support to Participatory Irrigation Manaagement
5 ! 0

FLOOD CONTROL
Flood Management - An Overview
4 2 78 In general, substantial areas in the I North-Eastern and eastern sectors in the country are afTected by chronic and severe floods ccaused by mightv rivers like the Brahmaputra and the Ganges and the coastal areas by sea i erosion and cyclones, etc The flood prone area in the country, as assessed by the Rashtriya B3arh Ayog, is 40 m ha i e l/8th o f the country's geographical area, out o f which about 32 i m ha can be provided with reasonable flood protection by various measures The Nationnal Programme of Flood Management was launched in 1954 It is estimated that an area a o f 14 2 m ha has been provided reasonable degree o f protection as a result o f consistruction of 16199 kms new embankments, 32003 kms drainage channels, protection to 906 towns/important villages and raising 4721 villages above flood level at the begginning o f the Eighth Plan (excluding 3 m ha already existing before 1954) During thee Eighth Plan the additional area benefited is estimated at 1 82 m ha against the (revised) I target o f 1.366 m ha Thus, at the end o f Eighth Plan, a total area o f 19 02 m ha (including 33 M ha before 1954) has been provided with reasonable flood protection which is abouut 59 4% of the total area protectable in thecountry The State-wise outlays and the lilikely expenditure during the Eighth Plan withoverall anticipated expenditure o f Rs 1867' 31 crore are given in Annexure-4 2 9 The States o f Andhra Pradesh, Arunachal Pradeesh, H P , Assam, Haryana, J & K, Karnataka,Kerala, Manipur, Meghalaya, Orissa, RajaSiSthan and Tripura have, bv and large, spentmore than the approved outlays
4 2 79 On the basis o f the statistics from 19953 to 1994, the total area affected annually on an average is about 7 56 m ha and the cnropped area is about 3 53 mha with as high as 10 45 m ha in year 1988 On an average, 1504 human lives are lost every year due to floods with 11316 lives lost in the year 1977 ' The total loss on account of flood damage to crops, houses and public utility is estimateed at Rs 41250 crore during the period 1953 - 1994. The maximum flood damage, as estimaated, was of the order o f Rs 4690 crore in the year 1988 The following Table 4 2.11 showA S the Plan expenditure, relief (for floods and cyclones) expenditure vis-a-vis the average ddamage which brings out that the expenditure for flood measures in the corresponding yeanrs is quite less than the expenditure on relief measures
Table 4.2.]. 11
Year Plan Relief Total Average damageexpdr expdr (2-3 ) (from [953 to the year)
1 2 3 4 5
1992-93 330 16 893 30 1223 46 977 851993-94 364 19 564 00 928 19 962 341994-95 308 82 630 00 938 82 982 131995-96 348 67 729 40 1078 07 -
1996-97 542 65 - - -
511

Snow Melt Contribution to River Discharge/Floods
4 2 80 It has been observed that the river discharge o f Himalayan snow-fed ri\ ers o f a unit area is roughly twice that o f peninsular contribution from snow meltmg and glacial drainage In the case o f glacial streams o f Punjab rivers, it was found in the Sutlej basin that the snowfall was best related with the longitude, therebx shouinu the etTecl ofwesterlv wind of w inter precipitation In the case o f the Chenab river system, the data showed that the total annual precipitation was poorly related with the elevation but the ratio o f rainfall to snowfall decreased with the increase o f elevation As far as quantitative estimation o f snowmelt contribution to the river discharge is concerned, though no definite conclusions may be drawn from the available studies, the annual contributions from ground snowmelt (March-June) may be roughly taken as around 20%, while the melt contribution o f snow on glacier ice during July-Sept may be about 50% o f the annual stream flow respectively Further, it is also to be noted that the latter component o f snowmeh contribution continues throughout the year making the river perennial The period from April to September is accelerated snowmelt period contributing large inflows to the streams, while October to March is the period when snowmelt is delayed and its contribution to the annual volume is small
Flood Forecasting and Warning and Dissemination of Forecasts
4 2 81 Flood forecasting and prior warning to flood prone areas are among the most important and cost-effective measures for flood mai\agement The Central Water Commission has set up a network o f flood forecasting and warning stations, covering most o f the inter-State rivers in the country The forecasting network needs to be extended to the remaining flood-prone rivers, ensuring close coordination and effective participation o f India Meteorology Department (IMD), National Remote Sensing Agency (NRSA), Indian Space Research Organisation (ISRO) for using to the best the remote sensing technique and telemetry The existing arrangements to make the forecasts reach the people in advance o f the actual flood need to be strengthened Currently, 157 flood forecasting stations are in operation and nearly 7500 flood forecasts are issued every year These forecasts are normally issued 24 to 48 hours in advance so as to give sufficient time to the concerned civil and engineering department authorities for dissemination o f information, for providing relief and rescue measures to people, as well as for protecting important engineering works/structures But much more is required to be done to improve the hydrometeorological networks, automation in data communication, accurate forewarnings, instant dissemination o f forewarnings, and modernisation o f the flood forecasting system for automatic data acquisition and transmission through \TTF and satellite The flood forecasting model MIKE II for water level forecasting and flood management technique on real time basis has been developed (although the co-relation o f the water level with the extent o f spread o f flood is still to be incorporated) and made operational in Damodar Catchment covering the system reservoirs Yamuna and Upper and Lower Godavari Basins The experience gathered from these works would be helpful for similar application in other basins
Strategy during Ninth Plan
4 2 82 The broad strategies/approaches for flood management consist o f (i) modifving the course o f flood in order to keep the flood waters away from development areas (ii)
512

removing the susceptibility to flood damage by keeping ouit o f the flood-prone areas, the people and development subject to damage (iii) miniimising the extent o f loss by reducing the financial and social impact of flood throughi some measures and (iv) living with floods. Keeping this in view, the strategy for implermentation o f flood management during the Ninth Plan would be as follows -
(i) Flood management coverage to additional! f lood prone areas v\ith due prioritisation/ phasing o f flood prone areas
(ii) Structural measures in combination with non-stiructural ones to be considered in the context o f flood management in a regiion/basin
(iii) Prioritisation/phasing o f works/region(s) to b e worked out with respect to the frequency o f flooding, its extent, sever-ity and damage potential etc and regions/areas delineated on flootd risk maps accordingly in each basin/sub-basin
(iv) Systematic survey to assess the cause((s), extent and nature o f waterlogging, saline and alkaline lands in irrigated commands on a priority for undertaking diagnostic measiures
(v) Investigation in detail by the States for realistic assessment/evaluation o f the measures for flood management suggested in various master plans o f the river basins/ sub- basins prepared at the prfe-feasibility level
(vi) Further extension of the coverage of flood forecasting and warning system and dissemination o f information in the quiickest possible manner covering the widest cross-sections of the population in the flood-prone areas
(vii) Undertaking on a priority basis adequate m<aintenance and restoration o f the created assets to ensure sustenance o f acc:rual o f the envisaged benefits
PARTICIPATORY IRRIGATION MANAGEMENT PROGRAMME
Background4 2.83 After independence, the need for expansion o f irri’gation facilities was fully recognised for increasing foodgrains production to meet thte growing requirements o f the population. Despite this, the expansion o f irrigation facilities, operation and maintenance o f irrigation system and distribution o f water have not received due attention Irrigation sector is today facing the twin issues o f sub-optimal sector planning and financial management on the one hand and inad(equate water management and maintenance on the other. Involving the farmers in the irrrigation systems is one obvious remedy for addressing the management problems The Ilrrigation Enquiry Committee, 1938 also known as Visvesvaraya Committee, had recomimended entrusting o f irrigation to a village or group o f villages if the farmers were willling to take up cooperative irrigation. The Command Area Development Programme started in 1974 envisaged the participation o f farmer organisations fi-om the start a‘s necessary to run the micro system. The Sixth Plan emphasised the need for parti(cipation o f farmers in the scientific management o f water resources The Seventh Plan reiterated the need for participation o f farmers in the management o f irrigation Thie National Water Policy, 1987 also stressed the involvement o f farmers in various aspects o f the management o f the irrigation system particularly in water distribution and collection o f water rates The Committee on Pricing o f Irrigation Water (1992) also recomnnended farmers participation in the management o f irrigation systems
513

4.2 .84 Inspite o f the growing reallisation o f the urgent need for farmers'participation in the management o f irrigation, the; progress has been slow so far It is estimated that today only 8,04,000 hectares arte being managed by WUAs The Table 4 2 12 provides some idea about the extent and performance o f farmers'organisations in a few selected States:
4.2.85 Amongst the major reasons considered to be responsible for the tardy progress in the implementation o f the PIM, 'are (a) the prolonged prevalence o f government- managed systems has sapped the initiative o f the farmers and made them dependent on the Government, (b) non-avaiilability o f funds for PIM At present flinds are available to a small extent undeir CAD programme as one-time subsidy to the WUAs(c) the farmers are reluctant tco adopt participatory approach unless deliveries of water can be made flexible, praictical and responsive to the need, (d) there are apprehensions in the minds o f fairmers that under the new system they might have to incur expenditure on operation aind maintenance in addition to increased water rates, (e) there is often a lack o f homogenteity in the composition o f farmer population and they
Table 4.2.12 Water Users Association
State No. ofWUA Area covered (ha.)
A P 32 17388Assam 30 15000Bihar 1 12197Gujarat 477 48500Karnataka 196 38400Kerala 3432 137280Madhya Pradesh 67 62800Maharashtra 118 48095Orissa .52 27589Tamil Nadu 276 13800West Bengal 10000 37000
are reluctant to come together, bejcause o f differences o f castes and classes, to form an associatipn; (f) the present inistitutional arrangements are not conducive to the introduction o f PIM Properly oiriented, trained and motivated officials to implement this programme are lacking and there is no dedicated wing for this purpose, (g) lack of an enabling law for the estab)lishment o f WUAs is an important impediment in the introduction o f PEM. There is a need to have a separate law for the formation o f Water User Farmers' Associations (W U A s) However, till such time as such a law is enacted, any existing law like State Irrigattion Act could be used with necessary amendments to define the rights and obligations cof the WUAs
514

4 2 86 The Union Government has taken several initiaatives for expanding the PIM in thecountry These, inter-alia, include a National Conference on PIM, held in New Delhi from June 19-23,1995, which adopted a plan o f action envisatging conferences at State level for creation o f awareness and understanding o f issuers, initiation o f measures for legal changes necessary to implement PIM, preparation o lf manuals, training o f farmers and officials etc Following the recommendations o f the N;ational Conference State/Regional Level Conferences were held Training programmes arfe conducted on PIM at the National level for officers and at State level for officers and fairmers Work on the preparation o f manuals for PEM in regional languages has been initialed The Ministry is in the process o f proposing amendments to the irrigation Acts o f Staites to give legal status to Water Users Association The Ministry has requested the Suate Governments to set up a High Level Group under the Chairmanship o f Chief Secrettary to prepare policy guidelines for implementing the PIM The Governments o f Gujarat, Hiimachal Pradesh, Karnataka, Kerala, Orissa, Rajasthan, Tamil Nadu and Uttar Pradesh hav*e already set up such High Level Groups The Planning Commission had set up a Workinig Group on Participatory Irrigation Management for the Ninth Plan.
4.2.87 The role o f the NGOs in bringing members off different communities together is quite important They can assist the Associations in orfganising themselves, drawing up the bye-laws, getting registered as societies, devising’ rules o f working together, maintaining books o f accounts, conducting meetings and! so on They can lend support to the Associations in their dealings with the agencies o f tlhe State
4 2.88 For successful implementation o f the PIM, the following aspects need special attention.
(a) Legal aspects -Appropriate Legislative b)acking should be provided as early as possible.
(b) Institutional aspects - High Level (Committee should be set up toformulate policies for the implementation o f PIM and review policy issues from time to time A Standing Committee for operational andmonitoring purposes should be set up In addition, there is a need for aseparate wing for PIM in the Departmemt o f Irrigation or Command AreaDevelopment The setting up o f traininig and research institutions likeWALMIS where they do not exist has beeen suggested Employment o f Community Organisers for motivatiing the farmers and later working with them in setting up WUAs has ailso been suggested There is a need to create a separate multi-disciplinairy wing for PIM in the Ministry of Water Resources in Government o f Inidia The setting up o f National Support Group for PIM can also be consiidered
(c) Financial Aspects - There is an urgent nteed to ensure that during Ninth Plan the PEM programme is prominenttly highlighted and adequately funded Under the Centrally Sponssored CAD Programme, the initial management subsidy o f Rs.275 per hia which was earlier available has been changed to a functional grant o f R‘s 500 per ha o f which Rs 225 each would b ̂ borne by Central and State Governments and Rs 50 by the farmers' association Also, non-CAD aind non-external assistance areas would need some consideration for tlhe functional grant if the PIM is implemented in such areas
515

4 2 89 A s p er the W ork ing G roup R eport, the physical program m e o f at least 2000 pilot p ro jec ts shou ld be taken up in the N in th Plan Som e additional pilot p ro jec ts can also be tak en up in the areas w here som e u p g rad atio n and m odernisation ot' the system s have a lready been com pleted under the N ational W ater M anagem ent P rogran in ie -P h ase-I and the W ater R esources C o n so lid a tio n Project The num ber o f p ilot pro|ect.s tak en up shou ld be p rog ressive ly increased from year to year and should add up to 2000 by th e end o f the P lan
4 2 .9 0 T here is also a need fo r constan t m on ito ring and evaluation o f the perfo rm an ce o f th e W U A s fo r the success o f the p ro g ram m e and for its replication in o th er areas
SPECIAL ACTION PLAN
4 2 91 In p u rsu an ce w ith the P rim e M in is te r’s ad d ress on 22"“̂ M arch 1998 (p a ra 4 2 38) a specia l ac tion p lan re levan t to set goal has been envisaged w hich has th ree -p ro n g ed strategy , i e , op tim isa tio n o f ex isting irrigation capacity u tilisation , ex pansion o f irrig a tio n fac ilitie s th ro u g h a tim e-b o u n d p ro g ram m e including exp lo ita tion o f g ro u n d w ater po ten tia l in the E astern R egion and effec tiv e harnessing o f in ter-state river w a te rs B esides th e above v ig o ro u s national cam p aig n needs to be launched through m ass education and pub lic aw aren ess using the elec tron ic and prin t m edia to convince the people that w a te r is a p rec io u s yet fm rte national re so u rce and th e re fo re it should be used m ore lud ic iouslv b \ tap p in g v ario u s effic ien t w ater sav ing p rac tices in agriculture, industry and to r dom estic uses, etc O p tim isa tio n o f ex isting irrigation cap ac ity includes renovation & m odern isa tion o f old irrig a tio n projects, accelera ted ch an g eo v er from land irrigation to crop irrigation at least in arid and sem i-arid areas, ren o v atio n /resto ra tio n o f old tanks alongw ith creation o f new tanks in v illages and tow ns and p rom otion o f m icro irrigation s \s te in s i e sp rink ler and drip irrigation , particu larly in w a te r short a reas E xpansion o f irrigation fac ilities include tim e-b o u n d co m p le tio n o f ongo ing p re -S ev en th Plan 108 m ajor and 176 m edium irrigation p ro jec ts as w ell as d ev e lo p in g g ro u n d w ate r po tential o f 1 5 lakh ha (out o f v ast g round w a te r po ten tial o f abou t 20 M ha) as ava ilab le in the eastern re-jion P ricing o f w ater for v a rio u s u ses is to be ra tiona lised so as to atleast fijlly recover the O & M cost o f irrigation system by the year 20 0 1 -0 2 R equ isite funds for regu lar and proper m ain tenance o f ex isting irrig a tio n sy stem s by setting apart certain p e rcen tag e o f plan and non-p lan funds in the S ta te B u d g e t every year is a lso to be ensured In the con tex t o f effective harnessing o f in te rs ta te river w a te r ava ilab le legal in s tru m en t i e In tersta te R iver W ater D ispu tes Act, 1956 and In te r-S ta te R iver B oard A ct, 1956 w ould be m ade m ore effective th ro u g h suitable am en d m en ts ensu rin g thereby the p ro cess o f ad judication o f in te r-S ta te river w ater d ispu tes, tim e-b o u n d p rocess S im ilarly , the in ter-S ta te River B oard Act is to be suitably m od ified to m ake it effective and m eaningfu l on the one hand and p rov ide un fe tte red au th o rity to the C entral G ovl to set up in ter-S ta te R iver Boards equ ipped w ith the sta tu to ry au th o rity on the o ther A co m p reh en siv e act is also required for regu la tion and d ev e lo p m en t o f ground w ater on susta inab le basis both in public and p riv a te sec to r E q u ally essen tia l and u rgen t need is to create public aw areness for ju d ic io u s w ate r use on one hand and to go for w ater conserv 'ation includ ing rain w ater harvesting on the o ther th rough e lec tro n ic and p rin t m edia cam paign
Ninth Plan Programme
516

A n n e x u r e - 4 . 2 . 1
Region-wise Status of Irrigation Development in India
SI No. Region
1. Eastern2. North-Estern3. Northen4. Southern5. Western
Total 6 U.Ts.
Geographical Area in(Sq.km.)
425432.00255083.00
1009133.00635757.00950885.00
3276290.00 10973.00
Total population (1991 census (in '000 ha)
186518.0031547.00
232754.00196442.00187598.00834859.0011444.00
TotalCultivable area as% Area of geogra- (in 000 Ha) phical area
Cultivable Total Ultimate Irrgn. Potential (U.I.P.) in th. ha.)
24990.00 6340.00
56381.0039531.0056506.00
183748.00208.00
6
58. 74 24. 85 55.87 62.18 59.42 56.08 18.96
Major & Medium7
12420.00 1235.00
21550.0010000.00
13162 ._0_0_ 58367.00
98 ■ 00
Minor Irri Surface8
16718.00 3011.00
26267.0015445.0019941.0081382.00
46.00
Total
10
29138.00 4246.00
47817.0025445.0033103.00 139749.00
188.00
U.I.P.as% of geogra phical area11
68.49 16. 65 47 . 38 40.02 34.81 42 . 65 17.13
U.I.P.as % of total ultivabl area12
116.6066.9784.8164.37 58. 58 76.0590.38
U.I.P.per 1000 populatio in ha.
13 156.22 134.59 205.44 129.53 176.46 167.39 16. 43
GRAND TOTAL 3287263.00 846303.00 183956.00 55.96 58465.00 81428.00 139937.00 42.57 76.07 183.82
Eastern. Orissa, W.B.,Bihar,Sikkim.North Eastern Arunacnal Pradesh, Assam, Manipur, Meghalaya, Mizoram,, Nagaland Tripura Northen Haryana Himachal Pradesh, J & K, Punjab, Rajasthan, Uttar PradeshSouthern Andnra Pradesh, Karnataka, Kerala, Tamil NaauWestern Goa, Gujarat, Maharashtra, Madhya PradeshU.T.'s Andaman&Nico,Delhi, Dadar & Nagar Haveli,Daman &Diu, Pondicherry, Chandigarh, Lakshadweep
Annexure-4 . 2 .1 (concld.)SIM»-n
Region Irrigation development upto March 1997 (in th.ha.) % of Achievement with respect to u . i : P .
JNO .
MaiGt 5 Me Minor Ifrigatio TotalPot. Utl. Pot. Utl. Pot . Utl. Pot. Utl.14 15 16 17 18 19 20 21
T Eastern 5804.33 5099.38 9709.31 8398.23 15513.64 13497.61 53.24 46.322. North-Estern 261.97 192.47 954.67 793.83 1216.64 986.30 28.65 23.233 . Northen 14108.77 12653.51 31472.17 29567 .10 45580.94 42220.61 95.32 88.304. Southern 6769.94 6365.30 7121.22 6824.72 13891.16 13190.02 54.59 51.845 . Western 5993.62 4120.72 7232.54 6620.51 13226 . 16 10741.23 39.95 32.45
Total 32938.63 28431.38 56489.91 52204.39 89428.54 80635.77 63.99 57 . 706 U.Ts. 18. 51 9.29 111.90 104.05 130.41 113.34 69 . 37 60.29
GRAND TOTAL 32957.14 28440.67 56601.81 52308.44 89558.95 80749 . 11 64.00 57. 70
5 1 7

Ninth Five Year Plan 1997-02(Rs. in crore)
Annexure-4.2.2
SI.No.
Name of States & U.Ts.
A G R E£ E D O U T L A Y
— --------Major & Minor CAD Flood TotalMedium Control
1 2 3l 4 5 6 7
1 Andhra Pradesh 5027 16, 775.73 76.50 127.41 6006.80
2 Arunachal Pradesh 2.301 202 48 5.65 69.52 279.95
3 Assam 135.12 429.99 25.07 120.24 710.42
4 Bihar 1450.00 725.00 125.00 400.00 2700.00
5 Goa 237.02 27.31 7.31 6.461 278.10
6 Gujarat 7368.00 963.55 50.00 10.00 8381.55
7 Haryana 1372.43 172.13 68.22 60.41 1673.19
8 Himachal Pradesh 35.00 196.55 7.30 20.00 25R.85
9 Jammu & Kashmir $ 183.00 156.00 23.50 85.00 447.50
10 Karnataka 5500.00 500.00 120.00 50.00 6170.00
11 Kerala 650.00 250.00 40.00 88.00 1028.00
12 Madhya Pradesh 1915.76 782.90 18.69 4.67 2722.02
13 Maharashtra 8969.06 1568.56 388.46 2.70 10928.80
14 Manipur 222.00 44.00 12.60 42.00 320.60
15 Meghaiaya 15.00 60.00 5.00 18.00 98.00
16 Mizoram 0.40 17 52 0.19 0.00 18.11
1 17 Nagaland 9.85 40.28 1 50 5.37 57.001
18 Orissa 3064.761 267.32 16.50 20.00 3388.581
19 Punjab 238.251 252.82 38447 409.70 1285.24
20 Rajasthan 1 1855.541 196.30 422.861 51.16 2525.86
21 SIklcim $ 0.00 10.00 1.00 30.00 41.00|22 Tamil Nadu 1000.00 357.65 90.00 0.00 1447.65123 Tripura 1 60.65 105.36 0.10 28.00 194.11'24 Uttar Pradesh ; 2600.12 490.00 120001 80.00 3290.1225 West Bengal 710.93 347.87 16.33| 328.44 1403.57
Total States 42638.01 8939.32 2026.15 2051.08 55654.56
26 A & N Island 0.00 5.77 0.00 4.23 10.0027 Chandigarh 0.00 0.00 0.00 1.2028 D & N Haveli 4.50 7.00 0.74 0.00 12.2429 Daman & Diu 1.60 1.02 0.30 2.191 5.1130 Delhi 0.00 13.03 0.00 120.00 133.0331 Lakshadweep 0.00 0.00 0.00 ^736 17.3632 Pondicherry 0.00 17.50 0.00 21.50 39.00
Total U.Ts. 6.10 45.52 1.04 165.28 217.94
Total States & Uts. 42644.11 8984.84 2027.19 2216.36 55872.50
* Central Sector 330.12 385.00 860.00 716.13 2291.25
Grand Total 42974.23 9369.84 2887.19 2932.49 58163.75
'The Fig.of Rs330 12crore under the Major & Medium component includes a total of Rs. 37 79 Crore for R&D and Rs.8.75 Crore for Sectt.& eco. Services.SFig Rs. 716.13 including Rs. 110.00 crore for Farkka. Barrage Project under Transport Sector.$ The Outlays indicated are proposed by the States
518
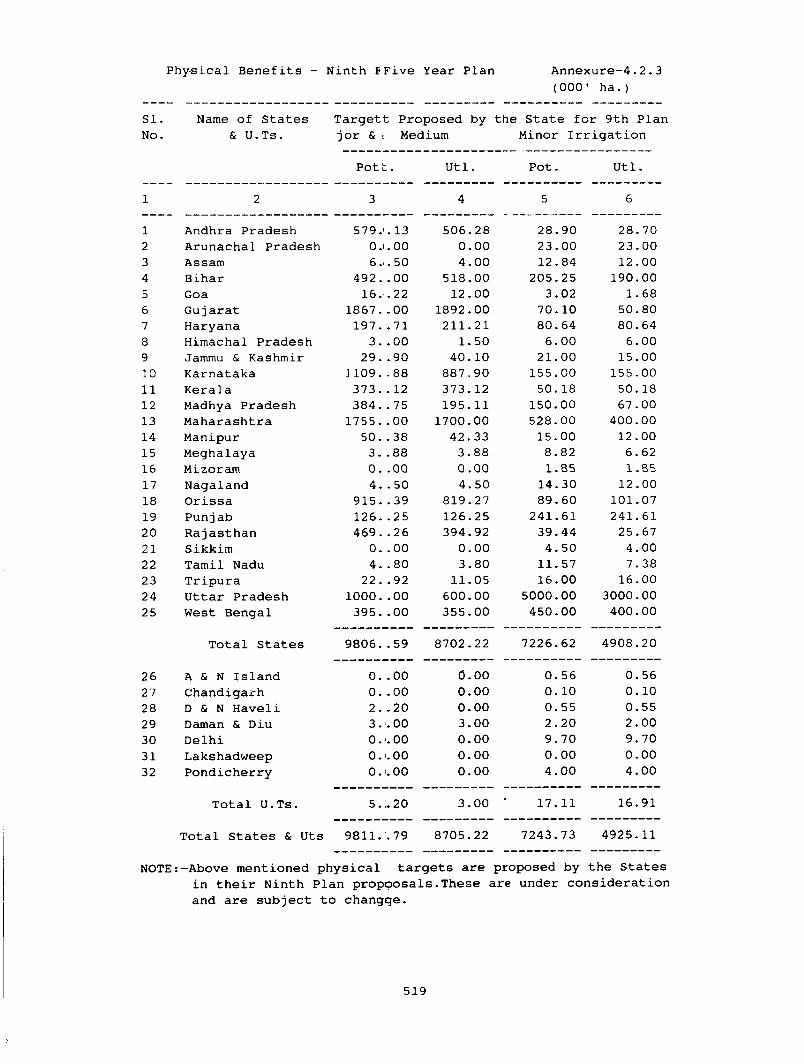
Physical Benefits - Ninth EFive Year Plan Annexure-4.2.3(000' ha.)
SI. Name of States Targett Proposed by the State for 9th PlaiNo. & U.Ts. jor & c Medium Minor Irrigation
Pott. Utl. Pot. Utl.
1 2 3 4 5 6
1 Andhra Pradesh 579.1. 13 506.28 28.90 28.702 Arunachal Pradesh 0.1.00 0.00 23.00 23.003 Assam 6...50 4.00 12.84 12.004 Bihar 492. .00 518.00 205.25 190.005 Goa 16. .22 12.00 3.02 1.685 Gujarat 1867. .00 1892.00 70.10 50.807 Haryana 197. .71 211.21 80.64 80.648 Himachal Pradesh 3. .00 1.50 6.00 6.009 Jammu & Kashmir 29. .90 40.10 21.00 15.0010 Karnataka 3109. .88 887.90 155.00 155.0011 Kerala 373. .12 373.12 50.18 50. 1812 Madhya Pradesh 384. .75 195.11 150.00 67.0013 Maharashtra 1755. .00 1700.00 528.00 400.0014 Manipur 50. .38 42.33 15.00 12.0015 Meghalaya 3. .88 3.88 8.82 6.6216 Mizoram 0. .00 0.00 1.85 1.8517 Nagaland 4. . 50 4.50 14.30 12.0018 Orissa 915. .39 819.27 89.60 101.0719 Punjab 126. .25 126.25 241.61 241.6120 Rajasthan 469. .26 394.92 39.44 25.6721 Sikkim 0. .00 0.00 4. 50 4.0022 Tamil Nadu 4. .80 3.80 11.57 7.3823 Tripura 22. .92 11.05 16.00 16.0024 Uttar Pradesh 1000. .00 600.00 5000.00 3000.0025 West Bengal 395. .00 355.00 450.00 400.00
Total States 9806. .59 8702.22 7226.62 4908.20
26 A & N Island 0. .00 O.oo 0.56 0. 5627 Chandigarh 0. .00 0.00 0.10 0.1028 D & N Haveli 2. .20 0.00 0.55 0.5529 Daman & Diu 3. .00 3.00 2.20 2.0030 Delhi 0. -00 0.00 9.70 9.7031 Lakshadweep 0. .00 0.00 0.00 0.0032 Pondicherry 0.1.00 0.00 4.00 4.00
Total U.Ts. 5.:-20 3.00 17.11 16.91
Total States & Uts 9811. ■.79 8705.22 7243.73 4925.11
NOTE:-Above mentioned physical targets are proposed by the States in their Ninth Plan propposals.These are under consideration and are subject to changqe.
519

lU^or £ ltedluift> I r r i f f A t l? D Sshn*« - Phyi Leal. a o U a v u a >t upte E lTb U i PIM u d Tsxgat to N in th Pl«n A nn u u ra 4 .2.4
U lt , Aeh i •Timanfe yhtli P l«o Aoh l • T«msat Aotua l Aotuml Aohi«TMu n t A c tu a l Aoh laTvsantAll. lilw* o f 5 tat»s Irxpn. ts ■ Dd e f T«e j« t 1992 -93 Aehi*Ton«nt 1994*95 1 1995-9C' 1Mo. « U .tB . Pot. tUl eh 92 1992-97 1993-94 K> jo i fi Hadlum S Kadlun
Po t. U t l . , P o t. U t l . Pot. . U t l.v Po t. U t l . ' 'P o t , ‘ U t l. 1 Pot. ., U t l.
1 2 3 4 ^- 5 6 7 8' , . 9 10 , 11 12 t 13 14JI 15
1
2Andhra P ra d t ih
A ruaaehal Prad^ihSOQO.OO 2999.DO 2B47.0D 419.00
0.00SOB.00
0.00
«.30 2.60 9.50 i.a o S.BO
0.003.10
0.00
2.60
0.004.40
0.00J As fan 970.00 n t . o o 111.00 120.00 74.80 5.55 5.55 7.77 7.77 6.51 6.51 0.84^ .. 0.844 BU iar <500.00 Z7S«.00 2295.00 315.00 410.00 4.00 3.20 27.50 22.00 0.00 o.tio 0.00 -1 0.00b • , 62.00 13.00 12.00 36.20 14.23 0.02 ‘ 0.07 0.00 ‘ , 0.00 0.00 0,00 ' 0.00 ’ 0.006 Oujax-Afe 3000.00 1246.00 9B6.00 ' 448.00 404.00 . 26.00 72.00 21.00 66.00 27.00 35.00 , 15.00 21.00V Har7ana • ' 3000.00 2035.00 1791.00 296.00 270,00 , 12.00 , 12.00 18.00 J8 .0 0 :J . 0-!46 V 8 .00 , 1.33 1.338 HljxiaahAl Pcada ih ^ ' 50.00 8.00 4.00 ^2.64 i.O O , 0.21 ' 0.20 0,24 ' 0.23 0 0.25 0.25 0.80 0.409 Janmtu b Kaihm lr 2S0.00 158.00 136.00 , 20.50 • » . 23,00 14.10 4.10 0.30 • 4.97 0.50 0.70 0.40 g 1.0010 Karnataka \ 2500.00 1317.00 1192.00 401.00 361,00 26.72 3.14 69.99 55.99 51.47 137.13 49.47 10.3511 Kara la 1000.00 416.00 367.00 / 148.00 148,00 16.52 16.52 2.62 2.62 24.72 24.72 11.45 11.45
Kftdhya Pradath £000.00 1962.00 1395.00 450.00 300,00 76.20 47.10 55.50 32.70 69.30 33.65 79.60 70.3513 »khar*«btra 4100.00 2030.00 103S.OO 400.00 444.00 35.00 0,00 60.00 58.00 50.00 55.70 70.00 70.0014 K M ilpu r IC S .00 59.00 50.00 ̂ 54.16 43,39 ) 0,00 0.00 • ' ' 0,00 ' 0.00 ’ 0.00 0.00 3.00 2.0015 Meghalaya 20.00 0.00 0.00 3.88 ̂ ' 3.00 0,00 * 0,00 ' 0.00 ' 0.00 0.00 0.00 0.00 ̂ 0.00Ifii Mlxoram s» 0.00 0.00 0,00 0.00 0,00 0,00 0.00 0.00 0.00 0.00 0.00 0.0019 Hagaland 10.00 0.00 0,00 0,00 0.00 0,00 0.00 0.00 0.00 0.00 0.00 0.00 0.00IB O z iftA * 3600.00 1409.00 1326.00 334.00 340.00 17.56, 22.05 12.72 17.56 17,85 12.72 46.48 17.8519 Punjab ̂■* ’ 3000.OO' 2367.00 2309.00 176.42 176.42 14.70 14.70 19.69 18.30 51.77 50.80 39.99 38.0620 Rajasthan 2750.00 1999.00 1887.00 288.61 232.13 43.04 31.59 62.47 42.77 60.12 40.40 60.47 1 .21 S lkX la 20.00 0.00 0.00 0.00 0.00 0.00 0.00 0.00 0.00 0.00 0.00 0.00 i 0.0022 TablU Sadu > » 1500.00 1545.00 1541.00 10.30 , 10 ,S7 , 0.00 , . 3.90 0,51 0.00 t 0.00 . 0-51 0.00 •' 0.0023 T r ip u ra 100.00 ’ 2.00 2.00 13.20 12,00 O.OOi, r 0.00 0,00 0.00 0.00 0.00 0.00 0.0024 U tta r P rada ih 12500.00 6805.00 5763.00 ' 976.00 600,00 54.00 65.00 62,00 60.00 12.00 62.00 56.00 76.0025 W«9t Banza i ^ 2300.00 1353.00 1258.00 170.53 ^ 171,56 9.08J 10.65 29,00 29,00 13.19 ' 4.46 ’ 8.15 5.75
T o ta l StAtvs 5B397.00 3072S.OO 26308.00 5083.44 r ■ t 4248,10 361.00* 314.45 458.81 437,71 387.94 475.65 445.58 374.93
2£ A 6 K Is land 0.00 0,00 0.00 0.00 0.00 0.0027 Chandigarh 0.00 0.00 0.00 0.00 0.00 0.0028 D & H K aY k li 0.00 0.00 0.00 0.00 0.00 0.0079 Du m b 6 D iu * 1.71 1.71 1,00 1.00 1.00 I ’.OO 0.55 0.00 0.00 0,0030 D .U il J 0.00 r 0.00 0.00 o.-oo 0.00 0,0031 Laksh&dwMp 0.00 0.00 0.00 0.00 0.00 0.0032 Psad lshkccy ' 2.so 2.50 0.13 0.13 0.16 O.IS 0.00 0.00 0.00 0.00
T o t« l U.T«. 9S.00 15.00 ,7.00 ’ 4.21 4.21 1.13 1.13 ' 1.16 1.16 0,55 0.00 0.00 0.00
Tefckl S ta t » £ U t i, 58495.00 30741.00. 26315.00, 5087.65 4252.3^ 362.13 31S.S8' 459.97 438.87 , 388.49 475.65 445.58 374.93
• M • 1 >HOTE Tb» pny«ae*X «Q b l«T«w ntt du ring B igh th P Iaa a t abaya Antio ip fttad &&d to change. '
520

1 Annexure 4.2.4 (concld.) (0 0 0 ' ha.)1 ----------------------------- -----------------------
Anted.Achi evement 1997-98 Ninth Plan Achievement 1 AchievementSI ante of states 1996-97 1 Target Target During UptoHo & U.Ts. Major £ Medium Major & Medium Major 6 medium 1992-97 March 97
Pot. Utl. Pot. Utl. Pot. Utl. Pot. Utl. Pot. Utl.
1 2 16 17 18 19 20 21 22 23 24 25_____________ j___________
1 Andhra Pradat 24.90 24.90 115.fil 152.18 579.13 506.28 46.10 36.80 3045.10 2883.80”2 Arunaohal Pra 0.00 0.00 0.00 0.00 0.00 0.00 0.00 0.00 0.00 0.003 Aaaam 0.00 6.50 1.15 0.20 6.50 4.00 20.67 27.17 196.67 138.174 Bihar 5.00 4.00 25.57 25.50 492.00 518.00 36.50 29.20 2802.50 2324.205 Ooa O.UO 0.00 3.50 1.00 16.22 12.00 0.02 0.07 13.02 12.076 oujarat 15.00 20.00 65.00 60.00 1867.00 1892.00 104.00 214.00 1350.00 1200.007 Haryana 12.00 3.29 45.00 41.00 197.71 211.21 43.79 42.62 2078.79 1833.628 Himachal Prad 1.05 0.51 0.30 0.15 3.00 1.50 2.55 1.59 10.55 5.599 Jannu 6 Kaahm 0.40 0.80 2.45 5.69 29.90 40.10 15.70 11.57 173.70 147.57.10 Karnataka 91.37 73.09 119.21 .95.36 1109.88 887.90 289.02 279.70 1666.02 1471.7011 Karala 42.00 42 .00 32.23 30.61 373.12 373.12 97.31 97.31 513.31 464.3112 Madhya Prad«s 75.00 42 .15 53.30 23.30 384.75 195.11 355.60 225.95 2317.60 1620.9513 Maharashtra 68.00 68.00 168.00 150.00 1755.00 1700.00 283.00 251.70 2313.00 1287.7014 Manipur 1.00 0.00 0.77 1.53 50.38 42.33 4.00 2.00 63.00 52.0015 Maghalaya 0.00 0.00 0.00 0.00 3.88 3.88 i 0.00 0.00 0.00 0.0016 Mizoram 0.00 0.00 0.00 0.00 0.00 0.00 0.00 0.00 0.00 0.0017 Ha^aland 0.00 0.00 0.00 0.00 4.50 4.50 0.00 0.00 0.00 0.0018 Orisaa 54.14 46.48 120.63 54.14 915.39 819.27 148.75 116.66 1557.75 1442.6619 Punjab 19.70 21.48 21.60 21.60 126 .25 126.25' 145.85 143.34 2512,85 2452.3-420 Rajasthan 48.78 42.48 48.60 46.46 469.26 394.92 274.88 201.39 2273.88 2088.3921 s lM O m 0.00 0.00 0.00 0.00 0.00 0.00 0.00 0.00 0.00 0.0022 Tamil Nadu 0.00 0.00 2 .18 0.00 4.80 3.80 0.51 4.49 1545.51 1545.4923 Tripura 0.30 0.30 0.85 0.85 22.92 11.05 0.30 0.30 2.30 2.3024 Uttar Pradash 69.00 100.00 140.00 75.00 1000.00 600.00 253.00 363.00 7059.00 6126.0025 W«st Bengal 31.66 24.66 74.00 67.00 395.00 355.00 91.08 74.52 1444.08 1332.52
_____________
Total States 559.30 502.16 1039.85 852.17 9806.59 8702.22 2212.62 2123.38 32938.62 28431.38
26 A & N island 0.00 0.00 0.00 0.00 0.00 0.00 0.00 0,00 0.00 0.0027 Chandigarh 0.00 0.00 0.00 0.00 0.00 ; 0.00 0.00 0.00 0.00 , 0.0028 D & M Havali 0.00 0.00 0.10 0.40 2.20 - 0.00 0,00 0.00 0.0029 Daman & Diu 0.67 0.00 0.00 0.00 3.00 3.00 3.22 2.00 3.22 2 .0030 Delhi 0.00 0.00 0.00 0.00 0.00 0.00 0.00 0.00 0.00 0.0031 La)cshadvreep 0,00 0.00 0.00 0.00 0.00 0.00 0.00 0.00 0.00 0.0032 Pondicherry 0.00 0.00 0.00 0.00 0.00 0.00 0.29 0 ^ 9 0.29 0.29
Total U.Ts. 0.67 0.00 0.10 0.40 5.20 3.00 3.51 2.29 18.51 9.29...........
TotAl Stat*« & U 559.97 502.16 1039.95 852.57 9811.79 8705.22 2216.13 2125.67 32957.13 28440.67
521

Major St Medium Irrigation Programme - Outlay and Expenditure in Eighth Plan Annexure-4.2.5(Rs. in cro
SI.No. Name of States & U.Ts. 8th Plan 1992-93 1993-94 1994-95 1995-96 1996-97 otal Anti rcentaOutlay Actual Actual Actual Actual Anted. Expdr. .9 w.r Expdr. Expdr. Expdr. Expdr. Expdr. 1992-97 Col.38 9 10
1 Andhra Pradesh2 Arunachal Pradesh3 Assam4 Bihar5 Goa6 Gujarat7 H a r y a n a8 Himachal Pradesh9 Jammu & Kashmir10 Karnataka11 K e r a l a12 Madhya Pradesh13 M afia r a s K t f a14 Manipur is Meghalaya16 Mizoram17 Nagaland18 O r i s s a19 Punjab2 0 R a j a s t h a n21 Sikkim22 Tamil Nadu23 Tripura2 4 Uttar Pradesh 2 5 West Bengal
Total States2 6 A & N Islands27 Chandigarh28 D & N Haveli29 Daman & Diu3 0 Delhi31 Lakshadweep32 Pondicherry
Total U.Ts. ates & Uts.
Central Sector Grand Total
2066.78 4.71 86.11 1927.17 114.70 3426.00 446.67 16.00 70.57 1936.09437.00 1791.29125.00
1 1 . 1 01.002 . 0 02614.33 257.731310.080 . 0 0260.00 35.002599.34 380.00
343.47 0.5023.64146.3022.03408.48 81.262.6916.93 294.2580.80314.7620.941.37 0.10 0.00189.0731.68165.820 . 0 066.528.38 284.7450.24
577.96 0.44 24.33 140.16 15.95 444.5888.67 2.4615.28445.12103.39318.89471.§326.916.950.080.45157.4441.68 196.740 . 0 074.045.55309.0078.00
613.11 0.50 25.65 145.90 29.19 384.36 74.62 2.59 17.34 466.61 113.75 366.5928.820.460.040 . 0 0152.1857.05279.040 . 0 083.233.68300.8084.45
537.710.4823.83179.7530.28651.9699.553.4319.06681.26146.56316.6711§3.§233.37
i.86 0 . 0 2 0.30195.0969.38 291.050 . 0 052.864.19373.00105.80
514.88 0.942 2 . 0 0 192.68 31.00 1063.19 201.29 3.22 17.11975.89130.00 297.5832.21 i.50 0.00 0.30 327.74 75.84 287.79 0.00 186.16 5.49 415.66
1 0 0 . 0 0
2587.13 2.86119.45 804.79128.45 2952.57545.3914.3985.722863.13 574.501614.493 ^ 0 .142.25
6 0 11021.52 275.63 1220.44 0.00 462.81 27.29 1683.20 418.49
142405
125.18 60.72 138.72 41.76 111.99 86.18 1 2 2 . 1 0 89.94 121.47 147.88 131.46 90.13m . m113.80
5 5 . 32 24.00 52.50 39.07 106.95 93.16 0.00 178.00 1 1 . 9 1 64.75 110.13
22310.21 3011.33 3539.90 4134.45 4971.28 5525.36 21182.32 94.940.00 0.00 0.00 0.00 0.00 0.00 0.00 0.000.00 0.00 0.00 0.00 0.00 0.00 0.00 0.005.23 3.21 1.14 1.00 0.68 0.91 6.93 132.531.60 0.20 0.35 0.55 0.55 0.55 2.20 137.500.00 0.00 0;00 0.00 0.00 0.00 0.00 0.000.00 0.00 0.00 0.00 0.00 0.00 0.00 0.002.49 0.72 0.00 0.00 0.00 0.00 0. 72 28.929.32 4.13 1.49 1. 55 1.23 1.46 9.85 105.70
22319.53 3015.45 3541.39 4136.00 4972.51 5526.82~ 21192.17 94.9595.00 31.68 30.02 23.05 26. 51 537.71 648.97 683.13
22414.53 3047.13 3571.41 4159.05 4999.02 6064.53 21841.14 97.44mmm97
NOTE The expenditure during Eighth Plan as in Col.9 are anticipated and are likely to change.
522

MINOR IRRIGATION - PHYSICAL DETAILS lANNEXURE-4.2.6 I l(OOOha ) |.......... ............................... .............. ................ .. .............______________ _______ ___ ............. ......
Ult. AchI evement | Eighth Plan j Achievement Actual 1 Actual Achievement Actual AchievementSI. Name o f States Irrgn. to e nd of Target 1992-93 Achievement 1994-98 [ 1995-36 1No. & U.Ts. Pot. mar ch 92 j 1993-94 ! M inor irrigation Minor irrigation
I 1 1 Pot. 1 Ull. 1 Pol. 1 Utl. ! Pot. 1 Utl. Pot. 1 Utl. 1 Pot. Ull. j Pot. Utl.__________ _______________ _ _1 | 2 | 3 l 4 | 5 ! 6 l 7 i 8 i 9 ' 10 i 11 1 12 13 1 14 1 15___________ „
1Andhra Pradesh 6260.00 2877.34 2662.63 500.00 400.00 7.40 7.40 6.00! 6.00 3.48 3.48 3.20 3.202 Arunachal Pradesh 168.00 64.89 55.84 20.00 20.00 3.22 1.601 3.14 1.75 3.90 2.00 4.00 2.153 Assam 1900.00 575.28 466.97 180.00 120.00 7.58 7.58 3.07 3.07 4.05 4.05 2.27 2.274 Bihar 6847.00 4876.90 4357.19 1832.00 1466.00 60.00 65.00 65.00 60.00 64.00 64.51 30.69 27.005 Goa 54.00 18.41 16.71 4.00 3.00 0.48 0.24 0.43 0.22 0.50 0.25 0.35 0.176 Gujarat 3103.00 1900.30 1804.22 180.00 150.00 7.00 4.00 4.00 3.00 5.00 5.00 8.40 16.407 Haryana 1512.00 1524.47 1483.72 100.00 90.00 10.00 10.00 10.00 10.00 10.50 8.40 11.80 9.508 Himachal Pradesh 303.00 141.61 122.45 25.00 2000 2.44 1.59" 1.50 1.50 1.62 1.02 1.61 0.269 Jammu i Kashmir 1108.00 363.62 352.31 40.00 40.00 2.23r 1.01 1.54 1.56 2.48 1.56 2.40 2.3610 Karnataka 3474.00 1435.48 1395.51 220.00 200.00 21.08 21.08 22.00 22.00 20.33 18.00 12.02 12.0211 Kerala 1679.00 518.04 482.41 100.00 85.00 7.30n 7.30 7.17 7.17 14.33 14.33 13.37 13.3712 Madhya Pradesh 11932.00 2560.52 2375.02 500.00 375.00 16.00 7.00 26.00 13.00 20.00 10.00 15.00 7.0013 Maharashtra 4852.00 2457.40 2212.10 400.00 325.00 32.00^25.00 31.50 25.00 31.50 25.00 33.40 27.0014 Manipur 469.00 49.57 41.21 15.00 12.00 1.91 1.91 2.21 isT 1.80 1.80 2.40 2.4015 Meghalaya 148.00 42.51 37.19 12.00 8.00 0.29 0.22 0.50 0.38 0.71 0.53 0.84 0.6316 Mizoram 70.00 10.54 9.03 6.00 4.00 0.48 0.48 0.51 0.51 0.51 0.51 0.37 0.3717 Nagaland 75.00 65.10 55.93 13.00 10.00 0.75 0.70i 0.35 0.30 0.32 0.30 0.36 0.3518 Orissa 5203.00 1245.38 1126.18 150.00 150.00 14.88 18.08j 22.25 14.97 26.46 22.25 19.11 26.4619 Punjab 2967.00 3290.45 3238.19 76.00 70.00 11.15 11.15 7.00 3.94 14.09 13.93 17.58 14.7020 Rajasthan 2378.00 2388.71 2316.63 300.00 280.00 6.73 4.04 6,87 4.12 6.16 4.32 6.84 4.1121 Sikkim 50.00 22.19 17.07 5.00 4.00 0.65 0.55 0,72 0.62 0.66 0.53 1.15 1.0222 Tamil Nadu 4032.00 2107.91 2102.52 110.00 107.00 1.82 2.10 1,62 1.82 1.65 1.62 1.65 1.6523 Tripura 181.00 87.38 78.83 27.00 16.00 1.26 1.26 0,95 0.95 1 22 1.22 0.69 0.6924 Uttar Pradesh 17999.00 18870 17340 5439.00 5000.00 961.00^1.00 775.00: 650.00 1013.00 1057.00 1193.00 1206.0025 West Bengal 4618.00 2772.37 2309.90 450.00 400.00 60.00 36.00 90.001 81.00 100.00 33.00 95.00 57.00f -■ ------
Total States 81382.00 50266.371 46459.761 10704.00 [ 9355.00 1237.65 1186,3! 1089.33! 914.25] 1348.27 1294.61 1477.50 1438.08.... ,.......-------26 A & N Island ------ 0.09 1 0.09 0.10 0.10 0.10 0.10 0.15 0.15
27 Chandigarh 0.02 0.02 ! 0.02 0.02 0.02 0.02 0.03 0.0328 D & N Haveli 1 0.05 0.05 : 0.13 0.07 0.02 0.07 6.03 0.032930"
Daman & Diu------ - - f—------ -— -̂-- i 1.19 1.19 , 1.12 1,12 0.25 0.00 1.14 1.19
Delhi 1 4.20 4.00 3,62 4.68 4.01 4.58r 4.0531 Lakshadweep 0.00
0.270.00 0.00 0.00
32 Pondicherry ! r 6.33 r a33j 0.33 0,33 0.27! 0.61, 0.61
------Total U.Ts. ! 46.00| 81.92' 77.66| 7.00 ̂ 5.00] 5.88 [ 5.22 . 5.70| 5.26 5.34 4,47 6,541 6.06
States & u fs 1 81428.00] 50348.29: 46537.421 10711.00] 9360.00: 1243.53 11191.5; 1095.03i 919,51 1353.61̂ 1299.08| 1484,04] 1444,14
------------ 7------r ■ ;--------’ T-------------’.......' " l ......... --------- 1---- -----"T' ----------[--------
523

A N N E X U R E -4 .2 .6 (c o n c ld .) i (000 ha.)
Antcd.Achievement Achievement Achievement 1 Target TargetSI. Name of States 1996-97 During Upto i Ninth Plan 1997-98No, & U.Ts. Minor Irrigation 1992-97 March 1997- Minor Irrigation Minor Irrigation
! 1 Pot. I Utl. 1 Pot. Utl. 1 Pot. ! utl. 1 Pot. 1 Utl. 1 Pot. i Utl.
1 t 2 1 16 17 1 18 19 1 20 I 21 i 22 1 23 1 24 1 25_____________ ___1 Andhra Pradesh 4.45 4.45 24.53 24.53 2901.87 2687.16 28.90 28.70 5.30 5.302 Arunachal Pradesh 4.27 2.20 18.53 9.70 S3.42 65.54 23.00 23.00 4.35 2.253 Assam 0.51 0.51 17.48 17.48 592.76 484.45 12.84 12.00 7.98 7.984 Bihar 11.65 10.00 231.34 216.51 5108.24 4573.70 205.25 190.00 8.71 7.005 Goa 0.35 0.18 2.11 1.06 20.52 17.77 3.02 1.68 0.27 0.206 Gujarat 10.60 7.00 35.00 35.40 1935.3 1839.62 70,10 50.800 9.50 7.507 Haryana 10.0 10.00 52.30 47.90 1576.77 1531.62 80.64 80.64 . 18.00 18.008 Himachal Pradesh 1.60 1.60 8.77 5.97 150.38 128.42 6.00 6.00 1.80 1.80§ Jamliiu 1. KastiRiiF T3§ 2.3i 11.00 §.§§ mm 3§1:1§ 21.00 15.00 ?:§0
10 Karnataka 20.10 20.10 95.53 93.20 1531.01 1488.71 155.00 155.00 14.00 14.0011 Kerala 12.91 12.91 55.08 55.08 573.12 537.49 50.18 50.18 12.84 12.8412 Madhya Pradesh 20.00 10.00 97.00 47.00 2657.52 2422.02 150.00 67.00 25.00 11.0013 Maharashtra L 33.40 27.00 161.80 129.00 2619.20 2341.10 528.00 400.00 152.00 130.0014 Manipur 2.50 2.50 10.82 9.98 60.39 51.19 15.00 12.00 3.00 3.0015 Meghalaya i 0.70 1 0.52 3.04 2.28 45.55 39.47 8.82 6.62 3.27 2.4516 Mizoram ! 0.32 0.32 2.19 2.19 12.73 11.22 1.85 1.85 1.36 1.3617 Nagaland 0.36 0.35 2.14 2.00 67.24 57,93 14.30 12.00 1.03 .1.0018 Orissa 29.39 19.11 112.09 100.87 1357.47 1227.05 89.60 101.07 66.08 29.3919 Punjab 13.90 '14.21 63.72 57.93 3354.17 3296.12 241.61 241.61 19.75 19.7520 Rajasthan 5.93 3.56 32.53 20.15 2421.24 2336.78 39.44 25.67 8.70 5.2121 Sikkim 0.86 0.80 4.04 3.52 26.23 i 20.58 4.50 4.00 0.90 0.8022 Tamli Nadu 0.57 1.65 7.31 8.84 2115.22 2111.36 11.57 7.38 1.68 0.5723 Tripura 1,08 1.08 5.20 5.20 92.58 84.03 16.00 16.00 4.20 4.2024 ; Uttar Pradesh 783.00 709.00 4725.00 4583.00 23595.00 ,21923.00 5000.00 3000.00 269.00 1000,0025
; 26
^West Bengal 100.00 60.00 1 445.00 267.00 3217.37! 2576.90 ̂ 450.00 1 400.00 150.00 150,00.................. .....__ ......._-__ ............._______ ...__ _ ............................total States 1 1070.8(^ 921,411 6223.55 5754.641 59489.9! 52214,41 7226,621 4908.20 792.32! 1440.60'
;A & N Island'....... “ i 0.12 , 0.12 0.56 0.56 0,55 0,55 0.56! 0.56 0.10 0,1027iChandigarh i 0.03 28 'd & N Haveli 0.03
0.03........ 0:03
i 0.12 0.121 0.12 0,12 0.10 0.10 ^ 0.02 0,020.26 0.251 0.26 b.25 0.551 0.55 0.09 0,09
29:Daman&biu ̂ 1.69 ' 1.44 I 5.39 4.94 5.39 4.94 2.20! 2.00 0.50 0,00SQipelhi_________31 Lakshadweep
4,18 3.30 21.64 18.52 21.641 18.52! 9.70! 9.70 4.74 4,090.00 0,00 0.00 0.00 0.00 i 0,00 0,00; 0,00 i 0.00 0,00
32 Pondicherry 0,48 0,48 L 2.02 2.01 2.02: 2.01 4.00! 4.00 0.48 0,48
^ fo ta l U.Ts,
' StatBS & UTs
; .̂ 6.53:;^ ^ .4 6 " ; 2 9 .^ 26.4T| 111.91, 104.07i 17.11: 16,91, 5,93 4,78
[ ‘ 1077:33' ■ 926:81 6253:54 5781.05! 56601.81 52318.5 7243.73; 4925.111 798.25 1445,38................................... ...........!................ ..............
524

Minor Irrigation Programme - Outlay and Expenditure during Eighth Plan Annexure-4.2.7(Rs. in crore)
SI.No. Name of States & U.Ts.
1 Andhra Pradesh2 Arunachal Pradesh3 Assam4 Bihar5 Goa6 Gujarat7 Haryana8 Himachal Pradesh9 Jammu & Kashmir10 Karnataka11 Kerala12 Madhya Pradesh13 Maharashtra14 Manipur15 Meghalaya16 Mizoram17 Nagaland18 Orissa19 Punjab20 Rajasthan21 Sikkim22 Tamil Nadu23 Tripura24 Uttar Pradesh 2 5 West Bengal
Total States
26 A & N Island 2 7 Chandigarh28 D & N flaveli29 Daman & Diu30 Delhi31 Lakshadweep32 Pondicherry
Total U.Ts. ates & Uts.
Central Sector Grand Total
8th Plan 1992-93 1993-94 1994-95 1995-96 1996-97 otal Anted PercentageOutlay Actual Actual Actual Actual Anted. Expdr. Col.9 w.r.t.Expdr. Expdr. Expdr. Expdr. Expdr. 19^2-97 Col. 33 4 5 6 7 8 9 10
234.68 60.53 95.29 66.90 84. 36 63.00 370.08 157.7053.69 10.77 12.25 14.40 15.84 14.38 67. 64 125.98183.45 44.07 38.00 40. 17 46.65 62.77 231.66 126.281021.30 69.47 34. 75 35.04 24.02 36.30 199.58 19. 5413.10 3.98 3.90 2.91 3.80 3.50 18.09 138.09240.00 45.61 39.18 77.74 119.85 158.84 441.22 183.84134.45 28.49 47.00 30.57 51.25 47.70 205.01 152.4895.25 21.42 17.14 21.61 26.96 36. 76 123.89 130.0784.20 16.05 16. 77 19.64 24.07 23.31 99.84 118.57306.91 44.05 63.39 73.87 62.45 64.04 307.80 100.29130.00 15.03 21.17 32.11 38.68 45.35 152.34 117.18728.37 125.82 131.09 118.68 121.43 137.48 634.50 87.11612.17 203.99 215.21 338.82 427.35 385.86 1571.23 256.6725.00 3.00 4. 75 5.34 6.02 6.21 25.32 101.2629.03 5. 78 4.19 3.86 5.65 5.25 24.73 85.1911.75 2.54 2.60 2.37 2.40 2.73 12.64 107.5721.00 2.41 3.49 2.26 3.38 1.92 13.46 64.11389.40 53.35 56.65 61.97 81.15 114.56 367.68 94.42113.20 17.16 21.68 28.11 29.35 33.26 129.56 114.45171.92 34.53 32. 13 32.67 50.09 45.23 194.65 113.2211.50 2.10 1.99 1.96 2.56 2.56 11.17 97.10250.00 41.63 40.70 39. 52 38.85 36.99 197.69 79.0831.50 6. 59 4.62 4.65 4.76 8.88 29. 51 93.68400.60 70.08 46.45 54.67 74.12 105.69 351.01 87. 62370.00 45.27 62.97 34.18 24.10 38.00 204.52 55.285662.47 973.72 1017.36 1144.03 1369.14 1480.57 5984.81 105.69
. - . - _ . - - _ • - ^ rs 1 M r\4.24 2.01 2.16 2.19 1.39 1.64 9.39 221.491.00 0.21 0.25 0.25 0.32 0.20 1.23 122.993.00 0.81 0.55 1.05 0.56 1.05 4.02 133.900.44 0.03 0.10 0.20 0.09 0.12 0. 54 123.028.00 1.32 2.13 1.40 1.80 0.64 7.29 91.100.00 0.00 0.00 0.00 0.00 0.00 0.00 0.005.11 1.43 1.37 1.73 2.71 2.94 10.19 199.3221.79 5.81 6. 56 6.82 6.87 6.59 32.65 149.85
5684.26 979.53 1023.92 1150.85 1376.01 1487.16 6017.46 105.86293.00 15.07 70.91 34.30 32.07 60.81 213.16 1 2 . I S5977.26 994.60 1094.83 1185.15 1408.08 1547.97 6230.62 104.24
mmi97NOTE;- The expenditure during Eighth Plan as in Col.9 are anticipated and are likely to change.
525

Command Area Development Programme - Outlay and Expenditure Annexure-4.2.8(Rs. in crore)
SI. Name of States No. & U.Ts.
1 Andhra Pradesh2 Arunachal Pradesh3 Assam4 Bihar5 Goa6 Gujarat7 Haryana8 Himachal Pradesh9 Jammu & Kashmir10 Karnataka11 Kerala12 Madhya Pradesh13 Maharashtra14 Manipur15 Meghalaya16 Mizoram17 Nagaland18 Orissa19 Punjab20 Rajasthan21 Sikkim22 Tamil Nadu23 Tripura 2J Tripura24 Uttar Pradesh25 West BengalTotal States
26 A & N Island 2 7 Chandigarh28 D & N Haveli29 Daman & Diu30 Delhi31 Lakshadweep32 PondicherryTotal U.Ts.
ates & Uts.Central Sector Grand Total
8th Plan Outlay 1992-93 Actual Expdr.1993-94ActualExpdr.
1994-95ActualExpdr.1995-96 Actual Expdr.
1996-97 Anted. Expdr.otal Ante Expdr. 1972-97
Percentage Col.9 w.r.t. Col. 33 4 5 6 7 8 9 10
55.00 17.66 24.94 27.53 10.00 7.20 87.33 158.781. 70 0.34 0.40 0.40 0.45 0.88 2.47 145.1216. 79 2.15 2.50 3.41 5.28 2.78 16.12 96.0170. 65 10.00 5.77 7.27 10.26 11.28 44. 58 63 .106.40 1.53 1.60 1.17 0.89 0.90 6. 09 95.1680.00 9.10 9.58 12.89 12.20 9.25 53.02 66.2845. 77 7.07 41.26 11.71 11.69 13.90 85. 63 187.092 .45 0.49 0.65 0.77 0.95 1.10 3.96 161.6310.00 1.65 1.93 2.29 3.08 2.70 11.65 116.50130.00 14.86 16.15 20.44 24.80 18.02 94.27 72 . 5260.00 8.93 10.00 11.54 11.38 12.00 53.85 89. 75128.05 11.06 9.61 8.82 8.24 6.21 43.94 34.31323.93 43.30 44.36 80.02 103.17 0.00 270.85 83. 617.00 1.16 0.74 1.33 1.72 2.01 6.96 99.430.00 0.59 0.48 0.10 0.11 0. 70 1.98 0.000.00 0.00 0.00 0.04 0.05 0.05 0.14 0.000. 50 0.10 0.03 0.00 0.03 0.14 0. 30 60.0033.40 3.68 3.88 3.74 3.53 4.00 18.83 56.38140.00 10.56 10.17 29.88 39.86 37.00 127.47 91.05412.69 58.23 53.74 63.92 81.31 97.50 354. 70 85.951.50 0.00 0.05 0.03 0.06 0.06 0.20 13.3345.00 9.23 9.74 10.82 11.52 12.32 53.63 119.180. 50 0.05 0.03 0.06 0.05 . 0.02 0.21 42 .00'0. 50 '0.05 0.03 -0.06 *0.05 ■0.02 ■ 0.21 ■ 42.0090.00 16.29 19.72 28.26 21.94 2 7.00 113.21 125.7918.00 0.86 1.50 1.89 2.33 0.75 7.33 40. 721679.33 228.89 268.83 328.33 364.90 267.77 1458.71 86.86
0.00 0.00 0.00 0.00 0.00 0.00 0. 00 0.000.00 0.00 0.00 0.00 0.00 0.00 0.00 0.000. 20 0.00 0.00 0.05 0.00 0.01 0.06 30.000. 60 0.00 0.00 0.00 0.00 0.00 0.00 0. 000.00 0.00 0.00 0.00 0.00 0.00 0.00 0.000.00 0.00 0.00 0.00 0.00 0.00 0.00 0.000.00 0.00 0.00 0.00 0.00 0.00 0.00 0.000.80 0.00 0.00 0.05 0.00 0.01 0.06 7 . 50
1680.13 228.89 268.83 328.38 364.90 267.78 1458.77 86.83830.00 104.45 116.22 123.68 124.40 138.32 607.07 73.14
2510.13 333.34 385.05 452.06 489.30 406.10 2065.84 82.30NOTE:- The expenditure during Eighth Plan as in Col.9 an anticipated and are likely to change.
526

|Annexure-4.i1 . 9Flood Control Pro gramme - Outlay and Expenditure 1 11Rs. in CRORE \----------1— — — — —
Si Name of States 8th Plan 1992-93 1993-94 1994-95 1995-96 1996-97 otal Anted PercentaqNo & U.Ts. Outlay Actual Actual Actual Actual Antcpd. Expdr. Col.9 w.r__ (1992-97) Expdr. Expdr. Expdr. 1 Expdr. Expdr. ■ 1992-97 Col. 3L 2 3 4 5T ̂ ' 6
I ^8 9 10 ■■■—------------------- --------- ------- -------- ---------- ----------- ---------- ---------
L Andhra Pradesh 143.54 118.11 126.87 55.75 13.14 10.00 323.87 225.63I Arunachal Pradesh 4-/1 1.04 1.43 2 .48 t 3.19 j' ■ 3.27 11.41 242.21i Assam 19.38 17.40 19.53 ! 21.11 20.17 97.-59 112.374 BiTiar 251.7IT 39.08 i 30.41 24.56 3b.4B 41.35 170.88 67.895 Goa D r s v 0.81 ! ■ 0.30 0 . 22 D.31 0.80 :274^ 271.11Guiarat ^ 10.00 3.62 ! 2.46 3.50^ ̂ 1.92 1.60 13.“20 132.00/B [Haryana b2.00 1 1 :3:3̂ 12. 59 ”“97 08 11. /6 I 11.00 55.76 107.23Himachal Pradesh 6.00 1.03 1. 38 1.49 r 2.03 3.~54 9.4/ lb7.83Jammu & Kashmir 40. Vb 8.26 8.83 11.07 [ 13.44 15.71 “577 31 140.64iU Karnataka 11.00 b. 64 11. Ob “8753 ^̂ 9.24 10.00 44.46 404.18IT Kerala 65.00 9 . 32 27.56 26.19^ 26. bb f' 35.50 125.12 192.4912 Madhya Pradesh 8.53 0. 69 0. 48 ■ 0. 57 1 0.71 1.08 3. 53 41.38T3 Maharashtra 1.46 0.31 0.31 0.62 ! 0.47 r 103771 104.92 7186.3014 Manipur 20.00 3.41 2.61 6.81 7.39 ̂ 6.96 27.18 T35.9013̂ Meqhalaya Br54 " 1.07 079B ■ 0.86 1 1.55 .... 1.43 5.87 68.741^ Mizoram 0.25 o:i8 D7ID r 0.00 ! 0.00 r ' 0.00 “0.28 112.00T7IB Naqaland 1. bU 0.20 T5705 “ 0.00 i 0.10 r 0.16 0.51 34.00Xirissa 42.05 6.27 p .. 7.90 9.25 13.00 44.21 10b.142D Puniab 125.00 14. lb 1 10.85 34.16 65.90 138.46 110.77Raiasthan 25.30 4.41 ! b.72 5.50 ! 18.73 .43.45 77.81 307.55jSi-kkim 0.00 071.5 1 0.12 0.12 0.34 ^ .. 2.34 3.07 0.0021 "22̂23
S:.KKim 0.00 0.15 1 0.I2"*’ 0.12 I 0.34 ̂ 2.34 3.07 ““” 0.00[Tamil Nadu Tripura 30.00 0. 70 0̂ .82'"“ 0.15 ; H37 38 1. 59 3.64 .. 12.138.00 I . 2 1 r 2 .20 1. 88 2 .13 2 .04 10. b2 131.b3H425 Uttar Pradesh 7XT.W 8.00 9.00 i:?.Tl- " TO.96 ID781 . 53.48 76.40West BenqaT '28U.OO 21.05 , 32.00 3H.65 47 .81 3 5.T3TT̂ 1 - 174.51 62.33i 253.67 : 272.15Total states 1293.09 280.48 *^313.29 439.91^ 1 1559.50 120.60’ D 7'ar ̂ 12b S N Islands 0. Ob 0.04 ̂ 0.01 1.46 ” 1.00 2 . 52 r““b038.002 / 28 iChahdiqarh 113 5 TT Hav^i 07 UO 0.00 ! 0.00 ' 0 .00 TT.UO 0.00 i “ 0.00 0.000̂ .02 0.00 0.00 0.00 0.00 L 0.00 0.00 “ 0.002930 Daman & Diu Delhi 1 • XVr 4IT7OT 0.209702 0.32
W . I 3 - ̂ 0.32 8.97 0.22 ' 12.49 T).3b14.32 1.41 54.b3 “ 120.51135732“3132 Lakshadweep 2.60 1.2 5 1.60 2735 2 .19 4.31 ;; 1.86- 9.25 355.81Pondicherry ; 4.44^ 1.10 2.00 2 .75 ' 3.77 - 13.93 313.67
48.28 _:t i t 5i;:: 13 . 56 ̂ 20.67 21.30^___ Total U. Ts._____ 14.40 : 81 .64 169.09292 709 326.95 : ; 268.07 : 292.82ates u uts. 1341.37 461.20 1641.14 122.35 “
I--— --------------------------------------
CehtfaT Sector 38.78 ^282.00 38.07 39.75 : 55.85 53.72 ----226.17 BO.20 “365.73 307.82 ; 348.67Grand Total T.^3 .37 ^30^16 __ 514.92 1867.31 115.03
NOTte:- The expenditure i.n Eigtli Planf Jin Col.9 are anticipated 1 .and are liKely to chanqe.
r>fc * Provisional97 ; ; ;;-.... - .■--------------- ■ - - - -1 1 - - . - 1 1
_____ j---------------- ........... ---------------
527

T------------------- ! .... ......... ■A n n e x u re -4 .2 .1 0
[Eighth Five Year Plan outlay & anticipated expenditure (1992-97).
(R s . In c ro re )
SI. N am e of States IMajor & M edium Minor ; CAD 1 Flood Control Total
No. & U Ts. Irrigation 1 Irrigation L- ----------- - -
1 2 3 4 ... .. . ! 6■7
j_ j
1 Andhra Pradesh 2 5 8 7 .1 3 3 7 0 0 8 87 33 ; 323 .87 I 3368.41
2 Arunachal Pradesh 2 ,86 6 7 .64 2 .4 7 ;_________1 1 4 1 ̂ 84 38
3 Assam 119.45 2 3 1 .6 6 16.12 L 97 .59 ; 4 6 4 ,8 2
4 Bihar 80 4 .7 9 199.58 4 4 .58 170 88 ^ 7 2 1 9 8 3 '
5 G oa 128 .45 18.09 6.091 2 .44 1 155 ,07;
6 G ujarat 2 9 5 2 .5 7 4 4 1 ,2 2 5 3 .O2 I 13 .20 ' 3460:011
7 Haryana 54 5 .3 9 205.01 85 .63 55 .76 ! 8 9 1 7 9 1
8 Him achal Pradesh 14.39 123 ,89 3 .96 9 .47 ; “ 1 5 1 ,7 1 '
9 iJ a m m u & Kashm ir 85 72 9 9 ,8 4 “ 11.6b 57.31 2 54 52
10 Karnataka 2 8 6 3 13 3 0 7 ,8 0 94.27^ 4 4 .46 3309,661
11 Kerala 5 7 4 50 152 .34 5 3 .85 125.12 9 0 5 ,8 1 !
12 M adhya Pradesh 1 6 1 4 4 9 1 6 3 4 ,5 0 4 3 ,94 3 53 2 2 9 6 ,4 6 ;
13 i M aharashtra I^ M a n ip u r
3 6 3 0 .3 9T 42T2 5
1571 ,2325 ,32
27 0 ,8 5 6 96
104.92] 27 18
5577T39 j"2 0 1 ,7 1 7
15161?"
M eghalayaM izoramNagaland
6 .14 0 .24
̂ T .05
24 73 12,64
[ V3“45^
1,98oT14
“" 0 ,3 0 '
^ '5 8 7 0 28
j 0:^ ’
38 72 13,30
18 Orissa 1021 52 367 68 18783 ! 44,2“̂1 \ 1452 24 119 Punjab 2 7 5 .6 3 129 ,56 127,47 [ 1 3 8 4 6 ! 6 7 1 1 2 1
20 Rajasthan 1 220.44 194.65 354 ,70 ! 7 7 ‘81 i 1847^60
21 Sikkim ^ 0 .00 11,17 0 ,20 3 ,07 ; 14 44
22 Tam il Nadu 462.81 197 ,69 53 ,63 3 ,64 7 1 7 ,7 7
23 Tripura 2 7 .29 29,51 0,21 ̂ 10,52 6 7 ,53
24 U ttar Pradesh 1683 .20 351,01 1 l l 2 1 ̂ 53 ,48 2 2 0 0 90
25 W e s t Bengal 41 8 .4 9 2 0 4 ,5 2 7 ,33 174,51 8 0 4 ,8 5
1-Total States ̂ 2 1 1 82 .3 2 5 9 8 4 ,8 2 1 1458 ,72 1 5 5 9 ,^ 1 30185^36
r-
26 A & N Islands 0 .00 9 ,39 o,6o1 11,91
27 Chandigarh 0 .00 1,23 0 ,00 0 ,00 1,23
28 D & N Haveli 6 .93 4 ,0 2 0 ,06 0 ,00 , 1 1 0 1
29 D am an & Diu 2 .20 0 54 0 ,00“̂ 1,41 4 .15“
30 Delhi 0 .00 7 ,29 0 ,00 5 4 ,53 6 1 .82
31 Lakshadweep 0 .00 0 ,0 0 0 ,00“̂ 9 ,25 9 .25
32 Pondicherry 0 .72 10,19 o,oo| 13,93 2 4 .84 ji—!
Total U.Ts. 9 .85 32 ,66 0 ,0 6 . 81 .64 “̂ 7 2 4 ^ 1 “i 1 ! !
To ta l S tates & Uts. 2 1 1 9 2 .1 7 6017,481L 1458.78J 1641 ,14 , 3 0 3 09 .5 7 ;i
Central Sector 6 4 8 .9 7 2 1 3 .1 6 ! 6 0 7 .0 7 2 2 6 ,1 7 ’7 1 6 9 5 .3 7 7
G rand Total 2 1 8 4 1 .1 4 6 2 3 0 .6 4 2 0 6 ^ 8 5 ^ 1867.^1 32 0 04 94 !1
i J1
528

4.3 Food and Nutrition Security
4 3 1 At the time o f independence the country faced two major nutritional problems, one was the threat o f famine and acute starvation due to lack o f national and regional food security systems, the other was chronic under-nutrition due to low dietary intake because o f lack o f purchasing power among the poorer segments o f the population
4 3 2 One o f the first efforts o f the country was to build up a food security system to ensure that the threat o f famine no longer stalks the country Investment in agriculture and the green revolution have ensured that the food production has kept pace with the population growth and by and large India remained self sufficient in food Establishment o f adequate buffer stocks has ensured availability o f food stuffs within affordable cost even during the times o f drought The fact that the country has not witnessed famine and acute starvation on a massive scale in the last five decades is the most eloquent testimony for the success o f these efforts
4.3 3 Even though self sufficiency in food production has been achieved, the population still lacks access to balanced food It is a matter o f concern that the even though cereal production has kept pace with the increasing requirements and average percapita intakes o f cereal have remained satisfactory, there has been a fall in the percapita consumption of pulses It is important not only to improve pulse production but also make them available at affordable cost The production and consumption o f vegetables and fruits continue to remain low Specific efforts have to be made to improve production and improved access to vegetables especially green-leafy vegetables at affordable cost both in rural and in urban areas
4 3 4 Poverty and lack o f purchasing power have been identified as two major factors responsible for low dietary intake The concern over the economic factors resulting in chronic undernutrition led to the use o f calorie intake as the basis o f estimating poverty and the development o f food for work programmes as one o f the remedial measures to alleviate this problem The food for work programme and employment assurance scheme are aimed at improving household food availability in Below' Poverty Line (BPL) families especially in seasons during the employment and food availability in rural areas are low To some extent these measures have helped in improvement in the household food availability but the problem o f equitable distribution o f available food and need based intrafamilial distribution o f food persisted
4 3 5 Public Distribution System (PDS) providing foodgrains at affordable prices is one o f the key elements o f the Government's Food Security system In spite o f obvious limitations PDS did play a role improving in regional food security specially in drought prone areas In an attempt to improve availability o f food to population living in most vulnerable areas (remote, tribal and drought-prone regions) the revamped public distribution system gave priority for establishment o f PDS in such vulnerable areas In spite o f mounting food subsidies evaluation studies indicate that supply o f subsidised food given through PDS has not resulted in improvement in household level food security. Self-sufficiency o f foodgrains at national level and availablility o f foodgrains at affordable cost at local level have not got translated into household level food security for the poor. In an attempt to limit the mounting cost o f food subsidy and at the same time ensure that people below poverty line do get subsidised foodgrains the targetted public distribution system providing food grains at subsidised cost only the people below poverty line was initiated If susscesfully implemented the targetted PDS is expected to achieve better household food security for families living below poverty line without substantially increasing food subsidy costs
529

4.3 6 Inter-relationship betweeen undernutrition and ill health has been well documented Low dietary intake and continiued heavy physical activity lead to negative energy balance resulting in chronic undernutritiion. Chronic undemutrition may be associated with reduction in the work capacity and increaised susceptibility to infections. Infections in turn can further worsen the existing undernutritiion. Undernutrition and its adverse health consequences are more often seen in pregnant andl lactating women, infants and preschool children
4.3 7 In an effort to reducce chronic undemutrition and its health hazards, food supplementation programmes tco identified vulnerable groups such as women and children were taken up initially by the O e p tt o f Social Welfare and later Deptt o f Women and Child Development ; in the Integrated; Child Development Scheme an attempt was made to provide essential health and nutrition irnputs to the women and children and pre-school education to children both in urban and rureal areas. Food supplementation to the school children in the form o f Mid day meal projgrammes were taken up in many states Programmes for prevention o f iodine deficiency/ disorders, anaemia and blindness due to Vit A deficiency were initiated by the Deptts o f H ealth and Family Welfare.
4 3 8 A review o f the o f nutrittional scenario in the eighties showed that there has been a marked reduction in the sevecre grades o f undemutrition and mortality due to severe undemutrition, however the excisting food supplementation programmes failed to achieve significant reduction in proportiion and number o f persons with mild and moderate degrees of chronic under-nutrition, becausee the programmes tried to provide food supplements to the identified segments o f the cojmmunity and not to identified person/ family of persons suffering undemutrition Speecific micro-nulrient deficiencies as such anaemia (due to deficiency o f iron, folic acid), icodine and vitamin A deficiencies continued to remain major public health problems becaiuse they cannot be tackled through food supplementation programmes and the propylaxiss programmes were not aimed at detection and correction of the deficiency in the individualls With the aheration dietary intakes and life styles newer problems such as obesity and inoncommunicable diseases has surfaced especially among the urban middle and upper incorme groups during the last decade Tackling all these problems through intersectoral cooperaticon between the concerned Departments including Deptts of Health, Family Welfare, Wom«en and Child Development, Education, Agriculture, Food Processing, Rural and Urban D)evelopment will receive due attention during the Ninth Plan period
4 3 9 The present chapter has two sections The sections on the food security deals with the perspectives, problems and prroposed initiatives to ensure food adequacy at the national, regional and household level TThe section on Nutrition deals with the nutritional problems due to lack or excess o f macro and micro nutrients especially among infants, women and children, the heahh consequencces o f these and the efforts to combat them
Food Security
Introduction
4.3 10 The National Agenda, for Governance o f the new Government has promised to ensure food security for all, crreate a hunger free India in the next five years and reform and improve the PDS so as to serve the poorest o f the poor in rural and urban areas The concept o f food security incluides peoples' access to basic food products, both physically and economicallv The proble^m of access to basic foods is particularly acute for the vulnerable sections of the scociety and in the deficit and inaccessible regions of the country

4 3 11 Food security implies a situation where everyone hasi access, at all times, to the food needed for an active and healthy life Thus, the essential elements o f food security are (a) adequate availability o f food, (b) efficient distribution through trade and / or public distribution system, and (c) availability o f adequate purchiasing power in the hands of the people
4 3 .12 A judicious combination o f domestic production ;and food trade can provide a reasonable degree o f stability in food availability, especiailly in a situation where food production is characterised by seasonal and annual flucttuations Seasonal and annua! instability in domestic supplies can also be reduced throiugh buffer stocking operations involving accummulation and offloading o f public stocks^ o f foodgrains in years of good and bad harvests respectively
4.3 13 An approach to national food security, wFhich relies largely on domestic production o f food needed for consumption as well as for building buffer stocks, can be described as a strategy o f self-sufficiency However:, a strategy for food security should not preclude external trade in food Trade may talke place on the margin and according to need: exports in surplus situations and importts in deficit periods
4 3 14 At the household level, food security implies; having physical and economic access to foods that are adequate in terms o f quantiity, quality and affordability Thus defined, household food security depends on am adequate income and assets, including cultivable land - owned and/oT leased - which emsure that each household \s able to produce or procure the food it needs The root cause o f household food insecurity is poverty Poverty may be chronic, seasonal or transitory These situations differ only in degrees All the poor have inadequate access to natural rresources, jobs, incomes or social support
4 3 15 A strategy for food security based largely on self sulfficiency in food production has the advantage o f promoting both productivity and purchasiing power among small peasants and agricultural labourers. In general, policies for imprroving household food security should include: (i) development strategies and macro-econiomic policies that would create conditions for growth with equity; (ii) accelerating growtth in the food and agricultural sectors which provide direct sources o f food and incorme with which to buy food, (iii) promoting rural development that focuses Qn the poor;, (iv) improving access to land and other natural resources, (v) providing cheap creedit for poor households, (vi) increasing employment opportunities, (vii) introducing inccome transfer scheme, including provision o f public distribution o f subsidised cheap' food; (viii) stabilising food supplies and food prices; (ix) improving emergency prepoaredness planning for providing food aid during natural disasters like drought, flood, earthqiuakes etc
India's Food Security System
4.3.16 Ensuring food security for the country has been a. major pre-occupation o f the Government since independence Over the last five decadess, policies and programmes have been designed to ensure availability o f foodgrains to all secctions o f the society, particularly the weaker sections. The basic food security system currrently consists of, apart from policies to promote domestic foodgrains output, minimium support prices, procurement and storage, public distribution, maintenance o f buffer stock and open market sales Trade in foodgrains, which is highly regulated even now, was never a strategic
531
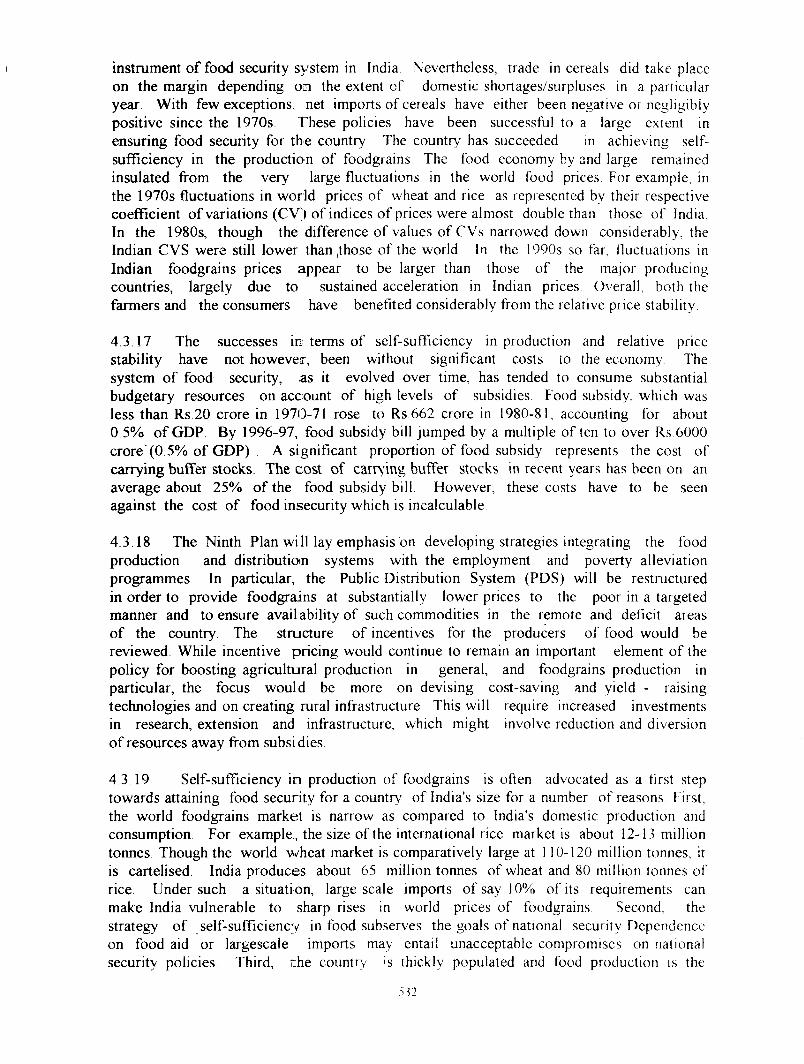
instrument o f food security system in India Nevertheless, trade in cereals did take place on the margin depending om the extent o f domestic shortages/surpluses in a particular year. With few exceptions, net imports of cereals have either been negative or negligibly positive since the 1970s. These policies have been successful to a large extent in ensuring food security for the country The country has succeeded in achieving self- sufficiency in the production o f foodgrains The food cconomy by and large remained insulated from the very large fluctuations in the world food prices For example, in the 1970s fluctuations in world prices o f wheat and rice as represented by their respective coefFicient o f variations (CV) o f indices o f prices were almost double than those o f India In the 1980s, though the difference o f values o f CVs narrowed down considerably, the Indian CVS were still lower than ,those o f the world In the 1990s so far, fluctuations in Indian foodgrains prices appear to be larger than those o f the major producing countries, largely due to sustained acceleration in Indian prices Overall, both the farmers and the consumers have benefited considerably from the relative price stability
4.3.17 The successes in terms o f self-sufficiency in production and relative price stability have not however, been without significant costs to the economy The system o f food security, ;as it evolved over time, has tended to consume substantial budgetary resources on account o f high levels o f subsidies Food subsidy, which was less than Rs.20 crore in 1970-71 rose to Rs.662 crore in 1980-81, accounting for about0.5% o f GDP. By 1996-97, food subsidy bill jumped by a multiple o ften to over Rs 6000 cro re '(0.5% o f GDP) A significant proportion o f food subsidy represents the cost of carrying buffer stocks. The cost of carrv'ing buffer stocks in recent years has been on an average about 25% o f the food subsidy bill However, these costs have to be seen against the cost o f food insecurity which is incalculable
4.3.18 The Ninth Plan will lay emphasis on developing strategies integrating the food production and distributioin systems with the employment and poverty alleviation programmes In particular, the Public Distribution System (PDS) will be restructured in order to provide foodgrains at substantially lower prices to the poor in a targeted manner and to ensure availability o f such commodities in the remote and deficit areas o f the country The structure o f incentives for the producers o f food would be reviewed. While incentive pricing would continue to remain an important element o f the policy for boosting agricultural production in general, and foodgrains production in particular, the focus would be more on devising cost-saving and yield - raising technologies and on creating rural infrastructure This will require increased investments in research, extension and infrastructure, which might involve reduction and diversion o f resources away from subsidies
4.3.19 Self-sufficiency in production of foodgrains is often advocated as a first step towards attaining food security for a country o f India's size for a number of reasons First, the world foodgrains market is narrow as compared to India's domestic production and consumption For example , the size o f the international rice market is about 12-13 million tonnes. Though the world w heat market is comparatively large at 1 10-120 million tonnes, it is cartelised. India produces about 65 million tonnes of wheat and 80 million tonnes of rice. Under such a situation, large scale imports o f say 10% of its requirements can make India vulnerable to sharp rises in world prices o f foodgrains Second, the strategy o f self-sufficiency in food subserves the goals o f national security Dependence on food aid or largescale imports may entail unacceptable compromises on national security policies Third, the country is thickly populated and food production is the
S32

predominant means o f livelihood for a large section o f peasant cultivators and agricultural labourers, who are not easily shiftable to other occupations, at least for quite sometime The process o f production o f food in this predominantly small-holding agricultural economy ensures employment, income as well as food security simultaneously Last, but not the least, the country continues to produce most o f the times cheaper foodgrains, particularly cereals, as compared to CIF cost o f imports So, except during the years o f severe shortfall in production , imports could not be a normal supplement to domestic supplies On the other hand, there have been hardly a few years o f surplus production supporting a sustained level o f exportable supplies
4 3 20 Significant strides have been made in domestic production o f foodgrains and towards ensuring self-reliant food security During the last decade (1986-87 to 1996-Q7), foodgrams production registered an annual compound growth rate o f over 3 percent During the Eighth Plan period, production o f foodgrains increased by about 30 million tonnes, that is from about 168 million tonnes in 1991-92 to about 199 million tonnes in 1996-97, representing an annual compound growth rate o f over 3 4 percent The Sub Group on Demand Projections for the Ninth Plan has estimated that the per capita consumption elasticity for foodgrains is about 0 3, Assuming 7% of growth of GDP and using estimated elasticity o f private consumption with respect to GDP at 0 88 and annual population growth o f 17%, the per capita final consumption growth rate works out to be 4 5% (0 88 X 7-17) Based on these parameters, the annual growth o f demand for foodgrains during the Ninth Plan is expected to be around 3% (4 5X0 3+1 7) This means that growth in domestic pvoductvon of foodgrains during the Ninth Plan will have to be maintained at the rate achieved during the Eighth Plan
4 3 .21 Much o f the high growth in the output o f agriculture in general, and foodgrains in particular, experienced during the Eighth Plan was the outcome of successive good monsoons in a row, a circumstance which cannot be assumed to obtain in the longer run Fundamentally, Indian agriculture continues to remain vulnerable to weather-induced aberrations Determined efforts would have to be made to reduce this vulnerability This cannot be achieved without accelerating agricultural investment, which has not witnessed significant growth in real terms since the beginning o f the 1980s For example, fixed capital formation in agriculture which was Rs.4537 crore in 1980-81 increased in real terms to only Rs,6133 crore in 1995-96, representing an annual compound growth o f about 2 0 percent Public investment in agriculture actually declined in real terms from Rs,1796 crore in 1980-81 to Rs 1329 crore in 1994-95 Secondly, in view o f the constant, and perhaps even declining, areas available for cultivation, agricultural growth in general and growth o f foodgrains output in particular, can come about only through rapid increases in productivity These require substantial investments in water and land improvement, besides technology development and its dissemination
4,3,22 Provided the required investments are made and adequate credit availability ensured, the country's agro-climatic situation and the present stage o f agricultural development do provide opportunities for substantial increases in the production o f foodgrains, even without expanding the net sown area under foodgrains For example, it is possible to increase the intensity o f farming and achieve higher yields on current land under foodgrains in the Eastern States o f the country, where the use o f HYV seeds, irrigation and fertilizer has been less than their potential Currently, about 65% of the area devoted to foodgrains are cultivated under rain-fed conditions These areas have the potential to double their yields under appropriate dry farming technologies and extension o f irrigation facilities
533

4.3 23 In the Ninth Plan, with the GDP expeected to grow by about 6.5%, the population growing by about 1 7% and the per capita final (consumption by about 4 %, the demand for foodgrains is expected to grow by 2 5 to 3 00% per annum. Therefore, efforts will need to be made to achieve a secular growth rate o f oujtput o f foodgrains o f over 3% in order to prevent large-scale imports during the yv^ears o f weather - induced shortfalls in production, and also to plan for regular exports^ in normal years It will be feasible to realise this target growth rate through a wesll-designed regionally differentiated strategy based on agronomic, climatic and environmerntal conditions and supported by research efforts in the areas o f bio-technology, micro-l biology, plant genetics etc
4 3 24 While an annual 3% growth o f foodtgrains output should be enough to feed the growing population, the new Government has forrmulated an Action Plan for doubling o f food production (cereals, pulses, oils and fat, sugar, ffruits and vegetables, milk, meat & fish) in order to make India hunger free in the next 10 ̂ years This means that growth o f food production will have to be accelerated at a cormpound rate o f over 7 per cent per annum
4 3.25 Availability o f foodgrains throuagh increased production is a necessary condition for food security but not a sufficient o^ne In order to ensure access to food for all, the prices must be affordable. Prices are deterrmined by demand- supply balance and price stability over time is conditioned by sustained boalance between demand and supply Such a balance may be disturbed for two reasons Fiirst, there could be occasional weather- induced declines or stagnation in the prodduction o f foodgrains Second , in a growing economy with rising per capita income, the growth o f demand for foodgrains could incipiently outstrip the growth o f domestic suppply In the first situation, the prices would witness a sudden rise In the absence o f any in-built corrective mechanism, the prices may even spiral due to speculation by thoe traders and panic buying by theconsumers In the second situation, the pricess o f foodgrains will have the tendency to rule higher than normal. Both the situaticons are liable to erode food security, particularly o f the poor
4.3 26 In order to combat the sudden spurt ini prices arising out o f occasional weather- induced declines in production, it is essesntial to design an effective buffer stocking programme. While a buffer stocking programime with a large public storage system exists in the country, it is essentially designed to safegiuard the floor prices o f the farmers during bumper harvests.lt has rarely been used succcessftilly to contain the spurts in open market prices, which have followed occasionail harvest failures With some re-orientation the existing buffer stocking programme cam be utilised not only to smoothen the year-to- year fluctuations in production, but alsso to curb speculative spurt in prices that occasionally afflicts the foodgrains market TTowards this end, the current practice of restrictive and discretionary open market sakes out o f the public stocks needs to be reviewed The correct policy to combat speculattion by the traders and panic buying by the consumers should be for the Government to) be ready at all times to intervene in the market Instead of holding back the stocks, which the Government often does for fear o f depleting the stocks meant for public distribution, the Government should release the stocks in adequate quantities at miarket related prices Simultaneously, the Government should replenish the stocks, or att least announce its intention to do so, through imports If too little quantities are re;leased for open sales at much below the market-rates, which is the current practice, these are likely to be cornered by the hoarders As far as possible, open sales should! be conducted through auction instead of the present practice o f sales to a chosen few Close monitoring o f prices should obviously be an important element o f this stratepgy
534

4.3 .27 In the second situation where the prices o f foodgrains rule higher than normal in a sustained manner and which indicates a treend o f demand outstripping domestic supply, it may be necessary to relax the policy o f self-sufficiency. It should be realised that by allowing grain prices to rule higher thian normal, consumption can be curtailed, production can be stimulated and the requirements o f imports foreclosed Achievement o f self-sufficiency in this mainner would clearly not be consistent with the aim o f ensuring affordability. Sacrificing food imports on the ahar o f self-sufficiency will do nothing to guarantee that the poor hiave enough to eat Banning food imports may even be counter productive. An enginieered terms o f trade, favorable to foodcrops, may result in a loss o f acreage under non--food crops In such an event, the country may end up spending more foreign exchainge on the import o f say, cotton or sugar Similarly, there is a strong case for Hbralisimg export o f foodgrains, especially when there are surpluses and public stocks pile up). Restricting exports as a matter o f policy may be counter productive in terms o f depressted prices and lower production, eventually forcing the Governm.ent to incur larger expenditure on higher support prices As a matter o f fact, import and export o f foodgrains; and other agricultural commodities should be allowed as a normal market operation
4 3.28 In general, there is a strong case for' liberalising the trade not only in foodgrains but also in all other agricultural commodities The virtually closed nature o f Indian agricultural trade, on both import and export side, has led to high protection for the oilseeds & sugar subsector and taxation o f foodgrains and cotton On the import side, opening up India's agriculture to more competition would resuih in important efficiency gams for all cvops and improve incentives to producers o f foocdgrains and cotton On the export side, opportunities o f exports o f foodgrains and o)ther rainfed agricultural products such as cotton & fruits will open up. Measures o f opening; up should include shifts from the use of quotas and restrictions to appropriate import tariffs; and export taxes, maintaining consistent export policies to allow the development o f oversejas markets, ending "stop and go" restrictions and eliminating domestic market and pricce controls Though India is unlikely to be more than a marginal importer/exporter o f basic aagricultural commodities, greater openness will increase India's efficiency and competitivene;ss, particularly in the foodgrains sector This will strengthen the food security system
4 3.29 Thus the objective o f ensuring access to food, embodied in the concept ofaffordability, involves convergence o f policces on at least four fronts production, bufferstock operation imports and exports o f foodgrains While the importance of production and trade in ensuring food security is ea;sily understood, the complementary role of a strong buffer stock management system is not
4.3 30 Fluctuating foodgrains production is a world-wide phenomenon and therefore,shortages and surpluses are the recurring themes for individual countries Facing a shortage situation at home, many countriies desperately buy in a rising market, thus pushing the prices higher Similarly, facimg a surplus situation at home, many countries try to sell aggressively in a soft market in thte fear that prices will fall further Because of the cumulative actions o f several countrries, particularly if their requirements are large, prices do fall or rise violently This k ind o f market behaviour tends to inflate the import bill or to deflate the export earning;s. In order to avoid paying more than necessary for import and receiving less than due on export, it is essential to build up sufficient capacity to hold back from purchases or sales for a short period This capacity is essentially a derivative o f a strong buffer stcock management system However, it needs to
535

be pointed out that too large a buffer stock can be expensive since it involves costs in the form o f interest payments, storage charges and storage losses Excessive stocking can also be harmfijl since stocks beyond a limit may constrict the supply stream and thereby trigger an unwarranted spurt in prices Hence, keeping the buffer stock down to a minimum size and relying on imports in the years o f lean output and exports in the years o f excess production appears to be a less costly option
4 3 31 Several Comm.ittees, set up by the Government in the past, have tried to determine the levels o f stocks in India for minimising the fluctuations in supply arising out of uncertainity in production A Technical Group set up by the Government in 1975 recommended a buffer stock o f i2 million tonnes o f foodgrains over and above the operational stocks which should range between the minimum o f 3 5 to 3 8 million tonnes on the 1st April o f the year and maximum o f 8 2 to 8 8 million tonnes on the 1st July In 1981, another Technical Group reviewed the buffer stocking policy On the basis o f this Group's report, the Government in 1984 took the decision to maintain public buffer stocks o f 10 million tonnes, in addition to the operational stocks which, on different dates o f the year, were to range between the lowest figure o f 6 5 million tonnes on 1st April and the highest figure o f 11.4 million tonnes on 1st July Yet another Technical Group se tup in 1988 recommended minimum levels o f stocks on different dates o f a year to be maintained by public agencies during the Eighth Plan This Group was o f the opinion that the buft'er stocks and the operational stocks cannot, in practice, be maintained as separate physical entities According to this Group's recommendations which were accepted by the Government and which are still in iorce, the total slocks to be maintained are 14 5 Million Tonnes on 1st April, 22 3 Million Tonnes on 1st July, 16 6 Million Tonnes on 1st October and 15.4 Million Tonnes on l"̂ January The assumption behind the stocks recommended by all these Technical Groups was that shortfalls in normal supply would be met entirely out o f the stocks. Needless to say that the prescribed volume o f stocks would get reduced to the extent that the country decides to import foodgrains during scarcity
4.3.32 As a matter o f fact, the Government can take advantage of the international 'fiitures' in foodgrains, primarily rice and wheat, as a medium o f buffer stock management at a relatively low volume The 'futures' can ensure a stable equilibrium in the prices of foodgrains even in a situation o f low domestic stocks For example, if the domestic situation demands physical imports o f foodgrains, the agent o f the Government (FCl, STC or MMTC) having a futures contract can exercise appropriate option and arrange for taking delivery o f foodgrains for actual shipments If the physical imports are not necessary, the agent can exercise the option for not taking delivery by paying the required fees However, to be effective, the Government through its agencies must have a sustained presence in the international fiitures market
Integrating Production and Distribution Systems
4.3.33 Adequate availability o f food at the national level does not necessarily lead to adequate availability in all the regions, especially in the deficit and inaccessible regions, o f the country Market imperfections (due to lopsided availability o f credit and insurance transport bottlenecks, inadequate storage capacities etc) and governmental restrictions hamper free movement o f foodgrains across intra-national borders These • plain the regional scarcities and large regional spreads in foodgrains prices Regional spreads t)f prices of cereals in major markets could be as high as 25% , which cannot be i'uilv accounted for by the transport cost differentials Minimising the restrictions, such as stock limits and penal
.̂16

provisions o f the Essential Commodities Act and introduction o f 'futures' in grain trade would greatly facilitate the development of a common market in the country A common market is the best guarantee for establishing an efficient distribution network
4.3.34 Apart from strengthening and expanding the market, there is a need to disperse the foodgrains production base in the deficit regions in order to ensure physical access to food for all at affordable prices The association between regional self- sufficiency in production and the level o f regional prices is quite strong This means that the consumers in the deficit regions have to pay substantially higher prices for foodgrains than those in the surplus regions. The (data on per capita consumption o f cereals and the corresponding values reported in the NSS 43rd Round Quinquennial Survey on Consumer expenditure show that the consumers in the rural areas o f many deficit States paid significantly higher unit prices than their counterparts in the surplus States (Table 4 3 1) For the poor consumers in the deficit regions higher prices o f foodgrains may imply lower consumption o f food and consequent poor intake o f nutrition While these problems will get minimised over time with greater market integration, in the short run an important element o f food security strategy should be to expand food production in the deficit regions which, otherwise, would remain as pockets o f food deprivation amidst plenty at the national level
Table 4.3.1
Monthly Per Capita Consumption and Unit pricc of Cereals in Rural areas of Selected States -1987-88
States Attribute Monthly Per Capita PriceConsumption (Kg) (per kg;
NorthHaryana Surplus 1 5 . 0 2 2 . 2H P Surplus 1 6 . 0 6 2 . 65J & K Deficit 1 7 . 2 6 2 . 95Punjab Surplus 1 2 . 4 1 2 . 15U. P. Surplus 1 5 . 3 2 2 . 35
WestGujarat Deficit 1 2 . 0 0 2 . 6M . P. Surplus 1 5 . 3 9 2 . 6Mahara Deficit 1 3 . 0 3 2 . 35shtraRajasthan Surplus 1 6 . 6 2 2 . 3EastAssam Deficit 1 4 . 23 3 . 7Bihar Deficit 1 5 . 3 9 3 . 4Orissa Surplus 1 5 . 7 2 3 . 3 5W. Bengal Deficit 1 5 . 12 3 . 6 5SouthA . P. Surplus 1 4 . 3 5 2 . 7 5Karnataka Surplus 13 . 25 2 . 6 5Kerala Deficit 1 0 . 3 6 3 . 65T. Nadu Deficit 12 . 24 3 . 5
D tes:1 The a t t r i b u t e of s u r p l u s / d e f i c i t i s based on thecomparison Of S t a t e s p e c i f i c annual annual consumption.
product ion and

Highlights of the system of Payment of wsyages in the form of foodgrains to JRY/EAS workkers
Foodgrains to the beneficiaries o f EAS/JRY willll be specially subsidised. The issue price will be roughly half the m arket price.
1 kg o f rice or w h ea t as desired, will be issuedd for each manda} 's work
A beneficiary under EAS/JRY, will be entitled i to get 10 to 15 Kgs of specially subsidised foodgrains per month.
Since only the really poor offer them selves i foi work imder EAS/JRY. it is a good selftargeting measure.
The entitlem ent o f specially subsided foodgi^rams under EAS/JRY is in addition to 10 kgs o f foodgrains a poor family is entitled to get per r montli under the restructured PDS
In addition to the price incentive, the Govermim ent has proposed to make the s\ stem adm inistratively m ore attractive. The proposahl is to give the w orkers food coupons w hich they can exchange for foodgrains at the Fair Pi*rice Shops to which their normal famil>- card is attached.
Since the scheme o f food coupons is m eant onnly for JRY/EAS workers and is optional, it will be small in size. Because o f sm allness o f f size it will be adm inistratively feasible to operate.
4.3.35 The strategy o f dispersal o f production base has several other spin-off benefitsFirst, hitherto deficit regions will increasingly conntribute to incremental production, since yield rates in the traditional surplus regions have plateued. Second, large transaction costs involved in transporting foodgrains from < a few surplus pockets to all corners o f thecountry can be avoided. For example, distri ibution cost consisting o f handling andstorage charges, freight, interest, transit and stoorage losses and administrative overheads typically constitute about 20% of the pooled econcomic cost o f foodgrains. Freight charges alone account for about 8% o f economic cost Rs.ail freight ex-North to the Southern States typically accounts for 10% o f the economic cosBt Third, widely dispersed employment and income effects, implicit in such a trategy, will subserve the objective o f poverty alleviation.
Linking Prodiuction and Distribution S>ystems with Employment and Poverty Alleviation Programmes
4.3.36 Increasingly higher production o f foood and its dispersal through an efficientmarketing infrastructure, including the Public D)istribution System ,is no guarantee for ensuring the food security o f the poorest segrments o f the population The poor musthave adequate entitlements to access food eithecr from the market or through the PDSEntitlements are better created and preserved thrcough employment programmes such as JRY, or income generation schemes such as IRIDP, since these are less prone to leakages These programmes, which already exist and will 1 continue during the Ninth Plan, can be increasingly linked to creation o f rural assets suchi as, irrigation and drainage channels, wells and tanks, check dams & bunds, roads & mandis ; etc These will strengthen the production base and enhance productivity o f the agriculturaal sector
5.^8

4.3 37 A system o f payment o f wages in the form o f foodgrains to JRY/EAS workers already exists in the country. However, fonr various reasons, partly administrative and partly behavioural, the system did not becomne popular with the workers As a part o f the restructuring exercise regarding PDS, the (Government has proposed to make the system of payment o f wages in the form o f food.dgrains more attractive to the workers The highlights o f the restructured system are givven in Box
Restructuring Public Distribution System i
4.3.38 A well targeted and subsid ised Public Distribution System (PDS) is an important constituent o f the strategy for poverty alleviation A subsidised PDS should essentially be viewed as a mechanism for in come transfer to low mcome segments of the population While conceptually the fijnction o f income transfer to the low income groups can be better performed by food coupons, for several reasons it may not be workable in the Indian situation First, dismantling of the P DS implicit in food coupons system ma\ not be acceptable. Second, PDS is linked to the system o f support prices and procurement operations as a part o f the current agricultitural price policy The time is not yet ripe \o disband the price support operations and there fore, the PDS which provides an outlet for offloading the foodgrains procured from sur plus areas to deficit areas Third, food coupon system is fraught with unmanageable admini strative problems associated with security printing o f coupons, fraud prevention, fresh issue o f stamps due to periodic indexation etc Fourth, food coupons have characteristics similar to cash and are liable to be misused Fifth, and move important, it has been argueed that coupons (equivalent to cash) would typically enhance the demand for highlyy subsidised foodgrains (due to shift m the demand curve to the right) while the suppply remains the same This will cause food prices to rise Increase in food price would mean deterioration in the well being o f those who are left out o f the coupon programme Under the circumstances, a poverty-based targeting o f PDS is abetter option from the point o f view o f ensuring the food security of the poor The PDS that existed till recently has been widely criticised for its failure to serve the population below the poveny line (Bl PL) , its urban bias, inequitous distribution as reflected in the poor coverage in the S tate 's with the highest concentration o f the poor, lack o f transparent and accountable arrangements for delivery and the consequent heavy leakages Realising this, the Governm lent has streamlined the PDS by targeting it to the BPL population at specially subsiiidised prices and with better monitoring of the delivery system The new system, nanmed Targeted Public Distribution System (TPDS), has come into operation with effect ft om 1st June, 1997
4 3 39 The principles o f TPDS was speh out earlier in the Report of the Working Group (WG) on National Policy on Public Distributio n system (June, 1996) set up in the Planning Commission in August, 1995, In view o f the fact that the poor devote a substantial part of their expenditure on foodgrains, it is essential to protect them from a continuous upward pressure on foodgrains prices, a phenomen on in-built in our system o f procurement prices, which need an annual increase as an in eentive for increasing production If the poor are not protected from the impact o f ever inci easing prices o f foodgrains, the effects of many o f the poverty alleviation measures an d programmes would get neutralised In other words, a system o f food subsidy becom es an essential element o f food security The challenge, however, is to contain the to tal food subsidy to the minimum necessary through a system o f targeting, so that the sub sidies benefit only those sections whom the State wants to protect
519

4 3.40 The W orking Group after discussing various forms and experiences o f targeting, such as, through wage employment programmes (JRY, EAS etc), area based targeting (ITDP, RPDS), exclusion o f non-poor and the system o f food coupons prevalent in some countries, suggested a scheme o f allocation o f foodgrains out o f the Central Pool to the States at two sets o f prices, namely, a highly subsidised price for the poor (BPL) and near open market prices for the non-poor (APL)
4.3 41 Based on detailed calculation, the Working Group in effect recommended an issue price for the poor at half the normal Central Issue Price (CIP) The Working Group hoped that over a period o f time, the absence o f appreciable difference between the open market prices and the near open market prices for the non-poor would reduce the demand for increased allocations over and above those meant for the poor Detailed calculations showed that a scale o f 20 kgs o f foodgrains per BPL family per month and priced at half the normal CIP could be accommodated within a sustainable limit o f annual subsidy and within historically available quantity o f foodgrains
4 3.42 The principles enunciated by the Working Group were adopted by the Government while implementing the TPDS However, by the time TPDS was implemented the numbers (population, BPL population, economic costs etc) underwent substantial escalation. As a consequence, the Government had to reduce the scale o f allocation to BPL families. Under the TPDS, a quantity o f 10 kgs o f foodgrains per family per month is being issued to the States on the basis o f the number o f BPL families The number o f BPL families has been determined on the basis of provisional estimates for madeby the Planning Commission, based on the methodology o f the Expert Group under Professor Lakadawala. Poverty-based targeting under TPDS is a major improvement over the erstwhile PDS
4.3.43 While the objective o f TPDS is to restrict the benefits o f subsidised foodgrains to the poor, allocations o f foodgrains out o f the Central Pool is being continued for the above poverty line (APL) population who were the beneficiaries o f the erstwhile PDS This is a transitory measure to soften the shock o f sudden v/ithdrawal o f entrenched benefits o f the erstwhile universal system However, the transitory allocations have been restricted to the past 10 years' average lifting which is in excess o f the requirement o f the BPL population in each State The unit subsidy for APL has also been substantially reduced
Innovative features of the TPDS* A llocation o f 10 kgs perm onth . per BPL fainilv is on an entitlement basis and is guaranteed
by the Centre No such guarantee has been given to the APL families \Mtii regard to oiiiicrentitlem ent or scale o f ration
* The Centre has com m itted to provide 10 kgs of foodgrains per BPL fainih per month <iiabout half the Central Issue Pnces (CIP). which has been linked to economic cosi
* A llocations to the APL families will be at full CIP
* TTie States have been asked to keep the end retail pnce at the Fair Price Shop lev el for theBPL population at no more tliari 50 paise per kg. o \e r the issue pnce for llie BPL population In otherwords. e.xpenses tov\ards tnuisport and retailers' margin caiinoi exceed ,50 paise f>er kg for the BPL population For the APL populalion no such limit lias beenprescribed and the Slates lia\ e been g i\cn ttie freedom to fi.\ the margin
540

4 3 ,44 A number o f innovative features have been introduced in the TPDS in order to provide differential treatment to the BPL population vis-a-vis the APL population.
4 3 45 In order to make the TPDS transparent and accountable and thereby plug the leakages, a number o f steps have been taken These include; (a) release o f foodgrains to the States subject to satisfactory- completion o f identification o f eligible families, (b) involvement o f the Panchayats/Nagar Palikas in the identification exercise as well as for supervision o f the work o f the Fair Price Shops, (c) constitution o f Vigilance Committees at FPS, Taluk, District and State level and (d) a system o f monitoring and reporting on the working o f TPDS
N U TRITIO N
introduction
4 3 46 At the time o f Independence the country faced two major nutritional problems - one was the threat o f famine and acute starvation due to low agricultural production and lack o f appropriate food distribution system The other was chronic energy deficiency due to poverty, low-literacy, poor access to safe-drinking water, sanitation and health care, these factors led to wide spread prevalence o f infections and ill health in children and adults Kwashiorkor, marasmus, goitre, beri beri, blindness due to Vitamin- A deficiency and anaemia were major public health problems The country adopted multi-sectoral, multipronged strategy to combat the major nutritional problems and to improve nutritional status o f the population
4 3 47 Green revolution resuhed in increased food production sufficient to meet the needs o f growing population, establishment o f adequate buffer stocks and PDS have ensured adequate per capita food availability and distribution at the national level Improvement in per capita income, poverty alleviation programmes including food for work and Employment Assurance Scheme have resulted in improvement o f purchasing power and household food availability Food supplementation programmes were initiated to meet the extra food requirement o f vulnerable groups namely pregnant and lactating mothers and preschool children Programmes for prevention o f iodine deficiency disorders, anaemia and blindness due to Vit A deficiency was initiated by the Deptts. o f Health and Family Welfare
4 3 48 During the last 50 years considerable progress has been achieved in many o f these programmes Famines no longer stalk the country. There has been substantial reduction in moderate and severe undernutrition in children and some improvement in nutritional status o f all segments o f population Kwashiorkor, marasmus, beri beri and blindness due to Vitamin- A deficiency have become rare However, it is a matter o f concern that milder form o f chronic energy deficiency (CED) continues to be widely prevalent in aduhs and children Undernutrition continues to be a major problem in pregnant and lactating women, over one- third o f the new-boms still weigh less than 2 5 kg at birth Even though there has been a marked reduction in blindness due to Vitamin-A deficiency, the less severe forms o f Vitamin- A deficiency persist Universal access to iodised salt has not been achieved and there has not been marked reduction in iodine deficiency disorders There is no decline in prevalence or severity o f anaemia and its health consequences During the last two decades, there had been major alterations in the life styles and dietary intake especially among urban middle and upper income group population. As a result newer problems such as obesity in adolescents and adults and increased risk o f non-communicable diseases are emerging
.541

4.3.49 India is currently undergoing demograph ic, economic, social, educational, agricultural and health transition. These factors individually and collectively can bring about substantial
alteration in health and nutritional status o f the population If through effective planning and inter-sectoral coordination, appropriate synergy is brought about, it will be possible to achieve substantial improvement in nutritional and health status o f the population
Major Nutritional Problems of Public Health Importance are;
□ Chronic energy deficiency and undem utntion□ Chronic energy excess and obesity□ Niicro-nutrient deficiencies
(a) Anaem ia due to iron and folate deficiency
(b) Vitamin -A deficienc\ and(c) Iodine deficiency disorders
4 3 50 Achievement o f Food and Nutrition Security is one o f the nine major objectives o f the Ninth Plan The strategy for achieving improvement in Nutritional Status during the
Ninth Plan period will be through effective im plementation o f the National Nutrition Policy and National Nutritional Action Plan with emph.iasis on inter-sectoral coordination
4.3.51 The Special Action Plan has accorded h igh priority to increasing food production and making India hunger free in ten years, it envisag es a mission mode approach for planning and implementation, with appropriate co-ordinatiorn between Centre, State and Panchayati Raj institutions so that set goals are achieved within i the defined time frame
Objectives during the Ninth Plan
4.3 52 Objectives during the Ninth Plan are to achieve :
1)
2)
3)
Freedom from hunger throug ;h increase in food production, effectivedistribution, improvement in pur chasing power o f the population.
Reduction in undernutrition and its health consequences through:universalisation o f ICDS, sere ening at risk groups’, growth monitoring, better targeting o f food supple ments to those suffering from undernutrition, close monitoring o f under-nou rished persons receiving food supplements, effective intersectoral coordina tion between health and nutrition workers to ensure early detection and man .igement o f health problems associated with or leading to undernutrition.
Prevention, early detection a nd effective management deficiencies and the associated h ealth hazards
o f micronutrient
Review of Nutrition Programmes during th e Earlier Eight Plan Periods
4.3 53 Nutritional status o f the population is affected by a wide variety o f factors Coordinated interventions from all the sector s are required for improving the nutritional status and reducing the disease burden due to nutritional problems Interventions to improve nutritional status can be classified as direct an d indirect interventions Planners, economists, and agricultural scientists drew up indirect inte rventions to improve nutritional status, such as programmes to improve the per capita incom e,, food production, purchasing power, equitable distribution o f food and income and poverty allleviation The Nutritionists, Health and Family Welfare professionals focussed their attention on direct interventions such as:
54 2

1. Tackling adverse health cornsequences o f nutrition-infection and nutrition- fertility interactions.
2. Programmes for prevention,!, early detection and effective management o fhealth problems associated wvith nutritional deficiencies.
3. Detection, correction and pre^vention o f micronutrient deficiencies.
4. Food supplementation to . specifically identified vulnerable segments ofpopulation to prevent or corrcect chronic energy deficiency.
Nutrition Intervention Programmess (1951-1992)
P eriod N utrition S ituation N utrition Services1950s Food Shortages Food Production Phase:
Technological advancement to improve food productionFood fortification measures to improve nutritive value.
1960s M alnutrition most pnrevalent in lower economic s tra ta ..
IDD as a Public Healthh problem
Com m unity Development Phase:
Launching o f Applied Nutrition ProgrammeM obile Food and N utiilion Extension Serviceslodisation o f salt
1970s - early Recognition o f Chronnic Energy Deficiency, Anaemia, Vitamin A deficiency as major nutritional problems o f publilic health importance
Direct Nutritional Interventions:
Special Nutrition Programme Prophylaxis against Anaem ia and Vitamin A deficiency
Mid 1970s Recognition that infeection and undem utrition were maajor causes o f morbidity and mortaality among infants and children
Multi Sectoral Indirect Interventions Phase:
Integrated Child Development Services (ICDS)Universal Immunisation Programm e (UIP)Oral Rehydration Therapy (ORT) Nutrition Promotion through poverty alleviation. Public Distribution o f Food, Health and Family W elfare measures. Adult Education.
1980s Felt need for nutritionnal bias in sectoral policies and prcogrammes
Efforts for adoption o f a National Nutrition Policy
1990s Recognition that M alnu trition is an impediment to national development; its use aas indicator o f Development Processs
Finalisation o f the National N utrition Policy
Source: Department o f W omen and Child Developmennt, Government o f India, New Delhi.
543

4.3.54 The initiatives and programme taken up during the last fifty years by the centre and state for improving nutritional status are described in detail in the respective chapters, to avoid duplication these are not discussed in this section The major focus o f discussion in this section will be on food supplementation programmes, which have been initiated at the state and national level to combat chronic energy deficiency especially in women and children
rMajor initiatives to improve nutritional status (during last fifty years were:
I □ Increasing food productionI □ Im proving food distributionI □ Increasing household food availabiht> through
(a) Food subsidy direct or indirect(b) Im proving purchasing power
' □ E iiorts o f health sector to tackle:(a) M icronutnent deficiencies(b) Infection and unwanted fertihtv which
increases CED
Prevention and management of chronic energy,^ deflciency (CED)
4 3.55 It has long been recognized that psregnant and lactating women and pre-schoolchildren are nutritionally the most vulnerable sejgments o f the population and undernutrition in them is associated with major health problemis Small-scale research studies in India and elsewhere had shown that food supplementatiorn is a feasible and effective method o f improving nutritional and health status o f these groujps. Based on these findings, India and many developing countries initiated food supplementtation programmes A number o f different programmes have been in operation either excliusively as feeding programmes such as mid day meal programme or as integrated heahh atnd nutrition package for vulnerable groups (such as expectant and nursing mothers and untder-five children) as in the Integrated Child Development Services (ICDS).
The Applied Nutrition Programme (ANP)
4.3 56 ANP was started in 1963 to promote pro)duction o f protective food such as vegetablesandJ fhiits and ensure their consumption by prejgnant or nursing mothers and children Nuitrition education was the main focus and eflFcorts were directed to teach rural communities thrrough demonstration how to produce food for theMr consumption through their own efforts
Major Food Supplementation Programmes a r e :
□□□a□
Applied N utrition Programm eSpecial N utrition Programm eTamil Nadu Integrated N utrition Project ITamil Nadu Integrated N utrition Project IIIntegrated Child Developm ent ServicesSchemeMid - day M eal Program m e
Thie Special Nutrition Programme (SNP)
4.35.57 This was started in 1970, the objectives wais to provide 500 K Cal and 25 g o f protein to
expectant and nursing mothers and 300 K Cal atnd 10 g o f protein to children six days a week The programme was taken up in rural areas imhabited predominantly lower socio-economic groups, in tribal areas and urban slums
Tamil Nadu Integrated Nutrition Project
4.3.58 The Tamil Nadu Integrated Nutrition Prroject (TIN ?) was an externally assisted health and nutrition intervention that offered a packaage o f heahh and nutrition services to young children and pregnant and lactating women in nural Tamil Nadu
5444

4.3.59 TINP-I was targeted at 6-36 monthi old children, and pregnant and lactating women Project activities were started in October 11980 in one pilot block and extended gradually tocover 177 out o f a total o f 385 rural blocks in the State, by 1989/90 O f these, 31 rural blockshave been subsequently converted to ICDS blocks, so that a total o f 146 blocks were covered by TINP-I The poorest districts not covered by ICDS were selected for coverage under TINP-I
TINP's main goals were:
□ to halve malnutrition among children under four years o f age;
□ to reduce infant mortality by 25%;
□ to reduce vitamin A deficiemcy in the under fives from about 27% to about 5%; and
□ to reduce anaemia in pregnaint and nursing women from about 55% to about 20% .
4 3 60 The project had four major ccomponents: nutrition services, health services, communications, and monitoring and evaluation The main strategies were to provide food supplements, nutrition education and primaary health care to pregnant and lactating women and children (6-36 month), to monitor thte growth o f children in this age group through monthly weighing and growth charting, amd to provide supplementary feeding and health checks to children with growth faltering, as well as intensive counselling to their mothers To provide these services, nutrition centres sttafFed by part-time women community nutrition workers were set up in about 9000 village;s They were assisted by local women's groupscreated under the project, in addition outireach and referral services for health care wasimproved
TINP-II
4.3 .61 TINP-II was designed to cover in ai phased manner, 316 o f the total 385 rural blocks in Tamil Nadu, with an estimated total popuilation o f 32 8 million The target population was children from birth until six years o f age (ass against 6-36 month old children in TINP I) and pregnant and lactating mothers The goals off TINP-II include
□ increasing the proportion o f children classified as "nutritionally normal" by 50% in new and 35% in T IN P -I areas,
□ reduction in infant mortality tto 55 per thousand live births,
□ 50% reduction in incidence o lf low birth weight
With the universalisation o f ICDS all the TITNP blocks will be converted into ICDS blocks
The Integrated Child Development Servicces Scheme (ICDS)
4 3.62 Experience gained from ANP and SINP showed that it is important to provide health and nutrition inputs and health and nutritiom education as an integrated package o f services Therefore, the ICDS programme was initiateed in 1975 with the following objectives: -
545

1. To improve the health and nutritioon status o f children 0-6 years by providing supplementary food and by coonrdinating with state health departments to ensure delivery o f required health iiinputs;
2. To provide conditions necessary fc'or pre-school children’s' psychological and social development through early sistimulation and education;
3. To provide pregnant and lactating \ women with food supplements;
4. To enhance the mother's ability too provide proper child care through health and nutrition education;
5. To achieve effective coordinationn of policy and implementation among the various departments to promote chhild development.
4.3.63 The anganwadi workers (AWW) providde supplementary food to children under 6 years o f age, pregnant and nursing women, pre-SGchool education to children between 3 and 6 years o f age and health and nutrition education. Health and family welfare workers (ANM) deliver a package o f services including immunizzation, health check-up, and organise referral services.
4.3.64 The target group receiving food suppleementation is children between the age o f 6 months to 6 years and pregnant, and lactating mothers. Efforts are made to provide 300 calories and 10 grams o f proteins per child, 5000 calories and 15 to 20 grams proteins for pregnant/nursing women and 600 calories and 2C0 grams of proteins to severely malnourished children as food supplements. It is expected thhat about 40% of the target population will utilise the services. It was believed that the progijramme will be self-targetting and the poorest and the most needy will access the benefits. Exxperience gained during the last two decades indicate that the most needy may not access thhe facility and even when they do the food provided acts more as a substitute than as a suppplement. The beneficiaries receive the supplements through ICDS infrastructure, which is funded by the Dept, o f Women and Child Development. The State Government and UTs nmeet the cost of food supplements through the State Plan budget. The funding constraints in t the states come in the way o f regular assured supply o f food to the anganwadis. The inputs from the health sector are often suboptimal; referral care for those with severe undernutritionn is often not available.
4.3.65 ICDS was initiated in 1975 on an exxperimental basis in 33 blocks. The initial geographic focus was on tribal, drought-prone £ areas and blocks with a significant proportion o f scheduled caste population. Even though the programme envisages special targetting towards malnourished children, who are to be gi^iven double the quantity o f the supplement, in practice most beneficiaries o f supplementary feeding are not selected through nutritional screening. Over the last two decades the ICDSS coverage has progressively increased. As o f 1996, there are 4,200 ICDS blocks with 5,92,5571 anganwadis in the country; the number of beneficiaries rose from 5.7 million children anad 1.2 million mothers in 1985 to 18.5 million children and 3.7 million mothers in 1996.
5446

Figure-1
PREVALENCE OF MALNUTRITION (0-3 Years) Weight for r Age- lAP Classification
Evaluation of foodsupplementation programmes
4 3.66 Concurrent andindependent evaluations are being carried out for all ongoing and completed food supplementation programmes so that lessons could be learnt from both successful and unsuccessful programmesNational Nutrition Monitoring Bureau (NNMB) has carried out evaluation o f the:
1 Applied nutrition programme (1977-78)2 Vit A prophylaxis programme
L---------------- (1977-78)3 Supplementary Nutrition
Programme( 1980-81)4 World food programme assisteed supplementary nutrition programme (1981-
82)5 Tamil Nadu Integrated Nutritiorn programme
Grades - IH & I \ ' Grade - n Grade - 1 Normal
Source-National Evaluation of ICDS
■ ICL'DS
ONCON-ICDS
Reasons for lack of improvement in Nutritional sctatus in ICDS areas include:
Nutrition Foundation of India (NFI) and National Institute o f Public Cooperation and Child Development (NIPCCD) had conducted evaluation o f ICDS. Data from the evaluation conducted by NIPCCD indicates that there was a reduction in severe CED in ICDS areas . from 15.3% during 1976- 78 to 8 7% during 1986-90 The nutritional status o f
children in ICDS areas was found to be better tbhan that o f children in non-ICDS areas (Fig 1). While 25 percent o f nursing mothers in ICDS5 areas introduced semi-solids supplements totheir breast fed infants at 6 months, only 1S9 percent did so in non-ICDS areas. Theseevaluations have shown the gains in terms otif improvement in nutritional status from theICDS programme have not been very impressivv^e.
4.3.67 One o f the major problems responsibUe for poor performance is the lack o f funds from the States for providing food supplementss on a regular basis. During the Ninth Plan in addition to the funds that are available throu£gh the State Plan and the externally assisted projects, the funds from ACA for BMS will aHso be available to fill critical gaps The focus
□
□
a
□□□
Inadequate coverage o f children below three yeaars of age who are at greatest risk of m alnutrition,Irregularity o f food delivenes to anganw adis annd hence irregular feeding and inadequate rations;Poor nutrition education (of m others and com munities) to improve feedm g practices at home;Inadequate training of w orkers in nutntion, g rrow th monitormg, and commumcation;Poor supervisionPoor co-ordination and linkage with health workkers Lack o f community ow nership and participation i
54-;7

will be on detection o f undernourished children and women who will receive available supplements on priority basis
ICDS in Ninth Plan
D uring N inth P lan effo rts will be m ade foim p ro \e p e rfo rm an ce u n d e r ICDS throu;;hr
□ Elimination of bottlenecks□ liiiproveineni in quality and rcgularit\ of
ser.ices□ Effectn e inter-sectoral coordination□ Growth nioiutonng□ Targetted nutritional supplements to children
and motliers with CED□ lm pro\cm ent in Nutrition and health
education□ Active com m unity/ PRI participation
4 3.68 ICDS today is perhaps thelargest programme o f its kind in the world ICDS programme is being modified to eliminate problems identified by the evaluation studies During the Ninth Plan every effort will be made a) to eliminate bottlenecks; b) improve the regularity and quality o f services c) ensure effective inter sectoral coordination between health, family welfare and nutrition programmes Growth monitoring, targetted nutritional supplements to children and mothers with CED, nutrition and health education will be intensified through joint coordination o f activities o f Anganwadi W orkers/ANMs, active community/ PRI participation in planning, implementation and monitoring o f ICDS activities at village level will be ensured Mahila Mandals will be actively involved in implementing various supplementary feeding programmes By 2002, it is planned to universalise ICDS programme in 5614 blocks with 804671 anganwadis, 57 9 million beneficiaries are to be covered by these anganwadis
The Mid day Meal Programme
4.3.69 Tamil Nadu was the first state to initiate a massive noon meal programme to children Under the scheme children between the ages o f 2-14 years attending Balwadis/ schools are fed daily through 63,000 Noon Meal Programme centres, at an expense o f Rs 0 44-0 90 per beneficiary. This programme has been sustained by the state for nearly two decades Andhra Pradesh initiated a similar mid day meals programme (MDM) in 1980 which was extended to cover all school children in the state in grade 1 to 5 in 1982-83 These programmes cater only to Balwadi/school children thereby 'excluding the poorest who cannot attend school The target age group does not include nutritionally the most vulnerable 6-24 months old children
The National Programme for Nutritional Support to Primary Education
4.3.70 In order to improve the nutritional status and school retention rates among primary school children, the programme for Nutritional Support to Primary Education (popularly know n'^s the M id-day Meal Scheme) was launched in 1995 as a 100% Centrally funded. Centrally Sponsored Scheme Under this scheme, all school children in the primary schools in government and government aided schools are to be covered It w'as envisaged that children will get pre-cooked food for 10 months in a year, where this is not possible, ready to eat foods or food grains are to be provided The Food Corporation o f India delivers the food grains for this programme directly at the district level under instructions from the central Department o f Education
,S4S

4 3 71 The National Nutrition Policy adopted in 1993 advocates a comprehensive intersectoral strategy for alleviating the multi-faceted problem of malnutrition and achieving an optimal state o f nutrition for all sections o f the society The Policy seeks to strike a balance between the short term measures like direct nutrition interventions and the long-term measures like institutional/structural changes and thus create an enabling environment and necessary conditions for improving nutritional and health status
4.3 72 The National Nutrition Goals envisaged under the Policy to be achieved by 2000 AD include reduction in the incidence o f moderate and severe malnutrition among pre-school children by half; reduction in the chronic undernutrition and stunted growth among children, reduction in the incidence o f low birth weight to less than 10 percent, elimmation of blindness due to Vitamin "A" deficiency; reduction in the iron deficiency anaemia among pregnant women to 25%, universal iodization o f salt for reduction o f iodine deficiency disorders to below the endemic level, due emphasis to geriatric nutrition, annual production o f 250 million tonnes o f food grains; improving household food security through poverty alleviation programmes, and promoting appropriate diets and healthy lifestyles
National Nutrition Policy
The National Nutrition Policy
Direct Short Term Interventions Indirect Long Term Intersention,s
• Universalisation o f ICDS • E nsunng household food security
• N utrition education of mother • Improving dietarv pattern
« Better coverage of expectant women • Im proving purchasing pow er
• Reachm g the adolescent girls • Strengthening PDS
• Control and elim ination o f m icronutnent m alnutrition
• Land Reforms
• Populansation of low cost nutntious foods• Better health and family welfare cov erage
• Fortification of food• Basic nutntion ajid health education
• Universal coverage o f IF A, Vit A and IDD• N utntion surveillance
Control Programm e • Information, education and com m uiucation
• Research
• Education and literacy
• Im proving status o f women
4.3 73 The Policy also prescribed a series o f action points/initiatives to be undertaken by various Ministries/Departments o f the Government Accordingly, a National Plan o f Action on Nutrition (NT*AN) was formulated in 1995 with sectoral commitments to be undertaken by the 14 nutrition-related Ministries/Departments viz , Agriculture, Food Production, Civil Supplies and Public Distribution, Education, Forestry, Information and Broadcasting, Health
.S49

and Family Welfare, Labour, Rural Development, Urban Development, Welfare, Women and Child Development etc. The Ministry/Department-wise Action Points, as laid down in the NPAN, are summed up in the following page:
Sectoral Commitments under National Plan of Action on Nutrition (NPAN)
Sector Sectoral Com mitm ents in the NPAN
1. Agriculture To ensure national level food security including buffer stocks and nutritional considerations in Agricultural policy'
2. Civil Supplies &PublicDistribution
To ensure food secunty' at the household level by making the essential foods available through the Public Distribution System to the people particularly to the disadvantaged sections.
3. Education To provide convergent services under Education Sector to enhance the nutritional and health status o f the community w ith special emphasis on girls' education and improved status o f women.
4. Forestry To popularise the growing o f plants/trees supplying food stoffs/fniits with special em phasis on Beta carotene (Vitam in A) rich species in the social forestry program m es with a view to create nutritional awareness and promote the consum ption of nutritious foods.
5. Health Prevention and control o f infections , m icronutnent malnutrition, diseases related to inappropriate diets, creating health awareness among the people and ensuring adequate primary health care for all
6. Fam ily W elfare To improve the nutritional status o f w om en and children through nutntion prophylaxis programmes, healtli and nutrition education and promotion of sm all family norm
7. Food To ensure food security in the country.8. Food Processing
IndustriesTo m eet the nutritional needs of the people by giving nutrition onentation to the projects in food processing sector.
9. Inform ation and broadcasting
To create a climate o f awareness in the country about the importance of nutrition for the well being o f the people and ways and means of preventing various form s o f malnutrition through its different units
10. Labour To protect and promote the nutrition o f various types of labour-agricultural, construction, industrial etc w ith special em phasis on children and women at work, through form ulation and enforcem ent o f appropriate labour laws.
11. RuralDevelopm ent
To improve purchasing power o f the people in rural areas through em ploym ent generation and poverty alleviation programmes with a view to improve food security at the household level
12. UrbanD evelopm ent
To ensure access to social services relating to health care, nutrition , women and child development, preschool and non-formal education and physical am enities like potable water supply, sanitation, sewerage, drainage etc., w ith a view to improve the nutritional level o f the urban poor
13. W elfare To improve nutrition of the disadvantaged sections of society by ensunng im plem entation o f nutritional com ponents o f various welfare programmes
14. W om en and childdevelopm ent
To ensiu^e appropriate development o f human resources both through direct nutrition interventions for specially vulnerable groups as well as through various developm ent policy instrum ents for unproved nutrition as laid down in the National Nutritional Policy Im proving nutrition and health o f women and children through strengthening and extension of ICDS program m e and setting up o f appropriate systems for monitoring the follow-up actions under N ational P lan o f Action for Children
Source National Plan o f Action on Nutrition (NPAN), Dept o f WCD, Government o f India, New Delhi, 1995
550

Sectoral Progress under NPAN
4.3 .74 ■ The M inistry o f Agriculture achieved record production o f 198.17 million tonnes o f food grains and 24.46 million tonnes o f oil seeds in 1996-97. The M inistry also intensified its activities towards gender-specific nutritional initiatives under 'W om en in Agriculture Programmes', besides setting up a Nutrition Cell in the Ministry to take care o f the commitments under NPAN. Also, a new scheme called Horticulture Intervention for Human Nutrition' was being formulated. Under National W atershed Development Project for Rained Areas (NWDPRA), training programmes relating to kitchen garden, home garden, backyard garden, rearing o f goat, sheep, pig, rabbit, poultry, fish culture, etc were conducted to promote production o f nutritious foods at the household level
4 3 75 The Ministry o f Civil Supplies, which has the commitment to ensure household level food security, expanded its areas o f operation to the most backward and remote areas It has also sought the intervention o f the State machinery in procuring as well as distributing the essential commodities like iodized salt, pulses, ORT packets etc The rise in expenditure on account o f food subsidy from Rs.2, 000 crores per annum in 1986-87 to Rs 6, 114 crores in 1996-97 clearly indicates the priority accorded to the food security system in the country. Further, to make the present Public Distribution System more effective, the programme was recast as Revamped PDS and launched in 2,446 Blocks o f the Area Development Projects, specially to cover the population in the drought-prone Areas, desert development areas, integrated tribal development project areas and other remote areas Later, in February 1997, the programme of RPDS was further recast as Targetted Public Distribution System (TPDS) to ensure household food security with a special focus on the people living below the poverty line It also accorded importance to people's participation in general and participation o f women in particular, by giving priority/reservation to women in allotting Fair-Price Shops and including them in the vigilance committees. To ensure effective supply o f essential food items to the disadvantaged sections o f the society, as many as 4 lakh Fair Price Shops were set up to cater to 16 crore families distributing the food worth more than Rs 15, 000 crores by the end o f 1996-97
4 3 76 In the education sector, a nation-wide programme o f Nutritional Support to Primary Education (Mid-Day Meal Scheme) was launched in 1995 to give a boost to Universalisation o f Primary Education by increasing enrollment, retention and attendance and simultaneously impacting upon nutritional levels o f primary school children By March 1997, the programme was expanded to cover a total o f 5.57 crore primary school children in 4426 Blocks with a focus on low Female Literacy Blocks.
4.3.77 While the strength o f the nutrition programmes o f the M inistry o f Forests and Environment lies in involving the local communities at district level in growing nutrition-rich plants/fhiits like Mango, Ber, Amla, Tamarind, Guava, Orange, Apple etc., it also distributed seedlings o f high quality plants and fruits rich with B Carotene and Vitamin A. Steps were also taken to create employment avenues for the rural labourers as a direct response to NPAN. In fact, 70 per cent o f the total allocation o f the Ministry was spent for employment generation and raising the income levels o f the poor. People's participation in the Joint Forestry M anagement Programme initiated by the M inistry could provide rights to the local tribal communities to collect various forest products for their consumption besides ensuring improvement in the nutritional status o f those living below the poverty line
551

4.3.78 The Ministry o f Health and Family Welfare is implementing programmes for prevention, detection and management o f chronic energy deficiency, anaemia, vitamin A deficiency and iodine deficiency disorders The Department o f Family Welfare fimds the National Prophylaxis programme against nutritional blindness aims at providing massive dose Vitamin "A" to infants and children between 9-36 months o f age In order to improve the coverage the first dose o f Vitamin "A" is administered at the time o f Measles Immunization and the next dose administered along with the Booster dose of DPT and OPV It has been reported that under the modified regimen, there has been substantial improvement in the coverage with first dose (50-75°/o) However, coverage for the subsequent doses is low
4.3 .79 The Department o f Family V/elfare also funds the National Prophylaxis Prcgramine against Nutritional Anaemia aimed at Iron and Folic Acid supplementation to pregnant women. The IDD Control Programme o f the Department o f Health aims at prevention, early detection and appropriate management o f IDDs The programme o f health and nutrition education to pregnant women has achieved 90-95 per cent coverage Breast-Feeding provides optimum nutrients and promotes growth during infancy It aiso protects against infections. Hence, breast-feeding is promoted at all levels, in the community and in the hospitals lEC to promote and protect breast feeding, timely and appropriate semi-solid supplements to breast fed infants are taken up Early detection and prompt treatment of infection and growth faltering in infancy and childhood are other major initiatives
4 3 .80 The Ministry o f Food ensures protection o f quality and nutritive value o f food grains right from the collection to ultimate consumption In this process, it procured as much as 91.94 lakh tonnes o f rice and 81 83 lakh tonnes o f wheat till January, 1997 About 803 3 tonnes o f rice and 596.00 tonnes o f wheat were distributed for the benefit o f weaker sections through the programmes o f RPDS, JRY, MDM, NP etc To train/equip the local farmers with the knowledge o f scientific storage o f food grains to prevent the nutritive losses in storage, special storage structures have been developed by the Indian Grain Storage Institute, Hapur, U ttar Pradesh
4.3 .81 The Ministry o f Food Processing Industries, in-charge o f manufacturing ready-to-eat nutritious foods and cooked food, has set up an exclusive Task Force ibr translating the Nutrition Policy directives into concrete plan o f action to bridge effectively the calorie gap and micro-nutrient deficiencies prevalent amongst children in general and the school-going children, in particular, through Mid-Day Meals Programme
4 3 82 The Ministry o f Information and Broadcasting which is the nodal agency in the area o f mass communication was closely involved in creating nutritional awareness and the importance o f balanced diet, measures to prevent nutritional deficiencies etc through various media channels o f AIR, Doordarshan and Field Publicity Units The Ministry made special effons to reach the messages concerning health and nutrition to the masses through appropriate jingles, filmJets, and advertisem.ents with proper screening and punch lines Doordarshan has been effectively telecasting messages daily, at prime time, on nutrition, family welfare and other related themes, free o f charge The Ministry was also actively involved in developing communication and executional strategies to increase the consumption levels o f micronatrients viz , Vitamin "A" and Iron o f various nutrition programmes ,
4 3 83 The Ministry o f Rural Areas and Fmploviiient is trying to improve the purchasmg power o f the fxiral people through various poverty alleviation, employment and income
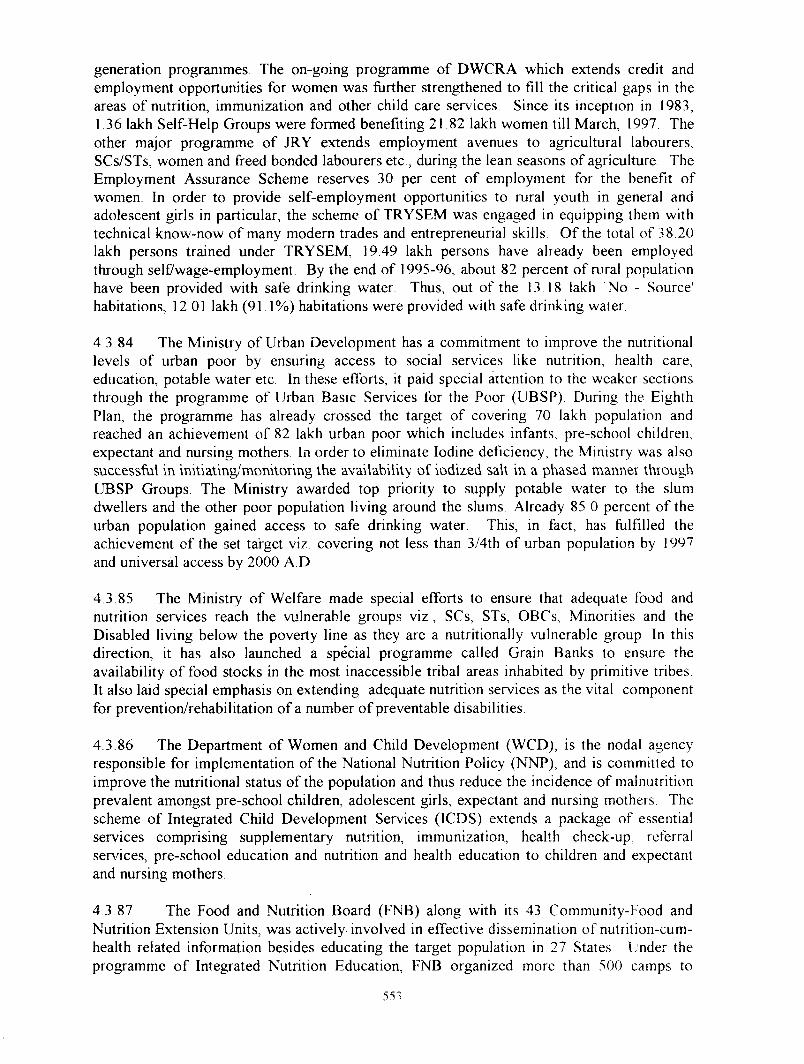
generation programmes The on-going programme o f DW CRA which extends credit and employment opportunities for women was further strengthened to fill the critical gaps in the areas o f nutrition, immunization and other child care services Since its inception in 1983,1 36 lakh Self-Help Groups were formed benefiting 21 82 lakh women till March, 1997 The other major programme o f JRY extends employment avenues to agricultural labourers, SCs/STs, women and freed bonded labourers etc , during the lean seasons o f agriculture The Employment Assurance Scheme reserves 30 per cent o f employment for the benefit o f women. In order to provide self-employment opportunities to rural youth in general and adolescent girls in particular, the scheme o f TRYSEM was engaged in equipping them with technical know-now o f many modern trades and entrepreneurial skills O f the total of 38 20 lakh persons trained under TRYSEM, 19.49 lakh persons have already been employed through self/wage-employment. By the end o f 1995-96, about 82 percent o f mral population have been provided with safe drinking water Thus, out o f the 13 18 lakh No - Source' habitations, 12.01 lakh (91.1%) habitations were provided with safe drinking water
4 3.84 The Ministry o f Urban Development has a commitment to improve the nutritional levels o f urban poor by ensuring access to social services like nutrition, health care, education, potable water etc In these efforts, it paid special attention to the weaker sections through the programme o f Urban Basic Services for the Poor (UBSP) During the Eighth Plan, the programme has already crossed the target o f covering 70 lakh population and reached an achievement o f 82 lakh urban poor which includes infants, pre-school children, expectant and nursing mothers In order to eliminate Iodine deficiency, the Ministry was also successful in im t\at\ng/momtonng the availability of iodized salt in a phased manner through UBSP Groups The Ministry awarded top priority to supply potable water to the slum dwellers and the other poor population living around the slums. Already 85 0 percent o f the urban population gained access to safe drinking water. This, in fact, has fulfilled the achievement o f the set target viz covering not less than 3/4th o f urban population b y 1 9 9 7
and universal access by 2000 A.D
4.3.85 The Ministry o f Welfare made special efforts to ensure that adequate food and nutrition services reach the vulnerable groups viz , SCs, STs, OBCs, Minorities and the Disabled living below the poverty line as they are a nutritionally vulnerable group In this direction, it has also launched a special programme called Grain Banks to ensure the availability o f food stocks in the most inaccessible tribal areas inhabited by primitive tribes It also laid special emphasis on extending adequate nutrition services as the vital component for prevention/rehabilitation o f a number o f preventable disabilities.
4.3.86 The Department o f Women and Child Development (WCD), is the nodal agency responsible for implementation o f the National Nutrition Policy (NNP), and is committed to improve the nutritional status o f the population and thus reduce the incidence o f malnutrition prevalent amongst pre-school children, adolescent girls, expectant and nursing mothers The scheme o f Integrated Child Development Services (ICDS) extends a package o f essential services comprising supplementary nutrition, immunization, health check-up, referral services, pre-school education and nutrition and health education to children and expectant and nursing mothers
4.3 87 The Food and Nutrition Board (FNB) along with its 43 Community-Food and Nutrition Extension Units, was actively involved in effective dissemination o f nutrition-cum- health related information besides educating the target population in 27 States Under the programme o f Integrated Nutrition Education, FNB organized more than 500 camps to
.553

expand intensive practical orieintation to 38,000 grass-root level functionaries It also organized 63708 demonstration camps and 4205 training courses during the Eighth Plan period. FNB also put in speciial efforts to generate nutritional awareness amongst rural masses by using multi-media sttrategy including print and electronic soft-ware Nutrition messages were disseminated thrcough 37 million printed post cards During the Eighth Plan period, 12 new Dairies were est:ablished to fortify milk with Vitamin A' and fortified 6088 MT salt with Iron During 1996-97, 35 voluntary organizations have been assisted to organize 6000 nutrition education camps and 24 Mini-Exhibitions to create mass awareness about the importance o f nutritioni and health in everybody's life
4 .3 .88 The National Institute o f Nutrition (NIN), Hyderabad has developed palatable 1 low-cost recipes for supplementary feeeding in children It also developed sample kits to monitor Iodine content in salt. In addittion to this, the Institute is also responsible to bring forth messages, education program m es, and audio-visual aids in building nutrition awareness in the general population. NIN has smccessfiilly completed 3 years o f operational research on horticultural intervention for proimoting Vitamin nutrition in niral areas, which has enhanced the micronutrient consumption^ at domestic household level. The National Nutrition M onitoring Bureau has been c:onducting surveys in 10 States since 1972 and carrying evaluation o f ongoing nutrition pirogrammes
4.3 89 The Central Food Tec;hnology Research Institute (CFTRI), Mysore was actively engaged in developing cost-effective enriched food products, designing and fabricating food processing industries and condlucting studies to develop various low cost, appropriate nutritionally rich recipes from lotcally available food stuffs The Institute also developed low cost supplementary food from iroasted cereals and pulses with 450-600 Kcal and 12-20g protein for ICDS programme Iinstitute has also prepared food mixes for diabetics, geriatric population, and various ready-to-eat food items in conformity with the Indian recipes and food habits especially for the beniefit o f working women
Progress during 1951-1996 andl Initiatives during the Ninth Plan
Food Production
Figure-2
PER C A PIT A N E T A V M L .-\B ILIT Y C JP F O O D G R .^ S
Cereals Pulses
1951 11971
Total Foodgrains
□ 1996
Source: Econom ic Survey 1997-98
4.3.90 One o f the major achievements in the last fifty years has been the green revolution and self-sufficiency in food production Food grain production has increased from 50 82 in 1950-51 to 198 8 million tons in 1996-97 It is a matter of concern that while the cereal production has been growing steadily at a rate higher than the population growth rate, the coarse grain and pulse production has not shown a similar increase. Consequently there has been a reduction in the per capita availability o f pulses ( f r o m 6 0 7 grams to 34 grams per day) and coarse grains (Table-4 3.2, Fig 2)
554

Table-4.3.2
Production of Food grains - Averaige Annual Growth(Millioni Tonnes)
Year Rice Wheat Coarse Pulses Total CompoundCereals Food Annual
Grains Growth(Percent)
1950-511960-611970-71
ri98o^8r1990-91 1997-98 ♦
20.5834^5842.23
52^6-[ 74 29"
6.46 15 38 8.4111.00 ' " 23774""[ "12.70
30.55 ^ 11.82"
50 8282.02
23 83
36.31" 29.02 10.6355 14
83.52 66.3832.7
3L1514.2613.08
108 42
T29"^59"H 6.39194;T3"
3.22"1.72
2.08 3 54"1.73
^EstimatedSource - Econom ic Survev 97-98
4 3 91 Reduction in per capita pulse availability may adversely affect the protein intake Coarse grains that are inexpensive and can provide substantially higher calories for the same cost If made available through PDS at subsidised rates, these will be self-targetting and improve calorie intake and reduce "hunger" among the poorest segments o f population Efforts to increase production o f pulses and coarse graim and distribution o f coarse grain through PDS might be taken up during Ninth Plan period
4 3 92 Yet another area o f concern is the lack o f sufficiemt focus and thrust in horticulture, because o f this, availability o f vegetables especially greem leafy vegetables and yellow/red vegetables throughout the year at affordable cost both in uirban and rural areas has remained an unfulfilled dream Health and nutrition education emphasising the importance of consuming these inexpensive rich sources o f micronutrientts will not result in any change in food habits unless there is harnessing and effective managem ent o f horticultural resources in the country to meet the growing needs o f the people ait affordable cost Efforts in this direction are being taken up in the Ninth Plan period.
Per capita income and expenditure on food
4.3.93 Poverty and lack o f purchasing power has been idlentified as the two major factors responsible for low food intake. The per capita Net Natiomal Product at 1980-81 prices has increased from Rs 1127 in 1951 to Rs 2449 by 1995 Food for work programme, EAS, DWCRA have also helped in improving purchasing power (of the population. During the last five decades there has been a marked improvement in the: incomes Especially among the middle and upper income group population in urban aireas, there has been substantial diversification in the household food basket and consequemt improvement in the quality o f food consumed Life styles have become more sedentary aind as a result the energy (calorie) requirement has declined. Simultaneously there has been am improvement in the availability and utilisation o f health care. As a result o f all these factors; there is a substantial reduction in severe grades o f undernutrition and severe deficiency disieases among the vulnerable preschool children and perceptible improvement in nutritional s;tatus o f the entire population
555

4 3 94 The data from NSSO 43 & 49/5C) rounds indicate that both in urban and rural population there has been a small reduction in cereal and pulse consumption and an increase in milk and edible oil consumption (Table-4 3 3)
Table-4.3.3
Time trends in consum ption of food stuffs (Consumption per person in kgs/month)
Food Intake
j RURAL URBAN
1987-88 1993-94 1987-88 1993-94Cereals 14,40 13 40 11 20 r 10.60Pulses 0 25 0.24 0 34 0 33Edible oil 0.33 0.37 0 54 0.56Milk 3 20 3 94 4 26 4 89
TI M E T R E N D IN F O
F i g u re -3
O D C O N S U M P T I O N
S o u r c e - N N M I
household intake o f cereals and millets remained above or at the level o f RDA (2) Pulses and legumes have been marginally below the RDA (3) Green leafy vegetables (majorinexpensive source o f vitamins and minerals) consumption has been only one-third o f RDA (4) Overall vegetable intake has been marginally below the RDA and has remained essentially unaltered (Fig 3 & 4)
4 3 95 Data from the National Nutrition Monitoring Bureau (NNMB) which has been monitoring food intake and nutritional status in ten States since 1973 also showed that there has been small but progressive reduction in intake o f cereal, millets and pulses, over the last two decades (Fig 3), vegetable consump-tion remained un- ahered (Fig 4) In addition the NNMB data showed that at the overall National level: (1)
Consumption of Vegetable
other vegetables Green Leafy vegetables
S P u i s e s & L e g u i r . e s
- C e re a !s & i i !e ts
Source - NNMBYear
56

4.3.96 Data from NNMB indicates that tlhere are differences in the consumption of foodstuffs between urban and rural areas The;re is relatively lower consumption of cereals and millets in urban area. Green leafy vegetabhes consumption is very low both in urban and rural areas (Fig 5) In view o f the fact that m ilder forms o f micronutrient deficiencies are widespread in urban and rural areas, it is im perative that steps are taken lo improve
CONSUMPTION PATTERN Figure-5
UrbanIGLV 1PULSESICEREALS& MILLETS I SUGAR & JAGGERY IFATS SOILS
I MILK PRODUCTS I FLESH FOODS I FRUITSICONDI. & SPICES INUTS& OILSEEDS IROOTS & TUBERS lOTHER VEG.
58%
8% 8% 2% 5%
3% 3%
Source - NNMB
availability o f green leafy vegetables There are substantial differences in the type o f foodstuffs consumed between income groups in urban areas Cereals and millets constitute more than 50% of the total food among the lov̂ v income group (LIG), mdusthal Jafcour aiKf slum dwellers, while for the high income group i(HIG) and middle income group (MK j), these food groups form about one-fourth and one third! o f the total food, respectively
Fig-u r e~ 6
M E A N I N T A K E O F C E R E A L S
4 3 97 Cereal intake is Ipwest among the HIG and shows a decreasing trend with better economic status (Fig 6). On the other hand, income status bears a positive relation with consumption of pulses, milk, fruits, flesh food, oil and sugar Among these foods, milk tended to show sharp differentials between the income groups Analysis o f data collected by Food and Nutrition Board and NNMB shows that there are large differences in cereal and pulse consumption between states (Fig 7a & 7b) The intake o f cereals varies from 369g/CU in Kerala to about 628g/CU in Orissa In K; ula and Tamil Nadu, the mean intake is below 460g/CU but in majority o f states the nitake is around 460g/CU (recommended intake-ICMR)
S o u r c e - N N M B ( 1 9 8 6 - 9 0 )
557

Figure -7a
A v e r a g e i n t a k e o f C e r e a l
A V E R A G E I N T A K E OF P U L S E SF i g u r e - 7 b
a s z
e
S T A T E SS o u rc e - ' N N M B (1 981 -1 991 .# FN B (1 980 -86)
4.3 98 The recommended intake o f pulses is 40g per day Only in Karnataka, Madhya Pradesh, Rajasthan and Uttar Pradesh is the mean intake above this level (Figure - 7b) in other words, a larger percentage o f the population consumes an inadequate level ot pulses as compared to cereals This observation is in line with the per-capita availability o f these foodstuffs Unless appropriate steps are taken to substantially augument the production of pulses in the country, the quality o f dietaries mav further deteriorate
55X

Intake of Nutrients
Average intake of EnergyFigure-8a
2450 2400 2350
„ 2300S 2250 % 2200 S 2150(Q1 2100
2050 2000
1950- I
F igu re -8bA v e ra g e in take of Pro te in s
Source - NNMB Source - NNMIB
4.3 .99 The major source o f information on nutrient intake covering more than one state and over the last two decades is the NNMB. Figures 8a & 8;b indicate time trends in energy and protein intake over the last two decades There has been a slight decline in energy and protein intake over the years but average national intake for prottein and energy remained at or near R D A
4.3.100 In contrast Vitamin A intakes has remained far below the RDA (Figure - 9b) It is however noteworthy that there has been decline in both the severe and milder clinical manifestation o f vitamin A deficiency over the last tw o decades Iron intake has shown a marginal decline over time (Figure - 9a). Because o f t;he poor bioavailability from Indian diets, the iron availability has remained suboptimal and ainaemia continues to remain a public health problem.
Figure-9a
A v e r a g e d a i l y i n t a k e o f
year
Rgm-9
Average Cteiiy Ir t^ cf \Zt3Tin
Source-NNMB
4 3 101 The mean energy intake varies from 2,206 kcal in the lowest income group to about 2,600 kcal in the highest. The two lowest income categonies show a difference o f 150 kcal in intake, but those with incomes between Rs. 30 and Rs. 9C»/capita/month show a similar intake Only families belonging to the highest income group have an average calorie intake above the
559

RDA o f 2,400 (Fig. 10). In rural area tlhe average protein intake varies 53g/cu in tlhe lowest income group with less than Rs 3 0 per capita per month, to 70g/cu amomg those with Rs.300 and more. However, tlhe average intake is close to the RDI o f 6(0g only in the top three income categories
4.3 102 Energy intake among majcor rural group o f cultivators, landle;ss agricultural labourers, non-agricultuiral labourers and others is shown in Fig Ilia Except in the cultivators group whejre intake is close to RDA o f 2400, in all othier groups the level is below RDA
NUTRIENT INTAKE BY INCOME
80
I 50
S 30
Figure -10
3000
2500
2000 3£1500 c
s1000 1
Ui500
0
INCOME (Rs/Capita/Month)
I Energy Intake -Protein intake
Source - NNMB (1983-90)
Figure-11a Energy intake o f Rural Populatiion
3000
•i
C 2000
3 1500 .5gB 1000IW 500
0
■ 1 1■ ■1 ■■ ■■
Cultivators I.LAgnculbiral
Source: NNM B (1975-79) Labouiers
OtheiLabourers
Othei Pooled
Category of Rural Populatiion
4.3.103 Among urbanpopulation groups differences in calorie consumption are far more obvious Females in slums consume 2000 Kcal as against 2600 Kcal consumed by those belonging to HIG Average intake o f MIG is just around RDA o f 2400 Kcal while the LIG and IL groups show a deficit o f about 160 Kcal per CU (Fig 1 lb) Urban families belonging to lower income group consume even lower energy than rural families
4.3.104 Energy consumption in labourers (urban and rural low-income groups) is low; persons performing manual labour require higher energy intake to meet their energy needs. Poor environmental sanitation and lack o f safe drinking water renders them more prone for infections As a result o f this dual insult, chronic energy deficiency continues to be a problem in this segment o f the population
Figure-1 lb
ENERGY INTAKE OF URBAN POPULATION
3000
HIG
Sourcoe NNMB (1984)
MIG LIG IL SD
Category r fU rten Populaticm
RDI
560

A v e r a g e i n t a ke o f En e ; r g yFigure-1 2
S t a t e s
S o u r c e : * N N M B ( 1 9 8 1 - 9 1 ) , P F N B ( 1 9 8 0 - 8 6 )
A v e r a g e i n t a k e o f P r o t e ; i n sF i g u r e - l 3
S o a r c « : * N N M B ( 1 9 8 1 - 9 1 ) , K F N B ( 1 9 8 0 - 8 6 )
Interstate difTerences
4.3.105 Data from the NSSO and NNMB show that there are substantial interstate differences in food consumption, energy, protein and v/itamin intake (Fig.7, 12,13,14). Nutrient intake in each State was higher in urban as com pared to rural population.
A v e r a g e I n t a k e o f V it am in AF tg u r « -1 4
1200
1000
flOO
6 0 0
4 0 0
200■ I - I . I l . l -
S D u rc « :‘ N N M B • FN B ( l e t o - a e ) States561

4 3 106 Data on nutrient intake among tribals is shown in Fig. 15a, b, c & d It is obvious that the tribals in different States have different level o f nutrient intakes In most States, the intake o f most o f the nutrients was lower among tribals than the non-tribal rural population
Figure-1 5a
P ro te in intake in T r ib a l Popu la tion
Fi g ure-1 5b
E n e rg y Intake in tribal population
S o u rc e ; N N M B (1 9 8 5 -8 7 )
In take of Vitamin C & RiboflavinFigure-1 5c
O)E
VEra
(0 CO 03(/) ■iz
OJ 0>ro T3
C■O2
(/)-TO
fO< a !
CD2
O
States
cnE
Source: NNMB ( 1985-87) Vitamin-C Riboflavin
562

I n t a k e o f I ron & V i t a m i n AF ig u re -1 5 d
3 0
3 5
2 5 -
2 0 ^
̂ I0 ----- lllllllJ5S 2Bra
E
2 ̂% ^
a.
States
3o
S o u r c e ; N N M B (1 9 8 5 - 8 7 ) Iron V ita m in - A
4.3.107 Available data from National Family Health survey on percentage of severely undernourished children in these States are shown in Fig. 16
F ig u re -1 6
S e v e r e l y u n d e r n o u r i s h e d c h i l d r e n(< 4 Y e a r s )
ssa.
S t a t e s
S o u r c e : N F H S 1 9 9 2 - 9 3
It is obvious that there are substantial differences in the nutritional status o f children between the states, especially in the prevalence o f moderate and severe chronic energy deficiency in under ^ive children. Kerala has the lowest energy and protein consumption and also the lowest prevalence o f severe undernutrition Madhya Pradesh and Orissa have relatively higher energy intakes but have higher prevalence o f severe CED
4 3 108 Statewise data regarding prevalence o f severe CED and under five mortality is shown in Fig. 17. In States with higher prevalence o f severe undernutrition also have higher under five mortality data (Fig. 17). Ample data exists to show that undernutrition increases susceptibility to infection and infection aggravates undernutrition This vicious cycle, if allowed to continue ends in death. Ready access and utilisation o f health care in Kerala which cuts the vicious cycle o f undernutrition and infection might be the most important
563

factor accounting for low undernutrition rates in Kerala. It is therefore imperative that health and nutrition programmes are co-ordinated to achieve optimal synergy between the two interventions so that there is improvement in nutritional and heahh status
M a i n u t r i l i o n a n d \ 1 o r t a l i t v R a l e s a m o n g C h i l d r c - r .
Stales
I U n d e r 5 M o r i a I t i y / 1 0 0 o I S e V e r e \ 1 1 n u I r 1 1 i n n i, “ o )
S o u r c e - N N M B ( 1 9 8 8 - 9 0 ) S R S ( 1 9 8 9 )
Intrafamilial distribution o f food
4.3,109 It is widely believed that in India especially among rural poor food distribution is not based on the need'; the bread winner gets sufficient food, the children the next share and the remains taken by the women. In times o f scarcity dietary intake o f women and children are likely to be most adversely affected. Several small studies in different States have reported
that intrafamilial distribution o fFigure-18
CALORIE INTAKE(Adult vs Preschool Children)
A + P-A+ P+
food follows this traditional pattern even today However, this may not applicable to all States and all strata o f society Analysis o f data from diet survey by 24 hours dietary recall method carried out by NNMB in 1975-80 given in (Fig. 18). This data shows that in 31% of households energy consumption was adequate in ail members o f the family In 19% of households energy consumption was inadequate for all members o f the family. It is noteworthy
that in 25% o f households energy intake was adequate among adults but not among the preschool children (Fig 18) Maternal education (high school and above) enabled the mothers to achieve a better intrafamilial distribution o f food (Table 4 3 4)
A -P +
A - P -P+ Preschool Children Adequacy P- preschool Children Inadequacy
A+ Adidt Adequacy A- Adult Inadequacy
Source-Brahmam et al., 1988
564

Table-4.3.4Percentage distribution of calorie adeqjuacy status and female literacy
Energy Status ofFemale literacy status
AdultMale Female
Pre-schoolchildren Illiterate
29.6
Primary+Secondary
35.6
High school and above
54.127.8 21.2 17.018.9 18.7 11.9
Others 23.7 24.5 17.0+ Indicates adequacy, - Indicates inadequacy; Sample size -1956
The importance o f nutrition education through all channels o f communication regarding appropriate infant and child feeding practices are o f paramount importance in ensuring that the preschool children especially the children from age groups 6-24 months get adequate food from the family pot; care and time spent on feeding the young child can pay rich dividends in term o f sharp reduction in undernutritioni in this age group
4 3.110 Diet surveys carried out in urban and rural areas among poorer segments o f the population indicate that dietary intake remains unaltered in women irrespective o f physiological status; the extra needs o f pregnancy and lactation are usually not met. Nutrition education to all the family members is required to ensure thait pregnant and lactating women do eat l/5 th or I/6th more than their habitual diet This is a critical input irv the efforts to reduce low birth weight and give the child a good start at birth.
Assessment o f Nutritional Status
4.3.111 Collecting data on food intake and computiing o f nutrient intake o f household and individual level are difficult and time consuming. T’hese data, do give some idea about at risk' states, sub segments o f population such as tribal, households or vulnerable groups v>?ithin households, however, these parameters cannot accuirately indicate nutritional status o f the individual or identify persons suffering from nutritionial deficiencies. Anthropometric indices (Height, Weight, midarm circumference etc.), haem oglobin estimation and clinical signs of nutritional deficiencies provide accurate and reliable information on nutritional status o f the individual. These parameters are used in clinical practice for screening and detection o f persons suffering from nutritional deficiencies These are also useful indices for assessment o f nutritional status at community level and have been widely used in monitoring o f nutritional status both o f individuals and o f commiunities Body mass index (weight in kg/height in cm^) is the most widely used index for aissessment o f nutritional status o f adults. In children weight for height (wasting), weight ifor age (underweight) height for age (stunting) are used for assessing nutritional status. Tlhe NNMB has been the major source o f data on nutritional status o f the population in ten Southern and Western States In '92-93 the National Family Heahh Survey (NFHS) had collected information on nutritional status in children in all States
565

Nutritional Status of Adults
Nutritional Status of Adult Males
Source: NNMB
Nutritional s ta tic (BMI)
□ 1975-79 I19838-90
4 3 112 Indian men and women are sho rter and lighter than their developed country counter parts Persons with BMI value less than 18 5 are considered to suffer from chronic energy deficiency (CED) The CED group is fijirther classified into different degrees first (17 to
---------------------------------- 18 5), second (16 to 17) and thirdFicgure-19a NNMB data on rural
population in ten states showed that the average BMI values were similar for both males and females Only half the aduhs had normal nutritional status while the rest suffered from different degrees o f CED CED grade II & III are associated with lowering o f work capacity. A positive shift in the distribution o f BMI values, noted during the 1970s and 1980s, is suggestive o f an improvement in nutritional status o f rural adults Data from NNMB repeat survey in 1996-97 confirms that there has been small reduction in severe grades o f CED, there is a small but significant increase in obesity both in men and women (Fig 19) Thus, the country has to gear up to face the health problems o f both undernutrition and obesity in future
4.3.113 NNMB does not have data from Northern and Eastern states During the Ninth Plan efforts will be made to collect data on nutritional status from these states many o f which have high morbidity, fertility, low literacy so that appropriate interventions can be planned and implemented.
Rgurre-19b
Nutritional Status of Adult Femaleis
Nutritional Status (BM)Source: NNNB 11975-79 ■ 1988-^90
4.3.114 Ninth Plan operational strategjy to improve the dietary intake of the family and improve nutritional status o f the adults; includes:
1)
2)
3 )
Adequate agricultural procduction o f cereals, pulses, vegetables and other food stuffs needed to flilly meett the requirement or growing population
Improvement in purchassing power through employment generation and employment assurance schiemes;
Providing subsidised foodi grains through TPDS to the families below poverty line.
Explore feasibility o f providing subsidissed millets to families Below Poverty Line (BPL) , use o f millets might ensure better self targetting and that the millets do really reach the
566

targetted families, if millets are used, the am ount o f millets provided could be increased without increasing total cost o f food subsidy D etails o f these initiatives are dealt with in the respective chapters
Nutritional status of vulnerable groups
Pregnant and lactating women
4.3 115 Traditional belief is that pregnant an d lactating women require additional dietaryintake to meet their own nutritional requirememts and also supply nutrients to the growing foetus and the infants, low dietary intake espexially in already chronically undernourished women will have adverse effects on health and nutritional status of both the mother and her offspring
4 3 .116 Studies undertaken during the eighties have shown that in pregnancy :
1 Basal metabolic rate is reducecd during the second and third trimester ofpregnancy
2 There is a reduction in the physic;al activity
3 There might be some increase in the as yet unmeasured "eft'iciency o f energyutilisation"
The saving in nutrients due to all these mijght to be sufficient to meet the increased requirements o f the growing fetus and physitological changes during pregnancy in well nourished women In habitually well nourisihed women, optimum weight gain during pregnancy and good obstetric outcome can be aichieved over a wide range o f habitual dietaiy intake In these well nourished women addhiomal dietary intake in pregnancy and lactation may in fact lead to obesity
4 3 117 In sharp contrast, in chronically undernourished and overworked women, continued low dietary intake during pregnancy might pose a serious threat to the welfare of the mother and the fetus in utero Part o f the observed association between poor maternal nutrition and poor obstetric outcome is also attrributable to the higher prevalence o f maternal risk factors during pregnancy and poor antenatal I care
4 3.118 Small scale research studies had show n that food supplements improve maternal nutrition and birth weights in poorer segmentts o f population. Encouraged by such data, almost all developing countries have embarketd on food supplementation programmes for pregnant and lactating women Very few o f thiese programmes have been evaluated for the impact o f food supplements on birth weight Available data, however, suggest that the impact, if any, is very limited One o f th e major problems in food supplem.entationprogrammes is that even when the logistics lof reaching the food to women have been meticulously worked out and efficiently carriecd out, food sharing within the family o f the recipient results in the target' women not gettiing the supplements in significant quantities Obviously this might be an important factor ressponsible for the demonstrated lack o f beneficial effect The lack o f adequate antenatal care and continued physical work during pregnancy are two other factors responsible for Hack o f impact
567’

4.3.119 Research studies in India and elsew here have shown that combining adequate antenatal care with efFectivc food supplememtation and some reduction in physical activity results in marked improvement in outcome o>f pregnancy, reduction in low birth weight and neonatal mortality Operationalisation and im plem entation o f this approach through intersectoral co-ordination under existing conditions need be taken up and evaluated. During the next decade there will be progressive increas>e in the economic constraints, in view o f their high cost and limited impact it might not bte possible to sustain the food supplementation programmes for all pregnant women in the comntry Under these circumstances the feasibility o f identifying the situations where there miglht be deterioration in maternal nutritional status and outcome o f pregnancy and targeting the food supplementation programme appropriately should be explored. Research studies have shcDwn that there are readily identifiable situations, which result in further deterioration o f maiternal nutrition and have adverse impact on outcome o f pregnancy. Some such situations are:
1. reduction in habitual dietary intake (droug'ht, preharvest season)2 increase in work (newly inducted manual llaborers)3 combination o f both the above (food for w/ork programmes)4. adolescent pregnancy5. pregnancy in a lactating woman6. pregnancy occurring within two years afte;r last delivery
Situations leading to deterioration of maternal nutrition during pregnancy
4.3.120 The local health workers as well as tlhe community can readily identify these women requiring additional food. The panchayat or similar local self-go\t institution can then he given the responsibility o f organising the elflforts to reach the food to these women Forobvious reasons these women are too busy and cannot spend hours in the anganwadi for
receiving the cooked food supplements The method to provide food supplementation to these women may vary from place to place and time to time; some may conveniently be provided food at the work site, in other situations provision o f subsidised food grain distributed through the Public Distribution System might be the feasible option In some other situations it might in fact be possible to envisage linkage between antenatal care and free food grains for pregnant and lactating women, in a pattern similar to the one that is envisaged in the mid day meal scheme for primary school children linking provision of the free food grain through PDS to school attendance, the ANM/PHC medical officer certifies that the woman has had antenatal care as required in the previous month and based on this the free food grain from the public distribution system may be provided to the pregnant woman With the Panchayati Raj and
□□□□a□
Reduction in habitual dietary intake Increase in work Combination o f both the above Adolescent pregnancy Pregnancy in a lactating woman Pregnancy occurring within two years after last delivery
Interventions to combat these include:
□ Identification o f at risk group individual
□ Increase dietary intake□ Reduce physical activity□ Provide appropriate ANC
Nagar Palika institutions it might be possible: to monitor these programmes at the local level and consequently achieve better coverage. The feasibility, utilisation, cost and impact o f such well directed, innovative strategies invol'ving close local monitoring need be assessed
.568

New born
jB irth w eigh ts o f Infants and m aterna l nutrition
r 60
- 50
- 40
-- 30
- 20
- - 10
II
4.3.121 Birth weight, an important determinant o f child survival and growth, is influenced by the nutritional and health status o f the mother Available data indicate that the mean birth weight in India about 2.7 Kg.; nearly one-third o f new-boms weigh less than 2.5 kg.Mortality rates in infants below 2 kg. are several folds higher and low birth weight is one o f the most important causes o f neonatal mortality. There has hardly been any change in birth weight in the past three decades . A gender difference has been noted in mean birth weights, female infants tending to be lighter than male counterparts. The incidence o f low birth weight is highest in low -incomegroups. There is a good correlation between birth weights and BMI o f mother (Fig 20)
4.3.122 A significant fall in birth weight has bieen observed in anaemic women; low birth weight rate doubles when Hb \eve\s fall below 8 gms/dl. There is an urgent need to screen all pregnant women and provide food supplement:s to those with weight less than 40 kg Effective antenatal care including detection and ttreatment o f anaemia are equally important Data from studies carried out in NIN indicate that by good antenatal care and utilisation o f available food supplements it would be possible to improve birth weight and achieve sustained reduction in low birth weight rates. During Ninth Plan this approach will be implemented throughout the country, through the RCH and ICDS programmes.
Figure -20
I M e a n b ir th w e ig h t
- P r e v a le n c e o f L B W (% ) L B W < 2 5 0 0 g
Sourcce- N u ir itk in N ew t ( 1991 )
Nutrition in infancy and eariy childhood (0-5 y^ears)
4.3.123 Preschool children (defined as aged 1-5 years by NNMB) constitute the most nutritionally vulnerable segment o f the population! and their nutritional status is considered to
beFigure-21
Prevalence o f Malnutrition among Childnen (1-5) Years
t (w e ^ h t fo r ig c )
Source- -N N M B (1988-90)SUlXilg (Hei^l/A«e)
C ltO B
Wi«i« (WagbUHqtki)
a sensitive indicator o fcommunity health and nutrition. The prevalence o funderweight, wasting and stunting among children asdetermined by
anthropometric measurements as shown in Fig. 21
569
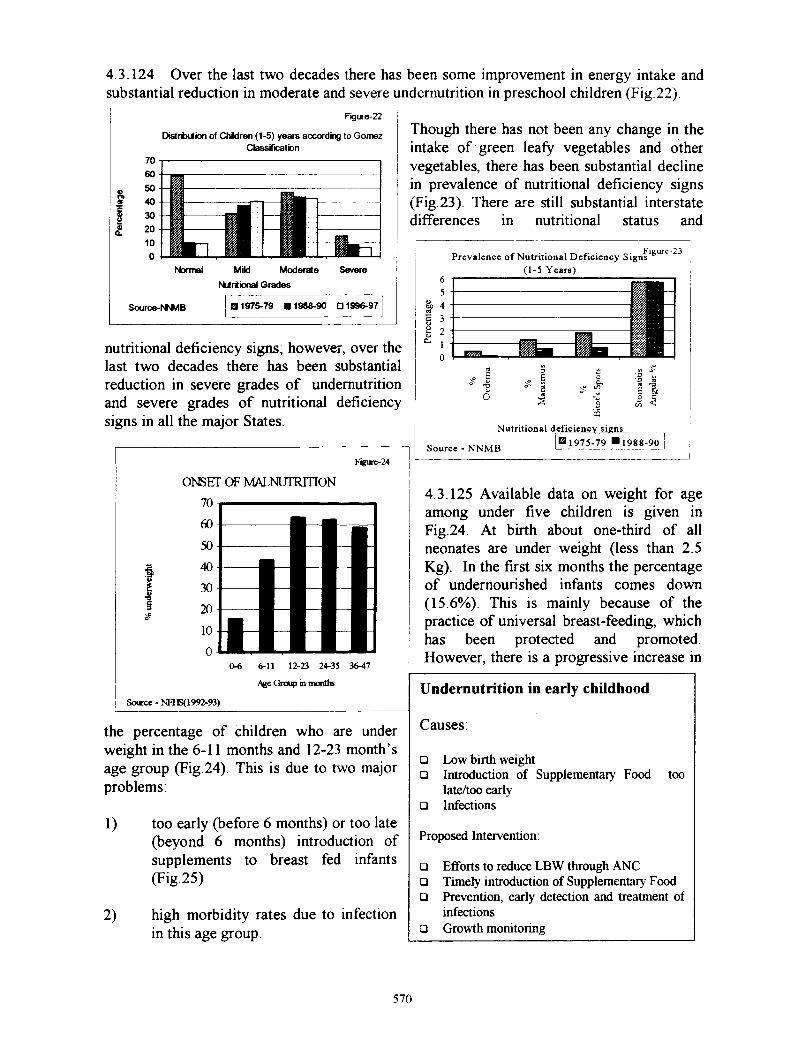
4.3 .124 Over the last two decades there has been some improvement in energy intake and substantial reduction in moderate and severe undemutrition in preschool children (Fig 22)
Figure-22
Distrfculion of Chidren (1-5) years according to Gomez CtassiTicatbn
S.
706050403020100
Normal MiM Moderate Severe
Nutritional Grades
Source-M «IB 11975-79 ■ 1988-90 □ 1996-97
figure-24
ONSET OF MALNUTRITION70
6-11 12-23 24-35 36-47
G toip in months
Source - NFHS(1992-93)
the percentage o f children who are under weight in the 6-11 months and 12-23 month’s age group (Fig.24). This is due to two major problems:
1) too early (before 6 months) or too late (beyond 6 months) introduction of supplements to breast fed infants (Fig.25)
2) high morbidity rates due to infection in this age group.
Though there has not been any change in the intake o f green leafy vegetables and other vegetables, there has been substantial decline in prevalence o f nutritional deficiency signs (Fig.23). There are still substantial interstate differences in nutritional status and
nutritional deficiency signs, however, over the last two decades there has been substantial reduction in severe grades o f undemutrition and severe grades o f nutritional deficiency signs in all the major States.
F igure-23P rev a le n c e o f N u tr it io n a l D e fic ie n c y S igns
(1-5 Y ears)
S o u rce - N N M B
N u trit io n a l d e fic ie n c y s igns_________
1 9 7 5 -7 9 " 1 9 8 8 - 9 0
4.3.125 Available data on weight for age among under five children is given in Fig.24. At birth about one-third o f all neonates are under weight (less than 2.5 Kg). In the first six months the percentage o f undernourished infants comes down (15.6%). This is mainly because o f the practice o f universal breast-feeding, which has been protected and promoted However, there is a progressive increase in
too
Undemutrition in early childhood
Causes:
□ Low birth weight□ Introduction of Supplementary Food
late/too early□ Infections
Proposed Intervention;
□ Eff̂ orts to reduce LBW through ANC□ Timely introduction of Supplementary Food□ Prevention, early detection and treatment of
infections□ Growth monitoring
570
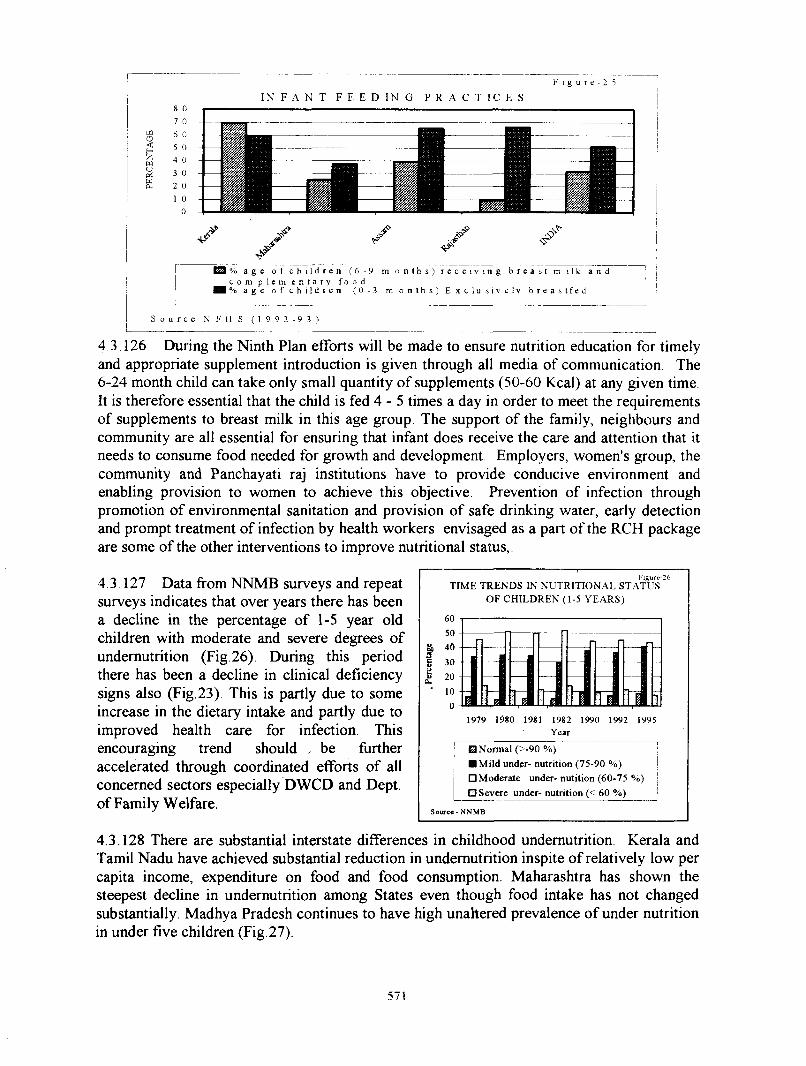
F 1 g u r e -"I N F A N T F E E D I N G P R A C T I C E S
wuCri
l % a g e o f c h i l d r e n ( 6 - 9 m o n t h s ) r e c e i v i n g b r e a s t m i l k a n d c o m p l e m e n t a r y f o o d
1 % a g e o f c h i l d r e n ( 0 - 3 m o n t h s ) E x c l u s i v e l y b r e a s t f e d
S o u r c e - N F H S ( 1 9 9 2 - 9 3 )
4 3 .126 During the Ninth Plan efforts will be made to ensure nutrition education for timely and appropriate supplement introduction is given through all media o f communication The 6-24 month child can take only small quantity o f supplements (50-60 Kcal) at any given time It is therefore essential that the child is fed 4 - 5 times a day in order to meet the requirements o f supplements to breast milk in this age group The support o f the family, neighbours and community are all essential for ensuring that infant does receive the care and attention that it needs to consume food needed for growth and development Employers, women's group, the community and Panchayati raj institutions have to provide conducive environment and enabling provision to women to achieve this objective Prevention o f infection through promotion o f environmental sanitation and provision o f safe drinking v/ater, early detection and prompt treatment o f infection by health workers envisaged as a part o f the RCH package are some o f the other interventions to improve nutritional status.
4 3 127 Data from NNMB surveys and repeat surveys indicates that over years there has been a decline in the percentage o f 1-5 year old children with moderate and severe degrees o f undernutrition (Fig.26). During this period there has been a decline in clinical deficiency signs also (Fig.23). This is partly due to some increase in the dietary intake and partly due to improved health care for infection. This encouraging trend should , be further accelerated through coordinated efforts o f all concerned sectors especially DW CD and Dept, o f Family Welfare.
T IM E T R E N D S IN N U T R IT IO N A L S T A T iTs O F C H IL D R E N (1-5 Y E A R S )
1979 1980
0 N o n n a ! (> -9 0 % )
■ M ild under- n u tritio n (7 5 -9 0 % )
□ M o d era te under- n u titio n (6 0 -7 5 % )
S Severe under- n u tritio n (< 60 % )
Source-NNMB
4.3 ,128 There are substantial interstate differences in childhood undemutrition. Kerala and Tamil Nadu have achieved substantial reduction in undem utrition inspite o f relatively low per capita income, expenditure on food and food consumption. M aharashtra has shown the steepest decline in undem utrition among States even though food intake has not changed substantially. M adhya Pradesh continues to have high unahered prevalence o f under nutrition in under five children (Fig 27)
571

F i g u r c - 2 7
P r c v a l a n c c o f S c e v e r e M a l n u t r i t i o n (1-5 Yr s . )
S o u r o e - N N MBI 1 9 - 7 5 - 7 9 11 9 8 8 - 9 0
4.3 .129 These data emphasize impoitiance o f health inputs in reducing infection related deterioration in nutritional status. Durin^g Ninth Plan additional assistance is being provided to poorly performing States for bridg»ing critical gaps in primary health care; optimal utilisation o f these and effectively targeetted food supplementation are expected to result in substantial improvement in health and nmtritional status o f under 5 children.
Children in the 5-14 age group:
4.3.130 Both the severity and magnituide o f undemutrition are less in 5-14 age group than that in early childhood. The mid day meial programmes and the school heahh programme are ongoing nutrition and health interventrioh in this age group; howerver both quality and coverage are often suboptimal. In addittion the non-school going children who are more at risk o f nutrition and heahh problems arre not covered. During the Ninth Plan the Education Dept, will intensify efforts to ensure umiversal enrollment and improved retention at school The midday meal programme will contiinue; there will be efforts to weigh all children and identify those suffering from moderate aind severe undernutrition and ensure that they benefit from the ongoing midday meal progrannme. School heahh check up and nutrition education will receive the attention that they desenve.
Emerging nytritional problem:
Adolescent Nutrition
4.3.131 Adolescents undergoing rapid! growth and development are one o f the nutrritionally vulnerable groups who have not received the attention they deserve. In under-mourished children rapid growth during adolescemce may increase the severity o f under nutrition. Early marriage and pregnancy will perpetuiate both maternal and child undemutrition. At tthe other end o f spectrum among the affluent segiments o f population, adolescent obesity is incrreasingly becoming a problem. In view cof these problems, nutrition education, health eiducation
Nutritional problem in adolescents
Undernutrition is due to:
a Unmet nutritional needs from childhood/ adolescents
□ Early marriage, teenage preganancy□ Micronuthent deficiencies especially iron
& iodine
Obesity is due to:
□ Overeating, junk food, lack of exercise
572

and the appropriate nutritional interventions for atdolescent are being taken up under ICDS and RCH Programmes during the Ninth Plan. In o>rder to reduce anaemia supplementation o f iron and folic acid to adolescent is also being takem up on a pilot basis under both these programme
Geriatric Nutrition
4.3.132 With increasing longevity 60 and beyond is rapidly increasing
the proportio>n and number o f persons in the age group It is noteworthy that in this age-group women outnumber mten. Available data from nutrition surveys indicate th a t in this group also the duel problem chronic encergy and micro nutrient deficiency on one hand and obesity on the other hand are increasingly seen. Lac;k o f social support, breaking up o f joint family syistem, changing life-styles all aggravate heahh and nutritional problems in elderly age group. Innovative: steps to provide societal support, health care and nmtrition services to the elderly are currently being takem up by several agencies. Simultaneously there are efforts to improve family and societal support to elderly according to the existing cultural ethos in different regions. Successful models for improving quality o f life o f the elderly will bereplicated elsewhere in the country.
Overeating and obesity.
4.3.133 During the last two decades there has been a major alteration in life styles and activity pattern among all segments o f population!. With the ready availability o f cookinggas, piped water supply, labour saving gadgets; and ready transport, there had been asubstantial reduction in the physical activity patttern and energy expenditure especially in middle and upper income group. However, th e dietary intake has not undergone any reduction; in fact ready availability o f fast foods, i(ce creams and other energy rich food items at affordable costs have resuhed in increased consum ption o f these by all members o f the family. All these have lead to increasing energy imtake over and above the requirement and consequent obesity in these segments o f population (Figure - 19). Nutrition and health education to convince the population about restrictting food intake and increasing exercise so that energy balance is maintained will be taken up during the Ninth Plan
M ajor Geriatric Nutritional problems are :
□ Chronic Energy□ Micronutrient deficiency□ Obesity
Factors responsible include;
□ Lack o f Social support□ Shift towards nuclear family
system□ Changing life styles
4.3.134 Operational strategy during the Ninthi Plan to improve health and nutritional status o f vulnerable segments includes
1) Pregnant and lactating women - sicreening to identify women with weight below 40 Kgs. and ensuring that tlhey/ their preschool children receive food supplements through Integrated Chiild Development Services Scheme (ICDS), adequate antenatal, intrapartum and neonatal care
2) 0-6 months infants - Nutrition education for (a) early initiation o f lactation (b) )rotection and promotion o f univ^ersal breast feeding (c) exclusive breast 'eeding for the first six m onths (unless there is specific reason sup
plementation should not be introduiced) (d) immunisation, growth monitoring and health care
573

3) Well planned nutrition education carried out through all channels o f communication to ensure that the infants and children in the critical 6-24 months period, do a) continue to get breastfed; b) get appropriate cereal-pulse- vegetabie based supplement fed to them at least 3-4 times a day- appropriate help in ensuring this through family/community/work place support; c) immunisation and health care for all children
4) Ensure that children in the 0-5 age group are screened, by weighment, children with moderate and severe undernutrition get double quantity supplements th r o u ^ ICDS, screen all 0-5 children for nutrition and health problems and provide appropriate intervention
5) Screen p r i m ^ school children and ensure that those with moderate and severe chronic e n e r ^ deficiency do receive the mid-day meal/ or their families get the cereals through TPDS.
6) M onitor for improvement in the identified undernourished infants, children and mothers; if there is no improvement, refer to physician for identification and treatment o f factors that might be responsible for lack o f improvement,
7) Nutrition education on how dietary needs o f different members o f the family vary and how they can all is met by minor modifications in the family meals. Intensive health education for improving the life style o f the population coupled with active screening and management o f the health problems associated with obesity.
Micronutrient deficiencies
Anaemia
4 3 135 Anaemia is the most wide spread yet most neglected Micronutrient deficiency disorder in India. Iron and folic acid deficiency due to inadequate intake o f green leafy
vegetables and other iron folate richFigure-28
PREVALENCE OF ANAEMIA AMONG PREGNANT WOMEN
NORMAL13%
SEVERt;13%
MOD40%
foodstuffs is the most common cause o f anaemia. Poor bioavailability o f iron from the phytate, fibre rich Indian diet aggravates the situation. Anaemia affects all age groups o f population from all strata o f the society. Pregnant women and pre-school children are the worst affected (Fig.28). Anaemia is associated with reduction in work capacity and increased susceptibility to infection Association betweenanaemia and low birth weight are well documented. Details o f the ongoing interventions for prevention and
management o f anaemia their impact and proposed Ninth Plan intervention is described in Chapter on Family Welfare
4.3.136 Operational strategy for the Ninth Plan for pregnant women:
& « rc e -IC M R (1 9 8 9 )
a) Screening o f all pregnant women using a reliable method o f hemoglobin estimation for detection o f anaemia, b) oral iron folate prophylactic therapy for all non-anaemic pregnant women (Hb > 11 g/dl), c) iron folate oral medication at the maximum tolerable dose
574

throughout pregnancy for women with Hb between 8 and 11 g/dl, d) parenteral iron therapy for women with Hb between 5 and 8 g/dl if they do not have any obstetric or systemic complication, e) hospital admission and intensive personalised care for women with Hb < 5 g/dl, f) screening and effective management o f obstetric and systemic problems in all anemic pregnant women
4.3.137 Operational strategy for the Ninth Plan for general population:
a) Fortification o f common foods with iron to increase dietary intake o f iron and improve hemoglobin status o f the entire population including children, adolescent girls and women prior to pregnancy
b) Health and nutrition education to improve consumption o f iron and folate rich foodstuffs such as green leafy vegetables.
Strategy for Improving Vit.A status during theNinth plan:
Efforts will be made to:
□ improve the coverage o f all doses o f massive dose o f Vit A administration
□ health and nutrition education to improve consumption o f foods rich in Beta-carotene, especially green leafy vegetables and yellow vegetables/ fruits
□ horticultural interventions at local level both in urban and rural areas to improve the availability o f Beta-carotene rich green leafy vegetables through out the year at affordable cost
c) Horticultural interventions toimprove availability o f green leafy vegetables in urban and rural areas at affordable costs throughout the year.
Vitamin A deficiency
4,3 138 In the fifties pediatricians in major hospitals in most States reported that blindness due to Vit A deficiency is a public health problem. Vitamin A deficiency in childhood is mainly due to inadequate dietary intake o f Vit. A. Increased requirement o f the Vit A due to repeated infection aggravated the magnitude and severity o f the deficiency. The association between measles, severe PEM and keratomalacia and high fatality in such cases was reported by many paediatricians. Prevalence o f night blindness and Bitot's spot in pre-school children ranged between 5% and 10% in most States. Blindness due to Vitamin A deficiency was one o f the major causes o f blindness in children below 5 years. In view o f the serious nature o f the problem o f blindness due to Vitamin A deficiency it was felt that urgent remedial measures in the form o f specific nutrient supplementation covering the entire population o f susceptible children should be undertaken In 1970 the National Prophylaxis Programme against Nutritional Blindness was initiated as a Centrally Sponsored Scheme (CSS) Under this CSS, all children between ages o f one and five years were to be administered 200,000 I U o f Vitamin A orally once in six months. Details o f the ongoing intervention for prevention o f Vitamin A deficiency and proposed Ninth Plan intervention is described in Chapter on Family Welfare.
575

Iodine deficiency disorders
4.3.139 Iodine deficiency disorders (IDD) have been recognised as a public health problem in India since mid-twenties. Initially, IDD w as thought to be a problem in sub-Himalayan region However, surveys carried out subsequently showed that IDD exists even in riverine and coastal areas No State in India is completely free from EDD. It is estimated that 61 million are suffering from endemic goitre and about 8 8 million people have mental/motor handicap due to iodine deficiency Universal use o f iodised salt is a simple inexpensive method o f preventing IDD
4.3 140 The National Goitre Control Programme was initiated in 1962 as a 100% Centrally funded Central sector programme with the aim o f conducting goitre survey, supplying good quality iodised salt to areas having high IDD, health education and resurvey after five years. The programme was renamed as the National Iodine Deficiency D isorder Control Programme in 1992 Details o f the ongoing intervention for control o f Iodine Deficiency Disorders and proposed Ninth Plan intervention is described in Chapter on Health
Health nutrition interactions
IDD Control Programme
Operationalinclude:
strategy for the Ninth Plan
□
production o f adequate quantity o f iodised salt o f appropriate quality; appropriate packaging at the site o f production to prevent deterioration in quality o f salt during transport and storage; facilities for testing the quality o f sah at production level, at retail outlets and household level so that consumers get and use good quality saltlEC to ensure that people consume only good quality iodised salt and reduction in the price differentials between iodised and non-iodised salt through subsidy to people below poverty line, improving ready access to iodised salt through TPDS
4.3 .141 It is well recognised that the pregnant and lactating women from one o f the most vulnerable segments o f the population from nutritional point o f view; the ill effects of maternal undem utrition affect not only o f the mother but also her offspring. Adverse nutrition and health consequences o f "too early, too close, too many and too late" pregnancies on the mother child dyad were recognised early in ' our country and contraceptive care was recognised as an indirect effective intervention to improve maternal and child nutrition Research studies during the sixties and seventies documented the magnitude and health hazards associated with chronic energy deficiency iron, folate, iodine and vit A deficiency National programmes to combat these w ere drawn up and are being implemented Yet another important indirect cause o f undernutrition continues to be infections Pediatricians still grapple with the vicious cycle o f severe CED and infection; obstetricians and pediatricians continue to tackle the increased morbidity in anaemic women and children With the advent o f HIV epidemic in India in the eighties, it is inevitable that over the next decade there will be an increase in the severe undernutrition associated with AIDS in all the age groups
576

Malnutrition and Mortality among Adults Figure-29
MALNUTRITION AND MORTALITY RATES AMONG ADULT MEN
4.3 .142 Both underautrition and obesity are associated with higher risk o f morbidity and mortality. A longitudinal study conducted by the NIN showed a good correlation between the nutritional status o f aduhs (as measured by BMI) and mortality during the subsequent 10- year period (1979-1989) (Fig. 29). Clinical data from India has unequivocally demonstrated the increased risk o f non- communicable disease especiallycardiovascular disease and diabetes and the higher mortality risk in obese individuals Association between low birth weight and ^perinatal and infant mortality and growth faltering and high-risk childhood mortality are well documented.
35
30
25
20
15
10
5
0 1 vyyy''>
—— w — —
<=16 16-17 17-18.5
BMI STATUS
= 18.5
Source-N IN (1989-90)
4.3.143 Association between severe grades o f anaemia and high perinatal and maternal mortality has been well documented. Anaemia is one o f the leading causes o f maternal mortality in India. Mortality rates are higher in children with moderate and severe grades of under nutrition. Vicious self-perpetuating cycle o f undernutrition increasing susceptibility to infectiot\ and infection aggravating undernutrition often ends in death HIV/AIDS is a new addition to the existing infections that causes undernutrition and resuh in death
4.3.144 The Health sector programmes during the Ninth Plan are aimed at combating both problems o f undernutrition and overnutrition The Reproductive and Child Health initiative and the Health Sector programmes strive for early detection and treatment o f both undernutrition and infections especially in preschool children and women Food supplementation especially if they are targetted to undernourished individual could reduce morbidity. During Ninth Plan, integrated health aind nutritional intervention will be taken up with appropriate intersectoral coordination to ensure rapid decline in undernutrition, morbidity and mortality.
Intersectoral coordination between health and ICDS functionaries
4.3.145 Over the last decade there has been substantial improvement in the collaboration between the AWWs and ANMs. The AWW have assisted the ANMs in immunisation and undertaking antenatal check ups. The ANM has been providing the micronutrient supplements as and when required. However the collaboration has not resulted in the improvement in the quality o f screening for umdernutrition, monitoring the improvement following supplementation, identification and management o f at risk women and children The quality o f nutrition and health education has also not improved substantially It is imperative that the ANM and the AWW are given orientation and training in nutrition and heahh problems, ongoing intervention programme in both the sectors, appropriate messages for nutrition and health education, so that they can function more effectively This area will receive due attention during the Ninth Plan because increasingly improving nutritional status will depend on the synergistic effect o f food supplements, infection management and fertility regulation. Effective antenatal care and targetting food supplements to women below 40 kg
577

will hold the key to reduction in low birth weight, breast feeding, growth monitoring and infection treatment will be needed for improving health and nutritional status o f the under fives and reducing under five mortality
4.3 146 Intersectoral coordination at and below the district level especially at the village level holds the key to improvement o f health and nutritional status o f the population within the available resources. It is essential that improving awareness regarding environmental sanitation and safe drinking w ater are done im settings which have access to both these Therefore, the drinking w ater and sanitation programmes both in urban and rural area should provide these facilities on high priority to Panchayat, anganwadi, primary school and primary health care institutions. Nutrition and health education forms a part o f school curriculum If these are taught in real life situation they w ill have more impact Utilising the time for "Socially usefiil productive work" in school for students and teachers' participation once in a month in health and nutrition check up, grow th monitoring, immunisation activities at the Anganwadi would not only improve children's knowledge and promote child to child care but also assist the hard pressed ANM and Anganwadi worker to complete their activities and keep the records meticulously.
4.3.147 Mahila Swasth Sangh and PRI members can assist in identifying pregnant and lactating women weighing below 40 Kg. and infants and children showing growth faltering and ensuring that these persons/families have access to food supplementation in the ICDS on priority basis. The agricultural workers and PRI members can ensure that green leafy vegetables, herbs and condiments are grown in the village land and supplied to anganwadi on a regular basis so that food supplements do have vitamin and minerals and are also more palatable.
M onitoring o f ICDS Programme:
4.3.148 Effective monitoring and midcourse corrections are essential for successftil implementation o f the intervention programm es, this is even more critical in programmes like ICDS that requires good intersectoral coordination for achievement o f the goals. Evaluation o f ICDS carried out by both Nutrition Foundation o f India (NFI) and National Institute of Public Cooperation and Child Development (NIPCCD) have suggested that there is a need for improved monitoring o f the implementation o f the programme
4.3.149 Both ICDS and the health fiinctionaries regularly file monthly progress report, which are collated and reported. However the existing monitoring systems are functioning suboptimally There are lacunae at the levels o f collection, reporting and collation There are delays in analysis and reporting. The reports o f the health and family welfare programme by the respective workers, and the Monthly progress reports sent by the ICDS workers are not utilised for district level monitoring and m idcourse correction o f the ongoing programmes Currently there are efforts to improve these and also ensure effective utilisation o f the available district data for area specific micro planning and monitoring
4.3.150 At the request o f the Dept, o f W omen and Child Development the National Institute o f Nutrition has carried out a study in Andhra Pradesh for improving the monthly progress reports o f the ICDS workers and improve m onitoring o f ICDS programme at district level The data from the study indicated that it w as possible to train and orient the ICDS functionaries to improve the quality and timeliness o f the reporting; analysis o f the data and discussions on the implications o f the reports with the functionaries facilitated the
57S

implementation o f midcourse corrections and led to improvement in performance Careful monitoring o f the data on prevalence o f uindernutrition in under five children will also be the first step towards building up o f a nutriti(on surveillance and response system at the critical district level
4.3.151 Under the Reproductive and Chiild Health initiatives the ANMs are to identify, and refer at risk' undernourished women and children. Collaboration between the ANM and the AWW at the village level would improve implementation and monitoring o f both health and nutrition programmes During the Ninth Plan period attempts will be made to improve the monitoring not only regarding the cov^erage but also quality o f services such as the identification o f the at risk' individuals, emsuring that they do take supplements, assessing the response to food supplements and if they are not improving, referring them to the PHC for examination and management
Monitoring Nutritional Status of the Poipulation
4.3.152 India is a vast and varied country. There are large differences in per capita income, availability o f the food stuffs, purchasing ipower, dietary habits, habitual consumption o f food stuffs, health and nutritional status betw een different States in the country In all States there are substantial urban-rural and inter-di‘strict variation in the above indices The tribal population differs considerably from the mon-tribal population residing in the same district
4 3 153 Sound, reliable data on the factors modifying dietary intake and nutritional status of the population in States/ districts are essential for policy makers, programme managers and monitoring agencies to carry out appropriate decentralized planning, policy and programme formulation which keeps in focus both the National goals and the local needs Ready availability o f data on process and impac:t indicators and continuous monitoring is vita! for midcourse correction o f ongoing programmes.
The strengths of NNMB are:□ Uniform sampling procedure in all
states□ Collection o f data by well-trained
personnel□ Good quality control□ Data analysis and reporting by
NNMB's Central Reference Lab
4.3.154 Until 1970 the information on food consumption and nutritional status o f the population was being collected by the state Departments o f Nutrition However there was no uniform methodology o f data collection, reporting and quality control measures hence it was difficult to make any interstate comparisons or draw inferences regarding time trends or impact o f ongoing intervention programmes
4.3.155 In 1972 the National Nutriition Monitoring Bureau was set up by the Imdian Council o f Medical Research to:
1
2.
Collect the data on dietary intake, and nutritional status on a continuous b»asis from different states and Evaluate the ongoing national nutriition programmes, identify their strengths and weaknesses and recommend midcoiurse corrections to improve their effectivemess.
Limitation of NNMB are:□ Monitoring is done in only 10 States□ Not all States have been covered in
all monitoring rounds;□ Monitoring rounds have not been
done every yearThere have been changes in sampling design and coverage over the years
□
579

4.3 156 The National Nutrition Monitoring Buireau (NNMB) has been undertaking surveys on dietary intake (household and individual) anid nutritional status o f the population on a continuing basis since 1972 in nine major St^ates (Andhra Pradesh, Gujarat, Karnataka, Kerala, Madhya Pradesh, Maharashtra, Tamil Naidu, Uttar Pradesh, West Bengal); Orissa has been included in 1977
4.3.157 The National Nutrition Policy envisjages that the Nutrition monitoring will be extended throughout the country and the Central Reference Laboratory o f NTsIIVIB situated iii National Institute o f Nutrition will assist the Dep)tt. O f Women & Child Development in this process.
4.3.158 India is currently undergoing demiographic, economic, social, educational, agricultural and heahh transition. These factors imdividually and collectively can bring about substantial alteration in heahh and nutritional staatus o f the population. Several programmes have been initiated to combat these problems Ini this context it becomes imperative that the existing mechanisms for monitoring and midccourse corrections are further strengthened, streamlined and utilized effectively.
4 3 159 Currently, the agricultural production (Deptt o f Agriculture), economic indices including expenditure on food (NSSO), demograjphic and heahh indices (SRS) are monitored on an yearly basis throughout the country. N S S O surveys on consumer expenditure provides information on expenditure on food and quantitty o f food consumption at household level But NSSO does not provide information on intrafamilial distribution o f food in the household. NNMB carries out nutrition suirveys, monitors dietary intake including intrafamilial distribution o f food and assessment: o f nutritional status but this is done only in ten states. There is at present no mechanism foir continuous monitoring o f nutritional status in the rest o f the States.
4.3.160 During the Ninth Plan efforts will be; made to extend Nutritional Monitoring on yearly basis throughout the country A ppropriate agencies/ institutions, which could undertake nutritional survey with good qualit;y control and ensure rapid, cost effective coverage will be identified in States, which ha've not been covered as yet The sampling fi-ame may be modified and improved th rough coordination with NSSO The Central Reference Laboratory o f NNMB will continue t(o be the focal point for training o f personnel and quality control. Mechanisms for data c;ollection, analysis and reporting will be strengthened so that updated information is availlable on yearly basis which could be utilised for planning intervention, monitoring o f p rogress o f ongoing interventions and effecting midcourse correction.
Research:
4.3 .161 India is one o f the pioneers in N utrition research not only in the Asian region but also in the world. Several research institutions aind Universities are carrying out the research studies with assistance from Ministries and resejarch funding agencies such as ICAR, ICMR, CSER, DBT and DST Basic, clinical, applied amd operational research studies carried out in the country have identified major nutritional problems in the country, their aetiology, appropriate remedial and preventive measures tto tackle the problem and the modalities o f effectively operationalising the intervention program m e at the regional and national level Initially the focus o f research was on deficiency diseases and chronic energy deficiency -
580
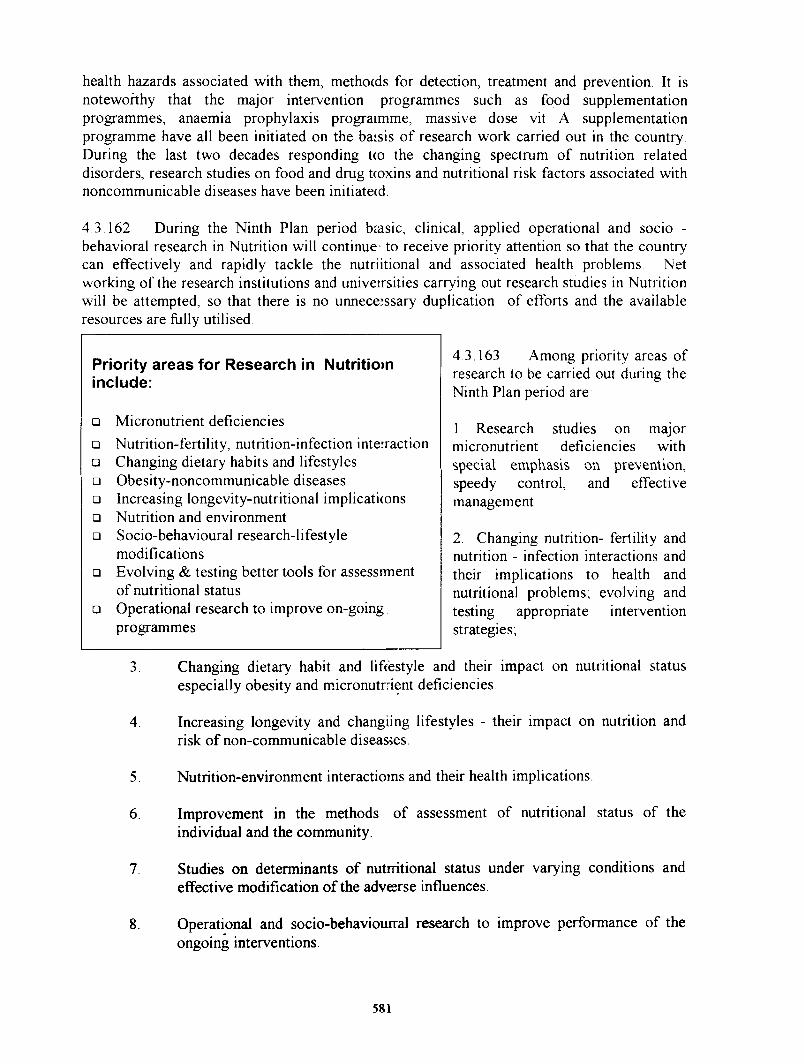
health hazards associated with them, methocds for detection, treatment and prevention. It is noteworthy that the major intervention programmes such as food supplementation programmes, anaemia prophylaxis program m e, massive dose vit A supplementation programme have all been initiated on the bassis o f research work carried out in the country. During the last two decades responding t(o the changing spectrum o f nutrition related disorders, research studies on food and drug tcoxins and nutritional risk factors associated with noncommunicable diseases have been initiatecd.
4 3.162 During the Ninth Plan period basic , clinical, applied operational and socio - behavioral research in Nutrition will continue: to receive priority attention so that the country can effectively and rapidly tackle the nutriitional and associated health problems Net working o f the research institutions and univeirsities carrying out research studies in Nutrition will be attempted, so that there is no unnecejssary duplication of efforts and the available resources are fully utilised
Priority areas for Research in Nutritiom include:
□ M icronutrient deficiencies□
□□□□□
□
Nutrition-fertility, nutrition-infection interraction Changing dietary habits and lifestyles Obesity-noncommunicable diseases Increasing longevity-nutritional implicati(ons Nutrition and environment Socio-behavioural research-lifestyle modificationsEvolving & testing better tools for assessrment o f nutritional statusOperational research to improve on-going programmes
4 3 .163 Among priority areas o f research to be carried out during the Ninth Plan period are
1 Research studies on major micronutrient deficiencies with special emphasis on prevention, speedy control, and effective management
2. Changing nutrition- fertility and nutrition - infection interactions and their implications to health and nutritional problems, evolving and testing appropriate intervention strategies;
3. Changing dietary habit and liftestyle and their impact on nutritional status especially obesity and m.icronutrrient deficiencies.
4. Increasing longevity and changiing lifestyles - their impact on nutrition and risk o f non-communicable diseasjes
5 Nutrition-environment interactioms and their health implications
6. Improvement in the methods o f assessment o f nutritional status o f the individual and the community.
7. Studies on determinants o f nutrritional status under varying conditions and effective modification o f the advesrse influences
8. Operational and socio-behaviourral research to improve performance o f the ongoing interventions.
581

4 3 164 Food Supplementation costs under the ICDS scheme is borne by the State Governments, the infrastructural costs are borne by the Department o f Women and Child Development. The Mid-Day Meal Program m e costs are borne by the Department of Education. The Anaemia Prophylaxis Program m e and Massive Dose Vitamin A Programme are fiinded by the Department o f Family W elfare and the Department o f Health provides the funds for Health Component o f Iodine Deficiency Disorder Control Programme It is obvious that different Departments are funding different programmes for improvement o f nutritional status o f the population Different departments wall continue to fund these ongoing nutrition programmes during the Ninth Plan period. The funding for infrastructure for the ICDS will continue to be borne by the Deptt o f W omen and Child Development and the state Govt continue to provide fiinds for food Supplementation.
4 3 165 During the Ninth Plan efforts will have to be made by the States to improve regularity o f supply o f food to ICDS centres and umprove the availability o f food supplements to the most needy by identifying at risk' individuals and families, providing food supplements to them on priority basis and monitoring their improvement Better targetting, reducing the wastage, building up o f the mechanisms for identification and provision o f supplements according to the needs, participation o f the Panchyati Raj /Nagar Palikas and the people themselves in the ongoing efforts to improve their nutritional status are some o f the mechanisms through which more effective utilisation o f available resources will be ensured during the Ninth Plan.
4 3 166 It is expected that with funds made available by the States, Centre and EAPs it will be possible to universalise food supplementation component o f the ICDS, improve the quality and coverage o f the programmes so that the country will quickly move towards achievement o f the nutrition and health goals specified in the National Nutrition Policy; however it may not be possible to achieve all the goals with in the Ninth Plan period During the Tenth plan period, further efforts will be made to rapidly bridge the existing gaps It is anticipated that accelerated economic development, improvement.in employment generation, rise in Gross Domestic Product and per capita income will make it possible both for the country and for the individual to invest more in nutrition and heahh and achieve substantial improvement in both.
Funding
382

CH APTER 5
INDUSTR Y AND MINERALS (including Village, Small, Cottaige, Agro and Food Processing Industries)
5.1 Fullfledged liberalisation, no doubit, started in 1991. But in the industrial sector, the Seventh Plan witnessed the commencemtent o f liberalisation of policy measures in 1985 itself The major ones were: delicensing o f non-M RTP, non-FERA companies for 31 industry groups and MRTP/FERA companies in backward areas for 72 industry groups; raising the assets limit for exemption o f companies from the puirview o f MRTP Act; exempting 83 industries under the MRTP Act for entry 'of dominant induistries, etc. Some other changes were also made in the areas o f licensing and procedures, import o f technology, import o f capital goods, allowing broad banding o f products in a mumber o f industries, etc. The Government also took some major decisions regarding the publiic sector reforms e.g. limiting the role o f the public sector to strategic, hi-tech and essential inifrastructure areas and gradually withdrawing from other areas. The Sick Industrial Compainies Act (SICA) was extended to public enterprises
in 1993 enabling sick public sector enterprises to be referred to the Board for Industrial & f’inancial Reconstruction (BIFR). Partial disinvestment was introduced in order to encourage wider public participation and a grcateir public ciccountability. Other reforms were also announced, such as professionalisation of tihe Boards of Directors of the public sector enterprises and evaluation o f performance throug;h Memoranda of Understanding (MOUs). These liberalisation measures and improvementts in the infrastructure sector viz power, coal, etc., contributed to a significant growth in in\dustrial production during the Seventh Plan period.
Introduction
Review O f Policy Reforms and Major Knitiatives
5.2 With the announcement of a new imdustrial policy in July 1991, a more comprehensive phase o f policy reforms was ushered in with a view to consolidating the gains already achieved in the Seventh Plan and providing greater competitive stimulus to the domestic industry. I ’his was followed by a series o f reforms introduced in the fiscal, trade and foreign investment policies. With these reforms, the Indian economy in general, and industry in particular, was freed from controls and o>pened to international competition for integration of Indian economy with the world economy'. The policy reforms continued through the Eighth Plan period and even subsequently.
5.3 A number o f policy initiatives were undertaken during the Eighth Plan. The thrust o f the new industrial policy was on substanti;al reduction in the scope o f industrial licensing, simplification o f procedures, rules and reg'.ulations. reforms in the Monopolies and Restrictive Trade Practices (MRTP) Act, reduction of areas reserved exclusively for the public sector, disinvestment o f equity o f selected publiic sector enterprises (PSEs), enhancing limits o f foreign equity participation in domestic industrial undertakings, liberalisation o f trade and exchange rate policies, rationalisation and reduction of customs and excise duties and personal and corporate income taxes, extension oif the scope of MODVAT etc. The basic objectives are to promote growlh, increase efficiency and international competitiveness.
583

5.4 The number o f industries requiring industrial licences was gradually reduced to 14 by the end of the Eighth Plan; this has since been reduced to six. Only four industries are now reserved for public sector. Separate policy measures were announced for Export Oriented
Units/Export Processing ZonesIndustrial Policy R eform s and m ajor Initiatives
N um ber o f industries requiring industrial licenses reduced to 6 Only 4 industries reserved for Public sector
Foreign direct investment policy liberalised Disinvestment Commission constituted for preparing an overall long term disinvestment programme for PSEs referred to it and the modalities for disinvestment.Sick Industrial Companies Act (SICA), 1985 amended to bring PSEs within the ambit o f SICA, 1985 and BIFR
National Renewal Fund set up to protect the interest o f w orkers likely to be affected due to restructuring or closure o f industrial unitsGrowth Centres Scheme taken up to develop infrastructure in backward areas to promote industrialisation To promote developm ent o f specific hilly, remote and inaccessible areas, Transport subsidy scheme extended till March, 2000Drugs Price Control Order am ended to give freedom to private sector including fixation o f drug prices Number of drugs under price control reduced from 143 to 72 New National Minerals Policy announced opening Mining industry to private sector including 50 percent foreign equity in 13 minerals
Technology Development Board set up to facilitate developm ent o f new technologies and assimilation o f imported technologies
and Technology Parks. Foreign Direct Investment Policy was further liberalised. In July 1996, a new list o f nine industries was approved, where joint ventures upto 74 per cent o f foreign equity would be clearedautomatically in sectors like infrastructure,non-conventional energy, electronics, software and sectors having asignificant export potential. The list o f industries eligible for automatic approval upto
51 per cent foreign equity was also expanded from 35 to 48. Trade liberalisation has reduced effective protection to import substitution
activities and encouraged export, oriented activities based on comparative advantage.
Thus, the policy initiatives have focussed on changing the basic orientation o f industry from inward looking to outward orientation and closer linkage with the global economy. Highlights o f policy reforms and major initiatives in the Eighth Plan are indicated in Box.
5.5 The Industrial Policy statement, 1991 envisaged disinvestment o f a part o f the Government holding in the share capital o f selected public sector enterprises. The disinvestment o f Government-owned equity constitutes a major step for improving theperformance o f PSEs, increasing public accountability and broad basing their managementand ownership. A programme o f partial disinvestment in public enterprises has been set inmotion. In order to suggest modalities of disinvestment of PSEs, Disinvestment Commission was constituted in August, 1996. The Government had referred 43 PSEs to the Commissionupto March 31, 1998. The Commission has since submitted eight Reports covering all the43 PSEs. The Commission has recommended varying levels o f disinvestment in some o f the PSEs and strgtegic sale/trade, sale/closure and sale of assets in some of these PSEs. Some o f its general recommendations relate to corporate governance o f PSEs, professionalisation o f management, setting up o f a Disinvestment Fund, restructuring of PSEs, greater autonomy to PSEs, etc.
584

5.6 In pursuance o f these recommendations o f the Commission, the Government has decided to disinvest its equity at different levels in GAIL, IOC, MTNL, CONCOR, ITDC, Modern Food Industries hd and
VSNL The other enterprise specific recommendations of the Commission are at various stages o fexamination/' implementation
5 7 The Sick Industrial Companies Act (SICA), 1985 was amended in 1993 to bring the Public Sector Enterprises also within the ambit o f the Board o f Industrial and Financial Reconstruction (BIFR) Since its inception in May, 1987, 3148
references have been registered with BIFR upto
March 31, 1998 under the Sick Industrial Companies Act (SICA) 1985 both in respect o f private companies and public sector undertak ings. The BIFR has approved/sanctioned 625 rehabilitation schemes and has recommended winding up in 579 cases As many as 202 companies, including four PSEs, have been declared "no longer sick" on successful completion o f the rehabilitation schemes sanctioned by the BIFR.
MAJOR RECOMMENDATIONS OF THE DISENVESTMENT COMMISSION
Dism\’estment Conimision constituted for preparimg an overall long term disinvestment programme for PSEs referred to i t . and the mcidalities for disinvestment.
Eight reports covering fort>-three PSEs submitted till August 1998. Three more PSEs have been referred to ilhe Commission subsequently.
The Commission has recommended dismvestmeiit at van ing le\ els for 11 PSEs.
Strategic sales in various proportions have been rec(3mmended for 19 enterprises.
Deferment of disin\’estment has been recommtended for eight enterprises.
No disinvestment has been recommended for one eniterprise.
The Commission has also made a number of general recommendations regarding establishment of Disinvestment Funid, delinking the disinvestment process trom the budgetarv' exerci'.se, reduction of Government equity, Voluntarv' Retirement Schenne, delegation of autonomy to PSEs, etc.
5 .8 The National Renewal Fund (NRF) was aruKounced by the Govt, o f India, as a part o f the new Industrial Policy, 1991 and was established on February 03, 1992 to protect the interests o f the workers likely to be affected by technological upgradation and modernisation in the Indian industry The aim o f the NRF is to prov'ide a social safety-net for labour. The Fund, to begin with, is o f a non-statutory nature and may include contributions from, inter-alia, the Government o f India, State Governments, financial institutions, insurance companies and industrial undertakings. The major objectives o f the Fund include providing assistance to cover the costs o f re-training and re-deployment o f emiployees arising out o f industrial restructuring, providing flinds, wherever necessary, for compensation o f employees affected by restructuring or closure o f industrial units both in the public and private sectors and providing funds for employment generation schemes both in the orgainised and unorganised sectors At present there are two approved schemes under NRF, namely, iraiplementation o f Voluntary Retirement Scheme (VRS) for central public sector undertakings a.nd re-training scheme for rationalised workers in organised sector. A total of 2,17,489 workers had availed of the VRS as on 31 08 1997 The NRF has been strengthened with the setting up o f Employee Resource Centres (ERC)ZEmployee Assistance Centres (EAC) Nearly 65,000 workers have been covered by the Employee Assistance Centres and as on 31.03 1997, 64,360 number o f workers have been surveyed,
585

31,714 counselled, 23,946 re-trained and 6,273 re-deployed The EAC network has been extended to additional locations where there is a substantial work outflow and presently, the scheme has a coverage o f 49 locations spread over 16 States through 13 nodal agencies
5 9 For promoting industrialisation o f backward areas in an effective manner by way o f developing the infrastructure, a Centrally sponsored scheme o f Growth Centres was taken up during the Eighth Plan As against the target o f setting up 71 Growth Centres in all the States/Union Territories dunng the Eighth Plan period, 66 Growth Centres had been approved till 31st March, 1998 Work on the setting up o f these Centres is in progress. A sum o f Rs 253 .75 crore was released as Central assistance for the approved Centres upto 31st March, 1998
5 10 To promote industrialisation o f specific hilly, remote and inaccessible areas such as Jammu6 Kashmir, Himachal Pradesh, Sikkim, North-Eastern States, Andaman and Nicobar Islands, Lakshadweep, eight hill districts o f Uttar Pradesh and Daijeeling district o f West Bengal, the Government o f India has extended the Transport Subsidy Scheme till 31st March, 2000 Since the inception o f the scheme in 1971, a sum o f Rs 360 77 crore had been re-imbursed by the Government o f India till 31st March, 1998 as transport subsidy to States/Union Territories
5.11 A new Drug Policy was announced in 1994 and Drug Price Control Order 1986 was amended in 1995 with the objective o f giving more freedom to the private sector including fixing o f prices o f drugs The number o f drugs under price control was reduced fi-om 143 to 72
5 12 The Government announced a new National Mineral Policy in 1993 for non-fuel and non-atomic minerals and also further amended the Mines & Minerals (Regulation & Development) Act 1957 under which the mining industry was opened to private sector for 13 minerals, including direct foreign investment up to 50 per cent equity participation. Beyond this limit approvals would be given on case by case basis The other important objective o f the new National Mineral Policy is to give more powers to the States for mineral development. The mineral concession rules and procedures have also been simplified for the benefit o f investors.
5.13 A number o f initiatives were taken under the new R&D policy for strengthening technological capabilities o f the Indian industries A Technology Development Board was established in 1996 with the mandate to facilitate development o f new technologies and assimilation and adaptation o f imported technologies by providing catalytic support to industries and R&D institutions to work in partnership. A system o f matching grants to R&D institutions showing commercial earnings through technology services was introduced in 1996
5 .14 The Prime MinistCT's Rozgar Yqjana (PMRY) was launched on 2nd October, 1993 Under this scheme, sdf-anploymait opportunities to educated unemployed youths, both rural as well as urban, are being provided with financial assistance from banks/financial institutions upto Rs. 1 lakh, with a subsidy o f 15 per cent o f the project/venture cost, subject to a maximum o f Rs.7,500, without collateral guarantee. During 1993-94, 31,800 beneficiaries were provided financial assistance by the banks. The number o f loans sanctioned were 1,94,292 in 1994-95, 2,99,265 in 1995-96 and 2,18,327 in 1996-97. During 1997-98 and 1998-99 (upto September 1998) the number o f loans sanctioned were 2,64,696 and 32,840 respectively.
586

5.15 With the aim o f reducing the backlog o f unemployment, a High Powered Committee (HPC) under the chairmanship o f the then Prime Minister recommended in 1994-95, the creation o f two million new job opportunities under the Khadi & Village Industries (KVI) sector during the remaining period o f the Eighth Plan. The KVIC is implementing this programme at an estimated cost o f Rs.5,600 crore, with one-third as budgetary support and the balemce through loans from commercial banks.
5.16 A number o f measures have been initiated for promoting the growth and developm.ent o f the food processing sector. These include:
(a) Deregulation o f the food processing industry except for beer and alcohol(b) Allowing foreign equity investment and automatic approval upto 51 per cent
foreign equity in high priority industries including food processing industries(c) Delicensing o f almost all food products excepting brewing and distillation o f
alcoholic beverages and items reserved for small scale industries(d) Making foreign technology import procedures, agreements, etc. easier.
Performance o f Industrial Sector
5.17 The industrial sector recorded an average annual compound growth rate o f 4.6 per cent from 1970-71 to 1979-80 and 6.6 per cent from 1980-81 to 1989-90 (at constant prices). It achieved a high growth rate of 8.5 per ccnt in the Seventh Plan (1986-86 to 1989-90). The main reason for the good performance was starting o f the liberalisation process and a number o f policy measures taken during the Plan period, inter-alia, including changes in the Eireas o f licensing and procedures, import o f technology, import o f capital goods coupled with a reasonable rate o f public investment and almost total protection to domestic industries from international competition through quantitative restrictions on imports as well as high tariff rates.
5.18 The Eighth Plan started in the backdrop o f an impressive industrial growth during 1970s and 1980. Though the average annual growth rate o f the industrial sector including mining, manufacturing and electricity generation during the Seventh Plan and the Armual Plan 1990-91 was 8.5 per cent, it was followed by a recession in the year 1990-91 when the average industrial growth rate achieved was just 0.6 per cent. Even so, the growth rate achieved during the Eighth Plan was encouraging as may be observed from Table 5.1.
Table 5.1Sector-wise Growth Rates in Eighth Plan
Ye a r M a n u f a c t u r i n g M i n i n g E l e c t r i c i t y G e n e r a l
E i g h t h Plan 7.30 8 . 00 7 .80 7.4ta r g e t199 2 - 9 3 2 .18 0.53 5.02 2.31993-94 6.07 3.50 7 .45 6.01 9 9 4 - 9 5 9.80 7.47 8.48 9.41 9 9 5 - 9 6 13.00 7 . 07 8 .17 12.11996-97 8.00 1.20 3.80 6.8
O v e r a l l S'-'' Plan 7.80 3.80 6.50 7 . 3
587

5 .19» The ovel-all rate o f industrial g row th gradiually increased from 2.3 per cent in 1992-93 to6.0 per cent in 1993-94, 9.4 per cent in 1994-95 and 12.1 per cent in 1995-96. How ever, in1996-97 it slumped to 7.1 per cent resulting in an average grow th rate o f 7.3 per cent - against a target o f 7.4 per cent - during the; Eighth Plan period. W hile m anufacturing
Table - S.2 Growth Rates of Selected Industry Groups
(Base: 1980-81 = 1001
Code- Industry Group Weight % GrowthGroup
SeventhPlanAverage
EighthPlanAverage
1. 2. 3. 4. 5 .
20-21 Food Products 5.327 5.0 322 Beverage, Tobacco & Tobacco p)roducts . 1.571 -1.1 1123 Cotton Textiles. 12.309 1.8 424 Jute, Hemp & Mesta Textiles. 1; 999 -0.3 025 Textile products, (incl. wear:ing
apparel)0.817 11.8 0
26 Wood & Wood products & Furniture & Fixtures.
0.448 -2.5 4
21 Paper & Paper products. 3.235 6.7 928 Manufacture of Leather & Fur products.0.489 6.4 529 Manufacture of Rubber Plastic;,
Petr.oleum & Coal Products.4.000 3.6 3
30 Manufacture of Chemicals & Chemical Products.
12.513 11.7 7
31 Manufacture of Non-metallic Minerals . 2.299 6.7 632 Basic Metals & Alloy industriles. 9.802 6.1 1033 Metal Products & Parts. 2.888 6.3 534 Machinery, Machine tools & pjarts. 6.240 6.0 635 Manufacture of Electrical Macchinery. 5.779 25.8 836 Manufacture of Transport Equ;ipment
& parts.6.386 6.5 13
37 Miscellaneous Manufacturing 'IndustriesO.905 23.1 12-3 Manufacturing. 77.107 8.9 71 Mining & Quarrying 11.464 5.6 34 Electricity 11.429 9.3 6
Overall index of industrial 100.000 8.5 7.3ptoduction.
maintained an upw ard trend in grow th from 1992-93 to 1995-96, mining and electricity generation maintained upw ard trend in jgrow th only upto 1994-95 and declined thereafl^r. The year 1996-97 w itnessed low/er grow th in all the sub-sectors o f industrycompared to previous years. On the whole^ tthe annual grow th rates in the Eighth Plan have been lower than those in the Seventh Plan in aill the three sectors o f industrial activity though the grow th rate in the m anufacturing sector hias been higher than targeted
.588

5 .20 The Table 5 2 shows the average annutal rate o f grow th recorded in industry groups at the tw o digit level during the Seventh and Eighth Plan periods
5 21 The group- wise industrial grow th r<ates indicate that Food Products, m anufacture o f chemicals and chemicals products, m anufatcture o f electrical machinery and miscellaneous manufacturing industries recorded significanttly lower grow th rate during the Eighth Plan period than in the Seventh Plan. How ever, beveraiges, tobacco & tobacco products, cotton textiles, paper and paper products, basic metals and allloy industries, manufacture o f transport equipment and parts achieved higher grow th rates.
5 22 The most im portant reason for the lowfer grow th rates during the Eighth Plan period as compared to the Seventh Plan period seems tco be that the industrial sector, which had been almost totally protected from both internal ais well as external competition during the previous four decades, was suddenly exposed to foreigin competition through a significant liberalisation o f imports and a drastic reduction in import duities The industry was hardly prepared for it and the slow -down was only to be expected as is rreflected in the very low growth rates realised in the first two years o f the Eighth Plan. By far, tlhe w orst affected was the capital goods sector First, the user sectors now had the option o f importing the most m odern capital goods and equipment which was often not available indiigenously and which was imperative for enabling these sectors to modernise themselves and thuss be in a position to meet the challenge o f opening up o f the economy Second, w ith a progresssive reduction in im port duties, many of the user sectors preferred to adopt a wait and watch' policy and postponed their investment plans The capital goods sector with a weight o f 16 4p fercen t in the Index o f Industrial Production (IIP), recorded grow th rates o f (-)12 Spercent, (-)O. 1 percent and (-)4 1 percent in 1991-92, 1992-93 and 1993-94 respectively. The capital goodjs sector took a num ber o f steps like import o f drawings and designs and upgiadation o f tecohnology to m eet this challenge assisted by a resum ption o f investment in a number o f sectcors, the capital goods sector was able to achieve a phenomenal grow th o f 24.8 per cent in 1994-95 and 17.8 per cent in 1995-96
5 23 A number o f industries w ere not abke to meet external com petition due to a variety o f reasons, an important one being their h istorical background For example, the development o f copper industry in the country was takem up on strategic considerations even though the quality o f domestic ore is very poor by inte;m ational standards The substantial import duty reduction effected in the last few years has be;en accom panied by a drastic fall in international prices o f copper resulting in the only producerr viz Hindustan Copper Ltd cutting down its production, incurring severe losses and not beimg in a position to make even essential renewals and replacements The paper industry was umable to meet external competition, reasons for the same being non-availability o f captive plantatiions to the industry In the hydrocarbon sector also, a num ber o f petroleum interm ediatesj w ere im ported while the dom estic capacity languished A num ber o f comm odities faced the problem o f dumping The machinery for investigation o f dumping w as not adequate t o deal with the increasing num ber o f cases
5 24 A m ajor reason for the slow -dow n cof grow th rate in the recent past has been the slow down o f investment. As is well known, i the pace o f public investment came down rather significantly The Government eflForts to control 1 the fiscal deficit resulted in a substantial decrease in the Plan expenditure which, coupled with a larger proportion o f Plan investment going to sectors like rural development, poverty alleviaticon and other social sectors, considerably reduced the public investment. The rate o f private inveistment also came down drastically due to (i) the
5>89

capital m arket being in a bad shape, (ii) high ccost o f borrov/ings, and (iii) introduction o f Minimum Alternate Tax (M AT). W ith considerablle freedom being granted to the private sector in the pricing o f issues, a large number o f compcanies came into the market with unduly high rates o f premium. Besides, some o f the other ste;ps taken by the Government, i.e. the changes in Badla system, affected investors' confidence adv/ersely. As a result, even good companies were not able to raise funds from the capital market. W /ith very high rates o f interest prevailing in the m arket during the last couple o f years, public limiited companies have been in no position to com e up with viable proposals and raise flinds frrom any source.
CAIPITAL GOODS (C.G.) EVDUSTRV
Worst affected sector of industry.Average Capaccity Utilization down to 50 percent in 1996-97 and likely to furtherr drop to 35-40 percent.Decline / dryiing up of Order Book position mainly due to lack t>fadequate Invesstments in Infrastructure sectorZero Duty Im ports of Capital Goods by Fertilizer, Refinerv Sector andSpecified Gootds required for Petroleum operations undertaken undercontract entesred into by Government with Indian or ForeignCompanies.Fear o f Extenasion of Zero Duty to other Sectors.Prevailing Invv'erted Duty / distorted Custom Dut\' Structure m case of many UemisContinued impport o f second hand machinery.Non-availabillity o f matching export credit with easy repayment facilities as oiffered by competitors abroad.
5 .25 Inadequate availability o f infrastructure like pow er and transportation bottlenecks,
inadequate handling facilities at ports, also aiTected
industrial production M ore im portantly, the quality o f infrastructure e.g. frequent interruptions o f pow er, and unduly long handling tim es at ports added to the real costs o f m anufacture and thus affected com petitiveness o f the dom estic industry. The addition to pow er capacity in the Eighth Plan was less than in the Seventh Plan even in absolute terms. Witfh electricity generation having a weight o f 11 43
percent in the index o f industrial production, a low rate o f grow th o f electricity generation also depressed the grow th rate o f industrial piroduction Second-hand machinery and large-
scale im ports o f basic m aterials and interm ediiate goods and com ponents due to anomalies in the tariff structure, uneconom ic scales o f dom iestic production in a number o f cases and the inability o f dom estic industry to m eet extem ial com petition by ensuring quality products, keeping to delivery schedule, etc., depressed imdustrial production. There was also low value- addition within the country, particularly in hJghi grow th sectors like automobiles and electronics due to increase in import o f components and initermediates to a considerable extent. There were
also a num ber o f anomalies in the tariflf structurre such as in the case o f fertilizer sector and refineries, w here the finished capital goods enjoiyed zero' rate o f import duty but the domestic m anufacturers w ere subject to taxes and duxties and import duties on intermediates and com ponents.
5 26 This analysis o f the industrial growtlti during the Eighth Five Y ear Plan is based on the Index o f Industrial Production 1980-81 In M ay 1998, the Central Statistical Organisation revised the base year to 1993-94; a revisedl series o f indices for the period April 1994 to O ctober 1997 has been brought out, taking int(o account the changes in the industrial structure during this period, with these changes, there Ihas been a slight change in the yearly industrial g row th rates since 1994-95. A comparative position o f the industrial growth rates based on 1980-81 and 1993-94 series is shown in Tablee 5 3
5>90
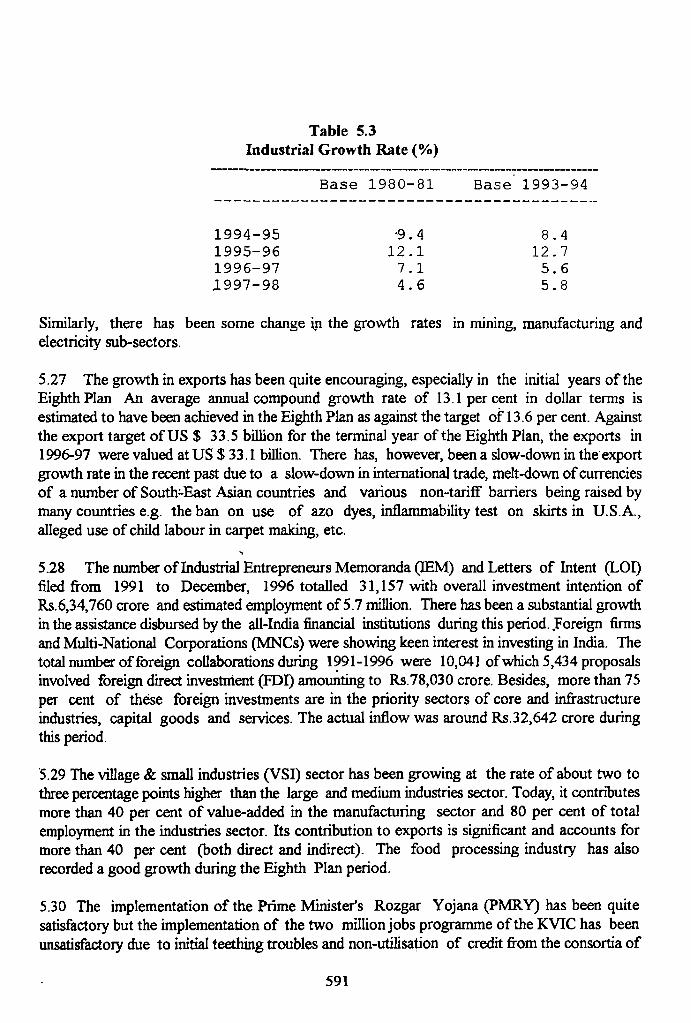
Table 5.3 Industrial Growth Rate (%)
Base 1980-81 Base 1993-94
1994-95 '9.4 8 ,41995-96 12 .1 12.71996-97 7 .1 5 . 61 997 -9 8 4 .6 5 .8
Similarly, there has been some change in the growth rates in mining, manufacturing and electricity sub-sectors.
5.27 The growth in exports has been quite encouraging, especially in the initial years o f the Eighth Plan An average annual compound growth rate of 13.1 percent in dollar terms is estimated to have been achieved in the Eighth Plan as against the target o f 13.6 per cent. Against the export target o f US $ 33.5 billion for the terminal year of the Eighth Plan, the exports in 1996-97 were valued at US $ 33.1 billion. There has, however, been a slow-down in the export growth rate in the recent past due to a slow-down in international trade, melt-down of currencies of a number o f South-East Asian countries and various non-tarifiF barriers being raised by many coimtries e.g. the ban on use o f azo dyes, inflammability test on skirts in U.S.A., alleged use o f child labour in carpet making, etc.
"S
5.28 The number o f Industrial Entrepreneurs Memoranda (lEM) and Letters o f Intent (LOI) filed from 1991 to December, 1996 totalled 31,157 with overall investment intention of Rs.6,34,760 crore and estimated employment of 5.7 million. There has been a substantial growth in the assistance disbursed by the all-India financial institutions during this period. Foreign firms and Multi-National Corporations (MNCs) were showing keen interest in investing in India. The total number o f foreign collaborations during 1991-1996 were 10,041 of which 5,434 proposals involved foreign direct investnient (FDI) amoimting to Rs.78,030 crore. Besides, more than 75 per cent o f these foreign investments are in the priority sectors o f core and infrastructure industries, capital goods and services. The actual inflow was around Rs.32,642 crore during this period.
5.29 The village & small industries (VSI) sector has been growing at the rate o f about two to three percentage points higher than the large and mediiun industries sector. Today, it contributes more than 40 per cent o f value-added in the manufacturing sector and 80 per cent o f total employment in the industries sector. Its contribution to exports is significant and accounts for more than 40 per cent (both direct and indirect). The food processing industry has also recorded a good growth during the Eighth Plan period.
5.30 The implementation o f the Prime Minister's Rozgar Yojana (PMRY) has been quite satisfactory but the implementation o f the two million jobs programme of the KVIC has been unsatisfactoiy due to initial teething troubles and non-utilisation o f credit from the consortia o f
591

banks by the KVIC and the States'K hadi and Village Industries Boards (KVTBs) D unng 1995- 96, new jobs created under this program m e w ere 1 5 lakh against the target o f three lakh The targets for 1996-97 and 1997-98 were kept ait 3 5 lakh and 5 5 lakh respectively In order to step up the pace o f implementation, the K '/IC iss taking steps like (i) setting up o f project appraisal cells (ii) adoption o f project approach, (iii) fcormulation o f bankable project profiles for the village industries sub-sector, (iv) laying m ore emp>hasis on creation o f new jobs, (v) setting up of national projects in areas o f leather, bete-keeping, food processing and (vi) implementing margin m oney scheme for village industiries by involving nationalised banks intensivciy
Performance of the Central Public Sectoir Enterprises
5.31 As on 31st M arch 1997, there w ere 2 42 Central public sector enterprises (PSEs) owned by the Government O f India with a total inv/estment o f Rs 1,93,121 crore Out o f these, 238 were operational enierprises with an investm ent o f Rs. 1,89,141 crore and employees'strength o f 20 lakh. O f these, 129 w ere profit-m iaking and 104 were loss-making enterprises, 3 PSE s were neither m jd n g loss nor profit a n d six had not commenced operation 1 he profitability profile o f the P S E sv '\e r the last decade is detailed in Statem ent-5 1
5 .32 For improving the performance o f tlhe PSEs a number o f measures were taken during the Eighth Plan The portfolio o f public stector investments is continually reviewed with a view
PublUc S«cUir RefonnsGreater operational autonomy and delegaition Powers granted to profit making Public Sccior Enterprises (PSEs) m terms of -
- incurring capital expenditure
- establishing joint ventures and subssidianes for strategic alliances
- restructurmg and implementation orf schemes for HRD subject to meeting the eligibilitv criteria and other guidelines.
Induction of professionals on the Boards i of PSEs
PSEs brought within the ambit o f Siick [ndustnal Compames Act (SICA), 1985 and Board for Industrial & Financial Reconstruction (BIff'R).
Concept of Nawatnas & Mini-ratnas
Disinvestment o f PSEs.
to focussing the public sector on strategic., hi-tech and essential infrastructure and opening other areas selectively to the private sector Tlhe Sick Industrial Companies Act, 1985 was amended for enabling referral o f sick PSE s to BIFIR for their revival/rehabilitation or closure as the case may be. A social security mechanism wais created to protect the interests o f the workers likely to be affected in the revival process A part o f the Governm ent equity was disinvested for encouraging wider public participation ancd developing market-driven accountability The Boards o f D irectors o f PSEs were given moire pow ers particularly for investment decisions and w ere made m ore professional A system o f M em orandum o f Understanding (M O l's ) vva:; introduced to provide the managements; o f the PSEs with more autonomy and accountabilitv The Concept o f Navratnas and Mini -Raitnas for giving autonomy to PSE'S was also inu oduced
592

5 33, In general, the PSEs have responded well t o the challenges o f globalisation and the opening up o f the economy However, there have b een some major problems. The mobilisation o f internal and extra budgetary resources by the PSEis has been well below the level projected in the Eighth Plan Coupled with the severe constrraint in budgetary support that could be provided to the PSEs, this has led to a slow-down im investments and growth plans o f the PSEs TWs has also affected their plans for expansion, rmodernisation, upgradation o f technology, diversification, etc. and thus their competitiveness
State Level Public Enterprises
'> 34 According to a survey carried out by the Institu te o f Public Enterprises, Hyderabad, (based on a little m ore than 50 per cent response), therre w ere 885 State-level public enterprises (SLPEs), as on 31.3 1994, with an estimated investiment o f about Rs 31,848 crore Num ber- wise, the maximum concentration o f State-level public enterprises is in Kerala (104 units) followed by U P (74 units), Karnataka and Tamil M adu (68 units each), Andhra Pradesh (59 units), Bihar (50 units), Gujarat (45 units), Maharjashtra, Orissa and Rajasthan (43 units each)I ripura has the minimum num ber o f umts (tw o unitis)
5 35 Out o f the total investment o f Rs 3 1,848 crore.', the maximum is in M aharashtra (Rs 7,069 crore) followed by Gujarat (Rs 4,473 crore), Andhira Pradesh (Rs 4,178 crore) and Karnataka (Rs 3,934 crore) At the bottom o f the list is Mizoraim with an investment o f only Rs 4 56 crore (as on 31 3 1993).
5 36 There were 137 continuously profit-m aking SLPEs with Gujarat and U P (13 enterprises each), heading the list followed by M ahairashtra (11 enterprises), Haryana, Karnataka and Punjab (nine enterprises each), Rajasthan (eighit enterprises), and at the bottom o f the list were Jamm u & Kashmir (one unit) M eghalaya ( tw o units) and Bihar (three units)
5.37 There w ere 41 continuously loss-making SL>PEs with Kerala heading the list (eight units), followed by U P. (five units), Assam, Mahairashtra and Orissa (four units each) Andhra Pradesh, Bihar, Gujarat, M eghalaya, Punjab, Rajastihan, Tamil Nadu had one unit each in this category
5.38 As many as 159 enterprises have shown m ixed performance with Kerala and Karnataka leading the list (19 units each), followed by M aharashtra, Andhra Pradesh and Punjab (13 units each), G oa (12 units), U P and Haryana (10 units e;ach), Orissa and Tamil Nadu (eight units each), Rajasthan (seven units). W est Bengal (six uinits), and Himachal Pradesh (five units) At the bottom o f the list are Tripura & M P (one uniti each), Arunachal Pradesh, Bihar, Jammu6 Kashimr, M anipur, M eghalaya (tw o units each), and Assam (four units)
5 39 The reasons for the industrial sickness o f the SLPEs have been num erous and varied The product mix or the range o f services provicded by these enterprises, the existence o f a poor m arketing organisation, cost structure o f the enterprises were some o f the im portant factors The business culture in these enterprises also contributed in a substantial m easure to their bad performance M ost o f these enterprises a re in the commercial sector and are engaged in the m anufacture o f scooters, textiles, electronics, pow er generating devices, detergents and chemicals, plywood products, rubber products, engineering goods, drugs & pharmaceuticals, etc
593

5.40 All the states, by and large, have initiatejd reform s o f their SLPEs. The central purpose o f these refom is is to cut dow n public spendiing either to reduce the budgetary deficits by reducing budgetary support or to increase alllocative efficiency. Efforts are also afoot to restructure as well as privatise the SLPEs which began in the late 1980s when the Auto Division o f H yderabad-based Allwyn Ltd. w/as hived o ff and handed over to M ahindra & M ahindra Ltd. and the Refngerator Division was privatised with the sale o f its assets to Voltas in 1994
5.41 Som e progress has been reported in the privatisation drive in the SLPEs. A num ber o f SLPEs have been privatised in Goa. In Gujairat, the State Governm ent had asked the Gujarat State Finance Commission to conduct a detaiUed exercise on privatisation o f the SLPEs The Com m ission made several recom m endations on disinvestment and privatisation o f the SLPEs and many companies have been identified for privatisation which include Gujarat Insecticides Ltd., Gujarat State Seeds Corporation, Gujarat State Handicrafts Corporation, Gujarat Maritime Board, Gujarat Agro Industries Corporation!, Gujarat Industrial Developm ent Corporation, Gujarat Small Industries Developm ent Corpoiration, etc
5 42 Haryana has made rapid strides tow ards privatisation. It has won remarkable appreciation on account o f transparency in various transactiions adopted in the entire process o f restructuring its public enterprises. Haryana Concast Ltd. andl Haryana Breweries, two large public enterprises have been privatised.
5 43 The Karnataka and Kerala Governments hiave drawn up ambitious programmes to privatise their public enterprises, particularly the loss-making ones. Some o f the units listed for pivatisation in K arnataka include K arnataka Telecom Ltd. and K arnataka State Electronics Development Corporation Ltd. Kerala has idemtified enterprises for privatisation such as Kerala M inerals & M etals Ltd., Trivandrum Rubber W orks Ltd , Scooters Kerala Ltd , Kerala State Salicylates & Chemicals Ltd., etc.
5.44 The M aharashtra Government has decidted to privatise State Industrial Corporation o f M aharashtra (SICOM ) and M aharashtra Tourism Developm ent Corporation It has also developed one o f the best voluntary retiremernt schemes in the country.
5 .45 The Government o f Orissa has taken so m e very meaningful m easures in the direction o f privatisation o f its public enterprises. Tfhe SLPEs have been transferred to the private sector on the basis o f outright sale, lease anid management contracts. The Charge Chrome Division o f Orissa Mining Corporation was; sold to Tata Iron & Steel Company in 1991 The Baramba Cooperative Sugar Mills was handedi over to Shakti Sugar M anagem ent Corporation o f Tamil Nadu on management contract in 1‘991. The Baragarh Cooperative was handed over to Ponni Sugar M anagem ent Industry on a m anagem ent contract in 1991. The East Coast Breweries was leased to United Brew eries in 1993
5 .46 There are also similar examples o f successsflil privatisation o f State-level public enterprises from other States such as Punjab (three uniits), Rajasthan (tw o units privatised and two units closed down), Tamil Nadu (four units under rrestructuring), U P. (15 sugar mills, 1 electronics unit and several textile mills have been listted for sale). W est Bengal (13 electronic units partly/wholly privatised and 3 units listed fcor outright sale), Assam (five units listed for privatisation and Ashok Paper Mills has a lready been leased out on a long term basis to Sanghi
594

Industries) In Bihar though a large possib ility o f privatisation exists, perform ance in this regard has not been satisfactory and no concrete steeps have been taken for privatisation o f the SLPEs in the State (only one unit, namely, Gavia Ccorporation was closed in late 1980s in view o f its continuing dismal performance). In the N ortth Eastern States, the progress in privatisation is reportedly slow. M eghalaya has, however, p^rivatised the activities o f its State Electricity Board.
5 47 Profitability profile o f public sector em terprises is given in Statem ent 5 .1
Outlays and Expenditure
5 48 Outlays and actual expenditure for incdustry and mineral projects in the central sector during the Eighth Plan period are given im Statement-5 2
5 49 Outlays for Central industrial and mimeral projects for the Ninth Plan are given inStatem ent-5 3 and outlays for States/U niion Territories are given in Statem ent-5.4
5.50 The production targets for the terminall year o f the Ninth Plan (2001-2002) are detailed in Statem ent-5.5, and indicative targets for village and small industries are given in Statement 5 6 .
Outlook and Issues for the Ninth Plan
5 .51 There has been a slow-dovvn in the rate ofmdustried growth in the recent past There aremany reasons for this; these include slow pac;e o f investment especially in infrastructural sectors,lack o f demand, inadequate availability and pcoor quality o f infrastructure, global recession leading to slow down in international trade, etc. Tak^ing into account the prevailing environment and the m easures taken to improve it, the target fo r' industrial grow th in the Ninth Plan has been set at 8.2 percent comprising 8.2 percent in manuffacturing, 9.3 percent electricity generation and 7.2 percent in mining.
Areas Neeeding Attention
Slow Down in the rate o f industrial growth in the reccent past.Inadequate availability/ and poor quality of infrastruc:;ture Slow down in exports.Need to review SSI reservation for critical export inidustries such as toys, garments and leather goods Need for greater flexibility in labour legislation.Slow progress of disinvestment o f PSEs.Hundred & four (104) loss-making PSEs; particularrly fifty four (54) ironically sick PSEs Regional imbalances in industrial development.Unsatisfactory workmg of BIFR.Low investment in domestic R&D; weak linkage o f 'R & D with industrySimplification or streamlining of procedures at State Governments level, especially elimination of multiple local licensing requirements.Feed-stock and pricing policy for fertilizers.Review and modification o f various food laws wi'hich ham per development of Food Processing Industry' Establishing forward linkages with FPI units in the form o f contract farming.Development of packaging industry with appropriatte policy and fiscal measures for increasing exports of processed foods.
595

5 52 O ne o f the m ajor constraints faced by thie industrial sector is inadequate availability o f infi-astructural support Further, the poor qualiity o f infrastructure e g frequent interruptions in pow er supply, transportation bottleneck's, comm unication problems, delays in handling cargo at ports, etc is adding to the real c;osts o f m anufacture and thus affecting the competitiveness o f domestic manufacturers and! providers o f serv ices These are also affecting exports adversely Unless the existing infrastruc;tural capabilities are strengthened adequately, the target for industrial grow th at 8 2 per cemt per annum and for export grow th at 1 ! 8 per cent per annum as envisaged in the Ninth IPlan would be difficult to achieve With the opening up o f the economy and globalisation, the importance o f competitiveness and hence the im portance o f adequate availability and requisite quality o f infrastructure cannot b e
over emphasised
5 .53 Indian industry has responded reasonaibly well to the challenge o f liberalisation and opening up o f the econom y There is a good aiwareness o f the need to modernise and upgrade process technologies; plant and equipm ent, atchieve economies o f scale, improve product quality; and devote greater attention to research and developm ent Such positive responses to the challenges o f market forces are resulting in improved competitiveness as well as increased exports This process o f adjustment needs to be continued and broadened For instance, in the era o f a liberalised econom ic environment., there is little justification for continuing with licensing in the case o f coal In the case o f co>al, partial delicensing has already been done by allowing captive coal mines for pow er generati(on This process needs to be taken further to its logical conclusion Delicensing o f coal w ould le a d to more efficient mining, greater attention to quality o f coal and custom er satisfaction amd prom ote healthy development o f the sector
5.54 Sound investment and foreign trade po lic ies play an important role in prom oting and sustaining a high rate o f grow th as well as expo rts Foreign direct investment (FDI) enhances technological strengths and economic efficiency o f domestic production, besides augmenting dom estic resource availability and reducing dependence on external borrowings It also boosts exports and ensures a sm ooth and effective trainsition to a m ore open economy. The rate o f foreign direct investment has started picking u p ' in response to the improved policy enw onm ent H ow ever, the country is not yet able to attract foreign direct investment com m ensurate with its potential. M any o f the smaller countries in Asia as well as China are able to attract much larger inflows o f foreign investment It should b)e possible to achieve foreign direct investment o f US $ 10 billion per annum in the next tw o tco three years In order to stimulate FDI inflows, the list o f industries for which autom atic approwal upto 51 per cent foreign equity participation has been perm itted will be suitably enlarged tco cover, am ong others, mining and exploration services Besides, this limit will be raised to 74 per cent Foreign equity participation upto 1 00 per cent will be considered in selected sectors such as hotels, tourism etc
5 55 The pace o f developm ent o f backward are<as continues to be a cause for concern With the doing away o f the system o f licensing o f indusjtries and coming into play o f m arket forces, the industries tend to gravitate tow ards aliready developed areas which provide better infrastructure, easier availability o f skilled w o rk - force and forw ard and backw ard linkages in term s o f availability o f raw materials and markcets for products Thus, the regional imbalances in industrial developm ent may tend to incre;ase. It is, therefore, imperative to take special m easures to prom ote developm ent o f industries in backw ard areas
5 96

5 56 The G row th Centres Scheme was initiated im the Eighth Plan to tackle the problem o f regional imbalances in industrial development. However, the Scheme has not been able to
make much headway during the Eighth Plan period and not a single Centre out o f the 66 approved had become functional upto 31.3 ,1998; whereas ;substantial resources have been thinly spread over a large number o f such Grow th Centres It iis imperative to prioritise the efforts on the large number o f Grow th Centres under implemientation, so that maximum benefits can be obtained from the investments in these Centres in tihe shortest possible time As a rule, work on new Growth Centres should not be taken up How(ever, an exception would be made in the case o f North-Eastern States and in very special cases Itt is now proposed to split the Growth Centi es in the North- Eastern States into two or more sub-C'entres since a large area may not be available ai one place; nor will there be enough takers for sco many units at one location Here again, it would be appropriate to concentrate on only onie location in each o f N orth -E astern States and start work on the next sub-Centre only whem the work on the first sub-Centre is nearing completion
5 57 The approved funding pattern o f the G row th Centres envisaged a contribution o f Rs 10 crore as equity by the Centre, Rs 5 crore as eqsuity by the concerned State, Rs 4 ci ore, including Rs.2 crore as equity from financial institiutions, Rs 1 crore from Nationalised Banks and Rs 10 crore as m arket borrowings, giving a total o f Rs 30 crore per Growth Centre However, the financial institutions and banks hav/e not been forthcoming to contribute their share even where they have appraised the project rejports Nor has it been possible to raise any worthwhile amounts as market borrowings Agaimst the Eighth Plan provision o f Rs 50 cvore by the Central Government for the Grow th Centres: Scheme as a whole, Rs 178 75 crore were actually provided during the Plan period A revise;d financing pattern for the Grow th Centres taking into account the problems being faced in tthe existing financing arrangement and the likely escalation in cost since the scheme was conc:eived in 1988, would need to be worked out and implemented at the earliest
5.58 The N orth Eastern States have continuecd to remain industrially backward due to isolation o f the region from the main centres o f trrade and industry, inadequate economic and physical infrastructure, small size o f the regional market, low accessibility o f the market outside the region, lack o f entrepreneurs, diflficuh terrain conditions, etc The development o f the N orth Eastern Region would need special attcention. A special package involving, among others, changes in the funding pattern o f the Grrowth Centres and integrated infrastructure development centres, extension o f transport subsjidy scheme, strengthening o f institutions concerned with entrepreneurship and human res<ources development etc , various physical concessions and incentives and specific measures fcor development o f individual sub-sectors like sericulture, handicrafts, handlooms, etc has been announced under a new Industrial Policy for the N orth Eastern States. It is hopted that this package would help to spur industrial and economic development o f the Noirth Eastern Region and help remove the feeling o f isolation o f the region from the mainlandl
5 59 The working o f the BIFR has left much to b e desired First, the stage at which the sick industrial units are referred to the BIFR does not leaive much scope for their revival Second, the BIFR has been taking too long a time to come up w/ith appropriate revival plans which, in most cases, only call for financial restructuring, conversi(on o f loans into equity, waiver/ moratorium o f interest on loans and sacrifices on the part of ̂ Central Government, State Governments, financial institutions and other Government agencie;s, etc which is generally not acceptable to
concerned organisations The technical conttent o f the revival schemes does not gel
SQ7

POLICY INITIATIVES FOR INDUSTRIAL DEV^ELOPMENT OF THE NORTH EASTERNREGIO)N
Entire expenditure on Growth Centres to be pro\'ideed as Central Assistance subject to a ceiling of Rs. 15 crore per Growth Centre.The ftinding pattern for the Integrated Infrastruccture Development Centres (IIDC) changed Irom 2:3 to 4:1 between Government of hidia(GOI) ancd Sm alllndustries Development Bank of hidia with GOI funding as a grant.Extension of Transport Subsidy Scheme for a peenod of another .seven vears i.e upto 31stM arch- 2007.The North East Development Financial Corporatiion (NliDFI) to be designated as nodal agenc\' for release of transport subsidy m NE States,Conveitmg the Growth Centres and IIDCs into toital tax free zones for a period of ten vears trom the commencement of production.Industries located in Growth Centres to be given Capital Investment Subsidy y/: 15'K. in plant and mechmery subject to a maximum of Rs.30 lakh.Setting up of dedicated branches/counters of cormmercial banks and NEDFI.An interest subsidy of 3% on working capital loan.is.Similar benefits to be extended to the New Indusstrial Units or their substantial expansions in other Growth Centre.s/IIDCs/Industnal Estates/Park.s/Exxport Promotion Zones set up by States m an\ zone. Expansion in the scope of the Prime Mmister 's Rozgar Yojana Scheme to co\'er areas of horticulture, piggeiy, poultry', fishing, small tea ^gardens etc so as to co \er all economicalh \'iable activities.
adequate attention M ore importantly, it has not been possible to close down a single unit, whether in private or public sector, based on the BIFR's recommendation. The entire system and w orking o f the BIFR, including the criteria for i identification o f industrial sickness and referring to the BIFR w ould have to be critically examinted and modified suitably to make it an effective instrum ent for revival o f sick industrial units.
5.60 Additionally, in the case o f PSU s referrred to the BIFR it involves repeated inter- ministerial consultations and multiple references to the Committee o f Secretaries, the Group o f M inisters, the Cabinet Com m ittee on Econoim ic Affairs, etc In the meantime, the various creditors stop giving supplies to such units oin credit and insist on cash payments while the Governm ent does not provide adequate funds (even for essential renewals and replacem ents Thus, the working condition o f the concerned P^SU deteriorates rather sharply The result is that in many instances, huge sums are being p^rovided to non-viable, non- revivable units as non-Plan support, w hereas many border-line urnits are not able to get even relatively small sums for maintaining their technological healthi in modernisation/ diversification to improve their com petitiveness It is imperative to dev/ise appropriate alternative mechanism for sick public sector enterprises which involves ai single point decision-making authority and includes technical expertise
5 .61 The National Renewal Fund (NRF) was i set up in 1992 to protect the interests o f the w orkers affected by industrial restructuring and provide a social safety net for the w orker While the voluntary retirement component o f thte scheme is under implementation, the retraining and redeployment component o f the scheme htas not progressed as per the objectives set out for it due to operational problems relating to m otivation o f employees, their age profile, specialisation, availability o f proper institudomal apparatus, etc The scheme, therefore, would have to be recast through appropriate modifi(cations to make it m ore effective and achieve the objectives for which NRF was set up
5<98

(i) Profit-making PSEs which are able to ffinance their development and growth plans on their own;
(ii) PSEs which are making only m arginal profits or losses and are not in a position to finance their modernisation/growth/diiversification plans without Government support, and
(iii) PSEs incurring substantial losses
5 63 The first set o f PSEs i e those making jgood profits are limited in number and include all companies in the oil sector, Steel /Authority o f India L.td (SAIL), Bharat Heavy Electricals Ltd (BHEL), Indian Petrochemicaals Corporation Ltd (IPCL), etc In puisuance o f the policy objective to make the public secttor m ore efficient and competitive, the Central Government has decided to grant enhanced au tonom y and delegation o f powers to profit-making public sector enterprises in terms o f incurrirng capital expenditure, establishing joint ventures and subsidiaries o f strategic alliances and rrestructuring and implementation o f schemes for HRD subject to meeting the eligibility c:riteria and other guidelines Eleven PSEs have been categorised as Navratnas and granted frreedom and powers in the above cited areas apart from enabling them to open offices in Indica and abroad, wind up posts upto Director level and raise loans trom the domestic market for emerging as global giants capable o f withstanding international competition The eleven PSEs .are Indian Oil Corporation Ltd (IOC), Hindustan Petroleum Corporation Ltd (HPCL)), Bharat IPetroleum Corporation Ltd (BPCL), Oil & Natural Gas Commission (ONGC), Gas Authoritvy o f India Ltd (GAIL), Indian Petrochemicals Corporation Ltd (IPCL), Steel Authority o f India Ltd (SAIL), Bharat Heavy Electricals Ltd (BHEL), National Thermal Power Corporatiion (NTPC), Videsh Sanchar Nigam Ltd (VSNL) and M ahanagar Telephone Nigam Ltd (MTTNL)
5 64 Another 97 profit-making PSEs have been identified for grant o f increased financial and managerial autonomy These have been furtl'her divided into two categories - (Category-I) and (Category- II) Category-I covers those PSiEs which had made profits in the last three years continuously, had pre-tax profit o f Rs 30 crrore or more in at least one o f the three years and have a positive networth Category-II coverrs those PSEs which have made profits in the last three years continuously and have a posittive networth The concerned administrative Ministry, however, will decide whether a poublic sector enterprise fulfils the requirements o f category-I/ category-II company before grranting it enhanced powers
5 .65 The second set o f PSEs i.e those making marginal profits/losses, would need to be provided limited budgetary support and o^ther assistance to enable them to stand on their own feet i e independent o f budgetary support, irn the shortest period It needs to be borne in mind that the public sector has been created ancd nurtured over the last four and a half decades o f planned development as an effective instrumemt for development and meeting the socio- economic imperatives The public sector has played arn important role in meeting the objectives o f growth, m odernisation and self-reliance However, poroblems have arisen in a number o f cases primarily because o f insufficient autonom y and lac;k o f operational freedom on the one hand and multiplicity o f objectives on the other. Thhe resuh is that many o f the PSEs have become procedure-oriented rather than result-orienteed and are not able to respond adequately to the opening up o f the economy and challenge o ff market forces Such undertakings would need to be provided limited support and assistancee to enable them to graduate to the first type o f PSE, and to stand on their own in the shorteest possible time
5 62 The public sector enterprises (FJibs) cam be divided broadly into three categories:
599

5.66 In the third group, there are a number o f enterprises which have been incurriiig huge losses for many years. Quite a few o f these undertakings were originaliy in the pnval e sector, becam e sick and w ere nationalised, primarily to protect the employment o f their workers M any o f these enterprises are not serving any socio-econom ic purpose As a m atter o f fact, keeping them on huge doses o f budgetary support - both Plan as well as non-Plan - is only resulting in sub-optimal usage o f scarce resources. Such financial resources can be utilised m uch better in many other areas with much greater gains to the economy as a whole In the case o f units which are not serving any socio- econom ic purpose and cannot be revived at reasonable cost and in limited time frame, hard decisions would need to be taken
Sick Public Sector Enterprises (PSEs)There are 1 0 4 loss making and 53 chrorucally sick (making 1os;ks for over five year.s j CenlraJ Public Sector Bnterpnses (PSEs).As on 31.3.1997, 60 PSEs stand referred to BIFRBIFR procedures are time-consnming and unsatisfactoiy', and require revamping for effective and cjiiick disposal of cases.A large num ber o f PSEs are potentially unrcvivable and need to he closed.Precise estimate o f likely fund requirement lor reviving potentially viable sick PSHs is not a\’ailablc but it IS not possible to accommodate such huge fund requirement m tlie PlanStrategic sale with transfer o f Management o f potentially viable PSEs, therefore, appears to be Uie best option for which s-peedy decisions are requiredI here is surplus work force in many PSlis, both healthy as well as sick I’Sl^s. T!ie resptmse to VR.S lia.s been rather unsatisfactory. More effective measuies are imperative to expeditiously reduce the work lorce and bring the .strength to optimum level. Availability of tunds in National Renewal l uiid is giossW iniidcqualc to meet the requirements o f VRS of sick PSI^sLack of a s<x:ial safety’ net poses a scnoiis potential of social unrest. There is an urgent need for creating a st)cia! safety' net.
5 67 The disinvestment o f equity o f the public sector enterprises (PSEs) was started primarily to subject the PSE s to the discipline o f market forces and make their managements more professional and result-oriented Unfortunately, so far, the disinvestment has been carried out mainly with a view to raising resources for reducing the fiscal deficit Besides, for a variety o f reasons, the progress o f disinvestment has been rather slow. The Disinvestment Commission was set up in August 1996 to consider the various issues related to disinvestment program m e and impart transparency to the system. Forty three PSEs were referred to the Commission for advice and recommendations The Disinvestment Commission has submitted eight reports on reforms and restnjcturing o f PSEs till August 1988 making specific recommendafions on each o f the forty-three PSEs Three more PSEs, namely, MMTC, STC and PEC have been referred to the Commission subsequently
5 68 .A number o f decisions have been taken on some o f the genera! recommendations o f the Commission made in its earlier reports such as granting greater autonomy to PSEs and induction o f nonofficial directors The Government has also decided to dismantle the administered price mechanism (APM ) if. respect o f petroleum products in a phased manner as also recommended by the Disinvestment Commission in its third report that disinvestment in companies dealing in petroleum prodvicts should be preceded by an aniiountement oi dismantling o f the APM as it would help enhancement o f their share vaiues !r :s imperative that decisions on other im portant issues such as creating a Disinvc.vmient Fund otTeiing shares in the dom estic retail market, revamping o f Voluntary- Retirement Scheme (\'R S ).
(ir>o

Em ployee Pension-cum - Insurance Scheme, Counselling Service to those taking VRS and providing safeguards to officers and staff for bonafide commercial decisions are expedited The Disinvestment Com m ission has suggested that the Governm ent should set up a definite tim e-fram e for taking action to eliminate further delays in im plem entation o f the recom m endations o f the Commission
5 69 The concept o f M em orandum o f Understanding (M O Us) betw een public sector undertakings and the Governm ent was introduced to provide greater autonom y to the PSUs in day-to-day management, hold them accountable foi the overall performance and mamtain an arms's length relationship between the PSUs and the Government However, in practice, these M OU s have tended to become one-sided with the Government hardly making any commitments on its part in the M OU s Furtherm ore, the targets of production profitability etc mentioned in the M OU s needs a critical review and appropriate modifications to make it achieve the objectives for which this system was introduced
5 70 In order to enable the institutions/organisations like National Institute o f Design, National Productivity Council, etc to play a more etTective role and augment their operations^ a system o f block grants is proposed to be introduced to provide them limited additional support in the initial years o f the Ninth Plan It is expected that this will help to suitably strengthen these organisations in selected areas and augment their resource generation capabilities so that they can stand on their own feet in subsequent years
5 71 It is generally believed that the machinery for investigations o f anti-duinping is not adequate to deal with the increasing num ber o f cases The increasing work load may be gauged from the fact that the number o f petitions increased from 3 in 1991-92 to 22 in 1996-97 Out o f the 22 cases only 1 1 could be finalised Adoption o f anti-dumping measures has assumed significance following liberalisation o f the Indian econom y Strict enforcem ent o f these measures, therefore, would have to be an essential com ponent o f the import liberalisation program m e in order to safeguard interests o f the dom estic industry
5 72 It has become a practice for the State Governm ents to bring out their industrial policy guidelines to a ttract industrial investment into the States while the fram ework o f the main policy guideline for industrial approval has been form ulated by the Central Government, the State policies are sometim es not in conform ity with the Central G overnm ent's policy guidelines. Further, unhealthy com petition among the States in regard to offering o f fiscal concessions and incentives for prom otion o f industrialisation may become counterproductive There is a need to bring a greater degree o f coordination betw een the Centre and the State G overnm ents and betw een State G overnm ents them selves regarding policy issues and fiscal concessions being offered by different States.
5 .73 There appear to be a num ber o f deficiencies in the existing system o f retention pricing o f fertilizers. First, there is no incentive for the fertilizer companies to optimise the capital cost o f the plants. As a m atter o f fact, higher the capital cost o f a plant, higher is the profit margin in absolute terms. Thus, there is a tendency on the part o f fertilizer companies to gold- plate' their capacity Second, in the case o f old plants, since the net block is extremely low and the retention price is based on the net worth, the returns are not adequate to maintain the plant in good technological health and carry out the necessary additions, modifications and replacements. Third, the operating norms are based on the best performance o f the previous tw o years This means that a unit, which has achieved excellent level o f working, has to
60!

m aintain it in order to be able to earn a reasonable return whereas a unit which has been worlcing inefficiently continues to get a good profit margin in spite o f higher consumption o f inputs and energy. This is patently unfair. Fourth, the system does not provide enough incentive for continued improvements in technological norm.s and energy consumption Fifth, in practice there are considerable delays in fixing the retention prices and payment o f subsidy to the fertilizer companies, which adversely affects their vyays and means position It is, therefore, im perative to move away from the complex system o f retention price system for individual plants.
5.74 The retention price-cum-subsidy scheme (RPS) was introduced with the objecti\e o f supplying fertilizers to farmers at affordable prices and at the same time ensuring a reasonable return on investment and promoting healthy development and growth o f the domestic fertilizer industry. As elaborated above, a number o f weaknesses o f the existing RPS have becom e apparent It would be better to separate the two objectives The objective o f facilitating healthy grow th and developm ent o f fertilizer industry can best be achieved by subjecting it to com petitive market forces The second objective o f making available fenilizers to the farm ers at a reasonable price may be achieved through provision o f a uniform subsidy to all fertilizer plants, taking into account the need to prom ote the use o f fertilizers and the fiscal capacity o f the Government. The amount o f subsidy payable on different t>'pes o f fertilizers may take into account the long run marginal cost o f producing/importing such fertilizers on the one hand and ensuring optimum balance in the usage o f different fertilizers on the other. So long as the petroleum products continue to be under administered price mechanism, the prices o f feedstock would also need to be taken into account in determining the fertilizer prices payable to the manufacturers.
5 75 In other words, all the three types o f fertilizers i.e nitrogen, phosphatic and potassic may be decontrolled, with the Governm ent providing a flat rate o f subsidy per unit o f each type o f fertilizer taking into account its fiscal capacity so as to achieve an optimum ratio in the consumption o f different types o f nutrients on the one hand and making available fertilizers to the farmers at a reasonable price on the other Clear signals may be given to the domestic fertilizer industry that they should restructure, modernise, control costs and improve their competitiveness so as to be able to produce fertilizers at international prices at an early date
5 .76 A nother major issue affecting fertilizer production is the lack o f a feedstock policy So far, the choice o f feedstock for fertilizers has been influenced primarily by the availability o f different feedstocks. In the early 1970s, naphtha emerged as the most important feedstock for nitrogenous fertilizers as against coke and coke oven gas used in the production o f nitrogen in India before 1970s. After the oil crisis o f 1973, naphtha prices rose sharply This resulted in the use o f fuel oil and coal as feedstock by the new fertilizer plants Presently, natural gas is the preferred feedstock for production o f ammonia and urea in India and elsewhere in the world But it is scarce and not easily available. Therefore, new fertilizer units are srill being based on naphtha as feedstock. The fertilizer units can be technology- wise flexible enough to switch over to natural gas or liquefied natural gas (LNG), which has also emerged as a competitive feedstock for production o f nitrogenous fertilizers
5 .77 The cost o f production o f fertilizers is highly sensitive to the cost o f feedstock Fuel oil, LSHS and naphtha have been priced for industrial users at import parity prices The price concession extended for the use o f these petroleum products for fertilizer production has been withdrawn. The price o f natural gas has been increased and linked to the international price
602

o f fuel oil with staggering ratio o f parity price i.e. in the first year it will be 50 per cent o f the fuel oil parity price, 65 per cent in the second year and 75 per cent in the third year It will be reviewed after three years with a view to introducing 100 per cent fuel oil parity price from the fourth year onwards. The transportation cost on HBJ pipeline has also been increased from Rs.850 per 1000 cu. Mtr. to Rs. 1150 per 1000 cu M tr Today, LNG is the preferred feedstock for producv'Dnof nitrogenous fertilizers. It has been estimated that the cost o f imported LNG is lower than the likely delivered cost o f imported naphtha to the consumers on HBJ pipeline The fertilizer industry is beset with problem s due to large differences in the cost o f production when different feedstocks are used. The natural gas reserves are not sufficient to cater to the rising demand o f the power, as well as the fertilizer sectors. There are bottlenecks with regard to storage and supply o f LNG The uncertainties regarding availability o f different feedstocks and the prices thereo f is a major problem facing the fertilizer industry It is imperative to form ulate and implement an appropriate feedstock policy so that the manufacturers can plan their capacity on a long-term basis
5 .78 W ith the coming into force o f the Uruguay round o f the General Agreement on Tariffs and Trade (GATT) and the World Trade Organisation ( \ \T 0 ) , the textile importing countries have committed themselves to phase out the M ulti-Fibre Arrangem ent (M FA) in 10 years beginning January 1995 This development is a mixed bag for developing countries, including India As far as the impact o f the M FA being phased out on the country's textile industry is concerned, it will have implications on both domestic and export front The textile industry will have to gear itself to face com petition from the producers o f cheap quality cloth The implications o f the new trade regime under W TO would need to be w orked out in right earnest at appropriate levels in order to face the new challenges successfully after 2005 A D For this long-term policies need to be adopted rightaway
5 .79 The TRIPS agreement under W TO is one o f the main challenges in the area o f know ledge and technology for Indian industry The global regime represented by TRIPS severely restricts national autonomy By enhancing the protection o f intellectual property rights across-the-board, this regime has tilted the baJance between the public interest, on the one hand, and the private interest o f the inventor, on the other, excessively in favour o f the latter The challenge posed by the new global regime has been com pounded by unilateral and arbitrary restrictions being placed by industrialised countries on transfer o f technology on the specious ground o f preventing proliferation o f "dual use" This situation will have to be faced in a concerted m anner both at the national and international levels. National laws will have to be suitably strengthened to withstand such unilateral restrictions. Gaps and ambiguities in the international regime will have to be availed o f creatively to seek m ore favourable interpretations o f its provisions. At the international level, a new initiative will have to be launched in concert with the developing countries to mitigate the rigours o f the international regime and to secure a more favourable deal at the impending review o f the TRIPS Agreem ent in the W TO Further, research and developm ent capabilities in general and industry- related in particular, would need to be strengthened. The industry-R&D linkage at present is not strong as in developed countries. While it is quite likely that the competitive market forces would throw up institutional mechanisms, including skills, for this linkage to get established, the State would intervene as a m atter o f policy and strategy, including adoption o f comprehensive approach in research and developm ent for creating com petitive and dynamic industry-R& D linkages to meet the challenges o f TRIPS
603

5,80 Environm ental pollution due to developmiental activities has increasingly become the focus o f concern, particularly due to the wide v^ariety o f emissions from the automobile and industrial activities The Rio Conference held 1 in June 1992 had adopted Agenda 21 to tackle the grow ing problem o f environmental detejrioration and its adverse consequences, inter-alia due to industrialisation It has become necessaary to keep in focus this concern while developing industries in the Ninth Plan Therefore, new projects will be based on environmentally sound industrial- friendly technologies and the exissting units would be upgraded and m odernised m ter-alia w ith the objective o f achieving <environment-friendly production from these units in the Ninth Plan The present mechanism i o f environmental surv eillance and monitoring industrial production would also be strengthesned
5 81 The small scale sector has shown considerab le resilience and in-built strength After the opening up o f the economy, its growth rate hias been about two to three percentage points higher than that o f large and medium industries The; sector has matured and is in a position to make a much greater contribution to the national economy as well as to meet the competition from large industry, including m uhi-nationals T h e SSI sector will be provided with necessarv incentives and support, mcluding making avaiilable credit to facilitate its growth and development leading to increased contribution to outputt, exports and employment generation
5 82 In accordance with the recom m endatiojns o f the Abid Hussain Committee, the definition o f small scale sector will be broadened fromi Small Scale Industries to small scale enterprises (SSEs), which will include not only industria l enterprises but also business enterprises Incentives, credit and prom otional facilitiies would be made available to all SSEs This would prom ote entrepreneurship, rapid grow/th o f industrial and business ventures in small scale sector and thus, additional employment
5 83 The small scale sector is presently pro(ducing about 8000 items, out o f which 822, items are still reserved for production in the small scale sector However, it has been observed that out o f the reserved items, as imany as 200 items are either not produced at all in the small scale sector or their p ro d u ctio n is insignificant In the case o f some reserved items, the present policy is only benefitting the existing large scale producers having "carry on business" licences by effectively shuttting out competition, to the detriment o f the consumer, w ithout any benefit to the smalll scale sector Besides, m the last few years, the grow th o f SSI sector in the nonreserved areeas has been higher than in the reserved categories which is p roo f o f the inherent strength and rresilience o f the small scale sector and its ability to respond to the challenge o f market forces Furtherm ore, out o f these 822 items, about 600 items are allowed to be im ported under O G L , which means that the SSI units have to face competition from multinational corporatiom s and large units abroad, whereas large units in the country are not allowed to produce these; items, thus preventing economic activity and employment within the country De- reservaition would also help a number o f SSI units to upgrade their technology, improve the qualify o f their products, expand their scale o f operations, and boost their exports as presently a num ber' o f export orders are being lost because o f inability o f domestic producers to supply the desired qiuantit>' in the required time-frame Thus, there does not appear to be much o f a ju stifica tion for continued reservation o f these items for production in the small scale sector The bi.sggest argument in favour o f dereservation is that, if at all, this is helping only a small perc;eniage o f units, whereas the policy framework should be supporting the entire SSI sectcor The Abid Hussain Commitee has also recom m ended com plete dereservation o f tthe products, presently reserved for the small scale sector However, it needs to be ensureed that this does not cause anv sudden di^locatuin
6'j 4

and problems for the weak small scale units and! an appropriate policy framework is provided, including phased dereservation to help small Sicale industries to sustain their grow th In the meantime, the list o f products reserved for sm all; scale sector will have to be continually reviewed and the investment limit for the small scale secttor will have to be revised upwards periodically to take account o f inflation and to enable the smiall scale sector to reap the economies o f scale and elfect upgradation o f technology to w ithstand the emerging competition, particularly in the export market The Government has enhanced the investment limit for tiny units from Rs 5 00 lakh to Rs 25 lakh The investment limit for smiall scale units was also raised from Rs 60 lakh to Rs 300 lakh in December 1997 which is no\w contem plated to be reduced to Rs 100 lakh
5 84 Perhaps, the biggest problem being faced by the small scale industries is inadequate avaiability o f credit. The Nayak Com m ittee hiad made a number o f recommendations to help the SSI sector in this regard M ost o f its retcomm endations have been accepted by the Reserve Bank o f India However, there is a need to closely monitor the implementation o f these recom m endations and see that they are impliemented in letter and spirit The financial institutions will be m otivated to offer factorinig services on a large scale to the small scale sector in addition to the present system o f cdiscounting bills The non-banking financial companies (NBFCs) would need to be encourajged through suitable finacial incentives to provide/earm ark enhanced loans/lending to tthe SSI units Friends and relatives o f SSI entrepreneurs could be given fiscal incentives at par with those investing in large units/public limited companies to lend to SSI units The finaincial and management base o f SFCs and SIDCs mav be suitably strengthened to enable them 1to provide better services to the SSI sector Banks/financial institutions may concentrate uipon cluster approach and set up specialised branches in such clusters o f SSI concen tra tions Setting up Local Area Banks (LAB) by financially strong and better managed SSI asso<ciations would also help in making available adequate credit to the SSI units
5 85 The Informal Group constituted by the Planming Commission to examine and recommend v/ays and means o f increasing the availabiliity o f bank credit to SSls and village and tiny units has recommended that the volume o f crediit available to SSI and village and tiny units should be in proportion to the contribiution o f SSI sector to the output o f the manufacturing sector The Reserve Bank o f India should examine the feasibility o f implementing this recommendation,
5 86 The Delayed Paym ents Act does not a p p e a r to have really helped the small scale industries. It is highly desirable to review this A c t and make appropriate changes to ensure that it achieves the objectives for which it has been enacted
5 87 The "consortium" concept for consumer itcems with approved quality standards would be m ore helpfiil to SSI units in m arketing their consum er products The State Industries Development Corporations (SIDCs), the Natiomai Small Industries Corporation (NSIC), the SSI associations, etc , may also be allowed to hielp the SSI units by setting up consortia o f m arketing agencies Simultaneously, to improv/e the quality standards o f SSI products, this sector may be provided quality testing facilities axt the clusters o f SSI concentrations The SSI associations may be helped by providing one-tiim e grant for setting up such quality testing facilities
60.‘5

5 88 In the unorganised sector, provision o f training, upgradation o f skills and im provem ent in tool kits, equipm ent and production techniques would go a long way in increasing production, productivity and income levels o f artisans, craftspersons weavers, spinners and w orkers, etc
5 89 There is a vast potential to increase exports o f the products o f handlooms, handicrafts, khadi and village industries, wool (unorganised sector) and coir industry Enhancem ent o f design inputs, adoption o f new production techniques and information about trends in export m arkets regarding products, utility aspects, prices, demand, etc, would help these sub- sectors to improve their perform ance and to achieve higher export targets
5 90 There is an urgent need to im prove the data base for the SSI sector Involving SSI associations/units on a voluntary basis, setting up com puter facilities and com puter-based netw orks and encouraging SSI units to submit information on a voluntary basis regarding production, employment, flow o f w orking capital, term loans and perform ance o f units on a quarterly basis through their associations would help in this effort The SSI units may be persuaded to provide such inform ation regularly and may be assured that this information w ould not be used against them The useflilness o f this information in the preparation o f suitable policy m easures for the grow th o f the SSI sector cannot be over- emphasised
5 91 India is the second largest producer o f fruits and vegetables How ever, only about one per cent o f fruits and vegetables are processed in the country, as against 70 to 80 per cent in the developed countries Besides, about 25 to 30 per cent o f the produce perishes due to grossly inadequate storage and cold chain facilities. It is imperative to set up extensive cold chain facilities th roughout the length and breadth o f the country O f late, there has been some interest on the part o f m ulti-nationals to set up such facilities but this would need considerable policy support, fiscal concessions and other assistance to make the private sector com e forw ard in a big way
5 .92 M any provisions o f the food laws and their implementation strategy have created hurdles in the w ay o f the grow th and developm ent o f food processing industry and trade. Particularly, the Prevention o f Food Adulteration Act and Rules has been a source o f considerable harassment The standards are unrealistic and there is m ore emphasis on policing than on prevention and even the definition o f adulteration is defective.. The various food laws w ould need to be review ed and suitably modified at a very early date. Further, the quality o f fruits and vegetables produced in the country is generally unsuitable for production o f high quality processed products There are also large variations in terms o f quality, size o f products, colour, taste, degree o f maturity, etc. P roper grading and sorting facilities are almost non-existent The farm ing o f fruits and vegetables needs to be organised on a scientific basis and forward linkages with the food processing units need to be established so as to facilitate the growth and developm ent o f food processing industry.
5 .93 Lack o f quality control and testing facilities is another major constraint being faced by the food processing industry As the industry' is highly dispersed and many o f the units are too small to afford individual testing facilities, the initiative for such facilities would have to be taken primarily by Industry A ssociations and other specialised agencies with the Government providing technical as well as financial support, especially in the initial stages
606

5.94 The unhygienic and insanitary conditions uinder which slaughtering and processing o f livestock as well as marine products take phace pose im portant problem to this sector Already there have been cases o f exports o f marine products having been rejected by certain countries on grounds o f unhygienic p>rocessing and handling conditions This is an area which needs urgent attention,
5 .95 The packaging industry for processed foods; is yet to develop as a result o f which there is a gap in contemporary packaging o f food proiducts The cost o f packaging is also v e r/h igh A ppropriate policy and fiscal m easures are reqmired to encourage scientific development o f packaging industry which is a prerequisite for (development o f food processing industrv and exports o f processed foods.
5.96 Special efibrts are required to rehabilitate amd modernise flour milling units, nee hullers, pulse milling, oil extraction, etc by providing credit and other facilities to improve yields and minimise wastages.
5.97 The experiment o f "factory on wheels" being tried in Karnataka v\ill be further developed and extended to other parts o f the coiuntr> so as to give a big boost to decentralised fruit processing industry
Ninth Plan (1997-2002) - Sectoral Profile
Metallurgical and Mineral Industries
5.98 The metallurgical and mineral industries cionstitute the bedrock o f industrial sector as they provide the basic raw materials for mosU o f the industries Up to the Seventh Plan, a significant progress was made in the developm ent o f mineral resources in the country which is amply depicted in the appreciation o f miineral inventory In the Eighth Plan, greater emphasis was laid on mineral exploration by adop tion o f improved technologies like rem ote sensing, geotechniques, etc , particularly for th(0se minerals in which the resource base o f the country is poor such as gold, diamond, nickel, tumgsten, rock phosphate, sulphur, etc. keeping in view the tim e lag betw een identification o f mew deposits and enhancement o f minerals' production.
5.99 As part o f the liberahsation drive which commenced with the new industrial policy brought out in July 1991, the Mines and M inerals (Regulation & Development) Act, 1957 was amended in January 1994 and a new Mineral iPolicy was announced With this, the mining sector was throw n open to the private sector imcluding foreign direct investment Further, the States were em powered to grant prospecfing lice;nces/mining leases without prior approval o f the Central Governm ent for minerals such as ap a tite and phosphatic ores, bar^'tes, dolomite, gypsum, kyanite, magnesite, molybdenum, nickel,, platinum, silver, and other precious metals, sillimanite, sulphur and its ores, dn, tungsten and vanadium ore W ith this only 11 minerals are left (excepting atomic and fiael minerals), for whiich State G overnm ents would require prior approval o f the Central Governm ent for giving licence for prospecting These are asbestos, bauxite, chrom e ore, copper, zinc, gold, iron ore., lead, limestone - except where it is used in k ih s for manufacture o f lime as building material-mianganese ore and precious stones The mining lease period has been increased to a maximum o f 30 years and a minimum o f 20 years The
607

prospecting period is also likewise increased from 2 to 3 years and further renewal up to a period not exceeding 5 years is allowed to facilitate more systematic and scientific prospecting and exploration for mmeral deposits
5.100 The restriction on equity holding by foreign nationals in a mming company has also been rem oved and the need to provide greater stability o f tenure to lease holders has been recognised. The amendments would be o f particular benefit to captive coal mines in the power sector - where a number o f projects have been approved - and other mines attached to mineral processing industries like steel, cement, etc , where an assured supply o f raw materials is essential. The period for which prospecting licences can be granted has been increased to three years and these licences can be renew ed at the discretion o f the State Govemnienis so tliat the total period does not exceed five years. Besides, it has been provided that no appeal to the Central Governm ent can be m ade for orders passed by the State Governm ents with regard to m inor minerals. The State G overnm ents have also been em pow ered to terminate leases oF m inor minerals w ithout prior approval o f the Central Governm ent The period before which a lease can lapse has also been increased from one year to tw o years With these changes in the national Mineral Policy, m ore pow er has been transferred to State Governments for mii)eral developm ent and administration
5.101 M aking available minerals at internationally competitive prices to consumers will be the policy objective in the Ninth Plan. The domestic mining industry will have to compete with im ports as no protection will be available except what is permitted within the world trade regime through the fiscal policy. The private sector will play a greater role in mineral developm ent and production in the Ninth Plan M any joint ventures, including with foreign parties, are expected to com e up. As a m atter o f strategic intervention by the Governm ent in the new econom ic environment, the dynamism o f policies, various rules procedures and enactments will be maintained, apart from promoting exploration for scarce minerals
Iron Ore
5.102 Iron ore constitutes one o f the major items o f export o f the countiy The production o f iron ore recorded an average annual compound growth rate o f 5 6 per cent during the period 1950-51 to 1995-96, comprising 12.5 per cent during the 1950s, 6 2 per cent during the 1960s, 2.9 per cent during the 1970s and 2 8 per cent during the period 1980-81 to1995-96. The production target set for the terminal year o f the Eight Plan (1996-97) was 72 million tonnes, consisting o f 32 million tonnes for exports and 40 million tonnes for domestic consumption. This target by and large has been realised The reserves o f high grade iron ore in the country are limited and, therefore, it is necessaiy to carry' out extensive exploration for establishing m ore reserves and at the same time ensuring conservation o f high grade minerals by blending with low grade ores As a matter o f policy, only low and medium grade ores, fines and tem porary surpluses o f high grade iron ore (+ 67 per cent iron content) particularly from Bailadila (M .P .) should be exported in the Ninth Plan and beyond
5.103 A production target o f 100 million tonnes o f iron ore has been set for 2 0 0 1 -02 , out o! which, export target is placed at around 32-35 million tonnes The production capacity o f iron ore in the country 'is about 107 million tonnes, comprising 39 56 million tonnes o f lumps 54.48 million tonnes o f fines, 4 million tonnes o f concentrates and 9 25 million tonnes o f pellets In order to m eet the production target, projects already identified, particularly in the public
608

sector such as 10 & 11-A and 11-B mining projects at Baiiadila (M P), will be completed in the Ninth Plan Research and developm ent efforts will be intensified for developing new technologies to make Indian steel industry internationally competitive as well as utilise more and more iron ore fines in the production o f steel as a m easure o f conservation o f iron ore
Iron & Steel
5 104 A production target o f 22.80 million tonnes o f finished steel was set for 1996-97, the ierminai year o f the Eighth Plan The actual producti'on was around 22 72 million tonnes In 1996-97, the actual production o f hot metal, c rude steel, saleable steel and pig iron from integrated steel plants in the country' was 18 64 mil lion tonnes, 16,15 million tonnes. 14 14 iriillion tonnes and 1,72 million tonnes respectively T he demand for 1996-97 was estimated at 24 million tonnes and the actual consumption was around 22 12 million tonnes with imports and exports o f the order o f 1 56 and 1 62 million tonnes respectively during the year
5 105 The secondary steel producers contributed about 12 18 million tonnes o f finished steel in 199b-‘"'7 as compared to 6 79 million tonnes in 1‘992-93 . The main integrated steel plants contrijTuied about iO 54 million tonnes o f finished ste’cl in 1996-97 as com pared to 8 41 million ionnes m I 992-93
5 Khi i luis, major augmentation in the finished steel capacity was in the private sector There w a s a marginal shortfall from the target in the prod uction o f finished steel The growth rate o f domestic consumption o f finished steel at 4 00 per cent was, however, lower than the Plan estimate o f 6 67 per cent during 1996-97
5 107 The domestic production o f finished steel from all sources is estimated to be around 39 million tonnes dunng 2001-02, the terminal yeai'o f the Ninth Plan and around 58 million tonnes in 2006-07, the terminal year o f the Tenth Plan O'ut o f this, dom estic consumption would be around 33 million tonnes, leaving a net exportable surplus o f around 6 million tonnes during 2001-02 The corresponding figures for 2006-07 w ould be 49 million tonnes and 9 million tonnes, respectively. Thus, the future thrust would b e on producing finished steel not only for the domestic market but also for export The steel consum ption is anticipated to grow at an average annual rate o f 8 85 per cent in the Ninth Plan and at 8 30 per cent in the Tenth Plan
5 108 Bhilai and Bokaro Steel Plants o f Steel A uthority o f India Ltd (SAIL) achieved the production targets set for the Eighth Plan, but D urgapur and Rourkela Steel Plants could not achieve the targets due to delays in com pletion o f m odernisation projects and slower-than-plarmed build-up o f production from t:hese m odernisations SAIL's production fell short o f the Eighth Plan target because o f this reason.
5 109 While the expansions o f Bhilai and Bokaro Steel Plants o f SAIL have since been completed, modernisation o f Durgapur Steel Plant (D SP) and Rourkela Steel Plant (RSP) has been delayed. Several new schemes such as autom ation o f blast furnaces and modernisation o f rolling mills, intering plants, coke oven batteriies, oxygen plants, etc., w ere taken up for implementation by SAIL in the Eighth Plan With the:se projects becoming fully operational in the early Ninth Plan, SAIL's physical and financial perform ance would improve further
609

5 110 SAIL raised an amount o f US $ 125 million during the Eighth Plan period through Global Depository Receipts (GDRs) mainly for financing its Plan programmes The response to the issue w as very encouraging. The issue was widely distributed to over 100 international institutional investors spread over 15 countries and listed at London Stock Exchange Under the policy o f disinvestment, SAIL's shares were also disinvested The equity structure o f SAIL by the end o f the Eighth Plan was : Governm ent o f India's 85 82 per cent, Financial Institutions 9 35 per cent, GDRs 3 5 per cent, individuals 0 43 per cent, foreign institutional investors0,11 per cent and domestic companies 0 0 9 per cent
5 111 The m ajor new projects planned to be taken up in the Ninth Plan are installation o f New M edium Structural Mill, Bloom Caster with ladle ftimace, reconstruction o f Blast Furnace No 3, etc at D urgapur Steel Plant; augm entation o f capacity, developm entof Row ghat Mines, installation o f Universal Beam Mill, etc a t Bhilai Steel Plant, renovation o f Cold Rolling Mill Phase-II, upgradation o f pipe plant, etc a t Rourkela Steel Plant; doublestrand slab caster, process control, m odernisation o f F[SM Phase-ll, etc at Bokaro Steel Plant
5 112 The Vizag Steel Plant (V SP) o f Rashtriya Ispat Nigam Limited (RINL) has been comm issioned flilly. It is, however, yet to> stablise its production at the rated capacity VSP is the only integrated steel plant in India to have hundred per cent continuous casting facihties and the entire production com prises long products Technologically, it is also one o f the m ost m odern steel plants in the country
5.113 The m ajor projects to be taken up for implementation in the Ninth Plan are Coal Dust injection in Blast Furnace Nos. I & II, Com bined Blowing o f LD Converters and expansion o f capacity from 3 00 M T to 4.05 M T liquid steel
5 .114 Some o f the major developmental objectives for the iron and steel industry in the Ninth Plan and beyond would be: (a) product ion o f 38 million tonnes o f finished steel by 2001-02 and 58 million tonnes by 2002-07; (b) provision o f iron and steel items o f international quality and prices to dom estic consum ers, (c) adoption o f ISO 9000 series certification and Total Quality M anagem ent (TQM ) by steel plaints, (d) achievement o f export target o f 6 million tonnes o f finished steel in 20 0 1 -02 , (e) p rom otion o f growth o f private investment including foreign direct investment in the iron and steel sector by maintaining dynamism in the policy fram ework.
Non-Ferrous Metals:
5 115 The liberalisation o f the economy affected non-ferrous metals industry rather severely during the Eighth Plan period There w as a sharp decline in the London Metal Exchange (LM E) prices o f non-ferrous metals, particularly copper, lead and zinc and a fall in demand o f these metals due to slow -dow n o f the econom y during the first two years o f the Plan A substantial reduction in im port duties w as effected under the new policy dispensation, which m ade imported non-ferrous metals, particulary copper, lead and zinc cheaper than indigenously produced metals. The domestic com panies had to resort to cut-backs in production, particularly o f lead and zinc by H industan Zinc Lim ited, a major producer o f these metals in the public sector In the case o f aluminium, though LM E prices remained depressed during the first two years o f the Plan, it did not affect the indigenous aluminium industr>' since it had comparative
610

advantage. The LM E prices tarted picking up vvdth the easing o f recession in the w estern w orld, econom y during early 1994, resulting in im provem ent in the situation for the dom estic producers.
5 .116 The investments by the public sector enterprises o f the M inistry o f Mines w ere well below the approved Eighth Plan outlays The maiin reason for this was the inability o f the concerned PSE s to mobilise adequate extra budgetary resources, which in turn was due to competitive environment and fall in international p rices o f non-ferrous metals coupled with reductions m im port duties. A welcom e developm ent in the new liberalised economic environm ent was the initiative taken by the private sector in investing in non-ferrous metals which w ere hitherto reserved for the public sector as a m atter o f policy, particularly copper and secondary zinc smelters The m etal-wise detail s are given below -
Aluminium
5 117 An average annual compound grow th rate o f 8 5 per cent in aluminium consumption was envisaged during the Eighth Plan period As agai nst this, the consumption o f the metal grew at 5 per cent. This was mainly due to factors such as slow-dow'n o f the economy during the first tw o years o f the Plan, slow off-take o f aluminium by the State Electricity Boards due to paucity o f resources, lower investment in the aluminiium consuming sectors because o f liquidity crunch in the economy, etc.
5.118 The production target set for the term inal year o f the Eighth Plan was also not realised, mainly due to anticipated addition to the capacity not coming through A new smelter o f 150,000 tpa capacity planned to be set up by the private sector Hindustan Aluminium Com pany in Andhra Pradesh was dropped on com m ercial considerations The public sector National Aluminium Company did not com plete it s debottlenecking programme due to some technical reasons and the private sector Indian Alumdnium Company was not able to bring into production its full rated capacity' as envisaged. M A LC O could not produce aluminium during 1992-93 to 1994-95 due to non-availability o f pow e r.
5 .119 The demand for aluminium is anticipated to grow at an average annual com pound grow th rate o f 8 per cent during the Ninth Plan period. The installed capacity o f aluminium is expected to increase from the present level o f 6 ,70 ,000 tpa to 7,14,000 tpa.
5 .120 It is expected that the private sector Indian Aluminium Company's capacity o f 117,000 tonnes will becom e operational with its Belgaum Sm elter's full capacity o f 65,000 tonnes per annum coming into production w ith assured pow er supply from its captive pow er plant which has been taken up for implem entation Besides, it is envisaged that the public sector National Aluminium Com pany will com plete the expansion program m e o f its alumina refinery in the N inth Plan and w ork on the expansion o f its sm elter will be initiated during the later years o f the N inth Plan. The additional capacity will becom e operational during the middle o f the Tenth Plan. Besides, with the completion o f debottlenecking program m e, about 12,000 tpa capacity will be added to National Aluminium Com pany's existing capacity o f 218,000 tpa. The H industan Aluminium Com pany is planning to set u p a new aluminium smelter o f 250,000 tpa capacity in Orissa in the N inth Plan. A new Cold Rolling Mill o f 40,000 tpa capacity has been approved to b e se t up at the K orba Smelter o f B A LC O in the Ninth Plan in order to improve the product-m ix o f the company
611

5.121 It is expected that three large expcort-oriented alumina plants o f one million tonnes capacity each will be set up in the private sector The industry has achieved international com petitiveness and will continue to maintaiin this position in the Ninth Plan It is envisaged that the industry will also launch prograrmm es to develop and prom ote use o f aluminium in various sectors o f the economy, particularly, in areas where it could replace wood, plastics, etc
Copper
5 .122 W hile the consumption o f copper haas been higher than anticipated during the Eighth Plan, the planned addition to the capacity hias not been realised mainly because o f change in the scope o f the expansion programme^ o f Khetrri Copper Complex o f Hindustan Copper Limited (HCL). The company has now planned to texpand Khetri Smelter capacity from 31,000 tpa to46.000 tp a as originally planned in the Eightth Plan
5.123 W ith the opening up o f the economy.', there was a spurt in the private sector investment in copper. Birla Copper Ltd. took up for iimplementation onclarge smeher o f 100,000 tonnes per annum capacity and one copper rod plsant o f 80,000 tpa capacity during the Eighth Plan period. M/s. Sterlite Industries Limited ahso took up for implementation a large smelter o f100.000 tpa capacity during the Plan periood. While the smelter o f Sterlite Industries Limited has come on stream, the plants o f Birla Coppeer Ltd are expected to come on stream during early 1998. A scrap-based smelter o f 50,000 ttpa capacity was taken up for implementation in the private sector by SWIL Ltd This is alsco expected to come on stream during early 1998 Besides, M/s. M ETD IST Ltd. is contem jplating to set up a large smelter o f 150,000 tpa capacity in the private sector which is antitcipated to come on stream during the Ninth Plan period. W ith this, and after the completio>n o f expansion o f the Khetri Smelter o f the HCL, the total copper capacity at the end o f the JNinth Plan is expected to reach 500,000 tpa from
the present level o f 47,500 tpa The to tall investment in these smelters is placed at Rs 5,400 crore. Besides, HCL, the only copper proiducer in the public sector, will make investment in expanding its existing mines and opening uip new mines. A thaist under R& D will be given in the Ninth Plan for developing bio-leaching tecchnology for recovering copper from lean grade ores
5.124 The copper demand is expected to grcow at the rate o f about 8 per cent per annum in the Ninth Plan. W ith this, by and large, there vwould be no demand-supply gap during the terminal year o f the Ninth Plan.
Zinc
5.125 There was a marginal increase in thae growth rate o f consumption o f primary zinc over that anticipated for the Eighth Plan. The caipacity creation target was also achieved with Binani Zinc Ltd. (BZL), a private sector primary zinc producer, having completed expansion o f its smelter in Alwaye (Kerala). H industan Z inc ; Limited (HZL), the major public sector primary zinc producer, deferred m ajor investm entis planned to be taken up in the Eighth Plan on commercial considerations
5 126 The demand for zinc is anticipated tto grow at the rate o f an average 6 per cent per annum during the Ninth Plan period Bothi the primary zinc producers, namely, HZL and BZL are likely to expand their capacities by 2^.0,000 and 30,000 tonnes respectively during the Ninth Plan period W ith this and taking in to account the availability from the secondry sources, there will be a gap in the dem and-supply too the tune o f about 50,000 tonnes during the vear
612

2001-02, the terminal year o f the Ninth Plan Ho wever, this gap could increase to 70,000 tonnes if the production from secondary sources fails to materialise, consequent to the ban on international movem ent o f hazardous waste aind scrap, including zmc ash under Basal Convention. HZL is contem plating to set up a new smelter, work, for which is expected to start during the Ninth Plan period But, it will come on stream only in the early part o f the Tenth Plan HZL has entered into a joint venture with B H PM o f Australia for exploration and developm ent o f zinc and lead resources in Rajasthain
Lead
5 127 In the Eighth Plan, primary lead demand was p'rojected to grov\ ai 8 per cent compound per annum The actual growth rate has been around 7 5 per cent This was piimarily because the actual consumption in the base year 1991-92 was liigher than that assumed for working out the grow th rate The production target set for the termi nal year o f the Eighth Plan ( 19‘̂ )(>-97) was not realised primarily because HZL had to resort to cut back in production on commercial considerations It is attributed to the effect o f liberalisation which made HZL non-competitive in lead production The company has initiated m easures to tackle this situation The capacity creation also fell short o f the target, though margimally, because o f the delay in completing the expansion programme planned by the only lead producer in the private sector - Indian Lead Private Ltd
5 128 The demand for lead is expected to grow at the compound rate of 7 pei cent per annum during the Ninth Plan period The private sector Indian Lead Ltd is planning to expandits capacity from the present level o f 25,000 tpa to 40 ,000 tpa in the Ninth Plan No addition to the existing lead capacity o f 65,000 tpa o f HZL is anticipated in the Ninth Plan HZL has, however, included in its Ninth Plan program m es, expa.nsion o f the existing Ram pura-Agucha lead-zinc m.ine and concentrator to increase the supply o f lead concentrates for captive use and taking up exploration projects for augmenting it s lead resource position in which it is presently deficit For expansion o f the secondary lead piroduction in the country, a major problem will be availability o f scrap, primarily because o f Basel Convention The availability o f domestic scrap will also be a constraint Therefore, new scrap-based lead capacity in the secondary sector is not expected to come up in the Ninth Plan
Capital Goods and Engineering Industry
5 .129 The capital goods and engineering industry comprising mainly o f M achine Tools, Electrical M achinery, Industrial M achinery, T ransport and Agricultural Equipment, Oil Exploration, Mining, Earth Moving and Construction equipm ent and control and instrumentation has crucial backward and forward linkages with the res t o f the industry sector The trend and pattern o f its grow th determine the productivity and perform ance param eters o f other industries In the past, the Government had protected th is sector through high custom s duties on im ports o f plant and machinery which had at times impeded the efforts o f other industries tow ards m odernisation and technological upgradation By mid 1970s, the share o f indigenously produced capital equipment in the total supply o f machinery reached a level o f over 80 per cent
5 130 The first attem pt at rationalising Indian capital goods industrv was made in 1975 by delicensing 24 industries including industrial machinen/, machine tools and other equipment Thereafter in 1985, 25 broad groups o f industries including several items o f industrial
6!:?

machinery w ere delicensed for non- M RTP, non-FERA companies Machine tool industry becam e the first group o f industries to be brc'>ad-banded in 1983 Industrial machinery sector was also broad-banded covering chemic:al, pharmaceutical, petrochemical and fertilizer machinery. In August, 1987 a Technology Up)gradation Scheme was launched for five groups o f capital goods industries The scheme was to encourage selective import o f foreign technology to upgrade the capita! goods indusstr^'
5.131 During the first two decades o f planned development, the growth rate o f the capital goods industry was impressive at 17 10 per cent for machinery'and machine tools (except electrical machinery), 14 9 per cent for electrical machintery and 1 1 05 per cent for transport equipment This was primarily because o f investment miade in setting up new capital goods capacities in the country and partly due to the base year pr oduction level being ver>' low During 1970s, the average annual com pound grow th rate; o f inachinerv' and machine tools (other than electrical machinery) was m oderate at 8 2 pe:r cent whereas the electrical machinery' group could achieve only5 4 per cent grow th rate dunng this period The pertbrmance o f transport equipm ent sector was much lower at 2 8 per (cent annual growth rate during 1970s The main reason for the low grow th rate in electrical imachinery during 1970s was low'er grow th in electricity generafion during the Fourth Phan period i e 1969-74 In the case o f transport equipm ent sector, the low er grow th rate was; primarily due to various controls on capacity expansion and new capacity creation in the auitomobile sector in order to restrict the demand for petroleum products During 1980s, the g ro w th rate in machineiy and machine tools sector (except electrical machinery) w as 6 5 per centl, whereas the electrical machinerv' group achieved a significantly higher grow th rate o f 18 9 per cent primarily due to large capacity expansion in pow er generation during the Fifth and Sixthi Plan periods The machinery and machine tools sector suffered due to lack o f technology upjgradation due to more emphasis on indigenisation
5 132 After the major industrial reforms (of 1991, the capital goods sector had negative grow th during 1991-92 to 1993-94 due to Ibalance o f payment crisis which necessitated an import squeeze affecting availability o f injputs and their costs, the tight monetary policy pursued by the Government to contain inflaticon, which affected the demand and raised the cost o f borrow ings for the industry, fall in dem^and due to reduction in public expenditure and investment as well as postponem ent o f investm ent plans in the private sector in anticipation o f fijrther reductions in im port duties and lack o f international competitiveness o f the dom estic capital goods industry H ow ever, the industry quickly responded to these challenges and upgraded itself The reforms started showinig positive results since 1994-95 with grow th rates o f 24.8 per cent and 17.8 per cent during 199H-95 and 1995-96, respectively Since 1995-96, however, there has been a slight down-slide as a result o f the overall industrial grow th slowing dow n primarily due to slow -dow n in electriciit}' generation, crude oil production, high cost o f borrowings, slump in the primary capital mairket and low investment in infi'astructure. Recovery in the capital goods sector is linked with (overall industrial revival The demand for capital goods being a derived demand, the long-teirm prospects o f the industry would depend on continuous and sustained grow th in overall industrial production
5 133 During the Ninth Plan, the capital g o o d s industry is expected to grow at 12-14 per cent per annum In order to sustain a gro 'w th rate o f this level, the industry needs to orient itself in term s o f quality and costs. Being ai capital intensive sector, the dom estic production is sometimes costlier than imports. The reasons for prevalence o f high cost pattern o f production in the capital goods industry are (i.) higher prices o f components and bought-out parts (due partly to low er scales o f production), (ii) a lower ratio o f sub contracting which usually
614

allows producers to minimise costs over the entiire production process, (iii) low utilisation o f capacity, especially by international standards, (iv) small sizes o f plants, (v) insufficient plant m odernisation and inability to keep pace wiith the CNC techniques used elsewhere in the world, (vi) higher inventory costs - Indian miachinery m anufacturers keep 6-12 months' production as inventory because o f uncertainties; regarding inputs and sales, poor distribution netw ork and infrastructure bottlenecks, (vii) an inverted duty structure with lower Custom duty on im port o f finished goods than duties o n im ported raw m aterials/com ponents, which puts the dom estic m anufacturers at a disadvantaige giving them negative protection against imports. D om estic m anufacturers are at a furthter disadvantage due to local levies (sales tax, octroi etc.) vis-a-vis foreign m anufacturers The ainomalies in excise duty (ED) and counter vailing duty (CV D ) also require rationalisation t o bring dom estic industry on par with foreign m anufacturers. D ue to these reasons and somce other inherent disadvantages like cost o f finance, infrastructure facilities, etc., zero' cu stom s duty on import o f items which are also manufactured in India, domestic capital goods imdustry does not have level playing field vis-a- vis imports. This needs urgent attention
5 134 Some o f the thrust areas during the Ninth P'lan are R&D and exports. Any R&D effort would have to be tow ards achieving im provem ents in the existing efficiency, security, safety and reliability o f systems. I f the industry is to de'velop and grow in a competitive market, it has to produce cheaper, better quality and b e tte r designed products, besides offering shorter delivery period and guaranteed service
5 135 There is a growing need for ensuring quiality in the products and services With the em ergence o f the open m arket economy, quallity m anagement is an essential management ingredient to harness the potential capabilities in the; organisafion to meet customer requirements and even exceed them in order to have an edge o v e r the competitors An organised effort at institutionalising quality management and spreading it to all sectors o f industry as a culture is increasingly being made
5.136 To be com petitive in the global market, p roduction costs have to be optimised The machining technology plays a vital role in the outiput, quality, productivity and competitiveness o f the engineering industry. The fijture level o f imanufacturing industry in the country would depend to a large extent on its ability to u p d a te its technology in tune with the current international trends
5 137 Small and medium sized engineering units are engaged in the m anufacture o f auto com ponents, metal parts o f electronic industrieis, machine tools, cutting tools, sheet metal products and fabrications, textile machineries, pnecision gauges and instruments, fabrication, heat treatm ent and surface treatm ent. The small amd medium units need support in technology upgradation and productivity improvement th ro u g h consultancy services and training R& D support for product development and testing are th e immediate requirements o f the engineering industry.
5 138 ISO 9000 certification will be encouraged for increasing exports. The ISO 9000 m ovem ents have laid great emphasis on the reliabiility and precision o f measuring instruments and equipment used in the laboratories which in turn contribute towards achieving a higher quality o f the end-product Consequently, the calibration o f m easuring instruments assumes
615

greater importance since ISO 9000 series standards make it mandatory that instruments used should have â known state o f calibration with precision o f national or international standards.
I
5.139 The different rates of levies likeisales tax, motor vehicles tax, road tax, etc., prevailing in different States for the automobile industry need to be rationalised. In the machine tools industry, the existing public sector units Will be encouraged to form joint ventures with reputed manufaaurers for technology upgradation. The PSUs engaged in the manufacture o f industrial, electrical and other machinery also'need to be privatised by forming joint ventures for technology upgradation and efficient management, wherever appropriate.-
Ship Building and Ship Repair Industry
5.140 The shipping industry is^closely connected with the ship building and ship repair industry for augmentation, service and maintenance. At present, there are 40 shipyards in the country, out o f which seven are in the public sector (four under the Ministry o f Surface Transport and three under the Ministry o f Defence), two in the State sector and the remaining in the private sector. The ship building industry has been delicensed and is open to the private sector, irrespective o f the size o f ships, except for construction of war-ships. At present, the private shipyards are not building large-sized ships due to various reasons like, non-availability'of adequate resources, inadequate returns, lack o f demand etc. The three public sector shipyards under the Ministry of Surface Transport are Cochin Shipyard Limited (CSL), Hindustan Shipyard Limited (HSL) and Hooghly Dock and Port Engineers Limited (HDPE). CSL and HSL are catering to ocean sector while HDPE is mainly confined to construction of fishing trawlers, barges, small passenger vessels, small crafts etc. CSL has been designed for building large size (86000 DWT) panamax type'vessels and oil tankers while HSL builds standard (21,500 DWT) pioneer class typ6 vessels.
5.141 The Indian shipyards have been finding it difBcdt to feee competition fi-om abroad, the m'aiii reasons being lack o f design base, very high cost of production, unduly Jong delivery periods and poor viability o f the shipyards. In the Eighth Plan, taking into account the problems faced by the ship-building industry, more emphasis was given to ship repair activity,
' which is more profitable and foreign exchange saving than ship-building. Ship repair industry has been recognised as a deemed export industry and a number o f concessions which are given to 100 per cent export oriented units, are available to this industry. The capacity utilisation o f the public sector shipyards in the ship-building activity was very low. The major reasons for the poor capacity utilisation are inadequate' flow o f orders, reluctance on the part o f ship owners to' place orders due to the higher price o f indigenous ships and long construction period compared to international builders. The pricing policy for construction of ships in Indian shipyards was revised in September, 1993 for a period of two years which expired in September, 1995.. Under this a subsidy o f 20 per cent fi-om the Central Government and 10 per cent from the owner o f the ship was provided to the shipyards.
5.142 During the Eighth Plan, the production in HSL was 113,895 DWT and in CSL 69,033 DWT, registering a capacity utilisation o f 30.27 per cent and 10.09 per cent respectively. However, as shiprepair is moire remunerative^ the-ship building docks and other facilities have been used by-these shipyards for ship repairs. During the Eighth Plan, CSL has achieved a turnover o f Rs. 390.94 crore in ship repair activity and CSL could turn around and start earning profits. During Eighth Plan period the turn over o f HSL was Rs. 198.21 crore. The HSL which
616

is presently incurring losses, needs to concentrate more on ship repair activity HDPE, which is presently a sick yard, is undergoing a short-term revival plan to com plete the existing orders A long-tem i revival plan including privatisation needs to be form ulated and implemented
5.143 Though in the existing scenario, ship repair is m ore profitable than ship building, the ship building industry needs to be maintained at least at the existing level o f production because o f the following reasons ;
5 144 (i) Ship building is a skill which has been developed by shipyards at considerable cost and should not be allowed to die out, (ii) ship building industry is supported world over by their respective Governments; Indian shipbuilding industry also needs such support fiom the Government, considering strategic requirements and also the foreign exchange saving invoK ed in it, (iii) the infi-astructural facility such as design setup, huge fabrication and assenibiy shops, machines, hydraulic presses, etc developed by shipyards will become redundant as these arc not fully useful for ship repair activity, and, (iv) ship building industn also supports anciliaty industries
5 i45 During the Ninth Plan, emphasis will continue to be on ship repair activity and the future o f ship building will depend on the competitiveness o f the Indian yards, which will have to improve their efficiency and modernise by forming joint ventures with reputed foreign shipviirds They may also diversify' their activities so that the idle rnacliineiy etc could be fully utilised ,A.nother advantage o f forming JVs is that the .IV partnc, I'.iav be Jiblc to j;et in\er-nalional orders
5 146 The National Ship Design and Research Centre (NSDRC). a society under the Ministiy o f Surface Transport was commissioned in 1993, to provide design/consultancy .services to the ship building industry' The Centre is yet to sustain its activities Considering the present situation o f the Indian ship-building industry, NSDRC should extend its consultancy sei'vices beyond the country’s borders so that it could sustain its operations rather than depending on budgetary support.
Electronics
5 147 The presence o f electronics is being felt in every sphere o f life Electronics has been identified as an effective tool in tackling various issues o f national im portance like literacy, education, health, agriculture, information infrastructure, population control, unemployment etc. It is set to bring about a social transform ation covering all spheres o f life in manufacturing, services, education, management and entertainm ent Its enviable role in key sectors o f the national economy for improving efficiency, achieving cost optim isation and improving safety as well as reliability, has been amply dem onstrated
5 148 During the Eighth Plan, the electronics industry is estimated to have achieved a cumulative growth o f 20 per cent in production and 41 per cent in exports In the terminal year o f the Eighth Plan, electronics production and exports w ere Rs 26,640 crore and Rs 6,287 crore, respectively, against the Eighth Plan target o f R s.36,000 crore and Rs 6,500 crore respectively. The infrastructure facilities created by Governm ent o f India like Software Technology Parks, Electronics H ardw are Technology Parks, Export Processing Zones, Standardization Testing and Quality Control (STQC) Laboratories are contributing a lot to the grow th o f the electronics industry
617

5.149 The Eighth Plan w itnessed liberalization in fiscal, industrial and trade policies. Licensing has been abolished for the electronics industry as a whole except for aerospace and defence electronics items. The EX IM policy has been liberalised. W ith the exception o f consum er electronics and telecom m unication products, no other items figure in the negative list o f imports. The consum er electronic item s are allowed for import under Special Im port Licence (SEL). The custom s duty on specified raw materials was reduced to 10 per cent and on components, com puter and com puter peripherals to 20 per cent. These changes in import duties have imparted the much needed dynamism to the com puter industry
5.150 The Software Technology Park scheme, initiated for boosting software development and exports, has m ade good progress. U pto 1996-97, 642 units were accorded approval under this scheme com pared to 121 units till January 1991
5.151 During the Eighth Plan, there has been a significant growth in investments in computers, consum er electronics and telecom m unication sectors Several foreign collaborations have been established in the sector with prominent multinational companies setting up production/design base in the country fo r exploiting the advantages o f cost-effective human capital and other inputs,
5.152 A target o f electronics production o f Rs 1,38,350 crore has been kept for the terminal year o f the N inth Plan, representing a com pound grow th rate o f about 39 per cent per annum. This will be 2.0 per cent o f world production, as compared to 0 7 per cent at present. An export target o f R s,49,000 crore has been set for the terminal year o f the Ninth Plan with a grow th rate o f 51 per cent. In order to achieve these ambitious targets, the required strategies will be designed and these include: rationalising tariffs, attracting foreign investment, promoting production at international levels o f costs and prices, m arket prom otion and export thrust, raising the quality o f products to international levels, rationalising o f procedures, dentifying niche areas in w orld market, strengthening manpower base, improving R&D efforts, encouraging computing in Indian languages, application o f electronics in different sectors o f the economy and strengthening data base,
5.153 The developm ent o f inform ation infrastructure in the country is increasingly becom ing significant and promises to bring far reaching changes in the lives o f the people Som e o f theareas which have been well appreciated by the society are Railway Passenger Reservation System, Screen Trading o f Scrips in stock exchanges, netw orks o f educational/ research institutions, etc. The access to Internet has already been established in various parts o f the country. During the N inth Plan, a National Information Infrastructure (N il) is being initiated w ith a high speed national netw ork and a regulatory authority Apart from this, the N ICN ET, a satellite based information netw ork o f National Informatics Centre (NIC), which has already been extended to almost all districts in the country will continue to serve mainly the Governm ent sector,
5.154 Diiring the N inth Plan, thrust will be given to jo int R & D projects with user agencies Special impetus will be given for technology development in selected areas leading to increased exports and for infrastructure developm ent to help exporters,
5 155 The technology developm ent perspective identified for the Ninth Plan period includes enhancing the product range o f audio and video products, incorporating emerging digital technology and home electronics products, industrial automation for increasing productivity and quality, w idespread use o f Internet, personal comm unication serv’ices and mobile satellite services, increasing com puter com m unication speed, m ore com puter penetration, strategic
618

electronic components, high resolution technologies, future air navigation systems, radar technologies, components, micro-electronics, multi-layer surface m ounted PCBs and colour display devices.
5 156 For global competitiveness, quality assurance to international standards is a pre-requisite There is a need to expand the presenr services o f STQC to cover areas like environmental/energy management systems, energy auditing. Information Technology (IT) and telecommunication sectors
5 157 The strength o f the country in the software area is well recognised There is a need to develop globally competitive and high quality software to encash on its comparative advantages Software houses should concentrate on areas like packaged software, software for factory autom ation, networking, virtual reality-based dessgn activities, telecom applications, etc Information technology (IT) has been identified as an area o f extreme focus in all fi.iture Plans All eflbrts will be made to make India a global IT Pow er and one o f the largest generators and exporters o f software in the world within r?n years. Action to achieve this ambitious national mission has been initiated under National Inform ation Infrastructure (N il) programme This includes a number o f initiatives like setting up o f National High-Speed Backbone NetW ork, Internet and Related Matters, Promotion o f STPI Infrastructure, E-Commerce, Cyber L.aws, Human Resource Development in IT and Softw are, Financing Software Industry, Tax concessions for the IT sector, etc
5 158 Availability o f high quality trained m anpower is a must in order to achieve the Ninth Plan targets especially in respect o f software exports To this end, emphasis will be laid during the Ninth Plan on introducing more job-oriented courses at all levels by encouraging private institutions to impart training in computer software area. The need o f specialised manpower in areas like software engineering practices, system analysis and design capability and project management skills will be catered through specialised courses to be initiated in the IITs, lIMs, National Centre for Software Technology (NCST)., Centre for Advanced Computing (C-DAC), etc Special manpower development schem es in the area o f Applications-Specific Integrated Circuit (ASIC) design, Hindi and regional languages as operating systems, schemes for SC/ST and backward regions in the N orth East will be initiated during the Ninth Plan. The connectivity o f a number o f educational institutions and R&D Centres and research institutions to national and international netw orks will be undertaken during the Plan period
Fertilizers
5,159 The production targets o f both nitrogenous and phosphatic fertilizers set for the Eighth Plan (1996-97) were not achieved primarily because the planned capacity addition o f seven lakh
tonnes in the case o f nitrogen (N) and tw o lakh tonnes ;n the case o f phosphate (P2O 5 ) did not materialise
5 160 In the case o f nitrogenous fertilizers, the shortfall was partly due to non-availability o f feedstock-natural gas - which was expected to be made available to units at Vijaipur. .Aonla and Jagdishpur (on HBJ pipeline) and tw o other small units in Krishna Godavan (KG) basin for their expansion projects planned for the Eighth Plan While Aonla and Vijaipur units got the gas, Jagdishpur could not get the gas allocation partly due to limitation in the availability o f gas from the HBJ pipeline and partly due to shifting o f priority for gas allocation to the power sector The other two small units also-did not get gas as anticipated because o f low gas reserves
619

in the KG basin Gas shortage also restriicted exploitation o f the full capacity o f gas-based plants The other reasons w ere low er comtribution o f nitrogen from the phosphatic fertilizer units
5 161 Due to nearly 100 per cent depemdence on imported raw materials, only a small addition in the capacity o f phosphatic ftertilizers was planned in the Eighth Plan mainly through adoption o f pipe-reactor technolosgy in the existing units where 25 to 35 per cent extra capacity could be achieved at nominal investment Even this addition in the phosphatic fertilizer capacity could not be realised duje to changes in the pricing policy in August, 1992 when decontrol o f phosphatic fertilizers (:along with potassic) was announced The demand for phosphatic icrtilizer slumped and rem ained stagnant inspite o f providing some ad-hoc subsidy Dom estic producers faced stiff competiti(on from imports which flooded the market as a result o f decontrol o f phosphatic fertilizer indiustry The dom estic units were forced to cut back production
5 162 The perform ance o f the sick publlic sector units continued to be a cause for concern throughout the Eighth Plan period The perform ance o f Durgapur, Nam rup and Barauni units o f Hindustan Fertilizer Corporation (HF'C) deteriorated in real terms though with derating o f capacities o f these units their losses camte down The Haldia project o f HFC failed to achieve commercial production and its commi-ssioning has been discontinued since 1986 The position o f Fertilizer Corporation o f Indiia (FCI) is broadly similar with the Gorakhpur unit remaining closed since 1990 following am explosion Ramagundam and Talcher w orking well below the rated capacity due to high ash content o f coal and technological problem s Both HFC and FCI along with Projects anid Development India Ltd (PD IL) a consultancy unit- have been referred to BIFR The rrevival package in the case o f PDIL has been finalised and implemented It did not envisage iinfiasion o f fresh funds The turn around package o f PD IL has been quite successful and the (company has recorded substantial improvement in its operating and financial perform ance TThe revival packages for HFC and FCI have been prepared and are under consideration o f the Government
5 163 The Pyrites, Phosphates & Chiemicals Ltd (PPCL) and Paradeep Phosphates Ltd (PPL), which produce only phosphati(c fertilizers, suffered due to shrinkage o f demand for phosphatic fertilizers following decontirol in August, 1992. Though these units were able to avert cash losses, they continued to make operating losses and were provided budgetary support for meeting their investment ne^eds Both these PSUs have embarked upon turn- around strategies to improve their perform ance : under a targeted time-frame.
5 .164 The Eighth Plan had advocated thie removal o f subsidy in a phased manner on fertilizers and creation o f free-market conditions i in the fertilizer market The decontrol o f phosphatic and potassic fertilizers led to a steep increaise in their prices with consequent decline in dem and for these fertilizers It also resulted in ove’.rdosing o f comparatively cheaper nitrogen through urea, which was under price control. The N P’K ratio o f fertilizer feed, which was 5:2.51 in 1991-92 and was approaching the optimal levfel o f 4:2; 1, drifted away after decontrol to 8.4:2 5 :1 in 1996-97, it has gone as far as 37:8.5:1 in the northern zone This has serious implications for long-term fertility o f soil and needs urrgent attention. A high pow er com m ittee was set up to suggest suitable changes in the pricing; policy o f fertilisers The committee has since submitted its report, which is under consideration! o f the Government
620
5.165 Among the key objectives for the Ninth Plan woDuld be long- term feed-stock policy for the fertilizer sector and an appropriate fertilizer pDricing policy which while maintaining a balance betw een the twin objectives o f tapering offlF the subsidy and encouraging fresh investment in the fertilizer sector, will help increase fertilizer consumption as well as correct the large disparity betw een the prices o f different nutrientfs for achieving their optimum application ratio.
5 166 The other areas which would need attention include strengthening o f infrastructure, especially for fertilizer movement (railways) and hancdling o f imported fertilizers (ports) which are becoming bottlenecks in meeting the demancd for nutrients in different parts o f the country This also implies that the location o f new fertiilizer plants would be encouraged in deficit areas in order to reduce the lead distance o f trainsportation and avoid logistic problem
5 167 The fertilizer industry should expand their soil testing services to advise the farmers on the balanced use o f fertilizers At the same timie, there is a need to educate the farmers on Integrated Plant N utrient System
5 168 W ith appropriate price correction, the demaand for phosphatic fertilizers during the Ninth Plan is anticipated to grow at 7 per cent per anmum and for nitrogenous fertilisers at 5 per cent per annum Based on these grow th rates, the dlemand would be 13 4 million tonnes for nitrogenous fertilisers and 4 6 million tonnes for P2 O 5 ; during the terminal year o f the Ninth Plan i.e 2001-02 W ith the projects under implementatio^n and under formulation, the domestic production is anticipated to meet almost 98 per cent o f the demand in the case o f nitrogenous fertilizers, leaving a gap o f 0 2 million tonnnes The gap in the case o f P2 O 5 would be 1.7 million tonnes The total investment in the fertiilizer sector in the Ninth Plan is estimated at around Rs. 13,300 crore, out o f which about Rs 9,3030 crore would be in the public sector and the balance in the private sector
Petrochemicals
5.169 Petrochem icals can be broadly categorised as polymers like polyethylenes commonly known as LDPE, LLDPE, HDPE, polypropylene (PP), polyvinyl chloride (PVC), elastomers like styrene butadiene rubber, poly butadiene rubber, fibrces such as PFY, PSF, acrylic fibre and intermediates such as ethylene, propylene, benzen6, capprolactam, dimethyl terephthalate (DMT), purified terephthalic acid (PTA), etc. Petrochem icals5 are m anufactured from the feedstocks coming from the petroleum refineries-naphtha and crracked LPG -and natural gas
5 .170 The m anufacture o f petrochem icals involves thrree stages : (a) m anufacture o f olefins such as ethylene, propylene and butadiene from petrroleum feedstocks, (b) m anufacture o f intermediates such as acryionitrile, DM T, PTA, and! (c) manufacture o f final products such as polymers, elastom ers and fibres
5.171 The petrochem icals industry in India m ade ia m odest beginning in the 1960'sw ith the commissioning o f a small-sized integrated petrocheemicals complex o f 60,000 tpa capacity by National Organic Chemicals (India) Ltd. (NOCIL)), followed by a small cracker and an LD PE plant by Union Carbide (India) Ltd. (UCIL), a 1 PSF plant by Imperial Chem icallndustnes (ICI) and a synthetic rubber plant by M /s Synthetics and Chemicals All these plants were set up in the private sector. The industry, howevfer, saw a phenomenal grow th with the
621

comm issioning o f Indian Petrochem icals Corporation Limited's (IPCL) - a public sector unit - cracker complex o f 1,30,000 tpa capacity at Baroda in the late 1970's and several < )i!ier plants in the private sector during the 1980's
5.172 The petrochem icals industry has been one o f the fastest growmg sectors in the Indian economy. The 1980s witnessed a significant growth in the consumption o f all petrochemicals with synthetic fibres and intermediates registering the highest growth rates o f around 16 per cent followed by therm oplastics at around 12 per cent per annum On the whole, the consumption o f petrochemicals grew at an annual compound rate o f 13 3 per cent in the 1980s In quantitative terms, the consum ption o f petrochemicals grew from around 7 5 lakh tonnes in 1979-80 lo well over 3.5 lakh tonnes in 1995-95 While the consumption has grown at a very healthy rate, capacity grow th has lagged behind Around the m other crackers, grew the dowTi-stream units which m anufacture a large variety o f consumer products o f plastics including synthetics and co tton blended cloth
5.173 Keeping in view the higher grow th rates realised during the !980s and the increase in demand for petrochemicals, letters o f intent/industrial licences were issued for the setting up o f crackers at Hazira in Gujarat, Auraiya in UP, Gandhar in Gujarat, Vizag in AP, Haidia in W est Bengal, Tengaghat in Assam, Payal near Ludhiana in Punjab, M angalore in Karnataka, Jam nagar in Gujarat and expansion o f National Organic Chemicals Industries Ltd cracker at Thane-Belapur in M aharashtra. The total investment in these crackers is estimated at artwnd Rs 40,000 crore. Besides, letters o f intent/industrial licences were issued for a number o f arom atic complexes. Out o f these, Hazira, Auraiya and Gandhar Phase-1 have been completed, w hereas the progress m ade in the implementation o f the other crackers as well as aromatic com plexes has been rather slow
5.174 The petrochem icals industry was not internationally competitive in the earlier closed econom y due to factors such as high input costs, high rates o f taxes and duties, infrastnictural bottlenecks, etc. With the opening up o f the economy, the industry was delicensed except for hazardous products like ethylene, propylene, butadiene, xylenes, toluene, polycarbonate, m ono ethylene glycol, etc. The import duties w ere progressively reduced
5.175 The Eighth Plan was form ulated in the background o f economic reforms which implied m uch greater fi-eedom to Indian industries to make their own business decisions in the competitive economic environment During the first three years o f the Plan, petrochemicals industry cam e under severe com petition with comparatively cheaper imports This was com pounded by a slow -dow n o f the economy during the first tw o years o f the Plan The international prices o f m ost o f the petrochemical products remained depressed during most o f the Eighth Plan period This resulted in cheaper imports and posed a serious threat to the dom estic petrochem icals industry
5.176 The dom estic producers had to resort to cut-backs in production, particularly o f intermediates. The profitability was also aflFected. The industiy responded to the new economic environment with restructuring, adoption o f the latest technologies and taking other m easures to im prove its competitiveness M ost o f the players in the industry have been able to adjust to the new econom ic environment The adoption o f the latest technologies by the industry has been through a combination o f absorption o f imported technologies in-house efforts, R& D and through industry-institutional R&D linkages
622

5 177 While the major players in the public sector, namely, Indian Petrochem icals Corporation Ltd and Hindustan Organic Chemicals Ltd. have taken up expansion/ diversification schemes, the Petrofils Cooperative Ltd has turned sick due to factors such as surplus capacity, cheaper imports, lower demand, steep price hike o f raw m aterials & intermediate inputs, severe liquidity crunch, working capital shortage, etc It has not been possible to work out any viable revival package so far
5 178 About 88% o f the indicative production targets o f the major petrochemicals, excluding fibre intermediates set for the termmal year o f the Eighth Plan - 1996-97 has been realised Production o f polymers and synthetic detergent (L AB) exceeded the indicative targets by 4% and 1 1% respectively and synthetic fibres, fibre intermediates and synthetic rubbers also achieved about 70° o. 81% and 69% o f their respective indicative targets. Among synthetic fibres, 82% o f the indicative target was realised in respect o f acrylic fibre and 100% in the case o f nylon industrial yarn The achievement was about 106% in respect o f DM T/PTA, which serve as the main raw materials for the production o f Polyster Filament Yarn (PFY) and Polyster Staple Fibre (PSF) With the installation o f 7 5 million tonne per annum mega cracker at Hazira the country has almost reached the stage o f self- sufficiency in petrochemical building blocks The new capacity additions in polymers, such as PVC at Gandhar Cracker o f I PC L and Hazira Cracker o f Reliance Industries I.td (RJL), Polypropylene at Baroda Complex o f IPCL and Hazira Complex o f RIL and synthetic rubber (SBR) at Baroda Complex o f IPCL, have bridged the gap between dom estic production and consum ption India has becom e net exporter o f PFY, PSF, PVC, PS and l.AB Following import liberalisation, com petition is, however, regulating the market and hence prices determine the buyers' choice to go either for indigenously produced products or the imported ones About 25% o f the total dom estic production o f petrochem icals is envisaged to be exported during the Ninth Plan period
5 179 The tempo o f investment in the petrochemicals sector slowed down in the Eighth Plan This is attributed to many factors, important ones being the cautious approach adopted by the industiy because o f liberalisation which, interalia, resulted in cheaper imports coming into the country due to depressed international prices during most o f the Eighth Plan period, liquidity cnm ch faced by the industry including non-availability o f funds from public financial
institutions to petrochem icals industry as a m atter o f Governm ent policy The position, however, improved from the third quarter o f 1995-96 when international prices o f some o f the petrochemical products started rising This improved profitability o f both the public and private sector companies The IPCL, commissioned Phase-I o f Gandhar petrochem ical complex with coming on stream o f Vinyl Chloride M onomer (based on imported ethylene) and caustic soda/chlorine units, etc The Phase-II comprising M other Cracker and dow n stream units is expected to be commissioned by December, 1998 The IPCL completed revamping and expansion program m e o f Poly Butadiene, PP and Butadiene units located at its V adodra cracker (Complex. It also completed expansion programme o f Ethylene and ITDPE units located at its M aharashtra Gas Cracker Com.plex, Nagothane
5 180 In order to provide technical services to the growing plastics processing industry including trained personnel, testing for standardisation and quality control o f the products, etc . Central Institute o f Plastics Engineering & Technology (CIPET) was established at M adras in 1968. M any Centres have also been set up in different parts o f the country The Extension Centres at Amritsar in Punjab, M ysore in Karnataka, Imphal in Manipur and Calcutta in West Bengal w ere set up during the Eighth Plan period Six new Centres at N arora (UP), Pune (M aharashtra), Jaipur (Rajasthan), in Kerala, Guwahati ( Assam), in J&K and Himachal Pradesh
623

are expected to be set up during the Ninth Plan. CIPET has joined hands with BPTA (British Polymer Training Association) to conduct BPTA-type training programme in India.
5.181 The petrochemicals industry has a major role to play in the Ninth Plan in achieving, interalia, the objectives such as employment generation, regional development, improvement in the quality of life of the citizens, etc. The emphasis in the Ninth Plan would be on achieving mternational competitiveness through restructuring, technological upgradation, expansion o f capacities, innovative managerial and marketing efforts and R&D, including effective and efficient industry-institutional R&D linkages. The private sector is expected to play a major role in fiirther development of the petrochemicals industry and a number of joint ventures abroad are expected to come up during the Ninth Plan period.
5.182 It is anticipated that the petrochemicals industry will achieve an annual compound growth rate o f around 15 per cent- synthetic fibres, 12 per cent electronics and polymer sectors at about 16 per cent in the Ninth Plan. The total investment m the petrochemicals industry in the Ninth Plan is placed at around- Rs.72,000 crore, out o f which the public sector is anticipated to contribute around Rs.6,000 crore. The investment is expected to get a boost, since restrictions imposed earlier on the public financial institutions for funding petrochemicals industry have been removed.
5.183 The industry would need to pay due attention to environmental issues like handling plastic wastes. It is expected to make investments for installing state-of-the-art technologies with adequate pollution abatement facilities. During the Ninth Plan, greater emphasis would be laid on performance plastics such as polyamides, polyacetals, polycarbonates, etc., the consumption o f which is linked to the growth of sectors like automobiles, electronics, telephones, agriculture, packaging, etc The changing Indian scene with rapid growth of these industries will push up the growth in the consumption of performance plastics. The petrochemicals industry being technology-intensive, linkages between research, manufacturing, design, engineering and academia will need to be strengthened.
Drugs and Pharmaceuticals
5.184 The Indian drugs and pharmaceuticals industry is one o f the largest arid most advanced among the developing countries. It is manufacturing a wide range of basic drugs and pharmaceuticals, covering several therapeutic regimes including antibiotics, anti- bacterials, steroids, harmones, vaccines, herbal preparations, etc.
5.185 The domestic drug industry is in a position to meet about 70 per cent o f the country's requirements o f bulk drugs and almost the entire demand for formulations. The setting up o f the Penicillin factory at Pimpri, Pune in the early 50's and the construction o f Indian Drugs& Pharmaceuticals Ltd. (IDPL) plants at Rishikesh and Hyderabad in the 60's have been milestones in the history o f the pharmaceutical industry in the country. These have been the building blocks on which the structure of the pharmaceutical industry in India has been built. The public sector investment in the pharmaceutical industry has been the engine of growth for the industry as a whole in the last three decades.
5.186 There were about 14,000 units producing drugs and formulations‘at the beginning of the Eighth Plan. This number has increased substantially since then. More than 30 per cent o f production o f bulk drugs comes from the small scale units. The production o f bulk drugs
624

and formulations has increased from Rs 240 crore and Rs 1200 crore respectively in 1980-81 to Rs.2186 crore and Rs 10,494 crore respectively in 1996-97 Exports o f drugs & pharmaceuticals increased from Rs. 161 32 crore in 1983-84 to Rs 2681 crore in 1996-97 Im ports increased from Rs 163 34 crore in 1983-84 to Rs 2096 crore in 1996-97
5.187 The five public sector units namely, Indian Drugs and Pharmaceuticals Ltd (IDPL), H industan Antibiotics Ltd (HAL), Bengal Chemicals and Pharmaceuticals Ltd (BCPL), Smith Stanistreet Pharmaceuticals Ltd (SSPL) and Bengal Immunity Ltd (BIL) have all been in the red due to outm oded technology, excessive workforce, high overheads, weak m arketing set-ups, excessive reliance on institutional sales, etc All these units w ere referred to BIFR and the revival packages approved by the Government for BCPL, BIL and SSPL are under implementation These companies are expected to turn around during the Ninth Plan IDPL could not achieve the target set forth in the revival package and BIFR has declared that the revival package has failed An attem pt is being made to put together a fresh revival package The Industrial Development Bank o f India, the operating agency appointed by B IF R is also in the process o f finalising a revival package for HAL
5 188 A new D rug Policy was announced in 1994 Under this Policy, industrial licensing has been done away with. A new Drug Price Control O rder was announced in 1995 reducing the number o f drugs under price control to 76 from the earlier 142 With these liberalisation measures, the drugs and pharm aceuticals industry has registered a higher grow th and the country has emerged as a net exporter o f drugs during the Eighth Plan period
5 189 Though R & D in the drug industry recorded a significant progress during the Eighth Plan period, the investment on drugs R & D in India is only 1 to 1.5 per cent o f its sales turnover, com pared to 12-15 per cent in the developed countries So far, the main thrust has been on process im.provements and not enough efforts have been made to discover new drug molecules from the basic stage.
5.190 The National Institute o f Pharmaceutical Education and Research (NIPER) is being set up at Mohali near Chandigarh. This institute has been declared as a centre o f excellence and is expected to fill up a major gap in the area o f pharmaceutical educafion, research and training
5 .191 A new program m e for promoting R&D in drugs and pharmaceuticals sector was initiated for which an outlay o f Rs 10 crore was provided in the Eighth Plan. A two-tier structure was set up to manage the program m e viz. an Apex Executive Conm iittee at the Secretaries level, chaired by Secretary, Departm ent o f Science & Technology and an Expert Committee at the operational level
5.192 The National Pharm aceutical Pricing Authority has been set up which has been entrusted with the task o f price fixation/revision and other related m atters Besides, a separate D epartm ent o f Indian System o f M edicines and H om eopathy has been set up and the National D rug Authority is being set up through an Act o f Parliament
5 .193 The domestic drugs and pharmaceutical market is anticipated to grow at an average annual rate o f 15 per cent and imports at 12 per cent during the Ninth Plan period The exports are expected to grow at an average annual rate o f 10 per cent for formulation and at 20 per cent for bulk drugs.
625

5 194 The area o f off-patent dnigs w ould be o f greater importance because ol'the post-GATT scenario during the Ninth Plan period The export growth potential o f drugs and piiannaceutica^ products would be tapped by wide expansion o f export operations to Africa, 1 atin America M iddle East, South East Asian countries, etc
5 195 The thrust o f the drugs R&D in the Ninth Plan will be on developing new drug moiccuics through basic and applied research for which industrv-institutional linkage vvould be strengthened, apart from pursuing the objective o f effective and etTic.ent computer-aided discoveries, setting up o f specialised laboratories and adoption o f good manufacturing and clinical practices. Realising that India has considerable potential for R&D m the area o f tropical diseases, the R& D efforts in this direction would be encouraged
5 .196 An investment o f the order o f Rs 1400 crore is anticipated to be made in the drugs R & D during the Ninth Plan period. This is to be financed mostly by the drugs and pharmaceutical industry units from their internal resources and partly by the Central and State Governments and contribution from the financial institutions
5 197 A number o f R & D programmes have been identified for being taken up in a coordinated m anner in the national laboratories, public sector undertakings and private sector units D evelopm ent o f sophisticated form ulations such as slow release forms, advanced drug delivery systems, etc., will receive due attention. Research and developm ent in the area o f Biotechnology by an understanding o f ON A replication mechanism related to the country's needs will also receive due emphasis
5.198 Pollution control measures, industrial safety and energy conservation will be considered as integral parts o f production activities o f pharm aceutical industry.
Chemicals and Pesticides Industry
5.199 The chemical industry plays a very vital role in the Indian econom y providing basic inputs to pharm aceuticals, petrochem icals, fertilisers and a large number o f othei allied chemical and consum er industries.
5.200 The chemical industry has been one o f "the fastest grow ing sectors in the Indian economy. India w as not in a position to export chemicals till the end o f the Seventh Plan in large quantities because o f high cost o f production o f chemicals as com pared to international prices During the Eighth Plan period, due to upgradation and m odernisation o f plants and the support provided by the G overnm ent for exports, the Indian chemical industry has shown an impressive perform ance in the field o f exports
5 .201 Dyes and dyestufis sector is one o f the im portant segm ents o f the chemical industry providing inputs to many consum ing industries It is capable o f meeting m ost o f the dom estic demands. The industry is practically self-sufficient in term s o f its inputs There are around 50 units in the organised sector having a total annual installed capacity o f 49,000 tonnes. The p ro d u ctio n achieved during 1996-97 was around 30,160 tonnes A large quantity o f dyes and dye-intem iediates is being exported The dyes and dyestuffs industry is also getting gradually integrated with the world economy and is phasing out enviioninentally unfriendly dyes and dyestufTs, including through banning their use In this direction, a decision has been taken for banning the use o f azo dyes in the textile industry
626

5 202 Pesticides including insecticides, fungicides, w eedicides, etc , are the other important segments o f the chemical industry. These are used e^xtensively in agriculture and public health Like the other segments o f the chemical industry', mcluding basic chemicals, the pesticide industry has also grown rapidly during the past fo rty years. Presently, more than 60 technical grade pesticides are being m anufactured in India. M o re than 125 units are engaged in the manufacture o f technical grade pesticides and over 5 0 0 units are making pesticide formulations
203 Production o f technical grade pesticides dunng 1996-97 was around 98,000 tonnes from an annual installed capacity o f 139,300 tonnes. .A.s. a result o f the increased production o f pesticides in India, import o f technical grade pestic;ides has declined considerablv O f late, the country has also entered the competitive field o f export o f pesticides During1996-97, pesticides valued at R s.8 5 1 crore w'ere exported
5 204 Though India has started producing new pesiticides, the manufacturers are continuing to import their intermediates in the absence o f technoltogy for producing them Efforts are being siiade lo acquire technology to m anufacture interme(diates for a number o f low-volume and high-cost new generation pesticides such as Butachlo>r, Endosulphan Synthetic Pyrethroids, etc
5 205 The Eighth Plan saw greater awareness oif environmental pollution and safety aspects and the new pesticides have to satisfy these criteria before being certified for use The use of DD r and BHC, which are high volume pesticiides, has been banned in agriculture
5 206 The alcohol and molasses industry forms an o th e r important segment o f the chemical industry and has made quite an impressive progress diuring the past forty years The M olasses Control Order, 196! and Ethyl Alcohol (Price Control) Order, 1971 - under which the prices and distribution o f molasses and alcohol were regulatecd - were rescinded in 1993 with a view to ensurtng free availability o f these products on competittive pnces to the down- stream industries Some States are, however, continuing with controls o n molasses and alcohol The matter needs to be reviewed in the larger interest o f the chemical inidustry
5.207 Several pesticides, which have been banned in the developed countries, are still being used in India These need to be reviewed Viable and effective alternatives to toxic pesticides, integrated pest management emphasising on the use of'environm ent- friendly pesticides and use o f control agents such as parasites and predators o f c;rop pests would be the policy direction in the Ninth Plan
5 208 There are a number o f international treat;ies in the chemical sector which are becoming increasingly im portant and would have large-scale implications for the Indian chemical industry Some o f the international treaties in this regard are the Chemical W eapons Convention, Basel Convention, M ontreal Protocol, London Guidelines, etc The domestic chemical industry is not fully aware o f these treaties aind their implications It should be made aware o f these by arranging visits o f delegations to various countries, seminars, symposia and technology collaborations during the Ninth Plan
5 209 India has ratified the Chemical W eapons C onvention which has come into force on 29th April, 1997 As far as India is concerned, the iniain obligations o f the Convention would relate mainly to the Indian chemical industry’ and. therefore, the Ciovernment will plav a crucial role in the implementation o f the Convention t o ensure that the growth o f the industrv
627
is not adversely aflfected while fulfilling the obligations under the Convention The Convention requires extensive declarations from the chemical industry which would also be subjected to routine on-site inspections o f declared plant sites and short-notice challenge inspections. For sensitisation o f the industry to meet various obligations under the Convention, there will be constant interaction with the industry by way o f meetings, seminars, workshops, discussions, trial inspections, etc Analytical back- up support will be developed in the Ninth Plan for this purpose.
Cement
5.210 The cement industry was under price and distribution controls for about four decades B oth price and distribution controls on cement were lifted in 1989 It was delicensed in 1991
5 .211 The cement industry has recorded a significant growth in the past one and a half decade The installed cement capacity exceeded the Eighth Plan target o f 97 million tonnes in1995-96 itself and touched a figure o f 105 million tonnes during 1996-97 The total capacity addition during the Eighth Plan period was about 30-35 million tonnes, representing a growth
rate o f around 8 .5 per cent per annum
5.212 Though there was shortfall in cement production during the first tw o years o f the Eighth Plan primarily due to infrastructure problems and depressed market conditions, the target o f 76 million tonnes set for the terminal year o f the Eighth Plan (1996-97) has been achieved. The Eighth Plan average annual grow th rate o f 7 2 per cent has also been achieved
5.213 The private sector is having a significant presence in the cement industry with over 85 per cent o f the production capacity. The public sector accounts for only around 15 per cent o f the production capacity. The Central public sector undertaking, the Cement Corporation o f India (CCI), is contributing to less than 5 per cent o f the country's cement production
5.214 The major areas o f concern for the grow th o f the cement industry continue to be .shortage o f pow er and good quality coal and limitations in railway capacity The cementindustry is setting up captive pow er plants to overcom e pow er problems
5 .215 The majority o f cement units based on uneconomic wet process have been converted into m odern dry process. Large-scale m odernisation and autom ation have led to lower energy consumption and improvement in quality A large number o f plants o f one million tonnes and above capacity have been set up with state-of- the-art dry process pre-calcinator technology, as a result o f which the quality o f cement produced in the country is comparable to the best in the world.
5.216 W ith the increase in the volume o f production, bulk handling and distribution o f cement have gained im portance. Looking at the country's ever increasing demand for infrastructure facilities as well as for large-scale export requirements, the Government o f India is setting up a pilot plant project for creating bulk cement movement facilities at Kalamobli, N ew Bombay
5.217 On the export front, the cement industry has made spectacular progress Indian cement m anufacturers have becom e internationally competitive and export cement to the neighbouring countries like Bangladesh, Sri Lanka, Nepal, Maldives. Middle East, etc
628

How ever, the export target o f 5 million tonnes set for the terminal year o f the Eighth Plan (1996-97) was not achieved due to transport bottlenecks, particularly inadequate port facilities, high sea freight, duties and levies and due to growing domestic demand Since the situation is not likely to improve in the near future, a conservative export target o f 8.0 million tonnes has been fixed for the terminal year o f the Ninth Plan, 2001-2002
5 218 The performance o f CCI has been unsatisfactory during the entire period o f the Eighth Plan. Production suffered badly due to pow er shortage, w orking capital shortage, etc For the Eighth Plan o f CCI an outlay o f Rs. 300 crore was approved This was to be funded entirely from internal and extra budgetary resources However, due to continuing losses, the company could neither generate internal resources nor mobilise extra-budgetapy resources for financing its Eighth Plan schemes In order to maximise benefits from its existing capacity, budgetary support o fR s.25 crore in 1994-95 and Rs. 13.65 crore in 1996-97 was provided by the Government. The company has becom e sick and has been referred to BIFR The turn-around strategy being considered involves privatisation o f some o f its units, financial restructuring, etc.
5.219 The demand for cement is anticipated to reach 109 million tonnes during the terminal year o f the Ninth Plan (2001-2002) based on 8 5 per cent annual average grow th rate The capacity and production targets for the year 2001-2002 are placed at 135 million tonnes and 113 million tonnes respectively
Sugar
5 .220 India has been the largest producer o f sugar for quite some time A fluctuating trend o f sugar production was witnessed in the first three years o f the Eighth Plan with an all-time high o f 16.4 million tonnes during 1995-96 and a very low o f 9.8 million tonnes in 1993-94 The Eighth Plan target was 15.5 million tonnes. As against this, production in 1996-97 is expected to be around 12.8-13.0 million tonnes. The decline in production was due to decrease in the area under cane cultivation and lower yield in the first tw o years o f the Plan. About tw o million tonnes o f sugar w ere im ported in 1993-94.
5 .221 The sugar industry until recently continued to fianction under a regulatory system where licence had to be obtained for establishing new capacity or expanding the existing installed capacity. The industry has been delicensed in September 1998. The dual price control system is, however, still in operation, under which 40 per cent o f the output is pre-em pted for distribution through Public Distribution System (PDS) at an ex-factory price which is fixed for each o f the 20 zones o f the country. The factories are free to sell the balance 60 per cent at m arket price.
5 .222 The Statutory Minimum Price (SM P) for sugarcane is fixed by the Government o f India on a basic recovery o f 8.5 per cent sucrose content and is used as the basis for determinig the levy price o f sugar. However, the price to be paid for sugarcane by the industry is the State Advised Price (SAP) fixed by the State Governments which is much higher than the SMP. This is clearly anomalous and needs to be rectified at the earliest.
5 223 For increasing the productivity o f sugar industry. Government o f India launched a Technology M ission Program m e in 1994 Under this program me, encouragem ent is being given to m odernisation/expansion o f sugar mills, improvement in cane recovery, etc , to
629

boost production. Financial assistance for this is being made available from the Sugai Developmenr Fund
5.224 ’] he Governm ent o f India allowed export o f sugar during the years 1995-96 and1996-97 to bring down the surplus stock o f sugar. Sugar mills are now perm itted to pack sugar in 50 kg. packs foi export purpose.', and also in small consumer packs for local sale.
5 225 Incentives are being provided for setting up sugar units o f minimum economic size As a pait o f restructuring o f sugar industry, the pnce and distribution controls o f molasses were abolished with effect from 19^/J In order to bring about greater efficiency in this sector, the Governm ent o f India has allowed sugar mills to set up downstream facilities
5 226 The demand for sugar during the terminal year o f the Ninth Plan (2001-2002) is anticipated to be around 19 5 million tonnes W ith the decontrol o f sugar industry, it is expected that the dom estic sugar industry v.'ill not only m eet this demand but will also produce surplus for exports
5 227 The activities o f Sugar Technology Mission (STM ) for technological innovations would need to be continued For effective human resource development. National Sugar Institute needs to be converted into an autonom ous body
Leather & Leather Goods
5 228 The leather industry has been identified as one o f the thrust areas o f exports Footwear sector has been identified as an area o f extrem e focus The export performance o f the leather sector has improved considerably during the Eighth Plan period. The value o f exports w ent up from Rs 3,076 crore during 1991-92 to Rs,5,861 crore during 1995-96 exceeding the Eighth Plan target o f Rs 5,463 crore However, during 1996-97, the exports were marginally down to Rs 5,798 crore. During the Eighth Plan period, the leather industry registered an annual growth late ranging between 20-25 per cent
5 229 A number o f policy initiatives w ere taken by the Government during the Eighth Plan period, interalia, facilitating import o f raw materials, consumables, com ponents and machinery for increasing production o f the leather and leather goods sector These included rationalisation o f import tarilTs, delicensing, allowing joint ventures, free imports at concessional duty, etc M anufacture o f finished leather fi-om semi-finished leather was delicensed in April 1993 Tanned or dressed fur skins and chamois leather have also been removed from the list of items requiring compulsory licensing with effect from July, 1997 Domestic manufacture o f com ponents for the shoe industry was encouraged by prom oting joint ventures and duty lalionalisatton on inputs required for m anufacture o f such com ponents Almost all the machinery items required for leather industry have been put under OGL and allowed to be imported at concessional rate o f duty Units in the Export Processing Zones have been allowed duty free import o f inputs
S 23fi The Government o f India also initiated two im ponant programmes in the Eighth Plan for achieving a lapid grow th of the leather industry These are UNDP assisted National l.eather Development Program m e (NTD P) and National Leather Technology Mission
630
;N LTM ) for sustainable development o f the leather industry. Both these program m es aie aimed at ensuring an integrated and balanced development and m odeniisation o f the leather indiistiy
"'.231 The leather industry is reserved for the small scale sector, whii.-h alonu the cottage sector accounts for over 75 per cent o f the total leather goods producuoi) tathe organised sector can enter this area only with a minimum expon obiigaiiuri oi 75 per cenl o f their production Units in the small scale and unregistered cottage sectoi s are encou!d,L>ed to export leather footw ear and leather products This policy is designed to meet I'le tv.ui objectives o f safeguarding the interests o f the small scale and cottage sectors and o f increased exports
5 232 One o f the problems in the leather sector has been inadequate supply o f raw inaterialsI.e. raw iiides and skins. The availability o f raw hides and skins is influenced bv the population o f animals, grow th rate o f different animal types, recovery o f carcasses, the production and marketing chains for raw hides and skins and management practices used in the■country
.■̂ 233 According to a survey by the Central Leather Research Institute (C'LRl j considerable fallen carcasses are not recovered and this contributes io a significant i(\ss o f raw hides and skins M odel centres have now been established for recoveiy o f fallen carcasses in \arious paris o f the country'. The NLTM has launched an iniliafiveto commission 25 demonstraiion centi es for recovery and for training the flayers and primary producers o f raw hides and skins, leading to quality improvement. Several steps are being taken to augment the potential oi raw hides and skins These include (a) tapping the full available potential, (b) exploring new potential li oiii the existing sources o f animals, (c) generating new indigenous resources with techno-economic benefits and (d) supplementing resource needs through imports
5 234 A major objective o f the Ninth Plan would be m odernisation o f leather processing industry as well as artisan sector in footw ear and leather goods segments This would include (a) cost- reduction through higher productivity, (b) putting in place cleaner production systems, and (c) focussing on global m arket leadership in selected vital sectors through im provem ent o f quality and consistency o f products
5 235 Tanning mdu.stiy in India is facing a major crisis due to non-compliance with the national pollution control standards A comprehensive technological package with both process changes and com m on effluent treatm ent needs to be developed with assistance from National Laboratories and other Governm ent agencies
5 236 The export target for the leather and leather products sector has been placed at US $ 3,218 miilHon and US $ 4,515 million respectively by the end o f the Ninth Plan
Textile Sector
5 237 Textile industry is one o f the largest and the most im ponant se c to rs ht the economv in term s o f output, employment generation and foreign exchange earnings It is presently contributing 20 per cent to the national industrial prodiictiou at.d 35 per cent i> • the toi.ai national export earnings. It has also m ade a significant contribution lo eruploymvn-. r.ciaii.'.■] by providing over 25 million jobs The production o f spun yam has grown a! ti.n a . ‘ ..sja
63 !

grow th rate o f a little over 5 .06 per cent over 17 years since 1980-81, The dominant share in spun yam is that o f cotton yam constituting about 81 per cent o f the total spun yam production The production o f co tton and non-cotton yarn has grown at the rate o f 4.48 per cent and o f blended yam at 8.47 per cent compound annually during the last 15 years Although the output o f blended yam and 100 per cent non-cotton yam has been growing, their shares have remained more or less the same, because over 70 per cent o f the spindles are suitable for production o f 100 per cent cotton and viscose yarn and the balance can use man-made fibres
5 .238 The dom estic production o f man m ade fibres and filament yarn has nearly tripled since 1985. This was primarily due to cuts in fiscal levies and tariff on man-made fibre intermediaries as per 1985 Textile Policy. This led to a spurt in the dom estic demand for these fibres The m ost notable grow th was that o f Polyester Filament Yarn (PFY), the production o f which rose very sharply as compared to viscose and nylon filament yam at 27.06 per cent during 1981-97 This has led to the expansion o f pow erloom sector - as PFY is largely used in this sector As against this, the production o f viscose filament yarn grew at an average annual compound grow th rate o f 2.06 per cent and nylon filament yam at 3.85 per cent during the same period. The spindlage capacity has been increased fi-om 28.09 million in 1992-93 to 33 53 million by the end o f M arch 1998. The per capita domestic availability o f cloth in the country has risen to about 30.78 sq. mtrs. in 1997-98 fi-om a little over 24.50 sq mtrs, in 1992-93
5.239 The production o f cloth grew at 6.54 per cent during the period from 1980-81 to1996-97. This w as accom panied by a distinct shift; in m arket share from the large-scale organised mill sector to the small-scale unorganised powerloom sector. The share o f mill output declined to 5.71 per cent and that o f powerloom rose fi'om 38.5 per cent to 72 5 per cent. This is also reflected in the average annual com pound grow th rate in production recorded during the period 1980-81 to 1996-97 among the major sub-sectors o f the textile industry. W hile the production o f mill sector recorded a negative grow th rate o f 5.11 per cent, production o f handlooom sector grew at an average com pound grow th rate o f 5.62 per cent and o f pow erloom sector at 10.83 per cent during the period 1980-97. Some o f the factors which led to negative performance o f the mill sector were stmctural transition coupled with lower productivity o f labour, obsolescence o f technology, increase in cost o f inputs and working capital shortage besides com petition fi-om the pow erloom sector because o f its greater cost advantage.
5.240 The grow th o f textile exports fi'om a modest figure o f Rs. 1336 crore at the beginning o f 1981 to R s.35,478 crore during 1996-97 (all textiles including readymade garments) was impressive. The share o f man-made fibre textiles, which was almost negligible during 1981 -82, now accounts for about 9 .07 per cent in the total textile exports, it recorded an annual compound grow th rate o f 34.57 per cent during the period fi-om 1981-82 to 1996-97 followed by 28.24 per cent for cotton textile fabrics, made-ups including yam and sewing thread and 13 68 for woollen textiles.
5 .241 The thrust areas for the textile sector during the Eighth Plan included greater emphasis on production o f value-added, diversified and quality goods for exports and increased capacity utilisation with sophisticated designs, product mix with the use o f latest technologies
632

5.242 During the Eighth Plan period, the organised mill sector concentrated increasingly on exports with the bulk o f the indigenous demand being met by the pow erloom sector The handloom esector produced high-value products for dom estic as well as export m arkets
5 .243 The physical targets o f yam and cloth production set for the terminal year o f the Eighth Plan (1996-97) were achieved and even surpassed in some cases. How ever, the export perform ance has been far short o f the targets.
5.244 As a part o f the world trade reforms, the Multi Fibre Arrangement (MF A) would cease to be in force after 2005. The Indian textile industry would get unrestricted access to the world m arket but would also face com petition in the international m arket as well as in the domestic m arket from foreign exporters. It is, therefore, imperative to take urgent steps to bridge the technological gap.
5.245 While the spinning sector has perform ed well, the weaving and processing sectors have not, because o f lack o f m odernisation. D ue to this, the exporters have been generally exporting only grey fabrics There is a considerable scope for increased processing resulting in higher value addition and better export earnings
5 .246 Upgradation o f these sectors needs special attention and large doses o f investment The modernisation o f textile sector would be a major thrust area in the Ninth Plan For this purpose, it is proposed to create a Textile M odernisation Fund
5.247 The ginning and processing units in the small-scale sector also suffer from obsolete technology, resulting in poor quality and wastage. It is imperative to provide adequate credit for m odernisation o f these units.
5 .248 The targets for spun and filament yam and cloth production for the terminal year o f the Ninth Plan (2001-2002) are placed at 3755 milhon kgs, 997 million kgs and 44000 sq . mts. respectively.
5 .249 The ju te sector would continue to play an important role during the Ninth Plan period A new organisation - National Centre for Jute Diversifiction - has em erged to provide forw ard and backward linkages between the existing and emerging entrepreneurs A number o f mills have R& D Centres and are diversifying their products. Exports are showing a steady upward trend.
5 .250 A major area o f thrust during the Ninth Plan would be to consolidate the achievements o f the UN D P-assisted National Jute Developm ent Program m e and to carry on the follow-up activities. The Plan will have the tw in objectives o f consolidation o f what has been achieved so far and moving into newer pastures. The thrust in the traditional sector would be on producing lighter material, m odernisation o f machines and processes, cost reduction and increased diversification and exports. N ew er pastures are enthusing new entrepreneurs, NGOs, W omen's G roups etc. in taking up ju te related activities leading to increased and diversified production, sustainable human resource development, etc
633

5 251 There are more than 380 paper mills in the country with installed capacity o f 4 ? 5 lakh tonnes. The induslr^/ is providing dircct em.ployment to about 2 lakh people and indireci employment to 10 lakh persons The Eighth Plan had projected the installed capacity o f paper and paper board at 35 iakh tonnes and production at 29 lakh tonnes While the installed capacity has exceeded the target, the production at 28 lakh tonnes was marginally lower than the target
5 252 As a part o f the liberalisation process, the paper industry has been delicensed subject to locational conditions In order to help the industry improve its production and financial viability, policy measures such as ft'ee import o f raw materials, broad banding o f different varieties o f paper and papei board, excise concessions for use o f non-conventional raw materials, etc , wei e taken up during the Eighth Plan period,
5 253 The paper industry is one o f the few sectors where the outcom e o f the global linkages has surfaced in the post-liberalisation era W ith the scaling down o f import duties to 20 per cent and the volatile international prices, the paper industry has been exposed to severe competition. The issues o f scale o f operations, cost competitiveness, quality upgradation have, therefore, assumed greater significance for the future o f the paper industry
5 254 The paper industry is dependent upon raw materials from forest sources W ood is the main raw material used by the industry' Paper and pulp industry world-over has recognised strategic importance o f w ood as a fibrous raw material and countries with captive plantations o f fast growing species would have a competitive edge over others because o f cost-effective and high quality raw materials secured through these plantations Assured raw materials facility and standardisation o f manufacturing process would result in higher recoveries and better quality product
5 255 One o f the serious constraints which have been faced in augmenting the supply o f forest-based raw m aterials is the restrictions imposed on captive industrial plantations under the national forest policy which rules out the provision o f even degraded forest lands to the paper industry for industrial plantations. An appropriate policy on industrial plantations needs to be v^'orked out to enable the industry not only to meet its raw matenal requirements but also help in increasing the green cover o f the country through captive plantations on degraded and waste lands
5 256 The problems facing the large paper mills are technological obsolescence and outdated processes and machinery The small paper mills are beset with problems o f obsolete equipment and inefficient chemical recovery systems which lead to high cost o f production and pollution problem s M ore than 70-80 per cent o f the paper used in India is o f low quality unlike international m arkets w here paper quality is much superior
5 257 Presently, major imports o f paper products include ivor>' card, art board, single coated paper, etc The competitiveness o f the paper industry in terms o f cost and quality would depend upon m odernisation, technological upgradation and economies o f scale in production Th^ production o f value-added products will also improve the viability o f paper mills
Paper Industry'
634

5 258 The paper industry is classified on the basis o f installed capacity, raw matenals consumed and the products m anufactured The proportion o f non-w ood raw materia! based paper has increased over the years At present, about 61 p e rc e n t o f the total produclion ot papei is based on non-w'ood raw materials and the balance 39 per cent is based on w ood M ost o f the small and medium sized paper mills are based on non-conventional materials, namely, w aste paper and agro residues Bagasse, a byproduct o f sugar industry, has found successfiji application in the m anufacture o f paper The G overnm ent is offering incentives to the units using such non-conventionai materials. In view' o f the constraints in the availability o f forest-based raw' materials the future capacities would have to be based on alternate sources.! elated fo recycleable, renewable and non-conventional raw materials
5 2 SO The mechanism o f waste paper collection from indigenous sources needs improvement ill lespect o f grading/sorting A stress on im proving R&D efforts would be required to improve input/output norms, improve quality and reduce energy costs, Timelv support is also needed by the paper industry by way o f rationalisation o f duty structure for imported paper vis-a-vis indigenous cost o f production on account o f volatile international prices and dumping
̂ 260 The Hindustan Paper Corporation Ltd (HPC) has five units, namely, Nagaoi> & Cachar Pape? Mills in Assam and three subsidiaries, namely, Hindustan Newsprint Lid (HNL), in Kerala M andya National Paper Mills Ltd (M N PM ) in Karnataka and Nagaland Paper & Pulp Co (N PPC)
5 26! F'xcept HNL, the performance o f other units has been below expectations In the case o f NPPC, the production has been suspended fi'om O ctober 1992 due to erratic pow er supply from the grid coupled with disturbed working conditions The revival o f NPPC is under consideration. At M NPM , the production has been suspended since April, 1993, due to shortage o f w orking capital and uneconoinical operations For M NPM , the only alternative appears to be privatisation
5.262 The Eighth Plan provision for HPC was Rs.360 crore, including budgetary' support o fR s.9 .0 crore The capacity utilisation was low' and the company suffered cash losses on account o f its sick units, namely, M N PM and NPPC. However, the capacity utilisation improved in the later part o f the Eighth Plan period The operating profits o f the company also improved The company has drawn up a plan for installation o f certain balancing equipment
to maximise capacity' utilisation.
5 263 Paper is an essential consum er item and is o f vital im portance for educational, scientific, industrial and commercial sectors o f the economy. W ith greater emphasis on increasing literacy level, the demand for paper would continue to grow With the grow th-oriented economy, the overall demand for paper and paper board is expected to be around 42 lakh tonnes by the end o f the Ninth Plan.
Newsprint
5 264 There are at present 35 mills with an annual installed capacity o f 7 63 lakh tonnes o f newsprint The production o f newsprint in 1996-97 was 3 00 lakh tonnes The capacity utilisation has been low, primarily because o f com petition from cheap imports The timely rationalisation o f duty structure is im portant to this sector as in the case o f paper and paper
63 5

board to maintain cost com petitiveness and to avoid any dumping
5 265 Besides the obsolete plant and machinery, the main problem being faced by the industry is inadequate availability and high prices o f raw m aterials The industry needs to be allowed captive plantations, at least on degraded forest and waste lands, to have an assured source o f raw materials U sage o f ahernative sources o f raw materials also needs to be encouraged to improve the level o f production. Am ong the alternative sources o f raw material, bagasse has been found to be a promising alternative. A leading Indian paper unit M /s Tamil Nadu Newsprint Ltd has successfully employed bagasse-based technology for m anufacture o f newsprint A nother alternative source is w aste paper, know n as recycled fibre. Deinking technology has also a crucial role to play in future newsprint production There exists a good scope for setting up newsprint capacity based on this technology The demand for newsprint by the end o f the N inth Plan is estim ated to be around 7.5 lakh tonnes
5.266 The perform ance o f N E PA was adversely affected on profitability and production fronts due to pow er shortages, accumulation o f stocks, inadequate availability o f inputs due to financial constraints, depressed m arket scenario, etc N EPA was referred to Disinvestment Com m ission which has recom m ended the company for strategic sale
5.267 H industan N ew sprint L td (HNL) in Kerala is a subsidiary o f Hindustan Paper C orporation (HPC) with a capacity o f 1 lakh tonne per annum The performance o f HNL has been quite satisfactory. The company has been consistently earning cash/operting profit during the Eighth Plan period.
Atomic Energy
5 .268 The activities o f the D epartm ent o f A tom ic Energy under Industry & M inerals sector pertain to the requirement o f heavy water, nuclear fuel, instruments and controls, spent fuel recovery and w aste disposal for nuclear pow er reactors
5 .269 The Uranium C orporation o f India Ltd. (U CIL) completed its project o f uranium M ining and Mill at N arw apahar, Bihar. The N uclear Fuel Complex (NFC) took up five new projects for im plem entation in the Eighth Plan for meeting fuel requirement o f the new nuclear pow er reactors.
5 270 Three o f the NFC's projects namely, New Zircaloy Fabrication Plant, New Uranium Oxide Plant and N ew Fuel Assembly Plant are at advanced stages o f completion. The tw o remaining projects namely Zirconium Sponge Plant and Titanium Sponge Plant are yet to start H ow ever, due to the scaling dow n o f the nuclear pow er target, the delay has not caused any problem in m eeting the fuel dem and o f the existing reactors
5.271 The D epartm ent o f Atom ic Energy has taken up the development o f fast breeder reactors which enable utilising Thorium as fuel for pow er reactors Simultaneously, it is p roposed to set up high flux research reactors to develop new fliel designs in order to econom ise on the use o f nuclear fuels. For augm enting uranium capacity, UCIL will develop a new uranium mine at Dom iasat in M eghalaya in the N inth Plan
5 .272 N o new heavy w ater plant will be set up in the Ninth Plan. A new spent ftiel re-processing plant, in addition to revam ping o f the old plant at Trombay, will be taken up in the Ninth Plan
636

5 273 The Indian Rare Earths (IRE) will take up joint ventures for beach sand processing in Andhra Pradesh and Tamil N adu in the Ninth Plan.
VILLAGE & SMALL INDUSTRIES
5 274 The Village and Small Industries (V SI) sector comprises m odern and traditional segments o f industr>'. The m odern segment includes small-scale industries (SSI) and powerloom s, which use m odern technology in the manufacturing process. The traditional segment consists o f handlooms, sericulture, khadi & village industries (KVI), coir industries, handicrafts and wool development (unorganised sector) Because o f immense potential o f creating new jobs at low cost, the VSI sector has been accorded high priority
5 275 The physical performance o f the VSI sector - production, employment and exports- is given in Statem ent-5 6
Small-Scale Industries (SSI)
5 276 The major problems faced by the SSI sector are (i) inadequate flow o f credit, (ii) use o f obsolete technology, machinery and equipment, (iii) poor quality standards, and (iv) inadequate infrastructural facilities The Governm ent has taken a number o f steps to mitigate the impact o f these problems For increasmg the flow o f credit, the Government has started setting up specialised branches o f banks exclusively meant for providing credit to SSls, simplification o f procedures, sensitising bank m anagers and reorienting them tow ards the working and the needs o f the SSI sector, conducting sample surveys, etc The SIDBI has already set up a Technology Development and M odernisation Fund with a corpus o f Rs 200 crore The Governm ent has also set up Technology Trust Funds with contributions from State Governm ents and industry associations for transfer and acquisition o f the latest technologies
5.277 U nder the scheme o f Integrated Infrastructure Developm ent Centres (IIDCs), infrastructure facilities are being developed in backward, rural areas. Fifty such IIDCs w ere to be set up during the Eighth Plan period, out o f which 22 have been approved This scheme would be continued during the N inth Plan period with erJianced incentives and financial assistance for hilly areas and N.E. States. Technology upgradation, transfer and acquisition o f appropriate technology would be encouraged through enhanced flow o f credit from financial institutions (FIs) and encouragem ent w ould also be given for adoption o f higher quality param eters and quality consciousness am ongst the SSI units.
5 .278 The sector also has the problem o f non-conform ing to quality standards which are vital for standardisation and continuous order flow for components, sub-assemblies and spares from large and medium sectors. To help the SSI sector, the Government has taken a number o f policy initiatives like allowing 24 per cent equity participation to large and medium-scale units in SSI units, simplification o f registration procedures, simplification o f environmental laws applicable to SSI units, allowing filing o f M em orandum o f Inform ation for all categories o f industries, except 17 categories o f polluting industries, simplification o f labour laws in respect o f small-scale units, etc
637
5.279 Financial assistance upto R s.75,000 per SSI uinit is being provided to acquire ISO 9000 or an equivalent quality certification
5.280 To provide technological support and training to small scale units. Tool Rooms with German, Danish and Italian assistance and experti'se are being set up at Indore, ^AJimedabad, Bhubaneshwar, Jamshedpur and Aurangabad Constiruction w ork for these Tool Room s has been completed M achine tools have been installed at Indore
5 281 A Process-cum -Product Developm ent Centire (PPDC) for essential oils has been set up at Kannauj (U P.), w th UNDP assistance fand contributions from the Central and U P Governments, to provide necessary inputs f o r m odernisation and upgradation o f technology o f essential oils and perfiimery industiry Steps have been initiated to overcome the problems being faced by the small scale units emgaged in exporting leather products by providing critical inputs used in the leather induistry M odernisation o f the existing Central Footw ear Training Centres (CFTCs) at M adras and Agra has been completed The CFTCs at C alcutta and M umbai provide technical m anpow er tco the leather industry-
5 282 The credit provided to the SSI sector by thte financial institutions is considered credit to priority sector' By M arch, 1997, the to tal crediit provided by public sector banks stood at Rs 31,542 crore. The cumulative disbursement by the State Financial C orporations am ounted to Rs 12,704 crore upto M arch, 1996
5 283 The Small Industries Developm ent Bank o f ■ India (SID BI) is providing credit to the small-scale sector directly and through refinance to the nationalised banks and Bill Rediscounting Scheme Under the direct assistancce scheme, SIDBI provides credit for (i) equipm ent purchase, (ii) industrial infrastructiure development, (iii) marketing, (iv) ancillary development, (v) resources support to factO)ring companies, (vi) assistance to leasing companies; (vii) direct project loans and (viii) direct discounting o f bills (equipment and com ponents)
National Small Industries Corporation (NSIC)
5.284 The NSIC was set up in 1955 to assist ssmall-scale entrepreneurs and artisans The C orporation is serving this sector through hire -purchase and leasing o f machinery and equipment, procurem ent and supply o f indigenouss and imported raw materials, technology transfer. Government stores purchase programme. p)rototype development, training, upgradation o f managerial skills, etc It helps SSI units in tecchnology upgradation by setting up common facilities and provides training at Prototype D evelopm ent & Training Centres (PDTCs) and their sub-centres It also provides m arketing assistaince, etc
5.285 The Corporation is periodically publishing a Directory' o f Units enlisted under the program m e U nder the Single W indow Scheme o f NSIC the small-scale units registered with the Corporation are getting advantage o f pr'eferential purchase policy over large and medium units. The N SIC also helps SSI units by discounting o f bills drawn on public sector units Besides, the Corporation provides assistancce to small industries for export o f products
5.286 The NSIC provides technological inputs and training to SSI units through five Prototype Development and Training C entres (;PDTCs) set up at Nev. Delhi, Rajkot, Howrah, Chennai and Hyderabad. These Centres p>rovide common facilities in areas like testing.
638
machining, casting, electroplating, etc. Sulb-centres o f PD TCs have been set up for different trades at Aligarh (U P ), Dindigul (Tamiil Nadu), Khammam (Andhra Pradesh) and Rajpura (Punjab). A Dem onstration- cum- Training Centre at Guwahati is conducting technical training as well as enterprise building program m te for the N orth Eastern States
5 287 The Corporation has developed imiproved tool kits for rural artisans, which are being distributed under the Rural Development Prrogramme. The Corporation offers concessional terms in respect o f earnest money, rate o f interejst and administrative charges for units in backward areas. Units, especially those prom oted by SC/ST entrepreneurs, technocrats, physically handicapped persons, ex-defence personntel and wom en entrepreneurs are also offered these concessions. The N SIC has introduced liberal term s for units taking up m odernisation / expansion, technological upgradation and for tools and dies. The Corporation has taken up equipm ent leasing activity which w ould he;lp the SSI units in modernisation, expansion and diversification. The scheme provides 100 peir cent finance, single window service for indigenous as well as im ported machines and tax rebatte on full year rental
5.288 For the Ninth Plan, the C o rp o ra tio n has envisaged an increase in its turnover from the estim ated Rs.664.03 crore in 1996-97 to Rs. 1,560 crore in the terminal year o f the Ninth Plan It w ould continue all the program m es; and schemes in the Ninth Plan with focus on tiny and rural industries W ith the proposed i increase in the investment ceiling for plant and machinery for SSI units upto Rs 300 lakh, miore units would be falling under the SSI sector The N SIC would have to focus on advanced techmology, higher quality parameters and modernisation o f SSI units
Khadi & Village Industries
5.289 The Khadi & Village Industries (K W I) sector is not only providing employment to people in rural and semi-urban areas at low/ investment per job, but also utilises local skill and resources and provides part-tim e as wfell as fiilltime w ork to rural artisans, wom en and minorities
5 .290 The production o f khadi cloth increassed from 105 million square m etres (m sqm) in1995-96 to 125 m.sqm in 1996-97. The tarrget o f khadi cloth production has been kept at 230 m.sqm in the terminal year o f the N inth Phan.
5.291 The production o f village industrie;s increased from Rs.3,504 crore in 1995-96 to Rs 4,120 crore in 1996-97. The target o f p)roduction for village industries for the terminal year o f the N inth Plan has been kept at Rs. 7,260 crore The employment in KV I sector increased from 57 lakh persons in 1995-96 to 58 lakh persons in 1996-97 During the Ninth Plan, about 23 lakh m ore persons are proposed to be p rov ided employment
5.292 There is a need to bring profit making; culture in the manufacture o f khadi cloth There is also an urgent need for reducing its dejpendence upon rebate and interest subsidy The Khadi and Village Industries Com m ission (IKVIC) and State Khadi and Village Industries B oards (SKVTBs) would have to becom te m ore professional to prom ote large-scale employment in the village industries sub -sex to r During the Ninth Plan, the KVIC has envisaged m ore emphasis being placed on the creation o f additional employment in village industries which has the potential o f geneirating additional employment at low investment, utilisation o f local raw materials and skills amd to fijlfil the demands o f local population The
639
spread o f village industries w ould also ensure incrrease in income levels and quality o f life o f rural w orkers, artisans and craftsmen. Therefore, the thrust area will be prom otion o f village industries under K V IC during the N inth Plain
Coir Industry
5.293 The coir industry is one o f the traditional cottage industries in India and is primarily located in the Southern States, namely, Kerala, T am il Nadu, K arnataka and Andhra Pradesh The coir industry utilises agro w astes o f coconut plantations and is labour-intensive The developm ent o f coir industry has all along been in areas where there is concentration o f coconut cultivation and availability o f coconut hussks
5.294 The coir industry employs m ore than five hakh persons and is manufacturing finished products such as mats, mattings, carpets, rags ettc In 1996-97, production o f coir fibre was2,76,000 tonnes and the export o f coir products is estim ated at R s.212 58 crore In the term inal year o f the N inth Plan the export o f coir products is targetted at Rs 400 crore.
5 295 The Coir B oard w as set up as an autonomcDus statutory body under the provisions o f Coir Industry Act, 1953. The Board is vested witlh the responsibilities o f promoting growth and development o f the coir industry, promotion! o f exports and increasing consumption o f coir and coir products within the country The Coir Board implements a number o f developmental program m es for the coir sector which include sichemes for dom estic m arket development, provision o f assistance for participation in exhibitions abroad, production o f publicity material on coir products, giving coir industry awards, stremgthening o f national level training institutes etc Further, the Board is implementing welfare schemes for the coir workers under the Model Coir Village Program m e. A m ajor scheme w h ich is being implemented in the coir sector is the scheme o f cooperativisation under which mot only financial assistance is given for m odernisation but m argin money is also p rov ided to various cooperatives. The scheme o f cooperativisation is intended to assist the formiation o f viable cooperatives and also to revitalise the potentially viable but dormant socie^ties. The National Coir Training and Design Centre, K alavoor and the Central Institute of" Coir Technology, Bangalore are engaged in scientific research and technology developm ent in white fibre and brow n fibre sectors, respectively. The activities o f the tw o research insstitutions include steps to improve the process o f fibre extraction, developm ent o f spinning rjatts, improvement o f softening/ bleaching/ dyeing/shade m anufacturing, etc
5 .296 The Governm ent has initiated a scheme o f M ahila Coir Yojana under which financial assistance is m ade available to w om en artisans to the extent o f 75 per cent o f the cost o f m otorised ratts subject to a maximum o f Rs. 7,500. The other major program mes are cooperativisation, welfare m easures for coir w o rk e rs and rebate on sale o f coir yarn
5 .297 The main problem s being faced by the coiir industry are low w age earnings due to use o f obsolete machinery and equipment, drudgery , non-availability o f medical, educational and other facilities o f social welfare. The coir industr^y is also facing stiff" competition in the export
m arket from countries like Sri Lanka and th e re is an urgent need to modernise the industry Schem es/program m es for m odernisation, diverrsification, developm ent o f new products with rubber/ plastic base, alternative uses o f coir pitih such as for fertilizer and increasing value addition by using new dyes and colour combinaitions, m odernisation o f looms, etc, would be implemented by the Coir B oard during the M inth Plan period New employment-oriented
64(0

implemented by the Coir Board during ithe Ninth Plan period. N ew em ploym ent-oriented schemiss like Mahila Coir Yojana would Ibe implemented with additional impetus Emphasis w ould be laid upon conversion o f part-tiim e jobs to full- tim e jobs and improving the wage earnings o f artisans and quality o f their life W elfare schemes would be implemented to help the artisans in areas like health care, thrift hoans, group insurance, etc Financial/fiscal incentives will be provided to exporters/m anufacturers/artisans to increase exports Emphasis would be laid upon new designs, intensive publicity in export m arkets, m arket feedback, etc
Handlooms
5 298 The handloom sector is providing ermployment to about 124 lakh persons which is next to agriculture in term o f employment intensiity This sector is facing problems like (i) obsolete technology and traditional production techiniques, (ii) dependence on rebate, (iii) high price o f hank yam, (iv) inadequate availability o f inputs like standard dyes and chemicals in small packs, new designs, training for upgradattion o f skills, etc, and (v) inadequate m arket intelligence and feedback The handloom ssector has inherent disadvantages like (i) unorganised stnicture and its dispersal throughout the c o u n try , (ii) weak financial base o f the weavers, (iii) bureaucratisation/ politicisation o f cooperatives, etc Inspite o f these handicaps, it has the potential to be transform ed into a self-reliiant and export- oriented sector
5.299 The production o f handloom clotth in 1996-97 was 7,235 miUion square m etres (msqm) For the terminal year o f the Ninth IPlan, production o f 8,800 m sqn\ has been erwisaged.
5 300 The handloom sector provided empkoyment to 124 lakh persons during 1996-97 By the end o f the Ninth Plan, the employment ini handloom s is expected to reach about 173 lakh persons
5 301 The exports o f cotton handloom tex tiles amounted to Rs 1,^21 81 crore in 1996-97 For the term inal year o f the Ninth Plan a ta rg e t o f R s .3 ,170 crore has been kept
5 302 The developmental schemes/programimes are focussing mostly upon w eavers under the cooperative fold. To increase the numbeir o f w eavers under the cooperative fold and to encourage production o f m arket-oriented I items, a schem e o f setting up 3,000 Handloom D evelopm ent Centres (H D C s) and 500 Quaility D yeing Units (Q D U s) with an investment o f Rs.831 crore w as taken up in 1993-94. Thie G overnm ent had approved setting up o f 1,588 H D Cs and 313 Q D U sup to 31 3 1997 and released a sum o f Rs. 80.91 crore to various State G overnm ents and U T Adm inistrations underr this scheme Based upon the feedback about the problem s faced in its im plem entation and ssuggestions from the State Governments, suitable corrective m easures have been incorporate(d in the scheme. Setting up o f remaining H D Cs/ Q D U s is proposed to be com pleted during tlhe N inth Plan
5 303 A High Pow er Com m ittee (HPC) wais set up to look into the problems and to suggest m easures for the grow th o f handloom s duiring the N inth Plan period. The HPC submitted its report in Decem ber, 1996. M ost o f the irecom m endations o f this com m ittee have been accepted by the G overnm ent and the schem es/program m es in the Ninth Plan are being form ulated on the basis o f these recom m enidations
641

5.304 The handloom sector uses bulk o f its yam requirements in the form o f hanks along with some quantity o f reeled yam. To ensure a regulai' supply o f hank yam to handloom weavers at reasonable prices a scheme for supplying hank yarn at mill gate prices through National H andloom Developm ent C orporation (N H D C) is being implemented Under the hank yarn obligation scheme it is m andatory for yam producers to supply upto 50 per cent o f their yarn production upto 40 counts in the form o f hank yam. This ensures hank yarn supply to the handloom weavers. The National Cooperative Development Corporation (NCDC) is providing financial/loan assistance for setting up new/expansion/ modernisation o f v/eavers' cooperative spinning mills.
5 .305 The scheme for supply o f hank yarn at mill gate prices through National Handloom Development Corporation (NHD(!^) was under implementation during 1996-97, and the NHDC utilised a subsidy o f Rs. 1.17 crore in 1996-97 for supply o f 46 91 lakh kgs yarn
5.306 The Janata Cloth Scheme was introduced in 1976 to provide sustained minimum wages to handloom weavers and also to provide cheap cloth lo the weaker sections o f the society The schem e is being gradually phased out and the weavers engaged in the m anufacture o f Janata Cloth are provided training and encouraged to manufacture high-value-added items to provide them gainful employment
5.307 The Association o f C orporations and Apex Societies o f Handloom (ACA SH ) was registered in 1984 under the Societies Registration Act The ACASH is coordinating and prom oting m arketing in the handloom sector. It is the nodal agency for supply o f handloom goods to the Central G ovenm ient D epartm ents / Agencies. During 1996-97, orders w orth Rs. 19.84 crore w ere executed by ACASH
5.308 In order to provide welfare m easures and better w orking conditions to handloom weavers, a package o f group insurance scheme, health scheme, thrift fund scheme and w orkshed-cum - housing scheme is being implem ented in the handloom sector These schemes w ould be continued during the N inth Plan and suitably modified keeping in view the recommendations o f the HPC. The guidelines o f workshed-cum-housing scheme and insurance scheme for weavers have been modified and the rates o f Central assistance have been stepped up.
5.309 The Handlooms (Reservation o f Articles for Production) Act 1985. stipulates the articles reserved for production in the handloom sector, which helps the handloom w eavers face the stiff com petition from the pow erloom sector. This scheme is also proposed to be continued in the N inth Plan.
5.310 A census o f handlooms was carried out in 1988. Many changes have taken place since then and keeping these in view a nationwide census o f handlooms has been carried out in 1996 The data collected are being scm tinised by the National Council o f Applied Econom ic Research (N CA ER) and the M inistry o f Textiles. The final figures o f the census are expected to be released shortly
5 .311 During the Ninth Plan period a greater stress would be laid on production o f marketable items, reduction in dependence upon rebate, enhanced inputs like dyes and chemicals in small packages, skill upgradation, designs and product, e t c , and welfare package to improve the quality o f life, and developm ent o f the w eavers The W orkshed-cum -H ousing scheme, with
642

higher targets, would be implemented duiring the Ninth Plan to provide better w ork places and safe environment, resulting in increasing productivity and earnings o f weavers
5.312 The Project Package Scheme, beiing implemented since 1992- 93, is one o f the major schemes to provide the requisite support ito w eavers in an integrated and coordinated manner. Altogether, 717 projects were sanctioned and Central grant to the tune o f Rs 60 60 crore was released to assist 1 67 lakh weavers during the Eighth Plan Similarly, as against a target o f 120 villages, 101 villages were covered umder the Integrated Handloom Development Scheme (IH VD ) to benefit 20,534 households duriing the Eighth Plan For this, a sum o f Rs 2 40 crore was released as Central grant Under the scheme o f M argin M oney for Destitute weavers, 1.14 lakh destitute weavers were covered duriing the Eighth Plan All the three Schemes, namely, the Project Package Scheme, IHVD and Margin M oney for Destitute Weavers Scheme have been m arged into M odified Project Packaige Scheme and has come into force w e f April, 1997
Powerlooms
5.313 The powerloom sector has emerg ed as the largest cloth manufacturing sector in the textile industry. Pow erloom s have not omly succeeded in providing employment to a large number o f people/weavers but also achieved higher exports o f readymade garm ents With the coming into effect o f the W orld T rade Organisation (W TO) regime and gradual phasing out o f Multi Fibre Arrangement (M FA), it has become imperative to develop new designs, to adopt more efficient and m odern p roduction techniques and machinery for weaving and processing to increase value addition an(d cater to the needs o f the upper segment o f export m arket
5 314 The setting up o f the Pow erloom Development Institute, CAD/CAM facilities, more number o f Powerloom W eavers' Service (Centres (PW SCs) and M odernisation and Technology Developm ent Fund are some o f the m easures which would be implemented in the Ninth Plan. Adequate credit flow from financial instituti(ons would have to be ensured for the modernisation o f the powerloom sector. Stricter implemientation o f labour laws and other statutory provisions is also being emphasised upon with the State Governments.
5.315 The Governm ent o f India appo in ted National Council o f Applied Econom ic Research (NCA ER) to conduct a joint census o f handloom s and pow erloom s at the national level and the results o f this census are expe;cted to be published shortly. There are 13 Powerloom Service C entres (PSCs) fianctioning under the Office o f the Textile Commissioner and 29 Pow erloom Service Centres under the Te^xtile Research Associations During the Eighth Plan period, 20 new PSC s w ere to be set up, o u t o f which 10 w ere sanctioned up to M arch, 1997
5.316 b o r d e r to give a thrust to the de’velopment o f the powerloom sector and to promote exports o f powerloom fabrics, the Governnnent has set up a separate export promotion council called the Pow erloom Developm ent and E :\po rt Prom otion Council (PDEX CIL)
5.317 The Government o f India introduced a G roup Insurance Scheme for powerloom w orkers in association with the Life Insurance Corp(oration o f India during 1992-93. All powerloom w orkers between the ages o f 18 and 60 yeairs, who had w orked during the year are eligible for insurance under this scheme. Recently, this scheme has been reviewed to make it more effective The scheme envisages annual premium t o be shared equally by the Central Government, State Governm ent and the powerloon'i w o rk e r For ai) insurance coverage o f Rs 10,000, an
643

annual premium o f Rs. 120 is charged The funds contributed by the Governm ent are channelised through the S tate Governm ents on reimbursement basis
5.318 The Governm ent had allocated five per cent o f the export quota o f fabrics and m ade-ups to the quota countries covered by the Multi Fibre Arrangem ent for the pow erloom m anufacturers in 1992. There are seven com puter-aided design centres functioning under various Textile Research Associations. During 1994-95, three computer-aided design centres w ere sanctioned by the Government. The aim o f such centres is to upgrade the quality and designs o f the cloth produced by the decentralised powerloom sector so as to enable the pow erloom sector com pete in the international m arkets
Handicrafts
5.319 In the context o f generating employment in rural non-farm sector, a major thrust during the Eighth Plan was to provide marketing opportunities to craflpersons This necessitated more efforts in organising exhibitions and melas in all the States Besides, eflForts were made to provide perm anent m arket structures at strategic places As a m easure o f export prom otion, greater attention has been and is being paid to those crafts which are relatively less known and have export potential. In order to achieve this, a number o f schemes pertaining to training, design developm ent, m arket prom otion, exhibitions and publicity, export prom otion are being undertaken
5.320 The training centres for craftsm en w ere mostly being operated departmentally but during the last three years, this scheme was given a new dimension by expanding it to nongovernm ental organisations and cooperative societies Several studies have shown that 70 to 80 per cent o f the trainees get gainful employment after completing the training This scheme would be continued in the Ninth Plan
5.321 Four Regional Design and Technical Development Centres undertake the development o f new designs and upgradation o f tools and equipm ent An Institute o f Carpet Technology is being set up at Bhadohi (UP) There are two Common Facility Service Centres at Farrukhabad and Ahmedabad in regard to H and-Block Prining The Metal Handicrafts Service Centre at M oradabad has been catering to hi-tech requirements o f exporters Two UNDP projects are also underw ay to develop ju te and w ood-based handicrafts
5.322 The major thrust in recent years has been on promoting grassroot organisations with the intention o f organising production on the lines o f m arket demand In addition, financial assistance is provided to cooperatives and voluntary organisations for opening and expanding em poria to m arket handicrafts. The Craft Development Centres established in identified pockets, provide extension services in respect o f design guidance, supply o f raw materials, com m on facility services and marketing netw ork
5.323 A com plete census o f the handicrafts sector by the National Council o f Applied Econom ic Research is underw ay in all the States. W ith UNDP assistance, the Government o f India has approved a project "Export Prom otion o f W ood-Based Handicrafts" with the objective o f increasing the exports o f w ood-based handicrafts on a sustainable basis
644

5.324 For the prom otion o f jute-based handicralfts, the UNDP has approved two schemes viz Design and M arket Developm ent and B eneficiary Oriented Program m e for implementation during the Eighth Plan period
5 325 A number o f schemes have been identifi ed under the Tribal Sub-Plan and the Special Com ponent Plan for SCs and STs. Special em ploym ent schemes for women have been initiated to provide employment, exclusively to w 'omen
5 326 In the handicrafts sub-sector, there is a v 'ast potential to achieve higher exports The exporters/artisans need to be provided with feedback regarding export markets, utility aspects, quality standards and new trends The p roposed schem es in this sector would be suitably moditied and would be made m arket- o rien ted t o help the artisans/ cooperatives/N G O s and Self-Help Groups (SHGs) to produce handicr aft items with a blend o f traditional and ethnic designs and utility concept. Stress w ould be o n developm ent through a cluster approach
5 327 There is an urgent need to help the artisans by providing quality raw materials, new designs improved techniques for manufacture o f articles, marketing support as well as welfiire and socio-econom ic benefits, to improve thei r w age earnings and quality o f life
5.328 During the Ninth Plan, emphasis is b e in g laid on marketing, skill upgradation, m odernisation, welfare and preservation o f craft heritage A number o f new schemes viz training o f trainers, com m on facility centres, com puterised design development, m arket workshops, design and development through rep u ted institutes, craft colleges like NTFT, NID, etc., pension to artisans and developm ent o f im proved tools & kits, dissemination are proposed to be implemented during the Ninth Plan.
Sericulture
5.329 India is the second largest producer o f si'lk in the world after China. It has the unique distinction o f producing all the four varieties o f silk: mulberry, eri, tasar and muga M ulberry accounts for 92.5 per cent, eri 5 .3 per cent, tasar 1 7 per cent and muga 0 5 per cent o f the total raw silk production in the country
5.330 Sericulture is an im portant labour-intensive and agro-based cottage industry providing employment to about 60 lakh persons. M ulberry sericulture is being practised in traditional States like Jammu & Kashmir, K arnataka, A n d h ra Pradesh, Orissa, Tamil Nadu and W est Bengal Tasar sericulture provides livelihood for th e tribal population o f Andhra Pradesh, Bihar, M adhya Pradesh, M aharashtra and Orissa. Eri and m uga sericulture is practised in all the seven N orth-Eastern States
5.331 The production o f raw silk is estimated at 14,000 tonnes (t) in 1996-97 The target for the terminal year o f the Ninth Plan has been fixed at 20,540 t. The employment in sericulture sector was estimated at 60 lakh in 1996-97 and th e targe t for the terminal year o f the Ninth Plan is 74 lakh persons.
5 332 The exports o f silk w ere w orth R s.880.44 c ro re in 1996-97 The target for terminal year o f the Ninth Plan is Rs 1520 crore
64 5

5 333 The Central Silk Board (CSB), a statutory organisation responsible for implementing the developmental schemes in sericulture, supplements the efforts o f the States by providing necessary support for research and developm ent and extension and training through its countryw ide netw ork o f institutions, units and extension centres The CSB has set up six ftill-fledged research and training institutes at M ysore (Karnataka), Berham pore (W est Bengal) and Pam pore (J&K) dealing with mulberry, Ranchi (Bihar) for tasar and Jorhat (Assam ) for m uga and M endipathar (M eghalaya) for eri silk For carrying out R&D in post-cocoon technology, a research institute has been set up at Bangalore
5 3 3 4 The National Silkworm Seed Project (N SSP) is implemented by the CSB and provides basic mulberry silkworm seeds to the rearers U nder this program me, 2 7 basic seed farms have been established to produce the basic stock and meet the seed requirements o f other m uhiplication farm s/State D epartm ent Farms As many as 35 Silkworm Seed Production Centres (SSPCs) have been set up in different States to produce Disease Free Layings (DFLs) for sale to the silkworm rearers These centres have provided 2 . 53 crore DFLs during 1 9 9 6 - 9 7
5.335 The CSB is installing cold storage plants to meet the demand for bivoltine layings in all the seasons. The CSB has established 318 Chawkie Rearing Centres under the Research Extension Centres and SSPCs to arrange supply o f healthy young silkworms to the sericulturists The CSB has also established Basic Seed M ultiplication Centres for supply o f D FLs o f Tasar, m uga and eri W ith the assistance o f Japan International Cooperation Agency (JICA), a Bivoltine Sericulture Technology Development Project is being implemented for evolving suitable mulberry bivoltine silkworm races. JICA has made available the services o f experts and trained 20 Indian scientists under the counterpart training program m e
5.336 The Central Silk Research Technological Institute, Bangalore, has developed an indigenous m ulti-end silk reeling machine with higher productivity' for producing quality silk from bivoltine and multi x bivoltine hybrid cocoons. Efforts are being made to make this m achine popular am ong private reelers by providing subsidy.
5.337 A scheme for establishing decentralised peripatetic sericulture centres for farmers has been form ulated by the CSB and farm ers/rearers are being provided training in improved sericulture practices. W' îth financial participation o f the CSB and the D epartm ent o f Rural D evelopm ent (M inistry o f Rural Areas and Em ploym ent), 13 Sericulture Training Schools for farm ers have been set up in various States. These provide advice, technical guidance and know ledge about sericulture to the farm ers o f non- traditional sericulture States.
5.338 U nder the National Sericulture Project (NSP), the main thrust was tow ards strengthening infrastructural facilities in the five traditional States and twelve pilot States to provide long term support for developm ent o f sericulture. This project ended on 31 st
D ecem ber, 1996 The infrastructural facilities created under NSP are being supplemented in the N inth Plan to boost production o f raw silk, particularly bivoltine variety, with higher productivity.
5 339 The Indian Silk Export P rom otion Council provides services for prom otion o f exports o f natural silk goods. It also acts as the registering authority for silk exporters. It produces and dissem inates information to its m em bers with respect to m arket developm ents in the world, m odifications in trade policies and future m arket trends The Council is providing sample catalogues containing sample swatches o f the fiill range o f silk products available in India
646

This information helps the potential buyersj, textile import agents and Indian missions abroad The CSB is implementing test sampling sccheme for exports of silk items to ensure adherence to the contracted quality parameters of exjport orders.
5.340 During the Ninth Plan period, the sericulture sub-sector would be made more vibrant by focussing upon (i) bringing in new mone productive and stable silkworm races, (ii) improved silkworm rearing practices, (iii) improvements in reeling by promoting installation of modem technology' based machines, (iiv) encouragement to plantations for tasar, eri and muga silk, (v) utilisation of infrastruc'.ture and organisations created under NSP, (vi) increasing the area under mulberry plantation, (vii) enhancing value addition by improving designs, colour combinations, finishing methods, etc , (viii) increase in exports by diversifying into dress materials and made-ups and ( ix) encouragement to bivoltine silk
Wool Development
5.341 The Central Wool Development Bo;ard (CWDB) set up in 1987, with headquarters at Jodhpur in Rajasthan, is looking after thie unorganised wool sector The Board has been implementing schemes like Integrated Shieep & Wool Development Project, Weaving & Designing Training Centre, Carpet Weav/ing Training Centre, Training Scheme for Woollen Products, Industrial Service Centres, Wool Testing Centres, Wool Scouring Plants, setting up of Machine Shearing-cum- Training Projects, letc
5.342 The woollen industry in India is smiall in size and widely scattered It is an industry where the organised sector, the decentraliised sector and the rural sector run complementary to each other towards meeting the requiremients of different sections of the domestic market as well as exports. The industry has the potential to generate employment in far flung areas, including hilly regions in the North and dessert tracks of the West It has a wide spectrum of units fi'om the modern sophisticated fiilly c;omposite mills in the organised sector to handloom and hand- knotted carpet manufacturing uniits at the village level
5.343 The woollen industry in India is priimarily located in the States of Punjab, Haryana, Rajasthan, Uttar Pradesh, Maharashtra anid Gujarat Forty per cent of the wool units are located in Punjab, 27 per cent in Haryana aind 10 per cent in Rajasthan, while the rest of the States account for the remaining 23 per ce;nt of the units. There are about 658 woollen units in the organised sector. Besides, there are ai large number of small- scale hosiery units, knotted carpet making units, powerlooms and hanidlooms in the decentralised handloom and khadi sector. The total number of persons employed in the woollen industry is estimated at around12 lakh.
5.344 The organised sector consists of composite mills, combing units, worsted and non-worsted spinning units and the maclhine- made carpet manufacturing units The decentralised sector includes hosiery and kniitting units, powerlooms, handmade knotted carpet units, handlooms and independent dyeing homses. One of the major problems is non-availability of the raw materials required by the industry. The country does not produce enough fine wool and against the total requirement of approximately 30 million kgs of apparel grade wool, indigenous production is around 4 to 5 miillion kgs. The balance requirement is met through imports, mainly from Australia.
647

5 345 The wool produced in India is of mediumi and coarse vaiieties which is ideally suited for making carpets, blankets etc Presently, the t(otal production is estimated at 43 2 million kgs., o f which 70 per cent is good carpet grade w ool
5 346 Apart from importing fine wool for worsted mills, medium range wool in large quantity is being imported from New Zealand and many oither countries to meet the domestic demand
5 347 During the Fiighth Plan, the programmes/scihemes im.plemented by the CWDB included setting up three more Industrial Service Centres ;at Pithoragarh and Pashulok in Uttar Pradesh and at Guru Nanakdev Universiiy, Amritsar, sianctioning one Wool Testing Centre to Himachal Pradesh State Wool Federal son by providiing an assistance of Rs 7 1 lakli, assisting 23 weav ers at the Weaving and Designing Centre at Jaisalmer and setting up 15 new Carpet Weaving Training Centres
5 348 The CWDB had also taken up an Integratced Angora Rabbit Development Project m 1994-95 Under this project, many units have beeen sanctioned which arc being implemented in Himachal Pradesh and Uttar Pradesh The CWIDB also publishes a quarterly news magazine "Wool Ways" to disseminate information on impoirtant aspects of wool and woollens and also sheep rearing Further, the Board is preparing v?ideo cassettes on important aspects of sheep rearing, wool production and benefits accruing frcom the schemes of the Board w'ith the help of Gujarat Sheep and Wool Development Corpioration Ltd (GUSHEEL) To expose Indian woollen products to new markets and to enssure a better price for the products made in remote areas, the Board has taken up a scheme called "Wool Expo" The first two Wool Expos were successfiilly organised by the Board in 1995-96 at New Delhi and Jodhpur
5.349 In order to give a thrust to the woollen sector, the Government set up the Wool Research Association (WRA) as a cooperatiwe research organisation in 1963 It is functioning under the administrative control of tlhe Ministry of Textiles The WRA is giving consultancy to CWDB to set up Woollen Industry Service Centres at Bikaner, Jaisalmer, Ahmedabad, Mum.bai, Amritsar and Mehboobnaigar in Andhra Pradesh A Computer ,A.ided Design Centre for carpet sector is being establishied in the cooperative sector at Jaipur with the nelp of CWDB and WRA Despite the effo>rts put in by the Central Woo! Development Board and other related organisations such as W/RA, the wool sector continues to be in the periphery where the wool grow'ers still live in abjject poverty and hardship One of the biggest problems impeding the growth of tiie sector is hack of adequate grazing grounds Besides, there is also a lack of pre-loom and post-loom processing facilities One of the weakest links in the wool sector is the lack of proper wool grrading system, as a result of which, the small producers are being exploited by the middlemen wv-ho do not offer prices commensurate with the wool grade There are also other problems like high import duty on machinery, differential rates o f import duty as applied to apparel grade wool and synthetic rags, lack of in-liouse training facilities, etc
5.350 During the Ninth Plan period, the Board hias proposed to extend its schemes lo more areas and improve wool productivity per sheep i in coordination with State Governments and Department of .A.nimal Husbandrv' and Ministry of Agricuhure Special attention would need to be paid to improv ing the quality and airea of grazing pastures
048

FOOD PROCESSING INDUSTRY
5.351 India has a tremendous potential for development of food processiiig industry- considering the fact that it has emerged as the largest producer of milk, the second laigesi producer of fruits and vegetables, the largestt producer of spices, groundnut and rape seed and the fourth largest producer of wheat Indiai also has one of the largest livestock population, apart from a long coastline of 7500 Kms wl-nich makes it the seventh largest producer offish Thus, India is amongst the top-ranking naitions in terms of total production of various raw materials required for development of thei food processing industry Despite all these advantages, India is nowhere in the world m^ap in terms of processing when compared with other countries like Brazil, Phillipines, Th;ailand and Malaysia which are processing 70 percent . 78 percent, 30 percent and 83 percemt respectively of their total horticultural produce The corresponding figure for India is only :about one percent This low level of processing, incidentally, is not due to lack of installed capacity There is surplus capacity available - of which only about 35 percent utilised because; of various reasons ranging from narrow product base to technological obsolescence, high cost ;and unsuitable quality of raw materials etc Besides, about 25 to 30 peiceiit of the produce is lost by way of post-harvesl losses dut lu poor handling, storage and transportation facilitie^s
5.352 The Government, being well aware- of the prospects for development of r;>od processing sector, has taken various initiatixves for its promotion These include sc;tin” up of a separate \4imst!‘Y tor Food Processing ancd promclit^'al bodies such as MaviivoExport Development Authority (MPEDA), Avgricultural and Processed Food Products l-xport Development Authority (APEDA) and National Florticulturc Board (NHB) The other major initiatives taken by the Government have been enumerated earlier in the Chapter
5 .353 Some new measures have been tak;en in 1997-98 e g dereservation of certain items including ice-creams and biscuits, repeal o f' the Cold Storage Order of 1968, etc The proposed raising of investment limit for the ;small-scale industry' is also expected to promote investments in this sector, especially in term.is of upgradation of technology
5 354 The policies pursued by the Governmejnt in the past have paid rich dividends Today, the food processing industry contributes ab<out 18 per cent to the industrial Gross Domestic Product (GDP) and employs around 15 milliom persons The food processing industry, however, is primarily functioning in the informal and uinorganised sector This sector has attracted a lot of foreign investment and till June, 1997, 4,,098 Industrial Entrepreneur Memoranda (lEM) envisaging an investment of Rs 47,146 crore had been received
5 355 It may, however, be mentioned that thiis growth is nowhere near the potential India has and the factors adversely affecting the growth of this industry include aspects such as primitive technology, inadequate infrastructure, poor quality of raw materials including non-availability in bulk, low productivity of various horticultiure crops, poor quality of packaging, inadequate working capital, lack of grading facilities and standards
Primary Food Processing
5 356 The primary food processing sector iincludes roller flour milling, rice processing cereal-based products, maize processing, p)ulse processing and pasta products The roller flour milling industry' is 100 years old and todiav, there are about 800 mills with a capacity ofi 8 million tonnes in this category. The cap;-acity utilisation. howe\er. is not satisfactoiT.
(649

being only about 40 percent. The major problemis being faced by this sector are obsolete equipment, high power consumption, high power rates, excessive levies by local and State Governments at various stages of procurement of wheat, selective credit control and low yields
5 357 The production of paddy in the country is exp>ected to reach 130 million tonnes by 2000 AD The processing of paddy is carried out in a variety of mills While some of the mills are modem, others are traditional shellers or huller-cum-shellers The Government has taken a few steps, both legislative and promotional, for modermisation of the rice milling industry Today, good quality machines are available within the icountry and, in fact, the Bureau of Indian Standards (BIS) has formulated standards on rubber roll dehuskers cleaners, polishers etc Separately, the Government has also been implementing the Huller Subsidy Scheme in various States to promote modernisation of the small hulleir units At present, there are about 34,000 modern rice mills processing approximately 65 p«er cent of the paddy production
5 358 The pace of m.odernisation of rice mills has not been as fast as expected There is still considerable scope in the field of modernisation anid the State Governments need to actively participate in order to check unauthorised growth of'huller mills in the country The rice milling industry suffers from several constraints such as olbsolete machines, low yields, non-recovery of by-products, losses due to poor warehousing anid packaging, inefficient use of energy, lack of skilled and trained manpower, lack of R&D etc Since the rice milling industry is dereserved it will invite state-of- the-art technology into this areai and will help improve the quality of rice available to food processing industry.
5.359 The bakery sector is the largest among the processed foods industry Out of bakery products, bread and biscuits account for 82 per ceint of the total production There are about75,000 bakery units in the small and cottage sectors whose production accounts for more than 60 per cent of the total output The current annuial turnover of this sector is valued at more than Rs 15,000 crore By 2002 AD, the output of b)iscuits will reach 44 lakh tonnes while that of bread will be 20 lakh tonnes The current fig^ures are 10 lakh tonnes and 14 lakh tonnes respectively. The annual per capita consunnption of bread in India is only 1 4 kgs which is well below the average of 25 kgs in mostt of the industrialised nations. Inspite of the vast potential of this sub-sector, the manufacture of bread and biscuits in India has missed out the benefits of the modern technology and alsvo on economies of scale during the last many years With the recent dereservation of biscuit indiustry, it is expected that the industry will be able to exploit economies of scale and also bring albout the necessary modernisation The bakery units need different grades of wheat with varying prrotein content and gluten strength which are not presently available in the country. The Indian Council of Agricultural Research (ICAR) will have to provide the necessary inputs to grow aipporpriate varieties of wheat in India
5 360 The increase in pulses production in India hias been rather slow and has not been able to keep pace with the growth in population Thte per capita availability of pulses today is in fact lower than what it was in 1950-51 More tham 75 per cent of the pulses produced in the country are converted into dais in about 10,000 miills of varying capacity all over the country Originating in the household sector, the pulse processing sector has developed now as an organised industry There are a number of diffic:ulties faced by the traditional pulse milling industries, e g low yields of pulse crops, labour-iintensive techniques, inadequate pre-milling treatment, processing time extending to several days or weeks, etc Dal milling industry' has been dereserved recently, which will promote induction of modern technology into this area
650

5 36] Vermicelli, noodles, macaroni and' spaghetti, better known as pasta products, are becoming increasingly popular Pasta p)roducts have gained popularity in the recent past, primarily in the urban ^.reas and particularity in metropolitan cities The growth in demand is consequent to the rising trend of urbaniisation due to industrial growth which necessitates a person's absence from home for consiiderable duration The installed capacity of pasta products in the country is estimated at 34, 000 tonnes per year per shift of eight hours It is estimated that a total of 178 units exist im the small-scale sector producing pasta products The demand for pasta products is expectecd to rise phenomenally in ftjture though there will be problems in the growth of this sector due to lack of pasta machinery manufacturers and adequate packaging materials Appropriate isteps would need to be taken to promote manufacture of pasta machinery
Horticulture
5 362 The total cropped area in the coumtry is about 180 36 million hectares out of which horticulture accounts for about 6 7 per centt India is the second largest producer of fruits and vegetables in the world, after China. The e;stimated production of fruits and vegetables in the country was expected to reach about 110' million tonnes by the end of ihe Eighth Plan Unfortunately, the post-harvest losses are lintolerably high and estimated to be about 25 to 30 percent of the output India has not be;en able to exploit its large output as far as processing is concerned as only about one; percent of its total horticultural produce is being processed. Iromcally, India is not able to utilise its existing installed capacity which stands at about 17 5 lakh tonnes
5 363 The marketing practices are not conducive to the growers who realise only 30 to 40 per cent of the price ultimately paid by the conisumers The balance amount is being shared by intermediai'ies at various stages Apart fr om the inhibiting factors mentioned above, other major constraints faced by this sub-sector include high cost of packaging, non-availability of packaging machinery, non-availability of qmality raw materials, lack of basic infrastructural facilities, complexity of land and food laws, inadequate linkages between farmers and processors, inadequate induction of technology, etc
Dairy Industry
5 364 India has become the largest milk procducing country in the world India's output of liquid milk reached 69 million tonnes in 1996, surpassing that of USA Milk production was almost stagnant from independence till about 1970 with an annual growth rate of only one percent Thereafter, there has been an improvemenit and during the Eighth Plan, it has registered an annual growth rate of 4 5 per cent
5 365 The milk production target of 70 milli(on tonnes at the end of the Eighth Plan is likely to have been achieved with per capita availability o f 204 gms per day against the recommended nutritional requirement of 220 gms per daiy. The Indian dairy industry has an installed processing capacity of 20 million litres per day with an estimated investment of Rs, 12,000 crore About 60% of the installed processing capjacity is in the cooperative sector Along with the increase in milk production, there has been a simultaneous increase in the production of milk powder including baby food, malted food products, condensed milk, etc As a resuU of liberalised industrial policy announced by thie Government in 1991, import of technology and machinery has become easier. This has resullted in the industry taking up manufacture of new
651

products like edible casein, pharmaceutical grade lactose and whey protein concentrate and other high value products which are export oriented.
5.366 The dairy industry, however, faces several constraints as the industry has traditionally been subjected to licensing and other restrictions The Government policy in this regard has been to give preference to the establishment of milk processing plants selling liquid milk This policy was guided by an overall shortage of milk and the national milk production falling short of nutritional requirement in the earlier years of planning era Consequently, the processing plants manufacturing products have received a lower priority Appropriate policy measures would need to be worked out to give a fillip to this sector
5.367 The PFA standards for the quality of milk and milk products, which were formulated in the early 195O's, have become outdated They are also not in conformity with international standards. The problem becomes more acute since there are very few testing laboratories and testing kits tor rapid quality testing at the grassroots level are not available It is imperative to closely examine the Prevention of Food Adulteration Act and carry out appropriate modifications at an early date
5 .368 Packaging of milk and milk products is another grey area, which needs attention Dair>- products, incidentally, are not included in the mandate of the Indian Institute of Packaging and only limited work could be done in the area of development of packaging at the National Dairy Research Institute, Kamal The industry’ also faces an acute shortage of cold storage facility for dairy products in major consumption centres The milk products industi7 also faces the problem of levy of sales tax at muhi points adding to the cost of the final product The system needs rationalisation to give a boost to this industry
Fisheries
5 369 Fish production in the country has increased from 7 8 lakh tonnes in 1951 to 47 89 lakh tonnes in 1994-95 The average annual growth rate in fish production during the last decade has been around 5.6 per cent. While the growth rate in the marine product sector has been about 5 per cent, the inland fishery sector has grown slightly faster at 6 7 per cent annually Exports fi-om the seafood sector have done well and crossed the one billion US$ mark during 1994-95 when 3,07,300 metric tonnes of marine products were exported, valued at Rs 3,375 27 crore Fish production is estimated to reach about 63 67 lakh tonnes by the turn of the century Out of this, about 33 .12 lakh tonnes will be contributed by the marine sector and the remaining 35 55 lakh tonnes will originate from the inland sector At this level, the per capita availability of fish will be 11 kg. per annum as against the present per capita availability of 9 kg per annum
5 370 The current annual marine fish production is around 26 92 lakh tonnes against a potenfial of 39 lakh tonnes The exploitation of resources in the coastal zone i e upto a depth of 50 metres has been rather heavy whereas resources beyond 50 metres are still under-exploited The contribution of deep-sea fishing to the total marine production has been less than 2 per cent The Government of India, therefore, had introduced the New Deep-Sea Fishing Policy in 1991 to give a tlirust to deep-sea fishing in the country The policy on deep-sea fishing, however, came under severe criticism from the traditional fishermen who complained of large-scale poaching and ecological disturbances perpetrated by the deep-sea fishing vessels On the recommendations of the Muran Committee, which was set up to
652

study these aspects, the Government has decided to discontinue giving Hcences for deep-sea fishing
5 371 India has a tremendous potential for the development offish processing and there were 367 units in 1996 having a total capacity of 6,496 0 tonnes per day About 45 per cent of these units are modem The capacity utilisation of fish processing units, however, is very low At present, hardly 20 per cent of the total fish production is being processed This sector, as in the case o f other food processing sectors, faces an acute shortage of infi-astructure in the form of cold chains The industry is also not equipped with basic facilities which are required for hygienic processing and this is going to seriously affect India's exports to the Western countries as most of them have formulated stringent standards of hygiene and quality control. This calls for urgent remedial action
Meat and Poultry Sector
5 372 India has the largest livestock population in the world However, the quality of the livestock remains poor The present production o f meat is about 3 7 million tonnes while production of high-value-added processed meat products is only about 50,000 tonnes The per capita consumption of livestock products in India is considerably lower than in other countries, e g , the per capita poultry meat consumption in India is only about 12 per cent of that in China The annual per capita consumption o f eggs in India is 29, and in rural areas, it is even lower It is also far below the recommendations of the National Institute of Nutrition which stipulates 180 eggs and 9 kgs o f all kinds of meat per aimum
5 373 There are about 3,600 slaughter houses in the country which are being managed by Municipal Corporations and other local bodies There are also 121 small meat processing units manufacturing high-value-added products like ham, bacon, sausages, etc Though the demand for meat and meat products is expected to increase due to the rise in per capita income, the meat industry has several constraints which impede its growth. The industry is using extremely primitive techniques and hygiene leaves much to be desired There are only a few modernised abattoirs and lack o f good hygienic production is affecting exports adversely Meat exports from India primarily consist o f buffalo meat followed by mutton Export o f poultry meat, eggs or processed meat is insignificant However, export of egg products in the form of powder or frozen products has started. Other factors impeding the growth of the meat industry are lack o f infrastructure like cold chain, inadequate availability of feed, poor transportation facilities, absence o f an inspection and quality control system, etc. These need to be attended to during the Ninth Plan period
Packaging
5 .374 The packaging industry in India is still at the infant stage though, as consumer awareness and standard o f living improves gradually, the need for packaged commodities is increasing. Most o f the raw material requirements o f the packaging industry are met by indigenous production, with the exception o f tin plates and plastics Though the supply of various packaging media has been increasing over the years, the demand-supply gap has been widening. During 1995-96 the quantum of packaging material produced/consumed is placed at6 million tonnes, valued at aproximately Rs. 10,000 crore
653

5 .375 The consumption pattern of some of the primary packaging media in India is in sharp contrast to the world situation While in the developed countries, the usage of plastics is proportionately more vis-a-vis paper and paper boards, the situation in India is exactly the reverse. The consumption of packaging media in India is much lower than in the developed countries. This is evident from the fact that the per capita consumption of paper and board in India is only 1.3 kg. as against 310 kgs. in USA and for plastics, it is only 0 7 kg in India as against 50 kgs. to 90 kgs. in the developed countries. The growth rate of consumption and demand for packaging in India is envisaged to be of the order o f 12 per cent per annum and by 2000 AD, the total requirement of all packaging will increase to about 9.33 million tonnes from the present level of about 6 million tonnes, implying an increase of 55 per cent
5.376 Testing, quality control and other laboratory facilities are available at the Indian Institute of Packaging and its Regional Centres and also at the Packaging Division of the Central Food and Technology Research Institute (CFTRI) These facilities, however, not only need to be enhanced but also need to be made more exhaustive to cover all packaging media and products packaging. The Bureau of Indian Standards (BIS) has separately developed technical specifications for packaging vanaspati, oils and ghee The packaging requirements relating to edible oils and a host of other processed foods and fiiiits like mangoes, tomato pulp, and mushrooms, etc. have still to be developed/specified These require adequate attention during the Ninth Plan period.
5 .377 Based on the experiences o f the Eighth Plan and keeping in mind the recommendations made by the Working Group on Food Processing Industries, specific policy measures have to be prescribed for each of the sub-sectors In the case of primary food processing sector, due emphasis will have to be given to aspects such as strengthening training and extension work, improving backward linkages for maize/coarse grains, improving efficiency of pulse milling industry, making energy audits compulsory for improving efficiency of existing units, bringing about modernisation in the roller flour milling and rice milling industry
5 .378 For horticulture-based sector, a relook needs to be taken at some o f the existing laws, apart from effecting improvements to enhance infrastructural facilities Amongst the laws to be reviewed, amendment of the Seed Policy would be one of the vital areas in order to induct suitable strains. Other important areas would be amendment of the Pesticides Act to ban the use o f BHC, etc and amendment of Food Laws to allow irradiation Other policy support required by this sub-sector would include continuance of the exemption of excise duties for all food and vegetable products, reduction of sales tax on food and vegetable products levied by the States, providing fiscal incentives by way of direct tax incentives for post-harvest infrastructure including cold chains, providing tax holidays in backward areas, setting up quality control laboratories, etc.
5 .379 As regards the dairy sector, the focus in the previous Plans has been on the processing o f liquid milk. A conscious attempt needs to be made in the Ninth Plan to promote the development of indigenous milk products. The country produces a wide variety of sweets based on milk but the export potential o f these sweets has not been tapped.
5 .380 Other areas which would need attention during the Ninth Plan are creation of cold storages, promotion of research and development in product development and technology upgradation, quality assurance, packaging, consumer awareness, etc.
654
5.381 The development of meat and poultry processing sector needs to be directed towards achieving the goal ofhygjenic production and proces sing o f meat and meat products, bringing about technological improvements and improving transport and storage facilities for efficient operation. At present, there are only a handful of modernised abattoirs and all efforts o f the Government in the past to modernise other abattoirs/slaughter houses have not been successful A fresh initiative in this respect during the Ninth Plain would be required The Government has encouraged the growth of meat processing units by offering financial incentives and through this, some joint sector projects have been successfully set up. Development of marketing infrastructure for meat and poultry products, however, was not taken up in the earlier Plans Only a few schemes of transport and storage were taken up and that too, in the public sector The Government will have to induce sufficient investments into this area in order to catalyse the growth of meat processing sector. Separately, investments will also have to be ensured for the establishment of quality control laboratories. A special emphasis has to be laid on the North Eastern States where meat and poultry processing, especially pork, is an important activity which is being done in unhygienic circumstances due to no n-availability of necessary infrastructure
5 .382 The main objectives of the developm.ent of the fisher>'sector during the Ninth Plan will be to create infrastructure for storage and transportation of fish in order to reduce wastage, to sufficiently strengthen the fish processing sector for greater value addition by adopting improved hygienic standards, better quality control measures, product diversification, induction of modem technology, improving packaging standards, etc. 'The aim would be to ensure remunerative prices to fisher folk and better wages for the labour One important element to be added in the Ninth Plan is strengthening o f traditional technologies such as fish drying and utilisation of low-value fish to make value-added products Separately, adequate emphasis will also be laid on promotion of fishery cooperatives to develop the export and domestic market for fishery products. Continued support will have to be given to the Coast Guards for monitoring amd surveillance o f the Exclusive Economic Zone (EEZ) For improving the survey work, the Fishery Survey o f India (FSI) needs to be duly strengthened by replacing its obsolete fleet of ships.
5.383 The packaging industry in India, by and large, being in the small-scale sector, suffers from inadequate research and development facilities The industry needs to be encouraged in order to enable it to grow to international standards. Besides, pilot projects may be set up in selected institutions to cater to the needs of the packaging industry The Government should promote product package-wise studies Export package specifications should be drawn up in detail and wherever necessary, as a code of practice. The facilities available within the country in some of the institutions have to be enhanced since their equipment has become obsolete The BIS may be encouraged to develop further specifications in consultation with the industry Due emphasis has to be given to develop low-cost paper and pulp from natural fibre agro-wastes for packaging applications, as there is already a scarcity of raw material for paper. Appropriate legislative measures will be useful to discourage the use of second grade packaging materials like tin plates or recycled plastics.
5 .384 The food processing industry faces the problem of finance, both working capital and also long-term finance. It is interesting to note that the fotod processing industry, while contributing to about 19 per cent o f the industrial GDP, has acc ess to only about 5 2 per cent of the total investments made in the industrial sector This sector is also not in a position to generate large internal resources and has to depend only upon extema.1 sources of finance. Given the fact that a sum of Rs.28,250 crore would be the investment reciuired during the Ninth Plan, as estimated
655

by the Working Group, it is imperative that the financial institutions adopt a more positive and pragmatic approach towards this industry In this regard, it is felt that the field officers in the banks/financial institutions should be impairted necessary training since the parameters involved in this sector are very different fi'om thoise of the manufacturing industry as a whole The Government may even examine the piossibility of creating a specialised bank for food processing industry with the equity subsc;ribed by the different financial institutions
5 385 Finally, there is the question o f availability of trained manpower for this industry, keeping in mind that it is expected to grow at a faister rate during the Ninth Plan period than in the last few years. There are very limited institutions within the country which are providing training in the field o f food processing and the mumber o f people being trained every year is grossly inadequate. Necessary flinding has to be forthcoming for this area to ensure that the growth of this industry does not get hampered by nom-availability o f technical manpower
656

statement 5.1 Profitability profile of Public Sector Enterprises
(lU. Crore)
Detaila 1980-81 1984-85 1985-85 1986-87 1987-88 1988-89 1989-90 1990-91 1991-92 1992-93 1993-94 1994-95 1995-96 1996-97
I. No. of operating enterpriceii2 Capital eoDployed3. Gross margin4 % Gross margin to capital esoployed5. Depreciation t deferred revenue expendit6. Gross profit7. % Gross profit to capital employed8 Interest9. Pre-tax profit / loss10. TaxII. Met profit/ Loss
Profit of profit making enterprises number of profit making enterprises Loss of loss making enterprises number of loss making enterprises No. of units making no loss no profit
12. % Net profit /Loss to capital enployed13. Dividends14. Retained profit
168 207 211 214 220 226 233 236 237 239 240 241 239 23618207 36382 42965 51835 55617 67629 84760 102084 117991 140110 159836 162451 173874 2020212401 7386 8270 9897 11082 13438 16412 18312 22223 25227 27707 33384 40526 4450113. 19 20.30 19.25 19.09 19. 93 19.87 19 , 36 17 .94 18 . 83 18 . 01 17. 33 20.55 23.31 22.03983 2758 2983 3376 4142 4866 5790 7210 8548 9270 9151 10754 12537 139271418 4628 5287 6521 6940 8572 10622 11102 13675 15957 18556 22630 27989 305747.79 12 .72 12. 31 12 .58 12.48 12.68 12.53 10 .89 11.59 11.39 11.61 13.93 16.10 15.131399 2529 3115 3420 3587 4167 5329 7601 9673 10881 11901 12862 13924 15101
19 2099 2172 3101 3353 4405 5293 3501 4002 5076 6655 9768 14065 15473222 1190 1000 1329 1323 1411 1504 1229 1647 1805 2110 2581 4187 5215-203 909 1172 1772 2030 2994 3789 2272 2355 3271 4545 7187 9878 10258557 2021 2857 3478 3775 4917 5751 5394 6079 7384 9768 12070 14704 1612094 113 119 108 114 117 131 124 133 131 121 130 134 129
760 1112 1685 1706 1745 1923 1962 3122 3723 4113 5223 4883 4826 586274 92 90 100 103 106 98 111 102 106 116 109 101 104
2 2 6 3 3 4 2 2 2 3 2 4 3-1.11 2 .50 2.73 3.42 3.65 4 43 4,47 2.23 2.00 2.33 2.84 4.42 5.68 5.09
83 176 191 297 320 353 323 413 687 792 1028 1436 2205 3080-286 733 961 1475 1710 2641 3466 1859 1668 2479 3517 5751 7673 7178
657

statement — 5.2ACTUAL EXPENDITURE FOR INDUSTRY AND MINERAL PROJECTS IN THE CENRAL SECTOR (Us. Crore)
SI. Ministry / No Department
EighthPlanOutlay 1992-93
A B
Actual Expenditure During Eighth Plan
1993-94 A B
1994-95 A B
1995-96 A B
1996-970 A B
Total Eighth Plan A B
10 . 12 . 15.1- Steel 14579,00 2831.92 2686 23 2559.10 2155.94 3201.93 2474 83 3104.50 2242,50 3250,51 2194.35 14947.96 11753.852 . Mi ne s 2083.00 271.63 256.23 220.27 185,74 204.01 157 24 2X1.62 152,16 502,73 338.45 1410.26 1089.823. Fertilizers 5484.00 228.79 207.11 264 - 86 223.14 608.02 469 95 1691.35 1221.74 2171.99 1466.29 4965.01 3588.234.* Petroleum & Natural Gas 2552.00 99. 73 91, 08 172.16 145.07 278.59 215 32 631.40 456.09 874,68 614.67 2056 56 1522.235. Chemicals & Petro-Chem 2402,00 313.50 286.30 400.89 337 81 544,86 421 13 1078.25 778.86 1318.04 926.24 3655.54 2750.346. Industrial Dev./IP&P 1162.00 881.22 804 .77 747.49 629 73 252.94 191 91 253.56 170.19 267.71 175.78 2402.92 1980.387. Heavy Industry 2771,00 433.90 396,26 297.08 250.28 313.76 238 06 329.89 231.83 307.22 183.40 1681.85 1299 838.* Surface Transport 152-00 11, 00 10 .05 13, 10 11.04 16. 34 12 40 23 66 16 . 63 41. 98 26.16 106,08 76.289. Electronics 588.00 73. 03 66 , 69 162 99 137.31 126.93 96 31 149,15 104.81 160.54 95.84 672,64 500.9610.*Atomic Energy 1300.00 147.55 134.75 149.52 125.97 166.61 128 77 155,84 112.43 204.61 138.13 824,13 640 .05ll.*Civil Supplies 21.00 4 . 33 3.95 4.30 3.62 4.40 3 34 5, 00 3 ,51 5. 00 3.28 23 . 03 17 .7012,*Bio-Technology 5.00 12.42 11.34 8.21 6.92 10 . 74 8 30 19.13 13,82 4.50 3.16 55.00 43.5413 *Economic Affairs 1400.00 457,41 417.73 1211.99 1021.05 840.66 638 07 412.55 289,94 891.84 585.77 3814 45 2952.5614. Textiles 177.00 23.71 21.87 4. 99 4.20 4. 80 3 69 9.50 6.84 31.55 21.25 74.55 57.8515.*DSIR 19.00 5.16 4.71 7.99 6.73 0. 00 0 00 7,53 5 29 6.10 3.64 26 78 20.3716. Supply 13.00 1.98 1.81 3.61 3.04 4.06 3 08 3.90 2,74 2 . 89 1.90 16.44 12 .5717.*Conmerce 127.00 23. 30 21.74 52 . 87 44 54 88.45 67 13 74 , 50 5.2 , 36 188 10 123.55 427.72 309.3218. Planning (NIC) 300.00 58.17 53.12 56.85 47 .89 77 . 79 59 02 83.08 58 .38 97 . 96 64 ,45 373.85 282 .8619-*0cean Development 15.00 3.'37 3.11 0 . 98 0.83 2.42 1 87 1, 74 1.25 4.50 3.03 13.01 10 .09
Total(Indus. & Mineral) A: 35150.00 5882.62 5478.85 6339.25 5340.85 6747.31 5190 42 8246.15 5925.37 10332.45 6969.34 37547.78 28908.83
Village & Small Industry
1. Department of SSI, A i R I 1629,55 302.88 276.60 326.67 275.21 429.06 331.83 544.58 393.48 491.422. Textile (VSI) 1157.00 129.45 118.22 182.59 153.82 196.62 152.06 216.02 156.08 207.293. Pood Processing Industry 146.00 30.01 27.41 38.47 32.41 39.58 30.61 40.41 29,20 35.88
331.81 2094.61 1608.93139.96 931.97 720.1424.22 184.35 143.85
Sub Total VSI B:
Grand Total (A+B)
A: Current Price
2932.55 462.34 422.23 547.73 461.44 665.26 514.50 801.01 578.76 734.59 495.99 3210,93 2472.92
38082,55 6344.96 5901.08 6886,98 5802.29 7412.57 5704.92 9047.16 6508.13 11067.04 7465.33 40758.71 31381.75
@ : Revised Estimates B: 1991-92 Prices.
• I&M Component only.
658

OUTLAYS FOR CENTRAL INDUSTRIAL & MINERAL PROJECTS FOR NINTH PLAN(1997-2002)
(Rs. crore)
statement - 5.3
SI. Ministry / N o . Department
EighthPlanOutlay Outlay
Ninth Plan Period (1997-2002)
GBS DBS lEBR
A. Industry S Minerals
1. Steel 14579.00 16232.50 85.50 85.50 16147.002. Mines 2083.00 7753.96 844.96 686.05 6909.003. Fertilizers 5484.00 11013.38 1043.38 800.00 9970.004 . » Petroleum & Natural Gas 2552.00 4386.62 0 . UO 0.00 4386.625. Chemicals & Petro-Chem. 2402.00 7176.65 171.00 171.00 7005.656. Industrial Dev. 1053.00 1353.75 1353.75 1353.75 0.007. Indus. Policy & Promotion 109.00 570.00 570.00 570.00 0 . 008 . Heavy Industry 2771.00 2027.00 551.00 551.00 1476.009 Surface Transport 152.00 161 80 161 80 161.90 0 .0010. Electronics 588.00 897.37 542.37 542.37 355.0011. Atomic Energy 1300.00 807.50 807.50 807.50 0.0012. Sugar s Edible Oils * 1. 80 1 . 80 1.80 0.0013. Consumer Affairs * 28.37 28.37 28.37 0.0014 . Bio-Technology 5.00 7.00 7.00 7.00 0 0015. Economic Affairs 1400.0016. Textiles 177.00 144.51 144.51 144.51 0.0017. OSIR 19.00 22.50 22.50 22.50 0.0018. Supply 13.00 22.19 22.IS 22.19 0.0019. Commerce 127.00 893.75 859.75 859.75 34.0020. Planning (NIC) 300.0021. Ocean Development 15.00 84 . 23 84 .23 84.23 0.00
B. VSI Sector
1. SSI 6 RI 1629.552. Textile (VSI) 1157.003. Food Processing Industry 146.00
4303.85 3786.85 3786.85 517.001270.00 1270.00 1270.00 0.00235.04 235.04 235.04 0.00
Note:-
* The Ministry o f Food Civil Sapplies has be«n renam ed the Ministry of Food and Consumer Affairs consisting of
three Departm ents - Sugar & Edible Oils, Consuimer Affairs and Food.
659

statement - 5.4
NINTH PLAN (1997-2002) OUTLAYS - STATES/UNION TERRITORIES(Rs. Lakh)
SI.No.
States /Union Territories
Ninth Plan (1997-2002)
ILargeIS MediumIndustries Mining
Village & SmallIndustries Total
1 . 2 . 3. 4 . 5 . 6 .
STATES1 . Andhra Pradesh 56240.00 525.00 39448.00 96213.002. Arunachal Pradesh 806.00 372.00 3432.00 4610.003. Assam 19500.00 1027.00 17477.00 38004.004 . Bihar 140.35 62.00 197.65 400.005. Goa 500.00 100.00 2855.00 3455.006. Gu jrat 82340.00 1195.00 36965.00 120500.007. Haryana 3164.00 121.00 11183.00 14468.008. Himachal Pradesh 6700.00 300.00 8000.00 15000.009. Jammu & Kashmir a a » *10. Karnataka 45400.00 700.00 56500.00 102600.0011. Kerala 60686.00 1000.00 50900.00 112586.0012. Madhya Pradesh 77712.00 2103.00 31482.00 111297.0013. Maharashtra 52835.00 1195.00 36230.00 90260.0014 . Manipur * ★ a *15. Meghalaya 5800.00 1200.00 3200.00 10200.0016. Mizoram 534.00 385.00 5973.00 6892.0017. Nagaland 1674.00 1900.00 8528.00 12102.0018. Orissa 3079.00 2400.00 6869.00 12348.0019. Punjab 25458.00 256.00 2416.00 28130.0020. Rajasthan 50051.00 95224.00 30063.00 175338.0021. Sildcim * * a ★22. Tamil Nadu 79500.00 791.00 60000.00 140291.0023. Tripura * ★ a *24. Uttar Pradesh 31000.00 1218.00 20447.00 52665.0025. West Bengal * * a ★
SUB-TOTAL (States) 6;03119.00 112074.00 432155.00 1147358.00
UNION TERRITORIES .1 . A & N Islands 0.00 0.00 3800.00 3800.002 Chandigarh * *3. Dadra S Nagar Haveli ★ It a *4. Daman & Diu 232.00 0.00 128.00 360.005'. Delhi 5010.00 0.00 5990.00 11000.006. Lakshadweep 0.00 0 . 00 915.71 915.797. Pondicherry 10700.00 0.00 7800.00 18500.00
SUB-TOTAL (Uts) 15942.00 0 . 00 18633.71 34575.79
GRAND TOTAL 619061.00 112074.00 450788.71 1181933.79
' Not included.
660

INDICATIVE PRODUCTION TARGET - NINTH PLAN 1997-2002 INDUSTRY & MINERAL DIVISION
Statement 5.5
SINo Industry Unit
1992-93Target
1992-93Actual
1993-94Target
1993-94Actual
1994-96Target
1994-95Actuals
1995-96Target
1995-96Actual
1996-97Target*
1996-97Actual
2001-2002Target
1 2 3 4 5 6 7 8 9 10 11 12 13 14
1 Iron ore Basic Metals
Mill.Ton 62.50 57.47 62.50 55.47 62 50 63.00 67.00 65 , 90 72,00 65.13 100.00
2 Hot Metal (Integrated Steel -do- 18 . 74 15.20 17 . 07 15 . 94 17.61 17.58 18.89 18, 74 19.89 27.003 Plg Iron for sale -do- 1.69 1 . 68 1.54 1.98 1 .82 1 , 70 1.62 2.79 2.16 3. 20 4.004 Crude Steel(Intgr St.) -do- 14.17 13. 36 15.33 13.67 15,31 15.62 16.85 18,23 16.67 23.005 Saleable Steel(Intd.St) -do- 16. 62 11 .33 17.67 11.98 17,38 12,80 14.32 14 .20 15,87 14.59 20.006 Aluminium Tho.Tonne 525.00 482.23 480.00 465.50 533,00 479,80 530.00 518.00 656,00 524.00 750.007 Copper -do- 44.00 45.28 39 .00 39 .00 45 .00 45.60 42.00 40.90 52 .00 38.40 425.008 Zinc Ingots -do- 153.00 126.60 154.10 145.10 131.00 149,10 155.00 141,60 167.00 140.10 161.109 Lead Ingots -do-
Non-Metalllc Mineral Products
58 . 50 52.50 58.50 37.41 46.00 43,80 60. 00 35,10 96.00 43. 78 78.50
10 CementBasic Chemicals
Mlll.Ton 51 .00 54.54 62.00 57 . 96 62 .00 62,00 68.00 67, 72 76.00 76.00 113,00
11 Caustic soda '000 tonllOO.OO 1085,60 1150.00 1080.00 1130.00 1156,10 1167.00 1356.80 1600,00 1459.30 1600,0012 Soda ash -do- 1520.00 1351.40 1550.00 1404.00 1420.00 1408.60 1430.00 1464.30 2000.00 1485.30 1968,0013 Calcium carbide ** -do- 100.00 94.00 115.00 94 . 00 110.00 97 . 40 110.00 95,30 170.00 91.30 120,00
Agricultural Chemicals
14 Nitrogenous fertilisers 000 ton7700,00 7430.30 7800,00 7231,20 8115.50 7950,70 8632.50 8777.00 9800.00 8599.40 14000.0015 phosphatic fertilisers -do- 2750,00 2306.20 2200.00 1815,80 2331,00 2492,80 2667,20 2558,00 3000.00 2555.90 3300.0016 B,H.C -do- 20,00 23. 80 24 . 50 23,53 21 . 00 25 . 40 21 , 00 34 . 30 25.00 24 . 80 0 . 0017 D.D.T. -do- 8.00 6,70 8 . 00 6,00 7 . 00 7 . 00 8,00 4 . 40 8.00 8.00 5.0018 Malathion -do- 3.00 2,30 3.00 3,00 3,00 1 . 44 3.00 2.14 4 . 00 2.51 6 . 00
Thermo Plastics and Synthet
19 L.D. polyethylene '000 ton 170.00 175,95 170,00 171,00 200.00 180.80 190.00 2.23. 66 180.00 218.15 185.0020 H.D. polyethylene/LLDPE -do- 2 70.00 49 , 58 270.00 224.81 310,00 319.45 380.00 203,42 400.00 276.23 774.00
661

statement 5.5 (Contd.)SI.No. Industry
2
1992-93 1992-93 1993-94 1993-94 1994-95Unit Target Actual Target Actual Target
1994-95 1995-96 1995-96 1996-97 1996-97 2001-2002Actuals Target Actual Target* Actual Target
10 11 12 13 14
21 Polyvinyl chloride22 Polypropylene23 Polystyrene24 Styrene butadiene rubber25 Polybutadiene rubber
Petrochemical Intermediates
-do- 230.00 000 tonne 100.00
-do--do--do-
2 2 . 0 040.0016.00
276.4795.2027.7535.5117.32
300.00100.0030.0040.0016.00
358.45 91.36 40.87 28.89 14 . 80
496.00110.0040.0028.00 18.00
496.00 107.38 51 .84 34.11 19.24
550.00180.0095.0045.00 28 . 00
392.48 115.00 50.88 35.00 21 ,38
450.00155.00110.0050.0025.00
424,76 32C,00 57,8950.0030.00
738.00387.00193.0076.0045.00
26 Acrylonitrile27 DMT/PTA28 Caprolactam29 Detergent Alkylate30 Methanol31 Phenol
Man-made fibres
'000 tonne -do- -do- -do- -do- -do-
26,00290.0040.00
165.00185.0052.00
26.52357.3458.32
206.87219.9052.60
26.00370.0085.00
209.00260.0055.00
26,00369,2391,00
211,51262,1048,78
27.00450.00110.00230.00265.0055.00
26.51440.7697.17
214.00377.00 57.80
24.00480.00101.00 220 .00
275.0056.00
26. 60455.00113.00225.00380.00 60.00
27.00450.00150.00200 .00
300,0075.00
27.00577.00105.00230.00300.0058.00
27.00911.00113.00260.00 450.0067.00
32 Viscose filament yarn '000 tonne 58,00 47,95 57.00 53.00 52.00 70.30 60.00 87.60 60,00 91,00 110.0033 Viscose staple fibre -do- 170,00 162,45 190.00 183.30 190.00 250.00 190.00 286.60 200,00 297,60 360.0034 Viscose tyre cord -do- 10,00 7 . 50 8.00 7.50 7.00 12.40 10.00 12.40 10 ,00 12,10 19.0035 Nylon filament yarn ** -do- 30,00 32,47 35.00 37.34 39.38 40.00 40.00 68.60 48 ,00 63,90 102.0036 Polyester staple fibre ** -do- 140,00 161.03 165.00 200.00 210.00 220.00 230.00 218.80 317,00 270,70 622.0037 Polyester filament yarn ** -do- 215,00 245.01 260.00 286.21 320.00 294.00 350.00 332.00 363,00 395,80 814.0038 Acrylic fibre ** -do- 50,00 56.35 75.00 67 . 57 85.00 81.39 80.00 40 , 06 85,00 34 , 67 103,00
Under Broadbanding
Drugs and Pharmaceuticals
39 Bulk Drugs40 Formulations
Food Products
41 Sugar 4 2 Vanaspati
Textiles
Rs, Crores 860,00 Rs, Crores4620,00
Million to 12,81 '000 tonne 900,00
1150.006000.00
10 . 60 900,00
1130.00 1320,005960.00 6900,00
11,00 9,70940,00 1000,00
1450.007300.00
12,001100,00
1518.007935.00
12 . 61 907.40
1570.008030.00
14 ,00 1100,00
1822,00 9125,00
14 , 78 974,60
1500.006000.00
15 , 30 1050,00
1720.00 5439,009080.00 21104,00
14 ,50 994,50
19,501100,00
4 3 Spun Yarn44 Cloth (mill sector)45 Cloth (decentralised)
million kgl940,00 1895,00 1860,00 2067,00mill mtr, 2810,00 2000,00 2255,00 1990,00
2150.002000.00
2090,00 1886,90
2150.002 0 0 0 . 0 0
2292,80 1958,00
2400.004150.00
2376,30 190B,40
3755.002600.00
Mill mtr, 19350,0 23045,00 21530,00 23482,0 25000,00 15770,90 26300,00 16072.80 25450.00 18223,00 41400.00662

statement 5,5 (Contd.)SI.No. Industry
1992-93 Unit Target
1992-93Actual
1993-94Target
1993-94Actual
1994-95Target
1994-95Actuals
1995-96Target
1995-96Actual
1996-97Target*
1996-97Actual
2001-2002Target
1 2 3 4 5 6 7 8 9 10 11 12 13 14
46 Jute manufacture Leather and Rubber Goods
47 Leather footwear(Orgn.)48 Rubber footwear (orgn.)49 Bicycle tyres (Organ.)50 Automobile tyres
Paper and Paper Products
51 Paper and paper board52 Newsprint
Industrial Machinery
'000 tonnel480.00 1310.00 1400.00 1448.00 1400.00 1364.60 1400.00 1430.80 1600.00 1401.10 1790.00
Mill, pair -do-
Million no -do-
27.0045.0035.0028.00
'000 ton2250.00 -do- 313.00
16.5328.4219.3019.56
2146.00 311.00
30.00 47.5038.0029.00
21 . 45 35 . 60 20.44 20 . 60
2362.00 2270.00 350.00 361.00
30.0032.00 22 . 0021.00
2250.00500.00
20 . 31 33.509 . 70
21 .00
2510.00450.00
30 . 0040.00 30 . 0025.00
2730.00480.00
19.42 27.8010.43 21. 97
2710.00410.00
42.0060.0050.0032.00
2900.00300.00
21.13 28.30 10.45 22.47
2800.00300.00
50.0040.0011.00 35.00
4200.00750.00
53 Machine Tools R s .Crs. 950,00 1043,80 1200.00 890.00 1050.00 1032.80 850.00 974.03 1150.00 1284,93 2300.0054 Mining Machinery -do- 80,00 82 , 40 90.00 88.70 88.00 93.20 110.00 129.74 130.00 133,81 156.0055 Metallurgical Machinery -do- 110,00 143,60 130.00 119.90 110.00 173.80 200.00 156.37 200.00 145,17 427.0056 Cement Machinery -do- 35,00 169,50 120.00 323.70 300.00 295.20 3SO.OO 365.80 475.00 455,34 675.0057 Chem. & Phar. Machinery -do- 400,00 506,90 450.00 795.40 720.00 685.70 800.00 759.98 650,00 881,12 2300.0058 Sugar Machinery -do- 90,00 102,8C 120.00 78.30 73.50 96.80 95.00 126.29 150,00 100,48 400.0059 Paper & Pulp Machinery -do- 40,00 60,30 60 . 00 49.20 47 . 25 51. 90 51.90 76.20 80,00 68.50 85.0060 Textile Machinery -do- 600,00 1100,00 1200.00 1150.00 1200.00 1200.00 1200.00 1051.00 800,00 1204.80 5400.00
Electrical Power Equipments
61 Steam Turbines62 Hydro Turbines63 Transformers64 Electric Motors
Th MW -do- MKVA MHP
2 . 59 0,75
38.00 7 , 00
3,12 0 , 26
34 , 80 5,30
3, 78 1,09
15,00 6 . 0 0
3. 74 0.80
33.50 6 . 0 0
4.11 0 , 96
36.00 6.93
4,11 0, 96
41,50 6 , 60
3,69 0 , 79
40,00 6,10
3,72 0.79
37.95 6 . 30
3. 96 1.00
60,00 8,00
4,11 0 . 96
33.07 7,20
7.002 . 00
53.0013.00
Construction Machinery
65 EarthmMoving Equipment Nos,
Agricultural Machinery
2750,00 2149,00 2700,00 1605,00 2100,00 2191,00 2500.00 3863.00 4200.00 4734.00 7500.00
66 Tractors Th. Nos. 465.00 146.00 170.00 138.60 147.00 157.80 180.00 201.73 240.00 244,76 301.00
663

statement 5.5 (Concld.)SI,No Industry Unit
1992-93Target
1992-93Actual
1993-94Target
1993-94Actual
1994-95Target
1994-95Actuals
1995-96Target
1995-96Actual
1996-97Target*
1996-97Actual
2001-2002Target
1 2 3 4 5 6 7 8 9 10 11 12 13 14
Rail & Water Transport Equipment
67 Elec. Locomotives + Nos. 140.00 140.00 135.00 135.00 155.00 155.00 155.00 160.00 195.00 155.31 200.0068 Diesel Locomotives + -do- 225.00 555.10 555.00 150,00 135.00 135.00 135.00 114.00 142.00 135.27 160,0069 Railway Coaches + -do- 1800.00 2500.00 2481.00 2481.00 1900.00 1900.00 1900.00 1362.00 1696.00 1903.80 2500.0070 Railway Wagons + T h .Nos. 25.00 25.00 30.00 19.20 24.00 14.70 16.00 19.04 25.00 23.50 68.0071 Ship Buildings & Repairs R s .crore 175.00 578.40 62.00 486.90 440.00 610.40 550.00 671.12 800,00 790.80 1796.00
72
Road Transport Equipment
Commercial Vehicles T h .Nos. 170.00 133.20 150.00 140.70 141.75 195.00 250.00 278.00 200.00 142.03 485.0073 Passenger Cars. -do- 185.00 162.60 170.00 209.70 240.00 261.90 300.00 345.00 250.00 241.20 800,0074 Jeeps -do- 40.00 39 . 30 45.00 48.10 72.00 48.60 50.00 59.60 45.00 72.36 120,0075 Scooters, Motor Cycles,
Mopeds & Three wheelers -do- 2000.00 1118.00 1600.00 1329.30 2640.00 1544.60 1900.00 1819.00 2400.00 2650.57 4600,00
76 Electronics
(A).Consumer Electronics R s .Crore 3800.00 3360.00 3900.00 4150.00 4600.00 4665.00 5400.00 5800.00 8500.00 6500.00 17000,00
(B).Industrial Electronics -do- 1700.00 1720.00 1950.00 1770.00 2300.00 2110.00 2750.00 2900.00 4500,00 3100.00 7700,00(C) Communication & -do- 2200.00 2800.00 3400.00 3150.00 4200.00 3250.00 5200.00 2600,00 7000.00 3000.00 21650.00
Broadcasting (D) Conputer Systems -do- 1000.00 1530.00 1250.00 1820.00 1500.00 2450.00 1850.00 2225.00 4300.00 2740.00 17850.00(E) Conponents -do- 2200.00 2240.00 2650.00 2680.00 3100.00 3150.00 3600.00 3550.00 7600.00 3700.00 15600.00(F) Strategic Electronics -do- 650.00 385.00 400.00 500.00 450.00 600.00 500.00 1075.00 1500.00 13C0.00 2250.00<G) Software for Exports -do- 550.00 675.00 900.00 1020.00 1300.00 1535.00 1800.00 2550.00 2600.00 3700.00 36500.00(H) Domestic Software** -do- 400.00 490.00 600.00 695.00 1500.00 1070.00 2700.00 1690.00 - 2600.00 19800,00
Note : * Target as per Eighth Plan.** Not included in Eighth Plan Target
664

VILLAGE & SMALL INDUSTRIES - NINTH FIVE YEAR PLAN (1997-2002) INDICATIVE TARGETS
Statement - 5.6
S.NO. INDUSTRY/SUB-SECTOR UNIT PRODUCTION EMPLOYMENT EXPORT
1996-97ACHVT
2001-02TARGET
1996-97ACHV
2001-02TARGET
1996-97ACHVT
2001-ta rg:
Rs. crore 412636 725000 160 185 39249 78900M.Sq. Mtrs. 125 230 12 18 - -
Rs. Crore 4120 7260 48 . 17 65 - -
000 Tonnes '271 350 5.5 6 208 400M.Sq. Mtrs. 7235 8800 124 173 1622 3170M.Sq. Mtrs. 19352 32000 70.79 80 400.89 9000MT.TONNES 14126 20540 59. 61 7 4 880 1520Rs. crore 29600 47000 70. 82 90 5628.62 9000MT.TONNES 44 56 N.A 6 - —
01 SMALL SCALE INDUSTRIES02 Khadi Cloth03 Village Industries04 Coir Fibre Industries05 Handloom Cloth06 Powerloom Cloth07 RAW SILK08 HANDICRAFTS09 RAW WOOL
665

CHAPTER 6
ENERGYOverview
6.1 Energy is a critical input for economic development and the development experience all over the world is associated with a massive increase in energy requirement. The fifty years since independence have seen an expansion in the total energy use in the country with a shift from noncommercial to commercial sources. The use of commercial energy has increased ten fold over this period Nevertheless, per capita energy use in India remains very low and growth in future requires a large increase in commercial energy. This calls for optimising the capacity to expand, domestic production o f commercial energy and the ability to do so will be a crucial constraint upon future growth. Even with the best efforts in this area India will remain energy deficient and import of energy in the form of crude oil & petroleum products and also coal will continue Efforts at managing energy demand through rational energy pricing will be especially important in the years ahead.
Non-Commercial Primary Energy Resources6.2 Fuelwood is an important source o f energy for cooking and heating in the rural and, to some extent, in the urban households. The total forest area in the country adds up to nearly 75 million hectares The growth in use o f wood for industry, construction, cooking, etc has exceeded the annual incremental availability of wood firom local sources and social forestry schemes. This has resulted in gradual deforestation with consequent adverse impact on the environment
6.3 Fuelwood is supplemented by dung and crop residues in meeting the domestic energy needs in the rural areas. The aimual availability of wet dung is estimated to be about 960 million toimes. Greater use o f dung cake as a source o f energy reduces the availability of dung as a valuable organic manure. Total availability o f crop residues is estimated to be 450-500 million tonnes. The draught animal population in the country has been estimated at 70 million and animal energy continues to be used in agricultural operations and for rural transportation
Commercial Primary Energy Resources
Coal6.4 India accounts for about 0.8 per cent o f the total geological reserves and 5 7 per cent o f the proven reserves o f coal in the world The geological coal reserves in the country are estimated to be about 205 billion tonnes compared to 196 billion tonnes assessed at the beginning o f the Eighth Plan. The proven minable reserves are currently estimated at 72 7 billion tonnes as against 67 billion tonnes at the beginning o f the Eighth Plan
Lignite6.5 Since the Seventh Plan, considerable emphasis has been laid on the exploration of lignite especially in the States o f Tamil Nadu, Rajasthan, Gujarat and Pondicherry These States are located at a considerable distance from the coal fields. Lignite reserves are now estimated at 27 45 billion tonnes as against 6.5 billion tonnes estimated at the beginning of the Eighth Plan The lignite deposits have been found suitable for power generation and are already being exploited for this purpose in Tamil Nadu.
666

6.6 India has about 0.04 per cent o f the world’s proven reserves of hydrocarbons The prognosticated geological resources of hydrocarbons in the country are tjstimated at 21 31 billion tonnes, o f which 61 per cent are oflfshore and 39 per cent onland Out of this, the geological reserves established are, however, only of the order of 5 .32 billion tonnes; It is assumed that half o f the prognosticated resource represents natural gas, of which only 12 per cent has till now been established As of the beginning of 1995, the balance of recoverable reserves are placed at 732 million tonnes o f crude oil and 660 billion cubic meters o f natural gas
Hydro Power6.7 Based on a systematic survey carried out during the Seventh Plan, the hydro-electric potential in the country is estimated at 600 Bkwh (billion kilowatt hour) per year as against472.15 Bkwh per year assessed earlier. This assessment o f hydro power potential is provisional as further studies are in progress and the estimates could be revised Out of the total potential available, nearly one-fifth has either been developed or is being developed Apart from this, the Central Electricity Authority (CEA) had also undertaken extensive studies to identify the sites for the development of pumped storage schemes. Sixty three sites have been identified for this with a probable potential of about 94,000 MW. There exists another 6,780 MW of potential for exploitation through mini/micro hydel schemes. A number of such schemes are under implementation
Nuclear Resources6 8 The country has uranium resources adequate to meet the life-time requirement of the first stage o f nuclear power development programme of 10,000 MW Apart from this, there are also large deposits of thorium available in the country. The present estimates show that the known deposits may yield 363,000 tonnes o f thorium oxide. Thorium resources, when used through breeder reactors, may produce 900,000 Bkwh of electricity.
6.9 Table 6 .1 gives the regional distribution of the primary commercial energy resources of the country. It is evident that the distribution of primary commercial energy resources is quite skewed. \^^ereas the Eastern region accounts for nearly 70 per cent of the total coal reserves the Western region has over 70 per cent o f the hydrocarbon reserves in the country. Similarly, more than 70 per cent o f the total hydel potential in the country is located in the Northern and the North-Eastern regions put together. The Southern region, which has only 6 per cent of the coal reserves and 10 per cent o f the total hydel potential, has most of the lignite deposits occurring in the country.
Table 6.1
Oil and Natural Gas
RegionCoal
(BMT)Lignite(BMT)
Crude Oil (MMT)
Natural Gas(BCM)
Hydro Power\ t w h )
Northern 1.1 1.1 - 4 225.00
Western 48.2 0.5 584 497 31.40
Southern 13.1 25.9 - - 61.80
Eastern 141.4 - ■ - 42.50
North-Eastern 0.9 - 148 159 239.30
Total 204.7 27.5 732 660 600.00
6.10 In addition, there also exists the potential o f coal bed methane, oil shale and gas hydrates in the country. As per the present estimates available the potential is placed at 850 billion cubic meters of coal bed methane, 6156 trillion cubic meters of gas hydrates and 600 million tonnes of oil shale.
667

6.11 A lafge potential of non-conventional sources of energy exists in the country These include bio-gas, solar PV and solar thermal, bio-masis gasifier, wind power, small hydro power, bagasse co-generation, etc. Table 6 2 gives the present assessment of the potential of these sources and their status of exploitation.
T able 6.2
Non-Conventional Resources
Source/Technology Potential/Avaiilability
Potential Exploited
Biogas Plants 12 nnillion 2.7 million
Biomass-based power 17,0(00 MW 69.5 MW
Efficient Woodstoves 120 milhon 20 million
Solar Energy 5x10'* Whr/yr 25 MW
Small hydro 10,0(00 MW 250 MW
Wind Energy 20,0)00 MW 1,000 MW
Ocean Thermal 50,0)00 MW
Sea Wave Power 20,CXX) MW
Tidal Power 9,000 MW
6.12 Even though the size of primary co>nmiercial energy reserves appears fairly large, their availability in per capita terms is quite modetrate on account of the large population of the country. If no significant ad^tions to reserves are nnade in the future, the per capita availability is going to decline further in the wake of rising p«opulation. Table 6.3 gives the details of per capita reserves and reserves to production (R/P) ratios of some of the conventional sources of energy as well as the major implications associated with development of these forms of energy sources
Table 6.3Per Capita Availabili ty o f Commercial Energy Resources
Availability Rt/PImplicationsResource
Total Per capitaRLatw
Coal 72BMT 76 Tonnes 90 Moderately high R/P, Land degradation/ Resettlement constraints/ Need for Large Imports Soon
Oil 0.8 BMT 0.8 Tonne 21 Low R/P, Large Imports Necessary
Gas 660 BCM 700 cm^ 30 Low R/P, Large Imports Necessary
Hydro 600 TWH 631 KWh Large Untapp>ed Potential, Environmental, Resettlement Constraints, Need for Large Investments
Nuclear 350,000Mwe*
- Large Potential, Technology / Safety Issues and Need f«- Large Investments
*Incliidiiig Thcxiuin Resources
6 6 8

6.13 Over the last five decades the country has takem major strides in stepping up the production o f commercial energy as shown in Table 6.4.
Table 6.4JTrends in Production of Primairy Commercial Energy_____________
Trends in Commercial Energy Production
Units1950-51 1960-61
Production1970-71 1980-81 1990-91 1996-97*
CoalLignite
Crude Oil Natural Gas Hydro PowerNuclear Power
Wind Power
MMTMMX
MMTMCMBkWhBkWhBkWTi
33 j 55.67 0.05
0450.26
2,52 7 84
72,95 114.01 211,73 288 653 39 4.80 14,07 22,54
6 82 10 51 33 02 33,871445 2358 17998 22890
25,25 46.54 71 66 68 632.42 3 00 6 14 9 01
- - 0,03 0,85* Provisional
6 14 , Coal continues to be the main source of primiary commercial energy not only for direct energy use in industry but also for indirect energy luse through power generation Concerted efforts made in exploration and development of hydr ocarbons has led to a significant step-up \n the production of oil and natural gas However, in recent years, the production of crude oil has been stagnating. The hydro-electric generation has ahso increased significantly There have been additions to nuclear power generation capacity as we;ll as power generation from nuclear power plants. The wind power generation has also picked usp significantly during last five years
6.15 As shown in Table 6 5 the share of commerciail energy in total primary energy supply has increased substantially fi'om 28 per cent in 50s to 6>6 percent in 1996-97 The share of noncommercial fuels has declined fi'om 74 per cent in 1950-51 to about 34 per cent in 1996-97 Fuelwood accounts for nearly 65 per cent of the totial non-commercial energy consumed in the country. Of the indigenous primary commercial ener gy production, the relative share of oil and natural gas has increased fi-om 1.2 per cent in 1950-5il to 27 9 per cent in 1996-97, the terminal year o f the Eighth Plan. The share of coal which wais 98% in 1950-51 has declined to 64 6 per cent in 1996-97. The changes in the pattern o f primairy energy supplies are shown in Table 6 5
669

Table 6.5Changes in the Pattern of Primary Energy' Supply
(MTOE)Prodiiction
1953-54 1960-61 1970-71 1980-81 1990-91 1996-97Commercial Primary EnergyCoal 23.62 35.64 36 48 56.96 94.68 124 09Lignite - 0.01 0.81 1.23 3 34 6 05Crude Oil 0.19 0.46 7.01 10.79 33.92 34 78Natural Gas - - 0.60 1 41 11.73 18.89Hydro Power 0.24 0.67 2.17 4.00 6 16 5.90Nuclear Power - - 0.63 0.78 1.60 2.35Wind Power - - - - - 0.07
Total 24.05 36.78 47.67 75 19 151.43 192 13Net Imports 2.20 6.04 12.66 24.63 31.69 62.29St. Changes (-) 0.24 2.87 069 3.80 5.37 7.83Intl. Bunkers (-) 0.53 0.50 0.24 0.21 0.14 0.16Total Commercial Energy Supply
25.48 39.45 59.40 95.81 177.61 246.43Non-Commercial Primary Energy Supply
64.13 74.38 86.72 108.48 122.07 127.51Total Primary Energy Supply
89.61 113.83 146.12 204.29 299.68 373.94
6.16 Fuelwood accounts for nearly 65% of the total non-commercial energy use in the household sector. In absolute terms, the consumption of fuelwood is estimated to be 161.4 million tonnes in 1996-97 The consumption of dungcake and crop residue is estimated to be 88 6 million tonnes
Primary Energy Imports6.17 The country is not self-sufficient in oil and oil products and the import dependence of the country for oil has been increasing over time The degree of self-sufficiency in oil which was around 35 per cent in 1975 has been increasing upto 1984-85 and was the highest at 70 per cent during that year. It has started declining thereafter in the wake of decline in indigenous productioh o f crude oil and rising demand for petroleum products In addition to POL imports, imports of superior quality coal are needed for use in the steel industry Imports of coal touched the 10 million tonnes mark in 1996-97. A limited quantity of electricity of around 1.5 billion units per annum is also imported from Bhutan. As shown in Table -6 6 the share of primary energy imports fii total primary commercial energy supplies in the country increased from 8 63 percent in 1953-54 to 25 .28 in 1996-97. Import dependence o f POL declined in the 1980s, because of the impact o f Bombay High oil production but it has started to increase again in the 1990s as domestic oil production has stagnated.
670

Table 6.6 Share of Net Energy Imports in
Primary Commercial Energy Supply(% )
Year Coal POL Electricity Total
1953-541960-611970-711980-811990-911996-97
(-)5.02 (-)2.08 (-)0 40
0.25 2 22 2,83
13,6517.39 21,71 25 45 15,5622.40
0 07 0 05
8,6315. 31
21 . 31
25 70 17,85 25,28
Pattern and Growth of Final Energy Consumption6,18 The total final energy consumption in the economy has increased from 84 5 MTOE in 1953- 54 to 290 ,4 MTOE in 1996-97 at an implicit rate of growth of 2 91% per annum compound The share of commercial energy in the final energy consumption has increased fi-om 24 1% to 56 1% during this period whereas that of non-commercial energy has declined from 75 9% to 43 9 percent The changes in the relative shares of commercial and non-commercial sources in the primary' energy supplies and the shares of different sources in the final commercial energy consumption are shovvn in Table 6,7,
Table 6.7Changes in Pattern of Energy Consumption
( % )
YearPrimarT Enerev Final Commercial Energy
Commercial Noncommercial
Coal Pet, Prod, Nat, (las Hlectncit\ Total
1953-54 28,4 71,6 80 1 16 7 0 ,0 3 2 1 00 ,0
1960-61 34,7 65 3 75 3 19 9 0 0 4,8 100 0
1970-71 40 6 59,4 56 1 34,1 0 6 9,2 1 0 0 ,0
1980-81 46,9 53 1 47,9 40 3 11 10,7 1 0 0 ,0
1990-91 59,3 40,7 35,9 43 6 5,5 15,0 100 0
1996-97 65 9 34,1 28,9 47,7 6,3 17 1 100 0
6 19 As may be seen from Table 6 7, the share of coal is declining in the final commercial energy consumption whereas that of oil & gas and electricity is increasing Oil and gas accounted for nearly 54% of the total final commercial energy consumption in 1996-97 Since these figures relate only to final energy consumption, only the direct use of coal, oil and natural gas in industry, households, transport sectors, etc, has been considered The use of these energy sources for indirect use through power generation is not included Presently, about 71% of total coal consumption and 30% of total natural gas consumption is used for power generation
6 20 Table 6 8 shows the changes in the relative shares of the different sectors in final commercial energy consumption over the years
571
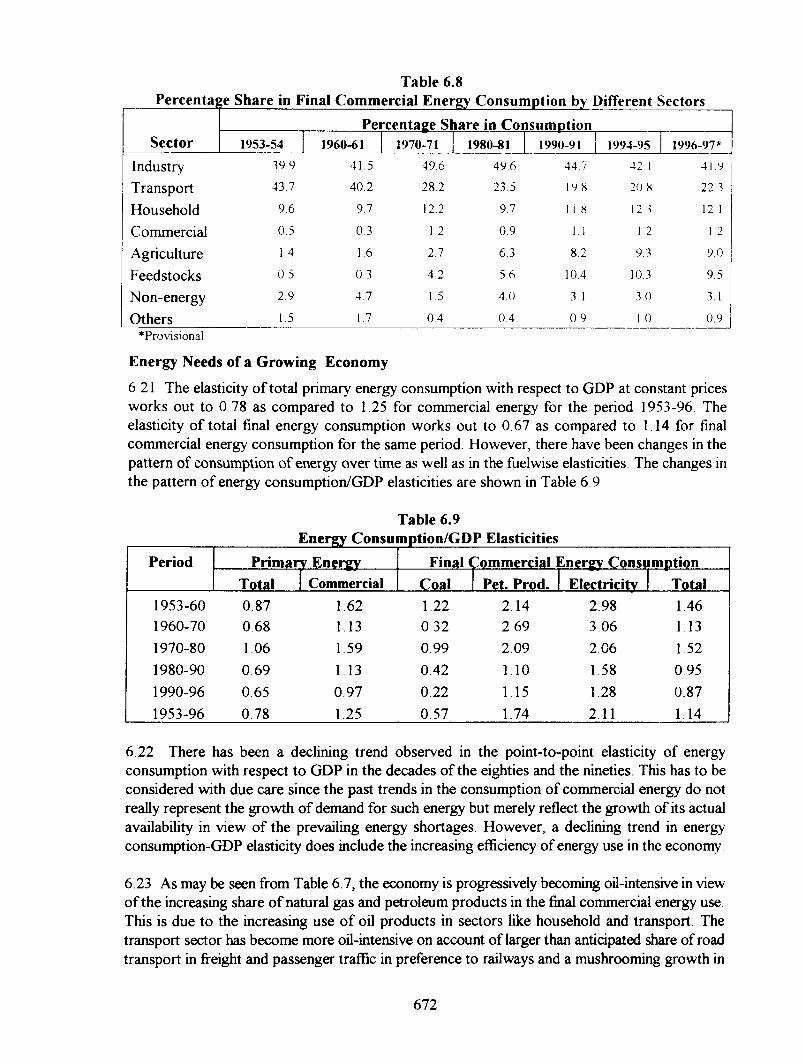
Table 6.8Percentage Share in Final Commercial Energy Consumption by Different Sectors
Sector 1953-54Percentage Share in Consumption
1960-61 1970-71 1980-81 1990-91 1994-95 1996-97*
IndustryTransportHouseholdCommercialAgricultureFeedstocksNon-energyOthers
39.9
43.7
9.6
0.5
1.4
0.5
2.9
1.5
41.5
40.2
9.7
0.3
1,6
0.3
4.7
1.7
49.6
28.2
12.2
1.2
2.7
4.2
1.5
0.4
49.6
23.5
9.7
0.9
6.3
5.6
4.0
0.4
44 7 19,8
I 1.8
1,1
8.2
10.4
3.1
0.9
41.9
22.3
12.1
1.2
9.0
9,5
3.1
0,9♦Provisional
Energy Needs of a Growing Economy6 21 The elasticity o f total primary energy consumption with respect to GDP at constant prices works out to 0 78 as compared to 1.25 for commercial energy for the period 1953-96 The elasticity o f total final energy consumption works out to 0 67 as compared to 1 14 for final commercial energy consumption for the same period. However, there have been changes in the pattern of consumption of energy over time as well as in the fiaelwise elasticities The changes in the pattern o f energy consumption/GDP elasticities are shown in Table 6 9
Table 6.9
Period Primarv Enercv Final Commercial Enersrv ConsumotionTotal Commercial Coal Pet. Prod. 1 Electricity 1 Total
1953-60 0,87 1,62 1.22 2.14 2,98 1 461960-70 068 1,13 032 2 69 3 06 1 131970-80 1.06 1.59 0,99 2.09 2.06 1.521980-90 0.69 1.13 0,42 1.10 1,58 0.951990-96 0.65 0,97 0,22 1 15 1.28 0.871953-96 0,78 1.25 0.57 1,74 2.11 1,14
6 22 There has been a declining trend observed in the point-to-point elasticity of energy consumption with respect to GDP in the decades o f the eighties and the nineties. This has to be considered with due care since the past trends in the consumption of commercial energy do not really represent the growth o f demand for such energy but merely reflect the growth of its actual availability in view of the prevailing energy shortages. However, a declining trend in energy consumption-GDP elasticity does include the increasing efficiency of energy use in the economy
6 ,23 As may be seen fi"om Table 6.7, the economy is progressively becoming oil-intensive in view o f the increasing share o f natural gas and petroleum products in the final commercial energy use This is due to the increasing use o f oil products in sectors like household and transport. The transport sector has become more oil-intensive on account of larger than anticipated share of road transport in fi-eight and passenger traffic in preference to railways and a mushrooming growth in
672

personalised transport modes like cars and 2-wheelers. The trends in the relative shares of oil products like LPG, SKO, MS, and diesel during the last three decades are shown in Table 6 10
Table 6.10Share of LPG, SKO, MS and Diesel in POL Consumption
Percentage Share in Consumption (excludino RBF)1970-71 1980-81 1990-91 1996-97
LPGSKOMSDiesel
Total
1.0
18 3 8 1
27.5 54.9
1.3 13 7 4 9
37 1 57.0
4 4 15 3 6 4
41 1 67.2
5 4 12 8
6 3 45 9 704
6 24 The share of the four oil products under consideration has increased from 54 9% in 1970-71 to 70.4% in 1996-97 If these trends continue in fijture as well it will give rise to severe balance of payments problems since all these products, except motor spirit, in addition to crude oil are imported at the margin Increase in dependence on oil for meeting the final energy needs of the economy results in a heavy outgo of foreign exchange as is indicated in Table 6 11
Table 6.11Share of POL imports in Total Imports and Exports
(Rs Billion)
Year Net POL Imports
TotalImports
TotalExports
Net POL Imports as % of Total
Imports Exports1970-71 1.3 16.3 15 3 8 1 8 61975-76 124 52.7 40.2 23 6 30 81980-81 52.6 125.5 67 0 41 9 78.41985-86 43.2 196 6 102.5 22 0 42.11990-91 97.7 431.9 325.5 22.6 30.01994-95 162.5 899 7 826.7 18.1 19.7
Long-Term Energy Scenario - Some Key Issues6 25 Based on end-use analysis and past income elasticities, it is estimated that the requirement for primary energy is likely to increse from 374 MTOE at the end of Eighth Plan to around 475-
500 MTOE by the end of the Ninth Plan i .e an annual growth rate of 4 9% Of this, the share of commercial energy is expected to increase from 66 percent at the end of Eighth Plan to 75 percent at the end o f Ninth Plan while that of non-commercial energy will decline from 34 percent to 25 percent The annual growth rate of commercial energy is therfore 6 8%
6.26 The energy import dependence is also expected to increase from about 25 percent at the end o f Eighth Plan to 28 percent at the end o f Ninth Plan This raises the issue of enegy security In view of stagnant domestic oil production, higher oil imports appear inevitable Uncertainties regarding prices and availability make the developing countries like India more vulnerable than the developed countries. Both refining and marketing operations have been opened to the private
673

sector. A new exploration licencing policy for making exploration and production competitive has been announced. The growing requirement of coal and the inability of the domestic production to meet this requirement may necessitate increased imports of coal even for power generation Allowing the entry o f private sector in coal production, without the captive consumption restriction, will go a long way in increasing the availability of coal.
6.27 The need for energy conservation and other demand management measures can not be over-emphasised. Some efforts are already being made in this direction However, the results achieved have not been to the desired level. There is a need for R&D and technology development in this field also
6.28 The demand for oil is increasing faster than the addition to hydrocarbon reserves in the country. The efforts made during the last few years by the oil industry have not yielded the expected results. There is a need for enhancing the pace of exploration and development in the hydrocarbons sector in order to add to the recoverable resources Concerted efforts are required in this area through the adoption of better techiiiques of oil exploration Similarly, adoption of latest technology would also improve the recovery from existing wells
6.29 Indian coal is not of a very good quality as the ash content of the coal is very high This not only leads to difficulties in utilisation but also generates larger quantities of fly ash, management of which becomes a difficult problem. Clean coal technologies are a must in order to reduce the detrimental environmental effects associated with high- ash coal utilisation Also, there is a need for induction of improved mining technologies in order to mine coal from lower seams which will help improve the quality of coal
6.30 The key issues facing India which have energy implications are, therefore, rising population, need for economic growth, access to adequate commercial energy supplies and the financial resources needed to achieve this, rational energy pricing regime, improvements in energy efficiency of both the energy supply and consumption, technological upgradation, a matching R&D base and environmental protection
Investment on Energy Supply System6.31 Energy is a capital intensive sector. Large investments are required to be made for meeting the rapidly growing demand for energy from different consuming sectors The relative share of expenditure on energy sector in the total Plan expenditure / outlay during successive Five Year Plans is shown in Table 6.12.
674

Table 6.12
Plan PeriodPlanExpend.(Rs.Cr.)@
Share of Energy Sector (%)
Power Oil/Gas Coal NRSE Total
First 1951-56 1,960 - - - - 19 7Second 1956-61 4,670 9,7 0 8 1,9 - 12,4Third 1961-66 8,580 14,6 2 6 13 - 18 5Fourth 1969-74 15,780 18 6 19 0 7 - 21,2
Fifth 1974-79 39,430 18,7 3 6 2 9 - 25,2Sixth 1980-85 109,290 16 7 7.8 3,5 0,1 28,1Seventh 1985-90 220,220 17 4 7.3 3,2 0,3 28,2Eighth* 1992-97 434,100 18 4 5,5 2-4 0,2 26 5
* Outlay'2: Expenditure at current price at tJie base ye:ir of the respectn e Plans.
6 32 The share of energy sector in the total public sector outlay has been increasing over the various Plan periods with the pov/er sector accounting for the major part Further in the Ninth Plan, a major thrust will be given to infrastructure development, particularly energy and power, and public expenditure in the sector would be enhanced.Energy Pricing6 33 The principles of pricing adopted for energy products have greatly influenced the pattern of growth of the energy sector in the country. The economic implications of energy pricing are multi-dimensional Firstly, they have a direct bearing on the efficiency of allocation of resources within the energy sector as well as in the overall framework of the economy This includes the impact of energy prices on inter-fiiel substitution. Secondly, the end-use efficiency in the sector is irectly influenced by energ>' prices Pricing of resources that are used in energy production is also important in view of the efficient use of these resources Thirdly, the pricing system determines the viability of the sector and its financial autonomy. Finally, in a country where income disparities are wide, energy prices could lead to distributive implications unless adequate safeguards are built in.
6.34 Until recently the prices of commercial energy sources in the country were entirely administered. The basic approach was to arrive at a retention price that will permit full recovery of the average costs and allow a reasonable rate of return on the capital employed in the industry However, this system did not always work in this manner and there was a tendency to under price both coal ind petroleum. There is an urgent need for dismantling the administrative pricing regime. More recently there has been a move to deregulate energy prices and shifting to market- based pricing. Where subsidies are necessary, they should be transparent and well focussed
6.35 There has been a growing concern about the subsidies, both direct and hidden Fixation of administered prices is often done in not so transparent a manner and it also ignores sound economic principles on eflBciency and sometimes on equity grounds. These subsidies have tended to be open-ended and have accrued to those who were not envisaged to be the real beneficiaries
675

6.36 At present, over 60% of the oil requirement is met from imported sources. As a result, petroleum products account for the outgo of a large proportion of the total exports earnings of the country in foreign exchange In 1996-97, India imported crude oil and petroleum products worth $9 3 billion (Rs.31,000 crore) The degree of self-sufficiency (measured as the ratio between indigenous production of crude oil and consumption of petroleum products in the economy in crude oil equivalent terms) is currently about 38 percent The level of exports earnings will have to increase in a sustained manner to pay for the energy imports pailicularly in view of the increase in the requirements of oil products and near stagnation in indigenous production o f crade oil
6 37 Energy conservation has received considerable attention since the first oil shock in 1973 The Fuel Pohcy Committee (1974) and the Working Group on Energy Policy (1979) had laid emphasis on the need for energy conservation The Report of the Inter-Ministerial Group on Energy Conservation in 1983 examined specific areas of energy conservation in different sectors The Advisory Board on Energy (ABE) had recommended the setting up of a National Energy Conservation Organisation (NECO), backed by comprehensive legislation on energy conservation. The Petroleum Conservation Research Association (PCRA) under the Ministry of Petroleum & Natural Gas has done pioneering work in bringing about general awareness of the need to conserve the use of oil The Department of Power set up the Energy Management Centre to undertake studies and suggest an action plan for energy conservation and more efficient use of energy Energy audits are being carried out in a number of industries There has been some improvement over the years in the efficiency of use of commercial energy in several sectors of the economy Table 6 13 below gives the energy savings potential for some sectors in comparison with the international consumption levels
Energy Conservation
Table 6.13Energy Savings Potential in Selected Industries/Sectors
India World
Industry (GCalyTonne)Aluminium 14 55 12 35Steel 8 to 9.55 4.0Cement 1.0 0 8Transport(Saving (%) 80% per tonne km. If freight moved from road to railUrban Transport For every 1 tonne of petrol
Saved, 0 33 tonnes of HSD is Required (savings 67%)
AgriculturePump Sets 30%DomesticCFL Vs Filament lamp 76%
6 38 The actual realisation of this potential will depend on policies including pricing both for energy products as well as for end-use equipment/devices and on institutional changes that take place in the energy sector
676

6 39 Often, the use of energy is accompanied by adverse impact on environment and ultimately on the human health Combustion of fossils fuels generates gases and contributes to atmospheric pollution The major source of such pollution is fiael combustion in power plants and industry as well as in motor vehicles, which result in the deterioration of the ambient air quality Inefficient chullahas in the household sector result in indoor air pollution which is damaging to the health particularly of the women. It therefore, becomes imperative that the future energy strategy should try to meet the requirement of energ>', particularly that o f the poor without having an adverse impact on environment and in a cost-effective manner Greater penetration by improved chullahs will help in achieving this objective
6 40 Energy issues will have to be analysed more from the efficient end-use and service point of view rather than merely aiming at augmenting the supply Such an approach would take into account the possibility o f improvements in the efficiency of energy production and use so that it is possible to continue the growth process on a sustainable basis
Energy Sector Reforms6 41 The most recent series of policy changing in the Energy Sector were mitiated in the year 1991 vide Industrial Policy Resolution announced in that year The policy to promote private participation in the Energy Sector programmes is guided by the need for additional investment and competitiveness Environmental management, protection conservation of the natural resources has also emerged as a key priority in the reform process in the Energy Sector in functional terms
Power Sector Reforms6 42 The Power Sector Reforms included functional reforms in the form of investment promotion, structural reforms in the form o f unbundling the existing vertically integrated monopoly and separate generation, transmission & distribution activities for rationalising their management; setting up of Central & State level Electricity Regulatory Commissions etc Various tax incentives, a certain assured rate of return to the investors have been granted Liberalised tariff reforms for hydro electric projects have also been notified This has been discussed in details in the Chapter on Pow er
Coal Sector Reforms6 43 These include permitting private sector in commercial coal mining by the required legislative amendments, offering coal blocks both for exploration and mining on competitive bidding basis, deregulation of coal prices, setting up of regulatory authority, re-structuring the coal sector by giving full autonomy to the various coal producing companies of Coal India Limited (CIL) and doing away with the concept o f holding company, accelerating the efforts for exploration o f coal deposits etc
Petroleum Sector Reforms6 44 Functional Reforms in the form of investment promotion have concentrated on private participation in upstream and downstream activities Both refining and marketing operations were opened to private sector A package has been formulated to attract private investment in the exploration of oil and gas which includes attractive fiscal concessions. A new exploration licensing policy for making exploration and production competitive has also been announced Setting up o f refineries in the private and joint sector have also been permitted. The structure reforms is being considered in the form of regulatory mechanism to a co-ordinated approach at the national level
Energy and Environment
677

6.45 Along with promoting the role o f market forces in the energy sector, this sector also has a role in promoting iiuman and social development This is particularly relexant in the Indian context where there exists considerable poverty, ill-health, illiteracy, etc
Energy Strategy' for the Future
6.46 The energy' strategy for the future could be divided into short-term strategy, medium- term strategy and long-term strategy The various components o f short/medium term-strategv could be -
Rationalising the tariflf structure of various energy products. particularK the prices charged by the State Electricity Boards (SEBs) from the various categories o f consumers This is an important component, if not a pre-requisite for the re-stnicturing of the SEBs in ordei that they become bankable and credit-worthy The SEBs ha\ e to be re-structured so as to permit them to operate on commercial lines.
Dismantling o f the .Administered Pricing Mechanism (.A.PM) in a fairly short time-frame Strengthening o f the institutional reforms that iia\e been initiated dunng the L-.iglith Fi\e Year Plan e g deregulation, etc An optimum utilisation o f existing assetsEfficiency in production system and reduction in transformation losses, including ihtise in traditional forms o f energ\' sourcesPromoting the R&D, transfer and use o f technologies and practices for en\ ironmenialK sound energy svstems, includitig new and renewable energy st)urces Improving energy efFiciency in accordance with national socio-economic and environmental prioritiesPromoting appropriate energy efficiency and emission standards to reduce adx ersc impact on the environmentEstablishing or enhancing, as appropriate and in cooperation w ith pri\ ate sector, labeling programmes for products to provide decision makers and consumers with infortnation on opportunities for energy efficiencyAdoption of energy-efficient technologies in major energy-intensive industries like iron, steel, chemicals, petroleum, pulp paper and cement.
6.47 The energy challenges need to be tackled in such i way that social, en\ ironmental. economic and security problems are ameliorated and not aggravated, as is typicalK the case with conventional energy strategies which either ignore these problems or do not deal with them adequately. Therefore, in the medium to long-term, it is necessary to adopt measures that will reduce the energy intensity o f the economy, some o f w hich are listed below
Demand management through greater conserx ation o f energ\. ciptimum fuel mix. structural changes in the economy, an appropriate modal mix in the transport sector, i.e greater dependence on rail than on road for the nun emeiit o f goods and passengers and a shift away from pri\ate modes to public modes tor passenger transport, greater reliance on co-generation. rec\cling. changcs in design o f different products to reduce the material mtensit\- o f those products etc
There is a need to shift to less energy-intensive modes of transptirt This would include measures to improve the transport infrastructure \ iz roads, better design o f vehicles, use o f Compressed Natural Gas (CNG) and s\nthetic I'uel etc Similarly, better urban planning would also reduce the demand tor cnerg\ use in the transport sector
67S

There is a need to move away from depletable to inexhaustible resources viz solar, wind, biomass energy, etc.
Greater emphasis has to be laid on the exploitation of hydro-electric power, particularly for meeting peak demand.
Greater attention will have to be paid to research, development, transfer and use of energy- efficient technologies and practices in the supply as well as end-use sectors. Attention will also have to be paid to factors like rehabilitation of displaced people, Environmental considerations, etc while adopting these technologies
6.48 From the above, it is evident that the demand for energy registered a high rate of growth, contributed largely by the rising population, rapid urbanisation, increasing income levels, changing life styles and structural changes in the economy To some extent, subsidised prices of certain forms o f energy also led to end-use inefficiencies and, consequently to an increase in the energy demand. The development of some of these energy resources is also beset with serious environmental implications. In the sections that follow, the various sources of energy viz coal, oil, electricity as well as issues relating to conservation etc are dealt with in greater detail
POWER SECTOR
6.49 Electricity is one of the key inputs for the overall socio-economic development of the country The basic responsibility of the power supply industry is to provide adequate electricity at economic cost, while ensuring reliability and quality of the supply Despite significant progress in capacity addition since Independence, the demand for electricity continues to outstrip the supply with the resuh that energy and peaking shortages continue to plague the economy With the increasing pace of economic developm.ent facilitated by the reforms initiated by the Government, the demand for power in both rural and urban areas is likely to increase rapidly in the coming years. The major task of the power sector during the Ninth Plan will, therefore, be to ensure that the anticipated demand is met adequately and in a reliable and cost-effective manner. The capacity addition, both in the public as well as private sector, fell short of the levels envisaged in the Eighth Plan and the total addition has been lower than what had been achieved during the Seventh Plan. It is expected that the impediments to private sector participation in the power sector would have since been sorted out and the public sector investment would be adequately supplemented by capacity additions in the private sector during the Ninth Plan
6.50 The Ninth Plan will lay emphasis on maximising benefits from the facilities already available in the power sector, through improvements in the operational efficiency of the power generation units, an overall reduction in system losses and enhancement in the efficiency of the end-use of electricity. Significant savings could accrue through integrated operations of the State and regional power systems and the Ninth Plan will lay stress on drawing up an active plan to move in that direction. The ongoing projects will be accelerated and completed at the earliest and , finally, the Ninth Plan will provide for advance action to be taken for the Tenth Plan projects with special emphasis on accelerating hydro development during the Tenth Plan onwards to ensure a balanced development o f the power system in different regions
679

6.51 The Public sector will continue to contribute significantly to capacity additions and substantially to transmission and distributiori during the Ninth Plan This would be made possible through reforms of power utilities, enabling them to mobilise adequate resources for funding their projects. Project implementation and management procedures will also have to be honed up for the power sector in the coming years to play a vital role
REVIEW OF THE EIGHTH PLAN PROGRAMME
Generation6.52 The gross energy generation from utilities at the beginning of the Eighth Plan w'as 286 7 Billion Units (BU). The Eighth Plan envisaged a gross energy generation requirement of 418 2 BU from utilities in the terminal year of the Eighth Plan i e 1996-97 As against this, the energy generation during the year 1996-97 was 394 5 BU. This works out to a compound growth rate o f 6.59 % during the Eighth Plan The slippage of 23 7 BU is mainly attributable to shortfall in generation in hydro and nuclear sectors
Capacity Addition6.53 The all -India installed generating capacity in Utilities at the beginning of the Eighth Planwas 69,065 MW. This comprised 19,194 MW of hydro, 48.086 MW of thermal (including 3095 MW o f gas based capacity) and 1,785 MW of nuclear The Eighth Plan programme envisaged a capacity addition o f 30,538 MW As against this, 16422 6 MW was added during the Eighth Plan. The details are shown in Table 6 14 _ _ ____________________________________
Tablo 6.14
A dditions to Instanc'd C apacity during the Eighth Plan
Eighth Plan (1992-97)
Type Target Achievement (MW)
Central State Private Total Central State Private TotalSector Sector Sector Sector Sector Sector
Hydro 3260 5860 162 9282 1465 794.7 168 2427.7Steam 5890 7050 2340 15280 4310 5098 500 9908 0Gas 2608 I960 306 4876 1942 942 5 762 4 3646.9Nuclear 1100 - - 1100 440 440.0
Total 12858 14870 2810 30538 8157 6835.2 1430.4 16422.6
6.54 The actual capacity addition of 16,422 6 MW dunng the Eighth Plan is about 46 percent less than the targeted addition and 23 26 p ercent less than the capacity added during the Seventh Plan. The slippages in the case of hydei capacity are as high as 73 8 percent of the target. The sector-wise percentage slippages are: Central 36 6 percent, State 54 0 percent and Private 49 4 percent. The achievement of 16422 MW dunng the Eighth Plan period represents an addition of 3284.6 MW per annum, compared to t ne targeted growth rate of 6108 MW per annum.

6 55 The main reasons for the shortfall in capacity addition are inadequate fiinding of the State as well as the Central sector projects, procedural delays mainly in land acquisition and environmental clearances, unresolved issues in fijel linkages, contractual failures, suspension of World Bank support and problems/delays in entrusting the projects to the executing agencies etc
Power Supply Position6 56 At the beginning of the Eighth Plan, the energy deficit was 7 8% and peak deficit of 18 8 percent With the targeted capacity addition of 30538 MW the anticipated power supply position assessed by the Central Electricity Authority (CEA) indicated a peaking deficit o f 2 0 7 percent and energy deficit of 9 percent However, at the end of the Eighth Plan period, with the actual capacity addition of 16422 MW, the peak deficit was restricted to 18 0 percent and energy deficit to 115 percent mainly due to a marked improvement in Plant Load Factor (PLF) of the thermal plants
Further Reduction in the Share of Hydro-Electricity6 57 The share of hydel generation in the total generating capacity of the country has declined from 34 percent at the end of the Sixth Plan to 29 percent at the end of the Seventh Plan and further to 25 5 percent at the end of the Eighth Plan The share is likely to decline even fijrther unless suitable corrective measures are initiated immediately Hydel power projects, with storage f'acilities, provide peak time support to the power system Inadequate hydel support in some of the regions is adversely affecting the performance of the thermal power plants In W'estern and Eastern regions, peaking power is being provided by thermal plants, some of which have to back down during off- peak hours.
Increase of Central Share in Total Installed Generation Capacity6 58 The Central sector undertakings viz. the National Thermal Power Corporation (NTPC) and the National Hydro Electric Power Corporation (NHPC) continue to play an important role in adding new generation capacities in different parts of the country The Central share in the total installed generation capacity increased from 25 .6 percent at the end of the Seventh Plan to 3 1 9 percent at the end of the Eighth Plan. It is likely to be around the same level at the end of the Ninth Plan
Performance of Thermal Power Plants6 59 The performance of the thermal power plants in the country registered an overall improvement during the Eighth Plan. The all-India average Plant Load Factor (PLF) of the thermal power plants increased from 55.3 percent at the beginning of the Eighth Plan to 64 4 percent by the end of the Eighth Plan. This is largely attributable to the concerted efforts put in by the Ministry of Power, the Central Electricity Authority, the State Governments and the Utilities The modernisation (Renovation &, Modernisation) programme (Phase-I) undertaken in respect of some of the older generation units in different parts o f the country contributed substantially to the overall improvement in generation during the last few years The R&M programme (Phase-II) taken up during the Year 1990-91 covered 44 thermal power stations comprising 198 units, totaling up to a capacity of 20869 MW The R&M programme specifically aimed at increasing the average PLF by about 4 to 5 percentage points. The progressive addition o f larger sized units in the power system has also contributed to the overall improvement in the performance of the thermal power stations in the country. While this is the position at the national level, the thermal plants in certain regions and States continued to function below satisfactory levels The best performance during the Eighth Plan was observed in the Southern region, followed closely by the Western and the Northern regions The plant performance in the Eastern and the North Eastern regions continued to remain below satisfactory level
6 8 1

6.60 The major portion of the 400 KV transmission network planned to be set up during the Eighth Plan was in the Central sector, while that of 220 KV in the State sector The implementation of the transmission programme during the Eighth Plan has been by and large satisfactory' The details of the targets and achievements during the Eighth Plan in respect of major transmission projects are as in Table 6.15
Transmission and Distribution Facilities
Table 6.15Targets and Achievements during the Eighth Plan in
respect of major transmission lines.
400 KV (ckt km) 220 KV (ckt.km)Sector
Target based Based Targeton annual Achievement On annual Achievementprogrammes Programmes
Central 6126 5949 1896 1727State 5159 5391 12824 13425
Total 11285 11340 14720 15152
In addition to these, 20 Km of 800 KV transmission line was set up in the Central Sector during 1996-97 for the first time in the country.
Transmission & Distribution (T & D) Losses6.61 The T&D losses in the power systems throughout the country continued to remain high during the Eighth Plan The all-India average T&D losses during 1994-95 were reported as 20.85%, thereby achieving a reduction of about one percentage point from the level of 22% at the beginning of the Eighth Plan However, in the absence of satisfactory metering arrangements for agricultural consumers, the level of losses indicated by the States could at best be an estimate of the energy not accounted for in the system including theft of power The continuing high T&D losses could be partly attributed to the low investments made on T&D facilities in different States and the extensive low-voltage distribution network in rural and urban areas These factors have also contributed to the poor quality of electricity supplies in many areas There is a strong case for privatising distribution in order to reduce the present high level of theft and pilferages A beginning can be made by mandatory privatisation of distribution in urban area with population of one million and above.
Policy Initiatives to Encourage Private Sector Participation in the Power Sector6.62 Due to paucity of resources with the Central/State PSUs and SEBs and in order to bridge the gap between demand and availability of power, a policy to encourage private sector participation was initiated in 1991 with the objective of mobilising additional resources for power generation, transmission and distribution. The legislation governing the electricity sector was amended in 1991 to facilitate the raising of capital fi-om domestic and foreign markets and to provide a more liberal, financial and legal environment to allow the private investors to set up generation capacities or operate as Licensee (Distribution) companies, which was hitherto a monopoly of the SEBs or public sector undertakings
682

6 63 Private investors are now allowed to set up generation capacities which would supply power m bulk to the grid These companies can also supply power directly to consumers with the concurrence of the State Governments. A two-part tariff notification governs the tariff for supply of power by the generating companies The policy permits private developers to set up power projects of any capacity and of any type (coal, gas, wind or solar) The policy also allows liberal capital structuring and an attractive return on investment Considering that the coal resources are concentrated in certain parts o f the country, a policy has also been evolved to facilitate the setting up of large-sized power plants located at pitheads in the country, in order to derive the benefits of economies of scale Mega projects, having a capacity of lOOOMW and above and supplying power to more than one State, would be identified by CEA, the Feasibility Reports prepared by NTPC and POW'^ERGRID would facilitate the selection of investors and finalisation of the transmission details.
6 64 The Government has been simplifying the procedures for clearances of the projects A notification was issued in September, 1996 enhancing the limit of capital expenditure of schemes requiring the concurrence of the Central Electricity Authority from Rs 400 crore to Rs 1000 crore in the case of generating station schemes to be set up by Independent Power Producers (IPPs) selected through the process of competitive bidding In the case of projects on the MoU/LoI route, the Government has clarified that Engineering, Procurement, and Construction (EPC) contracts have to be finalised by the promoter on the basis of International Competitive Bidding Further, two-stage clearance viz In principle' clearance, followed by techno-economic clearance (TEC), has been introduced Administrative clearance has been a serious impediment in the implementation of the project. Such bottleneck, wherever exists, needs to be removed in order to expedite project completion.
6 65 Besides promoting conventional power projects, the ‘Private Power Policy ‘ addresses other possibilities o f augmenting power generation through improved productivity and efficiency such as captive and co-generation plants, renovation & modernisation etc
6.66 The Government of India has made competitive bidding mandatory for the development o f new power projects. Though the process o f bidding is quite complex and requires a lot of preparatory work to be done before bids can be initiated, it is encouraging to note that the State Governments have adapted to the needs of the bidding process quite well In all, neariy 127 expressions of interest have been registered, aggregating to proposed investment of neariy Rs. 250,000 crore for setting up over 69000 MW of installed capacity Presently, there are about14 projects (costing more than Rs. 1000 crore) on the bidding route with proposed installed capacity o f 9353 MW, involving an investment of about Rs 30,917 crore The progress of the private power projects on the negotiated routes has also been quite significant Of the total 95 projects on the negotiated route, some projects require the Central Electricity Authority's techno- economic clearance (costing more than Rs. 1000 crore). In all, 29 of these project proposals have been accorded techno-economic clearance by the CEA while 68 have been given in principle' clearance, which include negotiated and bidding routes Besides the projects requiring CEA's techno-economic clearance, there is a very large number of projects, both on the competitive bidding route and the MoU/Lol route (costing less than Rs 1000 crore) which are being processed at the State level
683

6 67 The existing policy structure does not adequately address certain issues For instance, there has been less than satisfactory response in the area of hydro power development Only 29 expressions of interest for hydro power development of 12,780 MW capacity ̂have been received The lack of the desired level of response is believed to be mainly on account of hydrological and geological risks associated with hydro projects The existing policy needs to be suitably modified to facilitate greater flow of investment in hydro, R&M and T&D In addition the Ninth Plan should continue to lay emphasis on public sector investm.ent in these areas
Financial perform ance of the SEBs
6 68 There has been a significant improvement in the physical performance of the SEBs during the Eighth Plan period While the PLF of the thermal plants under SEBs improved from 50 6 percent in 1991-92 to 60 3 percent in 1996-97 and the specific oil consumption declined from 7 8 ml/Kwh in 1992-93 to 5 8 ml/Kwh in 1996-97, the T&D losses continued to remain high during the Eighth Plan period The financial performance of SEBs has also deteriorated over the period This can be seen from the Table 6,16:
Table 6.16 Financial Performance of the SEBs
Year Commercial losses (Rs. crore)
ROR(% ) Net l.R . 1 (Rs. crore) |
1992-93 (Actual) 4560 (-)12,7 (-) 161,5 I
1993-94 (Actual) 5888 (-)13,3 (-)1036.51994-95 (Actual) 6643 (-)144 (-) 103,21995-96 (Actual) 8324 (-)15 1 (-) 735,7 ;1996-97 (RE) 9453 (-)17,2 (-)2807,9 !
Total (Anticipated) 34868 (-)4844,8i
6 69 The commercial losses without subsidy increased from Rs 4117 crore at the beginning of the Eighth Plan to Rs 9453 crore at the end of the Plan, The ROR for the year 1996-97 was (-) 17 2 percent. The tariff charged on electricity on an average remained below the average cost
o f supply The gap was 37 paise in 1996-97 Agriculture and domestic sectors continued to be subsidised heavily. The average tariff charged from these categories was 21 paise and 92 paise respectively in 1996-97, compared to an average supply cost of 186 paise The hidden subsidy for the agriculture and domestic sector in 1996-97 according to the Revised Estimates was Rs 19,862 crore and is projected to further go up to Rs 23,010 crore in 1997-98 The subsidy for agricultural sector alone is Rs 15,628 crore in 1996-97(RE) and estimated to be Rs 18296 crore in 1997-98 If the agricultural tariff is increased to minimum of 50 paise per unit, the additional revenue mobilisation in 1997-98 would be of the order of Rs 2418 crore On the other hand, industrial and commercial categories partly cross subsidise the losses on account of sales to agriculture and domestic categories.
Plan expenditure during the Eighth Five Year Plan
6 70 .\n analysis of the Plan expenditure on the basis of actuals for 1992-93, 1993-94 and 1994- 95 (for Central/State & UTs) and the actual revised estimates for 1995-96 and 1996-97 for the Central sector and the revised estimates for the 1995-96 & 1996-97 for the State sector reveals the followln^
684
6 71 The actual expenditure on power by the Central sector during the Eighth Plan accounted only for 76 21% of the approved Eighth Plan outlay at constant prices and 99 45° o at current prices The estimated Net Budgetary- Support (GBS-External aid) during the Eighth Plan was Rs 4593 40 crore, which works out to about 102%, (at constant price) and about 134% (at current price) of the approved amount of Rs 3441 crore The major shortfall in the Central sector was due to non-mobilisation of resources through I R and Bonds and delay in the clearance of projects such as Chamera II, Talcher II etc
State Sector6 72 The Plan expenditure for the State sector during the Eighth Plan was 71 26“ o of the ap oved outlay at constant prices and 93 08% at current prices The major shortfalls were in the States of Assam, Bihar, Haryana, Meghalaya, Orissa and Uttar Pradesh The areas most atlected by the shortfalls were transmission and distribution
NINTH PLAN
6 73 The Ninth Plan priorities are as follows:
* Accelerated completion of the ongoing projects and initiation of measures to i'aciVitate investment in new projects
* Maximisation of benefits from the existing plants by improving their operational efficiency and capacity utilisation, improvement and augmentation of T&D network and dealing effectively with the problem of T&D losses and theft of power
* Facilitating the setting up of appropriate institutional and legislative mechanism for reforms and restructuring of the power sector which would act as a catalyst in improving the capabilities of power sector Utilities for undertaking long-term investments as vv̂ ell as leverage funds from the private sector for the development of the power sector For this purpose long term funds in the national and international market will be accessed for augmenting public expenditure to give a fresh impetus to growth.
* Greater emphasis by both the public and the private undertakings in generation, transmission and distribution sectors for improving the reliability and quality of power supplies to the consumers in different parts of the country and for increasing access to electricity in rural areas Special emphasis will be placed on accelerated electrification of the remaining villages v îth due attention to decentralised energy resources
* Undertaking advance action on hydel projects to improve the hydro-thermal mix by the end of the Tenth Plan and revamp the existing institutional structure and financing arrangements which are not presently conducive for hydro projects development A suitable policy for development of hydro projects needs to be formulated. In addition hydel projects would require enhanced budgetary support from the Government.
Central Sector
685

* Emphasis on the setting up of high capacity inter-regional transmission hnks to facilitate evacuation o f power from pit-head Mega projects envisaged during the Ninth and the Tenth Plans
* Facilitating gradual shifting from the State/Regional grid-based operations to an integrated National Grid.
* Simplification and streamlining of the procedures for clearances and investment decisions in the public sector.
* Encouragement to captive and co-generation power plants to supplement the capacity addition programmes envisaged in the Ninth Plan
Capacity Additions Required During the Ninth Plan6.74 According to the 15th Electric Power Survey, the electricity requirement at busbar (utilities only) in 2001-02 will be as in Table 6.17
Table 6.17Demand for power in 2001-02 as per 15th EPS
Region Energy Requirement Peak Load(MKWh) (MW)
Northern 181649 31735Western 176732 28430Southern 134671 21975Eastern 68243 11846North-Eastern 8148 1722Andaman & Nicobar Isl. 180 41Lakshadweep 27.4 7.r
All India 569650 95757
6.75 The methodology adopted in the 15th EPS report is partial end use method developed in CEA and is generally comprehensive and consistent with the available data base for projecting the power demands over short and medium time spans. End use technique has been adopted to forecast the electricity requirements where sufficient data regarding the programme for fliture is available such as all the major industrial and non-industrial loads with a demand of 1 MW & above and agricultural loads.
6.76 The Working Group Report on Power has envisaged a capacity addition requirement of 57734 MW during the Ninth Plan, comprising 11870 MW in Central sector, 17621 MW in State sector and 28244 MW in private sector.
6 .77 The rate of capacity utilisation, of the total installed generation capacity in position, realised in 1996-97 was 4646 Kwh/KW. If this rate o f utilisation of capacity is maintained during the Ninth Plan, the installed capacity requirement in 2002 works out to nearly 131726 MW. As on March 1997, the installed generation capacity in the country (utilities) is 85019.3 MW. Therefore, the capacity addition requirements during the Ninth Plan period, according to this, works out to about 46814 MW
6.78 As against the above, keeping in view the status o f the ongoing, sanctioned and new projects in the pipeline, it is assessed that a capacity addition of the order o f 40,245 MW would be feasible during the Plan period as per the details indicated in Table 6 18
686

Table 6.18Benefits from Sanctioned/CEA Cleared & New Schemes
During Ninth Plan (MW)
Source Ongoing/ sanctioned schemes
CEACleared/NewSchemes
Total
HydroThermalNuclear
9126.712647.0
880.0
693.0 16898 5
9819 7 29545.5
880.0
Total 22653.7 17591 5 40245.2
6.79 Out of the total addition of 40,245 MW envisaged during the Plan period, 11,909 MW will be in the Central sector and 10,748 MW will be in the State sector which works out to 29.6% and 26.7% of the capacity addition respectively A capacity addition of 17588 5 MW, constituting about 43 .7% of the capacity to be added during the Ninth Plan, is proposed to be in the private sector. The capacity addition proposed to be supplemented by the private sector, if it materialises fully, would be quite significant in the Ninth Plan period compared to earlier Plans and works out to 0.78 \1\V of capacity addition for every \ \Wv' capacity added in the Public sector.
6.80 The Common Minimum National Action Plan for the power sector has envisaged an improvement in the performance of thermal pow er stations as the "PLF of those thermal pow er stations having less than 40% PLF at present would be increased by 3% annually, by 2% in case of those plants with PLF between 40% and 60% and by 1% for those plants with PLF more than 60 percent". The overall PLF in the State sector in the country is expected to increase to a minimum of 65% and the national average to 70% by 2002 A.D. Realisation of these targets v/ould further reduce the requirement of capacity addition and help meet the demand during the Ninth Plan period.
6.81 A major portion of the incremental capacity of 40,245 MW referred to above can materialise only during the later years of the Ninth Plan. This implies the likelihood of power shortages during the first three years of the Ninth Plan. To overcome this, at least partially, it is imperative that all- out efforts are made to operate the power system efficiently. In addition, it may also be necessary to take up short-gestation power projects based on naphtha/gas in a selective manner to tide over the situation, though this has substantial foreign exchange implications. -
6.82 The capacity addition indicated above will be contingent upon fliel linkages being firmed up and early start of work on new projects. For the new projects in Public sector, particularly in the Central sector, it is essential that the procedure for input linkages/TEC/Investment clearance is streamlined and simplified. In the case o f private sector projects, the clearance procedures have to be streamlined. It will also be necessary to set up a regulatory mechanism as envisaged in the Common Minimum National Action Plan for Power. Based on the above, the cumulative generation capacity in the country by the end of 2001-02 will be as in Table 6.19.
687

Table 6.19Generating Capacity Anticipated at the end o f the
Ninth Plan (in MW)
Hydro Thermal Nuclear Total
21644 8 61149.5Capacity as on 31,3 .1997 Additionduring Nmth Plan 9819.7 29545.5
225
880
85019.3
40245.2
Total Capacityon 31.3.2002 31464.5 90695.0 3105 125264.5
6.83 The capacity addition o f about 40245 MW as envisaged by the Planning Commission will fall short o f the projected requirement. As already stated, to some extent the gap could be reduced by improving the performance o f the existing power stations, reducing the T«&D losses and adopting the Demand Side Management (DSM) measures
Power Supply Position
6 .84 At the beginning o f the Ninth Plan the energy deficit was 115% and peaking deficit was 18 0 percent With the capacity addition o f 40245 MW during the Ninth Plan the anticipated power supply position in 2001-02, as assessed by CEA, indicates an energy deficit of 1 4% and peaking deficit o f 11.6 percent.
Private Sector
6.85 The initial response o f the domestic and foreign investors to the policy of private participation in power sector has been extremely encouraging. However, many projects have encountered unforeseen delays. There have been delays relating to finalisation of power purchase agreements, guarantees and counter-guarantees, environmental clearances, matching transmission networks and legally enforceable contracts for fiael supplies The shortfall in the private sector was due to the emergence of a number o f constraints which were not anticipated at the time the policy was formulated. The most important is that lenders are not willing to finance large independent power projects, selling power to a monopoly buyer such as SEB, which is not financially sound because o f the payment risk involved if SEBs do not pay for electricity generated by the IPP Uncertainties about fuel supply arrangements and the diflBculty in negotiating arrangements with public sector fuel suppliers, which concern penalties for non-performance, is another area of potential diflRculty. It is important to resolve these difficulties and evolve a framework o f policy which can ensure a reasonable distribution of risks which make power sector projects attractive and financeable (see Box)
6 8 8

Partners in Progress
Privatisation
The policy o f inducting private investment into the power sector, initiated in 1992, was expected to add 2810 MW of power in the Eighth Plan The actual achievement was 1430 MW which is only 51% of the target The achievement ratio for the Central Sector washigher at 63% but the ratio for the State Sector was lower at 46%
The shortfall in the private sector was due to the emergence o f a number of constraints which were not anticipated at the time the policy was formulated The most important is that lenders are not willing to finance large independent power projects, selling power to a monopoly buyer such as SEB, which is not financially sound because o f the payment risk involved if SEBs do not pay for electricity generated by the IPP
Some small projects were able to get financing because the payment risk was deemed tobe acceptable. Five projects have received Central Government counter-guarantees and two more are eligible subject to resolution of other problems The Central Government will not provide counter-guarantees for power projects in future A number of private sector projects are seeking credit enhancement by escrowing certain receipts of the SEBs to assure payment o f IPP dues The scope for escrow arrangements is limited and in any case they do not increase the overall financial viability o f the SEB Rather, by earmarking part o f the SEB’s existing receipts for new private sector projects, they reduce the viability o f the rest o f the system
The ability to attract private investment into the power sector on a significant scale in fiiture therefore depends crucially upon bringing about improvements in the financial condition o f SEBs This in turn depends upon the progress achieved in reforming the SEBs including especially reforms o f the tariff structure and reform in distribution to reduce T&D losses International experience suggests that privatisation o f distribution is most likely to pave the way for a quicker induction of private investment into
generation
An important initiative could be to allow large users to buy power directly from generating companies with distribution companies bemg obliged to wheel the power to tne u s e r at
a pace to be fixed by the SERC
The progress of private sector power in India will also depend upon the ability o f the IPPs to enter into reliable fuel supply and transport arrangements which incorporate suitable penalty clauses to compensate IPPs for non-delivery o f fuel Public sector generating stations have typically not sought such arrangements because of the expectation that problems on this account will be resolved through inter-ministerial mechanisms Private sector investors areJikely to want more contractually water tight arra^ernejU_____
689

Private Sector - Where we Stand !
Status of Private Power Projects (As on 1st February. 1999)
DESCRIPTION NUMBER CAPACITY (MW)Projects Techno-economically 48 22987Cleared by CEA
Projects having in-principle 25 1 4309Clearance of CEA
Private power projects commissioned 17 3018in last5 years
Private povifer projects under 21 5168 8construction
Private power projects with finances 51 15873tied up with Indian Financial Institutions (IFIs)
Private power projects seeking financial 55 16980tie up w ith IF Is---------------------------------------------------------------------------------------------------------------------------
6.86 The incremental capacity of 40,245 MW referred to above, includes around 17,588 MW to be added by private generating companies In order to achieve the targeted private sector capacity creation during the Ninth Plan, the following additional facilitating measures have recently been suggested by the promoters. Most of these have been accepted while some of them are under the consideration of the Government
i) Speedy Environmental Clearance:
The Ministry of Environment and Forests has agreed to delegate the powers to States for environmental clearance o f :
a) all co-generation plants and captive plants up to 250 MW;b) coal-based plants upto 500 MW using fluidized technology subject to sensitive
areas restrictions;c) power stations upto 250 MW on conventional technology;d) Gas/Naphtha-based stations upto 500 MW.
ii) Access to Institutional Funds:
At present, there is a 15% limit on lending by the IFIs to any one sector e g power Keeping in view the large requirement of flinds for the power sector and considering that adequate budgetary support for such projects is not available, this 15% limit on the IFIs lending for infrastructure sectors has been removed. There is need to create capital market and debt market to boost investment in the sector.
690

iii) Fuel Linkages:Firm fuel linkage is being provided for the addition of capacity based on liquid fuels
iv) Viability of SEBs:The financial health of the SEBs will be improved through rationalisation of tariff, restructuring and reforms to make them economically viable and their projects bankable to generate energy on economic rate, to provide quality services to the consumers and to ensure a fair return to the investors This can be best achieved by unbundling single entity (SEBs) and corporatising the same for the above activities. In this context, some of the States have taken initiative by unbundling their respective SEBs into separate companies for Generation and Transmission & Distribution.
v) Regulatory Bodies:The Government of India has promulgated Electricity Regulatory Commission Act, 1998 for setting up of Independent regulatory bodies both at the Central level and at the State level viz the Central Electricity Regulatory Commission (CERC) and the State Electricity Regulatory Commissions (SERCs) at the Central and the State levels respectively These regulatory bodies would primarily look into all aspects of tariff fixation and matters incidental thereto
Independent Regulatory Commissions for Power
Reform of the Power Sector would be greatly aided by the establishment of Independent regulatory agencies responsible for setting tariffs and regulating power purchase agreements. The Electricity Regulatory Commission Act, 1998 provided the legal basis for setting up a Commission at the Central level with separate Commission at the State level.
Central Electricity Regulatory Commission
The Central Electricity Regulatory Commission (CERC) was constituted on 24.7.1998. The main functions of the CERC are:
to regulate the tariff of generating companies owned or controlled by the Central Governmentto regulate the tariff of generating companies, other than those owned or controlled by the Central Government, If such generating companies enter into or otherwise have a composite scheme for generation and sale of electricity in more than one State, to regulate the inter-State transmission of energy including tariff of the transmission utilities,to regulate inter-State bulk sale of power and to aid & advise the Central Government in formulation of tariff policy.
691

state Electricity Regulatory Commission
Section 17(1) of the Central Electricity Regulatory Commission Act, empowers the State governments to establish an Electricity Regulatory Commission for the State. State Regulatory Commission has been set up in Orissa and Haryana and it is expected that most States will establish regulatory commission within 1998-99. The main functions of the SERC would be;
to determine the tariff for electricity, wholesale, bulk, grid or retail; to detennine the tariff payable for use by the transmission facilities, to regulate power purchase and procurement process of transmission utilities and distribution utilities, to promote conipetition, efficiency and economy in the activities of the electricity industries, etcSubsequently as and when each State Government notifies, other regulatory functions could also be assigned to SERCs.
Power Sector Reforms:
6,87 The National Devdopment Council had constituted a Committee on Power to evaluate the working o f the power sector and, in this context, to examine inter alia the measures to make the SEBs viable by taking appropriate measures The Committee submitted its report to the then Prime Nfinister on 10th March, 1995 Some of the major issues which have been discussed in the report are as under:
i) Restoration of the autonomy and professionalisation o f the State Power Utilities and allowing such Utilities to have tariff structures that would generate adequate resources for the State Electricity Boards
ii) Setting up o f Tariff Boards at the National and regional level for regulating the tariflF policies of public and private Utilities The minimum agriculture tariff should gradually be increased so that it is not less than 50% of the cost o f supply
iii) Fuel supply agencies, the Railways and power Utilities should enter into a legally enforceable tripartite contracts with suitable bonus and penalty clauses to take C£ire of quality, quantity and punctuality o f despatches The Ministry o f Power should also evolve a long-term fuel policy for power generation in consultation with concerned Ministries taking into consideration, the availability o f resources, their geographical distribution, status of technology, economies of their utilisation and environmental aspects
iv) The conversion of loans of State Electricity Boards(SEBs) into equity with debt equity ratio of 1 1 Subsequently, the State Government equity is to be reduced in the first instance to 51% and thereafter to 26% in the final phase
v) Role o f the Central Electricity Authority -
692
The CEA should function as an apex agency for evolving tariff policy at the national level. It should modernise the appraisal system and function as a nodal agency for Planning, Research and Development
The CEA should continue to act as a single window agency for obtaining various statutory & non-statutory clearances. To achieve this, the Government should constitute Empowered Committees ai the National and State levels to facilitate the timely clearance o f the power projects
vi) To streamline forest clearance, “Forest Banks” may be created in advance in various States by the Forest Departments Forest clearance could be accorded against specific schemes and the extent of compensatory afforestation involved for such schemes could be debited to the “Forest Bank Account” o f the concerned power Utility which wiU deposit additional funds to the forest department to take further necessary action towards afforestation
vii) Power Grid should function as a clearing house for trading power between the State/Region
viii) The private sector should be involved in the generation and supply o f power to well identified areas and in the installation of regional power stations by utilising
inter-State transmission networks The power projects identified for the private sector should be awarded through c^Dmpetitive bidding route rather than MoU route
ix) A “Power Development Cess” o f 10 paise per Kwh should be levied by State /UT Governments on the total quantity o f electricity consumed in the country for funding hydro development, electricity conservation, the R&D and other activities in the power sector
6.88 Most o f the above recommendations have since been included under the Common Minimum National Action Plan on Power approved by the Chief Ministers o f States/UTs
Current Problem of Power Sector
6.89 The most important cause o f the problems being faced in the power sector is the irrational and unremunerative tariff structure Although the tariff is fixed and realised by SEBs, the State Governments have constantly interfered in tariff setting without subsidising SEBs for the losses arising out o f State Governments desire to provide power at concessional rates to certain sectors, especially agriculture. Power supply to agriculture and domestic consumers is heavily subsidised Only a part o f this subsidy is recovered by SEBs through cross subsidisation o f tariff from commercial and industrial consumers. The SEBs, in the process, have been incurring heavy losses If the SEBs were to continue to operate on the same lines, their internal resources generation during the next ten years will be negative, being o f the order o f Rs (-) 77,000 crore This raises serious doubts about the ability o f the States to contribute their share to capacity addition during the Ninth Plan and there after. This highlights the importance o f initiating power sector reforms at the earliest and the need for tariff rationalisation.
693

6.90 The programme of capacity addition of 17588 MW in the private sector may not involve any Plan funds but is critically dependent upon the financial credibility of States as well as the operational performance of State Utilities. Any investment by IPPs or even the bilateral and multilateral finances fi-om donor agencies can materialise only if the State Governments are able to provide concrete evidence that efforts in the direction of improving the operational and financial performance have been initiated by them. Reforms and restructuring are thus no longer a matter of choice but a necessity and precondition for the success of the Ninth Plan as well as for setting up a viable and sustainable basis for the programmes beyond the Ninth Plan.
6.91 A plan for power sector reforms cannot be designed and implemented without the consensus and active participation of State Governments. Accordingly discussions were held with the Chief Ministers of the States/UTs and a Common Minimum National Action Plan on Power (CMNAPP) was agreed upon in December 1996. A copy of the Plan is at Annexure 6.1
6 .92 Rationalisation of tariffs is one of the steps that needs to be taken urgently It is recognised that SEBs require urgent restructuring not only to improve their financial health but also to enable public and private sector companies to inject the much-needed incremental capital investment in generation, transmission and distribution and also to introduce competition in the power sector for bringing greater efficiency which could, in the long run, reduce tariffs for the consumers and ensure better service for them. The CMNAP seeks to carry out the rationalisation of tariff and restructuring o f SEBs within a definite time frame. The Plan also envisages that SEBs should be allowed maximum possible autonomy and run on commercial lines It acknowledges the need for private sector participation and also creation of Regulatory Commissions It deals with several related issues including forest clearances, development of hydro potential, mega power projects at pitheads and setting up of coal washeries. The CMNAP needs to be strictly implemented for removal of bottlenecks and faster development of the power sector
694

The objective of power sector reforms must be to generate electncity at an economic cost, provide a reliable and high quality service to the consumers, and ensure that the sector is financially viable and also provides an attractive envu-onment to bnng in pnvate investment. To achieve these objectives, it is desirable to reconsider the present arrangement m which the State Electncit> Boards operate as an integrated umt, with generation, transmission and distribution all bundled m a smgle entity Unbundling the SEBs and separating generation, transmission and distribution into separate corporations makes it possible to monitor efficiency levels m each activity and also to create appropnate mcentives for efficiency in each area. Unbundlmg also makes it easier to allow entry of private sector operators m each area in a suitable manner which ensure competitive efficiency. Several states have imtiated power sector reforms along these hnes as mdicated below:
OrissaOnssa was the first State to initiate reform of the Power Sector w e.f April 1,1996. The reform envisaged setting up of separate generating as well as Transmission and Distnbution (T& D) agencies. Accordingly, the State’s Electricity Board has been split into three entities viz Orissa Power Generation Corporation (OPGC- for thermal power), Orissa Hydro Power Corporation (OHPC - for hydel power) and Grid Corporation o f Orissa (GRIDCO - for transmission and distribution network). A Separate Regulatory Commission has been constituted as a statuton and autonomous mstitiation to regulate and co-ordinate the activities of all these corporations The state is now geared up to pnvatise the distnbution network w.e f 1-4-1999
HaryanaThe State Electncity Board was converted into tw’o separate entities on August 14, 1998. It has set up corporations namely Haryana Power Generation Corporation (HPGC) for generation and Haryana Vidyut Prasaran Nigam (PTVPNL) for transmission of power. On the Imes of the Orissa model, the State recently constituted a Regulatory Commission It has also appointed a Consultant to advise it on the privatisation of distribution There are plans to limit the distribution zones to two due to the wide variations m load across the state
Andhra PradeshThe SEB is to be spun off into three entities on the Imes of Onssa model. Distnbution in Andhra will be divided into 8 zones in which 51 per cent will be offered to the pnvate sector. The State has received Presidential assent for the Electricity Reform Bill 1998 pa\ ing the way for constitutmg a regulatory commission and dismantling the SEB
RajasthanOne of the first states to have proposed the model of privatising power distribution by hiving off a majority stake to the private sector. Despite this, the actual process of pnvatisation has been stalled due to vanous reasons. The plan is to hive off seven zones through the licensing route, whereby pnvate operators’ fmancial operations are governed by law and do not have to rely on a regulator for direction.
Power Sector Reforms Set in Motion
6 .93 The agenda for rationalisation o f tariff and implementation of other reforms in the power sector in various States is in the initial stage and may take some time to yield results. The capacity addition programme during the Ninth Plan period, particularly in the State sector depends upon the ability of State Utilities to mobilise adequate ftinds for their on-going projects as well as for implementing the R&M and T&D programmes. To supplement the efforts of State Utilities, additional funds are being made available to them from PFC on concessional interest rates for cx>mpletion of on-going projects, maximising benefits from existing assets and improving the T&D network during the Ninth Plan
695

6.94 The CMNAPP foresees private sector participation in distribution. The State governments may embark on a gradual programme o f private sector participation in distribution of electricity The process o f private participation should be initially in one or two viable geographical areas covering both urban and rural areas in a State and the State may extend them to other parts gradually. In this context, the Ministry o f Power has circulated a document entitled “Sample agreement for private management o f SEB distribution systems” to provide assistance to SEBs in the privatisation o f their distribution system. Orissa has already taken steps for private sector participation in Cuttack, Bhubaneshwar and Denknal districts. The Noida area in U P has also been handed over to the private sector for distribution The situation regarding induction of the private sector in d i^b u tio n will vary from State to State. The nature of generation plants and the pattern o f loads will have a bearing on the timing and scope of this policy reform
Renovation & Modernisation (R & M)
6.95 Much greater emphasis than at present needs to be given to R&M schemes to ensure regular maintenance and upgradation o f power plants to obtain optimal performance A comprehensive evaluation should be undertaken of the projects where R&M schemes have been implemented to ascertain the actual returns acruing through the R&M investments. Plant betterment and life extension schemes should be taken up immediately to improve the capacity utilisation o f the existing facilities.The R&M of existing power plants should be done in a time- bound manner The PFC and Central financial institutions should provide enhanced ftinding to R&M schemes. Clearance o f R&M projects may be given by State Governments No clearance from CEA/PEB need to be required.
6 96 Investments in R&M have distinct cost advantage over new generation capacity The instruments required to attract investment in these areas need to be defined and prioritised during the Ninth Plan
Transmission and Distribution M anagement
6.97 It had been recommended by the Rajadhyaksha Committee (1980) that the investment on transmission & distribution should not be less than the investment on power generation In practice, however, the investment on T&D has been considerably lower than on generation, thus affecting the system efficiency. The T&D losses in the countiy are as high as 21 4 percent. These comprise of 6-7% transmission losses and 14-15% distribution losses and include theft of power. With every reduction o f 1% in T&D losses there could be a saving of 800 MW of new capacity addition. This would be possible if comprehensive action plans for system improvement works are drawn up by the SEBs/ State Governments and the fiinds are made available to them by PFC and REC. Necessary amendments in the relevant Acts/Rules to allow private participation in transmission and distribution are being carried out
6 98 In order to avoid backing down o f base load stations and to utilise fully the power generated from private sector projects likely to be commissioned during the Plan period, the Ninth Plan recommends even development o f loads as well as strengthening o f T & D systems An exclusive interest subsidy scheme for improvement of sub-transmission and distribution system for North-Eastern region is to be initiated.
696
Losses - How long ?Transmission & Distribution
• The present level of Transmission and distribution losses is very high The All India T&D lossIS nearly 23% and the losses in some States are much higher. Losses in Delhi are as high as 50%.
• While a part of the T&D losses is due to technical deficiencies in the system and the large spread of low voltage distribution in rural area, a large portion of the Ime losses is due to theft& pilferage compounded by connivance on the part of line personnel
• There are large scale unmetered connections particularly for Agnculture sector apart from its low power tariff. Even if supply of electricity to agnculture is to be subsidised it should be metered so that proper accounting can be maintained.
• The proliferation of Low Tension (L T) distnbution lines has led to a low load density (as measured by demand m MW divided by length of T& D system) and high ratio of LT to HT lines This needs to be brought down preferably by upgrading the system voltage This would also check large amount of pilferage and reduce the losses considerably
• There is a strong case for pnvatismg distnbution in order to reduce the present high le\ cl of theft and pilferages A beginning can be made by mandaton privatisation of distribution in urban area with population of one million and above
• The Ninth Plan should target a reduction on T&D losses at the rate of 1% per year Each reduction of 1% in T& D losses is equivalent to generation of an additional revenue
of about Rs.590 crore at an average tariff prevailing in 1995-96
6.99 Compulsory metering at substations and on ail major feeders should be introduced Compulsory metering of all new electricity connections as also of connections to agriculture sector exceeding 10 HP must be undertaken and completed in two years All electric supplies should be metered by 2002 AD
6 100 The existing bulk sale tariff for electricity does not take into account the time of supply The SEBs should introduce the concept of time-related tariff to encourage eflBcient operation of the power system
6.101 The need for a national grid for integrated operation of the power system is well recognised. The ground work for the national grid to be functional in a time-bound manner is proposed to be worked out during the Ninth Plan period.
Project Implementation6.102 In every Plan, there have been delays in project implementation resulting in cost overruns in both the Central and State sectors. These overruns have not only eroded the available resources but also have adverse impact on mobilisation of additional resources. This is a matter of concern specially when a large-scale capacity addition programme is being contemplated during the Ninth Plan and eflForts must be made to optimise the use o f scarce resources. Languishing unfinished State projects should be transferred to Centre\private sector.
697

6.103 As far as extemally-aided projects are concerned, although there has been an improvement in the utilisation of total external aid in the Central sector during the Eighth Plan, utilisation in respect o f State sector projects has been below the target. The main reason was non-availability of counter-part funds with the States. The States could not provide these funds due to irrational tariff structure for electricity in the States. In the Ninth Plan, utmost importance will be given to streamlining the investment clearance procedure at all levels (Centre, State and Private) A Task Force to monitor the implementation of ongoing projects should be constituted and adequate funding should be made available to reduce the time and cost over runs.
Regional Disparities6.104 Regional disparities in electricity availability have widened over the years, inspite of the phenomenal progress made in capacity addition and generation during the successive Plans The Ninth Plan takes cognizance of these disparities as also the need for corrective actions The Central PSUs including PFC and PvEC as well as the State PSUs will have to play an important role in removing these regional disparities.
Nuclear Power6.105 In the early 1980s the Department of Atomic Energy initiated a long-term plan for achieving substantial expansion with a programme for adding nuclear generation capacity of10,000 MWe by 2000 A.D. based on the uranium resources available in the country As regards the potential, it was noted that by adopting the fast breeder technology a nuclear capacity of about 3,00,000 MWe could be added by using the indigenously available uranium resources The country also has one of the largest reserves of thorium which could also be exploited through the fast breeder technology for generation of electricity. Advance action by way of procurement of long delivery equipment and material was initiated for implementing thel0,000 MWe by 2000 A D programme. However, due to severe constraint of resources, there have been slippages in the implementation of this programme and it had to be scaled down to 3820 MWe The current nuclear capacity of 2225 MWe constitutes only 2.65% of the total installed capacity in the country The Nuclear Power Corporation o f India Ltd (NPCIL), has limited capability for generation of
internal resources. A major area of concern has been the delays in project implementation and the consequent cost over runs. However, the performance of nuclear power stations has improved considerably by the terminal year of the Eighth Plan and the present average PLF is to the tune of 55.9% as against 52.1% in 1992-93. This needs to be improved further
6.106 The Nuclear Power Corporation does not presently have adequate financial strength to implement the programme. There are inherent constraints to NPCIL's ability to mobilise funds from external sources or private equity. The Corporation heavily relies on Government support for the present For the development of nuclear power, budgetary support to the corporation needs to be continued. However, it has to commercialise its operations and achieve greater economic viability in the years ahead.
6.107 Keeping in view the experience of private sector participation in power sector (for thermal and hydro generation), there is a need to explore the possibility of private sector participation in the nuclear power programme There could be impediments in the process but some innovative initiatives need to be explored Since in the long run, nuclear power has to play an important role in the energy mix of the country, all possible alternatives for enlarging nuclear power generation need to be explored We have to ensure that the high degrees of self-reliance that has been achieved in the nuclear power generation is consolidated, upgraded and utilised for higher capacity addition R«&D in nuclear technology should be continued.
698

6 108 Coal will continue to be the major fuel for the power sector in India Based on the study conducted in the Planning Commission on cost o f generation with different fuels, it has emerged that the domestic coal and the natural gas at current price level are the cheapest fuels for power generation. However, the domestic production o f coal and gas is projected to fall short of the requirements during the Ninth Plan period In order to meet this situation, increased imports of coal and gas may be necessary. Some liquid fliel imports for short gestation capacity addition of 12000 MW, mainly using Naphtha and Furnace Oil may also be necessary A Model Fuel Supply Agreement (FSA) for supply of liquid fuels to be imported by the National Oil Companies has already been circulated to the States. In the long run, in order to promote the use of environment-friendly fuels, LNG import has been put under OGL Gas is likely to be a major source of energy during the 21st Century As the country enjoys a closer proximity to large gas resources in Middle East, gas imports to meet the energy demand of the country may also be more economical than imports of other fiiels
Captive power Generation
6.109 Industrial sector is the largest consumer o f electricity Besides purchasing power from the Utilities, a number of industries namely aluminium, cement, fertilizer iron, steel, paper, sugar etc have their own captive power plants either to supplement the electricity supply from the Utilities or for generating electricity as a by-product by using high pressure steam while utilising low pressure steam in their industrial process. The all India installed capacity of non-Utility power was 9302 MW at the beginning of the Eighth Plan. This capacity increased to 11889 MW by the end of March 1996 and yielded a generation of about 38 billion units in 1995-96 as against the target of 45 billion units during the Eighth Plan
6.110 As per the Common Minimum National Action Plan for Power, the State Governments should encourage co-generation/captive power plants and facilitate evacuation of power from these plants to the grids. The State Governments should formulate a clear and transparent policy for purchase of power and wheeling charges which provide fair returns to the cogeneration/captive power plants owners. Captive power plants should also sell electricity to a group of industries as well as to other categories of consumers in the State industrial zone or area Wheeling of power from captive power plants to consumers located at a distance either physically or on displacement basis should be encouraged and the States should issue clear and transparent long-term policy in this regard
6.111 To some extent the increase in captive power generation based on diesel is due to the very high subsidy being allowed on diesel prices under the Administered Price Mechanism Users may, therefore, find diesel-based power generated by their captive units cheaper than grid-supplied power, especially because the price of power supplied by Utilities to industry bears the burden of cross subsidisation to agriculture and household sectors. It is important that tariff rationalisation measures to be evolved in the Ninth Plan should minimise the effect of such distortions
R& D6 112 The Power sector is highly technology-intensive Therefore, technological upgradation and modernisation assume an important role, specially towards realising the utmost economy in generation, T & D and efficient utilisation o f electrical energy.
Fuel for Power Sector
699
6.113 The R&D programmes must necessarily provide inputs to future power programmes relating to both generation as well as transmission and distribution. Full advantage should be realised ot'the large base of R«feD capabilities that already exist in the country. Emphasis must be laid on solving field problems adversely affecting the production of power, creating bottlenecks in power system operation and affecting the quality of power supplied
6.114 Considering the large capacity additions required during the Ninth and Tenth Plans, there is a need for upgrading the relevant technologies by promoting the existing R&D institutions, transfer and use of advanced technologies and practices for environmentally sound energy systems, including new and renewable sources of energy. This should cover (I) creation of infrastructure facilities in high-tech areas such as - synthetic testing for 800 KV EHV/UHV transmission lines across the country; (ii) Mission mode R&D programmes to cater to the needs of Utilities and manufacturing industry with the participation of beneficiary industry for example, development of clean coal technologies (coal beneficiation/gasification), flexible AC transmission for operational flexibility of power system; (iii) experimental and demonstration projects in the State-of- the-art technology areas as for example NHVDC 2nd phase and third phase programme for the further development of HVDC system in the country, application of High Temperature Fuel Cells in stand alone systems feeding rural/remote areas and iv) environmental aspects including fly ash utilisation. To achieve these objectives and in order to acquire the new technologies, the existing testing facilities and research centres should be strengthened Already, a long-term perspective called Technology Vision for India 2020 has been prepared, which could form the basis for technology development programme for the power sector during the 9th Plan
Manpower Development6.115 During the Eighth Plan, there has been no appreciable change in the number of employees in the State Government, Utilities and electricity departments due to increasing automation as well as the conscious policy of redeploying surplus manpower. Not only a number of SEBs but also the Central power Utilities must continue to identify surplus manpower which could be redeployed through training and upgradation of skills The Ninth Plan is likely to add an average generating capacity of 8,000 MW annually compared to 3000-4000 MW annually in the past. Additional manpower would be needed not only in the public sector Utilities but also in the private sector to meet the requirement of capacity additions envisaged for generation, transmission and distribution and to compensate for normal decline due to retirement, death, migration etc. It is estimated that around 15 lakh employees may be manning the power sector by the end of Ninth Plan. The manpower per MW works out to around 10 in contrast to about13 at the end of the Eighth Plan.
6 116 To sustain quality in performance, induction level training programmes, as well as periodic refresher courses would be needed The modern techniques and tools like simulators will have to be used and the existing institutional arrangements have to be strengthened This is essential in view of the rate at which technological upgradation is taking place in this sector
Environmental Management6.117 Energy is one o f the basic inputs for economic growth All conventional fuels have varying degree of impact on environment when subjected to energy transformation and use In India, the general awareness about environmental impact of power projects has increased significantly and the measures for controlling and minimising the impact have been a subject of
700

public debate This has resulted in more strict implementation of pollution control laws Environmentally-benign energy systems, particularly new and renewable sources of energy, are being encouraged The Ninth Plan will place considerable emphasis on integrating energy, environment and economic policy decisions for sustainable development Special importance will be accorded to programmes aimed at catchment area treatment and reclamation of degraded land, in case of all major hydro electric projects In case of thermal pow er projects the emphasis will be on restricting air and water pollution to the prescribed levels Mega power projects using high sulphur content fiiels should set up ftiel gas desulpherisation (FGD) units to maintain the SOx emissions within the prescribed limit in future In order to promote the use of environment- friendly fliels, LNG would be an important source of energy during in pow er generation the 21st century High priority will also be accorded to enforcement of rigorous safety standards in all nuclear power projects
6 118 In addition to the above, the following measures are suggested for minimising the adverse impact on the environment:
i) Demand and supply side measures for conservation of energy as stated in Para6 2 88
n) Various measures such as afforestation, use of washed coal etc have to beencouraged to reduce the Green House Gasses (GHG) emission m the environment
iii) Portable gen-sets being run on diesel/petrol and used by the commercial anddomestic consumers should be minimised by ensuring reliable supply of electricity
6 119 The utilisation rate of fly ash in India is of the order of 2% as compared to 80% in Germany followed by 20% in Holland The poor rate of utilisation is attributed to (a) nonavailability of proper machmery, (b) ignorance regarding potential of fly ash utilisation in various applications ( c ) lack of clear policies to promote fly ash utilisation, etc
i Private entrepreneurs should be encouraged to set up facilities to utilise fly ash in building materials such as bricks, cement etc For this purpose, the State Governments may exempt the end products of ash from Sales Tax, in line with Excise Duty exemption given to ash-based product having minimum 25% ash given by Central Government Total exemption from Excise Duty/Sales Tax may also be accorded in case of indigenous equipment and total exemption from import duty, may be given to all imported equipments required for manufacture of ash based products.
ii Financial institutions may extend loans to ash-based industrial products on priority
iii In order to promote manufacture o f fly ash-based Portland Pozzlana Cement (FAPPC) Government Departments like CPWD, DDA, Power Utilities should be advised to use FAPPC for majority of applications
iv All new Thermal Power Stations should be^advised to earmark land in the planning stage itself for ash-based industries
701

V Stowing of underground mines using fly ash in place of riversand is to be considered in all coal projects.
Resettlement & Rehabilitation (R & R)6 120 The setting up of large hydel and thermal plants often necessitates clearing of 1 arge tracts o f land, affecting the lives of people, flora & fauna. Since the displacement of people becomes unavoidable , Government o f India has already evolved certain compensation packages which should be implemented in the proper manner. These are (a) providing early financial compensation and settlement in land requirement, (b) resettlement of people including construction o f dwellings in new areas © providing subsidy for farming in the new areas (d) starting of special training programmes in the areas of poultry, breeding, handicraft and cottage industries (e) employment avenues in the project and (f) provision of education, medical and drinking water facilities.
6 121 The feasible capacity addition during the Ninth Plan period would be of the order of 40245 MW of which 22656 7 MW is likely to come up in the public sector (11909 MW from Central sector and 10747 7 MW from State sector) The outlays assessed by the Planning Commission for the Ninth Plan for the power sector ftilly cover the requirements of all ongoing schemes in the public sector which will yield benefits of 16653 7 MW capacity (9126 7 MW of hydro, 6647 MW of thermal and 880 MW of nuclear) during the Ninth Plan In addition, these outlays are expected to take care of a major portion of the requirements of new generation schemes which will yield benefits of 6003 MW capacity (143 MW of hydro and 5860 MW of thermal) during the Ninth Plan period
Rural Electrification6.122 The rural electrification programme is viewed as a prime mover for rural development Electricity is not only the basic pre-requisite for industrialisation but it also contributes significantly to increasing agricultural productivity and other job and income generation activities, besides enhancing the quality of life in rural areas and controlling migration from rural to urban areas Electricity, therefore, deserves to be classified as a basic amenity along with others like housing, drinking water, health and education The time-span in which the objective of “Electricity to All” can become a reality will depend upon the priority assigned, the resources allocation, political will, the administrative skill and active interest of all agencies and people concerned associated with economic development o f the nation
6 123 As per the 1991 census, there are 5,87,288 villages in the country of which about 85% have been electrified by the end of March, 1996 As many as 13 States in the country have completed 100% village electrification However, this achievement is to be viewed with the existing defmition which declares 'a village as electrified if electricity is used for any purpose within the revenue boundary of that village' Thus, even in all these electrified villages, power connection may or may not be available on demand A large number of hamlets and harijan bastis adjoining the villages are yet to be electrified In this context, the Government of India has notified a change in the definition of village electrification as follows:
“ A village will be deemed to be electrified if electricity is used in the inhabited locality, within the revenue boundary of the village for any purpose whatsoever” against the old definition ” a village
702

should be classified as electrified if electricity is being used within its revenue area for any purpose whatsoever” .
6 124 The latest estimate of pump sets potential in the country by the Central Ground Water Board is about 195 lakh. As against this, only 115 lakh pump sets have been energised so far leaving a balance of 80 lakh pump sets yet to be energised. Rural Electrification Corporationm (R.E.C) ensures that the overexploitation of the ground water resources does not occur and accordingly extends loans for pumpset energisation only in such areas where sufficient potential is avaiable. Nevertheless efforts will continue to avoid over exploitation of ground water In spiteof large-scale pump sets energisation, the prevailing low tariff for agriculture does not provide any incentive to the farmer to adopt energy-efficient measures to optimise the consumption of electricity.
6.125 A large number of pump sets are of sub-standard quality and operate at sub-optimal efficiency Often the pumps have wrong features e g high discharge head, inefficient foot-valves, pipes with excessive friction, oversized motors and motors without capacitors Tt is estimated that the country could save 57 billion Kwh of electricity if higher efficiency is achieved in this sector The investment required is estimated to be of the order of Rs.l 100 crore. In this contest an interest subsidy scheme for financing efficient agricultural pumpsets needs to be introduced.
6 126 Rural areas are facing serious problems with regard to quality and reliability of electricity supply. A long L.T distribution network with inadequate capacity of transformers results in low voltage condition and higher T&D losses. These difficuhies can be overcome only by adopting large scale system improvement works including installation of capacitors, using higher voltage rural distribution lines and augmentation of transformer capacities
6.127 The electrification of dalit bastis and tribal villages is to be taken up on a priority basis Separate funds should be earmarked for their electrification under the Special Component Plan
or Tribal Sub-Plan.
6.128 There is also a need to review the guidelines for MNP taking note of national average electrification level of 85 percent. Around 86000 villages which are left out of electrification are located in remote and difficult areas Around 18,000 of these are in such localities where extension of grid will be costly and uneconomical and where development of load growth is unlikely due to thinly dispersed population. These remote areas in the counti^ need to be provided access to electricity and this can best be achieved through non-conventional energy sources
6.129 A target to electrify 30000 villages and energise 20 lakh pump sets during the Ninth Plan has been set. It is necessary to earmark institutional and funding arrangements for achieving these targets. The Ninth Plan will also deal with the problem of providing institutional support through the involvement of decentralised private companies, rural cooperatives and panchayats not only for implementing the schemes but also for the upkeep and maintenance of the assets created.
703

ENERGY CONSERVATION
Review of Eighth Plan.
6 130 The National Energy Efficiency Programme (NEEP) was initiated during the Eighth Plan which included components of policy package, financial arrangements including creation revolving funds, technical assistance, technology development, selective legislation and developing institutional capabilities The targets of electricity saving equivalent to an additional capacity of 5000 MW in the power sector and saving of 6 million tonnes of petroleum products by the terminal year of the Eighth Plan were set for the National Energy Efficiency Programme An outlay of Rs 1,000 crore was provided for the purpose of energy conservation during the Eighth Plan which included activhies of energy conservation being carried out in different Energy Departments,
6.131 The Ministry o f Power prepared an Action Plan to achieve the Eighth Plan targets, which envisaged conservation of 2250 MW on the supply side and 2750 MW on the demand side The supply side programmes included renovation and modernisation of old generating units, reduction in auxihary power consumption in thermal power stations and reduction in T&D losses These programmes had earmarked funds. The Central Electricity Authority has reported a saving of 2900 MW comprising 2030 MW on account of saving through the programmes of renovation and modernisation and auxiliary consumption reduction and the balance through reduction in transmission and distribution losses.
6.132 The Ministry of Power implemented various demand side saving measures through several programmes carried out by the Energy Management Centre (EMC), set up in 1989 under the Ministry of Power. The EMC has coordinated a large number of training programmes, awareness campaigns, projects and studies, demonstration projects, data base on energy efficient processes and technologies and implementation of multilateral and bilateral energy efficient projects etc
6 133 The demand side management measures resulted in significant achievements in reduction of specific electric consumption in major energy intensive industries like cement, steel, pulp and paper, etc Further, the rectificafion of pump sets taken up through limited pilot programmes have also resulted in saving of energy to some extent in the agriculture sector. In the domestic sector, energy efficient lighting and other energy saving devices have been introduced However, the actual savings in terms of Mega-Watts could not be quantified
6 134 Energy audits have been conducted in different types of industries The State Governments of Kerala, West Bengal and Tamil Nadu have issued notifications for mandators' energy audits in respect of high tension consumers Other States have also been requested to make energy audits compulsory for such industries. The response from various States are not encouraging The Ministry of Power has proposed to amend the provisions of the Electricity Act to provide for compulsory' energy audit for such industries classified as energy intensive
6 135 In the petroleum sector a saving of 3 6 million tonnes of products was achieved during the first three years of the Eighth Plan. During the following years of the Eighth Plan, tise Petroleum Conservation Research Association (PCRA), oil refineries, marketing companies and other users were able through their various programmes to achieve the target set for Eighth Plan
704

NINTH PLAN PROGRAM M E
6 136 The programmes started during the earlier Plans would continue The new initiatives for energy conservation during the Ninth Plan include electricity tariff rationalisation, effective role of financial institutions in funding energy conservation programmes, and standards and labelling for equipments and gadgets. It has been suggested that a Central Legislation on Energy Conservation could help coordinate the efforts of both Centre and the State in more effective implementation of the conservation programmes However such a legislation should not replicate the work already being done by other agencies
Targets for Ninth Plan
(i) On the supply side thermal power stations should aim at a reduction of 10% in heat rate by the end of the Ninth Plan
(ii) The T&D losses should be reduced at least by 1% during each year of the Ninth Plan
(iii) The auxiHary consumption especially in the old thermal stations should be reduced at least by 1 per cent
(iv) The demand side measures should be implemented through comprehensive progranimes in each sector e g , industrial, domestic, commercial and agricultural Each programme should provide for targeted savings, their quantification as also proper evaluation to ascertain the achievement
(v) Compulsory annual energy audit of large consumers should be undertaken
(vi) Time of the day metering should be introduced initially for large power consumers for better load management. Its coverage should be slowly extended
Demand Side M anagement
6 137 Demand Side Management (DSM) which is now increasingly being used in the developed countries is an effective instrument to bridge the gap between demand and supply It ensures that the electricity consumption can be effectively used in an optimal manner The DSM options include staggering of the load during the day so as to cut down the peak demand by flattening the load curve. This in turn would result in a substantial saving of additional capacity of generation.
6.138 Another DSM option is time of the day metering which improves capacity utilisation of power systems to reflect better the real cost of electricity Because of all- round energy
shortages, this option is not often feasible in India But it could be eflFective in the Western and Northern regions, where there is predominance of thermal generation and surplus power available at night which can be sold at concessional tariffs Night power could also be sold at a concessional rates to selected large industrial consumers The DSM does not require substantial investments but only involves cooperation of the users
705

Tackling Peak Power Demand?A special feature o f the Indian Power Sector is that the level o f demand at peak times in a day is \'erv' high
compared to the demand at o tf peak time For example, in the N CT o f Delh i, which has a large number t)f
domestic/commercial consumers, the ratio o f maximum and m in im um demand is almost as high as 1.5:1 or 2:1.
In such a situation, we require double the installed capacity' to meet demands at the peak time. It also results in
heavy overloading o f T & D system, causing operational problem and to some extent increase the distribution
losses in the system.
The problem needs to be tackled by adopting demand side management Techniques to “flatten the Load Cun 'e”
i.e reduce the peak load hour demand and create additional load during off-peak hours in the follow ing way:
• Introduce differential pnc ing according to time o f day thus giving ince^ti^'es to users to shift their
demand to the off-peak period. This requires introduction o f electronic time o f day (T .O .D ) metenng.
• Having a two-part tariff for all categones o f consumers in which the consumers have to pa\' an amount
that depends on the m axim um demands he makes, plus a charge for each unit o f energy consumed.
• U tilise Hydro Resources for peaking Generation. This also provides power at cheaper rate..
• Segregation o f Irrigation Feeders from Domestic Feeders. Im gation Feeders w ill be made on only at
off-peak hours.
• Staggering o f Office tim ings
• Comm ission the National grid to take advantage o f different peaking time o f different Regions.
Introduction o f more than one time zone m the country would help in this process.
6.139 The industrial sector still consumes a significant amount of electricity of about 34% and therefore, there is greater scope for implementing energy efficiency programmes in this sector One o f the major constraints in the implementation o f energy conservation programme in the industrial sector is non-availability o f energy efficient equipment and technologies. There is a need to develop the capability for manufacturing these equipments. Manufacturers should be motivated by providing necessary incentives such as concessional financing and reduction in custom and excise duties, sales tax, etc. to increase their production capacities for energy efficient equipments
6.140 The agriculture sector accounts for about 28 to 30% of the total electricity consumption in India. Around 12 million electrically operated pumps and 6 million diesel pumpsets are in operation in the country. Thus, this area has greater importance for energy conservation and there is a large scope for energy conservation by carrying out simple pumpset rectification measures Most of these pumps in operation are having sub-optimal efficiencies. A comprehensive pumpset
rectification programme will significantly increase the efficiency o f the pumpsets and the result would be savings up to 50% electricity consumption.
6 141 The funds to meet the expenditure of the programmes on the supply side like improvement in heat rate o f thermal stations, reduction in auxiliary consumption o f old thermal stations, reduction in T&D losses etc. are to be provided by the Power Finance Corporation (PFC) and Rural Electrification Corporation (REC) o f the Ministry o f Power under the overall co-ordination of the energy conservation cell o f the Ministry o f Power These funds could be in the form of loans
6 142 For the demand side programmes, funds may have to be found from the budget allocations o f the Central and State Governments
Financial Outlays6 143 The Ninth Plan (1997-2002) assessed outlays for the power sector is given at Annexure6 2 .
706

COAL & LIGNITE
6.144 The Ninth Plan envisages a major thrust to infrastructure development, particularly Energy and Power Coal and Lignite are the maj or energy resources for power generation Almost 70% of the country’s power generation is based on these two resources The Plan, therefore,
has made special emphasis on rapid and proper development of these resources, which forms the main thrust o f the country’s long term strategy Lignite is also called brown coal and unless the context indicates otherwise, reference to coal i s deemed to include lignite After nationalisation in 1975, development o f coal has been confine d to the public sector It is only recently that the sector has been opened up for private participaiiion The major coal producing companies in the country are Coal India Ltd (CIL), a centrally owned public sector undertaking and Singareni Collieries Co. Ltd (SCCL), a joint public sector undertaking of Government o f Andhra Pradesh, as major equity shareholder and Government of India Besides, captive collieries of TISCO/IISCO/DVC are also producing coal for captive consumption Besides Ney'veli Lignite Corporation (NLC), a public sector undertaking, lignite is also being produced by Gujarat Mineral Development Corporation (GMDC) and recently by Rajasthan State Mineral Development Corporation (RSMDC), both in the State Sector
REVIEW OF EIGHTH PLAN6 145 Some of the major objectives for coal sector during the Eighth Plan were a co-ordmated approach for production, transportation and pithead stock reduction of coal to meet fijlly the consumer demand, maximisation o f the use o f indigenous coking coal for steel making, beneficiation of non-coking coal, streamlining of project implementation procedures, introduction o f an effective environmental management plan, improvement of productivity, lignite development, scientific evaluation of coal & lignite resources and making the coal industry viable and self-supporting.
Exploration & Coal Resources6.146 The Eighth Plan objective for coal exploration was aimed at meeting the demand for coal over a 15 years perspective, through intensifi cation o f regional exploration in new areas and promoting recent discoveries.
6 147 The potential areas and the new finds that were identified during the Eighth Plan period with good quarriable prospects are located in the East Bokaro Coalfield, South Karanpura and Sohagpur Coalfields for metallurgical coal, Birbhum (coal seams under cover o f trap rocks), Sohagpur, Mand-Raigarh (Phutamura area witth Grade A coal), Tatapani - Ramkola and Korba for superior grade non-coking coal and Talc her, Korba, Rajmahal and Auranga Coalfield for inferior grade non-coking coal.
6.148 As a result o f intensified regional/promotional and detailed exploratory efforts, coal reserves have increased from a level o f 196 billion tonnes (bt) at the beginning o f the Eighth Plan i.e. as on 1.1.1992 to a level o f 204 65 bt as on 1 1 1997 Large quantities o f coal reserves have been added in the coalfields o f Ranigani, Domra and Birbhum in West Bengal, East Bokaro, Auranga, South Karanpura and Rajmahal group o f coal fields in Bihar, Talcher and Ib in Orissa, Sohagpur, Mand-Raigarh, Korba, Bisrampur and Tatapani-Ramkola in Madhya Pradesh and Godavari in Andhra Pradesh Of these, coking coal reserves are about 15% and
707

non-coking coal reserves are 85%, Category-wise about 35% are proved, 44% are indicated and 21% are inferred reserves. Grade-wise reserves o f non-coking coal comprise 1 18%Gr 'A', 3.96% Gr. 'B', 9.36% Gr. C\ 13 4% Gr D', 48 92% Gr E', F & G' and 23 18% ungraded coal. Similarly, depth-wise about 67% o f coal reserves are distributed in the range o f 0 - 300 m, 26% in the range o f 300 - 600 m and 7% in the range o f 600 - 1200 m
6.149 The coal reserves under proved category have increased from 61 14 bilhon tonnes (bt) at the beginning o f the Plan to 72.73 bt as on 11.1997 This is only about 35% of the available geological reserves. This brings in the necessity for flirther expediting the exploration efforts to upgrade the geological reserves to proved category for augmenting coa! production in
line with the growing demand
6.150 Against the Eighth Plan regional exploration drilling target for coal & lignite of 403400 metres, the achievement was about 299658 metres upto Sept 1996
6.151 The geological reserves o f lignite have increased from 6 473 bt as on 11 1992 to 27 45 bt a s o n l 1 1997 Of these, 25 88 bt (94%>) are in Tamil Nadu and Pondicherry, 1 02 bt (3.7%)) in Rajasthan and 0.47 bt (1 7%) in Gujarat.
Coal Demand
6.152 Against the annual average growth o f 7 34%> in the consumption o f coal during the Seventh Plan, the projected growth for the Eighth Plan was 6 32% The overall coal demand in the terminal year o f the Eighth Plan (1996-97) was estimated at 3 11 mt (excluding 7 mt o f washery middlings) against a coal consumption o f 228 94 mt (excluding 2 3 mt o f washery middlings) in 1991-92. As against this, the actual coal demand in 1996-97 has been 325 mt (excluding 7.7 mt o f washery middlings) with the share o f power sector (Utilities) at 215 mt including 5 mt o f washery middlings against the initial demand estimates o f 190 mt, which is followed by steel, cement etc Though the addition o f new coal based generation capacity has been only 9488 MW against the envisaged capacity addition of 14340 MW during the Plan, the increase in coal consumption in the power sector has been mainly due to improved PLF
performance o f the existing plants The power sector foresaw a shortfall of around 20 - 25 mt in the indigenous availability o f coal to meet their requirements during 1996-97 at the time of
the formulation o f the Annual Plan 1996-97 In the case o f steel sector, availability o f coking coal has fallen short o f requirements and imports have increased to a level o f around 9 mt during 1996-97 against 3 .5 mt originally envisaged There has been shortfalls in supply o f indigenous coal to the cement sector as well. The demand o f this sector was partly met by lignite particularly in the case o f cement plants located in Southern India and by some duty-free imports o f coal made against exports o f cement Besides, coal from the open market was also reportedly consumed by the sector for which no reliable data is available The main reasons for shortfalls in the availability o f domestic coal are regional demand supply mismatches, quality problems and inadequate rail evacuation facilities Besides, the constraints o f domestic coal production have affected the demand materialisation in the later pan o f the Eighth Plan The growth in consumption during the Eighth Plan was about 5.3%», with the actual consumption o f 295 .98 mt excluding 4 74 mt o f washery middlings The broad sectoral coal demand is given in Table 6.20 and details are given in Aimexure 6 3
708

Table 6.20 Sectoral Coal Demand
(million tonnes)
Sector 1991
-92
1992
-97
H I G H T H P L A N
_______1996-97____________
O ng . Rev. Pnn 'l
Targ T arg
Actual Actual
N IN T H PLAN
1997 2001
-98 -02
Target Target
G R (JW T H RATE
1996-97 2001-02
1991-92 1996-97
COKING
Steel ' 31.66
Cuke Ovens '
Suh-Total: 31.66
(Coking)
NON C OKINGI'Dwer
1 U t i l i t i e s )
C e m e n t
( ) t l i er s
134.60
(2 30)
9 97
52.71
(2 30)
32 43 42.00 40.50 34 71 41.40 49.60
2.00
32 43 42.00 40..50 34.71 41.40 51.60
147.04 1S5.30 210.00 199.26 205.90 262.00
(2.49) (4 70) (5.00) (2.58) (4.10) (5.00)
10.89 17.50 17.50 11.25 18.20 21.40
Sub-lotal: 197.28
(Non-Coking) (2.30)
TOTAL: 228.94
(2.30)
51.33 (>6 20 57.00 50.76 57 88 77 20
(2 70) (2 16) (2,70) (2.70)
209.26 26900 284.50 261.27 281.98 3()0.60
(2.49) (70 0 ) (7.70) (4 74) (6.80) (7.70)
24169 "11.00 325.00 295 98 323.38 412.20
(2 49) (70 0 ) (7.70) (4.74) (6.80j (7 70)
1.86 7.4
1.86 8.25
8 16 5.63
2.45 13.72
-0.75 8.75
5.78 6 ()(i
5 27 6,85
Note: Figiiies m biackets are vvasherv m iddling, and are not included in the totals.
Coal Production6 153 Against the average growth in coal production of 6 4% annually during the Seventh Plan, production of coal in the Eighth Plan was projected to grow at an average rate o f 6.08% annually The target for coal production in the terminal year of the Eighth Plan was fixed at 308 mt against an achievement of229,29m tin 1991-92 However, the production increased at an annual rate of about 4 5% only This has been mainly due to fixation of lower production targets for Coal India Ltd. with a view to liquidate the mounting pithead stocks in the initial years of the Plan. Domestic coal availability, however, fell short o f the demand in the subsequent years
of the Plan The target o f coal production in 1996-97 was set at 288.65 mt (CIL 252 mt, SCCL 30 2 mt & Others 6 45 mt) against the initially envisaged target o f 308 mt (CIL 270 mt, SCCL 33 mt & Others 6 5 mt) The domestic availability was lower than the estimated demand in 1996-97 The decision of the Ministry of Coal (MOC) not to take up coal projects yielding less than 16% of IRR has delayed work on a large number of new projects and has led to significant shortfalls in coal availability from new projects during the Eighth Plan The new underground projects could not be taken up due to costs o f production far exceeding the prevailing prices As a result, the underground opencast production ratio has declined and touched a low of 25 75
709

in 1996-97 as against 28:72 at the beginning o f the Plan. Besides, there have been severe shortfalls in capacity additions from new projects as a result of resource constraints and delays in the implementation o f ongoing projects which have adversely affected the coal production
programme. The details o f coal production are given in Table-6 21 and the company-wise production details are given in Annexure 6 .4______________________ ____
Table 6.21 Details of Coal Production
(million tonnes)
E I G H T H P L A N
Company 1991-92Actual
1992-93Actual
1996-97Ong.Targ.
Rev. Provl. Targ.
NINTH PLAN
1997 2001-98 - 02
Targ. Targ.
GROW TH r a i l ;
1996-97 2001-02
1991-92 1996-97
CIL 204.15 211.22 270.00 252.00 250.65 260.50 314.00 4.19 4,60SCCLTISCO/n s c o /
20.58 22,51 33.00 30.20 28.73 31.00 36.00 6,90 4,61
DVC 4.56 4.38 5.00 6.45 6.45 6.50 7.60 6,60 3,X‘JCaptiveBlocks
■ ■ " ■ 13.00 "
TOTAL: 229.29 238.11 308.00 288.65 285.66 298.00 370.60 4,50 5,34
Pithead Stocks6.154 In the year 1995-96, the MOC had reviewed the pithead stocks position o f CIL and declared some o f the stocks as non-vendible. As a result, stocks standing at 48 58 mt (CIL 47 8 mt, SCCL 0.70 & Others 0.08 mt) at the beginning o f the Eighth Plan have come down to a level o f 30.04 mt (CIL 27.88 mt, SCCL 1.91 mt & Others 0.25 mt) as on 1.4 1997. The envisaged draw down from the pithead stocks o f CIL during the Plan has also not materialised It was planned to draw 20 mt in 1992-93, 13.8 mt in 1993-94, 8.9 mt in 1994-95, 7 5 mt in 1995-96 and 2 mt in 1996-97 from the stocks o f CIL. As against this, there was an accretion o f 2 3 mt in 1992-93, a nominal reduction o f 0.49 mt in 1993-94, a reduction o f 4.45 mt in 1994-95 an accretion o f 1.91 mt in 1995-96, and a nominal reduction o f 0 10 mt in 1996-97
Coal Quality6.155 It was envisaged that the average ash content in the washed coking coal for steel plants at the desired level o f 17% +/- 0 5% would be maintained by the coal industry by undertaking the necessary modifications and retrofitting etc. o f existing washeries as per the recommendations of the Altekar Committee by 1994-95. However, the problem of higher ash content has not been overcome and the steel industry is increasingly depending on imports mainly due to inconsistencies in the quality o f washed coking coal being supplied by CIL at about 21% ash The washed coking coal production from CIL washeries has almost remained stagnant at around 9 mt
in the Eighth Plan The yield of the washeries has come down from 54% in 1992-93 to about 51% in 1996-97 The two new coking coal washeries namely Kedla and Madhuband which were scheduled to be commissioned during the Plan have not been commissioned
710

6.156 Regarding beneficiation o f non-coking coal for supply to the power plants situated at a distance o f more than 1000 kms from the coalfields, it was envisaged that beneficiation facilities
would be set up in the Eighth Plan. However, excluding the facility at Piparwar project, no new non-coking coal washery has come up in the Eighth Plan.
Demand-Supply M anagement
6.157 The Eighth Plan envisaged matching o f the field-wise production plan with the requirements o f the consuming sectors keeping in view the evacuation facilities It was also envisaged that the coal supply to Southern and Western region power stations would be based on a carefially drawn up action plan necessitating movement o f coal by coastal shipping from the Eastern region However, the originally envisaged targets o f coal production and coal demand have fallen short by 7 3% and 4 8% respectively during the Plan The constraints-of rail evacuation facilities have resulted in increased pithead stocks in the initial years o f the Plan Though the rail movement o f coal has increased significantly during the Eighth Plan, movement constraints were noticed particularly in areas like Korba,Talcher, Ib Valley, North Karanpura, Rajmahaletc which have large unrealised production potential The critical rail links have been identified and are to be taken up on priority' by the Railways.
6 158 The annual imports o f coking coal by the steel sector have reached a level o f 9 mt due to lack o f adequate availability and suitable quality o f coking coal from indigenous sources Delays in completion o f the modificatioa^retrofitting o f existing washeries as per the Altekar Committee recommendations and delays in implementation o f new washery projects have resulted in the shortfall o f washed coking coal availability. Shortage o f suitable raw coal feed to the washeries has also affected the washery performance The proposed utilisation o f Low Volatile Medium Coking coals (LVMC), to increase the availability o f raw coal feed for coking coal washeries supplying coal to the steel sectoT, has not come up to the required extent
6.159 Delays in implementation o f projects and non-availability o f resources for taking up new projects have adversely affected the coal production programme in the later part o f the Plan
6 160 The constraints o f production from underground mines continue. Though there has been an increase in the overall coal productio-n, it has been mainly the result o f the increase in production from opencast mines.
Project Implementation
6.161 New coal projects for an annual production o f 72 mt were to be sanctioned and started during the Eighth Plan. Against this, the total capacity sanctioned was only around 43 mt. The CIL and SCCL have not been able to take up a number o f technically viable projects in view o f the unsustainable low financial rate o f return in the context o f the administered prices. Implementation o f the ongoing projects has also suffered due to problems o f land availability and forest and environmental clearances.
6 .162 Land acquisition and the related r ehabilitation o f the land oustees continued to remain one o f the major constraints o f project implementation. The Plan envisaged that a national level rehabilitation policy would be finalised for adoption by the new projects with a view to mitigate the hardships o f land oustees. However, the nation^ level rehabilitation policy has not come
711

through yetEnvironmental Measures
6 163 The approval and implementation o f environmental management plans have become mandatory constituents o f the projects as per the project clearance procedures o f the Government Coal companies have also started reclamation o f mined-out areas particularly the opencast mines as per the approved en\'ironmental management plans Similarly, strict measures for controlling the effluents o f washeries, mines and workshops are also under implementation
6 164 Measures for protecting the environment o f coalfields have been continuing and special efforts have been made by creating a head under "Environmental Measures & Subsidence Control" to tackle fire and subsidence problems in Jharia and Raniganj coalfields respectively An acti~'i plan is to be drawn up for effective implementation o f the schemes A High Powered Committee has been constituted by the Government o f India for this purpose and its report is awaited.
Productivity
6 165 To arrest the low productivity in the underground mines and to improve the overall productivity o f men and machinery, the coal companies have drawn certain action plans, like implementation o f voluntary retirement scheme, de-commissioning o f uneconomic mines, re-location o f under-utihsed manpower, re-orientation o f investment programmes with preference for projects with relatively low gestation and higher outputs and maximisation o f underground production. As a result o f these measures, there has been a significant improvement in the overall Output per Manshift (OMS) levels o f coal companies However, the improvement in OMS has been mainly confined to opencast mines only and underground OMS needs to be fiirther improved Against the Plan target o f OMS of 1 65 t (UG 0 6 6 1, OC 4.32 t) for CIL and 1.36 t (UG 0.86 t, OC 6 43 t) for SCCL, the OMS in 1996-97 (Actual) for
CIL was 1,82 t(U G 0.59 t,O C 4,88 t) and for SCCL 1.19 t (UG 0 72 t, OC 6.25 t) In the case o f machine productivity, though the targets o f machine utilisation have been achieved when compared with the norms fixed by Central Mine Planning & Design Institute Ltd (CMPDIL) for various Heavy Earth Moving Machinery (HEMM) particularly in CIL, there is a necessity to review these productivity norms with a view to improve the capacity utilisation
Coal Transportation
6 166 About 66% o f the coal offtake is by railways Though the movement o f coal by Merry Go Round (MGR) system for pit-head power stations is increasing, still the component o f rail transportation continues to remain predominant in the overall coal movement In order to reduce the dependence on road transport mainly in view o f energy conservation, transportation o f coal by rail needs to be fijrther increased Critical transportation bottlenecks like construction o f rail links between Gevra and Pendra road, doubling o f Champa Gevra line in Korba, new railway line linking Rajmahal coalfield with main line, construction of new line fi'om Hindgir railway station to Gopalpur in Ib Valley, Tori-Dhonia link in North Karanpura field, increasing the capacity at Mugalsarai Junction etc have already been identified and work needs to be undertaken on these projects by the Railways on priority
6 167 Coking coal imports by the steel sector by the end o f the Plan was about 9 mt A gap o f 20 - 25 mt existed between the estimated demand and domestic availability o f coal for the power sector in the beginning o f 1996-97, warranting high level of non coking coal imports by the power sector However, the matching coal handling facilities at ports were not adequate As

per the Ministry of Surface Transport, at the beginning of the Eighth Plan the dedicated capacity for coal handling in Indian ports was reckoned as 7 mt only Out of this, 5 mt was available at Haldia and 2 mt at Tuticorin The number of coal berths at Haldia are two and at Tuticorin one In addition, coal is also being handled at cargo berths at Vishakhapatnam, Paradip and Madras on the East Coast One coal jetty has been added at Tuticorin port during the Eighth Plan for an ultimate capacity of 2 5 mt However, the interim capacity of tlus is only about 1 mt Thus, the aggregate coal handling capacity at major ports by the end of the Plan w as 8 5 mt only Some minor ports under State Governments are also handling some coal imports for which no statistics is available Thus, the option of large-scale imports does not appear to be available during the Ninth Plan due to capacity constraints in the ports
Science & Technology6 168 The thrust areas for R&D activities during the Eighth Plan continued to be Production, Productivity & Safety, Coal Beneficiation, Coal Utilisation; and Environment & Ecology During the Eighth Plan, apart from the continuing projects, forty new S&T projects were sanctioned till 1995-96 at an estimated cost of Rs 14.96 crore. However, no major project has been undertaken during the Eighth Plan under the S&T grant Even the IS-STAC projects under Department of Science & Technology did not come up m the desired way during the Plan As a resuh, the total S&T expenditure in the Plan has been limited to Rs 19 78 crore (23%) against an approved outlay of Rs 87 crore
Lignite6 169 Development of lignite in the Eighth Plan has not been satisfactory m spite of the thrust given The Barsinghsar Integrated Lignite Mine-cum-Power Project of NLC in Rajasthan has been deferred and this project is now to be taken up in the private sector The Mine-1 Expansion Project of NLC from 6 5 mtpa to 10 5 mtpa has got badly delayed due to the delay in the approval of the linked TPS-I Expansion Project and the funding arrangements However, the lignite production by GMDC has increased from 3 2 mt at the beginning of the Plan to 5 19 mt at the end of the Plan As against the NEC’s targeted growth of 7 5% annually for lignite production, the actual growth was 6 7% only
Private Sector Participation6 170 In order to augment the coal availability, certain measures were initiated for facilitating private sector participation in the coal sector during the Eighth Plan However, it was limited to captive consumption only Following were the areas allowed for private sector participation
(i) Captive coal mining by consumers engaged in power generation, iron & steel and cement industr>-
(ii) Construction of washeries on Build-own-Operate (BOO) basis
6 171 Forty seven mining blocks were identified for captive mining with an estimated reserve of about 14 bt and an annual production potential of 150 mt Of these, 16 proposals were cleared for power generation and 3 for steel making in both private and public sector Action was also initiated for construction of 7 washeries in private sector (3 coking coal and 4 non-coking coal) However, the pace of development has not been as desired
6 !72 Towards the end of the Eighth Plan, on 12th Feb.. 19^7, based on the recommendations of the Committee on Integrated Coal Policv’, the Government has taken decisior in principle
713

to permit commercial mining o f coal by the private sector without the captive-use restriction However, it is subject to legislative approval. Other decisions are enumerated in para 6 177.
Capital Restructuring
6.173 The Eighth Plan envisaged the coal industry to be made financially viable and capable of supporting itself through improvements in efficiency and productivity levels. Accordingly, the coal sector has initiated action for rationalisation o f manpower and closure o f uneconomic mines etc. As a result o f these measures and decontrol o f prices o f all coking coals and superior grade non-coking coals (A, B, C & D), the internal resource generation has increased which has led to reduced reliance on budgetary support. The Government has approved capital restructuring packages for SCCL in 1994 and CIL in 1996 to facilitate their turn around. But, due to delays in timely revision o f coal prices, prior to decontrol of certain grades of coal, the likely benefits of capital restructuring have got diluted.
Plan Outlays and Expenditure
6.174 The Eighth Plan approved a Central outlay o f Rs. 10507 crore (at 1991-92 prices) for coal & lignite sector excluding the contribution o f the Government o f Andhra Pradesh towards its share o f equity in SCCL estimated at Rs.850 crore. In addition, the outlay approved for NLC (Power) was Rs, 1000 crore. As against this, the cumulative expenditure in the Plan (1992-97) has been Rs, 10,714,22 crore including the contribution of Rs,487 crore from Government o f Andhra Pradesh for SCCL The cumulative expenditure in the case o f NLC (Power) has been Rs 429 48 crore. Thus, the overall expenditure o f MOC has been Rs. 11143 .7 crore including the contribution of Govt, o f Andhra Pradesh and NLC (Power) against the corresponding overall outlay o f Rs. 12357 crore. The overall expenditure forms about 90% of the total outlay at current prices and about 71% at constant prices (1991-92). The main reasons for the shortfall in the expenditure have been delay in the revision o f coal prices and non realisation o f outstanding coal sale dues affecting the generation o f internal resources. Also, the envisaged market borrowings have not fully come through. All these have affected the Plan expenditure adversely.
6.175 Based on the progress o f various major projects, the spillover to the Ninth Plan o f both coal & lignite projects is o f the order o f Rs.5598.72 crore (CIL Rs.3019.42 crore, SCCl- Rs.740.33 crore, NLC Mines Rs, 1838.97 crore) and of NLC (Power) it is 1847.15 crore, totaling Rs.7445.87 crore.
Coal Policy
6.176 Considering the important position o f coal and lignite in India’s energy strategy and the urgent need for rapid development o f these resources, the Planning Commission constituted a Committee on 'Integrated Coal Policy’, which submitted its report in May, 1996 The Committee has made a number o f recommendations for augmentation o f coal and lignite production and private sector participation in the coal sector. The major recommendations include coal conservation through reduction in specific coal consumption levels for power generation and adoption o f improved coal utihsation technologies for power generation and steel making, augmentation of domestic coal production by involvement of private sector, offering of coal blocks both for exploration as well as mining on competitive bidding basis, integrating the exploratory efforts for coal and lignite, creation o f a Special Fund and an independent body for coal and lignite exploration, deregulation o f coal prices, creation o f a Regulatory body for looking into price disputes etc., setting up o f more pithead coal/lignite-based thermal power stations.
714

augmentation o f railways and port infrastructure facilities, amendments/modifications in various Acts viz. Coal Mines (Nationalisation) Act 1973, Colliery Control Order, 1945, Coal Bearing Areas (Acquisition & Development) Act, 1957, Mines and Minerals (Regulation & Development) Act, 1970, Forest Conservation Act, 1980 etc. for facilitating private sector participation and expediting project clearance procedures.
6.177 Following recommendations o f the Committee have been accepted by the Government:
(i) Deregulation o f the prices and distribution o f the D Grade o f non-coking coal, hard coke and soft coke.
(ii) Allowing CIL and SCCL to fix the prices of E, F & G Grades o f non-coking coal till 1 St January, 2000, once in every six months by updating the cost indices as per the escalation formula contained in the 1987 Report o f the Bureau o f Industrial Costs and Prices (BICP).
(iii) .\llowing CIL and SCCL to fix the prices of E, F and G Grades o f non-coking coal in relation with the market prices and to distribute these grades o f coal after 1 st January, 2000.
(iv) Setting up of an Independent Body to monitor the detailed and regional explorationo f coal & lignite resources in the country.
(v) Allocation o f new blocks on the basis o f a competitive bidding process in which Indian companies including National Coal Companies (NCCs) may participate.
(vi) Establishment o f a Regulatory Body which would perform an appellate function to resolve any price disputes between the producers and consumers.
(vii) Subject to legislative approval, permission to any Indian company to mine coal without the restriction o f captive consumption. Implementation o f some o f these recommendations would need amendments to various statutes governing coal mining in the country.
NINTH PLAN (1997-2002)6.178 Following priority areas have been identified for the coal sector in the Ninth Plan:
Long-term planning for coal & lignite development, with regard especially to power demand & keeping in view the long gestation period o f coal projects Measures for augmenting domestic coal production to reduce the huge gap between demand and supply since large-scale imports are not feasible due to port and foreign- exchange constraintsImprove productivity o f men and machines, maximise capacity utilisation, improvement in technology, improved project implementation etc.Improve coal quality as also share o f UG mines in total coal production.Improve customer service, customer satisfaction and totally computerise the sales
operations and make them totally transparent.
715

Encouraging private sector participation to increase domestic coal production Proper demand management & conservation of coal by the end users Extension of infrastructure benefits to coal & lignite sector National Coal Companies to enter into joint ventures.Beneficiation of non-coking coal supplied to consumers beyond 700 kms to be made mandatoiy with utilisation of rejects for power generation through FBC route at pitheadsProper commercial mechanism for collection of outstanding coal & power sale dues More and more power plants at pitheads to ease movement constraints Streamlining of forestry & environmental clearance procedures More autonomy and responsibility to Public Sector Coal Companies Expediting coal and lignite exploration to match the reserves with the projected longterm production/demandImplementation of policy decisions contained in the Integrated Coal Policy Augmenting domestic coking coal availability with a view to contam the large imports by undertaking washing of Low Volatile Medium Coking Coals (LA'MC)Development of clean coal technologiesUtilisation of Coal Bed Methane as a source of commercial energyImprovement of environmental management in coal mining areasIntegrated approach for development of coal mining blocks with specific regard toenvironmental and forestry issuesRestructuring of coal industryProper coal pricing policyProper development of rail & port infrastructure facilities Improved safety & welfare measures for coal mine workers
Coal Demand6 179 As against the actual coal consumption of 296 mt excluding 4 74 mt of washery middlings, in 1996-97 the demand for coal estimated by the Working Group on Coal & Lignite, in the terminal year of the Ninth Plan, 2001-02, is 405 mt, excluding 7 70 mt of washery middlings. However, the coal demand for power, as estimated by the Working Group at 254 8 mt, excluding 5 5 mt o f washery middlings, was on the lower side and a review was made considering the new coal-based power plants yielding benefits in the Ninth Plan Accordingly, the coal demand for the power sector utilities in 2001-02 is now estimated at 262 mt, excluding 5 mt o f washery middlings Thus, the overall coal demand in 2001-02, the terminal year of the Ninth Plan, is now estimated at 412 .20 mt, excluding 7 70 mt of washery middlings, impl>ang an average annual growth of 6 85% in the Ninth Plan against about 5 3% in the Eighth Plan The power utilities are the largest consumers (64%) followed by steel (12%), cement (5 2%), etc it is to be noted that the estimated demand for power utilities will, how^ever, depend on the various clearances for the new private sector power projects by the end of 1997-98 and finalisation of fuel supply agreements with the coal companies The broad sectoral coal demand is given in Table 6 20 and details are given in Annexure-6 3
Coal Production
6.180 As against the actual coal production of 285 66 mt in 1996-97, the Working Group has estimated a coal production of 359 60 mt consisting of 303 ml from coalfields of CIL, 36 mt from those of SCCL, 7 6 mt from TISCO/IISCO/DVC and 13 mt from the Captive Blocks in
716

2001-02. However, after reviewing the possibilities o f incremental coal production from CIL it has been found feasible to increase the CIL’s target by 11 mt totaling to 314 mt in 2001-02. Thus
the overall coal production target in 2001-02 is fixed at 370.60 mt, implying an average annual compounded growth o f 5.3% during the Ninth Plan against the actual growth o f 4.5% in the Eighth Plan. The details o f coal production are given in Table 6.21 and company-wise coal production is given in Annexure-6.4.
6.181 The incremental production in the Ninth Plan over the Eighth Plan is about 85 mt against 56 mt o f incremental production in the Eighth Plan. The category-wise coal production is as given in Table-6.22.
Table 6.22Categorywise Coal Production in 2001-02
(in million tonnes)
Category CIL SCCL TISCO/ Captive IISCO/DVC Blocks
TOTAL
Existing 31.64 4.15 7 60 - 43.39Completed 118 57 19.15 - - 137.72Ongoing 108.08 8.37 - - 116,45New 55.71 4 33 - 13 00 73,04Total: 314 00 36 00 7.60 13.00 370 60
6 182 The coal production from the new schemes of CIL & SCCL is estimated at 60 04 mt which is about 17% of the total production and will be available only if these projects are taken up immediately with strict monitoring for their timely implementation and completion. Besides, the contribution from Captive Blocks at 13 mt (3 .5% of the total) is subject to the action taken by the promoters.
6 183 From the additional coal production potential o f 41 mt, from CIL sources (ECL- 2.5 mt, CCL-2.0 mt; WCL-3.4 mt; SECL-17.5 mt and MCL-15.9 mt) which has been identified by the Working Group, an increase o f 11 mt (MCL-4 mt; SECL-3 mt & WCL-4 mt) has been considered to be feasible in 2001-02.
6.184 Of the total projected production, 75% is envisaged to come from opencast mines and 25% from underground mines. This trend is fast depleting the reserves amenable for opencast mining and neglecting the development o f underground mines where large potential exists for meeting the future demand. Therefore, immediate action would need to be initiated for developing underground mines in view o f their long gestation periods.
Demand Supply Management6.185 When compared with the domestic availability there lies a large gap in meeting the projected demand o f coal in the year 2001-02. Against the assessed demand o f 412,20 mt, excluding 7,70 mt o f washery middlings, the indigenous availability is 370.60 mt only leaving a gap o f 41 60 mt. The steel sector has proposed to import 19 mt o f coking coal and two thermal
717

power stations have proposed to import 2 3 mt o f non-coking coal in 2001-02 This still leaves a gap o f 20 3 mt in 2001-02.
6.186 In view o f this large demand-supply mismatch there is a need for policy changes to augment coal production in the Ninth Plan and beyond by measures like facilitating pnvate sector participation in a big way, including the commercial mining by rationalisation o f coal prices In addition to these measures, proper demand management for coal by adopting suitable coal utilisation technologies by the end-use sectors, locating more and more pithead power stations to overcome the rail movement constraints, necessary amendments to the various Acts/Regulations, competitive bidding o f coal blocks, restructuring of coal industry etc are some of the areas which
need immediate attention, as brought out by the Committee on Integrated Coal Policy
Rail Movement6.187 Augmentation o f rail movement capacity by implementing the already identified critical rail links in potential coalfields is essential in the Ninth Plan to avoid mismatches and help materialisation o f coal demand The MOC has listed the following rail network constraints
(i) For movement of coal to the Northern India power stations an additional 14 rakes will have to be moved per day in 2001-02, through Mughal-Sarai Junction over the current average movement of 24 rakes a day In addition, there will be movement to non-power consumers at about 5 rakes a day in 2001-02 Thus, movement through Mughal-Sarai needs to cater to about 43 rakes a day in 2001-02
(ii) A new rail link between Korba and Korea-Rewa coalfields, which will enable coal companies to take up rapid expansion with least investment in Korba, to cater to the demand from Western India
(iii) The identified important rail links in MCL covering Talcher and lb Valley as per the Master Plan need to be completed.
(iv) In CCL, the Tori-Dhonia link is critical for tapping the vast potential of NKP area
(v) In ECL, the Pirpainti to Madhupur link in the Rajmahal coalfield is vital for expanding the production potential o f this field
6.188 While the trunk routes are looked after by the Ministry of Railways(MOR), the movement facilities Irom the coalfields to the trunk routes is lagging due to resource crunch being faced by the MOR It is, therefore, felt necessary by the MOC that it would have to fijnd these new infrastructural rail links through collections from excise duty leviable under Coal Mines Conservation & Development Act (CCDA) 1974, which is also meant for im.provement of transport infrastructure in the coalfields Presently, approximately Rs 335 crore is lying unspent in the consolidated fijnd o f the Government of India which were collected in the form of excise duty since the inception o f CCDA in 1974 As per the estimates o f the MOC, rail line for a distance of 490 kms in different coalfields of CIL is required to be covered with an estimated cost of Rs. 1127 crore
718

6 .189 The coal contributes 48% of the total railway revenue earning freight and out o f this 68% is from coal moved to power sector The regular increase in the coal freight charges are adversely afifecting the landed cost o f coal at consumers’ end. This may lead to competitive dis-advantage to the domestic coal. Therefore, the increase in the freight charges o f coal should be so devised to encourage the consumers to resolve to rail transportation
Pit-head Power Stations
6.190 In order to avoid coal transportation bottlenecks, it is essential to the extent feasible to opt for coal pit-head based power plants, with suitable arrangements for evacuation of power to the consuming States. The potential locations for such coal-based power plants at Talcherand Ib in Orissa, North Karanpura in Bihar, Singrauli in U.P., etc., and lignite-based power plants at
Jayamkondam, Mannargudi etc in Tamil Nadu have been identified
Port Facilities
6.191 Development o f port facilities is an important area for facilitating transport o f coal both indigenous and imported. Substantial imports are contemplated in the Ninth Plan in view o f the projected deficits between demand and domestic availability. It has also been suggested by the ‘Committee on Integrated Coal Policy’, that the coastal-based power stations may import power grade coals for the purpose in view o f the contemplated shortfall in the domestic availability in the Ninth Plan and beyond Proper policy for developing in-land water-ways for coal transportation needs consideration to supplement rail and road transport capacities and to conserve energy
6.192 In the Ninth Plan, it is proposed to provide mechanised coal handling facilities at Ermore near Madras and at Paradip for handling thermal coal. The number o f berths for coal handling, to be added, are four, two in each port. Once these facilities are completed, the expected additional coal handling capacity will be o f the order o f 28 mt by the end o f the Ninth Plan, o f which 20 mt will be at Paradip and 8 mt will be at Madras amounting to a total capacity o f 37 mt in 2001-02 against a total capacity o f 8.5 mt in 1996-97 at the end of the Eighth Plan
Productivity6.193 Productivity in terms o f output per man shift for CIL is targeted at 2.24 tonne (UG- 0 ,6 9 1, OC-6.53 t), in 2001-02, against the actual achievement o f 1 8 6 1 (UG-0 57 t, OC-5.12 t) in 1996-97. In the case o f SCCL the overall target is 1 30 t (UG-0.79 t, OC-4 50 t) in 2001-02, against the actual achievement o f 1 19 t (UG-0.72 t, OC-6.25 t) in 1996-97 Measures would need to be initiated for improving the productivity further.
6 .194 Productivity forHEMM in terms o f machine utilisation in CIL in 2001-02 is targeted at 72% for shovels, 60% for dumpers, 63% for dozers, 65% for drills and 93% for draglines against the CMPDEL norms o f 58%, 50%, 45%, 40?/o and 73% for these machines respectively In the case o f SCCL the targets are 57%, 55%, 72%, - , 98% respectively There is an urgent need to review the capacities, as well as norms for better utilisation o f HEMM, fixed by the CMPDIL
Economics of Coal Projects
6.195 The reforms in the coal sector leading to deregulation o f prices would change the economics o f coal projects. Earher, coal projects used to be considered for approval by the Government for low financial IRRs (12% or even less) in larger economic interests of the country
719

However, in view o f the mounting losses of coal companies, the MOC decided not to consider any coal project for approval with financial IRR of less than 16%. This resulted in the shelving o f many coal projects and the number o f new coal projects being planned and approved came dowTi sharply. This trend may lead to an unwelcome supply-demand mismatch. It is to be noted that coal projects invariably have long gestation periods and cannot be planned and implemented hurriedly. The recent recommendation o f the ‘Committee on Integrated Coal Policy’ regarding negotiated pricing for any coal produced from new mines is therefore welcome. Coal companies
would now be able to take up new projects based on negotiated prices The selling price o f coal fi'om these projects to yield the desired finacial IRR may be worked out through commercial agreements between the producers and the consumers Therefore, the criteria o f financial IRR at 16% should not become a hurdle in taking up of new projects
Washed Coking Coal6.196 The projected washed coking coal availability in 2001-02 from the CIL sources is 10,90 mt only. The incremental production in the Ninth Plan over the Eighth Plan is 1.2 mt However, the projected yield o f the washeries is only 48.2%. This is a matter o f serious concern. All possible measures need to be taken for improving the yield and the capacity utilisation of washeries and thereby improve the availability o f washed coal. Also, no new washery project is proposed by CIL in the Ninth Plan. The proposed imports o f coking coal by the steel sector in 2001-02 is 19 mt on qualitative and quantitative grounds. Any additional availability o f suitable quality of washed coking coal from CIL would reduce these imports and help the steel industry
6.197 Utilisation o f LVMC coals after washing needs to be taken up on priority during the Ninth Plan.
Beneficiation of non-coking coal6.198 The notification dated 19.9.1997 issued by the Ministry o f Environment & Forests (MOEF) makes it mandatory for thermal power plants located 1000 kms from pithead and also those located in urban areas/sensitive areas/ critically polluted areas, irrespective of their distance from pithead, excepting any pithead thermal power plant, to use beneficiated coal with ash content not exceeding 34% from 1st June, 2001. As there is only one non-coking coal washery, namely Piparwar, there is an urgent need to create the required capacities for beneficiating noncoking coal to comply with the MOEF notification. Also, 37% o f the total despatches to the power sector, currently, are over long distances This implies that about 120 mt of washing/beneficiation capacity would need to be created by 2001-02, which would require a capital investment o f about Rs.3000 crore at a specific investment o f Rs.25 to 30 crore per million tonne. The power sector has to enter into agreements with the coal companies for bearing this extra beneficiation costs. Also, to make the beneficiation economical, the washery rejects need to be utilised in FBC route power generation. Therefore in view o f CIL’s policy o f not commissioning any washery o f its own other than on BOO or BOOT basis and the long gestation period o f 36 to 48 months required for building washeries and also the enormous costs involved, there is an urgent need for finalisation o f the agreements with the consumers so that these
washing^eneficiation capacities can be created well in time. Though the private sector was permitted to wash coal by suitably amending the Coal Mines (Nationalisation) Act, 1973, the response has not been as desired due to issues involved in the settlement o f commercial terms with the power producers. Therefore, the setting up o f washeries by private parties as agents of power stations need to be promoted. This could be on the lines o f the Bombay Suburban Electric Supply (BSES) which has entered into the activity o f washing and despatch o f its linked coal
720

6.199 There is a need for beneficiation o f non-coking coal and it would be necessary for the consumers to bear the additional cost o f beneficiation. Also, MOC may pursuade coal companies to supply beneficiated coal to consumers on cost plus basis. Alternatively, beneficiation plants/deshaling plants may be offered on BOOT
Domestic Fuel6.200 In spite o f the efforts being made to encourage coal-based domestic fiaels like Coal Briquettes, Soft Coke and Special Smokeless Fuel (SSF), the growth in their production/consumption has not been encouraging. Suitable measures need to be taken to encourage increased private sector participation in producing these fuels to improve their availability at aflFordable prices, particularly for the people in rural areas
Exploration
6.201 In the Ninth Plan, regional/promotional/detailed exploration activities need to be intensified for upgradation o f reserves to proved’ and recoverable/mineable’ categories to permit projectisation o f suitable blocks for increased production to meet the rapidly increasing demand for coal and lignite So far, regional/promotional exploration has been flinded through budgetary support and carried out by Geological Survey o f India (GSI) and Mineral Exploration Corporation Ltd (MECL) Detailed exploration has been funded and implemented by the National Coal Companies (NCCs) themselves
6.202 In the emerging deregulated environment in the coal sector, the NCCs may no longer be interested in investing on exploration as it is not always certain that the particular coal bearing area on which the company has incurred heavy expenditure on exploration will be allotted to the same company for mJning
6 203 To ensure that there is no let up in regional exploration efforts, greater interv'ention by the Central Government in this area becomes imperative. The manner in which such exploration activity should be fianded and the institution that should be entrusted with this responsibility are issues that assume considerable importance during the Ninth Plan
6.204 Exploration is a continuous activity The mineable coal reserves are estimated to be around 20 billion tonnes out o f the estimated coal reserves o f around 204 billion tonnes. The Plan envisages increased efforts for coal exploration with the objective to bring the estimated coal reserves into mineable coal reserve category.- A total o f 5.55 lakh metres o f regional and promotional drilling for coal and 4 45 lakh metres for lignite is to be carried out during the Ninth Plan. The Plan envisages upgradation o f additional reserves o f 10 bt o f coal and 15 bt o f lignite. Both regional/promotional and detailed exploration will be extended to deeper areas Regional/promotional exploration will be carried out over the uncovered parts o f the known coalfields, areas where coal reserves occur at depths beyond present day depth-cut offs and the virgin coalfield areas which are unexplored so far. Besides, areas underlying the volcanic traps will also be explored. Detailed exploration will be canied out for proving the reserves occurring in the uncovered parts o f the known coalfields, as well as reserves occurring within the depth range o f 300 - 600 metres Exploratory efforts for coking coal will be intensified in the new areas o f Damodar Valley, as well as outside Damodar Valley - particularly in parts o f Rewa Gondwana Basin
721
6.205 Regional/promotional exploration for lignite will be carried out to trace the lateral, extensions o f the existing seams and for locating more deposits in geological continuity in Ramnad basin and other coastal areas in Tamil Nadu - Pondicherry region, Barmer, Bikaner and Nagaur basins in Rajasthan and in Kutch, Bhavnagar, Surat and Bharuch districts o f Gujarat Besides,
systematic exploratory work for lignite will be carried out in potential coastal areas o f Kerala, Karnataka, Andhra Pradesh and Maharashtra
6.206 Considering the urgent need for accelerating exploration for coal and lignite in view of the sharply gi owing demand for coal and the inability o f the NCCs in funding detailed exploration o f the coal blocks and also to establish matching reserves, it is proposed to set up an Independent Body for both regional/promotional and detailed exploration activities which will be carried out by private and public sector agencies and will be financed fi-om a Special Fund created for this purpose by levying an appropriate surcharge on every tonne o f coal and lignite produced in the country Exploration is a risk venture. It would, therefore, be necessary that financial incentives and concessions as allowed for infrastructure industries, are provided to Coal Sector, with an objective to mobilise resources for coal exploration In order to encourage private sector participation, there should be legal back-up for commercial exploration agencies to be given priority for exploitation as well However, they should apply for exploitation within the time fi'ame prescribed after exploration o f the block is completed
Science & Technology6 207 Thrust on completion o f ongoing S&T projects and identifymg suitable schemes for industrial application under the four thrust areas, namely , production, productivity & safety, coal beneficiation, coal utilisation and environment and ecology will continue to get priority, in the Ninth Plan along with the development o f in-house R&D in coal companies A three-pronged approach for development o f S&T in the coal sector has been proposed by the Working Group as mentioned below:
(i) Coal SIT Programme(ii) In-house R&D Programme(iii) Inter-sectoral Research
6.208 The thrust areas for IS-STAC programme have been identified as under:(i) Coal extraction technologies including extraction o f developed pillars(ii) Coal bed methane(iii) High ash coal combustion(iv) Clean coal technologies(v) Coal water slurry(vi) Synthesis o f organic chemicals fi'om coal(vii) Integrated gasification combined cycle process for power generation(viii) Alternatives modes of coal transport
6.209 Greater emphasis needs to be given to the area o f Coal Bed Methane exploration in view o f the large potential that has been estimated in the coal fields o f the country and as a new resource o f commercial energy which is environmentally-friendly
722
6 210 The thrust on improving the environmental management o f coalfield areas will continue in the Ninth Plan Strict implementation o f the environmental management plans for mitigating the adverse effects o f coal mining like land degradation, mine effluents, sound and air pollution etc , will be undertaken for sustainable development o f coal resources
6 211 The issue o f ash disposal is very critical from the environmental point o f view Most o f the Indian coals, being used for power generation, have 35% or more ash content Currently, about 203 mt o f coal is being fired for power generation alone in the country generating about 71 mt o f ash per annum Therefore, appropriate measures are required for handling this huge quantity o f ash being produced annually from burning the power grade coals Some o f the measures like filling the mined-out areas, both opencast and underground mines, with the ash from power plants to be carried by the railway wagons in their return, preparation o f bricks for construction activities, ballasting the railway tracks, etc. maybe taken up The services o f some NGOs may be useful in implementing and monitoring o f such projects for ash disposal with due regard to the environmental aspects Some schemes, by providing subsidies from Government, may deserve consideration Use o f clean coal technologies like FBCC, IGrCC etc should be promoted
6 212 Efforts towards stabilisation o f the mined-out subsidence-prone areas o f Raniganj coalfield and control o f fires in Jharia coalfield will be continued in the Ninth Plan Forestry maps will be superimposed over, and correlated with, the coal bearing areas maps for balanced development o f coalfields with minimal damage to environment Shifting the inhabitants from the affected areas is o f utmost importance and to be pursued with the help o f the local administration
6.213 Cleaning o f non-coking coal for transportation over long distances with a view to bring down the ash content to acceptable limits (34%) needs to be vigorously pursued both for environmental and economic consideration
Rehabilitation Policy
6.214 As a number o f coal mining projects were being delayed due to land acquisition and related rehabilitation o f the project displaced persons, it was felt necessary to have an uniform rehabilitation policy at least in coal sector A draft rehabilitation package was accordingly formulated for project-displaced persons in coal and power sectors which was considered by the Government. Final decision is awaijed A quick decision on this issue could reduce the time and cost overruns o f the projects
Private Sector Participation
6.215 The Ninth Plan envisages participation o f the private sector in a big way in the coal & lignite sector. This is all the more necessary to tap the large production potential o f the blocks offered to the private sector in order to augment domestic coal production and to reduce the gap between the envisaged demand for coal and domestic availability in the Ninth Plan and beyond While the public sector undertakings(PSUs) will continue to have lion’s share, efforts o f coal PSUs would be supplemented by private sector coal companies to avoid ^ny slippage between coal
Environmental Measures
723

demand and coal production levels Coal has been delicensed recently It makes it, therefore, imperative to bring in necessary legislative changes to the existing legal framework to facilitate private sector participation in coal production and distribution To achieve this objective. Government has already initiated certain actions, efforts would need to be made to further streamline administrative procedures to expedite the necessary clearances and required legislative changes.
6.216 During the INmth Plan, the ongoing process o f deregulation will need to be accelerated by expediting the required legislative changes This implies deregulation o f the pricing o f the remaining grades of coal, greater freedom to consumers to choose coal sources and negotiate the quantity and the price o f coal to be purchased by them and removal o f port/railway bottlenecks to increase and improve movement of coal, including imported coal, to provide a wider range of choice for the consumer.
Coal Sector Reforms
Expedite legislative amendments needed to allow private sect<.)r participation in commcrcial coal inininji.
AlIocatK)n o f coal blocks on competiti\'e bidding basis both for exploration and exploitation b\ li aniing
separate rules under M M R D Act, for grant o f prospectn e license/mining lease
Integiated d^brts for coal exploration for upgrading the resources.
Setting up o f Regulators Authority' for resolving anv price disputes etc.
Streamlining the administrative procedures for project clearances.
Restructuiing the coal sector by giving full autonom\- to each o f tlie subsidiarv coal companies anti doing
aw av w ith the concept o f holding company (C IL).
IJse o f beneficiated non coking coal is mandatoA' for power stations located 1 ()()() kms. a\\ a\' Ifoni pit-hcads
from 1st June 2001. Encouragmg private sector in setting up o f w asheries w ill augment w a.shing
capacities.
Thrust on clean coal technologies.
Augmentation o f port and rail infrastructural facilities to help mo\’cment o f coal.
6 217 In view o f the long gestation periods in developing coal projects, the necessary' policy changes for facilitating private participation will be taken up on priority For this purpose, the coal blocks will be offered on competitive bidding basis It is suggested to frame separate niles under MMRD Act for grant o f prospective license /mining lease in this regard
6 218 In order to encourage investments and accelerate development in the coal & lignite sector, it would be necessary to extend the benefits (both tax and fiscal) being extended to the infrastructure sectors like power, telecommunication, ports etc, to the coal & lignite sector as well
6.219 During the Ninth Plan, a legislative framework and an institutional structure need to be set up for the promotion and regulation o f private sector participation in coal and lignite development The coal and lignite companies should be encouraged to set up joint ventures, wherever possible, for developing new mines to attract private investment on a large-scale
Singareni Collieries Co. Ltd. (SCCL)
6 220 The SCCL is a joint venture o f Andhra Pradesh Government and Government o f India
724

with equity share holding in the ratio o f 51:49 respectively Because o f its location, SCCL primarily meets the major coal requirements o f the consumers in the Southern States If SCCL is to continue to play this role, a substantial enlargement in its activities would be necessary, which in turn would call for SCCL making investments on new coal mines’ development on a much larger scale than now. This would not be possible unless the Centre and the State Government o f Andhra Pradesh contribute towards a significant expansion in SCCL’s equity base Though the State Government has been able to contribute its share fully after a comprehensive capital restructuring plan implemented in 1994, it is now finding it difficult to continue the desired level o f contribution during the Ninth Plan. Even otherwise, SCCL has been relying more and more on borrowings over the years for its new projects, specially those taken up during the Eighth Plan. The company has accumulated a heavy debt burden and is now, once again, not in a position to produce enough coal to meet the rapidly increasing demand o f the Southern States. It is, therefore, imperative that the State Government should continue to contribute its share o f equity This will allow SCCL to expand its operations with the State Government
retaining 51% control over the company SCCL should also make efforts to form joint ventures for developing new mining areas
Lignite6 221 Lignite deposits are available in Tamil Nadu, Gujarat and Rajasthan All these States are far away from coalfields which are mostly located in eastern part o f the country It is, therefore, necessary to formulate and implement more number o f lignite projects and lignite based power plants to avoid unnecessary coal transport costs and stress on railway infrastructure Thus priority for the development o f lignite resources continues in the Ninth Plan The Working Group has assessed the demand for lignite in 2001-02 to be 54.44 mt The region-wise and sector-wise lignite demand is as given in Table-6 23.
Table 6.23 Lignite Demand 2001-02
(MT)
Region/ SectorState Power Cement Industry Total
Tamil Nadu 25.15 1.85 199 28.99Gujarat 3.60 1.40 4.50 9.50Rajasthan 14.00 0.90 14.90Others - 1.05 1.05Total: 42.75 4.30 7 39 54.44
6.222 The production o f lignite from NLC is targeted at 22 mt in 2001-02 The present capacity o f 17 mtpa o f Mine-I and Mine-II is to reach 21 mtpa by way of expanding Mine-I project from 6.5 mtpa to 10.5 mtpa. However, in view o f the contemplated additional lignite consumption by TPS-I operating at 80% PLF and operation o f TPS-II at 75% PLF the consumption o f lignite is expected to increase fi"om the current level Besides, the TPS-I expansion project is also to come up in the Ninth Plan for which lignite requirement is 2 94 mt In addition to this, NLC has to supply 1.9 mt o f lignite to a new power project, namely, ST-CMS Unit of 250
725

MW in the private sector The overall lignite requirement in Neyveli thus comes to 24 mt taking into account around 1.2 mt o f lignite supplies to nearby industries, particularly, cement and paper units This has necessitated the opening up o f a new mine, namely. Mine-1A project for a capacity o f 3 mtpa in the Ninth Plan In addition, NLC has proposed Mine-II expansion project for 3 mtpa capacity linked to TPS-II expansion project o f 500 MW in the Ninth Plan
6.223 It is also proposed to develop through the State Government the Jayamkondam Block for 9,5 mtpa to support a 1500 MW generation capacity and the South o f Vellar Block for 3 mtpa capacity to support 500 MW generation capacity in the Neyveli region These mines and power projects are proposed to be set up by the power sector
6 224 Besides the lignite production by NLC, production o f lignite in the State sector by GMDC is projected at 10 mt and by Rajasthan at 13 1 mt in the year 2001-02
Implementation of coal projects6.225 During the Ninth Plan, efforts would need to be continued to further streamline project implementation procedures to reduce the delay caused due to problems o f land acquisition, rehabilitation, environmental and forestry clearances, inadequate infrastructure facilities etc , so as to avoid cost and time overruns The responsibility o f identification and implementation o f compensatory afforestation should be on the part o f the concerned State Governments and the coal companies both public and private should deposit money for this purpose with the State Government and should be allowed to operate without any further delay However, in order to ensure strict implementation o f environmental mitigation measures, reputed NGOs alongwith the Governmental bodies may be involved.
6.226 Coal projects are time consuming and have long gestation periods Greater number o f economically viable coal projects both for production and coal beneficiation are to be formulated to satisfy coal demand and meet production targets/projections.
Safety & Welfare6 227 As in the Eighth Plan, safety and welfare o f the coal miners will continue to receive the utmost attention o f the Government during the Ninth Plan. Coal industry will continue to strive
to enhance the levels o f safety in coal mine operations by means o f safe mining technologies with a proper layout o f mines and haul roads, installation o f mining electronics for communications and operational controls in both underground and opencast mines, lighting and degassification of mines, installation o f telemonitoring systems in gassy mines, training o f workers, audio visual alarms etc. Computer-aided total mine management systems will be introduced in more mines on selective basis to improve both safety and productivity o f mine workers
6 228 The following major thrust areas for safety o f coal mine workers have been identified for the Ninth Plan:
(i) Avoidance o f disaster due to inundation, fire or explosion by improved ventilation in mines
(ii) Establishment o f telecommunication between underground workings and surface(iii) Training and retraining o f miners in safety management(iv) Ensuring necessary supervision and enforcement o f discipline
726

(v) Enforcement o f traffic rules for HEMMs in OC mines(vi) Special audit o f inundation-prone mines.(vii) Introduction o f RMR-based support system in all underground mines(viii) Development o f suitable hydraulic drilling machines for hard roof and roof bolting.(ix) Improved rescue services, etc
6 229 A proper action plan for disaster prevention and mitigation has to be formulated by the coal companies.
6 230 Housing satisfaction in the coalfield areas will be increased fi-om the current level o f 60% to about 77% by the end o f Ninth Plan in CIL and from 38% to 44% in SCCL Water supply facilities will be provided to cover an additional population o f around 2 lakhs in CIL and around 0 6 lakh in SCCL It is proposed to provide 7 hospitals with 5772 beds in the Ninth Plan in CEL and 6 hospitals with 680 beds in SCCL by 2001-02. Besides, measures for development o f roads, community buildings and school buildings have also been proposed
Occupational Diseases6 231 The occupational diseases associated with coal mining like pneumoconiosis, anthracosis, silicosis, etc are mainly due to air-borne dust in the mines and working places The working environment needs to be improved by proper ventilation and dust suppression particularly in the underground mines Deep underground mines need to be ventilated by conditioned air Regular medical checkups for coal miners as per the Statute should be rigorously pursued Regular monitoring o f air-borne dust in the mines and corrective steps should be strictly undertaken Improvements in the mining technology in this regard for preparation o f coal, transportation etc in underground mines are desirable
Problems of PSUs
6 232 The national coal companies have been facing various constraints in making available the planned coal production Some o f the major problems are enlisted below:
i) Realisation o f outstanding coal & power sale dues from power sector tilitiesii) Delay in project implementation on account o f land acquisition procedures, forest
land clearances and environmental clearances.iii) Rail infrastructure bottlenecks in the potential coalfieldsiv) Legislative constraints to oflf-load some o f the activities on contract basis in
the coal projectsv) Law and order problems particularly in the State o f Andhra Pradesh affecting the
operations o f SCCL. .vi) Inability to introduce Voluntary Retirement Schemes (VRS) to reduce excess
manpower, particularly in CEL, due to financial crunch
The recommendations o f the “Committee on Integrated Coal Policy’ have already addressed these issues, which need to be expeditiously implemented in the Ninth Plan
Coal Companies & Competition6 233 In the liberalised economy the competition is the guiding factor for reliable product and services. Currently, 98% of the coal produced in the country is from national coal companies Of
727

this, 88% is produced by CIL and 10% by SCCL. As such there is no competition in the industry In order to inculcate the spirit o f competition in the changed economic scenario, it is preferable
to do away with the concept o f holding company like CIL Each subsidiary o f CIL should be made independent and restructuring needs to be done as recommended by the “Committee on Integrated Coal Policy” At the same time, facilitating private sector participation in a big way is another critical area in the industry to bring in competition amongst the coal producers Unless private sector is given free hand, competition will be theoretical in nature particularly for public sector coal companies and there is always a scope for formation o f cartel for price control etc
Joint Ventures6.234 It may now become imperative for the domestic coal companies to chalk out fresh strategies both for coal production and marketing. This could be in the form o f having joint venture projects with majority or minority stake for coal production and beneficiation, in order to infuse higher level o f resource availability, improved technology and overall efficiency Coal companies would have to adopt more consumer-friendly approach towards coal quality and price. Some o f the independent power producers (IPPs) may have the resources to take up mining activity as well, but, they may not be having the experience o f mining coal In such cases, these IPPs may like to enter into equity participation with the existing NCCs Similarly, public sector utilities like National Thermal Power Corporation (NTPC) may like to enter into equity participation with the coal producers like SCCL/CIL for their proposed pithead power stations On the same lines, the Steel Authority o f India Ltd (SAIL)/ other steel producers in the private sector, may also like to enter into joint ventures with CIL for developing new coking coal mines instead o f banking only on imports for their fijture requirements
6.235 The demand-supply gap, resulting from the delays in taking up new coal projects due to shortage o f funds, may get reduced by these joint ventures Further, these joint ventures will bring in consumer satisfaction with regard to quality, quantity and assured coal supplies with feasible economics. The coal companies both in public and private sector may explore the possibility o f joint ventures in coal projects with the concerned State Governments This would help in resolution o f some o f the procedural difficulties usually being faced in project implementation particularly land acquisition and rehabilitation o f land oustees and forestry clearances etc
Problems of High Ash, High Price of Indian Coa!s6.236 The percentage o f high ash coals particularly E, F & G grades o f coal which contain more than 35% ash is approximately 49% o f the total coal reserves in the country (204 billion tonnes) Production-wise, around 42% o f total national coal production is in the form of these lower
grades only. As a major part o f these coals is used in thermal power plants, it has its telling effect on the performance o f the plants and disposal o f ash at the plant heads Price-wise too, the landed cost o f such coals at thermal power plants become disadvantageous specially due to railway tariff over long distances. O f late, the consumers located in coastal States like Gujarat, Maharashtra, Andhra Pradesh and Tamil Nadu are finding it cheaper to import coal from abroad than to purchase coal domestically.
6.237 Since the inferior grades o f coal have lower calorific value and higher inherent ash content, their quality can be improved through beneficiation at the mine head Beneficiation also reduces cost o f coal transport and makes it economic where coal has to be transported over long
728
distances. Beneficiation of coal to be transported beyond 1000 km has been made mandatory by the MOEF from the year 2001 A.D In totality, the landed price of indigenous coal, including railway transport charges and high State levies, has become higher on thermal equivalence basis when compared to the price of imported coal, specially in areas which are farther from the coalfields
Financial Outlays6 238 The Ninth Plan (1997-2002 ) assessed outlays for coal & lignite sector are given inAnnexure-6 5OIL & NATURAL GAS
6 239 The Petroleum and Natural Gas sector has played a crucial role in the economic development of the country since Independence The share of petroleum products and natural gas in the total final energy consumption has been increasing over the years and was 54% in 1996- 97 The country is heavily dependent on imports of crude oil and petroleum products and this dependence will increase in the years to come This underscores the need for increasing indigenous production The National Oil Companies (NOCs) have made continuous efforts for discovery of oil and gas in order to meet the ever- rising demand in the country Natural gas will become the most favoured source of energy due to its nature as a clean and environment- friendly fuel The available options for maximising the share of gas in energy through domestic as well as imported sources to meet the energy demand are being exammed The Petroleum and Natural Gas sector was opened up for private participation at the beginning of the Eighth Plan As of now, exploration, production, refining and marketing are open for private participation The Restructuring Group for the Oil sector (R-Group) has estimated an investm.ent of about US $ 100 billion in the Petroleum and Natural Gas sector up to 2010 for ensuring the security of of oil and gas supplies to various sectors of economy It was against this background that major incentives were announced by the Petroleum and Natural Gas sector to attract a larger degree of private participation A new exploration licensing policy has been announced recently by the Government to boost investment in exploration for increasing the level of hydrocarbon reserve accretion to enhance the domestic oil and gas production
Review of the Eighth Plan6 240 The major objectives for Petroleum and Natural Gas sector during the Eighth Plan included maximisation of indigenous production of crude oil and natural gas, a reasonable level of accretion of new hydrocarbon reserves through intensification of exploration activities, augmentation of domestic refining capacity with emphasis on cost-effective debottlenecking or expansion of existing refining capacity, encouragement to private sector participation etc
Demand for Petroleum Products6.241 The actual consumption of petroleum products was 79.16 million tonnes as against the Eighth Plan projected demand of 81 19 million tonnes in 1996-97 The compound average annual growth rate during the Eighth Plan period was 6.8 % as against the projection of 6.9% envisaged at the time of the formulation of the Eighth Plan. The cumulative consumption of petroleum products during the Eighth Plan was however lower at 341 69 million tonnes than the projected demand of 346 78 million tonnes due to lower than anticipated increase during the first two years of the Plan. These consumption figures include product sales through parallel marketing system (PMS) The share of imports of petroleum products
729

by private sector was less than 3% The consumption of petroleum products during the Eighth Plan is given in Table 6.24
Table 6.24 Consumption of Petroleum Products
Product
Light Distillates
M idd le Distillates
Heav-x’ Ends
I'otal:
(Million Tonnes)
1991-92 1996-97
Actual Target Achievements
10,12 18.52 14.54
34.40 48.83 49.06
12.45 13.84 15.56
56.97 81.19 79.16
6.242 While the indigenous production of crude oil has declined, the growth rate of demand for petroleum products is rising at a fast pace. This has led to higher volumes of imports of petroleum products during the Eighth Plan. The import dependence in respect of crude oil to meet the demand of petroleum products has gone up from about 50% in 1992-93 to 60% in the terminal year of the Eighth Plan
Exploration & Development6.243 Seismic Surveys. Against the revised 2D departmental survey target of 130370 Seismic Line Kilometre (SLK); the actual achievements was 145604 SLK during the Eighth Plan, i e an achievement of 127.9%. For contractual survey, the target was 22973 Ground Line Kilometre (GLK) and the achievement was 21286 GLK i e about 98% of the target. For 3D seismic surveys against the survey target of 4281 Seismic Square Kilometre (SSK), the achievement was 4788 SSK i.e. an achievement of 124.6% for onshore areas For offshore areas against the 2D survey target of 126023 SLK, the actual achievement was 109682 SLK i.e an achievement of 93% and for 3D surveys against the target of 77093 LK the achievement was 79846 SSK, giving an achievement of 104%.
6.244 Exploratory Drilling. As against the target of 3042 thousand metres for both the onshore and offshore regions during the Eighth Plan period, the achievement was 2883 thousand metres i.e. an achievement of 95percent. This was mainly due to the lower drilling achievements in Upper Assam Basin due to land acquisition and other environmental problems
6 245 Development Dnllmg: The achievement of development drilling during the Eighth Planwas 2718 thousand metres against the target of 3809 thousand metres i e an achievement of 7! percent. The lower achievement in development drilling target was due to the fact that some of the fields which were proposed to be developed by ONGC at the time of formulation of the Eighth Plan were offered for development to joint venture companies (JVCs)
Domestic Crude Oil Production
6 246 The Eighth Plan had emphasised the need for maximisation of domestic crude oil production However, against a total planned production of 197 3 million tonnes during 1992-97, the crude oil production was only 154 28 million tonnes The terminal year production
730

was only 32.90 million tonnes as against the target o f 47.08 million tonnes The medium-sized oil fields to be developed under Joint Ventures were expected to produce about 11 million tonnes o f crude oil during the Plan period The fiill production from these fields is now expected to materialise only in the Ninth Plan period on account o f delays in award o f contracts The details o f crude oil production during the Eighth Plan are given in Table 6 25
Table 6.25 Crude Oil Production
(Million Tonnes)
Organisation 1991-92 1996-97 Eighth Plan
Actual Target Achievement Cum. Target Achievement
1) ONGC i) Onshore 8.86 14.13 8.50 61.77 43.75ii) Offshore 18.96 29.25 20.18 118.96 94.57
Total ONGC 27.82 43.38 28.68 180.73 138.32
2) OIL 2 53 3.70 2.87 16.59 13.973) WC/Pvt. - - 1.35 0.0 1 99
Total: 30.35 47.08 32.90 197.32 15428
Gas Production and Utilisation
6 247 Consequent to the lower domestic production o f crude oil, the gas production was also lower than the Plan targets In addition, there was a shortfall in the production of free gas also on account o f delays in the development o f gas fields Against the Eighth Plan target o f 125.42 billion cubic metres (BCM), the actual gas production was 101 71 billion cubic metres. Accordingly, despatches to downstream users o f gas fell short o f the target The overall management o f the domestic gas sector has improved during the Eighth Plan with better utilisation o f the produced gas and minimisation o f flaring The level o f gas flaring was reduced from about 10.3 % o f the total production at the beginning o f
Table 6.26 Natural Gas Production
(Billion cubic metres)
Organization E ighth Plan
Cum ulative Target Actual Achievement
O N G C
I. O n land 28.64 19.32
ii. Offshore 87.34 74.08
Sub Total: 115.98 93.40
O IL
On land 9.44 7.47
JV C - 0.84
Total: 125.42 101.71
the Eighth Plan to about 4.9 % in the terminal year o f the Eighth Plan The production o f natural gas during the Eighth Plan is given in Table 6 26
731

6.248 The accretion to recoverable hydrocarbon reserves has not been very encouraging during the Eighth Plan period. The Reserves Replacement Ratio, which is a measure of reserves discovered to reserves depleted has declined to less than unity value, thereby implying that oil reserves are being depleted faster than being replenished. Against a total accretion target o f about 1325 million tonnes o f hydrocarbons during the Eighth Plan period, the accretion to recoverable reserves o f oil and gas was 700 million tonnes. Exploration results during the past four years have been characterised by discovery o f predominantly smaller size fields, creating uncertamties about their commercial exploitation. In order to intensify exploration, two major programmes have been launched in addition to the exploration programmes being implemented by National Oil Companies (NOCs). Starting from September, 1991 blocks in on-land and offshore areas are being offered for exploration on a continuous basis. So far, about 5 rounds o f bidding starting from 4th round to 8th round have been announced for the offer o f about 126 blocks but the response has not been very encouraging. In view o f the low reserve accretion during the first two years o f the Eighth Plan, an Accelerated Exploration Program was taken up in 1994.
POL Import6 .249 The import o f crude oil has increased from 24 .0 million tonnes in 1991-92 to 33 .90 million tonnes in 1996-97 and that o f petroleum products from 6.51 million tonnes to 16.86 million tonnes in the corresponding period The import bill for crude oil and petroleum products is given in Table 6.27.
Hydrocarbons Reserves Accretion
Table 6.27Net Imports Value of Crude Oil and Petroleum Products
( Rs.Crore)
Item 1991-92 1996-97 Cum . Eighth Plan
Actual Target Actual Value
Net Imports
a) Crude O il 7869 4408 18332 60573
b) P O L Products 5261 12892 13338 40399
Grand Total: 13130 17300 31670 100972
6.250 At the time o f the commencement o f the Eighth Plan, the total POL import bill was estimated to be Rs. 74,660 crore. However, the actual total POL import bill during the Eighth Plan period was Rs. 100,972 crore.
Refining Sector
6.251 The refining capacity at the beginning o f the Eighth Plan was 51 85 million tonnes. The Eighth Plan envisaged augmentation o f the domestic refining capacity to 65 million tonnes by 1996-97. The actual refining capacity at the end of the Eighth Plan was 61 55 million tonnes. The shortfall in the refining capacity was mainly due to delay in the commissioning o f Gujarat Refinery Expansion by 3 million tonnes per annum. The highest
732

priority has been accorded to low cost expansion of the refining capacities. The new grassroot refining capacities already commissioned during the Plan period are at Mangalore (3 million tonnes) and Panangudi (0.5 million tonnes) Although a number of private sector promoters were issued Letters Of Intent(LOIs) for setting up refining capacities, only 15 miilion tonnes per annum Reliance and 9 million tonnes per annum Essar refineries, are likely to come up by the year 2001 There is no firm indication of refineries being set up by other private sector promoters
Privatisation
6 252 The Government of India has thrown open the major segments in exploration and production, refining and marketing sectors for private investment These are as follows Exploration and Production
i) Announcement of exploration bidding rounds, on a continuous basis, foronland and ofTshore areas
li) Announcement of speculative seismic survey roundsiii) Offer discovered oil and gas fields for development by private sector either solely
or as joint venture with upstream sector PSlJs
Refining and Marketing
i) The setting up of new grass-root refineries by private sector either on their own or as joint ventures with downstream sector PS Us
ii) Setting up of lube refineries by private sectoriii) Parallel marketing of petroleum products by private sectoriv) The oil sector PSUs are also being permitted to form JVs among themselves
and with Indian and foreign companies
6.253 Parallel marketing of a number of petroleum products by private sector has been permitted and imports have been decanalised Due to constraints at ports and inland transport facilities, parallel marketing has succeeded only to a limited extent so far
Outlays
6 254 As against the approved outlay of Rs. 24,000 crore during the Eighth Plan period, the cumulative expenditure was Rs. 40452.94 crore. The gross budgetary support was only Rs 513 84 crore and the balance of the outlay was met by internal and extra-budgetary resources
NINTH FIVE YEAR PLAN
6 255 Taking into account the likely demand and the estimated indigenous crude oil production, the import dependence o f oil in 2001-02 may go up to 70% as against about 60% now The following areas would be given specific attention;
i) Acceleration o f exploration efforts especially in deep offshore areas as also in the frontier areas.
733

ii) Pursuing the possibility o f acquisition o f acreage in other countries for equity oiland provision o f incentives to domestic oil companies for this purpose
iii) Special attention on improving reservoir management and increasing recovery rates for all major fields by at least 5%
iv) Formulation o f an overseas oil and gas supply policy with a view to assessing the appropriate mix o f supply source to optimise the cost.
v) Deregulation/ rationalisation o f the administered price mechanism in order tocurb wastefijl coilsumption, generate internal resources and attract private capital.
vi) Examining the possibility o f importing natural gas at competitive rates, particularly in the form of liquefied natural gas (LNG) at coastal locations
vii) Creation o f adequate refining capacity (80-90% of demand o f petroleum products) and balance 10-20% requirement to be met fi'om imports for optimum supply mix and to take advantages o f international oil prices.
viii) Augmentation and upgradation for marketing and distribution facilities to meet the demand o f petroleum products
ix) Improvement o f product quality.
x) Removal o f existing administrative bottlenecks by further streamlining the existing procedure for Govenmient approval for various projects and their implementation.
xi) Setting up o f relgulatory mechanism, both in upstream and downstream sectors
xii) Setting up o f strategic tankages for ensuring supply o f crude oil and petroleum products
734

Thrust Areas in Oil and Natural Gas Sector Exploration and Production
Expeditious implementation o f the New Exploration Licensing Policy (NELP) Acceleration o f exploration efforts, especially in deep offshore areas and also in
fi-ontier areas.Improvement in reser\'oir management and enhancing oil recovery Exploration and exploitation o f Coal Bed Methane
Refining and Marketing
International refining margins are currently very low. Therefore, grassroot refineries in future should only be set up if they are economically viable, keeping in view likely movements in the international refining margin over time As the sector is expected to be fully decontrolled by 2002, the structure o f effective protection for refining needs to be kept at appropriate levels to ensure economic efficiency Grassroot refineries should be set up in partnership with international oil companies having financial and technical strengthEmphasis on infrastructure development for distribution and marketing o f petroleum products.Improvement o f product quality
Project Implementation
Removal o f existing administrative bottlenecks by further streamlining the existing procedure for Government approval for various projects and their implementation.
Private Sector Participation
Exploration, production, refining and marketing areas have been opened up for private participation. It is necessary to identify and sort out operational bottlenecks which stand in the way o f private participation. Looking ahead to the abolition of price control by 2002, the policy for the Petroleum sector needs to evolve in a manner which ensures a competitive environment at the marketing level.
Demand Projections for Petroleum Products
6.256 The demand o f petroleum products is estimated to grow at a compound annual growth rate o f 5.77% and is expected to be 104.80 million tonnes in the terminal year o f the Ninth Plan
This does not include liquid fuel requirement for power generation. The projected growth in demand for petroleum products is given in Table 6 28
735

Table 6.28Demand Projections of Petroleum Products (Million Tonnes)
P ro d u c ts 97-98 98-99 99-00 00-01 01-02
i) L ight D istillate 16.87 18.25 19 62 21 03 22.15ii) M iddle D istillate 50 45 53 43 56 62 60 24 64 38iii) H eav> 'E nds 16.41 16 88 17.43 17 80 18.27
T otal 83.73 88 56 93.67 99 07 104 80
Exploration and Development
6 .257 T he policy o f upgradation o f basin ca tegories by p rogressive exp lo ra tion did not yield desirab le resu lts W ith evolving geological concep ts and experience in o th er parts o f the w orld, it is seen tha t the less- explored basins in India e.g. G ondw ana basins could possibly be m ore p ro sp ec tiv e and need to be accorded priority fo r exploration E xp lo ration efforts should therefo re be spread o v er all the basins, including unexplored/less explored ones having favourable geo log ica l form ations. This w arran ts a change in exploration stra tegy 3D techno logy has been identified as a m ajor seism ic input fo r the developm ent o f the field ,as well as fo r m onitoring E O R processes. T he focus o f 2D surveys in A ssam and A runachal P radesh areas w ould be on the N o rth B ank o f B rahm aputra river, the belt o f Schuppan and fu rther detailing o f E ocene p rospects in this region The 2D surveys w ould also be carried ou t in G anga Valley, R ajasthan and S au rastra o ffsho re areas. In view o f the rapidly increasing dem and fo r oil in the com ing years, th e re is an u rgen t need to step up the level o f indigenous oil p rod u c tio n w hich has rem ained m ore o r less stagnant during the last 5-6 years. This will call fo r enlarging exp lo ra tion cov erag e o f the different sedim entary basins in the country A new th rust needs to be given fo r exploration in deep w aters, in the N o rth bank o f B rahm aputra as also in o ther fron tier a reas A certain minim um level o f exploration by the N ational Oil C om panies m ay still be necessary fo r upgrad ing the hydrocarbon resou rces and attracting private investm ents in this area. T he stra tegy to be adop ted to achieve this w ould be addressed during the N inth Plan.
Hydrocarbon Reserve Accretion
6.258 T he O N G C & the O IL have to g e th er p lanned to add 865 m illion to n n es o f oil equivalent in-place hydrocarbon reserves during N inth Plan. These efforts will be supplem ented by add ition o f som e reserves in the exploration b locks aw arded to the private parties An accre tion o f up to 200 million tonnes o f oil and oil equivalent o f gas (O + O E G ) is envisaged in deep w a te r areas w here a b reak th rough is expected in the N inth Plan T he estim ated recoverab le reserves will be in the range o f 245 84 to 342 72 million tonnes o f oil equivalent T he cum ulative oil and gas p roduction during the N inth P lan is p ro jec ted at 335 16 million to n n es o f oil equivalent. It m ay be m entioned th a t considering the reserve accre tion and the p ro d u c tio n o f oil and gas during the N inth Plan, the R eserve R eplacem ent R atio (R R R ) will be in the range o f 0.73 to 1.0. All efforts w ould be m ade to bring the R R R above the unity level A lthough a N ew E xploration Licensing Policy (N E L P) has already been form ulated, certain fiscai and financial incentives w ould be required under this Policy to attract investm ent for exploration E x p lo ra to ry activ ity should be given in frastructu re status to a ttrac t necessary m vestm ents froni bo th public and p rivate sec to r com panies
736

6 .259 T he average recovery fac to r in India is only abou t 28% o f initial oil in-place reserve. This is low by international standard Im provem ent in recovery fac to r w ould yield additional oil and gas w ithou t any co rrespond ing additionality in the reserve accre tio n Special steps are necessary in this regard
Crude Oil and Natural Gas Production
6 260 T he cum ulative p roduc tion during the N inth Plan period w ould be 180 82 million to n n es o f crude oil and 144 53 billion cubic m etres o f gas The p ro jec tion fo r oil and gas p rod u c tio n during the N inth Plan is given in T able-6 29
Table 6.29 OIL AND GAS PRODUCTION
O rgan isations 97-98 98-99 99-00 00-01 01-02 T O T A L
1 O IL P R O D U C T IO N (M illion Tonnes)
i)O N G C 27 73ii)O IL 3 10 lii) JV C PR O D N 3 59
28,09 3,20
4 40
29 183 29
4 08
29.87 3 38
3 93
30 02 3 50 3 46
144.89 16 47 19 46
T O T A L 34 42 35 69 36 55 37 18 36 98 180 82
2 G A S P R O D U C T IO N ( M M S C M D ) T O T A L (B C M )
i) ONGC^ 62 75ii)O IL 5 60 lii) JV C PR O D 6 73
63 816 33
7,26
65,49 7,19
6 98
65 29 7.81
6.82
69 04 8 28
6.79
119 04 12 86
12 63
T O T A L 75 08 77 40 79.66 79 92 84.11 144.53
M M S C M D M illion M etric S tandard C ubic M etre per D ay B CM ; Billion C ubic M etre
Gas Availability and Utilisation
6 261 T here are shortfalls in the availability o f natural gas vis-a-vis the com m itm ents already m ade in the different regions o f the country , especially on the H B J pipeline and in G andhar In addition , the dem and fo r natural gas in co re sec to rs like p o w er g enera tion and fertiliser p roduction has been on the increase M any S tates are planning to set up short-gestation pow er plants, based on naphtha, th ro u g h p rivate p rom oters. A gainst this background , a clear view on th e issues o f large-scale im port o f naph tha/ natural gas (L N G ) fo r p o w er generation has to be ad d ressed urgently . T he need fo r involving the P S U s in the petro leum sec to r to have a p artic ipa ting in terest in overseas oil and gas developm ent fo r sourcing th e new infrastructure w o u ld also be em phasised T he im port o f natu ral g as from M ynam ar and B angladesh is being considered
737

6 .262 T he gas utilisation, particularly the offshore gas, w ouid im prove w ith the com m issioning o f gas' com pression, evacuation , shore-based trea tm ent facilities as well as the augm entation o f th e capacity o f H B J pipeline in the first year o f the N in th Plan T he gas flaring w o u ld be reduced to m inim um level after the im plem entation o f this pro ject
T h e lo n g -term gas dem and w ou ld critically depend on;
i) Supplies o f o th er prim ary energy resou rces from dom estic sources ,ii) A vailability o f tran sp o rta tio n in frastructu re to reach fijels to the end-users ,
iii) M ix o f m ake versus buy op tions as in the case o f fertiliser sec to r ,iv) L ong-term p o w er plan, including m ode-m ix o f p o w er generation capacity creationv) S tipu lation arising from environm ental considerations and long-term
com petitiveness o f gas /L N G under expected currencies exchange ra te parties
Refining Capacity
6 263 T he refining capacity in the country at the end o f the E ighth Plan w as 6 1 5 5 million tonnes As per the present estim ates, this capacity may go up to 113 95 million tonnes by the term inal year o f the N inth Plan, w hich includes 24 million tonnes capacity addition from the p riv a te sec to r and 28 40 million tonnes o f capacity addition from PSU s and the joint venture p ro jec ts respectively T he refinery-w ise capacity addition during the N inth Plan is given in T ab le 6 .30
Table 6.30Refining Capacity Addition During 9th Plan
(M il l io n T onnes)
Refinenes 97-98 98-99 99-00 00-01 01-02
1. Capacit\-as on 61.55 1.4.9f
61 55 61.55 61 55 61 55
2 Panipat, IOC 0 00 3. Visakh, HPC
6.00 6.00 6.00 6,00— 3.00 3,00 3,00
4. Numaligarh. NRL — 3 00 3.00 3,005 Barauni Expn. IOC — 0 90 0,90 0,906 Mathura Expn. IOC — 0.50 0.50 0,507. Bma, BPC — - - 0,00 6 008 MRPL Expn — 6 00 6,00 6 009. Gujarat Expn. IOC
10. ESSAR,Pvt— — 3.00 3,00
— 9.00 900 9,0011. Reliance, Pvt — 15 00 15,00 15,00
Sub-total Cap Addition 0.00 6.00 43.40 46 40 52,40
Total 61.55 67.55 104.95 107 95 113,95
6 .2 6 4 T he above p ro jec ted refining capacity will be sufficient to tak e care o f the to ta l dem and o f p e tro leu m p ro d u c ts o f 104 80 m illion to n n es (T able 6 ,28) It is possib le th a t there m ay be slippages in the p lanned capacity com ing on stream bu t nevertheless it im plies a very low degree o f im port dependence in p ro d u c ts in net term s, th o u g h o f course, im port dependence on crude oil will increase. T he g ro w th o f refining capacity in fu tu re m ust be seen in the context o f the fact that th e in ternational refining m argins are currently very low. T herefore, g rassroo t refineries in future
738
should only be set up i f th ey are econom ically viable, keep ing in v iew likely m ovem ents in the international refining m argins overtim e. A s the sector is expected to be fully decontrolled by 2002, th e s tru c tu re o f effective p ro tec tio n fo r refining needs to be kep t at app ropria te levels to ensure econom ic efficiency. G rassro o t refineries should be set up in partnersh ip w ith in ternational oil com panies having financial and technical strength .
Infrastructure/Marketing
6.265 T he increase in the refining capacity as also the need to ca te r to the large dem and fo r p e tro leum p ro d u c ts will w arran t co rrespond ing additional infi-astructure in the form o f p o rt handling facilities fo r crude oil and petro leum im ports, crude oil and p roduct pipelines, crude and p ro d u c t tan k ag e etc. T he facilities tha t are necessary in this regard have been identified. A ny delay in setting up these facilities on tim e m ay create serious supply problem s, particu larly in th e N o rth -W este rn region. T he low er p o rt capacity , coupled w ith p o o r operational facilities, resu lts in a lo t o f idle tim e fo r the tan k ers and also affects p roduct availability. This p rob lem is bound to increase on accoun t o f the anticipated increase in dem and and consequen tial increased im ports during the N in th Plan period Similarly, the existing railways in frastructure will also need strengthening to handle the projected distribution o f p ro d u c ts
6 .266 In v iew o f the above, pipelines, p o rt facilities and p ro d u c t tankages w ould need to be acco rd ed in frastructu re sta tu s fo r a ttrac tin g investm ents fi"om com panies, b o th in the public and p rivate sector.
6 .267 A num ber o f p roduct pipelines are p roposed to be laid/upgraded during the N inth Plan for facilitating th e m ovem ent o f petro leum p ro d u c ts to the dem and locations T hese include, B ina-Jhansi-K anpur pipeline, C och in -K aru r pipeline, M anga lo re-B anga lo re pipeline, M adras- M adurai-T richy pipeline and L P G pipeline o f G A IL and upgradation o f K andla-B hatinda pipeline to 11.5 m illion tonnes. E ffo rts will be m ade to com plete these pipelines during the N inth Plan B esides, it is also p ro p o sed to install m any small feeder pipelines. A jo in t ven tu re com pany, P E T R O N E T has been form ed by IO C , H P C L , B P C L and IB P fo r the im plem entation o f p e tro leu m p ro d u c t pipeline p ro jec ts
6 .268 T here is a need to increase stra teg ic tankages fo r crude oil and petro leum p ro d u c ts to avoid d isruption o f supply in case o f w ar o r natural calamities. A ppropriate w ays and m eans m ay be evo lved to ra ise funds fo r th is purpose . T hese funds m ay be adm inistered by G overnm ent or by a reg u la to ry authority .
Import of Crude oil for Refineries
6 .2 6 9 C onsidering the dom estic p ro d u c tio n level during the N in th Plan, about 78 million tonnes o f crude oil w ould need to be im ported in the term inal year o f N inth Plan A dequate a rrangem en ts in te rm s o f p o rt facilities and o th e r pipeline in frastructu re w ould need to be synchronised fo r th e receip t and the despatch o f crude oil from the po rt to the refinery gate Som e o f th e facilities th a t need augm en ta tion are:
739

i) V adinar po rt in G ujarat is presently handling about 11 million tonnes o fim ported crude oil a year The requirem ent will go up to 47 million tonnes by 2001-02 fo r the refineries in the W estern & N orthern regions
ii) N ew C rude pipeline from Vadinar to B ina refinery in M adhya P radesh and capacity expansion o f Salaya-V iram gam , V iram gam -K oyali and V iram gam -Pan ipat P ipeline
iii) Similarly, augm en ta tion o f crude im port facilities at M angalore, C ochin & C hennai fo r th e refineries in the S ou thern region
iv) A ugm entation o f im port facilities at Haldia, or in alternate location, to supply ad eq u ate crude to B arauni & B ongaigaon refineries
Private Sector Participation
6 .2 7 0 A num ber o f steps have been tak en by the G overnm ent fo r encouraging private partic ipation in the petro leum sec to r T he econom ic reform s, initiated in 1991, seek to delicense th e industry and encourage p rivate sec to r initiatives fo r supplem enting and speeding up econom ic g row th . This liberalisation process has also opened up the petro leum industry, both u p stream and dow nstream sector. C on tinuous yearly exp lo ra tion bidding rounds are being co n d u c ted and offers o f sm all and m argm al fields are being m ade fo r private partic ipation in u p s tream sector. In the cu rren t contex t, the partic ipa tion o f private Indian and m ultinational com panies will not only provide the risk capital required for the upstream industry' bu t a lso help in new tech n o lo g y input In the dow nstream sector, in view o f the low risk environm ent, the participative response o f private/m ultinational com panies in the last few years is q u ite encouraging . It is n ecessary to identify and sort o u t operational bo ttlenecks w hich stand in th e w ay o f p rivate partic ipation . L ook ing ahead to the abolition o f price contro l by 2002, the policy fo r th e P e tro leu m sec to r needs to evolve in a m anner w hich encourages the developm ent o f a com petitive environm ent at the m arketing level This will also c reate a com petitive environm ent fo r the N O C s to re-engineer them selves for im proved perform ance and productivity In the long run, the private sec to r participation will help the Indian oil m dustry to play a global ro le
Pricing
6.271 T he con tinuance o f th e presen t adm inistered pricing regim e is com ing in the w ay o f large-sca le p rivate partic ipation . This aspect will also be suitably addressed to m ake Indian pe tro leum sec to r globally com petitive R eform s in pricing o f petro leum products w ould also help in con tain ing th e oil pool deficit The im port o f kerosene, L P G has been deregulated during the E igh th P lan period. T he p rice o f diesel linked to im port parity has been announced by the G overnm ent in Septem ber, 1997 The selling p n ce o f all g rades o f diesel w ould now be based on im port parity to be fixed on a m onth ly basis
7 4 0

6 272 To reduce the environm ental po llu tion caused by the increasing num ber o f diesel vehicles. G overnm ent has issued o rders to supply H SD w ith sulphur conten t o f 0 5 wt % and below in the four m etropolitan cities o f Delhi, M um bai, C alcutta and Chennai w e f April 1, 1996 A s the effects o f the environm ental po llu tion are no t confined to the m etropo litan cities, the G overnm en t has decided to extend the supply o f low -su lphur con ten t H SD th ro u g h o u t the country , by April 1999 In pu rsuance o f the above decision o f the G overnm ent, nine refineries plan to put up hydro-desu lphurisa tion facilities T he o ther five refineries are processing low sulphur crude and the stipulated quality can be produced w ithout any additional facilities In addition , supply o f low lead M o to r Spirit (0 15 gm s/ltr) has been in troduced from January, 1997 Supply o f unleaded M o to r Spirit fo r cars fitted w ith catalytic co nverters has been m troduced in fou r m etropolitan cities and will be extended to the entire country' fi^om April 2000
Energy Conservation
6 273 T he G overnm ent o f India attaches a very high priority to conser\'afion o f petroleum p ro d u c ts to con tain the dem and and to red u ce th e ever-increasing gap betw een dem and and m digenous supply o f crude oil and petro leum p ro d u c ts T he G overnm ent has initiated several m easures to p ro m o te conservera tion o f petro leum p ro d u c ts in the transport,industria l, agricu ltural and dom estic sec to rs T hese include ado p tio n o f m easures and p ractices w hich increase fuel efficiency, organ isa tion o f train ing p rog ram m es in the tran sp o rt sector, m odernisation o f boilers, furnaces and o ther o il-operated equipm ents, standardisation o f fuel- efricient irrigation pum psets, rectification o f existing pum psets in agricu lture sec to r to m ake them m ore energy efficient and developm ent, as well as prom otion, o f the use o f fuel-efficient equ ipm ent and appliances like kerosene and L P G stoves in the househo ld sec to r T hese activ ities are p rom oted and co o rd in a ted by the P e tro leum C onservation R esearch A ssocia tion (P C R A ) as well as the Oil C om panies
6 274 The following strategies are suggested for the intensification o f conservation efforts
i) Energy conservation should be viewed as a source o f energy and should be usedto bridge the gap between demand and supply
li) Energy conservation should be made attractive by providing incentives, whereverfeasible.
iii) Energy eflficiency standards should be prescribed in line with the international standards for equipment, appliances and processes and energy labelling o f equipment,appliances, technologies and processes should be made mandatory
iv) Fuel consumption norms should be established for different industriesv) Small and medium-scale industries should be encouraged to take up technology
upgradation and phase out inefficient equipmentvi) Price stmcture for petroleum products should be rationalised to reflect properly
the scarcity values.vii) Energy-audit should be made mandatory in energy intensive units
6 275 There has been a progressive reduction in the fiiel & loss in Indian refineries over the last several years But it is still quite high as compared to the fuel and loss in the refineries overseas with similar configuration In order to reduce energy consumption in the refineries, heat recovery needs to be optimised, steam leaks need to be minimised, advanced control
Environmental Management
741
techniques need to be encouraged and low efficiency equipment need to be upgraded For further improvement in energy consumption levels, bench-marking can be used as a reference platform to compare and identify the gaps, so that action plans to bridge the gaps can be prepared and implemented to the extent economically feasible.
Research and Development
6 .276 Research and Development (R&D) has played a key role in the development o f thepetroleum industry This is more so in the upstream sector where the discovery rate and production technology have shown a marked improvement with each innovation. In the downstream, such efforts, though not spectacular , have helped in improving the quality and product mix and in reducing the cost In the petroleum sector, the R&D efforts are highly capital-intensive. The NOCs have to play a major role in such R&D endeavours because o f high investment required in R&D in the petroleum sector.
6.277 It is necessary to ensure that the R&D agenda is decided with a market driven approach and demand articulation. The main thrust o f R&D in upstream sector would be directed towards improving the quality o f prospect, enhancement o f recovery from the existing fields, technological aspects o f marginal field development, deep-water technology and cost control in petroleum operations. In view o f the growing demand for gas as a clean fuel, R&D attention is required for finding and developing unconventional resources like coal bed methane (CBM), gas hydrates etc. In the refining sector, the R&D efforts towards technology upgradation for optimising product output and quality, including cost control, will be vital in satisfying the product demand, environmental imperatives and competitiveness
Financial Outlays
6.278 The assessed Ninth Plan outlay for the Petroleum sector is given at Annexure 6.6. The outlays would be met through internal and extra-budgetary resources o f PSUs In addition, substantial investment is expected from the private sector during the Ninth Plan.
NEW AND RENEWABLE SOURCES OF ENERGY
6.279 The major portion o f the country’s energy requirement is met from conventional energy sources like coal & petroleum. However, the vast majority o f our rural population still depend upon the locally available non-commercial sources o f energy like animal dung, crop waste and fijelwood. In order to ensure the efficient use o f these energy resources in an environmental friendly manner, it is important to promote the programmes o f non-conventional energy sources The new and renewable sources o f energy were accordingly given adequate importance during the earlier Plans and it is proposed to continue this momentum in the Ninth Plan. The programmes are promoted under the Central Ministry o f Non-Conventional Energy Sources (MNES) in coordination with the Governments o f States/UTS. The major programmes include power generation through wind, small hydro, biomass and solar energy, the socially oriented programmes to meet the rural energy requirements such as National Project on Biogas Development (NPBD), National Programme on Improved Chulhas (NPIC), Integrated Rural Energy Programme (IREP), solar energy for lighting, solar water heaters, solar cookers and other rural applications and other programmes with demonstration components. The promotion o f these programmes in
742

decentralised specific locations is justified when one compares the difficulties and costs involved in the transportation and supply o f conventional energy like coal, petroleum products, electricity, gas etc., to such remote and inaccessible areas. In addition, the new and renewable sources o f energy programmes are environment-fiiendly and sustainable in the long run in view o f the abundant potential o f such sources. However, exploitation o f these energy sources in a cost effective manner poses a challenge to the scientists and the planners at present
6.280 The programmes to develop non-conventional energy sources have so far relied heavily on Central subsidies provided to individuals either directly through Indian Renewable Energy Development Agency (IREDA) or to States through Central and Centrally Sponsored Schemes The emphasis in this sector during the Ninth Plan may have to shift from capital subsidies to interest subsidy and gradually move towards private entrepreneurship and community participation, without undue reliance on subsidies.In addition, it is necessary for the State Govts to have an increased role in these programmes so as to have a visible impact o f these programmes , especially in changing the lifestyle o f the rural people.
Assessment of NRSE Programmes
6.281 While the Ministry o f Non-Conventional Energy Sources (MNES) in the Centre had taken initiatives in promoting the non-conventional energy programmes during the Eighth Plan, it is, however, noticed that the matching efforts from the State Governments were lacking mainly because o f the constraints o f financial resources as well as institutional arrangements. The programmes which were socially oriented like biogas, improved chulhas and Integrated Rural Energy Programme (IREP) could not make the expected impact in changing the lifestyle o f the people mainly because o f the weak institutional set-up, lack o f suitable mechanism to maintain and put the non-fianctional systems back into operation, lack o f locally available trained and skilled manpower where such systems were installed etc. In the case o f the centralised power generation programmes like wind power, small hydro, biomass, energy from urban and industrial waste, solar power etc., it was seen that there were problems in buy-back of the power generated
fi"om these sources by the state utilities at an acceptable and economic price. In addition, lack o f suitable infi-astructure facilities like sub-stations, transformers etc to evacuate the power generated fi-om the decentralised energy sources was also acting as a major bottleneck. The absence o f a regulatory body to settle the differences between the entrepreneurs generating energy fi-om non-conventional energy sources and the Utilities buying this power is also a major
constraint in the promotion o f such programmes. In the case o f small hydro programmes, the State Governments, were finding it difficult to provide matching resources along with the Central fiands provided for this purpose. In the case o f solar power, the prevailing high capital, as well as operational cost o f such power projects, act as a hindrance in promoting it In order to overcome these difficukies, efforts \^1 be initiated during 9th Plan to access long-term fiands in the national and international markets. Necessary action would have to be taken to remove administrative bottlenecks, if any, and reverse the slow down in critical areas in promoting Non- Conventional Energy Sources The programmes to generate energy fi-om urban/municipal wastes were facing the problems o f the involvement o f too many agencies like Central Ministry, State Governments., local bodies like Municipal Corporations, Municipalities etc
6.282 The absence o f a suitable legislation and policy for promotion o f new and renewable sources o f energy had also acted as a deterrent in accelerating these programmes Concerted efforts have to be made in the new and renewable energy sources programme, particularly in the area o f increased role o f State Governments., effective institutional mechanism, both at the State
743

and the Central ievel so as to ensure that maintenance and trouble-free operation o f the systems installed. Framing o f a policy including a legislation with necessary regulatory mechanism in order to buy back the power generated from new and renewable sources and deliver the energy to the users is also necessary. It is also necessary' to bring down the cost o f energ>', especially from solar and other such renewable sources through suitable R&D and enhanced manufacturing facilities The indigenous production o f equipment should substitute imports and pave the way for viable technologies.
REVIEW OF THE EIGHTH PLAN
6.283 The thrust areas for development o f new and renewable sources o f energy (NRSE) during the Eighth Plan period were as under:
Operational programmes o f biogas, improved chulhas, low grade solar thermal devices would be enlarged and intensified so as to meet a significant proportion o f cooking and heating needs in the country especially in the rural areas At least 750 to 1000 MW of power capacity would be installed on the basis o f NRSE technologies o f wind energy, micro hydel, urban/agricultural wastes, solar photovohaics and also cogeneration programmes wherever feasible
6.284 An amount o f Rs. 857 crore was approved as outlay under the Central Sector programme to install 7.5 lakh biogas plants, 100 lakh improved chulhas, setting up power generation projects o f 100 MW through wind farms, 300 MW through utilisation o f urban /agricultural waste, 200
MW through micro hydel, 1720 KW through SPV systems and other programmes including SPV wind pumps, solar cookers, and other non-conventional energy programmes
6.285 A brief review o f the major programmes o f the Ministry o f Non-conventional Energy Sources (MNES) is given below
The physical achievements during the Eighth Plan in the socially oriented programmes are given below.
Target for Achievement1992-97 1992-97
Biogas Plants 7.5 lakh 9 60 lakhImproved Chulhas 100 0 lakh 127 00 lakhSolar cookers 3 .0 lakh 198 lakh
Wind Power
6.286 In the wind power programme against the target of 100 MW including private sector, the achievement during the Eighth Plan was 860 MW The implementation o f demonstration projects by States has provided operating experience, development o f sites, etc and have resulted in commercial development o f wind power T hese projects have also encouraged the State Governments to declare their policies for private sector participation All the States with wmd power potential have declared their promotional policies The private sector projects have gained
744

momentum in Andhra Pradesh, Gujarat and Tamil Nadu Wind power activities have also started in other potential States such as Karnataka, Maharashtra and Madhya Pradesh
Biomass Power and Co-generation
6.287 In the biomass-based co-generation /combustion programme, against the Eighth Plan target o f 300 MW the achievement was only 115 MW During 1993-94 MNES has launched a national programme for co-generation in sugar industries The response from the sugar mills is not yet very encouraging. The major constraints are non-availability o f capital with the industries for putting up co-generation plant in the existing sugar mills, lack o f proper policies in the States facilitating wheeling o f surplus power, banking and buy back of power generated by the co-generating industries and non-remunerative payment for power exported by the cogenerators.
Small Hydro
6 288 The progress o f small hydro programme has been very slow' Agamst the Eighth Plan target o f 200 MW' including the private sector, the achievement during the first two years was only 17 37 MW The achievement at the end o f the Eighth Plan was limited to 93 MW only The implementation o f subsidy-based projects by the States was not encouraging The allotment/clearance o f private sector projects was also slow The problems and constraints w ere mainly institutional and operational in nature Inadequate State Plan allocation, lack of coordination among the agencies, low priority by SEBs, lack o f clear policy for private sector panicipation are some o f the constraints
Indian Renewable Energy Development Agency (IREDA)
6 289 The Indian Renewable Energy Development Agency (IREDA) came into existence on 11th March, 1987 with the main objective o f operating a Revolving Fund for development, promotion and commercialisation o f technologies relating to new and renewable sources o f energy (NRSE) by providing soft term finances. IREDA has now assumed global dimensions with assistance received fi'om the Government, o f Netherlands, Line o f credit from World Bank and with assistance in the pipeline from DANID.\, .ADB etc
6 .290 The review o f the non-conventional energy programmes on completion of the Eighth Plan reveals that the progress in respect o f the socially oriented programmes like biogas, improved chulhas, solar cookers, solar PV programmes for lighting in villages etc., has been satisfactory and the Eighth Plan targets have been achieved. However, the progress in the case o f the
programmes for power production has not been very good during the Eighth Plan except in the case o f wind power programme. In the case o f small hydro power, the achievement during the Eighth Plan was limited to only 100 MW against the target o f 200 MW. In the case o f power from biomass also there was shortfall in achievements. Against the Eighth Plan target o f 300 MW the achievement was only 135 MW.
6.291 The economics o f decentralised power generation needs to be evaluated with reference to the delivered cost o f grid electricity vis-a-vis local generation cost. Cost o f grid electricity would include not only the generation cost but also the actual transmission &
745

distribution cost including the T & D losses Decentralised power generation cost, on the other hand, will include a higher capital cost but low or nil fiiel cost and also low distribution cost A proper comparison o f the relative costs o f electricity at the consumer end is necessary to evaluate different options for non-conventional energy programmes for power generation. The Ministry o f Non-Conventional Energy Sources (MNES), after realising the constraint o f fiands to be provided through Government budgetary support and taking into account the vast potential o f non-conventional energy sources available for large- scale power generation, had formulated a strategy and action plan with revised goals to achieve 2000 MW o f power generating capacity in the Eighth Plan. This action plan was based on the new strategy for market development and commercialisation. However, during the Eighth Plan the commercialisation o f these programmes through private sector participation was successflil only in the case o f wind power programme.
Integrated Rural Energy Programme
6.292 The Integrated Rural Energy Programme (IREP) which was started as a planning exercise during the Sixth Plan in the Planning Commission was taken up as a regular programme during the Seventh Plan. In the middle o f the Eighth plan, this programme was transferred to the
Ministry o f Non-Conventional Energy Sources from 1 4 94 onwards This programme aims at meeting the energy requirement in the selected blocks o f all the States/UTs by providing a cost- effective and optimal mix o f all the energy sources
6 293 The Central Sector outlays provided for IREP are utilised in creating capabilities for setting up planning cells in the States in their selected blocks. These funds were utilised in meeting the expenditure on staff component o f IREP as well as their training The States are providing funds for actual implementation o f the programme by providing the energy devices like biogas plants, improved chulhas, solar cookers etc
6.294 For proper upkeep and maintenance o f the energy devices, technical back- up units are set up both at the State level and district level. So far 19, state level and 171 district level technical back- up units have been set up. A National Training Centre has been set up in Delhi and a Regional Training-cum-R&D Centre has been set up in Lucknow (U P ) The Regional Training -cum.-R&D Centers are in the process o f being set up in Bangalore (Karnataka), Kheda (Gujarat) and Shillong (Meghalaya).
6.295 An amount o f Rs. 85 crore was approved under the Central Sector as the outlay for the Eighth Plan taking into account the resource constraint. A target to cover at least 100 blocks during each year o f the Eighth Plan with At least one block in each district, was fixed The approved State Sector outlay for IREP for the Eighth Plan was Rs. 82.03 crore
6 296 The Eighth Plan review, however, indicates that an expenditure o f Rs 41 58 crore had been incurred in the Central Sector and in terms o f physical achievements only on an average 60 to 70 blocks had been covered per year against the target o f 100 blocks per year. Thus, there was shortfall in achievements both in physical and financial terms in this programme during the Eighth Plan.
746

Endless Source ? Yes!The current utilisation of renewable energy sources is much below their potential. This is mainly due to the dispersed nature of these sources, development stage of some of these sources and high initial cost for renewable energy sources. The situation may not change drastically even at the end of the Ninth Plan. Therefore, the major areas of focus for the future must be to:
• Change the structure of the existing programmes from subsidy-driven to gradual commercialisation of non-conventional energy sources.• Gradual phasing out of subsidies in the socially oriented programmes like Bio-gas, Improved Chulhas, Biomass and Solar Photo Voltaics programmes.• Strengthening of .esearch, development and commercialisation of non-conventional energy sources.
Renewable Energy Potential & Achievement
Source/System Approximate Achievements Ninth Plan Potential (Up to 31.3.98) targets
Biogas plants (No.) 12 million 2.67 million 1.26 million
Improved Chulhas (No.) 120 million 26.29 million 19.6 million
Biomass/Gasifier 17,000 MW 105 MW 22 MW
Solar Photovoltaic 20 MW/sq.m. 28 MW 2.5 MW
Solar Thermal Systems 35 MW/Sq.m.
Solar Water Heating 30 million Sq.m.
Wind Power 20,000 MW
4.36 lakh Sq.m. 2.50 lakhs Sq.m
970 MW 1200 MW
Small Hydro Power Biomass Power Power from Municipal Waste
10,000 MW 1700 MW
1,700 MW
151 MW3.75 MW
3.75 MW
175 MW 300 MW 50 MW
NINTH PLAN
6 .297 The major thrust o f the programme for new and renewable sources of energy in the NinthPlan would be in the following two areas.
I) The stmcture o f the existing progr ammes for non -conventional energy is to bechanged towards gradual commercialisation o f non conventional energy Special efforts have to be made for exploiting the large cogeneration potential available in the country. Necessary legislation and other measures have to be undertaken to enable producers o f non-conventional energy to sell electricity to the State Electricity Boards at a remunerative price Necessary policy initiatives along with legislation for selling the Non-conventional energy power produced by the private entrepreneurs at a competitive price to the to the utilities will be taken up during the 9th Plan
747

ii) The socially oriented prograntmes have to be restructured such that the direct capital subsidy provided by Government to these programmes are brought to the minimum level and a definite time fi'ame is fixed during which the subsidies have to be phased out. The continuation o f these programmes during the Ninth Plan should take into account the vanous financial and fiscal incentives, interest
subsidy in place o f capital subsidy and the implementation of some o f the socially oriented programmes as a part of the other rural development programmes Some o f the socially oriented programmes which were continued under the Central Sector for a longer period, i.e more than 2-3 Five Year Plans should be gradually transferred to the States. In such cases, the readiness o f the States to implement these programmes is to be ascertained
6 298 There is a persistent demand fi-om the States to transfer all the CSSs to the States While this demand has considerable relevance for the development o f decentralised non-conventional energy sources, all the States may not have the necessary institutional and techiiical capability to undertake this task. It will be necessary during the Ninth Plan to define the roles o f the Centre
vis-a-vis the States for the development o f non-conventional energy sources
6 .299 At the field level, the IREP and the other programmes for development o f non-conventional energy sources need to be integrated into the other developmental programmes of the Centre and the State Governments
6.300 The power generation programmes through different sources like wind, small hydro, biogas and solar power would be given adequate attention during the Ninth Plan It is necessary to optimise the benefits under these programmes by conducting necessary evaluation o f the work done in the past in order to consolidate the gains through these programmes The programmes need an effective commercialisation approach with private sector participation wherever possible
6.301 There is no satisfactory arrangement at present for absorbing in the grid, the surplus electrical energy available from decentralised energy supply systems The Ninth Plan should take cognisance o f this and deal with the necessary policy initiatives.
6.302 The provision o f soft loans through financial agencies including Indian Renewable Energ\ Development Agency (IREDA) and other concessions for provision o f land, infrastructure for evacuating the power generated by the private entrepreneurs have to be ensured for implementing an effective power generation programme through non-conventional energy sources during the Ninth Plan
6.303 A major programme would be initiated for the production o f power through cogeneration in industries, especially in sugar mills using bagasse as the fuel This programme would be promoted through the MNES as per the existing pattern o f financmg which includes demonstration programmes in cooperative/private sugar industries, interest subsidy programme to enable the financial institutions to give soft loans at reasonably low rate o f interest to the private sugar mill owners, necessary financial and technical support for the preparation of detailed project reports for setting up cogeneration power plants in the existing sugar mills etc Co- generation programmes in industries will be given necessary thrust durmg the 9th Plan as these
748

programmes can be implemented in a shorter duration and would also help the industries to meet their power demand and enable them to sell the surplus power to the utilities.
6.304 There is a need to cx)nsider enacting a legislation during the Ninth plan to enforce energy conservation standards, installation o f co-generation systems etc
6.305 In order to promote the Solar PV programme, it is necessary to strengthen the R&D set up presently available and also bring down the cost o f production o f solar cells through fiscal and financial measures.
Fuel Wood Consumption in India
6 .306 A large section o f the society particularly the poor people are not in a position to meet their energy needs fi'om sources like kerosene, LPG, etc., at an affordable price. As a result the dependence on fiielwood consumption is on the increase. The major source of energy for domestic sector both in urban and rural areas continues to be fuelwood and total requirement o f fuelwood per year is estimated at 200 million tons o f which 102 milllion tons are expected to be obtained from forest areas and the balance 98 million tons are obtained from the farm forestry.
6 307 The availability o f wood from forests in terms o f fiielwood is increasing on an average by 21 million tons per year However, on a sustainable basis an additional 18 million tons per year are available As a result in 84 million tons to be met by excess removal from forest areas. This in turn brings pressure on the conservation o f our forest resources
6 308 The proposed solution to the problem is to development o f the degraded forest lands Studies show that development o f around 60 million hectares o f the degraded forest land in a phased manner would help result in meeting the fuelwood needs in full
6.309 For developing such degraded lands, an estimated Rs.25,000 per ha has to be invested In order to take up a programme o f development o f 5 million ha o f such degraded land during a Plan period an amount o f Rs 2500 crore will have to be invested This would result in additional fuelwood availability o f 2 tons per year.
6.310 In addition to the development o f degraded forest land the other programmes like Integrated Rural Energy Programme may also help in meeting the fiielwood requirements especially in rural areas These programmes aim at conservation/ promotion o f energy efficient chulhas, biogas, biomass and other solar energy devices.
6.311 Out o f the total rural energy consumption 65% is met from fuelwood. As per the estimates o f the Planning Commission, the fuelwood requirement is likely to go up to 180 million tons in 2001. This is in comparison to the actual consumption o f 162 million tons in 1996. In this context, expansion o f the biomass energy programmes comprising biomass production, biogas, improved chulhas, gasifiers, solar energy, etc. assumes importance in the Ninth Plan.
749

6.312 WTiile there is a notable achievement in the National Project on Biogas Development by the setting up o f more than 9 6 lakh family size biogas plants during the Eighth Plan, the component relating to community/institutional biogas plants has not picked up to the expected levels. A dedicated involvement o f the States concerned alone would help in promoting community- based plants as the promotion o f such plants will be possible only by the strong involvement o f the local bodies like panchayats, rural cooperatives and other micro- level administrative set- up in the villages With this in view, it is recommended that this component o f the biogas project should be transferred to the States with adequate budget provision under the State Plans,
6 313 In order to expand the family -size biogas plants under the existing programme, the Ninth Plan programme must include the low cost designs, improved working o f the plants through new R&D initiatives, an effective mechanism to deal with the maintenance o f the plants etc It is also necessary to quantify the benefits through this programme for fuelwood saving In order to justify the biogas programme as the best decentralised energy source especially in rural areas, the economic cost is to be taken as the basis In the case o f centralised source o f energy like electricity etc the actual cost is very high Thus, detailed surveys need to be made for these programmes to quantify the economic benefits on the ground and also to make these programmes more effective The Ninth Plan should aim at achieving a target o f at least 12 lakh family- size biogas plants
National Programme on Improved Chulhas
6 314 This is an ongoing programme since Sixth Plan with the provision o f sizeable investments in the form o f subsidy, both by the Central and State Governments While the physical achievements exceeded the targets fixed during the previous Plans, it is a matter o f concern that a large number o f chulhas installed are either not functioning or not in use An evaluation study
conducted by the National Council o f Applied Economic Research (NCAER) for the period 1992- 95 indicated that about a fourth o f the chulhas installed went out o f order within a year It was also observed that there was a marked indifference shown by a large number o f beneficiaries in
• the maintenance o f the chulhas. The study also indicated that the number o f self-employed workers and their competence in these programmes are short o f the requirements Therefore, unless some structural changes in the training o f the self-employed workers and the beneficiaries are made, expansion o f the programme, howsoever desirable, is likely to lead to a low degree o f success. This programme is being considered for transfer to the States during the Ninth Plan
Integrated Rural Energy Programme
6 315 This programme which is a Centrally Sponsored Scheme, provides for Central Government grants to the States for developing capabilities in the States and UT for preparing and implementing Integrated Rural Energy Programme and projects It fiarther provides for the expenditure on staff salaries and their training The State Sector component is utilised for actual implementation o f the programme While the progress achieved so far indicates that the programme covers around 660 blocks in the entire country, the actual efficacy of this programme is yet to be assessed fiilly Although some evaluation studies have been conducted, they have
National Project on Biogas Development (NPBD)
750

taken a very limited sample o f around 12 blocks The role played by the State Governments in this programme during the past had been very marginal. There were both institutional and financial constraints on the part o f the States This programme being a Centrally Sponsored Scheme is under consideration for transfer to States The size and the programme components during the Ninth Plan are thus to be decided keeping in view the above points
Power Generation Programmes
Wind Power
6 316 The wind power programme has attained a commercial stage and thus this programme during the Ninth Plan needs support only in terms o f fiscal incentives to encourage increased participation o f the private entrepreneurs to set up wind farms Also a suitable regulatory mechanism is required to decide on the buy- back o f the power generated by wind farm operators at an attractive and economic price and also providing for wheeling, banking and third party sales facilities New demonstration programmes could be limited, as the existing wind farms would provide the needed demonstration experience However, as far as wind resource assessment and surveys are concerned, it is necessary to carry out a nationwide survey during the Ninth Plan in order to identify the potential sites for development o f wind farms This programme should aim at achieving a target o f at least 2000 MW during the Ninth Plan and most o f it under commercial projects with the participation of private sector The demonstration programmes must be kept to the minimum.
6.317 For wind energy fiscal concessions like accelerated 100% depreciation etc were not needed Although this aspect has been overdone,one can now pull back What is required is to select a suitable technology and methodology through which, these technologies can penetrate at the fastest possible manner
Small Hydro Power
6.318 This programme could not pick up during the Eighth Plan due to various reasons such as the absence o f identified sites well in advance for taking up the programmes, the reluctance on the part o f the State Governments to actively involve, the long gestation combined with time and cost overruns o f small hydro projects etc. During the Ninth Plan, the structure o f the small hydro programme needs to be suitably modified. Therefore, the size o f the programme and the pattern o f financing o f these programmes have to take into account the points discussed above During the Ninth Plan a target should be to set up at least 175 MW capacity o f small hydro projects Biomass Power
6.319 The biomass power programme comprises the biomass combustion programme, biomass gasifiers and cogeneration programmes A beginning had been made during the Eighth Plan for experimental biomass production, utilisation and development o f gasifiers for different mechanical and electrical applications. More than 20 MW equivalent capacity projects have been installed against the Eighth Plan target o f 2 MW However, the cogeneration programme, especially in sugar mills using bagasse as the fiiel, is yet to pick up in a major way The main constraint for this is the lack o f suitable promotional incentives and the absence of demonstration programmes The promotional incentives modified recently are likely to result during Ninth Plan in private owners of sugar mills coming forward to replace their existing low pressure steam boilers by high pressure
751

ones and also canying out other modifications so as to make them suitable for power generation In addition, a regulatory mechanism is needed in respect of buy- back o f the cogenerated power
by State Utilities (SEBs) at an economic price and provide for facilities like wheeling, banking and third party sales etc. The programmes for power generation through biomass should aim at achieving a minimum target o f 500 MW during the Ninth Plan and this programme will include the contribution from the private sector especially in the areas of cogeneration of power in sugar mills and power generation through biomass combustion.
Solar Power
6.320 The generation o f electricity from solar energy, although technically feasible, is yet to reach the stage o f commercial viability. At the prevailing cost of solar cells, the cost of installations as well as the cost o f production o f electricity from solar energy is very high compared to the cost of electricity produced from other conventional sources. Thus, an increased thrust is to be provided for R&D so as to upgrade the existing technology and to reduce the cost of production of solar cells. As such, there are no large solar power plants operating in the country. As o f now, solar energy is useftil for decentralised applications like lighting, water pumping, passive heating o f buildings, water heating, cooking and other such applications. In order to promote solar power plants during the Ninth Plan, a preliminary survey has to be undertaken and a viable technology has to be found before going in for installing large size power plants both through solar thermal and solar photovoltaic technologies. It is desirable to try such plants on pilot scale so as to ascertain their trouble-free operation as well as the cost at which such power plants could be run The activities during the Ninth Plan are required to focus on these aspects instead o f merely
proposing large size plants.
Energy from Urban and Industrial Wastes
6 321 The achievements during the previous Plans in this area were not significant. As such, there are no successfiil 'arge- scale operation o f plants to utilise urban waste for production of energy in the country. Several technological options are available to produce electricity from different sources like waste from industrial effluents, municipal/urban waste, tannery waste, vegetable/market yard waste, sewage, pulp and paper industry waste etc The Ministry o f Non- Conventional Energy Sources is at present implementing a programme assisted by UNDP/GEF consisting o f 16 sub-projects on the above mentioned technologies. The feedback o f these sub- projects would be available by the end o f 1999. It is seen that a high degree o f coordination between the agencies involved like the Central and State Governments, the municipal corporations and the municipalities in towns and other local bodies is required to successfully implement the programme of energy from urban/industrial waste In view o f the reasons mentioned above, the Ninth Plan programme must be limited to the setting up of demonstration projects, creation o f conducive environment for the private sector to enter into this area by providing suitable incentives, provision o f necessary arrangement for State Utilities (SEBs)to buy back the power generated Necessary legislation, wherever required, to dispose o f the waste and to generate energy from such waste etc. should be undertaken Major capacity for electricity production from this source may not be possible during the Ninth Plan However, a target oriented approach can give necessary push to this programme A modest target of about 50 MW capacity addition under this programme can be achieved during the Ninth Plan
752

6.322 Under Solar Energy Programme, stand-alone systems are installed for applications like the solar thermal water heaters, solar cookers, solar dryers, solar desalination systems and solar photovoltaic street lights, solar photovoltaic domestic lights, solar lanterns etc In addition, hybrid systems using small aero generators, water pumping wind mills are also installed The Solar Energy Centre presently flinctioning under the administrative control o f the Ministry o f Non- Conventional Energy Sources, is carrying out the activities o f testing the solar thermal and photovoltaic devices The Centre is engaged in R&D activities to develop indigenous components for solar power generation, development o f materials suited to the requirement o f solar thermal and PV applications etc. The ongoing activities under the solar energy programme are proposed to be continued during the Ninth Plan with enhanced target especially for rural applications like solar cookers, solar water heaters, solar lanterns, solar PV domestic lighting systems etc While the use o f solar energy for decentralised and stand alone applications is picking up, there were problems during Eighth Plan in respect o f maintaining these systems A mechanism has to be evolved during the Ninth Plan to ensure maintenance and upkeep o f these systems with the involvement o f the local people at the village level Improved versions o f solar cookers should be introduced One should take note o f the good technology available for solar cookers in Asia
and other places
6.323 But, for large applications like power generation, photovoltaic cells are highly expensive SPV cells find applications in places like off-shore plants o f ONGC Similarly ,for applications
like communication equipments used by Armed Forces in remote places such as Ladakh regions, etc. and for Mount Everest and other Himalayan expeditions SPV technology is found suitable. In remote areas, in any case, alternative ways o f making available electricity are very difficult Under such circumstances solar energy devices become justifiable even at their higher initial cost. The efficiency level o f solar PV cells has increased from 9% to 13-14% at present and this may go up further Therefore, more focus has to be given to R&D
6.324 The capital subsidies provided for solar thermal systems for water heaters and solar cookers were abolished w .e.f July 1993 and April 1994 respectively In place o f capital subsidy, interest subsidy is being provided at present through MNES Budget so as to bring down the effective rate o f interest on loans by commercial banks to around 5 per cent The solar water heating systems have attained a stage o f commercialisation. The application o f solar water heaters for domestic, industrial and other commercial purposes has created an increased demand. In this context, emphasis is to be given to the programmes o f MNES for installation o f solar water heaters during the Ninth Plan for which the targets are indicted in the following paragraphs In the case o f solar photovoltaic systems, the capital subsidy is still being continued. During the Ninth Plan it is necessary to phase out the subsidy in the major programmes o f solar photovoltaics also
6.325 During the Ninth Plan a target o f 5000 KW (peak) capacity o f solar power packs, 5 lakh domestic solar PV lighting systems, 10 lakh solar lanterns, 10,000 solar PV water pumping systems, 13 lakh square metre collector area o f solar thermal water heating systems, 5 lakh solar cookers should be achieved. A programme o f this size will justify the capital and interest subsidy provided for these programmes and a large spread o f these devices could create a visible impact leading to increased manufacturing o f the devices Wherever possible the programmes have to be
given a commercial and market oriented approach.
Solar Energy Programme
753

Indian Renewable Energy Development Agency (IREDA)
6.326 The Indian Renewable Energy Development Agency (IREDA) a public sector financial corporation, is functioning under the administrative control o f MNES IREDA provides soft loans to the entrepreneurs to set up different types o f non-conventional energy projects which include wind power, biomass, small hydro, solar thermal, solar PV etc In order to maintain an acceptable debt equity ratio, IREDA is provided equity support by the Government o f India through the budget o f MNES. During the Eighth Plan, an amount o f Rs. 20 crore per year on an average was provided as equity support to IREDA.
New Technologies
6.327 The Ministry o f Non-Conventional Energy Sources is promoting the R&D activities in new technologies in different areas like use o f alternate fuels for surface transport in order to replace hydrocarbons. The programmes cover fuel cell technology, hydrogen energy, ocean energy etc. However, all these activities are still at research level and a planned programme may not be taken up during the Ninth Plan except in the case o f the alternate fuel for surface transport In the case o f alternate fiiel for surface transport, battery- operated vehicles have been tried in some urban areas. While the technology for promotion o f such vehicles is available, some initial support to introduce such vehicles in congested metropolitan areas is required
6.328 The Ninth Plan (1997-2002) assessed outlays for the Non-conventional Energy Sources in public sector are given at Annexure 6.7.
754

COMMON MINIMUM NATIONAL ACTION PLAN FOR POWER
A national consensus evolved for improving the performance o f the power sector in a time bound manner and the following was adopted.
I. National Energy Policy
* The Government would soon finalise a National Energy Policy
II. State Electricity Regulatory Commission
* Each State /Union Territory shall set up an independent State Electricity Regulatory Commission (SERC)
* To set up SERCs, Central Government will amend Indian Electricity Act, 1910 and Electricity (Supply) Act, 1948
* To start with such SERCs will undertake only tariff fixation
* l icencing, planning and other related ftinctions could also be delegated to SERCs as and when each State Government notifies it
* Appeals against orders o f SERCs will be to respective High Courts unless any State Government specifically prefers such appeals being made to the Central Electricity Regulatory Commission
III. Central Electricity Regulatory Commission
* Union Government will set up a Central Electricity Regulatory Commission (CERC)
* CERC will set the bulk tariffs for all Central generating and transmission utilities.
* Licencing, planning and other related functions could also be delegated to CERC as and when the Central Government notifies it
* All issues concerning inter-State flow and exchange o f power shall also be decided by the CERC
* To enable setting up o f CERC, Central Government will amend Indian Electricity Act, 1910 and Electricity (Supply) Act, 1948.
* To enaUle setting up o f CERC, Central Government will amend Indian Electricity Act 1910 and Electricity (Supply) Acy, 1948
IV. Rationalisation of Retail Tariffs
* Determination o f retail tariffs, including wheeling charges etc , will be decided by SERCs which will ensure a minimum overall 3% rate o f return to each utility with immediate effect
ANNEXURE -6.1
755
* Cross-subsidization between categories o f consumers may be allowed by SERCs. No sector shall however, pay less than 50% o f the average cost o f supply (cost o f generation plus transmission and distribution). Tariffs for agricultural sector will not be less than fifty paise per Kwh to be brought to 50% o f the average cost in not more than three years
* Recommendations o f SERCs are mandatory. If any deviations from tariffs recommended by it are made by a State/UT Government, it will have to provide for the financial implications o f such deviations explicitly in the State budget* Fuel Adjustment Charges(FCA) would be automatically incorporated in the tariff* There shall be a package o f incentives and disincentives to encourage and facilitate the implementation o f tariff rationalisation by the States.
V. Private Sector Participation in Distribution
* State Governments agree to a gradual programme o f private sector participation in distribution o f electricity. The process o f private participation shall be initially in one or two viable geographical areas covering both urban and rural areas in a State and the State may extend this to other parts o f the State gradually.
VI. Role of Central Agencies* The Central Government would make a comprehensive review o f the role o f Central Electricity Authority(CEA). Techno-economic approval of competitively bid power projects will be simplified and CEA shall not be concerned with capital cost, tariff and other commercial aspects o f the project. Powers regarding approval o f projects shall stand delegated to the States in respect o f thermal power stations upto 250 MW. However, in respect o f thermal projects beyond 250 MW capacity and other schemes, CEA’s appraisal will continue in respect o f planning and other related matters, such as to promote best optimal development o f the river and its tributaries for power generation including proper hydro-thermal coordination; the suitability o f location and size o f thermal power stations; fiiel linkages, adequacy o f power evacuation facilities covering interstate and intra-state and the transmission schemes form an integral part o f the National Power Grid for maximization o f benefits for the country as a whole. Subject to such technical clearances which shall be accorded within two months State Governments will have powers to accord approval for power projects.
* The role o f FIPB will be minimised by putting as many projects on the automatic clearance route as feasible.
* Government o f India will issue transparent guidelines and delegate more powers for environmental clearance to State agencies. State agencies should equip themselves with requisite physical and technical expertise.
* Government o f India will delegate more powers to the States for issue o f forest clearances Statutory amendments will be made in the relevant Central statutes
* Ministry o f Environment & Forests have proposed the following delegation to the States for environment clearance;-
(I) All co-generation plants and captive power plants upto 250 MW
(ii) Coal based plants upto 500 MW using fluidized bed technology subject to sensitive areas restrictions
756
(iii) Power stations upto 250 MW on conventional technology
(iv) Gas/Naphtha based station upto 500 MW
VII. Autonomy to the State Electricity Boards
* States will allow maximum possible autonomy to the State Electricity Boards The State Electricity Boards will be restructured and corporatised and run on commercial basis
VIII. Improvements in the Management Practices of State Electncity Boards
* State Electricity Boards will professionalise their technical inventory manpower and project management practices.
IX. Improvement of Physical Parameters
* Government o f India will carry out necessary amendments in the relevant Acts/Rules to allow private participation in transmission.
* State Governments will provide higher allocation for early completion o f public sector projects
* Renovation and modernisation of existing power plants shall be done in a time bound manner, PFC and other financial institutions will give higher priority for funding o f R&M schemes Clearance to R&M projects will fiilly be delegated to the States and no clearance will be required from CEA* PLF o f those thermal power stations having less than 40% PLF at present would be increased by 3% annually, by 2% in case o f those plants with PLF between 40 and 60% and by 1% for those plants with PLF over 60%. The overall PLF in the State sector in the country must come up to a minimum o f 65% and the national average to 70% by 2002 A.D
* Compulsory metering at substations and on all major feeders would be introduced. Compulsory metering o f all new electricity connections as also o f connections to agriculture sector exceeding 10 HP will be undertaken and completed in two years All electric supplies would be metered by 2002 A.D.
* Compulsory annual energy audit o f large consumers, i . e , 100 KVA and above would be undertaken.
* Time o f the day metering would be introduced for big power consumers for better load management.
X. Co-generation/Captive power plants
* State Governments will encourage co-generation/captive power plants. To facilitate evacuation o f power from these plants to the grids. States shall formulate clear and transparent policies for purchase o f power and wheeling charges which provide fair returns to the Co-generation/Captive power plant owners. Captive power plants could also sell power to a group o f industries as well as other categories o f consumers in the said industrial zone or area. Wheeling o f power from captive power plants to consumers located at a distance or through displacement basis shall be encouraged and the States will issue clear and transparent long term policies in this regard
757

* A national policy on hydro power development will be evolved by the Central Government which, inter-alia, would include development o f mega hydro projects, both in the public sector and the private sector, at locations with substantial hydro potential, along with concomitant transmission facilities for evacuation o f power to other Regions/States States shall prepare a shelf o f flilly cleared hydro projects for implementation on high priority Special efforts will be made to promote hydro-electric projects in Himachal Pradesh and Jammu & Kashmir
XH. Due Emphasis for Investment in North Eastern Region.
* Since there are geographical constraints in the North-Eastern Region, the Government shall constantly review the public and private investments being made in that region so that these States get equitable shares in the investments in the power sector
XIII. Allocation of liquid fuels
* Government shall finalise the linkages o f allocation o f liquid fliels for power plants in consultation with State Governments soon
XIV. Mega power projects at pitheads
* Development o f mega power projects at mine pitheads, both in the public sector and the private sector, with transmission facilities for evacuation o f power to other Regions/States would be encouraged.
XV Setting up of washeries
* Coal India Limited and its subsidiaries shall put up washeries at pitheads, wherever necessary In case CIL cannot set up the washery, private sector would be permitted to set up such washeries
at pitheads. In either case, supply, washing and transportation o f coal shall be on the basis of legally enforceable commercial contracts
XL Advance Action and High Priority for Hydro Projects
758

(Rs.crore)
Annexure - 6.2
FINANCIAL OUTLAYS IN RESPECT OF POWER SECTOR
SI.No.
SECTOR OUTLAYS
I. CENTRAL
(I) Ministry o f Pow^r 45591 05
(ii) NLC - Power 1866,36
(iii) DAE - Power 5842.00
TOTAL (CENTRAL) 53299.41
2. STATE 71227.00
ALL INDIA 124526.41
759

Annexure-6.3
Sectoral Coal Demand(in million tonnes)
Sector 1991-92Actual
E I G H T H P L A N NINTH PL.A.\
2001-02Proj.
GROW'TH R.ATE"..
1992-93
Actual
1993-94.Actual
1994-95Actual
1995-96A-Ct-ual
1996-97 Orig. Rev. Targ. Targ,
Prov.1997-98Targ
1996-97 2001-02
1991-92 1996-97
COKINGSteel ! 31.66 32.43 32.39 34.56 35.08 42.00 40.50 34.71 41.40 49,60 1.86 7,43Coke Ovens .' 2,00
Sub-Total. 31.66 32.43 32.39 34.56 35.08 42.00 40.50 34.71 41.40 51.60 1.86 8,25Coking
NON COKINGPower 134.60 147.04 162.50 166.45 184.52 185.30 210.00 199.26 205,90 262.00 8,16 5,63
(Utilities) (2.30) (2.49) (2.73) (2.67) (2.33) (4.70) (5.00) (2.58) (4.10) (5.00)Railways 4.42 3.19 1.93 0.66 0.27 3.00 0.40 0.12 0.13 - -51,38 -
Cement 9.97 10.89 10.36 U .12 11.00 17.50 17.50 11.25 18.20 21.40 .',,45 i;t,72Fertilizer 4.23 4.55 4.96 4.28 4.33 4.00 4.40 4.36 4.40 3.80 0.60 -2,71BRK& ! 23.15 33.20 27.60 27.36 30,00 33.50Others ! 38.50 38.88 36.24 39.46 (0.54) 2.07 6,80Power ! 15.71 15.00 14.40 15.30 16.10 25.80(Captive) ! (2.30) (2.10) (2.70) (1.62) (2.70) (2.70)Soft Coke/ 0.99 0.63 0.57 0.33 0.32 4.00 2.50 0.01 0.15 3,00 -60.00 2I3,0(,'LTC
Export 0.11 0.13 0.09 0.09 0.09 1.00 0.50 0.13 0.30 1,00 3.40 500Sponge 0.40 * * ♦ • 1.86 2.00 3.20 - 3.40 6,10Iron
Colliery 4.06 3.95 5.83 3.69 3.4(! 4.00 4.00 3.48 3.40 4,(',(! ■3.!! 4 2,82ConsumptionSub-Total: 197.28 209.26 220.48 226.08 244.65 269.00 284.50 261.27 281.98 360,60 5.78 6,66Non-Coking (2.30) (2.49) (2.73) (2.67) (4.36) (7.00) (7.70) (4.74) (6.80) (7,70)
TOTAL: 228.94 241.69 252.87 260.64 279.73 311.00 325.00 295.98 323,38 412,20 5,27 6,85(2.30) (2.49) (2.73) (2.67) (4.36) (7.00) (7.70) (4.74) (6,80) (7.70)
Note: Figures in brackets are washery middling, and are not Lncluded in the totals. * included in others.
Sectoral Targets Provl.
1996-97 1997-98 2001-02
Hot Metal Production (mt) 19,89 25.25 36.75
Cement Production (mt) 76.00 83.00 113.00
Coal Based Generation (BL^ 265.50 286.00 360,00
760

Companywise Coal Production
Annexure-6.4
(in million tonnes)
E IG H T H P LA N N IN T H P L A N G R O W T H RA T E
Comoanv 1991-92Actual
1992-93Actual
1993-94Actual
1994-95-Actual
1995-96Actual
1 996-97 Orig. Rev. Targ. Targ.
Prov.1997-98Targ.
2001-02Proj.
1996-97
1991-92
(%)2001-02
1996-97
Coal India Ltd.ECL 24.52 24.06 22.60 24.85 27.80 38.50 31.50 29.65 32.50 37.00 3.87 4.53BCCL 27.00 28.06 29.04 28.75 27.81 32.00 29.50 27.13 30.70 34.00 0.09 4.62CCL 31.21 32.37 33.52 31.21 30.76 45.50 35.20 32.21 34.00 41.30 0.63 5.10NCL 30.88 30.70 31.41 32.50 35.20 39.00 37.00 37.01 37.00 45.85 3.68 4.38W( L 24.73 25.75 26.50 27.24 29.01 30.00 29.50 31.23 30.50 34.70 4.78 2.13SE( L 44.17 46.04 47.54 50.00 53.17 45.50 52.50 55.30 55.50 68.90 4.59 4.50Mil. 20.69 23.14 24.29 2'.33 32.71 3S.50 36.00 3'.3-: 39.50 51.25 12.60 6.52NEC 0.95 1.10 1.20 1.19 0.82 1.00 0.80 0.75 0.80 1.00 4.62 5.92
Total CIL : 204.15 211.22 216.10 223.07 237.28 270.00 252.00 250.65 260.50 314.00 4.19 4.60
Sf C L 20.58 22.51 25.21 25.65 26.77 33.00 30.20 28.73 31.00 36.00 6.90 4.61
TISCO/
IlSCO/
DVC 4.56 4.38 4.73 5.01 6.08 5.00 6.45 6.28 6.50 7.60 6.60 3.89
CaptiveBlocks
13.00
TOTAL: 229.29 238.11 246.04 253.73 270.13 308.00 288.65 285.66 298.00 370.60 4.50 5.34
761

Ninth Plan (1997-2002) Financial Outlays - Coal & Lignite Sector
(at 1996-97 price level)(in Rs.Crore)
Annexure-6.S
Outlay
COAL& LIGNUE 17575.23
( Note: The Outlay for Neyveli Lignite Corporation- Power, at Rs. 1866.36 crore, is reflected under Power Sector
The total outlay for Ministry o f Coal including NLC - Power is Rs. 19441.59 crore).
762

Annexure-6.6
Financial Outlay -Petroleum & Natural Gas Sector
(Rs Crore)
Sl.No. Item Outlay
1. Exploration & Production 27603.00
2. Refining & Marketing 46411 18
Total 74014.18
763

Annexure - 6.7
FINANCIAL OUTLAYS IN RESPECT OF NON-CONVENTIONAL
SOURCES OF ENERGY(Rs.crore)
MNES 3800.14
764

CHAPTER 7
TRANSPORT
Overview
The Problem
7 1.1 Inadequacies and imbalances in transport threaten to constrain economic growth and the quality of life in both urban and rural India
7 1.2 The country’s transport system, which comprises rail, roads, sea port and airports, is facing capacity saturation, which means lost economic opportunities and deterioration of assets and services. The modal mix of transport has been continuously shifting against the railways with the result that bulk of the freight (over 60%) and passenger traffic (over 80%) is carried by road, which is undesirable from economic as well as environment angles A burgeoning energy import bill is one of the direct consequences of this
7 1.3 In the urban areas, lack of adequate mass transport, complete absence of demand management and policy distortions in the area of fuel pricing and bank finance have resulted in an explosion of personalised transport comprising mainly of scooters and cars This has contributed to high levels of pollution and alarming rates of accidents On the other side, a large number of villages lack a reliable all-weather connection with nearby markets and towns Some areas like North-East and J&K have remained physically and emotionally isolated because the transport system has not linked them with the rest of the country. . Certain environment friendly and socially cost-effective means of transport like coastal shipping, inland water transport and non-mechanised transpon, human or animal powered have remained undeveloped.
Inadequacies and Imbalances
7.1.4 Annexure 7.1.1 indicating the growth o f traffic and network underline the capacity constraints facing all the modes of transport The Indian Railways have extended their route length from 53,596 kms. in 1950-51 to 62,725 kms as on 31.3 97 registering an increase of 17% only. On the other hand, freight in tonne kms carried has risen six-fold, while passenger kms, have grown by five times during the same period. On an average, only about 2000 kms have been added to the system in each decade, while the Eighth Plan contributior; was even lower at 267 kms. Further, the Indian railway system is a multigauge one and the Broad Gauge part is 41,971 kms, of which only about 15,C ^’kms. are double/multi-track, despite the heavy congestion in the high density corridors.
7.1.5 The aggregate length of roads, which was 0.4 million kms in 1950-51, has increased eight-fold to 3 .32 million kms in 1995-96 but the number of passenger buses has gone up 13-fold from 0.34 lakh to 4.5 lakh and goods vehicle fleet 22-fold from 0 82 lakh to 17 85 lakh in the corresponding period. Out of the total road length constructed during the Eighth Plan, 66% were constructed under Jawahar Rozgar Yojana (JRY) These roads are of limited value from the point of view of movement of heavy traffic Further, only 20% of the surfaced roads are estimated to be in good condition, which compares unfavourably
76,5

with other countries*. The national highway network, which carries about 40% of the road traffic, is just a Uttle over 1% of the road network and just over 20% of the national highway network is single lane.
7.1.6 In the port sector also there has been an 11-fold increase in sea traffic from 19.38 million tonnes to 227.26 million tonnes from 1950-51 to 1996-97 with inadequate addition to the port capacity during the period. Much of the equipment at the ports is overaged and technologically obsolete. The major ports are operating at more than 100% capacity, as against the international utilisation norm of 55 to 65 per cent. This has resulted in congestion and increase in tum-around-time from 6.7 days in 1960-61 to 8 days in 1997-98.
7.1.7 Expansion of air traffic, of Indian Airlines from 83 million Revenue Torme Kms (RTKMs) in 1960-61 to 698 million RTKMs in 1996-97, has also taken place without commensurate increase in the ground handling capacity or upgradation of navigational equipment at the airports.
7.1.8 Not only is the network to be further developed and strengthened, there is also a need to redress the imbalances in the spread of the transport infrastructure and facilities. Armexure 7.1.2 presents the position regarding the availability of rail and road network State- wise. In most of the North-East and J&K, road length per 100 sq. km of area is quite low as compared to the other States in the country. In J&K and Arunachal Pradesh the average is as low as 5.9 and 12.2 per 100 sq. km. respectively, compared to all-India average of 73 per 100 sq.km. The railways have very little presence both in J&K and in most parts of the North Eastern region. A high level Commission, which enquired into the backlog of the basic minimum services and the infrastructure needs in the North Eastern region, has characterised the lack of adequate connectivity both intra-regionally, as well as with the rest of the country, as the most important problem of the region.
7.1.9 Another imbalance is the rural-urban dichotomy. Much of the network of rail, roads, ports and airports is geared to the needs of the urban economy, while the vast rural hinterland is very poorly served by communications. Of the nearly 6 lakh villages, only about three-fifths are known to be connected by all-weather roads at the end of the Eighth Plan. Even in respect of the larger habitations i.e. villages of more than 1000 persons, connectivity is estimated to be of the order of 85 per cent at the end of the Eighth Plan and here also, most hilly areas and the States of Orissa, Bihar and Madhya Pradesh present a particularly patchy picture.
7.1.10 The economic costs of the gaps in the transport infrastructure are easy to. surmise. The congestion on the roads leads to low speeds, resulting in high energy consumption and increased pollution. It is estimated that lack of proper maintenance has increased the fiiel consumption by 10-15 per cent per annum. In monetary terms, the loss to the economy is estimated to be Rs.3,000 to 4,000 crore per year. The delay on the roads and ports also results in high inventory costs for the industry, thus affecting its competitiveness vis-a-vis international industry operating on JIT(just-in-time) inventory principles. The congestion at the ports and the insufficiently developed air services also affect forgjgn investment decisions, which often place a great premium on the infrastructure.
7.1.11 The extreme overcrowding in almost all modes of passenger travel restricts personal mobility and the crush loading of suburban services, e.g. in the Mumbai suburban system, is injurious both to working efficiency and human dignity. The weaknesses of the transport infrastructure in the rural areas and in the remote regions deny them meaningful participation in the national economy. Environmental pollution of land , air and noise also affects the quality of life both in the cities as well as in the country side.
* Indonesia and Brazil 30%, Korea 70%, Japan and USA more than 85%
766
Distortions in the Inter-modal Mix7.1,12 The railways and the roadways are the two main modes of transport carrying the bulk of freight and passenger traffic. Successive policy statements, including the National Transport Policy Committee Report (1980) as well as the subsequent Plan documents have recommended that the railways should be given the lead role in the transport sector because of their greater energy efficiency, eco-friendliness and relative safety However, the railways have continued to yield their dominant position to the road transport While in the freight traffic, the share of the road transport has been estimated to have increased from 11% in 1951 to 60% in 1996, in passenger traffic, the share has gone up from 32% to 80% during the same period
7.1 13 The main reason for this continual slide in the railways’ share has been the inability o f the system to grow in proportion with the increase in the traffic requirements of the growing economy Since the railways are owned and managed entirely by the Government, resource constraints have all along led to under-funding of the system, which has meant under supply, both quantitatively and qualitatively Faced with capacity constraints, the railway system chose to concentrate on the movement of bulk materials for the core sector, namely power, steel, cement etc., thus losing its clientele in the high value non-bulk sectors which often recorded higher growth rates The skewed tariff policy, implying cross subsidisation of passenger traffic, has meant a continual increase in freight rates which, in turn, are driving away even some of the long distance bulk traffic from the railways to the roadways On the other hand, road traffic being largely in the private sector has moved aggressively to occupy the space vacated by the railways and in this it has been aided by a liberal permit and regulatory system for national trucking, cheap finance made available by the banking sector and an energy pricing policy which has subsidised diesel, while the railways pay an exceptionally high tariff for their electricity consumption.
7 1.14 International trends indicate that with the growth of the highway and aviation technologies the traffic tends to shift away from the railways However, in the continental economies like USA, China and erstwhile Russia, the railways have maintained their dominance. India’s size, geography and resource endowments also mandate a dominant role for the railw'ays, not to mention the environmental considerations, which in recent years are causing a rethinking even in the developed world.
7 115 In the inter-modal context, the coastal shipping and inland water transport also have not been able to realise their fiall potential o f growth though they are more energy efficient, environmentally cleaner and economical In the case of coastal shipping, the development has been stymied by the constraints o f port capacity and customs and procedural problems Inland water transport has its spatial limitations and most of the waterways suffer from navigational hazards like shallow water and narrow width of channel during dry weather, siltation, bank erosion, absence of infi-astructure facilities like terminals and inadequacy o f navigational aids At present, the share of these modes of transport is estimated to be less than 2%, though they have undeniable potential for relieving the pressure on surface modes o f transport
767
7.1.16 Non-motorised transport modes, powered by human and animal energy, could also play a bigger role in the developing transport scenario of the country Bicycles, rickshaws and similar vehicles, and even hand carts, have a considerable role in urban areas for catering to short trips in congested areas and on narrow streets and lanes and for providing access to formal mechanised modes of transport. Animal carts are an essential part o f the rural agricultural economy. But the elitist approach has not focussed on the development of these modes of transport as much as on the formal motorised modes, despite their manifold benefits like relatively lesser cost, simple technology, large employment potential, non-polluting operations etc. The provision of simple technological inputs o f improved designs, standardisation o f spare parts and ensuring safe and smooth movement could go a long way in achieving greater complementarity of various modes o f transport catering to the varied needs of the different sectors of the economy
7.1.17 In the urban, particularly the metropolitan areas there has been an explosion of personalised transport largely due to the failure of the Government to make available mass public transport in adequate measure. This trend has been abetted by the flooding of the consumer market with cars, light commercial vehicles and two & three wheelers, motorbikes o f alluring varieties, financed by cheap credit and powered by subsidised fuel This, combined with an almost total absence of demand management and rational road- use policies, has led to a phenomenal growth in the number of personal vehicles in recent years in the metro cities, most prominently in Delhi The resuh has been a worsening grid-lock of traffic, causing fatal and other serious accidents on an increasing scale The high levels of pollution have earned for Delhi even an international ranking
Transport & Energy
7.1.18 In the transport sector, energy planning has a special significance not only because transport is the second largest consumer of energy next to industry, but also because different modes of transport use energy with varying intensity and efficiency The transport sector consumed 18 80 million tonnes of oil equivalent (MTOE) of energy in 1984-85, which increased to 27.80 MTOE in 1993-94, registering an increase of about 48 per cent. In the case o f liquid fuel, the consumption has gone up by 89% in the corresponding period. This points to the need for modifying the inter-modal mix in favour o f energy efficient modes on the one hand and promoting energy efficiency in all modes by encouraging better design o f vehicles through fiscal incentives, if necessary, better geometry and surfaces o f roads and promoting greater awareness in the driving community as a whole, on the other.
Safety7.1.19 The continuous increase in the growth o f traffic in various modes of transport has raised serious issues concerning public safety. Table-7 1.1 gives the details of the accidents in different modes over a period.
768

Table -7.1.1 Accidents in Rail »& Road Sectors
Year Rail Road
Total Accidents Total Accidentsaccidents Per lakh Accidents Per lakh(Nos) Train Kms. ('000) Vehicles
1. 2. 3. 4. 5
1971 840 18 120.2 6.41981 1013 20 161.2 3.01991 532 9 294.0 1.41995________ 501____________________ 8________________ 328. 1_____________________________
Safety of operation is an area of concern in all modes of transport. Though the accident rate is coming down, the number of fatalities is still high. In road transport the number of fatalities increased from 15,000 in 1971 to 59,900 in 1995 which is truly unconscionable. Road safety has been a casualty both in the urban areas and the highways. In railways, the human failure and lack of proper man-machine interaction has affected safety. Another area of concern is the large number of unmanned level crossings, which are the scenes of frequent accidents. The provision of infrastructural facilities, particularly in the shape of modem commercial navigational equipment has lagged behind the growth of air traffic which has jeopardised the objective of providing safe and reliable air services. Country boats carrying men and materials in Bihar, West Bengal, Orissa and other parts of the country are often involved in accidents caused by overcrowding, coupled with the use of unserviceable crafts, inadequate traffic regulation and total absence of safety equipment on board.
Environment & Transport
7.1.20 Both the construction of transport infrastructure and the provision of transport services have an adverse impact on environment. The demand for infrastructure is increasing at a rapid pace and this is likely to go up leading to ftirther use o f the scarce land resources and the attendant problems of pollution of various kinds. The different modes of transport cause environmental degradation of various degrees and in diverse manner. The rail track and the roads use up scarce land and their construction has an adverse effect on the physical or the natural features of the areas, including a reduction in the vegetation cover. The road transport causes air and noise pollution, while the water transport poses the risk of marine pollution of the coastal waters. While there is a need to contain pollution and environmental degradation caused by all modes of transport, what is more urgently required is the containment of pollution caused by the operation of road transport, particularly in the mega chies. Table-7.1.2 presents the vehicular pollution load in some important cities.
769

Table-7.1.2 Vehicular Pollution Load (tonnes per day)
City 1987 1994
Delhi 8 71.92 104 6.30Mumbai 548.80 659.57Bangalore 253.72 304.47Calcutta 244.77 293.71Chennai 188.54 226.25
It is necessary to encourage sucii m odes o f transport w hich are not heavily dependen t on scarce land resources and to adopt construction procedures and practices w hich do not d isfigure the land and do not creatc ecological problems. Strict en forcem ent o f the an tipo llu tion laws, applicable to the transport sector, is also necessary.
Technology Upgradation
7.1.21 T ransport technology has a great inlluence on the productiv ity and safety o f the transport sector. Thus, the m odernisation o f the transport system and the incorporation o f the em erg in g techno log ies are essential e lem ents o f transport planning, w h ich m ust, at the sam e time, be based on the local needs, instead o f being im itative o f the techno logy used in en tire ly d iffe ren t c ircum stances in som e developed countries.
7 .1.22 T echno logy upgradation has been a thrust area in the successive Five Y ear Plans, but, desp ite this, the progress has been slow, particularly in respect o f bus chassis, engine design, m u lti-ax le vehicles, construction o f roads, cargo handling equ ipm ent at the ports, nav igational and co m m u n ica t io n facilities at the airports, m odern isa tion o f rolling s tock and s ignalling system in the railways. The position is m u ch w orse in regard to non-m otorised transport. It is necessary to upgrade the technology in all these areas w ith a v iew to im prov ing the productiv ity o f operation and the quality o f service, besides m ak ing the transport system, m ore safe and reliable.
Strategy for the Ninth Plan
7.1.23 A com prehens ive policy package is necessary to address the d iverse issues facing the transport sector. It is im perative to strengthen the Indian railway system in its reach and capacity so that it e tfectively links the distant parts ol' the country, helps to develop the econom ic potential o f the backw ard areas and carries the bulk o f the n a t io n 's long or m ed iu m haul traffic. S im ilarly , the road netw'ork needs to be expanded and strengthened to im prove accessib ility o f the hinterland, especially the rural areas and to facilitate the in tegra tion o f the isolated parts o f the country. T he length and breadth and the quality o f the h ig h w ay s m ust be im proved greatly as part o f a national grid to provide for speedy, efficient and econom ical carriage o f goods and people. Road transport needs to be regula ted for better energy clllcienc}’ and pollution control, while the m ass transport netw ork needs to be m ade v iable through a rational ta riff policy and a re furbishm ent o f the fleet. T he capacity o f the ports in terms o f their berths and cargo handling equ ipm ent needs to be vastly im proved to cater to the grow ing requirem ents o f the overseas trade, fhe
770

shipping industry needs to be enabled to carry higher shares of the sea borne trade in indigenous bottoms. The civil aviation sector needs to expand its carrying capacity for passengers and cargo, improve the ground handling facilities and provide connectivity to areas like the North-East. Conditions need to be created to ensure full utilisation o f the capacities created in the public sector with large investments made in the past
7.1.24 In the metropolitan areas, on the one hand, the provision of mass public transport has to be increased through a mix of environment - friendly modes - specially designed buses, light rail and metro and on the other, demand management has to be ensured through price-based as well as non-price-based measures so as to minimise the dependence on personalised transport. Similarly, non-mechanised transport should be accorded its rightfiil niche in a well conceived transport network
7.1.25 To bring about this sea change in the transport scene, many policy initiatives will be needed, each backed by adequate investment and complemented by suitable policy changes in other sectors. A Task Force on Infrastructure has been constituted with the aim of attracting investm.ents to specific projects
TASK FORCE ON INFRASTRUCTUREA Task Force on Infrastructure was constiluted underthc Chaimiaiiship of D\ Chainnan. Plaiuiing Commission comprising both Government and nidustn rcpresenlati ̂es with the ann of attractmg mvestment to specific projects of national and regional importance, and ensunng their timely completion
Initially, the Task Force will deal with the following projects focussing on mno\ ati\ e methods for financing themSix lane exfffessway of 7,000 km length, having North-South and East-West corridors.Four-Ianing of National Highways, andFive world-class international airportsThe terms of reference of the Task Force include.determining the routes for the expressways and National Highway, and establishing technical parameters thereof;identifying and recommending locations for the airports;establishing benchmarks and criteria for the airports;recommending financing options for expressway, highways and airports;recommending criteria for competitive bidding and selection of (EPC) contractors.recommending measures as are necessary for tmiely completion of projects includmg go\ ernmentalclearances; andoverseeing and monitormg timely implementation of the projects.
The Task Force will also formulate an Integrated National Transport Policy to strengthen the transport infrastructure in the coimtry. It would also recommend steps that can significantly improve and foster reforms in those key segments of the economy
Increased Share of Transport Sector in Plan Outlays
7.1.26 The resource requirements of this agenda for transport development are very substantial. The requirement of the highway sector alone in the Ninth Plan is estimated at about Rs.40,000 crore and this is exclusive of the requirements o f district and village roads. The total requirements of the transport sector add up to over Rs 200,000 crore, most o f which will have to be found locally. The India Infrastructure Report rightly points out that no more than 15% of the ftinds required for infrastructure can be expected to come from external sources External aid and borrowings have fianded irriportant transport projects in the past, particularly in the roads, ports and shipping sectors
771

Efforts will be made to increase the flow of such external resources but, at the same time, the pool o f local resources will be expanded so that want of counterpart funds for the external aided projects does not create undue regional and sectoral imbalances
7.1.27 The domestic fianding of the transport scctor can be either public or private Historically, the investments in the transport sector, particularly in the rail, road, ports and airports infrastructure, have been made by the State mainly because of the large volume of resources required, long gestation periods, uncertain returns and various externalities, both positive and negative, associated with this infrastructure However, the galloping resource requirements and the concern for managerial efficiency and consumer responsiveness have led to the active involvement of the private sector in infrastructure services in recent times In India too, considerable private investment exists in trucking, inter-city bus travel, shipping and lately in airline services. By and large mobile transport units like trucks, buses, wagons, ships and aircrafts lend themselves easily to private investment while the large fixed infrastructure has remained in the domain o f public investment. However, statutory and administrative initiatives have been taken in recent years to involve private capital in the expansion and strengthening of infrastructure in the railways, road, shipping and the airports. The private participation can take many forms like flill or joint ownership management contract, leasing, concessions like BOT etc. However, looking at the state of Indian capital markets, particularly for long-term debt, it may not be realistic to expect any large-scale contribution from the private sector in the transport area through evolution of a well developed policy and regulatory framework can result in gradual inflows from the private sector.
7.1.28 This underscores the need for adequate pubhc sector outlays for transport. The share o f transport in the public sector outlays has, however, been declining over several Plan periods. From 23% in the Third Plan, it dropped to 13% in the Eighth Plan and this has been partly responsible for the acute deficiencies being experienced in the transport sector in recent years, when the tempo of economic growth has accelerated (Annexure 7.1.3). It may be noted that when, in the Seventh Plan, the percentage of investment in railways to the total Plan investment was raised to 7.6% from 6% in the Sixth Plan, it resulted in a significant increase in output and productivity, with the railways carrying an unprecedented 70 million tonnes o f incremental freight There is, therefore, a strong case for increased allocations for the transport sector to relieve the constraints on further economic growth.
Internal Resources
7.1.29 There is a general recognition that the transport sector has to improve the internal generation of resources for fijnding the Plan. In this context, tariff reform assumes crucial significance. Pricing for many o f the transport services has hitherto been influenced by public utility considerations, giving rise to subsidies and concessions, many of which are unmerited. The result has been a depletion of resources and consequent contraction of investment. This has meant undersupply of services on the one hand and the appropriation o f “rent” by intermediaries on the other. Therefore, the pricing policy will, in fiiture, be based on flill recovery of costs. Wherever subsidies or concessions are regarded as essential on public policy considerations, attempts will be made to provide these directly through the general budget or sectoral budgets so that their costs become apparent and the health of the transport enterprise is not impaired Rigorous collection
772

of service charges will also be emphasised and leakages plugged through suitable enforcement mechanisms. Such reforms will also make the transport sector more attractive for private investment. The managerial efficiency and the initiative of private enterprise will be utilised for collection of charges through franchise or contractual arrangements, wherever feasible.
7 1 30 In sectors traditionally funded entirely by the State, such as roads, attempts will be made to mobilise resources through user charges in various ways Road users already contribute substantial revenues by way of taxes on fuels and vehicles, which go to the general exchequer Currently a small amount equivalent to 3.5 paise per litre, out o f the proceeds of excise and customs duties levied on motorspirit, is available for the development and maintenance of roads It may be necessary to make use of the principle of user charges in the form of dedicated levies on fuels and other inputs used in the transport sector for raising substantial revenues meant for construction and maintenance of highways. An additional tax at the rate of one rupee/litre o f petrol as announced in the Union Budget 1998-99 is a step in this direction. Similarly, major improvements in the existing highways are proposed to be taken up by the National Highway Authority of India through the public toll method. This , of course , will be in addition to the tolls to be charged by the private investors on road concessions under BOT arrangements
7 131 Non-tariff measures will also be taken for resource generation, for example through commercial exploitation of land and air space on properties belonging to the railways and other government agencies, particularly in the metropolitan areas This, however, will have to be handled through a transparent mechanism involving the concerned State Governments and local authorities
7.1.32 Along with revenue mobilisation through tariff and non-tariff measures, stress will be laid on productivity of human and material assets and cost cutting will be pursued vigorously in the public sector transport enterprises. The staffing policy, as well as the compensation systems, will be reviewed to link them with productivity to the extent possible.
Budgetary Support
7 1.33 The budgetary support for the transport sector has been declining consistently over the years. For example, in the railway sector, the budgetary assistance declined from as high as 75% in the Fifth Plan to a mere 23% in the Eighth Plan This combined with the policy o f keeping the passenger fare low, forced the railways to resort to market borrowing, whose heavy servicing burden further eroded the internal surpluses of the system There is a strong case for a higher budgetary support on both theoretical and practical considerations. The transport infrastructure has important externalities in view of its catalytic role in economic growth Many of our transport enterprises cannot take tariff and investment related decisions on purely commercial lines. When projects are taken up on strategic considerations or uneconomic routes have to be served on social policy grounds or essential commodities are to be carried at concessional freight, it is only proper that budgetary compensation is provided in order that the financial health o f the transport entity is not affected. In view o f these considerations, the budgetary support to the transport sub-sectors will have to be enhanced. For development projects, which are
773
commercially not viable, financial support will also be tapped from the beneficiary States which should share in the operational costs of such suboptimal investments
Related Issues7.1.34 As stated earlier, transport reform and development are not matters confined to financial investment in that sector only. Policy reforms or corrections will be needed in other related sectors. Energy pricing is one such area For rectifying the modal imbalance in the transport economy, it is necessary to follow a fuel pricing policy in line with social costs. The abnormally high tariff on power used by the railways needs to be reviewed and revised.
7.1.35 In the road development programme, there is a need for a clear appreciation of the priorities. Removal o f policy distortions in related sectors, a degree of demand management on the road sub-sector and supply improvement on the railways and other modes o f transport will go a long way in serving the objectives of energy and environment conservation. There is a strong case for using the tax and subsidy mechanism to correct the imbalance. A steep increase in the user charges for roads is called for in the metropolitan cities so that the social costs of pollution and accident relief are passed on to the road users and the proceeds o f the tax are used for promoting more benign modes
7.1.36 In the preceding paragraphs, the overall scenario and various issues concerning transport sector as a whole have been discussed In what follows, the status in respect of each of the sub-sectors in the transport sector in terms of the Eighth Plan review besides the emerging issues and strategies visualised for development, are elaborated
RAILW AYS
Introduction
7 1.37 The Indian Railways are one o f the largest railway systems in the world with63.000 route kms., approximately 7,000 locomotives, 34,000 passenger coaches, nearly300.000 wagons and employing nearly 1 6 million staff The system carries 11 million passengers and 1 20 million tonnes o f freight per day As a principal mode of transportation for long haul freight movement in bulk and long distance passenger traffic and for mass rapid transit in suburban areas, it occupies a unique position m the socioeconomic map o f the country and is considered as a vehicle and a barometer of growth
Review of the Eighth Plan
7.1.38 The main thrust in the Eighth Plan for the Railways was on capacity generation, besides rehabilitation and modernisation, manpower planning and human resource development, energy conservation, safety, financial viability and customer satisfaction through reliable and better quality of services
7.1.39 An outlay o f Rs.27,202 crore, comprising Rs.5,375 crore (20%) of budgetary support, Rs 3,000 crore (11%) of market borrowings and Rs 18,827 crore (69%) of internal resources was provided to the Railways for the Eighth Plan The financing of the approved outlay during each year of the Eighth Plan and the actual expenditure incurred are presented at Annexure 7.1.4 The investment during the Eighth Plan was financed through budgetary support of Rs.7311 crore (23%), extra budgetary resources to the tune of

Rs.6161 crore (19%) and internal resources of Rs 18,830 crore Rs 32,302 crore. The Plan head-wise details are given at Annexure 7 15
(58% ), totalling
7.140 Since the main stress was on capacity building, the targets and achievements in respect of various assets created during the Eighth Plan, which are given in Table-7.13 deserve attention
Table 7.1.3Target and Achievement during Eighth Pian-Railway Sector
Sub-sector Target % of-------------------------- totalPhysical Financial outlay
(Rs crore)
Achievement
Physical Financial
(Rs crore)
% ofactualexpend.
New Lines (Kms)Gauge Conversion(Kms ) Electrification (RKM) Doubling (RKM)Track Renewal s(RKM) Signalling & Safety
Rolling Stock:
i) Wagons{FWS)
ii)Locos:
ElectricDiesel
6,0002,700
12,500
9003,6001,350
6004500675
1,20,000 10,630
750749
3 31 13.23 4 96 2.21
16 54 2.48
669691527081089
13972
815702
1,2924948143111135409914
13375
4.00 15.32 4 43 3 45
16 75 2 83
41.4:
iii) Coaches
iv) EMUs
9,100
1,265
9496
1116
7.1 41 It will thus be seen that most of the investment has gone into replacement of the overaged assets mainly in the area of track and rolling stock Here also, the achievement was far short of the targets in respect of procurement of wagons Though the gauge conversion programme recorded significant achievement, the network expansion in terms of new lines was quite marginal Multi-plexing of track in busy corridors has also been quite modest while electrification of important sections has received adequate attention
Productivity7.1.42 During the period from 1950-51 to 1996-97 the freight transport output measured in terms of net tonne kilometre has increased by 6 3 times and the passenger output of non- suburban passenger kilometres by 5 4 times, while the network has grown by only 117 times in terms of route kilometres and 1 36 times in terms of track kilometres Other inputs, such as number of passenger coaches, wagons and tractive efforts of locomotives, have grown by 2 0 to 2,6 times only. The increase in transport output has been brought about by more intensive utilisation of the available assets, improvement in productivity and technological upgradation. Table-7 1 4 gives a detailed picture of railway productivity during the last five years
775

Table -7.1.4
Productivity Indicators in Railway sector
Item 1990-91 1991-92 1995-96 1996-97
1. Net Tonne K m , per
wagon per day (B G )
2. W agon K m . Per wagon
per day (B G )
3. W agon Turn-round
(in days) (B G )
4 Track U tilisation (B G )
I) Net Tonne Km . Per
Route K m (M illio n )
II) Passenger K m . Per
route Km . (M illio n )
5 Engine Km . Per day per
engine in use for goods(BG )
I) Diesel
I) Electrical
6 .Engine K m . Per day per
engine in use for passenger(BG)
I) Diesel
II) Electrical
7 M anpow er Productivity
1407
110.5
11.5
6.30
7.12
445
398
673
482
I) Net Tonne Km . Per employee 0.15
(M illio n )
II) Passenger K m . Per employee
(M illio n ) 0.18
1439
113.2
11.1
6.63
7.58
436
395
633
488
0.16
0.19
1792
151.2
9.1
6.45
7.55
415
422
580
531
0.17
1840
157.8
8.5
6.45
7.73
0.22
403
401
569
533
0.18
0.23
Wagon utilisation (BG) in terms of freight loading and movement expressed in net tonne kilometres (per wagon per day) has been moving up steadily and has reached 1840 NTKM in 1996-97, registering an increase of more than 28% over the Plan period. Other indices of asset utilisation also show some improvement.
776

Traffic Output7.1.43 The output performance o f the railway system is set out in Table-7 15
Table-7.1.5Traffic output in Railways during Eighth Plan
8“* Plan AchievementTarget
1995-96 1996-97
A. Revenue Earning Freight Traffic :
I) Originating 418.4 390.69 409.02
(Million Tonnes)
II) Transport Output 313.8 270.49 277 57
(Billion Tonne Kms)
B. Passenger Traffic :
I) Originating 4472 4018 4153
(No Million)
II) Transport Output 377.74 342.00 357.01
(Billion Passenger Kms)
7.1.44 In terms of total standard traffic units (tonne Kms + passenger kms) the output increased from 564 8 billion at the beginning of the Eighth Plan to 634.58 billion at the end of the Plan, representing an increase of 12.3% over the five year period i.e. a compound annual growth rate of 2.4 per cent. There is considerable shortfall compared to the targets set for the Eighth Plan both in respect of freight movement and passenger traffic This was partly accounted for by the sluggish growth in the first two years of the Plan in the core sectors of the economy which are the mainstay o f the railways’ bulk freight movement The transport output was also affected by the drop in leads on account of reduction in spatial gap between the centres o f production and consumption and changes in the pattern of development of industry. The later years recorded a considerably higher tempo o f activity with the spurt in the economy and industrial growth of over 8%, which resulted in a record incremental loading in the later years of the Plan Similar swings were also noticed in the passenger section of railways output
7.1.45 Another promising development in the Eighth Plan was the performance of the Container Corporation o f India Limited (CONCOR) which handled 96,000 Twenty feet Equivalent Units (TEUs) o f international container traffic at the beginning of the Eighth Plan and reached a level o f 400,000 TEUs in 1996-97, registering a compound annual growth rate o f 33 per cent. The domestic container traffic, which was 12,000 TEUs in 1991-92, is expected to increase to 300,000 TEUs by 1996-97, registering an annual growth rate of 90 per cent However, CONCOR’s share in total output is just over 2% and there is, therefore, enormous scope for growth in this area
777

7.1.46 The Eighth Plan also saw the 760 km long broad gauge Konkan Railway Project nearing completion. The full length has been commissioned in January, 1998. This project, unique in technical complexity and financing arrangements involving four beneficiary States, will accelerate the socio-economic development of the Konkan region on the west coast.
Ninth Five Year Plan
Objectives
7.1.47 The main thrust of the Ninth Plan would be on strengthening the capacity of the Indian railway system as the prime carrier of long distance bulk freight and passenger traffic. To this end, the railways will concentrate on multi-plexing and electrification of dense corridors, improvement in reliability of operations, containerisation of smalls and optimisation of total system operations.
Policy Framework
7.1.48 The railways’ share in total traffic in the economy has been declining over the years. This has come down from 89% in 1951 to 40% in 1995 in respect of freight traffic and from 68% to 20% over the same period in respect of passenger traffic. If this decline is to be arrested, there is a need for a quantum jump in the rate of growth of railways traffic output. With the economy growing at about 6-7% per annum the railways will continue to lose their share if their output grows at a lesser rate. However, any immediate improvement in the growth rate cannot be expected, since a long gestation is involved in the augmentation of capacity as well as shifts in modal preferences. Therefore, it is proposed to take decisive steps in the Ninth Plan, which would on the one hand influence the modal choice through relative pricing based on social costs and on the other hand augment the capacity and improve the productivity of the railway system. This would provide the basis for first decelerating the decline of the share of the railways and then reversing the present trend in the subsequent five year Plans.
7.1.49 The railways have generally concentrated on the bulk movement of the materials of the core sector in the economy over long distances. This makes the railways vulnerable to cyclical fluctuations in these sectors and to geographical shifts in their operations. Business from these sectors has also tended to shift to roads because of the greater convenience and flexibility of that mode. The railways have also been priced out of certain sectors because of frequent increases in the freight schedule. The railways will have to gear up for providing reliable service at competitive freight rates to win back the bulk traffic which has traditionally been dependent on rail. At the same time, they have to reorient their business to diversify their freight base. Special value-added services on the basis of fixed schedules need to be provided to capture a fair share of the high value non-core traffic. A flexible freight policy is necessary to deal with sectoral shifts in the economy. The low volume piecemeal goods traffic over long distances is best suited for carriage by containers. This requires the railways and the roads to combine together and provide an integrated transport service. So much on the demand side. A greater reason for the decline in railways’ share in goods and passenger traffic has been their inability to generate adequate capacity to meet the growth of traffic. This is evidenced by the extreme congestion on the high density corridors i.e. “golden quadrilateral” comiecting the metros of Delhi, Mumbai, Chennai and Calcutta. Also, the reach of the network has to be extended
778
to integrate the more remote areas with the national economy A substantial increase in the capacity o f the railway system will call for a considerable step up in the level of investments, apart from improvements in productivity Along with the rest of the transport sector, the railways have been seriously under-funded in recent Plan periods and the budgetary support has been woefully short of their needs The market borrowings particularly o f short and medium tenor are not suitable for financing an infrastructure sector like railways beyond a point, especially when socially-oriented projects are to be undertaken Budgetary support is necessary for a public utility like the railways which has to take up developmental projects for social and strategic reasons Even when the commercial character of railways is recognised there can only be a gradual downsizing of budgetary support because the tariff policies evolved over a long period take time to get adjusted
!7.1.50 However, there is no denying the fact that the expansion and the strengthening o f the railway system will have to be financed mostly by the railways through generation o f internal resources. This calls for a substantial improvement in the Indian railways’ operating ratio from the present high level o f 90 per cent This will require better operational and commercial management with emphasis on aggressive revenue generation on the one hand and rigorous cost control on the other
7.1.51 In order to find the areas of strength and weakness, the Railways needs to rationalise its management and accounting system so that the cost of its various activities may be assessed and rationalised on commercial lines
Tariff Policy
7.1.52 The tariff policy o f the railways has traditionally been one of restraint with regard to increase in passenger fares and periodical increases in case of freight rates This has been necessitated by the dual role o f the railways as a public utility acting as a catalyst of development and as a commercial organisation running on business principles Therefore, over the years, the railways have resorted to cross subsidisation in order to offset the losses incurred in passenger and other coaching services through additional revenues from freight movement. The policy has, however, resulted in several distortions While the bulk o f the rail output is consumed by the passenger segment, its contribution to revenue is relatively small. In 1994-95, passenger transport accounted for 60% of the total output, while its share in the revenues was only 28%
779

SUBSIDY OF PASSENGER TRAFFIC
In spite of the recommendations of successive fare and freight rate committees that price of each of the services offered by the railways should be cost based, the tariff poHcy followed by the Railways continues to involve heavy cross - subsidisation of the passenger business. Passenger fares in India are one of the lowest in the world. In 1991, the average revenue per passenger km in India was half the level of China. Within the freight category also, there is underpricing of freight for items of mass consumption such as foodgrains and sugar.
The subsidy in passenger fares has been increasing over the years and the fare/freight ratio has fallen from 0.5 in 1951-52 to 0.32 in 1996-97. This ratio is one of the lowest in the world. The policy of cross subsidisation has resulted in the freight rates on several commodity groups reaching unreasonably high levels, resulting in diversion of traffic to other modes, especially road transport with attendant social costs in terms of higher energy consumption and environmental damage. The continually increasing level of subsidisation in passenger fares is also generating excessive demand leading to extreme congestion and deterioration of services. Excessive demand for passenger traffic displaces freight and reduces the speed at which freight can be transported by the railways. The benefit of the subsidised services also does not always accrue to genuine passenger but is appropriated as “rent” by intermediaries.
The system of cross subsidisation has clearly gone too far. The overall fare structure does not generate sufficient resources to generate the surplus necessary for capacity expansion. Additional resources caimot be raised by increasing freight rates at the upper end where they are already too high. It is necessary to adjust passenger fares and fares on items of mass consumption to levels closer to the real cost of providing these services. A phased adjustment over a three year period is essential.
7.1.53 It has, therefore, become imperative to rationalise the tariff policy. While on the one hand, there is a need for sufficient flexibility in the freight rates to deal with the market fluctuations, there is a clear need for recovery of the full distributed cost from all categories of freight. This will lead to greater allocative efficiency. If certain essential goods have to be carried below cost, the same will be subsidised directly through the budget so that the benefit is clearly targetted and the cost becomes transparent.
7.1.54 More importantly, the passenger fares also need to be aligned more with cost and regular periodic increases of fares to absorb cost-escalation based on pre-determined productivity norms will generate resources, which can then be ploughed into the system for extending the services as well as improving their quality. A certain measure of flexibility in the fare schedule will also help in managing the demand in the peak season on the congested corridors and will reduce the incidence of rent-collection and other antisocial practices. Substantial fare revisions are called for in the suburban services where the subsidies are most pronounced, both in relation to costs of operation and the prices for alternative services. But the increased revenue must be used primarily for relieving the congestion and improving the services in these areas.
780

7.1.55 With the reduction of implicit subsidies on passenger travel, the bias against passenger transport should also go and the railways must plan for meeting the transport requirement of both passengers and freight on the basis of commercial principles. The increase in short distance passenger traffic particularly on high density corridors is, however, a matter of concern. Apart from the heavy losses suffered by the railways in their operations, the situation has become critical because ol'the saturation in these corridors. It may not be possible to introduce additional long distance passenger and freight services unless restraint is exercised in the growth of such short distance services.
7.1.56 In order to generate resources for the development plan, the railways may also have to explore other innovative non-tariff avenues like exploitation of railway land and air space, particularly in metro cities for the development of the system in the concerned areas, fhis. howc\er, will have to be done in a transparent manner with the concurrence of all the concerned authorities including the local bodies, who have a stake in the development of the area, the region and the railway system,
7.1.57 The budget for the year 1998-99 rellccts the direction Indian RaiKvays intends to take to reduce the extent of cross-subsidisation and making passenger traffic self- sustaining except m cases of targetted subsidies. Steps ha\'c been taken to provide scheduled deliveries to customers on contractual terms with a premium/penalty clause, fhis is likely to be the scenario for future also.
7.1.58 SimulVancously, attempls have been made lo grant treighl concessions to attract investments by customers in terminals - an area of heavy detention of rolling stock. The current year's budget has provided for a reduction in the classification of steel, limestone, dolomite and gypsum. Similarly, the taper of rates for coal, cement and iron and steel has also been made more attractive o\'cr middle and long distances. Railways are also examining the scheme of discounts on substantial offer of assured additional traffic.
Investment Strategy'
7.1.59 Considering the availability of resources and a large number of ongoing projects, it is essential to prioritise the existing portfolio in the Ninth Plan for better project management.
PRIORITISATION OF RAIL PROJECTS
The tendency to spread resources th in ly over a large number o f projects has been a m ajor problem in
the railway sector for quite some time. There is at present a large shelf o f ongo ing projects which
require a total expenditure o f about Rs.34.000 crore to complete. The position relating to construction
o f new railv\ ay lines and gauge conversion projects is especially alarm ing. The financial requirement
for com pleting all new line projects currently taken up by the railways is estimated to be above
Rs. 19,000 crore whereas for gauge conversion the total requirement is over Rs.9,000 crore. A t the
present rate o f a llocation, it w'ill take about 40 years to clear the backlog for new lines and 11 years to
complete gauge conversion projects.
The tendency to take on a large num ber o f projects leads inevitably to a very long com pletion period
during w h ich funds invested in the project earn no return and there are repeated cost over-runs. The
investment strategy o f the railwa\s must therefore by re-oriented to ensure speedy com pletion o f the
ongo ing projects. Railw ay projects must be re-prioritised lo ensure that resources are allocated more
rationally to bring about quicker completion o f p r i ^ i c c t s at a relatively advanced stage. New projects
must also be deferred until resources lustify expansion o f projects.
78 !

7.1.60 For taking up new projects, generally, the highest priority must be given to projects which augment the capacity o f the railway system in the high density corridors, apart from investments needed for ensuring safety and reliability of the services In this regard, the first priority needs to be accorded to multi-plexing and electrification of the system around the “golden quadrilateral”, where it is under maximum strain. The gauge conversion policy must also be geared to the operational requirements of the system at this juncture. Broadly speaking, gauge conversion may be accorded lower priority vis-a-vis new lines which either directly add to capacity or open up new areas
7.1.61 The new line projects do pose a difficuh choice The bulk of the network was laid prior to Independence and its configuration was largely determined by the strategic and commercial interests of the colonial power After Independence, attempts were made to remove the weaknesses o f the system But only about 9500 route kms could be added due to the meagre funds available for expanding the network. Many areas have still not seen a railway line Strategic considerations also demand the extension of the network in several areas, as do the infrastructural considerations in respect of the North-East, J&K and similar areas. Since very few new lines bring in adequate returns over the time horizon relevant to commercial decision making, the railways can take up only such o f the new line projects which have either demonstrated the operational need or appear viable in a reasonable time frame Other projects should be taken up only with financial support provided from the public exchequer or from the concerned State Governments and others who are to be regarded as common stake holders in the development of the concerned regions The same consideration should also apply to the operational losses which too must be shared by the beneficiary States or sectors until the railway line gains viability
7 1 62 These considerations apply particularly to metropolitan transport projects Because of the exponential growth of the metropolitan areas there is an increasing reliance on personalised transport leading to high social costs viz congestion, pollution, high accident rates and conspicuously inequitous sharing of public utility o f the road system. There is an urgent need for introducing/improving mass rapid transit systems in the major metro cities. The railways have a major role in providing such safe and clean system for these areas. The concerned State Governments and local bodies need to be involved in providing resources and associating themselves in the operations in order to ensure proper coordination between different modes in the matter o f route planning and fare structures. The Maharashtra Urban Transport Project (MUTP-II), which takes an integrated view o f both rail and non-rail components of the city’s transport needs and envisages Centre-State collaboration in addressing the complex metropolitan problem, is a case in point. Since the transport projects in the metropolitan cities require very large investment, external assistance could also be mobilised for completing the work in a reasonable period
7 1.63 Since the railway construction projects - new lines or gauge conversion -involve c jnsiderable manual labour, it may be possible to improve the viability of some of the projects if the labour component o f these projects is linked with the rural employment programme of either the Central or the State Governments. Necessary modalities will have to be worked out for integrating the demand-based approach of employment programmes with the need for quality work on a steady basis which has to characterise the major railway projects
782

7.1.64 Capacity building in the railways is as much a matter of investment in new assets as of making the best use of existing assets. The railways have recorded a gradual improvement in assets utilisation but there is ample scope for improvements in productivity when comparisons are made with the achievements of some of the other broadly comparable railway systems elsewhere. The wagon utilisation, in terms of NTKms per wagon per day, has recorded considerable improvement but even higher levels of performance are possible if the average running speed and the efficiency of terminal handling are improved The speed o f the freight trains is still very low, leading to long turn around time. This needs to be tackled by a proper utilisation of the latest technology and by operational improvements, besides the provision of dedicated corridors for through movement in busy sections.
7 1.65 The utilisation of the rolling stock depends upon the reliability o f the rolling stock as well as fixed assets. The success of the operational strategies to meet the traffic demand is considerably affected by the incidence of engine failures, hot box detachments, spring breakages, rail fracture and other track failures, failures of signalling and telecommunication equipment etc. Although some steps have been taken to improve the reliability of the rolling stock, there is a long way to go in controlling the adverse impact of the various types o f failures Therefore, in the Ninth Plan improvement in the reliability of assets would be closely monitored. Measures will be taken to reduce the operational costs by a change in the practices and systems which would result in improving the overall mobility of the rolling stock, less detention at terminals and better output in the workshops.
7.1.66 A whole range of cost control measures ranging from employment restraint to proper inventory management is also necessary to improve the operating results These will be rigorously pursued.
Safety
7.1.67 Safety of rail operations will be a prime objective during the Ninth Plan In both operational and investment programmes safety will be accorded high priority The need for upgrading the safety infrastructure through induction of technical aids to support the human element, enhancing the asset reliability and improving the work culture and ethos cannot be over-emphasised. Strengthening the technical and human based safety systems would be given priority in the Ninth Plan. In order to improve the safety and the security of the railway property and the pa^engers, efforts will be made to modernise the railway protection force by providing them modem equipment and weaponry as also through better training facilities and upgrading the information system The major train accidents are mostly due to human failure and the impacts of such accidents are more severe in the superfast trains. The probability of human failure should be reduced considerably by enhancing the accountability o f the operational staff This alongwith adequate safety measures would reduce their occurrence. Another area of concern is the unmanned level crossings. It is necessary to generate awareness especially in rural areas on the precautionary measures in using such unmanned level crossings
Productivity
783

7.1.68 The scope for private sector participation in providing rail infrastmcture and services is limited. Attempts have, however, been made to involve the private sector in augmenting the capacity o f the railway system in a number of ways The “Own Your Wagon Scheme (OYWS)” was launched in the Eighth Plan in order to tap the private sector resources for augmenting the supply of wagons. The private sector firms would procure the wagons, own them and lease them to the railways with or without preferential claim on allotment of capacity fpr the firms’ own use With the revision made in the scheme in February, 1994, the response has been encouraging during the period 1994-95 to 1996-97. The actual procurement under the scheme has been of the order of 9000 i.e about 77% of the target. It has also been decided to undertake some of the projects through investment by the private sector under “Build-Own-Lease-Transfer (BOLT)” scheme whereby the private entrepreneures and the financial institutions would build/manufacture/finance the assets for lease to the railways It is proposed to offer projects like gauge conversion, supply of rolling stock, electrification, doubling of existing single lines, telecom projects etc under this scheme
7.1.69 However, the experience during the Eighth Plan has underlined the difficulty of enlisting private participation in such infrastructural areas on affordable terms In order to attract increasing amount of private sector investment in the Railways and maximise the efficiency and gain arising out o f the synergestic effect of the private and public sector investment, restructuring of Indian Railways becomes inevitable
Private Sector Participation
784

RESTRUCTURING OF INDIAN IMILW AYS
In d ia n R a ilw a y s cu rren tly operate as a v e rtic a lly in teg ra ted m o n o lith ic o rg a n is a tio n ,
re spons ib le for a ll aspects o f ra ilw ay ope ra tion in c lu d in g d e v e lo p m e n t and m a in te n an ce
o f the track ne tw o rk , o pe ra tion o f fre igh t and passenger tra in s and o pe ra tio n o f several
ra ilw a y p ro du c t io n un its . T he large s ize o f In d ia n R a ih v a y s is a source o f streng th in
som e respects bu t the ra tio na le o f c o n t in u in g w ith the present s tructure in to the 21 ''
cen tu ry needs to be re-exam ined .
T he trend across the w o rld is to “ u n b u n d le " s ing le e n tity in fras truc ture o rg an is a tio n s
and crcate separate o rg an isa tio n s respons ib le for each d is t in c t u n b u n d le d c o m p o n e n t.
T h is enab les app rop r ia te co s tin g and p r ic in g o f tlie in d iv id u a l c o m p o n en ts o f the
b u n d le d serv icc , m a k in g it poss ib le to m easure c ffic ie nc} m the p ro duc t io n o f each
c o m p o n e n t , and a lso to m troduce c t)m p e lil io n at each stage as app ropria te . U n b u n d lin g
in teg ra ted m o n o p o lie s is p a r ticu la r ly h e lp fu l in in tro d u c in g private in v e s tm en t in to
in fras truc tu re s ince the private scctor can be a llow e d re la tiv e ly easy en try in to those
segm en ts w h ic h are p o te n tia lly c o m pe titiv e .
A p p ly in g these p r in c ip le s to the structure o f In d ia n R a ilw a y s suggest a n u m b e r o f
p o s s ib ilit ie s w h ic ii need to be exp io rcd . A n o b v io u s p o s s ib ility is to sp in o f f the
m a n u fa c tu r in g un its o f the R a ilw a y s in to separate c o m p an ie s and start c le te rm in ing
th e ir c o s t in g and p r ic in g on c o m m e rc ia l p r in c ip le s . I h is w o u ld in the lo ng run he lp to
create pressures fo r e ff ic ie n cy and w o u d a lso encourage the R a ilw a y s to d e v e lo p a
m o re c o m p e tit iv e p ro cu re m e n t p o licy .
In p r in c ip le one can go further and d is t in g u is h betw een the p ro v is io n o f track services,
w h ic h is a “ n a lu ra l m o n o p o ly " because o f e cono m ie s o f scale , and the use o f these
serv ices by in d iv id u a l fre igh t or passenger rail o pe ra tin g c o m p a n ie s w h ic h need no t be a
m o n o p o ly . O p e ra tio n o f the track ne tw o rk w o u ld have to rem a in in the p u b lic sector
fo r the fo rseeab le fu ture . R a ilw a y services on the o the r h and c o u ld be p ro v id ed by
separate co rpo ra tio n s w 'h ich m ay spec ia lise in fre igh t or passenger tra ffic . A p u b lic
sector presence w o u ld be essen tia l in th is area a lso b u t the area c o u ld be o pened to
pr iv a te c o m p a n ie s on a c o m p e tit iv e basis. P riva te operators c o u ld be a llo w e d to operate
m d iffe re n t segm en ts o f the ne tw o rk d e p e n d in g upon d e m a n d c o nd it io n s . T he presence
o f s upp lie rs w o u ld in troduce c o m p e tit io n and im p rov e serv ice a v a ila b il i ty and q u a lity to
users.
The res truc tu ring proposed above w il l raise a n um be r o f p ro b le m s re la tin g to v a lu a t io n
o f assets, s ta f f and personne l status, in c ide nce o f exc ise du ties and tax a tio n and
co rpo ra tised enterprises etc. H ow ever , these p ro b lem s can be s u ita b ly reso lved and
m u s t be v iew e d in the con tex t o f the po ten tia l advan tages from the p roposed
res truc tu ring . __________________
7.1.70 Efficiency of terminal operations constitutes one of the most important parametersof asset utilisation of railways. It has been estimated that the terminal detention constitute nearly of the total detention of rolling stock. Productivity of terminals is likelyto become more and more critical as the volume of traffic carried by the railways increases. In order to increase efficiency, reduce manpower costs and improve services to the customers, franchising the terminal operations to the private sector particularly at new project sites would be considered during the Ninth Plan.
7.1.71 Other areas of rail operation where the private sector would be involved include running of tourist trains, operation of cloak rooms and marketing of special freight trains which will have guaranteed transit time and shall run on time table paths etc. Railways have already made a begirming in private sector investment in rolling stock, awarding contracts of tourist trains and cloak room operations.

7.1.72 The Indian Railways and other organisations working under its umbrella have expertise in the field of rail services and manufacture of rail equipment. The Indian Railways and its organisations particularly RITES and IRCON have been providing expert services to various countries particularly in Africa. They are gearing up for bigger strides in the construction of infrastructure projects in the field of railways as well as other areas, besides exporting rolling stock.
Traffic Projections
Freight
7.1.73 The freight projections of the Ninth Plan have been made on the basis o f the analysis of the past perfonnance o f the users, the present status of their expansion programme as also the estimation o f the likely time frame of new plans coming on stream, the railways’ capacity to augment its fixed infrastructure and production capacity of its units engaged in the manufacture o f locomotives/coaches etc Particular note has been taken of the higher tempo of growth in the economy and the need for building a base for a higher share for the railways in the economy’s transport mix in the years to come. Accordingly, a growth rate of 5% is being assumed for the Ninth Plan period and even higher growth rates will have to be achieved in the Tenth and Eleventh Plan in order to reverse the trends in modal split. The projections are given in Table-7 1 6
TabIe-7.1.6Projected Freight Traffic at the end o f Ninth Plan
Export of Expertise
Actual Projected1996-97 2001-02
Originating Revenue earning traffic 409 525(million tonnes)Traffic Output (billion tonne kms) 278 353
7.1.74 The task of lifting additional freight traffic and meeting the requirements of different user sectors requires both short-term and long-term strategies. In the short-term, the capacity would be augmented through acquisition of additional rolling stock, improvement in terminal operations and speed of goods trains, encouraging private sector participation in the acquisition o f rolling stock etc. In the long run, the capacity would be augmented through improvement in the handling systems at terminals in close coordination with the users, improvement in wagon designs, development of high horse power locomotives and introduction of heavier trains, construction and operation of heavy haul freight routes etc. Sharing of cost between the Railways and the user sectors for introducing mechanical handling devices to reduce wagon detention time will also be considered.
786

Passenger Traffic7.1.75 Non-suburban and suburban traffic are estimated to grow to 313 and 87 million PKMs respectively at the terminal year o f 9* Plan as indicated in Table-7 17
Table-7.1.7Projected Passenger Traffic at the end of Ninth Plan
Actual 1996-97 Projected 2001-02
Passenger PKMs Passenger PKMs (million) (billion) (million) (billion)
Non-Suburban 1575 280.50 1793 313.00
Suburban 2578 76.50 2989 87.00
7.1.76 To deal with the requirement o f the growth and changing pattern of passenger traffic, high capacity mail and express trains, on traditional high density corridors and modern design o f coaches, lighter in weight and longer in length, would be introduced
OPERATIONAL STRATEGY FOR NINTH PLAN
Physical Targets
7 1 77 The main thrust of the Indian Railways at this juncture is to operationalise its strategy to launch the railway network into a higher trajectory especially in respect of higher growth rate in the freight traffic. For that besides productivity improvement, investment in capacity enhancement and technological upgradation of Indian Railways would be a necessary precondition
7.1.78 It is proposed that the Railways may set a target of 525 million tonnes of freight traffic and 353 billion tonne kms. to be achieved during the period 1997-2002 The following targets are proposed to be achieved by the year 2002 in respect of various programmes
Track Renewals
7 1 79 It is proposed to go for track renewal o f current arising on the A,B & C routes to the extent of 13,922 kilometres during the period 1997-98 to 2002.
Electrification
7.1.80 A total o f 2,334 route kilometres o f electrification is planned during the period 1997- 2002. This will complete the ongoing works and start electrification of the remaining part of the unelectrified sections of the golden quadrilateral’
New Lines
7.1.81 Construction of about 819 kms o f new hnes is planned during the period 1997-2002, Udhampur-Srinagar-Baramulla is being taken up as a national project at a cost of Rs 2500 crores.
787

7.1.82 In all about 2,500 kms. of doubling are planned to be commissioned during the period 1997-2002, as against over 1,100 kms. during the Vlll Plan period.
Acquisition of Rolling Stock
7.1.83 The acquisition of rolling stock depends on the quantum of traffic to be moved, the mix of traction and norms of asset utilisation. Following are the targets for the rolling stock acquisition during the period 1997-2002:
a). Wagons : It is proposed to acquire 1,36,000 wagons during Ninth Five Year Plan period. It may be mentioned that the indigenous wagon manufacturing capacity is about36,000 wagons per annum, the industry has not been ab e to supply more than 26,000 wagons in a year. The mdustry has to gear up their production to the rated capacity. Besides, it is also required that railways should phase out its 4-wheeler stock and replace them with higher capacity, roller bearing 8-wheeler stock. Increase in pay-load-to-tare-ratio of wagons by increasmg axle loads is also needed.
b). Locomotives ; The requirement of locomotives for the period 1997-2002 has been assessed as 785 diesels and 851 electric. Fhis takes into account the requirement of locomotives by Konkan Railway. Indigenous manufacturing capacity of Diesel Locomotive Works (DLW) and Chittaranjan Locomotive Works (CLW) will have to be extended by providing marginal inputs. It is required that railways should go for technology upgradation 5y induction o f high horse power ABB and GM locos. Introduction of high capacity light weight LHB coaches is also needed.
c). EMUs/DMUs/MEMUs: It is proposed to acquire 1973 EMUs/DMUs/MEMUs coaches during 1997-2002. Besides, the target for conventional coaches during the Ninth Plan is 10,909.
7.1.84 The proposed physical targets to be achieved by the Railways during the period 1997- 2002 in respect of major developmental activities are summarised as under:
Table 7.1.8 Physical targets — Ninth Plan - Railways
Doubling
Plan head Target for 1997-2002
Track renewal 13922 kms.Railway Electrification 2334 kms.New'lines 819 kms.Doubling 2500 kms.Gauge Conversion 3710 kms.Rolling Stock Acquisition Locomotive (No.)Electric 851Diesel 785Wagon procurement (No.) 136000EMUs/MEMUs/DMUs (No. 1973Other ConventionalCoaches (No.) 10909
The year-wise break up of the above mentioned physical targets are given at Annexure 7.1.6,
788

Container Traffic7.1.85 The traffic carried by CONCOR has registered a very impressive grov/th Presently, the entire container traffic moved on the Railways is handled by CONCOR, v^hich caters to both the international and domestic containers. The international container traffic is expected to increase from 4 lakh TEUs in 1996-97 to 10 5 lakh in 2001-02 and the domestic container traffic is expected to grow from 3 .0 lakh TEUs to 4 0 lakh TEUs
7.1.86 While bulk long distance freight will continue to be the mainstay, thrust has been given to winning back non-bulk, less than train load traffic back to rail from road by the multi-modal route. Container Corporation of India (CONCOR) has been strengthened with a new Domestic Division irf this effort to reverse the trend of declining market share of freight traffic.
Railway Research & Development
7.1.87 Some of the important research projects completed by the Research Design and Standard Organisation during the Eighth Plan include the design and manufacture of 2300 HP and 3100 HP diesel locomotives, design o f BG rail bus, development of AC-3 tier coach etc. In the Ninth Plan, the emphasis o f the research efforts would be on increasing the productivity of assets, reducing energy consumption, enhancing the safety of rail transport and increasing quahty consciousness. The important research projects proposed in the Ninth Plan are introduction o f disk brake on coaches, design of EMU with air suspension, design and development of continuous train control for increasing throughput, developing technology for high speed operation, development of fuel efficient Diesel Engine, etc.
M anpower
7.1.88 During the Eighth Plan, for improving manpower productivity of the railway employees a number of initiatives were taken to upgrade the quality of training programmes offered to railway personnel The training needs are periodically analysed and the training modules revised/updated Simulators for training of drivers and other modern training aids have been provided.
7.1.89 New initiatives, like granting incentives for acquiring higher qualification by the staff have been taken All these, clubbed with the overall improvements in infrastructure contributed towards increasing manpower productivity. During the first three years of the Eighth Plan period, the staff productivity increased by 5 .5 per cent
7.1.90 The Indian Railways have a regular work force of over 16 lakh employees. It is the single largest employer in the country In the recent years there has been an increase in the expenditure on staff. The staff cost which was about 50% of the working expenditure at the end of the Eighth Plan has now gone upto 56%. In order to ensure that the trend of high wage cost does not make Railways a losing entity, focussed measures would be required
7.1.91 During the Ninth Plan, in order to make the Indian Railways a dynamic growth oriented and successfiil enterprise in the fast changing environment, the human resource development strategy v/ould aim at further improving the work culture of the organisation. A customer oriented approach must be adopted by all departments and at all levels o f this huge organisation At the same time, the entire human resource development effort would
789

aim at instilling in the railwayman a pride in the grand enterprise, that is Indian Railways. Suitable programmes to boost the morale, enhance the productivity and promote the welfare o f railwaymen will be devised to imbue them with a sense of commitment to the vision of the Indian Railways regaining their position as the prime- mover of national economy and as one of the leading railway systems in the world, and, in the process, improving their own rewards and prospects.
ROADS
7.1.92 Roads have traditionally been the principal mode of connectivity between places and in hilly areas they are often the only mode available for the transportation of men and material. Apart from carrying traffic independently from point to point our road system is the main feeder to the railway system, ports and harbours and thus forms a part of an integrated transport network. India’s road network measured 3,319,644 kms. at the end of 1995-96, comprising National Highways (NH) (34,508 kms ), State Highways (SH) (135,187 kms.) and other roads including Major District Roads (MDR), Other District Roads (ODR), Village Roads (VR), Urban Roads and Project Roads having a length of 3,144,949 kms. This includes 916,010 kms. of road length constructed under the Central Government employment programmes like Jawahar Rozgar Yojana (JRY) and Employment Assurance Scheme (EAS) The development and maintenance of the National Highways is the responsibility o f the Central Government, which is normally carried out through the agency of the State Governments The rest of the network i e State Highways, Major District Roads, Other District Roads and Village Roads is with the State Governments and Panchayat Raj Institutions The Border Road Development Organisation is entrusted with the construction and maintenance of strategic roads in the hilly and diflficult terrain areas.
7.1.93 The National Highways are the major arterial roads which run through the length and breadth of the country connecting State capitals, industrial and business centres, ports, tourist centres and provide links with neighbouring countries. The State Highways are the secondary road system for inter-district movement in the State They connect State capitals with district headquarters, important towns and cities within the State and link up with the National Highways and the adjacent State Highways The Major District Roads and Other District Roads serve as a road system both for inter and intra-district movement. They traverse throughout the district linking areas of production and marketing in the district and connect with the nearest State Highways. The Village Roads serve as the feeder roads to this network for movement of agricultural and horticultural produce to the nearest urban consumer centres
Issues
7.1.94 India’s road network is seemingly very large, at a little over 3 million kms The figure has swelled recently because of the inclusion, for the first time, of village roads constructed under various employment programmes But even this network cannot meet the requirements o f accessibility and mobility for a country of India’s size and population The table in Annexure 7.1.2 gives road availability State-wise in relation to area and population. The all-India figure of 73.0 kms per 100 sq km of area comes out as fairly large in international comparisons. But the picture varies widely across the country Many areas like North-East and J&K are inadequately served by the road network. Similarly, around three fifths o f India’s 6 lakh villages are connected, by all-weather roads with
790

nearby market towns, while many habitations remain to be connected although successive Plans have focussed on the problem of rural connectivity.
7.1.95 The total road kilometerage has not been growing adequately to meet the demand for speedy and efficient transportation o f human and material traffic. The vehicle population in the country has grown from 0.3 million in 1951 to 33.56 million in1996 thus registering a growth rate of over 11% per annum Table-7.1 9 shows the growth o f traffic carried by roads since 1951:
Table-7.1.9 Growth o f Traffic
Cagtegory 1951 1995
Freight (BTK) 6 398
Passenger (BPK) * 23 1314
* Estimated
Road freight and passenger traffic have thus expanded at the rate of about 10% per annum.
7.1.96 In comparison with the growth of vehicular population as well as freight and passenger traffic, the road network has registered an annual growth rate o f over 4% i e from 0.4 million kms in 1951 to over 3 million kms in 1995. Further, the network has a large proportion of village roads which are generally o f limited value from the point of view of heavy vehicular traffic. The main arterial network comprising the National Highways and the State Highways is just over 5 0% of the total road system, while it carries more than 75% of the road based traffic. This trunk route system has grown even more sluggishly than the road system as a whole. Table-7.1.10 indicates that most o f the growth has occurred in the rural road sector, while the National and State Highways have expanded at the rate of1 24 and 1.82 per cent per annum respectively.
Table-7.1.10 Growth of Road Network
(coo Kms.)
Category 1951 1996 % age change p.a.
National Highways 19.8 (5%) 34.5 (1.04%) 1.24
State Highways 60.0 (15%) 135.1 (4.07%) 1.82
Other Roads 318.0 (80%) 3150.0 (94.89%) 5.23
Total 400.0(100%) 3319.6 (100%) 4.81
Note: Figures in parentheses are in percentages of total road network
791
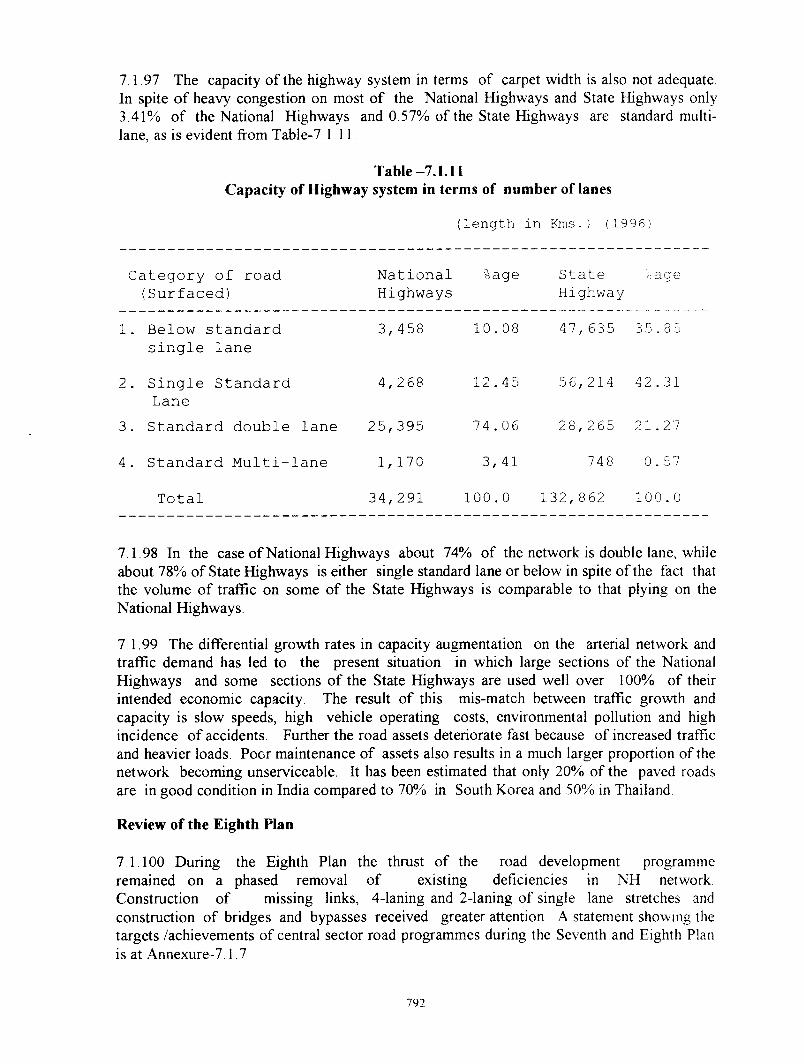
1.1.91 The capacity o f the highway system in terms of carpet width is also not adequate. In spite o f heavy congestion on most o f the National Highways and State Highways only 3.41% of the National Highways and 0.57% of the State Highways are standard multilane, as is evident from Table-7.1.11.
Table -7.1.11 Capacity of Highway system in terms of number of lanes
(length in Kms.) (1996)
Category of road (Surfaced)
National %age Highways
State ‘-age Highway
1. Below standard single lane
2. Single Standard Lane
3. Standard double lane
4. Standard Multi-lane
Total
3, 458
4, 268
10 . 08 47,635 35.85
12.45 56,214 42.31
25,395 74.06 28,265 21.27
1,170 3,41 748 0.57
34,291 100.0 132,862 100.0
7.1.98 In the case o f National Highways about 74% of the network is double lane, while about 78% of State Highways is either single standard lane or below in spite of the fact that the volume of traffic on some of the State Highways is comparable to that plying on the National Highways
7.1.99 The differential growth rates in capacity augmentation on the arterial network and traffic demand has led to the present situation in which large sections of the National Highways and some sections o f the State Highways are used well over 100% of their intended economic capacity. The resuh of this mis-match between traffic growth and capacity is slow speeds, high vehicle operating costs, environmental pollution and high incidence o f accidents. Further the road assets deteriorate fast because of increased tratTic and heavier loads. Poor maintenance o f assets also results in a much larger proportion of the network becoming unserviceable. It has been estimated that only 20% of the paved roads are in good condition in India compared to 70% in South Korea and 50% in Thailand
Review o f the Eighth Plan
7.1.100 During the Eighth Plan the thrust of the road development programme remained on a phased removal of existing deficiencies in NH network Construction of missing links, 4-laning and 2-laning of single lane stretches and construction of bridges and bypasses received greater attention A statement showing the targets /achievements of central sector road programmes during the Seventh and Eighth Plan is at Annexure-7 17
792

7.1.101 The general approach of the Eighth Plan was to speed up the completion of the ongoing works with a special emphasis on externally aided projects in order to contain the cost and time over runs and their spillover to the next Plan. The overall Hmitation of funds consequently meant insufficient provision for other highway works. Only about 600 kms were added to the National Highway network during the Eighth Plan. Similarconstraints affected most of the State level programmes as well. The rural roadsprogramme also fell short of the target of 100% connectivity for villages with population of more than one thousand.
7 1 102 The details of the Central sector outlay and the expenditure in the Eighth Plan are shown at Annexure-7.18.
National Highway Authority of India (NHAI)
7 1103 The National Highway Authority of India (NHAI), which was set up under the NHAI Act, 1988, was operationalised in February, 1995. The Authority, set up for a gradual assumption of direct responsibility for the development and maintenance of National Highways, has taken up the execution of selected externally aided highway projects and the implementation of privately assisted road projects under Built-Operate- Transfer (BOT) scheme and similar arrangements, as well as the development of passenger oriented wayside amenities along the highways The Authority has been allowed to raise fijnds through the issue of non-taxable bonds
7.1.104 The NH Act, 1956 was amended in June 1995 to encourage private participation in the development and maintenance of National Highway network Under the amended Act it is now possible for private entrepreneurs to develop and operate road projects, collect and retain the user fee (toll) and regulate the traffic on those roads NHAJ Act would have to be reviewed and suitably amended to provide for strengthening and rationalising the organisational structure, powers and functions of NHAI The Act would also need to incorporate adequate provision for BOT frame-work as well as creation o f an independent regulatory authority in respect o f private investements
7 1105 Modem road construction technology was adopted to provide longer life to roads Technically sound specifications like, dense bituminous macadam, asphaltic concrete, cement concrete pavements along weak national highway stretches, soil improvement by stabilisation and use of polymers in road construction were adopted Environmental effects like slope protection and soil erosion control, drainage and dust control, plantations and landscaping were encouraged New construction equipments and the system o f prequalification of contractors were introduced for large sized road packages
Objectives and Policy Framework for the Ninth Plan
7 1 106 The focus of the road development programme in the Ninth Plan would be on:
a. Strengthening and improving the crucial sections of the highway network through phased removal o f deficiencies and multi-laning of high density corridors;
793

b. Improving the road communications in remote areas such as the North-East;
c. Providing all- weather connectivity to remaining villages; and promoting energy conservation, safety and environment protection
7.1.107 A well defined plan taking a perspective o f 15-20 years would help to address the important issue of capacity constraint being experienced in this sector An integrated policy for the transport sector would inform the road development programme with accent on gradual modification o f the modal mix through a suitable inter-modal cooidinatiun njechanism. The road network will be expanded and strengthened keeping in view the traffic density and the need to realise optimal inter-modal mix. While the road network will be expanded and strengthened where traffic density warrants it, the decision on sectoral solution like provision of expressways need to be taken, keeping in view the cost and condition prevailing in our country. In view of budgetary constraints, although private enterprise will be encouraged in funding the construction and maintenance of roads and bridges, the role o f budgetary support will remain predominant in view of the crucial role that basic infi'astructure like roads play in catalysing development. In mobilising resouices for the road sector, the instrumentalities of user charges and dedicated levies will be used to the extent possible for carrying out expansion and improvement works
EXPRESSWAYS- NOW OR LATER
An expressw^ is very high quality, high speed, access controlled road which segregates local and cross traflnc The high speed of travel made possible by expressways improves the efficienc> of transport services, reduces vehicle operating cost and helps in reducing inventor>’ costs for the industry, thus improving its competitiveness vis-a-vis international industry operating on JIT (Just-in-Time) inventory principles. As the economy develops the provision of expressways becomes an essential requirement
Heavy investment is required not only for building multi-lane divided roads but also for associated facilities incluoing provision of modem communication and information system At an estimated cost of Rs. 11 crore per kilometre including land acquisition, a 1000 kms expressway will require Rs. 11000 crore. An expressway is, therefore, highly capital intensive facility.In most developed countries the construction and maintenance of expressways are financed largely from user charges and tolls The economics of expressway requires not only a ver\’ large volume of high speed traffic but also substantial movement of high value commodities so that the traffic can bear the high cost of construction and maintenance of the expensive facilityExpressways have to be fully fenced to prevent any unauthonsed entr) including cross traffic Unless this is done, high speed traffic would be veiy dangerous. Crossing from one side of the expressway to the other is, therefore, possible only through overpasses and underpasses. In developed countries this arrangement works well because farms are large and movement is motorised. In our situation, where there is need for people and animals to cross from one side to the other to access farm lands and villages and when much of this traffic is pedestrian, it is difficult to envisage people resorting to bndges or underpasses built at intervals of several kilometres. On the other hand, increasing the number of cross over points would be ver\ expensive.
Large scale introduction of expressways is, therefore, not feasible in our circumstanccs However, there may be some scope, albeit limited, of constructing expressways on some selected stretches where traffic density is exceptionally high, there are altemative routes for slow' moving local traffic and the need for cross traffic is low
7.1.108 Despite its importance, the National Highway network suffers from a large number of deficiencies which are required to be removed gradually Geomatrics and the riding quality will be improved for all the National Highways in general The thrust areas include 4-laning of high density traffic corridors, which would ease the mobility issue strengthening of existing roads, construction o f bypasses and ROBs, road development in the North Eastern
794

Region and development of strategic and border area roads which will receive top priority in the action plan. Packages of projects rather than isolated stretches, will be identified for development in order to ensure that highway users reap ftill benefits of the improvements carried out.
Four- laning
7.1.109 The high density traffic corridors of National Highways network is shown in Annexure 7.1.9. One of the major thrust o f the Ninth Plan would be on four laning of National Highways
MODERNISATION/UPGRADATION OF HIGH DENSITY CORRIDORS
The Indian National Highway system is excessively congested and physically deficient by international standards. To upgrade and modernise the National highway system, it is necessary that the already identified high density corridors, where the traffic exceeds 35000 passenger car units, are taken up for four laning using mechanical methods and improved technology. Top priority in road sector development is to be accorded to upgradation of National Highways on the Golden Quadrangle, linking Delhi, Mumbai Chennai and Calcutta
The total requirement of funds to complete work on the Go\den Quadrangle is estimated at around Rs.20000 crore. Development of North-South and East-West corridors will be incorporated in the existing alignment of the Golden Quadrangle supplemented by additional work to extend the alignment along North-South and East-West extremities Keeping in view the large requirement of funds on the one hand and the severe constraint of resources, the strengthening of the Golden Qudrangle and of North South - East West extension now have to concentrate on four laning in the first instance extending to six laning where necessary.
7.1.110 A special National Highway Development Project (NHDP) will be undertaken during the Ninth Five Year Plan. The total length of this project is 11860 kms. which include the major highway linking Delhi, Calcutta, Chennai and Mumbai constituting the golden quadrangle and North-South and East-West corridors The components of NHDP are to be implemented in three phases over a period of 10 years as detailed under -
795

Components of NHDP
Components Length Time Frame(Km.) (in years)
A Golden Quadrangle 5000® 5(Balance)
B. Spurs 4000 7North (Delhi-Jammu)South (Krishnagiri-Kanyakumari)East (Kanpur-Silchar)West (Udaipur Porbandar)
C Spines 2860 10North (Jhansi-Delhi)South (Jhansi-Bangalore)East (Jhansi-Kanpur)West (Jhansi-Udaipur)
Total 11,860
@ The total length o f the five corridors forming the golden quadrangle is around 6000 kms. o f which about 1000 kms. is already four laned or taken up for implementation
7.1.111 The programme for the Roads Wing of the Ministry o f Surface Transport is indicated at Annexure 7.1.10.
W idening to two lanes
7.1.112 The corridors where the density o f traffic is less than 20,000 passenger car units per day, widening to two lanes will receive priority. During the Ninth Plan period the widening of 1194 Kms is proposed to be undertaken
Strengthening and Improvement o f Existing Roads
7 1 113 The riding quality o f the pavements of National Highways is poor leading to increased vehicle operating costs The inherent structural weaknesses of the pavements results in their premature failure. Due to the expected deterioration on account of increased volume of traffic and axle load, about 15000 Kms where traffic is 20,000-35,000 PCUS/day have been identified to be in need o f strengthening alongwith the provision of paved shoulders Out of this the Ministry of Surface Transport will take up about 2900 Kms for strengthening and improvement, during the Ninth Plan period
796

7.1.114 The National Highway links through towns are known to cause delays to traffic as well as inconvenience to the city population This problem of congestion in and around cities/towns needs to be tackled on an urgent basis. At least 100 by-passes are required as per a recent estimate but during the Ninth Plan, 40 bypass works can be undertaken out of which 20 will be carried by the Ministry' of Surface Transport through budgetary fijnding There are about 600 level crossings along the National Highways requiring road over bridges There are also several bridges on NHs w'hose load carrying capacity is limited Such weak and distressed bridges would need to be reconstructed During the Ninth Plan, 266 major bridges/ROBs/Minor bridges will be taken up for construction out of which 2.i4 will be during the remaining four years of the Plan
Development of Roads in North Eastern Region
7 1.115 As per the decisions taken in the Chief Ministers’ Conference on North Eastern States, 10% of the central budget for the road sector should be allotted for road development in the N.E Region About 2700 Kms o f the NH length has been enta:sted to BRDB for development Works on newly declared National Highways will also be undertaken during the Ninth Plan period
State Highways and Major District Roads
7 1 116 The growth of State Highways and Major District Roads (MDR) has remained relatively stagnant both in respect of length as well as traffic carrying capacity The priority during the Ninth Plan would be to consolidate the existing network rather than lo expand its length. A network approach will be preferred while identifying the high density corridors for development The State Highways and the District Roads would be developed in such a way that the entire State road network would provide a feeder system to the rail network thereby avoiding development of a parallel road network. It is o f paramount importance that an integrated strategy to achieve simultaneous development of the three major categories of roads is formulated so as to eliminate existing bottlenecks in the movement of passenger and goods traffic
7 1.117 During the Ninth Plan Period the following will receive high priority inrespect of State Highways and MDRs:
i) Black-topping the entire length of State Highways and all MDRs with traffic of more than hundred commercial vehicles per day
ii) Replacement of Railway level crossings with overbridges wherever train vehicle units exceeded 50,000
iii) Construction of Bypasses with service roads for all district headquarters
iv) 50% of weak and narrow bridges with heavy traffic will be rehabilitated
v) 20% of the State Highways will be widened and strengthened as per traffic requirements
vi) Construction of all missing links in the State Highway network
Construction of By-passes/ROBs and Improvement of Congested Sections
797

7.1.118 The implementation of the above will be the primary responsibility of the State Governments. They will therefore be requested to prioritise their road development programme in line with the above mentioned six imperatives and workout detailed proposals.
Urban Roads
7.1.119 Urban Roads (UR) cater to the traffic requirements within municipal limits, military cantonmcnt areas, ports and railway areas. The urban road length in recent years has registered significant growth. This length has increased from 1.23 lakh kms. in 1980-81 to 2.11 lakh kms. in 1995-96. The existing road capacity is, however, not able to meet the requirements of the ever-growing motor vehicle population. As a result, there are frequent traffic jams, congestion and road accidents. Due to non-availability of adequate funds the needed number of flyovers, underbridges and bypasses could not be constructed. The absence of mass transport system in the metropolitan cities and the unprecedented increase in the number of personal vehicles has resulted in rapid deterioration of the urban road system. The problem of congestion in urban areas can only be solved with rigorous demand management, on one hand, and provision of mass transport system on the other. The construction of flyovers, underbridges and railway over bridges will be taken up wherever necessary but this offers no lasting solution to the problem.
Prevention of Encroachment and Ribbon Development
7.1.120 The concentration of population in cities and towns has been increasing over the last several decades. Rapid urbanisation has resulted in encroachments and ribbon development along NHs and particularly around newly constructed bypasses and bridges. Automobile repair shops, petrol pumps, residential buildings and commercial establishments have also sprung up in an uncontrolled manner. Such establishments have proved to be a hindrance to the smooth flow of traffic, consequently resulting in accidents. These will have to be removed through suitable legislative measures. Their re-emergence will be prevented by suitable institutional coordination between the highway authorities and town planning bodies.
Road Network in Remote and Strategic Areas
7.1.121 The existing road network in these regions is deficient due to inadequate capacity, poor riding quality, weak and distressed bridges/culverts. Many of the semi-permanent timber (SPT) bridges require to be replaced by RCC bridges. Some of the areas in these regions remain isolated or blocked for long periods and need special attention. The development of an efficient road network is an important pre-condition for the overall development of remote, inaccessible and strategic areas like North East and Jammu & Kashmir regions.
7.1.122 The special needs of the North East have been recently examined by a high level Commission which assessed the backlog in basic minimum services, including gaps in rural connectivity and the infrastructural needs of the region. Resources, both financial and organisational, will be mobilised at the Central and State levels to address the problem.
798
7.1.123 At the time of independence, the connectivity of villages with roads was rather poor.The development planning process laid special emphasis on rural development of which construction of rural roads has been a special component. The construction of rural roads received a boost with launching of the minimum needs programme in the Fifth Five Year Plan. Under the Minimum Needs Programme (MNP) it was mandated that thevillages with a population of 1000 and above (1981 census) would be connected with all- weather roads during the Eighth Plan. A review of the MNP (Rural Roads) has revealed that the connectivity level for this category of villages has reached 85% of the target. The MNP has now been replaced by the Basic Minimum Services (BMS) programme which envisage provision of connectivity to all villages and habitations by the end of 2002 A.D.
7.1.124 According to recent study by Planning Commission more than 40% of Indian villages are yet to be linked by all weather roads. Efficient delivery of social services (health, education and nutrition) and marketing of rural produce is difficult in areas not connected by good roads. This goes on to establish a strong positive correlation between rural connectivity and poverty and therefore, good and bad roads lead to wide disparity in the living conditions of our rural population. While the total cost of providing connectivity to all villages has been estimated at around Rs.50,000 crore, about one tenth would be required to achieve full connectivity for villages with a population of over 1000.
7.1.125 Since resources of this magnitude may not be available in the State Plans, efforts would be made to pool the resources under different rural road programmes like JRY, EAS etc. to supplement the efforts under BMS. One could explore the possibility of taxing agriculture products, market centres and replicating the experience of good rural connectivity States like Haryana, Punjab and Tamil Nadu.
7.1.126 The priority in the Ninth Plan will be to provide connectivity for the villages which have spilled over from the Eighth Plan. Efforts would continue to fulfil the targets of provision of road connectivity to all villages by the end of 2002 A.D. The States which have attained sufficient level of connectivity for villages with a population of 1000 and above will take up connectivity of villages and habitations with a population below 1000. The needs of difficult and remote villages and SC/ST concentrated areas will also be addressed on a priority basis. The State Governments will be encouraged and assisted to prepare and follow comprehensive Master Plan for development of State Highways and other roads in the States.
N ew so u rces o f fu n d in g
7.1.127 The funds for the development and maintenance of National Highways are provided by the Central Government on a yearly allocation basis. Similarly, the funds for development of State Highways. Major District Roads and Village Roads are provided by the respective State Governments. The budgetary allocations for the development of roads, however, have fallen far short of the requirements and there is a need to augment these resources. The road sector generates substantial revenues primarily through motor vehicle tax and taxes on fuel and spares. But the expenditure on the development of roads has remained comparatively low because these revenues go to the Consolidated Fund which is used for financing all developmental and other expenditures. Currently, a small amount
Rural Roads
799

equivalent to 3.5 paise per litre out o f the proceeds o f excise and customs duties levied on motor spirit, is available for de\ elopment and maintenance o f roads. Since very substantial resources arc required for expanding and upgrading the road network, various mechanisms for raising resources from road users have been under consideration. Internationally, the commonly used method for raising resources for rt)ad development is the levy o f user charges in the shape o f dedicated surcharges on fuel.
7.1.128 Another source o f revenue for road development is tolls which can be collected at fairly low and affordable levels from the users o f specific high density traffic sections o f
AUGMENTING RESOURCES FOR ROAD DEVELOPMENTThe investment strategy for the road sector has traditionally focussed on expansion o f the network
w ith inadequate attention to the quality o f the network especially on the National H ighways which
carry the bulk o f the traffic. F'or example less than 5% o f the National H ighways are four laned
and the quality o f the road surface is very poor. The net result is that the National H ighways are
h igh ly congested. Vehicle operating costs are very high and there are too m any accidents.
The removal o f the deficiencies in the case o f the National H ighways alone w ould require an
investment o f the order o f Rs.75000 crore at 1996 prices, against an annual provision o f Rs. 1500
crore for development o f National H ighways during 1997-98. A n even bigger investment would
be required to upgrade highways in the State sector.
G iven the huge fund requirements and the massive backlog o f previous years, private sector
financing is h igh ly desirable to supplement the Governm ental efforts in this area. However,
experience all over the world and the Viniiled cxpcricv^cc home. tb.'>U private sector
participation can at best make a lim ited contribution in this sector, and the bulk o f the effort w ill
have to come from the public sector. This calls for special efforts to raise resources for road sector
investment.
The most rational approach w ould be to cieate an earmarked fund for road development by levy o f
a cess on fuel. The additional tax at the rate o f rupee one per litre o f petrol, as announced in the
U nion Budget 1998-99 is expected to yield Fi.s.790 crore. A sim ilar cess o f one rupee per litre
should be imposed on diesel. This would raise revenue o f about Rs.4800 crore annually. A
m echanism should be devised whereby the money collected out o f these cesses on petrol and
diesel goes to the H ighw ay Development Fund, the road development agencies. The transfer of
money from the Fund to the im plem enting agencies may be based on objective criterion and made
in a transparent manner.
roads and bridges. Accruals froin such charges would enable viable BOT concessions as well as projects undertaken directly by NHAI or its subsidiaries (SPVs, Joint ventures etc.) through market borrowings. The amengled National Highw'ay Act, 19.56 has empowered the Government to levy toll on selected sections o f the National Highways. The toll revenue can reduce the burden on the Governnient. Some o f the existing 4-lane developed roads, newly constructed roads and bypasses will be taken up as toll roads.
External Aid for Road Projects
7.1.129 Despite higher allocation for Central/S tate Road Projects during the Ninth Plan, external assistance will continue to receive priority. Similarly, some State Highway projects including the State road development packages in North Hastern Region and some rural road development networks packages are expected to be posed (or ioreign funding. The larger external assistance would, however, need to be balanced by higher domestic resources so that counterpart fund requirements o f the externally aided projccls do not alteci local road development programme adversely.
800

7.1.130 Road sector was declared an ‘industr} ' to facilitate commercial borrowings. The National Highway Act 1956 was amended in June. 1995 to provide for a legal I'ramework for private sector participation in road development.
7.1.131 Various fiscal and tax concessions have been offered for undertaking road projects on BOT basis. The Government has also assured help in land acquisition, environmental clearances and simplification of procedures. Some State Governments have also taken significant steps like the setting up of dedicated organisations on the pattern of NHAI to promote road development, financed through user charges on BOT or State toll basis. Some small stretches of roads and bypasses have already been commissioned under these arrangements. The role of this device may become more significant once the policy Iramework including an independent regulatory system is put in operation and investors are able to overcome their apprehensions with regard to uncertainties of these long-term investments in such infrastructure. The policy framework is sought to be kept flexible to permit allocation of risks on an acceptable basis and sharing of risks between the Government and the private sector through grants or equity sharing.
7.1.132 Projects relating to bypasses, bridges and 4 laning of existing sections of National Highways which on the basis of traffic density are financially viable and bankable would be taken up through private sector participation. 11 projects involving an investment of about Rs. 580 CYorc have already been initiated under the BOT Schemes. As stated already, viable sections of the four major corridors are also proposed to be taken up under BOT scheme for four laning. NHAI has been given considerable flexibility to financially collaborate with the private or the public sectors and projects which are not viable on the basis of traffic density will be provided equity/loan support from NHAI. Several other ROB/Bypass projects have been proposed under the BOT scheme through State Governments. In addifion to the projects taken up through private sector participation under the programme of NHAI, some investment would be available under privatisation programme for non-NHAI roads. Thus, given the risk profile of toll road projects and the relative under development of Indian longterm debt market, private investment in roads is expected to be rather modest. Therefore, the budgetary support will continue to have a large and crucial role to play in road development during the Ninth Plan period.
Maintenance
7.1.133 The road network built at huge cost needs to be maintained properly to prevent disintegration and deterioration. Timely upkeep and maintenance prolongs the life of road assets. Properly maintained roads reduce vehicle operation cost (VOC) by providing good riding quality and add to safety of road users. To keep roads in good condition huge funds are required and these keep increasing in volume as the network to be maintained continues to grow in size.
7.1.134 Over the years, the maintenance of roads had received inadequate attenfion primarily due to lack of funds.
Private Sector Participation
8 0 !

MAINTENANCE OF ROADSStudies on maintenance o f roads ha\ e shown that under norm al axle load, roads deteriorate rapidly
be\ ond eight >ears o f use. U nfortu iia teh maintenance is a Non-Plan actn it> and tends to be
accorded a low priorit}'. This is e\ ident from our experience where the road network, bu ilt at a
huge cost, is show in g signs o f deterioration all round. A rupee spent on maintenance sa\ es two to
three rupees in vehicle operating cost besides prox id ing a \ e n cost effective option. A n d )c t.
a\ ailabilit> o f funds for m aintenance is only around 40 % to 6 0 % o f the normal reqiurement. In
case o f roads other than N ational H ighways, State Highwa\ s and M a jo r District Roads, the position
is m uch worse.
O p tim um utilisation o f scarce resources underlines the need not o n h for adequate data base w ith
regard to \ arious maintenance activities but also a proper R oad M aintenance M anagem ent System
in order to access the m aintenance requirement scientifica llv . It is also necessary to f in d additiona l
resources for maintenance o f roads. U sing the dedicated funds financed through levy on fuel and
collection through motor v ehicles taxes w ou ld go a long way in giv ing this vital activ itv its due
pnont> .
7,i .l35 The Tenth Finance Commission had considered the maintenance issue and evolved a formula based on the norms devised by the Ministry of Surface Transport. The norms were applied to the total road length in each State/UT to assess the requirements during the forecast period. Since the amount worked out was very large, the Commission limited the provision to double the level provided by the Ninth Finance Commission. The State-wise provision for maintenance as estimated by the Commission is shown at Annexure 7.1.11.
7.1.136 It is imperative that these provisions are substantially increased It is necessary to regard maintenance of roads, at least of highways - National and State - as a committed liability which must be provided for in full on the basis of technical norms before provision is made for meeting the other non-Plan needs. It is also necessary for the maintenance budgets to be allocated on a need-based programme. The establishment budgets under maintenance have tended to grow beyond the prescribed norms. This needs to be restrained because otherwise an ever-increasing proportion of maintenance budget tends to be appropriated by the establishment leaving very little for procurement of material and equipm.ent. Selectively, the maintenance work should be tried out on a contract basis in order to secure the benefits of competitive price and quality.
Highway Safety
7.1.137 The number and severity of road accidents has registered a steady increase in the country The past record has demonstrated the poor state of safety on our roads. The sharp increase in the volume of road traffic, the growth of vehicle population particularly the operation o f heavy and over-loaded commercial vehicles, the spurt in two-wheelers and over-crowded buses have aggravated the problem. To tackle the problem of road safety, it is necessary to adopt measures for the education of road users and the strengthening of enforcement. In the arena o f road construction, proper engineering measures can contribute towards promotion of road safety Apart from proper planning of road transport corridors, provision of medians, railings, lane marking and replacement of level crossing by road over bridges and properly designed grade separators would check occurrence of fatal road accidents Provision of separate bicycle lanes would not only improve the safety of road transport operations, but would also encourage use of environmental friendly nonmotorised modes.
802

7.1.138 Road constmction causes environmental pollution in diverse ways. It disturbs the natural drainage o f land, flow of rivers and streams in its vicinity and adversly affects the physical and natural features of the area. The unplanned dumping of the waste material of construction activities also causes adverse environmental impact.
7.1.139 The environmental impacts of road construction vary from region to region They are, particularly severe in hilly areas as it causes geological disturbances, loss of forest and vegetation cover and soil erosion, besides triggering flash floods In order to minimise the adverse impact on environment caused by road construction, it is necessary to adopt newer road construction and maintenance practices. In hilly areas, it is necessary that adequate attention is paid to route alignment to ensure that landslides or erosion-prone areas are avoided. Deforestation during road construction will have to be kept to the minimum, in consultation with the forest authorities. Any cutting of the trees must be replaced by plants of equivalent number.
Research and Development
7 1.140 Expansion, modernisation, upgradation and maintenance of highway networkrequires research and development(R&D) inputs These inputs ensure optimum utilisationof resources and help in finding cost-effective solutions for various road engineering problems
7 1 141 The huge cost of developing road network and the near technological freeze of several decades experienced by the sector on the one hand, and the extension of R&D capability in the country on the other, offer a vast scope for the introduction of improved planning methodology, designs and technologies as also new materials in the road development. The R&D activity will, therefore, be taken up in all areas of road development The objective will be the development of road planning and theconstruction technology which result in reduction in construction cost, vehicle operationcost, accident rates, congestion, pollution and pre-mature deterioration of roads To achieve this objective, it will be necessary to carry out research studies, construct experimental road sections and strengthen the existing capabilities of R&D organisations Areas like highway planning, management and designing, construction and material management pavement maintenance, bridge designs, road safety and environment studies will receive greater attention. Special attention will be paid to design improvement of non-motorised vehicles to achieve better efficiency and avoidance of drudgery In addition to the fresh R&D efforts, it is equally important to gainfiilly utilise the results of research work already carried out in the field of construction, maintenance and rehabilitation of road network in the developed countries. An effective mechanism will be evolved to identify these advanced technologies on selective basis with a view to adopting, introducing and absorbing them in our road development process
Technology Upgradation
7.1.142 Recent years have witnessed phenomenal growth of road traffic in the country Heavier vehicles with large volume of traffic ply on our highways. The traffic growth, existing inadequacies and deficiencies in the highway network call for a massive effort in
Environment Conservation
803

the development of highways in the country In cu r endeavour to build quality roads, the adoption of new technology would ensure that roads are constructed to modern standards and specifications
7 1 143 Road construction technology has not undergone any major change for severaldecades Many countries have mechanised road construction by introducing sophisticated and modern equipment. Considering the constraint on financial resources and the availability of abundant labour force, the technologies employed in the developed world cannot be simply imitated New techniques of construction have to be adapted to the prevailing conditions Having regard to the magnitude of the task of road constniction, it is necessary to adopt those technologies which can minimise the cost of construction and maximise the use of local resources The introduction of machine-based technology will have to be restricted to high density traffic roads and those sections of highways which are to be commercialised.
M anpower Development
7.1 144 In order to keep pace with the technological development in the field of road constRiction and maintenance and to improve the quality of road construction by making optimum use of available resources, emphasis will be laid on the development of technological skills of the manpower engaged in road/bridge construction and maintenance by creating awareness of modern construction techniques This objective would be achieved by sUengthening the training programmes, conducted by various organisations including the National Institute for Training of Highway Engineers (NITHE) and the Central Road Research Institute (CRRI) and by holding seminars and workshops To make effective use of the training facilities available in the country for highway engineers, efforts will be made to coordinate the training programmes of several State level training centres with that of NITHE.
Data Base
7.1 145 Transport planning is a continuous process In the absence of adequate and reliable data, this process is inhibited. Data on traffic flows and resource cost is necessary to study the aggregate and mode-wise traffic trends, forecast traffic demands, evolve optimal patterns o f allocation of traffic amongst different modes, formulate appropriate investment options and conduct cost-benefit appraisal Of the two principal modes of transport, inadequacies o f data pertaining to traffic flows and resource cost are more acutely perceived in relation to road. Considering the crucial importance of information on traffic flows and resource costs o f different modes of transport, a mechanism will be set up to collect, update and analyse the data of traffic flows and resource cost on a regular basis
ROAD TRANSPORT
7.1.146 Road transport is the dominant mode of transport for movement of passengers and freight in India It is ideally suited for short and medium distances due to its advantages in terms of easy availability, flexibility o f operation, adaptability to individual needs, door-to- door service and reliability. It is also the main mechanised means of transport in hilly and remote areas, not served by the railways. Road transport is one of the basic infrastructure for economic development of backward areas It also provides feeder
804

service to rail traffic, airways, ports and harbours. Road transport has grovv-n at a fast pace since 1950 The vehicle population has grown more than 100-fold during the last 45 years from 1951. The total number of all types of mechanised motor vehicles increased from a mere 3 lakh in 1950 to 336 lakh in 1996. The category-wise number of registered vehicles is given in Annexure-7 1 12
Review of the Eighth Plan
Outlay and Expenditure7 1 1 4 7 There was a shortfall in the expenditure as compared to the outlay for road transport under the Central Sector in the Eighth Plan. As against the approved outlay of Rs 264 crore, the expenditure was only Rs 80 16 crore The shortfall was primarily on account of the discontinuation of capital contribution to State Road Transport Corporations from 1993-94 onwards and the transfer of Delhi Transport Corporation to the Government of the National Capital Territory of Delhi (N.C T.D ) w.e.f August, 1996 The scheme-wise outlay and expenditure during the Eighth Plan are given in Annexure-7.1,13.
Goods Transport
7 1148 The goods vehicle fleet grew from 8 63 lakh in 1986 to 17 85 lakh in 1996, registering more than a two-fold increase Light carriage vehicles exhibited a faster growth than heavy carriage vehicles For instance, the number of heavy goods vehicles increased by 106 percent, while that of light carriage vehicles registered an impressive growth of 190% during the last ten years
7 1 149 The road freight operations are almost wholly owned and operated by the private sector. The State Road Transport Corporations in Jammu & Kashmir, Manipur, Mizoram, Sikkim and Tripura however, provide freight services with a limited number of trucks. A two-tier structure is prevailing in freight transport operations in the country One of the two tiers is of those transport companies/agencies which secure most of the freight contracts because of their reputation, reliability and dependability in services, the network of branches across the country, recognition by the banks and ability to offer security against the loss/damage. The other tier is of smaller operators having one to three vehicles. About 80- 90% of truck operators are estimated to be of this category
7.1 150 The commercial vehicle fleet in the country is not utilised optimally because of the high proportion of over-aged vehicles, absence of assured loads owing to individual truck owners being lone operators and poor loading and unloading facilities at the terminals leading to abnormal delay and detention. In order to overcome these constraints, it is necessary to set up loading and unloading facilities, parking areas, provision of space for transport operators’ offices served by banks and post offices in the outskirts of the cities. The setting up of such facilities by the State Governments would facilitate the formation of cooperatives of small truck operators. It would then be possible to coordinate the freight operations carried out at the two levels.
7 1 151 The country presently has outdated truck technology and practice of overloading trucks resulting in severe damage to roads. There is need o f modernising truck technology and strengthening of enforcement machinary to check the menace of overloading
80.S

7.1.152 An important feature of the road transport in India is that the bulk traffic on both National and the State highways is moved on two-axle rigid trucks. These vehicles are generally over-loaded and cause excessive damage to the highways
7.1.153 Road pavements deteriorate under the action of vehicle wheels. The damaging effect o f vehicle loads is cumulative in nature. The more the traffic and higher the wheel loads, the more will be the pavement deterioration and earlier the need to strengthen the road crust. It has been established that the damaging effect of an axle load increases exponentially and not linearly in relation to the damage caused by a standard axle o f 8.16 tonnes Muhiplier for the damaging effect is fourth power of the ratio of actual axle load to the standard axle. Thus, an axle load o f 12 tonnes will cause five times the damage than a standard axle and a 16 tonne axle load will imply damage equal to 16 passes of the standard axle. Since pavement design is based on cumulative number of standard axle loads over the design service life, higher axle loads eventually cause premature distress/failure of the road pavement. In turn this means higher vehicle operating costs and in the long run, need for increased outlays for road improvement and maintenance. While efforts would be made to strengthen the enforcement machinery to check overloading, it will also be necessary to modernise the truck fleet by introducing multi-axle vehicles.
Passenger Transport
7.1.154 The passenger services through road transport are provided both by the public and the private sectors in the country. However, over the years, the share of the public sector in the total fleet of buses has declined. (Annexure - 7.1 14) While in 1980-81 the public sector held 43 per cent o f the total number of buses in the country in 1995-96 its share came down to 24.7 per cent
State Road Transport Undertakings (SRTUs)
7.1.155 There is no uniformity in the organisational set up of the public sector road transport undertakings. Some States have Corporations constituted under the Road Transport Corporation Act, 1950, while some others have registered them under the Companies Act, 1956 Some States have departmental undertakings too
7.1.156 The total reported fleet strength of the SRTUs as on 31.3 .1997 was 1.13 lakhs, with a total capital investment of Rs.8187 crore. These SRTUs covered a length of 1074 crore effective kilometers during 1996-97. In the same year, 2337 crore passengers were carried by them. The SRTUs employ manpower of the order of 8 lakh.
Physical performance of SRTUs
7.1.157 There was an overall improvement in the productivity of SRTUs during Eighth Plan. Vehicle productivity increased from 257 revenue earning kilometers per bus held per day in 1989-90 to 278 km. per bus held per day in 1996-97. Similarly the staff productivity improved from 35.3 revenue earning kilometer per worker per day in 1989-90 to 40 5 km per worker per day in 1996-97. Fuel efficiency improved considerably from 4 35 kilometres per litre ( kmpl.) to 4.50 kmpl. during the same peroid The details are in Table-7 1.12,
806

T a b le - 7.1.12
Performance of State Road Transport Undertakings
Performance Indicator Seventh EighthPlan Planending ending
_______________ (1989-90) (1996-97)____________F leet u t il is a t io n 89 89
(% o f buses o n road )
V e h ic le p ro d u c t iv ity 257 278
(k m .p e r bus h e ld per d ay )
S ta f f p ro d u c t iv ity 35 .3 40 5
(k m .p e r w o rke r per day )
B us s ta f f ra tio (o n flee t 7 .93 7 6
operated )
F ue l c o n s u m p t io n (k m p l.) 4 35 4 5
7 1 158 There are however, wide differences in the performance, efficiency andproductivity o f the various SRTUs. While there are examples of efficiently run organisations like the road transport corporations in Tamil Nadu, Andhra Pradesh, Rajasthan, Maharashtra, Karnataka and Haryana Roadways, others are still deficient in many areas. The road transport corporations in Bihar, Assam, Orissa e tc , offer considerable scope for improvement. These SRTUs would need to chalk out an action programme for speedy improvement The SRTU-wise details are in Annexure-7 115
Financial Performance
7.1.159 Most of the SRTUs incurred losses and faced serious financial constraints As per the latest estimate, the net loss incurred by the SRTUs was Rs.770 crore in 1996-97, compared to Rs.342 crore in 1992-93. The main reasons for the losses incurred by SRTUs were : uneconomic fares, delay in revision of fares which in most of the cases took four to five years, loss on account of concessional travel and operations on uneconomic routes.
Non-motorised Transport
7.1.160 Non-motorised transport modes, powered by human and animal energy meet a substantial segment of the country’s transport needs. The human energy based modes include pedestrians, bicycles, manual rickshaws, cycle rickshaws, hand carts and boats. Animal powered modes include pack animals, animal drawn carts and tongas.
7.1.161 Very little data is available on a number of travel characteristics of the non- motorised modes of transport. A rough estimate puts the number of cycle rickshaws in India at 5 million and o f bulluck carts at over 15 million. Similarly, the population of draught animals is estimated at about 85 million which represents the equivalent of about 40 million horse power or 30,000 MW capacity and makes available 50 billion energy units
807

FINANCIAL HEALTH OF ROAD TRANSPORT UNDERTAKINGSW h ile the physical performance o f the State Road Transport Undertakings (S R l'U s ) has been
im prov ing , the financial performance o f the undertakings has been deteriorating, A m ajor reason
for this is inab ility o f State Governm ent to ensure econom ic fares, delays in im plem enting fare
increases and numerous fare concessions given to different classes o f passengers.
There are w ide variations in the fares fixed by various State Governments. The fare charged in
the pla ins in Haryana is 35.76 paise per passenger km . against 18.22 paise in Tam il Nadu. In the
h ills, Him.achal Pradesh charges 45.75 paise per passenger km. while .lam.mu & Kashm ir 21.25
paise per passenger km.
A nother factor w h ich adversely affects the finances o f the undertakings is the concession in fares
granted by the State Governm ents, The SRTUs incur loss o f Rs.385 crore annually due to
fincessions to students, physically handicapped, journalists, freedom fighters and other
categories o f commuters.
The SRTU s also carry the social burden o f provid ing services to remote areas where load factors
are very low and operations are therefore uneconom ic. The loss incurred by SRTUs on this
account was estimated at Rs.546 crore in 1996-97. The financial burden borne by SRTUs on
account o f concessional travel and operation on uneconom ic routes is much larger than the total
loss o f Rs.770 crore incurred by them. Jud ic ious pruning o f these concessions, w ould help to
e lim inate these losses w h ich are otherwise a burden on State finances.
per year. The non-motorised transport estimated to carry 210 billion passenger kms. and 43 billion tonne kms. as per the details given in Table-7.1.13.
T ab le-7 .1 .1 3
Non-M echanised Transport in India
Freight Orig. Passenger Oi'ig-
Traffic Freight Traffic passenger
Traffic (M illion)
(Billion (M illion (Billion
Tonne Km.) Tonne) (Pass.Km)
1. Human Transport 6.00 420.00 203.00 17150
2. Animal Transport 37.17 1922.50 7.2 360
Total (1 + 2) 43.17 2342.50 210.20 17510
7.1.162 In terms of tonne kms. and passenger kms. the share of non-motorised modes in total traffic is only 5% and 11% respectively. However, in terms of originating traffic these modes carry more than 5 times the freight and 4 times the passenger traffic as compared to the railways. These figures indicate the magnitude of the transport demand met by the non-motorised modes of transport.
7.1.163 The non-motorised modes are relatively inexpensive, environment-friendly, involve simple technology, have large employment potential, and sustain the rural economy. Considering the significance of non-motorised modes of transport, surveys and
808

field studies will be initiated to improve the availability of data on the operation o f these modes. The non-motorised modes also represent stagnant technology and drudgery. There is an urgent need for providing simple technological inputs of improved designs and standardisation of spare parts, in orde’ to ensure smooth and safe movements on pathways, improve efficiency and reduce dmdgery. Research in this direction will be encouraged so that the non-motorised modes fulfil their niche role in the transportation system.
Policy Framework
7.1.164 The rapid growth of vehicle population, the inadequacy of road infrastructure, the growing concern for environmental degradation and the proliferation of personal modes of transport call for emphasis on the provision of public modes of transport and introduction of mass rapid transit system in the metro cities. The bus technology, which continues to be primitive, needs improvement in various directions including the design of chassis.
7.1.165 In the urban areas, particularly in mega cities, the scope for generating additional capacity to meet the rising traffic demand is limited. On the other hand, private vehicle ownership is increasing at a rapid pace. It is, therefore, ncccssary Lo resort to demand management through such measures as parking control, cordon pricing, prohibition of personal cars driving down to central business destinations and enforcement of car pooling, with a view to curbing the inefficient use of private vehicles, conserve fuel, minimise environmental impact and generate revenues for augmentation of capacity on public U'ansport system. In the ivrena of road freight transport, emphasis will be laid on the upgradation of vehicle technology, particularly shift to multi-axle rigid trucks from two-axle rigid trucks and rationalising Motor Vehicle Tax preferably on annual basis. The administration of the Motor Vehicle Act will be streamlined and simplified. Enforcement will be made more effective. The objective will be to plug the leakages of revenue and reduce harassment of transport operators. In order to improve transparency and fairplay representatives of the transport operators will be involved in reviewing the operation of the enforcement machinery. The improvement in road safety will receive special attention during the Ninth Plan, The non-motorised modes of transport, which play an important niche role in the transportation system, will be provided with technological inputs to improve their efficiency and reduce drudgery.
7.1.166 The measures taken during the Eighth Plan to improve the productivity of the State Road Transport Undertakings will be continued during the Ninth Plan. These measures include replacement of overaged buses, inservice training to the operational staff, improved management practices and upgradation of vehicle technology. Efforts will also continue to periodically review the fare structure to compensate for the increased cost of operation. As a result of the measures, proposed to be taken, the productivity of SRTCs is likely to be improved. The productivity targets for the Ninth Plan are given in Annexure- 7.1.15.
7.1.167 The growing traffic demand cannot be met by the public sector undertakings alone. Supply of transport, therefore, has to be improved through integrated transport service by the public and the private sectors. The private sector is already playing a dominant role in the passenger transport service operation. The private sector own and operate 75% of the total bus fleet in the country. Considering the growth in traffic and the need for replacement of buses in the public sector, the share of the private sector is expected to rise further in the Ninth Plan. In view of the constraint of resources and the need to run the SRTUs
8()‘̂
efficiently, the SRTUs would give priority to acquisition of buses for replacement The incremental fleet requirement will, however, be met primarily by the private sector. However, those SRTUs, which have resources may be allowed to acquire fleet for expansion
Capital Contribution
7.1.168 From 1988 onwards the release of the Centre’s matching capital contribution is limited to those State Road Transport Corporations, which do not incur net loss or run at break-even. Over the years, the SRTCs have been incurring losses on account of concessions to different categories of commuters, delayed and inadequate fare revision, operation on uneconomic routes etc. To minimise the losses, the State Governments have been advised to meet the incremental traffic demands through the private operators The capital contribution to the SRTCs, in the light of this directive, was practically withdrawn. The SRTCs play a crucial role, particularly in the tribal, remote, hilly and sparsely populated areas. Capital contribution to some SRTCs may enable them to turn around financially. It is, therefore, proposed to review this policy during the Ninth Plan
Private Sector Participation
7.1.169 In the recent past, as a resuh of a deliberate policy of the Government, the private sector increasingly shared the burden of the public sector in providing the passenger traffic services While this has helped in meeting the passenger traffic requirements in the country, it has also exposed certain weaknesses of the private sector road transport operation. The bulk of passenger road transport services in the private sector are provided by operators who own one or two buses. These operators do not adhere to schedule, neglect maintenance and show scant regard for road safety. The presence of a large number o f operators makes the task of the State regulatory bodies in enforcing laws, rules and regulations extremely difficult. The private sector operators, guided by maximisation of profits, opt for remunerative routes, with the result that remote and rural areas where the operation is unremunerative tend to be neglected.
7.1.170 The weaknesses in the private sector road transport operation point to the need for organising transport operation on sound corporate lines. It is necessary that the State Governments formulate suitable guidelines, which inter-alia, lay down the minimum viable size of the fleet, criteria of technical and financial soundness o f the operators and a suitable mix of remunerative and un-remunerative routes which the private sector will be called upon to operate. The objective should be to ensure that the operators discharge their social and statutory obligations and provide efficient and reliable road transport services
Road Safety Programme
7.1.171 The steep increase in the road traffic, the spurt in personalised vehicles, the phenomenal growth in heavy and over-loaded commercial vehicles and the inadequacies as well as the deficiencies in the road network have aggravated the problem of road safety About 3 lakh road accidents are reported every year in the country, resulting in a loss of about 60,000 human lives which indicates that, on an average, there is one fatality in every five accidents. The fatality rate on Indian roads is exceptionally high, as compared to that of the world India’s share in the world vehicle population is only 4.2 per cent, whereas
810

in terms of fatalities it is 9 per cent. The accidents in the metro cities particularly in Delhi are increasing at an alarming rate. The total estimated economic loss as a result of accidents, including damage to the property, is estimated at Rs. 6000 crore per year.
7.1.172 Road safety is a multi-disciplinary area. Engineering, education, enforcement and public awareness play a big role. The focus on safety education provided in the Eighth Plan will be continued in the Ninth Plan, the road safety programmes in the Ninth Plan will also include proper signals, road signs, road markings, introduction of safety devices in manufacturing practices alongwith training/re-training of drivers and instructors, creation of awareness amongst road transport users, upgradation of safety monitoring practices by induction of modem technology, computerisation of traffic licensing system, systemising analysis of accidents etc. Traffic regulation through stringent enforcement of rules and severe punishment to frequent law breakers cannot be overemphasised.
Pollution
7.1.173 Pollution caused by the operation of automobiles has assumed an alarming proportion. The increasing number of transport vehicles, particularly personalised motor vehicles in the cities, cause air and noise pollution. The main reasons for the increasing level of pollution in the cities caused by road transport are poor maintenance of vehicles, large proportion of over-aged vehicles, more frequent traffic jams due to lack o f traffic planning, extensive over-loading, poor upkeep of roads, crowded highways, ribbon development, prevalance of old technology in heavy motor vehicles and very lax enforcement of rules and regulations pertaining to the pollution emission norms.
7.1.174 While the pollution level caused by the road transport has been increasing in all the cities, the worsening situation in the mega cities deserve special attention. In these cities, the automobiles have the dubious distinction of having the maximum share in total pollution. For example, it is estimated that the automobiles in Delhi contribute to nearly 2/3̂ ** of the total atmospheric pollution. The emission factors of different vehicles indicate that the personalised motor vehicles are the major contributors to pollution and this contribution is increasing at fast rate.
7.1.175 The emission of many of the pollutants in the country has increased rapidly during the past decade because of the rising vehicle pollution and the absence of pollution control. The rate of pollutant emission from vehicles is significantly higher than in the developed countries. Air pollution by the road vehicles, if not controlled now, is likely to increase manifold in the near future. There is, therefore, an urgent need to attend to the problem of pollution caused by road transport.
7.1.176 The Motor Vehicle Rules, 1988 provide for checking pollution. Their implementation, however, has not helped to control the increasing rate of pollution caused by the vehicles, particularly in the urban areas. This problem can be solved only through upgradation of technology in freight carriage, reduction in the number of personalised motor vehicles, awareness among transport users, strict enforcement of the legal provisions and strengthening of the public transport system. At the same time, it is necessary to contain the demand as well as relocate travel by resorting to demand management measures.
7.1.177 The main schemes proposed to be taken up in the Ninth Plan relate to development of infrastructure facilities for the operation of the buses of state road transport
811

undertakings, strengthening o f the motor vehicles department, road safety programmes and provision of loading and unloading facilities in the outskirts of major cities
PORTS
7.1.178 Ports, which are the gateways to India’s international trade, handle over 90% of foreign trade. There are 11 major ports and 139 operable minor/intermediate ports, studded along the 5560 kms. of the coast-line of India The major ports are administered by the Port Trusts under the control o f the Central Government, whereas the responsibility of minor/interrnediate ports lies with the concerned maritime State Governments. Major ports of the country are Calcutta and Haldia, Mumbai, Chennai, Cochin, Kandla, Visakhapatnam, Paradip, Tuticorin, New Mangalore, Mormugao and Jawahar Lai Nehru. A port at Enr.ore is under construction by Chennai Port Trust Port facilities, to some extent, have also been provided in Andaman & Nicobar Islands and Lakshadweep by Andaman Lakshadweep Harbour Works(ALHW) under the Central Government. A major portion of the dredging requirements of capital/maintenance nature are taken care of by the Dredging Corporation of India
Eighth Plan Review
Traffic and Capacities
7.1.179 The traffic at all the major ports has been growing continuously over the years. The traffic handled at major ports was 156.64 million tonnes in 1991-92, which increased to 215.21 million tonnes in 1995-96 and further to 227.26 million tonnes in 1996- 97, thereby registering an annual average growth o f nearly 7.3% during the Eighth Plan period. The details of port-wise traffic handled during the Eighth Plan are given at Annexure 7.1.16.
7.1.180 The POL traffic has registered a significant growth in terms of volume handled. However, its overall share in the total traffic has declined from 44 3% in 1992-93 to 43.16. % in 1996-97. The container traffic has shown a remarkable growth potential The container traffic accounted for nearly 4.58. % of the total traffic handled by the ports in 1992-93 which increased to 9.06. % in 1996-97. The container traffic is likely to increase substantially in the Ninth Plan. Coal and genera! cargo aie the other areas where substantial growth in traffic has been witnessed during the Eighth Plan The composition of traffic during the Eighth Plan is given at Annexure 7 1.17
Productivity
7.1.181 Port productivity, in terms of average ship berth day output and idle time at berth as percentage of total time at berth, has registered an improvement during the Eighth Plan period. The average ship berth day output increased from 3942 tonnes in 1991-92 to 4002 tonnes in 1994-95 and to 4249 tonnes during 1996-97 The idle time at berth as percentage of total time at berth decreased from 37% in 1991-92 to 33% in 1994-95 and ftjrther to 31% in 1996-97 However, the average turn around time of a ship increased from 6 7 days in 1991-92 to 7.8 days in 1996-97. During the same period, the average pre-berth waiting time has also shown an upward trend It increased from 1.6 days in 1991- 92 to 2.4 days in 1994-95 and further to 3 1 days in 1996-97
812

7.1 182 Labour productivity is one o f the important indicators for measuring the performance of a port An analysis o f the average output per “Gang Shift” achieved versus the norm of various cargo handled fixed in 1990, reveals that this ratio varies widely from 50% to 200%. Secondly, this ratio in most o f the cases is much above 100% which signify that the prescribed norms itself are at a low level and need to be updated and scientifically determined
7 1.183 Equipment utilisation has been low in most categories of equipment. Low productivity is mainly due to the operational constraints, such as, equipment breakdown, time spent on service and power failures etc. Overaging of installed equipments is another area of concern Out o f the total fleet strength, 88% of W harf Cranes, 66% of mobile cranes and 31% of Fork Lift Trucks have crossed their economic life
Eighth Plan Outlay and Programme
7.1.184 During the Eighth Plan an outlay o f Rs.3216 crore was approved for the ports sector. Against this, the actual expenditure totalled Rs 1907 01 crore, of which the major ports accounted for Rs. 1741.03 crore. Out of the total expenditure o f Rs 1907 01 crore, Rs. 1521 42 crore or 80% came from the internal resources and inter-corporate loans of major ports. The budgetary support accounted for 20% of the expenditure A part o f the budgetary support was on account of foreign aided projects (about Rs.l58 04 crore) and the domestic budgetary support was 119% of the expenditure. The details of the Eighth P\an Outlay and Expenditure from 1992-93 onwards are given at Annexure 7 IS
7.1.185 In respect of major ports there has been a heavy shortfall in expenditure as compared to the outlay during 1992-97. The main reasons for the shortfall have been the delays caused in sanctioning the schemes, slow progress o f work by the contractors, adverse weather conditions, contractual disputes/litigation, delays involved in tender finalisation/ awarding of contracts and deferment o f projects/ schemes, etc
Operational strategy for the Ninth Plan
7 1 186 During the Ninth Plan port development should keep pace with the expansion in traffic and changes in the shipping scenario including the size o f ships, specialisation and automation etc Container facilities would need to be augmented at the ports in line with the developments abroad. Mechanised loading and unloading facilities would need to be developed at certain locations to handle the coal requirements of the existing and new power stations which are likely to be commissioned during the Ninth Plan However, the fiinding of such captive facilities would need to be done by the user agencies Efforts need to be made to improve the POL handling facilities at the ports by planning in such a way that the completion of tanker discharge/unloading operations is achieved within 24 hours Acquistion o f new tankers and special carriers should take note of shipboard capacities, port facilities available and contemplated. Night navigation facilities would need attention at all the major ports to improve the turn-around of tankers, other vessels and berth utilisation. Before embarking on any major investment in creation of additional infrastructure facilities, the development and modernisation o f existing port facilities should receive priority to improve productivity at'ports. Besides, the maintenance of port infrastructure would need to be improved. The port capacity would need to be adequately augmented in view o f the projected traffic requirements during the Ninth Plan, with larger private sector participation and development o f selected minor ports
813

PRODUCTIVITY OF INDIAN PORTSPort productivity in the Ind ian context is not just an assessment o f the cargo hand ling tim e but depends also
to a very' large extent on the producti\at>' o f the entire logistic chain o f w h ich the port is onl\ a link, . Tlie
chain also comprises road-railway linkages, inadequate in land warehousing facilities, customs clearance
procedures etc. w h ich also affect port productivity
Certain productivity indicators like average sliip berth day output, idle time at berth, and average ship
turnaround tim e (A ST A ) have been continuoush impro\ in g but are still m uch lower w hen anah sed w ith
comparable fore ign ports. The A S T A for container ships in ports such as Singapore is only' 6 to 8 hours
whereas in Ind ia it is 3 .74 days at the most m odem p o r t JN PT In tenns o f containers handled per crane
hour the average for Ind ian ports is 14 to 17 boxes as against 25 to 27 for Singapore. 28 for H ongkong. 26
for Co lom bo and 27 to 30 for Kalang
The area o f port productivity m ust receive m ajor focus in the N inth P lan period. M odernisation o f port
equipm ent, revam ping the organisational structure o f ports and investments in inter-modal arrangements arc
a ll e.xpected to y ie ld higher productivit>' and greater customer satisfaction. D u n n g the N inth P lan period it
IS proposed to augm ent port capacity to reach 424 M T Measures to im prove productivity o f both m an and
m achine as reflected in the m odernisation and m anpow er p lann ing methods are expected to contnbute
substantially to the capacity creation effort o\ er the 9* p lan period
7.1.187 The traffic projections (commodity - wise during 2001-02 are detailed in Table7.1.14.
Table 7.1.14Commodity-wise Traffic Projections -- Ninth Plan — Port Sector
(in Million Tonnes)
S.No./Commodity Estimated ThroughputDuring 2001-02
1 POL 186 72 Iron Ore 34 43 Coal 93.74. Fertilizer 14 25. Containers 38.76. Other Gen. Cargo 56.2
Total 423.9
The details o f capacity augmentation are given below:
i) Capacity of major ports as on 31.3 .97 215 MTii) Capacity creation in the major ports
during 1997-2002 on account of 122 MTNew Schemes Of which :
a) Schemes to be funded by Ports 35 MTb) Improvement of the capacity of
existing assets 11 MTc) Schemes to be undertaken through
Private Sector 45 MTd) to be created by captive users 31 MTiii) Capacity accrual on account of spillover
schemes of 8‘ Plan which are under implementation 37 MT
iv) Additional capacity expected on account of productivity increasein Major Ports and contributions 50 MTby development of minor ports.
TOTAL 424 MT
814

7.1,188 The Ninth Plan visualises an actual physical capacity addition of about 209 million tonnes which include capacity addition of 122 million tonnes on account of new schemes (Annexure 7.1.19) depicting an annual growth of 19.4 percent The major increase in capacity will take place at JNPT, Kandla, Mormugao, New Mangalore, Mumbai, Chennai and Paradip, mainly to handle POL, coal and container traffic
7 1 189 In order to augment the resource base for the development of ports as envisaged above, there are a number of other steps that need to be taken including structural changes in the management o f major ports. They are discussed in the subsequent paragraphs
Corporatisation of Ports
7.1 190 The provisions of the Major Port Trusts Act, 1963 do not allow operation of services by Port Trusts on commercial lines. The approval of the Central Govt is required in a majority of decisions. Under this restrictive ambit, the ports are unable to operate in a market oriented economy with flexibility in commercial operations
CORPORATISATION OF PORTSThe present organisational structure o f the m ajor ports in the fo nn o f Port Trust presents nian>
problems. It creates time lags in decision m ak ing and is not conduci\e to such com m erc ia lh
oriented decision m aking needed for the management and operation o f a m odem port
A corporatised organisational structure w ill im part adm inistrative autonomy w h ich w ill directly
im prove the efficiency and viability’ o f operations . As a corporate entity Ind ian m ajor ports
w ou ld be able to raise resources through equity and debt from the market Access to institutional
finance w ill be easy since tangible assets w ill be available for use as collateral. Joint \ entures w ith
fore ign ports and private sector w ill be smoother and more efficient in a corporatised fram eu ork
Steps are being taken by the Go\1. o f Ind ia towards facihtating corporatisation. The Ennore port
w ill be the first corporatised port w h ich w ill be fo llow ed by Jaw ahar Lal Nehru port m the second
phase. A ction m respect o f corporatisation o f other ports w ill be taken up on the basis o f a study
and experience w ith regard to corporatisation o f the earher ports
Joint Ventures
7.1 191 A scheme for formation of Joint Ventures between major ports and foreign ports, between a major port and minor port(s) and between major ports and private companies (Indian and Foreign) has been approved. The objective is to attract new technology, introduce better managerial practices, expedite implementation of schemes, foster strategic alliances with minor ports for creation of optimal port infrastructure and enhance the confidence levels o f the private sector in the flmding of ports.
7.1.192 The existing norms o f productivity of labour and equipment will be stepped up and manning scales rationalised. Mechanical aids and cargo handling techniques will be introduced.
7.1 193 The surplus labour under both cargo handling and non cargo handling categories will be identified, re-trained for other trades where feasible and re-deployed to the best extent possible for meeting the additional requirement of labour during the Ninth Plan period.
815

7.1.194 Systematic and well-designed training will be imparted to the port personnel to improve their skills and to prepare them for the switch over from conventional general cargo handling operations to more sophisticated container handling and also for fast bulk handling operations. The training will also be given to managerial officers to improve their managerial capability.
7.1.195 All efforts Avill be made to eliminate the multiplicity of agencies present in
commercial cargo handling operations and ensure unified cargo handling labour with complete inter-changeability between shore and ship The start made in this direction at the Mumbai and Cochin ports for the merger o f Dock Labour Boards with Port Trusts may be continued and extended to other ports.
7.1.196 The complementary role of intermediate and minor ports to major ports in handling domestic and international traffic is well recognised and necessary assistance will be extended for selective development and modernisation of such ports showing potential and promise.
Private Sector Participation
7.1197 The broad objectives o f participation of private sector in port development have been to bring about an improvement in efficiency, productivity and quality of service as well as to usher in competitiveness in the provision of port services In addition, the private sector is expected to mobilise adequate resources required for capacity augmentation and to introduce the latest technology and improved management techniques in the ports sector.
7.1.198 The modernisation and augmentation of capacity at major ports to meet the projected traffic demand require huge investment With a view to harnessing sufficient resources, ushering in an element o f competition and introducing the latest technology and improved management techniques, the Government has opened up the port sector for private participation The Major Port Trusts Act 1963, permits private sector participation in port development and as such, no specific legislation is necessary for ensuring private sector participation in this sector. The issue o f private sector participation in ports gained momentum during the Eighth Plan and the focus shifted from leasing of existing assets to creation o f new port assets through private sector participation In order to ensure transparency and uniformity, detailed guidelines have been laid down in respect of the procedures to be followed for inviting private investment. The Government has already awarded the project for construction, management and maintenance of two berths container terminal on BOT basis at JNPT to a consortium headed by an Australian firm The cost of the project is around Rs.700 crore to be spent in three years The new terminal will augment the container handling capacity at JNPT to around one million TEUs annually Other ports are also preparing/implementing projects to augment capacity through private investment
7.1199 The following areas have been identified by the Government for private sector participation in the ports sector :
816

i) Leasing out assets o f the portsii) Construction and operation of container terminals, multipurpose cargo
berths and specialised cargo berths, warehousing, storage facilities, tank farms, container freight stations, setting up of captive power plants, etc
iii) Leasing of equipment for cargo handling and leasing of floating rafts from the private sector
iv) Pilotagev) Captive facilites for port-based industries
7 1 200 In order to attract the much needed private sector participation in the port sector during the Ninth Plan, it has been decided to amplify the guidelines to enable the major ports to forge joint ventures in the field o f port development and operations with Indian companies having/not having foreign equity Joint ventures will also be forged between major ports and maritime State Governments in respect o f projects in their own ports or other ports or ports o f maritime State Governments. During the Ninth Plan, with a view to bringing in global technology in port development and operations, it is envisaged to promote tie-up between Indian major ports and suitable foreign State ports, like Singapore/Rotterdom etc. under a Government to Government bilateral assistance programme, which would obviate the need to follow the tender route and help in the speedy implementation o f various projects in the port sector
7 1.201 Further, to make the system transparent and streamlined, an independent Tariff Authority foi Major Ports has been set up to deal with tariff matters. The Authority will fix and revise the various port charges and the charges to be collected by private providers o f ports facilities and publish the same from time to time
7 1 202 During the Ninth Plan, an ambitious investment plan through private sector participation is to be initiated. In addition to plan allocations for major ports, resources to the extent o f Rs 8000 crore are likely to be available for development o f ports. A major portion o f this investment is expected from the private sector
Science & Technology
7.1 203 In the light o f the rapid technological changes taking place in the maritime industry, the three major areas, w^here automation will be aimed at during the Ninth Plan, are :
(a) use o f Vessel Traffic Managements System (VTMS) to facilitate nightnavigation and help in safe pilotage o f vessels at the port channels.
(b) use o f computers in cargo handling operations (especially in containerterminals) as without a well developed data base and computer system to monitor the operations, efficiency in container handling operations cannot be realised.
(c ) use o f Electronic Data Interchange (EDI) for trade related documenttransactions to enable the ports and the port user community to usher in computer networking.
817

7.1 204 Initially, the handling of cargo for loading/unloading of ships in the Indian ports was to be done manually and was highly labour intensive. This scenario has changed with the advent of technological development in the maritime transportation system The emphasis has shifted towards carriage of goods in larger vessels, and mechanised loading/unloading The cumulative outcome of all these has been handling a larger quantity of cargo with less num.ber of workers at the Indian ports
7 1 205 The manning scales were evolved over a period of time based on local conditions and other factors that prevailed at individual ports The existing norms of productivity of labour and equipment can be stepped up and the manning scales rationalised based on a more rationalised categorisation of cargos, introduction of mechanical aids and cargo handling techniques Innovative efforts, including private sector participation in maintaining and leasing equipment, need to be initiated to improve the productivity levels at ports
Development of Intermediate and Minor Ports
7 1.206 Minor/intermediate ports are in the concurrent list of Constitution of India The primary responsibility of their development and management rests with the concerned maritime State Governments There are 163 minor and intermediate ports, out of which 139 are stated to be operable at present. Only a few of these ports are well developed, providing all -weather alongside berthing facilities, each handling over \ 0 million tonnes per year Many are only fair weather ports The minor ports handle cargo like fishery products, foodgrains, fertilizers, building materials etc
7.1.207 The traffic handled by the minor ports is continuously on the rise Traffic handled by these ports has increased from 12.78 million tonnes in 1990-91 to 24 93 million tonnes in 1996-97. Currently, nearly 10% of the total traffic is being accounted for by the minor ports.
7.1.208 The role of minor ports is increasingly assuming importance owing to the development of coastal shipping and is viewed as an alternative to the over-congested major ports Therefore, there is an urgent need for the concerned States to provide adequate funds for the development of minor ports so that they can effectively cater to coastal and sailing vessels and thereby serve as instruments for the development of hinterland. The Ministry of Surface Transport, Government of India as major policy initiative setup a Committee for Navigational Safety in Ports (NSPC) to take care of all aspects of navigational safety, navigational aids, pilotage, hydrographic survery etc , covering new and existing minor/captive/private ports The Ministry of Surface Transport has also set up a Maritime States Development Council under the chairmanship of the Minister for Surface Transport with Transport/Port Ministers from Maritime States as members with a view to coordinating the developmental activities of minor ports
7 1 209 For proper development of port infrastructure and to check wastefijl duplication of port facilities, an integrated approach will be evolved in the Ninth Plan to ensure utmost coordination among the major and minor ports
Manpower Planning
818

ROLE OF MINOR PORTSTraffic at Indian ports in the year 2020 is estimated to be 1,200 million tonnes whereas the existing capacity at the major ports can, at most be expanded to 550 MT Future expansion in port capacity therefore has to come through development of minor ports in a manner complementary to the major portsThe responsibility for developing minor/intermediate ports vests with the concerned State Governments However, the Government of India has also taken a number of steps to facilitate minor port development including amendments to the Major Port Trusts Act, 1963 to facilitate joint ventures between major and minor ports to enable them to access institutional funding and adopt the latest port management techniques Gujarat has taken the lead in planning the development of 10 green field ports of which 6 would be exclusively under the private sector. These projects are likely to involve an investment of Rs 14,566 Cr The ports to be developed by the private sector are to be given on BOMT (Build Operate Maintain and Transfer) basisMaharashtra has decided to invite competitive bids for the development of 7 minor ports (out of 48 in Maharashtra) on Build Own Operate Transfer (BOOT) basis In addition the State Govt has also formulated a policy for allocation of sites for captive jetties required by port based industries in the other minor ports Many in principle approvals have also been given to some companies for construction of private jetties to handle cargoAndhra Pradesh has embarked on a minor port development strategy in respect of two intermediate pons at Kakinada and Machilipatnam and minor ports During the Ninth Five Year Plan the State Govt, has decided to develop five ports viz , Kakinada, Machilipatnam, Vodarevu, Nizampatnam and Bhavanapadu at an estimated cost of Rs.41.02 Cr The development of Deep Water Port at Kakinada taken up with ADB loan assistance is completed and ships are being handled from. October, 96 successfully The State Govt, has also decided to privatise the operation and maintenance of the existing three berths on Operate Maintain Share and Transfer (OMST) basis and the fiiture berths to be constructed on Build Operate Share and Transfer (BOST) terms In Phase I the ports of Kakinada, Machilipatnam, Krishnapatnam and Nizampatnam were offered to the private sector and the remaining ports in Phase II.
Andaman & Lakshadweep Harbour Works (ALHW)
7 1.210 The ALHW executes the Plan projects related to the development of port and harbour facilities in the Union Territories of Andaman & Nicobar Islands and Lakshadweep. During the Eighth Plan, Rs.70.84 crore were spent on the schemes run by ALHW
7 1.211 In the Ninth Plan, the emphasis has been given on completion of spillover schemes o f the Eighth Plan and to carry out new schemes based on future requirements as indicated in the “Master Plan for Transport System in the Andaman & Nicobar Island and Lakshadweep” prepared by the Expert Committee and the recommendations of the Expert Committee (1986) set up for the “Development of Harbours in Lakshadweep” Both these Expert Committees were set up by the Ministry of Surface Transport
819

7.1,212 The MPSO was created in 1962 for carrying out hydrographic surveys of minor ports and inland waterways. This organisation works on “no profit, no loss basis” and charges for the survey undertaken. At present, this organisation is carrying out hydrographic surveys required for the construction and expansion of ports and harbours, inland waterways, survey o f rivers for navigation and flood control, coastal erosion and general navigational surveys o f harbours During the Eighth Plan, the MPSO has spent Rs 11 40 crore in its survey-related activities.
Dredging Corporation of India (DCI)
7 1 213 The DCI was created in 1976 to provide integrated dredging services to the major ports, minor ports, etc The DCI has a modern fleet of seven trailer suction hopper dredgers, two large cutter suction dredgers with pipelines, one ocean going tug and three inland dredgers and other allied crafts
7 1214 It was projected that 131 million cubic metres of capital dredging would be undertaken during the Eighth Plan period Against this, only 46 million cubic metres of capital dredging has been actually carried out During the Eight Plan, DCI spent Rs 88 43 crore on the dredging - related activities
7 1 215 The Ninth Plan proposals have been formulated keeping in view the following needs: (a) replacement of DCI dredgers which are more than 15 years old: (b) augmentation o f dredging capacities to meet the maintenance requirements of major and minor ports; (c) meeting the emerging needs of IWAI for Inland dredgers and (d) providing for ship-repair facilities for DCI dredgers The projected dredging requirements during the Ninth Plan period is estimated to be around 534 million cubic metres comprising of capital dredging o f 142 million cubic metres and maintenance dredging o f 392 million cubic metres.
SHIPPING
Introduction
7.1.216 The role o f shipping in promoting trade and economic development in a country has been recognised by maritime countries world over For India, with a coast line of about 5560 kms. studded with 11 major ports and more than 139 operable minor and intermediate ports, this sector is o f vital importance At present, over 90% of its international trade in terms of volume and 77% in terms of value is moved by sea
7 1.217 In all, there are 80 shipping companies including the public sector. Shipping Corporation of India (SCI) in the country. O f these, 10 principal private companies own a fleet o f 115 ships with a tonnage of 2.245 million GRT accounting for 32 7% of the total tonnage. The largest shipping company is SCI. It owns 118 ships with a tonnage of 3 037 million GRT accounting for 44 2% o f the total tonnage
7 1218 The financial position o f most o f the shipping companies has improved over a period o f time The financial position o f SCI has also shown an encouraging trend There has been a steady improvement in the financial performance of SCI over the years The net profit
Minor Ports Survey Organisation (MPSO)
820

of the company increased from Rs. 109 crore in 1990-91 to Rs 143 18 crore in 1992-93 and to Rs 323 crore in 1995-96 but came down to Rs.233 crore in 1996-97
7.1 219 An analysis o f the age-profile o f the Indian fleet, however does not depict an encouraging picture. A large number o f vessels have either completed their economic life or are due to complete it in the near future. Nearly 15% of the total fleet is in the age group o f above 20 years and 56% in the age group of 11 to 20 years, thus leaving only 29% in the age group of below 10 years. 31% o f the ships owned by SCI is in the age group upto 10 years, 56% between 11 and 20 years and another 13% in the age group of more than 20 years
7 1 220 The Indian shipping industry also plays a prominent role in foreign exchange (FE) earnings o f the country During 1996-97, the Indian shipping industry earned foreign exchange to the tune o f Rs. 5008 crore, as compared to Rs.3176 crore during 1992-93 The FE earnings of SCI were higher at Rs.2310.06 crore during 1996-97, compared to Rs 1745 crore during 1994-95
7.1 221 The share o f Indian shipping in India’s overseas trade is continuously declming, after attaining the peak level o f about 41% in 1987-88. At the beginning o f the Eighth Plan, the share o f Indian flag ships in its overseas trade was nearly 36% and by the terminal year o f the Plan it dropped to 28 percent This decline can be attributed mainly to the stagnating fleet strength, despite the fact that India’s exports and imports have grown at an average annual rate of \% percent The liberalisation of the Indian economy has sparked of a rapid growth in imports necessitating the country to promote the shipping sector so as to generate foreign exchange earnings/savings. The requisite fleet expansion programme needs to come through both the public and the private sectors.
Eighth Plan Performance
7.1.222 Indian shipping has made a steady progress during the post-independence period The Indian tonnage, which was only about 192 lakh GRT on the eve o f independence, reached 6 .6 million GRT by the beginning o f the Eighth Plan
7.1.223 For the expansion of Indian tonnage, the Government has taken a number o f steps during the Eighth Plan These include liberalisation o f the procedures regarding acquisition o f vessels, liberalisation o f ship repair procedure outside India and amendment o f the Merchant Shipping Act to facilitate external commercial borrowings by the shipping companies As a result o f these policy initiatives, the Indian tonnage has exceeded the Eighth Plan target o f 7 million GRT in December, 1995 itself i e more than a year ahead
Eighth Plan Thrust Areas
7.1.224 The thrust areas in the shipping sector during the Eighth Plan included scrapping o f obsolete vessels, acquisition o f modem fuel-efficient vessels, gradual delicensing and deregulation o f the shipping industry, cargo support to Indian shipping, human resource development etc.
7.1.225 In order to develop the Indian shipping industry, a new shipping policy was initiated in 1991 The several policy measures initiated since then are summarised below
821

i) No approval is required for acquisition of ships, except small crafts
ii) No approval is required for sale of ships and acquisition of ships from an Indian shipyard
iii) Shipping companies are given freedom to time charter out Indian ships
iv) Shipping companies are allowed to retain the sale proceed(s) of their ships abroad and utilise the same for fresh acquisition
v) Shipping companies are allowed to acquire vessels through bare boat charter- cum-demise method.
vi) The shipping companies are permitted to get their ships repaired in any shipyard without seeking prior approval o f the Government
vii) Quarterly Block Allocation Scheme for repair of ships has been dispensed with entirely and the RBI now releases foreign exchange for ships repair/drydocking and spares for imported capital goods without any value limit
viii) Certain sections of the Merchant Shipping Act have been amended to facilitate external commercial borrowings by the Indian shipping companies for acquisition of ships from abroad.
Plan Outlay and Expenditure
7 1.226 The details o f the Eighth Plan outlay and the progress of expenditure for theshipping sector are given in Table 7.1 15
Table 7.1.15 Plan Outlay and Expenditure
( Rs Crore)
Scheme 8“* Plan 1992-97 Outlay
1992-96Expdr.
(Actual)
1996-97 8“’’''“"------------------- Expdr.
Outlay Expdr.
1 Shipping Corpn of India
3300 00 2390.78 1895.03 267.80 2658.58
2 Interest Subsidy for sailing vessels
1.82 Nil - -
3 DG Shipping 98 18 89 81 25.01 14.50 104 31
Total 3400 00 2480.59 1920.04 282.30 T l t i m
822

7 1227 To meet the training needs, the Directorate General of Shipping is in the process o f upgrading and modernising the training equipments through a grant-in-aid from the Government of Japan The on-going schemes relate to acquisition of three simulators, namely ship handling simulator, engine room simulator and liquid cargo handling simulator These simulators have since been acquired and become operational
Tonnage Acquisition Target for the Ninth Plan
7 1228 The emphasis during the Ninth Plan will be mainly on maintaining the existing share of Indian flag vessels in its overseas trade At present, the share of Indian shippmy is as follows:
Externally Aided Projects
(i) In the liner trade it is 9 8 per cent, as against India’s entitlement under UNCTAD Liner Code of 40 per cent
(ii) In the dry bulk trade it is 15 6 per cent as against the expectation of 30 per cent
(iii ) In POL products it is 51 8 per cent as against the expectation of 80 percent
7 1 229 The shipping tonnage of 7 13 million GRT of the Indian fleet represents 14 per cent, of the world tonnage of 507 87 million GRT as on 1st July, 1996 To maintain the existing share, the ideal level of Indian tonnage should be around 14 million GRT by the end of the Ninth Plan. But, keeping in view the ground realities like the prevailing difficult conditions in international shipping, shortage of trained and qualified manpower, and constraint of resources, a tonnage of 9 million GRT has been set as the target for the Ninth Plan The additional tonnage would be 50 per cent newly built ships and 50 per cent second-hand acquisitions
Ninth Plan - Thrust Areas and Strategy
7 1 230 Recognising the role of.the shipping sector in the context of the over-all growth strategy in general and the promotion of export and foreign exchange earning in particular, modernisation and diversification of Indian fleet will be accorded top priority during the Ninth Plan The other objectives are;
(i) The world of shipping has undergone a structural change with the introduction of container vessels The strength of the Indian fleet will be augmented with the acquisition of modern fiiel-efficient vessels particularly suited for handling container cargo
(ii) To remove the constraints with a view to achieving the target of 9 millionGRT, the endeavors in brief, will be to (a) create a conduciveenvironment for raising resources from the capital markets and external borrowings, (b) relax the existing constraints of licensing and sectorwise allocation of tonnage in India’s overseas and coastal trade in a
823

phased manner; (c)provide further autonomy in ship acquisition, (d) address the issues of recruitment, training and retention of manpower in Indian Flag vessels; e) make appropriate amendments to the Merchant Shipping Act: (f) ensure speedy development of coastal shipping
(iii) Innovative means will be considered for the expansion of the fleet The setting up of subsidiaries off shore, dual registration of ships and foreign investment either as joint ventures or directly will be encouraged.
(iv) The system of cargo cupport o f canalising the cargo of public undertakings and Government Departments/ agencies through Transchart arrangem.ent will continue The present policy of purchase on FOB and sale on CIF terms is to be followed vigorously
(v) The infrastructural facilities at the ports will be geared not only to relieve theexisting congestion but also to take steps to develop the ‘hub and feeder’ system to enable them to handle large containerised vessels in an efficient manner The repair facilities will be strengthened to meet the requirements of the shipping sector.
Coastal Shipping
7 1 231 Coastal shipping is one of the most energy efficient and the cheapest mode of transport for movement o f bulk commodities over long distances It entails no investment in line-haul capacity except in navigational aids and terminal facilities Considering the vast coast line and severe congestion faced by the land modes of transport, the coastal shipping offers an effective alternative means o f transport The land route particularly along Chennai, Visakhapatnam on the east coast is parallel to the coast thereby holding the potential for diversion of rail/road cargo to the sea route which will result in immense savings owing to the energy efFiciency o f this mode o f transport.
7 1 232 Presently, the cargo moved by coastal shipping comprises coal, clinker, cement, crude oil, POL and iron ore. Over the years, the general cargo, which is an important component o f the coastal trade, has been weaned away by other modes o f transport Thermal coal is presently the major commodity moved by coastal shipping with a share of 63% followed by POL (23%) and iron ore (12%). General cargo accounts for just 1% of the total coastal cargo.
7 1 233 The development o f coastal shipping has been slow despite the fact that the entire coastal trade is reserved for Indian vessels. The shipowners are reluctant to acquire dedicated coastal vessels due to various impediments such as complex customs procedure, time-consuming system o f port clearance, high manning scales at par with overseas shipping, poor port infrastructure etc
7.1.234 One o f the important thrust areas during the Ninth Plan will be the development o f coastal shipping so that the potential o f this mode o f transport could be tapped with a view to relieving the pressure on other surface modes o f transport
7.1.235 The Ninth Plan target of coastal tormage is around 1 million GRT, as compared to0 7 million GRT as at present This target has been fixed in view of the increased movement
824

expected for commodities like coal, iron ore, clinkers etc. in the Indian coast on account of new projects which are coming up biz. Power plants (involving coal movement), mega refineries (involving POL movement), new cement plants on the west coast (involving movement of coal, clinker and cement) etc
7 1 1236 Though the target is modest, it can be achieved only if the various constraints to the growth of coastal tonnage are removed The low productivity at major ports, the paucity of ship repair services and the relative under development of minor ports all affect the operations of coastal shipping very adversely A package, which may include the creation of infrastructure facilities, the simplification of customs procedure, fiscal incentives for development of coastal shipping and synchronising minor port development with the needs of coastal shipping is essential to remove the various impediments hampering its growth
7 1 237 The development of coastal shipping in the country warrants that it should be accorded a status at par with other modes of domestic transport system without subjecting it to rigorous customs procedures. Further, there is a need to develop water transport as a part of a muhi-modal transport system to connect the major\minor ports with the hinterland in a cost- effective manner for the efficiency o f the maritime trade to increase the tonnage handled in our ports Development of minor ports is a necessary precondition for according coastal shipping its proper place in the domestic transport system While developing these ports special care should be taken to ensure that adequate infrastructure is provided for onward transmission of goods to hinterland
M anpower Planning
7 1 238 The ship acquisition target set for the Ninth Plan will require more than 10,000 trained crew to man them In addition, India is endowed with a tremendous potential to enter into the field of export of manpower services which has become a major source of foreign exchange earnings in developing countries like Philippines and South Korea This warrants not only the strengthening of the existing training institutes approved by the DG(Shipping) but also initiatives being taken urgently to supplement the efforts of DG (Shipping) by the development of private merchant marine training institutes and involvement of other major players in the field.
7 1 239 Keeping in view the enforcement of stringent standards of training and certification o f merchant marine personnel in the wake o f the implementation of IMO Convention, it is necessary to upgrade the existing training facilities. State-of-the-art simulators will need to be acquired besides other training equipment, to strengthen the training infrastructure
Lighthouses & Lightships
7 1 240 The Department of Lighthouse and Lightships is a revenue earning Department and derives its income from light dues and light charges from ships. During the Eighth Plan, the anticipated revenue earning is Rs 266 crore
7 1 241 The Eighth Plan provided an outlay of Rs 57 crore Against this, the expenditure has been Rs.25.48 crore
82.5

7.1.242 In the Ninth Plan, emphasis will be placed on automation of existing lighthouses, improvement in visual aids, replacement of existing light house tenders and improvement of training facilities. Establishment of new light houses would be considered on a selective basis.
INLAND W ATER TRANSPORT (FVVT)
Introduction
7,1 243 Inland water transport (IWT) is an energy efficient and cheapest mode of transport for bulk commodities originating and terminatmg on the water fronts It has a high employment potential However, at present it forms a very small part of the total transport network. In terms of tonne kilometres its share is less than 1 per cent The main reason for the small share of IWT is its spatial limitation.
7 1.244 India has navigable waterways aggregating 14,544 kms , of which only about 5,200 kms. of major rivers and 485 kms of canals are suitable for operation of mechanised crafts Most o f the waterways suffer from navigational hazards like shallow waters and narrow width of the channel during dry weather, siltation, bank erosion, absence of infrastructure facilities like terminals and inadequacy o f navigational aids. The existing availability of vessels for IWT in the public and private sectors put together is less than 400 vessels including tankers, bulk carriers, dumb barges and others of average capacity of 600 tonnes
7.1.245 Inland water transport was given priority commencing from the Sixth Plan by laying stress on the development of waterways and modernisation of vessels The two Central Government organisations namely, the Inland Waterways Authority of India (IWAI) and the Central Inland Water Transport Corporation Ltd (CIWTC) together constitute the basic machinery for bringing about a visible growth of the IWT sector The Inland Waterways Authority of India (IWAI) was set up in October, 1986 to coordinate and implement various Central schemes for the development of waterways Three waterways have been declared as “National Waterways” These are : Allahabad-Haldia stretch o f Ganga-Bhagirathi Hooghly river system; Sadiya-Dhubri stretch of Brahamputra river and the West Coast Canal (Kolla-Kottapuram) alongwith Chempakara Canal and Udyogmandal Canal. A number of hydrographic surveys and techno-economic studies have been undertaken on various waterways
7 1.246 The Central Inland Water Transport Corporation (CIWTC) was set up in 1967 by the Government to (i) operate river services, (ii) build ships for which it has a ship building yard at Rajabagan and (iii) undertake ship repair. The CIWTC has been incurring heavy losses. Its capacity remains under-utilised for want of adequate traffic offerings
Review of Eighth Plan
7.1.247 Inland water transport was given a high priority during the Eighth Plan. A provision of Rs 240 crore was made for IWT for the Eighth Plan, against which only a sum of Rs 63 94 crore was spent
7.1.248 There has been a wide gap between the Plan allocation and actual expenditure Only 26% of the allocated funds have been utilised by the IWT sector during the Eighth Plan. There have been major shortfalls in the implementation of the schemes related to
826
modernisation of Rajabagan dockyard, vessel acquisition and development and maintenance of West Coast canal. In general, there have been delays in conceptualisation and execution of the schemes and in achieving the physical and financial targets set for the IWAI and the CIWTC during the Eighth Plan.
7 1 249 The cargo moved by the CIWTC has not shown any upward trend and in fact it constituted a very insignificant proportion of the total cargo moved by IWT mode In contrast the private operators in Goa have shown a remarkable progress and maintained a steady upward trend in terms of iron ore movement by IWT The private operators in Calcutta have also made considerable progress in increasing their tonnage
Ninth Plan - Thrust Areas & Strategy
7 1 250 The potential of cargo movement by the declared National Waterways and other waterways is estimated to be 50 billion tonne kms. by 2005, compared to the current level of less than one billion tonne kms. Considering the potential role and significance of IWT, it is necessary that a substantial step-up in the traffic is achieved in the Ninth Plan, so that the IWT sector will be able to launch itself as a fliture alternative mode of environment-friendly transport system in the sectors identified for its growth It is estimated that a shift of one billion tonne kms to IWT will reduce the fijel cost by Rs 25 crore and the cost of transportation by Rs 45 crore
7 1251 Keeping in view the constraints facing IWT and recognising its potential for growth, the thrust will be to make IWT as an acceptable mode of transportation The basic requirements identified are reduction in cost and time of transportation and enhancement of safety and reliability of the cargo To achieve this, fairway, fleet, terminals and navigational aids are pre-requisites and unless these facilities are provided, IWT will not be able to offer its inherent advantages in terms of cost of transportation and ftjel saving.
7.1.252 To achieve a substantial step-up in traffic in the Ninth Plan the thrust should be on the creation of infrastructure in the form of fairways with adequate depth and width besides the setting up of terminals and navigational aids. At the same time, there is a need to augment the IWT fleet by suitable type of vessels and ensure adequate cargo support. The objective of developing IWT as an important mode of transport cannot be achieved only through the provision of budgetary support to the State enterprises. The private sector has to play a crucial role in the development of the sector. The private sector may be involved not only with ownership and operation of vessels for cargo and passengers but also with the construction and operation of terminals and river ports, the provision and operation of mechanised cargo handling system, fairway development including dredging, provision and maintenance of navigational facilities and provision of pilotage services. In order to attract the private sector for development of this mode, suitable fiscal incentives as well as measures aimed at providing cargo support need to be considered. The Inland Waterways Authority of India (IWAI) is the nodal agency for the development of the navigational infrastructure in the National Waterways..
7.1.253 Considering the huge requirements o f investible funds, there is also a need for taking suitable policy initiatives to channelise the funds for identified user agencies In the Ninth Plan, efforts will be made for pooling the resources through captive users such as public sector undertakings dealing with oil, coal, fertilisers and cement These agencies
827

will be encouraged to make liberal investment in IWT sector either as soft loan or as capital investment which would be recoverable either directly or indirectly over a period of time
7.1.254 Another important avenue to be explored as a source of funding for the IWTprojects would be the external resources. Investment in potential waterways as turn-key package with external assistance may be explored as part of privatisation
7.1.255 Efforts will be made to strengthen the activities of CIWTC through its fleetacquisition programme to facilitate movement of cargo through mechanised cargo- vessels Its performance specially in terms of fleet capacity utilisation needs urgent improvement.
7.1.256 Modernisation of waterways needs to be planned to facilitate 24-hour navigation in the inland waterways. To meet this goal, a number o f lighted buoys are to be provided along the entire water route. Possibilities will be explored for private participation in the provision of turn-key project for the supply, installation and maintenance of lighted buoys
7.1.257 Special emphasis would be laid on the development of inland water transportfacilities in the North-Eastern region. The main bulk commodities, which can beconsidered suitable for inland water transport movement are coal, POL, foodgrains, limestone and dolomite etc. The development of inland water transport facilities in the North-Eastern region would ensure cost effective transportation of the above mentioned commodities
7 1.258 In the past, there have been delays in the formulation and execution of the schemes/projects on account of organisational constraints Accordingly, human resource development is also essential if the Plan objectives are to be achieved With the objective of making IWT economically viable and self sustaining, a massive increase in its outlay has been suggested
Need for inter-sectoral coordination
7 1.259 Interlinking waterways and ports with coastal shipping holds good prospects in respect of several river systems in India. For instance, Ganga- Brahmaputra-Sunderbans river system has the potential to be integrated with Haldia-Calcutta ports, the Brahmani- Mahanadi river system with Paradip port, Krishna-Godavari-Buckingham Canal with Chennai port. West Coast Canal with Cochin port and the Mandavi-Zuari-Cumberjua Waterway with Mormugao Port. The development and connectivity o f these waterways with the ports will not only ensure development of the entire hinterland but will also help in relieving the pressure on the other already congested modes of transportation. Research and Development in IWT sector
7.1.260 Due to the nascent stage of development of the IWT sector, R&D has to play a crucial role in the development on this sector. Design of low-cost and shallow-draft vessel and introduction of navigational aids are important factors for improving the economics o f IWT In view of this, during the Ninth- Plan, an R&D Cell will be set up in IWAI to act as a nodal agency to coordinate the R&D activities required to be carried out in this sector.
828

7 1 261 Being labour-intensive in nature, the IWT sector has the potential for creating employment generation to many categories of personnel for river conservancy andriver-development activitiies, operation and maintenance of terminals and in particular, for manning the inland vessels
7 1 262 The requirement of trained manpower in the IWT sector can be classified into two groups. The first category' would consist of professionals in various fields, like hydrography, navigation, civil engineering, mechanical engineering, naval architecture and transport economics for the development and management of the waterways and operation of various supporting infrastructural facilities The second category' of personnel would be required for operational purposes to man the inland vessels
7 I 263 For building up trained and skilled manpower for IWT operations, the augmentation of Human Development Programme will be accorded priority and the setting up of a National Inland Navigation Institute, Regional Navigational Institutes andRegional Crew Training Centres will be considered during the Ninth Plan
7 1 264 The safety record of inland water transport is not very encouraging The various factors such as navigation aids etc suggested earlier for the development of inland water transport would help in improving the safety of inland water transport operations
CIVIL AVIATION
General
7.1.265 The civil aviation sector is broadly structured into three distinct functional entities, namely regulatory-cum-developmental, operational and infrastructural The regulatory functions are performed by the Directorate General of Civil Aviation(DGCA) and the Bureau of Civil Aviation Security (BCAS). The operational functions are performed by Air India Ltd., Indian Airlines Ltd., Pawan Hans Helicopters Ltd and other scheduled/non-scheduled airline operators. Air India Ltd (AI) provides international air services to/from India. Indian Airlines Ltd.(IA) and other scheduled/non-scheduled operators are responsible for providing domestic air services in the country Indian Airlines Ltd also provides international air services to some of the neighbouring countries Pawan Hans Helicopter Ltd provides helicopter support services primarily to the petroleum sector
7.1.266 The infrastructural facilities are provided by the Airports Authority of India, which is responsible for the management o f 92 airports, including the five international airports at Delhi, Mumbai, Calcutta, Chennai and Thiruvananthapuram, and 28 civil enclaves at the defence airports. The Indira Gandhi Rashtriya LFran Akademi (IGRUA) is the premier flying institute responsible for imparting flying training for award of Commercial Pilots Licence and Commercial Helicopters Pilots Licence Hotel Corporation of India, a subsidiary of Air India Ltd., is responsible for providing in-flight catering and it also operates hotels in the vicinity o f airports for catering to the transit passengers
Manpower Planning
829
7.1.267 Several significant developments took place in the field of civil aviation during the Eighth Plan period. With the repeal of the Air Corporation Act 1953 in 1994, the monopoly of Indian Airlines, Air India and Vayudoot over scheduled air transport services ended. Consequently, 6 private operators, who were hitherto operating as air taxis, were granted the status of scheduled airlines. During Eighth Plan, 7 scheduled operators and 19 air taxi operators have been given permits for operation of domestic air transport services in India. Air India Ltd. and Indian Airlines Ltd. were registered as companies under the Companies Act, 1956 and the undertakings of Air India Corporation and Indian Airlines Corporation were transferred to the respective new companies w.e.f 1.3.1994. With the enactment of the Airports Authority Act, 1994, the tw'o airports authorities viz. the International Airports Authority of India (lAAI) and the National Airports Authority (NAA) were merged w.e.f 1.4.1995 to form a single unified body, viz., the Airports Authority of India (AAI). Vayudoot Ltd. was merged with Indian Airlines l td. w .e.f 25th May, 1993.
7.1.268 Against an outlay of Rs. 3998 crore a sum of Rs. 7096.58 crore was spent during the Eighth Plan. The details of the outlays and expenditure during the Eighth Plan period for different constituent units in the civil aviation sector are given at Annexure-7.1.20. The bulk of the expenditure (98.76%) was financed from Internal and Extra Budgetary Resources (lEBR). The plan of Air India, Indian Airlines, Pawan Hans and Hotel Corporation of India were entirely financed from their lEBR.
Policy Framework and Programme for the Ninth Plan
7:1.269 In domestic air transport operations, the objective would be to provide adequate capacity, ensure healthy competition between the private and the public sector as also safe and reliable operations. To achieve this objective, the private sector would be encouraged to provide air service, while ensuring that only the technical and financially sound players enter the field. In this regard transparent norms would be worked out and regulatory mechanism strengthened with a view to promoting a healthy competition amongst the airlines and protecting the interest of the users.
7.1.270 Indian Airlines was virtually the sole provider of domestic air services for about four decades. With the opening of the domestic Civil Aviation sector, a number of Indian companies announced their plans to start an airline. However, a few of them really got started. Since many of them did not pursue the airline business, their licenses were cancelled. A couple of companies made an early exit after showing their presence for a while. The new airlines which remained in the field concentrated and over-expanded on trunk routes, made inroads into Indian Airlines market share on these routes and in the process reduced the capacity of the national carrier to subsidise the operation on other routes including those in backward and isolated areas. Led by over-enthusiasm these new entrants operated without adequate trained personnel and experience, sustained on the poached highly skilled manpower trained by the Indian Airlines and benefited by the route network developed by the national carrier during a period of more than four decades. While new entrants operated old aircrafts, which were heavy of fuel, Indian Airlines, faced with shortage of skilled manpower particularly pilots, could not fully utilise the rated capacity of the state-of-art aircraft acquired at a heavy cost. Unhealthy business practices
Review of the Eighth Plan
830
and the tendency to offer more frills to the passengers brought about the financial ruin of some of the new entrants; in the process, financial health o f the national carrier was also adversely affected
7 1271 The national carrier plays an important role in the provision of air services in the country. One of the policy objectives for the development o f civil aviation in the 9th Plan would be to create a proper environment to enable the national carriers to operate to full capacity and bear the social burden which ir is required to carry and, in the process, ensuring that the country' gets adequate return for investment made in developing infrastructure, in training highly skilled manpower and in acquisition of the sophisticated and costly array o f equipments and instruments
7.1 272 The bulk of the capacity o f both the Indian Airlines and the private operators is deployed on trunk routes carrying heavy traffic The regional routes, particularly, in isolated and backward areas are characterised by shorthaul operation un-economic load factor, high cost of operation and low revenue yield The operations on these routes are usually unviable In order to ensure that the scheduled operators provide air services on these routes. Route Dispersal Guidelines were issued. Under these guidelines, scheduled operators operating on specific trunk routes are required to deploy a part of their capacity on regional routes including routes in backward and remote areas However, the main burden for providing services on routes serving remote and backward areas is borne by the Indian Airlines. It is necessary that the financial losses of providing air services on these routes are shared equitably by a\\ operators It is equally important to ensure that remote areas are provided with reliable air services To meet these objectives, a more transparent and enforceable mechanism for cross subsidising these routes from the surplus generated by operation on trunk routes will be evolved
7 1273 Air services for distances less than 300 kms are generally uneconomical as compared to surface modes. The corridors where good surface transport modes can be introduced as an alternative to air services will be identified
7.1.274 There are twenty airports in seven States in the North Eastern Region Development programmes have been planned at the airports at Guwahati, Agartala, Shillong, Dimapur and Lilabari In addition, development works are already in progress at airports at Imphal, Tezpur, Silcher, Dibrugarh e tc , with the financial assistance from North Eastern Council Further, two new greenfield aerodrommes are under construction under State Plan at Tura in Meghalaya and Lengpui in Mizoram. Efforts will be made for operating flights in the North Eastern P.egion to connect each State with Calcutta/Guwahati, preferably on a daily basis In this connection, the recommendations of the High Level Commission on tackling the backlogs in basic minimum services and infrastructural needs would be kept in view
7.1.275 International air services are governed by bilateral agreements The general objective of India's bilateral civil aviation relations will be to provide adequate capacity to facilitate easy movement of international traffic to/from India But in doing so, a balance will be struck between the interests of the national carriers on the one hand and promotion of trade, commerce and tourism and convenience o f passengers on the other A more liberal approach will be adopted while negotiating the opening up of new routes, under-served routes and routes providing connection to neighbouring countries
831

7.1.276 The future development/upgradation of airports in the country will be undertaken on the basis of the role they are expected to play in handling the air traffic Master Plans for the development of international, national and regional hubs shall be prepared and upgradation/modernisation taken up accordingly Private sector investment will be encouraged in the construction of new airports from greenfield level and legal framework will be created for private/joint participation in the airlines and airport development projects.
7 1.277 Facilities for maintenance of aircrafts of domestic /foreign airlines will be developed and training of foreign pilots will be encouraged so as to promote regional cooperation and enhance foreign exchange earnings
Air India Ltd.
7.1.278 The international passenger traffic passing to/from India has shown a growth of 4.8% per annum during the period 1987-94. The growth rate for foreign carriers has been 6.3% per annum whereas that of Indian carriers has been only 1.74 percent. As a resuh of this, the market share of Air India in the international passenger traffic has shown a steady decline from 32.8% in 1980 to about 21.3% in 1997.
7 1 279 The growth in capacity and traffic carried by Air India Ltd during the Eighth Plan period is shown in Table 7.1.16.
Table 7.L16 Capacity and Traffic - Air India
(in million)
Year CapacityAvailable
(ATKMs)
CapacityUtilised
(RTKMs)
LoadFactor
(% )
1991-92 1973.1 1148.6 58.21992-93 1904.7 1094.8 57.51993-94 1912.9 1093.8 57.21994-95 2316.2 1384.6 59 81995-96 2610.4 1619.0 62 01996-97 2452.1 1484.6 60 5
7.1 280 While the capacity increased by 24.27%, traffic registered a growth of 29 25% in the Eighth Plan. The financial performance of the Air India during the Eighth Plan period is indicated in Table 7 1.17.
832

Table 7.1.17 Air India - Financial Performance
92-93 93-94 94-95 95-96 96-97
(Rs. in crore)
OperatingRevenue 2435.86 2581.76 2989.01 3426 55 3533.19
OperatingExpenses 2146,28 2459.96 2920.06 3647.56 3945 82
OperatingProfit/(loss) 289 58 121 80 68.95 221.01 412 63
TotalRevenue 2583 19 2767 96 3130 26 3562 70 3817.78
TotalExpenses 2250.05 2566.06 3089.46 3834.54 4114.72
Net Profit/ 333.14 201.90 40.80 (27184) (296.94)(loss)
7 1.281 Air India recorded profits during the first three years of the Eighth Plan Its market share in the international traffic, however, declined during the period to a low level of around 20% in 1993. With the capacity injection through wet leasing of aircrafts, starting from December, 1994, the maicet share improved to 21 3% in 1997 The profitability o f Air India during the period, however, was seriously affected by a softening of yields, partly caused by the necessity of selling the higher capacity.
7.1.282 Air India's Gulf operations, which have been the most profitable segment in its network, have been badly hit by over capacity resulting from the combined effect of new entrants like Indian Airlines, Oman Aviation and Quatar Airways, The resultant decline in Air India's passenger load factors on the Gulf from 64,7% in 1992-93 to 57.9% in 1995-96 put a downward pressure on yields, straining the profitability o f the airline.
7.1.283 The losses of Air India in Europe went up from about 85 crore in 1993-94 to about Rs. 188 crore in 1995-96 because of increased bilateral entitlements to European carriers, which, through higher capacities have led to fare wars and increased discounting in a bid to attract traffic. Further, the fall in the value o f Indian rupee has affected Air India's profitability adversely, as its proportion of dollar- related expenditure is higher than its proportion of dollar- related revenues
833

7 1.284 The key to improvement in the financial performance of Air India is in maximising yields and improving the net margins. To achieve this objective. Air India will intensify the marketing efforts, improve its product and on time performance Given the capacity constraint and the need to maximise asset utilisation. Air India will also stri\e to increase the m_arket share through code shares and alliances The strategy will be to deploy maximum fleet of the airline on core network and derive feed by building up secondary network through alliance and tie-ups
7 1 285 Air India has a number of routes which do not cover even their cash cost of operations but continue to corner the capacity This calls for reducing the frequencies on these routes and redeployment of the released capacity on relatively profitable routes such as India- Gulf route. In the Ninth Plan as a part of turn-around strategy, route rationalisation and redeployment of capacity will be a dynamic function so that Air India would be able to respond proactively to variations in market demand
7 1 286 The physical and financial performance of Air India will be examined in depth with a view to working out a comprehensive strategy for turn-around
7 1 287 The fleet of Air India as on December 31, 1996 consisted of 28 owned aircrafts, comprising 9 Boeing 747-200, 2 Boeing 747-300, 6 Boeing 747-400, 8 Airbus A3 10-300 and 3 Airbus A300-B4 aircraft At present. Air India's fleet consists of 5 types of aircraft having varied capacity and technical features This necessitates higher investment m creation of infrastructure facilities which are sub-optimally utilised
7 1 288 In the Ninth Plan, therefore. Air India will standardise its fleet to three aircraft types. The fleet with lesser aircraft types will require lesser investments on spares, maintenance facilities and simulators and will also result in better utilisation of aircraft infi-astructurai facilities and technical manpower of pilots and maintenance engineers
Indian Airlines Limited
7 1.289 The long-term annual growth in domestic passenger traffic from 1960-61 to 1987-88 has been around 10% per annum. However, during the period 1988-93, the growth was erratic and negative on overall basis. Following the entry of private scheduled operators, making available additional capacity on domestic routes, domestic passenger traffic grew significantly in 1993-94. The growth, however, was not sustained and began to taper off ft'om the very next year and later declined ftirther to register a negative rate of growth in 1996-97.
7.1.290 The growth in capacity and traffic carried by Indian Airlines Ltd during the Eighth Plan period is indicated in Table 7 118
834

Table 7.1.18 Capacity and Traffic - Indian Airlines
(in million)
Year Capacity Capacity LoadAvailable Utilised Factor(ATKMs) (RTKMs) (%)
199 U92 1089 9 761A 69 81992-93 967 685 70.91993-94 1057 695 65 81994-95 1026 686 66 91995^96 1045.8 722.7 69.11996-97 1075.2 698 1 649
7 1291 Indian Airlines achieved a negative growth of (-)l 34% and (-)8 28% in capacity and traffic, respectively in the Eighth Plan This is largely because Indian Airlines could not utilise its fleet and other facilities optimally due to exodus of pilots and engineers after the opening up of the sector to the private operators There was a marked decline in aircraft utilisation by Indian Airlines during the 1990s and the level achieved in 1995-96 for A-300, A-320 and B-737 aircrafts hovered between 1600 and 2200 hours, which is far below the previous or a desirable level of 2700 hours per annum per aircraft
7 1292 The share of Indian Airlines in the domestic market declined with the induction of capacity by other domestic operators. The loss in market share is largely concentrated on the trunk routes of Indian Airlines resulting in the private operators cornering almost half of this market segment
7 1 293 The fleet of lA at the end of Eighth Plan consisted of 10 A-300 aircrafts, 30 A-320 aircrafts and 12 B -137 aircrafts
7 1 294 The financial performance of Indian Airlines during the Eighth Plan period is indicated in Table 7 1 19
Table 7.1.19 Indian Airlines - Financial Performance
(Rs. in crore)
Financial 92-93 93-94 94-95 95-96 96-97OperatingRevenue 1513 12 1781.79 2044.72 2466.81 2848 55OperatingExpenses 1592.01 1849.76 2008.48 2310.30 2713.24OperatingProfit/(loss) (78.89) (67.97) 36.24 135.31 266 65Total Revenue 1560,97 1816.37 2070.24 2489.84 2914.39Total Expenses 1756.08 2074.83 2258.97 2599.82 2928 98Net Profit/ (loss) (195.11) (258.46) (188.73) (109.98) (14.59)
835

7.1.295 The Airline has incurred losses during Eighth Plan period. The deterioration in the physical performance of the airline was reflected in its financial performance. The airline, which was making profits till the end of 1980s, started making losses since 1989-90. From 1989-90 to 1996-97 Indian Airlines has incurred losses of over Rs.lOOO crore including a sum of around Rs.767 crore in the Eighth Plan. This has led to a severe reduction in the reserves of the Indian Airlines. Apart from the unsatisfactory physical performance, the reasons for poor financial performance after 1989-90 include the grounding of A 320 aircraft from February 1990 till October, 1990, the burden assumed by the airlines after the merger of Vayudoot and the absorption of high increase in the input cost by Indian Airlines.
7.2.296 Indian Airlines operations on routes in the North East & Jainmu and Kashmir have been traditionally loss- making. But these operations are vital and have to be maintained. Earlier, Indian Airlines was able to cross-subsidise these routes from surpluses on profitable routes. With the introduction of private airlines and consequent decline in the market share and profitability on trunk routes, the capacity of Indian Airlines to cross-subsidise these routes has been severely eroded. Indian Airlines has been operating services to these areas well above the mandatory guidelines of DGCA. The losses suffered by Indian Airlines on account of operations on these routes amount to Rs. 325 crore for the period from 1989- 90 to 1994-95.
7.1.297 A Committee of experts has examined the various causes of the deterioration in physical and financial performance of the Airlines and suggested turn-around strategies. In line vvilh the recommendations of the Committee, a fresh equity injection of Rs. 125 crore will be made by the Government of India to enable the Airlines to realign its presently unacceptable levels of leverage and also to serve as an indicator of the Government's continued commitment to the Airlines. As a part of financial restructuring the equity share holding of the Government in the Company will be brought down to 49%. The major effort, however, has to come from the organisation itself It is, therefore, necessary that the airlines should continue to improve its product so as to remain a dominant airline particularly on the trunk routes. This objective will be achieved through better fleet utilisation and by ensuring healthier industrial relations oriented towards enhanced productivity.
7.1.298 Indian Airlines has to play a role distinct from that of privately owned commercial airlines. A leading carrier in domestic aviation in which considerable amount of public investment had been made in the past, Indian Airlines is expected to meet certain strategic requirements and provide services which may be essential in the national interest. Indian Airlines is to act as a leader of the airlines industry in the country in establishing safety norms, reliability, productivity as well as viability. Over the years, it has developed expertise not only in the provision of air services but also in the field of engineering services and development of highly skilled personnel. Indian Airlines, therefore, has the potential to develop as a dominant regional player not only as a provider of air services but also as an institution which can provide training and engineering services to other users and airlines, both domestic and regional.
7.1.299 In order that Indian Airlines play this role, it is necessary, on the one hand, to create a conducive policy framework; and, on the other, to take suitable financial and organisational measures to make the airlines a viable and a vibrant enterprise. This calls for the restructuring of Indian Airlines in which ail stakeholders will be involved. Apart from financial restructuring aimed at improving its financial health and providing a sound
836

capital base, organisational restructuring will also be carried out so that it can function as a company managed by a Board constituted of professionals. Indian Airlines has to be given autonomy in their day- to- day working without the Government relinquishing its responsibility. There is a need to evolve fleet planning strategy which takes into account the route structure of the Indian Airlines so as to ensure optimum utilisation of resources, particularly aircrafts.
7.1.300 The market share of Indian Airlines in the domestic passenger traffic is presently hovering around 65 percent. Indian Airlines has targetted a market share of around 55-60% in the Ninth Plan.
Airports Authority of India
7.1.301 The Airports Authority of India is responsible for management and development of civil airports and civil enclaves at Defence airports in the country. Apart from this, the Authority is also responsible for providing navigational facilities to the aircrafts operating in India.
7.1.302 In 1996-97, 3.96 lakh aircraft movements involving 243 lakh domestic and 122 lakh international passengers and 2 lakh metric tonnes of domestic and 4.8 lakh metric tonnes of international cargo were handled at the AAI Airports. Presently, air operations are being carried out only through 61 airports. The remaining are lying unutilised or at best handling occasional aircraft operations.
7.1.303 The Airports Authority of India was able to attain substantially the goal ofupgradation of infrastructure and modernisation of communication facilities as well as maintenance of existing infrastructure during the Eighth Plan period. In order to keep pace with the growth of international trade and for promotion of exports the airport infrastructure was upgraded in terms of storage space, better handling capacities and development of cargo complexes particularly in Delhi and Mumbai airports. Investments were also made in respect of the hinterland airports, having potential for exports as well astourism such as Agra, Jaipur, Ahmedabad, Varanasi, Lucknow, Thiruvananthapuram.Substantial investments were made for the development of air strips and upgradation of communication facilities and other infrastructure in remote areas like North-East, J&K, Andaman & Nicobar islands as private investment was unlikely on account of the remoteness of the areas and adverse economic factors. Twelve airports were identified for being developed as model airports and renovation/construction of new terminal complexes, extension of runways, upgradation of communication facilities and other passenger related facilities were undertaken on a priority basis.
7.1.304 The Airports Authority of India has significantly improved its financialperformance during the Eighth Plan period. The details of the financial performance of the International Airports Division and the National Airports Division are given in Table 7.1.20.
837
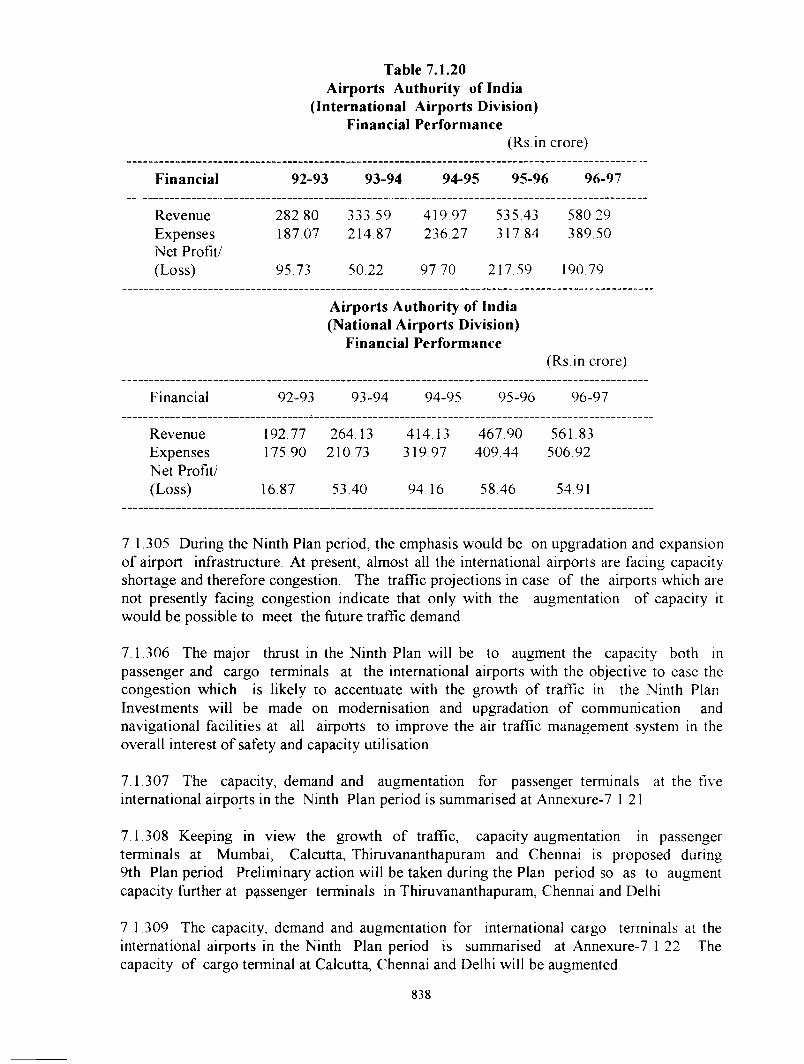
Table 7.1.20 Airports Authority of India
(International Airports Division) Financial Performance
(Rs in crore)
Financial 92-93 93-94 94-95 95-96 96-97
Revenue 282 80 333.59 419 97 535.43 580,29Expenses Net Profit/
187 07 214.87 236.27 317 84 389.50
(Loss) 95.73 50.22 97 70 217.59 190.79
Airports Authority of India (National Airports Division)
Financial Performance(Rs in crore)
Financial 92-93 93-94 94-95 95-96 96-97
Revenue 192.77 264.13 414.13 467 90 561 83Expenses Net Profit/
175.90 210 73 319 97 409 44 506 92
(Loss) 16.87 53.40 94 16 58 46 54.91
7 1.305 During the Ninth Plan period, the emphasis would be on upgradation and expansion of airport infrastructure. At present, almost all the international airports are facing capacity shortage and therefore congestion. The traffic projections in case of the airports which are not presently facing congestion indicate that only with the augmentation of capacity it would be possible to meet the future traffic demand.
7.1.306 The major thrust in the Ninth Plan will be to augment the capacity both in passenger and cargo terminals at the international airports with the objective to ease the congestion which is likely to accentuate with the growth of traffic in the Ninth Plan Investments will be made on modernisation and upgradation of communication and navigational facilities at all airports to improve the air traffic management system in the overall interest o f safety and capacity utilisation
7 1 307 The capacity, demand and augmentation for passenger terminals at the international airports in the Ninth Plan period is summarised at Annexure-7 121
five
7.1.308 Keeping in view the growth of traffic, capacity augmentation in passenger terminals at Mumbai, Calcutta, Thiruvananthapuram and Chennai is proposed during 9th Plan period. Preliminary action will be taken during the Plan period so as to augment capacity fiarther at passenger terminals in Thiruvananthapuram, Chennai and Delhi
7 1.309 The capacity, demand and augmentation for international cargo terminals at the international airports in the Ninth Plan period is summarised at Annexure-7 1 22 The capacity of cargo terminal at Calcutta, Chennai and Delhi will be augmented
838

7 1 310 The traffic demand at both passenger and cargo terminals would be closely monitored
7 1 311 Apart from augmenting the capacity at terminals, the programme for upgradation of runways, additional taxi-ways and increased aircraft parking stands at the international airports would be taken up during the Ninth Plan period as is summarised at Annexure- 7 1.23.
7 1312 These works are proposed to be taken at all the five international airports with a view to improving the runway capacity and safety of operation, facilitating the efficient movement of aircraft and providing better service to passengers
7 1313 The airports other than five international airports handle approximately 26 5% of the total traffic In the Ninth Five Year Plan period 30 domestic airports would be further developed for meeting the traffic demand AAI has planned to take up expansion and modification of existing terminal building, construction of new terminal building and terminal complexes at 30 Airports Extension/strengthening and construction of new iTjnways at 28 airports are planned during the period It is proposed to upgrade and modernise the Ground and safety services at the airports
7 1314 Communication and navigational facilities will be improved in the interest of safety Installation of Aircraft Collision Avoidance Systems (ACAS) equipment on all aircrafts flying in India shall be made mandatory Satellite based Communication, Navigation, Surveillance /Air Traffic Management (CNS/ATM) systems are being introduced at Delhi and Mumbai airports These will be extended to other airports as soon as possible. The objective will be to cover the entire air space by Secondary Surveillance Radars and Satellite Based Systems Further, a greater civil- military liaison will be maintained for joint surveillance of Indian air space
7.1.315 Speed and efficiency will be ensured in passenger and cargo handling. For this purpose, technological and other improvements will be made by the introduction of automation and computerisation, mobile check-in counters, improvement in immigration and security checks, mechanisation of baggage and ground handling services, provision of aero-bridges, improvement in systems o f passenger transfer between terminals, improvement in cargo terminals, reduction in bunching of flights and contracting out the operation and maintenance facilities
Development of airports through public/pTivate participation
7.1.316 As airport construction is highly capital intensive. Government alone will not be able to meet the investment requirement Private sector, therefore, will have to be encouraged to participate in the construction of airports at greenfield level A greenfield airport may be permited where an existing airport is unable to meet the projected requirements of traffic or a new focal point of traffic emerges with sufficient viability It can be allowed both as a replacement for an existing airport or for simultaneous operation. The Government may, while permitting a greenfield airport decide whether it will be in the public or private sector or to be taken up as a joint venture
8.19

7.1.317 In order to involve private sector in the development of airports in the country, Ministry o f Civil Aviation and Airports Authority of India have taken certain steps. These include creation of Directorate of Infrastructure Development in Airports Authority of India, creation o f Airport Restructuring Committee to identify existing airports for private sector participation etc. However, it is necessary to take up concrete steps for involving private sector in the development of airports. These have been identified and would be taken up by the Ministry of Civil Aviation and Airports Authority of India in a time bound manner.
PRIVATE PARTICIPATION IN DEVELOPMENT OF AIRPORTS
There is a need for the participation of private sector in the development of airports both for reasons of bridging the gap in resources as also to bring in greater efficiency in management of airports The legislative framework for privatisation of airports already exists in India. In fact, some airports are already owned by State Governments, private companies and even individuals.The strategy in the Ninth Plan will be to permit utmost latitude in the patterns of ownership and management of airports in the country. All the options in respect of the management of airports or parts o f airports will be kept open. These could be on Build- Own-Transfer (BOT), Build-Own-Lease-Transfer (BOLT), Build-Own-Operate (BOO), Lease-Develop-Operate (LDO), Joint Venture, Management Contract or Wrap-around Addition basis In each individual case, the exact pattern could be negotiated, depending on the circumstancesMinistry' of Civil Aviation will identify existing airports, in respect of which private sector involvement for development and upgradation of infrastructure is desired. Initially five airports will be identified for upgradation as world class international airports Ministry of Civil Aviation will also prepare a shelf o f projects in respect of greenfield airports. The pre-feasibility reports will be made available to private investors
In order to attract private investment, Airports Authority of India (AAI) will be corporatised. AAI will create separate profit centres for all individual airports and hive them off as subsidiary companies on a case to case basis, for the purpose of entering into commercial arrangements or joint ventures with private parties An independent statutory body will be set-up to facilitate expeditious decision on the proposals for setting up of greenfield airports.
Pawan Hans Helicopters Limited
7.1318 The main function of Pawan Hans Helicopters Ltd. is to provide support services to the oil sector. Pawan Hans is also meeting the helicopter requirements of State Governments, PSUs and other customers. With the increased competition, owing to the entry of private operators, Pawan Hans would need to strengthen its customer base The Company is exploring new areas for providing helicopter services such as police, para military forces, geophysical sur\^eys, adventure sports and tourists charters. It also hopes to become a maintenance centre for light helicopters for other smaller operators.
7.1 319 The financial position of Pawan Hans is quite sound as it was having monopoly in the market segment being catered to by it. However, with the entry of private operators, Pawan Hans will have to gear up to meet the challenge
840

7.1.320 Directorate General o f Civil Aviation (DGCA) is making efforts to enhance the level of air safety in India. These efforts are yielding good resuhs and as a result number of accidents are decreasing. The efforts will not only be continued but intensified in the Ninth Plan so as to enhance the safety level. DGCA has identified several steps to achieve this objective
7 1.321 The main thrust during the Ninth Plan period would be on stepping up the regulatory control through reorganisation, expansion of existing disciplines and development of human resources through intensive advanced training
Bureau of Civil Aviation Security
7.1.322 The Bureau of Civil Aviation Security (BCAS) is responsible for ensuringadequate security arrangements at the airports in all its aspects During the Ninth Planperiod, the BCAS will augment the existing BOmb Detection and Disposal Squads units atDelhi, Mumbai, Calcutta and Chennai airports. It will also provide latest security equipment namely Explosive Detectors, Coloured X-Ray Baggage inspection Systems, Metal Detectors (Door Frame and Hand held) at various airports in the country
Indira Gandhi Rashtriya Uran Akademi
7.1.323 The IGRUA was set up in 1985 to provide training fui commercial pilots TheAkademy, located at Fursatganj, U P is equipped with modern training aids including aircraft, helicopters and flight simulator etc. The Akademi, was initially being funded by the Government, Air India and Indian Airlines for meeting its requirement towards capital expenditure. However, since the major beneficiaries of the pilots getting the training from the Akademi are the two national carriers,viz.. Air India and Indian Airlines, it was decided that they should be required to contribute towards the expenditure of the Akademi
7.1.324 With the entry o f the private operators on the civil aviation scene, the national carriers are no more the only beneficiaries of the training imparted by the Akademi Therefore, contributions will also be raised from the private airlines. Efforts will be made to make the Akademi self-sustaining by increasing the number of trainees and enhancing the fees charged from the trainees
Hotel Corporation of India
7.1.325 Hotel Corporation o f India is a subsidiary of Air India. After a gap of about 11 years, it has turned the comer and is earning profits from 1994-95 The Company hopes to earn profits during the Ninth Plan period. The Air India will explore the possibilities of disinvestment in the Company during the Ninth Plan period
Directorate General of Civil Aviation
841

PROFILE OF TRANSPORT SECTOR
ANNEXURE 7 .1 .1
SL.
No.
Item
1. RAILWAYS
1.1 Route Length
1 .2 E le c t r i f ie d Route Length
1 .3 Throughput
1 .3 .1 F re ig h t t r a f f i c ( T o t a l )
1 .3 .2 Net Tonne (K m s.)
1 .3 .3 Passengers O r ig in a t in g
1 .3 .4 Passenger Kms.
1950-51 1960-61 1970-71 1980-81 1990-91 1991-92 1995-96 1996-97
Kms.
Kms.
M.Tonnes
B .T .K m s.
M i l l io n s
Mi U io n s
53596 562A7 59790 61240 62367 62458 62915 62725
388 748 3706 5345 9968 10653 12306 13018
9 3 .0 0 156.20 196.50 220.00 34 1 .4 0 360 .0 0 405.50 409.02
4 4 .1 2 87.68 127.36 158.47 24 2 .7 0 256.-90 273.52 279 .9 9
1284 1594 2431 3613 3858 4049 4018 4153
66517 77665 118120 208558 295644 314564 341999 357013
2 . ROADS
2 .1 T o t a l Length 000 Kms. 400 525 915 1485 2350 2486 3320 N .A.
o f w hich N a tio n a l Highways- 000 Kms. 22 24 24 32 3 3 .7 3 3 .7 34.5 N .A .
2 .2 Percentage o f V i l la g e w ith Percent NA NA N .A . 29 4 5 .8 4 6 .6 8 5 .7 N .A .
2 .3
1000 + p o p u la tio n connected
w ith a l l w eather roads
S urfaced Length 000 Kms. 156 234 398 684 1113 1160 1517 N .A .
3.
3 .1
ROAD TRANSPORT
No. o f Goods V e h ic le s In '000 82 168 343 554 1356 1514 1785 N .A .
3 .2 No. o f Passenger Buses In '000 34 57 94 162 331 358 449 N .A .
4.
4.1
MAJOR PORTS
No. o f m ajor p o rts Numbers 5 9 10 10 11 11 11 11
4 .2 T r a f f i c handled M .Tonnes 1 9 .3 8 33.12 5 5 .5 8 8 0.27 151.67 156.64 215.34 227.26
5.
5.1
MINOR PORTS
T r a f f i c handled K .Tonnes N .A . N .A . 6 .6 9 6.7 3 11.27 13.33 2 4 .3 6 2 4.93
6
6 .1
( i )
C IV IL AVIATION
In d ia n A i r l i n e s
A v a ila b le Tonne Kms. Mi l l i o n N .A . 113 208 663 927 1090 1046 1075
( i i ) Revenue Tonne Kms. Mi l l i o n N .A . 83 161 420 699 761 723 698
6 .2
( i )
A i r In d ia
A v a ila b le Tonne Kms. M i l l io n N .A . N .A . 515 1623 2260 1973 2610 2452
C i i ) Revenue Tonne Kms. M i l l io n N .A . N .A . 275 980 1381 1149 1619 1485
6 .3 No. o f A ir p o r t s arid Numbers N .A . N .A . N .A . 84 117 117 120 120
7.
7.1
C i v i l E ncla ve s
INLAND WATER TRANSPORT
Length o f N a v ig a b le Waterways Kms. 14544 14544 14544 14544 14544 14544 1-4544 14544
842

Road and R a il Route Length in R e la tio n t o Area and P o p u la tio n in In d ia
As on 31st March, 1996 (S ta te -W is e )
Annexure 7.1.2
ALL INDIA/STATE/UTs Area
(S q .K m s .)
P o p u la tio n T o t a l Road Length (K m s.) R a il ro u te Len gth (K m s-)
VLaKnS^
1991
Census
KOoQ
Length
(K m s.)
Per 100
Sq. Kms.
of Area
Per 1
Lakh of
P o p u la tio n
T o ta l Per 100
Sq. Kms.
Per 1
Lakh of
Popula tio i
1 2 3 4 5 6 7 8 9
ALL INDIA 3291080 8443 2403634 7 3 .0 284 .7 62915 1.91 7 .45
1. Andhra Pradesh 275068 664 172669 6 2 .8 2 6 0 .0 5057 1.8 4 7 .6 2
2. Arunachal Pradesh 83743 9 10240 12 .2 1137.8 1 0 .0 0 0.11
3. Assam 78438 223 68079 8 6 .8 305.3 2441 3.11 10.95
4 B ih a r 173877 863 85565 49 .2 99,1 5283 3.0 4 6 .1 2
5. Goa 3814 12 7457 195.5 6 2 1 .4 79 2 .0 7 6 .5 8
6 . G u ja ra t 196024 412 133850 6 8 .3 3 2 4 .9 5320 2.71 12.91
7 . Haryana 44212 163 27907 63.1 171.2 1452 3 .2 8 8.91
8. Himachal Pradesh 55673 51 29610 53.2 580.6 266 0.4 8 5.2 2
9. Jammu & Kashmir 222236 77 13042 5 .9 169.4 88 0 .0 4 1 .1 4
10. K avnatata Ik .U 3 1 8 .6 3124 1.6 3 6.97
11. K erala 38863 290 141856 3 6 5 .0 489.2 1053 2.71 3 .6 3
12. Madhya Pradesh 661 198936 4 4 .9 3 0 1 .0 6000 1.35 9 .0 8
13. Maharashtra 307690 788 359262 116 .8 4 5 5 .9 5462 1 .78 6 .9 3
14. Manipur 22327 18 10760 4 8 .2 597.8 1 0 .0 0 0 .0 6
15. Meghalaya 22429 18 8391 3 7 .4 466.2 0 0 .0 0 0 .0 0
16. Miroram 21081 7 6910 3 2 .8 987.1 2 0.01 0 .2 9
17. Nagaland 16579 12 13732 8 2 .8 1144.3 13 0 .0 6 1 .0 8
18. O ris s a 155707 315 210238 135 .6 667 .4 2191 1.41 6 .9 6
19. Punjab 50362 202 58151 115.5 287 .9 2121 4.21 10.50
20. Rajasthan 342239 439 134632 3 9 .3 306 .7 5924 1.73 13.49
21. Sikkim 7096 4 1834 2 5 .8 458.5 0 0 .0 0 0 .0 0
22. Ta m il Nadu 130058 556 205706 158.2 370 .0 4005 3 .0 6 7 .2 0
23. T r ip u r a 10486 27 14726 1 40 .4 5 45.4 45 0 .4 3 1 .6 7
24. U t ta r Pradesh 294411 1390 237358 8 0 .6 1 70.8 8934 3.0 3 6 .4 3
25. West Bengal 88752 680 77579 8 7 .4 114.1 3817 4 .3 0 5.61
UNION TERRITORIES
A & N Is la n d s 8249 3 1224 1 4 .8 4 0 8 .0 0 0 .0 0 0 .0 0
Chandigarh * 114 6 1723 1511.4 2 87 .2 11 9.65 1.8 3
D S N H a ve li 491 1 518 105.5 518 .0 0 0 .0 0 0 .0 0
Daman & Diu 3814 1 (a ) — — 0 0 .0 0 0 .0 0
D e lh i * 1483 94 26582 1792.4 2 8 2 .8 214 14.43 2 .2 8
Lakshadweep 32 1 (b ) — — 0 0 .0 0 0 .0 0
P o n d ich e rry 495 8 2343 4 73 .3 2 9 2 .9 11 2 .2 2 1 .3 8
Note: * Road le ngth in term s o f 1 2 ' w id th
(a ) In c lu d e d in Goa S ta te (b ) Not a v a ila b le
843

WEXLFE 7.1.3
TWNSRm SECICR - OUTLAY »D EWBCmre INH? ThC FUINS
(®(TFE + STATES)
(fe. crcre)
SeCtET First Plan
(1951-56)
Ssnrd Plan
(1<5&«1)
Third Plan
(19S1-66)
Fourth PLsi
(1969-74)
Fifth Plai
(1974-79)
Sixth Plai
(1983«)
Saeith Plai
(1965-90)
E i ^ Plai
(1 9 5 ^ ^
QjtL^ QjtL%' Bp*-. QjtL^ Bp*-. CUtl^ cut Ley B<fd-. CutL^ B<p*'. QjtL^ Bpi'. c u tl^ b ^ .tt
1 2 3 4 5 6 7 8 9 10 11 12 13 14 15 16 17
257 2T7 900 723 890 1335 1CE0 SB4 M V ?Tfi3 5100 ffiSS 12334 m 9 dJiii. VI
(tad Trai^xrt
15
12
W)
)
a s
)
)
%2
)
)
297
)
)
440
27
871
92
852
128
12E3
461
17D1
5CB
5®
11%
3887
1276
spnn
1TO 2151
12833
4119
16C65
TvW
ftrts 37 as 45 33 )153 95 195 3 » 571 488 ia 725 1230 1513 3557 ?TP
aiiFping 26 19 I& 5S
)
■)\
TO 1 5 « 0 Th ^65 m 72D 363? 5B3
iwr
)
)\
4 12 11 32 16 72 63 295 188 S I 152
Li^TthOBes
& Li^itdTips
)
)
)
4 7 6 14 9 12 * 30 * 57 25
Civil Ai/iatioi 29 23 43 49 55 2B 177 S 7 'SI* 859 957 758 19a 4CB3 7K9
Other TrBDsport 0 0 0 0 0 0 0 0 0 0 0 0 49 72 2 9 3Vi
Total Transport
Sector
5C6 iSt, 1299 I t D TS5 19E0 2571 2522 543D 55C 1^H) T3951 7?HA 29576 56C60 6m )
Total R U ic
Sedtr
2Q69 1930 4SD 46?2 7500 8B77 199G2 15(79 » 3 6 y*o) KB291 laxco 21S25 434100 ilW
Trw^jort Sectrr
a s / ^ t 3
R ijlic.Sw Irr
» .S 22.1 27.1 25.5 18.6 25.1 16.2 16.0 13.8 14.1 12.4 12.8 12.6 13.5 12.9 12.2
* ircUilsd irdT Ftrts sectrr. #/>ticipaUii.
844
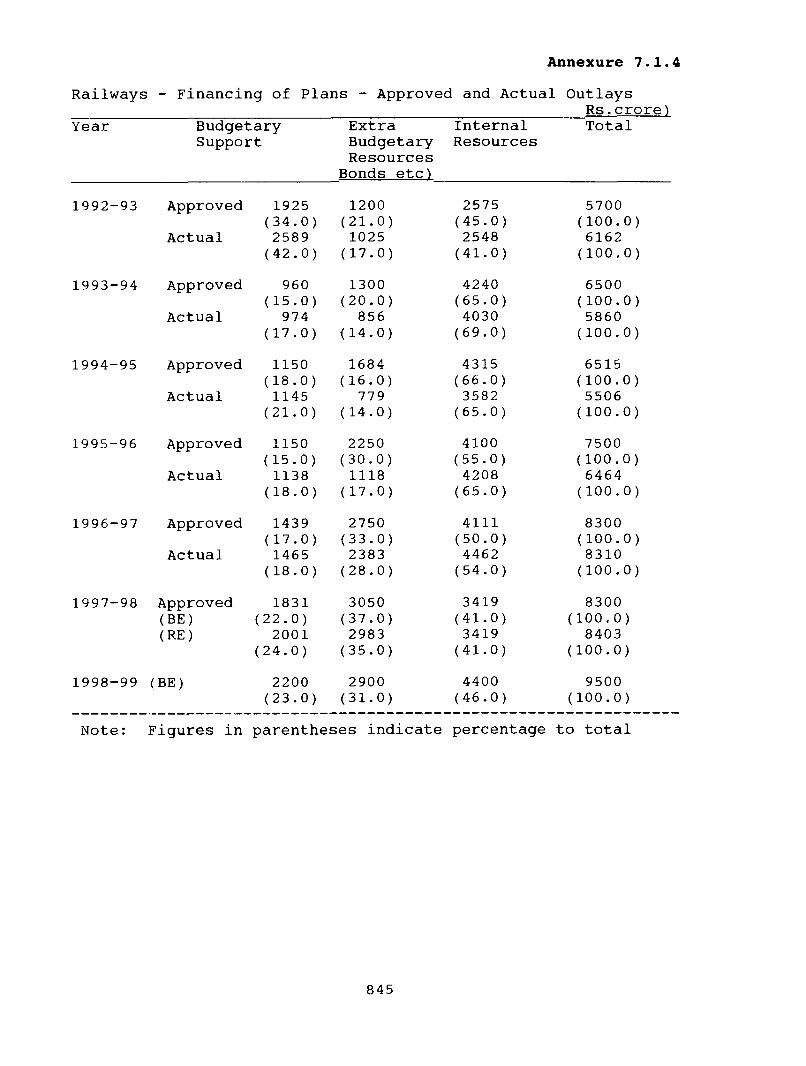
Annexure 7.1.4Railways - Financing of Plans - Approved and Actual Outlays
R s.crore)Year Budgetary
SupportExtra Budgetary Resources
Bonds e t c )
InternalResources
Total
1992-93 Approved 1925 1200 2575 5700( 34 . 0 ) ( 21 . 0 ) ( 45 . 0) ( 100 . 0 )
Actual 2589 1025 2548 6162( 42 . 0 ) ( 17 . 0 ) ( 41 . 0) ( 100 . 0)
1993-94 Approved 960 1300 4240 6500( 15 . 0 ) ( 20 . 0 ) ( 65 . 0) ( 100 . 0)
Actual 974 856 4030 5860( 17 . 0 ) ( 14 . 0 ) (69 . 0) ( 100 . 0)
1994-95 Approved 1150 1684 4315 6515( 18 , 0 ) ( 16 . 0 ) ( 66 . 0) ( 100 . 0)
Actual 1145 779 3582 5506( 21 . 0 ) ( 14 . 0 ) ( 65 . 0) ( 100 . 0)
1995-96 Approved 1150 2250 4100 7500( 15 . 0 ) ( 30 . 0 ) (55 . 0) ( 100 . 0)
Actual 1138 1118 4208 6464( 18 . 0 ) ( 17 . 0 ) ( 65 . 0) ( 100 . 0 )
1996-97 Approved 1439 2750 4111 8300( 17 . 0 ) ( 33 . 0 ) ( 50 . 0) ( 100 . 0)
Actual 1465 2383 4462 8310( 18 . 0 ) ( 28 . 0 ) ( 54 . 0) ( 100 . 0)
1997-98 Approved 1831 3050 3419 8300(BE) ( 22 . 0 ) ( 37 . 0) ( 41 . 0) ( 100 . 0)(RE) 2001 2983 3419 8403
( 24 . 0 ) ( 35 . 0 ) (41 . 0) ( 100 . 0)
1998-99 (BE) 2200 2900 4400 9500( 23 . 0 ) ( 31 . 0) ( 46 . 0) ( 100 . 0)
Note : Figures in parentheses indicate percentage to t o t a l
845
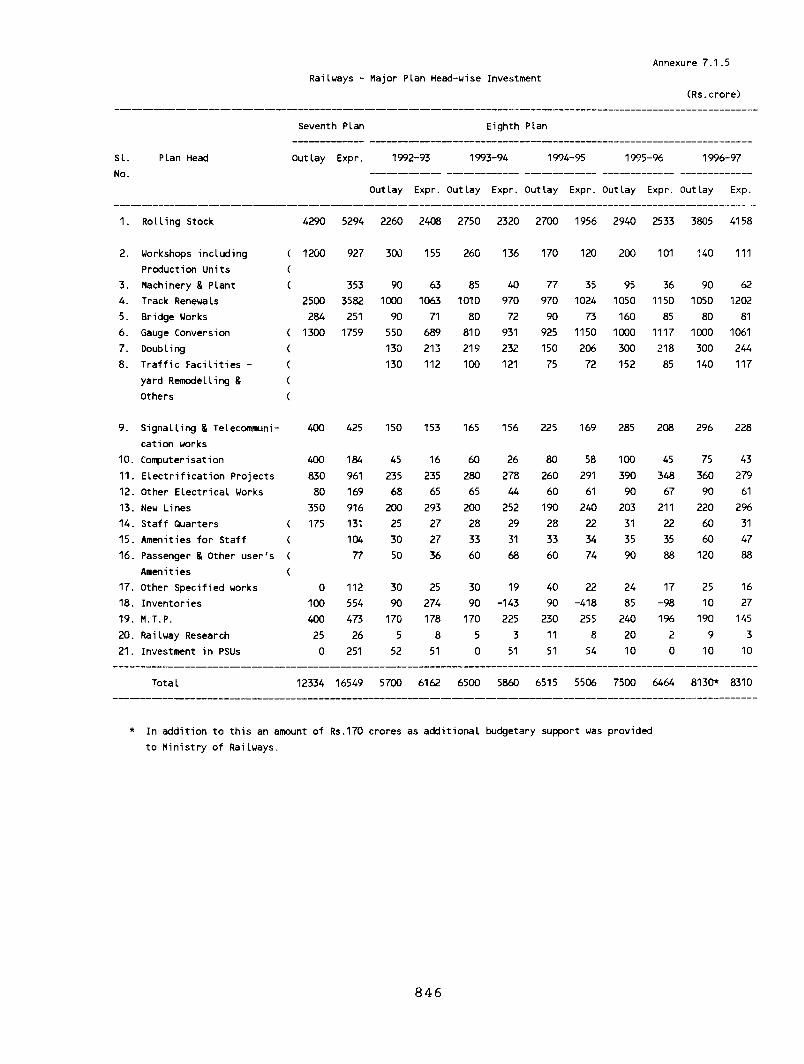
Railw ays - M ajor P lan Head-w ise Investm ent
Annexure 7.1.5
(Rs.crore)
Seventh Plan E ig h th Plan
S I .
No.
Plan Head O u tla y Expr. 1992-93 1993-9A 1994-95 1995-96 1996-97
Out lay Expr. Out lay Expr. Out la y Expr. O u tla y Expr. Out lay Exp.
1. R o llin g Stock 4290 5294 2260 2408 2750 2320 2700 1956 2940 2533 3805 4158
2. Workshops in c lu d in g ( 1200 927 300 155 260 136 170 120 200 101 140 111
P ro d uctio n U n its (
3 . M achinery & P la n t ( 353 90 63 85 40 77 35 95 36 90 62
4 . Tra ck Renewals 2500 3582 1000 1063 1010 970 970 1024 1050 1150 1050 1202
5. B rid g e Works 284 251 90 71 80 72 90 73 160 85 80 81
6. Gauge C onversion ( 1300 1759 550 689 810 931 925 1150 1000 1117 1000 1061
7. D oubling ( 130 213 219 232 150 206 300 218 300 244
8. T r a f f i c F a c i l i t i e s - ( 130 112 100 121 75 72 152 85 140 117
yard R em odelling & (
O thers (
9. S ig n a llin g S Telecommuni 400 425 150 153 165 156 225 169 285 208 296 228
c a tio n works
10. C om pu terisatio n 400 184 45 16 60 26 80 58 100 45 75 43
11. E l e c t r i f i c a t i o n P ro je c ts 830 961 235 235 280 278 260 291 390 348 360 279
12. O ther E l e c t r i c a l Works 80 169 68 65 65 44 60 61 90 67 90 61
13. New Lines 350 916 200 293 200 252 190 240 203 211 220 296
14. S ta ff Q u a rte rs ( 175 131 25 27 28 29 28 22 31 22 60 31
15. Am en itie s f o r S ta ff ( 104 30 27 33 31 33 34 35 35 60 47
16. Passenger S O ther u s e r 's ( 77 50 36 60 68 60 74 90 88 120 88
Am en itie s
17. O ther S p e c if ie d works 0 112 30 25 30 19 40 22 24 17 25 16
18. In v e n to r ie s 100 554 90 274 90 -1 4 3 90 -4 1 8 85 -9 8 10 27
19. M .T .P . 400 473 170 178 170 225 230 255 240 196 190 145
20. R ailw ay Research 25 26 5 8 5 3 11 8 20 2 9 3
21. Investm ent in PSUs 0 251 52 51 0 51 51 54 10 0 10 10
T o ta l 12334 16549 5700 6162 6500 5860 6515 5506 7500 6464 8130* 8310
* In a d d it io n to t h is an amount o f Rs.170 cro re s as a d d it io n a l budgetary suppo rt was pro vid e d
to M in is tr y o f R ailw a ys.
846
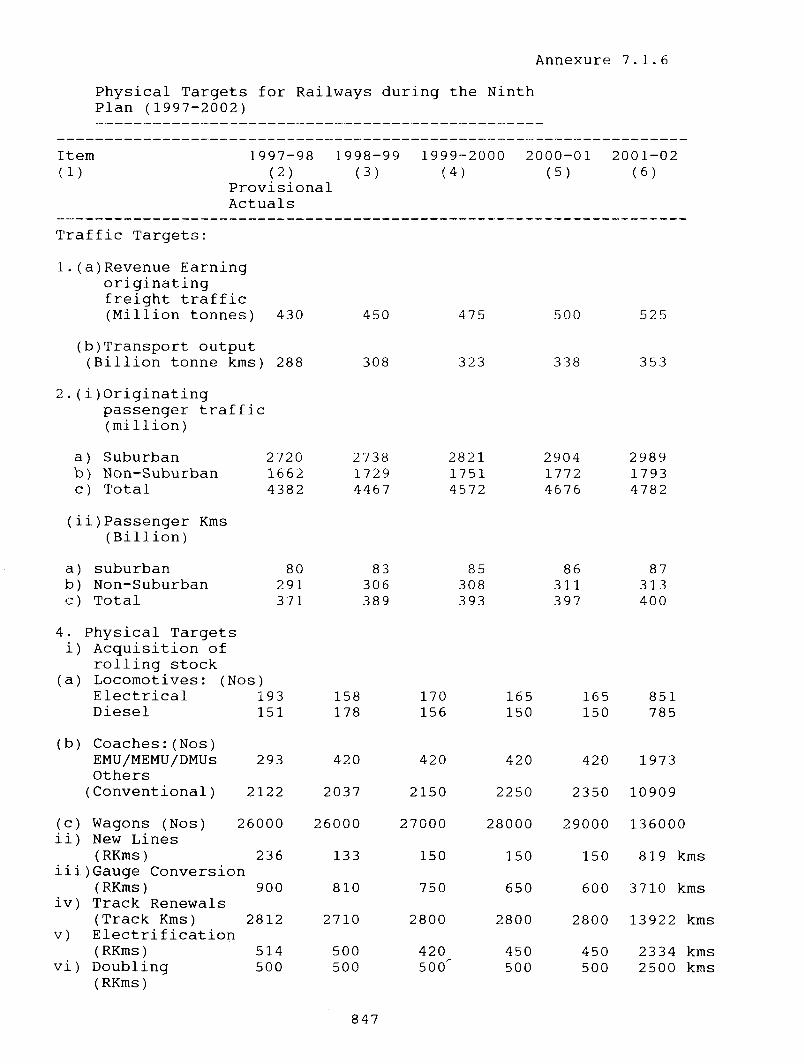
A n n e x u r e 7 . 1 . 6
Physical Targets for Railways during the Ninth Plan (1997-2002)
Item( 1 )
1997-98 1998-99(2) (3)
Provisional Actuals
1999-2000(4)
2 0 0 0 - 0 1(5)
2 0 0 1 - 0 2( 6 )
T r a f f i c Targets;
l . (a)Revenue Earning o r ig in a t in g f r e ig h t t r a f f i c (M il l ion tonnes) 430
(b)Transport output ( B i l l i o n tonne kms) 288
450
308
475
323
500
338
525
353
2 . ( i )Originatingpassenger t r a f f i c ( m i l l i o n )
a) Suburban 2720 2738b) Non-Suburban 1662 1729c) Total 4382 4467
282117514572
290417724676
298917934782
( i i ) Passenger Kms ( Bi l l ion)
a) suburbanb) Non-Suburbanc) Total
4. Physical Targets i ) A c g u is i t io n of
r o l l i n g stock (a) Locomotives: (Nos)
80291371
83306389
85308393
86311397
87313400
E le c t r i c a l 193 158 170 165 165 851
(b)
Diesel
Coaches:(Nos)
151 178 156 150 150 785
EMU/MEMU/DMUsOthers
293 420 420 420 420 1973
(Conventional) 2122 2037 2150 2250 2350 10909
(c)i i )
Wagons (Nos) New Lines
26000 26000 27000 28000 29000 136000
i i i( RKms) 23 6
) Gauge Conversion133 150 150 150 819 kms
iv)( RKms)Track Renewals
900 810 750 650 600 3 710 kms
V)(Track Kms) E l e c t r i f i c a t i o n
2812 2710 2800 2800 2800 13922 kms
(RKms) 514 500 420 450 450 2334 kmsVi) Doubling
(RKms)500 500
847
500" 500 500 25 00 kms

CENTRAL SECTOR ROADS - TARGETS & ACHIEVEMENTS
A n n e x u re 7 . 1 .7
SI. Scheme Unit VII Plan Period VIII Plan PeriodNo. (1992-97)
Target Achievements
Target Achievements
1. Missing Link Km. 15 92. Widening to two
lanesKm. 1503 1636 1094 901
3. Widening to four lanes
Km. 116 96 615 245
4. Strengthening weak 2 lane
Km. 3351 4025 3445 3542
5. Bypasses Nos. 11 12 14 96. Major Bridges Nos. 70 56 73 377. Minor Bridges
Including ROBNos. 375 392 326 264
848

'■ Ks .
J^NNEXURE 7.1.8Outlay/Expenditure of Road Sector (Centre -- Eighth Plan 1992-97)
Name of the Scheme 8th Plan Outlay
Revenue Section
1. Research & Development
2. Grant to NHAI3. Strategic Roads
TOTAI. (Revenue)
Capital Sectron
24 ,00 0 . 0 0
42.00
6 6 . 0 O'
2 0 . 0 0 1 j. 5' 0 . 0 0
Machinery Nat 1 onal !̂lgĥ ^̂ ay it'riqinal Worts;B’>;ternally aided 914.00Sclie-mesMa t: I onal iii gliway;\uttior 1 T;y i;:f India •■Hi. 00Knk;. entrusted toNKAI 0.00t>'rder Roads Developmerit Board ISO. 00
BE E-d .1993-94
EE E-Xp.1 9 9 5 - 9 f,
BE Exp.1990-97
BE Exp.1992-97
Total Ex d .
. 9u 1. 92 5.0 4 2.20 4 . 0 3.18 -- -50 3.20 3 . 25 1.00 11.500 . 5 0 0. 0 0 0. 0 1 0. 0 0 3.0'.̂ 3.00 3.00 3.00 10. 00 10. 00 16.0011.10 10.50 12 .51 10. 09 9.5 i- 9 . 50 5 1 7 . 50 7.51 4. 67 42 . 26
19.50 iO . 42 17 . 5 6 ] 9 7 Q 1 6 . 5 ‘ 15 . 68 15.01 13.70 20.76 15. 67 69.7 6
2 .50 1.85 2 .50 1.77 2 .4,; 2 3 8 1 . 00 0. 32 2 . 50 2. 44 8.7620 . ST 320.84 2 98.69 2 96.98 31^.5t 317.54 3 6 6 . 3 4 351.94 365.64 3 65.64 1652.94
8 0.00 80.30 220.00 J73.35 267 . 5' 2 11 . 4 8 3i9.55 265.04 317.00 369.80 1149.97
0 .00 0.0 0 0 . 0 0 0.00 0 . Of) 0.0 0 0. 00 0 . 00 200.00 200.00 200.00
0.00 0.00 0 . 00 0.00 o . o ; ; 0.00 0. 00 20 . 00 24 . 00 24 . 00 44 .00
38.00 41.00 41.00 47.04 48.00 48.00 52.00 51.00 53.00 52.99 M O.03
Schemes of Economic S Importance 60.00
Capital 2534.00
GRAND TOTAL 2 600.00(Revenue + Capital)
2.50 2.50
443.87 44 6.49
463.3"^ 458.91
3.25 3.25 3.0. 0.74 12.00 3.25 12.GO 12.00 21.74
565.44 522.39 522.3'^ 630.14 638.44 691.55 974.14 1026.87 3317.44
583.00 534.68 538.90 645.82 653.45 705.25 994.90 1042.54 3387.20
849

HIGH DENSITY TRAFFIC CORRIDORS OF NATIONAL HIGHWAYS
SI. NH No. Section Appx. LengthNo. KM
I. DELHI-BOMABY
1. 8 Delhi-Jaipur 2602. 8 Jaipur-Ajmer 1353. 8 Ajmer-Udaipur 2734. 8 Udaipur-Ahmedabad 2875. 8 Ahemdabad-Mumbai 473
Total 1428
II. DELHI-CALCUTTA
1. 2 Delhi-Agra 2002. 2 Agra-Kanpur 2803. 2 Kanpur-Allahabad-Varanasi 3314. 2 Varanasi-Barhi 2845. 2 Barhi-Calcutta 395
Total 1490
III AGRA-BANGALORE
1. 3,25 Agra-Jhansi 2002. 25 Jhansi-Lakhnadon 4003. 7 Lakhnadon-Nagpur 1604. 7 Nagpur-Hyderabad 4005. 7 Hyderabad-Bangalore 560
Total 1720
IV. MUMBAI-CHENNAI
1. 4 Mumbai-Pune 1452. 4 Pune-Satara-Belgaum 3153. 4 Belgaum-Chitradurga-Bangalore 4554. 4 Bangalore-Chennai 320
Total 1235
V. CHENNAI-BANGRIPOSI (JN WITH NH NO.6)
1. 5 Chennai-Vijayawada 4342. 5 Vijayawada-Vishakhapatnam 3953. 5 Vishakhapatnam-Bhubaneshwar 4184. 5 Bhubneshwar-Bangriposi 285
Total 1533
VI. MUMBAI-CALCUTTA
1. 3 Mumbai-Dhule 2732. 6 Dnule-Nagpur 5153. 5 Nagpur-Sambalpur 5 544. 5 Sambalpur-Calcutta 575
Total 1918
A n n e x u r e 7 . 1 . 9
850

Annexure 7.1.10
PHYSICAL TARGETS FOR THE NINTH PLAN
YEAR 1997 -2 0 0 2
A C T IV IT Y 1998-99PhysicalKms/nos.
1999-2000Physicalkms/nos.
2000-01Physicalkms/nos.
2001-02Physicalkms/nos.
T O T A LPhysicalkms/nos.
1. W id e n in g to two lanes 267 218 256 291 1032(kms .)
2. I'oi ir lan ing (kms.) 36 29 37 51 153
3. S trengthen ing/prov id ing
Paved shoulder (kms.) 624 .584 657 729 2594
4 Bypasses (nos.) 4 4 5 7 20
?. M a jo r Bridges/ 9 7 9 1 1 36Rehab i l i ta t ion
6. M in o r Br idge .s/R()Bs(nos.) 45 44 51 58 198
N o te : I tc in-wisc ach iev cm en l against Serial Nos. 1-6 o f the Tab ic above w ere 162 Km.. 49 Kms.. 314 Km.. N IL N os. . 4 Nos., and 28 Nos.. respectivcK' dur ing the year 1997-9X.
851

TENTH FINANCE COMMISSION
PROVISION FOR MAINTENANCE OF ROADS
A n n e x u r e 7 . 1 . 1 1
(Rs. lakhs)
State 1995-96 1995-97 1997-98 1998-99 1999-2000 1995-2000
Andhra Pr. 22471 30069 37667 45265 52863 188335Arunachal 1242 1628 2014 2399 2785 10068PradeshAssam 9295 11711 14128 16544 18960 70638Bihar 13586 16663 19741 22819 25896 98705Goa 914 1246 1579 1912 2245 7896Gujarat 25257 29732 34208 38683 43159 171039Haryana 6998 7544 8099 8658 9177 40476Himachal Pr. 3889 4928 5968 7007 8047 29839J&K 2749 3470 4191 4912 5633 20955Karnataka 14133 17785 21436 25088 28740 107182Kerala 10957 12772 14588 16403 18219 72939Madhya Pr. 28685 30922 33195 35486 37615 165903Maharashtra 47356 51050 54802 58583 62098 273889Manipur 400 667 933 1200 1466 4666Meghalaya 2812 3031 3254 3479 3688 16264Mizoram 1303 1404 1508 1612 1708 7535Nagaland 1438 1709 1980 2251 2522 9900Orissa 15280 20807 26334 31861 37388 131670Punjab 8393 10938 13482 16027 18571 67411Rajasthan 19238 20738 22263 23799 25227 111265Sikkim 851 917 984 1052 1116 4920Tamil Nadu 25697 27702 29738 31790 33697 148624Tripura 996 1339 1681 2024 2366 8406Uttar Pr. 31753 43086 54420 65753 77087 272099West 12975 17541 22108 26674 31240 110538Bengal
Total 308668 369399 430301 491281 551513 2151162
852
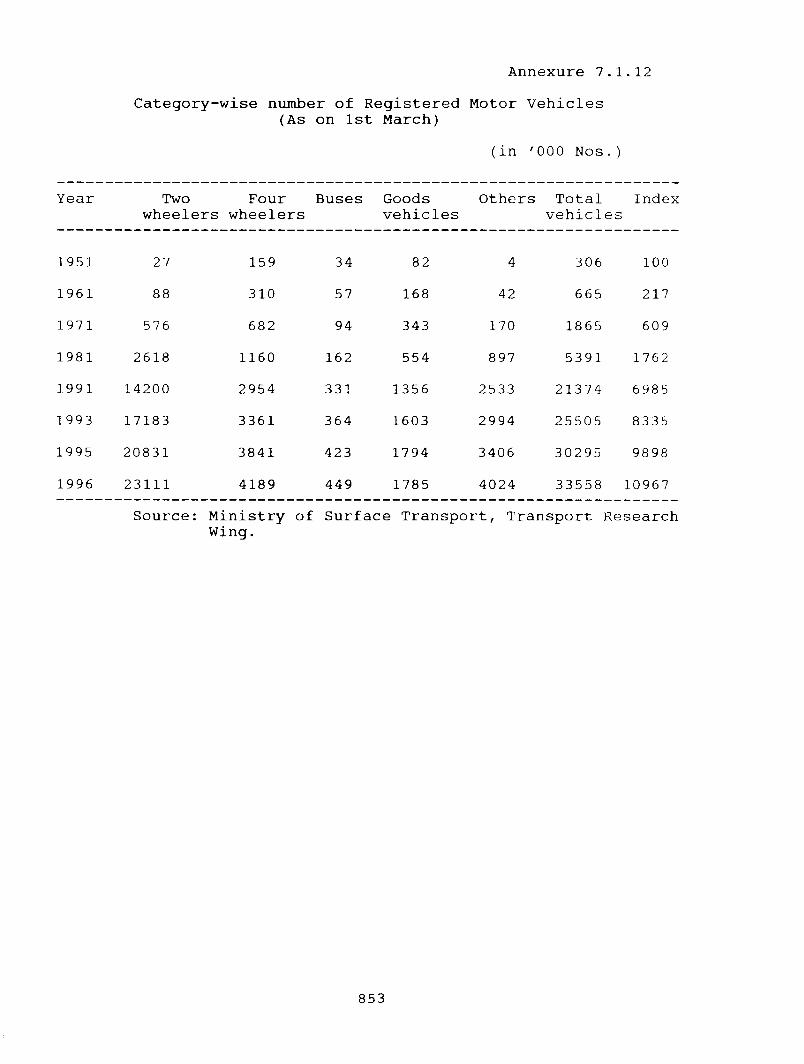
Annexure 7.1.12Category- wise number o f Registered
(As on 1st March)Motor
(in
Vehicles
' 000 Nos. )
Year Twowheelers
Fourwheelers
Buses Goodsv e h ic le s
Others Total Index v e h ic le s
1951 27 159 34 82 4 306 100
1961 88 310 57 168 42 665 217
1971 576 682 94 343 170 1865 609
1981 2618 1160 162 554 897 5391 1762
1991 14200 2954 331 1356 2533 21374 6985
1993 17183 3361 364 160 3 2994 25505 8335
1995 20831 3841 423 1794 3406 30295 9898
1996 23111 4189 449 1785 4024 33558 10967
Source: Ministry of Surface Transport , Transport Research Wing.
853

Annexure 7 . 1 . 1 3
Outlay and expenditure for Eighth Plan
ImportantP r o je c t s /Schemes
8th : 1992-
Approvedoutlay
Plan-97
Actual Expdr.
1. Delhi Transport Corp. 140.00 19 . 422. Capital Contribution
to SRTCs 70. 00 27. 14
3. Road Safety Prog. 35 . 80 29. 87Road sa fe ty Cell 0. 30 0 . 34P u b lic ity Measure 5 . 00 2 .37Grant-in-Aid 1. 50 0 . 82P ollution Testing Eguip. 10 . 00 6 .86Road Safety Eguip. 10.00 13.99National Highway/PetrollingScheme 9.00 5 . 49
4. Training Prog. 7 . 10 0 . 73including computerTraining of In s tr . 4 .50 0 . 22Training Prog. 0. 10 -Training of Driver 2 . 00 0.02Computer 0 . 50 0 . 49
5. Research & Development 4 . 00 0 . 16
6. CIRT 4.50 1.67
7. Mis. including Studies 2 . 60 0 . 62Transport Studies 2.00 0.46Data C o lle ction 0 . 60 0 . 16
8. New Scheme 0. 00 0.55Control of V. Po l lu t io n 0. 00 0 . 34Energy Conservation 0. 00 0.21
Total 264. 00 80 . 16
854

Annexure 7.1.14Share of Fleet (Passenger Buses) in the
Private & Public :Sector
(In '000 N o s . )
Year Private Public Total Share ofSector Sector public
s e c t o r (%)
1980-81 92 70 162 43 . 01981-82 91 74 165 44. 81982-83 100 76 176 43 . 21983-84 119 77 196 39 . 31984-85 131 80 211 37 . 91985-86 143 84 227 37. 01986-87 152 89 241 36. 91987-88 170 95 265 35 . 81988-89 179 99 278 35 . 61989-90 203 102 312 32 . 71990-91 225 106 331 32. 01991-92 251 107 358 29. 81992-93 271 110 381 28 . 71993-94 282 110 392 28. 01994-95 315 110 425 25 .91995-96 338 111 449 24. 7
Source: Ministry of Surface Transport, Transport Research Wing.
855

Amexure 7.1.15
PHYSICAL PROOUCTIVm IH)1CATORS OF STATE RCW) TRANSPORT UNDERTAKINGS - EIGHTW PLAN AND NINTH PLAN
Fleet U tU isa tio n
( % age of Buses
on Road)
Vehicle Productivity
(Kins, per bus held
per day)
Staff Productivity
(Kms. per worker
per day)
Bus Staff Ratio Fuel Efficiency
(On fle e t operated) (Kms. per L itre )
NAME OF H C
S.R.T.U.
8th Plan 9th Plan 8th Plan 9th Plan
Terminal Terminal Terminal Terminal
Year Year Year Year
1996-97 2001-2002 1996-97 2001-2002
Lat. Est Target Lat. Est Target
1. An*ra Pradesh
2. Arvnachal Pradesh
3. Assam
4. Bihar
5. Goa
6. Gujarat
7. Haryana
8. Himachal Pradesh
9. Jannu S Kashmir (B)
10. Karnataka
ferala
12. Machya Pradesh
13. hfaharashtra
14. Manipur (B)
15. H e ^ la y a
16. Mizoram (B)
17. Nagaland
18. Orissa
19. Pmjab toadways
20. PEPSU RTC
21. Rajasthan
22. Sikkim (B)
23-42 Tamil Nadu
43. Tripura (B)
44. Uttar Pradesh
45. Calcutta STC
46. North Bengal STC
47. South Bengal STC
ALL INDIA AVERAGE
97
84
76
78
73
87
95
97
70
91
80
80
93
41
50
45
29
64
94
90
90
70
60
91
79
72
58
97
84
85
70
79
88
95
97
ao
94
SD 91
64
61
60
65
90
95
93
91
75
94
75
93
85
90
81
92
8th Plan
Terminal
Year
1996-97
9th Plan
Terminal
Year
8th Plan 9th Plan 8th Plan 9th Plan
Terminal Terminal Terminal Termirel
Year Year Year Year
2001-2002 1996-97 2001-202 1996-97 2001-20C2
306 310
139 128
143 220
34 183
195 215
293 300
300 320
207 226
93 121
274 294
m 276
2SX, 260
280 3C5
84 1(B
73 98
45 56
47 92
139 255
241 268
258 270
281 300
65 75
383 394
90 135
214 252
146 174
193 261
132 204
278 302
Lat. Est. Target Lat. Est Target Lat. Est Target
39.8 41.0 8.0 7.8 5.0 5.0
23.5 28.1 5.4 5.4 3.7 3.7
14.7 26.0 13.6 9.7 4.1 4.3
4.7 1.0 48.0 312.0 4.0 4,0
32.0 34.0 8.5 8.0 3.7 4.0
45.1 45.1 7.5 7.5 4.8 5.0
54.1 57.7 5.8 5.8 4.4 4.5
39.6 40.4 5.4 5.7 3.4 3.5
15.4 18.2 6.7 6.5 3.6 3.7
43.5 50.8 6.3 5.8 4.6 4.5
36.6 39.6 9.2 8.7 3.8 3.9
22.7 37.5 11.2 6.9 4.3 4.6
39.5 45.4 7.4 7.4 4.6 4.6
7.6 10.7 22.0 10.6 3.5 3.5
15.2 22.2 9.6 7.3 3.3 3.4
7.1 6.9 14.3 13.3 3.2 3.3
8.3 18.4 19.4 7.7 3.7 3.5
18.0 35.0 14.0 8.0 4.0 4.1
44.9 50.8 5.3 5.3 4.2 4.2
46.9 49.9 4.8 5.0 4.3 4.3
51.7 57.4 6.2 6.0 4.8 4.8
20.7 20.7 5,1 5.1 3.2 3.2
52.3 51.3 7.9 7.8 4.2 4.3
9.2 15.8 14.0 10.5 3.5 3.5
30.6 38.5 7.4 7.0 4.6 4.7
15.9 21.3 11.7 9.7 3.5 3.5
27.6 36.2 9.6 8.0 3.9 4.0
26.0 36.9 9.3 6.3 3.7 4.1
40.5 44.5 7.6 7.3 4.5 4.5
856

(In Million Tonnes)
Annexure 7.1.16
Volume of Traffic at Major Ports
Name of the Port 1991-92 92-93 93-94 94-95 95-96 96-97l.Calcutta/Haldia 16.00 18.34 18.50 20.54 21.52 23 . 122 .Mumbai 26.26 28 . 95 30.51 30.67 33.92 33.733.J .L .Nehru 2.79 3.01 3. 38 5.01 6 .87 8.074.Chennai 25.05 25.33 26.54 29.46 30. 72 31.855.Cochin 7.48 7.98 7. 62 8.63 11.50 11. 746.Vizag 21.52 22.76 25.59 30.03 32.82 34. 507.Kandla 21.00 22.91 24. 50 26.50 30.34 33 . 738-Mormugao 15. 10 16.31 18.72 18.88 18.09 17.319.Paradip 7.30 7.60 8.33 10. 12 11.26 11.5810.New Mangalore 8.27 7.09 8.63 8.01 8.88 12.4611.Tuticorin 5.87 6.22 6.70 8.04 9.29 9. 17
Total 156.64 166.50 179.02 195.89 215.21 227.26
857

Annexure 7 . 1 . 1 7
Composition of Traffic Handled at Major Ports(In m i l l io n Tonnes)
CoiTunodity 1991-92 1992-93Actuals
1993-94Actuals
1994-95Actuals
1995-96Actuals
1996-97Actuals
POL 67. 60 73. 76 76 . 92 80. 37 90. 92 98. 08Iron Ore 32. 10 29. 83 34. 10 34. 35 34. 56 33 . 30Coal 22. 40 24. 49 26. 81 30. 80 33. 79 34 = 87F e r t i l i s e r 9. 92 9 . 91 9 . 47 11.00 12 .36 7. 18Container 6 . 72 7 . 62 11.90 15.01 17 . 44 20. 59General Cargo 17, 90 20. 89 19. 82 24. 36 26. 14 33 . 49
Total 156. 64 166. 50 179. 02 195 = 89 215. 21 227. 26
858

A n n e x u r e 7.1.18
P o r t s - E i g h t h P l a n O u t l a y a n a E x p e n d i t u r e
S . No . A n n u a l Plan A p p r o v e d E x p e n d i t u r e P e r c e n t a g eO u t l a y i n c u r r e d U t i l i s a t i o n(R s .c r o r e ) ( R s .crore) Plan O u t l a y
(A) M A J O R PORTS
(i) 1992-93 5 41.66 253. 44 46.8(ii) 1993-94 584 .34 270.99 46.4(i i i ) 1994-95 434.50 310.54 71.5(iv) 19 9 5 - 9 6 721 .43 419.26 5 8.1(V) 1996-97 576.60 486.80 84.4
Total(A) 2 8 5 8.53 1741.03 GO . 9
(B) O T H E R S ( D C I , A L H W , M P S O , e t c . )
( i) 1992-93 ■71,10 on c; O -no ^ Kj .
(ii) 1993-94 37 .20 45.71 122 . 9(iii) 1994-95 40.50 2 6.58 65 . 6(IV) 1995-96 92.70 42 . 44 45 . 8(V) 1996-97 55 . 00 30 . 67 55 . 8
T o t a l ( B ) : 296.50 165.98 55 . 9
Gr and Total(A) + ( B ) ; 31 5 5 . 0 3 1 907.01 60 . 44
859

Port-wise Traffic and capacity projections at the end of Ninth Plan
(In Million Tonnes)
S.No. Name of the Planned Capacity AugmentationPort By the End of 2002
Capacity ----------------------- ------------(As on Traffic New Spill Over Prod.
31.3.97) (2002) Schemes of VIII Plan Improv.and others
A n n e x u re 7 .1 .1 9
1. Calcutta 7.87 8.652. Haldia 17.70 23.08 7.53. Paradip 10.90 33.46 4.04. Vizag 31.45 45.01 0.55. Chennai 25.90 56.54 9.56. Tuticorin 7.60 16.24 3.17. Cochin 13.46 16.74 4.58. New Mangalorel6.45 34.91 13.09. Mormugao 19. IB 23.58 18.010. Mumbai 30.80 43.45 11.011. JNPT 9.90 24. 51 15.312. Kandla 24.00 97 .80 36.0
Total 215.21 423.94 122.4
37 50
37 50
860

Annexure 7.1.20
Statement Showing Details of Outlays and Expenditure during 8th Plan - Civil Aviatior*
(Rs. crores)
SI. Name of the Organisation No.
8th Plan Outlay
iy94-95
Approved ActualOutlay Expdr.
p̂rovedOutlay
Actual Expdr.
Approved ActualOutlay Expdr.
p̂rovedOutlay
Actual Expdr.
1996-97 1992-97----------- ------- Expdr.Approved Actual duringOutlay Expend. Ei^th Plan
1. Axr India Limited
2. Indian Airlines Limited
3. Vayudoot
4. Pawan Hans Limited
5. Airports Authority of India
a) International Airports Div.
b) National Airports Div.
1800.00
1 2 2 0 . 0 0
5.00
80.00
400.00(67.00)
0.50(0.50)
25.57
117.97
275.47( 2 0 . 00 )
571.76
155.24
0.50(0.50)4.90
75.38(1.50)
724.70
418.97
5.66 MA
28.28
135.80
250.00(3.71)
79. 31
253.54(1.54)
119.60
342.36(I’Kll)
703.11 2952.44 946.88
411.41 358.43
71.56
275.67(11.35)
162.31
300.00(46.25)
262.03(39.72)
2907.75
445.00
205.92
381,50 (48.55)
1214.16
397.93
189.25(18.06)
3886.53
1555.66
0.50(0.50)
49.90
1055.87(72.17)
6. D.G.C.A. 25.00(25.00)
7.00(7.00)
5.84(5.84)
7.25(7.25)
2.08(2.08)
4.00(4.00)
2.91(2.91)
5.45(5.45)
1.82(1.82)
2 .90 (2.90)
1.58(1.58)
14.23(14.23)
7. B.C.A.S.
8. I - G . R . U . A .
9. Hotel Corporation of India
10. Aero Club of India
1 0 . 0 0
( 1 0 . 0 0 )
45.00
10.00
3.00
1.42(1-42)
15.00
4.00
0.08(0.08)
0.30(0.30)
0.51
2.47
0 .00
1.00 (0.004)(1.00) (0.004)
1.00 0.0024
4.98
15.80
0 . 0 1
( 0 . 0 1 )
2.71
3.07
0 . 0 0
(.1-00)9.99
(4.99)15.00
0.01( 0 . 0 1 )
(0.0024)
0 . 1 2
(0 .1 2 )30.96
0 . 0 0
1.66( 1 . 6 6 )
4.33
18.00
0 . 0 1
( 0 . 0 1 )
0.44(0.44)
2 . 00
( 2 . 00 )
24.20
63.73
0 . 0 1
( 0 . 0 1 )
0.40(0.40)
1.15(1.15)
3998.00 1036.C8 875.13 1592.45 1128.19 1686.05 1401.00 3885.41 1704.5 4139.26 1987.75 7096.58(107.00) (29.00) (8.14) (11.97) (3.62) (Z3.ll) (14.26) (53.37) (41.98) (53.46) (20.04) (88.05)
NOTE : Figure in bracket indicates budgetary support
861

Annexure-7.1.21A IRPORTS A U TH O RITY OF INDIA
CA PA CITY , D E M A N D AND A U G M E N T A T IO N FOR PA SSEN G ER TERM INAI.S AT IN TERN A TIO N A L AIRPORTSN IN TH PLAN
At Comi plan peri
IVl
nencement of od (Annual in illions)
Growth rate At completion of p (Annual i Millions
Ian period n
Action plan
Airports Capacity Demand Capacity Demand
MumbaiInternational
i
5.0 4 76 5.5% 7.5 6.22 Constnjction o f Ph-III International Terminal to be completed in Aug'99
^ Domestic 6.45 6 30 10.5% 6.45 10 39 Construction o f Ph-II Domestic terminal under sanction. Expected completion Dec 2002. Capacity on completion-11 0 million Demand on completion 11 27 million
r Thiruvanantha puramInternational
0 3 6 0.85 7.5% 0.42 1.22 Extension o f existing Terminal to be completed in De<?99 New Complex to be constructed after techno-economic viability studies and land acquisition.
r Domestic 0 80 0.26 10.5% 0.80 0.42 N o action Required
CalcuttaInternational
0.52 0 61 7% 1.65 0 86 Modification Ph-I to be completed in Dec'2000 Modification Pn-11 to be completed in March 2002
Domestic 3 70 1 96 10.5% 3.70 3.23 New Domestic Terminal already commissioned in 1995
ChennaiInternational
0 46 1.54 7.5% 1 80 2.20 Construction o f International Terminal (Ph-Il) being taken up, Completion Dec'2001
’ Domestic 2 67 1 83 10 5% 2.67 3 01 Ph-II Domestic terminal proposed in Xth Plan
Delhiinternational
3 411
3.7 7% 3.40 5 18
1
Feasibility report o f Phase-11 terminal under submission, possibility o f private participation being explored
Domestic 7 2 4 3 10.5% 7.20 7 04 Possibility o f private participation for Constn Or New domestic terminal being explored.
80^

Annexure -7.1.22
A IR PO R TS A U TH O R ITY OF INDIA C A P A C IT \ , DEM AND AND A U G M EN TA TIO N FOR
IN T ER N A TIO N A L CARG O T ER M IN A LS AT M AJO R AIR PO R TSNINTH PLAN
AIRPORT AtCommencement o f Plan period (Annual m ' 000 tonnes)
Growthrate
At completion o f | plan period (Annual in 000 tonnes)
Action plan
Capacity Dem and Capacity DemandMumbai
1
186.86 200.20 12% 219.80 352.82 By implementing 'Instant Cargo Scheme', dwell time being reduced from 12 days to 48 hours for import and 2 days to 24 hrs. for export which shall V^rovide for enchanced capacity.
Calcutta 28.00 19.85% 12% 28.00 34.98 Construction o f Integrated Cargo Terminal Ph-1 to be completed m 2003 Capacity on Completion -33000 tonnes .
1 Demand on completion -38660 tonnes. Phase-II will be taken subsequently during lo"’ plan period .
Chennai 59.53 57.40 12% 93.44 101.16 Construction o f Integiated Cargo Terminal Ph-I to be completed in Oct'99.
Delhi
1
50.00
[
154.85 12% 219.50 272.90
j
Hxport Cargo Terminal Ph-.II to be completed in Aug'99. Import Cargo Terminal Ph.-11 to be completed in 2000. By implementing 'Instant Cargo Scheme ', dwell time being reduced from 12 days to 48 hrs. for import and 2 days to 24 hrs for export which shall provide for enhanced capacity
863

AIRPORTS AUTHORITY OF INDIA ACTION PLAN FOR MISCELLANEOUS WORKS
AT INTERNATIONAL AIRPORTS NINTH PLAN
Annexure - 7.L23
AIRPO R TS DESCRIPTIO N a c t i o n p l a n
M U M B A I Recarpetting o f Secondary Runway
Construction o f Parallel T axi Track to mam runway
B itum inous overlay being provided for restoration o f the pavem ent Under construction to increase the runway capacity.
Under construction for effic ient m ovem ent o f aircraft.
Construction o f N ew Taxi Links
Construction o f Apron
For parking additional 3 nos B -737 aircraft and 3 N os. A -320 aircraftM odification and face lifting works in hand.
Terminal Building N ew shed for storing heavy cargo beipg provided
Cargo C om plex Facility being upgraded
Fire detection and fighting m easures.
Operational and facilitation equipment's
CC TV system s, Passenger Friskm g/B aggage cheek equipm ent and other operational equipment's being upgraded/augm ented
T H IR U V A N A N T H A P URAM
Extension o f main runway The mam runway has been extended by 350 m to permit B -747 aircraft operation
Extension o f apron The existing apron being m odified to accom m odate 7 parking bays including one for B -747 against 4 parking bays at present
1
1 Tcm iinal BuildingInternational Terminal being m odified/extended to increase the capacity from 0 ,36 m illion pax to 0 42 m illion pax and augment passenger handling areas The building is being provided w ith central airconditioning..D om estic B uilding m odified for increased passenger handling
864

C A L C U T T A R esurfacing o f m ain runway
Reconstruction o f portion o f parallel taxi track.
Construction o f Apron
Term inal B uilding
Bitum inous overlay being provided for restoration o f the pavem ent.
D isused portion o f parallel taxi track being reconstructed to increase the runway capacity and effic ient m ovem ent o f aircraft
4 new bays are being added 6 old bays are being reconstructcd/strengthened
C ityside C anopies are proposed for both the term inals for protection o f passengers/visitors from bad weather
C H E N N A I Strengthening o f secondary runway
Construction o f Apron
Terminal Building.
The existing secondary runway being strengthened to handle B- 7 3 7 /A -3 2 0 type aircraft. The runway is also being im proved to meet international standards
6 new aircraft parking bays are being added
The Central atrium o f International Building is being covered to augm ent security hold space. Airside corridor with 2 additional aerobndges is being provided
DELHI Strengthening o f secondary runway
Strengthening o f main runway
Construction o f Taxi Track
Construction o f Apron
Term inal B uilding
Bitum inous overlay being provided for restoration
Bitum inous overlay being provided for restoration and strengthening to cater to heavier aircraft like M D -1 1
A new- taxi track conncctm g the ranways is being built for increasing runway capacities
7 new International bays have been added
M odification and facelift o f both term inals arc in hand
865

7.2 TELECOM M UNICATIONS
7 2 1 Telecommunication is one o f the prime support services needed t'oi rapid gro\vth and modernisation of various sectors of the economy Although the sector has grown rapidly in recent years, its grovvlh needs to be accelerated further in the Ninth Plan It is equally important to accelerate structural changes in this secior in line with trends in oiher countries to ensure that the telecommunication services are not only made available on the scale needed to sustain rapid growth in the economy as a whole but also that the quality and cost of these services come up to the requirements of a modernising economy
Eighth Plan Review
7 2 2 The two basic thrust areas of the Eighth Plan were rapid expansion of telecom network and hs transformation into a modern and efficient system Provision of an additional 75 lakh Direct Exchange Lines (DELs) and installation of 3 09 lakh Village Public Telephones (VPTs) were am.ong the major targets fixed for the Eighth Plan With the announcement of the National Telecom Policy in N4ay 1994, it was estimated that 100 lakh DELs will be required to be provided during the Eighth Plan to make available telephone on demand by 1997 and cover all the villages with public telephony by March 1997 The private sector was envisaged to play an important role in achieving this objective. However, due to various constraints, the provision of basic telecom services by the private operators is yet to take off as desired.
7.2 3 The performance o f the Government sector in achieving the targets has been quite encouraging. Against the target of creating an additional net switching capacity of 93 lakh lines, the achievement has been 109 58 lakh lines i e 17 8% more than the target Similarly, in the case of providing new connections, about 87 33 lakh DELs have been provided against the target of 75 lakh DELs, the achievement being about 16 4“ o more than the target.
7 2 4 As a result of the Mid-Term Review', the original targets fixed for tauik capacity (TAX) and optical fibre system were substantially enhanced from 2 72 lakh lines to 7 0 lakh lines and from 20000 route krns to 40000 route kms respectively with a view to improving the long distance connectivity. The achievement has been 9% higher than the target in the case of TAX capacity and 15% higher in the case of optical fibre cable
7 2 5 Rural connectivity was one of the major objectives of the Eighth Plan According to the original Plan target, 3.09 lakh villages were to be covered by March 1997 On the basis of the Mid-Term Review, the target was increased to 3 38 lakh Village Public Telephones (VPTs) due to increase in the number of villages from 5 76 lakhs to 6 05 lakhs. Assuming a significant contribution by the private sector, the National Telecom Policy (1994) had revised the target to cover all the 6 lakh villages by March 1997 As the provision of basic services by the private operators did not fake off as en\ isaged. the achievement of the target was limited to the extent of resources availability w ith the Department of Telecommunication. The progress in this regard has been such that only about 57.2% of the target could be achieved Paucity of funds and delay in the supply of equipment were the two important factors responsible for the situation All other importanL targets have been achieved during the Eighth Plan Details are in Annexure 7 2 9
866

7 2.6 On the financial side, the performance of the public sector with regard to resource mobilisation has been quite encouraging. Internal resources (IR) contributed about 80% of the anticipated Plan expenditure against the target of 70 percent. Against an approved outlay of Rs.25,137 crore, the likely expenditure is estimated to be Rs.27480 crore (at 1991-92 prices). The telecom sector has fared better than expected with regard to the extent of reliance on budgetary support for financing Plan expenditure Against the targeted budgetary support of Rs.390 crore, the actual utilisation is expected to be Rs 109 42 crore, i e less than 0.4% of the total outlay against the approved level of 15%
7 2 7 An outlay of Rs.23946 crore was approved for the Department ofTelecommunications including the Mahanagar Telephone Nigam Limited (MTNL) with internal and extra-budgetary resources constituting 99 6 per cent of the approved outlay The performance of the Department in respect of internal resource generation has been very encouraging as the achievement was 25% more than targeted (at 1991-92 prices) However, its performance in respect of resource mobilisation through bonds has not been satisfactory as only 65 6% of the target could be achieved Unfavourable conditions in the caphal market were primarily responsible for such development The good performance in interna! resource mobilisation more than compensated the shortfall in n^oiket borrowings (bonds) and the actual expenditure Rs 26102 crore was about 10“o more than targeted (at 1991-92 prices) The Table 7 2 1 gives the details
Financing pattern - DOT & MTNL(Rs Crore)
Approvedoutlay
As % of total
ActualExpenditure
As % ( total
[R 1655 6 .00 69 14 2 0 6 7 7 .4 5 79 .22
Bonds 7 0 2 6 .0 0 2 9 ,3 4 4 6 1 2 .1 5 17.67
Others 0.0 0 0 .0 0 7 1 2 .44 2.73
BS 3 6 4 .0 0 1.52 100.07 0 .38
Total: 23946.00 100.00 26102.09 100.00
7 .2 .8 The performances of the public sector undertakings in the telecom sector has been a mixed one. The two service organisations, viz. Mahanagar Telephone Nigam Limited (MTNL) and Videsh Sanchar Nigam Limited ( VSNL), have performed quite well But both of them have enjoyed monopoly position in their respective areas The same has not been true for the equipment manufacturing units, i e ITI Ltd and HTL Ltd , whose performance has been adversely affected, as a consequence of the policy of deregulation, liberalisation and competition From a profit-making unit in 1993-94, ITI Ltd has become a losing concern for the third year in succession The surplus generated by HTL Ltd. is only marginal and it may go the ITI way, if the present situation continues The main factors adversely affecting the performance and profitability of these companies are -
867

i) significant decline in the prices of telecom equipment;
ii) surplus manpower/large overheads;
iii) high cost of production/lack of modernisation and
iv) high interest liability.
7.2.9 The value-added services witnessed a healthy growth during the Eighth Plan. For Radio Paging and Cellular Mobile Telephone services private operators were given licences through a system of tendering. Radio Paging service was expected .to be available in most of the cities throughout the country by the end of 1997. Licences have also been issued to 36 companies for operation of Public Mobile Radio Trunked Services (PMRTS) in 80 cities on the basis of proposals invited in January, 1995. For the operation of E- Mail, Voice/Audiotex and 64 Kbps CUG domestic Data VSAT service using INSAT satellite system 16,38, and 13 licences have been issued respectively. These services have become operational on a commercial basis in many areas of the country. Cellular Mobile Telephone Services have already started in four metropolitan cities with two operators in each city. In other telecom circles 33 licences for 18 circles have been issued to 13 companies since December, 1995. Out of 33 licensees, 22 have already started their services in more than 50 cities/towns with a customer base of more than 1 lakh. Six licenccs have been issued in the six Stales of Andhra Pradesh, Mahrashtra, M.P., Rajasthan, Gujarat and Punjab. Internet services are being provided in about 20 cities at present by D O f and VSNL. The public data network "INET" has been extended to 95 cities, out of a total of 105 major cities planned for the INET. A high-speed satellite network called HV-NET has started operating which provides 64 Kbps data and voice communication capability from any point in the country. Integrated Services Digital Network (ISDN) has been started in 9 cities. More than 200 international leased circuits have been provided for software export.
Present Status
7.2.10 The basic telecom services network has expanded from 1 lakh connections at the time o f independence to 178 lakh Direct Exchange Lines (DELs) as on 31.03.98. It has witnessed a consistently high growth of 16-17% per annum during the last decade i.e. 1987- 97. The growth was further accelerated to more than 20 per cent during the Eighth Plan. During 1997-98, the growth rate was still higher at 22.4%. However, the growth in the waiting list has been equally impressive growing from 12.87 lakh in 1987-88 to 27.06 lakh in 1997-98. During the last five years, the waiting list on the average has been about 26.5 lakh. Viewed in the context of requirement and population size of the country, the rapid expansion seems moderate as reflected in the low telephone density of 1.84 (March, 1998) against the world average of 12. The main features of the present telecom network are :
More than 23400 telephone exchanges working in the country.
A network of more than 178 lakh telephone connections with about 20% ofthe total connections working in the rural areas.
STD/ISTD facility is available to more than 90% of the subscribers.
868

A network of about 4 28 lakh PCOs in urban areas.
Availability o f variety of services such as Mobile Radio Telephone, Radio Paging, Facsimile, Data Transmission, Integrated Services Digital Network (ISDN) etc. to cater to the business and other needs of customers
Cellular services are available in 4 metro cities and all other Circles except Andaman & Nicobar Islands and J&K.
Six licences for basic services have been granted for six States of M P , Andhra Pradesh, Gujarat , Rajasthan and Maharashtra Two operators M/s Bharati Telenet Ltd in M.P and Hughes Ispat Ltd in Maharashtra have started providing services.
7.2,11 The telecom sector has witnessed some fundamental structural and institutional reforms in the past decade. Telecom equipment manufacturing was completely deregulated in 1991 Value added services (including cellular services) were thrown open lo private sector in 1992 Basic services were opened to private participation in 1994 by dividing the country into 21 Telecom Circles and allowing one private operator per Circle to compete with DOT. An independent Telecom Regulatory Authority of India was set up in 1997. A new Policy for Internet Service Providers (ISPs) was announced in 1998 allowing mdependent service providers to enter the sector ending the earlier monopoly of VSNL Reorganization of DOT separating policy making fijnction and service provision and corporatisation of DOT’s operational network are two major institutional reforms which need to be implemented
NEW POLICY FOR INTERNET SERVICE PROVIDERS (ISPs)Internet is a rapidl)’ g ro w in g international ‘netw ork o f n e tw o rk s’ and eas\' a c ce ss to the Internet is an im portant e lem en t in international co n n ectiv ity T he new Internet P o licy am iounced b \ GoM o f India a im s at the w id est p o ssib le a c ce ss to th is fa c ility at affordable prices. P rov ision o f Internet ser \’ice has b een o p en ed to the private sector w ith hberal term s to ensure quick grow lh T he salient features o f the P o lic y are :
❖ A n y Indian com p an y is e lig ib le to b e lic e n se d as an ISP. T he fo reig n equitv p erm issib le is capped at 49 %.
❖ L icen ce per iod w o u ld be 15 years. N o lic en ce fe e for the first f iv e years and R e 1 per am ium for su bseq uent years.
❖ Separate lic e n c e w ill be issu ed for ea ch ser\'ice area. For th is purpose, tlie co u n tn has been d i\ ided in to separate serv ice areas in three ca teg o r ies \ iz
❖ Categorv' A ' S erv ice A rea - w h o le o f India❖ C ategory ‘B ’ S erv ice A rea - 20 territorial T e le co m C ircles. M etros - D elh i. M um bai. C alcutia and
C hennai and four m ajor c ities - A hm edabad , B angalore, H yderabad and Pune,o C ategory C ' Serv ice A rea - in secondary sw itc h in g areas o f D O T
❖ A co m p an y m ay obta in any num ber o f l ic en ces . T here shall be no lim it on num ber o f lic e n c es that caii be granted'to a comp^any in a particular area.
❖ P erform an ce B ank G uarantee (P B G ) o f R s.2 crore for C a t^ o r y A ' S e n ice Area. R s 20 lakli for C ategory ‘B ’ Serv ice A rea a n d f e .3 lakh for C ategory C ’ Serv ice Area to be subm itted a longw ith ap’p h ca tio n for each serv ice area.
❖ International co n n ectiv ity w o u ld be through ga tew a y s o f D O T . V S N L orauthorised p u b lic /G o v em m en t organisations. P rivate ISP s are a llo w ed to provide ga tev \a \ s after o b ta in m g security c learance. D irect in tercon n ectiv ity b e tw e en tw o separately licen ced ISPs shall be perm itted.
❖ E stab lishm en t o f tran sm ission lin ks - P n v a te ISP s can obtain transm ission links on lease from DO T. l ic en ced B a sic Serv ice O perator, R a ilw ays, State E lectricity B oards. N ational P ow er Grid Corporation or any other operator e sp ec ia lly a u th o n zed to lea se su ch lines. ISP s m ay a lso esta b lish their ow n tran sm ission links, provided they are not a v a ila b le from authorised sou rces and subject to p erm issio n o f authonty'
❖ ISP s w ill b e free to f ix their ow n tariff. H o w ev er , the T R A I m av re\ iew and fix a tariff at an \ tim e❖ T elep h o n y on the Internet is not penn itted .
869

Ninth Five Y ear Plan
Policy Fram ew ork
7.2.12 Telecommunications is a prime support service needed I'or rapid yrowii! arid modernisation It is also one of the fastest growing sectors in India and has irnirien.se potential for growth The telecommunication activity is commercial in nature and people are willing to pay for it Of all infrastructure sectors, it is perhaps the best suited for pn vate sector participation which would help to create a competitive environment and inipro\e ihe quality o f services to consumers. Deregulation and competition are key elements in telecommunication reforms all over the world and will be a guiding principle lo the evolution of policy in this sector in the Ninth Plan and beyond
7 2.13 Telecommunications is potentially a profitable sector and service provision by the Government sector should continue to be financed solely by internal and extra-budgetary resources. Budget support would be restricted to financing the monitoring and regulatory mechanisms only till they become self-financing. In exceptional situations some supplementation to the resources of the Department of Telecommunication (DOT) could be considered for providing services in unremunerative areas To ensure efficiency of operations and effective competition whh the private sector, the serx ice prox ision function of the DOT will have to be performed purely on commercial lines Necessary steps in this regard would be taken during the Ninth Plan. The organisational/institutional changes envisaged for the Government sector are discussed in detail under the head Problems and Strategy'.
7.2.14 The public sector will continue to play a dominant role in the provision of basic telecom services during the Ninth Plan Out of 237 lakh new connections envisaged to be provided during the Ninth Plan, the Department of Telecommunication and MTNL are expected to provide 185 lakh additional connections The Department would ensure the provision of necessary infrastructural facilities for the development of the telecom sector at the required pace. This will include creation of necessary facilities required for the smooth functioning of operations by the private sector both for the value-added as well as basic services, including inter-connectivity.
7.2.15 Private investment is also expected to play a major role supplementing the efforts of the public sector in expanding capacity and also providing competition v/ithin the system In the area o f value-added services, the private sector would continue to play a dominant role The quantum of investment by the private operators would basically be determined by the rate o f return on such investments - both basic as well as value-added services Necessary steps would be taken to streamline policy so as to remove the various bottlenecks to ensure effective participation and adequate investment by the private sector
7.2 16 The National Telecom Policy has envisaged that India should emerge as a major manufacturing base and major exporter of telecom equipment The manufacturing capacity o f the indigenous industry is small in relation to the other major operators in the world and exports constitute a very small proportion of the total production of telecom equipment in the country Promoting exports as a thrust area and development of Indian multi-nationals should be among the major goals To achieve this objective, the Ninth Plan would aim at removing the various constraints relating to transfer of the latest technology, access to cheap international finance, joint ventures with foreign companies rationalisation of custom and import duties on inputs and development of a strong industi>- sponsored R&D base
870

7.2.17 The annual production of telecommunication equipment in the country wasestimated to be about Rs 5000 croie (1996-97). The requirement of the telecom equipment during the Ninth Plan is expected to be about Rs 90,000 crore, including about Rs 27,000 crore of direct imports of finished products. The domestic production is expected to be about Rs 62,000 crore during the Ninth Plan Sufficient production capacities have been created in the areas of switching, transmission and terminal equipments to meet the Ninth Plan requirements though the domestic units have generally not been competitive in price compared to global market conditions Sufficient capacities are required to be set up in the new and emerging areas of V-SAT equipment. Wireless in Local Loop (WILL), DLC systems, Celiuiar phones, radio pagers etc
7 2 18 The Wireless Planning and Coordination (WPC) Wing, set up in 1952, is the national radio regulatory authority t o ensure orderly utilisation of radio frequency spectrum and Geo Stationary Orbit (GSO). It is supported by the Wireless Monitoring Organisation (WMO) in this activity With the opening up of the economy the number of players and services in the telecom scccor is bound to increase manifold Therefore, the Organisation would have to be strenyihened and modernised to enable it to perform its regulatory functions effectively The Government cannot afford to endlessly fund the massive investment needed for the modernisation efforts of the Organisation as the outlay of WMO is funded entirely throus;;i budget support The internal resources of WPC/ WMO are mainly in terms of ’ venue collected from royalty, licence fee and examination fee Recently, WMO ha' " t a r t e d charging the wireless users for services rendered other than of a regulatory nature such as removal of interference problems, radio noise measurements etc These revenues are expected to increase substantially over time The Ninth Plan should aim to make VVMO self-fmancing
7.2 19 The Telecom Regulatory Aut^.c-rity of India (TRAI), set up in 1997, is the apex organisation responsible for ensuring quality services and value for money to the consumers The interests of the con. ̂imers as a group are protected by TIL'M For individual grievances, a consumer can approach a Consumer Forum The three main areas of concern regarding the quality of serv ices have been billing, fault repair and redressal of other grievances An appropriate mechanism ensuring fool-proof and time-bound solution to the problems arising in the above three areas needs to be devised Computerisation and use of appropriate technological inputs would have to be an integral part of the strategy for ensuring quality services.
7 2.20 For international connectivity, Videsh Sanchar Nigam Ltd (VSNL) has a monopoly position till 2004 A.D. Keepmg in view the ensuing competion in overseas communications, the VSN1> has to be strengthened adequately so that it can compete effectively in a totally liberalised scenario. With rising tele-density and high penetration of services both in rural and urban areas, the demand for international telecom services is expected to increase manifold during the Ninth Plan. The strategy for development of VSNL has to be guided by the fact that the Company has been selected as one of the Navratnas', which is to be developed as an Indian Multinational
7 2.21 The Mahanagar Telephone Nigam Ltd (MTNL), which provides basic telecom services in Delhi and Mumbai, has *s!l now enjoyed a monopoly position In the Ninth Plan, it would be facing competition ■'om the private operators The quality of service and efficiency o f operations would ‘lold the key for its fliture growth and survival The development strategy of the Company during the Ninth Plan should be guided by these two
871

factors. To enable MTNL to prepare itself for the competition, it is essential to give full functional freedom to it with regard to raising and deploym.ent of resources, including access to international capital markets, choice of technology, strategic alliances/joint ventures with leading international players and redeployment and realignment of the work force. Recently, the Company has been accorded the 'Navratna' status which is expected to help it perform better.
Objectives and Targets
7.2.22 The National Telecom Policy 1994 outlined the basic framework for the future development of the telecom sector in the country. The stated objectives of the policy were : to provide telephone on demand; to achieve universal coverage; to ensure world standard in the services; to enable the country emerge as a major manufacturing base for telecom equipment and exports and to protect the defence and security interests of the country. Keeping in line with the basic spirit of the Policy, the major thrust during the Ninth Plan would continue to be on expansion, modernisation and improvement in efficiency. The major objectives envisaged for the Ninth Plan are :
(i) Universal coverage or telephone on demand;
(ii) Universal and easy accessibility;
(iii) World standard services lo the consumers at affordable prices;
(iv) Demand-based provision of existing value-added services and introduction of new services;
(v) Exports of telecom equipment and services as a major thrust area;
The detailed goals envisaged in pursuance of these broad objectives are given in Annexure- 7.2.1. The National Telecom Policy itself will be reviewed and modified to reflect experience gained thus for and the rapid technological changes which characterise this sector.
7.2.23 The objective of universal coverage of basic telecom services is envisaged to be achieved by providing telephone on demand. It has been observed that the actual registered demand, reflecting the waiting list at any point of time, does not indicate the true demand for the basic services. There is a large element of latent demand, which has led to ever increasing waiting list along with sustained high growth of network expansion and provision of new connections. Taking into account the changing structural composition of the economy, the composition of telecom services and the relative tariff rates, a constant review of the demand projections for the basic services would be called for. As on 31.3.1997, the telecom network had 145.33 lakh Direct Exchange Lines (DELs), with a waiting list of 28.87 lakh. The demand at the beginning of the first year of the Ninth Plan is estimated to be 174 lakh DELs. It is projected to grow to 360 - 380 lakh DELs by the terminal year i.e. 2001 - 2002 and 818 lakh DELs by 2007. Thus, 186 - 237 lakh additional DELs would have to be provided by the Government and the private sector during the Ninth Plan to achieve the objective of providing telephone on demand in Ninth Plan and 437 lakh additional DELs during the Tenth Plan. The Department of Telecommunication, including MTNL, is expected to provide 185 lakh new connections
872

and the remaining 52 lakh DELs are envisaged to be the private sector's contribution. Similarly, Govt, sector is envisaged to provide 285 lakh DE:Ls in the Tenth Plan, the private sector expected to contribute the remaining 152 lakh DELs.
7.2.24 Rural connectivity would be one of the major thrust areas during the Ninth Plan. Out of about 6 lakh villages, 3.01 lakh villages have been provided with telephone facilities so far (31.03.98). The remaining villages would be covered by the year 2002 through the joint efforts of the Department and the private operators. According to the guidelines issued for the entry of private operators into basic services, 10% of the total connections to be provided by them in each circle will have to be in the rural areas. Tentatively, a target of providing 2.39 lakh Village Public Telephones (VP Ts) has been kept for the Department of Telcommunication for the Ninth Plan. Any shortfall in the contribution by private sector would be made by increased eflbrts by the Go\ t. Deptt. of Telecom would ensure that financial requirements of the programme are fulh met. As the present technology i.e. analogue MARR system used for providing VPTs is not dependable, DOT would initiate necessary action to introduce new suitable technologies like Wireless in Local Loop (WILL), satellite based phones etc. at the earliest.
7.2.25 To ensure easy and smooth long-distance connectivity, a target of creatingadditional 18 lakh lines of trunk capacity (TAX) is proposed for the Ninth Plan. As longdistance connectivity is still the monopoly of the DoT, the entire capacit\ would be created by the Government sector. '\’he optical fibre system would be the mainstay of transmission expansion during the Ninth Plan. A target of 1.4 lakh route kilometers of optical fibre system is proposed for the Ninth Plan.
7.2.26 The other major targets envisaged for the Department of'felecommunication for the Ninth Plan are :
(i) One Public Call Office (PCO) for every 500 population in urban areas;
(ii) Provision of adequate number of PCOs in public institutions like hospitals, shopping centres, educational institutions etc.
(iii) STD PCO for every 10 kms. on the national highway;
(iv) STD facility to all exchanges by the year 2000;
(v) Digital connectivity to all exchanges upto SDCC level;
(vi) Packet Switched Public Data Network (PSPDN) to cover all District Headquarters (DHQs).
7.2.27 Connectivity from public places and in an emergency is quite poor and accessibility is quite difficult. This is specifically true in the case of hospitals, educational institutions and highways. Depending upon the size and the number of persons that may require the facility at a particular point of time, adequate connectivity in the form of PCOs would be ensured during the Ninth Plan. To illustrate, the major hospitals in the capital should have adequate number of PCOs in the emergency, OPD w'ards and one PCO in the corridor of each ward. The option of operating these PCOs on
873

franchise basis or as "pay phones" should be an integral part of the strategy to improve accessibility and connectivity in this area. Besides ensuring substantial improvement in accessibility, it would also become a major source of employment in the telecom sector
7.2.28 The value-added services are being provided by the private sector These are envisaged to be provided on demand during the Ninth Plan The demand for existing and new value-added services, as projected by the Working Group on Value-Added Services, is given in the Annexxire 7 2 5
7 2 29 Services like distance education and tele-ir-ed-cine would be of immense help to the common people living in rural and remote areas An integrated project for creating the basic infrasturcture for the provision of value-added and other telecom services in airal areas is envisaged to be taken up on pilot basis durir'> the Ninth Plan It is proposed to take up this pilot project in two districts each - one developed and the other backward - of the four States i.e. Punjab, Orissa, Kerala and Maharashtra
Science and Technology
7.2.30 Research and Development (R&D) would be accorded a higher priorhy during the Ninth Plan. The R&D effort in telecommunications has mainly been confined to the Government sector i.e. the Centre for Development of Telematics (C-DOT) and in-house research in the public sector undertakings A strong mdustry - sponsored R&D effort is a pre-requisite for making the Indian firms competitive internationally both in the provision o f services as well as in equipment manufacturing Well-funded and resuh - oriented R&D has to be an important part of the strategy to achieve the goal of developing Indian multinationals in both these areas. With a view to ensuring the provision o f adequate resources for this activity, it may be necessary to earmark a percentage of the turnover of the companies in the organised sector for R&D
7.2 31 Due to the fast changing technology in this sector and the existing technological gap in relation to the developed countries, India will have to rely on transfer of technology in a big way in the near fijture. In this context, strategic alliances with leading international companies will have to be an integral part of the over-all exercise of technology transfer
7 2 32 Software has become an important input in the telecom sector particularly for the switching equipment. It is crucial that India's competitive advantage in software is exploited to the fiillest extent for this purpose The country's expertise should be particularly relevant in areas such as network management systems and design of specialist chips
7 2 33 The R&D effort would have to be diversified Besides technologydevelopment, it should focus on services, system,s, processes and markets This will givethe relevant user orientation to R&D activity The R&D effort in telecommunicationwould be more effective if it is multi-disciplinary in character The telecom sector involves some of the most sophisticated concepts in economics, social sciences andmanagement, amongst other disciplines
874

C-DOT
7.2.34 The Centre for D evelopm en t o f T elem atics (C -D O T ) is the m ain public sec tor agency engaged in the research and deve lopm ent activities in the te lecom sector. Fhe focus o f its activities is on finding com prehensive solutions appropria te to the te lecom network requ irem ents ol’ the country. T he C -D O T has been a leader in the deve lopm en t o f rural sw itch ing system s i.e. Rural A uto Exchanges (R A X ). D uring the Eighth Plan, it has deve loped low capacity rugged digital sw itch ing systems. T hese are ideal for rural conditions as they are capable o f operating in non-a ircond itioned env ironm en t with sim ple m ain tenance procedures and operational back-up. For urban and scm i-urban applications, the C -D O T has developed a family o f digital sw itch ing system s ranging fr('m 1500 lines to 40 ,000 lines In the area o f transm ission, its m ain ach ievem en ts ha\ e been the deve lopm en t o f low capacity digital radio techno log ies for in terconnecting rural and urban exchanges, satellite system for digital m ultip lexers and optical co m m unica t ion systems.
7.2.35 D uring the Ninth FMan, the C - D O f plans to enhance its 256p RA X , both inleci’.nology and in features, so as to m ake it m ost con tem porary . It will also help inincrcasm g the size o f the export market. In the area o f switching, the o ther m ajor projects envisaged during the Ninth Plan include :
(i) l)eveU)ping a large switch with a capacity o f prov id ing connectiv ity to l,( '0,( '0(' subscribers and associa ted trunks and Busy H our Call .Access (B H C A ) o f 1.5 million;
(ii) P roviding necessary support functions for d ep loym en t o f intelligent network services in the field, including service sw itch ing functionality in the local exchanges and toll exchanges;
(iii) U ndertak ing a project to design and develop Service Control Poin ts(SCP), Service M anagem en t System s (S M S ) and Service C rea tion F .nvironment (S C F) to m ake serv'ice provis ion ing very fast and to offerservices as desired by the custom ers. T he system shall facilitate the servicep rovider to be different from network p rov ider/opera to r and
(iv) D evelop ing A T M techno logy-based Broad Band ISD N (B -ISD N ) family o f sw itch ing systems.
In the area o f transm ission , the m ajor projects envisaged during the Ninth Plan include :
(i) U ndertak ing extensive w ork on optical sw itch ing system s rela ting to Optical; Tine Terminating E quipm ent, Synchronous Digital Optical N e tw o rk and Photonic Amplifiers;
(ii) D evelop ing personal w ireless com m unica tion system s based on diffe ren t technologies;
(iii) D evelop ing h igh speed optical netw ork and
(iv) D evelop ing high speed satellite system s for cell transporta tion .
875

7.2.36 The public sector would continue to play a dominant role in the provision of basic services during the Ninth Plan. An effective and streamlined monitoring system is vital to ensure proper and timely implementation of the policies and the Plan targets for the public sector. This would call for the setting up of a monitoring mechanism, whereby the progress of various projects in the public sector is jointly monitored by the DOT and the Planning Commission. An Empowered Committee, headed by the Secretary. DOT with members from Telecom Commission, Ministry of Finance, Planning Commission, Ministry of Environment and Forest and Ministry of Programme Implementation, has been constituted for this purpose. This Empowered Committee would monitor and review the progress of implementation of all important projects.
7.2.37 For improving the quality of telephone services provided by the Department of Telecommunication, some of the basic parameters need to be monitored regularly. The quantitative targets of quality improvement envisaged during the Ninth Plan are :
Implementation and Delivery System
Targets of Quality Improvement
Sl.No. Parameter 1996-97Achievement
2001-2002Target
i) Fault/100 stns/n’ionth \7.2 9.5
ii) Trunk Efficiency % 80.6 85.0
iii) Local Call completion rate (Live)
55.7 65.0
iv) STD Call completion rate % (Live)
39.2 50.0
7.2.38 The overall implementation of the programmes in the telecom sector would be looked after by the Deptt. of Telecommunications. This would include overall policy formulation including licencing. DOT would also oversee the overall coordination between private and Govt, sector including the public sector companies. The Telecom Regulatory Authority of India (TRAI) would look after the various functions pertaining to regulation including ensuring compliance of terms and conditions of the licences, protecting interests of consumers, revenue sharing arrangement between operators, disputes between licensor and licensee etc.
Financing the Plan
7.2.39 The value-added service is one of the two main components of the telecom services. Under the prevailing policy, these services are to be provided by the private sector on demand. The necessary funds required for the provision of these services are envisaged to be mobilised by the private sector. The Govt, will initiate new policy measures to ensure that the required funds are available to the private operators at affordable cost.
876

7.2.40 W ith the open ing up o f the p ro \ ision o f basic services to the private com pan ies , private sector funds are envisaged to play a s ignificant role in tm anc ing the p ro v is io n o f these services. A ssum ing an additional dem and o f about 237 lakh lines during the N in th Plan, funds o f the order o f about R s.l .00.000 crore m ay be required for m ee tin g the target o f p rov id ing te lephone on dem and. The estim ate is based on the p revalen t cost o f R s ,45 ,000 per line. The exact requirem ent o f the funds w ould depend u p o n the techno logy to be used and o ther factors like the price o f the equ ipm ent, duty s tructure etc. T he G o v e rn m en t sector com pris ing the D epartm ent o f T e lecom m unica t ion (D O T ) and the M ah an ag a r T e lephone N ig am L im ited (M T N L ) is expected to m eet the bulk o f the additional dem and by prov id ing about 185 lakh new connections. As in the E ighth Plan, the entire requ irem ent is env isaged to be financed out o f internal and ex tra budgetary resources genera ted by the D O T and the M TN L. However, to com pensa te the G o v e rn m en t sector for bearing the responsib ility o f provid ing telecom services in the un rem unera t ive areas like v illages, rem ote , hilly, tribal and other areas, adequate budgetary support m ay have to be provided. Sharing a part o f the licence fee could be one o f the alternative m echan ism s to ach ieve this. B udgetary support to the Govt, sector w ould be restr ic ted to m on ito r ing and regulatory m echan ism s till they becom e self-financing,
7.2.41 T he outlay requirem ents o f the two PSU s engaged in the provision o f serv ice i.e, V idesh S anchar N igam L im ited (V S N L ) and M ahanagar T e lephone N igam L im ited (M T N L ) are en v isag ed to be m et entirely ou t o f their internal and ex tra budgetary resources. T he tw o te lecom equ ipm en t m anufacturing units i.e, ITI Ltd. and H T L Ltd, are facing severe financial p rob lem s as a result o f deregulation and com petit ion from the p rivate com pan ies including the M N C s. T he financing pattern for these two co m p an ie s during the N in th P lan w ould basically be determ ined by the revival package u lt im ate ly ag reed to by the G overnm ent.
Special Focus Areas
7.2.42 In the special focus areas, the p lans relating to i) Nafional Capital R eg ion (N C R );ii) N o rth E astern R eg ion (N ER); and iii) Tribal Areas will receive h igh priority.
I National Capital Region
7.2.43 P rov id ing m o d ern te lecom facilities in the w hole o f the N C R at par w ith those p rov ided in the N a tional Capital Territory o f Delhi is one o f the m ajo r s tra teg ies to deco n g es t Delhi. T h e p lan for infrastructure deve lopm ent for te leco m m u n ica tio n in the N C R shou ld aim to p rovide the fo llow ing ;
(i) to m ak e te lecom facilities available on dem and in the entire N C R at p a r w ith D elhi;
(ii) concessional tariff on telecom facilities in Delhi Metropolitan Area (DMA) towns as compared to the National Capital Territory of Delhi.
7.2.44 The number of working cormections (DHLs) in the NCR towns was 4.37 lakh as on 31.3.97. It is estimated that telephone demand would be 12.27 lakh as on 31.3.2002. Thus, 7.89 lakh new connections would have to be provided during the Ninth Plan to achieve
877

the objective of telephone on demand in the region. In the NCR towns, all the exchanges will be of electronic type and all the modern telecom facilities like cellular, paging, voice mail, videotex etc. will be made available in the entire NCR.
II North Eastern Region
7.2.45 The North Eastern region, being a sensitive border area and underdeveloped, would continue to be accorded special attention for the development of telecom facilities. Due to its difficult topography and landscape, the role of telecommunication is no less important than physical communications Under the new initiatives announced by the Prime Minister for the North Eastern Region, all the Central Ministries/Departments have to earmark at least 10% of their budget for specific programmes in the North Eastern States. Efforts should be made to create necessary facilities during the Ninth Plan to provide fax facilities upto the block level as recommended by High Level Commission for tackling the backlog in basic minimum services and infrastructural needs. Keeping in view the special needs of the region for more reliable telecom network, all sub-divisional headquarters would be connected.
III Tribal Areas
7.2.46 The need for an efficient and reliable telecom network in the tribal areas could hardly be overemphasised. Therefore, a more vigorous effort would be taken in these areas. The DOT would provide a total of 7.44 lakh new telephone connections in the tribal areas during the Ninth Plan. The details in this regard are as follows
Tribal Sub-Plan - Telecom
Items Eighth Plan Target Achvt.
Ninth Plan Target
(i) Switching Capacity (lines)
307300 511682 930000
(ii) Direct Exchange (lines)
240000 392340 744000
(iii) VPTs (nos.) 25000 24527 118192
(iv) Earth Stations (nos.)
21 33 200
Problems, Strategy & Action Plan
7.2.47 To ensure free and fair competition and efficiency of services, the three functions of policy making, regulation and service provision have to be separated from each other and performed by independent entities. The regulatory function has already been separated from policy making and service provision by setting up the TRAI. However, the Department of Telecommunication continues as the policy maker and as one of the service providers in the area of basic services. To take the reforms programme to its logical
878

conclusion, policy making including licensing, has to be separated from the operational wing of DOT. For service provision, the DOT in its present form of a Departmental undertaking has many constraints which affect its efficiency vis-a-vis private sector operators which are run purely on commercial lines. These constraints relate to quick decision making regarding the choice and introduction of new technology; determining optimum size of manpower; its composition and realignment; mobilisation of resources including market borrowings and strategic alliances with private sector including joint venture with leading international companies. To overcome these problems, the Deptt. of Telecommunications would be reorganized separating the policy making function from service provision. The operational network of DOT would be converted into a single corporation. Review of the role of Telecom Commission shall be an integral part of such restructuring. Necessary action would be initiated immediately and the entire exercise completed during 1998-99.
7.2.48 The private sector participation in basic services is yet to take off as desired, though it was opened to the private operators in 1994 with the announcement of National Telecom Policy. Out of 21 Circles in the country, service provision by the private sector has started only in two Circles so far i.e. M/s Bharati Telenet in M.P. and M/s Hughes Ispat in Maharashtra. Private sector projects are perceived to be non-viable due to non-availability of finance at affordable cost, high incidence of licence fee and various implementation problems like Right Of Way (ROW) for laying telephone cables. Similar problems are being faced by operators of value added services. Except, for cellular operators in melro cities, operators of various other value added services are stated to be facing financial problems. A comprehensive review of the present Policy is called for to ensure effective private sector participation. Ensuring adequate rate of return on investment to the private operators has to be an important part of the .strategy. It would also require a comprehensive review of the terms and conditions of the licencing policy including the licences already issued. Recognising the urgent need to sort out these issues/ problems on priority basis, the Government has set up a Group on Telecommunications under the Chairmanship of Deputy Chairman, Planning Commission. The Group would make recommendations on :
i) Proposed New Telecom Policy;
ii) Issues relating to existing licensees of basic and cellular services and suggest appropriate remedial measures within the framework of new Telecom Policy and
iii) Issues relating to TRAI.
7.2.49 Though private participation has been permitted in basic services, provision of long distance services, i.e. inter-circle connectivity continues to be a monopoly of the DOT. All over the world liberalisation in the area of long distance services has generally preceded liberalisation / privatisation of local services. Under the present policy, the monopoly o f the DOT in the area of long distance services is to be reviewed in 1999. Similarly, the monopoly of VSNL in providing international cormectivity is also due for review in the year 2004. To ensure world class services at competitive prices, this segment o f the telecommunication sector would also have to be thrown open in due course. The necessary action towards review of the present policy of domestic long distance connectivity would be initiated at the earliest and the new policy implemented by 1999 end.
879

TOWARDS COMPREHENSIVE TELECOM REFORMS
R evolu tionary ch a n ges are taking p lace in the te lecom sector all over the w orld driven by rapidly ch a n g in g tech n o lo g y w h ich is reducing co sts and increasing the sco p e for com petition . A s a result m ost coun tr ies are m o v in g aw ay from the traditional m odel o f te leco m m u n ica tio n s be ing v iew ed as an integrated public sector m o n o p o ly to a de-regu iated environm ent in w h ich the sector is opened up to co m p etitio n from private investors.
M od els for te leco m reform s var\' across countries but a basic approach co m m o n to m ost m o d els is to d istin gu ish betw een three fun ctions : p o licy m aking, serv ice provision and regulation . The pro v isio n o f serv ices can be organised to a llow for com petition from the private sector serv ice providers. T he sh ift from a m o n o p o lis tic structure to a com petitive one m ust be the central ob jec tiv e o f long term reform s in this sector. A s com p etition is increased and private players are a llo w ed to enter, the reguiatorv fun ction m ust be so organised to provide assurance to private operators o f fair treatm ent at the hands o f the G overnm ent, e sp ec ia lly w here the p o licy en v isa g es com petition w ith ex istin g public sector suppliers.
T he position regarding te leco m reform s in India can be sum m arised as fo llo w s :
❖ T he regulatory function has been separated and assign ed to the T e leco m R egulatory A u thorit\ o f India (T R A I). It is essen tia l to ensure that T RA I is seen to be a credible and independent regulator w'ith pow ers necessary to assure fair treatm ent for new' private entrants.
❖ T he serv ice function has not been fu lly separated from the p o licy m aking function sin ce both are co m b in ed in the D O T ex cep t for M T N L and V S N L being corporate bod ies. It is necessary to separate D O T ’s serv ice netw ork into a separate corporation w h ich , together w ith V S N L and M T N L w ill be pu blic sector serv ice providers d istinct from DOT.
❖ C om p etition w ith in the area o f serv ice provision a lso needs to be op tim ised . The present p o licy a llo w s co m p etitio n betw een MTT^IL/DOT and one basic and tw o cellu lar serv ice operators in each o f the four m etros and 2 0 other T e leco m C ircles in rest o f the country. H ow ever , inter-C ircle co n n ec tiv ity is a m o n o p o ly o f D O T w h ich is due for rev iew in 1999. International co n n ec tiv ity is a m o n o p o ly o f V S N L until 2 0 0 4 .
•> Internet serv ices have been recen tly opened up to private investors en d in g the m o n o p o ly o f V S N L in this area. H o w ev er , ISPs are not perm itted to provide v o ice te leph ony. T his restriction needs to be exam in ed in the contex t o f the trend o f co n v erg en ce w itn essed in the te lecom m u n ication sector.
Indian T elegraph A ct, 1885 is archaic and totally outdated. It needs to be repealed im m ed ia te ly and rep laced by a n ew leg isla tio n that takes into account the vast advan ces in tech n o lo g y and the present and future requirem ents o f the industry.
❖ A basic problem in the T e leco m sector is the unbalanced nature o f the ta r iff L ocal ca lls are h ea v ily su b sid ised by overchargin g on lon g d istan ce and international ca lls. T he TRA I is ex p ected to subm it its recom m en d ation s for a rational tar iff structure. O ver the longer run, te leco m tariffs m ust reflect the relative co st o f provid ing serv ices . C ross su b sid ies b en efitin g particular seg m en ts sh ou ld be kept to reasonable leve ls .
E xp erien ce thus far su g g ests that tiie p o licy fram ew ork needs review' in m any respects. T he operational prob lem s faced by cellu lar and basic serv ice providers need to be exam in ed and su itab le corrective action taken to ensure e ffe c tiv e com petition from these sources. A com p reh en siv e response to these prob lem s n eed s to be w orked out through a N e w T elecom P o licy w h ich w ill bu ild on the ex is tin g p o licy and a lso seek to address problem s o f the future.
7.2.50 The success or failure of deregulation will largely depend on how well the TRAI functions. It has to be made truly autonomous and self-financing to ensure its effective functioning. As it will have to handle complex issues of a multi-disciplinary nature, it needs to be supported by a team of highly qualified professionals from different fields like economics, law', telecommunication, business administration and finance.
880

7.2.51 Under the present Policy, value-added services are proxided by the private operators on franchise basis. For cellular mobile services and radio paging. onl\- two private operators are permitted in each circle. If the frequency spectrum permits, the number of operators could be increased to ensure greater competition. Following the principle of ensuring le\ el playing field to all the operators, the public-sector companies also need to be permitted to provide value-added services. Necessary action in this regard would be taken during 1998-99.
7.2.52 The National Telecom Policy has envisaged that India should emerge as a major manufacturing base and a major exporter of telecom equipment. The manufacturing capacity of the indigenous industry is small in relation to the other major operators in the world and export constitutes a small proportion of the total production. Development of Indian multi-nationals in this area should be our goal in the Ninth Plan, fhe nonavailability of the latest technology, poor R&D base, non-adoption of exports as a strategy of growth and limited access to international financial markets for cheap finance are among the major constraints to the achievement of this goal. The Ninth Plan should endeavour to remove the bottlenecks by initiating necessary policy changes. This may include encouragmg joint ventures, rationalisation of custom and import duties on inputs and development of a strong industry-sponsored R&D base.
7.2.53 The two PSUs i.e. ITl Ttd. and HIT l.td. have developed sufficiently large capacities for the manufacture of various types of telecom equipments. Infact. 111 Ltd. is the single largest Company in the telecom equipment manufacturing sector in the country, both in terms of turnover as well as employment. These two Companies ha\ e also developed over the years necessary technological capabilities and have sufficient skilled manpower. However, as a consequence of the policy of deregulation, liberalisation and competition, their performance has been adversely atfected and they are struggling for growth and stability. The existence of healthy, strong and efficient public sector companies provides the necessary cushion/check against the MNCs. The ITl Ltd. and the HTL Ltd. have an important role to play in this regard. These two Companies can also play an im^portant role in realising our goal of making India a major manufacturing base and exporter of telecom equipment and developing Indian Multinationals in this area. The two Companies have to be made efficient and competitive to play their due role in the changed scenario. This would call for their revival and restructuring, including providing the necessary funds for capital restructuring and allowing them to go in for strategic tie-ups with leading international players.
881

7.3.1 An efficient postal com m unica t ion system is crucial for grow th and m odern isa tion . T he Indian postal system is the largest in the w orld. ha\ ing a netw ork o f 1.53 lakh post offlccs. In term s o f population served per post office, it com pares quite well with the rest o f the world, both developed and de\ cloping countries. Only UK. f 'rance. A ustra lia and U SA . w ith a coverage o f 2978. 3413. 4468 and 5203 persons s e r \e d per post office respectively are ahead o f India, w here one post office serves an average population o f 5518. covering on an average an area o f 21.48 sq.kms. Besides provid ing a variety o f postal services, the Indian postal system is playing a vital role in the resource m obilisa tion efforts, especially in the rural areas. The im portance o f these functions is illustrated by the deposits to the tune o f Rs.91,795 crore in 160.5 m illion accounts m obilised under the P ost O ffice Saving B anks (PO B s) schem e as on M arch 31,1996
Eighth Five Year Plan - Review
7.3.2 Modernisation of the postal services by introducing the latest technology and expansion of the postal network in the uncovered areas, especially in the rural areas, were the two thrust areas of the Eighth Five Year Plan. A target of opening 3000 Extra Departmental Branch Offices (EDBOs), mainly in the rural areas, and 500 Departmental Sub-Offices (DSOs) were fixed for the Eighth Plan. The targets were later revised by the Department to 1440 and 650 for EDBOs and DSOs respectively. The performance with regard to the opening of DSOs, mainly in the urban areas, has been satisfactory with the achievement of 72% of the revised and 93% of the original target. However, in the rural areas only about 52% of the original target has been achieved. The response to the newly formulated scheme of Panchayat Sanchar Sewa Yojana has been lukewarm with only 38% of the target having been achieved.
7.3.3 Modernisation and mechanisation of postal operations were accorded the top priority in the Eighth Plan. The major targets fixed included installation of 5000 Multi Purpose Counter Machines (MPCMs), introduction of mechanised mail sorting system in two metro cities in addition to the commissioning of the system at Bombay and the setting up of the satellite-based money transfer system in 75 centres in the country. Except for the setting up of money transfer system, in respect of which the targets have been achieved fully, the performance in the other two areas has not been satisfactory. A mechanised mail sorting system was established in Chennai besides Mumbai. The metro city of Delhi would be covered during the Ninth Plan along with a few major urban hubs for mail processing. In the case of MPCMs only about half of the target could be achieved. Issues relating to choice of technology and standardisation of equipment, besides delay in the supply of equipment, were the main constraints.
7.3.4 During the first Seven Five Year Plans, construction of buildings has been the single most important activity of the Department of Posts. During the Eighth Plan, this activity was accorded a lower priority with mechanisation and modernisation of postal services being the first charge. However, keeping in line with the past trend, the building activity continued to be the dominant activity of the Department at the implementation level. The expenditure on buildings was excessive and out of control, constituting 52.55% of the actual expenditure, against 37.33% envisaged for it in the approved Eighth Plan outlay (at 1991-92 prices).
7.3 POSTS
882

7.3.5 For the Eighth Plan, an outlay o f Rs.325 crore was approved to he I'unded entirely through budget support. The expenditure is anticipated to be Rs.367.88 crore. which works out to Rs.286.77 crore at 1991-92 prices i.e. about 88% of the appro\'ed outlay. The shortfall in expenditure has been due to the slow' take-off o f the priority programme o f modernisation and mechanisation o f postal operations, especially during the first three years of the Plan.
Ninth Five Year Plan
Problems, Strategy and Policy Framework
7.3.6 The Ninth Plan would aim at making the postal services self-financing at the sectoral level. To achieve this objective, necessary policy measures w'ould have to be initiated to recover the operational cost and gradually eliminate the subsidy provided on various services in a time-bound manner. However, cross subsidisation amongst services may continue so as to ensure the provision o f the most essential services to the people, especially the poor, at affordable prices. Due autonomy may have to be given to the Postal Board to take appropriate decisions in this regard.
7.3.7 The revenue deficit of the Department o f Posts has been steadily increasing over the years and is currently estimated to be R s . l l l4 crore (1997-98 BE). The details o f the revenue deficit are given in Table 7.3.1.
Table 7.3.1 Details O f Postal Deficit
(in Rs. crore)
Non-Plan 1995-96(Actuals)
1996-97(Actuals)
1997-98(RE)
1998-99(BE)
Gross Rev. Expdtr. 2472.14 2982.32 3677.99 3788.51
DeductRecoveries 662.31 1064.44 1144.10 1192.00
NetExpdtr. 1809.83 1917.88 2533.89 2596.51
Receipts 1150.42 1214.62 1625.00 1700.00
Net Deficit 659.41 703.26 908.89 896.51
While the dependence on manual systems in most o f its operations has resulted in mounting operational cost for the Department, the deliberate policy o f subsidising the services especially in rural, hilly and tribal areas in deferenge to their social significance, has combined to steadily widen the gap between revenue and expenditure o f the Department.
883

7.3.8 The large quantum of subsidy provided on the postal stationery and services is the main reason for the deficit. Out o f twenty three services provided by the Department, only four i.e. Letter, Speed Post, Insurance and Foreign Mail are currently yielding surplus per unit o f activity/service. There seems to be little justification for subsidising .services like Registration, Money Order. Saving Bank, Regd. Newspaper etc. While the cutting down of costs and improving the efficiency o f operations have to be a continuous process, the situation also calls for a revision o f rates at regular intervals, which has not been done to the extent required in the past. Services like competition post card, in respect o f which people have the willingness and capacity to pay more, should be appropriately priced to generate more resources for the sector. Even the subsidy on postcards is excessive given the very low price charged for postcard. The pricing o f services meant for business/ commercial sector should be on a remunerative basis.
Subsidy on Major Postal Services - 1998-99 Projections
Cost per unit (Paisa)
Revenue per unit
(Paisa)
Subsidy per unit (Paisa)
Total traffic ( in lakh)
Total loss (Rs.Crore)
Post Card 336 25 311 4815 150Letter Card 330 129 201 6760 135Printed Postcard 336 150 186 1815 34
1 Comp. Postcard 391 258 133 379 5Regd. Newspaper 389 26 363 1352 49Registration 2065 1117 948 2729 259Money Order 2871 1623 1248 1085 135Parcel 3595 2724 870 619 54Savings Bank 1704 1522 182 = 4717 86LP.O. 1392 93 1299 249 33N.S.C.+K.V.P. 3132 2061 1071 671 72Mahila S. Yojana 4019 1522 2497 123 31
7.3.9 Upgradation o f technology and modernisation o f postal operations would continue to be a thrust area during the Ninth Plan. The use o f appropriate technology for speedy and reliable mail handling would be an important component o f the strategy in this regard. The main areas involved are:
(i) counter computerisation; -
(ii) mechanisation o f mail handling;
(iii) modernisation o f post offices;
(iv) electronic money transfer system and
(v) introduction o f mechanical aids.
7.3.10 Computerisation and information technology will have Jo play an importantrole in the entire scheme o f modernisation o f services, including developing effective and
884

efficient management information system. Besides improving the efficiency, it will lead to a marked improvement in the quality of services. Only a small segment o f the vast network has been computerised so far. With the limited resources available with the Government in the form o f budgetary support, it is not feasible to achieve the desired speed, spread and extent o f computerisation. To achieve full computerisation o f various services and operations throughout the country in a time-bound manner, the possibility o f private sector participation, including lease finance in this area will have to be seriously explored during the Ninth Plan.
7.3.11 The area of service provision would be further expanded during the Ninth Planby introducing new and diversified services including value-added services. Provision o f customised services, like mass mailing services, hybrid mail, corporate money transfer, etc. would be an important element of the strategy in this regard. New value-added services, like premium saving bank services based on smart card, gift services, etc. would beextended. The quality and efrlciency o f speed post/courier services would be furtherimproved and extended to more areas during the Ninth Plan.
7.3.12 About half of the Gram Panchayal Villages do not have a post office o f theirown, though they are serviced by the nearest office. As per the existing norms, only about 8041 o f such villages, including Gram Panchayat Villages, are qualified to have a post office on the basis o f two o f the existing three norms i.e. distance and population. The present scheme o f opening o f post office in the rural areas i.e. E^xtra Departmental Post Offices (EDBOs) is neither capable of ensuring expansion of services at the required pace due to limited public sector funds nor is it financially sustainable over a long period o f time due to large quantum of subsidy involved (67% to 85%). The response to the recently formulated scheme o f involving Gram Panchayats through the Panchayat Sanchar Sewa Yojana has not been encouraging. Innovative/alternative strategies would have to be adopted with a view to achieving the objective o f providing basic counter services inthe uncovered areas in order to provide postal connectivity essential for socioeconomic development. To make the service at the village level viable, convergence o f similar services like post, telecom, fair price shops etc. may have to be explored.
7.3.13 Postal services continue to be a Government monopoly. However, without affecting the predominant role o f the Government in this sector, it should be possible to provide self-employment opportunities to the educated youth and to small scale entrepreneurs by involving them in the provision of selected services. The major areas among these are :
(i) opening o f new post office in urban areas through licenced postal agents;
(ii) printing o f postal stationery;
(iii) sale o f stationery through licenced agents on franchise or commission basis and
(iv) processing o f bulk mail.
7.3.14 Till the Eighth Plan, construction of buildings has been the single most important activity o f the Department. Even during the Eighth Plan, the expenditure under the building programme has been more than the approved outlay, thus disturbing the Plan priorifies. The reliance on budget support for financing this acfivity would be kept at
885

the m inim um during the Ninth Plan period, keeping in view the more important competing needs o f programm es like expansion and modernisation. Alternative ways o f financing this activity, including use o f Postal Life Insurance (PLl) funds need to be explored and appropriately developed.
Objectives and Targets
7.3.15 Expansion o f the postal network, especially in the rural, far-flung and uncovered areas, and modernisation o f postal operations would continue to be the thrust areas during the Ninth Plan. The major objectives o f the Plan in the postal sector are envisaged to be:
(i) improving efficiency and quality o f services;
(ii) mechanisation and modernisation o f postal operations;
(iii) human resource development through adequate training and facility for skillupgradation keeping in line with the Department's need for technical expertise;
(iv) introduction o f new and more value-added services and strengthening the existing ones
(v) fmancial self-sufficiency;
7.3.16 Technology upgradation and modernisation programme would hold the key to theachievement o f the above objectives. This programme would be accorded the highest priority during the Ninth Plan. In the area o f expansion o f postal network, priority would be accorded to the provision o f postal facilities in the rural, hilly, tribal and difficultareas. The major targets/schemes envisaged for the Ninth Plan are :
(i) opening o f 2500 rural post offices (EDBOs) and 250 urban post offices (DSOs);
(ii) installation o f 5000 Multi Purpose Counter Machines;
(iii) modernisation o f 1025 post offices;
(iv) modernisation o f 100 mail offices;
(v) setting up o f satellite-based money transfer system with one hub, 200 VS AT and 2000 ESMOs;
(vi) setting up o f automatic integrated mail sorting systems in three major cities;
(vii) computerisation o f Regional Postal Life Insurance operations in 32 regions with upgradation o f computers in 20 circles;
(viii) construction o f postal buildings and staff quarters;
886

GOALS ENVISAGED BY DOT FOR NINTH FIVE YEAR PLAN
1. Availability
- To provide telephone on demand.
(This objective is to be achieved with the private sectorparticipation complementing the efforts o f the Government.)
2. Accessibility
- To provide telephone facility in all villages by the year 2000.
(This objective is to be achieved with the private sector participation supplementing the efforts o f DOT).
To increase the number o f telephones in the villages where only single telephone is working to meet the requirement o f increased economic activity.
- Public call offices for every 500 population in urban areas.
- S.T.D. PCOs on National Highways for every 10 kms.
3. Subscriber Trunk Dialling and Connectivity
- Provide S.T.D facility to all exchanges by the year 2000.- All exchanges upto SDCC level to have digital connectivity.
4. Modernisation and upgradation
Replace life expired and technologically obsolete switches with digital switches.
- Manual Trunk Services in SSA Headquarters to be computerised.- Computerised records o f cable network.
- Wireless in local loop, H.D.S.L, A.D.S.L and optical fibre technologies will be gradually introduced in the local network.
- Common Channel Signalling No.7 to be introduced upto DHQ level along with synchronisation o f transmission and switching network.
Introduction o f better and reliable technologies for providing Village Public Telephones.
A N N E X U R E 7.2.1
887
All life expired and unserviceable analogue systems will be replaced with digital systems.
5. Reliability
- All exchanges will have reliable media.Diversity in transition network between TAXs.
- Network management system for control and management of network.
6. Data Network
- PSPDN (Packet Switched Public Data Network) to cover all DHQs.
Frame relay network to provide access upto 2 Mbps will be introduced in major cities.
- High speed VS AT network for providing Voice and Data will be expanded.
- ATM network will be introduced.
- Internet network will be expanded.
7. Modernisation of Customer Services
- Computerised billing and accounting in all the Divisions.- Modernise Fault Repair Service.- Computerised Directory Enquiry Services for all SSAs.- Completion o f National Directory Enquiry service for all SSAs .- Computerise commercial activities in all the Divisions.- Provide greater accessiblity for payment o f bills.- Provide single window customer service centres.
8. New Services
- It is aimed to provide widest permissible range o f services with w'orld standard quality to the customers at reasonable prices. The following services are identified to be introduced by DOT.
- ISDN upto all SSA Headquarters.- IN in all major cities.- Mobile Satellite Service.- Personal Communication Service.- Multi-media Services.
The following services have been identified as Value Added Services by the Department o f Telecom for franchise to private/public sector companies on nonexclusive basis.
888

- Cellular Mobile Telephone Service.- Radio Paging Service,
niectronic Mail.- Voice Mail and Audiotex Service.- Video Conferencing- Videotex- Internet- Public Mobile Radio Trunked Service.- 64 Kbps CUG Data Service through VSAT.- Credit and Authorisation.
9. Telegraph
Ensure delivery o f 98% of the telegrams within 12 hrs. and 100% of telegrams within 24 hrs. through Store and Forward Fax facilities and by modernisation o f telegraph services by the introduction of micro-processor based technology.
10. Special Focus Areas
While providing telecom facilities liberally during the plan period 1997-2002, priority for early completion within this period will be given to the following areas
Sensitive Border areas.- Tribal and Hilly areas.- Industrial Growth Centres.
11. Staff Quarters :-
- Achieve 30% staff satisfaction for all the difficult areas o f North-East and other states.
- Achieve a staff satisfaction ration o f 20% on the average by 2002.
889

Annexure 7.2.2
CIRCLE-WISE TELE-DENSITY
Telecom Circle Te!e-densitv
Andhra Pradesh 1.43Assam 0.56Bihar 0.39Gujarat 2.60Haryana 2.18Himachal Pradesh 2.77Jammu & Kashmir 0.89Karnataka 2.17Kerala 2.94M adhya Pradesh 1.06Maharashtra 1.84North-East 1.03Orissa 0.63Punjab 3.48Rajasthan 1.39Tamil Nadu 1.73Uttar Pradesh(E) 0.74Uttar Pradesh (W) 0.74West Bengal 0.40A&N Island 2.24Mumbai 13.06Delhi 14.62Calcutta 4.77Chennai 7.88
All India : 1.72
890

Annexure 7.2.3
CIRCLE-WISE TELECOM NETWORK (as on 31.3.97)
Circle DELs Waiting List W/L as % of DELs(lakh) (lakh)
Andhra Pradesh 9.50 2.42 25.5Assam 1.25 0.28 22.7Bihar 3.32 0.51 15.5Gujarat 10.78 2.65 24.6Haryana 3.55 0.85 24.1Himachal Pradesh 1.41 0.46 33.0Jam-mu & Kashmir 0.60 0.33 48.4Karnataka 9.73 1.65 17.0Kerala 8.54 6.19 72.6M adhya Pradesh 6.98 0.48 7.0Maharashtra 12.41 2.48 20.0North East 0.93 0.12 2.9Orissa 1.98 0.44 22.2Punjab 7.24 1.84 25.5Rajasthan 6.07 1.56 25.7Tamil Nadu 8.81 2.85 22.4Uttar Pradesh(E) 5.05 0.58 11.6Uttar Pradesh(W) 3.21 0.73 14.1West Bengal 2.27 0.65 28.7A&N Island 0.06 0.02 40.7Mumbai 16.42 0.008 0.05Calcutta 5.20 0.84 16.3Delhi 13.70 0.02 0.2Chennai 4.22 0.80 19.1
Total: 143.23 28.75 19.9
891

Annexure 7.2.4
Status of Village Public Teleph one (VPTs) (as on 31.3.97)
Sl.No. Circle Total number of Villages
Villages with VPTs
% of villages with VPTs
1 .Andhra Pradesh 29460 21272 722.Assam 22224 7864 353. Bihar 79208 15569 204.Gujarat 18125 13923 775. Haryana 7018 6510 936.Himachal Pradesh 16997 5075 307.Jammu & Kashmir 6453 2003 318. Karnataka 27024 17481 659. Kerala 1530 1530 10010.Madhya Pradesh 71526 35367 4911 .Maharashtra 40430 26450 6512.North-East 14197 3136 2213.Orissa 46989 16173 3414. Punjab 13252 12007 9115. Rajasthan 37889 17325 4616.Tamil Nadu 20196 17038 8417.Uttar Pradesh(E) 75462 23394 3118.UttarPradesh(W ) 37106 13957 3819. West Bengal 38337 10985 2920.A&N Island 292 111 3821.Delhi 191 191 10022.Calcutta 468 421 90
Total: 604374 267782 44
892

VALUE ADDED SERVICES IDENTIFIED BY THE WORKING GROUP FOR THE NINTH FIVE YEAR PLAN
A N N E X U R E - 7.2.5
Name o f the Service
(I) Existing Value-added Services
1) Radio Paging2) Cellular Mobile Telephone3) Public VIobile Radio Trunking4) Electronic Mail5) Voice Mail/Audiotex6) Videotex7) Video Conferencing8) Closer Users Group (CUG) Domestic
Kbps Data Services via IN SAT Satellite System
9) INTERNET10) Credit Card Authorisation
(II) New Value-added Services (to be introduced during Ninth Plan)
1) Pay Phone Services2) Home Banking/Tele-Banking3) Automatic Teller Machine (ATM)4) Global Positioning Systems (GPS)5) Multi Media Services6) Global M obile Satellite Services7) M obile Satellite Phone through INSAT-2C8) Services using IN Platform9) Services using ISDN Platform10) Personal Communication Services11) Tele M edicine/Health Information Services12) Distance Education Services
(III) Emerging Value-added Services (Experimental/development stage by the end o f Ninth Plan.)
1) Multi M edia Data Bases2) Video on Demand3) Electronic and On-line Magazines
and Newspapers4) Video games/virtual reality5) Home ShoppingA^ideo Shopping
Projected demand
6 million 3 million3.5 lakh subscribers 5 million subscribers Not much expansion Not much expansion 1000 terminals
15000-20000 16 lakh 50000
7.5 lakh 3 lakh5000 terminals 2000 ground terminals 10 lakh 600005000 terminals
1 lakh terminals 15000 subscribers 1000 terminals 5000 terminals
893

Outlay, Expenditure, and Financing pattern of Telecom Sector
Annexure- 7.2.6
Eighth Plan Review
Crore)
Sectors/Heads of Developments
Outlay92-97
Approved Actual Expenditure Expend. ---------
92-97 1992-93 1993-94
Year-wise Actual
1994-95 1995-96 1996-97
I . DOT including C-DOT 23946.00 29644.99 3985.83 4846.00 5882.98 7309.19 7620,99of which (13225)i) Internal Resources 16556.00 23157.98 2716.02 3056.67 4656.98 6960.19 5768.12
1 1 ) Bonds 7026.00 5695,87 943.00 1600.00 951.00 349.00 1852.87iii) Others 0.00 675.00 300.00 100.00 275.00 0 . 00 0 . 00iv) Budgetary Support 364.00 116.14 26.81 89 . 33 0.00 0.00 0 . 00
II. MTNL (13225) 4407 .49 703.80 836.87 997.62 983.69 885,51i) Internal Resources 4063.36 553.24 643.30 997.62 983.69 885 . 51
ii) Bonds 193.00 0.00 193.00 0.00 0.00 0 . 00iii) Others 151.13 150.56 0 . 57 0.00 0.00 0 . 00
Total DOT including MTNL 23946.00 34052.48 4689.63 5682.87 6880.60 8292.88 8506.50of which (13225)1 ) Internal Resources 16556.00 27221.34 3269.26 3699.97 5654.60 7943.88 6653.63
li) Bonds 7026.00 5888.87 943.00 1793.00 951 .00 349.00 1852.871 1 1 ) Others 0 . 00 826.13 450.56 100.57 275.00 0.00 0 . 00iv) Budgetary Support 364.00 116,14 26 . 81 89 . 33 0.00 0.00 0 , 00
111, WMO (Budget Support) 26 . 00 12 . 22 1 . 63 3,05 1.50 1 . 38 4.66(13275)
IV. VSNL (13275) 800.00 1535.75 200.81 246.94 295.94 249.96 542 . 10i) Internal Resources* 800.00 1535.75 200.81 246.94 295.94 249.96 542 , 10
ii) EBR - Others 0.00 0.00 0.00 0 .00 0.00 0.00 0 . 00lii) Bonds 0.00 0.00 0.00 0.00 0.00 0.00 0.00
V. ITI (12859) 350.00 251.13 48.49 38 .14 35. 90 59 , 96 68 . 64i) Internal Resources# 350.00 0.00 12.96 0.00 0.00 0.00 17.53
ii) EBR - Others 0.00 223.28 35.53 38 .14 35. 90 59.96 23.26iii) Bonds 0.00 27.85 0.00 0.00 0.00 0.00 27.85iv) Budget Support 0.00 0.00 0.00 0.00 0.00 0.00 0 . 00
VI. HTL (12859) 15.00 11 .88 2.04 1 . 61 1.00 5 . 18 2.05i) Internal Resources 15.00 10 . 67 2.04 1 . 61 1 .00 5.18 0.84
ii) EBR - Others 0.00 1 .21 0.00 0.00 0.00 0.00 1.21iii) Bonds 0.00 0 . 00 0.00 0.00 0.00 0.00 0.00iv) Budget Support 0.00 0 . 00
G. Total Outlay/Expnd. 25137.00 35863.46 4942.60 5972.61 7214.94 8609.36 9123.95of which
IR 17721.00 28798.25 3485.07 3948.52 5951.54 8199.02 7214.10Bonds 7026.00 5916.72 943.00 1793.00 951.00 349.00 1880.72Others 0.00 1020.13 486.09 138.71 310.90 59. 96 24 . 47Budgetary Support 390.00 128.36 28 . 44 92 . 38 1. 50 1 . 38 4 . 66
Grand Total 25137.00 35863.46 4942.60 5972.61 7214.94 8609.36 9123.95
* : The actual IR for VSNL during 1992-97 is Rs.294.14, Rs.312.93, Rs.343.77, R s . 252.01 andR s .587.63 respectively
# : The actual IR of ITI during 1993-96 is -Rs.114,11, -Rs.78.37, -Rs.37.42 respectively.
894

Annexure-7.2.7EIGHTH PLAN REVIEW
Outlay, Expenditure and Financing Pattern of Telecom Sector (1991 -92 prices)
Sectors/Heads of Developments
Approved Actual Outlay Expend. 1992-97 1992-97
Yearwise Actual Expenditure
1992-93 1993-94 1994-95 1995-96 1996-97
I . DOT including C-DOT 23946.00 22675,76 3676.96 40B6.69 4534.79 5250.85 5126.46of which (13225)i) Internal Resources 16556.00 17553.24 2505.55 2577.73 3569.75 5000.14 3800,08
li) Bonds 7026.00 4449.39 869.93 1349,30 733.06 250,72 1246,38iii) Others 0 . 00 573.06 276,75 84 , 33 211.98 0 . 00 0 , 00iv) Budgetary Support 364 . 00 100,07 24 . 73 75 . 33 0 . 00 0 , 00 0 , 00
II. MTNL (13225) 3426.34 649.26 705.74 769.00 706.67 595.66i) Internal Resources 3124.20 510.37 542 . 50 769.00 706,67 595,66
ii) Bonds 162.76 0 . 00 162 ,76 0 .00 0.00 0.00lii) Others 139.37 138.89 0 ,48 0 , 00 0 , 00 0 . 00
Total DOT including MTNL 23946 . 00 26102.09 4326.23 4792,44 5303,78 5957,53 5722 . 12of which (13225)i) Internal Resources 16556.00 20577.45 3015.92 3120 . 23 4358.75 5706.81 4475,74
1 1 ) Bonds 7026.00 4612.15 869.93 1512,06 733.06 250.72 1246.381 1 1 ) Others 0 . 00 712 . 44 415.65 84 , 81 211 . 98 0 , 00 0 , 00iv) Budgetary Support 364.00 100.07 24 . 73 75.33 0.00 0 , 00 0 . 00
III. Wireless Monitoring Orgn. 26 . 00 9 . 36 1 . 50 2.57 1 . 16 0 , 99 3.13
IV. VSNL (13275) 800.00 1165.84 185.25 208,25 228 . 12 17 9 57 364.66i) Internal Resources 800.00 1165.84 185.25 208.25 228.12 179,57 364.66
1 1 ) EBR ~ Others 0 . 00 0.00 0.00 0 . 00 0 . 00 0 , 00 0.001 1 1 ) Bonds 0 . 00 0.00 0.00 0,00 0.00 0 , 00 0.00
V. ITI (12859) 350.00 193.82 44.73 32.16 27 . 67 43,07 46.17i) Internal Resources 350 , 00 23 . 75 11 . 96 0 , 00 0 . 00 0,00 11 . 79
li) EBR - Others 0.00 151.33 32.78 32 .16 27 . 67 43 , 07 15. 65ill) Bonds 0 . 00 18 . 73 0 . 00 0.00 0.00 0 .00 18.73
VI. HTL (12859) 15.00 9 .11 1 . 88 1.36 0.77 3.72 1 . 38i) Internal Resources 15.00 8 . 30 1. 88 1. 36 0 . 77 3.72 0.57
i3.) EBR - Others 0.00 0.81 0 . 00 0.00 0.00 0 , 00 0 . 81lii) Bonds 0.00 0.00 0,00 0.00 0 . 00 0 . OC 0 . 00
G .Total Outlay/Expnd 25137.00 27480,22 4559.59 5036.78 5561.50 6184 .89 6137.46of which
IR 17721.00 21875.33 3215.01 3329.84 4587.64 5890.10 4852.75Bonds 7026.00 4630,88 869.93 1512.06 733.06 250.72 1265.12Others 0.00 864.59 448.42 116,98 239.65 43.07 16.46Budgetary Support 390 .00 109.42 26.24 77.91 1 .16 0.99 3 , 13
Grand Total 25137.00 27480.22 4559.59 5036.78 5561.50 6184.89 6137 .46
895

Annexure- 7.2.8
NINTH PLAN (1997-2002)
O u t l a y , E x p e n d i t u r e a n d F i n a n c i n g P a t t e r n o f T e l e c o m S e c t o r .
(Rs.Crore)
Organisations/Head of Development.
9th PlanApproved Outlay *
1997-98Approved RE Outlay
1998-99Approved
OutlayI. DOT including C-DOT 10916.00 8725.00 11000.00
of which (13225)i) Internal Resources 8175.00 8171.00 8709.00
ii) Bonds 2741.00 554.00 2291.00iii) Others 0.00 0.00 0.00iv) Budgetary Support 0.00 0.00 0.00
[I. MTNL (13225) 1518.00 1325.00 2772.00i) Internal Resources 1070.85 1165.00 2042.00
ii) Bonds 447.15 160.00 730.00iii) Others 0.00 0.00 0.00
Total DOT including MTNL 12434.00 10050.00 13772.00of which 13225)i) Internal Resources 9245.85 9336.00 10751.00ii) Bonds 3188.15 714.00 3021.00
iii) Others 0.00 0.00 0.00iv) Budgetary Support 0.00 0.00 0.00
III. WMO (Budget Support) 7.00 4.76 6.10(13275)
IV. VSNL (13275) 825.00 1002.65 1004.65i) Internal Resources 825.00 1002.65 1004.65ii) EBR - Others 0.00 0.00 0.00
iii) Bonds 0.00 0.00 0.00/. ITI (12859) 72.00 72.00 94 .00
i) Internal Resources 0.00 0.00 0.00ii) EBR - Others 71.00 71.00 94.00
iii) Bonds 0.00 0.00 0.00iv) Budget Support 1.00 1.00 0.00
VI. HTL (12859) 16.29 14 .75 11.08i) Internal Resources 5.29 6.40 9.08ii) EBR - Others 9.00 6.35 0.00
iii) Bonds 0.00 0.00 0.00iv) Budget Support 2.00 2.00 2.00
Grand Total of which 46442.04# 13354.29 11144.16 14887.83IR 46398.000 10076.14 10345.05 11764.73Bonds - 3188.15 714.00 3021.00Others 0.00 80.00 77.35 94.00Budgetary Support 44.04 10.00 7.76 8.10Grand Total 46442.04 13354.29 11144.16 14887.83
* O rg a n isa t io n a l B reak -u p not finalised.. @ Includes Bonds.U I 'hc outlay is indicative. It w as based upon Interna! & Extra B udge ta ry R e sources ( I l ’B R ) as asessed
at the t im e o f initial fo rm ula t ion o f the Plan. As per the es t im ates o f the D e p a r tm en t o f T e leco m , the sec tor is l ikely to genera te lE B R o f m u ch h igher order. K eep ing the above in view, the A nnua l Plan ou t lays w ould be de te rm in ed on the basis o f assessm ent o f resou rces f rom yea r to year.
896

S c h e m e w i s e P h y s i c a l T a r g e t / A c h i e v e m e n t s - T e l e c o n u n u n i c a t i o n S e r v i c e
Annexure- 7.2.9
EIGHTH PLAN REVIEW
Eighth Plan 199r.-97 Annual Pliin Achievement
Name of Schemo ApprovedTarget
M-termTarget
Achieve- 92- ment
93 93-94 94-95 S5-96 96-97
1. Local Telecom System i) Switching Capacity 93 93 109,58 11 .84 18 . 27 22 . 3 26.02 31 .15
(lafchs lines) (22,70) (19.17) (1 .71) (3,41) (4.73) (5.22) (4.2)1 1 )Direct Exchange lines 75 75 87.33 9. 87 12 , 29 17 . 7 21 .83 25 . 64
(lakh lines) (19.7) (16.15) (1 ,91) (2.62) (3.58) (4.0) (4.04)ill)Leasing(DELs)
(la)ih lines)2.Long Distance Switch System i)Trun)t Auto Exchange (Nos . )1 i)Trunkcapacity(000 lines) 272 700
4
285762.25
lb 36, 65
3140.6
80 137 . 6
124197.2
35 350 . 2
3.Long Distance Trans,System
i)Coaxial System (000 )tm») 3 3
(174)
3 . 641 1,112 0.848
(16)
1 . 239
(28)
0.442
(30)
0ii)Microwave Systm(000 kms) 20 20 16.628 2 , 578 3.383 4 . 973 3.05 2 .844iii)UFH System(000 Jtms) 150 90 39 664 5 , 71 4.822 5 . 639 10.124 13.369IV) Optical Fibre Systm 20 40 46.058 3,586 6.442 6.915 13.315 15.8
(000 kms) V) Earth Stations(Nos.) 50 50 131 4 20 23 41 43VI) VSAT(No8.)4. Openwire and Telegraph i)Vxllage Pub. Telephone 360 338 193.428 30.72 33.001 47.659 25.977 56.719
(000 n o a .> 1 1 )Telex Capacitya) local(000 lines)b) Transit(-do-)
31 , 2 IS *■ . 431 5 . 39
3 2'»4 I . 708
2 132 0 . 648
1 .215 0 . 384
0 , 81 2 . 65
Note: Figures in brackets indicate MTNL component
897

Annexure- 7.2.10
S c h e m e w i s e P h y s i c a l T a r g e t T e l e c o n u n u n i c a t i o n S e r v i c e s
NINTH PLAN (1997-2002)
Name of Scheme: Unit 9th Plan -- Target
1997-99
Target Achvnt.
1998 -99
TaigeL
1.Local Telephone System:
i) Switching Capacity Lakh 230.00 36.00 35. 19 4 1 . OT)Lines (29.40) (5.2) (5.0) (5.3)
ii) Direct Exchange Lines -do- 185.00 29.00 32 . 59 36.00(25.0) (4.4) (4.4) (4.5)
lii) Leasing (DELs) -dc^-2.Long Distance Switching System:
i)Trunk Capacity (TAX) LakhLines 18 . 00 3 . 25 3 . L 4 4 . 50
(2.76) (0.5) (1.0) (0.55)3.Long Distance Transmission System
i)Coaxial Cable System Rout e 0 0 0 0Kms .
ii)Microwave System -do- 90000 18000 17995 19500iii)UHF System -do- 0 0iv)Optical Fibre System -do- 140000 22000 23822 35000v) Earth Stations Nos . - 200vi) VSAT Nos .4.0penwire 4 Telegraph:
ijvillage Public Nos . 239155 83000 42855 80500Telephones.
Note; Figures in brackets indicate MTNL component.
898
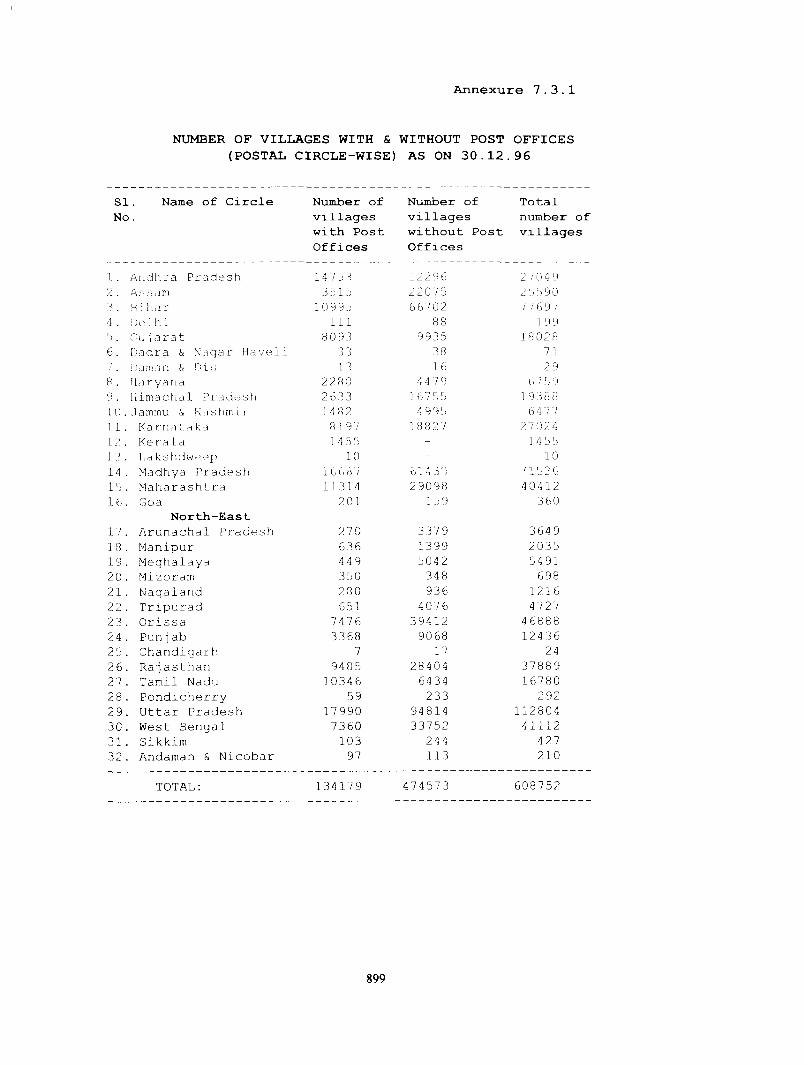
Annexure 7.3.1
NUMBER OF VILLAG ES WITH & WITHOUT POST O F F IC E S(POSTAL C IR C L E -W IS E ) AS ON 3 0 . 1 2 , . 9 6
SI Name of Circle Niimher of Niimber of TotalNo. villages villages niiTiiher of
with Post without Post villagesOffices Offices
1 . A r 1 d lira Pr a d e s h 14 7 5 3 12 2 9 6 2 7 0 4 ')2 . Assam 3515 22075 255903 . Bihar 10 995 66702 7 7 697■1 . Delhi 111 88 1 9 9r G u jarat 8 0 93 9 935 18 0286 . Dadra & Nagar Haveii 3 3 3 8 71;/ !!aii!ar; & Diii 1 3 1 6 298 . Ha ryana 2280 4 4 1 9 b / 5 ')o liimachal Pradosh 2 63 3 1 6755 1938810 .Jammu & Kashmir 14 8 2 4 9 95 64 7 711. Ka mat;a ka 8 19'/ 1 8827 2 7 0 2 412. Ke r a la 14 5 5 - 14 5 51,! . ha kshdweep 10 - 1014 . Madhya Pradesh i U U 0 / O 1 O '3 '15 2 6lb . Maharashtra 11314 29098 4 0 4 1 2lb. Goa
North-East201 1 5 9 3 60
17 . Arunachal Pradesh 270 337 9 364 918 . Manipur 636 13 99 203519 . Meghalaya 449 5042 549120 . Mi zoram 350 34 8 69821 . Nagaland 280 936 121622 . Tripurad 651 4076 472723. Orissa 747 6 39412 4 688824 . Punj ab 3368 9068 1243625 . Chandigarh 7 17 2426. Raj asthan 9485 28404 3788927 . Tamil Nadu ] 0346 6434 1678028 . Pondicherry 59 233 29229. Uttar Pradesh 17990 94814 11280430. West Bengal 7360 33752 4111231. Sikkim 103 244 42732 . Andaman & Nicobar 97 113 210
TOTAL: 134179 474573 608752
899

Annexure -7.3.2
E I G H T H P L A N
S c h e m e w ise O u t la y /E x p e n d itu re - D ep a rtm e nt o f Posts.
(Rs Crcre)
SI. Nauna of Schom® Approved Outlay Actual Actual ExpenditureNo. Outlay Allocated Expndr.-------------------------------------------------------
92-97 92-97# 92-97 92-93 93-94 94-95 95-96 96-97
1. Expansion of postal network
23.65 27.00 22 . 70 1.66 2 . 93 6.88 5.09 6 . 1 4
2 , Construction of postal buildings
121.35 140.33 1B 7 .89 38 . 98 50.01 45 . 85 29.57 23 . 48
3. Manpower Development (Training Programine)
5.00 7 .41 6 ,54 1 . 28 1 . 36 0 .73 1 , 59 1 . 58
4 . Machanisation & 132,53 1 91 . .̂ 7 129.37 15.26 6 . 87 3j .81 39.31 34 . 12
5 , Mail Moter Services (transport services)
14.80 5 . 25 7 , 61 2 . 98 3.19 1 . 44 0 . 00 0 . 00
6 . R M S Vehicles 2 . 50 3. 13 0 . 08 0.00 0 , 00 0 . 08 0.00 0 . 00
7 . Speed Post Service 5-50 5 , 57 3.29 0 . 23 0.18 1 . 20 0 . 77 0 . 91
8 . Material Management 4 . 90 4 . 70 1 . 80 0 . 00 0.77 0.77 0 . 22 0 . 04
9. National Savings (POSB)
2 , 50 2 . 00 0. 98 0.13 0.33 0, 52 0 . 00 0 . 00
10 Martetvr.q b.5u 7.27 3.61 0 . 53 0 .45 0 . 25 1 , 63 0 . 75
11 . Postal Life Insurance 5 .77 6. 97 4 . 01 0 . 08 0.19 1.13 1 , 00 1.61
Total 325.00 401.00 367.88 61 . 13 66.28 92 . 66 79. 18 68 . 63
#: Aggregate of outlays approved for the Annual Plans
900

Annexure-7.3.3
( 1 9 9 1 - 9 2 p r i c e s ) ( R s . C r o r e s )
Si. Name of Scheme Approved Outlay Actual Actual ExpenditureHo. Outlay Allocated Expndr ----------------------------------------------------
92-97 92-97# 92-97 92-93 93-94 94-95 95-96 96-97
EIGHTH PLAN
Scheme-wise Outlay/Expenditure -Department of Posts
1. Expansion of postal ne tworJt
23.65 20 - 22 17 . 09 1.53 2 . 47 5.30 3.66 4 .13
2 . Construction of post bu iIdinga
121.35 110 . 20 148.72 35 . 60 42 . 13 34 . 79 20.78 15.43
3 . Manpower Development (Training Programme)
5 . 00 5 . 55 5 . 02 1 .17 1.15 0,55 1 .12 1.04
4 . Machanisation & Modern 1 sa tion
132 . 53 147.23 95 . 42 13 . 94 6.79 25.65 27 , 62 22.42
5 . Mail Motor Services (transport services)
14 . 80 4 . 30 6 . 50 2 , 72 2 . 69 1.09 0 , 00 0.00
6 . R M S Vehicles 2 , SO 2 . 31 0.06 0 . 00 O.CO 0 . 06 0.00 0.00
7 . Speed Post Service 5 . 50 4 . 22 2.41 0 .21 0. 15 0 . 91 0 . 54 C
Hax-erlai Management i . 90 3, 67 1 .41 0.00 0.65 0 . 58 0.16 0 . 03
9. National Savings (POSB)
2 . 50 1 . 71 0 . 79 0.12 0.28 0 . 39 0.00 0.00
1 0 . Marketing 6.50 5 .74 2.69 0 . 48 0.38 0.19 1.15 0.49
11 , Postal Life Insurance 5 . 77 4 , 05 2.85 0.07 0.16 0 . 86 0 . 70 1.06
Total 325.00 309,20 286 . 77 56.39 55, 09 71.42 56,93 46.14
# ; Aggregate of outlays approved for the Annual Plans.
901

A n n e x u r e - 7 . 3 . 4
NINTH PLAN ( 1 9 9 7 - 2 0 0 2 )
S c h e m e w i s e O u t l a y / E x p e n d i t u r e - D e p a r t m e n t o f P o s t s .
(Rs.Crore)SINo
. Name of Schemes Ninth Plan
Outlay *
1997-
ApprovedOutlay
-98
RE
1998-99 1999-00 2000-01 2001-02
Approved Proposed Proposed Proposed Outlay Outlay Outlay Outlay
1. Expansion of postal network
3.55 3.55 5.03
2. Upgradation ofTechriv. ‘ ''■y.
29. 93 29. 96 20.03
3. Human Resource Development
2.79 2.79 2.94
4 . Modernisation of Mail processing.
8.79 4.57 12.72
5. Business Development and Marketing
3. 85 3. 63 4.25
6. Computerisation of Saving Scheme in Post Offices.
1.19 1.19 1.25
7 . Postal Life Insurance 4 .00 4.01 4 . 358. Philately. 0. 50 0. 50 0. 859. Postal Buildings
and Staff Quarter?.35.00 26. 50 39. 80
10. Streamlining of Adm. and fin. management.
5.40 3.30 3. 8
Total 507.25 95.00 80.00 95.00
* Scheme-’wise break-up not finalised.
902

Annexure-7.3.5
EIGHTH PLAN REVIEW P h y s i c a l T a r g e t s a n d A c h i e v e m e n t s
Eighth P l a n (92-97) Yoar-wiae AchievementsNaune of Schemes
Target Achievements 92-93 93-94 94-95 95-96 96-97
1. Expansion of Postal Services
a. Opening of post offices
EOBOe 3000* 1546 635 667 4 4 236DSOs 500** 466 116 1 15 31 53 151
b. Panchayat Dak Sewa Yojana 0 670 0 0 0 497 173(New Scheme)
c. Planting of Letter Boxes NA 113046 33661 44921 e 42125 26000- Rural- Urban
d. Provision of operational equipment
NANA
0 113 0 0
421250
113
NANA
(New Scheme)
2 Upgradation of Technology
i) Counter computerisation a. Supply of M P C Ms 5000 2660 0 250 1500 550 360b. Other programme for Modernisation NA 899 0 0 115 361 431
of postal operations (No. of POs) 11) Mechanisation of Mail handlings a. Mechnised Mail Proccessing (Metros) 3 2 Achvd. 0 0 Madras 0b. Electronic Money Tranfor (at Stations) 75 74 0 0 26 35 13c. Track. & Trace System for Speed Post 0 e 0 0 2 6 0
(at SPCCs)
d. Computer\sation of accounting fcinventory Functions - MIS (at circles) 19 6 0 6 0 0 0
e. Vehicular Support in Rural Areas 0 0 0 0 0 0 0i.e. cash Vane (New Schemes)
f. Introduction of Mechanical Aids
Hand steunp cacellors NA 26100 100 6000 14000 6000 0High/low speed stamp cacelling machine NA 220 0 0 135 85 0Electronic franking machine NA 40 0 0 0 40 0Enveloping Machines. - 0 - - - - 0
903
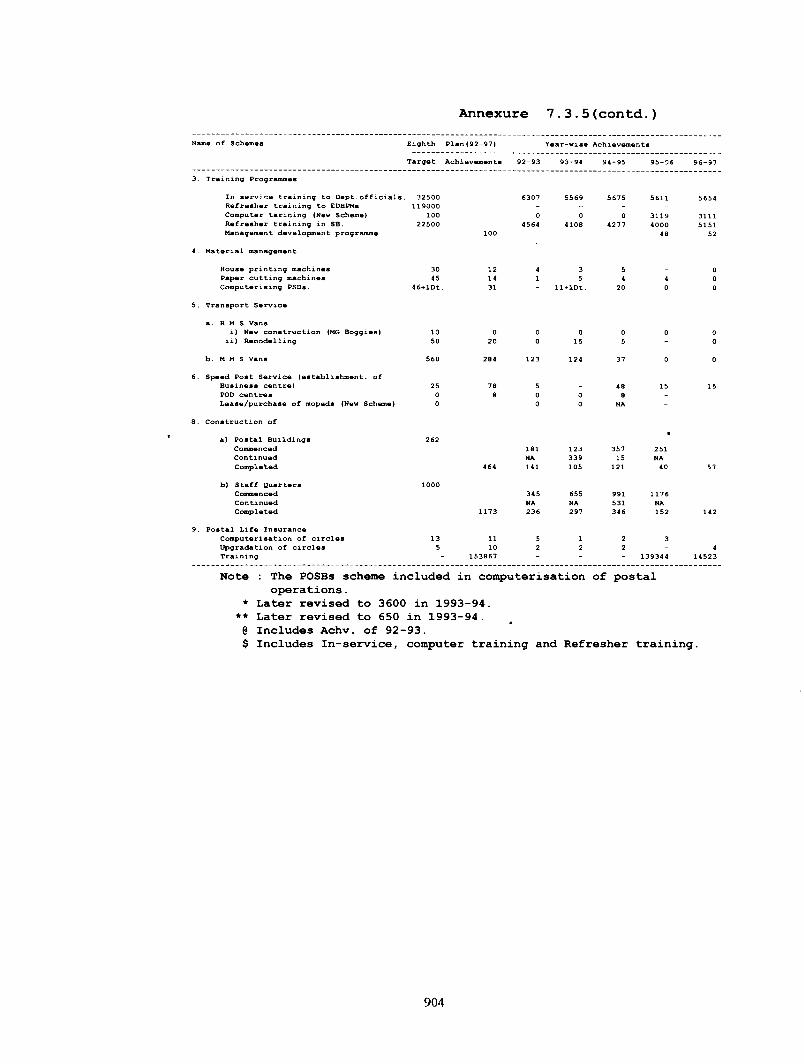
Annexure 7.3.5(contd.)Namo of Schomes Eighth Plan(92-97) Year-wise Achievements
Target Achievements 92-93 93-94 94-95 95-96 96-97
3. Training Prograramos
In earvic® training to Dept.officials 32500 6307 5569 5675 5611 5654Refr«sh®r training to EDBPMs 119000 - - -Computor tarining (New Scheme) 100 0 0 0 3119 3111Refresher training in SB. 22500 4564 4108 4277 4000 5151Management development programme 100 48 52
4. Material management
House printing machines 30 12 4 3 5 _ 0Pap«r cutting machines 45 14 1 5 4 4 0Computerising PSDs. 46+lDt 31 - 11+lDt. 20 0 0
5. Transport Service
a. R M S Vansi) New construction (MG Boggles) 10 0 0 0 0 0 0
ii) Remodelling 50 20 0 15 5 - 0
b. M M S Vans 560 284 123 124 37 0 0
6. Speed Post Service (establishment, ofBusiness centre) 25 78 5 - 48 15 15POD centres 0 8 0 0 8 _Lease/purchase of mopeds (New Scheme) 0 0 0 NA -
8. Construction of
a) Postal Buildings 262•
Commenced 181 123 357 251Continued NA 339 15 NACompleted 464 141 105 121 40 57
b) Staff Quarters 1000Commenced 345 655 991 1176Continued NA NA 531 NACompleted 1173 236 297 346 152 142
9. Postal Life InsuranceComputerisation of circles 13 11 5 1 2 3Upgradation of circles 5 10 2 2 2 - 4Training 153867 - - 139344 14523
Note : The POSBs scheme included in computerisation of postal operations.
* Later revised to 3600 in 1993-94.** Later revised to 650 in 1993-94.0 Includes Achv. of 92-93.$ Includes In-service, computer training and Refresher training.
904

NINTH PLAN (1997-2002) Physical Targets
Annexure -7.3.6
Name of Schemes Target(Nos.)
1. Expansion of Postal Services
a. Opening of post oftices
EDBOs 2500DSOs 250
b. Infrastuctural equipment to EDBOs 24000(New Scheme)
2. Upgradation of Technology
i) Counter computerisation
a . Supply of M P C Ms 4000b. Modernisation of Post Offices. 500
ii) Mechanical Equipment.
a. Hand Cancellors 10000
b. Stamp Cancelling Machines. 100
c. Electronic Franking Machines. 500
d Tying and bunding machines 30
iii) Satellite MO
a. Setting up of HUB
b. Installation of VSATs 200
c. Installation of ESMOs 2000
iv) Material Management
a. Printing & Paper cutting Machines 1
b. Diesel fork lift trolleys 4
905

Annexure 7 . 3 . 6 ( c o n t d . )Name of Schemes Target
(Nos.)
3. Human Resource Development
In service training to Dept, officials. 16500Refresher training for SB/SC work 20000Computer training 12000Decentralised training to EDBPMs 100000Distance decentralised training to 50000
Grp.C and Postman
4. Modernisation of Mail Processing
Setting up of AMPCs 3Mail office Modernisation 100RMS Vans 28Purchase of MMS Vehicles 30
6. Business Development and Marketing
Computerisation of PPCs 40Business office for Speed Post 5
Computerisation of SPCCs 50Bagging/containerisation in metros
6. Computerisatiori ol ir. PCs
SBCO Computerisation 500SB Computerisation 700
7. Postal Life Insurance
Computerisation of RPLI in regions 30Upgradation of computers in circles 20
8. Philately
Computerisation of Bureaux 200
9. Construction of Buildings
a) Postal Buildings 4 00b) Staff Quarters 950
10. Streamlining of Fin. & Admn. management
Computerisation of Fin. Managenient All Circles
906

7.4 INFORM ATION AND BROADCASTING
7.4.1 The Information and Broadcasting Sector has been witnessing a radical transformation in the past few years. Information technology has broken new frontiers and attained crucial importance. Given the technological advances and instant global reach, communications and the media have become an integral part o f life. With the convergence o f the communication, broadcasting and electronic technologies, the challenges faced by this sector are equally wide ranging in view o f the rapidly changing media scenario and a fiercely competitive environment. The important issues confronting this sector range from regulating this sector for provision o f free yet wholesome information and entertainment, to allowing enough freedom to the Government organisations in the field to enable them to perform effectively in the changed scenario. There is a necessity to review the whole gamut o f the present system and refix priorities so as to evolve a policy suitable to the needs and interests o f the people.
Review o f the Eighth Plan
7.4.2 The principal objectives o f the Eighth Plan for the broadcasting/telecasting sector were consolidation, technological modernisation and better and more relevant programming. As far as Information and Films Media are concerned the main thrust was on better services to the public.
7.4.3 The outlay for Information and Broadcasting sector for the Eighth Plan (1992- 97) was Rs.3634.00 crore. However, owing to shortfall in utilisation in the initial years of the Eighth Plan, allocation for the different Annual Plans during 1992-97 was Rs.2391.00 crore and utilisation was Rs.2089.00 crore i.e. 87.39 per cent Details of outlay and expenditure are at Annexure-7.4.1 & 7.4.2.
7.4.4 During the Eighth Plan period the broadcast and telecast media namely AIR and Doordarshan serv'ed as public broadcasters and contributed ?’gnificantly to the socioeconomic and cultural development o f the country. The period 1992-97 witnessed a perceptible increase in reach and coverage by both AIR and Doordarshan. There were 128 Broadcasting Centres and 222 transmitters covering about 95 per cent o f the population at the beginning o f the Eighth Plan. During the Eighth Plan period, AIR set up 73 Broadcasting Centres (including 8 commissioned after 31.3.97; 2 upgraded Centres and 4 yet to be commissioned ) and 167 Transmitters (including 62 replacement transmitters; 8 commissioned after 31.3.97; 12 yet to be commissioned). This excludes 10 transmitters which were de-commissioned. At the end o f the Eighth Plan 97 per cent o f the population was covered. Similarly, Doordarshan had set up 20 studios and 535 transmitters covering about 77 per cent o f the population at the beginning o f the Eighth Plan. During the Eighth Plan period, Doordarshan commissioned 21 more studios (including 5 Studios technically ready before the beginning o f Eighth Plan but commissioned during 1992-93) and 415 transmitters (HPTs: 25; LPTs : 286; VLPTs/Transposers : 104). Twenty nine transmitters were closed down during this period. Doordarshan thus extended its network to cover 87 per cent o f the population o f the country at the end o f the Eighth Plan. The targets and achievements o f the electronic media for the Eighth Plan period are at Annexure - 7.4.3.
907

7.4.5 During the Eighth Plan the involvement o f the Government in the films sector remained important especially in the development of good cinema with socially relevant themes backed by artistic and technical excellence, the development o f modern training infrastructure,encouraging the film society movement,providing impetus to the production of films for children and young people, establishing modern archival facilities for preservation o f films, supporting the documentary film movement, recognising outstanding films and film makers and providing access to good films in India and abroad through National and International Film Festivals. In addition ,the Government has continued to regulate the exhibition o f films through the Central Board o f Film Certification so that the medium o f film remains responsible and sensitive to the values and standards o f society without unduly curbing artistic expression and creative freedom.
7.4.6 The Eighth Plan schemes for the information media included introducfion o f state-of-the-art technology in various areas and large scale expansion o f the electronic media. Further, units such as the Song and Drama Division and the Directorate o f Field Publicity helped to bridge the information gap in areas which have limited access to electronic and print media.
Thrust Areas for the Ninth Plan
Broadcasting
All India Radio
7.4.7 As a public service broadcaster dedicated to the nation building process o f this vast country, AIR has contributed significantly in the socio-economic and cultural development o f the nation. The thrust in the Ninth Plan o f AIR will be :
i) To augment the programme content, making radio more attractive and competitive.
ii) To enhance the technical features and quality o f broadcast to make it more attractive.
iii) To provide wider choice o f programme channels to listeners across the country.
iv) To strengthen the primary channel service to serve as Public Broadcaster.
v) Human Resource Development in various disciplines.
vi) Execution o f Science and Technology schemes.
vii) Modernisation and renewal o f old and obsolete equipment and addition o f new facilities at broadcasting stations enabling better programme production and transmission.
7.4.8 The Ninth Plan physical targets include setting up o f 25 fullfiedged and three Relay Broadcasting Centres; 10 Community Radio Stafions; 28 Medium Wave, nine Short Wave and 28 VHF/FM transmitters; and three Studios. The scheme-wise break up is at Annexure - 7.4.4.
908

Doordarshan
7.4.9 Though Doordarshan has emerged as the biggest terrestrial broadcasting network in the emerging electronic media scenario, it is no longer the sole provider o f TV broadcast service in the country. The foremost task before Doordarshan during the coming years will ,therefore, be to take urgent steps not only to consolidate and maintain its primary position as the National Broadcaster responsible for Public Service Broadcasting in the country, but also to broaden its base.
7.4.10 The approach during the Ninth Plan would be;
a) Concentration on expansion o f network to areas into which a private broadcaster, if and when private broadcasting is permitted in the country, would not easily venture, namely, the North-East, J&K, tribal/hill areas, border areas etc.
b) Continuation o f existing schemes for the upgradation and modernisation o f its existing infrastructure, especially in the field o f news gathering, playback, uplinking and post production to bring about improvement in the quality o f signal throughout its network.
c) Introduction o f digital terrestrial transmitters at major kendras and expansion o f digital satellite channels and digital studio production in order to progress towards total digitalisation o f TV broadcasting.
7.4.11 For the Ninth Plan the physical targets include commissioning o f 26 studio projects (23 o f which are continuing schemes), 80 HPTs (14 continuing) and 422 LPTsA^LPTs (229 o f which are continuing schemes). Details are at Annexure - 7.4.4.
Information Media
7.4.12 In the light o f the lessons learnt from the Eighth Plan the micro strategies for the various M edia Units falling under the Information Sector are as follows:
Press Information Bureau (PIB)
7.4.13 The thrust will be on activities such as technological upgradation o f communication equipment at headquarters and branches; opening o f a branch office at Itanagar, Arunachal Pradesh; and schemes to cater to the needs o f the language press and to integrate the three news gathering streams o f the Ministry in terms o f technology and manpower.
Directorate o f Advertising and Visual Publicity (DAVP)
7.4.14 In the face o f stiff competition fi-om vibrant advertising agencies in the private sector, DAVP envisages strengthening o f the audio visual cell for providing better design inputs, strengthening o f exhibition facilities; modernisation o f DAVP headquarters and regional offices and creation o f software for publicising Government policies and developmental efforts.
909

7.4.15 The Division will continue with the modernisation efforts and take up activities such as upgradation o f Desk Top Publishing. - hardware and software; putting Publications Division on the Internet; publication o f special volumes related to heritage, etc. on the occasion o f 50 years o f Independence; human resource development and training; modernisation o f marketing set-up and exploring areas o f income generation on the lines o f Employment News.
Song & Drama Division
7.4.16 This Division proposes to concentrate on the following areas: extensive use o f traditional modes o f media, sound/light shows etc.; modernisation o f programme designing facilities; and utilising less popular folk art forms especially those o f the North-East and strengthening o f headquarters.
Directorate o f Field Publicity (DFP)
7.4.17 The strategy o f DFP would include strengthening the Organisation and increasing its coverage, replacement o f 16 mm projectors with portable video projector systems, computerisation o f regional offices and purchase o f films and creation o f local software for effective communication and streamlining the feedback mechanism and its development as an input in developmental programmes.
Photo Division
7.4.18 Photo Division will continue the modest beginning it made with its modernisation through introduction o f digital photography. Archival work will also receive priority.
Indian Institute of Mass Communications (IIMC)
7.4.19 IIMC and its branches will be strengthened to meet the specialised training needs o f the media units. Modernisation and expansion o f facilities for P^adio and TV journalism and video projection are also envisaged.
Films Media
7.4.20 The films sector provides a major source o f information, education and entertainment to millions o f people both in the rural and urban areas besides providing employment, both directly and indirectly, to lakhs o f workers. The industry has also contributed considerably to the development o f infrastructure in production, exhibition and other related areas.
7.4.21 The Ministry o f Information and Broadcasting provides the necessary interface between the film industry and the Government particularly in the context o f promoting meaningful socially relevant films. The direct involvement o f the Government has remained important especially in respect o f developmental aspects o f this sector.
Publications Division
910

7.4.22 The goals and objectives o f the Films sector would primarily relate to;
a) Production, distribution and exhibition of meaningful films;
b) Development/augmentation o f modem training infrastructure - two training institutes have already been established;
c) Encouragement to the Film Society movement;
d) Providing impetus and assistance to the production and exhibition o f films for children and young people;
e) Establishing modem archival facilities for preservation o f films;
f) Supporting the documentary film movement and production o f documentary films;
g) Awarding outstanding films and film makers;
h) Exposure to good films in India and abroad through national and international film festivals; and
i) Increasing and modernising essential infrastmcture alongwith manpower to ensure effective implementation o f the Cinematography Act.
7.4.23 The experiences o f the Eighth Five Year Plan have guided the strategies and policies to be adopted for achieving the objectives for the Ninth Five Year Plan. An increasing involvement o f the Government in the film industry is envisaged. The regulatory mechanism through the CBFC would be strengthened by increasing manpower. Aggressive marketing o f films produced by Films Division is required as their market abroad is very promising. A third important area is augmentation and modernisation o f training facilities in the country specially in the fields o f film and television production.
7.4.24 The broad strategies to be adopted for various Media Units under the Film sector would be as under:
Films Division
7.4.25 The thrust would be to further augment and modernise the equipment baseand create infrastmctural facilities for undertaking additional activities in conformity with their objectives. The scientific preservation o f films produced by the Division, which practically constitutes a visual record o f the history o f independent India, is also a priority area. There would be a gradual increase in the production o f films in video format which is the requirement o f the day keeping in view better exhibition opportunities over television.
National Film Archives of India (NFAI)
7.4.26 The National Film Archives o f India would continue with its fundamental objective o f conservation, preservation and restoration o f films and would act as a repository o f the
911

documented history o f Indian cinema. The Archives, would increase storage capacities by construction o f additional vaults in addition to acquisition o f more films.
Film and Television Institute of India (FTII), Pune
7.4.27 The priority areas in the Ninth Plan would be augmentation and modernisation o f the training infrastructure and training methods with a view to increase the output o f trained manpower. FTII would also develop the available land with proper infrastructure and facilities for shooting which would be made available to outside producers on hire, thus generating revenue for the Institute. This would be a part o f the long term strategy o f making the Institute self-supporting.
Satyajit Ray Film amd Television Institute (SRFTI), Calcutta
7.4.28 The Institute has been set up basically to provide additional infrastructure to augment trained manpower in the film and television sectors. The Institute would introduce five additional disciplines o f curriculum depending upon availability o f infrastructure as well as resources. The other important agenda would be construction o f hostel accommodation, staff quarters and accommodation for guest faculty.
National Centre for Children and Young People (NC'YP)
7.4.29 The N C ’YP would endeavour to increase production of high quality software and ensure a wider and greater reach o f their films. One o f the important areas which NC'YP would undertake and implement is setting up o f a modem complex at Hyderabad with various facilities for production, conservation, and exhibition o f children's films. The land for this purpose has already been acquired.
National Film Development Corporation (NFDC)
7.4.30 During the Ninth Plan, the NFDC would continue to be responsible for developing the film sector especially in the area o f production o f low cost good quality feature films with socially relevant themes. While doing so, it would encourage new talent and would encourage films which are creative and artistic having experimentation in form. The Corporation is primarily engaged in four areas which continue to be its thrust areas, namely, film financing/production, theatre financing , imports and projects. The Corporation would not depend upon budgetary support.
Directorate o f Film Festivals (DFF)
7.4.31 The Directorate would continue organising the International Film Festival o f India and other events to promote and encourage good cinema in India and abroad. It would also undertake activities of recognising outstcinding talent through the institution o f National Awards and activities covered under cultural exchange programmes. It is necessary for the Govenmient to undertake organisation o f such activities so that the good cinema movement is promoted actively.
912

7.4.32 The CBFC would implement its continuing programmes and schemes which mainly relate to augmenting the infrastructural facilities at headquarters and regional offices. This has become necessary as the number o f productions is steadily increasing and consequently the workload o f CBFC is increasing as well. CBFC would also create separate video certification units in the regional offices. The production in video format has been increasing steadily.
Film Society Movement: Federation o f Film Societies of India(FFSI)
7.4.33 The Federation o f Film Societies o f India, an apex body o f film societies in the country, is given grant-in-aid to propagate film consciousness and development o f audience taste in cinema. The FFSI plays a vital role in the spread o f the film society movement in the country.
Financial Arrangements
7.4.34 The financing pattern for this sector witnessed a complete change in the Eighth Plan period. The outlay for the Seventh Plan was almost fully financed by budgetary support. As against this, budgetary support comprised only 11.5 per cent o f the approved outlay for the Eighth Plan and internal and extra-budgetary resources accounted for 88.5 per cent.
7.4.35 The internal resources o f the Ministry are primarily generated from the commercial revenues o f Doordarshan and AIR. These, after adjusting the running expenditure on commercial services including payment o f commission, are placed in aNon Lapsable Fund' (NLF), which was constituted in 1975 to enable AIR and
Doordarshan to utilise the commercial revenues for specific developmental needs. Part o f these funds are being utilised for meeting Non-Plan expenditure. Due to this as well as the drastic reduction in budgetary support in the Eighth Plan, only limited funds were available to AIR and Doordarshan. Till the time the existing pattern o f governmental accounting is continued, it is essential that funding o f non-plan expenditure out o f NLF be phased out and the additional provision be made available to these two organisations for meeting their plan requirements.
7.4.36 The funding o f the Prasar Bharati Corporation will be one o f the major issues in the Ninth Plan. The Corporation is likely to incur an expenditure o f about Rs. 1600-1800 crore a year which is the amount spent on plan and non-plan heads o f both AIR and Doordarshan annually. The total commercial revenues o f AIR and Doordarshan are likely to be in the range o f Rs.700-800 crore per year. The gap o f about Rs. 1000 crore would have to be bridged. As Doordarshan is a public service broadcaster with substantial part o f its programmes aimed at dissemination o f news and information on developmental aspects such as education, health, agriculture, rural development, environment protection and so on, which are riot likely to earn much revenue for the Corporation, it would be extremely difficult for the Corporation to increase its revenue to meet the gap. Therefore, the funding pattern o f the Corporation would have to be worked out keeping in view its objectives and consequent constraints in revenue generation.
Central Board of Film Certification (CBFC)
913

lA .'h l In order to enable Doordarshan to achieve nation-wide coverage with emphasis on meaningful programmes, it is essential that the financial support to the Corporation is in keeping with its social objectives. However, within the given circumstances all-out efforts need to be made to explore all available sources o f resource generation so as to make the Corporation self-supporting as soon as possible.
7.4.38 The media units in the information sector are dependent entirely on budget support. While budgetary support will have to be provided, as most o f these organisations serve public interest, expenditure would need to be curbed by ensuring that there is no duplication o f efforts by Central and State level organisations. Improving the quality of services through training and upgradation o f techjiology is also imperative. However, training should be essentially funded through fees and sponsorship by industry with Government providing only basic support, if required, at the inception o f a training Institute.
7.4.39 In the film sector, only the National Film Development Corporation will be self-financing during the Ninth Plan while the other media units are dependent solely on budget support. Although it is recognised that films have an important role to play, efforts have to be made to make this sector financially independent through sponsorship by the film industry itse lf Units such as Central Board o f Film Certification etc. would however continue to require budgetary support.
Issues and Strategies
7.4.40 During the Ninth Plan period two major issues which would have to be addressed are the use o f Airwaves and Autonomy to All India Radio and Doordarshan.
(i) Broadcasting Authority of India
7.4.41 As a result o f rapid technological developments, the monopoly o f Doordarshan and All India Radio in matters o f broadcasting have, o f late, come under challenge from two angles. On the one hand. Government has allowed the reception o f foreign TV channels through dish antennae with some regulations but without effective control. On the other hand, some o f the organisers o f major sporting events have approached the Apex Court and have been demanding the right to broadcasting as part o f the freedom of speech and expression as guaranteed by Article 19 o f the Constitution. The Supreme Court o f India, in one o f their judgements on the airwaves, have observed that the Indian Telegraph Act, 1885 which is the only legal framework available to guide and regulate broadcasting in India, is totally inadequate to govern the modem broadcasting media and have directed the Union o f India to set up an independent autonomous body representative o f all sections and interests in the society to regulate the use o f airwaves.
7.4.42 Keeping in view the directions o f the Apex Court, a comprehensive Bill on Broadcast Law was placed before the Parliament in the 11th Lok Sabha. A Joint Parliamentary Committee (JPC) was constituted to examine the same. Before the JPC could submit its report, the 11th Lok Sabha was dissolved. With the dissolution o f the 11th Lok Sabha, the proposed bill is required to be re-introduced in the 12th Lok Sabha. Efforts are being made in this direction.
914
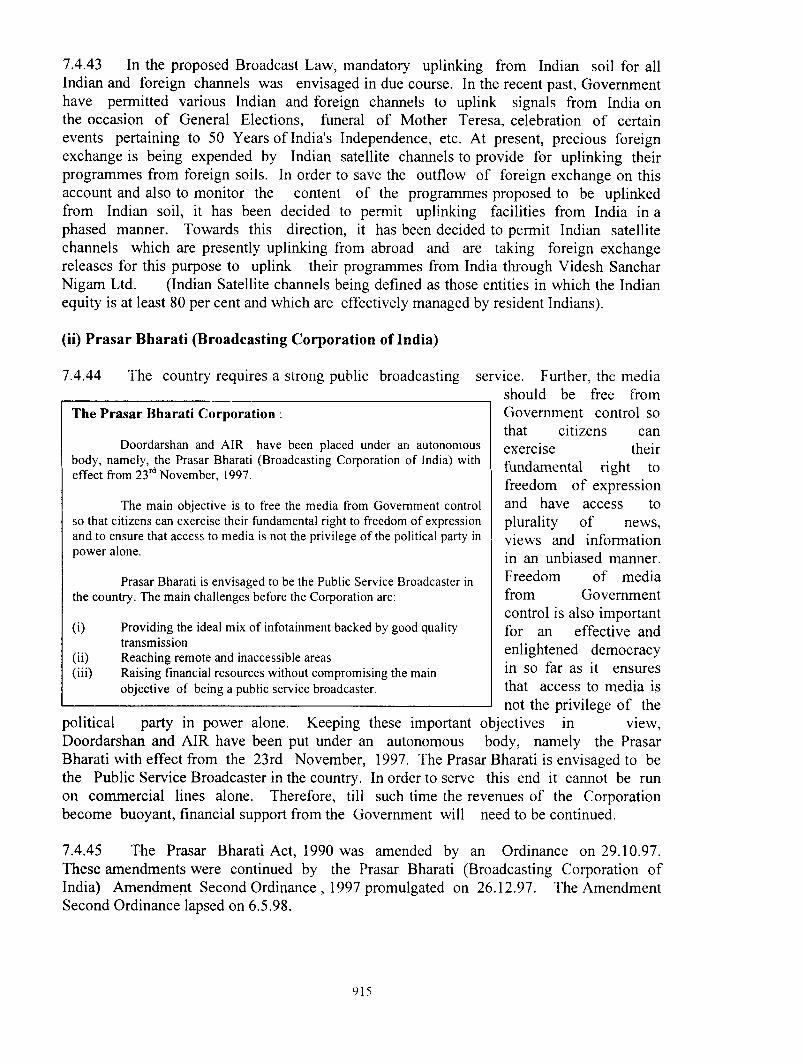
7.4.43 In the proposed Broadcast Law, mandatory uplinking from Indian soil for all Indian and foreign channels was envisaged in due course. In the recent past, Government have permitted various Indian and foreign charmels to uplink signals from India onthe occasion o f General Elections, funeral o f M other Teresa, celebration o f certainevents pertaining to 50 Years of India's Independence, etc. At present, precious foreign exchange is being expended by Indian satellite channels to provide for uplinking their programmes from foreign soils. In order to save the outflow o f foreign exchange on this account and also to monitor the content o f the programmes proposed to be uplinked from Indian soil, it has been decided to permit uplinking facilities from India in a phased manner. Towards this direction, it has been decided to permit Indian satellitecharmels which are presently uplinking from abroad and are taking foreign exchangereleases for this purpose to uplink their programmes from India through Videsh Sanchar Nigam Ltd. (Indian Satellite channels being defined as those entities in which the Indian equity is at least 80 per cent and which are effectively managed by resident Indians).
(ii) Prasar Bharati (Broadcasting Corporation of India)
7.4.44 The country requires a strong public broadcasting service. Further, the media_____ _ _ should be free from
Government control so that citizens canexercise theirfundamental right to freedom o f expression and have access to plurality o f news, views and information in an unbiased manner. Freedom o f media from Governmentcontrol is also important for an effective and enlightened democracy in so far as it ensures that access to media is not the privilege o f the
political party in power alone. Keeping these important objectives in view,Doordarshan and AIR have been put under an autonomous body, namely the Prasar Bharati with effect from the 23rd November, 1997. The Prasar Bharati is envisaged to be the Public Service Broadcaster in the country. In order to serve this end it cannot be run on commercial lines alone. Therefore, till such time the revenues o f the Corporation become buoyant, financial support from the Government will need to be continued.
The Prasar Bharati Corporation ;
Doordarshan and AIR have been placed under an autonomous body, namely, the Prasar Bharati (Broadcasting Corporation o f India) with effect from 23' ^ November, 1997.
The main objective is to free the media from Government control so that citizens can exercise their fundamental right to freedom o f expression and to ensure that access to media is not the privilege o f the political party in power alone.
Prasar Bharati is envisaged to be the Public Service Broadcaster in the country. The main challenges before the Corporation are:
(0
(ii)(iii)
Providing the ideal mix o f infotainment backed by good quality transmissionReaching remote and inaccessible areasRaising financial resources without compromising the mainobjective o f being a public service broadcaster.
7.4.45 The Prasar Bharati Act, 1990 was amended by an Ordinance on 29.10.97. These amendments were continued by the Prasar Bharati (Broadcasting Corporation o f India) Amendment Second Ordinance , 1997 promulgated on 26.12.97. The Amendment Second Ordinance lapsed on 6.5.98.
915

7.4.46 The Government had introduced a Bill in the Lok Sabha on 1.6.98 to restore the provisions o f the original Prasar Bharati (Broadcasting Corporation o f India) Act, 1990 in toto. The Bill was considered and passed by the House on 31st July, 1998. Since the Bill could not be considered in the Rajya Sabha in the same session, the Prasar Bharati ( Broadcasting Corporation o f India) Amendment Ordinance, 1998 v/as promulgated on 29.8.98 to give effect to the provisions o f the Bill.
Science and Technology Programmes
7.4.47 The focus o f the schemes to be undertaken by the Research Department o f Doordarshan and All India Radio during the Ninth Plan period will be on the development o f systems which are not available in the open market, formulation o f plans for introduction o f new services and technologies in networks and also development o f broadcast related consumer electronic products. Schemes relating to development o f studio systems in the field o f audio involving introduction o f pilot projects relating to model digital studio centres in some AIR FM stations, interactive radio services, development o f optomagnetic based editing system for programme production/post production, preparation o f 'Code o f Practice' on measurement aspects for digital studios and digital chain, development o f sub-systems and integration o f hardware and software for News Room automation in radio studios and usage of Internet for improving news collection would be taken up. For video systems, development o f multi-colour logo generators both for Doordarshan and for multi-purpose requirements is envisaged alongwith software based systems for graphics relating to sports coverage in com puter network mode.
7.4.48 Improvements in transmission techniques are proposed to be undertaken for better coverage o f radio signals by conducting experiments/field trials and formulating plans on 'T errestria l Digital Audio Broadcasting' in major centres. Adoption o f digital technology for programme distribution through satellite mode, enhancement o f quality in the existing AM/FM transmission and data broadcasting through FM subcarrier and satellite medium by establishing information booths for interactive multi-lingual access o f information for both radio and television are also envisaged. Transmission o f multi channels through Satellite-Digital Video Compression techniques is to be improved for better television coverage.
7.4.49 During the N inth Plan, further schemes are proposed for indigenising the Digital Audio Broadcasting (DAB) receiver, developing an integrated receiver decoder conforming to MPEG II standard with multiple video, audio and data output, as well as the development o f software for acoustics o f studios, interaction with other agencies on Information Super Highway concept in India and introduction o f a pilot project on low cost studios.
7.4.50 The R&D schemes o f Doordarshan will include News gathering through cellular phones, ghost cancellation, remote monitoring o f LPTsA^LPTs etc., Doordarshan Video on Internet, Pilot projects for introduction o f Digital Terrestrial Transmission, News Automation for major centres. Archive o f Video materials and Video-on-Demand during the Ninth Plan period to improve quality o f transmission and better management o f television network.
9 i6

7.4.51 Publicity support and information dissemination pertaining to the developmental programmes undertaken by the Government for the benefit o f people in general, including women are undertaken by the various Media Units. Publicity is also being provided to developmental schemes which are women specific in their content and focus. This would continue to be provided during the Ninth Five Year Plan. Programmes on issues o f specific interest to women will continue to be produced by associating competent women producers and broadcast/telecast in local dialects at timings convenient for the target audience.
Tribal Sub Plan/Special Component Plan
7.4.52 Special efforts are made by various media units to create awareness and disseminate information using different programme formats keeping in view the special needs o f SCs/STs and also to remove the existing socio-economic and political imbalances. Though the reach o f the electronic media, namely, All India Radio and Doordarshan includes the entire population in its coverage, including SC & ST groups, special efforts are proposed to improve transmission to areas which have a predominantly tribal population.
7.4.53 A number o f radio stations/transmitters and VLPTs/LPTs/HPTs for better coverage are also proposed to be set up in remote , tribal and hilly areas o f the country, especially in the North East, during the Ninth Plan. Various welfare schemes o f the Central and State Governments relating to SCs/STs are also given publicity from AIR stations. In Employment News, information relating to vacancies reserved for SCs/STs is included. AIR also broadcasts tribal welfare programmes as well as other programmes in tribal dialects. Moreover, replacement o f transmitters in tribal areas by those o f same or higher power, has also been proposed during the Ninth Plan.
7.4.54 All Tribal Sub Plan districts are covered by TV service fully/partially. Out o f 386 transmitters commissioned in the country during the Eighth Plan period, 116 were commissioned in TSP districts. One hundred and twenty four projects are under implementation in TSP districts. Two studios and 50 HPTs, LPTs and VLPTs are proposed (approved locations) in TSP districts.
7.4.55 The Press Information Bureau (PIB) formulated two schemes exclusively for tribals during the Ninth Five Year Plan namely, opening o f branch office o f PIB in North Eastern region and coordinating and organising Press parties from tribal areas. Under the Scheme 'Opening o f Branch Office', it is proposed to set up one branch office o f PIB at Itanagar (Arunachal Pradesh). Under the Scheme 'Coordinating and Organising Press Parties from Tribal areas', it is proposed to take small groups o f journalists from tribal areas to places where economic and welfare activities are being undertaken and to show them how the Government's social justice programmes help in improving the living standard o f the population.
7.4.56 Publications Division disseminates information through books and magazines. Articles on various developmental policies and programmes undertaken by the Government for upliftment o f the weaker sections particularly SCs and STs are published in
Women's Component
917

the journals o f the Division. The Ninth Plan schemes include publication o f ‘Y ojana’ in Assamese and Mobile bookshops for NE region.
l A . S l The Directorate o f Field Publicity(DFP) is a grass root level organisation through Vv-hich weaker sections have the opportunity to seek clarifications and pose further queries about various Government schemes affecting them. A large part o f the Directorate's activities are aimed at SC/ST population. O f its 260 field units, several are located in tribal areas, covering all 18 TSP states. The publicity activity in these areas is geared towards the specific socio- economic needs o f the tribal people. During the N inth Plan new units are also proposed to be set up in tribal areas. DPP also proposed to undertake conducted tours, purchase o f Portable Video Projector systems and computerisation under tribal sub plan.
7.4.58 The Song and Drama Division has also formulated schemes to ensure flow o f benefits to SCs and STs through promotion o f artistes belonging to these categories during the Ninth Five Year Plan. Schemes which would benefit the SCs and STs include the following:
(a) A total o f 8900 programmes are expected to be presented by the Division uiider the Tribal/Hilly/Desert area publicity scheme and the Tribal Centre at Ranchi for tribal welfare.
(b) 30,000 programmes are to be hosted under the 'Sensitive Area and Inner Line Publicity Scheme' and 'Tribal/Hilly/Desert area publicity scheme' as well as by the Sound and Light units at Delhi and Bangalore for the welfare o f SCs.
(c) Under the Sensitive and Inner Line Publicity Scheme for the North Eastern Sector 6300 programmes are to be presented.
(d) Special publicity will be organised in border and sensitive areas.
7.4.59 In the Films sector, the Film and Television Institutes o f India, at Pune andCalcutta, provide and will continue to provide adequate representation to personnel from tribal areas in their training programmes which are proposed to be taken up in the Ninth Five Year Plan. The National Centre o f Films for Children and Young People produces films for children. The Centre attaches considerable importance to the exhibition o f films in tribal belts. The National Film Development Corporation extends financial assistance to production o f films and construction o f theatres in the North Eastern Region. The Films Division would also continue to make featurettes and documentaries based on themes from tribal areas and North - Eastern region during the Ninth Plan.
918

Outlays, Expenditure and Financial Pattern of Information & Broadcasting Sector
ANNEXURE-7.4.1
(Rs. crore)
MediaEighthPlanOutlay(1992-97)
1992-93 1993-94 1 9 9 4 -■95 1995-96 1996-97
Outlay ActualExpend.
Outlay Actual Expend.
Appvd. Outlay
Actual Expend.
AppvdOutlay
Actual Expend.
Appvd. Outlay
Actual Expend.
1. Information 75.40 13 . 00 4 .38 10 . 36 3 . 95 11.45 11.64 17 .79 15.81 11 .36 12 .27
IRBS
0 . 00 75.40
0 .00 13 . 00
0 . 00 4 .38
0 . 00 10.36
0 . 00 3 . 95
0.00 11 .4'̂
0 . 00 11.64
0.00 17 .79
0.0015.81
0 .00 11.36
0 . 00 12 .27
2 . Films 123 .65 29 .84 14 . 90 21.64 14 . 02 2 5.5 i 23 . 33 28 . 93 31.90 41 .26 35 . 56
IRBS
15 .00 108 .65
2 .8427 . 00
1.3313.57
2 .50 19 . 14
5 . 16 8 .86
3.80 5 .27 18 . 06
4 . 10 24.83
6.49 25 .41
10.00 31 .26
6.80 2 8.76
3. Akashvani 1134 . 95 225.00 114.60 203.00 145 .43 132 . 37. 126 . 97 135 . 00 130.06 140.00 142 .24
IRBS
1058 . 08 76 .87
186 . 00 39.00
108 . 06 6 .54
178.00 25 . 00
130.78 14 .65
1 2 2 . 32 10 . 00
121.23 5 .74
110.00 25 . 00
110.00 20 . 06
115.00 25 . 00
115 . 00 27 . 24
4. Doordarshan 2300.00 265.16 176 .25 170 . 00 168 , 22 256.00 255.93 313.78 311.70 340.38 350 .44
IRBS
2143.92 156.08
230 . 16 35 . 00
175.34 0 . 91
149.5020.50
149 . 68 18 . 54
238.18 17 . 82
239.11 16 . 82
280.40 33 . 38
280 .40 31.30
307.00 33.38
307.00 43 . 44
Total 3634 . 00 533 . 00 310 . 13 405.00 331.62 425.30 417 .87 495 .50 489 .47 533.00 540.51
IR* 3217 . 00 419 . 00 284 . 73 330 . 00 285.62 364.30 365.61 394 . 50 396.89 432.00 428.80
BS 417.00 114 . 00 25 . 40 75 . 00 46.00 61 . 00 52 .26 101.00 92 . 58 101.00 111.71
♦ Total IR figure includes R s .15 crore of NFDC during the Eighth Plan.

Mediawise Expenditure/Outlay of Information and Publicity Sector ANNEXURE-7.4.2(Rs. crore)
Medi^ Units
(A) Information Media
fith Plan 1992-93(1992-97) ...............Outlay Outlay Actiial
Appvd. Expend.
1993-94 1994-95 1995-96 1996-97
Outlay Actual Appvd, Expend,
Appvd. Actual Appvd ActualOutlay Expend. Outlay Expend
Appvd Actual Outlay Expend.
1. Press Information Bureau 14.00 2 .00 0.36 1.44 0.38 1.50 1 .89 7.30 0.85 4.90 0.832. Publications Division 2.SO 0.64 0.00 0.30 0.08 0.30 0.26 0.30 0.18 0.20 0.173 . D.A.V.P. 5.00 0.€8 0 .50 0.30 0.29 0.30 1 .19 0.30 0.27 0.30 0.304 . Song & Drama Division 10.00 l.fSS 0.77 1.10 1.35 1.40 1.85 1.40 1.34 1.30 1.505. TDte. of Field Publicity 11.00 <2.35 1 ,00 0 .57 0 .84 1.00 1.60 1.35 .1.57 1-00 2 .006. Photo Division 4.'00 1.20 0.17 0.57 0.12 1.00 0.56 0.50 0.92 0.63 0.907. Registrar of Newspaper O.SO 0.28 0.34 0.05 0 07 0.05 0.06 0.08 0.08 0.00 0.008. I.I.M.C. 7.0D O.SO 0.^0 0. 70 0.55 1.10 1.25 4.00 3 .«7 1.87 1.739. SooChana Bhawan 11.20 3 .45 0 .72 ■0.39 0.26 0.80 0 .40 2.00 0.18 0.61 1.50110. Main Secre^tari-at 10.20 0.05 0.02 4.54 0.01 4.00 2.58 0.56 6.55 0.55 3 .34
TOTAL (A) 75.40 13 .TOO 4.38 10.>6 3 .95 11.45 11 .64 17.79 rs .81 11.36 12 .27
(B) Films Media1. Films Division 34.00 6.37 2.52 4.3^ 1.65 3 .00 3 .58 4 .58 5.13 4 .13 4.202. National Film -Archive of
India6.00 1.20 0.78 0.52 0 .62 0.90 1.21 2.40 4.54 1.54 1 03
3. Film & TV instt. of Indi TCalcutta
29.50 11. OX) 0.35 5.68 0 .00 5.68 2 .04 4.50 4.57 13 .76 13 .99
4 . Film i'TV Instt. of Indi Pune
8.00 1.00 0 95 0.65 0 75 5 .50 5.50 6 .54 6.54 5.54 5.22
5. N.C.F.C.&Y.P. 10 100 1.20 1.17 1.40 1.12 3 50 1.10 1 .50 1.60 1.30 1.506. NFDC * 20.00 6 .84 5.33 6 .50 7 16 5.80 7.27 5.60 7.99 10.00 6 .807 . Dte. of Film Festivals 15.00 2.00 3 .'60 2.44 2.54 3.00 2.49 3 .53 JL.29 3 .33 2 .528 . Film Societies <Movement 0.15 0.03 0 .03 0 .03 0.03 0.03 0 .03 0.03 0.03 0 .03 0.039.30.
C.B.-F.C.Jyoti Chitraban
1.00 0.20 0.17 0 .10 0.15 0.12 0.11 0.25 0 .21 0.35 1 .08
0 27
TOTAL (B) X 2 2 . 6 S 29 .84 14.90 21.64 14.02 25.53 23 .33 28.93 31.90 41.26 35 56TOTAL ̂ OF Ate 199.05 '42 .84 19.28 32.00 17.97 36,98 34.97 46,72 4*7. 7J. ‘52.62 47 83
* : NFDC's outlay/expenditure figures also include its Internal Resource.
920
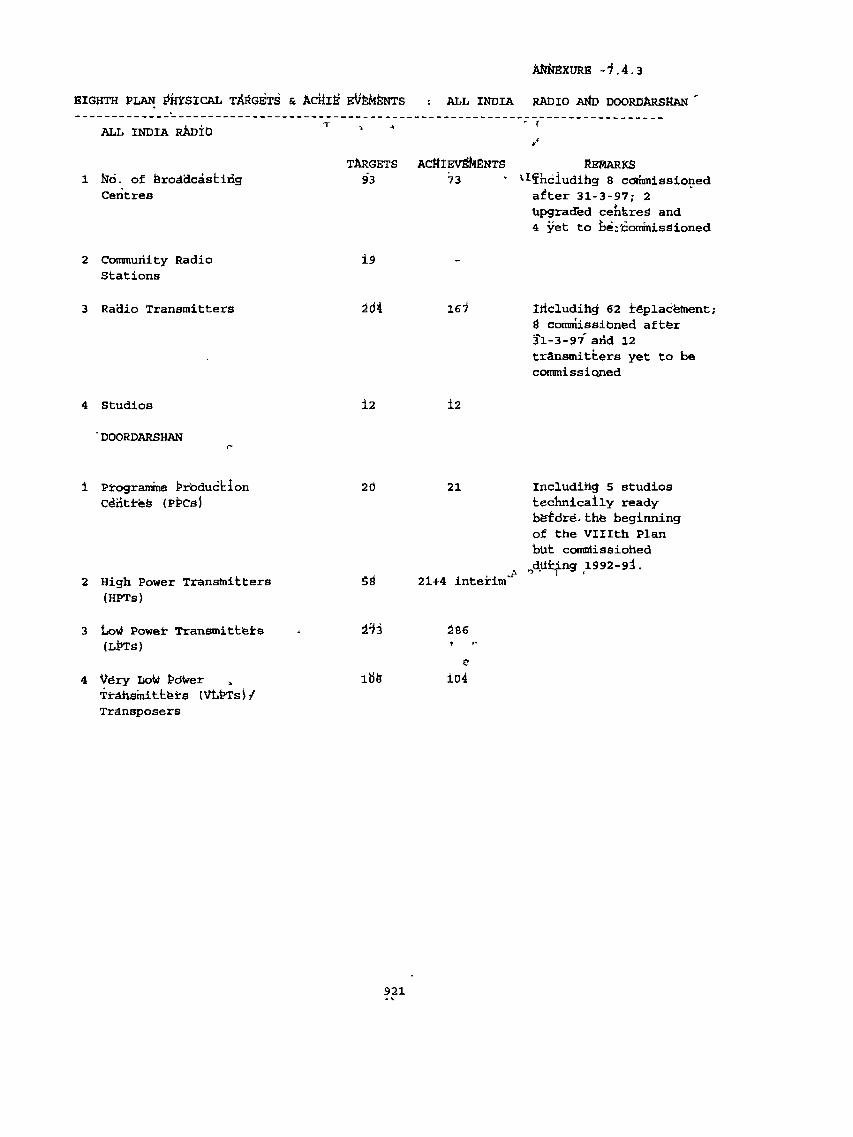
EIGHTH PLAN E^HYSICAL tXî GBTS & Aciil̂ EVfekfeUTS : ALL INDIA RADIO MtD DOORDARSIIaN
Afl̂ IBXURE - ’̂ .4 .3
ALL INDIA rAd IO
1 ild. of Broddcasfciiig Centres
2 Community Radio Stations
3 Radio Transmitters
4 Studios
■DOORDARSHAN
targets ACttlBV^NTS REMARKS93 73 ’ ^I^nciudihg 8 cdtnmissioned
after 31-3-97; 2 Upgraded centred and 4 yet to i>e;itotranisSioned
m
l2
167
±2
Iticludih^ 62 ir€placfetnent; d cotnmissibnfed aftfer 3"l-3-97̂ arid 12 transmitters yet to be commi ss i oned
1 PJrogramme ^r'oducbion C^iittefe (P to )
20 21
2 High Power Transtnitters (HPTs)
3 tiOvJ Poweir Trarismitttets (Li»TS)
4 Vdry LoW t>dWer ̂TrdhsmittfeSrs (VtitrTsJ/ Trdnsposers
iHi
ibfe
21+4 interim'
iS6t
clo4
Includitig 5 studios tecimically ready b&fdre- thfe beginning of the Vlllth Plan but comnlissiohed d̂tiir̂ ng l992-9i.
921

Aimexure-7 .4.4 STATEMENT SHOWING PHYSICAL TARGETS OF MEDIA UNITS FOR NINTH PLAN
ALL INDIA RADIO
SI. NAME OF THE SCHEME TARGETSNo.
INo. of Broadcasting Centres:
Full Fledged 2 5Relay Centres 3
2 Community Radio Stations 10
3 No. of Radio Transmitters:
Medium Wave 2 8Short Wave 9VHF/FM 28
4 Studios 3
DOORDARSHAN
1 Continuing Schemes
(a) Studio Projects 23(b) HPT Projects 14(c) LPTs & VLPTs 22 9
2 New Schemes
(a) Studio Projects 3(b) DD-I Transmitters
HPTs 2 8LPTs & VLPTs 193
(d) DD-II TransmittersHPTs 3 8
922

7.5.1 Information Technology (IT) is increasingly becoming the technological infrastructure for the service sector. Information Technology broadly includes all subsectors dealing with the generation, transmission and utilisation o f information like informatics, statistics, office automation, data processing. Management Information System (MIS), Decision Support System (DSS), Online and real-time computer applications, telecommunications, broadcasting and computer networking. IT and allied sectors have
7.5 INFORMATION TECHNOLOGY
NATIONAL TASK FORCE ON IT & SOFTW ARE DEVELOPM ENT
Govt, o f India has resoived to make India a global IT super power and a front runner in the information revolution. Towards achieving this objective, a National Task Force on Information Technology and Software Development was set up in May, 1998 with Shri Jaswant Singh, Dy. Chairman, Planning Commission as Chairperson. The Task Force submitted its first report on IT Action Plan on Development and Export o f Software and Data Communication on 25'^ July, 1998 and the second report on Development, Manufacture and Export o f IT Hardware on 3"‘' November, 1998. The final report concerns the citizens IT interface, content industry, IT RD&D, IT HRD and strategic policies.
The 108 recommendations o f first report and 81 recommendations o f second report o f IT Action Plan cover a wide spectrum o f issues relating to Telecom, Finance, Banking, Revenue, Commerce, Electronics, HRD, Defence and Rural Development.
The country should aim at an annual export target in excess o f US $ 50 billion for computer software and a target o f US $ 10 billion for computer and telecom hardware by year 2008. The compound growth rate o f more than 55% between 1992-97 is planned to be increased to 80% by 2008.
The IT Action Plan has suggested conscious efforts to spread the IT culture to all walks o f economic and social life o f the country. An ‘Operation Knowledge’ campaign has been launched for universalising IT education and IT-based education in the country in a phased manner.
A Policy framework and industrial strategy has been designed for making the Indian IT industry strong enough to meet the demands o f a zero duty regime under the WTO-ITA by the year 2003.
A Soft-Bonded IT units (S-BIT) scheme will seamlessly integrate the local and export production for maximizing the economies o f scale and substitute a-posteriori controls for the existing a-priori controls so as to maximize the velocity o f business.
Every secondary school, polytechnic, College and University library is planned to be given computer and INTERNET access by the year 2003
The IT Action Plan has brought about a new paradigm in setting up IT software and hardware manufacturing units for making them viable for meeting the local demands as well as exports by creating a policy ambiance and investment climate in the country comparable to those in Taiwan, Malaysia and Singapore.
immense potential for employment generation. It is expected to emerge as one o f the largest employers o f work force in the country, providing jobs to about 25% o f the labour force in the long run.
7.5.2 Following'recommendations o f the National Task Force on IT, 1-3% o f the budget o f all the M inistries/Departments has been earmarked for expenditure on IT applications. It is expected to generate about one million additional jobs every year. It would also lead to increased productivity in various sectors, timeliness o f implementation o f projects leading to the minimisation o f time and cost overruns as well as creation o f entirely new enterprises like Software Export, Internet-based enterprises, Electronic Commerce etc. There has now emerged a propensity for IT-led development. The impact o f IT will be especially predominant in the social sectors like health, education , judiciary and rural development.
923

7.5.3 The technological convergence o f IT, Telecommunication and Entertainment Electronics have opened new vistas in the life o f the common man. A National Information Infrastructure (N il) is evolving as a network o f networks including such nation-wide computer networks as NICNET under the Planning Commission, ERNET under the Department o f Electronics, HV N et and 1-Net under the Department o f Telecommunications in addition to an extensive Fibre Optic Telecommunication Backbone being set up by DOT. From the 40,000 route kilometers o f fibre optic laid by the end o f the Eighth Plan, the backbone is expected to be strengthened to more than 1,00,000 route kilometers through not only the efforts o f DOT, but also Railways and the private sector.
7.5.4 The impact o f the Global Information Infrastructure(GII) through Internet and low earth orbit satellite constellations will be consolidated during the Plan period with linkages to NIL An audition o f over 100 Mbps external gateway capacity for such linkages is expected to spawn an estimated 5000 small and medium scale knowledge-based enterprises.
7.5.5 The Local Area Network (LAN) and Metropolitan Area Network (MAN) segment is estimated to grow to 20,000 nodes per year by the end of the Plan, prodded by the increasing induction o f Wireless Data Communication equipment and Cellular Data Communication.
7.5.6 The public investment required for the above growth o f Information Technology sector, especially for supporting the social sector, creation o f the basic informatics infraistructure with universal access and the consequent creation o f employment, is recommended to be realised by allowing every Central, Centrally sponsored and State Plan Projects to utilise up to 3 percent o f their total Budget for Information Technology.
7.5.7 In order to enable India to emerge as Information Technology Super Power within the next 10 years a National Task Force on Information Technology and Software Development was set up in May, 1998 with Shri Jaswant Singh, Deputy Chairman, Planning Commission as chairperson.
924

7.6.1 Tourism is a major phenomenon of the modem society with significant socioeconomic consequences. Over the years, tourism has emerged as a major segment o f Indian economy contributing substantially to the foreign exchange earnings which have increased from Rs.4892 crore in 1991-92 to Rs. 10417 crore in 1996-97. The direct employment in the sector during 1995-96 was about 8.5 million persons, accounting for about 2.4 per cent of the total labour force.
7.6.2 An important feature o f the tourism sector, which is o f particular significance toIndia, is its contribution to national integration and creation o f a harmonious social and cultural environment. Over 100 million domestic tourists visiting different parts o f the country every year return with a better understanding o f the people living in the different regions o f the country' and the geographical, biological and cultural diversity o f India.Tourism also encourages respect for, and preservation of, monuments and heritageproperties and helps the promotion of art forms, crafts and culture.
Review of the Eighth Plan
7.6.3 There has been a gradual increase in the Central Plan outlay for tourism over the Plan periods from Rs. 1.58 crore in the Second Plan to Rs.272.00 crore in the Eighth Plan.
7.6.4 The details of the expendituTe during ilic Eighth P\an period lor the Department of Tourism and ITDC are given in the Table 7.6.1
7.6 TOURISM
Table 7.6.1 Eighth Plan Expenditure- Tourism
(Rs.Crore)
Sub-head 8thPlanOutlay
(1991-92Prices)
1992-93Exp.
1993-94Exp.
1994-95Exp.
1995-96 1996-97 Exp. Exp.
8thPlanExp.
(CurrentPrices)
Deptt.ofTourism
236 73.57 86.48 89.11 97.87 89.66 436.59
ITDC 36 5.84 7.28 8.82 14.20 17.69 53.83(32) (0.84) (2.28) (8.82) (14.20) (17.69) (43.83)
Total 272 79.41 93.76 97.93 112.07 107.35 490.420 2 ) (0.84) (2.28) (8.82) (14.20) (17.69) (43.83)
Figure in bracket indicates lEBR.
7.6.5 As against the Eighth Plan outlay o f Rs.272 crore (1991-92 prices), the expenditure during the period has been Rs.490.42 crore (current prices). The entire Plan expenditure of ITDC from the year 1994-95 onwards has been met from internal and extra budgetary resources. Bulk of the expenditure of the Department o f Tourism was incurred on tourism publicity.
925
7.6.6 The major schemes o f the Department o f Tourism relate to Promotion and Publicity, Central Assistance for the Development o f Tourist Infrastructure, Human Resource Development and Incentives. The Central Government investment for the improvement and creation o f tourist facilities is channelised through StateAJT Governments on a cost sharing basis. Under this pattern o f funding, the Central Department o f Tourism meets almost the entire expenditure, except the cost of land and interior decoration in the case o f construction projects.
7.6.7 In order to finance major projects for development o f tourist infrastructure, a new pattern o f financing was conceived during the Eighth Plan. Apart from the State and the Central Governments contributing towards the funding o f projects, the new scheme, known as Equity scheme, envisaged a major role for the financial institutions. As the State Governments could not formulate bankable projects, the scheme could not, however, make much headway in the Eighth Plan.
7.6.8 The Eighth Plan envisaged a growth o f 9% to 10% per annum in international tourist arrivals and about 2.75 million tourist arrivals were anticipated by the end o f the Eighth Plan. The target, however, could not be achieved due to various reasons such as armed conflict in the G ulf region, reduction in international outbound traffic during the period, law and order problems and health hazards in some parts o f the country. The number o f tourists who visited India during the Eighth Plan period increased from 1.78 million in 1991-92 to 2.33 million in 1996-97.
7.6.9 The main emphasis in the Eighth Plan for the ITDC was on consolidation rather than on expansion o f accommodation. The Corporation, which earned a net profit o f Rs.3.11 crore in 1991-92 improved the financial performance during the Eighth Plan period and earned a net profit o f Rs. 55.8 crore in 1996-97.
Policy F ram ew ork for the N inth P lan
7.6.10 The policy objective in the Ninth Plan will be to work towards creating a tourism product that provides the persons travelling to various places a pleasant experience on their trips, through an environment of peace, stability, security and an integrated system o f physical infrastructure that does not fail. Tourism should become a unifying force nationally and internationally, fostering better understanding through travel. It should also help to preserve, retain and enrich our world-view and life-style, our cultural expressions and heritage in all its manifestations.
7.6.11 It is important to realise that development o f tourism has an important indigenous dimension. The number o f middle and lower middle class tourists visiting distant places in the country is on the increase. The captive tourism around the places o f pilgrimage is also increasing fast. There is a need for creating adequate, hygienic, decent, low-cost facilities for such tourists. The measures for ensuring safety, particularly in difficult places o f pilgrimage at high altitudes, should be emphasised. Many o f these places o f captive tourism are in the regions which are economically poor. Development o f tourism in these areas, therefore, will accelerate the economic development o f these regions.
7.6.12 The diversity o f the tourism product in India makes it imperative that the development o f tourism has to be a joint effort o f all the infrastructural Departments, public sector undertakings. Slate Governments and the private sector. The approach to tourism
926

development in the Ninth Plan will accordingly be on coordinated efforts by the public and private sector and the major thrust will be on selected areas o f tourism
THE APPROACH AND THRUST IN THE NINTH PLAN
ITie approach in the Ninth Plan will be to concentrate on the de% elopment of selected centres ;md circuits tltrough effective coordination o f public and private efforts so as to achie\e s>nergy in the development o f this sector. Tlie Government will focus on the development of basic infrastnicture such as transport facihties and civic amenities and play a facilitating role m tlie proMSion ol' accom m odation and other facilities for all classes o f tourists, both domestic and international. A mechanism will be de\ eloped for effective coordination of all the relevant agencies concerned with promotion of tourism In developing tourism, it will be ensured that the sites are conserved and Hie environment is not degraded Tlie major thnist areas in the Ninth Plan will be
1 Indigenous and Natural Health Tounsm2 Rural and Village Tounsm3. Pilgrim Tourism4. Adventure Tourism5 Heritage Tounsm6 Youth and Senior Citizens Packages.
7.6 13 People's participation in tourism development including Panchayali Rajinstitutions, local bodies, non-governmental organisations and enterprising local youth will be encouraged to create public awareness and to achieve a wider spread o f tourist facilities
7 fc> 14 The infrastructure projects which are commercially viable, will be funded by the Govt, under the Equity Scheme except in the North Eastern States and selected hill districts in the country The existing pattern o f flinding would generally be applicable only to purely promotional and product development projects and in the North East Region and selected hill districts where the equity funding pattern is not insisted upon
7 6 15 The main schemes o f the Department o f Tourism, namely Central Assistance for Development o f Tourism Infrastructure and Promotion and Marketing would continue in the Ninth Plan. Efforts would be made to make them more effective
7.6.16 In order to give boost to foreign exchange earnings, employment and income generation through tourism activities, Export House Status will be granted to tourism units
EXPORT HOUSE STATUS TO TOURISM
The Govt, will grant Export House Status to Tounsm umts in the Ninth Plan Tlie tlireshold limit for eligibility o f such status for tourism units will also be revised downwards. The grant of Export House Status will entitle the tourism units to get all the benefits that are available to recognised export houses iiiclndiiig the entitlement of1 Special Import Licence (SIL)2. Free Trading of these SILs.3 Import o f several equipments under these SILs4 Waiver o f Bank guarantee for imports
Import o f cars agamst foreign exchange earnings.___________________________________________________5
7 6.17 ITDC will consolidate its existing activities The performance of ITDC will be improved through restructuring o f the existing properties and improving the quality o f service. No project relating to construction o f new hotels is envisaged during the Ninth Plan period
927

7.6.18 The availabiiily o f a diverse tourism product in the North East offers tremendous scope for development o f tourism in the region. Efforts will be made to exploit the potential through schemes to be specially designed for the purpose during the Ninth Plan period.
7.6.19 hi line with the recommendation of a high level Commission which has identified, among other things, the infrastructural needs o f the North East Region, the development activities would be selective and aimed at promoting eco-tourism and adventure tourism. Ih e programme o f development o f tourism o f State and Central Government would be co-ordinated. Local residents will be encouraged through suitable schemes to provide low-cost, decent guest room facilities for the tourists. Special emphasis will be laid on production of tourist brochures and other literature and on training o f local guides
Interscctoral Coordination
7.6.20 Availability o f basic infrastructural components like airports, railways, roads, waterways etc. is a critical requirement for the development o f tourism, hiadequate airline capacity and limited passenger handling capacity o f airports is a major bottleneck in the expansion o f tourism. The development programme o f Civil Aviation sector particularly that of Airports Authority of India would aid in pvonAolion of tourism. In order to facilitate movement o f tourists, particularly where the road segments are in poor condition, it will be important to develop water transport systems like cruises, catamarans, hydroplanes etc. in the private sector and the necessary berthing facilities at the respective ports.
7.6.21 Foreign tourists have a special fascination for rail transportation. The Ministry o f Railways has introduced two Special Tourist Trains and the introduction o f more o f such trains is being considered with private sector participation. Besides making efforts at providing railway platforms and linkages to all the international airports for boarding a train straight to connect important tourist centres, hygienic conditions, environment and passenger facilities in and around the main railway stations near the identified tourist centres will be improved.
7.6.22 The road segments connecting tourist centres and the road transport system require improvement as about 80'% o f the foreign and domestic tourists make use o f the road transport system for visiting different destinations. It is necessary to produce good quality road maps and provide adequate road signs in all the tourist routes
Manpower
7.6.23 Availability o f trained manpower is essential for the development o f a service sector like tourism. At present, there are 20 Institutes o f Hotel Management and Catering Technology and 13 Foodcraft Institutions functioning in the country. A number o f institutes have also started coming up in private sector since it can find adequate number o f trainees with the required paying capacity.
Tourism Promotion in North East
928

7.6.24 During the Ninth Plan period, the Government will consider the setting up o f new institutes only at such places where the demand for trained manpower far exceeds the availability and the private sector is not interested or cannot he motivated in providing adequate training facilities to fill the gap. Development of training facilities will he encouraged in the private sector and the Government will gradually withdraw from providing budgetary support for the setting up and running o f training institutes.
929

CHAPTER 8
ENVIRONMENT AND FORESTOVERVIEW
8.1 There has been an increasing awareness in recent years that protection o f the environment is necessary for sustaining the economic and social progress o f a country. This awareness was reflected at the Earth Summit in Rio de Janeiro in June 1992, where more than a hundred heads o f government adopted a global action plan called Agenda 21 aimed at integrating enviromnental imperatives with developmental aspirations and reiterated through the U.N. General Assembly Special Session on Environment held in June 1997. It is now accepted that, in terms o f natural resources, a country's demand for its sustenance should not exceed its carrying capacity. Over the last few decades, India has evolved legislations, policies and programmes for environmental protection and conservation o f natural resources. The Indian Goverrmient's policy has been expressed in the form o f statements on forestry, on the abatement o f pollution, the national conservation strategy and the policy statement on environment and development. The spirit o f Agenda 21 principles has already been incorporated in these policies. For instance, with regard to the social and economic dimensions o f Agenda 21, India has become a signatory to the Montreal Protocol for phasing out ozone depleting substances, the Basel Convention on tians-boundary hazardous substances, the Convention on biological-diversity and other international treaties. Similarly, poverty alleviation programmes have been launched wherein family plarming and welfare is a major focus. Environmental concerns are being integrated with development in decision making through mandatory clearance o f projects based on environmental impact assessment. Compliance with the conditions stipulated is being ensured by monitoring the progress o f implementation of Environmental Management Plans. Conservation and management o fresources for development are sought to be achieved through a combination o f regulatory and market-based economicinstruments. The role o f major groups including the NGOs, farmers and other communities is being strengthened by directly involving them in the process of identification, formulation and implementation o f environmental programmes. The important role of capacity building, legal instruments and mass media for promoting public awareness is fuily recognised.
8.2 Global environmental issues, such as ozone depletion, climate change due to accumulation o f Greenhouse Gases (GHGs), bio-diversity loss etc. are largely due to the rapid industrialisation o f the developed nations. India is an insignificant contributor to the GHG emissions as can be seen from the TableS. 1:
930
Policy on Environment and ForestThe Indian Government’s policy towards Environment is guided by the principles o f Agenda 21. The Government of India has issued Policy Statements on:> Forestry> Abatement of Pollution> National Conservation Strategy> Environment and DevelopmentIndia is already a signatory to the Convention on Biological Diversity, Montreal Protocol and Basel Convention.

T a b le 8.1: C A R B O N E M IS S IO N S L E V E L S IN S E L E C T E D C O U N T R IE S *(mi l l ion tonnes)
C o u n try S h are o f Share o f S h are o f E m iss io n sW ork! G ross W orld p er cap itaP op u la tion W orld C arb on1996 P rod u ct E m iss ion s
1994 1995
United States 5 26 23 5.3Russia 3 2 7 2.9
Japan 2 17 5 2.4G e r m a n y 1 8 4 2.9Ch in a 21 2 13 0.7India 17 1 4 0.3Indones ia 4 1 1 0.3Brazil 3 2 1 0.4
Total 56 59 58 0.9
(* C o m p ila tio n from sev era l in tern a tio n a l p u b lish ed sou rces)
8.3 The main environmental problems in India relate to air and water pollution, degradation o f common property resources, threat to biological diversity, solid waste disposal and sanitation. Increasing deforestation, industrialisation, urbanisation, transportation and input-intensive agriculture are some of the other major causes of environmental problems being faced by the country. Poverty presents special problems I’or a heavily populated country with limited resources.
STATUS OF INDIA'S ENVIRONMENT
Air Quality
8.4 The urban areas represent complex environmental problems. The living conditions o f millions o f urban poor are such that they pose a threat to their health and have potentially catastrophic social consequences. For the urban poor, the living conditions are the worst. If these problems are not addressed to in an adequate and timely manner, serious environmental and associated health consequences will 'follow ’. Burgeoning urban population beyond the carrying capacity of the different components of urban eco-systems, coupled with indifferent urban govemanc.i, are the root causes for urban environmental problems. Air pollution can cause
chronic and acute respiratory diseases, ventilatory malfunction, heart diseases, cancer of the lungs and even death. The blood lead levels of persons in Ahmedabad, Bombay and Calcutta have been reported to be higher than the corresponding levels of persons in lead-free gasoline areas. The details o f ambient air quality status in ten large cities/towns are at Anncxure I. In most o f the cities, while the SPM levels are significantly higher than the CPCB standards, the levels o f SO2 and NO^ are within the CPCB standards.
931
8.5 The rural population uses substantial quantities of non-commercial fuel i.e. crop residues, animal dung or wood. Although their share in total fuel consumption is decreasing, these still provide 80 per cent o f rural energy for cookmg. Several adverse health effects are suspected to arise due to indoor pollutior! especially where conventional‘sigri’ has not been replaced w'ith smokeless chulha. Respirator>' infection in children, chronic lung diseases, lung cancer in adults and adverse pregnancy outcomes, such as low' birth w'eight and still birth of the child, for women exposed during pregnancy, are some of the diseases associated with indoor pollution.
Water Resources and Water Quality
8.6 India is rich in water resources, being endowed with a network of rivers and vast alluvial basins to hold groundwater. Besides. India is blessed with snow cover in the I limalayan range wnich can meet a variety o f water requirements of the country. However, with the rapid increase in the population o f the country and the need to meet the increasing demands of irrigation, human and industrial consumption, the available water resources in many parts ol'the country are getting depleted and the water quality has deteriorated. In India, water pollution comes from three main sourccs: domestic sewage, industrial effluents and run-olf from agriculture.
8.7 fhe most significant environmental problem and threat to public health in both rural and urban India is inadequate access to clean drinking v\ ater and sanitation facilities. Almost all the surface water sources are contaminated and unfit for human consumption, fhe diseases commonly caused by contaminated water are diarrhoea, trachoma, intestinal worms, hepatitis etc. Many o f the rivers and lakes are getting contaminated from industrial effluents and agricultural run-off, with toxic chemicals and heavy metals which are hard to remove from drinking water with standard purification facilities. Even fish and shellfish in such water get contaminated and their consumption may cause diseases.
8.8 The Constitution o f India has assigned the responsibility of protecting the environment to the Union and State Governments. Environmental protection laws have been enacted under the Environment (Protection) Act, 1986; the Air (Prevention and Control o f Pollution) Act, 1981 and the Water (Prevention and Control o f Pollution) Act, 1974. The Environmental (Protection) Act, 1986 has empowered the Central Pollution Control Board (CPCB) to lay down and maintain the ambient air quality and water quality standards, to demand infonnation regarding effluent emissions, to shut down polluting activities and to prevent discharges of effluent and sewage. Although these regulations give the CPCB and its State-level counterparts broad powers to control the problem of air and water pollution, the enforcement has been weak.
Solid Wastes and Hazardous Chemicals
8.9 There has been a signiiicant increase in the generation o f domestic, urban and industrial wastes in the last few decades. This is largely the result of rapid population growlh and industrialisation. The per capita solid wa.ste generated is 0.20 tonnes in Mumbai, 0.44 tonnes in Delhi and 0.29 tonnes in Chennai. Although a major part o f the waste generated is
932

non-hazardous, substantial quantities o f hazardous waste is also generated, '['he growth o f chemical industries has resulted in the extensive use o f chemicals, which release huge quantities o f wastes into the environment in the form o f solids, liquids and gases. A substantial amount o f these wastes are potentially hazardous to the environment. The leaching o f hazardous wastes at the dumping sites is a common feature. This results in the contamination o f surface and groundwater supply and is a potential risk to human health. Effective control o f hazardous wastes is o f paramount importance for the maintencince o f health, environmental protection and natural resource management,
8.10 Hospital wastes being generated by mushroom growth ol'nursing homies pose a special risk and has the potential to take epidemic form.
8.11 In view o f the proliferation o f the chemical industry and the significant increase in the hazardous waste generation, the Government o f India framed the Hazardous Wastes (Management and Handling) Rules. 1989. Under these Rules, it is mandator>' for the hazardt)us waste generators to provide information on the quantity and type o f hazardous wastes produced.
Land Degradation and Soil Loss
8.12 Soil erosion is the most serious cause o f land degradation. Estimates show-that around 130 million hectares of land (45% of total geographical area) is affected by serious soil erosion through ravine and gully, cultivated waste lands, waterlogging, shifting cultivation etc. It is also estimated that India loses about 5310 million tonnes o f soil annually.
8.13 The accumulation ol salts and alkalinity affect the productivity o f agricultural lands in arid and semi-arid regions, which are under irrigation. The magnitude o f water logging in irrigated command has recently been estimated at 2.46 million hectares. Besides, 3.4 million hectares suffer from surface water stagnation. Injudicious use o f canal water causes water logging and a rise in the water table, which, if left uncorrected, eventually leads to salinisation. Although irrigation and drainage should go hand in hand, the drainage aspect has not been given due attention in both major and minor irrigation projects in the country. There has been waterlogging associated with many o f the large reservoirs since their inception.
8.14 Fertilisers and pesticides are important inputs for increasing agricultural production. Their use has increased significantly from the mid-60s. Over and unbalanced use o f these chemicals is fraught with danger. However, fertilisers and pesticide use are concentrated in certain areas and crops. Suitable agronomic practices will be helpful in this regard. Table 8.2 and Table 8.3 show that our consumption of pesticides and fertilisers is much below' than that o f the neighbouring countries.
933

T A B L E 8.2T R E N D S IN T H E C O N SU M P T IO N O F C H E M IC A L F E R T IL ISE R S IN SE L E C T E D A SIA N
C O U N T R IE S
Country Use o f Chemical Fertilisers per hectare of arable land (kg/ha)1970-71 1991-92
Bangladesh 15.7 109.8Bhutan 0.8 0.8India 13.7 75.2Nepal 2.7 27.2Pakistan 14.6 88.9Sri Lanka 55.5 93.1Philippines 28.7 54.8China 41.0 304.3Rep. o f Korea 245.0 451.7Japan 354.7 387.3
Source; FAQ.
TABLE 8.3 CONSUM PTION OF PESTICIDES IN
DIFFERENT COUNTRIES
S.No. Country Level of consumption (kg/ha)
1. Argentina 0.,2952 . India 0.,4503 . Turkey 0 .,2984 . Indonesia 0 ,.57 55 . U.S.A. 0 ,,5796. Thailand 1 ,.3677 . Mexico 1 ,. 3758 . Republic of Korea 6..5599 . Japan 9 ,. 180
10 . Hungary 12 ,.57311 . Italy 13 ,.355
Source : FAO
934

Forests, W ildlife and Bio-diversity
8,15 Forests are important for maintaining ecological balance and preserving the life supporting system o f the earth They are essential for food production, health and other aspects o f human survival and sustainable development
8 .16 Indian forests constitute 2% of the world's forest area but are forced to support 12% of the world's human population and 14% o f world's livestock population This is sufficient to indicate the tremendous biotic pressure they face
8,17 Forests in India have been shrinking for several decades owing to the pressure o f population on land for competing uses, such as agriculture, irrigation and power projects, industry, roads etc In India, forests account for about 19,27 per cent o f the total land area. On the other hand, in advanced countries, the area under forests is often about a third o f the total land area There is a need to have massive reforestation programmes, control over hacking and grazing and provision o f cheap fijel through alternative technologies
8 18 The National Forest Policy (1988) stipulates that a minimum of one-third o f the total land area of the country should be brought under forest or tree cover It is envisaged that this will be achieved by involving local stakeholders like the farmers, the tribals, the women, the NGOs and the Panchayat Raj Institutions (PRIs)
8 19 Another concern relating to the state o f forest resources is that o f bio-diversity and extinction o f species India has a rich heritage o f species and genetic strains o f flora and fauna. Out o f the total eighteen bio-diversity hot-spots in the world, India has two, one is the north-east Himalayas and the other is the Western Ghats, At present, India is home to several animal species that are threatened, including over 77 mammal, 22 reptiles and 55 birds and one amphibian species For in-situ conservation o f biological diversity, India has developed a network o f protected areas including national parks, sanctuaries and biosphere reserves This network,
which is being progressively expanded, now covers about 4% of the total land area o f the country As a result o f the amendments in 1991 to the Wildlife (Protection) Act, hunting o f all species o f wild life for commerce or for pleasure has been banned
REVIEW OF THE EIGHTH FIVE YEAR PLAN
8 ,20 The Ministry o f Environment and Forests was allocated an outlay o f Rs 1200 crore for its Eighth Plan (1991-92 prices) against which the actual expenditure was Rs, 1631 90 crore (current prices). The sector wise and year wise details o f outlays/expenditure is at Annexure II,
Environment
8.21 Environinental protection covers all those activities which relate to the formulation o f policies and programmes for prevention and mitigation o f pollution through the regulatory framework. Besides, activities which are initiated for the conservation o f ecology are also included. An amount o f Rs. 325 00 crore was allocated for the environment sector in the Eighth Plan. The major highlights o f the achievements in the environment sector during the Eighth
Plan are as below.
935

(a) Central Pollution Control Board
8.22 The main functions o f the Central Pollution Control Board are to act as regulatory agency for tlie prevention and control o f water and air pollution by invoking, wherever necessary, the Water (Prevention and Control of Pollution) Act - 1974, the Air (Prevention and Control o f Pollution) Act - 1981 and the Environmental (Protection) Act - 1986 and to supervise the w'ork o f the State Pollution Control Boards.
8.23 The major activities o f the Central Pollution Control Board during the Eighth Plan included the development and expansion o f laboratory facilities, management and operation o f the national air and water quality network, controlling pollution at sources, river basin studies, evaluation and implementation of national standards, hazardous waste management, including preparation o f an inventory of hazardous waste generating industries in diflerent States, preparation o f Zoning Atlas for siting industries in various districts of the country, development o f criteria for eco-labeling o f consumer products, remedial measures for vehicular pollution especially for vehicles in use in metro cities, noise pollution survey, training o f personnel engaged in preventing and controlling pollution and organising nation-wide awareness programmes for prevention and control o f pollution.
(b) Environment Statement (as part of Environmental Audit)
8.24 Submission o f an environmental statement by the polluting units to the concerned Slate Pollution Control Boards has been made mandatory' through a gazette notification issued under the Environment (Protection) Act - 1986. The environmental statement enables the units to take a comprehensive look at their industrial operations and facilitates an understanding o f material Rows and focusing on those areas where w’aste reduction, and consequently saving in input costs, is possible.
(c) Adoption o f Clean Technologies in Small Scale Industries
8.25 This scheme seeks (a) to promote the development and adoption o f clean technology, including waste re-use and recycling and (b) to link research and development with dissemination o f the R & D outcome and adoption o f clean technologies to prevent pollution in small scale industries. Activities relating to demonstration o f already proven cleaner technologies/techniques, preparation of sector-specific manuals on waste minimisation, setting up o f Waste Minimisation Circles in specific clusters of small scale industries, training and awareness programmes for the personnel in small scale industries and w-aste minimisation and demonstration studies in selected sectors v\cre undertaken during the Eighth Plan.
i) Abatement of Pollution
936

8.26 The concept o f Waste Minimisation Circles is as follows:
i) Promotion o f the concept o f waste minimisation thirough awareness and training programmes.
ii) Institutionalisation o f waste minimisation circles among the clusters of small scale industries o f the same category'.
iii) Sectoral studies on waste minimisation and demonstration in selected sectors.
iv) Demonstration o f improvement in environmental and, in turn, economic performance in a cluster o f small units.
v) Promotion o f increased general environment awareness among small scale units by providing training programmes on various environmental issues.
VI) Preparation o f sector-specific manuals on waste minimisation.
vii) Preparation o f training packages on waste minimisation and organisation o f trainingprogrammes for trainers and trainees.
(d) Environmental Statistics and Mapping
8.27 Under this scheme, activities relating to collection, collation and analysis o f environmental data and its depiction on an atlas were carried out. Activities relating to the production o f computerised maps and preparation o f Zoning Atlas for siting industries in selected districts were also taken up during the Eighth Plan.
(e) World Bank Assisted Industrial Pollution Control Project (Phase-I)
8.28 This project commenced in 1991 and is expected to be completed by the end o f March,1999. It has the following two broad components:
(i) Investment Component which provides for loan assistance to large and medium scale industries for installing pollution control equipments; establishment o f common effluent treatment plants for clusters o f small scale units; and establishment of demonstration projects for introducing energy and resource conservation measures in the small and medium scale sectors.
(ii) Institutional Development Component which is designed to strengthen the monitoring and enforcement abilities o f the Pollution Control Boards o f four industrialised States o f Gujarat, Maharashtra, Tamil Nadu and UttarPradesh. These include activities like acquisition of analytical and monitoring equipments, provision o f laboratory facilities and training.
937

8.29 The medium and large scale industries have utilised the loan amount disbursed to them by the IDBI and ICICI. As many as 35 common effluent treatment plants have been extended financial assistance. About 100 training programmes have been conducted for the personnel o f the Central and State Pollution Control Boards. A dozen demonstration projects have been approved for different technologies to be developed in various industries. The equipment for the identified State Pollution Control Boards under Phase-I have been partly procured,
(f) W orld Bank Assisted Industrial Pollution Prevention Project (Phase - II)
8.30 This project has been operational from 1996-97. The objectives o f the project are-(i) to strengthen the capabilities in the States of Rajasthan, Madhya Pradesh, Karnataka and Andhra Pradesh, (ii) to facilitate priority investments to prevent pollution from industrial sources by encouraging the use o f clean technologies, waste minimisation and resource recovery, (iii) to provide technical assistance for the adoption o f modem tools o f information and management, organisation o f clean technology institutional network and an extension service on environmentally sound practices for small scale industries. The project has three components, namely, institutional, investment and technical.
(g) Development of Standards
8.31 Development o f standards is a continuous process and they are notified as and when they are finalised for specific categories o f industries.
(h) Industrial Pollution Control
8.32 The activities under this programme include:-> Taking priority action to control industrial pollution, for which 17 categories o f
heavily polluting industries in the country have been identified and a time-bound programme has been given to the industries to instal necessary pollution control facilities and to comply with the prescribed standards. The follow-up action on compliance is being monitored.
> M onitoring o f action points relating to restoration o f environmental quality in critically polluted areas.
> Preparation o f Zoning Atlas for siting industries.> Implementation o f pollution control measures in Agra-Mathura region.
(i) Pollution M onitoring and Review
8.33 The activities under this programme include:-
> M onitoring o f coastal water, river water and ground water quality.> Assessment o f coastal pollution to plan for its prevention.> Ambient air quality monitoring.> Industrial inventory for large, medium and small scale industries.
938

(j) Economic Instruments
8.34 In an effort to integrate economic and environmental planning, a variety o f incentives to adopt efficiency enhancing and waste minimisation practices are being promoted. This includes enhancing the cess rates on water consumption, duty concessions, accelerated depreciation on pollution abatement equipment etc. To facilitate a wider introduction of such instruments, a study has been sponsored by the Ministry o f Environment & Forests to analyse the market-based instruments such as taxes/charges for industrial pollution abatement.
Economic InstrumentsGovernment policies, in addition to regulatory mechanisms, incorporate market based economic instruments in economic and environmental planning. For example:> Enhancement o f cess rates on water
consumption.> Duty concessions on import o f certain
pollution control equipments.> Accelerated depreciation on pollution
abatement equipment.
ii) Environmental Impact Assessment (EIA)
8.35 The purpose o f Environmental Impact Assessment is to appraise developmental projects to ensure that development takes place in harmony with environmental concerns. It also enables the project authorities to integrate environmental concerns in the project portfolio. In a way it is a preventive measure.
8.36 Other related activities carried out during the Eighth Plan included: carrying capacity studies (Doon Valley, National Capital Region), studies on improving the methodology and techniques o f environmental impact assessment of development projects, training programmes, promotion o f cleaner production programmes, including life cycle studies.
iii) Conservation and Survey
a) Botanical Survey of India (BSI)
8.37 About 65% o f the total area o f the country has been surveyed and three million herbarium specimens are in possession. During 1987-97, 106 new species were discovered by BSI. Surveys in special/fragile ecosystems like cold deserts, hot deserts, Alpine Himalayas, wetlands, mangroves and coastal areas have been undertaken. The BSI also undertook special projects such as a study on conservation and survey of rare and endangered species, all-India coordinated project on ethnobiology, florisJic study o f biosphere reserve areas, EIA in developmental project areas, geobotanical studies in Singhbhum and Khetri copper belts etc.
b) Zoological Survey o f India (ZSI)
8.38 About 65% o f the total area o f the country has been surveyed. During 1987-97, 759 new species were recorded. The main activities o f ZSI during the Eighth Plan were; exploration and survey o f faunal resources, taxonomic and ecological studies, maintenance and development o f national zoological collections, status survey o f endangered species, environmental impact assessment studies, publication o f Fauna o f India.
939
c) National Museum of Natural History (NMNH)
8.39 The NMNH, New Delhi is an institution devoted to environmental education. The highlights o f the Eighth Plan performance o f NMNH relate to "LEARN" (Lessons on Environmental Awareness and Resources at NMNH) for the students o f classes VI to XII o f Delhi Schools;'E nvironm ent Essay Competition (in Braille)' and Feel, Smell and T ell'fo r visually handicapped; and 'Knov/ About Dinosaurs' for teenagers.
d) Bio-diversit>' Conservation
8.40 The scheme on Bio-diversity Conservation was initiated during 1991-92 to ensure proper coordination among various agencies concerned with the issues relating to conserv'ation o f biological diversity and to review, monitor and evolve adequate policy instruments for the same. The Convention on Biological Diversit>' (CBD) was signed by 168 countries, including India, during the Rio meetings. India has since ratified the Convention.
iv) Research and Development
8.41 This is a continuing scheme for the promotion o f research in the multi-disciplinaryaspects o f environmental protection, conservation and development together with the creation o f facilities and development o f technical capabilities. To achieve these objectives, the research projects in the thrust areas are supported with grants-in-aid.
8.42 Under the scheme, programmes such as Man and the Biosphere Programme,Environmental Research Programme, Action-Oriented Research Programme on Eastern and Western Ghats and research projects in Climate Change are included. During the Eighth Plan, over 190 research projects in multi-disciplinary aspects were initiated. O f these, about 60 have been completed and results disseminated to the potential/interested user agencies.A Status Report on the All India Coordinated Project on Ethnobiology, documentinginformation o f the country-wide survey concerning traditional knowledge system, use of biological resources by the tribal population and their inter-dependence, has also been published. A report on the All India Coordinated Project-Ill on conservation o f endangered plant species has been published. A coordinated research project on 'Aerobio-pollution and Human Health' was launched to collect information, through survey, concerning air borne diseases involving 26 centres throughout the country.
8.43 Attention has also been paid to initiate studies on improving our understanding o f the subject o f climate change and on preparation o f inventories o f the greenhouse gases, which would be useful in projecting the scientific inputs for various discussions at the international level, as also to meet the requirements o f the general commitments emerging out o f the Framework Convention on Climate Change.
8.44 A new scheme on environmental information dissemination was launched during the Eighth Plan to ensure public participation in the programmes of environment awareness generation, control o f pollution and conservation o f natural resources. The scheme named as'Paryavaran Vahini' is being implemented from 1992-93. 184 districts in various states of ttie country have been selected to set up 'Paryavaran Vahinis' during the Eighth Plan period.
940

v) Environmental Education, Training and Information
8.45 In order to encourage participation o f school children in various activities related to ecological conservation and preservation o f the environment a scheme namely, Eco-clubs involving school children has been launched. The objective o f the Eco-clubs is not limited only to imparting environment education to school children but also includes mobilising them to participate in various envirormiental preservation efforts in their locality. During Eighth Plan period more than 5,000 such Eco-clubs have been set up in various schools o f the country.
8.46 An Environmental Information Systems (ENVIS) was set up by the Ministry o f Environment and Forests, to provide information on various subjects related to environment to decision-makers, researchers, academicians, policy planners, environmentalists, engineers and the general public. It is a decentralised system with a network o f distributed subject oriented centres, ensuring integration of national efforts in environmental information, collection, collation, storage, retrieval and dissemination to all user groups. A chain o f 22 such distribution centres, known as ENVIS centres, has been set up on various priority areas o f environment under the scheme, by the end of Eighth Plan.
8.47 Five Centres o f Excellence in the field of environmental education, ecological research, mining, environment and ornithology have been set up. These Centres provide various resource materials, traimng, research facilities clc., to a\\ concerned.
8.48 As per the recommendations of the Standing Committee on Bio-resources and Environment, 37 priority areas were identified for undertaking research projects involving remote sensing technologies under a scheme o f National Natural Resource Management System. Projects covering more than 18 areas have been considered by the Bio-resource Committee and sanctioned during the Eighth Plan.
8.49 Financial assistance has also been provided for the organisation o f seminars/ symposia/ workshops on environment related topics o f scientific interest and to provide a common platform to all professionals for sharing the up-dated knowledge on environmental-related areas.
vi) Policy and Law
8.50 The Government o f India has enunciated its policy, in the form o f poHcy statements, on Abatement o f Pollution, on Forestry and National Conservation Strategy and on Conservation and Development. In addition, there are laws for protection o f environment. These include Wild Life (Protection) A ct-1972; Forest (Conservation) A ct-1980;Water (Prevention and Control o f Pollution) A ct-1974; Air (Prevention and Control o f Pollution) A c t-1981; Environment (Protection) Act - 1986; Public Liability (Insurance) Act-1991; and National Environment Tribunal Act- 1995. The Environment (Protection) Act - 1986 sets out the parameters under which the Ministry o f Environment and Forests operates to formulate and carry out environmental policy at the national level. Underlying the policy statements is the recognition o f the principle that effective management and control o f natural resources requires the support and participation o f the people.
941

8.51 During the Lighlh Plan, considerable attention was given to make the pollution control laws more ei'fecti\ c and lo brmg an umbrella legislation for protection o f environment. A number o f Central and Siate executive authorities have been delegated powers for effective implementation o f the Environment Protection Act. Ih e Air (Prevention and Control o f Pollution) Act - 1081 and the Water (Prevention and Control o f Pollution) Act - 1974 have been amended to bring certain provisions of the Acts at par with those o f the Environment (Protection) Act - 1986.
8.52 The National Environment Tribunal Act - 1995, provides for strict liability for damages arising out o f any accidcnt occurring while handling any hazardous substance and for the establishment o f a National Environment Tribunal for effective and expeditious disposal o f cases arising from such accidents with a view to granting the relief and compensation for damages to persons, property and the environment and for matters connected therewith or incidental thereto.
vii) International Cooperation
8.53 During the Eighth Plan period, the Government o f India participated in the conventions on implementing the Rio Agreements and the AGENDA-21. Montreal Protocol, Commission on Sustainable Development, Global Environment Facility.
8.54 I'he Indo-Canada En\ ironment Facility, operational since 1993-94, is a commodity grant from the Canadian Government. The grant is in the form o f Murate o f Potash, which is sold in the Indian market and the proceeds passed on, through the Ministry o f Environment and Forests, to a registered socicty to undertake projects on environmental protection and conservation.
8.55 India became a pcirty to the United Nations Framework Convention on Climate Change (UNFCCC), Convention on Biological-diversity (CBD), Basel Convention on the Control o f Trans-boundary Movement o f Hazardous Wastes and their Disposal and Montreal Protocol on controlling the substances that deplete the Ozone layer.
viii) National River Conserv ation Programme
(a) Ganga Action Plan - Phase I
8.56 The Ganga Action Plan (GAP) Phase-I was launched by the Government o f India in June, 1986 as a 100% Centrally Sponsored Scheme with the objective o f improving the river water quality.
8.57 It was envisaged that industrial pollution would be tackled through the enforcement o f existing regulations by municipal authorities under which effluent treatment plants would be set up by industry. Under GAP-I, interception, diversion and treatment o f sewage works; electric crematoria; low-cost sanitation, and river front facilities were set up.
942

8.58 Out o f 261 schemes o f pollution abatement taken up in 25 Class-I cities along the river Ganga, 254 schemes have been completed till March, 1998 in the States o f Uttar Pradesh (105 schemes), Bihar (41 schemes) and West Bengal (107). There are four, three and one schemes which are pending in the states o f Bihar, West Bengal and Uttar Pradesh respectively.
8.59 The major reasons identified for the slippages have been problems in land acquisition, related litigation and contractual issues. 683 mid o f sewage treatment facilities have been installed against the target o f 873/882 (revised).
8.60 The scheme has been subjected to technical evaluation by four universities located on the banks o f Ganga. An ex-post evaluation m the 'Benefit Cost Analysis' framework is in progress and the final report is awaited. Achievements o f GAP-I are evident from Figure 1. As Biochemical Oxygen Demand (BOD) is a measure o f the amount of organic pollution in water, it serves as a useful parameter for assessing water quality. Maximum success in reducing pollution in the river Ganga has been achieved in Allahabad followed by Varanasi and Kanpur.
Figure 1: Water quality under Ganga Action Plan (Phase I) in Allahabad, Varanasi and Kanpur (BOD Levels)
16
14
12
^10i 8 cnE 6
4
2
0
■1 —1 1 : 1 f^ 1— I ^̂ Hj|i i ^ LJ . . .. ..
K a n p u r A l la h a b a d V a ra n a s i
u
U p s tre a m B e fo re G A P (1 9 8 6 )
U p s tre a m P re s e n t S ta tu s (1 9 9 7 )
D o w n s t re a m B e fo re G A P (1 9 8 6 )
D o w n s t re a m P re s e n t S ta tu s (1 9 9 7 )
943

(b) Ganga Action Plan - Phase II
8.61 The GAP Phase II was launched during the Eighth Plan. Works on the major polluted tributaries o f Ganga, namel)', Yamuna, Gomti and Damodar, were taken up with the objective o f improving the river water quality, as per the designated best use criteria. Works in 29 Class-I towns along the Ganga, which could not be included in the first phase were taken up in Phase-ll together with works in other smaller towns along the Ganga.
8.62 The Scheme was launched as a Centrally Sponsored Scheme with equal sharing by the Central and State Government, with the operation and mamtenance expenses being fully borne by the States. The Yamuna Action Plan and the Gomati Action Plan components were approved in 1993. No work was taken up on Damodar river during the Eighth Plan period. Summer average values for water quality (Dissolved Oxygen, BOD) on main stem o f river Ganga under GAP have been shown at Annexure III.
8.63 The approved outlay of GAP Phase II is Rs. 416.36 crore and funds to the tune o f Rs.7.34 crore have been released till 31.03.98.
(c) National River Conservation Plan (NRCP)
8.64 The NRCP, which was approved in July, 1995, envisages the coverage o f 18 grossly polluted stretches o f rivers in 10 States. As many as 46 towns are to be covered o f which 17 are in the Southern, 11 in the Western, 7 in the Eastern and 11 in the Central part, o f India. The NRCP was launched as a Centrally Sponsored Scheme with equal sharing between the Centre and the States. The total cost o f the scheme has been placed at Rs.772 crore and the time-frame for its completion is 10 years. Till March 1998, a sum o f Rs. 40.97 crore has been released by Government o f India.
8.65 The towns are proposed to be included in NRCP (Table 8.4).
8.66 The GAP-II and the National River Conservation Plan were approved as Centrally Sponsored Scheme with a sharing cost o f 50:50. Through a Government resolution dated 5.12.96, GAP-II was merged with NRCP to cover a total o f 141 towns on 22 rivers streches in 14 States.
8.67 The Operations & Maintenance^(0&M) under the NRCP has not been found to be satisfactory. Lack o f interest by the local bodies in the maintenance o f Sewage system etc. and problems o f uninterrupted power supply to Sewage Treatment Plants, Pumping Stations, Electric Crematoria etc. have been found to be the main causes. Unless O&M facilities created are improved, optimum benefits o f the project cannot be achieved.
944

TABLE 8.4 TOWNS TO BE COVERED UNDER NRCP
SI No Town SI No Town SI No T owti
Andhra Pradesh Madhya Pradesh 34 Chandbali
Mancharial 17 Indore 35 Dharamshala
Bhadrachalam 18 Ujjain Punjab
Rajamundri 19 Burhanpur 36 Ludhiana
Ramagundam 20 Mandideep 37 Jallundhar
Bihar 21 Bhopal 38 Phagwara
Ranchi 22 Vidisha 39 Phillaur
Jamshedpur 23 Jabalpur Rajasthan
Ghatshila 24 Seoni 40 Kota
Gujarat 25 Chapara 41 Keshoraipatta
Ahmedabad 26 Keolari Tamil Nadu
Karnataka 27 Nagda 42 Kumarapalayam
Shimoga Maharashtra 43 Bhawani
10 Harihara 28 Karad 44 Erode
11 Bhadravati 29 Sangli 45 Trichy
12 Davanagere 30 Nasik 46 Palli Palayam
13 K R Nagar 31 Nanded
14 Kollegal Orissa
15 Nanjangud 32 Cuttack
16 Sri Rangapat 33 Talcher
Forests
8.68 According to the State of Forest Report 1997, which is the sixth assessment o f the forest cover of India based on visual and digital interpretation o f the satellite data pertaining to the period 1993-95 on a scale o f 1:250,000, the forest cover o f the country is only 19.27% o f the total geographic area. Goa, Gujarat, Haryana, Himachal Pradesh, Jammu and Kashmir, Karnataka, Maharashtra, Mizoram, Punjab, Rajasthan, Sikkim, Tamil Nadu, Tripura, Uttar Pradesh and West Bengal have shown an improvement in the forest cover, whereas Andhra Pradesh, Arunachal Pradesh, Assam, Bihar, Kerala, Madhya Pradesh, Manipur, Meghalaya, Nagaland, Orissa, and the Union Territories o f Andaman & Nicobar Islands have shown a further deterioration o f forest cover. In Delhi, Chandigarh, Dadra and Nagar Haveli, and Daman and Diu, there was no change in forest cover during the period o f last two assessments. On an aggregate basis, there has been a reduction in the forest cover to the extent o f 5.482 sq. km between the two assessments o f 1995 and 1997. O f the greatest concem is the picture in the North Eastern States where a reduction to the extent o f 783 sq. km in the forest cover was reflected in the 1995 assessment. The 1997 assessment shows a somewhat better situation.
945

as the loss o f forest cover in this region has come down to 316 sq.km. Mizoram and Tripura have, in fact, shown gain in forest cover between two assessments. Extent of state-wise forest cover under different assessments (1987-95) is shown at Annexure IV and that o f 1997 assessment at Annexure V.
8.69 Under forest protection and regeneration, the scheme'Association o f Scheduled Tribes and Rural Poor in Regeneration o f Degraded Forests' was taken up on pilot basis with 37 projects in nine States namely Andhra Pradesh, Bihar, Gujarat, Madhya Pradesh, Maharasthra, Rajasthan, Orissa, West Bengal and Karnataka.
8.70 During the Eighth Plan, a Centrally Sponsored Schem e,'M odern Forest Fire Control Methods in India' was continued. The scheme was launched during the Seventh Plan with UNDP assistance as a pilot project in Uttar Pradesh and Maharashtra mainly to protect forests from fire. The Project was implemented in 13 states during Eighth Plan.
Afforestation & Eco-Development
A). Afforestation on degraded forests
8.71 The National Afforestation and Eco-Development Board was created at the time o f the biftircation o f the erstwhile National Wasteland Development Board, then under the Ministry o f Environment and Forests in July, 1992. Areas adjoining forests and fragile eco-systems were brought under the National Afforestation and Eco-Development Board (NAEB), while other wastelands were covered under the newly created National Wasteland Development Board in the Department o f Wasteland Development in the Ministry o f Rural Areas and Employment. An outlay o f Rs. 461 crore was finally allocated to the NAEB for reclaiming degraded forest area adjoining forests during the Eighth Plan. The schemes o f NAEB are:
(i) Integrated Afforestation and Eco-Development Projects (lAEPS) Scheme
8.72 This is intended to promote afforestation and development o f degraded forests by adopting an integrated watershed-based approach. This 100% Centrally Sponsored Scheme envisages micro-plan preparation by a multi-disciplinary team in consultation with the local people. During the Eighth Plan period under this scheme an area o f about 2,89,917 ha. was covered with a total expenditure o f Rs. 203.12 crore.
(ii) Fuelwood and Fodder Project Scheme
8.73 This is meant to augment the production o f fuelwood and fodder in 229 identified fuelwood deficient districts o f the country to meet the needs of the communities. The cost o f raising the plantations o f fuelwood and fodder is shared equally between the Central and the State Governments. Under this scheme an area o f about 3,87,216 ha. was covered with a total expenditure (central assistance component) o f Rs. 154.19 crore during the Eighth Plan period.
946

(iii) Non-Timber Forest Produce Scheme
8.74 The scheme provided for financial assistance to State Governments for increasing the production of Non-Timber Forest Produce (NTFP), including medicinal plants by raising plantations. This 100% Centrally Sponsored Scheme has a focus on creation o f NTFP plantation assets in tribal areas. During the Eighth Plan period an area o f about 1,06,170 ha. was covered with a total expenditure o f Rs. 56.47 crore under this scheme.
(iv) Grants-in-Aid Scheme
8.75 Promotion o f people's participation in afforestation activities is a mandate o f the NAEB. Under this scheme, non-governmental organisations (NGOs) are assisted financially for taking up afforestation and tree planting in public and private wastelands adjoining forest areas and building upon people's movement for afforestation. A total o f 338 projects were sanctioned and Rs. 7.51 crore were released to voluntar>'agencies during Eighth Plan period.
(v) Seed Development Scheme
8.76 Developing facilities for collection, testing, certification, .storage and use o f quality seeds for afforestation purposes is the aim o f this scheme. The scheme also aims at establishing seed certification protocol in the long-run, which would ultimately increase the productivity o f forests. Under this scheme a total amount o f Rs. 7.80 crore was released to States/UTs during Eighth Plan period.
(vi) Scheme of Aerial Seeding
8.77 A Centrally Sponsored Scheme of aerial seeding, which w'as started on a pilot basis in 1988-89 with 100% central assistance, continued during the initial years o f Eighth Plan period. The objective o f the scheme was to study the effectiveness o f aerial seeding technique o f afforestation for regenerating/revegetating difficult and inaccessible areas like ravines, hills/mountains, desert areas etc. However, this scheme was discontinued after 1993-94 on the basis o f technical report o f Indian Council o f Forest Research and Education (ICFRE). The ICFRE advised that they were not aware o f any technologies which make the seed penetrate in highly degraded and compacted soils on which better results were possible manually. In two years (1992-94) o f its implementation during the Eighth Phji, an amount of Rs. 2.49 crore were spent and an area o f 37,320 ha. was covered.
Afforestation under 20-Point Programme
8.78 NAEB, in Ministry o f Environment and Forests, is the nodal agency for fixing targets and monitoring the achievements for afforestation and tree planting activities under point 16 of the 20-Point Programme. During the Eighth Plan period under 16(a) (Seedling distnbulK n; 501.07 million seedlings w'ere distributed and under 16 (b) (area coverage) 4.56 iriiilion li'i o f area was afforested bringing the total national area covered under afforestation to 7.03 million ha. The Targets/achievements o f NAEB during the Eighth Plan are at Annexure VI.
947

8.79 A comprehensive evaluation of the following major afforestation schemes ofN AEBwas undertaken during the Eighth Five Year Plan by an independent and expert agency ; i)Integrated Afforestation and Eco-Development Projects Scheme (lAEPS), ii) Fuelwood andFodder Project Scheme (FFPS), iii) Non-Timber Forest Produce Scheme (NTFPS).
8.80 The main findings o f the evaluation report are as follows :
(i) Under lAEPS, the overall physical coverage vis-a-vis the area targets has been around 76%. The survival percentage has been in the range o f 50-80% in most o f the cases. The surviving plants have been found to be in good condition. Soil and moisture conservation measures such as contour bunding, gully plugging, trenches etc. have been given adequate attention. Lack o f funds for maintenance has led to ineffective protection through cattle proof trenches, fencing etc. Social fencing has been taken up only in a few cases and found to be effective.
(ii) Under FFPS, the overall physical coverage vis-a-vis area targets has been approximately 96%. The survival percentage has been in the range o f 50-85%. The surviving plants have been found to be in good condition.
(iii) Under NTFPS, the overall physical coverage vis-a-vis area targets has been approximately 94%. The survival percentage has been in the range o f 40-70%. The surviving plants have been found to be in good condition, except in the case of medicinal plants. Lack of funds for maintenance has led to ineffective protection through fencing and cattle proof trenches etc. Hedges o f thorny species and social fencing were taken up only in a few cases and found to be effective.
8.81 The main recommendations o f the evaluation report are as follows:
a) Although watershed approach has been found to be difficult to implement, theschemes should have the objectives o f saturating an idenfified watershed.
b) Projects should be prepared on the basis o f Participatory Rural Appraisal (PRA). Formation o f 'V an Suraksha Samities' / Forest Protection Committees should be taken up simultaneously.
c) Technology development needs to be enlarged in scope. Field trials o f developed technologies must be made more extensive.
d) Orientation o f the staff and their continuity in projects may be ensured for better results.
e) Implementing Agencies must consider formation o f Joint Forest Management Committees as their first responsibility in implementing the projects and no project should be prepared without taking local communities in confidence.
f) Choice o f species should be made carefully, for AOFFP projects good coppicers suited to the locality should be selected.
948

8.82 Based upon the above findings and recommendations the guidelines o f all schemes o f NAEB have been revised with emphasis on the following activities to make afforestation programmes more effective and people-oriented :
a) Joint Forest Management
8.83 People's participation in afforestation activities, popularly know as Joint Forest Management, has been made a central and integral part o f all plantation projects. The project authorities will be given adequate leverage by way o f'en try point activities'and more emphasis will be given along with adequate funds for building o f aw-areness etc. amongst communities. In the selection o f the project sites, village panchayats or other village level bodies would be associated. Such village bodies and local community will be involved in project preparation, implementation and usufruct sharing.
b) Micro Planning
8.84 Emphasis on micro-planning for project implementation after full consultation with the local communities is being given. In order to involve the local community in afforestation projects, sufficient flexibility to locate sites is being allowed to the field level implementing agencies.
c) Technology Extension
8.85 Sufficient flc.xibility along with appropriate funds will he provided to the implementing agency for implementing improved and established new technology in the field o f nurseries, plantation etc. for getting better results.
d) M onitoring and Evaluation
8.86 In order to ensure the adequacy o f the joint forest management efforts and the micro planning exercises, NAEB has proposed to take up three concurrent evaluations o f plantation projects instead o f the existing system of two evaluations.
B). W astelands Development
8.87 Realising the gravity o f the ecological and socio-economic problems arising out of land degradation and the urgency o f evolving and implementing integrated strategies for development o f the vast areas o f wastelands, the Government o f India set up a new Department o f W astelands Development under the Ministry o f Rural Development in July, 1992 with the mandate to develop non-forest wastelands. Following schemes/ programmes which are Central Sector Schemes (CS) are being implemented by the department to achieve its objectives;
(I) Integrated W astelands Development Projects Scheme (IWDP)
8.88 This is the flagship scheme of the Department with about 90% outlay o f the Department earmarked for it. The main objective o f the Scheme is to take up integrated wasteland development based on village/micro-watershed plans. These plans are prepared after taking into
949

consideration the land capability, site condition and local needs o f the people. Since T' April, 1995 all the projects o f IWDP are implemented on the basis of watershed approach, based on the guidelines o f Dr. C.H. Hanumantha Rao Committee. The guidelines envisage the bottom-up approach whereby the User Groups/ Self Help Groups themselves will decide their v\ork programme which is to be integrated at the district level. The people are involved in planning, implementation and monitoring o f watershed programme.
8.89 During the Eighth Five Year Flail period, 155 integrated wasteland development projects were sanctioned at total outlay o f Rs. 393.68 crore for the development o f 2.84 lakh hectare o f wastelands involving release o f Rs. 216.16 crore.
(ii) Technology Development, Training & Extension Scheme
8.90 The main objectives of the Scheme are to establish technical data base and to provide assistance to such projects, which are required for filling the gaps existing in the present technology. The scheme aims at compilation o f important technical data bases, initiated through various institutions, departments, universities, etc. for evolving suitable techniques to fill these gaps. The scheme also envisages the setting up o f demonstration centres for the reclamation o f problematic lands like saline, ravine, water logged etc. The scheme is implemented through Governmental agencies. Agriculture Universities, established and reputed Non-Government Organisations, public sector undertakings etc. Currently 57 projects are being implemented tluough various institutions, During the 8th Five Year Plan 66 projects with total investment o f Rs. 8.28 crore were sanctioned under the scheme.
(iii) Grant-in-Aid Scheme
8.91 Under this scheme, 100% Central grant is made available to registered voluntary agencies, cooperatives, Mahila Mandals, Yuva Mandals and other similar organisations for undertaking work, directly or indirectly encouraging afforestation and wastelands development. The work could include actual implementation o f small programmes like plantation and soil and moisture conservation, awareness raising, training and extension, organisation of the people for protection, maintenance and sharing o f usufruct etc.
8.92 During the Eighth Five Year Plan 234 projects were sanctioned in favour o f voluntary agencies and a sum o f Rs. 13.75 crore was released to VAs for development o f about 18,684ha. o f degraded land.
(iv) Investment Promotional Scheme
8.93 The principal objective o f this scheme is to mobilise resources from financial institutions/ banks, corporate bodies including user industries and other entrepreneurs for development o f wastelands belonging to individual farmers, community/ Panchayats, institutions and Government agencies. During the Eighth Five Year Plan, the physical achievement was 91 ha. with expenditure o f Rs. 1.08 crore and subsidy released was 0.21 crore.
950

(v) W astelands Development Task Force
8.94 Under this scheme, a Wastelands Development Task Force was created in March, 1995 for the development o f inaccessible and highly degraded ravines o f Morena District in Madhya Pradesh. During the Eighth Five Year Plan an allocation o f Rs. 3.5 crore was made for implementation o f the scheme.
(vi) Communication
8.95 Publication o f literature on Wastelands Development Programmes and preparation and distribution o f short-duration films/pamphlets have been undertaken for creating general awareness.
STRATEGY FOR THE NINTH FIVE YEAR PLAN
8.96 One o f the objectives o f the Ninth Five Year Plan is to ensure environmental sustainability o f the development process through social mobilisation and participation o f people at all levels. The Ninth Plan is also based on the belief that the principal task o f planning in a federal structure is to evolve a shared vision and commitment to the national objectives and development strategy. The Ninth Plan also lays greater stress on reorienting the policies than on direct intervention so as to signal and induce the various economic agents to function in a manner consistent with the national objectives.
8.97 The Ninth Plan strategy for the environment sector has been drawn in accordance with the need to develop the required measures to protect the environment in such a way as to achieve sustainable development. The Ninth Plan recognises the symbiotic relationship between the tribals and the forests and gives a special focus to the tribals and other weaker sections living in and around the forests.
8.98 A number o f enabling conditions have been already created for harmonising economic growth and environmental conservation. These include the macro-economic stability, the 73rd and the 74th Constitutional Amendments and the work being undertaken in various ministries.
ENVIRONM ENT
8.99 The strategy for the Ninth Plan is based on the belief that macro-economic stability is fiindamental not only for economic growth but also for sound environmental management. The Ninth Plan envisages a multi-pronged strategy for sustainable development o f the country. The important elem.ents o f this strategy are given in Box.
951

Important Elements of the Ninth Plan Strategy> Empowering the people through information generation, dissemination and access>• Involving the Industry in both the private and the public sector.> Integrating environment with decision making through valuation o f environmental
impacts; evolving market based economic instruments as an alternative to the command and control form o f environmental regulation; appropriate pricing of natural resources based on their long-term marginal cost o f supply; appropriate fiscal reforms and natural resource accounting.
> Evolving the rights for common property resources.> Inter-sectoral coordination and cooperation.> Ensuring scientific and technological inputs.> Participation o f people (particularly women) in the management and sharing of usufruct
through Joint Forest Management.> Involvement o f NGOs for av.'areness building and as an interface between forest
department and the people would be encouraged during the Ninth Plan.> Integrated development o f villages in and around forests.
FORESTS
8.100 The discipline o f forestry has been traditionally identified with either ecological stability or as a source o f industrial raw material, and not with the subsistence o f the rural poor. Participation o f people in the management and sharing o f usufruct will be achieved through Joint Forest Management which will be given priority in the schemes o f Ninth Plan.
8.101 Involvement o f NGOs in areas o f awareness building and community education and as an interface between the Forest Department and the people would be encouraged through various schemes during Ninth Plan.
8.102 Villages in and around the forests are normally with high percentage o f tribals and they are crucial for the protection and development o f forests. The development o f these under developed villages is basic to the well being o f the forests. During the Ninth Plan period due importance will be accorded to the all round development o f these villages.
8.103 It has been found that many times the land records of revenue and forest departments do not reconcile and they have overlapping areas shown in their maps. Similarly, the forest area on the ground, in many cases, is not demarcated with boundary pillars etc., leading to encroachments. Survey and demarcation of existing forest area would be taken up during the Ninth Plan.
8.104 Protection and management o f forests on the inter-state boundaries e.g. continuous forest patches at the tri-junction o f a) Karnataka, Tamil Nadu and Kerala; b) Madhya Pradesh Andhra Pradesh and Maharashtra etc. is very important to prevent them from becoming sanctuaries for anti-social elements instead of wild-life and it will be'given high priority.
952
8.105 Lack o f training o f the staff o f the Forest Department in combat methods against smugglers, poachers etc. will be tackled by giving high priority to the training o f the staff of the Forest Department.
8.106 Efforts will be made to take advantage of various Employment Generation Schemes of Rural Development Department to supplement funds for plantation activities.
8.107 Research, especially in the areas o f seed and tree improvement, non-timber forest produce, agro-forestry, alternatives o f timber, value addition to the various forest products etc. is basic to any scientific management o f forests. Indian Council of Forestry Research and Education, as an umbrella organisation, will try to concentrate on these areas.
8.108 Despite the fact that the women have greater stake and dependence on forests than men, in day to day life, empowering women has not reached the desired level. During the Ninth Plan period, with its emphasis on Joint Forest Management, efforts will be made to empower the women by ensuring their involvement from micro-planning stage to implementation and usufruct sharing.
8.109 During the Ninth Plan period welfare o f staff o f forest department will be given due priority.
PROGRAMMES FOR THE NINTH FIVE YEAR PLAN
8.110 Environmental protection requires both preventive and curative measures. The strategy for environmental protection in the Ninth Five Year Plan relies much more on initiatives and interventions through policies and programmes o f different sectors, notably. Health and Family Welfare, Transport, Rural Development, Energy, Agriculture, Fertilisers & Chemicals, Urban Development and Education. The underlying logic is that curative treatment should come only as the last resort, the primary emphasis being placed on the preventive approach.
8.111 Energy sector is a major polluter. In order to minimise its adverse impact on environment a number o f steps have been taken. All major power projects are subjected to an environmental impact assessment. Environmental clearance is granted to them only after stipulating appropriate environment management plans. These are rigorously monitored for compliance. Relocation and rehabilitation plans are an integral component o f hydro electric projects. A separate regulatory agency has been established for the nuclear power plants. In the interest o f transparency it is important that the annual reports o f the Department o f Power, the Department o f Coal and the Ministry o f Petroleum and Natural Gas should give a Balance Sheet o f carbon di-oxide generated by their activities and counterpart sink created by them or through resources contributed by them.
8.112 The Ministry o f Petroleum and Natural Gas has laid considerable stress on improving the quality o f petroleum, products, particularly, automotive fiiels like motor spirit and high speed diesel. The important aspects o f these efforts are:
953

(I) Phasing out lead in motor spirit
8.113 Supply o f motor spirit with low lead (0.15 gm/lt.) in Delhi, Bombay, Calcutta and Chennai has begun from June 1994, in Taj Trapezium from September, 1995 and in the whole country from January, 1997.
8.114 Supply of unleaded motor spirit for cars fitted with catalytic converters has started from April 1995 in four metropolitan cities and Taj Trapezium. This will be effected in all State and Union Territor}' capitals from December 1998 and throughout the country from April 2000 .
8.115 In order to meet the low lead specifications. Catalytic Reformer Units have already been installed at Barauni and Digboi refineries and are being installed at Mathura Refinery at an estimated cost o f about Rs.900 crore.
(II) Improvement in quality of high speed diesel (HSD)
8.116 As regards HSD, a Plan has been prepared to reduce the levels o f sulphur from the present 1% to 0.25% in a phased manner as indicated below;-
Supply o f diesel with 0.5% wt. 'S' max. to four metropolitan cities, i.e. Delhi, Mumbai, Calcutta and Chennai and Taj Trapezium from 1-4-1996.
Supply o f diesel with 0.25% 'S ' max. in Taj Trapezium from 1-9-1996.
Supply o f diesel with 0.25% 'S ' max. throughout the country by 1-4-1999.
8.117 Similarly, improvement in octane number, total sediments, distillation recovery etc. have been proposed. The investment for the product quality improvements in the refineries during the Ninth Plan is projected at about Rs.8000 crore.
8.118 In line with the objectives enshrined in Article 48-A o f the Constitution, the new National Mineral Policy, 1993 for non-fuel and non-atomic minerals, prohibits mining operations in identified ecologically fragile and biologically rich areas. The strip mining in forest areas is also to be avoided, as far as possible. The latter could be permitted only when accompanied by a comprehensive time-bound reclamation programme. The policy states further that no mining lease would be granted to any party, private or public, without a proper mining plan, containing the environmental management plan approved and enforced by statutory authorities. The environmental management plan should have adequate measures for minimising the environmental damage, for restoration of mined areas and for planting o f trees in accordance with the prescribed norms.
8.119 The Ninth Plan has chalked out issue-specific programmes, area-specific programmes and sector-specific programmes. The core items o f these programmes comprise: involvement o f people; strengthening o f the surveillance and monitoring system; preparation o f state o f environment reports at the all - India, State and district levels;
954

graduation from environmental impact assessment to economic impact assessment; introduction o f valuation and environmental economics and natural resource accounting.
Issue-Specific Programmes
(i) People's Involvement and Role of Information
8.120 A challenging task is mobilisation and involvement, o f the people in environmental protection. Environmental protection is not the sole responsibility o f the Government. All sections o f the society have to participate in this national endeavour.
8.121 The Ninth Plan has already had an auspicious beginning in this regard in the sense that through an amendment to the notification relating to environment impact assessment, a provision has been made for the process of public hearing. All important developmental activities, covered by the El A Notification dated 27-1-1994, are covered by this amendment, which provides that only after the issue o f a Press Notification regarding the intention to set up such a project and the due process o f public hearing, and only after giving sufficient notice, any major activity can be undertaken. It is also significant that even under the delegation o f powers to the State Governments under Environmental Protection Act, the provision o f public hearing is applicable.
8.122 Citizens Monitoring Committees are being established under the Nafional River Conservation Programme. Specific schemes have been launched for involving people from all cross-sections o f life from students to retired soldiers in the vast task o f environmental protection. Public is becoming restive and is eager to get involved through information dissemination an d 'rig h t to access'and by forcing transparency to the regulatory process.
8.123 People at large and the university system, particularly the science, engineering, and medical faculties, will be involved in monitoring and enforcement work. A lot more needs to be done and perhaps, this could save resources which would otherwise have been spent on creating new assets which remain unutilised/underutilised for several reasons including resource constraints.
8.124 Attitudinal changes are fundamental to protection of environment. Informed citizenry can play an immensely positive role in the area of abatement of pollution. When fijlly aware o f the adverse impact of polluted environment, the citizens can act in such a manner as to minimise the effect o f pollution on their health and property. If air and water resources are unfit and do not meet the acceptable standards, the people living in adjoining areas, if adequately informed, will take necessary precautions. If they have an altemafive they may not use the polluted resources. Or they may undertake necessary steps, if that is within their capability, to depollute before using them. They may also possibly organise themselves and force the responsible agencies and legislators to take appropriate action. If suitable action is not forthcoming they may, under the laws o f the land, even file public interest litigation. Thus, informed citizens can achieve what even regulators and enforcing agencies cannot. Information dissemination, right to access and involvement o f enlightened citizenry are fundamental to any democratic process. Given the weaknesses in enforcing environmental standards, perhaps this is the only alternative available.
955

8.125 Information is also useful for conducting research. For instance, at present there is hardly any epidemiological research linking the levels o f pollution to morbidity and mortality. This information is partly generated by several monitoring stations located across the length and breadth o f the country. Data gaps need to be identified and filled up. Information is a key resource which people require for getting organised and involved.
(ii) Strengthening of the Surveillance and Monitoring System
8.126 A wide network o f air and water quality monitoring stations has been established under National Ambient Air Quality Management, Global Environmental Monitoring System and other programmes. This needs to be meaningfully utilised. Considering the size o f the country and the changing nature o f the problems, the surveillance system needs to be established at least for each district. Other research and academic institutions and even the industry-, already having the capabilities for collection and analysis of data and information, need to be involved in this work. This will not only be the most cost-effective method but also an im^portant step for involving people and institutions. Secondly, the scope of surveillance needs to be broadened by including more technical parameters: toxic chemicals, pesticides, heavy metals etc. Bio-monitoring should also be taken up. Health and environmental surveillance and monitoring system should be integrated with other organisations like Central Ground W ater Board.
(iii) State o f Environment Report
8.127 The objective o f providing an acceptable standard o f natural environment is unexceptionable. Unfortunately, in the absence o f any aggregate picture in the form o f a systematic State o f Environment Report State-wise and on an all-India basis, it is difficult to give satisfactory answers on a macro level, to questions such as: Where do we stand today vis-a-vis our objective? In which direction are we heading and at what rate? The Ninth Plan envisages the preparation o f such State o f Environment Reports by the State Governments.
(iv) Integrating Environmental concerns with Decision Making
8.128 Similarly, the other important lacuna relates to the magnitude o f different environmental issues like water pollution, air pollution, soil degradation etc. These have both physical and economic dimensions. In the absence o f any idea about these two, especially the latter, any attempt at resource allocation and inter-se prioritisation would appear arbitrary and subjective.
8.129 In order to lend a reasonable degree o f rationality to the process o f policy formulation and decision making, the Ninth Plan lays specific emphasis on epidemiological studies and environmental economics. It is hoped that this would facilitate integration o f environmental concern with the decision making process.
(v) Natural Resource Accounting
8.130 The use o f Gross National Product (GNP) or Gross Domestic Product (GDP) alone as an indicator o f human welfare and well-being is no longer considered satisfactory. It does not reflect the sustainable income o f the country in the sense o f the flow o f goods and the
956

services that the economy could generate without reducing its productive capacity. Besides, it does not allow for the cost o f damage to environment and the resultant cost/suffering imposed on different sections o f the society.
8.131 Other serious limitations o f GNP as an indicator arise from the exclusion o f non-marketed goods and services from its purview and the treatment o f environmentally degrading, undesirable activities and other costs of repairing adverse environmental damages, as income, whereas these should be treated as costs.
8.132 In spite o f these shortcomings, if these are used to measure the changes that occur in the economy over time or the relative importance o f different sectors at any one point o f time or the difference in the economic situation among regions or countries, it is because there is no satisfactory alternative. The current debate is also with regard to the question as to whether a single measure o f human development and welfare can be evolved or whether there should be a satellite system o f accounts over and above the existing system. A number o f attempts have been made for incorporation o f natural resource accounts into income accounts. In order to make a beginning, an expert group under the Ministry o f Planning and Programme Implementation (Department o f Statistics - CSO) has been constituted for giving technical directions including finalisation o f the methodology to be followed for the preparation o f natural resource accounting both in physical and economic terms to integrate with the State Domestic Product.
Area-Specific Programmes
(i) National River Conservation Programme (NRCP)
8.133 The NRCP was started during the Eighth Five Year Plan as a Centrally Sponsored Scheme with 50 percent Central assistance. However, it was realised that many States were not in a position to match it with their own fimds to the extent o f 50 percent. Therefore, during the Ninth Plan period, it has been decided to make it 100% Centrally Sponsored Scheme. This includes Ganga Action Plan Phase I and Phase II. Besides, 26 towns in ten States will be covered. It is important that the lessons learnt from Ganga Action Plan Phase-I will prevent similar mistakes from recurring. Municipalities and elected bodies in major towns need to be considerably strengthened financially to enable them to implement the schemes o f urban sanitation, including underground sewerage, sewage diversion and treatment. It has often been noticed that requirements for operation and maintenance are not provided for sufficiently, as a result o f which the entire effort and investment are rendered infructuous. The State Governments need to make adequate provisions for operation and maintenance o f these assets. It is important to note that river pollution cannot be tackled unless a minimum flow o f water is maintained in the rivers.
957

National River Conservation Plan (NRCP)Covers Ganga Action Plan (GAP)- Phase I, Phase II and National River Conservation Plan GAP-I covers the cleaning o f Ganga along 25 class I towns. The total cost o f the plan is Rs462.04 crore. It is to be completed by March 1999
Under GAP-I specific schemes for improvement in the river water quality are listed below o f the sanctioned schemes have been completed (Sanctioned 261- Completed 254)
97%
a : : : JS a r i o t l o n o c d
lifeD: INTERCEPTION & DIVERSION LCS: LOW COST SANITATION RFD RIVER FRONT DEVELOPMENT
M I s c
[:---- ̂ Oomp>l«t®d
STP: SEWAGE TREATMENT PLANT CRE: ELECTRIC CREMATORIA MISC: MISCELLANEOUS
GAP-II covers cleaning o f Ganga along 59 towns o f three states viz Bihar, U P and West Bengal, cleaning o f Yamuna along 21 towns o f three states viz Delhi, Haryana and U P , cleaning o f Gomti along 3 towns in one state viz U P and cleaning o f Damodar along 12 towns in two states viz Bihar and West Bengal. The total cost o f the plan is Rs 1328 crore It is to be completed by March 1999/ Dec 2001 (for West Bengal and Damodar Action Plan)
Under NRCP 46 towns and 18 rivers o f 10 states viz Andhra Pradesh, Bihar, Gujarat, Karnataka, Maharashtra, Madhya Pradesh, Orissa, Punjab, Rajasthan and Tamil Nadu are to be covered The total cost o f the plan is Rs 77? . 09 crore. It is to be completed by March 2005
ii) National Lake Conservation Programme
8 134 Due to pressure o f human activities, a number o f lakes are shrinking or getting polluted beyond the point o f recovery. Encroachments, sihation, weed infestation, discharge o f domestic sewage, industrial effluents and surface run-oflF carrying pesticides and fertilizers from agricultural fields are among the major threats. The symptoms o f pressure due to encroachment and invasion are already being experienced in the form o f decrease in migratory bird population, fish and other fauna, poor water quality and prolific growth o f obnoxious weeds
958

8.135 On the recommendations o f a National Committee under the Chairmanship o f the Secretary o f the Ministry o f Environment & Forests, 21 urban lakes considered to be highly degraded were identified for conservation and management in 1993 Later, a committee under the Chairmanship o f Shri T.N. Khoshoo prioritised 11 lakes, as shown in the Table 8.5
TABLE 8.5 LIST OF LAKES UNDER NLCP
S.No. Name of Lake State
1 Dal2 Sukhna3 Sagar4 Bhoj5, Nainital6 Kodai Kanal7 Ooty8 Udaipur9 Rabindra Sarovar10. Powai11 Hussain Sagar
J & K Chandigarh Madhya Pradesh Madhya Pradesh Uttar Pradesh Tamil Nadu Tamil Nadu Rajasthan West Bengal Maharashtra Andhra Pradesh
8.136 O f these 11 lakes, the Bhoj in Bhopal has been covered by the 0£ C F
fijnding and the project is already in progress The remaining 10 lakes are proposed to be covered for conservation and management under the proposed NLCP The objective o f NI.CP is to arrest fiirther degradation o f lakes and to revive these water bodies to acceptable environmental standards
(iii) Taj Trapezium
8.137 In pursuance o f the suggestions made by the Honourable Supreme Court o f India for a separate Plan allocation for environmental protection o f Taj Mahal in the context o f a Civil Writ Petition in September 1996, the Central Government has made an allocation o f Rs JOOcrore during the Ninth Plan on a 50:50 matching basis with the State Government to cover the estimated cost o f Rs.600 crore to implement various Schemes relating to uninterrupted power supply to the industrial units o f Agra, construction o f Gokul & Agra Barrage and improvement o f drainage and sanitation in Agra city, all in the context o f environmental protection o f Taj
8.138 It has been decided to provide Rs.50 crore during 1997-98 from the budget o f the Ministry o f Environment and Forests for the aforesaid purpose This amount is to be placed at the disposal o f the Mission Management Board, which will implement the above schemes The Board has been set up in the State o f Uttar Pradesh and will be serviced by the State Government.
8.139 The Mission Management Board will consider the schemes prepared by different departments o f the U P Government in accordance with the directions o f the HonlDle Supreme Court. The Mission Management Board will consider the schemes drawn up as above and accord sanction to them within the financial limits o f expenditure allowed to them from year to year by matching contributions from the State and the Central Governments. The Mission Management Board will take necessary action for implementation o f the schemes sanctioned by them. It will also monitor, review and take corrective action for smooth implementation o f the sanctioned schemes.

8.140 In March 1992, an Expert Group was constituted by the Planning Commission to formulate a National Policy for the integrated development o f tlie Himalayas. With a view to operationalising the recommendations o f the expert group a Steering Committee has been constituted by the Planning Commission. Six sector-specific sub-committees have been set up under the Chief Secretaries o f the States o f the Himalayan region. These deal with I) Environment & Forests; ii) Agriculture & Allied Activities; iii) Industry & Industrial Infrastructure; iv) Social Sectors including Health & Family Welfare, Education; v) Transport, Communications and Tourism, and vi) Energy including Non-conventional Energy and Science & Technology. They are expected to formulate and implement appropriate schemes to protect the Himalayan ecosystem and biodiversity.
(^) Islands
8.141 With a view to recommending policies and programmes for the integrated, environmentally sustainal development o f Andaman and Nicobar and the Lakshadweep groups o f Islands, the Island Development Authority (IDA) has been reconstituted in August 1998. The Authority, which is chaired by the Prime Minister, also reviews periodically the progress o f implementation and impact o f the programmes o f development. Simultaneously, the Standing Committee o f the IDA has also been reconstituted under the chairmanship o f the Deputy Chairman, Planning Commission.
8.142 It is recognised that the requirements o f the islands are very different from those o f the main land. New approaches are therefore necessary. The single most important issue with which the IDA is concerned has been : how to strike a balance between development aspirations o f the Island people with the need to protect these unique and fragile eco-systems full o f genetic wealth and natural beauty. In addition, the far flung and strategic locations o f these Islands from defence considerations also need to be kept in mind. The various meetings o f the IDA have tried to grapple with these issues in one form or the other. While the M inistry o f Environment and Forests as a primary agency for conservation o f environmental resources has taken, from time to time, steps such as Coastal Zone Regulation Act and Declaration o f Biosphere Reserves a clear view with regard to the developmental aspect has now emerged as a result o f fruitful deliberations o f the Island Development Authority and its Standing Committee.
8.143 In view o f their fragility and distant location, the viability o f any purposeful industrial activity appears to have questionable relevance. The thrust areas have accordingly been identified as the Fisheries and the Tourism Sector. Although, other activities based on coconut, rubber, boat building and wood based industries have also been found to be suitable for encouragement, it appears that the developmental thrust on tourism alone, or in conjunction with fisheries, should meet the vital interest o f employment generation in harmony with the environmental concerns. The infrastructural needs in the form o f shipping services for bringing the Islands into the main-stream of national development, are also being given greater attention.
(iv) Himalayan Region
960

Sector-Specific Programmes
Environment
8.144 The sub-strategy under this broad head for achieving the wider purpose consists o f prevention o f pollution at source; encouragement, development and application o f the best available feasible technological solutions, application o f the "pollutor pays" principle, focus on heavily polluted areas and public participation.
(i) Strengthening the Central Pollution Control Board
8.145 The Central Pollution Control Board is the apex regulatory and enforcement agency. The programme areas for the Ninth Plan are proposed to be environmental monitoring and assessment o f pollution; environmental standards and action plans; enforcement o f
pollution abatement programme and promotion o f infrastructure and capacity upgradaiion programme.
8.146 Some o f the highlights o f the proposed activities are introduction o f bio-monitoring for assessment o f pollution and health o f aquatic system, water quality monitoring in medium and small rivers, ground water quality monitoring, soil pollution monitoring, epidemiological studies for formulation o f standards based on health considerations, environmental audit, promotion o f infrastructure and capacity upgrada^’^̂ n programme.
(ii) Industrial Pollution Control and Prevention Proj* i;ts
8.147 There are two projects for industrial pollution control and prevention under the World Bank assistance. The Phase-I Project, started in late 1991, is expected to be completed by the end o f March 1999. The Phase-II Project, which commenced in 1995, would be completed by 2001. Whereas the Phase-I project covered the States o f U.P., Tamil Nadu, Maharashtra and Gujarat, the Phase II project relates to Andhra Pradesh, Madhya Pradesh, Karnataka and Rajasthan. Under these projects, the State Pollution Control Boards are being strengthened by providing them essential infrastructure such as equipment for laboratories and training o f personnel. Other activities include demonstration projects for new technology. Common Effluent Treatment Plants (CETP) for clusters o f small scale industrial units and financial assistance to various industries for installing industrial pollution control equipments.
(iii) The Common Effluent Treatment Plants (CETP)
8.148 The CETP would be an important scheme for assisting in the setting up o f common facilities for clusters o f small scale units for treatment and disposal o f solid, liquid and gaseous waste generated by small scale units located in industrial estates/clusters. Under this scheme, the Central Government provides financial assistance to the extent o f 25 per cent o f the project cost with an equal share coming from the State Government and promoter's contribution o f 20 per cent. The remaining 30% is provided as loan by the IDBI at a concessional rate o f interest through the World Bank Loan and Credit. Assistance is provided to clusters o f tanneries, textile units, chemical units, dye, and dye-intermediate units.
%i

(iv) Adoption o f Clean Technologies in Small Scale Industries
8.149 A scheme for promoting the development and adoption o f clean technology including waste water re-use and re-cycling, has been formulated for small scale industries. This scheme links research and development with diffusion and adoption o f pollution prevention measures. Under this scheme, activities relating to demonstration o f already proven clean technologies, preparation o f sector-specific manuals on waste minimisation, setting up o f waste minimisation circles in specific clusters o f small scale industries, training and awareness programmes for personnel in small scale industries would be undertaken.
(v) Environmental Statistics and Mapping
8.150 The Ninth Plan proposes the preparation o f statistical data base and reports on the status and the trends in environmental quality with reference to air, water, soil and noise and depicting them on an Atlas. It is also proposed to prepare a Zoning Atlas for locating industries in States. Environmental statistical cells are proposed to be set up in the Central as well as the State Pollution Control Boards.
(vi) Environmental Impact Assessment and Development and Promotion o f CleanTechnologies
8.151 Studies on the carrying capacity status for Doon Valley, National Capital Territory, Damodar River Basin and Tapti River Estuary, initiated during the Eighth Plan, will be completed in the Ninth Plan. In addition to the work o f completing the status report, it is proposed to undertake the study o f the carrying capacity for Kochi region. A life cycle assessment study o f the steel sector has been formulated in consultation with the steel industry for being undertaken during the Ninth Plan. With regard to development and promotion of cleaner technologies, the Ninth Plan envisages the taking up o f demonstration projects for effective transfer o f technologies.
(vii) Conservation and Survey
8.152 India is a mega bio-diversity country. With the signing o f the Convention on Biological Diversity, India could take advantage of its bio resources, based on the principles of equitable benefit sharing, provided for in this Treaty. It is proposed to consolidate and draw upon the gains made in the past and to formulate more focussed strategies. This strategy comprises such elements as, for instance, modernisation of taxonomic surveys, creation of a national data base on bio-diversity and facilities for characterisation o f bio-resources at molecular level to enable the country to lay claims to benefits, creation o f capacity for bio-prospecting. Creation o f new/strengthening the existing administrative infrastructure to promulgate, administer and implement the regulations governing the use o f bio-resources both by the people within and outside the country and gaining access to bio-diversity resources are also envisaged as integral components o f this strategy.
962

8.153 India is also a signatory to the UN Convention to Combat Desertification. This convention is likely to enter its implementation phase during the Ninth Plan. Therefore, steps are proposed to be taken to meet India's obligations by formulating and implementing a National Action Programme.
8.154 The scheme for promoting environmental awareness and providing non-formal environmental education through the medium of Natural History Museums to encourage meaningful public participation is proposed to be continued during the Ninth Plan.
(viii) Biosphere Reserves
8.155 The Biosphere Reserve Management Programme is intended to conserve representative ecosystems. It is aimed at providing in-situ conservation of plants,animals and micro-organisms. This emphasises the need for the conservation o f the entire ecosystems o f suitable size to ensure self-perpetuation and unhindered evolution o f living resources.
(ix) Mangroves
8.156 The scheme on conservation and management o f mangroves was initiated in 1986. The main activities under the programme are surv'ey and identification o f problems, protection and conservation measures like natural re-generation, afforestation, nursery development, education and awareness programmes and research on various aspects o f mangrove ecosystems and coral ree f It is an on-going activity. Review meetings for both research projects and management action plans are periodically held to monitor the progress.
8.157 Four coral reef areas have been identified for intensive conservation and management. These include Gulf o f Kutch, Gulf ofMannar, Andaman and Nicobar Islands and Lakshadweep.
(x) W etlands
8.158 The scheme on conservation and management o f wetlands was initiated in 1987 with a view to laying down policy guidelines, taking up priority wetlands for intensive conservation measures, for monitoring the implementation of the programme o f conservation, management and research and to prepare an inventory o f Indian wetlands.
8.159 The main activities under the programme are data collection and survey, identification o f the problems, wetlands mapping, landscape planning, hydrology, control o f encroachments, eutrophication abatement, aquatic weed control, wildlife conservation, fisheries development, environmental awareness and research on various aspects o f wetlands processes and functioning o f these ecosystems. This is an ongoing activity. Reviews are periodically carried out to monitor the progress o f work both under the research projects and the management action plans.
963

(xi) Assistance to Botanical Gardens
8.160 This is an ongoing activity. An expert group screens and examines the proposals. In order to help conserve important representative eco-systems with a view to ensuring self-perpetuation and unhindered resolution o f the living resources, 14 potential sites in the country have been identified for being designated as bio-sphere reserv'es. It is proposed that the M anagement Action Plans for these bio-spheres would be prepared and put into implementation. Eco-development in the buffer zone area is proposed to be strengthened to ensure people's participation for protection and conservation o f the core zone area.
(xii) Bio-diversity Conservation
8.161 W ith the advent o f the Convention on Biological Diversity, the important issues that have emerged are those pertaining to (a) sovereignty o f a nation over biological resources; (b) provision o f access to genetic resources through prior informed consent based on m.utually agreed terms; (c) fair and equitable sharing o f benefits arising from the utilisation o f genetic resources;(d) access to, and transfer of, technology on concessional and preferential terms, including the technology protected by patents and other intellectual property rights and (e) the rights o f the local communities to equitable sharing o f benefits, arising from utilisation o f their knowledge and practices. These issues have to be viewed from two perspectives - national requirement and actions; and international negotiation needs, commitments and actions. The need for a comprehensive legislation has been fiilly recognised and the process o f drafting the same has commenced. The legislation will need to fully internalise the strengths and opportunities built in the Convention on Biological Diversity by the bio-diversity rich, developing countries. At the international level, the negotiations on this issue are expected to continue for some more time. It is expected that at the end o f these negotiations an enabling environment would be created for the countries o f origin to derive benefits from the use o f their knowledge and resources, as provided for in the Convention. It is essential to safeguard the country’s interests in these negotiations for meeting the challenges at the national and intemational levels. It is proposed to introduce new activities for building institutional capacity for bio-diversity utilisation, characterisation o f biological resources at molecular level, protection o f sacred groves and conservation o f medicinal plants. A separate bio-diversity cell is proposed to be set up in the Ministry o f Environment and Forests in the Ninth Plan. In order to realise the potential o f India's bio-diversity, the building up o f the institutional capacity for bio-diversity utilisation and the establishment o f in-situ and ex-situ conservation areas for medicinal plants and endangered species are important pre-requisites.
8.162 The Department o f Agriculture & Cooperation is in the process o f finalising a legislation relating to sui-generis system for the protection o f plant varieties. The objectives o f the proposed legislation are:
> To promote the availability o f high quality seeds and planting materials with a broad and diverse genetic base, keeping in view our diversified agro-climatic conditions and having regard to food security, protection of human and animal health and safeguarding o f environment.
964

To stimulate research and development in the formal and informal, public and private, sectors for new varietal development.
> To promote diffusion o f new varieties to farmers through the development o f seedindustry.
> To recognise and provide protection to fanner-varieties, land-races and extant-varietiesand ensure adequate returns to the breeders including farmer-breeders and public sector breeders.
> To recognise the rights o f farmers as breeders, conservators, cultivators and seedproducers.
> To promote the rights o f researchers and ensure their access to all biological materialsfor a strong and effective breeding programme.
(xiii) Research and Eco-generation
8.163 Ecological task forces, comprising ex-servicemen, are deployed in remote and difficult areas to undertake restoration o f degraded eco-systems through afforestation, soil conservation and water resource management techniques. The scheme also serves the important purpose o f rehabilitation o f the ex-servicemen in productive activities. At present, these ecological task forces are operational at Dehradun and Pithoragarh (U.P.); Jaisalmer (Rajasthan); and Sambha (J&K). It is proposed that these batallions will move from one area o f operation to another,
after achievement o f the targets, in consultation with the State Governments.
(xiv) Environmental Education, Training and Information
8.164 Under this broad head, it is proposed to continue to provide grant-in-aid to professional societies and NGOs for developing programmes in the areas o f environmental education, wild life and ecology. The Ninth Plan also envisages the strengthening o f the ENVIS Centres in the priority areas. A link would also be provided with the Internet. The Centres o f Excellence in the field o f environmental education, ecological sciences, mining, environment and ornithology and natural history would be continued.
(xv) Policy and Law
8.165 Grants are released to the State Pollution Control Boards and the Department o f Environment o f the State Governments with the objective o f strengthening their technical capabilities. Due to various decisions o f the Supreme Court and the High Courts, the responsibilities and commitments o f the State Pollution Control Boards are increasing. A comprehensive legislation is proposed during the Ninth Plan by adopting a cross medium approach; removing the multiplicity o f legislation and agencies, besides removing the overlapping and ambiguous policies currently in vogue. The labeling o f environmental friendly products by granting ECOMARK helps in pollution abatement. This important activity would be considerably supported during the Ninth Plan.
965

(xvi) The National Environment Tribunal Act, 1995
8.166 The National Environment Tribunal Act, 1995 has already come into effect. The Principal Bench o f the Tribunal will be located at New Delhi. The supporting infrastructure for this Tribunal w'ill be provided during the Ninth Plan.
(xvii) International Cooperation
8.167 In pursuance o f the Environment Action Programme 1993, the World Bank has initiated a project for environment management capacity building. The main components of the project are: environmental economics, environmental indicators, environmental law, environmental awareness and strengthening o f environfnental protection programmes. This project will be implemented through the Ministry o f Environment and Forests in cooperation with the Department o f Ocean Development and the Government o f Gujarat. A special emphasis is being placed on Gujarat because tlie State is not only one o f the fastest growing industrial regions of the country but is also expected to have high levels o f pollution, judged by the way the industries are making a headway in the State.
8.168 With the assistance o f the Japanese Government, studies are proposed to be carried out in Surat and Delhi for the formulation o f a project, specifically addressed to the concerns in the areas o f air, water quality and solid waste management. It is also proposed to prepare an Action Plan for regenerating the institutional structures goveming urban environmental management and for identification o f cost-effective technology options for improving the delivery o f environmental services.
Forestry & W ildlife and Afforestation
8.169 The programmes/schemes o f Ninth Five Year Plan are generally similar to those taken up during the Eighth Plan, such as Integrated Afforestation and Eco-Development Project, Fuelwood and Fodder Project Scheme, Non-Timber Forest Produce Scheme, Grants-in-Aid Scheme Seed Development Scheme etc. with greater focus and improved implementation on the basis o f the experience gained during Eighth Plan. The Planning Commission had set up a Working Group to examine the prospects o f leasing out o f degraded forest lands to the private entrepreneurs/Forest Corporations. The main term o f reference o f the Working Group was to assess the economic, social and environmental feasibility o f leasing or otherwise making degraded forest land available to the private entrepreneurs/Forest Corporations. The Working Group has submitted its report and has not recommended leasing o f forest land to the private entrepreneurs either directly or indirectly through forest corporations. The main reasons for not recommending the use o f government forests to private industry are as follows:
• Degraded forest lands leased out to industry would deprive a large populace which is dependant on these lands for their fuelwood and fodder needs
• It will be against the interest o f the farmers who wish to supply wood to industry.• The proposal would be against the National Forest Policy (1988), the Forest Conservation
Act (1980), and the Provisions o f Panchayats (Extension to the Scheduled Areas) Act, 1996.
966

• Paper and other industries consume only 10% of the raw material from forests. Leasing o f forest lands to these industries will adversely affect other sectors which are dependent on forests for raw materials.
• Industries will prefer to go for plantations o f one or two fast growing species in place ofmulti-layered mixed forest which results from natural regeneration.
• Industries have shown no interest in leasing the non-forest wastelands, and thereforetheir plan to operate on forest lands needs careful scrutiny.
W astelands Development
8.170 The Ninth Plan envisages regeneration o f wastelands to release pressures on the forests and standardisation o f the definition o f wastelands, assessment o f their magnitude and their development by a reorienation o f the policy o f “open access” to “common property resources” . Clear, quantified and phased arrangements would be evolved for an equitable sharing o f the usufruct. The programmes/schemes for the Wastelands Development o f Ninth Five Year Plan are generally similar to those taken up during Eighth Plan such as Integrated Wastelands Development Projects Scheme, Technology Development Scheme, Training & Extension Scheme and Investment Promotional Scheme etc.
8.171 The National Forest Policy 1988 envisages massive afforestation and social forestry programmes on all der\uded, degraded and unproductive lands. Approximately, 30 mha o f nonforest wastelands are to be brought under tree cover. This can be done by promoting farm- forestry, community forestry and agro-forestry by government agencies, NGOs and by individuals through institutional financing. The Working Group on the prospects o f leasing out degraded Forest Lands to the Private Entrepreneurs has recommended th a t ;• Private entrepreneurs may consider reclamation o f non-forest wastelands which are far
from habitation.• Industries should establish direct contact with the farmers as provided in the new Forest
Policy.• Laws regarding ceiling o f land should be liberalised to attract private entrepreneurs to
take forestry projects.
STATEW ISE ALLOCATIONS
8.172 The statewise approved outlays and actual expenditure for ecology & envirormient and for forestry sector during Eighth Plan (yearwise) are given at Annexure VII and VIII respectively.
967

A M BIENT A IR Q UALITY STATUS IN SOM E CITIES/TO W N S DURING 1998
ANNEXURE-8.1
CITY SPM S02 NOx
R C I R C I R C I
CPCBStandards
140 140 360 60.0 60.0 80.0 60.0 60,0 80,0
Delhi 284 272 305 15.2 17.4 18.6 22.4 37.3 37,5
Mumbai 340 NA 308 40.7 NA 39.1 24,9 NA 30.4
Howeirah 469 570 835 12.1 53.4 46.7 37,6 64.7 67.7
Chennai 60 156 85 9.2 10.0 11.0 8.1 16.9 6.8
Hyderabad 129 187 100 6.5 7.1 6.0 23.3 48.0 15.7
Ahmedabad 293 550 305 9.0 19.3 27.9 17.7 30.9 29.4
Cochin 133 131 116 8,8 9,8 10.5 13.8 19.9 9.9
Nagpur 236 157 162 4.7 5.7 4.0 20.0 15.5 9.2
Jaipur 207 226 302 6.8 6.4 7,5 106 9.9 11.7
Kanpur 433 495 451 15.9 18.6 17,1 15.6 18.3 17.1
Source; Central Pollution Control Board & National Environmental Engineering Research I nstitute.
RC!
ResidentialCommercial/ResidentialIndustrial
SPM = Suspended Particulate MatterS02 = Sulphur DioxideNOx = Nitrogen Oxides (as N02)Unit = mg/m3
968

ANNEXURE 8.2
EIGHTH PLAN OUTLAY AND YEARWISE EXPENDITURE(R s. c ro re )
Sector 8th PlanOutlayOriginal
Total Outlay Revised
Outlay1992-93
Expdt.1992-93
Outlay1993-94
Expdt.1993-94
Outlay1994-95
Expdt,1994-95
Outlay1995-96
Expdt.1995-96
Outlay1996-97
Expdt.1996-97
TotalExpdt.
Environment
325.00 402.00 48.00 45.09 70.00 71.15 79.00 103.52 80.00 63.00 125.00 124.18 406.95
NRCD 350.00 55.00 383.00 54.19 65.00 64.91 78.00 31.34 79.00 42.09 106.00 121.53 314.07
NAEB 275.00 510.00 115.00 114.45 98.00 90.33 103.00 103.13 104.00 93.18 90.00 87,55 488.64
ForestsandWildlife
250.00 502.90 62.00 60,92 85 00 77.13 100.00 90 26 107,50 98.37 148.40 95,58 422.24
lO T A I. 1200.00 1797.90 280.00 274.67 318.00 303.52 360.00 328,25 370,50 296.64 469.40 428.84 1631.90
969
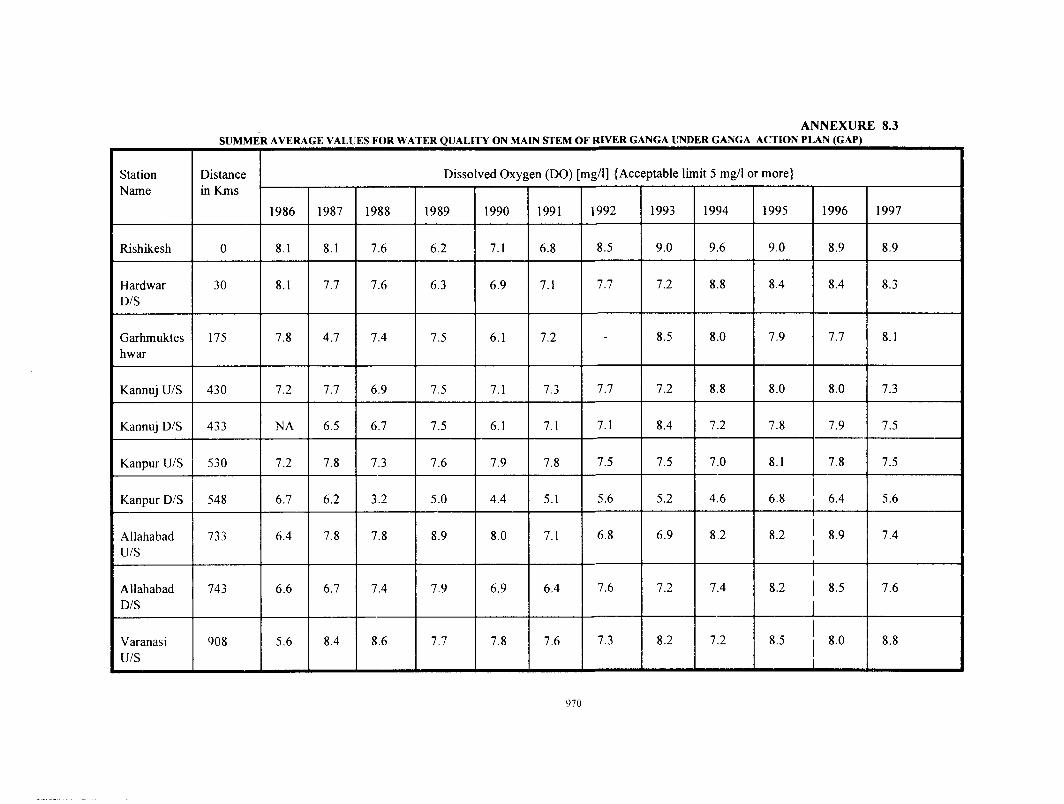
ANNEXURE 8.3S U M M E R A V E R A G E V A L U E S F O R W A T E R Q U A L I T Y O N M A I N S T E M O F R I V E R G A N G A U N D E R G A N G A A C T I O N P L A N ( G A P )
StationName
Distance in Kms
Dissolved Oxygen (DO) [mg/1] {Acceptable limit 5 mg/1 or more}
1986 1987 1988 1989 1990 1991 1992 1993 1994 1995 1996 1997
Rishikesh 0 8.1 8.1 7.6 6.2 7.1 6.8 8.5 9.0 9.6 9.0 8.9 8.9
HardwarD/S
30 8.1 7.7 7.6 6.3 6.9 7.1 7.7 7.2 8.8 8.4 8.4 8.3
Garhmukteshwar
175 7.8 4.7 7.4 7.5 6.1 7.2 - 8.5 8.0 7.9 7.7 8.1
Kannuj U/S 430 7.2 7.7 6.9 7.5 7.1 7.3 7.7 7.2 8.8 8.0 8.0 7.3
Kannuj D/S 433 NA 6.5 6.7 7.5 6.1 7.1 7.1 8.4 7.2 7.8 7.9 7.5
Kanpur U/S 530 7.2 7.8 7.3 7.6 7.9 7.8 7.5 7.5 7.0 8.1 7.8 7.5
Kanpur D/S 548 6.7 6.2 3.2 5.0 4.4 5.1 5.6 5.2 4.6 6.8 6.4 5.6
AllahabadU/S
733 6.4 7.8 7.8 8.9 8.0 7.1 6.8 6.9 8.2 8.2 8.9 7,4
AllahabadD/S
743 6.6 6.7 7.4 7.9 6.9 6.4 7.6 7.2 7.4 8.2 8.5 7.6
VaranasiU/S
908 5.6 8.4 8.6 7.7 7.8 7.6 7.3 8.2 7.2 8.5 8.0 8.8
970
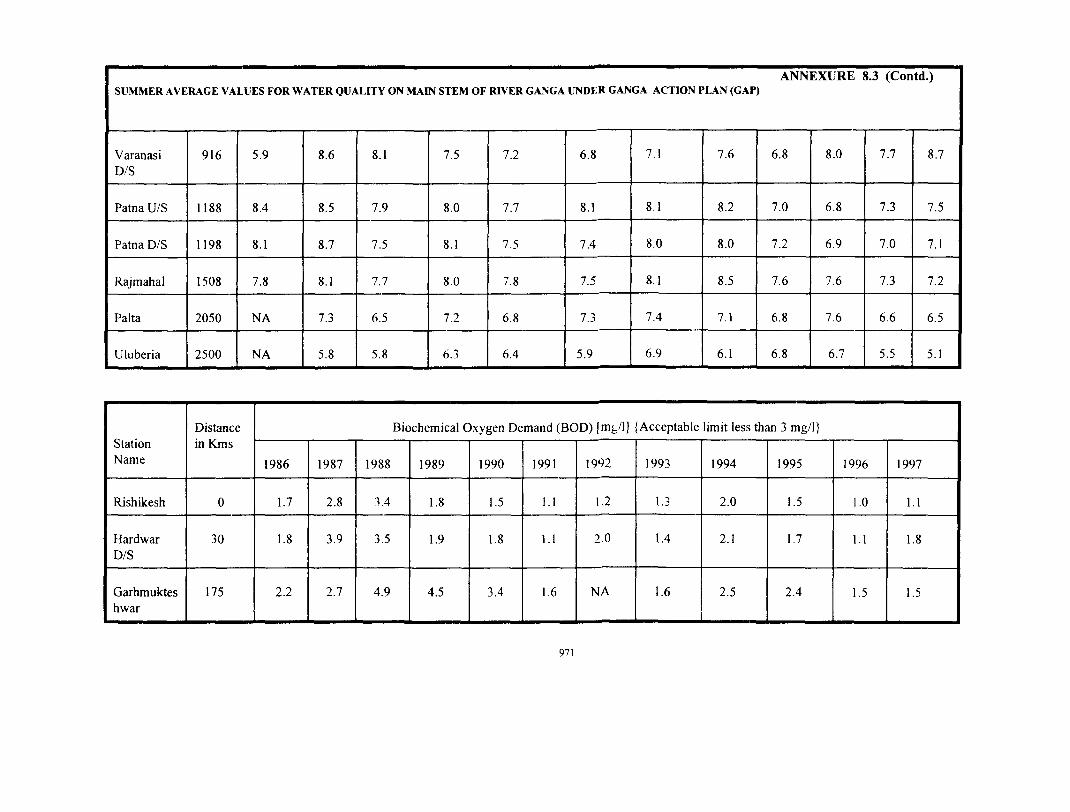
ANNEXURE 8.3 (Contd.)SUMMER AVERAGE VALUES FOR WATER QUALITY ON MAIN STEM OF RIVER GANGA UNDER GANGA ACTION PLAN (GAP)
VaranasiD/S
916 5.9 8.6 8.1 7.5 7.2 6.8 7.1 7.6 6.8 8.0 7.7 8.7
Patna U/S 1188 8.4 8.5 7.9 8.0 7.7 8.1 8.1 8.2 7.0 6.8 7.3 7.5
Patna D/S 1198 8.1 8.7 7.5 8.1 7.5 7.4 8.0 8.0 7.2 6.9 7.0 7.1
Rajmahal 1508 7.8 8.1 7.7 8,0 7.8 7.5 8.1 8.5 7.6 7.6 7.3 7.2
Palta 2050 N A 7.3 6.5 7.2 6.8 7.3 7.4 7.1 6.8 7.6 6.6 6.5
Uluberia 2500 NA 5.8 5.8 6.3 6.4 5.9 6.9 6.1 6.8 6.7 5.5 5.1
StationName
Distance in Kms
Biochemical Oxygen Demand (BOD) [m t/l] {Acceptable lim it less than 3 mg/1}
1986 1987 1988 1989 1990 1991 1992 1993 1994 1995 1996 1997
Rishikesh 0 1.7 2.8 3.4 1.8 1.5 I.l 1.2 1.3 2.0 1.5 1,0 1.1
HardwarD/S
30 1.8 3.9 3.5 1.9 1.8 1.1 2.0 1.4 2.1 1.7 1.1 1.8
Garhmukteshwar
175 2.2 2.7 4.9 4.5 3.4 1.6 NA 1.6 2.5 2.4 1.5 1.5
971

Annexure (Concld.)
Kannuj L)/S 430 5.5 2.7 2.2 1.0 2.6 NA 2.1 2.3 2.7 2.4 2.9 3.4
Kannuj D/S 433 NA 5.1 5.6 1.1 3.0 3.0 2.7 2.5 3.0 3.2 3.2 3.7
Kanpur U/S 530 7.2 2.9 1.8 1.1 2.7 1.5 1.7 1.9 5.0 2.0 2.8 3.1
Kanpur D/S 548 8.6 9.7 13.4 3.5 3.5 65.8 25.0 24.5 8.5 5.5 4.1 5.4
AllahabadU/S
733 11.4 7.0 2.8 2.6 2.6 2.3 2.0 1.8 2.3 4.5 2.5 3.3
AllahabadD/S
743 15.5 8.2 3.1 2.3 2.0 1.7 1.9 1.9 3.6 3.2 3.3 2.4
VaranasiU/S
908 10.1 4.1 3.3 3.0 2.6 1.2 0.9 0.8 1.8 2.6 2.2 3.1
VaranasiD/S
916 10.6 4.8 4.3 4.0 5.9 1.9 1.3 1.0 2.9 1.4 2.3 2.0
Patna U/S 1188 2.0 1.9 2.0 0.4 0.3 1.4 1.2 1.2 1.6 1.5 2.0 1.3
Patna D/S 1198 2 2 2.1 2.2 0.4 0.3 0.9 1.6 1.5 1.6 1.4 1.6 1.4
Rajmahal 1508 1.8 1.6 2.0 0.2 0.3 1.0 0.6 0.7 1.9 1.7 1,3 2.1
Palta 2050 NA 1.0 1.3 1.0 0.9 0.8 1.0 0.9 2.5 2.1 1.6 2.4
Uluberia 2500 NA 1.1 1.1 0.9 1.0 0.8 1.0 0.9 3.2 2.8 2.0 NA
Mean Value for the months o f March to June when the temperatures are high and flows are low.
972

ANmmRB. 8̂ 4
Revised forest cover in different assfesnienfr (1987 to \ 995> aftea incorporating interprelational Cofrections (Sq, km)
19S7Asgessntent 198S^Assessmcnt 199'l/§ssessmenf» rsi^3 Assessment ! 1995Assessment
CJriginalestimate
Revisedestimate
Original'estimate
Jfevisedeitanate
Original^esfimatc
Rfevisetfestimate^
OriginaUestimat&
Rsviaidestimate
Originalestimate
Revisedestim ate
Andhra Rradcsh 50,1?4 49,573 47,911 47,290' 47,911 47,290. 47,256 t43,25)S, 4?7.n2 47JJ2
Arunacllal PrSdesh 60,S0a 64,132 68,76? 69,002 6S,518 68,757 68,66F 68,661 68,621 68,621
Assam 26,386 25,160 26,05» 24,832 .25;977 24j751 24,508 24,061 24,061
JUZ-Bihar 28,T48 28,482 26,934 26,66 $ 26,9341 26,668 26,587 26,587 26,561 26.56L
iatkTDelhi r5 15 22 22 22 22 22 22 J26 26
:-mqhT.&oa, baman & 1.585 1,-240 1,302 1,255 1,302 1,255 I,25a 1,250 1,250 1,2m.
Gujaiit 13,570 11,991' 11,670 11,921 11,907 12,044 12,044 12,320
Haryana
Himachal Pradesh
644 513 563 513 5̂63 513 513 513 603
12,882 15,480 13',377 12,480 13,377 12,480 12,502 12.502 12,501
. m .
.njm.
Jammu & Kashmir
karhataka
Kerala
Maihyi î desh
Kiaharashtra
Manipur
20,880
32,264
10,402
i27,749
47,416
17,679
20,905
32,568
10,255
830,099
45,616
1^.475
20,424
32,100
10,149
133,191
44,058
17,885
20,449
32,104
10,292
135,541
44,044
17,685
20,424
32,195
10,149
133,191
44,058
17,885
20,449
32,199
10,292
135,541
44,044
17,685
20.443
32,343
10,336
135,396
43,859
17,621
20,443
32,343
10,336
135,396
43,859
17,621
20,433
32,382
10,336
135,164
43,843
17,558
20jn .__
/ ̂ irthfia 32aS2__
m ,336. -
__hnsTn.1 3 5 .164 I
43,843
17,558
m

Annexure 8.4 (Concld.)____
Meghalaya 16,511 16,466 15,690 1 5,645 15.920 15.8^5 15.769 15.769 1 5.714 1 5 .7 17
Mizoram 19,092 19 ,0 84 1X.17X 18.170 18.861 18.853 18.697 18.697 1 8.576 1 8 .576
Nagaland 14„^51 14 ,3 94 14,356 14.399 14.278 14,321 14.348 14.348 14.291 14.291
Orissa 53,163 5 3 2 5 3 47 .1 37 4 7 .2 2 7 47 .1 15 4 7 .2 0 5 47 .1 45 4 7 .145 4 7 .1 0 7 4 7 .1 0 7
Punjab 7 6 6 9 4 3 1,161 1.338 1.161 1.343 1.343 1.343 1.342 1.342
Rajasthan 12 .478 12 ,758 12,966 12.8X4 12.971 12.8X9 13.099 1 3 .0 99 13.2X0 13,2X0
Sik kim 2.8 39 2 ,7 5 6 3 ,1 24 3.041 3 .1 2 4 3.041 f.l 19 3 119 3,1 ,27 3 .127
Tamii Nadu 18,380 17 ,4 72 17.715 16.992 17,715 16.992 17.726 I 7.00^ 1 7 .7 66 17.04.^
1 Tripura 5.743 5 ,9 5 3 5,325 s 5.3 25 5.53^ v 53X V M S ̂ 53X " .̂53X
Uttar Pradfi sh 3 1 ,443 3 1 ,2 2 6 3 3 ,8 4 4 3 3 .6 2 7 33 .8 26 3 3 .6 0 9 <3.9(11 V1.96I 33.9X6 33.9X6
i W est B en g2i;l . 8,811 8 ,4 32 8 ,3 94 8.015 8.3 94 8.0 15 8.18(. 8 .1 86 8 .2 7 6 8.2 76
- A & N Islanc
1 i v ̂ I
s _
1
7,603
. r i
7 .601 7 ,624 7 .622 7.624 7.6 22 7 .624 7,6 24 7.61 5 7.615
1 I
PhanHigarV|!_____ _
j
1ii _2.......
' f ‘ '1
8 5 8 5 S 7 7
1DaHra M Haveli 23" 2 3 8 205 206 205 206 206 206 20 4 204
s x f ji■ cx; | .r r ;
j
! __PQndicheiT)1
8 1 NIL N IL ; NIL i NIL M L NIL NIL NIL NILi
M (' Ii
-£ ir a n d T ola ,_64: ;,04i 6 4 0 .8 9 640,1341 6 3 8 .8 0 4 ' 6 4 0 .6 9 4 6 3 9 .3 6 4 6 4 0 .1 0 7 6 3 9 .3 8 6 6 3 9 ,6 0 0 63X.X79
iV H .-M 1---Uil-1
n i . rrr, I 1;; r i— j_L — f U-r-t-r T—
974

EXTENT OF DENSE FOREST, OPEN FOREST AND MANGROVE IN 1997 ASSESSMENT (sq.km)
ANNEXURE 8.5
State/UT Dense Forest Open Forest Mangrove Total Forest Per capita (ha)
Andhra Pradesh 23,048 19,859 383 43,290 0.07
ArunachalPradesh
54,155 14,447 - 68,602 7.93
Assam 15,548 8,276 __ 23,824 0,11
Bihar 13,300 13,224 __ 26,524 0.03
Delhi 16 10 __ 26 NIL
Goa 995 252 5 1,252 0.11
Gujarat 6,337 5,250 991 12,578 0.03
Haryana 370 234 >_ 604 NIL
HimachalPradesh
9,560 2,961 12,521 0.24
Jammu and Kashmir
1 1.020 9,420 - 20,440 0.26
Karnataka 24,854 7,546 3 32,403 0.07
Kerala 8,454 1,880 __ 10,334 0.04
M adhya Pradesh 82,745 48,450 _ 1,31,195 0.20
M aharashtra 23,622 22,397 124 46,143 0.06
M anipur 4,937 12,481 _ 17,418 0.95
M eghalaya 4,044 11,613 __ 15,657 0.88
Mizoram 4,348 14,427 _ 18,775 2.72
Nagaland 3,487 10,734 _ 14,221 1.18
Orissa 26,101 20,629 211 46,941 0.15
Punjab 511 876 1,387 0.01
Rajasthan 3,690 9,663 __ 13,353 0.03
Sikkim 2,423 706 __ 3,129 0.77
Tamil Nadu 8,676 8,367 21 17,064 0.03
Tripura 1,819 3,727 -- 5,546 0.20
Uttar Pradesh 22,958 11,036 _ 33,994 0.02
West Bengal 3,557 2,669 2,123 8,349 0.01
A&N Islands 6,520 127 966 7,613 2.71
Chandigarh 6 1 __ 7 NIL
Dadar & Nagar Haveli
159 45 - 204 0.15
Daman & Diu __ 3 __ -> NIL
Lakashdweep _ _ -- NIL
Pondicherry .. __ __ NIL
TOTAL 3,67,260 2.61,310 4,827 6,33,397 0.07
975

PHYSICAL AND FINANCIAL ACHIEVEMENT OF NAEB DURING EIGHTH FIVE YEAR PLAN
ANNEXURE 8.6
SI. Scheme/activity 8th Plan Financial Physical PhysicalNo. Outlay Achievement Targets Achievements
(Rs. crore) (In hectare)
1. Integrated afforestation and 200.00 203.12Eco-development projects
2. Fuelw^ood and fodder projects scheme
3. Non-timber forest produce Scheme
4. Grant-in-aid to voluntary agencies
158,00 154.19
55.00 56.47
9.50 7.51
5. Seed development scheme 9.00 7.81
2.65.000 2,98.981
3.06.000 4,01,648
1,00,000 1,08,000
338 projects sanctioned
25 States assisted
6. Aerial Seeding Scheme 6.00 2.49 This scheme is in abeyance since 1994-95
976

APPROVED OUT LAYS AND ACTUAL EXPENDITURE FOR ECOLOGY & ENVIRONMENT OF DIFFERENT STATES
(Rs. Lakh)
ANNEXURE 8.7
A PP ROVE D ACTUAL E X P E N D I T U R E
E I G H T H PLAN 2 - 9 3 9 3 - 9 4 9 4 - 9 5 9 5 - 9 6 9 6 - 9 7 *
ANDAMAN & N I C O B A R 2 5 1 . 2 1 0 4 . 0 6 0
ANDHRA PRADEGH 1 0 0 3 8 3 6 1 0 8 3 2 5 0
ARUNACHAL24 4 6 6 9 9
ASSAM 4 3 ''•* 7 1 60 6 5 5 0
B I H AR 6 u 9 1 ^ 10 1 3 14 1 6
c h a n d i (.;a r h i - I / b . H 8 2 2 . 9 5 1 5 . .’>• 2 9 . 3 7 4 3 . 65
DADRA & NAGAR HAVEI . I ] 0 3 0 C 0 0DAMAN ^ D I U S d . 4 0 0 0 0D ELHI 2 2 0 ? (' 3 4 . 19 1 r > . c ^ 5 5 . 4 5 1 1 4 . 4 4
GOA 1 0 0 8 1 9 14 2 0
GUJ A RAT 9 5 0 5!! 52 58 1 0 4 4 2 6
HARYANA 6 0 0 r- 5 0 61 7 6 8 3
HI MACHAL P RADESH 1 8 5 34 38 4 1 67 0
JAMMU & KAS H MI R 8 a o I / n 12 3 1 3 6 17 6 0
KARNATAKA 3 0 0 60 7 5 8 5 2 1 3 3 4 7KERALA 7 30 NA NA NA 0 0
LAKSHADWEEP ■10 9 . 4 4 9 . 0 3 8 . 1 5 2 2 . 1 0
MADHYA P RADES H 2 4 7 6 8 1 3 5 1 7 6 9 2 1 0 7 2 1 8 9 0
MAHARASHRTA 2 4 3 0 2 3 2 3 2 6 2 5 0
M AN I P UR 1 0 0 17 19 2 0 2 4 3 5
MEGHALAYA 2 1 3 37 37 37 6 9 5 0
MI ZORAM2 5 5 3 2 2 12
NAGALAND 4 0 0 4 0 5 3O R I S S A 6 6 6 98 4 0 3 3 2 0 2 8 4 4 9 3P ON D I CH E R R Y 9 6 . 4 1 1 . 8 5 1 6 . 4 1 4 . 9 7 12 . 5P U N J AB 4 3 5 53 1 3 6 8 14R A J A S T H A N 1 2 9 6 1 9 7 2 1 8 2 5 4 1 9 5 1 7 5TAMI LNADU 2 0 0 0 24 1 11 1 2 0 3 9 3T R I P U R A 2 5 18 2 1 3 0 1 8 2 0UTTAR P RAD ES H 1 5 0 0 1 0 7 1 9 6 2 2 3 2 7 5 3 5 0WEST BENGAL 7 5 4 15 35 12 2 7 2 7 5
TOTAL 1 5 4 5 1 1 9 7 9 . . " 9 2 0 6 5 . 8 3 2 4 0 2 . 4 9 3 0 5 9 . 9 5 5 1 6 1 . 5 9
* Revised Estimate
Q77

APPROVED OUTLAYS AND ACTUAL EXPENDITURE FOR FORESTRY OFDIFFERENT STATES
ANNEXURE 8.8
(Rs . Lakh)
APPROVED OUT LAYS EIGH I'H PLAN
ACTUAL E.XPENDITURE
92-93 93-94 94-95 95-96 96-97*ANDAMAN & NICOBAR 2500.00 392.03 444.45 636.15 514.29 790.00ANDHRA PRADHSH 6842.00 927.00 781.00 931.00 2459.00 1252.00ARUNACHAL 4710.00 944.00 984.00 1135.00 1358.00 1262.00ASSAM 11260.00 1727.00 2242.00 2447.00 2490.00 2325.00BIHAR 18391.00 1730.00 1055.00 899.00 1030.00 1447.00CHANDIGARH 718.10 201.95 223.70 111.77 185.03 85.50DADRA & NAGAR HAVELl
790.00 198.62 264.25 264.99 247.71 260.00
DAMAN & DIU 105.00 26.91 21.96 27.65 29.93 35.50DELHI 715.00 220.63 312.61 430.20 NA 1925.00GOA 1030.00 194.00 208.00 211.00 209.00 254.00GUJARAT 30000.00 5770.00 4954.00 5350.00 7219.00 12482.00HARYANA 1 1770.00 2980.00 3240.00 3166.00 3512.00 3398.00HIMACHAL PRADESH 21000.00 4090.00 3491.00 3950.00 4760.00 5373.00JAMMU & KASHMIR 9880.00 1472.00 1508.00 2125.00 2627.00 2854.00KARNATAKA 20676.00 3471.00 5162.00 5407.00 5179.00 4433.00KERALA 9075.00 3274.00 2219.00 2400.0'O ZS26.00 2735.00LAKSHADWEEP 85.00 16.00 19.35 22.43 38.75 23.04
MADHYA PRADESH 18782.00 3628.00 4256.00 4197.00 5356.00 7438.00
MAHARASHRTA 50221.00 2812.00 5446.00 8074.00 8741.00 13389.00MANIPUR 2300.00 495.00 379.00 487.00 545.00 530.00MEGHALAYA 5978.00 1213.00 775.00 453.00 570.00 600.00MIZORAM 3105.00 614.00 597.00 574.00 600.00 600.00
NAGALAND 2850.00 124.00 350.00 110.00 385.00 337.00
ORISSA 10535.00 3844.00 3168.00 2916.00 2518.001945.00
PONDICHERRY 258.00 58.17 1.00 98.97 95.49111.31
PUNJAB 5593.00 725.00 809.00 725.001075.00 1080.00
RAJASTHAN 32655.00 3846.00 4393.00 6978.00 8830.00 8687.00
SIKKIM 1750.00 316.00 308.00 292.00 410.00 425.00
TAMILNADU 19500.00 4559.00 4561.00 4537.00 4724.00 4808.00
TRIPURA 2600.00 530.00 415.00 360.00 470.00 471.00
UTTAR PRADESH 36454.00 5966.00 4735.00 4139.00 5146.00 7405.00
WEST BENGAL 13559.00 L570.00 2168.00 2633.00 3320.00 3980.00
TOTAL 355687.10 57935.31 59562.32 66088.16 77470.20 92740.35
' Revised Estimates
‘);’ x

CHAPTER 9
SPECIAL AREA PROGRAMMES
9.1 Special Area Programmes have been formulated to deal with the special problems feced by certain areas arising out o f their distinct geo-physical structure and concomitant socio-economic development. Planning and Development o f an area within the state is primarily the responsibility o f the concerned State Governments. However, the Central Government is supplementing the efforts o f the State Governments in this direction through Special Central Assistance under the programmes such as Hill Area Development Programme (HADP) and Western Ghats Development Programme (WGDP), North Eastern Council (NEC), Border Area Development Programme (BADP),Desert Development Programme (DDP) and Drought Prone Area Programme (DPAP).Funds under Special Area Programmes are meant to deal with the specific problems of these areas. Hence Special Plan strategies are formulated and schemes drawn up by the State Governments keeping in view the basic needs o f the people and existing environniental considerations.
1. Hill Areas Development Programme (HADP) :
A. Historical Background:
9.2 The hill areas o f the country particularly the Himalayan and the Western Ghats regions support the basic life giving natural resources but they have very fragile and sensitive eco-systems. 'I'he need to conserve natural resources and the environment, particularly to prevent damage to fragile and irreplaceable eco-systems necessitated the inception o f Hill Area Development Programme (HADP) during the Fifth Five Year Plan. It was also aimed at balanced regional development.
9.3 The approach and the strategy o f the HADP has been evolving over time. The programmes implemented during the Fifth Plan period were mainly beneficiary oriented. While the emphasis shifted to eco-development in the Sixth Plan, the general tenor o f HADP remained substantially the same as that of the normal State Plan following the same sectoral approach. The Seventh Plan laid particular emphasis on the development o f ecology and environment as summed up in three phrases, namely, eco-restoration, eco-preservation, and eco-development. It aimed at evolving plans and programmes to take care o f socio-economic growth, development of infrastructure and promotion o f ecology o f the areas covered by the HADP. During the Eighth Plan attention was focussed on productive sectors o f the hill economies specially in modernising agricultural practices and small scale industries at household, cottage, and village levels. For this involvement o f people was considered o f paramount importance.The aim was to meet the actual basic needs o f the people through improved management o f the land and water resources.
B. Problems of Hill Areas :
9.4 M ajor environmental problems being faced by Hills are deforestation and soil- erosion, which are leading to the drying up of water resources, flash floods and decline in the yield o f food and cash crops, fodder, fuel and other minor forest produce. Similarly, poverty in the hills is another problem area which is directly related to the shortages of
979

materials for basic subsistence, especially where under the traditional land and water management system, the capacity of land to support the population has already been exceeded. Intensive human and livestock pressures along with indiscriminate felling of trees for commercial purposes in many hill areas have already led to loss o f soil and rapid depletion and destruction of forest cover. Besides, water retention capacity and productivity o f land have been adversely affected. These factors have impaired the ecology significantly and also resulted in deterioration in the economic c' ndition for the hill people. Traditional agricultural practices, especially shifting cultivation, have also contributed to destruction o f forests and soil erosion. Seemingly harmless activity such as prolonged grazing by livestock, especially goats and sheep, have further exposed many hill areas to serious ecological degradation. Development activities like construction o f buildings, roads, dams, large and medium industries and mining etc., have aggravated environmental problems. Consequently, perennial sources of water such as springs and small streams have dried up in many areas. The major challenge, therefore, is to devise suitable location-specific solutions, so as to reverse the process and ensure sustainable development o f the growing population and ecology of the hill areas.
C. Classification of Hill Areas
9.5 The responsibility for balanced social and economic development o f the hill areas rests primarily with the concerned State Governments.
9.6 The hill areas o f the country fall broadly into the following two categories :
(i) Areas which are co-terminus with the boundaries o f the State o f Union Territory, i.e., Hill States / Union Territories, namely, Jammu & Kashmir, Himachal Pradesh, Sikkim, Manipur, Meghalaya, Nagaland, Tripura, Arunachal Pradesh and Mizoram.
(ii) Areas which form part o f a State (which are termed as Designated Hill Areas) covered under the HADP, are the areas identified in 1965 by a Committee o f the National Development Council (NDC) and those recommended by the High Level Committee for Western Ghats in 1972. HADP would continue to be implemented during the Ninth Plan, only in those areas where it is already under operation namely:
(a) Two hill districts of Assam - North Cachar and Karbi Anglong.
(b) Nine districts of Uttar Pradesh - Dehradun, Pauri Garhwal, Tehri Garhwal, Chamoli, Uttar Kashi, Nainital, Almora, Pithoragarh and Udham Singh Nagar.
(c) Major part of Darjeeling District o f West Bengal.
(d) Nilgiris District of Tamil Nadu.
(e) 159 talukas o f Western Ghats area comprising parts o f Maharashtra (62 talukas), Karnataka (40 talukas), Tamilnadu (25 talukas) Kerala (29 talukas) and Goa ( 3 talukas).
980

9.7 The area and population of the Hill States and the Designated Hill Areas are detailed in Table 9 T ,
D. Pattern of Funding
9.8 The Hill States mentioned in para 9.6 (i) above are called 'Special Category States'. The Central Assistance for their development plans is pre-empted from the divisible pool before making allocations from it to the other States categorised as 'Non-Special Category States'. The Central Assistance is also given on liberal basis with 90% as grant and 10% as loan to Special Category States compared to 30% grant and 70% loan for other states.
9.9 In order to benefit the hill areas which form parts o f states,Special Central Assistance (SCA) is given under llADP. SC A provided for HADP is additive to normal State Plan funds and not meant to be utilised for normal State Plan activities. The schemes under HADP are to be properly dovetailed and integrated w'ith the State Plan schemes, fhe schemes undertaken under this programme also need to be conceived o f and designed to achieve the specific objectives of the progran'ime and should not be merely conventional State Plan schemes.
E. Objectives Approaches and Strategies for the INinth Five 'Vear Plan:
9 ]() During the last lour l ive Year Plans, substantial effort and resources were channelised for the de\elopment of infrastructure. However, the corresponding growth in the productive sectors ofrnost o fthe hill economies has not kept pace with the extent o f efforts and resources channelised. Considering the ecological degradation o f hill areas and subsequent impact on the economy and ecology o f not only the hill areas, but the plain areas as well the main objectives of the programme in the Ninth Plan would be eco-preservation and eco-restoration. All development schemes would be planned in this framework with emphasis on preservation of bio-diversity and rejuvenation o f the hill ecology. Traditional practices would be dovetailed with appropriate technology to serve the needs o f the people o f these areas. Traditional knowledge would be starting point for introduction o f modern science and technology. .A.11 schemes would be rooted in the existing cultural system so that they are easily acceptable and can help to provide maximum benefit to the people, fhe basic objective o f th e Hill Areas Development Programme has been socio-economic development o f the hills and the people living there in harmony with ecological development. The schemes implemented under HADP are, therefore, aimed at promoting the basic life support systems with sustainable use o f the natural resources o f the area covered by the programme. The strategy for the programme will be based on a two-pronged approach :
(i) Sub-Plan Approach: For the Hill areas covered by HADP the sub-plan approach has been adopted since the beginning ofthe Fifth Five Year Plan, under which a separate Sub- Plan for the hill areas in the concerned State is prepared indicating the flow o f funds from the State Plan and Special Central Assistance (SCA). In the case o f the WGDP, only the schematic approach is being followed, since the taluka’ (which is the territorial unit o f planning in the WGDP) is a unit of demarcation in respect of which the flow o f funds from State Plan arc difficult to quantii'y. Efforts are being made to follow the sub-plan approach in WGDP also.
981

(ii) Integrated W atershed Approach: Since the smallest viable geographical unit is the watershed, it is imperative that the integrated watershed approach be followed in HADP areas. The watershed is a geo-hydrological natural unit which has evolved through interaction o f rain water with the topography. The large majority o f inhabitants o f hill areas depend on agriculture and allied activities for their livelihood and the level of production is dependant on the health and vitality o f the concerned watershed. Although this approach is being followed in Niligris district and WGDP areas emphasis needs to be given to this approach in other HADP areas also. The approach followed by the National Watershed Development Project for Rainfed Areas (NWDPRA) is pertinent in this regard. Under this programme micro-watersheds wdth area between 500 to 1000 hectares are developed by measures such as conserving rain water, through treatment o f drainage lines in the micro-watersheds and promoting in-situ moisture conservation by eco-friendly agricultural production systems on arable land. This includes a 3-tier appropriate vegetation consisting o f grasses, shrubs and trees for fodder, fuel, timber and fruit in a topo sequence which is in consonance with soil depth and moisture.
9.11 The evaluation study on impact o f Watershed Development in Western Ghats Region o f Kerala has shown that the programme is beneficial as it has improved the lean flow in streams, resulted inhigher recharge o f ground water and helped in control of soil erosion. The evaluation also shows that better coordination between various development departmentswould be beneficial. It is also clear that it is important to create awareness about the programme amongst the beneficiaries.
HADP : N inth P lan : T h ru s t A reas
Eco-restoration and Eco-preservation Involvement o f the local population Gender sensitive planning Use o f appropriate technologyRedevelopment o f traditional agro-eco-systems based on traditional knowledge and technology Scientific approach to agriculture, animal husbandry and horticulture in order to raise productivity Development o f ecologically sustainable industries and tourism
Sectoral Approaches And Strategies
9.12 The following will be the approach and strategy in respect o f hill areas development planning during the Ninth Five Year Plan:
1. Agriculture And Allied Sectors
9.13 The large majority of the population in the hill areas depends on agriculture and allied activities. The important consideration in the approach to agriculture is the fact that in many areas particularly in U.P. hills there has been out-migration o f male population as a result o f which many o f the agricultural operations hitherto carried out by men have to be done by women, hence it is very important to look at the gender element in agricultural practices.
9.14 Appointment o f w'omen functionaries should be encouraged and extension work should be conducted through women as far as possible. T he other problems which hamper agricultural production in hill areas are small and fragmented land holdings, lack of transport and marketing facilities, and inadequacy in availability o f appropriate technology.
982

9.15 Application o f scientific inputs to agriculture and allied sectors, including identification o f crops suitable for the agro-climatic zones and multi-purpose species of trees and bushes to meet requirements of the people from a well-developed small land area are o f special importance. This approach is expected to spare considerable areas for permanent greening programmes, like social forestry or horticulture and serve the longterm objectives o f enhancing production on sustainable basis. Appropriate technologies to bring about localised self-sufficiency and generate alternative means o f livelihood, as opposed to heavy dependence on forests, and livestock rearing, can be encouraged. Use o f appropriate technologies to upgrade the traditional productive systems such as agricultural operations, livestock rearing, arts and crafts, household and cottage industries, etc., and to reduce drudgery o f women in fetching water, fuel- wood, fodder and other demanding daily domestic chores needs to be encouraged on priority. The technologies have to be need-based, more productive, elTicient, low-cost, and ecologically sustainable.
9.16 Extension services should enlighten and educate people on how to enhance productivity o f both cultivated and community land on a sustainable basis in the context of increasing human and livestock pressures. Consolidation of small and scattered land holdings would help in improving water and land management and ultimately, productivity o f the limited land assets o f the hills.
9.17 In order to reduce pressure on land, quality of livestock, including goats, sheep, pigs and poullvy birds has to be i.mpvoved and Iheir numbers reduced, '['here is an urgent need tor relating livestock population to the bearing capacity o f available land. Scrub animals could be systematically culled out. The livestock and cattle improvement programmes need to be integrated with fodder and cattle-feed development, stall feeding and scientific grazing. The land and livestock management systems have to improve rapidly. This w'ould imply creation o f suitable extension services, veterinary care, and other infrastructure for propogating high yielding variety of animals so as to enrich the local stock. The productivity o f pastures and grazing areas needs to be restored and enhanced. The effort should be to meet the requirements o f food, fuel-wood, timber and fodder through scientific utilisation o f scarce hill resources on sustainable basis from the least land area. Food security has to be ensured on top most priority. Development o f horticulture, sericulture and plantation, especially cash crops having low volume, light weight, high value and long shelf-life, could play an important role in generating employment opportunities, higher incomes and ecologically sound development in hilly areas.
9.18 Organic residue management would be encouraged to reduce emphasis on inorganic fertilizers. Earthworm technology, particularly in tea cultivation which has been successfully implemented may be introduced on a wider basis. Similarly, it would be appropriate to arrange for supply o f fertilizers in smaller convenient bags.
9.19 Horticulture is an important area which needs to be buttressed wdth adequate infrastructure facilities such as cold storage, food processing units and transport facilities. In addition to fruits, floriculture, mushroom cultivation, vegetable cultivation and production o f non-traditional types o f foods, such as olives, hazel nuts, strawberry, etc. would be encouraged. Care would also be taken to ensure economic viability o f the schemes. Area specific marketing infrastructure, especially for perishable produce and its processing, storage and packaging may be set up where such surpluses are imminent or evident.
983

9.20 W herever transport linkages have been estabHshed and local cultivation o f food- grains is not advantageous, strong Public Distribution System could be extended.
9.21 To reduce the use o f wood for packaging o f horticultural produce, suitable nonwood based packaging materials could be increasingly used on a viable basis.
9.22 Development o f sericulture can provide employment to educated and skilled workers and generate value-adding activities and bring in foreign exchange while maintaining the ecological sustainability o f the area.
9.23 The practice o f jhum cultivation in Assam_ hill areas needs to be controlled. For this a holistic approach is needed which would link up agriculture, animal husbandry and domestic sub-systems o f the village eco-system in the overall context o f forest management using traditional technology and knowledge as its base. The recently initiated NEC project for control o f shifting cultivation in upland areas should be dovetailed with HADP schemes and the existing Special Area Programme for Jhum, so as to wean the population of these areas away from this practice.
2. Irrigation
9.24 The system o f irrigation in hill areas requires systematic research so that water harvesting techniques can be used to efficiently provide water to the farmers. Sprinklers and drip irrigation can be encouraged along with small dams and lift irrigation schemes. Wherever possible catchment dams and community tanks may be provided. Development o f watersheds that can meet water requirements o f the people and conserve water and soil resources o f the area can be taken up for integrated development. For this, a multi-disciplinary approach is considered most appropriate for creating conditions conducive to development o f natural and human resources.
3. Industry
9.25 Many hill areas seem to be especially suited to industries that require pollution-free atmosphere, cool climate and precision skills such as electronics, watch-making, optical glasses, sericulture, etc. Traditional industries such as handloom products, etc. could be made economically viable by introduction o f m^aterial patterns and designs which have a large market. This may be done through cooperative societies, NGOs, or research institutions which can help the local weaver communities to make products which have a wide market. This applies also to other traditional crafts such as cane products, etc. In addition, high value industry may also be introduced such as watch making, electronics, etc. It is also important to develop agro-based industries which would enable processing o f local raw materials which have a ready local market. Sustainable forest plant and herb- based industries are other activities which can be environment friendly. Although, programmes are being implemented in these areas, it is essential to chalk out a detailed strategy for coordinated development o f economically viable industries which would use appropriate technology, improve productivity and enhance income generation without disturbing ecological balance. Due to higher transportation costs in these areas, industries which reduce weight and volume, but add value and increase shelf-life o f the locally available raw materials will be advantageous. Large and medium industries may not generally be considered suitable except under exceptionally favourable circumstances.
984

9.26 Mining can be carried out but with adequate ecological safeguards during and after the mining operations.
4. Tourism
9.27 Tourism can be organised as an industry, with due care taicen to avoid exploitative use of scarce local resources, especially water and fuel-wood, so that ecology o f the hills is preserved and benefits are reaped b\ the local population o f the area. Location specific suitable code of conduct for tourists may be evok ed so as to maintain clean and disease-free surroundings, protect local ecology and respect local traditions, culture and heritage.
5. Energy
9.28 Since the hill areas have immense hydroelectric potential micro-hydel projects would be encouraged. However, construction of dams would be considered very carefully clearly taking into account consideration of the geo-seismic condition o f the area. Since provision o f electricity facility to w idely spaced hamlets is a major problem in hill areas, appropriate solar energy technology would be ver> elfective in man> hill areas and these should be encouraged in areas covered under HADP / WGDP also. It is imperative that dependence on fire-wood be reduced. Non-conventional sources including bio-gas, wind turbines, etc. should be harnessed to provide for the eookiug. lighting and healing needs of the people of the hill areas.
6. Ecology & Forests
9.29 Regeneration and development of the hill environment cannot be achieved without willing and active cooperation of the people which will be forthcoming only if the benefits from improved land, water and forests resources reach directly and equitably to the people.
9.30 The hill areas prone to intense tectonic and seismic activities, need to be identified; activities such as indiscriminate road and building construction and creation o f artificial large water bodies need to be minimised and earthquake-proof construction designs should be used. Large projects etc. which might endanger the ecological balance and displace large number of people, should be very carefully considered before investment decisions are taken. Families whose agricultural land is acquired should be settled with productive assets.
9.31 Emphasis should be on (a) sustainable re-development o f traditional agro-eco- systems o f hill communities building upon traditional knowledge and technology. For this purpose a sharp departure from the conventional approach o f the traditionally trained agricultural scientists is required; (b) Further elaboration and refinement o f "Joint Forest Management Plan". One of the important elements o f these two activities should be conserving bio-diversity and their sustainable use by local communities. Species selection for forestry would be based on sustainable maintenance o f soil- fertility, soil, water management and the socio-economic needs o f the local communities. The policy o f reservation of forest would also need review because population pressure on de-reserved hill slopes has been increasing leading to ecological imbalances.
*-185

7. Medical & Health Facilities
9.32 Innovative approaches to family planning and welfare to contain population growth at sustainable levels, have to be adopted. The national programmes for fighting diseases endemic to hill areas such as Goitre, Malaria, Respiratory diseases, etc. would be strengthened. The problems o f lack o f trained medical personnel and lack o f proper facility would be mitigated to a certain extent by educating traditional para-medical practitioners and equipping them with necessary skills and equipments.
8. Infrastructure
9.33 Special care needs to be taken to ensure that hill roads are constructed as per traffic needs, scientific design and specifications suited to hill areas, so that loose soil is contained, proper drainage system is developed and chances o f land slides minimised. In such hill areas where the population density is low and the villages are small and scattered over long distances, building connectivity through appropriate types o f roads including link roads, bridle paths, foot bridges, etc. is a better strategy than concentration on motorable roads. Road construction should be completed in all respects without delays and roads should also be properly maintained.
9. Education
9.34 People have to be made aware o f the far reaching implications of environmental degradation and their active participation has to be sought in cco- restoration. Environmental aspects can be suitably woven into the curriculum o f primary and high school classes. Emphasis should be on effective use o f traditional technology, and to develop appropriate technology at the scale required for the hill areas.
10. Involvement of local people & NGOs
9.35 Efforts would be made to involve local population and to understand traditional systems. For this purpose, help would be taken from Panchayati Raj Institutions (PRIs). NGOs also would be approached for reaching the people. Afforestation programmes may be popularised through village Panchayats or village authorities, schools and other local organisations, groups and clubs.
11. Choice of Sectors / Activities / Schemes
9.36 Although it would not be appropriate to list water-tight compartments o f sectors / schemes which could be taken up under HADP / WGDP but the sectors chosen should conform to the major objectives o f the programme and lead to development with minimum disturbance to ecology. However, areas such as forest management, soil and water conservation and appropriate technology for agricultural and related sectors would receive priority. Resources should not be thinly spread on a large number o f projects and schemes.
986

9.37 Intensive efforts would be necessary at the implementation level to halt the process o f degradation o f the hills and improve productivity o f land. Financial and physical monitoring o f HADP by the State Governments would help improve implementation o f various programmes.
G. Allocation O f Special Central Assistance
9.38 In the Eighth Plan,the allocation o f SCA was based on the extant formula under which 86.61% of the outlay is given to HADP areas and 13.39% to WGDP areas.The actual amount given to each area depends on its population and area (1981 census). Under HADP
12. Implementation Measures
Allocation of Special Central Assistance for the Designated Hill Areas during the Seventh and Eighth Five Year Plans.
(Rs. in Crore)
Seventh Plan
Outlay
Eighth-------- PlanAllocation Outlayon yearly ------basis
Allocation on Yearly basis
r-*. 1 . bO 924 . 03 1235 . 62 1418 .33Districts of ;Assam 118.20 144.34 194 .34 215.61Tamil Nadu 33 . 75 41 . 53 55 .49 85 . 95Uttar Pradesh 533.50 679.19 910 . 04 1010 . 27West Bengal 44 .55 55 . 04 73.25+ 105 . 00Surveys & Studies 3 . 50 3 . 93 2 . 50 1 . 50B. Designated Talukas ofWestern Ghats Region 116 . 50 143 .77 191.03 215 . 68
equal weightage is given to these criteria while under WGDP area is given a weightage of 75% and population of 25% (Details o f the Allocations are in Table 9.2).
9.39 As against Rs. 1450 crore o f agreed outlay for the Eighth Plan, the allocation on year-to-year basis aggregated to Rs. 1634.01 crore.
H. Western Gh?ts Development Programme (WGDP)
9.40 The Western Ghats hill ranges run to a length o f about 1600 kms. more or less parallel to the west coast starting from the mouth of river Tapti in Dhule district of Maharashtra and ending at Kanyakumari, the southern-most tip o f India in Tamil Nadu. The region covers an area o f 1.60 lakh sq.kms. supporting a population o f 442 lakh (1991 Census). For delineation o f the area for coverage by the WGDP, the criteria o f elevation (600 metres above MSL) and contiguity with taluka (a territorial administrative unit) have been adopted.
9.41 The region generally receives 2000 mm to 7000 mm of rainfall. Most o f the rivers in peninsular India have their origin in Western Ghats o f which Godavari, Krishna, Kaveri, Kali Nadi and Periyar are o f inter-State importance. These water resources have
987

been harnessed for irrigation and power. About thirty per cent o f the area o f the Western Ghats region is under forest. The region is also a treasure house of plant and animal life. The traditional horticulture crops in the region are arecanut in the hills, and coconut in the coast along with mango and jack fruit. Tea, coffee, rubber, cashew and tapioca are the other important plantations / crops o f the region.
9.42 The ecological and environmental problems o f the area include increasing pressure o f population on land and vegetation; submergence o f forest areas under river valley projects, encroachment on forest lands; clear felling o f forests for raising tea. coffee, rubber and other plantations; mining operations, soil erosion, land slides; shifting cultivation; and declining wildlife population.
9.43 A separate Western Ghats Development Programme (WGDP) was launched in 1974- 75 as a part o f the programme for the development o f hill areas.
Western Gbats Development Programme (WGDP)
The W estern Ghats region has about 30 per cent of the area under forest; receives moderate to heavy rainfall and is a treasure house o f many endangered species o f plant and animals.
The W estern Ghats Developm ent Programm e covers 159 talukas spread over an area o f 1.60 lakh sq. km s. And is under im pkm entation since the begm nm g of the Fifth Five Year Plan with tfie aim o f eco-developm ent, eco-restoration and eco-preservation o f the areas.
The present approach from the Eighth Five Year Plan onwards has been to take up developm ental activities in an integrated m anner on the com pact watershed basis. The same approach is to be continued during the Ninth Five Year Plan.
9.44 I'he approach and strategy o f the programme has evolved through the Plans.During the Fifth Five Year Plan WGDP laid emphasis on economic well-being o f thepopulation in hill areas and exploitation o f the resources o f the hilly region. The main programmes during the Fifth Five Year Plan consisted o f activities in the areas o f horticulture, plantation, afforestation, minor irrigation, animal husbandry and tourism.
9.45 The Sixth Plan stressed the need for a balance in emphasis between beneficiaryoriented and infrastructural development schemes, keeping in view the vital importance o f ecological restoration and conservation. During the Sixth Plan the WatershedDevelopment Programme was taken up on a pilot basis.
9.46 Apart from the shift in the emphasis from beneficiary oriented schemes to eco- conservation and eco-development, a notable step initiated by the Planning Commission during the Sixth Plan was the involvement o f universities and research institutions located in the Western Ghats region in the programme.
9.47 The thrust o f the WGDP has been on sustainable development o f the areas coveredunder the programme since the last two Five Year Plans i.e. the Seventh and the EighthFive Year Plans. In its present form, WGDP operates on the following principles:
988

i) M aintenance of ecological balance essential for the life support system.
ii) Preservation of genetic diversity.
iii) Restoration of ecological damage caused by human interaction.
iv) Creation o f awareness among the people and educating them on the far- reaching implications o f ecological degradation and securing their active participation for the eco-development schemes.
9.48 The general approach under WGDP during the Eighth Five Year Plan wascontinuance o f the strategy adopted in the Seventh Five Year Plan which was to take up integrated development on compact watershed basis keeping in view the over-riding priorities o f eco-development and eco-restoration as w'ell as the basic needs o f the people like food, fodder, fuel and safe drinking water. In operational terms, integrateddevelopment of watershed approach envisages the following sequence o f actions:
a) Identification and delineation o f macro and micro w'atersheds in the entireWGDP area in the State by a competent research organisation.
b) Prioritisation of all the identified and delineated watersheds on the basis o f suitable criteria adopted by the State Government.
c) A preliminary or base-line survey o f the w atersheds taken up for development to determine the micro or mini watersheds to be taken up for development in each macro or major watershed, and the nature o f development programmes which need to be undertaken in each such area, keeping in view its development potential, the needs o f the local people and the financial allocations available.
d) Preparation of an integrated de\elopm ent plan for each macro / micro watershed covering all relevent activities, such as, soil-conservation. agriculture, afforestation, fuel and fodder development, minor irrigation, animal husbandry and sericulture.
e) Making necessary administrative and institutional arrangements for the implementation, monitoring and review- o f the integrated development programme for each watershed taken up for development.
9.49 The basic idea is that all development activity in the Western Ghats Region should be undertaken in an integrated manner in all selected watersheds on the lines indicated above. The concept o f integrated watershed development thus implies not just a development programme, but a general approach to all development programmes.
9.50 The approach to the WGDP during the Ninth Five Year Plan v^ould continue to be the same as for the last two five year plans.
989

9.51 At the instance of the Planning Commission, joint evaluation studies were carried out by the P.E.O. and the concerned State Governments. The evaluation reports are available for I'amil Nadu and Maharashtra. The reports indicate that the impact o f the Western Ghats Development Programme has been encouraging.
9.52 Perspective Plans for WGDP areas are available for Maharashtra, Karnataka, Kerala and Tamil Nadu. Necessary steps would be taken to operationalise these perspective plans during the Ninth Five Year Plan.
High Level Commission for the North-Eastern Region
9.53 A High Level Commission was appointed by the Prime Minister as part of his announcement o f New Initiatives for the North-Eastern Region in October. 1996. The Commission was required to examine the backlog in respect o f Basic Minimum Services in the seven North-Eastern States. It was also required to look into the gaps in important sectors o f infrastructure development in the North Eastern Region. In their report titled "Transforming the Northeast", which was submitted to the Prime Minister in March, 1997, the Commission furnished a detailed assessment o f the funds required to tackle the backlogs in Basic Minimum Services and infrastructural needs and made several specific
in difYerent concerning the
Evaluation Studies and Perspective Plans:
High Level Commission for the North Eastern Region
A High Level Commission (HLC) was set up following the announcem ent o f "New Initiatives for the North- Eastern Region" in late 1996. The HLC, in its Report entitled "Transforming the North-East" have assessed the requirem ent o f funds for tackling the backlog in Basic Minimum Services and infrastructural needs and recommended Policy initiatives and programmes to bridge these gaps and rejuvenate the local economy alongwith measures for institutional reforms and effecting public participation in the developm ent activities o f the Region.
2. The HLC have estimated that:
a) Rs.9395..'i4 crore would be required for tackling backlog in Basic M inimum Services in the seven States o f the North Eastern Region.
b) Rs.93619 crore - o f which R s.l7995 crore are estim ated for the Ninth Five Year Plan - is the indicative requirem ent o f funds for meeting the gaps in the infrastructural needs o f the Region.
recommendations important sectors development o f the Region. The total requirement o f funds for providing Basic Minimum Services was assessed at Rs.9395.54 crore. The indicative requirement o f funds for development o f infrastructure was put at Rs.93,619 crore o f which Rs. 17,995 crore was assessed to be the requirement for the Ninth Five Year Plan period. To operationalise the recommendations o f the Commission, the Planning Commission launched a State-wise e.Kercise. The phasing o f the requirements, as well as the monitoring arrangements, were w'orked out in consultation with the States. To the extent possible, the implementation of the
recommendations was internalised in the formulation o f the Ninth Five Year Plan proposals o f the seven States as well as those of the Central Ministries/ Departments. The Government also required the Central Ministries/ Departments to set apart 10% of their budget allocations for the purpose o f the development programmes o f the North-East. Since the requirements of the States in the North-Eastern Region could not be accommodated in the Plan proposals, it was decided to provide additional funds for the purpose through the mechanism o f a Central Pool created out o f the likely savings from the funds earmarked for the North-F:ast in the budgets o f the Central Ministries/ Departments. fhe administrative steps required to
990
operationalise the Central Pool are being finalised. Action is also in hand to include Sikkim in the North Eastern Council.
II. North Eastern Council (NEC):
H ighligh ts o f N inth P lan o f the NEC(i) D evelopm ent o f productive infrastructure;( i i ) Com pletion o f on-going projects on priority basis;(iii) D evelopm ent o f hydro electric and gas based power;(iv) D evelopm ent o f agriculture and allied sector;(v) Industrial development;(vi) Em phasis on survey and investigation;(vii) Tim ely com pletion o f projects covered under the PM ’s
New Initiatives announced for the NE Region.
9.54 The NEC was set up in August, 1972 under the NEC Act, 1971 (with its secretariat at Shillong) as an experiment of regional planning and development. As per provisions o f the statute under which it w as constituted, the Council is envisaged as an advisory body
empowered to discuss matters o f common interest to the Union and the NE States, and recommend to the Central/State Governments any matter o f common interest, inter-alia, in the fields o f economic and social planning, Inter-state transport and communications, power and flood control, etc. For securing balanced development, the NEC may formulate, for the Member States, a regional plan in regard to matters o f common importance to more than one State o f the Region, priorities o f the projects / schemes included in the plan and their location. However, over the years, the Council's role has been transformed largely into an organisation providing funds for financing important Inter- State development projects.
9.55 The projects financed by the NEC are implemented either by the State agencies or by the Central public sector undertakings / organisations. The NEC plan funds consist of Central assistance, loan from EIC and SLR borrowings.
9.56 The functions o f the NEC can be grouped into three categories:-
a) Regional Planning;
b) Zonal Council;
c) Reviewing the measures for maintenance o f security and law & order.
9.57 By the end o f the Seventh Five Year Plan, the NEC had incurred an expenditure o f Rs. 1284.68 crore since its inception. Another Rs. 411.45 crore were spent during1990-91 and 1991-92. The approved outlay for the Eighth Plan was Rs. 1160 crore at1991-92 prices. The total o f year-wise approved outlays worked out to Rs. 1648 crore. Against this, the NEC has incurred an expenditure o f Rs. 1581.28 crore.
9.58 The main emphasis o f the Council has been on the development ofinfrastructure in the NE Region, especially on projects with Inter-State ramifications. TheCouncil has been concentrating on enlarging transport and communications anddevelopment o f power and technical institutions. The year-wise position o f outlay andexpenditure under different sectors during the various years o f the Eighth Plan have been given in Table 9.3.
991

9.59 The NEC will continue its efforts for the development o f infrastructure during the Ninth Plan. Priority would be given to projects for the development o f transport and communication including roads and bridges, airports, waterways, etc. The effort o f the Council in the development of the transport and communications system would be so directed that all the States have at least two points o f access to the neighbouring States. The existing roads and other infrastructure would be improved in a cost effective manner. The spill-over works o f the earlier Plan periods would also be completed. The Council will take up improvement o f selected airports in the Region to facilitate air travel in financial collaboration with Airports Authority o f India.
9.60 Keeping in view the vast potential for the development o f hydro-electric power in the Region, the Council would make efforts to harness the same. Hydro-electric and gas- based pov/er projects would be taken up during the Ninth Plan to meet the power requirements o f the NH Region and, if feasible, to generate surplus for supply to other parts o f the country. The two hydro-electric projects, viz. Ranganadi and Doyang which are presently being implemented, would be completed and the Rokhia gas-based power project in Tripura would also be commissioned.
9.61 The Council would strengthen various technical and professional institutions to enhance the capacity and improve the quality of education and training imparted by them. Support to RIMS, Imphal, BB Cancer Institute, Guwahati, Forensic Science Laboratory, 4ssam , etc. would be provided to improve their facilities. The Council may also take up development o f new institutions for improved health care in this region.
9.62 With regard to agriculture and allied services, the Council would focus on introduction o f improved technology, empowerment o f farmers through training and demonstration and improving technical infrastructure for imparting technical advice and inputs; development o f market linkages and innovative projects in areas like horticulture, spices, aromatic and medicinal plants would be taken up. The possibility o f setting up joint ventures with private sector for processing o f various produce would be explored. The Council will also facilitate establishment o f infrastructure for production o f high quality seeds, in respect o f local crops, improved breeds o f poultry, piggery, other livestock and development o f fishery, etc.
9.63 In the area o f industrial development, the Council w'ould play a catalytic role by organising seminars/workshops, etc. in collaboration with various Chambers o f Trade and Industry to create awareness about the industrial potential o f the Region and to attract foreign and domestic investment in this area as also establishment o f institutes/facilities to provide raw materials o f desired specification, advice on technology input design, quality control, market information, etc. It would also strive to develop common approaches to expansion o f institutional credit and recovery mechanisms.
9.64 The Council will continue its efforts in sponsoring surveys and studies to explore the prospects in the North Eastern Region. It will take various steps to build up adequate data base to facilitate preparation o f suitable regional plans and projects. The Council would also develop suitable systems for the monitoring and evaluation o f various projects so that these projects are implemented in a timely and cost-effective manner.
Ninth Plan
992

9.65 The NEC is part-funding certain projects covered under the PM's New Initiatives announced for the NE: Region. Efforts will be made to complete these projects as early as possible.
9.66 In order to make the Council a more effective organ for the development o f the Region, the restructuring of the NEC has been receiving attention. Suitable legislative action to amend the NPiC Act is under consideration. The sectoral distribution o f NEC approved outlay for the Ninth Plan (1997-2002) is given in Table 9.4.
III. Border Area Development Programme (BAD?)
9.67 Border Area Development Programme was started during the Seventh Plan and w'as entirely funded by the Central Government. Its objective was balanced development o f the sensitive border areas in the Western Region through provision o f infrastructure facilities and promotion of a sense o f security among the local population. To start with the programme covered the States bordering Pakistan, i.e. Punjab, Rajasthan, Gujarat and Jammu & Kashmir (Details o f Allocations in Table 9,5). After a review in 1993-94, the programme was also extended to States which have international border with Bangladesh. During the Ninth Plan it is being extended to States which have a border with Myanmar. With this the programme would now cover twelve States, i.e. Jammu & Kashmir. Punjab, Gujarat. Rajasthan, West Bengal. Assam, Meghalaya, Mizoram, Tripura, Arunachal Pradesh, Nagaland, and Manipur.
Objectives
9.68 Initially, the main objective of the programme was development o f humanresources, particularly education - school, technical and vocational in the Community Development Blocks adjoining the border. After being revamped in 1993-94, while its objective continues to be balanced development in remote inaccessible areas situated near the border for ensuring effective administration, its scope has been reoriented to give a sharper focus for tackling special problems which arise in areas continguous to international border.
F u n d in g :
9.69 The Border Area Development Programme is a 100 % Centrally FundedProgramme. The outlay for the programme in the 8th Plan was Rs. 640 crore at 1991-92 prices (Details o f Allocation in Table 9.6). However, total releases from 1992- 93 to 1996-97 have been Rs. 736 crore. Funds are provided as Special Central Assistance on a 100%grant basis for execution of approved schemes. The block is the basic unit o f the programme. Funds are divided among the States by giving equal weightagethe following parameters:
B A D PC hanges in A pproach
• P rio r to 1993-94S ch em atic P ro g ram m e w ith em p h asis on ed u catio n
• A fte r 1993-94S ta te level p ro g ra m m e w ith em p h asis on balanced d e v e lo p m e n t o f b o rd e r b lo ck s
T erritoria l E xtension• P rio r to 7* P lan : B o rd er b lo ck s b o rd erin g P ak istan• E ig h th P lan : b o rd e r b lo ck s b o rd e rin g P ak istan &
B a n g la d esh• N in th P lan : b o rd e r b lo ck s b o rd erin g P ak istan .
B a n g la d esh and M y an m ar.
993

1. Population o f Border blocks (as per 1981 census)
2. Area o f [border blocks
3. Length o f the International border.
Eligible Schemes
9.70 Area specific schemes which address difficult problems o f the border areas only are eligible for implementation under the Programme. These are to be drawn up keeping in view factors such as remoteness, accessibility, perception o f threat from across the border, problems like smuggling, infiltration, subversion etc. and inadequacies relating to provision o f essential needs. Activities such as supply of drinking water, communication facilities, strengthening/creation of administrative machinery, improving Public Distribution System etc. can be taken up under the Programme. Since promotion o f sense o f security among the people in the Border Areas is an important aspect o f the Programme, schemes designed for public participation in crisis management, information and motivation o f the people including their involvement in prevention o f subversive activities, smuggling, infiltration etc. can be funded. Development o f community centres to cater to social and cultural needs o f the people o f these areas can also be taken up. Creation o f durable assets is to be preferred over revenue expenditure under the Programme.
9.71 As per the guidelines for the programmme, the funds under Ihe programme will not, be used to finance schemes, which arc to be accommodated in the State Plan. An exception can only be made when it is necessary to do so to augment facilities and services or to make up for deficiencies, consistent with the objectives of the Programme.
9.72 With the setting up o f two Committees, i.e. Empowered Committee at the Central level and Screening Committee at the State level, considerable flexibility has been given to States to formulate and implement schemes to meet the programme objectives. The Empowered Committee deals with the policy matters relating to the scope o f the programme, prescription o f the geographical limits of the area in the State and allocation of funds to the States. The Screening Committee at State level has to function Vv'ithin the directions o f the Empowered Committee. Individual schemes for each State are approved by the Screening Committee, chaired by the Chief Secretary o f the State. The Committee has complete freedom to execute the schemes through any o f the four agencies mentioned below ;
(a) State Governments; (b) Central Government; (c) Central Paramilitary Organisations located in the States, and (d) Non Government Organizations,
9.73 Although the voluntary organisations and agencies are to be selected with care, having regard to security o f sensitive areas due emphasis is also given to effective involvement o f local people / democratic institutions / voluntary agencies in order to inspire mutual trust and confidence between the Government and the people.
9.74 Indira Gandhi Nahar Project (IGNP) in Rajasthan has also been partially funded through BADP funds. The outlay in 8"’ Five Year Plan was Rs. 250 crore. However, total release o f Rs. 284 crore has been made during the 8‘'’ Five Year Plan. Mowever, from 1997- 98 the project is also being funded under another Centrally Sponsored Scheme viz,
994
Accelerated Irrigation Benefit Programme (AIBP). Hence, funding o f IGNP from BADP may he phased out as there have been pressing demands from various states to extend BADP to other international borders.
IV. Drought Prone Areas Programme (DPAP) / Desert Development Programme (DDP)
9.75 Depletion o f environment particularly in the tribal areas is largely attributable to the increasing biotic pressure on the fragile eco-systcm in the absence o f adequate investments and appropriate practices to augment and conserve the land and water resources. Over time tree coverage has been depleted, soil erosion has increased, water level has gone down and consequently the severity o f drought has increased leading to ecological degeneration. The DPAP and DDP programmes v/ere launched specifically to assess these problems with the objecli\e o f arresting the process of ecological degeneration and desertification. Since inception and upto 1994-95 Rs. 1742 crore have been spent under the DPAP programme and several thousand hectares o f land have been treated. However, in terms o f coverage. 10% of the total geographical area identified as drought prone has been treated, under the DDP only 1% of the total area has been covered.
9.76 In 1994-95. a High Level Committee was set up to review the DPAP and DDPprogrammes and ro suggest measures for improving the content and implementation of these programme. The Committee obser\ed that despile the fact that the programmes had been in operation tor almost two decades they had made very lillle impact on the ground. O f the factors responsible for this, it was identified, that a wide range o f activities were taken up despite the fact that they v '̂cre not related to the core objectives of land development and soil conservation, water conservation and afforestation and pasture development. Further. DPAP funds were not dovetailed v/ith those under other programmes related to land and w'ater conservation. Consequently, planning was continued on an ad-hoc basis along sectoral lines though planning along watershed lines had been recommended as a strategy. In most States very little effort had been made in this regard; though in some States the process of implementating the programmes on a watershed basis had been initiated. People's participation was conspicuous by its absence. In many cases the funds from these programmes did not constitute an additionality to the existing sectoral schemes but were used to substitute tor them. For instance, the PEO evaluation o f the DDP in 1994 found that in Gujarat and Rajasthan over 70% of the expenditure inanimal husbandry. 90% of the expenditure under soil and water conservation and96% o f the expenditure under forestry and pastures was from DDP. However, thesuccess o f experiments at Ralegaon Sidhi and Adgaon, in Maharashtra, Kabbalnala andMittemari in Karnataka and Jhabua in Madhya Pradesh, show that the adverse impact o f droughts can be contained, by concerted efforts based on the concept o f micro-watershed with a dedicated leadership whether from the government or an NGO and with people's participafion.
9.77 The High Level Committee evolved a new set o f criteria for identification o f drought prone and desert areas o f the country and recommended a strategy which involved a holistic approach to the development o f drought prone / desert blocks via the development of micro watersheds o f about 500 hectares as a unit. Watershed development plans were to be drawn up involving the people in the planning and prioritisation. Technical assistance was to be provided by a multi-disciplinary technical team comprising officers from various line departments associated with different activities related to watershed development.
995

W atershed D evelopm ent• New strategy with com prehensive common guideHnes For watershed development under Drought
Prone Areas Programm e (DPAP), Desert Development Programme (DDP), Integrated W asteland Developm ent Programm e (IW DP) and the Employm ent Assurance Scheme (EAS), introduced in 1995-96.
• The main features o f this strategy are:
@ A rea developm ent program m e to be iR:plemented exclusively on watershed basis.
@ Program m e activities to be confined to the identified watershed o f about 500 hectares and tobe executed on a project basis over a period o f four years
@ Com prehensive treatm ent plans to be prepared including soil and m oisture conservationm easures, w ater harvesting structures, afforestation, horticulture and pa.sture developm ent and upgradation o f existing common property resources.
@ G reater participation o f people ensured through a W atershed Association com prising all adult m em bers o f the Gram Panchayat.
9.78 As per the recommendations o f the High Level Committee, common guidelines have been issued for DPAP / DDP and watershed programmes o f the Integrated W atershed Development Programme. In addition upto 50% of the resources under the Employment Assurance Scheme have been earmarked for watershed related activities. Hence, the programmes do not suffer from lack o f financial resources. Yet, the progress has been slow and very uneven across States. During 1995-96 and 1996-97, the expenditure under DPAP and DDP w'as 42.5% and 56.8% respectively. Part o f the problem has been in operationalisation o f the new guidelines, particularly the creation o f the prescribed institutional arrangements from the village level to the State level. Also, as the DPAP is funded on an equal sharing basis between Centre and States, several States have used the EAS fimds for watershed projects as in this case the State governments are required to provide only 20%, with the Centre contributing 80%. Hence, the funding patterns would be rationalised in the Ninth Plan with all schemes o f poverty alleviation and area development being funded on a uniform pattern o f 75:25 sharing between the Centre and the States.
9.79 One o f the major constraints identified in the implementation o f the watershed programmes is the lack o f trained technical expertise for the preparation o f plans. Data on topography including soil and water endowments, location o f slopes for building o f water harvesting structures, details o f land use pattern etc. are required before a micro watershed plan can be prepared. Towards this end, training has to be given top priority, which has to include both panchayati raj functionaries as well as the administrative officers. To facilitate this process training o f trainers has to be taken up by various national and State level training institutes, agricultural universities and NGOs.
9.80 In the Ninth Plan this programme will be implemented through the PRIs. All aduh members residing in a watershed area will be members o f the Watershed Association and they will nominate 10 - 12 members on the Watershed Committee. The funds will be received by Zilla Parishads and the DPCs will appoint the project implementing agency. At the block level there will be a review Committee under the Block Pramukh and all village
996

pradhans will be members. However, at the village level the panchayats and the Watershed Association / Committee would have to evolve a system o f working in close cooperation with each other. The assets created would have to be maintained by the panchayats.
9.81 In the development o f rainfed agriculture, the issue o f research and adoption of appropriate technologies is crucial. These need to be location specific, low cost indigenous technologies, agricultural diversification, changes in cropping patterns and an effective extension system to reach the technologies / information to the people is critical in determining the effectiveness o f the programme. In addition, as these programmes o f area development are biased in favour o f those who own land, the question o f equity is a moot one. Land reforms with rights o f cultivation vested in tenants and share croppers, pattas to groups o f landless on common property resources and wastelands can go a long way in redressing the existing inequities in the system. Still the interests o f landless have to be protected.
9.82 In so far as the DDP is concerned, a somewhat different strategy would be required, with a concentration on livestock and fodder / pastures and other non-farm activities. Felling o f trees for fuelwood has to be restricted and non-conventional sources o f energy developed. Use o f scarce water has to be optimised, particularly when there is a failure o f even the minimal normal rains. In so far as the cold desert eco-system is concerned, it is limited to Ladakh and Kargil in J&K and Lahaul and Spiti and Kinnaur districts of Himachal Pradesh. W ith regard to these areas the research support is inadequate. But it is urgently required for development o f vegetables, horticultural plants and production o f vegetables seeds. Plants with medicinal value can be developed, mountain animals need to be given attention, and better ways o f water management developed.
9.83 It cannot be gainsaid that despite the limited success o f the DPAP / DDP programmes, development o f rainfed areas encompassing soil and water conservation along watershed lines has to be the strategy for sustainable development in the future. The problems o f low agricultural productivity, poverty and backwardness, in areas suffering from degradation o f natural resources, need to be addressed in a holistic manner. A number o f government departments both at the Centre and in the States as well as NGOs and external agencies are funding watershed development projects. But there is a great deal o f variation in the norms, procedures, and institutional arrangements as between the programmes. Hence, there is a need to evolve a common set o f guidelines, so that the implementation at the ground level is on a uniform pattern. A single coordinating agency at the district level under the supervision o f the Zilla Parishads should be identified and at the State level, the State Plarming Boards / Departments should be responsible for coordination. At the Central Level, a common set o f guidelines need to be evolved by the Planning Commission with concerned departm.ents o f the Central Governm.ent.
997

T able 9.1
H IL L AREAS
States Area(000) Sq.Kms.
Population(1981)Lakhs
I. Hill States:(Special Category States)®
1.Himachal Pradesh 55.672.Jammu & Kashmir 222.243.Manipur 22.364.Meghalaya 22.495.Nagaland 16.5 36.Tripura 10.487.Sikkim 7.3 0S.Arunachal Pradesh 8 3.589.Mizoram 21.09
42 . 81 59 . 87 14 .21 13 . 36 7 . 75 20.533 . 16 6 . 324 . 94
Sub-Total (I) 461.74 172.95
II.Designated Hill Areas (Covered under HADP)
a)i)
Hill Districts Uttar Pradesh
iii)
IV
Dehradun 3 . 09 7 . 62Pauri Garhwal 5.44 6 . 38Tehri Garhwal 4 .42 4 . 98Chamoli 9 . 12 3 . 64Uttar Kashi 8 . 02 1 . 91Nainital 6 . 79 11 .37Almora 7 . 02 7 . 57Pithorgarh 7 . 22 4.89AssamNorth Cachar 4.88! 6 .30Karbi Anglong 10.33!Tamil NaduNilgiris 2 . 54 6.29West BengalDarjeeling (Most part of the 2.4 7 5 . 59(district)
Sub-total (a) 71.34 66.54
998

Table 9.1 (Contd.)H IL L AREAS
States Area(000) PopulationSq.Kms. (1981)Lakhs
b) Designated Talukas ofWestern Ghats Areas #
i) MaharashtraDhule (2) 3 .32 4.30Nasik (8) 9 . 52 17.28Thane (5) 4.71 5 . 56Raigad(7) 4.30 7 .33Ratangiri (5) 5.43 8 .33Sindudurg (5) 3 . 66 5.29Kolhapur (10) ■7 . 09 18 .26Sangli (1) 0 , 64 1 . 11Satara (8) 6 . 75 12 . 87Pune (9) 9 . 81 16 . 09Ahmednagar (2) 3 . 17 4 . 56
.i) KarnatakaBelgaum (5) 6.45 14 . 88Chikmaglur (5) 4.41 4 . 08Kodagu {3) 4.08 4.60Dharwar (1) 1.08 1.60Hassan (4) 3 . 14 5 . 94Mysore (2) 2 . 79 3.40North Kanara (9) 8 . 64 8.81Shimoga (5) 6 . 59 8.32South Kanara (G) 7.07 15 . 03(Kanmeda)
I 1 KeralaCannanore (3) 3 . 53 17 . 56Wynad (3) 2 . 12 5 . 54Kozhikode {3) 2.33 22.45(Calicut)Malapuram (1) 2 .26 9 . 44Palaghat (3) 2 . 98 10 .68Trichur (1) 1.32 6 . 74Ernakulam (3) 1.68 7 . 91{Cochin)Idukki (4) 5 . 13 9 . 71Kottayam (2) 1.07 9.60Quillen (4) 4.15 16 . 24Trivandrum (2) 1 . 50 11.68
imil NaduNilgiris* (4) ★ ★Coimbatore (5) 5 . 92 24.65Periyar (1) 2.21 4 . 12Madurai (6) 8 . 22 22 . 27Triunavelli (6) 5.41 15.81Ramenathapuram (3) 2 . 05 8 . 01Kanya Kumari (4) 1 . 67 14 . 24
v) GoaGoa (3) 1 . 72 1.33Sub-total 1 (b) 160.49 388.38Total (HADP)II(a+b) 229.29 448 . 63Grand Total (I+II) 691.03 621.58
@ It excludes Assam, which is also a Special Category State.# In the case of Western Ghats Region Taluka is the unit of demarcation. The figure indicated in the brackets denote the number of Talukas in the District under the HADP in the Designated Talukas of Western Ghats Areas.* Also included in Designated Hill Districts.
999

Table 9.2ALLOCATION OF SPECIAL CENTRAL ASSISTANCE UNDER HILL AREAS
DEVELOPMENT PROGRAMME (HADP)
S t a t e / A r e a Five Y e a r P l a n s ( Ou t l a y ) A n n u a l P l an s ( Al loca t ion) (Rs. C r o r e )
1974-79 1980-85 1985-90 1992-97 1990-91 1991-92 1992-93 1993-94 1994-95 1995-96 1996-97
1) (2) (3) (4) (5) (6) (V (8) (9) (10) (I!) (12)
(A) Hill Areas in the State of Assam 24.00 71.58 118.20 194.34 38.87 38.87 38.87 42.05 42.05 46.32 46.32Tamil Nadu 7.00 21.81 33.75 55.49 11.09 11.09 11.09 17.81 17.81 19.62 19.62Uttar Pradesh 104.00 350.00 553.50 910.04 182.01 182.01 182.01 197.06 197.06 217.07 217.07West Bengal 15.00 29.85 44.55 96.60 16.32 19.32 19.32 20.61 20.61 22.23 22.23Survey & - 11.76 3.50 2.50 0.50 0.50 0.50 0.25 0.25 0.25 0.25Studies
Sub-Total (A) 150.00 485.00 753.50 1258.97 248.79 251.79 251.79 277.78 277.78 305.49 305.49
(B) Western Ghats Region:Kerala Maharashtra
Tamil Nadu Karnataka
4.886.453.55
4.04
17.8023,0813.02
14.25
23.8038.1019.90
28.20
39.0962.6932.72
46.35
6.0513.50
7.189.47
6.0513.507.18
9.47
6.1113.627.25
9.56
8.6313.847.22
10.24
8.6113.817.20
10.22
9.5215.287.97
11.30
9.4615.17
7.9111.22
GoaSurvey & Studies and Western Ghats Secretariat
1.000.08
3.653.00
6.000.50
9.550.63
1.610.40
1.610.40
1.620.06
2.120.17
2.120.26
2.340.10
2.320.43
Sub-Total (B) 20.00 75.00 116.50 191.03 38.21 38.21 38.22 42.22 42.22 46.51 46.51
Grand Total (A + B)
170.00 560.00 870.00 1450.00 287.00 290.00 :290.01 320.00 320.00 352.00 352.00
10 00
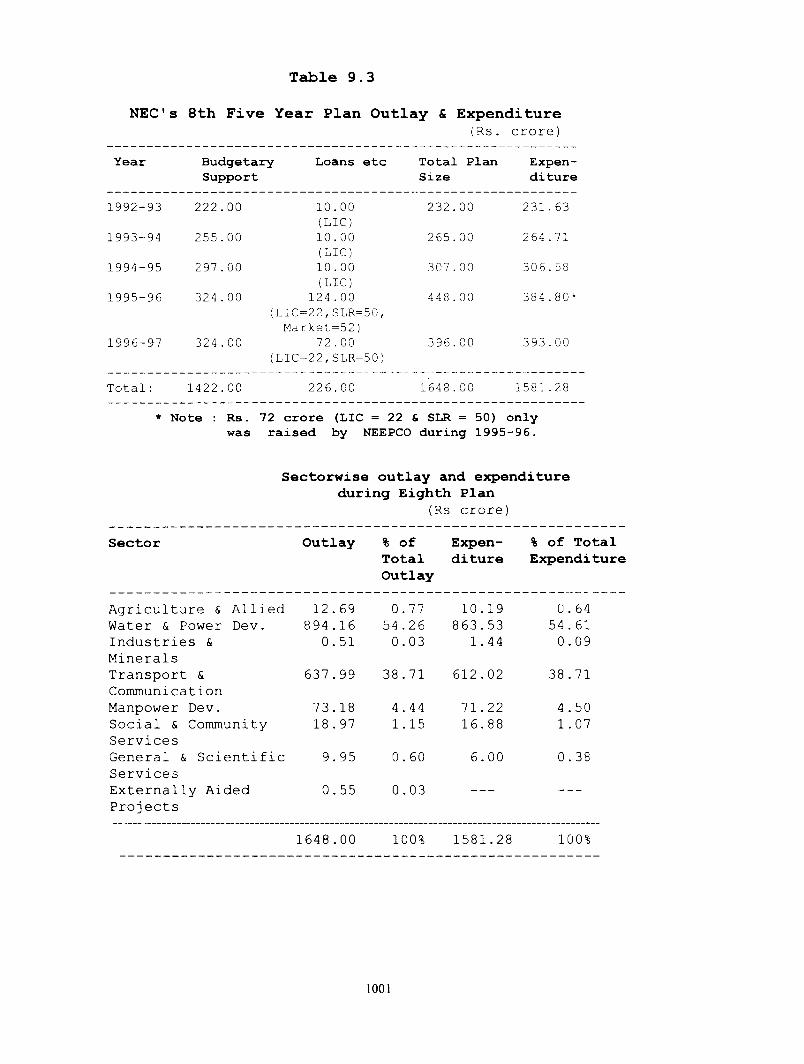
Table 9.3NEC's 8th Five Year Plan Outlay & Expenditure
(Rs. c r o r e )
Y e a r B u d g e t a r y L o a n s e t c T o t a l P l a n E x p e n S u p p o r t S i z e d i t u r e
1 9 9 2 - 9 3 2 2 2 . 0 0 1 0 . 0 0 2 3 2 . 0 0 2 3 1 . 6 3(LIC)
1 9 9 3 - 9 4 2 5 5 . 0 0 1 0 . 0 0 2 6 5 . 0 0 2 6 4 . 7 1(LIC)
1 9 9 4 - 9 5 2 9 7 . 0 0 10 . 00 3 0 7 . 0 0 3 0 6 . 5 8(LIC)
1 9 9 5 - 9 6 3 2 4 . 0 0 1 2 4 . 0 0 4 4 8 . 0 0 3 8 4 . 8 0 *(L I C =2 2 , S L R=5 0 ,
M a r k e t = 5 2 )1 9 9 6 - 9 7 3 2 4 . 0 0 1 2 . 00 3 9 6 . 0 0 3 9 3 . 0 0
{L1C=22 , SLR=50)
T o t a l : 1 4 2 2 . 0 0 2 2 6 . 0 0 1 6 4 8 . 0 0 1 5 8 1 . 2 8
* N o t e : R s . 72 c r o r e (LIC = 22 & SLR = 50) o n l ywa s r a i s e d b y NEEPCO d u r i n g 1 9 9 5 - 9 6 .
Sectorwise outlay and expenditure during Eighth Plan
(Rs crore)
Sector Outlay % of Expen- % of TotalTotalOutlay
diture Expendi ture
Agriculture & Allied 12 . 69 0.77 10.19 0. 64Water & Power Dev. 894.16 54 .26 863.53 54 . 61Industries & Minerals
0. 51 0.03 1.44 0.09
Transport & Communication
637.99 38.71 612.02 38.71
Manpower Dev. 73.18 4 .44 71.22 4.50Social & Community Services
18 . 97 1.15 16.88 1.07
General & Scientific Services
9. 95 0.60 6.00 0.38
Externally Aided Projects
0.55 0.03
1648.00 100% 1581.28 100%
1001

(Rs. Crore)
Tedale 9 . 4
Approved Outlay for the Ninth Plan of NEC
SectorsTotal
Schemes Total % of
OutlayOn-going New
Agriculture & Allied Services ✓ 22 .99 11.31 34 .30 1.40
Water, Power development and RRE 838.01 174.52 1012.53 41.30
Industries & Minerals 0 . 97 17 . 03 18 . 00 0 . 70
Transport & Communication 639.25 388.50 1027 .75 41 . 90
Manpower Development 152.06 19.22 171.28 7 . 00
Social & Community Services 40.89 49 . 95 90 . 84 3 . 70
General & Scientific Services 11.68 10 . 12 21.80 1 . 00
Externally aided projects 73 .50 - 73 . 50 3.00
Grand Total: 1779.35 670.65 2450.00 100
1002

E X P E N D IT U R E ON V A R IO U S SCHEMES UNDER BADP (BEFO R E REVAM PING)
Table 9.5
Rs . C r o r e
P r o g r a m me E x p e n d i t u r e
1 9 8 0 - b ' / 1 9 8 7 - 8 8 1 9 8 8 - 8 9 1 9 8 9 - 9 0 1 9 9 0 - 9 1 1 9 9 1 - 9 2 1 9 9 2 - 9 3
1 . D e p a r t m e n r o f E d u c a t i o n
C'. 0 0 2 5 . 0 0 4 5 . 0 0 50. 00 4 9 . 5 0 55 . 00 30 . 93
2 . I n d i r a G a n o n i N a h a i ' n' ̂ o j ^ 01
U . 'J 0 1 5 . 0 0 21.00 2 6 . 0 0 2 8 , 6 0 2 7 . 8 0 5 2 . 0 0
3 . M i n i s t r y o f Hor’ie A r r a i r s
4 0 . LI 0 1.10 0 . 0 0 0 . 1 7 1 . 1 9 0.88 1 . 9 9
4 . R e s e a r c h S t u d i e s ̂P ! a n n ' nq
Coiniii L s s_ L; j n;
u . (j 4 0 . 11 0.12 0 . 0 8 0 . u2 0.11 0.00
T o t a l 4 U . 0 4 4 1 . 2 1 66 . 62 7 6 . 2 5 80 . 0 8 8 3 . 7 9 84 . 92
1003

T a b l e 9 , 6
Releases made to States under BADP during Eighth Plan
( R s . l a k h )
States 1993-94
RELEASES
1994-95 1995-96 1996-97
A s s a m
G u j a r a t
J & K
M e g h a l a y a
M i z o r a m
P u n j a b
R a j a s t h a n
T r i p u r a
W e s t B e n g a l
3 9 1 . 5 7
6 9 8 . 1 4
1 4 0 0 . 0 0
3 8 9 . 2 8
2 8 3 . 5 7
6 4 4 . 6 2
1 9 0 5 . 7 4
8 0 3 . 8 6
2 1 8 3 . 2 2
4 3 7 . 3 3
7 9 3 . 3 3
1 7 5 0 . 0 0
4 2 3 . 3 4
3 2 5 . 3 4
7 8 8 . 3 3
2 0 4 4 . 0 0
9 8 1 . 3 3
2 4 5 7 . 0 0
4 1 2 . 0 0
8 5 8 . 0 0
2 0 6 8 . 0 0
3 9 5 . 0 0
2 7 3 . 0 0
8 5 4 . 0 0
2 5 6 3 . 0 0
1 0 9 6 . 0 0
3 0 8 1 . 0 0
4 1 2 . 0 0
8 5 8 . 0 0
2 0 6 8 . 0 0
3 9 5 . 0 0
2 7 3 . 0 0
8 5 4 . 0 0
2 5 6 3 . 0 0
1 0 9 6 . 0 0
3 0 8 1 . 0 0
T o t a l 5 7 0 0 . 0 0 1 0 0 0 0 . 0 0 1 1 6 0 0 . 0 0 1 1 6 0 0 . 0 0
Note :1993-94 In addition, Rs. 52.00 crore was released toRajasthan for Indira Gandhi Nahar Project & Rs. 1.00 crore toBihar for the Scheme for issue of photo identity cards in three districts. Thus the total amount re}.eased during 1993-94 is Rs.140.00 crore.
1994-95 In addition, Rs. 60.00 crore has been released to theIndira Gandhi Nahar Project in Rajasthan. Thus total amountreleased is Rs.160.00 crore.
1995-96 In addition, Rs. 60.00 crore has been released forIndira Gandhi Nahar Project. Thus total amount released is Rs.176.00 crore.
1996-97 In addition, Rs. 60.00 crore has been released forIndira Gandhi Nahar Project. Thus the total amount released is Rs.176.00 crore.
1004

C H A P T E R 10
S C I E N C E A N D T E C H N O L O G Y
10.1 The importance of developing S&T in a major way has been recognised since independence. The whole-hearted support provided to science and technology since then, has resulted in many accomplishments in a wide variety of disciplines* Moreover, these activities have played a dominant role in the socio-economic development o f the country. At the time of independence, the scientific and the technological base of the country was very small. But, today it consists of a wide spectrum of infrastructure in terms of laboratories, R&D institutions, in-house R&D establishments’ etc. covering several disciplines. There has been a significant growth in the capabilities and achievements in several high technology areas, namely nuclear and space sciences, electronics, defence etc. In addition to the growth in these and other strategic vital sectors, determined by sectoral needs, there have been spinoffs and technology transfers to other sectors, especially the broader production sectors, having large societal implications. Efforts have been mounted for developing the newly emerging areas viz. microelectronics; informatics/ telematics; biotechnology; new materials; renewable energy sources; ocean ' sciences; and several areas of basic research. Indian scientists and technologists have risen to the occasion to fulfil the national needs, whenever needed. Nevertheless, there is still much more to be done in the years ahead by evolving alternative strategies utilising the infrastructure and technical manpower created over the years to emerge as a global technical power. Science and technology efforts have to under-pin the growth of agriculture, industry, infrastructure and serv'ices so that the per capita incomes rise across the board and the economy becomes globally competitive.
10.2 India has been moving in a balanced manner leading to an economy which, while working towards fulfilling the expectations of its large population, is also globally relevant. The S&T policy and the approach that should be adopted for the Ninth Plan must, therefore, reflect the reality of the present day world in which nations progress along their own chosen paths but in a much more closely interconnected and interdependent manner.
10.3 In the context of exploring new horizons and new vistas of economic prosperity, S&T has to remain the main focal point and meet the economic, industrial, trade and societal challenges. The technology policy must go beyond technology import, absorption, adaptation and assimilation. More importantly, the benefits emerging from S&T must reach all sections of the community, including the weakest section of the society. While many of the earlier S&T inputs have been very useful for building up a viable S&T infrastructure, the new challenges require considerable modifications in the existing policies, especially with regard to the mechanisms of implementation.
10.4 It must be borne in mind that scientific explorations and widening the frontiers of knowledge are important activities of all civilised societies. India has had its ovra treasure house of traditional sciences. India has produced many giants in a variety of disciplines of science during the twentieth century. It must be ensured that creativity and excellence are nurtured amongst the younger generation and . India contributes to future discoveries and inventions on a scale that is appropriate for its size and history.
!005

10.5 India has made a substantial progress in a number of areas related to the economy viz. food security, average life expectancy, literacy and higher education. But, one cannot be complacent about these achievements, as growth towards excellence is a
continuous process and there is need to mountefforts to
control population and improve the levels offood security,
economic
S& T Policy and A pproach during the Ninth Plan
N eed for m ounting efforts to control population and improve the levels o f Food security, economic growth, literacy, health and so on, apart from realising the technological strengths in the emerging global industrial/economic environm ent by optim al utilisation o f the S&T Systems in India.Scientists with exceptional capabilities should be nurtured and supported fully by offering them, with in the country facilities comparable with international standards.To be in the forefront in some o f the chosen fields, the research programmes should be taken up on a mission mode through appropriate re-structuring and reorientation.
growth, literacy, health and so on, apart from realising the technological strengths in the emerging global industrial/ economic environment by optimal utilisation oi‘ the S& f system in the country, which provides immense opportunities and offers great challenges. There is need to sensitise the policy makers in the government about the significance o f Science and Technology especially in tackling these national priorities. Since a strong science base is a prerequisite for achieving technological competence, efforts will be continued to build and maintain the same. In this endeavour, scientists with exceptional capabilities should be nurtured and supported fully by offering them, within the country, facilities comparable with international standards; by creating more Centres o f Excellence in institutions of higher learning for supply o f future S&T manpower; and by utilising the existing infrastructure in terms o f facilities and manpower for planning and development o f S&T programmes.
10.6 To be in the forefront in some of the chosen fields o f agriculture, exports and industry, the research programmes should be taken up on a mission mode through appropriate restructuring and reorientation of many of the scientific institutions and laboratories.
10.7 In order to minimise the hierarchical bureaucracy in the R&D institutions, there is a need for radical change in the mindset of our science administrators. Efforts should be made to create a conducive environment through measures such as professionalisation of science auditing with the concepts of time accountability on decision makers and administrators as well as evaluation o f achievement of goals/targets; decentralisation of decision making powers and authority for implementation; introduction o f participative decision making processes in the S&T institution; etc. The Science and practitioners science need to be made central to all our planning and operations. The ultimate aim is to ensure that, by and large, the activities pertaining to scientific management, promotion and development are performed by scientists and technologists. For Indian Science to flourish, the administrators and government otTicials should act as facilitators o f science and not masters o f scientists. They should create conditions that encourage young scientists.
1006
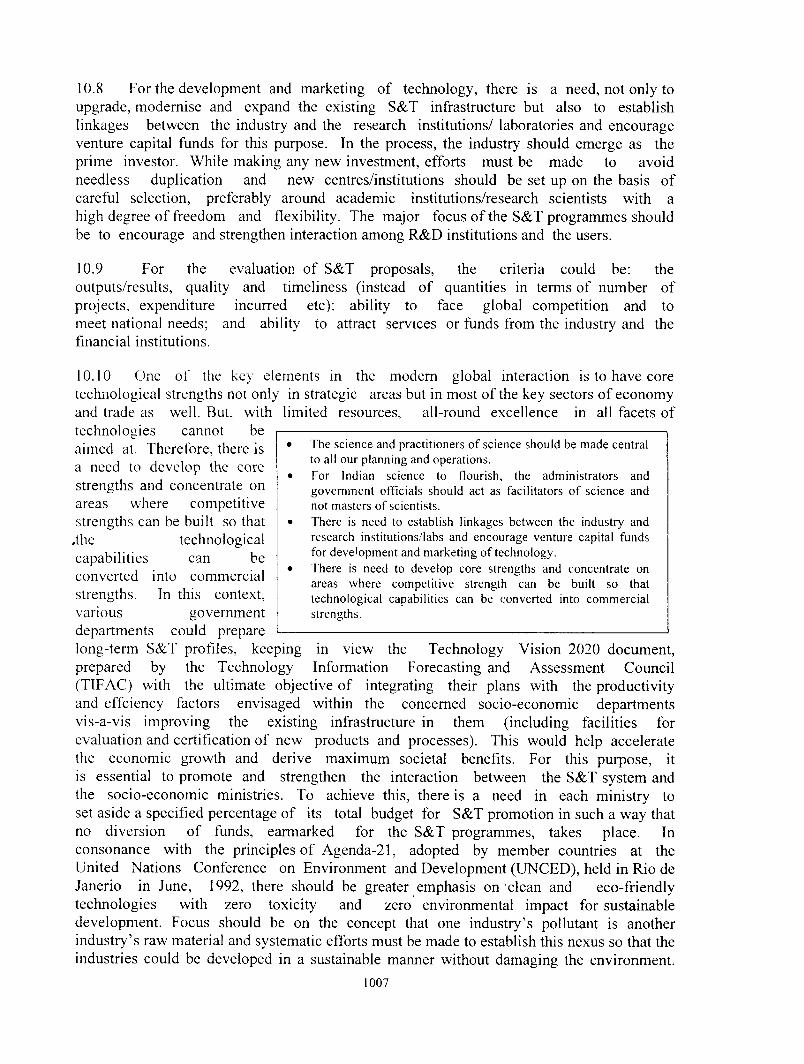
10.8 For the development and marketing o f technology, there is a need, not only to upgrade, modernise and expand the existing S&T infrastructure but also to establish linkages between the industry and the research institutions/ laboratories and encourage venture capital funds for this purpose. In the process, the industry should emerge as the prime investor. While making any new investment, efforts must be made to avoid needless duplication and new centres/institutions should be set up on the basis o f careful selection, preferably around academic institutions/research scientists with a high degree o f freedom and flexibility. The major focus o f the S&T programmes should be to encourage and strengthen interaction among R&D institutions and the users.
10.9 For the evaluation o f S&T proposals, the criteria could be: theoutputs/results, quality and timeliness (instead o f quantities in terms o f number of projects, expenditure incurred etc); ability to face global competition and to meet national needs; and ability to attract services or funds from the industry and the financial institutions.
10.10 One o f the key elements in the modern global interaction is to have core technological strengths not only in strategic areas but in most o f the key sectors o f economy and trade as well. But, with limited resources, all-round excellence in all facets of technologies cannot be
The science and practitioners o f science should be made central to all our planning and operations.For Indian science to flourish, the administrators and governm ent officials should act as facilitators o f science and not masters o f scientists.There is need to establish linkages between the industry and research institutions/labs and encourage venture capital funds for development and m arketing o f technology.There is need to develop core strengths and concentrate on areas where com petitive strength can be built so that technological capabilities can be converted into com mercial strengths.
aimed at. Therefore, there is a need to develop the core strengths and concentrate on areas where competitive strengths can be built so that
,the technologicalcapabilities can be converted into commercial strengths. In this context, various governmentdepartments could prepare long-term S&T profiles, keeping in view the Technology Vision 2020 document, prepared by the Technology Information Forecasting and Assessment Council (TIFAC) with the ultimate objective o f integrating their plans with the productivity and effciency factors envisaged within the concerned socio-economic departments vis-a-vis improving the existing infrastructure in them (including facilities for evaluation and certification o f new products and processes). This would help accelerate the economic growth and derive maximum societal benefits. For this purpose, it is essential to promote and strengthen the interaction between the S&T system and the socio-economic ministries. To achieve this, there is a need in each ministry to set aside a specified percentage o f its total budget for S&T promotion in such a w'ay that no diversion o f funds, earmarked for the S&T programmes, takes place. In consonance with the principles o f Agenda-21, adopted by member countries at the United Nations Conference on Environment and Development (UNCED), held in Rio de Janerio in June, 1992, there should be greater emphasis on clean and eco-friendly technologies with zero toxicity and zero environmental impact for sustainable development. Focus should be on the concept that one industry’s pollutant is another industry’s raw material and systematic efforts must be made to establish this nexus so that the industries could be developed in a sustainable manner without damaging the environment.
1007

For such a technology development process to take place, various organisations must set their machinery and management techniques appropriately.
10.11 For a qualitative growth, as distinct from the quantitative, human resource development and motivation must be regarded as key issues. This calls for several measures. The scientific and technical education needs to be oriented towards developing creative skills and innovative capabilities by creating conducive envirormient in our educational institutions, with greater emphasis on training o f scientists in
modem managementThere should be greater emphasis on clean and eco-friendly technologies and focus should be on the concept that one industry’s pollutant is another industry’s raw material.There is need to create conducive environm ent in our educational institutions for developing creative skills and innovative capabilities with greater emphasis on m odem m anagem ent techniques, technology m arketing and IPR related issues.
• Intensive efforts should be made to generate maximum resources for R&D from .the production and service sectors.
techniques, includingtechnology marketing and Intellectual Property Rights (IPR) related issues. In addition, creativity should also be encouraged in industry by a constant quest for productivity and quality so that the human resource could be tapped
effectively, irrespective o f their level. The S&T manpower must be given greater responsibilities to develop new energy efficient and environment-friendly processes based on automation and artificial intelligence, in addition to those concerning fiscal and material resources. Mobility of the S&T personnel among various R&D organisations, academic institutions and industries needs to be encouraged. Young scientists should be attracted through appropriate incentives to the scientific and technological research careers.
10.12 Science and technology activities in the States and Union Territories should be geared up to take up location- specific R&D programmes for providing S&T inputs in the key sectors o f socio-economic development by increasing the demands from State Governments for the S&T inputs, through promotion o f joint innovative programmes with industry, NGOs etc.
10.13 The process o f planning the programmes/projects in various S&T sectors involves giving policy directions from time to time, setting priorities among the various S&T sectors and restructuring the S&T system to suit the changing needs. In all these aspects, efforts should be made to utilise the 3-tier national apex level S&T mechanism comprising o f Cabinet Committee on S&T (CCST), Science Advisory Committee to the Cabinet (SACC) and the Committee o f Secretaries for S&T (COS S&T).
10.14 While the role o f the Government in supporting basic research, technology development and its application as well as the promotion o f S&T infrastructure would continue at an accelerated scale, intensive efforts should be made to generate maximum resources for R&D from the production and service sectors.
PRIORITISATION IN S&T AND THRUST AREAS
(A) Prioritisation
10.15 India is one o f the top ranking countries m the field o f basic research and her success in technology development has been very significant. India's capability in building nuclear reactors, communication and remote sensing satellites and guided
1008

missiles, just to mention a few, has been clearly demonstrated. The industries also handle a wide range o f technologies. With these capabilities, Indian S&T has come to be
regarded as one o f the powerful instruments o f growth and development, specially in the emerging scenario o f globalisation and competitive economy. In the wake o f recent developments and the new demands that are being placed
• Strategic sectors such as Atomic Energy and Space should continue to receive increasing investments.
• Injection o f technology in the fields o f agriculture and related products can make a significant impact on production.
• The Departm ent o f Biotechnology and other Scientific Departm ents should make a mark in the light o f the international control regimes pertaining to IPR and TRIPS for protecting the interest o f the country.
on the S&T system, it is charged with significantly new responsibilites and has a major role to play in the country's development. The IPR system has to be in tune with the rest o f the world for providing the requisite framework for India to emerge as global R&D platform.
10.16 During the earlier Plan periods, support to basic research has been receivinga rather high priority. Though this may continue to a considerable extent, a proper balance should be maintained between fundamental research and applied research in scientific fields. Recent developments have brought home the need to accord high priority to technology related areas, particularly the process technologies, which may be characterised as core technologies, which need to be strengthened with particular emphasis on ensuring partnership with the concerned socio-economic activities and industry wherever possible. In this process, the Indian industry and the users o f technology have a crucial role to play. They should be made aware that industrial R&D requires not merely continuous upgradation but generation o f technology as well, which would be able to sustain a competitive technological edge. Funding of R&D by industry and formation o f consortia for technology development will be essential in the new scenario. The industry initiatives ought to constitute the driving force not only for generating innovative industrial technologies which should be built on a wide and strong S&T base created so far, but also for bringing the same into rapid and widespread use through up-scaling at pilot level, market surveys and bench marking. In this context, it is necessary that, during the 9th Plan, emphasis is placed on clearlydefined criteria for prioritisation and identification o f thrust areas.
10.17 To determine science and technology priorities at any point o f time for acountry's development is a daunting task. Several demands compete with each other and the resources invariably limited. Evolving an optimal programme o f action calls for adetailed analysis o f the past developments, available strengths and visions o f the future.The criteria for prioritisation in the S& T sector can be based on several aspects such as academic excellence, strength in a particular activity, strong domestic market base, trends in world trade and world production, industry orientation, economic benefits, employment opportunities, commercially relevant technologies, strategically (security- related as well as industry-related) significant technologies, capability to addressnational needs and national competence vis-a-vis global status. In addition, the following considerations have to be kept in mind;
(i) Strategic sectors such as Atomic Energy and Space should continue to receive increasing investments. This is inevitable in the context of several export control regimes which appear to target particularly India.
1009
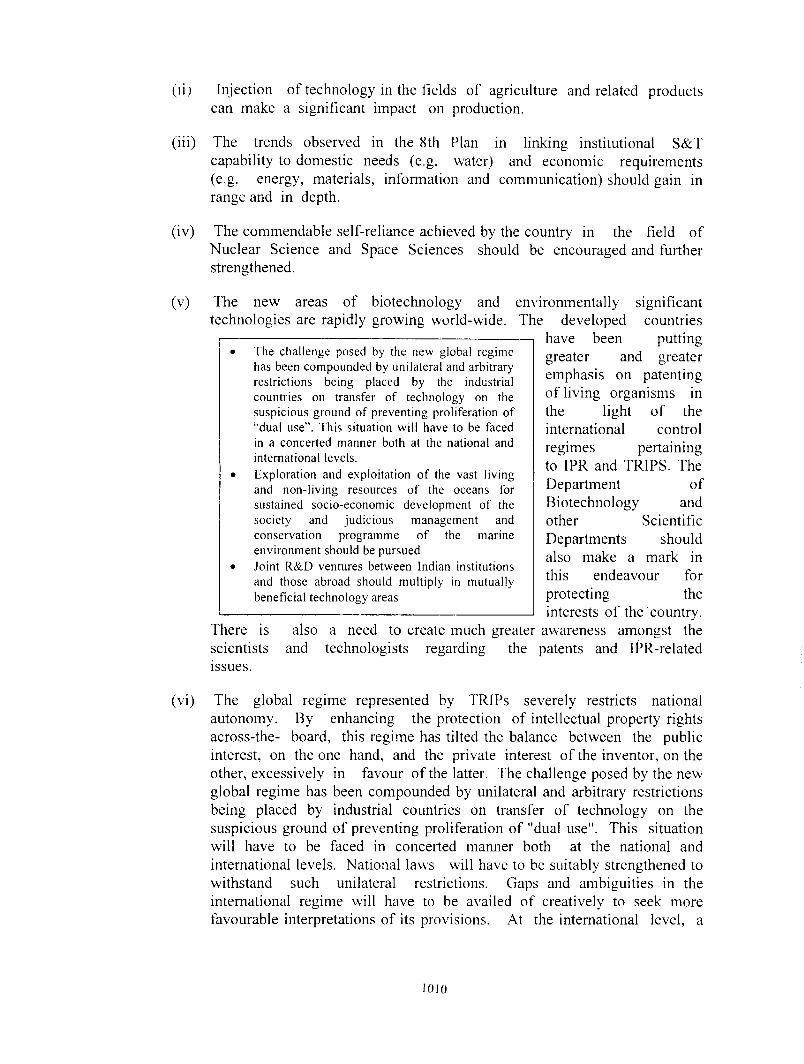
(li) Injection o f technology in the fields of agriculture and related productscan make a significant impact on production.
(iii) The trends observed in the 8th Plan in linking institutional S&Tcapability to domestic needs (e.g. water) and economic requirements (e.g. energy, materials, information and communication) should gain in range and in depth.
(iv) The commendable self-reliance achieved by the country in the field o fNuclear Science and Space Sciences should be encouraged and further strengthened.
(v) The new areas o f biotechnology and environmentally significanttechnologies are rapidly growing world-wide. The developed countries
have been puttinggreater and greater emphasis on patenting o f living organisms in the light o f theinternational control regimes pertainingto IPR and TRIPS. The Department ofBiotechnology andother ScientificDepartments shouldalso make a mark in this endeavour for protecting theinterests o f the country.
There is also a need to create much greater awareness amongst thescientists and technologists regarding the patents and iPR-related issues.
(vi) The global regime represented by TRIPs severely restricts nationalautonomy. By enhancing the protection o f intellectual property rightsacross-the- board, this regime has tilted the balance between the public interest, on the one hand, and the private interest o f the inventor, on the other, excessively in favour o f the latter. The challenge posed by the new global regime has been compounded by unilateral and arbitrary restrictions being placed by industrial countries on transfer o f technology on the suspicious ground o f preventing proliferation o f "dual use". This situationwill have to be faced in concerted manner both at the national and international levels. National laws will have to be suitably strengthened to withstand such unilateral restrictions. Gaps and ambiguities in theinternational regime will have to be availed o f creatively to seek more favourable interpretations o f its provisions. At the international level, a
The challenge posed by the new global regime has been compounded by unilateral and arbitrary restrictions being placed by the industrial countries on transfer o f technology on the suspicious ground o f preventing proliferation of “dual use” . This situation will have to be faced in a concerted manner both at the national and international levels.Exploration and exploitation o f the vast living and non-living resources o f the oceans for sustained socio-econom ic development o f the society and judicious management and conservation programme o f the marine environm ent should be pursued Joint R&D ventures between Indian institutions and those abroad should multiply in mutually beneficial technology areas
lOlO

new initiative will have to be launched in consultation with developing countries to mitigate the rigour o f the international regime and to secure a more favourable deal at the impending reviev.' o f the I'RlPs Agreement in the WTO.
(vii) The oceans are known to be the last frontier o f natural resources.Exploration and exploitation o f the vast living and non-living resourceso f the oceans for sustained socio-economic development o f the society and judicious management and conservation programme o f the marine environment should be pursued.
(viii) The investment in R&D from private industry should be stimulated to grow.
(ix) Joint R&D ventures between Indian institutions and those abroadshould multiply in mutually beneficial technology areas.
(x) Attracting creative scientific talent to the frontier areas o f research andbasic sciences should continue.
(B) Thrust Areas for Technology Promotion
10.18 Determination o f the thrust areas for technology promotion requires far wider consultation. The TIFAC has recently gone through an innovative exercise with the help o f several task forces to identify the thrust areas in various sectors o f economy, as part o f Vision 2020 programme. This should guide the efforts in selecting the areas o f thrust. For effective identification o f the priorities and the thrust areas, it is also essential to restructure the present S&T systems with a focus on greater autonomy in S&T with flexibility and accountability; strong monitoring and peer review' system; support to basic research on a long-term basis; human resource development in specialised areas; spin-offs from high-tech/strategic S&T fields (Atomic Energy, Space, Defence) for use in civilian sectors and bringing in professionals to the S&T system/services through the creation o f a pool o f science and technology managers for efficient management and administration o f scientific activities.
SCIENCE, TECHNOLOGY AND EDUCATION INCLUDING PROMOTION OF BASIC RESEARCH AND EXCELLENCE
10.19 Starting from the early 1970's, there has been a significant increase in the Government support for science and technology. India today has a wide base o f infrastructure for R&D. There are 200 universities, about 400 national laboratories and 1300 in-house R&D units o f industries. As a result o f this and other endowments, India has become internationally competitive in a number o f areas. This progress must be maintained and improved upon through appropriate training o f manpower in the emerging technologies with infrastructural development as the basic input and earmarking o f funds for higher education by the scientific departments in the form o f direct support to identified Centres in the universities.
10.20 The problems in bringing about improvements in S&T education pertain to the unavoidable socio-political influences on education, besides inadequacy o f laboratory
10! I

facilities in universities for research and teaching work at the M.Sc. and Ph.D levels. The academic community should try and isolate higher education from the negative external influences and build up the infrastructure and, where necessary, gradually motivate the faculty to do research by giving them a sense o f empowerment and autonomy o f fianctioning within the university system and through the revival o f the teacher training programmes o f the 1960's.
10.21 The Inter-University Centres, which are providing very valuable services to the university research community, should be encouraged by earmarked support through the UGC for running the existing Centres and for establishing new ones in other areas after appropriate assessment by a national body. The possibility o f supporting these Centres from scientific departments and socio-economic ministries should also beexplored. With a view to promoting a coordinated approach in the utilisation o f
instruments and equipment facilities, the possibility o f• I'he academic com munity should gradually motivate the
faculty to do research by giving them a sense of em powerm ent and autonomy o f functioning with in the university system.
• The inter-university centres, which are providing very valuable services to the university research community should be encouraged by earmarked support through the UGC.
• The operation o f research funds both at the level o f the indivvdual research w orker and at the institutional level, needs to be reviewed so that sub-critical support is avoided.
Regional Instrumentation
the
establishing Sophisticated Centres (RSIC) in universities and setting up advanced research Centres/ Groups in certain specialised fields such as optical materials, condensed matter physics, low energy accelerator research,
molecular electronics, laser instrumentation, colloides & surfactants, astronomy, astrophysics, plasma physics etc. may be explored.
10.22 The operation o f research funds both at the level o f the individual research worker and the institutional level needs to be reviewed so that subcritical support is avoided. At the level o f individual scientific worker, the research support should be based on the proven track record with maximum flexibility and autonomy in controlling the research fiinds. In this regard, the funding agencies may evolve common guidelines. At the institutional level, there should be greater provision for long-range programmes and infrastructural support, involving, wherever necessary, several related departments. Efforts should also be made to set up Centres o f Excellence around outstanding scientists or group o f scientists following a peer review system.
10.23 One o f the mechanisms for funding basic research is through the Extra Mural Research (EMR) budgets of several scientific agencies like DAE, DOS, DST, CSIR, DBT etc. and o f the socio-economic departments such as DOE, ONES,DARE etc. The EMR funding should be enhanced by carefully building up rigorous, objective, constructive and credible peer review systems. There also a need to provide autonomy in the use o f such funds. In building up such
The extra-m ural research funding should be enhanced by carefully building up rigorous, objective, constructive and credible peer review system.Efforts would also be made to provide financial support to the universities and related institutions for improving S&T infrastructure.Establishm ent o f some regional science and engineering research libraries in chosen institutions with net-working facilities
IS
a
1012

system o f scrutiny, guidance can be taken from the All India Council for Technical Education (AICTE), which has taken steps to strengthen technical education and support the R&D in engineering and technical institutions in the country.
10.24 Another source o f guidance is the Science and Engineering Research Council (SERC) which is the major EMR funding source for basic research in all areas of science and engineering and across all institutions. During the 9th Plan, the possibility o f upgrading the SERC mechanism to a significantly higher level with greater autonomy can be explored for the formulation o f broad R&D policies and providing direction regarding the setting up o f national facilities, coordinated R&D programmes etc.
10.25 In order to improve the facilities for basic research in the universities and research institutions, comparable to those in the developed countries, several measures are called for. These, inter-alia, include revival o f the UGC programme o f the Committee for Strengthening Infrastructure in S&T (COSIST) as an independent programme. In addition, strengthening o f programmes relating to Centres for Advanced Studies (CAS) and Special Assistance Programmes (SAP)/Department Special Assistance (DSA) programme should be taken up to make them much more responsive and stricter in their assessment and evaluation aspects. Efforts would also be made to provide financial support to universities and related institutions for improving S&T infrastructure. The efforts o f the National Board for Higher Mathematics (NBHM) o f the DAE, in supporting selected libraries to serve as regional resource centres in mathematics, may be expanded by establishing some regional science and engineering research libraries in chosen institutions with networking facilities.
10.26 Communication facilities are needed for the vast majority o f our research and teaching community to escape from intellectual isolation. Information technology needs to be deployed appropriately to ensure greater dissemination o f knowledge in various fields o f industrial and agricultural development. This can be achieved through full Internet connectivity with broad-band channels for multi media facility, networking o f libraries, computers etc. This will be a major information resource not only for basic research in science and engineering, but in all academic fields including health, medicine and humanities. It must be done in a well coordinated manner.
10.27 Another important area where the creation o f infrastructure is called for, relates to the accelerator based research facilities in the academic institutions/ universities in collaboration with UGC/Department o f Education. It will play a major role in keeping the country in the forefront o f modern technology. Various institutions are having plans to have different types o f accelerators and to develop experimental facilities such as detector arrays. There is a need to pool the technical and financial resources and build national facilities in this area. A national com.mittee needs to be set up for defining the priorities and drawing up national plans so that the available funds are most optimally deployed and duplication is avoided.
10.28 A major problem today is to find ways and means to attract the most talented youngsters to basic science at a young age. For this obviously, both the image o f a career in science and the available educational opportunities must be attractive enough as compared to other more lucrative options. This calls for a multi-pronged approach
1013
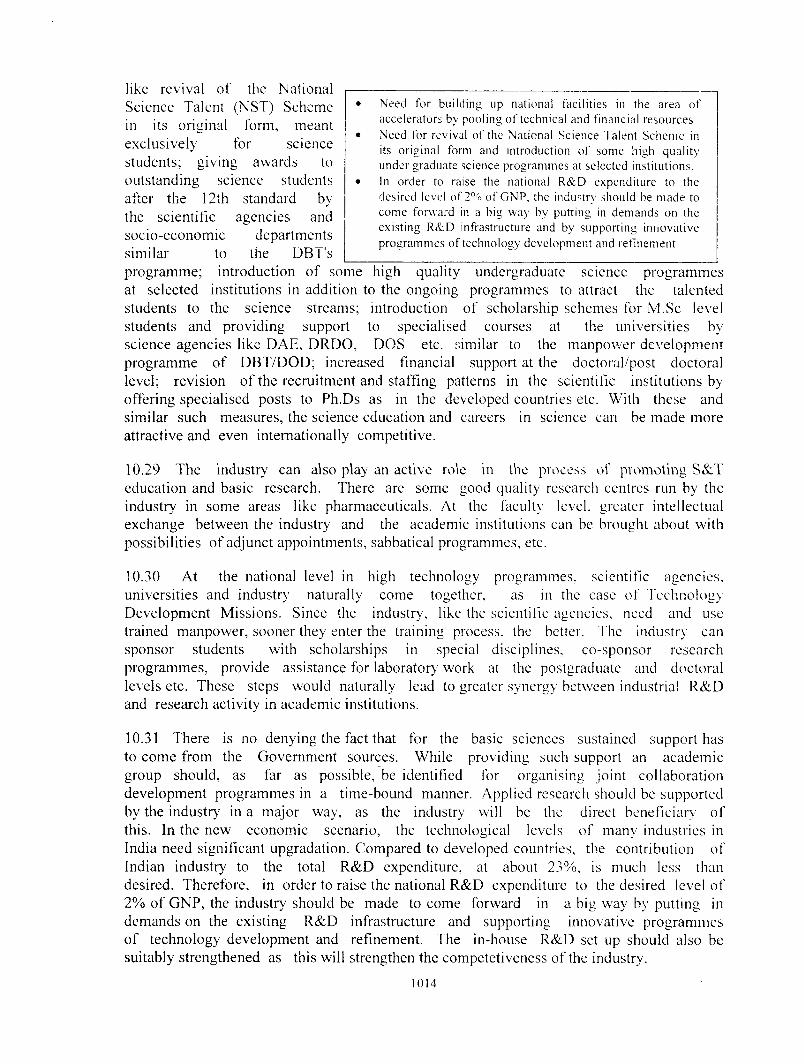
Need for building up national facilities in the area of accelerators by pooling o f technical and financial resources. Need for revival o f the National Science I'alent Scheme in its original form and introduction o f some high quality under graduate science programmes at selected institutions. In order to raise the national R&D e.xpenditure to the desired level of 2% o f GNP, the industry should be made to come forward in a big way by putting in demands on the existing R&D infrastructure and b>' supporting innovative programmes o f technology development and refinem ent
like revival of the National Science Talent (NST) Scheme in its original form, meant exclusively for science students; giving awards to outstanding science students after the 12th standard by the scientific agencies and socio-economic departments similar to the DBT's programme; introduction o f some high quality undergraduate science programmes at selected institutions in addition to the ongoing programmes to attract the talented students to the science streams; mtroduction o f scholarship schemes for M.Sc level students and providing support to specialised courses at the universities by science agencies like DAE, DRDO, DOS etc. similar to the manpower development programme o f DBT/DOD; increased financial support at the doctoral/post doctoral level; revision o f the recruitment and staffing patterns in the scientific institutions by offering specialised posts to Ph.Ds as in the developed countries etc. With these and similar such measures, the science education and careers in science can be made more attractive and even internationally competitive.
10.29 The industry can also play an active role in the process of promoting S&'l'education and basic research. There are some good quality research centres run by the industry in some areas like pharmaceuticals. At the faculty level, greater intellectual exchange between the industry and the academic institutions can be brought about with possibilities o f adjunct appointments, sabbatical programmes, etc.
10.30 At the national level in high technology programtnes, scientific agencies, universifies and industry naturally come together, as in the case o f Technology Development Missions. Since the industry, like the scientific agencics. need and use trained manpower, sooner they enter the training process, the better. The industry can sponsor students with scholarships in special disciplines, co-sponsor research programmes, provide assistance for laboratory work at the postgraduate and doctoral levels etc. These steps would naturally lead to greater synergy betw'cen industrial R&D and research activity in academic institutions.
10.31 There is no denying the fact that for the basic sciences sustained support hasto come from the Government sources. While providing such support an academic group should, as far as possible, be identified for organising joint collaborationdevelopment programmes in a time-bound manner. Applied research should be supported by the industry in a major way, as the industry will be the direct beneficiary o f this. In the new economic scenario, the technological levels o f many industries in India need significant upgradation. Compared to developed countries, the contribution o f Indian industry to the total R&D expenditure, at about 23%, is much less thandesired. Therefore, in order to raise the national R&D expenditure to the desired level o f 2% of GNP, the industry should be made to come forward in a big way by putting in demands on the existing R&D infrastructure and supporting innovative programmes o f technology development and refinement. The in-house R&D set up should also be suitably strengthened as this will strengthen the competetiveness of the industry.
1014

10.32 Thus, while formulating the 9th Five Year Plan, the goals in the sphere o f basicresearch and associated higher education have to be determined not only by the infrastructure available for R&D, but also by several other major considerations. These include: fierce technological competition during the transition to a liberalisedeconomic environment; strengthening o f the range and depth o f scientific and technological capabilities which can be achieved through high quality basic research and responsive education system; sound scientific and technological base to fulfill societal needs and the need for recognition o f the interconnection o f research in basic sciences with applied w'ork, technology, engineering and production vis-a-vis national development.
MECHANISMS FOR HARNESSING S&T FOR NATIONAL DEVELOPMENT
10.33 For harnessing S&T for national development, the Government has been adopting several methods. Technology transfer to industry is one o f them. Under this, the S&T capability is being transferred to the open market in the form o f products of
acceptable quality in a cost-There is need to strengthen further the mechanism of transfer o f teciinoiogy to industry during the Ninth Plan. Technology export is an important channel for enhancing the exportsIn order to improve the technological com petitiveness in the global market and enhance the technology export potential, attention has to be focussed on areas such as university-corporate R&D spending, lab to industry conversion, indigenous innovation. iPR protection etc.A novel experim ent for harnessing S&T has been the consortia approach' in which one of the laboratories acting as a nodal institution, forms a consortium with the industry or other departments.
effective manner. Severalnational laboratories have been doing this, either directly or through the National Research & Development Corporation (NRDC), which is a government agency for 'transfer and commercialisation o ftechnology'. The Department o f Space (DOS) has been doing so directly until the "AntrixCorporation", was set up for this
purpose. The Department o f Atomic Energy (DAE) has also been doing so for quite some time. There is a need to strengthen further this mechanism o f transfer of technology to industry during the Ninth Plan.
10,34 Technology export is an important channel for enhancing the exports. The industrial experience gained in the process o f technology acquisition, absorption and adaptation and the strong capabilities built in R&D and academic institutions can be shared with other countries for mutual benefits. In order to improve the technological competitiveness in the global market and enhance the technology export potential, attention has to be focussed on areas such as university-corporate R&D spending, lab to industry conversion, indigenous innovation, IPR protection etc. There is also a need to create institutional mechanism to promote technology exports and sensitise the export promotion agencies like the Export Promotion Councils (EPCs) about the role o f technology exports in catalysing overall exports. The Transfer and Trading in Technology (TATT) scheme o f DSIR could be further strengthened to promote export o f technologies, projects and services. NRDC can also play an important role by undertaking activities like pre-feasibility studies, market potential studies, awareness building among the Indian companies about technology transfer negotiations, organising seminars on matters such as those relating to WTO, providing assistance in filing foreign patents etc.
1015

10.35 A novel experiment for harnessing S&T has been the 'consortia approach 'in which one o f the laboratories acting as a nodal institution, forms a consortium with the industry or other departments. The Non-ferrous Materials Technology Development Centre (NFTDC) is an example o f this consortium approach with the Defence Metallurgical Research Laboratory (DMRL) acting as a nodal laboratory and four leading public sector enterprises, namely, National Aluminium Co. (NALCO), Bharat Aluminium Co. (BALCO), Hindustan Zinc Ltd. (HZL) and Hindustan Copper Ltd. (HCL), functioning as industry members o f the consortium. While the nodal laboratory, DMRL, provides extensive facilities and R&D support, the industry members contribute by way of corpus fund, deputation o f industry personnel and, most importantly, defining the market-oriented product development. Other examples o f such a consortium approach are: the Composite Product Development Centre, (COMPROC) o f the Defence Research & Development Laboratory; the Society for Biomedical Technology (SBMT) for the promotion o f bio-medical devices, a joint effort o f DRDO and DST and supported by the Ministry o f Welfare as well as the Ministry o f Rural Areas and Employment; the Centre for Laser Processing o f Materials (CLPM), recently set up jointly by DRDO, the Department o f Mines and the DST in Hyderabad, in association with the industry, for the purpose o f developing and demonstrating the capability in a new technology area.
10.36 Another mechanism, being adopted, has been through a kind o f Government- Industrv Interface' under the
A network o f testing and evaluation facilities. The National Accreditation Board for Laboratories (NABL), set up in tills direction, needs to be nurtured.W hile creating the mechanisms for harnessing S&T, it is necessary to ensure that the investment in technology developm entprogram m es is governed by national needs.
Programme Aimed At Technological Self Reliance (PATSER), in which assistance is provided to the industry, in the public as well as the private sectors in the area o f technology development and its transfer. A number o f multi- institutional projects have been recently developed, involving several departments and socio-economic ministries in the fields o f building materials, wood substitutes; mini-micro hydel power; CFC substitutes; high energy magnets; and laser processing o f materials. More such projects need to be taken up and a method may be evolved to ensure that the industrial links already established are further strengthened.
10.37 Still another mechanism to harness S&T, which has proved to be successful, is the "Technology " or the "Mission Mode Projects". This approach envisages new management structures with much closer linkages and better interaction and coordination among many departments/agencies for deriving large-scale, time-bound tangible applications o f S&T. A number o f mission mode programmes can be formulated, based on Technology Vision 2020 programme, with inputs from a wide cross-section of economic ministries and in line with the criteria laid down for prioritisation. In this context, the special requirements in the emerging global scenario have to be kept in mind. Such programmes can be o f two types. The first is the Missions o f Technological Significance in the areas such as energy, lasers, optics, drugs etc. The second is the Missions o f Societal Significance. These can be in the areas o f female health care, medical systems, AIDS education, transport systems etc.
1016
10.38 The success o f these mechanisms for harnessing S&T depends to a large extent on the allied infrastructure support. For example, in the light o f the experience with the implementation o f certain technology programmes, it was felt desirable to set up an Engineering Research Centre (ERC) in an educational institution or a forward looking research laboratory with respect to each o f the technology areas, selected to be built up. Such a Centre can function on a three-way partnership basis involving the academia, the industry and the Government Laboratory and/or agency. The fundamental aim o f such centre will be to bring together engineering and scientific disciplines to address R&D issues, crucial to technology advances from an engineering system perspective. This will also help educate the new generation of engineering students in cross disciplinary systems o f problem solving. The possible areas where ERCs can be established are: advanced manufacturing technology, technical accoustics and vibration control, advanced combustion engineering, experimental robotics, opto-electronics/ microelectronics, materials processing etc. While the management structures for a programme o f this nature are to be carefully planned, such a programme would require participation and long-term commitments from the industry, the user organisations and the government agencies. An excellent outcome o f such a cooperative endeavour is the receiver-based telephone answering chip developed jointly by the Indian Institute of Technology, Chennai (an academic institution), the BPL (an Indian company) and the Analog Devices (an MNC).
10.39 Another infrastructural necessity is a network o f testing and evaluationI'aciliiies. While there have been exceedingly good facilities for doing both basic and applied research, one needs high quality and standard testing and evaluation facilities for upscaling the technology development. Further, it is essential that such facilities in the long run get accreditation with the aim to provide to the nation a network o f testing, evaluation and calibration facilities in accordance with international standards. The National Accreditation Board for Laboratories (NABL), set up in this direction, needs to be nurtured. Some o f the areas o f S&T where such testing and evaluation facilities have already been set up are; wind tunnel facilities, building materials and characterisation facilities, geo technical centrifuge facilities, aeronautic material test facilities etc. The scope o f this initiative needs to be widened in such a way that itcan cater to the needs o f the small scale sector as well.
10.40 While creating the mechanisms for harnessing S&T, it is necessary to ensure thatthe investment in technology development programmes is governed by national needs. Depending on the emphasis on utilising technology for the improvement o f the economy, the pattern o f investment would require readjustments in various socioeconomic sectors. Science and Technology should be harnessed not to deepen theproblem o f unemployment but to make the quality o f the products more competitive. There should be innovation o f appropriate technology that will accelerate the process o f decentralised development. With regard to the financing o f technology development efforts, it should be ensured that all possible partners - the Government, the industry and the academia - are fully involved in their respective financial commitments and that other sources o f funds like the Technology Development Board (TDB), the ICICI, the financial institutions etc. are tapped. The investments from these sources should not, however, be used for building infrastructure which may prove costly, unproductive and redundant. During these endeavours, it is
1017

Efforts should be made for the developm ent and application o f appropriate technology packages for rural areas with active participation o f voluntary agencies; developm ent o f rural enterprises through science & technology intervention and com plem entary development o f rural infrastructure through application o f science & technology.
essential to make the monitoring and evaluation mechanisms perfect and institutionalised.
APPLICATION OF S&T FOR SOCIETAL DEVELOPMENT
10.41 Recognising that S&T can contribute significantly to poverty alleviation and improvement in the quality o f life, in recent years and particularly in the 8th Plan scientific departments/agencies like DST, DBT, DOD, CAP ART,ICAR, DOS, CSIR etc. have initiated several structured schemes with a focus on disadvantaged sections o f society including the weaker sections, women, rural poor, tribals etc.They have made attempts tocarry the fruits o f science to rural areas. For example, the use o f biomass as a source o f energy through briquetting, gasifiers, biomass plants etc. has become very popular. New experiments on wind, hydro and solar energy have also been tried and demonstrated. Other technologies relevant to societal development are in the areas o f low-cost housing, safe drinking water, sanitation, organic agricultural practices and biotechnology etc. These attempts apart, programmes such as Integrated Mission for Sustainable Development (IMSD) o f the DOS, have carried the fruits o f scientific research to several areas o f the country. With issues such as global warming and biodiversity becoming extremely important, the sectors o f ecology and environment have been given due importance and special attention. There have been a large number o f programmes on organic agriculture which have been implemented with a focus on natural ecology and sustainable development. Important studies have also been carried out to evaluate the social impact in the area o f health with particular reference to tuberculosis, diahorreal diseases, psycho-social research in family planning, AIDS, nutrition etc.
10.42 A careful scrutiny o f the important areas and the interests o f the scientificdepartments, the research institutions and the implementing agencies, particularly in the non-government sector, indicates that the major sectors for taking up intervention programmes are: agriculture, rural artisanal industry, energy, housing and habitat, drinking water, sanitation and health, ecology and environment. During the 9thPlan, efforts should be made by the S&T departments both in the States and the Centre,for the development and application o f appropriate technology packages for rural areas with active participation o f voluntary agencies; development o f rural enterprises through science & technology intervention and complementary development o f rural infrastructure through application o f science & technology. This calls for a well plarmed implementation strategy.
10.43 In formulating such a strategy, the first consideration is the unit o foperations at the grossroot level. As the village or a Panchayat is too small to undertake a project, the Block has emerged as a viable and stable administrative unit catering to the development needs o f about 1,00,000 people. Originally, the development emphasis in a Block was on the welfare and on the provision o f minimum socialinfrastructure. At the second stage, the focus shifted to area development. At present,
1018

the concern is towards poverty alleviation. Since the S&T inputs so far in all these stages have been only marginal, in the next stage, the focus must be on technology.
10.44 In this task, one o f the challenges before the S&T establishments is to build the local capability to identify local priorities, plan for solutions and participate as partners. In this, the voluntary organisations, which have a strong science &technology base and high level o f professionalism, have to play a very important role in implementing development projects with S&T inputs. Their role would be to help local Governments/Panchayats in ensuring S&T inputs in the development plans being finalised by the District Planning Committees. As the number o f such voluntary organisations is very limited at present, there is a need to have more such S&T fieldgroups. The necessar)' technical back-up for the development activity can be ensured by
formulating collaborativeprogrammes with the involvement o f S&T institutions, working scientists, technologists and the State S&T Councils. In theformulation o f a project, theimplementation mechanism andthe enterprise characteristics should be so built into it that it becomes financially viable. The success o f the Integrated Mission for Sustainable
• Voluntar>' organisations, which have a strong science & technology base and high level o f professionalism, have to play a very important role in implementing developm ent projects with S& T inputs
» For replication o f successl'ul models, measures likegranting sabbatical leave or attractive deputation terms to the scientists w orking on the project may be necessary.
• Special emphasis will be given to the promotion of research and developm ent and adaptation o f technologies for improving the life, working conditions and opportunities for gainful employment, o f women, especially in the rural areas.
Development (IMSD) initiated by the DOS to generate and implement locale-specific developmental plans at watershed level with the help o f Central/State agencies, academic institufions, NGOs and voluntary agencies in certain districts, is an excellent example in this regard.
10.45 Once a S&T department, either in the State or at the Centre, has successfully generated/demonstrated a model and proven its replicability, preferably through an assessment involving the other line departments and the financial institutions, a suitable inter-departmental structure/ mechanism may be set up for replication. Organisations like the National Small Industries Corporation (NSIC), the Small Industries Development Bank o f India (SIDBI) etc. should be involved in the replication o f the models in several diverse socio-economic/geographic contexts. To make this process a success, measures like granting sabbatical leave or attractive deputation terms to the scientists working on the project may be necessary. This will enable them to devote their time fuHy to their new assignments.
10.46 Another aspect that should be taken care of, under S&T application for societal development, is the improvement o f traditional technologies which have the potential o f employment generation and upgradation o f the quality o f life o f the common man. Special emphasis will be given to the promotion o f research and development and adaptation o f technologies for improving the life, working conditions and opportunities for gainful employment o f women, especially in the rural areas. The present state o f inventories o f traditional technologies in various sectors is weak. An initiative has been taken by the National Informatics Centre (NIC) to document these, through Geographical Information System Network (GISTNIC) at various district centres. This
1019

needs to be integrated/linked with the TIFAC's activities. During tlie 9th Plan, efforts sliould be made to have a complete documentation o f traditioanl knowledge, specially in the areas like health care, medicinal plants, nutrition, agriculture, water harvesting, building technologies, metallurgical practices, non-farm occupations, etc. Regional centres for promoting research and documentation in traditional sciences and technologies may be set up in the existing institutions around eminent experts/scientists to study docum.entation, validation, upgradation and diffusion of traditional knowledge.
SCIENCE & TECHNOLOGY IN THE STATES AND UNION TERRITORIES
10.47 With a view to planning and coordinating the activities o f science Sctechnology in the States, conscious efforts are being made over the years to set up at theState level a suitable organisational structure in the form o f State Council o f Science
and Technology and Department• The State level S&T m achinery has to take the role of
a m ajor "prime mover", while the Centre can play a catalytic and advisory role in encouraging thisinitiative.
• The focus should be on programmatic supportthrough strengthening the linkages/interactionbetween the State S&T Councils and the Central S&T agencies by suitably dovetailing each others'programmes._________________________________________
of Science & Technology to provide necessary planning and organisational inputs for pursuing science and technology activities relevant to the development o f the concerned State. The State level S&T machinery has to take the role o f a major "prime mover",
while the Centre can play a catalytic and advisory role in encouraging this initiative of the State Government through decentralised planning approach. Today, all the States and Union Territories have set up State Councils/Departments o f Science & Technology and the S&T activities are slowly gaining momentum.
10.48 During the Ninth Five Year Plan, the State Governments should be activated much more to bring about a rapid socio-economic development through the application o f science and technology. The focus should be on programmatic support through strengthening the linkages/interaction between the State S&T Councils and the Central S&T agencies by suitably dovetailing each others' programmes. Such efforts would go a long way in bringing about a rapid socio-economic development in the States. For this purpose, certain measures need to be taken both by the State Governments and the Central S&T departments.
10.49 The State Government should (i) ensure adequate linkages between the State S&T departments and the development departments for identification o f the S&T components o f the State' development sectors to improve the productivity o f the concerned sectors; (ii) formulate specific S&T projects which can be included in the State's annual and the Five Year Plans in such a way that they would contribute to the development o f the State; (iii) identify the specific role that S&T can play in helping the programmes o f poverty alleviation and improvement in the quality o f life o f the people o f the State; and (iv) earmark an outlay for, and encourage expenditure on, the S&T activities which would be o f direct relevance to the States/UTs, particularly in improving the operational efficiency and productivity.
10.50 The Central S&T departments/agencies should ; (i) help in undertaking or initiating studies/surveys which are o f special interest to the States/UTs on location-
1020

specific research and technology development, tleld trials o f technologies developed by various Central S&T agencies /States lor technology transfer; (ii) share mutually their experiences and the experiences o f the States for initiation o f regional development programmes through various interactive mechanisms; (iii) make the S&'f personnel working in various State Councils aware o f the areas, such as management o f S&T, patents, laboratory accreditation etc. (iv) dovetail their programme with the programmes o f State S&T Councils in the areas o f patents, laboratory accreditation, science and society; popularisation o f sciencc; entrepreneurship development; National Resource Data N4anagement System (NRDMS); biotechnology; remote sensing and information technology etc; (v) evolve suitable mechanisms for dissemination o f information o f successful de\elopm ental projects taken up by some o f the State S&T Councils/departments for horizontal transfer of information/ know-how through the medium of State S&T newsletters etc. and by the networking of Slate S&T Councils and Central S&T agencies/departments using the NICNE'r facility.
SCIENCE & TECM.NOLOG^ INTERFACE WH H INDI STKY
10.51 The domestic R&D system and the industrial enterprises are the two main pla>ers in the S&'f-industry interface which had been functioning so long in
distinct and distantIn the em erging com petitive environment, cooperation and cooruinai'ion between Indian enterprises and R&D institutions is not a m atter o f choice but rather o f compulsion derived from com petitive pressures.The initial emphasis and endeavour should be on developing synergies and alliances to enhance Indian industry's com petitive advantage and on gaining a greaiter share o f global markets
eompavlmcn\s wilhoul much interaction, as the former is generally in the strategic and non-competitive areas ofR&D whereas industrialR&D, which was concerned more with investigating
incremental production problems, was not geared to new process/ product development and was having little interaction with the national and international S&'Fcommunity. But now the move tow'ards a market economy is compelling both to establish a dialogue and work together for mutual advantage. This change is evident from the fact that the publicly funded R&D programmes are more market driven now than earlier; performance criteria arc linked to economic, socictal and environmental issues; there has been increasing awareness about the I PR and confidentiality issues and conscious efforts are being made to forge alliances and consortia for morecomprehensive technology/service packages. Even on the part o f the in-house R&D units, there has been an appreciation o f the need for innovative technology development, deployment o f larger investments in R&D and recognition of technology as one o f the effective instruments o f corporate strategy. While these attitudinal changes are desirable, cooperative efforts are also needed.
10.52 The increasing complexity o f technology makes it difficult for the individual enterprises, especially the small and medium enterprises (SMEs), to engage themselves in the competitive R&D and technological development efforts due to high financialrisks. In the emerging competitive environment, cooperation and coordinationbetw'een Indian enterprises and R&D institutions is not a matter o f choice but rather o f compulsion derived from competitive pressures. The need for cooperation is to bring about value addition to the products through endogenous resources/skills;
10:1

environmentally clean and economically viable processes; closely held technologies that are commercially denied to Indian industry; strategic/dual-use technologies; technology packages as available from commercially operating units; process/product upgradation and incremental productive improvements; and strategic alliances with partners abroad for gaining market/technology advantage/dominance.
10.53 The initial emphasis and endeavour should be on developing synergies and alliances to enhance Indian industry's competitive advantage and on gaining a greater share o f global markets in such areas like speciality chemicals, drugs and pharmaceuticals, footwear & leather products, automotive & light engineering components, customised software, textiles & garments, gems & jewellery, agro-based products etc. This is alread visible in the drugs and pharmaceuticals sector. Several Indian pharmaceutical companies have already forged strategic alliances with the domestic R&D institutions. The Drugs & Pharmaceuticals Research Scheme of the DST, the Home Grown Technologies o f the TIFAC and the PATSER scheme o f the DSIR are some examples o f successful Government intervention in shaping the cooperative endea\'ours. The specific roles to be played by the Government, the publicly funded R&D system, the industrial enterprises and the financial institutions in this process are elaborated in the following paras.
10.54 The Government will have to provide an economic environment favourable not only for the conduct o f different kinds o f business but also to catalyse the arrangements and the institutional mechanisms that would facilitate synergistic technological development, its absorption and upgradation. As a measure o f enhancing R&D/technology demand,
The Governm ent will have to provide an economic environm ent favourable not only for the conduct o f different kinds o f business but also to catalyse the arrangem ents and the institutional mechanisms that would facilitate synergistic technological development, its absorption and upgradation. The efficiency and effectiveness o f the R&D institutions can be significantly enhanced by providing them adequate flexibility and freedom to function in a market economy.The increased participation and involvement o f the industry in the decision m aking bodies o f R&D institutions will make their program m es not only more attractive to industry but also to the financial institutions offering venture/risk capital.
industry may be encouraged to establish its own R&D units by according tax incentives for investments on R&D; allowing accelerated depreciation for product development costs; cost- sharing o f R&D projects o f even private enterprises; etc. For improving the efficacy o f R&D/technology supply, a single window system for R&D funding may be introduced. The R& D /technology support facilities are required to be enlarged through the development of S&T information networks; the strengthening o f standardisation, quality control and assurance systems; enhancement o f the capacity o f local consulting firms to translate R&D outputs to economic value products; support to technology marketing efforts o f R&D institutions and promotion o f peer-groups through more active industry/ professional associations.
10.55 On the part o f the publicly funded R&D system, the avoidance of a purely bureaucratic approach is a necessity. The efficiency and effectiveness o f the R&D institutions can be significantly enhanced by providing them adequate flexibility and freedom to function in a market economy. They should, in turn, devise strategic R&D/business plans aligned with the national prionlies and tuned to the market needs by utilising multifunctional inputs in the project formulation with clear definition o f
1022

project objectives and outputs, by introducing operational flexibility at the bench level and by undertaking effective publicity and marketing o f R&D outputs. With a view to increasing the commercial attractiveness o f RsfeD outputs, the industry may be helped to identify and articulate its R&D needs, followed by prioritisation of programmes to be taken up for R&D and by avoiding subcritical funding. The increased participation and involvement o f the industry in the decision making bodies of R&D institutions will make their programmes not only more attractive to industry but also to the financial institutions offering venture/risk capital. Strategic alliances can be forged, if the technology is offered with performance guarantees, and more so, if offered as a technology-cum-financial package or as a turn-key project, This can be achieved by a consortium approach, where the R&D institutions, design and consultancy organisations, and financing institutions/venture capital firms will share the stakes in the technology package. The other steps which the R&D institutions should take relate to providing the enterprises access to technical information on several aspects like technological trends, technology sources, technology choices, technology assessment, sources o f raw materials and equipment, financing possibilities; meeting the needs o f industry for specialised training/skill development and facilitating mutual visits/short term placement o f one's experts into the others' system/ environment.
10.56 Parallely, there areseveral aspects in which mdustry has to extend itscooperation. For example, in the high risk and high cost R&D areas, the industry need to cooperate in supporting the programmes for the development of generic technology with publicly funded R&D. Some Indian examples are: CFCsubstitutes. Vitamin A,Cobalt-based chemicals, high energy rare earth magnets, Flosolver, Cobalt recovery. Carbon fibre for braiding applications. Membrane cell process for chlor alkali production, Titanium scrap recycling etc. These need to be proliferated to enable theIndian industry gain a competitive advantage in the market place. Promotion o f longterm R&D alliances between the in-house R&D units and the publicly funded R&D institutions is another method through which one can optimise on the time and costs of technology development and its application. This role apart, the industry should adopt a cooperative approach in identifying its R&D needs, inviting scientists/ technologists to serve on the Boards o f companies and, finally, in financing in a major way the projects o f their concern.
10.57 The financial institutions like SIDBI, banks and ICICI have a role to play inthis game. In the Indian context, it has been found difficult to raise funds for technologydevelopment and proving the technology either by the industry or the research institutions on their own or sometimes even- jointly by both o f them. While the newly established Technology Development Fund should cater to the bigger needs, the commercially operated venture capital financing has the potential to promote the synergising o f competencies o f the
102.3
I'he industry should adopt a cooperative approach in identifying its R&D needs, inviting scientists/ technologists to serve on the Boards o f com panies and, finally, in financing in a major way the projects o f their concern.Com mercially operated venture capital financing has the potential to promote the synergising o f com petencies o f the publicly funded R&D system and industry.The DFls and the venture capital funds may also introduce a scheme for technology insurance to underwrite the risk o f using the domestically developed new technology.

10.58 For technology demonstration/ proving, it is difficult for small and medium enterprises (SMEs) to raise funds from public capital markets due to the smallness o f size, the early stage o f development and the limited potential for leverage. The venture capital funds do provide finance for this activity, but their coverage has been small. Thereibre, this activity needs to be taken up by the other Development Financial Institutions (DFIs) especially by the SIDBI which deals with SMEs. The DFIs and the venture capital funds may also introduce a scheme for 'technology insurance' to under-write the risk in using the domestically developed new technology. Finally, a pragmatic action plan for a meaningful orchestration of Government-Industry-R&D system should be formulated.
10.59 Various steps are involved in the formulation of such an action plan. To start with, each publicly funded R&D institution may prepare, v/ith professional assistance, atleast a five year business plan and the funding by Government should be based on that business plan, with gradual reduction in the percentage o f Government funding over a period o f time. The next step should be networking and forging alliances with other R&D institufions and in-house R&D units to identify various facilities and services available with them which are required for their business plans. On the basis o f this, the small and medium enterprises can be assisted to meet their R&D/S&T needs. The R&D in industry should, on the other hand, move towards more innovative product and process development through several measures viz. networking with publicly funded R&D institutions, finding appropriate placements for the scientists to work in industry, giving representation to scientists on the Board o f Directors o f companies and by approaching the R&D institutions for relevant aspects o f their R&D/S&T requirements/ plans, in confidence. The Government intervention can be in terms o f providing ta.x incentives linked to direct benefits derived by the economy and creating an environment o f freedom and flexibility commensurate with the regulations o f a market economy. The financial institutions and the Chambers o f Commerce should formulate appropriate rules and guidelines to facilitate the funding o f technology development and demonstration activities o f the R&D institutions or the industry and to evolve and implement a technology insurance scheme to underwrite the risk o f using domestically developed technology.
Si&T COMMUNICATION, POPULARISATION AND BUILDING OF SCIENTIFIC TEMPER
10.60 With the setting up o f ihe National Council for Science & Technology Communication (NCSTC), considerable emphasis has been laid over the years on the popularisation o f science and the development o f scientific temper. A whole range o f programmes involving a large number of voluntary agencies as w'cll as official agencies are being undertaken in this direction. Some of the encouraging programmes are: training o f science communicators; development/production/ dissemination o f software for different media; support to popular science magazines in different languages; compilation o f computerised science communication databases; activity-based field projects involving people in large numbers, like celebration o f National Science Day. organisation o f Bharat Jan Gyan Vigyan Jatha and National Children's Science Congress etc. Besides these aclivifics. the National Council of Science Museums has established a chain of
pu b lic ly funded R & D system and industry in several w ays.
1024

Science Centres and Science Museums in the country under a common coordinating umbrella, with free exchange o f personnel, exhibits and training facilities.
G re a te r effo rts shou ld be m ade for in stilling the sc ien tific sp irit e sp ec ia lly am o n g the you th w ith a view to o v e rc o m in g the b arrie rs o f se c ta rian ism and soc ia l p re jud ices .
10.61 Notwithstanding the participationof members from professional academies, academic institutions and other scientific agencies/research institutions in science communication activities. there has been onh' a limited improvement in the pattern of institutional participation/ involvement in science popularisation activities/ programmes. In the Stales, for example, even though science popularisation is a specific priority and a thrust programme o f the State S&T Councils, there is a need to catalyse all the possible science communication activities through the active involvement ofinterested voluntary organisations. In addition, the National Council for EducationalResearch & Training (NChRT). New Delhi has been encouraging students and scienceteachers in creative activities designed to stimulate scientillc temper by improving the science text books, production o f several books on popular science etc.
10.62 The experience gained in organising the science popularisation programmesshould become the basis for undertaking new activities during the Ninth Plan, which could increasingh include encouragement to the publication of the popular science books, institution of incentives like prizes, awards and honours for outstanding science communicators, translation of outstanding popular science books published in foreign langauges; efficient distribution mechanism to make these accessible to the target readers through various communication media like radio, I V etc. To bring about change of attitudes and practices of primary school children and their teachers, efforts like children's science congress, ' joy of learning' children's projects, exhibitions, activity camps etc. by schools, voluntary organisations and dedicated science communicatorsmay be encouraged. Greater efforts should be made for instilling the scientific spirit especially among the youth w'ith a view to overcoming the barriers of sectarianism and social prejudices. Further, the existing network o f Adult Education Centres, Krishi Vigyan Kendras, District Industries Centres, Health Centres, Jan Shikshan Nilayams, State Science & Technology Councils etc. should be systematically involved in science popularisation activities. Research in sciencecommunication is another important area which needs encouragement. Some obvious areas o f research are: the levels o f science awareness in different communities;the effectiveness of different communication media; the impact of scientific literacy etc. Concerned agencies should support the creation o f facilities for research in science communication and education in the existing academic/research institutions. Otherpromising measures for popularisation o f science are: the formulation o f enablingmechanisms for the cooperative functioning of S&T personnel and teachers with capable voluntary organisations; the augmentation of the existing infrastructure in terms o f science museums, exhibitions, planetaria etc. the development o f locallyrelevant community science programmes; the setting up o f a network o f nodal centres in selected blocks and villages; and establishment o f accessibility both to the nodes of several electronic networks as well as to the stand alone systems, which will become important retrieval and referral systems o f information.
1025

S&T MANPOWER DEVELOPMENT AND EMPLOYMENT
10.63 When one is concerned wiih aspects such as technological innovations,implementation o f newly developed technologies and finding solutions to problems o f modernising and developing a society, especially in the context o f the process of liberalisation, the S&T manpower assumes a special significance and will he required in considerable strength. Moreover, it is an indirect measure o f the strength o f the country because o f the contribution of S&T activities to socio-economic development. But there have been a number o f hurdles in the process o f S&T manpower development. The major problems inhibiting the growlh of S&T manpower are unemployment and under-employment o f S&T personnel. The country is facing on the one hand a shortage o f S&T manpower in some encouraging areas and on the other a surplus in some conventional areas. In this context, the matters o f concern are the lack o f accurate estimation o f demand and supply o f S&T personnel in general and o f those in the specialised areas, in particular, especially an assessment o f trainingrequirements. The aspects that need consideration m such an estimation process pertain to the outturn and stock o f S&T personnel and their training needs.
10.64 As regards the outturn, it is noted that there has been a significant growth in the infrastructure for higher education and consequently there has been a steady increase in the number o f graduates, postgraduates and doctorates in the science and engineering
streams. Presently, the estimation o f the stock o f S&T personnel has been attempted by various organisations like the CSIR, the lAM R etc. and discipline-wise projections have been made. Taking clues from these
estimates/ projections, indepth studies need to be undertaken to estimate the demand and supply o f S&T personnel as well as their training needs.
10.65 While looking at the technical manpower, it is not the number alone that shouldbe considered important but the quality as well, especially when the aim is to harness optimally the available resources. But the high quality depends on theeducation and training facilifies available. Moreover, since the requirements o fmanpower depends on the needs o f the society from time to time, the system o feducation must change accordingly and adapt itself to the changing demands o f modern technology. This calls for modernisation o f the syllabi in variousscientific disciplines as a continuing activity.
10.66 Besides improvement in quality, what is crucial is the management o f S&T manpower. For this purpose, specific measures are needed. These include organisation of all -India level selections based upon competitive examinations, akin to the other major service sectors in the country; networking of R&D institutions, universities and industry with necessary cost sharing mechanism; creation o f new courses in the thrust areas involving academic sector and ufilising the facilities o f specialised institutions; involvement o f NRI experts in the upgradation o f knowledge and skills in the scientific and technological institutions; continuous training to the S&T employees in the subjects o f their respective specialisation or in the allied areas in which their professional background/exposure can be gainfully deployed; special training in
1026
• Besides im provem ent in quality, what is crucial is the m anagem ent o f S&T manpower.
• Establishm ent o f a National Science M anpower Information System (NSM IS) is required to make available information on scientific m anpower in all possible data forms at a single point.

accessing the information super highways; mobility o f scientists/ engineers among the sectors o f industry/R&D/plarming institutions, academia; active involvement o f S&T personnel in the decision making process; establishing linkages among the academic programmes, research work and the users; etc.
10.67 Apart from these, the establishment o f a National Science Manpower Information System (NSMIS) is required to make available infonnation on the scientific manpower in all possible data forms at a single point so that it can provide answers to manpower-related querries covering all the important aspects like characteristics of scientific institutions, inventory o f inplant training facilities, enrolment and outturn o f science postgraduates, utilisation o f S&T manpower, unemployment etc. To look into various S&T manpower-related functions, suitable -mechanism at the national level is called for.
INTERNATIONAL SCIENCE & TECHNOLOGY COOPERATION
10.68 International cooperation in S&T is essentially a mechanism to (a) facilitate interaction among scientific researchers o f various countries to update and refme their knowledge base for accelerating the pace o f investigation as also to fill up any gaps in the available information, (b) develop advanced technologies, high tech equipment and new materials required for the economic growth o f the participating countries and (c) take mutual advantage o f complemenlar>' scientific & technological capabilities amongst the participating countries' teams. The existing mechanisms o f cooperation under various programmes include exchange o f technical information as well as scientists and research workers; and joint research, training and R&D programmes. On the Indian side, S&T collaboration agreements, on a general basis, have involved the DST, the CSIR and the Indian National Science Academy (INSA), while separate specific sectoral agreements have been concluded by the DAE, the DOS, the DBT, the DOD, the DOE, the DNES and the DOE&F besides the Ministries o f Agriculture, Health etc.
For strengthening the international S&T cooperation, the formulation o f S&T programmes should take into consideration the prevailing national scenario as well as conditions and trends in other parts o f the world.
10.69 India has entered into intergovernmental S&T agreements with 46 countries. During the last 3-4 years a large number o f new agreements were concluded. Of these, the countries with which specific programmes o f cooperation are being actively followed are China, Hungary, Israel, Italy,Poland, Russian Federation and Ukraine. In addition, a few bilateral programmes are at an advanced stage o f implementation including an Indo-Prench Centre for the Promotion o f Advanced Research (IFCPAR) and an Indo-Uzbek Centre for the Promotion of Scientific & echnological Cooperation. Under multilateral cooperation, a Centre for Science & Technology o f the Non-Aligned & other Developing Countries (NAM S&T Centre) and an International Centre for Genetic Engineering & Biotechnology (ICGEB) were set up in New Delhi. Besides, the UN Centre for Space Science and Technology Education for Asia-Pacific Region was established in Dehradun.
10.70 During the past five years jo in t bilateral collaborative work undertaken with CIS, USA, France, Ukraine, European Community, Poland, Hungary, Germany, Japan, Netherlands, Sweden and Mauritius, includes 300 projects, visits o f about 800
1027

Indian S&T personnel, publication o f 650 joint research papers, visits o f about 100 foreign S&T personnel to India, 241 postdoctoral level fellowships, 73 joint workshops etc. Some examples o f multilateral collaboration are : UNESCO - Nehru Science Chair at Jav/aharlal Nehru Centre for Advanced Scientific Research in Bangalore and S&T projects with LTNDP assistance sponsored by the DST in the areas o f Natural Resource Data Management System, Meteorological Application to Agriculture and im.proving technology transfer through networking.
10.71 For strengthening further the international S&T cooperation, the formulationo f S&T programmes should take into consideration the prevailing national scenario as well as the conditions and trends in other parts o f the world. Besides mutuality o f interest, the investments on international S&T programmes should enhance self- reliance, yield social, economic and scientific returns to the participating countries oa equal terms and complement the ongoing national efforts. An internationalprogram,me should emerge as a follow-up o f the identification o f the technological gaps in certain areas. Even with regard to funding, the internal sources should be tapped first and then the collaborative activities with other countries should be undertaken to supplement it, based on the mutual interest o f the concerned parties. In order to coordinate the international S&T collaborative programmes, an advisory mechanism needs to be set up to formulate an overall policy, to evaluate the needs and suggest an approach for the future, including participation in major international experiments on a cost-sharing basis; visits o f foreign specialists; acquisition o f the cutting-edge technologies; imparting training to S&T personnel in IPR issues etc.
REVIEW OF THE EIGHTH FIVE YEAR PLAN PROGRAMMES
10.72 During the Eighth Five Year Plan, concerted efforts were made to implement well-defined, time-bound programmes in various disciplines o f science and technology. Science and Technology Advisory Committees were set up in most o f the socio
economic sectors for the identification.A three tier national level S&T structure;
Cabinet Com m ittee on Science and Technology (CCST)Science Advisory Com m ittee to the Cabinet (SACC)Com m ittee o f Secretaries on S&T (COS S&T)
formulation and implementation o f the S&T programmes in the concerned sectors. In order to promote science and technology activities at the grass- root level. State Science and Technology Councils/ departments were
strengthened and their interaction with various scientific institutions anddevelopment departments was ensured for effective implementation o f location- specific projects/ programmes. To take an overall view o f the scientific efforts and policy guidelines for the development o f S&T in the country, a three-tier national level S&T structure, viz. Cabinet Committee on Science and Technology (CCST), Science A dvisory Committee to the Cabinet (SACC) and a Committee o f Secretaries on Science and Technology (COS S&T) has been established.
10.73 There had been a number o f significant events during the Eighth Plan period in the science and technology sector. The successful launch o f the indigenously built INSAT 2A, 2B and 2C resulted in the provision o f several facilities like video conferencing, expansion o f TV services to more areas. The PSLV-D2 and D3 were successfully launched and remote sensing satellites (IRS P2 and P3) placed in orbit. The IRS-
1028
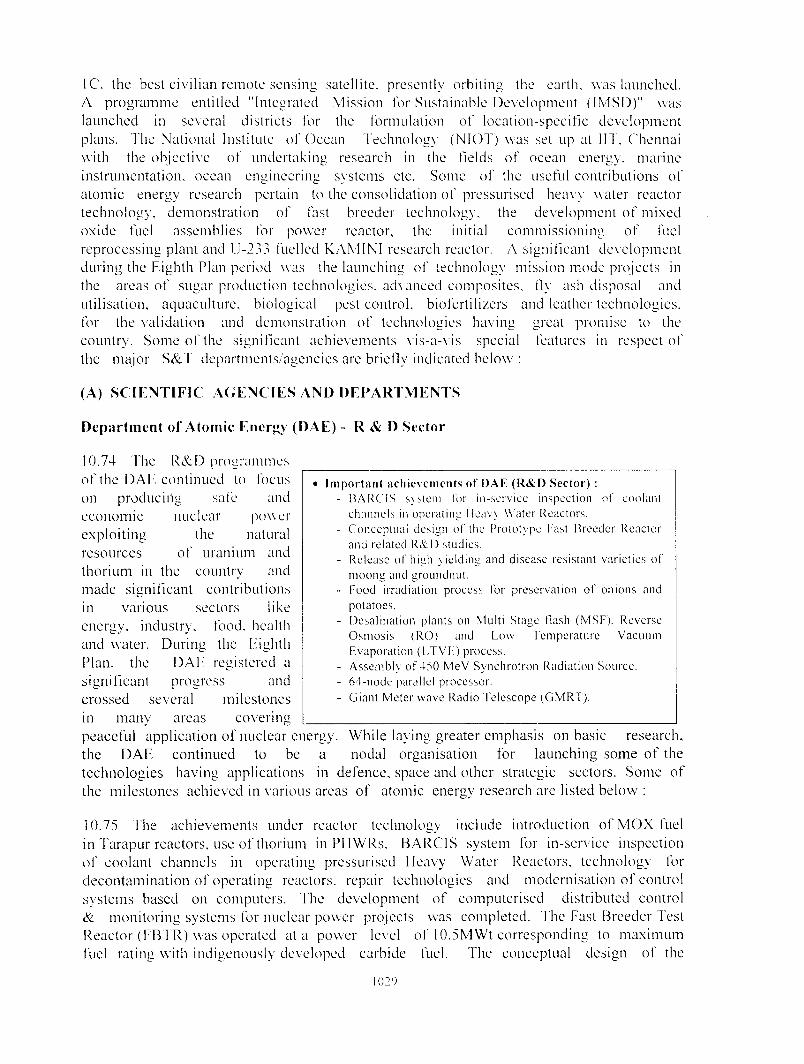
1C. the best civilian remote sensing satellite, presently orbiting the earth, was launched. A programme entitled "Integrated Mission for Sustainable Development (IMS!))" was launched in sexeral districts for the formulation of location-specific development plans. The National Institute o f Ocean Technolog}' (NIOT) was set up at IIT. Chennai with the objective of undertaking research in the fields o f ocean energy, marine instrumentation, ocean engineering s} stems etc. Some o f the useful contributions of atomic energy research pertain to the consolidation o f pressurised hea\y water reactor technology, demonstration of fast breeder iechnoiogy, the development of mixed oxide fuel assemblies for power reactor, the initial commissioning o f fuel reprocessing plant and lJ-2.i3 fuelled KAMINI research reactor. A significant development during the Eighth Plan period was the launching of technology mission mode projects in the areas o f sugar production technologies. ad\anced composites. Ily ash disposal and utilisation, aciuaculture, biological pest control, biofertilizers and leather technologies, for the validation and demonstration o f technologies having great promise to the country. Some o f the significant achievements \ is-a-\ is special features in respect of the major S&T departments/agencies are brielly indicated below :
(A) SCIKNTIFIC .AGENCIES AND DEPARTMENTS
Department of Atomic Energy (DAE) - R & D Sector
10.74 The i^&I) programmes o f the DAE continued to focus on producing safe andeconomic exploiting resources thorium in
nuclear power the natural
o f uranium and the country and
made significant contributions in various sectors like energy, industry, food, health and water. During the I:ighth Plan, the DAI: registered a significant progress and crossed several milestones in manv areas
Im p o rtan t acliiexcnients o f DAE (R& D Sector) :- [^ARCLS s \ s l e m Ibi' in-sci 'v icc in spec t ion oF c o o lan t
c h a n n e ls in o p c ia t in g H e a \ \ W a te r R eac tors .- C o n c e p tu a l d e s ig n o f the P ro to ty p e I 'ast B re ed e r R e ac to r
a n d re la ted R & D studies .- R e le a se o l 'h ig h \ ie ld ing a n d d ise a se re s is tan t v a r ie t ie s o f’
m o o n g and g ro u n d n u t .- F o o d irrad ia t ion p ro c ess fo r p re se rv a t io n ol ' o n io n s and
po ta toes .- t Je sa l in a t io n p lan ts on M ult i S ta g e Hash (M S F ) . R ev erse
O s m o s is ( R O ) and L o w T e m p e r a tu r e V a c u u m E v ap o ra t io n ( i .TVT:) p rocess .
- A s s e m b ly o f 4 5 0 M e V S y n c h ro t ro n R ad ia t ion S ource .- 6 4 - n o d e paral le l p rocesso r .- G ia n t M e te r w a v e R ad io T e le s c o p e ( G M R T ) .
peacel'ul application o f nuclear energy. While laying greater emphasis on basic research, the DAE continued to be a nodal organisation for launching some o f the technologies having applications in defence, space and other strategic sectors. Some of the milestones achieved in various areas o f atomic energy research arc listed below :
10.75 The achievements under reactor technology include introduction ol'M OX fuel in I'arapur reactors, use o f thorium in PHWRs. BARCIS system for in-service inspection o f coolant channels in operating pressurised Heavy Water Reactors, technology for decontamination o f operating reactors, repair technologies and modernisation o f control systems based on computers. The development o f computerised distributed control & monitoring systems for nuclear power projects w'as completed. The Fast Breeder fest Reactor (FBTR) was operated at a power level of 10.5MWt corresponding to maximum fuel rating with indigenously developed carbide fuel. The conceptual design o f the
1029

Prototype Fast Breeder Reactor (PFBR) and related R&D studies and the experimentalphase for the development of technology for the fabrication o f critical reactorcomponents. modelling studies relating to equipment and instrumentation were completed. Under the thorium utilisation programme, indigenously designed mini reactor, K/\M1NI utilising Uranium-233 was constructed at Kalpakkam. The design for ad\anced heavy water reactor in BARC was completed.
10.76 In the area o f prospecting I'or atomic minerals, with the proving o f the resources of Uranium in Meghalaya, Bihar and Andhra Pradesh, the resource base o f uranium in the country has been enlarged. The initial commissioning o f Kalpakkam reprocessing plant and commissioning o f radiochemical hot cell facility for the examination o f irradiated fuel were the other achievements in this area.
10.77 In the areas o f safety & environmental protection related to atomic energyactivities, many studies were completed and a number o f environmental monitoringand communication systems developed in BARC. Research in the non power related areas contributed significantly to socially relevant scctors such as health and food. In the field o f applications o f radio isotopes in health, radiation sterilisation o f medical products and contributions to diagnostics and therapy, yearly six lakh patient investigations and 1.5 to 2 million radiation treatment cases were handled using radioisotopes. A 10 Mev microtron developed at Indore was in the process o f commissioning for radio-lherapy work. The Regional Radialion Medicinc Centre (RRN4C), Calcutta installed a 4 Mev Linear Accelerator (LINAC), indigenously developed by SAMI-.FJl, Bombay and CSIO, Chandigarh enabling it to treat about 600 patients per month.
10.78 In the area o f agriculture and food, the achievements include the release o f high- yielding and disease resistant varieties o f moong and groundnut; food irradiation process for preservation o f spices, potatoes and onions; improvements and multiplication o f crop plants, developing technologies for the processing and maintenance o f quality o f fruits like mangoes. In the area o f water management, desalination plants on multi-stage flash (MSF) evaporation, reverse osmosis (RO) and low temperature vacuum e\'aporation (LTVE) processes were set up in the rural areas for purification o f brackish water.
10.79 In the area o f accelerators, CAT, Indore assembled India's first 450 MeV Synchrotron Radiation Source Indus-1 storage ring and three beamlines w'ere also ready. The other achievements in this area include: commissioning o f high resolution beam line at VECC, the Electron Cyclotron Resonance (ECR) Ion Source; and Superconducting booster LINAC and a booster synchrotron etc. The 500 KeV industrial electron accelerator was in an advanced stage o f fabrication for application in the plastics industry. In the area o f cryogenic technology, a closed cycle cryo-refrigerator was developed and a helium liquifier was under development at CAT. A laboratory was set up to carry out helium gas collection from the hot springs o f Bakreshwar and Tantloi.
10.80 The achievements in the areas o f robotics, computer technology, material characterisation etc. include the development o f a tele-operated manipulator for retubing operation o f nuclear reactors, installation of antenna control system for CiMRT at Pune, development o f several robotic devices for integrated automatic sampling and analysis system for reprocessing operation; installation and use o f several high
1030

speed super computer facilities like 64-node parallel processors, artificial intelligence- based graphics and speech-based user interfaces for nuclear facilities. In addition a National Centre for Compositional Characterisation o f Pure Materials was set up.
10.81 The DAE's R&D efforts have resulted not only in the saving o f large amount o f foreign exchange but also in providing a number o f state-of-the-art technologies to Indian industries including specialised consu'ancy services in areas such as computers, advanced instrumentation, power electronics, technology relating to materials, chemical and bio-chemical processes and associated equipment, robotics and non-destructive testing.
10.82 Apart from technology development and services, the DAE provided continued support to promote R&D in the frontier areas o f science through its aided institutions covering a wide spectrum o f subjects such as physics, mathematics, chemistry, biology, material science, condensed matter physics, accelerator-based research, gamma ray astronomy, astrophysics and seismology for creating knowledge base as w'ell as development o f strategic technologies. A major achievement o f the DAE was the setting up o f the Giant Meterwave Radio Telescope (GMRT), which was near completion at Khodad, near Pune. In the area o f life sciences, a new gene which controls the ability o f organism to grow at low temperatures was identified and the base sequence o f its DNA determined along with its expression under different conditions.
10.83 Some o f the measures taken for enlarging the scope of the DAE-university interactions include Inter-University Consortium for the Department o f Atomic Energy Facilities (lUC-DAEF) at Indore, the DHRUVA national facility and Global Environmental Radiation M onitoring (GERMON) programme for monitoring radiation exposure and radioactivity levels around the globe, installation o f prototype 10 MeV compact microtron at M angalore University, supply o f various lasers to universities by CAT for pursuing research work and setting up o f a neutron-generator in the Calcutta University by the Saha Institute o f Nuclear Physics, besides funding mission oriented R & D activities in some advanced areas o f science and technology by BRNS^ Several national research programmes/facilities were also implemented like the National Centre for Compositional Characterisation o f Pure Materials; the national facility for neutron beam research by BARC; the Centre for Research in Biological Sciences; Homi Bhabha Centre for Science Education by TIER and National Programme on Lasers by CAT. In addition, an international collaborative research programme involving the utilisation o f the international facility namely the Large Hadron Collider (LHC) at CERN, Geneva was implemented by CAT, BARC, VECC and other aided institutions like SINP and lOP.
Department of Space (DOS)
10.84 Over the last three decades, the Indian space programme has established a number o f capabiUties in the country, e.g building world- class satellites for communications and remote sensing; launching remote sensing satellites from India with indigenously developed
Indian Space program m e has established a num ber o f capabiHties in building world class satellites for com munication and remote sensing and launching remote sensing satellites with indigenously developed launch vehicle.Various milestones achieved:
INSAT-2A and 2B launched in July 1992 & July 1993 respectivelyINSAT-2C launched in December 1995.
- 1RS-P2 and 1RS-P3 launched in 1994 and 1996 respectively.IR S-1C launched in December 199.“),
1031
launch vehicle and reaching the benefits o f space technology to improve the quality o f life at the grass-root level, essentially through the two national space systems based on IN SA T andlR S .
10.85 The 1NSAT-2A and the INSAT-2B, launched in July 1992 and July 1993respectively have enhanced the INSAT space segment capacity, facilitating introduction o f metro channel in Doordarshan, rural networks, search & rescue service and additional regional channels. The INSAT-2C, launched in December 1995, has been providing additional capability for business communication, services and extended coverage to enable TV programme outreach beyond Indian boundaries catering to the population from South East Asia to the Middle East. The domestic mobile satellite services, being introduced with the INSAT-2C and to be augmented further using the INSAT-2D, will enable communications from any part o f India and the sea areas o f interest with small portable terminals and ship-mounted terminals. The INSAT- based Meteorological Data Collection System and the Disaster Warning System(DWS) are two invaluable contributions by the DOS for providing meteorologicalforecasts and cyclone warning services. A developmental communication project, started in Jhabua District of Madhya Pradesh has been providing training andawareness among the rural masses on better agricultural practices, land and water resources management, family planning, health care and hygiene. This project is expected to provide valuable inputs for planning and establishing such networks on a wider scale in the country.
10.86 The Earth Observation Systems, consisting o f a series o f remote sensing satellites,have been providing a wide variety o f data useful for natural resources management o f the country. The IRS-P2 and the IRS-P3 satellites, which were successfullylaunched and operationalised in 1994 and 1996 respectively, have beencomplementing the data requirements o f the user community. The IR S-1C, which is another sophisticated satellite, was launched in December 1995. The data from theIRS satellites, being used on operational basis for a wide range o f applications covering agricultural crop acreage and production estimation, forestry, wastelandmanagement, mineral prospecting, ground water targetting, snow melt run-off prediction, environmental monitoring, environmental impact analysis etc. has helped in several aspects o f decision making process. This data has also enabled the DOS to take up a major developmental project, viz.. Integrated Mission for Sustainable Development (IMSD) to formulate locale-specific developmental plans for sustainable development o f land and w'ater resources by synthesising thematic information derived fromremotely sensed data with other collateral information. This project is now being executed in 174 selected districts of the country. A more significant development is that the IRS satellite constellation has become an international system recently, with a US company, EOSAT, entering into commercial agreement with India for reception and marketing o f the IRS data worldwide.
10.87 Under the launch vehicle programme, the ASEV-D3 mission o f May 20,1992facilitated validation o f a number o f technologies useful for larger vehicles o f operational class. On this basis, the development o f the PSLV and the GSEV was initiated. With the two continuous successful missions, the PSLV was declared operational. The next one, i.e.,PSLV-CI, will carry the operational IRS-ID satellite in 1997. However,in respect o f the Geo-Synchronous Satellite Launch Vehicle (GSLV) whose first
1032

developmental flight was initially targetted towards now scheduled during the Ninth Plan.
the end o f the E ighth P lan, is
10.88 Among the other programmes, the MST Radar facility is being extensively used by the scientific community, including university students for advanced research in the area o f atmospheric sciences. The infrared telescope was commissioned and scientific validation with trial observations completed. Through the medium of the RESPOND programme, aimed at establishing a large S&T infrastructure base at the academic institutions in the country for carrying out space research projects/programmes, the DOS-academic interface has been strengthened. Over the past 25 years, the DOS has supported as many as 100 universities and research institutions in carrying out about 200 research projects in the areas o f space science and technology. In recognition of India's role in sharing her experience in the de\elopm ent and application o f space technology for societal benefits, the UN Asia-Pacific Regional Centre lor Space E’ducation was set up in India. Due to the strong DOS-industry interface, so far, about 225 technologies developed by ISRO/DOS. ha\ e been transferred to the industr\ for commercialisation. For handling technology marketing and providing consultancy services to the industry, ANTRIX Corporation was set up as a corporate unit within the DOS.
Department of Science and Technology (DST)
10.89 Fhe DST has been making increasing efforts to promote basic research. The financial support to basic research in the Eighth Plan was double that in the Seventh Plan.The number o f R&D programmes supported under basic research so far was more than 1236, involving a total cost o f about Rs 125 crore and 544 institutions. About 70% of this funding was received by the academic sector and more than 500 R&D programmes costing Rs. 8 crore were sanctioned for young scientists. National facilities and core groups were set up ‘ for
M ajo r ach ievem ents:• National facilities and core groups were set up for
promoting researcii in frontier areas o f S&T.• Experimental dem onstration on simultaneous
m anifestation o f light as a particle and a wave.• New series o f com pounds exhibiting novel liquid
crystalline phase.• International Advanced Research Centre for Powder
M etallurgy and New M aterials.• Treatment o f tuberculosis and other diseases using
lasers.• Dem onstration-cum sale o f PARAM super computer.• Integration o f seism ographs for use by IMD.• Mission Mode projects undertaken in the areas of:
Sugar Production Technologies.Advanced Composites.Fly Ash disposal and utilisation.
promoting research in the frontier areas o f S&T which include superconductivity, lasers, carbon and nano materials, neurosciences, x-ray crystallography, robotics, laser processing o f materials, nutritional studies etc. About 3000 original research papers were published by 13 DST supported autonomous institutions. Some o f the outstanding works o f these institutions were in the areas o f blood oxygenator, hydrocephalus, amorphous silicon solar cells, BOD Sensors, Plasma Nitriding Process etc. besides experimental demonstration on simultaneous manifestation o f light as a particle and a wave; and new series o f compounds exhibiting novel liquid crystalline phase. Several of these technologies were transferred to the industry.
103.:

10.90 Under the international R&D co-operation, efforts were made to expand and accelerate the pace o f collaborative research with a number o f countries abroad. Some o f the significant outcomes were; the setting up o f International Advanced Research Centre for Powder Metallurgy and New Materials, treatment o f tuberculosis and other diseases using lasers, demonstration-cum-sale o f PARAM supercomputers, integration o f seismographs for use by IMD etc.
10.91 Through the S&T Advisory Committees (STACs) set up in 22 Ministries to promote and coordinate the technology development programmes, the DST undertook several joint R&D projects with other Government departments and the industry in a number o f areas such as building materials, wood substitutes, orthopaedic devices, mini-micro hydel power, robotics, CFC substitutes, air pollution control catalysts, laser processing materials etc. A few mission mode projects that were undertaken, and the significant results that were demonstrated, relate to sugar production technologies, advanced composites, fiy ash disposal and its utilisation etc. Several society-related programmes were undertaken by the DST with an emphasis on development of technologies for poverty alleviation, employment generation, enhancement o f income and improvement in quality o f life o f rural and urban poor, women, scheduled castes and tribal populations and weaker sections. More than 364 projects involving 250 NGOs in the area o f rural and tribal development were implemented benefitting about170,000 people. Under the S&T Entrepreneurship Development Programme, more than 35000 job opportunities were created and more than 1000 industrial units were set up by trained entrepreneurs, providing additional employment to about 4000 people. Some o f the science popularisation efforts being organised by the National Council for Science & Technology Communication (NCSTC) included Bharat Jan Gyan Vigyan Jatha (BJGVJ)-1992, 144 episodes o f radio serial titled 'M anav Ka Vikas' - the longest science serial ever produced and broadcast simultaneously in 18 languages; two National Childrens' Science Congress in which thousands of children participated; production and telecast o f TV serials on different themes o f S&T etc. Under the programme o f National Resources Data Management System (NRDMS), 22 Data Base Centres were established in the country in different geo- environmental settings for developmental planning. The other important activities o f the DST pertain to the development o f an operational medium range weather forecasting model suited to indigenous needs using Super Computer and the strengthening of the State S&T Councils for the development and promotion o f State level S&T activities, particularly locale-specificprogrammes.
10.92 The India Meteorological Department (IMD) continued to engage itself in the dual role o f conducting research in the areas such as ozone in tropics, agricultural meteorology, use o f monsoon teleconnections etc. and providing specialised services in terms of meteorological forecasts to meet a variety o f demands from different types o f users through a network o f 5 Regional and 13 State Centres. The important programmes
Im portant program m es undertaken by IM D• M odernisation of radar data network for
improving the accuracy in the forecasting o f upper winds and severe storms.
• M odernisation o f upper air networtc with 40! MHz radio-theodolites.
• Installation o f CYBER-2000 com puter to make forecasting network more efficient.
• Com m issioning o f instruments like ceilographs/ skopographs at National Airports.
• World Bank Aided projects to upgrade the seismological instrumentation in peninsular India and hydrological networks.
1034
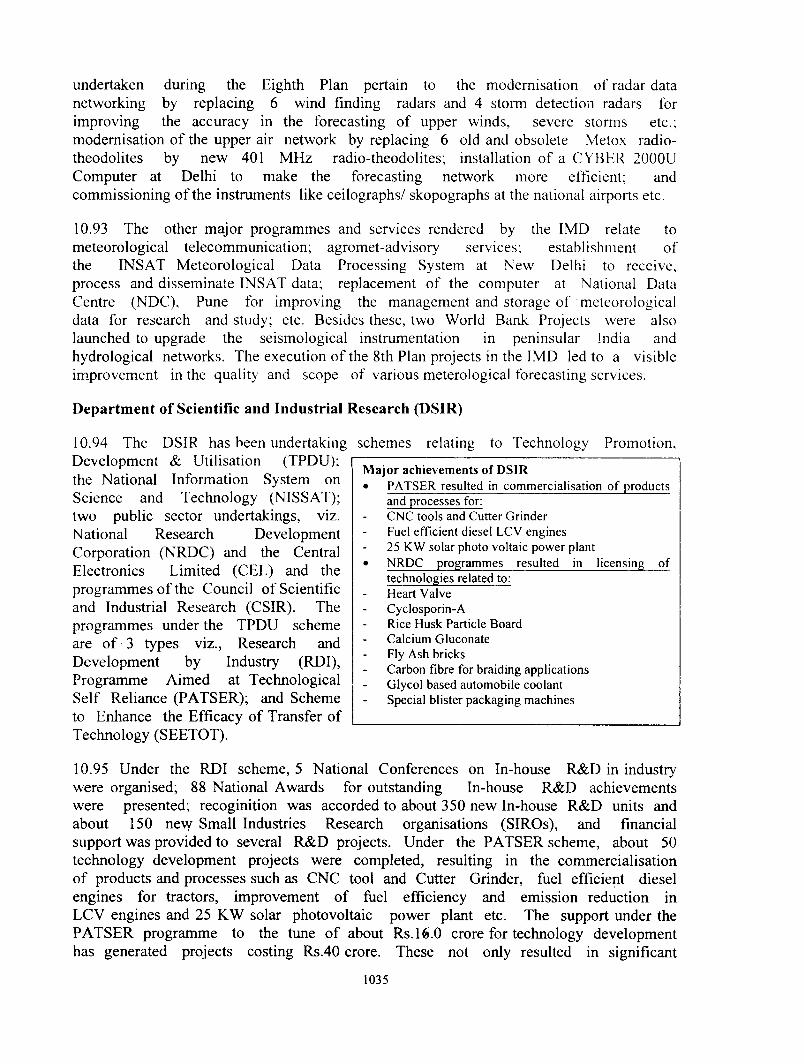
undertaken during the Eighth Plan pertain to the modernisation of radar datanetworking by replacing 6 wind finding radars and 4 storm detection radars forimproving the accuracy in the forecasting o f upper winds, severe storms etc.;modernisation o f the upper air network by replacing 6 old and obsolete N4etox radiotheodolites by new 401 MHz radio-theodolites; installation o f a CYBER 2000U Computer at Delhi to make the forecasting network more efficient; and commissioning o f the instruments like ceilographs/ skopographs at the national airports etc.
10.93 The other major programmes and services rendered by the IMD relate tometeorological telecommunication; agromet-advisory services; establishment of the INSAT Meteorological Data Processing System at New Delhi to receive, process and disseminate INS AT data; replacement o f the computer at National Data Centre (NDC), Pune for improving the management and storage o f meteorological data for research and study; etc. Besides these, two World Bank Projects were also launched to upgrade the seismological instrumentation in peninsular India and hydrological networks. The execution o f the 8th Plan projects in the IMD led to a visible improvement in the quality and scope o f various meterological forecasting services.
Department of Scientific and Industrial Research (DSIR)
10.94 The DSIR has been undertaking Development & Utilisation (TPDU); the National Information System on Science and Technology (NISSAT); two public sector undertakings, viz. National Research Development Corporation (NRDC) and the Central Electronics Limited (CEL) and the programmes o f the Council o f Scientific and Industrial Research (CSIR). The programmes under the TPDU scheme are o f 3 types viz., Research and Development by Industry (RDI), Programme Aimed at Technological Self Reliance (PATSER); and Scheme to Enhance the Efficacy o f Transfer o f Technology (SEETOT).
schemes relating to Technology Promotion,
M ajor achievem ents o f DSIR• PATSER resulted in com m ercialisation o f products
and processes for:CNC tools and Cutter Grinder Fuel efficient diese! LCV engines 25 KW solar photo voltaic power plant
• NRDC program m es resulted in licensing o f technologies related to:Heart Valve Cyclosporin-A Rice Husk Particle Board Calcium Gluconate Fly Ash bricksCarbon fibre for braiding applications Glycol based autom obile coolant Special blister packaging machines
10.95 Under the RDI scheme, 5 National Conferences on In-house R&D in industrywere organised; 88 National Awards for outstanding In-house R&D achievements were presented; recoginition was accorded to about 350 new In-house R&D units andabout 150 nev/ Small Industries Research organisations (SIROs), and financialsupport was provided to several R&D projects. Under the PATSER scheme, about 50technology development projects were completed, resulting in the commercialisation o f products and processes such as CNC tool and Cutter Grinder, fuel efficient diesel engines for tractors, improvement o f fiiel efficiency and emission reduction in LCV engines and 25 KW solar photovoltaic power plant etc. The support under the PATSER programme to the tune o f about Rs.16.0 crore for technology development has generated projects costing Rs.40 crore. These not only resulted in significant
1035
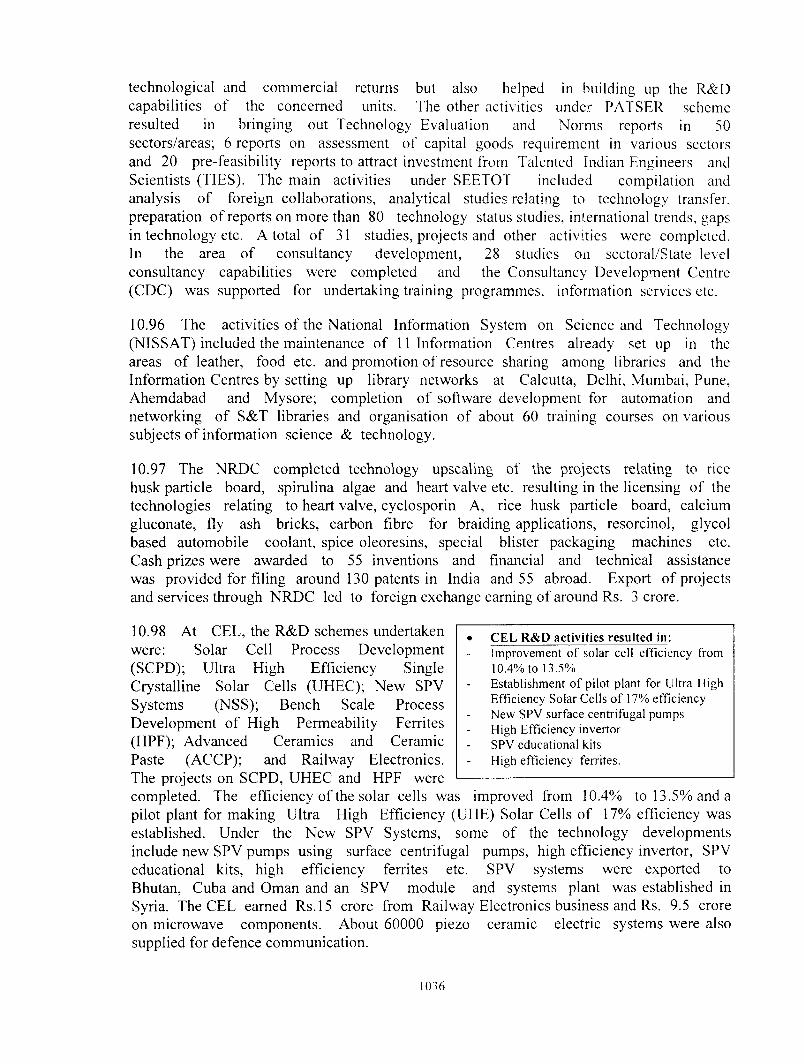
technological and commercial returns but also helped in building up the R&D capabilities o f the concerned units. The other activities under PATSER scheme resulted in bringing out Technology Evaluation and Norms reports in 50 sectors/areas; 6 reports on assessment o f capital goods requirement in various sectors and 20 pre-feasibility reports to attract investment from Talented Indian Engineers and Scientists (TIES). The main activities under SEETOT included compilation and analysis o f foreign collaborations, analytical studies relating to technology transfer, preparation o f reports on more than 80 technology status studies, international trends, gaps in technology etc. A total o f 31 studies, projects and other activities were completed. In the area o f consultancy development, 28 studies on sectoral/State level consultancy capabilities were completed and the Consultancy Development Centre (CDC) was supported for undertaking training programmes, information services etc.
10.96 The activities o f the National Information System on Science and Technology (NISSAT) included the maintenance o f 11 Information Centres already set up in the areas o f leather, food etc. and promotion o f resource sharing among libraries and the Information Centres by setting up library networks at Calcutta, Delhi, Mumbai, Pune, Ahemdabad and Mysore; completion o f software development for automation and networking o f S&T libraries and organisation o f about 60 training courses on various subjects o f information science & technology.
10.97 The NRDC completed technology upscaling of the projects relating to rice husk particle board, spirulina algae and heart valve etc. resulting in the licensing o f the technologies relating to heart valve, cyclosporin A, rice husk particle board, calcium gluconate, fly ash bricks, carbon fibre for braiding applications, resorcinol, glycol based automobile coolant, spice oleoresins, special blister packaging machines etc. Cash prizes were awarded to 55 inventions and financial and technical assistance was provided for filing around 130 patents in India and 55 abroad. Export o f projects and services through NRDC led to foreign exchange earning o f around Rs. 3 crore.
CEL R&D activities resulted in :Improvement o f solar cell efficiency from 10.4% to 13.5%Establishm ent o f pilot plant for Ultra High Efficiency Solar Cells o f 17% efficiency New SPV surface centrifugal pumps High Efficiency invertor SPV educational kits High efficiency ferrites.
10.98 At CEL, the R&D schemes undertaken were: Solar Cell Process Development(SCPD); Ultra High Efficiency Single Crystalline Solar Cells (UHEC); New SPV Systems CNSS); Bench Scale Process Development o f High Permeability Ferrites (HPF); Advanced Ceramics and Ceramic Paste (ACCP); and Railway Electronics.The projects on SCPD, UHEC and HPF were completed. The efficiency o f the solar cells was improved from 10.4% to 13.5% and a pilot plant for making Ultra High Efficiency (UHE) Solar Cells o f 17% efficiency was established. Under the New SPV Systems, some o f the technology developments include new SPV pumps using surface centrifugal pumps, high efficiency invertor, SPV educational kits, high efficiency ferrites etc. SPV systems were exported to Bhutan, Cuba and Oman and an SPV module and systems plant was established in Syria. The CEL earned R s.l5 crore from Railw'ay Electronics business and Rs. 9.5 crore on microwave components. About 60000 piezo ceramic electric systems were also supplied for defence communication.
1036

10.99 The Council o f Scientific & Industrial Research (CSIR) has built up over the years a network o f 40 specialised national laboratories with 80 field extension centres having expertise and knowledge-base in diverse scientific disciplines and serving practically all the socio-economic sectors. During the Eighth Plan, the CSIR reoriented its actitives to operate in an environment o f international competition and to strive towards self sustaining growth. For this, policy changes were brought about in the management structures and the mode o f functioning so that the CSIR system became more user responsive and market-driven. Efforts were also made to develop closer links with the user agencies and to forge strategic alliances through increased industry representation on the apex decision making bodies o f CSIR such as Governing Body, Technical Advisory Body etc. and by providing technical know-how on turn-key basis.
Im portant achievem ents o f the CSIR laboratories:• Design and fabrication o f all com posite aircraft.• New catalysts for refineries, petrochemical and chemical
industry,• New drugs for anti-fertility, bio-enhancer and memor)'
enhancer.• Novel cost-effective processes for 30 drugs and four drug
interm ediates licensed.• Long wall and wide stall m ethods o f mining.• Oil palm processing technologies.• M echanised pulse mill o f lOOKg/Hr capacity.• Hand operated daal mill o f 40-50 Kg/Hr. capacity.
10.100 There were several scientific & technological achievements by the CSIR laboratories. The country's first all-composite aircraft was designed and fabricated.
New catalysts were developed for refineries, petrochemical and chemical industry. A cost-effective novel process for NMP (a solvent used in refinery processes) was developed. New drugs for antifertility, bioenhancer andmemory enhancer weredeveloped and novel cost- effective processes for over 30 drugs and four drug intermediates
were licensed as anti-AIDS, anti-viral, anti-cancer, anfi-bacterials, anti-malarial, analgesics, anti-inflammatory and anti-allergic. In the Energy Sector appropriate techniques/ technologies were developed for long-wall mining and wide stall method o f mining, beneficiation o f coking and non-coking coal for reduction o f ash content, coal carbonisation, solvent refining, conversion o f synthetic gas/coal to middle distillates etc. The R&D in Food & Food Processing Sector led to the development o f oil palm processing technologies including a screw press o f 5tonnes FFB/hr capacity; mechanised pulse mill o f 100 kg/hr capacity and hand-operated daal mill o f 40-50 kg/hr capacity. The CSIR's wide-ranging, multi-disciplinary expertise and capabilities were gainfully utilised by several clients in the developed countries like USA (Abbot Laboratories, Parke-Davis, Smith-Kline Beecham, FMC, GE, Du Pont etc.), UK, Switzerland, Canada, Finland, as well as in the developing countries like China, Brazil, Indonesia and Oman.
10.101 During the Eighth Plan, the industrialproduction based on CSIR know-how increased to Rs.10,000 crore, with a productivity saving worth Rs. 800 crore. In addition, 250 new technologies were made available for licensing
Perform ance indicators o f CSIR• Industrial production based on CSIR know how increased to
Rs. 10,000 crore.• 250 New technologies m ade available for licensing.• 800 Technology license agreements signed.• 920 patents filed in India.• 120 patents filed in other countries.• Rs. 700 crore External Cash Flow generated through contract
R&D work and consultancy.
1037

and 800 technology licence agreements were executed. A total o f 920 patents were filed in India and another 120 patents abroad. Technical assistance was rendered to about 4000 entrepreneurs and an external cashflow to the tune o f around Rs. 700 crore was generated through contract R&D work and consultancy. These achievements apart, the CSIR has been able to create and nurture R&D manpower at all levels, over a wide spectrum of disciplines. This is realised through awards, Fellowships/ Associateships to scientists, sponsoring extramural research (EMR) schem.es to Universities/ R&D organisations etc. During the Eighth Plan period, a total o f around 5000 JRF, 6000 SRF, 1000 RA and 2000 Pool Officers were supported.
Department of Biotechnolog)' (DBT)
10.102 There were several breakthroughs in the field o f biotechnology, particularly in the areas o f molecular biology, plant and animal cell culture and in the development of immunology covering agriculture and allied areas, m.edical research, environment including biodiversity conservation with biotechnological tools etc. Major advances have taken place in basic research in modern biology, leading to the emergence of many techniques, tools and products to usher in a biotechnology revolution in the country. New leads for vaccines and drugs were made available through basic research. Cloning o f gene, structural studies using X-ray crystallography and genome
mapping have also provided clues for further work in \hc area of medical biotechnology. The development o f diagnostic kits for infectious diseases has received very high priority. The development of kits for tuberculosis, hepatitis A&C, amoebiasis, pregnancy, streptococcal infection in children and HlV-I&l! infections are in very advanced stages and negotiations on technology transfer
to industry are in progress. There was a significant breakthrough in wheat,where high frequency reproducable regeneration o f plants has been achieved and a large number o f plants have been transferred to the field. Tissue culture raised cardamom plant gave 37% higher yield. Through continued support to the States and socio-economic ministries for research and development programmes, demonstrafion activities, technology transfer, patenting o f inventions and conservation of natural resources, especially of genetic diversity, using biotechnological tools, efforts were made to formulate and implement joint proposals for promoting research in various areas o f biotechnology. During the Eighth Plan, about 700 projects were recommended for financial support, ten patent applications w'ere filed and 15 were under process. Atleast 10 technologies have been perfected and negotiations are in progress through BCIL and NRDC for their transfer to the industry. Some o f the scientific services provided by the DBT were: infrastructural facilities in the areas o f animal house, cell cultures, genetic engineering, germplasm collecfion etc. Thefacilities for fundamental research in structural biology, bioinformatics network etc. are being utilised extensively by a large number o f scientists and students in the country.
1038
M ajor achievements;• Diagnostic Kits for tuberculosis, hepatitis A & C,
Amoebiasis, Pregnancy, Streptococcal infection in childrenand m V - I & II,
• High frequency reproducible regeneration o f wheat plants.• Transfer o f technology for monoclonal M-13 bacteriophage.• Marketing o f Diagnostic kit for Leishmaniasis.• Cloning ol 'gene coding and expression in E.coli.• Mission mode projects initiated in the field o f
BiofertilisersBiological control o f pests Aquaculture.
• F.stablishment o f Centre for DNA Fingerprinting and Diaunostics (CDFD) at Hyderabad

10.103 The other significant contributions o f the DBT were transfer o f the technology for monoclonal M-13 bacteriophage to M/s Pharmacia Inc., USA., marketing o f a diagnostic kit for leishmaniasis developed at the CDRI Lucknow; the cloning o f the gene coding and expression in E. coli at IMTECH, Chandigarh; Alphanso' variety of mango through somatic embryogenesis; multiplication of a few endangered species of orchids and tea, cocoa, pepper and coffee; solvent extraction and chemical fractionation o f six plants at N il leading to the identification o f two active fractions with distinct antibacterial activity etc.
10.104 During the Eighth Plan period, three mission mode projects on biofertilizers, biological control o f pests and aquaculture were under implementation. The first two were successful while there was a slippage in the case o f the aquaculture project. Under the first one, there has been an increase in the grain yield with the use o f biofertilizers. Under the second, eight candidate biopesticides were developed and perfected. Under the aquaculture project only demonstration of freshwater prawn culture could be initiated in the States o f Orissa. Madhya Pradesh and Tamil Nadu. Due to the special efforts made by the DB'f, about 5000 persons belonging to SC/ST and weaker sections benefitted in terms o f employment opportunities, better nutrition and health care systems. In the earthquake-affected areas o f Latur and Osmanabad, 13000 families were benefitted through eight demonstration projects,
10.105 \n the area of Human Resource Development, postgraduate leaching andpostdoctoral research and training programmes are being conducted at 33 select universities and institutions; a number o f short-term training courses are being supported and a number o f national and overseas Associateships awarded. Underinternational cooperation, the significant programmes include the setting up o f a Centre of Excellence with the help o f SIDA; establishment of gene banks for medicinal and aromatic plants and a sub-programme on Asian Biotechnology and Biodiversity supported by UNDP/FAO. The significant research efforts at the two autonomous institutes, viz., the National Institute o f Immunology, New Delhi and the NationalCentre for Cell Science (NCCS). Pune pertain to immunisation, diagnostic tests based on synthetic peptides o f the various antigens of HIV; leprosy vaccine as immunotherapeutic and immunoprophylactic; a non-isotopic modality o f PCR-based DNA probe for tuberculosis; research on primary cultures o f human foreskin fibroblast etc. The third centre, viz.. International Centre for Genetic Engineering and Biotechnology (ICGEB), New Delhi became I'unctional from its new building. The significant areas o fresearch work o f this Centre relate to hepatitis vaccine, technology for production ofgamma interferon, diagnostic kits for AIDS etc. A new Centre for DNA Fingerprinting and Diagnostics has also been set up with DBT support at Hyderabad during the Eighth Plan.
DEPARTMENT OF OCEAN DEVELOPMENT (DOD)
10.106 The programmes o f the Department o f Ocean Development were broadly grouped as : Basic Research, Strategic Fields, Technology Development / Scientific Services and Societal Programmes. Under basic research, 42 projects were implemented in colla-boration with a large number o f national laboratories, universities and educational institutions. They provided interesting and useful results on the history of the sedimentation process and provided clues for the development o f potential drugs and chemicals from the marine organisms. They also facilitated identification o f the
1039

areas o f heavy metal pollution; characterisation o f the toxic components o f various pollutants specifically in some estuaries and coastal areas and standardisation o f technologies for extraction o f iodine from selected seaweeds.
10.107 The activities in strategic fields included polar exploration, PolymetallicNodules Programme andinternational cooperation.During the Eighth Plan, six expeditions to Antarctica were conducted and polar research was carried out on various aspectso f global climatic phenomena, ozone depletion, ice-core samples, etc. In one o fthese expeditions, thedistribution and abundance of krill, cephalopods andAntarctic fish were studiedand the feasibility o f commercia Polymetallic "Nodules programme.
M ajor achievements:• Six expeditions to Antarctica.s Survey of entire pioneer area o f 1,50,000 sq. Km. For
Polymetallic Nodules using hydrosweep,• Prototype o f remotely operated collector unit operating up
to 200 meter depth.• Bucket-in-pipe lifting system for transporting nodules from
the collector system.• Three process routes for recovery o f metals from nodules.• Identification o f 17 potential organisms having several
medicinal properties.• Established National Institute o f Ocean Technology
(NIOT) at Chennai.• Potential fishing zone advisories disseminated to 174 fish
landing centres.• Communication facilities created at nine places in four
southern states for enhancing the safety o f fishermen.
exploitation o f these resources was established. In thethe survey of the entire pioneer area o f 1,50,000
sq. Km. allotted to India in the Central Indian Ocean Basin has been completed usingthe hydrosweep. A prototype o f a remotely operated collector unit operating upto 200metre depth and a bucket-in-pipe lifting system for transporting nodules from the collector system was designed and fabricated and three process routes for the recovery o f metals from nodules were identified. As per the international agreement, out o f 50% o f the area to be relinquished in the Central Indian Ocean, 20% has already been relinquished to the International Seabed Authority.
10.108 The most important among the teclinology development projects relates to the development o f potential drugs from the ocean leading to the identification o f 17 potential organisms having several properties like anti-fertility, anti-microbial, antiviral, anti-diabetic, anfi-malarial, anti-hypertensive and anti-inflammatory. Out o f these, five organisms, which showed potent activity as anti-diabetic, anti-viral, anti-amoebic, anti-anxiety and larvicidal agents, have been identified for development o f atleast two herbal drugs in the next few years. The National Institute o f Ocean Technology (NIOT), set up in IIT, Chennai initiated projects in the areas o f Ocean Energy, Deep Sea Technology and Ocean Mining, Coastal Zone and Marine Instrumentation. These have enhanced the capabilities for generafing energy from the ocean; venturing into shallow bed mining; identification o f new sites for ports and harbours, etc. The major societal programmes initiated were: Coastal Ocean Monitoring and Prediction System (COMAPS); Nafional Ocean Informafion System (NOIS) and Marine Satellite Information Service (MARSIS). The data on various pollutants collected under the COMAPS programme, helped in drawing a long-term plan for keeping our coastal zone clean. The data collected through the NOIS, set up in 14 Nafional Marine Data Centres, is being used for planning, development, management o f specific fields o f ocean science and technology and exchange o f data with national and international institutions. Under the MARSIS programme, potential fishing zone advisories were disseminated to 174 fish landing centres on a regular
1040

basis. This helped the fishermen in getting better fish catches and reducing the time spent on reaching the fishing grounds which in turn reduced the overall operational cost and improved their incomes and living conditions. The communication facilities created at nine places in the four southern States and South Goa have benefited over 850 fishermen families and demonstrated the usefulness o f the communication system for enhancing the safety o f fishermen.
(B) SOCIO-ECONOMIC SECTORS
10.109 The integration ofJoint R&D projects identifled through IS-STAC mechanism;• Column floatation technology for industrial applications
(M inistry o f Mines)• Development and Testing o f STATCON Dynamic Voltage
Restorer (DVR) (M inistry o f Power)• Industrial application o f vorsyl separator (Ministry' o f Coal)• Super Clean Coal development for metallurgical industry
(M inistry o f Coal)• Introduction o f short wall m ining (M inistry o f Coal)• Energy efficient materials for m ining industry (M inistry of
Mines)
S&T component with the concerned socio-economic sectors was continued through the Science & Technology Advisory Committees (STACs) set up in 22 ministries with the objective o f identifying and formulating specific S&T Plans & promoting S&T programmes relevant to the concerned sector. The guidelines for STACs were formulated and assistance was provided to various socio-economic sectors in terms of identification of experts, thrust areas, linkages with national laboratories/ universities. Efforts were made to make the STACs more active in the overall S&T development and planning of the concerned sectors. An Inter- Sectoral Science & Technology Advisory Committee (IS-STAC) continued to function in the DST with a view to coordinating the STAC activities and providing a forum to share their expertise and experiences. This process served the dual purpose o f making the STACs, which were already functional, more active and in activating those which till then had not yet become functional.
10.110 With the active cooperation o f the STACs, several technology mission mode projects were initiated in the areas o f sugar production technologies, development o f advanced composites, fly ash utilisation, biofertilizers, biopesticides and aquaculture and a number o f important R.&D projects which have relevance to the concerned sectors identified and funded. An important initiative taken through the IS-STAC mechanism led to the identification o f some joint research projects/programmes and schemes in consultation with the concerned ministries/departments. Some examples o f such joint projects are: development o f indigenous column floatation technology for industrial applications ( Ministry o f Mines); development and testing o f STATCON Dynamic Voltage Restorer (DVR) (Ministry o f Power); industrial applications o f vorsyl separator ( M inistry o f Cc al); super clean coal development for metallurgical industry (Ministry o f Coal); introduction o f shortwall mining (Ministry o f Coal); energy efficient materials for mining industry (Ministry o f Mines) etc. The other measures o f the IS- STAC, which have an impact on the S&T inputs in the socio-economic sectors are: publication o f a newsletter, 'STAC Scan', covering information regarding technology needs o f the socio-economic ministries and organisation o f awareness workshops on, Control Technologies for Greenhouse Gas Emissions, Pre-combustion Clean Coal Technologies and R&D in Energy and Energy Efficiency.
1041

NINTH FIVE YEAR PLAN PROGRAMMES
(A) Scientific Agencies/Departments
DEPARTMENT OF ATOMIC ENERGY (DAE) - R&D sector :
10.111 The tlirust during the Ninth Plan in R&D sector will be on design and development o f fast breeder reactor; enhancement o f thorium utilisation; engineering development o f thorium-based advanced heavy water reactor and matching developments in the fuel cycle area; accelerator-based systems and fusion power; technology missions in radiation applications in health, agriculture and food, specially on food preservation, desalination and isotope hydrology; strategic technologies in the areas o f special materials, lasers, particle accelerators, computers, robotics, c»-yogenics and special instrumentation; safety and environmental protection; and technology spinoff to industry.
Thrust o f DAE (R«&D) during the Ninth Plan:• Design and developm ent o f fast breeder reactor,• Enhancem ent o f Thorium utilisation.• Engineering developm ent o f Thorium based advanced
heavy water reactor.• A ccelerator based systems and fusion power.• Technology missions in radiation application in health,
agriculture and food.• Safety and environm ental protection.• Technology spin-offs to industry.
10.112 On the power reactor front, the existing PHWR programme aims at moreefficient utilisation o f uranium and eventually o f thorium, development o f specificreactor systems, such as high temperature reactors. source-driven reactors which use spallation or fusion neutronsand accelerators as non-tlssion neutron sources in application areas such as desalination and compact power packs for use in
remote areas etc. The programme o f advanced heavy water reactors is aimed at getting a large fraction o f energy output from thorium. The Fast Breeder Technology Development Programme, pursued in IGCAR, will focus on schemes relating to R&D in engineering and technology development for Fast Breeder Reactors (FBRs). Under Nuclear Fuel Development, the efforts will be on modernisation o f fabrication and assembly facilities incorporating advanced automation systems and updating o f hot laboratory facilities. In addition, metallurgy and materials development programme for FBRs will be pursued for carrying out R&D work. The work on reprocessing of thermal reactor fuels will concentrate on upgrading the technology to the state-of- the-art by process innovations, equipment development, incorporation o f remote maintenance by robots, advanced techniques etc.
10.113 The activities relating to safety will be directed towards understanding safety- related phenomena, surveillance, monitoring and life prediction o f components through related experimental studies. Under the radiological safety programme, a Regional Radioactivity Laboratory will be set up for continuous monitoring o f very low levels o f short/long-lived radionuclides in a variety o f environmental matrices. The Atomic Energy Regulatory Board, (AERB) will' take up research related to nuclear industrial and radiation safety with specific emphasis on regulatory aspects covering development o f computer codes and their validation, studies connected with serious accidents, safety evaluation methodologies etc. The programme under radiation
1042

and radioisotope technology envisages improved infrastructui'e and state-of-the-art instrumentation in hydrology, industry and medicine, covering the upgradation o f isotope technology laboratory; the setting up o f Electron Beam Irradiation Centre; the development of prototype accelerator for various applications like food irradiation, medical product sterilisation and theraputics etc. The research work on the application o f nuclear energy for societal benefit will relate to research in nuclear agriculture, plant bio-technology, plant molecular biology, with application o f radiation-induced mutations and plant breeding techniques; plant tissue culture techniques for various applications; large-scale production of biopesticides and integrated pest management for maintaining high yields in crops etc. The R&L^ programme relating to the application o f radiation and radioisotope technology to health care will be intensified by establishing medical cyclotron with Positron Emission Tomography (PET) facility for metabolic imaging for diagnosis, including development o f new radiopharmaceuticals at site. A few mobile rural Cancer Centres will also be set up for early detection o f cancer in the rural population.
10.114 Some of the essential facilities that will be upgraded/set up include:animal house facillities at BARC and TMC; installation o f a high frequency NMRmachine; augmentation of low temperature facilities; completion o f the ongoing scheme relating to .-\dvanced Centre for fraining. Research and Education in Cancer (.AC rR E (') by fata \4emorial Centre ( fMC); establishment of linear accelerator; augcmentation o!' equipment at I'MC'; augmentation of space and infrastructure at 'fata \4emorial Hospital ( I MH); augmentation o f equipment at Cancer Research Institute (CRI); replacement ofm egatron linac system with dual energy linear accelerator etc.
10.115 Thrust will also be on the R&D programmes on accelerators. BesidesIhe ongoing programme on Superconducting Cyclotron, the Variable Energy Cyclotron Centre (VECC) would take up schemes relating to heavy ion accelerator W'ith Variable Elnergy Cyclotron, setting up o f radio active ion beam facility,radiation mcdicine and application, material science research using accelerator,recovery and analysis o f helium from hot springs, heavy ion experimental facilities etc. The Centre for Advanced Technology (CAT) will take up new projects forutilisation o f INDUS-Il, Protron Synchrotron, Accelerator Technology and Application and DAE-CERN collaboration for Large Hadron Collider (LHC). The laser programme will focus on demonstration o f laser-based processes for nuclear programme, spinoff techniques for use o f lasers in various applications, such as diagnostics, therapy in medical field, instrumentation and Non Destructive Testing and Evaluation (NDTE) applications. The thrust will be on the expansion of infrastructure facilities at CAT besides new activities relating to advanced lasertechnology and applications, special materials etc.
10.116 The programmes under basic research, which will receive priority relate toX-ray-based condensed matter research using INDUS-I and II; collaborativeresearch programme by using the upcoming international high energy facilities such as RHIC, Brookhaven and LHC, CERN and SpringS-Japan; frontier areas o f mathematical physics, condensed matter physics, astroparticle physics, Bose- Einstein condensation, quantum computation and ^communication and complexity theory, chemical physics etc. at TIER; condensed matter physics and surface studies, ultrafast parallel processing, setting up of research facilities for high
1043

temperature superconductors, composites, intermetallics and alloys, thin film, low temperature measurement etc. at Saha Institute o f Nuclear Physics (SINP); pelletron-based experimental programme, theoretical astrophysics and setting up experimental faciUties in biophysics at Institute o f Physics (lOP); and strengthening o f research in mathematical science at Institute o f Mathematical Science (IMS) and Mehta Research Institute (MRI). Under plasma research, the scheme relating to advanced plasm a research for steady state superconducting TOKAMAK will be continued and ADITYA will be upgraded to increase plasma purity in addition to augmentation o f diagnostics at IPR.
10.117 Under the technology development and transfer programme, the facilities to be set up include development o f electron beam melter, electron beam welder and electron beam evaporation unit; development o f plasma melter, plasma gas heater, RF plasma reactor and microwave & low pressure plasma reactors; development o f RF excited carbon laser, pulsed excimer laser and photo chemical reactor, facility for fabrication o f ultra high precision components along with balancing equipment for the accelerator programme, employing super conducting cavity and beamline equipment etc. The Centre for Product Engineering and Technology Transfer would be engaged in technology transfer.
10.118 The new national programmes proposed to be taken up include: neutronbeam research, facilities for macromolecular crystallography and superconductivity and cryogenics, international programmes relating to nuclear physics research with high energy accelerators by BARC; international collaboration programme for the study o f quark-gluon plasma at heavy ion colliders at VECC and SINP; and the setting up o f centres for radioastrophysics, applied mathematics and accelerator physics. In addition, facilities for high current isotope separation ion implantation; m ultielement gamma and Heavy-ion and neutron array detectors will be set up at SINP besides strengthening o f Homi Bhabha Centre for science education and the National Centre for Biological Science.
10.119 As in the past, FIRD will be accorded due priority in accordance with the requirements o f manpower arising out o f the global science and will maintain interaction with various science Departments o f the Government and other premier scientific agencies in the country during the execution o f its programmes.
DEPARTMENT OF SPACE (DOS)
10.120 While the basic vision for the space programme will continue to be the same as was enunciated at its inception, it will be adapted to respond effectively to the dynamic and complex scenario o f the coming years and unstinted efforts will be made towards developing and harnessing advanced space technologies to provide additional and newer services in a self-reliant manner for the socio-economic development of the country.
1044

Im portant m issions planned for Ninth Plan:• Satellites:- 1NSAT-2D and INSAT-2E- 1NSAT-3A, 3B, 3 C a n d 3 D
INSAT-3E as ground spare.GSAT satellite
- IR S-IDIRS-P4 (Oceansat-1)
- IRS-P5 (Cartosat-1)IRS-P6 (Resourcesat)
» Launch Vehicles:PSLV will be the workhorse vehicle for all IRS satellites. Enhancem ent o f payload capability and reliability o f PSLVO perationalisation o f GSLV enabling indigenous launch from 1NSAT-3C onwards.D evelopm ent o f Cryogenic Upper Stage (C20) and Solid Booster (S250).
10.121 Under the INSAT series, the INSAT-2D & 2E are planned to be launchedfollowed by four satellites of the INSAT-3 series (INSAT-3A, 3B. 3C, 3D) during the Ninth Plan. The INSAT-3E is planned to be a ground spare, with flexibility in configuration. The GRAMSAT network is planned to be established in the coming decade, integrating the potentials o f satellite communication and satellite remote sensing for a wide range o f applications for rural development, including tele-education and tele-health. The ongoing Jhabua Development Communication Project will be completed and large-scale replications o f the same in
several districts will be carried out. The new communication services proposed to be rendered include: Digital Audio and Data Processing, expansion o f mobile communication services etc. The GSAT satellite is planned to be launched during the Ninth Plan to meet these requirements. In the area o f earth observations, the majorobjective will be to emerge as a front ranking leader globally in high quality data,wide range o f application services etc.
10.122 While continuing to utilise the remote sensing technology for widening thescope o f the IMSD and the establishment o f NNRMS, efforts will be directed towards a better understanding o f the geosphere-biosphere interaction, enviommental protection o f the earth, establishment o f a National Disaster Warning and Management System etc. To achieve these objectives, the IRS-ID, identical to the IRS-IC and threemore remote sensing satellites, viz., the IRS-P4 (Oceansat-1), the IRS-P5 (Cartosat-1)and the IRS-P6 (Resourcesat) are planned to be launched during the 9th plan. Significant developmental efforts are also planned during the 9th Plan towards realisation o f the follow-on remote sensing satellites required to be launched during the 10th Plan such as the IRS-2A, the IRS-2B and the IRS-2C satellites, meteorological satellite and the microwave remote sensing satellite, which will ensure continuity of services in an enhanced manner and enable capitalising on the technology edge established in the global market. A National Disaster Warning and Management System using the potentials o f communication and remote sensing satellite, will be established.
10.123 In the area o f launch vehicle systems, interlocking the satellite requirements with the launch vehicle capability will be the prime objective. The Polar Satellite Launch Vehicle (PSLV) will continue to be the workhorse vehicle for launching all the IRS satellites. The major targets for the Ninth Plan are: enhancement of the payload capability and reliability o f PSLV; operationalisation o f Geosynchronous Satellite Launch Vehicle (GSLV) towards achievement o f self-reliance in launching communication satellites enabling indigenous launch from the INSAT-3C onwards, progressively enhancing the payload capability o f GSLV to meet the requirements
1045

of the state-of-art communication satellites; and the development of Cryogenic Hpper Stage (C20) and the Solid Booster (S250).
10.124 The Indian industry and academia will have an enhanced role, as partners in the national space effort. The Regional and State Remote Sensing Centres will play a major role as delivery systems for space application services at the grass-root level, in the international space scene, strategic alliances w'ill be forged with international agencies to service the commercial global space market. Research and development as well as technology development will continue to be the mainstay o f the space programme. Research programme in the area o f astronomy/ aeronomy missions, inter-planetary studies and microgravity experiments will be initiated. Human resource development will receive the maximum possible attention in the coming years. Even though the missions and tasks to be accomplished in the 9th Plan will be double that in the 8th Plan, there will not be any significant addition to the existing manpower, except in technologically complex and new initiatives. In all, 16 satellite missions and 11 indigenous launch vehicle missions are envisaged during the 9th Plan, as compared to 9 satellite missions and 5 indigenous launch vehicle missions in the 8th Plan.
DEPARTMENT OF SCIENCE AND TECHNOLOGY (DST)
10.125 The thrust o f the DST during the 9th Plan will be on building and sustaining a strong science & technology base in the country, developing centres of excellence in the frontline areas o f science & technology and modernising the infrastructure o f its autonomous research institutions.Under the SERC programme, new initiatives will be launched to further strengthen the S&T base in the country in selected areas o f technological importance. The overall approach will be to promote basic research around outstandingscientific groups and to a large extent in the academic sector. The SERC will be provided more autonomy and flexibility for better management o f R&D schemes and their proper monitoring and evaluation. Some o f the important initiatives under theSERC will include promotion o f research in less endowed universities; setting up Engineering Research Centres in the areas o f Concurrent Engineering, Bio-Engineering, Technical Acoustics etc; providing industrial research fellowships to work in the industry; encouraging some of the frontier areas like biodiversity, noise control, plasma chemistry, micro robotics, chemical engineering sciences, modern classical optics, stress biology and immunology, boundary layer modelling, study o f atmosphericchemistry etc. The research areas for the engineering sciences, will be in the disciplines like Chemical Engineering; Materials, Mining and Mineral Engineering; Robotics; Computer Engineering; etc. Under the programme o f Intensification of Research in High Priority Areas (IRHPA), the focus will be on setting up a few major
Important initiatives under SERC:• Promotion o f research in less endowed universities.• Setting up Engineering Researcii Centres in the area o f
Concurrent Engineering, Bio-Engineering, Technical Acoustics etc.
• Providing industrial research fellowships to work in industry.
• Encouraging frontier areas like biodiversity, plasma chemistry, micro-robotics, chemical engineering, modem classical optics, boundary layer m odelling etc.
M ajor facilities planned under IRPHA Electron Spray Mass Spectrom eter Radioactive Ion Beam Multi GeV Hadron Heavy Ion A ccelerator Low energy accelerator Confocal M icroscopy facility
1046

sophisticated facilities and Centres in the country to pursue frontline R&D, sue electron spray mass spectrometer, radioactive ion beam, multi-GeV Hadron he£ ion accelerator, low energy accelerator, confocal microscopy facility etc.
10.126 The National Accreditation Board for Testing and Calibration Laboratories (NABL) will be strengthened to meet the demands which are likely to go upto about 1500. Along with it, the assessors training programme and the laboratory awareness programme will be intensified. The NABL will be enrolled as a member o f the International Laboratory Accreditation Cooperation as well as the Asia Pacific Laboratory Accreditation Cooperation for achieving the Mutual Recognition Agreement.
10.127 As a part o f the National Science and Technology Manpower Informationl-ech n o lo g y Developm ent programmes: System (NSTMIS), a new initiative on• A m o re ho l is t ic a n d u se r f r iend ly a p p ro a c h to w a rd s
m a k in g th e h ig h tec h n o lo g ie s a n d p ro d u c ts a v a i lab le to the soc ie ty .
• D ru g d e v e lo p m e n t b a se d on t rad i t io n a l sy s te m s o f m ed ic in e .
• T e c h n o lo g y m is s io n m o d e p ro jec ts in the a rea s of:A g r o food F o o d p ro c e s s in g W a te r w a y s R o a d T ra n s p o r ta t io n l . ie c tn c P o w e r
T e l e c o m m u n ic a t i o n A v .a t io n S e n so rs
the setting up o f a National Science Manpower Information System, will be taken up and it will be integrated with the ongoing National Technical Manpower Information System o f the Ministry o f Human Resource Development. An on-line access to international databases on S&T slalistics will also be established. In the area of technology development, a more holistic and user-friendly approach will be adopted towards making the high technologies and
products available to the society. The thrust will be on technology missions, technology promotion and special technology projects through critical technology promotion, high technology intervention in selected export areas and prom otion of NGO/society/ organisation. In respect o f the Instrument Development Programme, it is proposed to support new projects for the development o f instruments in some new' areas like energy monitoring and management, sensors etc. besides conducting training programmes and transfer o f know-how o f instruments to industries. The new initiatives under drugs and pharmaceutical research will include: drug development based on traditional systems o f medicine like Ayurveda, Unani, and Sidha besides Homeopathy and support to joint projects leading to drug development for infectious diseases. For undertaking technology projects on a mission mode, the new areas will be agro food processing, waterways, road transportation, electric power, telecommunication, aviation, sensors, IPR and future technology forecast for India for 2020. The thrust of the S&T Entrepreneurship Development activities will be on strengthening and expansion o f the entrepreneurship development cells and the S&T Entrepreneurship Parks.Efforts will be made to initiate rural enterprise development through innovative S&T-based micro-enterprises in rural areas.
10.128 The science communication and . popularisation programme will beexpanded to cover more beneficiaries. The activities proposed include training in S&T communication through short-term courses for voluntary organisations, teachers; support to popular science magazines in regional languages; production and screeningo f science films on Doordarshan; development o f low-cost toys, dissemination of
1047

software for S&T communication/popularisation etc. The National Resources Data M anagement System (NRDMS) will concentrate on building specialised problem- oriented data bases and operationalising them for real-life planning and administrative decision making. The activites o f the State S&T Councils/Departments will be intensified so that the States will be able to take up major projects and a visible impact can be seen during the Ninth Plan. Under the international S&T co-operation programme, efforts will be made to strengthen bilateral and m.ulti-lateral jo in t venture programmes and to expand and accelerate the pace o f S&T co-operation with research institutions in a number o f countries. The 12 autonomous research institutions being supported by the DS'f, will be upgraded with state-of-the-art research facilities in a phased manner. In addition, funds would be provided for improvement o f S&T infrastructure in universities and related institutions.
10.129 The India Meterological Department (IMD) will further intensify its high technology efforts which have already resulted in improving the accuracy o f predicting severe weather, its timely warning and dissemination o f its long range predictions o f the monsoon. The major activities proposed during the Ninth Plan include: modernisation o f the observational and telecommunication systems, use o f contemporary radar and satellite technology for better understanding of weather systems, satellite-based dissemination o f timely warning o f tropical cyclones, monitoring o f seismic activities, exploitation o f remote sensing data for agro-meteorological advisories, etc.
DEPARTMENT OF SCIENTIFIC AND INDUSTRIAL RESEARCH (DSIR)
10.130 The efforts initiated by the DSIR in the areas o f Technology Promotion,Development and Utilisation (TPDU) under the three schemes viz., Research and Development by Industry (RDI), Programme Aimedat Technological reliance (PATSER) Scheme to Enhance Efficacy o f Transfer o f proposed to be taken up Rights (IPR) through education and development
Im portant programm es o f DSIR• Creation o f awareness o f Intellectual Property Rights (IPR)• Developm ent o f Export Promotion mechanism• Establishm ent o f Indian Internet server and a facility to
promote and support public and private institutions on database development.
• NRDC would promote:Design and engineering consultancy com paniesEquity investments in R&D com paniesPromotion o f small and medium industries in N E states.Self
and the
Technofogy (SEETOT) will be continued. ITie programmes include: creation o f awareness o f Intellectual Property
training and o f export
promotion mechanism to make the companies aware o f the processes involved in the acquisition o f technologies from abroad and their export. Some o f the activities/projects which NISSAT will initiate are: establishment o f Indian Internet Server and a facility to promote and support public and private institutions on database development, information resource
1048
R&D Activities planned by C E L• Process upgradation for larger size cells.• N ew /alternate SPV technology.• New SPV systems.• Electronics systems for Railways,
Telecom m unication and Power.• New ferrite materials.• Surge arresters• Beam sw itching array• Antenna elements
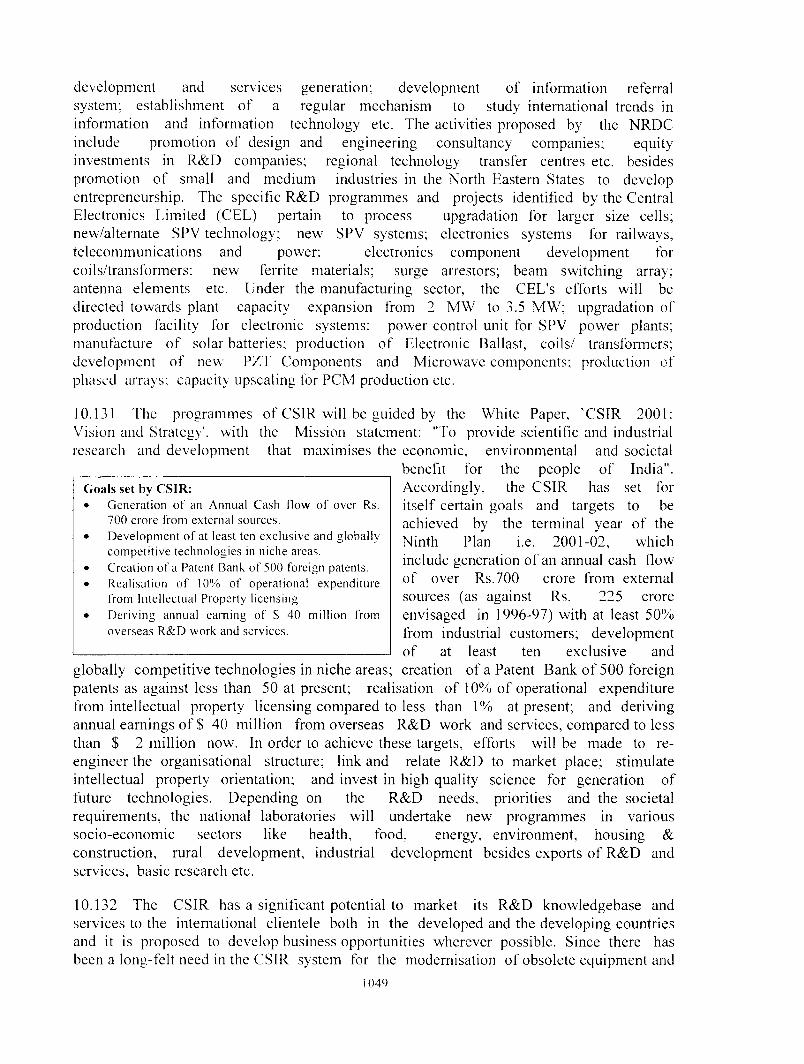
development and services generation; development o f information referral system; establishment o f a regular mechanism to study international trends in information and information technology etc. The activities proposed by the NRDC include promotion o f design and engineering consultancy companies; equity investments in Rc&D companies; regional technology transfer centres etc. besides promotion o f small and medium industries in the North Eastern States to develop entrepreneurship. The specific R&D programmes and projects identified by the Central Electronics Limited (CEL) pertain to process upgradation for larger size cells; new/alternate SPV technology; new SPV systems; electronics systems for railways, telecommunications and power; electronics component development for coils/transformers; new ferrite materials; surge arrestors; beam switching array; antenna elements etc. Under the manufacturing sector, the CEL's efforts will be directed towards plant capacity expansion from 2 MW to 3.5 MW; upgradation of production facility for electronic systems; power control unit for SPV power plants; manufacture o f solar batteries; production o f Electronic Ballast, coils/ transformers; development o f new PZT Components and Microwave components; production of phased arrays; capacity upscaling for PCM production etc.
10.131 The programmes o f CSIR will be guided by the White Paper, 'CSIR 2001: Vision and Strategy', with the Mission statement; " fo provide scientific and industrial research and development that maximises the economic, environmental and societal
benet'a for the people o f India".C oals set by CSIR:• G e n e r a t io n o f an A n n u a l C a sh f low o f o v e r Rs.
7 0 0 c ro re f ro m ex te rn a l sou rces .• D e v e l o p m e n t o f at least ten e x c lu s iv e a n d g lo b a l ly
c o m p e t i t i v e t e c h n o lo g ie s in n ich e areas.• C r e a t io n o f a P a ten t Bantc o f 500 fo re ign pa ten ts .• R e a l i sa t io n o f 10% o f o p e ra t io n a l e x p e n d i tu re
f ro m In te l lec tu a l P ro p e r ty l ic en s in g• D e r iv in g a n n u a l e a r n in g o f S 4 0 m il l io n from
o v e r s e a s R & D w o r k a n d se rv ices .
Accordingly, the CSIR has set for itself certain goals and targets to be achieved by the terminal year o f the Ninth Plan i.e. 2001-02, which include generation of an annual cash tlow of over Rs.700 crore from external sources (as against Rs. 225 crore envisaged in 1996-97) with at least 50% from industrial customers; development of at least ten exclusive and
globally competitive technologies in niche areas; creation o f a Patent Bank o f 500 foreign patents as against less than 50 at present; realisation o f 10% of operational expenditure from intellectual property licensing compared to less than 1% at present; and deriving annual earnings o f $ 40 million from overseas R&D work and services, compared to less than $ 2 million now. In order to achieve these targets, efforts will be made to reengineer the organisational structure; link and relate R&D to market place; stimulate intellectual property orientation; and invest in high quality science for generation of future technologies. Depending on the R&D needs, priorities and the societal requirements, the national laboratories will undertake new programmes in various socio-economic sectors like health, food, energy, environment, housing & construction, rural development, industrial development besides exports o f R&D and services, basic research etc.
10.132 The CSIR has a significant potential to market its R&D knowledgebase and services to the international clientele both in the developed and the developing countries and it is proposed to develop business opportunities w'herever possible. Since there has been a long-felt need in the CSIR system for the modernisation o f obsolete equipment and
1049

facilities, which have adversely affected the productivity and competitiveness o f the CSIR laboratories, the CSIR's endeavour will be to modernise and upgrade its facilities during the Ninth Plan in a phased manner. In the area o f Human Resource Development Programme, besides the ongoing activities, the CSIR will take special measures to formulate a structured scheme to bring together the working o f researchers from academia, national laboratories and in-house R&D units in industry. To meet the needs o f the CSIR Headquarters which has multifarious activities and responsibilities in the new context o f greater market orientation, self sufficiency and global competitiveness o f the laboratories, advanced level training programme will be organised. In addition, a well designed and workable Management Information System (MIS) linking the HQ and laboratories will be set up in order to optimise business opportunities, synergise the core competencies and the resource base and to bring in a sense o f transparency and empowerment. The proposed MIS will encompass customer and market information, project management, financial management, human resource management, investment management and intellectual property and technology management.
10.133 In respect o f residential buildings and other amenitites, the endeavour will be to bring the housing satisfaction up to an average level o f 60% (70% in remote locations, 60% in towns and 50% in metropolitan cities) by the end o f the Ninth Plan, as compared to 40% now. In order to achieve this target, a long-term plan has been evolved, seeking construction o f additional staff quarters in selected places (2500 quaiters); leasing o f accommodation for some categories of staff; and transit accommodation and hostel accommodation for research fellows. Further, in view o f CSIR's objective o f expanding its business development activity several fold in the Ninth Plan period, a few Business Centers - self contained modem offices - with tele-conferencing facilities through advanced communication systems will be set up initially at four places viz., Mumbai, Hyderabad, Delhi and Calcutta.
DEPARTMENT OF BIOTECHNOLOGY (DBT)
10.134 For providing the basic minimum requirements o f the population, including food, economic, ecological and livelihood security, since biotechnology is likely to become a lead technology in future, one o f the objectives o f the Ninth Plan programmes will be to realise the full potential o f biotechnology for national development. Accordingly, appropriate biotechnological inputs will be provided for enhancing the productivity and efficiency o f the concerned areas such as; health care system; soil fertility and environmental conservation and protection, aiming at sustainable development, particularly for rural areas. The projects/programmes in this sector will aim at meeting the livelihood and economic and ecological security o f the people through research and development, demonstration and application o f biotechnology covering all important sectors.
10.135 The main thrust o f biotechnology programmes during the Ninth Plan will be on bioindustrial development o f the country, ensuring judicious utilisation and conservation o f biological resources using the biotechnological tools; research and development for products, processes and’ technology generation for achieving academic excellence o f the highest national and international standards and for societal benefit; mission mode programmes in identified areas; biotechnology based programmes for weaker sections, SC/ST and rural areas; technology transfer activities
1050

Thrus t o f Biotechno l ogy pr ogr amme s :
• B io in d iis lr ia l devck iprncn t o f the couiitiA
• Jud ic io u s u tilisa tion and conscr\ation o f b io log ica l
resources us ing b io techno log ica l tools,
• Research and D eve lopm en t for product, processes
and technolog_\ generation.
• L ong term support for basic research in sectors like;
Structural b io logy
D rug de\ eloprncn t and design
G enom e m a p p in g and sequencing
Host parasite interaction
• Priority to program nies ol':
G enctic enhancem ent
M ic fo p ropag a tio n parks
Centres o f excellence in areas ot ̂ brain research,
m o le cu la r m ed ic ine etc.
with the help o f the Biotechnology Consortium India Limited (BCIL), the NRDC, financial institutions and industry; support to productdevelopment activities in some identified areas in collaboration with industry and financial institutions; human resource development at required levels; strengthening, expansion andoperationalisation o f a country-wide network in bioinformatics; and the setting up o f new infrastructure facilities and Centres o f Excellence in the areas of relevance to the country.
10.136 A major effort will also be toprovide long-term support for basic research in a few strategic sectors such as structuralbiology, drug development and design, genome mapping and sequencing, hostparasite interaction etc. From the viewpoint of both the societal needs and industrial development, some of the areas like basic ' molecular biology, crop biotechnology, medical research, industrial and environmental programmes will be accorded priority. Various aspects o f research on Irausgcnic plants and animals, immune system diagnostic development, prospecting o f useful genes and biomolecules from the biodiversity,Indian genome initative etc. will be studied. To ensure that the research leads areconverted into commercial ventures and to evolve appropriate biosafety guidelines andregulatory procedures, programmes on product development, especially fordiagnostics, biologicals and biomolecules would be taken up. Human resourcedevelopment covering all aspects o f biotechnology will also be pursued including technicians' training and popularisation of biotechnology in the country. Priority will be accorded to the programmes o f genetic enhancement, micropropagation parks and centres o f excellence in areas such as brain research, molecular medicine etc. besides training programmes for the scientists, legal experts and industries on patenting in biotechnology areas.
DEPARTMENT OF OCEAN DEVELOPMENT (DOD)
10.137 The importance and uses o f ocean are well known and the developmentstowards ocean science and technology are directed towards exploring and exploiting the vast resources o f the ocean on a sustained basis for the socio-economic benefit of the human society with integrated approach towards environment and development.
10.138 During the 9th Plan, five Antarctic expeditions will be undertaken, one each year and multi disciplinary research carried out in the areas o f atmospheric sciences, earth sciences, human physiology, biological oceanography and environmental sciences. An Antarctic Study Centre w'ill be established at Goa as a first polar research laboratory with a facility for sub-zero temperature research on ice cores retrieved from both Antarctica and the Himalayas. It will also function as a nodal point for the Antarctic scientific and logistic activities. The major activities under the Polymetallic Nodule (PMN) programme include; sampling w'ork of the Survey and Exploration in 40 selected
105 1

Im portant activities planned under Ocean Sciences:• Five A ntarctic expeditions.• Antarctic Study Centre at Goa as a first Polar
Research Laboratory with facility o f sub-zero tem perature research.
• Developing m ining device with a crawler, collector and riser system along with technology for collection o f nodules at a depth o f 6000 meters.
• Com m issioning o f 500 Kg./day capacity pilot plant for m etallurgy.
• Designing o f rem otely operated vehicle capable o f operating at 6000 m eters depth.
• Undertake studies on Ocean Thermal Energy Conversion (OTEC).
• Delineation o f continental she lf under the UN convention on the law o f the sea.
remotely operated vehicle capable o f operating at
blocks o f 25 km. x 25 km. at 5 km. grid covering 800 stations; Environmental Impact Assessment (EIA) study for monitoring the impact on the re-colonisation and restoration o f the original benthic organisms at Chavara and Manavalakuruchi areas; developing a mining device with a crawler, collector and riser system along with a technology for collection o f the nodules at a depth o f 6000 meters; commissioning o f 500 Kg/day capacity pilot plant for metallurgy; development o f an upgraded remotely operated vehicle at a depth o f about 200 metres and designing of
6000 metres depth.
10.139 The three ongoing programmes - Marine Satellite Information Service(MARSIS), Sea Level Modelling and Monitoring (SELMAM) and Data Buoy will be integrated under one scheme viz. Ocean Observation and Information Services and will be operated under four components viz. (a) ocean observation services (b) ocean information services (c) satellite oceanography and ocean modelling and (d) ocean dynamics. For the monitoring o f Marine Pollution (COMAPS), a Geographical Information System (GIS) will be developed to keep track o f the various sources of pollutants and two indigenously built coastal research vessels, Sagar Paschimi and Sagar Purvi will be utilised to monitor the health o f coastal waters o f India. Under the ongoing M arine Research and Manpower Development Scheme, research projects in the emerging and frontline areas o f ocean sciences will be funded and assistance provided to selected universities to undertake specialised courses in marine sciences. The construction o f an oceanarium in Goa, which was started by a foreign firm in the 8th Plan on Build, Own, Operate and Maintain (BOOM) basis, will continue. The NIOT will undertake studies on Ocean Thermal Energy Conversion (OTEC) and test new designs o f turbine, generators and caissons for various other applications o f the wave energy plant at Vizhingam. It will also work on the technologies relating to deep sea mining and the sub-systems used in deep sea applications. Under the ongoing project on Drugs from the Sea, efforts are on to develop two drugs and license them formarketing as traditional medicine and to file 2 to 3 international patents.
10.140 For promoting sustainable marine development, two new schemes viz., (i)Integrated Coastal Marine Area Management and (ii) Marine Biodiversity are proposed to be taken up. The objective o f the first is to ensure sustainable development through proper management o f the ocean resources and enforcement o f rules and regulations for ocean-related activities in the economic ocean zone and to make Indian oceans clean and productive. The second is intended to preserve, conserve and protect the marine flora and fauna and to promote sustainable development through proper use o f biological resources. Another important new scheme relating to'Delineation o f Outer Limits o f Continental Shelf" will be initiated. The objective o f this is to obtain the data through bathymetric and seismic surveys o f India's coastline
1052

for collection of relevant biological, geodetic and hydrographicSdata and preparation of required charts â id maps for submission to the Commissioh>son theDelineation o f the Continental Shelf under the UN Convention on the Law of theNSea (UNCLOS) by the year 2005. For this purpose, a ship equipped with sophisticate scientific instruments for the collection of data will be chartered. Delineation o f the continental margin will give an additional area of about 1.5 million Sq. km. outside the exclusive economic zone.
(B) S&T.in Socio-Econom ic Sectors
10.141 The efforts made in the Eighth Plan to integrate S&T component with theconcerned socio-economia sectors will be'^'pursued more vigorously during the Ninth Plan.- While the stress generally will be on identification o f technology priorities in various sectors and on undertaking R&D for technology absorption/upgradation and support to Research, Development and Demonstration (RD&D) projects, priority will be given to energy research . and technology development projects. The efforts will be to evolve a few joint ■technology developrtlent programmes in priority areas involving the user ministries, the industries and the acadamic institutions. Theattempt will be to evolve new mechanisms for identifying and catalysing multi-partnership sectoral projects in this fast changing technology scenario inassociation with the organisations involved in forecasting and assessment. The areas of common iijterest to more than one ministry such as clean coal technologies, telecommunications, alternate fuels, bio-reactor technology etc. will also be taken up.
FINANCIAL ASPECTS
10.142 The total Plan outlay for the S&T sector, has increased from Rs.4086 crore in the Seventh Plan to Rs.9393 crore in the Eighth Plan ( an increase o f 130% ). The actual expenditure during the Seventh Plan was Rs.5106 crore and in the Eighth Plan it is estimated to be of the order of Rs. 11561 crore (an increase of about 126%). This increase is in absolute terms. But if the growth o f S&T as measured by the ratio o f S&T expenditure to Gross National Product (GNP) is considered as an indicator, it is not very encouraging. It is only 0.81% of the GNP in 1994-95. This is very small as compared to that in developed countries like USA, UK, Japan, France, Germany etc. which spend about 2% to 3% o f their GNP on S&T. The experience of the developed world shows that increase in R&D expenditure can be achieved by substantially increasing the industrial R&D eixpenditure which is only about 0.60% of the sales turnover in India in 1994-95. In terms of the share of the industrial sector's R&D to the total( R&D expenditure, there was a slight decrease from 27% in 1992-93 to 26.5% in 1994-95. These figures show that the level o f expenditure made on R&D by the industry is very low (only about 27%) as compared to about 60 to 70% in the developed countries like USA, FRG and Japan. This calls for an appropriate policy for bringing about substantial increases both in Government and industrial R&D expenditures.
10.143 While the Government's role in supporting b^ic research, technology development and application as well as S&T infrastructure should continue and also be considerably enhanced, experience of other countries indicates that a substantial part of S&T expenditure has to come fi-om users and industries. With regard to the Central S&T Agencies/Departments there wijl be increases in their allocations
1053

depending on their projections. In respect o f the socio-economic sectors, it is necessary that the S&T allocation should have a relationship with the overall investment in that sector. This is possible, if all the socio-economic ministries allocate not less than a fixed percentage o f their respective total budget to S&T activities. This will go a long way in promoting S&T for sectoral development.
10.144 The second strategy will be to ensure that the industry, both in the public and the private sectors, invest substantially in the S&T areas. For this, incentives by themselves are not enough. The industry itself should take the challenge and initiate R&D programmes. While there is a need for the industry to substantially increase its R&D expenditure as a percentage to its sales turn over, the S&T agencies should utilise sources like the Technology Development Fund, SIDBI and other financial institutions. It is only then that the desired increase in R&D expenditure can be brought about.
10.145 Annexures 10.1, 10.2 and 10.3 summarise the financial outlays/expenditure in the Seventh & Eighth Plans in respect o f each o f the S&T Departments/agencies, various socio-economic ministries and the States/UTs.
1054

ANNEXURE-10.1
CENTRAL S«&T DEPARTMENTS/AGENCIES
PLAN ALLOCATION/EXPENDITURE
(Rs. in crore)
Seventh Seventh Eighth 1992-93 1993-94 1994-95 1995-96 1996-97 1992-97 9"'PlanS&T DEPARTMENTS 1997 to
/AGENCIES Plan Plan Plan Actuals Actuals Actuals Actuals Actuals Actual 2002Outlay Exp. Outlay Expenditure Outlay
Deptt. of Atomic Energy (R&D) 315.00 284.86 600.00 84.09 100.21 139.31 160.44 179.86 663.91 1500.00
Deptt. of Ocean Development (Including I&M)
110.00 72.63 130.00 31.18 35.84
♦
43.75
*
43.67
*
44.96
♦
199.40
*
510.62
Deptt. of Sc. & Technology 301.78 332.90 640,00 121.16 167.56 212.03 214.97 220.99 936.71 1497.35
Deptt. of Bio-Technology (Including l&M)
132.00 142.86 265.00 73.16 78.00 80.87 79.15 84.66 395.84 675.00
Scientific and Indus. Research (Including I&M)
370.00 400.91 655.00 118.89 141.62 157.91 176.16 180.35 774.93 1327.48
Deptt. of Space 793.96 1364.89 1804.00 360.03 547.36 604.17 754.14 889.15 3154.85 6511.72
TOTAL (S&T) 2022.74 2599.05 4094.00 788.51 1070.59 1238.04 1428.53 1599.97 6125.64 12022.17
Excluding Capital W orks component.
1055

ANNEXURE-10.2 S&T Plan Outlays under Socio-economic M in istries^epartments
(Rupees in Crore)
S Socio-economic Sectors No.
7th Plan 8th Plan 1992-93 139^-941985-90 1992-3T Rctuals Actuals
Outlay Actuals Outlays
1994-95Actuals
1995-96R.E.
199S-37B..S.
1992.-3"A.E,
1 Agric'̂ lt'dral Research (ICAR)2 Bio-medical Research (ICMR)3 Chemicalsi Aviation5 Civil Supplies S CoalCommerce
8 Communications > t Pharmaceuticals10 Ecology & Environment11 Education 17 Electronics13 Fertilizers14 Food15 Food Procassing16 Forests & Wild Life17 Heavy Industries18 Ministry of Home Affairs
(Forensic Science and Police Wire19 Industrial Development20 Information & Broadcasting21 Irrigation tWater Resources)22 Labour23 Mines24 National Test House (Supply)25 Non-conventional Energy Sources26 Petro-Chemicals27 Petroleum & Natural Gas
425,00 438.15150 ,QQ 141.57
2 , 59 2,833,47 1. aSZ -78 1,05
120,00 33 ,1912.7 7 13.,-: 1151.00 163 ,42
7. 00 u . Z Z
180.00 38 . 00
13 .64 Included
.CC 66 ,01 25.00
less)20 . 95 6 .25
10 .00 1.51 30 . 2414 , 75
130.3541 . 74 150.00
4,65
528.74 62.06 IQ .e i 6.78
in Food 4-3,70 76 .23 9 . 751
37 . 43 3 . 97 40.49 2 . 03 28 .89 8.40
162 . 30 47.60 212.61
1300 .00 167.70 11.50 2 .10 1.78
8 7 . 0 0 20 00423'.30 17 .4a 105.75 < 1147.50
, uu 70 . 00 40 . 00
b,50145.00 83 , 70 25, 00
92 , 00 20 . 00
76,85 * 1.40 * 34 .20 13 .00
120.80 * 88 . 20
249.20
1056
32 , 05 35,50 37 ,23 36 ,501,CQ 1,41 0 , 97 1 , 920 ,32 1,12 0 .05 0 ,551,66 1.50 2, 804 ,45. 3,92 0 , 00 11,104,51 @@ 4 ,23 6 ,48 ̂,?i'b50 ,18 '/b ,’ib S-^ H 7 « 117,84 @® ̂,1‘= 2 ,75 1,50 10 ,31
23 ,90 27,49 29,34 # m204,78 ®® 1^7 .66 + 294,43 ++
% ,^>7 14,58 23,35 # 34,15 ®®16 .34 15,42 15.86 # 15,0'i: W:0 , 56 6,1 s 0 T 0
A , + > 5 , 71i,3Q m 0 , 00 0.00 0 , 005,89 36 ,28 54.22 # 57,50 <m4,81 5 , 90 6.O'? t q (17
0 ,00 0 , 75 I . 14 3,30
11 ,16 8 .45 12,58 31,320 , 12 0 ,14 0,98 # 0,78 ®®8 , 90 9 ,18 13,33 # 14,47 @@0,30 0.55 0,77 # 2,37 @®9,65 6 , 04 5 ,12 8 , 772 ,10 3 ,60 4 . 06 5,5624,16 «® 11.72 # 9 , 80 @ 21,28 m0,00 1 , 00 3 , 00 10 , 00
40 , 27 47,73 73,14 # 97.26 @@
IS3 , 90 1257 .7140,10 181.387,39 12,690,35 2,392,80 12,7914,70 1 4 ,1 c;
73 38 , 80129,52 ++ 45s,7611,00l l lie ++ 143,08294.43 ++ 1304,63
2S,69 ++ 106,44n A 1 ** 80.092,41 ++ 11,260 , 0 0 + + 1 , 3 0
bS,b4 ++ 211,53 6,68 ++ 32,534,00 9,19
35 , 00 1,08 ++
14.66 ++ 0,85 ++ 7 , 50 3 ,80 23,41 ++ 10 , 00
106,99 ++
98 , 513 , 10
60 ,544 , 84 37,08 19 ,12 90 ,37 24 , 00365,39

ANNEXURE-10.2 (Concld.)
S«&T Plan O utlays under Socio-econom ic M inistries/Departm ents
(Rupees in Crore)
S Socio-economic Sectors No.
7th Plan 1985-90
Outlay Actuals
8th Plan1992-97Outlays
1992-93Actuals
1993-94Actuals
1994-95Actuals
1995-96R.E.
1996-97B.E.
1992-97A.E.
2 8 Power 76 . 22 74 . 58 251.37 43 . 51 56 .20 32.15 # 89.80 @@ 98 .78 ++ 320.442 9 Railways 25 . 00 27.28 25 . 00 7.78 2 .68 8.00 2 .00 9. 00 29 .4630 Rural Development 20 . GO 14 . 62 104.00 4 , 94 8 . 21 13,35 # 16.20 @@ 17.82 ++ 60.5231 Shipping & Transport 18.17 11. 98 20.00 2.43 3 . 76 3 .10 4 .37 7 .11 20 , 7732 Social Welfare & Nutrition 0 . 00 2.96 6.11 ** 0 . 65 0 . 87 1 25 1.20 1.20 5.1733 Steel 98 . 94 104.05 144.23 9 . 28 32 . 05 32 . 90 42 .56 4 9 .5 3 157.3834 Textile 70.95 67 .36 80 .75 7,82 1 3 .8 5 14 . 94 # 16.86 @® 18 .55 ++ 72.0?3 5 Urban Development 10.01. S.93 25.25 4 . 99 5.73 6. £>5 # §.50 9.35 ++ 35.57(Including Housing & Water Supply) 36 SSI & VSI + 9.62 24.30 @ 3.19 3.54 3 . 71 8 . 05 c ac
5 . 24 . 941978.49 2417.9? 720.88 916.14 1045.31 1363.67 5272.97
laJ Excluding Khadi and Village 7ndvst~i^s.* escimated on the basis of 1992-93 O'jtlay** Excluding Nutriticin+ Included under Industrial De'-'elopment
fixpenditure/R.E. Not Available, rherefore, the figures indicate B.E, only# Actual Expenditure Not Available. Therefore, the figures indicate R.E. only.++ Figures indicate Estimated B.E. only as firm figures of B.E. are not available.
1057

SfiT Plan Outlays for the Eighth Plan (1992-97) Under the State Plan.(Rs. in Lakhs)
S.No States/UTs 7th Plan 7th Plan 8th Plan 1992-93 1993-94 1994-95 1995-96 1996-97 1992-971985-90 1985-90 1992-97 Act ACT. ACT. ACT. R.E. A.E.Outlay ACT Outlay
ANMEXURE-10.3
1. A.P.2. Arun. Prad3. Assam4. Bihar5. Goa6. Gujarat7. Harayana8. H.P.9. J&K10. Karnataka11. Kerala12. M.P.13. Maharashtra14. Manipur15. Maghalaya 16 Mizoram17. Nagaland18. Orissa19. Punjab20. Rajasthan21. Sikkim22. Tamil Nadu23. Tripura24. U.P.25. West Bengal
610.0012.00
300.00300.00110.00450.00165.00100.00 100.00 200.00
1700.00650.00200 .00
200 .00
150.00 10.00 80.00
216.00400.00344.00
22 . 00
450.00200 .0 0
1000.00 320.00
208.0019.92
376.00430.00 127.20
8 8 . 0 0310.0079.0038.00
312.002302.00626.00193.00202 .0 061.0054.0057.00
479.00199.00130.0036.00
575.00208.001414.00 186.00
200.0047.00
462.00782.00300.00550.00662.00275.00190.00800.00
2193.00641.00568.00400.00193.00195.00100.00
4556.00750.00700.00250.00
1000.00225.00
1 0 0 0 . 0 0 1833.00
13.009.00
83.00119.0021.0039.0036.0033.0025.00
151.00478.00101.0047.0066.0041.0033.009.00
139.0037.0096.0043.00
121.00 37 .00
166.00 58 .00
15.0012.00
139.00 0.00
42.0011.00 66.0044.0017.00
196.00565.0076.0078.0064.0058.0036.0022 .00
254.0040.00
114.0032.00
140.0044.00
426.00117.00
10.0013.00
152.0037.0028.0035.0064.0045.0031.00
274.00649.00151.0072.0086.0045.0035.0010.00
387.0031.00
137.0028.00
215.00 41.00
303.00122.00
20.0016.00
204.00 26.0038.0019.00
117.0076.0033.00
293.00965.00220.0055.0087.0022 .00
48.0027.00
269.0030.00
159.0045.00
171.0053.00
597.00127.00
56.17.
1 1 0 .33.30.
320.123.146.255.292,1400,219,118,78,50,45,21 ,
297,58,
137,50,
153,51,
338,80.
00
00
00
00
00
0000
00
00
00000000
00
00
00
00
00
00
0000
00
00
0000
114.00 67.00
688.00215.00159.00424.00406.00344.00361.00
1206.004058.00767.00370.00381.00216.00196.00 89. 00
1346.00196.00643.00198.00800.00 226.00
1830.00 504.00
Total State 8289.00 8710.12 18872.00 2001.00 2608.00 3001.00 3717.00 4477.00 15804.00
1058

ANNEXURE-10.3 (Concld.)
S6T Plan Outlays for the Eighth Plan (1992-97) Undar the State Plan.(Rs. in Lakhs)
S.No States/OTs 7th Plan 7th Plan 8th Plan 1992-93 1993-94 1994-95 1995-96 1996-97 1992-971985-90 1985-90 1992-97 Act ACT. ACT. ACT. R.E. A.E.Outlay ACT Outlay
U.Ts.1. ASN Islands 26.00 58.54 135.00 36.24 41.57 11.51 22.13 28.00 139.452. Chandigarh 20.00 57.23 15.00 1.99 3.50 6.09 5.49 13.00 30.073. D & N Haveli 14.00 1.55 38.00 0.00 5.50 5. 50 5.50 5.50 22.004. Delhi 56.00 10.24 30.00 1.32 1.17 1.31 67.63 1.00 72.435. Daman & Diu ** 40.00 2.01 3.71 14.34 10.70 13.00 43.766. Lakshadweep 25.00 29.24 127.61 17.37 16.31 21.74 24 . 01 49.00 128.437. Pondicherry 36.00 1.03 13.00 0.50 7.00 2.10 4.49 5.50 19.59
Total 177.00 157.83 398.61 59.43 78.76 62.59 139.95 115.00 455.73
Grand Total 8466.00 8867.95 19270.61 2060.43 2686.76 3063.59 4212.68 4592.00 16259.73
* Including Ecology and Environment * * Included in Goa
1059