Prudential Investor Day Video ICICI Prudential Life Insurance ...
Upload
khangminh22Category
view
8download
0
A COMPARATIVE STUDY OF SBI MUTUAL FUND AND
ICICI PRUDENTIAL MUTUAL FUND
Submitted in a partial fulfilment
Of the requirement for the degree of
MASTER OF BUSINESS ADMINISTRATION
J.MOUNIKA
UNDER THE ESTEEMED GUIDANCE OF
Mrs. P. Kalpana
ASSISTANT PROFESSOR
ANURAG GROUP OF INSTITUTIONS
(Autonomous)
(Accredited by NBA, NAAC Approved by AICTE, New Delhi)
Venkatapur (V), Ghatkesar (M) Medchal (Dist.)- 500088
JAC : A Journal Of Composition Theory
Volume XV, Issue II, FEBRUARY 2022
ISSN : 0731-6755
Page No: 48
ABSTRACT
The mutual fund industry in India underwent a most successful in last ten years. Mutual funds
are one of the major instruments of wealth creation and wealth saving, which gives positive
results. As there are various investment options available for investors to invest and earn
profitable return. Among the other financial products, investment in mutual fund ensures the
minimum risks and maximum return to investors. The aim of mutual fund is to increase in
domestic savings and improvement in diversification of investments.
As there are various mutual fund schemes offered by various mutual funds
companies, always investors will have doubt to select the best mutual fund scheme which
gives high returns with low level of risk. Here, the study on comparison of mutual fund
schemes provided by SBI mutual fund and ICICI prudential mutual fund makes a
comparative on blue chip fund of two the firms.
As a result of, comparative study on SBI mutual funds and ICICI prudential mutual
funds .It is observed that ICICI blue chip fund is best mutual fund to invest by having good
returns for its schemes and provides high returns by medium level of risk. SBI blue chip fund
has less return compared to ICICI blue chip fund which shows that the best fund among the
two funds. To accurately compare blue chip funds it is preferable to determine the risk rate
using multiple measurements such as the Sharpe ratio and standard deviation.
JAC : A Journal Of Composition Theory
Volume XV, Issue II, FEBRUARY 2022
ISSN : 0731-6755
Page No: 49
CHAPTER-1
1.1 INTRODUCTION
A mutual fund is a company registered with the Securities and Exchange Board of India
(SEBI) that pools money from individual and corporate investors and invests it on their
behalf in equity shares, government securities, bonds, and call money markets, among other
things, before distributing the profits. To put it another way, a mutual fund allows an investor
to invest in a diversified portfolio of securities.
The returns got through these undertakings and the wealth gratitude perceived is
mutual by its unit containers in degree the measure of units owned by them. As such a Mutual
Fund is the most reasonable undertaking for the common person as it offers a chance to put
resources into an isolated, expertly controlled bushel of protections at an overall insignificant
expense.
MFs are regulated by SEBI, the Securities and Exchange Board of India. In terms of mutual
funds, SEBI has the following broad guidelines:
1. Mutual funds should be set up as trusts under the Indian Trust Act and managed by asset
management firms (AMCs).
2. Mutual funds must establish a Board of Trustees and Trustee Companies. They should
have a Board of Directors as well.
3. AMCs and Trustees of a Mutual Fund should be different legal organisations.
4. The AMC or any of its subsidiaries are not permitted to operate as fund managers for any
other funds.
5. AMCs must have their Articles and Memorandum of Association approved by SEBI.
6. All mutual fund schemes must be registered with the SEBI.
7. Mutual funds shall distribute at least 90% of their income to their investors.
8. There are other rules governing investing strategies.
A mutual fund is a company registered with the Securities and Exchange Board of India (SEBI).That pools
money from individual and corporate investors and invests it on their behalf in equity, Shares, government
JAC : A Journal Of Composition Theory
Volume XV, Issue II, FEBRUARY 2022
ISSN : 0731-6755
Page No: 50

securities, bonds, and call money markets, among other things, before Distributing the profits. To put it
another way, a mutual fund allows an investor to invest in a diversified portfolio of securities.
TYPES OF MUTUAL FUND SCHEMES:
Mutual funds provide a wide range of investing options. You can select them based on your
risk level, financial objectives, and time period. Here's how it's done.
OPEN ENDED FUNDS
Open ended funds allow investors to subscribe to or redeem units at any time based on the
current Net Asset Value (NAV). Liquidity and time flexibility are the main benefits of open
ended funds.
CLOSE ENDED FUNDS
These funds are listed on the stock exchange and have a set maturity period, such as 3-6
years. At the time of first introduction, investors have the option of subscribing to close
ended funds.
JAC : A Journal Of Composition Theory
Volume XV, Issue II, FEBRUARY 2022
ISSN : 0731-6755
Page No: 51
FUNDS BASED ON INVESTMENT OBJECTIVES
EQUITY/GROWTH FUNDS
When you invest in equity growth funds, you're actually investing in equities. These funds
primary goal is long-term capital growth. Equities and equity-related instruments account for
at least 65 percent of the assets of equity funds. These funds may invest in a variety of
industries/sectors or specialise in one or more. If you have a higher risk appetite and a long-
term financial goal, these funds are a good place to start.
DEBT/INCOME FUNDS
Debt/income funds typically invest 65 percent of their assets in fixed income products such as
bonds, corporate debentures, government securities (gilts), and money market instruments
using a more straightforward approach. These funds are less prone than equities funds to be
volatile.
BALANCE FUNDS
Balanced mutual funds engage in both equities and fixed income assets in order to generate
consistent returns and capital growth. These funds typically invest approximately 60% in
equities and 40% in financial securities such as bonds and debentures.
GILT FUNDS
Gilt mutual funds are solely invested in government bonds. Credit risk, is the risk that the
security's issuer would default, is not included in the Gilt funds. However it comes with an
interest rate risk, which is the chance of interest rates to rise or to fall.
TAX SAVING FUNDS
The Income Tax Act, 1961, provides for tax deductions under particular provisions. ELSS
mutual funds are designed to promote capital growth by investing primarily equities and are
best suited to investors with a higher risk appetite for capital gain. Tax saving funds have a
three-year lock-in period and are spread out over the medium to long term.
JAC : A Journal Of Composition Theory
Volume XV, Issue II, FEBRUARY 2022
ISSN : 0731-6755
Page No: 52

CHARACTERITICS OF MUTUAL FUNDS
A Mutual Fund has a place with the financing which have pooled their assets. The
responsibility for Mutual Fund is in the possession of the financing.
Common assets are trusts or enlisted affiliations oversaw by speculation experts and
other specialist organizations who acquire an expense for their administrations from
the asset.
The pool of the assets will keep resources into an arrangement of attractive ventures
(Shares and securities) so the worth of portfolio is refreshed each day.
Shared finances gather cash from small financial supporters and consequently they
will give an endorsement in units.
The financial backer's offer in the asset is indicated by "UNITS". The worth of the
unit’s changes according to the adjustment of portfolio worth consistently.
ADVANTAGES OF MUTUAL FUND
LIQUIDITY
Unless you choose closed-end mutual funds, buying and selling a mutual fund plan is
relatively simple. When the stock market is high, you can profitably sell your open-ended
equities mutual fund units. Keep a watch on the mutual fund's exit load and expense ratio.
DIVERSIFICATION
Because their success is predicated on stock market movements, equity mutual funds come
with their own set of risks.. Hence, the fund manager spreads your investment across stocks
of companies across various industries and different sectors called diversification in this way,
when one asset class doesn’t perform, the other sectors can compensate to avoid loss for
investors.
JAC : A Journal Of Composition Theory
Volume XV, Issue II, FEBRUARY 2022
ISSN : 0731-6755
Page No: 53

EXPERT MANAGEMENT
A mutual fund is right for traders who don’t have the time or capabilities to do the studies and
asset allocation. A fund supervisor looks after all of it and makes choices on what to do
together along with your funding. The fund supervisor and the group of researchers determine
on the proper securities inclusive of equity, debt or a mixture of each relying at the funding
targets of the Fund In addition, the fund manager makes a choice on how long the securities
will be held.
SUITS FOR EVREY FINANCIAL GOAL
In India, there are a variety of mutual funds accessible to suit the needs of investors from
various walks of life. You must make it a habit to set away some money (however tiny) for
investing, regardless of your income. Finding a mutual fund that fits your income, time
horizon, investment goals, and risk tolerance is simple.
TAX EFFICIANCY
Under Section 80C of the Income Tax Act, 1961, ELSS is entitled for a tax deduction of up to
Rs 1.5 lakh per year. Despite the fact that long-term capital gains (LTCG) over Rs1 lakh are
taxed at 10%, they have outperformed other tax-saving strategies in recent years.
1.2 OBJECTIVES
To study the selected schemes offered by ICICI prudential mutual fund, SBI mutual
fund.
To analyse the performance of selected schemes of SBI mutual funds and ICICI
Prudential mutual funds.
To study the recent trends in mutual funds.
1.3 NEED OF THE STUDY
The main purpose of the study is to know performance of mutual funds of SBI mutual funds
and ICICI prudential mutual funds. This helps to know about performance of both the mutual
fund companies and various schemes provided by the companies. To study the best
investment options provided by the selected companies.
JAC : A Journal Of Composition Theory
Volume XV, Issue II, FEBRUARY 2022
ISSN : 0731-6755
Page No: 54

1.4 SCOPE OF THE STUDY
The main focus of the study is to track the performance of two mutual fund schemes they are
SBI blue chip fund, SBI technology fund, SBI banking and financial services fund. ICICI
blue chip fund, ICICI technology fund, ICICI banking and financial services fund. Mutual
fund companies provide various schemes which will gives capital appreciation and growth of
fund with comparative risk. The objective of the study is to know the returns of the fund and
the risk of selected schemes.
1.5 LIMITATIONS OF THE STUDY
The study is limited to two mutual fund schemes of two mutual funds of few mutual funds
only companies. In the study the time period taken is very short of one year. The data used in
the study is collected through secondary sources.
1.6 RESEARCH METHODOLOGY
In this study comparison of SBI mutual fund and ICICI prudential mutual fund, the data
collected from secondary sources like news papers, websites, and research articles. This study
has not been used primary sources like questionnaire.
In the study two mutual fund companies and three mutual fund schemes are selected for
comparing their performance and five years data. Statistical tools used in the study are risk,
return and Sharpe ratio and quantitative data collected from websites.
Sharpe ratio = Rp-Rf /σp
Rp = the expected return on the investor's portfolio
RF = the risk-free rate of return
σp = the portfolio's standard deviation, a measure of risk
JAC : A Journal Of Composition Theory
Volume XV, Issue II, FEBRUARY 2022
ISSN : 0731-6755
Page No: 55
CHAPTER-2
2.1 LITERATURE REVIEW
1. Lubos pastor, M Blair vorsatz(2020)
During the COVID-19 crisis, they examine the performance and flows of active stock mutual
funds in the United States. We discover that most active funds underperform passive
benchmarks, which contradicts the popular belief that active funds thrive in downturns. This
underperformance is especially pronounced when compared to the benchmark. 500 indexes,
but it can also be seen when compared to style benchmarks. Funds with greater sustainability
and star ratings outperform their peers. Investors choose funds with strong sustainability
ratings and funds that use exclusion criteria when reallocating capital. The fact that investors
are still focused on sustainability during a huge crisis suggests that they see it as a priority.
2 .Pliar Grau- Carles,Luis Minguel Donecel (2019)
Financial performance measurements are used by market investors to evaluate fund managers
investment skills and select the best fund managers for their investments. The Sharpe ratio is
the most commonly used financial performance indicator, however it has some flaws.
Alternative measurements have been created by scholars and practitioners to compensate for
the Sharpe ratio's inadequacies. This study looked into the most commonly used performance
measurements. Their findings were assessed by ranking various investments. The results of
the study revealed that the method of measurement used has an impact on the ranking of
investments. The study introduces a novel method for determining a stable ranking based.
3 .Prabhat kumar Tripathi(2019)
Over the last few years, the mutual fund sector has grown at a breakneck rate, with new
products tailored to investors' needs and a slew of new companies joining the market. Mutual
funds aggregate the savings of a number of small participants who hope to profit from their
investment. The money has been accumulated and is now being invested. In a variety of asset
classes such as stock, debt funds, other liquid assets, and so on. The purpose of this research
is to examine the numerous SBI mutual funds and ICICI prudential mutual funds debt funds,
and to analyse the performance of similar debt funds On the basis of risk and return, SBI
Mutual Fund has partnered with ICICI Prudential to create SBI Prudential schemes. The
JAC : A Journal Of Composition Theory
Volume XV, Issue II, FEBRUARY 2022
ISSN : 0731-6755
Page No: 56

values of net assets for the purpose of analysing the performance, net asset values from 2011
to 2017 were used. For the time under consideration, the research confirms that the selected
debt fund at SBI Mutual Fund performed better than the selected ICICI Prudential mutual
funds.
4. Shivnangi agarwal (2017)
Mutual fund investing has grown in popularity in recent years because it provides investors
with the best risk-adjusted returns. The Indian market is no different, with mutual funds
having grown by a factor of ten over the years. As of 2016, the Indian mutual fund industry
was flooded with over 2,000 mutual fund schemes, each offering larger returns than its
contemporaries. This makes it difficult for the average investor to choose the best portfolio to
invest in, necessitating a thorough examination of the funds' performance. While knowing
and analysing mutual fund performance in the past does not guarantee future results, it can
provide insight into how the fund is likely to perform in the future.
5. Malcolm Wardlaw(2020)
By exploiting mutual fund outflow-induced price pressure to identify non fundamental price
fluctuation, a wide and fast rising literature investigates the influence of misevaluation on
business policy. I show that the usual method for calculating outflow-induced price pressure
mistakenly yields a measure that is a direct function of a stock's actual realised return during
the previous quarter, which calls into question its basic orthogonality. Outflows produce a
relatively minor quarterly fall in returns after removing these direct measures of return, with
no following reversal, and many established results in this literature no longer hold on to. I
make This research is based on a study of mutual funds in India, which is often regarded as
one of the most active money markets in the world.
6. Atanu Das (2019)
This research examines a sample of typical schemes from a diverse collection of fund
companies. There are well-defined criteria for judging their performance both in absolute and
relative terms. This study examines risk-returns factors for a variety of scenarios. The
relationship between investors' risk preferences and mutual fund schemes.RAP stands for risk
adjusted performance and is based on real-time data. Several tests were conducted.SAP used
to assess the performance of mutual funds using well-established criteria those tests and
measures recommendations for future analytic projects.
JAC : A Journal Of Composition Theory
Volume XV, Issue II, FEBRUARY 2022
ISSN : 0731-6755
Page No: 57

7. Raychaudhuri (2019)
In his paper learned with regards to diligence in shared asset execution in India. It utilized a
few tests from the writing to reason that there is constancy in the common asset market. It
was discovered that presentation estimates that were developed utilizing enormous slacks of
information are better indicators of future execution. Also, the expectations of execution for
longer future periods were better than forecasts made for short-run future periods. At last, it
was reasoned that auto-relapse tests for tirelessness might come up short in spite of the
presence of perseverance.
8 .Mittal and Gupta (2017)
Composed an article on the inclination and example of interest in common assets. The
principle destinations of the examination paper was to discover attention to the financial
backers about common assets, to concentrate on the components which influence the
financial backer's choice to put resources into shared assets and to emphasis on the preference
for shared assets when compared to other venture options available. To work on their review
they sorted every one of the kinds of shared assets into three classes as follows: Category I:
open finished assets, close finished assets and stretch subsidizes Category II: development
reserves, pay reserves, adjusted assets and currency market supports Category III: charge
saving plans, industry explicit assets, sectored reserves, file plans, load reserves and no - load
reserves.
9. Jonath Retuer, Eric Zitzewitz
The amount of scale diseconomies in asset management has a big impact on manager skill
tests and the expected level of performance persistence. We employ the fact that tiny
differences in returns can induce discrete changes in Morningstar ratings which in turn
generate discrete differences in fund size to determine the causal impact of fund size on
future profit. We find that ratings raise fund size significantly but that fund size has little
effect on fund performance using our regression discontinuity approach. The absence of
major fund-level diseconomies of scale according to Berk and Green (2004) shows that the
lack of performance persistence stems from a lack of performance stability.
10. Jeffrey A. Busse , Tarun Chordia
JAC : A Journal Of Composition Theory
Volume XV, Issue II, FEBRUARY 2022
ISSN : 0731-6755
Page No: 58

We investigate the relationship between transaction costs, portfolio characteristics, and
mutual fund performance. Using a new data set of actual mutual fund dealers, we discover
that after adjusting for investment strategy, larger funds have lower percentage transaction
costs than smaller funds. Larger mutual funds trade less frequently and hold larger equities to
avoid incurring greater trading fees. Because of the nature of their assets, larger funds have
lower gross returns than smaller funds meaning that diminishing returns to scale could be
attributable to fewer investment possibilities due to trading cost limits. Our findings are
striking when seen as a whole.
JAC : A Journal Of Composition Theory
Volume XV, Issue II, FEBRUARY 2022
ISSN : 0731-6755
Page No: 59
CHAPTER-3
COMPANY PROFILE
The ICICI Prudential Mutual Fund is India's second-largest asset management firm. In 1993,
ICICI Prudential Mutual Fund was founded. It is a private mutual fund business with
headquarters in Mumbai, India.3.1
Key people
Mr. Nimesh Shah MD & CEO
Mrs. S. Naren CEO
Mr. Rahul Goswami CEO-Fixed income
The products which were offered by ICICI Prudential Mutual fund are
Portfolio management services
Advisory services
Real estate investments and
Mutual funds
It is a joint venture between ICICI Bank in India and prudential plc, one of the largest players
in financial services sector.
Its major competitors are HDFC Mutual Fund, Kotak Mutual fund, Axis Mutual fund, SBI
Mutual fund, Birla sun life Mutual fund.
SBI Mutual fund
It is started in the year 1987 with its head office located in Mumbai, India. It is joint venture
between State Bank of India, an Indian public sector bank, and AMUNDI a European Asset
management company. It is a private company in Mutual fund industry. Its main product is
mutual fund.
JAC : A Journal Of Composition Theory
Volume XV, Issue II, FEBRUARY 2022
ISSN : 0731-6755
Page No: 60

Key people
Mr. Vinay M. Tonse CEO &MD
Mr. Densys de campigneulles Deputy CEO
D. P. Singh Executive director & chief marketing officer
Vinaya Datar Head Compliance & company secretary
INDUSTRY PROFILE
The Unit Trust of India was established by the Government of India under an Act of
Parliament in 1963, and the history of the Mutual Fund Industry in India can be traced back
to that year. The RBI was in charge of the regulatory and administrative aspects of UTI's
launch. The Reserve Bank of India handed over regulatory and administrative responsibility
of UTI to IDBI in 1978. (Industrial Development Bank of India). The Unit Scheme was the
first mutual fund scheme offered by UTI in India (1964). By the year end of 1988, UTI
secured Rs. 6,700crores in assets under management.
Public sector banks like State Bank of India, Punjab National Bank, Canara Bank, and other
non-UTI segments like General Insurance Corporation of India (GIC) and Life Insurance
Corporation of India (LIC) entered the market and launched public sector mutual funds in
1987. The mutual fund companies introduced by public sector banks;
SBI mutual fund
Canbank mutual fund
Punjab National Bank mutual fund
Bank of India mutual fund
Bank Of Baroda mutual fund
JAC : A Journal Of Composition Theory
Volume XV, Issue II, FEBRUARY 2022
ISSN : 0731-6755
Page No: 61
Asset management companies in India
Axis asset Management Company
Birla Sun Life Asset Management Company
HDFC Asset Management Company
ICICI Prudential Asset Management Company
SBI Asset Management Company
UTI Asset Management Company
DSP Mutual Fund
Kotak Mahindra Bank
Reliance Nippon Life Insurance
JAC : A Journal Of Composition Theory
Volume XV, Issue II, FEBRUARY 2022
ISSN : 0731-6755
Page No: 62

CHAPTER-4
4.1 DATA ANALYSIS
1.To study the selected schemes of SBI mutual fund and ICICI prudential mutual fund
TABLE- 1
SBI blue chip fund (G)
years returns (x-mean) (x-mean)^2
2015 8 -5.36 28.7296
2016 4.8 -8.56 73.2736
2017 30.2 16.84 283.5856
2018 -4.1 -17.46 304.8516
2019 11.6 -1.76 3.0976
2020 16.3 2.94 8.6436
total 66.8 702.1816
Average returns = ƩR/N =66.8/5
=13.36
Standard deviation = √Ʃ(x-X) ²/N = √702.1816^2/5
=11.8336
Sharpe ratio = Rp-Rf /σp
= 13.36-7.35/11.8336
= 0.12
Rp = the expected return on the investor's portfolio
RF = the risk-free rate of return
σp = the portfolio's standard deviation, a measure of risk
JAC : A Journal Of Composition Theory
Volume XV, Issue II, FEBRUARY 2022
ISSN : 0731-6755
Page No: 63

TABLE- 2
SBI technology fund (G)
years returns (x-mean) (x-mean)^2
2015 2.4 -15.3 234.09
2016 -3.3 -21 441
2017 13 -4.7 22.09
2018 17.1 -0.6 0.36
2019 12 -5.7 32.49
2020 47.3 29.6 876.16
total 88.5 1606.19
Average returns = ƩR/N =88.5/5
=17.7
Standard deviation = √Ʃ(x-X) ²/N = √1606.19^2/5
=17.2
Sharpe ratio = Rp-Rf /σp
= 17.7-7.35/17.92
= 0.17
JAC : A Journal Of Composition Theory
Volume XV, Issue II, FEBRUARY 2022
ISSN : 0731-6755
Page No: 64

TABLE- 3
SBI financial and banking services fund (G)
years returns (x-mean) (x-mean)^2
2015 15.3 -6.3 39.69
2016 17 -4.6 21.16
2017 40.7 19.1 364.81
2018 9.5 -12.1 146.41
2019 20.7 -0.9 0.81
2020 4.8 -16.8 282.24
total 108 855.12
Average returns = ƩR/N =108/5
=21.6
Standard deviation = √Ʃ(x-X) ²/N = √855.12^2/5
=13.0776
Sharpe ratio = Rp-Rf /σp
= 21.6-7.35/13.0776
= 0.21
JAC : A Journal Of Composition Theory
Volume XV, Issue II, FEBRUARY 2022
ISSN : 0731-6755
Page No: 65

TABLE- 4
Average returns and risk of SBI selected schemes
schemes average returns risk
SBI blue chip fund 13.36 11.8336
SBI finance and
banking services
fund 21.6 13.0776
SBI technology
fund 17.7 17.92
GRAPH- 1
Return and risk of SBI selected schemes
Interpretation
From the above graph and table it is observed that SBI banking and financial services fund
has higher returns of 21.6, with risk of 13.0776. SBI technology fund is having returns of
17.7 with risk of 17.92 and SBI blue chip fund is having the returns of 13.36 with risk
11.8336
0
5
10
15
20
25
1 2 3 4 5
Series1
Series2
Series3
Series4
JAC : A Journal Of Composition Theory
Volume XV, Issue II, FEBRUARY 2022
ISSN : 0731-6755
Page No: 66

TABLE- 5
Sharpe ratio analysis of three schemes of SBI mutual funds
schemes ratio rank
SBI blue chip
fund 0.12 3
SBI finance and
banking fund 0.21 1
SBI technology
fund 0.17 2
GRAPH- 2
Return and risk of SBI selected schemes
Interpretation
From the above table and graph it is observed that SBI finance and banking services
fund is performing well with Sharpe ratio of 0.21 with highest Sharpe ratio, SBI
technology fund stands 2nd rank with 0.17 Sharpe ratios. And 3rd position is to SBI blue
chip fund with Sharpe ratio of 0.12.
0
0.5
1
1.5
2
2.5
3
3.5
sbi bluechip fund sbi technology fund sbi finance and banking
ratio
rank
JAC : A Journal Of Composition Theory
Volume XV, Issue II, FEBRUARY 2022
ISSN : 0731-6755
Page No: 67

TABLE- 6
ICICI blue chip fund
years returns (x-mean) (x-mean)^2
2015 -0.2 -12.74 162.3076
2016 7.7 -4.84 23.4256
2017 32.7 20.16 406.4256
2018 -0.8 -13.34 177.9556
2019 9.8 -2.74 7.5076
2020 13.5 0.96 0.9216
total 62.7 778.5436
Average returns = ƩR/N =62.7/5
=12.54
Standard deviation = √Ʃ(x-X) ²/N = √778.5436^2/5
=12.2783
Sharpe ratio = Rp-Rf /σp
= 12.54-7.35/12.2783
= 0.11
Rp = the expected return on the investor's portfolio
RF = the risk-free rate of return
σp = the portfolio's standard deviation, a measure of risk
JAC : A Journal Of Composition Theory
Volume XV, Issue II, FEBRUARY 2022
ISSN : 0731-6755
Page No: 68

TABLE-7
ICICI banking and financial services fund
years returns (x-mean) (x-mean)^2
2015 -7.2 -20.72 429.3184
2016 21.1 7.58 57.4564
2017 45.1 31.58 997.2964
2018 -0.4 -13.92 193.7664
2019 14.5 0.98 0.9604
2020 -5.5 -19.02 361.7604
total 67.6 2040.558
Average returns = ƩR/N =67.6/5
=13.52
Standard deviation = √Ʃ(x-X) ²/N = √2040^2/5
=20.2018
Sharpe ratio = Rp-Rf /σp
= 13.52-7.35/2040.558
= 0.13
JAC : A Journal Of Composition Theory
Volume XV, Issue II, FEBRUARY 2022
ISSN : 0731-6755
Page No: 69

TABLE- 8
ICICI technology fund
years returns (x-mean) (x-mean)^2
2015 3.9 -18.44 340.0336
2016 -4 -26.34 693.7956
2017 19.8 -2.54 6.451
2018 19.1 -3.24 10.4976
2019 2.3 -20.04 401.6016
2020 70.6 48.26 2329.02
total 111.7 3781.399
Average returns = ƩR/N =111.7 /5
=22.34
Standard deviation = √Ʃ(x-X) ²/N = √3781^2/5
=7.5627
Sharpe ratio = Rp-Rf /σp
= 22.34-7.35/3781.399
= 0.21
JAC : A Journal Of Composition Theory
Volume XV, Issue II, FEBRUARY 2022
ISSN : 0731-6755
Page No: 70

TABLE- 9
Average returns and standard deviation of ICICI prudential mutual funds selected
schemes
Schemes
Average
returns Risk
ICICI blue chip
fund 12.54 12.27833
ICICI
technology fund 22.34 7.5627
ICICI banking
and financial
services fund 13.52 20.2018
GRAPH- 3
Return and risk of ICICI selected schemes
0
5
10
15
20
25
schemes average returns standard deviation
Series1
Series2
Series3
Series4
JAC : A Journal Of Composition Theory
Volume XV, Issue II, FEBRUARY 2022
ISSN : 0731-6755
Page No: 71

Interpretation
From the above table and graph it is observed that ICICI blue chip fund schemes have
higher returns of 12.54 with 12.2783 rate of risk. The ICICI technology funds have
22.34 returns with the risk of 7.5627 and the last scheme ICICI banking and financial
services fund have the returns of 13.52 and with risk of 20.2018.ICICI technology fund
is performing well with comparing other schemes.
TABLE- 10
Sharpe ratio of selected mutual fund schemes of ICICI prudential mutual fund
schemes ratio rank
ICICI blue chip fund 0.11 3
ICICI technology
fund 0.21 1
ICICI banking and
financial services 0.13 2
JAC : A Journal Of Composition Theory
Volume XV, Issue II, FEBRUARY 2022
ISSN : 0731-6755
Page No: 72

GRAPH- 4
Sharpe ratio of ICICI selected schemes
Interpretation
From the above table and graph it is observed that ICICI technology fund is performing well
with Sharpe ratio of 0.21 with highest Sharpe ratio, ICICI banking and finical services fund
stands 2nd rank with 0.13 Sharpe ratios. And 3rd position is to ICICI technology fund.
2. To compare selected schemes of SBI mutual fund and ICICI prudential mutual fund
TABLE- 11
ICICI and SBI blue chip fund returns
years ICICI SBI 2015 -0.2 8 2016 7.7 4.8 2017 32.7 30.2 2018 -0.8 -4.1 2019 9.8 11.6 2020 13.5 16.3
GRAPH- 5
0
0.5
1
1.5
2
2.5
3
3.5
1 2 3 4
schemes
ratio
rank
JAC : A Journal Of Composition Theory
Volume XV, Issue II, FEBRUARY 2022
ISSN : 0731-6755
Page No: 73
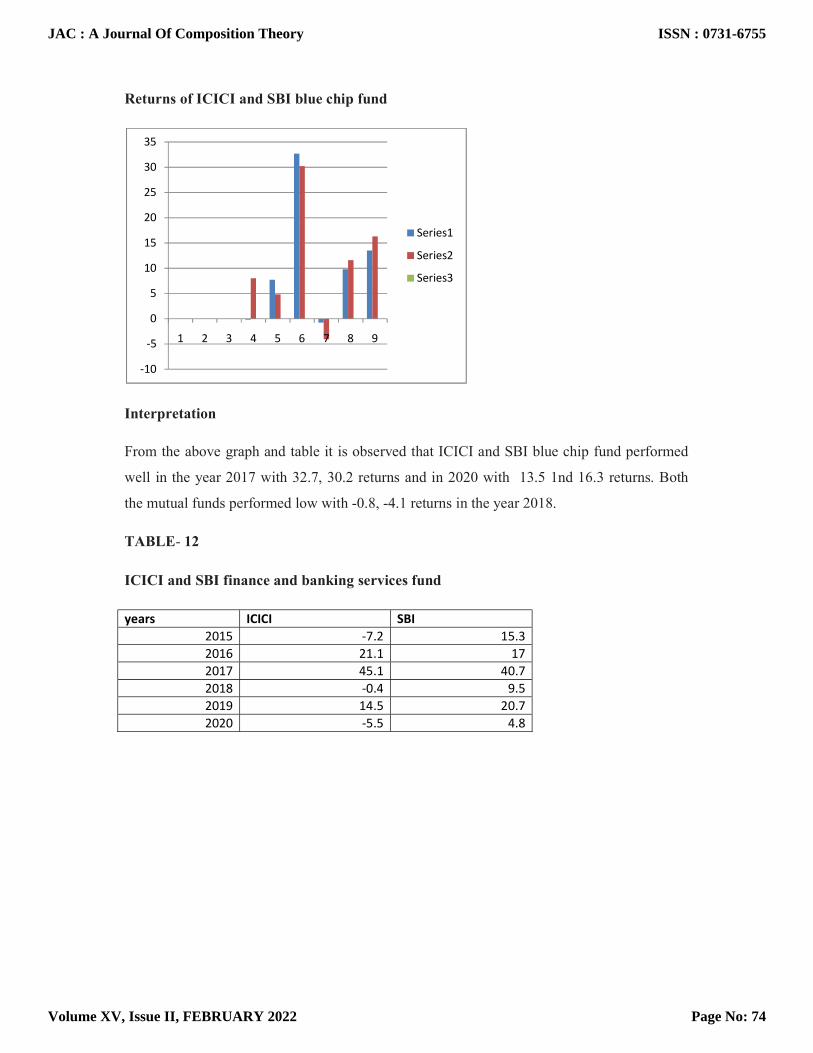
Returns of ICICI and SBI blue chip fund
Interpretation
From the above graph and table it is observed that ICICI and SBI blue chip fund performed
well in the year 2017 with 32.7, 30.2 returns and in 2020 with 13.5 1nd 16.3 returns. Both
the mutual funds performed low with -0.8, -4.1 returns in the year 2018.
TABLE- 12
ICICI and SBI finance and banking services fund
years ICICI SBI 2015 -7.2 15.3 2016 21.1 17 2017 45.1 40.7 2018 -0.4 9.5 2019 14.5 20.7 2020 -5.5 4.8
-10
-5
0
5
10
15
20
25
30
35
1 2 3 4 5 6 7 8 9
Series1
Series2
Series3
JAC : A Journal Of Composition Theory
Volume XV, Issue II, FEBRUARY 2022
ISSN : 0731-6755
Page No: 74

GRAPH -6
Returns of ICICI and SBI finance and banking services
Interpretation
From the above graph and table it is observed that ICICI and SBI finance and banking
services fund performed well in the year 2017 with 45.1, 40.7 returns and in 2016 with 21.1
and 17 returns. ICICI finance and banking services fund performed low with -7.2 in the year
2015.
TABLE- 13
ICICI and SBI technology fund returns
years ICICI SBI 2015 3.9 2.4 2016 -4 -3.3 2017 19.8 13 2018 19.1 17.1 2019 2.3 12 2020 70.6 47.3
-10
0
10
20
30
40
50
1 2 3 4 5 6
ICICI
SBI
JAC : A Journal Of Composition Theory
Volume XV, Issue II, FEBRUARY 2022
ISSN : 0731-6755
Page No: 75

GRAPH- 7
Returns of ICICI and SBI technology fund
Interpretation
From the above graph and table it is observed that ICICI and SBI technology fund performed
well in the year 2020 with 70.6, 47.3 returns. Both the mutual fund schemes performed low in
the year 2016 -4, -3.3 returns.
3 .Recent trends in mutual funds
Everyone, including the mutual fund industry, the year 2020 was a roller-coaster ride. The
sector has seen several changes due to a variety of factors. The Securities and Exchange
Board of India, the country's market regulator, has implemented a host of new rules and
regulations aimed at making mutual funds more transparent and investor-friendly.
Change in the mandate of multi cap funds
SEBI released a circular in September 2020 that changed the portfolio mandate of
multi cap fund schemes. From January 2021, multicap funds will be required to invest a
minimum of 25% in big cap, small cap, and mid cap equities, according to the new law. With
no market cap limits, this will increase the overall equity exposure of these schemes to 75
percent, up from the present minimum equity exposure of 65 percent.
-10
0
10
20
30
40
50
60
70
80
1 2 3 4 5 6
ICICI
SBI
JAC : A Journal Of Composition Theory
Volume XV, Issue II, FEBRUARY 2022
ISSN : 0731-6755
Page No: 76

This initiative attempts to make multi-cap funds more "true to label" and to ensure that they
have a well-diversified portfolio. Most multi-cap funds favoured large-cap equities, with little
or no exposure to small-cap stocks. To escape the new rule, many fund houses discussed
transforming their existing multi-cap schemes to ESG or Focused funds.
Introduction to flexi cap category
Many large fund companies were unhappy with the change in mandate for multi-cap
plans. Many senior fund managers and chief investment officers have spoken out against the
proposal, claiming that it will make the category riskier for investors. The adjustment had a
key flaw: it required a necessary 25% exposure to small-cap stocks. SEBI intervened on
November 6th, issuing a circular proposing the launch of a new mutual fund category called
Flexi Cap Funds, which are a market diversified category Flexi Cap Funds are a type of
mutual fund that invests in a variety Flexi cap funds are the new name for multi cap funds,
which are market cap agnostic and need a minimum equity commitment of 65 percent.
Change in NAV calculation
This year, the SEBI modified the procedures for calculating NAV in mutual funds.
Investors will receive the buy NAV on the day that their money reaches the asset
management company (AMC) under the new guidelines, regardless of the size of their
investments. This rule will take effect on February 1, 2021, although it will not apply to
liquid or overnight funds.
Inter-scheme transfer norms have been strengthened
Following the Covid-19 pandemic's liquidity problem, many fund houses attempted to
retain liquidity in some short-term loan schemes by moving bad credit to either balanced
funds or longer-term debt schemes. The Securities and Exchange Commission (SEBI) has
issued new guidelines to protect investors' funds from being harmed by this process.
Inter-scheme transfers in closed-ended funds can only be made within three business days of
the scheme's units being allotted to investors as of January 1, 2021. . SEBI also took notice of
the movement of bad credit from one scheme to another, ordering that fund houses not
transfer debt papers to another scheme if there is any negative market news or rumour about a
security in the media, or if an alert is generated about a security for its risk levels in the
preceding four months.
JAC : A Journal Of Composition Theory
Volume XV, Issue II, FEBRUARY 2022
ISSN : 0731-6755
Page No: 77

Separation of advisor distributors
This year, the Securities and Exchange Commission (SEBI) required the long-awaited
separation of consultants and distributors. This was done primarily to address the issue of
retail investor mis-selling and overpricing of services. A corporation with both advisory and
distribution arms can either provide financial advice or sell products to its clients, according
to the new rule. Individual planners and distributors must also select one of the roles and
register with AMFI accordingly.
A new risk-zero meter label
SEBI added a new category to the risk-o-meter to help investors make better decisions
about their investments in high-risk mutual funds. Aside from the existing five danger
categories, the risk-o-meter tool will also display the ‘Very high' risk category. SEBI also
ordered fund firms to disclose and assess risk based on the portfolio of a specific scheme
rather than a category. Fund houses will be forced to make monthly risk-o-meters and
portfolios public beginning January 1, 2021.
Dividend options renamed
In mutual funds, mis-selling in the pretext of regular payouts is a long-standing
practise. SEBI, finally took action to increase transparency in mutual fund dividend payouts,
directing fund houses to clearly state that dividends may be paid from their capital. As a
result, beginning in April 2021, dividend options in existing and future schemes will be
renamed to reflect a cleaner, more transparent nomenclature. Income distribution cum capital
with will be the new term for the dividend payout option.
Norms to bring more transparency in debt securities transaction
This year, the SEBI changed the disclosure rules for debt mutual funds to help investors
better understand the risk levels in the portfolios. Fund houses will have to report the yields
of the scheme's underlying instruments, as well as the portfolio, on a fortnightly basis under
the new rules. Prior to the new requirement, portfolio disclosure was done on a monthly
basis. Previously, fund houses simply disclosed the portfolio's indicative yield, not the precise
yields of the securities. The benefits of ventures will be conveyed to the unit holders. The unit
holders can sell their units in the open market at 'Net Asset esteem (NAV).
JAC : A Journal Of Composition Theory
Volume XV, Issue II, FEBRUARY 2022
ISSN : 0731-6755
Page No: 78

CHAPTER-5
FINDINGS
1. The following mutual fund scheme has highest returns
SBI blue chip is performing well by generating13.36 returns comparing to ICICI blue
chip fund.
ICICI technology fund is performing better than SBI technology fund by generating
22.34 returns.
SBI banking and financial services fund is performing better by generating 21.6
returns.
2. The following mutual fund schemes are compared using highest risk
ICICI blue chip has high rate of risk with 12.2783
ICICI technology fund has high risk 22.34
SBI banking and financial services fund has high risk 13.0776
3. The performance of the mutual fund schemes are evaluated with the help of Sharpe ratio
and ranks are given according to their performance
ICICI technology fund with 0.21
SBI blue chip fund with 0.12
SBI banking and financial services fund with 0.21
SUGGESTIONS
The following mutual fund scheme has highest returns
SBI blue chip is performing well by generating13.36 returns comparing to ICICI blue
chip fund.
JAC : A Journal Of Composition Theory
Volume XV, Issue II, FEBRUARY 2022
ISSN : 0731-6755
Page No: 79

ICICI technology fund is performing better than SBI technology fund by generating
22.34 returns.
SBI banking and financial services fund is performing better by generating 21.6
returns.
CONCLUSION
The performance of SBI and ICICI mutual funds' blue chip, technology, banking, and
financial services funds was compared in this study. It is observed that ICICI
technology fund is performing well with high returns. It is also observed that with the
highest Sharpe ratio 0.21 ICICI technology fund and SBI banking and financial
services fund will give higher returns
REFERENCE:
https://www.fincash.com/l/mutual-funds/sbi-bluechip-fund
https://www.fincash.com/l/mutual-funds/sbi-technology-opportunities-fund
https://www.fincash.com/l/mutual-funds/sbi-banking-financial-services-fund
https://www.fincash.com/l/mutual-funds/icici-prudential-bluechip-fund
https://www.fincash.com/l/mutual-funds/icici-prudential-technology-fund
https://www.fincash.com/l/mutual-funds/icici-prudential-banking-and-financial-
services-fund
www.mutualfundindia.com
www.amfindia.com
www.sbimf.com
www.icicipruamc.com
JAC : A Journal Of Composition Theory
Volume XV, Issue II, FEBRUARY 2022
ISSN : 0731-6755
Page No: 80
Copyright © 2022 FDOKUMEN