Q3FY21 - SBI
47
Q3FY21 Analyst Presentation 04.02.2021
-
Upload
khangminh22 -
Category
Documents
-
view
5 -
download
0
Transcript of Q3FY21 - SBI

Q3FY21
Analyst Presentation04.02.2021

Safe Harbor
Certain statements in these slides are forward-looking statements. These
statements are based on Management's current expectations and are
subject to uncertainty and changes in circumstances. Actual outcomes may
differ materially from those included in these statements due to a variety of
factors.

Contents
Financial Performance2
Business3
Capital Adequacy & Asset Quality4
Digital Journey5
Financial Inclusion & Sustainability6
Subsidiaries, Group Financials & Balance Sheet 7
Performance Highlights1

10%15%
20%13%
26%
39%
48%44%
78%
45.0
63.6
71.4
68.275.7
82.7 85.591.1 93.4
98.2
0
20
40
60
80
100
120
0%
10%
20%
30%
40%
50%
60%
70%
80%
90%
Apr-20 May-20 Jun-20 Jul-20 Aug-20 Sep-20 Oct-20 Nov-20 Dec-20 Jan-20
SBI Business Activity Index accelerating- latest value indicating activity almost normal
% of Indicators Showing Acceleration SBI Business Activity Index
Macro-Economic Indicators
Source: SBI Research4
High Frequency Activity Indicators
➢ Many of the high frequency indicators are showing
improved economic activity, with the Dec 2020 level
above the Pre-Covid level observed in Feb 2020
➢ Electricity Demand, Vehicle Registrations, Port Cargo
traffic, tractor sales, fertiliser sales petrol and diesel
consumption have resumed above pre-Covid level
➢ Our Business Activity Index continues to improve with
the latest reading near the pre-Covid level in February,
indicating resumption of activity almost to normal levels
40
41
35.9
4650.4
52.1 53 53.9 53.5
2430
49.2
40.46
53.29
5859.3 62.1
59.2
Apr-20 May-20 Jun-20 Jul-20 Aug-20 Sep-20 Oct-20 Nov-20 Dec-20
SBI Composite Index
SBI Composite Index Yearly SBI Composite Index Monthly
1.33
1.151.25
0.91
1.30
1.93
1.23 1.21
1.895.39
5.23
4.47
3.99
3.84
4.26
3.773.45
3.62
3.00
3.50
4.00
4.50
5.00
5.50
0.50
0.70
0.90
1.10
1.30
1.50
1.70
1.90
2.10
Apr-20 May-20 Jun-20 Jul-20 Aug-20 Sep-20 Oct-20 Nov-20 Dec-20
Significant decline in cost of borrowing for corporates
Aggregate issue (Rs Lakh Crore) Effective Weighted avg. yield in CP market

Key trends in Q3FY21
Retail credit growth – back to pre Covid-19 levels at 15.47% YoY
Personal gold loan book at Rs 17,492 cr, up four times in six months; Xpress credit up 35.7% YoY- demonstrates the
strength of SBI franchise and the ability to scale up rapidly in select product lines
Liability franchise – driven by brand, trust and reach
Savings account balances up 15.99% YoY; Current account balances up 11.33% YoY
Asset quality outcomes – restructuring applications at Rs 18,125 cr, well within guidance
Slippage ratio as on 31st Dec 2020 at 1.27% (including proforma slippages*); Collection Efficiency at 96.5%
Well provided for Stressed Book, PCR at 90.21#%
COVID-19 related contingency provisions at Rs 12,976 cr
Increasing digital customer onboarding - 41% of retail asset accounts and 60% of liability
customers added through digital channels in Q3FY21
*Accounts which would have slipped to NPA but for Honourable Supreme Court interim order dated 3rd Sep 2020
# Includes AUCA
5

Key Indicators
Rs. in CroresFor the quarter YoY
GrowthQ3FY20 Q2FY21 Q3FY21
Profit &
Loss(in Rs.
Crore)
Net Interest Income * 27,779 28,181 28,820 3.75%
Net Interest Margin –
Domestic (%)3.59 3.34 3.34 -25 bps
Operating Profit * 18,223 16,460 17,333 -4.88%
Profit Before Tax 10,970 6,341 6,991 -36.27%
Net Profit 5,583 4,574 5,196 -6.93%
Key
Ratios(in %)
Credit Cost 1.46 0.94 0.38 -108 bps
Net NPA 2.65 1.59 1.23 -142 bps
PCR 81.73 88.19 90.21 848 bps
Capital Adequacy 13.73 14.72 14.50 77 bps
Balance
Sheet(in Rs.
Crore)
Total Advances 23,01,669 23,83,624 24,56,607 6.73%
Total Deposits 31,11,229 34,70,462 35,35,753 13.64%
Retail Personal
Advances7,19,766 7,85,345 8,31,134 15.47%
6
* Excluding one-time interest income of Rs 4,039 crs and other income of Rs.452 crs in Q3FY20
1. NII grew at 21.40% YoY in Q3FY21
2. NIM (Domestic) was up 29 bps YoY in Q3FY21
3. Operating Profit grew by 26.23% YoY in Q3FY21
4. Net Profit grew by 133.78% YoY in Q3FY21
0.39
0.45
Dec 19 Dec 20
Return on Assets (%)
8.15
9.49
Dec 19 Dec 20
Return on Equity (%)
1,30,680
1,77,366
Dec 19 Dec 20
Xpress Credit
4,40,448
4,84,453
Dec 19 Dec 20
Home Loan
35.73% 9.99%
1,89,129
2,10,563
Dec 19 Dec 20
Current Account
11,51,701
13,35,861
Dec 19 Dec 20
Savings Account
11.33% 15.99%
6 bps 134 bps

Credit offtake trend continues to improve
7
Home Loan
Auto Loan
Personal Loan
Sep-20, 29%
Oct-20, -1%
Nov-20, 7%
Dec-20, 25%
Sanctions
Sep-20, 12%
Oct-20, 8%
Nov-20, 2%
Dec-20, 23%
Disbursements
Sep-20, 29%
Oct-20, 20%
Nov-20, 87%
Dec-20, 11%
Sanctions
Sep-20, 27%
Oct-20, 6%
Nov-20, 64%
Dec-20, 3%
Disbursements
Sep-20 , 55%
Oct-20, 73%
Nov-20, 56%
Dec-20, 68%
Sanctions
Sep-20, 61%
Oct-20, 86%
Nov-20, 64%
Dec-20, 77%
Disbursements
Month-wise YoY Growth

41,216
6,393
18,125
16,461
237
-
Total Slippages and Restructuringupto Q3FY21
Restructuring requests received tillDec 2020
Proforma Slippages for 9MFY21**
Slippages in Q3FY21*
Slippages in H1FY21
▪ Corporate credit mainly to highly rated corporates
▪ Large proportion of Retail book in SBI is to customers employed in Govt./ quasi–Govt./ large corporates
▪ SME sector supported by Govt guaranteed lending scheme; liberalized financing and handholding
▪ Significant proportion of International Banking book is to Govt/ PSU entities and well rated Corporates
Asset Quality trends
Assessment of Slippages and Restructuring
* Foreign office slippages in Q3FY21
** Slippages but for Hon’ble. SC interim order dated 3rd
Sep 2020
Rs. in Crores
8
~60,000
6,393
~ 20,000
~13,000
6,495
14,388
Estimated - Total Slippages andrestructuring at end of FY21
Estimated Slippages in Q3 & Q4FY21
Additional expected restructuring tillDec 2020
Restructuring requests received inOct 2020
Proforma Slippages in Q2FY21**
Slippages in H1FY21
Slippage ratio including Restructuring ~2.5%
As at Q2FY21 As at Q3FY21
Restructuring
Applications
Retail Personal SME Corporate Total
3,865 2,553 11,707 18,125

Provisions - details
9
As on Dec 2020
ParticularsTotal Outstanding
(in Rs. Crore)
Provisions
(in Rs. Crore)
Upto
Q2FY21
During
Q3FY21Total
Upto
Q2FY21
During
Q3FY21Total
Estimated proforma slippage till Q3FY21, but for
Hon. SC interim order on deferment of asset
classification (including 100% provision on
unrealized interest)
14,388 2,073 16,461 3,194 2,071 5,265
Restructuring applications received till Dec 31st
2020 (@10% of Outstanding Amount)6,495 11,630 18,125 650 814 1,464*
On accounts for which moratorium was granted
on International Book (Foreign Offices)239 - 239
COVID General Contingency provisions (basis the
assessment of estimated slippages + restructuring
book)
3,008 3,000 6,008
Total COVID 19 related provisions held 7,091 5,885 12,976
* Provision of Rs.348 Crs are included in Std assets provision as restructuring already implemented for Rs.4,506 Crs

At variance to long term trends
18.2
11.9
16.0
18.1 18.2 18.1
15.514.2
17.8
15.114.0
12.8
16.1
15.9
10.5
11.2
7.7
-1.1
-3.8
0.5
7.7
9.5
FY00 FY01 FY02 FY03 FY04 FY05 FY06 FY07 FY08 FY09 FY10 FY11 FY12 FY13 FY14 FY15 FY16 FY17 FY18 FY19 FY20 9MFY21
ROE (in %)Mean RoE (FY00 – FY15) – 15.2
0.75
0.57
0.73
0.86
0.94 0.990.89
0.84
1.01 1.04
0.88
0.71
0.88
0.97
0.65 0.680.46
-0.06
-0.19
0.02
0.38
0.45
FY00 FY01 FY02 FY03 FY04 FY05 FY06 FY07 FY08 FY09 FY10 FY11 FY12 FY13 FY14 FY15 FY16 FY17 FY18 FY19 FY20 9MFY21
ROA ( in %)Mean RoA (FY00 – FY15) – 0.84
Sustainable RoE – A perspective
FY17, 18 and 19 are aberrations – Reflects the most
difficult phase of corporate asset quality cycle - An uptick is
clearly visible now
Sustainable ROE of ~15% +
The Bank consistently delivered double digit ROEs
FY00–FY15: 15%+ ROEs for 10 years
10

Financial Performance
11

Financials – At a Glance
Rs. in Crores
NIM (Whole Bank) (%) 3.33 3.12 3.12 3.05 3.09 0 bps -21 bps 4 bps
NIM (Domestic) (%) 3.59 3.34 3.34 3.27 3.31 0 bps -25 bps 4 bps
Cost to Income Ratio (Cumulative) (%) 50.60 55.16 54.47 52.45 53.25 -69 bps 387 bps 80 bps
Cost to Assets (%) 2.01 1.96 1.95 1.97 1.90 -1 bps -6 bps -7 bps
Interest Income 67,692 66,814 66,734 1,94,642 2,00,049 -0.12 -1.41 2.78
Interest Expenses 39,913 38,633 37,915 1,19,324 1,16,406 -1.86 -5.01 -2.45
Net Interest Income 27,779 28,181 28,820 75,318 83,643 2.27 3.75 11.05
Non Interest Income* 9,106 8,528 9,246 29,144 27,271 8.42 1.54 -6.43
Operating Income 36,885 36,709 38,066 1,04,462 1,10,914 3.70 3.20 6.18
Operating Expenses 18,662 20,249 20,733 54,794 59,060 2.39 11.10 7.78
Operating Profit 18,223 16,460 17,333 49,667 51,854 5.31 -4.88 4.40
Total Provisions 12,639 11,886 12,137 38,760 37,894 2.11 -3.97 -2.23
Net Profit 5,583 4,574 5,196 10,907 13,960 13.60 -6.93 27.99
Quarter Ended Nine Months Ended Growth (%)
Q3FY20 Q2FY21 Q3FY21 9MFY20 9MFY21
Q3FY21
over
Q2FY21
Q3FY21
over
Q3FY20
9MFY21
over
9MFY20
12* Includes one-off item o/a of stake sale in SBI Life of Rs.3,484 Crs in Q2FY20 and Rs.1,540 Crs in Q1FY21

Total Income
Rs. in Crores
Fee Income 5,635 5,243 5,349 15,852 15,062 2.03 -5.08 -4.98
Profit/Loss on Sale of
Investments* 696 1,084 959 5,339 6,068 -11.55 37.73 13.66
Forex Income 635 528 610 1,826 1,606 15.54 -3.86 -12.00
Misc. Income 2,140 1,673 2,328 6,127 4,534 39.18 8.79 -26.00
of which:
Recovery in AUCA accounts 2,087 1,395 2,142 5,309 3,985 53.52 2.65 -24.93
Total Non Interest Income 9,106 8,528 9,246 29,144 27,271 8.42 1.54 -6.43
Total Income 76,798 75,342 75,981 2,23,786 2,27,320 0.85 -1.06 1.58
Interest on Loans 48,063 43,378 43,737 1,37,169 1,31,215 0.83 -9.00 -4.34
Interest on Resources 17,968 20,763 21,120 52,860 62,383 1.72 17.54 18.02
Other Interest income 1,660 2,674 1,877 4,613 6,451 -29.79 13.08 39.83
Total Interest Income 67,692 66,814 66,734 1,94,642 2,00,049 -0.12 -1.41 2.78
Quarter Ended Nine Months Ended Growth (%)
Q3FY20 Q2FY21 Q3FY21 9MFY20 9MFY21
Q3FY21
over
Q2FY21
Q3FY21
over
Q3FY20
9MFY21
over
9MFY20
13* Includes one-off item o/a of stake sale in SBI Life of Rs.3,484 Crs in Q2FY20 and Rs.1,540 Crs in Q1FY21

Fee Income Break Up
Rs. in Crores
Quarter Ended Nine Months Ended Growth (%)
Q3FY20 Q2FY21 Q3FY21 9MFY20 9MFY21
Q3FY21
over
Q2FY21
Q3FY21
over
Q3FY20
9MFY21
over
9MFY20
Loan Processing Charges 1,120 1,296 1,142 2,502 3,263 -11.90 1.97 30.40
Commission on Govt. Business 972 939 843 2,828 2,646 -10.29 -13.28 -6.45
Commission on LC/BG 771 728 833 2,192 2,238 14.43 8.08 2.08
Cross Selling 558 528 613 1,415 1,450 16.06 9.79 2.44
Account Maintenance Charges 356 102 125 854 375 22.21 -64.79 -56.01
Remittance, Collection, etc. 1,556 1,266 1,399 4,776 3,626 10.58 -10.05 -24.09
Misc. Fee Income 302 383 393 1,285 1,465 2.78 30.00 14.03
Fee Income 5,635 5,243 5,349 15,852 15,062 2.03 -5.08 -4.98
14

Total Expenses
Rs. in Crores
Quarter Ended Nine Months Ended Growth (%)
Q3FY20 Q2FY21 Q3FY21 9MFY20 9MFY21
Q3FY21
over
Q2FY21
Q3FY21
over
Q3FY20
9MFY21
over
9MFY20
Interest on Deposits 37,182 35,849 35,121 1,10,231 1,07,809 -2.03 -5.54 -2.20
Interest on Borrowings 1,521 1,429 1,119 5,467 4,270 -21.66 -26.43 -21.89
Other Interest paid 1,210 1,355 1,674 3,627 4,326 23.55 38.36 19.29
Total Interest Expenses 39,913 38,633 37,915 1,19,324 1,16,406 -1.86 -5.01 -2.45
Total Expenses 58,575 58,882 58,647 1,74,119 1,75,466 -0.40 0.12 0.77
Salary 6,855 6,933 6,940 20,381 20,905 0.10 1.24 2.57
Provisions for Employees 4,601 5,637 6,178 13,296 16,648 9.59 34.29 25.22
Staff Expenses 11,456 12,570 13,118 33,676 37,553 4.36 14.51 11.51
Overheads 7,207 7,679 7,615 21,118 21,507 -0.84 5.67 1.84
Of which:
Depreciation 815 820 845 2,403 2,486 3.06 3.75 3.44
Operating Expenses 18,662 20,249 20,733 54,794 59,060 2.39 11.10 7.78
15
Overheads Rs. in Crores
Quarter EndedNine Months
EndedGrowth (%)
Q3FY20 Q2FY21 Q3FY21 9MFY20 9MFY21
Q3FY21
over
Q2FY21
Q3FY21
over
Q3FY20
9MFY21
over
9MFY20
Rent, Taxes and Lighting 1,322 1,308 1,354 3,864 3,714 3.51 2.37 -3.89
Depreciation 815 820 845 2,403 2,486 3.06 3.75 3.44
Printing and Stationery 119 116 123 340 324 5.80 3.34 -4.80
Postage & Telecommunications 83 75 84 248 206 11.77 0.59 -16.90
Repairs and Maintenance to Bank's
Property224 206 221 652 590 7.06 -1.41 -9.58
Travelling & Halting 279 199 220 796 585 10.89 -21.10 -26.44
Deposit & General Insurance 798 1,089 1,060 2,366 3,102 -2.65 32.93 31.08
Business Acquisitions & Development
Expenses527 1,051 732 1,840 2,381 -30.37 38.85 29.37
ATM /CDM/Debit Card /Other Tech
Expenses1,824 1,638 1,849 5,233 4,860 12.87 1.39 -7.12
Misc. Expenses 1,216 1,177 1,127 3,376 3,259 -4.25 -7.29 -3.44
Overheads 7,207 7,679 7,615 21,118 21,507 -0.84 5.67 1.8416

Provisions & Profit
Rs. in Crores
Quarter Ended Nine Months Ended Growth (%)
Q3FY20 Q2FY21 Q3FY21 9MFY20 9MFY21
Q3FY21
over
Q2FY21
Q3FY21
over
Q3FY20
9MFY21
over
9MFY20
Ratios (Annualised) Q3FY20 Q2FY21 Q3FY21 9MFY20 9MFY21
ROA (%) 0.60 0.44 0.49 0.39 0.45
ROE (%) 8.15 9.49
Earning Per Share (Rs.) 24.89 20.33 23.10 16.27 20.76
Operating Profit 18,223 16,460 17,333 49,667 51,854 5.31 -4.88 4.40
Loan Loss 8,193 5,619 2,290 30,882 17,330 -59.24 -72.04 -43.88
Standard Assets -1,752 -257 1,506 -2,744 1,531 685.79 185.93 155.80
Investment Depreciation 3,287 653 518 1,142 2,402 -20.64 -84.24 110.24
Other Provisions -2,475 4,103 6,028 294 11,699 46.91 343.60 3,881.54
Income Tax# 5,386 1,767 1,795 9,185 4,932 1.54 -66.68 -46.30
Total Provisions 12,639 11,886 12,137 38,760 37,894 2.11 -3.97 -2.23
Net Profit 5,583 4,574 5,196 10,907 13,960 13.60 -6.93 27.99
17#Includes impact of DTA & MAT reversal of Rs 3,392 cr in Q3FY20, as the Bank moved to the new tax regime

▪ CD Ratio at ~62% is at cyclical lows
▪ Sufficient liquidity and headroom to fund likely
credit growth
Liquidity
8.91 8.728.35 8.22 8.16
3.51 3.292.37 2.20 2.08
Dec-19 Mar-20 Jun-20 Sep-20 Dec-20
Yield on Advances
Domestic Foreign Offices
Key Financial Ratios
18
4.97 4.944.48 4.35 4.26
2.46 2.341.78 1.60 1.46
Dec-19 Mar-20 Jun-20 Sep-20 Dec-20
Cost of Deposits
Domestic Foreign Offices
3.273.19 3.24 3.29 3.31
1.20 1.18 1.13 1.15 1.13
3.05 2.97 3.01 3.07 3.09
Dec-19 Mar-20 Jun-20 Sep-20 Dec-20
Net Interest Margins
Domestic Ops Overseas Ops Whole Bank
In %
YoY: MCLR 90 bps, 6M-LIBOR 164 bps, 3M-LIBOR 168 bps
Yield on Investments
7.27 7.19
6.55 6.47 6.42
Dec-19 Mar-20 Jun-20 Sep-20 Dec-20

Business
19

Rs. in Crores Dec 19 Dec 20 YoY Growth (%)
Current Account 1,89,129 2,10,563 11.33
Saving Bank 11,51,701 13,35,861 15.99
CASA 13,40,830 15,46,424 15.33
Term Deposits (TD) 16,57,367 18,78,391 13.34
Domestic Deposits 29,98,197 34,24,815 14.23
Foreign Offices 1,13,032 1,10,939 -1.85
Total Deposits 31,11,229 35,35,753 13.64
20
Strong Liability Franchise
TD, 54.85%
SA, 39.00%
CA, 6.15%
Dec 20
TD, 55.28%
SA, 38.41%
CA, 6.31%
Dec 19
CASA: 45.15%
Domestic Deposits
CASA: 44.72%

SME, 13.81%
Agri, 10.05%
Retail Pers., 39.08%
Corporates, 37.06%
Dec 20
Diversified Loan Portfolio
Retail: 62.94%
Domestic Advances
SME, 14.05%
Agri, 10.61%
Retail Pers., 36.38%
Corporates, 38.96%
Dec 19
Rs. in Crores Dec 19 Dec 20 YoY Growth (%)
Retail Personal 7,19,766 8,31,134 15.47
Agri 2,09,997 2,13,668 1.75
SME 2,78,035 2,93,654 5.62
Corporates 7,71,000 7,88,208 2.23
Domestic Advances 19,78,799 21,26,664 7.47
Foreign Offices Advances 3,22,870 3,29,943 2.19
Total Whole Bank Advances 23,01,669 24,56,607 6.73
Total Whole Bank Advances (Including CP and Corporate Bonds)
24,39,899 26,38,998 8.16
Retail: 61.04%
21

Retail Per BankingLeadership across all segments
Home
Loans
Personal Retail Portfolio of Rs 8.3 lakh crore
NPA ratio at 0.71%
Auto
Loans
Xpress
Credit
As on Dec 2020
#As per latest available data Bank’s market share in Home loans is 34.60% & in Auto loans is 32.72%
As a % of Dom. Adv. Dec 20: 39.08Dec 19: 36.37
22
YoY
Growth, %9.99 3.37 35.73 558.83 4.64
GNPA, % 0.67 0.73 0.36 0.04 1.91
O/S,
In Rs cr4,84,453 75,937 1,77,366 17,492 75,886
Other P
Seg Loans
Personal
Gold
Loans

Dec 20 Fund Based O/S
Sectors Amount % Share YOY Gr %
Infrastructure 3,22,679 15.17 -1.57
of which: Power 1,95,241 9.18 -1.98
Telecommunication 27,714 1.30 -26.67
Roads & Ports 67,253 3.16 17.68
Other Infrastructure 32,471 1.53 -3.66
Services 2,53,134 11.90 10.42
Iron & Steel 49,888 2.35 -7.28
Aviation & Airports 11,034 0.52 43.74
Tourism & Hotels 7,760 0.36 -16.53
Textiles 33,195 1.56 2.73
Petroleum & Petrochemicals 29,850 1.40 0.26
Engineering 20,480 0.96 -18.55
Comm. Real Estate 46,313 2.18 42.75
Other Industries 3,07,528 14.46 2.00
Home Loans 4,84,453 22.78 9.99
Auto Loans 75,937 3.57 3.37
Other Retail Loans 2,70,744 12.73 31.52
Agriculture 2,13,668 10.05 1.75
Total Domestic Advances 21,26,664 100.00 7.47
13% 13%
12% 12%
18% 18%
25% 26%
32% 31%
BBB
Dec 20
BB & below*
AAA
A
AA
Corporate Rating mix
38% share to PSUs / Govt. Depts.
Industry mix
Outstanding as on 31st Dec 20
Diversified Loan PortfolioHigh quality asset book with lower exposure to under stress sectors
23
Rs. in Crores
Sep 20
*Including NPA book and Unrated

Treasury Operations
AFS Book
Modified Duration: 2.00Modified Duration: 2.29
Total Investments Book
(Rs. in Crores)Dec 19 Dec 20
Domestic Investments 9,73,320 12,77,896
- of which- SLR 8,03,624 10,48,299
Foreign Offices Investments 50,794 44,062
Whole Bank Investments 10,24,114 13,21,958
57.81 58.96
42.13 41.03
0.06 0.01
Dec 19 Dec 20
Break up of Domestic Investments (%)
HTM AFS HFT
G-Sec and T Bill, 50.9%
CP, 6.9%
SDLs, 13.0%
Corporate Bonds, 21.6%
Others, 7.6%
Dec 20
G-Sec and T Bill, 53.7%CP, 11.2%
SDLs, 8.8%
Corporate Bonds, 20.1%
Others, 6.2%
Dec 19
24
Yield on Investment: 7.27% Yield on Investment: 6.42%

Capital Adequacy & Asset Quality
25
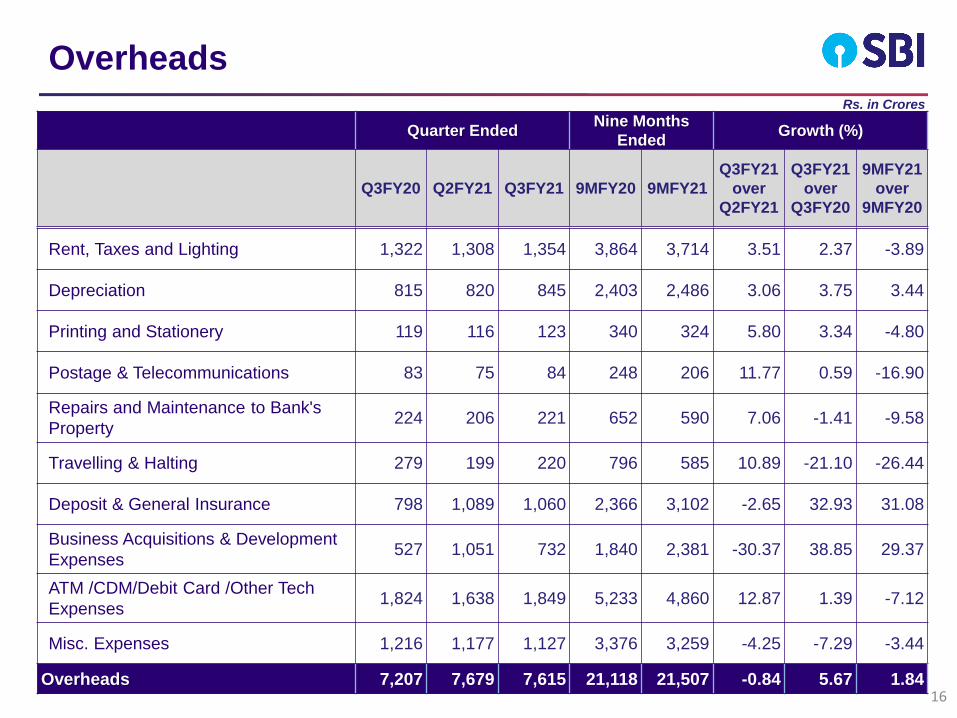
10.18 9.77 10.49 10.27
1.411.23
1.41 1.46
2.142.06
2.82 2.77
Dec-19 Mar-20 Sep-20 Dec-20
51.37
50.37 50.19
Sep 20 Dec 20Dec 19
• Adequate head room and risk appetite for credit growth
Capital ratios (%)
RWA to Total Assets (%)
SBI remains a well-capitalized bank with adequate
liquidity
11.59
13.73%14.72% 14.50%
26
Dec 19 Dec 20
Credit Risk Weighted
Assets on Advances to
Gross Advances (%)
55.29% 56.13%
11.00
13.06%
11.90
Tier 2 levels in FY21E
Tier 2 capital in CAR is
expected to come down to
~2% levels by March 21
on account of redemption
and exercise of call options
11.73
Tier II
AT1
CET1Tier I

Rs. in Crores
Without Proforma Slippages
Cumulative for the Period (%) Dec 19 Mar 20 June 20 Sep 20 Dec 20
Gross NPA Ratio 6.94 6.15 5.44 5.28 4.77
Net NPA Ratio 2.65 2.23 1.86 1.59 1.23
PCR 81.73 83.62 86.32 88.19 90.21
PCR (Excl. AUCA) 63.52 65.21 67.07 71.04 75.24
Corporate PCR (Excl. AUCA) 74.58 78.37 83.17 88.30 90.78
Slippage Ratio 2.42 2.16 0.60 0.53 0.36
Credit cost 1.80 1.87 1.56 1.24 0.95
1,59,661
1,49,092
1,29,661 1,25,8631,17,244
Dec 19 Mar 20 Jun 20 Sep 20 Dec 20
Gross NPA
58,249
51,871
42,704
36,451
29,032
Dec 19 Mar 20 Jun 20 Sep 20 Dec 20
Net NPA
Asset Quality (1/4)
27
With Proforma Slippages
Cumulative for the Period (%) Dec 19 Mar 20 June 20 Sep 20 Dec 20
Gross NPA Ratio 6.94 6.15 5.44 5.88 5.44
Net NPA Ratio 2.65 2.23 1.86 2.08 1.81
PCR 81.73 83.62 86.32 85.25 86.33
PCR (Excl. AUCA) 63.52 65.21 67.07 66.03 67.99
Corporate PCR (Excl. AUCA) 74.58 78.37 83.17 88.30 88.78
Slippage Ratio 2.42 2.16 0.60 1.72 1.27
Credit cost 1.80 1.87 1.56 1.51 1.10

28
Asset Quality (2/4)
Movement of NPAs: Q3FY20 Q4FY20 FY20 Q1FY21 Q2FY21 Q3FY21
Opening Level of Gross NPAs 1,61,636 1,59,661 1,72,750 1,49,092 1,29,661 1,25,863
Total Reductions 22,073 18,860 78,168 23,341 6,883 8,906
of which : Recovery + Upgradation 13,553 2,528 25,781 3,608 4,038 5,657
Gross Addition 20,098 8,291 54,510 3,910 3,085 287
of which : Increase in O/s 3,573 186 4,863 273 329 50
: Fresh Slippages 16,525 8,105 49,647 3,637 2,756 237
Net Increase -1,975 -10,569 -23,658 -19,431 -3,798 -8,619
Closing Level of Gross NPAs 1,59,661 1,49,092 1,49,092 1,29,661 1,25,863 1,17,244
Rs. in Crores
Segmental NPAs:Dec 19 Sep 20 Dec 20
NPA Ratio % NPA Ratio % NPA Ratio %
Retail: 62,507 5.18 60,430 4.75 55,290 4.13
Agri. 28,932 13.78 31,234 14.81 29,296 13.71
Per Segment 7,521 1.04 6,485 0.83 5,876 0.71
SME 26,054 9.37 22,711 8.19 20,117 6.85
Corporate 93,743 12.16 62,168 7.89 59,400 7.54
International 3,410 1.06 3,265 1.01 2,554 0.77
Total 1,59,661 6.94 1,25,863 5.28 1,17,244 4.77

Movement of NPAs and AUCA (3/4)
29
Movement of NPAs (incl. Advances under Collection)
Mar-18 Mar-19 Mar-20 Dec 20
Opening Level of GNPA + AUCA 2,52,066 3,27,653 3,09,755 3,16,684
Gross Addition (Increase in O/s + Slippages) 1,00,287 39,740 54,510 7,282
Total GNPA + AUCA + Additions 3,52,353 3,67,393 3,64,265 3,23,966
Total Recovery / Upgradation 19,863 39,857 35,032 17,289
Less: Write-off (Removal from AUCA/Haircut) 4,837 17,782 12,549 9,986
Closing Level of Gross NPAs + AUCA 3,27,653 3,09,755 3,16,684 2,96,691
Rs. In Crores

4,424 3,594
1,471
8,597
5,400
3,677 3,672
279
3,389
12,546
Dec-19 Mar-20 Jun-20 Sep-20 Dec-20
SMA 1 & SMA 2
SMA1 SMA2
8,101
7,266
17,946**
1,750
As on Dec 20
Fresh
SlippagesQ3FY20 Q1FY21 Q2FY21
Q3FY21
(reported)
9MFY20
(reported)
9MFY21
(reported
+pro-
forma)
Corporate 9,467 213 981 18,060 3,003
(1,809)
SME 1,578 990 -251 7,064 4,453
(3,714)
AGRI 2,965 468 1,833 10,282 10,932
(8,631)
PER 821 1,331 -982 3,907 2,656
(2,307)
IBG 1,694 636 1,174 237 2,229 2,047
Total 16,525 3,637 2,756 237 41,542 23,091
(16,461)In June 2020, RBI moratorium was in force.
Asset Quality (4/4)
30
• Figures in brackets indicate Proforma Slippages reckoned as std
o/a Hon’ble SC interim order dated 3rd Sept 2020.
• Net addition in Proforma Slippages in Q3FY21 is Rs.2,073 crs.
Accounts with exposure above Rs. 5 cr: CRILC data
11,986
** Of which corporate accounts with O/S of Rs 2,485 crs are
included under COVID -19 restructuring and accounts with
O/S of Rs 2,350 cr are included in proforma slippage for
9MFY21.

Digital Journey
31

1 Footnote
SOURCE: Source 3232
Digital Channel – Achieving disproportionate growth in share of
business (Performance in Q3FY21)
24*7 RTGS
Home Loan NTB: Apply
home loan & check
eligibility.
New Journeys Gone live: Q3
YONO Cash
YONO
Adoption
PAPL
~1.32 lac cards sourced in Q3FY21
~2005 avg. cards sourced daily
FSS –
Credit cards
Online
Marketplace
7,85,912 + AGL sanctions in Q3FY21
INR ~12,035 Cr sanction amount
~ 11,908+ avg. daily no of AGL sanction
Krishi
~32.77 Mn cumulative registrations
(~4.2 Mn during Q3FY21)
~46,000 avg. daily registrations
~6.9 Mn YONO Cash transactions in Q3FY21
~77,671 avg. daily YONO Cash transactions
INR 228.5 Cr GMV in Q3FY21
~3.82 lac Transactions on OMP in Q3FY21
INR 5,301 Cr disbursements during Q3FY21
~4,500 avg. daily no of PAPL disbursementsSearch functionality :
OMP Merchants
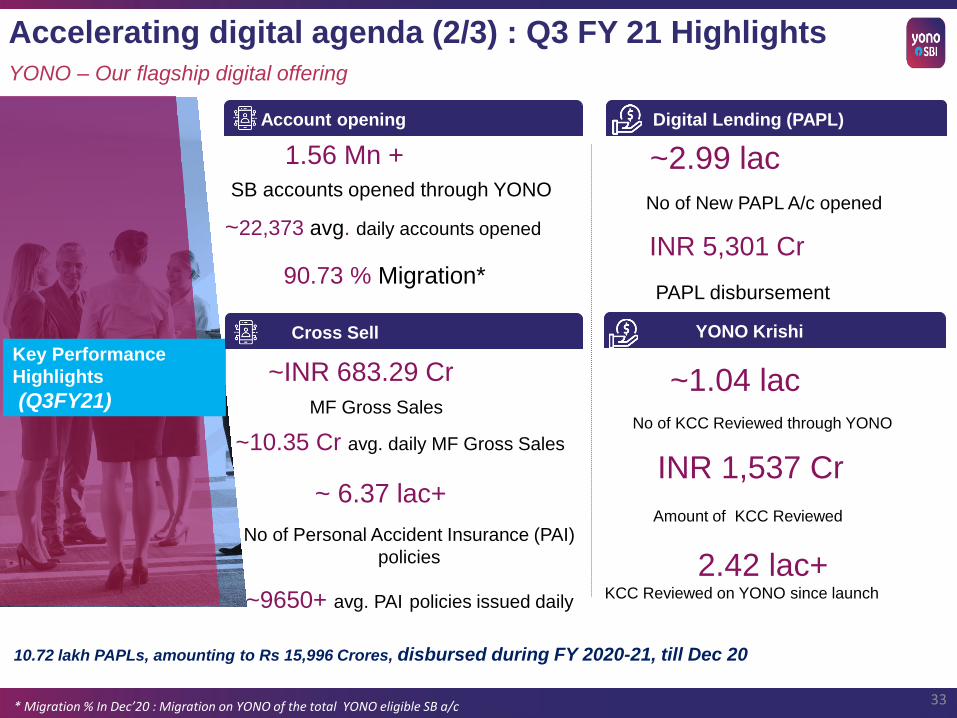
Accelerating digital agenda (1/3)YONO – Our flagship digital offering
IFFCO BAZAR YONO
-Krishi Mandi : Purchase seeds,
fertilizers & other Agri needs
Lock/Unlock
Key Performance
Highlights
(Q3FY21)
1.56 Mn +
SB accounts opened through YONO
~2.99 lac
No of New PAPL A/c opened
Account opening Digital Lending (PAPL)
INR 5,301 Cr
PAPL disbursement
YONO Krishi
~INR 683.29 Cr
MF Gross Sales
Cross Sell
~ 6.37 lac+
No of Personal Accident Insurance (PAI)
policies
~1.04 lac
No of KCC Reviewed through YONO
INR 1,537 Cr
Amount of KCC Reviewed
Accelerating digital agenda (2/3) : Q3 FY 21 HighlightsYONO – Our flagship digital offering
~22,373 avg. daily accounts opened
~9650+ avg. PAI policies issued daily
33
90.73 % Migration*
* Migration % In Dec’20 : Migration on YONO of the total YONO eligible SB a/c
10.72 lakh PAPLs, amounting to Rs 15,996 Crores, disbursed during FY 2020-21, till Dec 20
~10.35 Cr avg. daily MF Gross Sales
2.42 lac+ KCC Reviewed on YONO since launch

Technology and Innovation
UPI
ATM • Average no. of ATM transactions: ~13.1 Mn per day
Key highlights
Debit cards
• No. of cards: 294.53 Mn
• Debit Card spends: > 858.24 Mn transactions and Rs. 1367.86 bn spend during 9MFY21.
29.93% 13.41% 27.91% 24.71% 21.96%
Market share (As per latest available data)
Debit card spends POS terminals ATMs
Presence across multiple channels and payment acceptance touch points
Mobile Banking
No. of TransactionsMobile Banking
Transaction value
Customer touch points Payment acceptance touch points
Numbers (As on Dec 2020)
22,330
71,207
57,889
19 Mn
85 MnINB users
Branches
Mobile banking users
BC outlets
ATMs/ADWMs
1,46,000
4,17,514
10,14,861
Bharat QR
BHIM merchants
BHIM–Aadhar–SBI
SBI POS
BHIM SBI Pay
7,19,805
Accelerating digital agenda (3/3) Digital Leadership across channels
8,04,032
58%
28%
5%
9%
19%
67%
7%7%
Share of
Txns through
Alt. Channel
91%
Share of Txns
through
Alt. Channel
93%
Dec 2019 Dec 2020
1 Digital comprises of Internet, Mobile, UPI & YONO and Green Channel
Digital1
ATM & CDM
BC Channel
Branch
• Remit transactions handled (in 9MFY20): 3,629 Mn• Number of UPI users: 135 Mn
• Market share in remittances: 24.36% (Dec 2020) (#1 Remittance bank)
Numbers (As on Dec 2020)
34

Financial Inclusion & Sustainability
35
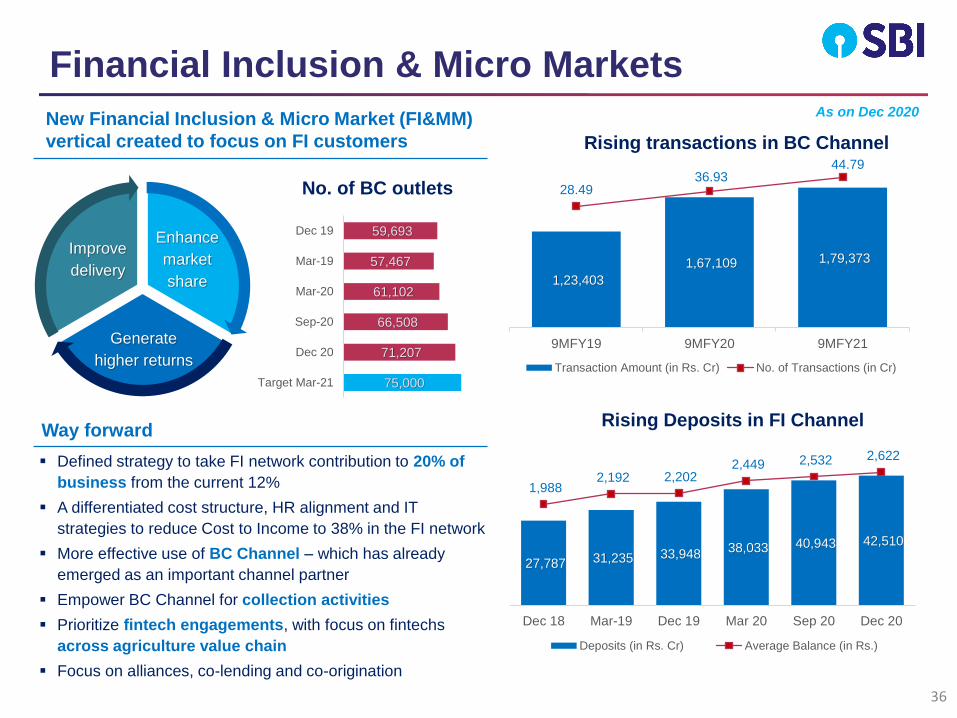
Way forward
Financial Inclusion & Micro MarketsAs on Dec 2020
36
1,23,403
1,67,109 1,79,373
28.4936.93
44.79
-40
-30
-20
-10
0
10
20
30
40
-
20,000
40,000
60,000
80,000
1,00,000
1,20,000
1,40,000
1,60,000
1,80,000
2,00,000
9MFY19 9MFY20 9MFY21
Rising transactions in BC Channel
Transaction Amount (in Rs. Cr) No. of Transactions (in Cr)
27,787 31,235 33,948 38,033 40,943 42,510
1,988 2,192 2,202
2,449 2,532 2,622
-
500
1,000
1,500
2,000
2,500
3,000
-
5,000
10,000
15,000
20,000
25,000
30,000
35,000
40,000
45,000
50,000
Dec 18 Mar-19 Dec 19 Mar 20 Sep 20 Dec 20
Rising Deposits in FI Channel
Deposits (in Rs. Cr) Average Balance (in Rs.)
Enhance
market
share
Generate
higher returns
Improve
delivery
New Financial Inclusion & Micro Market (FI&MM)
vertical created to focus on FI customers
▪ Defined strategy to take FI network contribution to 20% of
business from the current 12%
▪ A differentiated cost structure, HR alignment and IT
strategies to reduce Cost to Income to 38% in the FI network
▪ More effective use of BC Channel – which has already
emerged as an important channel partner
▪ Empower BC Channel for collection activities
▪ Prioritize fintech engagements, with focus on fintechs
across agriculture value chain
▪ Focus on alliances, co-lending and co-origination
75,000
71,207
66,508
61,102
57,467
59,693
Target Mar-21
Dec 20
Sep-20
Mar-20
Mar-19
Dec 19
No. of BC outlets

SBI ESG: Strategy
37
❖ Bank continues to align its business decisions and sustainability initiatives with the Sustainable
Development Goals – eight products linked to UN SDGs
❖ Bank acknowledges that its activities have direct and indirect positive and negative impacts
Constantly working to mitigate the latter through the incorporation of environmental, social and
governance related criteria into its screening and evaluation process
❖ Sector agnostic assessment of projects based on ESG parameters
❖ Pursuing projects related to renewable energy, clean mobility, affordable housing and SHG
finance
❖ Unmatched contribution towards achieving financial inclusion –
30,000 financial literacy camps, 152 rural self employment training institutes
❖ Committed to achieve carbon neutrality in its operations by 2030 in a phased manner
❖ Several SBI offices have already received the Indian Green Building Council (IGBC) certification
and also have rooftop solar panels installed for reduction of dependence on fossil fuels
❖ SBI Foundation – undertaking various environment conservation initiatives – tree plantation, water
conservation, waste management, community sanitation and others

Dec-16 Nov-17 Dec-18 Nov-19 Sep-20
SBI ESG: Portfolio, Ratings and Framework
38
BBMSCI
ESG RATINGS
Last updated: October 07, 2020
CCC B BB BBB A AA AAA
B B B B
BB
SBI ESG Rating History
No. of RE
Projects
financed
Capacity
installed
Deployed
Amount
Reference
Date
✓ ESG is integrated in our lending
decisions; key criteria for go / no-
go decisions
✓ Climate risk included as a risk factor
in key risk assessments within the
Bank
✓ Engaging with external
stakeholders – BFSI-SDG club
initiative, supporting various
initiatives of Climate Change
Council & FICCI taskforce for ESG
ESG – an
integral part
of our
lending
❑ Adopted with the objective of creating a positive impact
on environment
❑ The framework provides roadmap regarding:
▪ Green Bond issuance and
▪ Use of proceeds for projects falling under the
ambit of the Bank’s Green Bond portfolio
❑ Raised Green Bonds worth USD 800 million upto FY20
to finance green projects
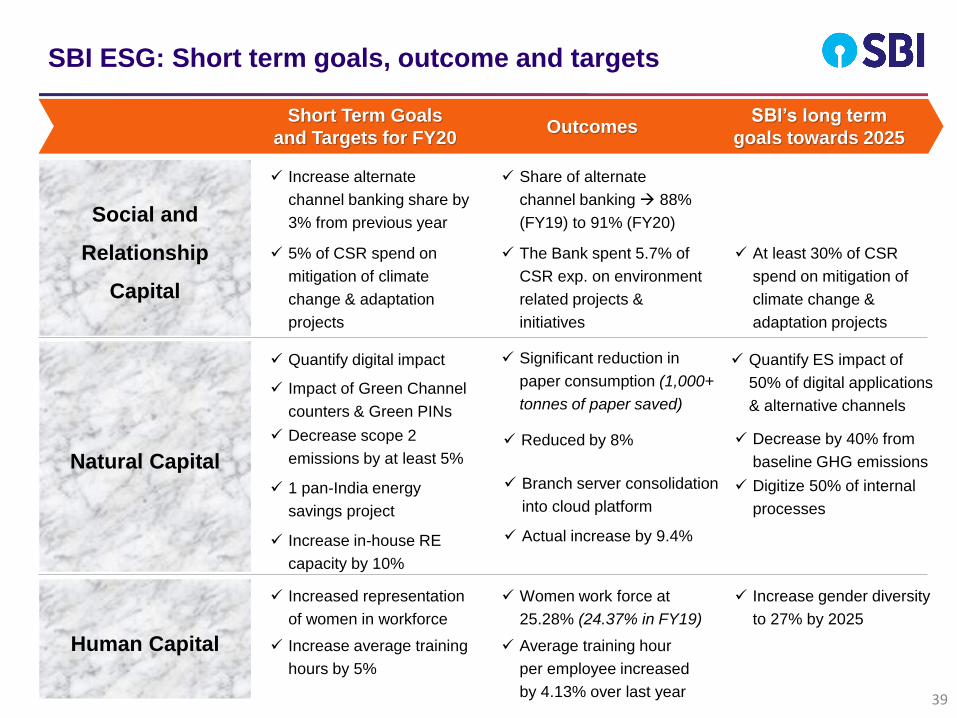
SBI ESG: Short term goals, outcome and targets
39
Social and
Relationship
Capital
Natural Capital
Human Capital
Short Term Goals
and Targets for FY20Outcomes
SBI’s long term
goals towards 2025
✓ Increase alternate
channel banking share by
3% from previous year
✓ Share of alternate
channel banking → 88%
(FY19) to 91% (FY20)
✓ 5% of CSR spend on
mitigation of climate
change & adaptation
projects
✓ The Bank spent 5.7% of
CSR exp. on environment
related projects &
initiatives
✓ At least 30% of CSR
spend on mitigation of
climate change &
adaptation projects
✓ Increased representation
of women in workforce
✓ Women work force at
25.28% (24.37% in FY19)
✓ Increase average training
hours by 5%
✓ Average training hour
per employee increased
by 4.13% over last year
✓ Increase gender diversity
to 27% by 2025
✓ Quantify digital impact ✓ Significant reduction in
paper consumption (1,000+
tonnes of paper saved)✓ Impact of Green Channel
counters & Green PINs
✓ Quantify ES impact of
50% of digital applications
& alternative channels
✓ Decrease scope 2
emissions by at least 5%✓ Reduced by 8%
✓ 1 pan-India energy
savings project
✓ Branch server consolidation
into cloud platform
✓ Increase in-house RE
capacity by 10%
✓ Actual increase by 9.4%
✓ Decrease by 40% from
baseline GHG emissions
✓ Digitize 50% of internal
processes

SBI ESG: Lines of credit from multilateral institutions
and banks
40
USD
300 mn
USD
625 mn
USD
274 mn
USD
214.3
mnUSD
177.3
mn
USD
277 mn
Signed in
Line of Credit from
Signed in
Line of Credit from
Focus on
agricultural and
microenterprise
loans
Designed to
complement
Government’s
flagship
affordable
housing
programme,
Pradhan Mantri
Awas Yojana
Leverage Indo-
German Solar
Energy
Partnership to
promote
proliferation of
Renewable
Energy
Signed in
Line of Credit from
Signed in
Line of Credit from
Signed in
Line of Credit from
Support GOI’s
programme to
generate
electricity from
installation of
rooftop solar
PV
Focus on large
greenfield solar
projects –
contribute to
National Solar
Mission &
reduce
dependence on
fossil fuels power
generation
Encourage
builders and
home loan
borrowers to
opt for energy
efficient
options
Aggregating to
USD 1.9 bn
Signed in
Line of Credit from

SBI ESG: Green Bond Programme
41
Project
Description
Projected
Emission
Reduction
(tCO2/ year)
Amount Outstanding
as on 30th Sept 2020
(in USD
million)
(in INR
crores)
Renewable energy,
solar and other
green projects
1,677,580 1,206 8,898
Date of Issue Amount (in USD million)
30th July 2018 50
28th Sept 2018 650
31st March 2020 100
Total 800
Permitted usage under Green Bond
Framework, certified by Climate Bonds Initiative
(CBI)
▪ Renewable energy
▪ Low carbon buildings
▪ Projects to lower Industry and energy-
intensive commercial transactions
▪ Waste and pollution control management
transactions
▪ Sustainable transportation
Compliance under Green Bond Framework
▪ Engaged CBI approved independent
assurance provider to assure the Bond and
certify compliance with the requirements of
Climate Bonds Standard
▪ Internal Green Bond Committee in place,
to oversee monitoring of existing projects
earmarked under Green Bonds, to enable
periodic compliance

Subsidiaries,
Group Financials &
Balance Sheet
42

SBI Subsidiaries – value unlocked in listed subsidiaries
43
Valuation of listed subsidiaries of SBI
SBI Subsidiaries Market Cap (in Rs. Crore) SBI Stake (in %) Value per share of SBI (Rs)
SBI Card 93,672 69.4 72.8
SBI Life 86,735 55.5 53.9
Other select listed investments NA NA 13.7
Total Rs 140/ share of SBI
• PAT: Rs. 809 Cr
• ROAE: 18.5%
• Net Worth : Rs. 6,186 Cr, Total Assets : Rs. 27,277 Cr
• Market Share :Spends : 20.1%, Card base : 18.8%
• Growth : Cards : 15% YoY, Receivables : 4% YoY
• Private market leadership Rank 1 in Total New Business Premium
(NBP) with 23.7% share
• Strong growth in Renewal Premium of 27%
• Gross Written Premium – Rs 346.1 billion; growth of 21%
• Protection share 11% on APE Basis; growth of 28%
• Strong Value Accretion : VoNB Margin: 19.3% on actual tax rate basis
• Assets Under Management – Rs 2 Trillion
• SBI General has written GWP of Rs.5,323 Crs with YoY growth of 9% as
compared to the Industry growth at 2.5%
• Ranked at 8th position amongst private insurers and 13th in the Industry overall
• Market share amongst private players improved to 6.37% as on 31st Dec 20 from
6.13% in 31st Dec 19. Overall market share stands at 3.62% as on 31st Dec 20
• 1st in Personal Accident with 15.7% share and 4th in Fire with 6.2% share
amongst Private insurers.
• Rank First in QAAUM with Market Share of 15.36%.
• AAUM at Rs. 456,498 Crores during Dec 20 Quarter.
• QAAUM grew by 29.45% YoY vis-à-vis Industry growth rate of
11% during Dec 20 Vs Dec 19.
Closing price as on 3rd Feb 2021

44
Name of subsidiary Area of Operations Other key notablesSBIs stake
(in %)
SBI Funds ManagementAsset Management under SEBI
(Mutual Fund) Regulations
First AMC to cross Rs. 5 Lakh AUM in Jan 21
Largest ETF Fund House
SBIMF – AAUM CAGR growth more than 30% vs 9.65% of Industry in last
three years
62.93
SBI General Insurance General Insurance
Bancassurance channel
• 30 % Business mix and highest profitable channel
• Offering health PA and home insurance products
• Retail products on YONO
Corporate agent tie ups with RRBs associated with SBI
70.0
SBI Capital Markets
Merchant Banking and Project
Advisory ServicesRanked No.1 - APAC Project Finance Loans (Bloomberg)
Ranked No.2-India Borrower Foreign Currency Loans (Bloomberg)100.0
SBI DFHI Primary Dealer
Major player in Primary & Secondary Market for Sovereign Bonds & T Bills
PAN-India presence for distribution/retailing of Sovereign Bonds & T Bills to
Cooperative Banks/trusts/Corporates etc.
69.04
Name of subsidiaryPAT (in Rs. Cr) Networth (in Rs. Cr) RoE (in %)
FY20 9MFY21 FY20 9MFY21 FY20 9MFY21
SBI Funds Group 587 498 1,928 2,292 30.4 21.7
SBI General Insurance 412 403 2,114 2,675 19.5 15.1
SBI Cap Group 318 691 2,193 2,891 14.5 23.9
SBI DFHI 127 240 1,045 1,199 12.2 20.0
SBI Subsidiaries – significant value in unlisted subsidiaries

Rs. In crores
Rs. In crores
SBI Group Financials – 9MFY21
Nine Months Ended
9MFY20 9MFY21
ROA (%) 0.43 0.49
ROE (%) 9.07 10.24
Earning Per Share (Rs.) 19.17 24.21
Expenses Ratio (%) 52.44 53.31
NIM (%) 3.10 3.12
Gross NPA Ratio (%) 6.84 4.72
Net NPA Ratio (%) 2.60 1.21
Nine Months EndedGrowth
(%)
9MFY20 9MFY21 YoY
Interest Earned 2,03,976 2,10,083 2.99
Non-Interest Income* 67,225 71,824 6.84
Total Income 2,71,201 2,81,907 3.95
Interest Expended 1,20,731 1,17,621 -2.58
Operating Expenses (i+ii) 95,690 1,06,566 11.37
(i) Employee Cost 35,916 40,091 11.62
(ii) Other Operating Expenses 59,775 66,475 11.21
Total Expenditure 2,16,422 2,24,187 3.59
Operating Profit 54,779 57,720 5.37
Provisions (other than Tax) 30,767 34,585 12.41
Add: Share in profit of associates 248 383 54.80
Less: Minority Interest 1,009 1,113 10.32
Tax Expenses 10,393 6,125 -41.07
Net Profit 12,858 16,280 26.61
45*Includes one-off Items
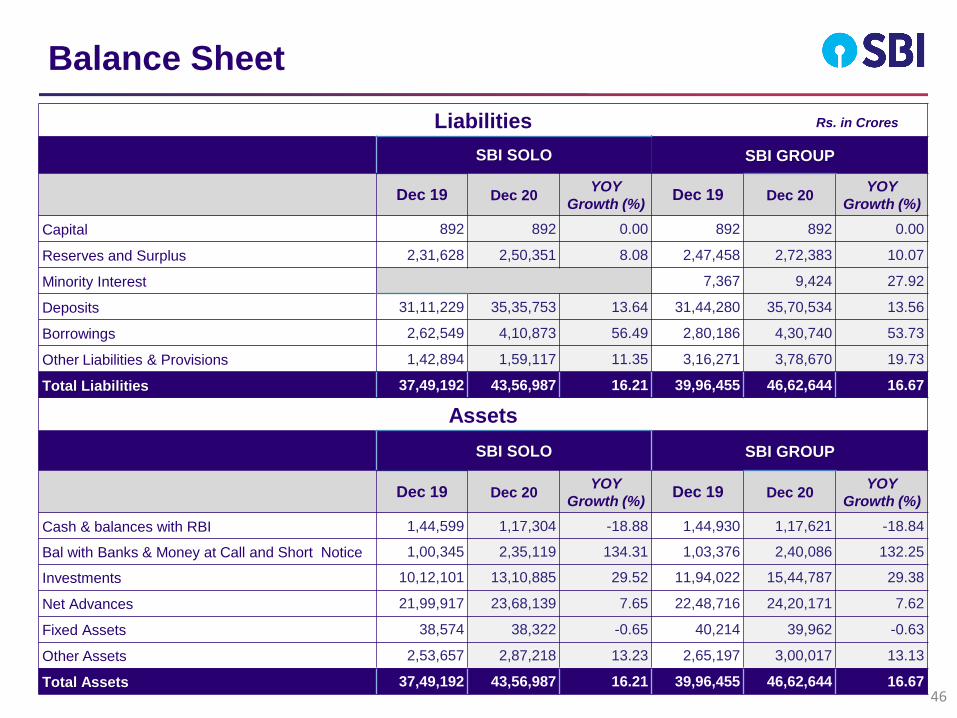
Balance Sheet
Liabilities
SBI SOLO SBI GROUP
Dec 19 Dec 20YOY
Growth (%) Dec 19 Dec 20
YOY
Growth (%)
Capital 892 892 0.00 892 892 0.00
Reserves and Surplus 2,31,628 2,50,351 8.08 2,47,458 2,72,383 10.07
Minority Interest 7,367 9,424 27.92
Deposits 31,11,229 35,35,753 13.64 31,44,280 35,70,534 13.56
Borrowings 2,62,549 4,10,873 56.49 2,80,186 4,30,740 53.73
Other Liabilities & Provisions 1,42,894 1,59,117 11.35 3,16,271 3,78,670 19.73
Total Liabilities 37,49,192 43,56,987 16.21 39,96,455 46,62,644 16.67
Assets
SBI SOLO SBI GROUP
Dec 19 Dec 20YOY
Growth (%) Dec 19 Dec 20
YOY
Growth (%)
Cash & balances with RBI 1,44,599 1,17,304 -18.88 1,44,930 1,17,621 -18.84
Bal with Banks & Money at Call and Short Notice 1,00,345 2,35,119 134.31 1,03,376 2,40,086 132.25
Investments 10,12,101 13,10,885 29.52 11,94,022 15,44,787 29.38
Net Advances 21,99,917 23,68,139 7.65 22,48,716 24,20,171 7.62
Fixed Assets 38,574 38,322 -0.65 40,214 39,962 -0.63
Other Assets 2,53,657 2,87,218 13.23 2,65,197 3,00,017 13.13
Total Assets 37,49,192 43,56,987 16.21 39,96,455 46,62,644 16.67
Rs. in Crores
46

Thank You