Marktstruktur und Preisbildung auf dem ukrainischen Markt für Rohmilch

Sticky Prices: IPO Pricing on Nasdaq and the Neuer Markt
Wolfgang Aussenegg
Department of FinanceVienna University of Technology
Pegaret Pichler1
Department of FinanceCarroll School of Management
Boston College
Alex Stomper
Department of Business StudiesUniversity of Vienna
April 2002
First Draft: March 2001
1Pegaret Pichler may be contacted at (617)552-3989 or by fax at (617)552-0431. An earlier draft of this paper circulated as The
First Prices in a New Market: Nasdaq vs. Neuer Markt. We thank Ekkehart Boehmer, Jim Booth, Wayne Ferson, Edie Hotchkiss,
Tim Jenkinson, Ed Kane, Gunter Loffler, Jay Ritter, Kristian Rydqvist, Phil Strahan, Josef Zechner, Christine Zulehner and
participants of seminars at Boston College, the University of Bergen, the University of Frankfurt, the University of Innsbruck, the
University of Oxford and Gerzensee, as well as the German Finance Association Annual Meeting (2001) for their helpful comments.
We are grateful to Schnigge AG for for their generous provision of data and to Nikolay Hovhannisyan for his valuable research
assistance.

Sticky Prices: IPO Pricing on Nasdaq and the Neuer Markt
Abstract
This paper examines the IPO pricing processes of two different markets, each
of which employs bookbuilding methods for marketing the IPO shares. For each
market we investigate two questions: Does bookbuilding serve mainly as a method
for distributing shares, or also as a means for gathering information? And, to what
extent do underwriters respond in IPO pricing to any information that they obtain
through bookbuilding?
We find that a direct comparison of these two markets sheds light on the book-
building process in each. For Nasdaq IPOs we find evidence consistent with informa-
tional rents being earned by investors for providing information during bookbuilding.
On the Neuer Markt there is no such evidence. Instead, we find evidence consistent
with rents being paid for information that helps underwriters to set indicative price
ranges prior to bookbuilding. The two markets differ further in how underwriters
respond to information in pricing IPOs. For the Neuer Markt, this response is severly
constrained since underwriters do not set prices above the price ranges. We estimate
the total cost of this “restriction ” to be approximately one billion Euros for our
sample of IPOs. While there are no such apparent restrictions for Nasdaq, we show
that also on this market IPO prices are “sticky” in that underwriters respond less to
information received later in the pricing process.
Key words: Initial public offerings; underpricing
JEL classification: G32

1 Introduction
It has been well documented in the academic literature that shares sold in initial public offerings
(IPOs) are on average underpriced.1 It has also been documented by Hanley (1993) that there
is a significant positive relationship between initial returns and the revision of IPO prices from
preliminary price ranges set some time before pricing.2 This suggests that underwriters adjust
IPO prices only partially in response to information learned between the time of setting the
price ranges and that of pricing.
There are a number of possible explanations for this “partial adjustment phenomenon”.
Benveniste and Spindt (1989) argue that underpricing may occur as a result of an auction-like
process in which underwriters obtain information from investors. To provide incentives for in-
vestors to truthfully reveal positive information about an issue, the underwriters only partially
adjust the IPO prices to such information, and allocate underpriced shares to those investors
who provide the positive information. Loughran and Ritter (2002) present an alternative the-
ory which builds on prospect theory. They argue that underpricing is essentially a form of
compensation to underwriters (in the form of quid pro quos that they receive from investors)
and that issuers care less about underpricing if offer prices are revised upwards due to good
news after the setting of price ranges. This theory allows for partial adjustment of offer prices
to both public and private information.
Alternatively, the partial adjustment phenomenon may occur due to constraints that are
imposed in “bookbuilding”, i.e. the process by which underwriters collect orders from potential
investors in IPO shares, and thus receive information for pricing these shares.3 If the partial
adjustment phenomenon reflects a lack of information-sensitivity of IPO prices beyond what
would result merely from the need to pay investors informational rents, then this may be due
to features of the bookbuilding process itself. We refer to such an effect as “price stickiness”.
1For example, Ritter (1984), Ibbotson, Sindelar and Ritter (1988), Loughran, Ritter and Rydqvist (1994), and Loughran and
Ritter (2001) all provide evidence of significant positive returns from the offer price to the first day closing price of IPOs. Such
underpricing is a phenomenon that can be observed in nearly all equity markets in the world (see e.g. Loughran, Ritter, and
Rydqvist (1994) and Ritter (2002)).2Maksimovic and Unal (1993) also document the existence of the phenomenon for thrift conversions.3There are differences across markets as to whether these orders are binding, or perhaps just “indications of interest”. This is
discussed further in the paper.
1

Even though the term bookbuilding is often used as a generic term, the details of the book-
building process differ across markets in ways that may affect IPO pricing. In this paper we
look at two different IPO markets, the Nasdaq market in the U.S. and the Neuer Markt (New
Market) in Germany, for evidence consistent with the theories described above.4 More specifi-
cally, we will ask two questions for each market: Does bookbuilding serve mainly as a method
for distributing shares, or also as a means for gathering information? And, to what extent do
underwriters respond in IPO pricing to information that they obtain through bookbuilding?
By addressing these questions for two markets that are quite similar, yet different in some of
the details of bookbuilding, we are able to increase our understanding of why IPO offer prices
may be sticky.
The Neuer Markt was created in March 1997 by the Frankfurt Stock Exchange in order
to facilitate the financing of young companies. In 1999 more companies went public on the
Frankfurt Stock Exchange than on the London Stock Exchange. (See Table 1.) Only Nasdaq
saw more IPO activity. The Neuer Markt is similar to U.S. equity markets in its disclosure
requirements for listing firms and is similar to Nasdaq in the types of firms that go public and
list there.5 Further, the Nasdaq and Neuer Markt IPO markets are similar in that investment
banks in both countries employ bookbuilding methods for marketing IPOs. However, the
bookbuilding process on the Neuer Markt differs from that on Nasdaq in a number of details
that affect our research questions.
First, we consider the question concerning the informational role of bookbuilding. In an-
swering this question, we search for and find in each market, evidence consistent with the
theory of Benveniste and Spindt (1989), i.e. that investors receive informational rents for pro-
viding underwriters with information of relevance for IPO pricing. But, there are differences
between the two markets, particularly in whether underwriters gather information mostly dur-
ing bookbuilding or mostly before they start to collect investors’ orders. On the Neuer Markt,
bookbuilding starts after the posting of preliminary price ranges, typically one week before
pricing. During this week, bookbuilding seems to be mainly a method for distributing IPO
4We do not assume that the theories are incompatible, but rather that they may coexist.5Kukies (2000) states that firms that go public on the Neuer Markt are “small, young and belong to industries in which future
growth opportunities rather than fixed assets determine market valuation”.
2

shares: while investors post orders, we find no evidence that they earn informational rents for
providing information contained in these orders. We do, however, find evidence consistent with
such rents being paid for information that determines where underwriters set price ranges prior
to bookbuilding. In contrast, for Nasdaq we find evidence consistent with an informational
role of bookbuilding after the setting of price ranges. Indeed, underwriters seem to use book-
building to gather information right up to the pricing date, i.e. even in pricing IPOs relative
to ranges set less than one week earlier. Thus, both the timing of information gathering and
the purpose of bookbuilding appear to differ across markets.
Next, we consider the second question about how underwriters respond to information
in pricing IPOs. In answering this question, the comparison of the two markets has been
instrumental for molding our understanding of each market. The first thing that we note is
that IPOs on the Neuer Markt are never priced above the posted preliminary price ranges. We
find that this is not an insignificant restriction. For those Neuer Markt IPOs with constrained
offer prices, we estimate the cost of the constraint to be on average more than sixteen million
Euros left on the table per issuer. This results in a total cost of more than one billion Euros
for our two-year sample of high technology IPOs!
On Nasdaq there is no such pricing restriction. In fact, half of the issues in our Nasdaq
sample are priced strictly above the posted ranges. However, in our efforts to directly compare
the two markets we find that there is also price stickiness in the Nasdaq IPO market. But,
this price stickiness takes a different form than on the Neuer Markt: for Nasdaq IPOs, we
find that the partial adjustment phenomenon is significantly stronger for IPOs that are priced
relative to ranges amended shortly before pricing the IPOs. This suggests that underwriters
are loathe to react to “last minute” information in pricing Nasdaq IPOs: if this information is
favorable, IPO prices are revised upwards by less and, hence, more money is left on the table
for investors, thus resulting in a stronger relation between the price revision and initial returns.
We believe that the explanation for price stickiness lies in the details of the bookbuilding
process. On the Neuer Markt, both the underwriters and investors make “commitments” prior
to the final pricing of IPOs. Investors commit to buying IPO shares since they submit binding
orders during the bookbuilding period. Underwriters on their part do not price IPOs above the
3

price ranges that are set at the start of bookbuilding. They will, however, price IPOs below
these ranges, if information learned during bookbuilding warrants doing so. In the Nasdaq
IPO market, large investors do not make formal binding commitments during bookbuilding,
and underwriters on their part do not commit to price IPOs within the price ranges. And yet,
we find that Nasdaq underwriters appear loathe to revise IPO prices too much relative to price
ranges set shortly before IPO pricing.
Our paper extends the existing literature by investigating information gathering in two mar-
kets that employ somewhat different bookbuilding processes. While we focus on IPO pricing,
other papers have examined other aspects of the bookbuilding process, such as the allocation
of IPO shares to investors who post orders. Cornelli and Goldreich (2001) examine bookbuild-
ing by one European investment bank and find that investors who post more informative bids
do on average earn higher profits since they receive more favorable allocations of IPO shares.
Jenkinson and Jones (2001) also examine data about order books of European IPOs and find
that, while some informed institutional bidders are favored in the allocation of IPO shares, this
favorable treatment is not necessarily a reward for information contained in their orders. Our
results for the Neuer Markt are more consistent with the latter results. Aggarwal, Prabhala
and Puri (2002) investigate for U.S. IPOs the question of favorable treatment for institutional
investors. They find that institutions receive higher allocations in IPOs priced above the pre-
liminary price ranges and in IPOs with higher initial returns. These results are consistent
with the model by Benveniste and Spindt (1989) and, hence, our results for Nasdaq if the
institutional order flow contains more information of relevance for IPO pricing than orders of
retail investors.
Further, our paper is related to empirical studies that show how initial returns reflect
information that is publicly available prior to the pricing of IPOs. While we regard such effects
more as something to control for in our analysis, than as the focus of our research, we confirm
several recent findings. As Loughran and Ritter (2002), Bradley and Jordan (2001), Lowry and
Schwert (2002), Benveniste, Ljungqvist, Wilhelm, and Yu (2002), and Ljungqvist and Wilhelm
(2001), we find that initial returns are related to primary and secondary market conditions
prior to IPO pricing. As in Bradley and Jordan (2001) and Boehmer and Fishe (2001), we
4
find that information contained in range amendments is relevant for explaining IPO pricing.
Finally, we control for an effect of underwriter reputation on IPO pricing: by following Habib
and Ljungqvist (2001) in treating issuers’ choice of underwriters as endogenous, we confirm
that underwriter reputation has no significant effect.6
The paper is organized as follows. The following section provides a description of institu-
tional differences and similarities between the Nasdaq and Neuer Markt IPO markets. The
third section describes our approach to examining the pricing processes of IPOs on the two
markets and presents our hypotheses. In the fourth section we describe the data. The fifth
section provides summary statistics and a discussion of our empirical results. The final section
concludes with a brief summary of the key results from Section 5, and a discussion of these
results.
2 Institutional Differences between Nasdaq and the Neuer Markt
In this section, we set the stage for the analysis of IPO pricing on Nasdaq and the Neuer Markt
by comparing relevant institutional features of the two primary markets.
Listing requirements: Table 2 states criteria that issuers must satisfy for initial listing on the
Neuer Markt and Nasdaq. While these criteria suggest that Neuer Markt IPOs may be smaller
than Nasdaq IPOs, there are few other differences.7 And in fact, the descriptive statistics in
Table 3 indicate few differences between our samples of IPOs on the two markets. Even in
terms of size, these IPOs are quite similar albeit with more variation across IPOs on the Neuer
Markt than on Nasdaq.
IPO pricing through bookbuilding: In both markets, bookbuilding is the dominant method
for selling IPO shares.8 Also, underwriters on both markets post price ranges some time before
the final pricing of issues. However, apart from these basic similarities, there are a number of
6However, we also explore the effect of underwriter reputation if treated as exogenous. Then, we obtain results that confirm
the findings of a number of other studies that are cited below.7In fact, the Neuer Markt even requires issuers to draw up financial statements according to US-Generally Accepted Accounting
Principles (GAAP) or International Accounting Standards (IAS).8This was also pointed out by Ljungqvist, Jenkinson and Wilhelm (2001) and Sherman (2001).
5

differences. The first of these differences concerns the duration of time between publishing the
price ranges and setting the offer prices of IPOs. On the Neuer Markt, the ranges are typically
posted one week prior to pricing and bookbuilding occurs during this week. On Nasdaq, there
is significant variation in when price ranges are first filed with the Securities and Exchange
Commission (SEC). In our sample, the earliest time that a range was first posted was 140 days
before pricing; the latest was 11 days before. Also, the duration of the bookbuilding period
is not formally designated on Nasdaq, while underwriters on the Neuer Markt announce in
advance for how long they collect investors’ orders.
Second, there are differences in underwriters’ ability to amend price ranges in response
to information that they obtain during bookbuilding. While such range amendments occur
almost never on the Neuer Markt, it is common that underwriters update price ranges prior
to the pricing of IPOs on Nasdaq. In our sample of Nasdaq IPOs with ranges in place three
weeks prior to pricing, about one-third of these ranges were amended at least one day before
the pricing date.
Third, IPOs on Nasdaq and the Neuer Markt differ in how underwriters set the offer prices
relative to the posted price ranges. While Nasdaq issues are frequently priced outside the final
price ranges, this happens very rarely at the Neuer Markt. In our sample, some Neuer Markt
issues are priced below the ranges, but none are priced above. The best explanation for this
phenomenon is that, during the bookbuilding period, investors place binding market orders
with underwriters on the Neuer Markt. In conversations with an investment banker we learned
that underwiters are concerned about legal problems that may ensue if they then price issues
above the upper bound of the posted ranges.9 In the United States, underwriters do not face
such problems since they collect non-binding orders during bookbuilding. However, there is a
legal restriction that IPOs may raise no more than 120% of the proposed maximum proceeds.
While this restriction may constrain IPO pricing, we find that many IPO firms amend their
ranges (and thus their proposed proceeds), possibly to avoid any such restriction, and that
only seven issues in our entire Nasdaq sample are priced at exactly 120% of the maximum of
the respective proposed proceeds. Thus, we do not believe that this is a binding restriction for
9For the same reason, underwriters do not amend the posted ranges.
6

most IPOs.
Pre-IPO trading: The Neuer Markt differs from Nasdaq in that there is a when-issued, forward
market for IPO shares. This “pre-IPO market”, also known as “Handel per Erscheinen” but
more commonly called the “grey market”, has grown rapidly in recent years. Grey market
trading starts after the setting of the price ranges, but before the pricing of IPOs. The last
grey market trading day is the day before the first exchange trading day. Several banks and
brokers act as market makers, but due to conflicts of interest they do not make the market in
IPOs for which they act as underwriters (see Loffler, Panther and Theissen (2001)). Bid and
ask quotes are published in newspapers, the internet and by large information vendors, like
Reuters or Bloomberg. All grey market transactions are contingent on whether an IPO takes
place and are settled on the IPO’s first trading day on the exchange. Selling IPO shares in this
market is (by definition) short-selling,10 and is restricted to institutions and large investors.11
3 The Hypotheses
In this section, we state hypotheses motivated by two main questions that are the focus of
the empirical analysis in Section 5. The first of these questions is whether bookbuilding serves
mainly as a method for distributing shares or also as a means for gathering information. The
second is whether IPOs differ in the extent to which underwriters respond in IPO pricing
to information that they obtain during bookbuilding. These questions take on a particular
interest for comparing the primary markets of Nasdaq and the Neuer Markt which are so
similar to each other, and yet differ in details (discussed above) that affect these questions.
To see this, consider the first question concerning the informational role of bookbuilding. The
answer to this question clearly depends on the extent to which underwriters can draw on
publicly available information in order to price IPOs. This extent is likely to differ across
the two markets due to the existence of an active pre-IPO trading market for IPOs only on
the Neuer Markt. Next, consider the second question concerning underwriters’ flexibility in
10As in the US, insiders who owned shares prior to the IPO are restricted in their ability to sell these shares.11See the website of Schnigge, http://www.schnigge.de/index.html
7
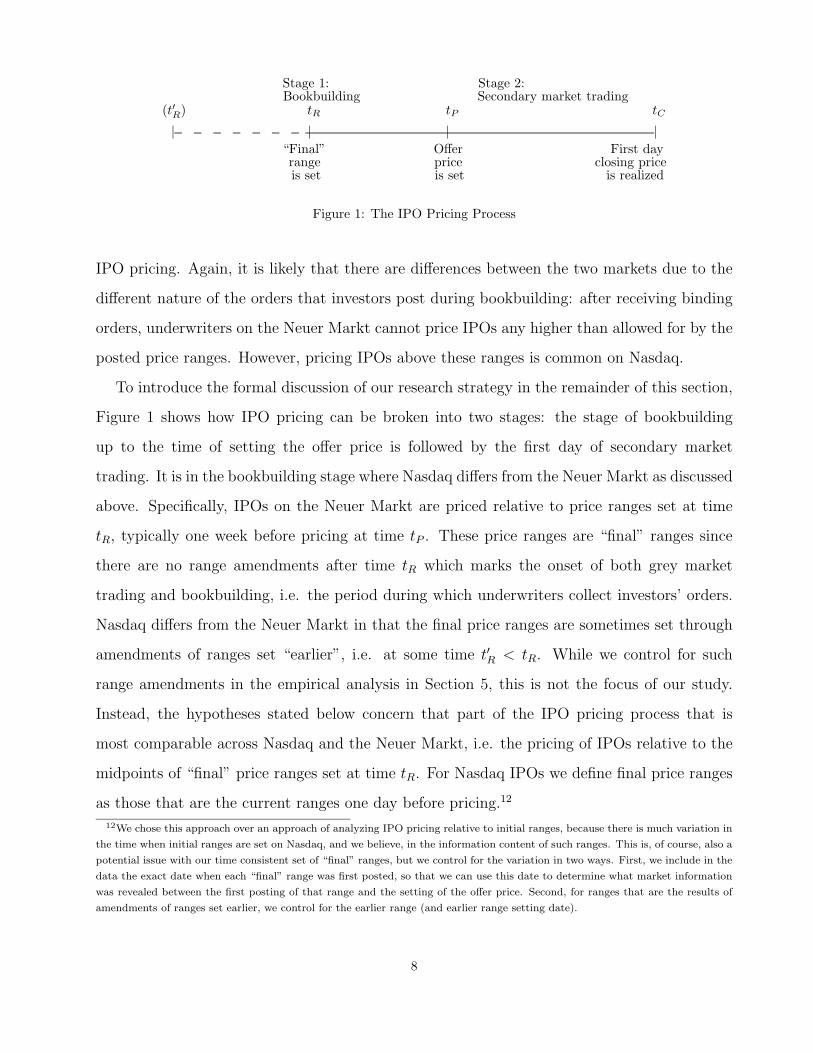
Stage 1: Stage 2:Bookbuilding Secondary market trading
(t′R) tR tP tC
| | | |“Final” Offer First dayrange price closing priceis set is set is realized
Figure 1: The IPO Pricing Process
IPO pricing. Again, it is likely that there are differences between the two markets due to the
different nature of the orders that investors post during bookbuilding: after receiving binding
orders, underwriters on the Neuer Markt cannot price IPOs any higher than allowed for by the
posted price ranges. However, pricing IPOs above these ranges is common on Nasdaq.
To introduce the formal discussion of our research strategy in the remainder of this section,
Figure 1 shows how IPO pricing can be broken into two stages: the stage of bookbuilding
up to the time of setting the offer price is followed by the first day of secondary market
trading. It is in the bookbuilding stage where Nasdaq differs from the Neuer Markt as discussed
above. Specifically, IPOs on the Neuer Markt are priced relative to price ranges set at time
tR, typically one week before pricing at time tP . These price ranges are “final” ranges since
there are no range amendments after time tR which marks the onset of both grey market
trading and bookbuilding, i.e. the period during which underwriters collect investors’ orders.
Nasdaq differs from the Neuer Markt in that the final price ranges are sometimes set through
amendments of ranges set “earlier”, i.e. at some time t′R < tR. While we control for such
range amendments in the empirical analysis in Section 5, this is not the focus of our study.
Instead, the hypotheses stated below concern that part of the IPO pricing process that is
most comparable across Nasdaq and the Neuer Markt, i.e. the pricing of IPOs relative to the
midpoints of “final” price ranges set at time tR. For Nasdaq IPOs we define final price ranges
as those that are the current ranges one day before pricing.12
12We chose this approach over an approach of analyzing IPO pricing relative to initial ranges, because there is much variation in
the time when initial ranges are set on Nasdaq, and we believe, in the information content of such ranges. This is, of course, also a
potential issue with our time consistent set of “final” ranges, but we control for the variation in two ways. First, we include in the
data the exact date when each “final” range was first posted, so that we can use this date to determine what market information
was revealed between the first posting of that range and the setting of the offer price. Second, for ranges that are the results of
amendments of ranges set earlier, we control for the earlier range (and earlier range setting date).
8
In the following subsections we develop hypotheses that enable us to address the two ques-
tions posed at the beginning of this section. Due to institutional differences, the exact forms
of the hypotheses differ across the two markets.
3.1 The Neuer Markt
As discussed in Section 2, the offer price of an IPO on the Neuer Markt is effectively constrained
by the upper bound of the price range. In this section, we propose hypotheses concerning the
implications of this “pricing constraint” and other institutional features of the Neuer Markt
for IPO pricing and underpricing. We focus on how the offer price of an IPO is set relative
to the center of the price range set at time tR. For an IPO on the Neuer Markt, this price
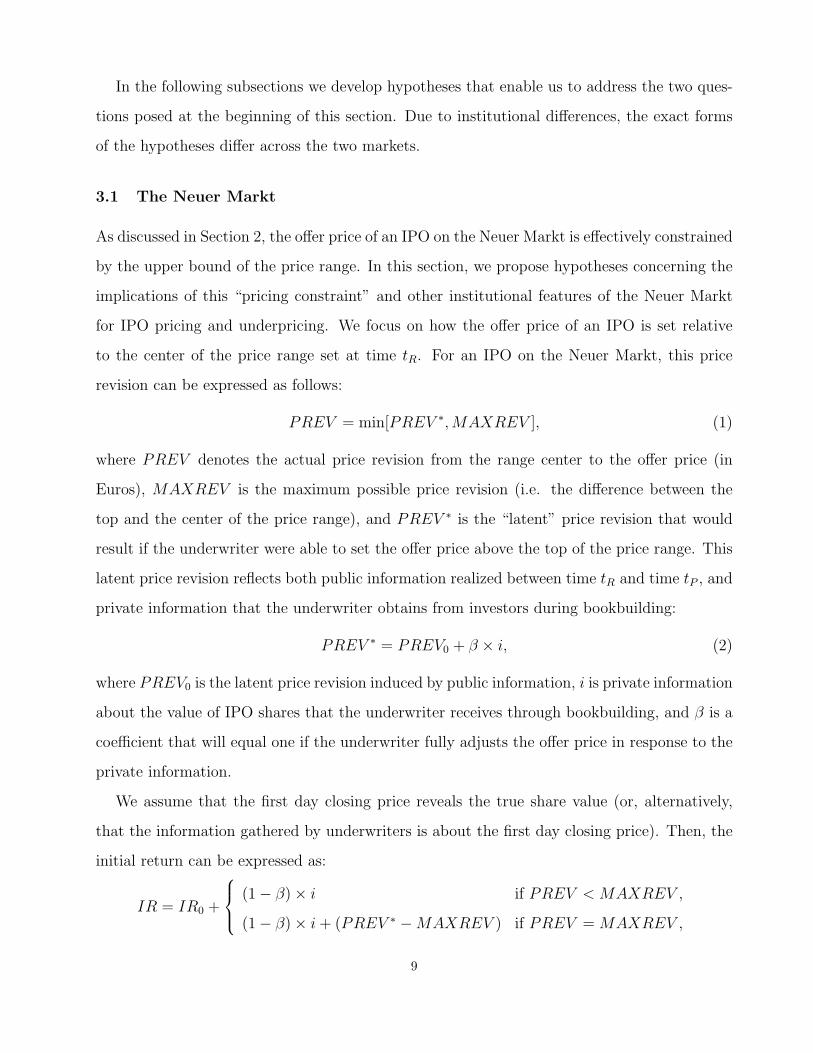
revision can be expressed as follows:
PREV = min[PREV ∗,MAXREV ], (1)
where PREV denotes the actual price revision from the range center to the offer price (in
Euros), MAXREV is the maximum possible price revision (i.e. the difference between the
top and the center of the price range), and PREV ∗ is the “latent” price revision that would
result if the underwriter were able to set the offer price above the top of the price range. This
latent price revision reflects both public information realized between time tR and time tP , and
private information that the underwriter obtains from investors during bookbuilding:
PREV ∗ = PREV0 + β × i, (2)
where PREV0 is the latent price revision induced by public information, i is private information
about the value of IPO shares that the underwriter receives through bookbuilding, and β is a
coefficient that will equal one if the underwriter fully adjusts the offer price in response to the
private information.
We assume that the first day closing price reveals the true share value (or, alternatively,
that the information gathered by underwriters is about the first day closing price). Then, the
initial return can be expressed as:
IR = IR0 +
(1 − β) × i if PREV < MAXREV ,
(1 − β) × i + (PREV ∗ −MAXREV ) if PREV = MAXREV ,
9
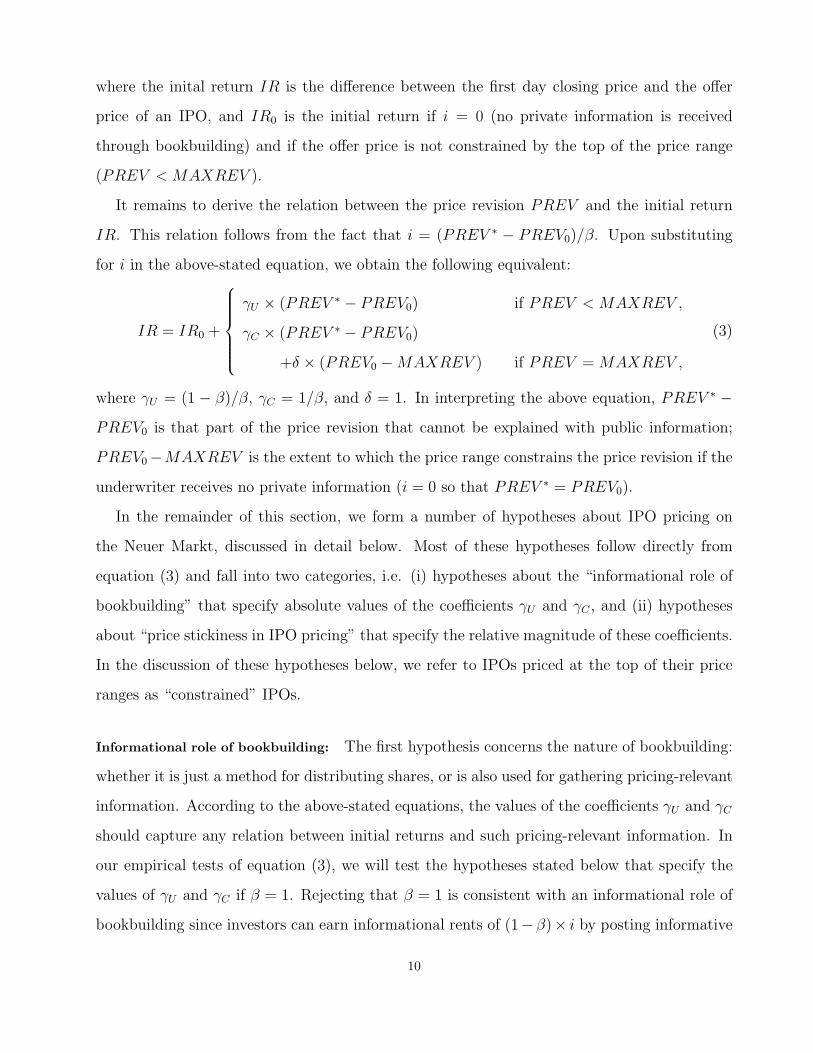
where the inital return IR is the difference between the first day closing price and the offer
price of an IPO, and IR0 is the initial return if i = 0 (no private information is received
through bookbuilding) and if the offer price is not constrained by the top of the price range
(PREV < MAXREV ).
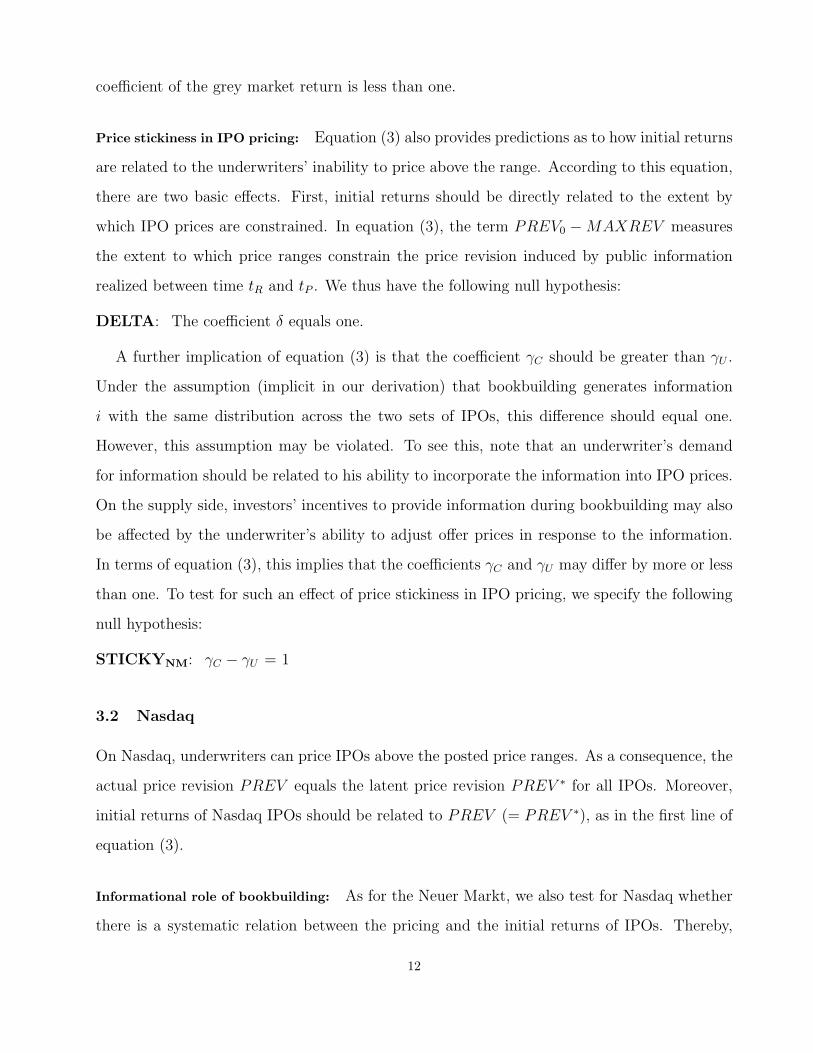
It remains to derive the relation between the price revision PREV and the initial return
IR. This relation follows from the fact that i = (PREV ∗ − PREV0)/β. Upon substituting
for i in the above-stated equation, we obtain the following equivalent:
IR = IR0 +
γU × (PREV ∗ − PREV0) if PREV < MAXREV ,
γC × (PREV ∗ − PREV0)
+δ × (PREV0 −MAXREV ) if PREV = MAXREV ,
(3)
where γU = (1 − β)/β, γC = 1/β, and δ = 1. In interpreting the above equation, PREV ∗ −PREV0 is that part of the price revision that cannot be explained with public information;
PREV0−MAXREV is the extent to which the price range constrains the price revision if the
underwriter receives no private information (i = 0 so that PREV ∗ = PREV0).
In the remainder of this section, we form a number of hypotheses about IPO pricing on
the Neuer Markt, discussed in detail below. Most of these hypotheses follow directly from
equation (3) and fall into two categories, i.e. (i) hypotheses about the “informational role of
bookbuilding” that specify absolute values of the coefficients γU and γC , and (ii) hypotheses
about “price stickiness in IPO pricing” that specify the relative magnitude of these coefficients.
In the discussion of these hypotheses below, we refer to IPOs priced at the top of their price
ranges as “constrained” IPOs.
Informational role of bookbuilding: The first hypothesis concerns the nature of bookbuilding:
whether it is just a method for distributing shares, or is also used for gathering pricing-relevant
information. According to the above-stated equations, the values of the coefficients γU and γC
should capture any relation between initial returns and such pricing-relevant information. In
our empirical tests of equation (3), we will test the hypotheses stated below that specify the
values of γU and γC if β = 1. Rejecting that β = 1 is consistent with an informational role of
bookbuilding since investors can earn informational rents of (1−β)× i by posting informative
10

orders and, hence, they post such orders. By substituting for β = 1 in the definitions of γU
and γC stated below condition (3) we obtain the following null hypotheses:
INFOU: The coefficient γU is equal to zero.
INFOC: The coefficient γC is equal to one.
The alternative hypotheses follow from the theory of Benveniste and Spindt (1989): to
obtain private information through bookbuilding, underwriters only partially adjust the offer
price with respect to positive information, i.e. β < 1. In this way, investors receive informa-
tional rents in the form of initial returns. Thus, the alternative hypotheses are: γU > 0 and
γC > 1.
We also test a related hypothesis concerning the grey market as a source of information for
IPO pricing. Specifically, we may fail to find evidence of an informational role of bookbuilding
since pre-IPO trading in the grey market may generate sufficient information to price IPOs
on the Neuer Markt. As grey market trading information is publicly available, there should
be no need to pay rents for information that emanates from this market. Underwriters should
fully adjust the offer prices of IPOs to information contained in grey market prices. Thus, the
following null hypothesis:
GREY: The price revision PREV ∗ is associated with a coefficient of one with the difference
between the last grey market price before time tP and the center of the price range set at time
tR.
In the remainder of the paper we refer to this difference between the last grey market
price before time tP and the center of the price range as the “grey market return”. The
alternative hypothesis follows from the possibility that underwriters need information to set
price ranges prior to the start of grey market trading. While we expect that grey market prices
publicly reveal this information, such revelation does not occur until after the setting of the
range. Thus, investors may earn informational rents for providing this information prior to
range setting. As a result, underwriters may cede rents to investors for information that is
subsequently contained in the grey market prices. This leads to a partial adjustment of IPO
prices to grey market prices. Consequently, the alternative to hypothesis GREY is that the
11
coefficient of the grey market return is less than one.
Price stickiness in IPO pricing: Equation (3) also provides predictions as to how initial returns
are related to the underwriters’ inability to price above the range. According to this equation,
there are two basic effects. First, initial returns should be directly related to the extent by
which IPO prices are constrained. In equation (3), the term PREV0 − MAXREV measures
the extent to which price ranges constrain the price revision induced by public information
realized between time tR and tP . We thus have the following null hypothesis:
DELTA: The coefficient δ equals one.
A further implication of equation (3) is that the coefficient γC should be greater than γU .
Under the assumption (implicit in our derivation) that bookbuilding generates information
i with the same distribution across the two sets of IPOs, this difference should equal one.
However, this assumption may be violated. To see this, note that an underwriter’s demand
for information should be related to his ability to incorporate the information into IPO prices.
On the supply side, investors’ incentives to provide information during bookbuilding may also
be affected by the underwriter’s ability to adjust offer prices in response to the information.
In terms of equation (3), this implies that the coefficients γC and γU may differ by more or less
than one. To test for such an effect of price stickiness in IPO pricing, we specify the following
null hypothesis:
STICKYNM: γC − γU = 1
3.2 Nasdaq
On Nasdaq, underwriters can price IPOs above the posted price ranges. As a consequence, the
actual price revision PREV equals the latent price revision PREV ∗ for all IPOs. Moreover,
initial returns of Nasdaq IPOs should be related to PREV (= PREV ∗), as in the first line of
equation (3).
Informational role of bookbuilding: As for the Neuer Markt, we also test for Nasdaq whether
there is a systematic relation between the pricing and the initial returns of IPOs. Thereby,
12
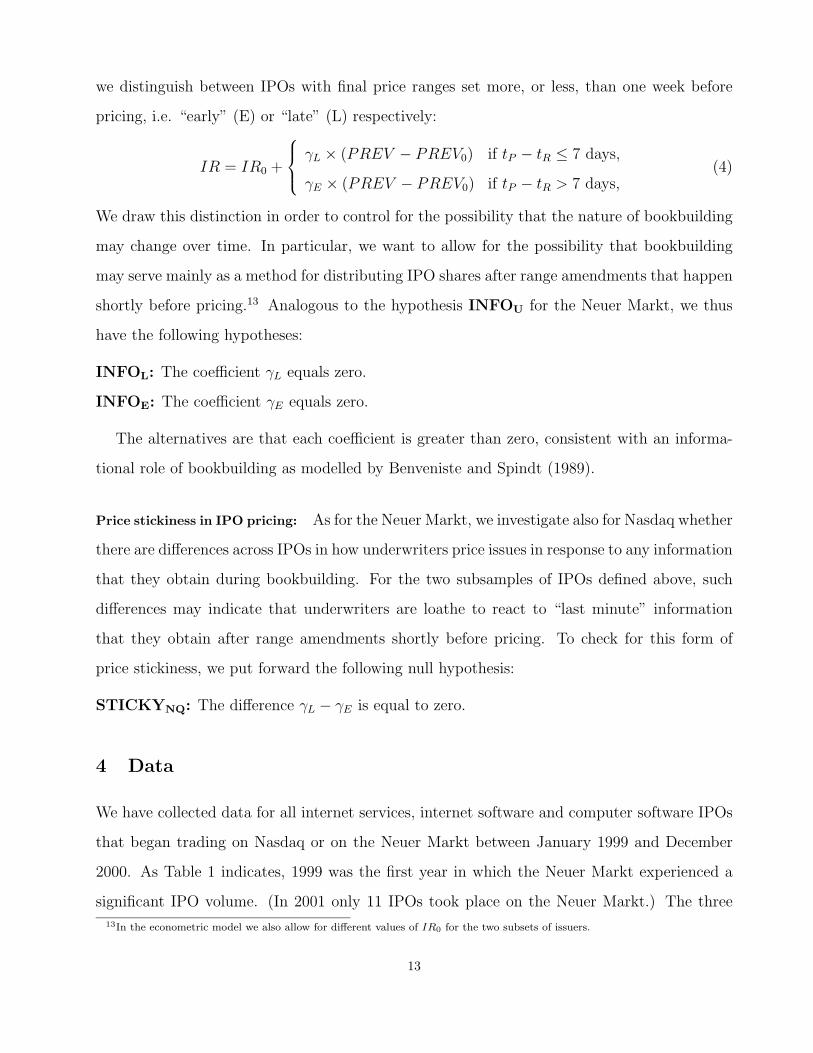
we distinguish between IPOs with final price ranges set more, or less, than one week before
pricing, i.e. “early” (E) or “late” (L) respectively:
IR = IR0 +
γL × (PREV − PREV0) if tP − tR ≤ 7 days,
γE × (PREV − PREV0) if tP − tR > 7 days,(4)
We draw this distinction in order to control for the possibility that the nature of bookbuilding
may change over time. In particular, we want to allow for the possibility that bookbuilding
may serve mainly as a method for distributing IPO shares after range amendments that happen
shortly before pricing.13 Analogous to the hypothesis INFOU for the Neuer Markt, we thus
have the following hypotheses:
INFOL: The coefficient γL equals zero.
INFOE: The coefficient γE equals zero.
The alternatives are that each coefficient is greater than zero, consistent with an informa-
tional role of bookbuilding as modelled by Benveniste and Spindt (1989).
Price stickiness in IPO pricing: As for the Neuer Markt, we investigate also for Nasdaq whether
there are differences across IPOs in how underwriters price issues in response to any information
that they obtain during bookbuilding. For the two subsamples of IPOs defined above, such
differences may indicate that underwriters are loathe to react to “last minute” information
that they obtain after range amendments shortly before pricing. To check for this form of
price stickiness, we put forward the following null hypothesis:
STICKYNQ: The difference γL − γE is equal to zero.
4 Data
We have collected data for all internet services, internet software and computer software IPOs
that began trading on Nasdaq or on the Neuer Markt between January 1999 and December
2000. As Table 1 indicates, 1999 was the first year in which the Neuer Markt experienced a
significant IPO volume. (In 2001 only 11 IPOs took place on the Neuer Markt.) The three
13In the econometric model we also allow for different values of IR0 for the two subsets of issuers.
13
industries that we study account for close to one-half of the IPO volume in each market during
1999 and 2000.14 By focussing only on these three industries we are able to conduct more of
a controlled experiment since we compare IPOs that are somewhat similar.15
All of the IPOs in our data set are firm commitment offerings. Because of our focus on
the information content of the preliminary price range, we exclude IPOs for which there was
no price range, but only a single suggested price. From the sample of Neuer Markt IPOs, we
further exclude issues that had been listed at another exchange prior to listing at the Neuer
Markt. This results in a sample of 326 Nasdaq IPOs and 117 Neuer Markt IPOs.
Most of the data describing the Nasdaq IPOs were obtained directly from the U.S. Securi-
ties and Exchange Commission’s (SEC) Edgar database. For secondary market trading data,
we draw on CRSP and Reuters as data sources. Industry definitions for Nasdaq firms were
obtained from IPO.com, but were cross-checked with the business descriptions.16 Data for the
Neuer Markt IPOs was obtained from Deutsche Borse AG (prospectuses, price ranges, and
other primary market information), and Reuters, Datastream and Karlsruher Kapitalmark-
tdatenbank (secondary market information) as well as from one of the two most important
market makers in the grey market, the German Schnigge AG (grey market prices). For each
IPO, we know the last grey-market trading price before the date of pricing the IPO. Unfortu-
nately, this information is not available for 10 IPOs, leaving us with a sample of 107 IPOs for
some of the regressions below.17
A data set of Nasdaq price ranges and final offer prices was constructed by searching all
the SEC filings prior to the offer date, starting with an S-1 (or SB-2) filing for the initial
IPO statements, followed by amendments in the form of S-1A (or SB-2A) filings and the final
prospectus (424B filing). After searching through more than 2,600 SEC filings, we created a
data set that includes for each IPO the first filed range and all range amendments, together
14After applying a number of exclusions, described below, the three industries account for 45.5% of all nonfinancial IPOs on the
Neuer Markt and 49.9% on Nasdaq.15Our empirical analysis confirms that industry focus is important. For example, we find that there are cross-market influences
between the Nasdaq and Neuer Markt IPO markets, but only when we check for such influences by industry. We did consider
including a wider range of industries in the study, but found that in all other industry categories the Neuer Markt data was too
sparse.16In doing this check, we found that many of the firms in our data set really belong to two, or all three, of our industry categories.
For this reason we treat these three indutries as one industry.17This lack of data seems to be due to Schnigge’s recent move to new premises.
14

with the dates on which all ranges were filed, and the final offer price and offer date. We
also obtained from these filings information on the proposed number of shares to be sold, the
number of shares outstanding and total assets at each range-posting date and the offer date.
This data set enables us to construct sets of “time consistent” ranges for any specified time
period before the IPOs. For example, as described in Section 3, our set of “final” ranges
includes only ranges that were in effect exactly one day before pricing each IPO.
Table 3 provides some descriptive statistics. The mean firm sizes and issue sizes are quite
similar between the two markets for our industries. However, the median firm size on the
Neuer Markt is less than half of the median size on Nasdaq and the Neuer Markt median issue
size is less than two-thirds of the median issue size on Nasdaq.18 We find that firms listing on
the Neuer Markt sell, on average, a somewhat larger fraction of their firm at the IPO than do
firms listing on Nasdaq.
5 Empirical Analysis
In our analysis of IPO pricing on Nasdaq and the Neuer Markt, we focus on that part of
the pricing process that is most comparable across markets, i.e. how underwriters price IPOs
relative to the final price ranges that are in place one day before the pricing date.19 In Section
5.1, we present summary statistics describing these ranges, IPO pricing, and initial returns. In
Sections 5.2 and 5.3 we analyse IPO pricing and underpricing as outlined in Section 3.
5.1 Descriptive Statistics
Table 4 provides descriptive statistics for the final price ranges of IPOs on Nasdaq and the
Neuer Markt (Panel A) and the pricing of IPOs relative to these ranges (Panel B). For Nasdaq
we present statistics for our total sample of IPOs and two subsamples, distinguishing between
18For Nasdaq IPOs the currency is US$, for Neuer Markt IPOs all currency amounts are in Euros. As we do not run any
regressions with both Nasdaq and Neuer Markt IPOs we do not convert any of the currencies. During the two years of our study
the value of the Euro ranged from $0.836/Euro to $1.216/Euro. The average value of one Euro during this time period was $1.012.19As discussed in Section 3, these price ranges are the only price ranges for IPOs on the Neuer Markt. For a number of Nasdaq
IPOs these“final” ranges are amended further on the pricing day. We do not include these range amendments in our analysis since
it is unlikely that any revision of IPO prices from the revised ranges is due to information that underwriters obtain after setting
the ranges.
15

IPOs with final price ranges set “early” or “late”, i.e. more or less than one week before
pricing. Comparing across markets reveals several differences. As discussed below, these
differences suggest that price ranges are set more deliberately on the Neuer Markt than on
Nasdaq. This is intuitively appealing since these ranges constrain IPO pricing on the Neuer
Markt, but not on Nasdaq where they serve as mere indications of likely IPO prices.
First, Panel A of Table 4 shows that the standard deviation of the range center is higher
for our sample of Neuer Markt IPOs than for the Nasdaq IPOs. A variance ratio test confirms
that this difference is statistically significant. This is consistent with the notion that Nasdaq
underwriters put less consideration into where they set price ranges than do underwriters on
the Neuer Markt. Furthermore, we find that within the sample of Nasdaq IPOs, the standard
deviation of the range center is higher for the group of IPOs with final price ranges set late
(i.e. within a week of pricing, tP − tR ≤ 7 days) than across the other IPOs. Again, a variance
ratio test rejects that there is no difference. This suggests that Nasdaq underwriters put more
consideration into setting price ranges shortly before setting the offer price, than at the start
of the pricing process.
Next, we consider the size of the final price ranges of IPOs on the two markets, as a
percentage of the range center. While the average range size is comparable across markets, a
variance ratio test reveals that final price ranges vary more in size across IPOs on the Neuer
Markt than across Nasdaq IPOs. Similar to the results discussed above, this suggests that, in
setting these ranges, underwriters on the Neuer Markt pick the range size deliberately, perhaps
due to concerns about losing flexibility in IPO pricing. Looking at the absolute rather than the
relative size of price ranges underscores this notion: while the upper and lower bounds of the
final price ranges differ by exactly US$2 for more than 95% of our Nasdaq IPOs, the absolute
range size varies considerably across IPOs on the Neuer Markt. On Nasdaq it thus appears that
underwriters set the range size “by default”, rather than considering it as a decision variable,
as on the Neuer Markt.
Panel B of Table 4 shows the distribution of IPO prices around the final price ranges. As
discussed in Section 2, this distribution differs between Nasdaq and the Neuer Markt: while
pricing IPOs above these ranges is common on Nasdaq, underwriters on the Neuer Markt
16

refrain from that. Besides this difference, there are also some similarities. Most important, it
seems as if underwriters on both markets set price ranges “too low” in order to deliberately
price most IPOs at the top of these ranges or above. This is true even for the pricing of Nasdaq
IPOs relative to ranges set late, i.e. less than a week before (tP − tR ≤ 7 days): more than
70% of these IPOs are priced above the ranges.
Table 5 provides summary statistics for two further variables that characterize IPO pricing.
The first of these variables is the price revision, i.e. the percentage by which underwriters price
IPOs above or below the midpoints of the final price ranges. The second is the initial return
of IPOs, i.e. the percentage return between the prices at which IPO shares are sold in the
primary market and the first day closing prices. Again, we find interesting differences between
the two markets. Consistent with the fact that IPOs on the Neuer Markt are never priced
above the price ranges, the average price revision is about one third of the average across
Nasdaq IPOs. This difference is statistically significant even after taking into account that
the standard deviation of the price revision is also significantly higher across Nasdaq IPOs.
Moreover, the two samples of IPOs differ in initial returns: the average initial return of the
Nasdaq IPOs is significantly higher than that of the IPOs on the Neuer Markt. Splitting the
Nasdaq IPOs into groups shows that this difference between the two markets is largely driven
by those Nasdaq IPOs that get priced relative to final price ranges set late, i.e. less than one
week before (tP − tR ≤ 7 days). Indeed, the initial returns of these IPOs are significantly
higher than those of both the other Nasdaq IPOs, and the IPOs on the Neuer Markt.
5.2 IPO Pricing on Nasdaq and the Neuer Markt
In this section, we analyze the pricing of IPOs on Nasdaq and the Neuer Markt. Besides
setting the stage for the analysis of initial returns in the next section, we explore effects of
institutional differences between the two markets that are described in Section 2. To do this,
we specify an empirical model for the pricing of IPOs relative to the final price ranges. For
Nasdaq IPOs, these price ranges are sometimes set by way of range amendments that happen
usually within the week before pricing. To control for effects of such “late” range amendments,
we distinguish in our model of IPO pricing between the two groups of Nasdaq IPOs with final
17
price ranges set more or less than one week before the pricing date (i.e. tP − tR > 7 days
and tP − tR ≤ 7 days respectively). On the Neuer Markt, there is no substantial variation in
when the final (and only) price ranges are set. Further, the time of setting these ranges marks
the onset of pre-IPO trading of IPO shares in the grey market. To explore the information
content of grey market prices, we include these prices as explanatory variables in our model
of IPO pricing. Apart from any changes in the analysis that are induced by the need to
control for such market-specific institutional features, we implement the same empirical model
of IPO pricing for Nasdaq and the Neuer Markt. To develop this model, we build on results
of previous studies of IPO (under-)pricing, discussed below. Table 6 states the notation and
exact definitions of our explanatory variables. We denote indicator variables as “I” and use
“ˆ” to denote instruments for endogenous explanatory variables.
The first group of papers identifies underwriter reputation as a potential explanatory
variable for the pricing of IPOs. Consistent with Titman and Trueman’s (1986) model, Carter
and Manaster (1990), Booth and Chua (1996), and Lowry and Schwert (2002) find that initial
returns are negatively related to underwriter reputation. Using only data from the 1990’s,
Beatty and Welch (1996) and Habib and Ljungqvist (2001) find a positive relation. But, Habib
and Ljungqvist also provide evidence that underwriter reputation is endogenous. To avoid an
endogeneity bias, we therefore instrument underwriter choice. The set of instruments is based
on the notion that renowned underwriters may be chosen for IPOs that are expected to generate
higher proceeds (Habib and Ljungqvist (2001)) or for IPOs of larger issuers (Beatty and Welch
(1996)). Specifically, we use as instruments the last total assets figure that is available for
issuers prior to their IPOs (ASSETS) and indicator (dummy) variables for (i) whether an
issuer intends to sell only a small fraction of the stock (IFSOLD<MEDIAN), (ii) whether the
issuer expects to raise below-median-level proceeds (IEPROC<MEDIAN), (iii) whether the issuer’s
expected market capitalization is below-median (IEMACP<MEDIAN) as well as (iv) fixed effects
for how market conditions may vary across IPOs in different months.20 Summary tables
for underwriter identity are stated in the Appendix, along with Carter-Manaster ranks for
20Expected IPO proceeds and expected market capitalization are computed using the center of the final range as the expected
share price. We use dummy variables to avoid the potential problem that this range center may be endogenous. Also, the exact
fraction of shares to be sold at the IPO may be endogenous.
18
underwriter reputation. While fewer than half of our sample of Neuer Markt IPOs were
underwritten by banks with Carter-Manaster ranks above 7, this is the case for almost all of
the Nasdaq IPOs. As a consequence, we choose different cut-off values to identify renowned
underwriters on Nasdaq and the Neuer Markt: for Nasdaq, the dummy IREN.UNDERWRITER
equals one for IPOs underwritten by banks ranked above 9; for the Neuer Markt, this dummy
equals one for IPOs with underwriters ranked above 7.
A second group of papers analyzes the relation between IPO underpricing and issue(r)
characteristics. As in Lowry and Schwert (2001) and (2002), we capture size-effects on the
pricing of IPOs by using control variables such as the last total assets figure that is available
for the issuers. We deviate from some papers in the literature by not including a control
variable for venture capital backing: Bradley and Jordan (2001) find this to be insignificant
after controlling for whether the IPO was in a high technology industry. As all of our IPOs are
high technology firms we do not expect venture capital backing to be a significant explanatory
variable within our sample. Finally, Habib and Ljungqvist (2001), Loughran and Ritter (2002)
and (2001), and Bradley and Jordan (2001) find that initial returns are negatively related to the
fraction of an issuer’s outstanding shares that are sold in the IPO (FSOLD). While we seek
to control for such an effect, we are concerned that issuers endogenously adjust this fraction in
response to or in anticipation of information that underwriters gather through bookbuilding.
Therefore, we instrument this variable using as instruments measures of issuer size as well as
(if available) the proposed fraction sold as reported in a time t′R filing that states the price
range before the last range amendment (FSOLDBEF ).21
The third group of studies deals with the effect on underpricing of the IPO pricing process
up to the setting of the final price ranges. Bradley and Jordan (2001) and Boehmer and
Fishe (2001) consider the relation between range amendments and initial returns. Bradley
and Jordan find that this relation is significantly positive but convex in that it is stronger for
positive than for negative range amendments. These findings suggest that underwriters may
set price ranges in order to deliberately affect the subsequent price revision. Our approach
is somewhat different in that we want to allow for the possibility of this happening, even if
21This instrument is available only for some Nasdaq IPOs with final price ranges set through range amendments.
19
the final range is not the result of a range amendment. Thus, for all IPOs we will use the
range-center (RCENTER) itself as an explanatory variable to help us explain the relation
between the pricing process up to the point of setting the final range and the revision of the
offer price from this range. As the range center is clearly endogenous, we instrument it using
measures of issuer size and proxies for the primary market conditions during the three weeks
prior to the filing at time tR that first states the range (i.e. the variables with the subscript
tR−3w in Panel B of Table 6 ). For Nasdaq IPOs with final ranges that were set through range
amendments we use slightly different proxies for market conditions (i.e. the variables with the
subscript t′R → tR in Panel B of Table 6 ) as well as the prior range center (RCENTERBEF ).
Finally, we take into account that the range center is set simultaneously (i.e. in the same
filing) with the fraction sold of issuers’ shares outstanding (FSOLD): as stated in Table 6, we
instrument each of these variables using the same set of instruments.22
The final group of papers deals with the effect of primary and secondary market con-
ditions on IPO underpricing. Bradley and Jordan (2001), Loughran and Ritter (2002) and
Lowry and Schwert (2002) all found that initial returns are positively related to the perfor-
mance of secondary market indices prior to the IPOs. The latter two papers also allow this
relation to be piecewise linear and find that it is strongest for positive secondary market re-
turns. Further, Bradley and Jordan (2001) and Lowry and Schwert (2002) show that initial
returns are also positively related to primary market conditions, i.e. the average initial return
of recent IPOs. Given these results, we allow for a piecewise linear relation of price revision to
both primary and secondary market performance. To obtain indices for primary market con-
ditions, we compute for each IPO in our sample the average initial return of IPOs on Nasdaq
and the Neuer Markt between the time tR at which the final price range is set and the time
tP of pricing the IPO. In addition to these indices for primary market conditions (denoted as
¯IRNQtR→tP
and ¯IRNMtR→tP
), we use the return of the Nasdaq Computer Index and the Neuer Markt
All Share Index during the same period of time (IXtR→tP ) to control for secondary market per-
22For example, we instrument RCENTER using the same instruments as for FSOLD. This can be seen as an unrestricted
reduced form of a structural model explaining simultaneously the range center and the fraction of an issuer’s stock sold in an
IPO. To estimate this model, we use SUR, thus allowing for correlation between the unexplained residuals of the two dependent
variables.
20
formance. For all of these variables, we estimate a piecewise linear effect on IPO pricing with
“kinks” at the variables’ 75%-percentiles.23 Finally, we take into account findings by Booth
and Chua (1996) and Benveniste, Ljungqvist, Wilhelm and Yu (2001) that initial returns are
negatively related to the number of recent IPOs in the same industry. To capture this effect,
we include as measures for IPO activity the number of high-tech IPOs on Nasdaq and on
the Neuer Markt that occur during the period between setting the final range and setting the
offer price (NNMtR→tP
and NNQtR→tP ).24
To summarize, we estimate the following model for how underwriters revise the offer price
from the center of the final range:
PREV ∗ = f(underwriter reputation, issue(r) characteristics,
IPO pricing process up to range setting,
primary & secondary market conditions, IPO activity) + ε,
(5)
where the dependent variable PREV ∗ is the price revision from the center of the price range
to the offer price, as a percentage of the offer price.25 Table 6 summarizes and presents the
exact definitions of all of the variables included in each of the broad categories in equation (5).
In the remainder of this section we estimate this model.
5.2.1 IPO Pricing on the Neuer Markt
To estimate model (5) for IPOs on the Neuer Markt, we must take into account that the price
revision is a right-censored variable since IPOs are not priced above the upper bounds of their
price ranges. This implies that we need a TOBIT model. In estimating this model, we must
allow for heteroscedasticity since IPOs may differ in the extent to which underwriters gather
23We use superscript + to denote the explanatory variables that capture these kinks. These variables equal those without the
superscript if these variables take values exceeding the 75%ile, and zero otherwise.24Note that we do not include data on withdrawn offerings. However, as argued by Benveniste, Ljungqvist, Wilhelm and Yu
(2001) this is endogenous and we do include many of the variables that they use to explain the probability of withdrawal. In
addition, we have run robustness checks of our results by repeating our entire analysis using only data for the years 1999 and
2000. As there were almost no withdrawals in 1999 but a number in 2000, we should obtain different results if withdrawals matter.
However, the results are the same and are also very similar to those reported.25We use the notation PREV ∗ (which is really the latent price revision), because in our regressions for IPO pricing on the Neuer
Markt we estimate a TOBIT model to account for the fact that the price revision PREV is constrained. (For unconstrained Neuer
Markt IPOs and for our Nasdaq analysis PREV ∗ = PREV , which is the actual price revision.) Note also that we express both
the price revision and initial returns as percentages of the offer price: by choosing the same normalization for both variables, we
remain consistent with the equations in Section 3.
21
information during bookbuilding.26 Since we expect that the informational role of bookbuilding
may vary across underwriters and may also be affected by market conditions, we control for
heteroscedasticity across groups of IPOs underwritten in the years 1999 and 2000 by more, or
less, renowned banks (with Carter-Manaster ranks above, or below, 7 respectively).
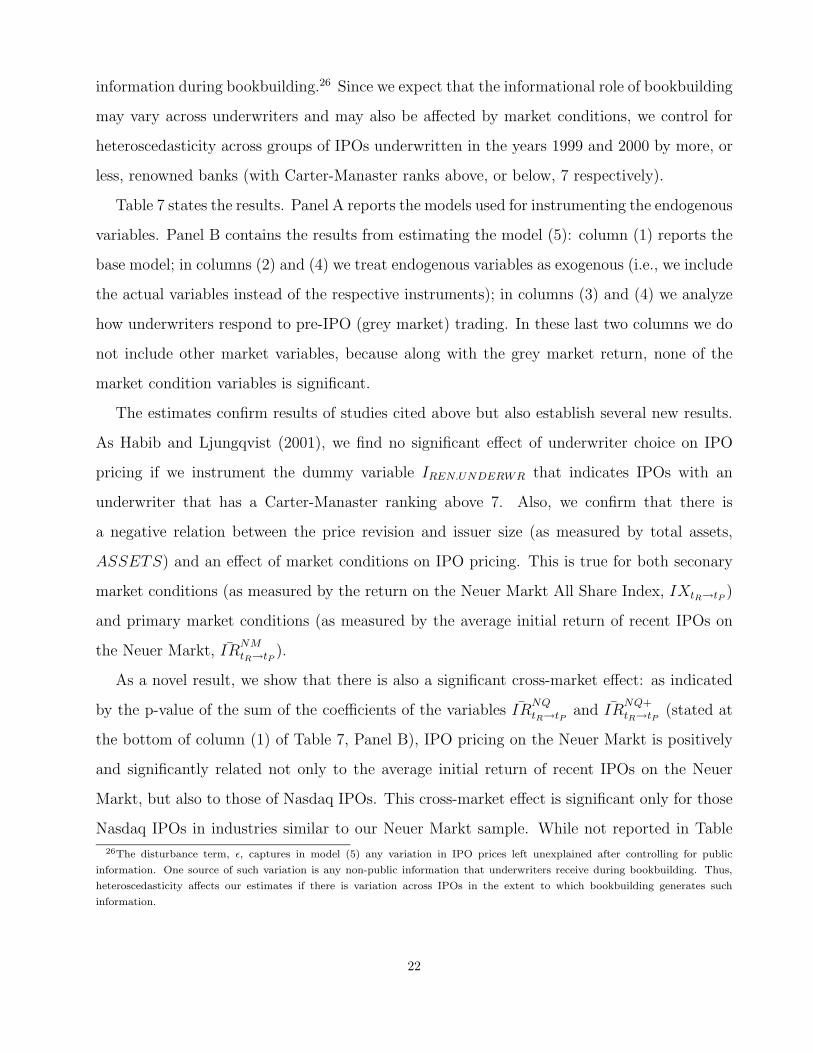
Table 7 states the results. Panel A reports the models used for instrumenting the endogenous
variables. Panel B contains the results from estimating the model (5): column (1) reports the
base model; in columns (2) and (4) we treat endogenous variables as exogenous (i.e., we include
the actual variables instead of the respective instruments); in columns (3) and (4) we analyze
how underwriters respond to pre-IPO (grey market) trading. In these last two columns we do
not include other market variables, because along with the grey market return, none of the
market condition variables is significant.
The estimates confirm results of studies cited above but also establish several new results.
As Habib and Ljungqvist (2001), we find no significant effect of underwriter choice on IPO
pricing if we instrument the dummy variable IREN.UNDERWR that indicates IPOs with an
underwriter that has a Carter-Manaster ranking above 7. Also, we confirm that there is
a negative relation between the price revision and issuer size (as measured by total assets,
ASSETS) and an effect of market conditions on IPO pricing. This is true for both seconary
market conditions (as measured by the return on the Neuer Markt All Share Index, IXtR→tP )
and primary market conditions (as measured by the average initial return of recent IPOs on
the Neuer Markt, ¯IRNMtR→tP
).
As a novel result, we show that there is also a significant cross-market effect: as indicated
by the p-value of the sum of the coefficients of the variables ¯IRNQtR→tP
and ¯IRNQ+tR→tP
(stated at
the bottom of column (1) of Table 7, Panel B), IPO pricing on the Neuer Markt is positively
and significantly related not only to the average initial return of recent IPOs on the Neuer
Markt, but also to those of Nasdaq IPOs. This cross-market effect is significant only for those
Nasdaq IPOs in industries similar to our Neuer Markt sample. While not reported in Table
26The disturbance term, ε, captures in model (5) any variation in IPO prices left unexplained after controlling for public
information. One source of such variation is any non-public information that underwriters receive during bookbuilding. Thus,
heteroscedasticity affects our estimates if there is variation across IPOs in the extent to which bookbuilding generates such
information.
22
7, we find no significant relation between the pricing of our sample of high-tech IPOs on the
Neuer Markt and the average initial return of contemporaneous Nasdaq IPOs in all industries.
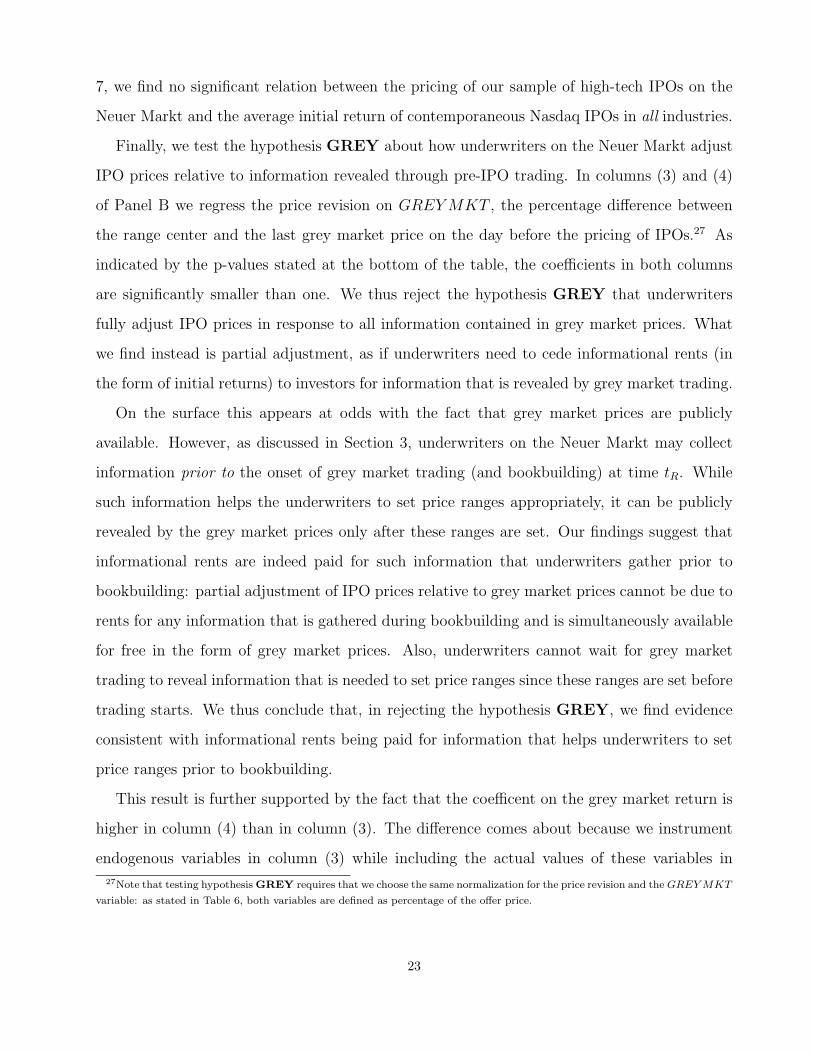
Finally, we test the hypothesis GREY about how underwriters on the Neuer Markt adjust
IPO prices relative to information revealed through pre-IPO trading. In columns (3) and (4)
of Panel B we regress the price revision on GREYMKT , the percentage difference between
the range center and the last grey market price on the day before the pricing of IPOs.27 As
indicated by the p-values stated at the bottom of the table, the coefficients in both columns
are significantly smaller than one. We thus reject the hypothesis GREY that underwriters
fully adjust IPO prices in response to all information contained in grey market prices. What
we find instead is partial adjustment, as if underwriters need to cede informational rents (in
the form of initial returns) to investors for information that is revealed by grey market trading.
On the surface this appears at odds with the fact that grey market prices are publicly
available. However, as discussed in Section 3, underwriters on the Neuer Markt may collect
information prior to the onset of grey market trading (and bookbuilding) at time tR. While
such information helps the underwriters to set price ranges appropriately, it can be publicly
revealed by the grey market prices only after these ranges are set. Our findings suggest that
informational rents are indeed paid for such information that underwriters gather prior to
bookbuilding: partial adjustment of IPO prices relative to grey market prices cannot be due to
rents for any information that is gathered during bookbuilding and is simultaneously available
for free in the form of grey market prices. Also, underwriters cannot wait for grey market
trading to reveal information that is needed to set price ranges since these ranges are set before
trading starts. We thus conclude that, in rejecting the hypothesis GREY, we find evidence
consistent with informational rents being paid for information that helps underwriters to set
price ranges prior to bookbuilding.
This result is further supported by the fact that the coefficent on the grey market return is
higher in column (4) than in column (3). The difference comes about because we instrument
endogenous variables in column (3) while including the actual values of these variables in
27Note that testing hypothesis GREY requires that we choose the same normalization for the price revision and the GREY MKT
variable: as stated in Table 6, both variables are defined as percentage of the offer price.
23

column (4), thus treating as exogenous underwriter choice, the final price ranges of IPOs, and
the fraction of issuers’ stock to be sold. In contrast to the instruments, these variables contain
information generated by the IPO pricing process before the start of bookbuilding. Once we
control for this information in column (4), the partial adjustment effect with respect to the
grey market return weakens.
5.2.2 IPO Pricing on Nasdaq
Because of institutional differences and differences in the level of IPO activity between Nasdaq
and the Neuer Markt, we deviate in three respects from the approach taken in the last section
to estimate model (5). First, we do not use a TOBIT model since underwriters of Nasdaq
IPOs frequently set offer prices above the final price ranges. Second, the greater availability of
data allows us to control for heteroscedasticity even better than in the last section. Thus, we
estimate a Prais-Winsten FGLS model, controlling for heteroscedasticity across groups of IPOs
with the same underwriter that start trading during the same interval of six months. Third,
we must take into account that the duration of time between range setting and pricing, tP −tR,
varies much more on Nasdaq than on the Neuer Markt. We suspect that this variation may
be associated with differences in the nature of bookbuilding as a means for both distributing
shares, and gathering information. In particular, we expect that information gathering is of
less importance after range amendments that happen within the week before pricing, i.e. for
tP − tR ≤ 7 days. We therefore split our sample of Nasdaq IPOs into two subsamples with
tP − tR > 7 days and tP − tR ≤ 7 days respectively and estimate model (5) separately for each
of these subsamples.28
The results are stated in Table 8 where Panel A presents models used for instrumenting
endogenous variables and Panel B contains results from estimating model (5). In columns
(1) and (2) we include the instrumented variables; in (3) and (4) we treat these endogenous
variables as exogenous.
We obtain several results that correspond to findings discussed in the last section. As on the
28Note that we cannot separate the effect of range amendments from the effect of a short duration of bookbuilding itself. This
is because the final price range is always set through range amendments if tP − tR ≤ 7 days, and there are no range amendments
for 90% of the IPOs with tP − tR > 7 days. We do, however, control for information released with earlier range postings.
24

Neuer Markt, there is evidence for a significant effect of recent primary and secondary market
conditions on the price revision. Also, there are again significant cross-market effects since
Nasdaq IPOs experience a higher price revision following high-tech IPOs on the Neuer Markt
with high average initial returns. In terms of point estimates, the cross-market influences are
not as strong for the pricing of Nasdaq IPOs as for the pricing of IPOs on the Neuer Markt.
This is not surprising considering the relative sizes of the markets.
Finally, we find that, similar to the Neuer Markt, the instruments for the range center,
the fraction of an issuer’s stock to be sold, and underwriter reputation have no explanatory
power while these variables have significant effects if treated as exogenous. However, the signs
of the coefficients of these variables in column (3) differ from those in column (4) of Table 7,
Panel B. For the effect of underwriter reputation, this is not surprising since previous studies
(cited above) also find contradictory evidence. For the coefficients of the range center and the
fraction sold, we expect that the different signs are a consequence of differences in the way in
which underwriters set price ranges. For example, if ranges are set randomly, then on average
those IPOs with higher range centers should have lower price revisions, and the range center
should have a negative coefficient for explaining price revisions. This is exactly what we find
for Nasdaq IPOs with early ranges. If on the other hand, ranges are set so as to incorporate,
but only partially, information that is gathered prior to setting the ranges, then the range
center should have a positive coefficient for explaining price revisions. This is what we find for
the Neuer Markt and for Nasdaq IPOs with ranges set late, although the latter coefficient is
not statistically significant.
5.3 Initial Returns
In this section, we analyze differences in IPO underpricing on Nasdaq and the Neuer Markt.
Specifically, we estimate empirical models based on equations (3) and (4) to test the hypotheses
stated in Section 3. Thereby, we draw on the results of the last section: we assume that the
model (5) determines PREV0, i.e. the price revision if the underwriter receives no private
information (i = 0). We realize that this assumption may not be fully satisfied since we may
fail to capture some publicly available information of relevance for IPO pricing. However, our
25

central results should be robust to that. To see this, note that many of the hypotheses in
Section 3 concern the relative strength of the relation between the price revision and initial
returns. While there may be some “omitted variable bias” of the absolute values of coefficients
measuring this relation, it is unlikely that this changes their relative magnitude. As a worst
case, such a bias may thus affect tests of hypotheses about the absolute magnitude of the
coefficients of equations (3) and (4),29 but we should obtain robust results in testing hypotheses
STICKYNM and STICKYNQ about their relative sizes.
5.3.1 Initial Returns on the Neuer Markt
In order to analyze IPO underpricing on the Neuer Markt, we need to convert equation (3)
into an econometric model. Thereby, we face the problem that we can directly observe the
latent price revision PREV ∗ only for IPOs priced within or below their price ranges. However,
a specific institutional feature of the Neuer Markt allows us to address this problem: pre-IPO
trading in the grey market should reveal any information of relevance for IPO pricing, including
non-public information i about the value of IPO shares.30 As a consequence, we use the model
in column (3) of Table 7, Panel B, to compute the price revision PREV ∗ that would have
been observed for IPOs with constrained offer prices if pricing had not been restricted by the
price ranges. We denote this price revision by PREVG. Using this variable, model (3) can be
written as follows:
IR = IR0 +
γU × (PREV − PREV0) + εU if ICON = 0,
γC × (PREVG − PREV0) + δ × (PREV0 − MAXREV ) + εC if ICON = 1,(6)
where εU and εC denote econometric disturbances. In estimating model (6), we allow for the
disturbance variance to differ between IPOs with constrained offer prices and the other IPOs.
Further, we use several control variables to capture IR0, the part of initial returns that can be
predicted using information that is publicly available prior to IPO pricing. Besides variables
for issuer size and market conditions, this includes also information contained in the filings that
set the final price ranges at time tR. Specifically, we control for the midpoints of these ranges29However, this problem is always present in empirical studies of the “partial adjustment phenomenon” as evidence for the
informational role of bookbuilding modelled by Benveniste and Spindt (1989).30Indeed, Loffler, Panther, and Theissen (2001) show that grey market prices are unbiased estimates of the price at which trading
of IPO shares opens in the secondary market.
26

and the fraction of issuers’ stock to be sold in IPOs as stated in these filings. By including
these control variables, we seek to isolate in the coefficients γU and γC the relation between
initial returns and information that underwriters obtain through bookbuilding after time tR.
Table 9 presents the results of estimating the above-stated model. Panel A reports descrip-
tive statistics for the central explanatory variables of the regressions stated in Panel B.31 Of
these, the variable PREV0 is the latent price revision if underwriters receive no private infor-
mation during bookbuilding, i.e. i = 0. We compute this price revision using the regression
reported in column (1) of Table 7, Panel B.32 We then calculate the following variables that
correspond to various terms of model (6):
• SURP = PREV − PREV0 denotes the “surprise” component of the price revision of
IPOs with unconstrained offer prices,
• SURPG = PREVG−PREV0 denotes the “surprise” component of the latent price revision
of IPOs with constrained offer prices, and
• CEXTENT = PREV0 − MAXREV denotes the percentage by which offer prices are
constrained, for i = 0.
The descriptive statistics in Panel A reveal a striking result. For the IPOs with constrained
offer prices, the price ranges induce very substantial price stickiness even if bookbuilding gen-
erates no information of relevance for IPO pricing, i = 0: CEXTENT is on average equal to
20.7% of the offer price (with a maximum of 81.6%). For issuers, this implies that money is
left on the table. Upon multiplying CEXTENT by issue size, we can calculate the cost in
terms of foregone IPO proceeds. Per IPO with a constrained offer price, on average more than
16 million Euros were left on the table due to lack of flexibility in revising upwards the offer
price. Across the 79 IPOs with a constrained offer price, the total amount of money left on
the table is more than one billion Euros!31In the regressions of Panel B we interact the grey market return with the indicator variable ICON which indicates constrained
IPOs. As discussed in Section 4, we do not have appropriate grey market returns for ten of our Neuer Markt IPOs. Of these,
three had constrained prices. Thus our number of observations for the regressions of Table 9, Panel B drops from 117 to 114.32We choose this model rather than that in column (2) in order to avoid endogeneity bias. We do not use the models in
columns (3) and (4) for estimating PREV0, because grey market prices contain information i that underwriters obtain through
bookbuilding.
27

Panel B of Table 9 contains the results from estimating model (6). Columns (1) and
(2) report estimates for the basic equation, obtained after substituting in equation (6) for
CEXTENT , SURP , and SURPG:
IR = IR0 +
γU × SURP + εU if ICON = 0,
γC × SURPG + δ × CEXTENT + εC if ICON = 1,(6′)
In column (3) we test the constraint imposed implicitly in the above-stated model that the two
“components” of CEXTENT , i.e. PREV0 and −MAXREV , have the same coefficient: we
cannot reject this constraint (p-value of 0.813, given at the bottom of column (3)). In column
(4) we test similar constraints imposed implicitly by using the above-stated definitions of the
“surprise variables”, SURP and SURPG. Again, we cannot reject these constraints (p-values
of 0.750 and 0.838, respectively). Given these results, we focus on the regressions of columns
(1) and (2) in the discussion below.
Informational role of bookbuilding: As discussed in Section 3, rejecting hypotheses INFOU
and INFOC, against the alternatives of γU > 0 and γC > 1 would be consistent with an
informational role of bookbuilding as modelled by Benveniste and Spindt (1989).33 However,
testing these hypotheses shows that there is no evidence for this: according to the p-values
stated in the bottom of Table 9, the coefficients γU and γC of the surprise variables SURP
and SURPG are not significantly different from zero and one respectively.34 Thus, for Neuer
Markt IPOs we find no evidence of an informational role of bookbuilding as in the model by
Benveniste and Spindt (1989).
To interpret this result, we need to keep in mind that the bookbuilding period is rather
strictly defined as the period after the time tR at which price ranges are set (typically only
one week prior to pricing). Thus, our result may just indicate that underwriters’ information
gathering is completed by that time. However, it may also be the case that underwriters do
gather information after time tR but that they can obtain this information at zero cost. This33To see this, note that underwriters must partially adjust IPO prices with respect to information i that they receive through
bookbuilding in order to induce that investors post informative orders: in terms of equation (3.1), investors must receive informa-
tional rents of (1− β)× i > 0 since β < 1. Using the definitions stated below equation (3), β < 1 implies that γU = (1− β)/β > 0
and γC = 1/β > 1.34As discussed above, this result is robust to relaxing the constraints that are implicitly imposed by substituting these surprise
variables into model (6).
28

interpretation is consistent with an institutional difference between Nasdaq and the Neuer
Markt, i.e. the existence of the “grey” forward market for IPO shares. After this market opens
at time tR, bookbuilding may provide underwriters only with such information that is also
contained in grey market prices. As these prices are freely and publicly available, there should
not be any informational rents associated with gathering this information.
Stickiness of IPO prices: In model (6′) and equation (3), any effect that constrained IPO
pricing may have on initial returns is captured by the coefficient δ of CEXTENT and by the
difference γC − γU . Hypotheses DELTA and STICKYNM state that, under the assumption
that bookbuilding generates information to an extent that does not vary with underwriters’
flexibility in IPO pricing, δ = 1 and γC−γU = 1. However, this assumption may not be satisfied:
as discussed above the statement of hypothesis STICKYNM, underwriters’ flexibility in IPO
pricing may affect how much information they obtain during bookbuilding. In terms of model
(6′), this implies that the coefficients γC and γU may differ by more or less than one. As
indicated by the p-values stated in the bottom of Table 9, Panel B, we can reject neither the
hypothesis STICKYNM, nor DELTA . Thus, it appears as if lack of flexibility in IPO pricing
has no effect on the extent to which bookbuilding generates information. Of course, this result
is perhaps another confirmation of our findings discussed above, i.e. that there is no significant
evidence for an informational role of bookbuilding at all.
5.3.2 Initial Returns on Nasdaq
In our analysis of IPO underpricing on Nasdaq, we again distinguish between two groups of
IPOs: those for which the final range was in place “early” (more than one week before pricing,
tP −tR > 7 days) and those for which the final range was set “late” (within a week of the pricing
date, tP − tR ≤ 7 days). By drawing this distinction, we can analyze how underwriters respond
in IPO pricing to information obtained at different times during bookbuilding. Specifically, we
will look for variation in the extent to which underwriters incorporate new information into
the offer price for these two sets of IPOs. To do this, we implement an econometric model
corresponding to equation (4), but we allow for different coefficients and heteroscedasticity
29

across the two groups of IPOs.35
Panel A of Table 10 reports summary statistics for the most important right-hand-side
variables of the regressions in Panel B. Besides the price revision PREV , this includes the
surprise price revision, SURP = PREV −PREV0, where the expected price revision PREV0
is computed using the estimates in columns (1) and (2) of Table 8, Panel B.36 By comparing
these variables across the two groups of IPOs we find that the variance of both variables is
smaller for those IPOs with final price ranges set late. While the price revision PREV is
positive for most IPOs in both groups, SURP is on average equal to zero (due to the way that
the surprise component of the price revision is calculated).
Panel B of Table 10 reports the regression results. Columns (1) and (2) report results
for the basic equation, without control variables. Columns (3) and (4) repeat this regression
with control variables (defined in Table 6). In columns (5) and (6) we repeat the regression
of columns (3) and (4), but with the actual price revision PREV , instead of the surprise
SURP . Comparing the coefficients of PREV and SURP , shows that these two variables
explain initial returns with very similar coefficients. This is natural since the information in
the surprise variable is orthogonal to the publicly available information in the expected price
revision PREV0. After controlling for such information, the coefficients of SURP and PREV
should therefore be equal. Columns (5) and (7) present the results of repeating the regression
of columns (5) and (6), but with the percent value of earlier range amendments, RAMEND,
included as a control variable for IPOs with late ranges.37 This last regression is included as a
robustness check and is discussed below when we discuss price stickiness. Except for that, we
focus mostly on the estimates in columns (1) - (4).
Informational role of bookbuilding: We reject both of the hypotheses INFOE and INFOL
stating that γE = 0 and γL = 0 respectively. As discussed above, rejecting these hypotheses
against the alternative of a positive coefficient is consistent with an informational role of
bookbuilding as modelled by Benveniste and Spindt (1989). In contrast with the Neuer Markt
35Note that we deviate from equation (4) by also allowing for differences in IR0, the initial returns if i = 0.36We use these estimates instead of those in columns (3) and (4) since we seek to avoid any endogeneity bias.37The coefficients of column (5) are not affected by the addition of this variable, so we do not write this column a second time.
30
results, an informational role of bookbuilding thus seems to exist even shortly before IPO
pricing: the coefficient of the surprise variable is significantly positive even for IPOs priced
relative to price ranges amended less than seven days before pricing.
Stickiness of IPO prices: As indicated by the p-values stated in the bottom of Table 10, Panel
B, we reject the hypothesis STICKYNQ that γE = γL in equation (4). This suggests that
there is variation across IPOs in the extent to which underwriters respond in IPO pricing to
information that they obtain through bookbuilding. In particular, underwriters seem to be
relatively reluctant to incorporate information into IPO pricing after a range amendment that
occurs “late”, i.e. shortly before pricing. If the information is favorable, SURP > 0 this “price
stickiness” implies that investors realize significantly higher initial returns. Based on the point
estimates for the coefficients γE and γL, an increase by 1% in the surprise price revision SURP
is associated with initial returns being higher by 1% × (γL − γE) ≈ 3.5% if this price revision
occurs after a late range amendment.38 Columns (5) and (7) show that this difference in initial
returns is not driven by “partial adjustment” in earlier range amendments: after controlling for
the size of these range amendments, RAMEND, the difference drops only by a small amount,
to 3.1%.39
6 Bookbuilding on the Neuer Markt versus Nasdaq: Conclusion
In this section, we summarize the results of the previous analysis in order to put into perspective
how the pricing of IPOs differs in three respects between Nasdaq and the Neuer Markt. First,
we present evidence suggesting that preliminary price ranges are set more deliberately on
the Neuer Markt than on Nasdaq. We find support for this notion in three places: (i) The
descriptive statistics discussed in Section 5.1 indicate that, on the Neuer Markt, price ranges
of IPOs exhibit more variation in their level and their width, than do price ranges of Nasdaq
IPOs. (ii) IPO pricing on the Neuer Markt shows a partial adjustment of IPO prices relative
to prices established by grey market trading of IPO shares. As discussed at the end of section
38This difference of 3.5% is found both in the regressions reported in columns (3) and (4) and those in columns (5) and (6).39The result is also not driven by differences in the distribution of the surprise price revision SURP across the two groups of
IPOs: in both groups, SURP takes positive / negative values for roughly 50% of the IPOs.
31

5.2.1, this suggests that investors receive informational rents for providing underwriters with
private information that helps them to set price ranges appropriately before this information
gets incorporated into the freely available grey market prices. (iii) As discussed at the end of
Section 5.2, underwriters on the Neuer Markt seem to set price ranges deliberately: inconsistent
with the ranges being set randomly, we find a positive relation between the midpoints of these
ranges and the subsequent revision of IPO prices from these midpoints.
Our second set of results relates to the first of our research questions: Does bookbuilding
serve mainly as a method for distributing shares, or also as a means for gathering information?
As reported in Section 5.3.1, we find no evidence of an informational role of bookbuilding on
the Neuer Markt. While this result may just indicate that underwriters’ information gathering
is completed before the start of bookbuilding, it may also be the case that the grey market sub-
stitutes for bookbuilding as a source of information. In any case, the purpose of bookbuilding
appears to differ between Nasdaq and the Neuer Markt: contrary to our findings for IPOs on
the Neuer Markt, we find evidence of an informational role of bookbuilding for Nasdaq IPOs.
As discussed in Section 5.3.2, this is true even shortly before the pricing of these IPOs.
Our third set of results relates to the second research question: Do IPOs differ in the
extent to which underwriters respond in IPO pricing to information that they obtain during
bookbuilding? On the Neuer Markt, IPO pricing is effectively constrained once price ranges
are set. In Section 5.3.1., we estimate the cost of this constraint in terms of foregone IPO
proceeds. On Nasdaq, there is no such “pricing restriction”. However, we find a different
form of price stickiness. As discussed in Section 5.3.2, the partial adjustment phenomenon is
significantly stronger for IPOs that are priced relative to final price ranges set shortly before
pricing. Thus, underwriters in both markets appear to be less flexible in responding to “last
minute” information. If this information is favorable, then IPO prices are revised upwards by
less, and more money is left on the table for investors.
These results are related to specific institutional differences between Nasdaq and the Neuer
Markt. The most important of these differences is that, on the Neuer Markt, investors submit
binding orders during the bookbuilding period rather than mere indications of interest, as is
common on Nasdaq. After collecting such binding orders, underwriters on the Neuer Markt
32
cannot price IPOs above the preliminary price ranges that are set at the start of bookbuilding.
As indicated by our results, this difference affects the entire bookbuilding process: (i) because
ranges constrain IPO pricing, it is important to set price ranges appropriately; (ii) to do this,
underwriters on the Neuer Markt gather more information before setting the price ranges and
less after that. Indeed, there is no evidence at all for an informational role of bookbuilding
after price ranges are set on the Neuer Markt.
Based on the results presented, “bookbuilding” should not be used as a generic term. Instead
we have shown how institutional differences between Nasdaq and the Neuer Markt affect the
extent to which IPO prices are “sticky”. On the Neuer Markt we can identify the institutional
source of this price stickiness as stemming from a two-sided commitment on the part of investors
and underwriters: investors to buy shares and underwriters to limit the price. On Nasdaq we
find evidence of stickiness, despite being unable to relate this to a clear institutional source.
We suspect that the stickiness on Nasdaq is due to a somewhat less formal form of commitment
between underwriters and investors. We also want to emphasize that even though we find that
pricing constraints are costly, we make no judgements as to whether they are good or bad.
As we know from the theory of strategic interactions, being able to precommit to particular
actions can increase a player’s outcome. And, despite the fixed nature of the constraint on
the Neuer Markt, we do find that average underpricing is significantly lower for internet and
high-tech Neuer Markt IPOs, as compared to similar Nasdaq IPOs for the same period of time.
33
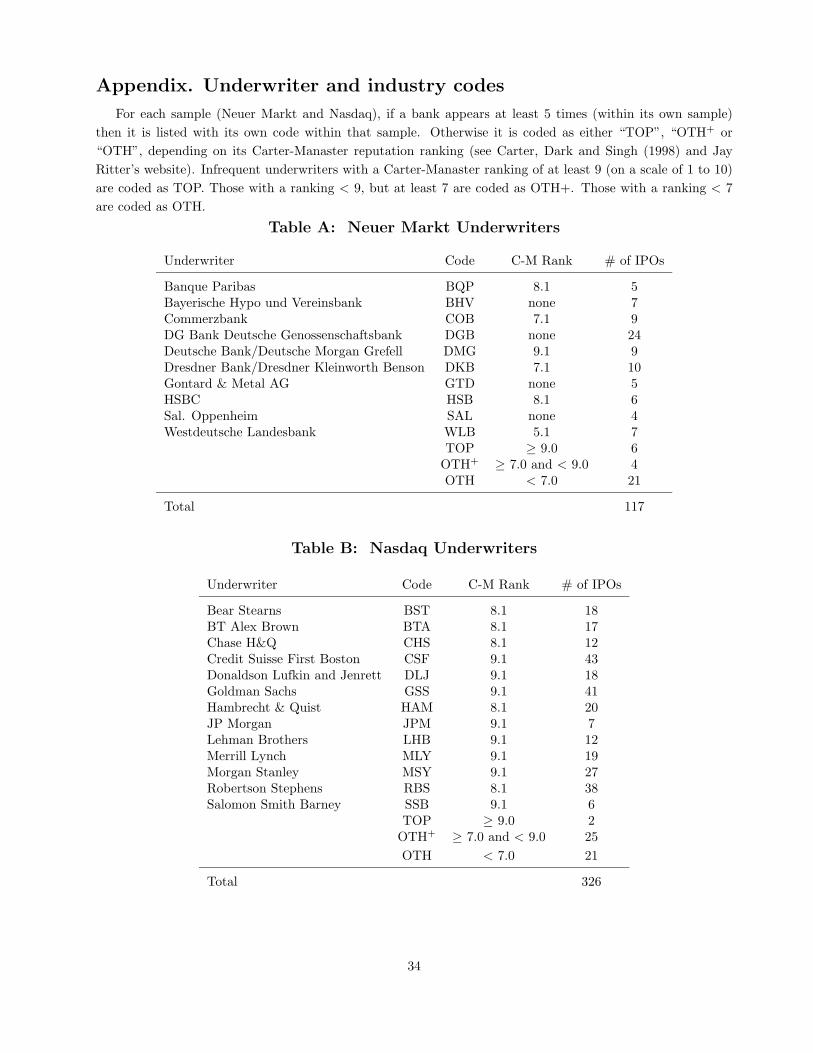
Appendix. Underwriter and industry codes
For each sample (Neuer Markt and Nasdaq), if a bank appears at least 5 times (within its own sample)then it is listed with its own code within that sample. Otherwise it is coded as either “TOP”, “OTH+ or“OTH”, depending on its Carter-Manaster reputation ranking (see Carter, Dark and Singh (1998) and JayRitter’s website). Infrequent underwriters with a Carter-Manaster ranking of at least 9 (on a scale of 1 to 10)are coded as TOP. Those with a ranking < 9, but at least 7 are coded as OTH+. Those with a ranking < 7are coded as OTH.
Table A: Neuer Markt Underwriters
Underwriter Code C-M Rank # of IPOs
Banque Paribas BQP 8.1 5Bayerische Hypo und Vereinsbank BHV none 7Commerzbank COB 7.1 9DG Bank Deutsche Genossenschaftsbank DGB none 24Deutsche Bank/Deutsche Morgan Grefell DMG 9.1 9Dresdner Bank/Dresdner Kleinworth Benson DKB 7.1 10Gontard & Metal AG GTD none 5HSBC HSB 8.1 6Sal. Oppenheim SAL none 4Westdeutsche Landesbank WLB 5.1 7
TOP ≥ 9.0 6OTH+ ≥ 7.0 and < 9.0 4OTH < 7.0 21
Total 117
Table B: Nasdaq Underwriters
Underwriter Code C-M Rank # of IPOs
Bear Stearns BST 8.1 18BT Alex Brown BTA 8.1 17Chase H&Q CHS 8.1 12Credit Suisse First Boston CSF 9.1 43Donaldson Lufkin and Jenrett DLJ 9.1 18Goldman Sachs GSS 9.1 41Hambrecht & Quist HAM 8.1 20JP Morgan JPM 9.1 7Lehman Brothers LHB 9.1 12Merrill Lynch MLY 9.1 19Morgan Stanley MSY 9.1 27Robertson Stephens RBS 8.1 38Salomon Smith Barney SSB 9.1 6
TOP ≥ 9.0 2OTH+ ≥ 7.0 and < 9.0 25OTH < 7.0 21
Total 326
34
References
[1] Aggarwal, Reena, Nagpurnanand R. Prabhala and Manju Puri, 2002, Institutional Alloca-
tion in initial public offerings: Empirical evidence, forthcoming Journal of Finance.
[2] Beatty, R. P. and I. Welch, 1996, Issuer expenses and legal liability in initial public offerings,
Journal of Law and Economics 39, 545–602.
[3] Benveniste, L., A. Ljungqvist, W. Wilhelm and X. Yu, 2001, Evidence of Information
Spillovers in the Production of Investment Banking Services, forthcoming Journal of Fi-
nance.
[4] Benveniste, L.M. and P.A. Spindt, 1989, How investment bankers determine the offer price
and allocation of new issues, Journal of Financial Economics 24, 343–361.
[5] Boehmer, Ekkehart and Raymond P. H. Fishe, 2001, Do underwriters encourage stock
flipping? The link between trading profits and pricing in IPOs, working paper, University
of Miami.
[6] Booth, James R. and Lena Chua, 1996, Ownership dispersion, costly information, and IPO
underpricing, Journal of Financial Economics 41, 291–310.
[7] Bradley, Daniel J. and Bradford D. Jordan, 2001, Partial adjustment to public information
and IPO underpricing, forthcoming Journal of Financial and Quantitative Analysis.
[8] Carter, Richard B., Frederick H. Dark and Ajai K. Singh, 1998, Underwriter reuptation,
initial returns and the long-run performance of IPO stocks, Journal of Finance 53, 285–311.
[9] Carter, R. B. and S. Manaster, 1990, Initial public offerings and underwriter reputation,
Journal of Finance 45, 1045–1067.
[10] Cornelli, Francesca and David Goldreich, 2001, Bookbuilding and Strategic Allocation,
Journal of Finance 56, 2337 - 2369.
[11] Habib, Michel A. and Alexander P. Ljungqvist, 2001, Underpricing and entrepreneurial
wealth losses in IPOs, Review of Financial Studies 14, 433–458.
35

[12] Hanley, Kathleen W., 1993, The underpricing of initial public offerings and the partial
adjustment phenomenon, Journal of Financial Economics 34, pp. 231-250.
[13] Ibbotson, R.G., Jody L. Sindelar, and Jay R. Ritter, 1988, Initial Public Offerings, Journal
of Applied Corporate Finance 1, 37-45.
[14] Jenkinson, T. and H. Jones, 2001, Bids and allocations in IPO bookbuilding, working
paper, Oxford University.
[15] Kukies, Jorg, 2000, The effects of introducing a new stock exchange on the IPO process,
working paper, University of Chicago.
[16] Ljungqvist, Alexander P. , 1997, Pricing initial public offerings: Further evidence from
Germany, European Economic Review 41, 1309–1320.
[17] Ljungqvist, Alexander P., Tim Jenkinson and William J. Wilhelm, Jr., 2001, Global Inte-
gration in Primary Equity Markets: The Role of U.S. Banks and U.S. Investors, forthcoming
Review of Financial Studies.
[18] Ljungqvist, Alexander P. and William J. Wilhelm, Jr., 2001, IPO allocations: discrimina-
tory or discretionary?, forthcoming Journal of Financial Economics.
[19] Loffler, Gunter, Patrick F. Panther and Erik Theissen, 2001, Who knows what when? The
information content of PreIPO market prices, working paper, University of Frankfurt/Main.
[20] Loughran, Tim and Jay R. Ritter, 2001, Why has underpricing increased over time?,
working paper, University of Florida.
[21] Loughran, Tim and Jay R. Ritter, 2002, Why don’t issuers get upset about leaving money
on the table in IPOs?, Review of Financial Studies 15, 413-443.
[22] Loughran, Tim, Jay R. Ritter and Kristian Rydqvist, 1994, Initial public offerings: Inter-
national insights, Pacific-Basin Finance Journal 2, 165–199.
[23] Lowry, Michelle and G. William Schwert, 2001, Biases in the IPO pricing process, working
paper, Penn State University and University of Rochester.
36

[24] Lowry, Michelle and G. William Schwert, 2002, IPO Market Cycles: bubbles or sequential
learning?, forthcoming Journal of Finance.
[25] Maksimovic, V. and H. Unal, 1993, Issue size choice and “underpricing” in thrift mutual-
to-stock conversions, Journal of Finance 48, 1659–1692.
[26] Ritter, Jay R., 1984, The ‘hot issue’ market of 1980, Journal of Business 57, 215–240.
[27] Ritter, Jay R., 2002, Investment Banking and Securities Issuance, Chapter 9 of North-
Holland Handbook of the Economics of Finance, George Constantinides, Milton Harris and
Rene Stulz, editors.
[28] Sherman, Ann E., 2001, Global trends in IPO methods: Book building vs. auctions,
working paper, University of Notre Dame.
[29] Titman, S. and B. Trueman, 1986, Information quality and the valuation of new issues,
Journal of Accounting and Economics 8, 159–172.
37
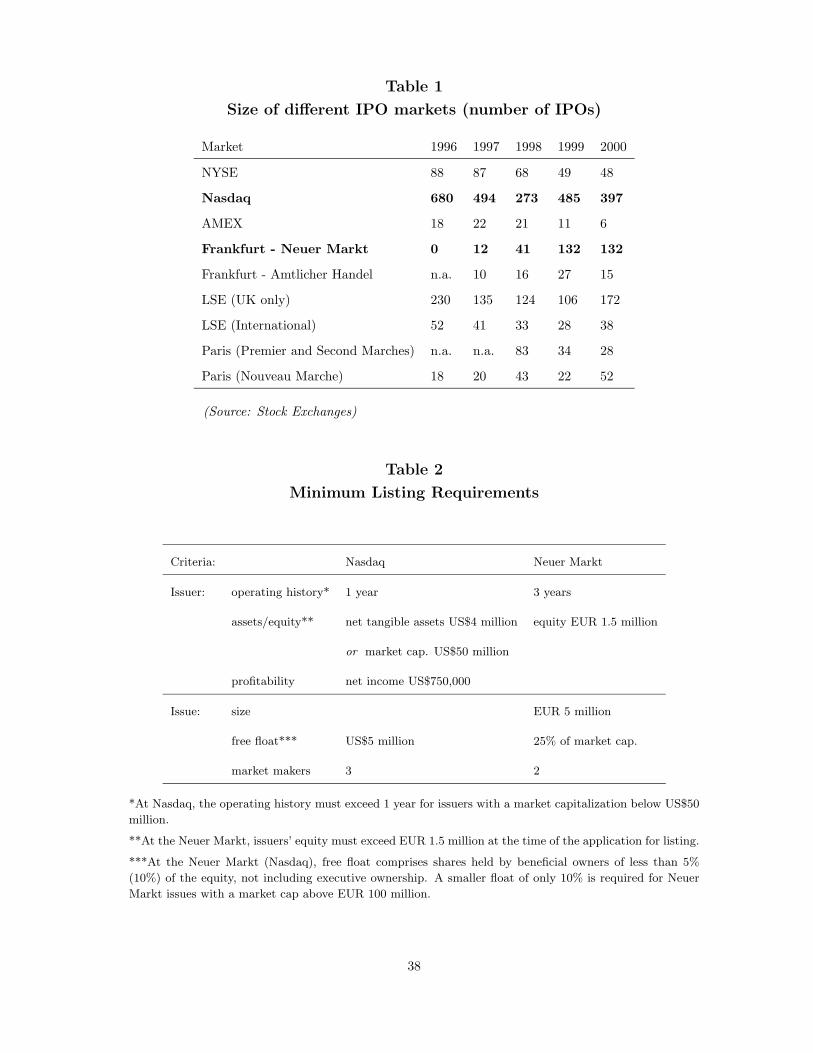
Table 1
Size of different IPO markets (number of IPOs)
Market 1996 1997 1998 1999 2000
NYSE 88 87 68 49 48
Nasdaq 680 494 273 485 397
AMEX 18 22 21 11 6
Frankfurt - Neuer Markt 0 12 41 132 132
Frankfurt - Amtlicher Handel n.a. 10 16 27 15
LSE (UK only) 230 135 124 106 172
LSE (International) 52 41 33 28 38
Paris (Premier and Second Marches) n.a. n.a. 83 34 28
Paris (Nouveau Marche) 18 20 43 22 52
(Source: Stock Exchanges)
Table 2
Minimum Listing Requirements
Criteria: Nasdaq Neuer Markt
Issuer: operating history* 1 year 3 years
assets/equity** net tangible assets US$4 million equity EUR 1.5 million
or market cap. US$50 million
profitability net income US$750,000
Issue: size EUR 5 million
free float*** US$5 million 25% of market cap.
market makers 3 2
*At Nasdaq, the operating history must exceed 1 year for issuers with a market capitalization below US$50
million.
**At the Neuer Markt, issuers’ equity must exceed EUR 1.5 million at the time of the application for listing.
***At the Neuer Markt (Nasdaq), free float comprises shares held by beneficial owners of less than 5%
(10%) of the equity, not including executive ownership. A smaller float of only 10% is required for Neuer
Markt issues with a market cap above EUR 100 million.
38

Table 3
Descriptive Statistics
Market capitalization is the offer price times the number of shares outstanding after the IPO, notincluding any shares issued under the greenshoe option. Issue size is the offer price times the numberof shares sold at the IPO, not including the greenshoe option. Fraction sold is the number of sharessold at the IPO divided by the number of shares outstanding (in %). Market capitalization andissues size are in million US$ for Nasdaq IPOs and million Euros for Neuer Markt IPOs respectively.Nasdaq IPOs are divided into two groups: IPOs with a “final” range that was set more than oneweek before the pricing date (early) and IPOs with a “final” range that was set within one week ofpricing (late).
Nasdaq Neuer Markt
early latetotal range range
Market Cap. (million US$) (million EUR)
Mean 497.8 430.5 694.7 476.9Std.Dev. 495.6 444.7 580.6 2,527.4Median 341.0 313.4 484.0 138.6Minimum 33.6 33.6 66.5 32.0Maximum 4,827.7 4,827.7 2,682.8 27,000.0
Issue Size (million US$) (million EUR)Mean 77.6 71.0 96.6 75.2Std.Dev. 52.8 50.2 55.8 234.9Median 62.6 60.0 80.0 38.3Minimum 16.5 16.8 16.5 8.0Maximum 408.0 408.0 300.3 2,489.4
Faction Sold (%) (%) (%) (%)Mean 19.5 20.2 17.2 26.8Std.Dev. 7.6 7.7 6.9 7.2Median 18.3 19.0 15.4 25.3Minimum 5.4 5.4 7.0 5.3Maximum 50.0 50.0 40.0 49.8
No of Issues 326 243 83 117
39
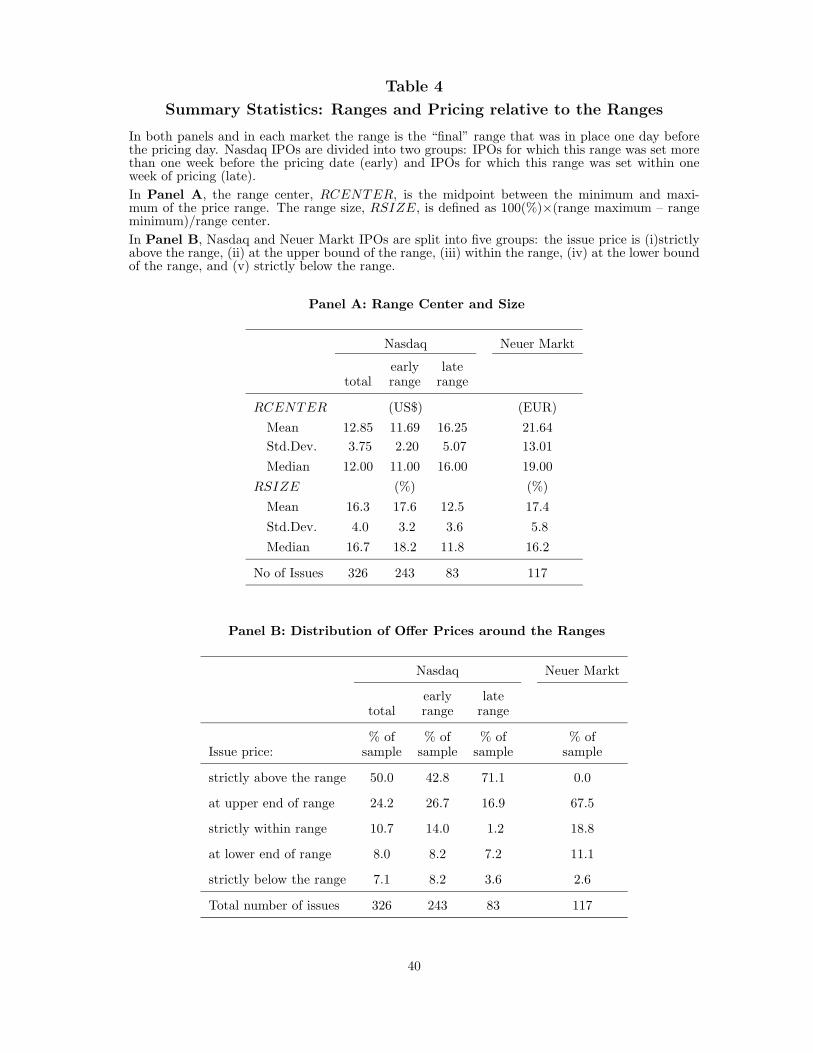
Table 4
Summary Statistics: Ranges and Pricing relative to the Ranges
In both panels and in each market the range is the “final” range that was in place one day beforethe pricing day. Nasdaq IPOs are divided into two groups: IPOs for which this range was set morethan one week before the pricing date (early) and IPOs for which this range was set within oneweek of pricing (late).In Panel A, the range center, RCENTER, is the midpoint between the minimum and maxi-mum of the price range. The range size, RSIZE, is defined as 100(%)×(range maximum – rangeminimum)/range center.In Panel B, Nasdaq and Neuer Markt IPOs are split into five groups: the issue price is (i)strictlyabove the range, (ii) at the upper bound of the range, (iii) within the range, (iv) at the lower boundof the range, and (v) strictly below the range.
Panel A: Range Center and Size
Nasdaq Neuer Markt
early latetotal range range
RCENTER (US$) (EUR)Mean 12.85 11.69 16.25 21.64Std.Dev. 3.75 2.20 5.07 13.01Median 12.00 11.00 16.00 19.00
RSIZE (%) (%)Mean 16.3 17.6 12.5 17.4Std.Dev. 4.0 3.2 3.6 5.8Median 16.7 18.2 11.8 16.2
No of Issues 326 243 83 117
Panel B: Distribution of Offer Prices around the Ranges
Nasdaq Neuer Markt
early latetotal range range
% of % of % of % ofIssue price: sample sample sample sample
strictly above the range 50.0 42.8 71.1 0.0
at upper end of range 24.2 26.7 16.9 67.5
strictly within range 10.7 14.0 1.2 18.8
at lower end of range 8.0 8.2 7.2 11.1
strictly below the range 7.1 8.2 3.6 2.6
Total number of issues 326 243 83 117
40
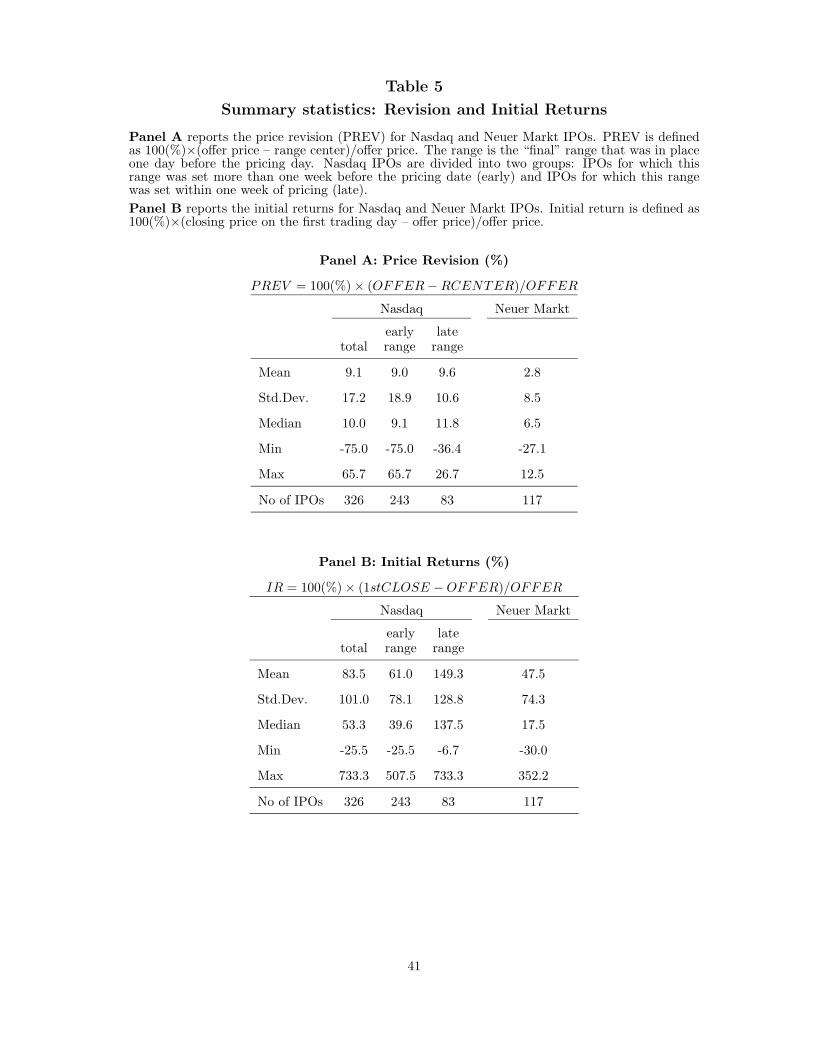
Table 5
Summary statistics: Revision and Initial Returns
Panel A reports the price revision (PREV) for Nasdaq and Neuer Markt IPOs. PREV is definedas 100(%)×(offer price – range center)/offer price. The range is the “final” range that was in placeone day before the pricing day. Nasdaq IPOs are divided into two groups: IPOs for which thisrange was set more than one week before the pricing date (early) and IPOs for which this rangewas set within one week of pricing (late).Panel B reports the initial returns for Nasdaq and Neuer Markt IPOs. Initial return is defined as100(%)×(closing price on the first trading day – offer price)/offer price.
Panel A: Price Revision (%)
PREV = 100(%) × (OFFER − RCENTER)/OFFER
Nasdaq Neuer Markt
early latetotal range range
Mean 9.1 9.0 9.6 2.8
Std.Dev. 17.2 18.9 10.6 8.5
Median 10.0 9.1 11.8 6.5
Min -75.0 -75.0 -36.4 -27.1
Max 65.7 65.7 26.7 12.5
No of IPOs 326 243 83 117
Panel B: Initial Returns (%)
IR = 100(%) × (1stCLOSE − OFFER)/OFFER
Nasdaq Neuer Markt
early latetotal range range
Mean 83.5 61.0 149.3 47.5
Std.Dev. 101.0 78.1 128.8 74.3
Median 53.3 39.6 137.5 17.5
Min -25.5 -25.5 -6.7 -30.0
Max 733.3 507.5 733.3 352.2
No of IPOs 326 243 83 117
41

Table 6Variables for IPO Pricing Model
Panel A: Explanatory Variables for Underwriter Reputation, Issue(r) Characteristics,and the IPO Pricing Process prior to Range Setting
Time Notation:tR Date of the filing that sets the “final” range that is in place one day before pricingt′R For IPOs with range amendments: date of the filing that sets the range
before the range amendment at date tR
tP Pricing datePricing Variables:OFFER IPO offer pricePREV 100(%) × (OFFER − RCENTER)/OFFER
ICON For Neuer Markt IPOs: Dummy that equals one if OFFER equals the range maximum1stCLOSE Closing price on first day of secondary market tradingUnderwriter Reputation:Endogenous:IREN.UNDERWR Dummy that equals one if an IPO is underwritten by a renowned bank:
Neuer Markt: underwriter with Carter-Manaster ranking ≥ 7Nasdaq: underwriter with Carter-Manaster ranking ≥ 9
IREN.UNDERWR Instrument for IREN.UNDERWR, linear combination of IFSOLD<MEDIAN ,IEPROC<MEDIAN , IEMCAP<MEDIAN , ASSETS, and variables for market conditions
Issue(r) characteristics:Exogenous:IFSOLD<MEDIAN Dummy variable indicating IPOs with below-median FSOLDIEPROC<MEDIAN Dummy variable indicating IPOs with below-median expected proceedsIEMCAP<MEDIAN Dummy variable indicating IPOs with below-median expected capitalizationASSETS Total assets of the issuerEndogenous:FSOLD Fraction of an issuer’s outstanding shares sold in an IPO (%)
(as stated in the filing at date tR)FSOLD Instrument for FSOLD: linear combination of IEMCAP<MEDIAN , ASSETS,
RCENTERBEF , FSOLDBEF , and variables for market conditionsIPO pricing process, prior to range setting:Exogenous:RCENTERBEF For Nasdaq IPOs with range amendments: center of the indicative price range
set in the filing at date t′RFSOLDBEF For Nasdaq IPOs with range amendments: fraction of an issuer’s
outstanding shares to be sold in an IPO (as stated in the filing at date t′R) (%)RAMEND For Nasdaq IPOs with range amendments:
RAMEND = (RCENTER − RCENTERBEF )/RCENTERBEF
Used only as a control variable for one regression in Table 10.Endogenous:RCENTER Center of the “final” price range in place one day before pricingRCENTER Instrument for RCENTER: linear combination of IEMCAP<MEDIAN , ASSETS,
RCENTERBEF , FSOLDBEF , and variables for market conditions
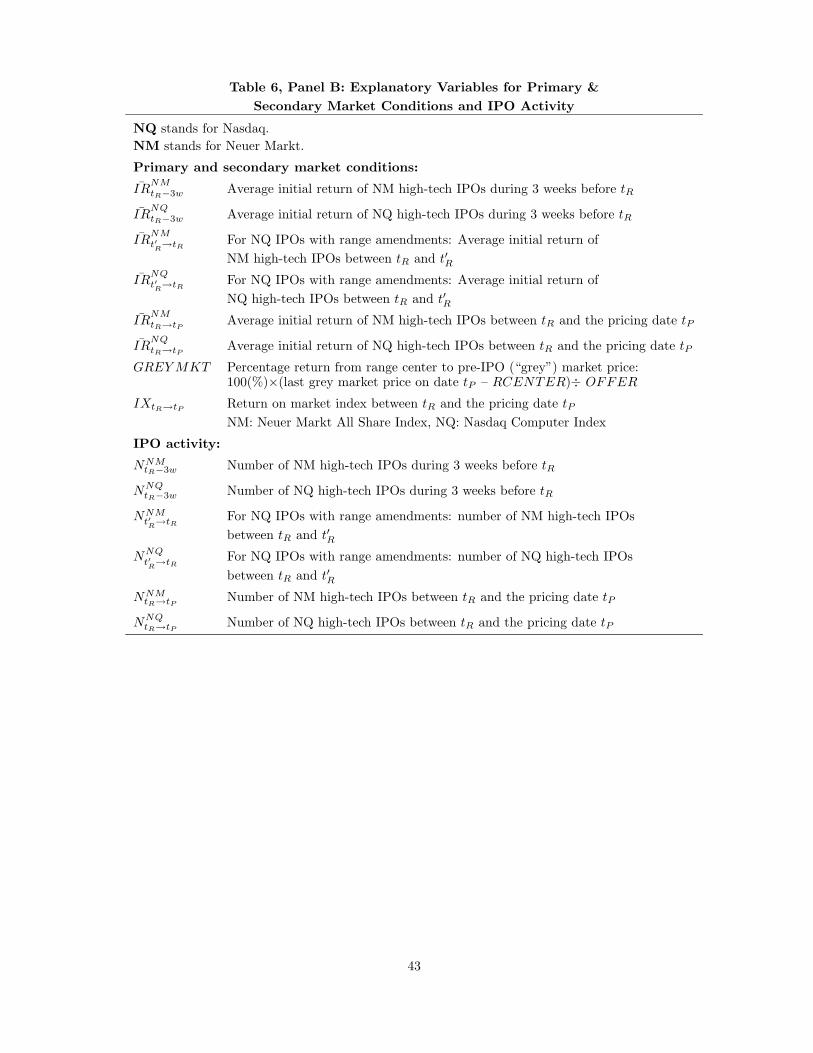
Table 6, Panel B: Explanatory Variables for Primary &Secondary Market Conditions and IPO Activity
NQ stands for Nasdaq.NM stands for Neuer Markt.
Primary and secondary market conditions:¯IR
NMtR−3w Average initial return of NM high-tech IPOs during 3 weeks before tR
¯IRNQtR−3w Average initial return of NQ high-tech IPOs during 3 weeks before tR
¯IRNMt′R→tR
For NQ IPOs with range amendments: Average initial return ofNM high-tech IPOs between tR and t′R
¯IRNQt′R→tR
For NQ IPOs with range amendments: Average initial return ofNQ high-tech IPOs between tR and t′R
¯IRNMtR→tP
Average initial return of NM high-tech IPOs between tR and the pricing date tP
¯IRNQtR→tP
Average initial return of NQ high-tech IPOs between tR and the pricing date tP
GREY MKT Percentage return from range center to pre-IPO (“grey”) market price:100(%)×(last grey market price on date tP – RCENTER)÷ OFFER
IXtR→tPReturn on market index between tR and the pricing date tP
NM: Neuer Markt All Share Index, NQ: Nasdaq Computer Index
IPO activity:
NNMtR−3w Number of NM high-tech IPOs during 3 weeks before tR
NNQtR−3w Number of NQ high-tech IPOs during 3 weeks before tR
NNMt′R→tR
For NQ IPOs with range amendments: number of NM high-tech IPOsbetween tR and t′R
NNQt′R→tR
For NQ IPOs with range amendments: number of NQ high-tech IPOsbetween tR and t′R
NNMtR→tP
Number of NM high-tech IPOs between tR and the pricing date tP
NNQtR→tP
Number of NQ high-tech IPOs between tR and the pricing date tP
43
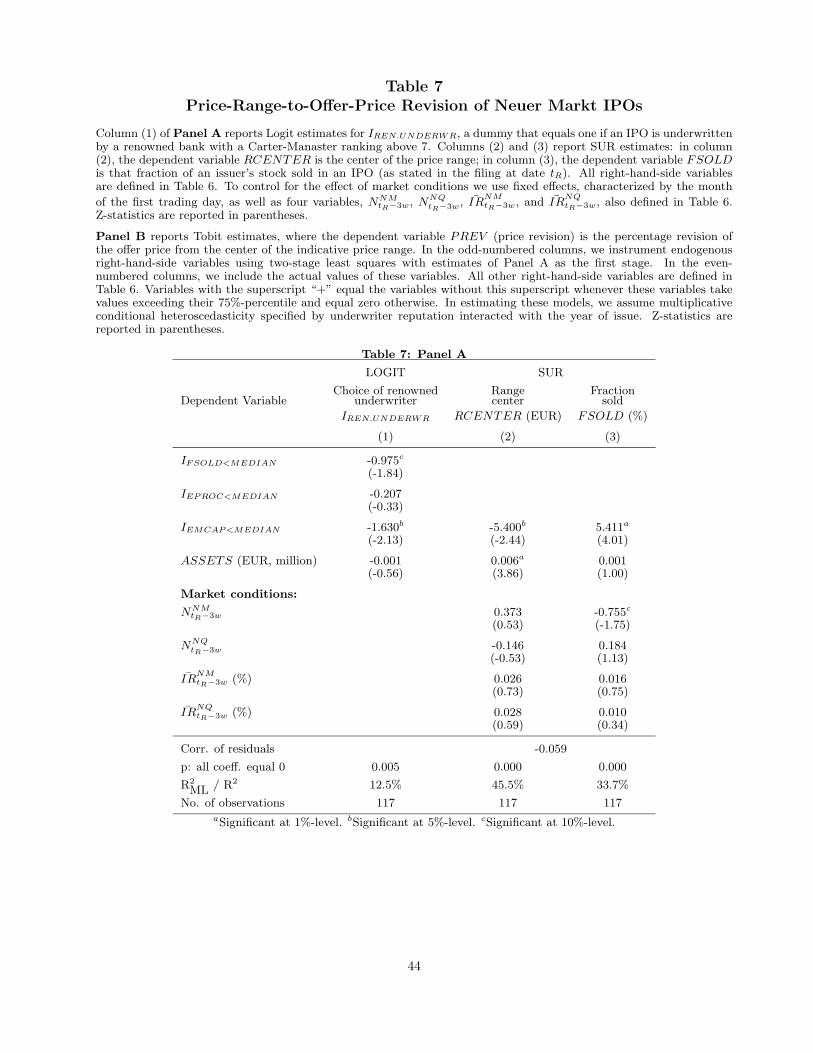
Table 7Price-Range-to-Offer-Price Revision of Neuer Markt IPOs
Column (1) of Panel A reports Logit estimates for IREN.UNDERWR, a dummy that equals one if an IPO is underwrittenby a renowned bank with a Carter-Manaster ranking above 7. Columns (2) and (3) report SUR estimates: in column(2), the dependent variable RCENTER is the center of the price range; in column (3), the dependent variable FSOLDis that fraction of an issuer’s stock sold in an IPO (as stated in the filing at date tR). All right-hand-side variablesare defined in Table 6. To control for the effect of market conditions we use fixed effects, characterized by the month
of the first trading day, as well as four variables, NNMtR−3w, NNQ
tR−3w, ¯IRNMtR−3w, and ¯IR
NQtR−3w, also defined in Table 6.
Z-statistics are reported in parentheses.
Panel B reports Tobit estimates, where the dependent variable PREV (price revision) is the percentage revision ofthe offer price from the center of the indicative price range. In the odd-numbered columns, we instrument endogenousright-hand-side variables using two-stage least squares with estimates of Panel A as the first stage. In the even-numbered columns, we include the actual values of these variables. All other right-hand-side variables are defined inTable 6. Variables with the superscript “+” equal the variables without this superscript whenever these variables takevalues exceeding their 75%-percentile and equal zero otherwise. In estimating these models, we assume multiplicativeconditional heteroscedasticity specified by underwriter reputation interacted with the year of issue. Z-statistics arereported in parentheses.
Table 7: Panel A
LOGIT SUR
Choice of renowned Range FractionDependent Variable underwriter center sold
IREN.UNDERWR RCENTER (EUR) FSOLD (%)
(1) (2) (3)
IFSOLD<MEDIAN -0.975c
(-1.84)
IEPROC<MEDIAN -0.207(-0.33)
IEMCAP<MEDIAN -1.630b -5.400b 5.411a
(-2.13) (-2.44) (4.01)
ASSETS (EUR, million) -0.001 0.006a 0.001(-0.56) (3.86) (1.00)
Market conditions:
NNMtR−3w 0.373 -0.755c
(0.53) (-1.75)
NNQtR−3w -0.146 0.184
(-0.53) (1.13)
¯IRNMtR−3w (%) 0.026 0.016
(0.73) (0.75)
¯IRNQtR−3w (%) 0.028 0.010
(0.59) (0.34)
Corr. of residuals -0.059
p: all coeff. equal 0 0.005 0.000 0.000
R2
ML / R2 12.5% 45.5% 33.7%
No. of observations 117 117 117aSignificant at 1%-level. bSignificant at 5%-level. cSignificant at 10%-level.
44

Table 7: Panel B
Dependent variable: PREV = 100(%) × (OFFER−RCENTER)/OFFER
TOBIT TOBIT TOBIT TOBIT(1) (2) (3) (4)
Intercept -21.010 26.057c 17.836 -10.911c
(-0.84) (1.75) (1.43) (-1.89)Endogenous:IREN.UNDERWR 3.721 -11.300
(0.18) (-1.02)
RCENTER (EUR) 1.342b 0.334(2.01) (0.74)
FSOLD (%) 0.111 -0.631b
(0.15) (-2.13)Exogenous:
IREN.UNDERWR 3.715 -9.607a
(0.63) (-4.22)
RCENTER (EUR) 0.032 0.381a
(0.13) (3.79)
FSOLD (%) -0.572 0.256(-1.53) (1.42)
IEPROC<MEDIAN -0.932 -8.079 -4.200 -1.080(-0.15) (-1.17) (-1.42) (-0.39)
IEMCAP<MEDIAN -6.234 -4.377 -3.568 -4.753(-0.71) (-0.61) (-0.65) (-1.23)
ASSETS -0.010b -0.002 -0.002 -0.003a
(EUR, million) (-2.40) (-0.95) (-0.83) (-3.02)
Market conditions:
GREYMKT (%) 0.797a 0.857a
(7.82) (9.40)
IXtR→tP (%) 1.128b 0.865(2.07) (1.56)
IX+tR→tP
(%) -2.420b -2.235b
(-2.47) (-2.29)
NNMtR→tP
-0.275 1.036(-0.22) (0.91)
NNQtR→tP
-0.101 -0.553(-0.17) (-0.99)
¯IRNMtR→tP
(%) 0.172 0.204b
(1.47) (2.03)
¯IRNM+tR→tP
(%) 0.021 0.076(0.14) (0.54)
¯IRNQtR→tP
(%) 0.125 0.120(1.43) (1.47)
¯IRNQ+tR→tP
(%) -0.012 -0.062(-0.16) (-0.90)
p: zero coeff. of IXtR→tP + IX+tR→tP
0.057 0.041
p: zero coeff. of ¯IRNMtR→tP
+ ¯IRNM+tR→tP
0.033 0.012
p: zero coeff. of ¯IRNQtR→tP
+ ¯IRNQ+tR→tP
0.010 0.144
p: coeff. of GREYMKT equals 1 0.023 0.058
p: all coeff. equal 0 0.006 0.006 0.000 0.000
R2
ML 34.8% 31.4% 77.3% 78.3%
No. of obs. 117 117 107 107aSignificant at 1%-level. bSignificant at 5%-level. cSignificant at 10%-level.
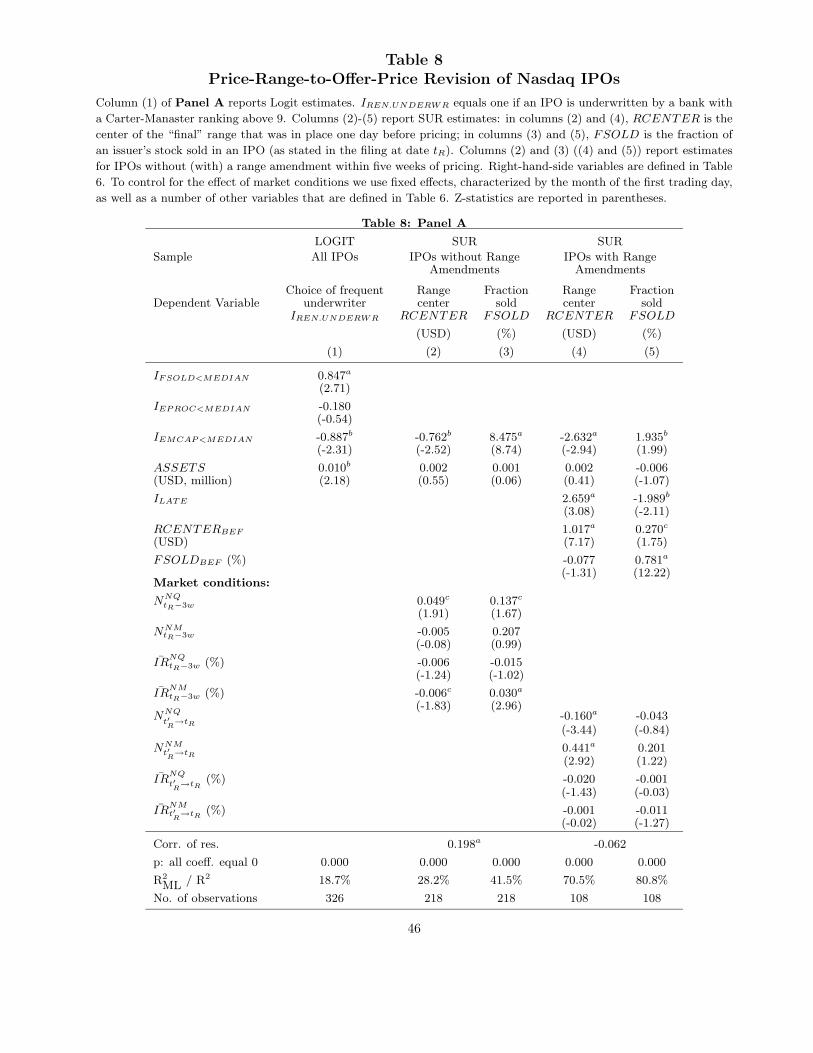
Table 8Price-Range-to-Offer-Price Revision of Nasdaq IPOs
Column (1) of Panel A reports Logit estimates. IREN.UNDERWR equals one if an IPO is underwritten by a bank with
a Carter-Manaster ranking above 9. Columns (2)-(5) report SUR estimates: in columns (2) and (4), RCENTER is the
center of the “final” range that was in place one day before pricing; in columns (3) and (5), FSOLD is the fraction of
an issuer’s stock sold in an IPO (as stated in the filing at date tR). Columns (2) and (3) ((4) and (5)) report estimates
for IPOs without (with) a range amendment within five weeks of pricing. Right-hand-side variables are defined in Table
6. To control for the effect of market conditions we use fixed effects, characterized by the month of the first trading day,
as well as a number of other variables that are defined in Table 6. Z-statistics are reported in parentheses.
Table 8: Panel A
LOGIT SUR SUR
Sample All IPOs IPOs without Range IPOs with RangeAmendments Amendments
Choice of frequent Range Fraction Range FractionDependent Variable underwriter center sold center sold
IREN.UNDERWR RCENTER FSOLD RCENTER FSOLD
(USD) (%) (USD) (%)
(1) (2) (3) (4) (5)
IFSOLD<MEDIAN 0.847a
(2.71)
IEPROC<MEDIAN -0.180(-0.54)
IEMCAP<MEDIAN -0.887b -0.762b 8.475a -2.632a 1.935b
(-2.31) (-2.52) (8.74) (-2.94) (1.99)
ASSETS 0.010b 0.002 0.001 0.002 -0.006(USD, million) (2.18) (0.55) (0.06) (0.41) (-1.07)
ILATE 2.659a -1.989b
(3.08) (-2.11)
RCENTERBEF 1.017a 0.270c
(USD) (7.17) (1.75)
FSOLDBEF (%) -0.077 0.781a
(-1.31) (12.22)Market conditions:
NNQtR−3w 0.049c 0.137c
(1.91) (1.67)
NNMtR−3w -0.005 0.207
(-0.08) (0.99)
¯IRNQtR−3w (%) -0.006 -0.015
(-1.24) (-1.02)
¯IRNMtR−3w (%) -0.006c 0.030a
(-1.83) (2.96)NNQ
t′R→tR
-0.160a -0.043(-3.44) (-0.84)
NNMt′R→tR
0.441a 0.201(2.92) (1.22)
¯IRNQ
t′R→tR
(%) -0.020 -0.001(-1.43) (-0.03)
¯IRNMt′R→tR
(%) -0.001 -0.011(-0.02) (-1.27)
Corr. of res. 0.198a -0.062
p: all coeff. equal 0 0.000 0.000 0.000 0.000 0.000
R2
ML / R2 18.7% 28.2% 41.5% 70.5% 80.8%
No. of observations 326 218 218 108 108
46

Table 8, Panel B reports Prais-Winsten FGLS estimates, where the dependent variable is PREV (price revision),
the percentage revision of the offer price from the center of the “final” range. In columns (1) and (2), we instrument
endogenous right-hand side variables using two-stage least squares with estimates of Panel A as the first stage. Other
right-hand-side variables are as defined in Table 6. Variables with the superscript “+” equal the variables without this
superscript whenever these variables take values exceeding their 75%-percentile and equal zero otherwise. We allow for
different coefficients if the “final” range is set “late” (within one week of pricing) or “early” (more than one week before
pricing), but we estimate all of these coefficients simultaneously. We allow for heteroscedasticity across groups of IPOs
underwritten by the same bank in any six months. Z-statistics are reported in parentheses.
Dependent variable: PREV = 100(%) × (OFFER−RCENTER)/OFFER
Prais-Winsten Prais-Winsten
“Final” Range “Final” Rangeset early set late set early set late
(1) (2) (3) (4)
Intercept 4.367 8.686 12.497 2.644(0.32) (0.55) (1.58) (0.19)
Endogenous:
IREN.UNDERWR -14.123 18.376(-0.61) (1.19)
RCENTER (USD) -0.716 0.087(-0.76) (0.16)
FSOLD (%) 0.206 0.404(0.51) (1.00)Exogenous:
IREN.UNDERWR 7.973a 1.438(3.58) (0.34)
RCENTER (USD) -0.950b 0.355(-1.98) (0.82)
FSOLD (%) -0.539a 0.376(-3.49) (1.04)
IEPROC<MEDIAN 1.649 -2.862 -2.040 -1.733(0.61) (-0.47) (-0.79) (-0.29)
IEMCAP<MEDIAN -6.572 -4.103 5.251c -4.095(-1.40) (-0.60) (1.66) (-0.69)
ASSETS 0.021 -0.047 -0.009 -0.017(USD, million) (0.58) (-0.82) (-0.49) (-0.38)
Market cond.:
IXtR→tP (%) 0.561a 0.573 0.614a 0.483(3.26) (0.69) (3.98) (0.65)
IX+tR→tP
(%) -0.254 -1.347 -0.342c -1.345(-1.27) (-0.72) (-1.88) (-0.76)
NNQtR→tP
-0.091 -0.006 -0.001 -0.559(-0.81) (-0.01) (-0.00) (-0.59)
NNMtR→tP
-0.083 -1.979 -0.194 -1.531(-0.30) (-0.62) (-0.73) (-0.53)
¯IRNQtR→tP
(%) 0.184a 0.022 0.189a 0.037(3.15) (0.31) (3.41) (0.59)
¯IRNQ+tR→tP
(%) -0.105a 0.007 -0.093a -0.003(-2.89) (0.12) (-2.63) (-0.06)
¯IRNMtR→tP
(%) 0.039 -0.146 0.026 -0.096(0.58) (-0.94) (0.43) (-0.68)
¯IRNM+tR→tP
(%) 0.010 0.162 0.022 0.122(0.16) (1.20) (0.38) (0.99)
p: zero coeff. of IXtR→tP + IX+tR→tP
0.020 0.631 0.038 0.573
p: zero coeff. of ¯IRNQtR→tP
+ ¯IRNQ+tR→tP
0.040 0.389 0.008 0.283
p: zero coeff. of ¯IRNMtR→tP
+ ¯IRNM+tR→tP
0.022 0.716 0.016 0.546
p: all coeff. equal 0 0.000 0.000
R2 35.2% 41.3%
No. of obs. 326 326aSignificant at 1%-level. bSignificant at 5%-level. cSignificant at 10%-level.

Table 9Initial Returns and Price-Range-to-Offer Revision
of Neuer Markt IPOs
Panel A reports descriptive statistics for some right-hand-side variables of the regressions in Panel B. ForIPOs priced strictly below the top of the price range, these are the actual percentage revision, PREV =100(%) × (OFFER − RCENTER)/OFFER, the predicted price revision, PREV0, estimated using themodel in column (1) of Panel B of Table 7, and the surprise price revision, SURP = PREV −PREV0. ForIPOs priced at the top of the price range, these are PREV0 (calculated as above), the latent price revisionconditioned on the information contained in the grey market prices, PREVG, estimated using the model incolumn (3) of Panel B of Table 7, the surprise price revision, SURPG = PREVG −PREV0, and the extentof censoring, CEXTENT = PREV0 − MAXREV , where MAXREV denotes the percentage differencebetween the center and the upper bound of the range.
Panel B reports GLS estimates. The dependent variable is the initial return between the offer priceand the closing price on the first trading day. Columns (1) – (2) report estimates for the variables thatcapture the “surprise” price revision. We test in column (3) the constraint (implied by the definition ofCEXTENT ) that the coefficients of PREV0 and MAXREV sum to zero. Column (4) reports estimatesfor the “components” of SURP = PREV − PREV0 for IPOs priced strictly below the top of the pricerange and SURPG = PREVG − PREV0 for IPOs priced at the top of the range. Control variables are asdefined in Table 6. In estimating these models, we allow for multiplicative conditional heteroscedasticityfor IPOs with an offer price censored at the top of the indicative price range. Z-statistics are reported inparentheses for robust standard errors that are more conservative than White (1980) standard errors sincethey are adjusted for clustering, i.e. non-independent disturbances for IPOs within the same month.
Table 9, Panel A
38 IPOs with OFFER <Top of Range (ICON = 0)
SURP PREV PREV0
Mean (%) -11.808 -7.168 4.640
Std.Dev. (%) 13.938 8.216 13.580
Median (%) -9.057 -5.334 2.764
Min (%) -47.359 -27.083 -26.077
Max (%) 26.077 5.682 51.164
79 IPOs with OFFER =Top of Range (ICON = 1)
SURPG PREVG PREV0 CEXTENT
Mean (%) 38.332 62.676 24.352 20.723
Std.Dev. (%) 64.519 67.957 17.288 18.301
Median (%) 11.160 29.377 20.900 17.042
Min (%) -49.904 -14.537 -8.190 -17.079
Max (%) 307.351 320.192 81.813 81.576
48

Table 9, Panel B
Dependent variable: INITIAL RETURN = 100(%) × (1stCLOSE −OFFER)/OFFER
GLS GLS GLS GLS(1) (2) (3) (4)
Intercept 7.987b 29.114a 29.082a 28.159a
(2.19) (3.09) (3.06) (3.32)
ICON 0.578 -1.483 0.071 0.527(0.09) (-0.21) (0.01) (0.05)
SURP ∗ (1 − ICON ) (%) : coefficient = γU 0.260 0.174 0.176(1.13) (0.73) (0.74)
SURPG ∗ ICON (%): coefficient = γC 1.080a 1.058a 1.060a
(13.12) (10.91) (11.07)PREV ∗ (1 − ICON ) (%) 0.072
(0.19)
PREV0 ∗ (1 − ICON ) (%) -0.248(-0.72)
PREVG ∗ ICON (%) 1.058a
(10.94)
PREV0 ∗ ICON (%) 1.063a -1.386(3.00) (-0.86)
MAXREV ∗ ICON (%) -1.438(-0.98)
CEXTENT ∗ ICON (%): coefficient = δ 0.785a 1.086a 1.347(3.39) (3.37) (0.89)
RCENTER (EUR) -0.165 -0.171 -0.119(-0.79) (-0.79) (-0.41)
FSOLD (%) -0.487b -0.490b -0.526b
(-2.19) (-2.21) (-2.16)
ASSETS 0.002 0.002 0.001(EUR, million) (0.67) (0.68) (0.52)
IXtR→tP (%) 0.739b 0.745b 0.759b
(2.08) (2.09) (2.03)
NNMtR→tP
-1.497 -1.458 -1.473(-0.95) (-0.92) (-0.90)
NNQtR→tP
-0.091 -0.096 -0.067(-0.24) (-0.26) (-0.19)
¯IRNMtR→tP
(%) -0.132 -0.130 -0.118(-1.50) (-1.40) (-1.39)
¯IRNQtR→tP
(%) 0.051 0.054 0.056(0.79) (0.80) (0.87)
Estimation of log(dist.variance):Intercept 5.651a 5.291a 5.289a 5.278a
(12.39) (12.44) (12.41) (12.42)
ICON 1.584a 1.976a 1.980a 1.993a
(3.06) (4.10) (4.12) (4.17)
p: hypothesis INFOU (H0 :γU = 0, HA :γU > 0) 0.129 0.233 0.230p: hypothesis INFOC (H0 :γC = 1, HA :γC > 1) 0.167 0.278 0.264
p: hypothesis STICKY (H0 :γC - γU = 1, HA :γC - γU �= 1) 0.460 0.661 0.659p: hypothesis DELTA (H0 :δ = 1, HA :δ �= 1) 0.353 0.790 0.819
p: coeff. of PREV0 ∗ ICON &MAXREV ∗ ICON sum to 0 0.813
p: coeff. of PREV ∗ (1 − ICON ) &PREV0 ∗ (1 − ICON ) sum to 0 0.750
p: coeff. of PREVG ∗ ICON &PREV0 ∗ ICON sum to 0 0.838
p: all coeff. equal 0 0.000 0.000 0.000 0.000
R2
ML 84.4% 85.9% 85.9% 85.9%
No. of obs. 114 114 114 114aSignificant at 1%-level. bSignificant at 5%-level. cSignificant at 10%-level.
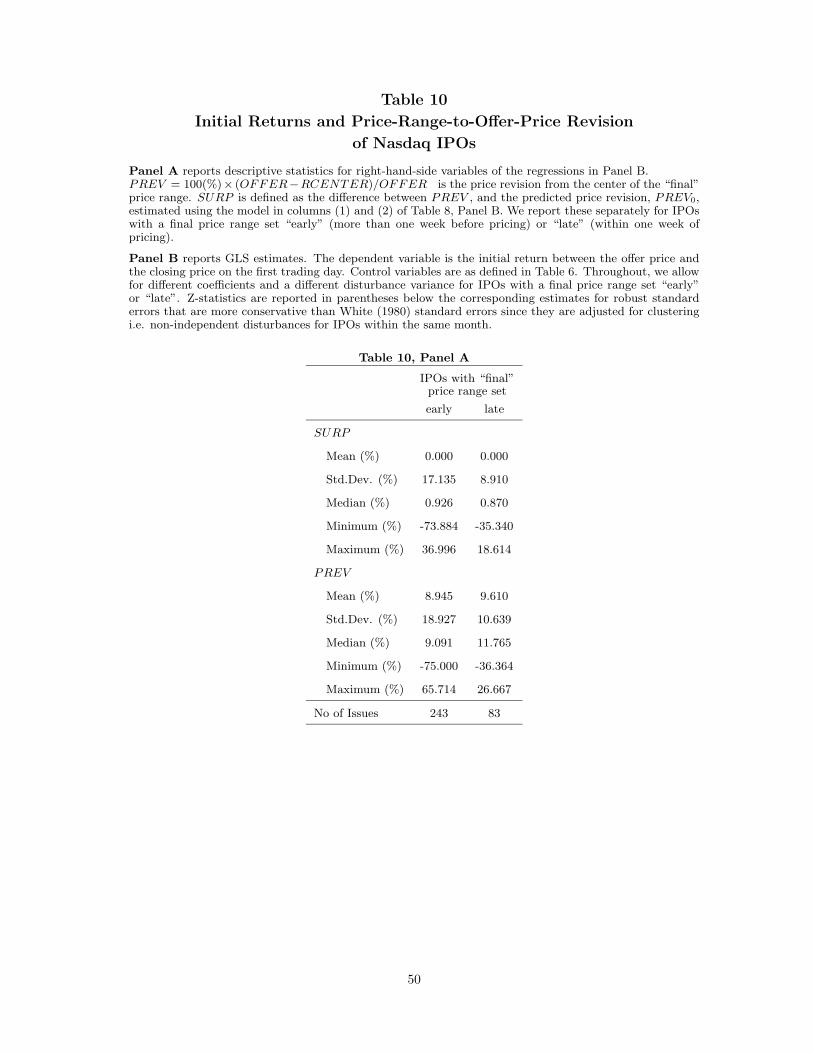
Table 10
Initial Returns and Price-Range-to-Offer-Price Revision
of Nasdaq IPOs
Panel A reports descriptive statistics for right-hand-side variables of the regressions in Panel B.PREV = 100(%)× (OFFER−RCENTER)/OFFER is the price revision from the center of the “final”price range. SURP is defined as the difference between PREV , and the predicted price revision, PREV0,estimated using the model in columns (1) and (2) of Table 8, Panel B. We report these separately for IPOswith a final price range set “early” (more than one week before pricing) or “late” (within one week ofpricing).
Panel B reports GLS estimates. The dependent variable is the initial return between the offer price andthe closing price on the first trading day. Control variables are as defined in Table 6. Throughout, we allowfor different coefficients and a different disturbance variance for IPOs with a final price range set “early”or “late”. Z-statistics are reported in parentheses below the corresponding estimates for robust standarderrors that are more conservative than White (1980) standard errors since they are adjusted for clusteringi.e. non-independent disturbances for IPOs within the same month.
Table 10, Panel A
IPOs with “final”price range set
early late
SURP
Mean (%) 0.000 0.000
Std.Dev. (%) 17.135 8.910
Median (%) 0.926 0.870
Minimum (%) -73.884 -35.340
Maximum (%) 36.996 18.614
PREV
Mean (%) 8.945 9.610
Std.Dev. (%) 18.927 10.639
Median (%) 9.091 11.765
Minimum (%) -75.000 -36.364
Maximum (%) 65.714 26.667
No of Issues 243 83
50

Table 10, Panel B
Dependent variable: INITIAL RETURN = 100(%) × (1stCLOSE −OFFER)/OFFER
GLS GLS GLS
IPOs with “final” IPOs with “final” IPOs with “final”
price range set price range set price range set
early late early late early late late
(1) (2) (3) (4) (5) (6) (7)
Intercept 60.955a 149.324a 103.038a 89.616b 94.668a 111.858a 129.167a
(9.35) (9.17) (3.86) (2.54) (3.56) (2.93) (2.85)
SURP (%): coefficient = γE or γL 2.332a 5.969a 2.111a 5.612a
(5.90) (5.15) (5.62) (6.53)
PREV (%) 2.145a 5.648a 5.291a
(5.63) (5.40) (5.00)
RAMEND (%) 0.354(0.98)
RCENTER (USD) 1.308 8.676a 1.613 5.745a 4.267c
(0.69) (4.58) (0.83) (2.77) (1.78)
FSOLD (%) -2.678a -5.868a -2.434a -6.674a -6.588a
(-6.14) (-5.97) (-5.01) (-6.09) (-5.87)
ASSETS -0.183a -0.196 -0.187a -0.178 -0.162(USD, million) (-3.29) (-0.74) (-3.16) (-0.66) (-0.60)
IXtR→tP (%) 0.718c 2.905 0.132 4.031 4.031(1.79) (0.94) (0.33) (1.18) (1.22)
NNQtR→tP
-0.274 1.453 -0.220 3.172 3.352(-0.76) (0.29) (-0.60) (0.61) (0.65)
NNMtR→tP
-1.356c 4.950 -0.876 -1.589 -2.017(-1.79) (0.44) (-1.02) (-0.12) (-0.16)
¯IRNQtR→tP
(%) 0.127 0.274c -0.105 0.240 0.207(0.74) (1.72) (-0.62) (1.36) (1.15)
¯IRNMtR→tP
(%) 0.168b 0.004 0.074 -0.230 -0.248(2.09) (0.03) (0.97) (-1.60) (-1.56)
p: all coeff.=0 0.000 0.000 0.000 0.000
p: hypothesis INFOL (H0 :γL = 0, HA :γL > 0) 0.000 0.000 0.000 0.000p: hypothesis INFOE (H0 :γE = 0, HA :γE > 0) 0.000 0.000 0.000
p: hypothesis STICKY (H0 :γL - γE = 0,
HA :γL - γE �= 0) 0.002 0.000p: coeff. of PREV (early) =
coeff. of PREV (late) 0.001 0.002
R2
ML 41.63% 54.32% 55.88%
No. of obs. 243 83 243 83 243 83 83aSignificant at 1%-level. bSignificant at 5%-level. c Significant at 10%-level.
51
Copyright © 2022 FDOKUMEN