
Q1 Hybrid Algorithm
13
Research Article A Hybrid Algorithm for Clustering of Time Series Data Based on Affinity Search Technique Saeed Aghabozorgi, Teh Ying Wah, Tutut Herawan, Hamid A. Jalab, Mohammad Amin Shaygan, and Alireza Jalali Faculty of Computer Science & Information Technology Building, University of Malaya, 50603 Kuala Lumpur, Malaysia Correspondence should be addressed to Saeed Aghabozorgi; [email protected] Received 4 October 2013; Accepted 2 February 2014; Published 25 March 2014 Academic Editors: H. Chen, P. Ji, and Y. Zeng Copyright © 2014 Saeed Aghabozorgi et al. is is an open access article distributed under the Creative Commons Attribution License, which permits unrestricted use, distribution, and reproduction in any medium, provided the original work is properly cited. Time series clustering is an important solution to various problems in numerous fields of research, including business, medical science, and finance. However, conventional clustering algorithms are not practical for time series data because they are essentially designed for static data. is impracticality results in poor clustering accuracy in several systems. In this paper, a new hybrid clustering algorithm is proposed based on the similarity in shape of time series data. Time series data are first grouped as subclusters based on similarity in time. e subclusters are then merged using the k-Medoids algorithm based on similarity in shape. is model has two contributions: (1) it is more accurate than other conventional and hybrid approaches and (2) it determines the similarity in shape among time series data with a low complexity. To evaluate the accuracy of the proposed model, the model is tested extensively using syntactic and real-world time series datasets. 1. Introduction Clustering is considered the most important unsupervised learning problem. e clustering of time series data is particularly advantageous in exploratory data analysis and summary generation. Time series clustering is also a pre- processing step in either another time series mining task or as part of a complex system. Researchers have shown that using well-known conventional algorithms in the clustering of static data, such as partitional and hierarchical clustering, generates clusters with an acceptable structural quality and consistency and is partially efficient in terms of execution time and accuracy [1]. However, classic machine learning and data mining algorithms are ineffective with regard to time series data because of the unique structure of time series, that is, its high dimensionality, very high feature correlation, and (typically) large amount of noise [2–4]. Accordingly, numerous research efforts have been conducted to present an efficient approach to time series clustering. However, the focus on the efficiency and scalability of these methods in handling time series data has come at the expense of losing the usability and effectiveness of clustering [5]. e clustering of time series data can be broadly clas- sified into conventional approaches and hybrid approaches. Conventional approaches employed in the clustering of time series data are typically partitioning, hierarchical, or model-based algorithms. In hierarchical clustering, a nested hierarchy of similar objects is constructed based on a pairwise distance matrix [6]. Hierarchical clustering has great visualization power in time series clustering [7]. is characteristic has made hierarchical clustering very suitable for time series clustering [8, 9]. Additionally, hierarchical clustering does not require the number of clusters as an initial parameter, in contrast to most algorithms. is characteristic is a well-known and outstanding feature of this algorithm and is a strength point in time series clustering because defining the number of clusters is oſten difficult in real-world problems. However, hierarchical clustering is cumbersome when handling large time series datasets [10] because of its quadratic computational complexity. As a result of its poor scalability, hierarchical clustering is restricted to small datasets. On the other hand, partitioning algorithms, such as the well-known k-Means [11] or k-Medoids algorithm [12], are among the most used algorithms in this domain. Hindawi Publishing Corporation e Scientific World Journal Volume 2014, Article ID 562194, 12 pages http://dx.doi.org/10.1155/2014/562194
Transcript of Q1 Hybrid Algorithm

Research ArticleA Hybrid Algorithm for Clustering of Time SeriesData Based on Affinity Search Technique
Saeed Aghabozorgi Teh Ying Wah Tutut Herawan Hamid A JalabMohammad Amin Shaygan and Alireza Jalali
Faculty of Computer Science amp Information Technology Building University of Malaya 50603 Kuala Lumpur Malaysia
Correspondence should be addressed to Saeed Aghabozorgi saeedumedumy
Received 4 October 2013 Accepted 2 February 2014 Published 25 March 2014
Academic Editors H Chen P Ji and Y Zeng
Copyright copy 2014 Saeed Aghabozorgi et al This is an open access article distributed under the Creative Commons AttributionLicense which permits unrestricted use distribution and reproduction in any medium provided the original work is properlycited
Time series clustering is an important solution to various problems in numerous fields of research including business medicalscience and finance However conventional clustering algorithms are not practical for time series data because they are essentiallydesigned for static data This impracticality results in poor clustering accuracy in several systems In this paper a new hybridclustering algorithm is proposed based on the similarity in shape of time series data Time series data are first grouped as subclustersbased on similarity in timeThe subclusters are thenmerged using the k-Medoids algorithmbased on similarity in shapeThismodelhas two contributions (1) it is more accurate than other conventional and hybrid approaches and (2) it determines the similarity inshape among time series data with a low complexity To evaluate the accuracy of the proposedmodel themodel is tested extensivelyusing syntactic and real-world time series datasets
1 Introduction
Clustering is considered the most important unsupervisedlearning problem The clustering of time series data isparticularly advantageous in exploratory data analysis andsummary generation Time series clustering is also a pre-processing step in either another time series mining task oras part of a complex system Researchers have shown thatusing well-known conventional algorithms in the clusteringof static data such as partitional and hierarchical clusteringgenerates clusters with an acceptable structural quality andconsistency and is partially efficient in terms of executiontime and accuracy [1] However classic machine learning anddata mining algorithms are ineffective with regard to timeseries data because of the unique structure of time seriesthat is its high dimensionality very high feature correlationand (typically) large amount of noise [2ndash4] Accordinglynumerous research efforts have been conducted to presentan efficient approach to time series clustering However thefocus on the efficiency and scalability of these methods inhandling time series data has come at the expense of losingthe usability and effectiveness of clustering [5]
The clustering of time series data can be broadly clas-sified into conventional approaches and hybrid approachesConventional approaches employed in the clustering oftime series data are typically partitioning hierarchical ormodel-based algorithms In hierarchical clustering a nestedhierarchy of similar objects is constructed based on apairwise distance matrix [6] Hierarchical clustering hasgreat visualization power in time series clustering [7] Thischaracteristic has made hierarchical clustering very suitablefor time series clustering [8 9] Additionally hierarchicalclustering does not require the number of clusters as an initialparameter in contrast to most algorithmsThis characteristicis a well-known and outstanding feature of this algorithmand is a strength point in time series clustering becausedefining the number of clusters is often difficult in real-worldproblems However hierarchical clustering is cumbersomewhen handling large time series datasets [10] because ofits quadratic computational complexity As a result of itspoor scalability hierarchical clustering is restricted to smalldatasets On the other hand partitioning algorithms suchas the well-known k-Means [11] or k-Medoids algorithm[12] are among the most used algorithms in this domain
Hindawi Publishing Corporatione Scientific World JournalVolume 2014 Article ID 562194 12 pageshttpdxdoiorg1011552014562194
2 The Scientific World Journal
k-Means and k-Medoids algorithms are very fast comparedwith hierarchical clustering [13] making them very suitablefor time series clustering Therefore these algorithms havebeen used in several works either in their ldquocrispyrdquo manner[3 14ndash18] or in their ldquofuzzyrdquo manner (Fuzzy c-Means andFuzzy c-Medoids) [17ndash20] Model-based clustering assumesa model for each cluster and determines the best data fitfor that model The model obtained from the generated datadefines the clusters [21] A few articles use model-based timeseries clustering [22ndash26] however two typical drawbackshave been discovered First the parameters should be setand the parameter setting is based on the userrsquos assumptionswhich may be false and may result in inaccurate clustersSecond model-based clustering has a slow processing time(especially neural networks) with respect to large datasets[27]
Aside from all of these conventional approaches somenew articles emphasize the enhancement of algorithms andpresent customizedmodels (typically as a hybridmethod) fortime series data clustering One of the latest works is an articleby Lai et al [28] who describe the problem of overlookedinformation as a result of dimension reduction Lai et al claimthat the overlooked information can result in time seriesclustering results that have a different meaning To solve thisissue they adopt a two-level clustering method where boththe whole time series and the subsequence of the time seriesare considered in the first and second levels respectively Laiet al employed Symbolic Aggregate ApproXimation (SAX)[29] transformation as a dimension reduction method andthe Cluster Affinity Search Technique (CAST) [30] as afirst-level clustering algorithm to group first-level data Tomeasure distances between time series data in the secondlevel Dynamic Time Warping (DTW) [31] was used on datawith varying lengths and Euclidean distance (ED) was usedon data of equal length However CAST algorithm is usedtwice in this approach once to generate initial clusters andthe other to split each cluster into subclusters which is rathercomplex
The authors in [32] also propose a new multilevelapproach for shape-based time series clustering First timeseries data are selected from a generated one-nearest-neigh-bor network To generate the time series network the authorspropose a triangle distance measurement to calculate thesimilarity between time series data Hierarchical clusteringis then performed on the selected time series data Sec-ond the data size is reduced by approximately 10 usingthis approach This algorithm requires a nearest-neighbornetwork in the first level The complexity in generating anearest-neighbor network is 119874(1198992) which is rather high Asa result the authors attempt to reduce the search area bydata preclustering (using k-Means) and limit the search toeach cluster only to reduce the creation network Howevergenerating the network itself remains costly rendering itinapplicable in large datasets Additionally the solution to thechallenge of generating the prototypes via k-Means when thetriangle is used as a distance measure is unclear
In this study the low quality problem in existing worksis addressed by the proposal of a new Two-step Time
series Clustering (TTC) algorithm which has a reasonablecomplexity In the first step of the model all the timeseries data are segmented into subclusters Each subclusteris represented by a prototype generated based on the timeseries affinity factor In the second step the prototypes arecombined to construct the ultimate clusters
To evaluate the accuracy of the proposed model TTC istested extensively using published time series datasets fromdiverse domains This model is shown to be more accuratethan any of the existing works and overcomes the limitationsof conventional clustering algorithms in determining theclusters of time series data that are similar in shape WithTTC the clustering of time series data based on similarityin shape does not require calculation of the exact distancesamong all the time series data in a dataset instead accurateclusters can be obtained using prototypes of similar timeseries data
The rest of this paper is organized as follows In Section 2some concepts and definitions are explained In Section 3 theproposed model is described In Section 4 the algorithm isapplied on diverse time series datasets and the experimentalresults are analyzed In Section 5 conclusions are drawn andfuture perspectives are discussed
2 Concepts and Definitions
The key terms used in this study are presented in this sectionThe objects in the dataset related to the problem at hand aretime series data of similar lengths
Definition 1 (time series) A time series 119865119894= 1198911 119891
119905
119891119899 is an ordered set of numbers that indicate the temporal
characteristics of objects at any time t of the total track life 119879[33]
Definition 2 (time series clustering) Given a dataset of 119873objects 119863 = 119865
1 1198652 119865
119873 where 119865
119894is a time series
The unsupervised partitioning process of D into 119862 = 1198621
1198622 119862
119896 occurs such that homogenous time series data are
grouped together based on similarity in shape a groupingthat is called time series clustering 119862
119894is then called a cluster
where119863 = ⋃119896119894=1119862119894and 119862
119894cap 119862119895= 0 for 119894 = 119895
Definition 3 (similarity in time) The similarity between twotime series data is based on the similarity in each time step
Definition 4 (similarity in shape) The similarity betweentwo time series is based on the similarities between theirsubsequences or their common trends regardless of timeoccurrence
Definition 5 (subcluster) A subcluster SC119894is a set of indi-
vidual time series data that are similar in time and arerepresented as a single prototype Time series data areattached to a new subcluster based on their affinity to thesubcluster Thus 119881 = SC
1 SC2 SC
119894 SC
119872 is the set
of all subclusters where 119896 lt 119872 ltlt 119873
The Scientific World Journal 3
0 50 100
0
2
4
minus2
minus4
0 50 100
0
2
4
minus2
minus4
(a)
0 50 100
0
2
4
minus2
minus4
0 50 100
0
2
4
minus2
minus4
(b)
Figure 1 Similarity in shape (b) and similarity in time (a) between two time series data
Definition 6 (affinity) The affinity of a time series 119865119909with a
subcluster SC119894is defined as follows
119886119894(119865119909) =
sum119910isinSC119894 1198601199091199101003816100381610038161003816SC119894
1003816100381610038161003816
(1)
where 119860119909119910
is the similarity between time series 119865119909and 119865
119910
and |SC119894| is the number of time series data that exist in the
subcluster SC119894 This value is used to distinguish the time
series data that have a low affinity by placing them into a newsubcluster
Definition 7 (prototype) The prototype is a time series 119877119894=
1199031 119903
119909 119903
119899 which represents the most typical time
point of a finite set of time series data in subcluster SC119894 The
prototype of each subcluster is constructed with regard to theaffinity of each time series with the subcluster
Time series clustering relies highly on a distancemeasureSeveral distancemeasures have been proposed by researchersin the literature [34ndash42] However ED andDTWare revealedto be the most common methods used in time series clus-tering because of the efficiency of ED and the effectivenessof DTW in similarity measurement Simple and fast ED isused as benchmark in numerous studies (approximately 80)[34 43ndash45] because it is parameter-free However it is notthe best choice as a distance function because it is extremelydependent on the domain of the problem at hand and thedatasetrsquos time series characteristics In fact ED is very weakand sensitive to slight shifts across the time axis [46ndash49]which limits it in terms of determining time series data thatare similar in time
In contrast to ED which proposes one-to-one matchingbetween time points DTW is suggested as a one-to-manymeasurement DTW is a generalization of ED which solvesthe local shift problem in the time series data to be compared(see Figure 1) The local shift problem is a time scale issuethat characterizes most time series data Handling local shifts
allows similar shapes to be matched even if they are out ofphase in the time axis that is they are similar in shape
Using this definition time series clusters with similarpatterns of change are constructed regardless of time pointsfor example to cluster share prices related to differentcompanies that have a common stock pattern independentof time series occurrence [22 50] DTW is thus superior toED [31 39 41 51 52] as the latter can only determine timeseries that are similar in time
DTW ldquowarpsrdquo the time axis to achieve the best alignmentbetween data points within the series Dynamic program-ming is generally used to effectively determine the warpingpath However warping causes a scalability problem thatrequires quadratic computation which is a huge challengefor DTW [53] However we do not need to calculate allof the distances when the proposed algorithm previouslymentioned is used therefore DTW can be adopted withoutaffecting clustering efficiency
3 The Proposed Algorithm
The detailed description of the proposed algorithm is pre-sented in this section Figure 2 shows the block diagramfor the proposed TTC algorithm First the size of the timeseries dataset is reduced (ie data reduction) using theconcept of affinity A prototype is then generated for eachsubcluster Consequently subclusters are merged using k-Medoids clustering
According to the steps above the activities of the TTC areexplained in the following sections
31 Step 1 Data Reduction The main objective of this TTCstep is to reduce the size of the dataset by defining a prototypefor each group of very similar time series data whichsignificantly decreases the complexity of TTCThe time seriesdata are first standardized using z-score (z-normalization)[54] which causes the time series data to be invariant to scale
4 The Scientific World Journal
Time series dataset Calculation of similarity in time
Subclustering
Calculation of similarity in shape
Preprocessing Averaging
k-Medoids clusteringLabeling
Step 1 (datareduction)
Step 2 (clustering)
Figure 2 Block diagram for the proposed TTC algorithm
and offset Supposing that 119865119894= 1198911 119891119905 119891119899 is a time series
with 119879 data points z-normalization is defined as
119911-Normalization (119865119894 120583119894 sd) =
119891119905minus 120583119894
sd (2)
where
120583119894=sum119899
119905=1119891119905
119899
sd = radicsum119899
119905=1119891119905(119891119905minus 120583119894)2
119899
(3)
where 120583119894is an arithmetic mean of data points 119891
1through 119891
119899
and sd is the standard deviation of all the data points in thegiven time series
Subsequently all the data are clustered as a whole basedon similarity in time In this step the affinity search techniqueconcept inCAST [30] is borrowed to generate the subclustersCAST was essentially introduced into the bioinformaticsdomain for gene expression clustering it is used in thisstep because the number of clusters does not need to bepredetermined in CAST In contrast to numerous algorithmsthat require the number of clusters to be predefined inadvance the mechanism used by the CAST algorithm candetermine clusters dynamically and deal effectively withoutliers CAST works based on the pairwise similarity matrixof objects The similarities between time series data arecalculated and stored in anN-by-N similaritymatrix (119860
119873times119873)
where 119860119894119895is the similarity between time series 119865
119894and time
series 119865119895 ED is used as the dissimilarity measure to calculate
the similarity (similarity in time) between time series dataFigure 3 illustrates the reasoning behind the use of ED to con-struct subclusters in the first step 1198601015840
119873times119873is assumed to be the
pairwise distance matrix where 1198601015840119894119895is the Euclidian distance
between 119865119894and 119865119895 This distance is mathematically defined as
1198601015840
119894119895= dis
ED(119865119894 119865119895) = radic
119899
sum
119894=1
(119891119894minus 119891119895)2
(4)
where the square root step can be removed because the squareroot function is monotonic and reverts to the same rankingsin clustering [2] The time complexity of this calculation canalso be reduced from linear to constant by caching some
Data reduction
Clustering
Similarity in time
Similarity in shape
Figure 3 Reasoning behind the use of DTW in calculating similar-ity in shape between the prototypes of subclusters in the second stepof TTC
of the calculated results [55] Given 119860119873times119873
the algorithm isperformed by adding and removing time series data from asubcluster based on a threshold affinity value between 0 and1 as defined by the user
A new subcluster (Definition 5) is constructed by the timeseries datum that has the highest similarity to other timeseries data Subsequently each time series datum is addedto a new subcluster based on its affinity with the subcluster(Definition 6) that is each subcluster is constructed witha time series datum and is gradually completed by theaddition of new time series data to the subcluster basedon the average similarity (affinity) between the unassignedtime series data and the current subcluster members Aspreviously mentioned subclusters are formed sequentiallywith an affinity threshold By defining the specific thresholdvalue the cluster accepts the high affinity time series datumThe affinity threshold 120572 is specified to determine whatis considered significantly similar This parameter controlsthe number and sizes of the produced subclusters After asubcluster is formed CAST deletes the low affinity objectsfrom the subcluster The process of adding to and removingfrom a subcluster is performed consecutively until no furtherchanges occur in the subcluster
After each subcluster is constructed a prototype is de-fined for each subcluster The construction of an effectivetime series prototype is a vexing problem [56 57] In thecurrent study we propose a novel approach to represent time
The Scientific World Journal 5
series data in a cluster The prototype of each subcluster iscalculated based on the affinity of each time series datumwith the subcluster An affinity set is maintained during thesubclustering process for all the time series data denoted as119886119894(Definition 6)The affinity of a time series datum evidently
implies its weight in the construction of the prototype Giventhe subcluster SC
119894 its prototype is defined by a time series
119877119894= 1199031 119903
119909 119903
119899 119903119909is then calculated as
119903119909=
sum119910isinSC119894 119886119894 (119865119910) lowast 119891119910119909
1003816100381610038161003816SC1198941003816100381610038161003816
(5)
where 119865119910= 1198911199101 119891
119910119909 119891
119910119899 is a time series datum in
CS119894and |SC
119894| indicates the number of time series data in the
subcluster
32 Step 2 Clustering In the first step the time series dataare grouped based on the similarity in time However twotime series data that are not similar in time may be similar inshape Similarity in shape is desirable in time series clusteringbecause the constructed clusters are very close to the groundtruth and are more meaningful However the methods thathave this feature such as DTW are often costly [53] in thesimilarity evaluation of time series data As a result severalresearchers such as [47 58ndash61] try to accelerate the processtypically by proposing efficient lower bound approximationsof DTW distance to reduce its complexity However most ofthese works are under the classification problem (the searcharea is pruned using a lower bound distance of DTW) andare not suitable for several clustering algorithms where thedissimilarity matrix must be fully calculated For examplein clustering algorithms such as k-Medoids or UnweightedPair-GroupMethod with Arithmetic Mean [62] all distancesmust be calculated and no pruning can be performed Insuch cases the clustering process benefits from a fast andaccurate similarity measure [63] However we do not haveto calculate similarity in shape between all time series datain the TTC because the very close time series data (similarin time) are similar in shape as well That is the dissimilaritymatrix does not need to be fully calculated using an expensivesimilaritymeasure such as DTWAs a result only a small partof the matrix is calculated by DTW using the prototypes ofthe subclusters which are small in size in the first step ofTTC (instead of all the data as a whole) Figure 3 depicts thereasoning behind the use of ED and DTW in the first andsecond steps of TTC respectively As this figure shows theintersimilarity between the time series data in the subclustersis computed based on similarity in time and intrasimilarityis calculated based on similarity in shape
Therefore the similarity between subclusters is calculatedand stored in an M-by-M similarity matrix 119861
119872times119872 where
119861119894119895is the similarity between the prototypes of subclusters
SC119894and SC
119895 First DTW distance among the prototypes
of the subclusters is calculated to construct the pairwisedissimilarity matrix 119861
119872times119872 where 119861
119894119895is the DTW distance
of two subclustersrsquo prototypes namely prototype 119877119894and
prototype 119877119895 as denoted by disDTW Suppose that 119877
119909=
1199031199091 119903
119909119894 119903
119909119899 is the prototype of SC
119909 where n is the
length of the prototype and 119903119909is calculated by (5) To compute
the distance between the prototypes of SC119909and SC
119910 an 119899 times 119899
matrix is constructed for the distance of all pairs as Z(119877119909
119877119910) where 119885
119894119895= disED(119903119909119894 119903119910119895) and disED( ) is the Euclidean
distance Given 119882 = 1199081 1199082 119908
119906 as a set of warping
paths where 119908119906= (1199031199091 1199031199101) (119903119909119894 119903119910119895) (119903
119909119899 119903119910119899) is a set
of points that define a traversal of matrix Z and the DTWbetween the two prototypes 119877
119909and 119877
119910is a warping path that
minimizes the distance between 119877119909and 119877
119910
disDTW (119877119909 119877119910) = min(119880
sum
119906=1
119882119906
119880) (6)
where (1199031199091 1199031199101) = (1 1) and (119903
119909119899 119903119910119899) = (n n) and 0 le 119903
119909119894+1minus
119903119909119894le 1 and 0 le 119903
119910119895minus 119903119910119895+1
le 1 for all 119894 lt 119899Given the pairwise dissimilaritymatrix different schemes
can be used for clustering k-Medoids which has been shownto be effective in the time series clustering domain [29ndash33] isselected The TTC algorithm is presented in Pseudocode 1
4 Analysis
41 Evaluation Metrics and Experimental Setup The experi-ment on the proposed model is conducted with one syntacticdataset and 12 real-word datasets obtained from the UCRTime Series Data Mining Archive in various domains andsizes [64] This set is selected because it is composed ofvarious numbers of clusters with different cluster shapes anddensity contains noise points and is used as a benchmark inseveral articles in previous literature
The well-known three-class Cylinder-Bell-Funnel (CBF)dataset is used as a syntactic dataset in the experiment on2PTC with large datasets The CBF dataset is an artificialdataset that has temporal domain properties and was origi-nally proposed by Saito in 2000This dataset has been used innumerous works [32 65 66] It includes three types of timeseries data Cylinder (c) Bell (b) and Funnel (f) DifferentCBF datasets are generated and used in this study Examplesof CBF time series datasets are shown in Figure 4
In general evaluating extracted clusters (patterns) is noteasy in the absence of data labels [66] However all theselected datasets in this study have class labels (ground truth)and can be applied in evaluating TTC using external indicesThe most commonly used external indices in the time seriesclustering domain are used in evaluating the accuracy ofTTC namely Rand Index andEntropy (The interested readermay refer to [67 68] for definitions)
Rand Index is a popular quality measure [69ndash71] forevaluating time series clusters it measures the agreementbetween two partitions that is how close clustering resultsare to the ground truthThe agreement between cluster119862 andground truth 119866 can be estimated using
RI (119862 119866) = radic |TP| + |TN||TP| + |TN| + |FP| + |FN|
(7)
where |TP| (True Positive) is the number of pairs belongingto one class in 119866 (ground truth) and are clustered together in119862 |TN| (True Negative) is the number of pairs that neither
6 The Scientific World Journal
Method (119863 120572 119870)Input 119863 the set of time-series119863 = 119865
1 1198652 119865
119899
120572 Affinity threshold119870 cluster number
Output 119862 set of clusterslowast119878119905119890119901 1 time-series data reductionlowast(1) 119863 = 119911-norm(119863) lowast119911-normalization of all time-series lowast(2) 119860[119873][119873] larrSmilarityED (119863) lowast Calculate disimilarity array based on (5)lowast(3) (SC [1 to119872] 119886 [1 to119873]) larrCAST(119860120572) lowast 119872 is determined automatically by CASTlowast(4) for 119894 = 1 to119872119872 is the number of sub-clusters(5) 119903 larrAverage (SC
119894 119886 [1 to119873]) lowast summarize the cluster lowast
(6) 119877 larr 119877 cup 119903 lowast119877 a collection of prototypes lowast(7) end forlowast119878119905119890119901 2 clusteringlowast(8) 119861 [119872][119872] larrSmilarityDTW(119877)(9) 1198621015840 larr 119896-medoids(119896 119861)(10)119862 larr labels(1198621015840)validate the MTC clustering results(11) return 119862
Pseudocode 1 Pseudocode related to TTC
0 50 100 150
0
2
4 Clusters (10) Clusters (12) Clusters (8)
minus2
0 50 100 150
0
2
4
minus20 50 100 150
0
2
4
minus2
minus4
Cylinder class Bell class Funnel class
Figure 4 Three samples of each Cylinder Bell and Funnel (CBF) class dataset
belong to the same class in 119866 nor are clustered together in119862 The types of error clustering are the |FN| (False Negative)which is the number of pairs that belong to one class in 119866but are not clustered together in 119862 and |FP| (False Positive)which is the number of pairs that do not belong to one class in119866 (dissimilar time series) but are clustered together in 119862 TheRandom Index evaluation criteria have values ranging from0 to 1 where 1 corresponds to the case wherein ground truthand clustering result are identical and 0 corresponds to thecase wherein they are completely different
The Entropy [72 73] of a cluster shows the dispersionof classes within a cluster (this dispersion should be low) inseveral domains Entropy has been adopted in the evaluationof time series clustering in literature [74 75] as well Itis a function of the distribution of classes in the resultingclusters For each cluster 119862
119895 the class distribution of data is
computed as the probability Pr(119866119894| 119862119895) wherein an instance
in 119862119895belongs to class 119866
119894 Using this class distribution the
normalized entropy of 119862119895is computed as
Entropy (119862119895) = minus
1
log ℎ
ℎ
sum
119894=1
Pr ((119866119894| 119866119895) times log (119866
119894| 119866119895))
(8)
where Pr(119866119894| 119862119895) = |119862
119895cap 119866119894||119862119895| ConEntropy is the
converse of Entropy based on the definition of Entropywherein ConEntropy is 1 when the ground truth and theclustering result are identical Overall ConEntropy (119864 isin
[0 1]) is defined as the sum of the individual cluster entropiesweighted by the size of each cluster
ConEntropy (119862 119866) = 1 minus 1
|119863|
119870
sum
119895=1
10038161003816100381610038161003816119862119895
10038161003816100381610038161003816times Entropy (119862
119895)
(9)
The Scientific World Journal 7
Table 1 Quality of TTC approach against the standard 119896-Medoids with regard to raw time series data and the time series data representedby PAA
Dataset Number of classes DS size Length 119896-Medoids (ED) 119896-Medoids (PAA-ED) TTCRI ConEnrtropy RI ConEnrtropy RI ConEnrtropy
50words 50 455 270 095 073 095 073 096 079Adiac 37 391 176 094 058 094 058 096 064CBF 3 900 128 067 029 07 041 088 078Coffee 2 28 286 08 06 078 054 086 068ECG200 2 100 96 061 018 061 018 055 014FaceFour 4 88 350 077 051 077 051 091 078FISH 7 175 463 077 032 08 032 083 048SwedishLeaf 15 625 128 09 054 09 054 09 058synthetic control 6 300 60 082 056 087 079 092 095Trace 4 100 275 075 051 078 059 085 078Two Patterns 4 4000 128 063 003 069 032 086 088Wafer 2 6164 152 043 001 043 001 05 021
Based on the measures above a good clustering solution isexpected to have high ConEntropy To avoid a biased evalu-ation the conclusions are drawn based on the average valueof the indices Although the focus of this study is improvingthe accuracy of TTC the scalability of the proposed model isalso calculated to prove its theoretical feasibility
42 Accuracy Evaluation In this section the results arecompared with those of partitional clustering First thedistance between the time series data is calculated using EDto compare TTC with conventional k-Medoids The readermay wonder why DTW is not used to compare the resultsIn simple terms the use of DTW does not result in afair comparison because DTW is not practically feasible inthe real world as a result of its very high complexity Thecomplexity of DTW in between each pair of time series datain k-Medoids is 119874(119868119896(119873 minus 119896)2 and 119874(1198992) where 119873 is thenumber of time series data 119896 is the number of clusters I is thenumber of iterations required for convergence and 119899 is thelength of time series data Therefore the total computationof k-Medoids is 119874(119868119896(119873 minus 119896)2 sdot 1198992) That is 119873(119873 minus 1)2
distance calculation is required to calculate the confusionmatrix alone (needed in clustering) where N is the numberof time series As a result the complexity of the distancematrix alone (not the entire clustering process) equals119873(119873minus1)11989922 which is very high For example given N = 1000 and
n = 152 in a dataset the number of instruction executionsis 11540448000 However using TTC on the same processrequires approximately 177084440 executions because theprocess operates on a fraction of the entire dataset with thereduction factor = 01 (see (11))
As a fair comparison in the subsequent experiment theraw time series data are represented by a representationmethod because time series data are represented by a rep-resentation method prior to clustering in the majority ofprevious literature Numerous studies focusing on the rep-resentation or dimensionality reduction of time series datahave been conducted [7 55 59] Among these representa-tion methods each of which has its strong points and
weaknesses Piecewise Aggregate Approximation (PAA) [5275] is adopted in this study because of its strength in therepresentation of time series data and its low complexity[76] The raw time series data are represented using differentcompression ratios (compressionratio = [4 6 8]) because theaccuracy of PAA itself depends on the number of segmenta-tions As a result themean of three accuracies for each datasetis calculated as the average accuracy of k-Medoids Table 1shows the quality of the TTC approach against quality of thek-Medoids with regard to raw time series data and the timeseries data represented by PAA
As expected the comparison ofTTCwith k-Medoids (ED)and k-Medoids (PAA-ED) shows that TTC is more accuratein most of the datasets TTC outperforms k-Medoids (ED)because ED cannot handle the local shifts in time series datawhich decreases the accuracy of the final clusters
Furthermore TTC is more accurate than the conven-tional k-Medoids on represented time series that is k-Medoids (PAA-ED) Although several outliers and noisesin raw time series data are handled in the time seriesrepresented by PAA the proposed algorithm namely TTCremains superior to k-Medoids (PAA-ED) because of itsshift-handling mechanism The result shows that improvedclustering quality is obtainable without reducing the timeseries dimension by using the prototypes of very similar timeseries data This result is the proof of the researcherrsquos claimthat the TTCmodel can outperform conventional algorithmsusing either raw time series data or dimensionality reductionapproaches
43 Comparing TTC with Hybrid Models As mentioned inrelated works one of the novel works close to the proposedmodel in this study is the two-level approach proposed byLai et al [28] called the 2LTSC In Lai et alrsquos work SAXtransformation is used as a dimension reduction methodand CAST is used as the clustering algorithm in the firstlevel In the second level DTW is used to calculate distancesbetween time series data with varying lengths and ED isused to calculate distances between data of equal length The
8 The Scientific World Journal
002040608
112
Aver
age a
ccur
acy
2LTSCTTC
50
word
s
Adia
c
CBF
Coff
ee
ECG200
Face
Four
FISH
Swed
ishLe
af
Synt
hetic
cont
rol
Trac
e
Two
patte
rns
Wat
er
Figure 5 Comparison of 2LTSC and TTC against ground truthusing the test datasets
2LTSC works with the CAST algorithm wherein the numberof clusters is indirectly determined by a threshold Hence thesame number of clusters (generated by 2LTSC) is also used inTTCafter the 2LTSC is run Figure 5 shows the best clusteringresult of both approaches
As mentioned a high-resolution time series is used in theTTC model which is superior to the dimensionality reducedtime series used in 2LTSC As a result the quality of TTCis increased after clustering occurs in the second level Thesubclusters are merged in the second step of TTC whichcauses the generated cluster structure to be more similar tothe ground truth
Another study that performed clustering in more thanone step is Zhang et al [32] which was discussed in theliterature review As previously mentioned Zhang et alproposed a new multilevel approach for shape-based timeseries clustering wherein several candidate time series dataare selected and clustered To compare this approach (calledthe graph-based approach) with the TTC model the qualityof TTC clustering in terms of different orders of the nearest-neighbor network is calculated and shown in Figure 6 Toprovide fair conditions the order of two to three is consideredin the graph-based approach which provides a reasonablereduction in the second layer
As the result shows TTC is superior to the graph-based algorithm in some datasetsThe graph-based approachnotably requires the generation of a nearest-neighbor graphwhich is costly However the graph-based approach canbe advantageous in datasets where similarity in time isessentially very important such as the Coffee dataset (asshown in Figure 6) To summarize the proposed modelnamely TTC can outperform rival approaches even withlower time complexity
44 Data Reduction To verify the effect of data reductionon final clustering some experiments are conducted In thisexperiment we calculate the error rate in the data reductionstep based on the CAST parameter that is the affinitythresholdDifferent sizes of the syntactic datasetCBF are usedin this experiment
0
02
04
06
08
1
12
TTC Hier
Aver
age a
ccur
acy
50
wor
ds
Adia
c
CBF
Coff
ee
ECG200
Face
Four
FISH
Swed
ishLe
af
Synt
hetic
cont
rol
Trac
e
Two
patte
rns
Wat
er
Graph based 1NN O2
Graph based 1NN O3
Figure 6 Quality of clustering using the graph-based approach ascompared with TTC
First a parameter is defined as reduction factor 119877factor
119877factor =119872
119873 (10)
where 119873 is the size of the dataset and 119872 is the number ofsubclusters generated by CAST (referred to as the number ofprototypes)
The error rate 119864rate of the subclusters is calculatedbased on the number of items in the same subclusterthat belongs to the same class (ground truth) [77] Given119866 = 119866
1 1198662 119866
119872 as ground truth clusters and 119881 =
SC1 SC2 SC
119894 SC
119872 as the subclusters generated by
CAST the subcluster SC119894is assigned to the class most
frequently found in the cluster to compute the error rate ofcluster SC
119894with respect to119866The error rate of this assignment
is then measured by counting the number of misclassifiedtime series data and dividing the result by the number of timeseries data in the subclusterM is assumed to be the numberof subclusters determined by CAST and the size of cluster 119862
119894
is shown by |SC119894| max(|SC
119894cap 119866119895|) is assumed to denote the
number of items in subcluster SC119894that are not in119866
119895The error
rate of cluster SC119894is then given by
119864rate (SC119894) =1
1003816100381610038161003816SC1198941003816100381610038161003816
max (10038161003816100381610038161003816SC119894 cap 11986611989510038161003816100381610038161003816) (11)
Given 119873 as the size of the dataset the overall error rate ofthe reduction step can be expressed as a weighted sum ofindividual cluster error rates
119864rate =119872
sum
119894=1
1003816100381610038161003816SC1198941003816100381610038161003816
119873119864119903(SC119894) (12)
As previously mentioned the affinity threshold in the TTCalgorithm determines the size and shape of sub clusters Ifthe value of the threshold is high sub clusters are denser andthe number of prototypes increases As a result the reduction
The Scientific World Journal 9
0005
01015
02025
03035
040
3
035 0
4
045 0
5
055 0
6
065 0
7
075 0
8
085 0
9
095
Error rateReducted factor
120572 affinity threshold
Figure 7 Reduction factor and error rate of the TTC approachacross affinity threshold values for the CBF dataset
0
02
04
06
08
1
60 100 300 600 900 1200 4000 5000 6000 8000
Aver
age a
ccur
acy
Dataset cardinality
TTCk-Medoids (ED)
Figure 8 Accuracy of TTC across different CBF dataset sizes
factor increases Figure 7 shows the reduction factor anderror rate of TTC across different affinity threshold valuesThe result shows that a good trade-off between reductionfactor and error rate is obtained in thresholds above 07for both datasets As the threshold value increases a lowererror rate is encountered The number of subclusters alsoincreases (and reduction factor is higher) The followingexperiment verifies that TTC can reduce the data size byapproximately 77 (119877factor = 023) The effectiveness of TTCis not significantly reduced that is the error rate is less than005
45 Evaluation of TTC on Large Datasets To confirm theeffectiveness of TTC further some experiments are con-ducted on large synthetic datasets For this purpose up to8000 CBF time series are generated To evaluate the resultsof the proposedmodel on large datasets the average accuracyof TTC with regard to different CBF data sizes is shown inFigure 8 The experiment on TTC was also conducted withrespect to different numbers of subclusters This experimentshows the accuracy of TTC on large datasets The averageaccuracy of TTC with respect to different numbers of sub-clusters is shown in Figures 8 and 9
As the result shows the quality of TTC is superior tothat of other algorithms The quality of TTC reaches 90(Figure 9) in most of the cardinalities of the dataset when 30
002040608
112
3 9 15 21 27 33 39 45 51 57 63 69 75 81 87 93 99 105
111
117
Number of subclusters (prototypes)
CBF300CBF600CBF900
CBF1200CBF4000
Aver
age a
ccur
acy
Figure 9 Accuracy of TTC across different numbers of subclusters
subclusters are usedThemaximum accuracy of conventionalapproaches is approximately 50 (Figure 8)The trend showsan increase in quality as the size of the dataset increases(Figure 8) Therefore the use of DTW is not necessary inthe clustering of all the data in very large datasets it can beapplied to smaller sets of a time series subset represented byprototyping instead
5 Conclusion and Future Works
We illustrated the advantages of using some time seriesdata as prototypes to cluster time series data based onthe similarity in shape We proposed a two-step clusteringapproach and showed its usage The results obtained byapplying TTC to different datasets were evaluated extensivelyClustering can be applied to a large time series dataset togenerate accurate clusters In the experiments with variousdatasets different evaluationmethods were used to show thatTTC outperforms other conventional and hybrid clusteringCurrently we are working on a multistep approach whichis very scalable in the clustering of very large time seriesdatasetsThis approachwill be performed as an anytime split-and-merge algorithm to present early results to the user andthus improve the clusters
Conflict of Interests
The authors declare that there is no conflict of interestsregarding the publication of this paper
Acknowledgments
This research is supported by High Impact Research GrantUniversity of Malaya no vote UMC628HIRMOHESC132 from the Ministry of Higher Education Malaysia
References
[1] A K Jain M N Murty and P J Flynn ldquoData clustering areviewrdquo ACM Computing Surveys vol 31 no 3 pp 316ndash3231999
10 The Scientific World Journal
[2] E Keogh and S Kasetty ldquoOn the need for time series datamining benchmarks a survey and empirical demonstrationrdquoDataMining and Knowledge Discovery vol 7 no 4 pp 349ndash3712003
[3] J Lin M Vlachos E Keogh and D Gunopulos ldquoIterativeincremental clustering of time seriesrdquo in Advances in DatabaseTechnologymdashEDBT 2004 pp 106ndash122 2004
[4] S Rani and G Sikka ldquoRecent techniques of clustering of timeseries data a surveyrdquo International Journal of Computationaland Applied vol 52 no 15 pp 1ndash9 2012
[5] C Ratanamahatana ldquoMultimedia retrieval using time seriesrepresentation and relevance feedbackrdquo in Proceedings of the 8thInternational Conference on AsianDigital Libraries (ICADL rsquo05)pp 400ndash405 2005
[6] M Vlachos J Lin and E Keogh ldquoA wavelet-based anytimealgorithm for k-means clustering of time seriesrdquo in Proceedingsof the Workshop on Clustering High Dimensionality Data and ItsApplications pp 23ndash30 2003
[7] E Keogh and M Pazzani ldquoAn enhanced representation of timeseries which allows fast and accurate classification clusteringand relevance feedbackrdquo in Proceedings of the 4th InternationalConference of Knowledge Discovery and Data Mining pp 239ndash241 1998
[8] T Oates M D Schmill and P R Cohen ldquoA method forclustering the experiences of a mobile robot that accords withhuman judgmentsrdquo in Proceedings of the National Conference onArtificial Intelligence pp 846ndash851 2000
[9] S Hirano and S Tsumoto ldquoEmpirical comparison of clusteringmethods for long time-series databasesrdquo in Active Mining vol3430 pp 268ndash286 2005
[10] X Wang K Smith and R Hyndman ldquoCharacteristic-basedclustering for time series datardquo Data Mining and KnowledgeDiscovery vol 13 no 3 pp 335ndash364 2006
[11] J MacQueen ldquoSome methods for classification and analysis ofmultivariate observationsrdquo in Proceedings of the 5th BerkeleySymposium Mathematical Statistics and Probability vol 1 pp281ndash297 1967
[12] L Kaufman P J Rousseeuw and E Corporation FindingGroups in Data An Introduction to Cluster Analysis vol 39Wiley Online Library 1990
[13] P S Bradley U Fayyad and C Reina ldquoScaling clustering algo-rithms to large databasesrdquo in Proceedings of the 4th InternationalConference on Knowledge Discovery amp Data Mining (KDD rsquo98)pp 9ndash15 1998
[14] C Guo H Jia and N Zhang ldquoTime series clustering based onICA for stock data analysisrdquo in Proceedings of the 4th Interna-tional Conference onWireless Communications Networking andMobile Computing (WiCOM rsquo08) pp 1ndash4 2008
[15] V Hautamaki P Nykanen and P Franti ldquoTime-series clus-tering by approximate prototypesrdquo in Proceedings of the 19thInternational Conference on Pattern Recognition (ICPR rsquo08) pp1ndash4 2008
[16] C A Ratanamahatana and V Niennattrakul ldquoClusteringmulti-media data using time seriesrdquo in Proceedings of the InternationalConference on Hybrid Information Technology (ICHIT rsquo06) pp372ndash379 2006
[17] D Tran and M Wagner ldquoFuzzy c-means clustering-basedspeaker verificationrdquo in Advances in Soft ComputingmdashAFSS2002 vol 2275 pp 318ndash324 2002
[18] J Alon S Sclaroff G Kollios and V Pavlovic ldquoDiscoveringclusters in motion time-series datardquo in Proceedings of the IEEE
Computer Society Conference on Computer Vision and PatternRecognition pp 375ndash381 2003
[19] S Aghabozorgi T YWah A Amini andM R Saybani ldquoA newapproach to present prototypes in clustering of time seriesrdquo inProceedings of the 7th International Conference of Data Miningvol 28 pp 214ndash220 2011
[20] M Ji F Xie and Y Ping ldquoA dynamic fuzzy cluster algorithm fortime seriesrdquo Abstract and Applied Analysis vol 2013 Article ID183410 7 pages 2013
[21] JW Shavlik andTGDietterichReadings inMachine LearningMorgan Kaufmann 1990
[22] A Bagnall and G Janacek ldquoClustering time series with clippeddatardquoMachine Learning vol 58 no 2-3 pp 151ndash178 2005
[23] C Biernacki G Celeux and G Govaert ldquoAssessing a mixturemodel for clustering with the integrated completed likelihoodrdquoIEEE Transactions on Pattern Analysis andMachine Intelligencevol 22 no 7 pp 719ndash725 2000
[24] M Ramoni P Sebastiani and P Cohen ldquoMultivariate clusteringby dynamicsrdquo in Proceedings of the National Conference onArtificial Intelligence pp 633ndash638 2000
[25] M Bicego V Murino and M Figueiredo ldquoSimilarity-basedclustering of sequences using hidden Markov modelsrdquo inMachine Learning and Data Mining in Pattern Recognition vol2734 pp 86ndash95 2003
[26] J Hu B Ray and L Han ldquoAn interweaved HMMDTWapproach to robust time series clusteringrdquo in Proceedings of the18th International Conference on Pattern Recognition (ICPR rsquo06)pp 145ndash148 2006
[27] B Andreopoulos A An X Wang and M Schroeder ldquoA road-map of clustering algorithms finding a match for a biomedicalapplicationrdquo Briefings in Bioinformatics vol 10 no 3 pp 297ndash314 2009
[28] C-P P Lai P-C C Chung and V S Tseng ldquoA novel two-levelclustering method for time series data analysisrdquo Expert Systemswith Applications vol 37 no 9 pp 6319ndash6326 2010
[29] E Keogh S Lonardi and C A Ratanamahatana ldquoTowardsparameter-free data miningrdquo in Proceedings of the 10th ACMSIGKDD International Conference on Knowledge Discovery andData Mining (KDD rsquo04) vol 22 pp 206ndash215 2004
[30] A Ben-Dor R Shamir and Z Yakhini ldquoClustering gene expres-sion patternsrdquo Journal of Computational Biology vol 6 no 3-4pp 281ndash297 1999
[31] S Chu E Keogh D Hart M Pazzani and Michael ldquoIterativedeepening dynamic time warping for time seriesrdquo in Proceed-ings of the 2nd SIAM International Conference on Data Miningpp 195ndash212 2002
[32] X Zhang J Liu Y Du and T Lv ldquoA novel clusteringmethod ontime series datardquo Expert Systems with Applications vol 38 no9 pp 11891ndash11900 2011
[33] B Morris and M Trivedi ldquoLearning trajectory patterns byclustering experimental studies and comparative evaluationrdquoin Proceedings of the IEEE Conference on Computer Vision andPattern Recognition (CVPR rsquo09) pp 312ndash319 2009
[34] C Faloutsos M Ranganathan and Y Manolopoulos ldquoFastsubsequence matching in time-series databasesrdquo in Proceedingsof the ACM SIGMOD International Conference on Managementof Data (SIGMOD rsquo94) vol 23 pp 419ndash429 1994
[35] H Sakoe and S Chiba ldquoA dynamic programming approachto continuous speech recognitionrdquo in Proceedings of the 7thInternational Congress on Acoustics vol 3 pp 65ndash69 1971
The Scientific World Journal 11
[36] H Sakoe and S Chiba ldquoDynamic programming algorithmoptimization for spoken word recognitionrdquo IEEE Transactionson Acoustics Speech and Signal Processing vol 26 no 1 pp 43ndash49 1978
[37] L Chen and R Ng ldquoOn the marriage of lp-norms and editdistancerdquo in Proceedings of the 30th International Conference onVery Large Data Bases vol 30 pp 792ndash803 2004
[38] J Aszligfalg H P Kriegel P Kroger P Kunath A Pryakhin andM Renz ldquoSimilarity search on time series based on thresholdqueriesrdquo in Advances in Database TechnologymdashEDBT 2006 pp276ndash294 2006
[39] M Vlachos G Kollios andD Gunopulos ldquoDiscovering similarmultidimensional trajectoriesrdquo in Proceedings of the 18th Inter-national Conference on Data Engineering pp 673ndash684 2002
[40] A Banerjee and J Ghosh ldquoClickstream clustering using weight-ed longest common subsequencesrdquo in Proceedings of the WebMining Workshop at the 1st SIAM Conference on Data Miningpp 33ndash40 2001
[41] L Chen M T Ozsu and V Oria ldquoRobust and fast similaritysearch for moving object trajectoriesrdquo in Proceedings of theACM SIGMOD International Conference on Management ofData (SIGMOD rsquo05) pp 491ndash502 2005
[42] E Keogh S Lonardi C A Ratanamahatana L Wei S-H Leeand J Handley ldquoCompression-based data mining of sequentialdatardquo Data Mining and Knowledge Discovery vol 14 no 1 pp99ndash129 2007
[43] E Keogh ldquoFast similarity search in the presence of longitudinalscaling in time series databasesrdquo in Proceedings of the 9th IEEEInternational Conference on Tools with Artificial Intelligence pp578ndash584 1997
[44] F K-P Chan A W-C Fu and C Yu ldquoHaar wavelets forefficient similarity search of time-series with and withouttime warpingrdquo IEEE Transactions on Knowledge and DataEngineering vol 15 no 3 pp 686ndash705 2003
[45] E Keogh M Pazzani K Chakrabarti and S Mehrotra ldquoAsimple dimensionality reduction technique for fast similaritysearch in large time series databasesrdquo Knowledge and Informa-tion Systems vol 1805 no 1 pp 122ndash133 2000
[46] C Ratanamahatana and E Keogh ldquoThreemyths about dynamictime warping data miningrdquo in Proceedings of the InternationalConference on Data Mining (SDM rsquo05) pp 506ndash510 2005
[47] E Keogh and C A Ratanamahatana ldquoExact indexing ofdynamic time warpingrdquo Knowledge and Information Systemsvol 7 no 3 pp 358ndash386 2005
[48] A Xi E Keogh C Shelton L Wei and C A RatanamahatanaldquoFast time series classification using numerosity reductionrdquo inProceedings of the 23rd International Conference on MachineLearning (ICML rsquo06) pp 1033ndash1040 2006
[49] D Berndt and J Clifford ldquoUsing dynamic time warping to findpatterns in time seriesrdquo in Proceedings of the AAAI94Workshopon Knowledge Discovery in Databases pp 359ndash370 1994
[50] S Aghabozorgi and Y W Teh ldquoStock market co-movementassessment using a three-phase clustering methodrdquo ExpertSystems with Applications vol 41 no 4 part 1 pp 1301ndash13142014
[51] J Aach andGM Church ldquoAligning gene expression time serieswith time warping algorithmsrdquo Bioinformatics vol 17 no 6 pp495ndash508 2001
[52] B K Yi and C Faloutsos ldquoFast time sequence indexing forarbitrary Lp normsrdquo in Proceedings of the 26th InternationalConference on Very Large Data Bases pp 385ndash394 2000
[53] S Salvador and P Chan ldquoToward accurate dynamic timewarping in linear time and spacerdquo Intelligent Data Analysis vol11 no 5 pp 561ndash580 2007
[54] J Han and M Kamber Data Mining Concepts and TechniquesMorgan Kaufmann San Francisco Calif USA 2011
[55] A Mueen E Keogh and N Young ldquoLogical-shapelets anexpressive primitive for time series classificationrdquo inProceedingsof the 17th ACM SIGKDD International Conference on Knowl-edge Discovery and Data Mining (KDD rsquo11) pp 1154ndash1162 2011
[56] V Niennattrakul and C Ratanamahatana ldquoInaccuracies ofshape averaging method using dynamic time warping for timeseries datardquo inComputational SciencemdashICCS 2007 pp 513ndash5202007
[57] S Aghabozorgi M R Saybani and T Y Wah ldquoIncrementalclustering of time-series by fuzzy clusteringrdquo Journal of Infor-mation Science and Engineering vol 28 no 4 pp 671ndash688 2012
[58] S-W Kim S Park and W W Chu ldquoAn index-based approachfor similarity search supporting time warping in large sequencedatabasesrdquo inProceedings of the 17th International Conference onData Engineering pp 607ndash614 2001
[59] B-K Yi H V Jagadish and C Faloutsos ldquoEfficient retrieval ofsimilar time sequences under time warpingrdquo in Proceedings ofthe 14th International Conference on Data Engineering pp 201ndash208 1998
[60] HDingG Trajcevski P ScheuermannXWang andEKeoghldquoQuerying and mining of time series data experimental com-parison of representations and distance measuresrdquo Proceedingsof the VLDB Endowment vol 1 no 2 pp 1542ndash1552 2008
[61] X Wang A Mueen H Ding G Trajcevski P Scheuermannand E Keogh ldquoExperimental comparison of representationmethods and distance measures for time series datardquo DataMining and Knowledge Discovery vol 26 no 2 pp 275ndash3092012
[62] R R Sokal ldquoA statistical method for evaluating systematicrelationshipsrdquoUniversity of Kansas Scientific Bulletin vol 38 no1958 pp 1409ndash1438 1958
[63] I Gronau and SMoran ldquoOptimal implementations of UPGMAand other common clustering algorithmsrdquo Information Process-ing Letters vol 104 no 6 pp 205ndash210 2007
[64] E Keogh Q Zhu B Hu et al ldquoThe UCR time seriesdata mining archiverdquo UCR Time Series Classification 2011httpwwwcsucredusimeamonntime series data
[65] J Lin E Keogh L Wei and S Lonardi ldquoExperiencing SAX anovel symbolic representation of time seriesrdquo Data Mining andKnowledge Discovery vol 15 no 2 pp 107ndash144 2007
[66] H Zhang T B Ho Y Zhang and M-S Lin ldquoUnsupervisedfeature extraction for time series clustering using orthogonalwavelet transformrdquo Informatica vol 30 no 3 pp 305ndash319 2006
[67] E Amigo J Gonzalo J Artiles and F Verdejo ldquoA comparisonof extrinsic clustering evaluation metrics based on formalconstraintsrdquo Information Retrieval vol 12 no 4 pp 461ndash4862009
[68] C Ratanamahatana E Keogh A J Bagnall and S LonardildquoA novel bit level time series representation with implicationsfor similarity search and clusteringrdquo in Proceedings of the 9thPacific-Asian International Conference on Knowledge Discoveryand Data Mining (PAKDD rsquo05) pp 771ndash777 2005
[69] J Wu H Xiong and J Chen ldquoAdapting the right measures forK-means clusteringrdquo in Proceedings of the 15th ACM SIGKDDInternational Conference on Knowledge Discovery and DataMining (KDD rsquo09) pp 877ndash886 2009
12 The Scientific World Journal
[70] M Chis S Banerjee and A E Hassanien ldquoClustering timeseries data an evolutionary approachrdquo Foundations of Compu-tational IntelligenceVolume 6 vol 206 pp 193ndash207 2009
[71] F Rohlf ldquoMethods of comparing classificationsrdquoAnnual Reviewof Ecology and Systematics vol 5 pp 101ndash113 1974
[72] M Song and L Zhang ldquoComparison of cluster representationsfrompartial second-to full fourth-order crossmoments for datastream clusteringrdquo in Proceedings of the 8th IEEE InternationalConference on Data Mining (ICDM rsquo08) pp 560ndash569 2008
[73] F Gullo G Ponti A Tagarelli G Tradigo and P Veltri ldquoA timeseries approach for clustering mass spectrometry datardquo Journalof Computational Science vol 3 no 5 pp 344ndash355 2012
[74] C J van Rijsbergen ldquoA non-classical logic for information re-trievalrdquoThe Computer Journal vol 29 no 6 pp 481ndash485 1986
[75] E Keogh K Chakrabarti M Pazzani and S Mehrotra ldquoDi-mensionality reduction for fast similarity search in large timeseries databasesrdquoKnowledge and Information Systems vol 3 no3 pp 263ndash286 2001
[76] E Keogh K ChakrabartiM Pazzani and SMehrotra ldquoLocallyadaptive dimensionality reduction for indexing large time seriesdatabasesrdquo ACM SIGMOD Record vol 30 no 2 pp 151ndash1622001
[77] C J van Rijsbergen Information Retrieval Butterworths Lon-don UK 1979
Submit your manuscripts athttpwwwhindawicom
Computer Games Technology
International Journal of
Hindawi Publishing Corporationhttpwwwhindawicom Volume 2014
Hindawi Publishing Corporationhttpwwwhindawicom Volume 2014
Distributed Sensor Networks
International Journal of
Advances in
FuzzySystems
Hindawi Publishing Corporationhttpwwwhindawicom
Volume 2014
International Journal of
ReconfigurableComputing
Hindawi Publishing Corporation httpwwwhindawicom Volume 2014
Hindawi Publishing Corporationhttpwwwhindawicom Volume 2014
Applied Computational Intelligence and Soft Computing
thinspAdvancesthinspinthinsp
Artificial Intelligence
HindawithinspPublishingthinspCorporationhttpwwwhindawicom Volumethinsp2014
Advances inSoftware EngineeringHindawi Publishing Corporationhttpwwwhindawicom Volume 2014
Hindawi Publishing Corporationhttpwwwhindawicom Volume 2014
Electrical and Computer Engineering
Journal of
Journal of
Computer Networks and Communications
Hindawi Publishing Corporationhttpwwwhindawicom Volume 2014
Hindawi Publishing Corporation
httpwwwhindawicom Volume 2014
Advances in
Multimedia
International Journal of
Biomedical Imaging
Hindawi Publishing Corporationhttpwwwhindawicom Volume 2014
ArtificialNeural Systems
Advances in
Hindawi Publishing Corporationhttpwwwhindawicom Volume 2014
RoboticsJournal of
Hindawi Publishing Corporationhttpwwwhindawicom Volume 2014
ComputationalIntelligence ampNeuroscience
Hindawi Publishing Corporationhttpwwwhindawicom Volume 2014
Industrial EngineeringJournal of
Hindawi Publishing Corporationhttpwwwhindawicom Volume 2014
Modelling amp Simulation in EngineeringHindawi Publishing Corporation httpwwwhindawicom Volume 2014
The Scientific World JournalHindawi Publishing Corporation httpwwwhindawicom Volume 2014
Hindawi Publishing Corporationhttpwwwhindawicom Volume 2014
Human-ComputerInteraction
Advances in
Computer EngineeringAdvances in
Hindawi Publishing Corporationhttpwwwhindawicom Volume 2014
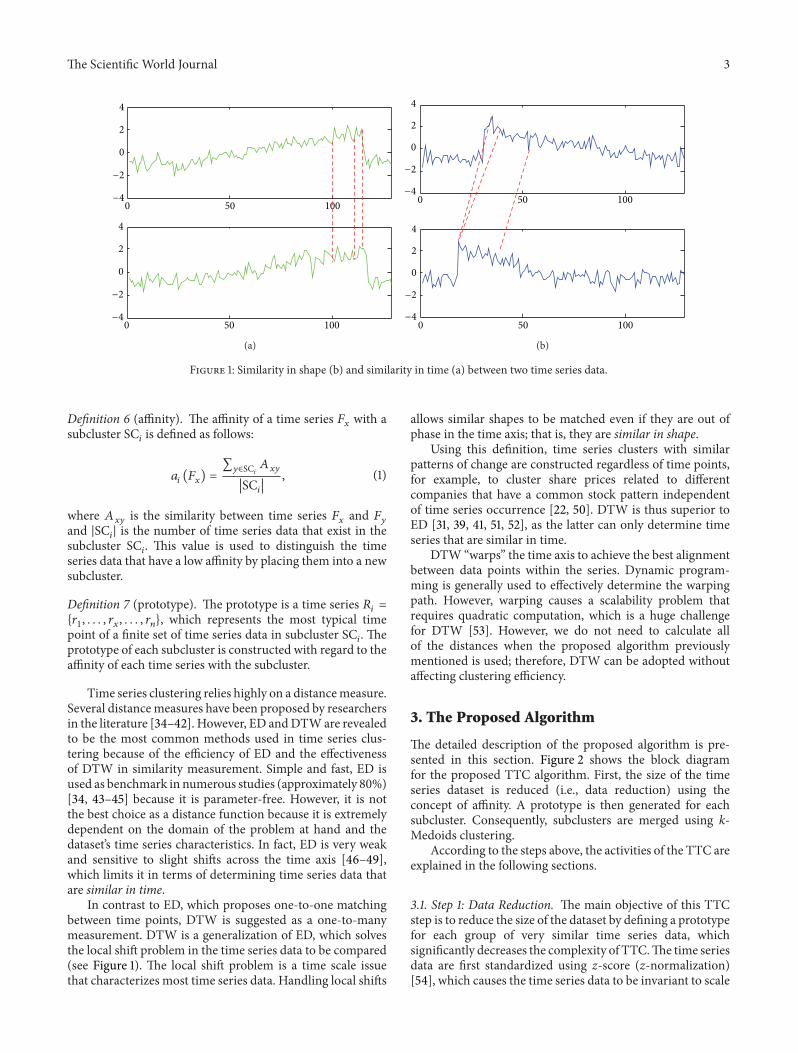