Nykredit Realkredit Group Interim Report Q1 2018
66
Nykredit Realkredit Group – Q1 Interim Report 2018 1/66 To Nasdaq Copenhagen and the press 9 May 2018 Q1 Interim Report 2018 – Nykredit Realkredit Group DKK million Nykredit Realkredit Group Q1/ Q1/ Change 2018 2017 Income 3,222 3,808 -586 Costs 1,190 1,178 -12 Impairment charges for loans and advances (8) (21) -14 Business profit 2,039 2,651 -612 Legacy derivatives 24 337 -313 Profit before tax for the period 2,064 2,988 -924 Tax 396 639 243 Profit for the period 1,667 2,349 -681 Contact For further comments, please contact Jens Theil, Head of Nykredit Press Relations, at tel +45 44 55 14 50. Nykredit Realkredit A/S Kalvebod Brygge 1-3 DK-1780 Copenhagen V Tel +45 44 55 10 00 www.nykredit.com CVR no 12 71 92 80
-
Upload
khangminh22 -
Category
Documents
-
view
1 -
download
0
Transcript of Nykredit Realkredit Group Interim Report Q1 2018

Nykredit Realkredit Group – Q1 Interim Report 2018 1/66
To Nasdaq Copenhagen
and the press
9 May 2018
Q1 Interim Report 2018 – Nykredit Realkredit Group
DKK million
Nykredit Realkredit Group Q1/ Q1/ Change
2018 2017 Income 3,222 3,808 -586
Costs 1,190 1,178 -12
Impairment charges for loans and advances (8) (21) -14
Business profit 2,039 2,651 -612
Legacy derivatives 24 337 -313
Profit before tax for the period 2,064 2,988 -924
Tax 396 639 243
Profit for the period 1,667 2,349 -681
Contact
For further comments, please contact Jens Theil, Head of Nykredit Press Relations, at tel +45 44 55 14 50.
Nykredit Realkredit A/S Kalvebod Brygge 1-3
DK-1780 Copenhagen V Tel +45 44 55 10 00 www.nykredit.com
CVR no 12 71 92 80

2/66 Q1 Interim Report 2018 – Nykredit Realkredit Group
MANAGEMENT COMMENTARY 2
Financial highlights 3
Q1/2018 – overview 4
Financial performance in Q1/2018 4
Results for Q1/2018 relative to Q4/2017 5
Outlook for 2018 5
Special accounting circumstances 6
Other 6
Uncertainty as to recognition and measurement 6
Material risks 6
Events since the balance sheet date 6
Business areas 7
Retail 8
Totalkredit Partners 10
Wholesale Clients 12
Wealth Management 14
Group Items 16
Capital, liquidity and funding 17
Equity and own funds 17
Funding and liquidity 18
Funding and liquidity 18
Credit ratings 20
Lending 21
Mortgage lending 22
Bank lending 24
Alternative performance measures 25
MANAGEMENT STATEMENT 26
Statement by the Board of Directors and
the Executive Board on the Interim Report 26
FINANCIAL STATEMENTS 27
Income statement and comprehensive statement 27
Balance sheets 28
Statement of changes in equity 30
Cash flow statement 32
Notes 33
CONTENTS

Nykredit Realkredit Group – Q1 Interim Report 2018 3/66
¹ "Profit for the period as % pa of average business capital (ROAC)" shows profit for the period relative to business capital. Profit corresponds to net profit or loss less interest expenses for Addi-tional Tier 1 (AT1) capital plus value adjustment of strategic equities recognised as "Other comprehensive income".
² For the purpose of return on equity, the AT1 capital raised in 2015 is treated as a financial obligation for accounting purposes, and the dividends for the period thereon for accounting purposes are included as interest expenses on subordinated debt in profit for the period. Moreover, the addition of value adjustment of strategic equities is recognised in "Other comprehensive income".
FINANCIAL HIGHLIGHTS
DKK million
Nykredit Realkredit Group Q1/ Q1/ Q4/
2018 2017 2017 2017
BUSINESS PROFIT AND PROFIT FOR THE PERIOD Net interest income 2,214 2,239 2,232 9,006
Net fee income 524 582 664 2,470
Wealth management income 313 342 355 1,402
Net interest from capitalisation (90) (107) (87) (360)
Trading, investment portfolio and other income 261 752 (202) 1,492
Income 3,222 3,808 2,961 14,010
Costs 1,190 1,178 1,431 4,977
Business profit before impairment charges 2,032 2,630 1,531 9,033
Impairment charges for loans and advances (8) (21) 930 379
Business profit 2,039 2,651 601 8,653
Legacy derivatives 24 337 29 1,517
Profit before tax for the period 2,064 2,988 630 10,170
Tax 396 639 145 2,091
Profit for the period 1,667 2,349 485 8,080
Other comprehensive income, value adjustment of strategic equities - (2) (78) (6)
Other comprehensive income, remaining items (17) (1) 3 1
Comprehensive income for the period 1,651 2,346 411 8,074
Interest on Additional Tier 1 capital charged against equity 58 57 59 233
SUMMARY BALANCE SHEET 31.03.2018 31.03.2017 31.12.2017 31.12.2017
Assets Receivables from credit institutions and central banks 37,589 40,240 48,031 48,031
Mortgage loans at fair value 1,168,690 1,133,497 1,163,879 1,163,879
Bank loans excluding reverse repurchase lending 57,128 56,256 55,783 55,783
Bonds and equities 88,272 103,043 102,125 102,125
Remaining assets 66,413 57,180 56,992 56,992
Total assets 1,418,092 1,390,216 1,426,810 1,426,810
Liabilities and equity Payables to credit institutions and central banks 24,630 17,885 13,319 13,319
Deposits excluding repo deposits 70,008 67,733 75,914 75,914
Bonds in issue at fair value 1,169,922 1,146,919 1,179,093 1,179,093
Subordinated debt 10,944 11,010 10,942 10,942
Remaining liabilities 66,633 73,372 68,695 68,695
Equity 75,956 73,297 78,847 78,847
Total liabilities and equity 1,418,092 1,390,216 1,426,810 1,426,810
FINANCIAL RATIOS Profit for the period as % pa of average business capital (ROAC)1 11.9 16.7 2.7 14.5
Profit for the period as % pa of average equity² 8.8 13.5 1.9 11.0
Costs as % of income 36.9 30.9 48.3 35.5
Total provisions for loan impairment and guarantees 8,214 8,099 7,915 7,915
Impairment charges for the period, % (0.00) (0.00) 0.08 0.03
Total capital ratio, % 24.4 23.9 25.3 25.3
Common Equity Tier 1 capital ratio, % 20.1 19.4 20.6 20.6
Internal capital adequacy requirement, % 10.3 10.2 10.2 10.2
Average number of staff, full-time equivalent 3,376 3,560 3,469 3,505

4/66 Q1 Interim Report 2018 – Nykredit Realkredit Group
FINANCIAL PERFORMANCE IN Q1/2018
The Nykredit Realkredit Group delivered a satisfactory financial perfor-
mance in Q1/2018, but the level was not as high as in Q1/2017. We
continued to record growth, both in the number of full-service custom-
ers with mortgage and bank lending and in assets under manage-
ment. Profit before tax was DKK 2,064m in Q1/2018, down from DKK
2,988m in Q1/2017. Of the total profit decline of DKK 924m, DKK
491m was attributable to lower trading, investment portfolio and other
income and DKK 313m resulted from lower positive value adjustment
of legacy derivatives.
Profit after tax was DKK 1,667m, corresponding to profit as a percent-
age of business capital (ROAC) of 11.9% and a return on equity of
8.8%.
In Q1 the Group strengthened its focus on creating the best customer
experience, and Nykredit's customer concepts continued to generate
satisfactory growth in the number of full-service BoligBank customers
and increasing business volumes.
Moreover, in Q1/2018 Nykredit Invest received four Morningstar Fund
awards, gaining a top ranking in four out of five categories. Nykredit
Invest was ranked the best fund manager in Denmark to manage eq-
uities and bonds, and Nykredit Invest was also named best in Den-
mark at bonds, short-dated bonds and global equities.
The Group has also intensified its efforts on large regulatory projects
(for instance the General Data Protection Regulation (GDPR) and
money laundering), the transition to the BEC IT platform and the pro-
ject where Nykredit and its partner banks are developing a new future-
proof mortgage lending platform. Despite these large projects and
generally high customer activity, costs for the year are still expected to
trend down.
Income
Total income remains high but dropped 15% to DKK 3,222m relative
to the very high level in Q1/2017.
Net interest income rose slightly by DKK 26m, excluding the Kun-
deKroner discounts. KundeKroner discounts were awarded in
Q1/2018 in the net amount of DKK 51m against DKK 0 in Q1/2017.
Net fee income, which chiefly relates to lending activity, including the
refinancing of mortgage lending and various other services, saw a to-
tal decrease of DKK 58m to DKK 524m, driven by lower activity in Re-
tail and Wholesale Clients compared with a high activity level in
Q1/2017.
Wealth Management generated income of DKK 313m, corresponding
to a drop of 8% on Q1/2017, which reflected lower customer activity in
Nykredit Markets compared with the high level in Q1/2017. The in-
come stems from activities carried out by the Group's entities in
Nykredit Markets, Nykredit Asset Management and Nykredit Portefølje
Administration A/S.
Net interest expenses from capitalisation, which includes interest on
subordinated debt, totalled DKK 90m against DKK 107m in Q1/2017.
Trading, investment portfolio and other income, including value adjust-
ments of swaps currently offered, fell by DKK 491m to DKK 261m on
the same period last year. In Q1/2018 investment portfolio income
was somewhat below the high level in the same period last year, as
the market was impacted by falling equity prices and widening yield
spreads.
Costs
The Group maintains a strong focus on building organisational effi-
ciency, while also running several large projects, of which some are
regulatory (such as GDPR and money laundering), whereas others
will drive additional efficiencies over time, for instance the develop-
ment of a new future-proof mortgage lending platform and broader
collaboration with BEC, an IT provider.
Due to these large projects, total costs have risen to DKK 1,190m
from DKK 1,178m in Q1/2017. However, a decline in costs for the full
year is expected. Costs as a percentage of income totalled 36.9% in
Q1/2018.
The average headcount declined by 184 persons, or 5%, to 3,376
compared with Q1/2017.
Impairment charges for loans and advances
Impairment charges for loans and advances remained low, resulting in
a net reversal of DKK 8m compared with a net reversal of DKK 21m in
Q1/2017.
The low impairment level was due to favourable economic trends,
benefitting most of Nykredit's customer segments. Following the im-
plementation of IFRS 9, Nykredit recognised additional impairment
provisions for bank lending of DKK 566m directly in equity in Q1/2018.
To this should be added the impact of a changed estimate of DKK
1,039m required to comply with the rules on impairment of mortgage
lending (IFRS 9) that was recognised in the Annual Report for 2017.
Reference is also made to note 1.
Impairment charges for mortgage lending reduced from DKK 32m to a
net reversal of DKK 146m.
Provisions for bank loan impairment and guarantees changed from a
net reversal of DKK 55m in Q1/2017 to provisions of DKK 138m in
Q1/2018.
Nykredit's impairment provisions for potential future losses on mort-
gage and bank lending totalled DKK 8,214m at end-Q1/2018.
Write-offs on mortgage and bank lending for the period were DKK
321m against DKK 316m in Q1/2017.
Q1/2018 – OVERVIEW

Nykredit Realkredit Group – Q1 Interim Report 2018 5/66
Legacy derivatives
Legacy derivatives, which are not included in business profit, went
down by DKK 313m to DKK 24m on Q1/2017 partly as a result of in-
terest rate movements. Legacy derivatives are a number of derivatives
which we no longer offer to our customers.
The portfolio of legacy derivatives had a total market value of DKK
5.8bn against DKK 5.9bn at end-2017. The portfolio was written down
to DKK 3.3bn at end-March 2018.
Tax
Tax calculated on profit for the period was DKK 396m, corresponding
to 19.2% of profit before tax.
Balance sheet
Nominal mortgage lending was DKK 1,144bn at end-March 2018, up
DKK 6bn compared with end-2017 and DKK 31bn compared with
Q1/2017. Totalkredit Partners and the Wholesale Clients and Wealth
Management divisions recorded lending growth, whereas Retail lend-
ing dropped by DKK 3.6bn following run-off of customers exclusively
having mortgage products and no banking relationship with Nykredit.
Nykredit's lending growth was recorded all across the country.
The Group's market share of total Danish private residential mortgage
lending was 41.1% at end-March 2018, which was unchanged on end-
2017.
Bank lending (including secured homeowner loans transferred to To-
talkredit) rose to DKK 61.9bn from DKK 60.0bn at end-2017. Com-
pared with Q1/2017 this was an increase of DKK 4.0bn. Of bank lend-
ing, secured homeowner loans transferred to Totalkredit totalled DKK
4.8bn as at 31 March 2018 and DKK 1.6bn as at 31 March 2017.
Deposits, excluding repo deposits, fell back by DKK 5.9bn to DKK
70.0bn from DKK 75.9bn at end-2017. This resulted from a reduction
in demand and fixed-term deposits, particularly due to one large client.
Compared with Q1/2017 deposits rose by DKK 2.3bn.
Nykredit Bank's deposits exceeded lending by DKK 13.3bn at end-
March 2018 compared with DKK 20.1bn at end-2017.
Equity
The Nykredit Realkredit Group's equity stood at DKK 76.0bn at end-
March 2018 against DKK 78.8bn at end-2017. The decrease was due
to the distribution of dividend in March.
Equity includes Additional Tier 1 capital of EUR 500m (DKK 3.8bn).
Calculated interest, which is treated as dividend for accounting pur-
poses, totalled DKK 58m for Q1/2018, which was unchanged on the
same period last year.
RESULTS FOR Q1/2018 RELATIVE TO
Q4/2017
The Group recorded a profit before tax of DKK 2,064m in Q1/2018
against DKK 630m in Q4/2017. The rise primarily resulted from a
changed estimate (IFRS 9) of mortgage loan impairment in Q4/2017,
reducing profit by DKK 1,039m.
Business profit rose to DKK 2,039m from DKK 601m in Q4/2017. Q4
profit was also affected by the changed estimate (IFRS 9) relating to
impairment.
Income went up by 9% on Q4/2017 to DKK 3,222m, owing to higher
trading, investment portfolio and other income, primarily related to
positive value adjustments of swaps currently offered and higher in-
come in Nykredit Markets.
Costs totalled DKK 1,190m, down 17% on Q4 last year. The decline
was due to extraordinary amortisation of IT intangibles, costs of a
shared sector-wide IT solution and higher marketing costs in Q4/2017.
Impairment charges for loans and advances reduced compared with
the previous quarter and came to a net reversal of DKK 8m compared
with an impairment charge of DKK 930m in Q4/2017. The impairment
charge for Q4/2017 was impacted by a changed estimate of DKK
1,039m relating to impairment of mortgage lending (IFRS 9).
Legacy derivatives amounted to DKK 24m, down DKK 5m on
Q4/2017.
OUTLOOK FOR 2018
In connection with the presentation of the Annual Report for 2017, our
guidance for business profit for 2018 was at around DKK 6.5bn-7.5bn.
Profit before tax is expected to be in the same region, as there are no
specific expectations for the development in legacy derivatives. In light
of the performance in Q1/2018, we maintain our guidance.
For 2018 we do not expect the same gains on derivatives and invest-
ment portfolio income as in 2017, which combined with continued low
interest rate levels means that income is expected to be lower than in
2017.
We expect a minor reduction in costs as a result of our efficiency and
restructuring initiatives.
Impairment charges for loans and advances are expected to have an
adverse earnings impact. The reason is generally rising impairment
levels compared with 2017, which was affected by reversals of impair-
ment provisions made in previous years.
The most significant uncertainty factors in respect of our outlook for
2018 relate to movements in interest rate markets and uncertainty
about loan impairments. Another uncertainty factor is price move-
ments in the portfolio of strategic equities.

6/66 Q1 Interim Report 2018 – Nykredit Realkredit Group
SPECIAL ACCOUNTING CIRCUMSTANCES
IFRS 9 was implemented with effect from 1 January 2018. The stand-
ard includes new provisions governing classification and measure-
ment of financial assets, impairment of financial assets and hedge ac-
counting.
An important feature of IFRS 9 is the new principles for calculation of
impairment of loans and advances and provisions, which have
prompted a DKK 566m rise in total impairment provisions for bank
lending at 1 January 2018. To this should be added the impact of a
changed estimate of DKK 1,039m relating to impairment of mortgage
lending that was recognised in the Annual Report for 2017.
Refer to note 1 to the Financial Statements for further information.
OTHER
Changes in the Board of Directors
At the Company's annual general meeting held on 22 March 2018,
Hans-Ole Jochumsen was elected a new member of the Board of Di-
rectors. Hans-Ole Jochumsen has had a long executive career in
BRFkredit, BG Bank, the Copenhagen Stock Exchange and the
Nasdaq Group. Hans-Ole Jochumsen contributes both Nordic and in-
ternational experience from various executive positions at Nasdaq.
Hans Bang-Hansen and Erling Bech-Poulsen both resigned from the
Board of Directors.
KundeKroner benefits programme
The Committee of Representatives of Forenet Kredit decided on 22
March to make a total capital contribution of DKK 2.4bn to be paid out
in 2018 and 2019 to the companies of the Nykredit Group. Totalkredit
A/S will receive DKK 1.7bn and Nykredit Realkredit A/S DKK 0.7bn.
In Totalkredit A/S, the contribution of DKK 1.7bn will go towards the
customer benefits programme, KundeKroner. This contribution will se-
cure the funding of discounts initially to personal customers having a
mortgage loan with Totalkredit, corresponding to an annual discount
of DKK 1,500 on their administration margin payments for each million
kroner borrowed in 2018 and 2019. In the course of 2018 business
customers will also receive annual discounts under the KundeKroner
programme of DKK 1,500 for each million kroner borrowed.
The DKK 0.7bn contribution to Nykredit Realkredit A/S is expected to
be used to expand Nykredit's customer programmes, offering primarily
business customers and homeowner customers even more benefits.
This amount will secure the funding of discounts to business custom-
ers of Nykredit Realkredit A/S, corresponding to an annual discount of
DKK 1,500 on their administration margin payments for each million
kroner borrowed in 2018 and 2019. Business customer discounts will
be introduced as from 1 July 2018. Part of the contribution is ear-
marked for expanding the customer programmes of Nykredit Bank
A/S.
The Nykredit Group's business customers with loans exceeding DKK
20m will only get a discount on their administration margin payments
for the first DKK 20m of their debt outstanding.
This means that after deduction of the KundeKroner discount, To-
talkredit homeowners with fully mortgaged homes are currently enjoy-
ing the lowest administration margins in the market on our main prod-
ucts, including fixed-rate repayment loans, which is Totalkredit's most
popular loan.
The idea behind the customer discounts is to ensure that the Group's
customers feel the benefits of having a financial provider that is owned
by its customers. Together with our majority shareholder, Forenet
Kredit, we want to share our progress with customers, so when
Nykredit performs well, our customers share in the success.
UNCERTAINTY AS TO RECOGNITION AND
MEASUREMENT
Measurement of certain assets and liabilities is based on accounting
estimates made by Group Management.
The areas in which assumptions and estimates significant to the finan-
cial statements have been made include provisions for loan and re-
ceivable impairment and unlisted financial instruments and are de-
scribed in detail in accounting policies (note 1), to which reference is
made.
MATERIAL RISKS
The Group's most material risks are described in detail in note 48 to
the Annual Report for 2017, to which reference is made.
EVENTS SINCE THE BALANCE SHEET DATE
No events have occurred in the period up to the presentation of the
Q1 Interim Report 2018 which materially affect the Group's financial
position.
Nykredit Realkredit Group – Q1 Interim Report 2018 7/66
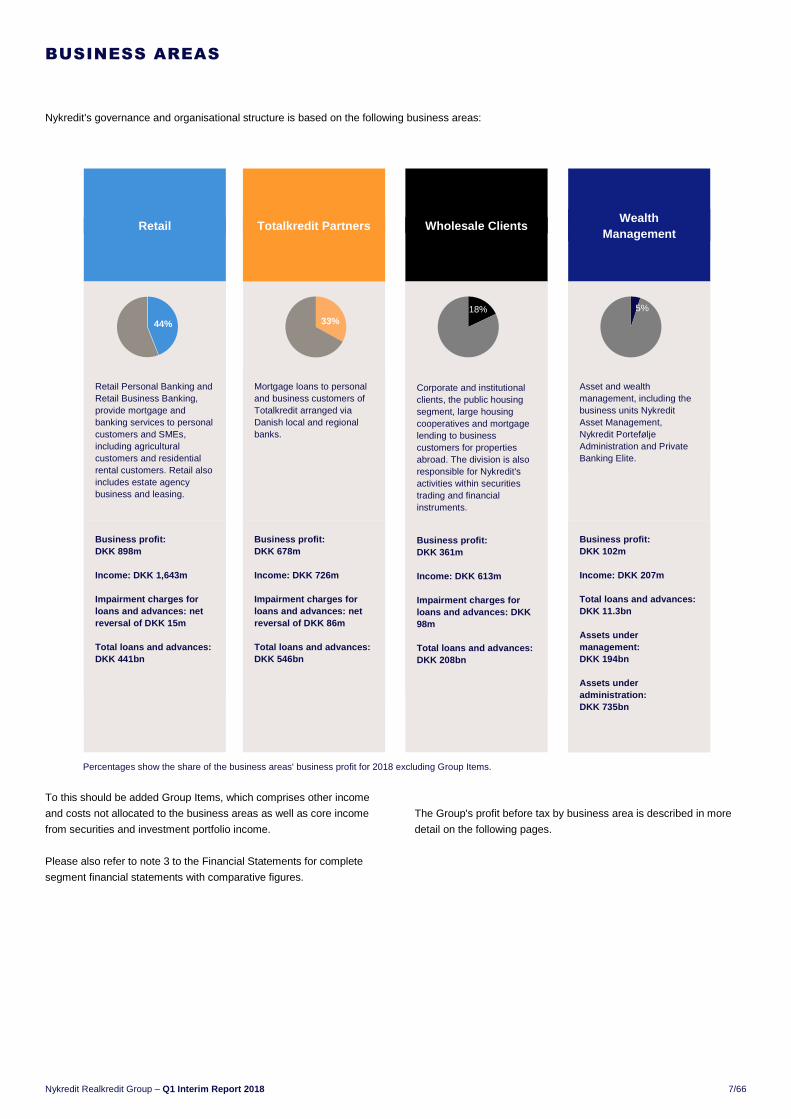
Nykredit's governance and organisational structure is based on the following business areas:
To this should be added Group Items, which comprises other income
and costs not allocated to the business areas as well as core income
from securities and investment portfolio income.
Please also refer to note 3 to the Financial Statements for complete
segment financial statements with comparative figures.
The Group's profit before tax by business area is described in more
detail on the following pages.
BUSINESS AREAS
Retail Totalkredit Partners
Wholesale Clients Wealth
Management
Retail Personal Banking and Retail Business Banking, provide mortgage and banking services to personal customers and SMEs, including agricultural customers and residential rental customers. Retail also includes estate agency business and leasing.
Mortgage loans to personal and business customers of Totalkredit arranged via Danish local and regional banks.
Corporate and institutional clients, the public housing segment, large housing cooperatives and mortgage lending to business customers for properties abroad. The division is also responsible for Nykredit's activities within securities trading and financial instruments.
Asset and wealth management, including the business units Nykredit Asset Management, Nykredit Portefølje Administration and Private Banking Elite.
Business profit: DKK 898m Income: DKK 1,643m Impairment charges for loans and advances: net reversal of DKK 15m Total loans and advances: DKK 441bn
Business profit: DKK 678m Income: DKK 726m Impairment charges for loans and advances: net reversal of DKK 86m Total loans and advances: DKK 546bn
Business profit: DKK 361m Income: DKK 613m Impairment charges for loans and advances: DKK 98m Total loans and advances: DKK 208bn
Business profit: DKK 102m Income: DKK 207m Total loans and advances: DKK 11.3bn Assets under management: DKK 194bn Assets under administration: DKK 735bn
Percentages show the share of the business areas' business profit for 2018 excluding Group Items.
44% 33%5%18%

8/66 Q1 Interim Report 2018 – Nykredit Realkredit Group
1 For Q1/2018 and Q1/2017. Other data from end-Q1/2018 and end-2017.
Retail consists of the business units Retail Personal Banking and Re-
tail Business Banking and provides mortgage and banking services to
personal customers and SMEs, including agricultural customers, resi-
dential rental customers and the wealth clients of Private Banking.
Mortgage loans granted via Totalkredit to Nykredit's personal custom-
ers also form part of Retail. The activities of Nykredit Mægler A/S and
Nykredit Leasing A/S are also included.
Nykredit serves its customers through 42 local customer centres and
the nationwide sales and advisory centre Nykredit Direkte®. 18 of
these centres serve business customers, of which five customer cen-
tres serve our largest retail business customers. Finally, ten centres
have specialist wealth management teams that serve our Private
Banking clients. The estate agencies of the Nybolig and Estate chains
constitute other distribution channels. Nykredit offers insurance in
partnership with Gjensidige Forsikring.
Retail customers are offered banking, mortgage lending, insurance,
pension, investment and debt management products.
Q1 – summary
In Q1/2018 Retail continued the implementation of a new service con-
cept aimed at strengthening our customer advisory services by giving
priority to new as well as existing full-service customers.
The number of new Private Banking customers and full-service
BoligBank customers grew satisfactorily during Q1. Similarly the in-
crease in business customers within the prioritised customer seg-
ments has been satisfactory.
In Q1 Retail Personal Banking lowered the interest rate on selected
housing loans to strengthen Nykredit's market position and competi-
tiveness. In addition, the KundeKroner discount will be raised annually
to 0.15% in 2018 and 2019 from 0.10% in 2017. It is given to retail
customers with loans in Totalkredit.
Retail Business Banking launched a new self-service solution in Q1
for all types of business customers in Nykredit, which in addition to im-
proving the customers' digital experience, contributes to faster assess-
ment and onboarding of new customers. We are also working on a
KundeKroner benefits model for our business customers.
Retail has also intensified efforts to ensure that Nykredit complies with
the tightened regulatory requirements concerning treatment of per-
sonal data, including further improvement of systems and controls to
prevent the risk of money laundering.
RETAIL
DKK million
Results – Retail Q1/ Q1/
2018 2017
Net interest income 1,184 1,192
Net fee income 280 312
Wealth management income 122 145
Net interest from capitalisation (63) (69)
Trading, investment portfolio and other income 120 185
Income 1,643 1,766
Costs 760 769
Business profit before impairment charges 883 997
Impairment charges for mortgage lending (99) 52
Impairment charges for bank lending 85 (3)
Business profit 898 948
Legacy derivatives 9 161
Profit before tax 907 1,109
DKK million
Selected balance sheet items and financial ratios, Retail Q1/
2018 2017
Personal Banking Loans and advances 186,885 188,566
- of which mortgage lending, nominal value 170,893 172,901
- of which secured homeowner loans 6,127 5,548
- of which bank lending 9,865 10,117
Deposits 27,719 27,214
Gross new mortgage lending1 6,036 5,959
Impairment charges for the period as % of
loans and advances1 0.03 (0.00)
Business Banking
Loans and advances 253,734 255,672
- of which mortgage lending, nominal value 233,423 235,548
- of which bank lending 20,311 20,124
Deposits 17,498 19,432
Gross new mortgage lending1 7,043 8,386
Impairment charges for the period as % of
loans and advances1 (0.05) 0.02
Total impairment provisions, end of period
Total impairment provisions 5,548 5,603
Total impairment provisions as % of loans and
advances 1.26 1.26
Provisions for guarantees 167 55

Nykredit Realkredit Group – Q1 Interim Report 2018 9/66
Arrears ratio, mortgage lending – Retail 75 days past due
Activities
Retail Personal Banking continued to grow its portfolio of secured
homeowner loans (lending), corresponding to a volume of DKK 6.1bn
in Q1/2018 against DKK 5.5bn at end-2017.
Bank loans and advances, other than secured homeowner loans, pro-
vided by Retail Personal Banking were DKK 9.9bn against DKK
10.1bn at end-2017. Bank deposits rose by DKK 0.5bn in the same
period to DKK 27.7bn.
Gross new lending in Retail Personal Banking increased by DKK
0.1bn to DKK 6.0bn, and nominal mortgage lending fell by DKK 2.0bn
to DKK 171bn.
Gross new lending in Retail Business Banking was DKK 7.0bn,
whereas nominal mortgage lending was down DKK 2.1bn to DKK
233.4bn.
Bank lending in Retail Business Banking increased by DKK 0.2bn to
DKK 20.3bn, and deposits fell by DKK 1.9bn to DKK 17.5bn.
Results
Retail's business profit fell by DKK 203m year-on-year to DKK 907m
in Q1.
Compared with the same period last year, income dropped by 7% to
DKK 1,643m, driven primarily by lower trading, investment portfolio
and other income. Investment portfolio income was somewhat lower in
Q1/2018 than the high level in the same period last year when it was
high. Q1/2018 the market was partly impacted by widening yield
spreads.
Impairment charges for loans and advances resulted in a net reversal
of DKK 15m compared with an impairment charge of DKK 49m in
Q1/2017.
Legacy derivatives generated a gain of DKK 9m against DKK 161m in
Q1/2017.
Arrears
At the December due date, Retail's 75-day mortgage loan arrears as a
percentage of total mortgage payments due were 0.82% against
0.76% at the same date in 2017.
0.0
0.2
0.4
0.6
0.8
1.0
1.2
1.4
1.6
1.8
2.0
2.2
%
Personal customers Non-agricu ltural SMEs
Agricul tura l customers Total Retail

10/66 Q1 Interim Report 2018 – Nykredit Realkredit Group
1 For Q1/2018 and Q1/2017. Other data from end-Q1/2018 and end-2017.
Under the Totalkredit brand, Totalkredit Partners provides mortgage
loans to personal and business customers arranged via 56 Danish lo-
cal and regional banks. Mortgage loans arranged by Nykredit are in-
cluded in the business area Retail.
Totalkredit Partners's business concept is based on partner banks be-
ing responsible for customer services and covering a proportion of the
risk of loss on the loan portfolio. The banks' share of the realised
losses is offset against their future commission payments from To-
talkredit and is recognised in the income statement as a reduction in
impairment charges for loans and advances.
Q1 – summary
Totalkredit Partners recorded lending growth all across the country –
which testifies to a strong alliance with our partner banks. The per-
sonal mortgage loan portfolio stood at DKK 537.7bn compared with
DKK 530.7bn at end-2017. The business loan portfolio accounted for
DKK 2,668m against DKK 2,056m at end-2017.
KundeKroner is Nykredit's customer benefits programme. The Com-
mittee of Representatives of Forenet Kredit has decided to make capi-
tal contributions to the Nykredit Group. A contribution of DKK 1.7bn is
expected to be used to expand Nykredit's customer benefits pro-
grammes giving primarily business customers and homeowner cus-
tomers even more advantages. This amount will secure the funding of
discounts to business customers of Nykredit Realkredit A/S, corre-
sponding to an annual discount of DKK 1,500 on their administration
margin payments in 2018 and 2019 for each million kroner borrowed.
The Nykredit Group's business customers with loans exceeding DKK
20m will only get a discount on their administration margin payments
for the first DKK 20m of their debt outstanding. Business customer dis-
counts will be introduced as from 1 July 2018.
The Totalkredit alliance is developing a joint future-proof IT platform,
which will ensure that the alliance as a whole is better positioned to of-
fer customers the best home financing options in the coming years. All
three of the collaborating IT partners have implemented the first part
of the platform, offering customers and advisers a better overview of
customers' aggregate facilities, including also Totalkredit mortgage
loans.
Totalkredit's partnership with local and regional partner banks also in-
cludes secured homeowner loans and business mortgages. The con-
cept of secured homeowner loans allows partner banks to transfer
bank loans secured on real estate to Totalkredit, thus funding these
loans. Totalkredit business mortgages are offered to the segments of-
fice and retail, residential rental as well as industry and trades. 40
banks, representing the majority of partner banks having business
customers with mortgage needs, have started offering business mort-
gages.
Activities
The Totalkredit Partners loan portfolio continued to grow, from nomi-
nally DKK 532.8bn at end-2017 to DKK 540.4bn at end-Q1/2018.
TOTALKREDIT PARTNERS
DKK million
Results – Totalkredit Partners Q1/ Q1/
2018 2017
Net interest income 632 668
Net fee income 134 134
Net interest from capitalisation (41) (48)
Trading, investment portfolio and other income 1 (5)
Income 726 749
Costs 133 151
Business profit before impairment charges 593 598
Impairment charges for mortgage lending (86) 11
Business profit 678 587
DKK million
Selected balance sheet items and financial ratios, Totalkredit Partners Q1/
2018 2017
Personal Banking Loans and advances 537,734 530,741
- of which mortgage lending, nominal value 526,263 519,818
- of which secured homeowner loans 11,471 10,923
Gross new mortgage lending1 29,820 22,972
Impairment charges for the period as % of
loans and advances1 (0.02) 0.00
Business Banking
Loans and advances 2,668 2,056
- of which mortgage lending, nominal value 2,668 2,056
Gross new mortgage lending1 626 373
Impairment charges for the period as % of
loans and advances1 - -
Total impairment provisions, end of period
Total impairment provisions 1,334 1,382
Total impairment provisions as % of loans and
advances 0.24 0.26

Nykredit Realkredit Group – Q1 Interim Report 2018 11/66
In Q1/2018 Totalkredit Partners recorded gross new lending at DKK
30.4bn against DKK 23.3bn in Q1/2017. Mortgage lending to personal
customers increased by DKK 6.4bn to DKK 526.3bn, and secured
homeowner loans grew by DKK 0.5bn to DKK 11.5bn. Business loans
rose by DKK 0.6bn to DKK 2.7bn.
Loans distributed through former business partners, which are now
managed directly by Totalkredit, amounted to DKK 25bn at end-
Q1/2018 against DKK 26bn at end-Q1/2017.
Results
Totalkredit Partners's business profit rose to DKK 678m against DKK
587m in Q1/2017.
The underlying trend in income was satisfactory, but income dropped
by DKK 23m to DKK 726m compared with Q1/2017, reflecting the
KundeKroner discounts awarded in Q1/2018.
Impairment charges for loans and advances went down from DKK
11m to a net reversal of DKK 86m.
Arrears
At the December due date, Totalkredit Partners's 75-day mortgage
loan arrears as a percentage of total mortgage payments due were
0.16% against 0.19% at the same date in 2017.
Arrears ratio, mortgage lending – Totalkredit Partners 75 days past due
0.0
0.1
0.2
0.3
%

12/66 Q1 Interim Report 2018 – Nykredit Realkredit Group
1 For Q1/2018 and Q1/2017. Other data from end-Q1/2018 and end-2017.
Wholesale Clients consists of the business units Corporate & Institu-
tional Banking and Nykredit Markets and comprises activities with
Nykredit's corporate and institutional clients, the public housing seg-
ment, large housing cooperatives and mortgage lending to business
customers for properties abroad. Wholesale Clients also handles
Nykredit's activities within securities and financial derivatives trading.
Q1 – summary
In Q1 Corporate & Institutional Banking generally experienced fierce
competition on prices and terms. Strategic financial advisory services
and capital market transactions continued to attract interest.
From the onset of the year, Nykredit Markets saw high customer activ-
ity across products and customer segments, including increased de-
mand for asset management services from the Group's wealth clients.
As the final half of the quarter was marked by financial market unrest,
naturally our customers adopted a more cautious and reluctant invest-
ment approach.
Activities
Mortgage lending amounted to DKK 187.3bn at end-Q1/2018, up DKK
1.5bn on end-2017.
Bank lending was up DKK 0.6bn on end-2017 to DKK 20.3bn. Bank
deposits dropped by DKK 4.7bn to DKK 9.4bn.
Results
Compared with Q1/2017, Wholesale Clients's business profit fell by
DKK 263m to DKK 361m.
Income remained high at DKK 613m, albeit lower than the high level
of DKK 681m recorded in Q1/2017, which saw a high activity level.
The decline was driven primarily by reduced fee income due to a
lower activity level compared with the high activity level in Q1/2017 in
addition to lower trading, investment portfolio and other income. At the
same time, investment portfolio income was somewhat lower in
Q1/2018 than the high level recorded in the same period last year. In
Q1/2018 the market was impacted by falling equity prices and widen-
ing yield spreads.
Impairment charges for loans and advances increased from a net re-
versal of DKK 78m to an impairment charge of DKK 98m due to im-
pairment charges on a few large CIB customers in Q1/2018.
Legacy derivatives amounted to DKK 16m against DKK 175m in
Q1/2017. A high level of income was recorded in Q1/2017.
WHOLESALE CLIENTS
DKK million
Results – Wholesale Clients Q1/ Q1/
2018 2017
Net interest income 372 357
Net fee income 113 135
Wealth management income 14 8
Net interest from capitalisation (25) (23)
Trading, investment portfolio and other income 139 203
Income 613 681
Costs 154 135
Business profit before impairment charges 459 546
Impairment charges for mortgage lending 42 (29)
Impairment charges for bank lending 56 (49)
Business profit 361 624
Legacy derivatives 16 175
Profit before tax 377 799
DKK million
Selected balance sheet items and financial ratios, Wholesale Clients Q1/
2018 2017
Lending/deposits Loans and advances 207,618 205,406
- of which mortgage lending, nominal value 187,275 185,734
- of which bank lending 20,343 19,672
Deposits 9,422 14,164
Gross new mortgage lending1 7,252 9,605
Impairment charges for the period as % of
loans and advances1 0.05 (0.04)
Total impairment provisions, end of period
Total impairment provisions 1,074 829
Total impairment provisions as % of loans and
advances 0.52 0.40
Provisions for guarantees 7 3

Nykredit Realkredit Group – Q1 Interim Report 2018 13/66
Arrears
At the December due date, Wholesale Clients's 75-day mortgage loan
arrears as a percentage of mortgage payments due were 0.12%. The
arrears ratio was 0.02% at the same date in 2017. This increase was
attributable to one specific exposure in arrears and does not reflect a
general trend.
Arrears ratio, mortgage lending – Wholesale Clients 75 days past due
0.0
0.1
0.2
0.3
%

14/66 Q1 Interim Report 2018 – Nykredit Realkredit Group
1 For Q1/2018 and Q1/2017.
Other data from end-Q1/2018 and end-2017. 2 The method of determination for assets under administration has been changed on the ba-
sis of MiFID II. Comparative figures for 2017 have also been restated.
The business division Wealth Management handles Nykredit's asset
and wealth management activities. Wealth Management comprises
the business areas Nykredit Asset Management, Nykredit Portefølje
Administration and Private Banking Elite. The latter is targeted at cli-
ents with investable assets in excess of DKK 7m.
Nykredit's asset management and portfolio administration services are
undertaken by Nykredit Asset Management and Nykredit Portefølje
Administration, and their products and solutions include Nykredit In-
vest, Private Portfolio, Savings Invest, Pension Invest and discretion-
ary asset management and administration agreements with institu-
tional clients, foundations, businesses, public institutions and personal
wealth clients.
Award-winning private banking
In Q1/2018 Nykredit Invest received four Morningstar Fund awards,
gaining a top ranking in four out of five categories. Nykredit Invest was
ranked the best fund manager in Denmark to manage equities and
bonds in a combined category, and was also named best fund man-
ager in Denmark of bonds, short-dated bonds and global equities.
Nykredit was awarded Best Private Banking in Denmark 2017 at the
Global Private Banking Awards ceremony. Furthermore, in 2017 our
Danish private banking clients named Nykredit best private banking
provider in Denmark in Prospera's annual private banking survey. The
awards were given in recognition of Nykredit's targeted and tenacious
efforts within private banking. Nykredit's focus on holistic advisory ser-
vices as well as a personal and individualised approach has landed
Nykredit in the absolute top rank.
Q1 – summary
Once again Private Banking Elite saw a quarter with satisfactory re-
sults and impressive client growth.
In 2018 Private Banking Elite maintained focus on increasing its mar-
ket share, both by landing new clients and by cultivating existing
Nykredit client relationships with Private Banking Elite potential.
51% of Nykredit Asset Management's investment strategies (GIPS
composites) generated above-benchmark returns in Q1/2018, and
89% generated above-benchmark returns over the past three years.
This is considered satisfactory. In Q1/2018 especially investments in
Danish government and covered bonds, including the hedge funds of
Nykredit Alpha, performed well.
WEALTH MANAGEMENT
DKK million
Results – Wealth Management Q1/ Q1/
2018 2017
Net interest income 28 22
Net fee income 5 4
Wealth management income 172 184
Net interest from capitalisation (2) (2)
Trading, investment portfolio and other income 3 4
Income 207 212
Costs 110 110
Business profit before impairment charges 97 103
Impairment charges for mortgage lending (3) (2)
Impairment charges for bank lending (3) (3)
Business profit 102 107
Legacy derivatives (0) 0
Profit before tax 102 108
DKK million
Selected balance sheet items and financial ratios, Wealth Management Q1/
2018 2017
Lending/deposits Loans and advances 11,320 10,779
- of which mortgage lending, nominal value 7,313 6,956
- of which secured homeowner loans 954 839
- of which bank lending 3,053 2,984
Deposits 12,663 13,464
Gross new mortgage lending1 532 330
Impairment charges for the period as % of
loans and advances1 (0.06) (0.05)
Total impairment provisions, end of period
Total impairment provisions 57 44
Total impairment provisions as % of loans and
advances 0.51 0.40
Provisions for guarantees 10 0
Assets under management 194,365 178,906
- of which Nykredit Group investment funds 63,867 61,472
Assets under administration ² 734,761 792,710

Nykredit Realkredit Group – Q1 Interim Report 2018 15/66
Activities
Private Banking Elite, which is behind part of total assets under man-
agement, recorded satisfactory net growth in assets under manage-
ment in Q1.
Total assets under management went up by DKK 15.5bn to DKK
194.4bn at end-Q1/2018. The increase was attributable to positive net
sales of DKK 16.1bn as well as negative value adjustments of DKK
0.6bn.
Total assets under administration fell by DKK 57.9bn to DKK 734.8bn
at end-Q1/2018. The decrease comprised net outflows of DKK 30.6bn
primarily from one large customer and positive value adjustments as
well as other returns of DKK 50.6bn.
Results
Wealth Management's business profit came to DKK 102m in Q1/2018,
which is marginally lower than in Q1/2017.
Income was DKK 207m against DKK 212m in Q1/2017. The decline
was due to reduced wealth management income driven by lower ac-
tivity compared with the high level in Q1/2017.

16/66 Q1 Interim Report 2018 – Nykredit Realkredit Group
Some income statement and balance sheet items are not allocated to
the business divisions but are included in Group Items.
Group Items also includes Nykredit's total return on the securities port-
folio. The activities of the companies Nykredit Ejendomme A/S and
Ejendomsselskabet Kalvebod A/S also form part of Group Items.
Results
The business profit of Group Items decreased by DKK 385m to DKK
0m relative to Q1/2017.
This development was chiefly due to lower investment portfolio in-
come compared with the high level in Q1/2017. Q1/2018 was charac-
terised by falling equity prices and widening yield spreads.
Unallocated costs rose by DKK 18m on Q1/2017 to DKK 33m.
GROUP ITEMS
DKK million
Results – Group Items Q1/ Q1/
2018 2017
Net interest income (2) (0)
Net fee income (7) (3)
Wealth management income 5 4
Net interest from capitalisation 39 34
Trading, investment portfolio and other income (2) 365
Income 33 400
Costs 33 15
Business profit (loss) before impairment charges (0) 386
Impairment charges for mortgage lending 0 (0)
Impairment charges for bank lending (0) 0
Business profit 0 385
DKK million
Selected balance sheet items and financial ratios, Group Items Q1/
2018 2017
Lending/deposits Loans and advances 1,228 670
- of which bank lending 1,228 670
Deposits 2,791 1,640

Nykredit Realkredit Group – Q1 Interim Report 2018 17/66
Own funds and capital adequacy are specified further in note 2 to the Financial Statements. 1 Capital in Q1/2018 and Q1/2017 has been determined exclusive of profit for the period.
Capital and capital adequacy are specified further in note 2. 2 At 1 January 2018, the Nykredit Realkredit Group's CET1 capital ratio was 20.5% after
recognition of the net impact of IFRS as at 1 January 2018 in Nykredit Bank. Nykredit does not apply the transitional arrangements set out in Article 473a (4).
The determination includes a deduction of DKK 843m, cf the mention in note 2 to the Finan-cial Statements.
EQUITY AND OWN FUNDS
Equity
Nykredit's equity was DKK 76.0bn at end-March 2018, down DKK
2.9bn on end-2017. The decrease was due to the distribution of divi-
dend in March.
Equity carried for accounting purposes includes Additional Tier 1
(AT1) capital of EUR 500m (DKK 3.8bn). For capital adequacy pur-
poses, AT1 capital is included in Tier 1 capital rather than in Common
Equity Tier 1 (CET1) capital.
Capital and capital adequacy
Nykredit's own funds include CET1 capital, AT1 capital and Tier 2
capital after deductions.
The risk exposure amount (REA) totalled DKK 342bn at end-Q1/2018,
which was higher than at end-2017. With own funds at DKK 83.7bn,
this corresponds to a total capital ratio of 24.4% against 25.3% at end-
2017. The CET1 capital ratio was 20.1% against 20.6% at end-2017.
Nykredit's Tier 1 capital consists mainly of CET1 capital. Tier 1 capital
totalled DKK 72.6bn, CET1 capital totalled DKK 69.0bn, and AT1 capi-
tal totalled DKK 3.7bn. CET1 capital is the most important capital
measure as this is the type of capital required to comply with most of
the regulatory capital requirements.
Capital target
Nykredit's capital policy is laid down annually by the Board of Direc-
tors and is to support the Group's strategy and objectives.
In accordance with its business model, Nykredit aims to have robust
earnings, a strong capital structure and competitive ratings. Based on
a structured capital management framework, the Group aims to be
able to maintain its business activities regardless of significant fluctua-
tions in economic trends. This implies having adequate access to cap-
ital to withstand an economic downturn and losses, and thus being
able to maintain active lending also during and after a crisis.
In 2017 Nykredit achieved considerable funding flexibility as a result of
the investor solution comprising a number of Danish pension compa-
nies. Nykredit thus has access to new CET1 capital through Forenet
Kredit's liquid assets and through an investment commitment from the
pension companies.
In consultation with the Danish FSA, the Board of Directors has thus
determined a CET1 capital requirement of 15.5-16.5% of REA. To this
will be added the further build-up of capital to meet the upcoming Ba-
sel requirements, which may still lead to an increase in REA of around
DKK 100bn.
CAPITAL, LIQUIDITY AND FUNDING
DKK million
Nykredit Realkredit Group
Equity (incl Additional Tier 1 capital) 31.03.2018 31.12.2017
Equity, beginning of year 78,847 70,957
Profit for the period 1,667 8,080
Fair value adjustment of equities available for
sale - (6)
Other adjustments (4,559) (184)
Equity, end of period 75,956 78,847
DKK million
Nykredit Realkredit Group
Capital and capital adequacy 31.03.2018 31.03.2017 31.12.2017
Credit risk 295,284 293,857 290,643
Market risk 21,354 22,193 24,724
Operational risk 25,709 21,246 21,246
Total risk exposure amount 342,347 337,297 336,613
Equity (incl AT1 capital) 75,956 73,297 78,847
AT1 capital (5,472) (5,465) (5,411)
Deduction, profit for Q1
(excluding AT1 interest)1 (1,610) (2,287) -
Proposed dividend - - (4,100)
CET1 capital additions/
deductions 119 188 304
CET1 capital 68,993 65,733 69,641
AT1 capital 3,741 3,867 3,860
AT1 capital deductions (86) (92) (156)
Tier 1 capital 72,647 69,508 73,345
Tier 2 capital 10,900 11,546 11,519
Tier 2 capital additions/
deductions 168 (104) 332
Own funds 83,716 80,950 85,196
CET1 capital ratio, %2 20.1 19.4 20.6
Tier 1 capital ratio, % 21.2 20.6 21.7
Total capital ratio, % 24.4 23.9 25.3
Internal capital adequacy requirement
(Pillar I and Pillar II), % 10.3 10.2 10.2

18/66 Q1 Interim Report 2018 – Nykredit Realkredit Group
FUNDING AND LIQUIDITY
Nykredit coordinates its liquidity and funding at Group level and gener-
ally issues bonds, senior debt and capital instruments out of Nykredit
Realkredit A/S.
Most of Nykredit's assets consist of lending secured by mortgages on
real estate. These loans are funded through issuance of mortgage
covered bonds (SDOs and ROs). Mortgage covered bonds are issued
by way of daily tap issuance coupled with refinancing auctions for
ARMs (adjustable-rate mortgages) and floating-rate loans, etc. Fur-
ther, the Group may issue different kinds of senior debt serving as
statutory supplementary collateral.
Bank lending is chiefly funded by deposits. At end-Q1/2018 Nykredit
Bank's deposits equalled 127% of lending against 137% at end-2017.
Liquidity
Nykredit's liquid assets are mainly liquid Danish and other European
government and covered bonds. These securities are eligible as col-
lateral in the repo market and with central banks and are thus directly
applicable for raising liquidity.
The Bank's stock of liquid assets was DKK 38.3bn against DKK
43.5bn at end-2017 determined under the LCR.
The unencumbered part of the liquid assets of the Group's mortgage
banks, including proceeds from senior debt in issue, totalled DKK
80bn at end-Q1/2018 against DKK 83bn at end-2017.
Nykredit's liquidity reserves meet the requirements of the Danish FSA
by a comfortable margin, as illustrated in the table below:
Nykredit Realkredit Group
LCR determination
(%) 31.03.2018 31.12.2017
Nykredit Realkredit Group 250 383
Nykredit Realkredit Group LCR in EUR 686 326
Total for mortgage banks 2,030 1,502
Mortgage banks including minimum liquidity
requirement 179 186
Nykredit Bank 129 148
Nykredit has been granted an exemption from including some of the
mortgage-related cash flows in the determination of the LCR, and the
Danish FSA has therefore set a minimum liquidity requirement. In
practice, this requirement means that Nykredit must hold a stock of liq-
uid assets of DKK 29.2bn, corresponding to at least 2.5% of total
mortgage lending. The stock of liquid assets eligible to meet the mini-
mum liquidity requirement amounted to DKK 52.4bn at end-Q1/2018.
In June 2016, the Danish FSA introduced an additional liquidity re-
quirement for Danish SIFIs. Danish SIFIs must fulfil the LCR require-
ment not only in DKK but also in significant currencies except for SEK
and NOK. The requirement only concerns EUR in Nykredit's case.
Benchmark bond series
Nykredit strives to build large, liquid benchmark bond series to obtain
an effective pricing of its bonds. Nykredit Realkredit and Totalkredit's
joint bond issuance contributes to creating large volumes and deep li-
quidity in the Group's key bond series.
With the adoption of the European Commission's legal act by the
Council and Parliament in Q4/2017, the joint funding model became
permanent, ensuring that Totalkredit may continue to issue bonds
through Nykredit Realkredit.
Liquidity is further underpinned by Nykredit's large market share.
Nykredit has concluded primary dealer agreements with a number of
securities brokers. The agreements are intended to:
� Underpin the liquidity of Nykredit's bonds in the primary and sec-
ondary markets.
� Minimise price fluctuations in Nykredit's bonds.
� Ensure that the participants offer consistent market making in
Nykredit's bonds.
� Ensure efficient pricing of the bonds.
With the introduction of the LCR (Liquidity Coverage Ratio), banks in-
creasingly prefer bonds with outstanding amounts of more than EUR
500m and high ratings. As much as 87% of the outstanding amounts
in Nykredit's active bond series is today classified in the top LCR cate-
gory, while 7% is in the second-best category.
Nykredit strives to have a product range that best suits our customers'
needs and investors' increased preference for very liquid bond series.
FUNDING AND LIQUIDITY

Nykredit Realkredit Group – Q1 Interim Report 2018 19/66
Bail-inable senior debt
In 2016 Nykredit Realkredit was the first financial business in Europe
to issue so-called Senior Resolution Notes (SRNs) – a special form of
bail-inable senior debt. SRNs are eligible to meet the regulatory debt buffer requirements as
well as S&P's additional loss-absorbing capacity (ALAC) criteria.
Nykredit has indicated that the Group will meet the ALAC criteria of
S&P Global Ratings in order to maintain its long-term rating of A. The Danish Ministry of Industry, Business and Financial Affairs has in-
troduced a bill to enable credit institutions to issue statutory bail-inable
senior debt instruments. The Act is expected to enter into force on 1
July 2018 and Nykredit expects new issues after that date to be made
in the statutory format. An amendment has been proposed to change the debt buffer require-
ment to 2% of lending or, together with the capital and bail-in (MREL)
requirements, at least 8% of the consolidated balance sheet. The Act
is expected to enter into force on 1 July 2018 and the requirement is
proposed to be implemented towards 2022. Implementation of the Act
in its current form will lead to an increase in the Group's liabilities eligi-
ble for bail-in from about DKK 100bn to around DKK 120bn. In this
connection, Nykredit expects to refinance maturing junior covered
bonds/senior secured bonds with bail-inable bonds.
In Q1/2018 Nykredit issued SRNs of approximately DKK 0bn, bringing
total SRN in issue to DKK 13.3bn at end-Q1/2018.
Issuance plan for 2018
Nykredit Realkredit will continue to issue covered bonds on tap and at
refinancing auctions. Nykredit expects to refinance bonds worth DKK
54bn at the auctions in June 2018, and DKK 47bn and DKK 32bn at
the auctions in September and December 2018.
Because of the low interest rate levels, borrowers increasingly re-
finance into bonds with maturities from 5 to 30 years. This has re-
duced the refinancing volumes. Nykredit expects this trend to con-
tinue.
Nykredit must meet the debt buffer requirements towards 2020,
amounting to at least 2% of total mortgage lending when fully phased
in. In light of the debt buffer requirement and S&P's ALAC criteria,
Nykredit expects to issue another DKK 0bn-5bn of SRNs in 2018.
Nykredit does not expect the proposal for amending the debt buffer
legislation to change the issuance plan for 2018. Going forward, SRNs
will replace most of the issuance of senior secured and senior unse-
cured debt.
Altogether this will result in a new funding structure that offers better
protection for ordinary senior creditors.
On the back of rising house prices, which reduce the requirement for
supplementary collateral, and the expected issuance plan, Nykredit
Realkredit does not expect to issue senior secured or unsecured debt
in 2018.
Nykredit Bank is expected to be subject to the minimum requirement
for own funds and eligible liabilities (MREL). Nykredit Bank has con-
cluded an agreement on long-term intercompany funding for the pur-
pose of meeting the MREL requirement.
DKK million
Nykredit Realkredit Group
Bonds in issue 31.03.2018 31.12.2017
Covered bonds (ROs), cf note 22 a 154,459 183,226
Covered bonds (SDOs), cf note 22 b 1,081,958 1,078,747
Senior secured debt, cf notes 22 c and 23 8,422 8,425
Senior unsecured debt, cf notes 22 d and 23 to
the financial statements of Nykredit Bank A/S 5,725 8,406
Senior Resolution Notes (SRNs), cf note 23 13,341 13,314
Subordinate loan capital, cf note 26 10,947 10,942
Additional Tier 1 capital, cf note 2 3,725 3,723
ECP issues, cf note 23 to the financial
statements of Nykredit Bank A/S 1,943 2,513
Supervisory Diamond for mortgage lenders
Benchmark Definition 31 March 2018 Limit value
Lending growth in segment
Annual lending growth may not exceed 15% in each of the segments personal
customers, commercial residential property, agriculture and other business.
Personal customers 3.8% 15.0%
Commercial residential properties 2.6% 15.0%
Agricultural properties (4.3)% 15.0%
Other business 0.4% 15.0%
Borrower's interest rate risk The proportion of lending where the LTV ratio exceeds 75% of the LTV limit and where the loan rate is fixed for up to two years only may not exceed 25% of the
total loan portfolio. Private residential and residential
rental 14.9% 25.0%
Interest-only period The proportion of IO loans for owner-occupied and holiday housing with an LTV
ratio above 75% of the statutory LTV limit may not exceed 10% of total lending. Private residential 9.4% 10.0%
Loans with short-term funding The proportion of loans to be refinanced must be below 25% per year and below
12.5% per quarter. Refinancing (annually) 15.2% 25.0%
Refinancing (quarterly) 3.3% 12.5%
Large exposures The sum of the 20 largest exposures must be less than equity.
Loans and advances:equity 37.9% 100.0%

20/66 Q1 Interim Report 2018 – Nykredit Realkredit Group
Total run-off under Nykredit Bank's EMTN programme in 2018 will be
DKK 2.1bn. Going forward, EMTN issuance in Nykredit Bank will be
concentrated in Nykredit Realkredit. Nykredit Bank will continue to is-
sue ECP. The total EMTN and ECP issuance requirement depends on
the development in customer deposit and lending levels as well as the
Bank's other business activities.
CREDIT RATINGS
Nykredit Realkredit and Nykredit Bank have rating relationships with
the international credit rating agencies S&P Global Ratings (S&P) and
Fitch Ratings regarding the credit rating of the companies and their
funding.
S&P Global Ratings
Nykredit Realkredit and Nykredit Bank each have a long-term rating of
A and a short-term rating of A-1 with S&P. The rating outlook is stable.
Senior Resolution Notes (SRNs) have a BBB+ rating with S&P.
SDOs and ROs issued by Nykredit Realkredit and Totalkredit through
rated capital centres are all rated AAA by S&P, which is the highest
possible rating. The rating outlook is stable.
Fitch Ratings
Nykredit Realkredit and Nykredit Bank each have a long-term rating of
A and a short-term rating of F1 with Fitch ratings. The rating outlook is
stable.
Senior Resolution Notes (SRNs) have an A rating with Fitch ratings.
Listing of ratings
A table listing Nykredit's credit ratings with S&P and Fitch Ratings is
available at nykredit.com/rating.

Nykredit Realkredit Group – Q1 Interim Report 2018 21/66
Housing prices in Denmark – inflation-adjusted
The Group recorded total mortgage and bank lending, excluding re-
verse repurchase lending, of a nominal amount of DKK 1,201bn
against DKK 1,194bn at end-2017.
Mortgage lending at fair value was DKK 1,169bn compared with DKK
1,164bn at end-2017.
Bank loans and advances were DKK 57.1bn at end-Q1/2018, equal to
an increase of 2%.
Guarantees provided by Nykredit amounted to DKK 6.4bn at end-
Q1/2018 against DKK 7.1bn at end-2017.
Impairment provisions for mortgage and bank lending totalled DKK
8.0bn against DKK 7.9bn at end-2017.
Write-offs totalled DKK 321m in Q1/2018, of which DKK 229m on
mortgage lending and DKK 92m on bank lending.
0
50
100
150
200
250
Index 100 = Q1/2000
Detached and terraced houses Owner-occupied flats
LENDING
Nykredit Realkredit Group
Loans, advances, guarantees and impairment charges for loans and advances
Loans, advances and
guarantees Total provisions for loan
impairment and guarantees
Impairment charges for loans and advances,
earnings impact
DKK million 31.03.2018 31.12.2017 31.03.2018 31.12.2017 Q1/2018 FY 2017
Mortgage lending, nominal value Nykredit Realkredit 504,451 508,606 3,712 4,004 (143) (143)
Totalkredit 639,608 629,502 1,531 1,563 (5) 645
Total 1,144,059 1,138,109 5,242 5,567 (148) 502
Bank lending
Nykredit Bank 57,128 55,783 2,783 2,290 71 (85)
Total 57,128 55,783 2,783 2,290 71 (85)
Receivables from credit institutions - - 2 - (1) (44)
Total - - 2 - (1) (44)
Reverse repurchase lending 36,726 27,566 - - - -
Guarantees 6,376 7,055 187 58 67 6
Loan impairment, %¹
Nykredit Realkredit - - 0.74 0.78 (0.03) (0.03)
Totalkredit - - 0.24 0.25 (0.00) 0.11
Total - - 0.46 0.49 (0.01) 0.04
Nykredit Bank - - 2.88 3.95 0.07 (0.15)
Total - - 2.88 3.95 0.07 (0.15)
¹ Loan impairment excluding receivables from credit institutions, reverse repurchase lending and guarantees.

22/66 Q1 Interim Report 2018 – Nykredit Realkredit Group
MORTGAGE LENDING
At end-Q1/2018, Nykredit's credit exposure in terms of nominal mort-
gage lending was DKK 1,144bn, up DKK 6.0bn on end-2017.
The security underlying mortgage lending is substantial. Also, mort-
gage loans granted via Totalkredit are covered by set-off agreements,
which means that Totalkredit may offset part of the losses incurred on
mortgage loans against future commission payments to the partner
banks which have distributed the loans.
The LTV ratios of the mortgage loan portfolio are shown in the table
below with individual loans relative to the estimated values of the indi-
vidual properties at end-Q1/2018.
Total provisions for mortgage loan impairment
Total impairment provisions for mortgage lending equalled 0.46% of
total mortgage lending compared with 0.49% at end-2017.
Total impairment provisions were down by DKK 325m compared with
end-2017 representing DKK 5,242m at end-Q1/2018. The decline was
mainly due to write-offs.
Of the reduction in Q1/2018, DKK 121m stemmed from owner-occu-
pied dwellings and DKK 204m from business property.
Earnings impact
Mortgage loan impairment was a gain of DKK 148m against a charge
of DKK 33m in Q1/2017. Of reversed loan impairment for the period,
DKK 39m was attributable to owner-occupied dwellings and DKK 62m
related to agricultural property.
Nykredit Realkredit Group
Debt outstanding relative to estimated property values
Total LTV (loan-to-value) LTV
DKK million/% 0-40 40-60 60-80 80-90 90-100 >100 Total average, %1
Owner-occupied dwellings 453,670 169,999 94,119 8,004 2,950 2,344 731,085 68
Private rental 80,770 28,335 12,954 1,388 735 3,092 127,274 66
Industry and trades 18,567 2,873 224 48 25 45 21,782 46
Office and retail 85,538 23,147 3,006 553 346 601 113,189 54
Agriculture 60,496 19,908 7,803 1,120 483 541 90,352 63
Public housing - - - - - - 69,970 -
Other 12,001 2,398 540 37 20 42 15,038 49
Total, end-Q1/2018 711,041 246,660 118,646 11,149 4,560 6,665 1,168,690 64
Total end-2017 718,351 238,377 116,266 12,109 4,633 4,310 1,163,879 63
¹ Determined as the top part of the debt outstanding relative to estimated property values.
Note: The figures are actual LTV ratios including any financed costs. Public authority guarantees reduce the credit risk relating to subsidised housing, which forms part of lending to the public housing segment. For this reason, LTVs of public housing offer no relevant risk data and have been excluded. In the table, debt outstanding is distributed continuously by LTV category. Loans with security covering for example between 0% and 60% of the mortgageable value are distributed with two thirds of the debt outstanding in the LTV range 0-40% and one third in the LTV range 40-60%.
Nykredit Realkredit Group
Provisions for mortgage loan impairment by property type1
31.03.2018 31.12.2017
DKK million Total impair-
ment provisions Earnings
impact Total impair-
ment provisions Earnings
impact
Owner-occupied dwellings 2,456 (39) 2,577 762
Private rental2 345 (14) 366 (108)
Industry and trades 77 (6) 88 (56)
Office and retail 471 11 493 21
Agriculture 1,294 (62) 1,353 99
Public housing 69 30 39 (0)
Cooperative housing 459 (50) 531 (250)
Other 73 (19) 121 34
Total 5,242 (148) 5,567 502
1 The breakdown by property type is not directly comparable with the Group's business areas.

Nykredit Realkredit Group – Q1 Interim Report 2018 23/66
Nykredit Realkredit Group
Arrears ratio, mortgage lending ‒ 75 days past due
Arrears
Mortgage loan arrears are determined 15 and 75 days past the due
date. Mortgage loan arrears represented 0.38% of total mortgage pay-
ments due 75 days past the December due date against 0.37% at the
same time the year before.
Correspondingly, bond debt outstanding affected by arrears as a per-
centage of total bond debt outstanding decreased from 0.48% to
0.27% compared with the same time the year before.
Properties acquired by foreclosure
In Q1/2018 the Group acquired 20 properties by foreclosure and sold
30. The property portfolio counted 53 properties at end-Q1/2018
against 63 at end-2017.
0.50
0.55
0.26
0.14
0.57
0.62
0.490.42
0.38 0.38
0.0
0.1
0.2
0.3
0.4
0.5
0.6
0.7
0.8
0.9
1.0
%
Nykredit Realkredit Group
Arrears ratio – 75 days past due
Arrears relative to total
mortgage payments
Debt outstanding affected by
arrears relative to total debt outstanding
Debt outstanding affected by
arrears
Due dates % % DKK billion
2017
- December 0.38 0.27 3.10
- September 0.30 0.29 3.30
- June 0.35 0.33 3.80
- March 0.38 0.39 4.40
2016
- December 0.37 0.48 5.30
- September 0.39 0.40 4.50

24/66 Q1 Interim Report 2018 – Nykredit Realkredit Group
BANK LENDING
Bank lending at amortised cost amounted to DKK 57.1bn against DKK
55.8bn at end-2017. Bank lending before impairment charges was
DKK 59.9bn against DKK 58.1bn at end-2017.
Reverse repurchase lending stood at DKK 36.7bn compared with DKK
27.6bn at end-2017. Guarantees provided were DKK 6.4bn against
DKK 7.1bn at end-2017.
Nykredit Bank recorded lending growth of 1.3%, excluding reverse re-
purchase lending, determined pursuant to the rules of the Danish
FSA, including rules relating to the FSA Supervisory Diamond model.
The Danish FSA's lending limit value indicates that growth of 20% or
more may imply increased risk-taking.
Total provisions for bank loan impairment
Provisions for bank loan impairment totalled DKK 2,783m against
DKK 2,290m at end-2017. The increase was primarily due to the im-
plementation of IFRS 9.
Guarantees
Guarantees provided were DKK 6,376m, down 9.6%, against DKK
7,055m at end-2017.
At end-Q1/2018, provisions for guarantees amounted to DKK 187m
against DKK 58m at end-2017.
Earnings impact
Provisions for bank loan impairment and guarantees for the period
were DKK 138m. In comparison, impairment charges for loans and
advances and provisions for guarantees were a reversal of DKK 102m
net in 2017.
Nykredit Realkredit Group
Provisions for bank loan impairment and guarantees by sector¹
Q1/2018 31.12.2017
DKK million
Total impairment provisions
Earnings impact
Total impairment provisions
Earnings impact
Public sector 2 (2) 2 2
Agriculture, hunting, forestry and fishing 137 2 104 10
Manufacturing, mining and quarrying 193 (31) 195 24
Energy supply 20 (15) 14 12
Construction 165 (7) 177 (22)
Trade 229 (6) 176 125
Transport, accommodation and food service activities 123 (1) 100 33
Information and communication 36 5 25 12
Finance and insurance 154 36 72 (42)
Real estate 757 (3) 663 (321)
Other 398 119 239 58
Total business customers 2,212 98 1,765 (111)
Personal customers 755 44 581 30
Total 2,969 140 2,348 (79)
- of which provisions for losses under guarantees 187 68 58 6
Impairment provisions for credit institutions 2 (2) - (23)
Total including impairment provisions for credit in stitutions 2,971 138 2,348 (102)
¹ As the breakdown is based on public sector statistics, it is not directly comparable with the Bank's business areas.

Nykredit Realkredit Group – Q1 Interim Report 2018 25/66
The Management Commentary is based on the Group's internal finan-
cial reporting.
In the opinion of Management, the Management Commentary should
be based on the internal management and business reporting, which
forms part of financial governance. Readers of the financial report are
thus provided with information that is relevant to their assessment of
the financial performance.
This information is also provided in the Management Commentary as
well as in note 3 to the Financial Statements for the business areas in-
cluded in the internal reporting.
Supplementary financial ratios
The financial highlights in the Management Commentary and the seg-
mental financial statements include a number of internal income state-
ment items, which have been specified in note 3 to the Financial
Statements. It should be noted in particular that "Net interest income"
in the financial highlights is based on net interest income from deposit
and lending activities and is thus not directly comparable with "Net in-
terest income" in the income statement, which also includes interest
income from, for instance, the bond portfolio.
The presentation is based on the same recognition and measurement
principles that apply to the Financial Statements. This consequently
means that key concepts such as "Profit (loss)", "Comprehensive in-
come", "Balance sheets" and "Equity" correspond to the items in the
Financial Statements.
In relation to the internal presentation of income, a number of supple-
mentary financial ratios are included in the Management Commentary.
Profit for the period as % pa of average business capital (ROAC). The
return target in the financial highlights shows profit for the period rela-
tive to average business capital. Profit corresponds to net profit or loss
less interest expenses for AT1 capital, which is treated as dividend in
the Financial Statements. Profit also includes value adjustment of
strategic equities, which is recognised in "Other comprehensive in-
come" in the Financial Statements. Business capital corresponds to a
capital target of 16% of the risk exposure amount.
Profit for the period as % pa of average equity. Profit for the period is
calculated as stated above. Average equity is calculated on the basis
of the value at the beginning of the period and at the end of all quar-
ters of the period.
Costs as % of income is calculated as the ratio of "Costs" to "Income".
ALTERNATIVE PERFORMANCE MEASURES

26/66 Q1 Interim Report 2018 – Nykredit Realkredit Group
STATEMENT BY THE BOARD OF DIRECTORS AND THE EXECUTIVE BOARD ON THE INTERIM
REPORT
The Board of Directors and the Executive Board have today reviewed
and approved the Interim Report for the period 1 January – 31 March
2018 of Nykredit Realkredit A/S and the Nykredit Realkredit Group. The Consolidated Financial Statements have been presented in ac-
cordance with IAS 34 "Interim Financial Reporting" as adopted by the
EU. The Interim Financial Statements of the Parent have been pre-
pared in accordance with the Danish Financial Business Act and the
Danish Executive Order on Financial Reports for Credit Institutions
and Investment Firms, etc. Moreover, the Interim Report has been prepared in accordance with
additional Danish disclosure requirements for interim reports of issu-
ers of listed bonds.
In our opinion, the Interim Financial Statements give a true and fair
view of the Group's and the Parent's assets, liabilities, equity and fi-
nancial position at 31 March 2018 and of the results of the Group's
and the Parent's operations and the Group's cash flows for the finan-
cial period 1 January – 31 March 2018.
Further, in our opinion, the Management Commentary gives a fair re-
view of the development in the operations and financial circumstances
of the Group and the Parent as well as a description of the material
risk and uncertainty factors which may affect the Group and the Par-
ent.
The Interim Report has not been subject to audit or review.
MANAGEMENT STATEMENT
Copenhagen, 9 May 2018
Executive Board
Board of Directors
Michael Rasmussen
Group Chief Executive
Steffen Kragh
Chairman
Marlene Holm*
Kim Duus
Group Managing Director
Merete Eldrup
Deputy Chairman
Hans-Ole Jochumsen
David Hellemann
Group Managing Director
Nina Smith
Deputy Chairman
Vibeke Krag
Søren Holm
Group Managing Director
Helge Leiro Baastad
Allan Kristiansen*
Anders Jensen
Group Managing Director
Olav Bredgaard Brusen*
Inge Sand*
Michael Demsitz
Leif Vinther*
Per W. Hallgren
* Staff-elected member

Nykredit Realkredit Group – Q1 Interim Report 2018 27/66
DKK million
Nykredit Realkredit A/S Nykredit Realkredit Group
Q1/2017 Q1/2018 Q1/2018 Q1/2017
INCOME STATEMENT
5,143 4,737 Interest income 6 6,447 6,966
4,032 3,743 Interest expenses 7 3,766 4,060
1,111 994 Net interest income 2,682 2,905
23 19 Dividend on equities 22 32
196 175 Fee and commission income 631 620
37 61 Fee and commission expenses 750 702
1,293 1,128 Net interest and fee income 2,585 2,855
241 113 Value adjustments 8 442 1,242
- 1 Value adjustments relating to sale of branch 1 -
229 222 Other operating income 217 44
681 692 Staff and administrative expenses 9 1,127 1,092
39 23
Depreciation, amortisation and impairment charges for property, plant and
equipment as well as intangible assets 10 26 46
33 31 Other operating expenses 37 40
30 (143) Impairment charges for loans, advances and receivables 11 (8) (21)
1,573 1,011 Profit from investments in associates and Group enterprises 12 1 4
2,552 1,871 Profit before tax 2,064 2,988
206 188 Tax 13 396 639
2,347 1,683 Profit for the period 1,667 2,349
Distribution of profit for the period 2,289 1,625 Shareholder of Nykredit Realkredit A/S 1,610 2,291
57 58 Holders of Additional Tier 1 capital notes 58 57
2,347 1,683 Profit for the period 1,667 2,349
COMPREHENSIVE INCOME
2,347 1,683 Profit for the period 1,667 2,349
Other comprehensive income
Items that cannot be reclassified to profit or loss : (1) (21) Actuarial gains/losses on defined benefit plans (21) (1)
- 5 Tax on actuarial gains/losses on defined benefit plans 5 -
(1) (17) Total items that cannot be reclassified to profit o r loss (17) (1)
Items that can be reclassified to profit or loss: - - Fair value adjustment of equities available for sale - 6
- - Tax on fair value adjustment of equities available for sale - (8)
- - Total items that can be reclassified to profit or l oss - (2)
(1) (17) Other comprehensive income (17) (3)
2,346 1,666 Comprehensive income for the period 1,651 2,346
Distribution of comprehensive income 2,289 1,609 Shareholder of Nykredit Realkredit A/S 1,593 2,289
57 58 Holders of Additional Tier 1 capital notes 58 57
2,346 1,666 Comprehensive income for the period 1,651 2,346
INCOME STATEMENT AND COMPREHENSIVE STATEMENT

28/66 Q1 Interim Report 2018 – Nykredit Realkredit Group
DKK million
Nykredit Realkredit A/S Nykredit Realkredit Group
31.12.2017 31.03.2018 Note 31.03.2018 31.12.2017
ASSETS
177 176 Cash balances and demand deposits with central banks 6,239 2,070
55,022 39,571 Receivables from credit institutions and central banks 14 31,349 45,961
1,212,448 1,210,153 Loans, advances and other receivables at fair value 1,168,665 1,191,378
499 491 Loans, advances and other receivables at fair value relating to sold foreign portfolio 491 499
1,212,947 1,210,644 Loans, advances and other receivables at fair value 15 1,169,156 1,191,877
282 264 Loans, advances and other receivables at amortised cost 16 94,182 56,126
38,390 32,037 Bonds at fair value 17 83,082 97,149
Equities 18 4,758 4,998 Equities measured at fair value through profit or loss 5,190 2,526
- - Equities available for sale - 2,450
4,758 4,998 Total 5,190 4,977
143 144 Investments in associates 151 150
47,099 47,509 Investments in Group enterprises - -
200 209 Intangible assets 235 227
Land and buildings - - Investment properties - 50
14 16 Owner-occupied properties 209 223
14 16 Total 209 273
98 89 Other property, plant and equipment 108 117
366 466 Current tax assets 977 549
1 - Deferred tax assets 117 143
175 230 Assets in temporary possession 246 184
7,347 6,842 Other assets 19 26,297 26,476
273 333 Prepayments 553 532
1,367,291 1,343,527 Total assets 1,418,092 1,426,810
BALANCE SHEETS

Nykredit Realkredit Group – Q1 Interim Report 2018 29/66
DKK million
Nykredit Realkredit A/S Nykredit Realkredit Group
31.12.2017 31.03.2018 Note 31.03.2018 31.12.2017
LIABILITIES AND EQUITY
5,353 5,020 Payables to credit institutions and central banks 20 24,630 13,319
- 8,000 Deposits and other payables 21 87,475 75,914
1,234,844 1,215,862 Bonds in issue at fair value 1,169,227 1,178,372
721 695 Bonds in issue at fair value relating to sold foreign portfolio 695 721
1,235,565 1,216,557 Bonds in issue at fair value 22 1,169,922 1,179,093
17,059 17,079 Bonds in issue at amortised cost 23 22,486 23,532
8,501 - Other non-derivative financial liabilities at fair value 24 1,490 19,021
- - Current tax liabilities 62 43
10,462 9,399 Other liabilities 25 24,188 25,248
- - Deferred income 15 9
1,276,939 1,256,054 Total payables 1,330,269 1,336,178
Provisions
135 135 Provisions for pensions and similar obligations 141 141
295 282 Provisions for deferred tax 406 439
51 50 Repayable reserves in pre-1972 series 50 51
- - Provisions for losses under guarantees 187 58
81 86 Other provisions 138 153
562 554 Total provisions 923 842
10,942 10,947 Subordinated debt 26 10,944 10,942
Equity
1,182 1,182 Share capital 1,182 1,182
Accumulated value adjustments
- - - revaluation reserves 5 19
- - - value adjustment of equities available for sale - 973
Other reserves
15,239 15,649 - statutory reserves - -
38,038 38,038 - series reserves 38,038 38,038
- - - non-distributable reserve fund 1,646 1,646
16,523 17,276 - retained earnings 31,259 29,124
4,100 - - proposed dividend - 4,100
75,082 72,145 Shareholder of Nykredit Realkredit A/S 72,130 75,082
3,765 3,826 Holders of Additional Tier 1 capital 3,826 3,765
78,847 75,971 Total equity 75,956 78,847
1,367,291 1,343,527 Total liabilities and equity 1,418,092 1,426,810
OFF-BALANCE SHEET ITEMS 27
- - Contingent liabilities 6,376 7,055
1,596 1,504 Other commitments 8,381 8,443
1,596 1,504 Total 14,757 15,498
BALANCE SHEETS

30/66 Q1 Interim Report 2018 – Nykredit Realkredit Group
DKK million
Nykredit Realkredit Group
2018 Sha
re c
apita
l¹
Rev
alua
tion
rese
rves
Acc
umul
ated
val
ue
adju
stm
ent o
f equ
ities
av
aila
ble
for
sale
Ser
ies
rese
rves
Non
-dis
trib
utab
le r
eser
ve
fund
2
Ret
aine
d ea
rnin
gs
Pro
pose
d di
vide
nd
Sha
reho
lder
of
Nyk
redi
t Rea
lkre
dit A
/S
Min
ority
inte
rest
s
Add
ition
al T
ier
1 ca
pita
l3
Tot
al e
quity
Equity, end-2017, cf the Annual Report 1,182 19 973 38,038 1,646 29,124 4,100 75,082 - 3,765 78,847
Transferred to equities measured at fair value
through profit or loss - - (973) - - 973 - - - - -
Changes in impairment charges
owing to implementation of IFRS 9 - - - - - (566) - (566) - - (566)
Changes in taxes due owing to
implementation of IFRS 9 - - - - - 125 - 125 - - 125
Equity, 1 January 1,182 19 - 38,038 1,646 29,655 4,100 74,641 - 3,765 78,406
Profit for the period - - - - - 1,610 - 1,610 - 58 1,667
Total other comprehensive income - - - - - (17) - (17) - - (17)
Total comprehensive income - - - - - 1,593 - 1,593 - 58 1,651
Foreign currency translation adjustment of
Additional Tier 1 capital - - - - - (3) - (3) - 3 -
Tax on Additional Tier 1 capital - - - - - (1) - (1) - - (1)
Distributed dividend - - - - - - (4,100) (4,100) - - (4,100)
Realised from the sale of properties - (14) - - - 14 - - - - -
Equity, 31 March 1,182 5 - 38,038 1,646 31,259 - 72,130 - 3,826 75,956
2017
Equity, 1 January 1,182 26 979 35,198 1,646 28,162 - 67,194 3 3,760 70,957
Profit for the period - - - - - 2,291 - 2,291 - 57 2,349
Total other comprehensive income - - (2) - - (1) - (3) - - (3)
Total comprehensive income - - (2) - - 2,291 - 2,289 - 57 2,346
Foreign currency translation adjustment of
Additional Tier 1 capital - - - - - (2) - (2) - 2 -
Tax on Additional Tier 1 capital - - - - - (3) - (3) - - (3)
Other adjustments - - - - - - - - (3) - (3)
Equity, 31 March 1,182 26 976 35,198 1,646 30,449 - 69,478 - 3,819 73,297
¹ The share capital is divided into shares of DKK 100 and multiples thereof. Nykredit Realkredit A/S has only one class of shares, and all the shares confer the same rights on shareholders. 2 A non-distributable reserve fund in Totalkredit A/S. ³ Additional Tier 1 (AT1) capital is perpetual, and payment of principal and interest is discretionary. For accounting purposes, the AT1 capital is consequently treated as equity. On 26 February 2015,
Nykredit issued EUR 500m (nominal) of AT1 capital, which may be redeemed from 26 October 2020. AT1 capital carries an interest rate of 6.25% pa up to 26 October 2020, after which date the interest rate will be fixed every five years. If the Common Equity Tier 1 (CET1) capital ratio of Nykredit Realkredit A/S, the Nykredit Realkredit Group or the Nykredit Group falls below 7.125%, the loan will be written down.
STATEMENT OF CHANGES IN EQUITY

Nykredit Realkredit Group – Q1 Interim Report 2018 31/66
DKK million
Nykredit Realkredit A/S
2018 Sha
re c
apita
l¹
Sta
tuto
ry r
eser
ves²
Ser
ies
rese
rves
Ret
aine
d ea
rnin
gs
Pro
pose
d di
vide
nd
Sha
reho
lder
of
Nyk
redi
t Rea
lkre
dit A
/S
Add
ition
al T
ier
1 ca
pita
l3
Tot
al e
quity
Equity, end-2017, cf the Annual Report 1,182 15,239 38,038 16,523 4,100 75,082 3,765 78,847
Changes in impairment charges owing to implementation of IFRS 9 - (566) - - - (566) - (566)
Changes in taxes due owing to implementation of IFRS 9 - 125 - - - 125 - 125
Equity, 1 January 1,182 14,797 38,038 16,523 4,100 74,641 3,765 78,406
Profit for the period - 1,011 - 614 - 1,625 58 1,683
Total other comprehensive income - - - (17) - (17) - (17)
Total comprehensive income - 1,011 - 597 - 1,609 58 1,666
Foreign currency translation adjustment of Additional Tier 1 capital - - - (3) - (3) 3 -
Tax on Additional Tier 1 capital - - - (1) - (1) - (1)
Distributed dividend - - - - (4,100) (4,100) - (4,100)
Dividend from Group enterprises - (118) - 118 - - - -
Other movements concerning equity investments - (42) - 42 - - - -
Equity, 31 March 1,182 15,649 38,038 17,276 - 72,145 3,826 75,971
2017
Equity, 1 January 1,182 10,957 35,198 19,856 - 67,194 3,760 70,954
Profit for the period - 1,535 - 754 - 2,289 57 2,347
Total other comprehensive income - - - (1) - (1) - (1)
Total comprehensive income - 1,535 - 754 - 2,289 57 2,346
Foreign currency translation adjustment of Additional Tier 1 capital - - - (2) - (2) 2 -
Tax on Additional Tier 1 capital - - - (3) - (3) - (3)
Dividend from associates - (3) - 3 - - - -
Dividend from Group enterprises - (670) - 670 - - - -
Other adjustments - 0 - (0) - - - -
Equity, 31 March 1,182 11,819 35,198 21,278 - 69,478 3,819 73,297
¹ The share capital is divided into shares of DKK 100 and multiples thereof. Nykredit Realkredit A/S has only one class of shares, and all the shares confer the same rights on shareholders. ² The item relates to a transfer to reserves for net revaluation according to the equity method. The item includes a non-distributable reserve fund of DKK 1,646m in Totalkredit. ³ Additional Tier 1 (AT1) capital is perpetual, and payment of principal and interest is discretionary. For accounting purposes, the bonds are consequently treated as equity. On 26 February 2015,
Nykredit issued EUR 500m (nominal) of AT1 capital, which may be redeemed from 26 October 2020. AT1 capital carries an interest rate of 6.25% pa up to 26 October 2020, after which date the interest rate will be fixed every five years. If the Common Equity Tier 1 (CET1) capital ratio of Nykredit Realkredit A/S, the Nykredit Realkredit Group or the Nykredit Group falls below 7.125%, the loan will be written down.
STATEMENT OF CHANGES IN EQUITY

32/66 Q1 Interim Report 2018 – Nykredit Realkredit Group
DKK million
Nykredit Realkredit Group
Q1/2018 Q1/2017
Profit for the period 1,667 2,349
Adjustments
Interest income, net (2,682) (2,905)
Depreciation, amortisation and impairment charges for property, plant and equipment as well as intangible assets 26 46
Loss from investments in associates (1) (4)
Impairment charges for loans, advances and receivables (8) (21)
Prepayments/deferred income, net (15) (55)
Tax on profit for the period 396 639
Other adjustments (186) (281)
Total (802) (233)
Change in operating capital
Loans, advances and other receivables (15,327) (3,363)
Deposits and payables to credit institutions 22,873 (1,479)
Bonds in issue (10,218) (2,650)
Other operating capital (18,430) (2,667)
Total (21,904) (10,391)
Interest income received 7,440 8,090
Interest expenses paid (5,252) (5,993)
Corporation tax paid, net (671) (171)
Cash flows from operating activities (20,387) (8,465)
Cash flows from investing activities
Acquisition of associates - (5)
Dividend received from associates - 3
Purchase and sale of bonds and equities, net 13,921 13,603
Purchase of intangible assets (24) (1)
Purchase of property, plant and equipment (2) (10)
Sale of property, plant and equipment 50 161
Total 13,944 13,751
Cash flows from financing activities
Distributed dividend (4,100) -
Purchase and sale of self-issued subordinated debt instruments (3) (1)
Total (4,103) (1)
Total cash flows for the period (10,546) 5,285
Cash and cash equivalents, beginning of period 48,031 34,829
Foreign currency translation adjustment of cash 104 126
Cash and cash equivalents, end of period 37,589 40,240
Cash and cash equivalents, end of period:
Cash balances and demand deposits with central banks 6,239 2,993
Receivables from credit institutions and central banks 31,349 37,248
Total 37,589 40,240
CASH FLOW STATEMENT

Nykredit Realkredit Group – Q1 Interim Report 2018 33/66
1. Accounting policies 34
2. Capital and capital adequacy 38
3. Business areas 39
4. Reconciliation of internal and regulatory income statement 41
5. Net interest income and value adjustments 42
6. Interest income 43
7. Interest expenses 43
8. Value adjustments 44
9. Staff and administrative expenses 44
10. Depreciation, amortisation and impairment charges for property,
plant and equipment as well as intangible assets 44
11. Impairment charges for loans, advances and receivables 45
12. Profit from investments in associates and group enterprises 50
13. Tax 50
14. Receivables from credit institutions and central banks 51
15. Loans, advances and other receivables at fair value 51
16. Loans, advances and other receivables at amortised cost 52
17. Bonds at fair value 53
18. Equities 53
19. Other assets 53
20. Payables to credit institutions and central banks 54
21. Deposits and other payables 54
22. Bonds in issue at fair value 54
23. Bonds in issue at amortised cost 55
24. Other non-derivative financial liabilities at fair value 55
25. Other liabilities 55
26. Subordinated debt 56
27. Off-balance sheet items 56
28. Related party transactions and balances 57
29. Fair value disclosures 58
30. Five-year financial highlights 62
31. Group structure 64
32. Classifications and value adjustments as at 1 January 2018 65
NOTES
Nykredit Realkredit Group

34/66 Q1 Interim Report 2018 – Nykredit Realkredit Group
1. ACCOUNTING POLICIES
General
The Consolidated Financial Statements for Q1/2018 are prepared in accordance
with IAS 34 "Interim Financial Reporting" as adopted by the EU and further Dan-
ish financial reporting and disclosure requirements for interim reports. Compli-
ance with IAS 34 implies observance of the principles of recognition and meas-
urement of the IFRS but also a less detailed presentation relative to the annual
report.
The Parent Interim Financial Statements for Q1/2018 have been prepared in ac-
cordance with the Executive Order on Financial Reports for Credit Institutions
and Investment Firms, etc. (the Danish executive order on the presentation of fi-
nancial reports) issued by the Danish Financial Supervisory Authority (FSA).
Changed accounting policies following implementatio n of IFRS 9 and
amendments to the Danish Executive Order on Financi al Reports
As mentioned in the Annual Report for 2017 (notes 1 and 52), IFRS 9 has been
implemented with effect from 1 January 2018. The standard includes new provi-
sions governing "classification and measurement of financial assets", "impair-
ment of financial assets" and "hedge accounting".
The Danish FSA also issued amendments to the IFRS-compatible Danish Exec-
utive Order on Financial Reports. The amended Executive Order comprises sig-
nificant IFRS 9 elements, including impairment of loans and advances at amor-
tised cost as well as classification of financial assets.
Under the provisions of IFRS 9, comparative figures for previous periods have
not been restated, as it is not possible to apply the impairment rules retrospec-
tively without post-rationalisation. The classification, measurement and impair-
ment as well as presentation of financial assets and liabilities in the comparative
figures stated in the Q1 Interim Report 2018 thus follow the same accounting
policies as described in note 1 of the Annual Report for 2017.
For the Group, an important feature of IFRS 9 is the new principles for calcula-
tion of impairment charges for loans, advances and other receivables as well as
provisions, which have prompted a DKK 566m rise in total impairment provisions
at 1 January 2018 in the Nykredit Bank Group and the Nykredit Group.
For mortgage lending in Nykredit Realkredit A/S and in the subsidiary Totalkredit
A/S, total impairment provisions and the balance sheet were not adjusted at 1
January 2018 following implementation of IFRS 9.
This is due to the fact that impairment of mortgage lending measured at fair
value is not covered by IFRS 9, cf "Accounting policies" in the Annual Report for
2017 (notes 1 and 52). Consequently, value adjustment of financial assets
measured at fair value is still determined within the framework of the provisions
set out in IFRS 13, which remain unchanged, and the Danish Executive Order
on Financial Reports.
Measurement of the credit risk relating to mortgage lending at fair value was
previously based on the same fundamental principles as applied to loans and
advances measured at amortised cost.
In accordance with amendments to the Danish Executive Order on Financial Re-
ports issued by the Danish FSA, in future, Nykredit will continue to record im-
pairments of mortgage lending applying the same principles as are used for im-
pairment of loans and advances at amortised cost (cf IFRS 9) and within the
framework of IFRS 13. Therefore, already in the Financial Statements for 2017,
Nykredit made a new accounting estimate of the impairment impact on mort-
gage lending and resolved that it would be appropriate to recognise the earnings
impact in 2017. As this is an accounting estimate and not a change in account-
ing policies, the amount was charged to the income statement. The impact led to
increased impairment provisions for mortgage lending of approx DKK 1.0bn,
which was charged to the income statement. The earnings impact after tax to-
talled about DKK 0.8bn in 2017.
Calculations of mortgage loan impairment measured at fair value involve some
adjustments relative to loans and advances measured at amortised cost. For
loans and advances measured at fair value, the probability of increased credit
losses will thus be assessed, even if the loans are not credit impaired at the date
of measurement. Furthermore, loans are not subject to impairment in stage 1
(12-month expected losses) already at the time of initial recognition, as this
would go against the principles of fair value measurement.
Group impairment charges, including Nykredit Bank's, also comprise expected
credit losses on financial assets measured at amortised cost – primarily loans
and advances, including leasing loans and balances with credit institutions –
loan commitments as well as financial guarantees. The increase has been offset
against loans and advances at amortised cost by DKK 501m and balances with
credit institutions by DKK 3m. In addition, provisions for guarantees and loan
commitments increased by DKK 62m, respectively. Reference is also made to
note 32.
Classification and measurement
The general principles for measurement of financial assets and liabilities have
changed following implementation of IFRS 9. But at Group level, the implemen-
tation has not given rise to significant changes in the presentation and classifica-
tion.
After initial recognition, financial assets must continue to be measured at amor-
tised cost, fair value through other comprehensive income or fair value through
profit or loss. The measurement is based on classification of the individual finan-
cial assets in accordance with the Group's business model.
NOTES
Nykredit Realkredit Group

Nykredit Realkredit Group – Q1 Interim Report 2018 35/66
Going forward, classification of financial instruments will be based on the follow-
ing business models:
� The asset is held to collect cash flows from payments of principal and inter-
est (hold to collect business model). Measured at amortised cost (AMC).
� The asset is held to collect cash flows from payments of principal and inter-
est and moderate sales activity (hold to collect and sell business model).
Measured at fair value with changes recognised through other comprehen-
sive income with reclassification to the income statement on realisation of
the assets (FVOCI).
� Other financial assets are measured at fair value through profit or loss
(FVPL). These include assets managed on a fair value basis, held in the
trading book or assets, where contractual cash flows do not solely comprise
interest and principal of the receivable. It is also still possible to measure fi-
nancial assets at fair value with value adjustment through profit or loss,
when such measurement significantly reduces or eliminates an accounting
mismatch that would otherwise have occurred on measurement of assets
and liabilities or recognition of losses and gains on different bases.
The principles of financial liabilities follow the accounting policies applied so far.
The Group's financial assets and business models were reviewed in 2017 to en-
sure correct classification thereof. The review included an assessment of
whether collecting cash flows is a significant element, including whether the
cash flows only consist of interest and principal.
This assessment is based on the assumption that ordinary rights to prepay loans
and/or extend loan terms fulfil the condition that the cash flow is based on col-
lection of interest and principal payments. Some product types are subject to
daily interest rate adjustment, but with an interest rate fixing based on a longer
time horizon. However, this is not assessed to significantly postpone the time
value of the money with the currently low interest rate level.
The assessment has not led to significant changes to the measurement and
classification of financial assets.
Receivables from credit institutions as well as bank loans and advances previ-
ously measured at amortised cost are still measured according to this principle.
Mortgage loans are still measured at fair value (FVPL). The same applies to the
liabilities that are issued for the purpose of funding these loans. Generally, mort-
gage loans are not transferred during their term, and the business model is
based on holding the portfolio in order to collect the cash flows. However, both
IFRS 9 and IAS 39 allows measurement at fair value through profit or loss. Mort-
gage loans granted in accordance with Danish mortgage legislation are funded
by issuing listed covered bonds of uniform terms.
Such mortgage loans may be prepaid by delivering the underlying bonds, and
the Group buys and sells self-issued covered bonds on a continuing basis as
they constitute a significant part of the Danish money market.
If mortgage loans and covered bonds in issue were measured at amortised cost,
the purchase and sale of self-issued covered bonds would lead to a timing differ-
ence between the recognition of gains and losses in the Financial Statements.
Thus, the purchase price of the portfolio would not equal the amortised cost of
the bonds in issue. If the portfolio of self-issued covered bonds was subse-
quently sold, the new amortised cost of the "new issue" would not equal the
amortised cost of the matching mortgage loans, and the difference would be
amortised over the remaining term-to-maturity.
In order to avoid the consequently inconsistent earnings impact, mortgage loans
are measured at fair value involving an adjustment for the market risk based on
the value of the underlying bonds and an adjustment for credit risk based on the
impairment need.
In connection with the implementation of IFRS 9, the following reclassifications
were made:
� Repo lending, which was previously included in "Loans, advances and other
receivables at amortised cost", are at 1 January 2018 included in "Loans, ad-
vances and other receivables at amortised cost". The reclassification has not
given rise to value adjustments, as the difference between fair value and net
amortised cost was insignificant at 1 January 2018.
� At 31 December 2017, the Nykredit Group held a portfolio of strategic equi-
ties that are value adjusted through other comprehensive income. At 1 Janu-
ary 2018, the portfolio was reclassified to the effect that value adjustment will
be recognised through profit or loss in line with other equities and be in-
cluded in "Equities measured at fair value through profit or loss". The portfo-
lio totalled approximately DKK 2.5bn at 31 December 2017.
After this the Group will have no financial assets that are measured at fair value
and value adjusted through other comprehensive income (FVOCI).
Other financial assets, including securities in the form of bonds and equities, will
be measured at fair value through profit or loss after initial recognition. In relation
to the bond portfolio, this should in Nykredit's assessment not be subject to the
two business models that form the basis for measurement at amortised cost or
measurement at fair value and value adjusted through other comprehensive in-
come. The reason is that the business model behind the portfolio is not intrinsi-
cally based on collecting cash flows from payments of principal and interest but
is based on, for example, short-term trading activity and investments focused on
cost minimisation, where contractual cash flows do not constitute a central ele-
ment but follow solely from the investment.
Measurement at fair value is otherwise performed according to unchanged prin-
ciples, cf IFRS 13, which are unchanged.
NOTES
Nykredit Realkredit Group

36/66 Q1 Interim Report 2018 – Nykredit Realkredit Group
Generally, financial liabilities should continue to be measured at amortised cost
after initial recognition and separated from the embedded derivative financial in-
struments, if these are not closely related to the host contract. However, finan-
cial liabilities, which are issued with a view to funding mortgage lending, are
measured at fair value through profit or loss, corresponding to previous practice.
Repo deposits were previously measured at fair value, but this was changed to-
gether with the relassification of repo lending. From and including 1 January
2018 repo deposits will be measured at amortised cost to attain a uniform ac-
counting treatment. The reclassification of repo lending and deposits impacted
measurement by an insignificant amount in Q1/2018.
Irrespective of the fact that a number of financial assets and liabilities must gen-
erally be measured at amortised cost, measurement at fair value is possible if
the fair value measurement eliminates or reduces an accounting mismatch that
would otherwise follow from different type measurement of one or more financial
instruments. Financial liabilities may also be measured at fair value if the instru-
ment is part of an investment strategy or a risk management system based on
fair values and is continuously stated at fair value in the reporting to Manage-
ment.
Derivative financial instruments (derivatives), which are assets or liabilities, are
measured at fair value through profit or loss, and this is unchanged compared
with current practice. Hedging interest rate risk (hedge accounting) is still made
according to the IAS 39 rules, in part as IFRS 9 does not yet comprise provi-
sions on macro hedging.
Equity instruments are not based on cash flows which comprise payment of prin-
cipal and interest. Therefore, these instruments will still be measured at fair
value with value adjustment through profit or loss (FVPL), as the Group has cho-
sen not to recognise value adjustment through other comprehensive income
(FVOCI).
Impairment for expected credit losses
For the Nykredit Group, an important feature of IFRS 9 is the new principles for
calculation of impairment of mortgage lending at fair value, loans, advances and
receivables as well as provisions for guarantees and loan commitments, includ-
ing unutilised credit facilities measured at amortised cost.
According to IAS 39, impairment was based on objective impairment criteria. Im-
plementation of IFRS 9 means that going forward impairment of loans and ad-
vances will be based on expected credit losses and that already at the time of
granting (stage 1), loans and advances are subject to impairment corresponding
to the expected credit losses arising from default within 12 months. This has led
to increased impairment provisions. Mortgage lending measured at fair value is
not subject to impairment for credit losses already at initial recognition, cf the
above.
Loans are impaired in three stages depending on whether the credit risk has in-
creased significantly since initial recognition:
� Stage 1 covers loans and advances without significant increase in credit risk.
These are subject to impairments corresponding to expected credit losses in
the event of default within the next 12 months. Loans and advances meas-
ured at amortised cost are subject to impairment already at the time of grant-
ing.
� Stage 2 covers loans and advances with significant increase in credit risk.
These are subject to impairment corresponding to expected credit loss dur-
ing the time-to-maturity.
� Stage 3 covers loans and advances in default or otherwise impaired. These
are subject to impairment according to the same principles as loans and ad-
vances in stage 2 based on expected credit losses during the time-to-ma-
turity, but with the difference that interest income attributable to the impaired
part of loans and advances measured at amortised cost, is not recognised
through profit or loss.
Impairment calculations are based on further development of existing methods
and models for impairment, taking into account forward-looking information and
scenarios. The definition of default has not been changed and will continue be-
ing dictated by the customer's financial position and payment behaviour (90-day
arrears).
In expected loss calculations, time-to-maturity corresponds to the contractual
maturity as a maximum, as adjustments are made for expected prepayments, as
required. Nevertheless, for credit-impaired financial assets, the determination of
expected losses should be based on contractual maturity.
Model-based impairment in stages 1 and 2 are based on transformations of PD
and LDG values to short-term (12 months) or long term (remaining life of the
product/cyclicality). The parameters are based on Nykredit's IRB models, and
forward-looking information is determined according to the same principles as
apply to regulatory capital and stress tests. For a small fraction of portfolios with
no IRB parameters, simple methods are used based on appropriate loss ratios.
A key element of the determination of impairment is establishing when a finan-
cial asset should be transferred from stage 1 to stage 2. The following principles
apply:
� For assets/facilities with 12-month PD <1% at the time of granting: Increased
PD for expected time-to-maturity of the financial asset of 100% and an in-
crease in 12-month PD of 0.5pp.
� For assets/facilities with 12-month PD >1% at the time of granting: Increased
PD for expected time-to-maturity of the financial asset of 100% or an in-
crease in 12-month PD of 2.0pp.
� The Group considers that a significant increase in credit risk has occurred no
later than when an asset is more than 30 days past due, unless special cir-
cumstances apply.
NOTES
Nykredit Realkredit Group

Nykredit Realkredit Group – Q1 Interim Report 2018 37/66
In stages 1 and 2, impairments are based on a number of potential outcomes
(scenarios) of a customer's financial situation. In addition to historical experi-
ence, the models should reflect current conditions and future outlook at the bal-
ance sheet date. The inclusion of scenarios must be probability-weighted and
unbiased.
The choice of macro scenarios is significant to total impairments which is very
sensitive to the choice of scenarios and probability weights.
Generally, three scenarios are applied:
� scenario reflecting the best estimate of the company (base-line)
� scenario reflecting high expected credit losses
� scenario with minor expected credit losses to cover an appropriate number
of likely losses based on the best estimate of the company. Due to the cur-
rently favourable economic trends and the financial strength of our custom-
ers, the base-line and a fairly positive scenario currently seem to coincide. In
case of changed economic trends, a scenario with an improved future out-
look will be part of the calculation method.
The calculation of macro-economic scenarios is based on the assumptions of eg
interest rates and property prices used to determine the internal capital ade-
quacy requirement. The base-line scenario is considered best estimate and is
included in the transaction matrices. The low scenario which leads to high ex-
pected credit losses corresponds to a "mild" stress in the capital model (used to
determine the internal capital adequacy requirement).
Stage 3 includes loans and advances/facilities where observations indicate that
the asset is credit impaired. Most often, this is where
� a borrower is experiencing considerable financial difficulties of owing to eg
changes in income, financial assets and wealth, leading to the assumption
that the customer is unable to fulfil their obligations
� a borrowers fails to meet their payment obligations
� there is an increased probability of bankruptcy or similar associated with a
borrower
� a borrower is offered reduced payment arrangements (for example, interest
rate and loan term) due to deterioration in the borrower's financial circum-
stances.
Relative to large stage 3 exposures, credit officers perform an individual assess-
ment of scenarios as well as changes to credit losses. Relative to small stage 3
exposures, the credit loss is determined using a portfolio model according to the
same principles as are used in an individual assessment.
Model-based impairment is still subject to management judgement according to
the same principles as are applied under the previous rules (IAS 39) and is sup-
plemented with an assessment of an improved/worsened macro scenario for the
long-term Probability of Default (PD).
Impairments are offset against the relevant assets (loans, advances and receiv-
ables as well as bonds). Impairment provisions for guarantees and loan commit-
ments are recognised as a liability.
Changed presentation of financial highlights and bu siness areas
Earnings presentation in Management Commentary and business areas
Presentations in the Management Commentary, including financial highlights, as
well as notes 3 and 4, were changed in the Q1-Q3/2017 interim reports. Com-
parative figures for Q1/2017 have been restated.
The change followed from a number of adjustments made by Management in
2017 to the internal reporting that forms an integral part of the governance of the
Company. The presentation has been changed primarily to present a more var-
ied picture of the Group's income.
This information is considered important and relevant to readers of the external
Financial Statements as a supplement to the income statement. Review of re-
sults for the period in the Management Commentary is consequently based on
the regular reports made to and considered by Management.
The most important change is that income will be broken down into several
items going forward, differentiating more clearly between stable types of income
and relatively more volatile income from trading and investment portfolio income,
for instance. Furthermore, investment portfolio income is recognised in "Income"
contrary to previously, when investment portfolio income was recognised as a
separate item.
In future reports the former "Profit from core business" will be replaced by the
new key item "Business profit". The difference between the two items is primarily
that "Business profit" comprises the former item "Investment portfolio income"
which is now included in "Income".
This implies a new presentation of income in the income statement grouped in
two main items; "Income" and "Legacy derivatives". In addition, income is di-
vided into five sub-items. The principles of recognition and measurement are
identical. The change is further described in note 1 of the Q1-Q3 Interim Report
2017 as well as the Annual Report for 2017.
Implementation of IFRS 15 "Revenue from contracts w ith customers"
The standard which was implemented on 1 January 2018 has not impacted the
Financial Statements for Q1/2018.
Significant accounting estimates and assessments
Measurement of certain assets and liabilities is based on accounting estimates
made by Group Management.
The areas in which assumptions and estimates significant to the financial state-
ments have been made include provisions for loan and receivable impairment,
unlisted financial instruments and provisions of the Annual Report for 2017.
Other information
Apart from the above changes made due to the implementation of IFRS 9, the
accounting policies are otherwise unchanged compared with the Annual Report
for 2017. For a full description of the Group's and the Parent's accounting poli-
cies, please refer to note 1 of the Annual Report for 2017, which is available at
nykredit.com/reports.
All figures in the Q1/2018 Financial Statements are rounded to the nearest mil-
lion Danish kroner (DKK). Due to the rounding-off to the nearest whole million
Danish kroner, the sum of individual figures and the stated totals may differ
slightly.
NOTES
Nykredit Realkredit Group

38/66 Q1 Interim Report 2018 – Nykredit Realkredit Group
DKK million
Nykredit Realkredit A/S Nykredit Realkredit Group
31.12.2017 31.03.2018 31.03.2018 31.12.2017
2. CAPITAL AND CAPITAL ADEQUACY
78,847 75,971 Equity for accounting purposes 75,956 78,847
- - Minority interests not included (1,646) (1,646)
(3,765) (3,826) Carrying amount of Additional Tier 1 capital recognised in equity (3,826) (3,765)
- (1,610) Profit for the period not included (1,610) -
75,082 70,536 Equity excluding Additional Tier 1 capital 68,874 73,436
(4,100) - Proposed dividend - (4,100)
(32) (36) Prudent valuation adjustment (68) (65)
- - Minority interests 685 815
(156) (163) Intangible assets excluding deferred tax liabilities (190) (184)
(124) (155) Provisions for expected credit losses in accordance with IRB approach - -
(327) (309) Other additions/deductions (309) (327)
90 - Transitional adjustment of deductions - 65
(4,649) (662) Common Equity Tier 1 capital deductions 119 (3,795)
70,433 69,874 Common Equity Tier 1 capital 68,993 69,641
3,723 3,725 Additional Tier 1 capital 3,741 3,860
(151) (78) Additional Tier 1 capital deductions (86) (159)
18 - Transitional adjustment of deductions - 3
3,589 3,647 Total Additional Tier 1 capital after deductions 3,655 3,704
74,022 73,521 Tier 1 capital 72,648 73,345
10,795 10,804 Tier 2 capital 10,900 11,519
227 (49) Tier 2 capital additions/deductions 168 461
3 - Transitional adjustment of deductions - (129)
85,048 84,276 Own funds 83,716 85,196
388,864 391,302 Credit risk 295,284 290,643
12,127 10,783 Market risk 21,354 24,724
12,189 12,910 Operational risk 25,709 21,246
413,180 414,995 Total risk exposure amount 342,347 336,613
Financial ratios
17.0 16.8 Common Equity Tier 1 capital ratio, % 20.1 20.6
17.9 17.7 Tier 1 capital ratio, % 21.2 21.7
20.5 20.3 Total capital ratio, % 24.4 25.3
Capital and capital adequacy have been determined in accordance with Capital Requirements Regulation (EU) No 575/2013 of the European Parliament and of the Coun-
cil of 26 June 2013.
Nykredit has been designated as a systemically important financial institution (SIFI) by the Danish authorities. As a result, a special SIFI CET1 capital buffer requirement
will apply to the Nykredit Realkredit Group. The requirement of 2% is being phased in and currently constitutes 1.6%. To this should be added the phase-in of the perma-
nent buffer requirement, currently 1.88%, applicable to all financial institutions.
In the Group's capital determination, a deduction has been made for parts of Totalkredit's non-distributable reserve fund. The deduction is based on the assessment of the
Danish FSA that the non-distributable reserve fund cannot be recognised fully according to a decision made by the Danish FSA concerning the non-distributable reserve
fund of another financial undertaking. Nykredit does not agree with the assessment of the Danish FSA and expects to discuss the issue with the Danish FSA from a legal
perspective in the course of 2018 with a view to reaching a formal decision concerning the treatment of Totalkredit's non-distributable reserve fund for capital adequacy
purposes. The deduction totals DKK 843m, consisting of a CET1 capital deduction of DKK 961m and additions to Tier 1 capital and own funds of DKK 18m and DKK
100m, respectively.
NOTES

Nykredit Realkredit Group – Q1 Interim Report 2018 39/66
DKK million
Nykredit Realkredit Group
3. BUSINESS AREAS
The business areas reflect Nykredit's organisation and internal reporting. Retail serves personal customers as well as small and medium-sized enterprises (SMEs). Wholesale Clients comprises activities with corporate and institutional clients, securities trading and derivatives trading. Wealth Management
comprises wealth and asset management activities. Please refer to the Management Commentary.
The presentation is based on the segments used for the internal management reporting.
Results
Q1/2018 Per
sona
l B
anki
ng
Bus
ines
s
Ban
king
Tot
al R
etai
l
Tot
alkr
edit
Par
tner
s
Cor
pora
te &
In
stitu
tiona
l B
anki
ng
Mar
kets
Tot
al
Who
lesa
le
Clie
nts
Wea
lth
Man
agem
ent
Gro
up It
ems
Tot
al
RESULTS BY BUSINESS AREA Net interest income 466 718 1,184 632 372 - 372 28 (2) 2,214
Net fee income 159 121 280 134 113 - 113 5 (7) 524
Wealth management income 86 36 122 - 14 - 14 172 5 313
Net interest from capitalisation (19) (43) (63) (41) (22) (2) (25) (2) 39 (90)
Trading, investment portfolio and other income 9 111 120 1 27 112 139 3 (2) 261
Income 702 942 1,643 726 503 110 613 207 33 3,222
Costs 488 272 760 133 100 54 154 110 33 1,190
Business profit (loss) before impairment charges 214 670 883 593 403 56 459 97 (0) 2,032
Impairment charges for loans and advances 112 (127) (15) (86) 98 - 98 (5) (0) (8)
Business profit 101 797 898 678 305 56 361 102 0 2,039
Legacy derivatives 0 8 9 - 10 5 16 (0) - 24
Profit before tax 101 805 907 678 315 61 377 102 0 2,064
BALANCE SHEET Assets
Mortgage loans at fair value 179,557 237,747 417,303 552,037 191,307 - 191,307 8,043 - 1,168,690
Reverse repurchase lending 36,726 36,726
Loans and advances at amortised cost 11,800 20,311 32,111 - 20,343 - 20,343 3,446 1,228 57,128
Assets by business area 191,356 258,058 449,414 552,037 211,650 - 211,650 11,489 37,954 1,262,544
Unallocated assets 155,547
Total assets 1,418,092
Liabilities and equity
Repo deposits 17,468 17,468
Bank deposits and other payables at
amortised cost 27,719 17,498 45,217 - 9,422 - 9,422 12,663 2,706 70,008
Liabilities by business area 27,719 17,498 45,217 - 9,422 - 9,422 12,663 20,174 87,475
Unallocated liabilities 1,254,660
Equity 75,956
Total liabilities and equity 1,418,092
The income statement format was adjusted in Q3/2017 in some areas. The previous income statement items "Income from core business" and "Profit from core business" have been replaced by "Income" and "Business profit". Compared with previously, these items now comprise "Investment portfolio income" which was separated out from core business but will be recognised as an integral part of "Income" ("Trading, investment portfolio and other income") going forward. Another important element is a more detailed presentation reflecting partly the composition of income and origin in the individual business divisions, and partly the degree of volatility of the individual items. Previously, income from the business divisions was presented as one single item, "Core income from busi-ness operations". In future income will be divided into and presented as five different items: "Net interest income" comprising net administration margin income from mortgage lending, including KundeKroner discounts as well as interest income from bank lending and deposits. "Net fee income" comprising income from mortgage refinancing and mortgage lending, income from bank lending, service fees, guarantee and leasing business. "Wealth management income" comprising asset management and administration fees. This item pertains to business with customers performed through the Group's entities Nykredit Markets, Nykredit Asset Management and Nykredit Portefølje Administration A/S but where income is ascribed to the business divisions serving the customers. "Net interest from capitalisation" comprising the risk-free interest attributable to equity and net interest from subordinated debt. Net interest is composed of the interest expenses related to debt, adjusted for the internal liquidity interest. "Trading, investment portfolio and other income", which includes income from swaps currently offered, derivatives transactions, Nykredit Markets activities, repo deposits and lending, debt capital markets activities as well as other income and expenses not allocated to the business divisions, including income from the sale of real estate. The organisation of the business areas is unchanged compared with previously. Capital costs previously recognised in Group Items have been allocated to the business divisions and the allocation key has been adjusted.
NOTES

40/66 Q1 Interim Report 2018 – Nykredit Realkredit Group
DKK million
Nykredit Realkredit Group
3. BUSINESS AREAS (CONTINUED)
Results
Q1/2017 Per
sona
l B
anki
ng
Bus
ines
s
Ban
king
Tot
al R
etai
l
Tot
alkr
edit
P
artn
ers
Cor
pora
te &
In
stitu
tiona
l B
anki
ng
Mar
kets
Tot
al
Who
lesa
le
Clie
nts
Wea
lth
Man
agem
ent
Gro
up It
ems
Tot
al
RESULTS BY BUSINESS AREA Net interest income 479 713 1,192 668 357 - 357 22 (0) 2,239
Net fee income 173 139 312 134 135 - 135 4 (3) 582
Wealth management income 94 52 145 - 8 - 8 184 4 342
Net interest from capitalisation (22) (47) (69) (48) (21) (2) (23) (2) 34 (107)
Trading, investment portfolio and other income 2 183 185 (5) 56 147 203 4 365 752
Income 726 1,040 1,766 749 535 146 681 212 400 3,808
Costs 489 280 769 151 93 41 135 110 15 1,178
Business profit before impairment charges 237 760 997 598 442 104 546 103 386 2,630
Impairment charges for loans and advances (7) 56 49 11 (78) - (78) (5) 0 (21)
Business profit 244 704 948 587 520 104 624 107 385 2,651
Legacy derivatives - 161 161 - 151 24 175 0 - 337
Profit before tax 244 865 1,109 587 671 128 799 108 385 2,988
BALANCE SHEET Assets
Mortgage loans at fair value 184,564 243,758 428,322 516,496 182,687 - 182,687 5,992 - 1,133,497
Reverse repurchase lending 23,449 23,449
Loans and advances at amortised cost 12,362 18,786 31,148 - 21,982 - 21,982 3,002 493 56,625
Assets by business area 196,926 262,544 459,470 516,496 204,669 - 204,669 8,993 23,943 1,213,571
Unallocated assets 176,645
Total assets 1,390,216
Liabilities and equity
Repo deposits 6,021 6,021
Bank deposits and other payables at
amortised cost 26,085 17,861 43,945 - 12,887 15 12,902 9,751 1,135 67,733
Liabilities by business area 26,085 17,861 43,945 - 12,887 15 12,902 9,751 7,156 73,753
Unallocated liabilities 1,243,165
Equity 73,297
Total liabilities and equity 1,390,216
NOTES

Nykredit Realkredit Group – Q1 Interim Report 2018 41/66
DKK million
Nykredit Realkredit Group
4. RECONCILIATION OF INTERNAL AND REGULATORY INCOME
STATEMENT Q1/2018 Q1/2017
Ear
ning
s pr
esen
tatio
n
in M
anag
emen
t C
omm
enta
ry
Rec
lass
ifica
tion
Inco
me
st
atem
ent
Ear
ning
s pr
esen
tatio
n
in M
anag
emen
t C
omm
enta
ry
Rec
lass
ifica
tion
Inco
me
st
atem
ent
Net interest income 2,214 468 2,682 2,239 666 2,905
Dividend on equities 22 22 32 32
Fee and commission income, net 524 (643) (118) 582 (665) (82)
Net interest and fee income (153) 2,585 34 2,855
Wealth management income 313 (313) - 342 (342) -
Net interest from capitalisation (90) 90 - (107) 107 -
Trading, investment portfolio and other income 261 (261) - 752 (752) -
Value adjustments 442 442 1,242 1,242
Other operating income 217 217 44 44
Total income 3,222 3,808
Costs 1,190 - 1,190 1,178 - 1,178
Business profit before impairment charges 2,032 2,630
Impairment charges for loans and advances (8) - (8) (21) - (21)
Profit from investments in associates 1 1 4 4
Business profit 2,039 2,651
Legacy derivatives 24 (24) - 337 (337) -
Profit before tax 2,063 - 2,063 2,988 - 2,988
Note 4 combines the presentation of income in the Management Commentary (internal presentation), including the financial highlights and business areas, and the formal
income statement of the Financial Statements.
The most important difference is that all income is recognised in two main items in the internal presentation: "Income" including sub-items and "Legacy derivatives". The
sum of these two items thus corresponds to "Net interest and fee income", "Value adjustments" and "Other operating income" in the income statement of the Financial
Statements. The column "Reclassification" thus comprises only differences between the internal presentation and the income statement with respect to these items.
Costs in the internal presentation correspond to total costs recognised in the Financial Statements: "Staff and administrative expenses", "Depreciation, amortisation and
impairment charges for property, plant and equipment as well as intangible assets" and "Other operating expenses".
Impairment charges for loans and advances correspond to the presentation in the income statement.
The internal presentation is based on the same recognition and measurement principles as the IFRS-based Financial Statements. Thus, profit before tax is identical.
NOTES

42/66 Q1 Interim Report 2018 – Nykredit Realkredit Group
DKK million
Nykredit Realkredit Group
5. NET INTEREST INCOME AND VALUE ADJUSTMENTS
Q1/2018 Interest income
Interest expenses
Net interest income
Dividend of equities
Value adjustments Total
Financial portfolios at amortised cost Receivables from and payables to credit institutions and central banks (9) 8 (18) - - (18)
Lending and deposits 490 (11) 501 - - 501
Repo transactions and reverse repurchase lending (43) (34) (9) - 3 (6)
Subordinated debt - 89 (89) - - (89)
Other financial instruments 22 25 (3) - - (3)
Total 460 77 383 - 3 386
Financial portfolios at fair value and financial in struments at fair value
Mortgage loans and bonds in issue 5,963 3,689 2,274 - 30 2,304
Bonds 121 - 121 - 10 131
Equities - - - 22 73 95
Derivative financial instruments (97) - (97) - 301 204
Total 5,987 3,689 2,298 22 414 2,734
Foreign currency translation adjustment 27 27
Net interest income and value adjustments 6,447 3,766 2,682 22 443 3,147
Q1/2017
Financial portfolios at amortised cost Receivables from and payables to credit institutions and central banks (9) 5 (14) - - (14)
Lending and deposits 468 2 465 - - 465
Subordinated debt - 90 (90) - - (90)
Other financial instruments 25 14 11 - - 11
Total 484 112 372 - - 372
Financial portfolios at fair value and financial in struments at fair value
Mortgage loans and bonds in issue 6,396 3,980 2,417 - 100 2,517
Repo transactions and reverse repurchase lending (25) (31) 6 - (0) 6
Bonds 205 - 205 - 407 612
Equities - - - 32 91 123
Investment properties - - - - (1) (1)
Derivative financial instruments (95) - (95) - 625 531
Total 6,481 3,948 2,533 32 1,223 3,788
Foreign currency translation adjustment 20 20
Net interest income and value adjustments 6,966 4,060 2,905 32 1,242 4,180
NOTES

Nykredit Realkredit Group – Q1 Interim Report 2018 43/66
DKK million
Nykredit Realkredit A/S Nykredit Realkredit Group
Q1/2017 Q1/2018 Q1/2018 Q1/2017
6. INTEREST INCOME
1 (9) Receivables from credit institutions and central banks (16) (11)
3,937 3,654 Loans, advances and other receivables 4,158 4,403
1,007 999 Administration margin income 2,259 2,438
Bonds 47 37 - self-issued covered bonds (SDOs, ROs) 65 78
82 56 - other covered bonds 75 149
16 14 - government bonds 14 20
33 19 - other bonds 30 41
Derivative financial instruments (5) (6) - foreign exchange contracts 12 17
51 (10) - interest rate contracts (108) (108)
- - - equity contracts (1) (3)
- - - other contracts (0) (0)
23 20 Other interest income 22 25
5,192 4,775 Total 6,509 7,048
(47) (37) Set-off of interest from self-issued covered bonds – note 7 (65) (78)
(1) (1) Set-off of interest from self-issued other bonds – note 7 3 (4)
5,143 4,737 Total 6,447 6,966
Of which interest income from reverse repurchase le nding entered as: (6) (10) Receivables from credit institutions and central banks (7) (2)
- - Loans, advances and other receivables (36) (23)
7. INTEREST EXPENSES
(15) (4) Credit institutions and central banks 0 (3)
(4) (12) Deposits and other payables (38) (21)
3,999 3,701 Bonds in issue 3,751 4,062
90 89 Subordinated debt 89 90
10 7 Other interest expenses 25 14
4,081 3,780 Total 3,827 4,143
(47) (37) Set-off of interest from self-issued covered bonds – note 6 (65) (78)
(1) (1) Set-off of interest from self-issued other bonds – note 6 3 (4)
4,032 3,743 Total 3,766 4,060
Of which interest expenses from repo transactions e ntered as: (19) (4) Credit institutions and central banks (8) (8)
(4) (12) Deposits and other payables (26) (23)
NOTES

44/66 Q1 Interim Report 2018 – Nykredit Realkredit Group
DKK million
Nykredit Realkredit A/S Nykredit Realkredit Group
Q1/2017 Q1/2018 Q1/2018 Q1/2017
8. VALUE ADJUSTMENTS
Assets measured at fair value through profit or los s 962 (275) Mortgage loans, a) (886) 2,625
1,683 (573) Totalkredit mortgage loan funding, a) - -
(35) (4) Other loans, advances and receivables at fair value, b) 3 -
88 (57) Bonds, b) 10 407
91 67 Equities, b) 73 91
- - Investment properties - (1)
3 (1) Foreign exchange 27 20
(6) 78 Foreign exchange, interest rate and other contracts as well as derivative financial instruments, b) 301 625
Liabilities measured at fair value through profit o r loss (861) 305 Bonds in issue, a) 916 (2,525)
(1,683) 573 Other liabilities - -
241 114 Total 443 1,242
a) Financial assets and liabilities classified at fair value on initial recognition.
b) Financial assets and liabilities classified under the trading book.
9. STAFF AND ADMINISTRATIVE EXPENSES
14 13 Remuneration of Board of Directors and Executive Board 13 14
440 474 Staff expenses 721 664
227 205 Other administrative expenses 394 414
681 692 Total 1,127 1,092
Remuneration of Board of Directors and Executive Bo ard
Board of Directors 1 1 Fees 1 1
Executive Board 10 10 Base salaries 10 10
4 2 Pensions 2 4
14 13 Total 13 14
Staff expenses 332 363 Salaries 561 508
43 45 Pensions 63 62
61 63 Payroll tax 93 89
4 3 Other social security expenses 4 6
440 474 Total 721 664
Number of staff 2,566 2,409 Average number of staff for the financial period, full-time equivalent 3,376 3,560
10. DEPRECIATION, AMORTISATION AND IMPAIRMENT CHARG ES FOR PROPERTY, PLANT AND
EQUIPMENT AS WELL AS INTANGIBLE ASSETS
Intangible assets 21 15 - amortisation 16 25
Property, plant and equipment 17 8 - depreciation 10 21
39 23 Total 26 46
NOTES

Nykredit Realkredit Group – Q1 Interim Report 2018 45/66
DKK million
11. IMPAIRMENT CHARGES FOR LOANS, ADVANCES AND RECE IVABLES
Nykredit Realkredit Group
Loans and ad-vances
Loans and ad-vances
Guaran-tees
Guaran-tees
Credit institu-
tions and
other
Credit institu-
tions and
other Total Total
2018 2017 2018 2017 2018 2017 2018 2017
Total impairment provisions Beginning of period 7,857 8,288 58 52 - 44 7,916 8,384
Impact following implementation of IFRS 9 506 62 3 571
Balance, 1 January 2018 8,363 120 3 8,487
New impairment provisions as a result of additions and change in credit risk 2,636 1,655 85 8 1 2,723 1,663
Releases as a result of prepayments and change in credit risk 2,727 1,562 18 10 2 - 2,747 1,572
Impairment provisions written off 241 282 - - 241 282
Transferred to "Impairment provisions for properties acquired by foreclosure" 7 49 - - - 7 49
Total provisions for impairment of loans, advances and receivables, and for guarantees 8,025 8,051 187 49 2 44 8,214 8,144
Earnings impact
Change in impairment provisions for loans and advances
(individual and collective) 94 (2) - 91
Change in impairment provisions for loans and advances (stages 1-3) (90) 67 (1) (23) -
Write-offs for the period, not previously provided for 80 34 - - 80 34
Recoveries on claims previously written off 13 67 13 67
Total (23) 61 67 (2) (1) - 44 58
Value adjustment of assets in temporary possession (17) (4) (17) (4)
Value adjustment of claims previously written off 15 (19) 15 (19)
Losses offset, cf partnership agreement concluded (49) (57) (49) (57)
Earnings impact, Q1 (73) (19) 67 (2) (1) - (8) (21)
Nykredit Realkredit A/S
Total impairment provisions Beginning of period 4,004 4,620 - - - 21 4,004 4,642
Impact following implementation of IFRS 9 -
Balance, 1 January 2018 4,004 - - - 4,004
New impairment provisions as a result of additions and change in credit risk 1,314 773 - - - 1,314 773
Releases as a result of prepayments and change in credit risk 1,508 (718) - - - - 1,508 (718)
Impairment provisions written off 94 (139) - - 94 (139)
Transferred to "Impairment provisions for properties acquired by foreclosure" 4 (32) - 4 (32)
Total provisions for impairment of loans, advances and receivables, and for guarantees 3,712 4,505 - - - 21 3,712 4,526
Earnings impact Change in impairment provisions for loans and advances
(individual and collective) 55 - - - 55
Change in impairment provisions for loans and advances (stages 1-3) (195) - - (195) -
Write-offs for the period, not previously provided for 81 11 - - 81 11
Recoveries on claims previously written off (14) (21) (14) (21)
Total (127) 45 - - - - (127) 45
Value adjustment of assets in temporary possession (17) 1 (17) 1
Value adjustment of claims previously written off 2 (16) 2 (16)
Losses offset, cf partnership agreement concluded - - - -
Earnings impact, Q1 (143) 30 - - - - (143) 30
NOTES
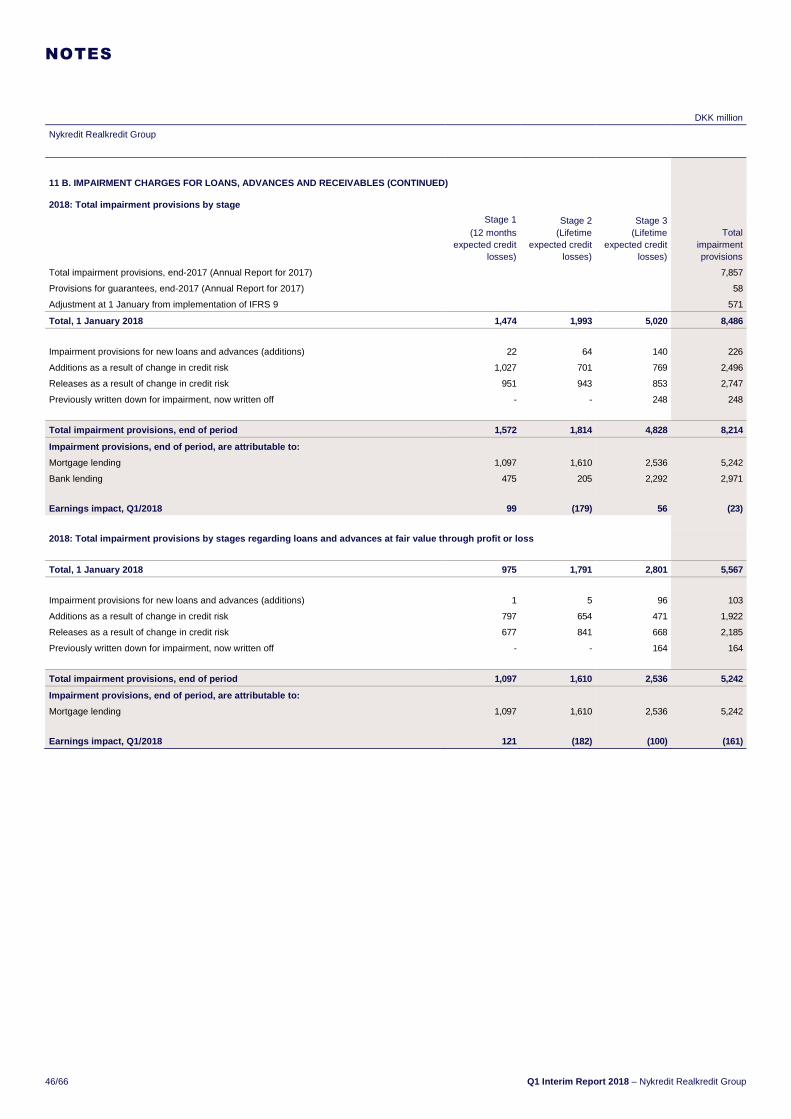
46/66 Q1 Interim Report 2018 – Nykredit Realkredit Group
DKK million
Nykredit Realkredit Group
11 B. IMPAIRMENT CHARGES FOR LOANS, ADVANCES AND RE CEIVABLES (CONTINUED)
2018: Total impairment provisions by stage
Stage 1 (12 months
expected credit losses)
Stage 2 (Lifetime
expected credit losses)
Stage 3 (Lifetime
expected credit losses)
Total impairment provisions
Total impairment provisions, end-2017 (Annual Report for 2017) 7,857
Provisions for guarantees, end-2017 (Annual Report for 2017) 58
Adjustment at 1 January from implementation of IFRS 9 571
Total, 1 January 2018 1,474 1,993 5,020 8,486
Impairment provisions for new loans and advances (additions) 22 64 140 226
Additions as a result of change in credit risk 1,027 701 769 2,496
Releases as a result of change in credit risk 951 943 853 2,747
Previously written down for impairment, now written off - - 248 248
Total impairment provisions, end of period 1,572 1,814 4,828 8,214
Impairment provisions, end of period, are attributa ble to: Mortgage lending 1,097 1,610 2,536 5,242
Bank lending 475 205 2,292 2,971
Earnings impact, Q1/2018 99 (179) 56 (23)
2018: Total impairment provisions by stages regardi ng loans and advances at fair value through profit or loss
Total, 1 January 2018 975 1,791 2,801 5,567
Impairment provisions for new loans and advances (additions) 1 5 96 103
Additions as a result of change in credit risk 797 654 471 1,922
Releases as a result of change in credit risk 677 841 668 2,185
Previously written down for impairment, now written off - - 164 164
Total impairment provisions, end of period 1,097 1,610 2,536 5,242
Impairment provisions, end of period, are attributa ble to: Mortgage lending 1,097 1,610 2,536 5,242
Earnings impact, Q1/2018 121 (182) (100) (161)
NOTES

Nykredit Realkredit Group – Q1 Interim Report 2018 47/66
DKK million
Nykredit Realkredit Group
11 B. IMPAIRMENT CHARGES FOR LOANS, ADVANCES AND RE CEIVABLES (CONTINUED)
2018: Total impairment provisions by stage regardin g loans and advances at amortised cost
Stage 1 (12 months
expected credit losses)
Stage 2 (Lifetime
expected credit losses)
Stage 3 (Lifetime
expected credit losses)
Total impairment provisions
Total impairment provisions, end-2017 (Annual Report for 2017) 2,290
Provisions for guarantees, end-2017 (Annual Report for 2017) 58
Adjustment at 1 January from implementation of IFRS 9 571
Total, 1 January 2018 499 202 2,219 2,919
Impairment provisions for new loans and advances (additions) 20 59 44 124
Additions as a result of change in credit risk 230 46 298 575
Releases as a result of change in credit risk 274 103 186 562
Previously written down for impairment, now written off - - 84 84
Total impairment provisions, end of period 475 205 2,292 2,971
Impairment provisions, end of period, are attributa ble to:
Bank lending 475 205 2,292 2,971
Earnings impact, Q1/2018 (22) 3 157 137
2017: Total impairment provisions
Individual impairment provisions
Collective impairment provisions
Banks and other
Provisions for guarantees
Total impairment provisions
Impairment provisions, beginning of period 6,003 2,285 44 52 8,384
Additions as a result of change in credit risk 616 8 624
Releases as a result of change in credit risk (535) 13 - (10) (533)
Impairment provisions for properties acquired by foreclosure (49) (49)
Previously written down for impairment, now written off (282) (282)
Total impairment provisions, 31 March 2017 5,753 2,298 44 49 8,144
Earnings impact, Q1/2017 81 13 - (2) 91
NOTES

48/66 Q1 Interim Report 2018 – Nykredit Realkredit Group
DKK million
Nykredit Realkredit A/S
11 B. IMPAIRMENT CHARGES FOR LOANS, ADVANCES AND RE CEIVABLES (CONTINUED) 2018: Total impairment provisions by stage
Stage 1 (12 months
expected credit losses)
Stage 2 (Lifetime
expected credit losses)
Stage 3 (Lifetime
expected credit losses)
Total impairment provisions
Total impairment provisions, end-2017 (Annual Report for 2017) 4,004
Total, 1 January 2018 528 951 2,524 4,004
Impairment provisions for new loans and advances (additions) 1 4 96 102
Additions as a result of change in credit risk 498 363 351 1,212
Releases as a result of change in credit risk 432 520 557 1,508
Previously written down for impairment, now written off - - 98 98
Total impairment provisions, end of period 596 798 2,317 3,712
Impairment provisions, end of period, are attributa ble to:
Mortgage lending 596 798 2,317 3,712
Earnings impact, Q1/2018 68 (153) (110) (195)
2017: Total impairment provisions
Individual impairment provisions
Collective impairment provisions
Banks and other
Total impairment provisions
Impairment provisions, beginning of period 3,043 1,577 21 4,642
Additions as a result of change in credit risk 295 478 - 773
Releases as a result of change in credit risk (219) (499) - (718)
Impairment provisions for properties acquired by foreclosure (32) - - (32)
Previously written down for impairment, now written off (139) - - (139)
Total impairment provisions, end of period 2,948 1,556 21 4,526
Earnings impact, Q1/2017 76 (21) - 55
NOTES

Nykredit Realkredit Group – Q1 Interim Report 2018 49/66
DKK million
11 C. DISTRIBUTION OF PROVISIONS FOR LOAN IMPAIRMEN T AND GUARANTEES, END OF PERIOD
Nykredit Realkredit Group
Q1/2018: Total impairment provisions by loans and a dvances
Stage 1 (12 months
expected credit losses)
Stage 2 (Lifetime
expected credit losses)
Stage 3 (Lifetime
expected credit losses)
Total impairment provisions
Loans and advances Bank and mortgage lending, gross 1,215,423 37,938 9,528 1,262,890
Total impairment provisions, end of period 1,499 1,776 4,752 8,026
Loans and advances, carrying amount 1,213,924 36,163 4,776 1,254,864
Guarantees and loan commitments Bank lending 18,511 390 191 19,093
Total impairment provisions, end of period 73 39 76 187
Guarantees and loan commitments, carrying amount 18,439 351 116 18,906
Q1/2017: Total impairment provisions by loans and a dvances
Individual impairment provisions
Collective impairment provisions Guarantees
Total impairment provisions
Loans and advances Bank and mortgage lending, gross 20,482 128,679 7,135 156,297
Total impairment provisions, end of period 5,753 2,298 49 8,100
Loans and advances, carrying amount 14,729 126,382 7,086 148,197
Nykredit Realkredit A/S
Q1/2018: Total impairment provisions by loans and a dvances
Stage 1 (12 months
expected credit losses)
Stage 2 (Lifetime
expected credit losses)
Stage 3 (Lifetime
expected credit losses)
Total impairment provisions
Loans and advances Bank and mortgage lending, gross 489,081 21,040 5,180 515,302
Total impairment provisions, end of period 596 798 2,317 3,712
Loans and advances, carrying amount 488,485 20,242 2,863 511,590
Q1/2017: Total impairment provisions by loans and a dvances
Individual impairment provisions
Collective impairment provisions Guarantees
Total impairment provisions
Loans and advances Bank and mortgage lending, gross 13,762 32,602 - 46,364
Total impairment provisions, end of period 2,948 1,556 - 4,505
Loans and advances, carrying amount 10,813 31,046 - 41,859
NOTES

50/66 Q1 Interim Report 2018 – Nykredit Realkredit Group
DKK million
Nykredit Realkredit A/S Nykredit Realkredit Group
Q1/2017 Q1/2018 Q1/2018 Q1/2017
11. IMPAIRMENT PROVISIONS FOR LOANS, ADVANCES AND R ECEIVABLES (CONTINUED)
11 d. Impairment provisions for properties acquired by foreclosure
204 114 Impairment provisions, beginning of period 139 272
32 4 Transfer from impairment provisions for loans and advances 7 49
17 15 Impairment provisions for the period 16 15
(16) (4) Impairment provisions reversed (23) (19)
(67) (17) Impairment provisions written off (23) (86)
171 112 Impairment provisions, end of period 117 232
Impairment provisions for properties acquired by foreclosure have been offset against "Assets in tempo-
rary possession".
12. PROFIT FROM INVESTMENTS IN ASSOCIATES AND GROUP ENTERPRISES
4 1 Profit from investments in associates 1 4
1,569 1,011 Profit from investments in Group enterprises - -
1,573 1,011 Total 1 4
13. TAX
22.0 22.0 Current tax rates, % 22.0 22.0
13.6 11.9 Permanent deviations 2.8 0.6
8.4 10.1 Effective tax rate, % 19.2 21.4
Permanent deviations are driven by investments in Group enterprises and associates as well as equities
available for sale in Q1/2017.
NOTES

Nykredit Realkredit Group – Q1 Interim Report 2018 51/66
DKK million
Nykredit Realkredit A/S Nykredit Realkredit Group
31.12.2017 31.03.2018 31.03.2018 31.12.2017
14. RECEIVABLES FROM CREDIT INSTITUTIONS AND CENTRA L BANKS
28,118 11,821 Receivables from central banks 13,645 34,058
21,954 17,560 Receivables from credit institutions 9,714 9,671
- - Reverse transactions with central banks - 231
4,950 10,189 Reverse repurchase lending to credit institutions 7,991 2,002
55,022 39,571 Total 31,349 45,961
15. LOANS, ADVANCES AND OTHER RECEIVABLES AT FAIR V ALUE
519,721 515,302 Mortgage loans 1,168,690 1,163,879
296 259 Arrears and outlays 466 432
- - Reverse repurchase lending to undertakings other than credit institutions and central banks - 27,566
4,486 1,702 Loans to Totalkredit serving as collateral in capital centres - -
688,444 693,382 Totalkredit mortgage loan funding - -
1,212,947 1,210,644 Total 1,169,156 1,191,877
On implementation of IFRS 9 reverse repurchase lending to undertakings other than credit institutions and
central banks was reclassified to loans and advances and other receivables at amortised cost.
15 a. Mortgage loans
516,221 508,622 Balance, beginning of period, nominal value 1,138,109 1,107,135
78,660 14,787 New loans 51,888 217,933
120 102 Indexation 102 120
(428) (1,011) Foreign currency translation adjustment (1,011) (428)
(15,080) (3,264) Ordinary principal payments (6,224) (25,394)
(70,871) (14,786) Prepayments and extraordinary principal payments (38,805) (161,257)
508,622 504,451 Balance, end of period, nominal value 1,144,059 1,138,109
(27) (24) Loans transferred relating to properties in temporary possession (25) (36)
(0) (0) Loans assumed by the Danish Agency for Governmental Management (0) (0)
508,595 504,427 Total 1,144,034 1,138,073
14,979 14,459 Adjustment for interest rate risk 29,715 31,117
(200) (200) - of which adjustment relating to sold foreign portfolio (200) (200)
Adjustment for credit risk (3,854) (3,584) Impairment provisions (5,059) (5,311)
519,721 515,302 Balance, end of period, fair value 1,168,690 1,163,879
As collateral for loans and advances, Nykredit has received mortgages over real estate and: 32,191 31,979 Supplementary guarantees totalling 63,776 63,479
428 489 Interim loan guarantees totalling 18,302 18,776
4,668 2,311 Mortgage registration guarantees totalling 22,090 25,792
NOTES

52/66 Q1 Interim Report 2018 – Nykredit Realkredit Group
DKK million
Nykredit Realkredit A/S Nykredit Realkredit Group
31.12.2017 31.03.2018 31.03.2018 31.12.2017
15. LOANS, ADVANCES AND OTHER RECEIVABLES AT FAIR V ALUE (CONTINUED)
15 b. Arrears and outlays
244 280 Arrears before impairment provisions 422 340
202 106 Outlays before impairment provisions 227 348
(150) (127) Individual impairment provisions for arrears and outlays (183) (256)
296 259 Total 466 432
15 c. Totalkredit mortgage loan funding
626,782 672,888 Balance, beginning of period, nominal value - -
227,837 54,694 New loans - -
(8,274) (10,833) Ordinary principal payments - -
(173,458) (38,080) Prepayments and extraordinary principal payments - -
672,888 678,668 Balance, end of period, nominal value - -
15,557 14,714 Adjustment for interest rate risk - -
688,444 693,382 Balance, end of period, fair value - -
16. LOANS, ADVANCES AND OTHER RECEIVABLES AT AMORTI SED COST
- - Bank lending 59,910 58,073
- - Reverse repurchase lending to undertakings other than credit institutions and central banks 36,726 -
16 16 Totalkredit mortgage loan funding - -
- - Mortgage loans 16 16
284 265 Other loans and advances 330 345
300 281 Balance, end of period 96,982 58,434
Adjustment for credit risk - - Impairment provisions (2,783) (2,290)
300 281 Balance after impairment, end of period 94,200 56,144
(18) (18) Set-off of "Other loans and advances" against "Bonds in issue at amortised cost" – note 23 (18) (18)
282 264 Total 94,182 56,126
In connection with the implementation of IFRS 9 total impairment provisions increased by DKK 566m, im-pacting the accounting balance as at 1 January 2018. Also, reverse repurchase lending previously meas-
ured at fair value is reclassified to loans, advances and other receivables at amortised cost.
NOTES

Nykredit Realkredit Group – Q1 Interim Report 2018 53/66
DKK million
Nykredit Realkredit A/S Nykredit Realkredit Group
31.12.2017 31.03.2018 31.03.2018 31.12.2017
17. BONDS AT FAIR VALUE
39,701 36,472 Self-issued SDOs 75,187 88,418
21,095 12,832 Self-issued RO's 25,757 34,324
- - Self-issued corporate bonds 391 722
200 199 Self-issued senior debt 199 200
25,488 19,528 Other covered bonds 68,411 80,094
10,716 10,103 Government bonds 9,642 12,031
2,187 2,407 Other bonds 5,028 5,023
99,387 81,540 Total 184,616 220,812
(39,685) (36,456) Set-off of self-issued SDOs against "Bonds in issue at fair value" ‒ note 22 (75,171) (88,402)
(16) (16) Set-off of self-issued SDOs against "Bonds in issue at amortised cost" – note 23 (16) (16)
(21,095) (12,832) Set-off of self-issued ROs against "Bonds in issue at fair value" – note 22 (25,757) (34,324)
- - Set-off of self-issued corporate bonds against "Bonds in issue at amortised cost" – note 23 (391) (722)
(200) (199) Set-off of self-issued senior debt against "Bonds in issue at fair value" – note 22 (199) (200)
38,390 32,037 Total 83,082 97,149
28,651 12,361
As collateral security for the Danish central bank and foreign clearing centres, bonds have been deposited
of a total market value of 14,692 28,736
The deposits were made on an arm's length basis in connection with clearing and settlement of securities and foreign exchange trades. The deposits are adjusted on a daily basis and generally have a repayment
term of very few value days.
Collateral security was provided on an arm's length basis.
18. EQUITIES
4,758 4,758 Equities measured at fair value through profit or loss, cf the Annual Report for 2017 2,526 2,526
- - Transferred from equities available for sale 2,450 -
4,758 4,758 Total 4,977 2,526
- - Equities available for sale, cf the Annual Report for 2017 2,450 2,450
- - Transferred to equities measured at fair value through profit or loss (2,450) -
- - Total - 2,450
In connection with the implementation of IFRS 9 equities available for sale" were reclassified as equities measured at fair value through profit or loss in the Nykredit Realkredit Group's financial statements. The
change will not affect the balance sheet.
19. OTHER ASSETS
5,335 4,891 Interest and commission receivable 3,440 3,528
34 36 Receivables from Group enterprises - -
1,309 1,244 Positive market value of derivative financial instruments 18,733 19,269
327 309 Defined benefit plans 309 327
343 362 Other assets 3,816 3,352
7,347 6,842 Total 26,297 26,476
NOTES

54/66 Q1 Interim Report 2018 – Nykredit Realkredit Group
DKK million
Nykredit Realkredit A/S Nykredit Realkredit Group
31.12.2017 31.03.2018 31.03.2018 31.12.2017
20. PAYABLES TO CREDIT INSTITUTIONS AND CENTRAL BAN KS
493 657 Payables to credit institutions 6,592 6,353
- - Payables to central banks 4,368 3,337
4,861 4,363 Repo transactions with credit institutions 13,671 3,398
- - Repo transactions with central banks - 231
5,353 5,020 Total 24,630 13,319
21. DEPOSITS AND OTHER PAYABLES
- - On demand 62,039 64,528
- - At notice 810 1,286
- - Time deposits 4,368 7,484
- - Special deposits 2,790 2,616
- 8,000 Repo deposits 17,468 -
- 8,000 Total 87,475 75,914
22. BONDS IN ISSUE AT FAIR VALUE
183,175 154,612 ROs 163,289 192,360
1,104,641 1,102,725 SDOs 1,103,025 1,100,930
4,981 4,957 Senior secured debt 4,957 4,981
3,748 3,749 Senior unsecured debt 3,749 3,748
1,296,545 1,266,043 Total 1,275,021 1,302,019
(60,980) (49,487) Self-issued bonds transferred from "Bonds at fair value" and "Bonds at amortised cost" (105,099) (122,926)
1,235,565 1,216,557 Total 1,169,922 1,179,093
22 a. ROs
174,622 146,324 ROs at nominal value 154,459 183,226
8,553 8,289 Fair value adjustment 8,831 9,134
183,175 154,612 ROs at fair value 163,289 192,360
(21,095) (12,832) Self-issued ROs transferred from "Bonds at fair value" – note 17 (25,757) (34,324)
162,079 141,780 Total 137,532 158,035
44 1 Of which pre-issuance 1 44
33,893 11,528 ROs redeemed and maturing at next creditor payment date 11,528 34,354
22 b. SDOs
1,082,459 1,081,657 SDOs at nominal value 1,081,958 1,078,747
22,183 21,067 Fair value adjustment 21,067 22,183
1,104,641 1,102,725 SDOs at fair value 1,103,025 1,100,930
(39,685) (36,456) Self-issued SDOs transferred from "Bonds at fair value" – note 17 (79,143) (88,402)
1,064,956 1,066,269 Total 1,023,882 1,012,528
4,544 4,899 Of which pre-issuance 4,899 4,544
71,305 61,127 SDOs redeemed and maturing at next creditor payment date 61,127 71,305
NOTES

Nykredit Realkredit Group – Q1 Interim Report 2018 55/66
DKK million
Nykredit Realkredit A/S Nykredit Realkredit Group
31.12.2017 31.03.2018 31.03.2018 31.12.2017
22. BONDS IN ISSUE AT FAIR VALUE (CONTINUED)
22 c. Senior secured debt
4,690 4,694 Senior secured debt at nominal value 4,694 4,690
291 263 Fair value adjustment 263 291
4,981 4,957 Senior secured debt at fair value 4,957 4,981
(200) (199) Self-issued senior secured debt transferred from "Bonds at fair value" – note 17 (199) (200)
4,781 4,759 Total 4,759 4,781
- - Senior secured debt maturing at next creditor payment date - -
22 d. Senior unsecured debt
3,723 3,725 Senior unsecured debt at nominal value 3,725 3,723
26 23 Fair value adjustment 23 26
3,748 3,749 Total 3,749 3,748
23. BONDS IN ISSUE AT AMORTISED COST
- - Corporate bonds 5,798 7,196
16 16 SDOs 16 16
3,735 3,728 Senior secured debt 3,728 3,735
13,314 13,341 Senior unsecured debt 13,341 13,314
27 27 Other securities 27 27
17,092 17,113 Total 22,911 24,288
- - Self-issued corporate bonds transferred from "Bonds at fair value" – note 17 (391) (722)
(16) (16) Self-issued SDOs transferred from "Bonds at fair value" – note 17 (16) (16)
(18) (18)
Other self-issued securities transferred from "Loans, advances and other receivables at amortised cost" –
note 16 (18) (18)
17,059 17,079 Total 22,486 23,532
24. OTHER NON-DERIVATIVE FINANCIAL LIABILITIES AT F AIR VALUE
8,500 - Repo transactions with undertakings other than credit institutions and central banks - 16,714
1 - Negative securities portfolios 1,490 2,307
8,501 - Total 1,490 19,021
25. OTHER LIABILITIES
7,198 6,361 Interest and commission payable 7,746 8,457
1,756 1,635 Negative market value of derivative financial instruments 12,728 12,905
1,508 1,403 Other 3,714 3,885
10,462 9,399 Total 24,188 25,248
NOTES
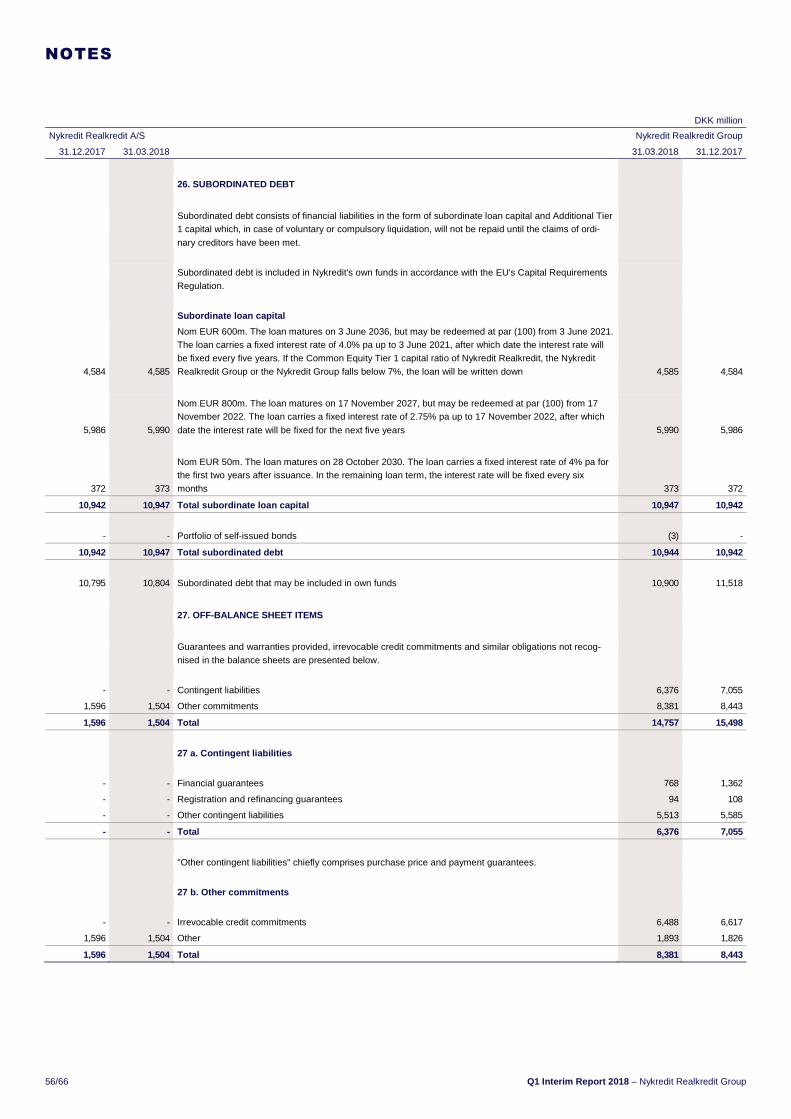
56/66 Q1 Interim Report 2018 – Nykredit Realkredit Group
DKK million
Nykredit Realkredit A/S Nykredit Realkredit Group
31.12.2017 31.03.2018 31.03.2018 31.12.2017
26. SUBORDINATED DEBT
Subordinated debt consists of financial liabilities in the form of subordinate loan capital and Additional Tier 1 capital which, in case of voluntary or compulsory liquidation, will not be repaid until the claims of ordi-
nary creditors have been met.
Subordinated debt is included in Nykredit's own funds in accordance with the EU's Capital Requirements
Regulation.
Subordinate loan capital
4,584 4,585
Nom EUR 600m. The loan matures on 3 June 2036, but may be redeemed at par (100) from 3 June 2021. The loan carries a fixed interest rate of 4.0% pa up to 3 June 2021, after which date the interest rate will
be fixed every five years. If the Common Equity Tier 1 capital ratio of Nykredit Realkredit, the Nykredit
Realkredit Group or the Nykredit Group falls below 7%, the loan will be written down 4,585 4,584
5,986 5,990
Nom EUR 800m. The loan matures on 17 November 2027, but may be redeemed at par (100) from 17 November 2022. The loan carries a fixed interest rate of 2.75% pa up to 17 November 2022, after which
date the interest rate will be fixed for the next five years 5,990 5,986
372 373
Nom EUR 50m. The loan matures on 28 October 2030. The loan carries a fixed interest rate of 4% pa for the first two years after issuance. In the remaining loan term, the interest rate will be fixed every six
months 373 372
10,942 10,947 Total subordinate loan capital 10,947 10,942
- - Portfolio of self-issued bonds (3) -
10,942 10,947 Total subordinated debt 10,944 10,942
10,795 10,804 Subordinated debt that may be included in own funds 10,900 11,518
27. OFF-BALANCE SHEET ITEMS
Guarantees and warranties provided, irrevocable credit commitments and similar obligations not recog-
nised in the balance sheets are presented below.
- - Contingent liabilities 6,376 7,055
1,596 1,504 Other commitments 8,381 8,443
1,596 1,504 Total 14,757 15,498
27 a. Contingent liabilities
- - Financial guarantees 768 1,362
- - Registration and refinancing guarantees 94 108
- - Other contingent liabilities 5,513 5,585
- - Total 6,376 7,055
"Other contingent liabilities" chiefly comprises purchase price and payment guarantees.
27 b. Other commitments
- - Irrevocable credit commitments 6,488 6,617
1,596 1,504 Other 1,893 1,826
1,596 1,504 Total 8,381 8,443
NOTES
Nykredit Realkredit Group – Q1 Interim Report 2018 57/66
27. OFF-BALANCE SHEET ITEMS (CONTINUED)
Additional contingent liabilities
Owing to its size and business scope, the Nykredit Group is continuously in-
volved in legal proceedings and litigation. The cases are subject to ongoing re-
view, and necessary provisions are made based on an assessment of the risk of
loss. Pending cases are not expected to have a significant effect on the Nykredit
Group's financial position.
Nykredit participates in the mandatory Danish deposit guarantee scheme. A new
scheme was introduced in 2015, as the Danish Guarantee Fund took over the
activities and assets of the Danish Guarantee Fund for Depositors and Investors
on 1 June 2015. The purpose of the Danish Guarantee Fund is to provide cover
for depositors and investors of failing institutions included in the Fund's scheme.
The scheme includes both natural and legal persons, and deposits are covered
by an amount equivalent to EUR 100,000 per depositor and EUR 20,000 per in-
vestor.
Nykredit also participates in the Danish Resolution Fund scheme, which is a res-
olution finance scheme that was also established on 1 June 2015. The Danish
Resolution Fund is funded by annual contributions from participating banks,
mortgage lenders and investment companies and, as from 31 December 2024,
the assets of the scheme must make up 1% of the sector's covered deposits.
Participating institutions make annual contributions to cover any losses incurred
by the Danish Resolution Fund in connection with the resolution of failing institu-
tions.
BEC is an IT provider of Nykredit Bank. According to BEC's articles of associa-
tion, Nykredit Bank may terminate its membership of BEC giving five years' no-
tice to expire at the end of a financial year. Should the membership terminate
otherwise for reasons related to Nykredit Bank, compensation will be payable to
BEC as defined in BEC's articles of association. If a bank merges and ceases
being an independent bank, the BEC membership terminates without notice but
a transitional scheme may apply.
Nykredit Realkredit has issued a letter of comfort stating that Nykredit Realkredit
will contribute capital to Nykredit Bank to ensure that Nykredit Bank's Tier 1 cap-
ital calculated according to the Basel II rules does not fall below 12-13%. How-
ever, Nykredit Realkredit will not contribute capital to Nykredit Bank if that will
bring Nykredit Realkredit's total capital ratio below the statutory capital require-
ment plus 0.5% or the internal capital adequacy requirement (ICAAP) plus 0.5%.
Nykredit Realkredit A/S is jointly taxed in Denmark with Forenet Kredit as the
administration company. Pursuant to the Danish Corporation Tax Act, the Com-
pany is liable as from the financial year 2013 for income taxes, etc, payable by
the jointly taxed companies and, as from 1 July 2012, for any obligations to with-
hold tax at source on interest, royalties and dividends of these companies.
Nykredit Realkredit A/S is liable for the obligations of the pension fund Nykredits
Afviklingspensionskasse (CVR no 23 24 62 18).
28. RELATED PARTY TRANSACTIONS AND BALANCES
Forenet Kredit, the Parent Nykredit A/S, Group enterprises and associates of
Nykredit Realkredit A/S as stated in the Group structure as well as Nykredit
Realkredit A/S's Board of Directors, Executive Board and related parties thereof
are regarded as related parties.
No unusual related party transactions occurred in Q1/2018.
The companies have entered into various intercompany agreements as a natu-
ral part of the Group's day-to-day operations. The agreements typically involve
financing, provision of guarantees, sales commission, tasks relating to IT sup-
port and IT development projects, payroll and staff administration as well as
other administrative tasks.
Intercompany trading in goods and services took place on an arm's length, cost
reimbursement or profit split basis.
Significant related party transactions prevailing/entered into in Q1/2018 include:
Agreements between Nykredit Realkredit A/S and Tota lkredit A/S
As part of the Group's joint funding activities, Nykredit Realkredit A/S has funded
mortgage loans granted by its subsidiary Totalkredit A/S on an ongoing basis.
Totalkredit A/S funds its lending by issuing a master bond for each capital centre
with Nykredit Realkredit A/S as the only creditor. The master bond constitutes
security for Nykredit Realkredit A/S's issuance of covered bonds (ROs and
SDOs) and serves to ensure that Totalkredit A/S transfers all payments to bond-
holders under the loans and advances granted by Totalkredit A/S to Nykredit
Realkredit A/S, no later than when Nykredit Realkredit A/S makes payments to
bondholders. The bondholders therefore enjoy the same security as if the To-
talkredit loans had been granted directly from Nykredit Realkredit A/S's own bal-
ance sheet.
Nykredit Realkredit A/S has granted loans, cf section 15 of the Danish Mort-
gage-Credit Loans and Mortgage-Credit Bonds etc. Act, to Totalkredit A/S serv-
ing as supplementary collateral in Totalkredit A/S's capital centres. The loans
amounted to DKK 1.7bn as at 31 March 2018. The loans constitute secondary
preferential claims and rank after the master bond in respect of the assets in To-
talkredit A/S's capital centres.
An agreement has been made to hedge market risk relating to collateral, includ-
ing investments, in Totalkredit's capital centres.
Agreement on the distribution of mortgage loans to personal customers via To-
talkredit A/S (this agreement was concluded on the same terms as apply to
other business partners, including commission payments).
Nykredit Realkredit A/S has granted loans of DKK 2.0bn to Totalkredit A/S in the
form of subordinated debt and DKK 4.0bn in the form of Additional Tier 1 capital.
Agreements between Nykredit Realkredit A/S and Nykr edit Bank A/S
Framework agreement on the terms for financial transactions relating to loans
and deposits in the securities and money market areas.
Nykredit Realkredit contributed DKK 2.0bn to Nykredit Bank A/S in the form of
Tier 2 capital.
Transaction between Nykredit Ejendomme A/S and the Kalvebod II Group
In Q1/2018 Nykredit Ejendomme A/S sold properties to a company in the Kalve-
bod II Group at a market value of DKK 218m. Both companies are wholly owned
by Nykredit Realkredit A/S.
NOTES
Nykredit Realkredit Group

58/66 Q1 Interim Report 2018 – Nykredit Realkredit Group
29. FAIR VALUE DISCLOSURES
Listed prices
The Group's assets and liabilities at fair value are to the widest extent possible
recognised at listed prices or prices quoted in an active market or authorised
market place.
Bonds at fair value are recognised at listed prices if external prices have been
updated within the past three trading days prior to the balance sheet date. If no
listed prices have been observed during this time span, the portfolio is recog-
nised at observable input.
Observable inputs
When an instrument is not traded in an active market, measurement is based on
the most recent listed price in an inactive market, the price of comparable trans-
actions or generally accepted valuation techniques based on, for instance, dis-
counted cash flows and option models.
Observable inputs are typically yield curves, volatilities and market prices of sim-
ilar instruments, which are usually obtained through ordinary providers such as
Reuters, Bloomberg and market makers. If the fair value is based on transac-
tions in similar instruments, measurement is exclusively based on transactions
at arm's length. Unlisted derivatives generally belong to this category.
Bonds not traded in the past three trading days belong to this category. The val-
uation is based on the most recent observed price, and adjustments are made
for subsequent changes in market conditions, eg by including transactions in
similar instruments (matrix pricing). Redeemed bonds belong to this category, as
there is no access to official prices in active markets.
Further, the valuation of derivatives implies the use of Credit Valuation Adjust-
ment (CVA), thus including counterparty credit risk in the valuation. The CVA of
derivatives with positive market value is primarily based on external credit
curves such as Itraxx Main, but also on internal data as regards customers with-
out OEI in the lowest rating categories, as there are no external curves suitable
for the calculation of credit risk on these customers. Finally, calculations are
made to simulate future exposures to interest rate swaps. Calculations entailing
increased CVA are included in the value adjustment.
Funding Valuation Adjustment (FVA) for the valuation of derivatives is thus
used. FVA allows for Nykredit's future funding costs incurred by derivatives
transactions where clients have not provided sufficient collateral. Nykredit has
used a funding curve for this calculation, which is assessed on the basis of ob-
jective prices of Danish SIFI banks' traded bonds. This calculation is made on
the basis of a "discount curve method".
FVA may involve both funding benefit and funding costs, but for Nykredit, the net
FVA adjustment will be a funding cost resulting from customers' insufficient or
lacking provision of collateral. Debit Valuation Adjustment (DVA) is now a sub-
element of the FVA adjustment. Net value adjustment due to CVA, DVA and
FVA amounted to a negative DKK 441m at 31 March 2018 against a negative
DKK 366m at end-2017.
Upon entering into derivatives contracts, further provisions are made in the form
of a so-called minimum margin for liquidity and credit risk and return on capital.
The minimum margin is amortised at the valuation of derivatives over their
times-to-maturity. At 31 March 2018, the non-amortised minimum margin
amounted to DKK 156m against DKK 157m at end-2017. With regard to liquidity
and credit risk, DKK 214m for end-March 2018 and DKK 216m for 2017 have
been included above in the net adjustment of FVA and CVA. Finally, in some in-
stances further value adjustment based on management judgement is made if
the models are not deemed to take into account all known risks, including eg le-
gal risks.
In some cases, markets, eg the bond market, have become inactive and illiquid.
When assessing market transactions, it may therefore be difficult to conclude
whether the transactions were executed at arm's length or were forced sales. If
measurement is based on recent transactions, the transaction price is compared
with a price based on relevant yield curves and discounting techniques.
Unobservable inputs
When it is not possible to measure financial instruments at fair value based on
prices in active markets or observable inputs, measurement is based on own as-
sumptions and extrapolations etc. Where possible and appropriate, measure-
ment is based on actual transactions adjusted for differences in eg the liquidity,
credit spreads and maturities of the instruments. The Group's unlisted equities
are generally classified under this heading, and valuation is based on the IPEV
Valuation Guidelines.
The positive market values of a number of interest rate swaps with customers in
the lowest rating categories have been adjusted for increased credit risk based
on additional CVA. The adjustment uses for instance the statistical data applied
by the Bank to calculate collective impairment provisions for loans and advances
at amortised cost. Interest rate swaps which have been fair value adjusted to
DKK 0 (after deduction for collateral) due to the creditworthiness of the counter-
party are also included in the category "Unobservable inputs".
Fair value totalled DKK 1,205m at 31 March 2018 after value adjustment. Credit
value adjustments came to DKK 2,897m at 31 March 2018 (2017: DKK 3,110m).
NOTES
Nykredit Realkredit Group
Nykredit Realkredit Group – Q1 Interim Report 2018 59/66
29. FAIR VALUE DISCLOSURES (CONTINUED)
The interest rate risk on these interest rate swaps is hedged in all material re-
spects. However, interest rate fluctuations may impact results to the extent that
the market value must be adjusted due to increased counterparty credit risk. A
0.1 percentage point change in interest rate levels will impact the fair value by
+/- DKK 110m.
However, financial assets measured on the basis of unobservable inputs ac-
count for a very limited part of total financial assets at fair value. At 31 March
2018, the proportion was thus 2.2% compared with 1.2% at end-2017. The pro-
portion of financial liabilities was 0.0% against 0.0% at end-2017.
Valuation, notably of instruments classified as unobservable inputs, is subject to
some uncertainty. Of total assets, DKK 4.1bn (2017: DKK 4.0bn) belong to this
category, thus accounting for a limited part of 0.3% (end-2017: 0.3%). Of finan-
cial liabilities, DKK 0.0bn (2017: DKK 0.0bn) is attributable to this category, thus
accounting for 0.0% (end-2017: 0.0%).
Assuming that an actual market price will deviate by +/-10% from the calculated
fair value, the earnings impact will be DKK 415m at 31 March 2018 (0.56% of
equity at 31 March 2018). The earnings impact for 2017 was estimated at DKK
402m (0.65% of equity at 31 December 2017).
Transfers between categories
Transfers between the categories Listed prices, Observable inputs and Unob-
servable inputs are made when an instrument is classified differently on the bal-
ance sheet date than at the beginning of the financial year. The value trans-
ferred to another category corresponds to the fair value at the beginning of the
year. With respect to interest rate swaps that have been fair value adjusted to
DKK 0 due to credit risk adjustment, separate calculations are made at the end
of each month.
In 2018 and 2017, transfers between the categories Observable inputs and Un-
observable inputs mainly resulted from changes to the ratings (credit risk) of
counterparties and primarily concerned interest rate swaps, as regards financial
instruments with positive market value.
Transfers between the categories Listed prices and Observable inputs mainly
resulted from bonds that are reclassified either due to traded volume or the num-
ber of days between last transaction and the time of determination. In Q1/2018
financial assets of DKK 13.4bn were transferred from Listed prices to Observa-
ble inputs and DKK 5.7bn from Observable inputs to Listed prices. Financial lia-
bilities of DKK 0.2bn were transferred from Listed prices to Observable inputs
and DKK 0.0bn from Observable inputs to Listed prices.
Redeemed bonds (usually comprised by "Listed prices") are transferred to "Ob-
servable inputs" on the last day before the coupon date, as there is no access to
official prices in active markets. At 31 March 2018 the amount was DKK 0.0bn
against DKK 2.3bn at end-2017.
No transfers were made between the categories Listed prices and Unobservable
inputs.
NOTES
Nykredit Realkredit Group
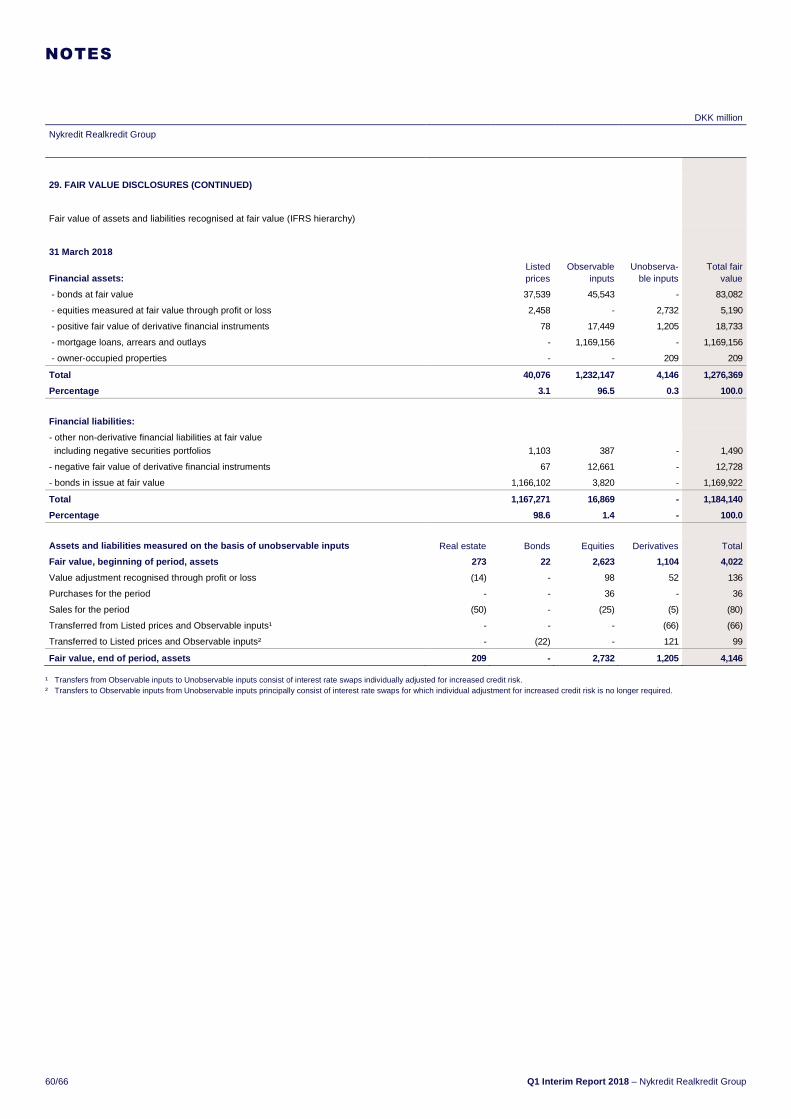
60/66 Q1 Interim Report 2018 – Nykredit Realkredit Group
DKK million
Nykredit Realkredit Group
29. FAIR VALUE DISCLOSURES (CONTINUED)
Fair value of assets and liabilities recognised at fair value (IFRS hierarchy)
31 March 2018
Financial assets: Listed prices
Observable inputs
Unobserva-ble inputs
Total fair value
- bonds at fair value 37,539 45,543 - 83,082
- equities measured at fair value through profit or loss 2,458 - 2,732 5,190
- positive fair value of derivative financial instruments 78 17,449 1,205 18,733
- mortgage loans, arrears and outlays - 1,169,156 - 1,169,156
- owner-occupied properties - - 209 209
Total 40,076 1,232,147 4,146 1,276,369
Percentage 3.1 96.5 0.3 100.0
Financial liabilities: - other non-derivative financial liabilities at fair value
including negative securities portfolios 1,103 387 - 1,490
- negative fair value of derivative financial instruments 67 12,661 - 12,728
- bonds in issue at fair value 1,166,102 3,820 - 1,169,922
Total 1,167,271 16,869 - 1,184,140
Percentage 98.6 1.4 - 100.0
Assets and liabilities measured on the basis of uno bservable inputs Real estate Bonds Equities Derivatives Total
Fair value, beginning of period, assets 273 22 2,623 1,104 4,022
Value adjustment recognised through profit or loss (14) - 98 52 136
Purchases for the period - - 36 - 36
Sales for the period (50) - (25) (5) (80)
Transferred from Listed prices and Observable inputs¹ - - - (66) (66)
Transferred to Listed prices and Observable inputs² - (22) - 121 99
Fair value, end of period, assets 209 - 2,732 1,205 4,146
¹ Transfers from Observable inputs to Unobservable inputs consist of interest rate swaps individually adjusted for increased credit risk. ² Transfers to Observable inputs from Unobservable inputs principally consist of interest rate swaps for which individual adjustment for increased credit risk is no longer required.
NOTES

Nykredit Realkredit Group – Q1 Interim Report 2018 61/66
DKK million
Nykredit Realkredit Group
29. FAIR VALUE DISCLOSURES (CONTINUED)
Fair value of assets and liabilities recognised at fair value (IFRS hierarchy) (continued)
31 December 2017
Financial assets: Listed prices
Observable inputs
Unobserva-ble inputs
Total fair value
- bonds at fair value 47,883 49,243 22 97,149
- equities measured at fair value through profit or loss 918 - 1,608 2,526
- positive fair value of derivative financial instruments 48 18,117 1,104 19,269
- reverse repurchase lending to credit institutions and central banks - 2,233 - 2,233
- other reverse repurchase lending - 27,566 - 27,566
- mortgage loans, arrears and outlays - 1,164,311 - 1,164,311
- equities available for sale 1,435 - 1,015 2,450
- owner-occupied properties - - 223 223
- investment properties - - 50 50
Total 50,284 1,261,470 4,022 1,315,777
Percentage 3.8 95.9 0.3 100
Financial liabilities: - other non-derivative financial liabilities at fair value including negative securities portfolios 200 2,107 - 2,307
- negative fair value of derivative financial instruments 31 12,874 - 12,905
- repo transactions with credit institutions and central banks - 3,629 - 3,629
- other repo transactions - 16,714 - 16,714
- bonds in issue at fair value 1,178,585 4,219 - 1,182,804
Total 1,178,816 39,543 - 1,218,360
Percentage 96.8 3.2 - 100
Assets and liabilities measured on the basis of uno bservable inputs Real estate Bonds Equities Derivatives Total
Fair value, beginning of period, assets 664 242 2,492 587 3,986
Value adjustment recognised through profit or loss 7 3 197 112 319
Unrealised capital gains and losses recognised in "Other comprehensive income" - - 72 - 72
Purchases for the year - 0 226 (43) 184
Sales for the year (399) (149) (365) - (913)
Transferred from Listed prices and Observable inputs¹ - - - 698 698
Transferred to Listed prices and Observable inputs² - (74) - (251) (325)
Fair value, end of period, assets 273 22 2,623 1,104 4,022
¹ Transfers from Observable inputs to Unobservable inputs consist of interest rate swaps individually adjusted for increased credit risk. ² Transfers to Observable inputs from Unobservable inputs principally consist of interest rate swaps for which individual adjustment for increased credit risk is no longer required.
NOTES

62/66 Q1 Interim Report 2018 – Nykredit Realkredit Group
DKK million
Nykredit Realkredit Group Q1/ Q1/ Q1/ Q1/ Q1/
2018 2017 2016 2015 2014
30. FIVE-YEAR FINANCIAL HIGHLIGHTS
SUMMARY INCOME STATEMENT
Net interest income 2,682 2,905 2,827 3,054 2,859
Net fee income (97) (51) (50) 57 (81)
Net interest and fee income 2,585 2,855 2,777 3,111 2,778
Value adjustments 443 1,242 (774) (724) (153)
Other operating income 217 44 40 47 43
Staff and administrative expenses 1,127 1,092 1,112 1,139 1,195
Depreciation, amortisation and impairment charges for property, plant and equipment
as well as intangible assets 26 46 48 66 53
Other operating expenses 37 40 40 18 27
Impairment charges for loans, advances and receivables (8) (21) (51) 329 515
Profit from investments in associates and Group enterprises 1 4 - - -
Profit before tax 2,064 2,988 895 883 878
Tax 396 639 191 197 200
Profit for the period 1,667 2,349 705 686 678
Value adjustment and reclassification of strategic equities against equity - (2) (16) 157 157
SUMMARY BALANCE SHEET, END OF PERIOD 31.03.2018 31.03.2017 31.03.2016 31.03.2015 31.03.2014
Assets
Cash balances and receivables from credit institutions and central banks 37,589 40,240 28,798 70,932 38,690
Mortgage loans at fair value 1,168,690 1,133,497 1,122,218 1,137,833 1,142,380
Bank loans excluding reverse repurchase lending 57,128 56,256 48,972 49,404 48,078
Bonds and equities 88,272 103,043 116,892 104,795 110,300
Remaining assets 66,413 57,180 83,278 97,683 88,302
Total assets 1,418,092 1,390,216 1,400,158 1,460,647 1,427,750
Liabilities and equity
Payables to credit institutions and central banks 24,630 17,885 44,015 38,860 49,174
Deposits and other payables 87,475 67,733 59,583 67,733 68,598
Bonds in issue at fair value 1,169,922 1,146,919 1,135,251 1,181,483 1,130,708
Subordinated debt 10,944 11,010 11,240 11,417 10,913
Remaining liabilities 49,165 73,372 83,931 97,952 108,805
Equity 75,956 73,297 66,137 63,203 59,553
Total liabilities and equity 1,418,092 1,390,216 1,400,158 1,460,647 1,427,750
OFF-BALANCE SHEET ITEMS
Contingent liabilities 6,376 7,185 6,391 8,768 7,420
Other commitments 8,381 5,901 6,969 5,580 7,847
FINANCIAL RATIOS 1
Total capital ratio, % 24.4 23.9 24.0 18.9 18.3
Tier 1 capital ratio, % 21.2 20.6 20.6 17.6 18.3
Return on equity before tax, % 2.7 4.2 1.4 1.7 1.7
Return on equity after tax, % 2.2 3.3 1.1 1.4 1.4
Income:cost ratio 2.7 3.6 1.8 1.7 1.6
Foreign exchange position, % 0.4 0.2 0.6 0.1 1.8
Loans and advances:equity (loan gearing) 16.6 16.6 18.2 19.3 20.7
Growth in loans and advances for the period, % 1.3 0.1 (0.6) (0.7) (1.3)
Total impairment provisions, % 0.64 0.66 0.68 0.75 0.68
Impairment charges for the period, % 0.00 0.00 0.00 0.03 0.04
Return on capital employed, % 0.12 0.17 0.05 0.05 0.05
¹ Financial ratios are based on the Danish FSA's definitions and guidelines. Definitions appear from note 53 in the Annual Report for 2017.
NOTES

Nykredit Realkredit Group – Q1 Interim Report 2018 63/66
DKK million
Nykredit Realkredit A/S Q1/ Q1/ Q1/ Q1/ Q1/
2018 2017 2016 2015 2014
30. FIVE-YEAR FINANCIAL HIGHLIGHTS (CONTINUED)
SUMMARY INCOME STATEMENT
Net interest income 994 1,111 1,223 1,337 1,156
Net fee income 133 181 213 262 137
Net interest and fee income 1,128 1,293 1,437 1,599 1,294
Value adjustments 114 241 (185) 107 320
Other operating income 222 229 234 218 200
Staff and administrative expenses 692 681 730 750 785
Depreciation, amortisation and impairment charges for property, plant and equipment
as well as intangible assets 23 39 38 56 44
Other operating expenses 31 33 34 (1) 11
Impairment charges for loans, advances and receivables (143) 30 (78) 190 456
Profit from investments in associates 1,011 1,573 83 94 382
Profit before tax 1,871 2,552 844 1,022 901
Tax 188 206 156 180 66
Profit for the period 1,683 2,347 688 842 834
SUMMARY BALANCE SHEET, END OF PERIOD 31.03.2018 31.03.2017 31.03.2016 31.03.2015 31.03.2014
Assets
Cash balances and receivables from credit institutions and central banks 39,747 36,647 16,246 49,421 29,220
Mortgage loans at fair value 515,302 526,637 543,181 575,285 599,102
Totalkredit mortgage loan funding 693,382 642,793 612,189 635,740 558,042
Bonds and equities 37,036 47,399 59,610 50,074 33,903
Remaining assets 58,060 63,373 59,537 68,993 81,796
Total assets 1,343,527 1,316,849 1,290,764 1,379,513 1,302,063
Liabilities and equity
Payables to credit institutions and central banks 5,020 15,691 22,870 23,383 25,097
Bonds in issue 1,216,557 1,183,579 1,172,452 1,256,513 1,182,411
Subordinated debt 10,947 11,011 11,162 11,369 10,670
Remaining liabilities 35,032 33,270 18,143 25,045 24,331
Equity 75,971 73,297 66,137 63,203 59,553
Total liabilities and equity 1,343,527 1,316,849 1,290,764 1,379,513 1,302,063
OFF-BALANCE SHEET ITEMS
Other commitments 1,504 1,410 1,257 1,060 1,285
FINANCIAL RATIOS 1
Total capital ratio, % 20.3 20.8 20.6 16.9 16.6
Tier 1 capital ratio, % 17.7 18.0 17.7 15.9 16.6
Return on equity before tax, % 2.4 3.6 1.3 1.7 1.5
Return on equity after tax, % 2.2 3.3 1.0 1.4 1.4
Income:cost ratio 4.1 4.3 2.7 2.3 1.8
Foreign exchange position, % 0.4 0.2 0.7 0.7 1.1
Loans and advances:equity (loan gearing) 6.8 7.2 8.2 9.1 10.2
Growth in loans and advances for the period, % (0.8) 0.1 (1.5) (1.6) 0.8
Total impairment provisions, % 0.71 0.85 0.76 0.75 0.58
Impairment charges for the period, % (0.03) 0.01 (0.01) 0.03 0.07
Return on capital employed, % 0.13 0.18 0.05 0.06 0.06
¹ Financial ratios are based on the Danish FSA's definitions and guidelines. Definitions appear from note 53 in the Annual Report for 2017.
NOTES

64/66 Q1 Interim Report 2018 – Nykredit Realkredit Group
DKK million
Nykredit Realkredit Group
31. GROUP STRUCTURE Ow
ners
hip
inte
rest
as
%,
31
Mar
ch 2
018
Pro
fit fo
r th
e pe
riod
in
2018
Equ
ity,
31
Mar
ch 2
018
Pro
fit (
loss
) fo
r 20
17
Equ
ity,
31 D
ecem
ber
2017
Name and registered office
Nykredit Realkredit A/S (Parent), Copenhagen, a) - 1,683 75,971 8,074 78,847
Totalkredit A/S, Copenhagen, a) 100 575 26,838 1,752 26,300
Nykredit Bank A/S, Copenhagen, b) 100 382 19,818 3,134 19,877
Nykredit Portefølje Administration A/S, Copenhagen, g) 100 35 760 136 725
Nykredit Leasing A/S, Gladsaxe, e) 100 26 697 78 671
Nykredit Mægler A/S, Copenhagen, c) 100 18 44 110 137
Nykredit Ejendomme A/S, Copenhagen, d) 100 23 535 65 512
Ejendomsselskabet Kalvebod A/S, Copenhagen, h) 100 1 232 (3) 231
Kalvebod Ejendomme I A/S, Copenhagen, d) 100 1 114 (6) 112
Kalvebod Ejendomme II A/S, Copenhagen, d) 100 0 114 3 115
Nykredit Adm. V A/S, Copenhagen, f) 100 - 1 - 1
The Group structure only includes significant subsidiaries. Financial information is provided in such order as the subsidiaries are recognised in the Consolidated Finan-
cial Statements.
All banks and mortgage providers subject to national financial supervisory authorities must comply with statutory capital requirements. The capital requirements may
limit intercompany facilities and dividend payments.
Num
ber
of s
taff
Rev
enue
1
Pro
fit (
loss
) be
fore
tax
Tax
Gov
ernm
ent a
id
rece
ived
Geographical distribution of activities Denmark: Names and activities appear from the Group structure above 3,364 7,371 2,066 396 -
Poland: Nykredit Realkredit A/S S.A. Oddzial w Polsce, branch, a) 12 3 (2) - -
1 For companies preparing financial statements in accordance with the Danish Financial Business Act, revenue is defined as interest, fee and commission income and other operating income.
a) Mortgage bank
b) Bank
c) Estate agency business
d) Property company
e) Leasing business
f) No activity
g) Investment management company
h) Holding company, no independent activities
Nykredit Realkredit A/S is wholly owned by and consolidated with Nykredit A/S, which is consolidated with Forenet Kredit. The financial statements of Forenet Kredit (in
Danish) and Nykredit A/S are available from:
Nykredit Realkredit A/S
Kalvebod Brygge 1-3
DK-1780 Copenhagen V
NOTES
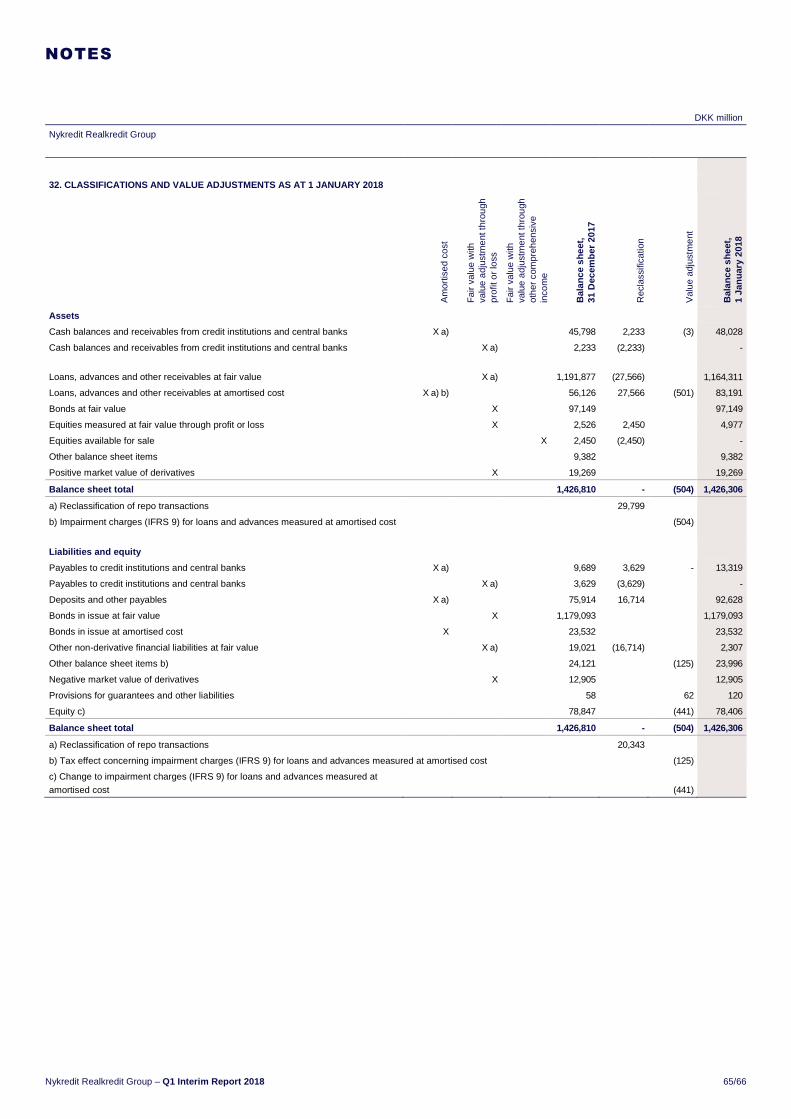
Nykredit Realkredit Group – Q1 Interim Report 2018 65/66
DKK million
Nykredit Realkredit Group
32. CLASSIFICATIONS AND VALUE ADJUSTMENTS AS AT 1 J ANUARY 2018
Am
ortis
ed c
ost
Fai
r va
lue
with
va
lue
adju
stm
ent t
hrou
gh
prof
it or
loss
Fai
r va
lue
with
va
lue
adju
stm
ent t
hrou
gh
othe
r co
mpr
ehen
sive
in
com
e
Bal
ance
she
et,
31
Dec
embe
r 20
17
Rec
lass
ifica
tion
Val
ue a
djus
tmen
t
Bal
ance
she
et,
1
Janu
ary
2018
Assets
Cash balances and receivables from credit institutions and central banks X a) 45,798 2,233 (3) 48,028
Cash balances and receivables from credit institutions and central banks X a) 2,233 (2,233) -
Loans, advances and other receivables at fair value X a) 1,191,877 (27,566)
1,164,311
Loans, advances and other receivables at amortised cost X a) b) 56,126 27,566 (501) 83,191
Bonds at fair value X 97,149 97,149
Equities measured at fair value through profit or loss X 2,526 2,450 4,977
Equities available for sale X 2,450 (2,450) -
Other balance sheet items 9,382 9,382
Positive market value of derivatives X 19,269 19,269
Balance sheet total 1,426,810 - (504) 1,426,306
a) Reclassification of repo transactions 29,799
b) Impairment charges (IFRS 9) for loans and advances measured at amortised cost (504)
Liabilities and equity
Payables to credit institutions and central banks X a) 9,689 3,629 - 13,319
Payables to credit institutions and central banks X a) 3,629 (3,629) -
Deposits and other payables X a) 75,914 16,714 92,628
Bonds in issue at fair value X 1,179,093 1,179,093
Bonds in issue at amortised cost X 23,532 23,532
Other non-derivative financial liabilities at fair value X a) 19,021 (16,714) 2,307
Other balance sheet items b) 24,121 (125) 23,996
Negative market value of derivatives X 12,905 12,905
Provisions for guarantees and other liabilities 58 62 120
Equity c) 78,847 (441) 78,406
Balance sheet total 1,426,810 - (504) 1,426,306
a) Reclassification of repo transactions 20,343
b) Tax effect concerning impairment charges (IFRS 9) for loans and advances measured at amortised cost (125)
c) Change to impairment charges (IFRS 9) for loans and advances measured at
amortised cost (441)
NOTES

66/66 Q1 Interim Report 2018 – Nykredit Realkredit Group
DKK million
Nykredit Realkredit A/S
32. CLASSIFICATIONS AND VALUE ADJUSTMENTS AS AT 1 J ANUARY 2018 (CONTINUED)
Am
ortis
ed c
ost
Fai
r va
lue
with
va
lue
adju
stm
ent t
hrou
gh
prof
it or
loss
Fai
r va
lue
with
va
lue
adju
stm
ent t
hrou
gh
othe
r co
mpr
ehen
sive
in
com
e
Bal
ance
she
et,
31 D
ecem
ber
2017
Rec
lass
ifica
tion
Val
ue a
djus
tmen
t
Bal
ance
she
et,
1 Ja
nuar
y 20
18
Assets
Cash balances and receivables from credit institutions and central banks X a) 50,249 4,950 55,198
Cash balances and receivables from credit institutions and central banks X a) 4,950 (4,950) -
Loans, advances and other receivables at fair value X a) 1,212,947 - 1,212,947
Loans, advances and other receivables at amortised cost X a) b) 282 - - 282
Bonds at fair value X 38,390 38,390
Equities measured at fair value through profit or loss X 4,758 4,758
Investments in Group enterprises b) 47,099 (441) 46,658
Other balance sheet items 7,306 7,306
Positive market value of derivatives X 1,309 1,309
Balance sheet total 1,367,291 - (441) 1,366,850
a) Reclassification of repo transactions 4,950
b) Change in equity in Nykredit Bank A/S as a consequence of new impairment charges
for loans and advances (441)
Liabilities and equity
Payables to credit institutions and central banks X a) 493 4,861 - 5,353
Payables to credit institutions and central banks X a) 4,861 (4,861) -
Deposits and other payables X a) - 8,500 8,500
Bonds in issue at fair value X
1,235,565
1,235,565
Bonds in issue at amortised cost X 17,059 17,059
Other non-derivative financial liabilities at fair value X a) 8,501 (8,500) 1
Other balance sheet items 20,210 20,210
Negative market value of derivatives X 1,756 1,756
Provisions for guarantees and other liabilities - -
Equity b) 78,847 (441) 78,406
Balance sheet total 1,367,291 - (441) 1,366,850
a) Reclassification of repo transactions 13,361
b) Change in equity as a consequence of new impairment charges for loans and advances (441)
NOTES
This document is an English translation of the original
Danish text. In the event of discrepancies between the
original Danish text and the English translation, the
Danish text shall prevail.