Q4 & Full Year 2018 Earnings Presentation - Investor Relations
33
Q4 & Full Year 2018 Earnings Presentation
-
Upload
khangminh22 -
Category
Documents
-
view
1 -
download
0
Transcript of Q4 & Full Year 2018 Earnings Presentation - Investor Relations

Q4 & Full Year 2018 Earnings Presentation
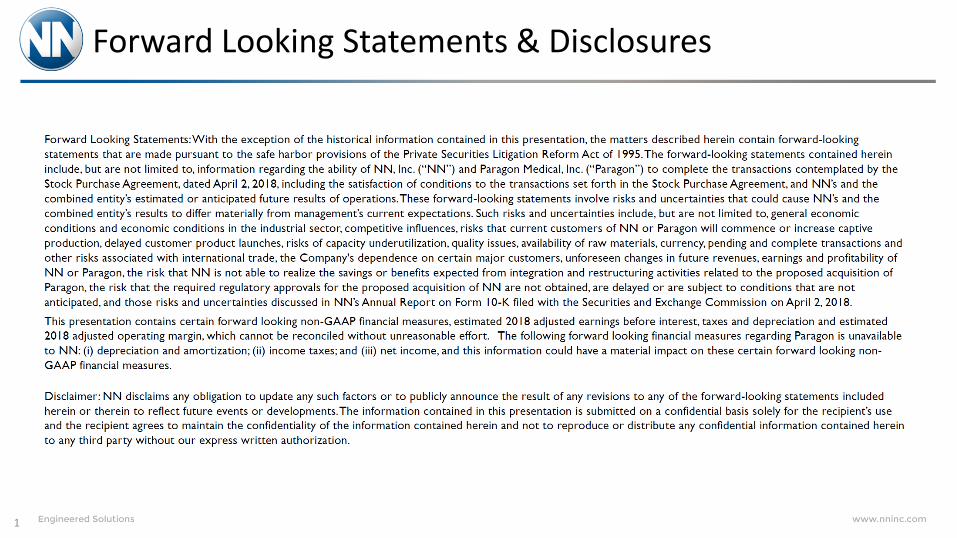
Forward Looking Statements & Disclosures
1
Fourth Quarter 2018

Fourth Quarter 2018 Highlights
3
• Net Sales of $199.5M• Organic growth of 4% in the quarter driven by Life Sciences• Offset by continued headwinds in the global automotive market• Acquisitions contributed $39.2M
• Adjusted Operating Margin expanded 300 bps to 11.8%• Improvements driven by Life Sciences growth and synergy capture• Enterprise flexing appropriately in the face of market and mix headwinds
• Adjusted Diluted EPS of $0.22
• Free Cash Flow for Q4 of ~$50M
• Net leverage reduction of ~20 bps in the quarter
• Non-Cash impairment charge of $199M• Driven by GAAP requirements• Does not impact our operating performance, cash flows or strategic plans moving forward
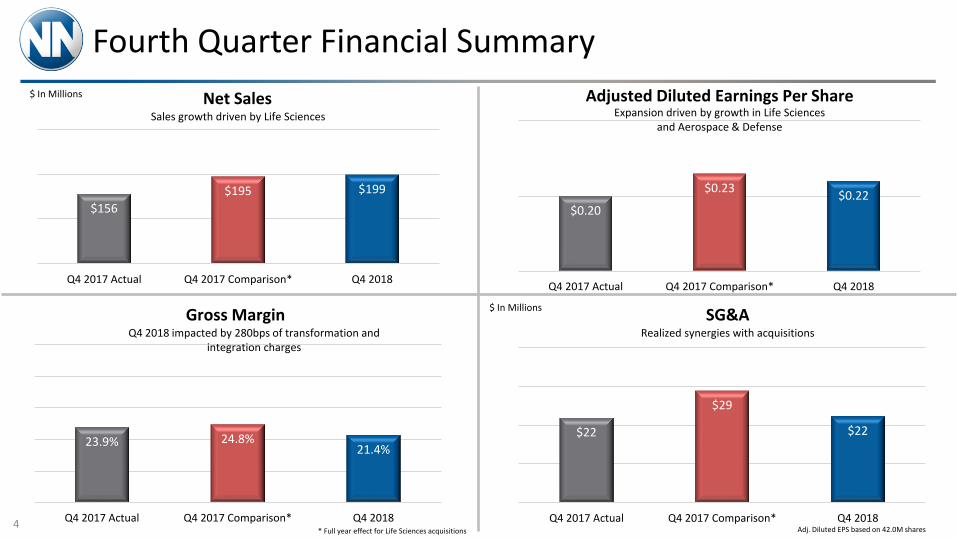
$156$195 $199
Q4 2017 Actual Q4 2017 Comparison* Q4 2018
$ In Millions
Fourth Quarter Financial Summary
4
Net SalesSales growth driven by Life Sciences
$0.20
$0.23 $0.22
Q4 2017 Actual Q4 2017 Comparison* Q4 2018
Adjusted Diluted Earnings Per ShareExpansion driven by growth in Life Sciences
and Aerospace & Defense
$22
$29
$22
Q4 2017 Actual Q4 2017 Comparison* Q4 2018
$ In Millions SG&ARealized synergies with acquisitions
23.9% 24.8%21.4%
Q4 2017 Actual Q4 2017 Comparison* Q4 2018
Gross MarginQ4 2018 impacted by 280bps of transformation and
integration charges
* Full year effect for Life Sciences acquisitions Adj. Diluted EPS based on 42.0M shares

Fourth Quarter Financial Summary
5
Adjusted Operating MarginIncremental sales volume and synergy capture
Adjusted EBITDA Margin
$ In Millions5.69x 5.95x
4.96x4.74x
0.00x0.20x0.40x0.60x0.80x1.00x1.20x1.40x1.60x1.80x2.00x2.20x2.40x2.60x2.80x3.00x3.20x3.40x3.60x3.80x4.00x4.20x4.40x4.60x4.80x5.00x5.20x5.40x5.60x5.80x6.00x6.20x6.40x
$300$400$500$600$700$800$900
$1,000$1,100$1,200
Q1 2018 Q2 2018 Q3 2018 Q4 2018
Term Loans Revolver Net Leverage
Outstanding Senior Debt & Net Leverage1
8.8% 8.8%
11.8%
0.0%
2.0%
4.0%
6.0%
8.0%
10.0%
12.0%
14.0%
Q4 2017 Actual Q4 2017 Comparison* Q4 2018
16.2%
15.8%
17.2%
15.0%
15.5%
16.0%
16.5%
17.0%
17.5%
Q4 2017 Actual Q4 2017 Comparison* Q4 2018
* Full year effect for Life Sciences acquisitions 1: As calculated per our credit agreement
Power Solutions Group
6
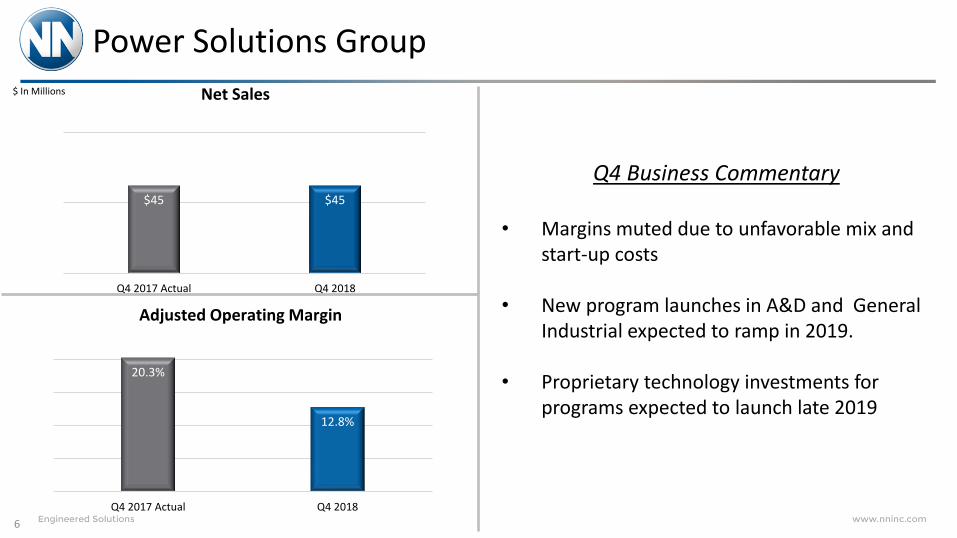
$45 $45
$20
$40
$60
Q4 2017 Actual Q4 2018
$ In Millions
Adjusted Operating Margin
Net Sales
Q4 Business Commentary
• Margins muted due to unfavorable mix and start-up costs
• New program launches in A&D and General Industrial expected to ramp in 2019.
• Proprietary technology investments for programs expected to launch late 2019
20.3%
12.8%
0.0%
5.0%
10.0%
15.0%
20.0%
Q4 2017 Actual Q4 2018
Mobile Solutions Group
7
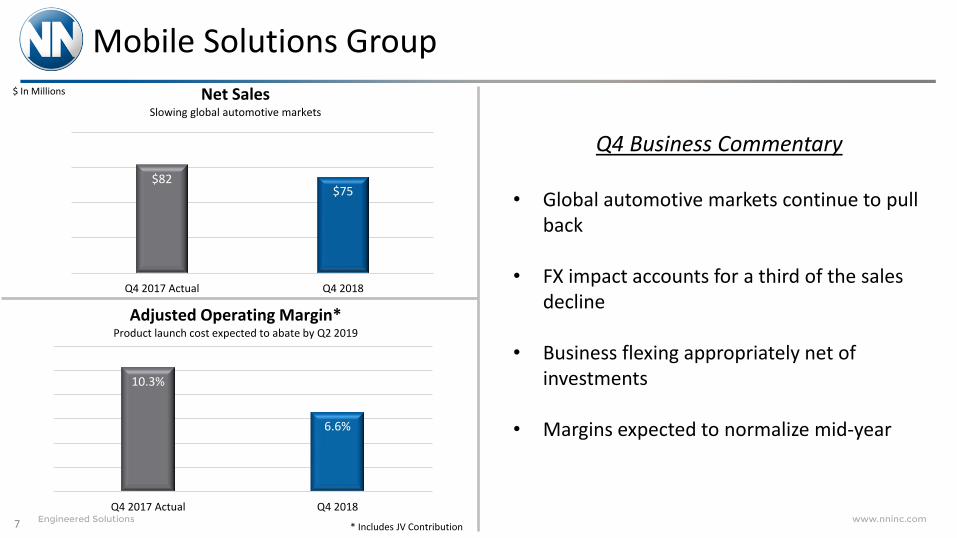
$82$75
$20
$40
$60
$80
$100
Q4 2017 Actual Q4 2018
$ In Millions
10.3%
6.6%
0.0%
2.0%
4.0%
6.0%
8.0%
10.0%
12.0%
Q4 2017 Actual Q4 2018
Adjusted Operating Margin*Product launch cost expected to abate by Q2 2019
Net SalesSlowing global automotive markets
Q4 Business Commentary
• Global automotive markets continue to pull back
• FX impact accounts for a third of the sales decline
• Business flexing appropriately net of investments
• Margins expected to normalize mid-year
* Includes JV Contribution

Life Sciences Group
8
$30
$69$79
$0
$20
$40
$60
$80
$100
Q4 2017 Actual Q4 2017 Comparison* Q4 2018
$ In Millions
20.3%
14.0%
19.7%
0.0%
5.0%
10.0%
15.0%
20.0%
25.0%
Q4 2017 Actual Q4 2017 Comparison* Q4 2018
Adjusted Operating MarginIntegration plan on track
Net SalesLife Sciences out performing expectations
Q4 Business Commentary
• Organic sales growth of 14% YoY• Paragon greater than 20%• Legacy business in line
• Backlog has almost doubled since mid-year 2018
• Overall performance ahead of plan
• Margins in line with typical seasonal activity
* Full year effect for Life Sciences acquisitions
Fourth Quarter 2018 Summary
9
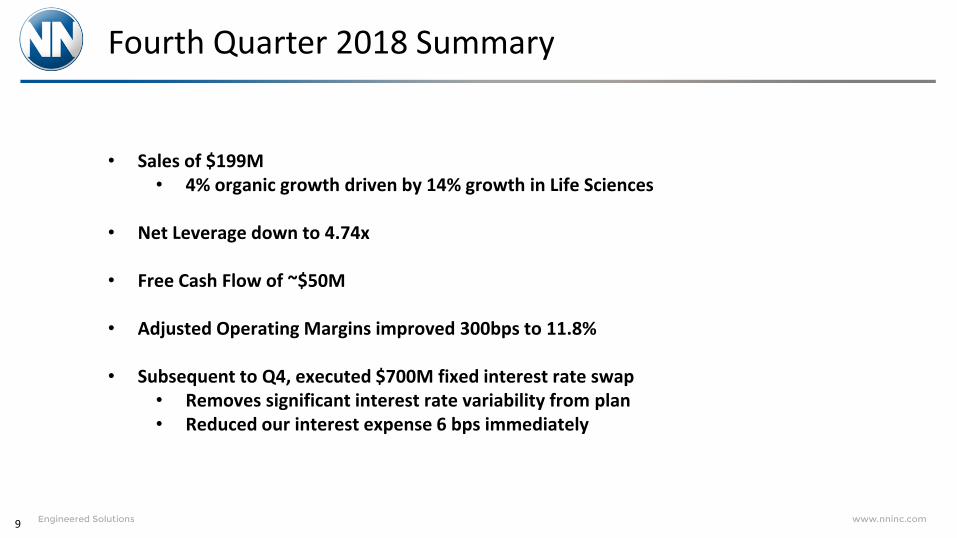
• Sales of $199M• 4% organic growth driven by 14% growth in Life Sciences
• Net Leverage down to 4.74x
• Free Cash Flow of ~$50M
• Adjusted Operating Margins improved 300bps to 11.8%
• Subsequent to Q4, executed $700M fixed interest rate swap• Removes significant interest rate variability from plan• Reduced our interest expense 6 bps immediately

Full Year 2018 & 2019 Business Expectations
2018 Financial Summary
11
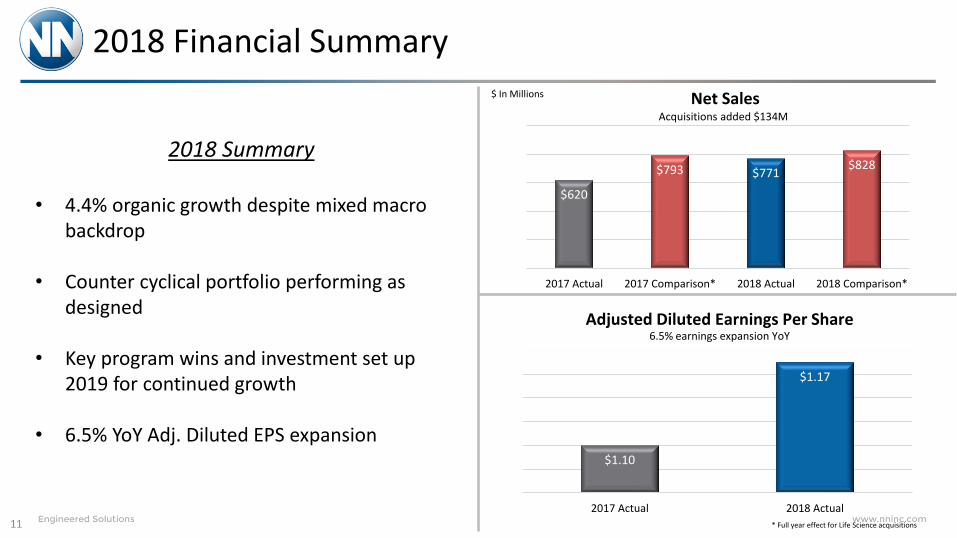
Net SalesAcquisitions added $134M
$ In Millions
2018 Summary
• 4.4% organic growth despite mixed macro backdrop
• Counter cyclical portfolio performing as designed
• Key program wins and investment set up 2019 for continued growth
• 6.5% YoY Adj. Diluted EPS expansion
$620
$793 $771 $828
0
200
400
600
800
1000
2017 Actual 2017 Comparison* 2018 Actual 2018 Comparison*
$1.10
$1.17
$1.06
$1.08
$1.10
$1.12
$1.14
$1.16
$1.18
2017 Actual 2018 Actual* Full year effect for Life Science acquisitions
Adjusted Diluted Earnings Per Share6.5% earnings expansion YoY
11.1%
10.7%
12.0% 12.0%
10.0%
10.5%
11.0%
11.5%
12.0%
12.5%
2017 Actual 2017 Comparison* 2018 Actual 2018 Comparison*
2018 Financial Summary
12
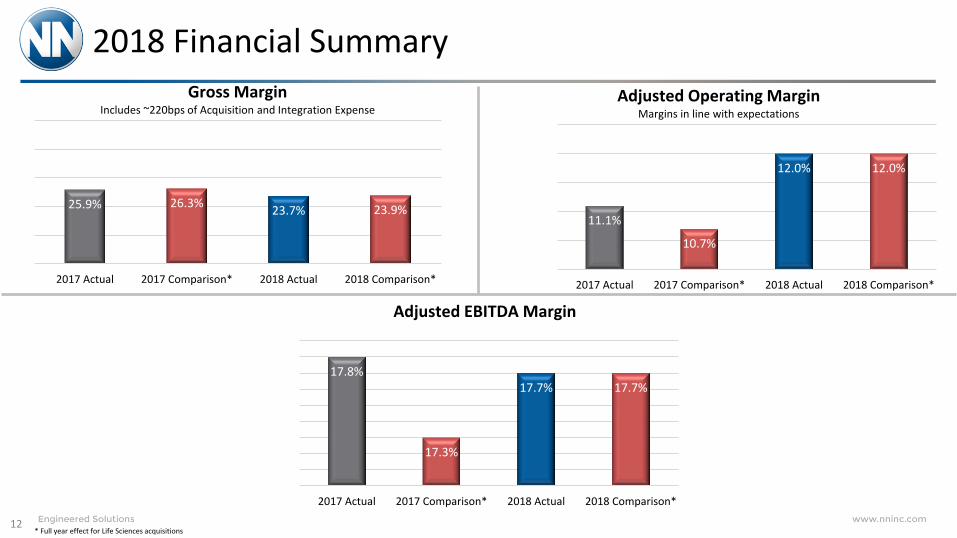
Adjusted Operating MarginMargins in line with expectations
Adjusted EBITDA Margin
17.8%
17.3%
17.7% 17.7%
17.0%17.1%17.2%17.3%17.4%17.5%17.6%17.7%17.8%17.9%
2017 Actual 2017 Comparison* 2018 Actual 2018 Comparison*
25.9% 26.3% 23.7% 23.9%
2017 Actual 2017 Comparison* 2018 Actual 2018 Comparison*
Gross MarginIncludes ~220bps of Acquisition and Integration Expense
* Full year effect for Life Sciences acquisitions

Power Solutions Group
13
$187 $190
$20
$70
$120
$170
$220
2017 2018
$ In Millions
19.0%17.7%
0.0%
5.0%
10.0%
15.0%
20.0%
2017 2018
2018 Adjusted Operating Margin
2018 Net Sales
2019 Business Outlook
• Housing starts flat, non-residential and Aerospace & Defense markets displaying growth in line with expectations
• Organic growth of 6-8% • Driven by new program start ups
• Continued improvement in operational efficiency• 2 new Aerospace & Defense facilities coming
fully online
• Margin improvements driven by continued Aerospace & Defense growth
Mobile Solutions Group
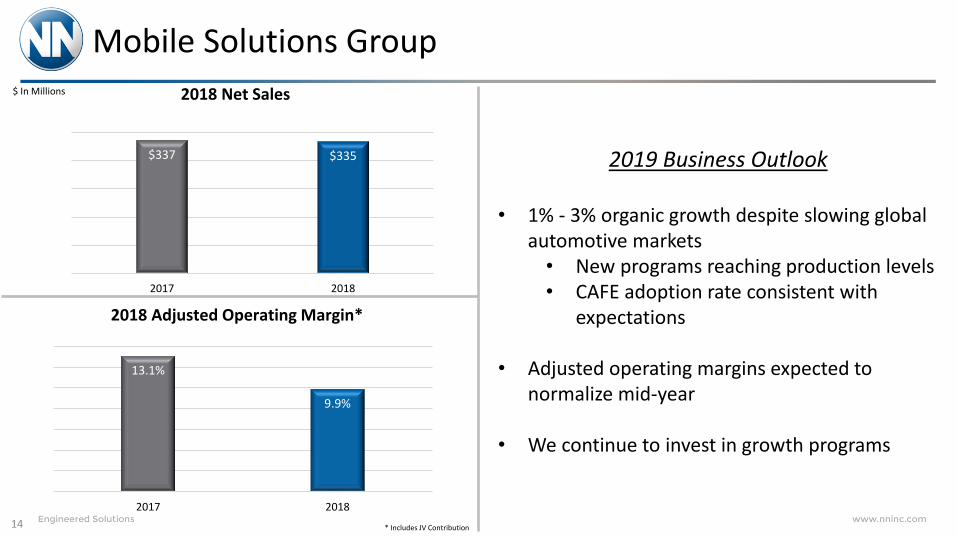
14
$337 $335
$100
$150
$200
$250
$300
$350
2017 2018
$ In Millions
13.1%
9.9%
0.0%
2.0%
4.0%
6.0%
8.0%
10.0%
12.0%
14.0%
2017 2018
2018 Adjusted Operating Margin*
2018 Net Sales
2019 Business Outlook
• 1% - 3% organic growth despite slowing global automotive markets
• New programs reaching production levels• CAFE adoption rate consistent with
expectations
• Adjusted operating margins expected to normalize mid-year
• We continue to invest in growth programs
* Includes JV Contribution

Life Sciences Group
15
$98
$271$248
$305
$0$50
$100$150$200$250$300$350
2017 Actual 2017 Comparison* 2018 Actual 2018 Comparison*
$ In Millions
23.6%
14.7%
20.8%19.0%
0.0%
5.0%
10.0%
15.0%
20.0%
25.0%
2017 Actual 2017 Comparison* 2018 Actual 2018 Comparison*
Adjusted Operating MarginSynergy capture remains on plan
Net Sales13% organic growth 2019 Business Outlook
• Solid macro backdrop expected to continue throughout 2019
• Anticipated organic growth of 12%-15%
• Synergy capture and continued operating improvements expected to drive further margin expansion
• Backlog expected to normalize as production capacity comes on line
* Full year effect for Life Sciences acquisitions

Guidance

+ Midpoint of 2019 Guidance
2019 Preview
17
2019 Operating Highlights+
Adjusted Operating Margin 12.7% 70bps Improvement
Adjusted EBITDA $170M
Free Cash Flow $45M
Forecasted FYE Net Leverage1 4.5x Quarter turn reduction
2019 Business Outlook
• Mixed macro expected to persist in 2019• Tailwinds in Medical & Aerospace & Defense
• 6% organic growth across the enterprise, driven by Life Sciences
• 35% YoY Adj. EPS Expansion to mid-point of guide
• Continued focus on de-leveraging
Transformed NN Annual Time Phasing
Q1 Q2 Q3 Q4
Net Sales % 23% - 25% 25% - 27% 25% - 27% 24% - 26%
Adj EPS % 13% - 15% 24% - 26% 30% - 32% 30% - 32%
1: As calculated per our credit agreement

2019 Guidance
18
2019 Guidance Commentary
Net Sales $870M - $890M All three segments expected to grow
Adj. Operating Margin(a) 12.4% - 13.0% Continued improvements in the NN Operating System
driving expansion
Adj. EBITDA $166M - $174M
Adj. Diluted EPS(b) $1.10 - $1.30 35% YoY Adj. EPS Expansion to mid-point of guide, on a comparable diluted basis
Free Cash Flow1 $40M - $50M Free cash flow focused on de-leveraging
1: Operating Cash Flow - Capex

1st Quarter 2019 Guidance
19
Fourth Quarter Actual
First Quarter Guidance Commentary
Net Sales $199.5M $205M - $215M Q1 Revenue in line with our expectations
Adj. EBITDA $34.4M $33M - $36M

Reconciliation Tables

21
$000s $000sNN, Inc. Consolidated 2018 2017 Power Solutions 2018 2017GAAP income from operations (188,170)$ 1,069$ GAAP income from operations (109,054)$ 5,660$ Restructuring and integration expense (10) 24 Restructuring and integration expense - - Acquisition and transition expense 15,568 6,696 Acquisition and transition expense 3,524 664 Amortization of intangibles 8,439 5,938 Amortization of intangibles 2,193 2,724 Impairments (Goodwill and fixed assets) 187,778 - Impairments (Goodwill and fixed assets) 109,100 - Non-GAAP adjusted income from operations (a) 23,605$ 13,727$ Non-GAAP adjusted income from operations (a) 5,763$ 9,048$
Non-GAAP adjusted operating margin (1) 11.8% 8.8% Non-GAAP adjusted operating margin (1) 12.8% 20.3%GAAP net sales 199,477$ 156,135$ GAAP net sales 45,194$ 44,620$
$000s $000sMobile Solutions 2018 2017 Life Sciences 2018 2017GAAP income from operations (75,925)$ 6,317$ GAAP income from operations 6,174$ 2,840$ Restructuring and integration expense (10) 24 Restructuring and integration expense - - Acquisition and transition expense 1,493 195 Acquisition and transition expense 4,122 884 Amortization of intangibles 885 859 Amortization of intangibles 5,361 2,355 Impairments (Goodwill and fixed assets) 78,054 - Impairments (Goodwill and fixed assets) - - Non-GAAP adjusted income from operations (a) 4,497$ 7,395$ Non-GAAP adjusted income from operations (a) 15,657$ 6,079$
Share of net income from joint venture (16,134) 1,072 Non-GAAP adjusted operating margin (1) 19.7% 20.3%Impairment of joint venture 16,589 - GAAP net sales 79,457$ 29,932$ Non-GAAP adjusted income from operations with JV 4,952$ 8,467$
Non-GAAP adjusted operating margin (1) 6.6% 10.3%GAAP net sales 75,359$ 82,084$
$000sElimination 2018 2017GAAP net sales (533)$ (501)$
(1) Non-GAAP adjusted operating margin = Non-GAAP adjusted income from operations/ GAAP net sales
Reconciliation of GAAP Income from Operations to Non-GAAP Adjusted Income from Operations
Three Months Ended Three Months Ended
Three Months Ended
December 31, December 31,
Three Months Ended Three Months Ended
December 31,
December 31, December 31,
22
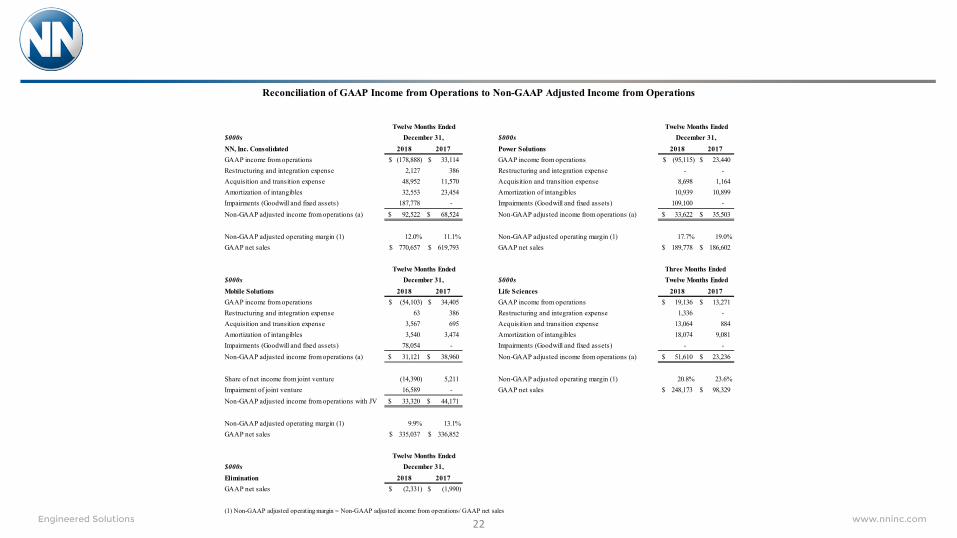
$000s $000sNN, Inc. Consolidated 2018 2017 Power Solutions 2018 2017GAAP income from operations (178,888)$ 33,114$ GAAP income from operations (95,115)$ 23,440$ Restructuring and integration expense 2,127 386 Restructuring and integration expense - - Acquisition and transition expense 48,952 11,570 Acquisition and transition expense 8,698 1,164 Amortization of intangibles 32,553 23,454 Amortization of intangibles 10,939 10,899 Impairments (Goodwill and fixed assets) 187,778 - Impairments (Goodwill and fixed assets) 109,100 - Non-GAAP adjusted income from operations (a) 92,522$ 68,524$ Non-GAAP adjusted income from operations (a) 33,622$ 35,503$
Non-GAAP adjusted operating margin (1) 12.0% 11.1% Non-GAAP adjusted operating margin (1) 17.7% 19.0%GAAP net sales 770,657$ 619,793$ GAAP net sales 189,778$ 186,602$
$000s $000sMobile Solutions 2018 2017 Life Sciences 2018 2017GAAP income from operations (54,103)$ 34,405$ GAAP income from operations 19,136$ 13,271$ Restructuring and integration expense 63 386 Restructuring and integration expense 1,336 - Acquisition and transition expense 3,567 695 Acquisition and transition expense 13,064 884 Amortization of intangibles 3,540 3,474 Amortization of intangibles 18,074 9,081 Impairments (Goodwill and fixed assets) 78,054 - Impairments (Goodwill and fixed assets) - - Non-GAAP adjusted income from operations (a) 31,121$ 38,960$ Non-GAAP adjusted income from operations (a) 51,610$ 23,236$
Share of net income from joint venture (14,390) 5,211 Non-GAAP adjusted operating margin (1) 20.8% 23.6%Impairment of joint venture 16,589 - GAAP net sales 248,173$ 98,329$ Non-GAAP adjusted income from operations with JV 33,320$ 44,171$
Non-GAAP adjusted operating margin (1) 9.9% 13.1%GAAP net sales 335,037$ 336,852$
$000sElimination 2018 2017GAAP net sales (2,331)$ (1,990)$
(1) Non-GAAP adjusted operating margin = Non-GAAP adjusted income from operations/ GAAP net sales
Reconciliation of GAAP Income from Operations to Non-GAAP Adjusted Income from Operations
Twelve Months Ended Twelve Months Ended
Twelve Months Ended
Twelve Months Ended
December 31, December 31,
Twelve Months Ended Three Months Ended
December 31,
December 31,
23
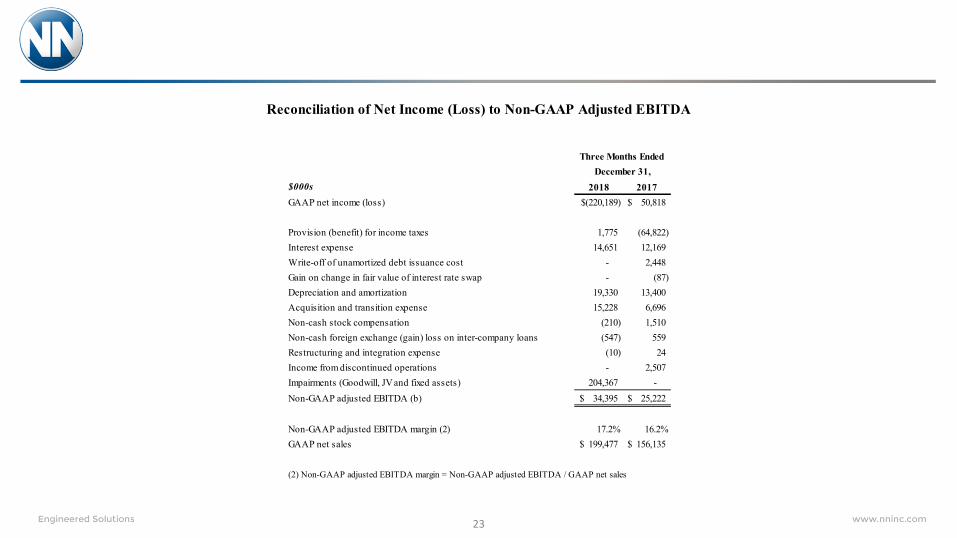
$000s 2018 2017GAAP net income (loss) (220,189)$ 50,818$
Provision (benefit) for income taxes 1,775 (64,822) Interest expense 14,651 12,169 Write-off of unamortized debt issuance cost - 2,448 Gain on change in fair value of interest rate swap - (87) Depreciation and amortization 19,330 13,400 Acquisition and transition expense 15,228 6,696 Non-cash stock compensation (210) 1,510 Non-cash foreign exchange (gain) loss on inter-company loans (547) 559 Restructuring and integration expense (10) 24 Income from discontinued operations - 2,507 Impairments (Goodwill, JV and fixed assets) 204,367 - Non-GAAP adjusted EBITDA (b) 34,395$ 25,222$
Non-GAAP adjusted EBITDA margin (2) 17.2% 16.2%GAAP net sales 199,477$ 156,135$
(2) Non-GAAP adjusted EBITDA margin = Non-GAAP adjusted EBITDA / GAAP net sales
December 31,
Reconciliation of Net Income (Loss) to Non-GAAP Adjusted EBITDA
Three Months Ended

24
$000s 2018 2017GAAP net income (loss) (264,467)$ 163,052$
Provision (benefit) for income taxes (10,957) (79,026) Interest expense 61,243 52,085 Write-off of unamortized debt issuance cost 19,562 42,087 Gain on change in fair value of interest rate swap - (101) Depreciation and amortization 71,128 52,406 Acquisition and transition expense 48,612 11,570 Non-cash stock compensation 2,413 5,226 Non-cash foreign exchange (gain) loss on inter-company loans 2,620 258 Restructuring and integration expense 2,127 386 Income from discontinued operations - (137,688) Impairments (Goodwill, JV and fixed assets) 204,367 - Non-GAAP adjusted EBITDA (b) 136,648$ 110,255$
Non-GAAP adjusted EBITDA margin (2) 17.7% 17.8%GAAP net sales 770,657$ 619,793$
(2) Non-GAAP adjusted EBITDA margin = Non-GAAP adjusted EBITDA / GAAP net sales
December 31,
Reconciliation of Net Income (Loss) to Non-GAAP Adjusted EBITDA
Twelve Months Ended

25
$000s 2018 2017GAAP net income (loss) (220,189)$ 50,818$
Pre-tax acquisition and transition expense 15,568 6,696 Pre-tax foreign exchange (gain) loss on inter-company loans (547) 559 Pre-tax restructuring and integration expense (10) 24 Pre-tax write-off unamortized debt issuance costs - 2,448 Pre-tax gain on change in fair value of interest rate swap - (87) Pre-tax amortization of intangibles and deferred financing costs 9,653 7,111 Pre-tax interest expense on cash held from divestiture - 3,720 Pre-tax impairments of fixed asset costs 5,236 - Tax effect of adjustment reflected above (c) (6,772) (5,695) Impairments (Goodwill and JV) 199,131 - Impact due to tax cuts and jobs act - (51,823) Divestiture of Business Segment, exclusive of tax reform 7,198 (7,983) Income from discontinued operations - 2,507 Non-GAAP adjusted net income (loss) (d) 9,268$ 8,295$
Amounts per share, diluted 2018 2017GAAP net income (loss) per diluted share (5.25)$ 1.82$
Pre-tax acquisition and transition expense 0.37 0.24 Pre-tax foreign exchange (gain) loss on inter-company loans (0.01) 0.02 Pre-tax restructuring and integration expense (0.00) 0.00 Pre-tax write-off unamortized debt issuance costs - 0.09 Pre-tax gain on change in fair value of interest rate swap - (0.00) Pre-tax amortization of intangibles and deferred financing costs 0.23 0.25 Pre-tax interest expense on cash held from divestiture - 0.13 Pre-tax impairments of fixed asset costs 0.12 - Tax effect of adjustment reflected above (c) (0.16) (0.20) Impairments (Goodwill and JV) 4.75 - Impact due to tax cuts and jobs act - (1.86) Divestiture of Business Segment, exclusive of tax reform 0.17 (0.29) Income from discontinued operations - 0.09 Non-GAAP adjusted net income (loss) per diluted share (d) 0.22$ 0.30$ Weighted average shares outstanding, diluted 41,959 27,925
Three Months Ended December 31,
Reconciliation of Net Income (Loss) to Non-GAAP Adjusted Net Income (Loss) and Net Income (Loss) per Diluted Share to Non-GAAP Adjusted Net Income (Loss) per Diluted Share
Three Months Ended December 31,

26
$000s 2018 2017GAAP net income (loss) (264,467)$ 163,052$
Pre-tax acquisition and transition expense 48,952 11,570 Pre-tax foreign exchange (gain) loss on inter-company loans 2,620 258 Pre-tax restructuring and integration expense 2,127 386 Pre-tax write-off unamortized debt issuance costs 19,562 42,087 Pre-tax gain on change in fair value of interest rate swap - (101) Pre-tax amortization of intangibles and deferred financing costs 37,741 28,206 Pre-tax interest expense on cash held from divestiture 3,607 6,160 Pre-tax impairments of fixed asset costs 5,236 - Tax effect of adjustment reflected above (c) (24,525) (23,485) Impairments (Goodwill and JV) 199,131 - Impact due to tax cuts and jobs act - (51,823) Divestiture of Business Segment, exclusive of tax reform 7,198 (7,983) Income from discontinued operations - (137,688) Non-GAAP adjusted net income (loss) (d) 37,182$ 30,638$
Amounts per share, diluted 2018 2017GAAP net income (loss) per diluted share (8.35)$ 5.87$
Pre-tax acquisition and transition expense 1.55 0.42 Pre-tax foreign exchange (gain) loss on inter-company loans 0.08 0.01 Pre-tax restructuring and integration expense 0.07 0.01 Pre-tax write-off unamortized debt issuance costs 0.62 1.52 Pre-tax gain on change in fair value of interest rate swap - (0.00) Pre-tax amortization of intangibles and deferred financing costs 1.19 1.02 Pre-tax interest expense on cash held from divestiture 0.11 0.22 Pre-tax impairments of fixed asset costs 0.17 - Tax effect of adjustment reflected above (c) (0.77) (0.85) Impairments (Goodwill and JV) 6.29 - Impact due to tax cuts and jobs act - (1.87) Divestiture of Business Segment, exclusive of tax reform 0.23 (0.29) Income from discontinued operations - (4.96) Non-GAAP adjusted net income (loss) per diluted share (d) 1.17$ 1.10$ Weighted average shares outstanding, diluted 31,678 27,755
Twelve Months EndedDecember 31,
Reconciliation of Net Income (Loss) to Non-GAAP Adjusted Net Income (Loss) and Net Income (Loss) per Diluted Share to Non-GAAP Adjusted Net Income (Loss) per Diluted Share
Twelve Months EndedDecember 31,

27
$000s % of Sales $000s % of SalesGAAP income from operations 40,175$ 4.6% 51,285$ 5.8%Restructuring and integration expense - 0.0% - 0.0%Acquisition and transition expense 21,000 2.4% 17,500 2.0%Amortization of intangibles 46,968 5.4% 46,968 5.3%Non-GAAP adjusted income from operations (a) 108,143$ 12.4% 115,753$ 13.0%
GAAP net sales
Guidance - Reconciliation of GAAP Income from Operations to Non-GAAP Adjusted Income from Operations
Twelve Months Ending December 31, 2019Low High
870,000$ 890,000$

28
$000s $000sGAAP Income from Operations 1,206$ 3,588$ Depreciation and amortization 24,386 24,386 Acquisition and transition expense 5,964 5,964 Non-cash stock compensation 1,300 1,300 Share of NI from China JV 164 164 Restructuring and integration expense - - Non-GAAP adjusted EBITDA (b) 33,020$ 35,402$
$000s $000sGAAP Income from Operations 40,175$ 51,285$ Depreciation and amortization 96,936 96,936 Acquisition and transition expense 21,000 17,500 Non-cash stock compensation 5,200 5,200 Share of NI from China JV 3,000 3,000 Restructuring and integration expense - - Non-GAAP adjusted EBITDA (b) 166,311$ 173,921$
Low High
Guidance - Reconciliation of GAAP Income from Operations to Non-GAAP Adjusted EBITDA
Twelve Months Ending December 31, 2019
Three Months Ending March 31, 2019Low High

29
$000s per share $000s per shareGAAP net income (loss) (10,520)$ (0.25)$ 1,807$ 0.04$ Pre-tax acquisition and transition expense 22,610 0.5 17,500 0.4 Pre-tax foreign exchange (gain)/loss on inter-company loans - - - - Pre-tax restructuring and integration expense - - - - Pre-tax write-off unamortized debt issuance costs - - - - Pre-tax write-off interest rate swap - - - - Pre-tax interest expense on cash held from divestiture - - - - Pre-tax amortization of intangibles and deferred financing costs 52,349 1.2 52,349 1.2 Tax effect of adjustment reflected above (c) (17,889) (0.4) (16,663) (0.4) Non-GAAP adjusted net income per share (d) 46,550$ 1.10$ 54,993$ 1.30$
Weighted average shares outstanding, diluted 42,200 42,200
Guidance - Reconciliation of GAAP Net Income to Non-GAAP Adjusted Net Income
Twelve Months Ending December 31, 2019Low High

30
Low High$000s $000s
Cash provided by operations 79,973$ 99,300$ CAPEX (40,000) (49,264) Non-GAAP free cash flow 39,973$ 50,036$
Guidance - Non-GAAP Free Cash FlowTwelve Months Ending December 31, 2018

Non-GAAP Financial Measures Footnotes
31
The Company discloses in this presentation the non-GAAP financial measures of adjusted income from operations, adjusted net income and adjusted diluted earnings per share. Each of these non-GAAP financial measures provide supplementary information about the impacts of acquisition and integration related expenses, foreign-exchange impacts on inter-company loans reorganizational and impairment charges. Over the past three years, we have completed six acquisitions, two of which were transformative for the Company. The costs we incurred in completing such acquisitions, including the amortization of intangibles and deferred financing costs, have been excluded from these measures because their size and inconsistent frequency are unrelated to our commercial performance during the period, and which we believe are not indicative of our ongoing operating costs. We exclude the impact of currency translation from these measures because foreign exchange rates are not under management’s control and are subject to volatility. Other non-operating charges such as, the write-off of our interest rate swap, are excluded as the charges on not indicative of our ongoing operating cost. We believe the presentation of adjusted income from operations, adjusted net income and adjusted diluted earnings per share provide useful information in assessing our underlying business trends and facilitates comparison of our long-term performance over given periods
(a) Non-GAAP Adjusted income from operations represents GAAP income from operations, adjusted to exclude the effects of restructuring and integration expense, non-operational charges related to acquisition and transition expense, intangible amortization costs for fair value step-up in values related to acquisitions, non-cash impairment charges, and when applicable, our share of income from joint venture operations. We believe this presentation is commonly used by investors and professional research analysts in the valuation, comparison, rating and investment recommendations of companies in the industrial industry. We use this information for comparative purposes within the industry. Non-GAAP adjusted income from operations is not a measure of financial performance under GAAP and should not be considered as a measure of liquidity or as an alternative to GAAP income from operations.
(b) Non-GAAP adjusted EBITDA represents GAAP net income (loss), adjusted to include income taxes, interest expense, Interest rate swaps and write-offs, depreciation and amortization, charges related to acquisition and transition costs, non-cash stock compensation expense, foreign exchange gain (loss) on inter-company loans, restructuring and integration expense, income from discontinued operations, and non-cash impairment charges, to the extent applicable. We believe this presentation is commonly used by investors and professional research analysts in the valuation, comparison, rating and investment recommendations of companies in the industrial industry. We use this information for comparative purposes within the industry. Non-GAAP adjusted EBITDA is not a measure of financial performance under GAAP and should not be considered as a measure of liquidity or as an alternative to GAAP income (loss) from continuing operations.
(c) This line item reflects the aggregate tax effect of all nontax adjustments reflected in the respective table. In addition, the footnotes reflect the after-tax amount of each individual adjustment item. NN, Inc. estimates the tax effect of the adjustment items identified in the reconciliation schedule above by applying NN, Inc’s. overall estimated effective tax rate to the pretax amount, unless the nature of the item and/or the tax jurisdiction in which the item has been recorded requires application of a specific tax rate or tax treatment.

Non-GAAP Financial Measures Footnotes
32
(d) Non-GAAP adjusted net income (loss) represents GAAP net income (loss) adjusted to exclude the tax-affected effects of restructuring and integration charges (related to plant closures and other charges incurred to implement our strategic goals that do not necessarily represent a major strategic shift in operations), charges related to acquisition and transition costs, amortization of intangibles costs for fair value step-up in values related to acquisitions and amortization of deferred financing costs, foreign exchange gain (loss) on inter-company loans, gains and losses in the fair value of interest rate swaps, estimated interest expense on cash held from divestiture, non-cash impairment charges, the impact of the Tax Cut and Jobs Act and income from discontinued operations. We believe this presentation is commonly used by investors and professional research analysts in the valuation, comparison, rating and investment recommendations of companies in the industrial industry. We use this information for comparative purposes within the industry. Non-GAAP adjusted income (loss) from segment operations is not a measure of financial performance under GAAP and should not be considered as a measure of liquidity or as an alternative to GAAP income (loss) from continuing operations.