Q4 2021 Result Full year 2021
31
Q4 2021 Result Full year 2021 Orri Hauksson and Óskar Hauksson 15 February 2022
-
Upload
khangminh22 -
Category
Documents
-
view
0 -
download
0
Transcript of Q4 2021 Result Full year 2021

Q4 2021 ResultFull year 2021
Orri Hauksson and Óskar Hauksson
15 February 2022

EBIT * m.ISK 918 m.ISK 4.692Q4 2020: m.ISK 907 2020: m.ISK 4.271
CAPEX m.ISK 1.809 m.ISK 5.498Q4 2020: m.ISK 1.528 2020: m.ISK 5.648
EBITDA * m.ISK 2.532 m.ISK 10.603Q4 2020: m.ISK 2.413 2020: m.ISK 10.156
EBITDA % * 37,8% 41,0%Q4 2020: 36,0% 2020: 39,6%
Q4 2021 12M 2021
Revenue m.ISK 6.700 m.ISK 25.841Q4 2020: m.ISK 6.703 2020: m.ISK 25.646
Highlights in Q4 and 2021including Míla
• Adjusted for ISK 300 million reduction of government fines in 4Q 2020 EBITDA increases by 5% between years.
• Total revenue unchanged between quarters
- Decline in equipment sales, data- and fixed line revenue
• Revenues from mobile services increase by 6%, which is mostly due to increase in roaming revenue and success of the pre-paid service Þrenna.
- Roaming income increases by 60 m.kr. which is more than doubling between years.
• Equipment sales are declining, due to increased travel by Icelanders abroad. Margin increases.
• Revenue from Premium increased by 11% between years, but revenue from Síminn Bíó and resale of foreign channels decreased.
• Cost control results in lower operating costs between years despite rising inflation.
Q4 2021
* Without government fine in Q2/Q4 2020
Operation

Income statement Effect on
2021 2020 % 2021 2020 % 2021 2020 % 2021
Net sales 6.700 6.703 0,0% 25.841 25.646 0,8% 24.543 23.969 2,4% ( 1.298)
Cost of sales ( 3.567) ( 3.474) 2,7% ( 12.927) ( 12.769) 1,2% ( 15.533) ( 13.965) 11,2% ( 2.606)
Operating expenses ( 2.215) ( 2.022) 9,5% ( 8.222) ( 8.806) -6,6% ( 6.750) ( 7.860) -14,1% 1.472
EBIT 918 1.207 -23,9% 4.692 4.071 15,3% 2.260 2.144 5,4% ( 2.432)
Net financial items ( 279) ( 144) 93,8% ( 999) ( 705) 41,7% ( 114) ( 288) -60,4% 885
Income tax ( 108) ( 139) -22,3% ( 727) ( 704) 3,3% ( 411) ( 397) 3,5% 316
Net profit from continuing operation 531 924 -42,5% 2.966 2.662 11,4% 1.735 1.459 18,9% ( 1.231)
Discontinued operation 123 131 2.247 254 3.478 1.457 1.231
Net profit 654 1.055 -38,0% 5.213 2.916 78,8% 5.213 2.916 78,8% 0
EBITDA 2.532 2.713 -6,7% 10.603 9.956 6,5% 5.502 6.006 -8,4% ( 5.101)
EPS 0,09 0,13 0,68 0,34 - -
Q4 With Míla 12M With Míla 12M Without Míla
* EBITDA and EBIT in graphs are without government fine in Q2/Q4 2020
Income Statement

Segments Áhrif Mílu
2021 2020 Change % 2021 2020 Change % 2021 2020 Change % 2021
Mobile 1.455 1.368 87 6,4% 5.593 5.321 272 5,1% 5.604 5.343 261 4,9% 11
Fixed voice 370 415 -45 -10,8% 1.551 1.714 -163 -9,5% 1.572 1.725 -153 -8,9% 21
Internet & network 2.199 2.237 -38 -1,7% 8.844 8.837 7 0,1% 7.342 7.334 8 0,1% -1.502
TV 1.641 1.639 2 0,1% 6.369 6.253 116 1,9% 6.383 6.266 117 1,9% 14
Equipment sales 634 677 -43 -6,4% 2.143 2.159 -16 -0,7% 2.148 2.162 -14 -0,6% 5
Other revenue 401 367 34 9,3% 1.341 1.362 -21 -1,5% 1.494 1.139 355 31,2% 153
Total revenue 6.700 6.703 -3 0,0% 25.841 25.646 195 0,8% 24.543 23.969 574 2,4% -1.298
Q4 including Míla 12M including Míla 12M excluding Míla
Revenue by segments
Revenues by segments in graphs are without Míla. Revenues from Spotify and Síminn Pay, which were previously categorized as mobile revenue, have been reclassified and now belong to other revenue.

Operations in 2021 including Míla
Strong results are due to cost cutting in 2020
• EBITDA increases by 4.4% between years
• Operating income increased slightly between years• Revenues from mobile services increase by over 6%, which is
explained by the success of the pre-paid service Þrenna, increased revenues from value-added services and SMS wholesale.
• Roaming income increases again.
• Operating profit increases by over ISK 400 million between years
• Depreciation almost unchanged between years
• Profit increases by almost ISK 300 million• Despite just over ISK 300 million increase in interest expenses
due to increased indebtedness following the refinancing in Q1 2021
• Síminn completed the sale of Sensa in Q2 2021 to Crayon Group Holding ASA (Crayon)
• Part of the sale proceeds were 699,635 shares in Crayon that have now been sold.
• The profit from the sale of the shares was just over ISK 120 million. higher than published in the announcement to the Stock Exchange on April 8, 2021.
• Síminn has never received media subsidies or other public contributions since the beginning of the epidemic
• Wage costs decrease by almost ISK 400 million or 6.2%
• This is due to a reduction in the number of full-time employee positions in 2020 and outsourcing of software development to Deloitte. Most of the change was in Q2 2020, which has improved results in 2021.
• Outsourcing has not resulted in an increase in IT costs.
• The cost of services sold increases due to a temporary increase in the cost of television operations.
• Personnel costs remains at a minimum, as there is almost no business travel or staff events.
• The cost of the sale of Míla is posted as prepaid cost which will lower the capital gain when the sale concludes.
• Increased sales and marketing costs is e.g. due to emphasis on new products.
• The decrease in product sales is related to an increase in Icelanders' travel abroad, but in return the margin increases.
• The margin on product sales increases by almost ISK 100 million between years.
*Adjusted for 200 m.kr. government fine in 2020

Balance Sheet and Cash Flow

Assets 31.12.2021 31.12.2020
Non-current assets
Property, plant and equipment................................. 2.219 18.991
Right-of-use assets.................................................... 753 5.378
Intangible assets....................................................... 19.403 32.544
Other non-current assets........................................... 675 544
Non-current assets 23.050 57.457
Current assets
Inventories............................................................... 923 1.127
Accounts receivables................................................. 2.234 3.147
Other current assets.................................................. 3.082 834
Cash and cash equivalents......................................... 3.509 735
Assets held for sale................................................... 36.929 1.906
Current assets 46.677 7.749
Total assets 69.727 65.206
Equity and liabilities 31.12.2021 31.12.2020
Equity
Total equity............................................................... 31.079 37.298
Non-current liabilities
Borrowings................................................................ 5.943 14.289
Finance lease............................................................ 653 5.066
Deferred tax liabilities.............................................. 604 670
Non-current liabilities 7.200 20.025
Current liabilities
Bank loans................................................................. 1.518 500
Accounts payables..................................................... 2.141 2.554
Current maturities of borrowings.............................. 180 1.663
Other current liabilities............................................. 1.783 2.390
Liabilities held for sale.............................................. 25.826 776
Current liabilities 31.448 7.883
Total equity and liabilities 69.727 65.206
Balance Sheet
* Without government fine in Q2/Q4 2020 Lease liabilities included from 2019

Cash Flow * 2021 2020
Cash flow from operating activities
Operating profit ................................................................................ 2.260 2.144
Operational items not affecting cash flow:
Depreciation and amortisation........................................................... 3.242 3.862
Gain on sale of fixed assets................................................................ ( 1) ( 2)
5.501 6.004
Changes in current assets and liabilitites............................................ ( 1.099) 461
Cash generated by operation 4.402 6.465
Net interest expenses paid during the period.................................... ( 77) ( 263)
Payments of taxes during the period.................................................. ( 565) ( 627)
Net cash from operating activities 3.760 5.575
Investing activities
Net investment in property, plant and equipments............................ 5.186 ( 3.399)
Other investment.............................................................................. ( 894) ( 211)
Sale of subsidiary and discontinued operation................................... 14.739 1.449
Investing activities 19.031 ( 2.161)
Financing activities
Dividend paid.................................................................................... ( 500) ( 500)
Purchase of own shares...................................................................... ( 2.965) ( 1.751)
Share capital reduction...................................................................... ( 7.968) 0
Payment of long term lease............................................................... ( 174) ( 334)
Net Financing activities...................................................................... ( 8.411) ( 292)
Financing activities ( 20.018) ( 2.877)
Increase (decrease) in cash and cash equivalents ............................... 2.773 537
Translation effects on cash................................................................. 1 ( 19)
Cash and cash equivalents at the beginning of the year...................... 735 217
Cash and cash equivalents at the end of the period............................ 3.509 735
Cash Flow
*Cash flow statement according to the financial statements. Míla classified as discontinued operation.
• Míla's assets are classified as assets held for sale in the 2021 balance sheet.
• The equity ratio decreases between years due to a decrease in share capital in 2021.
• Refinancing in Q1 2021 reduces Síminn's indebtedness and the capital structure changed when Míla refinanced funding from Síminn.
• Changes in operating assets and liabilities are explained by the pre-payment of part of the TV rights to the English Premier League and the costs related to the Míla sale process.
• The sale of assets and discontinued operations is related to the refinancing of Míla, as the refinancing was with an external loan but a loan from the parent company was repaid when the company's share capital was reduced. In addition, Míla acquired the RAN system and the IP / MPLS network from Síminn.
Balance sheet and cash flow

CAPEX

CAPEX
* Restated according to changes made to treatment of TV right.
• The Group's investments in fixed assets, TV rights and other intangible assets decrease by ISK 145 million between years.
• Síminn's investments decrease by ISK 477 million thereof investment in TV content by ISK 93 million.
• Míla investments increase by ISK 259 million.
• Síminn Pay's investments in fixed assets and intangible assets increase by ISK 71 million.
CAPEX 2021

Síminn Parent
CAPEX
*2018-2020 is Pro-forma RAN and IP/MPLS network sold to Míla in the beginning of 2021
• With the sale of the RAN system and IP / MPLS network to Míla, the annual investment need in Síminn’s telecommunication network decreased by ISK 500 - 600 million.
• Síminn's investments have been declining since 2019.
• During this period, great emphasis has been placed on strengthening and transforming the company's internal systems with the aim of reducing operating costs, increasing flexibility and facilitating product development.
- The share of these investments in total investment without TV content rights amounted to an average of 40% over the period 2019 - 2021.
• Following declining investments in the company’s telecommunication network, the importance of customers premises equipment (CPE’s) has increased.
- In recent years, the annual investment in STB’s, routers and other CPE’s has amounted to between ISK 400 - 450 million.
- The exception is in 2021, when investment in CPE’s was 35-40% less than in a normal year. The shortage of supply from foreign suppliers had a major impact.
CAPEX 2021

• In recent years, the main emphasis has been on fiber installation, first in the capital area, but in 2021 more focus was on urban areas outside the capital Area, and the emphasis in the future will be there.
• In 2021, investment in fiber projects amounted to ISK 1,663 million, which is 56% of the total investment for the year.
• Total investments in 2021 will increase by ISK 260 million between years but the increase is entirely in projects other than fiber optics.
• About 108,400 homes/premises had access to fiber at the end of 2021, of which about 80,000 are in the capital Area.
• About 13,400 new homes/premises gained access to fiber during the year, of which about 7,800 are in rural areas.
Fiber optic project
Míla
CAPEX
Premises connected – Capital Area Premises connected – Rural areas

Highlights

Síminn• Síminn and Míla entered into an agreement with Ericsson
for mobile network operations
• The relationship between Síminn and Ericsson spans over 100 years
• Ericsson is an undisputed global technology provider that meets safety demands from governments
• Five-year contract
• Continued development of 4G and faster development of 5G where the goal is to achieve 90% coverage by mid 2025
• Increased data speed and new business opportunities
• In March, Síminn's customers with 5G devices will have the option of a better connection, regardless of subscription
• New B2B packages launched at the beginning of the year
• Solutions at Síminn with an emphasis on network security
• Communication and network security needs of companies are solved with a package at a fixed price
• Powerful firewall, 24/7 monitoring, installation and consulting
• Important partners the key

Míla• Fiber installation
• In 2021, the number of fiber-optic connected spaces increased by 13,400, and a total of 108,400 connected spaces were connected at the end of the year.
• The increase was greater in the countryside this year, or about 7,800 compared to 5,600 in the capital area.
• The emphasis is now on the laying fiber cables in the countryside and this development will continue.
• Mobile distribution system• Before the end of the year, Míla completed the installation of a 31 5G
transmitters in the country.
• Síminn's frequency license set conditions for the installation of 30 5G base stations.
• The transmitters were installed in the capital area, in Þorlákshöfn, in Egilsstaðir and in Blönduós, as well as Seyðishólar.
• Thus, the distribution requirement for Síminn's license was met.
• International portal• At the end of the year, Míla and Farice signed an agreement that
guarantees Míla sufficient international bandwidth for the next 2 years based on estimated needs.
• The agreement provides international connections via the FARICE cable to London, the DANICE cable to Amsterdam and connections via a new cable, IRIS to Dublin, but it is expected that it will be put into use before the end of 2022.
• In addition, Míla buys international connections from Tele Greenland via the Greenland Connect cable to New York.
• With this agreement, Míla continues to ensure the best possible security in international connections.

Sale of Míla

The sale of Míla is awaiting approval from the competition authority
• For review• Síminn signed last October. an agreement for the sale of all its stake in Míla.
• The buyer is Ardian, a leading infrastructure investor in Europe.
• The value of the transaction is 78 b.ISK. and estimated sales gain of just over 46 b.ISK.
• Síminn will be paid 44 b.ISK. at closing in cash and 15 b.ISK. With a three-year bond.
• A 20-year wholesale agreement was agreed between Síminn and Míla.
• Ardian has invited Icelandic pension funds to participate in the acquisition.
• The Competition Authority is reviewing the transaction• The agency announced on 10 February that the merger notification was satisfactory and deadlines began to expire.
• It is not possible to say when the Competition Authority will complete the process, but hardly later than the middle of the year.
• Agreement with the state• Negotiations between the government and representatives of Míla, Síminn and Ardian to ensure that Míla's
operations are in line with national security interests in the new ownership of non-residents resulted in agreement last December where Míla undertakes certain requirements due to operations of their important network.
• This confirms that Míla's communications network meet the state's requirements for national security, and it can therefore be said that Míla's systems are the most secure electronic communications systems in the country.

• Expected capital gains are very large, which radically changes the company’s balance sheet.
• Apart from capital gains, the sale as such has an insignificant effect on the operations of Síminn hf.
• The relationship between Síminn and Míla continues to build on the same foundation as it has since the establishment of Míla.
• All transactions have always been on arm's length basis and Míla has had full independence in its operations, as there are strong requirements from public authorities in this regard.
• Most of Míla's products are based on public pricing and there is full price equality between parties in the market.
• A major change took place when Míla acquired the RAN and MPLS assets.• This change took place at the beginning of 2021 or before the Míla sale took place, and is therefore independent of the sale. The
effects of the changes in question are fully included in operating figures from 2021.
• The impact of that asset sale was described in detail in the Q1 2021 investor presentation.
• In the consolidated financial statements for 2021, Míla's assets are classified as assets held for sale and Míla's operations are classified as discontinued operations.
• The sale has no effect beyond what is traditional due to the sale of subsidiaries.
• Nothing in the relations is classified as a sale-leaseback.
• No lease obligations arise due to IFRS 16.
• Míla will continue to operate an open network after the sale to Ardian.
The sale of Míla has insignificant effect on operations
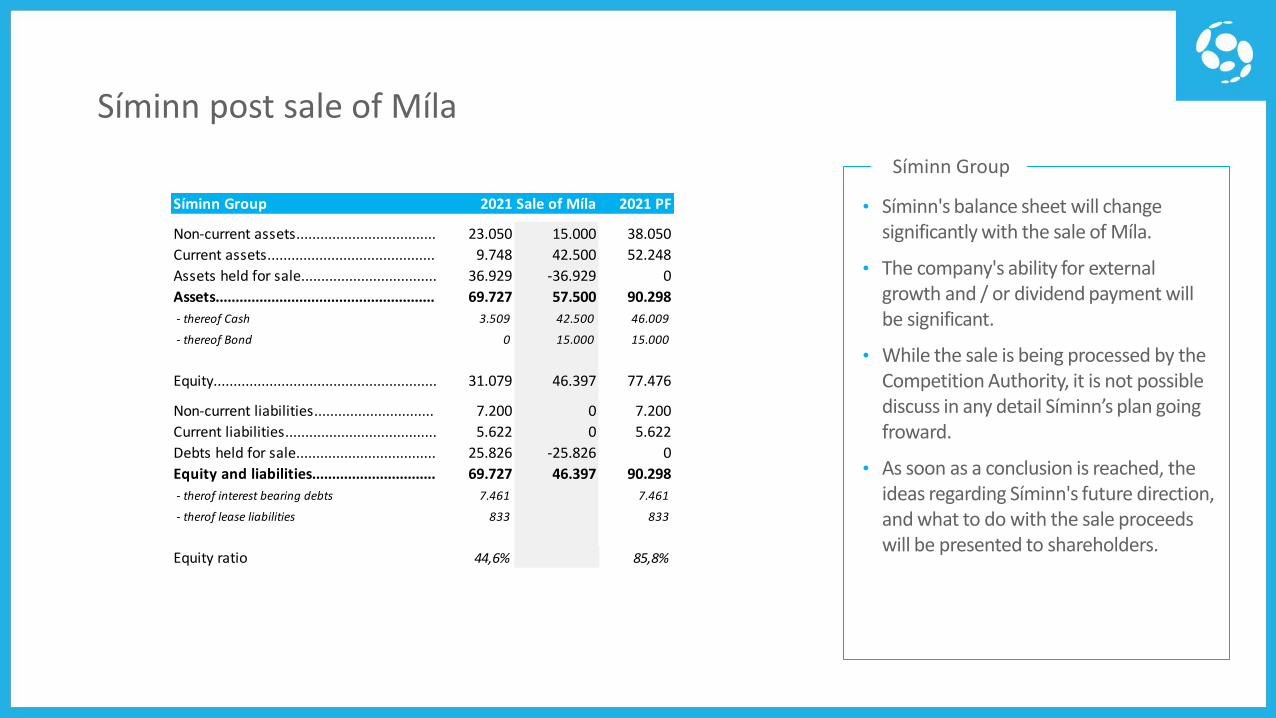
Síminn Group 2021 Sale of Míla 2021 PF
Non-current assets................................... 23.050 15.000 38.050
Current assets.......................................... 9.748 42.500 52.248
Assets held for sale.................................. 36.929 -36.929 0
Assets....................................................... 69.727 57.500 90.298
- thereof Cash 3.509 42.500 46.009
- thereof Bond 0 15.000 15.000
Equity........................................................ 31.079 46.397 77.476
Non-current liabilities.............................. 7.200 0 7.200
Current liabilities...................................... 5.622 0 5.622
Debts held for sale................................... 25.826 -25.826 0
Equity and liabilities............................... 69.727 46.397 90.298
- therof interest bearing debts 7.461 7.461
- therof lease liabilities 833 833
Equity ratio 44,6% 85,8%
Síminn post sale of Míla
• Síminn's balance sheet will change significantly with the sale of Míla.
• The company's ability for external growth and / or dividend payment will be significant.
• While the sale is being processed by the Competition Authority, it is not possible discuss in any detail Síminn’s plan going froward.
• As soon as a conclusion is reached, the ideas regarding Síminn's future direction, and what to do with the sale proceeds will be presented to shareholders.
Síminn Group

Proposals for the Annual General Meeting

AGM 2022
Dividend and share buyback
Dividend policy:
„Síminn hf. aims to distribute to shareholders with annual dividend and / or share buyback programs aminimum of 50% of profit after tax in accordance with laws and regulations at any given time. Whenmaking proposals for dividend payments and / or share buyback, the Board of Directors shall, amongother things, take into account criteria for the company’s capital structure, market conditions, investmentneeds in the coming years and the company’s financial obligations . “
The is proposing the following that the General Assembly on 10 March 2022:
1. 500 m.kr. in dividend – The same amount as in 2020.
2. Reduce share capital by cancelling shares for 240 m.kr. in nominal value. 3,18% of issued sharecapital.
3. Request authorization to buy up to 10% of issued shares in the next 18 months.
• A decision on the total amount of share buyback for the year has not been taken, but the Board of Directors will be authorized to work within the framework provided by the authorization of the Annual General Meeting and based on the dividend policy.

Shareholders

Shareholders 8.2.2022 Position % O/S
Stoðir hf. 1.162.220.631 15,41%
Lífeyrissjóður verzlunarmanna 868.257.927 11,52%
Lífeyrissj.starfsm.rík. A-deild 744.000.000 9,87%
Gildi - lífeyrissjóður 612.192.195 8,12%
Íslandsbanki hf,safnskráning 2 396.693.435 5,26%
Stapi lífeyrissjóður 307.351.432 4,08%
Brú Lífeyrissjóður starfs sveit 305.650.161 4,05%
Lífeyrissj.starfsm.rík. B-deild 286.618.000 3,80%
Birta lífeyrissjóður 275.446.563 3,65%
Söfnunarsjóður lífeyrisréttinda 251.575.320 3,34%
Top 10 shareholders 5.210.005.664 69,10%
Other Shareholders 2.070.691.792 27,46%
Shares outstanding 7.280.697.456 96,56%
Own shares 259.302.544 3,44%
Total number of shares 7.540.000.000 100%
Shareholders
• Share buyback
- Share buyback in 2021 amounted to ISK 2,965 million. which is an increase of more than 1,200 m.kr. from the year 2020.
- Dividend for the year was ISK 500 million. which is unchanged from the year 2020.
- The company's share capital was reduced by 8,000 m.kr. payment to shareholders in April 2021.
• Share buyback is ongoing and based on a plan announced to the Stock Exchange on 13 December.
• There were 1,242 shareholders at the end of the year, an increase of 369 in 2021.
• Síminn's shares rose by 49.6% in 2021.
Shareholders

Outlook 2022

Outlook for 2022
Changes ahead
• There have been major structural changes in the group recently with the sale of Sensa at the end of 2020 and the sale of Míla in October 2021.
• The EBITDA and CAPEX forecast is without Míla.
• EBITDA of Síminn is expected to be at similar level in 2022 compared to 2021.
• Revenue growth is expected but is unlikely to keep pace with inflation.
• If the ISK strengthens, it will offset to some extent domestic cost increases.
• Síminn’s CAPEX will increase considerably this year, which is temporary.
• Due to the increased cost of TV rights to the English Premier League and as it is now the first year of a new contract (front-loaded investment). A new contract will become investment in Q3 2022. The first payment was in 2021, but nothing is paid for the right in 2022.
• Due to increased investment in Síminn's internal systems. The projects are related to new income opportunities, e.g. TV market and Síminn's digital development.
• Excluding these temporary increase, investments in traditional fixed assets and other TV content rights are ISK 2.3 to 2.6 billion.

Guidance for 2022
EBITDA
2022
ISK 5,3 - 5,6 billion
2022
ISK 4,3 – 4,6 billionCAPEX
Group EBITDA excl. Míla was ISK 5.502 million in 2021Group CAPEX excl. Míla was ISK 2.503 million in 2021
Appendix

Business segments
• Mobile: Revenue from mobile services in Iceland and abroad, whether traditional GSM service, satellite service or other mobile service.
• Fixed voice: Revenue from fixed voice service (fees and traffic).
• Internet & network: Revenue from data service, incl. xDSL service, GPON, Internet, IP net, local loop and access network.
• TV: Revenue from TV broadcast and distribution and Síminn TV (fees, traffic and advertisement).
• Equipment sales: Revenue from sale of telco equipment.
• Other revenue: Revenue from sold telco service, IT and finance.

Disclaimer
Information contained in this presentation is based on sources that Síminn hf. (“Síminn” or the “company”) considersreliable at each time. Its accuracy or completeness can however not be guaranteed. This report contains forward-looking statements that reflect the management’s current views with respect to certain future events and potentialfinancial performance. Although the management believe that the expectations reflected in such forward-lookingstatements are reasonable, no assurance can be given that such expectations will prove to have been correct.
The forward-looking information contained in this presentation applies only as at the date of this presentation. Síminndoes not undertake any obligation to provide recipients of this presentation with any further information on thecompany or to make amendments or changes to this publication should inaccuracies or errors be discovered oropinions or information change. Other than as required by applicable laws and regulation.
This presentation is solely for information purposes and is not intended to form part of or be the basis of any decisionmaking by its recipients. Nothing in this presentation should be construed as a promise or recommendation.
Statements contained in this presentation that refer to the company’s estimated or anticipated future results orfuture activities are forward looking statements which reflect the company’s current analysis of existing trends,information and plans. Forward-looking statements are subject to a number of risks and uncertainties that couldcause actual results to differ materially depending on factors such as the availability of resources, the timing andeffect of regulatory actions and other factors.
By the receipt of this presentation the recipient acknowledges and accepts the aforesaid disclaimer and restrictions