The Power of Open - SUSE - Annual report FY2021
240
The Power of Open FY2021 Annual report
-
Upload
khangminh22 -
Category
Documents
-
view
2 -
download
0
Transcript of The Power of Open - SUSE - Annual report FY2021

The Power of Open
FY2021 Annual report
SUSE FY2021 Annual report

“ SUSE is powered by open source and its diverse community of over 56 million1 contributors that come together every day to solve problems and bring ideas to life. Inspired by the open source ethos, we are differentiated in the market by our solutions that are 100% open and interoperable. We believe in the Power of Open because we believe our customers deserve their most critical competitive advantage: choice. The choice of any software to create the IT infrastructure they need, the freedom from being locked in with single vendors, the flexibility to run all their mission-critical applications across any environment… all while enjoying the access to robust innovation that only the open source community offers.”Melissa Di Donato Chief Executive Officer
About this reportSUSE is pleased to present its first annual report as a listed company for the reporting period from 1 November 2020, to 31 October 2021 (except where otherwise specified). This report outlines SUSE’s economic, environmental and social performance in its fiscal year 2021. It shows how SUSE is creating value for our customers, employees, shareholders, partners and open source communities. This report contains the major financial and sustainability-related information necessary to evaluate SUSE’s performance. We include topics that are based on the following reporting principles: materiality, sustainability context, completeness, balance and stakeholder inclusion. Along with this report we also publish additional information online. Links to relevant online content
can be found embedded within this report. Our sustainability reporting references the GRI (Global Reporting Initiative) Standards. Financial results are provided both on an IFRS and an Adjusted Basis, with reconciliations provided to IFRS financial results.In this report you will find evidence of our commitment to deliver for our shareholders and stakeholders. We do this through providing an innovative, open workplace for our people to thrive so they can deliver the best of open source software to our customers. We invite you to read about what we are doing and to get involved by harnessing the Power of Open.#InnovateEverywhere
1. Why You Need an Open Source Software Strategy, BCG, April 2021

Annual contract value / Growth
$490.6M +26%
Adjusted revenue / Growth
$575.9M+15%
Adjusted EBITDA / Growth / Margin
$212.1M+22% / 37%
Financial highlights
Information for shareholdersAbout SUSE 22021 highlights 4Purpose, values and culture 6Chief Executive Officer’s letter 12Operating environment and stakeholders 16Business model 20Strategy 22Products and innovation 26Customers 30Financial commentary* 40SUSE on the capital market 55Managing responsibly 58Identifying and managing material issues 60ESG indicators, statements and notes 62Risk management and principal risks* 75
Corporate governanceReport of the Supervisory Board 86Corporate governance statement* 90Remuneration report 102
Consolidated Financial StatementsConsolidated Financial Statements 122Responsibility statement 197Independent auditor’s report 198
Annual report and accountsAnnual report and accounts 204Responsibility statement 216Independent auditor’s report 217
Additional informationGRI index and ESG data tables 221Glossary 235Financial calendar 237
Contents
* These sections together comprise the Combined Management Report and the Corporate Governance Statement as required by Luxembourg Law.
SUSE FY2021 Annual report 1

SUSE is one of the world’s largest open source companies. Thousands of customers globally trust SUSE with their most mission-critical needs. Our customers represent 60% of the Fortune 500, and 85% of all SAP HANA deployments run on SUSE Linux Enterprise Server.At SUSE, we were one of the first to recognize the power of open source, pioneering the harnessing of open source software innovation for the enterprise. We were also the first company to bring Linux to enterprise customers. Our solutions already power everything from autonomous driving to CAT scan and mammogram machines. Our open source software is embedded inside of air traffic control systems, weather forecasting technologies, trains and even satellites. To turn more customers into innovation heroes we have continued to transform our business over the last 12 months.SUSE offers clear differentiation that is meaningful to our customers: First is through our open approach. Unlike our competitors we provide truly open and interoperable solutions, giving our customers the flexibility to leverage best-in-class solutions and technology. Next, we are focused on mission-critical workloads. Our solutions support some of the world’s toughest workloads from on-premises, to the cloud and to the Edge. Our third area of differentiation is our cloud-native solution sets. SUSE’s solutions are optimized for modern use cases, such as management and optimization of both multi- and hybrid-cloud environments. Finally, we strongly believe that SUSE offers the best support for large-scale enterprises.
About SUSE
What SUSE offers
Everything in our world is connected. By connecting the right people, the right ideas and the right dots, we move forward. A single thought can lead to incredible innovation, and when we work together, incredible change happens. It’s what we at SUSE refer to as “the Power of Open.” This is how SUSE was built. SUSE customers, partners, employees and open source communities (the SUSE Diamond), sharing the belief that any problem can be solved together. That the whole is greater than the sum of its parts. So in a world where everyone wants to be the best at everything, here’s the one thing we want to be number one at: happy customers. We are here for those who seek clear answers to complicated questions; for those who need agility and stability in one solution. And we’ve already been solving customers’ problems for nearly 30 years. Every day, we live our purpose to be open in our roots, open in our approach. We liberate customers to innovate. At SUSE, we have stood the test of time through an obsession with continually adding value to the customer experience. We help our customers achieve the highest pinnacles of their innovation - turning them into innovation heroes.We do this by empowering our people to do their best, most creative and purposeful work with SUSE. A key foundation for our continued and accelerating success is the environment that everyone at SUSE has co-created and will continue to advance. Innovation is in our DNA, and it’s what makes us special.
#InnovateEverywhereRead more about our Strategy on page 22 Read more about our Customers on page 30
Who is SUSE?
SUSE FY2021 Annual report2

The SUSE Linux Enterprise family provides a stable, secure and well-supported Linux operating system for mission-critical workloads such as SAP S/4HANA and other solutions.
SUSE Rancher solutions enable our customers to standardize cloud-native workload operations across all devices and landscapes, including with end-to-end security meeting the highest standards thanks to SUSE’s NeuVector technology. By offering the most widely used container management platform, SUSE Rancher is well positioned to remain the most widely used Enterprise Container Management platform in the market, growing in the high double-digits.
Our new Edge offerings bring the best of our Linux and container technologies together. This is helping SUSE to truly innovate at scale by pushing business applications to where they are needed most.
Our innovative offerings put us right at the center of running modern enterprise workloads anywhere. They are comprised of three interconnected product families:
1 Business-Critical
Linux
3 Edge
2 Enterprise Container
Management
SUSE FY2021 Annual report 3

2021 highlights
Made game-changing acquisitions to lead in Hybrid CloudAcquired Rancher Group (Rancher) in November 2020, which revolutionized our Enterprise Container Management offering. We launched Rancher Desktop in June and the latest version of SUSE Rancher in September. In October we acquired NeuVector to strengthen container security.
See Strategy on page 22See Product and Innovation on page 26
Defined our ESG vision and broke new groundA new ESG vision is ensuring SUSE makes the most of our new public listing responsibility. Throughout and beyond the Covid-19 pandemic we harnessed our open source values to support employees and communities in need.
See Managing responsibly on page 58
Delivered innovation to products and introduced new open source projects Major updates across all three product families including SLE 15 SP3, SUSE Rancher 2.6 and SUSE Edge as well as accelerated speed of innovation through beta releases of open source projects including hyperconverged infrastructure solution Harvester, Rancher Desktop and Epinio.
See Product and innovation on page 26
Accelerating SUSE’s growthSUSE has strong FY21 momentum, building on 10 years of uninterrupted growth
We have a solid financial profile with a unique combination of fast-growing recurring revenues at scale as well as attractive adjusted profitability and cash generation. With our recent IPO on the Frankfurt Stock Exchange, we have never been more ready to accelerate our growth by innovating everywhere with our customers, partners, employees and communities.
Became a publicly listed company on the Frankfurt Stock ExchangeGiving us a new platform to accelerate our growth through acquisitions, enhance our core offerings and better harness emerging technologies.
See CEO Letter on page 12
In 2021 we:
SUSE FY2021 Annual report4

ACV
$490.6M
Adj. Cash EBITDA
$278.2M
10,000+Global partners
Adjusted EBITDA
$212.1M
Leverage
2.6X vs 5.0X prior year
53,000+Active Rancher users
Adjusted Revenue
$575.9M
Adjusted Cash EBITDA Margin
48% vs 36% prior year
$96.9MValue of deals with ACV in excess of $1M
2,000+Global Employees
ACV in Emerging
$84.5M
Adjusted unlevered free cash flow
$200.2M
ACV in Core
$406.1M
Acquisitions
2: Rancher Group and NeuVector
20.5%Women in leadership positions
Key financials
Thriving in our ecosystem
Growth
+26%Growth
+15%
Growth
+22%
Growth
+54%
Growth
+85%
Growth
+18%Growth
+55%
Margin
37%
Cash Conversion
94%
in more than
30 countries
SUSE FY2021 Annual report 5

Purpose, values and culture
Our visionary
people
Powered by our values
Our accountable
leaders
Our community-
inspired culture
Our purpose
We are open in our roots, open in
our approach: we empower our
customers to innovate everywhere
SUSE FY2021 Annual report6

Our community-
inspired culture
We believe SUSE is a great place to work. Here are our top three reasons:
1. Our unique and vibrant cultureSUSE’s culture is deeply rooted in the
ethos of the open source community, valuing collaboration, openness, inclusivity and ensuring we have fun along the way. We are intensely focused on the success of our customers and our partners. Our team is always striving to solve all the business challenges of tomorrow, today.
2. Our commitment to open innovationA key SUSE differentiator is our commitment to open source and open innovation. We contribute, participate and drive meaningful innovation with various open source communities. Innovation that we democratize and make available to the world without any barrier to entry, all driven by a strong, inclusive business model that values diverse opinions. And we ensure our solutions work with our partners’ and our competitors’ technologies, so our customers have as many options to succeed as possible. Our customers choose open source because it means access to cutting-edge innovations, flexibility to move at the pace they need, and choice to shape their success the way they want. And they choose SUSE because we are the most open, and we have their best interests at heart. Our culture doesn’t just enable us to optimize workflows, it helps SUSE create optimal solutions that are hugely powerful, yet extremely reliable, helping our customers and collaborators address global challenges such as enhancing cyber security, protecting human rights and tackling climate change.
3. Our passion for driving impact and doing good in the worldAt SUSE we believe open source, and being open, breaks down barriers. It extends across geographies, gender and political affiliations. We are an inclusive organization, ensuring all our people feel supported so they can do their best work. Our employees can join networks like our Women in Tech network, our Pride at SUSE network and our sustainability at SUSE network, called GoGreen. We also believe in giving back to our community. Every employee has the opportunity to provide financial donations on SUSE’s behalf to charities all around the world through our philanthropic giving program, SUSECares. Employees are also given one full day a year to volunteer for a charity of their choice. On a company-wide scale, we are planting one tree in Madagascar for every employee at SUSE. We chose Madagascar because it is home to our company mascot.
Our vision
Powering open source innovation everywhere
At SUSE, our purpose is simple, yet profoundly powerful: We are open in our roots, open in our approach. We empower our customers to innovate everywhere. This makes it easy for us to know when we are fulfilling our purpose at SUSE. It’s every time we help a customer become an innovation hero.By harnessing the Power of Open we are able to offer our customers possibilities with no limits – from the data center, to the cloud, to the Edge and beyond. And when we say beyond, we mean it. In FY21, SUSE worked with customer Hypergiant to deploy in the most hostile environment of all, putting Kubernetes clusters to work in orbit on satellites for the first time. At SUSE, we really do empower customers to innovate everywhere.
Read more about how SUSE is innovating in our Customers section on page 30
Our visionary
people
To achieve our purpose, we stay true to our ambitious vision: powering open source innovation everywhere. At SUSE we are on a continuing strategic mission to make this vision a reality and
enable a better future for the world. By daring to be different, SUSE can deliver more meaningful solutions for our customers, employees, partners and communities (the SUSE Diamond). We do this by harnessing the power of open collaboration to fuel long-term value creation for our stakeholders.
Read more about how SUSE is innovating in our Managing responsibly section on page 58
SUSE FY2021 Annual report 7

Purpose, values and culture continued
Our accountable
leaders
At SUSE we don’t just dream, we do; we don’t just talk, we act; we don’t just promise, we prove. This is SUSE and it’s what makes us unique. It’s also why we continue to earn the long-term trust of our stakeholders
in the SUSE Diamond. Our leadership team is laser-focused on creating a culture inspired by openness and diversity, where we collaborate without boundaries, and we learn from each other and give back to our communities. At SUSE, our customers are truly partners in co-creating innovation with SUSE. With every solution, our leadership team learns more about how we can adapt our products for various industries, continually building long-term trust and value, creating customers for life.At SUSE, we are utterly obsessed with delivering on our commitments to our stakeholders, doing what we say and saying what we do. It’s an obsession built on a long legacy of open source-led innovation, giving us a uniquely strong standing among the open source community. This legacy continues to influence how we work, collaborate and innovate, enabling our thriving employees to deliver customer success with passion and professionalism. To deliver this, our management team is also committed to providing an energetic and inspirational working environment for our employees across the world. Every day we come to work excited to raise the bar and deliver innovations that help turn our customers into innovation heroes, our partners into advocates and our communities into evangelists. We dare ourselves and each other to be different in every single way, every single day.
At SUSE our management teams make sure collaboration is fun, productive and inclusive. Our managers produce weekly videos to keep employees updated on events and training. This includes continuous engagement to actively show our people our managers truly care. This was evidenced in 2020 by our immediate action to deal with the effects of the Covid-19 pandemic.
Policies & procedures: The Company is committed to ensuring compliance with all local laws and regulations in the jurisdictions in which we operate.
Our Code of Business Ethics (COBE) sets out the standards of conduct expected, without exception, of everyone who works for SUSE in any of its worldwide operations. SUSE expects all employees, contract workers and third parties to apply the highest ethical standards in making business decisions, to raise any concerns about breaches of the COBE, and promote the standards and behaviors expected among colleagues.
Read more in Managing responsibly on page 58
See our Adaptability Heroes on our YouTube channel www.youtube.com/c/SUSE
The COBE includes specific policies concerning the following: • Diversity, Inclusion and Equal Opportunities Policy.• Supplier Code of Business Ethics.• Anti-bribery and Corruption Policy.• Whistleblowing Policy.• Anti-slavery and Human rights statement.• Charitable Donations and Political Activities.• Conflicts of Interest.
SUSE FY2021 Annual report8

Powered by our values
Everything we do at SUSE is driven fully by the Power of Open. This is built into our values, which were defined more clearly in 2019 by our employees, for our employees. Our values guide us to always work on things that really matter to our employees and our stakeholders, and they keep our management team accountable to SUSE. By empowering our employees, we ultimately drive value creation within our business, benefiting our customers, partners and communities. This is achieved by welcoming diverse opinions
that enable customers to make better decisions.Known as LOVE – ”Living Our Values Everyday” - it is the ethos that drives the entire SUSE team. Our values are our North Star, and they will serve as our guide as we enter the next stages of growth. They include:
We are SUSE Open source is in our DNA. We have the freedom to innovate with expertise, passion, fun and ambition, and through the exceptional power of open source we are working with the SUSE Diamond to change the world.
We are empowered and accountable We are empowered to be bold. We take responsibility, are accountable for our actions and are supported to learn from our mistakes to succeed.
We are collaborative We collaborate as one unified SUSE; with openness and honesty, valuing all contributions and learning from each other through challenge and curiosity.
We are passionate about customers Our customers are at the heart of everything we do. We are driven by innovation to best serve our customers.
We are respectful and inclusive We embrace our global community by listening and debating, and by having an open mind to deliver and give back every day.
We are trustworthy and act with integrity We are genuine, honest, fair and trusted to do what we say for our employees, customers, partners and communities.
These values actively support the Company’s priorities, encouraging consistent behaviors across the Company. They have also helped us create a strong ESG vision for SUSE to always ensure we manage SUSE responsibly with maximum input from the SUSE Diamond.
Read more in Managing responsibly on page 58
SUSE FY2021 Annual report 9

Open & Collaborative
SUSE FY2021 Annual report10

SUSE FY2021 Annual report 11

“Amid a challenging macro environment, FY21 turned out to be a remarkable year for SUSE. We made two acquisitions and went public on the Frankfurt Stock Exchange – all while delivering strong financial results, giving back to the community and adding immeasurable value to our customers. None of this would have been possible without the trust and partnership of our stakeholders.”
Melissa Di Donato Chief Executive Officer
SUSE FY2021 Annual report12

Chief Executive Officer’s letter
Dear shareholders, FY21 has been a pivotal year for SUSE. Amid a challenging macro environment, FY21 turned out to be one of the most remarkable 12 months in SUSE’s 29-year history. We made solid progress and celebrated new milestones, all while staying true to our purpose of empowering our customers to innovate everywhere with open source.To name a few highlights:In November 2020, we consolidated our position in the Enterprise Container Management industry with our acquisition of Rancher Group – a leader in Kubernetes management. Rancher is also one of the industry’s most widely adopted solutions for managing any Kubernetes distribution across all environments. With this strategic addition to the SUSE solution stack, we are advancing our vision of powering open source innovation everywhere.In April 2021, we extended our expertise into the U.S. federal sector and made our mark in this highly regulated industry with the launch of our new business, SUSE Rancher Government Solutions. In May 2021, we listed on the Frankfurt Stock Exchange – becoming the largest enterprise software IPO in Europe of 2021. With this milestone, we reaffirmed SUSE’s credibility and increased the visibility of our company as an important mission-critical technology partner for enterprises. We also broadened our access to additional funding which will accelerate our growth and enable greater employee engagement and retention, strengthening our unique and vibrant culture.
In October 2021, we capped the year with our acquisition of NeuVector, a leader in full lifecycle container security. NeuVector will enable customers to excel in end-to-end container security, delivering on an outstanding value proposition as a stand-alone offering, or as part of our SUSE Rancher solutions.
High growth, high marginsSUSE delivers exceptional performance as it achieves strong growth and high cash generation.Guided by our values, in FY21 we experienced an increase in revenue aided by a 26% rise in ACV (compared to the 12 months ended October 2020). We recorded over 36% year-on-year growth in Cloud ACV. We also saw a 27% increase in End user customer deals worth $1 million or more. During the last year, our adjusted revenue at SUSE was $575.9 million, representing growth of 15% (on a pro-forma basis including Rancher in both years) and our adjusted EBITDA margin was 37%.Our growth is powered by the increasing preference for digitalization among our customers, who rely on us for their mission-critical workloads and their ability to innovate everywhere. Our success is grounded in our innovative product portfolio and strong execution capabilities, coupled with a sizable market and accelerated growth through our M&A strategy. I am confident SUSE will continue to expand well beyond the boundaries of today’s addressable market, reaching even more customers around the world.
A pivotal year for SUSE with big milestones
SUSE FY2021 Annual report 13

In FY22, we will continue to focus on expanding our Business-critical Linux, Enterprise Container Management and Edge technology offerings. As SUSE assesses new opportunities in all three markets, we see huge potential to confidently and competently execute our growth strategy.
Open source for good The SUSE team sits at the very heart of our success. It is my conviction that our success as a business is intrinsically linked to our ability to meet some of the world’s most pressing needs. It is a privilege to lead a team that is empowered by open source and guided by our strong open source ethos.At the onset of the pandemic, we offered free operating systems and container management technologies to organizations that were producing medical devices to fight the virus. Inspired by this movement, Microsoft decided to join us in this good work. We also worked with organizations of all shapes and sizes to tackle the threat of the virus and to better understand the disease. The Wellcome Sanger Institute, for example, works with SUSE to track the spread of Covid-19 and help understand the emergence of variants. Likewise, alongside some of the largest laboratories in the world, companies like Ruvos have chosen to work with us to track testing data across the USA. In addition, we partnered with academic institutions such as Haifa University – home to over 18,000 students across the globe – to ensure that not a single hour of lectures was missed during the pandemic. Climate change, too, has been on all our minds in the last 12 months.
Chief Executive Officer’s letter continued
“As we look ahead to our fourth decade, I have never been more confident about sustaining our trajectory and the positive outcomes we will continue to deliver together.”
SUSE FY2021 Annual report14

Hypergiant, for example, is working with us to create the reusable satellite fleet of the future – tackling the growing concern around space junk. Similarly, ZAMG is partnering with us to model weather patterns and earthquake activity, using data science to better understand the effects of climate change.The UK-based Science and Technology Facilities Council’s JASMIN supercomputer, in collaboration with SUSE, is being used to model inner city temperature changes in a bid to help plan the sustainable cities of the future. We have continually demonstrated value to our customers, partners, employees and open source communities – the “SUSE Diamond” – to address the wider needs of the world. This included being flexible with payment terms for customers who have been adversely affected by the pandemic, providing free software and training to help our customers fast track their digital transformation, and equipping our employees with unprecedented support and flexibility as they made the smooth transition to remote working. SUSE has been and will continue to be a pillar of enduring support and collaboration with and for our Diamond.
Innovating sustainablyTo broaden SUSE’s positive impact on society and the environment, we are committed to seeking better and more efficient solutions that will lead to sustainable outcomes for our customers and stakeholders. Our new ESG (Environmental, Social and Governance) vision is a pledge of our continued commitment to our customers, partners, employees and communities.
Please read more in the section: Managing responsibly on page 58
Finally, I am enormously pleased that we have continued to give back to the community and deliver strong outcomes for our customers. None of our progress would have been possible if not for the trust and partnership with all our stakeholders, including you. Thank you for your continued support. As we look ahead to our fourth decade, I have never been more confident about our trajectory and the positive outcomes we will continue to deliver together for our customers, partners, employees, communities and the wider global community.
Melissa Di Donato Chief Executive Officer
SUSE FY2021 Annual report 15

Macroeconomic conditions Growth in the world economy has differed regionally during 2021 as a result of new Covid-19 surges and supply chain issues. There has been strong growth in markets such as the United States, which has benefited from strong fiscal stimulus. In China, growth has been moderated by more restrictive economic policies, and that is expected to continue in the near term. In Germany, the largest market in Europe, the ongoing impact of the Covid-19 crisis constrained growth in 2021. Covid-19 had relatively less impact in the broader European area in 2021, where GDP is expected to slow in 2022 compared with 2021. However, the outlook in Europe, and globally, remains uncertain with new variants of Covid-19 continuing to disrupt supply chains and many types of economic activity.
Industry outlookIT spending, and especially the open source segment, has historically remained resilient even in the face of economic uncertainty or downturns. Worldwide IT spending is projected to total $4.5 trillion in 2022, an increase of 5.5% from 2021, according to Gartner. Spending on enterprise software grew by 13.6% in 2021, driven by increased remote working during the pandemic, and it is projected to grow by a smaller 11.5% in 2022. IT infrastructure is changing as it adapts to key challenges faced by enterprises. These challenges include:
– The need to deploy applications across hybrid and multi-cloud infrastructure in a uniform, reliable and consistent way.
– Maintaining high standards of security and compliance.
– Increase of control, visibility and reliability of IT infrastructure as digitalization drives more IT capacity and explosive growth in data.
Open source as a foundation for innovationOpen source technologies underpin nearly all types of IT infrastructure and IT solutions as they are built upon the power of many, through community and user-led development. A range of key new and established technologies, like cloud computing, run predominantly on open source software. Open source is key for various uses — from container solutions and Edge to AI, machine learning and supercomputing. Open source based Android, for example, is dominating the mobile operating system market. We see three strong, structural trends globally which are expanding the market for open source solutions, and our long-term strategy directly positions SUSE to take advantage of each. These are:
– Digitalization driving explosive growth in workloads and data.
– Enterprises moving fast to hybrid and multi-cloud architectures.
– Growth of mobile applications and IoT driving Edge computing, which is accelerating demand for Linux and containers.
Operating environment and stakeholders
Opportunities abound for our open source innovation
SUSE FY2021 Annual report16

All these trends are accelerating demand for Linux and containers
Global trend
Explosive growth in workloads and data
Enterprises moving to hybrid and multi-cloud architectures
Growth in Edge computing
What it is The surge in data processing required by digitization and business-critical workloads continues to fuel growth in Linux as the preferred operating system for running workloads both on-premises as well as in the public cloud. The Business-critical Linux market is forecast to grow at 12% CAGR through 2024 (source: BCG).
Companies are rapidly adopting cloud-native technologies such as Kubernetes, and container management technologies to simplify the deployment and management of applications across hybrid and multi-cloud infrastructure. SUSE’s SAM for container management is expected to grow at a CAGR of approx. 52%, reaching approx. $4.4B in 2024 (source: BCG).
Edge computing takes place outside the cloud and on-premises data centers and covers a wide range of applications running in cars, in healthcare equipment, in factories, retail stores and others. The Edge market is rapidly emerging with an estimated CAGR of 27% through 2024 (source: BCG).
How we are responding
Our SUSE Linux Enterprise is the industry’s only adaptable operating system, making it ideal for running a wide variety of workloads including High-Performance Computing, enterprise applications such as SAP, as well as latest AI/ML solutions. We will continue to innovate and enhance our strong position as the operating system of choice for mission-critical solutions, while at the same time expand our go-to-market capabilities.
Our continued investment in container management technology positions us well for fast growth in the market. Our SUSE Rancher container management platform is a leader in the industry, and we continue to innovate and differentiate our offering with open source projects like Harvester, a comprehensive open source hyperconverged infrastructure (HCI) solution that accelerates digital transformation. Our acquisition of NeuVector will further strengthen our differentiation in container management and security to create new opportunities for growth.
SUSE is well positioned for rapid growth in this market, given Edge workloads’ heavy reliance on Edge-optimized operating systems and management of containerized workloads at massive scale. Leveraging our strengths in both Linux and Enterprise Container Management, we will continue to deliver innovative and unique Edge solutions while expanding our routes to market through partnerships with original equipment manufacturers (OEM), global system integrators (GSI) and independent software vendors (ISV).
SUSE FY2021 Annual report 17

Stakeholder group and why they are critical
Customers
Partners
Operating environment and stakeholders continued
Our key stakeholdersThe strength of our business is, in many ways, a reflection of the power of our relationships. We engage with all of our stakeholders to understand their needs and concerns, and we use this information in making strategic choices and developing open source solutions.At SUSE, we aim to create value for all our key stakeholder groups, over both the short and long
term. We consider our key stakeholder groups to be our SUSE Diamond ecosystem: customers, partners, open source communities and employees, as well as our investors. By empowering our customers, partners, open source communities and employees to lead enterprise digital transformation securely and seamlessly, we subsequently create value for investors.
How our customers deploy technology will make a tangible difference to how they transform their business. We design our solutions that add value and enable our customers to innovate everywhere.
What they tell us Our customers value SUSE’s open and interoperable solutions, and the innovative power we provide via our communities. Customers are increasingly focused on security, stability and an accelerating rate of change.
How we respond We are obsessed with improving the customer experience and are always focused on highly satisfied customers by enabling them to grow their business.We value our customers’ feedback as it helps us assess how well we are doing and where opportunities for improvement lie. In our annual customer survey, we were proud that we saw a growth in our NPS rating from 2020 and both SUSE and Rancher products were awarded a high satisfaction rating.
Our SUSE teams received excellent comments and reliability and high performance were selected as top brand attributes.Read more about our approach to addressing customer needs and challenges on page 30.
Our partners are often the crucial link between SUSE and our broad customer community. By fostering key partnerships, SUSE can provide more value for customers, while expanding our customer footprint. Our partners are also one of our biggest assets to communicate SUSE’s value through co-marketing. Partners include Amazon, Google and Microsoft. Our partner ecosystem includes independent hardware vendors (IHV) such as HPE as well as independent software vendors (ISV) such as SAP and Cloudera.
We also have managed service providers (MSP) such as Atos who run our software to help customers on our behalf.
What they tell us Our partners value building and delivering services around the enterprise-ready, open source solutions SUSE has a long history in delivering.
How we respond To support our partners, the SUSE One partner program provides a clear path forward for our partners to certify, build, sell and offer services with and through SUSE. The program creates paths for organizations to come together in different ways to accelerate business growth opportunity. This is all with a clear objective of fostering a virtuous feedback loop of innovation for collaborative success.
SUSE FY2021 Annual report18

Stakeholder group and why they are critical
Open source communities
Employees
Investors and shareholders
SUSE employees work closely with other open source community members to drive, build and refine the technologies that enable our customers to innovate everywhere. Their knowledge informs not only our code but SUSE’s passion and culture. Our relationships with open source communities also help build trust with our customers.Read more at https://community.suse.com/about
What they tell us Open source communities value SUSE’s dedication to innovation and the comprehensive support we provide, including access to a suite of learning resources
and accessible tools. Open source communities are driven to improve the world, and we help leverage their contributions to make this happen.
How we respond To provide the support the SUSE and Rancher open source communities want, we bring together accomplished and aspiring cloud-native and open source practitioners to quickly and efficiently develop practical cloud-native and open source knowledge and share passion and expertise with like-minded enthusiasts. This is supported by regular free Academy Classes, a podcast and an active blog, so members can come together
and learn how to innovate everywhere faster. We foster instruction tailored to different learning styles and goals, with assistance from peer learners and mentors, and hands-on practice and experimentation. This is all supported by regular and targeted webinars for open source communities, as well as our annual conference SUSECON. 2021 was the second year we ran SUSECON remotely, further expanding digital inclusion. Read more about digital inclusion at SUSE on page 58 in our Managing responsibly section.
As a knowledge business that operates in an ecosystem of collaboration, our employees are our most important asset. They help us build our business within and are the face of SUSE for our customer base.
What they tell us Our employees value the unique and vibrant inclusive culture that we all co-create here at SUSE. They value our team spirit
to solve problems large and small for our customers. They also value SUSE’s outward focus on doing more for the environment, giving back to the community, and tackling issues such as cybersecurity and climate change.
How we respond Because our employees are drawn to and highly value our unique culture, ensuring the
continued vibrancy of our culture is critical. We do this by pursuing ambitious diversity objectives to support a diversity of ideas. At SUSE, our people know they can make a real impact by daring to be different.Read more about our approach to people and employee engagement on page 58 in our Managing responsibly section.
SUSE offers investors a high-growth, high-margin investment opportunity. Our investors, particularly our long-term investors, give us the independence and ability to execute our strategy with confidence.
What they tell usInvestors are interested in our continued growth and long-term strategy. They also value
our unique position as innovators in interoperable, open source solutions — and the high barriers to entry in this space.
How we respond We manage the business with a view to delivering long-term sustainable value creation through delivering on our high growth and high margin potential. We communicate
regularly with our shareholders to explain the strategy, the key drivers of our growth and our investment plans. We report regularly on how we are delivering, and we actively seek their feedback which is reflected in our future planning.
SUSE FY2021 Annual report 19

Business model
Innovation at SUSESUSE’s current offerings, all grounded in our open source heritage, are key components of the modern cloud and edge workloads of enterprises. These offerings and consulting services support our three product families:
– Business-critical Linux – Enterprise Container Management – Edge
These enterprise-grade software packages are delivered through subscriptions with services.
Further details on page 26
SUSE leverages code and software that comes from the upstream community, which its engineers further develop and refine to make more efficient and ready for deployment to enterprise customers. This open source ethos creates a virtuous circle. SUSE leverages valuable contributions from the community which, in turn, allows it to build better, more stable, and more resilient products that benefit both SUSE’s customers and the open source community.
How open source powers innovation
Financial capital
High AEBITDA profits and cash generation
People capital
2,000+ ambitious, engaged employees in more than 30 countries
Relationship capital
Customers, partners, open source communities
Inputs
SUSE FY2021 Annual report20

The Power of Open
Software & services subscriptions
Our products and services meet customer and
partner requirements
Customers and partners
How our customers and partners deploy technology
will make a tangible difference to how
they transform their business
Open source communities
SUSE works closely with open source communities to drive, build and refine
the technologies
SUSE developer community
We bring together accomplished and aspiring
cloud-native and open source practitioners
SUSE product development
Our products are across three categories: Business-
critical Linux, Enterprise Container Management
and Edge
Financial capital
Adjusted Cash EBITDA Margin
48%
People capital
Employee retention
93%Relationship capital
Net retention rate
110.4%
Outputs
SUSE FY2021 Annual report 21

Strategy
Our strategyAt SUSE, we are on a mission to be the most innovative, trusted leader in providing open source solutions and technologies.
To ensure SUSE’s future is even brighter, we have charted a strategic path to become the global leader in open source software infrastructure. Our long-term strategy, strengthened by our core differentiators, will help us capitalize on ongoing digital transformation, supporting substantial growth. For more information on SUSE’s differentiators, see What SUSE offers on page 2.
Pillar 1 Organic growth acceleration
We will grow our core enterprise-grade Linux solutions and emerging technologies by focusing on five growth levers:– Commercial excellence– Underserved markets– Accelerators– Cross-selling– New solutions including Edge initiatives
Progress in 2021: We achieved significant growth in underserved markets, and the Rancher growth story continued with extremely successful cross-selling. We also set up dedicated teams to support the launch of our Edge offering and improve our pricing approach to better meet customer needs.
Outlook: Our near-term focus is on continuing to grow in Business-critical Linux and Enterprise Container Management, plus capturing market share in Edge and winning in other ecosystems with the goal to extend our excellent support towards new customers and partners as they pursue digital transformation.
Pillar 2 Platform for inorganic expansion
In pursuing strategic acquisitions:We seek to expand our existing product suite and add additional functionalities to increase the strength of our current offerings. We also seek acquisitions that are in line with our culture. If an acquired product is not open source, we would aim to turn it into an open source project and product.
Progress in 2021: SUSE has 15 to 20 acquisition targets under review at any one time. The Rancher Group and NeuVector acquisitions were two successful acquisitions in FY21. As a result of the Rancher acquisition, we saw emerging growth increase in multi-year deals. Rancher’s people have provided contributions to overall culture.
Outlook: In the near term, we are particularly focused on security solutions for applications deployed at the Edge or in cloud-native environments. We are seeking tuck-in or bolt-on acquisitions which can be quickly integrated with SUSE’s existing business.
Strategic pillars
Delivery on our strategy is enabled byOur peopleOur highly skilled workforce collaborates to innovate and ensures we are able to help our customers succeed.Details on page 7
Our core differentiators We are unique in the market place for a number of reasons. One key differentiator is our open approach. Unlike our competitors we provide truly open and interoperable solutions, giving our customers the flexibility to leverage best-in-class solutions and technology. Details on page 2
SUSE FY2021 Annual report22

Delivering on our strategy: How we do itEnsuring we capitalize on the explosive growth in digitalization, hybrid and multi-cloud architectures, and Edge computing requires us to manage and measure the right things.
The below highlight growth levers SUSE uses to stay on course to deliver on our long-term strategy and growth objectives. For more information on addressable markets and key market trends, see Operating environment and stakeholders on page 16.
Accelerators
What this is and why it is relevant: The cloud route to market provides opportunities to sell SUSE solutions via our extensive partner base. Our new business units like SUSE Rancher Government Services allow us to serve highly regulated markets. This greatly accelerates how SUSE does business and is poised to win in these new and emerging spaces. For more information, see Financial commentary on page 40.
Commercial excellence
What this is and why it is relevant: Our global customer organization delivers impressive reach throughout the customer journey with a unique combination of our highly motivated and effective enterprise and digital sales force, and extensive partner network. For more information see Products and innovation on page 26.
New solutions including Edge initiatives
What this is and why it is relevant: Unveiling new solutions shows our innovation at work and we see massive opportunities and growth in the Edge market in particular. We continue to deliver secure and reliable solutions through new products and industry-first certifications. For more information, see Products and innovation on page 26.
Cross-selling
What this is and why it is relevant: Following our acquisition of Rancher, we have seen substantial opportunities to leverage SUSE’s go-to-market channels and reach within existing customer base. We anticipate the same following our NeuVector acquisition. For more information, see Risk management on page 75.
Underserved markets
What this is and why it is relevant: We invest in markets which present opportunities for growth, including increased penetration in the federal market in North America and capitalizing on continued growth opportunities across APJ and LatAm. For more information, see Financial commentary on page 40.
Strategic acquisitions
What this is and why it is relevant: We seek to expand our existing product suite and add additional functionalities to increase the strength of our current offerings, extending the depth and breadth of the SUSE suite of products. For more information, see Risk management on page 75.
SUSE FY2021 Annual report 23

Passionate About Customers
SUSE FY2021 Annual report24

SUSE FY2021 Annual report 25

1 Business-
Critical Linux
3 Edge
2 Enterprise Container
Management
SUSE is a leader in enterprise- grade open source solutions for hybrid cloud IT, cloud native transformation and IT operations at the Edge. At SUSE, we are open in our approach and believe every business is on a journey of digital transformation, and that transformation can be enhanced and accelerated by open innovation.
In today’s hyper-connected world, innovation is occurring virtually everywhere – in the data center, in the cloud, at the Edge and beyond. The most successful businesses will be those that capitalize on open and interoperable solutions that let them harness innovation, no matter where it occurs. We drive open source innovation and at the same time ensure peace of mind by providing reliability and sustainability of technology which empowers our customers to innovate everywhere. SUSE’s current offerings, all grounded in our open source heritage, are key components of the modern cloud workloads of enterprises. These offerings and consulting services support our three product families:
Accelerating business transformation
Products and innovation
SUSE FY2021 Annual report26

Business-critical Linux is a mature and growing market, with SUSE continuing to be a central player. Addressing this market is the SUSE Linux Enterprise (SLE) product family, which provides an enterprise-ready, stable, secure, and professionally supported Linux operating system, designed for mission-critical workloads such as business applications, databases and a variety of other solutions.The Enterprise Container Management market is in a state of fast, high growth expansion, giving SUSE a significant opportunity for growth in the coming years. The SUSE Rancher product family enables our customers to standardize cloud-native workload operations across all devices and any landscape. By offering the most widely used container management platform, SUSE Rancher is well positioned to remain the most widely adopted container management platform in the market, growing in the high double digits. Given its fragmented and nascent state, the Edge market provides SUSE with tremendous opportunities for expansion in the future. In FY2021, SUSE introduced the new Edge Product Family, which is built on the best of Linux and containers, allowing SUSE to truly innovate at scale by pushing business applications to run as close as possible to where its customers are. These three product families put SUSE right at the center of running modern enterprise workloads everywhere.
Enterprise solutions to address customer transformation challengesAt the heart of SUSE’s strategy is our commitment to delivering open, interoperable products and solutions. SUSE products are not only open source, they are also truly open. This means SUSE software will always interoperate with leading products in the industry, even products from competitors. This approach is rooted in our belief that customers innovate best when they have the freedom to choose the products they believe best fit their needs. SUSE also recognizes that many organizations operate in a heterogeneous environment with multiple clouds, multiple Linux distributions, and multiple Kubernetes distributions and, as a result, does not offer an all-or-nothing value proposition. Instead, customers have complete freedom, choice, and flexibility to define and easily adapt the IT strategy that best fits their needs.We value our customers’ feedback and in our annual customer survey, we saw a growth in our NPS rating from 2020 and both SUSE and Rancher products were awarded a high satisfaction rating. Our SUSE teams received excellent comments and reliability and high performance were selected as
top brand attributes. In 2021, SUSE remained laser focused on creating a consistent enterprise compute platform from core to cloud to Edge delivering innovations to both new and existing products that tackle our customers’ transformation challenges. These challenges include:
– Minimizing the complexity of managing hybrid-cloud infrastructure and cloud-native apps.
– Modernizing legacy applications and accelerating time to market.
– Minimizing vendor lock-in while supporting IT and its future evolution.
– Securing all mission-critical workloads with maximum privacy and compliance.
– Managing the breadth, scale and complexity of Edge use cases.
The major updates across all three product families included:
SUSE Linux Enterprise Server 15 Service Pack 3 (SLES 15 SP3) Customers can now benefit from the latest infrastructure innovations from Intel, AMD, Arm, IBM Z and Power, as well as from enhanced database support and performance. Customers can also now meet the strictest security and data protection requirements with security technical implementation guide (STIG) compliance and cryptographic support. All those new capabilities are also available in the latest SUSE Linux Enterprise Server for SAP Applications, benefiting our customers running SAP. Together with this release, we have introduced SUSE Linux Enterprise Base Container Images (SLE BCI), a truly open, flexible and secure solution for developers and integrators to modernize applications without the lock-in imposed by alternative offerings. In addition, SLE BCI provides hardening and security certification for applications serving regulated markets. SLES 15 SP3 also introduced full compatibility between openSUSE, our community Linux distribution which is very popular among users and developers, and SUSE Linux Enterprise. That means workloads can now seamlessly move from development and testing environments running on openSUSE to enterprise production environments running on SUSE Linux Enterprise, without a need to change their applications or infrastructure. This will further increase the adoption of SLES.
SUSE FY2021 Annual report 27

SUSE Rancher 2.6SUSE Rancher helps IT professionals address the operational and security challenges of managing certified Kubernetes clusters in the data center, in the cloud and at the Edge. It also provides DevOps teams with integrated tools for building and running containerized workloads at scale. Version 2.6 is the first major release since Rancher was acquired by SUSE in November 2020. SUSE Rancher 2.6 features major updates across the platform that help enterprise customers better manage their growing Kubernetes environments. Enhancements include a redesigned platform experience offering a dramatically simplified user interface, improved logic-based workflows, full lifecycle management of hosted Kubernetes clusters in Microsoft AKS and Google GKE alongside existing Amazon EKS capabilities, plus new security, risk and compliance features.
SUSE Linux Enterprise (SLE) Micro 5.1Designed as a lightweight and secure operating system for containerized and virtualized workloads, SLE Micro 5.1 adds Edge-focused security features such as secure device onboarding and live patching, which allows for non-disruptive operating system updates. SLE Micro enables the modernizing of workloads with support for IBM Z and LinuxONE in addition to other key supported architectures. SLE Micro is also helping to expand SUSE’s reach into target industry segments, such as telecommunications and manufacturing. SLE Micro also makes it easy for organizations of all sizes to adopt Kubernetes because it is designed to work well with K3s, SUSE Rancher (RKE2) or third-party Kubernetes distributions.
SUSE EdgeAn open, lightweight, software infrastructure solution for building, deploying and managing Edge applications. SUSE Edge features our ultra-reliable, lightweight Linux operating system, SLE Micro, and industry defining lightweight Kubernetes distribution, K3s. Both are purpose-built for operating in Edge environments. SUSE Edge also includes SUSE Rancher for managing cloud-native containerized workloads and SUSE Manager for managing non-containerized workloads.
SUSE Manager 4.2A best-in-class Linux management solution designed for enterprise DevOps and IT operations teams, supporting multiple Linux distributions and multiple architectures (x86, IBM Power Systems and Z Systems).
Driving innovation with the open source community The combined resources of SUSE and Rancher have greatly accelerated the company’s speed of innovation. In 2021, SUSE announced beta releases of the following open source projects:
Harvester: An open source hyperconverged infrastructure (HCI) solution that accelerates digital transformation by allowing enterprises to consolidate, simplify and modernize existing IT operations. When combined with SUSE Rancher, Harvester unifies the delivery of virtual machines and containers, while eliminating the complexities, lock-in and overhead costs imposed by legacy HCI solutions.
Rancher Desktop: The simplest way to run Kubernetes and Docker workloads for more than 20M developers running in Windows, Linux, or Mac environments.
Epinio: Increases the productivity of developers when building and deploying applications rapidly on Kubernetes without requiring them to understand the complexities of the underlying infrastructure itself.
Opni: Observability data is part of every Kubernetes environment, but due to complexity few use it effectively to gather insights about the potential for downtime. Opni provides easy to use log and metric anomaly detection for Kubernetes by leveraging cutting edge AIOps (based on AI and Machine Learning) best practices to cluster operations. This results in better visibility of the Kubernetes environments, leading to better performance and availability.
Products and innovation continued
SUSE FY2021 Annual report28

Kubewarden: Security concerns remain a prominent barrier for Kubernetes adoption with enterprises. Kubewarden is designed to help remove those obstacles. Kubewarden allows operations and governance teams to codify the rules of what can and cannot be run in their environments. Policies are distributed and workloads and policies can be distributed and secured in the same way – ultimately removing bottlenecks organizations face and reducing the time DevOps teams need to spend reviewing policies. Kubewarden will be an ideal complement to the full lifecycle container security delivered by NeuVector which was recently acquired by SUSE.
In October 2021, SUSE announced the acquisition of NeuVector, a leader in full lifecycle container security that delivers end-to-end security, from DevOps pipeline vulnerability protection to automated security and compliance in production. NeuVector significantly enhances the enterprise-grade security capabilities in the SUSE Rancher container management platform.
Going forward, NeuVector will be positioned as a core pillar of a new cloud-native, open source security effort based on best practices, guidance and reference architectures within the movement toward zero trust security adoption. We are embarking on an effort to open source NeuVector, which will bring state of the art container security capabilities to the Kubernetes ecosystem. Our goal with an open source version of NeuVector is to drive adoption and become the premier choice to secure Kubernetes clusters, whether they are on-premises, in the cloud, or in Edge environments. Keeping our promise of open interoperability, NeuVector technology will also continue to work with partners to offer customers superior Kubernetes security across the cloud native ecosystem, on any platform or with any orchestrator.
Further enhancing our market leading offerings for SAP SUSE continues to lead in innovative enhancements to SUSE Linux Enterprise Server for SAP Applications, an SAP Endorsed App. The 2021 release helps reduce service outages with new high availability capabilities that are easy to set up, automate best practices set-up for specific server and public cloud environments, and improves system monitoring to help IT staff identify and fix problems before they affect business operations. The SUSE-initiated Trento Project is uniquely designed to provide a single console to discover SAP systems, warn of invalid configurations, and visualize and proactively manage system and SAP application status. Trento is currently being evaluated by selected customers, and SUSE plans to release it more broadly in the coming months.
85% of IT leaders agree that open source enables innovation at the Edge
Source: Insight Avenue
Improving security through innovationThe exponentially growing number of internet-of-things (IoT) and Edge computing devices has increased risk to networks and required countries to raise their compliance requirements for infrastructure providers, particularly those involved in services essential to their economies, governments, and health and safety of citizens. SUSE Linux Enterprise Server (SLES) has now obtained EAL 4+ level certification, allowing it to comply with the most demanding security requirements for mission-critical infrastructure. In addition, SUSE’s Common Criteria EAL 4+ software supply chain certification includes secure production, delivery of updates, and protection of critical digital assets. This enables the highest security standards for Edge and IoT devices for critical infrastructure providers such as telecommunications companies and others innovating at the Edge. SUSE is currently the only provider of a recent general-purpose Linux operating system with a secure software supply chain that is certified Common Criteria EAL 4+ .
SUSE FY2021 Annual report 29

The challenge Absa’s focus on pushing the boundaries of digital banking has enabled them to pioneer the banking landscape of the future. Absa’s rapid growth meant that its previous infrastructure had become difficult to manage, and costs had started to climb. Although its existing infrastructure had served the business well, it had limitations. Consequently, the Absa team decided to diversify and started exploring the market for solutions that would free them from the complexities and scaling issues that come with mega-cluster methodologies.
The solution: Enterprise Container Management
Driving Scale and Innovation in African Banking
Customers: Absa
Products – SUSE Rancher – K3s Lightweight Kubernetes
Why SUSE?SUSE Rancher emerged as the obvious solution — from a cost, usability and, most importantly, an innovation point of view. Absa knew it must become more agile and that its technology infrastructure needed to scale to hasten development velocity. With a desire to get new services to market quickly, the technology team realized scaling its legacy, mono-cluster architecture would get more expensive as projects proliferated. The best way to scale cost effectively would be to create a multi-cluster, microservices-based environment running in SUSE Rancher. SUSE Rancher’s innovative licencing model allowed Absa’s Cloud team to have as many clusters as they needed and to scale them rapidly without amassing additional costs, freeing the team to innovate. The efficiencies and reduction in costs that Absa realized were significant and occurred quickly.
– 75% reduction in overhead costs in SUSE Rancher compared to other vendors
– Management time reduced by 80% – 80% improvement in stability – Multi-cluster, multi-cloud capabilities not available elsewhere
– Fully resilient, self-healing platform that can tolerate multiple infrastructure failures
SUSE FY2021 Annual report30

“ At Absa, we strive to develop services that make a real difference to the lives of our customers and the African banking industry as a whole. Being able to innovate at speed and scale is critical for us.” Zak AndersonAbsa
SUSE FY2021 Annual report 31

Pioneering the evolution of manufacturing with Kubernetes
Customers: Continental AG
The challengeContinental has always been a forward-thinking organization. Naturally, digital transformation and modernization are major preoccupations. In manufacturing, however, the practical implications of modernizing legacy infrastructure, and all the software that runs within it, cannot be underestimated. Continental ran a virtualized infrastructure for many years, which suited the team well. But, over time, management and maintenance became problematic, leading Continental to Kubernetes and SUSE Rancher.
The solution: Enterprise Container Management
Product – SUSE Rancher
Why SUSE?Managing Continental’s Kubernetes-based infrastructure platform in SUSE Rancher has created a future-proofed architecture, which has removed complexity and significantly reduced management overheads. The new containerized architecture allows applications to be run in separate clusters, with development, test and production environments in place. By adopting a platform approach to infrastructure management, Continental has created a scalable, agile framework where collaboration and co-operation can reign. This would have been impossible before.
– 80% reduction in migration time when comparing methodologies
– 80% reduction in upgrade time; from days to hours
– Cost reductions — removing on-site server applications to the data center/cloud
– Central, global management platform for 45 regions and hundreds of developers
SUSE FY2021 Annual report32

“ Transforming large manufacturing organizations like Continental is a huge technical and philosophical challenge. The emphasis is on finding the most intuitive and efficient way to modernize while maintaining competitive advantage. Kubernetes and SUSE Rancher will help us achieve this.”Roland PaxiánContinental
SUSE FY2021 Annual report 33

Advancing the tactical edge with K3s and SUSE RGS
Customers: Booz Allen Hamilton
The challenge In dangerous conditions, the ability to access behavioral and situational data in real time and on the fly often means the difference between life and death. As a premier digital integrator for the U.S. Department of Defense, Booz Allen Hamilton delivers technology solutions that give military personnel the information edge in the field. Capitalizing on open source solutions like K3s, Booz Allen’s SmartEdge solution allows personnel to make real-time, data-driven decisions which dramatically improve operational outcomes and increase the probability of mission success.
The solution: Edge
Products – SUSE Edge – SUSE Rancher Government Services (RGS) – K3s Lightweight Kubernetes
Why SUSE?Working in collaboration with SUSE Rancher Government Services (SUSE RGS) the Booz Allen team is underpinning its SmartEdge platform with K3s, the fully certified CNCF (Cloud Native Computing Foundation) Kubernetes solution. Created by SUSE Rancher, and donated to the open source community, K3s is a super-lightweight Kubernetes distribution, designed for production workloads in unattended, resource-constrained, remote environments. Early consolidation of information, enabled by SmartEdge, allows entire units to strategize on the fly. Outcomes have been transformed as a result.
– 80% reduction in time-to-insight; from hours to seconds
– Ability to run containerized infrastructure on any device in any environment
– Removal of the gap between data capture and insight delivery
SUSE FY2021 Annual report34

“ With Edge computing and processing at the point of data collection, we will give military personnel access to real-time, data-driven insights so they can act at the speed of the mission. SmartEdge makes this possible at scale with an extensible platform utilizing open architecture principles and open source technologies.” Ki Lee Booz Allen Hamilton
SUSE FY2021 Annual report 35

SUSE Linux Enterprise delivers significant cost savings for IOCL
Customers: Indian Oil Corporation Limited
The challengeIndian Oil Corporation Limited (IOCL) is one of the largest producers of petrochemical products in India, operating over 32,000 fuel stations across India. Having relied on SAP ERP to support its key activities for many years, the company saw an opportunity to reduce costs and improve the performance of key business activities — from financial planning to supply chain management — by migrating its ERP solution to the SAP HANA real-time data platform.
The solution: Business-Critical Linux
Products – SUSE Linux Enterprise Server (SLES) for SAP Applications
– SUSE Manager
Why SUSE?SLES for SAP Applications is much easier to use than IOCL’s previous system, and SUSE Manager makes monitoring its SAP environment quick and simple. As a result, the team has slashed the time it takes to bring new hires up to speed from 12 months to just six months. With SLES for SAP Applications keeping the team’s mission-critical applications running smoothly, securely, cost-effectively and in compliance with industry standards, IOCL can focus on what it does best: designing the affordable energy solutions of the future.
– 30% cut in operating system costs – 50% less time required to train new hires
– 30% reduction in administration costs
SUSE FY2021 Annual report36

“ With SLES for SAP Applications, we’ve seen a 30% reduction in our operating system costs, and we’ve also been able to cut our infrastructure maintenance costs by a further 30%. What’s more, by moving from a multi-OS environment to a SUSE-only landscape, we’ve saved 30% on administration costs.”V.N.K ReddyIOCL
SUSE FY2021 Annual report 37

Respectful & Inclusive
SUSE FY2021 Annual report38

SUSE FY2021 Annual report 39

Financial commentary
Strong performance
Group PerformanceSUSE has been trading for 29 years. The Consolidated Financial Statements are shown on pages 122 to 196 and show the performance of the Group on a statutory basis. Key highlights are as follows:
Revenue and gross profitRevenue for the year ended 31 October 2021 is $559.5m (2020: $447.4m) representing 25% growth and gross profit is $516.3m (2020: $421.0m). Gross profit margin is broadly consistent, being 92.3% compared to 94.1% in the prior year.
Separately reported itemsItems reported separately due to their significance and non-operating nature are $26.9m for the year ended 31 October 2021 (2020: $25.5m) and comprise transaction costs of $25.5m (FY20: $6.0m), restructuring costs of $1.4m (FY20: $2.0m) and a reduction in tax indemnity asset of $nil (FY20: $17.4m). The increase in costs in the year is attributable to higher transaction costs due to the Initial Public Offering. There were no movements to the tax indemnity asset in the current year which made up a substantial amount of the prior year cost. Further details are set out in Note 8 to the Consolidated Financial Statements.
Amortization and depreciationAmortization and depreciation of $153.0m for the year ended 31 October 2021 (2020: $134.9m) includes $142.0m of amortization of intangible assets, $6.5m of depreciation on Right of use assets and $4.5m of depreciation on items of property, plant and equipment. The increase in amortization and depreciation in comparison to the prior year is attributable to the amortization of intangible assets acquired as part of the Rancher acquisition which completed in November 2020. The depreciation on Right of use assets has decreased from $10.5m in the prior year to $6.5m in the current year primarily due to the maturity of software leases recognised as part of the Transitional Services Agreements with Micro Focus when it sold the SUSE business to EQT in 2019. Further details are set out in Notes 15, 16 and 24 to the Consolidated Financial Statements.
Operating lossThe operating loss for the year ended 31 October 2021 is $200.9m (2020: $8.7m) with $182.2m of the increased loss being due to share-based payment costs. The IPO in May 2021 triggered an exit event which required the settlement of a historical option plan and the acceleration of vesting in another plan. Additionally new long-term incentive plans were created after listing.
SUSE FY2021 Annual report40

Net finance costsNet finance costs of $58.9m for the year ended 31 October 2021 (2020: $61.3m) includes $46.8m of interest on the Group’s external loan facilities, $4.5m of amortization of capitalized transaction costs and $9.0m of premiums in respect of the interest rate swap arrangement which were offset by foreign exchange gains in respect of the external loan facilities and the fair value gains on derivatives. Further details are set out in Note 11 to the Consolidated Financial Statements.
TaxationTaxation for the period is a credit of $54.3m (2020: $20.8m credit) in respect of the loss before tax of $261.9m, which represents an effective tax rate of 20.7%. The key items which reduce the rate below the reconciling tax rate of 26.5% are permanent differences relating to interest restrictions, irrecoverable withholding tax, taxable gains arising on the Rancher integration, deferred tax assets not recognized and prior year adjustments. Further details are set out in Note 12 to the Consolidated Financial Statements.
Loss for the yearThe loss for the year of $207.6m (2000: $51.6m) has increased for the reasons set out above.
Alternative Performance MeasuresThe above results are significantly impacted by the accounting treatments applied following the acquisition and carve out of SUSE from Micro Focus and the subsequent acquisitions of Rancher Federal Inc and Rancher Laboratories Inc. (Rancher Group). The Alternative Performance Measures (APMs) shown below have been calculated with the express purpose of showing the underlying trading of the business including, but not limited to, revenues, underlying profitability and cash flow generation. The Board believes these APM’s provide a clearer view of the underlying trading of the business and its progress. The reconciliation of the key APM’s to the IFRS measures are shown within this report so the reader can understand the adjustments made. SUSE presents APMs because they are used by management in monitoring, evaluating and managing its business, and management believes these measures provide an enhanced understanding of SUSE’s underlying results and related trends. Certain of these measures are derived from the IFRS accounts of SUSE, and others derived from the management reporting. The APMs are presented based on pro-forma numbers including Rancher as if owned for the whole of both years. NeuVector pro-forma results are excluded for most APMs, as it was acquired at the end of the financial year. NeuVector is included within Net Debt, Leverage and Contractual Liabilities and Remaining Performance Obligations. Key APM highlights are:-Adjusted Revenue $575.9 million vs. $499.1 million in the prior year, growth of 15%Adjusted EBITDA $212.1 million vs $173.6 million in the prior year, growth of 22%
SUSE FY2021 Annual report 41

Financial commentary continued
The Alternative Performance Measures for SUSE are:
APM (Note 1)
Year ended 31 October 2021
US $M’s
Year ended 31 October 2020
US $M’s % Year-on-year
movement
Annual Contract Value (ACV) 490.6 390.7 26%Adjusted Revenue 575.9 499.1 15%Annual Recurring Revenue (ARR) – SUSE (Note 2) 498.9 449.8 11%Annual Recurring Revenue (ARR) – Rancher (Note 2) 61.1 30.5 100%Annual Recurring Revenue (ARR) – SUSE & Rancher (Note 2) 560.0 480.3 17%Net Retention Rate (NRR) – SUSE (Note 2) 107.8% 108.3% 0%Net Retention Rate (NRR) – Rancher (Note 2) 144.5% 128.9% 12%Net Retention Rate (NRR) – SUSE & Rancher (Note 2) 110.4% 109.0% 1% Adjusted Gross Profit 534.9 468.5 14%Adjusted Gross Profit Margin 93% 94%Adjusted EBITDA 212.1 173.6 22%Adjusted EBITDA Margin 37% 35%Adjusted Cash EBITDA 278.2 179.3 55%Adjusted Cash EBITDA Margin 48% 36%Adjusted Profit after Tax 85.1 61.6 38%Adjusted Unlevered Free Cash Flow (Adjusted UFCF) 200.2 130.1 54%Cash Conversion 94% 75%Net Debt 720.5 895.5 20%Leverage 2.6x 5.0x 48%Contractual Liabilities and Remaining Performance Obligations (RPO) 600.0 429.7 40%
Note 1 – for a full definition of all APMs, please refer to the Glossary.Note 2 – ARR & NRR are measured three months in arrears, as of 31 July 2021 and 31 July 2020. SUSE ARR reflects SUSE Core solutions and all Services, excluding Rancher.
SUSE FY2021 Annual report42
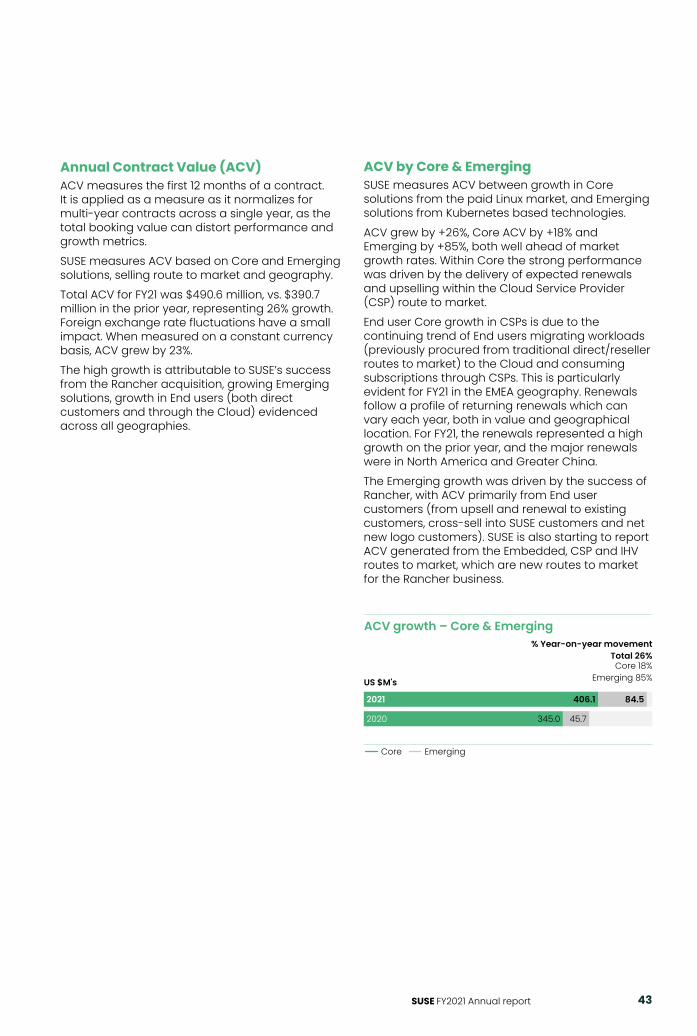
Annual Contract Value (ACV)ACV measures the first 12 months of a contract. It is applied as a measure as it normalizes for multi-year contracts across a single year, as the total booking value can distort performance and growth metrics. SUSE measures ACV based on Core and Emerging solutions, selling route to market and geography. Total ACV for FY21 was $490.6 million, vs. $390.7 million in the prior year, representing 26% growth. Foreign exchange rate fluctuations have a small impact. When measured on a constant currency basis, ACV grew by 23%.The high growth is attributable to SUSE’s success from the Rancher acquisition, growing Emerging solutions, growth in End users (both direct customers and through the Cloud) evidenced across all geographies.
ACV by Core & EmergingSUSE measures ACV between growth in Core solutions from the paid Linux market, and Emerging solutions from Kubernetes based technologies.ACV grew by +26%, Core ACV by +18% and Emerging by +85%, both well ahead of market growth rates. Within Core the strong performance was driven by the delivery of expected renewals and upselling within the Cloud Service Provider (CSP) route to market.End user Core growth in CSPs is due to the continuing trend of End users migrating workloads (previously procured from traditional direct/reseller routes to market) to the Cloud and consuming subscriptions through CSPs. This is particularly evident for FY21 in the EMEA geography. Renewals follow a profile of returning renewals which can vary each year, both in value and geographical location. For FY21, the renewals represented a high growth on the prior year, and the major renewals were in North America and Greater China.The Emerging growth was driven by the success of Rancher, with ACV primarily from End user customers (from upsell and renewal to existing customers, cross-sell into SUSE customers and net new logo customers). SUSE is also starting to report ACV generated from the Embedded, CSP and IHV routes to market, which are new routes to market for the Rancher business.
ACV growth – Core & Emerging
2021
2020 45.7
406.1 84.5
345.0
US $M's
Core Emerging
% Year-on-year movementTotal 26%Core 18%
Emerging 85%
SUSE FY2021 Annual report 43

Financial commentary continued
176.0210.6
2021 2020
Europe, Middle East and Africa 20%
151.1194.1
North America 28%
26.537.5
Asia Pacific and Japan 42%
28.935.2
Greater China 22%
8.213.2
Latin America 61%
US $M's
ACV by route to market (RTM)SUSE measures ACV by End user and Independent Hardware Vendors (IHV) routes to market. End user is where SUSE sells directly to a customer or through a distributor/reseller ecosystem, and to customers consuming software solutions through CSPs who host the SUSE offerings. The IHV route to market relates to two types of customers:
– IHV who manufacture equipment (e.g. servers and mainframe computers, laptops or desktops).
– Embedded, where SUSE’s software is placed permanently inside a device to perform a specific function (e.g. scanners in medical equipment).
ACV growth for the End user RTM is 29%, and for IHV 9%. The increase in End user is from the success of Rancher, where the majority of ACV is with End user customers, strong growth from CSP hyperscalers, an increase in the number of Managed Service Provider (MSP) partners, and from SLES End user renewals. The End user Route to Market also benefits from the growth in Emerging and Rancher Government Services, the strong renewals across both Core and Emerging solutions and CSP growth.The IHV ACV growth has been a more modest performance of 9% growth. Growth has been strong within embedded customers, though declined within the IHV route to market due to hardware shortages, and the shift to selling through other routes to market.
ACV by geographySUSE is diversified over five geographies (GEOs) of North America, EMEA, Asia Pacific and Japan, Latin America and Greater China. In 2021 EMEA represents the largest share of ACV at 43%, North America 40% and the remaining 17% across the smaller geographies. This has remained broadly consistent year on year.All geographies grew in FY21, from 20% in EMEA to 61% in Latin America, with the larger GEO’s of North America and EMEA contributing the most ACV due to their relative size. Key growth factors per GEO are as follows:
– North America – +28% growth. This is across all solutions, and North America benefits from Rancher, where the historic customer base has been more established, including Rancher Government Services, and North America was the largest GEO for retrospective consumption contracts in FY21.
– EMEA – +20% growth. Largely from upsell/new ACV through the CSP route to market and Core renewals, including a number of key Rancher deals.
– Asia Pacific & Japan – +42% growth. Had diversified growth in all routes to market, primarily within Core business, benefiting from an investment in leadership and the sales team.
– Latin America – +61% growth. Growth following investment in management, with good growth across all routes to market.
– Greater China – growth is limited to +22%, due to challenging market conditions. Greater China’s growth was supported by two large deals, one of which was a retrospective consumption contract. Growth was suppressed due to the IHV route to market.
ACV growth – Route to market ACV growth – Geography % Year-on-year movement
Total 26%End user 29%
IHV 9%
% Year-on-year movementTotal 26%
2021
2020 70.7
413.8 76.8
320.0
US $M's
End user IHV
SUSE FY2021 Annual report44

Adjusted RevenueAdjusted Revenue measures revenue excluding the deferred revenue fair value adjustment (also referred to as the deferred revenue haircut), resulting from acquisition accounting, to represent the performance of SUSE based on the invoiced bookings.Total Adjusted Revenue for FY21 was $575.9 million, vs. $499.1 million in the prior year representing 15% growth. Exchange rate fluctuations have a small impact. When measured on a constant currency basis, revenue grew by 14%. Reconciliation of IFRS Revenue to Adjusted Revenue is as follows:
US $M’s
Year ended 31 October
2021
Year ended 31 October
2020
% Year-on-year
movement
Revenue – IFRS 559.5 447.4 25%
AdjustmentsDeferred revenue haircut amortized 12.7 18.6 (32%)Pro-forma Rancher 3.7 33.1 (89%)Adjusted Revenue 575.9 499.1 15%
The deferred revenue haircut, which is the fair value adjustment to deferred revenues on acquisition, has declined by 32%, in alignment with the amortization recognition profile.The pro-forma Adjusted Revenue for Rancher was significantly lower for FY21, as it represents one month of November 2020, as opposed to FY20 which represents twelve months.
Adjusted Revenue by Core & EmergingSUSE Core Adjusted Revenue in FY21 was $506.6 million vs. $457.8 million in the prior year, a growth of 11%. The growth was largely from the End users through the CSP route to market, and renewals. The following contributed to the growth in Core Adjusted Revenue:
– CSP Core growth is consistent with continued migration of workloads to CSPs, especially to the large hyperscalers, but equally to MSPs on a percentage growth basis. The CSP revenue growth is consistent with the corresponding ACV growth.
– SUSE Core Renewals ACV has been growing year on year as well as securing multi-year contracts. This is reflected in the revenue growth.
– SUSE Core Services, a smaller part of the revenue.
– Growth in Rancher Government Services and attached revenue from renewals contributes to growth.
SUSE Emerging Adjusted Revenue was $69.3 million in FY21 vs. $41.3 million in the prior year, a growth of 68%. This is due to SUSE Rancher growth in ACV, and continued expansion of presence in North America and EMEA. In addition, revenue is starting to be generated in CSP & IHV markets, as SUSE gains traction in these routes to market. Prior to being acquired by SUSE, Rancher did not serve or target these routes to market.
Adjusted Revenue growth – Core & Emerging% Year-on-year movement
Total 15%Core 11%
Emerging 68%
2021
2020 41.3
506.6 69.3
457.8
US $M's
Core Emerging
SUSE FY2021 Annual report 45

Financial commentary continued
Annual Recurring Revenue & Net Retention RateAnnual recurring revenue measures the value of active subscriptions at a point of time, for one month, to determine a monthly recurring revenue. The monthly recurring revenue is multiplied by 12 to establish an annualized value. Net Retention Rate indicates the proportion of ARR that has been retained over the prior period from existing customers; it excludes net new customers and is inclusive of up-sell, cross-sell, down-sell, churn and pricing.SUSE measures ARR as an indication of performance from all contracted subscriptions on an annual basis. NRR enables SUSE to track the activity from the existing customer base. SUSE currently measures SUSE and SUSE Rancher separately as they were independent businesses, and on a combined basis. In the future the measures will become merged, reflecting the combining of the customer base. ARR & NRR are measured three months in arrears, for one month as of 31 July 2021 and 31 July 2020, and annualized for 12 months. The measures are calculated three months in arrears, given backdated royalties relating to IHV and Cloud are invoiced in arrears.
ARR & NRR
ARR as at 31 July 2021
Reported 31 October 2021
US $M’s
ARR as at 31 July 2020
Reported 31 October 2020
US $M’s% Year-on-year
movement
Annual Recurring Revenue (ARR) – SUSE 498.9 449.8 11%Annual Recurring Revenue (ARR) – Rancher 61.1 30.5 100%Annual Recurring Revenue (ARR) – SUSE & Rancher 560.0 480.3 17%Net Retention Rate (NRR) – SUSE 107.8% 108.3% 0%Net Retention Rate (NRR) – Rancher 144.5% 128.9% 12%Net Retention Rate (NRR) – SUSE & Rancher 110.4% 109.0% 1%
On a combined basis ARR increased from $480.3 million to $560.0 million representing 17% growth. The growth drivers are from both the SUSE ARR Core & Services solutions, and the acquired Rancher solutions. SUSE ARR as of July 2021 (reported as at 31 October 2021) was $498.9 million, a growth of 11%. The growth is divided between CSPs, with customers purchasing through the CSP route to market, and cross-selling and up-selling to the existing customer base.Rancher ARR as of July 2021 (reported at 31 October 2021) was $61.1 million, a growth of 100%. The ARR growth was a combination of net new logo customers to the Rancher solutions, and cross-selling and up-selling to the existing customer base. On a combined basis NRR remained broadly consistent with the prior year at 110.4% vs. 109.0%. This reflects SUSE NRR being consistent, and growth in the Rancher NRR as the Rancher business grows with the expansion of its existing customer base.SUSE NRR has remained broadly consistent with the prior year at 107.8% vs. 108.3% and reflects continued growth from the existing customer base who remain loyal to SUSE.Rancher NRR has increased from 128.9% to 144.5% representing 12% growth in line with the expansion of the Rancher customer base.
SUSE FY2021 Annual report46

Adjusted EBITDAAdjusted EBITDA represents earnings before net finance costs, loss of associate (as described more fully in Note 18 to the Consolidated Financial Statements the Group maintains a strategic share in a partnership of software corporations and accounts for its share of the losses of this associate using the equity method), tax, depreciation and amortization. It is adjusted for share-based payments, fair value adjustments to deferred revenue, statutory separately reported items, specific non-recurring items and net unrealized foreign exchange movements. Realized foreign exchange movements are included, and represent a gain or loss when an asset or liability is settled at an exchange rate which is different to the transaction date rate. SUSE management report Adjusted EBITDA to reflect the operational performance of SUSE.Total Adjusted EBITDA for FY21 is $212.1 million & 37% margin, vs. $173.6 million & 35% margin in the prior year, representing a 22% growth, and 2% margin improvement. The increase in Adjusted EBITDA is due to the revenue growth. Whilst SUSE has invested in headcount across the business, it has been a little slower than expected due to current market conditions. SUSE has benefited from cost synergies following the Rancher acquisition, and travel and physical marketing events cost savings due to the Covid-19 pandemic. This has resulted in an improved margin for FY21 at 37%.A further positive impact on margin, is that commission costs have increased year on year, but due to the costs being deferred under IFRS 15, the increase is reduced. In addition, the realized exchange rate adjustment has reduced costs in FY21, vs. a cost increase in FY20.The table below reconciles the IFRS operating loss to the Adjusted EBITDA:
IFRS operating loss to AEBITDA
US $M’sYear ended
31 October 2021Year ended
31 October 2020 % Year-on-year
movement
Operating loss – IFRS (Note 1) (200.9) (8.7) 2209%
AdjustmentsDepreciation and amortization 153.0 135.0 13%Separately reported items 26.9 25.5 5%Deferred revenue haircut amortized 12.7 18.6 (32%)Non-recurring items 23.9 21.4 12%Share-based payments – charge 175.2 11.8 1385%Share-based payments – ER taxes 7.0 - n.mForeign exchange – unrealized 16.1 (13.5) n.mAdjusted EBITDA – Non Pro-Forma 213.9 190.1 13%Pro-Forma Rancher (1.8) (16.5) (89%)Adjusted EBITDA – Pro-Forma 212.1 173.6 22%
Adjusted EBITDA Margin 37% 35%
Note 1: n.m represents not meaningful to comment.Depreciation and amortization for FY21 is $153.0 million, vs. $135.0 million in the prior year, representing a 13% increase. This is primarily due to the amortization of intangible assets acquired as part of the Rancher acquisition which completed in November 2020. The depreciation on right of use assets has decreased from $10.5 million in FY20 to $6.5 million in FY21 primarily due to the maturity of software leases recognized as part of the transitional services agreement with Micro Focus when it sold the SUSE business to EQT in 2019.
SUSE FY2021 Annual report 47

Financial commentary continued
Separately reported items for FY21 are $26.9 million, vs. $25.5 million in the prior year, representing a 5% increase. Separately reported items for FY21 comprise transaction costs of $25.5 million (FY20: $6.0 million), restructuring costs of $1.4 million (FY20: $2.0 million) and a reduction in tax indemnity asset of $nil (FY20: $17.4 million). The increase in the year is attributed to higher transaction costs following the IPO. There are no movements to the tax indemnity asset in the current period which made up a substantial amount of the prior year movement.Deferred revenue haircut amortized for FY21 is $12.7 million, vs. $18.6 million in the prior year, representing a 32% decrease. The haircut is released proportionally to the unwind of the acquired deferred revenue which declines to zero as time passes so significant decreases in releases are expected year on year. An additional haircut of $3.5 million was introduced in FY21 with the acquisition of Rancher, $2.9 million of which was released in FY21. Non-recurring items for FY21 are $23.9 million, vs. $21.4 million in the prior year, representing a 12% increase, and relate to:
US $M’sYear ended
31 October 2021Year ended
31 October 2020 % Year-on-year
movement
3rd Party Consulting Fees 1.3 4.9 (73%)Bonus 10.4 3.0 247%IT Costs 3.3 11.0 (70%)Transaction Costs 0.3 0.4 (25%)Transformation Costs 0.5 0.1 400%Rancher Integration Costs 8.1 1.8 350%Other 0.0 0.2 (100%)Total 23.9 21.4 12%
3rd Party Consulting Fees for FY21 are $1.3 million, vs. $4.9 million in the prior year representing a (73%) decline. The reduction in costs due to completion of implementation projects.Bonus for FY21 are $10.4 million, vs. $3.0 million in the prior year representing a 247% increase. The increase in costs is a result of the introduction of a retention program for Rancher employees and IPO-related incentives. This is excluded from AEBITDA as they do not reflect bonuses aligned to annual Group performance.IT Costs for FY21 are $3.3 million, vs. $11.0 million in the prior year representing a (70%) decline. As noted above the reduction in costs is due to the completion of major implementation programs.Transformation costs for FY21 are $0.5 million, vs. $0.1 million in the prior year. This relates to costs for roles that have become obsolete.The share-based payments charge for FY21 is $175.2 million, vs. $11.8 million in the prior year. This is due to the vesting in full of the Virtual Stock Option Program (VSOP) on the listing of the Company and the partial vesting of the Management Investment Participation Program (MIPP) scheme during the year triggered by the same event. Following the IPO in May 2021, new Long-Term Incentive Schemes were established. The increased share-based payment charge resulted in a corresponding increase in the employer tax charge from $0 million in FY20 to $7.0 million in FY21.Foreign exchange – in FY21 there was a unrealized loss of $16.1 million vs. an unrealized gain of ($13.5 million) in the prior year. This is due to movements in exchange rates, primarily Euro, in the year in comparison to the prior year.Pro-Forma Rancher for FY21 is small at ($1.8) million, vs ($16.5) million in the prior year. This is due to FY21 reflecting only one month of November 2020, as Rancher is incorporated into the IFRS results effective as of 1 December 2020.
SUSE FY2021 Annual report48

Adjusted Gross Profit & Adjusted Operating expensesAdjusted Gross Profit for FY21 is $534.9 million and 93% margin, vs. $468.5 million and 94% margin in the prior year. Adjusted operating expenses for FY21 are $322.8 million vs. $294.9 million in the prior year, an increase of 9%.
US $M’sYear ended
31 October 2021Year ended
31 October 2020 % Year-on-year
movement
Adj Revenue 575.9 499.1 15%Cost of sales 41.0 30.6 34%Adjusted Gross profit 534.9 468.5 14%% Margin 93% 94%Sales, Marketing & Operations 152.1 144.9 5%Research & Development 94.6 82.9 14%General & Administrative 76.1 67.1 13%Total Adjusted operating expenses 322.8 294.9 9%
Adjusted Gross ProfitAdjusted Gross Profit margin for FY21 of 93% was slightly down from last year as the cost of sales increased due to third-party costs relating to the new government business Rancher Government Solutions (RGS) won in North America, and investments to increase delivery capacity, with investment in Customer Care & Services headcount.
Sales, Marketing & OperationsSales, Marketing & Operations costs for FY21 are $152.1 million vs. $144.9 million in the prior year, representing a modest 5% increase, as variable pay from commissions are deferred under IFRS 15. The increase in Sales, Marketing and Operations costs, excluding IFRS 15, is 10%. This is mostly due to marketing revenue generating programs spend and headcount growth across sales teams. Increases in commission costs attached to ACV are largely offset by IFRS 15 cost deferrals, and FY21 saw reductions in travel costs due to Covid-19.
Research & DevelopmentResearch and Development costs for FY21 are $94.6 million vs. $82.9 million in the prior year, an increase of 14%. This represents SUSE’s continued investments in R&D, including SUSE Rancher development and pressure on cost base due to rising market salary levels. This increase is after realizing cost synergies from the acquisition of Rancher.The Group is committed to research and development in terms of both existing product lines and a range of new products. We focus and adapt our research and development activities based on our business strategy, the needs of our customers and changes in the marketplace. Our development activities focus on adding new or improved functionality desired by customers to our portfolio of products and software solutions.
General & AdministrativeGeneral and Administrative (G&A) costs for FY21 are $76.1 million vs. $67.1 million in the prior year, an increase of 13%. G&A costs for FY21 are at a higher run rate than FY20, due to the prior year being largely based on services from Micro Focus under transitional services agreements. SUSE has invested in IT, third party costs and headcount. Further, during FY21 SUSE incurred costs of increased staffing to meet demands of its public company status, consulting costs for strategic projects, offset by realized foreign exchange rate movements lowering costs.
SUSE FY2021 Annual report 49

Financial commentary continued
Adjusted Cash EBITDAAdjusted Cash EBITDA represents Adjusted EBITDA plus changes in contract liabilities (deferred revenue) in the related period and excludes the impact of contract liabilities deferred revenue haircut.SUSE measures Adjusted Cash EBITDA as it acts as a proxy for cash flow, and indicates SUSE’s ability to generate cash.Total Adjusted Cash EBITDA for FY21 is $278.2 million & 48% margin, vs. $179.3 million & 36% margin in the prior year, representing a significant improvement of 55% growth, and 12% margin improvement:
US $M’sYear ended
31 October 2021Year ended
31 October 2020 % Year-on-year
movement
Adj EBITDA 212.1 173.6 22%Change in deferred revenue 66.1 5.7 Adj Cash EBITDA 278.2 179.3 55%% Margin 48% 36%
IFRS Deferred Revenue to Adjusted Deferred Revenue
US $M’sYear ended
31 October 2021Year ended
31 October 2020 % Year-on-year
movement
Movement in contract liabilities: IFRS 76.1 12.6 504%Pro-Forma Rancher 2.7 11.7 (77%)Deferred revenue haircut amortized (12.7) (18.6) (32%)Movement in contract liabilities – Pro-Forma 66.1 5.7 1060%
The change in the adjusted deferred revenue for FY21 is $66.1 million resulting in Cash AEBITDA of $278.2 million. This is a significantly higher adjusted deferred revenue movement than the prior year, where the adjusted deferred revenue movement was $5.7 million, representing a $60.4 million increase. The positive adjusted deferred revenue movement has been driven by strong ACV growth in FY21 and continued success at selling multi-year contracts, paid in advance, during the year. SUSE has also been successful in securing multi-year and larger contracts for Rancher solutions.
Adjusted Profit After TaxAdjusted Profit after Tax represents Adjusted EBITDA less all depreciation and amortization for purchased software and development costs, finance costs and notional average taxes. This represents profit from ongoing operations, to measure the Adjusted earnings performance per share.The adjusted effective tax rate is 36%. This is higher than the statutory rate of 26.5% as a result of prior year adjustments, which increase the rate by 5% and other permanent differences including irrecoverable withholding tax and unrecognized deferred tax.
SUSE FY2021 Annual report50

The adjusted earnings per share are based on the weighted average number of shares during the year, representing $1.3 per share.
US $M’sYear ended
31 October 2021Year ended
31 October 2020 % Year-on-year
movement
Adj EBITDA 212.1 173.6 22%Depreciation – Property, plant and equipment 4.5 4.5 0%Depreciation – Right of use assets 6.5 10.5 (38%)Amortization – Purchased Software 8.1 5.9 37%Amortization – Development Costs 1.2 0.8 50%Net Finance Costs 58.9 61.3 (4%)Adj Profit before Tax 132.9 90.6 47%Notional Tax 47.8 29.0 65%Adj Profit After Tax 85.1 61.6 38%Adj Profit After Tax % 15% 12% 20%Weighted Average number of shares 63.2 n.m n.mAdjusted Earnings Per Share (Note 1). 1.3 n.m n.m
Note 1, Adjusted Earnings per Share was $1.3 per share in FY21.The Adjusted Earnings Per Share for the prior year was not calculated, as the number of shares were not comparable, as prior to the listed company status.The reconciliation of the IFRS Tax to the Notional Tax is as follows:
Reconciliation of IFRS Tax to Notional Tax
US $M’sYear ended
31 October 2021Year ended
31 October 2020 % Year-on-year
movement
IFRS tax 54.3 20.8 161%Tax on EBITDA adjustments (102.1) (49.8) 105%Notional Tax (47.8) (29.0) 65%
SUSE FY2021 Annual report 51

Financial commentary continued
Adjusted Unlevered Free Cash Flow and Cash ConversionAdjusted Unlevered Free Cash Flow (uFCF) is defined as Adjusted Cash EBITDA less capital expenditure related cash outflow, working capital movements, cash taxes and reversal of non-cash accounting adjustments relating to IFRS 15 and IFRS 16. Cash Conversion represents Adjusted uFCF divided by Adjusted EBITDA. Both metrics measure cash generated from business operations, indicating SUSE’s ability to generate cash.
US $M’sYear ended
31 October 2021 Year ended
31 October 2020 % Year-on-year
movement
Adjusted Cash EBITDA 278.2 179.3 55%Gross Capital Expenditure (4.8) (2.2) 118%Change in core working capital (20.0) 1.5 n.m.IFRS 15 (36.8) (22.4) 64%IFRS 16 (6.6) (10.4) (37%)Cash Taxes (8.0) (6.3) 27%Rancher Pro-Forma uFCF (1.8) (9.4) (81%)Adjusted uFCF 200.2 130.1 54%
Adj uFCF Conversion from Adj EBITDA 94% 75%
The Adjusted Unlevered Free Cash Flow (uFCF) has significantly increased for FY21, from $130.1 million to $200.2 million, representing a 54% increase. Cash conversion for FY21 is 94%. The key drivers were the increased profitability and higher positive movement in deferred revenue.
For FY21, in addition to the strong Adjusted Cash EBITDA performance, there is a decrease in working capital, due to the increase in ACV bookings over the prior year. The adjustment for IFRS 15 has increased, related to increased commission costs, in turn leading to higher cost deferrals.
Reconciliation of Adjusted Cash EBITDA:
US $M’sYear ended
31 October 2021Year ended
31 October 2020 % Year-on-year
movement
Operating (loss)/profit before depreciation and amortization (47.9) 126.3 n.m.
Separately reported items 26.9 25.5 5%Non-recurring items 23.9 21.4 12%Share-based payments – charge 175.2 11.8 1385%Share-based payments – ER taxes 7.0 0.0 100%Deferred revenue haircut amortized 12.7 18.6 (32%)Foreign Exchange – unrealized 16.1 (13.5) n.m.
Adjusted EBITDA non Pro-Forma 213.9 190.1 13%Rancher Pro-Forma Adjustment (1.8) (16.5) (89%)Adjusted EBITDA (SUSE & Rancher Pro-Forma) 212.1 173.6 22%Movement in contract liabilities 66.1 5.7 1060%Adjusted Cash EBITDA (SUSE & Rancher Pro-Forma) 278.2 179.3 55%
SUSE FY2021 Annual report52

Net DebtNet Debt measures the sum of non-current financial liabilities, non-current lease liabilities, current financial liabilities and current lease liabilities less cash and cash equivalents as of 31st October 2021.
US $M’sAs at
31 October 2021As at
31 October 2020 % Year-on-year
Movement
Net debt 720.5 895.5 20%Adjusted Cash EBITDA 278.2 179.3 55%Leverage 2.6x 5.0x 48%
Total Net Debt for FY21 was $720.5 million, lowering Net Debt by 20% versus the prior year. The net debt reduction is due to cash proceeds from the IPO used to pay down debt ($502M), thereby reducing borrowings plus cash generated from the business, and offset by debt raised for the Rancher acquisition ($300m) plus a cash payment to complete the NeuVector acquisition ($101m). The Net Debt & Leverage includes Cash from NeuVector.
US $M’sAs at
31 October 2021As at
31 October 2020% Year-on-Year
movement
Borrowings 764.9 974.0 21%
Cash (61.1) (94.9) (36%)Lease liabilities 16.7 16.4 2%Net Debt 720.5 895.5 20%
Contractual Liabilities & Remaining Performance Obligations (RPO)Contractual Liabilities & Remaining Performance Obligations, represents revenue that has been invoiced but not recognised plus amounts for contracted commitments that have yet to be invoiced. This view is combined, to add the contracted commitments to the deferred revenue balances.Contractual liabilities and remaining performance obligations as at the end of FY21 were $600 million vs. $429.7 million in the prior year, a growth of 40%. Contractual liabilities increased by 26%, aligned to ACV growth. The remaining performance obligations increased by 239% due to two large future contracts securing future revenues. The contractual liabilities balance includes NeuVector.
US $M’sYear ended
31 October 2021Year ended
31 October 2020 % Year-on-year
movement
Contractual Liabilities – Current 329.6 246.5 34%Contractual Liabilities – Non Current 178.2 156.0 14%Total Contractual Liabilities 507.8 402.5 26%
Remaining Performance Obligations 92.2 27.2 239%Total 600.0 429.7 40%
OutlookSUSE is pleased to report that FY21 has been a year of strong financial performance. Whilst there remain macro economic risks, in 2022 SUSE will continue to focus on its differentiated strategy to deliver continued growth in revenues, with high profit margins and good cash conversion. We look forward to making further progress in the year ahead.
SUSE FY2021 Annual report 53

Financial commentary continued
STATUTORY RESULTS OF OPERATIONS AND FINANCIAL POSITION OF SUSE S.A.For the statutory annual accounts of SUSE S.A., please refer to page 204.
Results of operationsThe Company’s income amounted to US$19.3 million (2020: US$0.3 million) and was attributable to providing services to other SUSE Group entities based on service level agreements. The significant increase in revenue in 2021 related to the $19.1 mllion recharge of certain transaction costs, predominantly related to the IPO.Other external expenses increased significantly from US$0.8 million in 2020 to US$44.2 million in 2021 due to the transaction costs of the IPO, and other costs related to the Company being listed. The transaction costs are all recognised in expenses in the individual accounts of SUSE S.A. in accordance with Luxembourg accounting principles. In 2021 interest receivable of US$5.0 million was due to a loan to an affiliated undertaking arising in the year (2020: US$nil). The loan of US$232.9 million was made on 20 May 2021 to Marcel Lux DebtCo SARL and bears interest at 4% margin +LIBOR of 0.75%. The maturity date of the loan is 25 November 2027. Interest payable represents foreign exchange losses.The loss for 2021 amounted to US$20.1 million (2020: loss of US$0.5 million).
Financial positionTotal assets increased from US$1,602.7 million as of 31 October 2020, to US$2,554.0 million as of 31 October 2021.Fixed assets primarily comprise shares in affiliated undertakings which increased from US$1,601.9 million as of 31 October 2020, to US$2,121.2 million as of 31 October 2021, with the Company increasing its investment in Marcel UK Topco Ltd. The Company also recognised loans to affiliated undertakings in the year of US$232.9 million (2020: US$ nil).Current assets increased from US$0.7 million as of 31 October 2020, to US$197.9 million as of 31 October 2021. This was driven by an increase of US$196.9 million in the amounts owed by affiliated undertakings mainly due to the transfer of funds received from the IPO to other Group entities.The Company’s capital and reserves increased from US$1,602.1 million as of 31 October 2020, to US$2,517.6 million as of 31 October 2021, due to capital contributions received in the year including US$669.5 million from the IPO. Current liabilities have increased from US$0.6 million as of 31 October 2020, to US$36.4 million as of 31 October 2021 due to outstanding transaction costs still to be invoiced, and amounts due to affiliated undertakings for payments they have made on behalf of the Company.
Other mattersThe Company had no branches during the current or previous financial year. The Company did not own or acquire any of its own shares during the current or previous financial year.
SUSE FY2021 Annual report54

SUSE on the capital market
Price development of the sharesTrading in SUSE’s shares commenced on 19 May 2021 at an issue price of €30. The share price held steady in initial trading and was up 1.5% after one week. Overall, the share price grew strongly for the remainder of the year, outperforming the TecDax, SDax and Stoxx600 indices, as shown in the graph below. On the last day of trading for SUSE’s financial year 2021 SUSE’s share price was €37.33. This represented an increase of just over 24% from the issue price at IPO.Measured as share price performance from IPO date, SUSE was one of the best performing IPOs in Europe at the time of its financial year end on 31 October 2021. Following initial trades after the IPO, liquidity in SUSE shares remains relatively low, due to the limited free float and continued holding of other shareholders.
On 17 May 2021, SUSE listed on the Regulated Market (Prime Standard) of the Frankfurt Stock Exchange and trading in SUSE’s shares commenced on 19 May 2021. With the final offer price of €30 per share, SUSE issued 18.3 million shares for net proceeds of €540,765,000 and became the largest enterprise software IPO in Europe of 2021. In addition, 14.2 million existing shares were placed from the holdings of Marcel LUX III SARL. The total market capitalization of SUSE at the time of placement came to €5 billion.Ahead of the IPO, investor interest in SUSE was very high. During the IPO, SUSE was supported by BofA Securities and Morgan Stanley as Joint Global Coordinators and Joint Bookrunners with Deutsche Bank, Goldman Sachs, JP Morgan and Jefferies as Joint Bookrunners. As part of the IPO process, SUSE management engaged extensively with potential investors from around the world, holding well over 100 virtual meetings.
Initial Public Offering
80
19-May
90
100
120
110
130
140
SUSE
Rebased to SUSE
19-Jun 19-Jul 19-Aug 19-Sep 19-Oct
TECDAX STOXX 600 SDAX
SUSE FY2021 Annual report 55

Analyst coverageAs at 31 October 2021, the following international banks report on SUSE’s shares:
– BofA Securities. – Deutsche Bank. – Goldman Sachs. – JP Morgan. – Morgan Stanley.
Communication with the capital marketsSUSE is aiming for open and effective dialogue with the capital markets. SUSE is looking to strengthen its relationships with investors, analysts and financial journalists and to foster the confidence of capital market participants through one-to-one conversations, phone calls, roadshows, conferences and company visits, within the boundaries of applicable law and regulation. Following the IPO blackout period and the Q2 results close period, SUSE has followed a full capital market engagement program. This has included publication of detailed financial statements after each quarter and these have been accompanied by an analyst conference on the day of publication of the results, which investors are also invited to attend. Senior management have held a number of virtual roadshows and attended several broker conferences and other events, most of which are still being held remotely rather than in person. A range of individual one-to-one meetings have been held in response to investor requests, including a number specifically to emphasize SUSE’s strong ESG credentials. SUSE has also engaged with other providers of finance and ratings agencies. These events have primarily been led by the CEO or the CFO, and a number of other members of senior management have participated to address specific areas of expertise and responsibility. The CFO has held regular meetings with the sell-side analysts that cover SUSE.SUSE has created an investor relations website and holds webcasts for investors and analysts following the publication of its financial results at each quarter. A Head of Investor Relations has been appointed and SUSE will further expand its investor relations work in 2022 as part of a best practice approach.
Shareholder holding
SUSE on the capital market continued
Dividend policySUSE currently does not intend to pay any dividends for the foreseeable future and intends to continue to invest in its business. However, SUSE will periodically review its dividend policy and will consider paying dividends if appropriate. Any future determination to pay dividends will be made in accordance with applicable laws, and will depend upon, among other factors, SUSE’s results of operations, financial condition, contractual restrictions and capital requirements. SUSE’s future ability to pay dividends may be limited by the terms of any existing and future debt or preferred securities.
Shareholder structureAs of 31 October 2021, SUSE’s share capital is $16,902,711.70 represented by 169,027,117 shares without any nominal value all subscribed and fully paid up. As of 31 October 2021, Marcel LUX III SARL, on behalf of EQT VIII fund, held 76.49% of the shares in SUSE and 23.51% of the shares in SUSE were publicly traded.
76.49%23.51%
Marcel Lux IIIFree float
SUSE FY2021 Annual report56

SUSE share data
ISIN: LU2333210958
WKN: 840400
Symbol: SUSE
Stock market listing: Frankfurt Stock Exchange
Stock market segment:
Regulated Market (Prime Standard)
Index memberships: SDAX and TecDAX from 20 September 2021Joined FTSE All World index from 17 December 2021 (after end of FY21)
Number of shares: 169,027,117
Share capital: $16,902,711.70
Class of shares: Ordinary shares in dematerialized form
Free float: 23.51%
Loss per share (FY21) in $:
$3.3
Highest price in Xetratrading in EUR:
€40.59
Lowest price in Xetra trading in EUR:
€25.56
Closing price in Xetra trading (29 October 2021) in EUR:
€37.33
Average daily turnover (Xetra trading):
€2.29 million per day in October
SUSE FY2021 Annual report 57

Environment, Society and GovernanceAs a business focused on harnessing the power of open source to help our customers innovate everywhere, our Environmental, Social and Governance (ESG) strategy is central to our business and our sustainable growth. Through it we seek to create shared value for our SUSE Diamond and to our investors. SUSE is a transparent and purpose-driven organization, innovating to provide solutions whilst making positive contributions to society. A strong commitment to ESG has been part of our success and we have already made significant progress in many areas. However, we know there is more work to be done in this area, and since becoming publicly listed in May 2021 we have continued to make rapid developments on our ESG journey.In 2021, we strengthened our approach to ESG and continued integrating sustainability into our daily processes. We have also reviewed our ESG vision and strategy, based on feedback from stakeholders during our materiality assessment exercise. Furthermore, we have aligned our ESG approach with industry reporting standards such as the Global Reporting Initiative (GRI), also inspired by the United Nations Sustainable Development Goals (UNSDGs). We now have a firm foundation in place to embed ESG management and contribute to a more sustainable future for all.
Our ESG visionOur vision is to drive real impact around societal and environmental topics of importance to our stakeholders. In order to execute our vision, we are focused on a combination of strong leadership, employee engagement and strategic partnerships.
Leadership commitmentOur ESG function reports directly to the CEO of SUSE, and the ESG vision and strategy are supported by our group-level goals. We have appointed an ESG Board Champion, Dr. Ariane Reinhart, to provide Board-level sponsorship and oversight of key ESG initiatives. We are also introducing ESG targets to the Management Board’s compensation in FY22, and embedding ESG KPIs across business functions.
Employee engagement The second element driving our vision is employee engagement. Our four employee networks (GoGreen, Women in Technology, Pride @ SUSE, Open Source Community Citizens) are critical to engaging employees at all levels in everything we do. This employee engagement further embeds ESG ethos into the organization and drives adoption and awareness to the causes we support. Employees get one day per year to volunteer, and we champion those who volunteer in their communities through awards and recognition programmes.
Managing responsibly
Highlights – By putting novel compute technologies, like K3s, on orbiting satellites Hypergiant ensures their longevity and ongoing usability. With K3s, satellite management and maintenance can be done from Earth. This completely removes the need to send engineers into orbit and reduces reliance on new device launches. SUSE is helping Hypergiant create a long-term future for space hardware.
– A world first: Kubernetes clusters in space for the first time.
https://www.suse.com/success/hypergiant/
Hypergiant is creating the reusable satellite fleets of the future with SUSE Rancher, tackling the growing concern around space junk and single-use hardware
Case study: Hypergiant
SUSE FY2021 Annual report58

Partnering for impact We engage with several external organizations who share our ethos and are focused on driving sustainability. One such example is the Eden Reforestation Project. Eden is a global non-profit initiative that we partnered with to plant the SUSE Forest in Madagascar (land of our beloved chameleon). This partnership will continue for years to come as we work with them to support reforestation in Madagascar and combat climate change.
Charting a course for a sustainable business Looking ahead, we will further harness innovation whilst continuing to be a powerful force for good, tackling global challenges such as climate change, human rights, data privacy, and inequality. To help us achieve our ESG vision, we have established an overarching ESG framework to guide our activities within three ESG pillars: employee matters, social matters, and environment matters. In addition to these pillars, our framework includes activities around business integrity and success. We have mapped our ESG approach and results on these four areas in the next section.
SUSE FY2021 Annual report 59

Identifying and managing material issuesAs part of developing our ESG framework, in 2021 we conducted an expanded materiality assessment to review the ESG topics that are most important to our business and our stakeholders, uncovering new issues and ensuring prioritization and strategic alignment to our ESG commitments. The materiality assessment was conducted through a combination of surveys and interviews with representatives from four key stakeholder groups:
– SUSE employees. – Customers and Partners. – Investors. – Suppliers.
Responses were analyzed and prioritized according to relevance and impact. This process generated a shortlist of seven key topics which have material impact to SUSE and are a priority to our stakeholders. As a responsible employer, people are at the core of our business, as such, ‘Diversity & Inclusion’ and ‘Employee Attraction & Retention’ topics are key to
Identifying and managing ESG material issues
Highlights: – ZAMG provides crucial services ranging from weather
forecasting to climate modelling and earthquake monitoring; working with partners like the European Space Agency to better understand the effects of climate change.
– To increase the granularity of its sophisticated forecasting models, ZAMG deployed a new HPI SGI supercomputer with 7,000 cores, running SUSE Linux Enterprise (SLE) High Performance Computing.
– SUSE ensures ZAMG always provides up-to-date weather information to citizens and government authorities.
https://www.suse.com/success/zentralanstalt-fur-meteorologie-und-geodynamik-zamg/
Working with SUSE, ZAMG models weather patterns and monitors earthquake activity, using data science to better understand the effects of climate change
Case study: Zentralanstalt für Meteorologie und Geodynamik (ZAMG)
LOW
LOW
HIGH
HIG
H
Biodiversity
Water consumption
Philanthropy
Ethical Marketing
Business model and product social innovation
Technology public policy
Digital inclusion
Sustainable procurement
Electronic wasteHealth & safety
GHG Emissions
Remuneration, equality & transparency
Employee engagement
IT for Green
Green IT
Training & development
Business ethics & complianceHuman rights
Open source community
Employee attraction & retention
Diversity inclusion & equal opportunities
Non-discriminationPrivacy & data security
Impact on Business
Impo
rtan
ce to
Sta
keho
lder
s
Materiality assessment FY21
SUSE FY2021 Annual report60

our sustainable growth. As a reliable service provider our focus on ‘Privacy & Data security’, ‘Business Ethics & Compliance’ and ‘Green Products & Services’ topics will enable us to continue to be an innovative and ethical company. As good corporate citizens, the ‘Open source community’ and ‘GHG Emissions’ topics will help us achieve our community and environmental commitments.
– Non-discrimination / Diversity & Inclusion. – Employee Attraction & Retention / Training & Development.
– Privacy & Data security. – Business Ethics & Compliance / Human rights. – Open source Community. – Green IT / Green Products and Solutions. – GHG Emissions (linked with our key goals on climate action).
Other topics were identified during the exercise, and while non-material, we have included some in our ESG strategy and disclosed metrics.
Reporting transparently on ESG topicsWe are committed to regularly share information about our ESG performance through several channels — including in this report, regulatory filings, social media, press releases and conversations with stakeholders. In addition, we have a dedicated ESG page on our website providing access to policies and ESG-related information.
Aligning with globally accepted frameworksThis report has been prepared in accordance with the GRI Standards – Core option, which meets the
requirements of the European Non-Financial Reporting Directive (2014/95/EU). In addition to these global standards, the United Nations Sustainability Goals (SDGs) have also inspired our ESG strategy and approach. Here are some of the key SDGs our business activities have contributed towards in 2021.
SDG 5 Gender Equality: One of the key metrics that we monitor is gender diversity in leadership, and we plan
to promote this through our mentorship programmes, employee networks like Women in Tech, and improving female to male Compa-Ratios.
SDG 8 Decent Work and Economic Growth : We promote learning and training activities not just for our employees but also through
partnerships to sponsor learning for the wider community.
SDG 13 Climate Action: We believe in taking urgent action to combat climate change and this is reflected
in our commitment to science-based targets and by linking leadership remuneration to climate action milestones.
SDG 16 Peace, Justice and Strong Institutions: We have introduced initiatives to strengthen business integrity & compliance with our
policies on code of business ethics, anti-bribery, anti-corruption, and data protection. In the future, we will continue to align with the EU’s directives for our corporate sustainability reporting.
SUSE FY2021 Annual report 61

Our areas of focusWe will continue to strengthen our ESG activities and governance. In the past few years, we have added more compliance and business integrity-related activities to our plans. We launched core policies such as Code of Business Ethics, Supplier Code of Business Ethics, and Diversity & Inclusion. We also aim to introduce more value-creation initiatives through our open source business model. We already have ambitious goals in place with regards to diversity, emission reduction and open
source community engagement. In 2022, we plan to build on our achievements to date and to further standardize and improve how we measure and report our progress in relation to sustainability. The tables in the following sections map our progress against our three areas of focus. Succeeding against these three pillars is supported by a commitment to business integrity, keeping us compliant and ethical in how we conduct business. This includes stronger policies and commitments to sustainable procurement, privacy and data security.
ESG indicators, statements and notes
Employee matters Social matters Environment matters
We continue to focus on diversity & inclusion, recruitment and employee retention. As such, we have increased our efforts on employee engagement, training, health and safety. We have increased our female leaders by +1.5% in 2021 and launched a new Early Career Mentorship Program for young women interested in technology.
Our engineering approach is based on open source, and therefore a core part of our business model and value proposition to our customers. We aim to increase open source community engagement and support digital inclusion more broadly. In 2021, we launched the Open Source Community Citizens employee network, a network dedicated to uniting employees who are passionate about promoting the open source principles.
We are committed to climate action, and playing our part in reducing GHG emissions. As part of this commitment, we will be setting science-based targets and producing a roadmap to achieve these targets in FY22. In the meantime, we have continued reducing direct emissions by moving our offices to renewable energy providers and limiting travel. Our reforestation project in Madagascar also fits our climate action agenda.
GoalAt least 30% women in leadership by 2026
GoalIncrease open source adoption (targets being set in FY22)
GoalScience-based emissions target (being set in FY22)
SUSE FY2021 Annual report62

Our compliance policies, governance framework and integrated risk management processes help us govern effectively as we grow our business. We are committed to effective and transparent governance to ensure integrity in the way we do business.
Governance oversightOur Management Board, made up of our CEO and CFO, is responsible for managing the day to day operations of SUSE, acting in the interests of the group, and addressing ESG challenges and opportunities to create sustainable growth. The Management Board determines our strategic direction and ensures our ESG strategy is aligned and implemented appropriately. The Management Board is responsible for ensuring compliance with all legal provisions as well as internal regulations. It is also responsible for delivering on our risk management strategy. As part of a dual management system, our Supervisory Board advises and oversees the Management Board and its strategy for long-term value creation. Our Supervisory Board meets at least four times a year.
Business integrity and success
Business ethics and complianceOur Code of Business Ethics (COBE) sets out the standards of conduct expected, without exception, of everyone who works for SUSE in any of our worldwide operations. Our COBE is directly linked to our values and acts as a guide in helping us to operate our business in a socially and ethically sound manner. We expect all SUSE employees, contract workers and third-party partners to apply the highest ethical standards in making business decisions, to actively raise any concerns about breaches of our COBE and promote the standards and behaviors expected of us and our colleagues. The Code of Business Ethics is available to all employees via our Policy Hub and includes specific policies, including:
– Diversity, Inclusion and Equal Opportunities Policy. – Supplier Code of Business Ethics. – Anti-bribery and Corruption Policy. – Whistleblowing Policy. – Anti-slavery and Human rights statement. – Charitable Donations and Political Activities. – Conflicts of Interest.
Source: Eden Reforestation ProjectsSUSE FY2021 Annual report 63

ESG indicators, statements and notes continued
Highlights – Energy and environmental efficiencies occur as a result of platform flexibility.
– By virtue of running SUSE Rancher Cardano can power down certain services overnight, spinning them up again in minutes the next morning. As a result, the team have been able to reduce costs by over 75%.
– Energy and environmental efficiencies occur as a result of platform flexibility.
– Better system stability. – Customer base growing and innovation hastening.
https://www.suse.com/success/Cardano-Group/
Open source is supporting the creation of the sustainable finance industry of the future.
Cardano, a leading pension provider, has partnered with SUSE Rancher to create energy savings of 75%
Case study: Cardano Group
We have a zero-tolerance policy toward bribery and corruption. Our Anti-bribery and Corruption Policy (including Gifts and Hospitality) has been shared across the organization and reinforced with a mandatory training program. We ask our employees to Pause, Reflect, Ask and Report to ensure matters that raise any concerns on bribery or corruption are considered carefully and escalated to a line manager or, if required, the Chief Legal Officer.
Privacy and data security The security and privacy of our customers is of the utmost importance to us. One of the ways in which their security and privacy may be threatened is through cyber attacks. We consider cyber attacks to be our most material risk and we have included more detail on the nature of the threat and how we are mitigating it on p.79 of the Risk management and principal risk section
“Our actions, words and behaviors matter. SUSE’s Code of Business Ethics defines our guiding principles and ensures that every decision we make is rooted in integrity, trust and compliance.”
Melissa Di DonatoChief Executive Officer
SUSE FY2021 Annual report64

Sustainable procurementThe security and resilience of our supply chain is vital to the success of our business. Our procurement processes are informed by our Supplier Code of Business Ethics which asks suppliers to confirm they have appropriate policies in place that comply with local laws. We are planning to introduce more sustainable procurement guidelines and extending the current checks to our supplier’s social, health, and environmental impact.
Business integrity and successKey policies: SUSE Code of Business Ethics (COBE), Information Security (ISMS) Policy Group, Supplier Code of Business Ethics (SCOBE)For ESG data tables and calculation notes refer to P226
ESG focus areas Our KPIs YoY progress/baseline Our future plans
Business Ethics and Compliance
Communication of principles for ethical and socially responsible business operations
100% (All employees communicated)
Strengthen policies and increase trainings for Business Ethics & Compliance.
Privacy and data security
Data breaches One data breach was identified in 2021. All affected customers were notified by the CFO and it was reported to authorities.A technical incident response team was established to identify the root cause and remediate it, in collaboration with the affected public cloud provider.
A third party has been contracted to support SUSE implement the processes and protections necessary to operate in accordance with ISO best practice guidelines by the end of FY22.
Sustainable Procurement
Number of suppliers and worth of goods and services purchased
Released the new policy, requesting commitment to local laws and regulations for the 1179 suppliers (Total Order Value at USD 76.1 million worth of goods and services).
Introducing sustainable procurement guidelines which will include social, health, and environment expectations to our rules of engagement with suppliers.
SUSE FY2021 Annual report 65

ESG indicators, statements and notes continued
Employee matters
High engagement and employee well-being are key priorities for SUSE. Our people are our strongest asset, and we want all employees to feel they can be honest and open at work every day. We stand by our belief that open innovation brings out the best of creativity and ingenuity in all of us. This is supported by our unique and vibrant culture that ensures everyone at SUSE can bring their authentic selves to work and perform at their peak. Our employees are also supported to give back to society through our program SUSECares, and they are encouraged to take a day of paid leave each year to volunteer at a charity of their choice.
Diversity and inclusionAt SUSE, we value unique talents and perspectives. We aspire to maximize opportunities for inclusion and belonging to create a working environment where our team members can thrive. We believe the contributions from every single employee, from every background, enable our customers to innovate everywhere. That’s why we are committed to building a diverse and inclusive workforce. We have established employee networks to create an inclusive and diverse environment for all employees. These include Pride at SUSE, SUSE Women in Tech, GoGreen and the Open Source Community Citizens Network. Our employee networks are led and managed by our own employees, with support from HR and the CEO’s Office. In 2021, we launched our new Diversity and Inclusion Policy and mandatory training, which demonstrates our commitment in this area. One of our key goals is to increase women in leadership positions, which increased from 19% to 20.5% in FY21, enabled by talent management programs and a
focus on mentorship and events catered to our female employees. We are proud of this achievement and confident of achieving our target of 30% women in leadership by 2026. Our Director of Diversity and Inclusion reports to the Chief HR Officer, and we have relevant people strategy metrics in place to map progress.
Non-discriminationAt SUSE, we are committed to creating an inclusive and welcoming work environment free from harassment and bullying where everyone can achieve their potential. We want to ensure all employees, as well as other parts of the SUSE Diamond, feel welcome and enjoy a work environment that is free from harassment, bullying and victimization.SUSE has an Anti-Harassment and Anti-Bullying Policy which outlines our corporate commitment to creating a safe and inclusive work environment for our entire SUSE Diamond by ensuring that all members are treated — and treat others — with dignity and respect. The policy covers bullying and harassment in the workplace (including virtual work settings) and in any work-related setting outside the workplace (e.g., business trips and work-related social events) and on social media. The policy also highlights mechanisms to address issues, from informal approaches guided by our Resolution Policy to formal procedures by means of Disciplinary Policy and Whistleblowing Policy.
Health and safetyThe health, safety, physical and mental well-being of our employees is essential to our continued success, so we are committed to making sure each employee across the globe feels safe and supported in conducting their duties at SUSE. Our Health & Safety (H&S) Committee, composed of seven employees across multiple business functions, meets weekly to discuss these topics and ensure all employees have the support and guidance they need. In addition, our Health & Safety Policy ensures we comply with all relevant regulations and provides guidelines for establishing a health and safety management system to manage workplace hazards and risks whilst promoting employee well-being.During the pandemic, recognizing that employees needed additional support to address their overall well-being, we launched SUSE Assist, an online employee well-being solution. SUSE Assist offers all our employees, and their families, access to free and confidential professional care services 24/7, 365 days a year. The H&S Committee also actively
SUSE FY2021 Annual report66

monitors the global Covid-19 situation and has created local travel and office guidelines to safeguard employees. Finally, we launched Crisis 24, an application which provides 24/7 emergency assistance to our employees around the world. This helps our employees feel more safe, secure, and confident, whether they are working at home, on the road or abroad. These initiatives and our overall collective efforts to protect the health and safety of our global team have been formally recognized, as we recently won the 2021 ERP Covid-19 Hero Employee Award. This emphasizes the strength of SUSE’s work to support our employees during Covid-19, giving SUSE industry-wide recognition.
Training and developmentWe have an established process for identifying high potential talent and implementing development plans so we can retain, grow and promote our key talent. During FY21 we started to track career moves at SUSE by introducing a target of 10%. This covers successful application to open roles from internal candidates, promotions and lateral career moves. Our driven and talented employees, managed to beat this target with over 20% career moves. We have also introduced a complete Leadership Development framework for all stages of the leadership pipeline. Our Emerging Leaders Academy prepares future leaders for their first step into leadership, while our first line managers and our growth mindset leader programs are aimed at more senior leaders.Our Talent Center of Excellence develops, designs, implements and evaluates the leadership development programs as well as the talent review process. They are supported in this effort by the Global HR Business Partners.
Remuneration equality and transparencyWe are committed to achieving pay equity throughout the organization and aim to ensure all our employees are paid fairly and competitively. To measure our progress, we focus on Compa-Ratios when reviewing pay increase proposals and review the relative movement to ensure the ratios generally remain equal.
Employee attraction and retentionWe need to attract and retain talent to ensure our continued growth and success. To do this, we aim to show that we are an ethical employer of choice, offering successful candidates the opportunity for rewarding and meaningful career progression.
The Recruitment function manages the candidate experience to ensure we can compete in the market. Retention of employees is tracked and measured on our HR Information System. We regularly review attrition data, together with other inputs (e.g. our employee survey), and we take steps to address any attrition issues identified.
Employee engagementOur employees are our greatest assets. Employee engagement is therefore a core people metric at SUSE. We use employee net promoter scores (eNPS) to measure overall employee engagement.Our current eNPS score of 30, places SUSE in the mid-range percentile for benchmark group (tech sector) in Workday Peakon, a platform used to measure the drivers which influence employee engagement, advocacy and well-being.Employee engagement is managed by our Director of Employee Engagement, who reports directly to the Chief HR Officer.
SUSE Hack Week 2021 was the 20th year for this long-standing SUSE tradition. All SUSE employees can learn, innovate and collaborate on a topic of their choice without boundaries. The event was sponsored by Google and Amazon Web Services, and in just five days, over 600 participants worked on 259 open source projects.
SUSE FY2021 Annual report 67

ESG indicators, statements and notes continued
Employee matters
Aspiration: Best in class employee satisfaction and eNPSKey policies: Diversity, Inclusion and Equal Opportunities Policy, COBEFor ESG data tables and calculation notes refer to P228
Transformational goal: At least 30% women in leadership by 2026
ESG focus areas Our KPIs YoY progress/baseline Our future plans
Diversity and inclusion
D&I Training Workplace Diversity, Inclusion and Sensitivity Training (83% completed)
In 2022 we plan to expand training on sustainability and diversity issues considerably. We also aim to do more to support our employee networks in contributing to our science-based emission target and Women in leadership goal. We will continue supporting initiatives such as Stonewall & Everywoman. We also seek to join new initiatives that can help us build diverse, inclusive, equitable teams to drive future success.
Employees by employment type, by gender
1,979Full-time:
Undisclosed 6Female 427Male 1546
66Part-time:
Undisclosed 1Female 21Male 44
Employees by employment contract, by region
Contract2,014Permanent
31Temporary
RegionAPAC – 143 (7.0%)EMEA – 1066 (52.1%)China – 190 (9.3%) LATAM – 53 (2.6%)North America – 593 (29.0%)
Women leaders 20.5% (increased from 19% in 2020)
Non- discrimination
Policies & procedures
Anti-Harassment and Anti-Bullying Policy In our next fiscal year, we will be rolling out training on ‘Preventing Bullying and Harassment’ to all employees and contractors.
Health & Safety Work-related fatalities
0 Continue monitoring & supporting our employees globally to reduce the impact of Covid-19 and other health risks.Covid-19
information 250 meetings held by the H&S Committee regarding Covid-19
43Confirmed and recovered Covid-19 employee cases
$262,000Total value of home working equipment
500Number of Crisis 24 downloads
SUSE FY2021 Annual report68

Employee matters continued
ESG focus areas Our KPIs YoY progress/baseline Our future plans
Training and development
Performance and career development reviews
Gender1,495No of eligible employees reviewed (81% of total)
283 1.183
29
Female Male Undisclosed
Position1,495
143 1.25498
Director & AboveNon-Director People LeadersNon-Director Individual Contributors
Continue investment in Talent and Leadership development. We will continue to focus on career moves in FY22 and have now doubled our target to 20% (from 10%).
Talent reviews 700 employees reviewed
Career moves (Career development metric) Target 10%
20.1%
Remuneration equality and transparency
Total compensation and benefits
$470,190,000 (104.3% increase from FY20)The increase in total compensation and benefits is due to increased headcount (circa 25% increase in average employee numbers year-on-year) and increased share-based payment expenses driven by the IPO triggering vesting conditions for certain share option schemes.
Continue to increase female to male Compa-Ratio to 100%.
Female / Male Compa-Ratio
Female Compa-Ratio is 99.84% of the Male Compa-Ratio.
Employee attraction and retention
New employee hires 800New employee hire rate 39%
We regularly review employee turnover data, together with other inputs (e.g. our employee survey), to ensure we take measures to address any attrition issues and have a plan to reduce our turnover rate in 2022.
Employee turnover rate in percentage
21.2% – Voluntary (15.6%) – Involuntary (5.6%)
Employee Attraction Our career website has seen an increase of 89% in visits by potential candidates compared to the previous year, and an increase in application clicks by 75%. We have also seen significant increases in talent being attracted to our posts on LinkedIn and Facebook (by 76% and 74% respectively).
Employee Engagement
Employee Volunteering
1,224 hours in total(Average of 0.6 hours per employee)
Increase our eNPS score with improved employee engagement.
eNPS 30eNPS score from September 2021, with a participation rate of 87%.
SUSE FY2021 Annual report 69

ESG indicators, statements and notes continued
Social matters
Organizations today face increasing pressure to become more agile to grow, compete and survive. By helping our customers digitally transform, we are helping them create more sustainable enterprises. This work is central to our mission of enabling better futures and delivering measurable value for our customers, employees, partners, communities and investors.To fulfill our mission, we focus on digital inclusion and increasing open source adoption. Open source communities are essential not only to our business but also to drive collaboration and innovation across all business sectors.
Digital inclusion and educationAt SUSE we believe digital access is a human right and we seek to promote access and equity in the open source community through professional development courses, internships, and apprenticeships.As a global leader in innovative, reliable and enterprise-grade open source solutions, we believe we can play a role in addressing the industry-wide talent shortage in the critical area of cloud native application delivery. We partnered with Udacity, the global online learning platform, to introduce the Cloud Native Application Architecture Nanodegree program. Through our Udacity Cloud Native Scholarship program, launched in 2021, 15,000 applicants competed for scholarships by participating in the Cloud Native Foundations course. SUSE sponsored 300 scholarships and given the importance of diversity and inclusion in the field of technology, 100
scholarships were awarded to women of color, a traditionally underrepresented group in the industry.We also support internal exchanges between colleagues and communities through the Open Source Community Citizens Employee network. Its mission is to make open source more accessible to non-coders and inspire each other on open source. The employee network was newly formed at the end of FY21 and has over 150 members.
Open source for goodBy enabling our customers to innovate, we use open source for good. Our code and solutions are found across the economy and have even been to Mars. Closer to home, we focus on using open source for good through university partnerships, ongoing Covid-19 support and climate change monitoring. At the onset of the pandemic, we offered free operating systems and container management technologies to organizations that were producing medical devices to fight the virus. Inspired by this movement, Microsoft decided to participate in this initiative.We also worked with organizations across all sectors to tackle the threat of the virus and to better understand the disease. The Wellcome Sanger Institute, for example, works with SUSE to track the spread of Covid-19 and analyze the emergence of variants. Likewise, alongside some of the largest laboratories in the world, companies like Ruvos have chosen to work with us to track testing data across the USA. Additionally, we partnered with academic institutions such as Haifa University – home to over 18,000 students across the globe – to ensure that not a single hour of lectures was missed during the pandemic.
SUSE FY2021 Annual report70

Social matters – Increasing open source adoption
Aspiration: Increase open source adoption (targets being set in FY22) Key policies: Open source PolicyFor ESG data tables and calculation notes refer to P232
ESG focus areas Our KPIs YoY progress/baseline Our future plans
Digital inclusion and education
Udacity and sponsor courses
$300,000 (USD) SUSE invested to sponsor
300 scholarships
Explore new programs that help young people gain critical job skills and experience.Increase our support for our community networks such as Open SUSE and SUSE & Rancher Community.
openSUSE Total number of nonSUSE contributors to openSUSE
139 (Percentage of nonSUSE contributors to openSUSE: 69.8 %)
Continue openSUSE community growth and increase community engagement.
Events Organized 3 events organized
openSUSE community engagement
81Average number of participants per event SUSE
openSUSE project members
450
Participants by country
For FY21, the top five countries by popularity using openSUSE are #1 Germany, #2 United States, #3 Brazil, #4 China and #5 Russia.
openSUSEThe openSUSE Project is a worldwide effort that promotes the use of Linux, tools around it, and open source. The openSUSE community is made up of multiple communities which collaborate as part of a global open source network. The openSUSE community develops, builds, and maintains many of the packages, tools, and infrastructure for the distribution. It works together in an open, transparent, and friendly manner as part of the global free and open source software community. The project is sponsored primarily by SUSE and supported by several open source companies and communities. SUSE provides openSUSE with resources to maintain and release openSUSE Linux distributions and tools such as the Open Build Service and openQA. SUSE supports openSUSE through the sponsoring of infrastructure, human resources, and funding. SUSE continuously maintains infrastructure and software alongside the community.
The governance model exists through a formal membership which is represented by the openSUSE board. The board provides guidance and supports other governance structures, provides conflict resolution and coordinates with SUSE, but it does not direct the project’s development where community mechanisms exist to accomplish the goals of the project. The openSUSE Project has more than 450 project members and 369 organizational members with Github privileges for the project. Project membership is seeing active growth after shifting the membership process to code.opensuse.org. The openSUSE project has grown extensively since its founding more than 15 years ago. A total of 35 members have served on the board since its founding.openSUSE has also historically engaged in community events to meet and encourage new users to try openSUSE distributions and tools. These include developer and system administrator-focused events, as well as community-based, grassroots events for adults and children.
SUSE FY2021 Annual report 71

ESG indicators, statements and notes continued
Highlights – SUSE Rancher brings highly available and scalable compute power to a diverse and growing research community, engaged in a range of climate-related projects.
– Supports STFC’s unique needs and the varying requirements of the global research community; ability to process petabytes of data from disparate sources, quickly and efficiently.
– Interoperable: flexibility to build, scale and transform on demand to support fast-moving research projects.
https://www.suse.com/success/stfc/
The UK-based Science and Technology Facilities Council’s JASMIN supercomputer, running on SUSE Rancher, is being used to model inner city temperature changes in a bid to help plan the sustainable cities of the future
Case study: STFC
Environment matters
At SUSE, we believe we all bear a responsibility to preserve our planet for generations to come. We want to be part of the solution to the challenges facing our world. We do this by enabling our customers to create innovative sustainable services and solutions, and by adapting our own operations to minimize our impact on the environment. We are currently developing a roadmap towards a science-based emission target and encourage all our business partners to share in our mission.
Green operations – Greenhouse gas emissionsWe are committed to reducing greenhouse gas emissions, and we will reduce our emissions by choosing lower-emission equipment, cars, and travel. We will also aim to source the most energy-efficient resources in our offices where possible.We track our GHG emissions and measure our output through reports from travel providers, company car records and utility invoices. We plan to create a roadmap to start reducing these emissions across the business. We also support climate action by planting trees through our SUSE Forest initiative. To date, we have planted 300,000 trees in Madagascar, the home of our beloved chameleon mascot, in partnership with Eden Reforestation Projects. This non-profit NGO helps to create livelihoods for millions of people living in poverty through reforestation.
Our commitment to reducing emissions is reinforced by the introduction of new climate action milestones linked to Management Board remuneration.
Green operations – EnergyWe try to consume as little energy as possible and source renewable energy wherever we can. We manage our energy efficiency on a regional basis, working with our landlords to review all options available to us. However, it can be challenging to accurately measure our energy performance as we rely on data from other organizations. Variable factors like fluctuating demand for data centers, equipment being added unexpectedly and office spaces being open for longer hours can all affect the accuracy of monitoring.Going forward, we will continue our commitment to measuring and managing our energy usage efficiently. We have committed to setting science-based targets in FY22 and will create a plan to deliver on these targets.
Green products and solutionsThe International Energy Agency estimates that 1% of all global electricity is used by data centers and cloud operations, giving us an opportunity to reduce the energy consumption and make a positive contribution to creating a more sustainable future. To do this, we strive to make sure our products use as little energy as possible.
SUSE FY2021 Annual report72

We have been driving product energy efficiency by: – Introducing Green IT performance objectives. – We continue our efforts to make our software energy efficient. Beneficiaries are also the openSUSE project and other Linux adopters, because our technology is (as open source software) available to everyone and is made available upstream.
– Creating a Future Product Roadmap in partnership with our Independent Hardware Vendors (IHV) partners.
We help our customers to become more environmentally friendly by better utilizing their hardware and by prolonging hardware usage life. We have also introduced green coding guidelines to help create more energy-efficient software. We are an active member of large improvement projects like Gaia-X that have a clear focus on building sustainable and energy-efficient cloud infrastructures in Europe.
Serving green economyThe impact of open source on sustainability issues is both broad and varied, and our solutions have helped several customers to address sustainability challenges in innovative ways. Hypergiant Industries, an artificial intelligence company, is using SUSE Rancher to create a fleet of sustainable satellites, tackling the growing problem of space junk and one-time use of valuable resources. Austrian meteorological and geodynamics agency ZAMG uses SUSE Linux Enterprise to model weather patterns and monitor earthquake activity, using data science to better understand the effects of climate change.
Source: Eden Reforestation Projects
SUSE FY2021 Annual report 73

Environmental matters
Aspiration: Controlled emissions measured by CO2eTransformational goal: Science-based emission targets For ESG data tables and calculation notes refer to P233
Key policies: Environmental policy
ESG focus areas Our KPIs YoY progress/baseline Our future plans
Green ops – Emissions
Direct (Scope 1) GHG emissions
257 tCO2e (tons of CO2 equivalent)
We aim to define science-based targets and create a roadmap to achieve science-based emission target.
Energy indirect (Scope 2) GHG emissions
Market based – 4,446 tCO2eLocation based – 3,224 tCO2e
Other indirect (Scope 3) GHG emissions
17,299 tCO2e (tons of CO2 equivalent)
GHG emission intensity
0.2 (t CO2e / square meter of office area)
Leadership compensation
New climate action milestones linked to management board remuneration (Refer Remuneration section)
Green ops – Energy
Energy consumption within the organization
9,362,071 kWh We plan to optimize our consumption levels across sites and source renewable energy, where possible. This will be done in alignment with a new Sustainable Procurement Policy.Energy intensity 467.1
(kWh / square meter of office area)
Green products and solutions
IPCEI – Cloud Infrastructure and Services (CIS) Projects
3/6 projects joined as part of Important Projects of Common European Interest (IPCEI) Consortia in EU
We aim to be a leader in Green Products initiatives.We aim to be involved more with the IPCEI – CIS projects and consortia and join more projects.
The way forward Our new ESG vision sets out bold ambitions for SUSE and a clear pathway to achieving our goals. In 2022, we will build further on our commitment to sustainability through a range of initiatives across the E, S and G pillars. We will also uphold our values through an open and collaborative approach to innovation as we believe this will be a key advantage in tackling global challenges for the greater good. We look forward to updating our shareholders on our progress on these important efforts. Link to ESG website page – https://www.suse.com/esg/
ESG indicators, statements and notes continued
SUSE FY2021 Annual report74

Risk management and principal risks
Risk management strategyThe Management Board, under the supervision of the Supervisory Board, has the overall responsibility for ensuring that SUSE’s activities comply with applicable legislation, regulatory requirements and internal policies. The Management Board decides on the organizational structure for risk management within the Group and on the allocation of resources for the Group’s internal control system and the Group’s risk management system.The Supervisory Board monitors the effectiveness of the risk management system.The internal control system and the risk management system that the Management Board oversees are designed to identify potential events that could negatively impact SUSE, its reputation and its financial performance. To help achieve this, SUSE has established appropriate systems for internal control and risk management to ensure compliance across the Group.SUSE’s accounting control system is designed to ensure that all business transactions are accurately accounted for on a timely basis and that reliable data on SUSE’s financial position is always readily available. There is a clear assignment of responsibilities within the Finance function and within each individual team within the Finance function.SUSE’s internal control system is an integral component of its risk management strategy. In connection with its accounting and financial reporting, the internal control system’s purpose is to ensure compliance with applicable laws, the principles of proper accounting, International Financial Reporting Standards as adopted by the EU and with the standards set by the Group as a whole. SUSE identifies, assesses and mitigates any risk with a direct influence on its financial reporting.SUSE actively monitors any actual or planned changes in accounting standards and, where necessary, seeks the advice of external experts to understand the impact of such changes. This helps to reduce the risk of accounting misstatements, particularly in relation to complex issues or where judgment is uncertain.Group Treasury is responsible for setting the Group’s financial risk management objectives and policies including hedging policy. Further details of
specific types of financial risk and how they are managed is provided in Note 29 to the Consolidated Financial Statements.The financial statements of the Group and SUSE S.A. are subject to external audits. SUSE is currently establishing an independent Internal Audit function which will further strengthen the internal control environment. Independent reviews of financial data are an integral part of the internal control framework. This ensures that potential errors are identified on a timely basis, accounting standards are complied with and financial reporting is robust. The risk management system seeks to provide the Supervisory Board and the Management Board with an overview of risks to help support their decision making. The risk management system aims to ensure that potential risks are identified early on, assessed and mitigated quickly and comprehensively and then managed on an ongoing basis.SUSE’s risk management system is based on the following six features:
1. Identify
2. Assess6. Report
4. Manage
3. Mitigate5. Monitor
SUSE FY2021 Annual report 75

Risk management and principal risks continued
The Management Board regularly updates the Supervisory Board on the risks facing the SUSE business and the mitigants in place to address such risks. The Supervisory Board supervises and monitors the effectiveness of the risk management system and provides advice on any other risks that SUSE faces and any mitigants that could be implemented. The Management Board is also supported by the Senior Leadership Team which is responsible for identifying risks facing the business, updating the Management Board and the Audit Committee and then overseeing the implementation of any necessary mitigants.In addition, and as explained in more detail on pages 90 to 91 of the Corporate Governance section, the Supervisory Board, the Management Board and the Senior Leadership Team have established a number of committees, including an Audit Committee, a Nomination and Remuneration Committee and a Risk and Compliance Committee to review, monitor and manage risks facing SUSE. In particular, one of the duties of the Audit Committee is to assess and monitor the effectiveness of SUSE’s internal control system, its risk management system and its internal audit system and to ensure compliance with applicable law and regulation.
Identifying principal risksTo prepare for the IPO, SUSE, with support from external advisers, undertook an exercise to record the main risks facing the SUSE business. This exercise identified 50 risks, which included a range of strategic, operational, compliance and reporting risks, as measured according to their likelihood of occurrence and impact. This exercise also helped to verify the risk factors that were included in the prospectus for the IPO.All risks were assessed with and without considering existing and planned mitigation measures, i.e. inherent risks and residual risks. The top 10 risks were identified and the assessment of such risks, on an inherent and residual basis, was then shared with the Supervisory Board and the Management Board. SUSE will refresh its review of the risks facing SUSE on a half-yearly cycle working in collaboration with the respective risk owners.The current top 10 risks that SUSE has identified are listed out on pages 79 to 83, together with a list of the existing measures in place to mitigate such risks, as well as the planned measures in place to further mitigate such risks.
Risk governance structure
Supervisory BoardSupervises and monitors the effectiveness of the risk management system and provides advice to the Management Board on risks facing SUSE and measures to mitigate such risks
Audit CommitteeAssesses and monitors the effectiveness of SUSE’s internal control system, its risk management system, its audit system and compliance
Management Board CommitteesEach chaired by a member of the Management Board or the Senior Leadership Team
Management BoardOverall responsibility for ensuring that SUSE’s activities comply with applicable legislation, regulatory requirements and internal policies.
Senior Leadership TeamChaired by the CEO. Identifies risks facing SUSE and oversees implementation of any necessary mitigants
SUSE FY2021 Annual report76

Assessment of principal risksAll identified risks will be assessed half-yearly on the basis of the likelihood of their occurrence and their potential impact on SUSE.With respect to the likelihood of a risk occurring, the following measures are considered:
Level Rating Percentage5 Almost certain >80%4 Likely 60% – <80%3 Possible 40% – <60%2 Unlikely 20% – <40%1 Remote 0% – <20%
With respect to the impact of a risk, the following measures are considered:
Level Rating Financial impact
Liability Reputation Operations
V Major >$30 million Major criminal sentence – personal liability, e.g. board member
Long-term international negative attention
Significant long-term interruption or shut-down of more than one business operation
IV High ≤$30 million – >$5 million
Minor criminal sentence – personal liability, e.g. board member
Short to medium-term international negative attention
Significant short-term interruption or shut-down of a significant business operation
III Medium ≤$5 million – > $500k
Significant administrative offence – no personal liability
Short to medium-term regional negative attention
Medium-term interruption or closure of significant parts of business operations
II Low ≤$500k – > $100k
Minor administrative offence – no personal liability
Medium-term local negative attention
Short-term interruption or closure of parts of business operations
I Insignificant Insignificant No personal liability or sentence
No or short-term local negative attention
Short-term interruption of insignificant parts of business operations
SUSE FY2021 Annual report 77

Risk management and principal risks continued
Inherent risks and residual risks – heat map
Likelihood
Impa
ctM
ajor
High
Med
ium
Low
Unlikely Likely Almost certain
Insi
gnifi
cant
Remote Possible
10
10
5
4
3
3
9
9
7
7
8
8
6
6
4
5
2
2
1
1
Movement – following impact of mitigating measures:
From Inherent risk To Residual risk
Topic
1 Cyber 6 Global economic and geopolitical uncertainty
2 Strategic relationships 7 Innovation and reacting to market trends
3 Product defects and liability 8 Technology infrastructure
4 Governance and compliance 9 Acquisition strategy
5 People 10 Competitors
Mitigation, management, monitoring and reporting Suitable risk-mitigating measures and controls are developed and implemented by the Senior Leadership Team or individuals who directly report to the Senior Leadership Team. Risks are then managed and monitored on an ongoing basis by such individuals. On a half-yearly basis, the top 10 inherent and top 10 residual risks are shared with, and reviewed by, the Management Board and the Supervisory Board.
SUSE’s top 10 risksThe heat map below sets out SUSE’s top 10 risks, as of 31 October 2021, as measured on an inherent and residual basis. This heat map was shared with the Management Board and the Supervisory Board and formed part of their review of the ongoing risks facing SUSE and the measures that are in place to mitigate such risks.
SUSE FY2021 Annual report78

Topic Description Mitigation
1 Cyber
Gross/Net ImpactMajor
Gross/Net LikelihoodAlmost certain/Possible
OwnershipCFO Office (IT)
Cyber attacks are increasingly prevalent and sophisticated. SUSE has experienced a number of cyber attacks and is likely to experience more in the future.A cyber attack could lead to significant operational disruption for SUSE that would prevent it from operating for an unspecified period of time.The security measures that SUSE has in place relating to its products and business operations, including through third-party service providers, may not prevent security breaches or data loss.A cyber attack, security breach or data loss could lead to reputational damage, a loss of trust in SUSE’s products with customers choosing alternative providers, costly legal disputes, legal and regulatory fines and class actions.
The cybersecurity team has been expanded with a dedicated VP of Information Security hired as global Chief Information Security Officer. The team increased from 1 FTE to 14 FTE with a dedicated product security team.SUSE has formed an IT and Cyber Security Committee to assess current and future cyber security risks and assess SUSE’s defenses.SUSE has instructed a third party to carry out a review of its security controls, cyber security framework and security perimeter. That same third party has been contracted to support SUSE implementing the processes and protections necessary to operate in accordance with ISO best practice guidance by the end of FY22.SUSE has introduced a Business Continuity and Disaster Recovery pilot and incident response retainer to detect, respond and recover from cyber security incidents.Appointed an expert cyber security adviser who sits on the IT and Cyber Security Committee.
2 Strategic relationships
Gross/Net ImpactMajor
Gross/Net LikelihoodLikely/Possible
OwnershipCFO Office (Finance)
SUSE’s success depends on its ability to continue to establish and maintain strategic relationships with industry leading cloud service providers (“CSPs”), IT hardware original equipment manufacturers (“OEMs”), independent IT hardware (“IHVs”) and independent software vendors (“ISVs”) and system integrators (“SIs”) to help SUSE to attract and retain a large customer base. Many of SUSE’s strategic partners have engineered and certified that their technologies run on or are compatible with SUSE’s offerings, e.g. SAP HANA. SAP could open up certification to additional vendors and reduce the value of this partnership.Some of SUSE’s strategic partners offer competing products and services and have their own sales forces and channels that they could use to sell such products and services. SUSE uses a variety of different indirect distribution methods for its offerings, including channel partners such as CSPs, distributors, embedded technology partners, OEMs, IHVs, ISVs and SIs. SUSE relies, to a significant degree, on these channel partners to select, screen and maintain relationships with its distribution network and to distribute SUSE’s offerings in a manner that is consistent with applicable law, regulatory requirement and quality standards.
SUSE has long-standing relationships with industry-leading companies, such as SAP, and its products are embedded within their offerings. As mentioned in the “Innovation and reacting to market trends” section, SUSE continues to ensure that its products are relevant so that it is an attractive Group to partner with.SUSE also has focused sales teams that sell SUSE’s products outside of SUSE’s relationships with CSPs, OEMs, IHVs, ISVs and SIs.
SUSE FY2021 Annual report 79

Risk management and principal risks continued
Topic Description Mitigation
3 Product defects and liability
Gross/Net ImpactMajor
Gross/Net LikelihoodLikely/Possible
OwnershipEngineering & Innovation
As SUSE’s products are open source, much of the code is developed by independent third parties over whom SUSE exercises no direct supervision or control. Despite quality control and testing procedures, errors have been and may continue to be found in SUSE’s offerings after deployment. If errors are discovered then SUSE may incur significant expenditures and devote significant technical resources to analyze, eliminate or work around any such errors. Errors or defects in SUSE’s products may cause system failures, security breaches, loss of data or performance issues for SUSE’s customers who may bring claims for damages against SUSE. Such errors or defects may lead to existing and future customers choosing not to use SUSE’s products.Agreements with customers generally contain provisions that seek to limit SUSE’s exposure but such provisions may not be effective or enforceable.
Peer review of open source software code, as well as SUSE’s own internal review, means that it is difficult to hide malicious code.SUSE has a contracting framework and infrastructure in place that seeks to manage risk and limit SUSE’s exposure to potential product liability claims. SUSE is developing a contract management tool to enhance its ability to review, negotiate and monitor customer contracts.
4 Governance and compliance
Gross/Net ImpactMajor/High
Gross/Net LikelihoodLikely/Possible
OwnershipCFO Office (Legal and IR)
SUSE’s activities are subject to various applicable laws, rules and regulations in the various jurisdictions in which it operates or sells its products. As a listed company, SUSE is also subject to more onerous corporate governance and disclosure requirements.SUSE’s compliance processes and controls may not be sufficient to effectively prevent or detect inadequate practices, fraud and violations of law or group-wide policies or violations of sanctions, trade controls and bribery laws. Employees may not understand what internal controls and policies are in place, why they are in place and their importance. Any violations of these laws and regulations could result in fines, reputational damage, criminal sanctions against SUSE, its officers or its employees and prohibitions on its conduct of business.SUSE’s share price and its reputation in the market is, to some extent, dependent on the successful delivery and execution of its investor relations program. If SUSE fails to successfully deliver and execute its investor relations program this could lead to an unfavorable reaction from shareholders, and the market more generally, causing reputational damage to its management and a loss of confidence in SUSE and its share price.
SUSE has rolled out a governance process that involves regular meetings of the Supervisory Board, the Management Board, the SLT, the Supervisory Board committees and the committees that report to the Management Board or the SLT to monitor the ongoing risks to the business.SUSE has refreshed many of its Group policies, including on Code of Business Ethics, Anti-Bribery and Corruption, Insider Dealing and Market Abuse, Share Dealing and Whistleblowing, to ensure strong governance and manage regulatory obligations. An independent reporting hotline has also been introduced and SUSE has refreshed its training on Anti-Bribery and Corruption.The CFO office has brought in additional resource to handle the increased regulatory obligations on SUSE and to assist its communication with shareholders. In particular, an IR director has been appointed, and Numis has been appointed as SUSE’s broker. New appointments have also been made in the Legal and Company Secretarial teams.
SUSE FY2021 Annual report80

Topic Description Mitigation
5 People
Gross/Net ImpactHigh
Gross/Net LikelihoodLikely/Possible
OwnershipHR
SUSE’s employees are its key asset and it is heavily reliant on those employees for its continued success. SUSE is an ambitious and rapidly growing business, operating in a highly competitive global market place. Its ability to successfully deliver on these ambitions depends on retaining, motivating and attracting current employees who have the attributes and skills to allow SUSE to continue to grow. Competition in the technology industry for qualified employees with relevant skills and experience, especially sales and technical employees, is intense. SUSE’s competitors may directly target its employees or SUSE may be unable to retain key employees and attract new employees.As the global economy continues to open up post-Covid, SUSE will not be immune to global dynamics and shifts in employee patterns, including the “Great Resignation” post-Covid.SUSE uses remuneration as an important retention tool and its recent IPO has caused share options to vest for a significant number of its employees, with no retention period built in. A number of senior employees with such vested share options have already resigned and it is possible that further such resignations may follow in the immediate to short term.Attrition rates, combined with planned additional headcount needs, create a significant risk that recruitment will not match the requirements of the business.
SUSE pays its employees competitive salaries that are benchmarked against external competitors. SUSE carries out an annual salary review to reward strong performance and ensure salaries remain competitive. The majority of employees are offered bonuses that are triggered on the basis of SUSE’s success.Many employees also receive share-based awards to incentivize their performance and align their interests with SUSE’s.All employees receive a competitive benefits package, including pension and health insurance.SUSE focuses on a number of health and well-being initiatives, and has a Health & Safety Committee and a Covid-19 Committee to oversee and implement such initiatives. The health, safety and well-being of employees is a standing agenda item at meetings of the Supervisory Board.SUSE also circulates regular Pulse surveys to employees to assess job satisfaction, views of SUSE and well-being. Management frequently updates employees on the performance of SUSE and its future prospects through Group wide communications.SUSE promotes a culture of openness and collaboration and encourages personal development among its employees with annual reviews and development programs.
6 Global economic and geopolitical uncertainty post Covid
Gross/Net ImpactHigh/Medium
Gross/Net LikelihoodPossible
OwnershipCFO Office (Finance)
While SUSE continues to benefit from a strong recovery and performance in global stock markets (since March 2020), there is always a risk of an economic downturn or uncertainty. Economies are facing supply chain issues, inflationary pressures and the “Great Resignation”. These may all impact demand for SUSE’s products. The short, medium and long-term effects of Covid-19 on the global economy are still uncertain – there are likely to be further issues that emerge from the Covid-19 pandemic in the next few years and these may have a negative impact on SUSE’s business. For example, the global economy is feeling the effects of another wave of Covid that is causing many countries to enter into lockdown.As part of its growth strategy, SUSE intends to continue expanding its geographical presence, including its sales and marketing activities. Part of this growth strategy includes expanding SUSE’s business into China and this may prove incompatible with SUSE’s core business focus in the US and its work with the US government. SUSE may find that it is unable to carry out business in certain parts of the world without hampering its business elsewhere.
SUSE is a well-capitalized business with strong cash flows and relatively low levels of leverage.The Supervisory Board, the Management Board and the Senior Leadership Team spend a significant amount of time preparing a rigorous budget for each financial year, analyzing SUSE’s forecast figures and reviewing SUSE’s strategic planning for the short and medium term.In the event of an economic downturn, SUSE has available to it a full range of cost reducing measures that it would be able to execute at relatively short notice.
SUSE FY2021 Annual report 81

Risk management and principal risks continued
Topic Description Mitigation
7 Innovation and reacting to market trends
Gross/Net ImpactHigh
Gross/Net LikelihoodLikely/Possible
OwnershipEngineering & Innovation
SUSE’s continued success relies on its ability to adapt to rapidly changing technologies and user preferences, to predict user preferences and industry changes, to continue to provide value to our customers, to adapt our offerings to evolving industry standards and to improve the performance and reliability of our offerings.The success of new and enhanced offerings depends on, amongst other things, SUSE’s ability to invest significant resources in research and development to enhance existing offerings and introduce new offerings in a timely manner and successfully promote such offerings and manage the risks associated with those offerings. SUSE’s ongoing success also depends on its continued investment in new business strategies and initiatives that complement its strategic direction and technology road map.
SUSE promotes a culture of innovation to continually improve product offerings. SUSE’s Chief Operating Officer, Chief Customer Officer, President Engineering & Innovation and Chief Technology & Product Officer are all members of the SLT that is chaired by the CEO and they are in regular contact with the Management Board.SUSE’s open source innovation model allows for continuous review and enhancement of open source software solutions.As well as organic growth, SUSE is pursuing inorganic growth to react and pre-empt market trends, as highlighted by its acquisitions of Rancher and NeuVector during FY21.
8 Legacy technology infrastructure
Gross/Net ImpactHigh
Gross/Net LikelihoodPossible/Unlikely
OwnershipCFO Office (IT)
SUSE relies on its technology infrastructure and the technology infrastructure of third parties for many of its internal functions, including selling SUSE’s products, supporting SUSE’s partners, fulfilling orders and billing, collecting and making payments and supporting the open source software SUSE’s customers use under support agreements with SUSE.SUSE’s technology infrastructure may be vulnerable to damage or interruption as a result of vulnerabilities and viruses, software errors, denial of service attacks, terrorist attacks, power loss and telecommunication failures.SUSE is working to improve and upgrade the quality, reliability and security of its legacy technology infrastructure, including its data centers. If any of SUSE’s data centers suffer from an outage, SUSE may not have the ability to build, integrate, develop, deliver and deploy key products like SLES to customers.
SUSE has developed and tested a business continuity plan for critical legacy technology infrastructure.SUSE has established a new, offsite back up service where data has been encrypted and stored.SUSE is also working to upgrade its legacy technology infrastructure and in FY22 will introduce a new backup and data recovery solution.
SUSE FY2021 Annual report82

Topic Description Mitigation
9 Acquisition strategy
Gross/Net ImpactMajor/High
Gross/Net LikelihoodPossible/Unlikely
OwnershipCorporate Development
Part of SUSE’s growth strategy is inorganic growth through planned acquisitions and during FY21 it completed the acquisitions of Rancher and NeuVector. As SUSE looks to continue to grow through targeted acquisitions, SUSE may choose the wrong targets that do not fit with SUSE’s business model and/or wider market trends and do not result in the growth or synergies that it expected.SUSE may also struggle to integrate acquired companies and products into the SUSE business, overpay for targets or inherit unforeseen liabilities from targets.
SUSE has carried out a strategic review with external advisers, the Supervisory Board and the Management Board to assess SUSE’s strengths and weaknesses and market trends.SUSE has a Corporate Development team that has 10 to 15 opportunities under review at any one time. SUSE carries out rigorous due diligence on potential targets, undertaken both internally and by external advisers.The M&A Committee reports to the Management Board and the Supervisory Board on merits of proposed transactions and the transaction terms.SUSE sets up a dedicated integration team to integrate a newly acquired business into SUSE.
10 Competitors
Gross/Net ImpactHigh
Gross/Net LikelihoodLikely/Unlikely
OwnershipCFO Office (Finance)
The enterprise software industry is rapidly evolving and intensely competitive. SUSE’s competitors may respond more quickly to market trends and their products may provide better performance or include additional features. SUSE is the second largest participant in the market but is much smaller than its main competitor. Smaller competitors could merge and create larger and potentially stronger competitors in the markets that we operate in. There are limited technology barriers to entry as open source software may be easily modified and redistributed. Competitive pressures could affect the prices that we are able to charge customers and result in reduced profit margins and/or potential loss of market share.Hyperscalers like Amazon Web Services, Google Cloud Platform and Microsoft Azure already create their own version of related enterprise software industry offerings and could compete head-to-head with SUSE.
As mentioned in the “Innovation and reacting to market trends” section, SUSE monitors customer requirements, market trends and the offerings of other suppliers and continues to update its offerings to respond to customer requirements.SUSE is one of the few independent open source companies that does not require customers to lock in to SUSE’s products.In October 2021, SUSE acquired NeuVector, Inc. to enhance SUSE Rancher, SUSE’s container management platform, bringing end to end security. This acquisition will provide cross selling opportunities to SUSE’s existing customer base.SUSE also provides a level of integration, technical support, software updates, partner and security certifications to customers that they are unable to achieve in-house or from SUSE’s competitors.
SUSE FY2021 Annual report 83

Trusted to Deliver
SUSE FY2021 Annual report84

SUSE FY2021 Annual report 85

Report of the Supervisory Board
Unfortunately, as a result of Covid restrictions, the Supervisory Board, the Audit Committee and the Nomination and Remuneration Committee have yet to meet in person but we hope to do so as soon as this is advisable.
Composition of the Management Board and the Supervisory BoardAs of 31 October 2021, the Management Board had the following two members:
– Melissa Di Donato, the Chief Executive Officer of SUSE.
– Andy Myers, the Chief Financial Officer of SUSE.Each member of the Management Board has been appointed until 30 April 2024.As of 31 October 2021, the Supervisory Board had the following eight members:
– Jonas Persson, Chair of the Supervisory Board. – Henning Kagermann, Vice Chair of the Supervisory Board.
– Adrian T. Dillon, Audit Committee Chair. – Nora M. Denzel, Nomination and Remuneration Committee Chair.
– Dr. Ariane Reinhart, Member of the Supervisory Board.
– Elke Reichart, Member of the Supervisory Board. – Johannes Reichel, Member of the Supervisory Board.
– Matteo Thun-Hohenstein, Member of the Supervisory Board.
Each member of the Supervisory Board was appointed for the period up until the Annual General Meeting that will resolve the formal approval of SUSE’s annual accounts for FY23. This Annual General Meeting must be held at the latest on 30 April 2024.
Dear shareholders,SUSE has had a groundbreaking and successful FY21. On 17 May 2021, SUSE listed on the Regulated Market (Prime Standard) of the Frankfurt Stock Exchange and trading in SUSE’s shares commenced on 19 May 2021. This has laid the foundation for the next phase of growth for SUSE. With the final offer price of €30 per share, SUSE issued 18.3 million shares for net proceeds of €540,765,000 and became the largest enterprise software IPO in Europe of 2021. Our CEO, Melissa Di Donato, is the first woman to be the CEO of a multi-billion euro company listing on the Frankfurt Stock Exchange.The share price has traded in a range of €25.56 to €40.59 and on the last day of trading for FY21, the share price closed at €37.33. As well as continuing to grow organically, SUSE has also expanded through targeted acquisitions. At the start of FY21, SUSE completed the acquisition of the Rancher Group and at the end of FY21 SUSE completed the acquisition of NeuVector. To prepare for SUSE’s IPO, SUSE converted from a SARL to an S.A. and the Supervisory Board and its committees were established for the first time in May 2021. The Supervisory Board then appointed Melissa Di Donato and Andy Myers as CEO and CFO of the Management Board, respectively.The Supervisory Board would like to thank the Management Board and all employees worldwide for their dedication and hard work during such a busy and successful FY21.In the following report, the Supervisory Board would like to inform you about the work that it and its committees have carried out during FY21, beginning with its inaugural meeting on 4 May 2021.
Jonas PerssonChair of the Supervisory Board
A groundbreaking year for SUSE
SUSE FY2021 Annual report86

SUSE is proud to have a diverse Management Board and Supervisory Board, with four female members out of a total of ten members.
Collaboration between the Management Board and the Supervisory BoardDuring FY21, the Supervisory Board exercised its duties as required by law with the utmost care. It supervised the management of SUSE by the Management Board and provided advice to the Management Board on SUSE’s strategic development. During and outside of meetings of the Supervisory Board, the Supervisory Board was in regular contact with the Management Board to discuss SUSE’s strategy, business development and risk management.During the reporting period, there were no conflicts of interest involving the members of the Management Board and the Supervisory Board which are required to be disclosed to the Supervisory Board and of which the Annual General Meeting must be informed.
Supervisory Board setup, meetings and prioritiesFollowing the appointment of the Supervisory Board members on 3 May 2021, the Supervisory Board passed a written resolution on 4 May 2021 to approve, amongst other things:
– The appointment of Jonas Persson as Chair of the Supervisory Board and Henning Kagermann as Vice Chair of the Supervisory Board.
– The Rules of Procedure for the Supervisory Board. – The creation of the Audit Committee and the Nomination and Remuneration Committee, the appointment of the members to those Committees and the approval of the Rules of Procedure to govern those Committees.
– The IPO and the listing of SUSE on the Frankfurt Stock Exchange.
The Supervisory Board met a total of five times in the period from May 2021 to 31 October 2021 and the Management Board attended all five of the Supervisory Board meetings.
At every meeting of the Supervisory Board there are a number of standing agenda items that are discussed. The Management Board is in attendance and there are updates from the CEO on operational and strategic performance, key stakeholders and the health, safety and well-being of employees, the CFO on financial performance and the Chief Legal Officer on legal, compliance and company secretarial matters. At its meeting on 19 May 2021, the Supervisory Board performed a deep dive of the IPO, in particular on pricing, the identity of SUSE’s top 20 shareholders and key investor feedback during the IPO roadshow.At its meeting on 28 June 2021, the Supervisory Board discussed the H1 2021 results, the proposed acquisition of NeuVector, Inc. and the reports from the Audit Committee and the Nomination and Remuneration Committee.On 3 September 2021, the Supervisory Board held a meeting at short notice and outside of SUSE’s normal board cycle. At this meeting, the Supervisory Board examined SUSE’s marketing and brand awareness activities and approved the proposed acquisition of NeuVector. The Supervisory Board provided its final approval to the acquisition of NeuVector through a written resolution on 26 October 2021.At the meeting on 8 September 2021, the Supervisory Board reviewed the draft Q3 2021 results as well as the content and format of the Q3 2021 results presentation.Over the course of two days on 17 and 18 October 2021, the Supervisory Board conducted a strategic review of the SUSE business, the budget for FY22 and received reports from the Chairs of the Audit Committee and the Nomination and Remuneration Committee, respectively. Following a period of reflection, the Supervisory Board approved the budget for FY22 through a written resolution.All members of the Supervisory Board attended all of the Supervisory Board’s meetings in person or via video conference, with the exception of Elke Reichart who sent her apologies for the Supervisory Board meeting on 3 September 2021 and provided her comments in advance on the topics that were discussed by the Supervisory Board.
SUSE FY2021 Annual report 87

Report of the Supervisory Board continued
– An update on whistleblowing incidents was provided and it was noted that the Whistleblowing Policy was being refreshed and an independent reporting hotline would be established.
– Risk management would be a regular standing agenda item for Audit Committee meetings with deep dives on particular risks, e.g. cybersecurity.
At the meeting on 18 October 2021, the Audit Committee covered the following items:
– A presentation by KPMG on its plan and strategy for its audit of SUSE’s financial statements for FY21.
– The audit fee proposal for FY21. – An update on the risk register and a presentation from Sebastian Drews (Head of IT) on cybersecurity and the steps that had been taken to increase SUSE’s cyber security defenses.
– An update on the intention to hire a “Big Four” Audit Manager to oversee the internal audit function and the delivery of the internal audit plan.
The three members of the Audit Committee attended both meetings of the Audit Committee. Representatives from KPMG, SUSE’s statutory auditor, attended both meetings of the Audit Committee.
CommitteesTo enable it to perform its tasks efficiently, the Supervisory Board has formed the Audit Committee and the Nomination and Remuneration Committee.
Audit CommitteeThe Audit Committee met on two occasions between May 2021 and 31 October 2021. During a financial year, the Audit Committee will meet at least three times per year, however, given SUSE’s listing in May 2021 and its financial year ending on 31 October 2021, it was agreed that only two meetings were required in FY21.At the meeting on 27 June 2021, the Audit Committee covered, among other things, the following items:
– Since it was the Audit Committee’s first meeting, an overview of the Audit Committee Rules of Procedure, including the main tasks of the Audit Committee.
– The draft consolidated interim results for the six months to 30 April 2021. These were discussed in detail with the CFO highlighting points of note.
– Although it was not a regulatory requirement, it was noted that the draft consolidated interim results were also being reviewed by KPMG and the key findings were discussed.
The table below shows which members of the Supervisory Board attended the various meetings of the Supervisory Board, the Audit Committee and the Nomination and Remuneration Committee.
Supervisory Board
Audit Committee
Nomination and Remuneration Committee
Jonas Persson 5(5) n/a 1(1)
Henning Kagermann 5(5) n/a n/a
Adrian T. Dillon 5(5) 2(2) n/a
Nora M. Denzel 5(5) n/a 1(1)
Dr. Ariane Reinhart 5(5) n/a n/a
Elke Reichart 4(5) 2(2) n/a
Johannes Reichel 5(5) n/a 0(1)
Matteo Thun-Hohenstein 5(5) 2(2) n/a
As allowed under SUSE’s Articles of Association and in compliance with Luxembourg law, the Supervisory Board also used written resolutions to approve certain matters when it was not possible for the Supervisory Board to meet in person or virtually.
SUSE FY2021 Annual report88

Nomination and Remuneration CommitteeThe Nomination and Remuneration Committee met once between May 2021 and 31 October 2021. During a financial year, the Nomination and Remuneration Committee is only required to meet once a year, however, the Nomination and Remuneration Committee expects it will meet more regularly than this. Given SUSE’s listing in May 2021 and its financial year ending on 31 October 2021, it was agreed that only one meeting was required in FY21. At the meeting on 18 October 2021, the Nomination and Remuneration Committee covered the following items:
– Since it was the Nomination and Remuneration Committee’s first meeting, an overview of the Nomination and Remuneration Committee Rules of Procedure, including the main tasks of the Nomination and Remuneration Committee.
– Succession planning for the Management Board, the Senior Leadership Team and new hires to the Senior Leadership Team.
– The remuneration system that had been drafted by Freshfields Bruckhaus Deringer LLP, Bonn & Schmitt and PwC to be compliant with Luxembourg law and the guiding principles of the German Corporate Governance Code.
– LTIP and bonus structure for future financial years.
Nora Denzel and Jonas Persson attended the meeting of the Nomination and Remuneration Committee on 18 October 2021 with Johannes Reichel sending his apologies. Representatives from Freshfields Bruckhaus Deringer LLP, Bonn & Schmitt and PwC also attended the meeting on 18 October 2021, as did the CEO and the CFO until their remuneration was discussed.
Audit of the annual and consolidated financial statementsSUSE’s annual and consolidated financial statements were given an unqualified audit opinion by KPMG Luxembourg. SUSE’s financial statements were submitted to the Supervisory Board well in advance of the meeting to approve the financial statements on 18 January 2022, giving the Supervisory Board time to review the statements ahead of the meeting. KPMG explained their audit report in detail on SUSE’s FY21 financial statements to the Audit Committee and the key findings were highlighted.
Following its own examination, and an update from the Audit Committee to the Supervisory Board following the explanation provided by KPMG to the Audit Committee of its audit report, the Supervisory Board concluded that no objections needed to be raised and concurred with the auditor’s audit findings. Accordingly, at its meeting on 18 January 2022, the Supervisory Board adopted SUSE’s annual financial statements and approved the consolidated financial statements along with the combined management report.
Corporate governanceThe Supervisory Board considers good corporate governance to be of utmost importance, an essential part of SUSE’s culture and crucial to SUSE’s long-term success. SUSE S.A. is a public limited liability company (société anonyme) incorporated in Luxembourg and is subject to Luxembourg law, in particular the Luxembourg law of 10 August 1915 on commercial companies as amended. As a Luxembourg public limited liability company, the shares of which are traded on the Frankfurt Stock Exchange, SUSE is neither required to adhere to the Luxembourg corporate governance regime that is applicable to companies that are traded on the Luxembourg Stock Exchange nor to the German corporate governance regime that is applicable to companies that are incorporated in Germany.German Stock Exchange rules (which are applicable to SUSE) require that certain recommendations of the German Corporate Governance Code that deal with the Audit Committee of the Supervisory Board need to be complied with in order for SUSE to be included in any of the DAX indices (DAX, MDAX, SDAX, TecDAX).These recommendations are C.10, D.3, D.9, D.10 and D.11 in the German Corporate Governance Code and are followed in full by SUSE.On behalf of the Supervisory Board
Jonas PerssonChair of the Supervisory Board
SUSE FY2021 Annual report 89

Corporate governance statement
Corporate governance overview Since its listing, SUSE has continued to review and enhance such processes and procedures on an ongoing basis and to embed such processes and procedures into the organization.
Corporate governance structureSUSE has a two-tier management structure in the form of the Management Board and the Supervisory Board. The two Boards have different responsibilities and different members although the Supervisory Board and the Management Board have joint responsibility for SUSE’s governance and risk management.The Management Board is responsible for managing SUSE and the Supervisory Board supervises the Management Board, without being authorized to interfere with the operation of the Management Board. A member of the Management Board cannot be a member of the Supervisory Board, and vice versa.Together, the Supervisory Board and the Management Board are responsible for ensuring that SUSE has an effective organizational structure in place with clear reporting lines. The Supervisory Board has established the Audit Committee and the Nomination and Remuneration Committee that report directly to the Supervisory Board. The members and the duties of the Audit Committee and the Nomination and Remuneration Committee are set out on page 96.
Corporate governance is the system for managing and supervising a company. SUSE considers good corporate governance to be of utmost importance, an essential part of SUSE’s culture and crucial to SUSE’s long-term success. Transparent and effective corporate governance encourages the confidence of SUSE’s investors, the financial markets, SUSE’s customers and other business partners, SUSE’s employees and the public. In preparation for SUSE’s listing on the Frankfurt Stock Exchange in May 2021, SUSE carried out a review of its governance processes and procedures and updated them where necessary to ensure it was ready for its IPO and that those processes and procedures met the standards required of a company listing on the Frankfurt Stock Exchange.
Corporate governance structure
Covid-19 Committee
Audit Committee
Nomination and Remuneration Committee
Senior Leadership TeamReports to the Management Board
Management BoardOverall responsibility for ensuring SUSE’s activities comply with applicable legislation, regulatory requirements and internal policies
Supervisory BoardSupervises and monitors the effectiveness of the risk management system and provides advice to the Management Board on risks facing the business and measures to mitigateAppoints the Management BoardAdvises the Management BoardSupervises the Management Board IT and Cyber
Committee
Disclosure Committee
Large Deal and Pricing Committee
Health & Safety Committee
M&A Committee
Risk and Compliance Committee
All Committees are Chaired by a member of the Management Board or the Senior Leadership Team
Delegates day to day operations to the Senior Leadership Team
SUSE FY2021 Annual report90

The Management Board has established seven committees: the Covid-19 Committee, the Disclosure Committee, the Health & Safety Committee, the IT and Cyber Committee, the Large Deal and Pricing Committee, the M&A Committee and the Risk and Compliance Committee. These committees are all chaired by a member of the Management Board or a member of the Senior Leadership Team (SLT). The purpose of each committee is set out on page 92.The SLT is led by the CEO of the Management Board. The Management Board delegates responsibility for certain areas of the business to the SLT. The SLT is a multi-functional team which consists of the Chief Revenue Officer, Chief Customer Officer, Chief Operating Officer, the Chief Customer Officer, the President of Engineering & Innovation, the Chief Human Resources and Transformation Officer, the Chief Technology & Product Officer, the Chief Legal Officer & Company Secretary, the Chief Communications Officer and the Chief Marketing Officer.
Corporate Governance CodesSUSE S.A. is a public limited liability company (société anonyme) incorporated in Luxembourg and is subject to Luxembourg law, in particular the Luxembourg law of 10 August 1915 on commercial companies as amended. As a Luxembourg public limited liability company, the shares of which are traded on the Frankfurt Stock Exchange, SUSE is neither required to adhere to the Luxembourg corporate governance regime that is applicable to companies that are traded on the Luxembourg Stock Exchange nor to the German corporate governance regime that is applicable to companies that are incorporated in Germany.German Stock Exchange rules (which are applicable to SUSE) require that certain recommendations of the German Corporate Governance Code that deal with the Audit Committee of the Supervisory Board need to be complied with in order for SUSE to be included in any of the DAX indices (DAX, MDAX, SDAX, TecDAX).These recommendations are C.10, D.3, D.9, D.10 and D.11 in the German Corporate Governance Code and are followed in full by SUSE.
Direction and leadership by the Management Board
– Responsible for managing SUSE. – Delegates responsibility to adequately qualified personnel in the SLT.
– Ensures compliance through the establishment of seven committees.
The Management Board is responsible for managing SUSE’s operations. The Management Board’s actions and decisions are focused on acting in the best interests of SUSE with the goal of sustainably increasing SUSE’s value. The members of the Management Board are jointly accountable for managing SUSE. In conjunction with the Supervisory Board, the Management Board determines the business and strategic aims of SUSE and ensures their implementation. The Management Board is also responsible for creating an effective organizational structure, delegating responsibility to adequately qualified personnel in the SLT, managing and monitoring the SUSE business by planning and executing the corporate budget (subject to approval from the Supervisory Board), allocating resources and management capacities, monitoring and making decisions on significant individual measures, implementing an efficient reporting system and supervising operational management.The Management Board must ensure that SUSE’s activities comply with applicable legislation, regulatory requirements and internal policies. This includes the establishment of the appropriate systems for internal control, compliance and risk management as well as establishing a compliance culture across the Group. The Risk management and principal risks section on page 75 describes the main features of the internal control system and the risk management system.The Management Board has launched a Code of Business Ethics (“COBE”) which provides the primary ethical and legal framework within which SUSE conducts its business. The COBE is communicated to employees globally and contains a fundamental set of rules that define how SUSE conducts its business. One of the ways that the Management Board ensures compliance with applicable legislation and regulatory requirements is through the establishment of committees. As mentioned above, the Management Board has established a total of seven committees: the Covid-19 Committee, the Disclosure Committee, the Health & Safety Committee, the IT and Cyber Committee, the Large Deal and Pricing Committee, the M&A Committee and the Risk and Compliance Committee.
SUSE FY2021 Annual report 91

Corporate governance statement continued
As part of SUSE’s ongoing assessment of its corporate governance processes and procedures, the Management Board may decide to create additional committees. The Management Board has refreshed its Whistleblowing Policy, explaining how employees can raise concerns about potential unethical conduct or illegal activity, and has communicated this to employees through a global communication. The Management Board has also introduced an independent Reporting Hotline and this is to be used by employees where they have concerns that they do not feel comfortable notifying internally. The Management Board is strictly separate from the Supervisory Board, which supervises the Management Board on management issues, and a member of the Management Board cannot be a member of the Supervisory Board, and vice versa. The Management Board meets as often as the business and interests of SUSE require and, as a minimum, every three months. Decisions of the Management Board are made by the majority of the votes of the members present or represented. In the case of a tie, the Chair shall have the casting vote. Certain transactions of fundamental importance and other Management Board decisions which would have a major impact on the business operations and on the financial position of SUSE are subject to the Supervisory Board’s approval. These matters are explained in more detail in the “Supervision of the Management Board by the Supervisory Board” section below. As of 31 October 2021, the Management Board comprised two members. The two current members of the Management Board have been appointed for a three-year term of office and their current term of appointment ends on 30 April 2024. The Supervisory Board is responsible for appointing the members of the Management Board and deciding their remuneration and the terms of their office (which may not exceed six years). Members of the Management Board may be re-appointed for successive terms. A member of the Management Board may be removed with or without cause and/or replaced, at any time, by a resolution adopted by the Supervisory Board.
These committees are all chaired by a member of the Management Board or a member of the SLT.
Committee Purpose
Covid-19 Committee
Assesses the impact of the Covid-19 pandemic on the well-being of SUSE’s employees and the operation of SUSE’s business.Manages SUSE’s response to the Covid-19 pandemic
Disclosure Committee
Monitors any inside information that SUSE has and assesses whether SUSE has any disclosure obligations
Health & Safety Committee
Assesses and monitors SUSE’s current Health and Safety operations and implements any necessary changes
IT and Cyber Committee
Assesses the strength of SUSE’s IT system and cyber security defenses.Implements any upgrades which are required to SUSE’s IT systems and cybersecurity defenses.
Large Deal and Pricing Committee
Reviews contracts with customers with unusual terms or where the value is in excess of $250,000.
M&A Committee
Identifies M&A targets and executes transactions. Reports to the Management Board and the Supervisory Board to provide transaction updates.
Risk and Compliance Committee
Identifies and assesses all risks facing SUSE and the measures in place to mitigate such risks.Reports in detail on top 10 risks facing SUSE to the Management Board.
SUSE FY2021 Annual report92

Supervision of the Management Board by the Supervisory Board
– Appoints members of the Management Board. – Supervises the Management Board on management issues.
– Established two Supervisory Board Committees – Audit Committee and Nomination and Remuneration Committee.
The Supervisory Board appoints the members of the Management Board and supervises the Management Board on management issues. It reviews the decisions of the Management Board with respect to their compliance with laws and their commercial suitability but does not manage SUSE. As of 31 October 2021, the Supervisory Board comprised eight members with Jonas Persson as chair. The Supervisory Board members were first appointed on 3 May 2021, ahead of the IPO, and were provided with an induction to prepare them to be directors of a listed company. The members of the Supervisory Board are appointed at a meeting of SUSE’s shareholders (normally the Annual General Meeting) by way of simple majority vote of the shares present or represented. The General Meeting determines the number, the duration of the mandate and the remuneration of the members of the Supervisory Board. The members of the Supervisory Board shall be elected for a term not exceeding six years and shall be eligible for reappointment. They may be removed with or without cause and/or replaced, at any time, by the General Meeting by a simple majority vote of the shares present and represented.The Management Board provides the Supervisory Board with a written report of the Management Board on the progress and development of SUSE’s business at least every three months. This report includes updates from the CEO on operational and strategic performance, key stakeholders and the health, safety and well-being of employees, from the CFO on financial performance and from the Chief Legal Officer on legal, compliance and company secretarial matters. Discussion of this report is a standing agenda item at each meeting of the Supervisory Board.
The Management Board must promptly pass to the Supervisory Board any information on events which are likely to have a significant effect on SUSE’s business. The chair of the Supervisory Board is in regular contact with the Management Board to discuss SUSE’s strategy, business development and risk management. Certain transactions of fundamental importance and other Management Board decisions with a major impact on the business operations and on the financial position of SUSE require the authorization of the Supervisory Board. The full list of reserved matters is set out on SUSE’s website and these matters include approval of the annual budget and annual business planning of SUSE, significant M&A transactions and the auditing and approval of SUSE’s annual financial statements.Through the Supervisory Board Committees, the Supervisory Board monitors the accounting process, the internal audit system and remuneration of employees. The tasks of the Supervisory Board also include reviewing and approving SUSE’s annual financial statements, SUSE’s management report and consolidated financial statements.The Supervisory Board meets as often as the business and interests of SUSE require but will meet at least four times per year. The chair of the Supervisory Board can convene additional meetings if necessary. The meetings of the Supervisory Board and its committees are called by their respective chairs. The Supervisory Board validly deliberates and makes decisions only if at least half of its members are present or represented. Resolutions of the Supervisory Board are passed by a simple majority vote of the participating members present or represented. In the case of a tie, the Chair shall have the casting vote. The Report of the Supervisory Board provides additional information about the meetings of the Supervisory Board held during FY21.
SUSE FY2021 Annual report 93

Jonas PerssonChair of the Supervisory BoardAppointed: 2021 Term expires: At the AGM approving SUSE’s annual accounts as at 31 October 2023 (held at the latest on 30 April 2024)
Current membership of Supervisory Boards (or equivalent): Chairman of the Board at Acumatica; Chairman of the Board at IFS; Chairman of the Board at Peltarion; Chairman of the Board at Sitecore; Member of the Board at Skandia; Chairman at Myrtel Management
Adrian T. DillonMember of the Supervisory BoardAudit Committee ChairIndependent DirectorAppointed: 2021 Term expires: At the AGM approving SUSE’s annual
accounts as at 31 October 2023 (held at the latest on 30 April 2024)Current membership of Supervisory Boards (or equivalent): Member of the Board and Chair of the Audit Committee at Datto, Inc; Member of the Board, Chair of the Audit & Risk Committee and a member of the Cybersecurity Committee at HealthEquity, Inc
Johannes ReichelMember of the Supervisory BoardAppointed: 2021 Term expires: At the AGM approving SUSE’s annual accounts as at 31 October 2023 (held at the latest on 30 April 2024)
Current membership of Supervisory Boards (or equivalent): Managing Director at EQT Partners GmbH; Member of the Supervisory Board at Ottobock SE & Co, KGaA; Member of the Supervisory Board at IFS AB; Member of the Supervisory Board at Workwave Holdings, Inc.; Managing Director at RFO GmbH & Co. KG; Managing Director at RFO II GmbH & Co. KG.
Elke ReichartMember of the Supervisory BoardIndependent DirectorAppointed: 2021 Term expires: At the AGM approving SUSE’s annual accounts as at 31 October 2023 (held at the latest on 30 April 2024)
Current membership of Supervisory Boards (or equivalent): Member of the Supervisory Board at Bechtle AG; Independent Non-Executive Director at esure Group plc
Supervisory Board
Corporate governance statement continued
Melissa Di DonatoChief Executive Officer Appointed: 2021 Term expires: 30 April 2024 Joined SUSE: 2019Degree: Bachelor’s degree in Russian language and literature and political science
from Manhattanville College, a master’s degree in Russian from American University and an MBA in International Business from American UniversityResponsibilities: Corporate development, strategy, HR, engineering and innovation, product, sales, marketing,
customers, transformation, investor relations, M&A and board and shareholder relationships. Current membership of Supervisory Boards (or equivalent): Independent Non-Executive Director at JPM Europe,
Management Board
SUSE FY2021 Annual report94

Dr Ariane ReinhartMember of the Supervisory BoardIndependent DirectorAppointed: 2021 Term expires: At the AGM approving SUSE’s annual accounts as at 31 October 2023 (held at the latest on 30 April 2024)
Current membership of Supervisory Boards (or equivalent): Member of the Executive Board at Continental AG, Group Human Relations and Director of Labor Relations and Sustainability; Member of the Supervisory Board at Vonovia SE
Nora M. DenzelMember of the Supervisory BoardNomination and Remuneration Committee ChairIndependent DirectorAppointed: 2021 Term expires: At the AGM approving SUSE’s annual
accounts as at 31 October 2023 (held at the latest on 30 April 2024)Current membership of Supervisory Boards (or equivalent): Chair of the Compensation Committee and member of the Technology and Nominating Committee at Advanced
Henning KagermannVice chair of the Supervisory BoardIndependent DirectorAppointed: 2021 Term expires: At the AGM approving SUSE’s annual accounts as at 31 October 2023 (held at the latest on 30 April 2024)
Current membership of Supervisory Boards (or equivalent): Member of the Supervisory Board and Chairman of its Strategy and Technology Committee at KUKA AG; Member of the Supervisory Board at Mambu; Chairman of the Board of Trustees (Kuratorium) at acetech (German Academy of Science and Engineering)
Matteo Thun-HohensteinMember of the Supervisory BoardAppointed: 2021 Term expires: At the AGM approving SUSE’s annual accounts as at 31 October 2023 (held at the latest on 30 April 2024)
Micro Devices; Member of the Technology and Science Committee at LME Ericsson; Member of the Compensation Committee, Technology and Cyber Committee and Audit Committee at NortonLifelock
Current membership of Supervisory Boards (or equivalent): Does not currently hold any Supervisory Board (or equivalent) memberships but is the Managing Director at EQT Partners AG
Andy MyersChief Financial Officer Appointed: 2021 Term expires: 30 April 2024Joined SUSE: 2020
Degree: Bachelor of engineering in production engineering and production management from the University of NottinghamQualification: ICAEW Chartered AccountantResponsibilities: Accounting, tax, audit, finance, treasury, risk management and
compliance, legal, investor relations, procurement and ITCurrent membership of Supervisory Boards (or equivalent): Non-Executive Director, Audit Chair and a member of the Remuneration Committee at Berkeley Group Holdings plc
SUSE FY2021 Annual report 95

To enable it to carry out its supervision activities effectively, the Supervisory Board has established two Supervisory Board Committees: the Audit Committee and the Nomination and Remuneration Committee. As part of SUSE’s ongoing assessment of its corporate governance processes and procedures, the Supervisory Board may decide to create additional committees.
Audit Committee
Members – Adrian T. Dillon (Chair), Elke Reichart and Matteo Thun-Hohenstein.
– Adrian T. Dillon and Elke Reichart are considered to be independent.
Duties – Informs the Supervisory Board of the outcome of SUSE’s statutory audit and explains how the statutory audit contributed to the integrity of financial reporting and what the role of the Audit Committee was in that process.
– Monitors the financial reporting drawing-up process and submits recommendations or proposals to ensure its integrity.
– Monitors the statutory audit of SUSE’s annual and consolidated financial statements.
– Reviews SUSE’s accounting and assesses and monitors the accounting process, effectiveness of the internal control system, the risk management system, the internal audit system and compliance.
– Recommends the statutory auditor and reviews and monitors the auditor’s independence, in particular the appropriateness of the provision of non-audit services to the Group.
The Audit Committee intends to meet three times during SUSE’s financial year.
ExpertiseAdrian T. Dillon has specific knowledge and experience in applying accounting principles and internal control procedures and is familiar with annual audits.Please see the description in the report of the Supervisory Board for information on the meetings of the Audit Committee during FY21.
Nomination and Remuneration Committee
Members – Nora T. Denzel (Chair), Jonas Persson and Johannes Reichel.
Duties – Identifies and recommends candidates suitable to be members of the Supervisory Board.
– Evaluates the independence of the independent members of the Supervisory Board.
– Reviews the structure, number of members and composition of the Supervisory Board and the Management Board.
– Provides advice to the Supervisory Board on the general remuneration policy and the identity of the members of the Supervisory Board, Management Board and SLT.
– Assists the Supervisory Board in its review and design of the diversity policy.
The Nomination and Remuneration Committee intends to meet at least once during SUSE’s financial year.Please see the description in the report of the Supervisory Board for information on the meetings of the Nomination and Remuneration Committee during FY21.
Competence profile, diversity concept and objectives for the composition of the Management BoardThe Supervisory Board works with the Management Board to ensure long-term succession planning for the Management Board. As mentioned in the report of the Supervisory Board, the Nomination and Remuneration Committee has focused on succession planning for the Management Board and the Senior Leadership Team.
DiversityIn addition to the professional skills and experience of the members of the Management Board, the Supervisory Board is of the opinion that diversity plays an important role in the successful performance and development of SUSE and that this should be reflected in the composition of the Management Board. In line with its focus on diversity, the Supervisory Board is therefore seeking to ensure that the Management Board consists of members who complement each other in terms of their personal and professional background, their experience and specialist knowledge. This will enable the Management Board, in its entirety, to call on as wide a range of experiences, knowledge and abilities as possible.
Supervisory Board Committees
Corporate governance statement continued
SUSE FY2021 Annual report96

Competence profile, diversity concept and objectives for the composition of the Supervisory BoardOn its formation in May 2021, the competence profile, diversity concept and objectives for the composition of the Supervisory Board were considered, with reference to the German Corporate Governance Code, and these objectives will continue to be reviewed on a regular basis. The Supervisory Board is composed of members who have strong backgrounds in finance, technology, HR, transformation and strategy for international companies, both public and private. The guiding principle for the Supervisory Board is to ensure qualified supervision and guidance for the Management Board. Any individuals who are nominated for election or re-election to the Supervisory Board should be individuals who can, based on their professional expertise and experience, integrity, commitment, specialist knowledge and character, successfully perform the work of a supervisory board member at a listed software company with international operations.
DiversityIn addition to the professional skills and experience of the members of the Supervisory Board, the Supervisory Board is of the opinion that diversity plays an important role in the successful performance and development of SUSE and that this should be reflected in the composition of the Supervisory Board. In line with its focus on diversity, the Supervisory Board is therefore seeking to ensure that the Supervisory Board consists of members who complement each other in terms of their personal and professional background, their experience and specialist knowledge. This will enable the Supervisory Board, in its entirety, to call on as wide a range of experiences, knowledge and abilities as possible. SUSE does not have a formal policy in place in respect of diversity for the members of the Supervisory Board and the Nomination and Remuneration Committee intends to adopt a formal policy during the course of 2022. Despite the absence of a formal policy, diversity within the Supervisory Board is reflected in the members’ individual educational and professional careers and the broad spectrum of experience that each possesses. For example, the members of the Supervisory Board have a broad range of ages and nationalities.Half of the independent members of the Supervisory Board are female and three out of eight members of the Supervisory Board are female.
SUSE does not have a formal policy in place in respect of diversity for the members of the Management Board and the Nomination and Remuneration Committee intends to adopt a formal policy during the course of 2022. Despite the absence of a formal policy, diversity within the Management Board is reflected in the members’ individual educational and professional careers and the broad spectrum of experience that each possesses. 50% of the Management Board is female and, as set out on page 62, SUSE’s goal is to have at least 30% women in leadership by 2026.
Skills and expertiseEach Management Board member must be able to perform the tasks required of a Management Board member in a listed software company with international operations. Furthermore the members of the Management Board must possess in-depth knowledge of SUSE’s business and the market environment and are usually expected to have several years of management experience. In view of SUSE’s business model, at least one member of the Management Board should have knowledge of the following areas:
– Strategy and strategic management. – Technology and SaaS companies, including the relevant markets and customer needs.
– Operations and technology, including IT and digitalization.
– Human resource management and development.
– Finance, including financing, accounting, controlling, risk management and internal control procedures.
– Corporate governance and compliance.Given the international focus of SUSE’s activities, at least some members of the Management Board should possess noteworthy international experience. The number of members of the Management Board is determined by the Supervisory Board. The Supervisory Board considers two to be an appropriate number of Management Board members given the current position of the SUSE business and its future strategy. The current composition of the Management Board meets the competence profile, the diversity concept and objectives for the composition of the Management Board, with each member of the Management Board being chosen following an extensive and thorough recruitment process.
SUSE FY2021 Annual report 97

Skills and expertiseIn view of SUSE’s business model, the Supervisory Board members must, taken as a whole, have all of the skills and expertise required to perform its task effectively. Therefore, at least one member of the Supervisory Board should have knowledge of the following areas:
– Strategy and strategic management. – Management of a company with international operations, in particular in software, SaaS or technology.
– Supervisory positions in Germany and/or abroad; – Corporate development of a company with an international footprint.
– Finance, including financing, accounting, controlling, risk management and internal control procedures.
– Corporate governance and compliance.The current composition of the Supervisory Board meets the competence profile, the diversity concept and objectives for the composition of the Supervisory Board, with each member of the Supervisory Board being chosen following an extensive and thorough recruitment process.
IndependenceThe Supervisory Board believes that the Supervisory Board should include at least two members who are independent. The Supervisory Board considers that all of its members, except for Johannes Reichel and Matteo Thun-Hohenstein, are independent in accordance with the criteria for independence set out in the German Corporate Governance Code.
Conflicts of interestThe members of the Management Board and the Supervisory Board must act in the best interests of SUSE. In all their decisions, they must neither pursue personal interests nor exploit for themselves business opportunities which are offered to SUSE or one of its subsidiaries for themselves or third parties.Each member of the Supervisory Board must inform the Chair of the Supervisory Board of any conflicts of interest without undue delay. Material conflicts of interest involving a member of the Supervisory Board that are not merely temporary shall result in the termination of that member’s Supervisory Board mandate. Each member of the Management Board must disclose conflicts of interest to the Chair of the Supervisory Board and to the rest of the Management Board without undue delay. During the reporting period, there were no conflicts of
interest involving members of the Management Board and the Supervisory Board that are required to be disclosed to the Supervisory Board and of which the AGM must be informed.
Board evaluation and effectiveness As SUSE listed in May 2021, the Supervisory Board has not yet completed its review of how effective the Supervisory Board and its committees fulfill their tasks. The Supervisory Board intends to undertake this review during 2022.
Relationship with majority shareholderAs of 31 October 2021, Marcel LUX III SARL, on behalf of EQT VIII fund, held 76.49% of the shares in SUSE and 23.51% of the shares in SUSE were publicly traded.Johannes Reichel and Matteo Thun-Hohenstein are both members of the Supervisory Board and are Managing Directors at EQT Partners, which are entities advising the EQT funds. They do not receive additional payment for their services as members of the Supervisory Board.Under article 7 quater of the Luxembourg Law of 24 May 2011 as amended, any material transaction between SUSE and a related party shall be subject to the approval of the Management Board. SUSE shall publicly announce any material transactions with related parties at the latest by the time of conclusion of the transaction.
General MeetingsGeneral meetings of shareholders (“General Meeting(s)”) shall be convened under the conditions, in the form and within the time limits provided for by the Law of 10 August 1915 and the Law of 24 May 2011 on the exercise of certain rights of shareholders in General Meetings of listed companies and transposing Directive 2007/36/EC of the European Parliament and of the Council of July 11, 2007 on the exercise of certain rights of shareholders of listed companies (the Shareholders Rights Law). General Meetings are conducted in English at SUSE’s registered office in the Grand Duchy of Luxembourg or at any other location in the Grand Duchy of Luxembourg as specified in the convening notice.SUSE shall ensure equal treatment for all shareholders who are in the same position with regard to participation in, and the exercise of voting rights at, the General Meeting. Any duly constituted General Meeting shall represent all SUSE’s shareholders. It shall have the widest powers to order, implement or ratify all acts connected with SUSE’s operations that are not conferred on the Management Board or the Supervisory Board.
Corporate governance statement continued
SUSE FY2021 Annual report98

General Meetings (other than the AGM of the shareholders) may be called as often as the interests of the Company require. The Management Board or the Supervisory Board are obliged to call a General Meeting if a group of shareholders representing at least 10% of SUSE’s share capital requests the convening of a General Meeting in writing, indicating the agenda of the proposed meeting. The AGM shall be held within six months of the end of SUSE’s financial year. Following the approval of the annual accounts and consolidated accounts, the AGM shall decide by special vote on the discharge of the liability of the members of the Management Board and Supervisory Board.In accordance with the Shareholders Rights Law, the convening notice to a General Meeting is to be published at least 30 days before the day of the General Meeting in the official gazette of Luxembourg (Recueil Electronique des Sociétés et Associations), in a Luxembourg newspaper and in such media as may reasonably be relied upon for the effective dissemination of information to the public throughout the European Union in a manner ensuring fast access to it and on a non-discriminatory basis. If a General Meeting is adjourned for lack of quorum, provided that the convening requirements of the Shareholders Rights Law have been complied with and no new item has been added to the agenda, the 30-day period is reduced to a 17-day period. The convening notice must inter alia contain the time and place of the General Meeting as well as the agenda and the nature of the business to be transacted at the General Meeting. The agenda for an extraordinary General Meeting shall also, where appropriate, describe any proposed changes to the Articles of Association. The convening notice must also set out a clear and precise description of the procedures shareholders must comply with in order to participate and to cast their vote in the General Meeting. The convening notice and the documents required to be submitted to the shareholders in connection with a General Meeting shall be posted on SUSE’s website from the date of the first publication of the convening notice for the General Meeting, as set out above. In accordance with the Shareholders Rights Law, shareholders holding, individually or collectively, at least 5% of the issued share capital of SUSE (a) have the right to put items on the agenda of the General Meeting and (b) have the right to table draft resolutions for items included or to be included on the agenda of the General Meeting. Those rights shall be exercised upon request in
writing by the relevant shareholders submitted to SUSE by postal services or electronic means at the address indicated by SUSE in the convening notice. The requests shall be accompanied by a justification or a draft resolution to be adopted in the General Meeting and shall include the electronic or mailing address at which SUSE can acknowledge receipt of these requests. Any such requests from shareholders shall be received by SUSE at the latest on the twenty-second (22nd) day before the date of the General Meeting. SUSE shall acknowledge receipt of these requests within forty-eight (48) hours from such receipt. Where the requests entail a modification of the agenda for the General Meeting already communicated to the shareholders, SUSE shall make available a revised agenda at the latest on the 15th day before the date of the General Meeting.Under normal circumstances each shareholder is entitled to attend the General Meeting, in person or by proxy, and to exercise voting rights in accordance with SUSE’s Articles of Association. Each SUSE share issued and outstanding represents one vote. The right to participate in the General Meeting and exercise voting rights is determined on the basis of share ownership on the fourteenth (14th) day at midnight (00:00 a.m.) (Luxembourg time) before the date of the General Meeting (the Record Date). All shareholders holding shares on the Record Date have the right to participate in the General Meeting regardless of the number of shares held. Shareholders shall notify the Company of their intention to participate in a General Meeting by a declaration in writing by post or by e-mail to the postal or e-mail address indicated in the convening notice which shall be received on the Record Date at the latest. Further details about attending and voting at the General Meeting will be included in the convening notice that will be available from SUSE’s website once the convening notice has been published.The General Meetings pass resolutions by a simple majority of votes cast unless the Articles of Association or the Law of 10 August 1915 provide for a different majority or different requirements. Abstention and nil votes will not be taken into account.The AGM is empowered to decide on the appropriation of distributable profit, the discharge of the members of the Management Board and the Supervisory Board, the election of Supervisory Board members, amendments to the Articles of Association, the issue of new shares and the authorization to acquire SUSE’s own shares, the approval of the remuneration system, the selection of the independent auditors and the approval of the annual financial statements.
SUSE FY2021 Annual report 99

Overview of shareholder rightsThe following disclosures are made in accordance with article 11 of the Luxembourg law on Takeover Bids of 19 May 2006.
(A) Share Capital StructureSUSE has issued one class of ordinary shares which is admitted to trading on the Frankfurt Stock Exchange. No other securities have been issued. The issued share capital as at 31 October 2021 amounts to $16,902,711.70 represented by 169,027,117 ordinary shares without any nominal value, all subscribed and fully paid up.SUSE shares are in dematerialized form.
(B) Transfer RestrictionsSubject to the below, at the date of this report, all SUSE shares are freely transferable but shall be subject to the provisions of German insider dealing and market manipulation laws and regulation, which prevent anyone who has material non-public information about a company from dealing in its shares and from manipulating the market. Notwithstanding the above, SUSE has a Share Dealing Code in place that contains restrictions on dealings by employees of SUSE and its subsidiaries. All awards to Management Board members under the LTI are subject to a holding period such that the total period from the grant to the release of shares is four years.
(C) Major Shareholding The shareholding structure of SUSE as at 31 October 2021 is as follows: Marcel LUX III SARL, on behalf of EQT VIII fund, held 76.49% of the shares in SUSE and 23.51% of the shares in SUSE were publicly traded.
(D) Special Control RightsAll the issued and outstanding shares of SUSE S.A. have equal voting rights with no special control rights attached.
(E) Control System in Employee Share SchemeSUSE’s Management Board is not aware of any issue regarding section e) of article 11 of the Luxembourg Law on Takeover Bids of 19 May 2006.
(F) Restrictions on Voting RightsEach SUSE share issued and outstanding represents one vote. The Articles of Association do not provide for any voting restrictions.
(G) Shareholders’ Agreement with Transfer RestrictionsAt the date of this report, the Supervisory Board and the Management Board have no information about any agreements that may result in restrictions on the transfer of securities of voting rights.
(H) Appointment of Board Members, Amendments to the Articles of AssociationThe appointment and replacement of members of the Supervisory Board and the Management Board and the amendments to the Articles of Association are governed by Luxembourg Law and the Articles of Association. The members of the Supervisory Board are appointed at a meeting of SUSE’s shareholders (normally the Annual General Meeting) by way of simple majority vote of the shares present or represented. The General Meeting determines the number, the duration of the mandate and the remuneration of the members of the Supervisory Board. Provided that SUSE has more than one shareholder, the Supervisory Board shall be composed of at least three members. The members of the Supervisory Board shall be elected for a term not exceeding six years and shall be eligible for reappointment. They may be removed with or without cause and/or replaced, at any time, by the General Meeting by a simple majority vote of the shares present and represented. In the event of a vacancy in the office of a member of the Supervisory Board, the remaining members of the Supervisory Board may appoint a successor to fill such vacancy until the following General Meeting at which such appointment shall be confirmed by the General Meeting or at which the General Meeting may appoint another member of the Supervisory Board. The Supervisory Board shall appoint a chair from among its members and may also appoint from among its members one or more vice-chair.The Supervisory Board is responsible for appointing the members of the Management Board. It determines the number of members of the Management Board, the duration of the mandate and the remuneration of the members of the Management Board. Provided that the Company has more than one shareholder, the Management Board shall be composed of at least two members. The members of the Management Board are elected for a term not exceeding six years. They are eligible for reappointment. The Management Board members may be removed with or without cause and/or replaced, at any time, by a resolution adopted by the Supervisory Board by a simple majority of the votes of the members present or represented. In the event of a vacancy in the office of members of the Management Board, the remaining members of the Management Board may appoint a successor to fill such vacancy until the following meeting of the Supervisory Board which shall resolve on a
Corporate governance statement continued
SUSE FY2021 Annual report100

permanent appointment. The Management Board may appoint a chair from among its members and may also appoint from among its members one or more vice-chair.The Articles of Association may be amended at a meeting of SUSE’s shareholders in an extraordinary general meeting. In this case, the quorum shall be at least 50% of all the shares issued and outstanding. If the said quorum is not present, a second meeting may be convened at which there shall be no quorum requirement. In order for the proposed resolutions to be adopted, and save as otherwise provided by the law, a two-thirds majority of the votes of the shareholders present or represented is required. Abstention and nil votes will not be taken into account.The Articles of Association are published under the ‘Investors’ Corporate Governance section on SUSE’s website, www.suse.com.
(I) Powers of the Management Board and the Supervisory BoardThe Management Board is vested with the broadest powers to manage the business of SUSE. It may take all acts of administration and of disposal in the interests of SUSE. All powers not expressly reserved by the law or by the Articles of Association to the General Meeting or the Supervisory Board fall within the authority of the Management Board. Certain major decisions require the authorization of the Supervisory Board.SUSE shall be bound against third parties in all circumstances by the joint signature of any two members of the Management Board. The Company shall also be bound against third parties by (i) the sole or joint signature(s) of any person or persons to whom such signatory power shall have been delegated by the Management Board or, (ii) with respect to matters of daily management, by the sole signature of a daily manager.During a period of five years from the day of the General Meeting held on 3 May 2021, the Management Board may from time to time issue shares within the limits of the authorized capital which is currently set at $26,000,000 (the Authorized Share Capital), at such times and on such terms and conditions, including the issue price, as the Management Board resolves and the Management Board is further authorized to arrange for a requisite change in SUSE’s Articles of Association to reflect such capital increase. The Management Board is authorized to suppress or limit any pre-emptive subscription rights for any issue of shares within the Authorized Share Capital.
The Management Board is authorized to attribute existing shares or issue new shares, to the following persons free of charge:
– Employees or a certain category of employees of SUSE.
– Employees of companies in which SUSE holds directly or indirectly at least ten per cent (10%) of capital or voting rights.
– Employees of companies holding directly or indirectly at least ten per cent (10%) of the capital or voting rights of SUSE.
– Employees of companies of which at least fifty per cent (50%) of the capital or voting rights are directly or indirectly held by a company holding directly or indirectly at least fifty per cent (50%) of the capital or voting rights of SUSE.
– Corporate officers of SUSE or of any of the companies mentioned above or certain categories of such corporate officers.
The Management Board is authorized to determine the conditions and modalities of any attribution or issue of shares free of charge (including any required minimum holding period). SUSE may, to the extent and under the terms permitted by law, repurchase its own shares.As at the date of this report, the Management Board does not have the authority to repurchase SUSE shares and no SUSE shares were repurchased during FY21.Interim dividends may be declared by the Management Board subject to observing the conditions laid down in the law.The Supervisory Board and the Management Board have set up several committees that report directly to the Supervisory Board and the Management Board, as appropriate. Their duties and members are set out above and the activities of the Audit Committee and the Nomination and Remuneration Committee for FY21 are included in the Report of the Supervisory Board.
(J) Significant Agreements or Essential Business ContractsThe Supervisory Board and the Management Board are not aware of any significant agreements to which SUSE is party and which take effect, alter or terminate upon a change of control of SUSE following a takeover bid.
(K) Agreements with Directors and EmployeesThere are no agreements between SUSE and the members of the Management Board or employees providing for compensation if they resign or are made redundant without valid reason or if their employment ceases because of a takeover bid.
SUSE FY2021 Annual report 101

Remuneration report
The remuneration report sets out the remuneration of members of the SUSE Management Board and Supervisory Board for the financial year ended 31 October 2021 (FY21), our first financial year as a listed company. As a Luxembourg incorporated company listed on the Frankfurt Stock Exchange, this report complies with statutory reporting requirements in Luxembourg.
Summary of FY21 business performance and remuneration outcomesFY21 was a strong year for the business as we worked towards the IPO. In particular, we delivered strong ACV performance (increasing 26% to $490.6m), adjusted EBITDA of $212.1m (an increase of 20% on FY20) and total ARR of $560.0m. The performance was delivered against a backdrop of uncertainty in light of the ongoing Covid-19 pandemic and is therefore a testament to the hard work of our teams.In light of the group’s strong FY21 performance, annual bonuses for the Management Board were in line with the maximum, equal to $2,032k and $1,053k for the CEO and CFO respectively. The Company’s first grant of awards under the LTI were made on IPO at 100% of the maximum level based on FY20 performance. The awards are a mix of restricted stock units (RSUs) and stock options. RSUs vest in equal tranches one, two and three years after the award date. Stock options vest in
equal tranches two and three years after the award date. All awards to Management Board members under the LTI are subject to a holding period such that the total period from the grant to the release of shares is four years.
Remuneration PolicyAs a newly listed company, a Remuneration Policy has not yet been approved by shareholders. However, the remuneration of the Management and Supervisory Boards has been consistent with the proposed Remuneration Policy since the Company’s IPO, in terms of maximum remuneration levels.In accordance with the Grand Ducal Law of 1 August 2019 in Luxembourg, a Remuneration Policy which governs the remuneration of our Management and Supervisory Boards will be submitted to shareholders for approval at our first Annual General Meeting on 24 March 2022 and will apply from this date. The Remuneration Policy, which is set out on pages 103-113 of this report, is consistent with the disclosures in the IPO Prospectus published in May 2021. This Remuneration Policy represents the “Remuneration System” for the purposes of the German Corporate Governance Code, a copy of which will also be available on the Company’s website. Nora DenzelChair of the Nomination and Remuneration Committee
Nora DenzelChair of the Nomination and Remuneration Committee
SUSE FY2021 Annual report102

SUSE S.A. Management Board Remuneration PolicyThis section sets out the Remuneration Policy that will be put forward for shareholder approval at the AGM on 24 March 2022. This Remuneration Policy represents the “Remuneration System” for the purposes of the German Corporate Governance Code, a copy of which will also be uploaded to the Company’s website.
Principles of the Management Board Remuneration PolicyThe Management Board Remuneration Policy of SUSE described in the following is designed to provide effective incentives for our strategy of organic growth acceleration supported by selective acquisitions. It thus delivers a key contribution to execute and achieve the SUSE growth strategy. The Remuneration Policy appropriately reflects the individual tasks and performance of the members of the Management Board, as well as SUSE’s overall situation and performance. It is based on the following principles:
Business strategy
– Promotes the execution of the SUSE organic and inorganic growth strategy supported by selective acquisitions.
Regulatory requirements
– Meets the requirements of the Luxembourg law of 24 May 2011 on the exercise of certain rights of shareholders at general meetings of listed companies, as amended by the law of 1 August 2019 transposing Directive (EU) 2017/828 of the European Parliament and of the Council of 17 May 2017 amending Directive 2007/36/EC with a view to promoting long-term shareholder engagement (the Law).
– Aims to comply with the guiding principles of the German Corporate Governance Code.
Shareholder interests
– Linked to the overall business strategy.
– Long-Term Incentives align the interests of executives and shareholders through share price development.
Performance and sustainability
– Focuses on the key performance indicators that reflect the business strategy over the short term, as well as the long-term indicators of sustained performance.
– Considers financial and non-financial performance targets which take into account the ESG strategy.
Straightforward and demanding
– The Remuneration Policy has been designed to provide simplicity.
– Clearly structured and easily comprehensible.
– Cascadable to tiers below the Management Board.
– Sets demanding and quantifiable targets.
Management Board remuneration consists of a mix of short-term and long-term remuneration elements to effectively promote the business strategy and the sustainable and long-term development of SUSE. In addition to financial performance targets, non-financial performance targets will be included from 2022 onwards. Those non-financial performance targets will comprise ESG objectives providing an additional incentive for the long-term and sustainable success of SUSE. Furthermore, the long-term variable remuneration is largely based on the growth of SUSE’s share price which ensures that the interests of the Management Board and the shareholders are aligned. An obligation to acquire and hold shares of SUSE also contributes to this alignment.SUSE’s Management Board remuneration complies with the requirements of the Law. When determining compensation for the Management Board, the Supervisory Board takes the respective compensation and employment conditions of senior management and the workforce of SUSE into account. The consistency of the Remuneration Policy for Management Board members, executives and employees is ensured by using the same overarching incentive structure, namely a short-term annual bonus and a long-term share-based incentive.
SUSE FY2021 Annual report 103

Remuneration report continued
Procedure of determining, implementing and reviewing the Remuneration PolicyThe Supervisory Board is responsible for the determination, implementation and review of the Management Board Remuneration Policy. In this regard, the Supervisory Board is supported by the Nomination & Remuneration Committee. The Nomination & Remuneration Committee develops recommendations for Management Board remuneration, taking into account the Law, the aforementioned principles as well as the recommendations of the German Corporate Governance Code (GCGC) in its applicable version. Prepared by the Nomination & Remuneration Committee the Remuneration Policy as well as any other matter relating to the individual remuneration of the Management Board members are discussed and resolved by the Supervisory Board. If necessary, the Nomination & Remuneration committee as well as the Supervisory Board may consult an independent external remuneration expert to support the determination of the remuneration of Management Board members as well as the determination and review of the system as a whole.The Remuneration Policy approved by the Supervisory Board will be submitted to the Annual General Meeting for approval. The Supervisory Board regularly reviews the Remuneration Policy and makes any changes that are deemed necessary. In the event of major changes to the Remuneration Policy, but at least every four years, the Remuneration Policy will be resubmitted to the Annual General Meeting for approval. If the Annual General Meeting does not approve the Remuneration Policy, a revised Remuneration Policy will be submitted for approval at the next regular Annual General Meeting.
Appropriateness of the Management Board remunerationThe remuneration of Management Board members appropriately reflects the individual tasks and performance as well as the economic situation, the success and future prospects of SUSE. The Nomination & Remuneration Committee regularly reviews the appropriateness of the Management Board remuneration and proposes adjustments to the Supervisory Board as necessary in order to ensure a remuneration package that is both in line with regulatory requirements and market competitive.To assess the appropriateness of the remuneration, the Nomination & Remuneration Committee considers the level of remuneration in comparison with the remuneration of Management Board members of comparable companies (external relativity assessment), as well as its internal relativity to the remuneration and employment conditions of senior management and the overall workforce of SUSE.To evaluate external relativity, comparable companies – based on country, company size and industry – are used as a peer group. The Supervisory Board decides on a suitable peer group and the composition of the group will be disclosed in the remuneration report.To evaluate internal relativity, the senior management and workforce of SUSE are taken into account. In this evaluation, both the current ratio as well as the change of the ratio over time of the Management Board’s remuneration compared to the remuneration of senior management and the workforce as a whole are assessed. The Supervisory Board determines how senior management and workforce are to be differentiated for the comparison.
Measures for avoiding conflicts of interestThe Supervisory Board’s rules of procedure set out guidelines for the avoidance of conflicts of interest which also need to be taken into consideration when determining, implementing or reviewing the remuneration of the Management Board. The Supervisory Board members are obliged to consider only the interests of the enterprise and must disclose conflicts of interest in a timely manner. In its report to the Annual General Meeting, the Supervisory Board will provide information about any conflicts of interest that have arisen and on how these have been dealt with. Material conflicts of interest that are not only temporary and that relate to a member of the Supervisory Board will lead to a termination of the mandate.
SUSE FY2021 Annual report104

Overview of the Remuneration PolicyThe following table provides an overview of SUSE’s Remuneration Policy.
Fixed compensation
Basic annual salary Fixed, non-performance related remuneration paid in instalments
Fringe benefits Include car allowance, private medical expenses insurance, life assurance and permanent health insurance.
Company pension plan The members of the Management Board are generally entitled to a Company Pension or cash allowance in lieu of pension contributions. The level of allowance is determined by the Supervisory Board with reference to market appropriateness.Different pension rules may apply according to the location of the member of the Management Board e.g. in order to comply with local tax regulations. For the current members of the Management Board, the pension allowances are:CEO: Allowance in lieu of a pension contribution of £30,000 gross per annum.CFO: Allowance in lieu of a pension contribution at a rate of 4.39% of his annual salary.
Variable (i.e. performance related) compensation
Short-Term Incentive (STI)
Performance criteria Determined by a minimum of 75% financial metrics and a minimum of 10% assessment of ESG metrics.Financial performance metrics may include:Annual Contract Value (ACV)RevenueAEBITDACash AEBITDA
Performance period One year
Limitation/cap 200% of the target amount
Payment Paid in cashThree equal Advance Payments of 20% of the target award at the end of Q1, Q2 and Q3Balancing payment made in Q1 of next financial year
SUSE FY2021 Annual report 105

Long-Term Incentive (LTI)
Equity instrument There are normally two LTI equity instruments which may be granted: Restricted Stock Units and stock options. The mix between each instrument will be reviewed and determined annually by the Nomination and Remuneration Committee.The maximum award which may be granted under the LTI is 300% of salary.
Performance conditions Pre-grant assessment criteria apply in respect of the financial year prior to the financial year in which awards are granted. Criteria may include ACV, AEBITDA and cash AEBITDA and other financial and non-financial metrics.The Nomination and Remuneration Committee assesses performance against the criteria in order to determine the level of grant.
Holding periods Compulsory holding period normally applies to ensure that the period from grant of an award until it becomes exercisable is at least four years.
Plan Type 1 – Restricted Stock Units (RSUs)
Vesting period Vest in three equal tranches on the first, second and third anniversaries of the date of grant.
Plan Type 2 – Market value stock options (Options)
Vesting period Vest in two equal tranches on the second and third anniversaries of the date of grant.
Exercise period Exercise period expires 10 years from grant.
Other contractual elements
Malus and clawback Partial or complete reduction or reclamation of variable compensation components.
Share ownership guidelines (SOG)
CEO: 150% of salary.Other Management Board members: 125% of salary.
Maximum remuneration GBP 10 million (see below)
Remuneration report continued
SUSE FY2021 Annual report106

a) Remuneration elements and structureThe Management Board Remuneration Policy is composed of fixed and variable elements, with the quantum set by the Supervisory Board based on comparisons against a basket of technology and technology-enabled companies based in Germany, elsewhere in Europe and the US. Fixed remuneration consists of the base salary, pension and benefits. Variable remuneration comprises a Short-Term Incentive (STI) and a Long-Term Incentive (LTI). The sum of base salary, benefits, pension, STI target amount and LTI target amount constitutes the total target remuneration.The majority of the total target remuneration of the Management Board is made up of variable, performance-based elements in order to ensure that Management Board pay outcomes are aligned with corporate and share price performance. The LTI has a greater weighting than the STI to ensure that Management Board remuneration outcomes are aligned to the sustainable and long-term development of SUSE. The proportion of the fixed remuneration in total target remuneration ranges between 30% and 35%, whereof base salary has a share of 90% to 95% and fringe benefits account for up to 10%. The proportion of variable remuneration in total target remuneration ranges between 65% and 70%, of which 40% to 45% is attributable to the STI and 55% to 60% to the LTI.The proportions may vary where Management Board members receive buyout awards to compensate for remuneration forfeited from previous employers. Any such buyout awards would be made taking into account the form (cash or shares), timing and expected value (i.e. the likelihood of meeting any existing performance criteria) of the remuneration being forfeited.
b) Maximum remunerationIn order to avoid uncontrolled and excessive Management Board remuneration, the remuneration is capped twice. Firstly, the payout of variable remuneration elements is limited to 200% of the target amount for the STI. Secondly, the Supervisory Board has determined an overall maximum remuneration for the Management Board members, which comprises the fixed and variable remuneration elements in respect of a financial year (defined as salary, pension and bonus earned in respect of a financial year and the value at vesting of LTIP awards granted for that financial year). Maximum remuneration achievable for a specific financial year may not exceed GBP 10m for each member of the Management Board.
2) Elements of the Remuneration Policy in detail
a) Fixed remuneration elementsi) Base salaryMembers of the Management Board receive a fixed annual base salary in cash, payable in installments.
ii) BenefitsMembers of the Management Board are also granted benefits. These may consist of car allowance, private medical expenses insurance, life assurance and permanent health insurance. All members of the Management Board are covered during the full term of appointment by a D&O insurance policy taken out by the Company providing for customary terms.The Company shall reimburse members of the Management Board for all reasonable travelling and similar out-of-pocket expenses incurred in the discharge of their duties subject to the provision of receipts and invoices in accordance with the Company’s expenses policy in force from time to time.The Company will pay the reasonable cost of tax and legal advice to enable the member of the Management Board and the Company to achieve an efficient and effective employment and compensation structure. Furthermore, in order to attract qualified candidates for the Management Board, the Supervisory Board has the right to grant sign-on payments to new Management Board members in an appropriate and market-compliant way, e.g. to compensate for forfeited remuneration from previous employers.The members of the Management Board are generally entitled to a Company pension or cash allowance in lieu of pension contributions. The level of allowance is determined by the Supervisory Board with reference to market appropriateness.Different pension rules may apply according to the location of the member of the Management Board, such as in order to comply with local tax regulations. The CEO receives an allowance in lieu of a pension contribution of £30,000 gross per annum and the CFO receives an allowance in lieu of a pension contribution at a rate of 4.39 % of annual salary.
SUSE FY2021 Annual report 107

b) Variable remuneration elementsVariable remuneration accounts for the majority of the Management Board remuneration. It comprises three elements:
– An STI in the form of an annual bonus with a performance period of one year.
– An LTI grant of Restricted Stock Units which vest in three equal tranches one, two and three years after the date of grant.
– An LTI grant of market value stock options which vest in two equal tranches two and three years after the date of grant.
LTI awards are subject to the achievement of pre-grant performance criteria in respect of the financial year prior to the financial year in which the grants are made. A holding period applies to all LTI grants such that the awards may not be disposed of until at least four years from the date of grant.The STI provides an incentive for the achievement of targets for key performance indicators of the business for the financial year. The measures are aligned to business strategy and targets are set taking into account the budget and consensus for the year. The LTI incentivizes the long-term performance of SUSE and creates alignment between members of the Management Board and shareholders through the grant of awards as Restricted Stock Units and market value stock options, which only deliver value to participants if the share price grows. In order to focus the Management Board on sustainable, long-term growth, the weighting of the LTI exceeds that of the STI.
iii) Short-Term Incentive1. Principles of the Short-Term IncentiveThe Short-Term Incentive (STI) is an annual cash bonus which rewards the contribution to the successful delivery of the business strategy in a specific financial year. The STI outcome is calculated by an assessment of performance conditions. The Supervisory Board will determine the weighting of each performance condition at the start of the relevant performance year. A minimum of 75% of the STI will be assessed against financial metrics, which may include Annual Contract Value, revenue, Adjusted EBITDA (AEBITDA) and cash AEBITDA. The STI payout is limited to 200% of the STI target amount.An element of the assessment will be based on performance against Environmental, Social and Governance (ESG) objectives with a minimum weighting of 10%.
2. Performance targets of the Short-Term Incentivea. Financial performance targets and multiplierEach year, a minimum of 75% of the STI will be assessed against financial metrics which are strategically important to the Company. These may include:
– Annual Contract Value (ACV): ACV represents the first 12 month monetary value of a contract. If total contract duration is less than 12 months, 100% of contract value is included in the ACV.
– Adjusted Revenue: Adjusted Revenue measures revenue excluding the deferred revenue fair value adjustments. Adjusted revenue represents the performance of SUSE based on the invoiced bookings and excludes fair value adjustments which relate to historic balance sheet adjustments.
– Adjusted EBITDA (Earnings Before Interest, Tax, Depreciation and Amortization): this measure represents earnings before net finance costs, share of loss of associate and tax, adjusted for depreciation and amortization, share-based payments, fair value adjustment to deferred revenue, statutory separately reported items, specific non-recurring items and net unrealized foreign exchange (gains)/losses.
– Adjusted Cash EBITDA: this measure represents Adjusted EBITDA plus changes in deferred revenue in the related period excluding the impact of the deferred revenue haircut.
For financial performance targets, the Supervisory Board defines a target value in consideration of relevant reference points such as the management plan, the state of the organization and other relevant factors for the relevant financial year. The Supervisory Board will also set a minimum performance level, below which there is no payout for that measure. Where the achieved value falls between the minimum performance level and the target value, or is above the target value, the payout of the STI for that measure is based on a sliding scale. Target values, thresholds and the resulting target achievements will be transparently disclosed in the remuneration report for the respective financial year.
Remuneration report continued
SUSE FY2021 Annual report108

b. Non-financial performance targetsIn addition to financial performance targets, non-financial performance targets, which particularly comprise Environmental, Social and Governance (ESG) aspects, will be included when measuring the overall success of SUSE. At the beginning of each fiscal year, the Supervisory Board will decide which ESG aspects will be included in the STI. The Supervisory Board will decide on specific targets of relevance and define objectives and their respective weighting. Defined objectives and the resulting target achievement will be transparently disclosed in the remuneration report for the respective financial year. ESG metrics may include employee and customer metrics (under the “Social” of ESG) and commitment to climate action (under the “Environment” of ESG). ESG metrics may include either input or output based metrics.
iv) Long-Term Incentive1. Principles of the Long-Term IncentiveAwards to Management Board members under the Long-Term Incentive (LTI) comprise Restricted Stock Units and market value stock options. Restricted Stock Units vest in equal tranches one, two and three years after the award date. Market value stock options vest in equal tranches two and three years after the award date. All awards to Management Board members under the LTI are subject to a holding period such that the total period from the grant to the release of shares is four years. At the beginning of the financial year prior to the financial year in which awards are granted, the Supervisory Board sets pre-grant performance criteria. At the end of the one year performance period, the Supervisory Board assesses the performance against the performance criteria in order to determine the grant value of awards.
2. Performance targets of the Long-Term Incentivea. Financial performance targetsThe pre-grant performance criteria will include a minimum 75% financial metrics which are strategically important to the Company. These may include metrics such as:
– Annual Contract Value (“ACV”): ACV represents the first 12 month monetary value of a contract. If total contract duration is less than 12 months, 100% of contract value is included in the ACV.
– Adjusted Revenue: Adjusted Revenue measures revenue excluding the deferred revenue fair value adjustments. Adjusted revenue represents the performance of SUSE based on the invoiced bookings and excludes fair value adjustments which relate to historic balance sheet adjustments.
– Adjusted EBITDA (Earnings Before Interest, Tax, Depreciation and Amortization): this measure represents earnings before net finance costs, share of loss of associate and tax, adjusted for depreciation and amortization, share-based payments, fair value adjustment to deferred revenue, statutory separately reported items, specific non-recurring items and net unrealized foreign exchange (gains)/losses.
– Adjusted Cash EBITDA: this measure represents Adjusted EBITDA plus changes in deferred revenue in the related period excluding the impact of deferred revenue haircut.
Defined objectives and the resulting target achievement will be transparently disclosed in the remuneration report for the respective financial year.
b. Non-financial performance targetsIn addition to the financial performance targets, non-financial performance targets, including in respect of ESG, may be included in the overall LTI target achievement. ESG metrics may include employee and customer metrics (under the “Social” of ESG) and commitment to climate action (under the “Environment” of ESG). ESG metrics may include either input or output based metrics. The Supervisory Board decides on relevant targets, defines concrete objectives and their weighting prior to each LTI grant.Defined objectives and the resulting target achievement will be transparently disclosed in the remuneration report for the respective fiscal year.
SUSE FY2021 Annual report 109

3) Further contractual agreements
a) Share ownership guidelinesManagement Board members are obliged to build a shareholding in SUSE S.A. over a period of four years after their first appointment as members of the Management Board. The share ownership guideline is 150% of gross base salary for the CEO and 125% of gross base salary for other Management Board members.
b) Malus and clawbackVariable remuneration elements are subject to malus and clawback provisions. In certain circumstances, the Supervisory Board is entitled to reduce outstanding variable remuneration in whole or in part (malus) and may also partially or completely reclaim variable remuneration elements already paid out at its reasonable discretion (clawback). The circumstances in which malus or clawback may apply are the discovery of a material misstatement resulting in an adjustment in the audited accounts; the discovery that any information used to determine the award (either the number of shares or the assessment of performance targets) was based on error, or inaccurate or misleading information; conduct amounting to fraud (or a comparable criminal offence), gross misconduct or a serious breach of duty; reputational damage to the Company attributable to the awards holder; material failure of risk management of the Company; insolvency or corporate failure for which the award holder is partly or wholly responsible.
4) Legal provisions concerning remuneration
a) Duration of the service agreementsAppointment periods usually range between three and five years and service agreements are generally aligned to these periods. The service agreements for the current members of the Management Board are three years in duration. Service agreements for the current members of the Management Board are under the UK Group Company and therefore subject to UK law. Service agreements for future members of the Management Board may be under a different Group Company.
b) Termination of employmentThe employment of the Management Board members may be terminated by the Company giving not less than six months’ notice in writing or by the Management Board members giving not less than six months’ notice in writing to the Company.In lieu of giving notice to terminate the Management Board member’s employment or at any time during any notice period, the Company may terminate the Management Board member’s employment with immediate effect and make a payment in lieu of notice (the Payment in Lieu) of an amount equal to:
– The basic salary which the Management Board member would have been entitled to receive under their service agreement during the notice period if notice had been given (or, if notice has already been given, during the remainder of the notice period).
– The car allowance and pension that the Management Board member would have been entitled to receive during the notice period if notice had been given (or, if notice has already been given, during the remainder of the notice period).
The Payment in Lieu will be payable in equal monthly installments on the normal payroll dates, subject to such deductions as may be required by law. These installments will continue until the date on which the relevant notice period would have expired or (if earlier) the date on which the Management Board member secures alternative employment or alternative engagements with the same or a higher basic salary or fee.If a Management Board member has given or received notice of termination, an STI award will not be paid to them during any period when the notice is effective, unless the Supervisory Board determines otherwise.Ordinarily any STI award will lapse on cessation of employment. However, if the Management Board member ceases employment by reason of death, injury, ill-health, disability, retirement, terminating their employment for cause (“aus wichtigem Grund”) for which the Company is responsible or any other circumstances if the Supervisory Board in its absolute discretion decides in any particular case, any STI award held by them will continue and the performance targets shall be considered at the normal time for determination and payment.
Remuneration report continued
SUSE FY2021 Annual report110

Ordinarily any LTI award will lapse on cessation of employment. However, if the Management Board member ceases employment by reason of death, injury, ill-health, disability, retirement, terminating their employment for cause (“aus wichtigem Grund”) for which the Company is responsible or any other circumstances if the Supervisory Board in its absolute discretion decides in any particular case, any LTI award held by them which has not vested will continue until the normal time of vesting. Alternatively, the Supervisory Board may decide that an award will vest immediately in which case the proportion of the award which shall Vest will be determined by the Supervisory Board in its absolute discretion taking into account such factors as the Supervisory Board may consider relevant. Unless the Supervisory Board in its absolute discretion decides otherwise, the LTI award will be reduced pro-rata to reflect the period of the year in employment.
c) Change of controlService agreements of the Management Board members do not include any provisions in the event of a change of control.The LTI rules state that in the event of a change of control, awards shall vest on the normal vesting date (unless this is not possible as a result of the structure of the change of control). The proportion of an award which shall vest will be determined by the Supervisory Board in its absolute discretion subject to such conditions as it may require.
d) Post-contractual non-competition clauseMembers of the Management Board may be subject to a post-contractual non-competition clause lasting up to twelve months. It may be necessary to pay compensation to members of the Management Board depending on the law under which the member is employed.
e) Secondary activitiesService agreements for members of the Management Board contain provisions permitting specified approved roles outside the Company if and as long as such positions do not affect the individual’s ability to perform the duties and do not otherwise conflict with, or are detrimental to, the interests and business operation of the company. In the event that the individual becomes aware of any conflicts of interest that may arise in relation to any approved role, they must disclose these to the Board together with any information or knowledge
acquired or gained by the individual in any manner whatsoever whilst the individual continues in office, which may be of value or which may be to the detriment of the company. Remuneration in respect of any such secondary activities will be deducted from the member’s Management Board remuneration.If Management Board members are employed at another group company, which compensates them fully, this compensation will be treated as compensation for their service as Management Board members and this Remuneration Policy will apply to that compensation.
5) Temporary deviations from the Remuneration PolicyThe Supervisory Board has the right to temporarily deviate from the Remuneration Policy in special and extraordinary circumstances (such as a serious financial or economic crisis), if this is in the interest of SUSE’s long-term well-being. Unfavorable market developments are not considered to be special and extraordinary circumstances that would permit a deviation from the Remuneration Policy.Even if there is a deviation from the Remuneration Policy, the remuneration must continue to be aligned with the long-term and sustainable development of SUSE and must be consistent with the success of SUSE and the performance of the Management Board.Any deviation from the Remuneration Policy under the aforementioned circumstances is only possible after a careful analysis of these exceptional circumstances and the options for reaction and on the basis of a proposal by the Nomination and Remuneration Committee and a corresponding resolution of the Supervisory Board that has identified the exceptional circumstances and the necessity for a deviation.A temporary deviation from the Remuneration Policy is possible with regard to the following elements: performance targets relating to the STI as well as the LTI. If existing remuneration elements have been adjusted but the incentive effects of Management Board remuneration cannot be adequately restored, the Supervisory Board is further entitled, in case of extraordinary developments and under the same conditions, to temporarily grant additional remuneration elements, or to replace individual remuneration elements with other components.
SUSE FY2021 Annual report 111

SUSE S.A. Supervisory Board Remuneration PolicyPrinciples of the Supervisory Board Remuneration PolicyPursuant to the law, a Remuneration Policy for the Supervisory Board members needs to be prepared and presented to the Annual General Meeting for resolution.The structure of the Supervisory Board remuneration of SUSE S.A. is based on the following principles:
– To ensure that the Supervisory Board can exercise its control and advisory function in an independent manner, the Supervisory Board remuneration solely consists of fixed remuneration. As the remuneration is independent from SUSE’s short-term success, the Supervisory Board is enabled to focus its activities on the long-term development of SUSE.
– In addition, it is ensured that the level of remuneration is appropriate to SUSE’s situation and takes into account the duties and responsibilities of the Supervisory Board members. Furthermore, the Supervisory Board remuneration of comparable companies is considered. In this respect, due consideration is taken in particular of the increased time required for the Chair and Deputy Chair of the Supervisory Board as well as for the Chair and members of the Committees.
The provisions of the Law and the recommendations of the German Corporate Governance Code (GCGC) form the regulatory framework of the Remuneration Policy of the Supervisory Board.
Procedure of determining, implementing and reviewing the Supervisory Board Remuneration PolicyThe remuneration of the Supervisory Board members is determined on the basis of SUSE’s Articles of Association.When determining and reviewing the Remuneration Policy, applicable regulations for dealing with conflicts of interests are considered.The Supervisory Board Remuneration Policy is submitted as a resolution at the Annual General Meeting at every material change and in any case at least every four years. In the event that shareholders do not approve the resolution for the Remuneration Policy at the Annual General
Meeting, a revised Remuneration Policy will be presented at the latest at the following ordinary Annual General Meeting.
Structure of the Supervisory Board Remuneration PolicyThe remuneration of the Supervisory Board members of SUSE solely comprises fixed remuneration components.The members of the Supervisory Board may receive a fixed annual remuneration (currently €70,000). For the Chair and Deputy Chair an increased remuneration is provided to reflect the higher responsibility and the associated time effort (currently fixed annual remuneration of €175,000 and €125,000 respectively). Supervisory Board members acting as Chair of a Supervisory Board Committee may receive additional fixed remuneration to reflect the additional associated responsibility and time effort of the role. The remuneration for the Chair of the respective Committees is currently as follows, provided the relevant Committee meets at least once a year to perform its duties:
Committee Current fee for Chair of the Committee
Audit €25,000
Nomination & Remuneration €25,000
Other (if any) €25,000
Supervisory Board members who only belong to the Supervisory Board or hold the office of Chair or Deputy Chair for part of a financial year receive corresponding proportionate remuneration on a pro-rata basis. The same approach applies to remuneration for a Chair or member of a Committee.The remuneration is due and payable in four equal installments at the end of the quarter for which the remuneration is paid.The fees may be reviewed from time to time by the Board and any changes will be set out in the remuneration report.Beyond the remuneration described above, SUSE shall reimburse the members of the Supervisory Board for their reasonable out-of-pocket expenses incurred in the performance of their duties as Supervisory Board members including any VAT on expenses.
Remuneration report continued
SUSE FY2021 Annual report112

Employees of EQT Partners who serve as members of the Supervisory Board of the Company shall not receive payments from the Company for their services, since these are considered to be covered by their contractual remuneration at EQT. As a rule, they are obligated to waive any compensation that may be due to them in connection with such positions.Furthermore, new members of the Supervisory Board may be granted a one-off stock grant on appointment up to the amount of €200,000 gross (the Stock Grant). During the period of the first mandate of the Supervisory Board member to the Company’s Supervisory Board, the Stock Grant shall be subject to a lock-up (the Vesting Period). During the Vesting Period, the Supervisory Board member shall not sell, transfer, encumber, use as collateral or otherwise dispose of or liquidate the Stock Grant. During the Vesting Period, the Stock Grant shall further be subject to the condition subsequent that certain bad leaver events occur.
The terms of the Supervisory Board membersAs provided by the Articles of Association, the Supervisory Board members are elected for a term not exceeding six (6) years.The General Meeting shall determine the terms of their office (including without limitation any notice period regarding their resignation). A member of the Supervisory Board may be removed with or without cause and/or replaced, at any time, by a resolution adopted by the General Meeting.
Total remuneration of the Supervisory Board for FY212
The remuneration of the Supervisory Board members is determined on the basis of SUSE’s Articles of Association and comprises fixed remuneration components only: a fixed annual fee, additional fixed fees and reimbursement for out-of-pocket expenses, as outlined in the Remuneration Policy. Employees of EQT Partners who serve as members of the Supervisory Board of the Company shall not receive payments from the Company for their services.The table below sets out the remuneration of the members of the Supervisory Board in respect of FY21. 100% of the remuneration of Supervisory Board members is fixed remuneration.
NamePosition Fees Benefits
One-off share awards1
Total remuneration
Jonas PerrsonChair of the Supervisory Board $103,403 n/a $244,440 $347,843Henning KagermannDeputy Chair of the Supervisory Board $73,859 n/a $244,440 $318,299Adrian T. DillonSupervisory Board Member $56,133 n/a $244,440 $300,573Dr. Ariane ReinhartSupervisory Board Member $41,361 n/a $244,440 $285,801Elke ReichartSupervisory Board Member $41,361 n/a $244,440 $285,801Johannes ReichelSupervisory Board Member n/a n/a n/a n/aMatteo Thun-HohensteinSupervisory Board Member n/a n/a n/a n/aNora M. DenzelSupervisory Board Member $56,133 n/a $244,440 $300,5731. Members of the Supervisory Board (excluding employees of EQT Partners) were granted a one-off stock grant of €200,000 gross on IPO.
Further details are available in the ‘Shares awarded or due to the Directors for the reported financial year’ table on page 116.2. The figures stated above have been converted from EUR to USD using an exchange rate of EUR 1:USD 1.18175 ave. rate May-Oct 2021.
SUSE FY2021 Annual report 113

Total remuneration of the Management Board for FY21The remuneration of the Management Board is determined by the Supervisory Board and is based on recommendations from the Nomination and Remuneration Committee. The table below sets out the remuneration earned by members of the Management Board during FY21 (over the full period 1 November 2020 to 31 October 2021).
Fixed remuneration1 Variable remunerationNamePosition
Base salary Benefits Pension STI2 LTI3 Other4
Total remuneration
Fixed vs. variable remuneration
Melissa Di DonatoCEO $1,062k $23k $41k $2,232k $905k $3,153k $7,416k
Fixed: 15%Variable: 85%
Andy MyersCFO $529k $19k $25k $1,053k $399k $463k $2,488k
Fixed: 23%Variable: 77%
1. The fixed remuneration figures above have been converted from GBP to USD using the average exchange rate on a monthly basis. 2. The annual STI figures above have been converted from GBP to USD using the exchange rate GBP 1: USD 1.3691 as at 31 October 2021. 3. The LTI figures above reflect the value of awards granted during the year. As the market value options have no value at grant, the value
above is wholly attributable to RSUs (equal to number of RSUs multiplied by the share price at grant, 30 EUR). The figures have been converted from EUR to USD using the exchange rate of EUR 1: USD 1.2219 on the date of grant (18 May 2021).
4. The “Other” figures above reflect the value of IPO related bonus awards made to reflect contributions to the business in the lead up to the IPO, as outlined in the Prospectus. The figures have been converted from GBP to USD using the average exchange rate for June 2021 (the month the awards were paid) of GBP 1: USD 1.4021.
Fixed remunerationThe fixed gross annual base salary amounts were set on IPO at £850,000 per year for the CEO, and at £450,000 for the CFO. The amounts in the table reflect the fixed remuneration earned and received by Melissa Di Donato and Andy Myers in their capacity as CEO and CFO respectively over the full FY21 (including prior to the IPO).Management Board members received the following additional benefits in the reporting year:
– An allowance in lieu of pension contributions:• CEO: £30,000 gross per annum.• CFO: 4.39% of annual salary.
– Membership of a private medical expenses insurance scheme. – Annual medical check-up. – Life assurance. – Permanent health insurance scheme. – Car allowance. – Reimbursement of out-of-pocket expenses (including travel expenses) incurred in the course of providing services to SUSE.
Remuneration report continued
SUSE FY2021 Annual report114

Variable remuneration1. Annual bonus outcomes in FY21The FY21 bonus plan was established prior to IPO and is paid in cash, but is aligned with the bonus set out in the Remuneration Policy. Performance under the annual bonus is based on financial measures (Annual Contract Value, Adjusted EBITDA and Adjusted Cash EBITDA) aligned with the Company’s KPIs and long-term strategy. For FY21, the performance targets and outcomes were:
– Annual Contract Value (50% weighting) – performance target of $488.1m, and actual performance of $473.2m corresponding to 96.9% of the target performance level.
– Adjusted EBITDA (50% weighting) – performance target of $147.7m, and actual performance of $171.6m corresponding to 116.2% of the target performance level.
– Adjusted Cash EBITDA (multiplier) – performance target of $214.5m, and actual performance of $235.5m corresponding to 109.8% of the target performance level.
The above performance target and actual performance attainment figures are at FY21 budget rates, the exchange rates used to set the budget and calculate the actual attainment relative to the target. It excludes adjustments for IFRS15 and IFRS16, which was also excluded from the performance targets.Reflecting the overall exceptional performance outcome, the maximum bonus was awarded, equivalent to $2,232k and $1,053k for the CEO and CFO respectively.
SUSE FY2021 Annual report 115

2. LTI awards in FY21LTI awards comprise a mix of Restricted Stock Units and stock options. The mix between each instrument is reviewed and determined annually by the Nomination and Remuneration Committee.A proportion of the value of the LTI grants for the Management Board are granted as stock options (also known as market value options), which have no intrinsic value at the date of grant and will only have value if the share price increases over the vesting and holding period to the point of exercise. This aligns with the German Corporate Governance Code principle that Management Board remuneration should be set in a way that promotes the corporate strategy and the Company’s long-term development. A holding period also applies to all LTI grants such that the awards may not be disposed of until at least four years from the date of grant.The value of LTI awards on vesting depends solely on share price and is therefore fully aligned to corporate performance and the shareholder experience. In addition, LTI awards are subject to a pre-grant assessment of SUSE’s achievement against performance criteria relating to the financial year prior to the financial year in which the awards are granted. For FY21, a formulaic approach was used whereby the performance is measured relative to two pre-set points (threshold and stretch target) and the LTI grant level is determined based on this positioning.
– 0% of the LTI is granted if performance is at threshold. – 100% is granted if performance is at stretch target. – Linear interpolation between these two points.
For the awards granted in FY21, performance was assessed by the Nomination and Remuneration Committee in respect of FY20 (i.e. before the IPO listing). The Committee determined that awards should be made at 100% of the opportunity level for the CEO and CFO respectively. The table below shows the award opportunities for the CEO and CFO respectively as a percentage of salary in relation to FY21.
Options award (% of salary)
RSU award (% of salary) Face value1
Melissa Di Donato, CEO 225% 75% $905kAndy Myers, CFO 187.5% 62.5% $399k1. Calculated as:
a) For the RSU award, the total number of shares subject to the award multiplied by the share price on IPO, which was €30; and b) For the options, the value is zero (because the exercise price is equal to the share price at grant). The figures have been converted from EUR to USD using the exchange rate of EUR 1: USD 1.2219 on the date of grant (18 May 2021).
Remuneration report continued
SUSE FY2021 Annual report116

Further details of the awards granted during FY21 are set out in the next section. For FY22, the LTI awards will be based on FY21 Adjusted EBITDA based on targets set during FY21 by the Nomination & Remuneration Committee as follows:
– 0% of the normal grant level will be granted if FY21 Adjusted EBITDA of $0m or lower. – 100% of the normal grant level will be granted for FY21 Adjusted EBITDA of $147.7m or above. – Straight line interpolation between these points.
Based on the FY21 Adjusted EBITDA outturn of $171.6m, 100% of the normal LTI grant level will be granted during FY22.
Share options awarded or due to the Directors for the reported financial yearThe table below sets out the share options granted to Directors during FY21:
Information regarding the reported financial year: 2021
The main conditions of share option plansOpening balance During the year Closing balance
NamePosition Plan
Pre-grant perfor-mance period
Award date
Vesting dates
End of holding period
Exercise period
Strike price of
the share (EUR)
Share options
awarded at the
start of the year
Share options
awarded
Share options vested
Share options
subject to a perfor-
mance condition
Share options
awarded and
unvested
Share options
subject to a holding
period
Melissa Di Donato CEO LTI
1/11/2020 –
31/10/2021 18/5/202118/5/2023 18/5/2024 18/5/2025
18/5/2025 –
18/5/2031 30.00 n/a 74,084 n/a n/a 74,084 n/a
Andy Myers CFO LTI
1/11/2020
– 31/10/2021 18/5/2021
18/5/2023 18/5/2024 18/5/2025
18/5/2025 –
18/5/2031 30.00 n/a 32,684 n/a n/a 32,684 n/a
Total n/a 106,768 n/a n/a 106,768 n/a
1. The number of awards granted is based on the face value of the grant and the share price on IPO (EUR 30).
SUSE FY2021 Annual report 117

Shares awarded or due to the Directors for the reported financial yearThe table below sets out the share awards granted to Directors during FY21:
Information regarding the reported financial year
The main conditions of share option plansOpening balance During the year Closing balance
NamePosition Plan
Pre-grant perfor-mance period Award date
Vesting dates
End of holding period
Shares awarded at the start of
the yearShare
awardedShare
vested
Shares subject to a perfor-
mance condition
Shares awarded
and unvested
at year end
Shares subject
to a holding period
Management Board:
Melissa Di Donato CEO LTI
1/11/2020 – 31/10/2021 18/5/2021
18/5/202218/5/202318/5/2024 18/5/2025 n/a 24,6941 n/a n/a 24,694 n/a
Andy Myers CFO LTI
1/11/2020 – 31/10/2021 18/5/2021
18/5/202218/5/202318/5/2024 18/5/2025 n/a 10,8941 n/a n/a 10,894 n/a
Supervisory Board:Jonas Perrson Chair n/a n/a 18/5/2021 30/4/2024 n/a n/a 3,000 n/a n/a 3,000 n/a
Henning Kagermann Deputy Chair n/a n/a 18/5/2021 30/4/2024 n/a n/a 6,666 n/a n/a 6,666 n/a
Adrian T. Dillon Member n/a n/a 18/5/2021 30/4/2024 n/a n/a 6,666 n/a n/a 6,666 n/a
Dr. Ariane Reinhart Member n/a n/a 18/5/2021 30/4/2024 n/a n/a 6,666 n/a n/a 6,666 n/a
Elke Reichart Member n/a n/a 18/5/2021 30/4/2024 n/a n/a 3,933 n/a n/a 3,933 n/a
Johannes Reichel Member n/a n/a n/a n/a n/a n/a n/a n/a n/a n/a n/a
Matteo Thun-Hohenstein Member n/a n/a n/a n/a n/a n/a n/a n/a n/a n/a n/a
Nora M. Denzel Member n/a n/a 18/5/2021 30/4/2024 n/a n/a 4,333 TBC n/a 4,333 TBC
Total n/a 31,264 n/a n/a 31,624 n/a
1. The number of awards granted is based on the face value of the grant and the share price on IPO (€30).
Remuneration report continued
SUSE FY2021 Annual report118

Malus and clawback provisionsVariable remuneration is subject to malus and clawback provisions. In certain circumstances, the Supervisory Board is entitled to reduce outstanding variable remuneration in whole or in part (malus) and may also partially or completely reclaim variable remuneration elements already paid out at its reasonable discretion (clawback).The circumstances in which malus or clawback may apply include:
– The discovery of a material misstatement resulting in an adjustment in the audited accounts. – The discovery that any information used to determine the award was based on error, or inaccurate or misleading information.
– Conduct amounting to fraud (or a comparable criminal offence), gross misconduct or a serious breach of duty.
– Reputational damage to the Company attributable to the awards holder. – Material failure of risk management of the Company. – Insolvency. – Corporate failure.
No malus or clawback was applied in relation to the remuneration earned during FY21.
Comparative information on the change of remuneration and Company performanceThe remuneration structure for the financial years prior to our IPO in May 2021 differs from the remuneration payable under the proposed Remuneration Policy (which will apply for the FY22 onwards subject to shareholder approval). We therefore believe that a year-on-year comparison of this historic data (prior to the Company’s IPO) would not be meaningful to shareholders.Starting next year, the Company will provide comparative information on the change of remuneration and Company performance for members of the Management Board and Supervisory Board, building up to a five-year comparison in line with Luxembourg reporting requirements.
Derogations and deviations from the Remuneration Policy and from the procedure for its implementationThis is not applicable for the reporting year on the basis of the Remuneration Policy having not been formally adopted. SUSE does not have any outstanding loans or advances to members of the Company’s Management Board and Supervisory Board or any guarantees for the benefit of any member of the Company’s Management Board and Supervisory Board. None of the members of the Management Board and Supervisory Board has entered into service contracts with the Company or any of our affiliates that provide for benefits upon the termination of their service.
SUSE FY2021 Annual report 119

Empowered & Accountable
SUSE FY2021 Annual report120

SUSE FY2021 Annual report 121

SUSE FY2021 Annual report122
Consolidated financial statements
Consolidated Statement of Comprehensive Income For the year ended 31 October 2021
122
Year ended 31 October 2021 Year ended 31 October 2020
Income statement: NotesHeadlineUS$’000
Separately reported
items(Note 8)US$’000
TotalUS$’000
Headline US$’000
Separately reported
items (Note 8) US$’000
Total US$’000
Revenue 7 559,539 - 559,539 447,421 - 447,421 Cost of sales (43,213) - (43,213) (26,453) - (26,453) Gross profit 516,326 - 516,326 420,968 - 420,968 Selling and distribution costs (154,192) - (154,192) (119,133) - (119,133) Research and development costs (100,117) - (100,117) (73,090) (2) (73,092) Administrative expenses (283,342) (26,894) (310,236) (76,010) (25,448) (101,458) Reversal of/(impairment loss) on trade receivables 19 265 - 265 (1,023) - (1,023) Operating (loss)/profit before depreciation and amortization (21,060) (26,894) (47,954) 151,712 (25,450) 126,262 Amortization of intangible assets 15 (141,980) - (141,980) (119,990) - (119,990) Depreciation – Property, plant and equipment 16 (4,496) - (4,496) (4,496) (4,496) Depreciation/impairment – Right of use assets 24 (6,485) - (6,485) (10,460) - (10,460) Operating (loss)/profit (174,021) (26,894) (200,915) 16,766 (25,450) (8,684) Finance costs 11 (58,884) - (58,884) (61,333) - (61,333) Finance income 11 8 - 8 21 - 21 Net finance costs 11 (58,876) - (58,876) (61,312) - (61,312) Share of losses of associate 18 (2,133) - (2,133) (2,449) - (2,449) Loss before tax (235,030) (26,894) (261,924) (46,995) (25,450) (72,445) Taxation 12 48,745 5,566 54,311 4,590 16,231 20,821 Loss for the period (186,285) (21,328) (207,613) (42,405) (9,219) (51,624) Attributable to: Equity shareholders of the parent (186,285) (21,328) (207,613) (42,405) (9,219) (51,624) Non-controlling interests - - - - - - Loss for the period (186,285) (21,328) (207,613) (42,405) (9,219) (51,624) Earnings per share 13 Basic - - (3.3) - - (36.9) Diluted - - (3.3) - - (36.9)

SUSE FY2021 Annual report 123
Consolidated Statement of Comprehensive Income For the year ended 31 October 2021
123
Year ended 31 October 2021 Year ended 31 October 2020
Notes HeadlineUS$’000
Separately reported
itemsUS$’000
TotalUS$’000
Headline US$’000
Separately reported
items US$’000
Total US$’000
Loss for the period (186,285) (21,328) (207,613) (42,405) (9,219) (51,624) Other comprehensive income: Items not to be reclassified to income statement: Remeasurement of defined benefit pension schemes 26 (590) - (590) (72) - (72) Related tax impact 12 1 - 1 (8) - (8) Items that may be reclassified to income statement: Currency translation differences 30 1,632 - 1,632 (26,600) - (26,600) Cash flow hedge – changes in fair value 29 (502) - (502) (7,335) - (7,335) Cash flow hedge – reclassified to income statement 29 8,963 - 8,963 6,498 - 6,498 Related tax impact 12 (2,148) - (2,148) 917 - 917 Other comprehensive losses for the period 7,356 - 7,356 (26,600) - (26,600) Total comprehensive loss for the period (178,929) (21,328) (200,257) (69,005) (9,219) (78,224) Attributable to: Equity shareholders of the parent (178,929) (21,328) (200,257) (69,005) (9,219) (78,224) Non-controlling interests - - - - - - Total comprehensive loss for the period (178,929) (21,328) (200,257) (69,005) (9,219) (78,224) The accompanying notes are an integral part of these Consolidated Financial Statements.

SUSE FY2021 Annual report124
Consolidated financial statements
Consolidated Statement of Financial Position As at 31 October 2021
124
Notes
As at 31 October
2021 US$’000
As at 31 October
2020 US$’000
Non-current assets Goodwill 15 2,685,751 2,134,881 Intangible assets 15 537,056 519,370 Property, plant and equipment 16 8,157 7,624 Right-of-use assets 24 14,415 13,677 Investment in associate 18 14,041 16,174 Derivative asset 29 6 11 Long-term pension assets 26 648 1,039 Other receivables 19 7,899 7,895 Deferred tax assets 12 190,010 107,347 Contract related assets 20 55,510 25,761 3,513,493 2,833,779 Current assets Trade and other receivables 19 138,038 101,042 Current tax receivables 12 1,663 1,523 Cash and cash equivalents 21 61,061 94,933 Contract related assets 20 28,865 19,649 229,627 217,147 Total assets 3,743,120 3,050,926 Current liabilities Trade and other payables 22 129,372 93,128 Borrowings 23 3,600 3,600 Lease liabilities 24 6,012 5,721 Provisions 25 4,866 7,199 Share-based payments 27 284 - Current tax liabilities 12 11,510 10,584 Deferred income – contract liabilities 28 329,611 246,485 485,255 366,717 Non-current liabilities Borrowings 23 742,148 934,660 Lease liabilities 24 10,708 10,729 Provisions 25 1,024 2,329 Non-current tax liabilities 12 7,439 6,601 Deferred tax liabilities 12 107,073 68,695 Retirement benefit obligations 26 6,552 7,541 Share-based payments 27 - 13,019 Deferred income – contract liabilities 28 178,175 155,989 Derivative liabilities 29 5,182 25,440 Other payables 22 13,554 11,861 1,071,855 1,236,864 Total liabilities 1,557,110 1,603,581

SUSE FY2021 Annual report 125
Consolidated Statement of Financial Position As at 31 October 2021
125
Notes
As at 31 October
2021 US$’000
As at 31 October
2020 US$’000
Equity Share capital 30 16,903 14 Share premium 30 2,523,011 1,604,251 Retained losses 30 (355,870) (130,824) Other reserves 27,30 21,169 3,200 Cash flow hedging reserve 29,30 (4,337) (12,798) Foreign currency translation reserve 30 (14,866) (16,498) Total equity 2,186,010 1,447,345 The accompanying notes are an integral part of these Consolidated Financial Statements.

SUSE FY2021 Annual report126
Consolidated financial statements
Consolidated Statement of Changes in Equity For the year ended 31 October 2021
126
The accompanying notes are an integral part of these Consolidated Financial Statements.
Notes
Share
capital US$’000
Share premium
US$’000
Retained losses
US$’000
Other reserve
US$’000
Cash flow hedging reserve
US$’000
Foreign currency
translation reserve
US$’000
Total
equity US$’000
As at 1 November 2020 14 1,604,251 (130,824) 3,200 (12,798) (16,498) 1,447,345 Loss for the period - - (207,613) - - - (207,613) Other comprehensive income/(expense) for the period - - (2,737) - 8,461 1,632 7,356 Total comprehensive income/(expense) for the period - - (210,350) - 8,461 1,632 (200,257) Transactions recorded in equity: Cancellation of nominal value 30 126 (126) - - - - - Contribution of share capital and share premium 30 16,763 249,435 - - - - 266,198 Proceeds from Initial Public Offering 30 - 669,451 - - - - 669,451 IPO transaction costs 30 - - (14,696) - - - (14,696) Equity-settled share-based payments 27 - - - 17,969 - - 17,969 Total transactions with owners 16,889 918,760 (14,696) 17,969 - - 938,922
As at 31 October 2021 16,903 2,523,011 (355,870) 21,169 (4,337) (14,866) 2,186,010

SUSE FY2021 Annual report 127
Consolidated Statement of Changes in Equity For the year ended 31 October 2020
127
The accompanying notes are an integral part of these Consolidated Financial Statements.
Notes
Share capital
US$’000
Share
premiumUS$’000
Retained
lossesUS$’000
Other
reserveUS$’000
Cash flow hedging reserve
US$’000
Foreign currency
translation reserve
US$’000
Total
equity US$’000
As at 1 November 2019 14 1,604,251 (80,037) 839 (11,961) 10,102 1,523,208 Loss for the period - - (51,624) - - - (51,624) Other comprehensive income/(expense) for the period - - 837 - (837) (26,600) (26,600) Total comprehensive income/(expense) for the period - - (50,787) - (837) (26,600) (78,224) Transactions recorded in equity: Equity-settled share-based payments 27 - - - 2,361 - - 2,361 Total transactions with owners - - - 2,361 - - 2,361 As at 31 October 2020 14 1,604,251 (130,824) 3,200 (12,798) (16,498) 1,447,345

SUSE FY2021 Annual report128
Consolidated financial statements
Consolidated Statement of Cash Flows For the year ended 31 October 2021
128
Notes
Year ended 31 October
2021 US$’000
Year ended 31 October
2020 US$’000
Loss for the period (207,613) (51,624) Net finance costs 11 58,876 61,312 Taxation 12 (54,311) (20,821) Share of losses of associate 18 2,133 2,449 Operating (loss)/profit for the period (200,915) (8,684) Addback: Depreciation – Property, plant and equipment 16 4,496 4,496 Depreciation – Right-of-use assets 24 6,485 10,460 Amortization of intangible assets 15 141,980 119,990 Amortization of contract related assets 20 9,260 4,068 Contract liabilities - fair value haircut 7, 28 13,647 20,179 Contract assets – fair value haircut 20 (940) (1,600) Share-based payments expense 27 175,164 11,827 Restructuring charges 8, 25 4,358 4,259 Tax indemnity asset 12 - 17,441 Foreign exchange movements 9 12,555 (5,001) Impairment (credit)/loss on trade receivables 19 (265) 1,023 Movements: Movements in trade receivables 19 (20,635) 2,623 Movements in other receivables 19 (594) 8,813 Movements in trade payables 22 4,759 956 Movements in other payables 22 12,378 36,765 Movement in other pensions 26 562 517 Movements in provisions 25 (7,996) (5,195) Movements in contract related assets 20 (46,087) (31,241) Movements in contract liabilities 28 63,425 (5,991) Settlement of share-based payments 27 (113,257) - Cash generated from operations 58,380 185,705 Interest paid 11 (47,616) (50,133) Interest received 11 8 21 Tax paid 12 (7,955) (6,271) Net cash inflow from operating activities 2,817 129,322 Cash flow from/(used in) investing activities Purchase of property, plant and equipment 16 (4,808) (1,990) Purchase and development of intangible assets 15 (10,496) (33,943) Acquisition of a business, net of cash 14 (586,764) (15,964) Net cash inflow/(outflow)from investing activities (602,068) (51,897) Net cash inflow before financing activities (599,251) 77,425
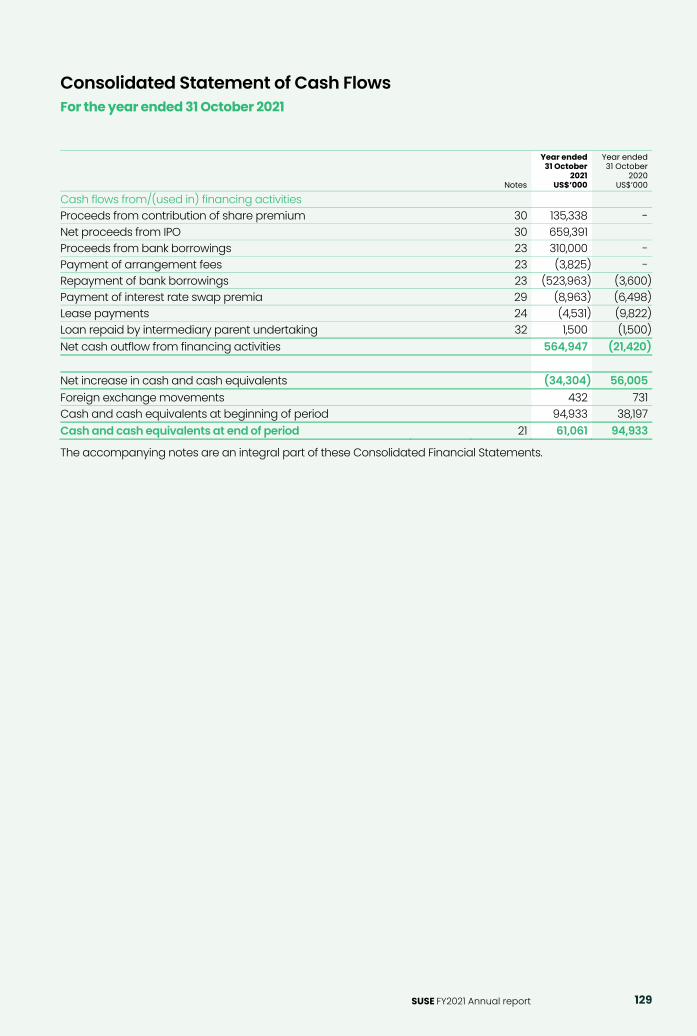
SUSE FY2021 Annual report 129
Consolidated Statement of Cash Flows For the year ended 31 October 2021
129
Notes
Year ended 31 October
2021 US$’000
Year ended 31 October
2020 US$’000
Cash flows from/(used in) financing activities Proceeds from contribution of share premium 30 135,338 - Net proceeds from IPO 30 659,391 Proceeds from bank borrowings 23 310,000 - Payment of arrangement fees 23 (3,825) - Repayment of bank borrowings 23 (523,963) (3,600) Payment of interest rate swap premia 29 (8,963) (6,498) Lease payments 24 (4,531) (9,822) Loan repaid by intermediary parent undertaking 32 1,500 (1,500) Net cash outflow from financing activities 564,947 (21,420) Net increase in cash and cash equivalents (34,304) 56,005 Foreign exchange movements 432 731 Cash and cash equivalents at beginning of period 94,933 38,197 Cash and cash equivalents at end of period 21 61,061 94,933 The accompanying notes are an integral part of these Consolidated Financial Statements.

SUSE FY2021 Annual report130
Consolidated financial statements
Notes to the Consolidated Financial Statements For the year ended 31 October 2021
130
1. General information SUSE S.A. (the “Company”) (société anonyme) incorporated and existing under the laws of the Grand Duchy of Luxembourg, with its registered office at 11-13 Boulevard de la Foire, L-1528 Luxembourg and registered with the Luxembourg Register of Commerce and Companies under number B225816. On 3 May 2021, the Company was transformed into a public limited liability company and the name of the Company changed from Marcel LUX IV SARL to SUSE S.A. The Initial Public Offering (IPO) of the Company was completed on 19 May 2021 when SUSE S.A. issued 18,300,000 shares at €30.00 per share for net proceeds of €540,765,000 and listed those shares together with a portion of the existing shares of the Company on the regulated market of the Frankfurt Stock Exchange (Prime Standard). The principal activity of the Group is that of an enterprise software company. The Group is a pioneer in open-source software which develops, markets and supports an enterprise grade ‘Linux’ operating system, open-source software defined infrastructure and application delivery solutions that give enterprises greater control and flexibility over their IT systems. The Company together with its wholly owned subsidiaries (the “Group” or the “SUSE Group”) collectively represent the operations of SUSE. These Consolidated Financial Statements of the Group are as at and for the year ended 31 October 2021. These Consolidated Financial Statements present the results of the Group as a whole. Details of the financial statements of the Company can be obtained at their registered office and at the Luxembourg Register of Commerce and Companies. These Consolidated Financial Statements were authorized for issuance on 19 January 2022. Information presented in the notes to these Consolidated Financial Statements have been presented in a systematic manner and typically following the order of the line items in the Consolidated Statement of Comprehensive Income and the Consolidated Statement of Financial Position.
2. Basis of preparation A. Basis of measurement The Consolidated Financial Statements have been prepared in accordance with International Financial Reporting Standards as adopted by the European Union (“EU IFRS” or “IFRS”). The Consolidated Financial Statements are presented in compliance with the requirements as set out in the Delegated Regulation 2019/815 on European Single Electronic Format (“ESEF Regulation”) which requires EU-regulated listed companies to produce their annual reports in eXtensible HyperText Markup Language (“XHTML”) for reporting periods beginning on or after 1 January 2020. An XBRL markup of the primary financial statements of the Group comprising the Consolidated Statement of Comprehensive Income, Consolidated Statement of Financial Position, Consolidated Statement of Changes in Equity and Consolidated Statement of Cash Flows has been created using the core taxonomy as specified in the ESEF Regulation. The Consolidated Financial Statements have been prepared under the historical cost basis except for the following items: Items Measurement basisDerivative financial instruments Fair value through profit and loss (“FVTPL”).Cash-settled share-based payments FVTPL. Retirement benefit obligations Plan assets and similar arrangements measured at fair value
through other comprehensive income (“FVOCI”) less the present value of the defined benefit obligation measured under the projected unit method (“actuarial basis”).
The preparation of these Consolidated Financial Statements in conformity with IFRS requires the use of certain critical accounting estimates. It also requires management to exercise its judgement in the process of applying the Group’s accounting policies. The areas involving a higher degree of judgement or complexity, or areas where assumptions and estimates are significant to the Consolidated Financial Statements are disclosed below in Note 3 ‘Critical judgments and sources of estimation uncertainty’. The principal accounting policies adopted by the Group in the preparation of the Consolidated Financial Statements are set out below in Note 4 ‘Significant accounting policies’.
131
2. Basis of preparation (continued) B. Basis of consolidation The Consolidated Financial Statements include the Company and its subsidiary undertakings together with the Group’s share of the results and net assets of equity accounted investments. Subsidiaries Subsidiaries are entities controlled by the Group. The Group has control over an entity where the Group is exposed to, or has rights to, variable returns from its involvement within the entity and it has the power over the entity to affect those returns. The existence and effect of potential voting rights that are currently exercisable or convertible are considered when assessing control. Control is presumed to exist when the Group owns more than half of the voting rights (which does not always equal percentage ownership) unless it can be demonstrated that ownership does not constitute control. The results of subsidiaries are consolidated from the date on which control passes to the Group. The results of disposed subsidiaries are consolidated up to the date on which control passes from the Group. Inter-company transactions and balances on transactions between Group companies are eliminated. Accounting policies of subsidiaries have been changed where necessary to ensure consistency with the policies adopted by the Group. Associates An associate is an entity that is neither a subsidiary nor a joint venture, over who’s operating and financial policies the Group exercises significant influence. Significant influence is presumed to exist where the Group has between 20% and 50% of the voting rights but can also arise where the Group holds less than 20% if it has the power to be actively involved and influential in operating and financial policy decisions affecting the entity. Associates are accounted for under the equity method, where the Consolidated Statement of Comprehensive Income and the Consolidated Statement of Financial Position includes the Group’s share of their profits and losses and net assets less any dividends received, less any impairment in value. Associates recorded as a result of an acquisition are recorded initially at cost. Unrealized gains arising from transactions between the Group and its associates are eliminated to the extent of the Group’s interests in the associates. Unrealized losses are eliminated in the same way as unrealized gains but only to the extent there is no evidence of impairment. C. Going concern The directors consider that the Company and its subsidiaries have adequate resources to continue in operational existence for a period of at least 12 months from the date of approval of these Consolidated Financial Statements. This assessment was made with due regard to an impact assessment of the ongoing Covid-19 (“Coronavirus”) pandemic, which initially emerged in March 2020. Management does not currently envisage Covid-19 to have a significant impact on the Group’s trading performance. In addition to the above the directors reviewed and assessed downside scenarios considered to be severe but plausible based on the principal risks and uncertainties to validate the continued application of the going concern basis in the preparation of the Consolidated Financial Statements of the Group. The directors evaluated the Group’s funding position, liquidity and financial covenant profile to ensure it had sufficient access to liquidity and covenant headroom for the Group to meet its obligations as they fall due for a period of at least 12 months from the date of signing the Group’s Consolidated Financial Statements on 19 January 2022. The going concern assessment period is from 20 January 2022 to 31 January 2023 (the “Assessment Period”). Furthermore, and in accordance with best practice guidance the directors considered events or conditions that may cast significant doubt on the Group’s ability to continue as a going concern in the period beyond the Assessment Period to 31 July 2023. The directors concluded that the disclosures contained herein sufficiently address relevant events and conditions in both the Assessment Period and the period beyond. In evaluating whether the going concern assumption is appropriate, the directors performed the following procedures: – reviewed the Group’s forecast cash flows, liquidity, covenant compliance and borrowing requirements over
the Assessment Period;

SUSE FY2021 Annual report 131
131
2. Basis of preparation (continued) B. Basis of consolidation The Consolidated Financial Statements include the Company and its subsidiary undertakings together with the Group’s share of the results and net assets of equity accounted investments. Subsidiaries Subsidiaries are entities controlled by the Group. The Group has control over an entity where the Group is exposed to, or has rights to, variable returns from its involvement within the entity and it has the power over the entity to affect those returns. The existence and effect of potential voting rights that are currently exercisable or convertible are considered when assessing control. Control is presumed to exist when the Group owns more than half of the voting rights (which does not always equal percentage ownership) unless it can be demonstrated that ownership does not constitute control. The results of subsidiaries are consolidated from the date on which control passes to the Group. The results of disposed subsidiaries are consolidated up to the date on which control passes from the Group. Inter-company transactions and balances on transactions between Group companies are eliminated. Accounting policies of subsidiaries have been changed where necessary to ensure consistency with the policies adopted by the Group. Associates An associate is an entity that is neither a subsidiary nor a joint venture, over who’s operating and financial policies the Group exercises significant influence. Significant influence is presumed to exist where the Group has between 20% and 50% of the voting rights but can also arise where the Group holds less than 20% if it has the power to be actively involved and influential in operating and financial policy decisions affecting the entity. Associates are accounted for under the equity method, where the Consolidated Statement of Comprehensive Income and the Consolidated Statement of Financial Position includes the Group’s share of their profits and losses and net assets less any dividends received, less any impairment in value. Associates recorded as a result of an acquisition are recorded initially at cost. Unrealized gains arising from transactions between the Group and its associates are eliminated to the extent of the Group’s interests in the associates. Unrealized losses are eliminated in the same way as unrealized gains but only to the extent there is no evidence of impairment. C. Going concern The directors consider that the Company and its subsidiaries have adequate resources to continue in operational existence for a period of at least 12 months from the date of approval of these Consolidated Financial Statements. This assessment was made with due regard to an impact assessment of the ongoing Covid-19 (“Coronavirus”) pandemic, which initially emerged in March 2020. Management does not currently envisage Covid-19 to have a significant impact on the Group’s trading performance. In addition to the above the directors reviewed and assessed downside scenarios considered to be severe but plausible based on the principal risks and uncertainties to validate the continued application of the going concern basis in the preparation of the Consolidated Financial Statements of the Group. The directors evaluated the Group’s funding position, liquidity and financial covenant profile to ensure it had sufficient access to liquidity and covenant headroom for the Group to meet its obligations as they fall due for a period of at least 12 months from the date of signing the Group’s Consolidated Financial Statements on 19 January 2022. The going concern assessment period is from 20 January 2022 to 31 January 2023 (the “Assessment Period”). Furthermore, and in accordance with best practice guidance the directors considered events or conditions that may cast significant doubt on the Group’s ability to continue as a going concern in the period beyond the Assessment Period to 31 July 2023. The directors concluded that the disclosures contained herein sufficiently address relevant events and conditions in both the Assessment Period and the period beyond. In evaluating whether the going concern assumption is appropriate, the directors performed the following procedures: – reviewed the Group’s forecast cash flows, liquidity, covenant compliance and borrowing requirements over
the Assessment Period;

SUSE FY2021 Annual report132
Consolidated financial statements
Notes to the Consolidated Financial Statements (continued) For the year ended 31 October 2021
132
2. Basis of preparation (continued) C. Going concern (continued) – evaluated a range of severe but plausible downside scenarios to reflect uncertainties inherent in forecasting
future operational and financial performance, including changes in the macro-economic environment. These include, but are not limited to, a reduction in forecast Annual Contract Value (“ACV”) growth and lower than expected renewal rates;
– considered various mitigation strategies available to management including, but not limited to, taking measures to reduce costs through a reduction in the number of incremental hires, reduced travel and marketing spend and commission payments in line with lower-than-expected revenues. Under each scenario, the mitigating actions identified are deemed to be in the control of, or realistically available to management;
– performed a further downside assessment to establish the impact during the Assessment Period of an extreme mitigated downside scenario, which extended the severe but plausible downside scenario modelling the impact of the Group experiencing a reduction in ACV (compared to FY21 actual levels) in respect of End user (New and Services), Cloud Services and IHV routes to market. In addition to this a significant reduction in the forecast End user renewal rate compared to historical averages was assumed.
In addition, the directors also considered the following factors in their going concern assessment: – the Group operates in a virtual environment and has the systems and processes that enables its employees
and operations to continue to function in a remote environment across all departments and all geographical areas. The Covid-19 pandemic has had a limited impact on day-to-day operations. Trading for the year ended 31 October 2021 has been in line with expectations.
– the vast majority of planned future revenues for 2022 arise from subscription contracts. The business model is a recurring revenues model, and there has not been any significant change to renewal rates. In FY21 and 2022 to date, the Group performed substantially in line with expectations and no significant slowdown has been noted in the current business. This is evident in key performance indicators of the Group such as ACV which was in line with expectations. Equally the Group has not observed a significant deterioration in cash collections or illiquidity of its customers since the pandemic began.
– significant non-current assets such as goodwill, intangible assets and deferred tax assets continue to be carried at an amount that is at least the recoverable amount. As the performance of the business to date coupled with future expected performance during the FY22 financial period is not expected to be significantly off budget there are no conditions for impairment.
– as at 31 October 2021 the Group had available liquidity of $142.1m ($61.1m in cash and $81m in available headroom on the Revolving Credit Facility).
– the Group retains sufficient liquidity to support operations and make scheduled interest and capital payments as they become due, throughout the Assessment Period in the severe but plausible downside scenarios and the extreme mitigated downside scenario. Further, the Revolving Credit Facility is forecast to remain unutilized in all modelled downside scenarios.
– currently there are no financial covenants applicable to the Group owing to the unutilized status of the Revolving Credit Facility as at 31 October 2021 and the date of approval of the Consolidated Financial Statements. As such, there is no risk of breach of financial covenants.
– the Group retains financial covenant compliance throughout the Assessment Period in the severe but plausible downside scenarios and the extreme mitigated downside scenario.
– the Group has a proven track record of taking timely actions to effectively mitigate downside risks, including cutting costs and conserving cash by managing working capital.
– on 21 May 2021, following the IPO at the Frankfurt Stock Exchange on 19 May 2021, the Group partially repaid some of its loan notes; further details are disclosed in Note 23.
133
2. Basis of preparation (continued) C. Going concern (continued) – an increase of $88.3m in the Revolving Credit Facility limit to $169.3m was approved by the Group’s lenders
on 22 December 2021 as disclosed in the Subsequent Events Note 34 of the Consolidated Financial Statements. This additional headroom arising from the increase in the Revolving Credit Facility limit was not considered as part of the going concern assessment and as such results in additional liquidity headroom for the Group.
– The directors concluded, after rigorously evaluating relevant, available information, that there are no other events or conditions, that may cast significant doubt upon the Group’s ability to continue as a going concern during the Assessment Period that require disclosure in the Group’s Consolidated Financial Statements for the year ended 31 October 2021. The directors also evaluated potential events and conditions during the period beyond the Assessment Period that may cast significant doubt on the going concern assessment, concluding that there were no other such events or conditions. Based on this comprehensive assessment, the directors concluded that the continued use of the going concern basis of accounting in preparing the Group’s Consolidated Financial Statements for the year ended 31 October 2021 remains appropriate. Accordingly, these accounts do not include any adjustments to the carrying amount or classification of assets and liabilities that would result if the Group were unable to continue as a going concern.
D. Functional and presentational currency The financial statements are presented in thousands of US dollars (denoted as “US$”), which is the functional currency of the Company in addition to several principal subsidiaries of the Group. E. Adoption of new and revised International Financial Reporting Standards (i) The following amendments were applied by the Group for the first time in the year ended 31 October 2021 but did not result in material changes to the Consolidated Financial Statements. – COVID-19 Related Rent Concessions (Amendment to IFRS 16) – Interest Rate Benchmark Reform – Phase 1 (Amendments to IFRS 9, IAS 39, IFRS 7, IFRS 4 and IFRS 16) – Definition of Material (Amendments to IAS 1 and IAS 8) – Definition of a Business (Amendments to IFRS 3) – Amendments to References to Conceptual Framework in IFRS Standards (ii) Amendments to current standards and interpretations available for early adoption or not yet endorsed by the EU which the Group did not apply were as follows: – Interest Rate Benchmark Reform – Phase 2 (Amendments to IFRS 9, IAS 39, IFRS 7, IFRS 4 and IFRS 16)* – Onerous Contracts – Costs of Fulfilling a Contract (Amendments to IFRS 7)** – Annual Improvements to IFRS Standards 2018-2020** – Property, Plant and Equipment: Proceeds before Intended Use (Amendments to IAS 16)** – Reference to the Conceptual Framework (Amendments to IFRS 3)** – Classification of Liabilities as Current or Non-current (Amendments to IAS 1)*** – IFRS 17 Insurance Contracts and amendments to IFRS 17 Insurance Contracts*** – Disclosure of Accounting Policies (Amendments to IAS 1 and IFRS Practice Statement 2)*** – Definition of Accounting Estimates (Amendments to IAS 8)*** – Deferred Tax related to Assets and Liabilities arising from a Single Transaction (Amendments to IAS 12)*** – Sale or Contribution of Assets between an Investor and its Associate or Joint Venture (Amendment to IFRS 10
and IAS 28)**** Management do not believe that the future impact of the amendments and interpretations to existing standards listed above will have a material impact on the Consolidated Financial Statements. * Required to be applied for annual periods after 1 January 2021 ** Required to be applied for annual periods after 1 January 2022 *** Required to be applied for annual periods after 1 January 2023 **** Available for optional adoption / effective date deferred indefinitely

SUSE FY2021 Annual report 133
133
2. Basis of preparation (continued) C. Going concern (continued) – an increase of $88.3m in the Revolving Credit Facility limit to $169.3m was approved by the Group’s lenders
on 22 December 2021 as disclosed in the Subsequent Events Note 34 of the Consolidated Financial Statements. This additional headroom arising from the increase in the Revolving Credit Facility limit was not considered as part of the going concern assessment and as such results in additional liquidity headroom for the Group.
– The directors concluded, after rigorously evaluating relevant, available information, that there are no other events or conditions, that may cast significant doubt upon the Group’s ability to continue as a going concern during the Assessment Period that require disclosure in the Group’s Consolidated Financial Statements for the year ended 31 October 2021. The directors also evaluated potential events and conditions during the period beyond the Assessment Period that may cast significant doubt on the going concern assessment, concluding that there were no other such events or conditions. Based on this comprehensive assessment, the directors concluded that the continued use of the going concern basis of accounting in preparing the Group’s Consolidated Financial Statements for the year ended 31 October 2021 remains appropriate. Accordingly, these accounts do not include any adjustments to the carrying amount or classification of assets and liabilities that would result if the Group were unable to continue as a going concern.
D. Functional and presentational currency The financial statements are presented in thousands of US dollars (denoted as “US$”), which is the functional currency of the Company in addition to several principal subsidiaries of the Group. E. Adoption of new and revised International Financial Reporting Standards (i) The following amendments were applied by the Group for the first time in the year ended 31 October 2021 but did not result in material changes to the Consolidated Financial Statements. – COVID-19 Related Rent Concessions (Amendment to IFRS 16) – Interest Rate Benchmark Reform – Phase 1 (Amendments to IFRS 9, IAS 39, IFRS 7, IFRS 4 and IFRS 16) – Definition of Material (Amendments to IAS 1 and IAS 8) – Definition of a Business (Amendments to IFRS 3) – Amendments to References to Conceptual Framework in IFRS Standards (ii) Amendments to current standards and interpretations available for early adoption or not yet endorsed by the EU which the Group did not apply were as follows: – Interest Rate Benchmark Reform – Phase 2 (Amendments to IFRS 9, IAS 39, IFRS 7, IFRS 4 and IFRS 16)* – Onerous Contracts – Costs of Fulfilling a Contract (Amendments to IFRS 7)** – Annual Improvements to IFRS Standards 2018-2020** – Property, Plant and Equipment: Proceeds before Intended Use (Amendments to IAS 16)** – Reference to the Conceptual Framework (Amendments to IFRS 3)** – Classification of Liabilities as Current or Non-current (Amendments to IAS 1)*** – IFRS 17 Insurance Contracts and amendments to IFRS 17 Insurance Contracts*** – Disclosure of Accounting Policies (Amendments to IAS 1 and IFRS Practice Statement 2)*** – Definition of Accounting Estimates (Amendments to IAS 8)*** – Deferred Tax related to Assets and Liabilities arising from a Single Transaction (Amendments to IAS 12)*** – Sale or Contribution of Assets between an Investor and its Associate or Joint Venture (Amendment to IFRS 10
and IAS 28)**** Management do not believe that the future impact of the amendments and interpretations to existing standards listed above will have a material impact on the Consolidated Financial Statements. * Required to be applied for annual periods after 1 January 2021 ** Required to be applied for annual periods after 1 January 2022 *** Required to be applied for annual periods after 1 January 2023 **** Available for optional adoption / effective date deferred indefinitely

SUSE FY2021 Annual report134
Consolidated financial statements
Notes to the Consolidated Financial Statements (continued) For the year ended 31 October 2021
134
3. Critical judgements and sources of estimation uncertainty The preparation of these Consolidated Financial Statements in conformity with IFRS requires the use of certain critical accounting estimates. It also requires management to exercise its judgement in the process of applying the Group’s accounting policies. The Group regularly reviews these estimates and updates them as required. Revisions to estimates are recognized prospectively. The following estimates are those which management view as critical and therefore could result in a material adjustment to the carrying amount of assets and liabilities in the next financial period should actual results differ: A. Identification and measurement of assets and liabilities acquired in a business combination Goodwill and other intangible assets such as intellectual property and customer relationships are subject to allocation adjustments under the acquisition method accounting for business combinations. Management evaluate the best available evidence for the allocation and measurement of intangible assets. Similarly, there is estimation uncertainty involved in the measurement of liabilities identified as part of a business combination. The recognition of acquired deferred revenue involved a step-down adjustment to reflect its fair value based on the cost to deliver the related service (“the haircut” to deferred revenue). The process involved a ‘bottom-up approach’ where the costs needed to fulfil the performance obligation are added to an appropriate profit margin. The costs to fulfil are reflective of those that market participants would incur to fulfil the service and do not include costs such as marketing, recruiting, and training, which are incurred prior to the business combination. B. Potential impairment of goodwill and intangible assets Impairment exists when the carrying value of an asset or cash generating unit exceeds its recoverable amount, which is the higher of its fair value less costs of disposal and its value in use. The fair value less costs of disposal calculation is based on available data from binding sales transactions, conducted at arm’s length, for similar assets or observable market prices less incremental costs of disposing of the asset. The value in use calculation is based on a DCF model. The cash flows are derived from the budget for the next three years and do not include restructuring activities that the Group is not yet committed to or significant future investments that will enhance the performance of the assets of the Group being tested. The recoverable amount is sensitive to the discount rate used for the DCF model as well as the expected future cash inflows and the growth rate used for extrapolation purposes. These estimated parameters have the highest impact on the calculation of the value in use for the entire SUSE Group. The key assumptions used to determine the recoverable amount, including a sensitivity analysis, are as disclosed in the notes to the financial statements. C. Fair value of share-based payments Measuring the fair value of share-based payment transactions requires the estimation and judgement in predicting the timing of vesting and the ultimate number of instruments that will vest over the life of a scheme. The events, as set out in Note 27, triggered the acceleration of the vesting of the share-based payments awards of the Group. The IPO event triggered the settlement of the VSOP liability in full and the acceleration of the vesting of the VSOs subject to a service condition. Further details are disclosed in Note 27. D. Loan modification On 21 May 2021, following the IPO at the Frankfurt Stock Exchange on 19 May 2021, the Group repaid some of the loan notes; further details are disclosed in Note 23. The modification of the expected cash flows for these notes resulted in an acceleration of the amortization of the loan related capitalized arrangement fees. E. Calculation or provisions A provision is a liability of uncertain timing or amount. The Group holds provisions in respect of lossmaking operations, a restructuring program, future dilapidation costs, and litigation costs. Provisions are made for the expected amounts payable in respect of known or probable costs as at each reporting date. Provisions are measured at present value where the time value of money is deemed significant.
135
3. Critical judgements and sources of estimation uncertainty (continued) F. Uncertain tax positions The Group is subject to income taxes in numerous jurisdictions. Significant judgement is required in determining the worldwide provision for income taxes including structuring activities undertaken by the Group and the application of complex transfer pricing rules. The Group recognizes liabilities for anticipated settlement of tax issues based on judgments of whether additional taxes will be due. Significant issues may take several periods to resolve. In making judgments on the probability and amount of any tax charge, management considers: – Status of the unresolved matter; – Strength of technical argument and clarity of legislation; – External advice; – Resolution process, past experience and precedents set with the particular taxing authority; – Agreements previously reached in other jurisdictions on comparable issues; and – Statute of limitations. The ultimate tax liability may differ from the amount provided depending on interpretations of tax law, settlement negotiations or changes in legislation. Where the final tax outcome of these matters is different from the amounts that were initially recorded, such differences will impact the financial statements in the period in which such determination is made. Most of the Group’s uncertain tax positions are inherited as part of a business combination and therefore, are subject to indemnification. The recoverability of related indemnification assets is itself a judgement. G. Recoverability of deferred tax assets The recoverability of deferred tax assets recognized by the Group is dependent on the future generation of taxable profits. The Group has a proven record of sustained taxable profits and Management are satisfied that losses generated in this and prior periods are substantially as a result of the costs of transactions including the SUSE acquisition, the IPO, current year acquisitions and subsequent costs of integration. H. Capitalization of software contracts and development costs In determining whether software contracts and development expenditure can be capitalized as intangible assets, judgment is required to determine whether intangible asset recognition criteria have been met at the time the expenditure is incurred or contract has commenced. These judgments impact the total amount of intangible assets presented on the Consolidated Balance Sheet. Additionally, Management exercise judgment in selecting an amortization period for development costs, the determinations of which are based on estimates regarding the period over which the intangible asset is expected to provide economic benefits to the Group. I. IPO transaction costs Qualifying costs of an equity transaction are accounted for as a deduction from equity to the extent that they are incremental costs directly attributable to the equity transaction that otherwise would have been avoided. Listing transactions often involve both listing existing shares and issuing new ones. The costs directly attributable to issuing new shares should be recognised directly in equity. Any costs attributable to listing existing shares should be expensed as they are incurred. Qualifying costs that relate to both existing shares and new shares are allocated based on the number of shares. In determining whether costs are directly attributable to the equity transaction, judgment is required to determine whether the recognition criteria have been met. These judgments impact the total amount of transaction costs presented in the Consolidated Statement of Comprehensive Income and Consolidated Statement of Changes in Equity. Set out below are the significant accounting policies of the Group to 31 October 2021 which have been applied consistently in the current year and prior financial reporting period:

SUSE FY2021 Annual report 135
135
3. Critical judgements and sources of estimation uncertainty (continued) F. Uncertain tax positions The Group is subject to income taxes in numerous jurisdictions. Significant judgement is required in determining the worldwide provision for income taxes including structuring activities undertaken by the Group and the application of complex transfer pricing rules. The Group recognizes liabilities for anticipated settlement of tax issues based on judgments of whether additional taxes will be due. Significant issues may take several periods to resolve. In making judgments on the probability and amount of any tax charge, management considers: – Status of the unresolved matter; – Strength of technical argument and clarity of legislation; – External advice; – Resolution process, past experience and precedents set with the particular taxing authority; – Agreements previously reached in other jurisdictions on comparable issues; and – Statute of limitations. The ultimate tax liability may differ from the amount provided depending on interpretations of tax law, settlement negotiations or changes in legislation. Where the final tax outcome of these matters is different from the amounts that were initially recorded, such differences will impact the financial statements in the period in which such determination is made. Most of the Group’s uncertain tax positions are inherited as part of a business combination and therefore, are subject to indemnification. The recoverability of related indemnification assets is itself a judgement. G. Recoverability of deferred tax assets The recoverability of deferred tax assets recognized by the Group is dependent on the future generation of taxable profits. The Group has a proven record of sustained taxable profits and Management are satisfied that losses generated in this and prior periods are substantially as a result of the costs of transactions including the SUSE acquisition, the IPO, current year acquisitions and subsequent costs of integration. H. Capitalization of software contracts and development costs In determining whether software contracts and development expenditure can be capitalized as intangible assets, judgment is required to determine whether intangible asset recognition criteria have been met at the time the expenditure is incurred or contract has commenced. These judgments impact the total amount of intangible assets presented on the Consolidated Balance Sheet. Additionally, Management exercise judgment in selecting an amortization period for development costs, the determinations of which are based on estimates regarding the period over which the intangible asset is expected to provide economic benefits to the Group. I. IPO transaction costs Qualifying costs of an equity transaction are accounted for as a deduction from equity to the extent that they are incremental costs directly attributable to the equity transaction that otherwise would have been avoided. Listing transactions often involve both listing existing shares and issuing new ones. The costs directly attributable to issuing new shares should be recognised directly in equity. Any costs attributable to listing existing shares should be expensed as they are incurred. Qualifying costs that relate to both existing shares and new shares are allocated based on the number of shares. In determining whether costs are directly attributable to the equity transaction, judgment is required to determine whether the recognition criteria have been met. These judgments impact the total amount of transaction costs presented in the Consolidated Statement of Comprehensive Income and Consolidated Statement of Changes in Equity. Set out below are the significant accounting policies of the Group to 31 October 2021 which have been applied consistently in the current year and prior financial reporting period:

SUSE FY2021 Annual report136
Consolidated financial statements
Notes to the Consolidated Financial Statements (continued) For the year ended 31 October 2021
136
4. Significant accounting policies A. Revenue recognition The Group derives its revenues primarily from subscription license services it offers to its customers under various software solutions. Customer subscriptions are usually 12, 24, 36 or 60 months in term and are typically billed in advance. Occasionally income is derived from fees collected retrospectively for service already provided. The Group also generates ancillary revenues from training and consulting contracts. Revenue is recognized when benefits arising from contractual performance obligations are transferred to a customer for an amount that reflects the consideration the Group expects to receive from a customer contract. IFRS 15 Revenue from Contracts with Customers establishes a five-step model of recognizing revenue from customer contracts that requires revenue to be recognized when control over goods and services is transferred to the customer. The Group applies five steps in recognizing revenue as follows: 1. Identify the contract with a customer The Group determines that it has a contract with a customer when the contract is approved, the party’s rights regarding the products and services to be transferred can be identified, the payment terms for the products and services are identified, the customer’s ability to pay can be determined and the contract has commercial substance. Judgment is used to assess the customer’s ability and intent to pay, which is based upon factors including the customer’s historical payment experience or credit and financial information pertaining to the customer. 2. Identify the performance obligations in the contract The Group’s performance obligations are identified based on the products and services that will be transferred to the customer that are both capable of being distinct and are distinct in the context of the contract. They consist of subscriptions including technical support and consulting services. Subscriptions and technical support are combined into one single performance obligation as both are rarely sold independent of one another and customers expect to receive both when purchasing a subscription. Performance obligations in relation to consulting are distinct and depend on the terms and conditions of the specific customer contract. 3. Determine the transaction price The Group determines the transaction price based on the consideration expected to be received in exchange for transferring performance obligations to the customer. Rebates paid to resellers as part of a contracted program are accounted for as a reduction to the transaction price. Rebates are measured in accordance with the contractual terms as agreed with the customer and are variable on account of sales volume within a period. The Group’s contracts do not contain significant financing components. The Group does not typically extend customer payment terms beyond a standard 30-day term. Rebates paid to partners as part of a contracted program are netted against revenue where the rebate paid is based on the achievement of sales targets made by the partner. 4. Allocate the transaction price to performance obligations in the contract When a contract contains a single performance obligation, the entire transaction price is allocated to that one performance obligation. The majority of revenue earned is delivered as part of a single performance obligation. Contracts that contain multiple performance obligations require an allocation of the transaction price to each performance obligation based on a relative standalone selling price (“SSP”). The Group determines the SSP based on the observable price when the Group sells the subscriptions or consulting services separately.
137
4. Significant accounting policies (continued) A. Revenue recognition (continued) 5. Recognize revenue when or as the performance obligation is satisfied Revenue is recognized at the time the related performance obligation is satisfied by transferring the promised subscription and service offerings to a customer. For each performance obligation, a determination is made as to whether the control is transferred over time or at a point in time. For performance obligations satisfied over time, a method to measure progress towards complete satisfaction is selected, based upon the most faithful depiction of performance. The selected method for each performance obligation type is applied consistently to similar contracts. Subscription license revenues are provided evenly over a defined term, such that revenue is deferred and recognized on a straight-line basis, over the contractual period of performance, (“over time”). For subscription license revenue where performance obligations are already provided, the revenue is recognized immediately as there are no future performance obligations (“point in time”). The Group recognizes certain professional services revenue as services are rendered and recognizes costs as they are incurred. The Group recognizes other revenue from fixed-price professional services contracts as work progresses over the contract period on a proportional performance basis, as determined by the percentage of labor costs incurred to date compared to the total estimated labor costs of a contract. The Group accounts for costs incurred and rebates offered related to acquiring revenue contracts as follows: – Cost of obtaining customer contracts - The Group capitalizes sales commission costs when they are
incremental and, if expected to be recovered, they are amortized over the customer life or pattern of revenue for the related contract. The Group applies a practical expedient to expense sales commissions costs as incurred where the related benefit is one year or less.
– Cost of consideration payable and rebates offered to a customer - Certain payments to customers such as rebates are treated as a reduction of the transaction price and are included in revenue as a variable consideration component.
– Rebillable expenses - The Group reports gross expenses that are recharged to customers, such as travel and accommodation, as a component of consulting revenue.
The Group presents deferred revenue as a contract liability. Rights to consideration from customers are only presented as accounts receivable if the rights are unconditional. Revenue allocated to remaining performance obligations represents contracted revenue that has not yet been recognized which includes unearned revenue and amounts that will be invoiced and recognized as revenue in future periods. B. Cost of sales Cost of sales includes costs of consulting, helpline support and royalties payable to third parties. C. Pension obligations and long-term pension assets (i) Defined contribution plans A defined contribution plan is a pension plan under which the Group pays fixed contributions into a separate entity. The Group has no legal or constructive obligations to pay further contributions if the fund does not hold sufficient assets to pay all employees the benefits relating to employee service in the current and prior periods. For defined contribution plans, the Group pays contributions to publicly or privately administered pension insurance plans on a mandatory, contractual or voluntary basis. The Group has no further payment obligations once the contributions have been paid. The contributions are recognized as an employee benefit expense when they are due. Prepaid contributions are recognized as an asset to the extent that a cash refund or a reduction in the future payments is available.

SUSE FY2021 Annual report 137
137
4. Significant accounting policies (continued) A. Revenue recognition (continued) 5. Recognize revenue when or as the performance obligation is satisfied Revenue is recognized at the time the related performance obligation is satisfied by transferring the promised subscription and service offerings to a customer. For each performance obligation, a determination is made as to whether the control is transferred over time or at a point in time. For performance obligations satisfied over time, a method to measure progress towards complete satisfaction is selected, based upon the most faithful depiction of performance. The selected method for each performance obligation type is applied consistently to similar contracts. Subscription license revenues are provided evenly over a defined term, such that revenue is deferred and recognized on a straight-line basis, over the contractual period of performance, (“over time”). For subscription license revenue where performance obligations are already provided, the revenue is recognized immediately as there are no future performance obligations (“point in time”). The Group recognizes certain professional services revenue as services are rendered and recognizes costs as they are incurred. The Group recognizes other revenue from fixed-price professional services contracts as work progresses over the contract period on a proportional performance basis, as determined by the percentage of labor costs incurred to date compared to the total estimated labor costs of a contract. The Group accounts for costs incurred and rebates offered related to acquiring revenue contracts as follows: – Cost of obtaining customer contracts - The Group capitalizes sales commission costs when they are
incremental and, if expected to be recovered, they are amortized over the customer life or pattern of revenue for the related contract. The Group applies a practical expedient to expense sales commissions costs as incurred where the related benefit is one year or less.
– Cost of consideration payable and rebates offered to a customer - Certain payments to customers such as rebates are treated as a reduction of the transaction price and are included in revenue as a variable consideration component.
– Rebillable expenses - The Group reports gross expenses that are recharged to customers, such as travel and accommodation, as a component of consulting revenue.
The Group presents deferred revenue as a contract liability. Rights to consideration from customers are only presented as accounts receivable if the rights are unconditional. Revenue allocated to remaining performance obligations represents contracted revenue that has not yet been recognized which includes unearned revenue and amounts that will be invoiced and recognized as revenue in future periods. B. Cost of sales Cost of sales includes costs of consulting, helpline support and royalties payable to third parties. C. Pension obligations and long-term pension assets (i) Defined contribution plans A defined contribution plan is a pension plan under which the Group pays fixed contributions into a separate entity. The Group has no legal or constructive obligations to pay further contributions if the fund does not hold sufficient assets to pay all employees the benefits relating to employee service in the current and prior periods. For defined contribution plans, the Group pays contributions to publicly or privately administered pension insurance plans on a mandatory, contractual or voluntary basis. The Group has no further payment obligations once the contributions have been paid. The contributions are recognized as an employee benefit expense when they are due. Prepaid contributions are recognized as an asset to the extent that a cash refund or a reduction in the future payments is available.
SUSE FY2021 Annual report138
Consolidated financial statements
Notes to the Consolidated Financial Statements (continued) For the year ended 31 October 2021
138
4. Significant accounting policies (continued) C. Pension obligations and long-term pension assets (continued) (ii) Defined benefit plans A defined benefit plan is a pension plan that is not a defined contribution plan. Typically, defined benefit plans define an amount of pension benefit that an employee will receive on retirement. This is usually dependent on one or more factors such as age, years of service and compensation. The liability recognized in the Consolidated Statement of Financial Position in respect of defined benefit pension plans is the present value of the obligation at the end of the reporting period less the fair value of pledged plan assets. The defined benefit obligation is calculated annually by independent actuaries using the projected unit credit method. The present value of the defined benefit obligation is determined by discounting the estimated future cash outflows using interest rates of high-quality corporate bonds that have terms to mature approximating to the terms of the related pension obligation. Actuarial gains and losses arising from experience adjustments and changes in actuarial assumptions are charged or credited to equity in other comprehensive income in the period in which they arise. Past-service costs are recognized immediately in the Consolidated Statement of Comprehensive Income. The current service cost is recognized in the Consolidated Statement of Comprehensive Income as an employee benefit and reflects the increase in the defined benefit obligation resulting from employee service in the current year, benefit changes, curtailments and settlements. The net interest cost is calculated by applying the discount rate to the net balance of the defined benefit obligation and the fair value of plan assets. This cost is included in employee benefit expense in the Consolidated Statement of Comprehensive Income. Long-term pension assets relate to the reimbursement right under insurance policies held in the Group with guaranteed interest rates that do not meet the definition of a qualifying insurance policy as they have not been pledged to the plan and are subject to the creditors of the Group. Such reimbursement rights assets are recorded in the Consolidated Statement of Financial Position as long-term pension assets. These contractual arrangements are measured at fair value through other comprehensive income (“FVOCI”). Fair value of the reimbursement right asset is deemed to be the present value of the related obligation because the right to reimbursement exactly matches the amounts of benefits payable. D. Share-based payments (i) Equity-settled transactions For all equity-settled share-based payment arrangements, the cost is recognized in employee expense with a corresponding increase in the capital contribution. The cumulative expense recognized for equity-settled transactions at each reporting date until the vesting date reflects the extent to which the vesting period has expired and the Group’s best estimate of the number of equity instruments that will ultimately vest. Service and non-market performance conditions are not considered when determining the grant date fair value of awards, but the likelihood of the conditions being met is assessed as part of the Group’s best estimate of the number of equity instruments that will ultimately vest. When the terms of an equity-settled award are modified, the minimum expense recognized is the grant date fair value of the unmodified award provided the original vesting terms of the award are met. An additional expense, measured as at the date of modification, is recognized for any modification that increases the total fair value of the share-based payment transaction, or is otherwise beneficial to the employee. Where an award is cancelled by the entity or by the counterparty, any remaining element of the fair value of the award is expensed immediately through profit or loss. The Group has the following equity-settled share-based payment arrangements: (a) Management Investment Participation Program The Management Investment Participation Program (“MIPP”) is an equity-settled Group share-based payment arrangement under which certain members of management have rights to subscribe for ordinary and preference shares of an intermediary parent company as a means of profit participation in return for services rendered to the Group. As the characteristics of the shares are similar to an option, the grant date fair value of shares issued is determined using a Black Scholes Merton valuation model.
139
4. Significant accounting policies (continued) D. Share-based payments (continued) (i) Equity-settled transactions (continued) (b) Long-term Incentive Plans The Long-term Incentive Plans (“LTIP”) are equity-settled share-based payment arrangements which allow employees to a pro-rata economic participation in the future value increase of the Group. The LTIP comprises two Restricted Stock Unit (“RSU”) Programs and a Stock Option Program for Senior Executives. RSUs Following the IPO on 19 May 2021, the Group established a Transitional RSU Award and an Annual RSU Award. Participants are granted a Conditional Share Award by the Group which comprises a number of RSUs. Each RSU is a promise to transfer one share of SUSE S.A. stock to a participant at the end of the vesting period, provided that the participant remains employed by the Group at the end of the respective vesting period. The transitional RSUs have a two-year vesting period. The Annual RSUs vest in three equal tranches after the date of grant. The grant date fair value is based on the spot price of an ordinary share of SUSE S.A on this date. The expense recognised is based on the estimate of the number of shares that will vest, following a graded vesting pattern over the vesting period. The expense is trued up at each reporting date to take into account leavers in that period. A 5% attrition rate is also applied to account for future leavers, where invested awards will be forfeited. This % is based on observed attrition rates adjusting for the fact actual leaver awards have already been removed. Annual Option Award Members of the Management Board and senior employees of SUSE are eligible for the grant of an Annual Option Award, with an exercise price equal to the IPO price. Annual Option Awards will vest in two equal tranches on the second and third anniversaries of the date of grant. The options will become exercisable on the respective vesting date of each tranche. For the initial grant one half of the options (1st tranche) will vest on 18 May 2023 and the other half (2nd tranche) on 18 May 2024; the option awards will expire on 18 May 2031, if not exercised. 100% of the Annual Options granted are subject to a service condition and follow a graded vesting pattern over the contractual period. The fair value of the Options is measured using the Black-Scholes Option model taking into account the terms and conditions upon which the options were granted. The risk-free interest rate is based on prices and yields of listed federal securities for zero coupon bonds, listed on the Frankfurt Stock Exchange. The future volatility for the life of the options was estimated based on the median volatility of peer groups/competitors used by ThompsonOne and other financial analysts. (c) Stock grant award to members of the Supervisory Board Members of the Supervisory Board were awarded a one-off stock grant of shares in SUSE S.A. at the initial listing price of €30.00. In aggregate, a total grant of €1,200,000 was made of which €262,080 was settled in cash and the residual amount of €937,920 was granted in the form of 31,264 SUSE S.A. shares. The shares are subject to a lock-up and during the vesting period the members shall not sell, transfer or dispose of the shares. If a bad leaver during the vesting period, the member shall re-transfer and re-pay the shares on a prorate basis. The vesting period is from the date of appointment on 4 May 2021 to 30 April 2024. The fair value is being recognised over the vesting period on a straight-line basis, with the cash amount already settled being treated as a prepayment. (ii) Cash-settled transactions The Virtual Share Options Programme (“VSOP”) is a cash-settled scheme in which certain employees can participate in the future share appreciation rights of the Group’s equity until an exit event. A liability is recognized for the fair value of cash-settled transactions. The fair value is measured initially at the date of grant and at each reporting date up to and including the settlement date, with changes in fair value recognized as an employee expense. The fair value is expensed over the period until the vesting date with recognition of a corresponding liability. Fair value is determined using valuation techniques as appropriate to the conditions of the options issued. The approach used to account for modifications and cancellations when measuring equity-settled transactions also applies to cash-settled transactions. The Initial Public Offering (IPO), on 19 May 2021, triggered an acceleration of an Exit Event under the terms of the scheme and resulted in an acceleration of VSOs vesting from March 2023 to May 2021. Further details are set out in Note 27.

SUSE FY2021 Annual report 139
139
4. Significant accounting policies (continued) D. Share-based payments (continued) (i) Equity-settled transactions (continued) (b) Long-term Incentive Plans The Long-term Incentive Plans (“LTIP”) are equity-settled share-based payment arrangements which allow employees to a pro-rata economic participation in the future value increase of the Group. The LTIP comprises two Restricted Stock Unit (“RSU”) Programs and a Stock Option Program for Senior Executives. RSUs Following the IPO on 19 May 2021, the Group established a Transitional RSU Award and an Annual RSU Award. Participants are granted a Conditional Share Award by the Group which comprises a number of RSUs. Each RSU is a promise to transfer one share of SUSE S.A. stock to a participant at the end of the vesting period, provided that the participant remains employed by the Group at the end of the respective vesting period. The transitional RSUs have a two-year vesting period. The Annual RSUs vest in three equal tranches after the date of grant. The grant date fair value is based on the spot price of an ordinary share of SUSE S.A on this date. The expense recognised is based on the estimate of the number of shares that will vest, following a graded vesting pattern over the vesting period. The expense is trued up at each reporting date to take into account leavers in that period. A 5% attrition rate is also applied to account for future leavers, where invested awards will be forfeited. This % is based on observed attrition rates adjusting for the fact actual leaver awards have already been removed. Annual Option Award Members of the Management Board and senior employees of SUSE are eligible for the grant of an Annual Option Award, with an exercise price equal to the IPO price. Annual Option Awards will vest in two equal tranches on the second and third anniversaries of the date of grant. The options will become exercisable on the respective vesting date of each tranche. For the initial grant one half of the options (1st tranche) will vest on 18 May 2023 and the other half (2nd tranche) on 18 May 2024; the option awards will expire on 18 May 2031, if not exercised. 100% of the Annual Options granted are subject to a service condition and follow a graded vesting pattern over the contractual period. The fair value of the Options is measured using the Black-Scholes Option model taking into account the terms and conditions upon which the options were granted. The risk-free interest rate is based on prices and yields of listed federal securities for zero coupon bonds, listed on the Frankfurt Stock Exchange. The future volatility for the life of the options was estimated based on the median volatility of peer groups/competitors used by ThompsonOne and other financial analysts. (c) Stock grant award to members of the Supervisory Board Members of the Supervisory Board were awarded a one-off stock grant of shares in SUSE S.A. at the initial listing price of €30.00. In aggregate, a total grant of €1,200,000 was made of which €262,080 was settled in cash and the residual amount of €937,920 was granted in the form of 31,264 SUSE S.A. shares. The shares are subject to a lock-up and during the vesting period the members shall not sell, transfer or dispose of the shares. If a bad leaver during the vesting period, the member shall re-transfer and re-pay the shares on a prorate basis. The vesting period is from the date of appointment on 4 May 2021 to 30 April 2024. The fair value is being recognised over the vesting period on a straight-line basis, with the cash amount already settled being treated as a prepayment. (ii) Cash-settled transactions The Virtual Share Options Programme (“VSOP”) is a cash-settled scheme in which certain employees can participate in the future share appreciation rights of the Group’s equity until an exit event. A liability is recognized for the fair value of cash-settled transactions. The fair value is measured initially at the date of grant and at each reporting date up to and including the settlement date, with changes in fair value recognized as an employee expense. The fair value is expensed over the period until the vesting date with recognition of a corresponding liability. Fair value is determined using valuation techniques as appropriate to the conditions of the options issued. The approach used to account for modifications and cancellations when measuring equity-settled transactions also applies to cash-settled transactions. The Initial Public Offering (IPO), on 19 May 2021, triggered an acceleration of an Exit Event under the terms of the scheme and resulted in an acceleration of VSOs vesting from March 2023 to May 2021. Further details are set out in Note 27.

SUSE FY2021 Annual report140
Consolidated financial statements
Notes to the Consolidated Financial Statements (continued) For the year ended 31 October 2021
140
4. Significant accounting policies (continued) E. Foreign currency (i) Functional and presentation currency The presentation currency of the Group is US dollars (denoted as “US$”). Items included in the financial statements of each of the Group’s entities are measured in the functional currency of each entity. (ii) Transaction balances Foreign currency transactions are translated into the functional currency using exchange rates prevailing at the dates of the transactions. Gains and losses resulting from settlement of such transactions and from the translation at year end exchange rates of monetary assets and liabilities denominated in foreign currencies are recognized in the Consolidated Statement of Comprehensive Income. (iii) Group companies The results and financial position of all the Group entities that have a functional currency different from the presentation currency are translated into the presentation currency as follows: – Income and expenses for each consolidated statement of profit or loss items are translated at average
exchange rates (unless this average is not a reasonable approximation of the cumulative effect of the rates prevailing on the transaction dates, in which case income and expenses are translated at the dates of the transactions);
– Assets and liabilities for each Consolidated Statement of Financial Position presented are translated at the closing rate as at the date of that Consolidated Statement of Financial Position;
– All resulting exchange differences are recognized in other comprehensive income and accumulated in the foreign currency translation reserve.
(iv) Exchange rates The most significant foreign currencies for the Group are the euro (“€”) and pound sterling (“£”). The exchange rates used as at 31 October 2021 (“Closing”) and for the 12-month period then ended (“Average”) are as follows:
Exchange Average Closing £1.00 : US$ 1.37 1.37 €1.00 : US$ 1.16 1.16
141
4. Significant accounting policies (continued) F. Business combinations and goodwill Business combinations are accounted for using the acquisition method when control is transferred to the Group. The cost of an acquisition is measured as the aggregate of the consideration transferred, which is measured at acquisition date fair value, and the amount of any non-controlling interests in the acquiree. For each business combination, the Group elects whether to measure the non-controlling interests in the acquiree at fair value or at the proportionate share of the acquiree’s identifiable net assets. Acquisition-related costs, not related to the issuance of debt, are expensed as incurred and included in administrative expenses. A business consists of inputs and processes applied to those inputs that have the ability to contribute to the creation of outputs. When the Group acquires a business, it assesses the financial assets and liabilities assumed for appropriate classification and designation in accordance with the contractual terms, economic circumstances and pertinent conditions as at the acquisition date. Goodwill is initially measured as the excess of the aggregate of the consideration transferred and the amount recognized for non-controlling interests and any previous interest held over the fair value of net identifiable assets acquired and liabilities assumed. If the fair value of the net assets acquired is in excess of the aggregate consideration transferred, the Group re-assesses whether it has correctly identified all of the assets acquired and all of the liabilities assumed and reviews the procedures used to measure the amounts to be recognized at the acquisition date. If the reassessment still results in an excess of the fair value of net assets acquired over the aggregate consideration transferred, then the gain is recognized in profit or loss. After initial recognition, goodwill is measured at cost less any accumulated impairment losses. For the purpose of impairment testing, goodwill acquired in a business combination is, from the acquisition date, allocated to a cash-generating unit (“CGU”) or group of CGUs within the Group being the lowest level of independently functioning components capable of generating cash flow. Where goodwill has been allocated to a CGU as part of the operation within that unit is disposed of, the goodwill associated with the disposed operation is included in the carrying amount of the operation when determining the gain or loss on disposal. Goodwill disposed in these circumstances is measured based on the relative values of the disposed operation and the portion of the cash-generating unit retained. G. Intangible assets (i) Purchased software including cloud arrangements Software contracts including cloud arrangements which contain a lease in the scope of IFRS 16 Leases can also be accounted for under IAS 38 Intangible Assets, should the underlying software or arrangement meet the definition of an ‘intangible asset’ through demonstration of ability to control that asset. The definition of an intangible asset is assumed to be met if the software is either located on premise, or, in the case of a cloud arrangement, is highly customized regarding its application architecture, and the software is fully integrated into the Group’s IT environment, as control is demonstrable. Software contracts are amortized over the contract term from the date the software is ready for its intended use. In cases where cloud arrangements involve customization of applicable architecture that is not deemed to be of a level sufficient to demonstrate control of an asset, the related arrangement is treated as a service contract with the service costs recognized rateably over the service period and any advance payments recognized as prepaid assets. (ii) Capitalized development costs The Group capitalizes directly attributable costs that meet the definition of ‘development expenditure’ under the standard in preparing software for its intended use as it expects to obtain the future economic benefit from the underlying resource developed. Development costs are amortized over a period of ten years relating to the expected useful life of the related IT systems developed.

SUSE FY2021 Annual report 141
141
4. Significant accounting policies (continued) F. Business combinations and goodwill Business combinations are accounted for using the acquisition method when control is transferred to the Group. The cost of an acquisition is measured as the aggregate of the consideration transferred, which is measured at acquisition date fair value, and the amount of any non-controlling interests in the acquiree. For each business combination, the Group elects whether to measure the non-controlling interests in the acquiree at fair value or at the proportionate share of the acquiree’s identifiable net assets. Acquisition-related costs, not related to the issuance of debt, are expensed as incurred and included in administrative expenses. A business consists of inputs and processes applied to those inputs that have the ability to contribute to the creation of outputs. When the Group acquires a business, it assesses the financial assets and liabilities assumed for appropriate classification and designation in accordance with the contractual terms, economic circumstances and pertinent conditions as at the acquisition date. Goodwill is initially measured as the excess of the aggregate of the consideration transferred and the amount recognized for non-controlling interests and any previous interest held over the fair value of net identifiable assets acquired and liabilities assumed. If the fair value of the net assets acquired is in excess of the aggregate consideration transferred, the Group re-assesses whether it has correctly identified all of the assets acquired and all of the liabilities assumed and reviews the procedures used to measure the amounts to be recognized at the acquisition date. If the reassessment still results in an excess of the fair value of net assets acquired over the aggregate consideration transferred, then the gain is recognized in profit or loss. After initial recognition, goodwill is measured at cost less any accumulated impairment losses. For the purpose of impairment testing, goodwill acquired in a business combination is, from the acquisition date, allocated to a cash-generating unit (“CGU”) or group of CGUs within the Group being the lowest level of independently functioning components capable of generating cash flow. Where goodwill has been allocated to a CGU as part of the operation within that unit is disposed of, the goodwill associated with the disposed operation is included in the carrying amount of the operation when determining the gain or loss on disposal. Goodwill disposed in these circumstances is measured based on the relative values of the disposed operation and the portion of the cash-generating unit retained. G. Intangible assets (i) Purchased software including cloud arrangements Software contracts including cloud arrangements which contain a lease in the scope of IFRS 16 Leases can also be accounted for under IAS 38 Intangible Assets, should the underlying software or arrangement meet the definition of an ‘intangible asset’ through demonstration of ability to control that asset. The definition of an intangible asset is assumed to be met if the software is either located on premise, or, in the case of a cloud arrangement, is highly customized regarding its application architecture, and the software is fully integrated into the Group’s IT environment, as control is demonstrable. Software contracts are amortized over the contract term from the date the software is ready for its intended use. In cases where cloud arrangements involve customization of applicable architecture that is not deemed to be of a level sufficient to demonstrate control of an asset, the related arrangement is treated as a service contract with the service costs recognized rateably over the service period and any advance payments recognized as prepaid assets. (ii) Capitalized development costs The Group capitalizes directly attributable costs that meet the definition of ‘development expenditure’ under the standard in preparing software for its intended use as it expects to obtain the future economic benefit from the underlying resource developed. Development costs are amortized over a period of ten years relating to the expected useful life of the related IT systems developed.

SUSE FY2021 Annual report142
Consolidated financial statements
Notes to the Consolidated Financial Statements (continued) For the year ended 31 October 2021
142
4. Significant accounting policies (continued) G. Intangible assets (continued) (iii) Other intangible assets Other intangible assets include customer relationships, intellectual property and non-compete agreements as a result of acquisitions and are stated at cost less accumulated amortization and accumulated impairment losses. Amortization is charged to the Consolidated Statement of Comprehensive Income on a straight-line basis over the estimated useful life of each intangible assets, details of which are set out in the notes to the financial statements. Such intangible assets are amortized from the date they are available for use. H. Property, plant and equipment Property, plant and equipment is stated at historical cost less accumulated depreciation and accumulated impairment. Historical cost includes expenditure that is directly attributable to the acquisition of the items. Subsequent costs are included in the asset’s carrying amount or recognized as a separate asset, as appropriate, only when it is probable that future economic benefits associated with the item will flow to the Group and the cost of the item can be measured reliably. All other repairs and maintenance expenditures are charged to the Consolidated Statement of Comprehensive Income during the financial year in which they are incurred. Depreciation is calculated using the straight-line method to write off the cost of each asset to its residual value over its estimated useful life as follows:
The assets’ residual values and useful lives are reviewed, and adjusted if appropriate, at each reporting date. An asset’s carrying amount is written down immediately to its recoverable amount if the asset’s carrying amount is greater than its estimated recoverable amount. Gains and losses on disposals are determined by comparing the disposal proceeds with the carrying amount and are included in the Consolidated Statement of Comprehensive Income. I. Impairment of non-financial assets Assets that are subject to amortization are reviewed for impairment whenever events or changes in circumstances indicate that the carrying amount may not be recoverable. Assets that have an indefinite useful life, such as goodwill, are not subject to amortization and are tested annually for impairment. An impairment loss is recognized for the amount by which the asset’s carrying amount exceeds its recoverable amount. The recoverable amount is the higher of an asset’s fair value less costs of disposal and value in use. For the purposes of assessing impairment, assets are grouped at the lowest levels for which there are largely independent cash flows, being cash-generating units. For annual impairment testing purposes, assets with indefinite useful lives are allocated to a group of two geographical-based CGUs being the EMEA and Non-EMEA operations. Impairment is determined for goodwill by assessing the recoverable amount of the group of CGUs to which the goodwill relates. Management monitors goodwill only at a segment level as the Group currently operates as a single Operating Segment as defined by IFRS 8 Operating Segments. In calculating value in use, the estimated future cash flows are discounted to their present value using the pre-tax discount rate that reflects current market assessments of the time value of money and the risks specific to the asset. The Group bases its impairment calculation on its most recent budgets and forecast calculations. These budgets and forecast calculations generally cover a period of three years. A four-year transition phase is applied in order to smooth the revenue growth in the last year covered by forecasts, to the terminal revenue growth. A long-term growth rate is calculated and applied to project future cash flows after the seventh year. In determining fair value less costs of disposal, recent market transactions are considered. If no such transactions can be identified, an appropriate valuation model is used. These calculations are corroborated by valuation multiples, quoted share prices for publicly traded companies or other available fair value indicators. When the recoverable amount of a CGU or group of CGUs is less than it’s carrying amount, an impairment loss is recognized. This is allocated first to goodwill and then pro-rata to other assets.
Asset class Estimated useful lifeLeasehold improvements 3 to 10 yearsFixtures and fittings 2 to 7 yearsComputer equipment 1 to 5 years
143
4. Significant accounting policies (continued) J. Trade receivables Trade receivables are initially recognized at the transaction price and subsequently measured at amortized cost less impairment losses based upon an expected credit loss methodology. The Group applies the IFRS 9 Financial Instruments simplified approach to measuring expected credit losses, which uses a lifetime expected loss allowance for all trade receivables. The Group assumes that the credit risk of a financial asset has increased if it is more than 30 days past due and considers a financial asset to be in default when the financial asset is more than 90 days past due. Loss rates applied are based on forecasted credit loss for individual customers based on observed patterns of trading history as adjusted for specific risk applied based on country of operation. The Group uses an allowance matrix to measure the expected credit losses of trade receivables from individual customers. The expected loss rates are based on the historical credit loss experience. These historical loss rates are adjusted to reflect current and forward-looking information on macro-economic factors. The Group considers economic factors prevailing at the measurement date (for example, the ongoing Covid-19 pandemic) and country specific risks to be the most relevant factors and has adjusted the historical loss rates based on expected changes in these factors. When determining whether the credit risk of a financial asset has increased significantly since initial recognition and when estimating expected credit losses (“ECLs”), the Group considers reasonable and supportable information that is relevant and available without undue cost or effort. This includes both quantitative and qualitative information and analysis, based on the Group’s historical experience and informed credit assessment, that includes forward-looking information. K. Cash and cash equivalents Cash and cash equivalents include cash in hand, deposits held at call with banks, other short-term highly liquid investments with original maturities of three months or less, and bank overdrafts. Bank overdrafts are shown within borrowings in current liabilities on the Consolidated Statement of Financial Position. L. Borrowings Borrowings are recognized initially at fair value, net of transaction costs incurred. Subsequent to initial recognition, interest bearing borrowings are stated at amortized cost using the Effective Interest Method (“EIR”) with the interest expense recognized in the Consolidated Statement of Comprehensive Income. A financial liability is derecognized when the obligation under the liability is discharged or cancelled or expires. When an existing financial liability is replaced by another from the same lender on substantially different terms, or the terms of an existing liability are substantially modified, such an exchange or modification is treated as the de-recognition of the original liability and the recognition of a new liability. When a financial liability is extinguished or transferred, the difference between the carrying amount of the transferred financial liability and the consideration paid, including any non-cash assets transferred or liabilities assumed, is recognized in the Consolidated Statement of Comprehensive Income. Where the net present value of the cash flows under the new terms is less than 10% different from the discounted present value of the remaining cash flows of the original debt instrument and the new terms of the liability are not substantially different, such modification does not result in extinguishment of the liability. The amortized cost of the financial liability should be recalculated by computing the present value of estimated future contractual cash flows that are discounted at the financial instrument’s original EIR. The difference in the respective carrying amounts is recognized in the Consolidated Statement of Comprehensive Income.

SUSE FY2021 Annual report 143
143
4. Significant accounting policies (continued) J. Trade receivables Trade receivables are initially recognized at the transaction price and subsequently measured at amortized cost less impairment losses based upon an expected credit loss methodology. The Group applies the IFRS 9 Financial Instruments simplified approach to measuring expected credit losses, which uses a lifetime expected loss allowance for all trade receivables. The Group assumes that the credit risk of a financial asset has increased if it is more than 30 days past due and considers a financial asset to be in default when the financial asset is more than 90 days past due. Loss rates applied are based on forecasted credit loss for individual customers based on observed patterns of trading history as adjusted for specific risk applied based on country of operation. The Group uses an allowance matrix to measure the expected credit losses of trade receivables from individual customers. The expected loss rates are based on the historical credit loss experience. These historical loss rates are adjusted to reflect current and forward-looking information on macro-economic factors. The Group considers economic factors prevailing at the measurement date (for example, the ongoing Covid-19 pandemic) and country specific risks to be the most relevant factors and has adjusted the historical loss rates based on expected changes in these factors. When determining whether the credit risk of a financial asset has increased significantly since initial recognition and when estimating expected credit losses (“ECLs”), the Group considers reasonable and supportable information that is relevant and available without undue cost or effort. This includes both quantitative and qualitative information and analysis, based on the Group’s historical experience and informed credit assessment, that includes forward-looking information. K. Cash and cash equivalents Cash and cash equivalents include cash in hand, deposits held at call with banks, other short-term highly liquid investments with original maturities of three months or less, and bank overdrafts. Bank overdrafts are shown within borrowings in current liabilities on the Consolidated Statement of Financial Position. L. Borrowings Borrowings are recognized initially at fair value, net of transaction costs incurred. Subsequent to initial recognition, interest bearing borrowings are stated at amortized cost using the Effective Interest Method (“EIR”) with the interest expense recognized in the Consolidated Statement of Comprehensive Income. A financial liability is derecognized when the obligation under the liability is discharged or cancelled or expires. When an existing financial liability is replaced by another from the same lender on substantially different terms, or the terms of an existing liability are substantially modified, such an exchange or modification is treated as the de-recognition of the original liability and the recognition of a new liability. When a financial liability is extinguished or transferred, the difference between the carrying amount of the transferred financial liability and the consideration paid, including any non-cash assets transferred or liabilities assumed, is recognized in the Consolidated Statement of Comprehensive Income. Where the net present value of the cash flows under the new terms is less than 10% different from the discounted present value of the remaining cash flows of the original debt instrument and the new terms of the liability are not substantially different, such modification does not result in extinguishment of the liability. The amortized cost of the financial liability should be recalculated by computing the present value of estimated future contractual cash flows that are discounted at the financial instrument’s original EIR. The difference in the respective carrying amounts is recognized in the Consolidated Statement of Comprehensive Income.

SUSE FY2021 Annual report144
Consolidated financial statements
Notes to the Consolidated Financial Statements (continued) For the year ended 31 October 2021
144
4. Significant accounting policies (continued) M. Leases The Group assesses at contract inception whether a contract is or contains a lease under IFRS 16 Leases and to establish if the contract conveys the right to control the use of an identified asset for a period of time in exchange for consideration. As a lessee, the Group applies a single recognition and measurement approach for all leases and recognizes lease liabilities to make lease payments and right-of-use assets representing the right to use the underlying assets. The Group recognizes right-of-use assets at the commencement date of the lease (i.e., the date the underlying asset is available for use); for lease contracts acquired in a business combination the acquirer recognizes a right-of-use asset and a lease liability. The lease liability is measured at the present value of the remaining lease payments. Right-of-use assets are measured at cost, less any accumulated depreciation and impairment losses and adjusted for any remeasurement of lease liabilities. The cost of right-of-use assets includes the amount of lease liabilities recognized, initial direct costs incurred, and lease payments made at or before the commencement date. In addition, the right-of-use asset is periodically reduced by impairment losses. Right-of-use assets are depreciated on a straight-line basis over the shorter of the lease term and the estimated useful lives of the assets, as follows:
At the commencement date of the lease, the Group recognizes lease liabilities measured at the present value of lease payments to be made over the lease term. The lease payments include fixed payments and variable lease payments that depend on an index or a rate. In calculating the present value of lease payments, the Group uses its incremental borrowing rate at the lease commencement date where the interest rate implicit in the lease is not readily determinable. Lease liabilities are increased to reflect the accretion of interest and reduced for the lease payments made. The carrying amount of lease liabilities is remeasured if there is a modification, a change in the lease term or a change in the lease payments. N. Taxation Income tax expense represents the sum of current and deferred taxes. The Group’s liability for current tax is calculated using tax rates and laws that have been enacted or substantively enacted by the reporting period date. The Group recognizes accruals for tax liabilities in respect of uncertain tax positions when it has a present obligation as a result of a past event and Management judge that it is probable that there will be a future outflow of economic benefits to settle the obligation. The Group recognizes indemnity assets in respect of acquired accruals for tax liabilities only, where the liability in question is recoverable under contractual obligation by the vendor and when the asset is deemed recoverable. Deferred tax is the tax expected to be payable or recoverable in the future arising from temporary differences between the carrying amounts of assets and liabilities in the financial statements and the corresponding tax bases used in the computation of taxable profit. Deferred tax liabilities are generally recognized for all taxable temporary differences, and deferred tax assets are recognized to the extent that it is probable that temporary differences or taxable profits will be available against which deductible temporary differences can be utilized. Deferred tax liabilities are not recognized to the extent they arise from the initial recognition of non-tax-deductible goodwill. Deferred tax liabilities are recognized for taxable temporary differences arising on investments in subsidiaries and associates, except where the Group is able to control the reversal of the temporary difference and it is probable that the temporary difference will not reverse in the foreseeable future. Deferred tax is calculated at the tax rates that are expected to apply in the period when the liability is settled or the asset realized, based on tax rates that have been enacted or substantively enacted by the reporting period date.
Lease category Estimated useful lifeOffice buildings 1 to 6 yearsOffice equipment 2 to 6 yearsMotor vehicles 3 to 5 yearsLeased software 0.5 to 1.5 yearsIT equipment 5 years
145
4. Significant accounting policies (continued) N. Taxation (continued) Tax assets and liabilities are offset when there is a legally enforceable right to set off current tax assets against current tax liabilities and when they relate to income taxes levied by the same tax authority on either the same taxable entity or on different taxable entities, which intend to settle the tax assets and liabilities on a net basis. Tax is charged or credited to the Consolidated Statement of Comprehensive Income, except when it relates to items charged or credited to other comprehensive income or directly to equity, in which case the tax is recognized in other comprehensive income or in equity. O. Share capital, share premium and dividend distribution Incremental costs not forming part of an acquisition and directly attributable to the issue of new shares are shown in equity as a deduction, net of tax, from the proceeds. Dividend distributions to the Company’s shareholders are recognized as a liability in the Group’s financial statements in the period in which the dividends are approved by the Company’s shareholders. Interim dividends are recognized when the entity has an obligation to make the payment and the amount to be paid can be determined reliably. P. Earnings per share Basic earnings per share (“EPS”) is calculated by dividing the net profit attributable to shareholders by the weighted average number of ordinary shares in issue during the year, excluding ordinary shares purchased by the Group and held as treasury shares and the shares held under the liquidity program. The diluted earnings per share is calculated by adjusting the weighted average number of ordinary shares outstanding to assume conversion of all dilutive potential ordinary shares. There is currently no category of dilutive potential ordinary shares. Q. Financial assets and financial liabilities (i) Financial assets measured at amortized costs A financial asset is measured at amortized cost if it meets both of the following conditions and is not designated as fair value through profit or loss: it is held within a business model whose objective is to hold assets to collect contractual cash flows and its contractual terms give rise on specified dates to cash flows that are solely payments of principal and interest on the principal amount outstanding. (ii) Financial assets at fair value through profit or loss or through other comprehensive income On initial recognition of an equity investment that is not held for trading, the Group may irrevocably elect to present subsequent changes in the investment’s fair value in OCI. This election is made on an investment-by-investment basis. All financial assets not classified as measured at amortized cost of FVOCI are measured at fair value through profit or loss. Financial assets at fair value through profit or loss are carried in the Consolidated Statement of Financial Position at fair value with net changes in fair value recognized in the Consolidated Statement of Comprehensive Income. (iii) Write-offs The gross carrying amount of a financial asset is written off when the Group has no reasonable expectation of recovering a financial asset. Financial assets that are written off could still be subject to enforcement activities to comply with the Group’s procedures for recovery of amounts due. (iv) Financial liabilities at fair value through profit or loss Financial liabilities at fair value through profit or loss include financial liabilities held for trading and financial liabilities designated upon initial recognition as at fair value through profit or loss. Financial liabilities are classified as ‘held for trading’ if they are incurred for the purpose of repurchasing in the near term. This category also includes derivative financial instruments (including separated embedded derivatives) entered into by the Group that are not designated as hedging instruments. Gains or losses on liabilities held for trading are recognized in the statement of profit or loss. Financial liabilities designated upon initial recognition as ‘fair value through profit or loss’ (“FVTPL”) are designated at the initial date of recognition, and only if the criteria in IFRS 9 Financial Instruments are satisfied. A derivative embedded in a host contract is separated if (i) the economic characteristics and risks are not closely related to the host, (ii) a separate instrument with the same terms as the embedded derivative would meet the definition of a derivative and (iii) the hybrid contract itself is not measured at FVTPL. Embedded derivatives are measured at FVTPL. Reassessment only occurs if there is either a change in the terms of the contract that significantly modifies the cash flows that would otherwise be required or a reclassification of a financial asset out of the fair value through profit or loss category.

SUSE FY2021 Annual report 145
145
4. Significant accounting policies (continued) N. Taxation (continued) Tax assets and liabilities are offset when there is a legally enforceable right to set off current tax assets against current tax liabilities and when they relate to income taxes levied by the same tax authority on either the same taxable entity or on different taxable entities, which intend to settle the tax assets and liabilities on a net basis. Tax is charged or credited to the Consolidated Statement of Comprehensive Income, except when it relates to items charged or credited to other comprehensive income or directly to equity, in which case the tax is recognized in other comprehensive income or in equity. O. Share capital, share premium and dividend distribution Incremental costs not forming part of an acquisition and directly attributable to the issue of new shares are shown in equity as a deduction, net of tax, from the proceeds. Dividend distributions to the Company’s shareholders are recognized as a liability in the Group’s financial statements in the period in which the dividends are approved by the Company’s shareholders. Interim dividends are recognized when the entity has an obligation to make the payment and the amount to be paid can be determined reliably. P. Earnings per share Basic earnings per share (“EPS”) is calculated by dividing the net profit attributable to shareholders by the weighted average number of ordinary shares in issue during the year, excluding ordinary shares purchased by the Group and held as treasury shares and the shares held under the liquidity program. The diluted earnings per share is calculated by adjusting the weighted average number of ordinary shares outstanding to assume conversion of all dilutive potential ordinary shares. There is currently no category of dilutive potential ordinary shares. Q. Financial assets and financial liabilities (i) Financial assets measured at amortized costs A financial asset is measured at amortized cost if it meets both of the following conditions and is not designated as fair value through profit or loss: it is held within a business model whose objective is to hold assets to collect contractual cash flows and its contractual terms give rise on specified dates to cash flows that are solely payments of principal and interest on the principal amount outstanding. (ii) Financial assets at fair value through profit or loss or through other comprehensive income On initial recognition of an equity investment that is not held for trading, the Group may irrevocably elect to present subsequent changes in the investment’s fair value in OCI. This election is made on an investment-by-investment basis. All financial assets not classified as measured at amortized cost of FVOCI are measured at fair value through profit or loss. Financial assets at fair value through profit or loss are carried in the Consolidated Statement of Financial Position at fair value with net changes in fair value recognized in the Consolidated Statement of Comprehensive Income. (iii) Write-offs The gross carrying amount of a financial asset is written off when the Group has no reasonable expectation of recovering a financial asset. Financial assets that are written off could still be subject to enforcement activities to comply with the Group’s procedures for recovery of amounts due. (iv) Financial liabilities at fair value through profit or loss Financial liabilities at fair value through profit or loss include financial liabilities held for trading and financial liabilities designated upon initial recognition as at fair value through profit or loss. Financial liabilities are classified as ‘held for trading’ if they are incurred for the purpose of repurchasing in the near term. This category also includes derivative financial instruments (including separated embedded derivatives) entered into by the Group that are not designated as hedging instruments. Gains or losses on liabilities held for trading are recognized in the statement of profit or loss. Financial liabilities designated upon initial recognition as ‘fair value through profit or loss’ (“FVTPL”) are designated at the initial date of recognition, and only if the criteria in IFRS 9 Financial Instruments are satisfied. A derivative embedded in a host contract is separated if (i) the economic characteristics and risks are not closely related to the host, (ii) a separate instrument with the same terms as the embedded derivative would meet the definition of a derivative and (iii) the hybrid contract itself is not measured at FVTPL. Embedded derivatives are measured at FVTPL. Reassessment only occurs if there is either a change in the terms of the contract that significantly modifies the cash flows that would otherwise be required or a reclassification of a financial asset out of the fair value through profit or loss category.

SUSE FY2021 Annual report146
Consolidated financial statements
Notes to the Consolidated Financial Statements (continued) For the year ended 31 October 2021
146
4. Significant accounting policies (continued) Q. Financial assets and financial liabilities (continued) (v) Derivative financial instruments and hedge accounting The Group uses interest rate swaps to hedge its interest rate risk. The derivative financial instrument is initially recognized at fair value on the date on which a derivative contract is entered into and is subsequently re-measured at fair value. Derivatives are carried as financial assets when the fair value is positive and as financial liabilities when the fair value is negative. R. Cash flow hedge The Group uses an interest rate swap to hedge its exposure to interest rate risk in a floating rate borrowing agreement. The effective portion of the gain or loss on the hedging instrument is recognized in other comprehensive income (“OCI”) in the cash flow hedge reserve, while any ineffective portion is recognized immediately in the statement of profit or loss as finance income or expense. The cash flow hedge reserve is adjusted to the lower of the cumulative gain or loss on the hedging instrument and the cumulative change in fair value of the hedged item. If cash flow hedge accounting is discontinued, the amount that has been accumulated in OCI remains in accumulated OCI if the hedged future cash flows are still expected to occur. Otherwise, the amount will be immediately reclassified to profit or loss as a reclassification adjustment. After discontinuation, once the hedged cash flow occurs, any amount remaining in accumulated OCI must be accounted for depending on the nature of the underlying transaction. At the inception of a hedge relationship, the Group formally designates and documents the hedge relationship to which it wishes to apply hedge accounting and the risk management objective and strategy for undertaking the hedge. The documentation includes identification of the hedging instrument, the hedged item, the nature of the risk being hedged and how the Group will assess whether the hedging relationship meets the hedge effectiveness requirements (including the analysis of sources of hedge ineffectiveness and how the hedge ratio is determined). A hedging relationship qualifies for hedge accounting if (i) there is an ‘economic relationship’ between the hedged item and the hedging instrument; and (ii) the effect of credit risk does not ‘dominate the value changes’ that result from that economic relationship. The ratio of the hedging relationship is the same as that resulting from the quantity of the hedged item that the Group actually hedges and the quantity of the hedging instrument that the Group actually uses to hedge. S. Provisions Provisions are recognized when the Group has a present legal or constructive obligation as a result of past events, it is probable that an outflow of resources will be required to settle the obligation and the amount has been reliably estimated. Where there are a number of similar obligations, the likelihood that an outflow will be required in settlement is determined by considering the class of obligations as a whole. A provision is recognized even if the likelihood of an outflow with respect to any one item included in the same class of obligations may be small. Provisions are measured at the present value of the expenditures expected to be required to settle the obligation using a pre-tax rate that reflects current market assessments of the time value of money and the risks specific to the obligation. The increase in the provision due to the passage of time is recognized as an interest expense.
5. Financial risk factors Refer to Note 29 Financial risk management, for details of financial risk factors.
147
6. Segmental analysis In accordance with IFRS 8 Operating Segments, the Group has derived the information for its segmental reporting using the information used by the Chief Operating Decision Makers (“CODMs”) for the purposes of resource allocation and assessment of segment performance. The CODMs comprise the SUSE Leadership Team (“Key Management Personnel”). The Group is organized into a single reporting segment for the following reasons: – All key decision-making and overall control is centralized; – Only revenues (and not profits) are reviewed on a geographical level; and – Costs of the Group are reviewed at a functional level. As the Group comprises a single reporting segment, the results reported in these Consolidated Financial Statements and accompanying notes relate to this single segment. Further disaggregation of the Group’s total revenue is disclosed in Note 7. All segment revenue is derived wholly from external customers and, as the Group has a single reportable segment, inter-segment revenue is zero. The Group is not dependent on any single customer for its revenue and no single customer in the current year or prior period, accounts for more than 10% of the Group’s revenue. The total of non-current assets other than financial instruments and deferred tax assets of the segment is as follows:
7. Revenue Subscription revenue is recognized as a single performance obligation over the contractual term of a contract. In determining the transaction price, the Group considers the effects of reseller rebates to be the main source of variable consideration where certain customers are entitled to rebates on the basis of volume of unit sales generated within a period. (a) Analysis of revenue from contracts with customers
As at 31 October
2021 US$’000
As at 31 October
2020 US$’000
Europe, Middle East and Africa 1,233,346 1,268,487 North America 2,085,479 1,451,873 Asia Pacific and Japan 1,970 2,248 Greater China 2,233 3,326 Latin America 449 487 Sub-total 3,323,477 2,726,421 Derivative asset 6 11 Deferred tax assets 190,010 107,347 Total non-current assets 3,513,493 2,833,779
Year ended 31 October
2021 US$’000
Year ended 31 October
2020 US$’000
Recognized over time: – Subscription revenue 530,873 432,410 Recognized at a point in time: – Subscription revenue 15,625 10,008 – Consulting revenue 13,041 5,003 Total 559,539 447,421

SUSE FY2021 Annual report 147
147
6. Segmental analysis In accordance with IFRS 8 Operating Segments, the Group has derived the information for its segmental reporting using the information used by the Chief Operating Decision Makers (“CODMs”) for the purposes of resource allocation and assessment of segment performance. The CODMs comprise the SUSE Leadership Team (“Key Management Personnel”). The Group is organized into a single reporting segment for the following reasons: – All key decision-making and overall control is centralized; – Only revenues (and not profits) are reviewed on a geographical level; and – Costs of the Group are reviewed at a functional level. As the Group comprises a single reporting segment, the results reported in these Consolidated Financial Statements and accompanying notes relate to this single segment. Further disaggregation of the Group’s total revenue is disclosed in Note 7. All segment revenue is derived wholly from external customers and, as the Group has a single reportable segment, inter-segment revenue is zero. The Group is not dependent on any single customer for its revenue and no single customer in the current year or prior period, accounts for more than 10% of the Group’s revenue. The total of non-current assets other than financial instruments and deferred tax assets of the segment is as follows:
7. Revenue Subscription revenue is recognized as a single performance obligation over the contractual term of a contract. In determining the transaction price, the Group considers the effects of reseller rebates to be the main source of variable consideration where certain customers are entitled to rebates on the basis of volume of unit sales generated within a period. (a) Analysis of revenue from contracts with customers
As at 31 October
2021 US$’000
As at 31 October
2020 US$’000
Europe, Middle East and Africa 1,233,346 1,268,487 North America 2,085,479 1,451,873 Asia Pacific and Japan 1,970 2,248 Greater China 2,233 3,326 Latin America 449 487 Sub-total 3,323,477 2,726,421 Derivative asset 6 11 Deferred tax assets 190,010 107,347 Total non-current assets 3,513,493 2,833,779
Year ended 31 October
2021 US$’000
Year ended 31 October
2020 US$’000
Recognized over time: – Subscription revenue 530,873 432,410 Recognized at a point in time: – Subscription revenue 15,625 10,008 – Consulting revenue 13,041 5,003 Total 559,539 447,421

SUSE FY2021 Annual report148
Consolidated financial statements
Notes to the Consolidated Financial Statements (continued) For the year ended 31 October 2021
148
7. Revenue (continued) (a) Analysis of revenue from contracts with customers (continued) On 15 March 2019, the Group acquired contract liabilities with a fair value of US$334.8 million. On 25 November 2020, the Group acquired contract liabilities with a fair value of US$26.4 million. On 27 October 2021, the Group acquired contract liabilities with a fair value of US$2.8 million. The following table shows the impact of the acquisition accounting adjustment of the contract liability haircut on recognized revenues:
(b) Revenue by product type
(c) Revenue by route to market
(d) Revenue by geographical location
Year ended 31 October
2021 US$’000
Year ended 31 October
2020 US$’000
Effect of contract liability haircut: Recognized revenue before fair value adjustment 572,246 466,000 Contract liability haircut amortized (12,707) (18,579) Total revenue 559,539 447,421
Year ended 31 October
2021 US$’000
Year ended 31 October
2020 US$’000
Core products 494,485 435,744 Emerging products 65,054 11,677 Total revenue 559,539 447,421
Year ended 31 October
2021 US$’000
Year ended 31 October
2020 US$’000
End user 457,674 344,899 Independent Hardware Vendor & Embedded 101,865 102,522 Total revenue 559,539 447,421
Year ended 31 October
2021 US$’000
Year ended 31 October
2020 US$’000
Europe, Middle East and Africa 269,385 217,790 North America 196,604 155,801 Asia Pacific and Japan 38,374 31,719 Greater China 39,995 29,841 Latin America 15,181 12,270 Total revenue 559,539 447,421
149
8. Separately reported items The Group has adopted a columnar presentation in its presentation of the Consolidated Statement of Comprehensive Income in order to disaggregate items of specific importance from operations in the normal course (referred to as “Headline”). In doing so, Management considers that this gives a better indication of the underlying results of the ongoing business. Such items are those which are expected to have standalone significance and are typically confined to a single financial reporting period. In determining this format, Management notes IAS 1 Presentation of Financial Statements does not provide definitive guidance as to the format of the Consolidated Statement of Comprehensive Income, but states key lines, which should be disclosed. It also encourages the disclosure of additional line items and the reordering of items presented on the face of the Consolidated Statement of Comprehensive Income when appropriate for a proper understanding of the entity’s financial performance.
(a) Transaction costs Transaction costs of US$25.5 million (2020: US$6.0 million) for the year ended 31 October 2021 relate to legal and other fees associated with the acquisition of Rancher and NeuVector and transaction costs relating to the partial placing of the share capital of the Group on the Frankfurt Stock Exchange that are not deemed directly attributable to the issuance of equity. Further details are set out in Note 30. (b) Restructuring costs Restructuring costs of US$1.4 million (2020: US$2.0 million) for the year ended 31 October 2021 relates to a program announced during the prior year to align the operations of the Group with its strategic objectives. Further details are set out in Note 25. (c) Tax Current year A tax credit of US$5.6 million (2020: US$0.6 million) arises in respect of tax-deductible transaction and restructuring costs. Prior year The Group accrued for pre-acquisition tax liabilities of US$24.4 million on acquisition of the SUSE business in respect of which it is legally indemnified under the terms of the acquisition agreement. A related tax indemnity asset of the same amount was recorded on acquisition. During 2020, following tax authority agreement of certain open assessment periods, US$15.7 million of the accrued pre-acquisition tax liabilities were released and the same amount of the tax indemnity asset written down (refer to Note 12 for details). In addition, there is a further reduction of US$1.7 million in indemnity asset (total reduction US$17.4 million) reflecting the impact of post-acquisition restructuring activity on the value of the indemnity asset.
Year ended 31 October
2021 US$’000
Year ended 31 October
2020 US$’000
Separately reported items: Transaction costs – acquisition of the Rancher Group 2,706 6,013 Transaction costs – Initial Public Offering 21,240 - Transaction costs – acquisition of NeuVector Inc 1,541 Total transaction costs (a) 25,487 6,013 Costs arising from a restructuring programme (b) 1,407 1,996 Reduction in tax indemnity asset recoverable (c) - 17,441 Expense items forming part of operating losses 26,894 25,450 Release of acquired uncertain tax liability (c) - (15,658) Tax credit on transaction and restructuring costs (5,566) (573) Total tax (credit) reported separately (5,566) (16,231) Separately reported items, net 21,328 9,219

SUSE FY2021 Annual report 149
149
8. Separately reported items The Group has adopted a columnar presentation in its presentation of the Consolidated Statement of Comprehensive Income in order to disaggregate items of specific importance from operations in the normal course (referred to as “Headline”). In doing so, Management considers that this gives a better indication of the underlying results of the ongoing business. Such items are those which are expected to have standalone significance and are typically confined to a single financial reporting period. In determining this format, Management notes IAS 1 Presentation of Financial Statements does not provide definitive guidance as to the format of the Consolidated Statement of Comprehensive Income, but states key lines, which should be disclosed. It also encourages the disclosure of additional line items and the reordering of items presented on the face of the Consolidated Statement of Comprehensive Income when appropriate for a proper understanding of the entity’s financial performance.
(a) Transaction costs Transaction costs of US$25.5 million (2020: US$6.0 million) for the year ended 31 October 2021 relate to legal and other fees associated with the acquisition of Rancher and NeuVector and transaction costs relating to the partial placing of the share capital of the Group on the Frankfurt Stock Exchange that are not deemed directly attributable to the issuance of equity. Further details are set out in Note 30. (b) Restructuring costs Restructuring costs of US$1.4 million (2020: US$2.0 million) for the year ended 31 October 2021 relates to a program announced during the prior year to align the operations of the Group with its strategic objectives. Further details are set out in Note 25. (c) Tax Current year A tax credit of US$5.6 million (2020: US$0.6 million) arises in respect of tax-deductible transaction and restructuring costs. Prior year The Group accrued for pre-acquisition tax liabilities of US$24.4 million on acquisition of the SUSE business in respect of which it is legally indemnified under the terms of the acquisition agreement. A related tax indemnity asset of the same amount was recorded on acquisition. During 2020, following tax authority agreement of certain open assessment periods, US$15.7 million of the accrued pre-acquisition tax liabilities were released and the same amount of the tax indemnity asset written down (refer to Note 12 for details). In addition, there is a further reduction of US$1.7 million in indemnity asset (total reduction US$17.4 million) reflecting the impact of post-acquisition restructuring activity on the value of the indemnity asset.
Year ended 31 October
2021 US$’000
Year ended 31 October
2020 US$’000
Separately reported items: Transaction costs – acquisition of the Rancher Group 2,706 6,013 Transaction costs – Initial Public Offering 21,240 - Transaction costs – acquisition of NeuVector Inc 1,541 Total transaction costs (a) 25,487 6,013 Costs arising from a restructuring programme (b) 1,407 1,996 Reduction in tax indemnity asset recoverable (c) - 17,441 Expense items forming part of operating losses 26,894 25,450 Release of acquired uncertain tax liability (c) - (15,658) Tax credit on transaction and restructuring costs (5,566) (573) Total tax (credit) reported separately (5,566) (16,231) Separately reported items, net 21,328 9,219

SUSE FY2021 Annual report150
Consolidated financial statements
Notes to the Consolidated Financial Statements (continued) For the year ended 31 October 2021
150
9. Operating costs by nature The Group classifies costs in the Statement of Comprehensive Income ‘by function’. Operating losses of US$200.9 million (2020: US$8.7 million) for the year are recorded after charging/(crediting) the following costs as classified ‘by nature’ set out below:
10. Auditor’s remuneration
Total IPO transaction costs (Note 30(d)) include US$1.8 million of audit related fees. US$0.9 million were deemed to be qualifying costs of an equity transaction of which 10.9% (US$0.1 million) were recorded as a deduction from equity with the remainder expensed to Separately Reported Items (Note 8). Non-qualifying costs of US$0.9 million were expensed to Separately Reported Items (Note 8) in the Income Statement.
Note
Year ended 31 October
2021 US$’000
Year ended 31 October
2020 US$’000
Operating costs by nature: Staff costs 31 295,026 218,350 Depreciation – property, plant and equipment 16 4,496 4,496 Depreciation – right-of-use assets 24 6,485 10,460 Amortization of intangible assets 15 141,980 119,990 Amortization of contract related assets 20 9,260 4,068 Deferred revenue fair value haircut 28 12,707 18,579 Share-based payments expense 27 175,164 11,827 Impairment loss on trade receivable 19 (265) 1,023 Net foreign exchange gains and losses: – Realized net foreign exchange loss (3,563) 8,513 – Unrealized net foreign exchange gain 16,118 (13,514) Expense items forming part of operating losses 657,408 383,792 Plus: Other expenses incurred 103,046 72,313 Total operating expenses for year 760,454 456,105
Year ended 31 October
2021 US$’000
Year ended 31 October
2020 US$’000
Audit services: Audit of Group Consolidated Financial Statements 957 540 Subsidiary financial statement audits 387 310 Audit related fees 1,802 - Total audit fees 3,146 850 Non-audit services: Tax services: Tax compliance services 154 76 Total remuneration to Group auditors and network firms 3,300 926
151
11. Net finance costs
(a) Finance costs
The total fair value of derivative liabilities as at 31 October 2021 was US$5.2 million (2020: US$25.4 million) comprising US$4.3 million (2020: US$12.8 million) in respect of those designated as hedging instruments and US$0.9 million (2020: US$12.6 million) attributed to the derivatives embedded in borrowings. (i) Derivatives designated as hedging instruments As the interest rate swap derivative is deemed to be hedge effective, the change in fair value of this hedging instrument of US$0.5 million (2020: US$7.3 million) has been recognized in other comprehensive income. Premia paid of US$9.0 million (2020: US$6.5 million) in respect of this hedging instrument have been recycled from the cash flow hedge reserve to the income statement. (ii) Embedded derivatives During the year a fair value gain of US$12.7 million (2020: US$6.9 million loss) in respect of the derivatives embedded in borrowings has been recognized as a component of finance costs. (b) Finance income
Year ended 31 October
2021 US$’000
Year ended 31 October
2020 US$’000
Finance costs 58,884 61,333 Finance income (8) (21) Net finance costs 58,876 61,312
Note
Year ended 31 October
2021 US$’000
Year ended 31 October
2020 US$’000
Finance costs: Interest payable on borrowings 46,828 48,412 Amortization of facility and debt issuance costs 4,453 5,043 Interest rate swap premia 29(d) 8,963 6,498 Commitment fees 748 1,589 Foreign exchange (gain)/loss on borrowings (10,787) (7,972) Fair value loss/(gain) on derivative liabilities 29(d) (12,668) 6,884 Loss on modification of borrowings 20,654 - Finance costs on borrowings 58,191 60,454 Net interest on retirement benefit obligations 26 39 56 Present value un-wind of lease obligation 24 654 823 Total finance costs 58,884 61,333
Year ended 31 October
2021 US$’000
Year ended 31 October
2020 US$’000
Finance income Bank interest income 8 21 Gain on modification to borrowings - - Total finance income 8 21

SUSE FY2021 Annual report 151
151
11. Net finance costs
(a) Finance costs
The total fair value of derivative liabilities as at 31 October 2021 was US$5.2 million (2020: US$25.4 million) comprising US$4.3 million (2020: US$12.8 million) in respect of those designated as hedging instruments and US$0.9 million (2020: US$12.6 million) attributed to the derivatives embedded in borrowings. (i) Derivatives designated as hedging instruments As the interest rate swap derivative is deemed to be hedge effective, the change in fair value of this hedging instrument of US$0.5 million (2020: US$7.3 million) has been recognized in other comprehensive income. Premia paid of US$9.0 million (2020: US$6.5 million) in respect of this hedging instrument have been recycled from the cash flow hedge reserve to the income statement. (ii) Embedded derivatives During the year a fair value gain of US$12.7 million (2020: US$6.9 million loss) in respect of the derivatives embedded in borrowings has been recognized as a component of finance costs. (b) Finance income
Year ended 31 October
2021 US$’000
Year ended 31 October
2020 US$’000
Finance costs 58,884 61,333 Finance income (8) (21) Net finance costs 58,876 61,312
Note
Year ended 31 October
2021 US$’000
Year ended 31 October
2020 US$’000
Finance costs: Interest payable on borrowings 46,828 48,412 Amortization of facility and debt issuance costs 4,453 5,043 Interest rate swap premia 29(d) 8,963 6,498 Commitment fees 748 1,589 Foreign exchange (gain)/loss on borrowings (10,787) (7,972) Fair value loss/(gain) on derivative liabilities 29(d) (12,668) 6,884 Loss on modification of borrowings 20,654 - Finance costs on borrowings 58,191 60,454 Net interest on retirement benefit obligations 26 39 56 Present value un-wind of lease obligation 24 654 823 Total finance costs 58,884 61,333
Year ended 31 October
2021 US$’000
Year ended 31 October
2020 US$’000
Finance income Bank interest income 8 21 Gain on modification to borrowings - - Total finance income 8 21

SUSE FY2021 Annual report152
Consolidated financial statements
Notes to the Consolidated Financial Statements (continued) For the year ended 31 October 2021
152
12. Taxation (a) Income tax expense / (credit)
(b) Tax charged /(credited) to other comprehensive income
(c) Tax credited directly to equity
(d) Factors affecting income tax for the year The Group’s total tax credit for the period of US$54.3 million (2020: US$20.8 million) represents an effective tax rate of 20.7% (2020: 28.7%). Differences between the expected tax credit, being the aggregate of the Group’s geographical split of losses multiplied by local tax rates, and the total tax credits are explained as:
Year ended 31 October
2021 US$’000
Year ended 31 October
2020 US$’000
Current tax Current tax expense – current year 7,083 6,220 Current tax expense / (credit) – prior period 1,997 (15,769) Total current tax (credit)/expense 9,080 (9,549) Deferred tax Deferred tax credit – current year (67,731) (14,038) Deferred tax expense – prior period 4,340 2,766 Total deferred tax credit (63,391) (11,272) Total income tax credit for the year (54,311) (20,821)
Year ended 31 October
2021 US$’000
Year ended 31 October
2020 US$’000
Deferred tax expense / (credit) 2,148 (917) Total tax charged/(credited) to other comprehensive income 2,148 (917)
Year ended 31 October
2021 US$’000
Year ended 31 October
2020 US$’000
Deferred tax credit 5,128 - Total tax credited directly to equity 5,128 -
Year ended 31 October
2021 US$’000
Year ended 31 October
2020 US$’000
Loss before tax for the year (261,924) (72,445) Aggregated expected income tax credit using weighted local tax rate of 26.5% (2020: 26.2%) (69,410)
(18,981)
Tax effect of: Non-deductible acquisition related expenses 919 1,532 Taxable gains on reorganisation 1,554 - Non-deductible share-based payment expenses 976 811 Non-deductible interest expense in Germany 1,360 1,403 Temporary differences not expected to reverse 3,401 1,523 Alternative basis of state and local taxes 412 328 Prior period over-provision 6,336 (13,003) Non-deductible reduction in tax indemnity asset - 4,971 Other differences 141 595 Total income tax credit (54,311) (20,821) Effective tax rate (20.7%) (28.7%)
153
12. Taxation (continued) (e) Factors affecting the income tax charge / (credit) in future years The Group’s future tax charge and effective tax rate could be affected by several factors including challenges by tax authorities to the Group’s transfer pricing arrangements and the pricing of intra-group transactions, tax legislation developments in countries around the world, including reforms related to the taxation of multinationals, the digital economy, and future acquisitions. (f) Recognition of acquired accruals for tax liabilities and tax indemnity asset The Group maintains accruals for tax liabilities in respect of certain potential tax risks in legal entities acquired as part of the prior period business combination which have been indemnified by the vendor of the business. Non-current tax liabilities include US$6.6 million (2020: US$6.6 million) related to such potential risks with a corresponding indemnity asset recorded in “other non-current receivables”. In the prior year US$15.7 million reduction in liability reflected the tax authority agreement of open assessment periods to which a portion of the accrued liability related. The reduction in liability resulted in a corresponding decrease in the indemnity asset no longer realizable. There are no significant accrued tax liabilities in respect of uncertain tax positions arising in relation to the post acquisition period. (g) Deferred taxes
Deferred tax assets are recognized to the extent that it is probable that temporary differences or taxable profits will be available against which deductible temporary differences can be utilized. Recognized deferred tax assets are mainly in respect of German and US subsidiaries. Deferred tax assets in Germany of US$53.8 million (2020: US$31.9 million) are recognized on the basis that they are fully offset by deferred tax liabilities in the same legal entity or tax group, with further deferred tax assets of US$11.5 million recognized on the basis of a deferred tax asset reversal calculation, based on Management’s projections of future profitability. Similarly, US$28.7 million (2020: US$:Nil) of US deferred tax assets are fully offset by US deferred tax liabilities with a further US$75.5 million (2020: US$73.3 million) of US deferred tax assets are recognized on the basis of a deferred tax asset reversal calculation. The Group has an unrecognized deferred tax asset in relation to temporary differences of US$5.8 million (2020: US$2.2 million) relating to unutilized foreign tax credits and carried forward tax losses.
A deferred tax liability of US$1.5 million (2020: US$1.5 million) is recognized in respect of tax liabilities expected to arise on the future repatriation of proceeds. Otherwise, no deferred tax liability is recognized in respect of unremitted earnings (including pre-acquisition earnings) of overseas subsidiaries of US$171.1 million (2020: US$148.3 million) as the Group can control the timing of the temporary differences and it is probable that such differences will not reverse in the foreseeable future. It is not practicable to estimate the amount of unrecognized deferred tax liabilities in respect of such unremitted earnings.
Deferred tax assets Taxlosses
US$’000
Contractliabilities
US$’000
Interestexpenses
US$’000
Financial derivatives
US$’000
Other items
US$’000 Total
US$’000 As at 1 November 2020 53,711 21,307 15,426 5,704 11,199 107,347 Arising on acquisition 12,390 (241) - - 1,643 13,792 (Charged)/credited to the income statement 52,153 (3,900) 14,883 (3,359) 6,113 65,890 (Charged)/credited to other comprehensive income - - - (2,147) - (2,147) Credited direct to equity - - - - 5,128 5,128 Reclassification (559) - - - 559 - As at 31 October 2021 117,695 17,166 30,309 198 24,642 190,010
Deferred tax liabilities Intangible assets
US$’000
Contract related assets
US$’000
Finance costs
US$’000
Other items
US$’000
Total
US$’000 As at 1 November 2020 (44,103) (12,037) (6,223) (6,332) (68,695) Arising on acquisition (35,343) (536) - - (35,879) (Charged)/credited to the income statement 12,089 (10,198) 4,068 (8,458) (2,499) (Charged)/credited to other comprehensive income - - - - - As at 31 October 2021 (67,357) (22,771) (2,155) (14,790) (107,073)

SUSE FY2021 Annual report 153
153
12. Taxation (continued) (e) Factors affecting the income tax charge / (credit) in future years The Group’s future tax charge and effective tax rate could be affected by several factors including challenges by tax authorities to the Group’s transfer pricing arrangements and the pricing of intra-group transactions, tax legislation developments in countries around the world, including reforms related to the taxation of multinationals, the digital economy, and future acquisitions. (f) Recognition of acquired accruals for tax liabilities and tax indemnity asset The Group maintains accruals for tax liabilities in respect of certain potential tax risks in legal entities acquired as part of the prior period business combination which have been indemnified by the vendor of the business. Non-current tax liabilities include US$6.6 million (2020: US$6.6 million) related to such potential risks with a corresponding indemnity asset recorded in “other non-current receivables”. In the prior year US$15.7 million reduction in liability reflected the tax authority agreement of open assessment periods to which a portion of the accrued liability related. The reduction in liability resulted in a corresponding decrease in the indemnity asset no longer realizable. There are no significant accrued tax liabilities in respect of uncertain tax positions arising in relation to the post acquisition period. (g) Deferred taxes
Deferred tax assets are recognized to the extent that it is probable that temporary differences or taxable profits will be available against which deductible temporary differences can be utilized. Recognized deferred tax assets are mainly in respect of German and US subsidiaries. Deferred tax assets in Germany of US$53.8 million (2020: US$31.9 million) are recognized on the basis that they are fully offset by deferred tax liabilities in the same legal entity or tax group, with further deferred tax assets of US$11.5 million recognized on the basis of a deferred tax asset reversal calculation, based on Management’s projections of future profitability. Similarly, US$28.7 million (2020: US$:Nil) of US deferred tax assets are fully offset by US deferred tax liabilities with a further US$75.5 million (2020: US$73.3 million) of US deferred tax assets are recognized on the basis of a deferred tax asset reversal calculation. The Group has an unrecognized deferred tax asset in relation to temporary differences of US$5.8 million (2020: US$2.2 million) relating to unutilized foreign tax credits and carried forward tax losses.
A deferred tax liability of US$1.5 million (2020: US$1.5 million) is recognized in respect of tax liabilities expected to arise on the future repatriation of proceeds. Otherwise, no deferred tax liability is recognized in respect of unremitted earnings (including pre-acquisition earnings) of overseas subsidiaries of US$171.1 million (2020: US$148.3 million) as the Group can control the timing of the temporary differences and it is probable that such differences will not reverse in the foreseeable future. It is not practicable to estimate the amount of unrecognized deferred tax liabilities in respect of such unremitted earnings.
Deferred tax assets Taxlosses
US$’000
Contractliabilities
US$’000
Interestexpenses
US$’000
Financial derivatives
US$’000
Other items
US$’000 Total
US$’000 As at 1 November 2020 53,711 21,307 15,426 5,704 11,199 107,347 Arising on acquisition 12,390 (241) - - 1,643 13,792 (Charged)/credited to the income statement 52,153 (3,900) 14,883 (3,359) 6,113 65,890 (Charged)/credited to other comprehensive income - - - (2,147) - (2,147) Credited direct to equity - - - - 5,128 5,128 Reclassification (559) - - - 559 - As at 31 October 2021 117,695 17,166 30,309 198 24,642 190,010
Deferred tax liabilities Intangible assets
US$’000
Contract related assets
US$’000
Finance costs
US$’000
Other items
US$’000
Total
US$’000 As at 1 November 2020 (44,103) (12,037) (6,223) (6,332) (68,695) Arising on acquisition (35,343) (536) - - (35,879) (Charged)/credited to the income statement 12,089 (10,198) 4,068 (8,458) (2,499) (Charged)/credited to other comprehensive income - - - - - As at 31 October 2021 (67,357) (22,771) (2,155) (14,790) (107,073)

SUSE FY2021 Annual report154
Consolidated financial statements
Notes to the Consolidated Financial Statements (continued) For the year ended 31 October 2021
154
13. Earnings per share Basic and diluted EPS is calculated by dividing the loss attributable to ordinary shareholders of the parent by the weighted average number of ordinary shares in issue during the year. During the year, long-term incentive awards were granted which would have an antidilutive impact on earnings per share as their conversion to ordinary shares would decrease loss per share from continuing operations.
14. Business combinations A. Acquisition of NeuVector (27 October 2021) Pursuant to the terms of the “Agreements and Plans of Merger” (“the Agreement”) dated 6 October 2021, and with the completion date of 27 October 2021, the Group acquired 100% of the assets and liabilities of (NeuVector Inc (“NeuVector”). The acquired entity is a non-listed entity headquartered in San Jose, California. (a) Transaction overview The completion date of 27 October 2021 was established as the contractual date of control transfer owing to the fulfilment of certain obligations by the Group being met on this date under the Agreement. NeuVector provides full lifecycle container security, offering end to end security for modern container infrastructures. The company’s customer base includes multiple industries including financial services, healthcare, transportation and government. The purpose of the acquisition and integration of NeuVector is to increase revenue and consequently shareholder value through integrated sales with other Group products. Assets and liabilities acquired as set out below are identified with reference to the books and records as at 27 October 2021. For convenience, the Group designated an acquisition date at the end of the month (31 October 2021) rather than the actual acquisition date during the month. No events between the ‘convenience’ date of 31 October 2021 and the actual acquisition date resulted in material changes in the amounts recognised. The amounts of revenue and profit or loss of NeuVector since the designated acquisition date included in the consolidated statement of comprehensive income for the reporting period are US$ nil. If the transaction had occurred on 1 November 2020, Management estimates that consolidated revenue for the SUSE Group would have been US$560.8 million and consolidated losses for the period would have been US$216.5 million. (b) Purchase consideration Per the Agreement, total consideration of US$131.2 million was satisfied in cash, the transfer of shares in SUSE S.A. and a transfer of certain liabilities payable by the acquirer under the terms of the agreement as at the date of acquisition. The purchase consideration transferred to the former owners of NeuVector was US$129.9 million which included cash of US$100.8 million and 695,691 shares in SUSE S.A. of US$29.1 million.
The consideration transferred in the acquisition is measured at fair value. Total shares in SUSE S.A. comprised 695,691 ordinary shares measured at the fair value of US$41.78 per ordinary share.
Year ended 31 October
2021
Year ended 31 October
2020 Loss for the year (US$’000) (207,613) (51,624) Weighted average number of ordinary shares in issue (number) 63,193,310 1,400,000 Basic and diluted loss per share (US$ per share) (3.3) (36.9)
US$’000 Cash consideration: Cash transferred and to be transferred to former owners 100,800 Amounts to be paid to settle employee-related liabilities and other obligations to third parties 1,345 Cash consideration paid and payable 102,145 Non-cash consideration: Shares issued at fair value 29,066 Total non-cash consideration 29,066 Total purchase consideration 131,211

SUSE FY2021 Annual report 155
155
14. Business combinations (continued) A. Acquisition of NeuVector (27 October 2021) (continued) (b) Purchase consideration (continued) Per the terms of the completion of the Agreement, on behalf of the former shareholders of NeuVector, the Group settled the fair value of certain employee-related (US$0.5 million) and third party (US$0.8 million) liabilities identified at the date of acquisition totalling US$1.3 million. Consequently, the fair value of identified liabilities of the business are reduced by this amount. Total consideration excludes transaction costs of US$1.5 million which have been expensed to the Income Statement in accordance with IFRS 3 Business Combinations. The analysis of cash flows on acquisition (included in cash flows from investing activities) is as follows:
(c) Identification of net assets acquired The provisional fair values of the identified assets and liabilities of NeuVector as at the date of acquisition are as follows:
The above fair value for intangible assets acquired is provisional and is subject to change within the measurement period. (i) Intangible assets Separately identifiable intangible assets of US$22.1 million meeting the definition of IAS 38 Intangible Assets within the transaction consist of brands (US$1.5 million) and technology (US$20.6 million). Due to the proximity of the acquisition to the year end, the valuation of the intangible assets is still in progress, therefore the valuations of intangible assets have been determined provisionally. The valuations will be completed within the measurement period. (ii) Property, plant and equipment The Group identified property, plant and equipment of US$65 thousand as part of the analysis of the transaction which primarily consist of office equipment, the fair value of which was deemed to approximate the previous carrying value.
US$’000 Cash outflow on investing activity: Cash consideration paid and payable (102,145) Net cash acquired 2,260 Net cash outflow on acquisition (99,885)
Notes
27 October 2021
US$’000 Identifiable assets at fair value Intangible assets (i) 22,100 Property, plant and equipment (ii) 65 Right of use assets (iii) 835 Trade and other receivables (iv) 2,181 Deferred tax assets (vi) 726 Cash and cash equivalents (b) 2,260 Total assets 28,167 Identifiable liabilities at fair value Trade and other payables (iv) 662 Lease liabilities (iii) 835 Deferred income – contract liabilities (v) 2,816 Deferred tax liabilities (vi) 5,074 Total liabilities 9,387 Net identifiable assets at fair value 18,780

SUSE FY2021 Annual report156
Consolidated financial statements
Notes to the Consolidated Financial Statements (continued) For the year ended 31 October 2021
156
14. Business combinations (continued) A. Acquisition of NeuVector (27 October 2021) (continued) (iii) Right of use assets and lease liabilities The Group analyzed the transaction to identify explicit and implied lease arrangements as defined by IFRS 16 Leases. The lease identified relates to office premises. The present value of future lease payments of US$0.8 million corresponds to the Right of use asset recognized. The leases identified as part of the transaction did not include any existing asset retirement obligations. (iv) Other working capital assets Other working capital assets are stated at their book value at the date of acquisition with equates to their fair value. Included within trade and other receivables are trade receivables which amount to US$0.7 million which is the gross contractual amounts and all of which is expected to be collected. There were no fair value adjustments required to trade receivables. (v) Deferred income – contract liabilities The Group acquired contract liabilities of US$2.8 million which included a step-down adjustment of US$1.0 million to reflect its fair value based on the costs to deliver the related service (“the haircut” to deferred revenue). The process involved a ‘bottom-up approach’ where the costs needed to fulfil the performance obligation are added to an appropriate profit margin. The key assumption within this exercise involved analysis of the costs associated with the activities required to generate a sale. The costs to fulfil are reflective of those that market participants would incur to fulfil the service. (vi) Deferred tax asset and liabilities Deferred tax assets of US$0.7 million and deferred tax liabilities of US$5.1 million were acquired. Refer to Note 12 Taxation for further details. (d) Goodwill
Goodwill of US$112.4 million represents the excess of the aggregate of the consideration transferred over the net identifiable assets acquired and liabilities assumed. Goodwill is attributable mainly to the growth opportunities in the markets NeuVector operates in, the skills and technical talent of NeuVector’s workforce and synergies expected to be achieved. The goodwill arising from the acquisition of the NeuVector that is expected to be tax deductible is US$ nil. B. Acquisition of the Rancher Group (25 November 2020) Pursuant to the terms of the “Agreements and Plans of Merger” (“the Agreement”) dated 6 July 2020, and with the completion date of 25 November 2020, the Group acquired 100% of the assets and liabilities of Rancher Labs Inc. and Rancher Federal Inc and their affiliates (“the Rancher Group”) during the period. The acquired entities are non-listed entities headquartered in Cupertino, California. (a) Transaction overview The completion date of 25 November 2020 was established as the contractual date of control transfer owing to the fulfilment of certain obligations by the Group being met on this date under the Agreement. Assets and liabilities acquired as set out in (c) below are identified with reference to the books and records of Rancher as at 25 November 2020. Since its consolidation as of 25 November 2020, Rancher has contributed US$53.5 million to consolidated revenue and a loss of US$12.0 million to consolidated loss for the period. Included within this loss is a share-based payment charge of US$65.5 million following the accelerated vesting of the VSOP (refer to Note 27). If the transaction had occurred on 1 November 2020, Management estimates that consolidated revenue for the SUSE Group would be US$554.8 million and consolidated losses for the period would be US$189.6 million. (b) Purchase consideration Per the Agreement, total consideration of US$583.7 million was satisfied in cash, transfer of shares of an intermediate parent company and a novation of liabilities as at the date of acquisition. The purchase consideration transferred to the former owners of the Rancher Group was US$530.0 million which included cash of US$491.3 million and shares in an intermediary parent undertaking of US$38.7 million. During Q2 2021 a US$0.5 million completion adjustment was recorded which reduced the purchase consideration by the same amount.
US$’000 Total consideration 131,211 Net identifiable assets acquired (18,780) Goodwill recognized on acquisition 112,431

SUSE FY2021 Annual report 157
157
14. Business combinations (continued) B. Acquisition of the Rancher Group (25 November 2020) (continued)
The consideration transferred in the acquisition is measured at fair value. Total shares in an intermediary parent undertaking of 28,433,517 comprised 2,844,352 ordinary shares and 25,599,165 preference shares measured at the December 2020 fair value of US$3.02 per ordinary share and US$1.18 per preference share. Per the terms of completion of the Agreement, on behalf of the former shareholders of the Rancher Group, the Group settled the fair value of certain employee related (US$40.1 million) and third-party (US$13.1 million) liabilities identified at the date of acquisition totalling US$53.2 million. Consequently, the fair values of identified liabilities of the business are reduced by this amount. Total consideration excludes transaction costs of US$8.7 million which have been expensed to the Income Statement in accordance with IFRS 3 Business Combinations. US$2.7 million was expensed in the year ended 31 October 2021 and US$6.0 million in the last annual financial statements. Analysis of cash flows on acquisition (included in cash flows from investing activities) is as follows:
(c) Identification of net assets acquired The fair values of the identified assets and liabilities of the Rancher Group inclusive of a working capital completion adjustment of US$0.5 million as at the date of acquisition are as follows:
US$’000 Cash consideration: Cash transferred to former owners 491,325 Amounts paid to settle obligations to employees and third parties 53,164 Cash consideration paid and payable 544,489 Non-cash consideration: Capital contribution (without issuance of shares) 38,698 Total non-cash consideration 38,698 Final purchase consideration 583,187
US$’000 Cash outflow on investing activity: Cash consideration paid and payable (544,489) Net cash acquired 55,065 Net cash outflow on acquisition (489,424)
Notes
25 November 2020
US$’000 Identifiable assets at fair value Intangible assets (i) 125,443 Property, plant and equipment (ii) 59 Right-of-use assets (iii) 324 Trade and other receivables (iv) 14,916 Cash and cash equivalents (b) 55,065 Deferred tax assets (vi) 13,066 Total assets 208,873 Identifiable liabilities at fair value Trade and other payables (iv) 6,644 Lease liabilities (iii) 312 Deferred income – contract liabilities (v) 26,362 Deferred tax liabilities (vi) 30,805 Total liabilities 64,123 Net identifiable assets at fair value 144,750

SUSE FY2021 Annual report158
Consolidated financial statements
Notes to the Consolidated Financial Statements (continued) For the year ended 31 October 2021
158
14. Business combinations (continued) B. Acquisition of the Rancher Group (25 November 2020) (continued) (i) Intangible assets Separately identifiable intangible assets of US$125.4 million meeting the definition of IAS 38 within the transaction consist of customer relationships (US$101.9 million), intellectual property (including technology and trademarks) of US$20.9 million and non-competition agreements (US$2.6 million). Customer relationships were identified as a separable intangible asset under IAS 38 on the basis of customer relationships that have benefit that can be measured and are viewed by Management as valuable to a market participant. The fair value of the customer relationships was determined by a qualified specialist in applying an income approach method under IFRS 13, specifically using the ‘Multi-period excess earnings method’. This method considers the present value of net cash flows expected to be generated by the customer relationships, by excluding any cash flows related to contributory assets. The method uses cash flow projections from financial budgets approved by Management covering a three-year period, a total contributory asset charge of 23.4%, after-tax discount rates applied to cash flow projections (which were in the range of 9.62% – 10.18%), the applicable long-term growth rate for revenue (2%) and an analysis of customer longevity and expected attrition. Customer duration was established in reference to order history of the Group prior to acquisition. Intellectual property (including technology and trademarks) was identified as a separable intangible asset under IAS 38. The fair value of intellectual property was determined using the ‘Relief from royalty method’. Under this method the cash flows generated by an intangible asset are approximated to the royalties which the owner of the asset would save, in comparison to the alternative of licensing an equivalent asset. Non-competition agreements were also identified as a separable intangible asset under IAS 38. The fair value of non-competition agreements was determined using the ‘incremental cash flow method’. Under this method, the expected cash flows of the entity inclusive of the intangible asset being valued are compared to the equivalent cash flows of a comparable entity with the intangible asset. (ii) Property, plant and equipment The Group identified property, plant and equipment of US$0.1 million as part of the analysis of the transaction which primarily consist of office equipment, the fair value of which was measured on a replacement cost basis. (iii) Right-of-use assets and lease liabilities The Group analyzed the transaction to identify explicit and implied lease arrangement as defined by IFRS 16 Leases. Leases identified primarily relate to office premises. The present value of future lease payments of US$0.3 million corresponds to the right-of-use asset recognized. The leases identified as part of the transaction did not include any existing asset retirement obligations. (iv) Other working capital assets Other working capital assets are stated at their book value at the date of acquisition and are subject to working capital adjustments as set out in (c) above. Included within trade and other receivables are the fair value of trade receivables which amount to US$12.6 million. A fair value adjustment of US$0.4 million was made in respect of aged trade receivable balances which the Rancher Group does not expect to recover. (v) Deferred income – contract liabilities The Group acquired contract liabilities of US$26.4 million which included a step-down adjustment of US$3.4 million to reflect its fair value based on the costs to deliver the related service (“the haircut” to deferred revenue). The process involved a ‘bottom-up approach’ where the costs needed to fulfil the performance obligation are added to an appropriate profit margin. The key assumptions within this exercise involved analysis of the costs associated with the activities required to generate a sale. The costs to fulfil are reflective of those that market participants would incur to fulfil the service. US$1.7 million of the haircut has been amortized to the Consolidated Income Statement in line with the deferred income released. (vi) Deferred tax assets and liabilities Deferred tax assets of US$13.1 million and deferred tax liabilities of US$30.8 million were acquired. Refer to Note 12 Taxation for further details.

SUSE FY2021 Annual report 159
159
14. Business combinations (continued) B. Acquisition of the Rancher Group (25 November 2020) (continued) (d) Commitments and contingencies On acquisition a commitment in respect of retention bonuses has arisen with annual vesting on the closing anniversary of the transaction over a 36-month period. The Group holds a future commitment as at 31 October 2021 of US$23.0 million in respect of service to be rendered by employees of the acquiree in future financial periods, of which US$7.1 million is accrued at 31 October 2021. (e) Goodwill
Goodwill represents the excess of the aggregate of the consideration transferred over the net identifiable assets acquired and liabilities assumed and is considered final as at the date of approval of these Consolidated Financial Statements. Goodwill is attributable mainly to the skills and technical talent of the Rancher Group’s work force and synergies expected to be achieved. The goodwill arising from the acquisition of the Rancher Group that is expected to be tax deductible is US$ nil.
15. Goodwill and intangible assets Intangible assets are amortized on a straight-line basis over their estimated useful lives as follows:
Intellectual property is amortized over the period in which the Group expects to derive benefit on the basis of technical obsolescence. Customer relationships are amortized on the basis of average contract duration reflecting the approximate mix of acquired customer contracts.
US$’000 Total consideration 583,187 Net identifiable assets acquired (144,750) Goodwill recognized on acquisition 438,437
Asset class Remaining useful life at reporting datePurchased software Varies by contractual term of license Development costs 8.9 yearsIntellectual property 2.1 – 3 yearsCustomer relationships 0.6 – 7.6 yearsNon-compete agreements 2.1 years

SUSE FY2021 Annual report160
Consolidated financial statements
Notes to the Consolidated Financial Statements (continued) For the year ended 31 October 2021
160
15. Goodwill and intangible assets (continued) (a) Roll forward of goodwill and intangible assets
Current period Development costs
US$’000
Purchased software US$’000
Intellectual propertyUS$’000
Customer relationships
US$’000
Non-compete
agreements US$’000
Goodwill US$’000
Total
US$’000 Cost 1 November 2020 9,046 27,823 315,963 360,005 - 2,134,881 2,847,718 Acquired in the period 1,021 9,475 - - - - 10,496 Acquired through a business combination - - 43,028 101,883 2,632 550,870 698,413 FX movements (2) 1,002 - - - - 1,000 31 October 2021 10,065 38,300 358,991 461,888 2,632 2,685,751 3,557,627 Accumulated amortization 1 November 2020 788 7,125 113,278 72,276 - - 193,467 Charge for the period 1,180 8,082 69,301 62,614 803 - 141,980 FX movements (35) 86 187 (865) - - (627) 31 October 2021 1,933 15,293 182,766 134,025 803 - 334,820 Carrying value 31 October 2021 8,132 23,007 176,225 327,863 1,829 2,685,751 3,222,807 31 October 2020 8,258 20,698 202,685 287,729 - 2,134,881 2,654,251
Prior period Development costs
US$’000
Purchased software US$’000
Intellectual propertyUS$’000
Customer relationships
US$’000
Non-compete
agreements US$’000
Goodwill US$’000
Total
US$’000 Cost 1 November 2019 - 2,871 315,963 360,035 - 2,134,881 2,813,750 Acquired in the period 8,963 24,980 - - - 33,943 Acquired through a business combination - - - - - - FX movements 83 (28) - (30) - 25 31 October 2020 9,046 27,823 315,963 360,005 - 2,134,881 2,847,718 Accumulated amortization 1 November 2020 - 1,088 43,568 27,459 - - 72,115 Charge for the period 788 5,929 69,682 43,591 - - 119,990 FX movements - 108 28 1,226 - - 1,362 31 October 2020 788 7,125 113,278 72,276 - - 193,467 Carrying value 31 October 2020 8,258 20,698 202,685 287,729 - 2,134,881 2,654,251 31 October 2019 - 1,783 272,395 332,576 - 2,134,881 2,741,635

SUSE FY2021 Annual report 161
161
15. Goodwill and intangible assets (continued) (b) Carrying value assessment The annual impairment test of goodwill is performed during the fourth quarter of each fiscal year, or more frequently, if events or changes in circumstances indicate that the carrying value of the asset may not be recoverable. The impairment test is performed at a single Group operating segment level, as the EBITDA of the Group is reviewed at this level. This represents the Group as a whole, being a single operating segment under IFRS 8 Operating Segments, which is the lowest level within the Group at which the goodwill is monitored for internal management purposes. The Group performed its annual impairment test as of 30 September 2021 during October 2021. As at 30 September 2021, the carrying amount of the goodwill allocated to the Group as a whole was $2,573.3m. The Group considers its operating performance in relation to the Board-approved budgets to be the key factor, when reviewing for indicators of impairment. The recoverable amount has been determined based on a ‘value in use’ calculation using cash flow projections built on the latest financial budgets approved by the Board covering a three-year period and a four-year transition phase to smooth the revenue growth to the terminal revenue growth. The pre-tax discount rate applied to the cash flow projections is 10.1% (2020: 9.4%). Cash flows beyond a seven-year forecast period are extrapolated using a 2.1% growth rate (2020: 2.0%). This growth rate is in line with the long-term average growth rate on a weighted average basis for the geographical markets in which the Group is operating. As a result of this analysis, Management has recognized no impairment in the current year (2020: US$ Nil). Key assumptions used in value in use assumptions and sensitivity to changes in assumptions Management view a reasonably possible change to the key assumptions which would result in an impairment for the financial year ended 31 October 2021 to be unlikely. The assumptions used in the impairment testing reflect past experience of the Group, are based on the Group’s current forecasts and are consistent with external sources of information. The sensitivity analysis for the key assumptions reflects the existence of sufficient headroom between the recoverable amount and the carrying value of the Group’s long-term assets. As shown below the headroom remains positive even in case of hypothetical adverse changes of the key assumptions. The Group’s forecasts used in the ‘value in use’ calculation include uncertainties including those related to the COVID-19 pandemic. Management is of the view that the COVID-19 pandemic has not had a significant impact on the Group’s business. The calculation of ‘value in use’ for the Group is most sensitive to the following key assumptions: – Revenue growth rates – EBITDA margins – Discount rate Revenue growth rate - Revenue growth rate decreases from 25.1% to 24.4% in the three-year budget period, which is consistent with the most recent budgets and objectives of the Group. While the Group can maintain high growth rates for extended periods, for the purposes of a perpetual valuation, it is assumed that the Group will approach a “steady state” with stable growth rates at some point in time. This implies that once the steady state is reached, the terminal growth rate should not exceed, for example, the long-term average inflation rates in the countries, in which a business operates. Hence, a terminal revenue increase of 2.1% was applied and consequently a four-year transition phase was included in order to account for the convergence of the revenue growth of 24.4% in FY24F to 2.1% in the terminal value. The growth rate used to extrapolate cash flows beyond the forecast period is based on a weighted average of the geographical markets in which the Group operates. EBITDA margins – EBITDA margins are based on average values achieved in the years preceding the beginning of the budget period. The EBITDA margin of the Group in 2021 was 28.8% (2020: 28.6%) increasing to 34.5% over the budget period allowing for anticipated efficiencies. Discount rates - Discount rates represent the current market risk of the Group and its weighted average cost of capital (“WACC”) which considers both debt and equity. The cost of equity is derived starting with a risk-free return, adding a relevant inflation spread and adjusting for country risk and market risk premia (adjusted for peer group beta factors). The cost of debt is estimated with reference to a basket of debt issued by other technology companies. The cost of debt has no impact on the results as there is no weighting related to debt from peers.

SUSE FY2021 Annual report162
Consolidated financial statements
Notes to the Consolidated Financial Statements (continued) For the year ended 31 October 2021
162
15. Goodwill and intangible assets (continued) (b) Carrying value assessment (continued) Sensitivity analysis for the key assumptions in the terminal period is presented in the table below:
The sensitivity analysis shows that for the terminal growth rate, even if this reduces to 1.5%, the headroom remains positive ($2,745.3m). Similarly, for EBITDA margin, even if the EBITDA margin is reduced to 33.0%, the headroom remains positive ($2,998.4m). For WACC, even with a significantly higher WACC of 11.0%, the headroom remains positive ($2,642.5m). Management analyzed reasonably possible changes in the key assumptions in the terminal period and do not believe that such changes in the key assumptions in the terminal period would cause the goodwill carrying amount to exceed its recoverable amount due to the significant headroom identified in the impairment test. This headroom is driven by strong demand for the Group’s products and services in its core markets as reflected in the forecasts and favourable valuation parameters from the market e.g. market capitalisation which are duly reflected in the discount rate estimation.
Headroom (US$’000)
Base case 3,250.6 Revenue growth rate (%) 2.5% 3,630.4 2.1% 3,250.6 1.5% 2,745.3 EBITDA Margin (%) 36.0% 3,508.7 34.5% 3,250.6 33.0% 2,998.4 WACC Rate (%) 11.0% 2,642.5 10.1% 3,250.6 9.0% 4,212.4

SUSE FY2021 Annual report 163
163
16. Property, plant and equipment
Current period Leaseholdimprovements
US$’000
Computer equipment
US$’000
Fixtures and fittings
US$’000 Total
US$’000 Cost 1 November 2020 2,316 10,809 1,514 14,639 Additions during the year 1,219 2,909 680 4,808 Acquired through a business combination 8 39 77 124 Disposals during the year - (4) - (4) FX movements 108 47 23 178 31 October 2021 3,651 13,800 2,294 19,745 Accumulated depreciation 1 November 2020 962 5,435 618 7,015 Charge for the period 602 3,459 435 4,496 Disposals during the year - (3) - (3) FX movements 72 4 4 80 31 October 2021 1,636 8,895 1,057 11,588 Carrying value 31 October 2021 2,015 4,905 1,237 8,157 31 October 2020 1,354 5,374 896 7,624
Prior period Leaseholdimprovements
US$’000
Computer equipment
US$’000
Fixtures and fittings
US$’000 Total
US$’000 Cost 1 November 2019 2,303 9,123 971 12,397 Acquired in the period 201 1,424 546 2,171 Disposals during the year (230) (25) (14) (269) Acquired through a business combination - - - - FX movements 42 287 11 340 31 October 2020 2,316 10,809 1,514 14,639 Accumulated amortization 1 November 2020 257 1,834 208 2,299 Charge for the period 612 3,401 483 4,496 Disposals during the year (27) (36) (25) (88) FX movements 120 236 (48) 308 31 October 2020 962 5,435 618 7,015 Carrying value 31 October 2020 1,354 5,374 896 7,624 31 October 2019 2,046 7,289 763 10,098

SUSE FY2021 Annual report164
Consolidated financial statements
Notes to the Consolidated Financial Statements (continued) For the year ended 31 October 2021
164
17. Subsidiary undertakings Details of subsidiaries of the Company as at 31 October 2021 are provided below. The principal activities of subsidiary undertakings are (A) Software sales and support functions, (B) Development of software, (C) Investment holding and (D) Intellectual property licensing.
Company name Country of incorporation Principal activities Ownership(3) Registered office address
Marcel Topco GmbH Germany (C) 100.0% (1) Maxfeldstraße 5, 90409 Nürnberg Marcel UK Topco Ltd(4) UK (C) 100.0% Waterfront, Waterside Park, Kingsbury
Crescent, Staines, UK TW18 3BA Marcel LUX DebtCo SARL Luxembourg (C) 100.0% 11-13 Boulevard de la Foire
L-1528 Luxembourg Marcel Bidco GmbH Germany (D) 100.0% Maxfeldstraße 5, 90409 Nürnberg SUSE International Holdings GmbH
Germany (C) 100.0% Maxfeldstraße 5, 90409 Nürnberg
Marcel Topco LLC USA (C) 100.0% (2) 251 Little Falls Drive, Wilmington DE 19808 United States
Marcel Bidco LLC USA (D) 100.0% 251 Little Falls Drive, Wilmington DE 19808 United States
SUSE Software Solutions Australia Pty Ltd
Australia (A) 100.0% Tower One International Towers Sydney', Level 17, 100 Barangaroo Avenue, Barangaroo NSW 2000
SUSE Software Solutions Austria GmbH
Austria (A) 100.0% Parkring 2, 1010 Vienna
SUSE Software Solutions Brasil Ltda
Brazil (A) 100.0% RUA FIDENCIO RAMOS 302, VILA OLIMPIA, CJ 43 TORRE B, Sao Paulo, Sao Paulo, 04551-010, Brazil
SUSE Software Solutions Canada ULC
Canada (A) 100.0% 701 Georgia St. W, PO Box 10149, Vancouver, British Colombia, Canada,
SUSE Software (Beijing) Ltd. China (A), (B) 100.0% Unit 01-04 and 14-16 of 1401 Unit 2, Building 1, No. 1 East Sanhuan Middle Road, Chaoyang District, Beijing
SUSE LINUX s.r.o. Czech Republic (A), (B) 100.0% Křižíkova 148/34, Karlín, 186 00 Praha 8 SUSE Software Solutions France Sarl
France (A) 100.0% 3 place Giovanni da Verrazzano Campus Verrazzano Bâtiment A RdC 69009 Lyon
SUSE Software Solutions Germany GmbH
Germany (A), (B) 100.0% Maxfeldstraße 5, 90409 Nürnberg
SUSE Software Solutions Hong Kong Ltd
Hong Kong (A) 100.0% 21/F, Edinburgh Tower, The Landmark, 15 Queen's Road Central, Hong Kong
SUSE Software Solutions India Private Ltd
India (A) 100.0% U & I Corporate Centre, 47, ECHELON, Sector 32, Gurgaon 122001, Haryana
SUSE Software Solutions Ireland Ltd
Ireland (A) 100.0% One Spencer Dock, North Wall Quay, Dublin 1
SUSE Software Solutions International Services Ltd
Ireland (A) 100.0% One Spencer Dock, North Wall Quay, Dublin 1
SUSE Software Solutions Israel Ltd
Israel (A) 100.0% 11 Amal , Rosh-Haayin, Israel , 48092, Israel
SUSE Software Solutions Italy srl
Italy (A) 100.0% Viale Giorgio Ribotta 11, CAP 00144, Rome, Italy
SUSE Software Solutions Japan KK
Japan (A) 100.0% Hibiya Mitsui Tower 12F, 1-1-2, Yurakucho, Chiyoda-ku, Tokyo, Japan
SUSE Software Solutions Korea Ltd
Korea (A) 100.0% 41F, Gangnam Finance Center 152, Teheran-ro, Gangnam-gu, Seoul

SUSE FY2021 Annual report 165
165
17. Subsidiary undertakings (continued)
(1) The ordinary share capital of Marcel Topco GmbH is 100% held by the Company.
(2) The ordinary share capital of Marcel Topco LLC is 99.99% held by the Company and 0.01% held by Marcel Topco GmbH.
(3) The ordinary share capital of all other subsidiaries is wholly owned by a subsidiary of the Company.
(4) During the period, Marcel UK Topco Ltd and Marcel LUX DebtCo SARL were incorporated.
Company name Country of incorporation Principal activities Ownership(3) Registered office address
SUSE Software SolutionsNetherlands BV
Netherlands (A) 100.0% Taurusavenue 29, Zuidtoren 14e verdieping, 2132LS , Hoofddorp, Netherlands
SUSE Software Solutions Portugal Sociedade Unipessoal Lda
Portugal (A) 100.0% Palácio Sottomayor, Rua Sousa Martins, 1 - 1.º esquerdo, 1069-316 Lisbon
SUSE Software SolutionsSingapore Pte Ltd
Singapore (A) 100.0% 71 Robinson Road #14 - 01, Singapore, 068895, Singapore
SUSE Software Solutions South Africa Pty Ltd
South Africa (A) 100.0% Regus Bryanston The Campus, Twickenham Building, Corner Sloane and Main Road, Johannesburg, 2021, South Africa
SUSE Software Solutions Spain S.L.
Spain (A) 100.0% Paseo de la Castellana 42, Madrid (28046)
SUSE Software Solutions Sweden AB
Sweden (A) 100.0% WeWork Urban Escape, Malmskillnadsgatan 32 , 11151 , Stockholm , Sweden
SUSE Software Solutions Schweiz AG
Switzerland (A) 100.0% Merkurstrasse 14, 8953, Dietikon
SUSE Software Solutions Taiwan Co Ltd
Taiwan (A),(B) 100.0% 4F.-2, No. 1, Songgao Road, XinYi District, Taipei City, 11073, Taiwan
SUSE Software Solutions Middle East FZ-LLC
UAE (A) 100.0% G.09, Building 1, DIC, Ground Floor, Dubai Internet City, Dubai, United Arab Emirates
SUSE Software Solutions UK Ltd
UK (A) 100.0% Waterfront, Waterside Park, Kingsbury Crescent, Staines, UK TW18 3BA
SUSE LLC USA (C),(D) 100.0% 1800 Novel Place, Provo UT 84606, United States
Rancher Federal Inc USA (A) 100.0% 64 PORTSMOUTH DR NOVATO CA 94949 United States
Rancher Labs LLC USA (A),(B) 100.0% 19409 Stevens Creek Blvd, Suite 260, Cupertino DE CA 94042, United States
YuanChe Technology Development (Shenzhen) Co., Ltd.
China (A), (B) 100.0% Room 201, Building A, No.1, Qianwan 1st Road, Qianhai Shenzhen-Hong Kong Cooperation Zone, Shenzhen, China
YunChe Information Technology (Shenzhen) Co., Ltd.
China (A), (B) 100.0% Dachong, Dashen Community, Yue Street, Nanshan District, Shenzhen, Building 3, Dachong Business Center (Phase 3), No.18 Road, 19A,19B-1, China
YunLong Technology Development (Shenzhen) Co., Ltd.
China (A), (B) 100.0% Dachong, Dashen Community, Yue Street, Nanshan District, Shenzhen, Building 3, Dachong Business Center (Phase 3), No.18 Road, 19A,19B-1, China
NeuVector Inc USA (A), (B) 100.0% 2880 Zanker Road, Suite 100, San Jose, CA 95134

SUSE FY2021 Annual report166
Consolidated financial statements
Notes to the Consolidated Financial Statements (continued) For the year ended 31 October 2021
166
18. Investment in associate Open Invention Network LLC (“OIN”) is a strategic partnership of software corporations that licenses global patent pools in exchange for a pledge of non-aggression by its participants. The initiative encourages freedom of action in the use of ‘Linux’ and the sharing of new ideas and inventions. At 31 October 2021 the Group’s 12.5% (2020: 12.5%) interest was carried at US$14.0 million (2020: US$16.2 million) after recording its share of losses for the year of US$2.1 million (2020: US$2.5 million) as detailed below:
The investment is accounted for under the equity method of accounting. The accounting year-end date of the associate investment is 31 December, and results are reported on a quarterly basis. The Group records an adjustment to align the reporting period of the associate and the basis for measurement of the Group. Assets, liabilities, and equity of the investment in the current year and prior period and the results for the period ended 31 October 2021 as adjusted were as follows:
There are no significant restrictions on the ability of the associate investment to transfer returns to the Group. There are no contingent liabilities to the Group’s interest in associate investments (2020: US$:Nil).
As at 31 October
2021 US$’000
As at 31 October
2020 US$’000
Carrying value of associate investment: 1 November 16,174 18,623 Acquired during the year - - Carrying value of associate before share of losses 16,174 18,623 Share of losses after tax for the year (2,133) (2,449) 31 October 14,041 16,174
As at 31 October
2021 US$’000
As at 31 October
2020 US$’000
Condensed balance sheet of associate investment: Non-current assets 17,504 21,731 Current assets 31,324 36,354 Current liabilities (398) (433) Non-current liabilities (2,175) (2,069) Net assets 46,255 55,583
Year ended 31 October
2021 US$’000
Year ended 31 October
2020 US$’000
Condensed income statement of associate investment: Revenue - - Loss after taxation for the year 9,222 11,745 Loss attributable to the Group for the year 1,153 1,468 Adjustment recorded for the year 980 981 Loss attributable to the Group for the year 2,133 2,449

SUSE FY2021 Annual report 167
167
19. Trade and other receivables
At 31 October 2021, the carrying amount of trade and other receivables approximates their fair value due to their short-term nature. The following table provides information about the ageing and the expected credit losses for trade receivables from individual customers as at 31 October 2021. The loss rates presented below have considered country specific risks.
The loss allowance for receivables has been disclosed separately in the Consolidated Statement of Comprehensive Income. Amounts charged in the allowance account are generally written off when there is no expectation of recovering additional cash. The movement in the loss allowance in the year is as follows:
Further details relating to the credit risk of financial instruments are disclosed in Note 29. Included within ‘Other receivables’ at 31 October 2021 was US$7.8 million (2020: US$5.5 million) in respect of accrued income resulting from completed performance obligations that are yet to be invoiced as at the reporting date. Accrued income is reclassified to trade receivables upon invoicing.
As at 31 October
2021 US$’000
As at 31 October
2020 US$’000
Current trade and other receivables Trade receivables 113,317 79,600 Less: expected credit losses (1,284) (1,466) Trade receivables, net 112,033 78,134 Prepayments 12,345 6,368 Other receivables 13,660 16,540 Total current trade and other receivables 138,038 101,042 Non-current other receivables Other receivables 7,899 7,895 Total non-current other receivables 7,899 7,895
Weightedaverage loss
rate%
Gross carrying amount US$’000
Expected credit
loss US$’000
Net carrying amount US$’000
Category Current 1% 107,628 (732) 106,896 Up to three months 5% 5,427 (290) 5,137 Three to four months 100% 172 (172) - Over four months 100% 90 (90) - As at 31 October 2021 113,317 (1,284) 112,033
As at 31 October
2021 US$’000
As at 31 October
2020 US$’000
Provision roll-forward: 1 November 1,466 443 Loss allowance provided in the year (265) 1,023 Receivables written off as uncollectible (146) - Receivables recovered previously written off as uncollectible 333 - Other movements (94) - Exchange movements (10) - 31 October 1,284 1,466

SUSE FY2021 Annual report168
Consolidated financial statements
Notes to the Consolidated Financial Statements (continued) For the year ended 31 October 2021
168
20. Contract-related assets
Contract-related assets are costs related to obtaining a customer contract which are capitalized when they are deemed to be incremental and expected to be recovered. The Group incurs directly attributable costs relating to a obtaining a contract in respect of consideration payable to customers (reseller funds), and employees and third-party providers (sales commissions). Reseller rebates are amortized over the estimated duration of the related revenue contract term. The Group incurred and capitalized reseller rebates of US$3.6 million (2020: US$4.5 million) during the year with related amortization of US$2.2 million (2020: US$3.4 million) expensed in the Statement of Comprehensive Income net of revenue recognized under the principles of IFRS 15 Revenue from Contracts with Customers. Sales commissions paid for new customer contracts are amortized on a straight-line basis over an expected customer life, which averages 96 months based on analysis of transactions and which considers expected renewal frequency. Sales commissions paid for customer contract renewals are not commensurate with new contracts and are amortized over 40 months, except where the renewal is less than one year, in which case the costs are expensed when incurred. Sales commissions paid to partners are amortized over the contract term. The Group incurred and capitalized sales commission costs of US$46.8 million (2020: US$27.0 million) during the year with related amortization of US$9.2 million (2020: US$4.1 million) expensed to the Statement of Comprehensive Income as a sales and marketing costs.
21. Cash and cash equivalents
Included in cash and cash equivalents at 31 October 2021 was US$0.7 million (2020: US$0.5 million) which is restricted for the purposes of lease deposits covered by actual cash deposits. Further details relating to the credit risk of financial institutions at which cash is deposited are disclosed in Note 29.
As at 31 October
2021 US$’000
As at 31 October
2020 US$’000
Presented as: Non-current 55,510 25,761 Current 28,865 19,649 Total contract-related assets 84,375 45,410
As at 31 October
2021 US$’000
As at 31 October
2020 US$’000
Cash at bank and in hand 61,061 94,933 Total cash and cash equivalents 61,061 94,933

SUSE FY2021 Annual report 169
169
22. Trade and other payables
Current other payables includes US$6.7 million (2020: US$8.5 million) and non-current other payables of US$12.6 million (2020: US$10.3 million) relate to contractual amounts payable under cloud software arrangements. At 31 October 2021, the carrying amount approximates to the fair value. Further information regarding the Group’s exposure to foreign currency and liquidity risk is set out in Note 29.
23. Borrowings (a) Amounts outstanding at the reporting date
On 25 November 2020, the Group entered into a new Senior Facility agreement for USD$300.0 million and the full amount was drawdown on this date. On 21 May 2021, following the IPO at the Frankfurt Stock Exchange on 19 May 2021, the Group repaid the 2nd Lien loan note of US$270.0 million and partially repaid US$232.3 million of the SC loan note. US$10.0 million drawn under the multi-currency US$81.0 million revolving current facility (“RCF”) on 12 October 2021 was repaid on 29 October 2021.
As at 31 October
2021 US$’000
As at 31 October
2020 US$’000
Current: Trade payables 11,703 4,700 Payroll related accruals 49,739 38,099 Tax and social security 15,289 10,505 Accrued royalties 4,215 7,082 Other payables 48,426 32,742 Total current trade and other payables 129,372 93,128 Non-current: Other payables 12,554 10,295 Tax and social security 1,000 1,566 Total non-current trade and other payables 13,554 11,861 Total trade and other payables 142,926 104,989
Loan note description Contractual
Interest termsEffective
interest rateContractual
maturity date31 October 2021
US$’000 31 October 2020
US$’000 Current borrowings USD 360,000,000 (B1) LIBOR + 3.25% 6.46% March 2026 3,600 3,600 EUR 300,000,000 (B2) EURIBOR + 3.5% 4.03% March 2026 - - USD 300,000,000 (SC) LIBOR + 4% 4.98% Nov 2027 - - USD 270,000,000 (2L) LIBOR + 7% 10.45% March 2027* - - USD 81,000,000 (RCF) LIBOR/EURIBOR +3% 5.68% Sept 2025 - - Total current interest-bearing loans and borrowings 3,600 3,600 Non-current borrowings USD 360,000,000 (B1) LIBOR + 3.25% 6.46% March 2026 336,570 338,037 EUR 300,000,000 (B2) EURIBOR + 3.5% 4.03% March 2026 339,329 340,156 USD 300,000,000 (SC) LIBOR + 4% 4.98% Nov 2027 66,249 - USD 270,000,000 (2L) LIBOR + 7% 10.45% March 2027* - 256,467 USD 81,000,000 (RCF) LIBOR/EURIBOR +3% 5.68% Sept 2025 - - Total non-current interest-bearing loans and borrowings 742,148 934,660 Total interest-bearing loans and borrowings 745,748 938,260

SUSE FY2021 Annual report170
Consolidated financial statements
Notes to the Consolidated Financial Statements (continued) For the year ended 31 October 2021
170
23. Borrowings (continued) (b) Loan modification Following the repayment of the 2nd Lien loan note and the partial repayment of the SC loan note, the modification of the expected cash flows for these loan notes resulted in an acceleration of the amortization of the loan related capitalized arrangement fees and the recognition of a loss due to the loan repayments in the amount of US$15.3 million. The Group has also incurred a prepayment fee of US$5.4 million in relation to the 2nd Lien loan note repayment. An assessment of modifications of the terms of the contract was not required as the original contract included the prepayment clause. Total arrangement fees of US$42.4 million (31 October 2020: US$38.6 million) are included in the calculation of the amortized cost using the effective interest method. US$38.6 million are attributable to the origination of the B1, B2 and 2nd Lien loan notes and US$3.8 million is attributed to the origination of the loan note used in the acquisition of the Rancher Group. I Reconciliation of movement in consolidated net leverage Consolidated net leverage, in applying the definition in the Group’s loan agreements, comprises the net total of (i) current and non-current interest-bearing borrowings, (ii) unpaid software liabilities and (iii) cash and short-term deposits as set out below:
Other payables amounts relate to unpaid software liabilities of US$19.3 million (2020: US$ 18.8 million). US$6.7 million is included in current payables and US$12.6 million (2020: US$10.3 million) in non-current payables. These amounts are included in the movement in other payables in the Consolidated Statement of Cash Flows. Proceeds from IPO of US$659.4 million (2020: US$ nil), proceeds of borrowings of US$310.0 million (2020: US$ nil), proceeds from contribution of share premium of US$135.3 million (2020: US$ nil) and proceeds from the repayment of a related party loan of US$1.5 million (2020: US$ nil), are offset by repayments of borrowings of US$524.0 million (2020: US$3.6 million), payments of premia on interest rate swaps of US$9.0 million (2020: US$6.5 million), payments of arrangement fees of US$3.8 million (2020: US$ nil) and lease payments of US$4.5 million (2020: US$9.8 million), results in a net cash inflow from financing activities during the period of US$564.9 million. For all other loan facilities, the Group currently does not expect any changes to the repayment schedule and no further adjustment or modification to the allocation of the capitalized arrangement fees was required. (d) Post balance sheet event – increase in revolving credit facility On 21 December 2021, the original revolving credit facility of US$81.0 million was increased by US$88.3 million to US$169.3 million under the Senior Facilities Agreement. At the date of approval of these Consolidated Financial Statements, the full amount was available for drawdown
As at1 November
2020 US$’000
AcquisitionsUS$’000
Foreignexchange
US$’000
Other movements
US$’000 Cash flow
US$’000
As at 31 October
2021 US$’000
Related to borrowings: Interest bearing borrowings (938,260) (310,000) 2,944 (24,395) 523,963 (745,748) Capitalized arrangement fees (38,584) - - (3,825) - (42,409) Amortization of arrangement fees 8,771 - - 15,240 - 24,011 Gain on loan modification (5,937) - - 5,227 - (710) Movement in borrowings (974,010) (310,000) 2,944 (7,753) 523,963 (764,856) Related to other items: Other payables (18,814) - - (483) - (19,297) Cash and cash equivalents 94,933 57,323 432 - (91,627) 61,061 Consolidated net leverage (897,891) (252,677) 3,376 (8,236) 432,336 (723,092)

SUSE FY2021 Annual report 171
171
24. Leases
Current year ITequipment
US$’000
Officebuildings
US$’000
Officeequipment
US$’000
Motor vehicles US$’000
Leased software US$’000
Total
US$’000 Cost 1 November 2020 933 18,983 162 1,675 - 21,753 Additions in the year - 4,866 - 1,039 - 5,905 Acquired through a business combination - 1,159 - - - 1,159 Terminations in the year - (2,269) (42) (312) - (2,623) Modifications in the year - (100) - (39) - (139) FX movements (7) 49 31 (110) - (37) 31 October 2021 926 22,688 151 2,253 - 26,018 Accumulated depreciation and impairment 1 November 2020 93 7,299 49 635 - 8,076 Charge for the year 191 5,244 86 729 - 6,250 Impairment charge - 235 - - - 235 Terminations in the year - (2,269) (42) (312) - (2,623) FX movements (7) (284) 19 (63) - (335) 31 October 2021 277 10,225 112 989 - 11,603 Net book value 31 October 2021 649 12,463 39 1,264 - 14,415 31 October 2020 840 11,684 113 1,040 - 13,677
Prior year ITequipment
US$’000
Officebuildings
US$’000
Officeequipment
US$’000
Motor vehicles US$’000
Leased software US$’000
Total
US$’000 Cost 1 November 2019 - 18,026 56 955 7,659 26,696 Additions in the year 933 4,813 132 915 - 6,793 Acquired through a business combination - - - - - - Terminations in the year - (2,876) - (182) (6,951) (10,009) Modifications in the year (1,411) (22) (25) (708) (2,166) FX movements - 431 (4) 12 - 439 31 October 2020 933 18,983 162 1,675 - 21,753 Accumulated depreciation and impairment 1 November 2020 - 3,570 7 251 3,641 7,469 Charge for the year 92 5,680 41 565 3,310 9,688 Impairment charge - 772 - - - 772 Terminations in the year - (2,876) - (182) (6,951) (10,009) FX movements 1 153 1 1 - 156 31 October 2020 93 7,299 49 635 - 8,076 Carrying value 31 October 2020 840 11,684 113 1,040 - 13,677 31 October 2019 - 14,456 49 704 4,018 19,227

SUSE FY2021 Annual report172
Consolidated financial statements
Notes to the Consolidated Financial Statements (continued) For the year ended 31 October 2021
172
24. Leases (continued) The majority of the Group’s contracted lease value are office buildings. The relevant lease population was ascertained following a review of all major supplier contracts to the Group to identify implied or embedded lease terms. The remaining term of the lease contracts varies between one month and six years. While extension options are available on some contracts, Management does not consider an exercise of the options reasonably certain and therefore they have not been included in the lease term. The Group recognized lease liabilities of US$16.7 million (2020: US$16.4 million) and right-of-use assets of US$14.4 million (2020: US$13.7 million) as at 31 October 2021. Lease contracts related to two vacant office buildings include a right-of-use asset impairment provision of US$3.6 million (2020: US$3.4 million), which increased by US$0.2 million (2020: increased by US$0.8 million) on remeasurement during the year as expensed in the Statement of Comprehensive Income in the current year. Management have performed a review of all leased assets at the financial reporting date and are satisfied that no further impairments to right-of-use assets exist as of 31 October 2021. The present value of lease liabilities at the balance sheet date was as follows:
Lease liabilities are discounted at the incremental borrowing rate at the lease commencement date. In order to calculate the incremental borrowing rate, the interbank offering rates in the country of the respective leased asset for the corresponding duration were taken as the reference rate and a spread of the Group's cost of debt was added as a risk premium. The weighted average discount rate applied during the year was 4.58% (2020: 4.04%). The maturity profile of the Group’s lease portfolio at the balance sheet date was as follows:
The total cash outflow for leases for the year was US$4.5 million (2020: US$10.6 million). The interest expense on liabilities for the year was US$0.7 million (2020: US$0.8 million).
As at 31 October
2021 US$’000
As at 31 October
2020 US$’000
Present value of lease liabilities: Current 6,012 5,721 Non-current 10,708 10,729 Total lease liabilities 16,720 16,450
As at 31 October
2021 US$’000
As at 31 October
2020 US$’000
Maturity analysis (contractual cash flows): Less than one year 6,815 6,362 One to five years 13,416 11,041 More than five years 3,777 303 Total undiscounted cash flows 24,008 17,706

SUSE FY2021 Annual report 173
173
25. Provisions
Dilapidation provisions relate to leased office buildings with contractual obligations to restore the premises to its original condition on lease expiration. The provision is expected to be fully utilized within 10 years. A provision for loss-making operations was identified on acquisition. During the year, US$3.2 million (2020: US$2.5 million) of the provision was released reflecting the net cash cost of fulfilling the contractual obligations of the loss-making operation. The restructuring provision includes the costs of initiatives to rationalize its operating activities. The Group recognized US$4.4 million (2020: US$4.3 million) which mainly includes employee termination benefits and is based on detailed plans announced by Management. US$1.4 million (2020: US$2.0 million) of the restructuring charge in the year is recorded within separately reported items (Note 8), with the remaining US$3.0 million (2020: US$2.3 million) recorded within the headline results of the Group. The restructuring is expected to be completed by the end of FY22. Legal provisions of US$0.2 million (2020: US$0.3 million) include Management’s best estimate of the likely outflow of economic benefits associated with legal matters.
Current year Dilapidation provision
US$’000
Loss-making operation
US$’000
Restructuring provision
US$’000
Legal provision US$’000
Total
US$’000 Cost 1 November 2020 768 5,930 2,514 316 9,528 Charged during the year 381 - 4,358 35 4,774 Released during the year (23) (2,995) (304) (75) (3,397) Utilized during the year (72) (181) (4,550) (42) (4,845) Reclassification - - (176) - (176) FX movements 36 - (32) 2 6 31 October 2021 1,090 2,754 1,810 236 5,890 Split as: Current 66 2,754 1,810 236 4,866 Non-current 1,024 - - - 1,024 Total provisions 1,090 2,754 1,810 236 5,890
Prior year Dilapidation provision
US$’000
Loss-making operation
US$’000
Restructuring provision
US$’000
Legal provision US$’000
Total
US$’000 Cost 1 November 2019 790 8,400 1,161 113 10,464 Charged during the year 50 - 4,259 120 4,429 Released during the year - - (252) - (252) Utilized during the year (69) (2,470) (2,486) - (5,025) Reclassification - - (120) 120 - FX movements (3) - (48) (37) (88) 31 October 2020 768 5,930 2,514 316 9,528 Split as: Current 61 4,330 2,492 316 7,199 Non-current 707 1,600 22 - 2,329 Total provisions 768 5,930 2,514 316 9,528

SUSE FY2021 Annual report174
Consolidated financial statements
Notes to the Consolidated Financial Statements (continued) For the year ended 31 October 2021
174
26. Retirement benefit obligations (a) Defined contribution schemes The Group has a number of defined contribution pension schemes. The principal defined contribution schemes are located in the US, UK and Germany. Pension costs for defined contribution schemes as expensed during the year were US$7.8 million (2020: US$5.4 million) of which US$1.2 million (2020: US$1.4 million) remained outstanding at the balance sheet date and forms part of payroll related accruals. (b) Defined benefit schemes There are defined benefit schemes in SUSE Software Solutions Germany GmbH and SUSE Software Solutions Schweiz AG, two wholly owned subsidiaries of the Group. The schemes are ‘final salary’ pension plans, which provide benefits to members in the form of a guaranteed level of pension payable for life in the case of retirement, disability and death. Benefits provided depend on the final salary, member’s length of service, social security ceilings and other factors. Pension entitlements are calculated by an independent actuary. There is no requirement for the appointment of Trustees. The schemes are administered locally with the assistance of pension experts. The German plan is closed for new membership. The schemes are composite of long-term pension assets and retirement benefit obligations as set forth below. (i) Long-term pension assets Long-term pension assets relate to the contractual arrangement under insurance policies held by SUSE Software Solutions Germany GmbH with guaranteed interest rates. The assets have not been pledged to a plan and are recorded in the Consolidated Statement of Financial Position as long-term pension assets. These contractual arrangements are treated as financial assets held at fair value since there is not a matching amount of benefits payable under the defined benefit plan. Movements in fair value of long-term pension assets are included in the Statement of Comprehensive Income. The movement on the long-term pension asset for the year is as follows:
Long-term pension assets are Level 3 assets under the fair value hierarchy. These assets have been valued by applying a discount rate to the future cash flows and considering the fixed interest rate, mortality rates and term of the insurance contract. There have been no transfers between levels for the period ended 31 October 2021 (2020: None).
Year ended 31 October
2021 US$’000
Year ended 31 October
2020 US$’000
At beginning of year 1,039 1,552 Acquired during the year - - Interest on long-term pension assets 9 18 Benefits paid - - Contributions paid 20 33 Transfer to pledged plan assets (426) (609) Fair value loss recognized during the year 2 (1) Exchange rate movements 4 46 At end of year 648 1,039

SUSE FY2021 Annual report 175
175
26. Retirement benefit obligations (continued) (b) Defined benefit schemes (ii) Retirement benefit obligations The following amounts have been included in the Consolidated Statement of Comprehensive Income for defined benefit schemes:
The following amounts have been recognized as movements in the Consolidated Statement of Other Comprehensive Income:
The key assumptions used in the actuarial valuation of the schemes as at the reporting date were:
Year ended 31 October
2021 US$’000
Year ended 31 October
2020 US$’000
Current service cost 476 449 Past service curtailment gain - - Pension costs/(credit) in operating expenses 476 449 Net interest expense on defined benefit scheme 39 56 Total defined pension expense/(credit) for the year 515 505
Year ended 31 October
2021 US$’000
Year ended 31 October
2020 US$’000
Re-measurement of retirement benefit obligations: Changes in actuarial assumptions 700 (70) Changes in financial assumptions 642 - Experience losses (727) 74 Total actuarial movement for the year 615 4 Fair value loss on plan assets (25) (76) Net interest expense on defined benefit scheme - - Total defined pension expense/(credit) for the year 590 (72)
As at 31 October
2021
As at 31 October
2020 Key assumptions: Rate of increase in final pensionable salary 2.00% - 2.75% 1.50% - 2.50% Rate of increase in pension payments 1.75% 1.50% Discount rate 0.35%-1.15% 0.05%-0.80% Inflation 1.00%-1.75% 1.00%-1.50% Life expectancy – retiring at age 65 at the end of the reporting year – Male 86 years 86 years – Female 89 years 89 years Life expectancy – retiring 15 years after the end of the reporting year – Male 88 years 88 years – Female 90 years 90 years

SUSE FY2021 Annual report176
Consolidated financial statements
Notes to the Consolidated Financial Statements (continued) For the year ended 31 October 2021
176
26. Retirement benefit obligations (continued) (b) Defined benefit schemes (continued) (ii) Retirement benefit obligations (continued) The net liability included in the Consolidated Statement of Financial Position arising from obligations in respect of defined benefit schemes is as follows:
The defined benefit obligation has moved as follows during the year and prior period:
As at 31 October
2021
As at 31 October
2020 Present value of funded obligations (14,205) (13,916) Fair value of plan assets 7,653 6,375 Defined benefit pension obligation for the year (6,552) (7,541)
Current year Defined benefit
obligation US$’000
Pledged plan assets
US$’000
Net obligation
US$’000 Included in Income Statement: 1 November 2020 (13,916) 6,375 (7,541) Transfer from non-plan assets - 446 446 Current service cost (476) - (476) Net interest expense (56) 17 (39) Benefits paid (235) 232 (3) Employer contributions - 466 466 Employee contributions (184) 184 - Administration expenses - (12) (12) Sub-total (14,867) 7,708 (7,159) Included in Other Comprehensive Income: Re-measurement of retirement benefit obligations: – Changes in actuarial assumptions 700 - 700 – Changes in financial assumptions 642 - 642 – Experience losses (727) - (727) Return on plan assets - (25) (25) Sub-total (14,252) 7,683 (6,569) Exchange rate movements 47 (30) 17 31 October 2021 (14,205) 7,653 (6,552)

SUSE FY2021 Annual report 177
177
26. Retirement benefit obligations (continued) (b) Defined benefit schemes (continued) (ii) Retirement benefit obligations (continued)
The expected contributions for the next annual reporting period are US$0.2 million (2020: US$0.2 million) in respect of the Germany scheme and US$0.3 million (2020: US$0.2 million) in respect of the Swiss scheme. The major categories of the plan assets are as follows:
The majority of the re-insurance contracts have guaranteed interest rates of 4.0%, with the remaining at 3.25% or 2.75%. None of the plan assets are represented by financial instruments of the Group. None of the plan assets are occupied or used by the Group. Through its defined benefit schemes the Group is exposed to a number of risks, the most significant of which are detailed below: – Life expectancy – the majority of the plan obligations are to provide benefits over the life of the member, so
increases in life expectancy will result in an increase in the plan liabilities as benefits would be paid over a longer period; and
– Inflation – some of the Group pension obligations are linked to inflation, and higher inflation will lead to higher liabilities. The majority of the plan assets are either unaffected by or loosely correlated with inflation, meaning an increase in inflation will also increase the deficit.
Prior year Defined benefit
obligation US$’000
Pledged plan assets
US$’000
Net obligation
US$’000 Included in Income Statement: 1 November 2019 (12,408) 4,869 (7,539) Transfer from non-plan assets - 609 609 Current service cost (449) - (449) Net interest expense (75) 19 (56) Benefits paid 15 (9) 6 Employer contributions - 391 391 Employee contributions (209) 209 - Administration expenses - (13) (13) Sub-total (13,126) 6,075 (7,051) Included in Other Comprehensive Income: Re-measurement of retirement benefit obligations: – Changes in actuarial assumptions (70) - (70) – Experience losses 74 - 74 Return on plan assets - (76) (76) Sub-total (13,122) 5,999 (7,123) Exchange rate movements (794) 376 (418) 31 October 2020 (13,916) 6,375 (7,541)
As at 31 October
2021 US$’000
As at 31 October
2020 US$’000
Full insurance contract – with the collective foundation 5,305 4,655 Re-insurance contracts – guaranteed interest rates 2,348 1,720 Total defined benefit assets 7,653 6,375

SUSE FY2021 Annual report178
Consolidated financial statements
Notes to the Consolidated Financial Statements (continued) For the year ended 31 October 2021
178
26. Retirement benefit obligations (continued) (b) Defined benefit schemes (continued) (ii) Retirement benefit obligations (continued) The table below provides information on the sensitivity of the defined benefit obligation to changes to the most significant actuarial assumptions. The table shows the impact of changes to each assumption in isolation, although, in practice, changes to assumptions may occur at the same time and can either offset or compound the overall impact on the defined benefit obligation. These sensitivities have been calculated using the same methodology as used for the main calculations:
An increase of one year in the assumed life expectancy for both males and females would increase the defined benefit obligations by 2.4% as at 31 October 2021 (2020: 2.4%).
27. Share-based payments The Group incurred a share-based payment expense of US$175.1 million (2020: US$11.8 million) in respect of the share-based payment schemes. An expense of US$7.0 million was incurred in the period in respect of employer taxes on these share-based payment schemes.
(a) Cash-settled share-based payment scheme (i) Virtual Share Options Program The Virtual Share Option Program (“VSOP”) is a cash-settled scheme in which employees can participate in the future share appreciation rights of the Group’s equity. The programme terms include service and performance conditions to be satisfied before the Virtual Share Options (“VSOs”) vest. Settlement of VSOs occurs only on an exit event or on expiration of the scheme, is in the form of cash and is in part dependent on the share prices of the Group as valued from an exit event. VSOs have an exercise price of between US$1.00 and US$1.40, being the fair values of a share on the date participants join the VSOP. 50% of VSOs granted are subject to a service condition and follow a graded vesting pattern over a contractual period of five years which implicitly will result in an acceleration should the exit occur within the anticipated timeframe. The other 50% of VSOs are dependent on the share price realized in an exit event, with none, some or all of these units vesting according to the terms of the scheme. The liability under the VSOP is measured initially at the grant date and is re-measured at the end of each reporting period until settled. The fair value of the VSOP attributable to both market and service conditions was measured by applying a Monte-Carlo simulation.
Sensitivity As at 31 October 2021 As at 31 October 2020 Change in
assumption%
Decrease in obligation
US$’000
Increase in obligation
US$’000
Decrease in obligation
US$’000
Increase in obligation
US$’000 Discount rate for liabilities 0.50% 1,508 (1,311) 1,625 (1,401) Price inflation 0.25% (255) 269 (435) 464 Salary growth rate 0.50% (427) 457 (246) 258
Year ended 31 October
2021 US$’000
Year ended 31 October
2020 US$’000
Cash-settled share-based payment transactions (a) – Virtual Share Options Program (a) (i) 157,200 9,466 Equity-settled share-based payment transactions (b) – Management Investment Participation Program (b) (i) 3,035 2,361 – Long-term incentive plans (b) (ii) 14,691 - Share Grant Award to Supervisory Board (c) 238 - Total expense arising from share-based payments 175,164 11,827 Employer taxes expense on share-based payments 7,010 - Total 182,174 11,827

SUSE FY2021 Annual report 179
179
27. Share-based payments (continued) (a) Cash-settled share-based payment scheme (continued) (i) Virtual Share Options Program (continued) On 25 November 2020, the Group acquired the Rancher Group (see Note 14). As per the transaction agreement, the Group allocated 70,234,174 of VSOs to the employees of the former Rancher Group. All options granted had a strike price of $1.40. On 19 May 2021, the shares of SUSE S.A. started trading on the Frankfurt Stock Exchange. The Initial Public Offering (IPO) triggered an acceleration of an Exit Event under the terms of the scheme and resulted in an acceleration of VSOs vesting from March 2023 to May 2021. In accordance with clause 5.3 of the scheme, management chose to settle the obligation partially through cash (30%) and the issuance of SUSE S.A. equity instruments (70%). Subsidiary companies, which employ the respective VSOP participants, were required to settle the outstanding VSOP obligations. On vesting, the VSOP liability was based on the SUSE S.A. IPO Listing Price of €30.00 which corresponded to the VSOP indexed share price of US$2.87. This resulted in a material expense for the year ended 31 October 2021 of which US$157.1 million (31 October 2020: US$9.5 million) is recorded in administrative expenses. A further US$6.2 million in respect of employer taxes is also recorded in administrative expenses. The fair value of the VSOP liability was US$ nil (31 October 2020: US$13.1 million) at the reporting date. US$0.3 million remains unpaid as at 31 October 2021. The following movements in units were recorded during the year ended 31 October 2021:
As at 31 October 2021, the service condition was satisfied for all units (2020: 33,807,121 units). The following lists the inputs into the model for the valuation of the VSOP as of the reporting date:
The expected volatility of the share price was determined based on the peer group analysis.
Year ended 31 October 2021 Year ended 31 October 2020 Units WAEP Units WAEP
Outstanding at start of year 72,639,801 $1.03 72,497,570 $1.00 Granted during the year 77,799,338 $1.42 11,028,998 $1.16 Cancelled during the year (10,527,248) ($1.12) (10,886,767) ($1.00) Vested during the year (139,911,891) n/a - n/a Outstanding at end of year - n/a 72,639,801 $1.03
Key input assumption 31 October 2021 31 October 2020 Exercise price n/a US$1.00 – US$1.40 Spot price of an ordinary share n/a US$1.40 Risk free rate n/a 0.17% Volatility n/a 38.6% Expected dividend yield n/a 0% Anticipated number of units vesting n/a 87.5% Anticipated exit event at reporting date n/a March 2023

SUSE FY2021 Annual report180
Consolidated financial statements
Notes to the Consolidated Financial Statements (continued) For the year ended 31 October 2021
180
27. Share-based payments (continued) (b) Equity-settled share-based payment scheme (i) Management Investment Participation Program The Management Investment Participation Program (“MIPP”) is an equity-settled Group share-based payment arrangement under which certain members of management have rights to subscribe for ordinary and preference shares of an intermediary parent company as a means of profit participation in return for services rendered to the Group. Members invest through two participation vehicles that own equity in that intermediary parent company. The purchase price per share paid by each member for initial grant of US$ 1.00 equals the price paid by the shareholder of the Company on initial investment. The purchase price for a subsequent grant in December 2020 was US$3.02 per ordinary share. There are two share categories in the parent company: ordinary shares and preferred shares. MIPP members are primarily invested in the ordinary shares, which result in higher return in the event of a favorable exit scenario. The MIPP agreement includes the call right for the shareholder and the put right for the respective member in the scenario of a leaver event. MIPP members will receive a payment from the intermediary parent company (not the Company or Group) in an exit event. Given that the payment is settled outside of the Group with no obligation on the Group or its subsidiaries, the MIPP is classified as an equity-settled plan. The implicit service condition is that members remain with the Group up to such time that an exit event occurs. In a bad leaver scenario, the investment is repurchased by the Group at cost (or at a lower fair value). In a good leaver scenario, the investment is repurchased at the fair value of the shares on the leaving date. The intermediary parent company that administers the scheme has a call option on repurchasing units from members who leave the Group during the period. The share-based payments charge associated with leavers is accelerated and expensed in full at the respective reporting date. The total expense estimated to be recorded over the life of the scheme, including an obligation to good leavers, is US$6.9 million. The amount of MIPP award recognized in equity (within “Other reserves”) as at 31 October 2021 amounted to US$6.2 million (31 October 2020: US$3.2 million) with the following movements in ordinary share units recorded during the year ended 31 October 2021:
In the year ended 31 October 2021, 7,158,924 of the ordinary shares of an intermediary parent company attributable to MIPP participants who have left the Group were repurchased. On 19 May 2021, the shares of SUSE S.A. started trading on the Frankfurt Stock Exchange. The MIPP was considered to be settled for these participants upon the repurchase as of 19 May 2021. There are five remaining participants in the MIPP, owing a total number of 2,674,356 units. The terms and conditions of the scheme remains unchanged for these participants. The original grant date and the fair value as at the grant date are unchanged and the vesting period is assumed unchanged until March 2023. Given the presence of preference shares at the investment level, the payoff on the scheme on the MIPP is similar to an option and a Black-Scholes Merton (“BSM”) model has been used to value the grant date fair value of the instruments granted. Set out below are the valuation inputs used in estimating the grant date fair value of instruments issued:
Year ended 31 October 2021
No. of units
Year ended 31 October 2020
No. of units At start of year 9,259,390 9,407,771 Additional units granted during year 573,890 1,039,619 Units repurchased during year (7,158,924) (1,188,000) At end of year 2,674,356 9,259,390
Key input assumption 31 October 2021 31 October 2020 Weighted average purchase price of a unit US$1.12 US$1.00 Weighted average fair value of a unit at respective grant date US$1.78 US$1.70 Volatility 41.5% 35% Expected dividend yield 0% 0% Anticipated exit event at reporting date March 2023 March 2023

SUSE FY2021 Annual report 181
181
27. Share-based payments (continued) (b) Equity-settled share-based payment scheme (continued) (ii) Long-term Incentive Plans The Long-term Incentive Plans (“LTIP”) are equity-settled share-based payment arrangements which allow employees, including the Management Board, to a pro-rata economic participation in the future value increase of the Group. The LTIP comprises the following plans: – Restricted Stock Units (“RSU”) – Annual Option Award
Restricted Stock Units (“RSU”) Following the IPO on 19 May 2021, the Group established a Transitional RSU Award and an Annual RSU Award. Participants are granted a Conditional Share Award by the Group which comprises a number of RSUs. Each RSU is a promise to transfer one share of SUSE S.A. stock to a participant at the end of the vesting period, provided that the participant remains employed by the Group at the end of the respective vesting period. The Transitional RSU Award represents a one-time transitional bonus and will vest in full two years after the date of grant. The Annual RSU Award may be granted to employees on an annual basis and will vest in three equal annual tranches after the date of grant. The grant date of the initial offers of these RSU awards is 21 May 2021. Further grants were made on 19 October 2021 and 27 October 2021 to new hires, including those who joined SUSE as part of the acquisition of NeuVector. Fair value is determined as at the grant date. 100% of RSUs granted are subject to a service condition and follow a graded vesting pattern over the contractual period. Normal voting rights will apply to the ordinary shares received on vesting, along with the right to receive declared dividends. Individuals will also be able to trade these shares, subject to any trading restrictions imposed. The total expense estimated to be recorded over the life of the scheme, including an obligation to good leavers, is US$71.4 million. The amount of RSUs awards recognized in equity (within “Other reserves”) as at 31 October 2021 was US$14.4 million (31 October 2020: US$ nil). The exercise price of the RSUs is nil and weighted average remaining contractual life to vesting is 593 days. The following movements in RSU units were recorded during the year ended 31 October 2021:
(ii) Long-term Incentive Plans Set out below are the valuation inputs used in estimating the grant date fair value of instruments issued:
Year ended 31 October
2021 US$’000
Year ended 31 October
2020 US$’000
Long-term incentive plans – Restricted Stock Units 14,380 - – Annual Option Award 311 - Total expense arising from Long-Term Incentive Plans 14,691 -
Year ended 31 October
2021 No. of units
Year ended 31 October
2020 No. of units
Outstanding at start of year - - Granted during the year 2,015,808 - Cancelled during the year (74,119) - Outstanding at end of year 1,941,689 -
Key input assumption Transitional RSU
Award Grant date 21 May 2021 27 October 2021 Fair value of options granted €30.40 €39.75 Share price on date of grant €30.40 €39.75 Exercise price (per share) Nil Nil Expected term 2 years 2 years Expected dividend yield Nil Nil

SUSE FY2021 Annual report182
Consolidated financial statements
Notes to the Consolidated Financial Statements (continued) For the year ended 31 October 2021
182
27. Share-based payments (continued) (b) Equity-settled share-based payment scheme (continued) (ii) Long-term Incentive Plans (continued)
Annual Option Award Members of the Management Board and senior employees of SUSE are eligible for the grant of an Annual Option Award. The CEO, CFO and four other senior employees were granted these Options on 19 May 2021. Annual Option Awards will vest in two equal tranches on the second and third anniversaries of the date of grant. The options will become exercisable on the respective vesting date of each tranche. For the initial grant one half of the options (1st tranche) will vest on 18 May 2023 and the other half (2nd tranche) on 18 May 2024; the Option Awards will expire on 18 May 2031, if not exercised. 100% of the Annual Options granted are subject to a service condition and follow a graded vesting pattern over the contractual period. The total expense estimated to be recorded over the life of the scheme, including an obligation to good leavers, is US$1.7 million. The amount of the Annual Option Awards recognized in equity (within “Other reserves”) as at 31 October 2021 amounted to US$0.3 million (31 October 2020: US$ nil). The following movements in Annual Option Award units were recorded during the year ended 31 October 2021:
Set out below are the valuation inputs used in estimating the grant date fair value of instruments issued:
Key input assumption Annual RSU Award Grant date 21 May 2021 19 October 2021 27 October 2021 Fair value of options granted €30.40 €38.27 €39.75 Share price on date of grant €30.40 €38.27 €39.75 Exercise price (per share) Nil Nil Nil Expected term 3 years 3 years 3 years Expected dividend yield Nil Nil Nil
Year ended 31 October 2021
No. of units
Year ended 31 October 2020
No. of units Outstanding at start of year - - Granted during the year 201,169 - Cancelled during the year - - Outstanding at end of year 201,169 -
Key input assumption Annual Option
Award Grant date 18 May 2021 18 May 2021 Fair value of options granted €6.17 €7.50 Share price on date of grant €30.00 €30.00 Volatility 37.8% 37.8% Risk-free interest rate (0.63%) (0.61%) Exercise price (per share) €30.00 €30.00 Expected term 2 years 3 years Expected dividend yield Nil Nil

SUSE FY2021 Annual report 183
183
27. Share-based payments (continued) (c) Share Grant Award to members of the Supervisory Board Members of the Supervisory Board (excluding employees of EQT Partners) were awarded a one-off stock grant of €200,000 of shares in SUSE S.A. at the initial listing price of €30.00. In aggregate, a total grant of €1,200,000 was made of which €262,080 was settled in cash and the residual amount of €937,920 was granted in the form of 31,264 SUSE S.A. shares at the initial listing price of €30.00. For share-based payment transactions where the terms of the arrangement provide the choice of whether the award is settled in cash or by issuing equity instruments, the Group shall account for that transaction, or components of that transaction, as a cash-settled share-based payment transaction to the extent that the Group has incurred a liability to be settled in cash or as an equity-settled share-based payment transaction to the extent that no such liability has been incurred. For the cash-settled component, IFRS 2 requires remeasurement at subsequent reporting dates. However, as the portion of the grant settled in cash of €262,080 was determined at the inception of the program and calculated based on the initial listing price it is not impacted or adjusted due to the future valuation of SUSE S.A. shares. The equity-settled component is measured at the grant date (19 May 2021) and assigned a fair value of €30.00, being the initial listing price. The vesting period for the grant is three years from the date of appointment (4 May 2021) to the latest date for the AGM to approve the annual accounts for the year ended 31 October 2023 (30 April 2024). The total expense estimated to be recorded over the life of the scheme, including an obligation to good leavers, is US$1.5 million. The amount of these awards recognized in equity (within “Other reserves”) as at 31 October 2021 amounted to US$0.2 million (31 October 2020: US$ nil).
28. Contract liabilities Revenue billed but not recognized in the Statement of Comprehensive Income is classified as ‘contract liabilities - deferred income’. Contract liabilities primarily relates to undelivered subscription services on multi-year billed contracts.
Contract liabilities as at 31 October 2021 were US$507.8 million (2020: US$402.5 million) and included an unamortized fair value reserve of US$7.3 million (2020: US$16.5 million) relating to deferred income acquired as part of a business combination. Remaining performance obligations represents contracted revenue that has not yet been recognized and which includes amounts that will be invoiced and recognized as revenue in future periods. The remaining performance obligations were US$92.2 million as at 31 October 2021 (2020: US$27.2 million).
As at 31 October
2021 US$’000
As at 31 October
2020 US$’000
Presentation in Statement of Financial Position: Current 329,611 246,485 Non-current 178,175 155,989 Total contract liabilities 507,786 402,474

SUSE FY2021 Annual report184
Consolidated financial statements
Notes to the Consolidated Financial Statements (continued) For the year ended 31 October 2021
184
28. Contract liabilities (continued) The movement in contract liabilities during the financial year is detailed as follows:
29. Financial risk management The table below sets out the carrying amounts of financial assets and liabilities of the Group as at the reporting date:
As at 31 October
2021 US$’000
As at 31 October
2020 US$’000
Deferred income roll-forward: Beginning of year 402,474 391,491 Acquired during year 33,644 - Fair value adjustment recorded on acquisition (4,465) - Fair value of contract liabilities acquired 29,179 - Plus: Amounts invoiced during year 636,028 458,314 Amounts recognized during year (559,539) (447,421) Other adjustments (356) 90 End of year 507,786 402,474
Financial assets – current year Amortized cost
US$’000
FVOCI
US$’000
FVTPL
US$’000
Total
US$’000 Non-current assets Derivative assets - - 6 6 Current assets Cash and cash equivalents 61,061 - - 61,061 Trade receivables 112,033 - - 112,033 Other receivables 13,660 - - 13,660 As at 31 October 2021 186,754 - 6 186,760
Financial assets – prior year Amortized cost
US$’000
FVOCI
US$’000
FVTPL
US$’000
Total
US$’000 Non-current assets Derivative assets - - 11 11 Current assets Cash and cash equivalents 94,933 - - 94,933 Trade receivables 78,134 - - 78,134 Other receivables 16,540 - - 16,540 As at 31 October 2020 189,607 - 11 189,618

SUSE FY2021 Annual report 185
185
29. Financial risk management (continued) Financial liabilities – current year Amortized
costUS$’000
FVOCI
US$’000
FVTPL
US$’000
Total
US$’000 Current liabilities Trade payables 11,703 - - 11,703 Borrowings 3,600 - - 3,600 Non-current liabilities Derivative liabilities - 4,337 845 5,182 Borrowings 742,148 - - 742,148 As at 31 October 2021 757,451 4,337 845 762,633 Financial liabilities – prior year Amortized
costUS$’000
FVOCI
US$’000
FVTPL
US$’000
Total
US$’000 Current liabilities Trade payables 4,700 - - 4,700 Borrowings 3,600 - - 3,600 Non-current liabilities Derivative liabilities - 12,798 12,642 25,440 Borrowings 934,660 - - 934,660 As at 31 October 2020 942,960 12,798 12,642 968,400 The Group does not hold any financial instruments that are classified as level 1 assets or liabilities as at 31 October 2021 (2020: none). Derivative financial instruments measured at fair value are classified as level 2 in the fair value measurement hierarchy as they have been determined using significant inputs based on observable market data. The fair values of financial derivatives are derived from forward interest rates based on yield curves observable at the reporting date together with the contractual interest rates. Interest-bearing borrowings are initially measured at fair value, net of transaction costs incurred. Subsequent to initial recognition, they are stated at amortized cost using the Effective Interest Method. Interest-bearing borrowings are classified as level 2 in the fair value measurement hierarchy. Future cash outflows for principal and interest are discounted over the remaining term using market interest rates at the reporting date. The fair value of borrowings amounted to US$766.1 million (2020: US$976.4 million) as at 31 October 2021. For other financial instruments such as trade and other receivables, cash and cash equivalents, trade and other payables, fair values approximate to book values due to the short maturity periods of these financial instruments. For trade and other receivables, allowances are made within book value for credit risk. There were no transfers of assets or liabilities between levels of the fair value hierarchy during the current year or prior period. The Group’s multi-national operations expose it to a variety of financial risks that include the effects of changes in credit risk, foreign currency risk, interest rate risk and liquidity risk. Risk management is carried out by Group Treasury under the direction of Management. Group Treasury identifies and evaluates financial risks alongside the Group’s operating units. Management provides written principles for risk management together with specific policies covering the risks set out below:

SUSE FY2021 Annual report186
Consolidated financial statements
Notes to the Consolidated Financial Statements (continued) For the year ended 31 October 2021
186
29. Financial risk management (continued) (a) Credit risk Credit risk is the risk of financial loss to the Group if a customer or financial institution fails to meet its contractual obligations and arises principally from the Group’s receivables from customers and financial institutions. Financial instruments which potentially expose the Group to a concentration of credit risk consist primarily of cash and cash equivalents and trade receivables. The carrying amount of financial assets represents the maximum credit exposure. The maximum exposure to credit risk at the reporting date was:
(i) Impairment of trade receivables The Group provides credit to customers in the normal course of business. Collateral is not required for those receivables, but on-going credit evaluations of customers’ financial conditions are performed. The Group maintains a provision for impairment based upon the expected collectability of accounts receivable. During the period a US$0.3 million (2020: US$1.0 million charge) reversal of the loss allowance was recognized in the Consolidated Statement of Comprehensive Income. The Group applies the IFRS 9 Financial Instruments simplified approach to measure its expected credit losses which uses a lifetime expected loss allowance for all trade receivables. The Group uses an allowance matrix to measure the expected credit losses of trade receivables from individual customers. The expected loss rates are based on the actual credit loss experience. These historical loss rates are adjusted to reflect current and forward-looking information on macro-economic factors. The Group has identified macro-economics, including the ongoing Covid-19 pandemic and country specific risks, to be the most relevant factors and has adjusted the historical loss rates based on expected changes in these factors. Concentration risk arises when a number of counterparties are engaged in similar business activities, or activities in the same geographical region or have economic features that would cause their ability to meet contractual obligations to be similarly affected by changes in economic, political or other conditions. Concentration risks indicate the relative sensitivity of the Group’s performance to developments affecting a particular industry. In order to avoid excessive concentration risk, the Group’s policies and procedures include guidelines to focus on the maintenance of a diversified portfolio. Identified concentration credit risk is controlled and managed accordingly. The Group evaluates the concentration risk with respect to trade receivables as low, as its customers are located in several jurisdictions and industries and operate in largely independent markets.
As at 31 October
2021 US$’000
As at 31 October
2020 US$’000
Trade receivables 112,033 78,134 Cash and cash equivalents 61,061 94,933 Total 173,094 173,067

SUSE FY2021 Annual report 187
187
29. Financial risk management (continued) (a) Credit risk (continued) (ii) Impairment of cash and cash equivalents Risk of counterparty default arising on cash and cash equivalents is controlled by banking with high quality institutions. The Group considers that its cash and cash equivalents have low credit risk based on the external ratings of the counterparties. The Group’s total cash and cash equivalents at 31 October 2021 of US$61.1 million (2020: US$94.9 million) were held with financial institutions with the following ratings:
(b) Market risk Market risk is the risk that changes in market prices will affect the Group’s income or value of its holdings of financial instruments. The objective of market risk management is to manage and control market risk exposures. The impact of the current Covid-19 pandemic is detailed in Note 2. The Group’s treasury function aims to reduce exposures to interest rate, foreign exchange and other capital management risks, to ensure liquidity is available as and when required, and to invest cash assets safely and profitably. The Group does not engage in speculative trading in financial instruments. (i) Interest rate risk Interest rate risk is the risk that the fair value or future cash flows of a financial instrument will fluctuate because of changes in market interest rates. The Group’s exposure to the risk of changes in market interest rates relates primarily to the Group’s long-term debt obligations with floating interest rates. To manage this, the Group entered into an interest rate swap (Note 29(d)), in which it exchanges, monthly, the difference between fixed and variable rate interest amounts calculated by reference to an agreed-upon notional principal amount.
As at 31 October
2021 US$’000
As at 31 October
2020 US$’000
Standard & Poor’s A+ 40,992 78,890 Standard & Poor’s A 184 - Standard & Poor’s AAA 2,186 - Standard & Poor’s A1 49 - Standard & Poor’s AA- 7,405 7,211 Standard & Poor’s A- - 4,972 Moody’s A1 - 2,005 Fitch A - 236 Fitch A+ 46 - Fitch A- 5,602 431 Fitch AA- 803 677 Moody’s A2 3,060 - Moody’s Aa3 208 - Moody’s A3 71 157 Standard & Poor’s Aa3 300 - Standard & Poor’s BB 105 107 Fitch BB+ - 48 Fitch BB - 176 Fitch BBB- 50 - Moody’s B1 - 23 Total 61,061 94,933

SUSE FY2021 Annual report188
Consolidated financial statements
Notes to the Consolidated Financial Statements (continued) For the year ended 31 October 2021
188
29. Financial risk management (continued) (b) Market risk (continued) (i) Interest rate risk (continued) The following table demonstrates the sensitivity to a reasonably possible change in interest rates on the portion of loans and borrowings affected, after the impact of hedge accounting. With all other variables held constant, the Group’s loss before tax is affected through the impact on floating rate borrowings, as follows, for a range determined by Management to be significant:
(1) Excludes the portion of the US dollar borrowings subject to the cash flow hedge as described in Note 29 (d).
(ii) Foreign exchange risk Foreign exchange risk arises from future commercial transactions, recognized assets and liabilities and net investments in foreign operations. Foreign exchange risk arises when such transactions, recognized assets and liabilities are denominated in a currency that is not the entity’s functional currency. The Group has investments in foreign operations, whose net assets are exposed to foreign currency translation risk. The Consolidated Statement of Comprehensive Income is exposed to currency risk on monetary items that are denominated in currencies other than the functional currency in which they are held. Foreign exchange exposures that give rise to net currency gains and losses are recognized in the Consolidated Statement of Comprehensive Income. Any gains or losses on consolidation are reported in the foreign currency translation reserve in the Consolidated Statement of Changes in Equity. The functional currencies of Group companies are primarily US dollar and euro. The Group is exposed to transactional foreign currency risk to the extent that there is a mismatch between the currencies in which sales, purchases, receivables and borrowings are denominated and the respective functional currencies of the Group companies. The following table demonstrates the sensitivity to a change in US dollar and euro exchange rates, with all other variables held constant.
The Group’s exposure to foreign currency changes for other currencies is not material. The Group manages the foreign exchange exposure from trade receivables by invoicing multi-year contracts up-front and minimizing credit periods granted to customers. Trade payable are primarily denominated in the functional currencies of the Group companies.
Fair value of borrowings
US$’000
Increase/ decrease in
basis points
Effect on loss before
tax US$’000
Euro 347,301 +45 (6,388) US dollar(1) 103,244 +60 (2,886) 450,545 (9,274) Euro 347,301 -45 6,388 US dollar(1) 103,244 -60 2,886 450,545 9,274
Increase/decrease EUR rate %
Effect on loss before tax
US$’000 5% increase 1,313 5% decrease (1,313)

SUSE FY2021 Annual report 189
189
29. Financial risk management (continued) (b) Market risk (continued) (iii) Capital management risk The Group’s objective when managing its capital structures is to minimize the cost of capital while maintaining adequate capital to protect against volatility in earnings and net asset values. The strategy is designed to maximize shareholder return over the investment cycle. For the purpose of the Group’s capital management, capital includes issued capital, share premium and all other equity reserves attributable to the equity shareholders. The primary objective of the Group’s capital management is to maximize shareholder value. The Group manages its capital structure and adjusts considering changes in economic conditions and the requirements of the financial covenants associated with borrowings. The Group monitors capital using a debt/equity gearing ratio in accordance with its borrowing agreements. Consolidated net leverage, applying the definition in the Group’s Senior Facilities Agreement, comprises the net total of current and non-current interest-bearing borrowings, unpaid software liabilities and cash and short-term depositions. In order to achieve this overall objective, the Group’s capital management, among other things, aims to ensure that it meets financial covenants attached to the borrowings. Breaches in meeting the financial covenants would permit the bank to immediately call loans and borrowings. The Group’s borrowing agreements contain a Consolidated Senior Secured Net Leverage Ratio covenant; which only applies in specific circumstances, in particular if the amount drawn on the Revolving Credit Facility (“RCF”) less cash and cash equivalents exceeds US$32.0 million, (being 40% of the total committed RCF). In the event that the US$32.0 million threshold is exceeded, the relevant covenant states that Consolidated Senior Secure Net Leverage (Borrowings and certain other payables less unsecured second lien debt less cash in proportion to EBITDA as defined by the Senior Facility Agreements) must not exceed 8.09. As at 31 October 2021, the ratio was 2.60 (2020: 3.51). No changes were made to the objectives, policies or processes for managing capital during the reporting period. The consolidated debt/equity ratio of the Group at 31 October 2021 is as follows:
(c) Liquidity risk Liquidity risk is the risk that the Group might have difficulties in meeting its financial obligations. The Group manages this risk by ensuring that it maintains sufficient levels of committed borrowing facilities and cash and cash equivalents to ensure that it can meet its operational cash flow requirements and any maturing financial liabilities, whilst at all times operating within its financial covenants. The level of operational headroom provided by the Group’s committed borrowing facilities is regularly reviewed. Where this process indicates a need for additional finance, this is addressed on a timely basis. The table below summarizes the maturity profile of the Group’s financial liabilities as at 31 October 2021 based on contractual undiscounted payments:
As at 31 October
2021 US$’000
As at 31 October
2020 US$’000
Total consolidated net leverage 723,092 897,891 Total equity 2,186,010 1,447,345 Debt/equity % 33.08% 62.04%
Current year Borrowings
US$’000
Leaseliabilities
US$’000
Trade and other
payables US$’000
Derivative liabilities US$’000
Total
US$’000 On demand or within one year 30,954 6,815 11,703 4,429 53,901 Between 1 and 2 years 30,832 5,205 - - 36,037 Between 2 and 5 years 756,786 8,211 - - 764,997 After 5 years 70,758 3,777 - - 74,535 As at 31 October 2021 889,330 24,008 11,703 4,429 929,470

SUSE FY2021 Annual report190
Consolidated financial statements
Notes to the Consolidated Financial Statements (continued) For the year ended 31 October 2021
190
29. Financial risk management (continued) (c) Liquidity risk (continued)
(d) Hedging activities and derivatives The Group is exposed to certain cash flow risks relating to its ongoing business operations and financing structure. Interest rate risks are managed using derivative instruments. The fair value of derivative assets and liabilities as at 31 October 2021 was as follows:
(i) Embedded derivatives During 2019, the Group entered into a US$270.0 million loan agreement with an interest rate of LIBOR +7%. An embedded LIBOR floor of 1% and prepayment option were separated and carried at fair value. The fair value of the embedded derivative was US$0.8 million (31 October 2020: US$12.6 million) at 31 October 2021. (ii) Derivatives not designated as hedging instruments During 2019, the Group entered a EUR 200 million EURIBOR interest rate cap and USD 105 million LIBOR interest rate cap to reduce interest rate volatility. Both interest rate caps have a termination date of 30 April 2022 and are designated at fair value through profit and loss. The fair values of these derivatives as at 31 October 2021, included in other financial assets was US$6 thousand (31 October 2020: US$0.01 million). (iii) Cash flow hedges As at 31 October 2021, the Group had an interest rate swap agreement in place with a notional amount of US$315 million to hedge the exposure to variable interest in a US$360 million loan. Under this agreement, the Group pays a fixed rate of interest of 2.927% and receives interest at a variable rate equal to one-month LIBOR on the notional amount. The agreement matures in April 2022. The amounts relating to items designated as hedging instruments as at 31 October 2021 were as follows:
Prior year Borrowings
US$’000
LeaseLiabilities
US$’000
Trade and other
payables US$’000
Derivative liabilities US$’000
Total
US$’000 On demand or within one year 46,059 6,362 4,700 8,801 65,922 Between 1 and 2 years 45,990 4,772 - 4,320 55,082 Between 2 and 5 years 142,169 6,269 - 1,200 149,638 After 5 years 994,947 303 - 3,332 998,582 As at 31 October 2020 1,229,165 17,706 4,700 17,653 1,269,224
As at 31 October 2021 As at 31 October 2020 Derivative
assetsUS$’000
Derivative liabilities
US$’000
Derivative assets
US$’000
Derivative liabilities US$’000
Derivative not designated as hedging instruments: Interest rate caps 6 - 11 - Embedded derivative liability - 845 - 12,642 Derivative designated as hedging instruments: Interest rate swap - 4,337 - 12,798 Total 6 5,182 11 25,440
As at 31 October
2021 US$’000
As at 31 October
2020 US$’000
At beginning of year 12,798 11,961 Other comprehensive income: Cash flow hedge reserve 502 7,335 Payments reclassified to profit or loss (8,963) (6,498) Total 4,337 12,798

SUSE FY2021 Annual report 191
191
29. Financial risk management (continued) (d) Hedging activities and derivatives (continued) (iii) Cash flow hedges (continued) There is an economic relationship between the hedged item and the hedging instrument as the terms of the interest rate swap match the critical terms of the fixed rate loan. The Group has established a hedge ratio of 87.5% (2020: 87.5%) for the hedging relationship as the underlying risk of the interest rate swap is identical to the hedged risk component. The Group uses the hypothetical derivative method to test effectiveness which compares changes in the fair value of the hedging instrument and hedging item attributable to the hedged risk. Hedge ineffectiveness can arise: – From different interest rate curves applied to discount the hedged item and hedging instrument; – From differences in timing of cash flows of the hedged item and hedging instrument; and – From the counterparties’ credit risk differently impacting the fair value movements. The remaining portion of US$0.5 million (2020: US$7.3 million) in respect of the hedged instrument is deemed to be wholly effective and has been recognized in other comprehensive income. Premia paid of US$9.0 million (2020: US$6.5 million) have been recycled from the cash flow hedge reserve during the year.
30. Capital and reserves (a) Share capital At 31 October 2021, the subscribed capital of the Company was US$16,902,712 (2020: US$14,000) as represented by 169,027,117 (2020: 1,400,000) shares without nominal value (2020: fully paid-up with a nominal value of US$0.01). The movement in share capital during the financial year is detailed as follows:
On 3 May 2021, the share capital of the Company was increased by US$ 126,000 from its original amount of US$ 14,000 to US$ 140,000 through the increase of the nominal value of each share from US$ 0.01 to US$ 0.10. The nominal value of the shares was cancelled, and the share capital of the Company set at US$ 140,000 divided into 1,400,000 shares without nominal value. Authorized share capital of US$ 26,000,000 (including the Company’s issued share capital) was created , represented by 260,000,000 shares without any nominal value. The share capital of the Company was further increased by US$ 14,860,000 from US$ 140,000 to US$ 15,000,000 through the creation and issuance of 148,600,000 new shares without nominal value. On 19 May 2021, on completion of pricing of the IPO, the Company raised net proceeds of €540,765,000 having transferred 18,300,000 ordinary shares of €30.00 per share to new investors, resulting in a credit to share premium. On 11 June 2021, the share capital of the Company was increased by US$3,126 by the creation of 31,264 new shares, resulting in a credit to share premium. On 26 October 2021, the share capital of the Company was increased by US$69,585 by the creation of 695,853 new shares resulting in a credit to share premium.
As at 31 October 2021
no. of shares
As at 31 October
2021 US$’000
As at 31 October
2020 US$’000
Beginning of year 1,400,000 14 14 Cancellation of nominal value – 3 May 2021 - 126 n/a Increases in share capital – 3 May 2021 148,600,000 14,860 n/a – 19 May 2021 18,300,000 1,830 n/a – 11 June 2021 31,264 3 n/a – 26 October 2021 695,853 70 n/a End of year 169,027,117 16,903 14

SUSE FY2021 Annual report192
Consolidated financial statements
Notes to the Consolidated Financial Statements (continued) For the year ended 31 October 2021
192
30. Capital and reserves (continued) (b) Share premium At 31 October 2021, the share premium of the Company amounted to US$2,523.0 million (2020: US$1,604.3 million). The movement in share capital during the financial year is detailed as follows:
During November 2020, Marcel LUX III SARL, the immediate parent company, made US$174.0 million capital contributions without the issuance of shares to the Company which were unconditional and without rights to receive any repayment or redemption prior to liquidation: – A first capital contribution of US$135,337,908 on 20th November 2020. This is included as an inflow in the
financing activities section of the Consolidated Statement of Cash Flows; – A second capital contribution of US$38,698,541 on 25th November 2020. This was a non-cash item and further
details are disclosed in Note 14. On 18 May 2021, Marcel LUX III SARL, the immediate parent company, made a capital contribution of US$63,088,930 without the issuance of shares to the Company which were unconditional and without rights to receive any repayment or redemption prior to liquidation. On 19 May 2021, on completion of pricing of the IPO, the Company raised net proceeds of €540,765,000 having transferred 18,300,000 ordinary shares of €30.00 per share to new investors, resulting in a credit to share premium. On 26 October 2021, the share premium of the Company was increased by US$29,003,153 without reserving any statutory preferential subscription rights to the existing shareholders for an aggregation subscription price of US$29,072,738. (c) Retained losses Retained losses as at 31 October 2021 amounted to US$355.9 million (2020: US$130.8 million) and included the Group’s loss for the period of US$207.6 million, other comprehensive income of US$2.7 million and expenses for the IPO of US$14.7 million which were recognized directly in equity (see note (d) below).
As at 31 October
2021 US$’000
As at 31 October
2020 US$’000
Beginning of year 1,604,251 1,604,251 Cancellation of nominal value – 3 May 2021 (126) - Capital contribution (November 2020) – First capital contribution (20 November 2020) 135,338 - – Second capital contribution (25 November 2020) 38,698 -
Increases in share capital – 3 May 2021 (Note 30(a)) (14,860) - – 18 May 2021 63,089 – 19 May 2021 (1,830) - – 11 June 2021 (3) - – 26 October 2021 29,003 - Proceeds from Initial Public Offering (19 May 2021) 669,451 - End of year 2,523,011 1,604,251

SUSE FY2021 Annual report 193
193
30. Capital and reserves (continued) (d) IPO transaction costs On 19 May 2021, a total of 168.3 million shares in SUSE S.A. were listed on the Frankfurt Stock Exchange (Note 30(a)), of which 18.3 million (11%) were newly issued. The Initial Public Offering resulted in total transaction costs of US$41.1 million. Qualifying costs of an equity transaction are accounted for as a deduction from equity to the extent that they are incremental costs directly attributable to the equity transaction that otherwise would have been avoided. Listing transactions often involve both listing existing shares and issuing new ones. The costs directly attributable to issuing new shares should be recognised directly in equity. Any costs attributable to listing existing shares should be expensed as they are incurred. Qualifying costs that relate to both existing shares and new shares are allocated based on the number of shares. Underwriter fees of US$18.2 million are deemed wholly attributable to the issuance of new shares and are deducted from equity. Of the remaining transaction costs, US$14.2 million are deemed to be ‘qualifying costs’ attributed to the IPO process and US$1.6 million (11%) are deducted from equity. The remaining US$13.0 million of ‘qualifying costs’ and US$8.6 million of ‘non-qualifying costs’ are expensed in the Income Statement (see Note 8).
(e) Hedging reserve The hedging reserve comprises the effective portion of the cumulative net change in the fair value of hedging instruments used in cash flow hedges pending subsequent recognition in profit or loss or directly included in the initial cost or other carrying amount of a non-financial asset or non-financial liability. (f) Foreign currency translation reserve The translation reserve comprises all foreign exchange differences arising from the translation of the financial statements of foreign operations, as well as the effective portion of any foreign currency differences arising from hedges of a net investment in a foreign operation. (g) Reserve requirements as a matter of Luxembourg company law In accordance with relevant law, the Company is required to transfer a minimum of 5% of its net profit for each financial year to a legal reserve. This requirement ceases to be necessary once the balance on the legal reserve reaches 10% of the issued share capital. The legal reserve is not available for distribution to the shareholders. The total loss for the year of the Company was US$20.1 million (2020: US$0.5 million).
Deducted
from equity US$’000
Expensed to Income
Statement US$’000
Total US$’000
Underwriter fees 18,218 - 18,218 Non-qualifying costs - 8,613 8,613 Qualifying costs – Allocated to newly issued shares 1,606 - 1,606 – Allocated to existing shares - 12,627 12,627
Associated tax impact (5,128) (4,951) (10,079) Total 14,696 16,289 30,985

SUSE FY2021 Annual report194
Consolidated financial statements
Notes to the Consolidated Financial Statements (continued) For the year ended 31 October 2021
194
31. Employees and key management personnel (a) Employee expenses
(b) Pension expenses
(c) Key management personnel Key management personnel (“Management”) are those people having authority and responsibility for planning, directing, and controlling the activities of the Group as well as those appointed managers of the Company. There were no advances and loans granted to members of Management or members of the Supervisory Board during the current year or prior period. The Group did not enter into any commitment or guarantee on behalf of key management personnel during the current year or period. The remuneration of the key management personnel of the Group is set out below in aggregate for each of the categories specified in IAS 24 Related Party Disclosures:
Year ended 31 October
2021 US$’000
Year ended 31 October
2020 US$’000
Wages and salaries 222,781 159,662 Redundancy and termination costs 4,358 4,259 Social security costs 17,586 13,521 Commission and bonuses 42,043 35,020 Pension costs 8,259 5,828 Share-based payment expenses 175,164 11,887 Total employee expenses for the year 470,191 230,177
Year ended 31 October
2021 US$’000
Year ended 31 October
2020 US$’000
Defined benefit schemes 476 449 Defined contribution schemes 7,783 5,379 Total pension costs 8,259 5,828
Year ended 31 October
2021 US$’000
Year ended 31 October
2020 US$’000
Wages and salaries 3,382 4,651 Social security costs 1,592 973 Supervisory Board fees 371 311 Commission and bonuses 7,551 4,377 Pension costs 35 142 Cost of employee share schemes 3,160 1,528 Total remuneration for the year 16,091 11,982

SUSE FY2021 Annual report 195
195
31. Employees and key management personnel (continued) (d) Number of employees
The average number of employees of the Group for the year was 2,045 (2020: 1,631).
32. Related party transactions To enable users of our financial statements to form a view on the effects of related party relationships on the Group, we disclose the related party relationship where control exists, irrespective of whether there have been transactions between related parties. All transactions with related parties are conducted on an arm’s-length basis and in accordance with normal business terms. Transactions between related parties that are Group subsidiaries are eliminated on consolidation. (i) Ultimate controlling party The ultimate controlling party of the Group is EQT Fund Management SARL, a limited liability company registered with the Luxembourg Register of Commerce and Companies. (ii) Transactions with subsidiaries All transactions between subsidiaries of the Group are in the normal course of business. Transactions between Group subsidiaries are eliminated on consolidation. Further details of the subsidiaries of the Group are included in Note 17. (iii) Transactions with associate investments All transactions with associate investments are in the normal course of business. There were no transactions with associate investments during the year. Further details are included in Note 18. (iv) Transactions with key management personnel The remuneration of key management personnel is set out in Note 31. There were no other transactions with key management personnel during the year. (v) Transactions with members of the Supervisory Board The remuneration of the Supervisory Board is set out in Note 31. In addition, members of the Supervisory Board (excluding employees of EQT Partners) were awarded a one-off stock grant of €200,000 of shares in SUSE S.A. at the initial listing price of €30.00, further details are set out in Note 27(c). (vi) Transactions with shareholders US$1.5 million was loaned by the Group to Marcel LUX I SARL on 20 August 2020. This loan was repaid in full on 23 November 2020. (vii) Transactions with other related parties Pension contributions to Group schemes are disclosed in Note 26.
Year ended 31 October
2021
Year ended 31 October
2020 Engineering & Innovation 710 585 Global Customer Office 617 436 Marketing and Product Development 187 129 Services 149 110 Customer Care 137 93 Chief Operations Officer - 64 Finance and procurement 92 78 Corporate Development & Alliances - 45 HR and Transformation 60 35 IT 71 41 Chief Growth Officer 8 - Operations - 10 Legal 7 8 Corporate 7 6 Total employees 2,045 1,640

SUSE FY2021 Annual report196
Consolidated financial statements
Notes to the Consolidated Financial Statements (continued) For the year ended 31 October 2021
196
33. Commitments and contingencies (i) Director and officer insurance The Group maintains insurance cover for all Directors’ and officers of Group companies against liabilities which may be incurred by them while acting in that capacity at the Group’s request. (ii) External borrowings guarantee The obligations of the obligor members of the Group under the external loan agreements (Senior Facilities Agreement and the related finance documents) are secured (subject to certain agreed security principles) by liens granted by obligor members of the Group over shares in obligor members of the Group, material intercompany receivables and material bank accounts. The Group’s guarantees under the external loan agreements include upstream, cross-stream and downstream guarantees by obligor members of the Group to each finance party under such agreements for the punctual performance by each other obligor member of the Group of their obligations under such agreements (subject to jurisdiction-specific guarantee limitations as set out therein).
34. Post balance sheet events (a) Ongoing impact of Covid-19 Management does not currently envisage a significant impact from the ongoing Covid-19 pandemic. An impact assessment performed by Management has analyzed the risk posed by the pandemic. Further details are included in Note 2C ‘Going concern’. While the status of the pandemic is constantly evolving, Management continues to monitor and observe performance to ensure changes in circumstances or events do not impact this assessment. (b) Increase in Revolving Credit Facility On 21 December 2021, the original revolving credit facility of US$81.0 million was increased by US$88.3 million to US$169.3 million under the Senior Facilities Agreement. At the date of approval of these Consolidated Financial Statements, the full amount was available for drawdown.

SUSE FY2021 Annual report 197
Responsibility Statement
197
We, Melissa Di Donato (Chief Executive Officer) and Andy Myers (Chief Financial Officer), confirm to the best of our knowledge, and in accordance with the applicable reporting principles, the Consolidated Financial Statements give a true and fair view of the assets, liabilities, financial position and profit or loss of SUSE, and the Group Management Report, which has been combined with the Management Report for SUSE S.A., includes a fair review of the development and performance of the business and the position of SUSE, together with a description of the material opportunities and risks associated with the expected development of SUSE. Melissa Di Donato Member of the Management Board, SUSE S.A.
Andy MyersMember of the Management Board, SUSE S.A.

SUSE FY2021 Annual report198
Independent auditor’s report To the Shareholders of SUSE S.A. 11-13, Boulevard de la Foire L-1528 Luxembourg Luxembourg
Report of the Reviseur d’entreprises agree
198
Report on the audit of the consolidated financial statements
Opinion We have audited the consolidated financial statements of SUSE S.A. (“the Company”) and its subsidiaries (the "Group"), which comprise the consolidated statement of financial position as at 31 October 2021, and the consolidated statement of comprehensive income, consolidated statement of changes in equity and consolidated statement of cash flows for the year then ended, and notes to the consolidated financial statements, including a summary of significant accounting policies. In our opinion, the accompanying consolidated financial statements give a true and fair view of the consolidated financial position of the Group as at 31 October 2021 and of its consolidated financial performance and its consolidated cash flows for the year then ended in accordance with International Financial Reporting Standards (IFRSs) as adopted by the European Union.
Basis for opinion We conducted our audit in accordance with the EU Regulation N° 537/2014, the Law of 23 July 2016 on the audit profession (“Law of 23 July 2016”) and with International Standards on Auditing (“ISAs”) as adopted for Luxembourg by the Commission de Surveillance du Secteur Financier (“CSSF”). Our responsibilities under the EU Regulation N° 537/2014, the Law of 23 July 2016 and ISAs as adopted for Luxembourg by the CSSF are further described in the « Responsibilities of “Réviseur d'Entreprises agréé” for the audit of the consolidated financial statements » section of our report. We are also independent of the Group in accordance with the International Code of Ethics for Professional Accountants, including International Independence Standards, issued by the International Ethics Standards Board for Accountants (“IESBA Code”) as adopted for Luxembourg by the CSSF together with the ethical requirements that are relevant to our audit of the consolidated financial statements, and have fulfilled our other ethical responsibilities under those ethical requirements. We believe that the audit evidence we have obtained is sufficient and appropriate to provide a basis for our opinion.
Key audit matters Key audit matters are those matters that, in our professional judgment, were of most significance in our audit of the consolidated financial statements of the current period. These matters were addressed in the context of the audit of the consolidated financial statements as a whole, and in forming our opinion thereon, and we do not provide a separate opinion on these matters. Revenue recognition of master license agreements a) Why the matter was considered to be one of most significance in our audit of the consolidated financial statements for the year ended 31 October 2021? The revenue of the Group amounts to USD 560 million for the year ended 31 October 2021, compared to USD 447 million for the year ended 31 October 2020. Revenue comprises USD 100.8 million derived from master license agreements for the year ended 31 October 2021. The Group derives its revenues primarily from subscription license services it offers to its customers under various software solutions. The revenue is recognized when benefits arising from contractual performance obligations are transferred to a customer for an amount that reflects the consideration the Group expects to receive from a customer contract. The Group applies five steps in recognizing revenue. Refer to accounting policy 4A and Note 7 of the consolidated financial statements. Certain revenue arrangements, which include master license agreements, can have multiple elements and there can be judgement identifying each separate performance obligation when sold together in a bundle. This judgement could materially affect the timing and quantum of revenue recognised in each financial year. There is also an inherent fraud risk in that there is particular stakeholders’ focus on certain key related revenue metrics such as revenue recognised and annual contract value in addition to there being various employee and key management incentive schemes which depend on financial performance. We assess these risks to be greater in those arrangements with bespoke terms, potentially leading to unidentified contract performance obligations.

SUSE FY2021 Annual report 199
199
b) How the matter was addressed during the audit? Our procedures over revenue recognition of master license agreement included, but were not limited to: – Assessing the Group’s policy in respect of identification of contract performance obligations against the
relevant accounting standards; – Assessing the design of the Group’s anti-fraud key controls in relation to revenue recognition; – Selecting all contracts over our set thresholds in the defined population and inspecting key documents
including the signed contract, purchase orders, delivery of software licences, sales invoices and related payment, and the Group’s revenue recognition checklist for that contract to identify revenue performance obligations;
– Assessing the appropriateness of the Management Board’s judgements in determining each separate performance obligation of the contract and its revenue recognition;
– Selecting high-risk journal entries related to revenue recognition of master license agreements to trace to appropriate supporting documentation;
– Assessing the adequacy of the Management Board’s critical judgement disclosures in respect of revenue recognition.
Impairment of goodwill a) Why the matter was considered to be one of most significance in our audit of the consolidated financial statements as at 31 October 2021? Goodwill represents USD 2,685.8 million or approximately 72% of the Group’s total assets as at 31 October 2021. For the purpose of impairment testing, goodwill acquired in a business combination is, from the acquisition date, allocated to a cash-generating unit (“CGU”) or group of CGUs within the Group being the lowest level of independently functioning components capable of generating cashflow. The Management Board performs an annual impairment test of the Cash Generating Units (CGUs) to which the goodwill is allocated to assess whether the recoverable amount is at least equal to it carrying value. Refer to accounting policy 4F and Note 15 of the consolidated financial statements. The Group’s assessment of impairment of goodwill is a judgmental process which requires estimates concerning the forecast future cash flows associated with the goodwill and assets held, the discount rates and the growth rate of revenue and costs to be applied in determining the value in use. b) How the matter was addressed during the audit? Our procedures over the impairment of goodwill included, but were not limited to: – Gaining an understanding of the process of preparation of the goodwill impairment test and testing design
and implementation of the key controls; – Assessing the appropriateness of the identification of the cash generating units and allocation of goodwill
and cash flows to those CGUs done by the Management Board; – Assessing the valuation models and key assumptions used by the Management Board; – Involving our own valuation specialists to test discount rates used by the Management Board; – Assessing the sensitivity analysis of the recoverable amount to the discount rate, profitability measure and
terminal growth rate for the CGUs; – Considering the adequacy and appropriateness of the disclosures provided on goodwill impairment
pursuant to the relevant accounting and financial reporting standards.

SUSE FY2021 Annual report200
Independent auditor’s report
200
Purchase Price Allocation (“PPA”) a) Why the matter was considered to be one of most significance in our audit of the consolidated financial statements as at 31 October 2021? On 25 November 2020, the Group acquired the Rancher Group for a total consideration of USD 583.2 million. Goodwill of USD 438.4 million was recognized at the time of this acquisition. On 27 October 2021, the Group acquired NeuVector Inc. for a total consideration of USD 131.2 million. Goodwill of USD 112.4 million was recognized at the time of this acquisition. Business combinations are accounted for using the acquisition method when control is transferred to the Group. The cost of an acquisition is measured as the aggregate of the consideration transferred, which is measured at acquisition date fair value, and the amount of any non-controlling interests in the acquiree. When the Group acquires a business, it assesses the financial assets and liabilities assumed for appropriate classification and designation in accordance with the contractual terms, economic circumstances and pertinent conditions as at the acquisition date. Refer to accounting policy 4F and Note 14 of the consolidated financial statements. The allocation of the purchase price as a result of the acquisitions within the Group to the identified assets and liabilities acquired, specifically in relation to the identification of intangible assets, contingent assets and contingent liabilities and the measurement of assets and liabilities was a matter of most significance to our audit due to the following: – Significant judgements in relation to the identification of certain assets; – Significant judgements made by the Management Board regarding the discount rate and forecast cash
flows included in the valuation models; – Significant judgements made by the Management Board regarding the useful lives of the intangible assets;
and – The magnitude of the assets and liabilities recognized in the Purchase Price Allocation (PPA) process. The Group performed a PPA for each acquisition separately with the assistance from an external valuation expert to identify and value the identifiable assets and liabilities, and specifically the intangible assets, contingent assets and contingent liabilities acquired as part of the acquisitions. b) How the matter was addressed during the audit? Our procedures over the purchase price allocation included, but were not limited to: – Obtaining the report issued by the external valuation expert engaged by the Management Board to perform
the PPA; – Involving our own valuation specialists to assess the asset and liability identification process, the
methodology adopted by the Management Board’s external valuation expert and the assumptions applied; – Testing the mathematical accuracy of the valuation models; – Considering the adequacy and appropriateness of the disclosures provided on business combinations
pursuant to the relevant accounting and financial reporting standards.

SUSE FY2021 Annual report 201
201
Other information The Management Board is responsible for the other information. The other information comprises the information stated in the consolidated annual report including the combined management report and the corporate governance statement but does not include the consolidated financial statements and our report of the “Réviseur d'Entreprises agréé” thereon. Our opinion on the consolidated financial statements does not cover the other information and we do not express any form of assurance conclusion thereon. In connection with our audit of the consolidated financial statements, our responsibility is to read the other information and, in doing so, consider whether the other information is materially inconsistent with the consolidated financial statements or our knowledge obtained in the audit or otherwise appears to be materially misstated. If, based on the work we have performed, we conclude that there is a material misstatement of this other information, we are required to report this fact. We have nothing to report in this regard.
Responsibilities of the Management Board and the Audit Committee for the consolidated financial statements The Management Board is responsible for the preparation and fair presentation of the consolidated financial statements in accordance with IFRSs as adopted by the European Union, and for such internal control as the Management Board determines is necessary to enable the preparation of consolidated financial statements that are free from material misstatement, whether due to fraud or error. The Management Board is responsible for presenting and marking up the consolidated financial statements in compliance with the requirements set out in the Delegated Regulation 2019/815 on European Single Electronic Format (“ESEF Regulation”). In preparing the consolidated financial statements, the Management Board is responsible for assessing the Group’s ability to continue as a going concern, disclosing, as applicable, matters related to going concern and using the going concern basis of accounting unless the Management Board either intends to liquidate the Group or to cease operations, or has no realistic alternative but to do so. The Audit Committee is responsible for overseeing the Group’s financial reporting process.
Responsibilities of the Réviseur d'Entreprises agréé for the audit of the consolidated financial statements The objectives of our audit are to obtain reasonable assurance about whether the consolidated financial statements as a whole are free from material misstatement, whether due to fraud or error, and to issue a report of the “Réviseur d'Entreprises agréé” that includes our opinion. Reasonable assurance is a high level of assurance, but is not a guarantee that an audit conducted in accordance with the EU Regulation N° 537/2014, the Law of 23 July 2016 and with ISAs as adopted for Luxembourg by the CSSF will always detect a material misstatement when it exists. Misstatements can arise from fraud or error and are considered material if, individually or in the aggregate, they could reasonably be expected to influence the economic decisions of users taken on the basis of these consolidated financial statements. Our responsibility is to assess whether the consolidated financial statements have been prepared in all material respects with the requirements laid down in the ESEF Regulation. As part of an audit in accordance with the EU Regulation N° 537/2014, the Law of 23 July 2016 and with ISAs as adopted for Luxembourg by the CSSF, we exercise professional judgment and maintain professional skepticism throughout the audit. We also: – Identify and assess the risks of material misstatement of the consolidated financial statements, whether due
to fraud or error, design and perform audit procedures responsive to those risks, and obtain audit evidence that is sufficient and appropriate to provide a basis for our opinion. The risk of not detecting a material misstatement resulting from fraud is higher than for one resulting from error, as fraud may involve collusion, forgery, intentional omissions, misrepresentations, or the override of internal control.
– Obtain an understanding of internal control relevant to the audit in order to design audit procedures that are appropriate in the circumstances, but not for the purpose of expressing an opinion on the effectiveness of the Group’s internal control.

SUSE FY2021 Annual report202
Independent auditor’s report
202
– Evaluate the appropriateness of accounting policies used and the reasonableness of accounting estimates and related disclosures made by the Management Board.
– Conclude on the appropriateness of the Management Board’s use of the going concern basis of accounting and, based on the audit evidence obtained, whether a material uncertainty exists related to events or conditions that may cast significant doubt on the Group’s ability to continue as a going concern. If we conclude that a material uncertainty exists, we are required to draw attention in our report of the “Réviseur d'Entreprises agréé” to the related disclosures in the consolidated financial statements or, if such disclosures are inadequate, to modify our opinion. Our conclusions are based on the audit evidence obtained up to the date of our report of the “Réviseur d'Entreprises agréé”. However, future events or conditions may cause the Group to cease to continue as a going concern.
– Evaluate the overall presentation, structure and content of the consolidated financial statements, including the disclosures, and whether the consolidated financial statements represent the underlying transactions and events in a manner that achieves fair presentation.
– Obtain sufficient appropriate audit evidence regarding the financial information of the entities and business activities within the Group to express an opinion on the consolidated financial statements. We are responsible for the direction, supervision and performance of the Group audit. We remain solely responsible for our audit opinion.
We communicate with the Audit Committee regarding, among other matters, the planned scope and timing of the audit and significant audit findings, including any significant deficiencies in internal control that we identify during our audit. We also provide the Audit Committee with a statement that we have complied with relevant ethical requirements regarding independence, and communicate to them all relationships and other matters that may reasonably be thought to bear on our independence, and where applicable, actions taken to eliminate threats or safeguards applied. From the matters communicated with the Audit Committee, we determine those matters that were of most significance in the audit of the consolidated financial statements of the current period and are therefore the key audit matters. We describe these matters in our report unless law or regulation precludes public disclosure about the matter.
Report on other legal and regulatory requirements We have been appointed as “Réviseur d'Entreprises agréé” by the Extraordinary General Meeting of the Sole Shareholder on 3 May 2021 and the duration of our uninterrupted engagement, including previous renewals and reappointments, is one year. The combined management report is consistent with the consolidated financial statements and has been prepared in accordance with applicable legal requirements. The corporate governance statement is included in the combined management report. The information required by Article 68ter paragraph (1) letters c) and d) of the law of 19 December 2002 on the commercial and companies register and on the accounting records and annual accounts of undertakings, as amended, is consistent with the consolidated financial statements and has been prepared in accordance with applicable legal requirements. We confirm that the audit opinion is consistent with the additional report to the audit committee or equivalent. We confirm that the prohibited non-audit services referred to in the EU Regulation N° 537/2014 were not provided and that we remained independent of the Group in conducting the audit. We have checked the compliance of the consolidated financial statements of the Group as at 31 October 2021 with relevant statutory requirements set out in the ESEF Regulation that are applicable to consolidated financial statements.

SUSE FY2021 Annual report 203
203
For the Group it relates to: – Consolidated financial statements prepared in a valid xHTML format; – The XBRL markup of the consolidated financial statements using the core taxonomy and the common rules
on markups specified in the ESEF Regulation as described in Note 2A. In our opinion, the consolidated financial statements of SUSE S.A. as at 31 October 2021, identified as susesa-2021-10-31-en.zip, have been prepared, in all material respects, in compliance with the requirements laid down in the ESEF Regulation. Our audit report only refers to the consolidated financial statements of SUSE S.A. as at 31 October 2021, identified susesa-2021-10-31-en.zip, prepared and presented in accordance with the requirements laid down in the ESEF Regulation, which are the only authoritative version. Luxembourg, 20 January 2022 KPMG Luxembourg
Société anonyme Cabinet de révision agréé
Christelle BousserPartner
KPMG Luxembourg is a Société anonyme with its registered office at 39, Avenue John F. Kennedy, L-1855 Luxembourg.

SUSE FY2021 Annual report204
Annual report and accounts
Balance Sheet As at 31 October 2021
204
Notes
31 October 2021
US$’000
31 October 2020
US$’000 ASSETS Fixed assets Financial assets Shares in affiliated undertakings 3.1 2,121,229 1,601,859 Loans to affiliated undertakings 3.2 232,901 - 2,354,130 1,601,859 Current assets Debtors Amounts owed by affiliated undertakings becoming due and payable within one year 197,538 673 Other debtors becoming due and payable within one year 335 67 4 197,873 740 Cash at bank and in hand 1,153 137 Prepayments 868 3 TOTAL ASSETS 2,554,024 1,602,739 CAPITAL, RESERVES AND LIABILITIES Capital and reserves Subscribed capital 16,903 14 Share premium account 2,523,011 1,604,251 Profit or loss brought forward (2,156) (1,646) Profit or loss for the financial year (20,148) (510) 5 2,517,610 1,602,109 Creditors Trade creditors becoming due and payable within one year 13,525 625 Amounts owed to affiliated undertakings becoming due and payable within one year 22,807 - Other creditors
Tax authorities 6 5 Other creditors becoming due and payable within one year 76 -
6 36,414 630 TOTAL CAPITAL, RESERVES AND LIABILITIES 2,554,024 1,602,739

SUSE FY2021 Annual report 205
Profit and Loss Account For the year ended 31 October 2021
205
Notes
Year ended 31 October
2021 US$’000
Year ended 31 October
2020 US$’000
Other operating income 7 19,311 327 Raw materials and consumables and other external expenses Other external expenses 8 (44,231) (829) Income from other investments and loans forming part of the fixed assets Derived from affiliated undertakings 10 5,009 - Other interest receivable and similar income Other interest and similar income 15 6 Interest payable and similar expenses Other interest and similar expenses (246) (9) Tax on loss 11 - - Loss after taxation (20,142) (505) Other taxes 11 (6) (5) Loss for the financial year (20,148) (510)

SUSE FY2021 Annual report206
Annual report and accounts
Notes to the Annual Accounts For the year ended 31 October 2021
206
1. General SUSE S.A. (the "Company") was incorporated in Luxembourg on 20 June 2018 subject to Luxembourg law for an unlimited period of time. The Company has its registered office at 11-13, Boulevard de la Foire, 1528 Luxembourg. The financial year of the Company starts on the first of November of each year and ends on the thirty first of October of the following year. The Company is managed by a Management Board under the supervision of the Supervisory Board. On 26 April 2021 the Company, under its former name Marcel Lux IV SARL, announced plans for an Initial Public Offering (“IPO”). In preparation for the IPO, on 3 May 2021 the corporate name of the Company was amended from Marcel Lux IV SARL to SUSE S.A. and the Company was transformed from a Société à responsabilité limitée into a Société anonyme. Since 19 May 2021, the Company is a Public Interest Entity in the meaning of the article 1(20) of the Luxembourg law of 23 July 2016 on the audit profession and part of its shares are admitted to trading on the regulated market of the Frankfurt Stock Exchange. The Company is regulated by the Commission de Surveillance du Secteur Financier (“CSSF”). The Company's object is to acquire and hold interests, directly or indirectly, in any form whatsoever, in any other Luxembourg or foreign entities, by way of, among others, the subscription or the acquisition of any securities and rights through participation, contribution, underwriting, firm purchase or option, negotiation or in any other way, or of financial debt instruments in any form whatsoever, and to administrate, develop and manage such holding of interests. The Company may also render every assistance, whether by way of loans, guarantees or otherwise to its subsidiaries or companies in which it has a direct or indirect interest, even not substantial, or any company being a direct or indirect shareholder of the Company or any company belonging to the same group as the Company (the "Connected Companies"). On an ancillary basis of such assistance, the Company may also render administrative and marketing assistance to its Connected Companies. The Company may subordinate its claims in favor of third parties for the obligations of any such Connected Companies. The Company may also borrow money in any form or obtain any form of credit facility and raise funds, except by way of public offer, though, including, but not limited to, the issue of bonds, notes, promissory notes, certificates and other debt or equity instruments, convertible or not, or the use of financial derivatives or otherwise. The Company may enter into any guarantee, pledge or any other form of security, whether by personal covenant or by mortgage or charge upon all or part of the undertaking, property assets (present or future) or by all or any of such methods, for the performance of any contracts or obligations of the Company and of any of the Connected Companies, or any director, manager or other agent of the Company or any of the Connected Companies, within the limits of any applicable law provision; and use any techniques and instruments to efficiently manage its investments and to protect itself against credit risks, currency exchange exposure, interest rate risk and other risks. In addition to the foregoing, the Company may perform all legal, commercial, technical and financial transactions and, in general, all transactions which are necessary or useful to fulfil its corporate object as well as all transactions directly or indirectly connected with the areas described above in order to facilitate the accomplishment of its corporate object in all areas described above. The Company also prepares consolidated financial statements, which are published with the Luxembourg Stock Exchange and the Luxembourg Business Register according to the provisions of the Luxembourg law of 19 December 2002, the Luxembourg law of 11 January 2008 and the Delegated Regulation 2019/815 on European Single Electronic Format (“ESEF Regulation”).

SUSE FY2021 Annual report 207
207
2. Accounting policies, valuation principles and methods 2.1 Basis of preparation The annual accounts are prepared in accordance with the law of 19 December 2002 as amended, the law of 11 January 2008, ESEF Regulation and rules and regulations prevailing as well as accounting principles generally accepted in the Grand Duchy of Luxembourg. The annual accounts have been prepared under the historical cost convention on a going concern basis. Accounting policies and valuation rules are, besides the ones laid down by the Law of 19 December 2002, determined and applied by the Management Board. These annual accounts have been prepared following the layout in the Title II of the law of 19 December 2002 on the register of commerce and companies and the accounting and annual accounts of undertakings, as subsequently modified. The preparation of annual accounts requires the use of certain critical accounting estimates. It also requires the Management Board to exercise its judgment in the process of applying the accounting policies. Changes in assumptions may have a material impact on the annual accounts in the period in which the assumptions change. The Management Board believes that the underlying assumptions are appropriate and that the annual accounts therefore present the financial position and results fairly. The Company makes estimates and assumptions that affect the reported amounts of assets and liabilities in the financial year. Estimates and judgements are continually evaluated and are based on historical experience and other factors, including expectations of future events that are believed to be reasonable under the circumstances. The comparative figures in the balance sheet, profit and loss account and in the notes are unaudited. Following the reclassification from Net Turnover to Other operating income for the financial year ended 31 October 2021, the presentation of the annual accounts of the financial year ended 31 October 2020 has been modified to ensure comparability. 2.2 Accounting and valuation policies The accounting and valuation policies applied by the Company are the following: 2.2.1 Expenses Expenses of the Company are charged directly to the profit and loss account in the period in which they are incurred. 2.2.2 Financial assets Historical cost model Valuation at purchase price Shares in affiliated undertakings and loans to affiliated undertakings are valued at purchase price/nominal value including incidental expenses. In the case of durable depreciation in value according to the opinion of the Management Board, value adjustments are made in respect of financial fixed assets, so that they are valued at the lower figure to be attributed to them at the balance sheet date. These value adjustments are not continued if the reasons for which the value adjustments were made have ceased to apply. 2.2.3 Debtors Debtors are valued at their nominal value. They are subject to value adjustments where their recovery is compromised. These value adjustments are not continued if the reasons for which the value adjustments were made have ceased to apply. 2.2.4 Prepayments This asset item includes expenditure incurred during the financial year but relating to subsequent financial periods.

SUSE FY2021 Annual report208
Annual report and accounts
Notes to the Annual Accounts (continued) For the year ended 31 October 2021
208
2 Accounting policies, valuation principles and methods (continued) 2.2 Accounting and valuation policies (continued) 2.2.5 Provisions Provisions are intended to cover losses or debts, the nature of which is clearly defined and which, at the date of the balance sheet, are either likely to be incurred or certain to be incurred but there is uncertainty as to their amount or the date on which they will arise. Provisions may also be created to cover charges which originate in the financial year under review or in a previous financial year, the nature of which is clearly defined and which at the date of the balance sheet are either likely to be incurred or certain to be incurred but there is uncertainty as to their amount or the date on which they will arise. 2.2.6 Creditors Creditors are recorded at their repayment value. Where the amount repayable on account is greater than the amount received, the difference is recorded in the profit and loss account when the debt is issued. 2.2.7 Deferred income This liability item includes income received during the financial year but relating to a subsequent financial year. 2.2.8 Interest income and expense Interest income and interest expenses are recognised on an accruals basis. 2.2.9 Foreign currency translation The Company maintains its books and records in United States dollars. Transactions expressed in currencies other than United States dollars are translated into United States dollars at the exchange rate effective at the date of the transaction. Long-term assets expressed in currencies other than United States dollars are translated into United States dollars at the exchange rate effective at the date of the transaction. At the balance sheet date, these assets remain translated at historic exchange rates. Cash at bank and in hand denominated in currencies other than United States dollars are translated at exchange rates prevailing at the balance sheet date. Exchange gains and losses arising from the translation are recorded in the profit and loss account. Other assets and liabilities are translated separately, respectively at the lower or at the higher of the value converted at the historic exchange rate or the value determined on the basis of the exchange rates effective at the balance sheet date. The exchange losses are recorded in the profit and loss account. The exchange gains are recorded in the profit and loss account on realisation. 2.2.10 Share-based payments Long term incentive plans (“LTIP”) Following the IPO on 19 May 2021, the Company established long term incentive plans where employees of the Group and the Management Board of SUSE S.A. receive variable remuneration. These LTIP are arrangements which allow employees and the Management Board to a pro-rata economic participation in the future value increase of the Group subject to employment conditions. The LTIP comprises two Restricted Stock Unit (“RSU”) Programs, and an Annual Option Award for Senior Executives (including members of the Management Board). Subject to the performance of the Group, the Management Board needs authorization from the Supervisory Board to implement a new LTIP arrangement in accordance with the provision of Luxembourg law. Further plans may therefore be released in the coming years. Restricted Stock Unit (“RSU”) Programs At the grant date and until the date of vesting, each RSU Program is a commitment to allocate for free one newly issued share of SUSE S.A. to a participant at the end of the vesting period, provided that the participant remains employed by the Group at the end of the respective vesting period. The transitional RSUs have a 2-year vesting period. The Annual RSUs vest in three equal annual tranches after the date of grant. At the vesting date, SUSE S.A. will increase its subscribed capital by incorporation of its share premium (Account 115 – Capital contribution without issue shares) and will create new shares at the par value of $0.10. These shares will be distributed to participants for free. If the employee leaves the Group before the vesting date, the units are forfeited.

SUSE FY2021 Annual report 209
209
2 Accounting policies, valuation principles and methods (continued) 2.2 Accounting and valuation policies (continued) 2.2.10 Share-based payments (continued) No expense is recognised for these share awards. Annual Option Award Members of the Management Board and senior employees of the Group are eligible for the grant of an Annual Option Award, with an exercise price equal to the IPO price. Annual Option Awards will vest in two equal tranches on the second and third anniversaries of the date of grant. The options will become exercisable on the respective vesting date of each tranche. For the initial grant one half of the options (1st tranche) will vest on 18 May 2023 and the other half (2nd tranche) on 18 May 2024; the option awards will expire on 18 May 2031, if not exercised. 100% of the Annual Options granted are subject to a service condition. At the vesting date, the award holders have the right but not the obligation to exercise this option. Should the holder do so, the holder shall pay a price of €30 per share. SUSE S.A. will increase its subscribed capital by contribution of cash and will create new shares at the par value of $0.10. The difference between the subscription price and the nominal value of the newly issued shares will be recorded as share premium. If a member of Management Board or senior employee leaves the Group before the vesting date, the options are forfeited. No expense is recognised for these share awards. Stock grant award to members of the Supervisory Board Some members of the Supervisory Board (excluding employees of EQT Partners) were awarded a one-off grant of €200,000 in 2021. The possible full amount of the fees due to the Supervisory Board Members over the vesting period was determined at the inception of the program and was calculated based on the IPO listing price. These members were able to opt for payment to be settled in cash or in shares in SUSE S.A. at the initial listing price of €30.00. At the grant date, SUSE S.A. will increase its subscribed capital by incorporation of its share premium (Account 115 – contribution of shares without nominal value) and will create new shares at the par value of $0.10 for the part settled in shares. These shares will be distributed to the relevant Supervisory Board Members for free. The expense corresponding to the cash paid by the Company for the portion of the grant settled in cash is being recognized over the period in which services are being provided by the Supervisory Board on a straight-line basis. The amount of the cash paid is initially recorded as prepaid expenses and then systematically amortized over the vesting period with the assumption that the service condition would be fulfilled. The Stock grant is subject to a lock-up period, during which the Supervisory Board Member cannot sell, transfer, encumber, use as collateral or otherwise dispose of or liquidate the Stock grant. The vesting period is from the date of appointment on 4 May 2021, to 30 April 2024. If the grant holder were to leave their role during the vesting period, they are required to re-transfer and re-pay the shares on a pro-rata basis. 2.2.11 Implications of Covid-19 on our business The Company's principal activity as the holding company of the SUSE Group is to administer and manage the interests it holds. Management have considered the impact of Covid-19 on the Company through assessment of the impact on the Group as the Company’s future performance depends on the performance of its subsidiaries. The key considerations include: (i) Operations – the Group operates in a virtual environment and has the systems and processes that enables
its employees and operations to continue to function in a remote environment across all departments and all geographical areas;
(ii) Liquidity – the Group has sufficient resources to meet its obligations as they fall due; and (iii) Performance - the Group performed substantially in line with expectations during FY21, and in FY22 to date.
The Group has not experienced any significant change to contract renewal rates and has not observed a significant deterioration in cash collections or liquidity of its customers since the pandemic began.
The Management Board have therefore determined that Covid-19 does not have a material adverse impact on the Company’s Investments and financial position as at 31 October 2021 and its financial performance for the year then ended. While the status of the pandemic is constantly evolving, the Management Board continues to monitor and observe performance to ensure changes in circumstances or events do not impact this assessment.

SUSE FY2021 Annual report210
Annual report and accounts
Notes to the Annual Accounts (continued) For the year ended 31 October 2021
210
3 Financial assets 3.1 Shares in affiliated undertakings
As at 31 October
2021 US$’000
As at 31 October
2020 US$’000
Gross book value – opening balance 1,601,859 1,601,859 Additions for the year 519,370 1,601,874 Disposals for the year - (1,601,874) Gross book value – closing balance 2,121,229 1,601,859 Net book value – closing balance 2,121,229 1,601,859 Net book value – opening balance 1,601,859 1,601,859 Undertakings in which the Company holds at least 20% of the share capital or is a general Partner are as follows:
Name of undertaking and registered officeOwnership
%
Net book value as at
31 October 2021US$
Net equity as at
31 October 2021* US$
Loss for the year ended
31 October 2021* US$
Marcel UK Topco Ltd, Waterfront Waterside Park, Kingsbury Crescent, Staines TW18 3BA 100% 2,121,229 2,111,898 9,331 * These figures represent the management accounts of the entity, statutory accounts are not yet available.
During the year ended 31 October 2020, the Company purchased 15,000 shares in Marcel Lux DebtCo SARL for the nominal value of US$1 per share. The Company then sold these shares to Marcel UK Topco Ltd for the same value. In addition, the Company exchanged its investment of US$637,176,010 in Marcel Topco LLC for 637,176,010 ordinary shares with nominal value of US$0.01, together with the share premium amount of US$630,804,250, in Marcel UK Topco Ltd. The Company also exchanged its investment of US$964,683,081 in Marcel Topco GmbH for 964,683,081 ordinary shares with nominal value of US$0.01, together with the share premium amount of US$955,036,250, in Marcel UK Topco Ltd. On 20 November 2020, the Company entered into the Capital Contribution Agreement without issue of shares with Marcel UK Topco Ltd for US$134,987,012. On 25 November 2020, the Company entered into the Capital Contribution Agreement with Rancher Labs Inc for 2,250,000 ordinary shares with a nominal value of US$0.001 and share premium, in exchange for a capital contribution without issuance of shares from Marcel Lux III SARL for US$38,698,541. On 25 November 2020, the Company entered into the Capital Contribution Agreement without issuance of shares with Marcel UK Topco Ltd in exchange for 2,250,000 ordinary shares in Rancher Labs Inc for US$38,698,541. This resulted in an addition to the investment held in Marcel UK Topco Ltd. On 20 May 2021, the Company acquired 102,833,504 shares in Marcel UK Topco Ltd with a nominal value of US$0.01 each and share premium for a total purchase price of US$345,683,926. 3.2 Loans to affiliated undertakings On 20 May 2021, the Company made a loan of US$232,901,548 to Marcel Lux DebtCo SARL. The loan bears interest at 4% margin +LIBOR of 0.75%. The maturity date of the loan is 25 November 2027. This loan has been classified as a financial asset as it is Management’s intention to contribute the receivable to Marcel UK Topco Ltd in exchange for shares. Marcel UK Topco Ltd will in turn use the receivable to partially offset a loan they hold with Marcel Lux DebtCo SARL. The interest on this loan has been recognised as Income from other investments and loans forming part of the fixed assets.

SUSE FY2021 Annual report 211
211
4 Debtors
As at 31 October
2021 US$’000
As at 31 October
2020 US$’000
Amounts owed by affiliated undertakings becoming due and payable within one year 197,538 673 Other debtors becoming due and payable within one year 335 67 197,873 740 On 6 March 2019, with an effective date as of 1 September 2018, the Company entered into a Consultancy Agreement with Marcel BidCo GmbH to render consultancy services to the latter in return for a remuneration pro-rata temporis on a yearly basis for the rendered services in an amount of 85% of the cost for the Advisory Board incurred by the Company. This agreement terminated upon IPO of the Company. The services provided were at an amount of US$163,635 for the financial year 2021 (2020: US$327,251). At 31 October 2021 the balance outstanding is US$163,635. On 14 March 2019, the Company made an Agreement for Current Account Transfer of US$1,000,000 to Marcel BidCo GmbH, which was paid out on behalf of the Company in accordance with the Letter of Direction as partial settlement of receivable of capital contribution from the Sole Shareholder. On 25 October 2019, Marcel BidCo GmbH refunded an amount of US$669,000 in cash to the Company. The balance outstanding at 31 October 2021 is US$331,000 (2020: US$331,000). On 11 September 2020, the Company entered into Share Purchase Agreements with Marcel UK Topco Ltd and sold 15,000 ordinary shares in Marcel Lux DebtCo SARL with a nominal value of US$1 each for the total sale price of US$15,000. This balance is outstanding as at 31 October 2021. On 17 May 2021, the Company entered an on-charging agreement in relation to the IPO costs with Marcel Bidco GmbH and SUSE LLC. The total costs recharged to these entities during financial year 2021 was US$16,723,303. On 18 May 2021, the Company entered into a Capital Contribution Agreement with Marcel Lux III SARL whereby the Company took ownership of a loan of US$63,088,930 against Marcel Bidco GmbH in exchange for the capital contribution. On 27 October 2021, the Company made a cash advance to Marcel UK Topco Ltd of US$29,072,738 with the intention to transfer into a capital contribution. The remaining balance of US$88,143,797 owed by affiliated undertakings results predominantly from the residual balance of a cash advance following the transfer of IPO funds to SUSE Ireland. This interest free, repayable on demand cash advance is being used by SUSE Ireland to make payments on behalf of SUSE S.A. The Other debtors balance is primarily VAT receivable.

SUSE FY2021 Annual report212
Annual report and accounts
Notes to the Annual Accounts (continued) For the year ended 31 October 2021
212
5 Capital and reserves
Subscribed capital
US$’000
Share premium accountUS$’000
Profit or loss brought forwardUS$’000
Profit or loss for the
financial year US$’000
Total US$’000
As at 1 November 2020 14 1,604,251 (1,646) (510) 1,602,109 Allocation of result of the year ended 31 October 2020 - - (510) 510 - Result for the financial year - - - (20,148) (20,148) Change to nominal value of shares 126 (126) - - - Contribution of share capital and share premium 16,763 249,435 - - 266,198 Gross proceeds from IPO - 669,451 - - 669,451 As at 31 October 2021 16,903 2,523,011 (2,156) (20,148) 2,517,610 At 31 October 2021, the subscribed capital of the Company was US$16,902,712 (2020: US$14,000) as represented by 169,027,117 (2020: 1,400,000) ordinary shares without nominal value (2020: fully paid-up with a nominal value of US$0.01). During November 2020, Marcel LUX III SARL, the immediate parent company, made US$174,035,097 capital contributions without the issuance of shares (from Account 115 – capital contributions without issuance of shares) to the Company which were unconditional and without rights to receive any repayment or redemption prior to liquidation. US$38,698,541 was a non-cash contribution, instead being shares in Rancher Labs Inc. On 3 May 2021, the share capital of the Company was increased by US$126,000 from its original amount of US$14,000 to US$140,000 through the increase of the nominal value of each share from US$0.01 to US$0.10, with a corresponding reduction to share premium of US$126,000. The nominal value of the shares was cancelled, and the share capital of the Company set at US$140,000 divided into 1,400,000 shares without nominal value. Authorized share capital of US$26,000,000 (including the Company’s issued share capital) was created, represented by 260,000,000 shares without any nominal value. The share capital of the Company was further increased by US$14,860,000 from US$140,000 to US$15,000,000 through the creation and issuance of 148,600,000 new shares without nominal value, with a corresponding reduction to share premium of US$14,860,000. On 18 May 2021, Marcel LUX III SARL, the immediate parent company, made a capital contribution of US$63,088,930 without the issuance of shares (from Account 115 – capital contributions without issuance of shares) to the Company which were unconditional and without rights to receive any repayment or redemption prior to liquidation. On 18 May 2021, the share capital of the Company was increased by US$1,830,000 from US$15,000,000 to US$16,830,000 through the creation and issuance of 18,300,000 new shares without nominal value, with a corresponding reduction to share premium of US$1,830,000. On 19 May 2021, on completion of pricing of the IPO, the Company raised proceeds of €549,000,000, equivalent to US$669,450,600, having transferred 18,300,000 ordinary shares of €30.00 per share to new investors, resulting in a credit to share premium. On 11 June 2021, the share capital of the Company was increased by US$3,126 by the creation of 31,264 new shares, with a corresponding reduction to share premium. On 26 October 2021, the share capital of the Company was increased by US$69,585.30 by the creation of 695,853 new shares together with a share premium in the amount of US$29,003,153.04. Legal reserve Under Luxembourg law, the Company is required to transfer to a legal reserve, a minimum of 5% of its net profits each year until this reserve equals 10% of the issued share capital. This reserve is not available for dividend distribution. No contribution has been made to this reserve as the Company is loss making.

SUSE FY2021 Annual report 213
213
6 Creditors Amounts due and payable for the accounts shown under ‘Creditors’ are as follows:
Within 1 year
US$’000
After 1 year and within
5 yearsUS$’000
After more than 5 years
US$’000
Total as at 31 October
2021 US$’000
Total as at 31 October
2020 US$’000
Trade creditors becoming due and payable within one year 13,525 - - 13,525 625 Amounts owed to affiliated undertakings becoming due and payable within one year 22,807 22,807 - Other creditors becoming due and payable within one year 82 - - 82 5 Total 36,414 - - 36,414 630 On 11 June 2021 the Company entered into a Management Services Agreement with SUSE Software Solutions UK Ltd for the on-charge of a proportion of costs of the Management Board. For the financial year ended 31 October 2021 US$52,020 has been on-charged to the Company (2020: US$nil), refer to Notes 8 and 9. All other amounts owed to affiliated undertakings relate predominantly to payments made on behalf of SUSE S.A. and recharged accordingly. The largest balance relates to IPO transaction costs paid by other SUSE Group entities including: SUSE Software Solutions Ireland Ltd US$15,215,715, SUSE Software Solutions UK Ltd US$2,816,905 and SUSE Software Solutions Germany GmbH US$1,947,568. Other creditors includes the employers tax liabilities on the Supervisory Board fees and share-based payments.
7 Other operating income The other operating income amounted to US$19,310,831 (2020: US$327,250) and was attributable to providing services to other SUSE Group entities based on service level agreements. The significant increase in 2021 related to the recharge of certain transaction costs, predominantly related to the IPO.
8 Raw material and consumables and other external expenses Other external expenses
Year ended 31 October
2021 US$’000
Year ended 31 October
2020 US$’000
IPO transaction costs 40,857 - Supervisory Board fees 371 - Management Board fees 52 - Share-based payment expense – Supervisory board 53 - Taxes related to Supervisory board remuneration 69 - Advisory Board fees 193 385 Audit fees 1,038 258 Management fees 200 83 Professional fees 469 74 Administration and accounting fees 592 16 Tax advice fees 89 7 Other expenses 207 4 Bank charges 4 2 Legal fees 37 - 44,231 829

SUSE FY2021 Annual report214
Annual report and accounts
Notes to the Annual Accounts (continued) For the year ended 31 October 2021
214
9 Management remuneration The emoluments granted to the members of the management and supervisory bodies in this capacity and the obligations arising or entered into in respect of retirement pensions for former members of those bodies for the financial year are broken down as follows (refer also to Note 8):
Year ended 31 October
2021 US$’000
Year ended 31 October
2020 US$’000
Management board Fees – refer Note 6 52 -
Supervisory board Fees 371 - Share-based payment expense 53 -
476 -
10 Income from other investments and loans forming part of fixed assets
Year ended 31 October
2021 US$’000
Year ended 31 October
2020 US$’000
Interest derived from affiliated undertakings (Note 3.2) 5,009 - 5,009 -
11 Taxes The Company is subject to all taxes relevant to commercial companies in Luxembourg.
12 Share-based payments Long term incentive plans (“LTIP) The total grants awarded under the LTIP are summarized in the table below:
Grant date in FY21 Annual RSU Transitional RSU Annual Option Awards
Total 21 May 19 Oct 27 Oct 21 May 27 Oct 18 May* 18 May** Granted during the year 957,792 83,546 97,426 740,025 137,019 100,585 100,584 2,216,977 Cancelled during the year (41,809) - - (32,310) - - - (74,119) Outstanding at end of year 915,983 83,546 97,426 707,715 137,019 100,585 100,584 2,142,858 * vesting after 2 years
** vesting after 3 years
As at 31 October 2021, there are 1,941,689 RSU units outstanding. Should the holder of the RSU unit be employed by the Group at the end of the vesting period, the entity would increase its capital by US$194,168.9. As at 31 October 2021, there are 201,169 options outstanding. Should the holder of the Annual Option Award be employed by the Group at the end of the vesting period and should the market price of the share be higher than grant price of €30 (US$34.68 equivalent), the entity would increase its capital by up to US$20,116.9 and a share premium of US$6,956,424. As at 31 October 2021, the fair value of the Annual Option Awards was determined as €6.17 and €7.50 for the awards that respectively have an expected term of 2 years and 3 years following the Black Scholes Merton Valuation Model. Under all LTIP programs, no shares have been issued to date.

SUSE FY2021 Annual report 215
215
12 Share-based payments (continued) Stock grant award to members of the Supervisory Board In aggregate, a total grant of €1,200,000 was made of which €262,080 was settled in cash and the residual amount of €937,920 was granted in the form of 31,264 SUSE S.A. shares on 11 June 2021. The total expense of €262,080 (equivalent US$320,391) is being recognised over the vesting period in line with the services being provided by the Supervisory Board. For the year ended 31 October 21 an expense of US$53,386 (net of tax) has been recognised (2020: US$nil).
13 Staff costs During the financial year ended 31 October 2021 the Company had no employees (2020: US$nil).
14 Audit fees KPMG are the auditors of the Company and the Consolidated Group for the financial year ended 31 October 2021. The total fees expensed by the Company are:
Year ended 31 October
2021 US$’000
Year ended 31 October
2020 US$’000
Audit fees – current year Company audit 18 - Audit fees – current year Group audit 758 148 Audit fees – prior year 52 110 Other audit related fees 210 - 1,038 258 There were also US$1,801,884 fees paid to KPMG in relation to professional services provided in connection to the IPO (other audit related fees). These are included in the IPO transaction costs balance in Note 8.
15 Off-balance sheet commitments On 14 March 2019, the Company, as Pledgor, entered into the Account Pledge Agreement and Receivables Pledge Agreement with Wilmington Trust (London) Ltd, as Pledgee, in connection with the Senior Facilities Agreement, Second Lien Notes Purchase Agreement and the Intercreditor Agreement, where the Pledgor has agreed to grant a pledge over the Security Assets standing to the credit of the Accounts of the Pledgee and over the Receivables to the Pledgee as security for the Secured Obligations in compliance with Senior Facilities Agreement, the Second Lien Notes Purchase Agreement (Marcel Bidco GmbH being the borrower) and in accordance with terms of these Pledge Agreements. On 21 May 2021, following the IPO at the Frankfurt Stock Exchange on 19 May 2021, the Group repaid the Second Lien loan Note. On 21 December 2021, an amendment was made to the Senior Facilities Agreement to increase the available revolving facility under the agreement of US$81,000,000 by US$88,300,000 to US$169,300,000. At the date of approval of these Financial Statements, the full amount was available for drawdown.
16 Related party transactions The remuneration of the members of the Management Board is borne by another entity in the SUSE Group. The Company has a Management Services Agreement with that entity to on-charge a proportion of costs of the Management Board. For the financial year ended 31 October 2021 US$52,020 has been on-charged (2020: US$nil). The Management Board have also received share awards during the year totalling 106,768 Annual Option Awards and 35,588 Restricted Stock Units (2020: US$nil). Refer to Note 12 for detail. The remuneration of the Supervisory Board amounts to US$424,353 (2020: US$nil). Please refer to Notes 4 and 6 for details of all other transactions with related parties.

SUSE FY2021 Annual report216
Responsibility statement
216
We, Melissa Di Donato (Chief Executive Officer) and Andy Myers (Chief Financial Officer), confirm, to the best of our knowledge, and in accordance with the applicable reporting principles, the Annual Financial Statements give a true and fair view of the assets, liabilities, financial position and profit or loss of SUSE S.A., and the Management Report for SUSE S.A., which has been combined with the Group Management Report, includes a fair review of the development and performance of the business and the position of SUSE S.A., together with a description of the material opportunities and risks associated with the expected development of SUSE S.A. Melissa Di Donato Member of the Management Board
Andy MyersMember of the Management Board

SUSE FY2021 Annual report 217
Independent auditor’s report To the Shareholders of SUSE S.A. 11-13, Boulevard de la Foire L-1528 Luxembourg Luxembourg
Report of the Reviseur d’entreprises agree
217
Report on the audit of the annual accounts
Opinion We have audited the annual accounts of SUSE S.A. (the "Company"), which comprise the balance sheet as at 31 October 2021, and the profit and loss account for the year then ended, and notes to the annual accounts, including a summary of significant accounting policies. In our opinion, the accompanying annual accounts give a true and fair view of the financial position of the Company as at 31 October 2021 and of the results of its operations for the year then ended in accordance with Luxembourg legal and regulatory requirements relating to the preparation and presentation of the annual accounts.
Basis for opinion We conducted our audit in accordance with the EU Regulation N° 537/2014, the Law of 23 July 2016 on the audit profession (“Law of 23 July 2016”) and with International Standards on Auditing (“ISAs”) as adopted for Luxembourg by the Commission de Surveillance du Secteur Financier (“CSSF”). Our responsibilities under the EU Regulation N° 537/2014, the Law of 23 July 2016 and ISAs as adopted for Luxembourg by the CSSF are further described in the « Responsibilities of “Réviseur d'Entreprises agréé” for the audit of the annual accounts » section of our report. We are also independent of the Company in accordance with the International Code of Ethics for Professional Accountants, including International Independence Standards, issued by the International Ethics Standards Board for Accountants (“IESBA Code”) as adopted for Luxembourg by the CSSF together with the ethical requirements that are relevant to our audit of the annual accounts, and have fulfilled our other ethical responsibilities under those ethical requirements. We believe that the audit evidence we have obtained is sufficient and appropriate to provide a basis for our opinion.
Key audit matters Key audit matters are those matters that, in our professional judgment, were of most significance in our audit of the annual accounts of the current period. These matters were addressed in the context of the audit of the annual accounts as a whole, and in forming our opinion thereon, and we do not provide a separate opinion on these matters. Presentation, recognition and measurement of Incentive schemes a) Why the matter was considered to be one of most significance in our audit of the annual accounts for the year ended 31 October 2021? Further to the admission of the Company’s shares to trading on the regulated market of the Frankfurt Stock Exchange on 19 May 2021, the Company entered into four incentive schemes which are described in accounting policy 2.2.10. The Company’s Management Board and some of the Supervisory Board members benefit from these incentive schemes to a certain extent. Refer to accounting policy 2.2.10 and Note 12 of the annual accounts. Certain programs were initiated in the year ended 31 October 2021. The Share Grant Award resulted in the increase of share capital of USD 3.126 on 11 June 2021 and in a prepaid expense of USD 320.391, out of which USD 53.386 were charged to the profit and loss account for the year ended 31 October 2021. The three long term incentive plans had no effect on the balance sheet and profit and loss account as at and for the year ended 31 October 2021. They could result in an increase in share capital, should the market price of the share be higher than USD 30 at the vesting date of the Annual Option Award and should the service condition be met at the vesting date of the three long term incentive plans. The recognition, measurement and presentation of incentive schemes was a matter of most significance to our audit due to the following: – The accounting policy election requires Management Board’s judgement because of the lack of
authoritative guidance; – There are related parties benefiting from these incentive schemes; – Further programs may be released in the coming years.

SUSE FY2021 Annual report218
Independent auditor’s report
218
b) How the matter was addressed during the audit? Our procedures over incentive schemes included, but were not limited to: – Assessing the Company’s accounting policy in respect of incentive schemes against the relevant
Luxembourg legal and regulatory requirements relating to the preparation and presentation of the annual accounts;
– Assessing the design of the Company’s Key controls in relation to incentive schemes; – Agreeing the proper application of the accounting policy and related accounting entries; – Tracing the amounts recognized in the balance sheet and profit and loss account and the information
disclosed in the notes to the annual accounts to supporting documentation; – Assessing the adequacy of the Management Board’s critical judgement disclosures in respect of incentive
schemes.
Other matter – unaudited corresponding figures We draw attention to the fact that we have not audited the corresponding figures of the Company as at 31 October 2020 and for the year then ended, or any of the related notes and accordingly, we do not express an opinion on them.
Other information The Management Board is responsible for the other information. The other information comprises the information stated in the annual report including the combined management report and the corporate governance statement but does not include the annual accounts and our report of the “Réviseur d'Entreprises agréé” thereon. Our opinion on the annual accounts does not cover the other information and we do not express any form of assurance conclusion thereon. In connection with our audit of the annual accounts, our responsibility is to read the other information and, in doing so, consider whether the other information is materially inconsistent with the annual accounts or our knowledge obtained in the audit or otherwise appears to be materially misstated. If, based on the work we have performed, we conclude that there is a material misstatement of this other information, we are required to report this fact. We have nothing to report in this regard.
Responsibilities of the Management Board and the Audit Committee for the annual accounts The Management Board is responsible for the preparation and fair presentation of the annual accounts in accordance with Luxembourg legal and regulatory requirements relating to the preparation and presentation of the annual accounts, and for such internal control as the Management Board determines is necessary to enable the preparation of annual accounts that are free from material misstatement, whether due to fraud or error. The Management Board is responsible for presenting the annual accounts in compliance with the requirements set out in the Delegated Regulation 2019/815 on European Single Electronic Format (“ESEF Regulation”). In preparing the annual accounts, the Management Board is responsible for assessing the Company’s ability to continue as a going concern, disclosing, as applicable, matters related to going concern and using the going concern basis of accounting unless the Management Board either intends to liquidate the Company or to cease operations, or has no realistic alternative but to do so. The Audit Committee is responsible for overseeing the Company’s financial reporting process. Responsibilities of the Réviseur d'Entreprises agréé for the audit of the annual accounts The objectives of our audit are to obtain reasonable assurance about whether the annual accounts as a whole are free from material misstatement, whether due to fraud or error, and to issue a report of the “Réviseur d'Entreprises agréé” that includes our opinion. Reasonable assurance is a high level of assurance, but is not a guarantee that an audit conducted in accordance with the EU Regulation N° 537/2014, the Law of 23 July 2016 and with ISAs as adopted for Luxembourg by the CSSF will always detect a material misstatement when it exists. Misstatements can arise from fraud or error and are considered material if, individually or in the
SUSE FY2021 Annual report 219
219
aggregate, they could reasonably be expected to influence the economic decisions of users taken on the basis of these annual accounts. Our responsibility is to assess whether the annual accounts have been prepared in all material respects with the requirements laid down in the ESEF Regulation. As part of an audit in accordance with the EU Regulation N° 537/2014, the Law of 23 July 2016 and with ISAs as adopted for Luxembourg by the CSSF, we exercise professional judgment and maintain professional skepticism throughout the audit. We also: – Identify and assess the risks of material misstatement of the annual accounts, whether due to fraud or error,
design and perform audit procedures responsive to those risks, and obtain audit evidence that is sufficient and appropriate to provide a basis for our opinion. The risk of not detecting a material misstatement resulting from fraud is higher than for one resulting from error, as fraud may involve collusion, forgery, intentional omissions, misrepresentations, or the override of internal control.
– Obtain an understanding of internal control relevant to the audit in order to design audit procedures that are appropriate in the circumstances, but not for the purpose of expressing an opinion on the effectiveness of the Company’s internal control.
– Evaluate the appropriateness of accounting policies used and the reasonableness of accounting estimates and related disclosures made by the Management Board.
– Conclude on the appropriateness of the Management Board’s use of the going concern basis of accounting and, based on the audit evidence obtained, whether a material uncertainty exists related to events or conditions that may cast significant doubt on the Company’s ability to continue as a going concern. If we conclude that a material uncertainty exists, we are required to draw attention in our report of the “Réviseur d'Entreprises agréé” to the related disclosures in the annual accounts or, if such disclosures are inadequate, to modify our opinion. Our conclusions are based on the audit evidence obtained up to the date of our report of the “Réviseur d'Entreprises agréé”. However, future events or conditions may cause the Company to cease to continue as a going concern.
– Evaluate the overall presentation, structure and content of the annual accounts, including the disclosures, and whether the annual accounts represent the underlying transactions and events in a manner that achieves fair presentation
We communicate with the Audit Committee regarding, among other matters, the planned scope and timing of the audit and significant audit findings, including any significant deficiencies in internal control that we identify during our audit. We also provide the Audit Committee with a statement that we have complied with relevant ethical requirements regarding independence and communicate to them all relationships and other matters that may reasonably be thought to bear on our independence, and where applicable, actions taken to eliminate threats or safeguards applied. From the matters communicated with the Audit Committee, we determine those matters that were of most significance in the audit of the annual accounts of the current period and are therefore the key audit matters. We describe these matters in our report unless law or regulation precludes public disclosure about the matter.

SUSE FY2021 Annual report220
Independent auditor’s report
220
Report on other legal and regulatory requirements We have been appointed as “Réviseur d'Entreprises agréé” by the Extraordinary General Meeting of the Sole Shareholder on 3 May 2021 and the duration of our uninterrupted engagement, including previous renewals and reappointments, is one year. The combined management report is consistent with the annual accounts and has been prepared in accordance with applicable legal requirements. The corporate governance statement is included in the combined management report. The information required by Article 68ter paragraph (1) letters c) and d) of the law of 19 December 2002 on the commercial and companies register and on the accounting records and annual accounts of undertakings, as amended, is consistent with the annual accounts and has been prepared in accordance with applicable legal requirements. We confirm that the audit opinion is consistent with the additional report to the audit committee or equivalent. We confirm that the prohibited non-audit services referred to in the EU Regulation N° 537/2014 were not provided and that we remained independent of the Company in conducting the audit. We have checked the compliance of the annual accounts of the Company as at 31 October 2021 with relevant statutory requirements set out in the ESEF Regulation that are applicable to annual accounts. For the Company it relates to: – Annual accounts prepared in a valid xHTML format. In our opinion, the annual accounts of SUSE S.A. as at 31 October 2021, identified as susesa-2021-10-31-en.zip, have been prepared, in all material respects, in compliance with the requirements laid down in the ESEF Regulation. Our audit report only refers to the annual accounts of SUSE S.A. as at 31 October 2021, identified as susesa-2021-10-31-en.zip, prepared and presented in accordance with the requirements laid down in the ESEF Regulation, which are the only authoritative version. Luxembourg, 20 January 2022 KPMG Luxembourg
Société anonyme Cabinet de révision agréé
Christelle BousserPartner
KPMG Luxembourg is a Société anonyme with its registered office at 39, Avenue John F. Kennedy, L-1855 Luxembourg.

SUSE FY2021 Annual report 221
GRI Index and ESG data tables
This report has been prepared in accordance with the GRI Standards – Core option, which meets the requirements of the European Non-Financial Reporting Directive (2014/95/EU). To support the topics discussed in the ‘Managing responsibly’ section, we have included the GRI Index and data tables below. Although, we cover a wide range of topics in the ‘Managing responsibly’ section, the following were identified as material topics for FY21 and covered in the GRI Index below.
– Non-discrimination / Diversity & Inclusion. – Employee Attraction & Retention / Training & Development. – Privacy & Data security. – Business Ethics & Compliance / Human rights. – Open source Community. – Green IT / Green Products and Solutions. – GHG Emissions (linked with our key goals on climate action).
SUSE GRI Index 2021
General DisclosuresOrganizational profile
GRI Code Disclosure Location (Page number) or Reasons for omission
Disclosures 2016
GRI 102-1 Name of the organization About SUSE (Page 2)
GRI 102-2 Activities, brands, products, and services About SUSE (Pages 2-3)
GRI 102-3 Location of headquarters Corporate governance (Page 91)
GRI 102-4 Location of operations Consolidated financial statements (Pages 130; 164-165)
GRI 102-5 Ownership and legal form Consolidated financial statements (Pages 130-131)
GRI 102-6 Markets served About SUSE (Pages 2-3)
GRI 102-7 Scale of organization 2021 highlights (Page 5)
GRI 102-8 Information on employees and other workers Diversity and inclusion (Pages 66; 68); Employee attraction and retention (Pages 67; 69)
GRI 102-9 Supply chain Sustainable procurement (Page 65)Appendix – Sustainable procurement (Pages 226-227)
GRI 102-10 Significant changes to the organization and its supply chain
Sustainable procurement (Page 63)Appendix – Sustainable procurement (Pages 224-226)
GRI 102-11 Precautionary Principle or approach Risk management and principal risks (Pages 75-83)
GRI 102-12 External initiatives Digital inclusion and education (Pages 70-71); openSUSE (Pages 70-71); Green operations – Greenhouse gas emissions (Pages 72-73)
GRI 102-13 Membership of associations SUSE on the capital market (Pages 55-56)
Strategy
GRI Code Disclosure Location (Page number) or Reasons for omission’
GRI 102-14 Statement from senior decision-maker Chief Executive Officer’s letter (Pages 13-15)
GRI 102-15 Key impacts, risks, and opportunities Risk management and principal risks (Pages 75-83)

SUSE FY2021 Annual report222
GRI Index and ESG data tables continued
Ethics and integrity
GRI Code Disclosure Location (Page number) or Reasons for omission’
GRI 102-16 Values, principles, standards, and norms of behaviour
Purpose, Values and Culture (Pages 6-9)
GRI 102-17 Mechanisms for advice and concerns about ethics
Business ethics and compliance (Pages 63-65)
Governance
GRI Code Disclosure Location (Page number) or Reasons for omission’
GRI 102-18 Governance structure Corporate governance (Pages 90-95)
GRI 102-19 Delegating authority Corporate governance (Pages 96-101)
GRI 102-20 Executive-level responsibility for economic, environmental and social topics
Corporate governance (Pages 96-101)
GRI 102-21 Consulting stakeholders on economic, environmental and social topics
Operating environment and stakeholders (Pages 16-19);Corporate governance (Pages 96-101)
GRI 102-22 Composition of highest governance body and its committees
Corporate governance (Pages 94-99)
GRI 102-23 Chair of the highest governance body Corporate governance (Pages 94-95)
GRI 102-24 Nominating and selecting the highest governance body
Report of the Supervisory Board (Pages 86-89)
GRI 102-25 Conflicts of interest Business ethics and compliance (Pages 63-65);Remuneration report (Page 104)
GRI 102-26 Role of highest governance body in setting purpose, values and strategy
Corporate governance (Pages 90-101)
GRI 102-27 Collective knowledge of highest governance body
Corporate governance (Pages 90-101)
GRI 102-28 Evaluating the highest governance body’s performance
Corporate governance (Pages 90-101)
GRI 102-29 Identifying and managing economic, environmental, and social impacts
Corporate governance (Pages 90-101)
GRI 102-30 Effectiveness of risk management processes Risk management and principal risks (Pages 75-83)
GRI 102-31 Review of economic, environmental and social topics
Risk management and principal risks (Pages 75-83)
GRI 102-32 Highest governance body’s role in sustainability reporting
Managing responsibly (Pages 58-59)
GRI 102-33 Communicating critical concerns Risk management and principal risks (Pages 75-83)
GRI 102-34 Nature and total number of critical concerns Risk management and principal risks (Pages 75-83)
GRI 102-35 Remuneration policies Remuneration report (Pages 102-119)
GRI 102-36 Process for determining remuneration Remuneration report (Pages 102-119)
GRI 102-37 Stakeholders’ involvement in remuneration Operating environment and stakeholders (Pages 16-19)

SUSE FY2021 Annual report 223
Stakeholder engagement
GRI Code Disclosure Location (Page number) or Reasons for omission’
GRI 102-40 List of stakeholder groups Operating environment and stakeholders (Pages 16-19)
GRI 102-41 Collective bargaining agreements / Percentage of employees covered by collective agreements
Operating environment and stakeholders (Pages 16-19)
GRI 102-42 Identifying and selecting stakeholders Operating environment and stakeholders (Pages 16-19)Identifying and managing material issues (Pages 60-61)
GRI 102-43 Approach to stakeholder engagement Operating environment and stakeholders (Pages 16-19)Identifying and managing material issues (Pages 60-61)
GRI 102-44 Key topics and concerns raised Operating environment and stakeholders (Pages 16-19)
Reporting practices
GRI Code Disclosure Location (Page number) or Reasons for omission’
GRI 102-45 Entities included in the consolidated financial statements
Consolidated financial statements (Pages 122-197)
GRI 102-46 Defining report content and topic boundaries About this report (Page 1)
GRI 102-47 List of material topics Identifying and managing material issues (Pages 60-61)
GRI 102-48 Restatements of information There is no restatement of information as this is our first report
GRI 102-49 Changes in reporting There are no changes in this report as this is our first report
GRI 102-50 Reporting period About this report (Page 1); Report of the Supervisory Board (Pages 86-89)
GRI 102-51 Date of most recent report There is no recent report as this is our first report
GRI 102-52 Reporting cycle About this report (Page 1)
GRI 102-53 Contact point for questions regarding the report
Corporate governance (Pages 90-101)
GRI 102-54 Claims of reporting in accordance with the GRI Standards
Identifying and managing material issues (Pages 60-61)
GRI 102-55 GRI content index GRI Index (Pages 221-234)
GRI 102-56 External assurance About this report (Page 1)Independent auditor’s report (Pages 198-203; 217-220)
Topic Disclosures
GRI 200: Economic
GRI 205: Anti-corruption 2016
GRI 205-103 Anti-Corruption – Management approach disclosures
Business ethics and compliance (Pages 63-65)
GRI 205-2 Communication and training about anti-corruption policies and procedures
Business ethics and compliance (Pages 63-65)
GRI 205-3 Confirmed incidents of corruption and actions taken
Appendix – Business ethics and compliance (Page 226)

SUSE FY2021 Annual report224
GRI Index and ESG data tables continued
Topic disclosures continued
GRI Code Disclosure Location (Page number) or Reasons for omission’
GRI 300: Environmental
GRI 302: Energy 2016
GRI 302-103 Energy: Management approach disclosures Green operations – Energy (Pages 72-74)
GRI 302-1 Energy consumption within the organization Green operations – Energy (Pages 72-74)
GRI 302-3 Energy intensity Green operations – Energy (Pages 72-74)Appendix - Pillar3 Environment matters (Page 234)
GRI 305: Emissions 2016
GRI 305-103 Emissions: Management approach disclosures
Green operations – Greenhouse gas emissions (Pages 72-74)
GRI 305-1 Direct (Scope 1) GHG emissions Green operations – Greenhouse gas emissions (Pages 72-74)
GRI 305-2 Energy indirect (Scope 2) GHG emissions Green operations – Greenhouse gas emissions (Pages 72-74)
GRI 305-3 Other indirect (Scope 3) GHG emissions Green operations – Greenhouse gas emissions (Pages 72-74)
GRI 305-4 GHG emissions intensity Green operations – Greenhouse gas emissions (Pages 72-74)Appendix – Pillar3 Environment matters (Page 233)
GRI 308: Supplier Environmental Assessment 2016
GRI 308-103 Supplier Environmental Assessment: Management approach disclosures
Sustainable procurement (Page 65)
GRI 400: Social
GRI 401: Employment 2016
GRI 401-103 Employment: Management approach disclosures
Employee attraction and retention (Pages 67; 69)
GRI 401-1 New employee hires and employee turnover Employee attraction and retention (Pages 67; 69)Appendix – Employee turnover (Page 231)
GRI 401-2 Benefits provided to full-time employees that are not provided to temporary or part-time employees
Remuneration equality and transparency (Pages 67; 69)Appendix – Remuneration (Page 230)
GRI 403: Occupational Health and Safety 2018
GRI 403-103 Occupational Health and Safety: Management approach disclosures
Health and safety (Pages 66-68)
GRI 403-2 Types of injury and rates of injury, occupational diseases, lost days, and absenteeism, and number of work-related fatalities
Health and safety (Pages 66-68)Appendix – Health and safety (Page 229)
GRI 403-5 Worker training on occupational health and safety
Health and safety (Pages 66-68)Appendix – Health and safety (Page 229)
GRI 403-9 Work-related injuries Health and safety (Pages 66-68)Appendix – Health and safety (Page 229)
GRI 404: Training and Education 2016
GRI 404-103 Training and Education: Management approach disclosures
Health and safety (Pages 66-68)
GRI 404-3 Percentage of employees receiving regular performance and career development reviews
Training and development (Pages 67; 69)

SUSE FY2021 Annual report 225
Topic disclosures continued
GRI Code Disclosure Location (Page number) or Reasons for omission’
GRI 400: Social continued
GRI 405: Diversity and Equal Opportunity 2016
GRI 405-103 Diversity and Equal Opportunity: Management approach disclosures
Diversity and inclusion (Pages 66-68)
GRI 405-1 Diversity of governance bodies and employees Corporate governance (Pages 90-101); Diversity and inclusion (Pages 66-68); Employee matters (Page 66); Appendix – Pillar1 Employee Matter (Page 228)
GRI 405-2 Ratio of basic salary and remuneration of women to men
Remuneration equality and transparency (Pages 67; 69); Employee matters (Page 66); Appendix – Pillar1 Employee Matter (Page 228)
GRI 406: Non-discrimination 2016
GRI 406-103 Non-Discrimination: Management approach disclosures
Non-discrimination (Pages 66-68)
GRI 406-1 Incidents on discrimination GRI-406-1 not fully tracked currently but planned for FY22
GRI 409: Forced or Compulsory Labor 2016
GRI 409-103 Forced or Compulsory Labor: Management approach disclosures Business ethics and compliance (Pages 63-65)
GRI 409-1 Operations and suppliers at significant risk for incidents of forced or compulsory labor
Business ethics and compliance (Pages 63-65)
GRI 412: Human Rights Assessment 2016
GRI 412-103 Human Rights Assessment: Management approach disclosures
Business ethics and compliance (Pages 63-65)
GRI 413: Local Communities 2016
GRI 413-1 Operations with local community engagement, impact assessments, and development programs
Open source for good (Pages 70-71)Appendix – Social matters (Pages 232)openSUSE (Page 71)
GRI 414: Supplier Social Assessment 2016
GRI 414-103 Supplier Social Assessment: Management approach disclosures
Sustainable procurement (Page 65)
GRI 418: Customer Privacy 2016
GRI 418-103 Customer Privacy: Management approach disclosures
Privacy and Data security (Pages 64-65)
GRI 418-1 Substantiated complaints concerning breaches of customer privacy and losses of customer data
Privacy and data security (Pages 64-65)Appendix – Privacy and data security (Page 226)

SUSE FY2021 Annual report226
Data tables for 4 ESG sub-sectionsBusiness integrity and success
Business ethics & complianceIncidents of corruption
Total number of confirmed incidents of corruption 0Number of public legal cases regarding corruption brought against the organization or its employees during the reporting period 0Total amount of monetary losses as a result of legal proceedings (USD) 0Total number of confirmed incidents in which employees were dismissed or disciplined for corruption 0Total number of confirmed incidents when contracts with business partners were terminated or not renewed due to violations related to corruption 0
Internal communication anti-corruption policies and procedures to employees
Total number of employees that the organization’s anti-corruption policies and procedures have been communicated to 2,045Percentage of employees that the organization’s anti-corruption policies and procedures have been communicated to 100%
ExplanationAll business partners have been notified via the public facing website of www.suse.com. The policies relating to Anti-Bribery & Anti-Corruption as well as the Company’s Code of Business Ethics and the Supplier Code of Business Ethics, are available in the public domain via the suse.com website. Anti-corruption is a legal requirement and compliance ensure the business remains above aboard not only in eyes of the law but also with respect to its ethical and moral obligations and position.
Privacy & Data securitySUSE has appointed an external Data Protection Officer (“DPO”) and has registered this DPO with its supervisory authority, the Bayerisches Landesamt für Datenschutzaufsicht. Contact from data subjects with relation to privacy matters is handled through a managed/dedicated email address – [email protected]. Data Subject Access Requests for access and/or deletion are handled using SUSE’s OneTrust (the number one most widely used platform to operationalize privacy, security and data governance) based workflow to ensure such requests are properly and diligently completed and documented accordingly.
Substantiated complaints concerning breaches of customer privacy and losses of customer dataNumber of substantiated
complaints received concerning breaches of customer privacy
Complaints received from outside parties and substantiated by the organization 0Complaints from regulatory bodies 0
Total amount of monetary losses as a result of legal proceedings related to privacy (USD)
Total amount of monetary losses as a result of legal proceedings associated with consumer privacy (USD) 0Total amount of monetary losses as a result of legal proceedings associated with customer privacy (USD) 0Total amount of monetary losses as a result of legal proceedings associated with data security and privacy (USD) 0Total amount of monetary losses as a result of legal proceedings associated with user privacy (USD) 0
GRI Index and ESG data tables continued

SUSE FY2021 Annual report 227
Data breaches
Number of data breaches 1Percentage of data breaches involving confidential information 100%Percentage of data breaches involving customers’ confidential business information (CBI) or personally identifiable information (PII) 100%Percentage of data breaches involving customers’ protected health information (PHI) 0%Percentage of data breaches involving personally identifiable information (PII) 100%Number of account holders affected 500Number of customers affected 420Number of customers affected by data breaches involving customers’ PHI 0Number of customers affected by data breaches involving only customers’ PII 420Number of students affected 0Number of users affected 500
Description of corrective actions implemented in response to data breachesAll affected customers were notified by CFO and it was reported to authorities. A Technical Incident Response team was established to identify the root cause and remediate it – in collaboration with the affected public Cloud Provider.
Sustainable procurementProcurement supports the business in obtaining the best value offer for SUSE from a range of different suppliers. SUSE have policies regarding Suppliers Code of Business Ethics which asks suppliers to confirm they have appropriate policies in place that at least match the local laws. It enables SUSE to make infirmed choices about how and who to undertake business with.Procurement, in conjunction with legal team and the business stakeholder, are responsible for the initial due diligence of the supplier base and making sure they have signed up to date contracts before providing services to SUSE. Procurement are responsible for the commercial activities with the supplier and Legal look after the legal terms within any agreements. The Privacy & Data security team will ensure that data where it is stored by a supplier is safely and securely looked after. The Business stakeholder will look after the day to day activities with the supplier.Currently not tracking the changes in supply chain and supplier locations, but we plan to introduce these metrics in FY22. We are also planning to introduce more sustainable procurement guidelines and extending the current checks to our suppliers social, health, and environmental impact.
Suppliers and goods and services supplied
Number of goods and services suppliers 1,179Worth of goods and services purchased (USD) 76,100,000
Number of suppliers by region
Region Number of suppliers Percentage of suppliers (%)
Americas 340 28.8Europe 629 53.4Africa and Middle East 31 2.6Asia, Australasia 179 15.2Total 1,179 100.0

SUSE FY2021 Annual report228
Pillar 1 – Employee matters
Diversity and inclusionEmployees by gender
Gender Number of employees Percentage of employees (%)
Female 449 22.0Male 1,589 77.0Undisclosed 7 1.0Calculated total 2,045
Employees by employment type, by gender
Gender Employment type Number of employees Percentage of employees (%)
Female Full time 427 20.9Part time 21 1.0
Male Full time 1,546 75.6Part time 44 2.2
Undisclosed Full time 6 0.3Part time 1 0.1
Calculated total 2,045
Employees by employment contract, by gender
Gender Contract type Number of employees Percentage of employees (%)
Female Indefinite/Permanent 436 21.3Fixed term/Temporary 12 0.6
Male Indefinite/Permanent 1,573 76.9Fixed term/Temporary 17 0.8
Undisclosed Indefinite/Permanent 5 0.2Fixed term/Temporary 2 0.1
Calculated total 2,045
Employees by employment contract, by region
Employment contract Region Number of employees Percentage of employees (%)
Indefinite/Permanent
Asia Pacific 142 6.9Europe, Middle East, and Africa (EMEA) 1,040 50.9
China 189 9.2Latin America (LATAM) 51 2.5
North America 592 29.0Fixed term/Temporary
Asia Pacific 1 0.1Europe, Middle East, and Africa (EMEA) 26 1.3
China 1 0.1Latin America (LATAM) 2 0.1
North America 1 0.1Calculated total 2,045
GRI Index and ESG data tables continued

SUSE FY2021 Annual report 229
Health & SafetyWork-related fatalities
Employment contract Employment type Work-related fatalities Rate of fatalities
All All 0 0
ExplanationThis is measured and recorded in the board meeting report. As of 31 Oct 2021, there have been no fatalities.
Total work-related injuries
Total work-related injuries 0
Types of work-related injuries
Type of work-related injury Percentage of occurrence (%)
Falls, slips, trips 0
ExplanationThis is measured and recorded in the board meeting report. As of 31 Oct 2021, there have been no injuries reported and therefore ‘types of injury’ is not relevant.
Worker training on occupational health and safety
Employment contract Employment type Average hours of training Number of employees
All All 1 1,700
DescriptionAs more of our employees work from home, we have invited all our hybrid and home-working employees to complete a DSE assessment. This annual assessment is designed to support and facilitate safer working conditions and includes questions related to posture and comfort whilst working at home. Following on from the results of each employee’s assessment, we send furniture items (including chairs and desks) as needed. We also conduct Fire and First Aid training for dedicated individuals on each site. Finally, we shared an office training with all employees which outlined how employees should act safely in the office during Covid-19. It was mandatory to complete this training before entering a SUSE office. This ensured that all employees entering SUSE offices were acting safely and with precaution to limit the spread of the virus.
Crisis24 Application
Rate of download of the Crisis24 app 500
Total number of employees
Total number of employees 2,045Total number of employees working from home 1,900
ExplanationDuring Covid the majority of employees are working from home.Significant Location of Operation: Countries where there are 100 or more employees

SUSE FY2021 Annual report230
Covid-19 Information
Number of confirmed Covid-19 cases in the Company 43Number of work from home employees that were provided with furniture/equipment 1,200Value of the provided furniture/equipment to employees working from home (USD) 262,000
Training and developmentEmployees who received a regular performance and career development reviews
Number of employees Percentage of employees (%)
By gender
Male 1,183 79.1Female 283 18.9Undisclosed 29 1.9
By category
Director and above 143 9.6Non-Director people leader 98 6.6Non-Director individual contributor 1,254 83.9Total 1,495
ExplanationThe performance data comes from our Mid Year Review Conversation – which covers Performance and Career Development. 1,495 overall is up on numbers as compared to the previous year end conversation (1,411 in FY20), although down on % completion. The overall population of employees eligible for review at Mid Year was 1,847, for example in some geographies temporary employees with benefits would not be eligible for review but would be counted in overall HC.Hence overall % completion is 1,495 / 1,847 = 81% and the same principle applies for the other breakdowns such as gender and level.In addition to this process we also request employees to complete their career profiles in Workday annually. This is a voluntary activity but acts as a stimulus for the career conversation. 547 employees completed this activity meaning that we now have 1,660 career profiles completed in Workday. This activity helps to drive our overall Company goal to ensure that in this financial year 10% or more of our employees have career moves (lateral and promotions). We over-achieved against this career moves target closing the year with 20.1% of employees gaining a career move or promotion.
Remuneration equality and transparencyTotal compensation and benefits
Total compensation and benefits (USD) 470,190,000
Explanation – This Total Cost is primarily driven by the increase in headcount and is in line with our expectations. – Benefits provided to full-time employees that are not provided to temporary or part-time employees – Part time employees have access to the same benefits as Full time employees, however temporary employees will not have access to benefits, leave or stock ownership unless legally required.
– Definition used for ‘Significant locations of operation’ – Countries where there are 100 or more employees.
– Significant location of operations – USA, Germany, China, Czech Republic, UK.
GRI Index and ESG data tables continued

SUSE FY2021 Annual report 231
Employee attraction and retentionNew employee hires
Total number of employee hires 800New employee hire rate (% of total employees) 39.0
New employee hires, by age group
Age group Number of new employee hires Percentage of new employee hires (%)
Under the age of 30 204 25.5Between the ages of 30 and 50 489 61.1Over the age of 50 100 12.5Undefined 7 0.9Calculated total 800
New employee hires, by gender
Gender Number of new employee hires Percentage of new employee hires (%)
Female 219 27.4Male 575 71.9Undisclosed 6 0.8Calculated total 800
New employee hires, by region
Region Number of new employee hires Percentage of new employee hires (%)
Asia Pacific 82 10.2Europe, Middle East, and Africa (EMEA) 276 34.5China 100 12.5Latin America (LATAM) 25 3.1North America 317 39.6Calculated total 800
Employee turnover
Employee turnover number 405Employee turnover rate in percentage 21.2%
ExplanationEmployee turnover rate:= 405 (Total employee turnover) / 1914 (Average Employee HC over 12 months) = 21.16%

SUSE FY2021 Annual report232
Employee turnover rate by type
Voluntary employee turnover rate 15.6%Involuntary employee turnover rate 5.6%
Employee Volunteering
Total number of employee voluntary days 1224Average number of voluntary days per employee 0.6
ExplanationAll permanent employees are eligible for 1 x paid volunteering day per year. Calculation: Total number of employee volunteer Hours vs. days/Total employee HC as of 31 October 2021 = 1224/2045 = 0.60
Pillar 2 – Social matters
Digital inclusion and educationUdacity and sponsor courses
Number of students undertaking the course 15,000Number of scholarships 300Total value of the scholarships (USD) 300,000
Explanation SUSE is pleased to have sponsored scholarships for 300 select learners to advance through Udacity’s full Cloud Native Application Architecture Nanodegree program at no cost – valued at around US$1600 per nanodegree.
openSUSENon SUSE contributors to OpenSUSE
Number of nonSUSE contributors to OpenSUSE 139Percentage of nonSUSE contributors to OpenSUSE 69.8%
Explanation The above captures a recent survey regarding packagers and maintainers contributing to openSUSE. More information can be found on the wiki at https://en.opensuse.org/Maintainers-surveys_2021. These numbers are specific to the distribution and not to other openSUSE projects like the Open Build Service, software.opensuse.org, Kiwi, openQA. etc. Github stats indicate there are 111 teams comprised of a total of 369 people with contributor rights to openSUSE repositories.
OpenSUSE community engagement
Number of the events organized 3Average number of SUSE participants per event 81Average number of Non-SUSE participants per event 366
Explanation Three main events in addition to weekly (and adhoc) community meetings:
– OpenSUSE Conference (global) – 246 registered and much higher attendees. – OpenSUSE Asia Summit (global) – 187 registered and much higher attendees. – OpenSUSE Workshop (Europe) – 14 registered and much higher attendees.
Total SUSE attendees average is at least 81 for the above three events average, but some SUSE attendees might not use SUSE email addresses which makes it difficult to track.
GRI Index and ESG data tables continued

SUSE FY2021 Annual report 233
Pillar 3 – Environmental matters
Green ops – Emissions
Total direct
(Scope 1) GHG
emissions(t CO2e)
Emissions from
Electricity – Location
based(t CO2e)
Emissions from
Electricity – Market
based(t CO2e)
Emissions from
District cooling
– Location based
(t CO2e)
Emissions from
District cooling
– Market based
(t CO2e)
Energy indirect GHG
Emissions – Scope 2
location based
(t CO2e)
Energy indirect
GHG Emissions – Scope 2
market based
(t CO2e)
GHG emissions – Scope 1
and 2 location
based(t CO2e)
GHG emissions – Scope 1
and 2 market based
(t CO2e)
GHG emission intensity (t CO2e /
square meter of
office area)
Total other indirect
(Scope 3) GHG
emissions(t CO2e)
257.2 3,159.8 4,382.1 63.7 63.7 3,223.6 4,445.8 3,480.7 4,703.0 0.2 17,299.0
ExplanationThe reporting period is calendar year 2020 for the calculated fields. Due to the nature of SUSE’s operation, only three greenhouse gases are considered to be released in significant quantifies for tracking; CO2, CH4, and N2O.
Emission calculation – For the purposes of setting inventory organizational boundaries, SUSE has adopted the Operational Control Approach.
– Quantification methods used for the inventory are in accordance with best practice as followed by WRI/WBSCSD GHG Reporting Protocol, based on the most recently available factors. Please see Appendix C for details on emission factors datasets and calculations of the footprint.
– Scope 1: Direct Sources – are emissions from sources that are owned or controlled by SUSE directly. Activity data and emissions include on-site stationary combustion of fossil fuel burning equipment (e.g., heating boilers) or process-based emissions (e.g. back-up electricity generators). Also included, are emissions from Company-owned or leased vehicles, for whose fuel purchase SUSE is responsible.
– Scope 2: Indirect Sources – are emissions associated with the consumption of purchased or acquired electricity. Activity data and emissions include the purchase of electric power, steam, heating & cooling from the local utility.
– Scope 3: Indirect Sources – all indirect emissions (not included in Scope 2) that occur in the value chain of the reporting company, including both upstream and downstream emissions. Scope 3 data was estimated for the purpose of materiality assessment using the Quantis Tool, linking input data on company activities and expenditures to a combination of economic input output and process life cycle inventory data.
GHG emission intensity: = (Scope 1 + Scope 2 (MB))( metric ton of carbon dioxide equivalent)/office area (square meter)

SUSE FY2021 Annual report234
Green ops – Energy
Energy consumed
from Natural gas (kWh)
Energy consumed from Diesel
(kWh)
Non-renewable
district cooling
(kWh)
Energy intensity
(kWh / office area)
Total energy consumed within the
organisation(kWh)
Total electricity
purchased that is
renewable (kWh)
Percentage of renewable
electricity
Purchased non-
renewable electricity
(kWh)
Total purchased
electricity (kWh)
1,125,736 109,530 28,800 467.1 9,362,069.6 3,811 0.05 8,094,193 8,098,004
ExplanationThe reporting period is calendar year 2020 for the calculated fields.
Total energy consumed within the organization:= the sum of all Scope 1 & 2 consumption (natural gas, diesel, electricity, district cooling)
Energy intensity: = energy consumption (kWh)/ office area (square meter)
GRI Index and ESG data tables continued

Alternative Performance Measure DefinitionsThis document contains certain alternative performance measures (collectively, “APMs”) including ACV, ARR, NRR, Adjusted Revenue, Adjusted EBITDA, Adjusted EBITDA margin, Adjusted Cash EBITDA, Adjusted Cash EBITDA margin, Adjusted uFCF, Cash Conversion, and Net Debt, Leverage that are not required by, or presented in accordance with, IFRS, Luxembourg GAAP or any other generally accepted accounting principles. Certain of these measures are derived from the IFRS accounts of the Company and others are derived from management reporting or the accounting or controlling systems of the Group.SUSE presents APMs because they are used by management in monitoring, evaluating and managing its business, and management believes these measures provide an enhanced understanding of SUSE’s underlying results and related trends. The definitions of the APMs may not
be comparable to other similarly titled measures of other companies and have limitations as analytical tools and should, therefore, not be considered in isolation or as a substitute for analysis of SUSE’s operating results as reported under IFRS or Luxembourg GAAP. APMs such as ACV, ARR, NRR, ACV to Revenue Conversion, Adjusted Revenue, Adjusted EBITDA, Adjusted Cash EBITDA, Adjusted Cash EBITDA Margin, Adjusted uFCF, Cash Conversion, RPO and Net Debt are not measurements of SUSE’s performance or liquidity under IFRS, Luxembourg GAAP or German GAAP and should not be considered as alternatives to results for the period or any other performance measures derived in accordance with IFRS, Luxembourg GAAP, German GAAP or any other generally accepted accounting principles or as alternatives to cash flow from operating, investing or financing activities.SUSE has defined each of the following APMs as follows:
Glossary
AI Artificial Intelligence
Annual Contract Value or ACV
ACV represents the first 12 months monetary value of a contract. If total contract duration is less than 12 months, 100% of invoicing is included in ACV;
Annual Recurring Revenue or ARR
ARR represents the sum of the monthly contractual value for subscriptions and recurring elements of contracts in a given period, multiplied by 12. ARR is calculated three months in arrears, given backdated royalties relating to IHV and Cloud, and hence reflects the customer base as of three months prior;
Adjusted Cash EBITDA this APM represents Adjusted EBITDA plus changes in contract liabilities in the related period and excludes the impact of contract liabilities – deferred revenue haircut;
Adjusted Cash EBITDA Margin
expressed as a percentage, this APM represents Adjusted Cash EBITDA divided by Adjusted Revenue;
Adjusted Gross Profit this APM represents Adjusted Revenue less operating costs adjusted for non-recurring items;
Adjusted Gross Profit Margin
expressed as a percentage, this APM represents Adjusted Gross Profit divided by Adjusted Revenue;
Adjusted Earnings per share
is Adjusted PBT divided by weighted average at the end of the year shares
Adjusted EBITDA this APM represents earnings before net finance costs, share of loss of associate and tax, adjusted for depreciation and amortization, share – based payments, fair value adjustment to deferred revenue, statutory separately reported items, specific non-recurring items and net unrealized foreign exchange (gains)/losses;
Adjusted EBITDA Margin expressed as a percentage, this APM represents Adjusted EBITDA divided by Adjusted Revenue;
Adjusted Profit After Tax is Adjusted EBITDA (post IFRS 15 and 16), less D&A (excluding intangible amortization for Customer relationships, intellectual property and non-complete agreements) less net financial expense, less notional tax;
Adjusted Revenue Revenue as reported in the statutory accounts of the Group, adjusted for fair value adjustments;
SUSE FY2021 Annual report 235

Adjusted Unlevered Free Cash Flow or Adjusted uFCF
this APM represents Adjusted Cash EBITDA less capital expenditure related cash outflow, working capital movements (excluding deferred revenue, which is factored into Adjusted Cash EBITDA, and non-recurring items), cash taxes and the reversal of non-cash accounting adjustments relating to IFRS 15 and IFRS 16;
Cash Conversion Expressed as a percentage, this APM represents Adjusted uFCF divided by Adjusted EBITDA
Cloud Computing / Cloud The on-demand delivery of IT resources-applications, storage, databases, networking and more – over the Internet, providing anytime/anywhere access to servers, files, images, documents and application services from any device with an internet browser
Contractual Liabilities and Remaining Performance Obligations” or “RPO
RPO represents the unrecognized proportion of remaining performance obligations towards subscribers (e.g., the amount of revenue that has been invoiced, but not yet recognized as revenue) plus amounts for which binding irrevocable commitments have been received but have yet to be invoiced
Containers Form of virtualization that bundles the complete runtime environment for an application into one package, making them lightweight, portable and platform independent
CSR Corporate social responsibility
DevOps Software development and IT operations
Edge Computing/Edge A decentralization of computation and storage nodes in between the sensors and cloud/core data center, as well as a market segment in which the Company operates
Enterprise Container Management
Automates the deployment and management of containers and helps to deploy the same application across different environments without needing to redesign it
Enterprise Linux Open source Linux operating system packaged with software tools and services designed for corporate, academic or business use
Enterprise Operating Systems
Refers to an operating system packaged with software tools and services for corporate, academic or business use as well as one of the market segments in which the Company operates
HPC High performance computing
Hybrid Cloud Describes the integration of public and private cloud, based on orchestration of platforms and software
Kubernetes Management Open source container orchestration platform that helps manage distributed, containerized applications at massive scale
Linux Freely distributable, cross platform operating system that can be installed on PCs, laptops, netbooks, mobile an table devices, servers and supercomputers
ML Machine learning
Leverage Expressed as a multiple, Leverage is Net Debt divided by Adjusted Cash EBITDA
Net Debt This APM represents the sum of current and non-current interest bearing borrowings (net of un-amortized capitalized arrangement fees, gains or losses on loan modifications), current and non-current lease liabilities, less cash and cash equivalents
Net Retention Rate or NRR expressed as a percentage, NRR indicates the proportion of ARR that has been retained over the prior 12-month period, which is inclusive of up-sell, cross-sell, down-sell, churn and pricing. It excludes ARR from net new logo End user customers. The NRR is calculated three months in arrears, aligned to the calculation of ARR
Paid Linux Linux operating system, typically includes software subscription with proprietary add-on tools, packages and services plus certifications
Public Cloud Off-premise cloud computing infrastructure for the general public provided by the Internet
Glossary continued
SUSE FY2021 Annual report236

17 March 2022 Release of Q1 results
24 March 2022 Annual General Meeting
7 July 2022 Release of Q2 results and H1 financial report
22 September 2022 Release of Q3 results
19 January 2023 Release of Q4 and FY22 results
19 January 2023 Publication of FY22 Annual Report
SUSE financial calendar

SUSE S.A.11-13 Boulevard de la FoireL-1528 LuxembourgGrand Duchy of LuxembourgR.C.S. Luxembourg B 225816
www.suse.com