share - Observer Research Foundation
191
-
Upload
khangminh22 -
Category
Documents
-
view
2 -
download
0
Transcript of share - Observer Research Foundation
© 2022 Observer Research Foundation and Global Policy Journal. All rights reserved. No part of this publication may be reproduced, stored in a retrieval system or transmitted in any form or by any means, electronic, mechanical or photocopying, recording, or otherwise, without the prior permission of the publisher.
Observer Research Foundation 20 Rouse Avenue, Institutional Area New Delhi, India 110002 [email protected] www.orfonline.org
ORF provides non-partisan, independent analyses on matters of security, strategy, economy, development, energy and global governance to diverse decision-makers including governments, business communities, academia and civil society. ORF’s mandate is to conduct in-depth research, provide inclusive platforms, and invest in tomorrow’s thought leaders today.
Editing and Production: Preeti Lourdes John
Design and Layout: Rahil Shaikh and Simijaison Designs
ISBN: 978-93-90494-66-8
Citation: Soumya Bhowmick and Nilanjan Ghosh, eds., Sustainable Development in Action: Examining Global North-South Divergences, (New Delhi: ORF and Global Policy Journal, 2022).
This volume of essays is dedicated to the memory of those we lost to the
COVID-19 pandemic, and those who braved the storm.
Contents
Introduction: Development at the Crossroads 6 Soumya Bhowmick and Nilanjan Ghosh
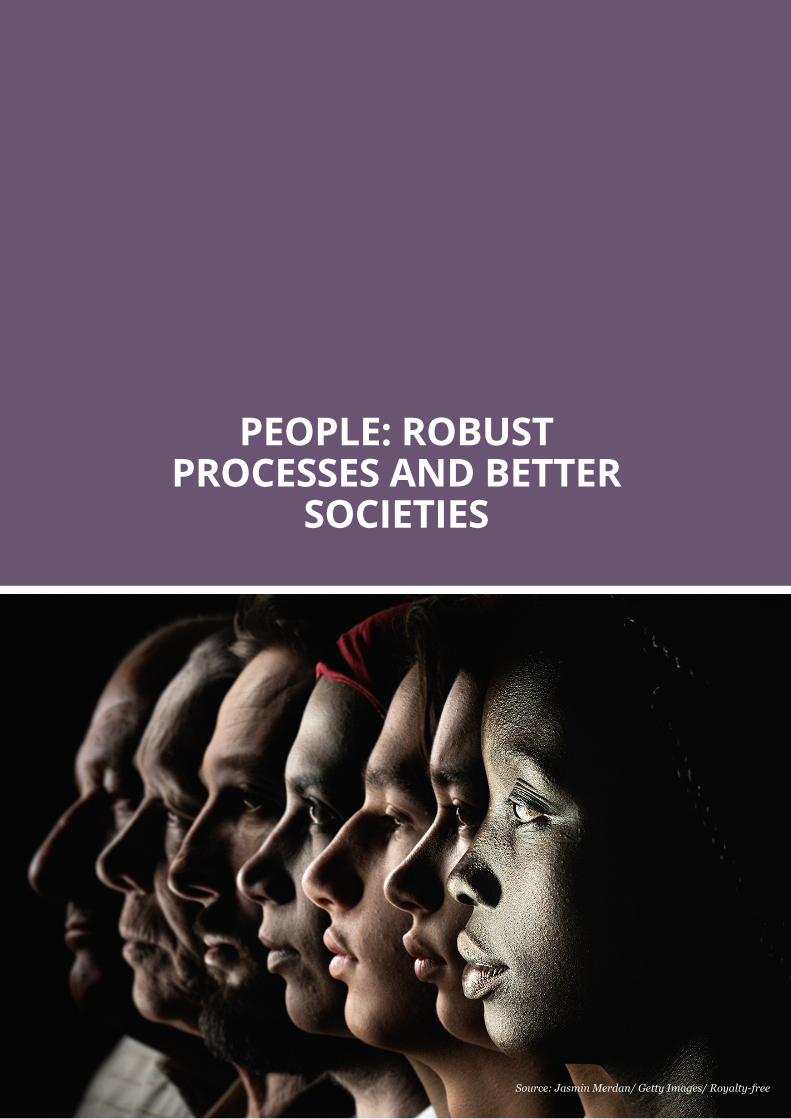
People: Robust Processes and Better Societies 15
Globalisation and the South Asian Farmer 16 Yoginder. K. Alagh A Queer Economic Lens on the SDGs 28 M. V. Lee Badgett SDG 6: Blending Two Visions of Resilience for Water 36 John H. Matthews War, Peace and Conservation: Partnerships as a Pathway to Achieving the SDGs 45 Emil Uddhammar Education, Technology Diffusion, and Human Capital Accumulation: Trends and Concerns for
Developing Countries 51 Andrea Cabello Human Rights in Outer Space: Building on SDG 16 59 Robin Ramcharan Mental Health in an Unequal World: Assessing the Impact of COVID-19 69 Shoba Suri Land Reforms and Optimal Farm Size: Linkages with Rural Inequality and Socioeconomic Development 82 Roshan Saha
Planet: Synergising Enterprise, Environment and Communities 91
Towards an Equitable and Sustainable Blue Economy in Australia 92 Tania Lado Insua, John Whittington, David Hope,
and Irene Penesis E-Mobility for a Sustainable World: Unavoidable
Automobility and Global South-North Perspectives 100 Joyashree Roy and Shreya Some Valuing Nature’s Contribution 119 Madhu Verma and Asi Guha Measuring Progress in Pursuit of the Planet Goals 128 Anamitra Anurag Danda Towards an Inclusive Wealth-Based Measure of Sustainable Development 137 Preeti Kapuria
Prosperity: Of Lives and Livelihoods 149
Growth-Development-Environment: Embracing an Ensemble Approach to Sustainability 150
Purnamita Dasgupta Overcoming Pandemic-Exacerbated Youth Unemployment in Africa 160 Theophilus Edwin Coleman and Letlhokwa George Mpedi Paradiplomacy as a Pathway to Achieve SDG 11:
Is Urban India Ready? 170 Renita D’Souza High-Income and Highly Unequal: The US Falls
Behind in SDGs 8 and 10 179 Terri B. Chapman
About the Editors and Authors 190
INTRODUCTION
Source: anaion/ Getty Images/ Royalty-free
Development at the Crossroads
Soumya Bhowmick and Nilanjan Ghosh
8
Introduction
The global development paradigm is at a critical crossroad. The COVID-19 pandemic has not only exposed the vulnerabilities of global economies no matter their positions in the global development
curve, but also showed the divergence the capacities of the Global North and South to combat the crisis. Further, the post-pandemic economic revival is not exhibitive of the axiomatic north-south divide. Yet, there is no denying that social security and the welfare state—or the lack of it in certain economies—were important in providing a much-needed cushion under shocks. Indeed, the pandemic has been a ‘global common’.
At the same time, the UN Sustainable Development Goals (SDGs), which have emerged as the cornerstone of global development governance in recent years, ended up the victim of this new ‘global common’. The 2030 Agenda for Sustainable Development, encompassing a shared vision of peace and prosperity for the planet across space and time, was adopted by all the UN member nations in 2015 at the end of the tenure of the Millennium Development Goals. This entailed the global call for the adoption of the 17 SDGs that seek to reconcile sustainable living, distributive justice, and economic progress through the co-existence of equity, efficiency and sustainability principles in development governance. In other words, the emerging challenge of development governance should be viewed through the prism of reconciling the “irreconcilable trinity” of equity, efficiency, and sustainability (1)—a monodimensional equivalent of the Penrose Tribar (2). This trinity delineates what development economist Mohan Munasinghe calls the “discourse of sustainomics” (3).
In course of this reconciliation, the SDGs emphasise that humanity can survive and flourish on this planet with all other species, and are largely dependent on the ecosystem services provided by biodiversity. The destruction of the biodiversity entails losses in various provisioning and regulating services of the ecosystem and
Development at the Crossroads
9
raise questions on the long-term sustainability of life and livelihoods. In the process, SDGs stress on various equity parameters (such as ending poverty and deprivations, reducing inequality, improving human capital) and efficiency parameters (such as spurring economic growth and industrialization), all while combating the forces of climate change and meeting conservation goals. And the much-needed global partnership to realise the SDGs is espoused under SDG 17.
The growth trajectories of the world economies have been visibly exhibiting convergence clubs between the developed and developing nations, essentially generating ‘twin-peak’ (4) development scenarios. Against this backdrop, the SDGs, which provide a common framework for all countries pursuing holistic long-term development, tends to present trade-offs, not only among the contending goals, but also from a trans-boundary perspective. For example, advancement on SDG 9 (industry, innovation and infrastructure) will always have the historic tendency to have negative externalities on SDG 13 (climate action). Again, the adoption of ‘green growth’ strategies in some of the most advanced nations may have essentially left a negative footprint on the developing world, as these countries gradually shift their lower-value chain production units to the Global South. If the progress made by the developed world with respect to certain SDGs comes at a cost of developing nations, the global community is merely engaging in a zero-sum game. Moreover, having a common set of targets for all countries ignores the legacy of the unsustainable growth trajectory pursued in the past by some and also puts undue pressure on developing countries, substantially limiting their growth trajectories in pursuance of sustainable development.
The pandemic has only worsened the manifestations of these trends. Given the changes in societal, economic, and environmental orders due to COVID-19, the inherent trade-offs that affect sustainable development may be adding to the crisis; the complex network of inter-linkages among the SDGs and across countries will not allow the whole framework to function if one of them falls apart. Efforts at mitigating the severe fallouts of the pandemic can be synergised with achieving the SDG targets if countries give due consideration to sustainability (5). To meet the targets of the SDGs, a renewed focus and ample financing avenues from both public and private channels is needed. An urgent emphasis on directed policy action is needed to bring about the desired reforms, keeping in mind the limitations imposed by these trade-offs. The pandemic has also caused the international political processes to change to advance the sustainable development agenda, as we see the digital space becoming the new norm.
Amid the lack of resources, aligning policies to the SDGs may be a more difficult challenge for the Global South as compared to the Global North. The developed world
10
Introduction
and international organisations should play a more proactive role by synergising their efforts with the interests of the Global South. However, to drive policy change, it is important that the essence of the SDGs be embraced along with tending to the social and economic issues arising in the aftermath of the pandemic. Embracing these development goals will help the world prepare better for global crises as they have the potential to ensure access to universal health coverage and better primary services, more inclusive and prosperous economies (6), and renewed environmental efforts and societal resilience.
This GP-ORF volume explores the potential to alter the trade-offs existing within the SDGs framework into synergies considering the post-pandemic development priorities. The volume is divided into the three main domains that define Agenda 2030—people, planet and prosperity.
People: Robust Processes and Better Societies
The challenges faced by the developed and the developing world with regards to augmenting their human and social capital is likely to vary to a great extent, primarily owing to the latter’s limited economic opportunities. The nature of the constraints faced by the two sets of countries is also very different. For example, with respect to food security (SDG 2), the developed world may be more concerned with ensuring nutritional security at large (7), while the developing countries still reel under the pressure to ensure food sufficiency as well as nutritional security. This section is a compilation of essays based on SDGs 1-6 and SDGs 16 and 17.
There is no doubt that the pandemic has dampened various developmental opportunities in the last two years. These range from global poverty (SDG 1), increasing by around 120 million (8), to women suffering a higher proportion of job losses due to the economic crisis (9). Here again, the effects have been disproportionately shared by the developing world (10). However, this also creates opportunities to make progress along SDG 17, forging strong public-private partnerships, and through regional cooperation. In India, the World Bank has been financing the provision of food and support to the disadvantaged classes through community kitchens and providing financial services (11). Against this backdrop, it is important to explore the potential challenges and opportunities arising within different countries’ development agenda while focusing on the multiple ramifications of the COVID-19 pandemic (and the subsequent lockdowns and curfews imposed by countries as a response) as being felt by people across communities.
Development at the Crossroads
11
Planet: Synergising Enterprise, Environment and Communities
With reference to environmental policies allowing for the preservation of natural capital at sustainable levels, even while pursuing global economic growth, the developing world has been placed somewhat unfavourably. The pandemic and the response it has necessitated from governments across the world led to a large diversion of resources towards protecting lives and livelihoods and, subsequently, away from environmental protection schemes. The resource-limited developing world has suffered the brunt of this diversion, and there must be sufficient cognisance of this in the global community. This section focuses on the SDG 7 and SDGs 12-15.
In February 2021, a new strategy on adaptation to climate change (12) was adopted by the European Commission, promoting focus on Africa and Small Island states through scaled up international finance and stronger global engagement. According to the State of India’s Environment 2021 report (13), no state is on track to meet all SDGs by 2030. Budgetary allocations to the Ministry of Environment, Forests and Climate Change have also decreased from the previous year (14). However, certain key proposals such as the Green Hydrogen Energy Mission, Jal Jeevan Mission (Urban), Deep Ocean Mission, voluntary vehicle scrapping policy, and capital infusion to key agencies such as Solar Energy Corporation of India, Indian Renewable Energy Development Agency, Clean Air programme and Swachh Bharat Mission 2.0, need to be acknowledged in favour of achieving the planetary goals in the SDG framework.
Prosperity: Of Lives and Livelihoods
The International Labour Organization has projected a loss of 90 million full time jobs and a decline of global labour income by 8.3 percent in 2021 (15). While employment in financial and insurance activities and information and communication sectors are seeing an increase, accommodation and food services, and the retail, manufacturing and construction sectors have been hit the hardest. These indicate significant decline in the productivity of the existing physical and human capital, which generates disincentives for private sector participation in augmenting these forms of capital further. The OECD lowered its forecast for India’s real GDP value in the fourth quarter of 2021 by 7.8 percent from the pre-pandemic prediction (16). The pandemic also saw an increase in the role of the gig economy (17), while the tech industry (18), which is growing at 2.3 percent year on year, could lead India’s economic recovery.
12
Introduction
Even before the pandemic hit the developing countries, these economies were showing signs of distress and employment loss due to adverse shocks generated from the more advanced parts of the world. Moreover, while almost all countries were quick to respond to these economic fallouts by introducing fiscal and monetary stimulus, the average figures were significantly lower (19) for the developing world. This is expected to create a lasting and sustained impact on the growth trajectory of these nations unless the trade-offs and synergies existing among the countries within the SDGs framework are utilised effectively to further economic growth, job recovery and reduced inequalities, albeit with sustained international support. This section is a compilation of essays on SDGs 8-11.
Conclusion
The ‘decade of action’ must now be seen as the ‘decade in action’. The onset of the pandemic has impeded the progress on many goals and has led to a regression (rather than progression) of what was achieved. The challenges of meeting the goals were already quite steep, and the pandemic has only made it more difficult. There are two ways forward—spurring up action or readjusting the timeline. The post-pandemic economic recovery has been a challenge for many governments. They must now consider if the neo-Keynesian responses are going to prevail as they did during the pandemic, or if governments will need to act as enabling institutions to spur the market forces. The neo-Keynesian response has fallouts in the forms of presuuring the governmental exchquer. Therefore, the policy response from the perspective of better developmental governance at all levels (global, national, meso, and micro) needs to be one that creates enabling conditions for concerted efforts from all possible stakeholders (government, non-governmental institutions, the corporate sector, and civil society) to meet the goals within this ‘decade in action’. The essays in this volume also further this idea through the creation of a more integrated and transdisciplinary framework.
The authors acknowledge Rohith Vishwanath and Aritrika Chowdhury for their research assistance.
Development at the Crossroads
13
Endnotes
(1) Nilanjan Ghosh, “Ecological Economics: Sustainability, Markets, and Global Change,” in Global Change, Ecosystems, Sustainability, ed. Pranab Mukhopadhyay, Nandan Nawn and Kylan Das (New Delhi: Sage Publishing, 2017): 11-25.
(2) The Penrose tribar, or the impossible triangle, is a triangular impossible object that appears as an optical illusion. While two bars of the triangle can lie in one place, the third bar cannot intersect with these and lies in another place. In reality, no three-dimensional object in an ordinary Euclidean space can exist; L. S. Penrose and R. Penrose, “Impossible Objects: A Special Type of Visual Illusion,” The British Journal of Psychology 49, no. 1 (1958): 31–33, doi:10.1111/j.2044-8295.1958.tb00634.x. PMID 13536303.
(3) Mohan Munasinghe, Making Development More Sustainable: Sustainomics Framework and Practical Applications (Colombo: MIND Press, 2007)
(4) Danny T Quah, “Twin Peaks: Growth and Convergence in Models of Distribution Dynamics,” The Economic Journal 106, no. 437 (1996): 1045–55, https://www.jstor.org/stable/2235377
(5) ODI, “ODI Bites: the impacts of Covid-19 on achieving the SDGs,” YouTube video, 15:47 min, June 2, 2020, https://odi.org/en/events/odi-bites-the-impacts-of-covid-19-on-achieving-the-sdgs/
(6) United Nations Sustainable Development Group, Shared Responsibility, Global Solidarity: Responding to the Socio-economic impacts of COVID-19, United Nations, March 2020, https://unsdg.un.org/resources/shared-responsibility-global-solidarity-responding-socio-economic-impacts-covid-19
(7) Isabella Nyambayo, “Food Security In Developed Countries (Europe And USA) – Is It Insecurity And Insufficiency Or Hunger And Poverty In Developed Countries?,” BAOJ Nutrition, 1, no. 1 (2015), http://dx.doi.org/10.24947/baojn/1/1/00101
(8) “COVID-19 pushed 119-124 million into poverty: World Bank updates estimates,” Down To Earth, January 12, 2021, https://www.downtoearth.org.in/news/economy/covid-19-pushed-119-124-million-into-poverty-world-bank-updates-estimates-75013
(9) Amita Pitre, “What About Women? Budget 2021 Ignores Gender Gap Widened by COVID,” The Quint, February 2, 2021, https://www.thequint.com/voices/women/union-budget-2021-women-ignored-inequality-gap#read-more
(10) World Bank Group, “COVID-19 to Add as Many as 150 Million Extreme Poor by 2021,” October 7, 2020, Washington, https://www.worldbank.org/en/news/press-release/2020/10/07/covid-19-to-add-as-many-as-150-million-extreme-poor-by-2021
(11) The World Bank, “Food Security Update,” World Bank Group, https://www.worldbank.org/en/topic/agriculture/brief/food-security-update
(12) European Commission, “Building a Climate-Resilient Future - A new EU Strategy on
14
Introduction
Adaptation to Climate Change,” February 24, 2021, https://ec.europa.eu/commission/presscorner/detail/en/ip_21_663
(13) “State of India’s Environment 2021: People and planet in peril,” Down To Earth, February 24, 2021, https://www.downtoearth.org.in/blog/pollution/state-of-india-s-environment-2021-people-and-planet-in-peril-75661
(14) Simi Mehta and Ritika Gupta, “COP26 and India’s NDCs,” Inter Press Service, March 16, 2021, http://www.ipsnews.net/2021/03/cop26-indias-ndcs/
(15) International Labour Organization, ILO Monitor: COVID-19 and the world of work. Seventh Edition, ILO, 2021, https://www.ilo.org/global/topics/coronavirus/impacts-and-responses/WCMS_767028/lang--en/index.htm
(16) Shoaib Daniyal, “Indian economy to be hardest hit by Covid-19 despite recovery, predicts new OECD report,” Scroll, March 10, 2021, https://scroll.in/article/989096/indian-economy-to-be-hardest-hit-due-to-covid-19-despite-recovery-predicts-new-oecd-report
(17) “COVID-19 lockdown led to increasing role of gig economy,” The Hindu, January 29, 2021, https://www.thehindu.com/business/Economy/economic-survey-covid-19-lockdown-led-to-increasing-role-of-gig-economy/article33695898.ece
(18) Srinath Srinivasan, “Tech industry leading India’s recovery post Covid,” Financial Express, February 18, 2021, https://www.financialexpress.com/industry/technology/tech-industry-leading-indias-recovery-post-covid/2196681/
(19) International Labour Organization, COVID-19: Tackling the Jobs Crisis in the Least Developed Countries, ILO, 2021, https://www.un.org/ohrlls/sites/www.un.org.ohrlls/files/covid-19_tackling_the_jobs_crisis_in_the_ldcs.pdf
SDG 6: Blending Two Visions of Resilience for Water
15
PEOPLE: ROBUST PROCESSES AND BETTER
SOCIETIES
Source: Jasmin Merdan/ Getty Images/ Royalty-free
Globalisation and the South Asian Farmer
01
Yoginder. K. Alagh
Globalisation and the South Asian Farmer
17
The Indian subcontinent and its neighbourhood are globalising. Economists believe that under benign conditions, it is an axiom that trade helps both parties, but this is not always true. In a festschrift on
Swedish economist Gunnar Myrdal (1), this author wrote:
“...Myrdal was the only strong critic of Trade Dominated Development Theory, in addition to the late Raul Prebisch in the late Sixties of the last century. The Values of the Washington Consensus, which Myrdal had analysed brilliantly in his critical book on Value and Social Theory” are in fact opposed to that interpretation.
This paper is in that tradition. It discusses trade and its effect on South Asian farmers, particularly on income and food security concerns.
Changing Position on Trade and Agriculture
In late March 2018, India’s Trade Minister Suresh Prabhu made a very important statement during a World Trade Organization (WTO) brainstorming session: “While some of the new issues being raised by others may also be of relevance to India, [it is] existing issues such as agriculture are critical livelihood issues which are extremely important for India” (2).
With this statement, India, which has played a leadership role in South Asia’s global agricultural trade policy position, modified a position that it, South Asia and the G77 had held for decades in agricultural globalisation debates. To understand what caused this change, it is necessary to go back. The larger context of globalisation in which trade takes place needs to be set as the backdrop in which India played a role in the world and its current marginalised position since the outcomes will depend on the functioning of global markets.
18
People: Robust Processes and Better Societies
In South Asia, the food security angle is still compelling. The WTO’s proposed restrictions on India’s initiatives on food security are also sourced from its India pundits who work as experts with governments. For poor households in South Asia, two things matter—employment and rations at a subsidised price.
The angst against food security stems from a political economy viewpoint. Studies by the Food and Agriculture Organization on poverty removal, where subsidised grains are modelled with a price support programme, demonstrate the viability of a two-track approach if government budgets can support them. In India, this modelling originated in the Sardar Patel Institute (3). The opposite counterfactual uses the same general equilibrium modelling, with lower prices hurting agricultural incomes and food purchases and calories falling.
A little history of the WTO’s opposition to price support programmes is informative. The original World Bank studies by Garry Purcell and Ashok Gulati (4) had argued that India taxes its agriculture, an assessment often used in the debates. But in this century, it can no longer be said that India taxes its agriculture while also asking it to cut down its subsidies. Indeed, Purcell and the World Bank changed their stance to say that no anti-agriculture bias existed and India did subsidise its agriculture (5). Statements of the following kind became common: Mary Whelan, chairing India’s trade policy review, said: “Concerns were expressed over subsidies for agricultural products and inputs, which have contributed to large grain stocks and export restrictions on agricultural goods” (6).
Gulati and colleagues subsequently fell in line and in 2005 admitted: “We report less disprotection of Indian agriculture in the 1990’s than in earlier studies” (7). The present argument, supposedly pro-agriculture and anti-consumption for the poor subsidies, is a fallback to those World Bank studies, and the attack is on food security.
The WTO picks up the old Indian general equilibrium calculations. In these arguments, poverty goes down by agricultural investment more than by food security entitlements. This happens because in these models, agricultural investment and food security are not provided, and one is forced to choose between them (Gulati says it is dumb to give food subsidies (8)). Agricultural growth reduces poverty, but a lot of the poor remain. Why not avoid the terrible choice and have both more agricultural investment and some food subsidies for the starving?
It is now being said that South Asian economies are ‘middle-income countries’, and poverty is eliminated or nearly so with economic reform. A research report presented to the Indian government says that World Bank studies show a large decrease in poverty in India (9), (10). These contrast with Indian studies that do not show such
Globalisation and the South Asian Farmer
19
a large decline in poverty. This is an interesting finding, but it needs some discussion because of its importance for policymaking. This issue is important in terms of growth and redistribution strategies. The findings are based on World Bank Poverty norms stated as ‘X dollars per person per day in purchasing power parity prices (PPP) in a particular year’. There is an interesting history to the origin and use of these estimates.
Indian estimates of poverty are based on minimum nutritional requirements in terms of calorie intake per person per day based on what is called the ‘Akroyd scale’. This goes back to estimates presented in the 1970s by a task force chaired by this author (11). Subsequently, an attempt was made to add social needs to such requirements. The World Bank announced its first estimate of poverty with a ‘one dollar per person per day’ norm applied across countries and used PPP rates rather than exchange rates. Interestingly, the World Bank justified the usage of the ‘one dollar’ requirement norms as being equal to the Indian minimum nutritional calorie requirement norms. Even then it was pointed out that if purchasing power parity was worked out at US prices, Indian urban poverty was estimated at a very high figure.
PPP prices create a very special problem because they are based on market exchange rate calculations, which are based on weights between countries that are estimated by their trade structure in terms of the commodity spread of exports and imports. This has nothing to do with the consumption pattern of poor people but creates considerable difficulties of a conceptual nature. Trade weights are not the weights of the consumption pattern of poor people and, as such, purchase parity norms can give weird results. For instance, such norms earlier showed that more than two-thirds of Indians in urban areas were poor, and now show that there is little poverty in India. The norms were wrong then and may be wrong now as well.
Poverty in South Asia has been declining, according to all estimates, which has been happening gradually over the last four decades (particularly in Bangladesh). But only the very brave like the World Bank and economists working with or advising the government (12) will say that poverty has been nearly eliminated. The focus must remain in the real world and on the poor farmers.
Food security and farmer support programmes must be protected. This would then provide the basis for the no challenge clause that commerce ministers have reportedly been working on to defend public stock holding in the green box over the ten percent subsidy limits. This is important if South Asia wants to escape the trap of the so-called peace clause—Article 13 of the WTO Agreement in Agriculture (AOA), which protects a country’s food procurement program against WTO action, subject to certain conditions being met—of four or eight years, giving up the eventual
20
People: Robust Processes and Better Societies
abolition of hunger over temporary relief from the global grain cartels. The problem is more severe as the food security laws in South Asia provide for non-grain subsidies to the real poor, such as a glass of milk to the poor lactating mother. It should be easy to establish a knowledge network to support the no challenge position against the line against food security (13).
It is important to take a stand because models that support agriculture without any nuance on the size of farmers are like Trojan horses. A consistent stand is essential since—as the DG of WTO, a friend from another developing country, pointed out—the opposition will press for trade facilitation, and our bargaining space will get to be narrower.
The Traditional Indian Argument
According to G.S. Bhalla (14), the avowed objective of the AOA was to create a free multilateral trade regime. The aim was to eliminate or considerably reduce obstacles to market access, including restrictions, controls and high tariff walls; to eliminate or considerably reduce domestic support; and to streamline the export subsidy regime. But the provisions of the AOA, the modalities adopted for making the reduction commitments, and the way these were translated into specific commitments all suffered from serious limitations. India played a role as a concept builder and strategist for developing countries.
First, in market access, in the choice of the base year period of 1986-1989, prices were extremely low, and this enabled developed countries to get away with much higher than the true tariff equivalents. Second, most major players indulged in dirty tariffication that enabled them to come to higher figure base tariff equivalents by as much as 61 percent for the European Economic Community and 44 percent by the US. Because of dirty tariffication, developed countries retained very high tariffs for highly protected commodities such as dairy and sugar products. This resulted in the continuation of extensive border protection for several high-value agricultural commodities. On the other hand, oil seeds, fruits, and vegetables, which were less protected, were further liberalised (15). This policy proved deleterious to the interests of developing countries like India. Third, the method of making an average reduction in tariffs enabled the developed countries to make minimum reductions (of 15 percent) on highly protected sensitive items and much larger reductions in non-competitive products with low tariffs. The administration of tariff-rate quotas by developed countries was also discriminatory.
Globalisation and the South Asian Farmer
21
The policy bind plaguing India is a difficult one, even if the arguments are not ideologically anti-trade or those of a lack of policy interest. If a feasible alternate transitional policy set exists, a sensible approach will be to try to establish a roadmap of economic policies for a few major crops first. This author argued that it was the only logical course in a liberalising economy, else agriculture would be left out of the process of reform with serious negative consequences (16). Economist Lance Taylor described a multifaceted price system (MPS) as a “transition from an administered towards a market regime”; he said the “homely virtues [of MPS] are perhaps becoming more evident” by citing the Polish and Indian examples and commended India for “developing effective multi-tiered pricing systems for their nationalized firms and even in agriculture” (17). In a review of the post-socialist transition from a global development economics point of view, Taylor said that MPS policy has a level playing objective, such that the transition to a global economy is knowledge-based and without avoidable human costs.
This author has argued that a framework of a similar kind should be evoked for the agricultural sector (18). It is important to develop a roadmap for principal crops that are not based on historical costs but on opportunity costs at the margin so that technological progress and South Asia’s inherent competitive advantages (good soils, the sun and monsoons) are given free rein to play. The capital costs for such an economy at the margin will be higher than historical costs. But current output costs will be lower per unit of output, although they will again require larger working capital requirements (see Table 1 for an illustrative set of policies for paddy).
Using the 1999/2000 cost of cultivation data for paddy in Punjab, it was found that the average cost of cultivation per hectare was INR 21,119, ranging between INR 13,077 and INR 51,310 with a coefficient of variation of 27.06 percent. This is the range within which market intervention will fix a price. Of 30 tehsils (local unit of administrative division) for which data was collected, 14 had higher costs than the state average. But there was no information on if the costs were higher due to technical superiority or poor natural resource endowments. Tehsil-level irrigation data was available, and it suggested that poorly endowed water tehsils in southwest Punjab had higher irrigation costs—the average cost per kilo of paddy was INR 3.84, and could range between INR 2.24 and INR 18.12 per kilo. In areas with per hectare costs higher than the state average, three had per kilo costs lower than the state average. These tehsils also had per hectare seed costs higher than the state average, suggesting a possible technical superiority. The existing policies include no allowances for higher capital costs and internalisation of technological superiority. The data highlights the problem, but without access to capital costs at a level of disaggregation, it was difficult to develop a long-range numerical marginal cost framework.
22
People: Robust Processes and Better Societies
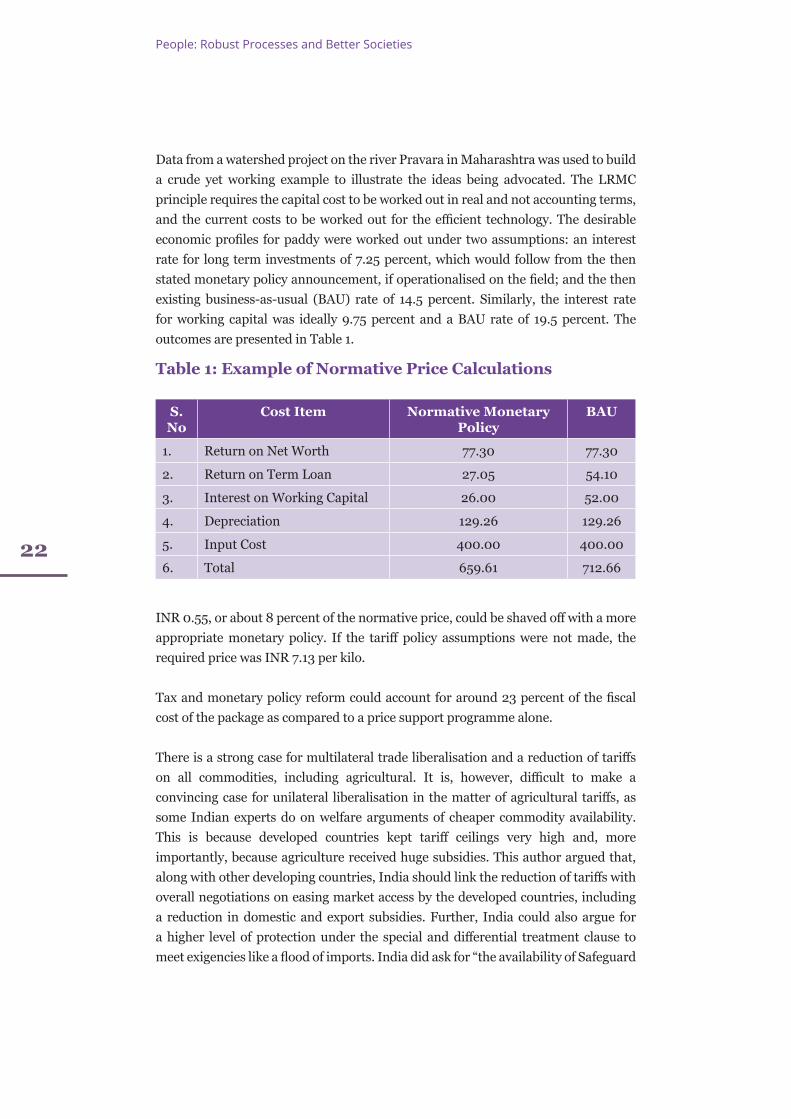
Data from a watershed project on the river Pravara in Maharashtra was used to build a crude yet working example to illustrate the ideas being advocated. The LRMC principle requires the capital cost to be worked out in real and not accounting terms, and the current costs to be worked out for the efficient technology. The desirable economic profiles for paddy were worked out under two assumptions: an interest rate for long term investments of 7.25 percent, which would follow from the then stated monetary policy announcement, if operationalised on the field; and the then existing business-as-usual (BAU) rate of 14.5 percent. Similarly, the interest rate for working capital was ideally 9.75 percent and a BAU rate of 19.5 percent. The outcomes are presented in Table 1.
Table 1: Example of Normative Price Calculations
S. No
Cost Item Normative Monetary Policy
BAU
1. Return on Net Worth 77.30 77.30
2. Return on Term Loan 27.05 54.10
3. Interest on Working Capital 26.00 52.00
4. Depreciation 129.26 129.26
5. Input Cost 400.00 400.00
6. Total 659.61 712.66
INR 0.55, or about 8 percent of the normative price, could be shaved off with a more appropriate monetary policy. If the tariff policy assumptions were not made, the required price was INR 7.13 per kilo.
Tax and monetary policy reform could account for around 23 percent of the fiscal cost of the package as compared to a price support programme alone.
There is a strong case for multilateral trade liberalisation and a reduction of tariffs on all commodities, including agricultural. It is, however, difficult to make a convincing case for unilateral liberalisation in the matter of agricultural tariffs, as some Indian experts do on welfare arguments of cheaper commodity availability. This is because developed countries kept tariff ceilings very high and, more importantly, because agriculture received huge subsidies. This author argued that, along with other developing countries, India should link the reduction of tariffs with overall negotiations on easing market access by the developed countries, including a reduction in domestic and export subsidies. Further, India could also argue for a higher level of protection under the special and differential treatment clause to meet exigencies like a flood of imports. India did ask for “the availability of Safeguard
Globalisation and the South Asian Farmer
23
mechanism under AoA to the developing countries alone when this is eliminated for the developed countries that are exclusively enjoying it at present” (19).
India also proposed to the WTO that all direct payments, decoupled income support and income insurance and income safety-net programmes, and direct payments under production limiting programmes should be included in the non-product specific aggregate measurement of support and should be subject to a reduction commitment as per the AoA. India’s other suggestions were that product-specific support provided to low-income resource-poor farmers be excluded from the AMS calculations, and that total domestic support should be brought down below the de minimis level within three years by developed countries and five years by developing countries.
Agricultural Growth and Hunger
The issue is not of grain but access. One needs money to buy food, even if farmers produce it and shops have it. Agricultural growth is needed not to grow grain but to create a widespread source of income. When many people live in rural areas, as in India, only widespread agricultural growth can trigger broad-based rural growth, and this is the only guarantee to reducing hunger. The State can feed a few people, and it certainly must do so. The really starving are the destitute. Women-headed households, disabled wage earners and the old must all be given grain. Poor girl children must be given free meals to keep them in school, and poor pregnant women and lactating mothers must get the assistance they need. There are also sharply defined geographical pockets of starvation, placed there by the atrocities of man on nature and the environment. But on a mass scale, no government can do the task, and thus countries must grow so that there is work and people earn and can buy food. (20)
Paradoxically, to grow on a widespread basis, grain growth must slow down more than in the past. Generally, the pattern is that non-grain crops grow faster than grain crops, animal husbandry and fish. Diversification is key, and incomes will grow fast in response to demand changes. But it may not happen fast enough. Reform and investment in rural infrastructure are needed, although it will be difficult to achieve since the rural economy is complex (21).
This stance has a historical background to India’s and South Asia’s WTO negotiations. Two further arguments have a history (22). This was the perception that India never had a trade strategy and that the scope for intervention in agricultural markets was limited by the fiscal crunch. There was an element of force in these arguments that are
24
People: Robust Processes and Better Societies
yet to be used for trade negotiations. The export strategy in South Asia in the 1970s of “supply planning” and an “appropriate system of incentives” gave way in the mid-1980s to export set-offs, such as those of South Korea. Imports of edible oil, grains, and wage goods have been a part of policy since the mid-1970s. More generally, as agricultural policy moved from the emphasis on grain self-sufficiency in the 1970s to diversification in the early 1980s and a resource-based agro-climatic strategy by the late 1980s, the role of regional specialisation and trade became more explicit. It has been argued that agricultural diversification in large countries is basically driven by domestic demand (23). International trade would also hasten the process (24). This followed from trade theory and was welcomed (25). It has also been argued that the trading agricultural agro-climatic regions were also those that had more often than not followed sustainable land and water development policies (26). The fiscal argument is overdone since the intervention in agricultural markets should be only at the margin, in some regions and in particular contexts, and in any case, tariff, tax and monetary policy instruments were also available.
There was, therefore, considerable synergy seen in trade, diversification, and sustainable development. In agro-climatic literature, for example, economists and policymakers supported the recommendations of studies on diversification and agricultural markets (27). Scholars have also argued that South Asia can impose high tariffs if it wants to (28). These are contentious issues in any negotiation, as the comments in Trade Policy Reviews highlight. The arguments made previously keep being repeated. Thus, in the 2002 Trade Policy Review, Canada “noted that many tariffs remained high, and hoped that high tariff and non-tariff barriers would not impede access to high quality and competitively priced imported goods for Indian consumers” (29). Switzerland argued that “the rather large proportion of unbound tariff lines as well as the gap between bound and applied rates provided scope for uncertainty, and diminished the predictability needed by economic operators.” Japan “thought that India’s tariff was a bit too high” (30). The EU stated that “there was still a need to cut down the high number of rates and to simplify the complex tariff structure” (31). New Zealand “was concerned about the increase in the average MFN tariff from 35% in 1997/98 to 41% in 2001/02. New Zealand also had reservations about the extent of tariff escalation on agricultural forestry imports” and it “looked forward to working with India in the relevant negotiations to address some of these issues” (32). The US “asked about India’s plan to simplify its tariff and excise structure, and to reduce rates, which were prohibitively high” and even Norway wanted tariff simplification to “cover fish and fish products, and hoped it would do so at the lower levels” (33). When the US administration commented adversely on India at the 2017 Buenos Aires Ministerial Meeting, it was following a long tradition. But then again, former US President Donald Trump’s trade war gave India space for tariff raising (34).
Globalisation and the South Asian Farmer
25
Some economists and policymakers, on the other hand, keep on repeating earlier arguments in a mechanical way, without appreciating that now the arguments are that: South Asia does not discriminate against agriculture as much as it did in the past; there is a new playing field in the case of rice and wheat; it subsidises agriculture in a big way; and that such subsidies will always be up for discussion in the next round.
A version of this paper was presented by the author at the Durgabai Deshmukh Memorial Lecture 2021 and was titled ‘The Janus Face of Agricultural Policies, Kisans and Sethias: Local and Global’.
Endnotes
(1) Yoginder Kumar Alagh, “Introduction,” in Economic Policy in a Liberalising Economy: Indian Reform in this Century (Gateway East, Singapore: Springer Nature Pte Ltd., 2018): 5.
(2) “New issues in WTO important for aspirational India: Suresh Prabhu”, Economic Times, February 20, 2018, https://economictimes.indiatimes.com/news/economy/foreign-trade/new-issues-in-wto-important-for-aspirational-india-suresh-prabhu/articleshow/63003319.cms
(3) R. Radhakrishna and Shovan Ray, Handbook of Poverty in India: Perspectives, Policies, and Programmes (UK: Oxford University Press, 2006)
(4) Garry Pursell and Ashok Gulati, “Liberalizing Indian Agriculture: An Agenda for Reform”, Policy Research Working Paper 1172, The World Bank, 1993, Washington, https://ideas.repec.org/p/wbk/wbrwps/1172.html
(5) D. Rosenthal et. al., Have Economy Level Reforms Helped Indian Agriculture, (Washington: World Bank, 1996)
(6) World Trade Organization, “Trade Policy Reviews: Second Press Release and Chairperson’s Conclusions, India: June 2002”, WTO, June 21, 2002, https://www.wto.org/english/tratop_e/tpr_e/tp196_e.htm
(7) Kathleen Mullen et.al., “Producer Support Estimates (PSEs) for Agriculture in Developing Countries: Measurement Issues and Illustrations from India and China”, MTID Discussion Paper, International Food Policy Research Institute, 2005, Washington, D.C., https://www.ifpri.org/publication/producer-support-estimates-pses-agriculture-developing-countries
(8) Ashok Gulati and PrernaTerway, “From Plate to Plough: Get smarter on the farm,”
26
People: Robust Processes and Better Societies
The Indian Express, October 3, 2018, https://indianexpress.com/article/opinion/columns/investment-in-farming-farmer-subsidies-india-agriculture-policy-arun-jaitley-minimum-support-prices-5383478/
(9) Homi Kharas, Kristofer Hamel, and Martin Hofer, “The start of a new poverty narrative”, The Brookings Institution, June 19, 2018, https://www.brookings.edu/blog/future-development/2018/06/19/the-start-of-a-new-poverty-narrative/
(10) Bill and Melinda Gates Foundation, “The Stories behind the Data 2018”, Goalkeepers Report 2018, https://www.gatesfoundation.org/goalkeepers/report/2018-report/?download=false
(11) Planning Commission, Perspective Planning Division, Report of The Task Force on Projections of Minimum Needs and Effective Consumption Demand, New Delhi, Government of India, 1979
(12) Surjit Bhalla, “India is a Middle Income Now: Raise The Poverty Line,” The Indian Express, June 30, 2018, https://indianexpress.com/article/opinion/columns/india-is-middle-income-now-raise-the-poverty-line-5239269/
(13) Suresh Prabhu, “Brainstorming Session on WTO in the Post-MC11 Phase”, Department of Commerce, Ministry of Commerce, Government of India and the Centre for WTO Studies, IIFT, February 19-20, 2018
(14) Yoginder Kumar Alagh, “Agricultural Pricing in a WTO Economy: Policy Advice and Decisions,” Economic Developments in India 138 (2009), https://academicfoundation.org/index.php?route=product/product&product_id=655
(15) Dale E. Hathaway and Merlinda D. Ingco, “Agricultural Liberalisation and the Uruguay Round,” in The Uruguay Round and the Developing Economies, World Bank Discussion Paper 307, ed. Allan Winters and Will Martin, (D.C., Washington: World Bank, 1995), 1-24, https://doi.org/10.1596/0-8213-3469-7
(16) Yoginder Kumar Alagh, “The Janus Face of Agricultural Policies, Kisans and Sethias: Local and Global” Social Change 51, no. 4: 463–74, (December 2021), https://doi.org/10.1177/00490857211051242
(17) Yoginder Kumar Alagh, “The Future of Indian Agriculture,” The Indian Economic Journal 59, no. 1 (2017): 40-55, https://journals.sagepub.com/doi/10.1177/0019466220110103
(18) Yoginder Kumar Alagh, “Agricultural Price Policy in an Open Economy,” (paper presented at Tenth Dharm Narain Memorial Lecture, Delhi, Institute of Economic Growth, 2003)
(19) Ministry of Commerce and Industry, Department of Commerce WTO: Agreement on Agriculture; India’s Proposals, New Delhi, 2001
(20) Yoginder Kumar Alagh, “The Poverty Debate in Perspective: Moving Forward with the Tendulkar Committee,” Indian Journal of Human Development 4, No. 1 (2010): 33-44, https://journals.sagepub.com/doi/pdf/10.1177/0973703020100102
Globalisation and the South Asian Farmer
27
(21) Yoginder Kumar Alagh, The Future of Indian Agriculture, National Book Trust, New Delhi, India, 2013
(22) Anwarul Hoda and C.S. Sekhar, “Agricultural Trade Liberalization Poverty and Food Security: The Indian Experience”, Discussion Paper at JNU-IFPRI Workshop on “The Dragon and the Elephant: A Comparative Study of Economic and Agricultural Reforms in China and India”, New Delhi, 2003
(23) Yoginder Kumar Alagh, “India’s Agricultural Trade with the ESCAP Region,” Studies in International Trade, Vol. 10, New York, U.N. (1995/1997)
(24) Yoginder Kumar Alagh, “India’s Agricultural Trade,” Indian Economic Journal (1999)
(25) Yoginder Kumar Alagh, “India’s Agricultural Trade with the ESCAP Region”
(26) Yoginder Kumar Alagh, The Future of Indian Agriculture
(27) Yoginder Kumar Alagh, The Future of Indian Agriculture
(28) Yoginder Kumar Alagh, “The Janus Face of Agricultural Policies, Kisans and Sethias: Local and Global”
(29) World Trade Organization, Trade Policy Review: India 2002, WTO, June 21, 2002, https://www.wto.org/english/tratop_e/tpr_e/tp195_e.htm
(30) World Trade Organization, Trade Policy Review: India 2002
(31) World Trade Organization, Trade Policy Review: India 2002
(32) World Trade Organization, Trade Policy Review: India 2002
(33) World Trade Organization, Trade Policy Review: India 2002
(34) Anwarul Hoda, “No winners in this Trump’s trade war,” Financial Express, March 9, 2018, https://www.financialexpress.com/world-news/no-winner-in-this-trumps-trade-war/1092211/
A Queer Economic Lens on the SDGs
02
M. V. Lee Badgett
A Queer Economic Lens on the SDGs
29
L esbian, gay, bisexual, transgender, and intersex (LGBTI) people face many economic challenges, whether they live in high-income, middle-income, or low-income countries. It is no exaggeration to say that
all countries are developing countries when it comes to LGBTI people’s rights and broad inclusion. LGBTI advocates and researchers in many countries have been making visible what is often invisible—economic inequalities created by exclusionary practices in markets, political spaces, and social settings (1). This essay outlines some of the synergies and barriers for addressing those inequalities in the context of the sustainable development agenda. LGBTI people have much to gain from broader inclusion, and they have much to contribute to economic development when given the opportunity.
On balance, the 2030 Agenda for Sustainable Development offers hope to LGBTI people, even as it perpetuates their invisibility. Calls for equality pervade the Sustainable Development Goals (SDGs), emphasising the accompanying pledge “that no one will be left behind” (2). For example, SDG 5 calls for gender equality and the empowerment of women and girls, and SDG 10 calls for reducing inequality and promoting “the social, economic, and political inclusion for all, irrespective of age, sex, disability, race, ethnicity, origin, religion, or economic or other status.” Although left unnamed in the 2030 Agenda, LGBTI people have read their inclusion into these goals. The category of “women and girls” should include lesbian, bisexual, and transgender women. And as in the past on many human rights issues, it is possible to use the “or other status” umbrella and “no one left behind” promise to argue for LGBTI inclusion more broadly, since LGBTI people are shut out of many sectors covered by the SDGs (3).
While the quality and quantity of data on LGBTI people varies across countries, research conducted by academics, government agencies, and LGBTI civil society organisations confirm the general economic exclusion of LGBTI people in all
30
People: Robust Processes and Better Societies
countries studied (4). In many countries, LGBTI people report on surveys that they have experienced discrimination or unfair treatment in the workplace. Experiments in several countries have found that LGBTI applicants are less likely than identically qualified heterosexual people to be invited to interview for jobs in countries as diverse as Sweden, Malaysia, Thailand, Vietnam, the US, and Greece. Gay and bisexual men earn less than comparable heterosexual men, a gap that is consistent across many countries. This sort of economic inequality contributes to the high rates of poverty of LGBTI people seen in many studies. Economic barriers are compounded by poor treatment in educational settings and the health effects of stigma, violence, and discrimination. The COVID-19 pandemic appears to have deepened the harms from exclusion, according to some qualitative and quantitative studies (5).
Strategies to Overcome Barriers
To overcome these barriers, LGBTI people and their organisations are using several general strategies in many countries—pursuing the enactment of human rights protections into law; organising to influence policymakers and decision-makers in important sectors (such as local and multinational businesses, the education sector, healthcare, and others); creating direct programmes to improve the economic livelihoods of LGBTI people; and creating the organisations, evidence, and ideas needed to push the inclusion agenda forward. These strategies can be found in some form in most countries, regardless of income level, and they are both standalone and ometimes linked to the SDGs. But it is important to understand how progress differs in low/middle-income and high-income countries.
Consider the question of formal legal rights. In the 1960s, the legal rights of homosexuals, as they were then mostly known, were sparse in all parts of the world (6). Over the next half-century, legal rights for LGBTI people grew much more rapidly in high-income countries. Richer countries increasingly have decriminalised homosexuality and being gender non-conforming, added legal protections against discrimination in employment and other settings, and legally recognised the chosen family relationships of LGBTI people. Currently, 31 countries allow (or will soon allow) same-sex couples to marry, including high-income and, increasingly, middle-income countries. At the same time, around 70 countries—mostly low-income countries and some high-income countries in the West Asia and North Africa region—still criminalise private, consensual same-sex activity (7).
Also, a worrying trend is visible mainly in low-income countries (but also parts of the US and EU) that have seen a backlash against LGBTI rights. That backlash can take the form of efforts to require discrimination and to enhance criminalisation
A Queer Economic Lens on the SDGs
31
of political and social dimensions of being LGBTI. Public opinion surveys also demonstrate that developing countries tend to have lower levels of social acceptance of LGBTI people than high-income countries, and acceptance levels have declined for many low-income countries over the last decade (8).
At least two reasons have been offered for this correlation of LGBTI rights and public opinion with national income. One argues that as countries get richer and move beyond concerns about basic subsistence, they become less tied to traditional beliefs and authorities and more open to individual rights (9). The other perspective is the “economic case for LGBTI equality,” which suggests that LGBTI inclusion itself contributes to economic development. It is not surprising that inclusion would help reduce the income gaps, health disparities, and school bullying that harm the wellbeing of LGBTI people around the world. The novel connection of the “economic case” is how inclusion boosts the whole economy by enhancing human capital (education and health, in particular), reducing inefficient discrimination, and recognising the importance and power of diversity (10).
While it is likely that both proposed explanations contribute to the correlation between LGBTI rights and GDP, the “economic case” constitutes one of the new ideas being used by businesses, LGBTI advocates and others to push for more inclusion, including formal rights in developing economies. Economic arguments for equality have fueled new strategies to win nondiscrimination laws and marriage equality in high-income countries. The argument has been brought to developing countries by studies that have estimated the (partial) cost of LGBTI exclusion in several developing or emerging countries. Starting with India, a World Bank study found a loss of as much as 1 percent of GDP just from employment discrimination and health disparities. Later studies in the Philippines, Kenya, and South Africa also found a cost of exclusion to the order of 1 percent or more of GDP (11). From this perspective, LGBTI inclusion has important synergies with the 2030 Agenda both in terms of reducing inequality and contributing more broadly to macroeconomic growth that benefits all people.
At a micro level, LGBTI people and organisations in developing countries are also pursuing direct efforts to improve the skills, livelihoods, employment, and entrepreneurship opportunities for LGBTI people (12). India has seen more public effort in this direction than other countries, with new opportunities for LGBTI people in education, skills training, job searches, and entrepreneurship created by government programmes as well as community-led projects (13). Much less evidence exists for these individual-level approaches in high-income countries, where efforts to encourage large companies to be more inclusive of LGBTI people
32
People: Robust Processes and Better Societies
are the predominant strategy to improve opportunities. This difference highlights the need to think about different inclusion strategies for economies with a large informal sector than for those with more organised, regular employment structures. Many possible strategies are complementary in both developing and high-income countries, such as the human rights arguments for inclusion and the economic case for equality.
Data to Catalyse Inclusion
The SDGs also highlight another need related to LGBTI people—data for monitoring progress and for designing evidence-based practices to expand inclusion. Recognising this need, the UN Development Programme has led a process to develop a global LGBTI Inclusion Index to give countries their own measurement of inclusion of LGBTI people in health, education, economic wellbeing, personal security and violence, and political and civic participation (14). The 51 indicators included in the index measure both legal rights and opportunities along with the lived experience of LGBTI people. Countries could use their own index values to track progress internally and to make external comparisons. The index is being piloted in 2022 in a subset of countries.
Implementing the LGBTI Inclusion Index will require several kinds of data, not all of which are commonly available right now. Data on legal rights exists on many of the policies included as indicators, but little is known about the implementation of nondiscrimination efforts, another set of indicators. Data on the lived experience of LGBTI people is especially rare, however, and what exists is often not comparable across countries.
Some progress is taking place as national statistics offices begin to include questions on sexual orientation and gender identity on national surveys. But here again, there is a divergence between high-income and lower-income countries. The Organisation for Economic Co-operation and Development (OECD) reports that 19 high-income countries are collecting data on sexual orientation in at least one of their national surveys, and three include some questions about gender identity (15). Outside of the OECD, Ecuador, Peru, and India are notable pioneers in collecting data on at least some subgroups of the broad LGBTI community. The LGBTI Inclusion Index is also intended to catalyse countries’ efforts to expand data collection and inclusion of sexual orientation, gender identity, and sex characteristics questions on national surveys.
A Queer Economic Lens on the SDGs
33
Conclusion
These three issues—economic inequality and exclusion, formal legal rights, and data—are closely connected to fulfilling the SDG mandate to “leave no one behind”. Without better data, it is difficult to convince decision-makers and other stakeholders that they need to be more inclusive of LGBTI people and to provide more economic opportunities. Without formal rights, it may be harder to convince governments that statistical inclusion is essential. High-income and lower-income countries can learn from each other about the legal and economic strategies that can improve economic inclusion for LGBTI people in all countries.
Endnotes
(1) M.V. Lee Badgett, The Economic Case for LGBT Equality: Why Fair and Equal Treatment Benefits Us All, (Boston: Beacon Press, 2020)
(2) United Nations Department of Economic and Social Affairs: Division for Sustainable Development Goals, “Transforming Our World: The 2030 Agenda for Sustainable Development,” United Nations, https://sdgs.un.org/2030agenda.
(3) Jeffrey O’Malley and Andreas Holzinger, The Sustainable Development Goals: Sexual and Gender Minorities, United Nations Development Programme, 2018, https://www.undp.org/publications/sexual-and-gender-minorities; Elizabeth Mills, “Leave No One Behind’: Gender, Sexuality and the Sustainable Development Goals”, Institute of Development Studies, October 1, 2015, https://www.ids.ac.uk/publications/leave-no-one-behind-gender-sexuality-and-the-sustainable-development-goals/#:~:text=Report-,’Leave%20No%20One%20Behind’%3A%20Gender%2C%20Sexuality,and%20the%20Sustainable%20Development%20Goals&text=In%20an%20unprecedented%20move%20to,Development%20Goal%20(MDG)%20framework; Andrew Park and Lucas Ramon Mendos, “For All: The Sustainable Development Goals and LGBTI People”, RFSL, 2019, https://doi.org/10.13140/RG.2.2.23989.73447
(4) Marieka Klawitter, “Meta-Analysis of the Effects of Sexual Orientation on Earnings,” Industrial Relations: A Journal of Economy and Society 54, no. 1 (2015): 4–32, https://doi.org/10.1111/irel.12075; Marie-Anne Valfort, “LGBTI in OECD Countries: A Review”, OECD Social, Employment and Migration Working Papers, No. 198 (Paris: OECD Publishing, 2017) https://dx.doi.org/10.1787/d5d49711-en; Badgett, The Economic Case for LGBT Equality: Why Fair and Equal Treatment Benefits Us All; M. V. Lee Badgett, Christopher S. Carpenter, and Dario Sansone, “LGBTQ Economics,” Journal of Economic Perspectives 35, no. 2(2021): 141-170, http://dx.doi.org/10.1257/jep.35.2.141
34
People: Robust Processes and Better Societies
(5) OutRight Action International, Vulnerability Amplified: The Impact of the COVID-19 Pandemic on LGBTIQ People, 2020, https://outrightinternational.org/content/vulnerability-amplified-impact-covid-19-pandemic-lgbtiq-people; Henrique Pereira et al., “Psychosocial Impacts of COVID-19 Pandemic on Lesbian, Gay, and Bisexual People Living in Portugal and Brazil—A Qualitative Study,” Journal of Psychosexual Health 3, no. 2 (2021): 146–59, https://doi.org/10.1177/26318318211017466
(6) M.V. Lee Badgett, Kees Waaldijk, and Yana van der Meulen Rodgers, “The Relationship between LGBT Inclusion and Economic Development: Macro-Level Evidence,” World Development 120 (2019): 1–14, https://doi.org/10.1016/j.worlddev.2019.03.011
(7) Lucas Ramon Mendos et al., State-Sponsored Homophobia 2020: Global Legislation Update, Geneva, International Lesbian, Gay, Bisexual, Trans and Intersex Association, 2020, https://ilga.org/state-sponsored-homophobia-report
(8) M V Lee Badgett, Andrew Park, and Andrew Flores, Links Between Economic Development and New Measures of LGBT Inclusion, Los Angeles, CA, The Williams Institute, UCLA School of Law, 2018, https://williamsinstitute.law.ucla.edu/wp-content/uploads/GDP-and-LGBT-Inclusion-April-2018.pdf; Andrew R. Flores, Social Acceptance of LGBTI People in 175 Countries and Locations 1981 to 2020, Los Angeles, CA, The Williams Institute, UCLA School of Law, 2021, https://williamsinstitute.law.ucla.edu/publications/global-acceptance-index-lgbt/
(9) Ronald F. Inglehart, “Changing Values among Western Publics from 1970 to 2006,” West European Politics 31, no. 1–2 (2008): 130–46, https://doi.org/10.1080/01402380701834747
(10) Badgett, The Economic Case for LGBT Equality: Why Fair and Equal Treatment Benefits Us All
(11) Badgett, The Economic Case for LGBT Equality: Why Fair and Equal Treatment Benefits Us All. In addition, the organization Open For Business has conducted studies finding a similar sized economic benefit of LGBTI inclusion for the Czech Republic, the Caribbean, Hungary, Poland, Romania, Ukraine, and Uzbekistan, all available at https://open-for-business.org/reports
(12) M.V. Lee Badgett, Katya Burns, Pawan Dhall, and Claire Gheerebrant, Identifying Effective Strategies to Improve Livelihoods of LGBTI People, 2021, https://static1.squarespace.com/static/5ea8b30ef6cf00375e8df429/t/6213bf7bac1b5635ccf62f2f/1645461372476/Badgett+et+al+LGBT+Strategies+Paper+Dec+2021.pdf
(13) National AIDS Control Organization and United Nations Development Programme, Skilling for Livelihood Opportunities for Transgenders in India, NACO and UNDP, 2017, https://www.in.undp.org/content/india/en/home/library/poverty/skilling-and-livelihoods-for-transgender-community.html; All Manipur Nupi Maanbi Association et al., Guidelines for Economic Inclusion of Gender and Sexual Minorities in India Beyond the Corporate World, Kolkata, India, 2019, https://vartagensex.org/wp-content/uploads/2020/12/Economic-Inclusion-Kol-Cnslttn-2019-Report-Final.pdf
A Queer Economic Lens on the SDGs
35
(14) United Nations Development Programme, Measuring LGBTI Inclusion: Increasing Access to Data and Building the Evidence Base, New York, UNDP, 2016; M. V. Lee Badgett and Randall Sell, “A Set of Proposed Indicators for the LGBTI Inclusion Index,” Word Bank Group and United Nations Development Programme, New York, 2018, https://openknowledge.worldbank.org/handle/10986/30994
(15) Organisation for Economic Co-operation and Development, Society at a Glance 2019: OECD Social Indicators, OECD, 2019, 1–136
SDG 6: Blending Two Visions of Resilience for Water
03
John H. Matthews
SDG 6: Blending Two Visions of Resilience for Water
37
T he Sustainable Development Goals (SDGs) and the United Nations Framework Convention on Climate Change (UNFCCC) have emerged as parallel tracks for economic development. In theory, ‹sustainable
development’ and a low-carbon, resilient path for economic development should be entirely reconcilable, but in practice, coherence between the language, implementation, and tracking of these international processes has proven to be challenging. This essay will focus on the role of freshwater resources, the water sector, and water as a medium for sustainability and resilience. These qualities have diverged between policy frameworks and, as a result, in terms of actions in both highly developed and developing countries. SDG 6 is a clear example of how a ‹sectoral’ issue—water—is being interpreted in ways that lead to parallel rather than convergent approaches to economic development with the climate agenda. Many of these differences reflect longstanding discussions within the water and economic development communities.
Two Water Communities: WASH and WRM
The intent and purpose of SDG 6 is access to clean, reliable, and affordable drinking water, inclusive of safe and effective sanitation services. Sometimes referred to as the ‹WASH SDG,’ it reflects the initiative and effort of many individuals and organisations that focus on sanitation and hygiene issues, including water supply for the urban and rural poor. Gender is a strong element here, given the specific health and social and economic risks associated with women and girls not having access to safe and secure water and sanitation. However, among many in the water community, SDG 6 represents both a clear and urgent need for billions of individuals, as made clear by four specific targets:
38
People: Robust Processes and Better Societies
6.1: By 2030, achieve universal and equitable access to safe and affordable drinking water for all
6.2: By 2030, achieve access to adequate and equitable sanitation and hygiene for all and end open defecation, paying special attention to the needs of women and girls and those in vulnerable situations
6.A: By 2030, expand international cooperation and capacity-building support to developing countries in water- and sanitation-related activities and programmes, including water harvesting, desalination, water efficiency, wastewater treatment, recycling and reuse technologies
6.B: Support and strengthen the participation of local communities in improving water and sanitation management
The phrasing of these targets derive largely from one part of water professionals. By training and focus of action, many in the water community fall into two broad categories—water resources management (WRM) and water, sanitation, and hygiene (WASH). Groups focusing on WRM most often have a technical orientation towards disciplines such as engineering, hydrology, economics or, more recently, applications such as environmental flows, water governance, energy production, agriculture, and climate adaptation. WRM programmes and projects can potentially span any scale, but they are perhaps most visible as large infrastructure projects, such as storage reservoirs, hydropower facilities, irrigation networks, and urban water utilities. The water sector, as the term is often used, is included within WRM, but WRM is a broader term, with deep connections to sectors such as agriculture, cities, energy, disaster risk management, and natural resource management.
WASH has historically represented two distinct areas. WASH in high-density regions such as cities often includes water utilities, where there is a significant overlap with WRM specialists; engineering and economics are fundamental elements for this work (1). However, advocacy and funding that targets SDG 6 often emphasise low-density regions, such as rural and periurban areas where centralised water, wastewater treatment and supply systems have not historically existed and may have significant financial, structural, or operational obstacles. Hilly or mountainous areas, for instance, might require large investments and intensive energy expenditures to move water or waste using a traditional centralised utility. In regions of great poverty, a water utility may need large subsidies to function economically, for maintenance and repair operations, to meet regulatory requirements, and expand and adapt to changing social and technological conditions over time. Areas with large refugee or
SDG 6: Blending Two Visions of Resilience for Water
39
migrant populations or that are touched by disasters may be even less suitable for the hub-and-spoke water supply and treatment solutions developed in the Global North over the last two centuries, even though alternative approaches are available.
Given where the needs for these two areas of WASH exist most acutely, low-density WASH needs are typically most widespread and greatest in the Global South rather than the Global North. A regional difference is more likely to exist with high-density regions as well, as cities in the Global North more often have systems that were established more than a century ago, often within a strong WRM framework. In such cases, they often have more elaborate governance and regulatory frameworks, even if they have more inherited, ‘legacy’ infrastructure, designed for quite different social and economic conditions than currently exist. Exceptions to both high- and low-density patterns can be found (e.g., for indigenous groups in the United States, Australia, and Canada for low-density WASH, and cities such as Mumbai and Manila for high-density WASH, though very often these latter investments were made in a colonial context), but these assumptions broadly direct investment and aid programmes globally.
As a result, tension has developed between WASH and WRM around the language of sustainable development, water, and how to develop and implement water supply and sanitation projects in rural and periurban areas. SDG 6 is not written in the language of WRM and instead speaks largely in the language of basic access and essential dignity. Indeed, major WASH organisations emphasise water and sanitation as a basic requirement or foundation for economic development.
As a result, a rural water supply project conceived through a WASH lens might look very different from a similar WRM project. While the WASH might be designed to provision low-tech water services rapidly at a low cost to target populations, the WRM might add decision and evaluation criteria such as upstream-downstream impacts, eco-hydrological impact and climatic variability analyses, or consideration of tradeoffs associated with water-related stakeholders such as farmers and energy producers. The costs, decisions about the project location, rapidity to service, and longevity of service might vary significantly between the two versions of the project. Monitoring and evaluation systems between these fields will also differ. Typically, a WRM rural supply project is likely to require additional time, effort, technical expertise, and (in sum) more costs, while a WASH rural supply project will likely be cheaper and faster to deployment but may be more likely to fail (or to fail before its intended operational lifetime). The added deliberation and analysis for a WRM-driven project will typically be designed against a wider array of contingencies and for durability and reliability. The higher level of design effort before the project even
40
People: Robust Processes and Better Societies
begins is, at least ideally, a significant difference in the project’s longevity. Good governance and community support cannot overcome a bad infrastructure project.
The reasons for these differences are historical, persistent, and longstanding. Low-density WASH efforts are normally embedded within health and sanitation agencies and institutions rather than water resource management agencies and institutions, so the motivations and indicators of progress differ in fundamental ways. For instance, urgency in meeting basic service needs is prioritised much more than infrastructure reliability in meeting basic supply and sanitation needs in middle- and low-income countries. A quickly deployed project may also be quite brittle and fail prematurely without sufficient project preparation. Best practices for WRM projects ensure some data analysis and an understanding of upstream and downstream (hydrological) context and how a new project may interact with existing projects, including energy, transport, or other water sector projects. This level of project preparation is often absent in WASH-driven projects, even with large international WASH organisations, which often lack engineers, hydrologists, or other technical water resources management staff. The scale of the projects involved may also differ in a consistent way between the approaches, with WRM projects often having larger budgets for project preparation. Finance sources may also influence project design and expectations (2).
Resilience: One Word Dividing Two Approaches to Water Supply and Sanitation
Climate change has muddled the WRM-WASH tension further, particularly through the language of ‹resilience’. Resilience has a long history in both English and in economic development, predating any awareness of anthropogenic climate change, while the application of ‹resilience’ implying relevance to or as a synonym for climate adaptation is quite recent. In the author’s perception and experience in regional and global climate discussions, this latter definition is certainly restricted to the 21st century, with the widespread use of the term in a climate change-specific context beginning about 2015.
Climate change has notably reinvigorated usage of ‹resilience’ among water professionals, but in practice, the two communities often use the same word to describe quite different endpoints, processes, and/or targets for water investments. Climate resilience for WRM, for instance, is largely associated with risk assessment processes designed to ensure that investments can perform despite shifting climate conditions, which is sometimes also called climate proofing. Infrastructure performance is the key indicator in this case. Typically, resilience is approximated by the engineering
SDG 6: Blending Two Visions of Resilience for Water
41
concept of being robust to a wide variety of potential conditions. Robustness for climate resilience especially refers to how future water conditions may shift with additional climate change, often over a timespan for at least 20 years of operations. In some cases, other aspects of resilience may also apply, such as flexibility or redundancy. For WRM, resilience operates at the level of a supply and sanitation ‹system,’ inclusive of the infrastructure as well as its operation and governance and the eco-hydrological aspects of provisioning a water supply. For WRM practitioners, refining definitions of climate resilience for supply and sanitation systems and developing more effective tools, frameworks, and methodologies is an ongoing and active area of engagement. Often, WRM groups invest in developing high internal capacity and detailed decision-making processes for climate risk assessment.
WASH practitioners tend to emphasise social aspects of resilience conferred by having reliable access to basic sanitation, especially at a household, neighbourhood, and/or community level. Resilience as a social quality, in this case, is an outcome of WASH services rather than an operational target for planning and design. Thus, increases in net access, availability, health status, child mortality from waterborne diseases, school enrollment for girls, the quantity of water or sanitation services per capita, and proximity to the water or sanitation sources to the target audience are examples of typical resilience indicators for WASH. The existence of improved WASH facilities is assumed to provide social resilience to climate impacts, even if those facilities have not had extensive climate proofing. For disaster recovery and refugee supply and sanitation issues, urgency in service delivery often takes full precedence over planning or implementation that might result in a broader definition of resilience. In middle- and low-income countries, household social indicators are used for reporting progress for SDG 6 rather than the robustness or flexibility of the supply and sanitation systems themselves.
Prioritising Climate Resilience
The descriptions provided here of alternative WRM and WASH approaches to SDG 6 and supply, and sanitation systems more generally are somewhat caricatured, but the contrast between urgency and access against reducing system-level risks associated with infrastructure, implementation, maintenance, and governance remain widespread. Indeed, they also approximate longstanding divisions within national governments (often public health vs finance and environment ministries), UN bodies (UNICEF vs UN Habitat), NGOs (for instance, WaterAid vs Global Water Partnership), and distinct WASH and WRM programmes within bilateral and multilateral development aid groups (such as Sida, World Bank and US AID). Some
42
People: Robust Processes and Better Societies
groups, such as the UK’s Foreign, Commonwealth and Development Office and the World Bank, have worked to merge, reduce, or eliminate these divisions within their own institutional borders in recent years, yet these patterns have been slow to disappear in practice.
SDG 6 does not mention climate change or resilience more generally, and although targets 6.4, 6.5, and 6.6 are not specific to WASH, most of the funding and emphasis for SDG 6 is on the WASH targets. SDG 6 ultimately describes success as increased service access. Yet the assumption behind these targets is presumably that the benefits conferred by improved and basic supply and sanitation should be durable beyond 2030. Climate change is widely viewed as one of the most important influences in driving changes in how we manage water resources (3), and certainly, the intended operational lifespan of meaningful supply and sanitation systems should span climate-relevant timescales of a decade or more. Water insecurity, in this view, is also climate insecurity and vice-versa.
The 2015 Paris Agreement is silent on water, WASH, WRM, and most other sectors, and water has not been a significant feature in UNFCCC Conference of the Parties (COP) statements subsequent to the Paris Agreement (4). While the water sector is now represented more formally in the COP negotiations through the Marrakesh Partnership for Global Climate Action, many climate adaptation practitioners have come to recognise that water is essential for credible, effective resilience and adaptation for our economies, ecosystems, and communities (5). Defining the level of climate impact and the amount of additional funding and implementation has had a powerful influence on WRM practitioners. If SDG 6 largely reflects the agenda of the WASH community, the UNFCCC has altered the WRM community’s understanding of the need to specify and define climate risks and opportunities (6).
For both SDGs and the Paris Agreement, national parties—that is, countries—are the entities tasked with setting national priorities. For the UNFCCC, national commitments focus on climate mitigation and adaptation through national climate plans, referred to as nationally determined contributions (NDCs). NDCs describe priorities and focal areas rather than specific investments, and for many middle- and low-income countries, water supply and sanitation issues are widely mentioned. Moreover, an older UNFCCC policy instrument called national adaptation plans (NAPs) describes specific projects, often as a list of priorities for donors, and many countries include WASH projects explicitly in their NAPs.
SDG 6: Blending Two Visions of Resilience for Water
43
The potential for linkages between SDG 6 and the Paris Agreement exists but remains largely unrealised. The following suggestions may be useful in this context:
1. Develop recommendations for describing resilient WASH facilities and programmes for NAPs and NDCs that can enable non-WRM agencies to affirm the relevance of both social and climate resilience to these investments.
2. Streamline and potentially standardise climate risk assessment methodologies for rural supply and sanitation systems for middle- and low-income countries. Groups such as the Global Water Partnership and WaterAid have begun to develop such programmes, but acceptance, implementation and scaling may take some time. WASH programmes may need to make other adjustments, such as adding WRM staff for some technical analyses, developing WASH sensitive tools, and explicitly considering tradeoffs and synergies around social and climate aspects of resilience.
3. Develop climate resilience indicators for sanitation and supply systems to support and complement social resilience indicators. Significant efforts have already begun in this space (7). These efforts mark a period in which resilience indicators are becoming standardised at sectoral, subsectoral, and asset class levels in some leading institutions.
4. Use finance and policy enabling processes that encourage or require credible climate risk assessment reporting. Little climate finance is applied to WASH investments, and what little climate finance is at work in this space has largely been limited to a handful of countries (8). Used correctly, finance instruments and institutions can ensure that investments include evidence of risk assessments, reflect emerging insights around social and climate resilience, and that appropriate monitoring and evaluation systems are in place. Explicit coordination between NDCs/NAPs and SDG 6 seem critical, especially for middle- and low-income countries. Multilateral, bilateral, and national funding sources are moving in this direction, albeit slowly.
5. Track SDG 6 progress with climate resilience monitoring and evaluations indicators. The gains that SDG 6 are intended to represent should not be lost shortly after 2030 because of ongoing climate impacts. Access and urgency will remain critical, and household level assessments are an important tool for understanding a critical unit of impact. System-level assessments are also important to ensure that households are considered in isolation.
44
People: Robust Processes and Better Societies
Conclusion
SDG 6 and the Paris Agreement will both benefit from a view of resilience that could span social, infrastructure, governance, and eco-hydrological components. It is possible that many WASH projects are indeed resilient across these domains, but this is unknown unless specifically assessed for these qualities. In effect, WASH and WRM communities need a shared agenda, set of indicators, and methodologies.
Endnotes
(1) Arup, Stockholm International Water Institute (SIWI), The Resilience Shift, and The Rockefeller Foundation, The City Water Resilience Approach, 2019, https://www.arup.com/perspectives/city-water-resilience-approach
(2) Nathaniel Mason et al., Just Add Water: A Landscape Analysis of Climate Finance for Water, London: Overseas Development Institute (ODI) and Water Aid, 2020, https://washmatters.wateraid.org/publications/just-add-water-climate-finance
(3) D. Mark Smith et al., Adaptation’s thirst: Accelerating the convergence of water and climate action (Background paper prepared for the 2019 report of the Global Commission on Adaptation), Rotterdam and Washington, DC, Global Commission on Adaptation, 2019, https://hdl.handle.net/10568/106030
(4) United Nations Climate Change, “The Paris Agreement,” United Nations Framework Convention on Climate Change (UNFCCC) Secretariat, https://unfccc.int/process-and-meetings/the-paris-agreement/the-paris-agreement
(5) Alliance for Global Water Adaptation, Watering the NDCs: National Climate Planning for 2020—How water-aware climate policies can strengthen climate change mitigation & adaptation goals, 2020, https://www.wateringthendcs.org/
(6) Patrick A. Ray and Casey M. Brown, Confronting Climate Uncertainty in Water Resources Planning and Project Design: The Decision Tree Framework, Washington, DC, World Bank Group, 2015, http://hdl.handle.net/10986/22544
(7) Guy Howard et al., “The how tough is WASH framework for assessing the climate resilience of water and sanitation,” npj Clean Water 4, no. 39, (2021), https://doi.org/10.1038/s41545-021-00130-5; World Bank, Resilience Rating System: A Methodology for Building and Tracking Resilience to Climate Change, Washington, DC, World Bank Group, 2021, https://openknowledge.worldbank.org/handle/10986/35039
(8) “Just Add Water: A Landscape Analysis of Climate Finance for Water”
War, Peace and Conservation: Partnerships as a Pathway to Achieving the SDGs
04
Emil Uddhammar
46
People: Robust Processes and Better Societies
I n the discourse on development, one key institution is not often spoken about, although it should be. This is peace, or Hobbesian peace, within a country but also between countries. However, in goal 16 of the Sustainable
Development Goals (SDGs), it is mentioned as the first of 12 areas to “significantly reduce all forms of violence and related deaths everywhere”. Let us here explore its significance.
If a sufficiently strong central government with well-functioning institutions throughout the territory and social peace are on one end of a scale, civil war is on the other end. Although deaths as a consequence of war have declined dramatically since the end of the Second World War, civil conflicts, such as the war in Syria and in the region of Congo, are responsible for a surge in violence-related deaths in recent decades.
The philosopher Thomas Hobbes argued that without government and its institutions, man easily falls victim to his inner sins in a civil war of all against all. “In such condition”, Hobbes wrote, ”there is no place for industry; because the fruit thereof is uncertain: and consequently no culture of the earth; no navigation, nor use of the commodities that may be imported by sea; no commodious building; no instruments of moving, and removing, such things as require much force; no knowledge of the face of the earth; no account of time; no arts; no letters; no society; and which is worst of all, continual fear, and danger of violent death; and the life of man, solitary, poor, nasty, brutish, and short” (1).
To sustain a Hobbesian peace, and to go further in the direction of development, it is important for key political institutions to find institutional designs that make central and local governments credible in the eyes of the citizens and private stakeholders
War, Peace and Conservation: Partnerships as a Pathway to Achieving the SDGs
47
(2). In the absence of such credible commitments, trust in government quickly erodes, and so does the willingness to cooperate with it. In the words of Hobbes, “there is no place for industry; because the fruit thereof is uncertain” (3).
However, civil war is not the only hindrance to development. It is that in many instances, the institutions of central government do not function equally across the country. Consider three cases: one relating to gender equality and two concerning biodiversity protection via ecotourism. In the latter two, this author will also explore how civic engagement and the private sector can ameliorate some weaknesses of central government.
The first example is the right for women to inherit land. During a project in 2008, the author asked a lawyer in Kenya to investigate this right in the country. Complaints are often heard that women get overruled by male relatives in this respect, and several organisations fight for women’s property rights. The lawyer’s findings showed that women in Kenya had equal rights to inherit property since 1981, highlighting five instances of women in the country filing cases against male relatives on inheritance and winning. However, in rural Kenya, the traditional law upheld by community elders often says that only men can inherit land. Few women in rural areas know about the formal court system, let alone how to file a case and even fewer have the economic means to do so. Thus, the uneven distribution of government institutions, often focused around the capital and other major urban areas, can have a direct effect on inequality.
In developing countries, the central government is sometimes weak and erratic, including when it comes to the protection of designated national parks. In some cases, biodiversity has been severely damaged by the lack of Hobbesian peace, such as in Uganda during the wars between 1978 and 1986 when wildlife was eradicated in the national parks (4). In the Democratic Republic of Congo (DRC), northern parts of Cameroon and Benin, rebel or terrorist groups have occasionally taken refuge in national parks during the last decades.
The second example comes from a similarly troubled part of Africa, the ‘Mountains of the Moon’ at the intersection of Uganda, the DRC and Rwanda, which is a last hiding place for the critically endangered mountain gorilla. Here, an institutional design seems to have emerged, where government, conservation interests and internationally-linked tourist operators are present. In this region, different militias have created conflict with the respective central government forces over the last 40 years. At the same time and place, the critically endangered mountain gorilla has thrived and continued to increase its population from 300 to more than 1000 (5). How can this be?
48
People: Robust Processes and Better Societies
Research shows that this is a result of the combination of increased conservation initiatives, international ecotourism and some government assistance, which has produced a frequent monitoring of these habitats, thus pacifying violent rebel activities and checking poaching (6).
All three countries have severe security problems—the DRC directly, and Uganda and Rwanda indirectly since they share a border with the DRC. Yet, the mountain gorilla populations have increased steadily.
The Rwandan security forces are well represented in the Volcanoes national park. For every gorilla walk—96 persons are allowed each day in small groups—three armed guards follow. In Uganda, 112 persons are allowed to walk and visit habituated gorilla families in the two parks each day in groups of eight (7). At a fee of US$700 per person and walk, this leads to a monetary inflow of over US$25 million per year for the Ugandan government alone. In addition, the local hospitality industry flourishes and creates employment opportunities.
Around the parks in Rwanda and Uganda, private owners have erected lodges that cater to the tourists. Private tour operators provide customers with the logistics of travel and accommodation, while their agents in foreign countries recruit the tourists. However, an important source of revenue for these mixed institutions has been with the COVID-19 pandemic.
The third case is also from Kenya, where Hobbesian peace has been fragile. Many violent incidents have erupted from land issues. Another conflict is poaching; elephants and black rhino have been most severely targeted since the 1970s, with the central government not being able to stem the tide. How can conservation be promoted in such conditions?
A partial solution was unexpectedly found via a social invention by entrepreneur Jake Grieves Cook, who was born in Kenya during colonial times. Cook made his career in the hospitality industry internationally, before turning to ecotourism in 1997. Cook’s company Porini Camps at that time negotiated a land-lease agreement with Massai landowners in Selenkey, an area that is a mere 12 kilometres from the Amboseli National Park.
5,300 hectare was set aside for wildlife in the Selenkey Conservancy. For this, Porini Camps paid a monthly lease fee to the landowners to not use the area for grazing. The agreement included procedures for handling any breach of the decided rules, starting with graduated sanctions. The company could erect a tented camp and bring in tourists in limited numbers, who had to pay a conservation fee aside from lodging
War, Peace and Conservation: Partnerships as a Pathway to Achieving the SDGs
49
and safari activities. During severe droughts, the Maasai could be allowed to graze their cattle in the area. Most of the employees in the conservancy—guides, camp staff and wildlife rangers—were to be hired from among the Maasai landowners. The agreement was to be renegotiated every five years.
This was a pioneering achievement as it set aside land for conservation on a voluntary basis—importantly, leasing (not buying) the land from the local Maasai landowners—and providing an economically viable alternative land use—biodiversity conservation and limited tourism instead of cattle grazing. It also increased the area under conservation in the wider Amboseli socioecological system by 14 percent (8).
Several similar conservancies have been set up in the wider Masai Mara socioecological system, covering 136,000 hectares, almost doubling the area under protection in the Masai Mara National Reserve. Wildlife has increased substantially in the protected areas (9). It includes more than 14 000 landowners generating more than 5 million USD yearly (as of 2019) (10). The social invention of land-lease for conservation thus alleviated a potential conflict over land issues while simultaneously increasing protection and surveillance against poaching.
As in the case of the gorillas in Uganda, the conservancies in Kenya are highly dependent on international tourism, and the prolonged COVID-19 pandemic poses a severe challenge to their survival.
What is clear from these examples is that Hobbesian peace is indeed an important public good, but that it can also be promoted in civil society—encouraging women to claim their land rights, finding new land use for conservation in cooperation with the private sector. Institutions with credible commitments do not have to be created by the central government alone. They can also be developed in cooperation between idealistic forces, private operators, and the government.
Hobbesian peace is a precious and delicate flower of great importance for humankind and biodiversity. It needs to be nurtured, not taken for granted.
Endnotes
(1) Thomas Hobbes, “Of The Natural Condition of Mankind as Concerning Their Felicity and Misery,” in Leviathan (London: Penguin Classics, 1651/1968), 186
(2) Elinor Ostrom, Governing the Commons: The Evolution of Institutions for Collective Action, (Cambridge: Cambridge University Press, 1990); Elinor Ostrom, “A general framework for analyzing sustainability of socio-ecological systems,” Science 325, no. 5939 (2009): 419-422, https://doi.org/10.1126/science.1172133
50
People: Robust Processes and Better Societies
(3) Hobbes, “Of The Natural Condition of Mankind as Concerning Their Felicity and Misery,” 186
(4) Robert Malpas, “Elephant Losses in Uganda – and Some Gains,” Oryx 16, no. 1 (1981): 41-44, https://doi.org/10.1017/S0030605300016720; Michael B. Brown, Douglas T. Bolger and Julian Fennessy, “All the eggs in one basket: A countrywide assessment of current and historical giraffe population distribution in Uganda,” Global Ecology and Conservation 19 (2019): e00612, https://doi.org/10.1016/j.gecco.2019.e00612
(5) World Wildlife Foundation, “Global mountain gorilla population count grows to 1063,” December 16, 2019, https://wwf.panda.org/wwf_news/press_releases/?357316/Global-mountain-gorilla-population-count-grows-to-1063
(6) Maryke Gray and José Kalpers, “Ranger-based monitoring in the Virunga-Bwindi region of East-Central Africa,” Biodiversity and Conservation 14 (2005): 2723-2741, https://doi.org/10.1007/s10531-005-8406-x; Martha M Robbins et al., “Population dynamics of the Bwindi Mountain Gorillas,” Biological Conservation 142, no. 12 (2009): 2886-2895, https://doi.org/10.1016/j.biocon.2009.07.010
(7) Interview with Christoffer Zachrisson, Kigali, Rwanda, October 2019
(8) Emil Uddhammar, “Development, conservation, and tourism: conflict or symbiosis?,” Review of International Political Economy 13, no. 4 (2006): 656-678, https://doi.org/10.1080/09692290600839923; Emil Uddhammar, Turismens betydelse för utveckling och naturvård I Afrika, Stockholm, Svenskt Flyg, 2013, https://www.svensktflyg.se/2013/04/1687/
(9) Sara Blackburn et al., “Human–wildlife conflict, benefit sharing and the survival of lions in pastoralist community–based conservancies,” Journal of Applied Ecology 53 (2016): 1195-1205, https://doi.org/10.1111/1365-2664.12632
(10) Maasai Mara Wildlife Conservacies, State of Mara Conservacies Report 2019, Narok, Kenya, Maasai Mara Wildlife Conservacies Association, 2019, https://maraconservancies.org/research-papers-publications/

Education, Technology Diffusion, and Human Capital Accumulation: Trends and Concerns for Developing Countries
05
Andrea Cabello
52
People: Robust Processes and Better Societies
T he Sustainable Development Goals (SDGs), adopted by the United Nations, are integrated goals that aim to reduce poverty and foster development. Education and human capital accumulation are essential
for the attainment of such goals and relate specially to SDG 4 (quality education), SDG 8 (decent work and economic growth) and SDG 9 (industry, innovation, and infrastructure). Indeed, the pursuit of quality education affects a country’s ability to engage in the global economy and its economic development.
Economic literature has investigated the determinants of growth since the development of the neoclassical growth model in the 1950s (1). Some of this literature also focuses on the role of education and human capital. Although there is some debate on the importance of this role is and its effect on productivity and growth, efforts have been made to improve measurement and estimation issues to guide policy. To understand these implications for education policies and human capital accumulation, one must consider the relationship between human capital and growth theory and how education and technology enter the picture.
Human Capital and Growth Theory
According to the neoclassical growth theory, technology is the main driver of productivity and growth. As technology assimilation depends on human capital accumulation, educational metrics have been used as a proxy to ascertain this impact, as human capital is an elusive concept. Typically, three mechanisms of transmission for the role of education are considered—education increases levels of human capital (the knowledge and education accumulated over a person’s life), it contributes to the enhancement of the innovative capacity of the economy, and it helps advance the diffusion of information and technology (2). It is also argued (3) that higher levels of
Education, Technology Diffusion, and Human Capital Accumulation: Trends and Concerns for Developing Countries
53
human capital led to a stronger social cohesion. An attempt to estimate human capital externalities suggested external returns of 4 percent, depending on the estimation, and indicate that these returns may be growing as human capital becomes more and more important over time (4).
This is in line with traditional growth theory results (5), which argues that the stock of human capital (6) affects the rate of growth (7) and suggests a relationship with educational indicators (8). However, more recent analyses with more robust methods have showed that this effect on growth and productivity is not as significant (9) due in part to measurement issues (10). Recent literature has addressed these issues more thoroughly (11) and the idea that the quality of education received and not only the quantity affects results has been considered (12).
The World Bank’s Human Capital Index, calculated since 2018, measures “the human capital that a child born today can expect to attain by her 18th birthday, given the risks of poor health and poor education prevailing in her country” (13). Therefore, it focuses on health and education issues that may influence the accumulation of human capital and thus productivity in the future. Globally, data predating the COVID-19 pandemic showed that children in low-income countries would be 37 percent as productive as if they had full education and health, while children born in a high-income country would be 70 percent as productive in the same situation (14). This highlights the unequal development of human capital across the world and its possible effects on growth. Such disparities are due to differences in the quantity and quality of schooling, as 25 percentage points of the difference reflect the differences in learning-adjusted years of schooling, which considers the expected years of school with learning as evaluated by harmonised test scores.
These results have important consequences for convergence, that is, that some type of catching up can take place between rich and poor countries in terms of income and growth. A faster growth rate is expected for poorer countries due to diminishing returns, especially on capital. Much of the literature focuses on whether convergence will or will not take place and how issues like human capital affect such trajectories. Endogenous growth theories, which take into account research and development (R&D) and technology diffusion that lead to increasing returns, suggest a lack of convergence because growth depends on the reinvestment on technology as an endogenous process. So, if the quality (and quantity) of education affects the economy’s ability to perform R&D and the technology diffusion process, education matters, meaning that convergence is not assured because those countries in a better position to perform these activities will grow faster while those that are not will fall behind.
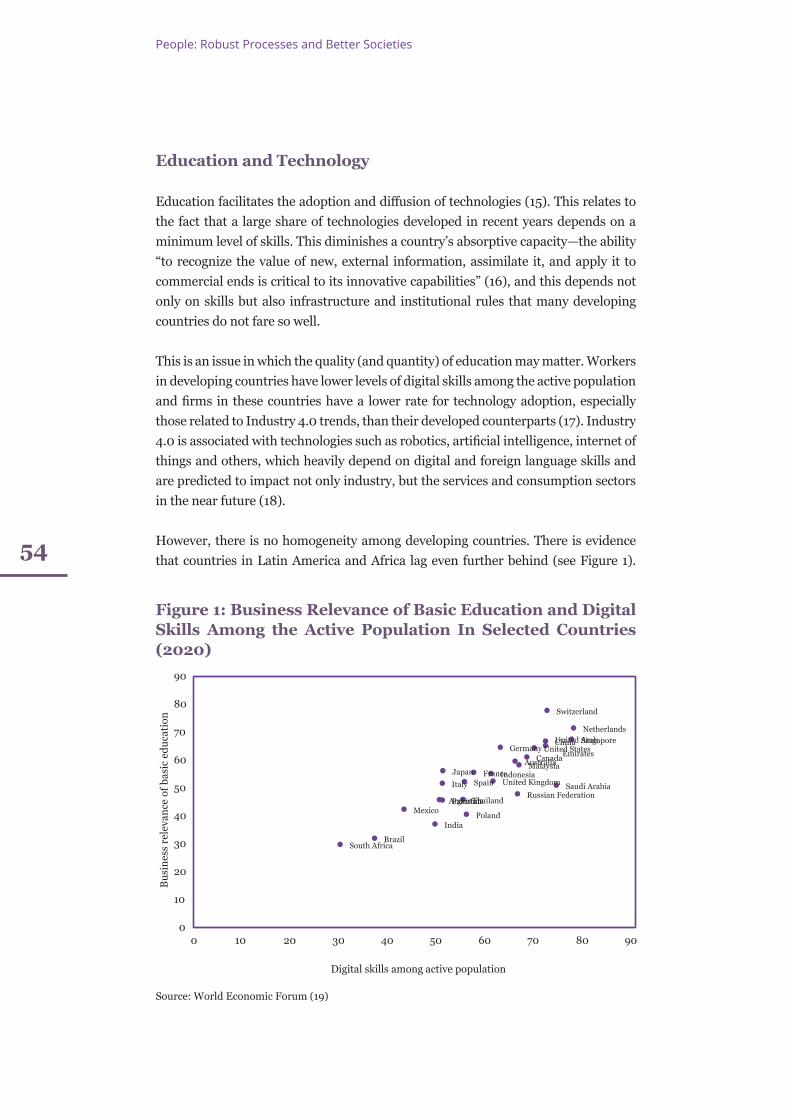
54
People: Robust Processes and Better Societies
Education and Technology
Education facilitates the adoption and diffusion of technologies (15). This relates to the fact that a large share of technologies developed in recent years depends on a minimum level of skills. This diminishes a country’s absorptive capacity—the ability “to recognize the value of new, external information, assimilate it, and apply it to commercial ends is critical to its innovative capabilities” (16), and this depends not only on skills but also infrastructure and institutional rules that many developing countries do not fare so well.
This is an issue in which the quality (and quantity) of education may matter. Workers in developing countries have lower levels of digital skills among the active population and firms in these countries have a lower rate for technology adoption, especially those related to Industry 4.0 trends, than their developed counterparts (17). Industry 4.0 is associated with technologies such as robotics, artificial intelligence, internet of things and others, which heavily depend on digital and foreign language skills and are predicted to impact not only industry, but the services and consumption sectors in the near future (18).
However, there is no homogeneity among developing countries. There is evidence that countries in Latin America and Africa lag even further behind (see Figure 1).
Figure 1: Business Relevance of Basic Education and Digital Skills Among the Active Population In Selected Countries (2020)
Source: World Economic Forum (19)
South Africa
China
India
IndonesiaMalaysia
Pakistan
Saudi Arabia
Thailand
United Arab
EmiratesAustraliaCanada
France
Germany
Italy
Japan
NetherlandsSingapore
Spain
Switzerland
United Kingdom
United States
Poland
Russian FederationArgentina
Brazil
Mexico
0
10
20
30
40
50
60
70
80
90
0 10 20 30 40 50 60 70 80 90
Bus
ines
s re
leva
nce
of b
asic
edu
cati
on
Digital skills among active population
Education, Technology Diffusion, and Human Capital Accumulation: Trends and Concerns for Developing Countries
55
Figure 1 shows the level of digital skills among the active population and the business relevance of basic education for a selected sample of countries.
As Figure 1 shows, countries located in Asia seem to provide education of higher relevance for companies, and their population seems to have higher levels of digital skills when compared to other developing nations.
Figure 1 also shows the dire situation of the BRICS countries. China appears to be the only country from the group to pick up the digital pace and attend to market needs, which means that there is possibly no catching up taking place between these countries and developed ones. The situation improves when considering the business relevance of tertiary education but in many of the BRICS countries, access to higher education is still limited, which may contribute to enhanced social inequalities in these countries.
This means that many developing countries are facing a growing skill gap between what is learned in schools and the demands of an economy that is under the process of automation. This leads to a very unequal situation—while some countries discuss disappearing jobs and remedial strategies amid advanced and globalised industries and value chains, others have a large population lacking the minimum skills to enter such an automation process. There is evidence that developing countries are not taking advantage of new technologies (20), and this may be one of the causes for them falling behind.
The consequences of such a situation are the lack of growth convergence, as described, and an international division of labour in which low-income countries remain focused on sectors of low productivity that do not yield the opportunity to overcome growth challenges.
This is also aligned with the discussion on the middle-income traps—when a country has a steady growth rate until it reaches intermediate income levels but becomes stagnant after this point, leading to a failure to catch up and completely develop. The few countries that were able to overcome the development challenge—grow past a low- and intermediate-income level to become a high-income level country, such as Singapore and South Korea—had a systematic commitment to education policy both in terms of access and quality (21). This relates to the development of digital skills, but also foreign language skills, and the institution of strong general education and vocational education institutions to help ease the process of technology assimilation and, therefore, growth.
56
People: Robust Processes and Better Societies
Conclusion
The growth challenge for developing countries is becoming more complex each day. The lack of sound educational policies and their possible effect on growth means that the more technology advances, the more some will stay stagnant. This is worrisome as it may increase global inequality patterns and make it harder for low-income countries with low-educated populations to integrate themselves in recent economic trends, such as the Industry 4.0 process, which are highly dependent on digital and foreign language skills.
As an additional concern, the COVID-19 pandemic has impacted education through the adoption of online emergency procedures. In developing countries, the access to internet and equipment is still an issue for many families, alongside their low digital skills, to access educational platforms. This means that the lack of convergence may increase. Human capital accumulation and education policies are even more important in these countries so that a whole generation of students—and their countries—are not left behind.
This means that the SDGs, particularly SDG 4, point in the right direction to ensure that developing countries can overcome these challenges successfully. The results on primary education already show (22), but there is a long way ahead.
Endnotes
(1) Robert Solow, “A Contribution to the Theory of Economic Growth,” The Quarterly Journal of Economics 70, no. 1 (1956), 65-94, https://academic.oup.com/qje/article-abstract/70/1/65/1903777
(2) E A Hanushek and L Woessmann, L., “Education and Economic Growth,” in Economics of Education, ed. Dominic Brewer and Patrick McEwan, (San Diego: Elsevier, 2010), 60-67.
(3) World Bank, The Human Capital Index 2020 Update: Human Capital in the Time of COVID-19, Washington DC, World Bank, 2020, https://openknowledge.worldbank.org/handle/10986/34432
(4) Daron Acemoglu and Joshua Angrist., “How large are human-capital externalities? Evidence from compulsory schooling laws,” NBER Macroeconomics Annual, no. 15, (2000), 9-59, https://www.nber.org/system/files/chapters/c11054/c11054.pdf
Education, Technology Diffusion, and Human Capital Accumulation: Trends and Concerns for Developing Countries
57
(5) Robert Lucas, “Human Capital and Growth,” American Economic Review 105, no. 5 (2015), 85-88, https://www.aeaweb.org/articles?id=10.1257/aer.p20151065
(6) N Gregory Mankiw, David Romer and David Weil., “A contribution to the empirics of economic growth,” The Quarterly Journal of Economics 107, no. 2, (1992), 407-437, http://home.uchicago.edu/~vlima/courses/econ203/fall01/mankiw_romer_weil.pdf
(7) Robert Barro, “Human Capital and Growth,” American Economic Review 91, no. 2, (2001), 12-17, https://www.aeaweb.org/articles?id=10.1257/aer.91.2.12
(8) Paul Romer, “Human Capital and Growth: Theory and Evidence,” Carnegie-Rochester Conference Series on Public Policy 32, no. 1 (1990), 251-286.
(9) Jess Benhabib and Mark M. Spiegel., “The role of human capital in economic development evidence from aggregate cross-country data,” Journal of Monetary Economics 34, no. 2 (1994), 143-173, https://www.sciencedirect.com/science/article/abs/pii/0304393294900477
(10) Francesco Caselli, Gerardo Esquivel and Fernando Lefort., “Reopening the convergence debate: a new look at cross-country growth empirics,” Journal of Economic Growth 1, no. 3 (1996), 363-389, https://link.springer.com/article/10.1007/BF00141044
(11) Philippe Aghion and Peter Howitt., “Capital, innovation, and growth accounting,” Oxford Review of Economic Policy 23, no. 1 (2007), 79-93, https://academic.oup.com/oxrep/article-abstract/23/1/79/512933
(12) Eric Hanushek, and Dennis D. Kimko., “Schooling, labor-force quality, and the growth of nations,” American Economic Review 90, no. 5 (2000), 1184-1208, https://www.aeaweb.org/articles?id=10.1257/aer.90.5.1184
(13) World Bank, The Human Capital Index 2020 Update : Human Capital in the Time of COVID-19, Washington DC. World Bank, 2020, https://openknowledge.worldbank.org/handle/10986/34432
(14) World Bank, The Human Capital Index 2020 Update: Human Capital in the Time of COVID-19, Washington DC. World Bank, 2020, https://openknowledge.worldbank.org/handle/10986/34432
(15) Daron Acemoglu and Joshua Angrist., “How large are human-capital externalities? Evidence from compulsory schooling laws,” NBER Macroeconomics Annual, no. 15 (2000), 9-59, https://www.nber.org/system/files/chapters/c11054/c11054.pdf
(16) Wesley Cohen and Daniel Levinthal., “Absorptive capacity: A new perspective on learning and innovation,” Administrative Science Quarterly, (1990), 128-152, https://www.jstor.org/stable/2393553?origin=crossref&seq=1
(17) World Economic Forum, The Future of Jobs Report, October 2020, World Economic Forum, https://www.weforum.org/reports/the-future-of-jobs-report-2020
(18) Heiner Lasi, Peter Fettke, Hans-Georg Kemper, Thomas Feld, and Michael Hoffmann., “Industry 4.0.,” Business & information systems engineering 6, no. 4 (2014), 239-242,
58
People: Robust Processes and Better Societies
https://link.springer.com/article/10.1007/s12599-014-0334-4
(19) World Economic Forum, The Future of Jobs Report, October 2020, World Economic Forum, https://www.weforum.org/reports/the-future-of-jobs-report-2020
(20) Lucas Santos Dalenogare, Guilherme Brittes Benitez, Néstor Fabián Ayala, and Alejandro Germán Frank., “The expected contribution of Industry 4.0 technologies for industrial performance,” International Journal of Production Economics 204 (2018), 383-394, https://www.sciencedirect.com/science/article/abs/pii/S0925527318303372
(21) Barry Eichengreen, Donghyun Park, and Kwanho Shin., “Growth slowdowns redux: New evidence on the middle-income trap,” National Bureau of Economic Research, No. w18673 (2013), https://www.nber.org/system/files/working_papers/w18673/w18673.pdf
(22) United Nations Development Programme, “SDG’s in Action- (Goal 4) Quality Education,” UNDP Sustainable Development Goals, https://www.undp.org/sustainable-development-goals#quality-education
Human Rights in Outer Space: Building on SDG 16
06
Robin Ramcharan
60
People: Robust Processes and Better Societies
G oal 16 of the Sustainable Development Goals (SDGs) seeks to foster societies of peace, justice, democracy, equitable development, and human rights. Initially targeting societies on Earth, it can also be
used as a framework to develop the protection of human rights in outer space. While there are scholarly works that address human rights law in outer space, there are none that address this in terms of SDG 16 (1). This essay seeks to kick-start that discussion.
A technological tipping point has been passed that will allow the full gamut of humanity’s interactions to take place in outer space. This includes war, international cooperation, development, commerce, humanitarian collaboration and private sector activities. States and private business entities now operate in space. The latter—Space X, Virgin Galactic, and Blue Origin—have paved the way in helping private citizens claim the status of “astronaut” through space tourism flights in reusable space vehicles. State-led space agencies, of which there are over 47 globally (2) (10 in Asia), now collaborate with the private sector transport vehicles in accessing space. The possibility of humans colonising and living in space colonies on celestial bodies is no longer a sci-fi fantasy.
Terrestrial human rights norms and obligations are applicable in outer space. In resolution 1721 (XVI) of 1961, the UN General Assembly proposed two principles as guidance in the exploration and use of outer space and celestial bodies:
(a) International law, including the Charter of the UN, applies to outer space and celestial bodies.
(b) Outer space and celestial bodies are free for exploration and use by all States in conformity with international law and are not subject to national appropriation (3).
Human Rights in Outer Space: Building on SDG 16
61
The resolution was jointly sponsored by the US and the Soviet Union and was adopted unanimously.
Applicability of SDG 16 in Outer Space
Eminent scientists such as the late Stephen Hawking have argued that humanity’s survival depends on finding other planets in outer space that humans could inhabit. SDG 16 calls for the establishment of peaceful, just and inclusive societies, grounded in respect for universal human rights. The principles of SDG 16 are applicable to human societies wherever they may be, including in outer space and the celestial bodies.
SDG processes can also be used to contribute to aligning the SDGs with international human rights standards. Stated summarily:
(a) Humans take with them their inalienable rights in the Universal Declaration of Human Rights wherever they go.
(b) Outer space and the celestial bodies have been declared by the UN General Assembly as the common heritage of humankind.
(c) SDG 16 covers space and the celestial bodies in virtue of (a) and (b) above.
(d) What is needed now is a supplementary instrument on the legal rights of humans in outer space.
(e) If humans were to discover other beings in outer space, the principles of the Universal Declaration of Human Rights would be applicable to them, supplemented, if need be, to take in the specific characteristics of the extra-terrestrial beings.
The SDGs address the myriad, interconnected challenges facing the sustainability of human life on Earth that may be aided using outer space. In the 2020-2030 decade, at the core of the SDGs is “the need for action to tackle growing poverty, empower women and girls, and address the climate emergency” (4).
Aside from their well-known military applications, satellites and outer space stations can contribute to mapping environmental degradation, deforestation, rising sea levels, agricultural patterns, water scarcity and weather systems. They are part of global civilian and military communication infrastructure and provide
62
People: Robust Processes and Better Societies
global positioning services for ordinary citizens. On the humanitarian front, natural disasters are mapped by satellite imagery. The latter is also used in the investigative work of human rights organisations to track cases of ethnic cleansing and genocide (5). Some of the objectives of SDG 16 may be well served by the use of outer space. (see Box 1).
Box 1: Objectives of SDG 16 (6)
16.1: Significantly reduce all forms of violence and related deaths rates everywhere.16.2: End abuse, exploitation, trafficking and all forms of violence against and torture of children. 16.3: Promote the rule of law at the national level and international levels and ensure equal access to justice for all.16.4: By 2030, significantly reduce illicit financial and arms flows, strengthen the recovery and return of stolen assets and combat all forms of organized crime.…16.8: Broaden and strengthen the participation of developing countries in the institutions of global governance.…16.10: Ensure public access to information and protect fundamental freedoms, in accordance with national legislation and international agreements.16.a: Strengthen relevant national institutions, including through international cooperation, for building capacity at all levels, in particular in developing countries, to prevent violence and combat terrorism and crime.
As such, SDG 16 is applicable to human activities in each country on the Earth’s surface and to the outer-space environment.
International Human Rights Law and Outer Space: A Primer
Analysis of the applicability of international human rights law (IHRL) to outer space requires an understanding of some fundamentals of this body of law that was created for the benefit of the individual human beings rather than States. The following aspects of IHRL are particularly relevant to outer space law: sources of IHRL, territorial applicability, property, life, peace, environment and governance.
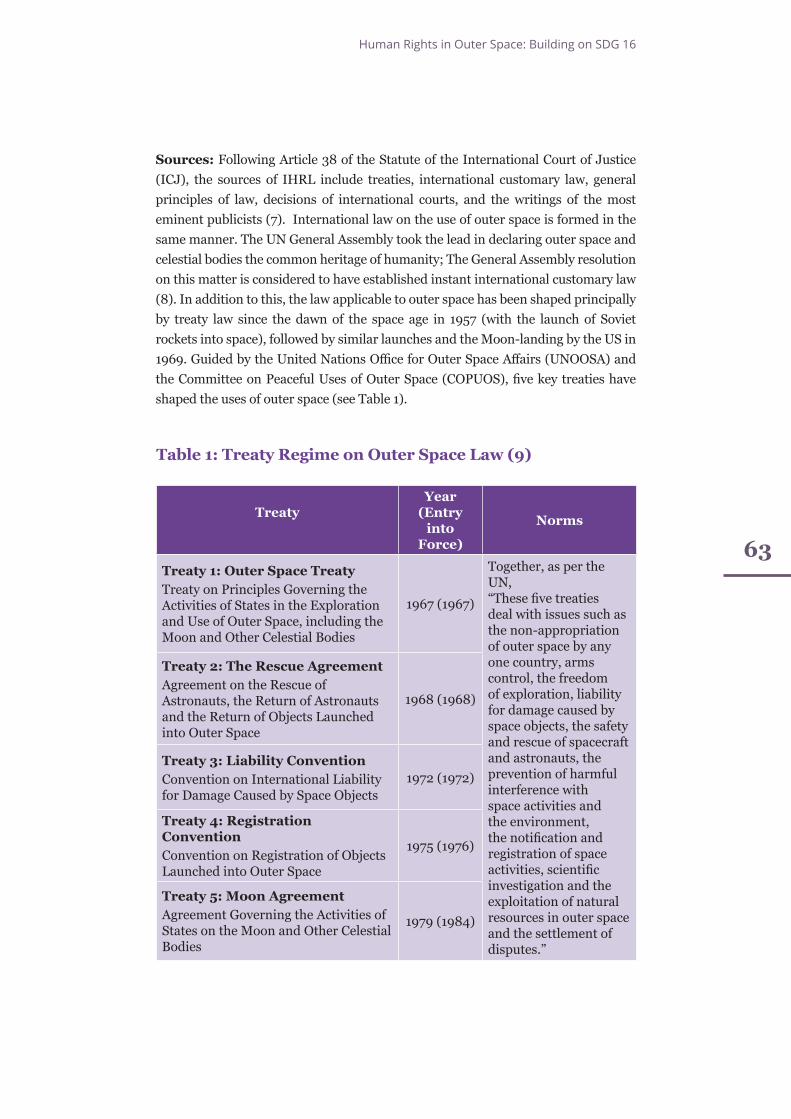
Human Rights in Outer Space: Building on SDG 16
63
Sources: Following Article 38 of the Statute of the International Court of Justice (ICJ), the sources of IHRL include treaties, international customary law, general principles of law, decisions of international courts, and the writings of the most eminent publicists (7). International law on the use of outer space is formed in the same manner. The UN General Assembly took the lead in declaring outer space and celestial bodies the common heritage of humanity; The General Assembly resolution on this matter is considered to have established instant international customary law (8). In addition to this, the law applicable to outer space has been shaped principally by treaty law since the dawn of the space age in 1957 (with the launch of Soviet rockets into space), followed by similar launches and the Moon-landing by the US in 1969. Guided by the United Nations Office for Outer Space Affairs (UNOOSA) and the Committee on Peaceful Uses of Outer Space (COPUOS), five key treaties have shaped the uses of outer space (see Table 1).
Table 1: Treaty Regime on Outer Space Law (9)
TreatyYear
(Entry into
Force)
Norms
Treaty 1: Outer Space TreatyTreaty on Principles Governing the Activities of States in the Exploration and Use of Outer Space, including the Moon and Other Celestial Bodies
1967 (1967)
Together, as per the UN, “These five treaties deal with issues such as the non-appropriation of outer space by any one country, arms control, the freedom of exploration, liability for damage caused by space objects, the safety and rescue of spacecraft and astronauts, the prevention of harmful interference with space activities and the environment, the notification and registration of space activities, scientific investigation and the exploitation of natural resources in outer space and the settlement of disputes.”
Treaty 2: The Rescue AgreementAgreement on the Rescue of Astronauts, the Return of Astronauts and the Return of Objects Launched into Outer Space
1968 (1968)
Treaty 3: Liability ConventionConvention on International Liability for Damage Caused by Space Objects
1972 (1972)
Treaty 4: Registration Convention Convention on Registration of Objects Launched into Outer Space
1975 (1976)
Treaty 5: Moon Agreement Agreement Governing the Activities of States on the Moon and Other Celestial Bodies
1979 (1984)
64
People: Robust Processes and Better Societies
Territoriality: IHRL applies to the territory of each country bound by its provisions. Public international law (PIL) is established in the international realm between countries, while IHRL is applicable to the domestic realm, specifically within the territorial boundaries or jurisdiction of each State.
As humanity’s activities stretch farther and for longer into outer space, critical questions will come to the fore regarding the notion of ‘territory’ in outer space, keeping in mind the UN General Assembly’s pronouncement that outer space and the celestial bodies are the common heritage of humanity and are not applicable to national appropriation. Nevertheless, international instruments drafted on and for Earth “may find extra-territorial application in outer space [because]… the establishment of sovereignty “is no pre-requisite for the application of human rights treaties that were initially drafted for application on planet Earth only” (10). Effective control over the settlement seems to be sufficient. Notably, that the human rights of astronauts, the “envoys of mankind”, are protected in outer space.
Property: IHRL guarantees the right to property. However, given that states’ territories do not extend to outer space, nor can they own territory in outer space, this human right applies in the outer space environment to the extent that property carried on board and property developed by countries on international space stations will remain the property of the nations or their nationals on board an international space station. This includes any intellectual property that is generated on board spacecraft where scientific experimentation is carried out. Article 27 of the Universal Declaration of Human Rights (11) and Article 15 of the International Convention on Economic Social and Cultural Rights (12) covers this aspect. The situation with regard to private property is still unclear. National legislations on the commercial activities of private entities in outer space will need to be monitored in this regard.
Life: As per the Human Rights Committee (HRC), the right to life is “the supreme right from which no derogation is possible” (13). The 17 SDGs aim at preserving life wherever it exists. In this regard, it is noteworthy that General Comment 36 (2018) of the HRC expounded on the incompatibility of the threat or use of nuclear weapons and the right to life (14). Outer space law seeks to limit the militarisation and nuclearisation of outer space. Under Article IV of the Outer Space Treaty (1967), states have agreed to: not placing in orbit around the Earth or other celestial bodies any nuclear weapons or objects carrying weapons of mass destruction (WMDs); not installing WMDs on celestial bodies or station WMDs in outer space in any other manner; not establishing military bases or installations, test "any type of weapons," or conduct military exercises on the moon and other celestial bodies (15).
Human Rights in Outer Space: Building on SDG 16
65
Peace: There has been increasing awareness of the “right to peace,” as is recognised in the UN General Assembly Resolution 39/11 of 1984 (16) and in UN Human Rights Council pronouncements (17). Article 38 of the 2012 ASEAN Human Rights Declaration also recognises the right to peace (18). Additionally, the Outer Space Treaty stipulates that space shall be the province of all mankind and that the Moon and other celestial bodies shall be used exclusively for peaceful purposes (19).
Environment: In 2021, the Human Rights Council recognised, for the first time, the right to a healthy environment (20). The UN High Commissioner for Human Rights, Michelle Bachelet, has warned of the “triple planetary threats of climate change, pollution and nature loss as the single greatest human rights challenge of our era” (21).
The outer space “environment” is fundamentally different from Earth’s environment in that, so far as known, the former does not support animal and plant life. Aspects of protecting the space ‘environment’ are dealt with in the Registration Convention and the Liability Convention, which seek to prevent excessive space debris and to provide compensation for victims of such debris on Earth. Nevertheless, with the possibility of space communities and the creation of human habitats on celestial bodies or on space stations, the human right to a clean environment will extend to outer space.
Governance: International human rights institutions and processes, “regulate the internal relation between a government and individuals under its jurisdiction, and, to the extent that they are effective, chiefly rely on domestic mechanisms of enforcement” (22). Global human rights institutions, like States, “issue rules and claim the authority to sanction those who fail to comply with those rules” (23) and can thus constrain the behaviour of states, though their capacity to enforce is circumscribed. Their capacity to ‘govern’ is based on a perceived legitimacy among people and not only governments. International institutions generally seek to uphold international law, which has a “prima facie justification in virtue of the public goods it promotes.” However, “this principle of legality is weighed against a jurisdictional principle of subsidiarity, a procedural principle of adequate participation and accountability, and a substantive principle of achieving outcomes that do not violate fundamental rights” (24).
IHRL would need to be capable of regulating the outer space “jurisdiction,” in which there are no politically-bound territorial states in the classical sense. UNOOSA and COPUOS could incorporate IHRL considerations into their work, including dialogue on the application of the principle of “universality” beyond Earth.
66
People: Robust Processes and Better Societies
Harmonising SDG 16 with Outer Space Law
The Outer Space Treaty stipulates that: States shall be responsible for national space activities whether carried out by governmental or non-governmental entities; States shall be liable for damage caused by their space objects; and States shall avoid harmful contamination of space and celestial bodies (25).
As humans increasingly move into outer space, human activities there will inevitably rise. Indeed, in a prescient analysis, professor and international space law scholar Carl Christol noted in 1968 that human rights standards and the outer space activities of human beings were inevitably linked (26). The Space Generation Advisory Council, which collaborates with UN space bodies, has noted recently that the SDGs “overlap considerably with both human rights and ethics issues as well as space technology. This connection makes the SDGs, and their human rights components, a defining challenge of the emerging space generation” (27). It is, therefore, necessary to think through the applicable human rights regime that will govern the presence of humans in outer space. It is important to find a common ground, beyond sovereignty-based thinking, when approaching humankind’s activities in outer space (28).
This article has sought to open a discussion on the interconnection between SDG 16, human rights and space law by pointing to some of the grounding principles on which further work needs to be done. The legal and policy bases for upholding the dignity and equality of human beings in outer space is an area that needs to be urgently addressed. SDG 16 is the only one of the 17 goals explicitly formulated in human rights terms. The processes launched by SDG 16 can help to develop further the human rights regime applicable in outer space. This dimension should be added to SDG reporting and recommendatory processes in the future.
Endnotes
(1) Roy Balleste, “Interstellar Travel and the Mission for Outer Space: A Human Rights Perspective,” SMU Science and Technology Law Review 18, no. 3 (2015), https://scholar.smu.edu/scitech/vol18/iss3/2; A. Ferreira-Snyman and G. Ferreira, “The Application of International Human Rights Instruments in Outer Space Settlements: Today’s Science Fiction, Tomorrow’s Reality” Potchefstroom Electronic Law Journal 22, no. 1 (2019), https://journals.assaf.org.za/index.php/per/article/view/5904; Daniel Ireland-Piper and Steven Freeland, “Human Rights and Space: Reflections on the Implications of Human Activity in Outer Space on Human Rights Law,” Groningen
Human Rights in Outer Space: Building on SDG 16
67
Journal of International Law 9, no. 1 (2021), https://ugp.rug.nl/GROJIL/article/view/37954
(2) United Nations Office for Outer Space Affairs, “Worldwide Space Agencies,” UNOOSA, https://www.unoosa.org/oosa/en/ourwork/space-agencies.html
(3) United Nations Office for Outer Space Affairs, “International Co-Operation in the Peaceful Uses of Outer Space,” UNOOSA, December 20, 1961, https://www.unoosa.org/oosa/en/ourwork/spacelaw/treaties/resolutions/res_16_1721.html
(4) United Nations Sustainable Development Goals, “The Sustainable Development Agenda,” UN, https://www.un.org/sustainabledevelopment/development-agenda/
(5) Annette Froehlich and Claudiu Tăiat, Space in Support of Human Rights (Springer Nature: Switzerland, 2021).
(6) United Nations Sustainable Development Goals, “Peace, Justice and Strong Institutions,” UN, https://www.un.org/sustainabledevelopment/peace-justice/
(7) International Court of Justice, “Statute of the International Court of Justice,” ICJ, https://www.icj-cij.org/en/statute
(8) United Nations Office for Outer Space Affairs, Treaty on Principles Governing the Activities of States in the Exploration and Use of Outer Space, including the Moon and Other Celestial Bodies, UNOOSA, https://www.unoosa.org/oosa/en/ourwork/spacelaw/treaties/introouterspacetreaty.html; United Nations Office for Outer Space Affairs, “Declaration of Legal Principles Governing the Activities of States in the Exploration and Use of Outer Space,” UNOOSA, https://www.unoosa.org/oosa/en/ourwork/spacelaw/principles/legal-principles.html
(9) United Nations Office for Outer Space Affairs, “Space Law,” UNOOSA, https://www.unoosa.org/oosa/en/ourwork/spacelaw/index.html; United Nations Office for Outer Space Affairs, “ Status of International Agreements Relating to Activities in Outer Space,” UNOOSA, https://www.unoosa.org/oosa/en/ourwork/spacelaw/treaties/status/index.html
(10) Ferreira and Ferreira, “The Application of International Human Rights Instruments in Outer Space Settlements: Today’s Science Fiction, Tomorrow’s Reality”
(11) United Nations Human Rights Office of the High Commissioner, “Universal Declaration of Human Rights (1948),” OHCHR, https://www.ohchr.org/EN/Issues/Education/Training/Compilation/Pages/UniversalDeclarationofHumanRights(1948).aspx
(12) United Nations Human Rights Office of the High Commissioner, “International Covenant on Civil and Political Rights,” OHCHR, January 3, 1976, https://www.ohchr.org/en/professionalinterest/pages/cescr.aspx
(13) United Nations Human Rights Office of the High Commissioner, “CCPR General Comment No. 6: Article 6 (Right to Life),” OHCHR, April 30, 1982, https://www.refworld.org/docid/45388400a.html
68
People: Robust Processes and Better Societies
(14) United Nations Human Rights Committee, “International Covenant on Civil and Political Rights: General Comment 36, Article 6: Right to Life,” UN, September 3, 2019, https://tbinternet.ohchr.org/_layouts/15/treatybodyexternal/Download.aspx?symbolno=CCPR/C/GC/36&Lang=en
(15) “The Outer Space Treaty at a Glance,” Arms Control Association, October 2020, https://www.armscontrol.org/factsheets/outerspace
(16) United Nations Human Rights Office of the High Commissioner, “Declaration on the Right of Peoples to Peace,” OHCHR, November 12, 1984, https://www.ohchr.org/EN/ProfessionalInterest/Pages/RightOfPeoplesToPeace.aspx
(17) United Nations Human Rights Office of the High Commissioner, “The Right to Peace,” OHCHR, April 4, 2013, https://www.ohchr.org/EN/NewsEvents/Pages/RightToPeace.aspx
(18) Association of Southeast Asian Nations, “ASEAN Human Rights Declaration,” ASEAN, November 19, 2012, https://asean.org/asean-human-rights-declaration/
(19) Treaty on Principles Governing the Activities of States in the Exploration and Use of Outer Space, including the Moon and Other Celestial Bodies
(20) UN Human Rights Council, “The human right to a clean, healthy and sustainable environment,” UNHRC, October 18, 2021, https://digitallibrary.un.org/record/3945636
(21) United Nations Human Rights Office of the High Commissioner, “Environmental crisis: High Commissioner calls for leadership by Human Rights Council member states,” OHCHR, September 13, 2021, https://www.ohchr.org/EN/NewsEvents/Pages/DisplayNews.aspx?NewsID=27443
(22) Johan Schaffer, “Legitimacy, global governance and human rights institutions: Inverting the puzzle,” in The legitimacy of international human rights regimes: Legal, political and philosophical perspectives, eds. Andreas Føllesdal, Johan Karlsson Schaffer and Geir Ulfstein (Cambridge: Cambridge University Press, 2013), 212–42, https://papers.ssrn.com/sol3/papers.cfm?abstract_id=2066563
(23) Schaffer, “Legitimacy, global governance and human rights institutions: Inverting the puzzle,” 6
(24) Schaffer, “Legitimacy, global governance and human rights institutions: Inverting the puzzle,” 10
(25) Treaty on Principles Governing the Activities of States in the Exploration and Use of Outer Space, including the Moon and Other Celestial Bodies
(26) Carl Q. Christol, “Human rights in outer space,” in Impact of Aerospace Science and Technology on Law and Government Conference (Washington, DC, Aerospace Research Central, 1968), https://arc.aiaa.org/doi/10.2514/6.1968-910
(27) “Ethics and Human Rights in the Space Sector,” Space Generation Advisory Council, https://spacegeneration.org/projects/ehr
(28) Roy Balleste, “Interstellar Travel and the Mission for Outer Space: A Human Rights Perspective,” SMU Science and Technology Law Review 18, no. 3 (2015), pp.244-245
Mental Health in an Unequal World: Assessing the Impact of COVID-19
07
Shoba Suri
70
People: Robust Processes and Better Societies
A ccording to a World Health Organization (WHO) survey in 2020, the pandemic has disrupted mental health services in over 90 percent of countries globally (1). More than 60 percent of countries
also reported disruptions to mental health services for vulnerable people, including children, adolescents, older adults, and women requiring antenatal or postnatal services. Estimates (2020) by the Lancet on the impact of the pandemic on global health suggests a rise in major depressive disorders by 28 percent and anxiety disorders by 26 percent (2). Mental health is estimated to cost the world economy US$6 trillion by 2030 (3). Every dollar invested in evidence-based care for depression and anxiety returns US$5 in better health and productivity (4). Also, mental health is integral to achieving the Sustainable Development Goals (SDGs), particularly goal 3 (good health and wellbeing). Therefore, mental health needs to be prioritised from human rights and economic perspectives.
Widespread Impacts
The pandemic has heightened the demand for mental health services, with fear, isolation, and the loss of lives and income triggering mental health conditions or aggravating pre-existing ones. Across societies, the effects of social isolation and the economic fallout have led to mental health distress. People are experiencing increased anxiety, depression, loneliness, and sadness because of the fear of infection, death, losing family members, losing incomes or livelihoods, or being socially isolated and separated from loved ones (5). In addition, individuals with pre-existing mental illnesses or established mental illnesses and substance-use disorders are at an increased risk of infection with COVID-19 and have a higher risk of adverse physical and psychological effects (6). Unfortunately, 75 percent to 80 percent of the population suffering from mental disorders in middle-to-low-income countries never receive the necessary help (7).
Mental Health in an Unequal World: Assessing the Impact of COVID-19
71
According to the World Happiness Report 2021, mental health is one of the biggest casualties of the pandemic and the resulting lockdowns (8). Women, the young, and poor people have been the worst affected, thus, increasing the existing inequalities in mental wellbeing.
Children’s mental state has also been affected by forced confinements. Moreover, children, including adolescents, are at particular risk of abuse during the pandemic (9). The closure of schools combined with restrictions on movement has limited the scope for children to interact and access learning opportunities, taking a toll on their mental health. A UK-based study on young people with a history of mental health found that 32 percent of the respondents agreed that the pandemic had worsened their mental health (10). Family’s health, school and university closures, loss of routine and loss of social connection were causes of concern. Studies show changes in behaviour, with many being irritable and restless and an increased lack of concentration among school-going children (11),(12). Stress and social isolation impact brain health and development, which increases the risk of developing lifelong challenges in children (13).
Women are at a greater risk of suffering mental health problems, with increased stress and anxiety due to their lower socioeconomic position relative to men, a heavier burden of daily chores, and a larger role in managing household food security (14). Sixty-six percent of women compared to 34 percent of men reported stress and anxiety during the pandemic in India (15). During the COVID-19 crisis, pregnant and new mothers are certainly more anxious due to potential difficulties in accessing services and social support and fear of infection. Lack of women’s empowerment, denial of decision-making capabilities, and domestic violence play a big role in the incidence of poor mental health conditions among women in developing countries (16). Similar findings have been reported for women in developed countries, and there have been calls to enact policies that prioritise women and their mental health during the pandemic (17).
Frontline workers are also at high risk of internal ill health, including suicide attempts and the threats of collapse and stigmatisation. Studies among healthcare workers indicate increased depression, distress, insomnia, and the need for psychosocial support (18),(19). Reports from Chile, Italy, Spain, the Philippines, the United Arab Emirates, the UK and the US document how dedicated teams provide mental health support for healthcare workers (20).
The impact of the pandemic on mental health is both short- and long-term and has been further aggravated by disruptions to mental health services and support during
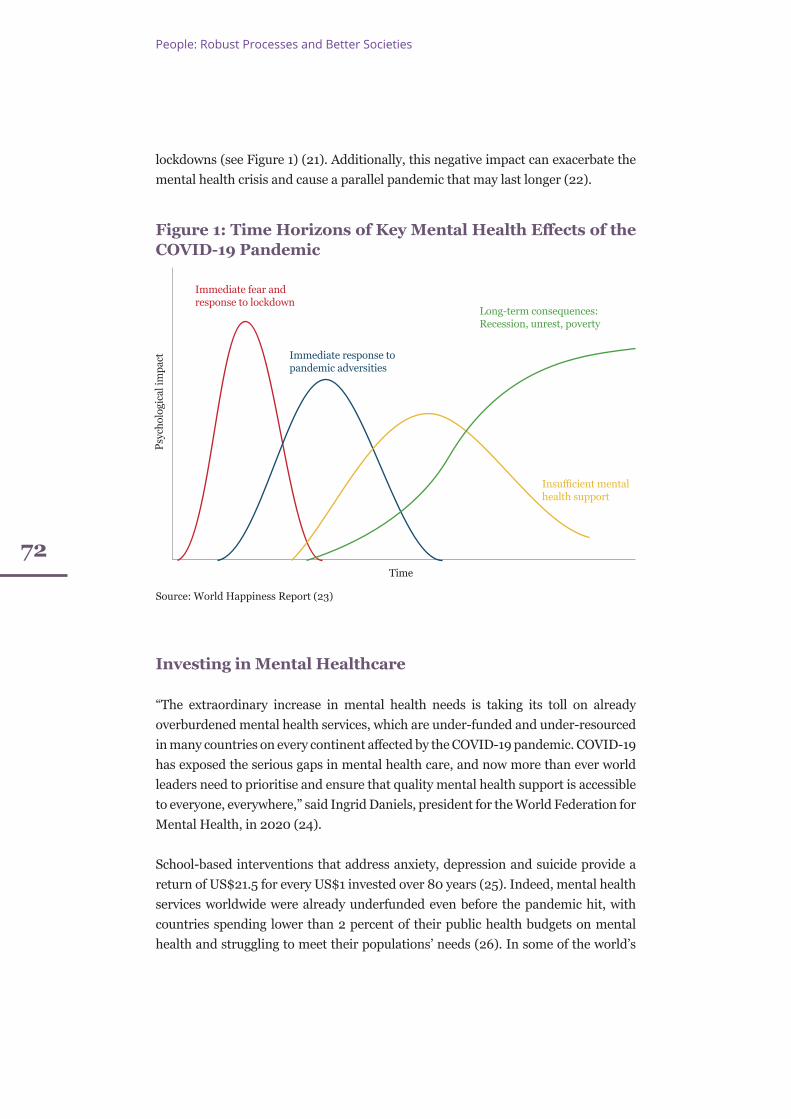
72
People: Robust Processes and Better Societies
lockdowns (see Figure 1) (21). Additionally, this negative impact can exacerbate the mental health crisis and cause a parallel pandemic that may last longer (22).
Figure 1: Time Horizons of Key Mental Health Effects of the COVID-19 Pandemic
Source: World Happiness Report (23)
Investing in Mental Healthcare
“The extraordinary increase in mental health needs is taking its toll on already overburdened mental health services, which are under-funded and under-resourced in many countries on every continent affected by the COVID-19 pandemic. COVID-19 has exposed the serious gaps in mental health care, and now more than ever world leaders need to prioritise and ensure that quality mental health support is accessible to everyone, everywhere,” said Ingrid Daniels, president for the World Federation for Mental Health, in 2020 (24).
School-based interventions that address anxiety, depression and suicide provide a return of US$21.5 for every US$1 invested over 80 years (25). Indeed, mental health services worldwide were already underfunded even before the pandemic hit, with countries spending lower than 2 percent of their public health budgets on mental health and struggling to meet their populations’ needs (26). In some of the world’s
Time
Psyc
holo
gica
l im
pact
Immediate fear and response to lockdown
Immediate response to pandemic adversities
Long-term consequences: Recession, unrest, poverty
Insufficient mental health support
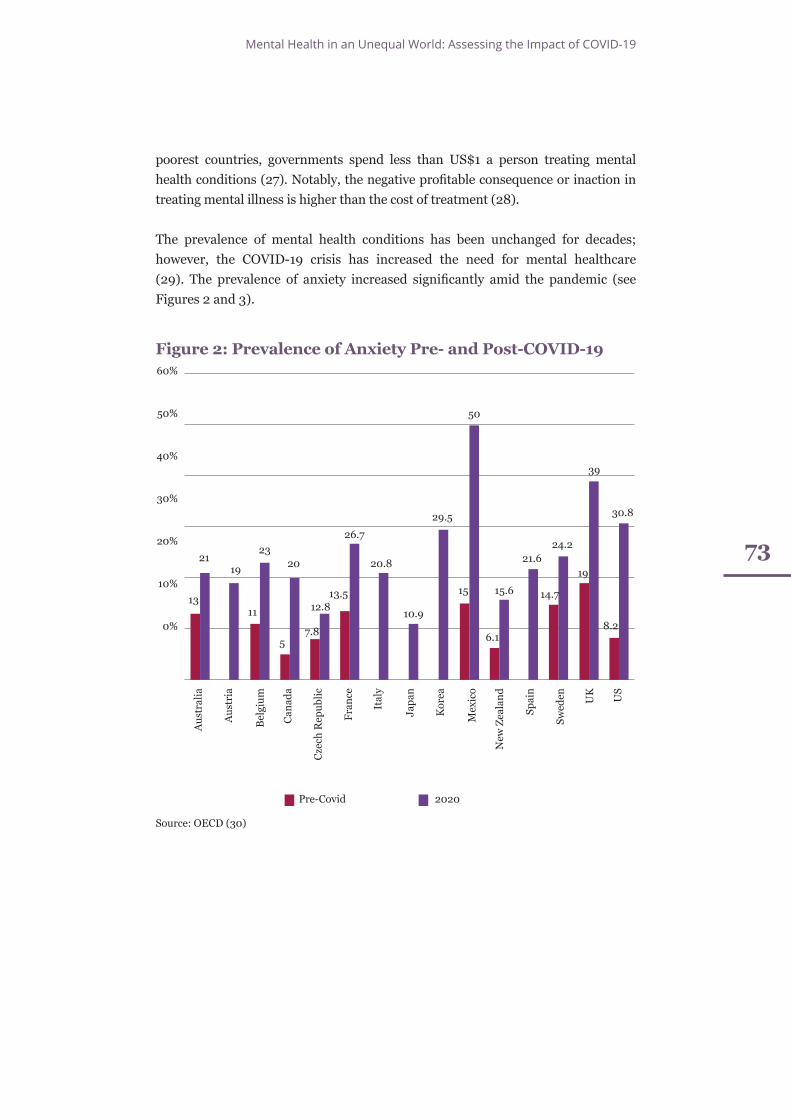
Mental Health in an Unequal World: Assessing the Impact of COVID-19
73
poorest countries, governments spend less than US$1 a person treating mental health conditions (27). Notably, the negative profitable consequence or inaction in treating mental illness is higher than the cost of treatment (28).
The prevalence of mental health conditions has been unchanged for decades; however, the COVID-19 crisis has increased the need for mental healthcare (29). The prevalence of anxiety increased significantly amid the pandemic (see Figures 2 and 3).
Figure 2: Prevalence of Anxiety Pre- and Post-COVID-19
Source: OECD (30)
Pre-Covid 2020
60%
50%
40%
30%
20%
10%
0%
Aus
tral
ia
Japa
n
Aus
tria
Kor
ea
Bel
gium
Mex
ico
Can
ada
New
Zea
land
Cze
ch R
epub
lic
Spai
n
Fran
ce
Swed
en
Ital
y
UK US
21
13
19
23
11
5
20
12.8
7.8
13.5
26.7
20.8
10.9
29.5
15 15.6
6.1
21.6
14.7
24.2
39
19
30.8
8.2
50
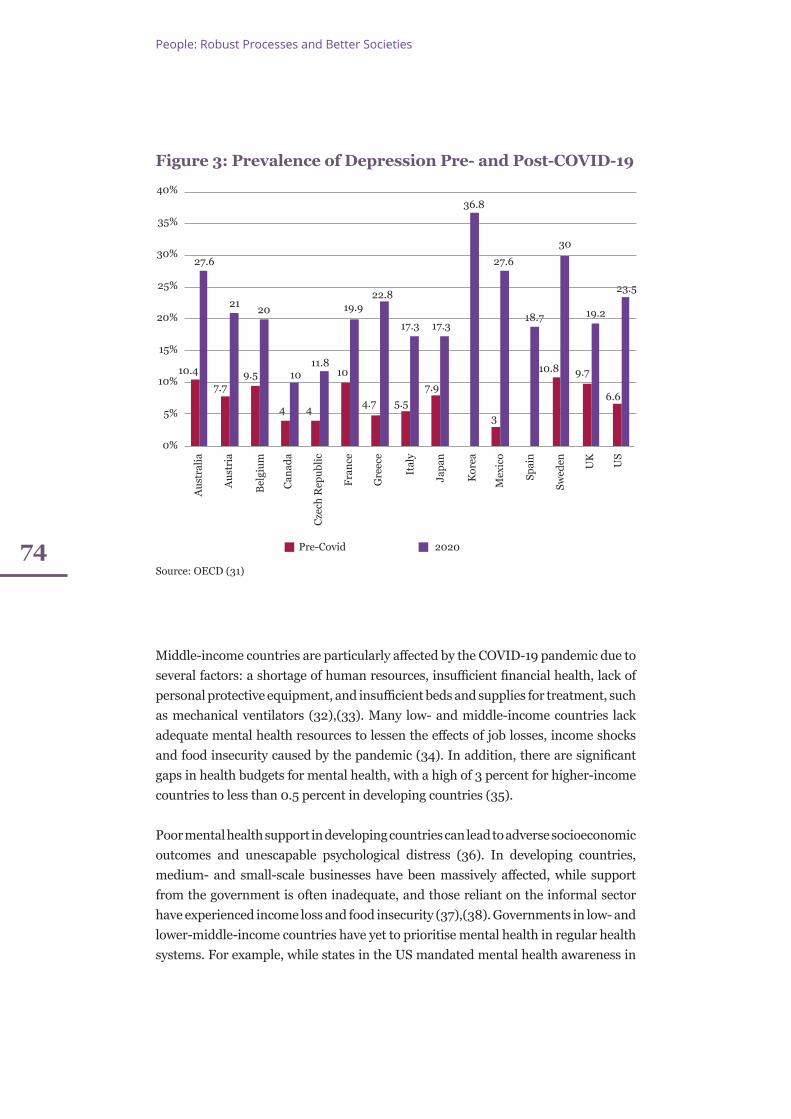
74
People: Robust Processes and Better Societies
Figure 3: Prevalence of Depression Pre- and Post-COVID-19
Source: OECD (31)
40%
35%
30%
25%
20%
15%
10%
5%
0%
Aus
tral
ia
Ital
y
Aus
tria
Japa
n
Bel
gium
Kor
ea
Can
ada
Mex
ico
Cze
ch R
epub
lic
Pre-Covid 2020
Spai
n
Fran
ce
Swed
en
Gre
ece
UK US
10.4
27.6
21
7.79.5
20
4
1011.8
4
10
19.922.8
4.7 5.5
17.3
7.9
17.3
36.8
27.6
3
18.7
30
10.8 9.7
19.2
23.5
6.6
Middle-income countries are particularly affected by the COVID-19 pandemic due to several factors: a shortage of human resources, insufficient financial health, lack of personal protective equipment, and insufficient beds and supplies for treatment, such as mechanical ventilators (32),(33). Many low- and middle-income countries lack adequate mental health resources to lessen the effects of job losses, income shocks and food insecurity caused by the pandemic (34). In addition, there are significant gaps in health budgets for mental health, with a high of 3 percent for higher-income countries to less than 0.5 percent in developing countries (35).
Poor mental health support in developing countries can lead to adverse socioeconomic outcomes and unescapable psychological distress (36). In developing countries, medium- and small-scale businesses have been massively affected, while support from the government is often inadequate, and those reliant on the informal sector have experienced income loss and food insecurity (37),(38). Governments in low- and lower-middle-income countries have yet to prioritise mental health in regular health systems. For example, while states in the US mandated mental health awareness in
Mental Health in an Unequal World: Assessing the Impact of COVID-19
75
schools even before the COVID-19 pandemic, more than 75 percent of adolescents in India have never attended a mental health awareness session (39).
Public, perceived, and self-stigmatising attitudes to mental illness have been identified as critical barriers to mental healthcare-seeking behaviours. Mental health stigma prevents individuals from using mental health services or receiving treatment. Internalised stigma—shame and embarrassment and fear of disclosing one’s mental health conditions—also acts as deterrents (40). A 2018 survey reported that 42 percent of respondents cited high cost and poor insurance coverage as crucial walls to accessing mental healthcare, with one in four people being forced to choose between mental health treatment and essentials (41). Because of this prohibitive pricing, lack of insurance coverage, and the social stigma still associated with mental and substance use disorders, most people with behavioural health issues cannot access treatment.
Evidence from developing countries indicates higher stress levels and mental health issues in women with household food insecurity (42). A comparative study among seven middle-income countries on mental health in the general population during the pandemic highlights the risk factors for adverse mental health, including age (less than 30 years), high education, single and separated status and worrying about COVID-19 (43). The lower-middle-income countries in Africa and Asia face the risk of an exacerbated burden of mental health issues due to weak health systems and the lower socioeconomic status of their populations (44). Access to healthcare services and governments’ responses to the pandemic on public safety measures were crucial in lowering levels of anxiety and depression in some developing countries (45).
The Way Forward
Mental health is integral to meet the SDGs, which calls for interdisciplinary and intersectoral solutions. Amid the pandemic, the WHO recommended the dedicated allocation of resources for mental healthcare in national response and recovery plans for countries to maintain mental health services (46).
The WHO has also established a Special Initiative for Mental Health, which centres on scaling-up mental healthcare as part of universal health coverage and leaving no one behind by increasing quality interventions and services for individuals with mental health conditions (47).
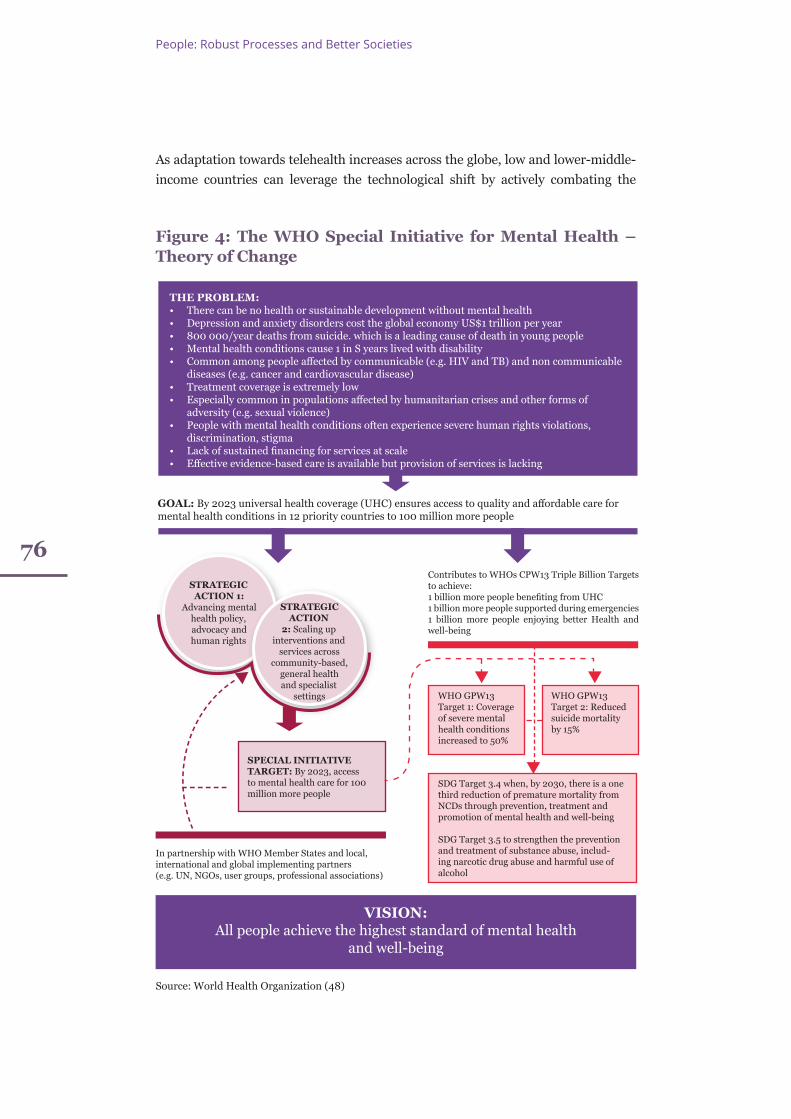
76
People: Robust Processes and Better Societies
As adaptation towards telehealth increases across the globe, low and lower-middle-income countries can leverage the technological shift by actively combating the
Figure 4: The WHO Special Initiative for Mental Health – Theory of Change
Source: World Health Organization (48)
THE PROBLEM:• There can be no health or sustainable development without mental health• Depression and anxiety disorders cost the global economy US$1 trillion per year• 800 000/year deaths from suicide. which is a leading cause of death in young people• Mental health conditions cause 1 in S years lived with disability• Common among people affected by communicable (e.g. HIV and TB) and non communicable
diseases (e.g. cancer and cardiovascular disease)• Treatment coverage is extremely low• Especially common in populations affected by humanitarian crises and other forms of
adversity (e.g. sexual violence)• People with mental health conditions often experience severe human rights violations,
discrimination, stigma• Lack of sustained financing for services at scale• Effective evidence-based care is available but provision of services is lacking
GOAL: By 2023 universal health coverage (UHC) ensures access to quality and affordable care for mental health conditions in 12 priority countries to 100 million more people
STRATEGIC ACTION 1:
Advancing mental health policy, advocacy and human rights
STRATEGIC ACTION
2: Scaling up interventions and
services across community-based,
general healthand specialist
settings
SPECIAL INITIATIVE TARGET: By 2023, access to mental health care for 100 million more people
In partnership with WHO Member States and local, international and global implementing partners(e.g. UN, NGOs, user groups, professional associations)
Contributes to WHOs CPW13 Triple Billion Targets to achieve:1 billion more people benefiting from UHC1 billion more people supported during emergencies1 billion more people enjoying better Health and well-being
WHO GPW13 Target 1: Coverage of severe mental health conditions increased to 50%
SDG Target 3.4 when, by 2030, there is a one third reduction of premature mortality from NCDs through prevention, treatment and promotion of mental health and well-being
SDG Target 3.5 to strengthen the prevention and treatment of substance abuse, includ-ing narcotic drug abuse and harmful use of alcohol
WHO GPW13 Target 2: Reduced suicide mortality by 15%
VISION: All people achieve the highest standard of mental health
and well-being
Mental Health in an Unequal World: Assessing the Impact of COVID-19
77
gender/area digital divide, especially for women and racial minorities (49). Indeed, psychiatry has shown the highest adaptation among telehealth services globally (50).
Mental healthcare must be integrated into universal health coverage worldwide (51). For resource-constrained nations, low-cost scalable solutions are needed to address the mental health situation. The psychological impact of the pandemic has highlighted the vulnerability of people and the need for additional mental health support around the world. This momentum can be seen as an opportunity to address the unmet needs of the vulnerable groups by considering effective ways of investing in mental health support to improve overall wellbeing. Mental health issues should be incorporated within general health policies and plans and should be carefully monitored and evaluated to achieve the desired outcomes.
Endnotes
(1) “COVID-19 disrupting mental health services in most countries, WHO survey,” World Health Organization, October 5, 2020, https://www.who.int/news/item/05-10-2020-covid-19-disrupting-mental-health-services-in-most-countries-who-survey.
(2) D.F. Santomauro et al., “Global prevalence and burden of depressive and anxiety disorders in 204 countries and territories in 2020 due to the COVID-19 pandemic,” The Lancet 398 (2021):1700-1712, https://www.thelancet.com/journals/lancet/article/PIIS0140-6736(21)02143-7/fulltext
(3) “Mental Health Matters,” The Lancet Global Health 8 (2020): e1352, https://www.thelancet.com/journals/langlo/article/PIIS2214-109X(20)30432-0/fulltext
(4) WHO, “World Mental Health Day: an opportunity to kick-start a massive scale-up in investment in mental health,” August 27, 2020, https://www.who.int/news/item/27-08-2020-world-mental-health-day-an-opportunity-to-kick-start-a-massive-scale-up-in-investment-in-mental-health
(5) United for Global Mental Health, The Impact of COVID-19 on Global Mental Health: A Briefing, 2020, https://unitedgmh.org/sites/default/files/2020-09/The%2BImpact%2BOf%2BCovid-19%2BOn%2BGlobal%2BMental%2BHealth%2BReport.pdf
(6) W. Cullen, G. Gulati, B.D. Kelly, “Mental health in the COVID-19 pandemic,” QJM: An International Journal of Medicine 113, no. 5 (2020): 311-312, https://academic.oup.com/qjmed/article/113/5/311/5813733
(7) Mona, “Mental health in times of COVID: Lessons we refuse to learn,” ORF, May 20,
78
People: Robust Processes and Better Societies
2021, https://www.orfonline.org/expert-speak/mental-health-in-times-of-covid-lessons-we-refuse-to-learn/
(8) John Helliwell, Richard Layard, Jeffrey D. Sachs, Jan-Emmanuel De Neve eds., World Happiness Report 2021, Sustainable Development Solutions Network, 2021 https://worldhappiness.report/ed/2021/
(9) United Nations Economic Commission for Latin America and the Caribbean and United Nations Children’s Fund, Violence against children and adolescents in the time of Covid-19, ECLAC - UNICEF, 2020, https://repositorio.cepal.org/bitstream/handle/11362/46486/4/S2000610_en.pdf
(10) United Nations Sustainable Development Group, COVID-19 and the Need for Action on Mental Health, UN, May 2020, https://unsdg.un.org/sites/default/files/2020-05/UN-Policy-Brief-COVID-19-and-mental-health.pdf
(11) Mireia Orgilés et al., “Immediate psychological effects of the COVID-19 quarantine in youth from Italy and Spain,” Frontiers in Psychology 11 (2020), https://www.frontiersin.org/articles/10.3389/fpsyg.2020.579038/full
(12) D.F. Santomauro et al., “Global prevalence and burden of depressive and anxiety disorders in 204 countries and territories in 2020 due to the COVID-19 pandemic,” The Lancet 398 (2021):1700-1712, https://www.thelancet.com/journals/lancet/article/PIIS0140-6736(21)02143-7/fulltext
(13) Liubiana Arantes de Araújo et al., “The potential impact of the COVID-19 pandemic on child growth and development: a systematic review,” Jornal de Pediatria 97 (2021): 369-377, https://pubmed.ncbi.nlm.nih.gov/32980318/
(14) Jiang Du et al., “Psychological symptoms among frontline healthcare workers during COVID-19 outbreak in Wuhan,” General hospital psychiatry 67 (2020): 144-145, https://www.ncbi.nlm.nih.gov/pmc/articles/PMC7194721/pdf/main.pdf
(15) “COVID-19 and the Need for Action on Mental Health, May 2020”
(16) UN Women, “The shadow pandemic: Violence against women during COVID-19,” May 27, 2020, https://www.unwomen.org/en/news/in-focus/in-focus-gender-equality-in-covid-19-response/violence-against-women-during-covid-19
(17) Raj Anita et al., “Time from COVID-19 shutdown, gender-based violence exposure, and mental health outcomes among a state representative sample of California residents,” EClinicalMedicine 26 (2020), https://www.thelancet.com/pdfs/journals/eclinm/PIIS2589-5370(20)30264-9.pdf
(18) Jianbo Lai et al., “Factors associated with mental health outcomes among health care workers exposed to coronavirus disease 2019,” JAMA network Open 3, no. 3 (2020): e203976-e203976, file:///C:/Users/Dell/Downloads/lai_2020_oi_200192.pdf
(19) Reinaldo Calcano, Insights from the Canadian front lines of the COVID-19 pandemic, Potloc, 2020, https://www.potloc.com/blog/en/potloc-study-canadian-health-
Mental Health in an Unequal World: Assessing the Impact of COVID-19
79
workers-insights-front-lines-covid-19-pandemic
(20) “COVID-19 and the Need for Action on Mental Health, May 2020”
(21) James Banks, Daisy Fancourt and Xiaowei Xu, “Mental health and the COVID-19 pandemic,” in World Happiness Report 2021, John Helliwell et al. eds., 2021, https://worldhappiness.report/ed/2021/mental-health-and-the-covid-19-pandemic/
(22) Felipe Ornell et al., “The next pandemic: impact of COVID-19 in mental healthcare assistance in a nationwide epidemiological study,” The Lancet Regional Health-Americas 4 (2021), https://www.thelancet.com/journals/lanam/article/PIIS2667-193X(21)00057-0/fulltext
(23) “World Happiness Report 2021”
(24) WHO, “Global challenge for movement on mental health kicks off as lack of investment in mental health leaves millions without access to services,” October 7, 2020, https://www.who.int/news/item/07-10-2020-global-challenge-for-movement-on-mental-health-kicks-off-as-lack-of-investment-in-mental-health-leaves-millions-without-access-to-services
(25) United Nations Children’s Fund, The State of the World’s Children 2021: On My Mind, UNICEF, October 2021, https://www.unicef.org/media/108036/file/SOWC-2021-executive-summary.pdf
(26) “Global challenge for movement on mental health kicks off as lack of investment in mental health leaves millions without access to services”
(27) “The State of the World’s Children 2021: On My Mind”
(28) Richard Layard, “The economics of mental health,” IZA World of Labor (2017), https://wol.iza.org/uploads/articles/321/pdfs/economics-of-mental-health.pdf
(29) Organisation for Economic Co-operation and Development, Tackling the mental health impact of the COVID-19 crisis: An integrated, whole-of-society response, OECD, May 2021, https://www.oecd.org/coronavirus/policy-responses/tackling-the-mental-health-impact-of-the-covid-19-crisis-an-integrated-whole-of-society-response-0ccafa0b/
(30) Tackling the Mental Health Impact of the COVID-19 Crisis: An Integrated, Whole-of-Society Response
(31) Tackling the Mental Health Impact of the COVID-19 Crisis: An Integrated, Whole-of-Society Response
(32) Megan L. Ranney et al., “Critical supply shortages—the need for ventilators and personal protective equipment during the Covid-19 pandemic,” New England Journal of Medicine 382, no. 18 (2020): e41, https://www.nejm.org/doi/full/10.1056/NEJMp2006141
(33) Choon-Looi Bong et al., “The COVID-19 pandemic: effects on low-and middle-income
80
People: Robust Processes and Better Societies
countries,” Anesthesia and analgesia 131, no. 1 (2020): 86-92 https://doi.org/10.1213/ANE.0000000000004846
(34) Tabassum Rahman et al., “Food insecurity and mental health of women during COVID-19: Evidence from a developing country,” PloS One 16, no. 7 (2021): e0255392, https://journals.plos.org/plosone/article?id=10.1371/journal.pone.0255392
(35) Matthew Ridely et al., “Poverty, depression, and anxiety: Causal evidence and mechanisms,” Science 370, no. 6522 (2020), https://www.science.org/doi/10.1126/science.aay0214?url_ver=Z39.88-2003&rfr_id=ori:rid:crossref.org&rfr_dat=cr_pub%20%200pubmed
(36) Manuela Angelucci and Daniel Bennett, “The Economic Impact of Depression Treatment in India,” IZA Institute of Labour Economics, May 2021, https://www.iza.org/publications/dp/14393/the-economic-impact-of-depression-treatment-in-india
(37) Ahmed J. Pirzada, “How are developing economies coping with Covid-19 crisis,” Economics Observatory, July 1, 2021, https://www.economicsobservatory.com/how-are-developing-economies-coping-with-the-covid-19-crisis
(38) World Bank, Global Economic Prospects, June 2020. Washington DC, World Bank Group, 2020, https://openknowledge.worldbank.org/handle/10986/33748
(39) Shekhar Saxena and Anisha Padukone, “School based online programs instruct pupils about good mental health,” Scientific American, September 14, 2021, https://www.scientificamerican.com/article/school-based-online-programs-instruct-pupils-about-good-mental-health/
(40) King’s College London, “Stigma ‘key deterrent’ in accessing mental health care,” ScienceDaily, February 14, 2014, https://www.sciencedaily.com/releases/2014/02/140225193406.htm
(41) National Council for Mental Wellbeing, “New Study Reveals Lack of Access as Root Cause for Mental Health Crisis in America,” 2018, https://www.thenationalcouncil.org/press-releases/new-study-reveals-lack-of-access-as-root-cause-for-mental-health-crisis-in-america/
(42) Tabassum, “Food insecurity and mental health of women during COVID-19”
(43) Cuiyan Wang et al., “The impact of COVID-19 pandemic on physical and mental health of Asians: A study of seven middle-income countries in Asia,” PloS One 16, no. 2 (2021): e0246824, https://journals.plos.org/plosone/article?id=10.1371/journal.pone.0246824
(44) Sujita Kumar Kar, et al., “Mental health research in the lower-middle-income countries of Africa and Asia during the COVID-19 pandemic: a scoping review,” Neurology, Psychiatry and Brain Research 38 (2020): 54-64, https://pubmed.ncbi.nlm.nih.gov/33162686/
Mental Health in an Unequal World: Assessing the Impact of COVID-19
81
(45) Cuiyan Wang et al., “Mental Health of the General Population during the 2019 Coronavirus Disease (COVID-19) Pandemic: A Tale of Two Developing Countries.” Psychiatry International 2, no. 1 (2021): 71-84, https://www.mdpi.com/2673-5318/2/1/6
(46) “COVID-19 disrupting mental health services in most countries, WHO survey”
(47) Patel Vikram et al., “The Lancet Commission on global mental health and sustainable development,” The Lancet 392, no. 10157 (2018): 1553-1598, https://www.thelancet.com/journals/lancet/article/PIIS0140-6736%2818%2931612-X/fulltext
(48) World Health Organization, Special Initiative for Mental Health (2019-2023): Universal Health Coverage for Mental Health, WHO, May 2019, https://www.who.int/publications/i/item/special-initiative-for-mental-health-(2019-2023)
(49) “Digital tools for mental health in a crisis,” The Lancet Digital Health 3, no.4 (2021): e204, https://www.thelancet.com/pdfs/journals/landig/PIIS2589-7500(21)00045-5.pdf
(50) Oleg Bestsennyy et al., “Telehealth: a quarter trillion dollar post covid-19 reality,” Mc Kinsey & Company, July 9, 2021, https://www.mckinsey.com/industries/healthcare-systems-and-services/our-insights/telehealth-a-quarter-trillion-dollar-post-covid-19-reality
(51) Maxim Polyakov, James Sale, Sarah Kline and Shekhar Saxena, “No health without mental health”: the urgent need for mental health integration in universal health coverage, United for Global Mental Health, 2020, https://unitedgmh.org/sites/default/files/2020-12/Universal%20Health%20Coverage%20-%20No%20Health%20Without%20Mental%20Health.pdf
Land Reforms and Optimal Farm Size: Linkages with Rural Inequality and Socioeconomic Development
08
Roshan Saha
Land Reforms and Optimal Farm Size: Linkages with Rural Inequality and Socioeconomic Development
83
A griculture is still the primary source of livelihood for most of India’s population. The agricultural sector accounts for 23 percent of the country’s GDP, but employs 59 percent of its workforce (1). Notably,
70 percent of the rural population derive their livelihood from the agriculture sector (2). Moreover, 82 percent of Indian farmers are categorised as small and marginal, implying that they own farmlands between 1 to 2 hectares and less than 1 hectare of land respectively (3). At the national level, the poorest 50 percent of agricultural households own an average of 0.28 hectares of land, while the richest 1 percent own an average of 9.01 hectares of land, which is estimated to be the optimal farm size (4),(5). Due to the complex linkages that exist between land ownership and agricultural productivity, livelihood, poverty (6), social and cultural dynamics, environmental conservation (7) and overall human development (8), it is necessary to understand the structure of land ownership, especially in agriculture. Land reforms aimed at ensuring tenure security, and those where property rights are not well-defined, provide several rights to land users but also deny these rights to those who do not own any land. These rights are defined as use rights, mortgaging rights and transfer rights (9).
The current situation in India is characterised by a burgeoning number of farms but dwindling farm size, resulting in low agricultural productivity. This has implications for agricultural productivity as well as for income generation and social welfare in rural areas. Consolidating land holdings to ensure that the farms are economically feasible for agricultural activities holds the key to ensuring a vibrant agricultural sector and a flourishing rural economy. But to do so requires establishing a framework that suggests the criteria for consolidating land holdings based on estimates of optimal farm size across regions. Through the interlinkages between land rights and investment, access to credit and land transfers, land reforms also become central to the agenda of sustainable development in rural areas. Land reforms have the
84
People: Robust Processes and Better Societies
potential to help achieve several of the Sustainable Development Goals (SDGs), such as responsible consumption and production (SDG 12), no poverty (SDG 1), reduced inequality (SDG 10), zero hunger (SDG 2), and peace, justice and strong institutions (SDG 16).
Historical Attributes and the Political Economy of Land Reforms
Prior to independence, Indian land cultivators had to pay a fee to the administration, which was an important source of revenue for the British administration in India. It accounted for 60 percent of the total British government revenue in 1841, but this share declined gradually as other sources of tax revenue were identified in the subsequent years (10).The colonial system of land tenure has to some extent influenced the present political economy of land tenure ownership and its impacts. The colonial land tenure system can be categorised into three broad types—zamindari (landlord-based system), raiyatwari (individual cultivator-based system), and mahalwari (village-based system) (11). Most states that belonged to the Bengal presidency followed the zamindari system; Assam (separated from Bengal in 1874) and the Madras and Bombay presidencies adopted the raiyatwari system; and the North-western provinces and Punjab adopted the village-based system (12). In areas where the property rights were assigned to landlords during the colonial period, the level of investment in agriculture and agricultural productivity post-independence was significantly lower than areas where the property rights were assigned to the cultivators (13). This shows that historical institutions played an important role in determining the policy choices and outcomes after independence.
Following independence, Indian states were given the authority to enact land reform laws to overcome the challenges of the zamindari system to simplify the land tenure system, prevent fragmentation and enact ceilings on land holdings with the broader objective of creating an egalitarian agrarian economy. These reforms were enacted in several phases, most notably during the 1960s and 1970s. However, the objectives of land reforms are far from being met. In 2014, 11 states implemented reforms that marked a reversal from what previous laws were trying to accomplish (14); the new laws allow industries and non-farmers to buy large parcels of agricultural land for non-agricultural use. Although it may be argued that these reforms are aimed at boosting the industrial sector (especially given the agriculture sector’s low share in the national economy), it is still necessary to ensure egalitarian land distribution due to the large number of people who are engaged in it economically.
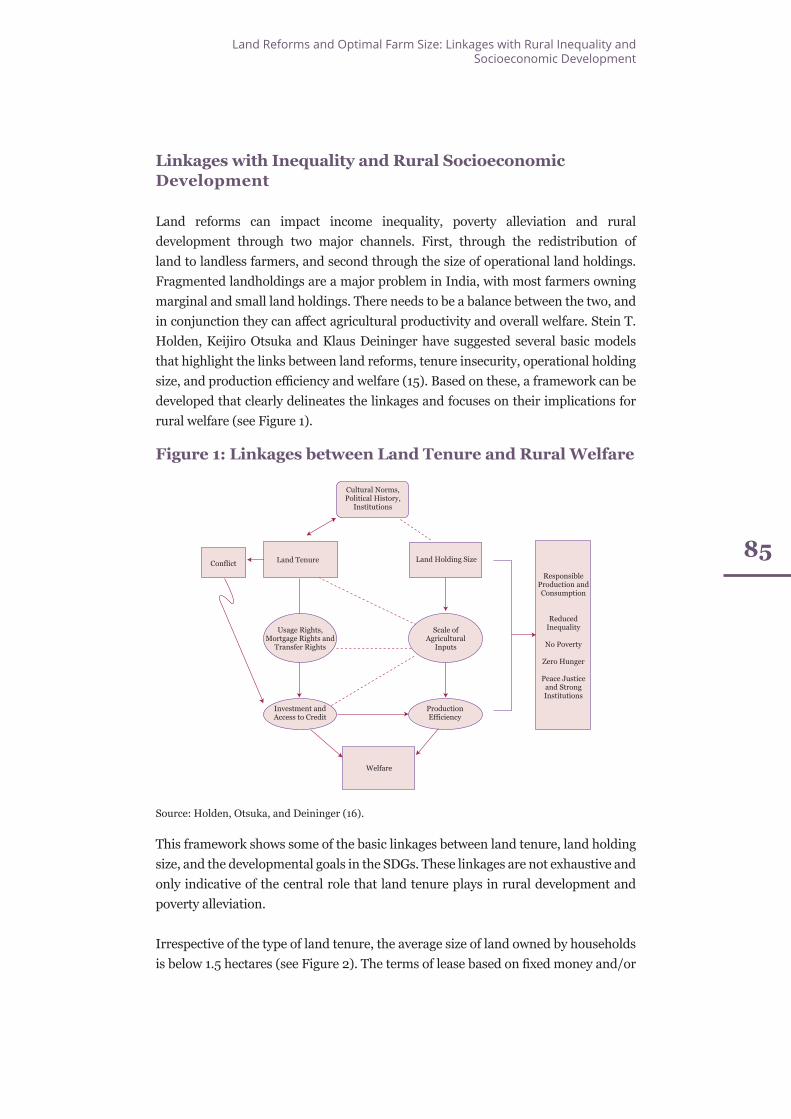
Land Reforms and Optimal Farm Size: Linkages with Rural Inequality and Socioeconomic Development
85
Linkages with Inequality and Rural Socioeconomic Development
Land reforms can impact income inequality, poverty alleviation and rural development through two major channels. First, through the redistribution of land to landless farmers, and second through the size of operational land holdings. Fragmented landholdings are a major problem in India, with most farmers owning marginal and small land holdings. There needs to be a balance between the two, and in conjunction they can affect agricultural productivity and overall welfare. Stein T. Holden, Keijiro Otsuka and Klaus Deininger have suggested several basic models that highlight the links between land reforms, tenure insecurity, operational holding size, and production efficiency and welfare (15). Based on these, a framework can be developed that clearly delineates the linkages and focuses on their implications for rural welfare (see Figure 1).
Figure 1: Linkages between Land Tenure and Rural Welfare
Source: Holden, Otsuka, and Deininger (16).
This framework shows some of the basic linkages between land tenure, land holding size, and the developmental goals in the SDGs. These linkages are not exhaustive and only indicative of the central role that land tenure plays in rural development and poverty alleviation.
Irrespective of the type of land tenure, the average size of land owned by households is below 1.5 hectares (see Figure 2). The terms of lease based on fixed money and/or
Land Tenure Land Holding Size
ResponsibleProduction andConsumption
ReducedInequality
No Poverty
Zero Hunger
Peace Justiceand StrongInstitutions
Investment andAccess to Credit
ProductionEfficiency
Welfare
Scale ofAgricultural
Inputs
Conflict
Cultural Norms,Political History,
Institutions
Usage Rights,Mortgage Rights and
Transfer Rights
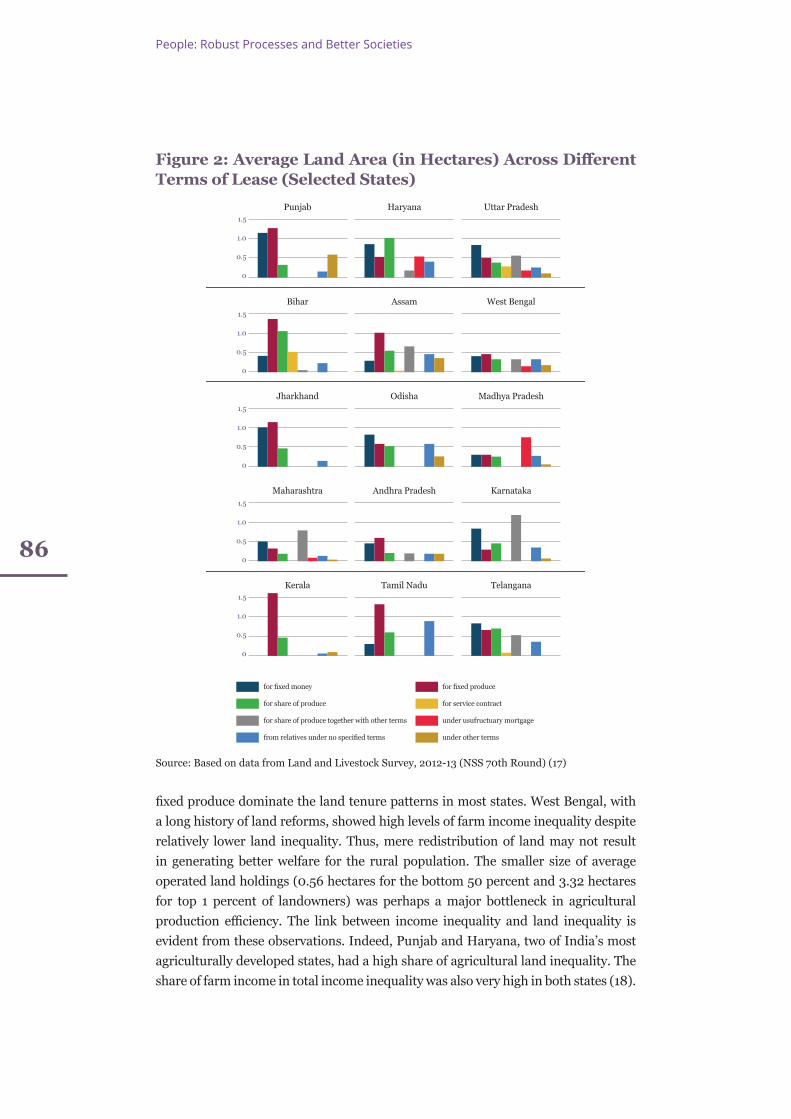
86
People: Robust Processes and Better Societies
Figure 2: Average Land Area (in Hectares) Across Different Terms of Lease (Selected States)
Source: Based on data from Land and Livestock Survey, 2012-13 (NSS 70th Round) (17)
fixed produce dominate the land tenure patterns in most states. West Bengal, with a long history of land reforms, showed high levels of farm income inequality despite relatively lower land inequality. Thus, mere redistribution of land may not result in generating better welfare for the rural population. The smaller size of average operated land holdings (0.56 hectares for the bottom 50 percent and 3.32 hectares for top 1 percent of landowners) was perhaps a major bottleneck in agricultural production efficiency. The link between income inequality and land inequality is evident from these observations. Indeed, Punjab and Haryana, two of India’s most agriculturally developed states, had a high share of agricultural land inequality. The share of farm income in total income inequality was also very high in both states (18).
1.5
1.0
0.5
0
1.5
1.0
0.5
0
1.5
1.0
0.5
0
1.5
1.0
0.5
0
1.5
1.0
0.5
0
Punjab
Kerala
Maharashtra
Jharkhand
Bihar Assam
Haryana
Tamil Nadu
Andhra Pradesh
Odisha Madhya Pradesh
West Bengal
Uttar Pradesh
Telangana
Karnataka
for fixed money
for share of produce
for share of produce together with other terms
from relatives under no specified terms
for fixed produce
for service contract
under usufructuary mortgage
under other terms
Land Reforms and Optimal Farm Size: Linkages with Rural Inequality and Socioeconomic Development
87
To understand the role of land in income inequality in rural communities, Raya Das and Ravi Srivastava used an approach of decomposing income inequality among agricultural households in India by income components—farm, wage, non-farm and livestock income (19). Farm income explains the highest share in income inequality among agricultural households. It was also observed that land inequality is a major determinant of income inequality among agricultural households. Furthermore, farm income is observed to grow the least for marginal farmers and growth is proportional to the farm size (20). Evidence of the link between land and income inequality showcases that land reform measures under the current dynamics of the agrarian economy must also aim to optimise farmer welfare, subject to a minimum threshold of operational land holding for viable agricultural output and maximum permissible limit for distributive justice. But how does one determine the lowest permissible limit? This introduces a new dimension to the issue of land reform.
Optimal Farm Size: A Theoretical Construct
The policy planner’s objective should be to maximise the impact of land reform on farmer welfare such that the farmer can produce output that generates an adequate income to at least meet the basic requirements defined by a metric of social welfare (such as the poverty line). The inability to generate such a 'decent' income has forced farmers across the country to work in the non-farm sector. The minimum land required to produce such a level of output should be set as the 'floor' for land holdings. According to a recent study by Andrew D. Foster and Mark R. Rosenzweig, the optimal farm size in India is estimated to be 24.5 acres (approximately 9.9 hectares) (21). This is substantially larger than the current average farm size (as depicted in Figure 2). Under the current situation, most farmers can be assumed to be below this floor and must thus engage in occupations other than agriculture to supplement their income. According to a study on income inequality in agricultural households (22), most households with a higher share of wage income are in the lower income quartile, and thus shifting to the non-farm sector may not have been helpful in alleviating the problem of rural income inequality. Instead, it may lead to farmers being pushed to the margins.
Setting a floor may help overcome the problem of fragmented landholdings and create economies of scale. The optimal farm size can be achieved through the consolidation of land holdings, as Foster and Rosenzweig suggest. While it has been argued that small farms are productive, and the government has been enthusiastic about the large number of small farms in India (23), Foster and Rosenzweig have shown that the productivity of small farms gradually decreases as the size of the farm increase, reaches a minimum, and eventually increases with farm size. They
88
People: Robust Processes and Better Societies
argue that as the farm size increases, it requires additional labour and/or capital, which in turn require further expenses. But as the farm size increases beyond a particular threshold, the ability to use inputs that have higher capacity, such as machines, yields economies of scale and raises the productivity and net income of the farmers. The objective of land reforms should be to ensure that either the farms are operating at a very small but productive scale using only family labour, or that they are able to exploit the economies of scale associated with large land holdings through the consolidation of farms. Therefore, land reforms are a critical element in addressing rural poverty and income inequality, especially among farmers. The mere redistribution of surplus land to the landless will not yield the desired results on its own. It needs to be accompanied by other laws and contracts that allow for the efficient use of the plot of land.
If implemented effectively, it would allow farmers to generate a steady flow of income from their farms, which could then be used to invest in physical capital such as inputs and human capital such as education for their children. Both these would lead to higher income in future periods, and improve agricultural productivity and the aggregate welfare of the household. Although the law of inheritance will mean land ownership passes on to the next generations, the returns from investment in human capital in the earlier periods may generate higher sources of earnings from non-farm activities. Labour will thus migrate from the agriculture sector to other sectors based on their relative skill levels. Under a regime of well-defined property rights, this will allow the household to either lease the land for agricultural practices or hire labour for farming instead of engaging family labour. This will create a market for agricultural labour that will allow other households aiming to overcome the poverty or low-income trap an opportunity to do so. It will also facilitate the reallocation of labour across and within the sectors in a manner that matches the skill distribution across the population.
Conclusion
Although most states have implemented land reforms, its impacts have not always been desirable. Despite redistributing land to the landless farmers, it has had the undesirable impact of fragmented landholdings. In addition to political economy factors, several de jure factors have also led to the land reform measures falling short of their objectives. An important reason behind this is the various exemptions to the existing land ceiling laws, which leaves adequate space for elite landowners to override the laws (24). The legacy of colonial institutions has led to the accumulation of political power in the hands of the landed gentry, and they continue to enjoy superiority in the agrarian social hierarchy. To ensure that land reforms lead to the
Land Reforms and Optimal Farm Size: Linkages with Rural Inequality and Socioeconomic Development
89
creation of a more egalitarian distribution of land holdings, enforcing a land ceiling alone may not be sufficient. It is also necessary to ensure that farmlands are feasible for economically productive agricultural activities. Consolidating land holdings to meet an optimal farm size (around 9 hectares) can be one way to expand agricultural output and income, and thereby reduce poverty. Since land inequality is highly interlinked with income inequality among agricultural households, it also serves a dual purpose of addressing rural income inequality.
Endnotes
(1) Food and Agriculture Organization of the United Nations, “FAO in India - India at a glance,” FAO, https://www.fao.org/india/fao-in-india/india-at-a-glance/en/
(2) “FAO in India – India at a glance”
(3) “FAO in India – India at a glance”
(4) Raya Das and Ravi Srivastava, “Income inequality among agricultural households in India: A regression-based decomposition approach,” Review of Development Economics 25, no. 3 (2021): 1128-1149, https://onlinelibrary.wiley.com/doi/10.1111/rode.12758
(5) Andrew D. Foster and Mark R. Rosenzweig, “Are there too many farms in the world? Labour Market Transaction Costs, Machine Capacities and Optimal Farm Size,” Journal of Political Economy 130, no. 3 (2022). https://doi.org/10.1086/717890
(6) Timothy Besley and Robin Burgess, “Land Reform, Poverty Reduction, and Growth: Evidence from India,” The Quarterly Journal of Economics 115, no. 2 (2000): 389-430, https://academic.oup.com/qje/article-abstract/115/2/389/1840440
(7) W. Sawadgo, “Land Tenure, agri-environmental policy, and conservation practice use in Iowa,” (PhD Diss., Iowa State University, 2020), https://doi.org/10.31274/etd-20200624-112
(8) Tseng et al, “Influence of land tenure interventions on human wellbeing and environmental outcomes,” Nature Sustainability 4 (2021): 242-251, https://www.nature.com/articles/s41893-020-00648-5
(9) Stein T. Holden, Keijiro Otsuka, and Klaus Deininger, “Land Tenure Reforms, Poverty and Natural Resource Management: Conceptual Framework,” in Land Tenure Reform in Asia and Africa: Assessing the Impacts on Poverty and Natural Resource Management, ed. Stein T. Holden, Keijiro Otsuka and Klaus Deininger (Hampshire: Palgrave Macmillan, 2013), 7, https://doi.org/10.1057/9781137343819_1
(10) Abhijit Banerjee and Lakshmi Iyer, “History, Institutions, and Economic Performance: The Legacy of Colonial Land Tenure Systems in India,” The American
90
People: Robust Processes and Better Societies
Economic Review 95, no. 4 (2005): 1190-1213, https://www.aeaweb.org/articles?id=10.1257/0002828054825574
(11) Banerjee and Iyer, “History, Institutions, and Economic Performance: The Legacy of Colonial Land Tenure Systems in India”
(12) Banerjee and Iyer, “History, Institutions, and Economic Performance: The Legacy of Colonial Land Tenure Systems in India”; Besley and Burgess, “Land Reform, Poverty Reduction, and Growth: Evidence from India”
(13) Banerjee and Iyer, “History, Institutions, and Economic Performance: The Legacy of Colonial Land Tenure Systems in India”
(14) Flavia Lopes and Mridula Chari, “In 12 years, 11 states Changed Land Ceiling Laws in favour of Industry over Farmers,” India Spend, February 9, 2021, https://www.indiaspend.com/land-rights/in-12-years-11-states-changed-land-ceiling-laws-in-favour-of-industry-over-farmers-724650
(15) Holden, Otsuka, and Deininger, “Land Tenure Reforms, Poverty and Natural Resource Management: Conceptual Framework”
(16) Holden, Otsuka, and Deininger, “Land Tenure Reforms, Poverty and Natural Resource Management: Conceptual Framework”
(17) National Sample Survey Organisation, Ministry of Statistics and Programme Implementation, Government of India, Land and Livestock Holdings Survey 2013, NSSO 70th Round, http://microdata.gov.in/nada43/index.php/catalog/LLS
(18) Das and Srivastava, “Income inequality among agricultural households in India: A regression-based decomposition approach”
(19) Das and Srivastava, “Income inequality among agricultural households in India: A regression-based decomposition approach”
(20) Sanjay Chakravorty, S Chandrashekhar, and Karthikeya Naraparaju, “Income Generation and Inequality in India’s Agricultural Sector: The Consequences of Land Fragmentation,” Indira Gandhi Institute of Development Research, November 2016, http://www.igidr.ac.in/pdf/publication/WP-2016-028.pdf
(21) Foster and Rosenzweig, “Are there too many farms in the world? Labour Market Transaction Costs, Machine Capacities and Optimal Farm Size”
(22) Das and Srivastava, “Income inequality among agricultural households in India: A regression-based decomposition approach”
(23) “Are there too many farms in the world? New research on agricultural productivity in developing countries,” Yale Economic Growth Centre, January 2022, https://egc.yale.edu/research/rosenzweig-2022
(24) Ishrat Hussain, “Agriculture Land and Ceiling Laws in India: An Overview,” International Journal of Legal Developments and Allied Issues 5, no. 2 (2019): 26-46, https://thelawbrigade.com/land-laws/agriculture-land-and-ceiling-laws-in-india-an-overview/
PLANET: SYNERGISING ENTERPRISE, ENVIRONMENT
AND COMMUNITIES
Source: Jasmin Merdan/ Getty Images/ Royalty-free
Towards an Equitable and Sustainable Blue Economy in Australia
09
Tania Lado Insua, John Whittington, David Hope, and Irene Penesis
Towards an Equitable and Sustainable Blue Economy in Australia
93
As the world transitions towards an era of sustainability, new initiatives and opportunities relating to the sustainable use of the oceans are emerging.
Globally, 40 percent of the world’s population live within 150 km of the coast (1). However, in the case of Australia, this number is more than double, with 85 percent of Australians living in coastal regions (2). The country also holds the world’s third largest exclusive economic zone (EEZ), with 8.2 million sq km off Australia and 2 million sq km off the Australian Antarctic Territory (3).
While the advances of the modern world are providing new challenges and opportunities, the nature of Australia as an ocean country dates back thousands of years to its Traditional Owners from Aboriginal and Torres Strait Island background and the relation to ‘Country’, as land and sea connected in a holistic way (4). Australian culture, industry and livelihoods are strongly reliant on sustainable ocean use. Australia’s future, following its past, is linked to the ocean and to the development of its blue economy.
Importance of Sustainable Blue Economy
The World Bank defines the blue economy as the “sustainable use of ocean resources for economic growth, improved livelihoods and jobs, and ocean ecosystem health” (5). In Australia, the National Marine Science Plan’s Midway Report (6) refers to the blue economy as “an economy that manages Australia’s most valuable resources – our oceans and coasts – to deliver a healthy marine environment, strong economy and vibrant society”.
94
Planet: Synergising Enterprise, Environment and Communities
Many activities are considered part of the blue economy, such as renewable energy, fisheries and aquaculture, maritime transport, and tourism. These activities extend from coastal to offshore areas, and across national and international borders, making the management of the blue economy a global issue.
The global annual economic value generated by the ocean assets of the blue economy has been estimated at between US$1.5-2.5 trillion (7, 8). In 2018, a total of 338,974 jobs in Australia were related to the blue economy (9).
In 2015, Australia published its 10-year National Marine Science Plan with a focus on sustainability and recommendations for the development of Australia’s blue economy (10). With an estimated value of US$71 billion per annum (AUD$100 billion per annum) by 2025, Australia’s interest in the opportunities to grow the blue economy is increasing (11).
However, Australia is not alone in its aspirations for blue economic growth. In 2020, the High-Level Panel for a Sustainable Ocean Economy united 14 countries to facilitate solutions and develop an agenda for transitioning to a sustainable ocean economy (12). Five building blocks were agreed to develop such an economy (13)—(i) decision-making based on science and data; (ii), goal-oriented ocean planning; (iii) mobilisation of investments based on innovation and derisking finance; (iv) stopping land-based pollution; and (v) changing the ocean accounting to reflect the true value of the ocean. These considerations promote the principles and practice underlying the broader global agenda on sustainability.
The United Nations (UN) 2030 Agenda for Sustainable Development (14) proposed 17 Sustainable Development Goals (SDGs) and 169 targets as an action plan for prosperity with a focus on sustainable practices. The blue economy has components that link to most SDGs, but the most critical is SDG 14, which aims to “conserve and sustainably use the oceans, seas and marine resources for sustainable development” (15).
Across the globe, the alignment of ocean management with sustainability is becoming more apparent. The European Union is currently making the transition from the “blue growth” terminology and objectives to a “sustainable blue economy” (16), leaving behind non-sustainable practices and focussing on a transformation to the blue economy through the European Green Deal (17) that tackles climate and environmental-related challenges. A similar impetus for sustainable growth underlies the approach from other countries, including Australia (18).
Towards an Equitable and Sustainable Blue Economy in Australia
95
With the potential of generating six times more food and 40 times more renewable energy (19), unlocking the sustainable use of the ocean is a critical step to global sustainability.
The Blue Economy CRC: Underpinning the Growth of Australia’s Blue Economy
Aquaculture has been practised for centuries by Australia’s Traditional Owners, who have sustainably harvested and cultured Sea Country for millennia (20). Currently, Australian aquaculture has a gross value of AU$1.6 billion (US$1.16 billion) per year (21). Aquaculture gross value production (GVP) increased by 10 percent in 2019-20, accounting for 51 percent of the total fisheries-related GVP. This contrasts with a decrease of 12 percent GVP in wild-catch fisheries over the same period (22). Recognising the opportunities presented through the sustainable growth of aquaculture, Australia is investing in developing the engineering, technology, production practices, and regulatory environment to allow aquaculture to operate sustainably further offshore.
A critical component of a sustainable future is the shift towards renewable energy and decarbonisation of industry. Australia’s EEZ has some of the highest quality and abundance of marine related renewable energies (offshore wind, tidal, wave, ocean current, salinity gradient, and thermal energies) in the world. As an example, offshore wind in Australian waters is comparable to areas such as the North Sea where this resource is commonly used and has a well-established industry (23). The use of offshore renewable technologies in combination with other renewable energy sources, such as green hydrogen, can support the decarbonisation of complete industry sectors in the near future as the engineering and regulatory challenges are addressed.
The migration of the aquaculture sector to offshore waters requires new engineering designs that can address the specific needs of high-energy environments. There is a need to bring together industrial engineering expertise to collaborate with the offshore renewable energy and offshore aquaculture sectors.
As the aquaculture and renewable offshore energy sectors design new solutions, the environmental footprint of the infrastructure, farming systems and energy generation will need to be evaluated and monitored.
96
Planet: Synergising Enterprise, Environment and Communities
Many of the challenges experienced by the aquaculture sector and the offshore renewable energy sector in moving offshore are similar and related to their need for new and fit-for-purpose policy and legislative arrangements. These regulatory arrangements should support industry while ensuring that new technologies and processes emerging for high-energy environments are sustainable. This is challenging with ocean resources spanning multiple jurisdictions. For example, in Australia, state governments have jurisdiction over inshore waters to three nautical miles, while the Australian federal government has jurisdiction out to 200 nautical miles (24). There is a need for consultation and engagement across different sectors to develop management tools and regulatory frameworks that can be applied across borders.
As nations strengthen their alignment with the SDGs, national initiatives are emerging for active deliverables in the short-, medium- and long-term. In Australia, this is supported by increased investment in research and development to underpin sustainable growth. The Blue Economy Cooperative Research Centre (CRC) is an example of active research and training in the Australian blue economy sector.
The Blue Economy CRC is a 10-year initiative by 40 Australian and international partners across industry, research, and governmental organisations with a combined vision of aquaculture and renewable energy moving sustainably offshore to develop the blue economy (25). The Blue Economy CRC leverages connections between different sectors through five programmes: offshore engineering and technology; seafood and marine products; offshore renewable energy systems; environment and ecosystems; and sustainable offshore developments. The combination of strategic partners makes this initiative a holistic solution to the blue economy issues in Australia and is the country’s largest such initiative to date.
In its short life, the Blue Economy CRC has already completed 20 research projects and commissioned another 11 (26). In addition, 12 PhD scholarship projects have been commissioned thus far, which also cover a wide range of research topics. Through these projects, new research has started towards decarbonising the aquaculture industry by supplying clean power via green hydrogen and offshore renewable energy, new marine spatial planning tools are in use, two major policies are under consideration to develop offshore renewable energy initiatives and to farm the oceans sustainably in Commonwealth waters, and new technologies and engineering designs are under development for a more sustainable future.
Towards an Equitable and Sustainable Blue Economy in Australia
97
One Ocean for a Sustainable Future
As the UN Decade of Ocean Science for Sustainable Development (2021-2030) advances, there is a need to connect initiatives across the globe to support blue growth.
The impact of the COVID-19 pandemic has reinforced the need for reliable national food and energy production, has highlighted the limitations on supply chains across the globe, and the need for economic recovery. There is a significant opportunity to increase food and energy production while sustainably managing the oceans. This will require developing the skills of the new workforce that will support the blue economy into the future. Sustainable growth cannot be developed in isolation; it requires at a global level the combination of scientific and Traditional Knowledge; the co-development of regulatory frameworks by government, industry, academia and community; and, ultimately, the exploration of innovative solutions in harmony with the environment.
The Blue Economy CRC acknowledges the Traditional Custodians and Elders of the land and sea on
which we work and observe and recognise their unique connection to land and sea. We pay our respects
to Aboriginal and Torres Strait Islander peoples past, present and future. The authors acknowledge
the financial support of the Blue Economy CRC, established and supported under the Australian
Government’s CRC Program (Grant No. CRC-20180101). The CRC Program supports industry-led
collaborations between industry, researchers, and the community. The authors also wish to acknowledge
the support of all of their Partners (and their staff), the Board, and Research Program Leadership Team
for their ongoing commitment and collaboration in pursuing the goals of the Blue Economy CRC.
Endnotes
(1) Joel E. Cohen et al., “Estimates of coastal populations,” Science 278, no. 5341 (1997): 1209-1213, https://www.science.org/doi/full/10.1126/science.278.5341.1209c
(2) National Marine Science Committee, National Marine Science Plan 2015-2025: The Midway Point, NMSC, 2021, https://www.marinescience.net.au/midway/
(3) I. Penesis and J. Whittington, “Australia’s Blue Economy Cooperative Research Centre,” in Preparing a Workforce for the New Blue Economy: People, Products and Policies, ed. Liesl Hotaling and Rick Spinrad (Elsevier, 2021), 335-348, https://blueeconomycrc.com.au/book-chapter-published-preparing-a-workforce-for-the-new-blue-economy/
98
Planet: Synergising Enterprise, Environment and Communities
(4) National Oceans Office, Australian Marine Parks, Government of Australia, Sea Country – An Indigenous Perspective: The South-East Regional Marine Plan, 2002, https://parksaustralia.gov.au/marine/management/resources/scientific-publications/sea-country-indigenous-perspective/
(5) The World Bank, 2017, “What is the Blue Economy?” The World Bank Group, https://www.worldbank.org/en/news/infographic/2017/06/06/blue-economy
(6) “National Marine Science Plan 2015-2025: The Midway Point 2015-2015”
(7) Organisation for Economic Co-operation and Development, The Ocean Economy in 2030, Paris, OECD, 2016, https://www.oecd.org/environment/the-ocean-economy-in-2030-9789264251724-en.htm
(8) World Wild Fund for Nature, Baltic Ecoregion Programme - All Hands on Deck: Setting Course Towards a Sustainable Blue Economy, WWF, 2015, http://wwf.panda.org/?254101
(9) “National Marine Science Plan 2015-2025: The Midway Point”
(10) National Marine Science Committee, Government of Australia, National Marine Science Plan 2015-2025: Driving The Development of Australia’s Blue Economy, 2015, https://www.marinescience.net.au/nationalmarinescienceplan/
(11) United Nations Department of Economic and Social Affairs, “Transforming our world: the 2030 Agenda for Sustainable Development”, UNDESA, https://sdgs.un.org/2030agenda
(12) M.R. Stuchtey, A. Vincent, A. Merkl, M. Bucher et al., Ocean Solutions That Benefit People, Nature and the Economy, Washington, DC, World Resources Institute, 2020, www.oceanpanel.org/ocean-solutions
(13) “Ocean Solutions That Benefit People, Nature and the Economy”
(14) United Nations Sustainable Development Goals, Transforming our world: the 2030 Agenda for Sustainable Development, United Nations, 2016, https://sustainabledevelopment.un.org/post2015/transformingourworld/publication
(15) “Transforming our world: the 2030 Agenda for Sustainable Development”
(16) European Commission, “Communication from the Commission to the European Parliament, the Council, the European Economic and Social Committee and the Committee of the Regions on A New Approach for a Sustainable Blue Economy in The EU - Transforming The EU’s Blue Economy for a Sustainable Future,” Brussels, 2021, https://eur-lex.europa.eu/legal-content/EN/TXT/?uri=COM:2021:240:FIN
(17) European Commission, “Communication from the Commission to the European Parliament, the Council, the European Economic and Social Committee and the Committee of the Regions on The European Green Deal, Brussels, 2019, https://eur-lex.europa.eu/legal-content/EN/TXT/?uri=CELEX:52019DC0640
Towards an Equitable and Sustainable Blue Economy in Australia
99
(18) “Transforming our world: the 2030 Agenda for Sustainable Development”
(19) Christopher Costello, Ling Cao and Stefan Gelcich et al., The Future of Food from the Sea, Washington, DC, World Resources Institute, 2019 https://www.oceanpanel.org/blue-papers/future-food-sea
(20) “National Marine Science Plan 2015-2025: The Midway Point”
(21) A. Steven, M. Dylewski, and R. Curtotti, Australian fisheries and aquaculture statistics 2020, Canberra, Australian Bureau of Agricultural and Resource Economics and Sciences (ABARES), August 2021, https://doi.org/10.25814/0wzy-re76
(22) “Australian fisheries and aquaculture statistics 2020”
(23) C. Briggs, et al., Offshore Wind Energy in Australia, Launceston, Tasmania, Blue Economy Cooperative Research Centre, 2021, https://blueeconomycrc.com.au/offshore-wind-key-to-australias-clean-energy-future/
(24) “Australia’s Blue Economy Cooperative Research Centre”
(25) “Australia’s Blue Economy Cooperative Research Centre”
(26) Blue Economy Corporative Research Centre, Annual Report 2020-2021, Launceston, Tasmania, Blue Economy Cooperative Research Centre, 2021, https://blueeconomycrc.com.au/reports/
E-Mobility for a Sustainable World: Unavoidable Automobility and Global South-North Perspectives
10
Joyashree Roy and Shreya Some
E-Mobility for a Sustainable World: Unavoidable Automobility and Global South-North Perspectives
101
People and freight movement accounts for 15 percent of global greenhouse gas emissions (1). Not all mobility or even automobility demand can be fully avoided as it is the mobility service that connects
the point of demand and point of supply in an interdependent modern human society (see Figure 1 and Table 1). It is important then to consider how unavoidable automobility (mobility necessary to access services essential for human living) can be promoted bearing in mind the Sustainable Development Goals (SDGs), particularly SDG 7 (ensure access to affordable, reliable, sustainable and modern energy for all) and SDG 13 (take urgent action to combat climate change and its impacts) (2). Policymakers, spatial planners and service-delivery providers are the key actors to introduce any change related to mobility services, supplemented by information sharing to enhance user awareness and shape user behaviour (3). While digitalisation, information and communication, and interactive technologies may help in reimagining mobility services (4) their influence on the impact of mobility and energy demand on the environment is yet to be assessed (5).
Mobility is not just for the physical transportation of passengers but for goods as well. Societies with a high interdependence through import-export of goods lead to an increased demand for automobility. Importantly, 90 percent of all global freight movement is by ships that run on fossil fuels (6).
North-South Binary
Existing literature on collective sustainable living (7) and eco-modern justice (8) highlights the need for mainstream research to go beyond traditional binary representations to show equity, such as North-South, rich-poor, developed-developing, or Annex I- Non-Annex I countries. The north-south binary, which emerged amid globalisation from traditional political economy literature (9), trade
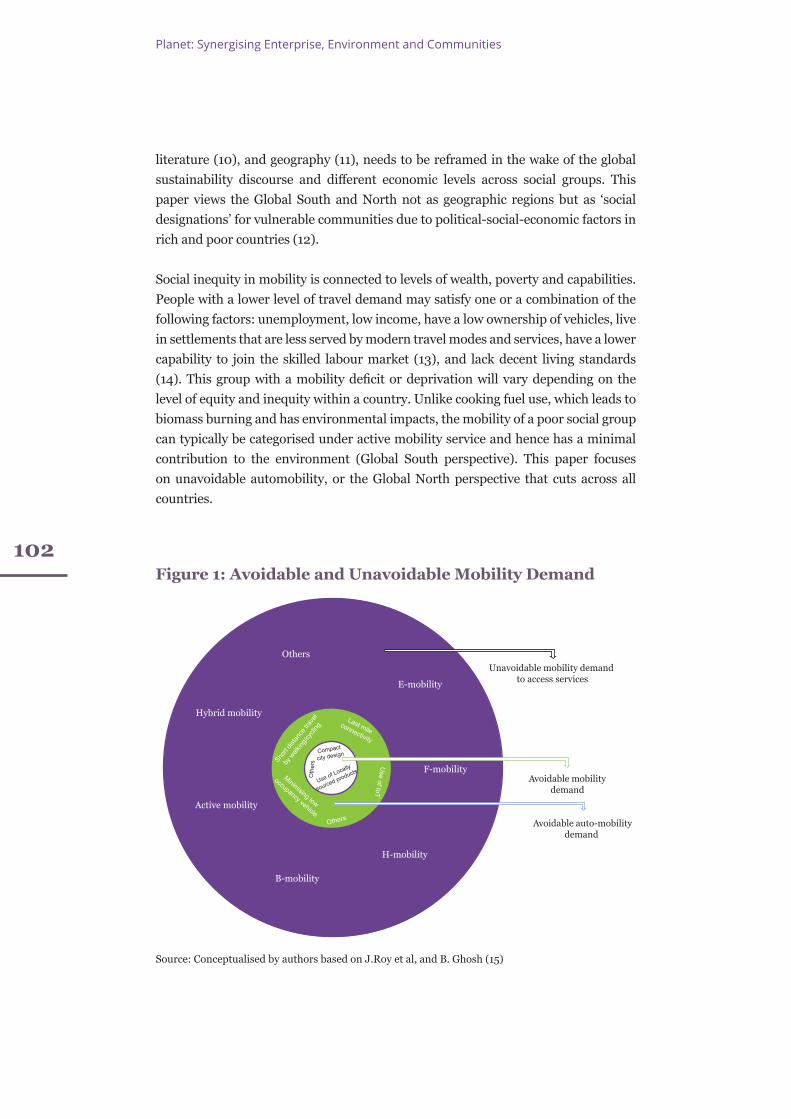
102
Planet: Synergising Enterprise, Environment and Communities
literature (10), and geography (11), needs to be reframed in the wake of the global sustainability discourse and different economic levels across social groups. This paper views the Global South and North not as geographic regions but as ‘social designations’ for vulnerable communities due to political-social-economic factors in rich and poor countries (12).
Social inequity in mobility is connected to levels of wealth, poverty and capabilities. People with a lower level of travel demand may satisfy one or a combination of the following factors: unemployment, low income, have a low ownership of vehicles, live in settlements that are less served by modern travel modes and services, have a lower capability to join the skilled labour market (13), and lack decent living standards (14). This group with a mobility deficit or deprivation will vary depending on the level of equity and inequity within a country. Unlike cooking fuel use, which leads to biomass burning and has environmental impacts, the mobility of a poor social group can typically be categorised under active mobility service and hence has a minimal contribution to the environment (Global South perspective). This paper focuses on unavoidable automobility, or the Global North perspective that cuts across all countries.
Figure 1: Avoidable and Unavoidable Mobility Demand
Source: Conceptualised by authors based on J.Roy et al, and B. Ghosh (15)
Unavoidable mobility demand to access services
Avoidable auto-mobilitydemand
Avoidable mobility demand
E-mobility
F-mobility
H-mobility
B-mobility
Active mobility
Hybrid mobility
Others
Short
distan
ce tr
avel
by w
alking
/cycli
ng
Last mileconnectivity
Minimising low
occupancy vehicle
Use of IoT
Others
Oth
ers
Compact
city design
Use of Locally
sourced products
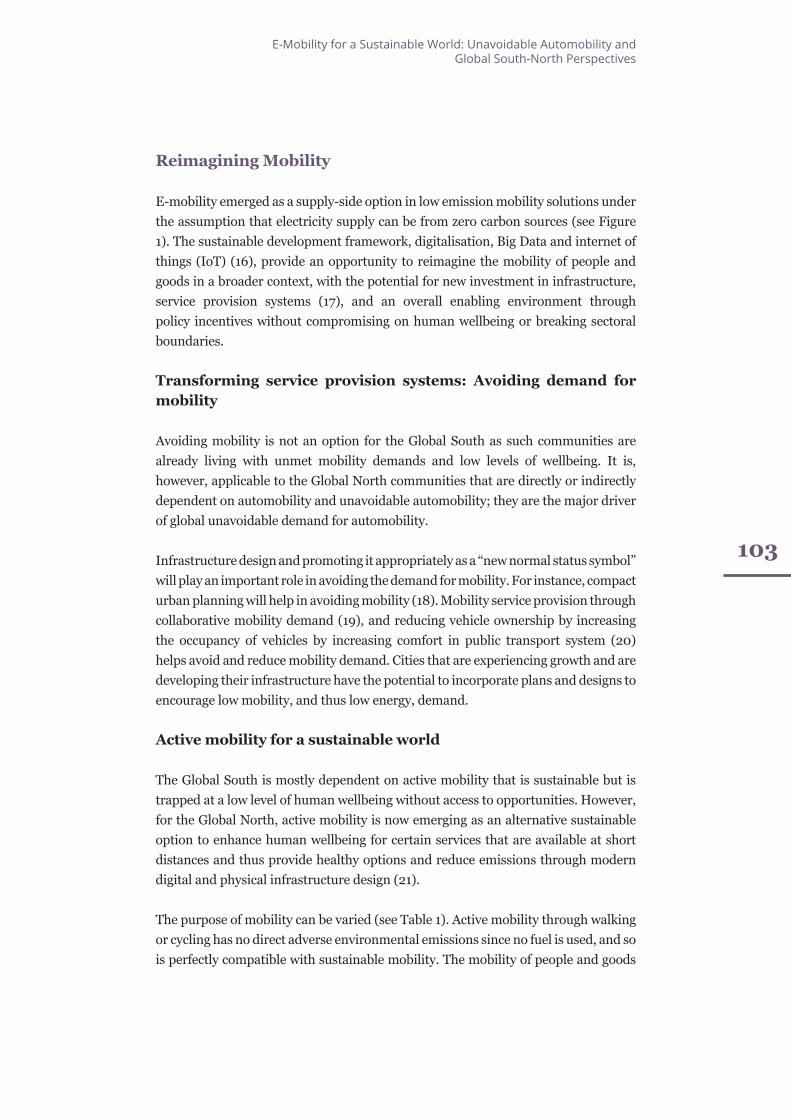
E-Mobility for a Sustainable World: Unavoidable Automobility and Global South-North Perspectives
103
Reimagining Mobility
E-mobility emerged as a supply-side option in low emission mobility solutions under the assumption that electricity supply can be from zero carbon sources (see Figure 1). The sustainable development framework, digitalisation, Big Data and internet of things (IoT) (16), provide an opportunity to reimagine the mobility of people and goods in a broader context, with the potential for new investment in infrastructure, service provision systems (17), and an overall enabling environment through policy incentives without compromising on human wellbeing or breaking sectoral boundaries.
Transforming service provision systems: Avoiding demand for mobility
Avoiding mobility is not an option for the Global South as such communities are already living with unmet mobility demands and low levels of wellbeing. It is, however, applicable to the Global North communities that are directly or indirectly dependent on automobility and unavoidable automobility; they are the major driver of global unavoidable demand for automobility.
Infrastructure design and promoting it appropriately as a “new normal status symbol” will play an important role in avoiding the demand for mobility. For instance, compact urban planning will help in avoiding mobility (18). Mobility service provision through collaborative mobility demand (19), and reducing vehicle ownership by increasing the occupancy of vehicles by increasing comfort in public transport system (20) helps avoid and reduce mobility demand. Cities that are experiencing growth and are developing their infrastructure have the potential to incorporate plans and designs to encourage low mobility, and thus low energy, demand.
Active mobility for a sustainable world
The Global South is mostly dependent on active mobility that is sustainable but is trapped at a low level of human wellbeing without access to opportunities. However, for the Global North, active mobility is now emerging as an alternative sustainable option to enhance human wellbeing for certain services that are available at short distances and thus provide healthy options and reduce emissions through modern digital and physical infrastructure design (21).
The purpose of mobility can be varied (see Table 1). Active mobility through walking or cycling has no direct adverse environmental emissions since no fuel is used, and so is perfectly compatible with sustainable mobility. The mobility of people and goods
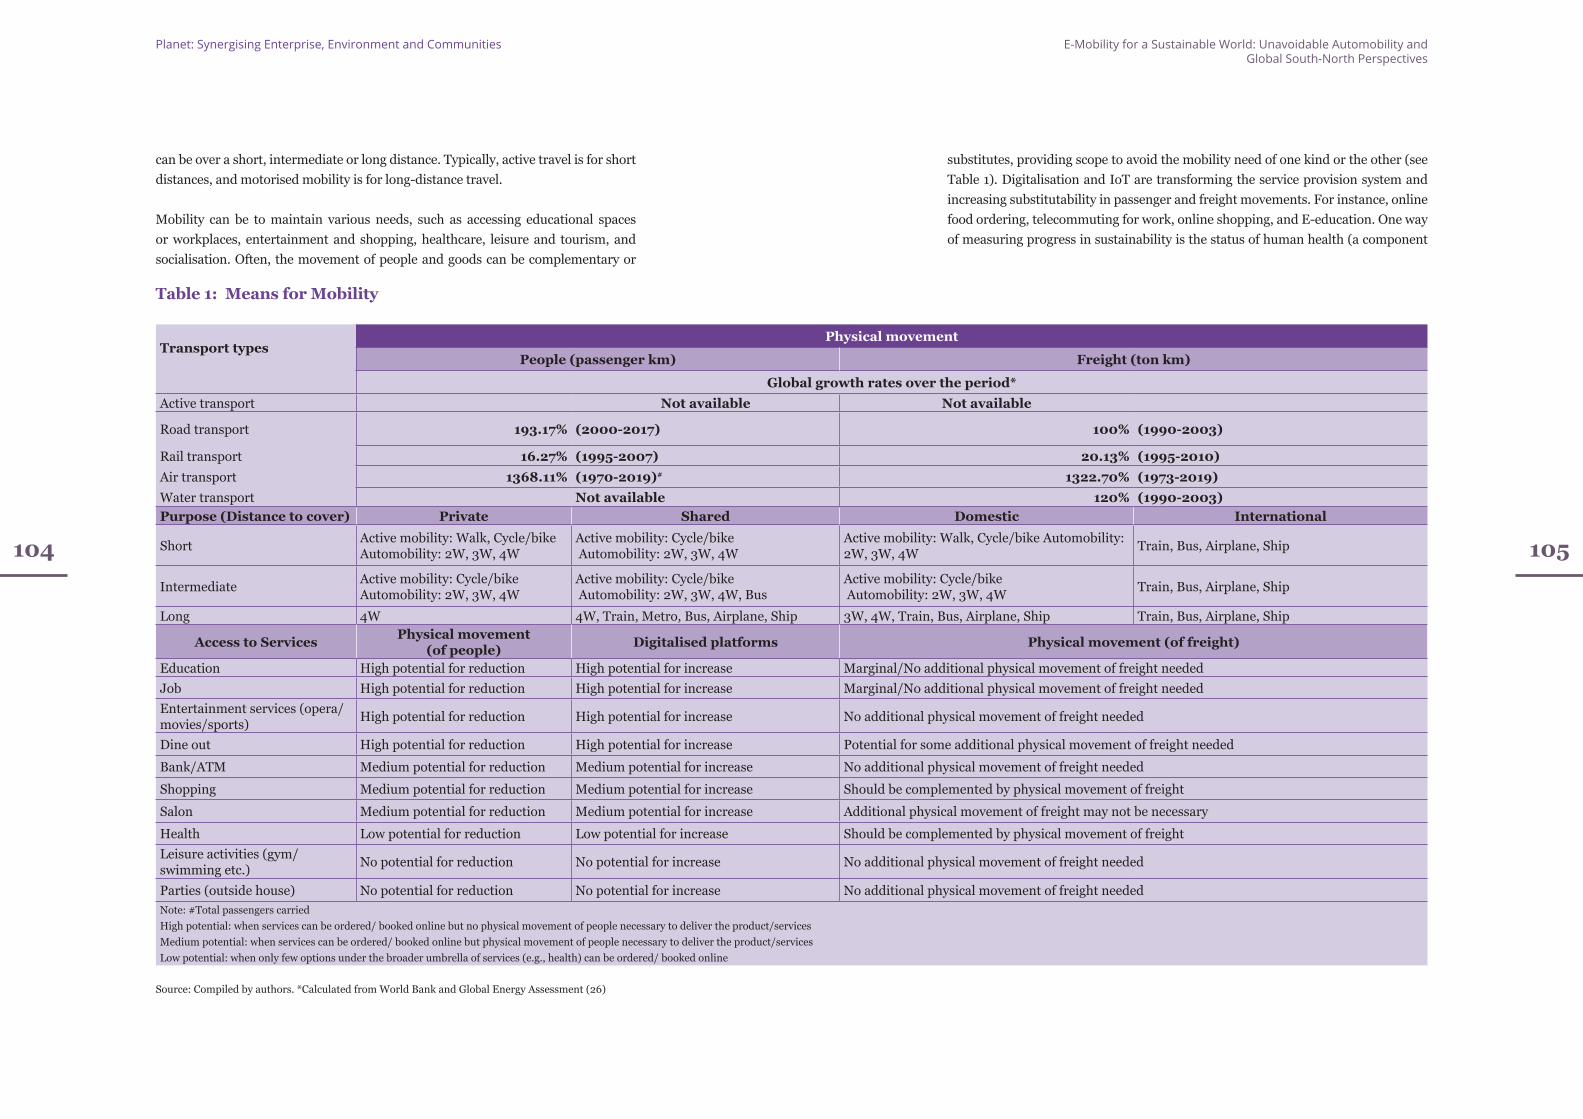
104
Planet: Synergising Enterprise, Environment and Communities E-Mobility for a Sustainable World: Unavoidable Automobility and Global South-North Perspectives
105
can be over a short, intermediate or long distance. Typically, active travel is for short distances, and motorised mobility is for long-distance travel.
Mobility can be to maintain various needs, such as accessing educational spaces or workplaces, entertainment and shopping, healthcare, leisure and tourism, and socialisation. Often, the movement of people and goods can be complementary or
Table 1: Means for Mobility
Transport typesPhysical movement
People (passenger km) Freight (ton km)
Global growth rates over the period*Active transport Not available Not available
Road transport 193.17% (2000-2017) 100% (1990-2003)
Rail transport 16.27% (1995-2007) 20.13% (1995-2010)Air transport 1368.11% (1970-2019)# 1322.70% (1973-2019)Water transport Not available 120% (1990-2003)Purpose (Distance to cover) Private Shared Domestic International
Short Active mobility: Walk, Cycle/bikeAutomobility: 2W, 3W, 4W
Active mobility: Cycle/bike Automobility: 2W, 3W, 4W
Active mobility: Walk, Cycle/bike Automobility: 2W, 3W, 4W Train, Bus, Airplane, Ship
Intermediate Active mobility: Cycle/bikeAutomobility: 2W, 3W, 4W
Active mobility: Cycle/bike Automobility: 2W, 3W, 4W, Bus
Active mobility: Cycle/bike Automobility: 2W, 3W, 4W Train, Bus, Airplane, Ship
Long 4W 4W, Train, Metro, Bus, Airplane, Ship 3W, 4W, Train, Bus, Airplane, Ship Train, Bus, Airplane, Ship
Access to Services Physical movement (of people) Digitalised platforms Physical movement (of freight)
Education High potential for reduction High potential for increase Marginal/No additional physical movement of freight neededJob High potential for reduction High potential for increase Marginal/No additional physical movement of freight neededEntertainment services (opera/movies/sports) High potential for reduction High potential for increase No additional physical movement of freight needed
Dine out High potential for reduction High potential for increase Potential for some additional physical movement of freight needed
Bank/ATM Medium potential for reduction Medium potential for increase No additional physical movement of freight needed
Shopping Medium potential for reduction Medium potential for increase Should be complemented by physical movement of freight
Salon Medium potential for reduction Medium potential for increase Additional physical movement of freight may not be necessary
Health Low potential for reduction Low potential for increase Should be complemented by physical movement of freightLeisure activities (gym/ swimming etc.) No potential for reduction No potential for increase No additional physical movement of freight needed
Parties (outside house) No potential for reduction No potential for increase No additional physical movement of freight neededNote: #Total passengers carriedHigh potential: when services can be ordered/ booked online but no physical movement of people necessary to deliver the product/servicesMedium potential: when services can be ordered/ booked online but physical movement of people necessary to deliver the product/servicesLow potential: when only few options under the broader umbrella of services (e.g., health) can be ordered/ booked online
Source: Compiled by authors. *Calculated from World Bank and Global Energy Assessment (26)
substitutes, providing scope to avoid the mobility need of one kind or the other (see Table 1). Digitalisation and IoT are transforming the service provision system and increasing substitutability in passenger and freight movements. For instance, online food ordering, telecommuting for work, online shopping, and E-education. One way of measuring progress in sustainability is the status of human health (a component
106
Planet: Synergising Enterprise, Environment and Communities
of multidimensional metrics used to measure human wellbeing) (22). Studies show life-cycle CO2 emission reduced by 14 percent with each additional cycle trip and by 62 percent with each avoided car trip (23). But such a shift in active mobility is determined by the availability of and access to infrastructure. Active mobility cannot happen in an urban centre if the city is not walkable by design (24). Thus, the overall demand for mobility might decline if managed strategically. But unless well-managed, it can lead to an increase in energy use and emissions as well (25).
Table 2: Adoption of E-Vehicles by Types
E-vehicle types Implementation in countriesE-bike (2W) China (27)E-rickshaw (3W) India (28)E-cars (4W) Norway, Iceland, Sweden, Finland (29)
E-buses China, India (30)E-trucks (freight) US (31)Electric trains/ metros/ underground rails
Hamburg (Germany) (32)
Electric cruise boats US, South Korea (33)Electric tram Kolkata, Mumbai (India) (34)
Source: Compiled by the authors
E-mobility for Unavoidable Mobility in a Sustainable World
How can unavoidable mobility needs be met in a sustainable world, immediately for the Global North and expanded in the future for the entire population? E-mobility, H-mobility (hydrogen fuel-driven mobility) and B-mobility (biofuel-driven mobility) can be the solution. The rise in the use of lithium-ion batteries has enabled E-mobility to become a major feature of decarbonisation (see Table 2).
In light duty vehicles, E-mobility through fully battery-operated vehicles instead of internal combustion engines are becoming a commercial reality faster than anticipated across the globe (35). This is due to changes in national policies, vehicle manufacturing companies adopting new business ventures, business prospects evolving due to change in company valuation, and innovation in mobility technologies (see Table 3).
In India, initiatives such as a massive expansion of metro-rail networks in multiple cities are promoting E-mobility. Rising liquid fuel costs and the ban on two-stroke
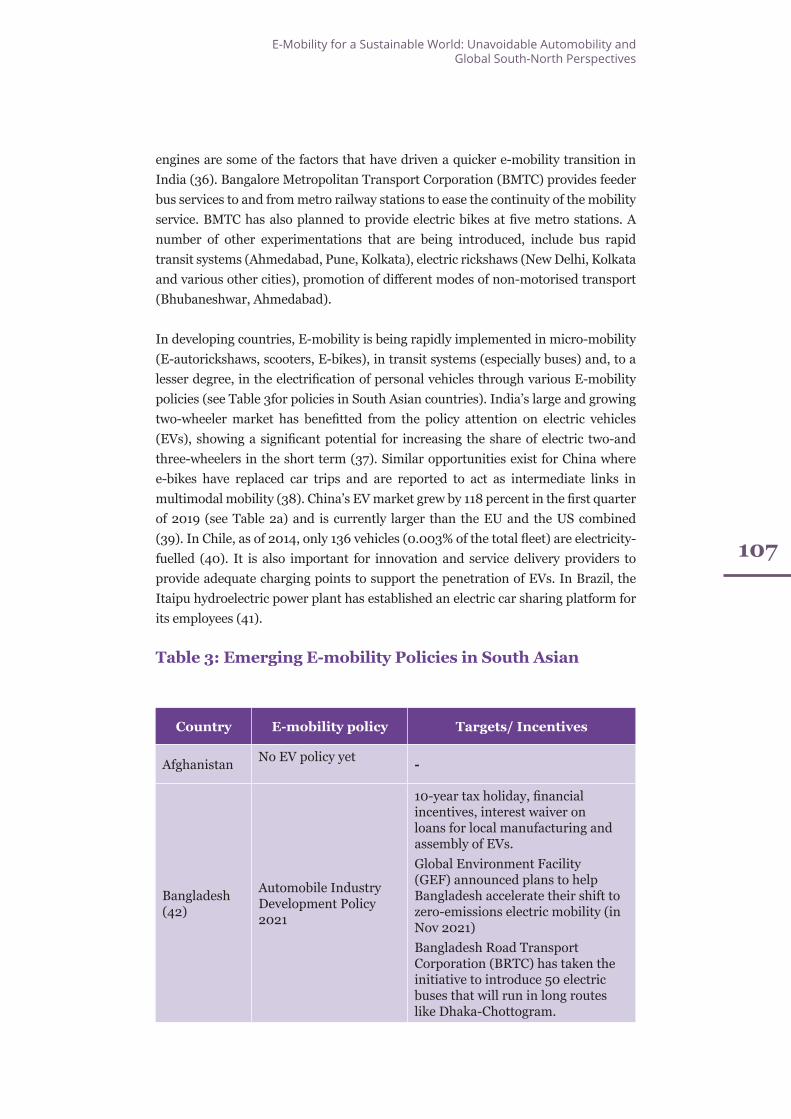
E-Mobility for a Sustainable World: Unavoidable Automobility and Global South-North Perspectives
107
engines are some of the factors that have driven a quicker e-mobility transition in India (36). Bangalore Metropolitan Transport Corporation (BMTC) provides feeder bus services to and from metro railway stations to ease the continuity of the mobility service. BMTC has also planned to provide electric bikes at five metro stations. A number of other experimentations that are being introduced, include bus rapid transit systems (Ahmedabad, Pune, Kolkata), electric rickshaws (New Delhi, Kolkata and various other cities), promotion of different modes of non-motorised transport (Bhubaneshwar, Ahmedabad).
In developing countries, E-mobility is being rapidly implemented in micro-mobility (E-autorickshaws, scooters, E-bikes), in transit systems (especially buses) and, to a lesser degree, in the electrification of personal vehicles through various E-mobility policies (see Table 3for policies in South Asian countries). India’s large and growing two-wheeler market has benefitted from the policy attention on electric vehicles (EVs), showing a significant potential for increasing the share of electric two-and three-wheelers in the short term (37). Similar opportunities exist for China where e-bikes have replaced car trips and are reported to act as intermediate links in multimodal mobility (38). China’s EV market grew by 118 percent in the first quarter of 2019 (see Table 2a) and is currently larger than the EU and the US combined (39). In Chile, as of 2014, only 136 vehicles (0.003% of the total fleet) are electricity-fuelled (40). It is also important for innovation and service delivery providers to provide adequate charging points to support the penetration of EVs. In Brazil, the Itaipu hydroelectric power plant has established an electric car sharing platform for its employees (41).
Table 3: Emerging E-mobility Policies in South Asian
Country E-mobility policy Targets/ Incentives
Afghanistan No EV policy yet -
Bangladesh (42)
Automobile Industry Development Policy 2021
10-year tax holiday, financial incentives, interest waiver on loans for local manufacturing and assembly of EVs.Global Environment Facility (GEF) announced plans to help Bangladesh accelerate their shift to zero-emissions electric mobility (in Nov 2021)Bangladesh Road Transport Corporation (BRTC) has taken the initiative to introduce 50 electric buses that will run in long routes like Dhaka-Chottogram.
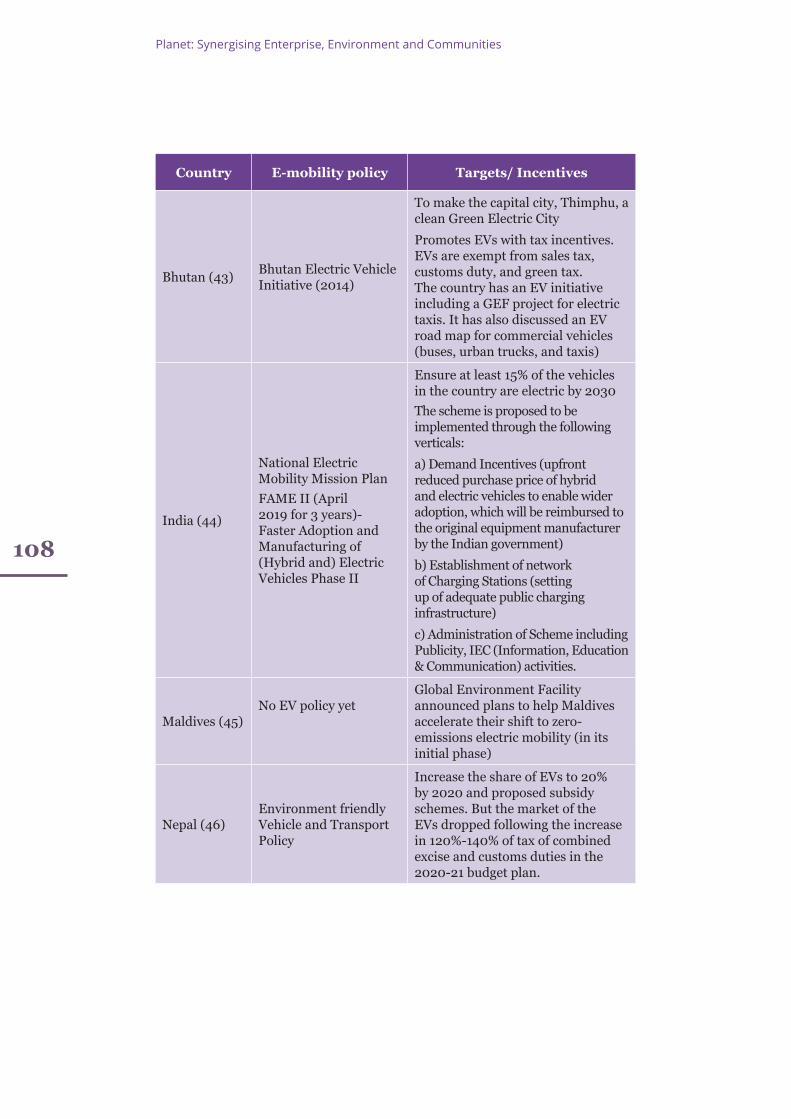
108
Planet: Synergising Enterprise, Environment and Communities
Country E-mobility policy Targets/ Incentives
Bhutan (43) Bhutan Electric Vehicle Initiative (2014)
To make the capital city, Thimphu, a clean Green Electric City
Promotes EVs with tax incentives. EVs are exempt from sales tax, customs duty, and green tax. The country has an EV initiative including a GEF project for electric taxis. It has also discussed an EV road map for commercial vehicles (buses, urban trucks, and taxis)
India (44)
National Electric Mobility Mission PlanFAME II (April 2019 for 3 years)- Faster Adoption and Manufacturing of (Hybrid and) Electric Vehicles Phase II
Ensure at least 15% of the vehicles in the country are electric by 2030The scheme is proposed to be implemented through the following verticals:
a) Demand Incentives (upfront reduced purchase price of hybrid and electric vehicles to enable wider adoption, which will be reimbursed to the original equipment manufacturer by the Indian government)
b) Establishment of network of Charging Stations (setting up of adequate public charging infrastructure)
c) Administration of Scheme including Publicity, IEC (Information, Education & Communication) activities.
Maldives (45)No EV policy yet
Global Environment Facility announced plans to help Maldives accelerate their shift to zero-emissions electric mobility (in its initial phase)
Nepal (46)Environment friendly Vehicle and Transport Policy
Increase the share of EVs to 20% by 2020 and proposed subsidy schemes. But the market of the EVs dropped following the increase in 120%-140% of tax of combined excise and customs duties in the 2020-21 budget plan.
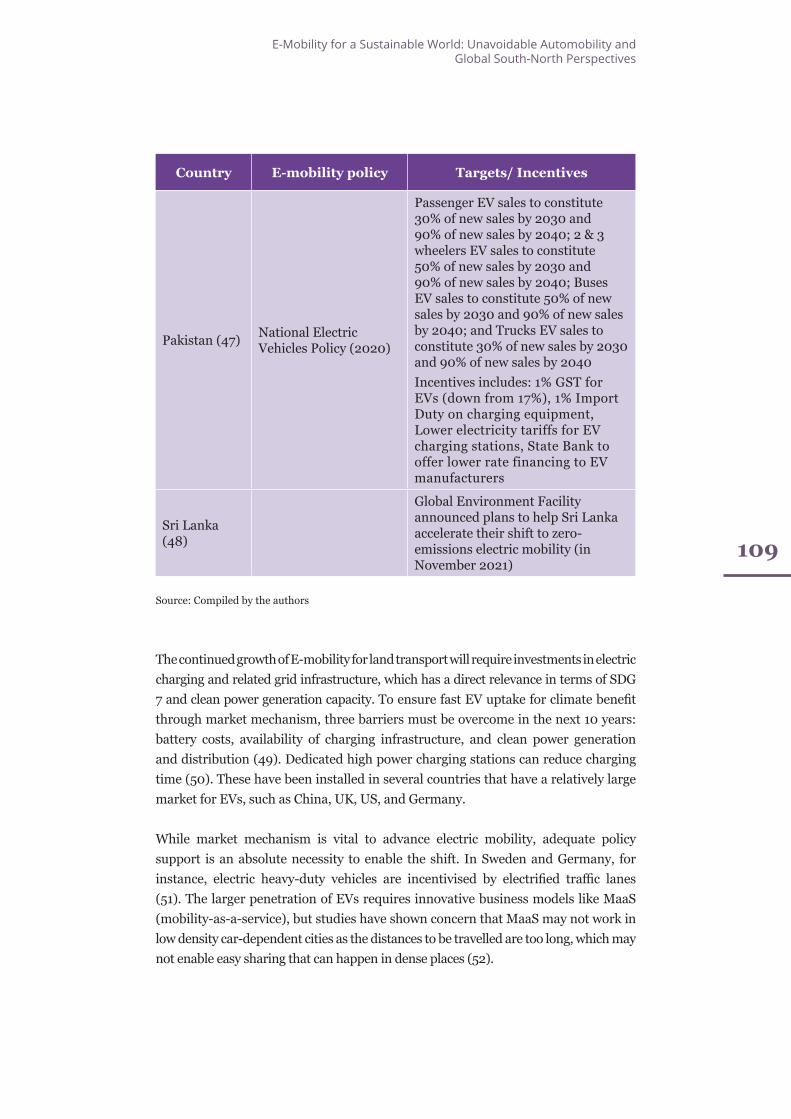
E-Mobility for a Sustainable World: Unavoidable Automobility and Global South-North Perspectives
109
Country E-mobility policy Targets/ Incentives
Pakistan (47) National Electric Vehicles Policy (2020)
Passenger EV sales to constitute 30% of new sales by 2030 and 90% of new sales by 2040; 2 & 3 wheelers EV sales to constitute 50% of new sales by 2030 and 90% of new sales by 2040; Buses EV sales to constitute 50% of new sales by 2030 and 90% of new sales by 2040; and Trucks EV sales to constitute 30% of new sales by 2030 and 90% of new sales by 2040Incentives includes: 1% GST for EVs (down from 17%), 1% Import Duty on charging equipment, Lower electricity tariffs for EV charging stations, State Bank to offer lower rate financing to EV manufacturers
Sri Lanka (48)
Global Environment Facility announced plans to help Sri Lanka accelerate their shift to zero-emissions electric mobility (in November 2021)
Source: Compiled by the authors
The continued growth of E-mobility for land transport will require investments in electric charging and related grid infrastructure, which has a direct relevance in terms of SDG 7 and clean power generation capacity. To ensure fast EV uptake for climate benefit through market mechanism, three barriers must be overcome in the next 10 years: battery costs, availability of charging infrastructure, and clean power generation and distribution (49). Dedicated high power charging stations can reduce charging time (50). These have been installed in several countries that have a relatively large market for EVs, such as China, UK, US, and Germany.
While market mechanism is vital to advance electric mobility, adequate policy support is an absolute necessity to enable the shift. In Sweden and Germany, for instance, electric heavy-duty vehicles are incentivised by electrified traffic lanes (51). The larger penetration of EVs requires innovative business models like MaaS (mobility-as-a-service), but studies have shown concern that MaaS may not work in low density car-dependent cities as the distances to be travelled are too long, which may not enable easy sharing that can happen in dense places (52).
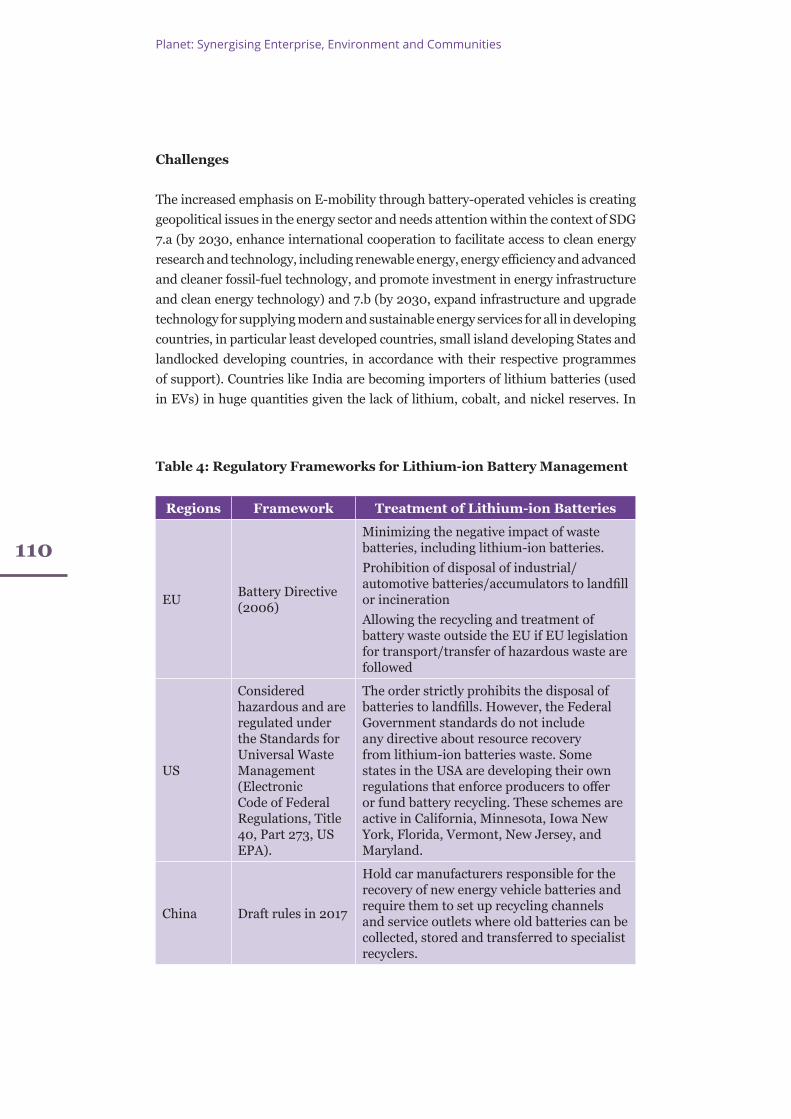
110
Planet: Synergising Enterprise, Environment and Communities
Challenges
The increased emphasis on E-mobility through battery-operated vehicles is creating geopolitical issues in the energy sector and needs attention within the context of SDG 7.a (by 2030, enhance international cooperation to facilitate access to clean energy research and technology, including renewable energy, energy efficiency and advanced and cleaner fossil-fuel technology, and promote investment in energy infrastructure and clean energy technology) and 7.b (by 2030, expand infrastructure and upgrade technology for supplying modern and sustainable energy services for all in developing countries, in particular least developed countries, small island developing States and landlocked developing countries, in accordance with their respective programmes of support). Countries like India are becoming importers of lithium batteries (used in EVs) in huge quantities given the lack of lithium, cobalt, and nickel reserves. In
Table 4: Regulatory Frameworks for Lithium-ion Battery Management
Regions Framework Treatment of Lithium-ion Batteries
EU Battery Directive (2006)
Minimizing the negative impact of waste batteries, including lithium-ion batteries. Prohibition of disposal of industrial/automotive batteries/accumulators to landfill or incinerationAllowing the recycling and treatment of battery waste outside the EU if EU legislation for transport/transfer of hazardous waste are followed
US
Considered hazardous and are regulated under the Standards for Universal Waste Management (Electronic Code of Federal Regulations, Title 40, Part 273, US EPA).
The order strictly prohibits the disposal of batteries to landfills. However, the Federal Government standards do not include any directive about resource recovery from lithium-ion batteries waste. Some states in the USA are developing their own regulations that enforce producers to offer or fund battery recycling. These schemes are active in California, Minnesota, Iowa New York, Florida, Vermont, New Jersey, and Maryland.
China Draft rules in 2017
Hold car manufacturers responsible for the recovery of new energy vehicle batteries and require them to set up recycling channels and service outlets where old batteries can be collected, stored and transferred to specialist recyclers.
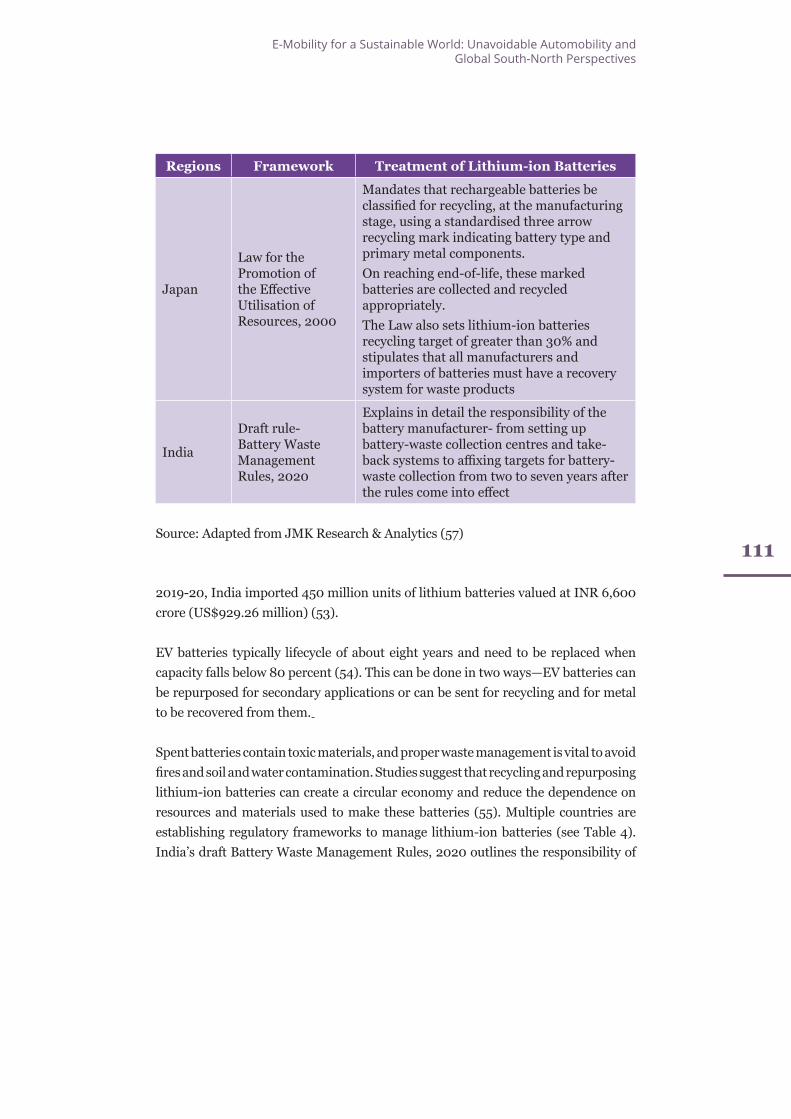
E-Mobility for a Sustainable World: Unavoidable Automobility and Global South-North Perspectives
111
2019-20, India imported 450 million units of lithium batteries valued at INR 6,600 crore (US$929.26 million) (53).
EV batteries typically lifecycle of about eight years and need to be replaced when capacity falls below 80 percent (54). This can be done in two ways—EV batteries can be repurposed for secondary applications or can be sent for recycling and for metal to be recovered from them.
Spent batteries contain toxic materials, and proper waste management is vital to avoid fires and soil and water contamination. Studies suggest that recycling and repurposing lithium-ion batteries can create a circular economy and reduce the dependence on resources and materials used to make these batteries (55). Multiple countries are establishing regulatory frameworks to manage lithium-ion batteries (see Table 4). India’s draft Battery Waste Management Rules, 2020 outlines the responsibility of
Regions Framework Treatment of Lithium-ion Batteries
Japan
Law for the Promotion of the Effective Utilisation of Resources, 2000
Mandates that rechargeable batteries be classified for recycling, at the manufacturing stage, using a standardised three arrow recycling mark indicating battery type and primary metal components. On reaching end-of-life, these marked batteries are collected and recycled appropriately. The Law also sets lithium-ion batteries recycling target of greater than 30% and stipulates that all manufacturers and importers of batteries must have a recovery system for waste products
India
Draft rule-Battery Waste Management Rules, 2020
Explains in detail the responsibility of the battery manufacturer- from setting up battery-waste collection centres and take-back systems to affixing targets for battery-waste collection from two to seven years after the rules come into effect
Source: Adapted from JMK Research & Analytics (57)
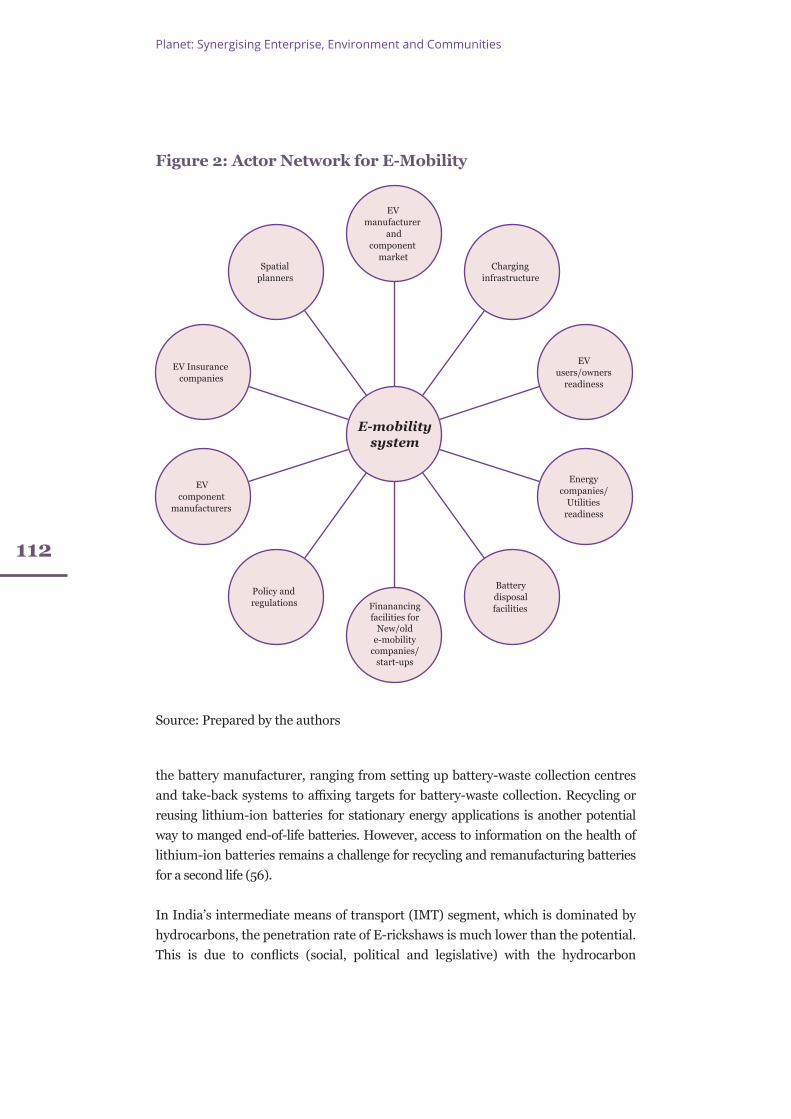
112
Planet: Synergising Enterprise, Environment and Communities
the battery manufacturer, ranging from setting up battery-waste collection centres and take-back systems to affixing targets for battery-waste collection. Recycling or reusing lithium-ion batteries for stationary energy applications is another potential way to manged end-of-life batteries. However, access to information on the health of lithium-ion batteries remains a challenge for recycling and remanufacturing batteries for a second life (56).
In India’s intermediate means of transport (IMT) segment, which is dominated by hydrocarbons, the penetration rate of E-rickshaws is much lower than the potential. This is due to conflicts (social, political and legislative) with the hydrocarbon
Figure 2: Actor Network for E-Mobility
Source: Prepared by the authors
E-mobilitysystem
EV manufacturer
and component
marketCharging
infrastructure
EV users/owners
readiness
Energy companies/
Utilities readiness
Battery disposal facilities
Policy and regulations
EV component
manufacturers
EV Insurance companies
Spatial planners
Finanancing facilities for
New/old e-mobility
companies/ start-ups
E-Mobility for a Sustainable World: Unavoidable Automobility and Global South-North Perspectives
113
regime along with varying cultural bias for rickshaws despite the fast technology development in this segment. E-rickshaw technology is readily available but policy inertia, institutional preparedness, competition with the incumbent technology based on hydrocarbons are causing delays in transforming the IMT segment (58).
Importantly, a deep electrification in the transport sector may have an adverse impact on SDG 7 because increases in electricity demand can lead to an increase in prices, adversely affecting the affordability of modern energy for poor populations, unless pro-poor redistributive policies are in place (59). Decarbonising the transport sector will require significant integrated planning of transport and power infrastructure and the involvement of multiple social actors (see Figure 2) for systemwide benefits.
Conclusion
Considering E-mobility in the context of the climate goal (SDG 13) will likely conflict with the aims of SDG 7 (ensuring access to affordable, reliable, sustainable, and modern energy for all). Mobility-poor social groups can be categorised under active mobility service users and hence have a minimal impact on the environment. Social inequity in modern energy and mobility is connected to levels of wealth, poverty and capability. Viewing the Global South and North not as geographic regions but as ‘social designations’ for vulnerable communities provides a useful analytical framing—the Global South community has active mobility users with a minimum direct contribution to the environment but has less access to modern energy to meet the wellbeing needs. Global South as a social group that is living with low purchasing power, energy poverty and mobility deficit and is mostly dependent on active mobility, have the rights to enhance mobility and access to modern energy. At the same time, the automobility needs of the Global North have increased manifold in recent decades.
Mobility per se is not a problem, and can be better for health outcomes and overall human wellbeing (SDG 3) if it is in active mode. The overall demand for mobility can lead to an increase in energy use and emissions, unless managed properly. E-mobility is one solution.
Policymaking must keep abreast with this shift and to transform mobility practices. The growth in active mobility and its ability to replace automobility should be quantified to get an idea of avoidable and unavoidable mobility. Research must focus on the various social groups and particularly on the transition for the Global North. A systemic approach is needed to transition from fossil fuel-mobility to E-mobility in the Decade of Action.
114
Planet: Synergising Enterprise, Environment and Communities
Endnotes
(1) International Energy Agency,Tracking Transport 2020,Paris, IEA, 2020, https://www.iea.org/reports/tracking-transport-2020.
(2) UN Sustainable Development Goals, “Global indicator framework for the Sustainable Development Goals and targets of the 2030 Agenda for Sustainable Development”, https://unstats.un.org/sdgs/indicators/indicators-list/
(3) Joyashree Roy et al., “Demand side climate change mitigation actions and SDGs: literature review with systematic evidence search,” Environmental Research Letters, 2021, https://iopscience.iop.org/article/10.1088/1748-9326/abd81a/pdf
(4) “Demand side climate change mitigation actions and SDGs: literature review with systematic evidence search”
(5) Jens Malmodin and Dag Lundén, “The energy and carbon footprint of the global ICT and E & M sectors 2010- 2015” Sustain., (2018). doi:10.3390/su10093027; G. Cook, G. et al., “Clicking clean: Who is winning the race to build a green internet?” Greenpeace Inc., (2017)
(6) Madhubani Ghosh and Joyashree Roy, “Climate action and maritime business education: the pedagogy of experiential learning,” IIRE Journal of Maritime Research & Development 3, No. 2 (2019).
(7) Bronwyn Hayward and Joyashree Roy, “Sustainable living: bridging the north-south divide in lifestyles and consumption debates,” Annual Review of Environment and Resources, No. 44 (2018).
(8) J. Roy and Foreman, “Ecomodern Justice”, Breakthrough Dialogue 2021, (2021). https://thebreakthrough.org/journal/no-14-summer-2021/ecomodern-justice-summer-issue-intro
(9) Charlie Dannreuther and Rohit Lekhi, “Globalization and the political economy of risk,” A Review of International Political Economy 7, no. 4 (2002).
(10) Bernhard Gunter and Rolph Van der Hoeven, “The social dimension of globalization,” A review of the Literature.” Int’l Lab. Rev 143, (2004).
(11) James Faulconbridge and Jonathan Beaverstock, “Globalization: Interconnected Worlds” in Key Concepts of Geography, ed. Sarah Holloway (London: Sage, 2008), 331-343.
(12) David Naguib-Pellow, Resisting Global Toxics: Transnational Movements for Environmental Justice (Cambridge, MA: MIT Press, 2007); Lucy Bell, “Place, people and processes in waste theory: a global South critique” Cultural Studies 33, No. 1(2019), 98-121; Hayward and Roy, “Sustainable living: bridging the north-south divide in lifestyles and consumption debates”
(13) Pengjun Zhao and Z Yu, “Rural poverty and mobility in China: A national-level survey,”
E-Mobility for a Sustainable World: Unavoidable Automobility and Global South-North Perspectives
115
Journal of Transport Geography 93, No. 103083 (2021).
(14) Felix Creutzig et al., “Towards demand-side solutions for mitigating climate change,” Nature Climate Change 8, No. 4 (2018), 260-263; Oswald, Y., A. et al., “Large inequality in international and intranational energy footprints between income groups and across consumption categories”. Nat. Energy, No. 5 (2020), 231– 239,
(15) Joyashree Roy et al., “Demand side climate change mitigation actions and SDGs: literature review with systematic evidence search”; B. Ghosh, “Transformation beyond experimentation: sustainability transitions in megacities” (PhD diss., University of Sussex, 2019), pp 99-120
(16) S. Liyanage et al., “Flexible mobility on-demand: An environmental scan,” Sustainability 11, No.5 (2019).
(17) Felix Creutzig et al., “A typology of 100,000 publications on demand, services and social aspects of climate change mitigation,” Environmental Research Letters 16, No. 3 (2021).; Creutzig et al., “Towards demand-side solutions for mitigating climate change,” Environmental Research Letters 16, No. 3 (2021); Roy et al., “Demand side climate change mitigation actions and SDGs: literature review with systematic evidence search,” Environmental Research Letters 16, No.4 (2021), pp 32.
(18) Joyashree Roy et al., “Demand side climate change mitigation actions and SDGs: literature review with systematic evidence search,” Environmental Research Letters 16, No.4 (2021), pp 32.
(19) Sohani Liyanage et al., “Flexible mobility on-demand: An environmental scan,” Sustainability 11, No. 5 (2019), 1262.
(20) Bipashyee Ghosh, “Transformation beyond experimentation: sustainability transitions in megacities” (PhD diss., University of Sussex, 2019), pp 99-120 “Demand side climate change mitigation actions and SDGs: literature review with systematic evidence search,” Environmental Research Letters 16, No.4 (2021), pp 32.
(21) Joyashree Roy et al., “Demand side climate change mitigation actions and SDGs: literature review with systematic evidence search,” Environmental Research Letters 16, No.4 (2021), pp 3; Liyanage et al., “Flexible mobility on-demand: An environmental scan,”Sustainability 11, no. 5 (2019), 1262
(22) UNESCO, Report of the Inter-agency and Expert Group on Sustainable Development Goal Indicators, New York, United Nations (2017), pp 49. http://unstats.un.org/sdgs/iaeg-sdgs/; UNFCCC, Sustainable Development Goals Knowledge Platform, New York, UNFCC (2015), https://sustainabledevelopment.un.org/?menu=1300
(23) Christian Brand et al., “The climate change mitigation effects of daily active travel in cities,” Transportation Research Part D: Transport and Environment 93, (2021).
(24) Priyadarshi Shukla et al., “Electric Vehicles Scenarios and a Roadmap for India”, UNEP DTU Partnership (2014).
116
Planet: Synergising Enterprise, Environment and Communities
https://backend.orbit.dtu.dk/ws/portalfiles/portal/104752085/Electric_Vehicle_Scenarios_and_a_R oadmap_for_India_upload.pdf; Roy et al., “Demand side climate change mitigation actions and SDGs: literature review with systematic evidence search,” Environmental Research Letters 16, No.4 (2021).
(25) Erol Gelenbe and Yves Caseau, “The impact of information technology on energy consumption and carbon emissions,” Ubiquity, (2015), 1-15; G. Cook, G. et al., Clicking clean: Who is winning the race to build a green internet?, Amsterdam, Greenpeace Group, 2020, https://www.actu-environnement.com/media/pdf/news-28245-clicking-clean-2017.pdf
(26) World Bank, “World Development Indicators, Railways, passengers carried (million passenger-km) – World (2021a)”, https://data.worldbank.org/indicator/IS.RRS.PASG.KM?locations=IN-1W; World Bank, “World Development Indicators, Railways, goods transported (million ton-km) – World (2021b)”, https://data.worldbank.org/indicator/IS.RRS.GOOD.MT.K6?locations=1W; World Bank, “World Development Indicators, Air transport, freight (million ton-km) – World (2021c)”, https://data.worldbank.org/indicator/IS.AIR.GOOD.MT.K1?locations=1W; World Bank, “World Development Indicators, Air transport, passengers carried – World (2021d)”, https://data.worldbank.org/indicator/IS.AIR.PSGR?locations=1W; Global Energy Assessment, “Global Energy Assessment - Toward a Sustainable Future,” Cambridge University Press and International Institute for Applied Systems Analysis, 2012, https://previous.iiasa.ac.at/web/home/research/Flagship-Projects/Global-Energy-Assessment/Home-GEA.en.html
(27) “The global electric bike market is projected to grow from $18.58 billion in 2021 to $52.36 billion in 2028 at a CAGR of 16.0% in forecast period, 2021-2028,” Fortune Business Insights, https://www.fortunebusinessinsights.com/electric-e-bike-market-102022
(28) “India Electric Rickshaw (E-Rickshaw) Market: Insights and Forecast up to 2030,” Benzinga, November 29, 2021, https://www.benzinga.com/pressreleases/21/11/24326622/india-electric-rickshaw-e-rickshaw-market-insights-and-forecast-up-to-2030
(29) “These countries have the most electric cars; check list,” Livemint, August 12, 2021, https://www.livemint.com/auto-news/global-evs-sale-climbs-up-here-s-list-of-countries-with-most-electric-cars-11628745051665.html
(30) Department of Heavy Industry, Ministry of Heavy Industries & Public Enterprises, Government of India, “Operational guidelines for Delivery of Demand Incentive Under FAME India Scheme”, December 2019, https://www.dhi.nic.in/writereaddata/fame/famedepository/19-E__didm_WriteReadData_userfiles_guideline.pdf; “India Electric Rickshaw (E-Rickshaw) Market”
(31) “Electric Truck Market Size, Share & Trends Analysis Report By Vehicle Type (Battery Electric Trucks, Hybrid Trucks), By Region, And Segment Forecasts, 2020 – 202,” Grand View Research, September 2020, https://www.grandviewresearch.com/
E-Mobility for a Sustainable World: Unavoidable Automobility and Global South-North Perspectives
117
industry-analysis/electric-trucks-market
(32) “Get to your destination with renewable power,” Deutschebahn, https://gruen.deutschebahn.com/en/measures/ice
(33) Mordor Intelligence Industry Reports, “Electric boat and ship market - growth, trends, covid-19 impact, and forecast (2022 - 2027),” Mordor Intelligence, https://www.mordorintelligence.com/industry-reports/electric-boat-and-shipmarket
(34) Sumit Banerjee, “Kolkata was the first city in Asia to get the electric tram!,” Get Bengal, March 4, 2020, https://www.getbengal.com/d e t a i l s / k o l k a t a - w a s - t h e - f i r s t - c i t y - i n - a s i a - t o - g e t - t h e - e l e c t r i c - t r a m (35) Niklas Höhne et at., “A seismograph for measuring the transformation to net zero greenhouse gas emissions–discussion paper,” New Climate Institute, (2021). https://datadrivenlab.org/wpcontent/uploads/2021/11/DiscussionPaper_Transformation-seismograph_Nov21.pdf
(36) “Operational guidelines for Delivery of Demand Incentive Under FAME India Scheme”
(37) Sohail Ahmad and Felix Creutzig, “Spatially contextualized analysis of energy use for commuting in India,” Environmental Research Letters 14, No. 4 (2019), doi:10.1088/1748-9326/ab011f.
(38) Christopher R. Cherry et al., “Dynamics of electric bike ownership and use in Kunming, China,” Transport Policy 45, (2016), 127-135
(39) Joyashree Roy et al., Critical Junctions on the Journey to 1.5°C: The Decisive Decade, London/The Hague, Climate Strategies, 2021
(40) Girard Aymeric & Simon François, “Case study for Chile: The electric vehicle penetration in Chile,” Electric Vehicles: Prospects and Challenges, (2017), 245-285.
(41) Adam Vanzella et al., “Move: test case for electric carsharing at Itaipu” (paper presented at 21st International Conference on Intelligent Transportation System, 2018).
(42) Ashraf Hossain Bhuiyan, “Electric-mobility in Bangladesh prospects and possibilities,” Financial Express, October 8, 2021, https://thefinancialexpress.com.bd/views/electric-mobility-in-bangladesh-prospects-and-possibilities-1633702313
(43) Lhaba Tshering, “Bhutan Electric Vehicle Initiative” (paper presented at the BAQ Conference, Colombo, Sri Lanka, November 2014) https://www.uncrd.or.jp/content/documents/22548EST-P2_Bhutan.pdf
(44) Government of India, Faster adoption and manufacturing of hybrid and electric vehicles Phase II (FAME II)
(45) UN Environment Programe, “UN-led partnership to accelerate electric mobility shift in 27 countries,” UNEP, November 10, 2021, https://www.unep.org/news-and-stories/press-release/un-led-partnership-accelerate-electric-mobility-shift-27-countries
(46) “This is how Nepal should improve its electric vehicle policies” OnlineKhabar, 2021,
118
Planet: Synergising Enterprise, Environment and Communities
https://english.onlinekhabar.com/electric-vehicle-policies-nepal.html
(47) Moaz Uddin, comment on “Pakistan’s national electric vehicle policy”, The International Council on Clean Transportation, January 10, 2020, https://theicct.org/pakistans-national-electric-vehicle-policy-charging-towards-the-future/
(48) UNEP, “UN-led partnership to accelerate electric mobility shift in 27 countries”
(49) “Critical Junctions on the Journey to 1.5°C: The Decisive Decade”
(50) Priyadarshi Shukla et al., “Electric Vehicles Scenarios and a Roadmap for India”
(51) “Critical Junctions on the Journey to 1.5°C: The Decisive Decade”
(52) Peraphan Jittrapirom et al., “Mobility as a service: A critical review of definitions, assessments of schemes, and key challenges.” Urban Planning (2017). https://www.cogitatiopress.com/urbanplanning/article/view/931
(53) Ministry of Science and Technology, Government of India, Lok Sabha UNSTARRED QUESTION No.1018, http://164.100.24.220/loksabhaquestions/annex/173/AU1018.pdf
(54) Nikhil Ghanekar, “India faces two major challenges in its transition to electric vehicles,.” Scroll, April 25, 2021, https://scroll.in/article/992703/india-faces-two-major-challenges-in-its-transition-to-electric-vehicles
(55) JMK Research & Analytics, “Recycling of lithium-ion batteries in India- $1,000 million opportunity.” (2019). https://jmkresearch.com/electric-vehicles-published-reports/recycling-of-lithium-ion-batteries-in-india1000-million-opportunity/; Lohani, “Recycling Li-ion batteries: Opportunities and challenges.” (2020). https://www.orfonline.org/expert-speak/recycling-liion-batteries-opportunities-challenges-68409/
(56) Leil Ahmadi et al., “A cascaded life cycle: reuse of electric vehicle lithium-ion battery packs in energy storage systems,” The International Journal of Life Cycle Assessment 22, No. 1 (2017), 111-124.
(57) JMK Research & Analytics, “Recycling of lithium-ion batteries in India- $1,000 million opportunity.”
(58) Joyashree Roy et al., “Where is the hope? Blending modern urban lifestyle with cultural practices in India,” Current Opinion in Environmental Sustainability 31, (2018), 96-103. (59) Carmen Klausbruckner et al., “A policy review of synergies and trade-offs in South African climate change mitigation and air pollution control strategies,” Environmental Science & Policy 57, (2016), 70-7
Valuing Nature’s Contribution
11
Madhu Verma and Asi Guha
120
Planet: Synergising Enterprise, Environment and Communities
Nature provides a wide range of contributions to human quality of life, from life support systems to spiritual and scientific inspiration (1). The Intergovernmental Science-Policy Platform on
Biodiversity and Ecosystem Services (IPBES), which assesses the state of biodiversity and the resultant ecosystem services it provides society (or, in other words, the benefits derived from various ecosystems), has provided a new nomenclature to describe ecosystem services—nature’s contributions to people (NCPs). NCPs encompass all contributions, positive and negative, of living nature—such as the diversity of organisms, ecosystems, and the associated ecological and evolutionary processes—to the quality of human life. Beneficial contributions from nature include food provision, water purification, flood control, and artistic inspiration. On the other hand, detrimental contributions include disease transmission and predation that damages people or their assets. Importantly, several NCPs may be perceived as benefits or detriments depending on the cultural, temporal, or spatial context (2). For example, the provision of food and water can be considered as benefits, while extreme events like tropical storms and the spread of pest-borne diseases are detrimental to human wellbeing.
While people are aware of the uses of nature, its value has not yet translated into a mindset or habit change among them. Traditional accounting systems like the gross domestic product (GDP) often fail to measure human wellbeing (3). Therefore, the assessment of economic performance does not take natural capital and ecosystem services emanating from them into consideration. This results in a structural imbalance where nature is exploited to create wealth (4).
The value of nature can be estimated from different perspectives using dissimilar frameworks. The difference in methodology often leads to significant deviation in the findings. For instance, while estimating carbon sequestration, the social cost of carbon can be as high as US$86 per ton (5) while another method puts the market
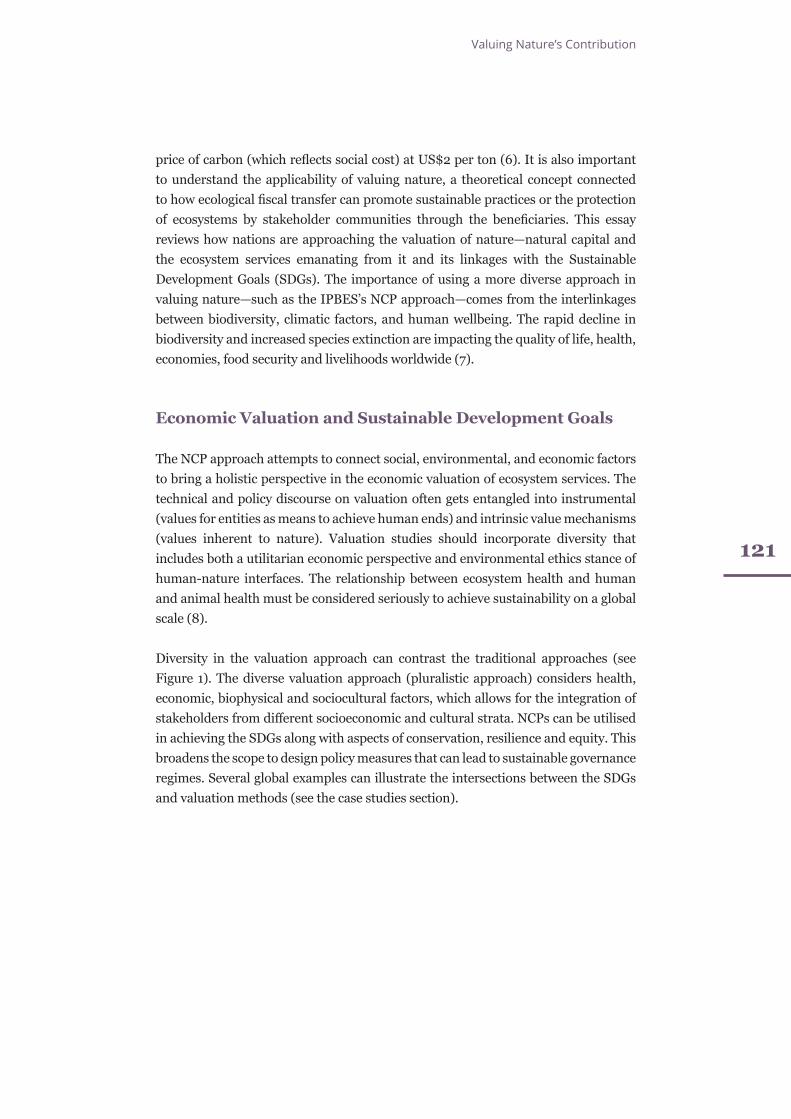
Valuing Nature’s Contribution
121
price of carbon (which reflects social cost) at US$2 per ton (6). It is also important to understand the applicability of valuing nature, a theoretical concept connected to how ecological fiscal transfer can promote sustainable practices or the protection of ecosystems by stakeholder communities through the beneficiaries. This essay reviews how nations are approaching the valuation of nature—natural capital and the ecosystem services emanating from it and its linkages with the Sustainable Development Goals (SDGs). The importance of using a more diverse approach in valuing nature—such as the IPBES’s NCP approach—comes from the interlinkages between biodiversity, climatic factors, and human wellbeing. The rapid decline in biodiversity and increased species extinction are impacting the quality of life, health, economies, food security and livelihoods worldwide (7).
Economic Valuation and Sustainable Development Goals
The NCP approach attempts to connect social, environmental, and economic factors to bring a holistic perspective in the economic valuation of ecosystem services. The technical and policy discourse on valuation often gets entangled into instrumental (values for entities as means to achieve human ends) and intrinsic value mechanisms (values inherent to nature). Valuation studies should incorporate diversity that includes both a utilitarian economic perspective and environmental ethics stance of human-nature interfaces. The relationship between ecosystem health and human and animal health must be considered seriously to achieve sustainability on a global scale (8).
Diversity in the valuation approach can contrast the traditional approaches (see Figure 1). The diverse valuation approach (pluralistic approach) considers health, economic, biophysical and sociocultural factors, which allows for the integration of stakeholders from different socioeconomic and cultural strata. NCPs can be utilised in achieving the SDGs along with aspects of conservation, resilience and equity. This broadens the scope to design policy measures that can lead to sustainable governance regimes. Several global examples can illustrate the intersections between the SDGs and valuation methods (see the case studies section).
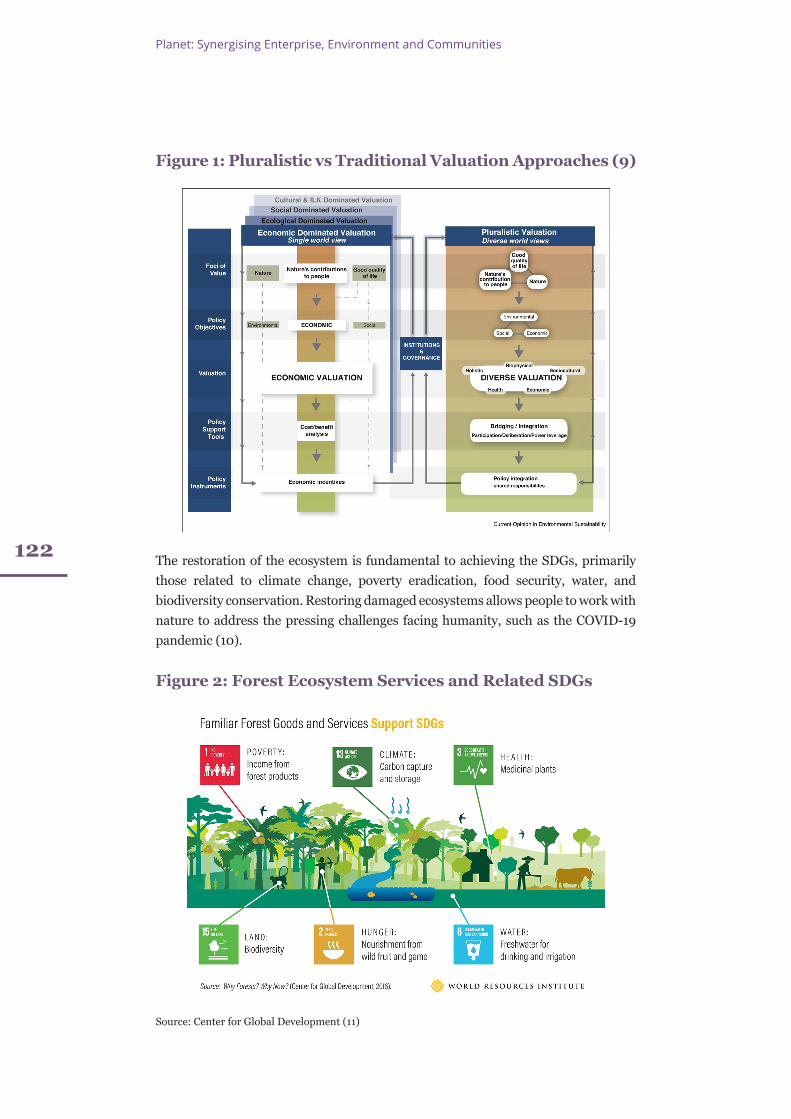
122
Planet: Synergising Enterprise, Environment and Communities
The restoration of the ecosystem is fundamental to achieving the SDGs, primarily those related to climate change, poverty eradication, food security, water, and biodiversity conservation. Restoring damaged ecosystems allows people to work with nature to address the pressing challenges facing humanity, such as the COVID-19 pandemic (10).
Figure 1: Pluralistic vs Traditional Valuation Approaches (9)
Figure 2: Forest Ecosystem Services and Related SDGs
Source: Center for Global Development (11)
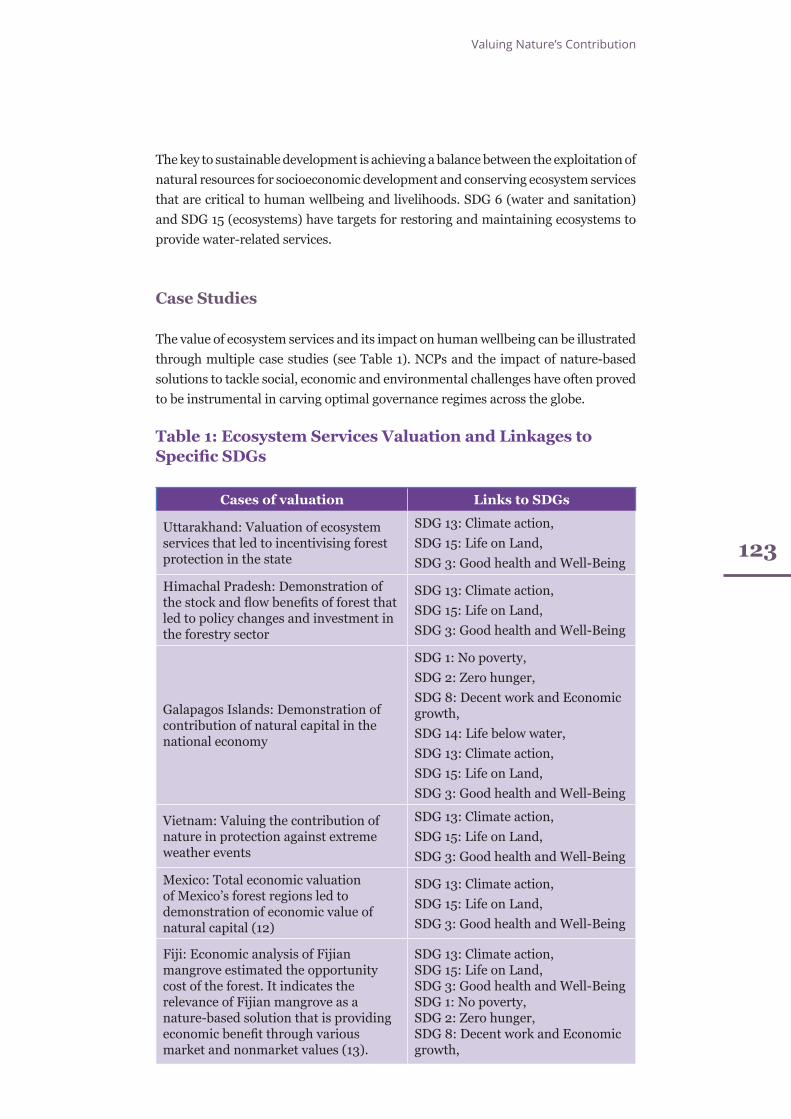
Valuing Nature’s Contribution
123
The key to sustainable development is achieving a balance between the exploitation of natural resources for socioeconomic development and conserving ecosystem services that are critical to human wellbeing and livelihoods. SDG 6 (water and sanitation) and SDG 15 (ecosystems) have targets for restoring and maintaining ecosystems to provide water-related services.
Case Studies
The value of ecosystem services and its impact on human wellbeing can be illustrated through multiple case studies (see Table 1). NCPs and the impact of nature-based solutions to tackle social, economic and environmental challenges have often proved to be instrumental in carving optimal governance regimes across the globe.
Table 1: Ecosystem Services Valuation and Linkages to Specific SDGs
Cases of valuation Links to SDGs
Uttarakhand: Valuation of ecosystem services that led to incentivising forest protection in the state
SDG 13: Climate action,SDG 15: Life on Land,SDG 3: Good health and Well-Being
Himachal Pradesh: Demonstration of the stock and flow benefits of forest that led to policy changes and investment in the forestry sector
SDG 13: Climate action,SDG 15: Life on Land,SDG 3: Good health and Well-Being
Galapagos Islands: Demonstration of contribution of natural capital in the national economy
SDG 1: No poverty,SDG 2: Zero hunger,SDG 8: Decent work and Economic growth,SDG 14: Life below water, SDG 13: Climate action,SDG 15: Life on Land,SDG 3: Good health and Well-Being
Vietnam: Valuing the contribution of nature in protection against extreme weather events
SDG 13: Climate action,SDG 15: Life on Land,SDG 3: Good health and Well-Being
Mexico: Total economic valuation of Mexico’s forest regions led to demonstration of economic value of natural capital (12)
SDG 13: Climate action,SDG 15: Life on Land,SDG 3: Good health and Well-Being
Fiji: Economic analysis of Fijian mangrove estimated the opportunity cost of the forest. It indicates the relevance of Fijian mangrove as a nature-based solution that is providing economic benefit through various market and nonmarket values (13).
SDG 13: Climate action,SDG 15: Life on Land,SDG 3: Good health and Well-BeingSDG 1: No poverty,SDG 2: Zero hunger,SDG 8: Decent work and Economic growth,
124
Planet: Synergising Enterprise, Environment and Communities
Some illustrative case studies are detailed below:
Uttarakhand, India
The state of Uttarakhand has 38,000 sq km of recorded forest area, which constitutes around 71 percent of the state’s total geographical area (14). Even after having such a rich reserve of natural resources, the contribution of forestry to the Gross State Domestic Product is only 2.08 percent (15). This highlights the limitations of the current accounting system in estimating the contribution of the forest to the state’s GDP.
A study estimated the economic value of 21 ecosystem services from the Uttarakhand forests at anywhere between INR 95,112 crore (US$12,757 million) to INR 1,93,904 crore (US$26,007 million) annually. Along with this, the forests of Uttarakhand also help to conserve timber stock, which can be valued at between INR 14,13,676.20 crore (US$1,89,605 million) and INR 17,44,413.36 crore (US$2,33,964 million). Notably, several flow benefits of forests are intangible and therefore remain unaccounted in the market transaction.
Himachal Pradesh, India
The forests of Himachal Pradesh, a predominantly mountainous state in the Western Himalayas, play a vital role in preserving the fragile Himalayan ecosystem. Himachal’s recorded forest area is 37,033 sq km, or 66.52 percent of its geographical area (16) In 2016, a study conducted on the valuation of ecosystem services in Himachal provided important estimates. The stock and flow values from forests were combined and the total annual value of the Himachal forests was estimated to be over INR 5,300,000 crore (US$7,10,847 million). If the annual value of possession of the forest land is added, the value rises to INR 6,390,882 crore (US$8,57,158 million). A rough calculation by using the wholesale price index as a land price inflation factor would put this value at about INR 6,444,900 crore (US$8,64,403 million).
Galapagos Islands, Ecuador
The Galapagos Islands are an apt example of a pristine habitat providing multiple benefits to the local and global communities. Galapagos is a major global tourist destination and the tourism sector provides almost 70 percent of all employment opportunities on the islands. In 1998, the Galapagos National Park raised US$5 million from entrance fees, although only 1 percent of that revenue was spent on conservation purpose (17). Nature-based tourism can make the islands’ tourism industry sustainable and resilient to climate change. A multisectoral and cross-
Valuing Nature’s Contribution
125
cutting climate action programme—that can improve agricultural activity, reduce carbon emissions, and improve ecosystems and ecosystem services—is required to catalyse nature-based ecotourism in the archipelago. The programme can potentially benefit about 250,000 people (18).
Vietnam
A study conducted on three coastal communes—Bang La, Dai Hop and Tan Thanh—in northern Vietnam on the economic benefits of mangrove systems can be seen as nature-based solutions (NBS). Qualitative and quantitative assessments were done in 2005 and 2013 to understand the potential of the restored mangrove forest. In 1987, a storm damaged a 3-km-long dyke, with repairs costing about US$300,000. A similar storm in 2005 did not damage the dyke due to the protection provided by the 1-km-wide mangrove forest. However, a mini dyke had to be repaired for US$5000 (18). The net savings of US$295,000 can be attributed to NBS by the mangrove forest.
Conclusion
The links between an improvement in the delivery of NCPs or ecosystem services and the SDGs must be considered while designing local, regional and global strategies. In this regard, the economic valuation of ecosystem services can provide the required information to promote evidence-based decision-making. The outcome of such policymaking will reflect in climate change adaptation and mitigation strategies and adopting sustainable development pathways. The key is to consider both instrumental and intrinsic valuation parameters in defining the calculus that considers economic, environmental and sociocultural factors in a balanced manner.
Endnotes
(1) Kate A. Brauman et al., “Global trends in nature’s contributions to people,” Proceedings of the National Academy of Sciences 117, no. 51 (2020): 32799-32805, https://dx.doi.org/10.1073%2Fpnas.2010473117
(2) Intergovernmental Science-Policy Platform on Biodiversity and Ecosystem Services, Global assessment report on biodiversity and ecosystem services of the Intergovernmental Science-Policy Platform on Biodiversity and Ecosystem Services, E.
126
Planet: Synergising Enterprise, Environment and Communities
S. Brondizio, J. Settele, S. Díaz, and H. T. Ngo, eds., Bonn, Germany, IPBES secretariat, 2019, https://doi.org/10.5281/zenodo.3831673
(3) Shunsuke Managi, Pushpam Kumar, Edward B. Barbier, David N. Barton et al., Inclusive Wealth Report 2018: Measuring sustainability and well-being, United Nations Environmental Programme, 2018 https://www.unep.org/resources/inclusive-wealth-report-2018
(4) “Inclusive Wealth Report 2018: Measuring sustainability and well-being”
(5) Katharine Ricke et al.,”Country-level social cost of carbon,” Nature Climate Change 8, no. 10 (2018): 895-900.
(6) Tanushree Chandra, “Pricing carbon: Trade-offs and opportunities for India,” Observer Research Foundation (2021), https://www.orfonline.org/expert-speak/pricing-carbon-trade-offs-opportunities-india/
(7) “Global assessment report on biodiversity and ecosystem services of the Intergovernmental Science-Policy Platform on Biodiversity and Ecosystem Services”
(8) Madhu Verma and Amit Mallick, “Securing India’s tiger habitats and natural assets for preventing future pandemics,” Mongabay, July 3, 2020, https://india.mongabay.com/2020/07/commentary-securing-indias-tiger-habitats-and-natural-assets-for-preventing-future-pandemics/
(9) Unai Pascual et al., “Valuing nature’s contributions to people: the IPBES approach,” Current opinion in environmental sustainability 26 (2017): 7-16, https://www.sciencedirect.com/science/article/pii/S1877343517300040
(10) United Nations Environment Programme, Becoming #Generationrestoration: Ecosystem Restoration for People, Nature and Climate, Nairobi, UNEP, 2021, https://wedocs.unep.org/bitstream/handle/20.500.11822/36251/ERPNC.pdf
(11) Frances Seymour and Jonah Busch, Forests and SDGs: Taking a Second Look, World Resources Institute (2017), https://www.wri.org/insights/forests-and-sdgs-taking-second-look
(12) W. Neil Adger, Katrina Brown, Raffaello Cervigni and Dominic Moran, “Total economic value of forests in Mexico.” Ambio 24, no. 5 (1995): 286-296, https://www.jstor.org/stable/4314349
(13) Task Force on Economic Benefits of Protected Areas of the World Commission on Protected Areas (WCPA) of IUCN, in collaboration with the Economics Service Unit of International Union for the Conservation of Nature and Natural Resources (IUCN), Economic Values of Protected Areas: Guidelines for Protected Area Managers, Gland, Switzerland and Cambridge, UK, IUCN, 1998, https://www.iucn.org/content/economic-values-protected-areas-guidelines-protected-area-managers-0
(14) Forest Survey of India (FSI), “State of Forest Report 2017 – Uttarakhand,” Dehradun, FSI, Ministry of Environment & Forests, https://fsi.nic.in/forest-report-2017
Valuing Nature’s Contribution
127
(15) Madhu Verma et al., Green Accounting of Forest Resources, Framework for Other Natural Resources and Index for Sustainable Environmental Performance for Uttarakhand State and Capacity Building on Environmental Statistics and Green Accounting, Directorate of Economics & Statistics Planning Department, Government of Uttarakhand, 2018, https://des.uk.gov.in/pages/display/160-green-accounting-of-forest-resource
(16) Forest Survey of India (FSI), “State of Forest Report 2017 – Himachal Pradesh,” Dehradun, FSI, Ministry of Environment & Forests, https://fsi.nic.in/forest-report-2017
(17) Julia Novy, Incentive Measures for Conservation of Biodiversity and Sustainability: A Case Study of The Galapagos Islands, United Nations Environmental Programme, 2005, https://vdocument.in/a-case-study-of-the-galapagos-islands.html?page=1
(18) Cesar Eduardo Neira, Climate Change: The new Evolutionary Approach for the Galapagos, Green Climate Fund, 2005 https://www.greenclimate.fund/document/climate-change-new-evolutionary-challenge-galapagos
(19) Nguyen Thi Kim Cuc, “Mangrove forest restoration in northern Viet Nam,” in Enhancing Food Security Through Forest Landscape Restoration: Lessons from Burkina Faso, Brazil, Guatemala, Viet Nam, Ghana, Ethiopia and Philippines, eds. C. Kumar, S. Begeladze, M. Calmon, C. Saint-Laurent (Gland, Switzerland: IUCN, 2015), pp. 106-121
Measuring Progress in Pursuit of the Planet Goals
12
Anamitra Anurag Danda
Measuring Progress in Pursuit of the Planet Goals
129
The Sustainable Development Goals (SDGs) set ambitious objectives for all countries across the three dimensions of sustainable development—economic development, social inclusion, and
environmental sustainability—and demand a holistic strategy that combines the three, an unusually complicated agenda for governments.
The SDGs can be clustered as ‘people goals’ (SDGs 1-6), ‘prosperity goals’ (SDGs 7-11), and ‘planet goals’ (SDGs 12-15), in addition to the peace (SDG 16) and partnership (SDG 17).
For a global view of the SDGs, 12 countries have been selected and grouped in four categories of three each as the best (ranked top three in the SDG Index, a tool to measure progress on the SDGs developed by the Sustainable Development Solutions Network), the biggest (in terms of population; accounting for about 40 percent of the global human population), the smallest (members of Small Island Developing States), and the poorest based on the Sustainable Develop Report 2021 (1) (see Table 1). If a country is on track or maintaining SDG achievement, it is assigned 1, 0.5 for moderately improving, 0 for stagnating, and -1 for decreasing trend.
The SDGs were already off track even before the COVID-19 pandemic and is now all but derailed. “For the first time since the adoption of the SDGs, the global average SDG Index score for 2020 has decreased from the previous year: a decline driven to a large extent by increased poverty rates and unemployment following the outbreak of the COVID‑19 pandemic” (2). At the same time, this is an opportunity to build back better. For areas such as the Sundarbans, which have witnessed intersecting impacts of COVID-19 and climate change (3), building back better means moving back in space or yielding space for natural processes, besides rebuilding lives and livelihoods in a manner that lowers the risks and decarbonises energy supply. For the developed world, building back better primarily requires reducing material and
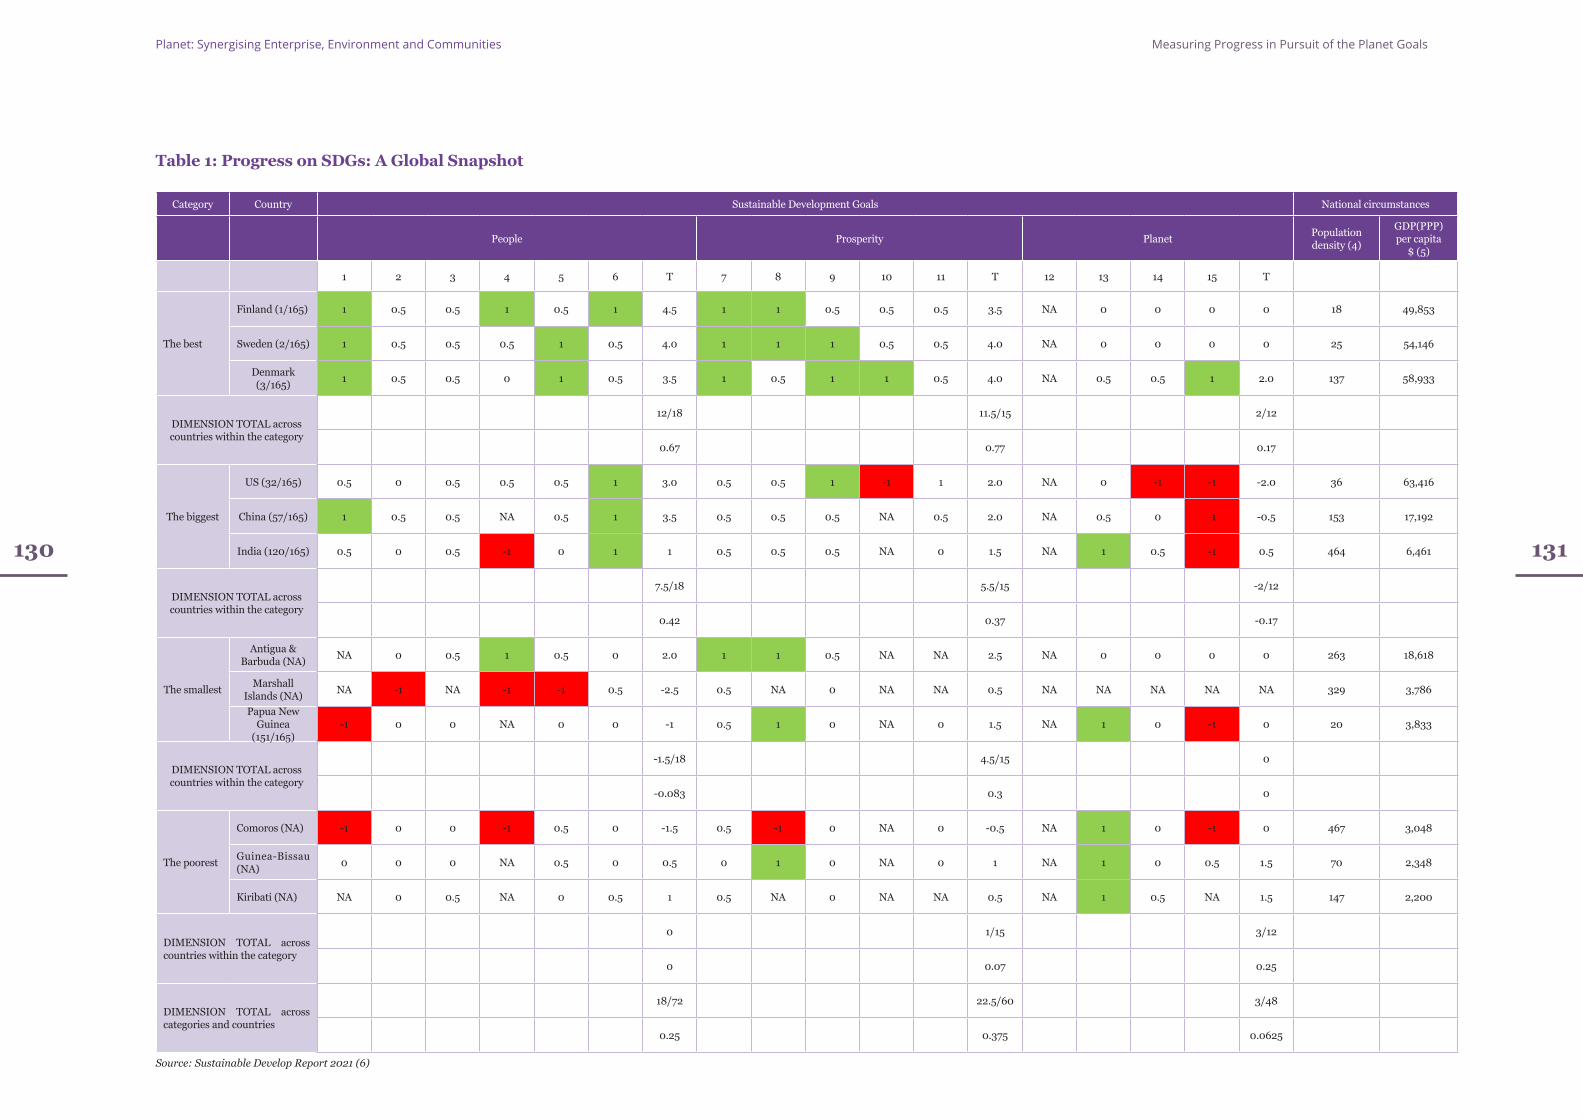
130
Planet: Synergising Enterprise, Environment and Communities Measuring Progress in Pursuit of the Planet Goals
131
Table 1: Progress on SDGs: A Global Snapshot
Category Country Sustainable Development Goals National circumstances
People Prosperity Planet Population density (4)
GDP(PPP) per capita
$ (5)
1 2 3 4 5 6 T 7 8 9 10 11 T 12 13 14 15 T
The best
Finland (1/165) 1 0.5 0.5 1 0.5 1 4.5 1 1 0.5 0.5 0.5 3.5 NA 0 0 0 0 18 49,853
Sweden (2/165) 1 0.5 0.5 0.5 1 0.5 4.0 1 1 1 0.5 0.5 4.0 NA 0 0 0 0 25 54,146
Denmark (3/165) 1 0.5 0.5 0 1 0.5 3.5 1 0.5 1 1 0.5 4.0 NA 0.5 0.5 1 2.0 137 58,933
DIMENSION TOTAL across countries within the category
12/18 11.5/15 2/12
0.67 0.77 0.17
The biggest
US (32/165) 0.5 0 0.5 0.5 0.5 1 3.0 0.5 0.5 1 -1 1 2.0 NA 0 -1 -1 -2.0 36 63,416
China (57/165) 1 0.5 0.5 NA 0.5 1 3.5 0.5 0.5 0.5 NA 0.5 2.0 NA 0.5 0 -1 -0.5 153 17,192
India (120/165) 0.5 0 0.5 -1 0 1 1 0.5 0.5 0.5 NA 0 1.5 NA 1 0.5 -1 0.5 464 6,461
DIMENSION TOTAL across countries within the category
7.5/18 5.5/15 -2/12
0.42 0.37 -0.17
The smallest
Antigua & Barbuda (NA) NA 0 0.5 1 0.5 0 2.0 1 1 0.5 NA NA 2.5 NA 0 0 0 0 263 18,618
Marshall Islands (NA) NA -1 NA -1 -1 0.5 -2.5 0.5 NA 0 NA NA 0.5 NA NA NA NA NA 329 3,786
Papua New Guinea
(151/165)-1 0 0 NA 0 0 -1 0.5 1 0 NA 0 1.5 NA 1 0 -1 0 20 3,833
DIMENSION TOTAL across countries within the category
-1.5/18 4.5/15 0
-0.083 0.3 0
The poorest
Comoros (NA) -1 0 0 -1 0.5 0 -1.5 0.5 -1 0 NA 0 -0.5 NA 1 0 -1 0 467 3,048
Guinea-Bissau (NA) 0 0 0 NA 0.5 0 0.5 0 1 0 NA 0 1 NA 1 0 0.5 1.5 70 2,348
Kiribati (NA) NA 0 0.5 NA 0 0.5 1 0.5 NA 0 NA NA 0.5 NA 1 0.5 NA 1.5 147 2,200
DIMENSION TOTAL across countries within the category
0 1/15 3/12
0 0.07 0.25
DIMENSION TOTAL across categories and countries
18/72 22.5/60 3/48
0.25 0.375 0.0625
Source: Sustainable Develop Report 2021 (6)
132
Planet: Synergising Enterprise, Environment and Communities
energy consumption. Divergence in climate action is expected given the different national circumstances, but to what degree?
The Best
Three Scandinavian countries—Finland, Sweden, and Denmark—are closest to achieving the SDGs by 2030, but they score 85.9, 85.6 and 84.9 respectively, much lower than the maximum possible score of 100. While all three are high-income countries with low population densities, their environmental practices are likely unsustainable. In the case of Finland and Sweden, there is no forward movement on any of the planet goals. None of the three countries have been assessed on SDG 12 (ensure sustainable consumption and production patterns) for want of trend information on relevant indicators. The lack of environmental sustainability is linked with the nature of production and consumption of the modern world, particularly societies that have made marked progress in science and technology. However, Finland, Sweden, and Denmark, make significant progress in the prosperity and people goals and prioritise these goals over planet goals by as much as 3.9 times and 4.5 times respectively.
The Biggest
For the three most populous countries (US, China, and India), the planet goals are even less of a priority, with a decreasing trend in at least one of the planet goals in each of the countries. Of the three, the US has the poorest performance in the planet goals despite the least population pressure and significantly higher income, possibly because of high average consumption. None of the three countries furnish sufficient data for trends to be identified for SDG 12 despite the UN defining 11 targets and 13 indicators for this goal (for indicators such as material footprint and domestic material consumption, target levels are yet to be defined or data is out of date and unavailable). The levels of consumption and production have negative impacts on the living world represented by SDG 14 (life below water) and SDG 15 (life on land). Although the highest priority for the US, China and India are the people goals followed by prosperity goals, all three countries report positive movement on climate action.
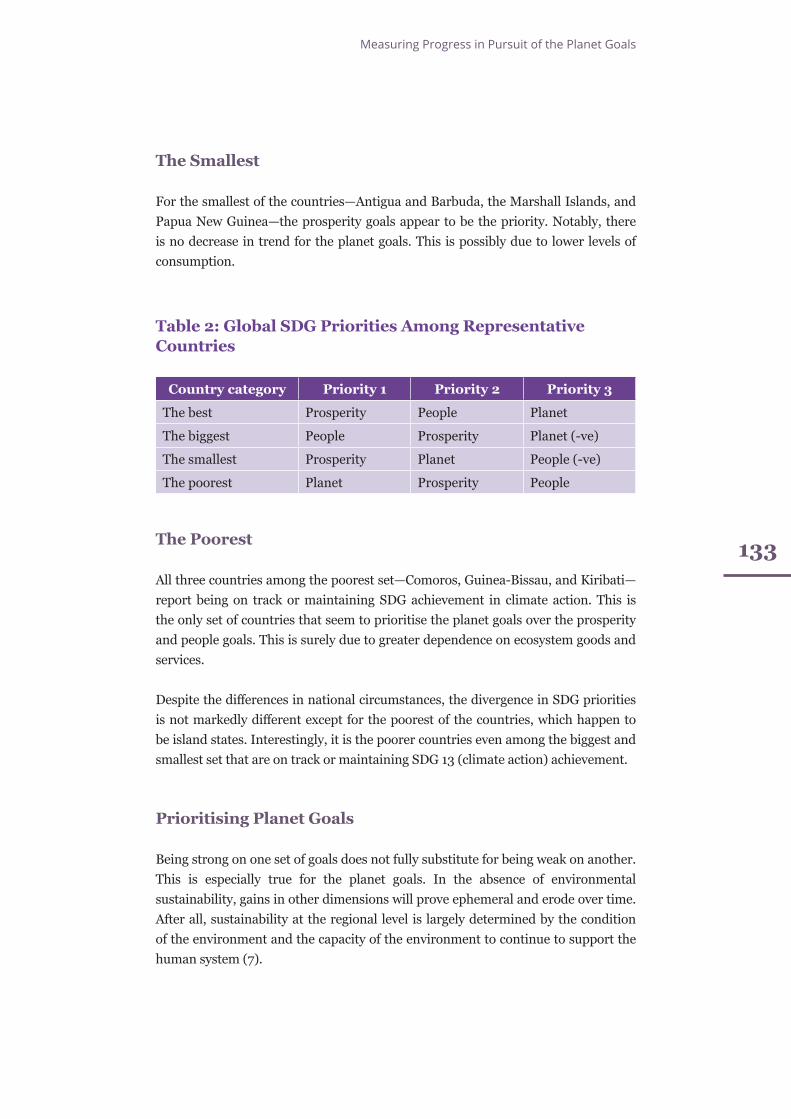
Measuring Progress in Pursuit of the Planet Goals
133
The Smallest
For the smallest of the countries—Antigua and Barbuda, the Marshall Islands, and Papua New Guinea—the prosperity goals appear to be the priority. Notably, there is no decrease in trend for the planet goals. This is possibly due to lower levels of consumption.
Table 2: Global SDG Priorities Among Representative Countries
Country category Priority 1 Priority 2 Priority 3
The best Prosperity People Planet
The biggest People Prosperity Planet (-ve)
The smallest Prosperity Planet People (-ve)
The poorest Planet Prosperity People
The Poorest
All three countries among the poorest set—Comoros, Guinea-Bissau, and Kiribati—report being on track or maintaining SDG achievement in climate action. This is the only set of countries that seem to prioritise the planet goals over the prosperity and people goals. This is surely due to greater dependence on ecosystem goods and services.
Despite the differences in national circumstances, the divergence in SDG priorities is not markedly different except for the poorest of the countries, which happen to be island states. Interestingly, it is the poorer countries even among the biggest and smallest set that are on track or maintaining SDG 13 (climate action) achievement.
Prioritising Planet Goals
Being strong on one set of goals does not fully substitute for being weak on another. This is especially true for the planet goals. In the absence of environmental sustainability, gains in other dimensions will prove ephemeral and erode over time. After all, sustainability at the regional level is largely determined by the condition of the environment and the capacity of the environment to continue to support the human system (7).
134
Planet: Synergising Enterprise, Environment and Communities
Limiting factors are imposed by the physical world on the living world, and by the living world on the built world—the human system comprising of the social and economic systems. The human system must stay within the capacity of the ecosystem to be sustainable. Similarly, the economy must remain within the capacity of the social system. Planet goals will have to be prioritised, although the global trend is currently exactly the opposite. Across the four categories of countries assessed, the priority seems to be the people goals by four times and the prosperity goals by six times over the planet goals. The needed new orientation of governments towards holistic development during the ‘decade of action’ remains elusive. However, among the planet goals, SDG 13 seems to have the greatest traction among the sample countries, although globally the situation remains dismal.
Climate action essentially implies mitigation, adaptation, and the mobilisation of finance. Globally, progress is slow on all three counts, although richer nations have committed to doubling their funding by 2025 to help low- and middle-income countries deal with the damage already caused by climate change (8). Finance is key to climate action, and the developed nations must meet their pledge to mobilise US$100 billion a year for mitigation and adaptation in developing countries. The Green Climate Fund (GCF), established under the Cancún Agreements in 2010 as a dedicated financing vehicle for developing countries within the global climate architecture and serving as the financial mechanism of the United Nations Framework Convention on Climate Change and the Paris Agreement, has a significant role to play. However, total GCF financing committed thus far is only US$10.0 billion across 190 projects (9).
On the mitigation front, progress is not commensurate with the current need, and the world is on track for a global temperature rise of 2.70C by the end of the century (10).
Adaptation is a long way off as well. Extreme weather events are responsible for annual consumption losses to the tune of US$520 billion and for pushing 26 million people into poverty every year (11). The poor remain at risk since they work in sectors highly susceptible to extreme weather events and live in fragile housing in vulnerable areas across the world.
Conclusion
The best three countries and one of the smallest, Antigua & Barbuda, do not exhibit a decreasing trend on any of the 15 SDGs considered in this exercise. This ought to be the bare minimum globally. The commonality among these countries is that there are
Measuring Progress in Pursuit of the Planet Goals
135
improvements in people and prosperity goals while there is no decline in the planet goals. In contrast, the biggest three countries as a group exhibit decreasing trends in planet goals with relatively smaller improvements (compared to the best) in people and prosperity goals. Given that this group accounts for about 40 percent of the global population, the countries in this group will have to find ways to halt declining trends in the planet goals, particularly biodiversity loss on land and in water. This is more challenging for the second-largest country, India, than the others because of the much higher population density. The only other country, Comoros, with comparable population density exhibits decreasing trends in people and prosperity goals.
The lesson that can be drawn from this limited assessment is that improvements in people and prosperity goals do not necessarily have to be at the expense of the planet goals; Finland, Sweden, Denmark, India, Antigua & Barbuda, despite different national circumstances, stand testimony to this at the halfway mark of the journey towards achieving SDGs by 2030.
Endnotes
(1) Jeffrey Sachs et al., The Decade of Action for the Sustainable Development Goals: Sustainable Development Report 2021 (Cambridge: Cambridge University Press, 2021), pp 518.
(2) Sachs et al., The Decade of Action for the Sustainable Development Goals, p 9.
(3) Tanaya Dutta Gupta, Amrita Chakraborty, and Anamitra Anurag Danda, “Confronting Cascading Disasters, Building Resilience: Lessons from the Indian Sundarbans,” ORF Occasional Paper No. 297, January 2021, Observer Research Foundation.
(4) World Bank, Data: Population Density (people per sq. km of land area), Washington DC, World Bank Group, https://data.worldbank.org/indicator/EN.POP.DNST
(5) Statistics Times, “List of countries by GDP (PPP) per capita,” Statistics Times, https://statisticstimes.com/economy/countries-by-gdp-capita-ppp.php
(6) Jeffrey Sachs et al., The Decade of Action for the Sustainable Development Goals: Sustainable Development Report 2021 (Cambridge: Cambridge University Press, 2021), pp 518.
(7) Anne M.Wallis, Michelle L.M. Graymore and Anneke J. Richards., “Significance of environment in the assessment of sustainable development: The case for south west Victoria,” Ecological Economics 70, no. 4 (2011), 595-605.
(8) UN Climate Change Conference, COP26 Presidency Compilation of 2021-2025 Climate
136
Planet: Synergising Enterprise, Environment and Communities
Finance Commitments, United Kingdom, United Nations Climate Change Conference, 2021, https://ukcop26.org/wp-content/uploads/2021/11/Table-of-climate-finance-commitments-November-2021.pdf.
(9) Green Climate Fund Project Portfolio, “Project portfolio,” Green Climate Fund, https://www.greenclimate.fund/projects/dashboard.
(10) United Nations Environment Programme, Emissions Gap Report 2021: The Heat Is On – A World of Climate Promises Not Yet Delivered, Nairobi, UNEP, 2021, https://www.unep.org/resources/emissions-gap-report-2021
(11) World Bank, Natural Disasters Force 26 Million People into Poverty and Cost $520bn in Losses Every Year, New World Bank Analysis Finds, Washington DC, World Bank Group, 2016, https://www.worldbank.org/en/news/press-release/2016/11/14/natural-disasters-force-26-million-people-into-poverty-and-cost-520bn-in-losses-every-year-new-world-bank-analysis-finds
Towards an Inclusive Wealth-Based Measure of Sustainable Development
13
Preeti Kapuria
138
Planet: Synergising Enterprise, Environment and Communities
Inclusive wealth as an indicator of sustainable development has gained increasing attention since the release of the Inclusive Wealth Report 2012 at the United Nations Conference on Sustainable Development. Inclusive
wealth—also known as comprehensive wealth or genuine wealth—is the social value (not dollar price) of all capital assets, including produced capital, human capital, natural capital, and the other capitals that contribute to human wellbeing. Inclusive wealth is a measure of an economy’s productive base or an index of an economy’s production potential (1). An increase in inclusive wealth indicates an improved productive base that can maintain or enhance the living standards of future generations. The value of a capital asset is the present discounted value of the expected flow of benefits (utility from consumption), both current and future, generated by an asset, referred to as intertemporal social welfare (2),(3). The benefits are the value of the marginal contribution of an asset to intertemporal social welfare, also called an asset’s shadow price. Development can only be sustainable if this value of all capital assets does not decline over time. Hence, sustainability reduces to a weighted sum of the stocks of those assets where weights are the assets’ shadow prices, and the weighted sum is the economy’s wealth. An economy can be said to be sustainable at a point in time if its wealth per capita at constant shadow prices are non-decreasing at that time (4) or the intertemporal social welfare represented by non-decreasing inclusive wealth is non-declining.
It is necessary to look beyond per capita GDP to track and measure economic progress such that it incorporates social costs and environmental impacts of economic activities and improvements in intergenerational wellbeing. The inclusive wealth measurement involves not only traditional capital stocks (produced and financial capital) but is extended to include the contribution of human capital, natural capital, and social capital. Together, these five types of capital make up the comprehensive wealth portfolio. This makes the inclusive wealth approach a holistic assessment of the contributions of different capital types while providing unique insights into the
Towards an Inclusive Wealth-Based Measure of Sustainable Development
139
trade-offs and synergies among capital types. By involving green accounting in a country’s assessment of capital assets, the inclusive wealth approach can be seen as a way to understand human-environmental interactions (5). Such an assessment can draw attention towards the changing state of a country’s natural resource base and its impact on long-term economic and social sustainability (6).
The Inclusive Wealth Index (IWI) is an alternative measure to GDP and the Human Development Index. The IWI is an important metric to measure sustainable development. It complements GDP to provide a comprehensive measure of wealth and whether development based on such wealth is sustainable in the future. However, the metric poses a huge measurement challenge. Measuring the stock of different forms of capital and their unit values can be extremely difficult. Studies have suggested using even partial monetary measurements of capitals along with biophysical and social capital accounts to guide economies on their development trajectories (7).
The inclusive wealth measures are considered critical in prioritising national strategies on the Sustainable Development Goals (SDGs) by guiding policies and investments towards improving produced and human capital without compromising the natural capital of a country. SDG 17, which aims to strengthen the means of implementation and revitalise the global partnership for sustainable development, is supported by the inclusive wealth measurement by placing people and the planet at the centre. The goal emphasises the sharing of technology, enhancing knowledge, and improving trade to build the capacities of countries to move towards achieving the SDGs. Wealth measurement can highlight the institutional, policy and data challenges related to achieving various SDG targets. An increase in inclusive wealth can guide the evaluation of progress on poverty eradication (SDG 1), achieving food security while promoting sustainable agriculture (SDG 2), and supporting healthy lives and human wellbeing (SDG 3). It can indicate if a country is on a path of sustained and inclusive economic growth (SDG 8), which includes adopting sustainable consumption and production patterns (SDG 12), taking steps to combat climate change and its impacts (SDG 13), and protect and restore marine (SDG 14) and terrestrial (SDG 15) resources.
Initiatives Emphasising Measuring Inclusive Wealth
‘The Economics of Biodiversity: The Dasgupta Review’ makes a strong case for an inclusive measure of wealth to assess whether economic development is sustainable. The emphasis is on introducing natural capital into national accounting systems and transforming institutions and systems to support a more sustainable engagement with nature (8).
140
Planet: Synergising Enterprise, Environment and Communities
The World Bank and the UN are pushing for an extension of national accounts based on comprehensive wealth accounting. The World Bank first published a set of comparable international comprehensive wealth figures in the 1990s, with updates in subsequent years. As part of the World Development Indicators database, the World Bank began computing countries’ genuine savings in 1997 (9). Genuine savings are the adjusted net savings values, changes in the natural resource base and environmental quality and produced and human capital (10),(11). Since 2011, the World Bank has started estimating comprehensive wealth in sustainability analysis (12). The Changing Wealth of Nations 2021 is the fourth report on global wealth accounting. It has expanded coverage and measures of capital assets, including natural capital, and applies purchasing power parity prices to wealth, and decomposition analysis to understand the drivers of change in wealth and has introduced blue natural capital to the core accounts, such as marine fisheries and mangroves. The report provides policy insights to guide sustainable development in the context of impacts of climate change, management of assets under conditions of risk and uncertainty, and how climate policies could affect the value of assets under alternative future scenarios about the low-carbon transition (13).
The Inclusive Wealth Reports (IWR) by the UN Environment Programme evaluates the capacities and performance of countries to measure the sustainability of their economies and human wellbeing. The IWR 2018 extends the empirical reach of IWR 2012 and IWR 2014 and tracks the progress of 140 countries that comprise a significant share of the global economy (US$56.84 trillion) and population (almost 6.89 billion people). It compares percentage annual growth rates in inclusive wealth per head with those of GDP per capita in the 140 countries over the 1992-2014 period (14).
The World Economic Forum (2017, 2018) uses an inclusive growth and development index to measure current wellbeing along with wealth-based measures of the long-term sustainability of well-being (15),(16).
The World Inequality Report provides estimates of global income and wealth inequality based on the most recent findings compiled by the World Wealth and Income Database (17). Another notable report that provides an assessment of the underlying wealth of nations is the ‘Valuing Wealth, Building Prosperity’ by the Bennett Institute for Public Policy at Cambridge University (18). The wealth assessments in this report are based on a new metric for measuring social capital and well-beingthat goes beyond GDP. The report by the Commission on the Measurement of Economic Performance and Social Progress (the “Stiglitz Commission”) (19) calls for adopting indicators to reflect on the distribution of wellbeing in a society and its sustainability across social, economic, and environmental dimensions.
Towards an Inclusive Wealth-Based Measure of Sustainable Development
141
Applying the Inclusive Wealth Approach
Several empirical studies provide evidence for sustainable development based on an inclusive measurement of wealth. Some have even used genuine savings to evaluate sustainability.
The first cross-country application of green accounting methods to the measurement of net savings was presented in 1993 by David W. Pearce and Giles D. Atkinson, who combined estimates of depletion and degradation for 20 countries with standard national accounting data to examine the true savings of these countries (20). As a result, many countries appeared unsustainable since their gross savings were less than the combined sum of conventional capital depreciation and natural resource depletion. The assessment of sustainable development by Kirk Hamilton and Michael Clemens is based on genuine savings estimates from the World Bank’s national accounts data between 1970 and 1993 (21). They define genuine savings as net savings less the value of resource depletion and environmental degradation plus the value of investment in human capital. Their estimates reveal a declining trend for most countries (particularly in Sub-Saharan Africa), consistently negative genuine saving in the West Asia and North Africa region, with the East Asia and Pacific region on the top.
In an assessment of whether nations and regions meet the sustainability criterion, using World Development Indicators for 1970-2001, Kenneth Arrow, Partha Dasgupta, Lawrence Goulder, Gretchen Daily, Paul Ehrlich, Geoffrey Heal, Simon Levin, Karl-Go¨ran Maler, Stephen Schneider, David Starrett and Brian Walker found striking differences between genuine investment and net domestic investment for West Asia and North Africa and Sub-Saharan Africa regions (22). In these regions, the loss of natural resources more than offset the accumulation of manufactured capital and human capital. For the US and the UK, estimated genuine investment exceeded domestic net investment, since the increase in human capital exceeded the value of natural resource depletion. Estimated growth rates for per capita genuine wealth were found to decline at an annual rate of 2.6 in the Sub-Saharan Africa region and at an annual rate of 3.8 percent in the West Asia and North Africa region after adjusting for technological change. Estimated growth rates of wealth for the US and the UK were positive, although the US estimate is about a third of the UK estimate.
The changes in inclusive wealth, both in absolute and per capita terms, and inclusive wealth per capita adjusted have been studied by many analysts. Rintaro Yamaguchi, Moinul Islam, and Shunsuke Managi found only 60 percent of 140 countries having non-declining wealth in per capita terms from 1990 to 2014, while 95 percent of nations showed positive growth rates in absolute terms during this period (23).
142
Planet: Synergising Enterprise, Environment and Communities
Around 58 percent of the studied countries experienced an increase in inclusive wealth per capita adjusted for carbon damage, oil capital gains, and total factor productivity. Notably, almost all European and North American countries have experienced increasing wealth in both absolute and per capita terms. In contrast, countries with negative growth in inclusive wealth per capita are typically in Africa, Asia, or Latin America and the Caribbean. They further report an increase in aggregated produced and human capital per capita by 94 percent and 28 percent, respectively, while natural capital per capita declined by 34 percent. Importantly, they found overall capital composition of inclusive wealth in 2014 to be 24 percent for produced capital, 64 percent for human capital, and 11 percent for natural capital, closer to the Changing Wealth of Nations (24) results (27 percent, 64 percent, and 9 percent, respectively), where the inclusion of urban land and exclusion of fishery may explain the difference. According to the 2021 Changing Wealth of Nations report, global wealth grew significantly between 1995 and 2018. However, for some countries the growth in total wealth per capita was disappointing, and even negative in some cases. The strongest performance was found among upper-middle-income countries, which had increases in wealth of over 200 percent between 1995 and 2018. Low-income countries saw per capita wealth growth by less than the global average, at 22 percent compared with 44 percent. Interestingly, per capita wealth changes were found to be consistently lower than total wealth growth. Twenty-six countries, across different income groups, saw a decline or stagnation in per capita wealth as population growth outpaced net growth in asset value, especially in Sub-Saharan Africa.
Many scholars have noted the declining value of stock of natural capital per head. In an estimation of aggregate wealth across developed and developing countries, Partha Dasgupta, Shunsuke Managi and Pushpam Kumar find that the global produced capital per head has approximately doubled and human capital per head increased by about 13 percent, but the value of the stock of natural capital per head declined by nearly 40 percent (25). Natural capital deterioration is considered as the main driving force of declining wealth per capita following fossil fuel extraction (26).
Natural capital is a critical determining factor even in the ASEAN region (27); all countries with a high natural capital share in their inclusive wealth (Cambodia, Malaysia, Laos, and Indonesia) have experienced a negative inclusive wealth per capita growth from 1990 to 2014, while the countries with low natural capital share (Vietnam, Thailand, the Philippines, and Myanmar) have achieved positive inclusive wealth per capita growth. Overall, the region consists of both sustainable and unsustainable countries, with positive inclusive wealth per capita growth.
Towards an Inclusive Wealth-Based Measure of Sustainable Development
143
Extending Basic Inclusive Wealth Measurement to a Sustainability Perspective
Following the definition of sustainability—non-declining inclusive wealth per capita—many scholars have developed an inclusive wealth-based total factor productivity (TFP) to do away with the conventional TFP that mainly focuses on the contribution of humanmade capital and labour force productivity toward GDP growth. The inclusive wealth-based TFP includes both human and natural capital in addition to man-made capital (28).
Kenneth J. Arrow, Partha Dasgupta, Lawrence H. Goulder, Kevin J. Mumford and Kirsten Oleson (2012) developed a comprehensive measure of wealth that included reproducible and human capital, natural capital, health improvements and technological change, to assess sustainability in five countries (the US, China, Brazil, India, and Venezuela) (29). Using data from the 1995-2000 period, they concluded that investments in human capital and knowledge capital (in addition to investments in reproducible capital) are critical to maintaining per capita wealth in the US and Brazil. In contrast, in China and India the investments in reproducible capital alone were sufficient to offset the per capita decrease in natural capital. For Venezuela, per capita wealth was not maintained unless increases in health capital were taken into account. The US, China, India, and Brazil were found to meet the sustainability criterion, although Brazil met the requirement by a narrow margin. Venezuela did not meet this requirement because of the substantial depletion of natural capital and negative estimated TFP growth. In the US and India, investments in human capital turned out to be crucial to increases in per capita wealth; in China, it was the investments in reproducible capital.
Human health and education have emerged as important factors for economic growth in many studies (30). Health status has larger positive effects on the economic growth in Sub-Saharan Africa relative to education status. Studies have shown health stock as a vital component of global sustainable development whose measurement along with other forms of capital is required to accurately measure national wealth and sustainability. Accounting for health stock reveals significant differences in the value of this capital among all 140 countries based on population, fertility, mortality, working-age population, life expectancy, the stability or instability of the country, and the balance of immigration and emigration. Human capital advantages have been found to be a major contributor to TFP and economic growth in most G7 countries (31). On average, human capital contributed to 68 percent of overall inclusive wealth, whereas produced capital contributed to 25 percent, and natural capital contributed to 7 percent for all G7 countries together. Using the Malmquist Productivity Index to measure cross-country productivity over the 1990-2010 period for 140 countries,
144
Planet: Synergising Enterprise, Environment and Communities
the authors found incorporating TFP with natural capital to be having a significant impact on inclusive wealth as a sustainability measure (32). After adjusting three main factors (carbon damage, oil capital gains and the latest TFP results), the number of countries showing positive growth rates in wealth increased from 85 to 101. Emphasis on socioeconomic improvements, increases in per-capita GDP and educational attainment are highlighted for long-term global sustainability. Larger populations are linked to lower inclusive wealth per capita, while addressing climate change challenges and reducing the reliance on natural resources are considered crucial for improving human wellbeing (33).
The national-level inclusive wealth studies have made great progress in directing development efforts towards sustainable growth. The inclusive wealth measure of provinces in China between 2000 and 2015 show that three types of capital have increased to varying degrees, with produced capital increasing by 615.6 percent, natural capital increasing by 33.8 percent, and human capital increasing by 337 percent (34). While the total amount of inclusive wealth has increased by 300.4 percent in the past 15 years. Surprisingly, despite this increase, provinces in China are still facing unbalanced development across the country compared to developed nations. The use of the natural capital, more specifically renewable resources, has restricted the wealth growth in some provinces. Although ecological services account for a small proportion of the total inclusive wealth, the rapid growth of carbon damages poses a threat to future wealth accumulation. Inclusive wealth measures in Indonesia also reveal depreciation of both renewable and non-renewable natural capital in driving the decline in wealth per capita, even though sustainability has been improving, although marginally, due to increases in the rates of produced and human capital growth (35). Japan presents a different set of issues related to depopulation, an ageing population, and the excessive burden of environmental regulations (36). There are prefectures in Japan, where sustainability is increasingly being lost to these concerns. decreasing wealth growth is caused by the increasing damage to health capital, mainly in rural areas, whereas produced capital has had positive effects but has not mitigated the damage.
Conclusion
This paper makes a case for adopting an inclusive measure of wealth while assessing the sustainability of economic growth. Sustainable development is defined in terms of non-declining per capita inclusive wealth. Measuring inclusive wealth requires assigning values to all types of capital, which is challenging. Nevertheless, the inclusive wealth approach is insightful and much needed to direct national strategies and to achieve the SDGs. It provides an opportunity to assess how sustainable present
Towards an Inclusive Wealth-Based Measure of Sustainable Development
145
consumption and production decisions are from the perspective of wellbeing and the needs of future generations. Economic policy planning and evaluation that are based on TFP must not target only GDP growth but move towards incorporating inclusive wealth into the measurement of TFP.
Most countries, both developed and developing, have compromised their natural capital in favour of produced and, to a lesser extent, human capital. Even worse, many countries have degraded natural capital along with produced and human capital, particularly in Africa and Asia and the Pacific, while oil-rich Gulf nations have converted massive natural capital into other types of capital, especially human capital. Most G7 countries have a human capital advantage. Human health has emerged as a critical capital asset in inclusive wealth measurement. Demographic change is an important factor impacting sustainable development.
Although the rich economies are becoming more financialised, less and less of natural capital depreciation is getting compensated by net increases in other forms of capital. For developing economies, high and rising natural capital depreciation is a major concern that must be addressed by increasing the accumulation of other forms of capital. In either case, high levels of natural capital depreciation will continue to widen the gap between the rich and poor and may affect fostering sustainable development.
Going forward, further research on integrated social-economic-ecological models is needed to explain the links between growing natural resource scarcity and accompanying inequality, as is creating an expanded dataset and diverse set of factors to incorporate inclusive wealth in sustainable development planning.
Endnotes
(1) United Nations Environment Program, The Inclusive Wealth Report 2018: Measuring Sustainability and Well-Being, New York, UNEP, 2018, https:// www.unep.org/resources/report/inclusive-wealth-report-2018
(2) Stephen Polasky et al., “Inclusive Wealth as a Metric of Sustainable Development,” Annual Review of Environment and Resources 40 (2015): 445–466, https://doi.org/10.1146/annurev-environ-101813-013253
(3) Kenneth Arrow et al., “Are We Consuming Too Much?,”Journal of Economic Perspectives 18, no. 3 (2004) 147–172, https://www.aeaweb.org/
146
Planet: Synergising Enterprise, Environment and Communities
articles?id=10.1257/0895330042162377
(4) Kenneth J. Arrow et al., “Sustainability and the Measurement of Wealth,” Environment and Development Economics, 17 (2012): 317-353, http://dx.doi.org/10.1017/S1355770X13000193
(5) Bingqi Zhang,Wataru Nozawaand ShunsukeManagi, “Sustainability Measurements in China and Japan: An Application of the Inclusive Wealth Concept From a Geographical Perspective,” Regional Environmental Change 20:65 (2020), https://doi.org/10.1007/s10113-020-01658-x
(6) Daniel Powell, “The Inclusive Wealth of Nations,” Our World, August 24, 2012, https://ourworld.unu.edu/en/the-inclusive-wealth-of-nations
(7) Polaskyet al., “Inclusive Wealth as a Metric of Sustainable Development”
(8) Partha Dasgupta, The Economics of Biodiversity: The Dasgupta Review, London, HM Treasury, 2021, https://www.gov.uk/government/publications/final-report-the-economics-of-biodiversity-the-dasgupta-review
(9) Kirk Hamilton, Genuine Saving as a Sustainability Indicator, Environment Department papers no. 77, Environmental Economics Series, World Bank, 2000, https://openknowledge.worldbank.org/handle/10986/18301
(10) Kirk Hamilton and Michael Clemens, “Genuine Savings Rates in Developing Countries,” The World Bank Economic Review 13, no. 2 (1999): 333-356, https://doi.org/10.1093/wber/13.2.333
(11) J. Ram Pillarisetti, “The World Bank’s ‘Genuine Savings’ Measure and Sustainability,” Ecological Economics 55 (2005): 599– 609, https://doi.org/10.1016/j.ecolecon.2005.01.018
(12) World Bank, The Changing Wealth of Nations: Measuring Sustainable Development in the New Millennium, Washington, DC, The World Bank, 2011, https://openknowledge.worldbank.org/handle/10986/2252
(13) World Bank, The Changing Wealth Of Nations: Managing Assets for the Future, Washington, DC, The World Bank, 2021, https://openknowledge.worldbank.org/bitstream/handle/10986/36400/9781464815904_esb.pdf
(14) “The Inclusive Wealth Report 2018: Measuring Sustainability and Well-Being, 2018”
(15) World Economic Forum, The Inclusive Growth and Development Report 2017, Geneva, WEF, 2017, https://www.weforum.org/reports/the-inclusive-growth-and-development-report-2017
(16) World Economic Forum, The Inclusive Development Index: Summary and Data Highlights 2018, Geneva, WEF, 2018, https://www.weforum.org/reports/the-inclusive-development-index-2018
(17) Lucas Chancel, Thomas Piketty, Emmanuel Saez, Gabriel Zucman, World Inequality
Towards an Inclusive Wealth-Based Measure of Sustainable Development
147
Report 2022, World Inequality Lab, https://wir2022.wid.world/download/
(18) D. Zenghelis, M.Agarwala, D.Coyle, M. Felici, S.Lu and J. Wdowin, Valuing Wealth, Building Prosperity: The Wealth Economy Project on Natural and Social Capital, One Year Report, Benett Institute for Public Policy, University of Cambridge, 2020, https://www.bennettinstitute.cam.ac.uk/publications/valuing-wealth-building-prosperity/
(19) Joseph E. Stiglitz, Jean-Paul Fitoussi and Martine Durand, Beyond GDP: Measuring What Counts for Economic and Social Performance, Paris, OECD Publishing, 2018, https://doi.org/10.1787/9789264307292-en.
(20) David W. Pearce and Giles D. Atkinson,“Capital Theory and the Measurement of Sustainable Development: an Indicatorof “Weak” Sustainability,” Ecological Economics8, no.2 (1993):103–8http://dx.doi.org/10.1016/0921-8009(93)90039-9
(21) Hamilton and Clemens, “Genuine Savings Rates in Developing Countries”
(22) Arrow et al., “Are We Consuming Too Much?”
(23) RintaroYamaguchi, Moinul Islam, and ShunsukeManagi, “Inclusive Wealth in the Twenty-firstCentury: A Summary and Further Discussion of Inclusive Wealth Report 2018,” Letters in Spatial and Resource Sciences, 12, no. 2 (2019): 101–111, https://doi.org/10.1007/s12076-019-00229-x
(24) “The Changing Wealth of Nations: Measuring Sustainable Development in the New Millennium, 2011”
(25) Partha Dasgupta, Shunsuke Managi and Pushpam Kumar, “The Inclusive Wealth Index and Sustainable Development Goals,” Sustainability Science (2021), https://doi.org/10.1007/s11625-021-00915-0
(26) Robi Kurniawan and Shunsuke Managi, “Linking Wealth and Productivity of Natural Capital for 140 Countries Between 1990 and 2014,” Social Indicators Research 141 (2019): 443-462, https://doi.org/10.1007/s11205-017-1833-8
(27) Kei Endo and Shinya Ikeda, “How Can Developing Countries Achieve Sustainable Development: Implications from the Inclusive Wealth Index of ASEAN Countries,” International Journal of Sustainable Development & World Ecology (2021): 50-59, https://doi.org/10.1080/13504509.2021.1910591
(28) Masayuki Sato, Kenta Tanaka and Shunsuke Managi, “Inclusive Wealth, Total Factor Productivity, and Sustainability: An Empirical Analysis,” Environmental Economics and Policy Studies 20 (2018): 741–757, https://doi.org/10.1007/s10018-018-0213-1
(29) Arrow et al., “Sustainability and the Measurement of Wealth”
(30) Isma AddiJumbri, Shinya Ikeda and ShunsukeManagi, “Heterogeneous Global Health Stock and Growth: Quantitative Evidence From 140Countries, 1990–2100,” Archives of Public Health 76, no. 81 (2018), https://doi.org/10.1186/s13690-018-0327-8
(31) IsmaAddiJumbri and ShunsukeManagi, “Inclusive Wealth with Total Factor
148
People: Robust Processes and Better Societies
Productivity: Global Sustainability Measurement,” Global Sustainability 3 (2019), e5 :1-16, https://doi.org/10.1017/sus.2020.1
(32) Kurniawan and Managi, “Linking Wealth and Productivity of Natural Capital for 140 Countries Between 1990 and 2014,” Social Indicators Research 141 (2021): 443-462, https://link.springer.com/article/10.1007%2Fs11205-017-1833-8
(33) Robi Kurniawan and Shunsuke Managi, “Measuring Long-term Sustainability with Shared Socioeconomic Pathways Using an Inclusive Wealth Framework,” Sustainable Development 26, no. 6 (2018): 596-605, https://doi.org/10.1002/sd.1722
(34) Wang Jingyu , Bai Yuping,Wurihan Yihzong , Li Zhihui, Deng Xiangzheng, Moinul Islam and Shunsuke Managi, “ Measuring Inclusive Wealth of China: Advances in Sustainable Use of Resources,” Journal of Environmental Management 264 (2020), https://doi.org/10.1016/j.jenvman.2020.110328
(35) Robi Kurniawan and Shunsuke Managi, “Economic Growth and Sustainable Development in Indonesia: An Assessment,” Bulletin of Indonesian Economic Studies 54, no. 3 (2018): 339-361, http://dx.doi.org/10.1080/00074918.2018.1450962
(36) Shinya Ikeda, Tetsuya Tamaki, Hiroki Nakamura and ShunsukeManagi, “Inclusive Wealth of Regions: The Case of Japan,” Sustainability Science 12 (2017): 991–1006, https://link.springer.com/article/10.1007/s11625-017-0450-4
PROSPERITY: OF LIVES AND LIVELIHOODS
Source: Yuichiro Chino/ Getty Images/ Royalty-free
Growth-Development-Environment: Embracing an Ensemble Approach to Sustainability
14
Purnamita Dasgupta
Growth-Development-Environment: Embracing an Ensemble Approach to Sustainability
151
O ver the course of the last 50 years, the narrative on the relationship between economic growth, development and the environment has moved from being a simplistic and reductionist, growth-
led storyline to that of a dynamic and complex articulation, often with contrarian views. The most important driver of this narrative evolution is the burgeoning of formal and structured scientific evidence on the adverse feedbacks to human society (food security, medicinal plants, pest prevalence, nutrition, extreme events, and many more) from the depletion and degradation of the environment (1), (2), (3), (4), (5). It is unsurprising that South Asia, just as some other parts of the world, is facing many challenges on the sustainable development front. South Asia is among the world’s most biodiverse regions, it traverses several agroclimatic typologies, its mountains are labelled as water towers, and river basins support densely populated and culturally diverse communities. Consequently, impacts from deforestation, loss of natural vegetation, degrading soil and water quality, pollution and waste accumulation, declining crop yields, and increasing disaster risks (such as droughts, extreme rainfall events and floods) have cascading and multiplier in-situ and ex-situ impacts on social and economic wellbeing.
There is another dynamic in the growth versus environment story that dominates the South Asian context. This is the reality of meeting the aspirations of millions of people for a decent quality of life in a sustainable manner. Globally, there is a consensus that economic growth has helped alleviate poverty and achieve transitions in economic and demographic wellbeing, with plenty of historical evidence that the size of the cake matters. On the other hand, it is indisputably true that resources and competencies are unequally distributed, with distributional anomalies growing over time both across and within countries and leaving the Global South struggling to meet its developmental targets, which are often set at levels below those for the Global North. Attaining sustainability in this complex situation can be a reality
152
Prosperity: Of Lives and Livelihoods
only if a dynamic process brings the North and South together, which is a core idea underpinning the 2030 Agenda for Sustainable Development with its 17 core goals (the SDGs) (6).
The environment dynamic in developing countries is interesting and distinct from the developed world. In many parts of the Global South, an intense nature-people relationship exists, which fits well within a sustainable futures perspective (7),(8),(9). It is not about the exploitation of nature but is centred on living in harmony with nature. This has led to an increasing recognition within formal discussions of what has often also been characterised as ‘informal’, ‘community’ or ‘citizen’ science (10) and their role in effective collective action (11). The efforts of several dedicated researchers, individuals, and community leaders, has created the confidence that modern technology and science can combine meaningfully with traditional knowledge and generations of community wisdom. Many discussions around nature-based solutions across sectors centre around this core approach towards sustainability—for instance, in developing agrotourism and community-led flood early warning systems, the use of traditional agricultural practices and biofertilisers, community adoption of solar technology, and green micro enterprises. The learning that resilience is served best by leveraging cultural diversity and creating bonds between the users and the creators of STEM (science, technology, engineering, and mathematics) solutions is a welcome development.
Inequality and Resilience
For the most part, the conventional approach for economists has been to separate the question of efficiency from distribution or equity, although immense contributions have been made to enhance the understanding of inequality per se, and especially in the last four decades (12),(13). One of the major learnings from the Millennium Development Goals process was that while national level goals and targets were being achieved (at least partially for many), there were sub-populations that were yet to reach these targets (14). It is hoped that this concern will be addressed in achieving the SDGs. There has been considerable focus on the issue of how inequality and efficiency (conventionally interpreted as leading to growth) interact and ways to address the adverse fallouts. The debate has drawn substantial attention particularly in the context of poverty alleviation, technology adoption, labour markets, social cohesion, infrastructure, and, more recently, for managing the consequences of climate change (15), (16), (17), (18), (19), (20), (21), such that it is now rare for academic papers to discuss poverty issues without also mentioning inequality.
Growth-Development-Environment: Embracing an Ensemble Approach to Sustainability
153
Perhaps the most talked about illustration of the relevance of equity is from the sphere of climate change. Setting a limit to global warming by the turn of the century implies that the world must operate within a carbon budget, with the budget allocated across countries. This in turn links up with climate justice issues, distributional concerns, and basic principles of fairness, including the oft discussed one of common but differentiated responsibilities at the global level (see for instance, IPCC 2018 (22)). At the national and sub-national levels, targeted resource allocation for specific conservation outcomes can be pursued, keeping in view multiple priorities (23).
While most countries were in serious pursuit of the SDGs, the Covid pandemic hit hard, and recovery plans, are expectedly focussed on re-building lives and livelihoods at the earliest. Given the size of the population in South Asia alone, what happens here affects approximately one-fourth of humankind. The dynamics of recovery has pushed every sector to introduce resilience as a key aspect of success, from agriculture to industry to the service sector. Going green is being discussed as the roadmap ahead, alongside the need to rapidly address any reversals or brakes caused by the pandemic in the pursuit of the SDGs. While much is still achievable, the choices to be made in achieving these just got tougher. While proponents of de-growth may apply the pandemic lens as an opportunity to strengthen degrowth (24) the reality is that many emerging and developing economies may take considerable time to overcome the dip in per capita incomes, which may have consequences for investing in a green recovery. A recent analysis for the Indian economy reveals that attaining planned pre-COVID-19 levels of socioeconomic development (in terms of targets under SDG 1 for poverty alleviation), along with pre-COVID-19 climate action (corresponding to a low level of climate challenges) can be tougher with the foreseeable GDP growth rates through 2030-31, without additional external resources (25). Given that India accounts for a quarter of the global poor, the analysis reveals that the SDG1 target for poverty alleviation (as per the International Poverty Line) is still achievable, though a higher level of alleviation could have been far more easily achieved with the same effort, if the COVID-19 shock to the economy had not occurred.
Drivers of Transition
What happens in the Global South is also driven by its share of the global population, particularly in a pandemic world, which has seen an accentuation of unemployment and major displacement of workers in certain sectors. A word on technological progress would be in order here. Recently, economists have been flagging the need to promote technologies which do not displace workers or further inequities without major gains in productivity, but rather encourage those that can indeed free up resources or lead to multiplier effects. Inclusive technologies build resilience,
154
Prosperity: Of Lives and Livelihoods
contribute to adaptation and mitigation, and exploit synergies between short-term gains and long-term sustainability. Weaving in the possibilities of long term and catastrophic risks linked to the environment, such as those from climate change, implies the use of specific policy instruments that could help the transition to cleaner technologies, such as balancing carbon taxes with subsidies and incentives that could promote the deployment of such technologies, thereby also ensuring that the transition occurs in a timely manner (26).
For an economy in transition, the SDGs are perhaps best served when resources are allocated to blend new technologies and innovation with established methods that have stood the test of time, and allow a quick turnaround time for adapting to ground-level improvisation. This is perhaps most relevant for the social sector as the practicalities of funding, ease of adoption of new technologies, and human resource capabilities call for increased co-engagement of the private sector in areas typically considered as public sector dominant domains, such as healthcare and education. Blended finance is a key to this process. Blended finance seeks to bring in commercial or philanthropic finance to complement and enhance investments made through other channels (such as official development assistance or through the public sector) to help countries meet commitments on different counts, such as the SDGs or Nationally Determined Contributions to the climate goal. Early lessons on strategies for effective implementation are being learnt as projects pick up on ground (for instance, in the solar energy and micro credit sectors), even as more conversations are required to understand how best to facilitate these in the development context. This requires bringing together various stakeholders (legal, financial, sectoral) to examine the multiple aspects (laws, layering of profit and not-for-profit investments and their returns, optimal financial instruments to support green development, developing metrics to evaluate social impacts to name a few) (27).
From Protagonist to Ensemble
What is required is a sort of integration between growth and development, which is indeed difficult to achieve and may have led to one aspect being sacrificed in favour of the other, when faced with apparently difficult choices. Dialogue and negotiation is needed to extract the best out of growth to achieve a continuum of intent and action for attaining sustainable development. For instance, ensuring that funding itself does not become a limit to adaptation and mitigation of climate change or for biodiversity conservation. Growth gains should similarly be channelised towards bridging inequities and fostering participatory processes. Global distribution of final demand, exports, and consumption behaviour must be in sync with sustainable transitions in developing countries. The conventional framing of consumer welfare in terms of
Growth-Development-Environment: Embracing an Ensemble Approach to Sustainability
155
a utility function that enables a choice between present and future consumption is being increasingly revisited in economic policy models to enable the incorporation of risks to sustainability, introduce differentiations between public and private goods, discount rates that onboard future risks, and include the costs of greenhouse gas emissions in growth models. Many of these approaches and ideas have emerged in the context of climate change.
What is important is to see growth not just as an end but as a means to an end, with the true end being an inclusive and equitable path towards achieving the SDGs. This seems to be understood at the conceptual and global scale. For instance, India’s commitments at COP26 included achieving net zero by 2070, increasing the share of non-fossil in installed electricity generation to 50 percent, and enhancing the emissions intensity reduction target to 45 percent, while working towards zero emission vehicles. However, the realisation of these targets requires resources and trust that international processes will indeed fulfil the much-required finance, technical support, and capacity building. Embedding climate change within development is thus framed as being in consonance with the overall transition to sustainability. The same logic can be applied at national and sub-national scales where synergies and trade-offs between development and environment are part of everyday lives in the Global South. The choices are undoubtedly tough. That three major international financial institutions published reports in 2021 on environment and biodiversity loss and its economic impacts, especially for natural resource-dependent developing countries, speaks volumes on the imperative to sync the two (28),(29),(30).
A major driver in this context is that sustainable and just transitions require resources. While some of these required resources may be made available by diverting investments (financial, human) from conventional (non-environment-friendly) sources, the costs (in terms of inputs, logistics, skilling and employment) to adopt cutting edge, environment-friendly technologies could also be much higher, even as tariff and non-tariff barriers are proposed to meet mitigation targets in the Global North. Strengthened North-South and South-South partnerships can contribute majorly in different ways in embedding resilience so that sustainable development can become a reality. Investing in greener forms of energy, transportation, and supply chains can be prioritised. Positioning development as fostering human-nature relationships is the way forward in ensuring that the SDGs are embedded within the development architecture. Given the diversity of needs and distribution of resources, this architecture will vary from state to state. However, convergence in terms of achievement of targets across sub-national groups and entities can be made a realistic pursuit.
156
Prosperity: Of Lives and Livelihoods
There are diverse ways in which this pursuit can be made more meaningful by bringing together growth, environment, and development. Long gone are the days when economic efficiency, commonly understood as improvements in production and manifested as a rise in per capita GDP, suffices to achieve socially optimal and sustainable outcomes. For over half a century, efforts have intensified to improve GDP estimates, and construct better measures of economic wellbeing than the conventional GDP, early ones including the Measure of Economic Welfare (31) and the Index of Sustainable Economic Welfare (32). There are several approaches and framings that provide options for actionable pathways and implementation-oriented solutions—for instance, accounting and including ecosystem services in decision-making, the Nature-Future framework of the Intergovernmental Science-Policy Platform on Biodiversity and Ecosystem Services (33),(34), One Planet-One Health (35), green recovery (36) and Living in Harmony with nature (37). The philosophy underpinning the sustainable development agenda can be strengthened in the post-pandemic world through approaches that mend nature-people relationships in the interest of human health and wellbeing (38),(39) and safeguard planetary health for the wellbeing of the present and future generations. It is time to move from a protagonist-led approach to that of an ensemble cast, enabling the collective pursuit of sustainability.
Endnotes
(1) Brian Beckage et al., “The Earth has humans, so why don’t our climate models?,” Climatic Change 163 (2020): 181–188, https://doi.org/10.1007/s10584-020-02897-x
(2) Food and Agriculture Organization of the United Nations (FAO), Alliance of Biodiversity International and International Center for Tropical Agriculture (CIAT), Indigenous Peoples’ food systems: Insights on sustainability and resilience from the front line of climate change, Rome, Italy, FAO, Alliance of Biodiversity International, CIAT, 2021, https://doi.org/10.4060/cb5131en
(3) United Nations Children Fund, The Climate Crisis is a Child Rights Crisis: Introducing the Children’s Climate Risk Index, New York, UNICEF, 2021, https://www.unicef.org/reports/climate-crisis-child-rights-crisis
(4) Organisation for Economic Co-operation and Development, Biodiversity, Natural Capital And The Economy: A Policy Guide For Finance, Economic And Environment Ministers, OECD Environment Policy Papers, No. 26, Paris, OECD, 2021, https://doi.org/10.1787/1a1ae114-en
(5) Maria A. Martin et al., “Ten New Insights In Climate Science 2021: A Horizon Scan,”
Growth-Development-Environment: Embracing an Ensemble Approach to Sustainability
157
Global Sustainability 4 (2021): e25, https://doi.org/10.1017/sus.2021.25
(6) Division for Sustainable Development Goals (DSDG) in the United Nations Department of Economic and Social Affairs (UNDESA), “Transforming our world: the 2030 Agenda for Sustainable Development,” United Nations, https://sdgs.un.org/2030agenda
(7) Carolyn J. Lundquist et al., Visions for Nature and Nature’s Contributions to People for The 21st Century, Auckland, New Zealand, Intergovernmental Science-Policy Platform on Biodiversity and Ecosystem Services (IPBES), National Institute of Water and Atmospheric Research (NIWA) and Netherlands Environmental Assessment Agency (PBL), 2017, https://research.wur.nl/en/publications/visions-for-nature-and-natures-contributions-to-people-for-the-21
(8) Yanfen Wang et al., “Drivers of change to mountain sustainability in Hindu Kush Himalaya,” in The Hindu Kush Himalaya Assessment: Mountains, Climate Change, Sustainability and People, ed. P. Wester et al., (Switzerland: Springer Nature, 2019): 17-56, https://link.springer.com/chapter/10.1007/978-3-319-92288-1_2
(9) Sandra Díaz et al., “The IPBES Conceptual Framework — Connecting Nature and People,” Current Opinion in Environmental Sustainability 14 (2015): 1–16, https://doi.org/10.1016/j.cosust.2014.11.002
(10) Steffen Fritz et al., “Citizen science and the United Nations Sustainable Development Goals,” Nature Sustainability 2 (2019): 922–930, https://doi.org/10.1038/s41893-019-0390-3; Dilek Fraisl et al., “Mapping citizen science contributions to the UN sustainable development goals,” Sustainability Science 15 (2020): 1735–1751, https://doi.org/10.1007/s11625-020-00833-7
(11) Elinor Ostrom, “A Polycentric Approach for Coping with Climate Change,” Annals of Economics and Finance 15, no. 1 (2014): 97-134, https://econpapers.repec.org/article/cufjournl/y_3a2014_3av_3a15_3ai_3a1_3aostrom.htm
(12) Thomas Piketty, Capital in the Twenty-First Century, trans. Arthur Goldhammer (Cambridge: Harvard University Press, 2014)
(13) Joseph E. Stiglitz, Amartya Sen and Jean-Paul Fitoussi, Mismeasuring our Lives: Why GDP Does not Add Up (New York: The New Press, 2010)
(14) United Nations System Task Team on The Post 2015 UN Development Agenda, Review of The Contributions of The MDG Agenda to Foster Development: Lessons for The Post-2015 UN Development Agenda, Discussion Note, UN, 2012, https://sustainabledevelopment.un.org/post2015/index.php?page=view&type=400&nr=843&menu=35
(15) Kholeka Mdingi and Sin-Yu Ho, “Literature review on income inequality and economic growth,” MethodsX 8 (2021): 101402, https://doi.org/10.1016/j.mex.2021.101402
(16) Purnamitra Dasgupta et al., “Economic Growth, Human Development and Welfare,” in Rethinking society for the 21st Century: Report of the International Panel on Social Progress, Cambridge, Cambridge University, 2018, https://www.cambridge.org/core/books/abs/rethinking-society-for-the-21st-century/economic-growth-human-
158
Prosperity: Of Lives and Livelihoods
development-and-welfare/8B7659D1E1754DCC928C080A5C487650
(17) Marc Fleurbaey and Didier Blanchet (2013), Beyond GDP: Measuring Welfare and Assessing Sustainability (New York: Oxford University Press, 2013), https://oxford.universitypressscholarship.com/view/10.1093/acprof:oso/9780199767199.001.0001/acprof-9780199767199
(18) Augustin Kwasi Fosu, “Growth, Inequality and Poverty in Sub-Saharan Africa: Recent Progress in a Global Context,” Oxford Development Studies 43, no. 1 (2015): 44-59, https://doi.org/10.1080/13600818.2014.964195
(19) Santanu Chatterjee and Stephen J. Turnovsky, “Infrastructure and inequality,” European Economic Review 56, no. 8 (2012): 1730–1745, https://doi.org/10.1016/j.euroecorev.2012.08.003
(20) David H. Autor, “Why Are There Still So Many Jobs? The History and Future of Workplace Automation,” Journal of Economic Perspectives 29, no. 3 (2015): 3-30
(21) Joseph E. Stiglitz, “The Origins of Inequality and Policies to Contain It,” National Tax Journal 68, no. 2 (2015): 425-448, http://dx.doi.org/10.17310/ntj.2015.2.09
(22) Joeri Rogelj, Drew Shindell, and Kejun Jiang et al., “Mitigation Pathways Compatible with 1.5°C in the Context of Sustainable Development,” in IPCC Special Report: Global Warming of 1.5°C, ed. Valérie Masson-Delmotte et al., Geneva, Intergovernmental Panel on Climate Change, 2018, 93-174, https://www.ipcc.ch/sr15/download/
(23) Purnamitra Dasgupta and Kavitha Srikanth, “Achieving the climate goal with intergovernmental transfers to the forestry sector: insights from the Indian experience,” Climatic Change 164 (2021): 45, https://doi.org/10.1007/s10584-021-03016-0
(24) Lewis R Dartnell and Kaitlin Kish 2021, “Do Responses to The COVID-19 Pandemic Anticipate a Long-Lasting Shift Towards Peer-to-Peer Production or Degrowth?,” Sustainable Production and Consumption 27 (2021): 2165-2177, https://doi.org/10.1016/j.spc.2021.05.018
(25) Purnamitra Dasgupta et al. “Impact of COVID-19 on India: Alternative Scenarios for Economic and Social Development ,” Journal of the Asia Pacific Economy 26, no. 2 (2021), https://doi.org/10.1080/13547860.2021.1917096
(26) Daron Acemoglu et al., 2016. “Transition to Clean Technology,” Journal of Political Economy 124, no. 1, https://www.journals.uchicago.edu/doi/abs/10.1086/684511
(27) Organisation for Economic Co-operation and Development, “Blended Finance,” OECD, https://www.oecd.org/dac/financing-sustainable-development/blended-finance-principles/
(28) Biodiversity, Natural Capital And The Economy: A Policy Guide For Finance, Economic And Environment Minister
(29) Partha Dasgupta, The Economics of Biodiversity: The Dasgupta Review, London, Her Majesty’s Treasury, 2021, https://www.gov.uk/government/publications/final-report-
Growth-Development-Environment: Embracing an Ensemble Approach to Sustainability
159
the-economics-of-biodiversity-the-dasgupta-review
(30) Justin Andrew Johnson et al., The Economic Case for Nature: A Global Earth-Economy Model to Assess Development Policy Pathways, Washington, D.C., World Bank Group, 2021, https://openknowledge.worldbank.org/handle/10986/35882
(31) William Nordhaus and James Tobin, “Is Growth Obsolete?,” in Economic Research: Retrospect and Prospect, Volume 5, Economic Growth (Cambridge: National Bureau of Economic Research, 1972): 1-80, https://www.nber.org/books-and-chapters/economic-research-retrospect-and-prospect-volume-5-economic-growth/growth-obsolete
(32) Herman E. Daly and John B. Cobb Jr., For the Common Good (Boston, USA: Beacon Press Boston, 1989)
(33) Sandra Díaz et al., The Global Assessment Report on Biodiversity and Ecosystem Services: Summary for Policymakers, Bonn, Germany, Intergovernmental Science-Policy Platform on Biodiversity and Ecosystem Services (IPBES) Secretariat, 2019, https://zenodo.org/record/3553579
(34) Sandra Díaz et al., “The IPBES Conceptual Framework — Connecting Nature and People”
(35) John H. Amuasi, “Reconnecting for Our Future: The Lancet One Health Commission,” The Lancet 395, no. 10235 (2020):1469–1471. https://doi.org/10.1016/S0140-6736(20)31027-8
(36) Edward B. Barbier EB, “Greening The Post-Pandemic Recovery in The G20,” Environment and Resource Economics 76 (2020): 685–703, https://doi.org/10.1007/s10640-020-00437-w
(37) Convention on Biological Diversity (CBD), Global Biodiversity Outlook 5, Montreal, CBD, 2020, https://www.cbd.int/gbo5
(38) “Visions for Nature and Nature’s Contributions to People for The 21st Century”
(39) Merrilyn Walton, One Planet, One Health (Sydney: Sydney University Press, 2019)
Overcoming Pandemic-Exacerbated Youth Unemployment in Africa
15
Theophilus Edwin Coleman and Letlhokwa George Mpedi
Overcoming Pandemic-Exacerbated Youth Unemployment in Africa
161
Y oung people between the ages of 15 and 20 constitute 20 percent of the population in Sub-Saharan Africa (1), making Africa the continent with the most youthful population (2). While the youthful population
presents an opportunity in terms of human resources, it may also pose a threat if most young people are not educated, skilled and do not have decent jobs. The labour markets in most Global South countries are currently reeling from the impacts of the COVID-19 pandemic (3). This is because the global health crisis necessitated that governments impose stringent measures, including lockdowns, to limit the spread of the coronavirus (4). The lockdowns have had an egregious impact on vulnerable persons, including young people, women, and the less skilled. Indeed, “vulnerable groups are at heightened exposure to suffer from the impact of the COVID-19 due to the nature of their jobs (informality) and limited access to quality health, safe non-public transport, water, and sanitation” (5).
The pandemic has worsened the existing economic problems in many African countries. While the economic policies and governmental support to vulnerable persons in developed countries like the US seem to have positively impacted youth employment, in most African countries, the effect of the pandemic has snowballed into dire youth unemployment challenges. Accordingly, governmental policies must be directed at economic recovery, particularly bridging the unemployment gap among the youth. With the African governments focused on rejuvenating vital aspects of their economies, it is important to question the extent to which the COVID-19 pandemic has impacted or derailed governmental responses and commitment towards achieving the Sustainable Development Goals (SDGs), particularly SDG 8 (6). SDG 8 deals with sustained and inclusive economic growth as a propeller to create decent work for all persons, including young people and improve the standard of living (7).
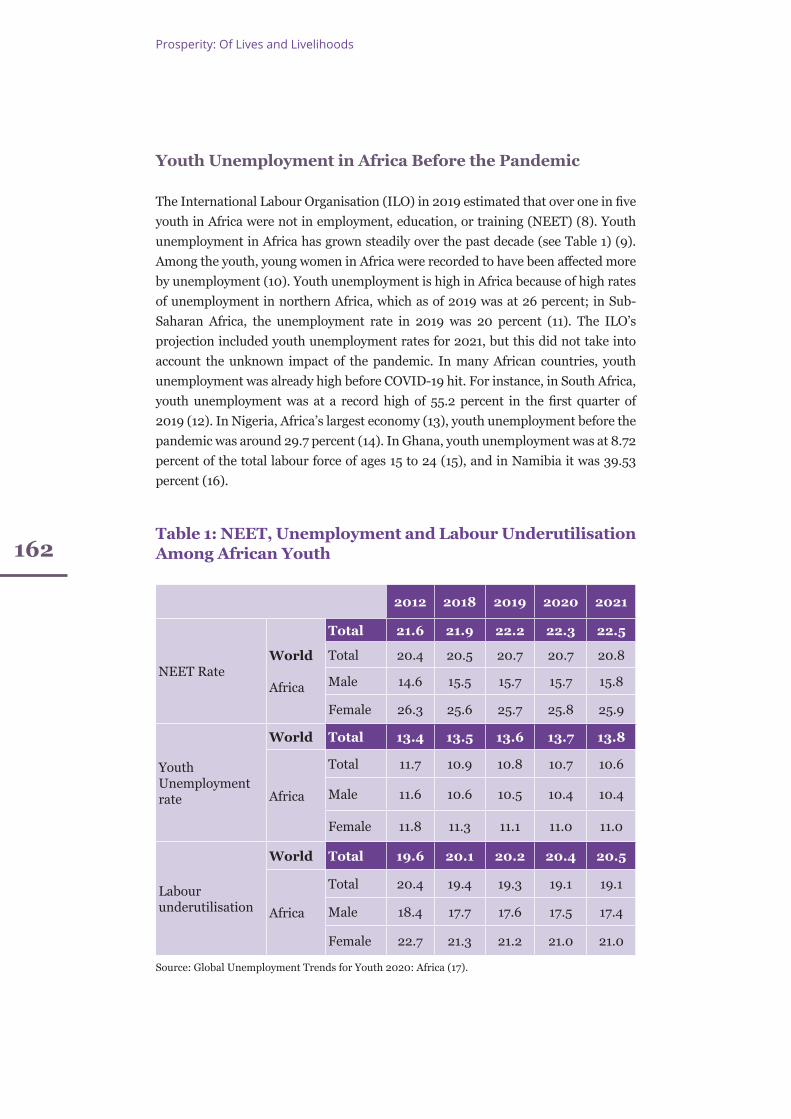
162
Prosperity: Of Lives and Livelihoods
Youth Unemployment in Africa Before the Pandemic
The International Labour Organisation (ILO) in 2019 estimated that over one in five youth in Africa were not in employment, education, or training (NEET) (8). Youth unemployment in Africa has grown steadily over the past decade (see Table 1) (9). Among the youth, young women in Africa were recorded to have been affected more by unemployment (10). Youth unemployment is high in Africa because of high rates of unemployment in northern Africa, which as of 2019 was at 26 percent; in Sub-Saharan Africa, the unemployment rate in 2019 was 20 percent (11). The ILO’s projection included youth unemployment rates for 2021, but this did not take into account the unknown impact of the pandemic. In many African countries, youth unemployment was already high before COVID-19 hit. For instance, in South Africa, youth unemployment was at a record high of 55.2 percent in the first quarter of 2019 (12). In Nigeria, Africa’s largest economy (13), youth unemployment before the pandemic was around 29.7 percent (14). In Ghana, youth unemployment was at 8.72 percent of the total labour force of ages 15 to 24 (15), and in Namibia it was 39.53 percent (16).
Table 1: NEET, Unemployment and Labour Underutilisation Among African Youth
2012 2018 2019 2020 2021
NEET RateWorld
Africa
Total 21.6 21.9 22.2 22.3 22.5
Total 20.4 20.5 20.7 20.7 20.8
Male 14.6 15.5 15.7 15.7 15.8
Female 26.3 25.6 25.7 25.8 25.9
Youth Unemployment rate
World Total 13.4 13.5 13.6 13.7 13.8
Africa
Total 11.7 10.9 10.8 10.7 10.6
Male 11.6 10.6 10.5 10.4 10.4
Female 11.8 11.3 11.1 11.0 11.0
Labour underutilisation
World Total 19.6 20.1 20.2 20.4 20.5
Africa
Total 20.4 19.4 19.3 19.1 19.1
Male 18.4 17.7 17.6 17.5 17.4
Female 22.7 21.3 21.2 21.0 21.0
Source: Global Unemployment Trends for Youth 2020: Africa (17).
Overcoming Pandemic-Exacerbated Youth Unemployment in Africa
163
Youth Unemployment in Africa During the Pandemic
Every individual in Africa is entitled to certain basic rights, which are enshrined in key international, regional, and subregional legal instruments and some national constitutions. The rights of young people include access to education, rights at work, social protection, the right to affordable housing, and the right to healthcare, including mental health. However, many young people are unable to access those rights. Considering that most young people find themselves in vulnerable positions, there have been calls for governmental support through non-contributory social assistance/protection policies (18). In terms of the labour market in Africa, the constitutions of many countries permit the freedom of movement and other economic rights, which includes the right to work (19). These rights are not absolute. For instance, during the pandemic-induced lockdowns in many African countries, only essential workers were permitted to go to work (20).
Many businesses that did not have the financial muscle to survive the lockdowns were forced to shut down, with workers losing jobs. Atypical workers and those in the informal sector, many of whom aged 15 years or above, were also impacted (21). According to the ILO, the fragile nature of the global economy due to the pandemic could lead to massive global unemployment of almost 25 million (mostly in the formal sector) (22). The African Union estimates that nearly 20 million jobs, both in the formal and informal sectors, are likely to be destroyed due to the impact of the pandemic (23). According to the African Union, the increase in youth unemployment may lead to social unrest (24). In individual African countries, the impact of the pandemic on youth unemployment has been unprecedented. For instance, youth unemployment in 2020 reached 46 percent in South Africa (25); 35 percent in Nigeria (26); 41.7 percent in Namibia (27); and 12 percent in Ghana (28).
Governmental Response
African governments introduced several measures to avert the impact of the pandemic, especially on unemployment. In countries with robust social security systems, governmental initiatives supplemented the existing social security structures. In South Africa, for instance, the Temporary Employee/Employer Relief Scheme supplemented the Unemployment Insurance Fund to provide benefits to employees and employers whose businesses were closed due to the pandemic (29). In countries without social security systems, the pandemic served as an eyeopener on the importance of such structures. It is noteworthy that most of the initiatives in Africa were aimed at mitigating the impact of the pandemic by keeping the already
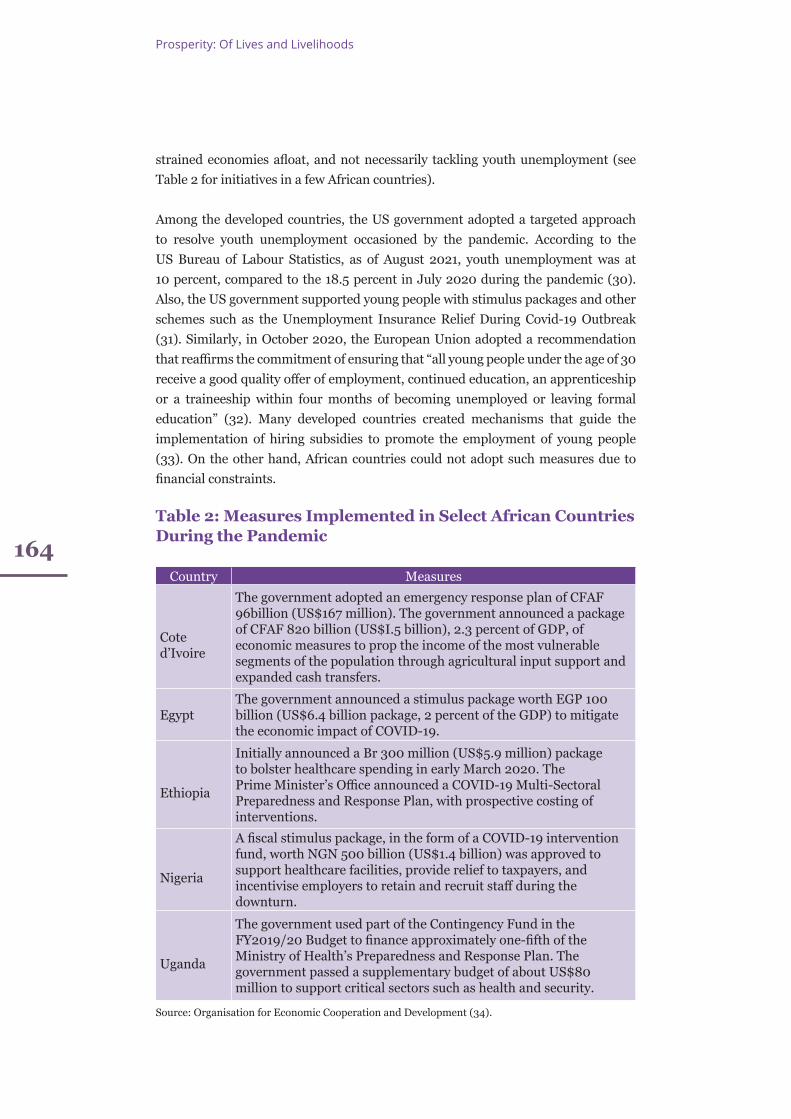
164
Prosperity: Of Lives and Livelihoods
strained economies afloat, and not necessarily tackling youth unemployment (see Table 2 for initiatives in a few African countries).
Among the developed countries, the US government adopted a targeted approach to resolve youth unemployment occasioned by the pandemic. According to the US Bureau of Labour Statistics, as of August 2021, youth unemployment was at 10 percent, compared to the 18.5 percent in July 2020 during the pandemic (30). Also, the US government supported young people with stimulus packages and other schemes such as the Unemployment Insurance Relief During Covid-19 Outbreak (31). Similarly, in October 2020, the European Union adopted a recommendation that reaffirms the commitment of ensuring that “all young people under the age of 30 receive a good quality offer of employment, continued education, an apprenticeship or a traineeship within four months of becoming unemployed or leaving formal education” (32). Many developed countries created mechanisms that guide the implementation of hiring subsidies to promote the employment of young people (33). On the other hand, African countries could not adopt such measures due to financial constraints.
Table 2: Measures Implemented in Select African Countries During the Pandemic
Country Measures
Cote d’Ivoire
The government adopted an emergency response plan of CFAF 96billion (US$167 million). The government announced a package of CFAF 820 billion (US$I.5 billion), 2.3 percent of GDP, of economic measures to prop the income of the most vulnerable segments of the population through agricultural input support and expanded cash transfers.
EgyptThe government announced a stimulus package worth EGP 100 billion (US$6.4 billion package, 2 percent of the GDP) to mitigate the economic impact of COVID-19.
Ethiopia
Initially announced a Br 300 million (US$5.9 million) package to bolster healthcare spending in early March 2020. The Prime Minister’s Office announced a COVID-19 Multi-Sectoral Preparedness and Response Plan, with prospective costing of interventions.
Nigeria
A fiscal stimulus package, in the form of a COVID-19 intervention fund, worth NGN 500 billion (US$1.4 billion) was approved to support healthcare facilities, provide relief to taxpayers, and incentivise employers to retain and recruit staff during the downturn.
Uganda
The government used part of the Contingency Fund in the FY2019/20 Budget to finance approximately one-fifth of the Ministry of Health’s Preparedness and Response Plan. The government passed a supplementary budget of about US$80 million to support critical sectors such as health and security.
Source: Organisation for Economic Cooperation and Development (34).
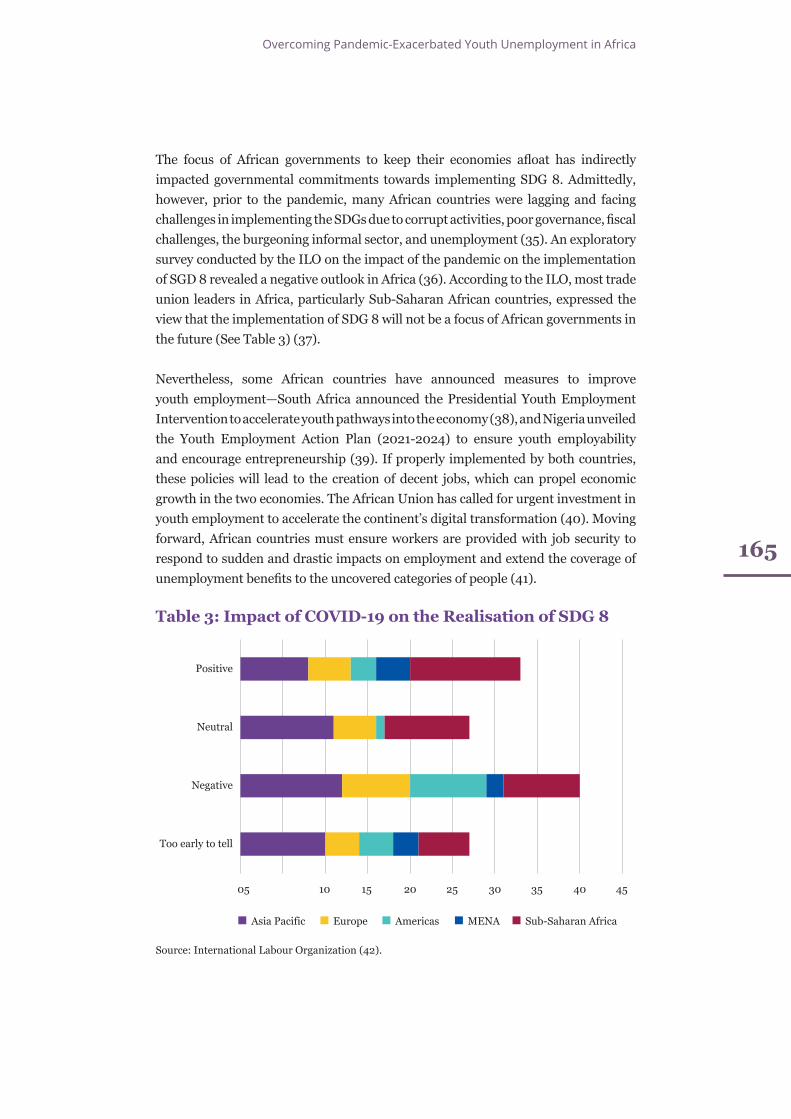
Overcoming Pandemic-Exacerbated Youth Unemployment in Africa
165
The focus of African governments to keep their economies afloat has indirectly impacted governmental commitments towards implementing SDG 8. Admittedly, however, prior to the pandemic, many African countries were lagging and facing challenges in implementing the SDGs due to corrupt activities, poor governance, fiscal challenges, the burgeoning informal sector, and unemployment (35). An exploratory survey conducted by the ILO on the impact of the pandemic on the implementation of SGD 8 revealed a negative outlook in Africa (36). According to the ILO, most trade union leaders in Africa, particularly Sub-Saharan African countries, expressed the view that the implementation of SDG 8 will not be a focus of African governments in the future (See Table 3) (37).
Nevertheless, some African countries have announced measures to improve youth employment—South Africa announced the Presidential Youth Employment Intervention to accelerate youth pathways into the economy (38), and Nigeria unveiled the Youth Employment Action Plan (2021-2024) to ensure youth employability and encourage entrepreneurship (39). If properly implemented by both countries, these policies will lead to the creation of decent jobs, which can propel economic growth in the two economies. The African Union has called for urgent investment in youth employment to accelerate the continent’s digital transformation (40). Moving forward, African countries must ensure workers are provided with job security to respond to sudden and drastic impacts on employment and extend the coverage of unemployment benefits to the uncovered categories of people (41).
Table 3: Impact of COVID-19 on the Realisation of SDG 8
Source: International Labour Organization (42).
05 10 15 20 25 30 35 40 45
Too early to tell
Negative
Neutral
Positive
EuropeAsia Pacific Americas MENA Sub-Saharan Africa
166
Prosperity: Of Lives and Livelihoods
Conclusion
The pandemic is an eye-opener for African countries to institute measures that provide social protection and assistance for the youth. The economic impact of the pandemic has derailed the governmental commitment towards achieving the SDGs since the policies adopted by African governments were aimed at keeping their strained economies afloat. In realising SDG 8, especially with regards to youth employment, post-COVID-19 policies must be geared at implementing youth employment strategies in the various sectors of the African economy. African governments must also provide emergency and additional fiscal support for young people and support work-based learning and apprenticeship. Most importantly, the governments must strengthen employment services for young persons.
Endnotes
(1) Population Reference Bureau and African Union, Africa’s Future: Youth and Data Defining their Lives, PRB and Youth Division, Department of Human Resources, Science and Technology (HRST) of the African Union Commission, 2019, https://www.prb.org/wp-content/uploads/2019/10/Status-of-African-Youth-SPEC.pdf
(2) Kingsley Ighobor, “Africa’s Youth: A ‘Ticking Time-Bomb’ Or an Opportunity?,” UN, May, 2013, https://www.un.org/africarenewal/magazine/may-2013/africa%E2%80%99s-youth-%E2%80%9Cticking-time-bomb%E2%80%9D-or-opportunity
(3) Sangheon Lee, Dorothea Schmidt-Lau and Sher Verick S, “The Labour Market Impact of the Covid-19: A Global Perspective,” The Indian Journal of Labour Economics 63 (2020): 11-15, https://link.springer.com/article/10.1007/s41027-020-00249-y
(4) Helen Onyeaka et al., “Covid-19 Pandemic: A Review of the Global Lockdown and its Far-Reaching Effects,” Science Progress 104, no. 2 (2021): 1-18, https://doi.org/10.1177/00368504211019854
(5) United Nations Economic Commission for Africa, Socio-Economic Impact of Covid-19 in Southern Africa, UNECA, May, 2020, https://www.uneca.org/?q=eca-covid-19-response/eca-presentations-covid-19
(6) Manuar Mukarram, “Impact of Covid-19 on Sustainable Development Goals (SDGs),” Strategic Analysis 44, no. 3 (2020): 253-258, https://doi.org/10.1080/09700161.2020.1788363
(7) International Labour Organisation, “Goal 8: Promote Inclusive and Sustainable Economic Growth, Employment and Decent Work for All,” ILO, https://www.ilo.org/
Overcoming Pandemic-Exacerbated Youth Unemployment in Africa
167
global/topics/dw4sd/theme-by-sdg-targets/WCMS_556964/lang--en/index.htm (accessed 10 February 2022).
(8) International Labour Organisation, Global Unemployment Trends for Youth 2020: Technology and the future of jobs, Geneva, Africa, ILO, March, 2020, https://www.ilo.org/global/publications/books/WCMS_737648/lang--en/index.htm
(9) “Global Unemployment Trends for Youth 2020: Technology and the future of jobs”
(10) “Global Unemployment Trends for Youth 2020: Technology and the future of jobs”
(11) “Global Unemployment Trends for Youth 2020: Technology and the future of jobs”
(12) Statistics South Africa, “Youth Graduate Unemployment Rates Increases in Q1: 2019,” May 15, 2019, http://www.statssa.gov.za/?p=12121.
(13) African Development Bank, Africa’s Economic Outlook 2019: Macroeconomic Performance and Prospects, AfDB, 2019, https://www.afdb.org/en/documents/document/african-economic-outlook-aeo-2019-107319
(14) National Bureau of Statistics, Labour Force Statistics – Volume I: Unemployment and Underemployment Report (Q4 2017-Q3 2018), Nigeria, NBS, 2018, pp. 30, https://nigerianstat.gov.ng/elibrary/read/856
(15) The World Bank, “Unemployment, Youth Total (% of Labour Force ages 15-24) (Modelled ILO Estimates)- Ghana,” World Development Indicators, The World Bank Group, 2020, https://data.worldbank.org/indicator/SL.UEM.1524.ZS?locations=GH.
(16) The World Bank, “Unemployment, Youth Total (% of Labour Force ages 15-24) – Namibia,” World Development Indicators, The World Bank Group, 2020, https://data.worldbank.org/indicator/SL.UEM.1524.ZS?locations=GH.
(17) “Global Unemployment Trends for Youth 2020: Technology and the future of jobs”
(18) Letlhokwa G. Mpedi, “Unemployment Protection in Southern African Development Community: Trends and Challenges”, Zeitschrift Fur Auslandisches un Internationals Arbiets-und Sozialrecht 22 (2008):271; Babatunde Omilola and Sheshangai Kaniki, Social Protection in Africa: A Review of Potential Contribution and Impact on Poverty, UNDP, March, 2014 http://dx.doi.org/10.13140/RG.2.2.12233.29284
(19) Article 24 of the Constitution of Ghana (1992); Article 39 of the Constitution of Kenya (2010); Article 41 of Constitution of the Federal Republic of Nigeria (1999); Article 21 of the Constitution of South Africa (1996).
(20) David Anthony Pittaway, “To Save Lives: The Ethical Precedents set by South Africa’s Leadership During Lockdown” Phrominon 21 (2020), https://doi.org/10.25159/2413-3086/8424; Amnesty International, Amnesty International Report (2020/21): The State of World Human Rights, 2021, https://www.amnesty.org/en/documents/pol10/3202/2021/en/
(21) United Nations Development Programme, Note on Impact of Covid-19 on the Economy
168
Prosperity: Of Lives and Livelihoods
of Madagascar: Scenarios and Recommendations, UNDP, 2020, https://www.undp.org/coronavirus/socio-economic-impact-covid-19
(22) International Labour Organisation, “Almost 25 million Jobs Could be Lost Worldwide as a result of the Covid-19 Pandemic,” March 18, 2020, https://www.ilo.org/global/about-the-ilo/newsroom/news/WCMS_738742/lang--en/index.htm#:~:text=Based%20on%20different%20scenarios%20for,of%20188%20million%20in%202019
(23) African Union, Impact of the Coronavirus (Covid-19) on the African Economy, AU, 6 April, 2020, https://au.int/fr/node/38326
(24) “Impact of the Coronavirus (Covid-19) on the African Economy”
(25) Statistics South Africa, “You will Still Find it Difficult to Secure Jobs in South Africa,” June 4, 2021, http://www.statssa.gov.za/?p=14415.
(26) International Labour Organisation and Federal Ministry of Youth and Sports Development, Federal Republic of Nigeria , Nigerian Youth Action Plan 2021-2024 Abuja, Nigeria, ILO and Federal Republic of Nigeria, 2021, pp. 13, http://www.ilo.int/africa/countries-covered/nigeria/WCMS_819111/lang--en/index.htm
(27) United Nations Human Rights Office of the High Commissioner, “Intersessional Seminar on Youth and Human Rights,” April 12, 2021, https://www.ohchr.org/EN/Issues/Youth/Pages/IntersessionalSeminaronYouth.aspx
(28) The World Bank, “Addressing Youth Unemployment in Ghana Needs Urgent Action, calls New World Bank Report,” September 29, 2021, https://www.worldbank.org/en/news/press-release/2020/09/29/addressing-youth-unemployment-in-ghana-needs-urgent-action.
(29) “COVID-19 Temporary Employee/Employer Relief Scheme (C19 TERS), 2020”, Staatskoerant, March 26, 2020, https://www.gov.za/sites/default/files/gcis_document/202003/43161gen215.pdf
(30) The United States of America Bureau of Labour Statistics, “Employment and Unemployment among Youth Summary,” United States of America Department of Labor, August 18, 2021, https://www.bls.gov/news.release/youth.nr0.htm.
(31) United States of America Department of Labor, “Unemployment Insurance relief During Covid-19 Outbreak,”, https://www.dol.gov/coronavirus/unemployment-insurance#fact-sheets.
(32) European Commission, “The Reinforced Youth Guarantee,” https://ec.europa.eu/social/main.jsp?catId=1079&langId=en. See also, Dennis Tamesberger and Joham Bacher, “Combatting Youth Unemployment with a Fair EU Youth Guarantee’Guarantee” CESifo Forum 22(2021): 3-7.
(33) European Commission, “The Reinforced Youth Guarantee”; Tamesberger and Bacher, “Combatting Youth Unemployment with a Fair EU Youth Guarantee’Guarantee”
(34) Organisation for Economic Cooperation and Development, Covid-19 in Africa:
Overcoming Pandemic-Exacerbated Youth Unemployment in Africa
169
Regional Socio-Economic Implications and Policy Priority, OECD, May 2020, https://www.oecd.org/coronavirus/policy-responses/covid-19-and-africa-socio-economic-implications-and-policy-responses-96e1b282/.
(35) Kennedy Mahlatsi, “Achieving Sustainable Development Goals (SDGs) in Africa: Prospects and Challenges,” The Thinker 87, no. 2 (2021): 61, 67, https://journals.uj.ac.za/index.php/The_Thinker/article/view/535; Durokifa AA & Ijeoma EC, “Neo-colonialism and Millennium Development Goals (MDGs) in Africa: A Blend of an Old Wine in a New Bottle,” African Journal of Science, Technology, Innovation and Development 10, no. 3 (2018): 363, https://doi.org/10.1080/20421338.2018.1463654
(36) International Labour Organisation and The Bureau for Workers’ Activities , The Likely Impact of Covid-19 on the Achievement of SDG 8: A Trade Union Opinion Survey, Geneva, ILO - ACTRAV, 2021, pp. 13, https://www.ilo.org/actrav/pubs/WCMS_770036/lang--en/index.htm
(37) “The Likely Impact of Covid-19 on the Achievement of SDG 8: A Trade Union Opinion Survey”
(38) Department of Labour South Africa, Republic of South Africa, October 28, 2021, https://www.labour.gov.za/presidential-youth-employment-interventions-call-for-proposals-to-support-youth-participation-in-the-economy.
(39) International Labour Organisation and Federal Ministry of Youth and Sports Development, Federal Republic of Nigeria, Nigerian Youth Action Plan 2021-2024 Abuja, Nigeria, ILO and Federal Government of Nigeria, 2021, pp. 24-27, http://www.ilo.int/africa/countries-covered/nigeria/WCMS_819111/lang--en/index.htm ,
(40) African Union, The Digital Transformation Strategy for Africa (2020-2030), AU, May 18, 2020, https://au.int/en/documents/20200518/digital-transformation-strategy-africa-2020-2030.
(41) International Labour Organisation, Unemployment Protection in the Covid-19 Crisis: Country Responses and Policy Considerations, Geneva, ILO, 2020, pp. 2, https://labordoc.ilo.org/discovery/fulldisplay/alma995095984402676/41ILO_INST:41ILO_V2
(42) “The Likely Impact of Covid-19 on the Achievement of SDG 8: A Trade Union Opinion Survey”
Paradiplomacy as a Pathway to Achieve SDG 11: Is Urban India Ready?
16
Renita D’Souza
Paradiplomacy as a Pathway to Achieve SDG 11: Is Urban India Ready?
171
F ar beyond being outcomes of growth and development, cities are the womb that nurtures the progress delivering such growth and development. Such progress is not limited to a single dimension, but
encompasses finance, commerce, technology, innovation, culture, and other faces of advancement. Cities are magnets of talent and capital, and are the driving forces of increasing prosperity. Urbanisation is a measure of development and sustainable urbanisation is a critical mechanism for achieving sustainable development, particularly goal 11 (sustainable cities and communities) of the Sustainable Development Goals (SDGs).
Cities are not just symbols of progress and prosperity, they also bear the burden of the myopia that has long defined such progress and prosperity. The untenable nature of growth has entailed pressure on basic infrastructure and essential services, such as housing, water, sanitation and public transport. This myopia has bred poverty and inequality and has imposed environmental costs in the form of pollution and climate change.
As such, cities derive significant importance and wield great influence in shaping the outcomes of efforts initiated by the global collective to strike a balance between economic growth, social development, and environmental sustenance.
It is vital to see the urban picture in numbers to understand its importance: Cities are currently home to over 55 percent of the global population, a figure that is projected to increase to 68 percent by the middle of the current century. About 96 percent of the predicted urbanisation will occur in the less developed world (East Asia, South Asia and Africa), of which 35 percent of the increment in urbanisation, between 2018 and 2050, will be witnessed in three countries alone—India, China and Nigeria (1). Urban centres also generate more than 85 percent of the global GDP today (2).
172
Prosperity: Of Lives and Livelihoods
Finally, cities account for two-thirds of energy use and 70 percent of global CO2 emissions (3).
Avenue for Cooperation
The costs and benefits associated with urbanisation are not evenly distributed across all urban geographies. A 2019 study predicting the top 10 cities by 2035 (by GDP, population, and GDP growth) presented key insights. Several cities in China—one of the fastest growing economies, the richest developing country, and the largest global carbon emitter—appear in the top 10 on all three measures: Beijing, Shanghai, Guangzhou and Shenzhen in GDP; Chongqing and Shanghai in population; and Chongqing, Shanghai, Shenzhen and Tianjin in GDP growth. On the other hand, no Indian cities feature in the top 10 GDP list; Mumbai is at the 10th position in the population; and Mumbai, Bengaluru and Delhi feature in the top 10 for GDP growth (4).
The process of development in cities—through industrialisation and expansion of the non-farm sector, growth in the informal economy, significant population pressures, and densification of the network of transport and connectivity—can exacerbate issues such as poverty, inequality, crime, pollution and climate change. The way these problems manifest themselves in the urban areas is different from that in the rural areas. For example, congestion and slums characterise pollution and housing poverty in urban areas This highlights the need for cities to be given the space on global platforms to connect, cooperate and collaborate with each other to arrive at optimal solutions through the exchange of information, policy ideas, knowledge and best practices. Cities need to liaise and forge partnerships with their peers in economic and technological terms as well.
While globalisation may have obscured boundaries and, to some extent, the distinction between identities, it has accorded cities the opportunity to carve out unique identities by establishing positions on the global chessboard. Several cities have leveraged this opportunity to emerge as ‘global’ cities by engaging in relatively autonomous, locally driven paradiplomacy on issues of sustainable development, climate change, infrastructure and other matters of shared interest. City diplomacy takes place through the development of inter-urban networks, the establishment of multilateral organisations, town-twinning initiatives, and bilateral cooperation agreements (5).
Some of the global networks and city multilaterals that have catalysed urban diplomacy include the United Cities and Local Governments organisation, which
Paradiplomacy as a Pathway to Achieve SDG 11: Is Urban India Ready?
173
has strived to accord urban voices their rightful space in the global governance landscape; the Global Parliament of Mayors, whose raison d’etre is to ensure that the views and voices of the member mayors reach the global high table; the Commonwealth Local Government Forum, the objective of which is to facilitate the sharing of experience and information; the C40 Cities Climate Leadership Group, a collaboration between the mayors of the world’s leading cities focused on climate change mitigation; and the Local Governments for Sustainability initiative, which seeks to build an inclusive sustainable urban world (6).
Sao Paulo has attracted international attention for its vibrant model of urban paradiplomacy. The city’s Municipal International Relations Secretariat (Secretaria Municipal de Relações Internacionais; SMRI), a formal institution, was established in 2001 to provide assistance to the mayor’s office in boosting international relations between the city and foreign subnational governments through connections with consuls, embassies and international representatives. In 2013, the SMRI was renamed as Municipal Secretariat of International and Federative Relations (Secretaria Municipal de Relações Internacionais e Federativas; SMRIF) (7).
The Sao Paulo paradiplomacy model driven by the SMRIF has become a template for other international offices in Brazil. SMRIF has engaged in projects with multilateral agencies, partnered with multinational businesses, participated in city networks, exchanged cooperation agreements with other cities, and sought financial assistance from foreign entities for local development initiatives. It has acted as a liaison between the administrations of Sao Paulo and other Brazilian cities. It has managed public relations with consulates and chambers of commerce, and has been handling trade related matters. It has focussed on international partnerships to enhance local urban management (8).
To work alongside SMRIF, SP Negócios, a mixed capital company, was set up to boost investments in the city, enhance the city’s image and forge institutional partnerships (9). Sao Paulo’s model of paradiplomacy has sought to foster urban development through international cooperation and fortify its global position. This has been achieved through activities such as World Expo in Zaragoza (2008) and through participation at platforms such as the C40 network. The city has carved its space in the international landscape of urban paradiplomacy, earned a reputation for itself, envisioned development projects that benefit the city, and has leveraged opportunities for international cooperation (10).
174
Prosperity: Of Lives and Livelihoods
Decentralising Powers
It is difficult to imagine thriving and flourishing cities in the absence of good governance. Given the distinct character of cities, the decentralisation of power to urban local bodies (city governments) as an efficient instrument of development (11) is critical for urban progress. The relationship between decentralisation and good governance is underpinned by the assumption that local governments will be more efficient in governing the local economy than national level administrative authorities. Effective decentralisation entails a well-defined devolution of functional and financial powers and responsibilities and the consequent consolidation of local institutional capacity, allowing for transparent, accountable and robust decision-making, which is the essence of good governance. Decentralisation for good governance has important ramifications on achieving SDG 11 (sustainable cities). Making cities sustainable involves the provision of safe and affordable housing, greening of public spaces, boosting of public transport, promotion of employment and business opportunities, building of resilient urban economies and communities, and facilitation of inclusive urban planning and management (12). In large geographies such as India, decentralisation not only facilitates an improved and efficient delivery of essential services and basic infrastructure, but also enables local governments, which are favourably placed to locate and understand the structure of local economic and social problems, to respond swiftly with more effective solutions (13).
City diplomacy is an extension of the decentralisation phenomenon. Municipal paradiplomacy is an opportunity for municipal authorities to accentuate their self-determination by expanding their space of action and influence with minimum or no intervention from the higher levels of the administrative hierarchy. Through the agency of city diplomacy, municipal authorities explore innovative solutions and mechanisms to tackle local problems. The municipal authorities rely on a further consolidation of their competencies to influence international forces in favour of their local interests. Enabled by decentralisation, municipal authorities have autonomously launched themselves on the global markets by building a unique local brand and reputation to attract capital and investments, build networks, strike exchanges of technology and best practices, and forge trade and cultural connections. This freedom afforded by urban paradiplomacy could allow municipal authorities to become self-reliant in plugging any deficits in resources and funding to perform their functional mandate. Urban paradiplomacy reinforces self-determination in the form of self-rule when municipal authorities, delinked from the higher levels of administration, enter bilateral or multilateral cooperation agreements with their international counterparts. Urban diplomacy facilitates municipal authorities to throw light on domestic urban issues at avenues beyond national borders and
Paradiplomacy as a Pathway to Achieve SDG 11: Is Urban India Ready?
175
reach global high tables. As such, urban diplomacy renders municipal authorities as capable political agents that wield influence on decision-making as a matter of supranational engagements (14).
Where India Stands
In 1993, India enacted the 74th Constitutional Amendment Act, which mandated that urban local bodies be set up and powers devolved to them. But are the municipal authorities in the country favourably placed to accrue the gains of city diplomacy that flow from decentralisation? Consider Mumbai, India’s richest and most populous city.
Mumbai became a member of the C40 initiative in December 2020, but this appears more as a win for the state government instead of an instance of urban paradiplomatic effort resulting from decentralisation (15). Furthermore, no significant collaborative effort has fructified between the Municipal Corporation of Greater Mumbai and Shanghai Municipal People’s Government since the signing of the “Mumbai-Shanghai Sister City Agreement” in 2014 (16).
Mumbai has 15 sister-city relationships, with its partnership with Stuttgart, Germany, being the most active. However, this relationship, which is primarily cultural and business-oriented, is being managed by the Indian Honorary Consulate in Stuttgart rather than the municipal authorities (17).
Mumbai has failed to leverage its brand as the financial capital of India. Despite being a vibrant financial and business hub, Singapore and Hong Kong have proved more successful than Mumbai in luring multinationals to set up their headquarters in the city. In the post-pandemic period, manufacturing activities that have exited China have relocated to Ho Chi Minh City, Vietnam, and Bangkok, Thailand, rather than Mumbai. Additionally, the city is not a favoured destination as to host multilateral summits and meetings of international organisations (18).
More specifically, in May 2021, the Mumbai municipal commissioner approached the mayors of six sister-cities for assistance amid the COVID-19 vaccine crunch (19). But this too does not appear to be an independent act, and requires the approval of the state government.
The 74th Amendment has left much to be desired on the decentralisation of powers to city governments. The functional space for the urban local bodies is not clearly defined and overlaps significantly with that of the state. There is a
176
Prosperity: Of Lives and Livelihoods
clear violation of the principle of subsidiarity in India. Not only are the municipal powers and responsibilities a matter of state discretion, so are the financial powers of levying, collecting and appropriating taxes, duties and tolls, as well as the very delineation of an area as “urban”. The recommendations of the State Finance Commissions—an institution set up for monitoring and informing on the betterment of municipal financial health—have been ignored by the state governments, resulting in an underfinanced municipal functional mandate. As opposed to the developed world, which has empowered its mayors to be the chief executive of the city, India has confined the role of the mayor with limited powers or as merely ceremonial (20).
The current level of decentralisation characterising urban local bodies in India renders them weak in their performance and operations. Urban diplomacy is a distant dream. It is in the fiscal and administrative interest of the states and the centre to consider the decentralisation of local bodies. Today, such decentralisation might seem as being the subject of the luxury of political will. Not too far in the future, the untenable nature of current urban development, infrastructure pressures and environmental problems will question the sustainability of the current governance model and compel decentralisation as a means to good governance and the foundation for urban diplomacy. However, the space for urban diplomacy may be appropriately defined to include functional autonomy suitable to the stature and capability of urban local bodies.
Stronger legislation than the 74th Amendment is needed to effectively deal with the limitations of the latter amendment. Such legislation should clearly demarcate the functions and responsibilities of the urban local bodies independent of the state government. The legislation should identify a clear financing formula needed to be adhered to by the state government in transferring finances to the urban local bodies. This financing formula should be commensurate to the roles and responsibilities assigned to the urban local bodies by the constitution. The urban local bodies should not require state approval in every single matter preventing them from being crippled in their decision making. Nevertheless, the legislation should also clearly state matters in which the state can override the urban local bodies. The legislation must clearly demarcate the coordination between the states and the urban local bodies. Such an approach will give the urban local bodies both functional and financial autonomy and clarify their powers and responsibilities. The legislation should allow urban local bodies the agency, within reasonable limits, to devise solutions to local problems with paradiplomacy as one of the strategies. This will not only empower them within reasonable limits but also reduce the administrative and fiscal burden of states.
Paradiplomacy as a Pathway to Achieve SDG 11: Is Urban India Ready?
177
Endnotes
(1) Christine Knudsen et al., World Cities Report 2020: The Value of Sustainable Urbanization, Key Findings and Messages, Nairobai, Kenya, United Nations Human Settlements Programme, 2020, https://unhabitat.org/World%20Cities%20Report%202020
(2) Dominion Funds, “Cities are the Powerhouse of the Modern Economy,” Dominion Fund Management Limited, https://dominion-funds.com/insights/2021/03/cities-are-the-powerhouse-of-the-modern-economy/
(3) “World Cities Report 2020: The Value of Sustainable Urbanization, Key Findings and Messages”
(4) Iman Ghosh, “These will be the most important cities by 2035,” World Economic Forum, October 31, 2019, https://www.weforum.org/agenda/2019/10/cities-in-2035/
(5) Elisabetta Mocca, “(Nearly) Outside the Shadow of Hierarchy: An Enquiry into the Teleology of Municipal Paradiplomacy in the EU,” The Hague Journal of Diplomacy 15, no. 3 (2020), https://brill.com/view/journals/hjd/15/3/article-p303_4.xml?language=en
(6) Alyssa Ayres, “The New City Multilateralism,” Council on Foreign Relations, June 27, 2018, https://www.cfr.org/expert-brief/new-city-multilateralism
(7) Richard Stren and Abigail Friendly, “Toronto and São Paulo: Cities and International Diplomacy,” Urban Affairs Review 55, no. 2 (2017): 375-404, https://doi.org/10.1177%2F1078087417722862
(8) Richard Stren and Abigail Friendly, “Toronto and São Paulo: Cities and International Diplomacy”
(9) Richard Stren and Abigail Friendly, “Toronto and São Paulo: Cities and International Diplomacy”
(10) Richard Stren and Abigail Friendly, “Toronto and São Paulo: Cities and International Diplomacy”
(11) Ejaz Ghani, “Will decentralisation help India?” Financial Express, March 18, 2020, https://www.financialexpress.com/opinion/will-decentralisation-help-india/1901194/
(12) Department of Economic and Social Affairs Sustainable Development, United Nations, “Goal 11: Make cities and human settlements inclusive, safe, resilient and sustainable,” UN, https://sdgs.un.org/goals/goal11
(13) “Will decentralisation help India?”
(14) Elisabetta Mocca, “(Nearly) Outside the Shadow of Hierarchy: An Enquiry into the Teleology of Municipal Paradiplomacy in the EU”
(15) Badri Chatterjee, “Mumbai joins C40 cities to fight climate change,” Hindustan Times,
178
Prosperity: Of Lives and Livelihoods
December 5, 2020, https://www.hindustantimes.com/mumbai-news/mumbai-joins-c40-cities-to-fight-climate-change/story-v7RLfDWeu2q2kJQjYzEoSK.html
(16) Sifra Lentin, Mumbai-Shanghai Sister Cities Agreement: Challenges and Opportunities, Mumbai, Gateway House: Indian Council on Global Relations, 2017, https://www.gatewayhouse.in/mumbai-shanghai-sister-cities-report/
(17) “Mumbai-Shanghai Sister Cities Agreement: Challenges and Opportunities”
(18) Akshay Mathur, “Relocating Mumbai in the geoeconomics of the Indo-Pacific,” Observer Research Foundation, January 30, 2021, https://www.orfonline.org/expert-speak/relocating-mumbai-in-geoeconomics-of-indo-pacific/
(19) “BMC seeks vaccines from Mumbai’s 6 sister cities, ‘ready to pay in advance’,” The Indian Express, May 29, 2021, https://indianexpress.com/article/cities/mumbai/bmc-seeks-vaccines-from-mumbais-6-sister-cities-ready-to-pay-in-advance-7334816/
(20) Ramanath Jha, “The Unfinished Business of Decentralised Urban Governance in India,” Issue Brief No. 340, Observer Research Foundation, 2020, https://www.orfonline.org/research/the-unfinished-business-of-decentralised-urban-governance-in-india-61201/
High-Income and Highly Unequal: The US Falls Behind in SDGs 8 and 10
17
Terri B. Chapman
180
Prosperity: Of Lives and Livelihoods
I t was long assumed that inequality was a natural feature of economic development, that an initial period of high inequality would be followed by greater equality, represented, for example, by the Kuznets Curve (1). The
Kuznets Curve, an inverted U-shaped curve, illustrates the idea that as economies begin to grow, they experience steep increases in inequality. However, a decline then follows once countries reach a certain level of economic growth (2). This hypothesis was a compelling idea at the time of its development in the 1950s but has since displayed its inadequacy in explaining the complex relationship between growth and inequality. Many high-income countries, especially the US, are contending with rapidly increasing inequality—without any signs of reversal (3).
More recently, many prominent economists have argued that inequality is an inevitable result of economic growth or the natural result of differences in talent, ability, and people's own choices (4). From these perspectives, high economic inequality can and should be tolerated (5),(6). However, there is ample evidence to suggest that inequality is not inevitable, and it is not, in fact, the result of individual choice or talent but rather a sociopolitical and market failure (7),(8),(9). Economic inequalities result from many social, political, and economic factors that create abundant opportunities for some and few desperate chances for others. Furthermore, individual characteristics like age, race, ethnicity, gender, migration status, and disability strongly determine economic wellbeing. Policy choices too—from education systems to financial regulations, taxation, and labour laws—reinforce economic inequality. We should care about rising inequality both from the moral standpoint: it is unfair, but also because it is destabilising, imperils democracy, and weakens the health of the economy (10),(11),(12). Addressing inequality is also a priority agreed upon by the 193 countries that adopted the Sustainable Development Goals (SDGs) in 2015.
High-income and Highly Unequal: The US Falls Behind in SDGs 8 and 10
181
This paper looks at the intersection of SDG 10 (reduced inequalities within and among countries) and SDG 8 (promote sustained, inclusive, and sustainable economic growth, full and productive employment, and decent work for all). The SDGs are as relevant for advanced economies as for developing countries as is illustrated by the US. This paper looks at work and inequality in the US, as this is a particularly salient area of underperformance.
The US lags in achievement towards several of the targets under SDG 8 and SDG 10. The American experience also illustrates inequalities in employment extend into many aspects of people’s lives, defining their life chances, health risks, access to healthcare, educational and career opportunities, and their ability to participate fully in society (13). The issue of equality and work is therefore not just about income and consumption. It is about an unfair system that translates income into opportunity, safety, protection, and life satisfaction. Persistent and rising inequality in the US indicates that concerted efforts are needed to address it. Fortunately, most efforts to reduce economic inequality, such as redistribution and broad-based education, also tend to have further-reaching benefits. Such efforts can support greater societal resilience and the stability of institutions.
Income and Wage Inequality: High and Rising but Not Inevitable
Traditional economic models posit that economic growth is needed to raise living standards. However, more recent evidence suggests that economic growth alone does not necessarily create productive and decent jobs or translate into improved wellbeing (14). Over the last five decades, GDP per capita in the US has risen from approximately US$20,000 to around US$60,000 (in constant 2015 US dollars). While GDP per capita growth gives insights into changes in peoples' living standards, it obscures who benefits from growth. To understand how peoples’ incomes changed, it is critical to look beyond the average (mean) GDP per capita and consider how incomes are distributed across the population.
Income inequality is a pervasive challenge globally. The richest 10 percent of the global population holds more than half of total income (52 percent), while the bottom fifty percent has just 8.5 percent of income. This is also true in many developing economies, where despite rising average incomes, they face high-income inequality (15). Trends in inequality vary between countries. India, for example, has seen a drastic rise, with the income share of the richest 10 percent of the population increasing from 34.4 percent in 1990 to 57.1 percent in 2018. In Mexico in 1990, the highest decile owned 53.2 percent of income, compared to 8.8 percent among the
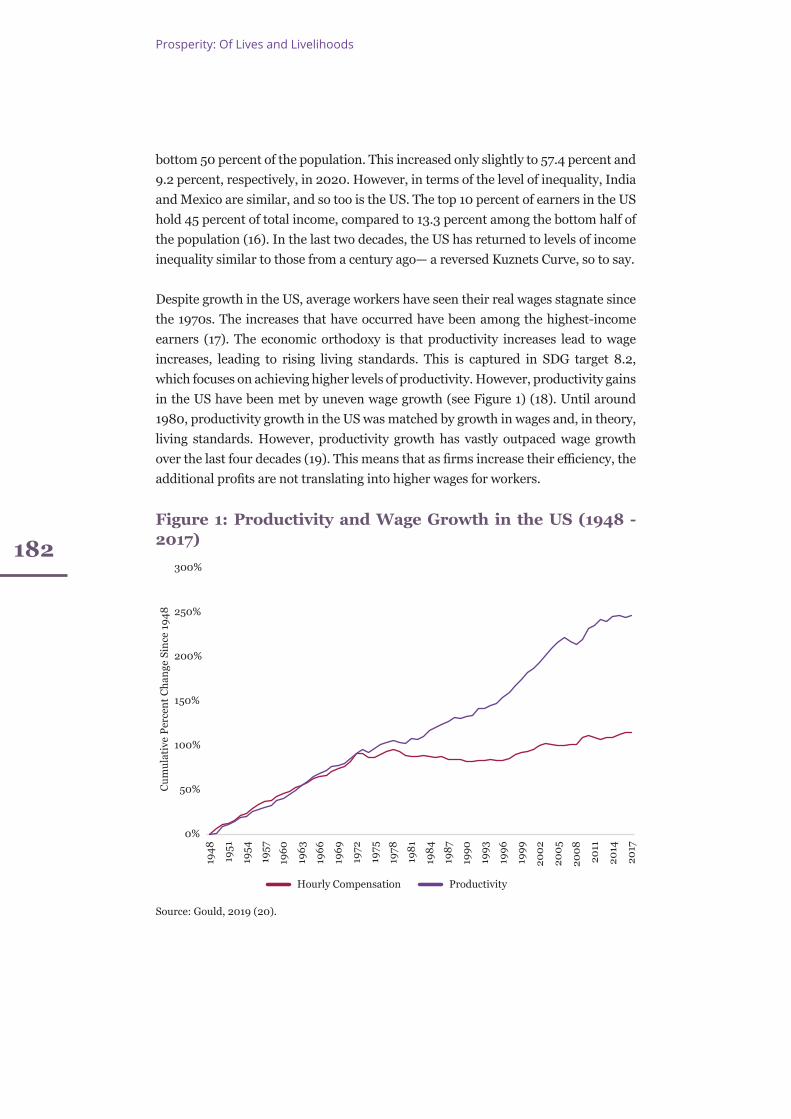
182
Prosperity: Of Lives and Livelihoods
bottom 50 percent of the population. This increased only slightly to 57.4 percent and 9.2 percent, respectively, in 2020. However, in terms of the level of inequality, India and Mexico are similar, and so too is the US. The top 10 percent of earners in the US hold 45 percent of total income, compared to 13.3 percent among the bottom half of the population (16). In the last two decades, the US has returned to levels of income inequality similar to those from a century ago— a reversed Kuznets Curve, so to say.
Despite growth in the US, average workers have seen their real wages stagnate since the 1970s. The increases that have occurred have been among the highest-income earners (17). The economic orthodoxy is that productivity increases lead to wage increases, leading to rising living standards. This is captured in SDG target 8.2, which focuses on achieving higher levels of productivity. However, productivity gains in the US have been met by uneven wage growth (see Figure 1) (18). Until around 1980, productivity growth in the US was matched by growth in wages and, in theory, living standards. However, productivity growth has vastly outpaced wage growth over the last four decades (19). This means that as firms increase their efficiency, the additional profits are not translating into higher wages for workers.
Figure 1: Productivity and Wage Growth in the US (1948 - 2017)
Source: Gould, 2019 (20).
0%
50%
100%
150%
200%
250%
300%
1948
1951
1954
1957
1960
1963
1966
1969
1972
1975
1978
1981
1984
1987
1990
1993
1996
1999
2002
2005
2008
2011
2014
2017
Cum
ulat
ive
Perc
ent C
hang
e Si
nce
1948
Hourly Compensation Productivity
High-income and Highly Unequal: The US Falls Behind in SDGs 8 and 10
183
Wage inequality is persistent not just between the highest and lowest income earners but between different groups of society. SDG 10 focuses on both within and between country inequalities. People of colour, women, persons with disabilities, and migrants tend to have significantly lower wages than other population sub-groups. For example, black men earn 22 percent less than white men in the US (21). Black women earn 34 percent less than white men and 12 percent less than white women (22). Racial wage gaps are not only high but have also increased since 1980 (23). While inequalities in work are context specific, globally, women earn 77 cents for every dollar earned by men (24). The US ranks 53rd globally on the gender pay gap (25).
Social Mobility: The Stifling Chances
Not only are wages drastically unequal in the US, but so too are access to opportunities. The relationship between them is illustrated by the ‘Great Gatsby Curve’ (GGC) (26). The GGC illustrates the relationship between inequality and intergenerational social mobility, revealing a strong correlation between the two. SDG target 10.3 captures the need for addressing inequality of opportunity. Economic and social inequities translate into fewer chances to gain a quality education, participate in the labour market, find decent and fulfilling work, and earn a stable and adequate income with sufficient protections.
The “American dream” is rooted in the idea that you can achieve anything if you work hard enough. However, very few people move up the ladder in the US. In fact, life chances—including education, income, and occupation—are strongly determined by where a person comes from and who their parents are (27),(28). In societies with low levels of social mobility, there is little movement on the ladder. If you are born to working-class parents, you will most likely end up in a working-class position. Similarly, you will likely be well off if you are from a well-off family. On the other hand, highly mobile societies in which where you come from matters less for where you end up. In the US, 31 percent of children born to parents in the lowest income quintile, for example, also end up in the lowest income quintile as adults, while 37 percent of children born to parents in the highest income group also end up in the highest income group as adults (29).
Social mobility trends are more difficult to estimate in lower-income and developing economies, but there also appears to be significant variation in the levels of mobility achieved. Greater equality of opportunity and social mobility means that people born into different class or income positions have greater chances of moving up or down. When there is little movement, poor people stay poor, and the well-off stay well-off.
184
Prosperity: Of Lives and Livelihoods
Labour market inequities in the US and the policies that reinforce them result in unfulfilled potential.
Social Protections: A Perilously Inadequate System
Poor quality jobs with low wages impact other aspects of peoples’ lives beyond their incomes. For instance, unsafe working conditions can lead to long-term health problems, injuries or death; poor quality employment contracts can lead to economic and social risks due to a lack of access to social safety nets; long or unpredictable hours can have economic penalties for single-parents or vulnerable populations, and employment instability can lead to psychological and mental health strain. Work and the conditions thereof shape many aspects of life beyond income and consumption. SDG target 10.4 addresses the need for expanding social protections to enhance equity, which is drastically inadequate in the US.
Many basic social protections in the US, such as health insurance, are linked directly to employment. This system favours more advantaged workers, those with higher incomes and better contracts. For example, the provision of paid sick leave is mainly at the discretion of private employers (30). As a result, less than half of low-wage workers have paid sick leave compared to 92 percent of the highest income earners (31). Moreover, less than half of part-time workers have access to paid sick leave, compared to 86 percent of full-time workers (32).
The US is one of the only countries globally that does not have a federal policy for paid parental leave. The country does have the Family and Medical Leave Act (FMLA), offering unpaid leave for new parents, people with longer-term illnesses, and those taking care of a loved one. However, the FMLA is only available to a subset of workers (33). Because of the stringent requirements for eligibility (length of employment, size of employer, and number of hours worked), just 56 percent of the workforce is eligible (34). As a result, this benefit is more accessible to men, white, non-Hispanic, higher educated, and higher-wage workers. For example, 38 percent of low-wage workers are eligible compared to 63 percent of non-low-wage workers (35).
Conditions: Precarity and Work
SDG target 8.5 pertains to achieving full and productive decent work for all. However, vast disparities persist concerning employment, especially full and productive employment in the US. For example, the labour force participation rate (LFPR), a
High-income and Highly Unequal: The US Falls Behind in SDGs 8 and 10
185
measure more reflective of inequities than the unemployment rate, reveals vast gender disparities in work. The LFPR among females stands at 55.3 percent, compared to 66.6 percent among men (36). The US falls behind many other economies which have achieved higher female LFPR than the US—for example, it is 56.5 percent in Botswana, 57 percent in Cuba, and 74 percent in Ethiopia (37).
Target 8.6 concerns the need to improve opportunities specifically for youth by reducing the number of young people who are not in education, employment, or training. In the US, 16.9 percent of the 16-to-19 age group fall into this category (38). This is above the average of 13 percent among high-income countries (39).
Moreover, employment in the US is generally considered ‘at-will,’ which allows employers to fire workers at any time without reason and warning. The justification for at-will employment is that workers have the same right to leave a job without reason. It is also rooted in a pro-business approach to the labour market, allowing businesses to be nimble by quickly hiring and firing workers as needed. The US is the only high-income country that uses this approach, while other countries favour greater protections for workers, resulting in better outcomes. At-will employment is particularly problematic when we consider it in the context of the social protections outlined above.
The rise of the gig economy and the informalisation of work in the US through contractualisation, a process observed in many advanced and developing economies, has made this issue even more pressing. While non-standard employment offers some workers desirable benefits such as flexibility, research has revealed persistent issues related to pay, collective bargaining, safety, hours, and lack of protections. Moreover, it tends to be the less advantaged segments of society who are afforded non-standard opportunities, further increasing inequality in pay, opportunities for progression, and fulfilment.
Purpose and Fulfilment
A final and perhaps less obvious but crucial example is the dimension of purpose and fulfilment. Work is necessary for most of us to meet our basic consumption needs. But it is also a channel through which people can find and pursue purpose. Because people spend immense amounts of time working, when our jobs match our ambitions, interest and life goals, we are more likely to enjoy and benefit from our work. But these attributes of jobs are not equally distributed. The tendency towards greater contractorisation of work and the fragmentation of jobs into little bits and
186
Prosperity: Of Lives and Livelihoods
pieces means that many people are making ends meet in jobs that provide them with little fulfilment or purpose. As anthropologist David Graeber argues, self-worth is defined by one's work, and thus, a "profound psychological violence" has resulted from the emergence of what he calls “bullshit jobs”. The internal violence Graeber describes is the conflict of self-worth derived from one's occupation, being stripped away by the nature of “pointless” service sector jobs (40).
The COVID-19 pandemic has resulted in many people in the US quitting their jobs, a phenomenon termed “the great resignation”; in September 2021 alone, 4.4 million people in the US left their jobs by choice (41). The risks associated with frontline work and the lack of protections like sick leave changed the equation for many people. These risks were not equally allocated either. For example, 65 percent of people with a college degree or higher worked from home in 2020, compared to 19 percent of those employed with less education (42).
The continuation of social and economic inequalities in work is compounded by the fact that many people are in jobs that provide little dignity, respect, responsibility, purpose, or fulfilment. Satisfying and decent work improves well-being, but the current economic approach to insecure, poor quality, low-wage jobs mean people do not have adequate opportunities.
Conclusion
The US has a long way to achieve many of the SDGs. This paper looks specifically at the intersection of SDGs 8 (work) and 10 (inequality), arguing that the US has made policy decisions that have led to vast inequities in work. Income inequality is among the highest in advanced economies, and is increasing; opportunities are highly concentrated leading to rigidity in intergenerational mobility and inequality of outcomes; social protections are vastly inadequate for meeting even the most basic social needs and are availed to only the most advantaged workers; labour laws are lacking for addressing issues of worker security and equity in the context of informalisation; and inequities in fulfilment and life satisfaction are further complicating an already unequal system in the US.
Inequality in incomes, opportunities, protections, working conditions, and satisfaction intersect with other factors like age, race, gender, disability status, and migration status. As such, it is often the least well-off who face the greatest injustices in work. The consequences of inequality in the world of work are far greater than income. They extend to people’s health, opportunities, protections, security, safety,
High-income and Highly Unequal: The US Falls Behind in SDGs 8 and 10
187
and wellbeing. Policy levers for changing the balance exist, such as taxation, labour contracts, worker classifications, redistribution, raising the federal minimum wage, strengthening social protection and delinking them from employment, financial aid for higher education, and the provision of childcare. While the US has favoured a particular labour market model that avails little in the way of rights and protections for workers, and minimal redistribution, other countries have chosen different paths with more success. As a result, the US is falling behind on SDGs 8 and 10 and the impacts are far reaching.
Endnotes
(1) Simon Kuznets, “Economic Growth and Income Inequality,” The American Economic Review 45, no. 1 (1955): 1-28, https://www.jstor.org/stable/1811581
(2) Kuznets, “Economic Growth and Income Inequality”
(3) United Nations Department of Economic and Social Affairs, World Social Report: 2020: Inequality in a Rapidly Changing World, Washington DC, UNDESA, 2020, https://www.un.org/development/desa/dspd/world-social-report/2020-2.html
(4) Peterson Institute for International Economics, How to Fix Economic Inequality: An Overview of Policies for the United States and Other High-Income Economies, Washington DC, PIIE, 2021, pp. 16, https://www.piie.com/microsites/how-fix-economic-inequality
(5) Edward Conard, The Upside of Inequality: How Good Intentions Undermine the Middle Class (New York: Penguin Random House, 2016).
(6) Don Watkins, and Yaron Brook, Equal is Unfair: America’s Misguided Fight against Income Inequality (New York: St. Martin’s Press, 2019).
(7) Joseph Stiglitz, The Price of Inequality: How Today’s Divided Society Endangers our Future (New York: W. W. Norton and Company, 2013).
(8) Angus Deaton, The Great Escape: Health Wealth and the Origins of Inequality (Princeton: Princeton University Press, 2013).
(9) Kay Lehman Schlozman, Henry E. Brady, and Sidney Verba, “Growing Economic Inequality and its Political Roots,” Reliogions 8, 97 (2017): 1-17, https://doi.org/10.3390/rel8050097
(10) Jonathan D. Ostry, Andrew Berg, Charalambos G. Tsangarides, “Redistribution, Inequality and Growth,” International Monetary Fund 2014, no. 002 (2014):1-30, https://www.elibrary.imf.org/view/journals/006/2014/002/006.2014.issue-002-en.xml
188
Prosperity: Of Lives and Livelihoods
(11) Joseph Stiglitz, The Price of Inequality: How Today’s Divided Society Endangers our Future, (New York: W. W. Norton and Company, 2013).
(12) Martin Gilens, Affluence and Influence: Economic Inequality and Political Power in America, (Princeton: Princeton University Press, 2012).
(13) Van de Werfhorst, Herman G. and Wiemer Salverda, “Consequences of Economic Inequality: Introduction to a Special Issue,” Research in Social Stratification and Mobility 30, no. 4 (2012): 377-387, http://dx.doi.org/10.1016/j.rssm.2012.08.001
(14) International Labour Organization, “Employment-rich Economic Growth,” https://www.ilo.org/global/topics/dw4sd/themes/employment-rich/lang--en/index.htm
(15) Lucas Chancel, Thomas Piketty, Emmanuel Saez, Gabriel Zucman et al., World Inequality Report 2022, (Paris, World Inequality Lab, 2022), https://wir2022.wid.world/download/
(16) World Inequality Database. “Income Inequality, USA, 1913-2021,” https://wid.world/country/usa/
(17) Drew Desilver, “For Most U.S. Workers, Real Wages Have Barely Budged in Decades,” Pew Research Center (2018), https://www.pewresearch.org/fact-tank/2018/08/07/for-most-us-workers-real-wages-have-barely-budged-for-decades/
(18) Elise Gould, “Decades of Rising Economic Inequality in the U.S.: Testimony before the U.S. House of Representatives Ways and Means Committee,” Economic Policy Institute (2019), https://www.epi.org/publication/decades-of-rising-economic-inequality-in-the-u-s-testimony-before-the-u-s-house-of-representatives-ways-and-means-committee/
(19) Gould, “Decades of Rising Economic Inequality in the U.S.”
(20) Elise Gould, “State of Working America Wages 2019,” Economic Policy Institute (2020), https://www.epi.org/publication/swa-wages-2019/
(21) Valerie Wilson and William M. Rodgers, “Black-white wage gaps expand with rising wage inequality,” Economic Policy Institute (2016): 1-66, https://www.epi.org/publication/black-white-wage-gaps-expand-with-rising-wage-inequality/
(22) Wilson and Rodgers, “Black-white wage gaps expand with rising wage inequality”
(23) Wilson and Rodgers, “Black-white wage gaps expand with rising wage inequality”
(24) UN Women, “Equal Pay for Work of Equal Value,” UN Women, https://www.unwomen.org/en/news/in-focus/csw61/equal-pay
(25) World Economic Forum, Global Gender Gap Report 2020, Geneva, WEF, 2020, https://www.weforum.org/reports/gender-gap-2020-report-100-years-pay-equality
(26) Alan Krueger, “The Rise and Consequences of Inequality in the United States” (speech, Washington DC, January 12, 2012), Obama White House Archives, https://obamawhitehouse.archives.gov/blog/2012/01/12/chairman-alan-krueger-discusses-rise-and-consequences-inequality-center-american-pro#:~:text=In%20his%20
High-income and Highly Unequal: The US Falls Behind in SDGs 8 and 10
189
prepared%20remarks%2C%20Chairman,threat%20to%20our%20economic%20growth.
(27) Dylan Shane Connor and Michael Storper, “The Changing Geography of Social Mobility in the United States,” PNAS, 117, no. 48 (2020), https://www.pnas.org/doi/10.1073/pnas.2010222117
(28) Emily Beller and Michael Hout, “Intergenerational Social Mobility in the United States in Comparative Perspective,” Future of Children, 16, no. 2 (2006), https://www.jstor.org/stable/3844789
(29) Sarah Reber, Chenoah Sinclair, Opportunity Engines: Middle-Class Mobility in Higher Education, Brookings Institution, 2020, pp. 3, https://www.brookings.edu/research/opportunity-engines-middle-class-mobility-in-higher-education/
(30) U.S. Department of Labor, “Leave Benefits,” DOL, https://www.dol.gov/general/topic/benefits-leave
(31) Usha Ranji, Michelle Long, and Alina Salganicoff, Coronavirus Puts a Spotlight on Paid Leave Policies, Kaiser Family Foundation, 2020, https://www.kff.org/coronavirus-covid-19/issue-brief/coronavirus-puts-a-spotlight-on-paid-leave-policies/
(32) “Coronavirus Puts a Spotlight on Paid Leave Policies”
(33) U.S. Department of Labor, “Leave Benefits”
(34) Scott Brown, Jane Herr, Radha Roy, and Jacob Alex Kierman, Employee and Worksite Perspectives of FMLA: Who is Eligible?, Abt Associates Inc. for the U.S. Department of Labor, 2020
(35) “Employee and Worksite Perspectives of FMLA: Who is Eligible?”
(36) The World Bank, “Labor force participation rate, female (%) of female population ages 15+ (modeled ILO estimate) - United States,” The World Bank Group, https://data.worldbank.org/indicator/SL.TLF.CACT.FE.ZS?locations=US
(37) The World Bank Group, “Labor force participation rate, female (%) of female population ages 15+ (modeled ILO estimate) – United States”
(38) Drew Desilver, “Millions of Young People in U.S. and E.U. are Neither Working Nor Learning,” Pew Research Center (2016), https://www.pewresearch.org/fact-tank/2016/01/28/us-eu-neet-population/
(39) The World Bank, “Share of youth not in education, employment or training, total (% of youth population),” The World Bank Group, https://data.worldbank.org/indicator/SL.UEM.NEET.ZS
(40) David Graeber, Bullshit Jobs (New York: Simon & Schuster, 2018).
(41) Bureau of Labor Statistics, U.S. Department of Labour, https://www.bls.gov/news.release/archives/jolts_11122021.htm 2021.
(42) Bureau of Labor Statistics, U.S. Department of Labour, https://www.bls.gov/news.release/atus.nr0.htm, 2021.
About the Editors and Authors
About the Editors and Authors
191
Soumya Bhowmick is an Associate Fellow at Observer Research Foundation’s Centre for New Economic Diplomacy.
Nilanjan Ghosh is Director of Observer Research Foundation’s Centre for New Economic Diplomacy, and the Kolkata Centre.
Yoginder. K. Alagh is a noted economist and former Union Minister of Government of India.
M. V. Lee Badgett is a Professor of Economics at the University of Massachusetts Amherst, and the author of The Economic Case for LGBT Equality: Why Fair and Equal Treatment Benefit Us All (Beacon Press, 2020).
John H. Matthews is Executive Director at the Alliance for Global Water Adaptation.
Emil Uddhammar is a professor emeritus of political science at Linnaeus University, Sweden.
Andrea Cabello is a Professor of Economics at University of Brasilia in Brazil.
Robin Ramcharan is Executive Director, Asia Centre, and Lecturer at Mahidol University International College, Bangkok.
Shoba Suri is a Senior Fellow at Observer Research Foundation’s health initiative.
Roshan Saha is a Doctoral Candidate at the Department of Agricultural Economics and Rural Sociology, Auburn University, US.
Tania Lado Insua is an ocean engineer and the Manager, Research and Partnerships for the Blue Economy CRC.
John Whittington is the CEO of the Blue Economy CRC.
David Hope is the Research Executive Officer for the Blue Economy CRC.
Irene Penesis is a professor in marine renewable energy and the Research Director for the Blue Economy CRC.
Joyashree Roy is the inaugural Bangabandhu Chair Professor and Director of the Centre on South and Southeast Asia Multidisciplinary Applied Research Network
192
About the Editors and Authors
on Transforming Societies of Global South at the Asian Institute of Technology, Thailand.
Shreya Some is a scientist in the Technical Support Unit of Intergovernmental Panel on Climate Change, Working Group III, and a Visiting Researcher at the Global Change Programme, Jadavpur University, India.
Madhu Verma is Chief Economist, World Resources Institute (WRI) India, New Delhi.
Asi Guha is Project Associate, Economics Centre, World Resources Institute (WRI) India, New Delhi.
Anamitra Anurag Danda is Senior Visiting Fellow with ORF’s Energy and Climate Change Programme.
Preeti Kapuria is a Fellow at ORF Kolkata with research interests in environment, development and sustainable agriculture and food systems.
Purnamita Dasgupta is Chair Professor and Head, Environmental & Resource Economics Unit at the Institute of Economic Growth, Delhi, India.
Theophilus Edwin Coleman is a Postdoctoral Research Fellow, University of Johannesburg, South Africa.
Letlhokwa George Mpedi is the Deputy Vice-Chancellor: Academic, University of Johannesburg, South Africa.
Renita D’Souza is a Fellow at Observer Research Foundation, Mumbai, under the Inclusive Growth and SDGs programme.
Terri B. Chapman is a Program Manager for Economic Policy at the Observer Research Foundation America in Washington DC.
The editors acknowledge Bhavesh Kumar Sindhura, Sanah Singh, Debosmita Sarkar and Suyash Das for their invaluable support with this volume.