QEX Jan Feb 2012 Cover.indd
31
ARRL 225 Main Street Newington, CT USA 06111-1494 The national association for AMATEUR RADIO TM $ 5
-
Upload
khangminh22 -
Category
Documents
-
view
18 -
download
0
Transcript of QEX Jan Feb 2012 Cover.indd

ARRL 225 Main StreetNewington, CT USA 06111-1494
The national association for AMATEUR RADIO
TM
$5
QEX Jan Feb 2012 Cover.indd 1 11/16/2011 9:34:11 AM
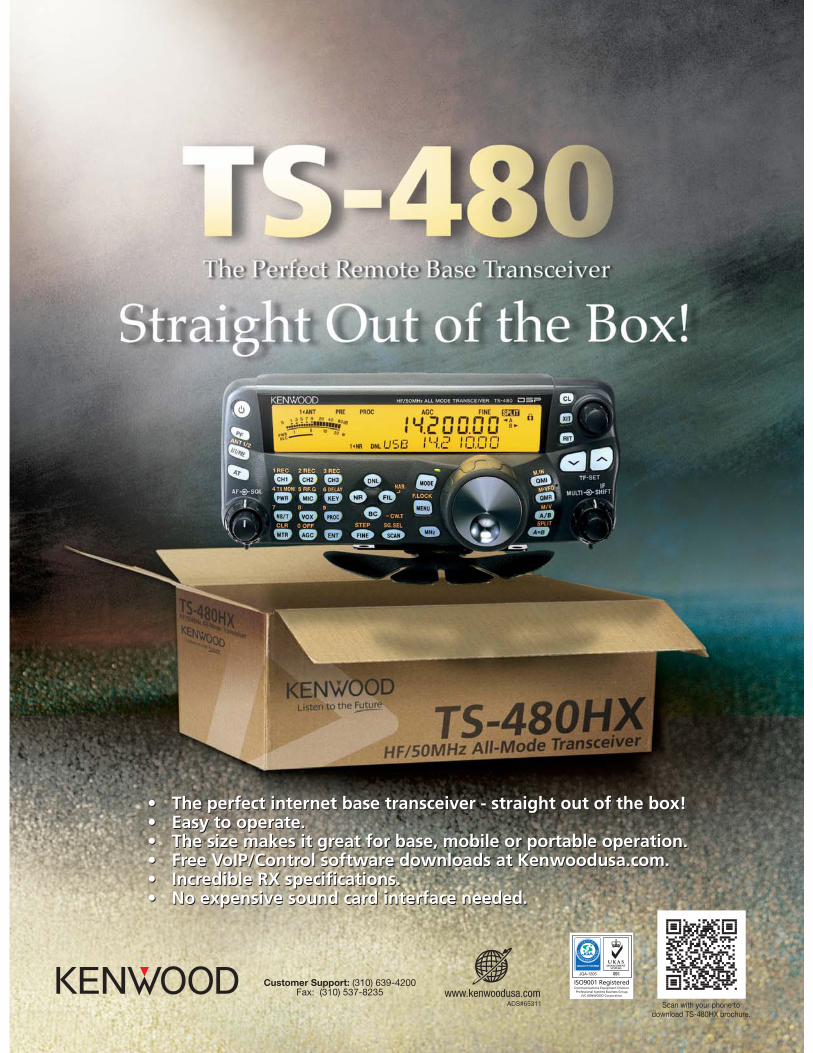
• The perfect internet base transceiver - straight out of the box!• Easy to operate.• The size makes it great for base, mobile or portable operation.• Free VoIP/Control software downloads at Kenwoodusa.com.• Incredible RX specifications.• No expensive sound card interface needed.
• The perfect internet base transceiver - straight out of the box!• Easy to operate.• The size makes it great for base, mobile or portable operation.• Free VoIP/Control software downloads at Kenwoodusa.com.• Incredible RX specifications.• No expensive sound card interface needed.
Customer Support: (310) 639-4200Fax: (310) 537-8235
ADS#65311 Scan with your phone todownload TS-480HX brochure.
QEX – January/February 2012 1
About the Cover
In order to ensure prompt delivery, we ask that you periodically check the address information on your mailing label. If you find any inaccura- cies, please contact the Circulation Department immediately. Thank you for your assistance.
Copyright © 2011 by the American Radio Relay League Inc. For permission to quote or reprint material from QEX or any ARRL publication, send a written request including the issue date (or book title), article, page numbers and a description of where you intend to use the reprinted material. Send the request to the office of the Publications Manager ([email protected]).
Features
Some Homemade CapacitorsLuiz Amaral, PY1LL/AC2BR
In This Issue
January/February 2012
QEX (ISSN: 0886-8093) is published bimonthly in January, March, May, July, September, and November by the American Radio Relay League, 225 Main Street, Newington, CT 06111-1494. Periodicals postage paid at Hartford, CT and at additional mailing offices.
POSTMASTER: Send address changes to: QEX, 225 Main St, Newington, CT 06111-1494 Issue No 270
Harold Kramer, WJ1B Publisher
Larry Wolfgang, WR1B Editor
Lori Weinberg, KB1EIB Assistant Editor
Zack Lau, W1VT Ray Mack, W5IFS Contributing Editors
Production Department
Steve Ford, WB8IMY Publications Manager
Michelle Bloom, WB1ENT Production Supervisor
Sue Fagan, KB1OKW Graphic Design Supervisor
David Pingree, N1NAS Senior Technical Illustrator
Carol Michaud, KB1QAW Technical Illustrator
Advertising Information Contact:
Janet L. Rocco, W1JLR Business Services 860-594-0203 – Direct 800-243-7768 – ARRL 860-594-4285 – Fax
Circulation Department
Cathy Stepina, QEX Circulation
Offices
225 Main St, Newington, CT 06111-1494 USA Telephone: 860-594-0200 Fax: 860-594-0259 (24 hour direct line) e-mail: [email protected]
Subscription rate for 6 issues:
In the US: ARRL Member $24, nonmember $36;
US by First Class Mail: ARRL member $37, nonmember $49;
International and Canada by Airmail: ARRL member $31, nonmember $43;
Members are asked to include their membership control number or a label from their QST when applying.
Index of AdvertisersAmerican Radio Relay League: .................... 6,
Cover III, Cover IVArray Solutions: ...........................................24Down East Microwave Inc: ...........................23Kenwood Communications: .................Cover II
National RF, Inc: ............................................6Nemal Electronics International, Inc: ...........23RF Parts:................................................21, 23Tucson Amateur Packet Radio: ...................24
Q Factor Measurements on L-C CircuitsJacques Audet, VE2AZX
Pic’n on the ThunderBolt John Maetta, N6VMO
Tech NotessDoyle Strandlund, W9NJD
SDR: SimplifiedRay Mack, W5IFS
End Man-Made Noise with the Noise Canceller Fred Brown, W6HPH
Fred Brown, W6HPH, eliminates most man-made noise from his receiver with the NC (Noise Canceller). With his four-transistor circuit you can shift the phase of the signals coming from a separate noise antenna, and vary the amplitude of those signals to cancel the noise coming from the main receive antenna. One of the transistors serves as a phase splitter, allowing you to switch between 0° and 180° for the base phase shift. A dual-gate MOSFET serves as a variable-gain amplifier. (K9QZI Photo)
Upcoming Conferences
Out of the BoxRay Mack, W5IFS
2011QEX Index

The American Radio Relay League, Inc, is a noncommercial association of radio amateurs, organized for the promotion of interest in Amateur Radio communication and experimentation, for the establishment of networks to provide communications in the event of disasters or other emergencies, for the advancement of the radio art and of the public welfare, for the representation of the radio amateur in legislative matters, and for the maintenance of fraternalism and a high standard of conduct.
ARRL is an incorporated association without capital stock chartered under the laws of the state of Connecticut, and is an exempt organization under Section 501(c)(3) of the Internal Revenue Code of 1986. Its affairs are governed by a Board of Directors, whose voting members are elected every three years by the general membership. The officers are elected or appointed by the Directors. The League is noncommercial, and no one who could gain financially from the shaping of its affairs is eligible for membership on its Board.
“Of, by, and for the radio amateur,” ARRL numbers within its ranks the vast majority of active amateurs in the nation and has a proud history of achievement as the standard-bearer in amateur affairs.
A bona fide interest in Amateur Radio is the only essential qualification of membership; an Amateur Radio license is not a prerequisite, although full voting membership is granted only to licensed amateurs in the US.
Membership inquiries and general corres- pondence should be addressed to the administrative headquarters:
ARRL 225 Main Street Newington, CT 06111 USA Telephone: 860-594-0200 FAX: 860-594-0259 (24-hour direct line)
Officers
President: KAY C. CRAIGIE, N3KN570 Brush Mountain Rd, Blacksburg, VA 24060
Chief Executive Officer: DAVID SUMNER, K1ZZ
The purpose of QEX is to:
1) provide a medium for the exchange of ideas and information among Amateur Radio experimenters,
2) document advanced technical work in the Amateur Radio field, and
3) support efforts to advance the state of the Amateur Radio art.
All correspondence concerning QEX should be addressed to the American Radio Relay League, 225 Main Street, Newington, CT 06111 USA. Envelopes containing manuscripts and letters for publication in QEX should be marked Editor, QEX.
Both theoretical and practical technical articles are welcomed. Manuscripts should be submitted in word-processor format, if possible. We can redraw any figures as long as their content is clear. Photos should be glossy, color or black-and-white prints of at least the size they are to appear in QEX or high-resolution digital images (300 dots per inch or higher at the printed size). Further information for authors can be found on the Web at www.arrl.org/qex/ or by e-mail to [email protected].
Any opinions expressed in QEX are those ofthe authors, not necessarily those of the Editor or the League. While we strive to ensure all material is technically correct, authors are expected to defend their own assertions. Products mentioned are included for your information only; no endorsement is implied. Readers are cautioned to verify the availability of products before sending money to vendors.
The American Radio Relay League
Larry Wolfgang, WR1B
Empirical Outlook
2 QEX – January/February 2012
Looking Back and Looking ForwardThe beginning of a new year always leads to thoughts about where we have been and
where we are going. Many of us think about New Year’s Resolutions, and wonder how long we will be able stick with the new plans. On a personal note, I was pleased to move beyond the medical issues that had me out of service for the second half of 2010. A full return to health in 2011 has made it a good year! I look forward to an active 2012, and blending Amateur Radio into many of the outdoor activities I enjoy. I recently participated in some hidden transmitter hunting, and a bit of walking to get different angles on the “fox” while tracking it down was good exercise. I am also resolving to make at least one HF QSO each week. That may not seem like much effort, and many weeks I expect to make more than one QSO. Since I have sometimes gone a month or more without turn-ing on my radio, this will be a reasonable goal.
As always, we had some excellent articles in QEX during 2011, and we can look for-ward to more of the same in 2012. For several months it seemed that our stock of articles to publish was very thin, and we struggled to reach our goal of a 48 page issue several times. In fact, this issue is one of the thinner issues we have published in a long time. For the immediate future we seem to have turned that corner, and have several multipart articles lined up for 2012.
If you have been thinking about writing an article for QEX, I would ask you to move that to the top of your Resolutions list. We can definitely churn through a lot of material for every issue, so we do need a steady stream of good articles. I’ve written about sub-mitting articles in the past, and continue to encourage our readers to write about a proj-ect you have built, an explanation of some technical issue that interests you or just about anything related to Amateur Radio technology. I always mention our need for a “plain” manuscript file with just text, and for separate high resolution photo and graphics files. One article that I had planned to use in this issue turned out to be unusable because the author had only submitted low-resolution images embedded into a Word file, and was then unable to send separate photos. Since we didn’t have printable photos, we were forced to hold the article and hope the author can supply good photos later.
What projects have you started or completed in the past year? I hope when you take stock, 2011 will have been a good year for your hobby interests. One holdover for me from a couple of years ago has been to try building a few more projects using surface mount components. I recently acquired a high definition Web camera for my computer. The immediate goal was better picture quality when we Skype with our son, daughter-in-law and granddaughters in Wyoming. The ulterior motive was to have a better way to magnify an image of the circuit board as I try to place those SMD parts on the solder paste prior to heating the board to melt that paste. For about $40 on sale, I am hoping this camera will be a very inexpensive “microscope” for my workbench. I’ll let you know how that goes.
There is some exciting news to share about QEX on the International front. ARRL has recently partnered with Practical Electronics, a Chinese hobby electronics and Amateur Radio magazine, to bring some of the technical articles from QEX to their readers. Many Chinese Amateur Radio operators, electronics engineers, teachers and students read Practical Electronics each month to learn about radio and electronics. Editor Tong Huang, BG1WXD, plans to select QEX articles from past and current issues and trans-late them into Chinese. Starting with the 2012 issue, he will publish a few articles in each issue of Practical Electronics. Now their readers will also be able to learn from and experiment with many QEX projects.
I wish you all a happy, healthy and prosperous 2012!

QEX – January/February 2012 3
Luiz Amaral, PY1LL/AC2BR
2073 Hering Ave, Floor 2, Apt 02, Bronx, NY 10461; [email protected]
Some Homemade CapacitorsDo you enjoy homebrewing your equipment? How about building the
capacitors for a special project? When the author couldn’t find the capacitors he needed at a reasonable price, that’s exactly what he did!
In some 10 or 12 countries around the world, 500 kHz (600 m) is an experimen-tal band for ham radio operators. In Brazil, while waiting for an official license for hams to work on that band, I started to study all of the problems involved with equipment, and some corresponding solutions to become active.
I wrote this article because I had the problem of getting good capacitors for my 500 kHz system at a reasonable price. High-current, high-capacitance mica capacitors for RF are rather expensive and I needed several. Because the frequency was low, the required capacitance values were too high and one solution was to build the capaci-tors at home, with simple and easy-to-find materials. Besides, wrapped-foil capacitors had to be avoided to avoid undesirable stray inductances, so I wanted capacitors with plates that have a plane, flat surface.
With homemade solutions, it is always possible to tailor the component to our needs. That is sometimes difficult to achieve with commercial units.
I tried many solutions and many materi-als as dielectrics for my capacitors. There were many plastic sheets, some metalized and some not. Some were already manu-factured with glue. For the electrodes, I tried aluminum, gold, tin and copper foils. Soldering ease is a must for the electrode metal, because with many layers, these must be interconnected.
All the plastics I tried showed much too high equivalent series resistance (ESR) values, which means they had an unaccept-able loss and a very low dielectric rigidity (supporting only rather low voltages). Tin-coated paper is easily soldered, but is dif-ficult to find in the market because, even for chocolates, where they were once largely
used, they have been replaced by metalized plastic.
Aluminum is very easy to buy and is inexpensive, but it is difficult to solder. I tried some special fluxes designed for aluminum, but didn’t succeed because foil is very thin. Thin gold foils are very easy to find, are not very expensive and solder easily, but a simple puff tears them, making things very hard to handle.
The SolutionEventually, the solution I chose was
mica for the dielectric and copper foil for the electrodes. Mica is found in the market as thin sheets, and its suppliers can cut them for you in the required dimensions (cutting mica at home is not a very easy task). They have very high dielectric rigidity, very low loss and excellent thermal stability. Copper foils as thin as 0.1 mm are found in rolls, solder very well, cut easily and are rather inexpensive.
We are dealing here with plane capaci-
tors, and their capacitances are given by:
C = 0.00885 K A (n – 1) / d[Eq 1]
Where C is given in pf, K is the dimen-sionless dielectric constant, A is the area of the conductor electrodes in mm2, n is the number of layers and d is the dielectric thick-ness in mm. In the literature, the multiplying constant in Equation 1 appears to be 0.224, but in this case the units are inches instead of millimeters.
[The constant 0.00885 is derived from the permittivity of free space, usually desig-nated as 0. Physics texts give the value of 0 as 8.85×10 F/m. We can replace 10 with the metric prefix pico, expressing the value in pF/m. Since the author specifies the area of the capacitor plate in mm2, rather than in m2, we have another factor of 10 , hence the value of 0.00885. — Ed.]
In Figure 1 we see the example of a plane capacitor with only one layer. The electrode foils have their areas smaller than those of
Figure 1 — This drawing shows the construction of a simple capacitor, with two conducting plates separated by a layer of insulating material, or dielectric.

4 QEX – January/February 2012
the dielectrics so we don’t decrease the effec-tive dielectric rigidity due the great electric field at the edges of the electrodes. The small excess of the electrode material beyond the dielectric is for soldering purposes, with other layers for paralleling them, and for con-nection with the external terminals.
The choice of the dielectric is primarily tied to two factors: the working voltage and the dielectric constant. The first factor defines the thickness of the dielectric for the chosen material and, together with the second factor defines what we may call specific capaci-tance of that dielectric.
Normally, the builder doesn’t have a sim-ple means to measure the dielectric constant of a given material nor will he or she even have a micrometer to measure its thickness with precision. What to do, then? It is simple. In Equation 1, with n = 2, that is, only one dielectric layer, we can call the product of the constant 0.00885 by the ratio of the two unknowns K and d:
C = A [Eq 2]
where = 0.00885 × K / d. Then is a constant for the chosen dielectric. All layers have the same K and the same d, therefore the same .
Since we don’t know K and d for our dielectric, we measure as follows: on a piece of the chosen dielectric, we carefully adapt two equal electrodes with reasonable dimensions and the same known area, A, forming a capacitor as shown in Figure 1. We measure the value of C, and we can rewrite Equation 2 as:
= C / A With a known value of , to get the capaci-tance of a capacitor made with this dielectric (given thickness and dielectric constant), we need only know the area, A, of the electrodes and multiply it by . So, is the specific capacitance for that dielectric.
The test capacitor, as all final ones, must be assembled with some compression to guarantee that the electrodes are at the cor-rect distance, eliminating problems that arise because the electrodes are not perfectly on the same plane when they are homemade. You can make a final adjustment of the capacitance value by varying such compres-sion.
Electrode DimensionsThe biggest problem we have is just
to dimension the electrodes. Suppose we already know the value of , and so we can calculate any capacitor. In general, the num-ber of layers, n, is greater than 2 and we have a complication because n is an integer. In Equation 1, using the value of , we have:
C = × A (n – 1) [Eq 3]
We want to get a capacitance, C, using the chosen electrodes with area A, and want to know how many layers we need. Rewriting Equation 3 solved for for n, we have:
n = C / ( A) + 1 [Eq 4]
As a general rule, the ratio C / ( A) is not an integer, so neither will n be an inte-ger. This means that the last layer must be used for adjusting the value of C by vary-ing its size. So, we build a capacitor with n – 1 layers and, for the last one, we adjust its area to get the desired capacitance. This happens because there is an imprecision on the expression of Equation 3, because every measurement has its errors, and the capacitance per layer also depends upon the mechanical pressure applied to it.
We may choose, at will, the area we want for the electrodes, since their dimensions are much greater than the related thicknesses. The physical shape of the capacitor stack for a given capacitance will be something like a parallelepiped — higher and narrower or vice-versa, according to the builder’s wishes.
Building the CapacitorFigure 2 shows the three templates used in
the construction of my capacitors. The tem-plate at the top left has a rectangular shape with dimensions of 5 cm × 6 cm and is used to cut the electrodes.
The electrode foil may be cut with a simple retractable blade knife, as shown in Figure 3. You could also use any other sharp cutter or even a pair of scissors.
The template, at the bottom left of Figure 2 is square with dimensions of 6 cm × 6 cm. It is used to cut the dielectric, as needed. In my case it is made of mica sheets 0.2 mm thick, as shown in Figure 4. (I bought them already cut because it is difficult to cut mica correctly.) The template on the right is used to put the electrodes over the dielectric. It is the assembling template. Figure 5 shows the assembling template with dimensions included. With these dimensions, the effec-tive electrode area is 2,500 mm2.
The dielectric (after cut) is adjusted in the corresponding place at the assembling tem-plate, as shown in Figure 6. The electrodes, after cut, are adjusted at the suitable space of the template, as shown in Figure 7. Note that when positioned correctly, alternate electrodes stay outside opposite edges of the dielectric sheets for the external connec-tions. After having cut the electrodes from the copper foil, you must remove all the burrs with a retractable knife or other tool. Be sure to deburr both sides, to avoid damag-ing the dielectric. The electrodes must be put in alternate mode, that is, the odd ones with
Figure 2 — At the top left of this photo you can see the template that the author used to give the size of the capacitor dielectric. The template for the size of the conducting foil
plates is shown at the lower left. On the right is the assembling template, used to position the conducting foil plates and the dielectric
layers between the plates.
Figure 3 — This photo shows the author cutting a piece of the copper foil to make one
conducting plate for his capacitor.
Figure 4 — The author purchased mica plates to use as the dielectric layer in his capacitors. Mica can be difficult to cut to
size, so he purchased plates already cut to the necessary size.
Figure 5 — This photo of the assembling template shows the dimensions the author used for his capacitor pieces. The template
is made from pieces of acrylic or other rigid plastic cut to dimension and then held
together with machine screws and bolts.
QEX – January/February 2012 5
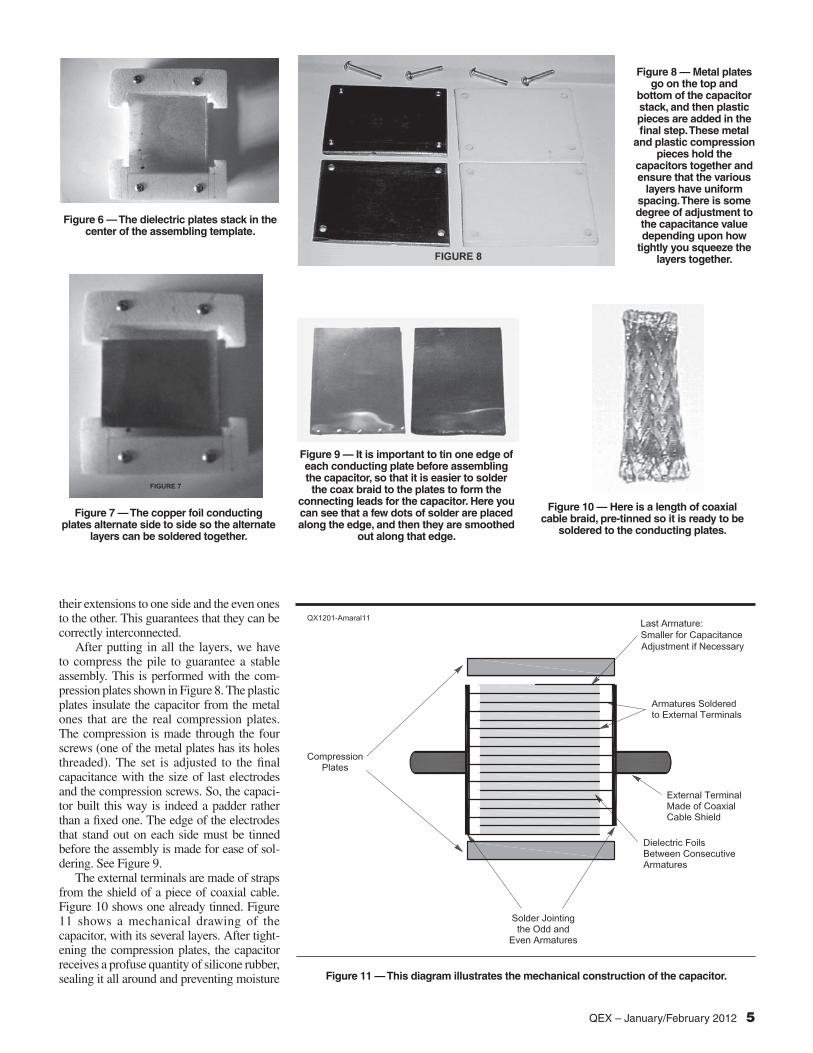
Figure 6 — The dielectric plates stack in the center of the assembling template.
Figure 7 — The copper foil conducting plates alternate side to side so the alternate
layers can be soldered together.
Figure 8 — Metal plates go on the top and
bottom of the capacitor stack, and then plastic pieces are added in the final step. These metal
and plastic compression pieces hold the
capacitors together and ensure that the various
layers have uniform spacing. There is some degree of adjustment to the capacitance value depending upon how
tightly you squeeze the layers together.
their extensions to one side and the even ones to the other. This guarantees that they can be correctly interconnected.
After putting in all the layers, we have to compress the pile to guarantee a stable assembly. This is performed with the com-pression plates shown in Figure 8. The plastic plates insulate the capacitor from the metal ones that are the real compression plates. The compression is made through the four screws (one of the metal plates has its holes threaded). The set is adjusted to the final capacitance with the size of last electrodes and the compression screws. So, the capaci-tor built this way is indeed a padder rather than a fixed one. The edge of the electrodes that stand out on each side must be tinned before the assembly is made for ease of sol-dering. See Figure 9.
The external terminals are made of straps from the shield of a piece of coaxial cable. Figure 10 shows one already tinned. Figure 11 shows a mechanical drawing of the capacitor, with its several layers. After tight-ening the compression plates, the capacitor receives a profuse quantity of silicone rubber, sealing it all around and preventing moisture
Figure 9 — It is important to tin one edge of each conducting plate before assembling the capacitor, so that it is easier to solder the coax braid to the plates to form the
connecting leads for the capacitor. Here you can see that a few dots of solder are placed along the edge, and then they are smoothed
out along that edge.
Figure 10 — Here is a length of coaxial cable braid, pre-tinned so it is ready to be
soldered to the conducting plates.
Figure 11 — This diagram illustrates the mechanical construction of the capacitor.

6 QEX – January/February 2012
Figure 12 — Here are two views of a completed capacitor. Notice that the edges
have been sealed by the use of a room temperature vulcanizing (RTV) silicone
rubber sealer.
from getting into the capacitor. This rubber is soft and flexible enough to permit capaci-tance adjustments through the compressor screws.
Finally, Figure 12 shows a finished capac-itor in two positions, so we can also see the silicon rubber.
I made all the capacitance adjustments for all of my capacitors with the Array Solutions AIM-4170 antenna analyzer. This device is a real R-L-C meter.
ConclusionThe results were really fantastic. The
four capacitor filter of my 500 kHz system worked very well. The filter itself could be the subject of another article. A tuned dummy load (with a series capacitor to com-pensate for its residual inductance) for high power operating at that band was built with similar results. This method of building high capacitance RF capacitors for high currents and voltages works fine in my project.
Luiz Amaral, PY1LL / AC2BR, is a retired nuclear physicist and university professor. He has a Masters degree in physics, but is very interested in all about mathematics, comput-ers, communications and general technology. He was born in Rio de Janeiro, Brazil, and now lives in New York, NY.
Luiz holds many patents, including some that are deferred and others pending. He has been a ham since January, 1958, and he has used and experimented with almost all modes including ATV (in 1964 with a camera without any conventional image device), packet radio and satellite communication, having designed and built many Amateur Radio rigs.
He holds the call signs PY1LL in Brazil and AC2BR in the USA. He prefers to work on the lower HF bands, like 160, 80 and 40 m. He is also active on D-Star (2 m and 70 cm) as well as 6 m. Luiz has a complete design for a trans-mitter for the experimental 500 kHz band.
He is a widower with 3 children and 5 grandchildren.
Handheld VHF directionfinder. Uses any FM xcvr.
Audible & LED displayVF-142Q, 130-300 MHz
$239.95VF-142QM, 130-500 MHz
$289.95
Switchable,T-Pad Attenuator,
100 dB max - 10 dB minBNC connectors
AT-100,$89.95
The perfect finishing touchfor your homebrew projects.
1/4-inch shaft couplings.NPD-1, 33/4 x 2 3/4,
7:1 drive$34.95
NPD-2, 51/8 x 3 5/8,8:1 drive$44.95
NPD-3, 51/8 x 3 5/8;6:1 drive$49.95
A Hot, Active, NoiseReducing Antenna System
that will sit on your deskand copy 2200, 1700, and
600 through 160 MeterExperimental and Amateur
Radio Signals!Type NLF-2 System:
$369.95

QEX – January/February 2012 7
Jacques Audet, VE2AZX
7525 Madrid St, Brossard, QC CANADA J4Y 1G3; [email protected]
Q Factor Measurements on L-C Circuits
The author reviews existing measurement techniques and offers insight into loaded and unloaded Q factors as applied to LC circuits and antennas.
A simpler method is proposed that uses an SWR analyzer along with a spreadsheet that easily computes the unloaded Q.
IntroductionThe Q factor gives a figure of merit for
inductors and capacitors. It is the ratio of reactance to resistance. For filters, it relates directly to the circuit selectivity: The higher the Q, the better the selectivity and the lower the insertion loss of the filter. For oscillators, higher Q also means that lower phase noise is produced. In the case of antennas, a lower Q is generally preferred, giving a larger SWR bandwidth.
Transmission methods are traditionally used for making quality factor (Q) mea-surements on L-C circuits. This implies that a signal source and an RF voltmeter or spectrum analyzer must be available for such measurements. These are not always available however. Since SWR analyzers are becoming commonplace in many amateur radio rooms, it then becomes tempting to use this instrument for Q measurements on L-C circuits.
Let’s review the existing methods that are currently used for Q measurements that only require scalar measurements — that is, no phase measurements are required. The last method details how the SWR analyzer can be used to measure the unloaded Q of L-C circuits.
1 – The Classical Q Meter MethodThis is the technique you would use if
you had access to a Q Meter, such as an HP / Agilent Q Meter model HP 4342A. See Figure 1. A very low impedance source is required, typically 1 milliohm, and a very high impedance detector is connected across the L-C circuit. The unloaded Q (QU) of
a single reactance component is given by Equation 1.
S PU
S P
X RQ
R X [Eq 1]
where XS and RS are the series reactance and loss resistance, and RP and XP are the corresponding parallel loss resistance and reactance components.
In the test set-up we need to make the
source resistance RS as small as possible, since it adds to the coil or capacitor resis-tance. Similarly, the detector resistance, RP
shunting the L-C should be much higher than the RP of the component under test. Note that the L-C circuit is commonly represented as having a resistor in series (RS) with L and C or a shunt resistor (RP) in the parallel model to represent the losses.
Measurement consists of setting the source frequency and adjusting the tuning 1Notes appear on page 11.
Figure 1 — Block diagram of the classical Q meter as used in the HP 4342A.
Figure 2 — The signal generator and the source are weakly coupled to the L-C circuit under test, allowing measurement of the 3 dB bandwidth.
8 QEX – January/February 2012
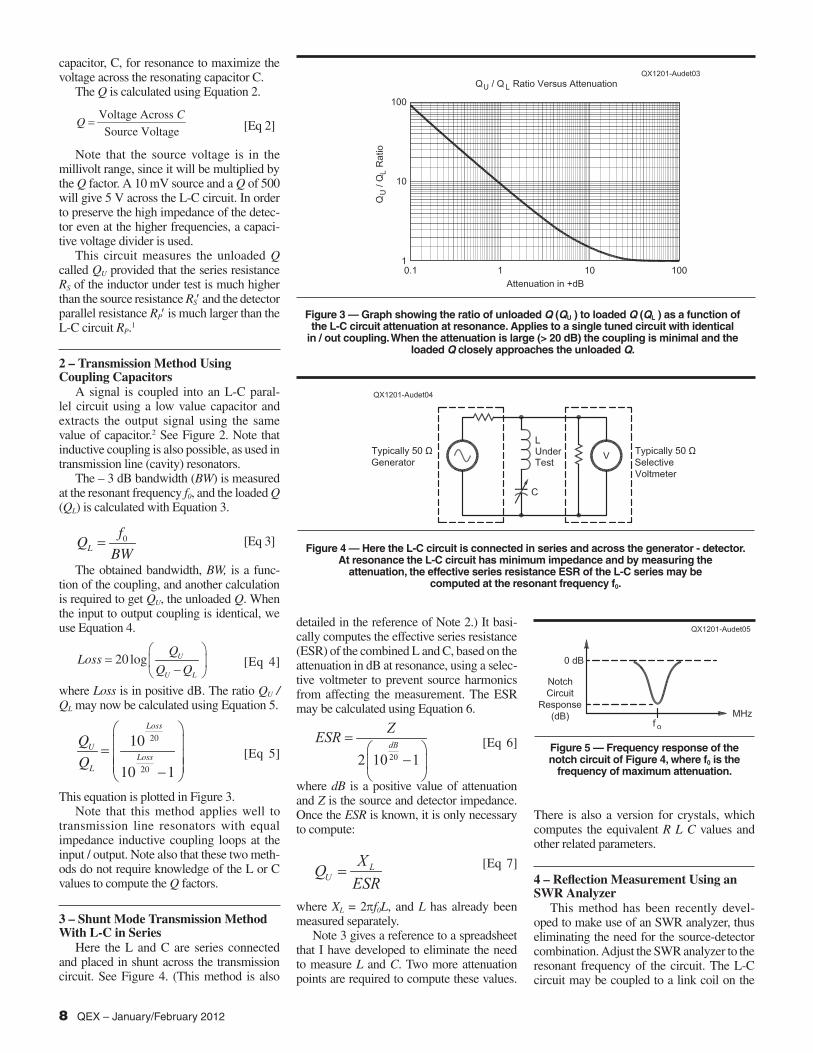
capacitor, C, for resonance to maximize the voltage across the resonating capacitor C.
The Q is calculated using Equation 2.
Voltage Across
Source Voltage
CQ [Eq 2]
Note that the source voltage is in the millivolt range, since it will be multiplied by the Q factor. A 10 mV source and a Q of 500 will give 5 V across the L-C circuit. In order to preserve the high impedance of the detec-tor even at the higher frequencies, a capaci-tive voltage divider is used.
This circuit measures the unloaded Q called QU provided that the series resistance RS of the inductor under test is much higher than the source resistance RS and the detector parallel resistance RP is much larger than the L-C circuit RP.1
2 – Transmission Method Using Coupling Capacitors
A signal is coupled into an L-C paral-lel circuit using a low value capacitor and extracts the output signal using the same value of capacitor.2 See Figure 2. Note that inductive coupling is also possible, as used in transmission line (cavity) resonators.
The – 3 dB bandwidth (BW) is measured at the resonant frequency f0, and the loaded Q (QL) is calculated with Equation 3.
0L
fQ
BW [Eq 3]
The obtained bandwidth, BW, is a func-tion of the coupling, and another calculation is required to get QU, the unloaded Q. When the input to output coupling is identical, we use Equation 4.
20 log U
U L
QLoss
Q Q [Eq 4]
where Loss is in positive dB. The ratio QU / QL may now be calculated using Equation 5.
20
20
10
10 1
Loss
ULoss
L
Q
Q [Eq 5]
This equation is plotted in Figure 3.Note that this method applies well to
transmission line resonators with equal impedance inductive coupling loops at the input / output. Note also that these two meth-ods do not require knowledge of the L or C values to compute the Q factors.
3 – Shunt Mode Transmission Method With L-C in Series
Here the L and C are series connected and placed in shunt across the transmission circuit. See Figure 4. (This method is also
detailed in the reference of Note 2.) It basi-cally computes the effective series resistance (ESR) of the combined L and C, based on the attenuation in dB at resonance, using a selec-tive voltmeter to prevent source harmonics from affecting the measurement. The ESR may be calculated using Equation 6.
[Eq 6]
where dB is a positive value of attenuation and Z is the source and detector impedance. Once the ESR is known, it is only necessary to compute:
[Eq 7]
where XL = 2 f0L, and L has already been measured separately.
Note 3 gives a reference to a spreadsheet that I have developed to eliminate the need to measure L and C. Two more attenuation points are required to compute these values.
There is also a version for crystals, which computes the equivalent R L C values and other related parameters.
4 – Reflection Measurement Using an SWR Analyzer
This method has been recently devel-oped to make use of an SWR analyzer, thus eliminating the need for the source-detector combination. Adjust the SWR analyzer to the resonant frequency of the circuit. The L-C circuit may be coupled to a link coil on the
Figure 3 — Graph showing the ratio of unloaded Q (QU ) to loaded Q (QL ) as a function of the L-C circuit attenuation at resonance. Applies to a single tuned circuit with identical
in / out coupling. When the attenuation is large (> 20 dB) the coupling is minimal and the loaded Q closely approaches the unloaded Q.
Figure 4 — Here the L-C circuit is connected in series and across the generator - detector. At resonance the L-C circuit has minimum impedance and by measuring the
attenuation, the effective series resistance ESR of the L-C series may be computed at the resonant frequency f0.
Figure 5 — Frequency response of the notch circuit of Figure 4, where f0 is the
frequency of maximum attenuation.

QEX – January/February 2012 9
SWR analyzer, which provides variable cou-pling. As shown in Figure 7, the amount of coupling is adjusted until the SWR drops to 1:1. The frequency is recorded as f0. Then the frequency is offset above or below f0 to obtain an SWR reading between 2 and 5. Now plug the new frequency and SWR values in the spreadsheet that I provide to calculate the unloaded Q factor. Note that the L or C val-ues are not required to compute the Q factor.
As shown in Figure 8 the coupling may also be realized with a second variable capacitor, Ca, which serves as an impedance divider. Both capacitors have their frame grounded, along with the SWR analyzer. This makes the construction and operation of the SWR - Q meter much easier.
Both circuits transform the L-C circuit effective parallel resistance RP to 50 + j 0 as required by the analyzer to obtain a 1:1 SWR at resonance. The capacitance value of Ca will be in the order of 10 to 50 times the value of C, the main tuning capacitor. A slight interaction will be present between these two adjustments when adjusting for 1:1 SWR.
Note that a variable inductive divider can be used, in series with the inductor under test, instead of the capacitive divider of Figure 8. In this case the SWR analyzer is connected across this variable inductor, which allows matching to the SWR analyzer 50 input. I do not recommend this as the Q of the vari-able inductor is probably not going to be as high as the matching capacitor, Ca. The Q of these matching components have a second order effect on the measured QU.
At a Q factor of 300, a 1% error in SWR gives a 1% error in Q. Assume that the mea-sured SWR is 4 and the SWR meter has a reso-lution of 0.1. If the error in SWR is 0.1, then the error in Q is 2.5%. Other errors include the Q of the tuning capacitor, and the Q of the matching component, Ca, or the link coil to a lesser degree.
Here are some simulation results:At Q = 200 the average error on the cal-
culated Q is – 0.5% when the test frequency is below resonance. Above resonance, the average error drops to – 0.05%.
At Q = 50 the average error on the calcu-lated Q is –1.0% when the test frequency is below resonance. Above resonance, the aver-age error drops to –0.7%.
These small errors come from the reac-tance of the coupling element (link coil or Ca in the capacitive divider).
The following errors were obtained by simulation with an inductor Q of 200.
The matching capacitor Ca should have a Q of 500 or larger. A Q value of 500 for Ca gives – 6% error and a Q value of 1000 for Ca gives – 0.6% error.
Interestingly the link coil Q may be as low as 50 and the error is only – 0.4%.
The losses of the transmission line between the SWR analyzer and the Q mea-suring circuit should be kept to a minimum. An attenuation of 0.05 dB gives –1.6% error on the calculated Q.
So far the Q factor measurement included both the combined Qs of the L and C, since it is difficult to separate their individual Q values. When the capacitor Q (Qcap) is known the inductor Q (Qind) may be calculated like parallel resistors:
1 1 1
ind capQ Q Q [Eq 8]
Note that the combined Q of the L-C cir-cuit is 17% lower with Qind = 200 and Qcap = 1000, compared to having a capacitor with an infinite Q.
Figure 6 — Effective series resistance as computed from the attenuation in dB, in a 50 system.
Figure 7 — Set-up for measuring the unloaded Q of L-C resonant circuit.
The coupling is adjusted for 1:1 SWR at resonance. The link should have
approximately 1 turn per 5 or 10 turns of the inductor under test.
Figure 8 — Here the variable coupling to the SWR analyzer is provided by the capacitive divider formed by Ca and C. Ca is typically 10
to 50 times larger than C.
Measuring the Q of Low Value Capacitors (< 100 pF) Using the Delta Q Method
Two Q measurements are required:First measure the Q of a test inductor
(preferably having a stable high Q) and record it as Q1 and record the amount of capacitance C1 used to resonate it.
Second, connect the low value capaci-tor to be tested across the tuning capacitor, decrease its capacitance to obtain resonance again. Note the measured Q as Q2 and the amount of capacitance C2 used to resonate. (Q2 should be less than Q1).
Compute the Q of this capacitor as follows:
[Eq 9]
Note that (C1 – C2) is the capacitance of interest. It may be measured separately using a C meter. If Q2 = Q1 the Q of the capacitor becomes infinite.
Unloaded and Loaded QLooking back at method 1, the measured
Q is the loaded Q and it approaches the unloaded Q as the source impedance goes toward zero and the detector impedance is infinite.

10 QEX – January/February 2012
With method 2, the measured Q is the loaded Q and a correction is required based on insertion loss to obtain the unloaded Q. In this case the L-C circuit under test “sees” the same Q as we have measured, (if it could look at its environment by looking towards the source and detector).
Such is not the case in methods 3 and 4. In method 3 the L-C circuit will typically “see” a 50 source and a 50 detector that are effectively in parallel. This adds 25 in series with the ESR of the L-C circuit, and reduces the Q that it sees. This loaded Q sets the selectivity of the notch filter created by the circuit.
In method 4, the L-C “sees” the SWR analyzer internal impedance, say 50 . Remember that the Rp value is transformed to 50 at the analyzer, and effectively is in par-allel with the analyzer’s internal impedance. This means that the actual Q factor seen by the L-C circuit is reduced by half. This value is the loaded Q of the L-C circuit. In this case the coupling factor equals 1.5
Now consider a 50 dipole antenna. The series R-L-C model may be applied to a reso-nant dipole antenna, which presents approxi-mately 50 at the feed point. When the dipole is fed by a low loss transmission line the SWR meter connected at the transmitter will measure the antenna unloaded Q at an SWR = 2.62 as calculated from equation 3: Q = f0 / BW. Note that the spreadsheet given in Note 4 will calculate the dipole Q factor under these conditions.
When the antenna is fed by a 50 source, its effective bandwidth will double, since the total resistance seen by the dipole is now the radiation resistance plus the transmitter out-put resistance.
Here we still have the loaded Q = unloaded Q / 2. This assumes that the trans-mitter output impedance and the feed line are 50 . The Q derived from the bandwidth at SWR points of 2.62 gives the unloaded Q value, independently of the transmitter out-put impedance.
In the general case, the complex imped-ance of the transmitter reflected at the antenna will modify its effective bandwidth and its actual resonant frequency. Note that the SWR meter connected at the transmit-ter will not show this effect since it can only measure the unloaded Q of the dipole. Also, the bandwidth of the matching circuits at the transmitter will affect the effective imped-ance seen by the antenna and modify its loaded Q and bandwidth.
One way to measure the effective band-width of the dipole might be to insert an RF ammeter in series with one dipole leg. Find the frequencies where the current is reduced by ~ 30% and compute the effec-tive bandwidth this way. In the receive mode
selective voltmeter to prevent source har-monics from affecting the measurement.
Compute the ESR from the minimum attenuation measured at resonance.
The L or C values are required to compute the Q value.
The author’s spreadsheet computes the series/parallel R-L-C values from 3 attenu-ation measurements. This technique is also useful for crystal measurements.
This is potentially the most accurate method, if the attenuation is measured with high accuracy using a vector network ana-lyzer (VNA).
4 – Reflection measurement using an SWR analyzer. See Figures 7 and 8.
This technique requires a matching capacitor or variable link coupling. There will be a slight interaction between the matching components and the main tuning capacitor.
Adjust two variable capacitors or vary link coupling to obtain an SWR of approxi-mately 1:1
Toroidal inductors are difficult to test with variable link coupling. Use the capacitive divider method instead. With link coupling, keep the link close to the grounded end of the coil, to minimize capacitive coupling. In gen-eral air wound coils are more delicate to test since they are sensitive to their environment.
The L and C values are not required.Offset the frequency to have an SWR
increase. Note the frequency and SWR.The author’s spreadsheet computes the
unloaded Q factor directly.This technique requires the least equip-
ment of any of the methods.Best accuracy is obtained with a link coil
or a variable capacitive divider.While all four methods do not require
phase or complex impedance measurements,
the dipole antenna will also exhibit the same loaded Q = unloaded Q / 2 if the receiver impedance is 50 . Your antenna effective bandwidth may be twice as large as you really thought!
Summary of the Four Methods Presented in this Article
1 – Classical Q Meter. See Figure 1. This shows a set-up as used by the HP / Agilent model HP 4342A.
This technique uses a transmission method that requires a very low impedance source and very high impedance detector, which are not easy to realize.
Set the frequency and adjust the reference capacitor for resonance.
The measurement approximates the unloaded Q. Corrections are difficult to apply.
You don’t have to know the L-C values.2 – Transmission Method Using
Coupling. See Figure 2. This technique requires a source and a voltmeter.
Find the –3 dB transmission bandwidth points.
The measurement requires two low-value, high Q coupling capacitors.
It measures the loaded Q as used in the test circuit.
You need to correct the loaded Q value for attenuation to find the unloaded Q, if the attenuation is less than 30 dB.
The accuracy of the Q measurement remains somewhat dependant upon the Q factor of the coupling capacitors. Refer to Figure 2. With 1 pF coupling capacitors hav-ing a Q of 1000, the error on Q was –1.4%.
The L or C values are not required.3 – Shunt mode transmission method
with LC connected in series. See Figure 4.This method requires a source and a
Figure 9 — This graph shows the K factor versus SWR. At SWR = 2.62 the correction factor K equals 1 while at SWR = 5.83 the K factor is 2.
QEX – January/February 2012 11
method 4 only requires an SWR analyzer. The accuracy of the SWR analyzer method has been validated from RF Simulations and by actual measurements.
Since this method relies on SWR mea-surements, the accuracy of the measuring instrument should be verified. The SWR = 2 point may easily verified by placing two accurate ( 1%) 50 resistors in parallel at the analyzer output using a tee connector. Note the reading obtained at the frequency of interest and compute the SWR offset from the ideal value of 2.00. Then perform the Q measurements around this same SWR value, possibly above and below the resonant fre-quency and average the Q results.
To compensate for inaccuracies in deter-mining the frequency (f0) of 1:1 SWR, it is recommended that you perform the Q mea-surement at two frequencies above and below the f0, as done in the spreadsheet provided in Note 4.
Note 5 covers other methods of mea-suring Q using a vector network analyzer, mostly suitable for use at microwave fre-quencies.
Jacques Audet, VE2AZX, became interested in radio at the age of 14, after playing with crystal radio sets and repairing old receivers. At 17, he obtained his first ham license, and in 1967 he obtained his B Sc degree in elec-trical engineering from Laval University. He then worked in engineering functions at Nortel Networks, where he retired in 2000. He worked mostly in test engineering on a number of products and components operating from dc to light-wave frequencies.
His areas of interest are in RF simulations, filters, duplexers, antennas and using comput-ers to develop new test techniques in measure-ment and data processing.
Notes1Hewlett Packard Journal, September
1970, www.hpl.hp.com/hpjournal/pdfs/IssuePDFs/1970-09.pdf
2Wes Hayward W7ZOI “Two Faces of Q,” w7zoi.net/2faces/twofaces.html
3There is an Excel spreadsheet to perform the various Q calculations on my website: ve2azx.net/technical/Calc_Series-Par_RLC.xls for RLC circuits.
4The MathCad™ and the corresponding Adobe PDF file as well as the Excel file may be downloaded from the ARRL website at www.arrl.org/qexfiles/. Look for the file 1x12_Audet.zip.
5 Darko Kajfez “Q Factor Measurements, Analog and Digital,” www.ee.olemiss.edu/darko/rfqmeas2b.pdf
Appendix 1In the SWR analyzer method, the equivalent parallel resistance RP of the L-C circuit is transformed to 50 to give 1:1 SWR at resonance by using an adjustable link coupling or a variable capacitive divider. As the frequency is varied around resonance, it may be set at two frequencies where the absolute value of the reactance, X, is equal to RP.
Abs(X) = RP
Normalizing these impedances gives impedances of 1 for RP and j for X. Since these are in parallel, the resulting impedance, Z, will be:
[Eq A-1]
Taking the absolute value of Z we get Z = 0.707. This is the –3 dB point, since this value is 3 dB below the initial value of 1.The complex reflection coefficient is:
[Eq A-2]
The absolute value of the reflection coefficient | | is 0.447. The return loss RL in dB is given by:
RL = –20 log | | = 6.99 [Eq A-3]
The corresponding SWR is given as:
[Eq A-4]
At the – 3 dB points, the bandwidth (BW) is related to the unloaded Q factor as follows:
0U
fQ
BWTherefore, measuring the bandwidth, BW, at SWR = 2.62 allows us to compute the unloaded Q (QU) of the circuit. So far, we need three measurement points. One point at frequency f0 that gives 1:1 SWR and two points at fL and fH below and above resonance that give an SWR of 2.62. The last two points are symmetrical around f0, so only one is measured as f = fH.
Since fL × fH = f0 [Eq A-5]
The other frequency fX is assumed to be at:
[Eq A-6]
The bandwidth BW1 may now be calculated:
[Eq A-7]
Since we want to be able to measure at any SWR value, we need to add a correction factor, K, resulting from the use of bandwidth BW1.
[Eq A-8]
The correction factor, K, is the bandwidth multiplication factor. It is a function of the SWR. I derived K using Mathcad™ numerical calculations and then normalized the value. I used a fifth order polynomial to fit the computed data. See Figure 9. Note 4 gives the Mathcad™ and Adobe PDF files that I used, as well as more details on the derivations. The complete equation as used in my spreadsheet for the unloaded Q factor becomes:
10.5 0.5
1
jZ j
j
0
1
U
K fQ
BW
[Eq A-9]

12 QEX – January/February 2012
Fred Brown, W6HPH
PO Box 73, Palomar, CA 92060; [email protected]
End Man-Made Noise with the Noise Canceller
With a simple phase-shifting circuit, you can cancel most types of man-made noise coming into your receiver.
Noise is the enemy of radio communica-tion. Even at UHF it is now possible to make almost noiseless receivers. So, most of our noise comes from the antenna, whether it is of atmospheric, cosmic, or human in origin.
Local man-made noise can be com-pletely canceled with the noise canceller (NC). You can understand the principle of the circuit by looking at the block diagram of Figure 1. The noise antenna is positioned to pick up as much noise and as little signal as possible. Usually a ground-mounted quarter-wave vertical is the best noise antenna. The noise is applied to a variable phase-shift net-work, amplified, and fed to the receiver input through a variable resistor, R. If R is large compared to 50 , little signal energy from the main antenna will be lost in it.
If noise from the NC is applied to the receiver input, and adjusted so it is equal in amplitude but 180° out of phase with noise from the main antenna, complete cancel-ation is possible. It is necessary that the noise source be fixed, however. The NC will not work on noise from passing vehicles, noise from distant thunder storms and similar sources.
The RC Phase ControllerThe RC phase controller shown in Figure
2 is basic to the NC. With this arrangement, you can achieve a range of phase control of more than 90° by means of the variable resis-tor. With proper choice of component val-ues, there will be little change in amplitude throughout the control range. Two of these circuits cascaded will give more than 180° of phase control, and if used in conjunction with a phase splitter, you can achieve a full 360° of control.
Figure 1 — This block diagram shows how the Noise Canceller can be connected to an HF transceiver, so that it will not affect transceiver performance. A connection is made to the
receiver circuit inside the transceiver at the point marked with an X on this diagram.
K9QZI Photo

QEX – January/February 2012 13
75 Meter VersionFigure 3 shows a 75 meter version of the
NC. The variable resistor of Figure 2 is pro-vided by the series-connected diodes on the emitters of Q1 and Q2. Noise from the noise antenna first passes through the high-pass fil-ter of C1 and L1. This combination also pro-vides an impedance transformation from 50
to the 5000 input impedance of Q1. The back-to-back connected diodes provide some protection from your transmitted RF. A choice of either zero or 180° phase shift is provided by the switch on the phase splitter, Q3.
Amplification is provided by the dual-gate MOSFET, Q4. The 60 H inductor resonates with the input capacitance of Q4, so there will be no amplitude change when switching between the Q3 emitter and col-lector.
Other OptionsThere are numerous other possibilities.
You could replace the diodes on the emitters of Q1 and Q2 with a dual potentiometer. You could also replace capacitors C2 and C3 with varactor diodes.
It should be possible to make a multi-band version of the NC. My experiments with a 20 meter version showed that the phase shifter network would also work on 80 and 40 meters. So you could have 80, 40, and 20 meters with fixed values of C2 and C3. The 20 meter version required that C2 and C3 be reduced to 12 pF. I also found that it was necessary to reduce the 1 k emitter resistors on Q1 and Q2 to 470 to maintain reasonably constant amplitude across the phase control range. Of course I also had to change C1, L1, L2, and T1. The phase shift part of the 75 meter version worked on 160 but not on 40 meters. A multi-band version would require that the input circuit, C1 and L1, be replaced by a high-pass filter to keep out AM broadcast stations. The tuned output amplifier would also need to be replaced with
Figure 3 — Here is the complete schematic diagram of a 75 m version of a Noise Controller. All diodes are 1N4148. T1 is an 80 H toroid, with a 20 turn primary and a 2 turn secondary.
Other bands will require changes in the values of C1, C2, C3, L1, L2 and T1.
Figure 2 — The variable resistor provides more than 90° of phase control, with very
little change in amplitude.

14 QEX – January/February 2012
Notes from a UserI built a copy of the Noise Canceller and use it with a Ten Tec Orion II, which has automatic switching for a separate receive
antenna. I would recommend using a rig with this capability. If your rig does not have this feature, there is an adapter described in the article by Gerald Fasse, W8GF, “A Receive-Only Antenna Adapter,” on page 37 of the October 2011 issue of QST. That is an easy project to build. Also, I highly recommend a relay to protect the NC. The relay should ground the NC input whenever you transmit.
I built my NC using a piece of perfboard and point-to-point wiring techniques. I just followed the schematic diagram. Photos A and B show my Noise Canceller.
The NC design makes it possible to adjust the phase of the noise, so you can completely cancel the noise, which is not pos-sible in the commercial units I have tried.
The trickiest challenge for me was trying to find a usable noise antenna! Give it a try! I think you will like it as much as I do.Troy Wideman, W6HVPresident Old, Old Timers Club (OOTC)
a high input-impedance wide band amplifier. You can easily check the performance of the phase-shift network with a dual-trace scope and a signal generator. Be sure to keep the input below 10 mV so the diodes will not be driven into non-linear operation.
Operating InstructionsSome modern transceivers have a separate
receive antenna input, to which the NC could be connected. If your transceiver does not have this feature it will be necessary to con-nect to the antenna input of the receiver por-tion of your transceiver, shown as point X on Figure 1. Usually there will be an unused pin on the accessory socket, which will permit a no-holes modification. If there is no unused pin, there will often be a connection for some function you are not using that can be discon-nected to free up a pin for the NC. The acces-sory socket will also usually provide a ground connection and +12 V to power the NC.
With the NC disconnected or turned off,
Photo A — This photo shows the component side of Troy (W6HV) Wideman’s Noise Canceller. This project is quick and easy to build
using perfboard wiring. The noise antenna input is shown on the left. The 20 k resistor wiring comes off the board near the center and
the phase reversal switch is towards the right side. The 5 k resistor wiring comes off the right side of the board and goes to the receiver
antenna input.
Photo B — Here is a photo of the wiring side of Troy (W6HV) Wideman’s Noise Canceller. Notice that Q3 and Q4 are mounted on
the bottom of the perfboard, and that Q3 is mounted upside down on the board.(A)
(B)
W6HV Photo W6HV Photo
first note the level of noise coming from the main antenna, as indicated on the S-meter. (Of course this is with the receiver tuned to a quiet part of the band, free of signals.) Now replace the main antenna with a 50 resis-tor and connect the NC. Set the noise from the NC to the same S-meter reading. Then
reconnect the main antenna and search for a null with the phasing control.
If no reduction in noise occurs, flip the phase reversal switch and search again. When the point of minimum noise is found, alter-nately adjust the amplitude and phase control until the noise is completely wiped out.
K9QZI Photo
QEX – January/February 2012 15
John Maetta, N6VMO
460 Milky Way, Lompoc, CA 93436; [email protected]
Pic’n on the ThunderBoltRather than having a computer connected to your Trimble Thunderbolt GPS
unit, you can build a PIC microcontroller to display the receiver status and let you know when the oscillator PLL has locked.
More radio and test equipment manu-facturers are adding external reference frequency inputs to their products. As a consequence, many amateurs are incorpo-rating GPS-disciplined oscillators (GPSDO) into their shacks. Microwave enthusiasts and many VHF/UHF Amateur Radio operators have been snatching up Trimble ThunderBolt GPS-disciplined oscillators from the surplus market. These once very expensive and accurate time pieces are now within the budget range of many amateurs and experimenters. My ThunderBolt “kit” came with a power supply, antenna, coax, serial cable and the GPSDO receiver.
A GPSDO provides highly accurate 10 MHz and 1 pps (pulse per second) sig-nals to synchronize your radios and test equipment. My ThunderBolt GPSDO is used to provide a 10 MHz reference fre-quency to my Flex-1500 software defined radio and my VHF/UHF/microwave trans-verters. Frequency accuracy is better than 1 ppB (part per billion) or ± 0.144 Hz on the 2 meter band.
The ThunderBolt is equipped with a 9600 baud RS-232 port to obtain status updates and to control several aspects of its operation. Trimble has developed a Windows graphical user interface (GUI), called TBoltMon.exe, which will enable you to control or obtain status to and from the ThunderBolt via a PC com port. TBoltMon.exe is available on the internet for free.1
The Problem
Although the TBoltMon software is easy to use, amateurs have found that they only need to know if the ThunderBolt has acquired enough GPS satellite data to achieve a phase lock of its 10 MHz and 1 pps outputs. Many don’t like having to connect a
serial cable and then run TBoltMon to see if the GPSDO is ready to use. Also, having a PC constantly connected to the ThunderBolt may not be practical. Monitoring and report-ing ThunderBolt status seemed like the per-fect job for a PIC microcontroller.
This article will only detail the PIC status module design, software description and circuitry. Your construction method, instal-lation and the PIC programming interface is a personal preference. There are many simple homebrew and inexpensive PIC pro-gramming hardware solutions available on the Internet. I can also program your PIC and get it back to you for return postage if you choose.
The Solution
I mounted my ThunderBolt receiver and its power supply in an appropriate enclosure,
with access ports for its various outputs and power.
The PIC microcontroller chosen for this function is the Microchip PIC16F628 (IC1). It is powerful, fast and cheap. It has 2 KB of RAM and a built-in USART (universal synchronous asynchronous receiver trans-mitter), also known as a serial port. The PIC USART can be easily programmed to trans-mit and receive the 9600 baud ThunderBolt commands and status packets. The results can then be displayed by using just two LEDs.
What Data And How Much?The ThunderBolt can provide more
status data than this project requires. You can reference the Trimble Standard Interface Protocol, section A.10.31 of the ThunderBolt User Guide for more informa-tion on command and status data.2
1Notes appear on page 17.

16 QEX – January/February 2012
When the ThunderBolt reports that it does not have any critical or minor alarms, the oscillator is phase locked and is useable. All the PIC needs to do is send the ThunderBolt the request for its Supplemental Timing Packet (8F-AC), then read the data and check for any alarms.
The CircuitAs powerful as it is, the PIC can’t per-
form all these tasks alone. It requires some additional components to perform this task. See Figure 1. You will need a 4 MHz crystal (Y1), a MAX233 RS-232 level converter integrated circuit (U2), LEDs, resistors, capacitors and something to mount these components on. All these components are detailed in the Bill of Materials in the caption for Figure 1.
Figure 1 — Here is the schematic diagram of the PIC controller for the Trimble Thunderbolt GPS-disciplined oscillator. Component Jameco Part No. DescriptionC1, C2 — 332541 Cap, Mono, 22 pF,100 V, 5%, NPØC5 — 94161 Cap, Radial, 1 F, 50 VDS1, DS2 — 333973 LED, Red, 643 nm, T-1 3/4J1 — 5747840-3 Jack, D-Sub, 9 Pin, Male, AMP/Tyco R1 — 691024 Res, CF, 4.7 k ,1/4 W, 5%R2, R3 — 690785 Res, CF, 470 , 1/4 W, 5%U1 — IC, Microcontroller, PIC16F627-04/P U2 — 106163 IC, DRV/REC, MAX233CPP, 5 V, DIP-20 Y1 — 137832 CRY 4.000 MHz, 50 ppm, 17 pFOptional Components:DIP18 — 683139 Socket IC, 18 Pin, 1-390261-5DIP20 — 526221 Socket IC, 20 Pin, 390261-6LED Mounting H/W — 23077 LED Mounting H/W, T1-3/4Components available from Jameco www.jameco.com 800-831-4242
You can use any method you prefer to build this circuit. I used a PIC prototyping assembly board to develop the software, hardware selection and schematic. Once the circuit and software were stable, I used Eagle Layout Editor from CadSoft to develop a printed circuit board. The “Light” version is available free on the internet.3
Power requirements are +3.3 to +5 V dc. Current draw is ~100 mA. You can use the ThunderBolt external +5 V dc supply to power this project.
The MAX233 (U2) converts the PIC USART RS-232 levels, at RB1 and RB2 into the standard RS-232 levels required by the ThunderBolt at J1. PIC outputs RB4 and RB5 drive the two status LEDs (DS1 and DS2).
The ProgramThe PIC will start to execute the pro-
gram upon power up and will transmit the status request to the ThunderBolt. The ThunderBolt will then respond back with the 68 byte serial Supplemental Timing Packet data. The PIC will store each of the 68 bytes into its internal memory. After all 68 bytes have been transferred and stored, the PIC will read bytes 8 and 9 (critical alarm data) and add them. If the sum of these two bytes is not equal to zero, the PIC brings RB4 high to light DS1 indicating that one or more critical alarms are present.
The PIC then reads bytes 10 and 11 (minor alarm data) and adds these two bytes. Once again, if the sum is not equal to zero, the PIC brings RB5 high to light DS2 indi-

QEX – January/February 2012 17
cating that one or more minor alarms are present.
If no alarms are detected then DS1 and DS2 remain extinguished. The process repeats every 6 seconds.
Preparation and OperationThe following instructions assume you
have just received your ThunderBolt and installed the correct outdoor GPS antenna, downloaded the Users Guide and famil-iarized yourself with the operation of TBoltMon.
More than likely, your ThunderBolt may have arrived factory configured to continu-ously output all data packets every second. Its last owner may have altered its configuration to do something else. So, we must prepare it to stop automatically transmitting status and cooperate with our PIC status module. We’ll instead have it wait for our PIC to ask it for status.
To do this, connect the ThunderBolt serial port to a PC com port and run TBoltMon.exe. Pull down the “Setup” menu and select “Packet Masks and Options.” Uncheck all boxes in the “Packet 8E-A5 Masks” window. Click “Set Masks” button and then the “Save Segment” button.
Click “Close” and exit TBoltMon. Connect the PIC status module to the ThunderBolt serial port. Power them both up. Depending on how long the ThunderBolt has been powered off, it can take up to one hour for it to acquire satellites, clear all of its alarms and turn off both LEDs.
ConclusionNow all you need to do is glance over at
the ThunderBolt to see that it is ready to use.Hmmm…it may be time to enter this
year’s ARRL Frequency Measurement Test!I programmed the PIC using PICBasicPro
2.60A. All program source files, sche-matic, Eagle circuit board files, and a bill of materials can be downloaded at my personal website: www.n6vmo.com\PIC\TBOLTVMOn.zip. The program source code files and circuit board files are also available for download from the ARRL QEX files website.4
Notes1You can download the Trimble Thunderbolt
control program, TBoltMon.exe at: www.trimble.com/support.shtml
2You can download the ThunderBolt Users Guide at: www.trimble.com/support.shtml
3The Eagle Layout Editor software is available for free download at: www.cadsoftusa.com
4The PIC program source files, Eagle circuit board files are available for download from the ARRL QEX files website. Go to www.arrl.org/qexfiles and look for the file 1x12_Maetta.zip.
Figure 3 — This is the parts placement diagram for the controller circuit.
1 inch QX1201-Maetta02
PIC16F648A
U1
U2MAX232
R2 470
R1
4.7
k
R3 470
4 MHzY1
PAD10
PAD9
PAD8
PAD7
PAD5
PAD3
PAD4
PAD11
PAD1
PAD2
+ C51μF
C122pF
C222pF
DS1
DS2
S1
QX1201-Maetta03
Figure 2 — The circuit board pattern is shown here.

18 QEX – January/February 2012
Tech Notes
Doyle Strandlund, W9NJD
2849 N - 035 W, Huntington, IN 46750
Switchable AmplifierMany years ago I needed a tuned RF am-
plifier that could be switched to amplify in either direction. This was not a bidirectional amplifier such as used in telephone circuits, in which signals are duplexed to amplify in both directions at the same time. This idea is one useful for transceivers, in which we need to amplify signals in one direction through the circuit on receive, and in the other direc-tion on transmit, one way at a time. Its main feature is that the signals are partitioned so that any extraneous signals stay at the ends where they belong. There are nearly always oscillators that would develop mixer products when there is any possibility of any other sig-nals being present, so it is logical to prevent such interaction rather than trying to fight it.
I built a number of these circuits, using junction FETs, operating at different band-widths and at frequencies between 3 and 10 MHz. All of the amplifiers I built were stable and satisfactory in performance. Figure 1 shows the basic circuit.
There are two FETs, Q1 and Q2, and these are enabled by removing cut-off bias from one and applying cut-off bias to the other at terminals L and R, depending on the direc-tion of the signal between ports I/O 1 and I/O 2. Tuned transformer T1 is connected through a blocking capacitor to the gate of Q1, so when Q1 is enabled, it amplifies the signal to transformer T2, connected to the drain of Q1. The primary winding of T2 is center-tapped, and the end of the primary that is not connected to Q1 is connected to the gate of Q2 via a blocking capacitor. The drain of Q2 is connected to the secondary of T1, along with the connection to the gate of Q1. Since Q2 is cut off when Q1 is amplify-ing, the drain-to-gate capacity of Q2 forms a neutralizing capacitor, which stabilizes Q1 and keeps Q1 from oscillating. Does this remind you of 1920s tuned radio frequency (TRF) receivers using triodes?
You could achieve a 2:1 gain change by using a voltage divider across the bias resistor
at the R and L control lines. The bias resistor values would be the same values you would normally use with a single transistor one-way amplifier.
When Q2 is enabled, Q1 is cut off, and signal goes right-to-left, again neutralized and stable, because the gate-to-drain ca-pacitance of Q1 neutralizes Q2. What more could you want?
The source resistors, marked “g” on Fig-ure 1 do not have bypass capacitors, to allow gain control by virtue of negative feedback, as desired, in each direction. These resistors are connected to a common, bypassed, resis-tor to set the FET operating points. Since the FETs are of the same type, a common resistor
Figure 1 — This schematic diagram illustrates the concept of the switchable amplifier. Component values are not given because the values will depend upon the operating frequency, desired gain and transistors used. The author used MPF107 FETs for some of the amplifiers he built many years ago.
with one bypass capacitor may be used, as shown on Figure 1.
The capacitors marked “t” are tuned to resonance with their respective windings. The capacitors marked “b” are bypass capaci-tors dependent in size on the frequency and circuit impedance where they are used. Those in the control lines may be critical to switch-ing timing, and the control lines must have dc paths to ground when they are enabling the transistors. The capacitors marked “c” are sized for signal coupling, and must be large enough to not disturb the neutralization. The resistors and bypass capacitors on the dc supply points, marked “V” filter signals from the supply.
QEX – January/February 2012 19
SDR: Simplified
Ray Mack, W5IFS
17060 Conway Springs Ct, Austin, TX 78717; [email protected]
An Update on Last IssueI ordinarily have all of the software
complete before the article goes to press. I had the DSP software complete, but not the associated Windows software. Those of you who looked on the qexfiles website for the software from last issue went away empty handed, for which I apologize. As you read this, the software is on the web-site in an incomplete state (unless I have a big breakthrough in the next couple of days). Go to www.arrl.org/qexfiles and look for the file 11x11_Mack_DSP.zip.
A Software Adventure (Again)I developed the Windows framework in
the Nov/Dec 2011 issue to allow you to connect Line In and Line Out from a sound card to an experimental DSP program. I downloaded the latest Visual Studio Express C/C++ compiler for 2010 and installed it, which went without problems. The help system shows several different sound interfaces to the operating system drivers. One is the DirectSound interface that is part of DirectX. The DirectSound interface is entirely in C++, but the func-tion calls and data structures are basically just improved C. The advantage of Direct-Sound should to be a simplified connec-tion from your application program to the hardware underneath the operating sys-tem. That was mostly the case, as I wrote the initial test program to take the DDS generator and output the waveform to Line Out. The problem occurred when I tried to connect the Line In or microphone to the program. The call to create the input buffer always returns E_INVALIDARGUEMNT, even though the code is identical to that in the help files. I searched the web and also checked many local bookstores and Amazon for any books that might give tutorials on DirectX or DirectSound, but I was unsuccessful. There is simply no information aside from the help files re-garding DirectSound. I have not given up and will continue to work on a solution. One resource I found after much digging is the DirectX control panel, which can increase the amount of debug information
that is returned to our Windows programs.
More Detail of the DSP Experimenter Program
The code in the sidebar from the Nov/Dec 2011 issue focused on the DSP aspects of the program and glossed over the connections to the sound card using the operating system. This time we will look at exactly how to use DirectSound to implement a framework that can be used for any DSP experimentation using sample rates up to 192 kHz (if a high performance card is attached.)
A FIFO (first in first out) is a buffer with a single input register and a single output register. When implemented in hardware, one device (producing device) puts data into the FIFO using the input register and the other device removes data from the FIFO (consuming device) using the output register. Typical FIFOs have an indicator when the FIFO is half full and perhaps other fractions of full. The consuming device must pull data from the FIFO as fast or faster than the producing device. Our DSP Experimenter Program will create two FIFOs that are implemented in software inside the DirectX part of the operating system. Software FIFOs are also called circular buffers, but they operate the same way as a hardware FIFO. One process (such as the microphone driver) will put data into the circular buffer and another process (our program) will remove the data from the circular buffer. Once the program initialization is complete, all DSP operations occur by removing one or more samples from the line in buffer and then putting one or more samples in the line out buffer.
In order to get the two circular buffers to operate, we have to set up the Direct-Sound system. It is important to set up the output part of the system first, because it typically sets the sample rate for both input and output. The first function called is DirectSoundEnumerate, which informs our program of all potential output devices. The second function is DirectSoundCap-tureEnumerate, which informs our pro-
gram of all potential input devices. It is interesting that the input device number is not necessarily the same for input and output. My TI USB sound card is device 1 for output and device 4 for input.
Once we chose the input and output hardware to use, we call DirectSound-Create. This creates a DirectSound object that initializes all of the data structures for sound output, and connects our program to the selected hardware device. The next function call is SetCooperativeLevel. This allows our program to keep its connection to the output despite other program con-nections. The last call is to CreateSound-Buffer, which sets up all of the parameters for the sampling and the size of the circular buffer.
Now we are ready to initialize the sound input. The first call is to DirectSoundCap-tureCreate. This creates another object that is specific to sound input, and con-nects our program to the selected input hardware. CreateCaptureBuffer sets up the sampling and the size of the circular buffer for the input device. This is the one that returns that pesky E_INVALIDARGU-MENT error for me. There is one last call to CreateEvent, which is the equivalent of the half full indication of a hardware FIFO. Each time the buffer reaches the thresh-old, the DirectX system calls a function we provide to let our program know that the appropriate amount of data is ready for us to process. No processing occurs, however, until we tell the system to do its job by calling the Play function for the output buffer and the Start function for the input buffer.
Next IssueWith luck (and a lot of debugging) I
will soon have a fully functional software system running. After I solve the E_IN-VALIDARGUMENT error and have the FM transmitter running, then my next experiment will be to implement an FM demodulator complete with deemphasis.

20 QEX – January/February 2012
Out of the Box
Ray Mack, W5IFS
17060 Conway Springs Ct, Austin, TX 78717; [email protected]
In the past, this column covered just new products or book reviews. We are expand-ing the scope of this occasional column to include short features that are not worthy of a full article.
Low Noise Op-Amp ParametersIf you are building a direct conversion
receiver such as a Soft Rock, the audio op-amps are the first stage where you can set the overall noise figure of the system. Op-amps are characterized by noise voltage in nV/ Hz rather than noise figure. The “ Hz” part of the noise parameter is very strange looking and its origin is not obvious. After all, we understand hertz as a physical value, but the square root of hertz is hard to imagine. Jon Titus is a freelance writer for various techni-cal journals and wrote most of the words that follow. He graciously granted permission to use his work.
The nV/ Hz specification refers to ther-mal noise, or Johnson noise, caused by the effect of temperature on the electrons in a resistive device, which pretty much includes everything. Second, the specification identi-fies the spectral density of noise as a root-mean-square (RMS) value over a given bandwidth. We use RMS to account for the random nature of the noise; it expresses the actual average energy in the signal rather than any instantaneous energy (which theoreti-cally can be quite large).
Suppose you have decided to use a Texas Instruments OP27A op-amp with an input noise voltage (Vn) of 3.5 nV/ Hz in your Soft Rock. You will operate the op-amp from 300 Hz to 4000 Hz, so you take the square root of the 3700 Hz bandwidth (60.8 Hz ). Multiply 3.5 nV/ Hz by 60.8 Hz and you get 213 nV. The op-amps in the Soft Rock have a gain of approximately 100, so the noise also gets multiplied by 100. You have 21.3 V of noise. Use a 1 V output (0 dBV) from the op-amp and calculate the signal-to-noise ratio: SNR = 20 × log (1 V / 21.3× 10 6 V) = 93.4 dB.
So how does the Hz unit get into a noise value in the first place? In 1928, John B. Johnson at Bell Telephone Labs explained
the creation of noise in conductors and Harry Nyquist, also at Bell Labs, followed with a paper (worth reading) that provided a theoretical basis for this noise and related it to temperature and resistance alone. We can rewrite Nyquist's equation for thermal elec-tromotive force:
E2dv = 4kRTdv as E2 = 4kRT or as E = (4kRT)1/2
where k = Boltzman’s constant in joules/Kelvin, R = resistance in ohms, T = temperature in Kelvin, and E represents the noise voltage.
We combine all of the values into a single number and collect all of the units together. The numbers are irrelevant since we are only looking at the units of the resulting expres-sion.
The first transformation to MKS units comes from changing ohms into volts, joules, and seconds and by extension kg, meters, amperes and seconds. The sequence below shows the transformation:
and
therefore:
or
The next transformation is for the units of Boltzman’s constant:
so:
The final equation for noise voltage is:
In this equation, the Kelvin units cancel out, we separate the Amperes (A), and multi-plying by s/s yields the next equation:
When we rearrange the equation and col-lect terms we get:
The (kg × m2)/(A × s3) units equal 1 V, so:
Since 1/s = Hz, we get:
and, thus,
These steps show the source of the V/ Hz unit, and that it has an empirical and theoreti-cal origin.
A Little History
I have corresponded on a number of occasions with Jon Titus. I just knew him as a fellow writer and contributing editor. As I was looking for a copy of his article, I found Jon’s biography. Jon is credited with creating the first personal computer kit, the Mark 8, in 1974, which used the Intel 8008 CPU. That computer is now on display in the Smithsonian Institute. Jon has also worked as editorial director for a couple of techni-cal journals as well as Vice President of Reed Business Information. He helped start the Blacksburg Group, where he wrote and edited computer and electronics books.

QEX – January/February 2012 21
Upcoming Conferences2012 Southeastern VHF
Society Conference
April 21-22, 2012Charlotte, NC 28208
Doubletree Hotel / Charlotte Airport2600 Yorkmont RoadCharlotte, NC 28208
704-357-9100
The Southeastern VHF Society (SVHFS) holds a Technical Conference once a year. The goal of the conference is to raise the technical level of amateurs by providing a forum for presenting technical papers relat-ing to VHF, UHF and Microwaves, to provide a focal point for discussions on operating practices and procedures, on exploration of modes such as EME, MS, FAI, E-skip and other topics that promote operation on Amateur bands above 50 MHz. Annual membership in the society is extended as a benefit of attending the conference.
The conference will feature technical programs, noise figure and antenna gain testing, banquet prizes, vendor displays, and an equipment auction. ARRL President Kay Cragie, N3KN, will be the banquet speaker.
The Society solicits the submission of papers and presentations for the upcom-ing 17th Annual Southeastern VHF Society Conference. Papers and presentations are solicited on both the technical and opera-tional aspects of VHF, UHF and Microwave weak signal Amateur Radio. Some sug-gested areas of interest are:
Transmitters; Receivers; Transverters; RF Power Amplifiers; RF Low Noise Pre Amplifiers; Antennas; Construction Projects; Test Equipment And Station Accessories; Station Design And Construction; Contest-ing; Roving; DXpeditions; EME; Propagation (Sporadic E; Meteor Scatter; Troposphere Ducting; etc.); Digital Modes (WSJT; etc); Digital Signal Processing (DSP);Software Defined Radio (SDR); Amateur Satellites ;Amateur Television
In general papers and presentations on non weak signal related topics such as FM repeaters and packet will not be accepted but exceptions may be made if the topic is related to weak signal.
All submissions for the proceedings should be in Microsoft Word (.doc) format. Submissions for presentation at the confer-ence should be in PowerPoint (.ppt) format, and delivered on either a USB memory stick or CDROM, or posted for download on a website of your choice.
Pages are 8½ by 11 inches with a 1 inch margin on the bottom and ¾ inch margin on the other three sides. All text, drawings, photos, etc, should be black and white only (no color).
Please indicate when you submit your
paper or presentation if you plan to attend the conference and present your paper in person, or if you are submitting solely for publication.
For more information as it becomes available visit the Conference Page at www.svhfs.org.
2012 Annual Conference, Society of Amateur Radio Astronomers
June 24 – 27, 2012National Radio Astronomy
ObservatoryGreen Bank, WV
Call for Papers The Society of Amateur Radio Astrono-
mers (SARA) hereby solicits papers for presentation at its 2012 Annual Meeting and Technical Conference, to be held June 24 through June 27, 2012, at the National Radio Astronomy Observatory (NRAO), Green Bank WV. Papers on radio astronomy hardware, software, education, research strategies, and philosophy are welcome.
SARA members or supporters wishing to present a paper should email a letter of in-tent, including a proposed title and informal abstract or outline (not to exceed 100 words) to the SARA vice president at [email protected], no later than March 1, 2012. Be sure to include your full name, affiliation, postal address, and email ad-dress, and indicate your willingness to at-tend the conference to present your paper.
Submitters will receive an email re-sponse, typically within one week, along with a request to proceed to the next stage, if the proposal is consistent with the planned program. A formal Proceedings book will be published in conjunction with this Meeting. Papers will be peer-reviewed by a panel of SARA members with appropriate profes-sional expertise and academic credentials. First-draft manuscripts must be received no later than April 1, 2012, with feedback, acceptance, or rejection emails to be sent within two weeks thereafter. Upon final editing of accepted papers, camera-ready copy will be due not later than May 1, 2012.
Due to printer’s deadlines, manuscripts received after that deadline will not make it into the Proceedings. Instructions for prepa-ration and submission of final manuscripts appear in the Guidelines for Submitting Papers document on the SARA website. The last four year’s Proceedings were a landmark accomplishment for our organi-zation. Please help the Society of Amateur Radio Astronomers to make the 2012 edi-tion even better!
For more information go to www.radio-astronomy.org.
Quality
Transmitting
& Audio Tubes
• COMMUNICATIONS
• BROADCAST
• INDUSTRY
• AMATEUR
An Address to Remember:
www.rfparts.com
E-mail:
FAX: 760-744-1943 or 888-744-1943
3CPX800A7
3CPX5000A7
3CW20000A7
3CX100A5
3CX400A7
3CX400U7
3CX800A7
3CX1200A7
3CX1200D7
3CX1200Z7
3CX1500A7
3CX2500A3
3CX2500F3
3CX3000A7
3CX6000A7
3CX10000A7
3CX15000A7
3CX20000A7
4CX250B
4CX250BC
4CX250BT
4CX250FG
4CX250R
4CX350A
4CX350F
4CX400A
4CX800A
4CX1000A
4CX1500A
4CX1500B
4CX3000A
4CX3500A
4CX5000A
4CX7500A
4CX10000A
4CX10000D
4CX15000A
4X150A
YC-130
YU-106
YU-108
YU-148
YU-157
572B
807
810
811A
812A
813
833A
833C
845
866-SS
872A-SS
5867A
5868
6146B
7092
3-500ZG
4-400A
M328 / TH328
M338 / TH338
M347 / TH347
M382
– TOO MANY TO LIST ALL –
Immediate Shipment from Stock
MILLIWATTS to KILOWATTS
From
More Watts per Dollar
s m
s m
Se Habla Español • We Export
TECH HELP / ORDER / INFO: 760-744-0700
ORDERS ONLY:
800-RF-PARTS • 800-737-2787

22 QEX – January/February 2012
Feature ArticlesA 10 MHz to 6 GHz Power Meter (Hontoria):
Jul/Aug, p 17A Driverless Ethernet Sound Card (Toledo):
Jan/Feb, p 12A Flexible 2-Port Network Calculator Tool
(McDermott): May/Jun, p 15A New Hroizontal Polarized High Gain
Omni-Directional Antenna (Apel): Nov/Dec, p 3
A New Theory For the Self Resonance, Inductance and Loss of Single Layer Coils (Payne): May/Jun, p 39
A Stable Low-Noise VFO for VHF-UHF Transceivers and Transverters (Stephensen): May/Jun, p 3
A Study of Tall Verticals (Christman): May/Jun, p 26
A Two Diode Frequency Doubler (Pivnichny): Jan/Feb, p 9
An All Purpose High Gain Antenna for 2400 MHz (Paskvan): Jan/Feb, p 39; Fdbk: Mar/Apr, p 47
An All-Digital Transceiver for HF (Ahlstrom): Jan/Feb, p 3
An Optimum Height for an Elevated HF Antenna (Siwiak): May/Jun, p 32
Converting a Vintage 5 MHz Frequency Standard to 10 MHz with a Low Spurious Frequency Doubler (Roos): Mar/Apr, p 19
Examining Multi-band Operation of Near End Fed Wire Antennas (Skelton): Nov/Dec, p 22
Extended Bandwidth Crystal Ladder Filters With Almost Symmetrical Responses (Gordon-Smith): Jul/Aug, p 36
Filter Synthesis using Equal Ripple Optimization (Appel): Jul/Aug, p 22
Loop Antennas — The Factor “N” (Leenerts): Jan/Feb, p 35
Measuring Coils In Tuned Circuits For Short Wave Frequencies (Vermasvuori): Sep/Oct, p 20
Network Control of the W8ZR StationPro II (Christensen): Mar/Apr, p 9
Octave for Curve fitting (Wright): Sep/Oct, p 25
Octave for L-Networks (Wright): Mar/Apr, p 44
On Determining Loop Gain through Circuit Simulation (Post): Mar/Apr, p 3
Playing With the Lambda Diode (Franke): Sep/Oct, p 14
Programmable PLL (Si570) Local Oscillator for HF Receivers, Transmitters and Transceivers (Johnson): Jul/Aug, p 3
Remote Rig Operation (Gable): Nov/Dec, p 10
SDR2GO: A DSP Odyssey (Hill): Mar/Apr, p 36
Seventh-Order Unequal-Ripple SVC Low-Pass Filters with Improved Second Harmonic Attenuation (Gordon-Smith): Jan/Feb, p 29;
Simulating Tapped Coupled Inductors (Sergin): Jan/Feb, p 18
Statement of Ownership, Managerment, and Circulation: Nov/Dec, p 32
Taming the SMPS Beast (Cowan): Nov/Dec, p 19
The Design of Mixed-Coupling LC Band-Pass Ladder Filters (Gordon-Smith): Nov/Dec, p 25
The Effect of Soil Properties on the Performance of Antenna Radials (Doty): Sep/Oct, p 8
The Effects of Ground Conductivity on Antenna Radials (Doty): Mar/Apr, p 15
Tr a n s m i s s i o n a n d R e c e p t i o n o f Longitudinally-Polarized Momentum Waves (Zimmerman): Jul/Aug, p 31
VSC-X: A Virtual Serial Cable to Remotely Program Your Mobile Radio (Hansen): Sep/Oct, p 3
About the CoverA Stable Low-Noise VFO for VHF-
UHF Transceivers and Transverters (Stephensen): May/Jun, p 1
An All-Digital Transceiver for HF: Jan/Feb, p 1
Converting a Vintage 5 MHz Frequency Standard to 10 MHz with a Low Spurious Frequency Doubler (Roos): Mar/Apr, p 1
Programmable PLL (Si570) Local Oscillator (Johnson): Jul/Aug, p 1
Taming the SMPS Beast (Cowan): Nov/Dec, p 1
VSC-X: A Virtual Serial Cable to Remotely Program Your Mobile Radio (Hansen): Sep/Oct, p 1
Annual Index2010 QEX Index Jan/Feb, p 47
Book ReviewReceiver Design and Technology (Allison):
Sep/Oct, p 30
Empirical Outlook (Wolfgang)2 0 1 1 A R R L a n d TA P R D i g i t a l
Communications Conference: Nov/Dec, p 2
Becoming a QEX Reader: Mar/Apr, p 2Do You Have Some Technical Expertise to
Share!: Jul/Aug, p 2HSMM Losses (Mack): Jan/Feb, p 2Looking Back/Looking Forward (Mack):
Jan/Feb, p 2Old QEX Article Files: May/Jun, p 2We’ve Got E-Mail: Sep/Oct, p 2Web Update: Jul/Aug, p 2Writing for QEX (Mack): Jan/Feb, p 2
FeedbackAn All Purpose High Gain Antenna for 2400
MHz (January/February 2011, pp 39-46) (Paskvan): Mar/Apr, p 47
Letters to the EditorA Flexible 2-Port Network Calculator
(McDermot and Raymond): Sep/Oct, p 37A New Theory For the Self Resonance,
Inductance and Loss of Single Layer Coils (May/June 2011) (Payne): Sep/Oct, p 39
A Simple Path to Complex Impedance (Sep/Oct 2010) (Bowman): May/Jun, p 45
A Study of Tall Verticals (May/June 2011) (Christman and Kjartansson): Sep/Oct, p 38
An RF Phase Meter (Nov/Dec 2010) (Koehler): Sep/Oct, p 38
Converting a Vintage 5 MHz Frequency Standard to 10 MHz With a Low Spurious Frequency Doubler (Mar/Apr 2011) (Doan): Sep/Oct, p 37
Design, Construction and Evaluation of the Eight Circle Vertical Array for Low Band Receiving (Mar/Apr 2010) The Lost 6 dB (Lahlum/Harrison/McGwier): May/Jun, p 45
Letters to the Editor (May/June 2010) (Anderson): Sep/Oct, p 38
Octave for L-Networks (Mar/Apr 2011) (Wright): Sep/Oct, p 37

QEX – January/February 2012 23
On Determining Loop Gain Through Circuit Simulation (Mar/Apr 2011) (Post/Wiedmann): Sep/Oct, p 37
Select IEEE C95 Standards Available at No Charge (Montague): Nov/Dec, p 37
The “True” TLT H-Mode Mixer (Jul/Aug 2010) (Vermasvuori): Sep/Oct, p 38
Tr a n s m i s s i o n a n d R e c e p t i o n o f Longitudinally Polarized Momentum Waves (Jul/Aug 2011) (Wolfgang): Nov/Dec, p 37
Tr a n s m i s s i o n a n d R e c e p t i o n o f Longitudinally Polarized Momentum Waves (Jul/Aug 2011) (Cross/Downey/(Lahmeyer/Pavlak/Widup/Zimmerman): Nov/Dec, p 38
VSC-X: A Virtual Serial Cable to Remotely Program Your Mobil Radio (Sep/Oct 2011) (Tcimpidis): Nov/Dec, p 37
Next Issue in QEXJul/Aug, p 46May/Jun, p 25Sep/Oct, p 7
SDR: Simplified (Mack)An Inexpensive DSP Evaluation Kit; Direct
Digital Synthesis in Software: Nov/Dec, p 33
Cascaded Integrator Comb Filters: Sep/Oct, p 32
DDS-FM Transmitter Code (Sidebar to SDR: Simplified): Nov/Dec, p 34
Upcoming Conference30th Annual ARRL and TAPR Digital
Communications Conference: May/Jun, p 46; Jul/Aug, p 45; Sep/Oct, p 40
45th Annual Central States VHF Society Conference: May/Jun, p 46; Jul/Aug, p 45
2011 Annual Conference, Society of Amateur Radio Astronomers: Jan/Feb, p 48
2011 IEEE Microwave Theory & Techniques Society (MTT-S) International Microwave Symposium (IMS2011): May/Jun, p 46
Southeastern VHF Society Conference: Jan/Feb, p 48
AMSAT 2011 Space Symposium and Annual Meeting: Jul/Aug, p 46; Sep/Oct, p 40
Microwave Update 2011 and 37th Eastern VHF/UHF Conference: Jul/Aug, p 45; Sep/Oct, p 40
Society of Amateur Radio Astronomers 2011 Annual Conference: May/Jun, p 46
Western Regional Conference 2011 Society of Amateur Radio Astronomers: Jan/Feb, p 48
Se Habla Español • We Export
An Address to Remember:
www.rfparts.com
E-mail:
TECH HELP / ORDER / INFO: 760-744-0700
ORDERS ONLY:
800-RF-PARTS • 800-737-2787
FAX: 760-744-1943 or 888-744-1943
• Wattmeters
• Transformers
• TMOS & GASFETS
• RF Power Transistors
• Doorknob Capacitors
• Electrolytic Capacitors
• Variable Capacitors
• RF Power Modules
• Tubes & Sockets
• HV Rectifiers
MILLIWATTS
KILOWATTS
From
More Watts per Dollar
to
s m
s m
We are your #1 source for 50MHzto 10GHz components, kits andassemblies for all your amateur
radio and Satellite projects.
Transverters & Down Converters,Linear power amplifiers, Low Noise
preamps, coaxial components,hybrid power modules, relays,
GaAsFET, PHEMT's, & FET's, MMIC's,mixers, chip components,
and other hard to find itemsfor small signal and low noise
applications.
We can interface our transverterswith most radios.
Please call, write orsee our web site
for our Catalog, detailed Productdescriptions and
interfacing details.
Down East Microwave Inc.19519 78th Terrace
Live Oak, FL 32060 USATel. (386) 364-5529
www.downeastmicrowave.com
We Design And ManufactureTo Meet Your Requirements
800-522-2253This Number May Not
Save Your Life...But it could make it a lot easier!Especia l ly when i t comes toordering non-standard connectors.
RF/MICROWAVE CONNECTORS,CABLES AND ASSEMBLIES
• Specials our specialty. Virtually any SMA, N,TNC, HN, LC, RP, BNC, SMB, or SMCdelivered in 2-4 weeks.
• Cross reference library to all majormanufacturers.
• Experts in supplying “hard to get” RFconnectors.
• Our adapters can satisfy virtually anycombination of requirements between series.
• Extensive inventory of passive RF/Microwavecomponents including attenuators,terminations and dividers.
• No minimum order.
12240 N.E. 14TH AVENUENORTH MIAMI, FL 33161
TEL: 305-899-0900 • FAX: 305-895-8178E-MAIL: [email protected]
BRASIL: (011) 5535-2368
NEMAL ELECTRONICS INTERNATIONAL, INC.
*Protoype or Production Quantities
URL: WWW.NEMAL.COM

24 QEX – January/February 2012
Vector Network Analyzer Model VNA 2180Measures impedance magnitude, phase and transmission parameters for antennas, fi lters, and discrete components - using one or two ports. ■ Frequency range is 5KHz to 180MHz.■ Data plots include: impedance, SWR, return
loss, S11 and S21.■ Plots can be saved for before and after
comparisons. ■ Dual Smith charts with zoom and rotation.■ Time Domain Reflectometer (TDR) Functions.■ New – 6 port VNA multiplexer for measuring directive arrays including
Phase/Magnitude vector scope software.
n
ons.g directive arrays including
www.arraysolutions.comSunnyvale, Texas USAPhone 214-954-7140 [email protected] 214-954-7142
Array Solutions analyzers are used by amateur, commercial, and professional broadcast engineers.See our web site for other products and additional details on these analyzers.
ACOM Sales and Service for Amplifi ers and Accessories
Other Quality Products from Array Solutions...Prosistel Rotators Strongest Rotators on the Market
OptiBeam AntennasGerman Engineering means High Performance
Phillystran, Inc.Offi cial Worldwide Phillystran Distributor
Hofi ®
Surge Arrestors &Antenna Switches
RigExpert Analyzers andInterfaces
Array Solutions Your Source for Outstanding Radio Products
Top-ranked Measurement Equipment from Array Solutions
AIM uhf Analyzer
Announcing the NEW: PowerAIM 120 Vector Impedance Analyzer for Broadcast Engineers
PowerMaster II■ New Larger, Sharp & Fast
LCD Display■ Reduced Energy consumption■ USB and RS-232 interface built-in■ New - Both 3kW and 10kW
couplers on one display - switched■ Hi / Lo Power Level Monitoring■ Supports 2 like couplers simultaneously
(3kW & 3kW, 3kW & V/UHF, 10kW & 10kW)■ SWR Threshold Protection (with amp PTT bypass)
n
d
■ Frequency range from 5 kHz to 1 GHz.
■ Data plots include SWR, RL, R + X, series and parallel, magnitude, phase, and more.
■ Dual Smith charts with rotation and 20 markers.■ Plots and calibration fi les can be saved and used anytime
in CVS and dynamic formats.■ AIM 4170C is still in production covering 5kHz to 180 MHz.■ Time Domain Reflectometer (TDR) Functions.
NEW!NEW!
NEW!
Single and Dual Rack Mount available
New “Power Master Basic” Software
FREE!
■ Patented, unique technology offers the broadcast engineer the full capabilities of a single port network analyzer
■ Small, lightweight, software-driven instrument
■ Easy to carry on airlines and in the fi eld.
■ Very simple to set up and use. ■ Safe measurements in RF-dense
broadcast environments.■ Time Domain Reflectometer (TDR) Functions.
TA P R
™

SHOP DIRECT or call for a dealer near you.ONLINE WWW.ARRL.ORG/SHOP ORDER TOLL-FREE 888/277-5289 (US)
ARRL The national association for
AMATEUR RADIO®
225 Main Street, Newington, CT 06111-1494 USA
*Shipping and Handling charges apply. Sales Tax is required for orders shipped to CT, VA, and Canada. Prices and product availability are subject to change without notice.
QEX 1/ 2012
ARRL’s popular license manuals just got even better! Each book now includes the ARRL Exam Review CD-ROM. Use the software with your book to review the study material. Take randomly-generated practice exams using questions from the actual examination question pool. Additional features allow you to print sample exams…as many as you like. ARRL Exam Review tracks your progress, giving you the feedback you need to ne-tune your studies. You won’t have any surprises on exam day!
Get your FIRST ham radio license!
The ARRL Ham Radio License Manual—Second EditionLet ARRL guide you as you get started in Amateur Radio—as you select your equipment, set-up your rst station and make your rst radio contact.• Easy-to-understand “bite-sized” sections. Pass the 35-question
Technician Class exam.• Includes the latest question pool with answer key,
for use through June 30, 2014. • Software included featuring the ARRL Exam Review
CD-ROM. • Designed for self-study and classroom use. Intended
for all newcomers, instructors and schoolteachers.ARRL Order No. 0977
Upgrade and enjoy more frequency privileges!
The ARRL General Class License Manual—Seventh EditionUpgrade to General and experience the thrill of worldwide communications!• Pass the 35-question General Class exam.• All the Exam Questions with Answer Key, for use July 1, 2011 to June 30, 2015.• Software included featuring the ARRL Exam Review CD-ROM.• Detailed explanations for all questions, including FCC rules.ARRL Order No. 8119
The ARRL Extra Class License Manual—Ninth EditionComplete the journey to the top and enjoy all the operating privileges that come with earning your Amateur Extra Class license.• Pass the 50-question Extra Class exam.• All the Exam Questions with Answer Key, for use through June 30, 2012.• Software included featuring the ARRL Exam Review CD-ROM.• Detailed explanations for all questions, including FCC rules.ARRL Order No. 8874
Achieve the highest level of Amateur Radio licensing!
Only $29.95*/ea. Order Today!
Book and CD-ROM
Study
Anywhere!
Also Available—
ARRL Exam Review for Ham Radio
CD-ROM Ver 2.0ARRL Order No. 6467
$39.95*

SHOP DIRECT or call for a dealer near you.ONLINE WWW.ARRL.ORG/SHOP ORDER TOLL-FREE 888-277-5289 (US)
ARRL225 Main Street, Newington, CT 06111-1494 USA
QEX 1/2012
The national association for
AMATEUR RADIO ®
The ARRL Handbook—2012 Edition
The ARRL Handbook for Radio Communications has kept technologists—amateur, professional and students—immersed in the radio art for generations. It has maintained its place at the forefront—a single resource covering electronic fundamentals, radio design, and loads of practical treatments and projects. • New Test Equipment and Measurements chapter• New projects, including High-Power RF Samplers, RF Current Meter, and a Two-Tone Audio Oscillator from the ARRL Lab• Updated Elsie™ fi lter design software…and more!Fully-searchable CD-ROM included!
The ARRL Antenna Book—22nd Edition
The ARRL Antenna Book for Radio Communications includes all the information you need for complete antenna systems—from planning, to design and construction. Extensively revised, it includes antennas from the HF low bands through VHF, UHF and microwave; fi xed station, portable, mobile, maritime, satellite and more!• Every chapter updated or completely rewritten• New designs, including a C-pole ground-independent HF antenna, a 40 meter Moxon beam, and half-element designs for Yagis• Updated EZNEC-ARRL version 5.0 antenna modeling software …and more!Fully-searchable CD-ROM included!
Hardcover Handbook 2012 Edition. Book with CD-ROM.ARRL Order No. 6634...............Retail $59.95 Special ARRL Member Price $49.95*
Softcover Handbook 2012 Edition. Book with CD-ROM.ARRL Order No. 6672………… Retail $49.95*
CD-ROM System Requirements: Windows® 7, Windows Vista®, or Windows® XP, as well as Macintosh® systems, using Adobe® Acrobat® Reader® software. The Acrobat Reader is a free download at www.adobe.com. PDF fi les are Linux readable. The ARRL Antenna Book utility programs are Windows® compatible, only. Some utilities have additional limitations and may not be compatible with 64-bit operating systems.*Actual dealer prices may vary. Shipping and handling charges apply. Sales Tax is required for all orders shipped to CT, VA, and Canada. Prices and product availability are subject to change without notice.
Hardcover Antenna Book 22nd Edition. Book with CD-ROM.ARRL Order No. 6801...............Retail $59.95 Special ARRL Member Price $49.95*
Softcover Antenna Book 22nd Edition. Book with CD-ROM.ARRL Order No. 6948………… Retail $49.95*
Get the HARDCOVER editions for the softcover price when you order NOW or while
supplies last. Beautifully bound, these are an essential reference for every ham.BONUSOFFER!