XX век: приложение на метода DEA
44
-
Upload
independent -
Category
Documents
-
view
4 -
download
0
Transcript of XX век: приложение на метода DEA


BANK OF GREECE Economic Research Department – Special Studies Division 21, Ε. Venizelos Avenue GR-102 50 Αthens Τel: +30210-320 3610 Fax: +30210-320 2432 www.bankofgreece.gr Printed in Athens, Greece at the Bank of Greece Printing Works. All rights reserved. Reproduction for educational and non-commercial purposes is permitted provided that the source is acknowledged. ISSN 1109-6691

Editorial The South-Eastern European Monetary History Network (SEEMHN) is a
community of financial historians, economists and statisticians, established in April
2006 at the initiation of the Bulgarian National Bank and the Bank of Greece. Its
objective is to spread knowledge on the economic history of the region in the context
of European experience with a specific focus on financial, monetary and banking
history. The First and the Second Annual Conferences were held in Sofia (BNB) in
2006 and in Vienna (OeNB) in 2007. Additionally, the SEEMHN Data Collection
Task Force aims at establishing a historical data base with 19th and 20th century
financial and monetary data for countries in the region. A set of data has already been
published as an annex to the 2007 conference proceedings, released by the OeNB
(2008, Workshops, no 13).
On 13-14 March 2008, the Third Annual Conference was held in Athens,
hosted by the Bank of Greece. The conference was dedicated to Banking and Finance
in South-Eastern Europe: Lessons of Historical Experience. It was attended by
representatives of the Albanian, Austrian, Belgian, Bulgarian, German, Greek,
Romanian, Russian, Serbian and Turkish central banks, as well as participants from a
number of universities and research institutions. Professor Michael Bordo delivered
the key note speech on Growing up to Financial Stability. The participants presented,
reviewed and assessed the experience of SE Europe with financial development,
banking and central banking from a comparative and historical perspective.
The 4th Annual SEEMHN Conference will be hosted by the National Serbian
Bank on 27th March 2009 in Belgrade. The topic of the Conference will be Economic
and Financial Stability in SE Europe in a Historical and Comparative Perspective.
The papers presented at the 2008 SEEMHN Conference are being made
available to a wider audience in the Working Paper Series of the Bank of Greece.
Here we present the ninth of these papers, by Nikolay Nenovsky, Martin Ivanov and
Gergana Mihaylova.
July, 2008
Sophia Lazaretou SEEMHN Coordinator Member of the Scientific and Organizing Committee


THE EVOLUTION OF BULGARIAN BANKS’ EFFICIENCY DURING THE TWENTIES: A DEA APPROACH
Nikolay Nenovsky Bulgarian National Bank, University of Orleans and ICER
Martin Ivanov
Institute of History, Sofia
Gergana Mihaylova Agency for Economic Analysis and Forecasting, Sofia
ABSTRACT This paper studies the dynamics of the bank efficiency in Bulgaria in the years 1923 and 1928. In the course of research several interdependencies were detected, related mainly to the reaction of different types of banks to the financial crisis and the financial stabilization. Official bank balance sheets were used as well as the profit and loss statements of 50 Bulgarian credit institutions. After their classification into sub-groups different variations of DEA (data envelopment analysis), in particular the intermediation approach, were applied to the banks’ financial positions. The DEA overcomes several deficiencies in the traditional accounting measurement of bank efficiency, which has made it very popular in latest literature. To our knowledge this method has not been applied so far to historical data. Keywords: Bulgarian monetary history; Banking system; Βanking efficiency; DEA modelling. JEL classification: N24; G21. Acknowledgements: We would like to express our gratitude to Joanna Bachovska who helped with the data collection. Correspondence Nikolay Nenovsky Bulgarian National Bank University of Orleans and ICER email: [email protected]


7
1. Introduction
This paper mainly explores the empirical measurement of the Bulgarian
banking system’s efficiency over the twenties. The period covers an important time
span of the Bulgarian monetary stabilization, in particular from the beginning of the
monetary stabilization in 1924, going through the official pegging of the lev in 1928,
until the eve of the Great Depression. The banks’ efficiency has been assessed by
applying one of the sophisticated empirical technique (Data Envelopment Approach,
DEA), which enables comparison of the efficiency of both individual banks and bank
groups based on selected criteria. The calculations relate to the two years – 1923 and
1928, thus allowing some comparison of the results for the banks’ efficiency. The
results help approbation of a number of theoretical hypotheses and assumptions as
well as “discovery” of new, so far neglected or unknown theoretical relationships.
First – insomuch as the banking system (and its structure) was able to play the
role of a “substitute institution”, a phrase coined by Alexander Gerschenkron,
mobilizing capitals needed for Bulgaria’s industrialization. As is well-known,
Gerschenkron believes that to catch up with developed economies (or reduce the time
for industrialization) backward and undercapitalized peripheral economies need
substitute institutions. In Gerschenkron’s view such institutions can be universal
banks, the state or even ideology (in the case of USSR)1.
Second, as mentioned above, it would be useful to compare efficiency across
various types of banks (grouping of could be based on various criteria like ownership,
assets volume, regionality, etc). Over the period, the diversity of banks is conditioned
by the fact that the banking market was segmented. Diversity was a response to the
need of finding different ways of collecting dispersed savings, or seen from another
perspective – of accommodating the various types of informational asymmetry2.
Third, the selected years (1923 and 1928) help answer the question as to what
extent and in what way bank efficiency is conditioned by different factors such as
type of monetary regime (the years 1924-1928 are characterized by stabilization of the
lev), capital inflows (1926 Refugee Loan and the 1928 Stabilization Loan), and an
1 For details see, Sylla and Toniolo (2001), Sylla (2005) and Gershenkron (1962, 1952). 2 This is shown in a number of studies; see, for example Karklisiiski (1941), Tugan-Baranovsky (1989, 1915) and Verdier (2001).

8
institutional factor like the absence of systematically regulated accounting norms of
banks and the general lack of information transparency. We need also to mention that
the overall financial system safety net, i.e. lender of last resort, deposit insurance, etc.,
starts functioning in the early thirties, i.e. the years after the Great Depression.
The study can lead us to some other methodological dependencies. As we
already mentioned, the 20ies are characterized by lack of information transparency
which is reflected in fabricated or misrepresented banks’ balance-sheets and profit
and loss accounts. A common practice was the so-called “connected or insider
lending” (Kossev, 2008). An empirical analysis of efficiency gives important
indications about the bad behavior of banks, which is manifested in banks’ failures.
For instance, a case of discrepancy between a bank’s high efficiency (measured based
on official records’ data) and a subsequent failure of that bank calls for a concrete
historical investigation which could reveal the actual reasons for such failure. In other
words, a discrepancy like this could take us to new and interesting economic and
financial relationships, as well as to a close study of archive records.
The structure of the paper is as follows: first, we give a short overview of the
basic facts and events in Bulgaria’s monetary and banking history, thus placing bank
efficiency into a concrete historical context. The second part describes the
methodology fundamentals of measurement as well as the data employed and its
sources. The third part discusses the empirical findings and the conclusion examines
possible future research studies.
2. Bulgaria (1923-1928): facts from the monetary and banking
history
Following a series of political and financial cataclysms, in 1924 Bulgaria re-
established the prewar principles of monetary orthodoxality within the context of the
Europe-wide dominating gold exchange standard. In 1926 under League of Nations’
stabilization program the BNB was granted further autonomy and in 1928 the lev was
pegged de jure to the dollar. The stabilization was backed up by a special Stabilization
Loan granted by a Consortium of American and British banks under League of Nation
auspice (for details on these see, Hristophorov, 1946 and Avramov, 2007).

9
The financial stabilization achieved boosted up the country’s economic
recovery. After a few years of severe cataclysms, in 1925 the prewar level of the GNP
per capita was exceeded and in the following years a moderate growth of economy
achieved (Ivanov, 2006). In the context of this relatively stable environment the
banking system played an important role for the economic growth. It was gravely
affected by the hyperinflationary spiral in early 20ies with sector incomes going down
to half their 1911 level. For comparison, the added value in agriculture and industry in
1921 remained at prewar levels (98% and 112% of the 1911 added value,
respectively). However, between 1924 and 1929 the real incomes in the financial
services area increased twofold from 1.1 to 2.2 billion levs. A gradual increase of
deposits across all sub-segments of the banking sector is a further evidence of
restoring confidence in the banking system.
Table 1: Bank deposits, in million levs (1921 prices) 1921 1923 1925 1929 Real growth
in % for the period 1921-1929
State-owned banks 1935 2662 2975 3366 73.90%Private banks 2343 2529 2463 3473 48.20%Building societies 0 0 0 173.2 -
Agricultural co-operations 179.2 222.3 278.8 510.5 184.80%Popular banks 84.8 124.6 342.6 877.9 935.30% Total 4542 5538 6059 8916 96.30%
Source: Own estimates, Statistical Annual, BNB Bulletin.
The data in the table indicate that those benefiting most from the macro-
stabilization were the rural and town co-operations (popular banks), followed by the
state-owned banks. The private credit institutions found it hardest to win the public
confidence with deposits attracted going up by only 48% - much below the
performance of the public financial institutions.
The 1920s deepened the trend of bank market segmentation already started in
the first decade of the 20th century. Comfortably sheltered under the protection wing

10
of the state the rural and town co-operations were able to strengthen their previous
grounds and on the eve of the Great Depression the industry expanded to include a
new competitor – the so-called building societies. Operating as quasi banking
institutions these specialized in long-term mortgage lending. As private initiative was
more and more squeezed down in scope, competition among these banks (around 140
at the time) spurred up further. Their priority remained financing of industry and trade
while the public and cooperative credit head-offices financed mainly the agricultural
sector.
The macroeconomic stabilization and the two external loans granted under the
guarantee of the League of Nations (1926 Refugee Loan (7%) and 1928 Stabilization
Loan (7.5%)) allowed Bulgaria to find a place on the global investment map. The high
interest rate differential between the country’s and the external interest rate levels
provoked the interest of major international financial institutions such as the French
Paribas and the Deutsche bank. The increased capital inflows and the downpour,
within a short time, of “gold rain” from the Stabilization Loan resulted in substantial
growth of the local financial institutions’ lending activities. Only a year after it
started, credit inflation exceeded prudent levels and undermined the banking sector
stability.
Table 2: Volume of banks’ loan portfolio (at current prices, in million levs)
1925 1927 1928 Nominal growth for the period 1925-1928
State-owned banks 2654 3689 4622 74% Private banks 3452 4991 6448 87%
Cooperative banks 313 1449 1961 512% Total 6419 10128 12986 102%
Source: Own estimates, Statistical Annual
The macroeconomic risks of the inflation were further aggravated in the
absence of information transparency and the almost entire lack of a state-regulated
banking sector. The only tools the BNB could employ were annual examinations of
the private financial institutions, credited by the BNB, (the rural credit co-operations

11
played a role similar to today’s Bulgarian Agricultural Bank, while the town banks
come closer to the currently operating Bulgarian Central Co-operative Bank) and
refinancing through rediscounting of their portfolio. Both instruments however can
only roughly tune the system. No matter how thoroughly or scrupulously conducted,
examinations are quite an inflexible form of monitoring as they take place long after
the end of the financial year with findings normally becoming available not until
another eight to ten months. In an environment of easy access to external financing,
portfolio rediscounting is also of limited impact. The reduced Central Bank’s credit
was easily compensated by borrowing from abroad.
The absence of legislative regulation reduced the information transparency of
the financial sector to the minimum. The balance sheets published (not always and not
by all) were not standardized and so enabled risk players to conceal or show all sorts
of accounts under a single item. Misrepresentation and «window-dressing» of balance
sheets were public secret; still, counter-actions were taken only in the heat of the
crisis in 1931. Even a sketchy overview of historical events in the 30ies allows us to
formulate some assumptions and hypotheses.
Without any pretense of exhaustiveness, it could be assumed that with
monetary stabilization in place the banks’ efficiency in Bulgaria increased. This
occurred as a result of the imposed financial discipline and boosted competition in the
banking sector. Second, it could be expected that foreign and state-owned banks in
general would have higher efficiency than local private institutions. This is both on
account of the limited resource and the sharp shortage of capital, as well as the more
direct relationship between the private banks’ efficiency and the achieved
macroeconomic stabilization. Third, the lacking accounting standards, deficient
information transparency and imperfect regulatory framework of the banking sector
would naturally have an adverse bearing on the banks’ efficiency level. Due to the
opposite nature of the above two effects (monetary stability and lack of transparency)
it is difficult to determine a priori which of the effects would outweigh the other; yet
overall the expected benefits of the lev stabilization are a weaker than anticipated
improvement. Fourth, the capital inflow (capital injection from abroad in the form of
the two external loans) in an environment of unclear banking rules brings detriment
rather than advantage, hence presumably a decline in efficiency. Of course it is

12
difficult to evaluate and measure the effects independently; nevertheless an empirical
assessment could provide some valuable information.
3. Measuring banks’ efficiency: theoretical premises and empirical
problems
Over the last years a number of new approaches have emerged for measuring
the DMU (decision making units’) efficiency and productivity, mainly associated with
the Data Envelopment Analysis (DEA) and the Stochastic Frontier approach (SFA)
(Coelli et al., 2005). These approaches were also applied to the banking systems of
most countries, to mention just a few studies by Grigorian and Manole, 2002; Jemric
and Vujcic, 2002; Pawlowska, 2005; Fiorentino et. al., 2006; Luciano and Regis,
2007; Loukianova 2008, and others, Bulgaria including: Nenovsky et al., 2004;
Nenovsky et al., 2007. As far as we know, DEA has not been applied to historical
data as it is difficult to compile a database of banks’ inputs and outputs in the absence
of detailed, standardized or regularly published balance sheets and profit and loss
accounts. In such cases it is much easier to use traditional measurements such as ROE
and ROA.
In short (in the case of banks) DEA is a method of linear programming to
assess the efficiency of individual banks against a defined efficiency frontier (the
most efficient banks), which is derived from the model itself. This frontier indicates
the maximum efficiency possible, and banks are positioned on or below it with the
distance indicating the loss of potential efficiency. DEA is an approach alternative not
only to the traditional ROE and ROA indicators, but to regressional analysis as well
(while regressional analysis is based on estimation of average trends, DEA is based on
frontier scores measurement). DEA advantage is that it does not involve a pre-
formulated format of the production function; its drawbacks however come from the
fact that it is highly dependent on extreme findings and can not tell what part of the
divergence from the frontier stands for the bank’s inefficiency and what – for random
error. There are two forms of DEA (Chart 1), one showing the divergence
(inefficiency) АВ in relation to outputs - frontier (left Chart), and a second one

13
showing the divergence (inefficiency) АВ with regard to inputs – frontier (right
Chart)3. In this particular case the inefficiency level is measured with δ = OA/OB.
Chart 1. Two DEA forms: output oriented (left) and input oriented (right)
If we show the production function q = f(x) on Chart 2, then the rate of
inefficiency input-measured is drawn by AB/AP, and the rate of inefficiency output-
measured is drawn by CP/CD.
Chart 2. Input-measured and output-measured inefficiency
3 Actually the major microeconomic objectives are being reproduced, namely profit maximization at a given amount of costs or vice versa – minimizing costs at a pre-determined (targeted) profit.
14
The last element of importance in measuring banks’ efficiency or inefficiency
respectively is the use of Variable Returns to Scale (VRS) of a bank’s production
function, which makes up for the unrealistic assumption of Constant Returns to Scale
(CRS) (see Chart 3).
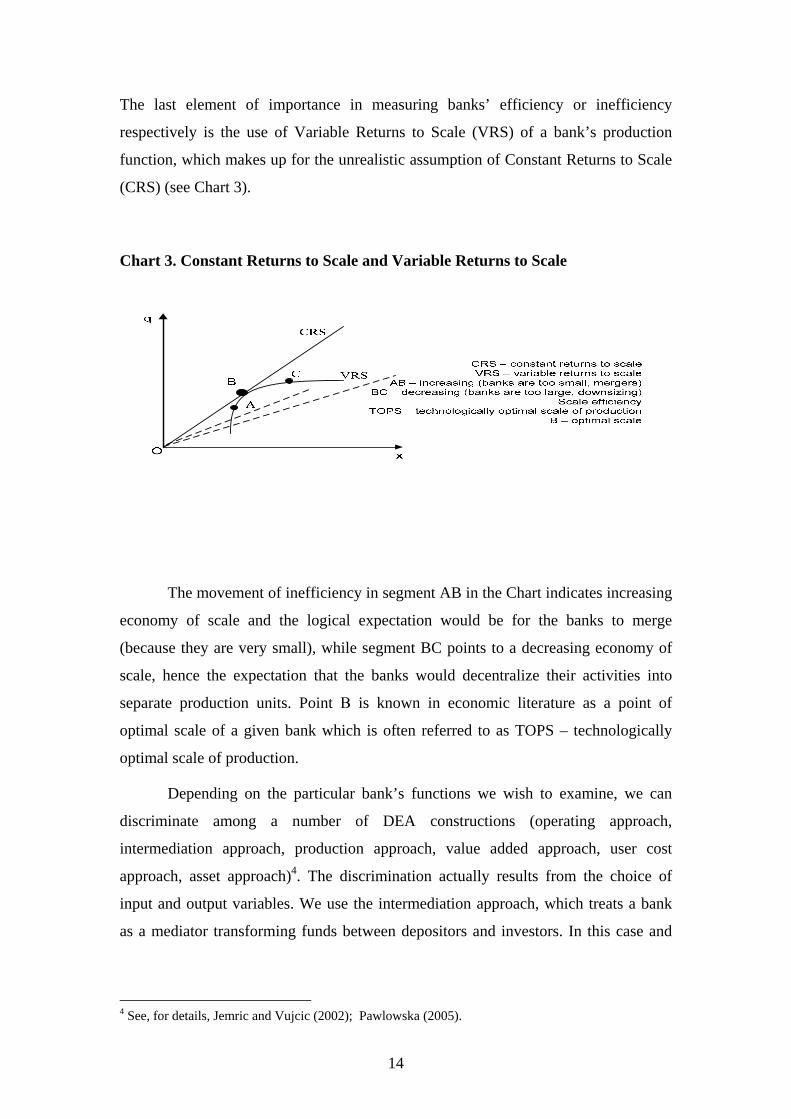
Chart 3. Constant Returns to Scale and Variable Returns to Scale
The movement of inefficiency in segment AB in the Chart indicates increasing
economy of scale and the logical expectation would be for the banks to merge
(because they are very small), while segment BC points to a decreasing economy of
scale, hence the expectation that the banks would decentralize their activities into
separate production units. Point В is known in economic literature as a point of
optimal scale of a given bank which is often referred to as TOPS – technologically
optimal scale of production.
Depending on the particular bank’s functions we wish to examine, we can
discriminate among a number of DEA constructions (operating approach,
intermediation approach, production approach, value added approach, user cost
approach, asset approach)4. The discrimination actually results from the choice of
input and output variables. We use the intermediation approach, which treats a bank
as a mediator transforming funds between depositors and investors. In this case and
4 See, for details, Jemric and Vujcic (2002); Pawlowska (2005).

15
based on the construction of banks’ balance sheets in the ‘20s we have the following
configuration (see Chart 4):
Chart 4: Intermediation DEA – inputs and outputs involved
The inputs involved in the intermediation approach are the labor and capital
which a bank has and uses for the production of its outputs. Since there are no
available data for measuring labor (the number of employed per banks), we use
variables that indirectly reflect the labor in an individual bank unit. For this purpose
we take two variables – the total value of a bank’s assets and the bank’s
administrative costs. The bank’s assets can be used as an approximator of labor in so
far as the bank’s size determines the amount of labor needed for the functioning of the
bank. If, however, the labor of a bank at an initial point of time is more productive
than the labor of another bank of the same size, then at a next point the first bank will
have accumulated larger amount of assets. It is also possible that banks of equal size
have different number of employed. This is in the case where a bank with less human
resources needs to put additional workload on the existing ones (therefore the value of
total assets of a bank is not a perfect measure for labor).
Bank
Inputs Outputs
deposits
fixed assets
number of employed (total assets (model 1), administrative costs (model 2))
loans
securities

16
A bank’s administrative costs can also be used since they reflect labor costs.
We need to have in mind that administrative costs also include rental and electricity
costs, etc., but the available data do not allow for their disaggregation by type.
Although the administrative costs, as defined in the Proffit&Loss account, cover other
costs as well, this is a better indicator of the banks’ inputs than assets are, since during
the reference period most of the banks were small production units and so, for
instance, did not have their own buildings to carry out their activities. Thus, they
incurred rental costs reflected in the administrative costs, i.е. capital expenses are
taken into account (for those of the banks that did not own real property).
We use for inputs also the banks’ fixed assets and the attracted deposits that
serve as a source of financing of their principal activities, i.e. lending to economic
agents and securities investments, which are the basic outputs. Since for the purpose
of measuring labor two variables are used (a bank’s total assets and its administrative
costs), calculations are made for the two variations in order to compare the results.
Due to more serious disadvantages of using a bank’s total assets as an indicator of
labor, we give priority to the results of the model employing administrative costs. The
results from the models should nevertheless outline the same dependencies in spite of
some quantitative differences.
As stated above, the banks’ balance sheets over the reference period were not
standardized, which necessitated processing of data to isolate the variables used in the
model. While not pretending to exhaustiveness, the balance sheet (Table 3) given
below is an aggregation of almost all items that can be found in the individual balance
sheets of the bank units. The Profit&Loss account (Table 4) also indicates more than a
few differences in the way it is presented, but overall the impression is that costs and
incomes are not shown on a more disaggregated level.

17
Table 3: Bank balance sheet
Table 4: Profit and Loss Statement
The banks’ efficiency is calculated for the years 1923 and 1928. The data used
in the various calculation models were published in the State Gazette (see data
sources at the end of the paper). As the publication of banks’ balance sheets in the
State Gazette was not a requirement at that time, not all existing banks disclosed their
performance to the public. The group of banks included in the efficiency calculation
were determined in the following manner: from the available balance sheets
promulgated in the State Gazette for the two years (1923 and 1928) the banks singled
out are among those operating in both these years, of which the fifty largest were
taken. In the model using administrative costs as an indicator of labour (Model 2) the
number of banks in the group is forty-six because four large banks from the group of
fifty banks did not publish their Profit&Loss accounts.
For the purpose of this research and for validating the hypotheses the banks
are grouped in terms of their ownership as well as based on whether they merged or
went bankrupt as a result of the crisis. Thus, the following groups of banks are
Assets Enterprises Cash in banks Securities Portfolio Current debtor accounts Commodities Fixed assets Protested bills Discounted bills Furniture Other assets
Liabilities Capital Different reserve funds (pension funds,
foresights funds, etc.) Bank deposits Current creditor accounts Other liabilities Profit & Loss
Losses Costs (wages, rents, heating,
lighting,amortisation, etc.) Profit for the current year
Profits From interests, commissions,
securities, commodities, etc.

18
examined: private Bulgarian banks, private foreign banks, state-owned banks, merged
banks or banks that went bankrupt as a result of the crisis.
4. Discussing the findings
The banks’ efficiency is estimated using the models of constant returns to
scale and variable returns to scale (CCR-model and BCC-model). The CCR-model
was developed by Charnes et al. (1978), while the BCC-model was defined by Banker
et al. (1984). The efficiency scores calculated under the BCC-model are higher than
the efficiency scores under the CCR-model. The BCC-model compares DMUs with
the DMUs, operating in the same region of returns to scale, while the CCR-model
compares DMUs in the whole sample. To determine the efficiency scores we use the
software DEAFrontier developed by Joe Zhu. The results presented below are based
on the BCC-model, i.e. the assumption of variable returns to scale has been applied.
We consider this model as the most appropriate one since normally the units operate
under variable returns to scale. This has been also confirmed by the model
calculations.
The first model (Model 1), which uses as inputs the value of total assets, fixed
assets and deposits, and as outputs – securities and loans, indicates some decrease in
the efficiency across individual bank units and a greater number of banks forming the
efficiency frontier (in 1923 the number of efficient banks is 10, while in 1928 they are
13). In addition, the comparison of results indicates equalization of the banking
system, i.е. most of the banks that were far from the efficiency frontier in 1923 came
closer to it in 1928. This is also confirmed by the decreased standard deviation over
the reference years.

19
Chart 5: Bank efficiency in 1923 - Model 1
Note: The banks with efficiency score 1 form the efficiency frontier. The maximum efficiency a bank can reach is 1, and the minimum efficiency is 0. Chart 6: Bank efficiency in 1928 - Model 1
Note: The banks with efficiency score 1 form the efficiency frontier. The maximum efficiency a bank can reach is 1, and the minimum efficiency is 0.
Banka na tutunoproizvoditelite
Napreduk
UnionZora
Otechestvo
Burgaska banka
Bulgarska stopanska banka
Bulgarska centralna kooperativna banka
Elenska turgovska banka
Italianska I bulgarska turgovska banka
Loveshka turgovska banka
Selsko-esnafska banka
Sofiiska banka
Gradivo
Zemledelec
Bulgarsko-populiarna banka
Suedinenie
Banka za naroden kredit
Bulgarska banka
Trakiiska bankaDupnishka turgovska kreditna banka
Industrialna banka
Iznosno-vnosna banka Kreditna banka
Gornooriahovska banka
Evreiska populiarna banka
Balkanska banka
Banka za turgovia I kreit
Banka za turgovia industria I knijnina
Vidinska banka
Plevenska turgovska banka
Bulgarska kreditna bankaBanka na suedinenite industrii
Internacionalna banka Bulgaria
Oriahovska turgovska banka
BNB Bulgarska turgovska banka
Plovdiv
Franko-bulgarska ipotekarna banka
Bulgarsko-amerikanska banka
Bulgarska spestovna bankaBulgarska generalna banka
Bulgarska zemedelska banka
Turgovski sgovor
Turgovsko kreditna banka
Franko-belgiiska banka za Bulgaria
Bulgarska garancionna banka
Bulgarska skontova banka
Asbarez
Bulgaria
0.00
0.20
0.40
0.60
0.80
1.00
0 5 10 15 20 25 30 35 40 45 50
Banka na tutunoproizvoditelite
Napreduk
Union
Zora
Balkanska bankaOtechestvo
Banka za naroden kredit
Banka za turgovia I kreit
Banka za turgovia industria I knijnina
Banka na suedinenite industrii
Bulgarska kreditna banka
Burgaska banka
Suedinenie
Bulgarska banka
Bulgarska stopanska banka
Bulgarska centralna kooperativna banka
Bulgarsko-populiarna banka
Vidinska banka
Gornooriahovska banka
Dupnishka turgovska kreditna banka
Evreiska populiarna banka
Elenska turgovska banka
Iznosno-vnosna banka
Industrialna banka
Italianska I bulgarska turgovska banka
Kreditna banka
Loveshka turgovska banka
Plevenska turgovska banka
Selsko-esnafska banka
Sofiiska banka
Gradivo
Trakiiska banka
Zemledelec
Internacionalna banka Bulgaria
Oriahovska turgovska banka
BNB Bulgarska turgovska banka
Plovdiv
Franko-bulgarska ipotekarna banka
Bulgarsko-amerikanska banka
Bulgarska spestovna banka
Bulgarska generalna banka
Bulgarska zemedelska banka
Turgovski sgovor
Turgovsko kreditna banka
Franko-belgiiska banka za Bulgaria
Bulgarska garancionna banka
Bulgarska skontova bankaAsbarez
Bulgaria
0.00
0.20
0.40
0.60
0.80
1.00
0 5 10 15 20 25 30 35 40 45 50
20
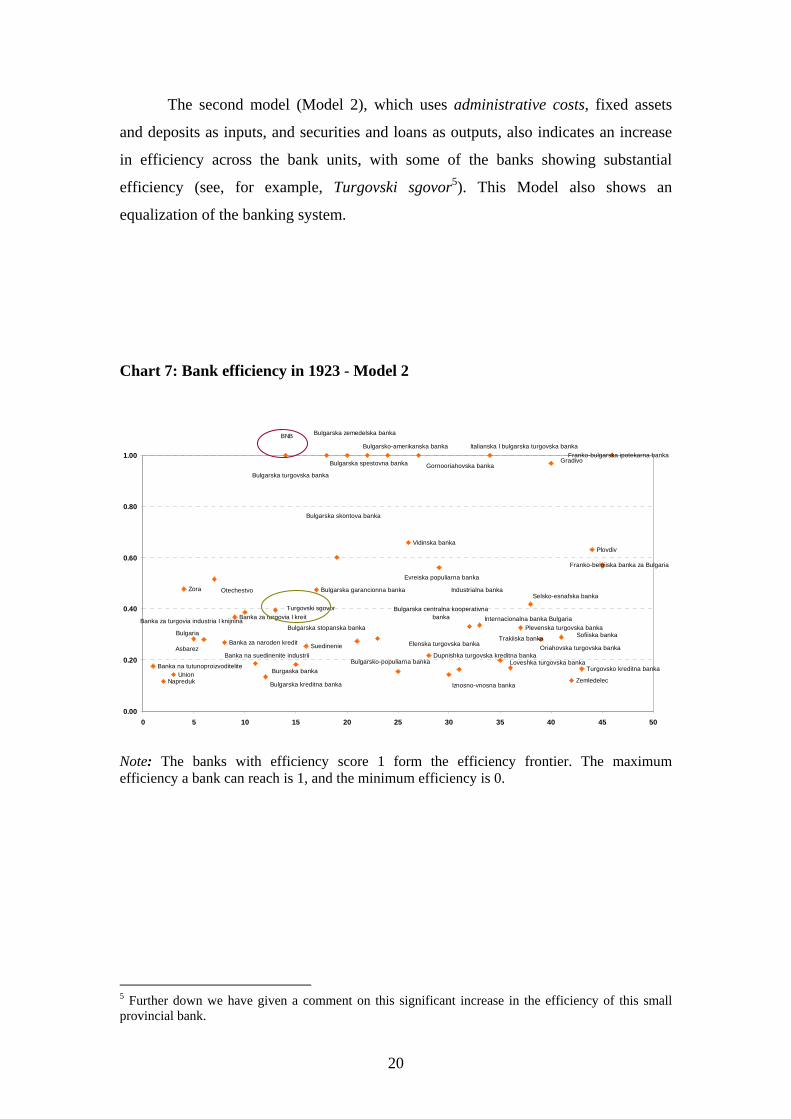
The second model (Model 2), which uses administrative costs, fixed assets
and deposits as inputs, and securities and loans as outputs, also indicates an increase
in efficiency across the bank units, with some of the banks showing substantial
efficiency (see, for example, Turgovski sgovor5). This Model also shows an
equalization of the banking system.
Chart 7: Bank efficiency in 1923 - Model 2
Note: The banks with efficiency score 1 form the efficiency frontier. The maximum efficiency a bank can reach is 1, and the minimum efficiency is 0. 5 Further down we have given a comment on this significant increase in the efficiency of this small provincial bank.
Banka na tutunoproizvoditelite
NapredukUnion
Zora
Banka za naroden kredit
Banka za turgovia I kreit
Suedinenie
Bulgarska garancionna banka
Vidinska banka
Dupnishka turgovska kreditna banka
Plevenska turgovska banka
Zemledelec
Turgovsko kreditna banka
Plovdiv
Franko-belgiiska banka za Bulgaria
Franko-bulgarska ipotekarna banka
Loveshka turgovska banka
Iznosno-vnosna banka
Sofiiska banka
Internacionalna banka Bulgaria
Bulgarsko-amerikanska banka
Bulgarska zemedelska banka
Italianska I bulgarska turgovska banka
Selsko-esnafska banka
Elenska turgovska banka
Industrialna banka
Asbarez
Banka za turgovia industria I knijnina
Banka na suedinenite industrii
Evreiska populiarna banka
Trakiiska banka
Turgovski sgovor
Bulgarska kreditna banka
Oriahovska turgovska banka
Gradivo
Burgaska bankaBulgarsko-populiarna banka
Gornooriahovska banka
Bulgarska centralna kooperativna banka
Bulgarska spestovna banka
Bulgarska stopanska banka
BNB
Bulgarska skontova banka
Bulgarska turgovska banka
Bulgaria
Otechestvo
0.00
0.20
0.40
0.60
0.80
1.00
0 5 10 15 20 25 30 35 40 45 50

21
Chart 8: Bank efficiency in 1928 - Model 2
Note: The banks with efficiency score 1 form the efficiency frontier. The maximum efficiency a bank can get is 1, and the minimum is 0.
The aggregated results for the group of banks as a whole indicate a significant
improvement in the efficiency in the reference years under all models. The increase in
efficiency is higher in Model 2 where administrative costs are used as an indicator of
labour. This is possibly due to a better optimization of administrative costs in 1928
when the banks managed their inputs better. A possible reason for the significant
improvement is the banks’ re-orientation to banking activities proper at the expense of
untypical activities 6.
6 Over the period, a great number of these banks conducted not only banking but ‘real’ economic activities, as well.
Banka na tutunoproizvoditelite
Napreduk
Union
Zora
Banka za naroden kredit
Banka za turgovia I kreit
Suedinenie
Vidinska bankaDupnishka turgovska kreditna banka
Plevenska turgovska banka
Zemledelec
Turgovsko kreditna banka
Plovdiv
Franko-belgiiska banka za Bulgaria
Franko-bulgarska ipotekarna banka
Bulgarska garancionna banka
Loveshka turgovska bankaIznosno-vnosna banka
Sofiiska banka
Internacionalna banka Bulgaria
Bulgarsko-amerikanska banka
Bulgarska zemedelska banka
Italianska I bulgarska turgovska banka
Selsko-esnafska banka
Elenska turgovska bankaIndustrialna banka
Asbarez
Banka za turgovia industria I knijnina
Banka na suedinenite industrii
Evreiska populiarna banka
Trakiiska banka
Turgovski sgovor
Bulgarska kreditna banka
Oriahovska turgovska banka
Gradivo
Burgaska banka
Bulgarsko-populiarna banka
Gornooriahovska banka
Bulgarska centralna kooperativna banka
Bulgarska spestovna banka
Bulgarska stopanska banka
BNB
Bulgarska skontova banka
Bulgarska turgovska banka
Bulgaria
Otechestvo
0.00
0.20
0.40
0.60
0.80
1.00
0 5 10 15 20 25 30 35 40 45 50

22
Table 5: Banks’ efficiency (all banks)
1923 1928 1923 1928 1923 1928
Model 1: Assets_VR
S
Model 1: Assets_VRS
Model 1.1: Assets_VRS
Model 1.1: Assets_VRS
Model 2: Administrative
costs_VRS
Model 2: Administrative
costs_VRS STDEV 0.24903 0.21776 0.25021 0.21885 0.30874 0.25373
MEDIAN 0.66139 0.75914 0.65725 0.72405 0.32851 0.74350
AVERAGE 0.68499 0.74866 0.66934 0.73786 0.44573 0.73101
MIN 0.17284 0.34891 0.17284 0.34891 0.11733 0.14321
MAX 1.00000 1.00000 1.00000 1.00000 1.00000 1.00000
Count 50 50 46 46 46 46 number of efficient banks
10 13 8 12 17 19
Note: In Model 1 the results of the whole group of fifty banks are shown, while in Model 1.1 the results of the forty-six banks included in the calculation of efficiency as per Model 2. Model 1 and Model 1.1 use as inputs the amount of banks’ total assets, their fixed assets and deposits, while Model 2 employs administrative costs, fixed assets and deposits.
The improved efficiency of the group of banks is a result of the growing
competition which is also evidenced by the reduced concentration measured with the
share of the four largest banks in total assets, loans and deposits.
Table 6: Concentration ratio (the four largest banks) 1923 1928 Banks’ assets 79.3% 75.0% Credits, provided to banks’ clients 87.8% 80.1% Deposits of banks’ clients 74.5% 71.1%
The efficiency analysis by bank groups – private Bulgarian banks, state-owned
banks and foreign banks confirms the hypothesis that the foreign banks are the most
efficient as they are equipped with more sophisticated technological resources, and
therefore they manage better their administrative costs. We should have in mind that
the foreign banks which are basically set up with external funds and foreign
ownership, pose higher requirements when managing their resources for better
production utilization.

23
Table 7: Banks’ efficiency (private foreign banks) 1923 1928 1923 1928 1923 1928
Private foreign banks
Model 1: Assets_VRS
Model 1: Assets_VRS
Model 1.1: Assets_VRS
Model 1.1: Assets_VRS
Model 2: Administrative
costs_VRS
Model 2: Administrative
costs_VRS STDEV 0.22951 0.05884 0.27842 0.07038 0.21471 0.00000 MEDIAN 0.92296 0.99739 0.87838 1.00000 1.00000 1.00000 AVERAGE 0.81682 0.96363 0.79206 0.96481 0.89265 1.00000 MIN 0.41149 0.85923 0.41149 0.85923 0.57058 1.00000 MAX 1.00000 1.00000 1.00000 1.00000 1.00000 1.00000 Count 7 7 4 4 4 4 number of efficient banks
3 3 2 3 3 4
Note: In Model 1 the results of the whole group of fifty banks are shown, while in Model 1.1 the results of the forty-six banks included in the calculation of efficiency as per Model 2. Model 1 and Model 1.1 use as inputs the amount of banks’ total assets, their fixed assets and deposits, while Model 2 employs administrative costs, fixed assets and deposits.
The most significant improvement of efficiency in the reference years is
observed with the private Bulgarian banks. Nevertheless, their efficiency level is quite
low due to their limited resource. Their intra-group equalization is the highest; i.e. the
banks with a very low efficiency score move faster to the efficiency frontier possibly
because they are more dependent on monetary stabilization. The unregulated increase
of their credit portfolio as a result of substantial insider lending leads to serious
improvement of their efficiency score; the results however should be cautiously
interpreted. The accelerated growth of credit portfolios and the widening of exposures
to special persons put these bank units at risk (for details see, Turgovski sgovor).
Table 8: Banks’ efficiency (private Bulgarian banks)
1923 1928 1923 1928 1923 1928
Private Bulgarian
banks
Model 1: Assets_VRS
Model 1: Assets_VRS
Model 1.1: Assets_VRS
Model 1.1: Assets_VRS
Model 2: Administrative
costs_VRS
Model 2: Administrative
costs_VRS STDEV 0.23532 0.20323 0.23478 0.20555 0.26265 0.24956 MEDIAN 0.64331 0.65547 0.63303 0.66883 0.28026 0.68646 AVERAGE 0.66019 0.68930 0.65342 0.69156 0.37166 0.68380 MIN 0.17284 0.34891 0.17284 0.34891 0.11733 0.14321 MAX 1.00000 1.00000 1.00000 1.00000 1.00000 1.00000 Count 38 38 37 37 37 37 number of efficient Banks
5 6 4 5 3 3
Note: In Model 1 the results of the whole group of fifty banks are shown, while in Model 1.1 the results of the forty-six banks included in the calculation of efficiency as per Model 2. Model 1 and Model 1.1 use as inputs the amount of banks’ total assets, their fixed assets and deposits, while Model 2 employs administrative costs, fixed assets and deposits.

24
The state-owned banks are more efficient than the local Bulgarian banks and
less efficient than the foreign banks. The group of state-owned banks includes the
Bulgarian National Bank (BNB), which during the first of the investigated years plays
the role of a commercial bank accumulating considerable resources channeled
gradually to increasingly longer-term investment projects. It is among the banks
forming the efficiency frontier. The policy of the state aimed to provide incentives to
the state-owned banks brings these banks to the foreground, thereby distorting
competition in the banking system.
Table 9: Banks’ efficiency (state-owned banks)
1923 1928 1923 1928 1923 1928
State-owned banks
Model 1: Assets_VRS
Model 1: Assets_VRS
Model 1.1: Assets_VRS
Model 1.1: Assets_VRS
Model 2: Administrative
costs_VRS
Model 2: Administrative
costs_VRS STDEV 0.40642 0.25270 0.40642 0.25270 0.39881 0.25270 MEDIAN 0.65437 1.00000 0.65437 1.00000 0.66835 1.00000 AVERAGE 0.64814 0.87365 0.64814 0.87365 0.65513 0.87365 MIN 0.28382 0.49460 0.28382 0.49460 0.28382 0.49460 MAX 1.00000 1.00000 1.00000 1.00000 1.00000 1.00000 Count 4 4 4 4 4 4.00000 number of efficient banks
2 3 2 3 2 3
Note: In Model 1 the results of the whole group of fifty banks are shown, while in Model 1.1 the results of the forty-six banks included in the calculation of efficiency as per Model 2. Model 1 and Model 1.1 use as inputs the amount of banks’ total assets, their fixed assets and deposits, while Model 2 employs administrative costs, fixed assets and deposits.
The results for the banks that failed after the Great Depression indicate (see
Tables 10 and 11) that most of them operated increasing returns to scale. For the
production units, to function at increasing returns to scale and operate more
efficiently, they could have merged as normally these were small units, in which any
further employment would lead to higher specialization of labour. The fact that they
did not merge and did not benefit from the scale could be a reason for their greater
vulnerability during the crisis, and subsequently for their failure. What also makes an
impression is that some of the banks, although on the efficiency frontier or very close
to it, also failed after the crisis. This could as well be as a result of their accumulation
of considerable amount of loans that led to increased efficiency in 1928. Still, the
value of bad loans in the banks’ portfolios need also be considered. An attempt was

25
made to measure the impact of bad loans; however, the calculations showed no
change in the results. The reason for this is that with no regulations in place the banks
did not state correctly the amount of their bad loans in their balance sheets, which
leads to underestimation of this effect. In order to establish how much some of the
banks owe their high efficiency to credit expansion, they will have to be studied
individually.
Table 10: Bankrupt banks (Model 1.1) Bank’s Name 1923 Return of
(to) scale 1928 Return of
(to) scale Banka na tutunoproizvoditelite 0.7212 Decreasing 0.4586 Increasing
Napreduk 0.5389 Decreasing 0.3631 Increasing Union 0.6536 Increasing 0.5405 Increasing Zora 0.5175 Increasing 0.5619 Increasing
Asbarez 0.5727 Increasing 0.6346 Increasing Otechestvo 0.8818 Decreasing 1.0000 Increasing
Banka za turgovia i kreit 0.6619 Decreasing 0.5723 Increasing Banka za turgovia industria I
knijnina 0.7736 Decreasing 0.5563 Increasing
Banka na suedinenite industrii 0.2217 Increasing 0.5190 Increasing Bulgarska kreditna banka 0.1728 Increasing 0.5471 Increasing
Turgovski sgovor 1.0000 Decreasing 0.9135 Increasing Burgaska banka 0.5181 Decreasing 0.5904 Increasing
Suedinenie 0.7422 Decreasing 0.5503 Increasing Bulgarska garancionna banka 0.6270 Increasing 1.0000 Increasing
Bulgarska spestovna banka 1.0000 Increasing 0.7905 Increasing Bulgarska stopanska banka 0.6330 Increasing 0.8311 Increasing
Bulgarsko-amerikanska banka 1.0000 Decreasing 1.0000 Constant Bulgarsko-populiarna banka 0.4333 Decreasing 0.4915 Increasing
Vidinska banka 0.6609 Increasing 0.8302 Increasing Gornooriahovska banka 0.8343 Increasing 1.0000 Increasing
Dupnishka turgovska kreditna banka
0.6988 Increasing 0.7924 Increasing
Evreiska populiarna banka 0.8520 Increasing 1.0000 Increasing Elenska turgovska banka 0.2300 Increasing 0.3489 Increasing
Iznosno-vnosna banka 0.5246 Increasing 1.0000 Increasing Industrialna banka 1.0000 Decreasing 0.7872 Decreasing
Loveshka turgovska banka 0.9188 Decreasing 0.6688 Increasing Oriahovska turgovska banka 0.3021 Increasing 0.5015 Increasing Plevenska turgovska banka 0.5650 Decreasing 0.4722 Increasing
Selsko-esnafska banka 0.8946 Increasing 0.3982 Increasing Sofiiska banka 0.4459 Decreasing 0.4739 Increasing
Trakiiska banka 0.6112 Decreasing 0.7311 Increasing Zemledelec 0.4210 Increasing 0.9806 Increasing
Turgovsko kreditna banka 0.4270 Decreasing 0.9164 Increasing Plovdiv 1.0000 Increasing 0.6994 Increasing
26
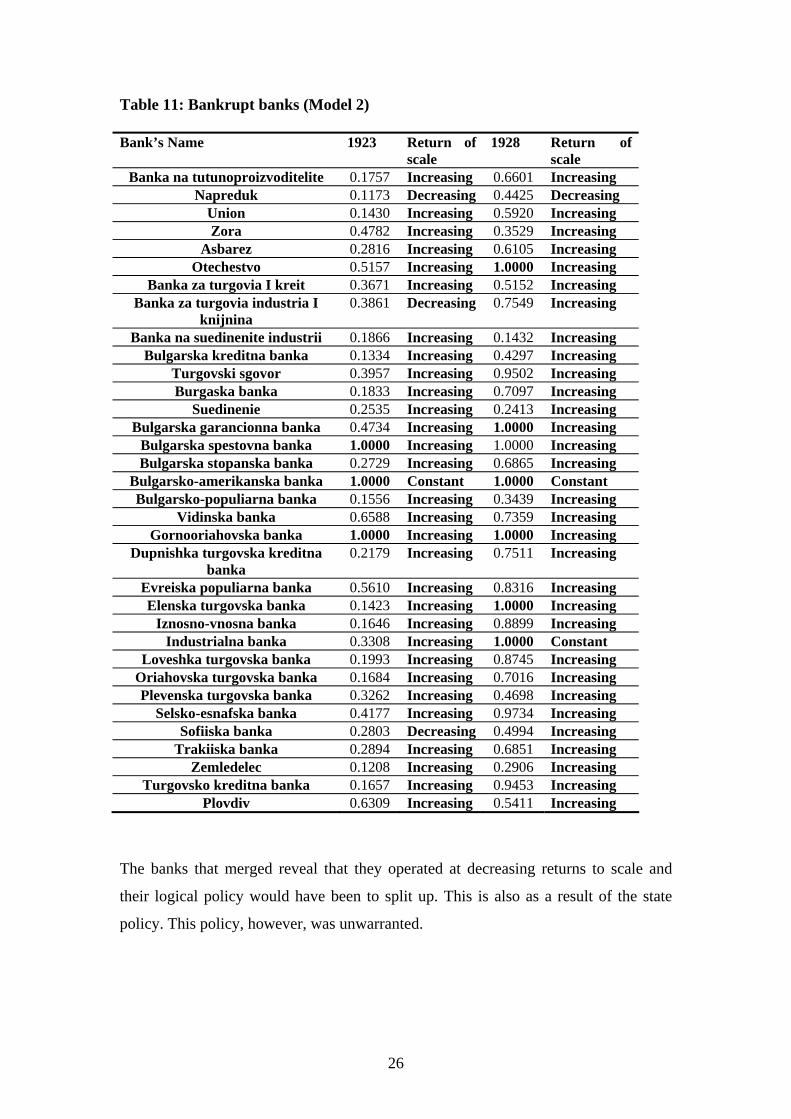
Table 11: Bankrupt banks (Model 2) Bank’s Name 1923 Return of
scale 1928 Return of
scale Banka na tutunoproizvoditelite 0.1757 Increasing 0.6601 Increasing
Napreduk 0.1173 Decreasing 0.4425 Decreasing Union 0.1430 Increasing 0.5920 Increasing Zora 0.4782 Increasing 0.3529 Increasing
Asbarez 0.2816 Increasing 0.6105 Increasing Otechestvo 0.5157 Increasing 1.0000 Increasing
Banka za turgovia I kreit 0.3671 Increasing 0.5152 Increasing Banka za turgovia industria I
knijnina 0.3861 Decreasing 0.7549 Increasing
Banka na suedinenite industrii 0.1866 Increasing 0.1432 Increasing Bulgarska kreditna banka 0.1334 Increasing 0.4297 Increasing
Turgovski sgovor 0.3957 Increasing 0.9502 Increasing Burgaska banka 0.1833 Increasing 0.7097 Increasing
Suedinenie 0.2535 Increasing 0.2413 Increasing Bulgarska garancionna banka 0.4734 Increasing 1.0000 Increasing
Bulgarska spestovna banka 1.0000 Increasing 1.0000 Increasing Bulgarska stopanska banka 0.2729 Increasing 0.6865 Increasing
Bulgarsko-amerikanska banka 1.0000 Constant 1.0000 Constant Bulgarsko-populiarna banka 0.1556 Increasing 0.3439 Increasing
Vidinska banka 0.6588 Increasing 0.7359 Increasing Gornooriahovska banka 1.0000 Increasing 1.0000 Increasing
Dupnishka turgovska kreditna banka
0.2179 Increasing 0.7511 Increasing
Evreiska populiarna banka 0.5610 Increasing 0.8316 Increasing Elenska turgovska banka 0.1423 Increasing 1.0000 Increasing
Iznosno-vnosna banka 0.1646 Increasing 0.8899 Increasing Industrialna banka 0.3308 Increasing 1.0000 Constant
Loveshka turgovska banka 0.1993 Increasing 0.8745 Increasing Oriahovska turgovska banka 0.1684 Increasing 0.7016 Increasing Plevenska turgovska banka 0.3262 Increasing 0.4698 Increasing
Selsko-esnafska banka 0.4177 Increasing 0.9734 Increasing Sofiiska banka 0.2803 Decreasing 0.4994 Increasing
Trakiiska banka 0.2894 Increasing 0.6851 Increasing Zemledelec 0.1208 Increasing 0.2906 Increasing
Turgovsko kreditna banka 0.1657 Increasing 0.9453 Increasing Plovdiv 0.6309 Increasing 0.5411 Increasing
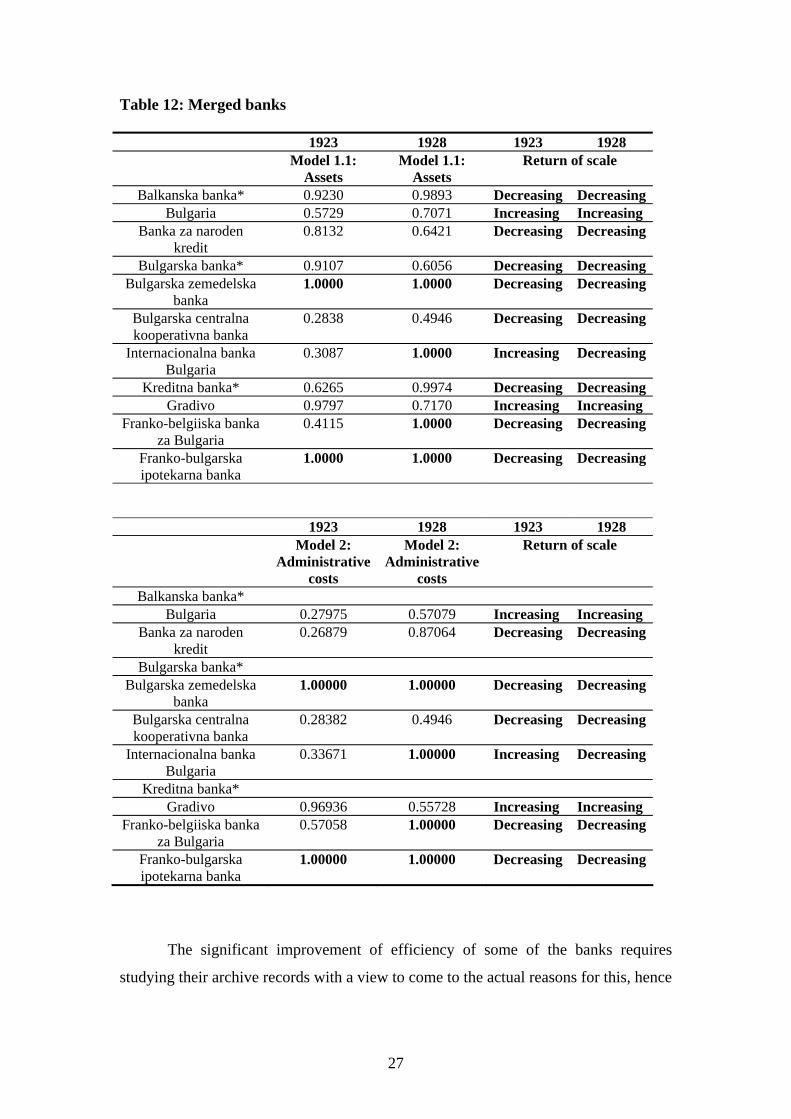
The banks that merged reveal that they operated at decreasing returns to scale and
their logical policy would have been to split up. This is also as a result of the state
policy. This policy, however, was unwarranted.
27
Table 12: Merged banks
1923 1928 1923 1928 Model 1.1:
Assets Model 1.1:
Assets Return of scale
Balkanska banka* 0.9230 0.9893 Decreasing Decreasing Bulgaria 0.5729 0.7071 Increasing Increasing
Banka za naroden kredit
0.8132 0.6421 Decreasing Decreasing
Bulgarska banka* 0.9107 0.6056 Decreasing Decreasing Bulgarska zemedelska
banka 1.0000 1.0000 Decreasing Decreasing
Bulgarska centralna kooperativna banka
0.2838 0.4946 Decreasing Decreasing
Internacionalna banka Bulgaria
0.3087 1.0000 Increasing Decreasing
Kreditna banka* 0.6265 0.9974 Decreasing Decreasing Gradivo 0.9797 0.7170 Increasing Increasing
Franko-belgiiska banka za Bulgaria
0.4115 1.0000 Decreasing Decreasing
Franko-bulgarska ipotekarna banka
1.0000 1.0000 Decreasing Decreasing
1923 1928 1923 1928 Model 2:
Administrative costs
Model 2: Administrative
costs
Return of scale
Balkanska banka* Bulgaria 0.27975 0.57079 Increasing Increasing
Banka za naroden kredit
0.26879 0.87064 Decreasing Decreasing
Bulgarska banka* Bulgarska zemedelska
banka 1.00000 1.00000 Decreasing Decreasing
Bulgarska centralna kooperativna banka
0.28382 0.4946 Decreasing Decreasing
Internacionalna banka Bulgaria
0.33671 1.00000 Increasing Decreasing
Kreditna banka* Gradivo 0.96936 0.55728 Increasing Increasing
Franko-belgiiska banka za Bulgaria
0.57058 1.00000 Decreasing Decreasing
Franko-bulgarska ipotekarna banka
1.00000 1.00000 Decreasing Decreasing
The significant improvement of efficiency of some of the banks requires
studying their archive records with a view to come to the actual reasons for this, hence

28
to some new economic and financial dependencies. Such is the case with the small
provincial bank Turgovski sgovor whose archives have revealed interesting facts.
The bank was established in 1919 by a group of local merchants and producers
of rice in Pazardjik. In parallel with their financial operations until 1925 the company
was also engaged in trading and ran their own shop in the town. The serious
difficulties were not long in coming and around 1926 – 1927 Turgovski sgovor was
“in possession” of 1179 thousand levs in judicially protested portfolio out of a total of
1732 thousand levs in extended loans. Overstated as these audit data might seem
(circa 70% non-performing loans) it is more than clear that the bank was in deep
crisis. The newly appointed management in 1927 was received with high hopes by the
BNB local branch in Pazardjik. In the words of the bank clerk the new Management
Board had a chance to clear away the “bad heritage” as its members possessed “high
morals” and the bank’s director was “very energetic”.
In 1928 the fixed capital of Turgovski sgovor increased from 1 to 2 million
levs. Attempts were made to cut down administrative costs with the director assuming
the functions of cashier as well after the position was closed. The situation however,
as evident by the last audit (if we can rely on the last audit findings), remains “not
really good” and after 1927 dividend payment was not resumed. The new examination
report prepared in 1931, however, paints a bleak picture. The report no longer
mentions the Management Board’s “high morals”, or the director’s enthusiasm. This
time the new BNB auditor points out that “the members of the Management Board
show little interest in the company’s activities” as they were engulfed in their private
business. The management was actually in the hands of the director, Assen G. Petrov,
a son-in-law of one of the major shareholders, Nikola Ivanov. The bank was rusted by
insider loans: “The Management Board and the key shareholders have used the bank’s
funds widely for their own needs; yet another portion they have granted to closely
related persons”. The loans to connected persons amount to 2663 thousand levs, with
deposits being only 1380 thousand levs. Of equal concern is the conclusion that “the
bank’s trade turnover over the last three years can not be estimated due to constant
transformation of accounts and their keeping jointly (on a disaggregated basis) with
other accounts”. Some idea about the size of impaired assets could be obtained by the
figures in the table below:

29
Table 13: Adjusted asset of Turgovski sgovor for the years 1927 – 1931, in
thousand levs
1927 1929 1930 1931
Balance-sheet asset*
3992.9 5104.7 7827.2 6995.9
Adjusted asset**
3600.3 4619.6 6273.9 4716.3
Percentage of impairment
-9.83 -9.50 -19.84 -32.58
Source: Central State Archives Note:* Based on publications in the State Gazette, ** Based on the BNB audit
The in-depth study of Turgovski sgovor in Pazardjik reveals problems that can
be found at an individual level: (i) Financial institutions do not show truthfully their
bad loans in their published balance sheets. They swell their portfolios by including
non-performing loans, i.e. empty assets to puff up phony efficiency; (ii) Opaque
account keeping. If we cite once again the audit report for the year 1931: “constant
transformation of accounts and their keeping jointly with other accounts (on a
disaggregated basis)”. (iii) Even the BNB is not always a reliable external auditor.
Often, the case depends on local involvements and/or lack of professional skills
locally. Thus, the change of the auditor (in 1931) led to a radical revision of the
assessment of the bank’s financial position.
The above findings and problems indicate that the DEA results need to be
cautiously interpreted. The data on input and output variables verified on a bank-by-
bank basis especially for the smaller banks whose results given below the models
point to high efficiency whereas they actually did not perform so efficiently. An
investigation of these banks at an individual level will be carried out at a later stage of
studying the banks’ efficiency in past periods. When handling historical data,
researchers inevitably face this kind of difficulties, which necessitates additional
studying of archive records to overcome them.
5. Conclusions and directions for further research
The attempt to apply DEA to historical data on the Bulgarian banking system
is broadly successful both technically and as a possibility to formulate a number of
30
theoretical dependencies. In general, it confirms the basic hypotheses from economic
literature about the role of the banking system in peripheral countries: the banks’
efficiency increases with the development of monetary stabilization; the private
foreign banks and the state-owned banks demonstrate the highest efficiency while the
Bulgarian private institutions are the least efficient. In spite of the existing differences
one can observe an equalization of efficiency in the late 1920s, in comparison with
the initial date in the analysis (1923), which points to a higher competition.
Nevertheless, the BNB is one of the most efficient banks as it is almost always on the
efficiency frontier, which is in a sense an illustration of violating the principles of free
competition. In spite of our endeavors to have a model clear of any “bad loans” in
order to see the impact of “credit inflation” resulting from the two external loans, the
findings as a whole are not very satisfactory due to undisclosed data on accumulated
bad receivables. The case of Turgovski sgovor is a vivid illustration of the lack of
transparency concerning balance-sheet reporting. As to the returns to scale analysis, it
largely confirms the relationship that the banks performing on the frontier of
increasing returns to scale subsequently go bankrupt, while those performing at
decreasing returns to scale subsequently merge.
Some new directions for analysis within the above approach can be mapped
out. First, a different type of efficiency estimation techniques can be employed – the
stochastic frontier for instance. Second, the factors conditioning the dynamics of
efficiency need be identified which could be achieved by using a panel econometric
model where efficiency is regressed with a number of variables – economic and other.
Normally, this type of analysis - the so-called regression analysis - comprises the
second stage of the modern research of bank’s efficiency (once the efficiency has
been measured). These two options relate to the technical sophistications. With regard
to expanding the scope of research, it would be well to have a comparative analysis
done of the banking efficiency in the Balkan countries between the two World Wars
including the other credit institutions such as credit co-operations, popular banks, etc.
Of course, empirical measurements must be complemented by “in-depth” historical
and sociological investigations of individual banks and credit institutions, as these
carry information that is lost with econometric and statistical analyses.
31
References
Avramov, R. (2007). Communal Capitalism. From the Bulgarian Economic Past, in 3 Volumes, Bulgarian Science and Culture Foundation Publishing House [Sofia Аврамов, Р. (2007). Комуналният капитализъм. Из Българското стопанско минало, в 3 тома, изд. Фондация българска наука и куртура, София].
Banker, R., A. Charnes, W. Cooper (1984), Some Model for Estimating Technical
and Scale Inefficiencies in a Data Envelopment Analysis, Management Science, No 30.
Battilossi, S. (2006). The Determinants of Multinational Banking during the First
Globalization, 1870-1914, Oesterreichische Nationalbank Working Paper No 114.
Berger, A.N, D. Humphrey (1997), Efficiency of Financial Institutions: International
Survey and Directions for Future Research, European Journal of Operational Research, vol. 98.
Briones, I., A. Villela (2006). European Banks and their Impact on the Banking
Industry in Chile and Brazil: 1862-1913, Oesterreichische Nationalbank Working Paper No 108.
Caner, S., V. Kontorovich (2004). Efficiency of the Banking Sector in the Russian
Federation with International Comparison, Экономический журнал (HSE Economic Journal), том 8, No 3, с. 357-376.
Chakalov, А. (1931). Agricultural Credit Problems in Bulgaria, Journal of the
Bulgarian Economic Society, year XXX, issue 3, p. 139-169. Чакалов, А. (1931). [Проблемите на земеделския кредит в България, Списание на Българското Икономическо Дружество, год. XXX, кн. 3, с. 139-169].
Charnes, A., W. Cooper, A. Rhodes (1978), “Measuring the Efficiency of Decision
Making Units”, European Journal of Operational Research, No 2. Coelli, T., D. Prasada Rao, Ch. O’Donnell, G. Battese (2005). An Introduction to
Efficiency and Productivity Analysis, Second Edition, Springer. Cooper, W., L. Seiford, J. Zhu (2004). Data Envelopment Analysis: Models and
Interpretations, Chapter 1, 1-39, in W.W. Cooper, L.M. Seiford and J. Zhu (eds), Handbook on Data Envelopment Analysis, Kluwer Academic Publisher, Boston, 2004
Ferraton, C. (2007). Associations et Coopératives. Une Autre Histoire Economique,
éd. Eres, Ramonville Saint-Agne. Fiorentino, E., A. Karmann, M. Koetter (2006). The Cost Efficiency of German
Banks: A Comparison of SFA and DEA, University of Dresden.

32
Ganev, H. (2006). My Life Path. Development of the Co-operative Movement in Bulgaria between the two World Wars, Zahari Stoyanov Publishing House, Sofia Ганев, Х. (2006), [Моят жизнен път. Развитие на кооперативното движение в България между двете световни войни, изд. Захарий Стоянов, София].
Grigorian, D., V. Manole (2002), “Determinants of Commercial Bank Performance in
Transition: An Application of Data Envelopment Analysis, IMF Working Paper No. 146.
Hristophorov, А. (1946). A course in Bulgarian Banking, in 2 Volumes, Publication
of the General Student Support Fund, Sofia [Христофоров, А. (1946). Курс по българско банково дело, в 2 тома, Издание на „Общия фонд за подпомагане на студентите”, София].
Hristophorov, А. (1939). Development of the Conjuncture Cycle in Bulgaria, 1934-
1939, Sofia Royal Printing Office [Христофоров, А. (1939). Развитие на конюнктурния цикъл в България 1934-1939, Придворна печатница, София].
Ivanov, M. (2006). Bulgaria’s National Income, 1892–1924. – BNB Discussion
Papers No 54 Иванов, М. (2006) [Националният доход на България, 1892-1924, Дискусионни материали, БНБ, № 54].
Jemric I. and B. Vujcic (2002), “Efficiency of Banks in Croatia: a DEA Approach”,
Croatian National Bank. Karklisiiski, N. (1941). Findings about the Banking Institutions’ Credit Activities
from the Perspective of their Impact on the Key Economic Sectors in Bulgaria, Sofia Кърклисийски, Н. (1941) [Констатации върху кредитната дейност на банковите институти с оглед на въздействието им върху по-важните отрасли на българското народно стопанство, София].
Kossev, K. (2008). The Banking Sector and the Great Depression in Bulgaria, 1924-
1938: Interlocking and Financial Sector Profitability, paper presented at the 3rd SEEMHN conference, Athens, March.
Loukianova, E. (2008). Analysis of the Efficiency and Profitability of the Japanese
banking System, IMF Working Paper WP/08/63. Luciano, E., Regis, L. (2007). Bank Efficiency and Banking Sector Development: the
Case of Italy, ICER Working Paper No 5. Matousek, R., Taci, A. (2004). Efficiency in Banking and Empirical Evidence from
the Czech Republic, Economics of Planning, vol. 37, pp. 225-244. Nagy, D. (2006). Bank Efficiency in the Enlarged European Union, Magyar Nemzeti
Bank Working Papers, No 3.

33
Nenovsky, N., P. Chobanov, D. Koleva, G. Mihaylova (2007). Efficiency of the Bulgarian Banking System: Traditional Approach and DEA, Agency for Economic Programming and Forecasting, Ministry of Finance, Sofia.
Nenovsky, N. (2005). Exchange Rate Inflation: France and Bulgaria in the Interwar
Period. The Contribution of Albert Aftalion (1874-1956), Edition of Bulgarian National Bank.
Nenovsky, N., M. Tomova, T. Naneva (2004), The Efficiency of Banking System in
CEE. Inequality and Convergence to the EU, in Financial markets in CEE, Stability and Efficiency Perspectives, (Balling, M., F.Lierman, A. Mullineux, eds.), Routledge, London, pp. 225 – 251.
Pawlowska M. (2005), Competition, Concentration, Efficiency and their Relationship
in the Polish Banking Sector, National Bank of Poland, Working Paper No 32. Société des Nations (1931). Mémorandum sur les banques commerciales, 1913-1929,
Genève. Sylla, R., G. Toniolo (2001). Eds., Patterns of European Industrialization: The
Nineteenth Century, Routledge, New York. Sylla, R. (2005). The Origins of National Financial Systems: Alexander Gershenkron
Reconsidered, Book reviews, EH.Net. Toshev, D. (1948). Monetary and Banking Activities (lectures), Varna University
Press Тошев, Д. (1948). [Парично и банково дело (лекции), Университетска печатница, Варна].
Tugan-Baranovsky, М. (1989, [1915]). Social Premises of Co-operation, Economics
(Экономика) Publishing House, Moscow, [Туган-Барановский, М. (1989, [1915]), Социальные основы кооперации, изд. Экономика, Москва].
Verdier, D. (2001). How and Why Financial Systems Differ: A Survey of the
Literature, European University Institute. Data sources: State Gazette: 1923, Number 1, 2, 3, 7, 9, 11, 14, 19, 20, 30, 36, 55, 63, 231, 241, 246, 252, 255, 257, 264, 267, 270, 271, 273, 274, 275, 276, 277, 278, 280, 281, 282, 285, 287, 290, 291 State Gazette: 1928, Number 3, 13, 19, 31, 32, 34, 35, 36, 39, 53, 55, 58, 85, 232, 235, 237, 243, 246, 247, 251, 254, 256, 258, 261, 263, 264, 265, 266, 267, 269, 271, 272, 275, 277, 278, 279, 284, 285, 294

34
Appendix I: Individual results of the banks – Model 1, Model 1.1, Model 2
Model 1
1923 1928 1923 1928 Input-
Oriented Input-
Oriented Input-
Oriented Input-
Oriented CRS CRS VRS VRS
Bank No.
Bank’s Name Efficiency Efficiency Efficiency Efficiency
1 Banka na tutunoproizvoditelite
0.70795 0.34550 0.72119 0.45856
2 Napreduk 0.51104 0.36199 0.53891 0.36306 3 Union 0.63034 0.52180 0.65358 0.54051 4 Zora 0.43812 0.43349 0.51752 0.56189 5 Balkanska banka 0.91788 0.88901 0.92296 0.98926 6 Asbarez 0.54852 0.49531 0.57267 0.63462 7 Bulgaria 0.56061 0.62683 0.57288 0.70707 8 Оtechestvo 0.86130 0.72680 0.88178 1.00000 9 Banka za naroden kredit 0.76602 0.58502 0.81323 0.64210
10 Banka za turgovia i kredit 0.65267 0.54127 0.66188 0.57230 11 Banka za turgovia industria
i knijnina 0.74913 0.55217 0.77361 0.55629
12 Banka na suedinenite industrii
0.17264 0.24137 0.22167 0.51903
13 Bulgarska kreditna banka 0.17240 0.54312 0.17284 0.54705 14 Turgovski sgovor 1.00000 0.66600 1.00000 0.91354 15 BNB 1.00000 0.52983 1.00000 1.00000 16 Burgaska banka 0.49489 0.57928 0.51810 0.59038 17 Suedinenie 0.72704 0.51802 0.74221 0.55030 18 Bulgarska banka AD 0.86081 0.40678 0.91073 0.60561 19 Bulgarska garancionna
banka 0.59421 0.56983 0.62698 1.00000
20 Bulgarska generalna banka 0.28596 0.81889 1.00000 0.89952 21 Bulgarska zemedelska
banka 0.69490 0.88041 1.00000 1.00000
22 Bulgarska skontova banka 0.45383 0.85086 0.60745 1.00000 23 Bulgarska spestovna banka 0.78490 0.69653 1.00000 0.79049 24 Bulgarska stopanska banka 0.62726 0.79131 0.63303 0.83106 25 Bulgarska turgovska banka 0.88441 1.00000 1.00000 1.00000 26 Bulgarska centralna banka 0.21781 0.16043 0.28382 0.49460 27 Bulgarsko-amerikanska
banka 1.00000 1.00000 1.00000 1.00000
28 Bulgarsko-palestinska banka
0.41545 0.48345 0.43331 0.49152
29 Vidinska banka 0.64367 0.82038 0.66091 0.83018 30 Gornooriahovska banka 0.81051 0.63734 0.83433 1.00000 31 Dupnishka turgovska
kredita banka 0.67519 0.71979 0.69881 0.79240

35
32 Evreiska popularna banka 0.83810 0.70634 0.85200 1.00000 33 Elenska turgovska banka 0.15752 0.17906 0.23001 0.34891 34 Iznosno-vnosna banka 0.50615 0.19177 0.52460 1.00000 35 Industrialna banka 1.00000 0.73801 1.00000 0.78718 36 Internacionalna banka
Bulgaria 0.08847 0.49708 0.30873 1.00000
37 Italianska i Bulgarska turgovska banka
0.71257 0.50440 0.75676 0.85923
38 Kreditna banka 0.59037 0.89235 0.62651 0.99739 39 Loveshka turgovska
akcionerna banka 0.88626 0.59424 0.91882 0.66883
40 Oriahovska turgovska banka 0.27861 0.38517 0.30205 0.50150 41 Plevenska turgovska banka 0.56147 0.42801 0.56498 0.47216 42 Selsko-esnafska banka 0.86799 0.38626 0.89458 0.39818 43 Sofiiska banka 0.42191 0.47294 0.44585 0.47394 44 Gradivo 0.96936 0.05751 0.97967 0.71699 45 Trakiiska banka 0.59661 0.67791 0.61120 0.73110 46 Zemledelec 0.41608 0.78843 0.42098 0.98061 47 Turgovsko kreditna banka 0.41153 0.89152 0.42702 0.91642 48 Plovdiv 0.22894 0.08115 1.00000 0.69944 49 Franko-belgiiska banka za
Bulgaria 0.40232 0.20626 0.41149 1.00000
50 Franko-bulgarska ipotekarna banka
1.00000 1.00000 1.00000 1.00000

36
Model 1.1
1923 1928 1923 1928 Input-
Oriented Input-
Oriented Input-
Oriented Input-
Oriented CRS CRS VRS VRS
Bank No.
Bank’s Name Efficiency Efficiency Efficiency Efficiency
1 Banka na tutunopriozvoditelite
0.70795 0.34550 0.72119 0.45856
2 Napreduk 0.51104 0.36199 0.53891 0.363063 Union 0.63034 0.52180 0.65358 0.540514 Zora 0.43812 0.43349 0.51752 0.561895 Balkanska banka 6 Asbarez 0.54852 0.49531 0.57267 0.634627 Bulgaria 0.56061 0.62683 0.57288 0.707078 Otechestvo 0.86130 0.72680 0.88178 1.000009 Banka za naroden kredit 0.76602 0.58502 0.81323 0.64210
10 Banka za turgovia i kredit 0.65267 0.54127 0.66188 0.5723011 Banka za turgovia industria i
knijnina 0.74913 0.55217 0.77361 0.55629
12 Banka na suedinenite industrii
0.17264 0.24137 0.22167 0.51903
13 Bulgarska kreditna banka 0.17240 0.54312 0.17284 0.5470514 Turgovski sgovor 1.00000 0.66600 1.00000 0.9135415 BNB 1.00000 0.52983 1.00000 1.0000016 Burgaska banka 0.49489 0.57928 0.51810 0.5903817 Suedinenie 0.72704 0.51802 0.74221 0.5503018 Bulgarka banka AD 19 Bulgarska garancionna banka 0.59421 0.56983 0.62698 1.0000020 Bulgarska generalna banka 21 Bulgarska zemedelska banka 0.69490 0.88041 1.00000 1.0000022 Bulgarska skontova banka 0.45383 0.85086 0.60745 1.0000023 Bulgariska spestovna banka 0.78490 0.69653 1.00000 0.7904924 Bulgarska stopanska banka 0.62726 0.79131 0.63303 0.8310625 Bulgarska turgovska banka 0.88441 1.00000 1.00000 1.0000026 Bulgarska centralna
kooperativna banka 0.21781 0.16043 0.28382 0.49460
27 Bulgarsko-amerikanska banka
1.00000 1.00000 1.00000 1.00000
28 Bulgarsko-palestinska banka 0.41545 0.48345 0.43331 0.4915229 Vidinska banka 0.64367 0.82038 0.66091 0.8301830 Gornooriahovska banka 0.81051 0.63734 0.83433 1.0000031 Dupnishka turgovska kreditna
banka 0.67519 0.71979 0.69881 0.79240
32 Evreiska popularna banka 0.83810 0.70634 0.85200 1.0000033 Elenska turgovska banka 0.15752 0.17906 0.23001 0.3489134 Iznosnо-vnosna banka 0.50615 0.19177 0.52460 1.0000035 Industrialna banka 1.00000 0.73801 1.00000 0.7871836 Internacionalna banka
Bulgaria 0.08847 0.49708 0.30873 1.00000

37
37 Italianska i Bulgarska turgovska banka
0.71257 0.50440 0.75676 0.85923
38 Kreditna banka 39 Loveshka turgovska banka
akcionerna banka 0.88626 0.59424 0.91882 0.66883
40 Oriahovska turgovska banka 0.27861 0.38517 0.30205 0.5015041 Plevenska turgovska banka 0.56147 0.42801 0.56498 0.4721642 Selsko-esnafska banka 0.86799 0.38626 0.89458 0.3981843 Sofiiska banka 0.42191 0.47294 0.44585 0.4739444 Gradivo 0.96936 0.05751 0.97967 0.7169945 Trakiiska banka 0.59661 0.67791 0.61120 0.7311046 Zemledelec 0.41608 0.78843 0.42098 0.9806147 Turgovsko kreditna banka 0.41153 0.89152 0.42702 0.9164248 Plovdiv 0.22894 0.08115 1.00000 0.6994449 Franko-belgiiska banka za
Bulgaria 0.40232 0.20626 0.41149 1.00000
50 Franko-belgiiska ipotekarna banka
1.00000 1.00000 1.00000 1.00000

38
Model 2
1923 1928 1923 1928 Input-
Oriented Input-
Oriented Input-
Oriented Input-
Oriented CRS CRS VRS VRS
Bank No.
Bank’s Name Efficiency Efficiency Efficiency Efficiency
1 Banka na tutunoproizvoditelite
0.11425 0.23972 0.17567 0.66005
2 Napreduk 0.11581 0.39560 0.11733 0.44245 3 Union 0.10704 0.53712 0.14297 0.59201 4 Zora 0.43812 0.13918 0.47822 0.35289 5 Balkanska banka 6 Asbarez 0.22736 0.33163 0.28160 0.61047 7 Bulgaria 0.23063 0.44066 0.27975 0.57079 8 Otechestvo 0.50937 0.41276 0.51566 1.00000 9 Banka za naroden kredit 0.18305 0.61517 0.26879 0.87064
10 Banka za turgovia i kredit 0.33633 0.44075 0.36706 0.51520 11 Banka za turgovia industria
i knijnina 0.38613 0.75373 0.38613 0.75490
12 Banka na suedinenite industrii
0.17264 0.02535 0.18664 0.14321
13 Bulgarska kreditna banka 0.12819 0.42224 0.13336 0.42968 14 Turgovski sgovor 0.21341 0.31897 0.39572 0.95020 15 BNB 0.62873 0.39742 1.00000 1.00000 16 Burgaska banka 0.17646 0.67170 0.18329 0.70972 17 Suedinenie 0.23354 0.21067 0.25351 0.24134 18 Bulgarska banka AD 19 Bulgarska garancionna
banka 0.36445 0.35474 0.47338 1.00000
20 Bulgarska generalna banka 21 Bulgarska zemedelska
banka 0.10261 0.16902 1.00000 1.00000
22 Bulgarska skontova banka 0.41451 0.23229 0.60160 0.51152 23 Bulgarska spestovna banka 0.67260 0.73367 1.00000 1.00000 24 Bulgarska stopanska banka 0.15907 0.57314 0.27288 0.68646 25 Bulhgarska turgovska banka 0.17367 0.63749 1.00000 1.00000 26 Bulgarska centralna
kooperativna banka 0.18087 0.18099 0.28382 0.49460
27 Bulgarsko-amerikanska banka
1.00000 1.00000 1.00000 1.00000
28 Bulgarsko-palestinska banka
0.13867 0.32488 0.15556 0.34388
29 Vidinska banka 0.64367 0.70957 0.65877 0.73593 30 Gornooriahovska banka 1.00000 0.85251 1.00000 1.00000 31 Dupnishka turgovska
kreditna banka 0.16877 0.60032 0.21789 0.75108
32 Evreiska popularna banka 0.49687 0.23478 0.56099 0.83159 33 Elenska turgovska banka 0.03564 0.21787 0.14226 1.00000 34 Iznosno-vnosna banka 0.12485 0.18914 0.16456 0.88986

39
35 Industrialna banka 0.30161 1.00000 0.33083 1.00000 36 Internacionalna banka
Bulgaria 0.10057 0.69658 0.33671 1.00000
37 Italianska i Bulgarska turgovska banka
0.48201 0.71312 1.00000 1.00000
38 Kreditna banka 39 Loveshka turgovska
akcionerna banka 0.16109 0.59977 0.19927 0.87451
40 Oriahovska turgovska banka 0.09079 0.36899 0.16838 0.70163 41 Plevenska turgovska banka 0.26838 0.35255 0.32620 0.46981 42 Selsko-esnafska banka 0.29967 0.90727 0.41771 0.97344 43 Sofiiska banka 0.23104 0.48705 0.28026 0.49941 44 Gradivo 0.96936 0.01746 0.96936 0.55728 45 Trakiiska banka 0.24411 0.57190 0.28941 0.68514 46 Zemledelec 0.09696 0.26646 0.12078 0.29061 47 Turgovsko kreditna banka 0.14741 0.41916 0.16568 0.94529 48 Plovdiv 0.22894 0.08115 0.63090 0.54108 49 Franko-belgiiska banka za
Bulgaria 0.30326 0.33067 0.57058 1.00000
50 Franko-bulgarska ipotekarna banka
1.00000 1.00000 1.00000 1.00000

40
Appendix II: Data Envelopment Analysis – a basic presentation In case of multiple input and output factors the efficiency score7 is defined as:
Efficiency = Weighted sum of outputs
Weighted sum of inputs
The efficiency scores of the separate decision making units (DMUs), calculated by using the data envelopment analysis (DEA), obtains values between 0 and 1. When the DMU receives efficiency score of 1, then it forms the efficiency frontier and lies on it.
The optimal weights are obtained by solving the presented mathematical programming problem:
(1)
Subject to
For each of I firms there are N inputs and M outputs. In that case the column vectors xi and yi represent the set of inputs and outputs respectively for the i-th firm, while the data for all I firms is represented by the NxI input matrix, X, and the MxI output matrix, Y.
The following multiplier form avoids the problem of obtaining an infinite number of solutions by imposing a new constraint:
(2)
Subject to
The equivalent envelopment form of this linear programming problem is the preferred one to solve, as it involves fewer constraints than the multiplier form (AII.2):
(3)
Subject to
Here θ is a scalar, and λ is an Ix1 vector of constants (i.e. weights). The value of θ obtained is the efficiency score of the i-th firm and it satisfies θ ≤ 1, where a value of 1 indicates a point on the frontier, i.e. a technically efficient firm. To obtain the value
7 The presented specifications of the DEA models are based on Coelli et al. (2005), where more detailed information on efficiency measurement models could be found.
)/(max '', iivu xvyu
Ij ,....,2,1=1/ '' ≤jj xvyu0, ≥vu
)(max ', Ivu yu
Ijj ,...,,...,2,1 0=1' =Ixv
0, ≥vu0'' ≤− jj xvyu
θλθ ,min
0≥Υ+− λIy
0≥λ0≥Χ− λθ Ix

41
of θ for each firm, the linear programming model must be solved I times. The presented approach to the linear programming problem (AII.2) assumes constant returns to scale (CRS). The CRS problem can be easily modified to account for VRS by adding a convexity constraint, which allows to envelope the data points more tightly than under the CRS specification and thus provides technical efficiency scores that are greater than or equal to those obtained using the CRS model. The VRS linear programming problem is:
(4)
Subject to
θλθ ,min
0≥Υ+− λIy
0≥λ
0≥Χ− λθ Ix111 =Ι

42
43
BANK OF GREECE WORKING PAPERS
61. Hall, S. G., G. Hondroyiannis, P.A.V.B. Swamy and G. S. Tavlas, “A Portfolio Balance Approach to Euro-area Money Demand in a Time-Varying Environment”, October 2007.
62. Brissimis, S. N. and I. Skotida, “Optimal Monetary Policy in the Euro Area in the Presence of Heterogeneity”, November 2007.
63. Gibson, H. D. and J. Malley, “The Contribution of Sector Productivity
Differentials to Inflation in Greece”, November 2007.
64. Sideris, D., “Wagner’s Law in 19th Century Greece: A Cointegration and Causality Analysis”, November 2007.
65. Kalyvitis, S. and I. Skotida, “Some Empirical Evidence on the Effects of U.S. Monetary Policy Shocks on Cross Exchange Rates”, January 2008.
66. Sideris, D., “Real Exchange Rates over a Century: The Case of Drachma/Sterling Rate”, January 2008.
67. Petroulas, P. and S. G. Hall, “Spatial Interdependencies of FDI Locations: A Lessening of the Tyranny of Distance?”, February 2008.
68. Matsaganis, M., T. Mitrakos and P. Tsakloglou, “Modelling Household Expenditure on Health Care in Greece”, March 2008.
69. Athanasoglou, P. P. and I. C. Bardaka, “Price and Non-Price Competitiveness of Exports of Manufactures”, April 2008.
70. Tavlas, G., “The Benefits and Costs of Monetary Union in Southern Africa: A Critical Survey of the Literature”, April 2008.
71. Chronis, P. and A. Strantzalou, “Monetary and Fiscal Policy Interaction: What is the Role of the Transaction Cost of the Tax System in Stabilisation Policies?, May 2008.
72. Balfoussia, H., “An Affine Factor Model of the Greek Term Structure”, May
2008. 73. Brissimis, S. N., D. D. Delis and N. I Papanikolaou “Exploring the Nexus between
Banking Sector Reform and Performance: Evidence from Newly Acceded EU Countries”, June 2008.
74. Bernholz, P., “Government Bankruptcy of Balkan Nations and their Consequences
for Money and Inflation before 1914: A Comparative Analysis”, June 2008. 75. Oosterlinck, K. and U. R. Loredana “Multiple Potential Payers and Sovereign
Bond Prices”, June 2008.

44
76. Kossev, K. D., “The Banking Sector and the Great Depression in Bulgaria, 1924-1938: Interlocking and Financial Sector Profitability”, June 2008.
77. Buyst, E. and I. Maes, “The Regulation and Supervision of the Belgian Financial
System (1830-2005)”, June 2008. 78. Barisitz, S. “Banking Transformation (1989-2006) in Central and Eastern Europe
– with Special Reference to Balkans”, June 2008. 79. Lazarević, Ž., “Banking Performance in South-Eastern Europe during the Interwar
Period”, July 2008. 80. Apostolides, A., “How Similar to South-Eastern Europe were the Islands of
Cyprus and Malta in terms of Agricultural Output and Credit? Evidence during the Interwar Period”, July 2008.
81. Avramov, R. and D. Gnjatović, “Stabilization Policies in Bulgaria and Yugoslavia
during Communism’s Terminal Years: 1980s Economic Visions in Retrospect”, July 2008.