kim-absl-ftp-ser-qg-1100-days.pdf - Aditya Birla Mutual Funds
Upload
khangminh22Category
view
2download
0
Law Working Paper N° 560/2020
December 2020
Ryan BubbNew York University and ECGI
Emiliano CatanNew York University
© Ryan Bubb and Emiliano Catan 2020. All rights reserved. Short sections of text, not to exceed two paragraphs, may be quoted without explicit permis-sion provided that full credit, including © notice, is given to the source.
This paper can be downloaded without charge from:http://ssrn.com/abstract_id=3124039
https://ecgi.global/content/working-papers
The Party Structure of Mutual Funds

ECGI Working Paper Series in Law
Working Paper N° 560/2020
December 2020
Ryan BubbEmiliano Catan
The Party Structure of Mutual Funds
We are grateful to Alon Brav, Martijn Cremers, Andrew Eggers, Jeff Gordon, Rob Jackson, Wei Jiang, Marcel Kahan, Louis Kaplow, Lewis Kornhauser, Ed Rock, Holger Spamann, Gerald Rosenfeld, Jonathon Zytnick, and seminar participants at Oxford University, New York University, the NYU-Penn Law and Finance Conference, the University of Michigan, Columbia University, the University of California Berkeley, Harvard Law School, Goethe-University Frankfurt, the Conference on Empirical Legal Studies, the American Law and Economics Association, and the American Finance Association for helpful comments and discussions. We thank Nicolas Duque Franco and Stephanie Thomas for very able research assistance.
© Ryan Bubb and Emiliano Catan 2020. All rights reserved. Short sections of text, not to exceed two paragraphs, may be quoted without explicit permission provided that full credit, including © notice, is given to the source.

Abstract
We investigate the structure of mutual funds’ corporate governance preferences as revealed by how they vote their shares in portfolio companies. We apply unsupervised learning tools from the machine learning literature to analyze a comprehensive dataset ofmutual funds’ votes and find that a parsimonious two-dimensional model can explain the bulk of mutual fund voting. The two dimensions capture competing visions of corporate governance and are closely related to the recommendations of the leading proxy advisors.Model-based cluster analysis shows that mutual funds are organized into three ‘parties’—the Traditional Governance Party, the Shareholder Reform Party, and the Shareholder Protest Party—that follow distinctive philosophies of corporate governance and shareholders’ role. Our preference measures for mutual funds generate a range of insights about the broader system of corporate governance.
Keywords: mutual funds, proxy voting, spatial models, corporate governance
JEL Classifications: G30, G23
Ryan Bubb*Professor of LawNew York University, NYU School of Law40 Washington Sq. SouthNew York, NY 10012., United Statesphone: + 001 212.992.8871e-mail: [email protected]
Emiliano CatanProfessor of LawNew York University, NYU School of Law40 Washington Sq. SouthNew York, NY 10012., United Statesphone: +001 12.998.6130e-mail: [email protected]
*Corresponding Author

The Party Structure of Mutual Funds∗
Ryan Bubb New York University
Emiliano Catan New York University
Abstract. We investigate the structure of mutual funds’ corporate governance preferencesas revealed by how they vote their shares in portfolio companies. We apply unsupervisedlearning tools from the machine learning literature to analyze a comprehensive dataset ofmutual funds’ votes and find that a parsimonious two-dimensional model can explain thebulk of mutual fund voting. The two dimensions capture competing visions of corporategovernance and are closely related to the recommendations of the leading proxy advisors.Model-based cluster analysis shows that mutual funds are organized into three ‘parties’—theTraditional Governance Party, the Shareholder Reform Party, and the Shareholder ProtestParty—that follow distinctive philosophies of corporate governance and shareholders’ role.Our preference measures for mutual funds generate a range of insights about the broadersystem of corporate governance.
∗We are grateful to Alon Brav, Martijn Cremers, Andrew Eggers, Jeff Gordon, Rob Jackson, Wei Jiang,Marcel Kahan, Louis Kaplow, Lewis Kornhauser, Ed Rock, Holger Spamann, Gerald Rosenfeld, JonathonZytnick, and seminar participants at Oxford University, New York University, the NYU-Penn Law and Fi-nance Conference, the University of Michigan, Columbia University, the University of California Berkeley,Harvard Law School, Goethe-University Frankfurt, the Conference on Empirical Legal Studies, the AmericanLaw and Economics Association, and the American Finance Association for helpful comments and discus-sions. We thank Nicolas Duque Franco and Stephanie Thomas for very able research assistance. Bubb:[email protected]. Catan: [email protected]. First draft: Feb. 14, 2018. This draft: December 15, 2020.

1. Introduction
To understand corporate governance in the United States, one must understand the voting
behavior of mutual funds. Mutual funds have grown to hold about one-third of publicly
traded stock and are subject to legal duties to vote that stock in the interest of their in-
vestors.1 In tandem with the growth of mutual funds as corporate shareholders, corporate law
and practice have evolved to elevate the role of the shareholder franchise. Shareholder votes
today play an important role in setting issuer-level corporate governance policies, including
through the use of shareholder proposals to spur governance reforms, and have become an
important tool used by institutional investors to discipline corporate management.
But despite these trends that have made mutual funds central players in corporate gov-
ernance, we know relatively little about their behavior as company owners. In this paper we
develop the first systematic account of the structure of mutual fund preferences over corpo-
rate governance. We focus on two basic questions. First, what are the main ways in which
mutual funds differ in their corporate governance preferences, as reflected in how they vote?
Second, given that variation in voting behavior, what are the characteristic “types” of mu-
tual funds in terms of their corporate governance philosophies? As a theoretical matter, it is
not obvious why mutual funds’ voting behavior would vary systematically. Mutual funds are
merely financial intermediaries that face broadly similar financial incentives and legal duties
with respect to voting the shares in their portfolio companies. One might expect that they
would generally vote their shares in a way that would maximize the value of their portfolios
and would generally agree on how to do so. But we document substantial heterogeneity in
mutual funds’ voting behavior and investigate its determinants.
We use a comprehensive sample of mutual funds’ votes on 181,951 proposals from 5,774
portfolio companies by 4,656 mutual funds. The full data matrix of mutual fund votes,
composed of funds as rows and proposals as columns, is massive, with 847,163,856 cells. But1See SEC, Proxy Voting by Investment Advisers, Release No. IA-2106 (Jan. 31, 2003); 17 CFR
275.206(4)-6.
1

because most mutual funds own only several hundred portfolio companies, and hence vote
on only a small fraction of all public companies’ proposals, 96.7% of the cells in the data
matrix are empty. This type of data analysis task—uncovering the underlying structure of a
large but sparsely populated dataset—is referred to as an “unsupervised learning” problem
in the machine learning literature. We apply tools from that literature to develop a new
window into the structure of mutual funds’ corporate governance preferences that generates
a range of insights into the broader system of corporate governance.
First, we hypothesize that mutual funds’ corporate governance preferences can be orga-
nized or represented as positions along a small number of latent dimensions. To investigate
this hypothesis, we use a type of iterative expectation maximization algorithm to both im-
pute the missing data and to extract the principal components of the completed data matrix
in order to approximate our high dimensional data matrix using a rank-two matrix. We find
that this parsimonious two-dimensional model of mutual fund preferences can indeed explain
the bulk of mutual fund voting. The explanatory power of a relatively low dimensional model
reflects linkages between issues in the high-dimensional proposal space.
The first dimension of our estimated preference space primarily captures the tendency of
funds to oppose (support) management when the leading proxy advisor, ISS, recommends
against (in favor of) management but its main competitor, Glass Lewis, does not. It thus
captures fund voting behavior for proposals on which the two proxy advisors disagree. In
contrast, dimension 2 primarily captures funds’ tendency to vote in line with Glass Lewis’s
recommendations, irrespective of ISS’s recommendations. These findings show that the cor-
porate governance philosophies tracked by the recommendations of the two leading proxy
advisors underlie the main ways mutual funds differ in their voting behavior. We also char-
acterize the substantive approaches to corporate governance these two dimensions measure.
Dimension 1 measures a strong preference to vote against management on range of proposal
types, including those that implicate fundamental shareholder rights, shareholder proposals
on compensation, CSR proposals, and proxy contests. In contrast, the most distinctive as-
2

pect of dimension 2 is that it captures a strong tendency to oppose management on the two
most numerous proposal categories: uncontested director elections and say-on-pay proposals.
The dramatic reduction in the dimensionality of the data we achieve in turn helps us to
characterize the typology of mutual fund corporate governance preferences. We use model-
based cluster analysis to identify three main groups of mutual funds in terms of their pref-
erence scores. We conceptualize these groups as mutual fund “parties” and show that they
are a fundamental feature of mutual fund voting. For example, for most proposals with at
least a minimal amount of disagreement among mutual funds, the majority of one party
was opposed to the majority of the other two parties. Driving these disagreements between
the parties are distinctive patterns in their voting behavior, on the basis of which we label
them the Traditional Governance Party, the Shareholder Reform Party, and the Shareholder
Protest Party.
Funds in the Traditional Governance Party—which is by far the largest party in terms of
assets under management and includes the “Big Three” passive managers, i.e., BlackRock,
Vanguard, and State Street—are distinctly deferential to management on issues that are
traditionally understood as matter for the board, and not shareholders, to decide. But
members of the Traditional Governance Party are most likely to break with management
over proposals that implicate fundamental shareholder rights and proxy contests, reflecting
assertions of shareholder power in their traditional domain.
The Shareholder Reform Party, in contrast, opposes management at much higher rates
than the other two parties over a range of proposal categories involving targeted requests
for reforms to corporate governance. These include proposals on fundamental shareholder
rights related to voting, CSR proposals, shareholder proposals on compensation, and proxy
contests. The Shareholder Reform Party also casts withhold votes on uncontested director
elections in a targeted manner in order to advance concrete governance reforms.
Finally, the Shareholder Protest Party opposes management at much greater rates than
the other two parties on uncontested director elections and on say-on-pay votes. These votes
3

amount to symbolic “protest” votes—they are effectively nonbinding—that voice general
displeasure with management rather than request specific reforms, hence our label for this
party.
We then investigate the factors that shape mutual funds’ party membership. We find
that funds that have stronger incentives to do their own research for voting are more likely
to be members of the Traditional Governance Party and less likely to be members of the
Shareholder Reform Party. A proxy for whether the investment advisor takes a “compliance
approach” to voting, based on the titles of the executives in charge of voting at the advisor,
strongly predicts party membership, particularly for passive advisors. Most strikingly, almost
all of the funds advised by the passive advisors in our three mutual fund parties that our
proxy indicates follow a compliance approach are members of either the Shareholder Reform
Party or Shareholder Protest Party. In contrast, almost all funds advised by passive advisors
that do not use compliance language in their proxy executives’ titles are members of the
Traditional Governance Party. This suggests that party membership among passive advisors
in large part reflects advisors’ decisions whether to outsource to proxy advisors in order to
economize on the costs of voting.
Our characterization of the party structure of mutual funds provides a new perspective on
institutional investors’ voting behavior that sheds light on important corporate governance
issues. Consider, for example, two key trends in the asset management industry that have
raised concerns about corporate governance in recent years. First, the ongoing shift away
from active management and toward passive management has led to concerns that passive
managers are likely to do a poor job monitoring corporate management (Bebchuk and Hirst,
2019; Brav, Jiang, Li, and Pinnington, 2020). In one recent paper, for example, Heath,
Macciocchi, Michaely, and Ringgenberg (2020) find that index funds “are more likely to cede
power to a firm’s management” by voting with management at greater rates. Concerns about
the incentives of passive managers has led to calls by some scholars to strip passive managers
of their right to vote corporate shares (Lund, 2018). Second, there is growing concern about
4

the influence of the proxy advisors on corporate governance, including with respect to the
informational basis for their recommendations and to potential conflicts of interest (Larcker,
McCall, and Ormazabal, 2015; Li, 2018). The SEC recently finalized major reforms to the
regulation of proxy advice intended to address these concerns.2
Our findings on the party structure of mutual funds provides a useful lens through which
to view these controversies. Consider first the concern that passive advisors support man-
agement at greater rates than active advisors. Our framework provides a richer and more
nuanced account of this phenomenon: large passive advisors are more likely to be members
of the Traditional Governance Party. While it is true that the Traditional Governance Party
supports management at greater rates than the other two mutual fund parties, we character-
ize more specifically the corporate governance philosophy and voting behavior of the party.
We show that the Traditional Governance Party is distinctly deferential to management on
operational matters that are traditionally understood as within the province of the board,
rather than shareholders. In contrast, the Traditional Governance Party commonly breaks
with management on proposals related to fundamental shareholder rights—entailing efforts
to change the company’s basic corporate governance rules (e.g., proposals to declassify the
board or to adopt dual-class structures)—and proxy contests. This suggests that the shift
toward passive management does not portend a new era of managerial entrenchment through
shifts in fundamental governance rules or unreflective opposition to shareholder dissidents’
efforts to challenge corporate management.
In a similar way, we provide a much clearer account of the substantive views of corporate
governance that the two leading proxy advisors represent. Our characterization is based
on a comprehensive analysis of the actual patterns in voting behavior of mutual funds in
each of the two mutual fund parties that correspond to the recommendations of the proxy
advisors—the Shareholder Reform Party and the Shareholder Protest Party. Examination
of the stated policies of the proxy advisors reveals little by way of major differences. And2Securities and Exchange Commission, Exemptions From the Proxy Rules for Proxy Voting Advice, Re-
lease No. 34-89372 (Sept. 3, 2020).
5

yet we show that their apparently similar stated corporate governance policies are belied by
large differences in voting behavior of these two groups of mutual funds.
We show moreover that there is a link between the shift toward passive investment
management on the one hand and concern about the influence of the proxy advisors on
the other. Our results show that the growth of the largest passive managers—like the
Big Three—can be expected to weaken the influence of the proxy advisors, since these
managers are typically members of the Traditional Governance Party. On the other hand,
if smaller passive managers proliferate in response to shifts in investor preference toward
passive management, then our results show that these are the types of institutional investors
most likely to simply take a compliance approach to voting and outsource it to the proxy
advisors.
Our main contribution is in using machine learning techniques to establish a set of key
descriptive facts about institutional investors’ voting behavior and corporate governance
preferences. We build on a substantial literature on shareholder voting. One strand in this
literature examines the substantive content of institutional investors’ corporate governance
preferences. Choi, Fisch, and Kahan (2013) shows that three of the very largest mutual fund
investment advisors vote quite differently on director elections both from each other and
from the recommendations of ISS, showing substantial heterogeneity in mutual fund voting
behavior. Choi, Fisch, and Kahan (2008) and Ertimur, Ferri, and Oesch (2018) identify
a range of firm- and director-level characteristics that shape the votes of mutual funds
and the recommendations of proxy advisors. Our methodology advances this literature by
characterizing systematically and comprehensively the main ways mutual funds vary in their
voting behavior. We show that institutional investors are grouped into three main parties
in terms of their voting behavior and we characterize the substantive corporate governance
preferences underlying the three groups.
Another strand of this literature focuses on the influence of the proxy advisors. Choi,
Fisch, and Kahan (2010) estimate that an ISS recommendation can shift the vote of 6 to
6

10% of shares in uncontested director elections. Ertimur, Ferri, and Oesch (2013), Larcker,
McCall, and Ormazabal (2015), and Malenko and Shen (2016) focus on say-on-pay votes
and find that the proxy advisors’ recommendations affect both voting outcomes as well as
companies’ compensation practices. Our finding that the first two principal components of
the voting matrix are closely associated with the recommendations of ISS and Glass Lewis,
each of which are located in one of the three mutual fund parties, provides more evidence for
how profoundly the proxy advisors shape the “politics” of shareholder voting. Importantly,
our methodology is completely data driven. That is, rather than come to the data with any
specific hypothesis in mind, we use unsupervised learning techniques to uncover the main
ways funds differ in their voting behavior, revealing a latent structure to their preferences
that it turns out is closely related to the recommendations of the proxy advisors.
A related set of papers look at the role of funds’ incentives to invest in information.
Morgan, Poulsen, Wolf, and Yang (2011) find that large funds and funds with greater own-
ership stakes in the underlying issuer are less likely to support shareholder proposals. Iliev
and Lowry (2014) focus on actively managed mutual funds and find that active funds that
have higher benefits and lower costs from conducting their own research tend to vote more
independently from ISS. We build on those findings by showing that investment advisors’
incentives influence their funds’ party membership, especially for passive advisors. We show
that much of the variation in party membership of passive advisors stems from whether they
approach voting as a compliance matter to be a performed at minimum cost.
The paper most closely related to ours is Bolton, Li, Ravina, and Rosenthal (2020),
which also estimates a spatial model of voting by institutional investors. Our paper differs
from that paper in multiple ways. Most fundamentally, Bolton et al. (2020) interprets
their first dimension of institutional investors’ preferences as reflecting the extent to which
investors weigh social responsibility when casting their votes. But as we discuss in Section
2.6.4 below, the dimensions of the preference spaces estimated in both papers track voting
preferences on a wide range of corporate governance issues, not just proposals that implicate
7

corporate social responsibility, which make up only a tiny fraction of the sample. Second,
while Bolton et al. (2020) aggregate their voting data to the fund family level, it is the
investment advisor, not the fund family, to which fund voting is generally delegated, and the
two organizations are often not the same. Aggregating data to the fund family level discards
important heterogeneity in voting behavior and moreover results in misestimation of the
preferences of some fund organizations. Accordingly, we hand-code from fund disclosures the
investment advisor to which voting authority is delegated at each fund, which is often the sub-
advisor, and use those investment advisors as the aggregate fund organization of interest.
Finally, our paper differs from Bolton et al. (2020) in that we perform cluster analysis
to identify the main parties into which funds can be divided and characterize the way in
which those parties vote, and we study which advisor-level characteristics are systematically
associated with membership in each mutual fund party.
The plan of the paper is as follows. In Section 2 we estimate a low-dimensional model
of mutual fund corporate governance preferences and characterize the main dimensions on
which funds’ preferences vary. In Section 3 we classify mutual funds into three distinct parties
and characterize the parties’ voting behavior. In Section 4 we use our preference measures
to investigate the determinants of mutal funds’ party membership. Section 5 concludes.
2. The Dimensions of Mutual Fund Preference
Corporate shareholders vote on a range of issues, including on the election of directors and
on various corporate governance policy issues. Our goal is to uncover the structure of mutual
funds’ corporate governance preferences, as revealed through how they vote their shares in
their portfolio companies. We investigate in this section the main ways in which mutual
funds differ in their corporate governance preferences by applying principal components
analysis (PCA) to estimate a parsimonious spatial model. The dramatic reduction in the
dimensionality of the data we achieve then facilitates our characterization of the “party
structure” of mutual funds—identifying clusters of funds that vote similarly—in the following
8

section.
2.1. Voting data. Mutual funds and other registered investment companies—alone among
institutional investors—are required to publicly disclose teir votes. Our mutual fund voting
data is from ISS Voting Analytics, which is drawn from public filings by mutual funds on
Form N-PX. Our sample period is from 2010 - 2015. We treat the set of domestic equity and
balanced mutual funds in the CRSP mutual funds database that hold U.S. common stock
as the population of interest.3 Hence, we only keep in our sample the mutual funds from
ISS Voting Analytics that we can match to such a CRSP fund. We use ticker, fund name,
and family name as well as data from EDGAR to link the two datasets. After excluding
votes cast by funds that voted on fewer than 30 proposals, the full sample covers votes
on 181,951 proposals from 5,774 portfolio companies by 4,656 mutual funds from 474 fund
families. Table 1 compares the overall CRSP population of domestic equity and balanced
mutual funds from 2010 - 2015 holding U.S. common stock to those we were able to match
to a fund in the ISS Voting Analytics data in that year that was included in our estimation
sample. The estimation sample includes votes by funds representing about 55% of the funds
in the CRSP population in each year, and about 80% of the value of U.S. common stock
held by domestic equity and balanced funds in CRSP.
We also include as “voters” in the data matrix rows for management, ISS, and Glass
Lewis based on their respective recommendations.4 This enables us to place these actors in
the same preference space as the mutual funds, which aids in interpretation of the model.5
The resulting data matrix, formed by funds as rows and proposals as columns, has a total3More specifically, we select funds in CRSP with crsp_obj_cd equal to "ED**" or "M" (indicating domestic
equity and balanced funds) and exclude any such funds that the CRSP portfolio data indicate do not holdU.S. common stock.
4The data on management recommendations and ISS recommendations come from ISS Voting Analytics.Following Larcker, McCall, and Ormazabal (2015), we impute Glass Lewis’s recommendations by identifyinga set of mutual funds that follow Glass Lewis, based on information from the Proxy Insight website, andcoding the Glass Lewis recommendation as the majority vote among the Glass Lewis followers for proposalsin which at least two of the Glass Lewis followers voted on it and more than two-thirds of the Glass Lewisfollowers voted in the same direction.
5Including these three actors as voters in the data matrix has a negligible effect on our estimates; allresults are robust to excluding them.
9
of 847,709,709 cells. However, because each individual mutual fund owns only a fraction of
the portfolio companies covered in the dataset, and therefore votes on only a small fraction
of the proposals in the sample, there are only 28,318,233 votes in the sample. In other words,
96.7% of the cells in the data matrix are empty.
2.2. Estimating a low-dimensional model of mutual fund preference. Each of the
181,951 proposals represents a variable in the dataset, and the sheer number of variables
threatens to swamp attempts to use the data to systematically characterize mutual funds’
voting behavior. Many of these variables, however, are highly correlated. Relatedly, we
hypothesize that much of the variation in mutual funds’ votes on these proposals is driven
by preferences and other factors that can be well represented as positions in a much lower
dimensional space.
To investigate this, we use PCA, which can be motivated and derived in a number of
different ways. One way is in terms of finding the mutually orthogonal directions in the
data having maximal variances (Joliffe, 2002). This is an important sense in which PCA
helps us identify the main ways mutual funds differ in their voting behavior. An alternative
framing of PCA is that it finds a low rank approximation of the data that minimizes the
squared approximation error. In particular, let X be the n× p matrix of votes of n funds on
p proposals. To find the best (in a least squares sense) rank k approximation of X, we solve:
minZ,A,M
‖X − ZA−M‖2,
where Z is an n × k matrix of principal component “scores,” A is a k × p “coefficient” (or
“loadings”) matrix, and M is an n × p matrix with each row equal to a vector containing
the means of each variable. Let zi be the i-th row of Z, aj be the j-th column of A, and mj
be the mean of the j-th column of X. Then the problem can be written element-by-element
10

as:
minZ,A,M
n∑i=1
p∑j=1
(Xij − ziaj −mj)2.
The solution to this complete-data problem can be calculated using the singular value de-
composition of the centered data matrix (X −M).
A challenge to performing PCA posed by our data, however, is that 96.7% of the entries
in the data matrix are missing. Let O ⊂ {1, . . . , n} × {1, . . . , p} denote the set of (i, j) such
that Xij is observed. PCA can be generalized to this setting as:
minZ,A,M
∑i,j∈O
(Xij − ziaj −mj)2,
which lacks an analytic solution. We fit the model using a type of expectation maximization
algorithm proposed by Kiers (1997) and further analyzed in Ilin and Raiko (2010) and Josse
and Husson (2012). To estimate a k dimensional model, the algorithm proceeds as follows:
1. Impute missing observations in X using the mean of each variable.
2. Perform PCA on the completed dataset to estimate (Z, A, M). Retain k dimensions
of Z and A; denote the truncated matrices as Zk and Ak.
3. Reimpute the missing values of X using M + ZkAk.
4. Repeat steps 2 and 3 until convergence.
The principal component scores zi can be understood as the projection of the rows of
X (each representing a fund) onto a k dimensional subspace. The fund preference scores
can also be understood as estimates of funds’ “ideal points” in a spatial model.6 We will
refer to these measures as “fund preference scores,” but they do not capture “preference” in
only a narrow attitudinal or ideological sense. Rather our estimated fund preference scores6Heckman and Snyder (1997) develop a linear probability model approach to estimating a spatial model
of preferences over discrete choices and show that the agents’ preference parameters in such a model can beestimated using PCA.
11

are best understood as descriptive summaries of the latent two dimensions that best explain
differences in funds’ votes.
2.3. Filtering the sample. One challenge of applying our estimation approach to the
data is that it is computationally expensive, given the enormous size of the data matrix.
Many of the proposals in the full dataset, however, contain little information. In particular,
the vast majority of proposals are highly lopsided, with almost all funds voting the same
way. The most numerous type of lopsided proposal is votes on management nominees in
uncontested director elections. These lopsided votes contain little information about the
relative preferences of mutual funds. To see the intuition, consider the extreme case of
a unanimous vote—unanimous votes contain no information about mutual funds’ relative
preferences. To focus on informative votes, and to make the computation more manageable,
we drop all proposals for which fewer than 5% of funds voted in the minority.7 Similarly, for
a proposal to be included in the estimation sample, we require that at least 20 mutual funds
vote on it, and for a fund to be included it must have voted on at least 30 sample proposals.
The resulting estimation sample covers votes by 4,329 mutual funds on 43,871 proposals
from 3,966 portfolio companies. Table 2 provides counts of proposal types for the estimation
sample and the full sample. The prefixes “MP” and “SP” in the proposal categories refer to
management proposals and shareholder proposals, respectively. Proposals to elect directors
nominated by management are by far the most common type of proposal. Shareholder
proposals are less numerous than management proposals and mostly focused on corporate
governance issues.
With 4,332 voters (4,329 funds plus management, ISS, and Glass Lewis) and 43,871
proposals, there are a total of 190,049,172 potential votes in the estimation sample and
therefore cells in our data matrix. The median fund, however, owns a total of only 498 unique
portfolio companies over the sample period, and as a consequence there are only 6,788,5227In unreported results, we experimented with smaller lopsidedness thresholds, down to the 3% lopsid-
edness threshold used in Bolton, Li, Ravina, and Rosenthal (2020), and larger ones, up to 10%, and findqualitatively similar results.
12

votes in the estimation sample. In other words, 96.4% of the cells of the estimation sample
data matrix are empty.
2.4. The number of dimensions. An initial question is how many dimensions of mutual
fund preference are needed to provide a good model of mutual fund preferences. The eigen-
values of each principal component provide one perspective on the issue. The eigenvalue of
the k-th principal component measures the variance in the voting data along that dimension.
Figure 1 plots the eigenvalues of the first thirty principal components. Note that starting
with the third component, the plot becomes linear. In what follows, we thus focus on the
first two dimensions as a parsimonious model of mutual fund preference.8
Table 3 provides the classification percentage (CP) and average proportional reduction in
error (APRE) for models using 1 - 10 dimensions. The CP is simply the percentage of votes
that the model classifies correctly, where a predicted value Mij + zki a
kj > 0.5 is classified as a
“Yes” vote, and Mij + zki a
kj < 0.5 is classified as a “No” vote. APRE measures the reduction
in error the model achieves in classifying votes relative to a simple benchmark model of
predicting that all funds vote with the majority on the proposal.9 A two-dimensional model
performs well, correctly classifying 89% of the votes, with an APRE of 47%.
2.5. The distribution of mutual funds’ preferences. Figure 2 shows the estimated
preference scores of mutual funds. Also depicted with triangles are the average of the invest-
ment advisors’ funds’ preferences (weighted by each fund’s TNA) for a subset of the mutual
fund investment advisors in the data.10
The distribution of fund scores in this two-dimensional preference space takes a tri-8The third principal component primary tracks a single investment advisor’s voting behavior—
Blackrock—and hence is of little general interest.9For each proposal, the proportional reduction in error (PRE) is equal to
Number Minority Votes−Number Classification ErrorsNumber Minority Votes . The APRE sums over all of the proposals:∑m
j=1Number Minority Votesj−Number Classification Errorsj∑m
j=1Number Minority Votesj
.10We discuss in some detail in Section 4 how we identified the investment advisor to which each fund
delegates voting authority.
13

angular shape, with a group of funds clustered around each of the three vertices of the
triangle. Management is located near the lower-left vertex, and several of the very largest
fund advisors—including Blackrock, Vanguard, State Street, and Fidelity—are located in the
same cluster of funds. The leading proxy advisor, ISS, is located near the lower-right vertex
of the triangle, and the second leading proxy advisor, Glass Lewis, is likewise located near
the upper-left vertex. By dramatically reducing the dimensionality of funds’ voting behavior,
from their votes on 43,871 proposals down to the two directions in that high-dimensional
proposal space that capture the maximal variance in funds’ voting choices, our preference
estimates suggest that funds can be usefully classified into three main groups, those clustered
at each of the three vertices that map out the distribution of fund’s preference scores. We
turn in Section 3 to describing the voting behaviors of these three clusters of funds.
It is noteworthy that the two leading proxy advisors are located in orthogonal directions
from management in this space. That is, while one might imagine that management, mutual
funds, and the proxy advisors sit on a single dimension that ranges from an extreme man-
agerialist view on one end to an extreme “shareholder rights” view on the other, with each
fund ordered according to the intensity of their shareholder rights views, a better represen-
tation of mutual fund preferences is that there are two orthogonal dimensions of shareholder
preferences. A fund can be extreme on dimension 1 without being extreme on dimension 2,
and vice-versa.
2.6. The interpretation of the dimensions. We interpret the dimensions by studying
the pattern of loadings aj across proposals on the two dimensions. If a proposal loads
positively on a dimension, then funds that score positively (negatively) on the dimension are
predicted to be more (less) likely to vote affirmatively (and vice-versa for proposals that load
negatively). Figure 3 shows the distributions of proposals’ loadings on the two dimensions.
For each dimension there is substantial variation in loadings across proposals. To interpret
the dimensions we need to characterize the kinds of proposals that load heavily in either
14

direction on each dimension. One challenge in our application of PCA is the sheer number
of variables in the model, which prevents us from simply listing the proposals that load
heavily in each direction on each dimension and offering an intuitive interpretation of the
principal components, as is often done in PCA (see Joliffe, 2002, pp. 63-77, for a useful
discussion). Rather, we must describe in meaningful ways the characteristics of proposals
and identify which characteristics are associated with loadings on each dimension.
2.6.1. The recommendations of the proxy advisors and management. We begin by noting
that the extreme locations of ISS, Glass Lewis, and management in the preference space
imply that the loadings are associated with the recommendations of these three key actors.
We also know institutionally that the recommendations of these three actors play important
roles in the proxy voting process (Ertimur, Ferri, and Oesch, 2013; Malenko and Shen,
2016). Ertimur, Ferri, and Oesch (2018) argue in particular that ISS and Glass Lewis play
an “agenda-setting role” in the sense that many institutional investors will only seriously
consider opposing management if a proxy advisor recommends against management. All of
this suggests that the recommendations of the proxy advisors and management might be
related to the interpretation of our estimated preference space.
To investigate this hypothesis, we regress the absolute value of the loadings, which mea-
sures how strongly each dimension predicts voting on the proposal, on indicators for whether
each proxy advisor recommended against management on the proposal. The results are re-
ported in Table 4. Column (1) shows that there is a substantial association between whether
ISS opposes management and how strongly the proposal loads on dimension 1. The coef-
ficient on ISS’s recommendation is about 1.3 times the standard deviation of the absolute
value of the loadings. In contrast, the coefficient on Glass Lewis’s recommendation is close
to zero.11 Column (2), however, adds an interaction term between the two proxy advisors’11The sample used to estimate the regressions in Table 4 is substantially smaller than the number of
proposals in our estimation sample because Glass Lewis’s recommendations are only available for 34% of theproposals. In unreported analysis, we regress the absolute value of loadings on dimension 1 against a dummyfor whether ISS recommends against management (and a constant) using the sample of proposals for which
15
recommendations, which results in a large jump in the explanatory power of the model, from
an R2 of 0.47 in column (1) to 0.82 in column (2). The pattern of coefficients reveals that the
category of proposals with by far the strongest loadings on dimension 1 is proposals for which
ISS recommends against management and Glass Lewis recommends in favor of management.
So Glass Lewis’s recommendations do indeed seem to play an important role: dimension 1
captures variation in preference most strongly when ISS and Glass Lewis disagree on the
merits of the proposal and ISS opposes management.
For dimension 2, in contrast, column (3) shows that proposals load much more strongly
when Glass Lewis opposes management, but that there is no substantial association between
ISS’s recommendations and the loadings on dimension 2. Adding the interaction term in
column (4) adds little to the explanatory power of the model.
To further investigate, we split the set of proposals into the four categories mapped
out by the four possible combinations of the proxy advisors’ recommendations vis-à-vis
management. Figure 4 reports the densities of raw loadings on dimensions 1 (top panel) and
2 (bottom panel) for each of those four groups of proposals. The conditional density of the
loadings on dimension 1 for the key group that our earlier regressions indicate load most
strongly on dimension 1—proposals for which ISS opposes management and Glass Lewis
supports management—is bimodal, with modes on each extreme side of the distribution.
The bottom panel similarly shows a mix of positive and negative loadings on dimension
2. To further refine our interpretation, we need to know more about the substance of the
proposals that determines the signs of the loadings.
To proceed, we make the signs of loadings more comparable across proposals by “polar-
izing” each loading based on management’s recommendation. In particular, if management
recommends against a proposal, we multiply the raw proposal loading by −1 to calculate its
“polarized loading.” The signs of polarized loadings can be interpreted in terms of supporting
ISS’s and management’s recommendations are available—even if Glass Lewis’s recommendation is missing.The estimation sample includes 43, 636 proposals, and the coefficients for the dummy and the constant arethe same as those reported in column (1) of Table 4 to the third decimal place.
16

or opposing corporate management on the substantive issue raised by the proposal.
Figure 5 reports the conditional densities of the polarized loadings for the same four
groups of proposals. Unlike for the raw loadings, the signs of the polarized loadings on di-
mension 1 are strikingly uniform within each of the four groups. Moreover, the conditional
densities for each of the four subgroups have little overlap, reflecting that the recommen-
dations of management and the proxy advisors play important roles in determining the
direction and magnitude of the loadings of each proposal on dimension 1.
As noted in the regressions above, a key driver of the variation in loadings on dimension
1 is disagreement between Glass Lewis and ISS. The conditional density on the far left of
dimension 1 corresponds to proposals for which ISS opposes management and Glass Lewis
supports management. Scoring highly positively (negatively) on dimension 1 is thus strongly
predictive of voting against (with) management on these proposals. Similarly, the density on
the far right corresponds to proposals for which ISS supports management and Glass Lewis
opposes management. These include almost all of the proposals that load substantially
positively on dimension 1, and the interpretation of these mirrors that of the left-most con-
ditional density. To a lesser extent dimension 1 also captures the tendency of funds to oppose
management when ISS and Glass Lewis both oppose management (the second conditional
density from the left). Finally, note that dimension 1 does not substantially track variation
in preferences over proposals for which neither proxy advisor opposes management—the bulk
of the conditional density for this group is near 0.
Turning to dimension 2 in the bottom panel of Figure 5, the polarized loadings are
overwhelmingly negative, indicating that, unlike dimension 1, dimension 2 measures a form
of preference generally opposed to management’s recommendations. This is consistent with
management’s extremely negative score on dimension 2. The conditional densities also show
that recommendations from Glass Lewis in opposition to management are associated with
a leftward shift in the polarized loadings, and that, in contrast, the ISS’s recommendations
play little role. This is consistent with ISS’s score on dimension 2 near 0, depicted in Figure
17

2.
In summary there are strong relationships between the the loadings of proposals on the
two dimensions of our preference space and the recommendations of the two leading proxy
advisors and management. Dimension 1 primarily captures the tendency of funds to oppose
management when ISS (but not Glass Lewis) opposes management and to support man-
agement when ISS (but not Glass Lewis) supports management. Dimension 2 primarily
captures the tendency of funds to oppose management when Glass Lewis opposes manage-
ment, irrespective of ISS’s recommendations.
These associations between the proxy advisors’ recommendations and the loadings of
proposals presumably reflect both the causal influence of their recommendations on funds’
voting choices (Malenko and Shen, 2016) as well as the fact that the proxy advisors’ recom-
mendations themselves track important features of institutional investors’ preferences (Choi,
Fisch, and Kahan, 2010). Ertimur, Ferri, and Oesch (2018) argue convincingly that a major
reason for the correlation between ISS recommendations and institutional investors’ votes is
that ISS aggregates institutional investors’ preferences through regular meetings with and
surveys of its clients and then synthesizes its clients’ views into a set of proxy voting guide-
lines. We turn now to the substantive corporate governance preferences underlying these
dimensions.
2.6.2. Substantive corporate governance issues. As reflected in the 38 categories of proposals
shown in Table 2, shareholders vote on a wide range of issues. To develop an interpretation of
the preference space in terms of substantive corporate governance preferences, we investigate
whether particular types of proposals, in terms of their substantive content, tend to load
strongly on each dimension. Note that many of the 38 proposal categories in Table 2 are on
closely related issues. To proceed, we outline below what we consider to be the eight main
corporate governance issues implicated by these shareholder votes.
1. The board’s supervisory role and director independence. A main responsibility of the
18

board of directors is to supervise the firm’s top management. Key to performing
this supervisory function, it is commonly thought, is director independence and a
commitment by the directors to invest the time and effort necessary to perform their
task effectively.
2. Compensation. Another core corporate governance issue is executive compensation.
There are two main concerns: first, that the top managers are not paid excessive
amounts, and second that the top managers are given strong performance incentives.
3. Corporate finance. Shareholder interests are implicated by corporate financing de-
cisions, most importantly stock sales that threaten to dilute existing shareholders’
interests.
4. Corporate malfeasance. Much of corporate law is directed at deterring insiders from
engaging in self-dealing that treats the company and its shareholders unfairly and
other forms of malfeasance. Concern about such malfeasance might manifest in votes
to ratify the company’s auditors following accounting restatements or other forms of
reporting problems.
5. Corporate social responsibility. While the shareholder primacy norm remains the dom-
inant conceptualization of corporate purpose, institutional investors are increasingly
pushing corporate management to consider broader social issues.
6. Fundamental shareholder rights. While the board of directors holds legal authority to
manage the business and affairs of the corporation. The firm’s shareholders retain a
set of fundamental rights. First, they elect the board of directors. Second, they are
accorded voting rights to approve (or not) certain major corporate transactions, most
importantly mergers. Third, they have the right to sue fiduciaries that breach their
fiduciary duties or otherwise violate shareholders’ rights. Fourth, they have the right
to sell their shares. But there is substantial variation in the precise scope of these
19

fundamental shareholder rights across companies.
7. Responsiveness to shareholders. Many institutional investors expect the board to re-
spond to shareholders’ demands even when shareholders do not formally have the right
to decide the matter. The two principal examples of this are: (1) board implementa-
tion of precatory shareholder proposals that received substantial support in an earlier
meeting; and (2) the replacement of directors who receive a large withhold vote.
8. Company performance. Institutional investors in general care about company per-
formance, of course. They might express concerns about company performance by
withholding votes on director elections.
We group proposals into this taxonomy of substantive corporate governance issues based
on their proposal type, as shown in Table 5. We also create a set of subcategories for each
corporate governance issue category in order to explore variation within each category. We
assign all uncontested director election proposals to their own “Director Elections” category;
we explore variation in loadings among director election proposals below. Of the 43,871
proposals in the sample, we are able to assign corporate governance issue categories to
42,271 of them, which indicates that our conceptual taxonomy is fairly comprehensive.12
Note that two of the corporate governance issue categories outlined above—responsiveness
to shareholders and company performance—were assigned no proposals in Table 5. We
consider those issues in our analysis of uncontested director elections below.
Figures 6 and 7 show how the proposals load on the different corporate governance cat-
egories and subcategories for dimensions 1 and 2, respectively. The bar plots in the left
column in the figures show the average absolute value of the loadings on proposals in each
subcategory, with the vertical dotted line drawn at the mean absolute value of the loadings
across all proposals as a reference point. The average absolute value of loadings provides a12Of the 1,600 proposals that we could not assign to a corporate governance issue category in our taxonomy,
793 were management proposals to adjourn the shareholders’ meeting, and 382 were described in the votingdata as simply "Other Business."
20

measure of the extent to which each dimension tracks mutual funds’ voting preferences for
proposals in each category. The second column shows the densities of polarized loadings for
each subcategory of proposals, with the solid vertical lines drawn at the mean polarized load-
ing for each subcategory. The signs of the polarized loadings indicate whether the dimension
measures preferences to support (positive sign) or oppose (negative sign) management on
the proposal.
Consider dimension 1 first. As an initial matter, note that dimension 1 puts some weight
on all proposal categories—there are no categories with mean absolute value loadings far be-
low the mean, and the densities show that there are some proposals with substantial loadings
in every subcategory. So the substantive corporate governance preferences captured by di-
mension 1 encompass all of these issues. There are, however, a number of proposal categories
that load particularly strongly on dimension 1: shareholder proposals on compensation, CSR
proposals, proxy contests, and say-on-pay proposals. In most of these cases—CSR, share-
holder proposals on compensation, proxy contests—the proposals load systematically against
management on dimension 1. In the case of the two most numerous categories, however—
director election and say-on-pay proposals—substantial numbers of proposals load in favor
of management as well as against management, leading to mean polarized loadings close to
zero.
By contrast, in the case of dimension 2, Figure 7 shows more heterogeneity across cate-
gories in the intensity of proposal loadings. Consider, for example, CSR proposals. Only pro-
posals related to corporate political contributions and board diversity load strongly against
management on dimension 2 and not environmental proposals and other social proposals.
Also noteworthy is the contrast with dimension 1 on the two most numerous types of propos-
als. Uncontested director election proposals and say-on-pay proposals both load relatively
strongly against management on dimension 2, leading to much more negative average po-
larized loadings than on dimension 1. Dimension 2 also seems to track particularly strongly
preferences on votes to ratify auditors, votes to appoint an independent board chair or lead
21

director, and votes that implicate fundamental shareholder rights, all of which load strongly
against management on dimension 2.
2.6.3. Analysis of director election proposals. So far we have grouped together uncontested
director election proposals into a single category. But there is substantial heterogeneity in
the loadings of director election proposals on the two dimensions as well as in the corporate
governance issues implicated across these proposals. This raises the question of what issues
are driving the variation in loadings for director election proposals. Ertimur, Ferri, and Oesch
(2018) find that the primary driver of shareholder voting in uncontested director elections is
the recommendations of the proxy advisors, which in turn are based on a specific set of con-
cerns. We follow their basic approach by creating a set of proxies for some of the substantive
issues in corporate governance raised by director elections and explore their correlation with
the loadings. We construct indicator variables that proxy for whether a particular director
election proposal raises concerns about five of the eight corporate governance issues in our
taxonomy: (1) board supervision; (2) compensation; (3) corporate malfeasance; (4) board
responsiveness; and (5) corporate performance. Tables 6 and 7 provide details about the
construction of these indicator variables and their summary statistics, respectively.
Table 8 reports the results of regressions of the polarized loadings on our proxies for the
corporate governance issues implicated by the proposal.13 As an initial matter, note the
contrast between the constants estimated for each dimension: the constant on dimension
1 is 0.001, compared to −0.004 for dimension 2. This means that, in the absence of the
corporate governance concerns captured by our proxies, dimension 1 on average loads mildly
pro-management, whereas dimension 2 loads strongly anti-management.
In terms of the coefficients on our proxies for corporate governance issues, the two main
issues that explain the variation in loadings on dimension 1 are board supervision and re-
sponsiveness. The coefficients on both are negative and substantially larger in absolute13The size of the sample used to estimate the regressions is substantially smaller than the set of director
election proposals in our estimation sample because the Voting Analytics Directors Database only coversfirms in the S&P 1500 and say-on-pay votes only started to be cast at a meaningful rate in 2011.
22

magnitude than the estimated constant. These appear to be the two main issues that result
in negative loadings of direction election proposals on dimension 1.
By contrast, our proxies for corporate governance issues are much less predictive of the
loadings of director election proposals on dimension 2—the R2 of the model for dimension 2
is only 0.016, compared to 0.174 for dimension 1. The concerns underlying the variation in
loadings of director election proposals on dimension 2 remain mysterious, but these results
suggest that, unlike for dimension 1, they do not track the standard set of corporate gov-
ernance concerns for which we have included proxies. We hypothesize that dimension 2 is
capturing funds’ propensity to use withhold votes on director elections to signal general dis-
satisfaction with the performance of the board rather than to push for particular corporate
governance reforms.
2.6.4. The role of corporate social responsibility vs. profit seeking. Our analysis of the main
dimensions of institutional investor voting preferences contrasts sharply with the approach
and conclusions of Bolton, Li, Ravina, and Rosenthal (2020). To interpret the dimensions of
their estimated preference space, they first identify the institutions located at extreme points
in the space. They point out that the institutional investors located at the left-most extreme
of their first dimension are predominantly socially responsible investors such as Calvert and
Domini Social Investments and public pension funds. They contrast this group with the
more conventional, non-SRI investors that are at the right-most extreme. On that basis
they conclude that the main dimension of investor preference reflects an “ideology” based on
how socially responsible vs. “money conscious” investors are. As Bolton et al. (p. 321) put
it: “the issue that most separates institutional investors is the degree to which they weigh
social responsibility.” This would be a surprising conclusion and belies a large academic
literature on corporate governance that focuses mostly on other issues, such as takeover
defenses (Bebchuk, Cohen, and Ferrell, 2009), director independence (Ryan and Wiggins,
2004), and the extent to which executive compensation is linked to corporate performance
23

(Murphy, 2013). Similarly, recent survey evidence on the corporate governance preferences
of institutional investors shows that CSR is not a major focus. McCahery, Sautner, and
Starks (2016) reports the top corporate governance concerns cited by institutional investors,
only two of which relate to CSR (“Socially irresponsible behavior”, ranked #9 of 17; and
“Financial contributions to political parties or politicians”, ranked #16 of 17),
But while in both our estimated preference space and Bolton et al’s model, the first
dimension does indeed track voting behavior on CSR proposals, concerns about social re-
sponsibility are only a small part of an appropriate interpretation of the preference spaces
estimated in both this paper and in Bolton et al. (2020). In particular, the first dimensions
of both preference spaces strongly predict voting across a wide range of corporate governance
issues. Of the proposals that have an absolute value of loading on dimension 1 greater than
the median absolute value loading in our model, only 3% are about CSR. Bolton et. al
(2020, Section 6) likewise shows that the first dimension of their estimated preference space
predicts mutual funds’ voting behavior across the full gamut of proposals, not just on the
small subset that relate to CSR. CSR is in fact only a minor part of the main ways funds
differ in their voting behavior.
It is useful to contrast the approach taken in Bolton et al. (2020) to interpreting the
preference space with the approach taken to interpreting similar models applied to voting in
Congress, for which the particular preference estimation methodology employed in Bolton
et al. (2020) was developed. The main finding of that literature is that, for most of U.S.
history, votes in Congress can be well explained based on a single dimension that represents
a left-right ideological spectrum (Poole and Rosenthal, 2007). A voluminous literature in
political science has shown that locations of members of Congress in the left-right ideological
space are highly predictive of their voting behavior on every major political issue. As Poole
and Rosenthal (1991) puts it:
A contemporary liberal, for example, is likely to support increasing the minimumwage, oppose aid to the Contras, oppose construction of MX missiles, supportmandatory affirmative action programs, and support federal funding of health
24

care programs. Indeed, this consistency is such that just knowing that a politicianfavors increasing the minimum wage is enough information to predict, with a fairdegree of reliability, the politician’s views on many seemingly unrelated issues.
If we applied Bolton et al. (2020)‘s approach to interpret the Congressional preference
space, it would entail selecting a single one of the many issues that legislators’ locations on
the left-right ideological space predicts voting on. But this would be a misreading of the
nature of Congressional politics. For the same reason, we see no basis—in either our empirical
findings or in the empirical findings reported in Bolton et al. (2020)—for interpreting the
main preference dimension of institutional investor voting behavior in terms of the degree to
which the funds weigh social responsibility.
2.6.5. Summary. In summary, the pattern of loadings shows that the main ways mutual
funds differ in their corporate governance preferences, as reflected in their voting behav-
ior, are closely related to the recommendations of ISS and Glass Lewis. Each of the two
main dimensions of mutual fund voting preferences, moreover, encompasses a wide range of
corporate governance issues. To anticipate our findings on how the three main clusters of
funds vote below, we emphasize here a key difference between the two dimensions. The two
most numerous types of proposals—uncontested director election proposals and say-on-pay
proposals, which together account for 77% of the estimation sample—load almost uniformly
negatively on dimension 2 (i.e., against management), resulting in strongly negative average
loadings on dimension 2. In contrast, about two-thirds of the set of proposals in these two
types load positively on dimension 1. Moreover, we find that the key corporate governance
concerns that drive the negative loadings of director elections on dimension 1 are board su-
pervision concerns, such as the fraction and role of independent directors on the board, as
well as concerns that the board has been unresponsive to shareholder demands for corporate
governance reforms. We show in section 3 below that these key differences in the patterns in
loadings on the two dimensions in turn drive systematic differences in how the three clusters
of funds in our preference space vote.
25

2.7. Robustness checks. We perform a range of robustness checks and report the results
in the Online Appendix. First, so far we have estimated our principal components model
using fund-level voting data. However, much of the decisionmaking about voting occurs at
the investment advisor level, and most investment advisors manage many funds. In Section
1.1 of the Online Appendix we aggregate funds’ votes up to the investment advisor level and
reestimate the model, finding the same basic dimensions of fund preference and orientation
of advisors as in our fund-level model.
Second, one concern about our estimates is the high degree of missingness in the data
matrix: 96.4% of the cells of the estimation sample data matrix are empty. Our finding that
our scores are robust to estimation at the advisor level substantially mitigates this concern.
To further investigate whether the amount of missing data is distorting our estimates, in
Section 1.2 of the Online Appendix we construct a new fund-level sample with far less
missing data by restricting the proposals in the sample to those from S&P 500 companies
and the funds to those that vote on a large fraction of those proposals. The resulting sample
has far less missing data: only 37.2% of the cells in the data matrix are empty. Reestimating
the model on this restricted sample reveals the same basic configuration of preferences as
in the main estimation sample, giving greater confidence that our imputation approach can
handle the high degree of missingness in the estimation sample.
Finally, in Section 1.3 of the Online Appendix we investigate the stability of the preference
space by dividing the sample into three two-year cohorts and estimating the model separately
for each cohort. We find that funds’ preferences are highly stable over time.
3. The Party Structure of Mutual Funds
The scatter plot of mutual funds’ preferences in Figure 2 reveals that there are three distinct
modes, or clusters, of mutual funds located near the boundaries of the preference space. In
this section we use cluster analysis—a standard unsupervised learning tool from the machine
26

learning literature—to identify more formally three characteristic “types” of mutual funds
in terms of their corporate governance philosophies that correspond to those three modes.
3.1. Empirical framework. We cluster mutual funds on the basis of their scores on the
first two principal components of their voting data using a Gaussian mixture model. We
model mutual funds’ two-dimensional scores z as random vectors with density of the form:
f(z) =M∑
m=1αmφ(x;µm,Σm), (1)
where M is the number of components of the mixture and αm represents the mixing propor-
tion of the m-th Gaussian component, which has mean µm and covariance matrix Σm. We
put no restrictions on Σm and estimate the parameters using the expectation maximization
algorithm as outlined in Celeux and Govaert (1995). We use a four component model in
order to capture each of the three modes evident in the scatter plot in Figure 2 plus a com-
ponent to capture the funds that lie between and far from each of the three modes. Each
mutual fund i is then assigned to the component with the greatest conditional probability
that zi arises from it.
3.2. The estimated party structure. Figure 8 plots the contours for the estimated Gaus-
sian mixture density along with a scatter plot of the mutual fund preference scores. The
scores of the mutual funds that were classified into one of the three components correspond-
ing to the three extreme modes are plotted with dark shaded circles. The scores of mutual
funds classified into the fourth component are plotted with lighter unshaded circles.
We interpret the three extreme clusters as mutual fund “parties” in the sense that each
cluster is a group of funds with similar corporate governance preferences as reflected by their
voting behavior. Much like members of a political party generally vote together, so too do the
members of a mutual fund party. For reasons discussed in our analysis below, we label the
party in the lower-left of the preference space the “Traditional Governance Party,” the one
27

on the right the “Shareholder Reform Party,” and the one in the upper-left the “Shareholder
Protest Party.”
To give a sense of which mutual funds populate the three parties, Table 9 lists the top
ten investment advisors in each party by total net assets (TNA) of the advisors’ funds in the
party as of 2013.14 There are major investment advisors in each party. We report systematic
differences in the funds that compose each party in section 4.2 below.
3.3. Party coherence. Table 10 provides measures of the degree to which party members
vote together. For each proposal, we calculate the outcome voted for by a majority of each
party’s members. We then report the fraction of party members’ votes in each proposal cat-
egory that were cast in the opposite direction of the party’s majority. The column labeled
“All” reports the corresponding fractions for all mutual funds considered as a single party,
which serves as a useful benchmark. Considering mutual funds as a whole, 21% of mutual
fund votes in the sample are cast in the opposite way from how a majority of mutual funds
voted on the proposal. In contrast, for all proposals, only 12% of the votes of Traditional
Governance Party members were cast against the majority of the party, and the correspond-
ing figures for the Shareholder Reform Party and Shareholder Protest Party are 1% and 8%,
respectively (and the differences between the parties are all statistically significant at the 1%
level). Perhaps one reason the latter two parties exhibit substantially more coherence in their
voting than the Traditional Governance Party is that those parties have a clear focal point
in a proxy advisor’s recommendations to coordinate their votes—ISS for the Shareholder
Reform Party and Glass Lewis for the Shareholder Protest Party.
There is also variation in the degree to which party members vote together across pro-
posal types. Of particular note, the category with the highest level of disagreement for the
Traditional Governance Party is proxy contests, at 25%. Proxy contests involve particularly
information intensive business judgments. But on the other hand, on average 75% of party14The ranking of investment advisors we recover may differ from the rankings one would recover using
ownership information from 13-F filings because our dataset only reflects ownership stakes of funds thatreport their votes in form N-PX.
28

members vote the same way on proxy contests.
3.4. Disagreement between parties. While the funds in each party tend to vote together,
the majority of each of the three parties voted the same way on only 44% of proposals in
the estimation sample. Put differently, on 56% of the proposals, the majority of one party
was opposed to the majorities of the other two parties. The fact that there is disagreement
among the three parties on most proposals that generate at least a minimum amount of
controversy shows how fundamental the party structure is to mutual fund voting.
The majority vote of the Shareholder Reform Party is the same as that of the Shareholder
Protest Party for only 55% of proposals, which illustrates that the voting patterns of the two
parties are quite different. Panel A of Table 11 further breaks down the rates of agreement
and disagreement between the two parties based on whether each party supported or opposed
management. Most of the cases of agreement occur when both parties support management
(40% of proposals) rather than when both oppose management (15% of proposals). In
contrast, the table shows that each of the two parties opposes management more frequently
on their own than with the other party. The two parties both oppose management on only
15% of sample proposals, compared to 20% for which the Shareholder Reform Party does
so on its own and 24% for the Shareholder Protest Party on its own. The two parties thus
follow distinctive patterns of opposition to management.
Panels B and C provide the corresponding frequencies for the Traditional Governance
Party paired with each of the other two parties. They show that the Traditional Governance
Party supports management at much greater rates than the other two parties and that,
when it does oppose management, it typically does so along with one or both of the other
two parties. In only 0.7% of estimation sample proposals does a majority of the Traditional
Governance Party oppose management but the majority of each of the other two parties
supports management.
29

3.5. Party corporate governance philosophies. Consider now the substantive visions
of corporate governance that animate each of the three parties. Figure 9 provides the fraction
of votes cast according to management’s recommendation by each party by proposal category
for the estimation sample, using the same grouping of proposals into corporate governance
issues used in Section 2.15 In Table 12 we investigate the variation in each party’s votes
on uncontested director elections using the same set of proxies for the corporate governance
issues implicated by each proposal used in Section 2.6.3.
3.5.1. The Traditional Governance Party. We begin with the Traditional Governance Party,
which is at the lower left vertex of our preference space. Funds in this party have negative
scores on both dimensions, so their voting behavior is inversely related to the loadings of
proposals on both dimensions. Mutual funds in the Traditional Governance Party generally
support management at higher rates than do members of the other two parties, but they are
distinctly deferential on issues that are traditionally understood as matters for the board,
rather than shareholders, to decide. These include proposals related to executive compen-
sation and CSR proposals. In contrast, the Traditional Governance Party is most likely to
break with management on proposals related to fundamental shareholder rights and on proxy
contests. Fundamental shareholder rights proposals involve efforts to change the company’s
basic corporate governance rules, for example by declassifying the board, removing poison
pills, or eliminating dual-class common stock structures. Management typically recommends
in the direction of limiting fundamental shareholder rights. Members of the Traditional Gov-
ernance Party vote against management on almost half of fundamental shareholder rights
proposals related to the rules governing director elections and somewhat less frequently for
other types of fundamental shareholder rights proposals. This is in line with a traditional15In unreported analysis we calculate the fraction of votes cast according to management’s recommendation
by each party by proposal category for the full sample of proposals. Since the proposals that did not pass thelopsidedness filter typically involve funds overwhelmingly supporting management, the cross-party differencesin support shrink. However, the ordering across parties in terms of how frequently they support managementremains qualitatively identical to the one we recovered using the estimation sample.
30

conception of corporate governance in which, while the board is in charge day-to-day, share-
holders have a set of fundamental rights to, for example, replace the entire incumbent board
by majority shareholder action at an annual meeting. The Traditional Governance Party
also opposes management at a substantial rate in proxy contests, which is consistent with
our interpretation of the party’s underlying corporate governance philosophy. In sum, the
Traditional Governance Party supports management prerogatives in their traditional domain
but is not managerialist—the party frequently opposes management to defend shareholder
rights.
In voting on uncontested director elections, Table 12 shows that, in the absence of an
indication that the election raises any of the corporate governance issues we have proxies for,
the Traditional Governance Party and the Shareholder Reform Party support management
at similar rates; the constant is 0.91 for the the former compared to 0.90 for the latter.
But the Traditional Governance Party’s support of management drops much less than the
Shareholder Reform Party’s does in response to our proxies for corporate governance issues.
This suggests that the Traditional Governance Party is much less prone to using director
election votes to further a corporate governance reform agenda.
3.5.2. The Shareholder Reform Party. The Shareholder Reform Party is located in the right
vertex of the preference space and has extremely positive scores on dimension 1 but scores
near 0 on dimension 2. This implies that the party’s voting behavior is predicted by propos-
als’ loading on dimension 1 rather than on dimension 2. Across a wide range of corporate
governance issues, the Shareholder Reform Party opposes management at much higher rates
than either of the other two parties. These include proposals on fundamental shareholder
rights related to voting, CSR proposals, proxy contests, and shareholder proposals on com-
pensation. The fact that funds in the Shareholder Reform Party are disproportionately
supportive of these proposal categories reveals that the party engages in targeted requests
for specific corporate governance reforms to a much greater extent than the other two par-
31

ties (hence our label for the party). The party’s substantive view of corporate governance,
moreover, goes beyond the traditional view outlined above and includes shareholder inter-
vention in matters such as CSR and executive compensation that are traditionally within
the purview of the board rather than shareholders.
The patterns in the party’s votes on uncontested director elections, reflected in the re-
gression results reported in Table 12, reinforce this interpretation. When a director election
proposal implicates concerns about board supervision—for example, the nominee is a non-
independent member of a board committee—or about board responsiveness to shareholder
demands, there is a roughly seven-fold increase in the Shareholder Reform Party’s opposition
to management, from about 10% of votes cast in opposition to about 70%. This suggests
that funds in the Shareholder Reform Party use their votes on uncontested director election
proposals to target discrete issues related to a company’s corporate governance that funds in
the party believe should be addressed. Given that ISS is located squarely in the center of the
Shareholder Reform Party, our findings echo the results of Ertimur, Ferri, and Oesch (2018),
who show that a set of specific corporate governance concerns, including concerns related to
board supervision, responsiveness, and compensation, drive ISS’s withold recommendations
on uncontested director elections.
3.5.3. The Shareholder Protest Party. The Shareholder Protest Party is located in the
upper-left of the preference space, with negative scores on dimension 1 and highly posi-
tive scores on dimension 2. This means that its voting behavior is inversely related to
proposals’ loadings on dimension 1 and positively related to their loadings on dimension 2.
For the proposal categories for which the Shareholder Reform Party most frequently opposes
management, the Shareholder Protest Party’s voting behavior is intermediate between the
other two parties. What is most distinctive about the Shareholder Protest Party is how
it votes on the two most numerous proposal categories: uncontested director election pro-
posals and say-on-pay proposals. On these proposals—which together make up 77% of the
32

sample—the Shareholder Protest Party opposes management at substantially greater rates
than do the other two parties. The Shareholder Protest Party’s average rate of opposition
to management on say-on-pay proposals is 43% higher than that of the Shareholder Reform
Party and 470% higher than that of the Traditional Governance Party. For uncontested
director election proposals, the Shareholder Protest Party opposes management at a rate
55% higher than that of the Shareholder Reform Party and 300% higher than that of the
Traditional Governance Party. Both of these types of proposals are generally non-binding
and instead serve as signaling devices for shareholders to communicate their displeasure with
management. The Shareholder Protest Party uses these “protest” votes at much higher rates
than the other two parties, hence our label for the party.
Table 12 shows that our proxies for corporate governance issues explain little of the
variation in the votes of the Shareholder Protest Party on uncontested director elections.
The R2 of the model for the Shareholder Protest Party is only 1%, compared to 24% in
the case of the Shareholder Reform Party. This suggests that, for funds in the Shareholder
Protest Party, their substantial fraction of withheld votes reflects general discontent with
the way the company is being run rather than concerns related to the specific governance
issues we have proxies for.
3.6. Mapping the votes on specific proposals. To build further intuition about the
window into mutual fund voting behavior our framework provides, Figure 10 depicts the
spatial map of votes for a say-on-pay proposal at PolyOne Corporation from its 2015 annual
shareholder meeting. We plot the “Yes” and “No” votes cast by each fund at the location
of the fund’s estimated preference scores, using different marker styles to identify “Yes” and
“No” votes according to whether the model correctly classified the fund’s vote. Also depicted
is the “cutting line” that separates the areas of the preference space predicted to vote “Yes”
and “No.”
The voting on this proposal illustrates well the party structure of mutual funds. As
33

shown in the figure, most funds in both the Shareholder Reform Party and Traditional
Governance Party supported the proposal, whereas most funds in the Shareholder Protest
Party opposed it. This proposal thus illustrates one of the characteristic features of the
Shareholder Protest Party, which opposes say-on-pay proposals at greater rates than the
other two parties. Overall the model correctly classifies the votes of 91% of funds and
achieves a PRE of 47%. We provide spatial maps of the votes on several other proposals of
range of types in the Online Appendix.
3.7. Party influence. Consider now the extent to which each party influences voting out-
comes. The sizes of the parties, as measured by TNA, shape their degree of influence since
more shares owned means more votes. The Traditional Governance Party is much larger than
the others, at 66% of sample TNA as of 2013, compared to only 6.9% for the Shareholder
Protest Party and 6.2% for the Shareholder Reform Party. But size is not all that matters for
party influence. Also important is how they vote. A party that votes in a more coordinated
manner, for example, will have more influence. Furthermore, whether a party’s votes are
pivotal on any given proposal depends on the entire distribution of votes for the proposal. A
party that takes stands against management only when other shareholders overwhelmingly
support management, for example, will have little influence on voting outcomes.
We estimate each party’s influence by asking: if the party did not exist, how would voting
outcomes—in terms of the passage or failure of proposals—have changed? To measure this,
we exclude uncontested director elections governed by a plurality voting rule, which always
pass. After also dropping a small number of proposals for which the voting outcomes data
show fewer shareholder votes than the total mutual fund votes in our sample (indicating
data problems), the resulting sample includes 15,962 proposals. We assume that in the
counterfactual in which a party did not exist, the shares voted by the party would instead
have been voted to mirror the voting behavior of all other mutual funds in the data.
As a conservative, lower-bound estimate of each party’s influence, we first exclude only
34

the shares voted by mutual funds in the party in our sample. We calculate the number
of shares voted by each fund on each proposal by using the fund’s most recent quarterly
holdings reported in CRSP. This is conservative because our sample includes only a fraction
of the holdings of all institutional investors, and many other shares owned by institutional
investors are voted in line with the behavior of one of our mutual fund parties.16
To get a rough sense for how large each party’s influence in aggregate might be, including
these additional institutional investor holdings for the party that are not in our sample, we
also report estimates based on scaling up each mutual fund’s holdings using the following
procedure. First, we calculate the total holdings in each portfolio company’s common stock
held by all institutional investors.17 We exclude any holdings by a single institution that are
greater than 20% of the common stock outstanding of the issuer, since it is implausible that
very large holders vote in a manner similar to diversified mutual funds. We then calculate
a scaling factor for each proposal equal to the number of shares in the company owned by
all institutional investors divided by the number of shares in the company owned by the
mutual funds in our voting data. After winsorizing this scaling factor,18 we use it to scale
the number of votes cast by each mutual fund in the excluded party.
3.7.1. Results. The lower-bound, mutual-fund-only estimates are given in Panel A of Table
13. Column (2) shows that excluding the Traditional Governance Party would result in the
outcome of over 4% of proposals changing. In contrast, excluding either (or both) of the16For example, the investment advisors in our data also vote the shares they manage on behalf of non-
mutual fund clients, and surely in many cases they do so in a similar way to how they vote the shares of themutual funds they advise. Similarly, non-mutual fund institutional investors use proxy advisors much likemutual funds do and presumably many vote in line with one of the three mutual fund parties.
17For the period prior to 2013 Q2, we use the Thomson-Reuters institutional ownership data. From 2013Q2 on we use the WRDS 13F data, since the Thomson-Reuters data is incomplete in the more recent period(Ben-David, Franzoni, Moussawi, and Sedunov, 2016).
18In some cases this scaling factor is very large, because most institutional investor holdings in the issuerare not in our data. In those cases our assumption that the distribution of votes of the institutional investorshares not in our data mirrors the distribution of votes of the mutual funds in our data becomes implausible.We thus winsorize the scaling factor at 5. A further complication is that, if one scales the holdings of themutual funds in our data by this scaling factor, in some cases the total number of scaled mutual fund votesexceeds the total number of votes cast on the proposal. Accordingly, in those cases we use a scaling factorequal to the total votes cast on the proposal divided by the total votes cast on the proposal by mutual fundsin our data.
35

Shareholder Reform and Shareholder Protest parties would change the outcome of fewer
than 1% of proposals. Columns (3) and (4) show that the Traditional Governance Party’s
influence is mostly in helping management win—4.5% of proposals for which the voting
outcome followed management’s recommendation would have come out the other way in
the absence of the Traditional Governance Party. But column (4) reveals a key role of the
other two parties—9% of proposals that went against management’s recommendation would
have instead gone management’s way in the absence of the Shareholder Reform Party and
the Shareholder Protest Party. In contrast, only 1.6% of proposals that management lost
would have turned out the other way had the Traditional Governance Party been excluded.
This shows that the Shareholder Reform and Shareholder Protest parties play a distinctive
and important role, belying their modest size in terms of assets, in producing pressure on
management through shareholder votes. Interestingly, the Shareholder Reform Party plays
a markedly larger role in this regard than the Shareholder Protest Party, despite the two
parties’ similar sizes. To be sure, management losses are rarer events than management wins,
but on the other hand they are much more significant events for corporate governance.
The scaled results, using all shares owned by institutional investors, are qualitatively
similar but with much larger magnitudes. Management would have lost 16% of proposals
that they in fact won in the absence of the Traditional Governance Party. And management
would have won a full 23% of proposals that they lost had the Shareholder Reform Party
and Shareholder Protest Party been excluded.
4. The Determinants of Mutual Funds’ Party Membership
What factors underlie the sorting of mutual funds into the three parties? In this section
we first examine whether there are systematic differences among the three parties in their
mutual fund members’ investment management characteristics. We then investigate the
extent to which differences in investment managers’ incentives to become informed about
voting determines mutual funds’ party membership.
36
4.1. Data. We use data on funds’ investment management characteristics from CRSP. Ta-
ble 14 provides a list of variable definitions and Table 15 provides summary statistics. We
measure characteristics at both the individual fund level and at the level of the investment
advisor. Each mutual fund (e.g., the Vanguard Total Stock Market Index Fund) is man-
aged by an investment advisor (e.g., The Vanguard Group, Inc.), which typically manages
multiple funds. The decisionmaking about voting funds’ shares generally occurs at the in-
vestment advisor level. For active funds, but not passive funds, the fund’s portfolio manager
is sometimes consulted by the executives in charge of proxy voting at the advisor, although
their influence in the voting outcome varies by advisor (Bew and Fields, 2012; Morningstar,
2017).
In many cases, a fund’s investment advisor delegates portfolio management responsibil-
ities to a different investment advisor as “sub-advisor.” In such cases, typically the respon-
sibility for determining how to vote the fund’s shares is also delegated to the sub-advisor
(Morgan, Poulsen, Wolf, and Yang, 2011). Importantly, the “fund family” identified in both
the CRSP and Voting Analytics datasets does not accurately capture the investment advi-
sor organization that votes funds’ shares. For example, Fidelity Investments sponsors both
actively managed funds and index funds. The active funds are generally advised by Fi-
delity Management and Research whereas the index funds are sub-advised by Geode Capital
Management, a separate company, which determines how those funds vote. Accordingly,
we reviewed SEC filings to determine for each fund the investment advisor to which voting
authority is delegated. In cases in which the fund uses a sub-advisor, this is often the sub-
advisor.19 We will use the term “investment advisor” to refer to the organization to which a
fund delegates voting responsibility.20
19In cases in which a fund delegates voting authority to multiple subadvisors, we set the advisor to missing.20To give a sense for the importance of correctly tracking the voting investment advisor, rather than relying
on the fund family reported in CRSP, 9.3% of family-proposal combinations in the sample involve cases inwhich funds in the family did not vote unanimously, compared to only 3% of advisor-proposal combinations.These statistics are calculated excluding cases in which only a single fund in the advisor / family voted onthe proposal. The bulk of the cases of non-unanimous voting within families thus reflect delegation of votingresponsibility to different investment advisors altogether.
37

An important distinction in the analysis that follows is between “active advisors” and
“passive advisors.” We define an advisor as active if more than 50% of the advisor’s assets
under management is in active funds, and as passive otherwise. Note that this means that
active advisors manage some passive funds, and vice-versa.
4.2. Party characteristics. Table 16 provides the the average characteristics of the funds
that populate the three parties (weighted by fund TNA). The main difference is that funds
and advisors in the Traditional Governance Party are on average much larger than those in
the other two parties. The Traditional Governance Party also has smaller fractions of active
funds and of active advisors than the other two parties, as well as greater average number
of stocks held per fund and per advisor (although these differences are not statistically
significant). Active funds in the Traditional Governance also earn higher abnormal returns,
calculated using a four-factor model, than active funds in the other two parties.
4.3. Advisors’ incentives to generate information about voting. Many different fac-
tors in principle might play a role in determining mutual funds’ party membership, including
idiosyncratic preferences of the individual executives involved and conflicts of interest stem-
ming from business ties (Davis and Kim, 2007; Cvijanović, Dasgupta, and Zachariadis, 2016).
We focus here on just one potential source of variation in mutual funds’ party membership:
the strength of investment managers’ incentives to invest resources in generating information
about how to vote. Iliev and Lowry (2014) find that proxies for such incentives are negatively
related to funds’ reliance on the recommendations of ISS. Relatedly, in recent years concerns
have been raised that many mutual funds approach voting as a “compliance function.” In-
deed, SEC Commissioner Michael Piwowar has suggested that the SEC’s policies may have
led to advisors taking such a compliance approach, stating:
By requiring advisers to vote on every single matter – irrespective of whether suchvote would impact the performance of investment portfolios – our previous ac-tions may have unintentionally turned shareholding [sic] voting into a regulatory
38

compliance issue, rather than one focused on the benefits for investors.21
To investigate the role of investment advisor’s incentives to become informed in determining
their mutual fund party membership, we focus on three determinants of advisor incentives.22
First, we use the log of the advisor’s total net assets (TNA) to capture scale economies in
voting—larger advisors can spread the costs of becoming informed about voting on a larger
asset base. Second, we use the log of the number of stocks held by the advisor’s funds
to capture diseconomies of scope—the more portfolio companies the advisor must follow,
the greater are the costs of becoming informed about all of the votes the advisor must
cast. Third, the existing literature argues that active advisors face different incentives from
passive advisors to become informed about voting (Rock and Kahan, 2019). On the one
hand, passive advisors generally cannot simply divest from a position and hence must use
“voice” (e.g., voting) rather than “exit” if they are unhappy with the company’s governance
or management. On the other hand, unlike active managers, passive managers lack incentives
to use their voting rights to improve investment returns in order to attract investment flows
away from competitors, since their competitors hold essentially the same portfolio. The
investment selection process of active advisors, moreover, might generate information that
is useful for voting. In summary, it is theoretically ambiguous which form of investment
management generates stronger incentives to become informed about voting.
We report in Table 17 the results of multinomial logit regressions predicting party mem-
bership on the basis of these determinants of advisors’ incentives, first for the entire sample
and then separately for active advisors and for passive advisors. Column (1) shows that
membership in the Traditional Governance Party is strongly negatively associated with the
number of firms held by the advisor and strongly positively associated with the advisor’s
TNA. Stronger incentives to become informed about voting is thus predictive of Traditional
Governance Party membership. Furthermore, the marginal effect of having an active advisor21SEC Commissioner Michael Piwowar, Opening Statement at the Proxy Advisory Services Roundtable
(Dec. 5, 2013).22We focus on advisor-level, rather than fund-level, characteristics because decisionmaking about how to
vote funds’ shares is generally made at the advisor level.
39

is -0.22 and marginally statistically significant. Passive advisors are thus substantially more
likely to be members of the Traditional Governance Party than are active advisors, ceteris
paribus.
In contrast, column (2) shows that these patterns are reversed for the Shareholder Reform
Party. Larger advisor TNA predicts that the fund is less likely to be a member of the party,
and similarly greater number of stocks held by its advisor predicts the fund ismore likely to be
in the party. This indicates that having greater incentives to become informed about voting
predicts that the fund is less likely to be a member of the Shareholder Reform Party. Since
ISS is located in the Shareholder Reform Party, this echoes the findings of Iliev and Lowry
(2014) that high net benefits of voting predict lower reliance on ISS’s recommendations. In
contrast, column (3) shows no significant relationships between our determinants of fund
incentives and membership in the Shareholder Protest Party. We also report results from
the multinomial logit model with the sample restricted to subgroups of active advisors in
columns (4) - (6) and of passive advisors in (7) - (9) and find similar results.
To summarize, greater incentives to invest in voting predicts a higher likelihood of mem-
bership in the Traditional Governance Party, and a lower likelihood of membership in the
Shareholder Reform Party. Recall that the Shareholder Reform Party’s voting is closely asso-
ciated with the recommendations of ISS whereas the Traditional Governance Party’s voting
behavior does not track either of the two leading proxy advisors. This suggests a potential
explanation for this pattern of findings: that they are a result of investment managers’ incen-
tives to outsource voting to the proxy advisors in order to economize on the costs of voting.
In an extreme form, this might be due to mutual funds taking a “compliance approach” to
voting in which they attempt to comply with their legal obligations with respect to voting
at the lowest cost possible.
To investigate this explanation further, we code a dummy for whether each investment
advisor takes a “compliance approach” based on the titles of their proxy voting executives,
as reported by Proxy Insight. The titles of these executives vary across investment advisors.
40

The most common title listed is “Chief Compliance Officer”; investment advisors and mutual
funds are required under SEC rules to appoint a Chief Compliance Officer, who is responsible
for administering its compliance procedures.23 Other titles used include “Head of Corporate
Governance,” “Chief Investment Officer,” and “Director, Investment Proxy Research.” We
set Compliance Approach to 1 if all of the advisors’ proxy voting executives have titles that
include compliance language and set it equal to 0 otherwise.24
Our Compliance Approach indicator is included in Table 16, which provides average
characteristics of funds by party. It shows that only 6.5% of Traditional Governance Party
members take a compliance approach, according to our proxy, as compared to 30% and 41%
of the members of the Shareholder Protest Party and Shareholder Reform Party, respectively.
This is consistent with the hypothesis that funds that take a compliance approach tend to
outsource more to the proxy advisors.
To explore the “compliance approach” hypothesis further, we create a dummy variable
SR or SP equal to 1 if the fund is a member of either the Shareholder Reform Party or the
Shareholder Protest Party, since each of these two parties is associated with the recommen-
dations of a major proxy advisor. Table 18 reports a series of logistic regressions estimated
using the sample restricted to funds that belong to one of the three mutual fund parties
(i.e., excluding funds that belong to no party). We begin in column (1) with a regression of
Compliance Approach on our proxies for advisors’ incentives to become informed about vot-
ing. As expected, the advisors’ TNA is strongly negatively related to Compliance Approach.
Column (2) of Table 18 shows that Compliance Approach is strongly predictive of SR or
SP, with a marginal effect of 0.41. In column (3) we report results from a regression of SR
or SP on our determinants of fund incentives. The number of stocks held by the advisor237 CFR §275.206(4)-7(c); 17 CFR §270.38a-1(a)(4).24Titles that we consider as including "compliance" language are titles that include the term "compliance",
"operations," or "administation." Examples of titles that do not include such compliance language, and hencetrigger Compliance Approach = 0, include: "Vice President," "Managing Director," "Senior Proxy Analyst,""Corporate Governance Analyst," "ESG Analyst," "President", "Chief Executive Officer", "Vice President ofProxy Voting," "Head of Corporate Governance," "Chief Investment Officer," "Director, Investment ProxyResearch," and "Assistant Portfolio Manager."
41
is positively associated with SR or SP, whereas the advisor’s TNA is strongly negatively
associated with SR or SP, consistent with our basic hypothesis. Interestingly, these results
persist after adding Compliance Approach to the model, shown in column (4).
Columns (5) - (7) report the same models using just the active advisors in the sample
and reveal that Compliance Approach is much less predictive of being a member of the
Shareholder Reform or Shareholder Protest parties instead of the Traditional Governance
Party among active advisors. Comparing columns (5) and (6) shows that adding Compliance
Approach to the model actually increases the magnitude of the marginal effects of fund
incentives on SR or SP.
In contrast, restricting the sample to just passive advisors, column (8) shows that the
marginal effect of Compliance Approach is 0.84. In essence, passive advisors are members of
either the Shareholder Reform Party or the Shareholder Protest Party if (and essentially only
if) they follow a compliance approach to voting. Comparing columns (9) and (10) shows that,
for passive advisors, much of the relationship between our determinants of fund incentives
and SR or SP disappears once we control for Compliance Approach. These results thus
provide strong support for the hypothesis that much of the variation in party membership
of passive advisors in particular stems from whether they approach voting as a compliance
matter and focus on simply minimizing the costs associated with complying with their voting
obligations. Our findings thus provide some corroboration of the concerns that have been
raised that mutual funds are treating their voting obligations as a compliance matter, to be
met at minimal costs, particularly for smaller passive advisors.
5. Conclusion
In this paper we have systematically characterized the corporate governance preferences
of mutual funds. We show that a model with just two latent dimensions of preference is
highly predictive of mutual fund voting behavior. Our parsimonious measures of mutual
funds’ corporate governance preferences generate a number of descriptive insights about the
42

broader system of corporate governance and moreover enable the quantitative testing of
various hypotheses. In particular, we show that mutual funds are clustered into three par-
ties, the Traditional Governance Party, the Shareholder Reform Party, and the Shareholder
Protest Party. Members of the Traditional Governance Party vote in line with a traditional
conception of corporate governance in which the board, and not shareholders, manages the
business and affairs of the corporation. The Shareholder Reform Party, in contrast, actively
pushes for specific corporate governance reforms, including intervention in matters related
to operational decisionmaking that are traditionally the purview of the board. Finally, the
Shareholder Protest Party focuses on monitoring corporate management and expressing its
displeasure through largely symbolic “protest votes” in uncontested director elections and
say-on-pay proposals. We furthermore document systematic relationships between funds’ in-
vestment management characteristics and their party membership. We find that funds that
have stronger incentives to generate their own information for voting are more likely to be
members the Traditional Governance Party and less likely to be members of the Shareholder
Reform Party. A proxy for whether the investment advisor takes a “compliance approach”
to voting strongly predicts party membership, suggesting that party membership in part
reflects advisors’ decisions whether to outsource to proxy advisors to economize on the costs
of voting. Most strikingly, funds advised by the passive advisors in our three mutual fund
parties are members of either the Shareholder Reform Party or Shareholder Protest Party
essentially if and only if their advisor takes a compliance approach. We hope the introduction
of our measures of mutual fund corporate governance preferences to the literature will enable
other researchers to test quantitatively a range of theories and hypotheses about corporate
governance.
References
Bebchuk, L., A. Cohen, and A. Ferrell (2009): “What Matters in Corporate Gover-nance?,” The Review of Financial Studies, 22(2), 783–827.
43

Bebchuk, L., and S. Hirst (2019): “Index Funds and the Future of Corporate Gover-nance: Theory, Evidence, and Policy,” Columbia Law Review, 119(8), 2029–2145.
Ben-David, I., F. Franzoni, R. Moussawi, and J. Sedunov (2016): “The Granu-lar Nature of Large Institutional Investors,” Working Paper 22247, National Bureau ofEconomic Research.
Bew, R., and R. Fields (2012): “Voting Decisions at US Mutual Funds: How InvestorsReally Use Proxy Advisers,” Unpublished working paper.
Bolton, P., T. Li, E. Ravina, and H. Rosenthal (2020): “Investor Ideology,” Journalof Financial Economics, 137(2), 320–352.
Brav, A., W. Jiang, T. Li, and J. Pinnington (2020): “Picking Friends Before Picking(Proxy) Fights: How Mutual Fund Voting Shapes Proxy Contests,” SSRN Scholarly PaperID 3101473, Social Science Research Network, Rochester, NY.
Celeux, G., and G. Govaert (1995): “Gaussian Parsimonious Clustering Models,” Pat-tern recognition, 28(5), 781–793.
Choi, S., J. Fisch, and M. Kahan (2010): “The Power of Proxy Advisors: Myth orReality?,” Emory Law Journal, 59(4), 869.
(2013): “Who Calls the Shots: How Mutual Funds Vote on Director Elections,”Harv. Bus. L. Rev., 3, 35.
Choi, S. J., J. E. Fisch, and M. Kahan (2008): “Director Elections and the Role ofProxy Advisors,” Southern California Law Review, 82(4), 649–702.
Cvijanović, D., A. Dasgupta, and K. E. Zachariadis (2016): “Ties That Bind:How Business Connections Affect Mutual Fund Activism,” The Journal of Finance, 71(6),2933–2966.
Davis, G. F., and E. H. Kim (2007): “Business Ties and Proxy Voting by Mutual Funds,”Journal of Financial Economics, 85(2), 552–570.
Ertimur, Y., F. Ferri, and D. Oesch (2013): “Shareholder Votes and Proxy Advisors:Evidence from Say on Pay,” Journal of Accounting Research, 51(5), 951–996.
(2018): “Understanding Uncontested Director Elections,” Management Science,64(7), 3400–3420.
Heath, D., D. Macciocchi, R. Michaely, and M. C. Ringgenberg (2020): “DoIndex Funds Monitor?,” SSRN Scholarly Paper ID 3259433, Social Science Research Net-work, Rochester, NY.
Heckman, J. J., and J. M. Snyder (1997): “Linear Probability Models of the Demandfor Attributes with an Empirical Application to Estimating the Preferences of Legislators,”RAND Journal of Economics, pp. S142–S189.
44

Iliev, P., and M. Lowry (2014): “Are Mutual Funds Active Voters?,” The Review ofFinancial Studies, 28(2), 446–485.
Ilin, A., and T. Raiko (2010): “Practical Approaches to Principal Component Analysisin the Presence of Missing Values,” Journal of Machine Learning Research, 11(Jul), 1957–2000.
Joliffe, I. (2002): Principal Component Analysis. Springer-Verlag New York.
Josse, J., and F. Husson (2012): “Handling Missing Values in Exploratory MultivariateData Analysis Methods,” Journal de la Société Française de Statistique, 153(2), 79–99.
Kiers, H. A. (1997): “Weighted Least Squares Fitting Using Ordinary Least Squares Al-gorithms,” Psychometrika, 62(2), 251–266.
Larcker, D. F., A. L. McCall, and G. Ormazabal (2015): “Outsourcing ShareholderVoting to Proxy Advisory Firms,” The Journal of Law and Economics, 58(1), 173–204.
Li, T. (2018): “Outsourcing Corporate Governance: Conflicts of Interest Within the ProxyAdvisory Industry,” Management Science, 64(6), 2951–2971.
Lund, D. S. (2018): “The Case Against Passive Shareholder Voting,” Journal of Corpora-tion Law, 43(3), 493–536.
Malenko, N., and Y. Shen (2016): “The Role of Proxy Advisory Firms: Evidence froma Regression-Discontinuity Design,” The Review of Financial Studies, 29(12), 3394–3427.
McCahery, J. A., Z. Sautner, and L. T. Starks (2016): “Behind the Scenes: TheCorporate Governance Preferences of Institutional Investors,” The Journal of Finance,71(6), 2905–2932.
Morgan, A., A. Poulsen, J. Wolf, and T. Yang (2011): “Mutual Funds as Monitors:Evidence from Mutual Fund Voting,” Journal of Corporate Finance, 17(4), 914–928.
Morningstar (2017): “Passive Fund Providers Take an Active Approach to InvestmentStewardship,” Unpublished working paper.
Murphy, K. J. (2013): “Chapter 4 - Executive Compensation: Where We Are, and HowWe Got There,” in Handbook of the Economics of Finance, ed. by G. M. Constantinides,M. Harris, and R. M. Stulz, vol. 2, pp. 211–356. Elsevier.
Poole, K. T., and H. Rosenthal (1991): “Patterns of Congressional Voting,” AmericanJournal of Political Science, 35(1), 228–278.
(2007): Ideology and Congress. Oxford University Press.
Rock, E. B., and M. Kahan (2019): “Index Funds and Corporate Governance: LetShareholders Be Shareholders,” SSRN Scholarly Paper ID 3295098, Social Science Re-search Network, Rochester, NY.
45

Ryan, H. E., and R. A. Wiggins (2004): “Who Is in Whose Pocket? Director Compen-sation, Board Independence, and Barriers to Effective Monitoring,” Journal of FinancialEconomics, 73(3), 497–524.
46

Appendix
Table 1: CRSP Coverage
Year Number ofCRSP Funds
Number ofMergedFunds
Fraction TNA CRSP($ millions)
TNAMerged ($millions)
Fraction
2010 5,507 2,968 0.54 5,462,796 4,274,650 0.782011 5,718 3,042 0.53 5,263,227 4,092,580 0.782012 5,708 2,980 0.52 5,863,155 4,527,865 0.772013 5,716 3,072 0.54 7,803,258 6,379,391 0.822014 5,821 3,446 0.59 8,668,008 7,466,128 0.862015 5,937 3,290 0.55 8,438,582 6,673,425 0.79
Notes: Number of CRSP Funds is the number of domestic equity and balanced funds in CRSP in therespective year that hold U.S. common stock. Number of Merged Funds is the number of such funds thatwere merged with a fund from ISS Voting Analytics for which we estimated a preference score using datafrom the respective year. TNA CRSP and TNA Merged are the sum of total net assets in the CRSP andmerged samples, respectively.
47
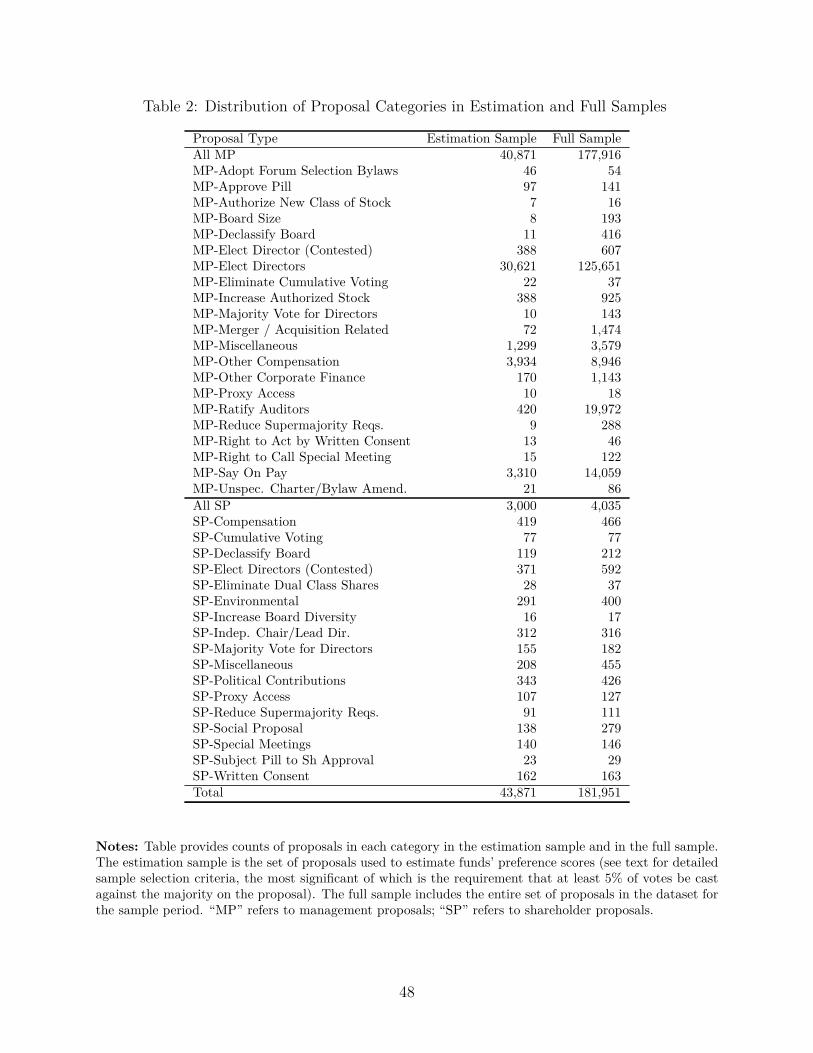
Table 2: Distribution of Proposal Categories in Estimation and Full Samples
Proposal Type Estimation Sample Full SampleAll MP 40,871 177,916MP-Adopt Forum Selection Bylaws 46 54MP-Approve Pill 97 141MP-Authorize New Class of Stock 7 16MP-Board Size 8 193MP-Declassify Board 11 416MP-Elect Director (Contested) 388 607MP-Elect Directors 30,621 125,651MP-Eliminate Cumulative Voting 22 37MP-Increase Authorized Stock 388 925MP-Majority Vote for Directors 10 143MP-Merger / Acquisition Related 72 1,474MP-Miscellaneous 1,299 3,579MP-Other Compensation 3,934 8,946MP-Other Corporate Finance 170 1,143MP-Proxy Access 10 18MP-Ratify Auditors 420 19,972MP-Reduce Supermajority Reqs. 9 288MP-Right to Act by Written Consent 13 46MP-Right to Call Special Meeting 15 122MP-Say On Pay 3,310 14,059MP-Unspec. Charter/Bylaw Amend. 21 86All SP 3,000 4,035SP-Compensation 419 466SP-Cumulative Voting 77 77SP-Declassify Board 119 212SP-Elect Directors (Contested) 371 592SP-Eliminate Dual Class Shares 28 37SP-Environmental 291 400SP-Increase Board Diversity 16 17SP-Indep. Chair/Lead Dir. 312 316SP-Majority Vote for Directors 155 182SP-Miscellaneous 208 455SP-Political Contributions 343 426SP-Proxy Access 107 127SP-Reduce Supermajority Reqs. 91 111SP-Social Proposal 138 279SP-Special Meetings 140 146SP-Subject Pill to Sh Approval 23 29SP-Written Consent 162 163Total 43,871 181,951
Notes: Table provides counts of proposals in each category in the estimation sample and in the full sample.The estimation sample is the set of proposals used to estimate funds’ preference scores (see text for detailedsample selection criteria, the most significant of which is the requirement that at least 5% of votes be castagainst the majority on the proposal). The full sample includes the entire set of proposals in the dataset forthe sample period. “MP” refers to management proposals; “SP” refers to shareholder proposals.
48

Table 3: Goodness of Fit by Number of Dimensions
# of dims CP APRE1 0.86 0.332 0.89 0.473 0.91 0.564 0.92 0.625 0.93 0.686 0.94 0.727 0.95 0.768 0.96 0.799 0.96 0.82
10 0.97 0.84
Notes: Table provides two goodness of fit measures for models estimated using the specified number ofdimensions. The classification percentage (CP) is the percentage of votes that the model classifies cor-rectly, where a predicted value Mij + zk
i akj > 0.5 is classified as a “Yes” vote, and Mij + zk
i akj < 0.5 is
classified as a “No” vote. The average proportional reduction in error (APRE) measures the reductionin error the model achieves in classifying votes relative to a simple benchmark model of predicting thatall funds vote with the majority on the proposal. For each proposal, the proportional reduction in error(PRE) is equal to Number Minority Votes−Number Classification Errors
Number Minority Votes . The APRE sums over all of the proposals:∑m
j=1Number Minority Votesj−Number Classification Errorsj∑m
j=1Number Minority Votesj
.
49

Table 4: Association between Proxy Advisor Recommendations and Loadings
Abs. Value of Loading on Dimension 1 Abs. Value of Loading on Dimension 2(1) (2) (3) (4)
ISS Rec. 0.004∗∗∗ 0.007∗∗∗ 0.0002∗∗∗ 0.0005∗∗∗
(0.0001) (0.00004) (0.0001) (0.00004)GL Rec. 0.0001 0.003∗∗∗ 0.004∗∗∗ 0.005∗∗∗
(0.0001) (0.00003) (0.0001) (0.00003)ISS Rec. * GL Rec. −0.007∗∗∗ −0.001∗∗∗
(0.0001) (0.0001)Constant 0.002∗∗∗ 0.001∗∗∗ 0.002∗∗∗ 0.002∗∗∗
(0.00003) (0.00002) (0.00003) (0.00002)Observations 14,980 14,980 14,980 14,980R2 0.469 0.817 0.590 0.592
Notes: Regressions are at the proposal level with standard errors clustered at the shareholder meeting level.“ISS Rec.” is a dummy variable for whether ISS recommended against management. “GL Rec.” is a dummyvariable for whether Glass Lewis recommended against management. Dependent variables are the absolutevalue of the loadings on each dimension. * p < 0.1; ** p < 0.05; *** p < 0.01.
50

Table 5: Corporate Governance Concepts and Proposal Categories
Corp. Governance Category: Subcategory Proposal Type NBoard Supervision: MP-Board Size MP-Board Size 8Board Supervision: SP-Indep. Chair/Lead Dir. SP-Indep. Chair/Lead Dir. 312CSR: SP-Environmental SP-Environmental 291CSR: SP-Increase Board Diversity SP-Increase Board Diversity 16CSR: SP-Political Contributions SP-Political Contributions 343CSR: SP-Social Proposal SP-Social Proposal 138Compensation: MP-Other Compensation MP-Other Compensation 3934Compensation: MP-Say On Pay MP-Say On Pay 3310Compensation: SP-Compensation SP-Compensation 419Corporate Finance: MP-Increase Authorized Stock MP-Increase Authorized Stock 388Corporate Finance: MP-Other Corporate Finance MP-Other Corporate Finance 170Corporate Finance: MP-Other Corporate Finance MP-Authorize New Class of Stock 7Corporate Malfeasance: MP-Ratify Auditors MP-Ratify Auditors 420Director Elections MP-Elect Directors 30621Fund. Sh. Rights: FSR-Director Election Rules SP-Majority Vote for Directors 155Fund. Sh. Rights: FSR-Director Election Rules SP-Declassify Board 119Fund. Sh. Rights: FSR-Director Election Rules SP-Proxy Access 107Fund. Sh. Rights: FSR-Director Election Rules SP-Cumulative Voting 77Fund. Sh. Rights: FSR-Director Election Rules MP-Eliminate Cumulative Voting 22Fund. Sh. Rights: FSR-Director Election Rules MP-Declassify Board 11Fund. Sh. Rights: FSR-Director Election Rules MP-Majority Vote for Directors 10Fund. Sh. Rights: FSR-Director Election Rules MP-Proxy Access 10Fund. Sh. Rights: FSR-Other MP-Approve Pill 97Fund. Sh. Rights: FSR-Other MP-Adopt Forum Selection Bylaws 46Fund. Sh. Rights: FSR-Other SP-Subject Pill to Sh Approval 23Fund. Sh. Rights: FSR-Other Voting Rules SP-Written Consent 162Fund. Sh. Rights: FSR-Other Voting Rules SP-Special Meetings 140Fund. Sh. Rights: FSR-Other Voting Rules SP-Reduce Supermajority Reqs. 91Fund. Sh. Rights: FSR-Other Voting Rules SP-Eliminate Dual Class Shares 28Fund. Sh. Rights: FSR-Other Voting Rules MP-Right to Call Special Meeting 15Fund. Sh. Rights: FSR-Other Voting Rules MP-Right to Act by Written Consent 13Fund. Sh. Rights: FSR-Other Voting Rules MP-Reduce Supermajority Reqs. 9Proxy Contest: MP-Elect Director (Contested) MP-Elect Director (Contested) 388Proxy Contest: SP-Elect Directors (Contested) SP-Elect Directors (Contested) 371
Notes: Table provides the mapping from proposal types to corporate governance categories and subcate-gories.
51

\footnote
Table 6: Director Election Variable Definitions
Variable Description SourceBoardSupervisiondfm
Dummy equal to one if one or more of the following was truefor director nominee d in firm f in the year leading to meetingm where d was up for election: d was Absent from over 25% ofboard/committee meetings; d was a non-independent committeemember; d was non-independent and the board of f was minority-independent; d was overboarded; the board of f lacked a key com-mittee.
Voting Analytics Direc-tors Database
Compensationdfm Dummy equal to one if director nominee d was a member of theCompensation Committee of firm f and was up for election at ameeting m during which shareholders voted on a mananagementSay on Pay proposal that received less than 70% of the votes castin favor (and equal to zero otherwise).
Voting Analytics Vot-ing Results Database;Voting Analytics Direc-tors Database
CorporateMalfeasancefm
Dummy equal to one if during the year leading to the meeting mthe firm filed an item 4.02 8-K filing indicating that the financialstatements previously filed with the SEC can no longer be reliedupon (and equal to zero otherwise).
Westlaw
BoardResponsivenessfm
Dummy equal to one if during the year leading to meeting m, firmf failed to implement a precatory shareholder proposal that hadobtained the support of more than 50% of the outstanding sharesin the previous annual meeting (and equal to zero otherwise).
Voting Analytics Vot-ing Results Database;SharkRepellent;EDGAR
Performancesfm Dummy equal to one if firm f’s five-year total shareholder returnwas at the bottom quartile of the distribution of the variable amongallfirms in the same 3-digit SIC code as firm f (and equal to zerootherwise—including for firms that have not been publicly tradedfor at least five years).
CRSP
Table 7: Director Election Variables Summary Statistics
N Mean St. Dev. Min Median MaxBoard Supervision 8,505 0.088 0.284 0.00 0.00 1.00Compensation 8,505 0.103 0.304 0.00 0.00 1.00Responsiveness 8,505 0.025 0.156 0.00 0.00 1.00Corporate Malfeasance 8,505 0.0215 0.145 0.00 0.00 1.00Performance 8,505 0.136 0.343 0.00 0.00 1.00
52

Table 8: Association between Director Election Features and Loadings
Polarized Loading Dimension 1 Polarized Loading Dimension 2(1) (2)
Board Supervision −0.005∗∗∗ 0.001∗∗∗
(0.0002) (0.0002)Compensation −0.0001 0.0004∗
(0.0002) (0.0002)Corporate Malfeasance −0.0002 −0.001∗∗∗
(0.0005) (0.0003)Responsiveness −0.004∗∗∗ −0.002∗∗∗
(0.0005) (0.0003)Performance −0.0001 −0.0004∗∗
(0.0002) (0.0002)Constant 0.001∗∗∗ −0.004∗∗∗
(0.0001) (0.0001)Observations 8,505 8,505R2 0.174 0.016
Notes: Regressions are at the firm-year-nominee level with standard errors clustered at the meeting level.Sample is all uncontested director election proposals with non-missing feature information. Dependentvariables are the polarized loadings on dimension 1 (column 1) and dimension 2 (column 2). * p < 0.1; **p < 0.05; *** p < 0.01.
53

Table 9: Top Fund Investment Advisors in Each Party by TNA
Advisor TNA ($millions)
Traditional Governance Party1. Vanguard Group Inc 1,310,9932. Capital Research & Management Company 706,7703. Fidelity Management & Research Company 607,2384. BlackRock Inc 454,3825. T Rowe Price Associates Inc 210,5626. SSGA Funds Management Inc 96,1417. Dodge & Cox 69,2518. JP Morgan Investment Management Inc 61,6659. Wellington Management Inc 59,22210. Teachers Advisors Inc 42,394
Shareholder Reform Party1. Dimensional Fund Advisors LP 87,0342. OppenheimerFunds Inc 45,5563. Principal Management Corporation 41,7184. Wells Fargo Funds Management LLC 34,2565. First Trust Advisors LP 30,6146. SunAmerica Asset Management LLC 25,8617. USAA Asset Management Company 22,7148. Fred Alger Management Inc 15,1619. Delaware Management Company 14,73010. ProFund Advisors LLC 12,909
Shareholder Protest Party1. Franklin Advisers Inc 141,3352. Columbia Management Inv Advisers LLC 111,9313. Charles Schwab Investment Management Inc 75,4844. Neuberger Berman Management LLC 24,7925. Allianz Global Investors Fund Mgmt LLC 15,1266. Yacktman Asset Management Company 13,0307. Russell Investment Management Company 10,5248. Van Eck Associates Corporation 10,1149. Loomis Sayles & Company LP 8,70410. Sterling Capital Management LLC 3,628
Notes: The panels list in order the top 10 advisors in each party by total TNA as of 2013 of advisor funds inthe party. The TNA of each advisor may differ from the TNA one would recover using ownership informationfrom 13-F filings because our dataset only reflects ownership stakes of funds that report their votes in formN-PX.
54

Table 10: Fraction of Votes Cast in the Party’s Minority
Proposal Category All TG Party SR Party SP PartyBoard Supervision 0.31 0.10 0.04 0.32Compensation 0.23 0.11 0.02 0.04Corporate Finance 0.19 0.21 0.00 0.07Corporate Malfeasance 0.11 0.02 0.01 0.13CSR 0.34 0.08 0.07 0.07Director Elections 0.18 0.12 0.01 0.08Fundamental Shareholder Rights 0.29 0.20 0.02 0.10Proxy Contest 0.26 0.25 0.03 0.09All 0.21 0.12 0.01 0.08
Notes: For each proposal category we determine the majority vote among members of each party, countingeach fund in the party as one vote. We then report the fraction of party member votes cast against theparty’s majority.
Table 11: Disagreement Between the Parties
Panel A: SR Party vs. SP Party
SP Party Opposes Management SP Party Supports ManagementSR Party Opposes Management 0.15 0.20SR Party Supports Management 0.24 0.40
Panel B: SR Party vs. TG Party
TG Party Opposes Management TG Party Supports ManagementSR Party Opposes Management 0.08 0.28SR Party Supports Management 0.02 0.62
Panel C: SP Party vs. TG Party
TG Party Opposes Management TG Party Supports ManagementSP Party Opposes Management 0.06 0.34SP Party Supports Management 0.03 0.58
Notes: For each proposal category we determine the majority vote among members of the party, countingeach fund in the party as one vote. We then report the fraction of estimation sample proposals on which themajority in each party supports or opposes management as indicated in the row and column headings.
55

Table 12: Association between Director Election Features and Votes for each Party
Vote with ManagementTG Party SR Party SP Party
(1) (2) (3)Board Supervision −0.135∗∗∗ −0.594∗∗∗ 0.030
(0.047) (0.021) (0.029)Compensation −0.061∗ −0.088∗∗∗ 0.038
(0.031) (0.027) (0.028)Corporate Malfeasance 0.007 −0.072 −0.208∗∗∗
(0.012) (0.055) (0.059)Responsiveness −0.178∗∗∗ −0.635∗∗∗ −0.263∗∗∗
(0.038) (0.050) (0.046)Performance 0.017 −0.015 −0.031
(0.011) (0.023) (0.024)Constant 0.912∗∗∗ 0.904∗∗∗ 0.552∗∗∗
(0.029) (0.009) (0.019)Observations 744,523 452,867 146,762R2 0.023 0.240 0.010
Notes: Regressions are at the firm-year-nominee level with standard errors two-way clustered at the meetingand advisor level. * p < 0.1; ** p < 0.05; *** p < 0.01.
56

Table 13: The Influence of the Parties on Voting Outcomes
Party Excluded Outcome Would Have Changed Mgmt Won Would Lose Mgmt Lost Would Win(1) (2) (3) (4)
Panel A: Sample mutual funds onlySR Party 0.4 0.1 6.5SP Party 0.2 0.1 2.4SR & SP Parties 0.5 0.1 9.0TG Party 4.4 4.5 1.6
Panel B: All institutional investorsSR Party 1.0 0.2 16.2SP Party 0.5 0.2 6.4SR & SP Parties 1.4 0.3 23.3TG Party 15.4 16.0 4.3
Notes: Table reports the percentage of proposals in the column category for which the outcome would havebeen different had the party given in the row been excluded. We assume that the shares owned by theexcluded party would instead have been voted to mirror the distribution of votes for non-party members.Panel A excludes only the holdings of mutual funds in our sample. Panel B excludes all shares held byinstitutional investors that belong to the party using the procedure described in the text.
57

Table 14: Variable Definitions
Variable DescriptionScore 1f Fund’s score on first principal component of voting matrix.Score 2f Fund’s score on second principal component of voting matrix.TG Partyf Indicator for whether fund belongs to the Traditional Governance Party.SR Partyf Indicator for whether fund belongs to the Shareholder Reform Party.SP Partyf Indicator for whether fund belongs to the Shareholder Protest Party.Activef Indicator for whether fund is actively managed. If Active Share data is
available for the fund: = 1 if CRSP indicates fund is not an index fund andfund has Active Share > 0.3, = 0 otherwise. If Active Share data is notavailable for the fund: = 1 if CRSP indicates fund is not an index fund, = 0otherwise. For the small number of funds for which this indicator would notbe the same in all years in the data (e.g., because Active Share changes), weset Active = 1 if the fund meets the criteria for a majority of years in thedata and Active = 0 otherwise.
Number StocksHeldft
Total number of stocks held in the fund’s portfolio as of the latest reportavailable for the fund in the CRSP fund portfolio dataset for the correspond-ing year. Defined yearly between years 2011 and 2015.
AverageMonthlyAbnormalReturn (bp)ft
Average monthly abnormal return (in basis points) experienced by the fund(defined only for actively managed funds). Abnormal returns are calculatedusing a four-factor model on the basis of fund-level monthly portfolio returnsobtained from CRSP. Defined yearly between years 2011 and 2015.
TNAft Total market value of stocks held in the fund’s portfolio as of the latestreport available for the fund in the CRSP fund portfolio dataset for thecorresponding year, in millions of dollars. Defined yearly between years2011 and 2015.
Adv. Activea Indicator for whether the fund’s investment advisor focuses on actively man-aged funds. Advisor Active = 1 if 50% of the advisor’s funds under man-agement are in active funds and = 0 otherwise. For the small number ofadvisors for which this indicator would not be the same in all years in thedata, we set Adv. Active = 1 if the advisor meets the criteria for a majorityof years in the data and Adv. Active = 0 otherwise.
Adv. NumberStocks Heldat
Number of different U.S. equity securities held by the advisor (derived fromCRSP Mutual Fund portfolio-level data). Defined yearly between years 2011and 2015.
Adv. TNAat Dollar value of the U.S. equity securities held by the advisor, in million dol-lars (derived from CRSP Mutual Fund portfolio-level data). Defined yearlybetween years 2011 and 2015.
ComplianceApproacha
Indicator for whether the titles of the fund’s investment advisor’s proxyvoting executives listed on Proxy Insight website use compliance language(see text for details).
58

Table 15: Mutual Fund Variables Summary Statistics
N Mean St. Dev. Min Median MaxScore 1 14,923 0.6 41.2 -86.6 -10.8 77.2Score 2 14,923 -1.6 32.3 -60.0 -3.6 170.1TG Party 14,923 0.34 0.47 0 0 1SR Party 14,923 0.09 0.29 0 0 1SP Party 14,923 0.22 0.41 0 0 1Active 14,923 0.77 0.42 0 1 1TNA 14,923 1,437 7,302 0 223 354,003Number Stocks Held 14,923 176 328 1 75 3,335Average Monthly Abnormal Return (bp) 10,703 -11 59 -828 -10 998Adv. Active 14,923 0.74 0.44 0 1 1Adv. TNA 14,923 86,238 180,979 0 16,429 1,266,098Adv. Number Stocks Held 14,923 1,365 1,064 1 1,136 3,481Compliance Approach 13,569 0.35 0.48 0 0 1
Notes: Each observation is a fund-year.
Table 16: Fund Characteristics by Party
TG Party SR Party SP Party TG-SR TG-SP SR-SPActive 0.6 0.73 0.87Total Value Holdings ($m) 51,253 3,006 6,035 ** **Number Stocks Held 553 478 176Avg. Monthly Abnormal Return (bp) -2 -21 -17 *** ***Adv. Active 0.5 0.69 0.87Adv. Total Value Holdings ($m) 516,997 25,274 47,694 *** ***Adv. Number Stocks Held 2,140 1,341 1,255Compliance Approach 0.065 0.41 0.3 **
Notes: Statistics reported in the first three columns are means taken over observations from 2013 forfunds in each party, weighted by each fund’s TNA. The final three columns report levels of statisticalsignificance for pairwise differences between the parties (e.g., “TG-SR” refers to the difference between theTraditional Governance and Shareholder Reform parties). Statistical significance is calculated through F-tests on coefficients from a regression of the covariate of interest against the three party dummies (wherestandard errors are clustered at the advisor level and observations are weighted by the fund’s TNA).
59

Table17:The
Determinan
tsof
PartyMem
bership
(1)
(2)
(3)
(4)
(5)
(6)
(7)
(8)
(9)
TG
Party
SRPa
rty
SPPa
rty
TG
Party
SRPa
rty
SPPa
rty
TG
Party
SRPa
rty
SPPa
rty
ActiveAdv
isor
-0.215
∗-0.036
0.025
(0.112)
(0.102)
(0.067)
Log(Adv
.Num
berof
Firm
s)-0.140
∗∗∗
0.086∗
∗0.002
-0.127
∗∗∗
0.080∗
∗0.012
0.110
-0.050
-0.067
∗
(0.031)
(0.037)
(0.023)
(0.035)
(0.037)
(0.024)
(0.208)
(0.143)
(0.041)
Log(Adv
.TNA)
0.110∗
∗∗-0.072
∗∗∗
-0.005
0.087∗
∗-0.062
∗∗∗
-0.005
0.122∗
∗∗-0.081
∗0.002
(0.023)
(0.016)
(0.009)
(0.034)
(0.015)
(0.011)
(0.017)
(0.043)
(0.010)
N17717
17717
17717
13297
13297
13297
4420
4420
4420
Adv
isorTyp
eAll
All
All
Active
Active
Active
Passive
Passive
Passive
Not
es:Thist
able
repo
rtst
heresults
ofthreediffe
rent
multin
omiallogitestim
ations.The
outcom
evaria
bleha
sfou
rpossib
levalues:TG
Party,
SRPa
rty,
SPPa
rty,
andNoPa
rty(the
omitt
edba
selin
e).In
each
row,w
erepo
rtthemargina
leffe
ctsof
thecorrespo
ndingcovaria
teon
thelik
elihoo
dthat
thefund
will
belong
intherelevant
party.
Inthecase
ofcovaria
testhat
aredu
mmies,
themargina
leffe
ctcorrespo
ndsto
thechan
gein
the
varia
blefrom
zero
toon
e.Stan
dard
errors
(inpa
renthe
sis)areclusteredat
thead
visorlevel.
InColum
ns1-3,
theestim
ationsampleconsist
sof
allfun
d-year
observations.In
Colum
ns4-6(7-9)theestim
ationsampleconsist
son
lyof
fund
-years
underactiv
e(passiv
e)ad
visors.*
p<
0.1;
**p
<0.
05***
p<
0.01.
60

Table18:Com
plianceApp
roachan
dOutsourcing
toPr
oxyAdv
isors
(1)
(2)
(3)
(4)
(5)
(6)
(7)
(8)
(9)
(10)
Com
plianc
eApp
roach
SRor
SPSR
orSP
SRor
SPSR
orSP
SRor
SPSR
orSP
SRor
SPSR
orSP
SRor
SP
ActiveAdv
isor
-0.102
0.106
0.158
(0.124)
(0.132)
(0.120)
Log(Adv
.Num
berof
Firm
s)-0.041
0.167∗
∗∗0.200∗
∗∗0.179∗
∗∗0.218∗
∗∗-0.162
0.032
(0.045)
(0.046)
(0.046)
(0.049)
(0.051)
(0.219)
(0.027)
Log(Adv
.TNA)
-0.095
∗∗∗
-0.132
∗∗∗
-0.117
∗∗∗
-0.120
∗∗∗
-0.131
∗∗∗
-0.117
∗∗∗
-0.053
∗∗∗
(0.026)
(0.018)
(0.018)
(0.025)
(0.023)
(0.020)
(0.019)
Com
plianc
eApp
roach
0.412∗
∗∗0.289∗
∗∗0.230∗
0.160∗
0.837∗
∗∗0.722∗
∗∗
(0.109)
(0.088)
(0.134)
(0.097)
(0.099)
(0.104)
N10395
10408
11415
10395
7043
7889
7030
3365
3526
3365
Adv
isorTyp
eAll
All
All
All
Active
Active
Active
Passive
Passive
Passive
Not
es:Fo
rallm
odelsrepo
rted
inthetable,
thesampleis
restric
tedto
fund
sthat
belong
toon
eof
thethreemutua
lfun
dpa
rties(i.e.,fun
dsin
nopa
rtyareexclud
ed).
Colum
n1repo
rtsthemargina
leffe
ctsfrom
alogitmod
elin
which
thede
pend
entvaria
bleequa
ls1ifthefund
’sad
visor
follo
wsacomplianc
eap
proach,a
ndzero
othe
rwise
.Colum
ns2-11
repo
rttheresults
oflogitmod
elsin
which
thede
pend
entvaria
bleequa
ls1if
thefund
belong
sto
either
theSh
areh
olde
rReform
orSh
areh
olde
rPr
otestpa
rties,
andzero
ifit
belong
sto
theTr
adition
alGoverna
ncePa
rty.
Ineach
row,w
erepo
rtthemargina
leffe
ctsof
thecorrespo
ndingcovaria
teon
thelik
elihoo
dthat
thefund
will
belong
totheSh
areh
olde
rReform
orSh
areh
olde
rPr
otestpa
rties.
Foralls
pecific
ations,inthecase
ofcovaria
testhat
aredu
mmies,
themargina
leffe
ctcorrespo
ndsto
thechan
gein
thevaria
blefrom
zero
toon
e.Stan
dard
errors
(inpa
renthe
ses)
areclusteredat
thead
visorlevel.
InColum
ns5-7(8-10)
theestim
ationsample
consist
son
lyof
fund
-years
unde
ractiv
e(passiv
e)ad
visors.
61

300
600
900
0 10 20 30k
valu
e
Figure 1: Scree Plot
Notes: This figure plots the eigenvalues corresponding to the first thirty principal components extractedfrom our estimation sample vote matrix.
62
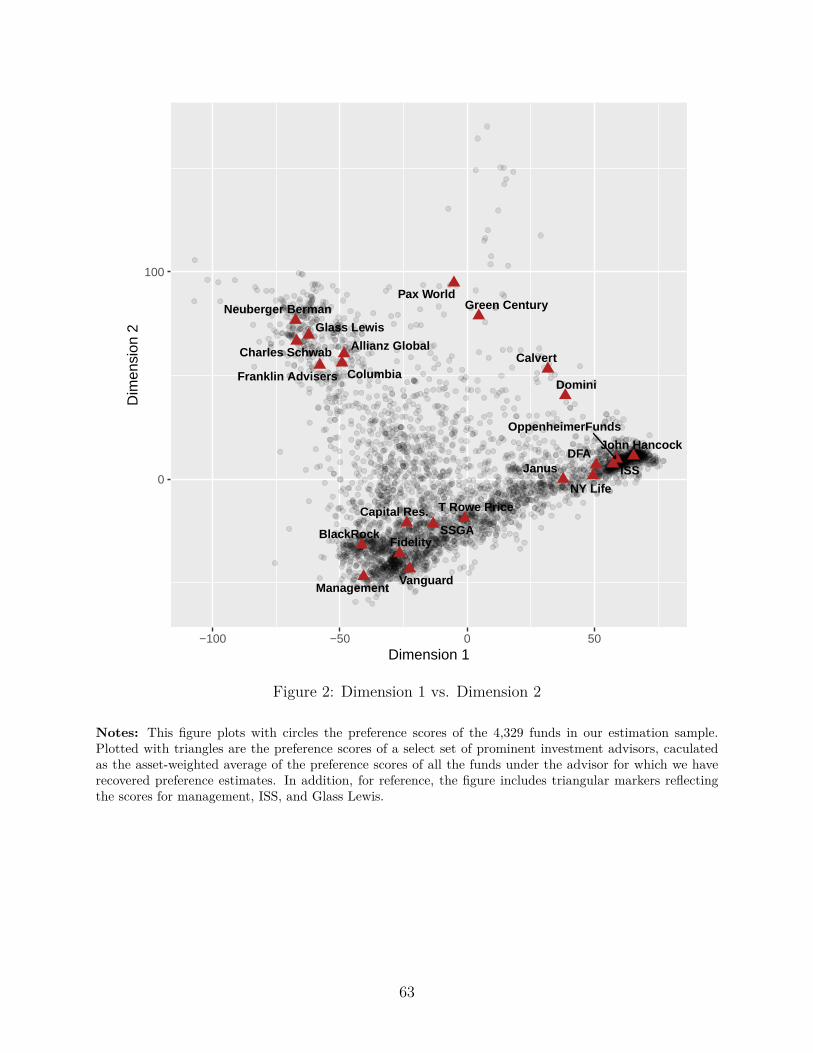
Management
ISS
Glass Lewis
Allianz Global
BlackRock
Calvert
Capital Res.
Charles Schwab
Columbia
DFA
Domini
Fidelity
Franklin Advisers
Green Century
Janus
John Hancock
Neuberger Berman
NY Life
OppenheimerFunds
Pax World
SSGA
T Rowe Price
Vanguard
0
100
−100 −50 0 50Dimension 1
Dim
ensi
on 2
Figure 2: Dimension 1 vs. Dimension 2
Notes: This figure plots with circles the preference scores of the 4,329 funds in our estimation sample.Plotted with triangles are the preference scores of a select set of prominent investment advisors, caculatedas the asset-weighted average of the preference scores of all the funds under the advisor for which we haverecovered preference estimates. In addition, for reference, the figure includes triangular markers reflectingthe scores for management, ISS, and Glass Lewis.
63

−0.010 −0.005 0.000 0.005 0.010Raw Loadings − Dimension 1
−0.010 −0.005 0.000 0.005 0.010Raw Loadings − Dimension 2
Figure 3: Distribution of loadings across proposals
Notes: This figure shows the univariate densities of the loadings of proposals on dimensions 1 and 2.
64

RecommendationsGL with Mgmt, ISS against Mgmt GL Against Mgmt, ISS Against Mgmt
GL with Mgmt, ISS with Mgmt GL Against Mgmt, ISS with Mgmt
−0.010 −0.005 0.000 0.005 0.010Raw Loadings − Dimension 1
−0.010 −0.005 0.000 0.005 0.010Raw Loadings − Dimension 2
Figure 4: Conditional densities of raw loadings
Notes: The top panel of figure shows the conditional densities of raw loadings on dimension 1 across four sub-sets of proposals. The unshaded conditional density corresponds to proposals for which Glass Lewis’s (ISS’s)recommendation was the same as (the opposite from) management’s recommendation. The conditional den-sity shaded in light grey corresponds to proposals for which both Glass Lewis’s and ISS’s recommendationswere against management’s recommendation. The conditional density shaded in medium grey correspondsto proposals for which both Glass Lewis’s and ISS’s recommendations were the same as management’s rec-ommendation. The conditional density shaded in dark grey corresponds to proposals for which Glass Lewis’s(ISS’s) recommendation was the opposite from (the same as) management’s recommendation. The bottompanel shows the conditional densities of raw loadings on dimension 2 for the same four subsets of proposals.
65

RecommendationsGL with Mgmt, ISS against Mgmt GL Against Mgmt, ISS Against Mgmt
GL with Mgmt, ISS with Mgmt GL Against Mgmt, ISS with Mgmt
−0.010 −0.005 0.000 0.005 0.010Polarized Loadings − Dimension 1
−0.010 −0.005 0.000 0.005 0.010Polarized Loadings − Dimension 2
Figure 5: Conditional densities of polarized loadings
Notes: The top panel of figure shows the conditional densities of polarized loadings on dimension 1 acrossfour subsets of proposals. The unshaded conditional density corresponds to proposals for which GlassLewis’s (ISS’s) recommendation was the same as (the opposite from) management’s recommendation. Theconditional density shaded in light grey corresponds to proposals for which both Glass Lewis’s and ISS’srecommendations were against management’s recommendation. The conditional density shaded in mediumgrey corresponds to proposals for which both Glass Lewis’s and ISS’s recommendations were the same asmanagement’s recommendation. The conditional density shaded in dark grey corresponds to proposals forwhich Glass Lewis’s (ISS’s) recommendation was the opposite from (the same as) management’s recommen-dation. To polarize the loadings relative to management, the raw loadings on dimension 1 are multipled by-1 if management recommended against the proposal. The bottom panel shows the conditional densities ofpolarized loadings on dimension 2 for the same four subsets of proposals.
66

Boa
rdS
uper
visi
onC
ompe
nsat
ion
Cor
pora
teF
inan
ceC
orpo
rate
Mal
feas
ance
CS
RD
irect
orE
lect
ions
Fun
dam
enta
lS
hare
hold
erR
ight
s
Pro
xyC
onte
st
0.000 0.002 0.004 0.006
MP−Board Size
SP−Indep. Chair/Lead Dir.
MP−Other Compensation
MP−Say On Pay
SP−Compensation
MP−Increase Authorized Stock
MP−Other Corporate Finance
MP−Ratify Auditors
SP−Environmental
SP−Increase Board Diversity
SP−Political Contributions
SP−Social Proposal
MP−Elect Directors
FSR−Director Election Rules
FSR−Other
FSR−Other Voting Rules
MP−Elect Director (Contested)
SP−Elect Directors (Contested)
Avg. Absolute Polarized Loadings−0.010 −0.005 0.000 0.005 0.010
Polarized Loadings
Dimension 1
Figure 6: Proposal loadings by corporate governance categories - Dimension 1
Notes: The left panel of this figure reports the mean of the absolute value of the polarized loadings ondimension 1 in each of 18 categories of proposals. The right panel of this figure reports the density of thepolarized loadings on dimension 1 for each of those categories, together with a vertical full line that indicatesthe mean of the polarized loadings on dimension 1 in the relevant category. To polarize the loadings relativeto management, the raw loadings on dimension 1 are multipled by -1 if management recommended againstthe proposal.
67

Boa
rdS
uper
visi
onC
ompe
nsat
ion
Cor
pora
teF
inan
ceC
orpo
rate
Mal
feas
ance
CS
RD
irect
orE
lect
ions
Fun
dam
enta
lS
hare
hold
erR
ight
s
Pro
xyC
onte
st
0.000 0.002 0.004 0.006
MP−Board Size
SP−Indep. Chair/Lead Dir.
MP−Other Compensation
MP−Say On Pay
SP−Compensation
MP−Increase Authorized Stock
MP−Other Corporate Finance
MP−Ratify Auditors
SP−Environmental
SP−Increase Board Diversity
SP−Political Contributions
SP−Social Proposal
MP−Elect Directors
FSR−Director Election Rules
FSR−Other
FSR−Other Voting Rules
MP−Elect Director (Contested)
SP−Elect Directors (Contested)
Avg. Absolute Polarized Loadings−0.010 −0.005 0.000 0.005 0.010
Polarized Loadings
Dimension 2
Figure 7: Proposal loadings by corporate governance categories - Dimension 2
Notes: The left panel of this figure reports the mean of the absolute value of the polarized loadings ondimension 2 in each of 18 categories of proposals. The right panel of this figure reports the density of thepolarized loadings on dimension 1 for each of those categories, together with a vertical full line that indicatesthe mean of the polarized loadings on dimension 1 in the relevant category. To polarize the loadings relativeto management, the raw loadings on dimension 1 are multipled by -1 if management recommended againstthe proposal.
68

Shareholder Reform Party
Traditional Governance Party
Shareholder Protest Party
0
100
−100 −50 0 50x
y
Figure 8: The Parties
Notes: This figure identifies the three “mutual fund parties” as three of the four clusters of funds recoveredfrom applying a four-component Gaussian mixture model to the vector of mutual fund scores on dimensions 1and 2. Each circular marker corresponds to a mutual fund. The marker’s location corresponds to the mutualfund’s preference scores. The cluster corresponding to each of the three main parties—the TraditionalGovernance Party, the Shareholder Reform Party, and the Shareholder Protest Party—is labeled in thefigure, and the markers corresponding funds belonging to that party are filled in dark grey. The figure alsodepicts using blue lines the contour plots of the density of mutual fund preference scores estimated using theGaussian mixture model.
69

●
●
●
●
●
●
●
●
●
●
●
●
●
●
●
●● ●
●
●
●
●
●
●
●
●
●
●
●
●
●
●
●
●
●
●
●● ●
●
●
●
●
●
●
●
●
●
●
●
●
●
●
●
Boa
rdS
uper
visi
onC
ompe
nsat
ion
Cor
por.
Mal
.C
orpo
rate
Fin
ance
CS
RD
irect
.E
lect
.
Fun
dam
enta
lS
hare
hold
erR
ight
s
Pro
xyC
onte
st
0.00 0.25 0.50 0.75 1.00
SP−Indep. Chair/Lead Dir.
MP−Board Size
SP−Compensation
MP−Other Compensation
MP−Say On Pay
MP−Ratify Auditors
MP−Increase Authorized Stock
MP−Other Corporate Finance
SP−Social Proposal
SP−Political Contributions
SP−Increase Board Diversity
SP−Environmental
MP−Elect Directors
FSR−Other
FSR−Other Voting Rules
FSR−Director Election Rules
SP−Elect Directors (Contested)
MP−Elect Director (Contested)
Fraction Vote with Management
Party ● ● ●SP Party SR Party TG Party
Figure 9: Fraction of Funds in Party Voting with Management
Notes: This figure summarizes the voting behavior of funds in the different parties across different categoriesof proposals. For each category of proposal, and for each mutual fund party, we calculate what fraction ofthe votes cast on the category by the funds in each party followed management’s recommendation.
70

Gl
Ma
In
Ru
Am
O'
VaVaVa VaVaVa
Ch
Di
Co
Nu
Te
Am
Te
Ch
Fe
In
In
Mu
PrPr
Fi
Ch
Bl
FiFi
Ev
MuGo
Fi
Va
Ch
AlAl
Va
Al
Fi
FrQu
CC
Jo
MFFe
Fi
Je
Bl
Ch
Dr
Nu
SE
Va
Go
Lu
FrFr
Ru
Fr
Pu
Co
Mu
PuPuPu
To
We
LuSE
Go
To
Ch
Ch
In
Va
AmAmAm
We
AmHS
Al
He
Ic
Co
Al
FrFr
T
MuMF
Ch
Ad
No
Go
Bl
GeGe
No
Al
Va
T T MF
Dr
RE GoFi
VaDi
Le
Bl
DiDi
Ch
T
Ma
Ca
No
Su
Te
Ti
PrPr Pr
Te
Co
Jo JoJo
Ca
Me
Bl
Bl BlBlBl Bl
Bl BlBl
BlBl
MF
In
Pr
Vo
Bl
Va
SE
SS
Ha
Pr
In
Pr
Th
Mu
SS
Pu
Va
Di
Co
USPr PrPrPrPrPrPr
Co
DrIn
NuPr
Pr
Fr
Fe IrSu
DiFi
Va
Ch
In
Ca
Bl
Gl
Bl Fi
Ir
No
Go
ThThThThThThSS
SSSS
PN
In
DiDiDi
We
Su
Se
Pr
We
Wi Nu
Te
WeIn
In
InDi
MF
Fr
Fi
VT
Di
VoSS
PrPr
Me
Pu
BlBl
Bl BlBl
SE
ChCh
CaSe
Wa
LuDi PrFi
Ge
Pu
Wi
Fi
AQ
In
No
No
SSSS
DiChCh
DiAl
SS
Ch
Ch
Go
Fi
Fi
PN
PN
De
Go
RoRo
Kn
●
●
●
●●● ●●●
●
●
●
●
●
●
●
●
●
●●
●●
●●
●●●
●
● ●
●
● ●
●
●● ●●
●
●●
●
●
●
●
●
●
●●
●
●●
●●●●
●
●
●
●
●
●
●
●●●
●
●●
●
●
●
●●
●
●●
●
●
●
●
●●
●
●
●
●●●
●
● ●
●
●
●
●●
●
●
● ●
●
●
●
●
●
●●●
●
● ●●
●
●
●●●
●● ●●●●●●
●
●●
●●
●
●●
●
●
●●
●●
●
●
●●●●●●●●
●
●
●
●●●●
● ●●● ●
●
●
●
●
●
● ●
●
●
●
●●●●●●●●●●
●
●
●
●
●
●
●●
●● ●●
●●
●
●
●
●●
●●●
●
●
● ●● ●●●●
● ●●●
●
●
●
●●
●●
●●
●●●
●
●
●
●
●
●
●
●●
●●
●
−50
0
50
100
−40 0 40 80
Dimension 1
Dim
ensi
on 2
●
●
Correct N
Correct Y
Incorrect N
Incorrect Y
Figure 10: A Say-on-Pay proposal at PolyOne Corporation.
Notes: This figure describes the votes cast on a Say-on-Pay management proposal at PolyOne Corporationby all the mutual funds in our database. The vote of each fund in the sample that voted on the proposal isplotted with a marker located at the fund’s preference score. In the legend, “N” and “Y” refer to votes againstand for the proposal, respectively, and “Correct” and “Incorrect” refer to whether the model’s prediction forthe fund’s vote was correct. The two letters close to each marker indicate the corresponding fund’s advisor.The upward-sloping line in the center of the figure reflects the “cutting line” generated by the principalcomponent analysis for this proposal. That line separates the funds that the model predicted would supportthe proposal from those that the model predicted would oppose the proposal.
71

about ECGI
The European Corporate Governance Institute has been established to improve corpo-rate governance through fostering independent scientific research and related activities.
The ECGI will produce and disseminate high quality research while remaining close to the concerns and interests of corporate, financial and public policy makers. It will draw on the expertise of scholars from numerous countries and bring together a critical mass of expertise and interest to bear on this important subject.
The views expressed in this working paper are those of the authors, not those of the ECGI or its members.
www.ecgi.global

ECGI Working Paper Series in Law
Editorial Board
Editor Amir Licht, Professor of Law, Radzyner Law School, Interdisciplinary Center Herzliya
Consulting Editors Hse-Yu Iris Chiu, Professor of Corporate Law and Financial Regulation, University College London
Horst Eidenmüller, Freshfields Professor of Commercial Law, University of Oxford
Martin Gelter, Professor of Law, Fordham University School of Law Geneviève Helleringer, Professor of Law, ESSEC Business School and Oxford Law Faculty Curtis Milhaupt, Professor of Law, Stanford Law SchoolEditorial Assistant Úna Daly, ECGI Working Paper Series Manager
https://ecgi.global/content/working-papers

Electronic Access to the Working Paper Series
The full set of ECGI working papers can be accessed through the Institute’s Web-site (https://ecgi.global/content/working-papers) or SSRN:
Finance Paper Series http://www.ssrn.com/link/ECGI-Fin.html Law Paper Series http://www.ssrn.com/link/ECGI-Law.html
https://ecgi.global/content/working-papers
Copyright © 2022 FDOKUMEN