Mutual funds biased preference for the parent's stock: evidence and explanation
13
PLEASE SCROLL DOWN FOR ARTICLE This article was downloaded by: [Alves, Carlos] On: 10 August 2010 Access details: Access Details: [subscription number 925512614] Publisher Routledge Informa Ltd Registered in England and Wales Registered Number: 1072954 Registered office: Mortimer House, 37- 41 Mortimer Street, London W1T 3JH, UK Applied Financial Economics Publication details, including instructions for authors and subscription information: http://www.informaworld.com/smpp/title~content=t713684415 Mutual funds biased preference for the parent's stock: evidence and explanation Carlos Alves a ; Victor Mendes bc a Faculty of Economics, CEF.UP, University of Porto, Porto, Portugal b CMVM-Portuguese Securities Commission, 1056-801 Lisboa, Portugal c CEFAGE-UE, Universidade de Évora, 7000-803 Évora, Portugal First published on: 27 July 2010 To cite this Article Alves, Carlos and Mendes, Victor(2010) 'Mutual funds biased preference for the parent's stock: evidence and explanation', Applied Financial Economics, 20: 16, 1309 — 1320, First published on: 27 July 2010 (iFirst) To link to this Article: DOI: 10.1080/09603107.2010.491439 URL: http://dx.doi.org/10.1080/09603107.2010.491439 Full terms and conditions of use: http://www.informaworld.com/terms-and-conditions-of-access.pdf This article may be used for research, teaching and private study purposes. Any substantial or systematic reproduction, re-distribution, re-selling, loan or sub-licensing, systematic supply or distribution in any form to anyone is expressly forbidden. The publisher does not give any warranty express or implied or make any representation that the contents will be complete or accurate or up to date. The accuracy of any instructions, formulae and drug doses should be independently verified with primary sources. The publisher shall not be liable for any loss, actions, claims, proceedings, demand or costs or damages whatsoever or howsoever caused arising directly or indirectly in connection with or arising out of the use of this material.
-
Upload
independent -
Category
Documents
-
view
0 -
download
0
Transcript of Mutual funds biased preference for the parent's stock: evidence and explanation

PLEASE SCROLL DOWN FOR ARTICLE
This article was downloaded by: [Alves, Carlos]On: 10 August 2010Access details: Access Details: [subscription number 925512614]Publisher RoutledgeInforma Ltd Registered in England and Wales Registered Number: 1072954 Registered office: Mortimer House, 37-41 Mortimer Street, London W1T 3JH, UK
Applied Financial EconomicsPublication details, including instructions for authors and subscription information:http://www.informaworld.com/smpp/title~content=t713684415
Mutual funds biased preference for the parent's stock: evidence andexplanationCarlos Alvesa; Victor Mendesbc
a Faculty of Economics, CEF.UP, University of Porto, Porto, Portugal b CMVM-Portuguese SecuritiesCommission, 1056-801 Lisboa, Portugal c CEFAGE-UE, Universidade de Évora, 7000-803 Évora,Portugal
First published on: 27 July 2010
To cite this Article Alves, Carlos and Mendes, Victor(2010) 'Mutual funds biased preference for the parent's stock: evidenceand explanation', Applied Financial Economics, 20: 16, 1309 — 1320, First published on: 27 July 2010 (iFirst)To link to this Article: DOI: 10.1080/09603107.2010.491439URL: http://dx.doi.org/10.1080/09603107.2010.491439
Full terms and conditions of use: http://www.informaworld.com/terms-and-conditions-of-access.pdf
This article may be used for research, teaching and private study purposes. Any substantial orsystematic reproduction, re-distribution, re-selling, loan or sub-licensing, systematic supply ordistribution in any form to anyone is expressly forbidden.
The publisher does not give any warranty express or implied or make any representation that the contentswill be complete or accurate or up to date. The accuracy of any instructions, formulae and drug dosesshould be independently verified with primary sources. The publisher shall not be liable for any loss,actions, claims, proceedings, demand or costs or damages whatsoever or howsoever caused arising directlyor indirectly in connection with or arising out of the use of this material.

Applied Financial Economics, 2010, 20, 1309–1320
Mutual funds biased preference for
the parent’s stock: evidence and
explanation
Carlos Alvesa,* and Victor Mendesb,c
aFaculty of Economics, CEF.UP, University of Porto, Porto, PortugalbCMVM – Portuguese Securities Commission, Avenida da Liberdade,
no. 252, 1056-801 Lisboa, PortugalcCEFAGE-UE, Universidade de Evora, Largo dos Colegiais, 2,
7000-803 Evora, Portugal
The potential manager-investor conflict of interests in mutual funds is a
classic agency problem. Using a database from Portugal, we show that
mutual funds tend to overweight the stocks issued by their parent and
underweigh the stocks of competitors. This cannot be explained by
performance, risk, securities’ characteristics or information advantage;
funds invest in the stock of their parent company especially when there is
widespread selling, and avoid selling them when the stock is experiencing
low performance. This agency relationship is costly for fund investors:
compared with the competitor’s stock, the parent’s stock underperforms
after being acquired by the fund.
I. Introduction
The potential manager-investor conflict of interests in
mutual funds is a classic agency problem. Mutual
fund investors would like the maximization of risk-
adjusted returns. Mutual fund companies are sup-
posedly motivated by their own profits. If the
optimizing choices of the mutual fund managers
differ from the alternatives that maximize risk-
adjusted fund returns, one can foresee that some
conflicts may appear. However, if mutual fund
investors react to poor performances (with severe
capital outflows) and reward good performances
(with strong capital inflows), interests could be
aligned. In this case, maximization of mutual fund
performance is the way to optimize net capital flows,
to maximize the value managed and management fees
(Chevalier and Ellison, 1997).
The literature provides evidence that the behaviourof mutual fund investors does not prevent the
existence of self-interest in fund management.
Chevalier and Ellison (1997) claim that the behaviour
of fund investors actually stimulates fund managers
to alter the riskness of the portfolios they manage inorder to capitalize the investors’ reaction.1 Brown
et al. (1996) report that the deep losers in the middle
of the year increase the volatility of portfolios trying
to achieve superior performances by the end of the
year. Carhart et al. (2002) found that fund managersinflate end of quarter portfolio prices with last minute
large purchases of stocks already held, thus artifi-
cially increasing the performance of the assets they
manage. Finally, Cohen and Schmidt (2007) report
that mutual fund families acting as trusts in thecontext of 401(k) retirement plans do systematically
overweight the sponsor firm. Once again, the fund
*Corresponding author. E-mail: [email protected] a related issue, Nikiforow (2010) finds that training on behavioural finance influences fund managers’ perception ofbiases (in the behaviour of others) and their own behaviour.
Applied Financial Economics ISSN 0960–3107 print/ISSN 1466–4305 online � 2010 Taylor & Francis 1309http://www.informaworld.com
DOI: 10.1080/09603107.2010.491439
Downloaded By: [Alves, Carlos] At: 10:47 10 August 2010

managers subordinate portfolio decisions to their
self-interest.In Portugal, the vast majority of Portuguese equity
funds is managed by wholly owned subsidiaries(mutual fund companies) of larger banks (parent
companies). Almost all parent companies are publiclytraded. Portuguese law allows mutual funds to tradeand hold the parent’s stock. We investigate whether
equity funds investing in stock issued by Portuguesecompanies hold and trade the parent’s stock differ-ently than stock issued by other financial institutions
or any other stocks. The first question we address istherefore the following: Do Portuguese mutual fundsselect more frequently and overweight stocks issued by
their parent than other stocks? The answer is yes. Thenext step is to find out an explanation for thisbehaviour. Is the tilting explained by the parent’s
weight in the market? Is it explained by risk, perfor-mance, or other stock characteristics?
Examining 2573 portfolios of Portuguese equityfunds, publicly disclosed between January 1995 and
June 2009, we find that funds hold too much stock ofthe parent in terms that are not explained byperformance, risk or other factors, and that they
systematically underweight other financial institu-tions’ stocks. One possible explanation for thisportfolio distortion is superior information: fund
managers could have access to information about theparent that other funds do not have. This may causethe fund to invest differently in the parent than other
funds. However, we find that the future performanceof the parent does not explain the mutual fundholdings of the parent’s stock.
An alternative explanation for the fund biased
portfolios is the self-interest of fund managers,2 thatis, the own interest of the parent company. Whenbuying stocks of the parent, the mutual fund not only
withdraws these securities from the market, therebypreventing them from being acquired by hostileinvestors, but it also diminishes the number of
shares that the parent directors and the main share-holders need to hold in their own portfolio toapprove resolutions in the parent’s shareholders’
meetings. In Portugal, the mutual fund companies(not the fund investors) determine the vote of the
stocks held in the fund portfolio. This voting right
can be subordinated to the will of the parent.3
Secondly, the purchase, holding and absence ofselling of the parent’s stock in mutual funds is alsofavourable to the interests of the parent because of
the signalling effect to other investors. As a result,investing in the stock of the parent is favourable tothe interests of the parent managers (and the share-holders that support them), a fact that is especially
true in the case of small (for international standards)companies where the takeover threat is very real.Thirdly, the purchase of the parent’s stock decreasesthe downward price pressure on the stock of the
parent when other funds are selling large amounts ofthis stock.4 We find that not only do funds hold toomuch of the parent’s stock but also the investment inthe parent occurs especially when there is widespread
selling of the parent’s stock and the stock isexperiencing low performance.
This agency relationship is costly for mutual fundinvestors. Compared with the stock of competitors,the parent’s stock exhibit, in the following quarter
after being aquired by the fund, a 8.1% annualizedunderperformance. This means that the performanceof the funds would be higher had they bought thestock of the competitors instead. Moreover, fund
managers are shielded in the fact that Portuguesefund investors do not generally react to the perfor-mance exhibited by the fund (Alves and Mendes,
2007, 2008). This means that fund flows are notsensitive to the fund performance, which means thatthe mutual fund companies do not bear the costs oflower fund flows; the slightly lower management fees5
are compensated, at the conglomerate level, by theprofits related to the price sustentation of the parent’sstock. Thus, by not maximizing the value of the fundassets, there does not seem to exhist any relevant loss
of wealth for the mutual fund companies andmanagers.
This article is structured as follows. In the next sec-tion we present a brief overview of thePortuguese Market and the dataset. Sections III and
IV analyse fund portfolios, and buys and sales ofstocks, respectively. Some final remarks are inSection V.
2 Ferris and Yan (2007), for example, study agency conflicts that exist within a mutual fund in the context of Namesakemutual funds.3 In order to show how the main shareholders of a financial group can profit from shares held in collective investmentinstruments controlled by them, even when they are not very large, the Champalimaud family was found to clearly illustratethis occurrence. For several years, this family managed to hold 49% of the capital voting rights of Banco Totta & Acores; themere absence of the investment funds that were managed by that bank from the shareholders’ general assembly meetingsensured its complete control.4 Cohen and Schmidt (2007), in the context of mutual fund companies and 401(k) plan sponsors, also find evidence ofoverweighting, and rule out the information explanation as well.5 The Net Asset Value (NAV) of the fund is slightly lower due to underperformance.
1310 C. Alves and V. Mendes
Downloaded By: [Alves, Carlos] At: 10:47 10 August 2010

II. The Portuguese Market and Dataset
The Portuguese mutual fund law
The Portuguese capital markets law meets therequirements of the European and IOSCO standards.In items that are relevant for the present research,insider trading is prohibited and is enforced by thePortuguese Securities Commission (CMVM). ThePortuguese mutual funds law also observes interna-tional standards. For instance, fund startups requireregulatory approval. The same applies to prospectus,fund advertising, fee structure and performancedisclosure.
In terms of portfolio allocation, the Portuguese lawallows mutual funds to trade and hold their parent’sstock. Recognizing the potential conflict of interests,the legislation in force only allows the acquisition ofsecurities issued by the mutual fund company, or by acompany with which it has a control relationship, inthe event that they are listed companies. However,this norm only warns of the conflict regarding theprice and it does not prevent such conflict at the levelof the constitution, reinforcement or maintenance ofthose holdings.
The Portuguese market offers unique conditionsfor the study of this kind of conflicts of interest.6 Infact, most mutual fund companies are wholly-ownedsubsidiaries of larger financial institutions, and thehead of the conglomerate is (generally) a publiclytraded listed company. Mutual funds are allowed toinvest in the parent’s stock and the voting rights areexercised by the fund companies on behalf of thefund, but they are not required to inform the fundinvestors in advance on how they plan to vote thestock they hold in the portfolio. Moreover, the publicinformation available in Portugal is unlike that of anyother market, given that not only is the value of theportfolios managed by the funds and their composi-tion published monthly, but also the value of eachinvestment unit is published daily, meaning that it ispossible to monitor the fund portfolios on a monthlybasis.7 This is important for two reasons: firstly,if holdings are driven by superior information,
then transactions of this stock must be more frequent;secondly, the likelihood of ‘window dressing’(Lakonishok et al., 1991; O’Neal, 2001) is lesser inmarkets where financial information is disclosed on amonthly basis. Consequently, monthly portfoliosallow one to maximize the probability of analysingthe ‘true’ portfolios, and to find the ‘true’ assetallocation motivations.
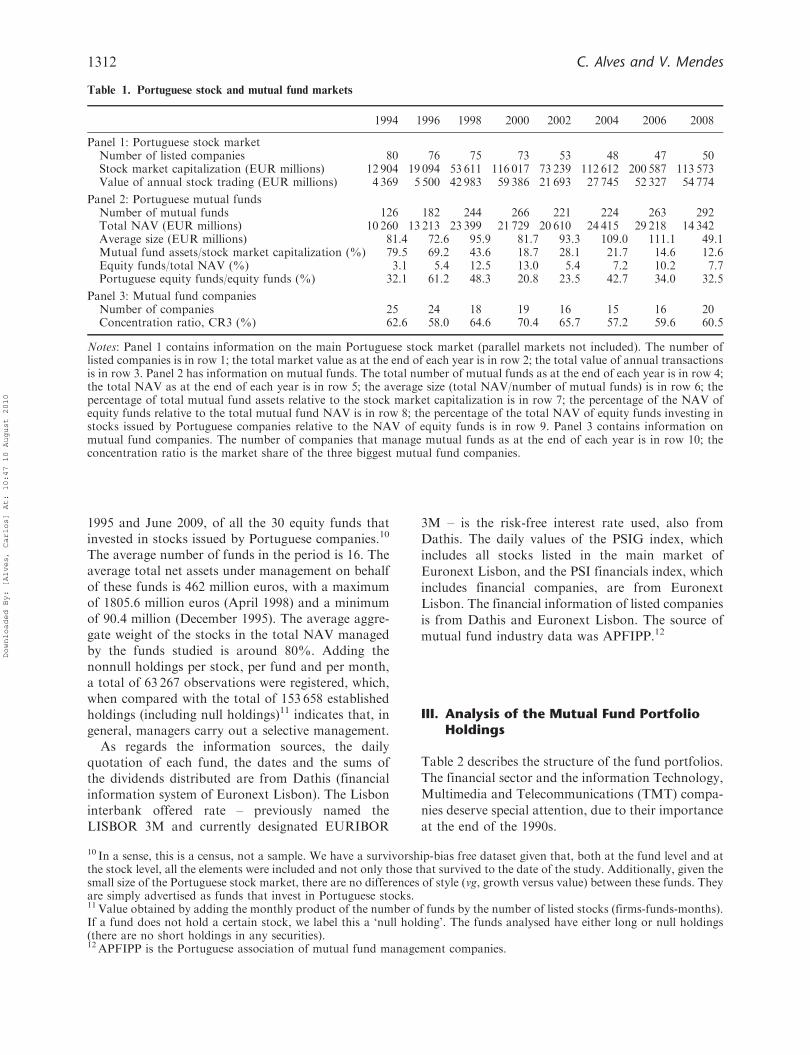
The Portuguese market
The Portuguese stock and mutual fund markets aresmall (Table 1). Nevertheless, its fund industry iscomparable to other European countries in someaspects. In France, for instance, the average fund sizewas USD 87 million in 1997, and equity fundsrepresented 11% of the total market value of funds(Otten and Schweitzer, 2002). These figures are notvery different from those for Portugal. Portuguesefunds are managed by specialized mutual fundcompanies. Each company manages a fund familythat, typically, includes one monetary fund, severalbond funds, one Portuguese equity fund, and someinternational equity funds.8 On average, between1994 and 2008 the number of funds per companywas 12, similar to the European average.9 The marketshare of the three largest mutual fund companies is ahigh 60.5% in Portugal in 2008, also similar to thelevels exhibited in other European countries (Ottenand Schweitzer, 2002).
The Portuguese market exhibits two relevant char-acteristics. Firstly, in general each company onlymanages one Portuguese equity fund. Secondly, thedistribution of funds throughout channels other thanbanks is virtually inexistent: banks are the primarypromoters and distributors of funds. These banks aresimultaneously the head of the conglomerate, thedepositary institutions and the fund distributors. Andthey are, in general, listed companies.
The dataset
We study mutual fund portfolios, reported at the endof each month, publicly disclosed between January
6Mutual fund research typically focusses on the US market for it is more mature. Nevertheless, the number of Europeanmutual funds surpasses the number of US mutual funds (Otten and Schweitzer, 2002).7However, mutual funds are only traded over-the-counter. As far as we know, Hungary is the only other country in the EUwhere portfolios are disclosed each month, but not for all mutual fund categories.8 In spite of the existence of fund families, the possibility of switch across different funds belonging to the same family at no(or negligible) cost is virtually inexistent. The existence of transaction costs dissuades mutual fund investors from transferringtheir money from one member of the family to another member (during our sample period, the back-end load fees applicablewere the same inside and outside the family). Inside each family, the Portuguese equity funds (funds that invested in shares ofstock issued by Portuguese companies) were managed independently from the other equity funds investing in foreign stocks(international equity funds).9 In 1997 there were 17 000 funds in Europe, managed by 1400 mutual funds companies (Otten and Schweitzer, 2002), or 12.1funds per company.
Mutual funds biased preference for the parent’s stock 1311
Downloaded By: [Alves, Carlos] At: 10:47 10 August 2010
1995 and June 2009, of all the 30 equity funds thatinvested in stocks issued by Portuguese companies.10
The average number of funds in the period is 16. Theaverage total net assets under management on behalfof these funds is 462 million euros, with a maximumof 1805.6 million euros (April 1998) and a minimumof 90.4 million (December 1995). The average aggre-gate weight of the stocks in the total NAV managedby the funds studied is around 80%. Adding thenonnull holdings per stock, per fund and per month,a total of 63 267 observations were registered, which,when compared with the total of 153 658 establishedholdings (including null holdings)11 indicates that, ingeneral, managers carry out a selective management.
As regards the information sources, the dailyquotation of each fund, the dates and the sums ofthe dividends distributed are from Dathis (financialinformation system of Euronext Lisbon). The Lisboninterbank offered rate – previously named theLISBOR 3M and currently designated EURIBOR
3M – is the risk-free interest rate used, also fromDathis. The daily values of the PSIG index, which
includes all stocks listed in the main market of
Euronext Lisbon, and the PSI financials index, which
includes financial companies, are from EuronextLisbon. The financial information of listed companies
is from Dathis and Euronext Lisbon. The source of
mutual fund industry data was APFIPP.12
III. Analysis of the Mutual Fund PortfolioHoldings
Table 2 describes the structure of the fund portfolios.
The financial sector and the information Technology,
Multimedia and Telecommunications (TMT) compa-
nies deserve special attention, due to their importance
at the end of the 1990s.
Table 1. Portuguese stock and mutual fund markets
1994 1996 1998 2000 2002 2004 2006 2008
Panel 1: Portuguese stock marketNumber of listed companies 80 76 75 73 53 48 47 50Stock market capitalization (EUR millions) 12 904 19 094 53 611 116 017 73 239 112 612 200 587 113 573Value of annual stock trading (EUR millions) 4 369 5 500 42 983 59 386 21 693 27 745 52 327 54 774
Panel 2: Portuguese mutual fundsNumber of mutual funds 126 182 244 266 221 224 263 292Total NAV (EUR millions) 10 260 13 213 23 399 21 729 20 610 24 415 29 218 14 342Average size (EUR millions) 81.4 72.6 95.9 81.7 93.3 109.0 111.1 49.1Mutual fund assets/stock market capitalization (%) 79.5 69.2 43.6 18.7 28.1 21.7 14.6 12.6Equity funds/total NAV (%) 3.1 5.4 12.5 13.0 5.4 7.2 10.2 7.7Portuguese equity funds/equity funds (%) 32.1 61.2 48.3 20.8 23.5 42.7 34.0 32.5
Panel 3: Mutual fund companiesNumber of companies 25 24 18 19 16 15 16 20Concentration ratio, CR3 (%) 62.6 58.0 64.6 70.4 65.7 57.2 59.6 60.5
Notes: Panel 1 contains information on the main Portuguese stock market (parallel markets not included). The number oflisted companies is in row 1; the total market value as at the end of each year is in row 2; the total value of annual transactionsis in row 3. Panel 2 has information on mutual funds. The total number of mutual funds as at the end of each year is in row 4;the total NAV as at the end of each year is in row 5; the average size (total NAV/number of mutual funds) is in row 6; thepercentage of total mutual fund assets relative to the stock market capitalization is in row 7; the percentage of the NAV ofequity funds relative to the total mutual fund NAV is in row 8; the percentage of the total NAV of equity funds investing instocks issued by Portuguese companies relative to the NAV of equity funds is in row 9. Panel 3 contains information onmutual fund companies. The number of companies that manage mutual funds as at the end of each year is in row 10; theconcentration ratio is the market share of the three biggest mutual fund companies.
10 In a sense, this is a census, not a sample. We have a survivorship-bias free dataset given that, both at the fund level and atthe stock level, all the elements were included and not only those that survived to the date of the study. Additionally, given thesmall size of the Portuguese stock market, there are no differences of style (vg, growth versus value) between these funds. Theyare simply advertised as funds that invest in Portuguese stocks.11 Value obtained by adding the monthly product of the number of funds by the number of listed stocks (firms-funds-months).If a fund does not hold a certain stock, we label this a ‘null holding’. The funds analysed have either long or null holdings(there are no short holdings in any securities).12APFIPP is the Portuguese association of mutual fund management companies.
1312 C. Alves and V. Mendes
Downloaded By: [Alves, Carlos] At: 10:47 10 August 2010

Both the banks and the financial companiespossess, in general, a NAV weight (Panel 1) that islower than the respective stock market capitalizationof Euronext Lisbon (Panel 2). The circumstances asto why the influence of financial institutions in thefunds is inferior to their market weight can beexplained by the agency theory. The routing of fundcapital for the acquisition of stock of other financialintermediaries would be materialized in the search forcompetitors’ stock and, consequently, their pricesustentation. Furthermore, Table 2 does not reportthe parent’s stock in fund portfolios. The (eventual)subordination of the choices of fund managers to theinterests of the parent would happen throughthe acquisition of the parent’s stock and not by theacquisition of stock of the other conglomerates. Thuspositions held in stocks of financial institutions(banks and insurance companies) of the conglomeratethe mutual fund company belongs to are identified.Only holdings in which the listed financial institutionholds directly or indirectly more than 50% of themutual fund company are considered, ignoring otherholdings in listed companies of the conglomerate.13
These holdings in stocks of the parent will be labelled‘H holdings’, ‘H stocks’ or ‘type H’.
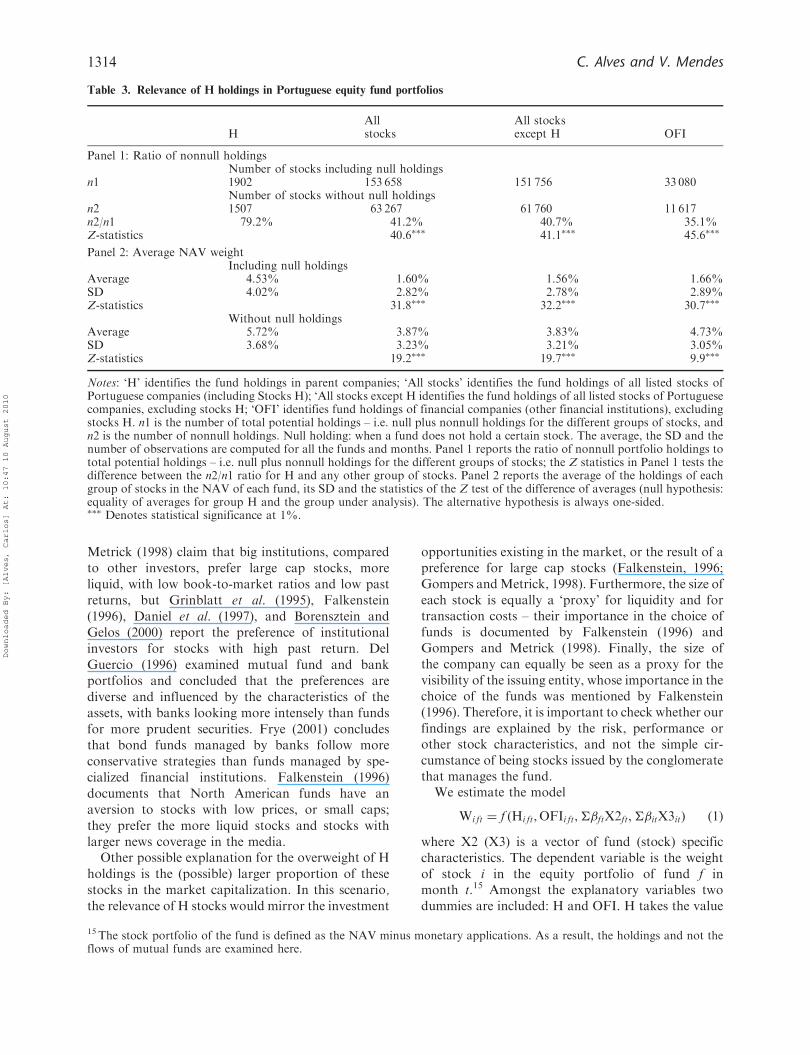
We find 1507 nonnull and 395 null holdings, tomake up a set of 1902 holdings of type H. It canimmediately be noted (Table 3 – Panel 1) that theratio of nonnull holdings (79.2%) is bigger than that
verified for the totality of the listed stocks including(41.2%) or excluding (40.7%) H holdings, and for theother holdings in financial intermediaries (OFI –35.1%). These differences are statistically significant.In other words, in more than three out of fourpossible occasions one finds H stocks in fundportfolios; for assets in general the frequency withwhich they enter nonnull holdings is two in five.Furthermore, the weight of H holdings in the NAV ofthe fund is superior to that verified for the other typesof stocks (Panel 2). On average, each H stockrepresents 4.53% (5.72%) of the NAV, if the nullholdings are (are not) considered.
On the other hand, the average of the other listedstocks is only 1.56% (3.83%) with (without) nullholdings, and the average position in financial assetsexcluding H holdings is 1.66% (4.73%) with (with-out) null holdings. The null hypothesis of equalaverages for H and the other stocks analysed isalways rejected, the weight of H stocks in the NAV ofthe fund being, on average, significantly superior tothe weight of other stocks.
How can we explain this tilting towards theparent’s stock and away from the competitors’stock? It could be the case that the overweightingresults from the different risk of the assets.14
Furthermore, several studies have shown that thechoices of institutional investors reflect preferencesfor other stock characteristics. Gompers and
Table 2. Portfolio allocations of the Portuguese equity funds (%)
1995 1997 1999 2001 2003 2005 2007 2009 [Jun] 1995–09 [Jun]
Panel 1: NAV weightFinancial companies 16.5 23.7 31.5 15.7 16.6 17.0 19.4 9.4 16.2Banks 15.1 20.0 25.6 15.7 16.6 17.0 19.2 9.4 15.6TMT 5.3 11.2 13.8 27.7 25.7 20.5 9.6 18.1 19.7Others 42.9 48.1 42.8 39.5 57.8 62.4 71.0 72.5 64.1
Panel 2: Stock market capitalization weightFinancial companies 47.6 40.6 38.5 32.7 33.7 27.1 29.2 16.4 27.6Banks 42.7 35.3 33.4 32.6 33.7 27.1 28.8 16.4 26.7TMT 3.2 18.0 19.1 29.5 29.5 26.2 18.3 14.6 23.0Others 49.3 41.4 42.3 37.8 36.9 46.7 52.5 69.0 50.2
Notes: ‘Financial companies’ identifies the financial sector firms; ‘Banks’ identifies the banks; ‘TMT’ identifies theinformation technology, multimedia and telecommunications companies; ‘Other Stocks’ identifies the firms that are notfinancial or TMT; Panel 1 has the average of the weights in the NAV, computed for each fund at the end of each month, forevery set of stocks (Financial companies, Banks, TMT and Other stocks). Panel 2 presents the average of the weights in thetotal stock market capitalization, computed for each fund at the end of each month, for every set of stocks (Financialcompanies, Banks, TMT and Other stocks). In Panel 1 the components do not add up to 100% because fund portfolios alsoinclude monetary applications.
13 Those positions are the relevant ones for the definition of the conglomerate’s strategy and for the re-election of the topmanagers of the parent company, given that the exercise of voting power in the other companies is directly or (in the majority)indirectly controlled by the parent.14 The importance of systematic risk in fund managers’ decisions is well documented by Brown et al. (1996), and risk-aversionis highlighted by Flavin (2006).
Mutual funds biased preference for the parent’s stock 1313
Downloaded By: [Alves, Carlos] At: 10:47 10 August 2010
Metrick (1998) claim that big institutions, comparedto other investors, prefer large cap stocks, moreliquid, with low book-to-market ratios and low pastreturns, but Grinblatt et al. (1995), Falkenstein(1996), Daniel et al. (1997), and Borensztein andGelos (2000) report the preference of institutionalinvestors for stocks with high past return. DelGuercio (1996) examined mutual fund and bankportfolios and concluded that the preferences arediverse and influenced by the characteristics of theassets, with banks looking more intensely than fundsfor more prudent securities. Frye (2001) concludesthat bond funds managed by banks follow moreconservative strategies than funds managed by spe-cialized financial institutions. Falkenstein (1996)documents that North American funds have anaversion to stocks with low prices, or small caps;they prefer the more liquid stocks and stocks withlarger news coverage in the media.
Other possible explanation for the overweight of Hholdings is the (possible) larger proportion of thesestocks in the market capitalization. In this scenario,the relevance of H stocks would mirror the investment
opportunities existing in the market, or the result of apreference for large cap stocks (Falkenstein, 1996;Gompers andMetrick, 1998). Furthermore, the size ofeach stock is equally a ‘proxy’ for liquidity and fortransaction costs – their importance in the choice offunds is documented by Falkenstein (1996) andGompers and Metrick (1998). Finally, the size ofthe company can equally be seen as a proxy for thevisibility of the issuing entity, whose importance in thechoice of the funds was mentioned by Falkenstein(1996). Therefore, it is important to check whether ourfindings are explained by the risk, performance orother stock characteristics, and not the simple cir-cumstance of being stocks issued by the conglomeratethat manages the fund.
We estimate the model
Wi ft ¼ f ðHi ft, OFIi ft,��ftX2ft,��itX3itÞ ð1Þ
where X2 (X3) is a vector of fund (stock) specificcharacteristics. The dependent variable is the weightof stock i in the equity portfolio of fund f inmonth t.15 Amongst the explanatory variables twodummies are included: H and OFI. H takes the value
Table 3. Relevance of H holdings in Portuguese equity fund portfolios
All All stocksH stocks except H OFI
Panel 1: Ratio of nonnull holdingsNumber of stocks including null holdings
n1 1902 153 658 151 756 33 080Number of stocks without null holdings
n2 1507 63 267 61 760 11 617n2/n1 79.2% 41.2% 40.7% 35.1%Z-statistics 40.6��� 41.1��� 45.6���
Panel 2: Average NAV weightIncluding null holdings
Average 4.53% 1.60% 1.56% 1.66%SD 4.02% 2.82% 2.78% 2.89%Z-statistics 31.8��� 32.2��� 30.7���
Without null holdingsAverage 5.72% 3.87% 3.83% 4.73%SD 3.68% 3.23% 3.21% 3.05%Z-statistics 19.2��� 19.7��� 9.9���
Notes: ‘H’ identifies the fund holdings in parent companies; ‘All stocks’ identifies the fund holdings of all listed stocks ofPortuguese companies (including Stocks H); ‘All stocks except H identifies the fund holdings of all listed stocks of Portuguesecompanies, excluding stocks H; ‘OFI’ identifies fund holdings of financial companies (other financial institutions), excludingstocks H. n1 is the number of total potential holdings – i.e. null plus nonnull holdings for the different groups of stocks, andn2 is the number of nonnull holdings. Null holding: when a fund does not hold a certain stock. The average, the SD and thenumber of observations are computed for all the funds and months. Panel 1 reports the ratio of nonnull portfolio holdings tototal potential holdings – i.e. null plus nonnull holdings for the different groups of stocks; the Z statistics in Panel 1 tests thedifference between the n2/n1 ratio for H and any other group of stocks. Panel 2 reports the average of the holdings of eachgroup of stocks in the NAV of each fund, its SD and the statistics of the Z test of the difference of averages (null hypothesis:equality of averages for group H and the group under analysis). The alternative hypothesis is always one-sided.��� Denotes statistical significance at 1%.
15 The stock portfolio of the fund is defined as the NAV minus monetary applications. As a result, the holdings and not theflows of mutual funds are examined here.
1314 C. Alves and V. Mendes
Downloaded By: [Alves, Carlos] At: 10:47 10 August 2010

of one if stock i is the parent, while OFI is one if stocki is a financial institution but is not the parent.
The performance of stock i in the 12 previousmonths (Alpha) is included as a regressor. It isproxied by the alpha estimate of the Carhart (1997)4-factor model.16 Likewise, the next period perfor-mance is considered (FAlpha); it controls for theeventual ability of fund managers to anticipatethe stock’s performance. The cross-productFAlphaitþ1 �Hift is also included. If funds invest inthe familiar because they are better informed abouttheir own parent firms, then this could explain thetilting towards parent company stocks.
A measure of the systematic risk of stock i (Beta)17
and the estimates of the HML, SMB and WMLcoefficients18 were equally included as regressors aswell as the weight of stock i in the market. In theory,diversified portfolios reflect the investment opportu-nities, for which reason it would be expected that theweight of each asset in the market plays a significantrole in determining its weight in the portfolio.Furthermore, small companies could benefit morefrom a given amount of overweighting and could alsouse portfolio bias as an unfriendly takeover defensemechanism. Given the imposed legal restrictions onthe composition of fund portfolios, it would not beprobable that the weight of each stock in the markethas a linear effect on the composition of the portfo-lios; it rather would be expected that the impact of thefirst 5% and (if this be the case) of the part thatexceeds 5% would be differentiated. Thus, twovariables are defined. WL5, which limits the weightin the market to a maximum of 5%, is computed as
WL5it ¼Min ðWMit, 5%Þ ð2Þ
where WMit corresponds to the weight of asset i inthe Euronext Lisbon in month t. In turn, WH5quantifies the weight in the market that goes beyondthe 5% limit.
As regards fund characteristics, we include thefund’s market share (MSft�1) in the equity fundssegment and the market share of the managementcompany (MSCft�1), both in the preceeding month.
In the context of the reduced size of the Portuguesemarket, the share of the management company canbe seen as an indicator of the size of the financialconglomerate. The size of the fund is used as a proxyfor the costs of acquiring information (Sirriand Tufano, 1998). The fund’s performance in thepreceeding year (FPAlpha), proxied by the Carhart’salpha, is also included. Mutual funds that haveperformed better in the past would be expected toexhibit more portfolio tilting because their betterperformance allows them more flexibility in deviatingfrom the optimal portfolio. Finally, the laggeddependent variable is included to control for theeventual sluggishness of the management.
Model (1) is estimated by Ordinary Least Squares(OLS), with clustered SEs. Stock-, month- and fund-specific dummy variables are also included. Resultsare in Table 4, column 1.19
The effect of H is positive and significant. We inferthat the interests of the parent are revealed by thechoices of the funds, at least with respect to the choiceof the relevant stocks for the exercise of power in theconglomerate. The OFI variable has a negative andsignificant coefficient, confirming the reluctance offunds to choose stocks of other financial conglomer-ates, implying a reduced propensity to channel theclients’ money to support the demand for the stocksof competitors.
The weight of each stock in the market has apositive and significant impact on the weight of theasset in the portfolio, and the impact on the first 5%(WL5) is greater than that of WH5. There does notexist preference for stocks with better past perfor-mances for the alpha and WML coefficients are notsignificant. On the contrary, there is preference forstocks with the highest systematic risk. As regards theother risk sources, preference for large cap andreduced book-to-market stocks seems clear.20 Thereis also evidence that fund managers are not able toanticipate performance, for the FAlpha coefficient isnonsignificant. There is no evidence as well that fundsinvest in the familial because they are better informedabout their own parent firms (the cross-product
16Continuous raw returns and the Jensen’s alpha were also tested, but results are similar and not reported.17 Proxied by an estimate of the Carhart’s beta.18HML quantifies the book-to-market effect and corresponds to the return of a portfolio that is long in high book-to-marketstocks and short in low book-to-market stocks; SMB measures the size effect, and corresponds to the return of a portfolio thatis long in small caps and short in big caps; WML measures the momentum effect, being therefore a return for a portfolio longin stock winners and short in recent losers.19A different procedure was used to test the robustness of our results. We performed OLS regressions for each month andfund, allowing the stock i to change from observation to observation. A methodology analogous to that of Fama andMacBeth (1973) was then used to compute the average of these individual estimates. Results (not reported) for the relevantvariables are similar.20 This result is in accordance with Lakonishok et al. (1994), who claim that institutional investors prefer glamour stocks, withhigh past returns and low book-to-market. Del Guercio (1996) states that the preference for large companies and (especially)for low book-to-market is especially true amongst banks and less intense amongst funds.
Mutual funds biased preference for the parent’s stock 1315
Downloaded By: [Alves, Carlos] At: 10:47 10 August 2010

Table 4. Mutual fund portfolio holdings regressions
[1] [2] [3]W WMC W
Constant �0.949��� �0.007 �0.95���
�7.51 �0.73 �7.51Alpha 0.001 �0.002 0.005
0.04 �0.51 0.26Alpha �H �0.125 0.074�� �0.110
�0.27 2.29 �0.24Beta 0.090��� 0.032��� 0.087���
6.72 17.21 6.58HML �0.016��� �0.010��� �0.015���
�5.75 �16.46 �5.59SMB �0.045��� �0.014��� �0.043���
�7.38 �14.22 �7.17WML �0.003 �0.001 �0.003
�0.98 �1.22 �0.91FAlpha �0.013 0.021 �0.016
�0.26 1.44 �0.31FAlpha �H �0.136 �0.056 �0.152
�1.07 �1.09 �1.18H 0.099��� 0.009�� 0.092���
2.81 2.15 2.61DUM 0.114���
6.03OFI �0.092��� �0.031��� �0.090���
�7.85 �20.84 �7.74WL5 0.164��� 0.002��� 0.162���
8.83 6.90 8.82WH5 0.043��� �0.005��� 0.044���
7.31 �21.71 7.38WH5 �H �0.020 �0.004��� �0.020
�1.60 �5.05 �1.61Dependentvariable t�1
0.837��� 0.099��� 0.836���
46.79 2.83 46.59MSft�1 �0.001 0.005��� �0.001
�1.05 19.29 �0.94MSCft�1 �0.0003 �0.0003��� �0.0003
�0.61 �3.62 �0.54FPAlpha �0.017 0.009 �0.015
�0.49 0.67 �0.44FPAlpha �H 0.079 �0.021 0.070
0.64 �0.54 0.56N 138 215 140 821 138 215R2 Adjusted 0.88 0.24 0.88
Notes: In columns 1 and 3, the dependent variable is W – the weight of stock i (i¼ 1, . . . , 111) in theequity portfolio value (monetary applications were excluded) of fund f ( f¼ 1, . . . , 30) in month t(t¼ 1, . . . , 90). In column 2 the dependent variable is WMC – the weight of stock i in the marketcapitalization of the stock. ‘H’ is a dummy variable, equal to 1 if the stock i is the parent’s stock;‘OFI’ is a dummy variable, equal to 1 if the stock i is a financial company but is not the parentcompany; ‘WL5’ is the minimum between the stock market capitalization weight of stock i and 5%;‘WH5’ is the maximum between the stock market capitalization weight of stock i minus 5% and 0;‘Alpha’ is the past performance computed via the Carhart model; ‘Beta’ represents the Carhartmodel’s betas; ‘HML’, ‘SMB’, and ‘WML’ are the regressors of the Carhart model for, respectively,the book-to-market, size and momentum effects; ‘FAlpha’ is the future performance computed viaCarhart’s model; ‘MS’ is the fund’s market share; ‘MSC’ is the market share of the managementcompany; ‘FPAlpha’ is the fund’s performance in the preceeding year, proxied by the Carhart’salpha. Values in italic are t-statistics. Stock-, month- and fund-specific dummy variables are alsoincluded as regressors.��� and �� denote statistical significance at 1 and 5%, respectively.
1316 C. Alves and V. Mendes
Downloaded By: [Alves, Carlos] At: 10:47 10 August 2010

FAlpha �H is not significant). The fund-specificvariables are not relevant, and the lagged dependentvariable is highly significant.
In short, we conclude that funds hold too muchstock of the parent company and this tilting is notexplained by a preference for size, book-to-market,momentum, or other stock and market characteris-tics. The preferences of mutual fund investors cannotexplain the tilting as well. In fact, in the Portuguesemarket equity fund investors do not have any controlover the investment decisions of fund managers.
We next perform robustness tests. As an alternativespecification for the dependent variable, we use theweight of each stock as a percentage of the marketcapitalization of the stock (WMC). Results are inTable 4, column 2. The basic conclusion regarding theoverweight of H stocks in funds’ portfolios ismaintained, and the underweight of OFI stocks isalso present. Finally, in the sample period, nine fundswere acquired by other mutual fund companies. Theportfolio holding changes around such events is veryuseful to test the agency relationship hypothesis.When a fund is acquired by another conglomerate,we would expect to observe an increase in the newparent’s shares.21 Thus, we create a new dummyvariable, DUM, equal to 1 if share i is the new parent,in every other month after the acquisition. Model (1)is reestimated with this additional variable (Table 4,column 3). The estimated DUM coefficient is positiveand highly significant. This means that the weight ofthe new parent’s stock increases after the acquisition,providing evidence in favour of the agency relation-ship hypothesis. Moreover, if we redefine this vari-able as being 1 in the 6 months after the acquisition,its estimated coefficient (results not shown) is asignificant 0.368, which, when compared with the0.114 exhibited in Table 4, means that the newparent’s weight strongly increases in the 6 monthsafter the acquisition; thereafter, the weight in theportfolio decreases. Thus, we observe an increase inthe new parent’s weight in fund portfolios and thisadjustment is particularly intense during the 6 monthsafter the acquisition.
IV. Analysis of the Mutual Funds’ Net Buysand Sales
Analysis of net sales
If one looks at the monthly (net) flows of investments(instead of holdings), during the sample period the
funds analysed bought stocks in 28 016 occasions(of which 688H and 5113 OFI) and sold stocks in 26058 occasions (of which 681H and 4548 OFI). Thedistribution of these operations amongst the differentpast performance quartiles evidences that, on aver-age, the intensity of the sales of OFI and other stockssurpasses the H-sales in all performance quartiles.This different behaviour can be interpreted as evi-dence that mutual funds try to influence the price ofH stocks.
We compute the relative intensity of sales as
ISitf ¼Sði, t, f Þ=Hði, t� 1, f ÞPKj ðtÞ
i¼1Sði, t, f Þ
Hði, t�1, f Þ
� �.Kj ðtÞ
ð3Þ
where ISitf represents the intensity of sales of stock i,in month t, by fund f; S(i, t, f) represents themonetary value of the (net) sales of stock i; H(i, t�1,f ) is the value held in stock i by fund f at the end ofmonth t�1; Kj(t) is the number of firms that in montht integrated performance quartile j ( j¼ 1, 2, 3 and 4).The numerator corresponds to the weight of the soldstock in the portfolio. The denominator gives theaverage ratio S(i, t, f)/H(i, t�1, f ) for all firms that inmonth t integrated performance quartile j.
On average, the intensity of the OFI and otherassets sales surpasses the H-sales in all performanceclasses (Table 5). Furthermore, for the OFI stocks,sales are more intense in the worst performance class(Quartile 4) than in Quartile 1. Regarding H stocks,the intensity of sales is higher when they exhibit bestperformances (Quartiles 1 and 2) and lower for worstperformances. This means that mutual funds sell loserstocks more intensely than winner stocks, if they areissued by competitors. However, funds exhibit theopposite behaviour vis-a-vis the parent’s stock.
In order to better understand if we can address thisbehaviour to self interest or to the better ability ofmutual funds at predicting the future return of Hstocks, we compare the future return of H stocks withthe return of the PSI Financial Index every time afund sells H stocks. If mutual funds sell H stocksmotivated by superior information or special skills inforecasting the future performance of the parent’sstock, we expect that the following period return ofthe parent is lower than the following period return ofthe PSI Financials. We find that in 51.49% (48.28%)of the cases the following quarter (year) return ofH-stocks is lower than the return of the PSIFinancials. These percentages are not statisticallydifferent than 50%, meaning that funds do notevidence special skills at forecasting the future returns
21And a reduction in the ex-parent’s stock. In all the nine cases, however, the process was a merger, meaning that there is noex-parent.
Mutual funds biased preference for the parent’s stock 1317
Downloaded By: [Alves, Carlos] At: 10:47 10 August 2010

of the parent’s stock when they sell this particularstock.
When funds sell OFI stock, in 51.16% (53.19%) ofthe cases the return of OFI shares in the followingquarter (year) is lower than the return of the PSIFinancials, which seems to evidence that funds arenot better at predicting the future returns of H stocksthan OFI stocks.
Analysis of net buys
Looking at buys, we compare the future return ofstocks bought with the future return of the PSIFinancials. We find that the following quarter (year)return of H stocks is lower than the return of the PSIFinancials in 53.42% (51.88%) of the cases.Moreover, comparing the following quarter returnof the shares bought with the return of the PSIFinancials, H stocks exhibit a �6.94% annualizedunderperformance. This means that the funds per-formance would be higher had they bought OFI stock(instead of stock of the parent). On the contrary, OFIstocks exhibit a 1.21% annualized overperformance.This evidence is consistent with self interestmotivations.
In order to further analyse this issue, we use themodel
WBUYi ft¼ fðEXPMi ft�1,EXMi ft,EXFQi ftþ1,NOBFit,
NOSFit,DEXMi ft,NCFft,WPMi ft�1Þ
ð4Þ
The dependent variable is the weight of the net buyvalue (null values included) of stock i (i¼H, OFI) inmonth t by fund f in the NAV of the fund. Theindependent variables are EXPM¼ excess return ofstock i (i.e. return of the stock minus the return of thePSI Financials) in the previous month, EXM¼ excessreturn of stock i in month t, EXFQ¼ excess return ofstock i in the following quarter, DEXM¼dummyvariable, equal to 1 if EXM is lower than the averageof EXMminus 1 SD, NOBF¼ number of other fundsthat also buy the stock, NOSF¼ number of fundsthat sell the stock, NCF¼ absolute capital flowsdivided by the NAV of the fund,22 andWPM¼weight of the previous month holding ofstock i in the NAV of the fund.
Model (4) is estimated by OLS, separately for Hand OFI stocks, with month- and fund-specificdummy variables and clustered SEs (Table 6). Weconclude that agency costs are one source of portfoliobias. In fact, the investment in the stock of the parentoccurs specially when there is widespread selling ofthe parent’s stock (that is, when the number of fundsselling the stock increases). Moreover, funds buymore intensely the parent’s stock when its return iswell below the average return of the PSI financials.Finally, there are signs that the intensity of buys ishigher when funds anticipate that the future excessreturn of the parent’s stock is negative (the EXFQcoefficient is negative but not significant). Theseresults provide partial support for the liquidityhypothesis: funds buy stocks of the parent when
Table 5. Distribution of sales of stocks by groups of stocks and performance
Quartile 1 (best) Quartile 2 Quartile 3 Quartile 4 (worst) (Quartile 1�Quartile 4)
Shares HAverage 0.61 0.65 0.52 0.44 0.16Z-statistics [1] �12.1��� �13.3��� �42.8��� �35.3��� 4:5���
N 99 301 228 53 681
All Except HAverage 1.01 1.02 1.02 1.02 �0.01Z-statistics [1] 0.07 0.22 0.39 0.13 �0:07Z-statistics [2] �3.94��� �4.01��� �9.87��� �4.13���
N 5894 6521 7455 5507 25 377
Shares OFIAverage 0.67 0.83 0.73 0.86 �0.18Z-statistics [1] �8.84��� �2.13�� �3.62��� �0.83 �1:05Z-statistics [2] �1.40� �2.19�� �2.72��� �2.41���
N 790 1755 1538 465 4548
Notes: This table includes total sales for all mutual funds and all months. Sales and purchases correspond to the difference(positive in the first case and negative in the second) between the number of shares in the portfolio in two consecutive months,ignoring therefore the purchases and the sales that are mutually compensated every month, as there does not exist a report onthese operations.�, �� and ��� denote statistical significance at 1, 5 and 10%, respectively.
22 To calculate NCF we follow the money approach (Gruber, 1996).
1318 C. Alves and V. Mendes
Downloaded By: [Alves, Carlos] At: 10:47 10 August 2010

returns are negative (Coval and Stafford, 2007). Asregards the buys of the competitors’ stock, besides the‘herding behaviour’ noticed, three relevant variablesare the previous month, the month and the followingquarter excess returns. This means that funds buythe stocks of the competitors when they experiencehigher performance. However, there is not anyattempt to support its price when it is depressed bymarket sales.
V. Conclusions
We study the portfolios of the Portuguese equityfunds in the period January 1995 to June 2009 and
conclude that funds hold too much stock of theparent. In fact, not only was it shown that H-stocksare more frequently selected for the portfolios of thefunds than any other stocks, but also the averageweight of the parent stock significantly exceeds theweight of the other stocks. This excessive weight isnot justified by risk diversification, past performance,systematic risk, size, book-to-market and momentumeffects, nor by the structure of the market. We alsodid not find evidence that funds invest in the familialbecause they are better informed about the parent.Other financial assets are insufficiently represented infunds’ portfolios; other financial intermediaries’ stockis less frequently and less intensely selected because itis issued by competitors.
One possible explanation for the biased fundportfolios is the own interest of the parent. Theholding of the parent’s stock favours the financialconglomerate where the mutual fund is managed.When buying the parent’s stock, the mutual fundwithdraws these securities from the market, prevent-ing them from being acquired by hostile investors. Atthe same time, the number of shares that the parentdirectors and the main shareholders need to hold intheir own portfolio to approve resolutions in theparent’s shareholders meetings diminishes. In fact, inPortugal, the mutual fund companies (not the fundinvestors) determine the vote of the stocks held in theportfolio. This voting right can be subordinated tothe will of the parent.
We find evidence that not only funds hold toomuch of the parent’s stock but also the investment inthe parent occurs especially when there is widespreadselling of the parent’s stock. This agency relationshipis costly for mutual fund investors: compared withthe stock of competitors, the parent’s stock exhibits a8.1% annualized underperformance after beingaquired by the fund. This means that the performanceof the funds would be higher had they bought thestock of the competitors instead. The absence ofmaximization of the value of the fund assets does notseem to encompass any relevant loss of wealth for themutual fund companies and managers becausePortuguese fund investors do not generally react tothe fund performances.
Our results support the idea that the managersof the mutual fund companies must act independentlyin the pursuit of the fund investors’ interests, and thatthe mutual fund companies must inform the marketthe reasons underlying the exercise of voting rights infirms they hold in their portfolios. These two mea-sures contribute to an increase in transparency in theexercising of voting rights, and to the potentialalignment of the exercise of these rights with theinterests of the fund investors, without eliminating
Table 6. Mutual fund buys regressions
[1] [2]H OFI
Constant 1.339� 0.694���
1.67 3.76EXPM �0.442 0.245���
�1.33 5.47EXM 0.750�� 0.309���
2.10 5.97EXFQ �0.204 0.094���
�1.53 5.06NOBF 0.047��� 0.033���
4.32 25.42NOSF 0.013� 0.000
1.64 0.17DEXM�NOSF 0.012�� 0.002
2.16 1.23NCF 0.424� 0.095���
1.81 3.86WPM �1.364 1.699���
�1.00 5.88N 1730 31 458R2 Adjusted 0.15 0.21
Notes: In column 1 the dependent variable is the weight ofthe net buy value of H stocks in month t by fund f in theNAV of the fund; in column 2 the dependent variable is theweight of the net buy value of OFI stocks in month t byfund f in the NAV of the fund. EXPM is the excess returnof the stock in the previous month; EXM is the excessreturn of the stock in the month; EXFQ is the excess returnof the stock in the following quarter; DEXM is a dummyvariable, equal to 1 if the return of the stock is lower thanthe average excess return minus one SD; NOBF is thenumber of other funds that also buy the stock; NOSF is thenumber of funds that sell the stock; NCF is the normalizedcapital flows and WPM is the weight of the previous monthholding of the stock in the NAV of the fund. Values in italicare t-statistics. Month- and fund-specific dummy variablesare also included.�, �� and ��� denote statistical significance at 1, 5 and 10%,respectively.
Mutual funds biased preference for the parent’s stock 1319
Downloaded By: [Alves, Carlos] At: 10:47 10 August 2010

‘per se’ the possible agency costs. Our results alsosupport the idea that the managers must inform themarket about their investment policy regarding thestocks issued by their parent company.
Acknowledgements
The views stated in this article are those of the authorand are not necessarily those of the PortugueseSecurities Commission. CEF.UP and CEFAGE-UEare supported by FCT through POCTI of theQCAIII, which is financed by FEDER andPortuguese funds.
References
Alves, C. and Mendes, V. (2007) Are mutual fund investorsin jail?, Applied Financial Economics, 17, 1301–12.
Alves, C. and Mendes, V. (2008) Does performance explainmutual fund flows in small markets? The case ofPortugal, paper presented at 2008 FMA AnnualMeeting Program, Dallas, TX.
Borensztein, E. and Gelos, R. (2000) A panic-prone pack?The behavior of emerging market mutual funds, IMFWorking Paper No. WP/00/198, InternationalMonetary Fund.
Brown, K., Harlow, W. and Starks, L. (1996) Of tourna-ments and temptations: an analysis of managerialincentives in the mutual fund industry, Journal ofFinance, 51, 85–110.
Carhart, M. (1997) On persistence in mutual fund perfor-mance, Journal of Finance, 52, 57–82.
Carhart, M., Kaniel, R., Musto, D. and Reed, A. (2002)Leaning for the tape: evidence of gaming behavior inequity mutual funds, Journal of Finance, 57, 661–94.
Chevalier, J. and Ellison, G. (1997) Risk taking by mutualfunds as a response to incentives, Journal of PoliticalEconomy, 105, 1167–201.
Cohen, L. and Schmidt, B. (2007) Attracting flows byattracting big clients: conflict of interest and mutualfund portfolio choice, Working Paper, HarvardBusiness School.
Coval, J. and Stafford, E. (2007) Asset fire sales (andpurchases) in equity markets, Journal of FinancialEconomics, 86, 479–512.
Daniel, K., Grinblatt, M., Titman, S. and Wermers, R.(1997) Measuring mutual fund performance withcharacteristic-based benchmarks, Journal of Finance,52, 1035–58.
Del Guercio, D. (1996) The distorting effect of the prudent-man laws on institutional equity investments,Journal of Financial Economics, 40, 31–62.
Falkenstein, E. (1996) Preferences for stock characteristicsas revealed by mutual fund portfolio holdings,Journal of Finance, 51, 111–35.
Fama, E. and MacBeth, J. (1973) Risk, return, andequilibrium: empirical tests, Journal of PoliticalEconomy, 71, 607–36.
Ferris, S. P. and Yan, X. (2007) Agency conflicts indelegated portfolio management: evidence fromNamesake mutual funds, Journal of FinancialResearch, 30, 473–94.
Flavin, T. (2006) How risk averse are fund managers?Evidence from Irish mutual funds, Applied FinancialEconomics, 16, 1355–63.
Frye, M. (2001) The performance of bank-managedmutual funds, Journal of Financial Research, 24,419–42.
Gompers, P. and Metrick, A. (1998) How are largeinstitutions different from other investors? Why dothese differences matter for equity prices and returns?,Working Paper Series No. 1830, Harvard University,Cambridge, Massachusetts.
Grinblatt, M., Titman, S. and Wermers, R. (1995)Momentum investment strategies, portfolio perfor-mance, and herding: a study of mutual fund behavior,American Economic Review, 85, 1088–105.
Gruber, M. (1996) Another puzzle: the growth in activelymanaged mutual funds, Journal of Finance, 51,783–810.
Lakonishok, J., Schleifer, A., Thaler, R. and Vishny, R.(1991) Window dressing by pension fund managers,American Economic Review, 81, 227–31.
Lakonishok, J., Shleifer, A. and Vishny, R. (1994)Contrarian investment, extrapolation, and risk,Journal of Finance, 49, 1541–78.
Nikiforow, M. (2010) Does training on behaviouralfinance influence fund managers’ perception andbehaviour?, Applied Financial Economics, 20, 515–28.
O’Neal, E. (2001) Window dressing and equity mutualfunds, Working Paper, Babcock Graduate School ofManagement, Wake Forest University.
Otten, R. and Schweitzer, M. (2002) A comparison betweenthe European and the US mutual fund industry,Managerial Finance, 28, 14–35.
Sirri, E. and Tufano, P. (1998) Costly search and mutualfund flows, Journal of Finance, 53, 1589–622.
1320 C. Alves and V. Mendes
Downloaded By: [Alves, Carlos] At: 10:47 10 August 2010