Are Islamic mutual funds exposed to lower risk compared to ...
19
Are Islamic mutual funds exposed to lower risk compared to their conventional counterparts? Empirical evidence from Pakistan Farrukh Naveed and Idrees Khawaja Air University School of Management (AUSOM), AIR University, Islamabad, Pakistan, and Lubna Maroof Department of Business Studies, Bahria University, Islamabad, Pakistan Abstract Purpose – This study aims to comparatively analyze the systematic, idiosyncratic and downside risk exposure of both Islamic and conventional funds in Pakistan to see which of the funds has higher risk exposure. Design/methodology/approach – The study analyzes different types of risks involved in both Islamic and conventional funds for the period from 2009 to 2016 by using different risk measures. For systematic and idiosyncratic risk single factor CAPM and multifactor models such as Fama French three factors model and Carhart four factors model are used. For downside risk analysis different measures such as downside beta, relative beta, value at risk and expected short fall are used. Findings – The study finds that Islamic funds have lower risk exposure (including total, systematic, idiosyncratic and downside risk) compared with their conventional counterparts in most of the sample years, and hence, making them appear more attractive for investment especially for Sharīʿah-compliant investors preferring low risk preferences. Practical implications – As this study shows, Islamic mutual funds exhibit lower risk exposure than their conventional counterparts so investors with lower risk preferences can invest in these kinds of funds. In this way, this research provides the input to the individual investors (especially Sharīʿah-compliant investors who want to avoid interest based investment) to help them with their investment decisions as they can make a more diversified portfolio by considering Islamic funds as a mean for reducing the risk exposure. Originality/value – To the best of the author’s knowledge, this study is the first attempt at world level in looking at the comparative risk analysis of various types of the risks as follows: systematic, idiosyncratic and © Farrukh Naveed, Idrees Khawaja and Lubna Maroof. Published in ISRA International Journal of Islamic Finance. Published by Emerald Publishing Limited. This article is published under the Creative Commons Attribution (CC BY 4.0) licence. Anyone may reproduce, distribute, translate and create derivative works of this article (for both commercial and non-commercial purposes), subject to full attribution to the original publication and authors. The full terms of this licence may be seen at http://creativecommons.org/licences/by/4.0/legalcode The current research also provides input to the fund managers. As this study showed that Islamic mutual funds have lower risks compared to their conventional counterparts, fund managers can focus on launching Islamic mutual funds to attract risk-averse Sharīʿah-compliant investors. The managers in conventional investment firms should also deal with Islamic funds along with their conventional peers. Islamic mutual funds 69 Received 19 January 2019 Revised 5 February 2019 22 May 2019 25 February 2020 4 March 2020 Accepted 6 March 2020 ISRA International Journal of Islamic Finance Vol. 12 No. 1, 2020 pp. 69-87 Emerald Publishing Limited 0128-1976 DOI 10.1108/IJIF-01-2019-0012 The current issue and full text archive of this journal is available on Emerald Insight at: https://www.emerald.com/insight/0128-1976.htm
-
Upload
khangminh22 -
Category
Documents
-
view
4 -
download
0
Transcript of Are Islamic mutual funds exposed to lower risk compared to ...

Are Islamic mutual funds exposedto lower risk compared to theirconventional counterparts?Empirical evidence from Pakistan
Farrukh Naveed and Idrees KhawajaAir University School of Management (AUSOM),
AIR University, Islamabad, Pakistan, and
Lubna MaroofDepartment of Business Studies, Bahria University, Islamabad, Pakistan
AbstractPurpose – This study aims to comparatively analyze the systematic, idiosyncratic and downside riskexposure of both Islamic and conventional funds in Pakistan to see which of the funds has higher riskexposure.Design/methodology/approach – The study analyzes different types of risks involved in both Islamicand conventional funds for the period from 2009 to 2016 by using different risk measures. For systematic andidiosyncratic risk single factor CAPM and multifactor models such as Fama French three factors model andCarhart four factors model are used. For downside risk analysis different measures such as downside beta,relative beta, value at risk and expected short fall are used.Findings – The study finds that Islamic funds have lower risk exposure (including total, systematic,idiosyncratic and downside risk) compared with their conventional counterparts in most of the sample years,and hence, making them appear more attractive for investment especially for Sharīʿah-compliant investorspreferring low risk preferences.Practical implications – As this study shows, Islamic mutual funds exhibit lower risk exposure thantheir conventional counterparts so investors with lower risk preferences can invest in these kinds of funds.In this way, this research provides the input to the individual investors (especially Sharīʿah-compliantinvestors who want to avoid interest based investment) to help them with their investment decisions asthey can make a more diversified portfolio by considering Islamic funds as a mean for reducing the riskexposure.Originality/value – To the best of the author’s knowledge, this study is the first attempt at world level inlooking at the comparative risk analysis of various types of the risks as follows: systematic, idiosyncratic and
© Farrukh Naveed, Idrees Khawaja and Lubna Maroof. Published in ISRA International Journal ofIslamic Finance. Published by Emerald Publishing Limited. This article is published under theCreative Commons Attribution (CC BY 4.0) licence. Anyone may reproduce, distribute, translate andcreate derivative works of this article (for both commercial and non-commercial purposes), subject tofull attribution to the original publication and authors. The full terms of this licence may be seen athttp://creativecommons.org/licences/by/4.0/legalcode
The current research also provides input to the fund managers. As this study showed that Islamicmutual funds have lower risks compared to their conventional counterparts, fund managers canfocus on launching Islamic mutual funds to attract risk-averse Sharīʿah-compliant investors. Themanagers in conventional investment firms should also deal with Islamic funds along with theirconventional peers.
Islamic mutualfunds
69
Received 19 January 2019Revised 5 February 2019
22May 201925 February 2020
4March 2020Accepted 6March 2020
ISRA International Journal ofIslamic Finance
Vol. 12 No. 1, 2020pp. 69-87
EmeraldPublishingLimited0128-1976
DOI 10.1108/IJIF-01-2019-0012
The current issue and full text archive of this journal is available on Emerald Insight at:https://www.emerald.com/insight/0128-1976.htm

downside risk, for both Islamic and conventional funds, and thus, provides significant contribution in theliterature of mutual funds.
Keywords Downside risk, Systematic risk, Islamic mutual funds, Idiosyncratic risk, Total risk,Mutual fund
Paper type Research paper
IntroductionMutual funds are considered an important method of investment. They represent an indirectway to invest for individual investors who do not possess relevant knowledge and expertiseto invest directly. Different asset management firms exist, which collect money fromindividual investors for the purpose of investment in different securities. There is a growingtrend in the mutual funds industry of Pakistan for asset management firms to have bothIslamic and conventional funds. Investors are more interested in risk and return analyses ofmutual funds because they make investment decisions on these bases. Although mutualfunds are good investment vehicles, they are not free from risk. They involve various kindsof risks such as market risk, fund-specific risk, downside risk and others. Sharīʿah-compliance risk is also involved in Islamic mutual funds.
In case of systematic or market risk, the fund faces financial losses due to the uncertaintyinherent in the entire market. This kind of risk cannot be reduced by proper diversificationbecause it occurs due to factors beyond the control of asset management firms; for example,inflation, change of interest rate, bad economic conditions, etc. (Hayat and Kraeussl, 2011).Vidal-García and Vidal (2014) stated that mutual funds are also prone to idiosyncratic orfund-specific risk. Fund-specific risk is the risk associated with particular funds and is not aphenomenon of the whole market. This type of risk varies from fund to fund. It can bereduced by diversification because it occurs due to micro-economic factors that can becontrolled and managed by fund managers. Finally, mutual funds are also exposed todownside risk. Downside risk is the probability of losses associated with the mutual fundsin case of a decline in the market. In simple words, it is the financial risk associated withlosses.
Both risk and return are important considerations for investors, which provide themwithinput to make investment decisions. Therefore, previous studies analyzed the risk andreturn characteristics of mutual funds in different countries of the world (Hayat andKraeussl, 2011; Boo et al., 2017). However, most of these studies provide a separate analysisof the performance and risk of mutual funds. Although, previous studies such as Ashraf(2013) and Boo et al. (2017) comparatively analyzed the performance of both Islamic andconventional mutual funds, these studies did not pay attention to comparatively analyze therisk exposure of these funds.
Investors have various risk preferences, and therefore, they want to know about the riskexposure of mutual funds to make investment decisions. Sharīʿah-compliant investors aremore sensitive to risk exposures. They want to invest in funds, which are Sharīʿah-compliant on the one hand and are exposed to lower risk on the other. Therefore, acomparative risk analysis of both Islamic and conventional mutual funds is required toinform investors about the funds having low risk exposures.
Unfortunately, the literature does not explore this issue in detail and studies thatundertake comparative risk analysis of mutual funds are rare. Reddy et al. (2017) took theinitiative to comparatively analyze the risk exposure of mutual funds, but their study waslimited only to the systematic risk exposure of mutual funds. Vidal-García et al. (2016)analyzed the idiosyncratic risk exposure of mutual funds, but their study was limited to
IJIF12,1
70

conventional funds. Rodriguez (2015) analyzed the total and systematic risk exposures ofmutual funds, but his study only focussed on conventional mutual funds. Hayat andKraeussl (2011) attempted to analyze the systematic and downside risk exposures of mutualfunds, but they only looked at Islamic funds and did not compare the risks of Islamic andconventional funds to see which kind of fund has lower risk exposures.
Therefore, this study aims to compare the total, systematic, idiosyncratic and downsiderisk exposures of Islamic funds with their conventional counterparts to see which one hashigher risk exposures. This study is different from previous studies conducted on mutualfund risk exposures in the sense that it provides a comparative risk analysis of both Islamicand conventional funds including total, systematic, idiosyncratic and downside risk. To thebest of our limited knowledge, this study is the first attempt to comparatively analyzevarious types of risks involved in both kinds of funds and thus makes a significantcontribution to the literature.
Therefore, it is worthwhile to explore the mutual funds industry of Pakistan and addressvarious issues involved in it. The rest of the paper is organized as follows. Afterdifferentiating between Islamic and conventional mutual funds, as well as giving an insightinto the mutual funds industry in Pakistan, the next section reviews the previous literatureand presents the hypothesis. The research methodology is described in the followingsection. The paper then presents the study results, while the conclusion and studyimplications are provided in the last section.
Islamic vs conventional mutual fundsMutual funds are classified in two different categories. Some are conventional funds, whichhave a long history and acceptance by investors, while others are Islamic funds, which areconsidered a relatively new phenomenon. Islamic funds differ from conventional funds onmany bases. The basic difference is that Islamic funds follow investment rules prescribed bythe Sharīʿah (Islamic law). Before making investments, Islamic funds ensure that the modeof operation and capital structure of each business is Sharīʿah compliant. Islamic mutualfunds do not make investments in businesses that are prohibited by the Sharīʿah such asalcohol, tobacco, biotechnology for human cloning, arms/weapons and companies whosecapital structure relies heavily on debt to avoid dealing with interest. Islamic mutual fundsexclude investment in fixed capital instruments such as corporate bonds, certificates ofdeposits, warrants and some derivatives such as put and call options. The invested fundsmust also be free from interest-based debt, speculation, maysir (gambling) and gharar(excessive uncertainty).
Bin Mahfouz and Ahmed (2014) stated that Islamic scholars have developed Sharīʿahscreening criteria for analyzing the Sharīʿah-compliance of Islamic funds. The Sharīʿahscreening criteria are divided into two categories, namely, qualitative or sector screeningand quantitative or financial screening. To be considered a Sharīʿah-compliant fund, anIslamic mutual fund must pass both of these criteria. Under the qualitative or sectorscreening, it is seen that mutual funds invest in the assets of those companies or sectorswhose primary business is Sharīʿah-compliant and which do not produce or sell Sharīʿah-restricted products or services such as tobacco, alcohol, gambling and weapons. Similarly,Islamic funds cannot make investments in companies that are directly involved in interest orgharar (uncertainty). Therefore, Islamic mutual funds in Pakistan do not invest in the sharesof conventional banks and insurance companies.
Islamic mutual funds must also comply with the quantitative or financial screeningcriteria (Ghoul and Karam, 2007). The financial screening criteria exclude investment incompanies having high levels of debt, liquidity and interest-based investment. The
Islamic mutualfunds
71

Accounting and Auditing Organization for Islamic Financial Institutions (AAOIFI)proposed some financial screening ratios. Islamic mutual funds only invest in firmswhere these ratios are in the prescribed range. If these ratios exceed the range prescribedby Sharīʿah scholars, then investment in the company is prohibited. These ratios includedebt to market capitalization ratio, cash and interest-bearing securities to marketcapitalization ratio, and finally cash and account receivables to market capitalizationratio. Total assets can also be used in place of market capitalization. According toAAOIFI’s Investment Standard, the collective amount of the debt should not exceed 33per cent of the total market capitalization of the firm. This restriction is imposed to makesure that the firm does not have an excessive level of debt because interest-based debtsare forbidden in Islam. Therefore, Islamic mutual funds cannot make investment in theshares of a firm, which has raised interest-based debt more than 33 per cent of its marketcapitalization.
The second important financial screening criterion is cash and interest-bearing securitiesto market capitalization ratio. This ratio ensures that investment in interest-bearingsecurities is at an acceptable level. According to Sharīʿah investment rules, investment isforbidden in fixed-income securities such as treasury bills, corporate bonds, governmentbonds, certificates of deposits and preferred stock. AAOIFI prescribed that the total amountof interest-taking deposits should not exceed 33 per cent of the firm’s market capitalization.Therefore, Islamic mutual funds cannot invest in shares of a firm where interest-takingdeposits exceed 33 per cent of market capitalization or total assets. For example, as of 2017,the Meezan Islamic Fund (one of the premier Islamic funds in Pakistan) invested in cement,petroleum, oil and gas and fertilizer companies where the debt to asset ratio was 7.81 percent, 5.85 per cent, 0.00 per cent and 23.5 per cent, respectively. Similarly, the cash andinterest-bearing securities to market capitalization ratio of these companies was 15.66 percent, 0.00 per cent, 22.29 per cent and 25.07 per cent, respectively. All these ratios are in theprescribed range, which shows the Sharīʿah-compliance of Meezan Islamic Fund. Similarly,other Islamic mutual fund ratios are also in the acceptable range.
Finally, the third important financial screening criterion is cash and account receivablesto market capitalization ratio. According to the Sharīʿah rules, all liquid assets such as cashand account receivables (debt) must be traded at par value and cannot be traded above orbelow par. That is to avoid interest. Therefore, if any firm has the majority of its assets inthe form of cash or account receivables (debts), its shares can only be traded at par value(Khatkhatay and Nisar, 2006). The cash and account receivables to market capitalizationratio criterion is imposed to avoid investment in firms whose liquid assets (cash and accountreceivables) are traded above or below par. AAOIFI prescribed that total value of the firm’stangible assets should not be less than 30 per cent of its total assets. Therefore, Islamicmutual funds can make investments only in those firms whose cash and account receivablesto market capitalization ratio is at an acceptable level.
After all these restrictions, if some portion of the firm’s income is generated by activitiesimpermissible in Sharīʿah, it must be purified by applying the necessary purificationprocess to make sure that the income generated by impermissible ways is excluded fromtotal income.
Conventional funds, on the other hand, do not follow these Sharīʿah investment rules andregulations. Islamic funds are gaining popularity, especially in Muslim countries becauseMuslims are not allowed to invest in interest-based products. Islamic funds are speciallydesigned to meet the increasing demand for Sharīʿah-compliant investments by Musliminvestors.
IJIF12,1
72

An insight into the mutual funds industry in PakistanA growing trend in the mutual fund industry of Pakistan has been seen from the last decade,which is presented in Figure 1. In this era, different new funds were launched, includingboth Islamic and conventional funds. The mutual funds industry of Pakistan contributesabout 9.6 per cent share in the global Islamic mutual funds industry and is considered in thetop five in the global Islamic mutual fund industry based on the number of funds and assetsunder management. Pakistan has 124 Islamic mutual funds with assets under managementequal to US$2.6bn (as of 2017), which is the fourth largest share in the global Islamic mutualfund industry, after Malaysia, Saudi Arabia and Luxembourg. Malaysia and Saudi Arabiacontribute significantly to the global Islamic mutual funds industry but the majority of theirinvestment is limited to money market and equity funds. Luxembourg invests primarily incommodity-based Islamic funds. In contrast, asset management firms in Pakistan haveinvested in a variety of Islamic mutual funds, including equity, money market, assetallocation, balanced, growth, index tracker, commodity, pension, cash and fixed income.
Literature reviewAsmentioned above, various kinds of risks are involved in mutual funds. Therefore, variousstudies have been conducted which measured different kinds of fund risks using variousrisk measures. Studies such as Lhabitant (2001), Rodriguez (2015), Namvar et al. (2016) andHuang et al. (2017) analyzed the systematic risk exposure of conventional mutual fundsusing a single-factor capital asset pricing model (CAPM)or multifactor models. Themultifactor models proposed by Fama and French (1993) and Carhart (1997) are widely usedfor analyzing the systematic risk exposure of mutual funds and various securities. Bali et al.(2014) analyzed hedge funds’ exposure to different measures of macroeconomic risk that areinterpreted as measures of economic uncertainty. In their earlier study, Bali et al. (2012) alsoanalyzed the systematic risk behaviour of hedge funds using three-factor and four-factormodels by taking a large data set of hedge funds. They also analyzed how systematic riskexplains the cross-sectional variation in these funds and concluded that fund returns arepositively associated with systematic risk. Huang et al. (2017) provided the empiricalevidence that hedge funds are also exposed to systematic risk. They further stated that theperformance of these funds is based on the direction of systematic risk exposure.
Figure 1.Growth of the Mutual
Funds Industry inPakistan
Islamic mutualfunds
73

Yang and Hou (2016) analyzed the relationship between mutual fund pay-performancesensitivity and risk. They concluded that fund risk (measured by volatility of returns) ispositively associated with pay performance. Philpot and Peterson (2006) analyzed themarket risk exposure of different funds by using the CAPM model. They also analyzed thefunds’ systematic risk determinants and found that management fee, tenure and turnoversignificantly explain the funds’ systematic risk. Bryant and Liu (2011) investigated theimpact of funds’ management structure on their risk exposure and found that team-managed funds have higher risk exposure than their risk-adjusted peers. Marco et al. (2011)comparatively analyzed the risk-taking behaviour of ethical and conventional mutual funds.They also analyzed how managerial compensation and incentives influence the risk of thesefunds. The study found significant difference in the risk-taking behaviour of these funds.Dwyer et al. (2002) analyzed the impact of gender diversity on the risk-taking behaviour ofmutual funds and found that female managers take less risk compared to male fundmanagers.
Some other studies analyzed the idiosyncratic risk-taking behaviour of mutual funds.Wang (2011) studied the idiosyncratic risk of mutual funds and found that the funds havinglow idiosyncratic risk and high alpha have greater performance than the funds having lowidiosyncratic risk and low alpha. Vidal-García et al. (2016) analyzed the idiosyncratic riskinvolved in mutual funds and its impact on fund returns. They found that idiosyncratic risksignificantly determines the mutual funds’ returns. Vidal-García and Vidal (2014) analyzedthe idiosyncratic risk involved in mutual funds using Fama and French’s (1993) three-factormodel. They also investigated how this specific risk determines the fund performanceseasonality and found that it does not significantly explain the seasonality in fundperformance. A unique contribution in the literature is made by Gao et al. (2017) as theyinvestigated the idiosyncratic risk involved in mutual funds along with analyzing theimpact of local religious beliefs on it. They found that local religiosity negatively affects theidiosyncratic risk of mutual funds. Wagner and Winter (2013) also analyzedthe idiosyncratic risk of mutual funds using a newly proposed liquidity-adjusted multifactormodel.
Bodnaruk et al. (2019) investigated the downside risk and downside risk timing ability ofconventional mutual funds. They found positive downside risk timing ability in mutualfunds. Baghdadabad and Glabadanidis (2013) used downside risk-adjusted performancemeasures for performance analysis, including drawdown CAPM and downside beta. Thedownside risk of the funds is also measured using the data set of Malaysian mutual funds.Baghdadabad and Fooladi (2015) used the concept of downside risk for developing thedownside risk-adjusted performance measure and applied it on the dataset of Malaysianmutual funds.
Many studies such as Abdullah et al. (2007), Ashraf (2013), Abdelsalam et al. (2014) andBoo et al. (2017) comparatively analyzed the performance of Islamic and conventionalmutual funds. These studies primarily focussed on mutual fund performance while ignoringthe risk aspect of mutual funds. As the Islamic mutual funds are distinguished fromconventional funds on different bases, the researchers also focused on analyzing the riskbehaviour of Islamic funds, but less work has been done in this regard. Hayat and Kraeussl(2011) took the initiative and analyzed the risk-return characteristics of Islamic mutualfunds using the dataset of different countries. They measured the systematic risk of usingthe famous CAPM model while the downside risk was measured by downside CAPM andrelative beta measures. They also analyzed the market timing ability of Islamic funds usingthe Treynor and Mazuy (1966) model. They found that Islamic mutual fund managers arebad market timers. A recent attempt was made by Reddy et al. (2017) as they comparatively
IJIF12,1
74

analyzed the performance of Islamic, socially responsible and conventional funds in thecontext of the United Kingdom. The study used CAPM and a three-factor model for theperformance and risk evaluation. The result showed that Islamic and socially responsiblefunds perform close to the conventional funds and have better risk-return tradeoff.
A more recent attempt was made by Vidal-García et al. (2019) to analyze the idiosyncraticrisk of mutual funds, along with analyzing the relationship between mutual fund risk andperformance. They found that mutual fund risk is inversely related with fund performance.Similarly, Deb (2019) investigated downside risk exposure of Indian equity mutual funds. Heused value at risk (VAR) for downside risk measurement. The result revealed that Indianequity mutual funds also exhibit considerable downside risk. Chowdhury et al. (2018)analyzed risk-return characteristics of mutual funds prevailing in Bangladesh usingdifferent measures and found higher risk in these funds.
Although all the above studies are important attempts to tackle the issue of mutualfunds’ various risks, some important aspects are still overlooked. These studies basicallyonly analyzed the risk exposure of conventional funds; only a few studies included Islamicfunds in their sample. Hayat and Kraeussl (2011) analyzed the systematic and downside riskof only Islamic equity funds. Reddy et al. (2017) included Islamic funds in their sample alongwith conventional funds but they only analyzed the systematic risk of both Islamic andconventional finds. None of the previous studies comparatively analyzed the idiosyncraticand downside risk exposures of both Islamic and conventional funds to show which oneshave higher risk exposures.
Hypothesis developmentIslamic mutual funds make investments in less leveraged firms. According to Fama andFrench (2002), high debt financing increases the agency cost and lowers the firm’sprofitability, and thus increases the firm’s risk. Casey and Anderson (1997) stated that thedebt agency cost reduces when the firm raises financing through equity rather than debt.Holmes and Kent (1991) argued that highly leveraged firms are riskier as they lose bothproperty and control over the firm. Alaghi (2011) argued that a high level of debt financingincreases the risk exposure because it increases the variability of the firm’s income.Therefore, Khasawneh and Dasouqi (2017) showed a positive association between debtfinancing and risk exposure of firms. A more recent attempt was made by El Alaoui et al.(2016) for analyzing the impact of Sharīʿah screening criteria (debt ratio) on systematic risk.They showed that stocks, which pass through the Sharīʿah screening criteria have lowerrisk exposures in most cases due to employing lesser levels of debt. As discussed above,Islamic mutual funds only invest in the assets (shares) of those firms where the amount ofthe debt raised is less than 33 per cent of market capitalization or total assets. Therefore, dueto investing in less leveraged firms, Islamic mutual funds face lower risk than theirconventional counterparts. Islamic mutual funds also avoid investment in government orcorporate bonds, treasury bills and collateralized debt obligations. Earlier studies found thatvarious types of risks are involved in these securities such as interest rate risk, credit risk,etc. Weinstein (1981) investigated the systematic risk exposure of corporate bonds. Thesestudies tried to create the link between default risk, interest rate risk and systematic risk andshowed that high default risk and interest rate risk lead to higher exposure to systematicrisk. They argued that as the debt level increases, the probability of default also increases,and thus systematic risk becomes higher.
Reddy et al. (2017) argued that, because of the Sharīʿah restrictions, Islamic funds cannotinvest in collateralized debt obligations (CDOs) and credit default swaps (CDS), whichprotects them against market downturns. As mentioned earlier, Islamic funds can only
Islamic mutualfunds
75

invest in firms where the cash and interest-bearing securities (fixed-income securities) tomarket capitalization ratio is at an acceptable level. The lower cash and interest-bearingsecurities to market capitalization ratio indicates that a smaller amount of funds is investedin fixed-income securities. Due to increasing cash ratio, the chances of default risk increasebecause more money is tied up in fixed-income securities. The high default risk increases theprobability of systematic risk. Therefore, due to the acceptable level of investment in fixed-income securities, Islamic funds are exposed to lower risk. Based on the above arguments,the following hypothesis is developed:
H1. Islamic mutual funds have lower risk exposure (more especially in terms of totalrisk, systematic risk, fund specific risk and downside risk) than their conventionalcounterparts.
Research methodologyThis study uses various risk measures for analyzing the risk exposure of both Islamic andconventional mutual funds in Pakistan. First, the funds’ monthly returns are calculatedusing the following measure:
Rp ¼ NAVt � NAVt�1ð Þ=NAVt�1 (1)
where NAVt and NAVt�1 are the funds’ net asset values at the end of the month t and t� 1.Following Yang and Hou (2016), the total risk is measured by the standard deviation of
the funds’ monthly returns. For measuring systematic risk, two risk measures are used.Following Hayat and Kraeussl (2011) and Rodriguez (2015), the systematic risk is measuredby the CAPMmodel:
Rit � Rft ¼ a1 þ b 1 Rmt � Rft� �þ « (2)
where:Rit – Rft= excess returns;Rft = risk-free rate of return; andRmt = represents themarket return.
By regressing the excess market return on the excess fund returns, the beta coefficient iscalculated, which measures the systematic risk exposure. The CAPM is a single-factormodel, the factor it accounts for being excess market return. Contrary to this model,multiple-factor models are introduced by the researchers, which are widely used in thefinance literature for analyzing the performance and risk of stocks and mutual funds. Athree-factor model, introduced by Fama and French (1993), also accounts for size and valuepremium factors along with market risk premium. The empirical studies proved that it is abetter model than the single factor CAPM. Themodel is presented below:
Rit � Rft ¼ a1 þ b 1ðRmt � RftÞb 2 SMBþ b 3 HMLþ « (3)
where Rp – Rf are the excess fund returns. Rm is market return and Rf is risk-free rate ofreturn. SMB (small minus big) is the size premium, which is the difference of small cap andlarge cap portfolios. HML is the value premium factor, which accounts for high minus lowbook to market ratio. By regressing all three factors on excess returns, betas are estimated.Themarket beta of the three-factor model represents the systematic risk.
Carhart (1997) extended the three-factor model and presented a four-factor model, whichis also widely used in the finance literature to measure the performance and risk of mutual
IJIF12,1
76
funds. He added the momentum factor in the three-factor model. The model is presentedbelow:
Rit � Rft ¼ þa1 þ b 1ðRmt � RftÞ þ b 2SMB þ b 3HML þ b 4MOM þ « (4)
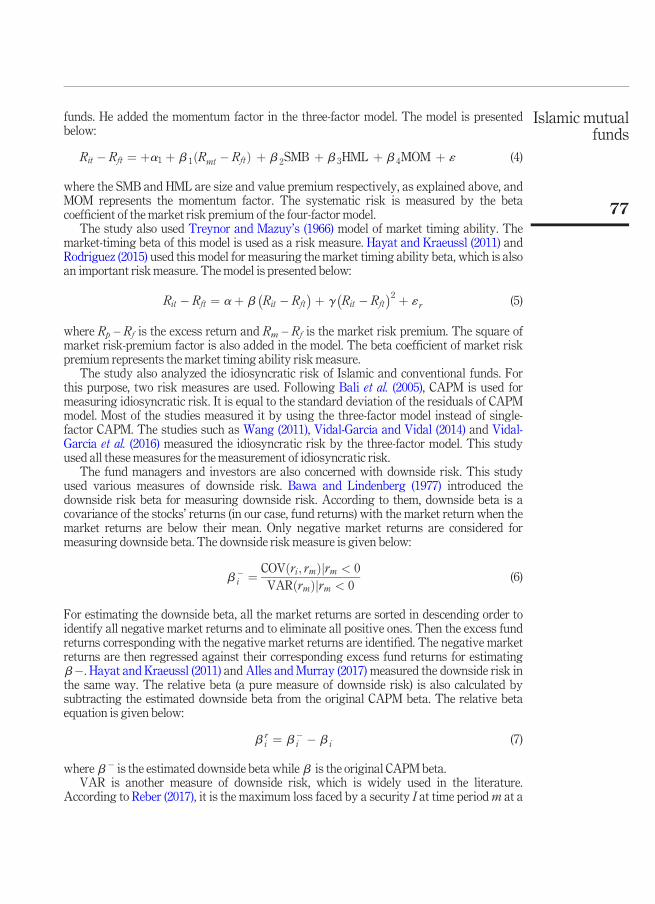
where the SMB and HML are size and value premium respectively, as explained above, andMOM represents the momentum factor. The systematic risk is measured by the betacoefficient of the market risk premium of the four-factor model.
The study also used Treynor and Mazuy’s (1966) model of market timing ability. Themarket-timing beta of this model is used as a risk measure. Hayat and Kraeussl (2011) andRodriguez (2015) used this model for measuring the market timing ability beta, which is alsoan important risk measure. The model is presented below:
Rit � Rft ¼ aþ b Rit � Rft� �þ g Rit � Rft
� �2 þ « r (5)
where Rp – Rf is the excess return and Rm – Rf is the market risk premium. The square ofmarket risk-premium factor is also added in the model. The beta coefficient of market riskpremium represents themarket timing ability risk measure.
The study also analyzed the idiosyncratic risk of Islamic and conventional funds. Forthis purpose, two risk measures are used. Following Bali et al. (2005), CAPM is used formeasuring idiosyncratic risk. It is equal to the standard deviation of the residuals of CAPMmodel. Most of the studies measured it by using the three-factor model instead of single-factor CAPM. The studies such as Wang (2011), Vidal-García and Vidal (2014) and Vidal-García et al. (2016) measured the idiosyncratic risk by the three-factor model. This studyused all these measures for the measurement of idiosyncratic risk.
The fund managers and investors are also concerned with downside risk. This studyused various measures of downside risk. Bawa and Lindenberg (1977) introduced thedownside risk beta for measuring downside risk. According to them, downside beta is acovariance of the stocks’ returns (in our case, fund returns) with the market return when themarket returns are below their mean. Only negative market returns are considered formeasuring downside beta. The downside risk measure is given below:
b �i ¼ COVðri; rmÞjrm < 0
VARðrmÞjrm < 0(6)
For estimating the downside beta, all the market returns are sorted in descending order toidentify all negative market returns and to eliminate all positive ones. Then the excess fundreturns corresponding with the negative market returns are identified. The negative marketreturns are then regressed against their corresponding excess fund returns for estimatingb�. Hayat and Kraeussl (2011) and Alles and Murray (2017) measured the downside risk inthe same way. The relative beta (a pure measure of downside risk) is also calculated bysubtracting the estimated downside beta from the original CAPM beta. The relative betaequation is given below:
b ri ¼ b �
i � b i (7)
where b� is the estimated downside beta while b is the original CAPM beta.VAR is another measure of downside risk, which is widely used in the literature.
According to Reber (2017), it is the maximum loss faced by a security I at time periodm at a
Islamic mutualfunds
77

given confidence interval (1 � a). This study calculated VAR at a 95 per cent confidenceinterval. Expected shortfall is also a measure of downside risk, which is the loss of securitythat is incurred beyond the VAR for the worst possible cases. In VAR, we estimate thechances of loss at a given confidence interval but the expected shortfall tells us the chancesof loss beyond that particular interval for the worst possible cases. The expected shortfallmeasure is provided below:
ES ¼����Xn
j¼1
Ri;j
.n����8RI ;j < �VaRi;t (8)
where R is the monthly returns of the funds and n is the number of monthly returns belowVARit.
Sample and data collectionThis study uses a comprehensive data set of all possible funds available in Pakistan. Thesample size comprises 206 funds, including 90 Islamic and 116 conventional funds. It is thelargest sample size that has ever been used in the context of Pakistan. Rao et al. (2015) andArif et al. (2019) used a relatively small sample of Pakistani mutual funds (60 and 28 mutualfunds, respectively) while analyzing the comparative performance of Islamic andconventional funds. In the current study, only those funds having net asset values of at least12months are included in the sample. Newly launched funds with net asset value for lessthan this period have been excluded due to the unavailability of data on their net assetvalues. The sample includes both open-ended and pension funds. Furthermore, it is freefrom survivorship bias. The study used quantitative data, which is collected from differentsources. The monthly net asset values are used for measuring the funds’ various kinds ofrisks. The net asset value data is taken from the mutual fund association of Pakistan(MUFAP), which also provides other valuable information about Islamic and conventionalfunds prevailing in Pakistan. The three-month T-bill rate is used as a measure of risk-freerate of return, and its data is collected from the State Bank of Pakistan (SBP). Forconventional funds, risk evolution KSC 100 Index is used as a benchmark and proxy ofmarket return. KMI 30 Shari’ah index, which was developed by the mutual cooperation ofMeezan Bank and State Bank of Pakistan in 2009, is used as a benchmark for the riskevaluation of Islamic funds. Pakistan Stock Exchange (PSX) provides the historical data ofboth these indices. For implementing the multifactor models, the size and value premiumfactors are calculated using the market capitalization and book to market ratio of stocks.The annual financial statements of stock issuing firms are used for this purpose. The data of8 years from 2009 to 2016 is collected because the KMI Shari’ah index was developed in 2009and thus no data is available for this index from previous years.
Empirical resultsBefore analyzing the risk exposure, the normality of the funds return is analyzed. This isdone by using skewness, kurtosis and the JarqueBera test. Table I shows the values of thesetests. The values of skewness show that the return distribution is not symmetric in most ofthe study years. These values are positively or negatively skewed. Similarly, the kurtosisvalues show that the return distribution of both kinds of funds is platykurtic in most of thestudy years. Table I also shows the values of the JarqueBera test. The null hypothesis of thistest assumes the normality of distribution. All the p-values of this test are significant in most
IJIF12,1
78
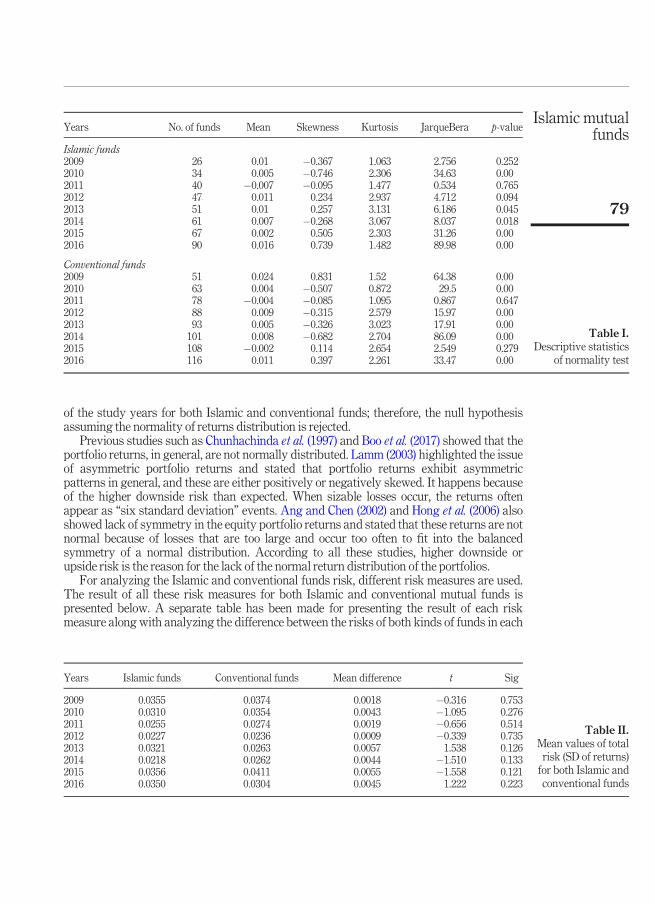
of the study years for both Islamic and conventional funds; therefore, the null hypothesisassuming the normality of returns distribution is rejected.
Previous studies such as Chunhachinda et al. (1997) and Boo et al. (2017) showed that theportfolio returns, in general, are not normally distributed. Lamm (2003) highlighted the issueof asymmetric portfolio returns and stated that portfolio returns exhibit asymmetricpatterns in general, and these are either positively or negatively skewed. It happens becauseof the higher downside risk than expected. When sizable losses occur, the returns oftenappear as “six standard deviation” events. Ang and Chen (2002) and Hong et al. (2006) alsoshowed lack of symmetry in the equity portfolio returns and stated that these returns are notnormal because of losses that are too large and occur too often to fit into the balancedsymmetry of a normal distribution. According to all these studies, higher downside orupside risk is the reason for the lack of the normal return distribution of the portfolios.
For analyzing the Islamic and conventional funds risk, different risk measures are used.The result of all these risk measures for both Islamic and conventional mutual funds ispresented below. A separate table has been made for presenting the result of each riskmeasure along with analyzing the difference between the risks of both kinds of funds in each
Table I.Descriptive statistics
of normality test
Years No. of funds Mean Skewness Kurtosis JarqueBera p-value
Islamic funds2009 26 0.01 �0.367 1.063 2.756 0.2522010 34 0.005 �0.746 2.306 34.63 0.002011 40 �0.007 �0.095 1.477 0.534 0.7652012 47 0.011 0.234 2.937 4.712 0.0942013 51 0.01 0.257 3.131 6.186 0.0452014 61 0.007 �0.268 3.067 8.037 0.0182015 67 0.002 0.505 2.303 31.26 0.002016 90 0.016 0.739 1.482 89.98 0.00
Conventional funds2009 51 0.024 0.831 1.52 64.38 0.002010 63 0.004 �0.507 0.872 29.5 0.002011 78 �0.004 �0.085 1.095 0.867 0.6472012 88 0.009 �0.315 2.579 15.97 0.002013 93 0.005 �0.326 3.023 17.91 0.002014 101 0.008 �0.682 2.704 86.09 0.002015 108 �0.002 0.114 2.654 2.549 0.2792016 116 0.011 0.397 2.261 33.47 0.00
Table II.Mean values of totalrisk (SD of returns)for both Islamic andconventional funds
Years Islamic funds Conventional funds Mean difference t Sig
2009 0.0355 0.0374 0.0018 �0.316 0.7532010 0.0310 0.0354 0.0043 �1.095 0.2762011 0.0255 0.0274 0.0019 �0.656 0.5142012 0.0227 0.0236 0.0009 �0.339 0.7352013 0.0321 0.0263 0.0057 1.538 0.1262014 0.0218 0.0262 0.0044 �1.510 0.1332015 0.0356 0.0411 0.0055 �1.558 0.1212016 0.0350 0.0304 0.0045 1.222 0.223
Islamic mutualfunds
79

year. Table II shows the mean values of total risk exposure (measured by standard deviation(SD) of funds’ return) in each year along with t score and p-values. This table indicates thatIslamic mutual funds have lower mean values of total risk exposure in most of the studyperiod. The total risk exposure of conventional mutual funds is lower only in 2 years: 2013and 2016. Although the mean difference exists in the total risk values for both kinds offunds, it is not statistically significant. Thus, the overall result of Table II indicates thatIslamic mutual funds have lower total risk compared to their conventional peers.
Table III indicates the yearly mean values of market risk or systematic risk for bothkinds of funds measured by CAPM beta. Market risk is the phenomenon of the wholemarket and not the phenomenon of specific funds or the industry. This type of risk cannotbe reduced by diversification. It can be seen from Table III that both Islamic andconventional funds exhibit different systematic risk exposures. In some years (2009, 2010,2011 and 2012), the systematic risk exposure of Islamic funds is lower than theirconventional counterparts while in other years conventional funds have lower systematicrisk exposure. The systematic risk is also measured by using multi-factor models. Tables IVand V indicate the mean values of these risk measures. The systematic risk of Islamic funds(measured by the three-factor model) has lower mean values in most of the study years.Table III shows that Islamic funds have a lower systematic risk exposure in all the yearsexcept 2013, 2015 and 2016, wherein the conventional funds show a lower risk exposure.Although mean differences in the three-factor systematic risk exist between Islamic andconventional funds, these are not statistically significant in any of the years except 2009.Similarly, the four-factor systematic risk exhibits the same pattern.
Table III.Yearly mean valuesof systematic risk(CAPM beta) for bothIslamic andconventional funds
Years Islamic funds Conventional funds Mean difference t Sig
2009 �0.1965 0.4255 0.6221 �8.386 0.000*2010 0.2208 0.3122 0.0914 �1.116 0.2672011 0.2664 0.2844 0.0180 �0.258 0.7972012 0.3725 0.4026 0.0301 �0.552 0.5822013 0.2364 0.1450 0.0914 1.698 0.0942014 0.4039 0.4214 0.0175 �0.166 0.8682015 0.4129 0.3542 0.0586 0.812 0.4182016 0.3907 0.3463 0.0562 0.792 0.430
Note: * Indicate the level of significance at 1%
Table IV.Yearly mean valuesof systematic risk(three-factor beta) forboth Islamic andconventional funds
Years Islamic funds Conventional funds Mean difference t Sig
2009 �0.2137 0.4323 0.6460 �8.791 0.000*2010 0.2229 0.3232 0.1002 �1.197 0.2342011 0.2720 0.2976 0.0256 �0.342 0.7332012 0.2954 0.4333 0.1379 �2.489 0.014**2013 0.1356 0.0652 0.0704 1.310 0.1952014 0.4039 0.4214 0.0175 �0.209 0.8352015 0.4229 0.3828 0.0400 0.558 0.5772016 0.4010 0.3481 0.0529 0.916 0.361
Note: *, ** Indicate the level of significance at 1 and 5%, respectively
IJIF12,1
80

Table V indicates that Islamic funds have a lower systematic risk exposure (measured bythe four-factor model) in the whole study period except 2013, 2015 and 2016. The meandifferences of this risk measure are insignificant in all the years except 2009 and 2012.Table VI shows the yearly mean values of market timing ability risk measure for both kindsof funds. The table indicates that the Islamic mutual funds have a lower market-timing betain the first four study years while in the remaining period, conventional funds exhibit alower market timing risk. The mean differences of this risk measure are not statisticallysignificant in any of the study years except 2009 and 2013. Table VII indicates the meanvalues of idiosyncratic risk (measured by CAPM) in each year for both kinds of funds.Idiosyncratic risk is firm-specific risk rather than a phenomenon of the whole market. It canbe reduced by proper diversification. Each individual firm has different level ofidiosyncratic risk, and thus the funds do too.
Table VII indicates that Islamic mutual funds have lower idiosyncratic risk in most of thestudy years as these funds have lower mean values of this risk measure. The idiosyncraticrisk of conventional funds is lower only in two years: 2009 and 2013. The mean differencesof this risk measure are not significant in any of the years except 2011 and 2015. Theidiosyncratic risk was also measured by multi-factor (three-factor and four-factor) models.Tables VIII and IX show the results of these risk measures. It can be seen from these tablesthat Islamic funds have lower idiosyncratic risk (measured by multi-factor models) in mostof the study years as the mean values of these risk measures are lower for Islamic fundscompared to their conventional counterparts. The conventional funds have loweridiosyncratic risk only in two years: 2009 and 2013. The mean differences of these riskmeasures are also not statistically significant in most of the study years.
Table V.Yearly mean valuesof systematic risk
(four-factor beta) forboth Islamic and
conventional funds
Years Islamic funds Conventional funds Mean difference t Sig
2009 �0.2864 0.4215 0.7079 �7.611 0.000*2010 0.2210 0.3205 0.0995 �1.164 0.2472011 0.2528 0.2788 0.0260 �0.403 0.6872012 0.3335 0.4317 0.0981 �1.749 0.083**2013 0.1455 0.0650 0.0804 1.482 0.1432014 0.4142 0.4292 0.0149 �0.177 0.8602015 0.4273 0.4042 0.0231 0.330 0.7412016 0.3714 0.2787 0.0927 1.527 0.128
Note: *, ** Indicate the level of significance at 10 and 5%, respectively
Table VI.Yearly mean values
of market timingability beta for both
Islamic andconventional funds
Years Islamic funds Conventional funds Mean difference t Sig
2009 �0.3192 0.3667 0.6859 �8.262 0.000*2010 �0.2166 �0.2406 0.0240 0.101 0.9202011 0.8418 0.8511 0.0092 �0.038 0.9702012 0.0840 0.2496 0.1656 �0.967 0.3352013 0.1312 0.0069 0.1242 2.183 0.033**2014 0.6990 0.4830 0.2160 0.885 0.3792015 0.4795 0.3891 0.0904 1.152 0.2512016 0.4182 0.3768 0.0413 0.692 0.490
Note: *, ** Indicate the level of significance at 1 and 5%, respectively
Islamic mutualfunds
81

This study also analyzed the downside risk exposure of both Islamic and conventionalfunds. For this purpose, different downside risk measures are used. Downside beta is thefirst and most famous measure of downside risk. Table X indicates the yearly mean valuesof downside beta for both kinds of funds. This table clearly shows that Islamic funds havelower mean values of downside beta in most of the study years. Conventional funds havelower downside beta only in three years: 2013, 2015 and 2016. Although the differences inthe mean values of this risk measure exist for both kinds of funds, these are insignificant inall the years except 2009. Table XI shows the relative beta yearly mean values, which is apure downside risk measure. In some years, the value of this risk measure is zero for both
Table VII.Yearly mean valuesof idiosyncratic risk(CAPM) for bothIslamic andconventional funds
Years Islamic funds Conventional funds Mean difference t Sig
2009 0.0235 0.0221 0.0013 0.380 0.7052010 0.0215 0.0227 0.0012 �0.450 0.6542011 0.0180 0.0208 0.0028 �1.761 0.081***2012 0.0206 0.0217 0.0011 �0.675 0.5012013 0.0238 0.0225 0.0012 0.442 0.6592014 0.0159 0.0180 0.0021 �1.131 0.2602015 0.0177 0.0254 0.0077 �4.496 0.000*2016 0.0189 0.0210 0.0020 �1.402 0.162
Note: *, *** Indicate the level of significance at 1 and 10%, respectively
Table IX.Yearly mean valuesof idiosyncratic risk(four factors) for bothIslamic andconventional funds
Years Islamic funds Conventional funds Mean difference t Sig
2009 0.0299 0.0153 0.0146 3.670 0.000*2010 0.0189 0.0193 0.0004 �0.161 0.8722011 0.0145 0.0160 0.0015 �1.147 0.2542012 0.0164 0.0174 0.0010 �0.622 0.5352013 0.0188 0.0182 0.0006 0.261 0.7952014 0.0129 0.0143 0.0013 �0.849 0.3972015 0.0154 0.0219 0.0064 �4.216 0.000*2016 0.0153 0.0160 0.0007 �0.599 0.550
Note: *Indicate the level of significance at 1%
Table VIII.Yearly mean valuesof idiosyncratic risk(three factors) forboth Islamic andconventional funds
Years Islamic funds Conventional funds Mean difference t Sig
2009 0.0468 0.0178 0.0290 7.141 0.000*2010 0.0202 0.0212 0.0009 �0.363 0.7182011 0.0159 0.0192 0.0032 �2.214 0.029**2012 0.0184 0.0197 0.0012 �0.774 0.4402013 0.0200 0.0189 0.0011 0.446 0.6562014 0.0135 0.0152 0.0016 �0.989 0.3242015 0.0163 0.0228 0.0065 �4.236 0.000*2016 0.0161 0.0176 0.0015 �1.244 0.215
Note: *, ** Indicate the level of significance at 1 and 5%, respectively
IJIF12,1
82

Islamic and conventional funds because it is calculated by subtracting the downside betafrom the original CAPM beta. If all the market returns are negative in any particular year,the value of both downside beta and original CAPM beta will be the same; thus, the relativebeta value will be equal to zero.
Table XI also shows that Islamic mutual funds have lower mean values for relative betarisk measure in all of the study years. The mean differences of this risk measure for bothkinds of funds are also insignificant in all the relevant years except 2009. Tables XII andXIII show the mean values of VAR (95 per cent) and expected shortfall, respectively. Thesevalues are shown in negative numbers. Reber (2017) stated that the values of VAR andexpected shortfall are taken as positive in empirical analysis, which facilitatesinterpretation. Table XII shows that Islamic funds have lower mean values of VAR (95 percent) downside risk measure in all the study years except 2009 and 2013. The meandifferences exist between the Islamic and conventional funds VAR (95 per cent) values butare not statistically significant in any year except 2015.
Finally, Table XIII shows that Islamic funds also have lower expected shortfall values inmost of the study years. The mean differences of this risk measure for both Islamic andconventional funds exist but are statistically significant at a 1 per cent level only in twoyears. The Islamic funds show a higher level of risk exposure (measured by expectedshortfall) only in two years: 2011 and 2015; however, in the remaining years theconventional funds exhibit higher risk compared with their Islamic peers.
All the above results clearly indicate that Islamic funds have overall lower total,systematic, idiosyncratic and downside risk exposures than their conventional counterparts,
Table X.Yearly mean valuesof downside beta for
both Islamic andconventional funds
Years Islamic funds Conventional funds Mean difference t Sig
2009 �0.1965 0.5171 0.7137 �7.926 0.000*2010 0.2208 0.3122 0.0914 �1.116 0.2672011 0.2664 0.2844 0.0180 �0.258 0.7972012 0.3725 0.4040 0.0314 �0.575 0.5662013 0.3626 0.3140 0.0485 0.605 0.5462014 0.4432 0.5277 0.0142 �0.166 0.8682015 0.3660 0.3031 0.0628 0.895 0.3722016 0.2892 0.2312 0.0580 0.904 0.367
Note: *Indicate the level of significance at 1%
Table XI.Yearly mean valuesof relative beta forboth Islamic and
conventional funds
Years Islamic funds Conventional funds Mean difference t Sig
2009 0.0000 0.0915 0.0915 �2.309 0.025**2010 0.0000 0.0000 0.0000 – –2011 0.0000 0.0000 0.0000 – –2012 0.0000 0.0000 0.0000 – –2013 0.1261 0.1690 0.0428 �0.959 0.3392014 0.0000 0.0000 0.0000 – –2015 �0.0468 �0.0511 0.0042 0.359 0.7202016 �0.1015 �0.1150 0.0135 0.563 0.574
Note: **Indicate the level of significance at 5%
Islamic mutualfunds
83

which leads to the acceptance of the study hypothesis. In a recent study, Reddy et al. (2017)also reported a lower risk (only systematic risk) exposure of Islamic funds than theirconventional counterparts in the context of the United Kingdom and global mutual funds.
Conclusion and implicationsThis study analyzed the systematic, fund-specific and downside risk exposures of bothIslamic and conventional funds to see which ones have higher risk exposures. The studyused different risk measures, which are widely used in the finance literature. After analyzingthese risk measures, it is found that Islamic funds have a lower total risk exposure in most ofthe sample years. The systematic or market risk of Islamic funds is found to be lower inmost of the study years using different systematic risk measures. The study also found thatIslamic funds have a lower idiosyncratic (fund-specific) risk in most of the study periods byemploying all three fund-specific risk measures. Finally, for analyzing the downside riskexposure of mutual funds, four risk measures are used and the result indicates that Islamicfunds have a lower downside risk exposure than their conventional counterparts in most ofthe study years. All the above results lead to the acceptance of the study hypothesis thatIslamic funds exhibit lower risk exposures than their conventional counterparts.
The current research has implications for individual investors and fund managers.Individual investors need to consider mutual funds’ risk along with their returns when makinginvestment decisions. Earlier studies showed that investors also care about risk and prefer toinvest in less risky investment alternatives. In Pakistan, the demand for Sharīʿah-compliantinvestment and Islamic mutual funds is increasing, which can be traced from the mutual funds’
Table XII.Yearly mean valuesof VAR 95% for bothIslamic andconventional funds
Years Islamic funds Conventional funds Mean difference t Sig
2009 0.0252 �0.0217 0.0050 �0.700 0.4862010 �0.0419 �0.0512 0.0092 1.455 0.1492011 �0.0350 �0.0404 0.0054 1.179 0.2422012 �0.0197 �0.0249 0.0052 1.555 0.1232013 �0.0339 �0.0335 0.0004 �0.065 0.9482014 �0.0271 �0.0340 0.0069 1.568 0.1192015 �0.0444 �0.0560 0.0116 2.424 0.016**2016 �0.0232 �0.0266 0.0034 1.451 0.144
Note: **Indicate the level of significance at 5%
Table XIII.Yearly mean valuesof expected shortfallfor both Islamic andconventional funds
Years Islamic funds Conventional funds Mean difference t Sig
2009 �0.0315 �0.0282 0.0032 �0.483 0.6302010 �0.0536 �0.0634 0.0097 1.259 0.2112011 �0.0426 �0.0475 0.0049 0.884 0.3782012 �0.0286 �0.0374 0.0087 1.588 0.1152013 �0.0440 �0.0418 0.0022 �0.334 0.7392014 �0.0355 �0.0430 0.0074 1.360 0.1762015 �0.0603 �0.0820 0.0216 4.013 0.000*2016 �0.0358 �0.0451 0.0092 2.577 0.011*
Note: *Indicate the level of significance at 1%
IJIF12,1
84

historical data. Sharīʿah-compliant investors want to avoid interest, and they also want to maketheir investment less risky compared to conventional investment alternatives. As this studyshows that Islamic mutual funds exhibit a lower risk exposure than conventional funds,investors with lower risk preferences can invest in these kinds of funds more comfortably. Inthis way, the current research provides input to individual investors (especially Sharīʿah-compliant investors) to help them with their investment decisions as they can create a morediversified portfolio by considering Islamic funds as ameans of reducing their risk exposure.
ReferencesAbdelsalam, O., Fethi, M.D., Matallín, J.C. and Tortosa-Ausina, E. (2014), “On the comparative
performance of socially responsible and Islamic mutual funds”, Journal of Economic Behaviorand Organization, Vol. 103 No. 1, pp. 108-128.
Abdullah, F., Hassan, T. andMohamad, S. (2007), “Investigation of performance ofMalaysian Islamic unit trustfunds: comparisonwith conventional unit trust funds”,Managerial Finance, Vol. 33No. 2, pp. 142-153.
Alaghi, K. (2011), “Financial leverage and systematic risk”, African Journal of Business Management,Vol. 5 No. 15, pp. 6648-6650.
Alles, L. and Murray, L. (2017), “Asset pricing and downside risk in the Australian share market”,Applied Economics, Vol. 49 No. 43, pp. 4336-4350.
Ang, A. and Chen, J. (2002), “Asymmetric correlations of equity portfolios”, Journal of FinancialEconomics, Vol. 63 No. 3, pp. 443-494.
Arif, M., Samim, M.M., Khurshid, M.K. and Ali, A. (2019), “Islamic versus conventional mutual fundsperformance in Pakistan: comparative analysis through performance measures and DEAapproach”, European Online Journal of Natural and Social Sciences, Vol. 8 No. 1, pp. 76-88.
Ashraf, D. (2013), “Performance evaluation of Islamic mutual funds relative to conventional funds:empirical evidence from Saudi Arabia”, International Journal of Islamic and Middle EasternFinance andManagement, Vol. 6 No. 2, pp. 105-121.
Baghdadabad, M.R.T. and Fooladi, M. (2015), “Using downside risk in evaluating the performance ofMalaysian mutual funds”, International Journal of EmergingMarkets, Vol. 10 No. 3, pp. 427-447.
Baghdadabad, M.R.T. and Glabadanidis, P. (2013), “Evaluation of Malaysian mutual funds in themaximum drawdown risk measure framework”, International Journal of Managerial Finance,Vol. 9 No. 3, pp. 247-270.
Bali, T.G., Brown, S.J. and Caglayan, M.O. (2012), “Systematic risk and the cross section of hedge fundreturns”, Journal of Financial Economics, Vol. 106 No. 1, pp. 114-131.
Bali, T.G., Brown, S.J. and Caglayan, M.O. (2014), “Macroeconomic risk and hedge fund returns”,Journal of Financial Economics, Vol. 114 No. 1, pp. 1-19.
Bali, T.G., Cakici, N., Yan, X. and Zhang, Z. (2005), “Does idiosyncratic risk really matter?”, The Journalof Finance, Vol. 60 No. 2, pp. 905-929.
Bawa, V.S. and Lindenberg, E.B. (1977), “Capital market equilibrium in a mean-lower partial momentframework”, Journal of Financial Economics, Vol. 5 No. 2, pp. 189-200.
Bin Mahfouz, S. and Ahmed, H. (2014), “Shariah investment screening criteria: a critical review”,Journal of King Abdulaziz University: Islamic Economics, Vol. 362 No. 3853, pp. 1-37.
Bodnaruk, A., Chokaev, B. and Simonov, A. (2019), “Downside risk timing by mutual funds”, TheReview of Asset Pricing Studies, Vol. 9 No. 1, pp. 171-196.
Boo, Y.L., Ee, M.S., Li, B. and Rashid, M. (2017), “Islamic or conventional mutual funds: who has theupper hand? evidence fromMalaysia”, Pacific-Basin Finance Journal, Vol. 42 No. 1, pp. 183-192.
Bryant, L.L. and Liu, H.C. (2011), “Mutual fund industry management structure, risk and the impacts toshareholders”, Global Finance Journal, Vol. 22 No. 2, pp. 101-115.
Islamic mutualfunds
85

Carhart, M.M. (1997), “On persistence in mutual fund performance”, The Journal of Finance, Vol. 52No. 1, pp. 57-82.
Casey, K.M. and Anderson, D.C. (1997), “A note on institutional ownership and capital structure:evidence from the petroleum industry”,Oil and Gas Tax Quarterly, Vol. 45 No. 4, pp. 727-736.
Chowdhury, T.S., Habibullah, M. and Nahar, N. (2018), “Risk and return analysis of closed-end mutualfund in Bangladesh”, Journal of Accounting, Business and Finance Research, Vol. 3 No. 2, pp. 83-92.
Chunhachinda, P., Dandapani, K., Hamid, S. and Prakash, A.J. (1997), “Portfolio selection and skewness:evidence from international stockmarkets”, Journal of Banking and Finance, Vol. 21No. 2, pp. 143-167.
Deb, S.G. (2019), “A VaR-based downside risk analysis of Indian equity mutual funds in the pre-and post-global financial crisis periods”, Journal of EmergingMarket Finance, Vol. 18 No. 2, pp. 210-236.
Dwyer, P.D., Gilkeson, J.H. and List, J.A. (2002), “Gender differences in revealed risk taking: evidencefrommutual fund investors”, Economics Letters, Vol. 76 No. 2, pp. 151-158.
El Alaoui, A.O., Bacha, O.I., Masih, M. and Asutay, M. (2016), “Sharīʿah screening, market risk and contagion:amulti-country analysis”, Journal of Economic Behavior andOrganization, Vol. 132 No. 1, pp. 93-112.
Fama, E.F. and French, K.R. (1993), “Common risk factors in the returns on stocks and bonds”, Journalof Financial Economics, Vol. 33 No. 1, pp. 3-56.
Fama, E.F. and French, K.R. (2002), “Testing trade-off and pecking order predictions about dividendsand debt”,The Review of Financial Studies, Vol. 15 No. 1, pp. 1-33.
Gao, L., Wang, Y. and Zhao, J. (2017), “Does local religiosity affect organizational risk-taking? Evidencefrom the hedge fund industry”, Journal of Corporate Finance, Vol. 47 No. 1, pp. 1-22.
Ghoul, W. and Karam, P. (2007), “MRI and SRI mutual funds: a comparison of Christian, Islamic(morally responsible investing), and socially responsible investing (SRI) mutual funds”, TheJournal of Investing, Vol. 16 No. 2, pp. 96-102.
Hayat, R. and Kraeussl, R. (2011), “Risk and return characteristics of Islamic equity funds”, EmergingMarkets Review, Vol. 12 No. 2, pp. 189-203.
Holmes, S. and Kent, P. (1991), “An empirical analysis of the financial structure of small and largeAustralianmanufacturing enterprises”, Journal of Small Business Finance, Vol. 1 No. 2, pp. 141-154.
Hong, Y., Tu, J. and Zhou, G. (2006), “Asymmetries in stock returns: statistical tests and economicevaluation”,The Review of Financial Studies, Vol. 20 No. 5, pp. 1547-1581.
Huang, Y.S., Chen, C.R. and Kato, I. (2017), “Different strokes by different folks: the dynamics of hedgefund systematic risk exposure and performance”, International Review of Economics andFinance, Vol. 48 No. 1, pp. 367-388.
Khasawneh, A.Y. and Dasouqi, Q.A. (2017), “Sales nationality and debt financing impact on firm’sperformance and risk: evidence from Jordanian companies”, EuroMed Journal of Business,Vol. 12 No. 1, pp. 103-126.
Khatkhatay, M.H. and Nisar, S. (2006), “Sharīʿah Compliant Equity Investments: An Assessment ofCurrent Screening Norms”, Proceedings of the Seventh Harvard University Forum on IslamicFinance, Harvard University Press, Cambridge, MA.
Lamm, R.M. (2003), “Asymmetric returns and optimal hedge fund portfolios”, The Journal ofAlternative Investments, Vol. 6 No. 2, pp. 9-21. No
Lhabitant, F.S. (2001), “Assessing market risk for hedge funds and hedge fund portfolios”, The Journalof Risk Finance, Vol. 2 No. 4, pp. 16-32.
Marco, I., Muñoz, F. and Vargas, M. (2011), “Do ethical and conventional mutual fund managers showdifferent risk-taking behavior?”,The Spanish Review of Financial Economics, Vol. 9 No. 1, pp. 11-19.
Namvar, E., Phillips, B., Pukthuanthong, K. and Rau, P.R. (2016), “Do hedge funds dynamically managesystematic risk?”, Journal of Banking and Finance, Vol. 64 No. 1, pp. 1-15.
Philpot, J. and Peterson, C.A. (2006), “Manager characteristics and real estate mutual fund returns riskand fees”,Managerial Finance, Vol. 32 No. 12, pp. 988-996.
IJIF12,1
86

Rao, Z.U.R., Tauni, M.Z. and Iqbal, A. (2015), “Comparison between Islamic and general equity funds ofPakistan: difference in their performances and fund flow volatility”, Emerging Economy Studies,Vol. 1 No. 2, pp. 211-226.
Reber, B. (2017), “Does mispricing, liquidity or third-party certification contribute to IPO downsiderisk?”, International Review of Financial Analysis, Vol. 51 No. 1, pp. 25-53.
Reddy, K., Mirza, N., Naqvi, B. and Fu, M. (2017), “Comparative risk adjusted performance of Islamic,socially responsible and conventional funds: evidence from United Kingdom”, EconomicModelling, Vol. 66 No. 1, pp. 233-243.
Rodriguez, J. (2015), “Are micro-cap mutual funds indeed riskier”, Review of Accounting and Finance,Vol. 14 No. 4, pp. 352-362.
Treynor, J. and Mazuy, K. (1966), “Can mutual funds outguess the market”, Harvard Business Review,Vol. 44 No. 4, pp. 131-136.
Vidal-García, J. and Vidal, M. (2014), “Seasonality and idiosyncratic risk in mutual fund performance”,European Journal of Operational Research, Vol. 233 No. 3, pp. 613-624.
Vidal-García, J., Vidal, M. and Nguyen, D.K. (2016), “Do liquidity and idiosyncratic risk matter?Evidence from the European mutual fund market”, Review of Quantitative Finance andAccounting, Vol. 47 No. 2, pp. 213-247.
Vidal-García, J., Vidal, M., Boubaker, S. and Manita, R. (2019), “Idiosyncratic risk and mutual fundperformance”,Annals of Operations Research, Vol. 281 Nos 1/2, pp. 349-372.
Wagner, N. and Winter, E. (2013), “A new family of equity style indices and mutual fund performance:do liquidity and idiosyncratic riskmatter?”, Journal of Empirical Finance, Vol. 21 No. 1, pp. 69-85.
Wang, G. (2011), “Idiosyncratic risk and risk taking behavior of mutual fund managers”, PhDdissertation, Singapore Management University.
Weinstein, M. (1981), “The systematic risk of corporate bonds”, The Journal of Financial andQuantitative Analysis, Vol. 16 No. 3, pp. 257-278.
Yang, T. and Hou, W. (2016), “Pay-performance sensitivity and risk-taking behaviors: evidence fromclosed-end funds”, EmergingMarkets Review, Vol. 29 No. 1, pp. 274-288.
About the authorsFarrukh Naveed is a PhD scholar at Air University School of Management, Air University,Islamabad, Pakistan. He is currently working as lecturer at Riphah International University,Faisalabad, Pakistan. His areas of specialization include Islamic finance, investment management,and corporate governance. Farrukh Naveed is the corresponding author and can be contacted at:[email protected]
Idrees Khawaja, PhD, is a Professor of Economics and Business at Air University, Islamabad. Heholds a PhD in Economics from Pakistan Institute of Development Economics (PIDE) and Post Docsfrom the University of Oxford and the University of California, Los Angeles (UCLA). He has 11 yearsof corporate experience and 20 years of teaching experience in different reputed universities ofPakistan.
Lubna Maroof, PhD, is an Assistant Professor of Finance at Bahria University, Islamabad,Pakistan. She holds a PhD in Business Administration from NUST Business School, Rawalpindi,Pakistan. Her areas of interest include investment management and corporate finance.
For instructions on how to order reprints of this article, please visit our website:www.emeraldgrouppublishing.com/licensing/reprints.htmOr contact us for further details: [email protected]
Islamic mutualfunds
87