Funds of funds portfolio composition and its impact on the performance: evidence from the Italian...
19
Munich Personal RePEc Archive Funds of funds portfolio composition and its impact on the performance: evidence from the Italian market Alessandro Carretta and Gianluca Mattarocci University of Rome Tor Vergata - Sefemeq department June 2005 Online at http://mpra.ub.uni-muenchen.de/4293/ MPRA Paper No. 4293, posted 31. July 2007
-
Upload
independent -
Category
Documents
-
view
1 -
download
0
Transcript of Funds of funds portfolio composition and its impact on the performance: evidence from the Italian...

MPRAMunich Personal RePEc Archive
Funds of funds portfolio composition andits impact on the performance: evidencefrom the Italian market
Alessandro Carretta and Gianluca Mattarocci
University of Rome Tor Vergata - Sefemeq department
June 2005
Online at http://mpra.ub.uni-muenchen.de/4293/MPRA Paper No. 4293, posted 31. July 2007

Funds of Funds’ portfolio composition and its impact on performance:
evidence from the Italian market
by
Alessandro Carretta University of Rome “Tor Vergata”
Tel. 06-72595921 Fax 062040219
Address: Via Columbia 2 - 00133 Roma e-mail: [email protected]
and
Gianluca Mattarocci University of Rome “Tor Vergata”
Tel. 06-72595911 Fax 062040219
Address: Via Columbia 2 - 00133 Roma e-mail: [email protected]
Version June 2005
Preliminary draft
Do not quote without permission
JEL classification: E44, G11
Keywords: Funds of Funds, Diversification strategy, Portfolio composition

1
Funds of Funds’ portfolio composition and its impact on the performance:
evidence from the Italian market
Alessandro Carretta* and Gianluca Mattarocci**
Abstract
Funds of Funds (FoF) are particular investment funds that invest resources in some mutual funds. This type of funds offers the possibility to achieve an higher diversification that an investor can’t realize using other instruments.
One of the main differences among FoFs available is the strategy adopted by the manager to select the investment funds to include in the portfolio and the number of funds included in the portfolio. The funds’ selection could be naïf or based on some aspect related to the funds‘ history as the past performance achieved, the fund’s investment style or the manager’s reputation.
This paper analyses FoF’s Italian market and verifies whether the performance is influenced by either the diversification strategy or the number of funds included in the portfolio. The analysis demonstrates that FoFs’ best performers are those which are less geographically or sectorially concentrated; there are significant differences following different criteria/constraints applied in the funds’ selection.
1. Introduction
Since the Eighties Funds of Funds (FoF) are financial instruments traded in the American market. In the Nineties they registered a significant growth in US and only at the beginning of the new millennium in Europe did they become an actively traded financial instrument.1
The fast growth registered in last years could be explained in the light of the high financial innovation that characterized these markets. In fact, new instruments proposed allow the achievement of higher performances, but they are more complex and investors are unable to evaluate the risk profile of these investments. So the choice of delegating the selection and the management of these instruments represents an alternative frequently used by retail and institutional investors.2
The FoF’s manager selects investment funds using information and skills that investors probably do not have and this selection service is remunerated by the investor who hopes to achieve higher results buying this type of advisory service. The work is structured in two sections: in the first the FoFs’ characteristics and criteria adopted for the portfolio construction are explained and the second tries to verify the relationship between the fund’s diversification strategy and results achieved.
* Alessandro Carretta is full professor of Banking at the University of Rome “Tor Vergata”. ** Gianluca Mattarocci is PHD candidate of Banking and Finance at the University of Rome “Tor Vergata”. 1 Davidson C. (2003), The fund of funds market: a global review, AltAsset research. 2 Liang B. (2003), On the performance of alternative investments: CTAs, hedge funds and funds of funds, working paper.

Fund of Funds portfolio composition and its impact on the performance: evidence from the Italian market
2
2. Fund of Funds and the diversification strategies adopted 2.1 Definition of Funds of Funds Mutual funds are complex financial instruments characterized for a full or partially full independence of the fund’s manager from the investor. Some instruments are developed to reduce the informative gap between the manager and investors, but it is impossible to say that investors know everything about a particular mutual fund and they can select correctly funds that respond better to their objectives. The lack of transparency that characterizes FoFs’ investments and the difficulties related to the funds’ selection are hypothesis that justifies the existence of this type of instrument.3 FoFs are open-end funds that differ from other mutual funds because they invest resources in individual managed funds. 4 The FoF’s approach is founded on the principles presented in Markowitz’s work about benefits of diversification5 and represents an application of the theoretical results on the relationships between portfolio’s size and variance.6 Earlier works consider the effect of diversification on portfolio of stock and/or bonds 7 but, more recently, some authors have presented studies on the impact of diversification among different mutual funds.8 Higher benefits related to the portfolio’s diversification could be explained as an effect of the reduction of the unsystematic risk that characterized a well diversified portfolio9 and higher benefits are related to FoFs that invest in actively managed funds where the opportunity to reduce active risk make possible to enlarge the number of potential subscribers.10 The FoF offers the opportunity to diversify investment on different portfolios’ managers with different investment styles that select investment opportunities considering different geographic areas or different industrial sectors.11 The main advantage of investing FoF must be identified in the possibility to increase the selection capability and these results could be easily achieved if investors choices to utilize more manager that are specialized in investing in particular assets.12 This type of instrument represents an high risk investment opportunity because the final composition of a portfolio is the result of choices realized by different managers that have different objectives and strategies. In fact, investors can select FoF’s manager but they do not control the manager’s choices about diversification level and the criteria adopted in the selection of mutual funds.13 Furthermore, the FoF’s manager defines the portfolio’s composition selecting mutual funds but he does not control investments made by single portfolios’ managers and it is possible that
3 Mattoo M. (2004), “Structured alternative investment products”, in Euromoney Institutional Investors (2004) Euromoney Alternative Investments Handbook 2004/05, Euromoney yearbooks, pp. 96-103. 4 Bisogni G.B. (2000), “Il fondo di fondi” in Assogestioni (2000), La disciplina delle gestioni patrimoniali, Bancaria Editrice, pp. 286-303. 5 Markowitz H. (1952), “Portfolio selection”, Journal of Finance, vol. 7, pp. 77-91. 6 Elton E.J. and Gruber M.J. (1977), “Risk reduction and portfolio size: an analytical solution”, Journal of Business, vol. 50, n° 4, pp. 415-437. 7 Evans J.L. and Archer S.H. (1968), “Diversification and the reduction of dispersion: an empirical analysis”, Journal of Finance, vol. 23, n° 5, pp. 761-767. 8 Statman M. (1987), “How many stocks make a diversified portfolio”, Journal of Financial and Quantitative Analysis, vol. 22, pp. 353-363. 9 Lhabitant F.S. and Learned M. (2002), Hedge funds diversification: how much is enough?, FAME research paper. 10 Waring B., Whitney D., Pirone J. and Castille C. (2000), “Optimizing manager structure and budgeting manager risk”, Journal of Portfolio Management, vol. 26, no. 3, pp. 90–104. 11 Still L. (2004), Why are funds of funds increasingly popular?, Equinox newsletter, n° 6, p. 690. 12 Barry C. B. and Starks L.T. (1984), “Investment management and risk sharing with multiple managers”, Journal of Finance, vol. 39, n° 2, pp. 477-491. 13 Cardani A., Comi E. and Lazzari V. (2003), L’offerta dei fondi di fondi speculativi in Italia, LIUC papers.

Fund of Funds portfolio composition and its impact on the performance: evidence from the Italian market
expected strategies/performances of the mutual funds’ managers do not respond to the ex-post results.14
The FoF’s managers are remunerated for this service of investment opportunities’ selection, like other types of mutual funds, by different types of fees: a management fee that represents a fixed remuneration for funds selection and an incentive fee that is calculated on the extra-performance on the benchmark.15 Investors pay so a double commission for investing in FoFs, commissions to single funds manager and fees to FoFs manager, and these instruments could be more expensive than a self-made portfolio of mutual funds.16 The higher level of commissions that characterized these funds could be acceptable only if the portfolio composition service grants extra-performances that the investor cannot achieve by using other financial instruments.17 2.2 Types of diversification strategies and portfolio’s heterogeneity constraints
Main characteristics of a FoF can be identified in the number of funds included in the portfolio, in the criteria adopted for the selection and in selection constraints that managers are eventually subjected to.
The choice of the number of funds to include in the FoF’s portfolio must consider that benefits related to the introduction of a fund in a diversified funds’ portfolio are lower for higher diversified portfolios. 18 The number of funds must be defined considering the pay-off between risk diversification and trading costs: an high number of funds determinate high performance stability but it also causes higher transaction costs and lower net gains.19 Empirical analysis show that higher benefits are obtained by portfolios that invest in ten or twenty funds in function of the correlation between single portfolios20 but there is evidence that demonstrate that, in particular markets, the number of funds is significantly lower. 21 The reduction of benefits related to the diversification could be explained analyzing the inefficiencies of multi-funds portfolios: a higher segmentation of wealth on different funds’ managers increases the probability of duplication of holdings and it’s also probable that strategies adopted by different funds’ managers are not tuned.22 The number of funds to include in a hypothetical portfolio depends on the risk profile of a typical subscriber, on the sectorial and geographical specialization and on the covariance between different sectors and geographical areas.23
FoF’s results are influenced by criteria adopted in the portfolio’s construction and investors select the FoF that best fits their risk-return preferences.24 The criteria adopted could be classified in four main strategies: the naive approach, the style approach, the past performance analysis and the reputation approach.
14 Jerome S. (2004), Quantitative analysis of asset allocation in a multi-manager fund: an application to the gold mining sector, HEC working paper. 15 Colombini F., Mancini A. and Mannucci S. (2003), “La performance dei fondi comuni d’investimento”, Edibank, pp. 43-56. 16 Liang B. (2002), Hedge funds, funds of funds and commodity trading advisor, CWRU working paper. 17 Brown S.J., Goetzmann W.N. and Liang B. (2004), Fees on fees on funds of funds, Yale ICF working paper. 18 O’Neal E.S. (1997), “How many mutual funds constitute a diversified mutual funds portfolio?”, Financial Analyst Journal, pp. 37-46. 19 Statman M. (2004), “The diversification puzzle”, Financial Analyst Journal, vol. 60, n° 4, pp. 44-53. 20 Farrell M. and Gregoriou G. (2000), “Funds of funds: when more definitely means less”, Canadian Business Economic, vol. 8, n°2, pp. 82-85. 21 Brands S. and Gallagher D.R. (2003), A note on portfolio selection, diversification and Fund of Funds, working paper. 22 Connelly T.J. (1997), “Multi-fund diversification issues”, Journal of Financial Planning, n°8, pp. 34-37. 23 Moultrup J. (1998), “The Multiple-Equity Fund Portfolio Investment Strategy, Part I”, Journal of Financial Planning, n° 8, art. 11. 24 Amenc N., Martellini L., Vaissié M. and Giraud J.R. (2004), An overview of European multimanagement practice, EDEC working paper.
Fund of Funds portfolio composition and its impact on the performance: evidence from the Italian market
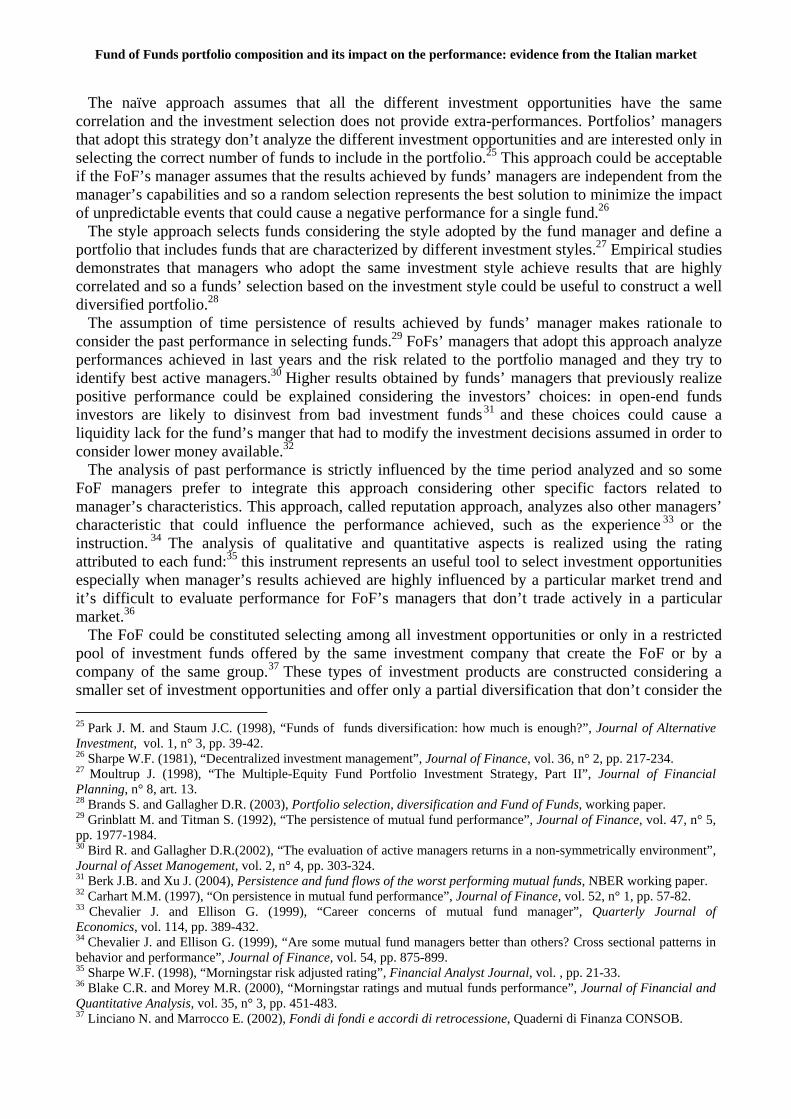
The naïve approach assumes that all the different investment opportunities have the same correlation and the investment selection does not provide extra-performances. Portfolios’ managers that adopt this strategy don’t analyze the different investment opportunities and are interested only in selecting the correct number of funds to include in the portfolio.25 This approach could be acceptable if the FoF’s manager assumes that the results achieved by funds’ managers are independent from the manager’s capabilities and so a random selection represents the best solution to minimize the impact of unpredictable events that could cause a negative performance for a single fund.26
The style approach selects funds considering the style adopted by the fund manager and define a portfolio that includes funds that are characterized by different investment styles.27 Empirical studies demonstrates that managers who adopt the same investment style achieve results that are highly correlated and so a funds’ selection based on the investment style could be useful to construct a well diversified portfolio.28
The assumption of time persistence of results achieved by funds’ manager makes rationale to consider the past performance in selecting funds.29 FoFs’ managers that adopt this approach analyze performances achieved in last years and the risk related to the portfolio managed and they try to identify best active managers.30 Higher results obtained by funds’ managers that previously realize positive performance could be explained considering the investors’ choices: in open-end funds investors are likely to disinvest from bad investment funds31 and these choices could cause a liquidity lack for the fund’s manger that had to modify the investment decisions assumed in order to consider lower money available.32
The analysis of past performance is strictly influenced by the time period analyzed and so some FoF managers prefer to integrate this approach considering other specific factors related to manager’s characteristics. This approach, called reputation approach, analyzes also other managers’ characteristic that could influence the performance achieved, such as the experience 33 or the instruction. 34 The analysis of qualitative and quantitative aspects is realized using the rating attributed to each fund:35 this instrument represents an useful tool to select investment opportunities especially when manager’s results achieved are highly influenced by a particular market trend and it’s difficult to evaluate performance for FoF’s managers that don’t trade actively in a particular market.36
The FoF could be constituted selecting among all investment opportunities or only in a restricted pool of investment funds offered by the same investment company that create the FoF or by a company of the same group.37 These types of investment products are constructed considering a smaller set of investment opportunities and offer only a partial diversification that don’t consider the 25 Park J. M. and Staum J.C. (1998), “Funds of funds diversification: how much is enough?”, Journal of Alternative Investment, vol. 1, n° 3, pp. 39-42. 26 Sharpe W.F. (1981), “Decentralized investment management”, Journal of Finance, vol. 36, n° 2, pp. 217-234. 27 Moultrup J. (1998), “The Multiple-Equity Fund Portfolio Investment Strategy, Part II”, Journal of Financial Planning, n° 8, art. 13. 28 Brands S. and Gallagher D.R. (2003), Portfolio selection, diversification and Fund of Funds, working paper. 29 Grinblatt M. and Titman S. (1992), “The persistence of mutual fund performance”, Journal of Finance, vol. 47, n° 5, pp. 1977-1984. 30 Bird R. and Gallagher D.R.(2002), “The evaluation of active managers returns in a non-symmetrically environment”, Journal of Asset Manogement, vol. 2, n° 4, pp. 303-324. 31 Berk J.B. and Xu J. (2004), Persistence and fund flows of the worst performing mutual funds, NBER working paper. 32 Carhart M.M. (1997), “On persistence in mutual fund performance”, Journal of Finance, vol. 52, n° 1, pp. 57-82. 33 Chevalier J. and Ellison G. (1999), “Career concerns of mutual fund manager”, Quarterly Journal of Economics, vol. 114, pp. 389-432. 34 Chevalier J. and Ellison G. (1999), “Are some mutual fund managers better than others? Cross sectional patterns in behavior and performance”, Journal of Finance, vol. 54, pp. 875-899. 35 Sharpe W.F. (1998), “Morningstar risk adjusted rating”, Financial Analyst Journal, vol. , pp. 21-33. 36 Blake C.R. and Morey M.R. (2000), “Morningstar ratings and mutual funds performance”, Journal of Financial and Quantitative Analysis, vol. 35, n° 3, pp. 451-483. 37 Linciano N. and Marrocco E. (2002), Fondi di fondi e accordi di retrocessione, Quaderni di Finanza CONSOB.
Fund of Funds portfolio composition and its impact on the performance: evidence from the Italian market
opportunity of a diversification of judgment:38 better results achieved by this strategy could be a consequence of lower fees applied by the investment companies of the group.39 3. Research design
The analysis proposed considers the impact of diversification level and funds’ selection strategy on the portfolio results. The analysis is released considering both the performance achieved and the risk exposure of the FoF’s portfolio using the standard RAP approach.
The choices of FoF’s managers in portfolio composition can impact on the performance and criteria adopted in the funds’ selection allow to achieve higher results than other funds. The analysis proposed considered the main difference of FoF results that could be explained analyzing the different criteria adopted in the portfolio composition. The analysis of the FoF is possible only for those funds that invest in standard financial instruments that are obliged to give information about investments released. 3.1 Data
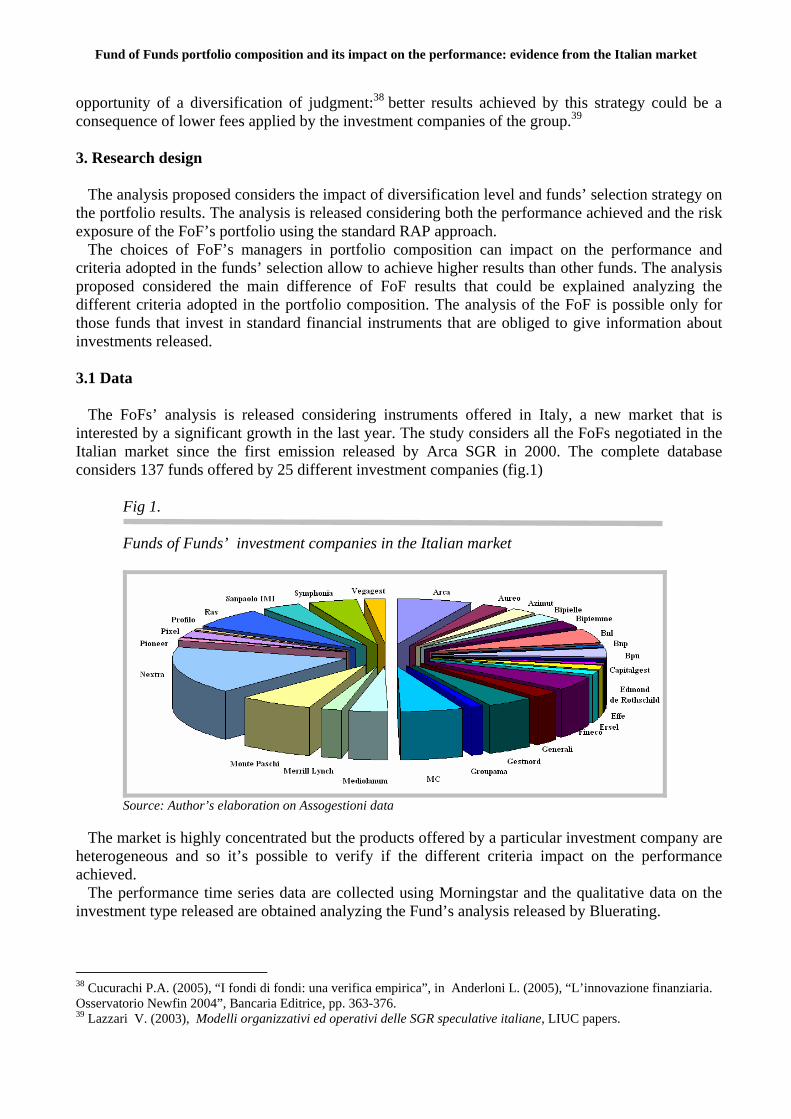
The FoFs’ analysis is released considering instruments offered in Italy, a new market that is interested by a significant growth in the last year. The study considers all the FoFs negotiated in the Italian market since the first emission released by Arca SGR in 2000. The complete database considers 137 funds offered by 25 different investment companies (fig.1)
Fig 1. Funds of Funds’ investment companies in the Italian market
Source: Author’s elaboration on Assogestioni data
The market is highly concentrated but the products offered by a particular investment company are
heterogeneous and so it’s possible to verify if the different criteria impact on the performance achieved.
The performance time series data are collected using Morningstar and the qualitative data on the investment type released are obtained analyzing the Fund’s analysis released by Bluerating.
38 Cucurachi P.A. (2005), “I fondi di fondi: una verifica empirica”, in Anderloni L. (2005), “L’innovazione finanziaria. Osservatorio Newfin 2004”, Bancaria Editrice, pp. 363-376. 39 Lazzari V. (2003), Modelli organizzativi ed operativi delle SGR speculative italiane, LIUC papers.

Fund of Funds portfolio composition and its impact on the performance: evidence from the Italian market
3.2 Methodology The study analyzes different aspects related to the remuneration mechanism and funds’ selection
mechanism. The aspect considered in the work are the management and incentive fee, the level of industrial and sectorial diversification of the funds selected and criteria adopted for funds selection by FoFs’ managers.
The performance analysis is realized using a classical regression analysis on panel data but a more detailed analysis is proposed using the standard RAP approach and the persistence analysis of the results achieved. The choice to select only RAP that use standard deviation or Beta as a measure of risk is a consequence of aspects considered in the work: the main objective of the work is to study the relationship between portfolio composition and FoFs risk/return profile and so studies proposed in literature about this aspect are directly derived from Markowitz and they do not use alternative risk measures.
3.3 Results The analysis of FoFs’ convenience for investors must consider the returns of these types of
instruments in the period analyzed. The simple analysis of the results achieved by the FoF evidences that the period analyzed is
characterized by a bull market phase and a bear one. (table 1) The first two years (2001-2002) are the worst years for the FoFs’ market and in the two last years there is a clear evidence of new up-trend of the market (2003-2004).
Table 1: Performance of Funds of Funds
2001 2002 2003 2004
Mean -7.05% -15.45% 6.39% 6.39%
Maximum 3.80% 20.60% 41.80% 13.40% RG
Minimum -22.50% -36.60% -4.90% -5.40%
Mean 1.00% 1.11% 1.11% 1.17%
Maximum 1.60% 2.50% 2.50% 2.75% Management fee
Minimum 0.00% 0.00% 0.00% 0.00%
Mean 0.01% 0.31% 0.37% 0.18%
Maximum 0.01% 5.6% 5.50% 2.80% Incentive
Fee
Minimum 0.00% 0.00% 0.00% 0.00%
Mean -8.05% -16.87% 4.91% 2.34%
Maximum 2.879% 12.50% 39.71% 11.50% RN
Minimum -23.48% -36.60% -5.60% -7.50%
Strategies adopted to remunerate FoFs’ managers can influence results achieved by FoFs. The
choice to adopt a remuneration mechanism that relates fees with results achieved could incentive

Fund of Funds portfolio composition and its impact on the performance: evidence from the Italian market
managers to achieve higher performance and so types of remuneration mechanism must be considered in FoFs’ selection. The next table analyses separately the results achieved by FoFs that use an incentive fee and results of those that don’t apply this type of remuneration. (table 2)
Table 2: Performance of Funds of Funds and incentive fees
FoFs with incentive fees
FoFs without incentive fees
Mean RG -13.03% -7.05% 2001
Mean RN -11.05% -8.05%
Mean RG -20.86% -14.23% 2002
Mean RN -23.83% -15.31%
Mean RG 10.56% 5.03% 2003
Mean RN 7.88% 3.94%
Mean RG 4.43% 3.52% 2004
Mean RN 2.29% 2.36%
The performance analysis evidences that funds that incentive fees cause positive extra-performances in the bull market (years 2003-2004) but determinate higher losses in the bear market (years 2001-2002).40 This result could be explained considering that a fund’s manager who is paid by an incentive fee has a predisposition to be more active in the market and this approach makes the best benefits when are available profitable opportunities but it’s a failure when the high frequency of portfolio re-balances causes only higher transaction costs for the absence of profitable investment opportunities.41
The analysis of the impact of portfolio characteristics on the results achieved by FoFs is a partial analysis because it considers only one of the aspect analyses by investors to select investment opportunities. A more detailed analysis of the results achieved by the FoFs is released using the RAP approach and analyzing the extra-return for unit of risk exposure. RAPs considered in the study are measure founded on the same criteria adopted by Markowitz to define benefits of diversification and, in particular, the RAP selected are the Sharpe ratio,42 the Information ratio,43 the Treynor index44 and the Jensen’s alpha.45
40 Elton E.J., Gruber M.J. and Blake C.R. (2003), “Incentive fees and mutual funds”, Journal of Finance, vol. 58, n° 2, pp. 779-804. 41 Wermers R. (2000), “Mutual fund performance: an empirical decomposition into stock picking talent, style, transaction costs and expenses”, Journal of Finance, vol. 55, n° 4, pp. 1655-1695. 42 Sharpe W.F. (1994), “The Sharpe ratio”, The Journal of Portfolio Management, vol. 21, n. 1 pp. 49-58. 43 Goodwin T.(1998), “The Information ratio”, Financial Analyst Journal, vol.54, n. 4, pp. 34-43. 44 Treynor J. (1965), “How to rate Management of investment funds”, Harward Business Review, vol. 44, n. 1, pp. 131-136. 45 Jensen M.C. (1968), “The performance of mutual funds in the period 1945-1964”, Journal of Finance, vol. 23, n. 1, pp. 28-30.

Fund of Funds portfolio composition and its impact on the performance: evidence from the Italian market
8
Table 3: RAP for Funds of Funds using a standard segmentation
Sample Variables S2002 α2002 TR2002 IR2002 S2003 α2003 TR2003 IR2003 S2004 α2004 TR2004 IR2004
Mean -7.60 -1.93 -10.41 -1.33 1.67 0.31 5.82 -0.93 5.48 -0.62 4.75 -2.31 All
St. Dev. 0.0389 0.0402 0.2327 0.0661 0.0547 0.0521 0.2029 0.0733 0.0597 0.0406 0.0598 0.0884
Mean -8.82 -4.29 -14.59 -3.63 3.16 2.96 8.88 1.01 5.72 0.08 7.21 0.12 Incentive fee
St. Dev. 0.0345 0.0627 0.0725 0.0641 0.0727 0.0878 0.1502 0.0876 0.0439 0.0689 0.0777 0.0797
Mean -1.38 -16.16 0.84 3.78 2.63 8.83 1.61 4.94 -0.02 7.47 -0.36 -1.38 Stocks
St. Dev. 0.0299 0.0553 0.0752 0.0403 0.0467 0.0680 0.1170 0.0570 0.0438 0.0581 0.0693 0.0667
Mean -1.43 9.79 -0.79 -1.33 -0.27 0.33 0.27 7.86 -0.19 2.95 -1.57 -1.43 Obligations
St. Dev. 0.0631 0.0244 0.5084 0.0906 0.0915 0.0116 0.0669 0.1007 0.1038 0.0169 0.0672 0.1538
Mean -4.33 -27.33 -3.67 -0.25 -2.13 25.38 -5.13 2.80 -0.90 1.10 -3.10 -4.33 Flexibles
St. Dev. 0.0423 0.0582 0.3629 0.0942 0.0757 0.0694 0.6847 0.0999 0.0808 0.0401 0.0728 0.0706
Mean -2.26 -10.53 -3.02 0.93 -1.28 1.30 -3.23 5.46 -1.28 3.80 -4.15 -2.26 Balanced
St. Dev. 0.0288 0.0256 0.0469 0.0644 0.0292 0.0274 0.0290 0.0609 0.0402 0.0266 0.0316 0.0716
Mean -8.09 -1.91 -13.36 -1.15 0.18 -1.09 6.82 -2.88 6.09 -0.76 3.54 -3.57 Geographic concentrated
St. Dev. 0.0419 0.0204 0.1689 0.0661 0.0473 0.0238 0.3379 0.0686 0.0728 0.0288 0.0477 0.1033
Mean -7.35 -1.94 -8.86 -1.43 2.32 0.93 5.39 -0.07 5.16 -0.55 5.39 -1.64 Geographic not concentrated
St. Dev. 0.0373 0.0476 0.2598 0.0666 0.0568 0.0596 0.1004 0.0741 0.0516 0.0457 0.0646 0.0793
Mean -6.69 -2.65 -10.73 -2.62 1.79 -1.10 3.41 -2.59 5.20 -1.77 4.89 -2.80 Sectorial concentrated
St. Dev. 0.0457 0.0579 0.0797 0.0741 0.0360 0.0315 0.0582 0.0597 0.0563 0.0511 0.0559 0.0902
Mean -7.94 -1.66 -10.29 -0.86 1.62 0.84 6.71 -0.32 5.58 -0.21 4.70 -2.13 Sectorial not concentrated
St. Dev. 0.0358 0.0314 0.2687 0.0628 0.0604 0.0572 0.2344 0.0771 0.0611 0.0355 0.0614 0.0882

Fund of Funds portfolio composition and its impact on the performance: evidence from the Italian market
9
The analysis on the overall sample evidences that results achieved in the 2002 are on average lower than the results achieved in the other years. This trend in the Italian FoF’s market is not strange because all the most important world financial markets achieved, in this year, low results and all investment products traded in Italy registered the same result.46
To make a more detailed study of the results achieved by FoFs, an analysis of results achieved by some sub-samples characterized by different remuneration mechanism, different funds’ classification in Assogestioni database and different exposure to geographical/sectorial risk has been realesed.
The first interesting aspect that arises from the analysis is the relationship between the remuneration mechanism and results achieved: FoFs that applied incentive fees, as demonstrated for other mutual funds,47 achieve higher result in term of return for unit of risk than the mean result obtained by the overall sample.
Another possible criteria used to select FoFs is the type of investment released and there some studies in literature that demonstrates that differences in funds’ style influence results achieve.48 In fact FoFs are classified on the basis of the relative importance of risky and unrisky assets in the portfolio: the classification adopted is the same used to order other investment fund and it attributes each fund in one of four main classes. Results obtained don’t evidence that there is a best class of FoFs and the unique result is that in mean higher performance are obtained by the stock FoFs but maximum results aren’t obtained by the funds classified in this group.
The last aspect considered in the analysis of a mutual fund is the sectorial and geographic concentration. 49 The importance of these two aspects are related to the traditional debate presented in literature about the criteria useful to maximize the portfolio’s diversification.50 RAP analysis evidenced that there non clear superiority of one criteria of selection among others and the only one conclusion that can be deducted from the data is that the diversification benefits are higher for the bear market phase when a well diversified portfolio allows to minimize losses.
The impossibility of defining a criteria that allows to select FoF using the standard approach adopted to evaluate other investment funds makes clear that other aspects are relevant in FoF’s evaluation. A more detailed analysis is released using information collected by reports of each FoF and the attention is concentrated on aspects that seem to be more discriminate in the Italian market.51
The first aspect considered in the analysis are the percentage of funds created by the same SGR or by related investment companies and number of funds where the manager invests. (Fig. 2) In fact the analysis of information available reveals that FoFs’ portfolios are very heterogeneous: minus than 10% of FoFs analyzed could be considered not concentrated and others present a different level of concentration that indicates different strategies adopted by FoFs’ managers.
Another difference can be identified in constraints applied to the portfolio selection. The Italian FoFs’ market isn’t characterized by a clear prevalence of one type of FoF: less than half-percent of FoFs available do not invest in funds issued by the same company or by companies of the same group and less than 5% invest only in related funds. (Fig. 2)
46 Assogestioni (2004), Guida Italiana al Risparmio Gestito, Fact Book. 47 Brown K.G., Harlow W.V. and Starks L.T. (1996), “Of tournaments and temptations: an analysis of managerial incentives in the mutual funds industry”, Journal of Finance, vol. 51, n° 1, pp. 85-110. 48 Grinblatt M. and Titman S. (1993), “Performance measurement without benchmarks: an examination of mutual fund returns”, Journal of Business, vol. 66, n° 1, pp. 47-68. 49 Potter M.E. (2001), What you see is not what you get: mutual fund tracking error and fund diversification properties, Babson College working paper. 50 King B.F. (1966), “Market and industry factors in stock price behavior”, Journal of Business, vol. 39, n° 1, pp. 139-190. 51 The data about detailed descriptions of the FoF’s composition are collected using www.fondionline.it.

Fund of Funds portfolio composition and its impact on the performance: evidence from the Italian market
Fig 2. Funds of Funds’ portfolio concentration and percentage invested in funds related
Source: Author’s elaboration on fondionline data
Another interesting aspect is related to the strategy adopted in the funds’ selection. The analysis of the diversification strategy is released analyzing each FoF’s prospect and the selection strategy declared by the FoF’s manager. Clustering FoFs on the basis of four main strategies of selection analyzed in the previous section, it is clear that there is not a leading strategy adopted by Italian FoFs’ managers.52 (Fig. 3)
Fig 3. Funds of Funds’ diversification strategies
Source: Author’s elaboration on fondionline data
This brief analysis makes clear that the FoFs’ market is characterized by high heterogeneity and it could be useful to check whether if the different aspects analyzed have a clear impact on the performance achieved. The analysis of the FoFs’ managers choices reveals a relationships between criteria adopted, constraints subjected to and results achieved. (tab. 4)
52 The naïf diversification represents a residual category in which are classified all the FoF that do not declare a particular criteria in the selection of mutual funds.

Fund of Funds portfolio composition and its impact on the performance: evidence from the Italian market
11
Table 4: RAP for Funds of Funds on the basis of portfolio’s composition criteria
Sample Variables S2002 α2002 TR2002 IR2002 S2003 α2003 TR2003 IR2003 S2004 α2004 TR2004 IR2004
Mean -8.16 -1.92 -13.21 -1.37 0.32 -1.08 6.13 -2.82 5.52 -0.91 3.35 -4.17 Funds linked
St. Dev. 0.0396 0.0196 0.1583 0.0649 0.0445 0.0225 0.3148 0.0640 0.0705 0.0274 0.0458 0.1005
Mean -7.24 -1.93 -8.57 -1.31 2.40 1.07 5.66 0.10 5.46 -0.43 5.71 -1.04 Funds not linked
St. Dev. 0.0383 0.0494 0.2703 0.0675 0.0586 0.0615 0.1034 0.0763 0.0515 0.0476 0.0663 0.0773
Mean -6.06 -1.06 3.59 0.88 2.94 0.88 4.18 3.00 8.33 0.33 7.19 3.33 Concentrated
St. Dev. 0.0358 0.0365 0.4738 0.0715 0.0412 0.0154 0.0622 0.0602 0.0651 0.0511 0.0711 0.0941
Mean -7.99 -2.17 -13.56 -0.14 -4.47 6.01 7.64 2.52 6.12 -0.80 6.23 -3.38 Not concentrated
St. Dev. 0.0389 0.0409 0.1213 0.1718 0.5599 0.5582 0.2605 0.4170 0.1399 0.0383 0.2115 0.0840
Mean -7.40 -3.00 -9.90 -4.90 0.75 -1.92 1.92 -5.75 7.25 -1.44 4.88 -2.88 Naif diversification
St. Dev. 0.0566 0.0298 0.0659 0.0980 0.0328 0.0332 0.0476 0.0739 0.0594 0.0324 0.0432 0.0852
Mean -7.39 -1.04 -6.65 0.30 1.15 -0.46 9.46 -1.54 6.34 -0.16 4.66 -1.63 Performance diversification
St. Dev. 0.0324 0.0310 0.4638 0.0498 0.0608 0.0286 0.3776 0.0605 0.0765 0.0385 0.0609 0.0969
Mean -7.30 -1.68 -11.41 -1.41 3.20 1.84 6.55 0.57 5.51 -0.55 5.18 -1.98 Style diversification
St. Dev. 0.0404 0.0376 0.0766 0.0655 0.0551 0.0695 0.1197 0.0785 0.0464 0.0450 0.0605 0.0838
Mean -8.32 -2.76 -12.84 -1.40 -0.16 -0.52 2.80 -0.80 3.21 -0.93 4.10 -3.52 Reputation diversification
St. Dev. 0.0360 0.0534 0.0656 0.0647 0.0521 0.0360 0.0702 0.0699 0.0511 0.0411 0.0677 0.0910

Fund of Funds portfolio composition and its impact on the performance: evidence from the Italian market
12
The analysis of constraints and strategies adopted in funds’ selection evidences some interesting aspects that could be useful in the selection of FoF. FoF’s managers that must invest a significant amount of the money managed53 in a small number of funds emitted by the same investment company or by companies connected achieve, in more than 80% of cases, a lower result than others FoFs. This result could be considered rationale if the benefits related to lower fees are not sufficient to justify a selection realized on a restricted set of mutual funds and this result is the same obtained by similar analysis realized on the Italian market.54
Portfolio’s concentration is analyzed using an unusual approach respect to other studies proposed in literature. Previous studies considers the number of funds included in the portfolio managed55 and they don’t evaluate that it’s possible to differentiate investments not only using a different set of funds but also investing a higher/lower percentage of wealth in a particular fund. The analysis presented considers the percentage of wealth invested in the five most important funds and classifies as concentrated each FoF that invests more than the 70% of money managed in this set of funds. The results obtained evidenced that more concentrated funds achieve mean higher results than less concentrated funds and so there is a clear evidence that too much diversification don’t provide extra-performances.
The criteria adopted in the selection of funds influenced results achieved by FoFs and it is possible to identify a hierarchy in criteria adopted. The performance analysis seem to be the best criteria to construct portfolio managed and there is clear evidence that the best performing are never those that adopt the simpler strategy of selection, the naïf strategy. These results makes clear that a more detailed analysis of funds to include in the FoF’s portfolio determinates a higher performance and/or a lower risk and so the higher cost related to this type of funds could be economic rationale.
The FoFs’ risk-return profile cannot be studied without considering the time persistence of the results achieved and the usefulness of the historical data to predict returns.56 (table 5)
The incentive fees could be considered a reasonable criterion to select FoFs because more than half-percent of these funds achieve results that are significantly higher with respect to the mean.
The analysis of funds’ classifications do not allow to discriminate between good and bad investment opportunities and there in no clear evidence for all the time period considered on the relative superiority of a geographical or sectorial diversification.
The choice to buy FoF that invests only in funds realized by the same investment company or by companies of the same group do not represent an efficient criteria to select investment opportunities otherwise the choice to invest only in funds concentrated determinates a higher probability to achieve the best results.
Criteria adopted in the selection of funds seem to be an useful instrument to select investment funds. Worst performances are achieved by FoF’s manager select funds using a naïve strategy that allow them to minimize costs related to the selection process but expose them to a risk of uncorrected funds picking. Selection processes that are characterized by a more detailed analysis of fund’s manager characteristics and strategies allows the achievement of high results and the best one for the time period considered seems to be the historical performance selection criteria.
53 The threshold used in the analysis id the 50% of portfolio managed but the same results can be obtained using also lower threshold. 54 Ciquemani G. and Siciliano G. (2001), Quanto sono grandi i vantaggi della diversificazione? Un’applicazione alle gestioni patrimoniali in fondi e ai fondi di fondi, Quaderni di finanza della CONSOB n° 47. 55 Connelly T.J. (1997), “Multi-fund diversification issues”, Journal of Financial Planning, vol. , n° , pp. 34-37. 56 Cucurachi P.A. (1999), “L’analisi delle performance e la valutazione degli asset manager” in Carluccio E.M. (1999), Strategie, benchmarking e valutazione delle performance, Bancaria Editrice, pp. 119-170.

Fund of Funds portfolio composition and its impact on the performance: evidence from the Italian market
13
Table 5: Persistence analysis for FoF
2002 2003 2004 Criteria segmentation 1° 2° 3° 4° 1° 2° 3° 4° 1° 2° 3° 4°
Incentive fee 40.63% 40.63% 15.63% 3.13% 24.39% 34.15% 29.27% 12.20% 34.04% 38.30% 14.89% 12.77%
Stocks 21.43% 35.71% 14.29% 28.57% 33.33% 20.00% 33.33% 13.33% 28.57% 23.81% 33.33% 14.29%
Obligations 16.67% 33.33% 33.33% 16.67% 12.50% 12.50% 50.00% 25.00% 10.00% 50.00% 20.00% 20.00%
Flexibles 16.28% 25.58% 37.21% 20.93% 11.63% 23.26% 41.86% 23.26% 16.67% 35.19% 33.33% 14.81%
Balanced 38.46% 19.23% 23.08% 19.23% 13.79% 20.69% 41.38% 24.14% 25.71% 28.57% 22.86% 22.86%
Geographic concentrated 21.43% 37.14% 27.14% 14.29% 22.78% 27.85% 34.18% 15.19% 23.47% 38.78% 26.53% 11.22%
Geographic not concentrated 24.24% 30.30% 36.36% 9.09% 12.12% 12.12% 57.58% 18.18% 17.39% 32.61% 43.48% 6.52%
Sectorial concentrated 26.98% 33.33% 20.63% 19.05% 24.00% 32.00% 26.67% 17.33% 27.59% 37.93% 16.09% 18.39%
Sectorial not concentrated 41.18% 35.29% 11.76% 11.76% 41.18% 29.41% 23.53% 5.88% 47.62% 33.33% 9.52% 9.52%
Funds linked 21.52% 31.65% 29.11% 16.46% 15.38% 25.27% 38.46% 19.78% 19.82% 36.04% 28.83% 15.32%
Funds not linked 21.05% 34.21% 34.21% 10.53% 10.53% 15.79% 57.89% 15.79% 14.81% 35.19% 40.74% 9.26%
Concentrated 29.31% 31.03% 20.69% 18.97% 25.71% 31.43% 24.29% 18.57% 30.38% 36.71% 15.19% 17.72%
Not concentrated 17.39% 52.17% 21.74% 8.70% 19.23% 26.92% 38.46% 15.38% 21.05% 42.11% 26.32% 10.53%
Naif diversification 29.73% 27.03% 24.32% 18.92% 25.00% 34.09% 27.27% 13.64% 32.65% 32.65% 16.33% 18.37%
Performance diversification 40.00% 0.00% 20.00% 40.00% 0.00% 16.67% 41.67% 41.67% 12.50% 43.75% 31.25% 12.50%
Style diversification 40.63% 40.63% 15.63% 3.13% 24.39% 34.15% 29.27% 12.20% 34.04% 38.30% 14.89% 12.77%
Reputation diversification 21.43% 35.71% 14.29% 28.57% 33.33% 20.00% 33.33% 13.33% 28.57% 23.81% 33.33% 14.29%

Fund of Funds portfolio composition and its impact on the performance: evidence from the Italian market
14
4. Conclusions FoFs are complex financial investments which offer the opportunity to achieve risk-returns results that could not be obtained using other instruments. Results obtained in the past determinate a significant diffusion of the instrument that in the last few years begin to be traded in new markets. The popularity of the instrument makes it necessary to study FoF’s distinctive characteristics that that must be considered in the evaluation of its risk-return profile. The standard segmentation that considers geographical/sectorial concentration or funds’ typology on the basis of Assogestioni classification seem to be not useful when identifying the best investment opportunities in FoFs’ market. The relevant aspects in the FoFs’ selection are the number of funds includes in the portfolio, the selection strategy adopted and the constraints in the selection of mutual funds. Best results are achieved by FoFs that do not have too fragmented portfolios and are not constrained to invest in funds emitted by related investment companies. Portfolio’s construction criteria is another factor that influence results achieved by FoFs’ managers and the empirical analysis makes clear that resources invested in the funds selection allow to achieve higher results. The analysis proposed in this work could be completed considering also Fund of Hedge Funds (FoHF) that are excluded from this analysis. To achieve that result it’s necessary to collect information directly from the FoHFs’ managers because the transparency of information available is lower for this type of funds.57 At this step this approach could not be released for the lack of information and so there is no clear evidence of the relationship between portfolio’s composition and performance achieved for this particular type of FoF. An empirical analysis for this type of instrument must consider also that the returns’ distribution of hedge funds is not normal and the standard RAP approach is not useful to evaluate this instrument:58 the non-availability of the data and problems related to the construction of a RAP measure for these financial instruments make impossible to realize this analysis.
57 Kat A. (2002), Portfolios of hedge funds, Alternative Investment Research Centre working paper. 58 Carretta A. and Mattarocci G. (2005), The performance evaluation of hedge funds: a comparison of different approaches, working paper.

Fund of Funds portfolio composition and its impact on the performance: evidence from the Italian market
15
References Amenc N., Martellini L., Vaissié M. and Giraud J.R. (2004), An overview of European multimanagement practice, EDEC working paper Assogestioni (2004), Guida Italiana al Risparmio Gestito, Fact Book Barry C. B. and Starks L.T. (1984), “Investment management and risk sharing with multiple managers”, Journal of Finance, vol. 39, n° 2, pp. 477-491 Berk J.B. and Xu J. (2004), Persistence and fund flows of the worst performing mutual funds, NBER working paper Bisogni G.B. (2000), “Il fondo di fondi” in Assogestioni (2000), La disciplina delle gestioni patrimoniali, Bancaria Editrice, pp. 286-303 Blake C.R. and Morey M.R. (2000), “Morningstar ratings and mutual funds performance”, Journal of Financial and Quantitative Analysis, vol. 35, n° 3, pp. 451-483. Brands S. and Gallagher D.R. (2004), A note on portfolio selection, diversification and Fund of Funds, working paper Brands S. and Gallagher D.R. (2003), Portfolio selection, diversification and Fund of Funds, working paper Brown K.G., Harlow W.V. and Starks L.T. (1996), “Of tournaments and temptations: an analysis of managerial incentives in the mutual funds industry”, Journal of Finance, vol. 51, n° 1, pp. 85-110 Brown S.J., Goetzmann W.N. and Liang B. (2004), Fees on fees on funds of funds, Yale ICF working paper Cardani A., Comi E. and Lazzari V. (2003), L’offerta dei fondi di fondi speculativi in Italia, LIUC papers Carhart M.M. (1997), “On persistence in mutual fund performance”, Journal of Finance, vol. 52, n° 1, pp. 57-82 Carretta A. and Mattarocci G. (2005), The performance evaluation of hedge funds: a comparison of different approaches, working paper Chevalier J. and Ellison G. (1999), “Are some mutual fund managers better than others? Cross sectional patterns in behavior and performance”, Journal of Finance, vol. 54, pp. 875-899 Chevalier J. and Ellison G. (1999), “Career concerns of mutual fund manager”, Quarterly Journal of Economics, vol. 114, pp. 389-432 Ciquemani G. and Siciliano G. (2001), Quanto sono grandi i vantaggi della diversificazione? Un’applicazione alle gestioni patrimoniali in fondi e ai fondi di fondi; Quaderni di finanza della CONSOB n° 47 Colombini F., Mancini A. and Mannucci S. (2003), La performance dei fondi comuni d’investimento, Edibank, pp. 43-56 Connelly T.J. (1997), “Multi-fund diversification issues”, Journal of Financial Planning, n° 8, art. 7 Cucurachi P.A. (1999), “L’analisi delle performance e la valutazione degli asset manager” in Carluccio E.M.(1999), Strategie, benchmarking e performance nell’asset management, Bancaria Editrice, pp. 119-170 Cucurachi P.A. (2005), “I fondi di fondi: una verifica empirica”, in Anderloni L. (2005), L’innovazione finanziaria. Osservatorio Newfin 2004, Bancaria Editrice, pp. 363-376 Davidson C. (2003), The fund of funds market: a global review, AltAsset research Elton E.J. and Gruber M.J. (1977), “Risk reduction and portfolio size: an analytical solution”, Journal of Business, vol. 50, n° 4, pp. 415-437 Elton E.J., Gruber M.J. and Blake C.R. (2003), “Incentive fees and mutual funds”, Journal of Finance, vol. 58, n° 2, pp. 779-804

Fund of Funds portfolio composition and its impact on the performance: evidence from the Italian market
16
Evans J.L. and Archer S.H. (1968), “Diversification and the reduction of dispersion: an empirical analysis”, Journal of Finance, vol. 23, n° 5, pp. 761-767 Farrell M. and Gregoriou G. (2000), “Funds of funds: when more definitely means less”, Canadian Business Economic, vol. 8, n°2, pp. 82-85 Goodwin T. (1998), “The Information ratio”, Financial Analyst Journal, vol.54, n. 4, pp. 34-43 Grinblatt M. and Titman S. (1992), “The persistence of mutual fund performance”, Journal of Finance, vol. 47, n° 5, pp. 1977-1984 Grinblatt M. and Titman S. (1993), “Performance measurement without benchmarks: an examination of mutual fund returns”, Journal of Business, vol. 66, n° 1, pp. 47-68 Jensen M.C. (1968), “The performance of mutual funds in the period 1945-1964”, Journal of Finance, vol. 23, n. 1, pp. 28-30 Jerome S. (2004), Quantitative analysis of asset allocation in a multi-manager fund: an application to the gold mining sector, HEC working paper Kat A. (2002), Portfolios of hedge funds, Alternative Investment Research Centre working paper King B.F. (1966), “Market and industry factors in stock price behavior”, Journal of Business, vol. 39, n° 1, pp. 139-190 Lazzari V. (2003), Modelli organizzativi ed operativi delle SGR speculative italiane, LIUC papers Lhabitant F.S. and Learned M. (2002), Hedge funds diversification: how much is enough?, FAME research paper Liang B. (2002), Hedge funds, funds of funds and commodity trading advisor, CWRU working paper Liang B. (2003), On the performance of alternative investments: CTAs, hedge funds and funds of funds, working paper Linciano N. and Marrocco E. (2002), Fondi di fondi e accordi di retrocessione, Quaderni di Finanza CONSOB Markowitz H. (1952), “Portfolio selection”, Journal of Finance, vol. 7, pp. 77-91 Mattoo M. (2004), “Structured alternative investment products”, in Euromoney Institutional Investors (2004) Euromoney Alternative Investments Handbook 2004/05, Euromoney yearbooks, pp. 96-103 Moultrup J. (1998), “The Multiple-Equity Fund Portfolio Investment Strategy, Part I”, Journal of Financial Planning, n° 8, art. 11 Moultrup J. (1998), “The Multiple-Equity Fund Portfolio Investment Strategy, Part II”, Journal of Financial Planning, n° 8, art. 13 O’Neal E.S. (1997), “How many mutual funds constitute a diversified mutual funds portfolio?”, Financial Analyst Journal, pp. 37-46 Park J. M. and Staum J.C. (1998), “Funds of funds diversification: how much is enough?”, Journal of Alternative Investment, vol. 1, n° 3, pp. 39-42 Potter M.E. (2001), What you see is not what you get: mutual fund tracking error and fund diversification properties, Babson College working paper Sharpe W.F. (1981), “Decentralized investment management”, Journal of Finance, vol. 36, n° 2, pp. 217-234 Sharpe W.F. (1994), “The Sharpe ratio”, The Journal of Portfolio Management, vol. 21, n. 1 pp. 49-58 Sharpe W.F. (1998), “Morningstar risk adjusted rating”, Financial Analyst Journal, vol. 7-8 , pp. 21-33 Statman M. (2004), “The diversification puzzle”, Financial Analyst Journal, vol. 60, n° 4, pp. 44-53 Still L. (2004), Why are funds of funds increasingly popular?, Equinox newsletter, n° 6, p. 690

Fund of Funds portfolio composition and its impact on the performance: evidence from the Italian market
17
Treynor J. (1965), “How to rate Management of investment funds”, Harward Business Review, vol. 44, n. 1, pp. 131-136 Waring B., Whitney D., Pirone J. and Castille C. (2000), “Optimizing manager structure and budgeting manager risk”, Journal of Portfolio Management, vol. 26, no. 3, pp. 90–104 Wermers R. (2000), “Mutual fund performance: an empirical decomposition into stock picking talent, style, transaction costs and expenses”, Journal of Finance, vol. 55, n° 4, pp. 1655-1695