Audited annual report as at 31st December 2011 Variable Capital ...
264
Audited annual report as at 31st December 2011 UBAM Variable Capital Investment Company Luxembourg R.C.S. Luxembourg B 35 412
-
Upload
khangminh22 -
Category
Documents
-
view
1 -
download
0
Transcript of Audited annual report as at 31st December 2011 Variable Capital ...
Audited annual report as at 31st December 2011
UBAM Variable Capital Investment Company Luxembourg
R.C.S. Luxembourg B 35 412
The report is the English translation of the audited annual respectively unaudited semi-annual report in French. In case of a discrepancy of content and/or meaning between the French and English versions, the French version shall prevail. No subscription can be received on the basis of this report. Subscriptions are only valid if made on the basis of the current prospectus respectively the simplified prospectus supplemented by the subscription form, the latest annual report and the most recent semi-annual report, if published thereafter.
Additional Information for Investors in the Federal Republic of Germany
For the following sub-funds of UBAM no notification for public distribution in the Federal
Republic of Germany was submitted and shares in these sub-funds may NOT be publicly offered
to investors within the scope of the German investment law. As a consequence, the following
sub-funds are NOT available to investors in Germany: UBAM – European Emerging Equity and
UBAM – Europe Equity Dividend+.
Sal. Oppenheim jr & Cie. AG & Co. KGaA, Unter Sachsenhausen 4, D-50667 Köln, Germany, has
undertaken the function of Paying and Information Agent in the Federal Republic of Germany (the
“German Paying and Information Agent”).
Applications for the redemptions and conversion of shares may be sent to the German Paying and
Information Agent. All payments to investors, including redemption proceeds and potential distributions,
may, upon request, be paid through the German Paying and Information Agent.
The full prospectus, the key investor information documents, the articles of association of the company
and the annual and semi-annual reports may be obtained free of charge in hardcopy form at the office
of the German Paying and Information Agent during normal opening hours. The statement of changes
in the composition of the investment portfolio is also free of charge upon request at the office of the
German Paying and Information Agent available.
The issue, redemption and conversion prices of the shares and the notices to Shareholders are also
available free of charge from the German Paying and Information Agent.
The issue, redemption and conversion prices and the notices to Shareholders will be published in
Germany in the German newspaper „Börsen-Zeitung“.
UBAM
Contents
Page 3
Organisation .....................................................................................................................................................8
Report of the Board of Directors ..................................................................................................................11
Report of the réviseur d'entreprises agréé..................................................................................................35
Consolidated statement of net assets..........................................................................................................37 Consolidated statement of operations and other changes in net assets.................................................38 UBAM - DYNAMIC US DOLLAR BOND .........................................................................................................40
Statement of net assets ................................................................................................................................40 Changes in number of shares outstanding...................................................................................................40 Key figures ....................................................................................................................................................41 Statement of investments and other net assets ...........................................................................................42 Geographical and industrial classification of investments ............................................................................44 Statement of operations and other changes in net assets ...........................................................................45
UBAM - DYNAMIC EURO BOND....................................................................................................................46 Statement of net assets ................................................................................................................................46 Changes in number of shares outstanding...................................................................................................46 Key figures ....................................................................................................................................................47 Statement of investments and other net assets ...........................................................................................48 Geographical and industrial classification of investments ............................................................................50 Statement of operations and other changes in net assets ...........................................................................51
UBAM - YIELD CURVE US DOLLAR BOND..................................................................................................52 Statement of net assets ................................................................................................................................52 Changes in number of shares outstanding...................................................................................................52 Key figures ....................................................................................................................................................52 Statement of investments and other net assets ...........................................................................................54 Geographical and industrial classification of investments ............................................................................55 Statement of operations and other changes in net assets ...........................................................................56
UBAM - YIELD CURVE EURO BOND ............................................................................................................57 Statement of net assets ................................................................................................................................57 Changes in number of shares outstanding...................................................................................................57 Key figures ....................................................................................................................................................57 Statement of investments and other net assets ...........................................................................................59 Geographical and industrial classification of investments ............................................................................61 Statement of operations and other changes in net assets ...........................................................................62
UBAM - YIELD CURVE STERLING BOND ....................................................................................................63 Statement of net assets ................................................................................................................................63 Changes in number of shares outstanding...................................................................................................63 Key figures ....................................................................................................................................................63 Statement of investments and other net assets ...........................................................................................64 Geographical and industrial classification of investments ............................................................................65 Statement of operations and other changes in net assets ...........................................................................66
UBAM - GLOBAL BOND (CHF)......................................................................................................................67 Statement of net assets ................................................................................................................................67 Changes in number of shares outstanding...................................................................................................67 Key figures ....................................................................................................................................................67 Statement of investments and other net assets ...........................................................................................69 Geographical and industrial classification of investments ............................................................................70 Statement of operations and other changes in net assets ...........................................................................71
UBAM
Contents (continued)
Page 4
UBAM - CORPORATE US DOLLAR BOND...................................................................................................72 Statement of net assets ................................................................................................................................72 Changes in number of shares outstanding...................................................................................................72 Key figures ....................................................................................................................................................73 Statement of investments and other net assets ...........................................................................................74 Geographical and industrial classification of investments ............................................................................77 Statement of operations and other changes in net assets ...........................................................................79
UBAM - CORPORATE EURO BOND .............................................................................................................80 Statement of net assets ................................................................................................................................80 Changes in number of shares outstanding...................................................................................................80 Key figures ....................................................................................................................................................81 Statement of investments and other net assets ...........................................................................................82 Geographical and industrial classification of investments ............................................................................85 Statement of operations and other changes in net assets ...........................................................................86
UBAM - OPTIBOND (EURO)...........................................................................................................................87 Changes in number of shares outstanding...................................................................................................87 Key figures ....................................................................................................................................................87 Statement of operations and other changes in net assets ...........................................................................88
UBAM - ABSOLUTE RETURN (USD).............................................................................................................89 Statement of net assets ................................................................................................................................89 Changes in number of shares outstanding...................................................................................................89 Key figures ....................................................................................................................................................89 Statement of investments and other net assets ...........................................................................................90 Geographical and industrial classification of investments ............................................................................91 Statement of operations and other changes in net assets ...........................................................................92
UBAM - ABSOLUTE RETURN (EURO)..........................................................................................................93 Statement of net assets ................................................................................................................................93 Changes in number of shares outstanding...................................................................................................93 Key figures ....................................................................................................................................................93 Statement of investments and other net assets ...........................................................................................94 Geographical and industrial classification of investments ............................................................................95 Statement of operations and other changes in net assets ...........................................................................96
UBAM - EMERGING MARKET BOND (formerly EMERGING MARKET BOND (USD)) ..............................97 Statement of net assets ................................................................................................................................97 Changes in number of shares outstanding...................................................................................................97 Key figures ....................................................................................................................................................97 Statement of investments and other net assets ...........................................................................................99 Geographical and industrial classification of investments ..........................................................................101 Statement of operations and other changes in net assets .........................................................................103
UBAM - LOCAL CURRENCY EMERGING MARKET BOND (formerly LOCAL CURRENCY EMERGING MARKET BOND (USD)) ........................................................104
Statement of net assets ..............................................................................................................................104 Changes in number of shares outstanding.................................................................................................104 Key figures ..................................................................................................................................................105 Statement of investments and other net assets .........................................................................................106 Geographical and industrial classification of investments ..........................................................................108 Statement of operations and other changes in net assets .........................................................................109
UBAM - EMERGING MARKET CORPORATE BOND (formerly EMERGING MARKET CORPORATE BOND (USD))...................................................................110
Statement of net assets ..............................................................................................................................110 Changes in number of shares outstanding.................................................................................................110 Key figures ..................................................................................................................................................111 Statement of investments and other net assets .........................................................................................113 Geographical and industrial classification of investments ..........................................................................116 Statement of operations and other changes in net assets .........................................................................118
UBAM
Contents (continued)
Page 5
UBAM - GLOBAL HIGH YIELD SOLUTION.................................................................................................119 Statement of net assets ..............................................................................................................................119 Changes in number of shares outstanding.................................................................................................119 Key figures ..................................................................................................................................................120 Statement of investments and other net assets .........................................................................................122 Geographical and industrial classification of investments ..........................................................................123 Statement of operations and other changes in net assets .........................................................................124
UBAM - EUROPEAN CONVERTIBLE BOND...............................................................................................125 Statement of net assets ..............................................................................................................................125 Changes in number of shares outstanding.................................................................................................125 Key figures ..................................................................................................................................................125 Statement of investments and other net assets .........................................................................................126 Geographical and industrial classification of investments ..........................................................................127 Statement of operations and other changes in net assets .........................................................................128
UBAM - EURO 10-40 CONVERTIBLE BOND ..............................................................................................129 Statement of net assets ..............................................................................................................................129 Changes in number of shares outstanding.................................................................................................129 Key figures ..................................................................................................................................................129 Statement of investments and other net assets ........................................................................................131 Geographical and industrial classification of investments ..........................................................................132 Statement of operations and other changes in net assets .........................................................................133
UBAM - CALAMOS US EQUITY GROWTH .................................................................................................134 Statement of net assets ..............................................................................................................................134 Changes in number of shares outstanding on............................................................................................134 Key figures ..................................................................................................................................................134 Statement of investments and other net assets .........................................................................................136 Geographical and industrial classification of investments ..........................................................................138 Statement of operations and other changes in net assets .........................................................................139
UBAM - NEUBERGER BERMAN US EQUITY VALUE................................................................................140 Statement of net assets ..............................................................................................................................140 Changes in number of shares outstanding.................................................................................................140 Key figures ..................................................................................................................................................140 Statement of investments and other net assets .........................................................................................142 Geographical and industrial classification of investments ..........................................................................143 Statement of operations and other changes in net assets .........................................................................144
UBAM - DR. EHRHARDT GERMAN EQUITY...............................................................................................145 Statement of net assets ..............................................................................................................................145 Changes in number of shares outstanding.................................................................................................145 Key figures ..................................................................................................................................................145 Statement of investments and other net assets .........................................................................................147 Geographical and industrial classification of investments ..........................................................................148 Statement of operations and other changes in net assets .........................................................................149
UBAM - EUROPE EQUITY............................................................................................................................150 Statement of net assets ..............................................................................................................................150 Changes in number of shares outstanding.................................................................................................150 Key figures ..................................................................................................................................................150 Statement of investments and other net assets .........................................................................................151 Geographical and industrial classification of investments ..........................................................................153 Statement of operations and other changes in net assets .........................................................................155
UBAM
Contents (continued)
Page 6
UBAM - SWISS EQUITY................................................................................................................................156 Statement of net assets ..............................................................................................................................156 Changes in number of shares outstanding.................................................................................................156 Key figures ..................................................................................................................................................156 Statement of investments and other net assets .........................................................................................158 Geographical and industrial classification of investments ..........................................................................159 Statement of operations and other changes in net assets .........................................................................160
UBAM - IFDC JAPAN EQUITY......................................................................................................................161 Statement of net assets ..............................................................................................................................161 Changes in number of shares outstanding.................................................................................................161 Key figures ..................................................................................................................................................162 Statement of investments and other net assets .........................................................................................163 Geographical and industrial classification of investments ..........................................................................165 Statement of operations and other changes in net assets .........................................................................166
UBAM - IFDC JAPAN OPPORTUNITIES EQUITY.......................................................................................167 Statement of net assets ..............................................................................................................................167 Changes in number of shares outstanding.................................................................................................167 Key figures ..................................................................................................................................................167 Statement of investments and other net assets .........................................................................................168 Geographical and industrial classification of investments ..........................................................................169 Statement of operations and other changes in net assets .........................................................................170
UBAM - PCM GLOBAL EQUITY VALUE......................................................................................................171 Statement of net assets ..............................................................................................................................171 Changes in number of shares outstanding.................................................................................................171 Key figures ..................................................................................................................................................171 Statement of investments and other net assets .........................................................................................172 Geographical and industrial classification of investments ..........................................................................174 Statement of operations and other changes in net assets .........................................................................176
UBAM - VP VALUE CHINA EQUITY.............................................................................................................177 Statement of net assets ..............................................................................................................................177 Changes in number of shares outstanding.................................................................................................177 Key figures ..................................................................................................................................................177 Statement of investments and other net assets .........................................................................................179 Geographical and industrial classification of investments ..........................................................................181 Statement of operations and other changes in net assets .........................................................................182
UBAM - ASIA EQUITY (formerly SOUTH PACIFIC AND ASIA EQUITY) ..................................................183 Statement of net assets ..............................................................................................................................183 Changes in number of shares outstanding.................................................................................................183 Key figures ..................................................................................................................................................183 Statement of investments and other net assets .........................................................................................185 Geographical and industrial classification of investments ..........................................................................187 Statement of operations and other changes in net assets .........................................................................188
UBAM - EQUITY BRIC+ ................................................................................................................................189 Statement of net assets ..............................................................................................................................189 Changes in number of shares outstanding.................................................................................................189 Key figures ..................................................................................................................................................190 Statement of investments and other net assets .........................................................................................191 Geographical and industrial classification of investments ..........................................................................194 Statement of operations and other changes in net assets .........................................................................196
UBAM - EUROPEAN EMERGING EQUITY..................................................................................................197 Changes in number of shares outstanding.................................................................................................197 Key figures ..................................................................................................................................................197 Statement of operations and other changes in net assets .........................................................................198
UBAM
Contents (continued)
Page 7
UBAM - TURKISH EQUITY ...........................................................................................................................199 Statement of net assets ..............................................................................................................................199 Changes in number of shares outstanding.................................................................................................199 Key figures ..................................................................................................................................................199 Statement of investments and other net assets .........................................................................................201 Geographical and industrial classification of investments ..........................................................................202 Statement of operations and other changes in net assets .........................................................................203
UBAM - RUSSIAN EQUITY...........................................................................................................................204 Statement of net assets ..............................................................................................................................204 Changes in number of shares outstanding.................................................................................................204 Key figures ..................................................................................................................................................204 Statement of investments and other net assets .........................................................................................205 Geographical and industrial classification of investments ..........................................................................206 Statement of operations and other changes in net assets .........................................................................207
UBAM - EUROPE EQUITY DIVIDEND+........................................................................................................208 Statement of net assets ..............................................................................................................................208 Changes in number of shares outstanding.................................................................................................208 Key figures ..................................................................................................................................................209 Statement of investments and other net assets .........................................................................................210 Geographical and industrial classification of investments ..........................................................................212 Statement of operations and other changes in net assets .........................................................................213
UBAM - MONEY MARKET INSTITUTIONAL LIQUIDITY (EUR) .................................................................214 Changes in number of shares outstanding.................................................................................................214 Key figures ..................................................................................................................................................214 Statement of operations and other changes in net assets .........................................................................215
UBAM - MONEY MARKET INSTITUTIONAL LIQUIDITY (USD) .................................................................216 Changes in number of shares outstanding.................................................................................................216 Key figures ..................................................................................................................................................216 Statement of operations and other changes in net assets .........................................................................217
UBAM - SQUARE ..........................................................................................................................................218 Statement of net assets ..............................................................................................................................218 Changes in number of shares outstanding.................................................................................................218 Key figures ..................................................................................................................................................219 Statement of investments and other net assets .........................................................................................220 Geographical and industrial classification of investments ..........................................................................221 Statement of operations and other changes in net assets .........................................................................222
UBAM - CUBE ...............................................................................................................................................223 Statement of net assets ..............................................................................................................................223 Changes in number of shares outstanding.................................................................................................223 Key figures ..................................................................................................................................................223 Statement of investments and other net assets .........................................................................................224 Geographical and industrial classification of investments ..........................................................................225 Statement of operations and other changes in net assets .........................................................................226
Notes to the financial statements ...............................................................................................................227
Global exposure calculation method (unaudited information) ...............................................................263
UBAM
Organisation
Page 8
REGISTERED OFFICE 18, boulevard Royal L-2449 Luxembourg Grand Duchy of Luxembourg BOARD OF DIRECTORS Mrs. Emmy LABOVITCH Managing Director
Union Bancaire Privée, UBP SA Geneva, Switzerland Chairman of the Board of Directors (since 14th January 2011)
Mr. Pierre BERGER
Managing Director UBP Gestion Institutionnelle SA Geneva, Switzerland Director
Mr. Daniel VAN HOVE
Managing Director Orionis Management S.A. Luxembourg, Grand Duchy of Luxembourg Director
Mr. André GIGON Managing Director
Union Bancaire Privée, UBP SA Geneva, Switzerland Chairman of the Board of Directors (until 14th January 2011)
MANAGERS APPOINTED BY THE BOARD Mr. Pierre BERGER Mr. Daniel VAN HOVE
INVESTMENT MANAGERS Union Bancaire Privée, UBP SA 96-98 rue du Rhône CH-1211 Geneva 1 Switzerland Union Bancaire Privée, UBP S.A., London Branch 26 St James's Square Londres SW1Y 4JH United Kingdom Union Bancaire Privée, UBP SA, Zurich Branch Bahnhofstrasse 1 CH-8022 Zurich Switzerland
UBAM
Organisation (continued)
Page 9
INVESTMENT ADVISER UBAM International Services 18, boulevard Royal L-2449, Luxembourg Grand Duchy of Luxembourg DOMICILIARY AGENT, ADMINISTRATIVE AGENT, REGISTRAR AND TRANSFER AGENT ANDCUSTODIAN BANK Union Bancaire Privée (Luxembourg) S.A. 18, boulevard Royal L-2449 Luxembourg Grand Duchy of Luxembourg GENERAL DISTRIBUTOR Union Bancaire Privée, UBP SA 96-98 rue du Rhône CH-1211 Geneva 1 Switzerland CABINET DE REVISION AGREE Deloitte Audit, Société à responsabilité limitée 560, rue de Neudorf L-2220 Luxembourg Grand Duchy of Luxembourg LEGAL ADVISER Elvinger, Hoss & Prussen 2, place Winston Churchill L-1340 Luxembourg Grand Duchy of Luxembourg INFORMATION ON THE MAIN REPRESENTATIVE OFFICES ABROAD The information documents concerning the SICAV, ie the articles of incorporation, the complete prospectus and the simplified prospectus, the annual and semi-annual reports and the statement of changes in investments for the period referring to this report are available free of charge at the office of the SICAV, 18, boulevard Royal, L-2449 Luxembourg and at the office of the following financial intermediaries:
UBAM
Organisation (continued)
Page 10
- Representing for Switzerland and general distributor Union Bancaire Privée, UBP SA, 96-98, rue du Rhône, CH-1211 Geneva 1 Tél: + 41 (0) 58 819 21 11 Payment services, execution place and jurisdiction place are established, for the shares distributed in Switzerland, in the place here-above mentioned. Supplementary information concerning the distribution of the different types and classes of shares of the SICAV in Switzerland are specified in the complete and the simplified prospectus. Announcements in Switzerland concerning the SICAV are published in the "Feuille Officielle Suisse du Commerce" and in "L’Agefi" (Switzerland). The subscription and redemption prices of the shares of the different sub-funds are published jointly in "Le Temps" at the time of each issue and redemption, but at least once a week. Investors liable to a tax in Switzerland are hereby warned that transactions made on the SICAV’s shares may be subject to a different tax treatment depending on the canton in which the investor is taxed. Potential investors in the SICAV’s shares must nevertheless inquire about the legislation and rules applicable to the acquisition, holding, selling and redemption of shares, in the light of their place of residence. Additional information for Swiss investors in accordance with the guide lines on transparency with regard to management fees as of 7th June 2005 of the SFA: Trailer fees for the commercialisation of the SICAV to distributors and investment managers are taken directly from the management and advisory fees. Rebates from the management and advisory fees are granted to institutional investors who, from a commercial perspective are holding shares of the SICAV for third parties. - Paying agent and information place in Germany SAL. OPPENHEIM JR. & CIE. KGaA, 4, Unter Sachsenhausen, D-50667 Cologne - Paying agent in Austria ERSTE BANK DER OESTERREICHISCHEN SPARKASSEN AG, Graben 21, A-1010 Vienna - Financial agent in Belgium FUND ADMINISTRATION SERVICE & TECHNOLOGY NETWORK BELGIUM (FASTNET) Avenue du Port, 86 C b320, B-1000 Brussels - Official distributor agent in Spain ALLFUNDS BANKS S.A., Nuria 57, E-28034 Madrid The information documents concerning the SICAV can be obtained by the shareholders from the distributor agent or from UBP GESTION INSTITUCIONAL S.A., Avenida Diagonal 520, 2°2aB, E-08006 Barcelona. - Correspondant bank in France CACEIS BANK, 1-3, Place Valhubert, F-75206 Paris Cedex 13 The correspondent is also in charge of the subscriptions / redemptions processing and of the ividend payments of the shares of the SICAV. - Paying agent in Italy State Street Bank S.p.A., Via Col Moschin 16, I-20136 Milan - Official distributor agent in Portugal BEST - Banco Electronico de Serviço Total, S.A., Praça Marquês de Pombal, no. 3 - 3°, 1250-161 Lisbon - Representative in United Kingdom UNION BANCAIRE PRIVEE, 26 St James's Square, GB-London SW1Y4JH - Distributor agent in Singapore UNION BANCAIRE PRIVEE (Singapore) Ltd, 6 Battery Road # 15-01, SG-Singapore 049909 - Distributor agent in Sweden Carnegie Investment Bank AB, Gustav Adolfs Torg 18, SE Stockholm 103 38 * * Hagströmer & Qviberg Fondkomissions AB was taken over by Carnegie Investment Bank AB.
UBAM
Report of the Board of Directors
Page 11
1. MANAGER’S REPORT 1.1 A retrospective on financial markets Growth inevitably weighed down by the shocks and crises The sharp rise in inflation in the first half of the year, related to the steady climb in commodity prices until mid-April, quickly put a serious dampener on global economic activity. Consumers became frugal as they lost their purchasing power, and business confidence was also shaken by the increasing uncertainty surrounding the economic trend. As a result, economic indicators almost all showed figures below expectations in the third quarter whilst the impact of the output freezes in Japan following the tsunami remained rather enigmatic. Another factor prompting economic players to ever more caution was debt, both the worsening sovereign debt crisis in the eurozone in the second half of the year, and the endless wrangling in the US about raising its debt ceiling. However, whereas the eurozone teetered on the brink of a downward spiral and recession in several of its countries, the US showed clear signs of a recovery in the last quarter of the year, partly attributable to a rebound in private consumer spending. Meanwhile the UK was particularly hard hit by the high inflation, the austerity measures and the fall in demand from Europe. Emerging countries felt the impact of the monetary tightening made necessary by the rocketing inflation (largely because of the importance of foodstuffs in those regions) and of the slowdown in exports towards developed countries. Whilst China’s growth rate was only mildly affected, thanks to the strength of its domestic demand, the slowdown was much more marked in other Asian countries and in Brazil. Overall world growth dropped from 4.5% in 2010 to about 3.8% in 2011 (at purchasing power parity), with emerging countries still in the lead (5.9%, compared with 1.4% for developed countries). Central banks did not have it easy: they had to contend with the risk of inflation in the first half of the year, and then gradually implement measures to stimulate the world economy and resolve banks’ liquidity problems worsened by the eurozone debt crisis. In developed countries central banks opted to maintain expansionary monetary policies, although the European Central Bank initially reacted to the surge in inflation by raising its rates, before having to cut them again, whilst implementing several unconventional measures to release the interbank market from deadlock. It also reactivated its sovereign bond purchasing scheme, especially targeting Spanish and Italian bonds, to contain the rise in yields. As planned the Fed ended its second round of quantitative easing (QE2) in June, pledging to keep its key rate unchanged until mid-2013. It also announced a restructuring of its balance sheet, and planned to sell its short-maturity holdings to buy longer ones (“Operation Twist”). Turning to emerging countries, Brazil’s central bank stood out, having raised its rates by 175 bp, completely reversed its policy by cutting them by 50 bp in August, just a month after its last hike. The Chinese central bank also started easing its monetary policy towards the end of the year, which included a reduction in banks’ reserve requirements. Bond markets: a flight to quality With their safe-haven status, sovereign bonds from the UK (+16.9% according to the Merrill Lynch index), the US (+9.8%), Germany (+9.7%) and Switzerland (+8.9%) were the winners, with their 10-year yields dropping to 1.98% (-142 bp), 1.88% (-142 bp), 1.83% (-113 bp) and 0.66% (-105 bp) respectively at the end of the year. The US’s historic loss of its triple-A rating was fully compensated by concern about growth and the sovereign debt crisis. In contrast the 10-year yields of Portugal (+676 bp, to 13.36%), Italy (+229 bp, to 7.11%) and Greece (+2,249 bp, to 34.96%) shot up as investors lost confidence in those countries’ governments and in the eurozone authorities, which failed in their many attempts to curb the crisis. Risk premiums on non-financial investment-grade corporate bonds increased only slightly, whilst spreads widened much more noticeably in the banking sector and among the more risky segments. Most credit indices nevertheless posted positive performances, as did emerging countries’ external debt. Emerging market local debt in dollars, on the other hand, ebbed slightly due to the currency impact.
UBAM
Report of the Board of Directors (continued)
Page 12
The greenback changed course in the third quarter, allowing it to end the year on the rise against all the major currencies, except the yen (-5.2%) in spite of all the Japanese central bank’s interventions, and the Swiss franc (flat). The latter, thanks to the steps taken by the SNB, clocked up a rise of less than 3% against the euro, settling at 1.22 after a brush with parity. The euro showed remarkable resilience (-3.1% against a basket of the currencies of its main trading partners), given the growing doubts surrounding its survival in its present form. The massive liquidity injections and its safe-haven status propelled gold to new heights (USD 1,900 an ounce) until September, after which it eased under some profit-taking, but nevertheless ended the year 10% up. Equity markets: developed countries fare better The S&P 500’s 0.00% for 2011 belies the volatility that prevailed throughout the year and gave investors a rough ride. Most equity markets posted losses, with the MSCI All Countries in local currency, all net dividends reinvested, shedding 6.5%. In some emerging countries the corrections were steep, for example India (-25.4%), China (-18.5%), Russia (-15.8%) and Brazil (-12.2%). Eurozone markets (the MSCI EMU lost 14.9%) suffered particularly from the sharp fall in banking stocks. Switzerland and the UK weathered the storm much better, dropping only 6.5% and 1.8% respectively, whilst the US, as represented by the MSCI USA, achieved a slim gain of 1.4% thanks to dividends. As regards sectors, although commodities managed to contain their losses, base materials recorded the worst performance of all major sectors worldwide with -19.6%, closely followed by financials with -18.4%. At the other end of the scale, the defensive sectors health care and consumer staples achieved some significant gains (+9.5% and +9.0% respectively). Lastly, despite oil rising by more than 8%, the energy sector dropped slightly (-1.4%).
UBAM
Report of the Board of Directors (continued)
Page 13
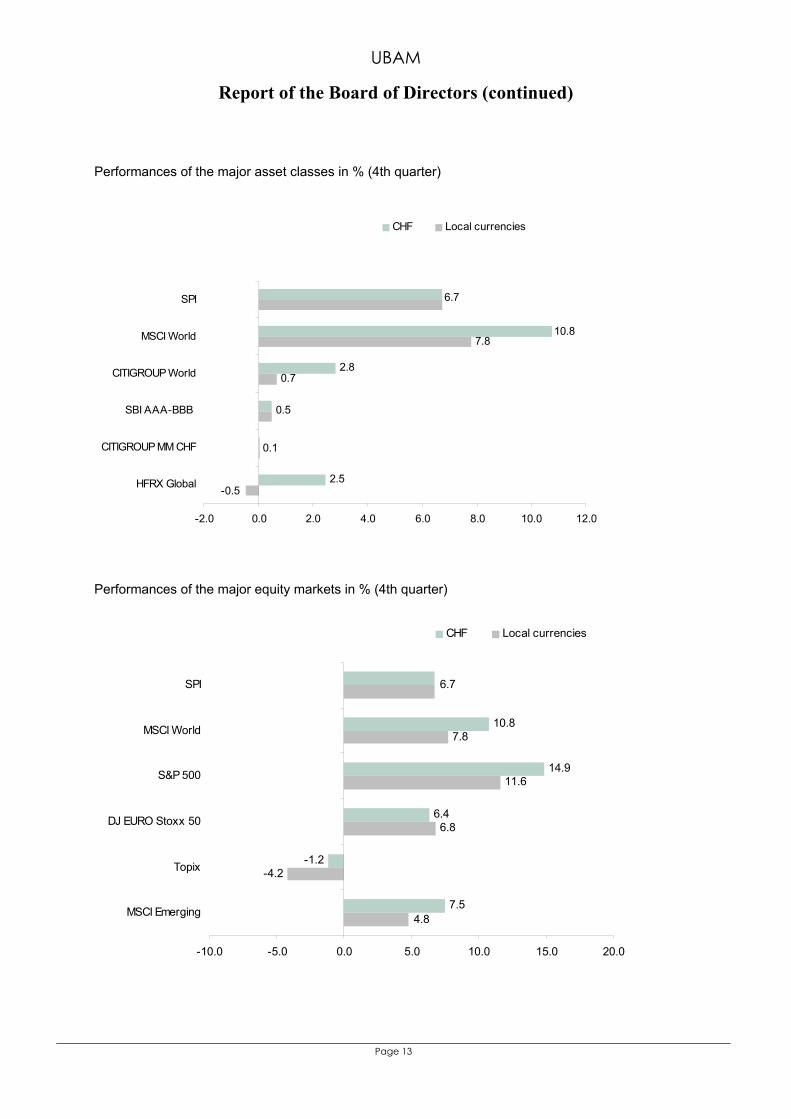
Performances of the major asset classes in % (4th quarter)
2.80.7
6.7
2.5
10.8
0.5
0.1
-0.5
7.8
-2.0 0.0 2.0 4.0 6.0 8.0 10.0 12.0
SPI
MSCI World
CITIGROUP World
SBI AAA-BBB
CITIGROUP MM CHF
HFRX Global
CHF Local currencies
Performances of the major equity markets in % (4th quarter)
10.8
14.9
6.4
-1.2
7.8
11.6
6.8
-4.2
6.7
7.54.8
-10.0 -5.0 0.0 5.0 10.0 15.0 20.0
SPI
MSCI World
S&P 500
DJ EURO Stoxx 50
Topix
MSCI Emerging
CHF Local currencies
UBAM
Report of the Board of Directors (continued)
Page 14
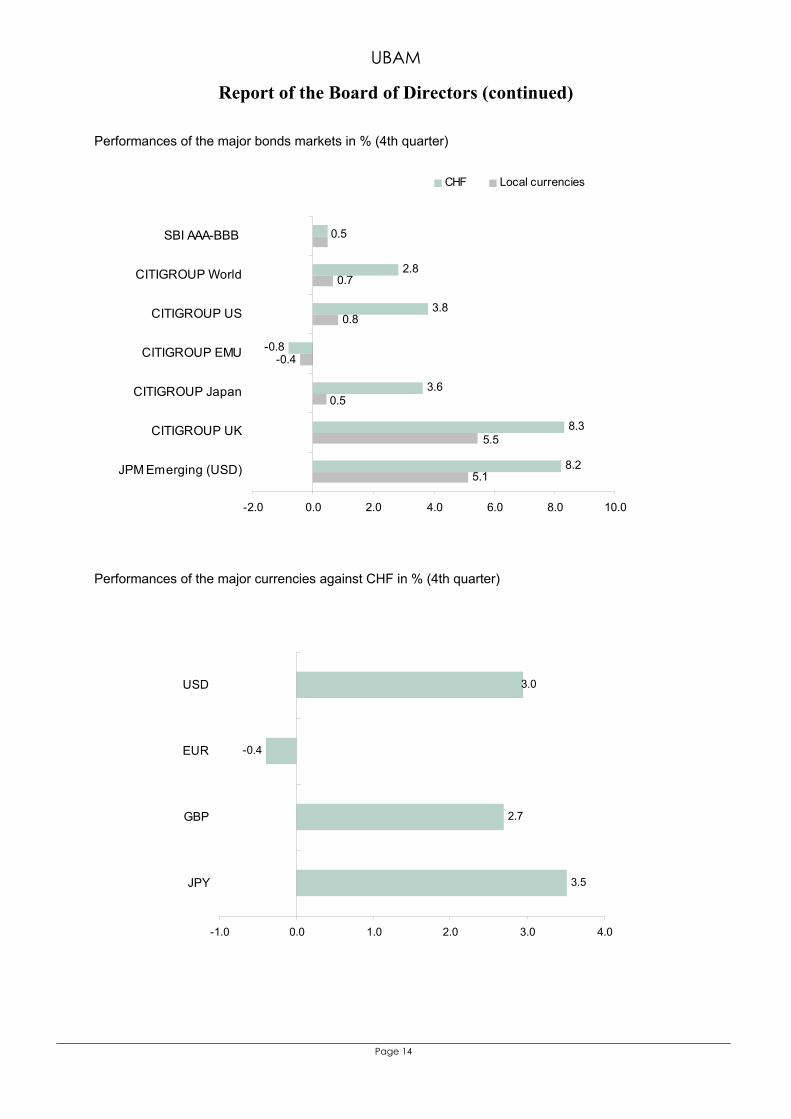
Performances of the major bonds markets in % (4th quarter)
2.8
3.8
-0.8
3.6
8.2
0.7
0.8
5.1
8.3
0.5
0.5
-0.4
5.5
-2.0 0.0 2.0 4.0 6.0 8.0 10.0
SBI AAA-BBB
CITIGROUP World
CITIGROUP US
CITIGROUP EMU
CITIGROUP Japan
CITIGROUP UK
JPM Emerging (USD)
CHF Local currencies
Performances of the major currencies against CHF in % (4th quarter)
2.7
3.5
3.0
-0.4
-1.0 0.0 1.0 2.0 3.0 4.0
USD
EUR
GBP
JPY
UBAM
Report of the Board of Directors (continued)
Page 15
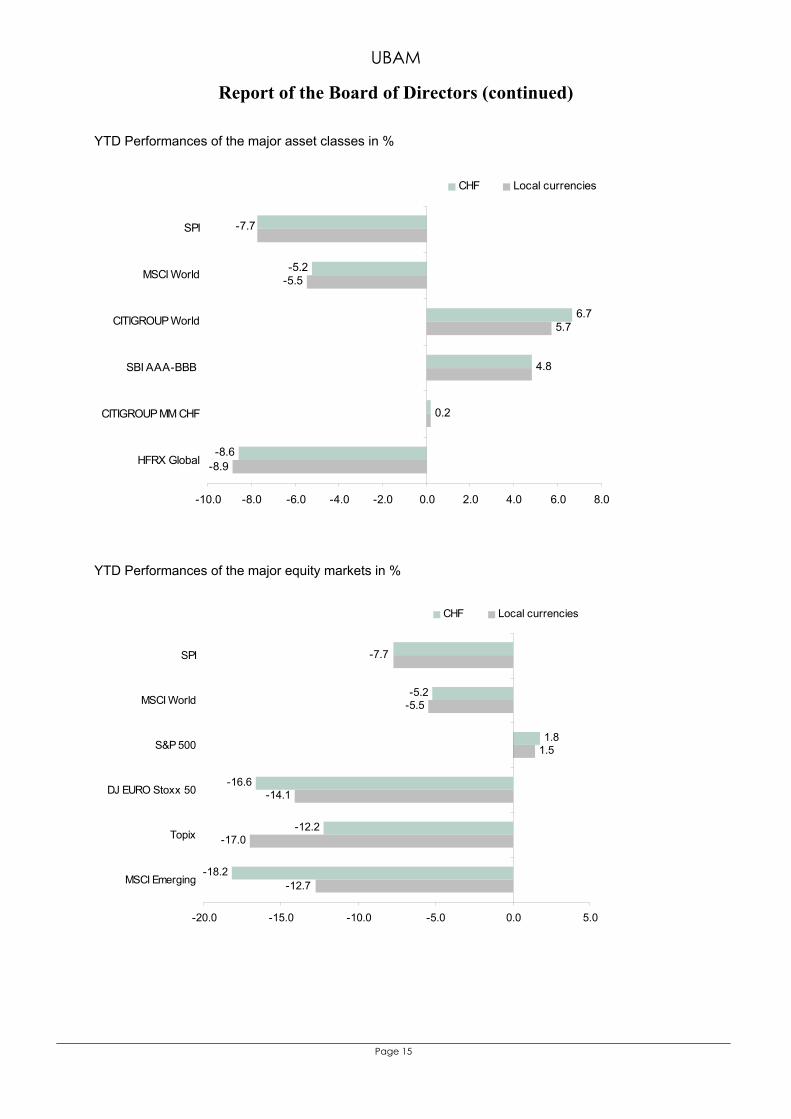
YTD Performances of the major asset classes in %
6.75.7
-7.7
-8.6
-5.2
4.8
0.2
-8.9
-5.5
-10.0 -8.0 -6.0 -4.0 -2.0 0.0 2.0 4.0 6.0 8.0
SPI
MSCI World
CITIGROUP World
SBI AAA-BBB
CITIGROUP MM CHF
HFRX Global
CHF Local currencies
YTD Performances of the major equity markets in %
-5.2
1.8
-16.6
-12.2
-5.5
1.5
-14.1
-17.0
-7.7
-18.2-12.7
-20.0 -15.0 -10.0 -5.0 0.0 5.0
SPI
MSCI World
S&P 500
DJ EURO Stoxx 50
Topix
MSCI Emerging
CHF Local currencies
UBAM
Report of the Board of Directors (continued)
Page 16
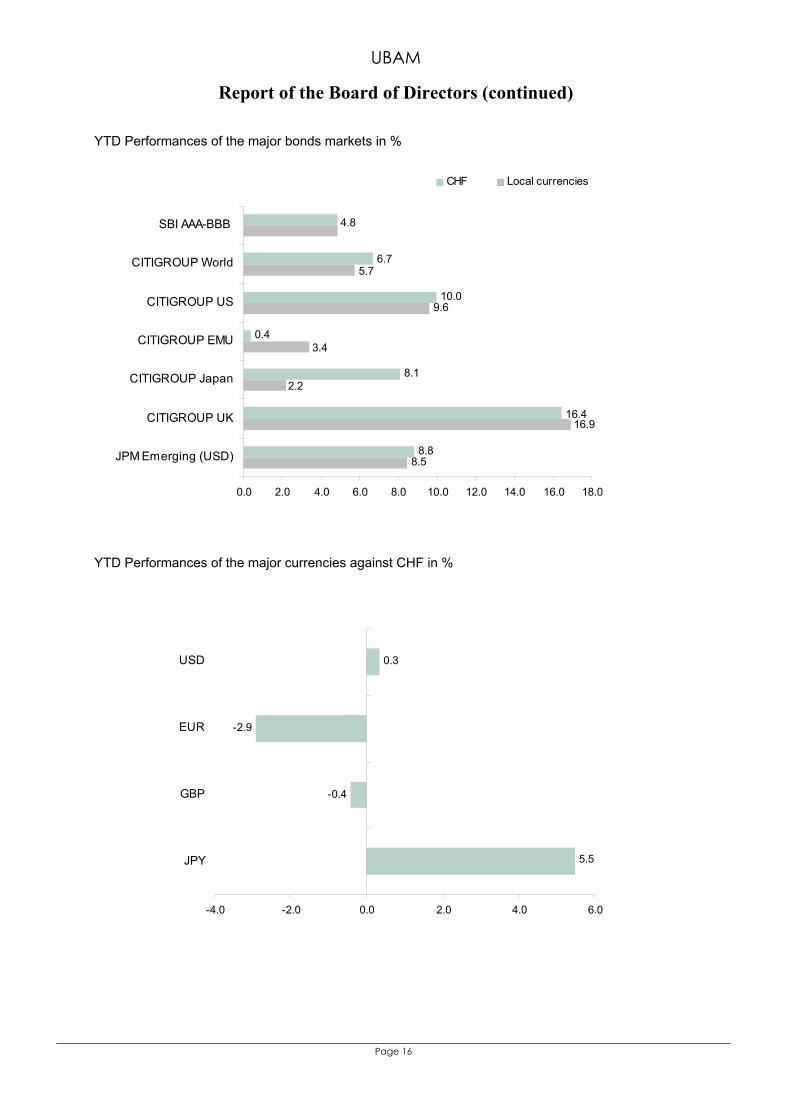
YTD Performances of the major bonds markets in %
10.0
0.4
8.1
8.8
9.6
8.5
6.7
16.4
4.8
5.7
3.4
2.2
16.9
0.0 2.0 4.0 6.0 8.0 10.0 12.0 14.0 16.0 18.0
SBI AAA-BBB
CITIGROUP World
CITIGROUP US
CITIGROUP EMU
CITIGROUP Japan
CITIGROUP UK
JPM Emerging (USD)
CHF Local currencies
YTD Performances of the major currencies against CHF in %
0.3
-2.9
-0.4
5.5
-4.0 -2.0 0.0 2.0 4.0 6.0
USD
EUR
GBP
JPY
UBAM
Report of the Board of Directors (continued)
Page 17
1.2 Sub-funds' report UBAM - DYNAMIC US DOLLAR BOND 2011 saw the US economy stabilise. Economic players regained confidence towards the end of the year and the job market picked up again after the mid-year slump. The real estate sector is also sending out some positive signals. Europe’s sovereign debt crisis stayed at the forefront of financial markets’ preoccupations throughout the year as it spread from the eurozone’s periphery to the entire area and, as it swelled, affected the banking sector. Risk-aversion generally waned over the third quarter, following two European summits at which eurozone member States pledged to tighten their budget policies, and after the European Central Bank announced liquidity measures for banks. The sub-fund provides a 3% yield with an average credit rating of A and an average duration of 16 months, a very attractive level. The sub-fund returned a 2011 performance of -0.70% (AC share). UBAM - DYNAMIC EURO BOND 2011 saw the US economy stabilise. In Europe, Germany is still the main driver of the eurozone’s economic activity, which is heavily dependent on developments in the sovereign debt crisis. Europe’s sovereign debt crisis stayed at the forefront of financial markets’ preoccupations throughout the year as it spread from the eurozone’s periphery to the entire area and, as it swelled, affected the banking sector. Risk-aversion generally waned over the third quarter, following two European summits at which eurozone member States pledged to tighten their budget policies, and after the European Central Bank announced liquidity measures for banks. The sub-fund provides a 4.2% yield with an average credit rating of A and an average duration of 16 months, a very attractive level. The sub-fund returned a performance of -0.07% over the year (AC share). UBAM - YIELD CURVE US DOLLAR BOND 2011 saw the US economy stabilise. Economic players regained confidence towards the end of the year and the job market picked up again after the mid-year slump. The real estate sector is also sending out some positive signals. Europe’s sovereign debt crisis stayed at the forefront of financial markets’ preoccupations throughout the year as it spread from the eurozone’s periphery to the entire area and, as it swelled, affected the banking sector. Risk-aversion generally waned over the third quarter, following two European summits at which eurozone member States pledged to tighten their budget policies, and after the European Central Bank announced liquidity measures for banks. These factors were positive for US Treasury bonds and for defensive corporate debt, to which the sub-fund is also exposed. The sub-fund gained 8.45% in 2011 (AC share). UBAM - YIELD CURVE EURO BOND 2011 saw the US economy stabilise. In Europe, Germany is still the main driver of the eurozone’s economic activity, which is heavily dependent on developments in the sovereign debt crisis. Europe’s sovereign debt crisis stayed at the forefront of financial markets’ preoccupations throughout the year as it spread from the eurozone’s periphery to the entire area and, as it swelled, affected the banking sector. Risk-aversion generally waned over the third quarter, following two European summits at which eurozone member States pledged to tighten their budget policies, and after the European Central Bank announced liquidity measures for banks. These factors were positive for the German Bund. The sub-fund benefited from its defensive positioning on eurozone sovereign debt, particularly France’s and Italy’s, and from its exposure to investment-grade corporate debt. In 2011, the sub-fund returned a performance of +2.92% (AC share).
UBAM
Report of the Board of Directors (continued)
Page 18
UBAM - YIELD CURVE STERLING BOND 2011 saw the US economy stabilise. Economic players regained confidence towards the end of the year and the job market picked up again after the mid-year slump. The real estate sector is also sending out some positive signals. Europe’s sovereign debt crisis stayed at the forefront of financial markets’ preoccupations throughout the year as it spread from the eurozone’s periphery to the entire area and, as it swelled, affected the banking sector. Risk-aversion generally waned over the third quarter, following two European summits at which eurozone member States pledged to tighten their budget policies, and after the European Central Bank announced liquidity measures for banks. These factors were positive for UK government bonds and for defensive corporate debt, to which the sub-fund is also exposed. In 2011, the sub-fund returned a performance of +15.47% (AC share). UBAM - GLOBAL BOND (CHF) 2011 saw the US economy stabilise. In Europe, Germany is still the main driver of the eurozone’s economic activity, which is heavily dependent on developments in the sovereign debt crisis. Europe’s sovereign debt crisis stayed at the forefront of financial markets’ preoccupations throughout the year as it spread from the eurozone’s periphery to the entire area and, as it swelled, affected the banking sector. Risk-aversion generally waned over the third quarter, following two European summits at which eurozone member States pledged to tighten their budget policies, and after the European Central Bank announced liquidity measures for banks. These factors were positive for AAA-rated sovereign debt. In 2011, the sub-fund returned a performance of +1.12% (AC share). UBAM - CORPORATE US DOLLAR BOND 2011 saw the US economy stabilise. Economic players regained confidence towards the end of the year and the job market picked up again after the mid-year slump. The real estate sector is also sending out some positive signals. Europe’s sovereign debt crisis stayed at the forefront of financial markets’ preoccupations throughout the year as it spread from the eurozone’s periphery to the entire area and, as it swelled, affected the banking sector. Risk-aversion generally waned over the third quarter, following two European summits at which eurozone member States pledged to tighten their budget policies, and after the European Central Bank announced liquidity measures for banks. The reduction in risk exposure made in April was beneficial to the sub-fund. In 2011, the sub-fund returned a performance of +4.44% (AC share). UBAM - CORPORATE EURO BOND 2011 saw the US economy stabilise. In Europe, Germany is still the main driver of the eurozone’s economic activity, which is heavily dependent on developments in the sovereign debt crisis. Europe’s sovereign debt crisis stayed at the forefront of financial markets’ preoccupations throughout the year as it spread from the eurozone’s periphery to the entire area and, as it swelled, affected the banking sector. Risk-aversion generally waned over the third quarter, following two European summits at which eurozone member States pledged to tighten their budget policies, and after the European Central Bank announced liquidity measures for banks. The reduction in the sub-fund’s risk exposure made in April, its defensive positioning on eurozone banking-sector credit and its country allocation were beneficial. In 2011, the sub-fund returned a performance of +2.30% (AC share).
UBAM
Report of the Board of Directors (continued)
Page 19
UBAM - ABSOLUTE RETURN (USD) On the whole the bond market had a decent 2011 in the credit and government debt segments. The strong performance is mainly attributable to the fall in interest rates in the US and Germany. As for the uncertainty, it was chiefly due to the sovereign debt crisis in the eurozone. The European Central Bank’s string of measures greatly contributed to curbing risk-aversion in December. In 2011, the sub-fund returned a performance of -2.30% (APC share). UBAM - ABSOLUTE RETURN (EURO) On the whole the bond market had a decent 2011 in the credit and government debt segments. The strong performance is mainly attributable to the fall in interest rates in the US and Germany. As for the uncertainty, it was chiefly due to the sovereign debt crisis in the eurozone. The European Central Bank’s string of measures greatly contributed to curbing risk-aversion in December. In 2011, the sub-fund returned a performance of -1.05% (APC share). UBAM - EMERGING MARKET BOND (FORMERLY UBAM - EMERGING MARKET BOND (USD)) The JP Morgan EMBI Global gained +8.46% in 2011. The index started the year on a weak note, but embarked on an extended rally from mid-February to early August, only to collapse in the second half of September in the wake of the global financial market turmoil. It recovered strongly in Q4, however. The main driver of performance, especially in H2, was the investment-grade segment, which benefited hugely from the global flight to quality. The JP Morgan EMBI Global Investment Grade rose by +9.87% in 2011, compared to +6.58% for the JP Morgan EMBI Global Non-Investment Grade. UBAM - Emerging Market Bond performed in line with the benchmark in the first four months of 2011. However, its underweight in sovereign investment-grade and its bias towards non-sovereign high-yield names detracted from its relative return in June-August and again in November and early December, when there was another global flight to quality. The sub-fund rose by +1.26% over the year (AC share). UBAM - LOCAL CURRENCY EMERGING MARKET BOND (FORMERLY UBAM - LOCAL CURRENCY EMERGING MARKET BOND (USD)) Local currency emerging markets bonds performed strongly in local currency terms in 2011, supported by tighter monetary policies in the first half and by easing inflation expectations in the second half. However, the US dollar and US Treasury rallies in the second half, fuelled by Fed intervention and mounting concerns about the euro, more than offset gains in local currency terms. The JP Morgan GBI-EM Global Diversified fell by -1.75% in USD terms over the year. UBAM - Local Currency Emerging Market Bond’s overweight in Asia and underweight in Eastern Europe detracted from its relative return in H1, and in Q2 in particular. However, the sub-fund’s emphasis on countries with good growth prospects, healthy external balances and no fiscal refinancing difficulties boosted its relative return in Q3 during the height of the global financial market sell-off. The sub-fund fell by -5.36% over the year (AC share).
UBAM
Report of the Board of Directors (continued)
Page 20
UBAM - EMERGING MARKET CORPORATE BOND (FORMERLY UBAM - EMERGING MARKET CORPORATE BOND (USD)) The JP Morgan Corporate EMBI Diversified gained +3.24% in 2011. In the first half of the year, the high-yield segment of the index boosted returns thanks to strong risk appetite. In the second half, and in particular around the global financial market turmoil in September, the investment-grade segment drove EM corporate bond returns, fuelled by the global flight to quality, whereas the high-yield segment detracted. The JP Morgan Corporate EMBI Diversified Investment Grade rose by +5.41% and the JP Morgan Corporate EMBI Diversified High Yield fell by -2.56% in 2011. UBAM - Emerging Market Corporate Bond outperformed its benchmark in H1 2011 due to its bias towards the BBB- / BB range. The sub-fund scaled back its exposure to high yield and the banking sector in H2, and also temporarily increased its cash holdings. This helped to temper the impact of the global flight to quality. The sub-fund rose by +0.95% over the year (AC share). UBAM - GLOBAL HIGH YIELD SOLUTION 2011 saw the US economy stabilise. In Europe, Germany is still the main driver of the eurozone’s economic activity, which is heavily dependent on developments in the sovereign debt crisis. Europe’s sovereign debt crisis stayed at the forefront of financial markets’ preoccupations throughout the year as it spread from the eurozone’s periphery to the entire area and, as it swelled, affected the banking sector. Risk-aversion generally waned over the third quarter, following two European summits at which eurozone member States pledged to tighten their budget policies, and after the European Central Bank announced liquidity measures for banks. The reduction in the sub-fund’s risk exposure made in April, and the tactical exposure to high yield initiated in the last quarter were beneficial. The sub-fund fell by -1.83% over the year (AC share). UBAM - EUROPEAN CONVERTIBLE BOND Although 2011 started off reasonably well, the second half of the year was characterised by uncertainty about the potential restructuring of Greek debt, contagion to other peripheral countries and the effects on the real economy. Stock markets in Europe were highly volatile. Foreign exchange rates had a significant effect, with equity indices ending the year with divergent returns. The Euro Stoxx 50 NR lost -14.1%, while the Stoxx Europe 50 NR fell by just -5.1%. The spreads of private issuers moved in line with equities. Over the year, the Itraxx Main (investment-grade issues) widened by +65bp to 170bp and the Crossover index (below-investment-grade issues) widened by +325bp to 760bp. Convertible bonds spreads widened by +180bp to 530bp. There was considerable activity in the primary market in the first half of the year, with 21 new issues. However, there were just three new issues in the second half. The total amount issued was still just over EUR 10 billion. In 2011, the sub-fund returned a performance of -9.59% (AC share).
UBAM
Report of the Board of Directors (continued)
Page 21
UBAM - EURO 10-40 CONVERTIBLE BOND Although 2011 started off reasonably well, the second half of the year was characterised by uncertainty about the potential restructuring of Greek debt, contagion to other peripheral countries and the effects on the real economy. Stock markets in Europe were highly volatile. Foreign exchange rates had a significant effect, with equity indices ending the year with divergent returns. The Euro Stoxx 50 NR lost -14.1%, while the Stoxx Europe 50 NR fell by just -5.1%. The spreads of private issuers moved in line with equities. Over the year, the Itraxx Main (investment-grade issues) widened by +65bp to 170bp and the Crossover index (below-investment-grade issues) widened by +325bp to 760bp. Convertible bonds spreads widened by +180bp to 530bp. There was considerable activity in the primary market in the first half of the year, with 21 new issues. However, there were just three new issues in the second half. The total amount issued was still just over EUR 10 billion. In 2011, the sub-fund returned a performance of -5.31% (AC share). UBAM - CALAMOS US EQUITY GROWTH After dashed hopes of sharp growth in March and a long dry spell over the summer, the US economy finally picked up in the last quarter of 2011, clocking up an estimated growth rate of +1.8% for the year. On the job market, the summer lull was quickly replaced by a relatively strong recovery towards the end of the year. US companies impressed market players with the strength of their margins and of their balance sheets. The US equity market was quite closely correlated to the economy. Following a sharp correction in early August, it gradually improved, with the S&P 500 N. R. ending 2011 up +1.5%. Against this backdrop, the portfolio’s net asset value dropped by -8.32% (AC share). Our relative underperformance is essentially due to our stock-picking, particularly in the IT, health care and energy sectors. The main change we made to the sector allocation was to gradually reduce the weighting of consumer discretionary, from a significant overweighting to an equal weighting to that in the index. UBAM - NEUBERGER BERMAN US EQUITY VALUE After dashed hopes of sharp growth in March and a long dry spell over the summer, the US economy finally picked up in the last quarter of 2011, clocking up an estimated growth rate of +1.8% for the year. On the job market, the summer lull was quickly replaced by a relatively strong recovery towards the end of the year. US companies impressed market players with the strength of their margins and of their balance sheets. The US equity market was quite closely correlated to the economy. Following a sharp correction in early August, it gradually improved, with the S&P 500 N. R. ending 2011 up +1.5%. Against this backdrop the portfolio's net asset value dropped by -4.94% (AC share), this relative underperformance essentially due to our sector allocation, i.e. a substantial overweighting of energy and the absence of consumer staples. The main portfolio change was to consumer discretionary, to which we had practically no exposure, and which we gradually overweighted. UBAM - DR. EHRHARDT GERMAN EQUITY 2011 was a trying year in every way. Although it showed unprecedented economic strength and achieved figures not seen since before the country’s reunification, Germany found itself in the middle of the European debt turmoil. This affected its equity market, which was no more spared than the other eurozone markets, ending the year some 15% down, far behind the US, which managed to end the year in positive territory. As regards the sub-fund, whilst it performed in line with the DAX index, it demonstrated the validity of a so-called flexible investment approach. Whilst it finished the year at the same level as the index, the sub-fund did not get there the same way: the approach used on the sub-fund meant its volatility was much reduced, as was the impact of sharp market corrections. In 2011, the sub-fund returned a performance of -14.65% (AC share).
UBAM
Report of the Board of Directors (continued)
Page 22
UBAM - EUROPE EQUITY The MSCI Europe Net Return fell by -8.08% in 2011. The obvious main driver over the year of this fall was the sovereign debt crisis, which dominated the headlines. Fear of contagion and the absence of comprehensive measures to tackle the underlying issues made investors wary of the asset class. We also saw increasing divergence of European economies over the year, with strong figures from Germany and other northern European countries contrasting sharply with rising unemployment and weak GDP data in southern Europe. The sub-fund outperformed by +37bp in a year characterised by sharp market swings and high volatility. Within our cyclical exposure we preferred luxury brands and high-quality car manufacturers. Within our defensive positions we preferred companies with high cash flow and low debt as well as strong healthcare plays. We avoided the telecom and utilities sectors. In 2011, the sub-fund returned a performance of -8.40% (AC share). UBAM - SWISS EQUITY In 2011, companies listed on the Swiss stock market were shaken by the macroeconomic crisis abroad in spite of the country's exemplary management of its economy. The deeper the eurozone and the US got mired in their debt crises, the more Swiss listed companies suffered as investors rushed to invest in the franc, making the currency too expensive for listed companies to operate effectively. This historic rise in the Swiss franc prompted the SNB to intervene on the foreign exchange market to avert a devastating blow to the Swiss economy. With the SPI Net Return down -7.72%, two sectors achieved positive performances in 2011: health care and the media. Technology lost almost half of its value. Over the fourth quarter, we increased exposure to health care and insurance and UBAM - Swiss Equity gained +8.22%, thereby outperforming the index. In 2011, the sub-fund returned a performance of -13.02% (AC share). UBAM - IFDC JAPAN EQUITY The Japanese economy was devastated by the earthquake and tsunami that hit it on 11th March 2011. Economic growth, previously forecast at +1.5% for the year, will probably be recorded at -0.8%, according to economists. It suffered the triple blow of the natural disaster, of the world economic slowdown, and of the dizzying rise of the yen against the dollar. Having started out promisingly, the Japanese market recorded the bulk of its losses for the year, -17%, following the tragic events, and then managed to pick up again until the fall of markets across the board in the summer. Amid all this, the sub-fund’s net asset value fell by -18.01% (AC share), a slight underperformance vs. the Topix T. R. (-17%). The portfolio kept its positioning generally unchanged, with an overweighting of the tech, IT and materials sectors. The main change to the sector allocation was the overweighting of the financial sector through the purchase of real estate companies. UBAM - IFDC JAPAN OPPORTUNITIES EQUITY The Japanese economy was devastated by the earthquake and tsunami that hit it on 11th March 2011. Economic growth, previously forecast at +1.5% for the year, will probably be recorded at -0.8% according to economists. It suffered the triple blow of the natural disaster, of the world economic slowdown, and of the dizzying rise of the yen against the dollar. Having started out promisingly, the Japanese market recorded the bulk of its losses for the year, -17%, following the tragic events, and then managed to pick up again until the fall of markets across the board in the summer. In spite of these very adverse market conditions, the sub-fund’s net asset value only fell by -5.63% (APC share), compared with -17% for the Topix T.R. This strong outperformance is partly due to our overweighting of small and mid caps and domestic firms, but mainly to our focus on companies trading at very low valuations.
UBAM
Report of the Board of Directors (continued)
Page 23
UBAM - PCM GLOBAL EQUITY VALUE As we entered 2011, we made the portfolio more defensive, expecting a mixed and volatile economic environment to impact equity markets. We were rewarded by positive absolute gains in healthcare and consumer staples in the US and in Japan, and beat the benchmark in materials, consumer discretionary, financials and utilities. The financial holdings outperformed the sector benchmark due primarily to an underweight in European financial firms. However, this sector was one of the most depressed and was obviously impinged on by the ongoing European debt crisis. Financials were the main cause for the sub-fund’s annual underperformance vs. the MSCI AC World Net Return USD. There is an underlying base of solid demand and modest economic growth in emerging countries and the US. However, we believe that negative macro news will continue to permeate many markets, producing mispriced stocks and buying opportunities. We recently increased our cash position in order to buy into this longer-term economic story at lower prices. In 2011, the sub-fund returned a performance of -9.10% (AC share). UBAM - VP VALUE CHINA EQUITY 2011 was a trying year in every way. China eventually felt the pressure of the world economic slowdown and although the strength of its domestic consumption demonstrated remarkable resilience, this was no compensation for the fall in exports towards Europe. Neither did the clear signs of overheating in the real estate sector do anything to help investors’ confidence. This said, however, figures seem to be suggesting that the slowdown is now under control. In these very tricky circumstances, our sub-fund ended the year down 3.86% on its benchmark (MSCI Golden Dragon Net Return USD). Its annual performance was hampered mainly by the stock-picking (especially in the real estate sector), whilst the sector allocation was neither beneficial nor detrimental. It was mainly during the period of extreme stress, from mid-August to the end of September, that the sub-fund corrected the most, losing almost 7% in terms of relative performance. In 2011, the sub-fund returned a performance of -22.52% (APC share). UBAM - ASIA EQUITY (FORMERLY UBAM - SOUTH PACIFIC AND ASIA EQUITY) Since mid-March, when the current team took over management of the portfolio, the sub-fund has returned -28.5% vs. -12.3% for the benchmark. The underperformance was due to our view early in the year that the global economic slowdown would resemble a mid-cycle correction for Asia rather than a 2008-like event. Macro data has yet to convincingly prove our initial outlook wrong. This cautious view did lead us to drastically underweight financials, yet we underestimated the magnitude of the shift in investor sentiment and capital flows out of Asia, both of which contributed to drag down all cyclical stocks. On the whole, we focused on fundamental valuations and upheld our belief in regional growth, but value and growth strategies both fared poorly in 2011. This was compounded by our focus on mid- and small-cap stocks which significantly underperformed large caps. In 2011, the sub-fund returned a performance of -34.93% (AC share).
UBAM
Report of the Board of Directors (continued)
Page 24
UBAM - EQUITY BRIC+ 2011 was a difficult year in every way. The BRIC markets underperformed developed markets, in particular the US. The rampant inflation that had prevailed in those economies since the summer of 2010 required very restrictive measures to be taken by the authorities, which took its toll on those markets. The BRICs were then dealt the “coup de grâce” when investors’ risk-aversion took hold in the second half of the year. In these very trying circumstances, our sub-fund ended the year down 3% (for the AP class) on its benchmark. Its overall performance was strongly affected by our structural overweighting of India (which was a clear underperformer in 2011), and by our bias towards small and medium caps. Approximately two thirds of the sub-fund’s underperformance is attributable to the equal weighting of the four segments, and the last third to the underlying managers’ underperformance compared with their respective benchmarks (including the small-cap bias). In 2011, the sub-fund returned a performance of -25.86% (APC share). UBAM - TURKISH EQUITY Turkish equities fell sharply in 2011, with the MSCI Turkey 10/40 down 36% due to weak stock returns and a fall of the lira against the dollar. Economic data tended to be strong over the year, with high GDP growth and falling inflation, but a number of other factors concerned investors, such as the persistently-high current account deficit and the central bank’s unorthodox policy measures. Turkish equities also suffered from external factors, such as the peripheral debt crisis in the eurozone and fears of recession in Europe leading to risk aversion. The sub-fund outperformed its benchmark by +472bp over the year thanks to its continued focus on relative valuation within sectors. In 2011, the sub-fund returned a performance of -32.02% (AC share). UBAM - RUSSIAN EQUITY Russian equities experienced a weak 2011, with the MSCI Russia 10/40 Net Return down -23.66%. Russian equities rallied during the first quarter on the back of higher energy prices due to the turmoil in the Middle East, but they fell sharply in the second and third quarters as fears of a slowdown in emerging markets and the worsening sovereign debt crisis in Europe increased risk aversion. Energy prices remained high throughout the year, boosting earnings in the energy sector, such that the Russian market ended 2011 trading at very low multiples. However, expanded privatisation plans and higher payout ratios were not enough to trigger renewed investor appetite for the asset class. The sub-fund underperformed its benchmark by -246bp over the year in a difficult environment. In 2011, the sub-fund returned a performance of -26.12% (AC share). UBAM - EUROPE EQUITY DIVIDEND+ The sub-fund launched on 15th December 2011 rose by 0.56% over the year. UBAM - MONEY MARKET INSTITUTIONAL LIQUIDITY (EUR) The money market curve in euro steepened in 2011, with the 3-month Euribor going from 1% to 1.36% and the 1-year from 1.51% to 1.95%. Europe’s sovereign debt crisis stayed at the forefront of financial markets’ preoccupations, as it spread from the eurozone’s periphery to the entire area and, as it swelled, affected the banking sector. Faced with the worsening refinancing difficulties, the ECB cut its key rate by 50bp (from 1.5% to 1%) and made unlimited liquidity available at 1% for 3 years. Amid the uncertainty the ECB will be keeping rates low, as inflationary risks should stay modest in the medium term. Most holdings reaching maturity were reinvested in investment-grade fixed- and floating-rate bonds and the average duration was kept longer than that of the benchmark index. The sub-fund posted a performance* of +0.94% (I+C share) for the year, against +0.87% for the index. * With a full redemption on 22.12.2012.
UBAM
Report of the Board of Directors (continued)
Page 25
UBAM - MONEY MARKET INSTITUTIONAL LIQUIDITY (USD) The money market curve steepened in 2011, with the 3-month Libor going from 0.30% to 0.58%, the 6-month from 0.45% to 0.81% and the 1-year from 0.78% to 1.13%. 2011 saw the US economy stabilise. Economic players regained confidence towards the end of the year and the job market picked up again after the mid-year slump. The real estate sector is also sending out some positive signals. In the circumstances the Fed kept its rates unchanged (0%-0.25%) and confirmed that they would stay low until mid-2013. It also declared itself prepared to take any further stimulus measures required. Most holdings reaching maturity were reinvested in investment-grade fixed- and floating-rate bonds and the average duration was kept longer than that of the benchmark index. The sub-fund posted a performance of -0.41% (I+C share) for the year, against +0.10% for the index. * With a full redemption on 20.12.2012. UBAM - SQUARE 2011 was fraught with uncertainty due to onslaughts both from nature, with the earthquake in Japan, and from the economy with the debt crisis, especially in Europe. After falling short of its goals in the first half of the year, the sub-fund drastically reduced its risk-taking in the second. In 2011, the sub-fund returned a performance of -2.38% (IC share as the AC share was not priced all over the year). UBAM - CUBE 2011 was fraught with uncertainty due to onslaughts both from nature, with the earthquake in Japan, and from the economy with the debt crisis, especially in Europe. After falling short of its goals in the first half of the year, the sub-fund drastically reduced its risk-taking in the second. In 2011, the sub-fund returned a performance of -6.01% (APC share).
UBAM
Report of the Board of Directors (continued)
Page 26
1.3. Perspectives 2012: more trouble ahead World economic growth is likely to slow to around 3% in 2012 because many of the problems that arose in 2011 are far from solved and there is a risk of downward forecast revisions. The eurozone crisis has still not been successfully tackled and will probably cause a severe recession in early 2012. Growth prospects in the US are better than in the eurozone, as a recession is not expected, but unlikely to exceed 2%. Emerging economies, particularly in Asia, should keep slowing down, especially at the beginning of the year, but even with a growth forecast around 5% rather than the 6% and more recorded in previous years, the outlook is much better than for developed countries. There is still much uncertainty about where the economy is going, which will force central banks to keep to policies that favour growth. In the eurozone the very restrictive fiscal policies are going to weigh on the economy and the ECB will have to adopt a more aggressive strategy entailing another key rate cut and bigger cash injections or the purchase of bonds from struggling countries. As for the Fed, it should also keep its rates very low and could shift the focus of its interventions and liquidity injections from the banking sector to the real estate market. Emerging countries’ central banks will gradually lift their siege on inflation, which eased back close to its target towards the end of the year. They should now turn their attention to more economic stimulus. There should therefore be less pressure on credit, and more key rate cuts or reductions to banks’ reserve requirements in the first half of the year. Risky assets have limited prospects because growth is running out of steam, in spite of the strong support from monetary policy. Earnings growth is likely to slow down markedly in all regions, and particularly in the eurozone, where a contraction looks likely in 2012. Whilst equity market valuations are low, there is a risk of earnings forecasts being revised down by financial analysts. Government bond yields have dropped very low in Germany and the US. The current monetary policy-makers’ strategy is to encourage these low yields, but this will make it more difficult to attract investors. Furthermore, the eurozone crisis will keep the risks to the Mediterranean member States’ public debt high and more credit rating downgrades are threatening developed countries in 2012. Given these circumstances, the outlook is better for corporate credit: the cyclical slowdown should not trigger too much of a rise in the default rates, which makes risk premiums high – and therefore worth capturing – and yields more attractive than those of sovereign bonds.
The outlook for commodities is unclear because they are very dependent not only on the economic trend in China and in the G7 countries, but also on how much central banks all over the world will loosen their grip on monetary policy. However, the imbalances between supply and demand in some segments are obvious, which could throw up some attractive opportunities during the year. Gold should still benefit from the more aggressive reflation policies expected in 2012, as well as from the geopolitical tensions and the persisting risks on the euro and the dollar. The eurozone sovereign debt crisis and key rate expectations should weaken the euro, but doubts will remain as to the dollar’s stability in the medium term, because intervention to deleverage public debt is likely to be limited in 2012.
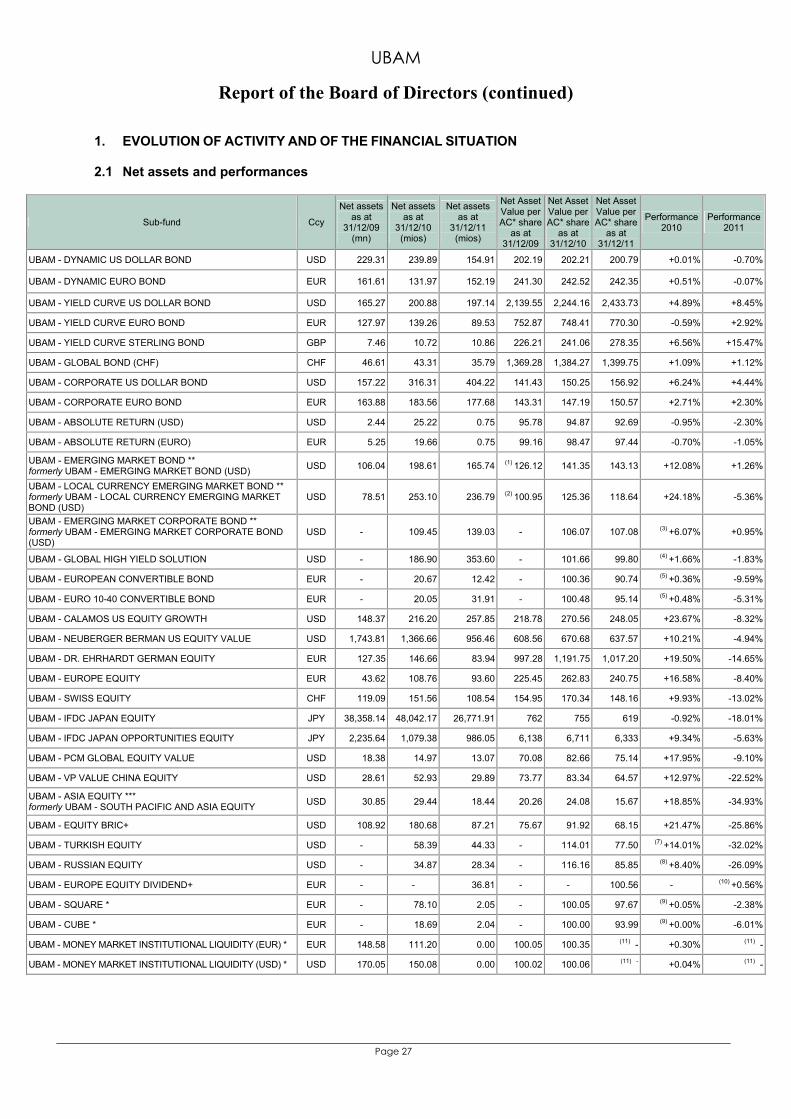
UBAM
Report of the Board of Directors (continued)
Page 27
1. EVOLUTION OF ACTIVITY AND OF THE FINANCIAL SITUATION 2.1 Net assets and performances
Sub-fund Ccy
Net assets as at
31/12/09 (mn)
Net assets as at
31/12/10 (mios)
Net assets as at
31/12/11 (mios)
Net Asset Value per AC* share
as at 31/12/09
Net Asset Value per AC* share
as at 31/12/10
Net Asset Value per AC* share
as at 31/12/11
Performance2010
Performance2011
UBAM - DYNAMIC US DOLLAR BOND USD 229.31 239.89 154.91 202.19 202.21 200.79 +0.01% -0.70%
UBAM - DYNAMIC EURO BOND EUR 161.61 131.97 152.19 241.30 242.52 242.35 +0.51% -0.07%
UBAM - YIELD CURVE US DOLLAR BOND USD 165.27 200.88 197.14 2,139.55 2,244.16 2,433.73 +4.89% +8.45%
UBAM - YIELD CURVE EURO BOND EUR 127.97 139.26 89.53 752.87 748.41 770.30 -0.59% +2.92%
UBAM - YIELD CURVE STERLING BOND GBP 7.46 10.72 10.86 226.21 241.06 278.35 +6.56% +15.47%
UBAM - GLOBAL BOND (CHF) CHF 46.61 43.31 35.79 1,369.28 1,384.27 1,399.75 +1.09% +1.12%
UBAM - CORPORATE US DOLLAR BOND USD 157.22 316.31 404.22 141.43 150.25 156.92 +6.24% +4.44%
UBAM - CORPORATE EURO BOND EUR 163.88 183.56 177.68 143.31 147.19 150.57 +2.71% +2.30%
UBAM - ABSOLUTE RETURN (USD) USD 2.44 25.22 0.75 95.78 94.87 92.69 -0.95% -2.30%
UBAM - ABSOLUTE RETURN (EURO) EUR 5.25 19.66 0.75 99.16 98.47 97.44 -0.70% -1.05%
UBAM - EMERGING MARKET BOND ** formerly UBAM - EMERGING MARKET BOND (USD) USD 106.04 198.61 165.74 (1) 126.12 141.35 143.13 +12.08% +1.26%
UBAM - LOCAL CURRENCY EMERGING MARKET BOND ** formerly UBAM - LOCAL CURRENCY EMERGING MARKET BOND (USD)
USD 78.51 253.10 236.79 (2) 100.95 125.36 118.64 +24.18% -5.36%
UBAM - EMERGING MARKET CORPORATE BOND ** formerly UBAM - EMERGING MARKET CORPORATE BOND (USD)
USD - 109.45 139.03 - 106.07 107.08 (3) +6.07% +0.95%
UBAM - GLOBAL HIGH YIELD SOLUTION USD - 186.90 353.60 - 101.66 99.80 (4) +1.66% -1.83%
UBAM - EUROPEAN CONVERTIBLE BOND EUR - 20.67 12.42 - 100.36 90.74 (5) +0.36% -9.59%
UBAM - EURO 10-40 CONVERTIBLE BOND EUR - 20.05 31.91 - 100.48 95.14 (5) +0.48% -5.31%
UBAM - CALAMOS US EQUITY GROWTH USD 148.37 216.20 257.85 218.78 270.56 248.05 +23.67% -8.32%
UBAM - NEUBERGER BERMAN US EQUITY VALUE USD 1,743.81 1,366.66 956.46 608.56 670.68 637.57 +10.21% -4.94%
UBAM - DR. EHRHARDT GERMAN EQUITY EUR 127.35 146.66 83.94 997.28 1,191.75 1,017.20 +19.50% -14.65%
UBAM - EUROPE EQUITY EUR 43.62 108.76 93.60 225.45 262.83 240.75 +16.58% -8.40%
UBAM - SWISS EQUITY CHF 119.09 151.56 108.54 154.95 170.34 148.16 +9.93% -13.02%
UBAM - IFDC JAPAN EQUITY JPY 38,358.14 48,042.17 26,771.91 762 755 619 -0.92% -18.01%
UBAM - IFDC JAPAN OPPORTUNITIES EQUITY JPY 2,235.64 1,079.38 986.05 6,138 6,711 6,333 +9.34% -5.63%
UBAM - PCM GLOBAL EQUITY VALUE USD 18.38 14.97 13.07 70.08 82.66 75.14 +17.95% -9.10%
UBAM - VP VALUE CHINA EQUITY USD 28.61 52.93 29.89 73.77 83.34 64.57 +12.97% -22.52%
UBAM - ASIA EQUITY *** formerly UBAM - SOUTH PACIFIC AND ASIA EQUITY USD 30.85 29.44 18.44 20.26 24.08 15.67 +18.85% -34.93%
UBAM - EQUITY BRIC+ USD 108.92 180.68 87.21 75.67 91.92 68.15 +21.47% -25.86%
UBAM - TURKISH EQUITY USD - 58.39 44.33 - 114.01 77.50 (7) +14.01% -32.02%
UBAM - RUSSIAN EQUITY USD - 34.87 28.34 - 116.16 85.85 (8) +8.40% -26.09%
UBAM - EUROPE EQUITY DIVIDEND+ EUR - - 36.81 - - 100.56 - (10) +0.56%
UBAM - SQUARE * EUR - 78.10 2.05 - 100.05 97.67 (9) +0.05% -2.38%
UBAM - CUBE * EUR - 18.69 2.04 - 100.00 93.99 (9) +0.00% -6.01%
UBAM - MONEY MARKET INSTITUTIONAL LIQUIDITY (EUR) * EUR 148.58 111.20 0.00 100.05 100.35 (11) - +0.30% (11) -
UBAM - MONEY MARKET INSTITUTIONAL LIQUIDITY (USD) * USD 170.05 150.08 0.00 100.02 100.06 (11) - +0.04% (11) -
UBAM
Report of the Board of Directors (continued)
Page 28
(1) The net asset value calculation and the issue, redemption and conversion of this sub-fund were suspended between 13th November 2008 and 18th January 2009 included.
(2) The Net Asset Value calculation and the issue, redemption and conversion of this sub-fund were suspended between 27th October 2008 and 19th April 2009 included.
(3) This sub-fund was launched on 22nd June 2010. (4) This sub-fund was launched on 3rd December 2010. (5) These sub-funds were launched on 6th April 2010. (6) This sub-fund was launched on 3rd May 2010. (7) This sub-fund was launched on 16th April 2010. (8) This sub-fund was launched on 10th September 2010. The AC class was issued on 24th November 2010 at a price of EUR
107.16. (9) These sub-funds were launched on 23rd September 2010. (10) This sub-fund was launched on 15th December 2011 at a price of EUR 100.00. The first net asset value is dated 16th
December 2011. (11) The net assets of these sub-funds were totally redeemed at the date of this report. However, the Board of Directors decided to
maintain the option to subscribe again. * The performance is calculated on the basis of the I+C classes for UBAM - MONEY MARKET INSTITUTIONAL LIQUIDITY
(EUR) and UBAM - MONEY MARKET INSTITUTIONAL LIQUIDITY (USD), on the basis of the IC class for UBAM - SQUARE and on the basis of the APC class for UBAM - CUBE.
** The name of these sub-funds changed with effect from 1st December 2011 (see Note 18). *** The name of this sub-fund changed with effect from 15th March 2011 (see Note 18).
UBAM
Report of the Board of Directors (continued)
Page 29
2.2 Life of the SICAV On 14th January 2011, the SICAV’s Board of Directors decided to co-opt Mrs Emmy Labovitch as a new member of the Board of Directors, replacing Mr André Gigon, who resigned, and to appoint her as the Chairman of the aforementioned Board of Directors with effect from 14th January 2011. On 10th February, the SICAV’s Board of Directors took note of Union Bancaire Privée (Luxembourg) S.A.’s decision to transfer the central administration, recording agent and European Fund Administration’s (EFA) transfer functions to CACEIS Bank Luxembourg (“CACEIS”) with effect from 1st March 2011. The Board decided to merge the UBAM - OPTIBOND (EURO) compartment into the UBAM - DYNAMIC EURO BOND compartment by acquisition, with effect from 15th March 2011, and to grant the UBAM - SQUARE and UBAM - CUBE compartments the possibility to invest primarily in other securities of the same nature as shares from 15th March 2011. The Board also altered the frequency with which the UBAM - EQUITY BRIC+ compartment’s net asset value is calculated. This will be calculated daily from 15th March 2011. It also changed the title of the UBAM - SOUTH PACIFIC AND ASIA EQUITY compartment to UBAM - ASIA EQUITY with effect from 15th March 2011 following the alteration of the management delegation and the reorganisation of the compartment’s investment policy. Securities lending operations were initiated as of 1st March 2011 (see note 17). On 20th July 2011, Union Bancaire Privée, UBP SA waived its management fee for UBAM - SQUARE and UBAM - CUBE in light of the planned liquidation of these compartments. On 24th October 2011, the SICAV’s Board of Directors decided:
a. With effect from 15th November 2011, to liquidate the UBAM - EUROPEAN EMERGING EQUITY compartment;
b. With effect from 1st December 2011, to change the following compartment names as follows: - UBAM - EMERGING MARKET BOND (USD) to UBAM - EMERGING MARKET BOND; - UBAM - LOCAL CURRENCY EMERGING MARKET BOND (USD) to UBAM - LOCAL
CURRENCY EMERGING MARKET BOND; - UBAM - EMERGING MARKET CORPORATE BOND (USD) to UBAM - EMERGING MARKET
CORPORATE BOND. On 28th November 2011, the SICAV’s Board of Directors decided to launch the sub-fund UBAM - EUROPE EQUITY DIVIDEND+, which aims to invest its net assets primarily in equities and other similar transferable securities and, in addition, warrants on transferable securities, convertible bonds or bonds with warrants on transferable securities, bonds and other debt securities, money market instruments, issued, for at least 75% of the net assets, by companies (i) having their registered office, or (ii) conducting a major part of their commercial activity, or (iii) owning, as holding companies, a majority interest in companies with their registered office in the European Union. This sub-fund focuses primarily on companies offering an attractive dividend return. For D shares, a quarterly dividend is paid based on the decision of the Board of Directors. Type A shares were issued at a price of EUR 100.00. The first Net Asset Value calculation was dated 16th December 2011.
Lastly, the net assets of the UBAM - MONEY MARKET INSTITUTIONAL LIQUIDITY (USD) and UBAM - MONEY MARKET INSTITUTIONAL LIQUIDITY (EUR) compartments have been completely redeemed based on their net asset values as at 20th December 2011 and 22nd December respectively. These two compartments have not been liquidated, and remain dormant as at the date of the present report (see note 18).
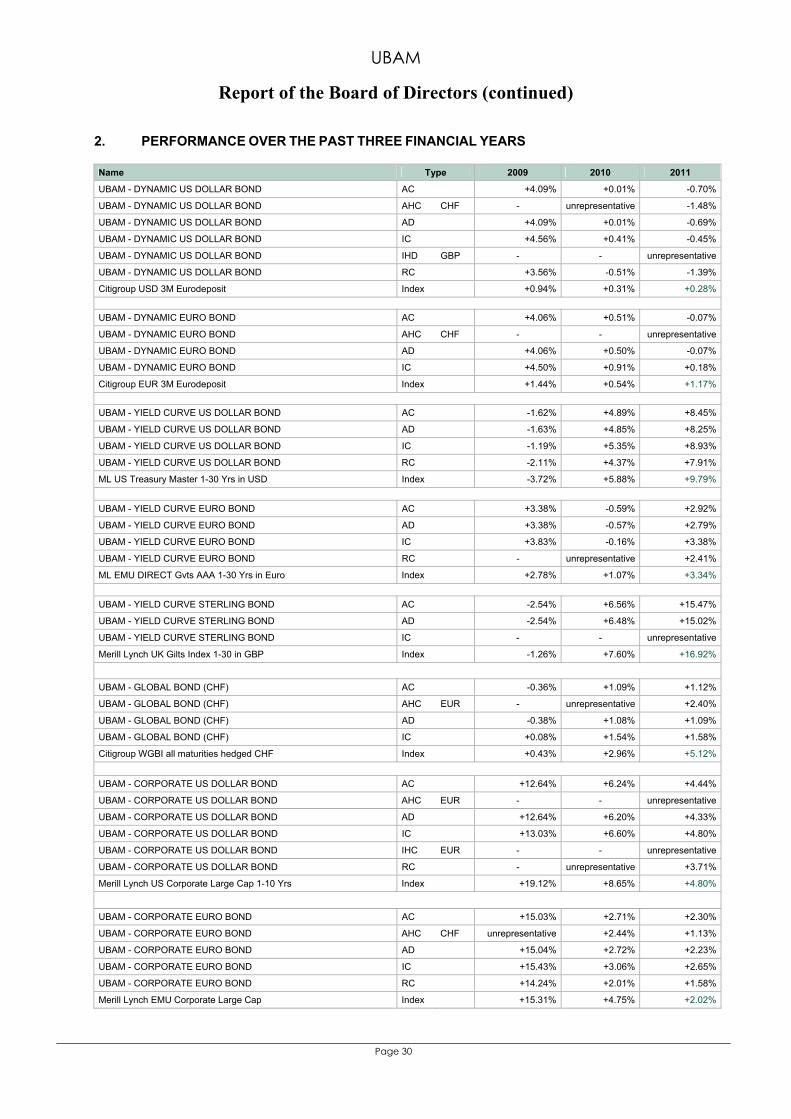
UBAM
Report of the Board of Directors (continued)
Page 30
2. PERFORMANCE OVER THE PAST THREE FINANCIAL YEARS Name Type 2009 2010 2011
UBAM - DYNAMIC US DOLLAR BOND AC +4.09% +0.01% -0.70%
UBAM - DYNAMIC US DOLLAR BOND AHC CHF - unrepresentative -1.48%
UBAM - DYNAMIC US DOLLAR BOND AD +4.09% +0.01% -0.69%
UBAM - DYNAMIC US DOLLAR BOND IC +4.56% +0.41% -0.45%
UBAM - DYNAMIC US DOLLAR BOND IHD GBP - - unrepresentative
UBAM - DYNAMIC US DOLLAR BOND RC +3.56% -0.51% -1.39%
Citigroup USD 3M Eurodeposit Index +0.94% +0.31% +0.28% UBAM - DYNAMIC EURO BOND AC +4.06% +0.51% -0.07%
UBAM - DYNAMIC EURO BOND AHC CHF - - unrepresentative
UBAM - DYNAMIC EURO BOND AD +4.06% +0.50% -0.07%
UBAM - DYNAMIC EURO BOND IC +4.50% +0.91% +0.18%
Citigroup EUR 3M Eurodeposit Index +1.44% +0.54% +1.17% UBAM - YIELD CURVE US DOLLAR BOND AC -1.62% +4.89% +8.45%
UBAM - YIELD CURVE US DOLLAR BOND AD -1.63% +4.85% +8.25%
UBAM - YIELD CURVE US DOLLAR BOND IC -1.19% +5.35% +8.93%
UBAM - YIELD CURVE US DOLLAR BOND RC -2.11% +4.37% +7.91%
ML US Treasury Master 1-30 Yrs in USD Index -3.72% +5.88% +9.79% UBAM - YIELD CURVE EURO BOND AC +3.38% -0.59% +2.92%
UBAM - YIELD CURVE EURO BOND AD +3.38% -0.57% +2.79%
UBAM - YIELD CURVE EURO BOND IC +3.83% -0.16% +3.38%
UBAM - YIELD CURVE EURO BOND RC - unrepresentative +2.41%
ML EMU DIRECT Gvts AAA 1-30 Yrs in Euro Index +2.78% +1.07% +3.34% UBAM - YIELD CURVE STERLING BOND AC -2.54% +6.56% +15.47%
UBAM - YIELD CURVE STERLING BOND AD -2.54% +6.48% +15.02%
UBAM - YIELD CURVE STERLING BOND IC - - unrepresentative
Merill Lynch UK Gilts Index 1-30 in GBP Index -1.26% +7.60% +16.92%
UBAM - GLOBAL BOND (CHF) AC -0.36% +1.09% +1.12%
UBAM - GLOBAL BOND (CHF) AHC EUR - unrepresentative +2.40%
UBAM - GLOBAL BOND (CHF) AD -0.38% +1.08% +1.09%
UBAM - GLOBAL BOND (CHF) IC +0.08% +1.54% +1.58%
Citigroup WGBI all maturities hedged CHF Index +0.43% +2.96% +5.12% UBAM - CORPORATE US DOLLAR BOND AC +12.64% +6.24% +4.44%
UBAM - CORPORATE US DOLLAR BOND AHC EUR - - unrepresentative
UBAM - CORPORATE US DOLLAR BOND AD +12.64% +6.20% +4.33%
UBAM - CORPORATE US DOLLAR BOND IC +13.03% +6.60% +4.80%
UBAM - CORPORATE US DOLLAR BOND IHC EUR - - unrepresentative
UBAM - CORPORATE US DOLLAR BOND RC - unrepresentative +3.71%
Merill Lynch US Corporate Large Cap 1-10 Yrs Index +19.12% +8.65% +4.80%
UBAM - CORPORATE EURO BOND AC +15.03% +2.71% +2.30%
UBAM - CORPORATE EURO BOND AHC CHF unrepresentative +2.44% +1.13%
UBAM - CORPORATE EURO BOND AD +15.04% +2.72% +2.23%
UBAM - CORPORATE EURO BOND IC +15.43% +3.06% +2.65%
UBAM - CORPORATE EURO BOND RC +14.24% +2.01% +1.58%
Merill Lynch EMU Corporate Large Cap Index +15.31% +4.75% +2.02%
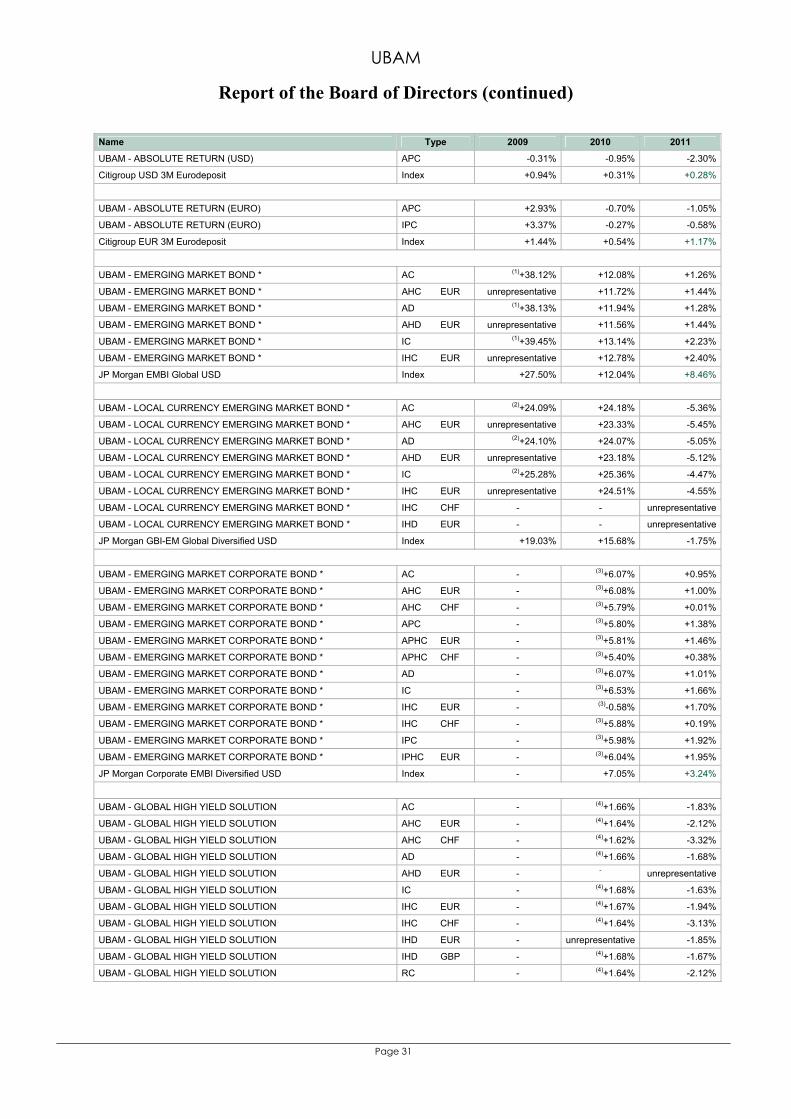
UBAM
Report of the Board of Directors (continued)
Page 31
Name Type 2009 2010 2011
UBAM - ABSOLUTE RETURN (USD) APC -0.31% -0.95% -2.30%
Citigroup USD 3M Eurodeposit Index +0.94% +0.31% +0.28%
UBAM - ABSOLUTE RETURN (EURO) APC +2.93% -0.70% -1.05%
UBAM - ABSOLUTE RETURN (EURO) IPC +3.37% -0.27% -0.58%
Citigroup EUR 3M Eurodeposit Index +1.44% +0.54% +1.17%
UBAM - EMERGING MARKET BOND * AC (1)+38.12% +12.08% +1.26%
UBAM - EMERGING MARKET BOND * AHC EUR unrepresentative +11.72% +1.44%
UBAM - EMERGING MARKET BOND * AD (1)+38.13% +11.94% +1.28%
UBAM - EMERGING MARKET BOND * AHD EUR unrepresentative +11.56% +1.44%
UBAM - EMERGING MARKET BOND * IC (1)+39.45% +13.14% +2.23%
UBAM - EMERGING MARKET BOND * IHC EUR unrepresentative +12.78% +2.40%
JP Morgan EMBI Global USD Index +27.50% +12.04% +8.46%
UBAM - LOCAL CURRENCY EMERGING MARKET BOND * AC (2)+24.09% +24.18% -5.36%
UBAM - LOCAL CURRENCY EMERGING MARKET BOND * AHC EUR unrepresentative +23.33% -5.45%
UBAM - LOCAL CURRENCY EMERGING MARKET BOND * AD (2)+24.10% +24.07% -5.05%
UBAM - LOCAL CURRENCY EMERGING MARKET BOND * AHD EUR unrepresentative +23.18% -5.12%
UBAM - LOCAL CURRENCY EMERGING MARKET BOND * IC (2)+25.28% +25.36% -4.47%
UBAM - LOCAL CURRENCY EMERGING MARKET BOND * IHC EUR unrepresentative +24.51% -4.55%
UBAM - LOCAL CURRENCY EMERGING MARKET BOND * IHC CHF - - unrepresentative
UBAM - LOCAL CURRENCY EMERGING MARKET BOND * IHD EUR - - unrepresentative
JP Morgan GBI-EM Global Diversified USD Index +19.03% +15.68% -1.75%
UBAM - EMERGING MARKET CORPORATE BOND * AC - (3)+6.07% +0.95%
UBAM - EMERGING MARKET CORPORATE BOND * AHC EUR - (3)+6.08% +1.00%
UBAM - EMERGING MARKET CORPORATE BOND * AHC CHF - (3)+5.79% +0.01%
UBAM - EMERGING MARKET CORPORATE BOND * APC - (3)+5.80% +1.38%
UBAM - EMERGING MARKET CORPORATE BOND * APHC EUR - (3)+5.81% +1.46%
UBAM - EMERGING MARKET CORPORATE BOND * APHC CHF - (3)+5.40% +0.38%
UBAM - EMERGING MARKET CORPORATE BOND * AD - (3)+6.07% +1.01%
UBAM - EMERGING MARKET CORPORATE BOND * IC - (3)+6.53% +1.66%
UBAM - EMERGING MARKET CORPORATE BOND * IHC EUR - (3)-0.58% +1.70%
UBAM - EMERGING MARKET CORPORATE BOND * IHC CHF - (3)+5.88% +0.19%
UBAM - EMERGING MARKET CORPORATE BOND * IPC - (3)+5.98% +1.92%
UBAM - EMERGING MARKET CORPORATE BOND * IPHC EUR - (3)+6.04% +1.95%
JP Morgan Corporate EMBI Diversified USD Index - +7.05% +3.24%
UBAM - GLOBAL HIGH YIELD SOLUTION AC - (4)+1.66% -1.83%
UBAM - GLOBAL HIGH YIELD SOLUTION AHC EUR - (4)+1.64% -2.12%
UBAM - GLOBAL HIGH YIELD SOLUTION AHC CHF - (4)+1.62% -3.32%
UBAM - GLOBAL HIGH YIELD SOLUTION AD - (4)+1.66% -1.68%
UBAM - GLOBAL HIGH YIELD SOLUTION AHD EUR - - unrepresentative
UBAM - GLOBAL HIGH YIELD SOLUTION IC - (4)+1.68% -1.63%
UBAM - GLOBAL HIGH YIELD SOLUTION IHC EUR - (4)+1.67% -1.94%
UBAM - GLOBAL HIGH YIELD SOLUTION IHC CHF - (4)+1.64% -3.13%
UBAM - GLOBAL HIGH YIELD SOLUTION IHD EUR - unrepresentative -1.85%
UBAM - GLOBAL HIGH YIELD SOLUTION IHD GBP - (4)+1.68% -1.67%
UBAM - GLOBAL HIGH YIELD SOLUTION RC - (4)+1.64% -2.12%
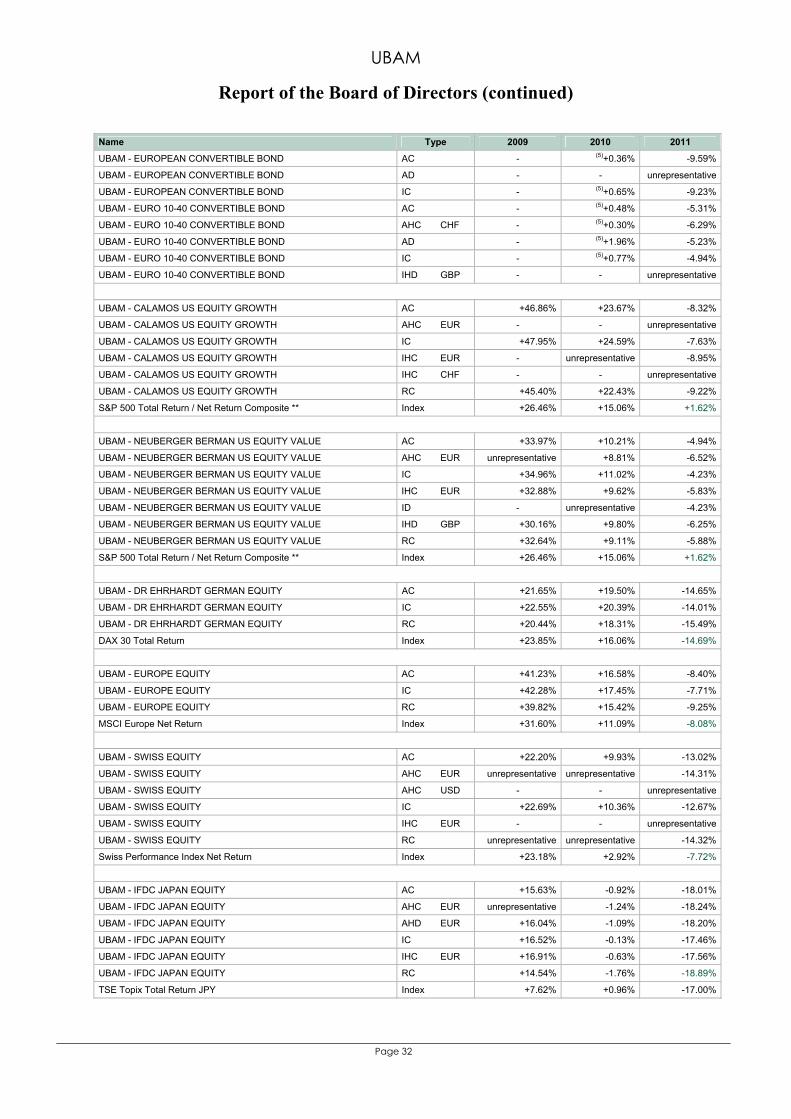
UBAM
Report of the Board of Directors (continued)
Page 32
Name Type 2009 2010 2011
UBAM - EUROPEAN CONVERTIBLE BOND AC - (5)+0.36% -9.59%
UBAM - EUROPEAN CONVERTIBLE BOND AD - - unrepresentative
UBAM - EUROPEAN CONVERTIBLE BOND IC - (5)+0.65% -9.23%
UBAM - EURO 10-40 CONVERTIBLE BOND AC - (5)+0.48% -5.31%
UBAM - EURO 10-40 CONVERTIBLE BOND AHC CHF - (5)+0.30% -6.29%
UBAM - EURO 10-40 CONVERTIBLE BOND AD - (5)+1.96% -5.23%
UBAM - EURO 10-40 CONVERTIBLE BOND IC - (5)+0.77% -4.94%
UBAM - EURO 10-40 CONVERTIBLE BOND IHD GBP - - unrepresentative
UBAM - CALAMOS US EQUITY GROWTH AC +46.86% +23.67% -8.32%
UBAM - CALAMOS US EQUITY GROWTH AHC EUR - - unrepresentative
UBAM - CALAMOS US EQUITY GROWTH IC +47.95% +24.59% -7.63%
UBAM - CALAMOS US EQUITY GROWTH IHC EUR - unrepresentative -8.95%
UBAM - CALAMOS US EQUITY GROWTH IHC CHF - - unrepresentative
UBAM - CALAMOS US EQUITY GROWTH RC +45.40% +22.43% -9.22%
S&P 500 Total Return / Net Return Composite ** Index +26.46% +15.06% +1.62%
UBAM - NEUBERGER BERMAN US EQUITY VALUE AC +33.97% +10.21% -4.94%
UBAM - NEUBERGER BERMAN US EQUITY VALUE AHC EUR unrepresentative +8.81% -6.52%
UBAM - NEUBERGER BERMAN US EQUITY VALUE IC +34.96% +11.02% -4.23%
UBAM - NEUBERGER BERMAN US EQUITY VALUE IHC EUR +32.88% +9.62% -5.83%
UBAM - NEUBERGER BERMAN US EQUITY VALUE ID - unrepresentative -4.23%
UBAM - NEUBERGER BERMAN US EQUITY VALUE IHD GBP +30.16% +9.80% -6.25%
UBAM - NEUBERGER BERMAN US EQUITY VALUE RC +32.64% +9.11% -5.88%
S&P 500 Total Return / Net Return Composite ** Index +26.46% +15.06% +1.62%
UBAM - DR EHRHARDT GERMAN EQUITY AC +21.65% +19.50% -14.65%
UBAM - DR EHRHARDT GERMAN EQUITY IC +22.55% +20.39% -14.01%
UBAM - DR EHRHARDT GERMAN EQUITY RC +20.44% +18.31% -15.49%
DAX 30 Total Return Index +23.85% +16.06% -14.69%
UBAM - EUROPE EQUITY AC +41.23% +16.58% -8.40%
UBAM - EUROPE EQUITY IC +42.28% +17.45% -7.71%
UBAM - EUROPE EQUITY RC +39.82% +15.42% -9.25%
MSCI Europe Net Return Index +31.60% +11.09% -8.08%
UBAM - SWISS EQUITY AC +22.20% +9.93% -13.02%
UBAM - SWISS EQUITY AHC EUR unrepresentative unrepresentative -14.31%
UBAM - SWISS EQUITY AHC USD - - unrepresentative
UBAM - SWISS EQUITY IC +22.69% +10.36% -12.67%
UBAM - SWISS EQUITY IHC EUR - - unrepresentative
UBAM - SWISS EQUITY RC unrepresentative unrepresentative -14.32%
Swiss Performance Index Net Return Index +23.18% +2.92% -7.72%
UBAM - IFDC JAPAN EQUITY AC +15.63% -0.92% -18.01%
UBAM - IFDC JAPAN EQUITY AHC EUR unrepresentative -1.24% -18.24%
UBAM - IFDC JAPAN EQUITY AHD EUR +16.04% -1.09% -18.20%
UBAM - IFDC JAPAN EQUITY IC +16.52% -0.13% -17.46%
UBAM - IFDC JAPAN EQUITY IHC EUR +16.91% -0.63% -17.56%
UBAM - IFDC JAPAN EQUITY RC +14.54% -1.76% -18.89%
TSE Topix Total Return JPY Index +7.62% +0.96% -17.00%
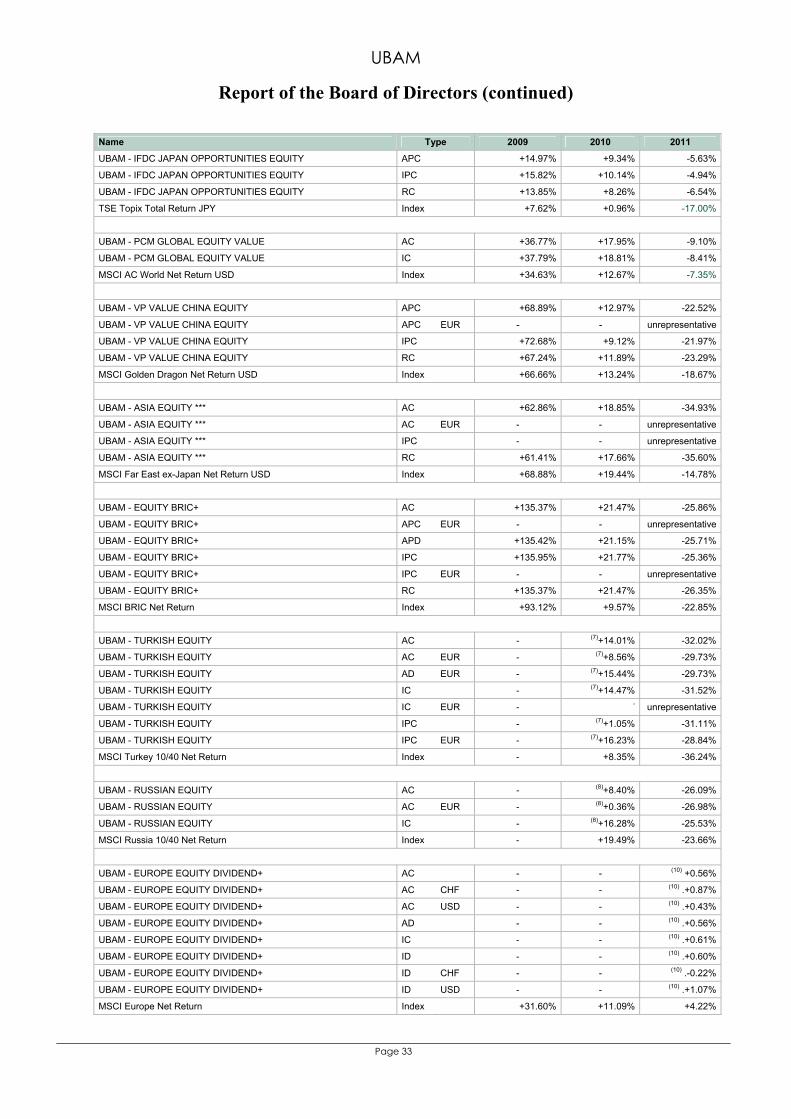
UBAM
Report of the Board of Directors (continued)
Page 33
Name Type 2009 2010 2011
UBAM - IFDC JAPAN OPPORTUNITIES EQUITY APC +14.97% +9.34% -5.63%
UBAM - IFDC JAPAN OPPORTUNITIES EQUITY IPC +15.82% +10.14% -4.94%
UBAM - IFDC JAPAN OPPORTUNITIES EQUITY RC +13.85% +8.26% -6.54%
TSE Topix Total Return JPY Index +7.62% +0.96% -17.00%
UBAM - PCM GLOBAL EQUITY VALUE AC +36.77% +17.95% -9.10%
UBAM - PCM GLOBAL EQUITY VALUE IC +37.79% +18.81% -8.41%
MSCI AC World Net Return USD Index +34.63% +12.67% -7.35%
UBAM - VP VALUE CHINA EQUITY APC +68.89% +12.97% -22.52%
UBAM - VP VALUE CHINA EQUITY APC EUR - - unrepresentative
UBAM - VP VALUE CHINA EQUITY IPC +72.68% +9.12% -21.97%
UBAM - VP VALUE CHINA EQUITY RC +67.24% +11.89% -23.29%
MSCI Golden Dragon Net Return USD Index +66.66% +13.24% -18.67%
UBAM - ASIA EQUITY *** AC +62.86% +18.85% -34.93%
UBAM - ASIA EQUITY *** AC EUR - - unrepresentative
UBAM - ASIA EQUITY *** IPC - - unrepresentative
UBAM - ASIA EQUITY *** RC +61.41% +17.66% -35.60%
MSCI Far East ex-Japan Net Return USD Index +68.88% +19.44% -14.78%
UBAM - EQUITY BRIC+ AC +135.37% +21.47% -25.86%
UBAM - EQUITY BRIC+ APC EUR - - unrepresentative
UBAM - EQUITY BRIC+ APD +135.42% +21.15% -25.71%
UBAM - EQUITY BRIC+ IPC +135.95% +21.77% -25.36%
UBAM - EQUITY BRIC+ IPC EUR - - unrepresentative
UBAM - EQUITY BRIC+ RC +135.37% +21.47% -26.35%
MSCI BRIC Net Return Index +93.12% +9.57% -22.85%
UBAM - TURKISH EQUITY AC - (7)+14.01% -32.02%
UBAM - TURKISH EQUITY AC EUR - (7)+8.56% -29.73%
UBAM - TURKISH EQUITY AD EUR - (7)+15.44% -29.73%
UBAM - TURKISH EQUITY IC - (7)+14.47% -31.52%
UBAM - TURKISH EQUITY IC EUR - - unrepresentative
UBAM - TURKISH EQUITY IPC - (7)+1.05% -31.11%
UBAM - TURKISH EQUITY IPC EUR - (7)+16.23% -28.84%
MSCI Turkey 10/40 Net Return Index - +8.35% -36.24%
UBAM - RUSSIAN EQUITY AC - (8)+8.40% -26.09%
UBAM - RUSSIAN EQUITY AC EUR - (8)+0.36% -26.98%
UBAM - RUSSIAN EQUITY IC - (8)+16.28% -25.53%
MSCI Russia 10/40 Net Return Index - +19.49% -23.66%
UBAM - EUROPE EQUITY DIVIDEND+ AC - - (10) +0.56%
UBAM - EUROPE EQUITY DIVIDEND+ AC CHF - - (10) .+0.87%
UBAM - EUROPE EQUITY DIVIDEND+ AC USD - - (10) .+0.43%
UBAM - EUROPE EQUITY DIVIDEND+ AD - - (10) .+0.56%
UBAM - EUROPE EQUITY DIVIDEND+ IC - - (10) .+0.61%
UBAM - EUROPE EQUITY DIVIDEND+ ID - - (10) .+0.60%
UBAM - EUROPE EQUITY DIVIDEND+ ID CHF - - (10) .-0.22%
UBAM - EUROPE EQUITY DIVIDEND+ ID USD - - (10) .+1.07%
MSCI Europe Net Return Index +31.60% +11.09% +4.22%
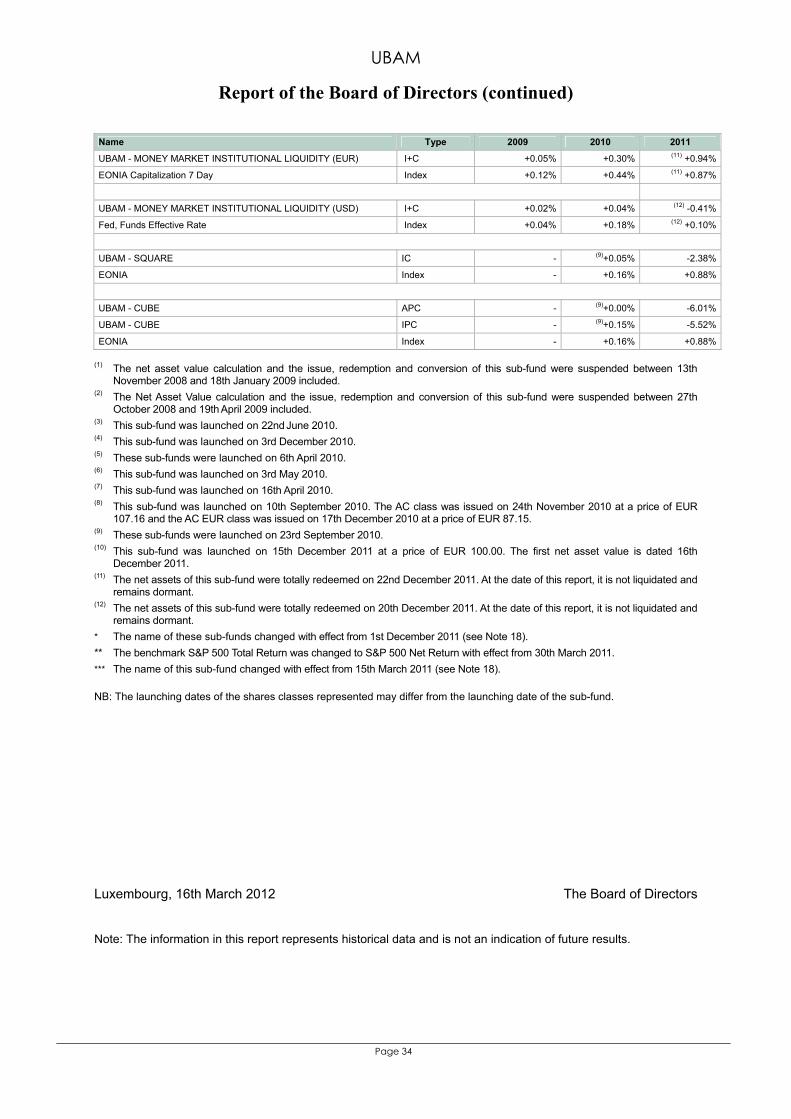
UBAM
Report of the Board of Directors (continued)
Page 34
Name Type 2009 2010 2011
UBAM - MONEY MARKET INSTITUTIONAL LIQUIDITY (EUR) I+C +0.05% +0.30% (11) +0.94%
EONIA Capitalization 7 Day Index +0.12% +0.44% (11) +0.87%
UBAM - MONEY MARKET INSTITUTIONAL LIQUIDITY (USD) I+C +0.02% +0.04% (12) -0.41%
Fed, Funds Effective Rate Index +0.04% +0.18% (12) +0.10%
UBAM - SQUARE IC - (9)+0.05% -2.38%
EONIA Index - +0.16% +0.88%
UBAM - CUBE APC - (9)+0.00% -6.01%
UBAM - CUBE IPC - (9)+0.15% -5.52%
EONIA Index - +0.16% +0.88% (1) The net asset value calculation and the issue, redemption and conversion of this sub-fund were suspended between 13th
November 2008 and 18th January 2009 included. (2) The Net Asset Value calculation and the issue, redemption and conversion of this sub-fund were suspended between 27th
October 2008 and 19th April 2009 included. (3) This sub-fund was launched on 22nd June 2010. (4) This sub-fund was launched on 3rd December 2010. (5) These sub-funds were launched on 6th April 2010. (6) This sub-fund was launched on 3rd May 2010. (7) This sub-fund was launched on 16th April 2010. (8) This sub-fund was launched on 10th September 2010. The AC class was issued on 24th November 2010 at a price of EUR
107.16 and the AC EUR class was issued on 17th December 2010 at a price of EUR 87.15. (9) These sub-funds were launched on 23rd September 2010. (10) This sub-fund was launched on 15th December 2011 at a price of EUR 100.00. The first net asset value is dated 16th
December 2011. (11) The net assets of this sub-fund were totally redeemed on 22nd December 2011. At the date of this report, it is not liquidated and
remains dormant. (12) The net assets of this sub-fund were totally redeemed on 20th December 2011. At the date of this report, it is not liquidated and
remains dormant. * The name of these sub-funds changed with effect from 1st December 2011 (see Note 18). ** The benchmark S&P 500 Total Return was changed to S&P 500 Net Return with effect from 30th March 2011. *** The name of this sub-fund changed with effect from 15th March 2011 (see Note 18). NB: The launching dates of the shares classes represented may differ from the launching date of the sub-fund. Luxembourg, 16th March 2012 The Board of Directors Note: The information in this report represents historical data and is not an indication of future results.
Deloitte Audit Société à responsabilité limitée 560, rue de Neudorf L-2220 Luxembourg B.P.1173 L-1011 Luxembourg Tel: +352 451 451 Fax: +352 451 452 992 www.deloitte.lu
Société à responsabilité limitée au capital de 35.000 EUR RCS Luxembourg B 67.895
Page 35
REPORT OF THE REVISEUR D’ENTREPRISE AGREE
To the Shareholders of UBAM Following our appointment by the general meeting of the shareholders of 20 April 2011, we have audited the accompanying financial statements of UBAM (‘’SICAV’’) and of each of its sub-funds, which comprise the statement of net assets and the statement of investments and other net assets as at 31st December 2011 and the statement of operations and other changes in net assets for the year then ended, and a summary of significant accounting policies and other explanatory notes to the financial statements. Board of Directors of the SICAV’s responsibility for the financial statements The Board of Directors of the SICAV is responsible for the preparation and fair presentation of these financial statements in accordance with the Luxembourg legal and regulatory requirements relating to the preparation of the financial statements. This responsibility includes: designing, implementing and maintaining internal control relevant to the preparation and fair presentation of financial statements that are free from material misstatement, whether due to fraud or error; selecting and applying appropriate accounting policies; and making accounting estimates that are reasonable in the circumstances. Responsibility of the réviseur d’entreprises agrée Our responsibility is to express an opinion on these financial statements based on our audit. We conducted our audit in accordance with International Standards on Auditing as adopted for Luxembourg by the Commission de Surveillance du Secteur Financier. Those standards require that we comply with ethical requirements and plan and perform the audit to obtain reasonable assurance whether the financial statements are free from material misstatement. An audit involves performing procedures to obtain audit evidence about the amounts and disclosures in the financial statements. The procedures selected depend on the judgement of the réviseur d’entreprises agréé, including the assessment of the risks of material misstatement of the financial statements, whether due to fraud or error. In making those risk assessments, the réviseur d’entreprises agréé considers internal control relevant to the entity’s preparation and fair presentation of the financial statements in order to design audit procedures that are appropriate in the circumstances, but not for the purpose of expressing an opinion on the effectiveness of the entity’s internal control. An audit also includes evaluating the appropriateness of accounting policies used and the reasonableness of accounting estimates made by the Board of Directors of the SICAV, as well as evaluating the overall presentation of the financial statements. We believe that the audit evidence we have obtained is sufficient and appropriate to provide a basis for our audit opinion.
Société à responsabilité limitée au capital de 35.000 EUR RCS Luxembourg B 67.895
Page 36
Opinion In our opinion, the financial statements give a true and fair view of the financial position of UBAM and of each of its sub-funds as of 31st December 2011, and of the results of their operations and changes in their net assets for the year then ended in accordance with the Luxembourg legal and regulatory requirements relating to the preparation of the financial statements. Other matter Supplementary information included in the annual report has been reviewed in the context of our mandate but has not been subject to specific audit procedures carried out in accordance with the standards described above. Consequently, we express no opinion on such information. However, we have no observation to make concerning such information in the context of the financial statements taken as a whole For Deloitte Audit, Cabinet de révision agréé Philippe Lenges, Réviseur d’entreprises agréé Partner Luxembourg, 4th April 2012 560, rue de Neudorf L-2220 Luxembourg
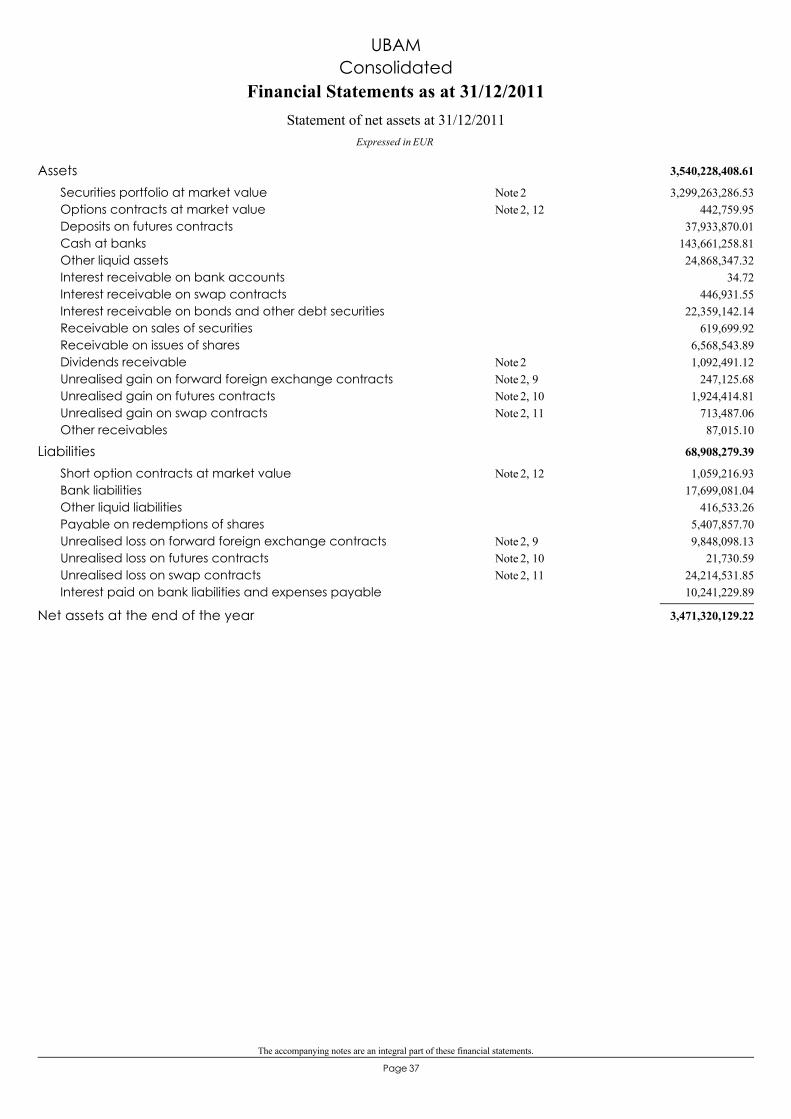
The accompanying notes are an integral part of these financial statements.
37Page
3,540,228,408.61Assets3,299,263,286.53Securities portfolio at market value 2Note
442,759.95Options contracts at market value 2, 12Note37,933,870.01Deposits on futures contracts
143,661,258.81Cash at banks24,868,347.32Other liquid assets
34.72Interest receivable on bank accounts446,931.55Interest receivable on swap contracts
22,359,142.14Interest receivable on bonds and other debt securities619,699.92Receivable on sales of securities
6,568,543.89Receivable on issues of shares1,092,491.12Dividends receivable 2Note
247,125.68Unrealised gain on forward foreign exchange contracts 2, 9Note1,924,414.81Unrealised gain on futures contracts 2, 10Note
713,487.06Unrealised gain on swap contracts 2, 11Note87,015.10Other receivables
68,908,279.39Liabilities1,059,216.93Short option contracts at market value 2, 12Note
17,699,081.04Bank liabilities416,533.26Other liquid liabilities
5,407,857.70Payable on redemptions of shares9,848,098.13Unrealised loss on forward foreign exchange contracts 2, 9Note
21,730.59Unrealised loss on futures contracts 2, 10Note24,214,531.85Unrealised loss on swap contracts 2, 11Note10,241,229.89Interest paid on bank liabilities and expenses payable
3,471,320,129.22Net assets at the end of the year
UBAM
Financial Statements as at 31/12/2011
Expressed in EUR
Statement of net assets at 31/12/2011
Consolidated
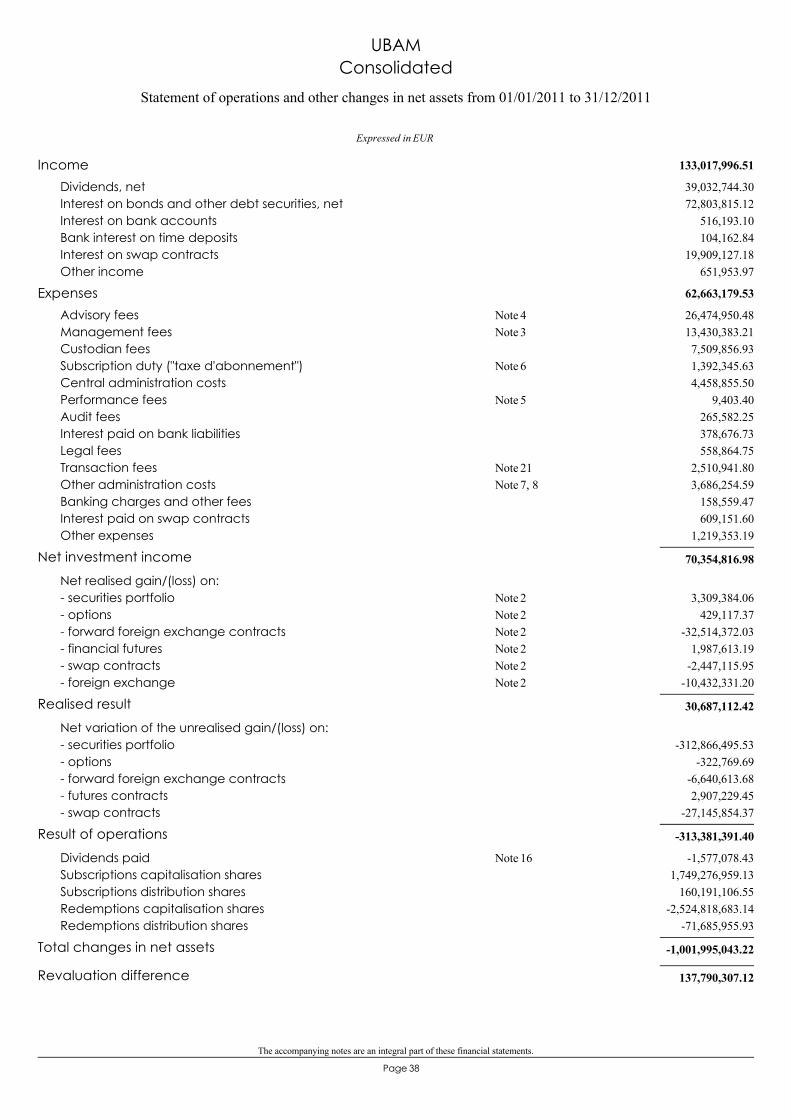
The accompanying notes are an integral part of these financial statements.
38Page
133,017,996.51Income39,032,744.30Dividends, net72,803,815.12Interest on bonds and other debt securities, net
516,193.10Interest on bank accounts104,162.84Bank interest on time deposits
19,909,127.18Interest on swap contracts651,953.97Other income
62,663,179.53Expenses26,474,950.48Advisory fees 4Note13,430,383.21Management fees 3Note7,509,856.93Custodian fees1,392,345.63Subscription duty ("taxe d'abonnement") 6Note4,458,855.50Central administration costs
9,403.40Performance fees 5Note265,582.25Audit fees378,676.73Interest paid on bank liabilities558,864.75Legal fees
2,510,941.80Transaction fees 21Note3,686,254.59Other administration costs 7, 8Note
158,559.47Banking charges and other fees609,151.60Interest paid on swap contracts
1,219,353.19Other expenses
70,354,816.98Net investment income
Net realised gain/(loss) on:3,309,384.06- securities portfolio 2Note
429,117.37- options 2Note-32,514,372.03- forward foreign exchange contracts 2Note
1,987,613.19- financial futures 2Note-2,447,115.95- swap contracts 2Note
-10,432,331.20- foreign exchange 2Note
30,687,112.42Realised result
Net variation of the unrealised gain/(loss) on:-312,866,495.53- securities portfolio
-322,769.69- options-6,640,613.68- forward foreign exchange contracts2,907,229.45- futures contracts
-27,145,854.37- swap contracts
-313,381,391.40Result of operations
-1,577,078.43Dividends paid 16Note1,749,276,959.13Subscriptions capitalisation shares
160,191,106.55Subscriptions distribution shares-2,524,818,683.14Redemptions capitalisation shares
-71,685,955.93Redemptions distribution shares
-1,001,995,043.22Total changes in net assets
137,790,307.12Revaluation difference
EUR
Statement of operations and other changes in net assets from 01/01/2011 to 31/12/2011
UBAMConsolidated
Expressed in

The accompanying notes are an integral part of these financial statements.
39Page
4,335,524,865.32Net assets at the beginning of the year
3,471,320,129.22Net assets at the end of the year
EUR
Statement of operations and other changes in net assets from 01/01/2011 to 31/12/2011
UBAMConsolidated
Expressed in
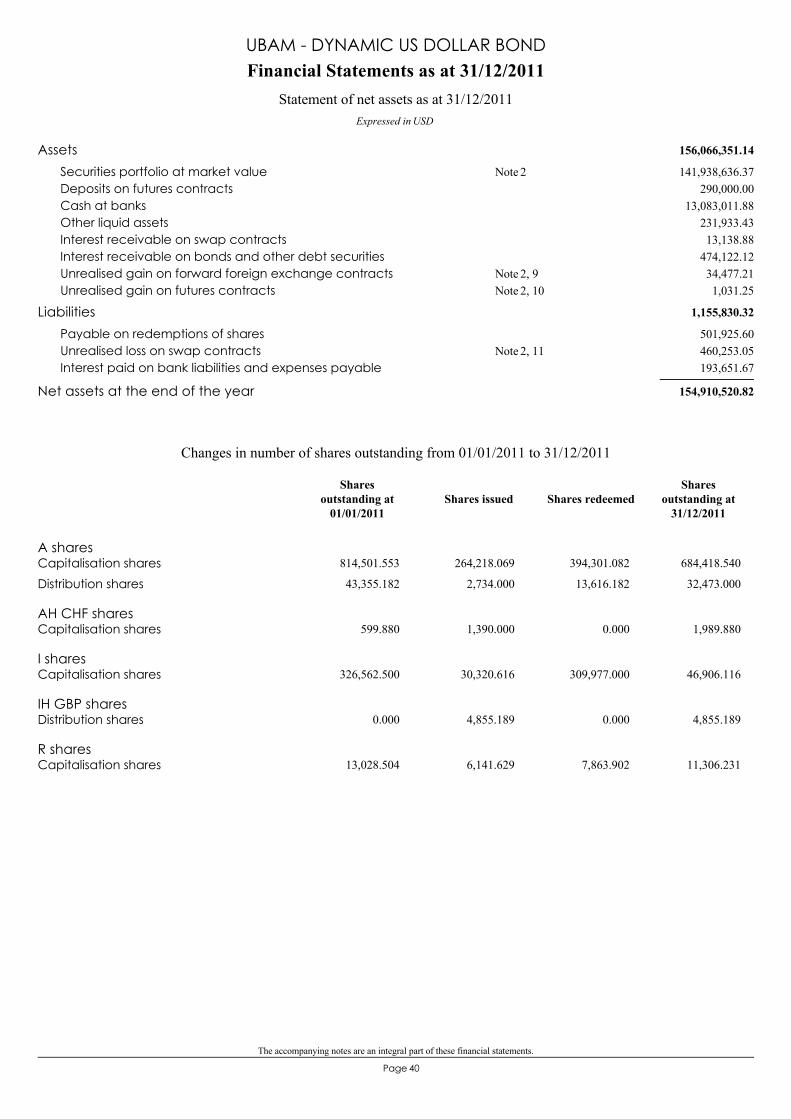
The accompanying notes are an integral part of these financial statements.
40Page
156,066,351.14Assets141,938,636.37Securities portfolio at market value 2Note
290,000.00Deposits on futures contracts13,083,011.88Cash at banks
231,933.43Other liquid assets13,138.88Interest receivable on swap contracts
474,122.12Interest receivable on bonds and other debt securities34,477.21Unrealised gain on forward foreign exchange contracts 2, 9Note1,031.25Unrealised gain on futures contracts 2, 10Note
1,155,830.32Liabilities501,925.60Payable on redemptions of shares460,253.05Unrealised loss on swap contracts 2, 11Note193,651.67Interest paid on bank liabilities and expenses payable
154,910,520.82Net assets at the end of the year
Financial Statements as at 31/12/2011
Expressed in USD
Statement of net assets as at 31/12/2011
UBAM - DYNAMIC US DOLLAR BOND
A sharesCapitalisation shares 814,501.553 264,218.069 394,301.082 684,418.540
Distribution shares 43,355.182 2,734.000 13,616.182 32,473.000
AH CHF sharesCapitalisation shares 599.880 1,390.000 0.000 1,989.880
I sharesCapitalisation shares 326,562.500 30,320.616 309,977.000 46,906.116
IH GBP sharesDistribution shares 0.000 4,855.189 0.000 4,855.189
R sharesCapitalisation shares 13,028.504 6,141.629 7,863.902 11,306.231
Changes in number of shares outstanding from 01/01/2011 to 31/12/2011
Shares issued Shares redeemedShares
outstanding at31/12/2011
Sharesoutstanding at
01/01/2011
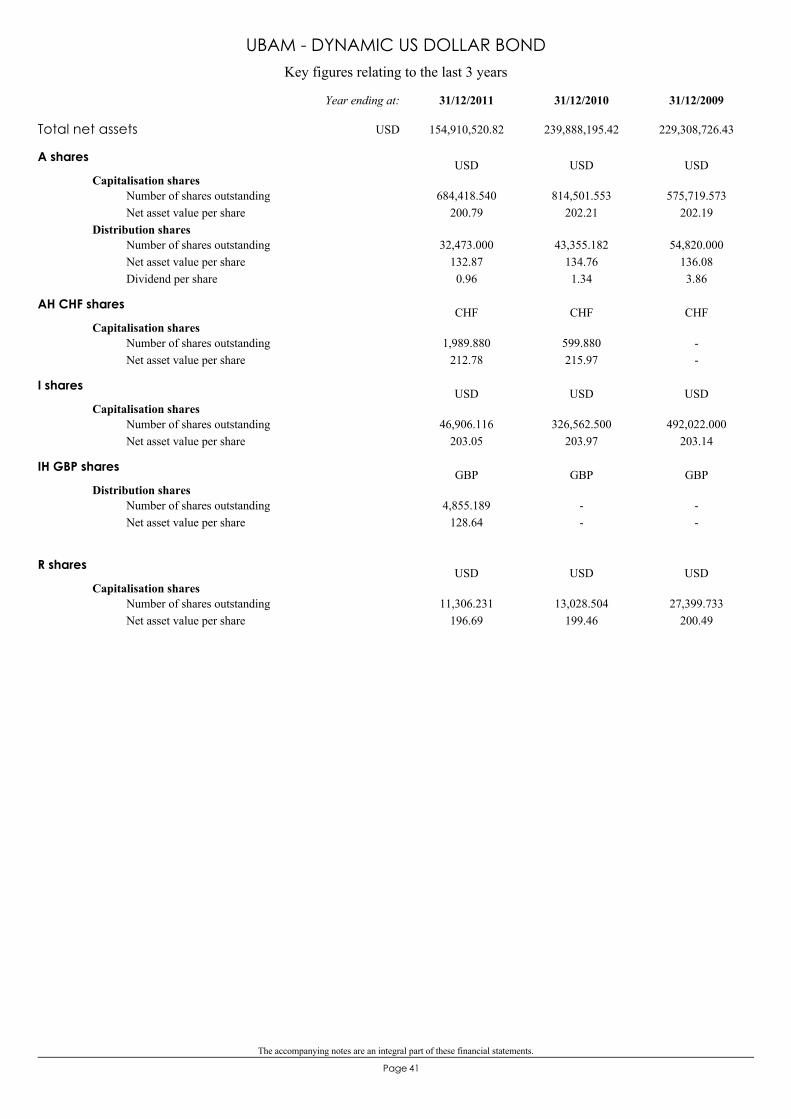
The accompanying notes are an integral part of these financial statements.
41Page
Key figures relating to the last 3 years
UBAM - DYNAMIC US DOLLAR BOND
A shares
Capitalisation shares684,418.540
200.79814,501.553
202.21575,719.573
202.19Number of shares outstandingNet asset value per share
Distribution shares32,473.000
132.870.96
43,355.182134.761.34
54,820.000136.083.86
Number of shares outstandingNet asset value per shareDividend per share
USD USD USD
AH CHF shares
Capitalisation shares1,989.880
212.78599.880215.97
--
Number of shares outstandingNet asset value per share
CHF CHF CHF
I shares
Capitalisation shares46,906.116
203.05326,562.500
203.97492,022.000
203.14Number of shares outstandingNet asset value per share
USD USD USD
IH GBP shares
Distribution shares4,855.189
128.64--
--
Number of shares outstandingNet asset value per share
GBP GBP GBP
R shares
Capitalisation shares11,306.231
196.6913,028.504
199.4627,399.733
200.49Number of shares outstandingNet asset value per share
USD USD USD
Total net assets 154,910,520.82 239,888,195.42 229,308,726.43
31/12/200931/12/201031/12/2011Year ending at:
USD
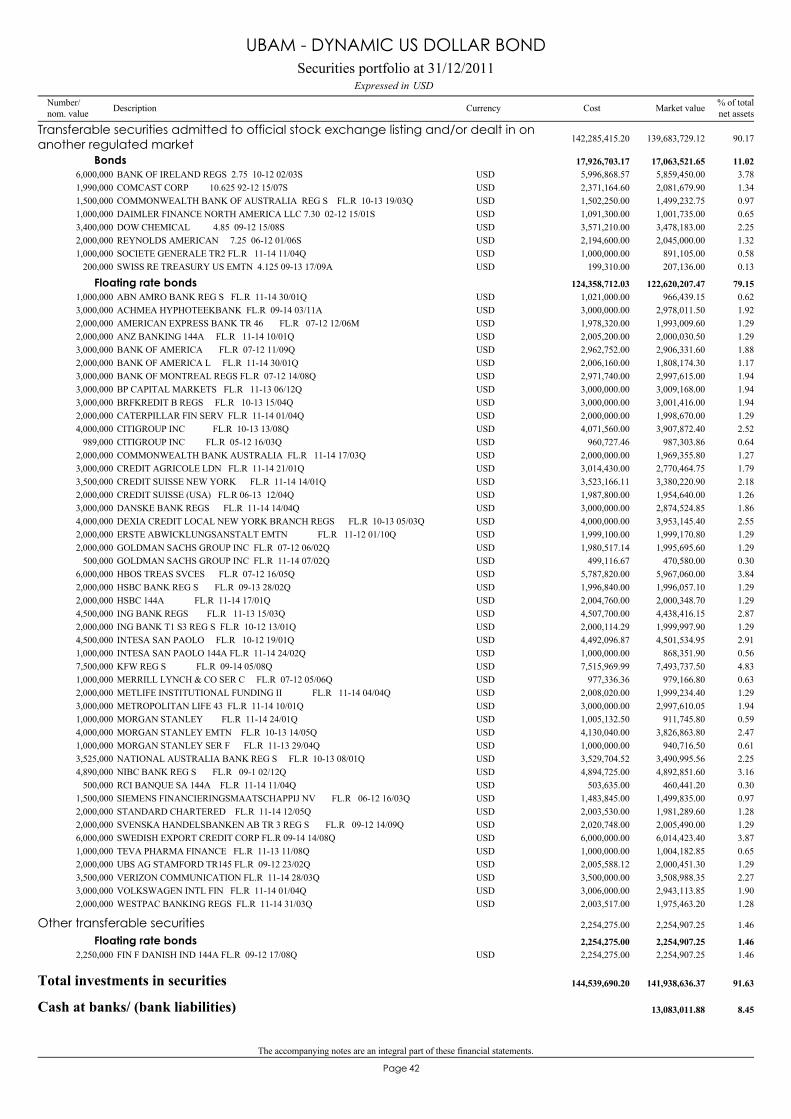
The accompanying notes are an integral part of these financial statements.
42Page
BANK OF IRELAND REGS 2.75 10-12 02/03S6,000,000 5,859,450.00 3.78USD 5,996,868.57
Transferable securities admitted to official stock exchange listing and/or dealt in onanother regulated market 139,683,729.12 90.17142,285,415.20
Bonds 17,063,521.65 11.0217,926,703.17
COMCAST CORP 10.625 92-12 15/07S1,990,000 2,081,679.90 1.34USD 2,371,164.60COMMONWEALTH BANK OF AUSTRALIA REG S FL.R 10-13 19/03Q1,500,000 1,499,232.75 0.97USD 1,502,250.00DAIMLER FINANCE NORTH AMERICA LLC 7.30 02-12 15/01S1,000,000 1,001,735.00 0.65USD 1,091,300.00DOW CHEMICAL 4.85 09-12 15/08S3,400,000 3,478,183.00 2.25USD 3,571,210.00REYNOLDS AMERICAN 7.25 06-12 01/06S2,000,000 2,045,000.00 1.32USD 2,194,600.00SOCIETE GENERALE TR2 FL.R 11-14 11/04Q1,000,000 891,105.00 0.58USD 1,000,000.00SWISS RE TREASURY US EMTN 4.125 09-13 17/09A200,000 207,136.00 0.13USD 199,310.00
ABN AMRO BANK REG S FL.R 11-14 30/01Q1,000,000 966,439.15 0.62USD 1,021,000.00Floating rate bonds 122,620,207.47 79.15124,358,712.03
ACHMEA HYPHOTEEKBANK FL.R 09-14 03/11A3,000,000 2,978,011.50 1.92USD 3,000,000.00AMERICAN EXPRESS BANK TR 46 FL.R 07-12 12/06M2,000,000 1,993,009.60 1.29USD 1,978,320.00ANZ BANKING 144A FL.R 11-14 10/01Q2,000,000 2,000,030.50 1.29USD 2,005,200.00BANK OF AMERICA FL.R 07-12 11/09Q3,000,000 2,906,331.60 1.88USD 2,962,752.00BANK OF AMERICA L FL.R 11-14 30/01Q2,000,000 1,808,174.30 1.17USD 2,006,160.00BANK OF MONTREAL REGS FL.R 07-12 14/08Q3,000,000 2,997,615.00 1.94USD 2,971,740.00BP CAPITAL MARKETS FL.R 11-13 06/12Q3,000,000 3,009,168.00 1.94USD 3,000,000.00BRFKREDIT B REGS FL.R 10-13 15/04Q3,000,000 3,001,416.00 1.94USD 3,000,000.00CATERPILLAR FIN SERV FL.R 11-14 01/04Q2,000,000 1,998,670.00 1.29USD 2,000,000.00CITIGROUP INC FL.R 10-13 13/08Q4,000,000 3,907,872.40 2.52USD 4,071,560.00CITIGROUP INC FL.R 05-12 16/03Q989,000 987,303.86 0.64USD 960,727.46COMMONWEALTH BANK AUSTRALIA FL.R 11-14 17/03Q2,000,000 1,969,355.80 1.27USD 2,000,000.00CREDIT AGRICOLE LDN FL.R 11-14 21/01Q3,000,000 2,770,464.75 1.79USD 3,014,430.00CREDIT SUISSE NEW YORK FL.R 11-14 14/01Q3,500,000 3,380,220.90 2.18USD 3,523,166.11CREDIT SUISSE (USA) FL.R 06-13 12/04Q2,000,000 1,954,640.00 1.26USD 1,987,800.00DANSKE BANK REGS FL.R 11-14 14/04Q3,000,000 2,874,524.85 1.86USD 3,000,000.00DEXIA CREDIT LOCAL NEW YORK BRANCH REGS FL.R 10-13 05/03Q4,000,000 3,953,145.40 2.55USD 4,000,000.00ERSTE ABWICKLUNGSANSTALT EMTN FL.R 11-12 01/10Q2,000,000 1,999,170.80 1.29USD 1,999,100.00GOLDMAN SACHS GROUP INC FL.R 07-12 06/02Q2,000,000 1,995,695.60 1.29USD 1,980,517.14GOLDMAN SACHS GROUP INC FL.R 11-14 07/02Q500,000 470,580.00 0.30USD 499,116.67HBOS TREAS SVCES FL.R 07-12 16/05Q6,000,000 5,967,060.00 3.84USD 5,787,820.00HSBC BANK REG S FL.R 09-13 28/02Q2,000,000 1,996,057.10 1.29USD 1,996,840.00HSBC 144A FL.R 11-14 17/01Q2,000,000 2,000,348.70 1.29USD 2,004,760.00ING BANK REGS FL.R 11-13 15/03Q4,500,000 4,438,416.15 2.87USD 4,507,700.00ING BANK T1 S3 REG S FL.R 10-12 13/01Q2,000,000 1,999,997.90 1.29USD 2,000,114.29INTESA SAN PAOLO FL.R 10-12 19/01Q4,500,000 4,501,534.95 2.91USD 4,492,096.87INTESA SAN PAOLO 144A FL.R 11-14 24/02Q1,000,000 868,351.90 0.56USD 1,000,000.00KFW REG S FL.R 09-14 05/08Q7,500,000 7,493,737.50 4.83USD 7,515,969.99MERRILL LYNCH & CO SER C FL.R 07-12 05/06Q1,000,000 979,166.80 0.63USD 977,336.36METLIFE INSTITUTIONAL FUNDING II FL.R 11-14 04/04Q2,000,000 1,999,234.40 1.29USD 2,008,020.00METROPOLITAN LIFE 43 FL.R 11-14 10/01Q3,000,000 2,997,610.05 1.94USD 3,000,000.00MORGAN STANLEY FL.R 11-14 24/01Q1,000,000 911,745.80 0.59USD 1,005,132.50MORGAN STANLEY EMTN FL.R 10-13 14/05Q4,000,000 3,826,863.80 2.47USD 4,130,040.00MORGAN STANLEY SER F FL.R 11-13 29/04Q1,000,000 940,716.50 0.61USD 1,000,000.00NATIONAL AUSTRALIA BANK REG S FL.R 10-13 08/01Q3,525,000 3,490,995.56 2.25USD 3,529,704.52NIBC BANK REG S FL.R 09-1 02/12Q4,890,000 4,892,851.60 3.16USD 4,894,725.00RCI BANQUE SA 144A FL.R 11-14 11/04Q500,000 460,441.20 0.30USD 503,635.00SIEMENS FINANCIERINGSMAATSCHAPPIJ NV FL.R 06-12 16/03Q1,500,000 1,499,835.00 0.97USD 1,483,845.00STANDARD CHARTERED FL.R 11-14 12/05Q2,000,000 1,981,289.60 1.28USD 2,003,530.00SVENSKA HANDELSBANKEN AB TR 3 REG S FL.R 09-12 14/09Q2,000,000 2,005,490.00 1.29USD 2,020,748.00SWEDISH EXPORT CREDIT CORP FL.R 09-14 14/08Q6,000,000 6,014,423.40 3.87USD 6,000,000.00TEVA PHARMA FINANCE FL.R 11-13 11/08Q1,000,000 1,004,182.85 0.65USD 1,000,000.00UBS AG STAMFORD TR145 FL.R 09-12 23/02Q2,000,000 2,000,451.30 1.29USD 2,005,588.12VERIZON COMMUNICATION FL.R 11-14 28/03Q3,500,000 3,508,988.35 2.27USD 3,500,000.00VOLKSWAGEN INTL FIN FL.R 11-14 01/04Q3,000,000 2,943,113.85 1.90USD 3,006,000.00WESTPAC BANKING REGS FL.R 11-14 31/03Q2,000,000 1,975,463.20 1.28USD 2,003,517.00
FIN F DANISH IND 144A FL.R 09-12 17/08Q2,250,000 2,254,907.25 1.46USD 2,254,275.00
Other transferable securities 2,254,907.25 1.462,254,275.00
Floating rate bonds 2,254,907.25 1.462,254,275.00
Total investments in securities 141,938,636.37 91.63144,539,690.20
Cash at banks/ (bank liabilities) 13,083,011.88 8.45
Securities portfolio at 31/12/2011USDExpressed in
UBAM - DYNAMIC US DOLLAR BOND
Number/nom. value Description Currency % of total
net assetsMarket valueCost
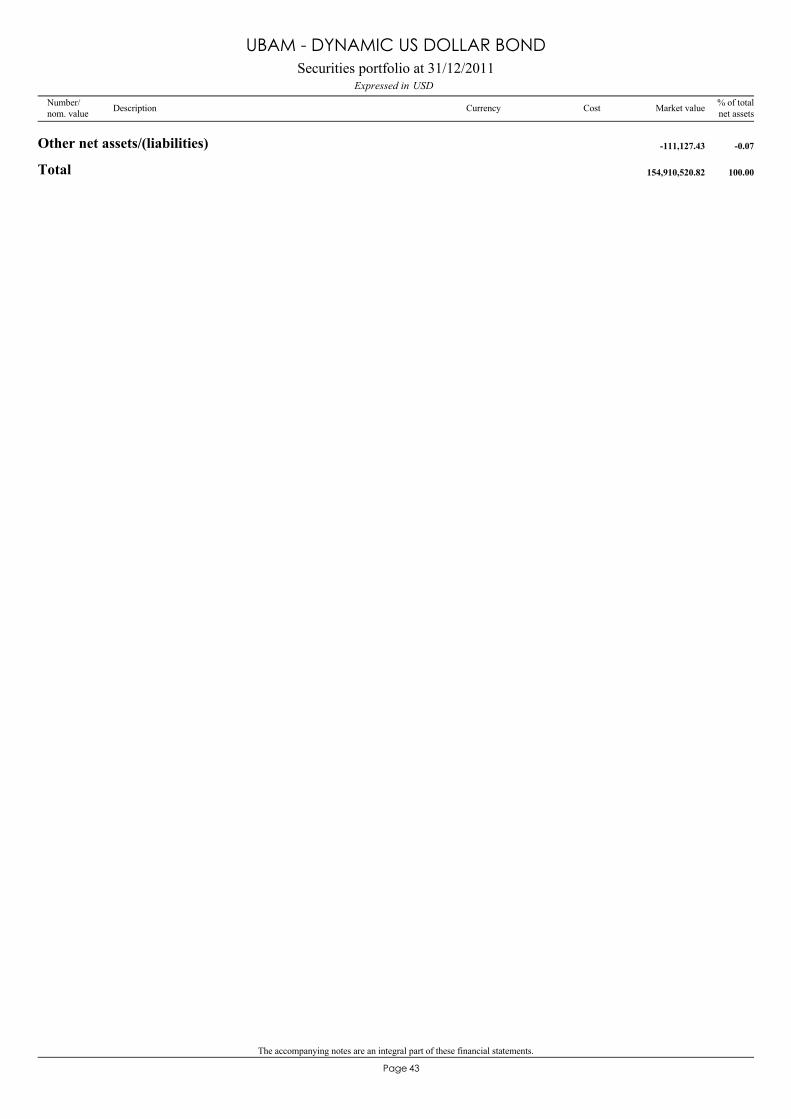
The accompanying notes are an integral part of these financial statements.
43Page
Other net assets/(liabilities) -111,127.43 -0.07
Total 154,910,520.82 100.00
Securities portfolio at 31/12/2011USDExpressed in
UBAM - DYNAMIC US DOLLAR BOND
Number/nom. value Description Currency % of total
net assetsMarket valueCost

44Page
United States of America 36.06The Netherlands 12.73United Kingdom 9.64Australia 7.06Germany 6.12Denmark 5.26Sweden 5.16Ireland 3.78France 2.67Canada 1.94The Netherlands Antilles 0.65Italy 0.56
91.63
(by domicile of the issuer) % of net assets
Geographical classification of investments
UBAM - DYNAMIC US DOLLAR BOND
Banks and credit institutions 59.44Holding and finance companies 21.78Communications 2.27Chemicals 2.25Graphic art and publishing 1.34Tobacco and alcoholic drinks 1.32Miscellaneous sectors 1.29State 1.29Pharmaceuticals and cosmetics 0.65
91.63
% of net assets
Industrial classification of investments
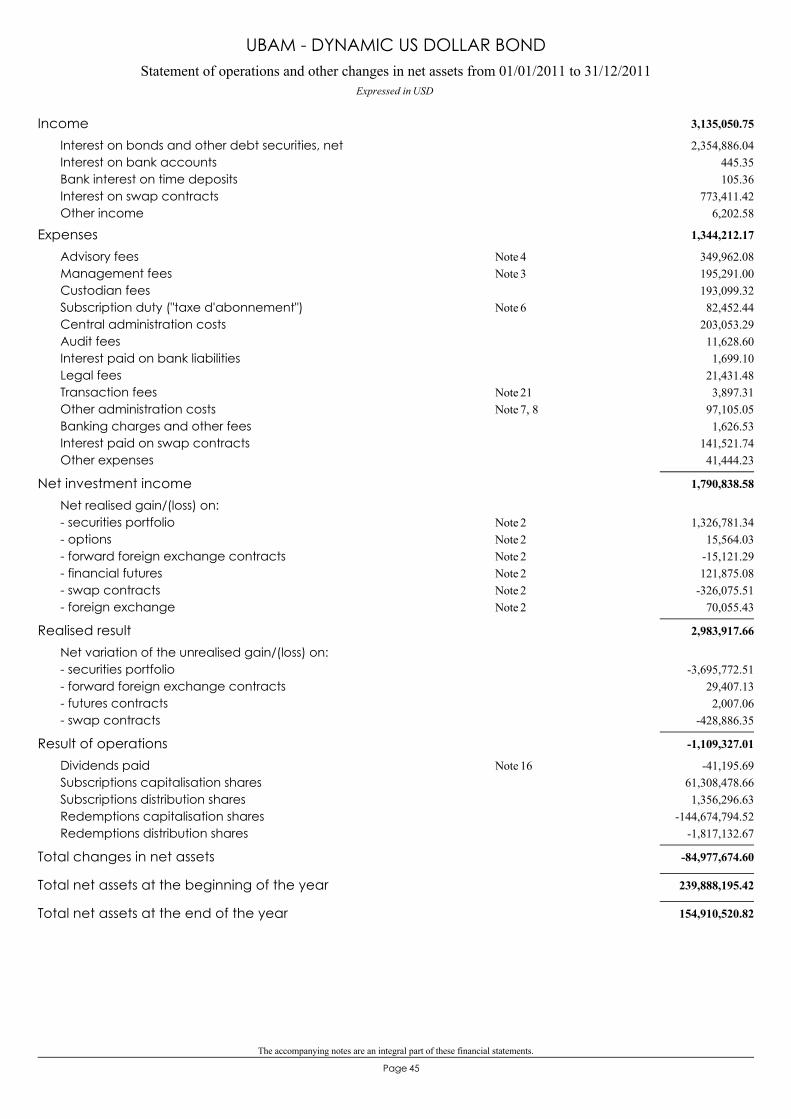
The accompanying notes are an integral part of these financial statements.
45Page
Statement of operations and other changes in net assets from 01/01/2011 to 31/12/2011Expressed in USD
UBAM - DYNAMIC US DOLLAR BOND
3,135,050.75Income2,354,886.04Interest on bonds and other debt securities, net
445.35Interest on bank accounts105.36Bank interest on time deposits
773,411.42Interest on swap contracts6,202.58Other income
1,344,212.17Expenses349,962.08Advisory fees 4Note195,291.00Management fees 3Note193,099.32Custodian fees82,452.44Subscription duty ("taxe d'abonnement") 6Note
203,053.29Central administration costs11,628.60Audit fees1,699.10Interest paid on bank liabilities
21,431.48Legal fees3,897.31Transaction fees 21Note
97,105.05Other administration costs 7, 8Note1,626.53Banking charges and other fees
141,521.74Interest paid on swap contracts41,444.23Other expenses
1,790,838.58Net investment incomeNet realised gain/(loss) on:
1,326,781.34- securities portfolio 2Note15,564.03- options 2Note
-15,121.29- forward foreign exchange contracts 2Note121,875.08- financial futures 2Note
-326,075.51- swap contracts 2Note70,055.43- foreign exchange 2Note
2,983,917.66Realised resultNet variation of the unrealised gain/(loss) on:
-3,695,772.51- securities portfolio29,407.13- forward foreign exchange contracts2,007.06- futures contracts
-428,886.35- swap contracts
-1,109,327.01Result of operations-41,195.69Dividends paid 16Note
61,308,478.66Subscriptions capitalisation shares1,356,296.63Subscriptions distribution shares
-144,674,794.52Redemptions capitalisation shares-1,817,132.67Redemptions distribution shares
-84,977,674.60Total changes in net assets
239,888,195.42Total net assets at the beginning of the year
154,910,520.82Total net assets at the end of the year
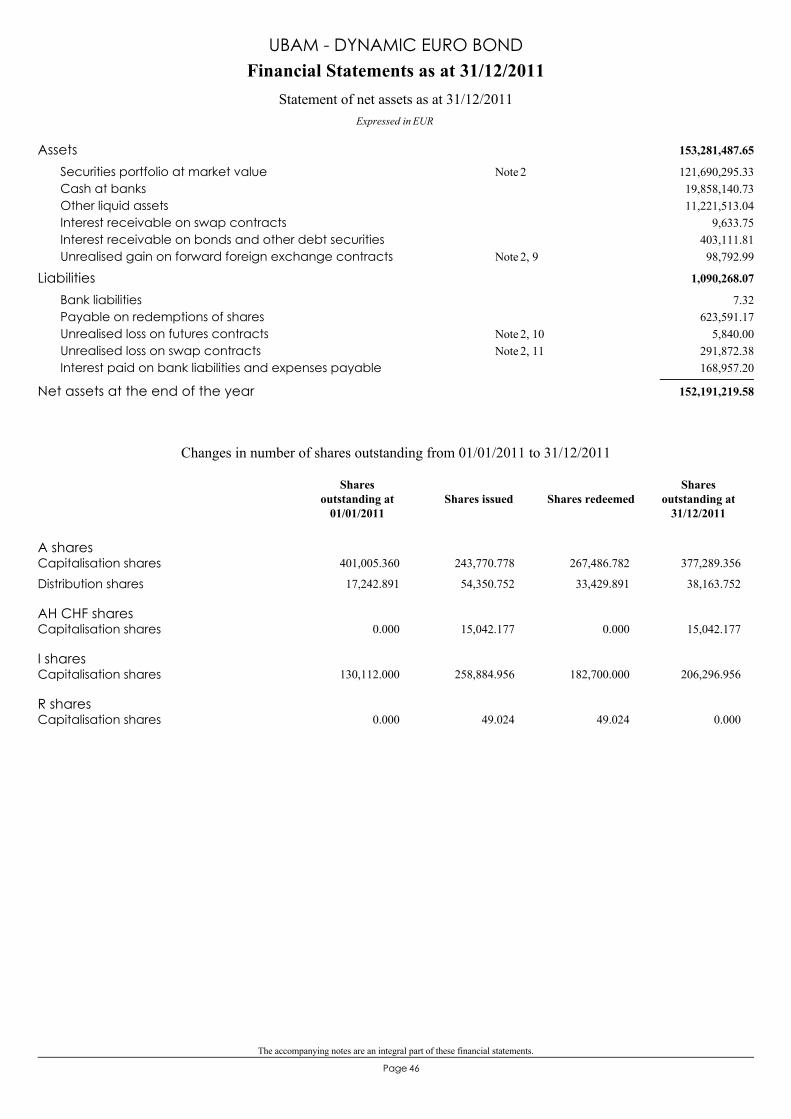
The accompanying notes are an integral part of these financial statements.
46Page
153,281,487.65Assets121,690,295.33Securities portfolio at market value 2Note19,858,140.73Cash at banks11,221,513.04Other liquid assets
9,633.75Interest receivable on swap contracts403,111.81Interest receivable on bonds and other debt securities98,792.99Unrealised gain on forward foreign exchange contracts 2, 9Note
1,090,268.07Liabilities7.32Bank liabilities
623,591.17Payable on redemptions of shares5,840.00Unrealised loss on futures contracts 2, 10Note
291,872.38Unrealised loss on swap contracts 2, 11Note168,957.20Interest paid on bank liabilities and expenses payable
152,191,219.58Net assets at the end of the year
Financial Statements as at 31/12/2011
Expressed in EUR
Statement of net assets as at 31/12/2011
UBAM - DYNAMIC EURO BOND
A sharesCapitalisation shares 401,005.360 243,770.778 267,486.782 377,289.356
Distribution shares 17,242.891 54,350.752 33,429.891 38,163.752
AH CHF sharesCapitalisation shares 0.000 15,042.177 0.000 15,042.177
I sharesCapitalisation shares 130,112.000 258,884.956 182,700.000 206,296.956
R sharesCapitalisation shares 0.000 49.024 49.024 0.000
Changes in number of shares outstanding from 01/01/2011 to 31/12/2011
Shares issued Shares redeemedShares
outstanding at31/12/2011
Sharesoutstanding at
01/01/2011
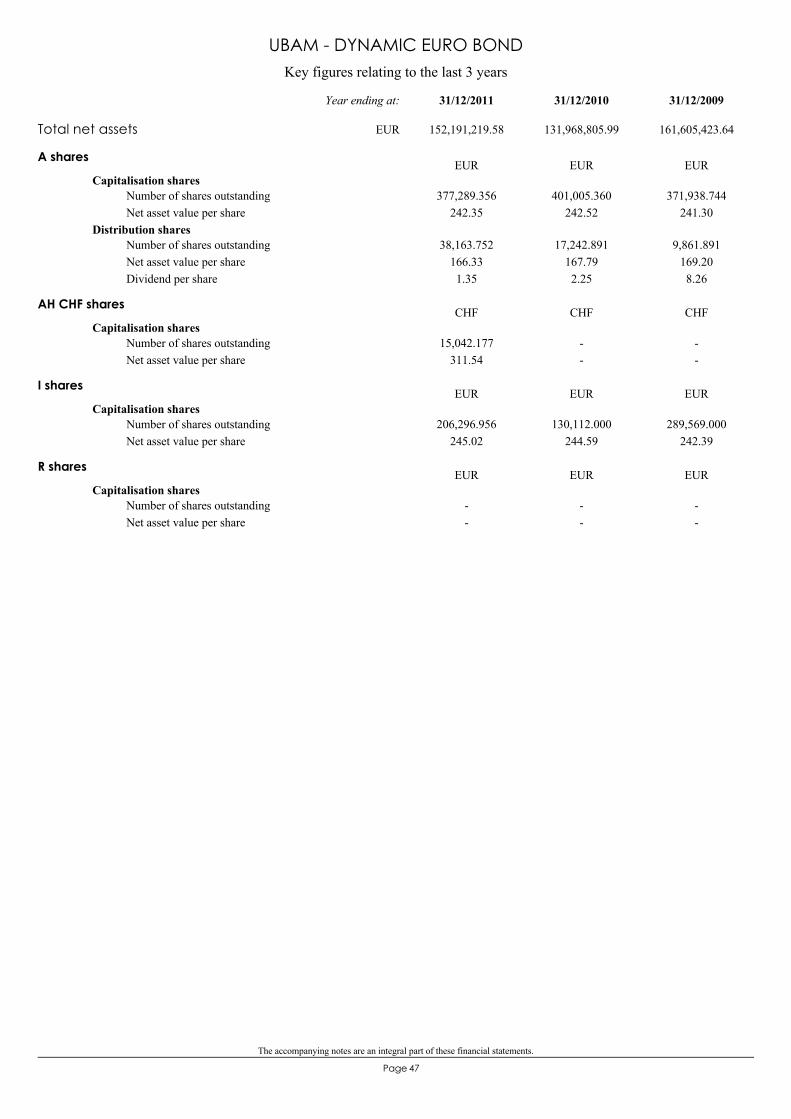
The accompanying notes are an integral part of these financial statements.
47Page
Key figures relating to the last 3 years
UBAM - DYNAMIC EURO BOND
A shares
Capitalisation shares377,289.356
242.35401,005.360
242.52371,938.744
241.30Number of shares outstandingNet asset value per share
Distribution shares38,163.752
166.331.35
17,242.891167.792.25
9,861.891169.208.26
Number of shares outstandingNet asset value per shareDividend per share
EUR EUR EUR
AH CHF shares
Capitalisation shares15,042.177
311.54--
--
Number of shares outstandingNet asset value per share
CHF CHF CHF
I shares
Capitalisation shares206,296.956
245.02130,112.000
244.59289,569.000
242.39Number of shares outstandingNet asset value per share
EUR EUR EUR
R shares
Capitalisation shares--
--
--
Number of shares outstandingNet asset value per share
EUR EUR EUR
Total net assets 152,191,219.58 131,968,805.99 161,605,423.64
31/12/200931/12/201031/12/2011Year ending at:
EUR
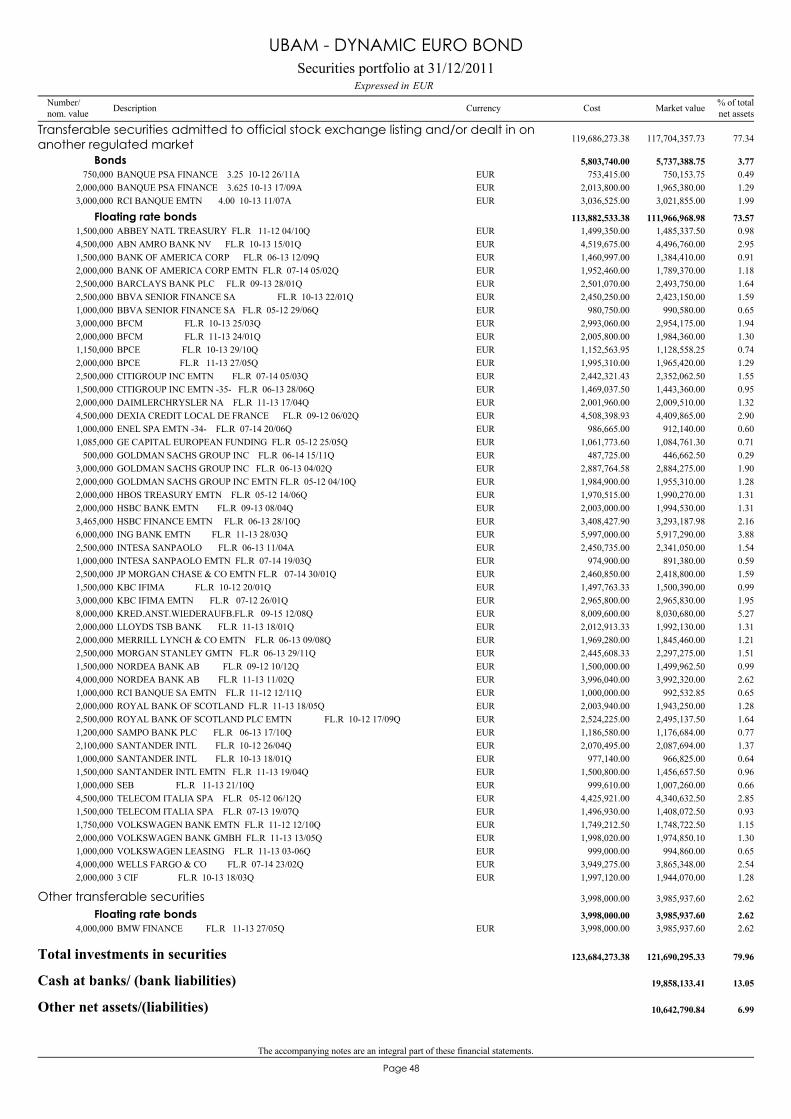
The accompanying notes are an integral part of these financial statements.
48Page
BANQUE PSA FINANCE 3.25 10-12 26/11A750,000 750,153.75 0.49EUR 753,415.00
Transferable securities admitted to official stock exchange listing and/or dealt in onanother regulated market 117,704,357.73 77.34119,686,273.38
Bonds 5,737,388.75 3.775,803,740.00
BANQUE PSA FINANCE 3.625 10-13 17/09A2,000,000 1,965,380.00 1.29EUR 2,013,800.00RCI BANQUE EMTN 4.00 10-13 11/07A3,000,000 3,021,855.00 1.99EUR 3,036,525.00
ABBEY NATL TREASURY FL.R 11-12 04/10Q1,500,000 1,485,337.50 0.98EUR 1,499,350.00Floating rate bonds 111,966,968.98 73.57113,882,533.38
ABN AMRO BANK NV FL.R 10-13 15/01Q4,500,000 4,496,760.00 2.95EUR 4,519,675.00BANK OF AMERICA CORP FL.R 06-13 12/09Q1,500,000 1,384,410.00 0.91EUR 1,460,997.00BANK OF AMERICA CORP EMTN FL.R 07-14 05/02Q2,000,000 1,789,370.00 1.18EUR 1,952,460.00BARCLAYS BANK PLC FL.R 09-13 28/01Q2,500,000 2,493,750.00 1.64EUR 2,501,070.00BBVA SENIOR FINANCE SA FL.R 10-13 22/01Q2,500,000 2,423,150.00 1.59EUR 2,450,250.00BBVA SENIOR FINANCE SA FL.R 05-12 29/06Q1,000,000 990,580.00 0.65EUR 980,750.00BFCM FL.R 10-13 25/03Q3,000,000 2,954,175.00 1.94EUR 2,993,060.00BFCM FL.R 11-13 24/01Q2,000,000 1,984,360.00 1.30EUR 2,005,800.00BPCE FL.R 10-13 29/10Q1,150,000 1,128,558.25 0.74EUR 1,152,563.95BPCE FL.R 11-13 27/05Q2,000,000 1,965,420.00 1.29EUR 1,995,310.00CITIGROUP INC EMTN FL.R 07-14 05/03Q2,500,000 2,352,062.50 1.55EUR 2,442,321.43CITIGROUP INC EMTN -35- FL.R 06-13 28/06Q1,500,000 1,443,360.00 0.95EUR 1,469,037.50DAIMLERCHRYSLER NA FL.R 11-13 17/04Q2,000,000 2,009,510.00 1.32EUR 2,001,960.00DEXIA CREDIT LOCAL DE FRANCE FL.R 09-12 06/02Q4,500,000 4,409,865.00 2.90EUR 4,508,398.93ENEL SPA EMTN -34- FL.R 07-14 20/06Q1,000,000 912,140.00 0.60EUR 986,665.00GE CAPITAL EUROPEAN FUNDING FL.R 05-12 25/05Q1,085,000 1,084,761.30 0.71EUR 1,061,773.60GOLDMAN SACHS GROUP INC FL.R 06-14 15/11Q500,000 446,662.50 0.29EUR 487,725.00GOLDMAN SACHS GROUP INC FL.R 06-13 04/02Q3,000,000 2,884,275.00 1.90EUR 2,887,764.58GOLDMAN SACHS GROUP INC EMTN FL.R 05-12 04/10Q2,000,000 1,955,310.00 1.28EUR 1,984,900.00HBOS TREASURY EMTN FL.R 05-12 14/06Q2,000,000 1,990,270.00 1.31EUR 1,970,515.00HSBC BANK EMTN FL.R 09-13 08/04Q2,000,000 1,994,530.00 1.31EUR 2,003,000.00HSBC FINANCE EMTN FL.R 06-13 28/10Q3,465,000 3,293,187.98 2.16EUR 3,408,427.90ING BANK EMTN FL.R 11-13 28/03Q6,000,000 5,917,290.00 3.88EUR 5,997,000.00INTESA SANPAOLO FL.R 06-13 11/04A2,500,000 2,341,050.00 1.54EUR 2,450,735.00INTESA SANPAOLO EMTN FL.R 07-14 19/03Q1,000,000 891,380.00 0.59EUR 974,900.00JP MORGAN CHASE & CO EMTN FL.R 07-14 30/01Q2,500,000 2,418,800.00 1.59EUR 2,460,850.00KBC IFIMA FL.R 10-12 20/01Q1,500,000 1,500,390.00 0.99EUR 1,497,763.33KBC IFIMA EMTN FL.R 07-12 26/01Q3,000,000 2,965,830.00 1.95EUR 2,965,800.00KRED.ANST.WIEDERAUFB.FL.R 09-15 12/08Q8,000,000 8,030,680.00 5.27EUR 8,009,600.00LLOYDS TSB BANK FL.R 11-13 18/01Q2,000,000 1,992,130.00 1.31EUR 2,012,913.33MERRILL LYNCH & CO EMTN FL.R 06-13 09/08Q2,000,000 1,845,460.00 1.21EUR 1,969,280.00MORGAN STANLEY GMTN FL.R 06-13 29/11Q2,500,000 2,297,275.00 1.51EUR 2,445,608.33NORDEA BANK AB FL.R 09-12 10/12Q1,500,000 1,499,962.50 0.99EUR 1,500,000.00NORDEA BANK AB FL.R 11-13 11/02Q4,000,000 3,992,320.00 2.62EUR 3,996,040.00RCI BANQUE SA EMTN FL.R 11-12 12/11Q1,000,000 992,532.85 0.65EUR 1,000,000.00ROYAL BANK OF SCOTLAND FL.R 11-13 18/05Q2,000,000 1,943,250.00 1.28EUR 2,003,940.00ROYAL BANK OF SCOTLAND PLC EMTN FL.R 10-12 17/09Q2,500,000 2,495,137.50 1.64EUR 2,524,225.00SAMPO BANK PLC FL.R 06-13 17/10Q1,200,000 1,176,684.00 0.77EUR 1,186,580.00SANTANDER INTL FL.R 10-12 26/04Q2,100,000 2,087,694.00 1.37EUR 2,070,495.00SANTANDER INTL FL.R 10-13 18/01Q1,000,000 966,825.00 0.64EUR 977,140.00SANTANDER INTL EMTN FL.R 11-13 19/04Q1,500,000 1,456,657.50 0.96EUR 1,500,800.00SEB FL.R 11-13 21/10Q1,000,000 1,007,260.00 0.66EUR 999,610.00TELECOM ITALIA SPA FL.R 05-12 06/12Q4,500,000 4,340,632.50 2.85EUR 4,425,921.00TELECOM ITALIA SPA FL.R 07-13 19/07Q1,500,000 1,408,072.50 0.93EUR 1,496,930.00VOLKSWAGEN BANK EMTN FL.R 11-12 12/10Q1,750,000 1,748,722.50 1.15EUR 1,749,212.50VOLKSWAGEN BANK GMBH FL.R 11-13 13/05Q2,000,000 1,974,850.10 1.30EUR 1,998,020.00VOLKSWAGEN LEASING FL.R 11-13 03-06Q1,000,000 994,860.00 0.65EUR 999,000.00WELLS FARGO & CO FL.R 07-14 23/02Q4,000,000 3,865,348.00 2.54EUR 3,949,275.003 CIF FL.R 10-13 18/03Q2,000,000 1,944,070.00 1.28EUR 1,997,120.00
BMW FINANCE FL.R 11-13 27/05Q4,000,000 3,985,937.60 2.62EUR 3,998,000.00
Other transferable securities 3,985,937.60 2.623,998,000.00
Floating rate bonds 3,985,937.60 2.623,998,000.00
Total investments in securities 121,690,295.33 79.96123,684,273.38
Cash at banks/ (bank liabilities) 19,858,133.41 13.05
Other net assets/(liabilities) 10,642,790.84 6.99
Securities portfolio at 31/12/2011EURExpressed in
UBAM - DYNAMIC EURO BOND
Number/nom. value Description Currency % of total
net assetsMarket valueCost
The accompanying notes are an integral part of these financial statements.
49Page
Total 152,191,219.58 100.00
Securities portfolio at 31/12/2011EURExpressed in
UBAM - DYNAMIC EURO BOND
Number/nom. value Description Currency % of total
net assetsMarket valueCost
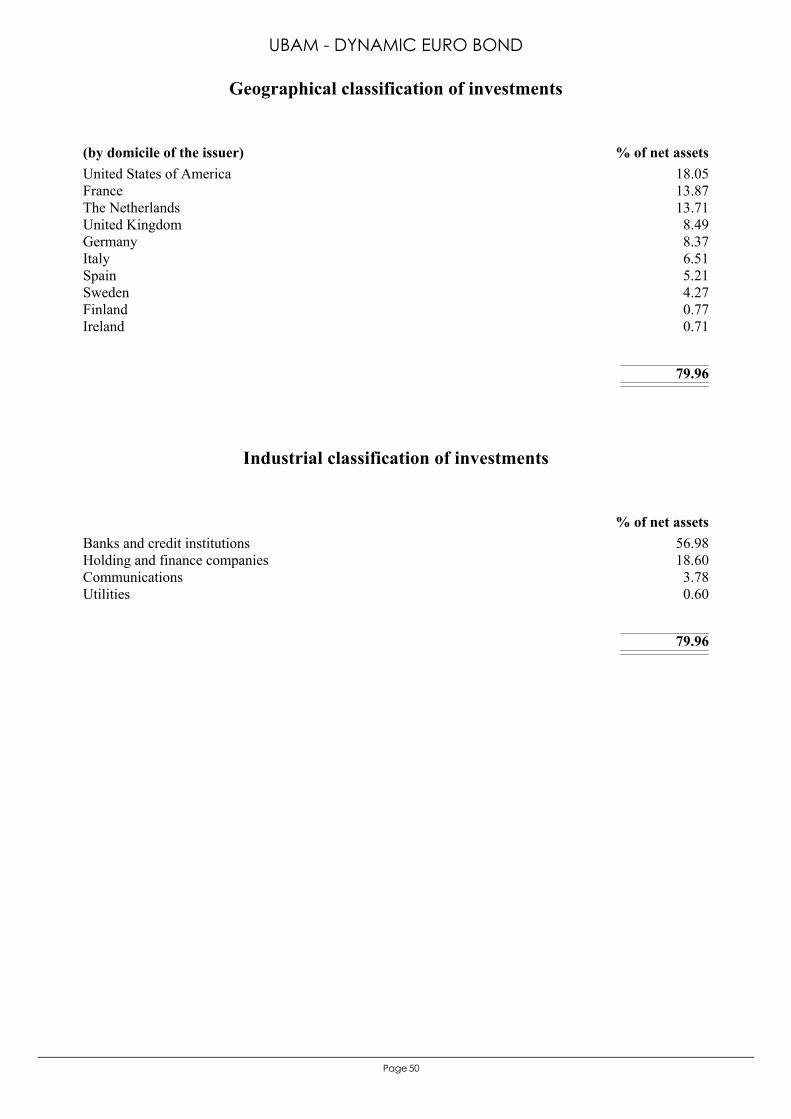
50Page
United States of America 18.05France 13.87The Netherlands 13.71United Kingdom 8.49Germany 8.37Italy 6.51Spain 5.21Sweden 4.27Finland 0.77Ireland 0.71
79.96
(by domicile of the issuer) % of net assets
Geographical classification of investments
UBAM - DYNAMIC EURO BOND
Banks and credit institutions 56.98Holding and finance companies 18.60Communications 3.78Utilities 0.60
79.96
% of net assets
Industrial classification of investments

The accompanying notes are an integral part of these financial statements.
51Page
Statement of operations and other changes in net assets from 01/01/2011 to 31/12/2011Expressed in EUR
UBAM - DYNAMIC EURO BOND
3,257,316.79Income2,715,331.84Interest on bonds and other debt securities, net
48,302.94Interest on bank accounts12,410.05Bank interest on time deposits
470,604.57Interest on swap contracts10,667.39Other income
1,065,822.51Expenses249,885.90Advisory fees 4Note153,064.93Management fees 3Note157,095.41Custodian fees60,552.20Subscription duty ("taxe d'abonnement") 6Note
159,095.59Central administration costs9,461.74Audit fees
25,388.17Interest paid on bank liabilities16,122.65Legal fees3,278.14Transaction fees 21Note
65,055.34Other administration costs 7, 8Note2,513.82Banking charges and other fees
127,761.22Interest paid on swap contracts36,547.40Other expenses
2,191,494.28Net investment incomeNet realised gain/(loss) on:
853,968.33- securities portfolio 2Note15,068.38- options 2Note
-62,817.11- forward foreign exchange contracts 2Note-15,712.81- futures contracts 2Note
-328,344.00- swap contracts 2Note322,261.54- foreign exchange 2Note
2,975,918.61Realised resultNet variation of the unrealised gain/(loss) on:
-3,015,855.81- securities portfolio98,792.99- forward foreign exchange contracts-8,255.00- futures contracts
-270,023.96- swap contracts
-219,423.17Result of operations-31,677.75Dividends paid 16Note
126,875,261.59Subscriptions capitalisation shares9,129,596.78Subscriptions distribution shares
-109,985,036.61Redemptions capitalisation shares-5,546,307.25Redemptions distribution shares
20,222,413.59Total changes in net assets
131,968,805.99Total net assets at the beginning of the year
152,191,219.58Total net assets at the end of the year
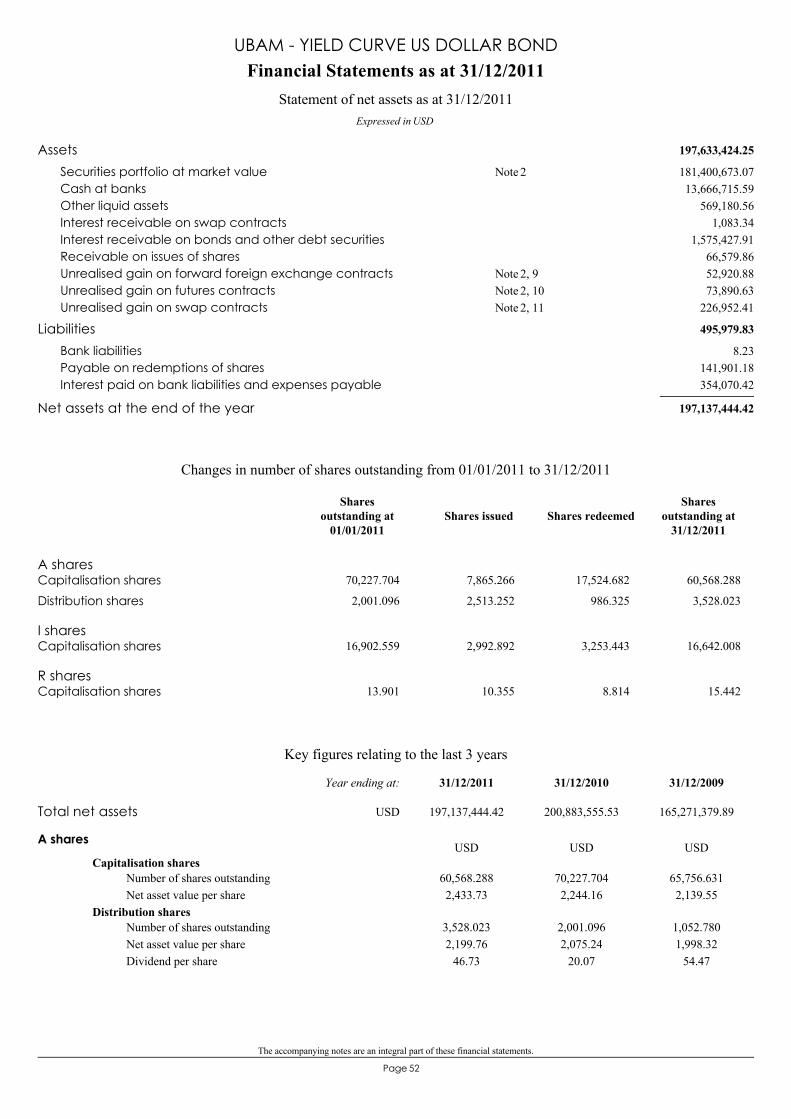
The accompanying notes are an integral part of these financial statements.
52Page
197,633,424.25Assets181,400,673.07Securities portfolio at market value 2Note13,666,715.59Cash at banks
569,180.56Other liquid assets1,083.34Interest receivable on swap contracts
1,575,427.91Interest receivable on bonds and other debt securities66,579.86Receivable on issues of shares52,920.88Unrealised gain on forward foreign exchange contracts 2, 9Note73,890.63Unrealised gain on futures contracts 2, 10Note
226,952.41Unrealised gain on swap contracts 2, 11Note
495,979.83Liabilities8.23Bank liabilities
141,901.18Payable on redemptions of shares354,070.42Interest paid on bank liabilities and expenses payable
197,137,444.42Net assets at the end of the year
Financial Statements as at 31/12/2011
Expressed in USD
Statement of net assets as at 31/12/2011
UBAM - YIELD CURVE US DOLLAR BOND
A sharesCapitalisation shares 70,227.704 7,865.266 17,524.682 60,568.288
Distribution shares 2,001.096 2,513.252 986.325 3,528.023
I sharesCapitalisation shares 16,902.559 2,992.892 3,253.443 16,642.008
R sharesCapitalisation shares 13.901 10.355 8.814 15.442
Changes in number of shares outstanding from 01/01/2011 to 31/12/2011
Shares issued Shares redeemedShares
outstanding at31/12/2011
Sharesoutstanding at
01/01/2011
Key figures relating to the last 3 years
A shares
Capitalisation shares60,568.2882,433.73
70,227.7042,244.16
65,756.6312,139.55
Number of shares outstandingNet asset value per share
Distribution shares3,528.0232,199.76
46.73
2,001.0962,075.24
20.07
1,052.7801,998.32
54.47
Number of shares outstandingNet asset value per shareDividend per share
USD USD USD
Total net assets 197,137,444.42 200,883,555.53 165,271,379.89
31/12/200931/12/201031/12/2011Year ending at:
USD
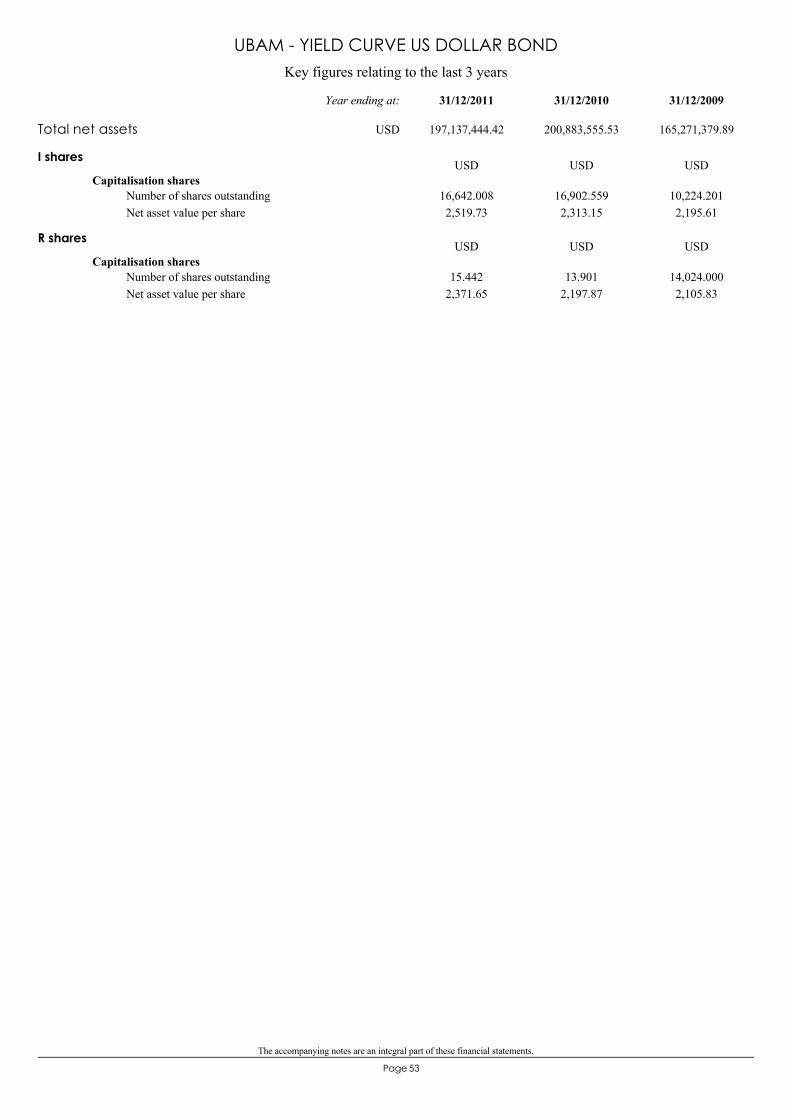
The accompanying notes are an integral part of these financial statements.
53Page
Key figures relating to the last 3 years
UBAM - YIELD CURVE US DOLLAR BOND
I shares
Capitalisation shares16,642.0082,519.73
16,902.5592,313.15
10,224.2012,195.61
Number of shares outstandingNet asset value per share
USD USD USD
R shares
Capitalisation shares15.442
2,371.6513.901
2,197.8714,024.0002,105.83
Number of shares outstandingNet asset value per share
USD USD USD
Total net assets 197,137,444.42 200,883,555.53 165,271,379.89
31/12/200931/12/201031/12/2011Year ending at:
USD
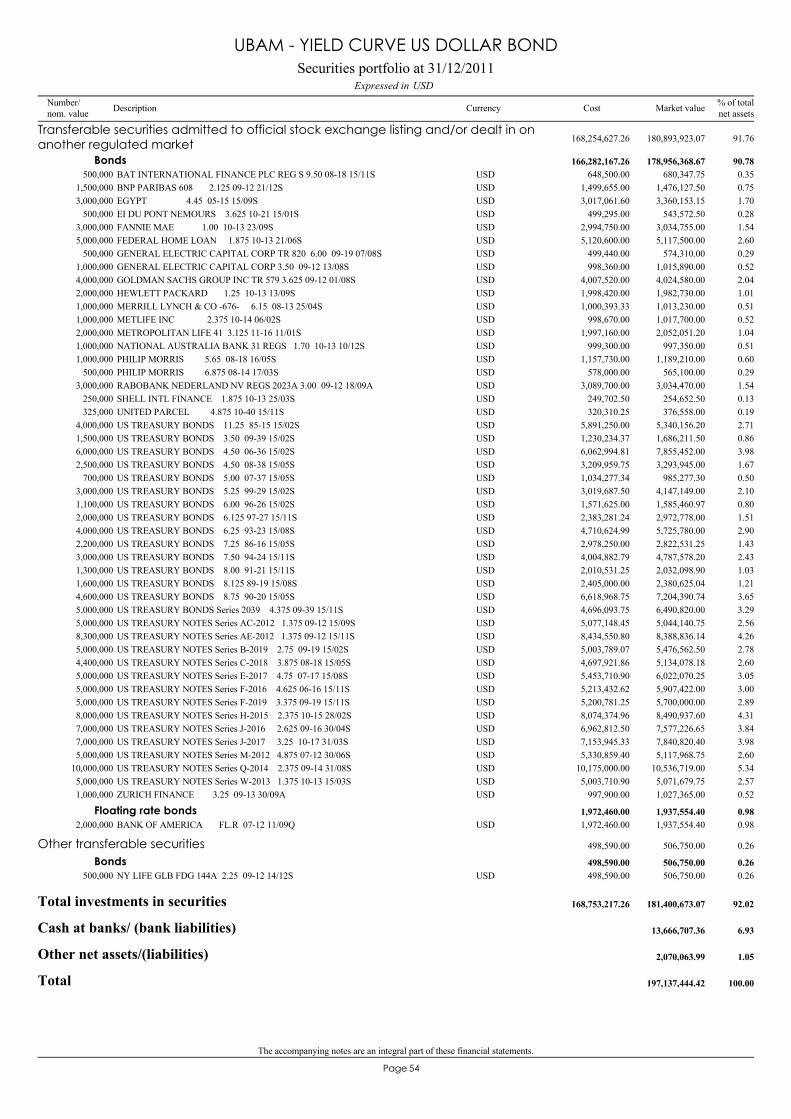
The accompanying notes are an integral part of these financial statements.
54Page
BAT INTERNATIONAL FINANCE PLC REG S 9.50 08-18 15/11S500,000 680,347.75 0.35USD 648,500.00
Transferable securities admitted to official stock exchange listing and/or dealt in onanother regulated market 180,893,923.07 91.76168,254,627.26
Bonds 178,956,368.67 90.78166,282,167.26
BNP PARIBAS 608 2.125 09-12 21/12S1,500,000 1,476,127.50 0.75USD 1,499,655.00EGYPT 4.45 05-15 15/09S3,000,000 3,360,153.15 1.70USD 3,017,061.60EI DU PONT NEMOURS 3.625 10-21 15/01S500,000 543,572.50 0.28USD 499,295.00FANNIE MAE 1.00 10-13 23/09S3,000,000 3,034,755.00 1.54USD 2,994,750.00FEDERAL HOME LOAN 1.875 10-13 21/06S5,000,000 5,117,500.00 2.60USD 5,120,600.00GENERAL ELECTRIC CAPITAL CORP TR 820 6.00 09-19 07/08S500,000 574,310.00 0.29USD 499,440.00GENERAL ELECTRIC CAPITAL CORP 3.50 09-12 13/08S1,000,000 1,015,890.00 0.52USD 998,360.00GOLDMAN SACHS GROUP INC TR 579 3.625 09-12 01/08S4,000,000 4,024,580.00 2.04USD 4,007,520.00HEWLETT PACKARD 1.25 10-13 13/09S2,000,000 1,982,730.00 1.01USD 1,998,420.00MERRILL LYNCH & CO -676- 6.15 08-13 25/04S1,000,000 1,013,230.00 0.51USD 1,000,393.33METLIFE INC 2.375 10-14 06/02S1,000,000 1,017,700.00 0.52USD 998,670.00METROPOLITAN LIFE 41 3.125 11-16 11/01S2,000,000 2,052,051.20 1.04USD 1,997,160.00NATIONAL AUSTRALIA BANK 31 REGS 1.70 10-13 10/12S1,000,000 997,350.00 0.51USD 999,300.00PHILIP MORRIS 5.65 08-18 16/05S1,000,000 1,189,210.00 0.60USD 1,157,730.00PHILIP MORRIS 6.875 08-14 17/03S500,000 565,100.00 0.29USD 578,000.00RABOBANK NEDERLAND NV REGS 2023A 3.00 09-12 18/09A3,000,000 3,034,470.00 1.54USD 3,089,700.00SHELL INTL FINANCE 1.875 10-13 25/03S250,000 254,652.50 0.13USD 249,702.50UNITED PARCEL 4.875 10-40 15/11S325,000 376,558.00 0.19USD 320,310.25US TREASURY BONDS 11.25 85-15 15/02S4,000,000 5,340,156.20 2.71USD 5,891,250.00US TREASURY BONDS 3.50 09-39 15/02S1,500,000 1,686,211.50 0.86USD 1,230,234.37US TREASURY BONDS 4.50 06-36 15/02S6,000,000 7,855,452.00 3.98USD 6,062,994.81US TREASURY BONDS 4.50 08-38 15/05S2,500,000 3,293,945.00 1.67USD 3,209,959.75US TREASURY BONDS 5.00 07-37 15/05S700,000 985,277.30 0.50USD 1,034,277.34US TREASURY BONDS 5.25 99-29 15/02S3,000,000 4,147,149.00 2.10USD 3,019,687.50US TREASURY BONDS 6.00 96-26 15/02S1,100,000 1,585,460.97 0.80USD 1,571,625.00US TREASURY BONDS 6.125 97-27 15/11S2,000,000 2,972,778.00 1.51USD 2,383,281.24US TREASURY BONDS 6.25 93-23 15/08S4,000,000 5,725,780.00 2.90USD 4,710,624.99US TREASURY BONDS 7.25 86-16 15/05S2,200,000 2,822,531.25 1.43USD 2,978,250.00US TREASURY BONDS 7.50 94-24 15/11S3,000,000 4,787,578.20 2.43USD 4,004,882.79US TREASURY BONDS 8.00 91-21 15/11S1,300,000 2,032,098.90 1.03USD 2,010,531.25US TREASURY BONDS 8.125 89-19 15/08S1,600,000 2,380,625.04 1.21USD 2,405,000.00US TREASURY BONDS 8.75 90-20 15/05S4,600,000 7,204,390.74 3.65USD 6,618,968.75US TREASURY BONDS Series 2039 4.375 09-39 15/11S5,000,000 6,490,820.00 3.29USD 4,696,093.75US TREASURY NOTES Series AC-2012 1.375 09-12 15/09S5,000,000 5,044,140.75 2.56USD 5,077,148.45US TREASURY NOTES Series AE-2012 1.375 09-12 15/11S8,300,000 8,388,836.14 4.26USD 8,434,550.80US TREASURY NOTES Series B-2019 2.75 09-19 15/02S5,000,000 5,476,562.50 2.78USD 5,003,789.07US TREASURY NOTES Series C-2018 3.875 08-18 15/05S4,400,000 5,134,078.18 2.60USD 4,697,921.86US TREASURY NOTES Series E-2017 4.75 07-17 15/08S5,000,000 6,022,070.25 3.05USD 5,453,710.90US TREASURY NOTES Series F-2016 4.625 06-16 15/11S5,000,000 5,907,422.00 3.00USD 5,213,432.62US TREASURY NOTES Series F-2019 3.375 09-19 15/11S5,000,000 5,700,000.00 2.89USD 5,200,781.25US TREASURY NOTES Series H-2015 2.375 10-15 28/02S8,000,000 8,490,937.60 4.31USD 8,074,374.96US TREASURY NOTES Series J-2016 2.625 09-16 30/04S7,000,000 7,577,226.65 3.84USD 6,962,812.50US TREASURY NOTES Series J-2017 3.25 10-17 31/03S7,000,000 7,840,820.40 3.98USD 7,153,945.33US TREASURY NOTES Series M-2012 4.875 07-12 30/06S5,000,000 5,117,968.75 2.60USD 5,330,859.40US TREASURY NOTES Series Q-2014 2.375 09-14 31/08S10,000,000 10,536,719.00 5.34USD 10,175,000.00US TREASURY NOTES Series W-2013 1.375 10-13 15/03S5,000,000 5,071,679.75 2.57USD 5,003,710.90ZURICH FINANCE 3.25 09-13 30/09A1,000,000 1,027,365.00 0.52USD 997,900.00
BANK OF AMERICA FL.R 07-12 11/09Q2,000,000 1,937,554.40 0.98USD 1,972,460.00Floating rate bonds 1,937,554.40 0.981,972,460.00
NY LIFE GLB FDG 144A 2.25 09-12 14/12S500,000 506,750.00 0.26USD 498,590.00
Other transferable securities 506,750.00 0.26498,590.00
Bonds 506,750.00 0.26498,590.00
Total investments in securities 181,400,673.07 92.02168,753,217.26
Cash at banks/ (bank liabilities) 13,666,707.36 6.93
Other net assets/(liabilities) 2,070,063.99 1.05
Total 197,137,444.42 100.00
Securities portfolio at 31/12/2011USDExpressed in
UBAM - YIELD CURVE US DOLLAR BOND
Number/nom. value Description Currency % of total
net assetsMarket valueCost
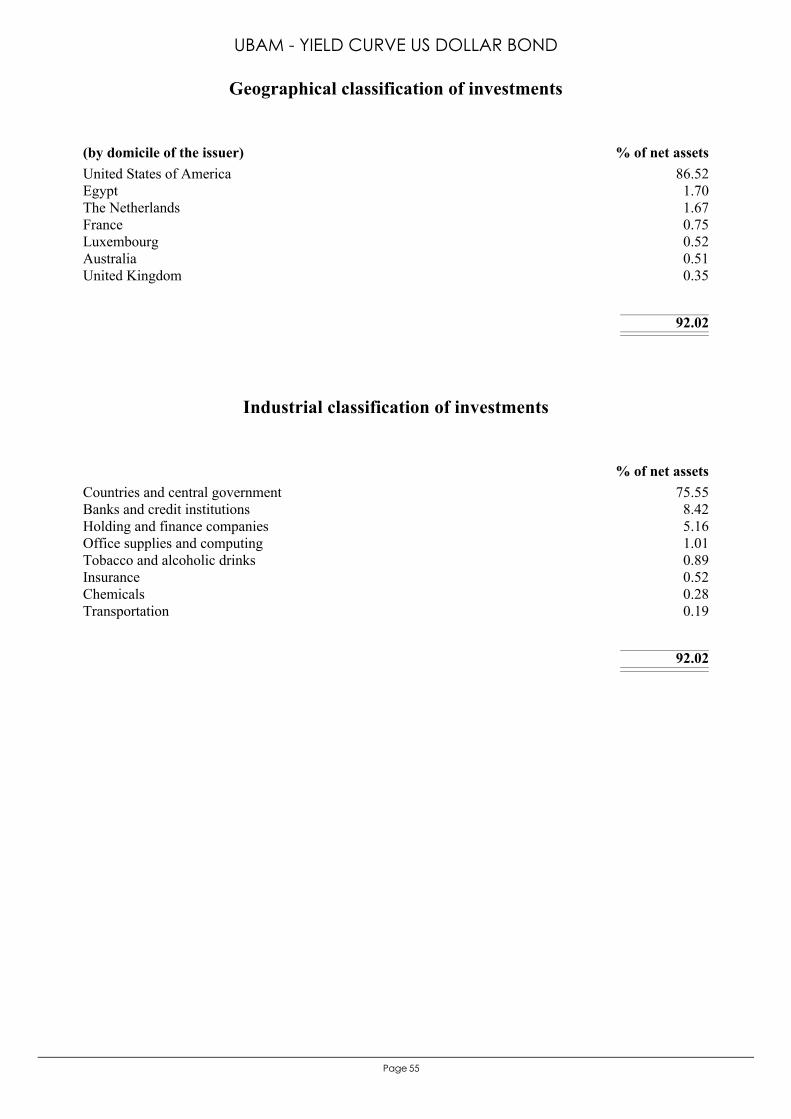
55Page
United States of America 86.52Egypt 1.70The Netherlands 1.67France 0.75Luxembourg 0.52Australia 0.51United Kingdom 0.35
92.02
(by domicile of the issuer) % of net assets
Geographical classification of investments
UBAM - YIELD CURVE US DOLLAR BOND
Countries and central government 75.55Banks and credit institutions 8.42Holding and finance companies 5.16Office supplies and computing 1.01Tobacco and alcoholic drinks 0.89Insurance 0.52Chemicals 0.28Transportation 0.19
92.02
% of net assets
Industrial classification of investments
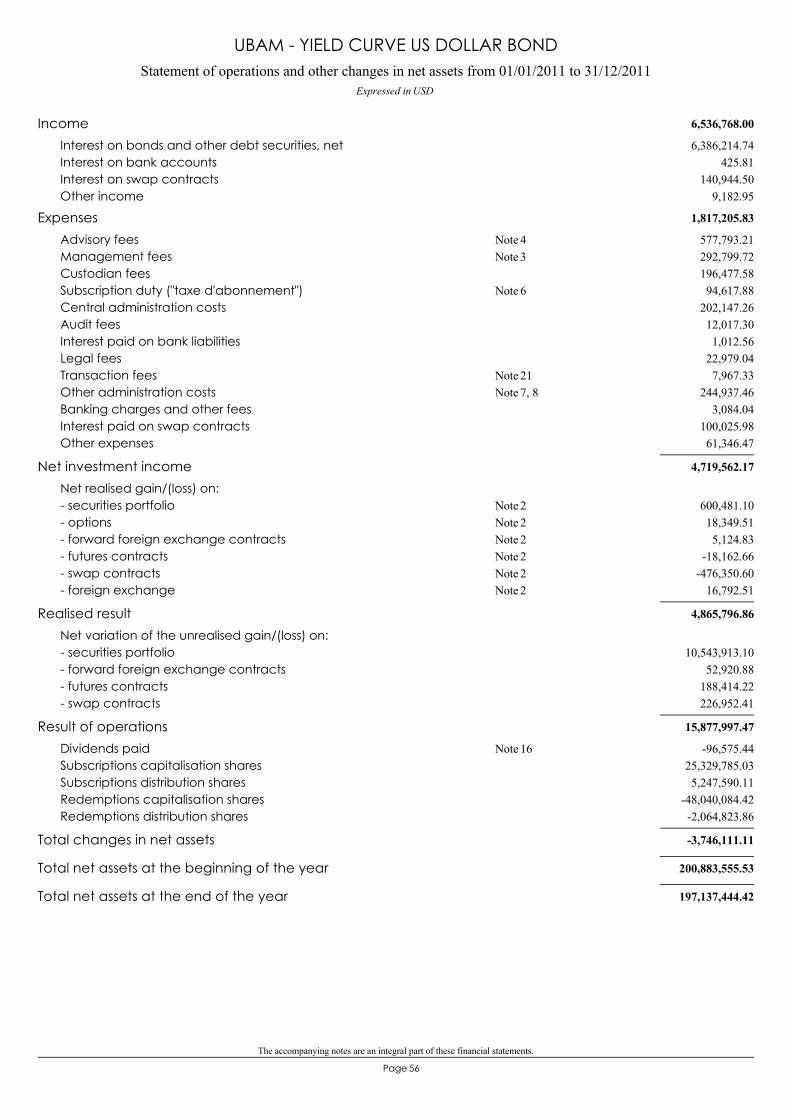
The accompanying notes are an integral part of these financial statements.
56Page
Statement of operations and other changes in net assets from 01/01/2011 to 31/12/2011Expressed in USD
UBAM - YIELD CURVE US DOLLAR BOND
6,536,768.00Income6,386,214.74Interest on bonds and other debt securities, net
425.81Interest on bank accounts140,944.50Interest on swap contracts
9,182.95Other income
1,817,205.83Expenses577,793.21Advisory fees 4Note292,799.72Management fees 3Note196,477.58Custodian fees94,617.88Subscription duty ("taxe d'abonnement") 6Note
202,147.26Central administration costs12,017.30Audit fees1,012.56Interest paid on bank liabilities
22,979.04Legal fees7,967.33Transaction fees 21Note
244,937.46Other administration costs 7, 8Note3,084.04Banking charges and other fees
100,025.98Interest paid on swap contracts61,346.47Other expenses
4,719,562.17Net investment incomeNet realised gain/(loss) on:
600,481.10- securities portfolio 2Note18,349.51- options 2Note5,124.83- forward foreign exchange contracts 2Note
-18,162.66- futures contracts 2Note-476,350.60- swap contracts 2Note
16,792.51- foreign exchange 2Note
4,865,796.86Realised resultNet variation of the unrealised gain/(loss) on:
10,543,913.10- securities portfolio52,920.88- forward foreign exchange contracts
188,414.22- futures contracts226,952.41- swap contracts
15,877,997.47Result of operations-96,575.44Dividends paid 16Note
25,329,785.03Subscriptions capitalisation shares5,247,590.11Subscriptions distribution shares
-48,040,084.42Redemptions capitalisation shares-2,064,823.86Redemptions distribution shares
-3,746,111.11Total changes in net assets
200,883,555.53Total net assets at the beginning of the year
197,137,444.42Total net assets at the end of the year
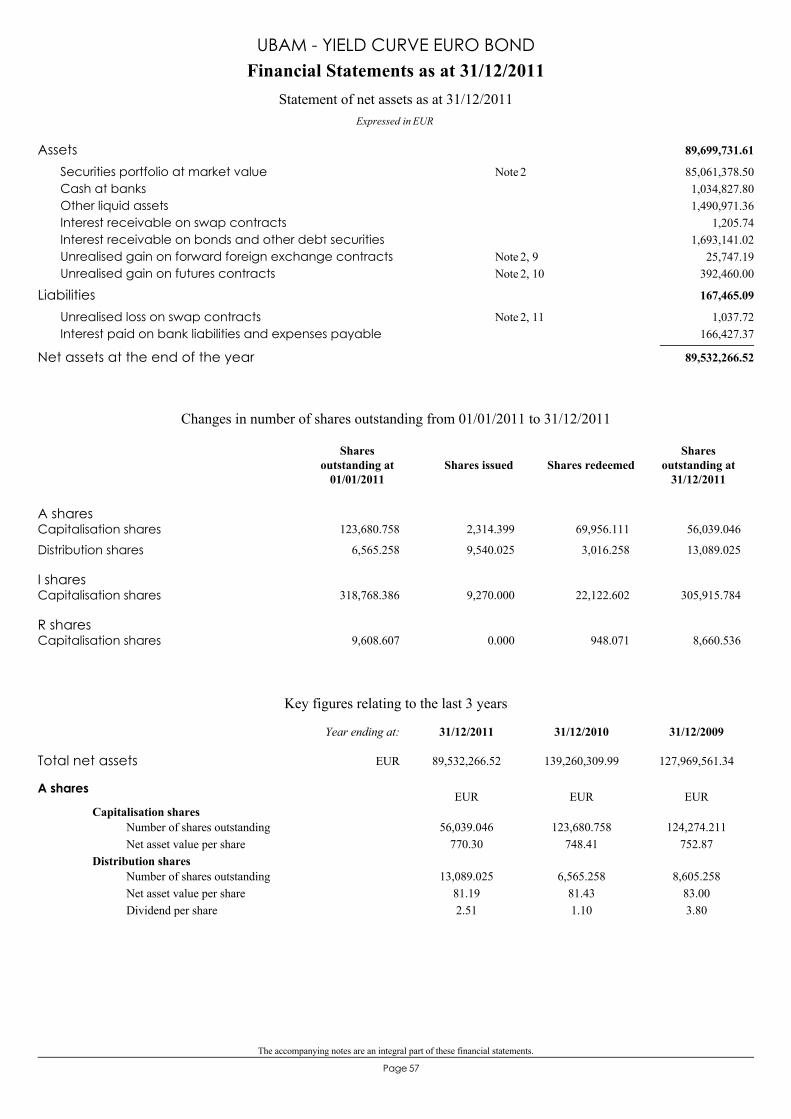
The accompanying notes are an integral part of these financial statements.
57Page
89,699,731.61Assets85,061,378.50Securities portfolio at market value 2Note1,034,827.80Cash at banks1,490,971.36Other liquid assets
1,205.74Interest receivable on swap contracts1,693,141.02Interest receivable on bonds and other debt securities
25,747.19Unrealised gain on forward foreign exchange contracts 2, 9Note392,460.00Unrealised gain on futures contracts 2, 10Note
167,465.09Liabilities1,037.72Unrealised loss on swap contracts 2, 11Note
166,427.37Interest paid on bank liabilities and expenses payable
89,532,266.52Net assets at the end of the year
Financial Statements as at 31/12/2011
Expressed in EUR
Statement of net assets as at 31/12/2011
UBAM - YIELD CURVE EURO BOND
A sharesCapitalisation shares 123,680.758 2,314.399 69,956.111 56,039.046
Distribution shares 6,565.258 9,540.025 3,016.258 13,089.025
I sharesCapitalisation shares 318,768.386 9,270.000 22,122.602 305,915.784
R sharesCapitalisation shares 9,608.607 0.000 948.071 8,660.536
Changes in number of shares outstanding from 01/01/2011 to 31/12/2011
Shares issued Shares redeemedShares
outstanding at31/12/2011
Sharesoutstanding at
01/01/2011
Key figures relating to the last 3 years
A shares
Capitalisation shares56,039.046
770.30123,680.758
748.41124,274.211
752.87Number of shares outstandingNet asset value per share
Distribution shares13,089.025
81.192.51
6,565.25881.431.10
8,605.25883.003.80
Number of shares outstandingNet asset value per shareDividend per share
EUR EUR EUR
Total net assets 89,532,266.52 139,260,309.99 127,969,561.34
31/12/200931/12/201031/12/2011Year ending at:
EUR
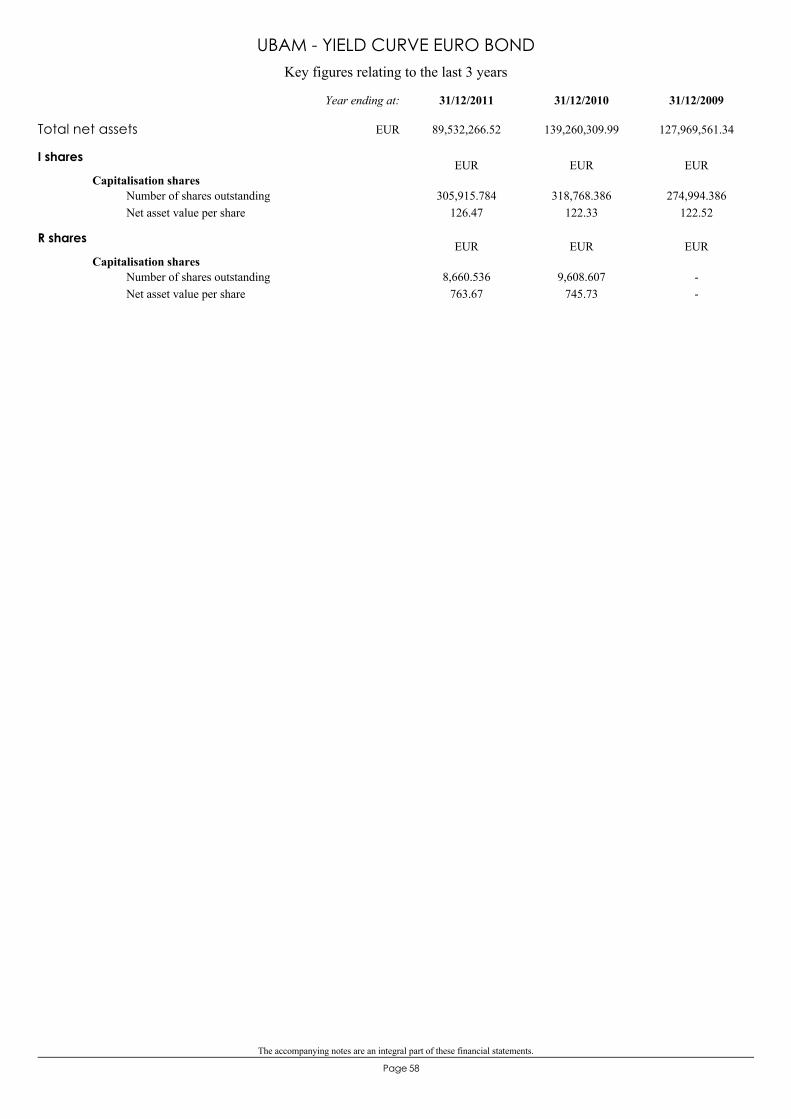
The accompanying notes are an integral part of these financial statements.
58Page
Key figures relating to the last 3 years
UBAM - YIELD CURVE EURO BOND
I shares
Capitalisation shares305,915.784
126.47318,768.386
122.33274,994.386
122.52Number of shares outstandingNet asset value per share
EUR EUR EUR
R shares
Capitalisation shares8,660.536
763.679,608.607
745.73--
Number of shares outstandingNet asset value per share
EUR EUR EUR
Total net assets 89,532,266.52 139,260,309.99 127,969,561.34
31/12/200931/12/201031/12/2011Year ending at:
EUR
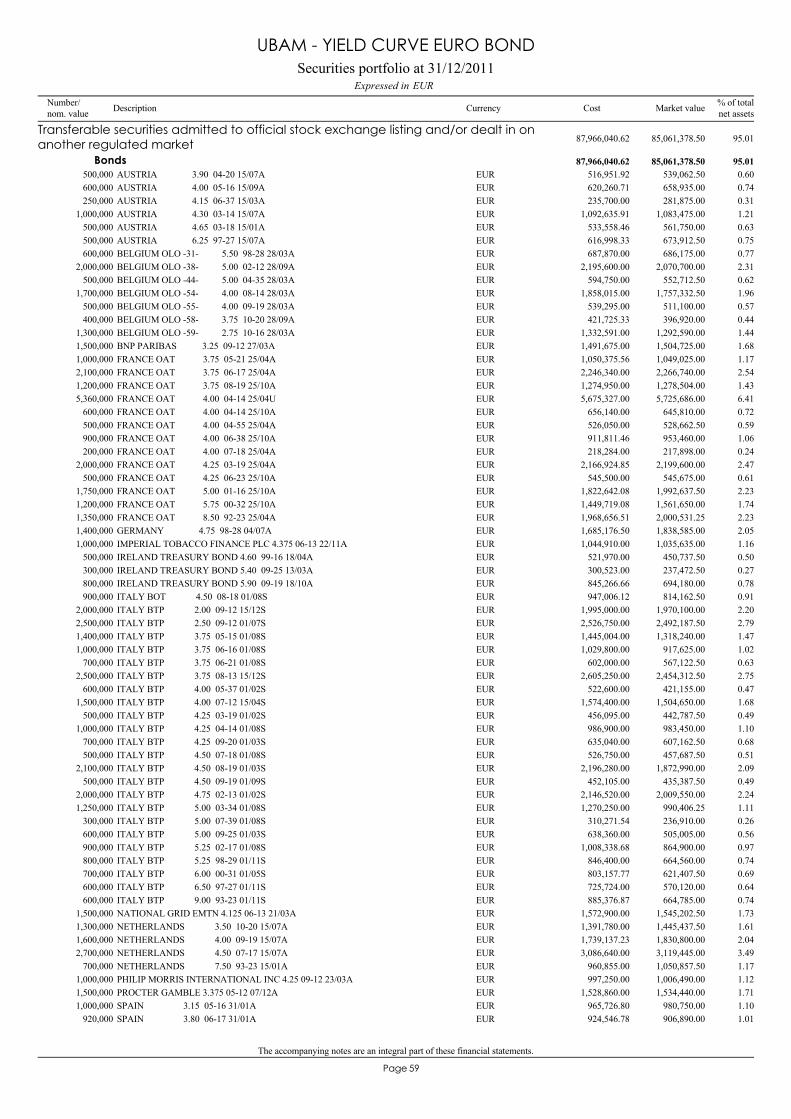
The accompanying notes are an integral part of these financial statements.
59Page
AUSTRIA 3.90 04-20 15/07A500,000 539,062.50 0.60EUR 516,951.92
Transferable securities admitted to official stock exchange listing and/or dealt in onanother regulated market 85,061,378.50 95.0187,966,040.62
Bonds 85,061,378.50 95.0187,966,040.62
AUSTRIA 4.00 05-16 15/09A600,000 658,935.00 0.74EUR 620,260.71AUSTRIA 4.15 06-37 15/03A250,000 281,875.00 0.31EUR 235,700.00AUSTRIA 4.30 03-14 15/07A1,000,000 1,083,475.00 1.21EUR 1,092,635.91AUSTRIA 4.65 03-18 15/01A500,000 561,750.00 0.63EUR 533,558.46AUSTRIA 6.25 97-27 15/07A500,000 673,912.50 0.75EUR 616,998.33BELGIUM OLO -31- 5.50 98-28 28/03A600,000 686,175.00 0.77EUR 687,870.00BELGIUM OLO -38- 5.00 02-12 28/09A2,000,000 2,070,700.00 2.31EUR 2,195,600.00BELGIUM OLO -44- 5.00 04-35 28/03A500,000 552,712.50 0.62EUR 594,750.00BELGIUM OLO -54- 4.00 08-14 28/03A1,700,000 1,757,332.50 1.96EUR 1,858,015.00BELGIUM OLO -55- 4.00 09-19 28/03A500,000 511,100.00 0.57EUR 539,295.00BELGIUM OLO -58- 3.75 10-20 28/09A400,000 396,920.00 0.44EUR 421,725.33BELGIUM OLO -59- 2.75 10-16 28/03A1,300,000 1,292,590.00 1.44EUR 1,332,591.00BNP PARIBAS 3.25 09-12 27/03A1,500,000 1,504,725.00 1.68EUR 1,491,675.00FRANCE OAT 3.75 05-21 25/04A1,000,000 1,049,025.00 1.17EUR 1,050,375.56FRANCE OAT 3.75 06-17 25/04A2,100,000 2,266,740.00 2.54EUR 2,246,340.00FRANCE OAT 3.75 08-19 25/10A1,200,000 1,278,504.00 1.43EUR 1,274,950.00FRANCE OAT 4.00 04-14 25/04U5,360,000 5,725,686.00 6.41EUR 5,675,327.00FRANCE OAT 4.00 04-14 25/10A600,000 645,810.00 0.72EUR 656,140.00FRANCE OAT 4.00 04-55 25/04A500,000 528,662.50 0.59EUR 526,050.00FRANCE OAT 4.00 06-38 25/10A900,000 953,460.00 1.06EUR 911,811.46FRANCE OAT 4.00 07-18 25/04A200,000 217,898.00 0.24EUR 218,284.00FRANCE OAT 4.25 03-19 25/04A2,000,000 2,199,600.00 2.47EUR 2,166,924.85FRANCE OAT 4.25 06-23 25/10A500,000 545,675.00 0.61EUR 545,500.00FRANCE OAT 5.00 01-16 25/10A1,750,000 1,992,637.50 2.23EUR 1,822,642.08FRANCE OAT 5.75 00-32 25/10A1,200,000 1,561,650.00 1.74EUR 1,449,719.08FRANCE OAT 8.50 92-23 25/04A1,350,000 2,000,531.25 2.23EUR 1,968,656.51GERMANY 4.75 98-28 04/07A1,400,000 1,838,585.00 2.05EUR 1,685,176.50IMPERIAL TOBACCO FINANCE PLC 4.375 06-13 22/11A1,000,000 1,035,635.00 1.16EUR 1,044,910.00IRELAND TREASURY BOND 4.60 99-16 18/04A500,000 450,737.50 0.50EUR 521,970.00IRELAND TREASURY BOND 5.40 09-25 13/03A300,000 237,472.50 0.27EUR 300,523.00IRELAND TREASURY BOND 5.90 09-19 18/10A800,000 694,180.00 0.78EUR 845,266.66ITALY BOT 4.50 08-18 01/08S900,000 814,162.50 0.91EUR 947,006.12ITALY BTP 2.00 09-12 15/12S2,000,000 1,970,100.00 2.20EUR 1,995,000.00ITALY BTP 2.50 09-12 01/07S2,500,000 2,492,187.50 2.79EUR 2,526,750.00ITALY BTP 3.75 05-15 01/08S1,400,000 1,318,240.00 1.47EUR 1,445,004.00ITALY BTP 3.75 06-16 01/08S1,000,000 917,625.00 1.02EUR 1,029,800.00ITALY BTP 3.75 06-21 01/08S700,000 567,122.50 0.63EUR 602,000.00ITALY BTP 3.75 08-13 15/12S2,500,000 2,454,312.50 2.75EUR 2,605,250.00ITALY BTP 4.00 05-37 01/02S600,000 421,155.00 0.47EUR 522,600.00ITALY BTP 4.00 07-12 15/04S1,500,000 1,504,650.00 1.68EUR 1,574,400.00ITALY BTP 4.25 03-19 01/02S500,000 442,787.50 0.49EUR 456,095.00ITALY BTP 4.25 04-14 01/08S1,000,000 983,450.00 1.10EUR 986,900.00ITALY BTP 4.25 09-20 01/03S700,000 607,162.50 0.68EUR 635,040.00ITALY BTP 4.50 07-18 01/08S500,000 457,687.50 0.51EUR 526,750.00ITALY BTP 4.50 08-19 01/03S2,100,000 1,872,990.00 2.09EUR 2,196,280.00ITALY BTP 4.50 09-19 01/09S500,000 435,387.50 0.49EUR 452,105.00ITALY BTP 4.75 02-13 01/02S2,000,000 2,009,550.00 2.24EUR 2,146,520.00ITALY BTP 5.00 03-34 01/08S1,250,000 990,406.25 1.11EUR 1,270,250.00ITALY BTP 5.00 07-39 01/08S300,000 236,910.00 0.26EUR 310,271.54ITALY BTP 5.00 09-25 01/03S600,000 505,005.00 0.56EUR 638,360.00ITALY BTP 5.25 02-17 01/08S900,000 864,900.00 0.97EUR 1,008,338.68ITALY BTP 5.25 98-29 01/11S800,000 664,560.00 0.74EUR 846,400.00ITALY BTP 6.00 00-31 01/05S700,000 621,407.50 0.69EUR 803,157.77ITALY BTP 6.50 97-27 01/11S600,000 570,120.00 0.64EUR 725,724.00ITALY BTP 9.00 93-23 01/11S600,000 664,785.00 0.74EUR 885,376.87NATIONAL GRID EMTN 4.125 06-13 21/03A1,500,000 1,545,202.50 1.73EUR 1,572,900.00NETHERLANDS 3.50 10-20 15/07A1,300,000 1,445,437.50 1.61EUR 1,391,780.00NETHERLANDS 4.00 09-19 15/07A1,600,000 1,830,800.00 2.04EUR 1,739,137.23NETHERLANDS 4.50 07-17 15/07A2,700,000 3,119,445.00 3.49EUR 3,086,640.00NETHERLANDS 7.50 93-23 15/01A700,000 1,050,857.50 1.17EUR 960,855.00PHILIP MORRIS INTERNATIONAL INC 4.25 09-12 23/03A1,000,000 1,006,490.00 1.12EUR 997,250.00PROCTER GAMBLE 3.375 05-12 07/12A1,500,000 1,534,440.00 1.71EUR 1,528,860.00SPAIN 3.15 05-16 31/01A1,000,000 980,750.00 1.10EUR 965,726.80SPAIN 3.80 06-17 31/01A920,000 906,890.00 1.01EUR 924,546.78
Securities portfolio at 31/12/2011EURExpressed in
UBAM - YIELD CURVE EURO BOND
Number/nom. value Description Currency % of total
net assetsMarket valueCost
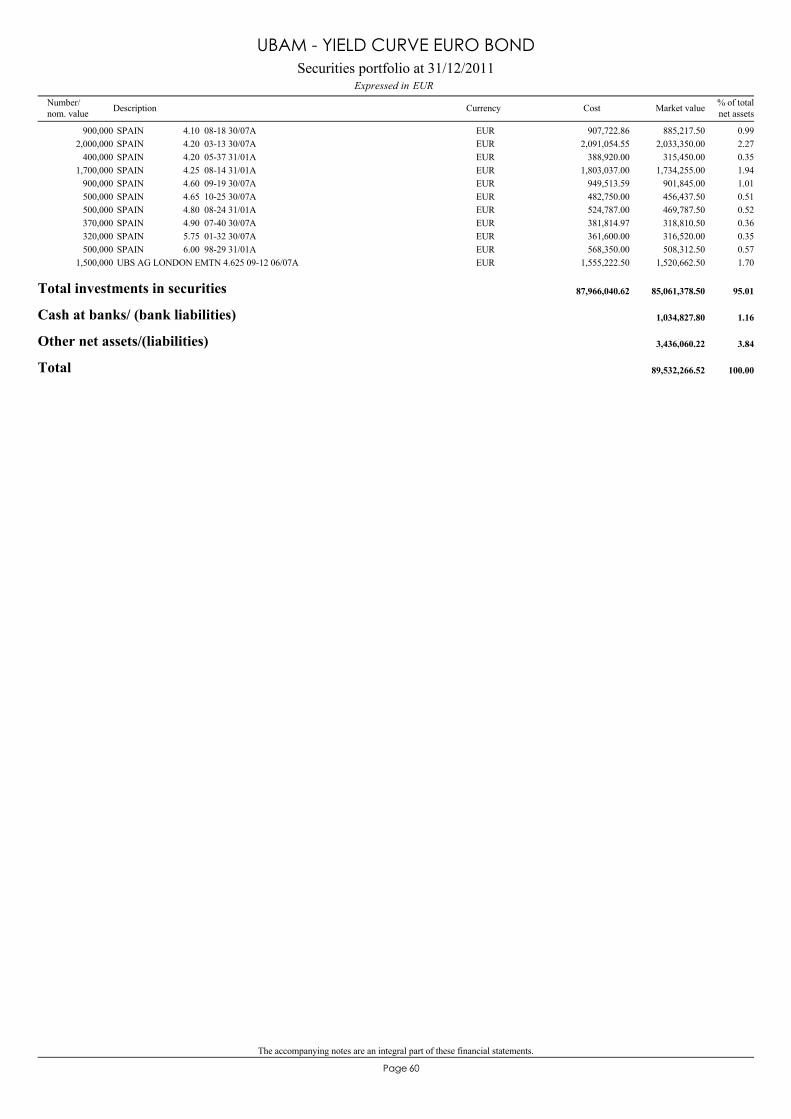
The accompanying notes are an integral part of these financial statements.
60Page
SPAIN 4.10 08-18 30/07A900,000 885,217.50 0.99EUR 907,722.86SPAIN 4.20 03-13 30/07A2,000,000 2,033,350.00 2.27EUR 2,091,054.55SPAIN 4.20 05-37 31/01A400,000 315,450.00 0.35EUR 388,920.00SPAIN 4.25 08-14 31/01A1,700,000 1,734,255.00 1.94EUR 1,803,037.00SPAIN 4.60 09-19 30/07A900,000 901,845.00 1.01EUR 949,513.59SPAIN 4.65 10-25 30/07A500,000 456,437.50 0.51EUR 482,750.00SPAIN 4.80 08-24 31/01A500,000 469,787.50 0.52EUR 524,787.00SPAIN 4.90 07-40 30/07A370,000 318,810.50 0.36EUR 381,814.97SPAIN 5.75 01-32 30/07A320,000 316,520.00 0.35EUR 361,600.00SPAIN 6.00 98-29 31/01A500,000 508,312.50 0.57EUR 568,350.00UBS AG LONDON EMTN 4.625 09-12 06/07A1,500,000 1,520,662.50 1.70EUR 1,555,222.50
Total investments in securities 85,061,378.50 95.0187,966,040.62
Cash at banks/ (bank liabilities) 1,034,827.80 1.16
Other net assets/(liabilities) 3,436,060.22 3.84
Total 89,532,266.52 100.00
Securities portfolio at 31/12/2011EURExpressed in
UBAM - YIELD CURVE EURO BOND
Number/nom. value Description Currency % of total
net assetsMarket valueCost
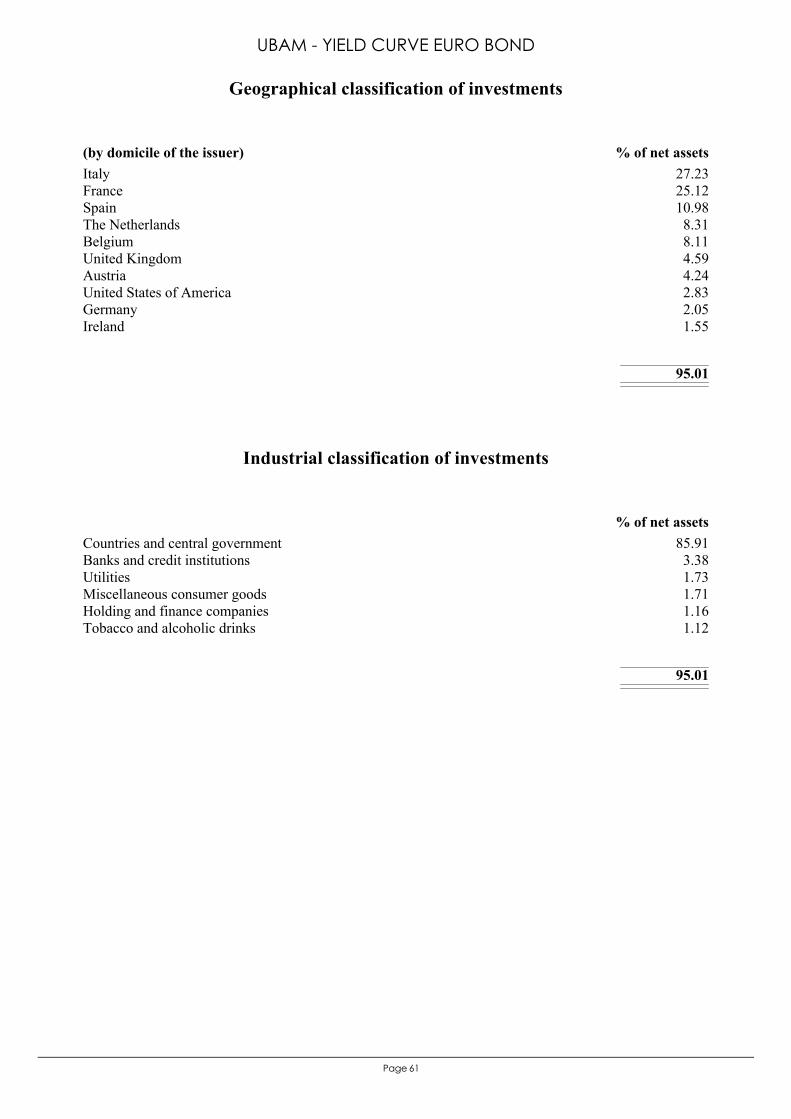
61Page
Italy 27.23France 25.12Spain 10.98The Netherlands 8.31Belgium 8.11United Kingdom 4.59Austria 4.24United States of America 2.83Germany 2.05Ireland 1.55
95.01
(by domicile of the issuer) % of net assets
Geographical classification of investments
UBAM - YIELD CURVE EURO BOND
Countries and central government 85.91Banks and credit institutions 3.38Utilities 1.73Miscellaneous consumer goods 1.71Holding and finance companies 1.16Tobacco and alcoholic drinks 1.12
95.01
% of net assets
Industrial classification of investments
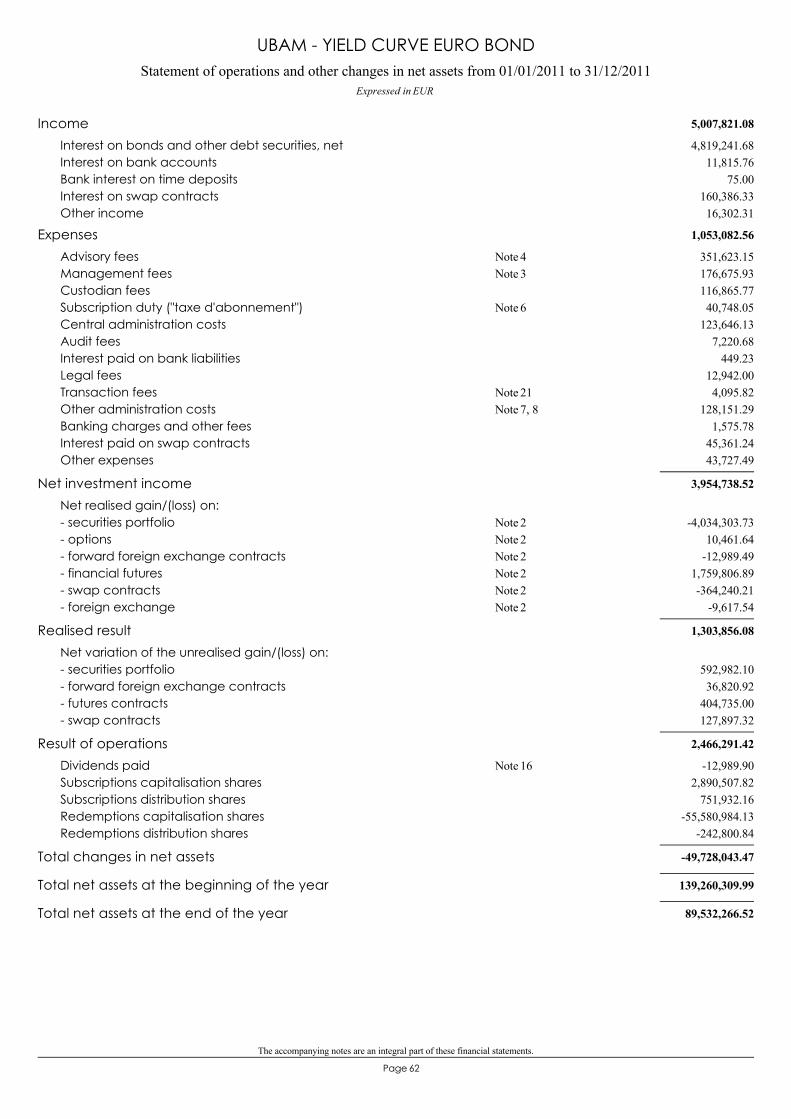
The accompanying notes are an integral part of these financial statements.
62Page
Statement of operations and other changes in net assets from 01/01/2011 to 31/12/2011Expressed in EUR
UBAM - YIELD CURVE EURO BOND
5,007,821.08Income4,819,241.68Interest on bonds and other debt securities, net
11,815.76Interest on bank accounts75.00Bank interest on time deposits
160,386.33Interest on swap contracts16,302.31Other income
1,053,082.56Expenses351,623.15Advisory fees 4Note176,675.93Management fees 3Note116,865.77Custodian fees40,748.05Subscription duty ("taxe d'abonnement") 6Note
123,646.13Central administration costs7,220.68Audit fees
449.23Interest paid on bank liabilities12,942.00Legal fees4,095.82Transaction fees 21Note
128,151.29Other administration costs 7, 8Note1,575.78Banking charges and other fees
45,361.24Interest paid on swap contracts43,727.49Other expenses
3,954,738.52Net investment incomeNet realised gain/(loss) on:
-4,034,303.73- securities portfolio 2Note10,461.64- options 2Note
-12,989.49- forward foreign exchange contracts 2Note1,759,806.89- financial futures 2Note-364,240.21- swap contracts 2Note
-9,617.54- foreign exchange 2Note
1,303,856.08Realised resultNet variation of the unrealised gain/(loss) on:
592,982.10- securities portfolio36,820.92- forward foreign exchange contracts
404,735.00- futures contracts127,897.32- swap contracts
2,466,291.42Result of operations-12,989.90Dividends paid 16Note
2,890,507.82Subscriptions capitalisation shares751,932.16Subscriptions distribution shares
-55,580,984.13Redemptions capitalisation shares-242,800.84Redemptions distribution shares
-49,728,043.47Total changes in net assets
139,260,309.99Total net assets at the beginning of the year
89,532,266.52Total net assets at the end of the year
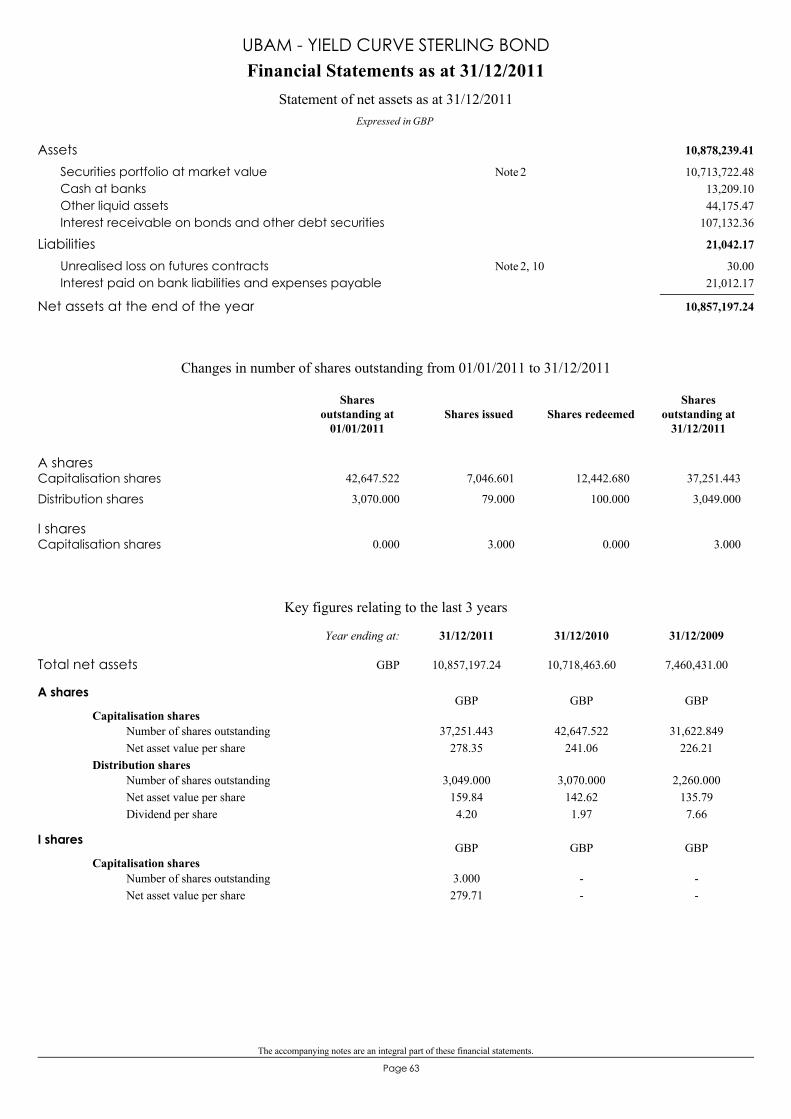
The accompanying notes are an integral part of these financial statements.
63Page
10,878,239.41Assets10,713,722.48Securities portfolio at market value 2Note
13,209.10Cash at banks44,175.47Other liquid assets
107,132.36Interest receivable on bonds and other debt securities
21,042.17Liabilities30.00Unrealised loss on futures contracts 2, 10Note
21,012.17Interest paid on bank liabilities and expenses payable
10,857,197.24Net assets at the end of the year
Financial Statements as at 31/12/2011
Expressed in GBP
Statement of net assets as at 31/12/2011
UBAM - YIELD CURVE STERLING BOND
A sharesCapitalisation shares 42,647.522 7,046.601 12,442.680 37,251.443
Distribution shares 3,070.000 79.000 100.000 3,049.000
I sharesCapitalisation shares 0.000 3.000 0.000 3.000
Changes in number of shares outstanding from 01/01/2011 to 31/12/2011
Shares issued Shares redeemedShares
outstanding at31/12/2011
Sharesoutstanding at
01/01/2011
Key figures relating to the last 3 years
A shares
Capitalisation shares37,251.443
278.3542,647.522
241.0631,622.849
226.21Number of shares outstandingNet asset value per share
Distribution shares3,049.000
159.844.20
3,070.000142.621.97
2,260.000135.797.66
Number of shares outstandingNet asset value per shareDividend per share
GBP GBP GBP
I shares
Capitalisation shares3.000279.71
--
--
Number of shares outstandingNet asset value per share
GBP GBP GBP
Total net assets 10,857,197.24 10,718,463.60 7,460,431.00
31/12/200931/12/201031/12/2011Year ending at:
GBP
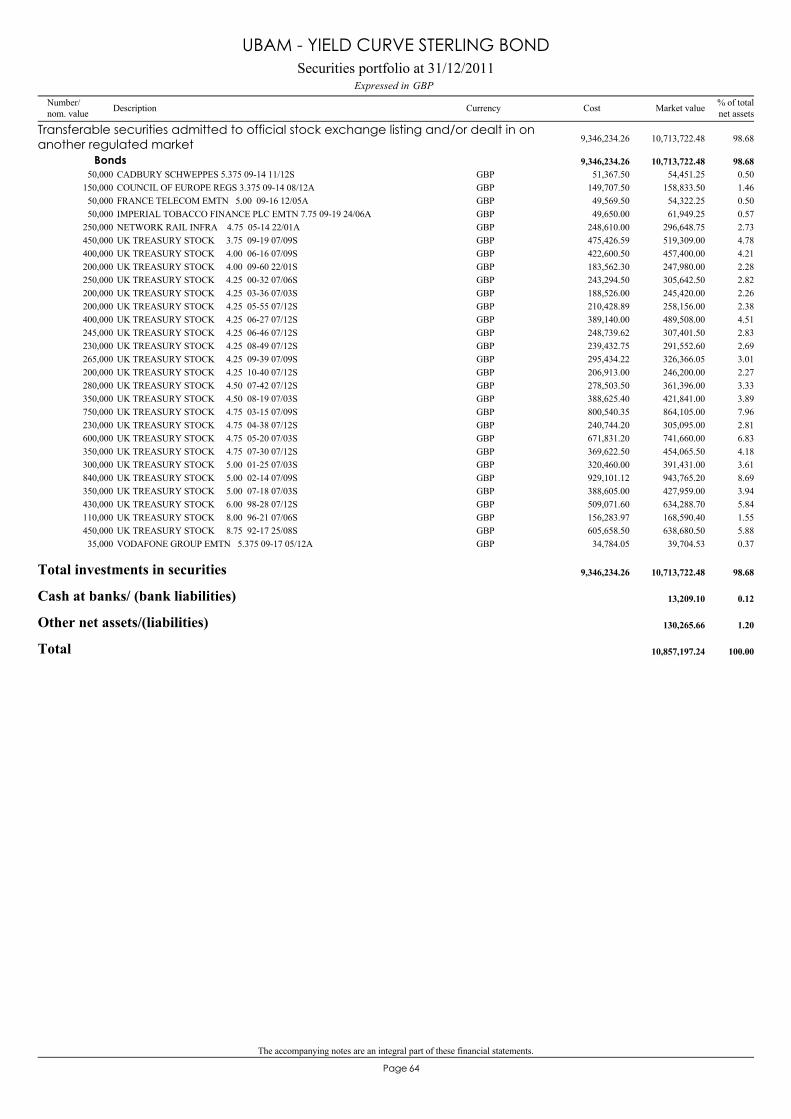
The accompanying notes are an integral part of these financial statements.
64Page
CADBURY SCHWEPPES 5.375 09-14 11/12S50,000 54,451.25 0.50GBP 51,367.50
Transferable securities admitted to official stock exchange listing and/or dealt in onanother regulated market 10,713,722.48 98.689,346,234.26
Bonds 10,713,722.48 98.689,346,234.26
COUNCIL OF EUROPE REGS 3.375 09-14 08/12A150,000 158,833.50 1.46GBP 149,707.50FRANCE TELECOM EMTN 5.00 09-16 12/05A50,000 54,322.25 0.50GBP 49,569.50IMPERIAL TOBACCO FINANCE PLC EMTN 7.75 09-19 24/06A50,000 61,949.25 0.57GBP 49,650.00NETWORK RAIL INFRA 4.75 05-14 22/01A250,000 296,648.75 2.73GBP 248,610.00UK TREASURY STOCK 3.75 09-19 07/09S450,000 519,309.00 4.78GBP 475,426.59UK TREASURY STOCK 4.00 06-16 07/09S400,000 457,400.00 4.21GBP 422,600.50UK TREASURY STOCK 4.00 09-60 22/01S200,000 247,980.00 2.28GBP 183,562.30UK TREASURY STOCK 4.25 00-32 07/06S250,000 305,642.50 2.82GBP 243,294.50UK TREASURY STOCK 4.25 03-36 07/03S200,000 245,420.00 2.26GBP 188,526.00UK TREASURY STOCK 4.25 05-55 07/12S200,000 258,156.00 2.38GBP 210,428.89UK TREASURY STOCK 4.25 06-27 07/12S400,000 489,508.00 4.51GBP 389,140.00UK TREASURY STOCK 4.25 06-46 07/12S245,000 307,401.50 2.83GBP 248,739.62UK TREASURY STOCK 4.25 08-49 07/12S230,000 291,552.60 2.69GBP 239,432.75UK TREASURY STOCK 4.25 09-39 07/09S265,000 326,366.05 3.01GBP 295,434.22UK TREASURY STOCK 4.25 10-40 07/12S200,000 246,200.00 2.27GBP 206,913.00UK TREASURY STOCK 4.50 07-42 07/12S280,000 361,396.00 3.33GBP 278,503.50UK TREASURY STOCK 4.50 08-19 07/03S350,000 421,841.00 3.89GBP 388,625.40UK TREASURY STOCK 4.75 03-15 07/09S750,000 864,105.00 7.96GBP 800,540.35UK TREASURY STOCK 4.75 04-38 07/12S230,000 305,095.00 2.81GBP 240,744.20UK TREASURY STOCK 4.75 05-20 07/03S600,000 741,660.00 6.83GBP 671,831.20UK TREASURY STOCK 4.75 07-30 07/12S350,000 454,065.50 4.18GBP 369,622.50UK TREASURY STOCK 5.00 01-25 07/03S300,000 391,431.00 3.61GBP 320,460.00UK TREASURY STOCK 5.00 02-14 07/09S840,000 943,765.20 8.69GBP 929,101.12UK TREASURY STOCK 5.00 07-18 07/03S350,000 427,959.00 3.94GBP 388,605.00UK TREASURY STOCK 6.00 98-28 07/12S430,000 634,288.70 5.84GBP 509,071.60UK TREASURY STOCK 8.00 96-21 07/06S110,000 168,590.40 1.55GBP 156,283.97UK TREASURY STOCK 8.75 92-17 25/08S450,000 638,680.50 5.88GBP 605,658.50VODAFONE GROUP EMTN 5.375 09-17 05/12A35,000 39,704.53 0.37GBP 34,784.05
Total investments in securities 10,713,722.48 98.689,346,234.26
Cash at banks/ (bank liabilities) 13,209.10 0.12
Other net assets/(liabilities) 130,265.66 1.20
Total 10,857,197.24 100.00
Securities portfolio at 31/12/2011GBPExpressed in
UBAM - YIELD CURVE STERLING BOND
Number/nom. value Description Currency % of total
net assetsMarket valueCost
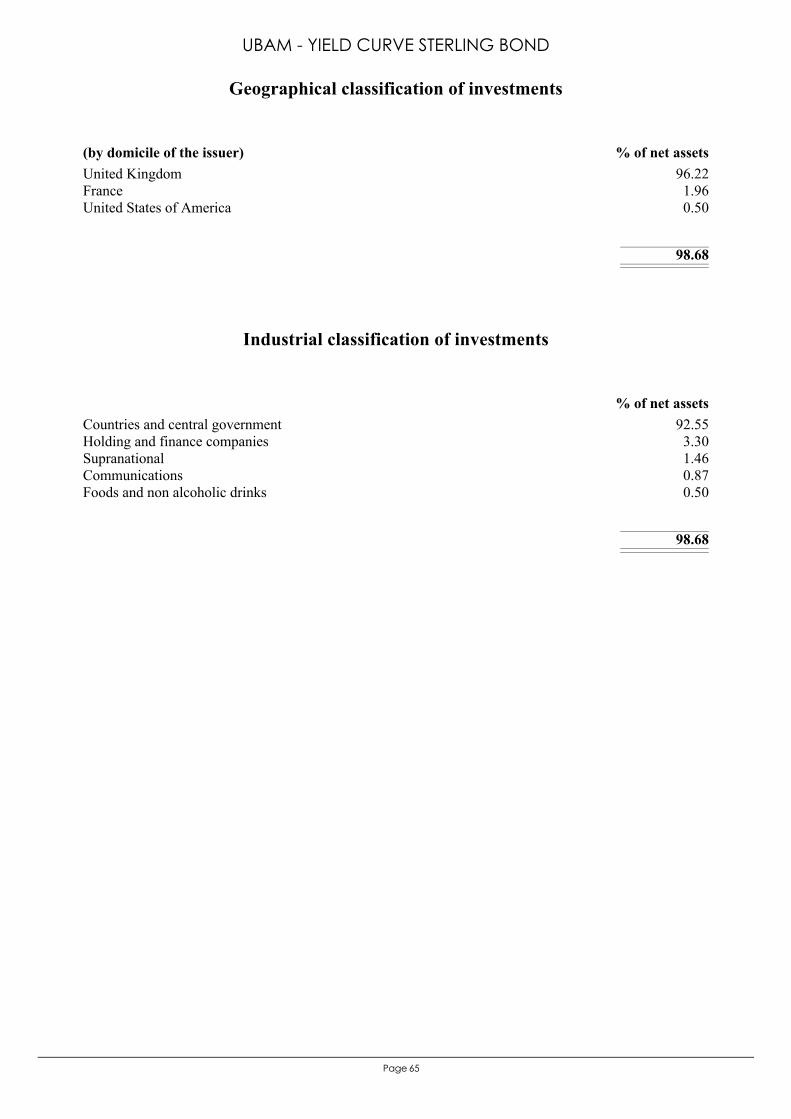
65Page
United Kingdom 96.22France 1.96United States of America 0.50
98.68
(by domicile of the issuer) % of net assets
Geographical classification of investments
UBAM - YIELD CURVE STERLING BOND
Countries and central government 92.55Holding and finance companies 3.30Supranational 1.46Communications 0.87Foods and non alcoholic drinks 0.50
98.68
% of net assets
Industrial classification of investments
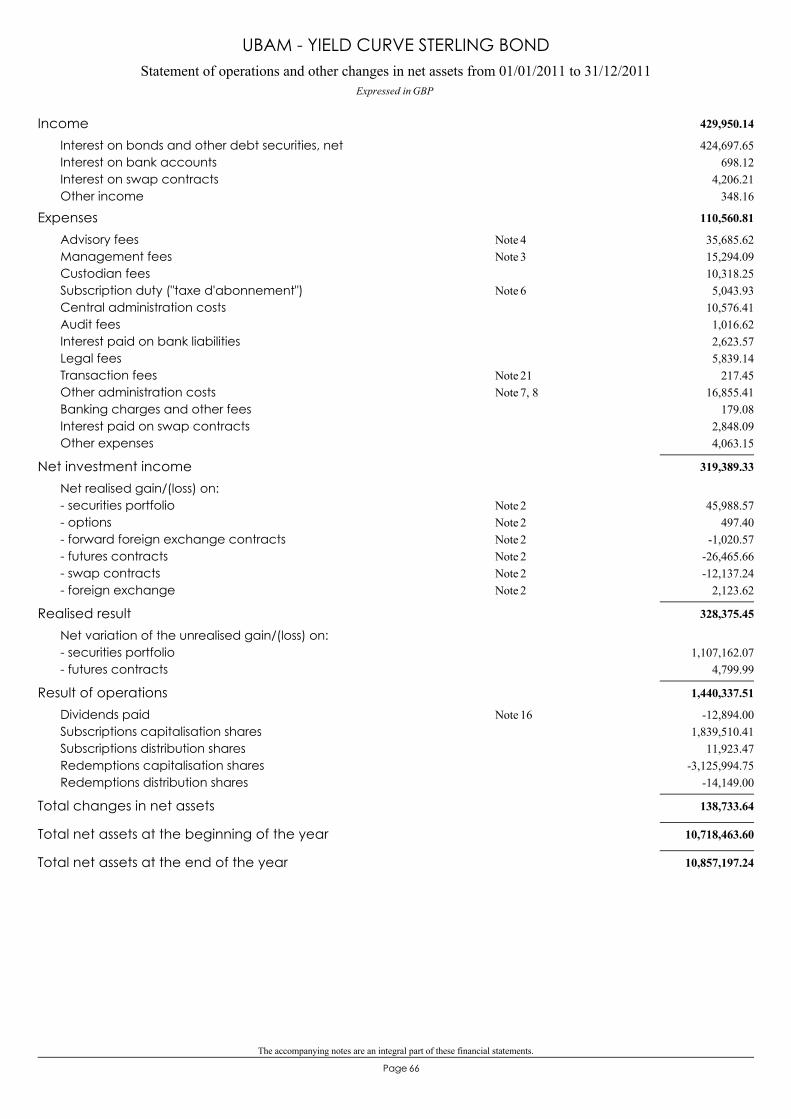
The accompanying notes are an integral part of these financial statements.
66Page
Statement of operations and other changes in net assets from 01/01/2011 to 31/12/2011Expressed in GBP
UBAM - YIELD CURVE STERLING BOND
429,950.14Income424,697.65Interest on bonds and other debt securities, net
698.12Interest on bank accounts4,206.21Interest on swap contracts
348.16Other income
110,560.81Expenses35,685.62Advisory fees 4Note15,294.09Management fees 3Note10,318.25Custodian fees5,043.93Subscription duty ("taxe d'abonnement") 6Note
10,576.41Central administration costs1,016.62Audit fees2,623.57Interest paid on bank liabilities5,839.14Legal fees
217.45Transaction fees 21Note16,855.41Other administration costs 7, 8Note
179.08Banking charges and other fees2,848.09Interest paid on swap contracts4,063.15Other expenses
319,389.33Net investment incomeNet realised gain/(loss) on:
45,988.57- securities portfolio 2Note497.40- options 2Note
-1,020.57- forward foreign exchange contracts 2Note-26,465.66- futures contracts 2Note-12,137.24- swap contracts 2Note
2,123.62- foreign exchange 2Note
328,375.45Realised resultNet variation of the unrealised gain/(loss) on:
1,107,162.07- securities portfolio4,799.99- futures contracts
1,440,337.51Result of operations-12,894.00Dividends paid 16Note
1,839,510.41Subscriptions capitalisation shares11,923.47Subscriptions distribution shares
-3,125,994.75Redemptions capitalisation shares-14,149.00Redemptions distribution shares
138,733.64Total changes in net assets
10,718,463.60Total net assets at the beginning of the year
10,857,197.24Total net assets at the end of the year
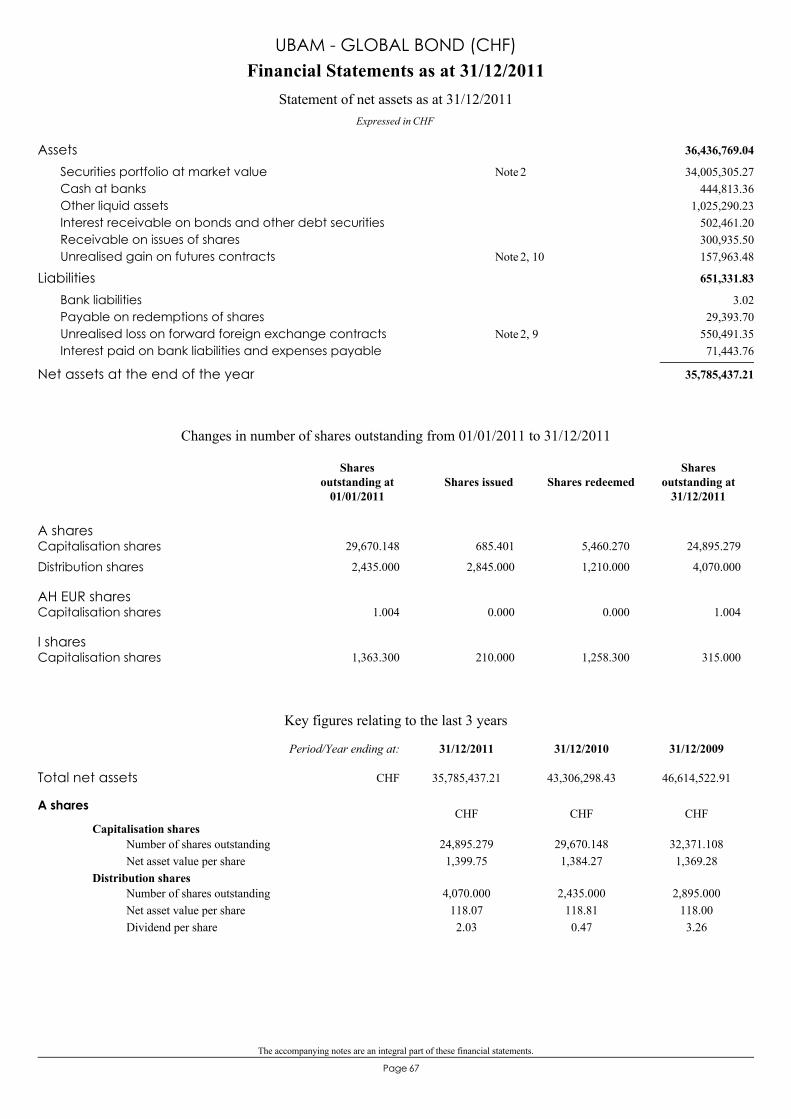
The accompanying notes are an integral part of these financial statements.
67Page
36,436,769.04Assets34,005,305.27Securities portfolio at market value 2Note
444,813.36Cash at banks1,025,290.23Other liquid assets
502,461.20Interest receivable on bonds and other debt securities300,935.50Receivable on issues of shares157,963.48Unrealised gain on futures contracts 2, 10Note
651,331.83Liabilities3.02Bank liabilities
29,393.70Payable on redemptions of shares550,491.35Unrealised loss on forward foreign exchange contracts 2, 9Note71,443.76Interest paid on bank liabilities and expenses payable
35,785,437.21Net assets at the end of the year
Financial Statements as at 31/12/2011
Expressed in CHF
Statement of net assets as at 31/12/2011
UBAM - GLOBAL BOND (CHF)
A sharesCapitalisation shares 29,670.148 685.401 5,460.270 24,895.279
Distribution shares 2,435.000 2,845.000 1,210.000 4,070.000
AH EUR sharesCapitalisation shares 1.004 0.000 0.000 1.004
I sharesCapitalisation shares 1,363.300 210.000 1,258.300 315.000
Changes in number of shares outstanding from 01/01/2011 to 31/12/2011
Shares issued Shares redeemedShares
outstanding at31/12/2011
Sharesoutstanding at
01/01/2011
Key figures relating to the last 3 years
A shares
Capitalisation shares24,895.2791,399.75
29,670.1481,384.27
32,371.1081,369.28
Number of shares outstandingNet asset value per share
Distribution shares4,070.000
118.072.03
2,435.000118.810.47
2,895.000118.003.26
Number of shares outstandingNet asset value per shareDividend per share
CHF CHF CHF
Total net assets 35,785,437.21 43,306,298.43 46,614,522.91
31/12/200931/12/201031/12/2011Period/Year ending at:
CHF
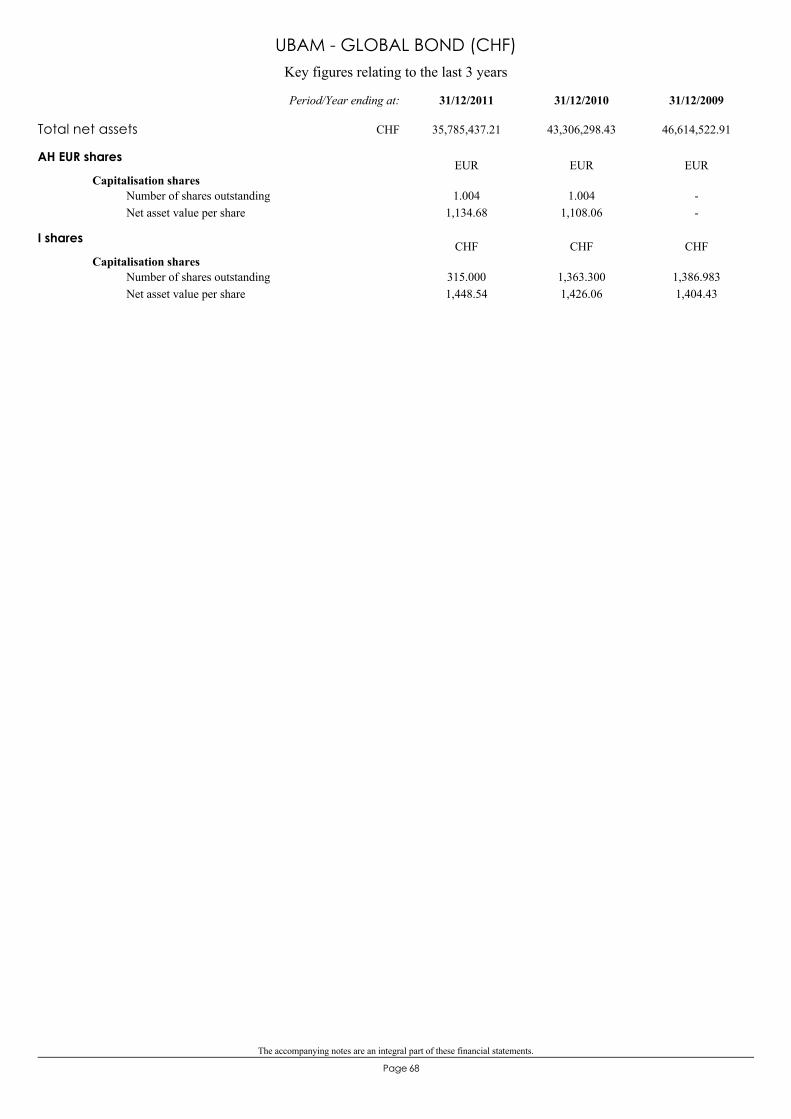
The accompanying notes are an integral part of these financial statements.
68Page
Key figures relating to the last 3 years
UBAM - GLOBAL BOND (CHF)
AH EUR shares
Capitalisation shares1.004
1,134.681.004
1,108.06--
Number of shares outstandingNet asset value per share
EUR EUR EUR
I shares
Capitalisation shares315.0001,448.54
1,363.3001,426.06
1,386.9831,404.43
Number of shares outstandingNet asset value per share
CHF CHF CHF
Total net assets 35,785,437.21 43,306,298.43 46,614,522.91
31/12/200931/12/201031/12/2011Period/Year ending at:
CHF
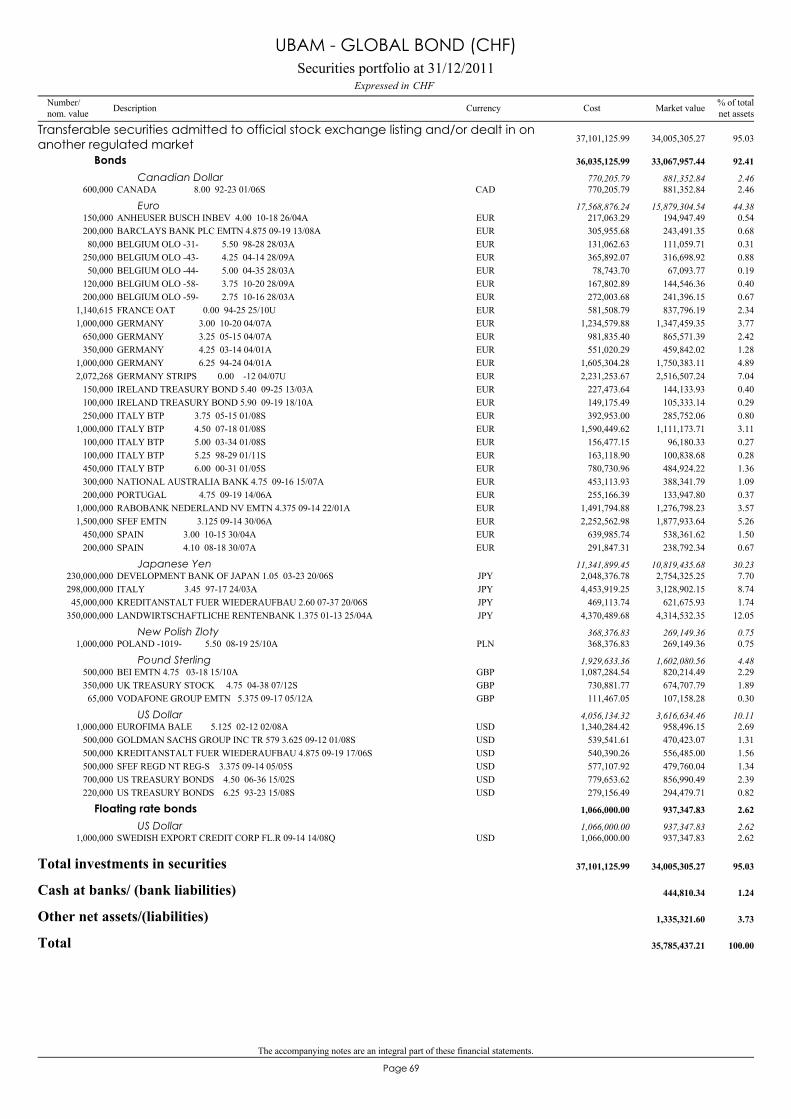
The accompanying notes are an integral part of these financial statements.
69Page
CANADA 8.00 92-23 01/06S600,000 881,352.84 2.46CAD 770,205.79
Transferable securities admitted to official stock exchange listing and/or dealt in onanother regulated market 34,005,305.27 95.0337,101,125.99
Bonds 33,067,957.44 92.4136,035,125.99
Canadian Dollar 881,352.84 2.46770,205.79
ANHEUSER BUSCH INBEV 4.00 10-18 26/04A150,000 194,947.49 0.54EUR 217,063.29Euro 15,879,304.54 44.3817,568,876.24
BARCLAYS BANK PLC EMTN 4.875 09-19 13/08A200,000 243,491.35 0.68EUR 305,955.68BELGIUM OLO -31- 5.50 98-28 28/03A80,000 111,059.71 0.31EUR 131,062.63BELGIUM OLO -43- 4.25 04-14 28/09A250,000 316,698.92 0.88EUR 365,892.07BELGIUM OLO -44- 5.00 04-35 28/03A50,000 67,093.77 0.19EUR 78,743.70BELGIUM OLO -58- 3.75 10-20 28/09A120,000 144,546.36 0.40EUR 167,802.89BELGIUM OLO -59- 2.75 10-16 28/03A200,000 241,396.15 0.67EUR 272,003.68FRANCE OAT 0.00 94-25 25/10U1,140,615 837,796.19 2.34EUR 581,508.79GERMANY 3.00 10-20 04/07A1,000,000 1,347,459.35 3.77EUR 1,234,579.88GERMANY 3.25 05-15 04/07A650,000 865,571.39 2.42EUR 981,835.40GERMANY 4.25 03-14 04/01A350,000 459,842.02 1.28EUR 551,020.29GERMANY 6.25 94-24 04/01A1,000,000 1,750,383.11 4.89EUR 1,605,304.28GERMANY STRIPS 0.00 -12 04/07U2,072,268 2,516,507.24 7.04EUR 2,231,253.67IRELAND TREASURY BOND 5.40 09-25 13/03A150,000 144,133.93 0.40EUR 227,473.64IRELAND TREASURY BOND 5.90 09-19 18/10A100,000 105,333.14 0.29EUR 149,175.49ITALY BTP 3.75 05-15 01/08S250,000 285,752.06 0.80EUR 392,953.00ITALY BTP 4.50 07-18 01/08S1,000,000 1,111,173.71 3.11EUR 1,590,449.62ITALY BTP 5.00 03-34 01/08S100,000 96,180.33 0.27EUR 156,477.15ITALY BTP 5.25 98-29 01/11S100,000 100,838.68 0.28EUR 163,118.90ITALY BTP 6.00 00-31 01/05S450,000 484,924.22 1.36EUR 780,730.96NATIONAL AUSTRALIA BANK 4.75 09-16 15/07A300,000 388,341.79 1.09EUR 453,113.93PORTUGAL 4.75 09-19 14/06A200,000 133,947.80 0.37EUR 255,166.39RABOBANK NEDERLAND NV EMTN 4.375 09-14 22/01A1,000,000 1,276,798.23 3.57EUR 1,491,794.88SFEF EMTN 3.125 09-14 30/06A1,500,000 1,877,933.64 5.26EUR 2,252,562.98SPAIN 3.00 10-15 30/04A450,000 538,361.62 1.50EUR 639,985.74SPAIN 4.10 08-18 30/07A200,000 238,792.34 0.67EUR 291,847.31
DEVELOPMENT BANK OF JAPAN 1.05 03-23 20/06S230,000,000 2,754,325.25 7.70JPY 2,048,376.78Japanese Yen 10,819,435.68 30.2311,341,899.45
ITALY 3.45 97-17 24/03A298,000,000 3,128,902.15 8.74JPY 4,453,919.25KREDITANSTALT FUER WIEDERAUFBAU 2.60 07-37 20/06S45,000,000 621,675.93 1.74JPY 469,113.74LANDWIRTSCHAFTLICHE RENTENBANK 1.375 01-13 25/04A350,000,000 4,314,532.35 12.05JPY 4,370,489.68
POLAND -1019- 5.50 08-19 25/10A1,000,000 269,149.36 0.75PLN 368,376.83New Polish Zloty 269,149.36 0.75368,376.83
BEI EMTN 4.75 03-18 15/10A500,000 820,214.49 2.29GBP 1,087,284.54Pound Sterling 1,602,080.56 4.481,929,633.36
UK TREASURY STOCK 4.75 04-38 07/12S350,000 674,707.79 1.89GBP 730,881.77VODAFONE GROUP EMTN 5.375 09-17 05/12A65,000 107,158.28 0.30GBP 111,467.05
EUROFIMA BALE 5.125 02-12 02/08A1,000,000 958,496.15 2.69USD 1,340,284.42US Dollar 3,616,634.46 10.114,056,134.32
GOLDMAN SACHS GROUP INC TR 579 3.625 09-12 01/08S500,000 470,423.07 1.31USD 539,541.61KREDITANSTALT FUER WIEDERAUFBAU 4.875 09-19 17/06S500,000 556,485.00 1.56USD 540,390.26SFEF REGD NT REG-S 3.375 09-14 05/05S500,000 479,760.04 1.34USD 577,107.92US TREASURY BONDS 4.50 06-36 15/02S700,000 856,990.49 2.39USD 779,653.62US TREASURY BONDS 6.25 93-23 15/08S220,000 294,479.71 0.82USD 279,156.49
SWEDISH EXPORT CREDIT CORP FL.R 09-14 14/08Q1,000,000 937,347.83 2.62USD 1,066,000.00
Floating rate bonds 937,347.83 2.621,066,000.00
US Dollar 937,347.83 2.621,066,000.00
Total investments in securities 34,005,305.27 95.0337,101,125.99
Cash at banks/ (bank liabilities) 444,810.34 1.24
Other net assets/(liabilities) 1,335,321.60 3.73
Total 35,785,437.21 100.00
Securities portfolio at 31/12/2011CHFExpressed in
UBAM - GLOBAL BOND (CHF)
Number/nom. value Description Currency % of total
net assetsMarket valueCost
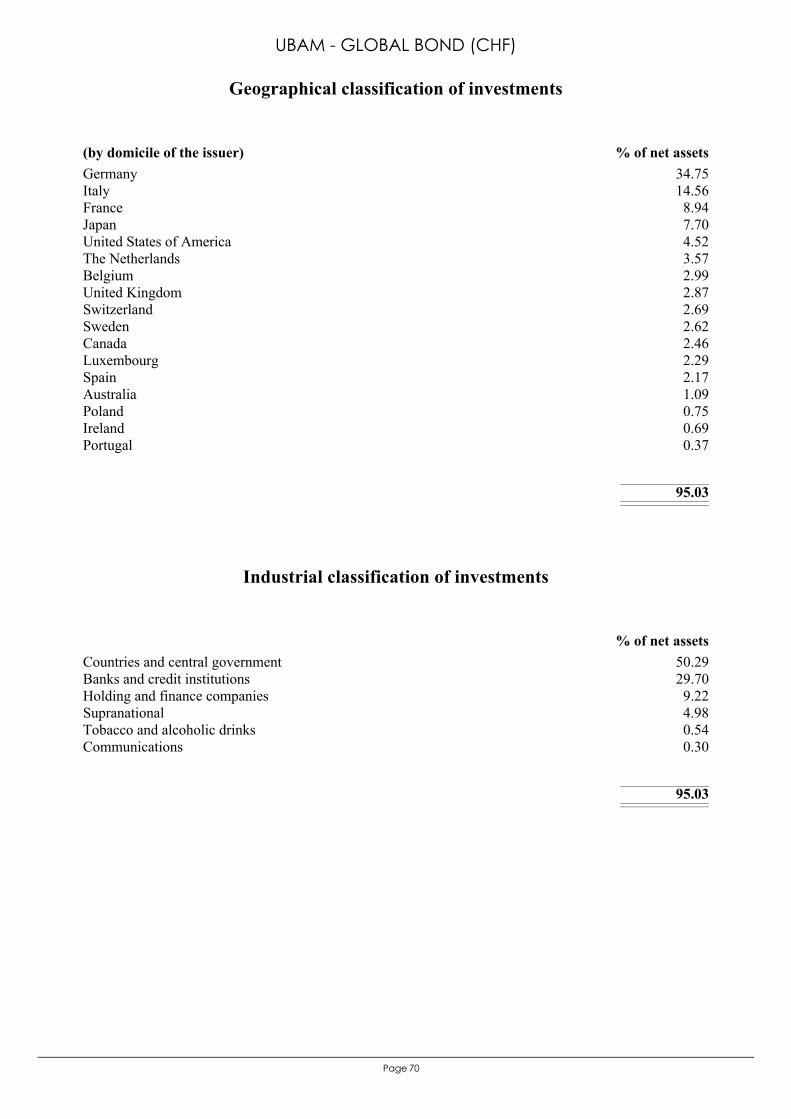
70Page
Germany 34.75Italy 14.56France 8.94Japan 7.70United States of America 4.52The Netherlands 3.57Belgium 2.99United Kingdom 2.87Switzerland 2.69Sweden 2.62Canada 2.46Luxembourg 2.29Spain 2.17Australia 1.09Poland 0.75Ireland 0.69Portugal 0.37
95.03
(by domicile of the issuer) % of net assets
Geographical classification of investments
UBAM - GLOBAL BOND (CHF)
Countries and central government 50.29Banks and credit institutions 29.70Holding and finance companies 9.22Supranational 4.98Tobacco and alcoholic drinks 0.54Communications 0.30
95.03
% of net assets
Industrial classification of investments
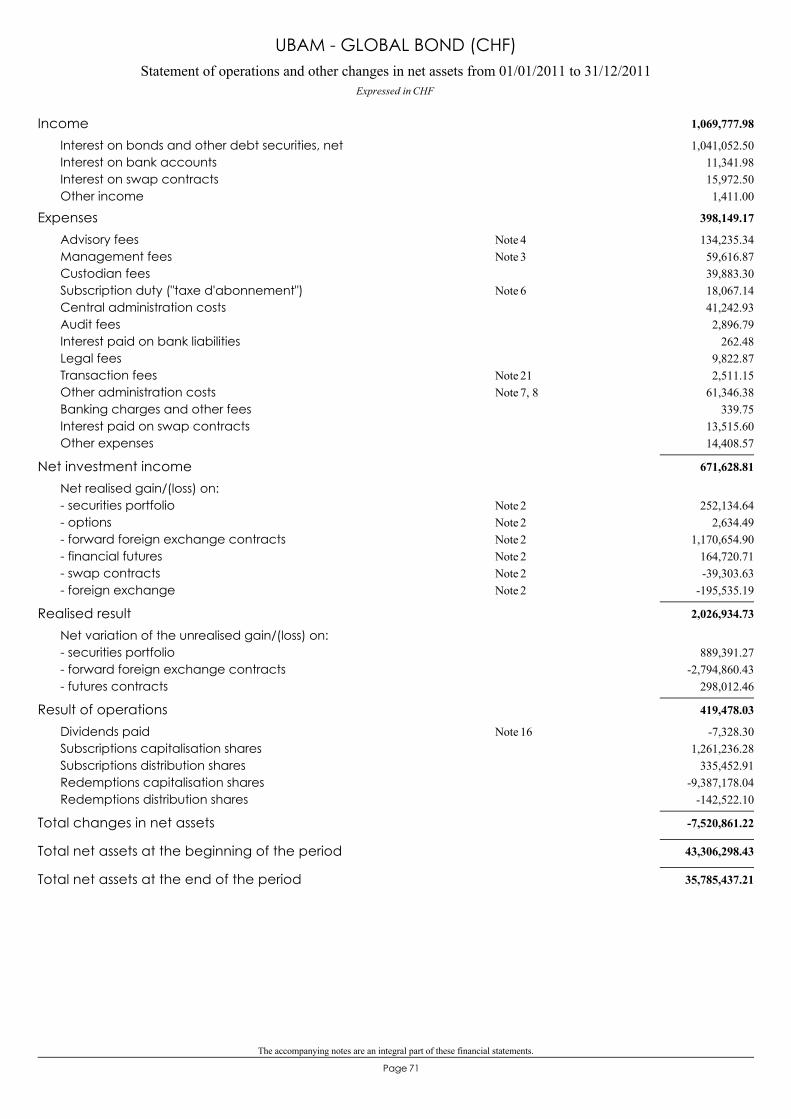
The accompanying notes are an integral part of these financial statements.
71Page
Statement of operations and other changes in net assets from 01/01/2011 to 31/12/2011Expressed in CHF
UBAM - GLOBAL BOND (CHF)
1,069,777.98Income1,041,052.50Interest on bonds and other debt securities, net
11,341.98Interest on bank accounts15,972.50Interest on swap contracts1,411.00Other income
398,149.17Expenses134,235.34Advisory fees 4Note59,616.87Management fees 3Note39,883.30Custodian fees18,067.14Subscription duty ("taxe d'abonnement") 6Note41,242.93Central administration costs2,896.79Audit fees
262.48Interest paid on bank liabilities9,822.87Legal fees2,511.15Transaction fees 21Note
61,346.38Other administration costs 7, 8Note339.75Banking charges and other fees
13,515.60Interest paid on swap contracts14,408.57Other expenses
671,628.81Net investment incomeNet realised gain/(loss) on:
252,134.64- securities portfolio 2Note2,634.49- options 2Note
1,170,654.90- forward foreign exchange contracts 2Note164,720.71- financial futures 2Note-39,303.63- swap contracts 2Note
-195,535.19- foreign exchange 2Note
2,026,934.73Realised resultNet variation of the unrealised gain/(loss) on:
889,391.27- securities portfolio-2,794,860.43- forward foreign exchange contracts
298,012.46- futures contracts
419,478.03Result of operations-7,328.30Dividends paid 16Note
1,261,236.28Subscriptions capitalisation shares335,452.91Subscriptions distribution shares
-9,387,178.04Redemptions capitalisation shares-142,522.10Redemptions distribution shares
-7,520,861.22Total changes in net assets
43,306,298.43Total net assets at the beginning of the period
35,785,437.21Total net assets at the end of the period
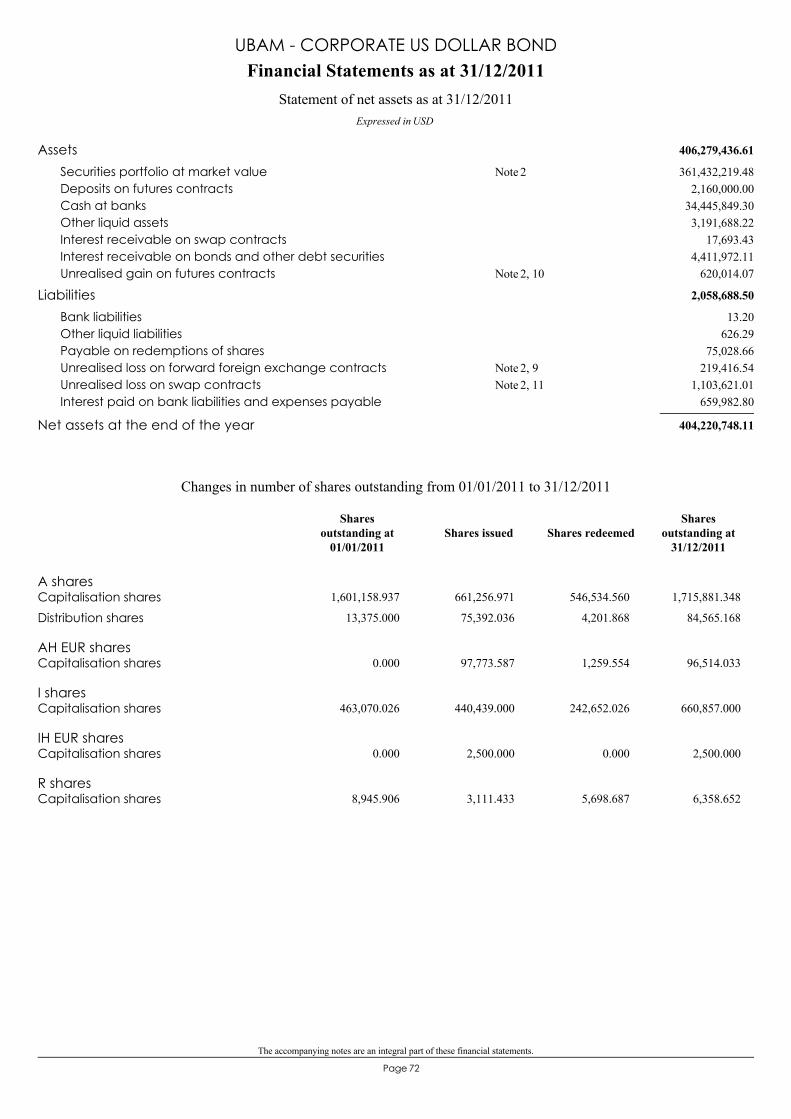
The accompanying notes are an integral part of these financial statements.
72Page
406,279,436.61Assets361,432,219.48Securities portfolio at market value 2Note
2,160,000.00Deposits on futures contracts34,445,849.30Cash at banks3,191,688.22Other liquid assets
17,693.43Interest receivable on swap contracts4,411,972.11Interest receivable on bonds and other debt securities
620,014.07Unrealised gain on futures contracts 2, 10Note
2,058,688.50Liabilities13.20Bank liabilities
626.29Other liquid liabilities75,028.66Payable on redemptions of shares
219,416.54Unrealised loss on forward foreign exchange contracts 2, 9Note1,103,621.01Unrealised loss on swap contracts 2, 11Note
659,982.80Interest paid on bank liabilities and expenses payable
404,220,748.11Net assets at the end of the year
Financial Statements as at 31/12/2011
Expressed in USD
Statement of net assets as at 31/12/2011
UBAM - CORPORATE US DOLLAR BOND
A sharesCapitalisation shares 1,601,158.937 661,256.971 546,534.560 1,715,881.348
Distribution shares 13,375.000 75,392.036 4,201.868 84,565.168
AH EUR sharesCapitalisation shares 0.000 97,773.587 1,259.554 96,514.033
I sharesCapitalisation shares 463,070.026 440,439.000 242,652.026 660,857.000
IH EUR sharesCapitalisation shares 0.000 2,500.000 0.000 2,500.000
R sharesCapitalisation shares 8,945.906 3,111.433 5,698.687 6,358.652
Changes in number of shares outstanding from 01/01/2011 to 31/12/2011
Shares issued Shares redeemedShares
outstanding at31/12/2011
Sharesoutstanding at
01/01/2011
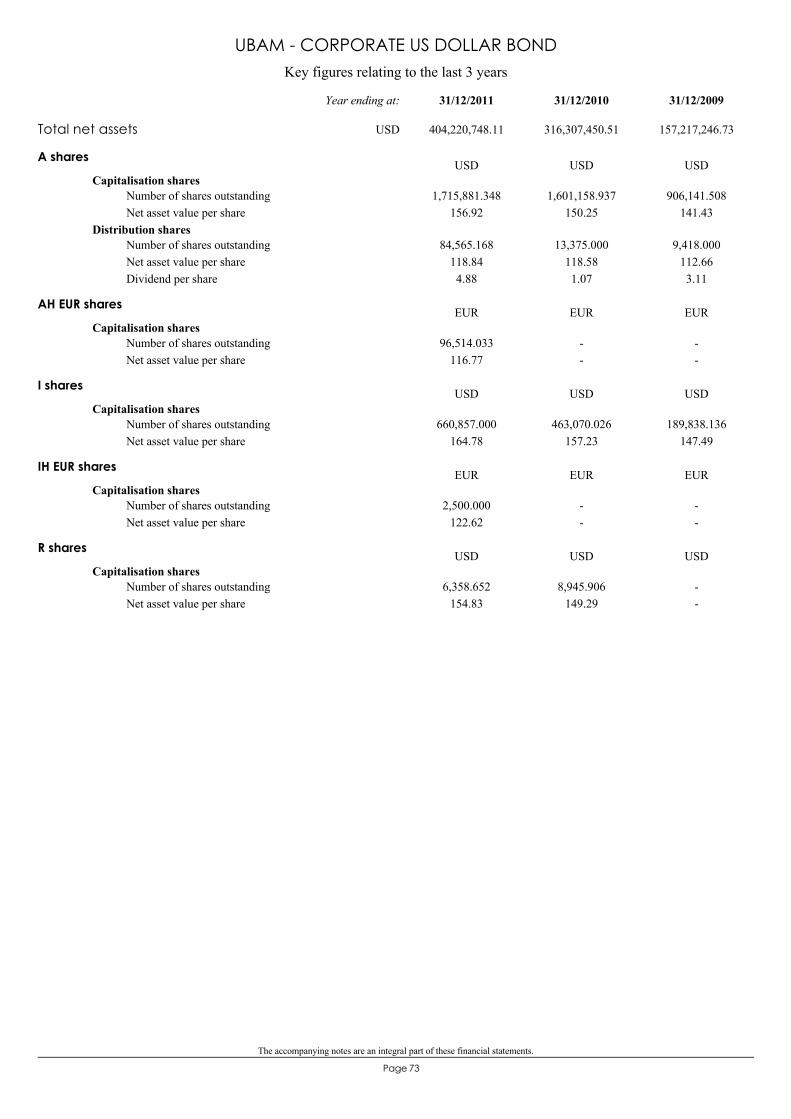
The accompanying notes are an integral part of these financial statements.
73Page
Key figures relating to the last 3 years
UBAM - CORPORATE US DOLLAR BOND
A shares
Capitalisation shares1,715,881.348
156.921,601,158.937
150.25906,141.508
141.43Number of shares outstandingNet asset value per share
Distribution shares84,565.168
118.844.88
13,375.000118.581.07
9,418.000112.663.11
Number of shares outstandingNet asset value per shareDividend per share
USD USD USD
AH EUR shares
Capitalisation shares96,514.033
116.77--
--
Number of shares outstandingNet asset value per share
EUR EUR EUR
I shares
Capitalisation shares660,857.000
164.78463,070.026
157.23189,838.136
147.49Number of shares outstandingNet asset value per share
USD USD USD
IH EUR shares
Capitalisation shares2,500.000
122.62--
--
Number of shares outstandingNet asset value per share
EUR EUR EUR
R shares
Capitalisation shares6,358.652
154.838,945.906
149.29--
Number of shares outstandingNet asset value per share
USD USD USD
Total net assets 404,220,748.11 316,307,450.51 157,217,246.73
31/12/200931/12/201031/12/2011Year ending at:
USD
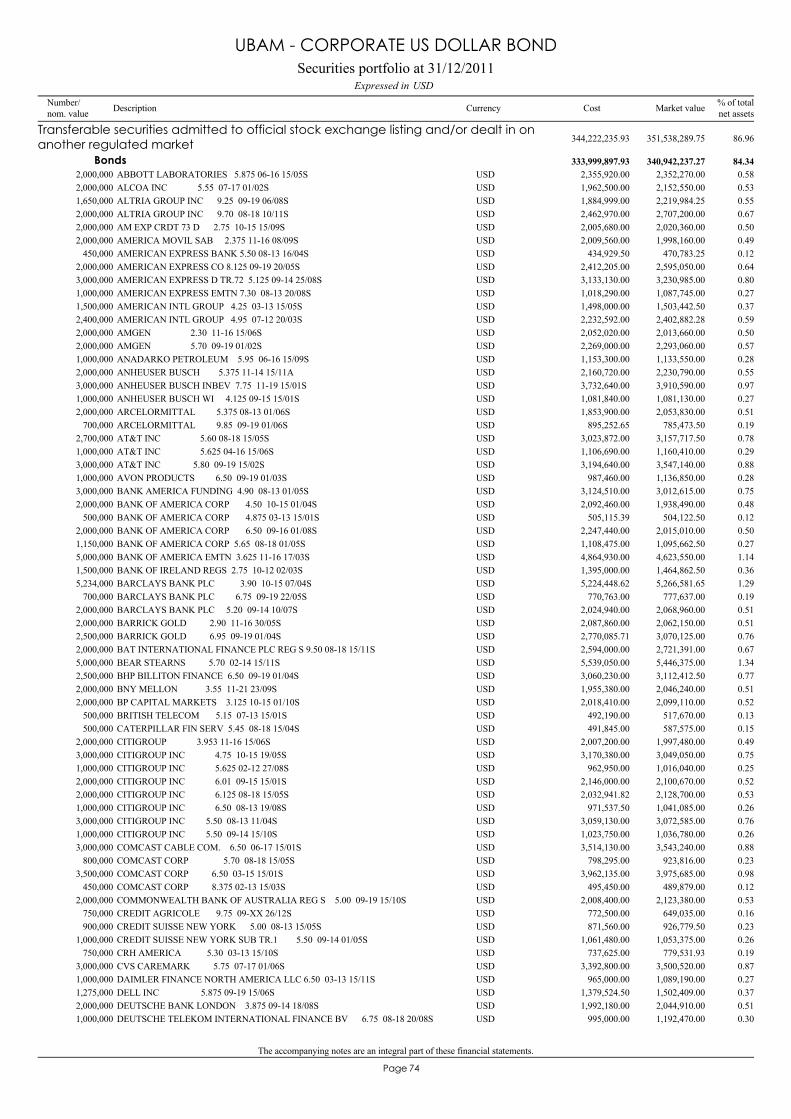
The accompanying notes are an integral part of these financial statements.
74Page
ABBOTT LABORATORIES 5.875 06-16 15/05S2,000,000 2,352,270.00 0.58USD 2,355,920.00
Transferable securities admitted to official stock exchange listing and/or dealt in onanother regulated market 351,538,289.75 86.96344,222,235.93
Bonds 340,942,237.27 84.34333,999,897.93
ALCOA INC 5.55 07-17 01/02S2,000,000 2,152,550.00 0.53USD 1,962,500.00ALTRIA GROUP INC 9.25 09-19 06/08S1,650,000 2,219,984.25 0.55USD 1,884,999.00ALTRIA GROUP INC 9.70 08-18 10/11S2,000,000 2,707,200.00 0.67USD 2,462,970.00AM EXP CRDT 73 D 2.75 10-15 15/09S2,000,000 2,020,360.00 0.50USD 2,005,680.00AMERICA MOVIL SAB 2.375 11-16 08/09S2,000,000 1,998,160.00 0.49USD 2,009,560.00AMERICAN EXPRESS BANK 5.50 08-13 16/04S450,000 470,783.25 0.12USD 434,929.50AMERICAN EXPRESS CO 8.125 09-19 20/05S2,000,000 2,595,050.00 0.64USD 2,412,205.00AMERICAN EXPRESS D TR.72 5.125 09-14 25/08S3,000,000 3,230,985.00 0.80USD 3,133,130.00AMERICAN EXPRESS EMTN 7.30 08-13 20/08S1,000,000 1,087,745.00 0.27USD 1,018,290.00AMERICAN INTL GROUP 4.25 03-13 15/05S1,500,000 1,503,442.50 0.37USD 1,498,000.00AMERICAN INTL GROUP 4.95 07-12 20/03S2,400,000 2,402,882.28 0.59USD 2,232,592.00AMGEN 2.30 11-16 15/06S2,000,000 2,013,660.00 0.50USD 2,052,020.00AMGEN 5.70 09-19 01/02S2,000,000 2,293,060.00 0.57USD 2,269,000.00ANADARKO PETROLEUM 5.95 06-16 15/09S1,000,000 1,133,550.00 0.28USD 1,153,300.00ANHEUSER BUSCH 5.375 11-14 15/11A2,000,000 2,230,790.00 0.55USD 2,160,720.00ANHEUSER BUSCH INBEV 7.75 11-19 15/01S3,000,000 3,910,590.00 0.97USD 3,732,640.00ANHEUSER BUSCH WI 4.125 09-15 15/01S1,000,000 1,081,130.00 0.27USD 1,081,840.00ARCELORMITTAL 5.375 08-13 01/06S2,000,000 2,053,830.00 0.51USD 1,853,900.00ARCELORMITTAL 9.85 09-19 01/06S700,000 785,473.50 0.19USD 895,252.65AT&T INC 5.60 08-18 15/05S2,700,000 3,157,717.50 0.78USD 3,023,872.00AT&T INC 5.625 04-16 15/06S1,000,000 1,160,410.00 0.29USD 1,106,690.00AT&T INC 5.80 09-19 15/02S3,000,000 3,547,140.00 0.88USD 3,194,640.00AVON PRODUCTS 6.50 09-19 01/03S1,000,000 1,136,850.00 0.28USD 987,460.00BANK AMERICA FUNDING 4.90 08-13 01/05S3,000,000 3,012,615.00 0.75USD 3,124,510.00BANK OF AMERICA CORP 4.50 10-15 01/04S2,000,000 1,938,490.00 0.48USD 2,092,460.00BANK OF AMERICA CORP 4.875 03-13 15/01S500,000 504,122.50 0.12USD 505,115.39BANK OF AMERICA CORP 6.50 09-16 01/08S2,000,000 2,015,010.00 0.50USD 2,247,440.00BANK OF AMERICA CORP 5.65 08-18 01/05S1,150,000 1,095,662.50 0.27USD 1,108,475.00BANK OF AMERICA EMTN 3.625 11-16 17/03S5,000,000 4,623,550.00 1.14USD 4,864,930.00BANK OF IRELAND REGS 2.75 10-12 02/03S1,500,000 1,464,862.50 0.36USD 1,395,000.00BARCLAYS BANK PLC 3.90 10-15 07/04S5,234,000 5,266,581.65 1.29USD 5,224,448.62BARCLAYS BANK PLC 6.75 09-19 22/05S700,000 777,637.00 0.19USD 770,763.00BARCLAYS BANK PLC 5.20 09-14 10/07S2,000,000 2,068,960.00 0.51USD 2,024,940.00BARRICK GOLD 2.90 11-16 30/05S2,000,000 2,062,150.00 0.51USD 2,087,860.00BARRICK GOLD 6.95 09-19 01/04S2,500,000 3,070,125.00 0.76USD 2,770,085.71BAT INTERNATIONAL FINANCE PLC REG S 9.50 08-18 15/11S2,000,000 2,721,391.00 0.67USD 2,594,000.00BEAR STEARNS 5.70 02-14 15/11S5,000,000 5,446,375.00 1.34USD 5,539,050.00BHP BILLITON FINANCE 6.50 09-19 01/04S2,500,000 3,112,412.50 0.77USD 3,060,230.00BNY MELLON 3.55 11-21 23/09S2,000,000 2,046,240.00 0.51USD 1,955,380.00BP CAPITAL MARKETS 3.125 10-15 01/10S2,000,000 2,099,110.00 0.52USD 2,018,410.00BRITISH TELECOM 5.15 07-13 15/01S500,000 517,670.00 0.13USD 492,190.00CATERPILLAR FIN SERV 5.45 08-18 15/04S500,000 587,575.00 0.15USD 491,845.00CITIGROUP 3.953 11-16 15/06S2,000,000 1,997,480.00 0.49USD 2,007,200.00CITIGROUP INC 4.75 10-15 19/05S3,000,000 3,049,050.00 0.75USD 3,170,380.00CITIGROUP INC 5.625 02-12 27/08S1,000,000 1,016,040.00 0.25USD 962,950.00CITIGROUP INC 6.01 09-15 15/01S2,000,000 2,100,670.00 0.52USD 2,146,000.00CITIGROUP INC 6.125 08-18 15/05S2,000,000 2,128,700.00 0.53USD 2,032,941.82CITIGROUP INC 6.50 08-13 19/08S1,000,000 1,041,085.00 0.26USD 971,537.50CITIGROUP INC 5.50 08-13 11/04S3,000,000 3,072,585.00 0.76USD 3,059,130.00CITIGROUP INC 5.50 09-14 15/10S1,000,000 1,036,780.00 0.26USD 1,023,750.00COMCAST CABLE COM. 6.50 06-17 15/01S3,000,000 3,543,240.00 0.88USD 3,514,130.00COMCAST CORP 5.70 08-18 15/05S800,000 923,816.00 0.23USD 798,295.00COMCAST CORP 6.50 03-15 15/01S3,500,000 3,975,685.00 0.98USD 3,962,135.00COMCAST CORP 8.375 02-13 15/03S450,000 489,879.00 0.12USD 495,450.00COMMONWEALTH BANK OF AUSTRALIA REG S 5.00 09-19 15/10S2,000,000 2,123,380.00 0.53USD 2,008,400.00CREDIT AGRICOLE 9.75 09-XX 26/12S750,000 649,035.00 0.16USD 772,500.00CREDIT SUISSE NEW YORK 5.00 08-13 15/05S900,000 926,779.50 0.23USD 871,560.00CREDIT SUISSE NEW YORK SUB TR.1 5.50 09-14 01/05S1,000,000 1,053,375.00 0.26USD 1,061,480.00CRH AMERICA 5.30 03-13 15/10S750,000 779,531.93 0.19USD 737,625.00CVS CAREMARK 5.75 07-17 01/06S3,000,000 3,500,520.00 0.87USD 3,392,800.00DAIMLER FINANCE NORTH AMERICA LLC 6.50 03-13 15/11S1,000,000 1,089,190.00 0.27USD 965,000.00DELL INC 5.875 09-19 15/06S1,275,000 1,502,409.00 0.37USD 1,379,524.50DEUTSCHE BANK LONDON 3.875 09-14 18/08S2,000,000 2,044,910.00 0.51USD 1,992,180.00DEUTSCHE TELEKOM INTERNATIONAL FINANCE BV 6.75 08-18 20/08S1,000,000 1,192,470.00 0.30USD 995,000.00
Securities portfolio at 31/12/2011USDExpressed in
UBAM - CORPORATE US DOLLAR BOND
Number/nom. value Description Currency % of total
net assetsMarket valueCost
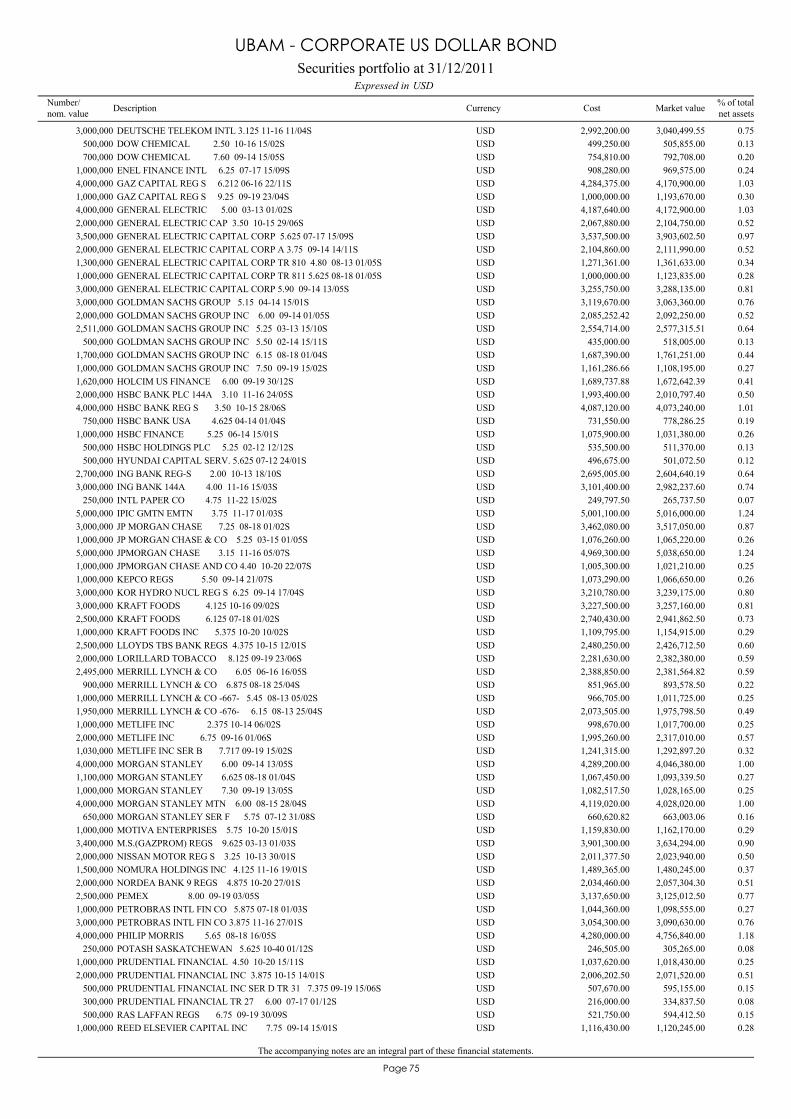
The accompanying notes are an integral part of these financial statements.
75Page
DEUTSCHE TELEKOM INTL 3.125 11-16 11/04S3,000,000 3,040,499.55 0.75USD 2,992,200.00DOW CHEMICAL 2.50 10-16 15/02S500,000 505,855.00 0.13USD 499,250.00DOW CHEMICAL 7.60 09-14 15/05S700,000 792,708.00 0.20USD 754,810.00ENEL FINANCE INTL 6.25 07-17 15/09S1,000,000 969,575.00 0.24USD 908,280.00GAZ CAPITAL REG S 6.212 06-16 22/11S4,000,000 4,170,900.00 1.03USD 4,284,375.00GAZ CAPITAL REG S 9.25 09-19 23/04S1,000,000 1,193,670.00 0.30USD 1,000,000.00GENERAL ELECTRIC 5.00 03-13 01/02S4,000,000 4,172,900.00 1.03USD 4,187,640.00GENERAL ELECTRIC CAP 3.50 10-15 29/06S2,000,000 2,104,750.00 0.52USD 2,067,880.00GENERAL ELECTRIC CAPITAL CORP 5.625 07-17 15/09S3,500,000 3,903,602.50 0.97USD 3,537,500.00GENERAL ELECTRIC CAPITAL CORP A 3.75 09-14 14/11S2,000,000 2,111,990.00 0.52USD 2,104,860.00GENERAL ELECTRIC CAPITAL CORP TR 810 4.80 08-13 01/05S1,300,000 1,361,633.00 0.34USD 1,271,361.00GENERAL ELECTRIC CAPITAL CORP TR 811 5.625 08-18 01/05S1,000,000 1,123,835.00 0.28USD 1,000,000.00GENERAL ELECTRIC CAPITAL CORP 5.90 09-14 13/05S3,000,000 3,288,135.00 0.81USD 3,255,750.00GOLDMAN SACHS GROUP 5.15 04-14 15/01S3,000,000 3,063,360.00 0.76USD 3,119,670.00GOLDMAN SACHS GROUP INC 6.00 09-14 01/05S2,000,000 2,092,250.00 0.52USD 2,085,252.42GOLDMAN SACHS GROUP INC 5.25 03-13 15/10S2,511,000 2,577,315.51 0.64USD 2,554,714.00GOLDMAN SACHS GROUP INC 5.50 02-14 15/11S500,000 518,005.00 0.13USD 435,000.00GOLDMAN SACHS GROUP INC 6.15 08-18 01/04S1,700,000 1,761,251.00 0.44USD 1,687,390.00GOLDMAN SACHS GROUP INC 7.50 09-19 15/02S1,000,000 1,108,195.00 0.27USD 1,161,286.66HOLCIM US FINANCE 6.00 09-19 30/12S1,620,000 1,672,642.39 0.41USD 1,689,737.88HSBC BANK PLC 144A 3.10 11-16 24/05S2,000,000 2,010,797.40 0.50USD 1,993,400.00HSBC BANK REG S 3.50 10-15 28/06S4,000,000 4,073,240.00 1.01USD 4,087,120.00HSBC BANK USA 4.625 04-14 01/04S750,000 778,286.25 0.19USD 731,550.00HSBC FINANCE 5.25 06-14 15/01S1,000,000 1,031,380.00 0.26USD 1,075,900.00HSBC HOLDINGS PLC 5.25 02-12 12/12S500,000 511,370.00 0.13USD 535,500.00HYUNDAI CAPITAL SERV. 5.625 07-12 24/01S500,000 501,072.50 0.12USD 496,675.00ING BANK REG-S 2.00 10-13 18/10S2,700,000 2,604,640.19 0.64USD 2,695,005.00ING BANK 144A 4.00 11-16 15/03S3,000,000 2,982,237.60 0.74USD 3,101,400.00INTL PAPER CO 4.75 11-22 15/02S250,000 265,737.50 0.07USD 249,797.50IPIC GMTN EMTN 3.75 11-17 01/03S5,000,000 5,016,000.00 1.24USD 5,001,100.00JP MORGAN CHASE 7.25 08-18 01/02S3,000,000 3,517,050.00 0.87USD 3,462,080.00JP MORGAN CHASE & CO 5.25 03-15 01/05S1,000,000 1,065,220.00 0.26USD 1,076,260.00JPMORGAN CHASE 3.15 11-16 05/07S5,000,000 5,038,650.00 1.24USD 4,969,300.00JPMORGAN CHASE AND CO 4.40 10-20 22/07S1,000,000 1,021,210.00 0.25USD 1,005,300.00KEPCO REGS 5.50 09-14 21/07S1,000,000 1,066,650.00 0.26USD 1,073,290.00KOR HYDRO NUCL REG S 6.25 09-14 17/04S3,000,000 3,239,175.00 0.80USD 3,210,780.00KRAFT FOODS 4.125 10-16 09/02S3,000,000 3,257,160.00 0.81USD 3,227,500.00KRAFT FOODS 6.125 07-18 01/02S2,500,000 2,941,862.50 0.73USD 2,740,430.00KRAFT FOODS INC 5.375 10-20 10/02S1,000,000 1,154,915.00 0.29USD 1,109,795.00LLOYDS TBS BANK REGS 4.375 10-15 12/01S2,500,000 2,426,712.50 0.60USD 2,480,250.00LORILLARD TOBACCO 8.125 09-19 23/06S2,000,000 2,382,380.00 0.59USD 2,281,630.00MERRILL LYNCH & CO 6.05 06-16 16/05S2,495,000 2,381,564.82 0.59USD 2,388,850.00MERRILL LYNCH & CO 6.875 08-18 25/04S900,000 893,578.50 0.22USD 851,965.00MERRILL LYNCH & CO -667- 5.45 08-13 05/02S1,000,000 1,011,725.00 0.25USD 966,705.00MERRILL LYNCH & CO -676- 6.15 08-13 25/04S1,950,000 1,975,798.50 0.49USD 2,073,505.00METLIFE INC 2.375 10-14 06/02S1,000,000 1,017,700.00 0.25USD 998,670.00METLIFE INC 6.75 09-16 01/06S2,000,000 2,317,010.00 0.57USD 1,995,260.00METLIFE INC SER B 7.717 09-19 15/02S1,030,000 1,292,897.20 0.32USD 1,241,315.00MORGAN STANLEY 6.00 09-14 13/05S4,000,000 4,046,380.00 1.00USD 4,289,200.00MORGAN STANLEY 6.625 08-18 01/04S1,100,000 1,093,339.50 0.27USD 1,067,450.00MORGAN STANLEY 7.30 09-19 13/05S1,000,000 1,028,165.00 0.25USD 1,082,517.50MORGAN STANLEY MTN 6.00 08-15 28/04S4,000,000 4,028,020.00 1.00USD 4,119,020.00MORGAN STANLEY SER F 5.75 07-12 31/08S650,000 663,003.06 0.16USD 660,620.82MOTIVA ENTERPRISES 5.75 10-20 15/01S1,000,000 1,162,170.00 0.29USD 1,159,830.00M.S.(GAZPROM) REGS 9.625 03-13 01/03S3,400,000 3,634,294.00 0.90USD 3,901,300.00NISSAN MOTOR REG S 3.25 10-13 30/01S2,000,000 2,023,940.00 0.50USD 2,011,377.50NOMURA HOLDINGS INC 4.125 11-16 19/01S1,500,000 1,480,245.00 0.37USD 1,489,365.00NORDEA BANK 9 REGS 4.875 10-20 27/01S2,000,000 2,057,304.30 0.51USD 2,034,460.00PEMEX 8.00 09-19 03/05S2,500,000 3,125,012.50 0.77USD 3,137,650.00PETROBRAS INTL FIN CO 5.875 07-18 01/03S1,000,000 1,098,555.00 0.27USD 1,044,360.00PETROBRAS INTL FIN CO 3.875 11-16 27/01S3,000,000 3,090,630.00 0.76USD 3,054,300.00PHILIP MORRIS 5.65 08-18 16/05S4,000,000 4,756,840.00 1.18USD 4,280,000.00POTASH SASKATCHEWAN 5.625 10-40 01/12S250,000 305,265.00 0.08USD 246,505.00PRUDENTIAL FINANCIAL 4.50 10-20 15/11S1,000,000 1,018,430.00 0.25USD 1,037,620.00PRUDENTIAL FINANCIAL INC 3.875 10-15 14/01S2,000,000 2,071,520.00 0.51USD 2,006,202.50PRUDENTIAL FINANCIAL INC SER D TR 31 7.375 09-19 15/06S500,000 595,155.00 0.15USD 507,670.00PRUDENTIAL FINANCIAL TR 27 6.00 07-17 01/12S300,000 334,837.50 0.08USD 216,000.00RAS LAFFAN REGS 6.75 09-19 30/09S500,000 594,412.50 0.15USD 521,750.00REED ELSEVIER CAPITAL INC 7.75 09-14 15/01S1,000,000 1,120,245.00 0.28USD 1,116,430.00
Securities portfolio at 31/12/2011USDExpressed in
UBAM - CORPORATE US DOLLAR BOND
Number/nom. value Description Currency % of total
net assetsMarket valueCost
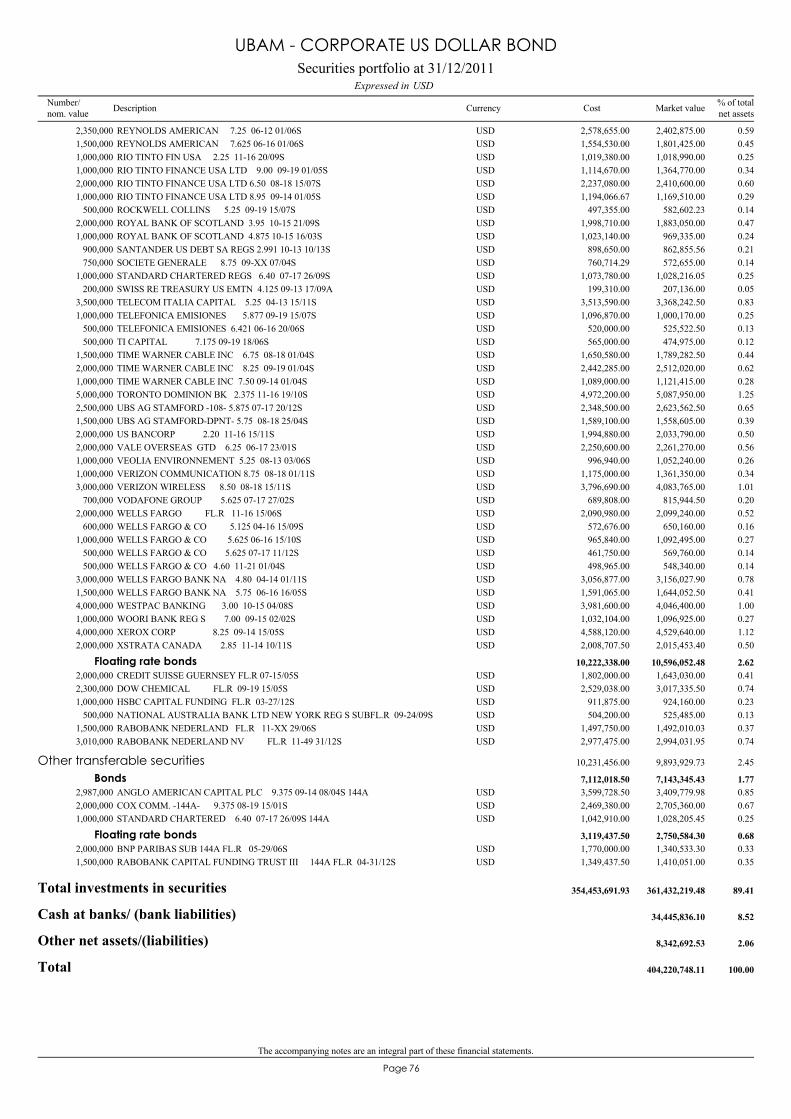
The accompanying notes are an integral part of these financial statements.
76Page
REYNOLDS AMERICAN 7.25 06-12 01/06S2,350,000 2,402,875.00 0.59USD 2,578,655.00REYNOLDS AMERICAN 7.625 06-16 01/06S1,500,000 1,801,425.00 0.45USD 1,554,530.00RIO TINTO FIN USA 2.25 11-16 20/09S1,000,000 1,018,990.00 0.25USD 1,019,380.00RIO TINTO FINANCE USA LTD 9.00 09-19 01/05S1,000,000 1,364,770.00 0.34USD 1,114,670.00RIO TINTO FINANCE USA LTD 6.50 08-18 15/07S2,000,000 2,410,600.00 0.60USD 2,237,080.00RIO TINTO FINANCE USA LTD 8.95 09-14 01/05S1,000,000 1,169,510.00 0.29USD 1,194,066.67ROCKWELL COLLINS 5.25 09-19 15/07S500,000 582,602.23 0.14USD 497,355.00ROYAL BANK OF SCOTLAND 3.95 10-15 21/09S2,000,000 1,883,050.00 0.47USD 1,998,710.00ROYAL BANK OF SCOTLAND 4.875 10-15 16/03S1,000,000 969,335.00 0.24USD 1,023,140.00SANTANDER US DEBT SA REGS 2.991 10-13 10/13S900,000 862,855.56 0.21USD 898,650.00SOCIETE GENERALE 8.75 09-XX 07/04S750,000 572,655.00 0.14USD 760,714.29STANDARD CHARTERED REGS 6.40 07-17 26/09S1,000,000 1,028,216.05 0.25USD 1,073,780.00SWISS RE TREASURY US EMTN 4.125 09-13 17/09A200,000 207,136.00 0.05USD 199,310.00TELECOM ITALIA CAPITAL 5.25 04-13 15/11S3,500,000 3,368,242.50 0.83USD 3,513,590.00TELEFONICA EMISIONES 5.877 09-19 15/07S1,000,000 1,000,170.00 0.25USD 1,096,870.00TELEFONICA EMISIONES 6.421 06-16 20/06S500,000 525,522.50 0.13USD 520,000.00TI CAPITAL 7.175 09-19 18/06S500,000 474,975.00 0.12USD 565,000.00TIME WARNER CABLE INC 6.75 08-18 01/04S1,500,000 1,789,282.50 0.44USD 1,650,580.00TIME WARNER CABLE INC 8.25 09-19 01/04S2,000,000 2,512,020.00 0.62USD 2,442,285.00TIME WARNER CABLE INC 7.50 09-14 01/04S1,000,000 1,121,415.00 0.28USD 1,089,000.00TORONTO DOMINION BK 2.375 11-16 19/10S5,000,000 5,087,950.00 1.25USD 4,972,200.00UBS AG STAMFORD -108- 5.875 07-17 20/12S2,500,000 2,623,562.50 0.65USD 2,348,500.00UBS AG STAMFORD-DPNT- 5.75 08-18 25/04S1,500,000 1,558,605.00 0.39USD 1,589,100.00US BANCORP 2.20 11-16 15/11S2,000,000 2,033,790.00 0.50USD 1,994,880.00VALE OVERSEAS GTD 6.25 06-17 23/01S2,000,000 2,261,270.00 0.56USD 2,250,600.00VEOLIA ENVIRONNEMENT 5.25 08-13 03/06S1,000,000 1,052,240.00 0.26USD 996,940.00VERIZON COMMUNICATION 8.75 08-18 01/11S1,000,000 1,361,350.00 0.34USD 1,175,000.00VERIZON WIRELESS 8.50 08-18 15/11S3,000,000 4,083,765.00 1.01USD 3,796,690.00VODAFONE GROUP 5.625 07-17 27/02S700,000 815,944.50 0.20USD 689,808.00WELLS FARGO FL.R 11-16 15/06S2,000,000 2,099,240.00 0.52USD 2,090,980.00WELLS FARGO & CO 5.125 04-16 15/09S600,000 650,160.00 0.16USD 572,676.00WELLS FARGO & CO 5.625 06-16 15/10S1,000,000 1,092,495.00 0.27USD 965,840.00WELLS FARGO & CO 5.625 07-17 11/12S500,000 569,760.00 0.14USD 461,750.00WELLS FARGO & CO 4.60 11-21 01/04S500,000 548,340.00 0.14USD 498,965.00WELLS FARGO BANK NA 4.80 04-14 01/11S3,000,000 3,156,027.90 0.78USD 3,056,877.00WELLS FARGO BANK NA 5.75 06-16 16/05S1,500,000 1,644,052.50 0.41USD 1,591,065.00WESTPAC BANKING 3.00 10-15 04/08S4,000,000 4,046,400.00 1.00USD 3,981,600.00WOORI BANK REG S 7.00 09-15 02/02S1,000,000 1,096,925.00 0.27USD 1,032,104.00XEROX CORP 8.25 09-14 15/05S4,000,000 4,529,640.00 1.12USD 4,588,120.00XSTRATA CANADA 2.85 11-14 10/11S2,000,000 2,015,453.40 0.50USD 2,008,707.50
CREDIT SUISSE GUERNSEY FL.R 07-15/05S2,000,000 1,643,030.00 0.41USD 1,802,000.00Floating rate bonds 10,596,052.48 2.6210,222,338.00
DOW CHEMICAL FL.R 09-19 15/05S2,300,000 3,017,335.50 0.74USD 2,529,038.00HSBC CAPITAL FUNDING FL.R 03-27/12S1,000,000 924,160.00 0.23USD 911,875.00NATIONAL AUSTRALIA BANK LTD NEW YORK REG S SUBFL.R 09-24/09S500,000 525,485.00 0.13USD 504,200.00RABOBANK NEDERLAND FL.R 11-XX 29/06S1,500,000 1,492,010.03 0.37USD 1,497,750.00RABOBANK NEDERLAND NV FL.R 11-49 31/12S3,010,000 2,994,031.95 0.74USD 2,977,475.00
ANGLO AMERICAN CAPITAL PLC 9.375 09-14 08/04S 144A2,987,000 3,409,779.98 0.85USD 3,599,728.50
Other transferable securities 9,893,929.73 2.4510,231,456.00
Bonds 7,143,345.43 1.777,112,018.50
COX COMM. -144A- 9.375 08-19 15/01S2,000,000 2,705,360.00 0.67USD 2,469,380.00STANDARD CHARTERED 6.40 07-17 26/09S 144A1,000,000 1,028,205.45 0.25USD 1,042,910.00
BNP PARIBAS SUB 144A FL.R 05-29/06S2,000,000 1,340,533.30 0.33USD 1,770,000.00Floating rate bonds 2,750,584.30 0.683,119,437.50
RABOBANK CAPITAL FUNDING TRUST III 144A FL.R 04-31/12S1,500,000 1,410,051.00 0.35USD 1,349,437.50
Total investments in securities 361,432,219.48 89.41354,453,691.93
Cash at banks/ (bank liabilities) 34,445,836.10 8.52
Other net assets/(liabilities) 8,342,692.53 2.06
Total 404,220,748.11 100.00
Securities portfolio at 31/12/2011USDExpressed in
UBAM - CORPORATE US DOLLAR BOND
Number/nom. value Description Currency % of total
net assetsMarket valueCost
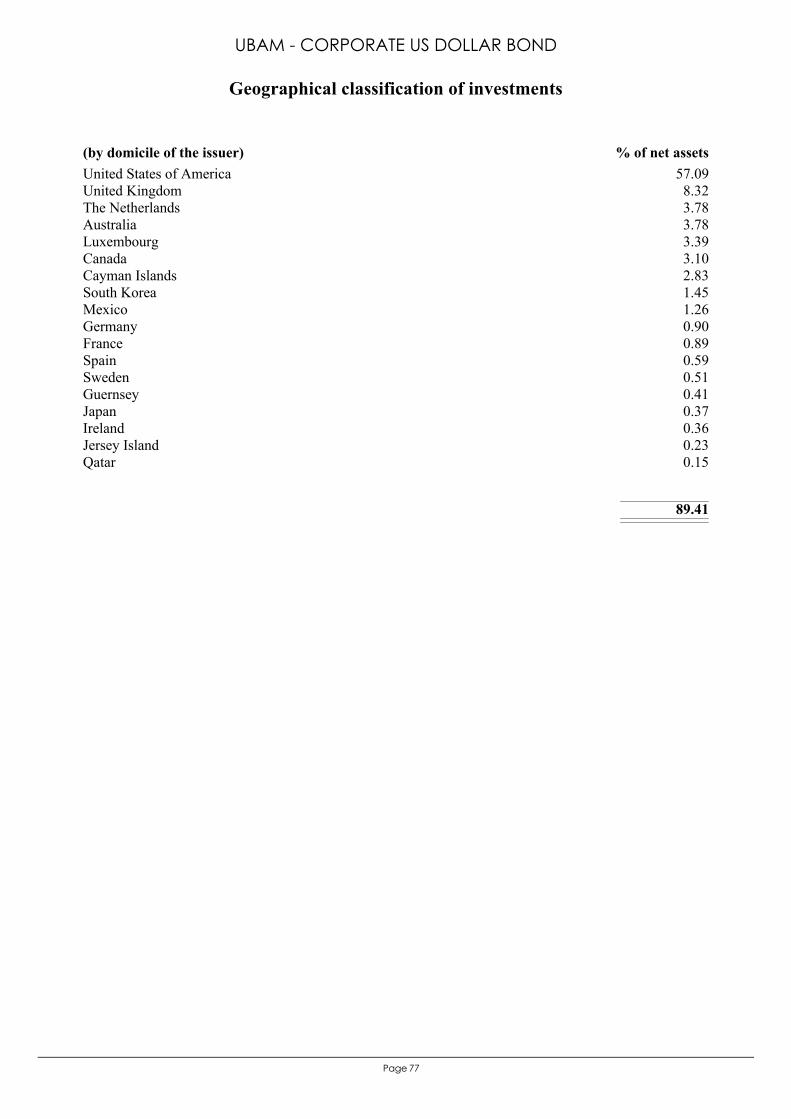
77Page
United States of America 57.09United Kingdom 8.32The Netherlands 3.78Australia 3.78Luxembourg 3.39Canada 3.10Cayman Islands 2.83South Korea 1.45Mexico 1.26Germany 0.90France 0.89Spain 0.59Sweden 0.51Guernsey 0.41Japan 0.37Ireland 0.36Jersey Island 0.23Qatar 0.15
89.41
(by domicile of the issuer) % of net assets
Geographical classification of investments
UBAM - CORPORATE US DOLLAR BOND
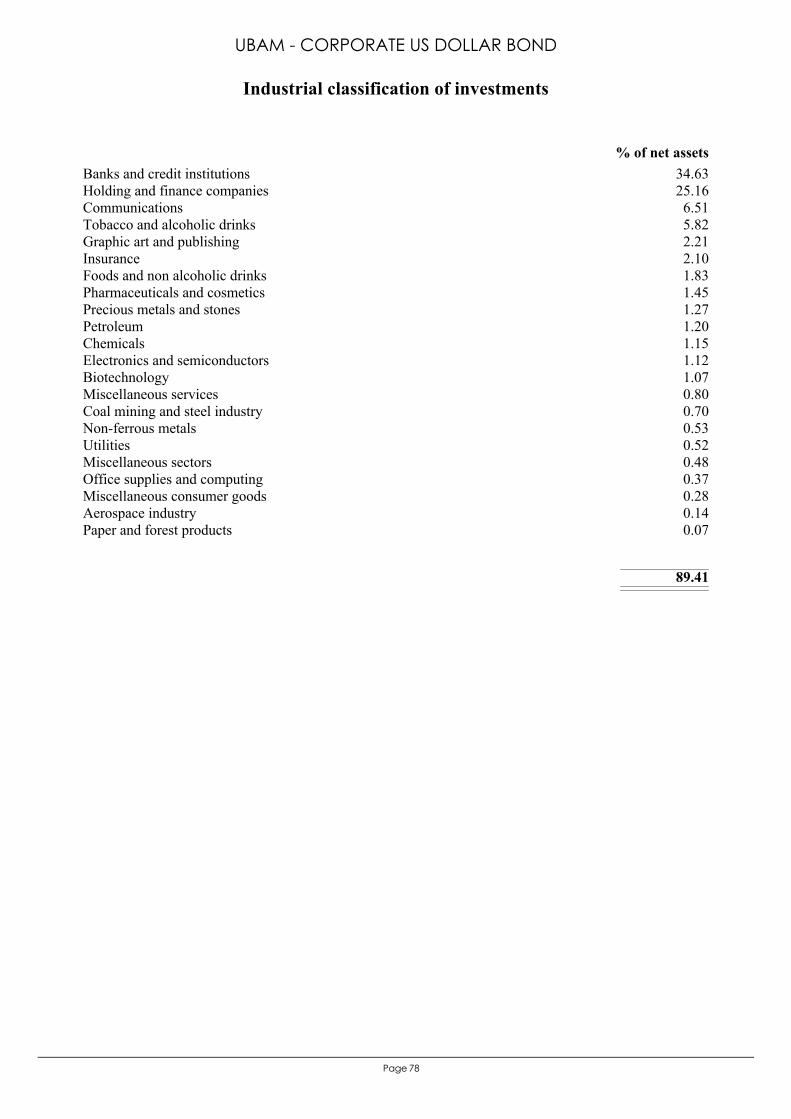
78Page
Banks and credit institutions 34.63Holding and finance companies 25.16Communications 6.51Tobacco and alcoholic drinks 5.82Graphic art and publishing 2.21Insurance 2.10Foods and non alcoholic drinks 1.83Pharmaceuticals and cosmetics 1.45Precious metals and stones 1.27Petroleum 1.20Chemicals 1.15Electronics and semiconductors 1.12Biotechnology 1.07Miscellaneous services 0.80Coal mining and steel industry 0.70Non-ferrous metals 0.53Utilities 0.52Miscellaneous sectors 0.48Office supplies and computing 0.37Miscellaneous consumer goods 0.28Aerospace industry 0.14Paper and forest products 0.07
89.41
% of net assets
Industrial classification of investments
UBAM - CORPORATE US DOLLAR BOND

The accompanying notes are an integral part of these financial statements.
79Page
Statement of operations and other changes in net assets from 01/01/2011 to 31/12/2011Expressed in USD
UBAM - CORPORATE US DOLLAR BOND
17,109,145.88Income16,212,659.91Interest on bonds and other debt securities, net
1,201.53Interest on bank accounts121.04Bank interest on time deposits
892,388.82Interest on swap contracts2,774.58Other income
3,073,389.80Expenses998,320.38Advisory fees 4Note516,720.97Management fees 3Note328,449.30Custodian fees139,187.33Subscription duty ("taxe d'abonnement") 6Note334,469.95Central administration costs19,826.14Audit fees
736.45Interest paid on bank liabilities30,223.34Legal fees16,452.19Transaction fees 21Note
398,071.21Other administration costs 7, 8Note4,147.47Banking charges and other fees
209,824.29Interest paid on swap contracts76,960.78Other expenses
14,035,756.08Net investment incomeNet realised gain/(loss) on:
2,046,750.25- securities portfolio 2Note32,481.30- options 2Note
420,651.97- forward foreign exchange contracts 2Note2,916,309.24- financial futures 2Note
872,111.27- swap contracts 2Note-466,939.28- foreign exchange 2Note
19,857,120.83Realised resultNet variation of the unrealised gain/(loss) on:
-5,626,950.45- securities portfolio-219,416.54- forward foreign exchange contracts940,913.02- futures contracts
-1,143,855.94- swap contracts
13,807,810.92Result of operations-219,624.40Dividends paid 16Note
189,890,164.70Subscriptions capitalisation shares8,969,425.50Subscriptions distribution shares
-124,034,487.18Redemptions capitalisation shares-499,991.94Redemptions distribution shares
87,913,297.60Total changes in net assets
316,307,450.51Total net assets at the beginning of the year
404,220,748.11Total net assets at the end of the year
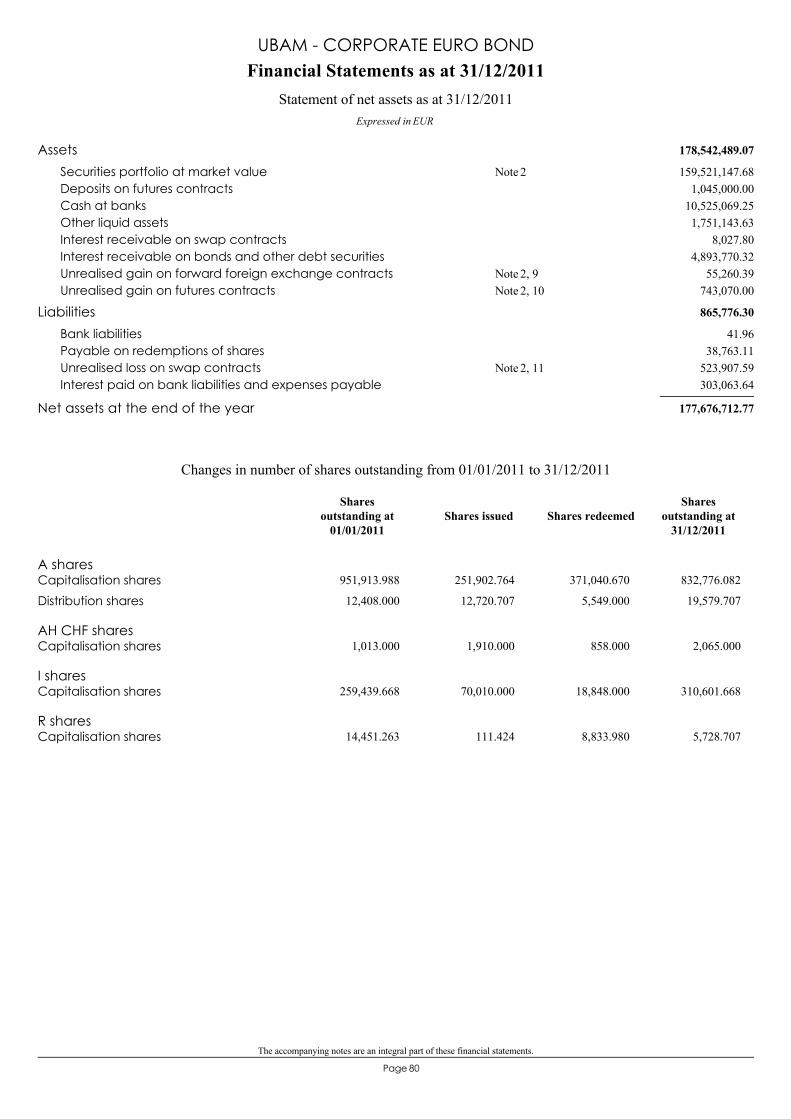
The accompanying notes are an integral part of these financial statements.
80Page
178,542,489.07Assets159,521,147.68Securities portfolio at market value 2Note
1,045,000.00Deposits on futures contracts10,525,069.25Cash at banks1,751,143.63Other liquid assets
8,027.80Interest receivable on swap contracts4,893,770.32Interest receivable on bonds and other debt securities
55,260.39Unrealised gain on forward foreign exchange contracts 2, 9Note743,070.00Unrealised gain on futures contracts 2, 10Note
865,776.30Liabilities41.96Bank liabilities
38,763.11Payable on redemptions of shares523,907.59Unrealised loss on swap contracts 2, 11Note303,063.64Interest paid on bank liabilities and expenses payable
177,676,712.77Net assets at the end of the year
Financial Statements as at 31/12/2011
Expressed in EUR
Statement of net assets as at 31/12/2011
UBAM - CORPORATE EURO BOND
A sharesCapitalisation shares 951,913.988 251,902.764 371,040.670 832,776.082
Distribution shares 12,408.000 12,720.707 5,549.000 19,579.707
AH CHF sharesCapitalisation shares 1,013.000 1,910.000 858.000 2,065.000
I sharesCapitalisation shares 259,439.668 70,010.000 18,848.000 310,601.668
R sharesCapitalisation shares 14,451.263 111.424 8,833.980 5,728.707
Changes in number of shares outstanding from 01/01/2011 to 31/12/2011
Shares issued Shares redeemedShares
outstanding at31/12/2011
Sharesoutstanding at
01/01/2011
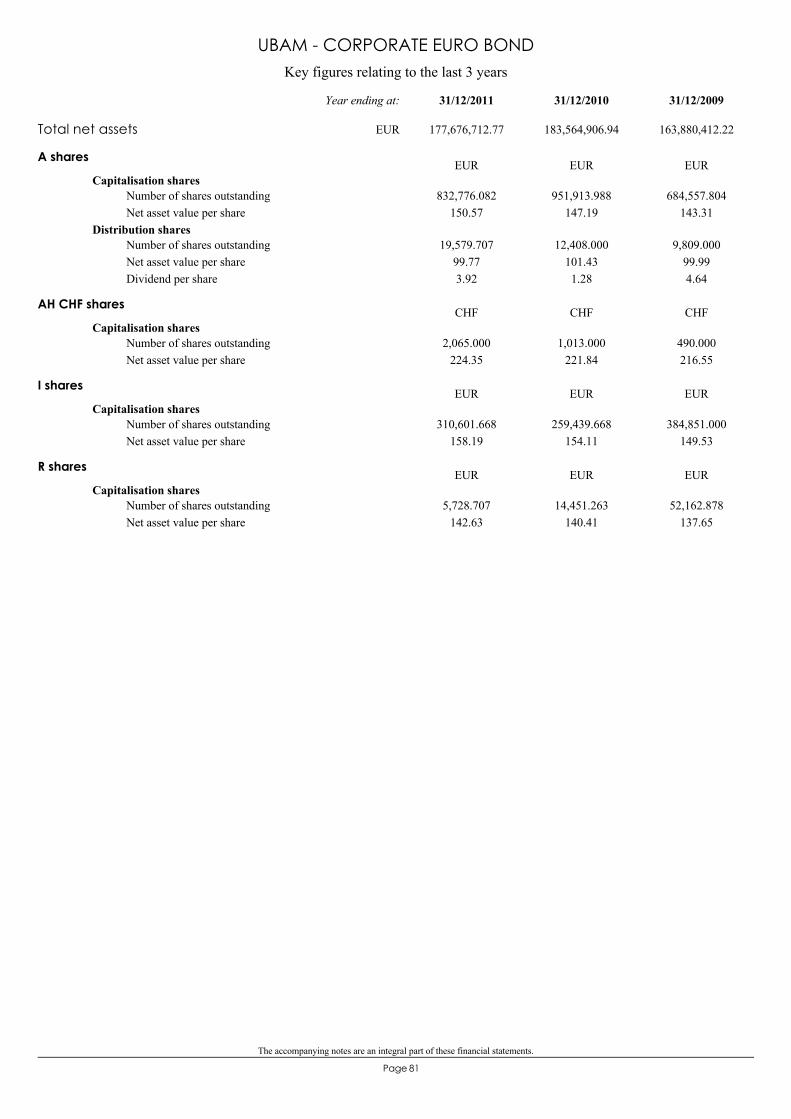
The accompanying notes are an integral part of these financial statements.
81Page
Key figures relating to the last 3 years
UBAM - CORPORATE EURO BOND
A shares
Capitalisation shares832,776.082
150.57951,913.988
147.19684,557.804
143.31Number of shares outstandingNet asset value per share
Distribution shares19,579.707
99.773.92
12,408.000101.431.28
9,809.00099.994.64
Number of shares outstandingNet asset value per shareDividend per share
EUR EUR EUR
AH CHF shares
Capitalisation shares2,065.000
224.351,013.000
221.84490.000216.55
Number of shares outstandingNet asset value per share
CHF CHF CHF
I shares
Capitalisation shares310,601.668
158.19259,439.668
154.11384,851.000
149.53Number of shares outstandingNet asset value per share
EUR EUR EUR
R shares
Capitalisation shares5,728.707
142.6314,451.263
140.4152,162.878
137.65Number of shares outstandingNet asset value per share
EUR EUR EUR
Total net assets 177,676,712.77 183,564,906.94 163,880,412.22
31/12/200931/12/201031/12/2011Year ending at:
EUR
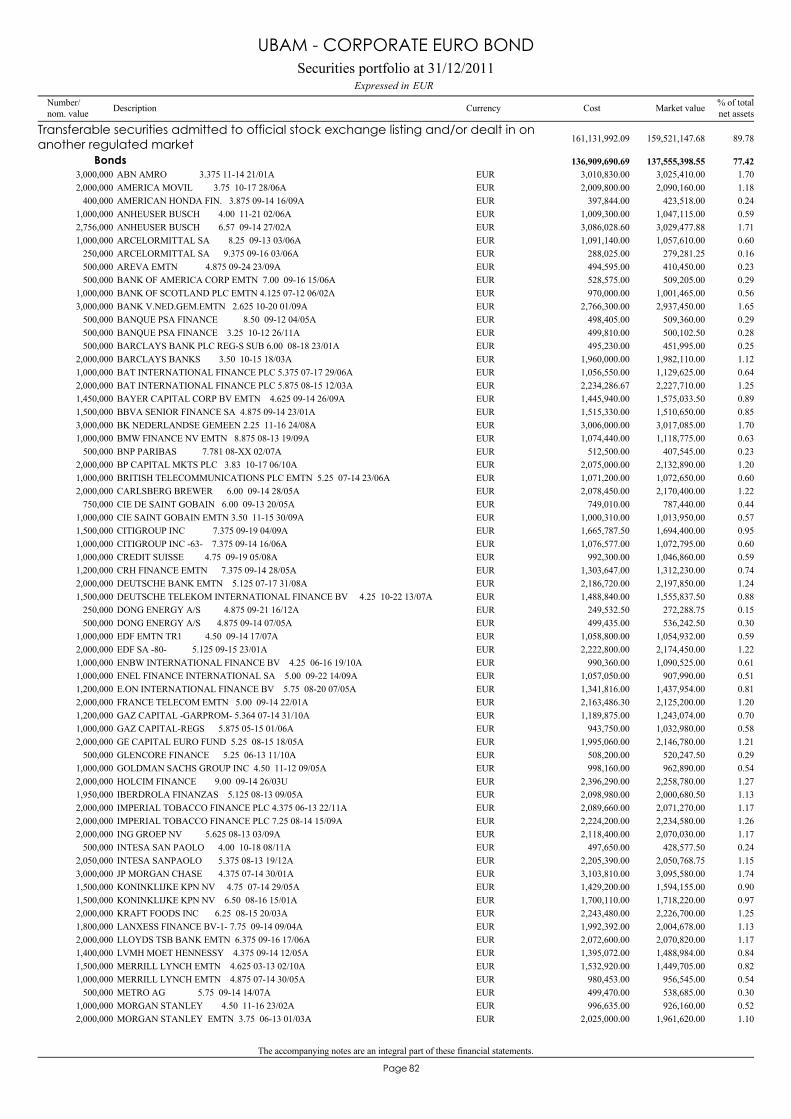
The accompanying notes are an integral part of these financial statements.
82Page
ABN AMRO 3.375 11-14 21/01A3,000,000 3,025,410.00 1.70EUR 3,010,830.00
Transferable securities admitted to official stock exchange listing and/or dealt in onanother regulated market 159,521,147.68 89.78161,131,992.09
Bonds 137,555,398.55 77.42136,909,690.69
AMERICA MOVIL 3.75 10-17 28/06A2,000,000 2,090,160.00 1.18EUR 2,009,800.00AMERICAN HONDA FIN. 3.875 09-14 16/09A400,000 423,518.00 0.24EUR 397,844.00ANHEUSER BUSCH 4.00 11-21 02/06A1,000,000 1,047,115.00 0.59EUR 1,009,300.00ANHEUSER BUSCH 6.57 09-14 27/02A2,756,000 3,029,477.88 1.71EUR 3,086,028.60ARCELORMITTAL SA 8.25 09-13 03/06A1,000,000 1,057,610.00 0.60EUR 1,091,140.00ARCELORMITTAL SA 9.375 09-16 03/06A250,000 279,281.25 0.16EUR 288,025.00AREVA EMTN 4.875 09-24 23/09A500,000 410,450.00 0.23EUR 494,595.00BANK OF AMERICA CORP EMTN 7.00 09-16 15/06A500,000 509,205.00 0.29EUR 528,575.00BANK OF SCOTLAND PLC EMTN 4.125 07-12 06/02A1,000,000 1,001,465.00 0.56EUR 970,000.00BANK V.NED.GEM.EMTN 2.625 10-20 01/09A3,000,000 2,937,450.00 1.65EUR 2,766,300.00BANQUE PSA FINANCE 8.50 09-12 04/05A500,000 509,360.00 0.29EUR 498,405.00BANQUE PSA FINANCE 3.25 10-12 26/11A500,000 500,102.50 0.28EUR 499,810.00BARCLAYS BANK PLC REG-S SUB 6.00 08-18 23/01A500,000 451,995.00 0.25EUR 495,230.00BARCLAYS BANKS 3.50 10-15 18/03A2,000,000 1,982,110.00 1.12EUR 1,960,000.00BAT INTERNATIONAL FINANCE PLC 5.375 07-17 29/06A1,000,000 1,129,625.00 0.64EUR 1,056,550.00BAT INTERNATIONAL FINANCE PLC 5.875 08-15 12/03A2,000,000 2,227,710.00 1.25EUR 2,234,286.67BAYER CAPITAL CORP BV EMTN 4.625 09-14 26/09A1,450,000 1,575,033.50 0.89EUR 1,445,940.00BBVA SENIOR FINANCE SA 4.875 09-14 23/01A1,500,000 1,510,650.00 0.85EUR 1,515,330.00BK NEDERLANDSE GEMEEN 2.25 11-16 24/08A3,000,000 3,017,085.00 1.70EUR 3,006,000.00BMW FINANCE NV EMTN 8.875 08-13 19/09A1,000,000 1,118,775.00 0.63EUR 1,074,440.00BNP PARIBAS 7.781 08-XX 02/07A500,000 407,545.00 0.23EUR 512,500.00BP CAPITAL MKTS PLC 3.83 10-17 06/10A2,000,000 2,132,890.00 1.20EUR 2,075,000.00BRITISH TELECOMMUNICATIONS PLC EMTN 5.25 07-14 23/06A1,000,000 1,072,650.00 0.60EUR 1,071,200.00CARLSBERG BREWER 6.00 09-14 28/05A2,000,000 2,170,400.00 1.22EUR 2,078,450.00CIE DE SAINT GOBAIN 6.00 09-13 20/05A750,000 787,440.00 0.44EUR 749,010.00CIE SAINT GOBAIN EMTN 3.50 11-15 30/09A1,000,000 1,013,950.00 0.57EUR 1,000,310.00CITIGROUP INC 7.375 09-19 04/09A1,500,000 1,694,400.00 0.95EUR 1,665,787.50CITIGROUP INC -63- 7.375 09-14 16/06A1,000,000 1,072,795.00 0.60EUR 1,076,577.00CREDIT SUISSE 4.75 09-19 05/08A1,000,000 1,046,860.00 0.59EUR 992,300.00CRH FINANCE EMTN 7.375 09-14 28/05A1,200,000 1,312,230.00 0.74EUR 1,303,647.00DEUTSCHE BANK EMTN 5.125 07-17 31/08A2,000,000 2,197,850.00 1.24EUR 2,186,720.00DEUTSCHE TELEKOM INTERNATIONAL FINANCE BV 4.25 10-22 13/07A1,500,000 1,555,837.50 0.88EUR 1,488,840.00DONG ENERGY A/S 4.875 09-21 16/12A250,000 272,288.75 0.15EUR 249,532.50DONG ENERGY A/S 4.875 09-14 07/05A500,000 536,242.50 0.30EUR 499,435.00EDF EMTN TR1 4.50 09-14 17/07A1,000,000 1,054,932.00 0.59EUR 1,058,800.00EDF SA -80- 5.125 09-15 23/01A2,000,000 2,174,450.00 1.22EUR 2,222,800.00ENBW INTERNATIONAL FINANCE BV 4.25 06-16 19/10A1,000,000 1,090,525.00 0.61EUR 990,360.00ENEL FINANCE INTERNATIONAL SA 5.00 09-22 14/09A1,000,000 907,990.00 0.51EUR 1,057,050.00E.ON INTERNATIONAL FINANCE BV 5.75 08-20 07/05A1,200,000 1,437,954.00 0.81EUR 1,341,816.00FRANCE TELECOM EMTN 5.00 09-14 22/01A2,000,000 2,125,200.00 1.20EUR 2,163,486.30GAZ CAPITAL -GARPROM- 5.364 07-14 31/10A1,200,000 1,243,074.00 0.70EUR 1,189,875.00GAZ CAPITAL-REGS 5.875 05-15 01/06A1,000,000 1,032,980.00 0.58EUR 943,750.00GE CAPITAL EURO FUND 5.25 08-15 18/05A2,000,000 2,146,780.00 1.21EUR 1,995,060.00GLENCORE FINANCE 5.25 06-13 11/10A500,000 520,247.50 0.29EUR 508,200.00GOLDMAN SACHS GROUP INC 4.50 11-12 09/05A1,000,000 962,890.00 0.54EUR 998,160.00HOLCIM FINANCE 9.00 09-14 26/03U2,000,000 2,258,780.00 1.27EUR 2,396,290.00IBERDROLA FINANZAS 5.125 08-13 09/05A1,950,000 2,000,680.50 1.13EUR 2,098,980.00IMPERIAL TOBACCO FINANCE PLC 4.375 06-13 22/11A2,000,000 2,071,270.00 1.17EUR 2,089,660.00IMPERIAL TOBACCO FINANCE PLC 7.25 08-14 15/09A2,000,000 2,234,580.00 1.26EUR 2,224,200.00ING GROEP NV 5.625 08-13 03/09A2,000,000 2,070,030.00 1.17EUR 2,118,400.00INTESA SAN PAOLO 4.00 10-18 08/11A500,000 428,577.50 0.24EUR 497,650.00INTESA SANPAOLO 5.375 08-13 19/12A2,050,000 2,050,768.75 1.15EUR 2,205,390.00JP MORGAN CHASE 4.375 07-14 30/01A3,000,000 3,095,580.00 1.74EUR 3,103,810.00KONINKLIJKE KPN NV 4.75 07-14 29/05A1,500,000 1,594,155.00 0.90EUR 1,429,200.00KONINKLIJKE KPN NV 6.50 08-16 15/01A1,500,000 1,718,220.00 0.97EUR 1,700,110.00KRAFT FOODS INC 6.25 08-15 20/03A2,000,000 2,226,700.00 1.25EUR 2,243,480.00LANXESS FINANCE BV-1- 7.75 09-14 09/04A1,800,000 2,004,678.00 1.13EUR 1,992,392.00LLOYDS TSB BANK EMTN 6.375 09-16 17/06A2,000,000 2,070,820.00 1.17EUR 2,072,600.00LVMH MOET HENNESSY 4.375 09-14 12/05A1,400,000 1,488,984.00 0.84EUR 1,395,072.00MERRILL LYNCH EMTN 4.625 03-13 02/10A1,500,000 1,449,705.00 0.82EUR 1,532,920.00MERRILL LYNCH EMTN 4.875 07-14 30/05A1,000,000 956,545.00 0.54EUR 980,453.00METRO AG 5.75 09-14 14/07A500,000 538,685.00 0.30EUR 499,470.00MORGAN STANLEY 4.50 11-16 23/02A1,000,000 926,160.00 0.52EUR 996,635.00MORGAN STANLEY EMTN 3.75 06-13 01/03A2,000,000 1,961,620.00 1.10EUR 2,025,000.00
Securities portfolio at 31/12/2011EURExpressed in
UBAM - CORPORATE EURO BOND
Number/nom. value Description Currency % of total
net assetsMarket valueCost
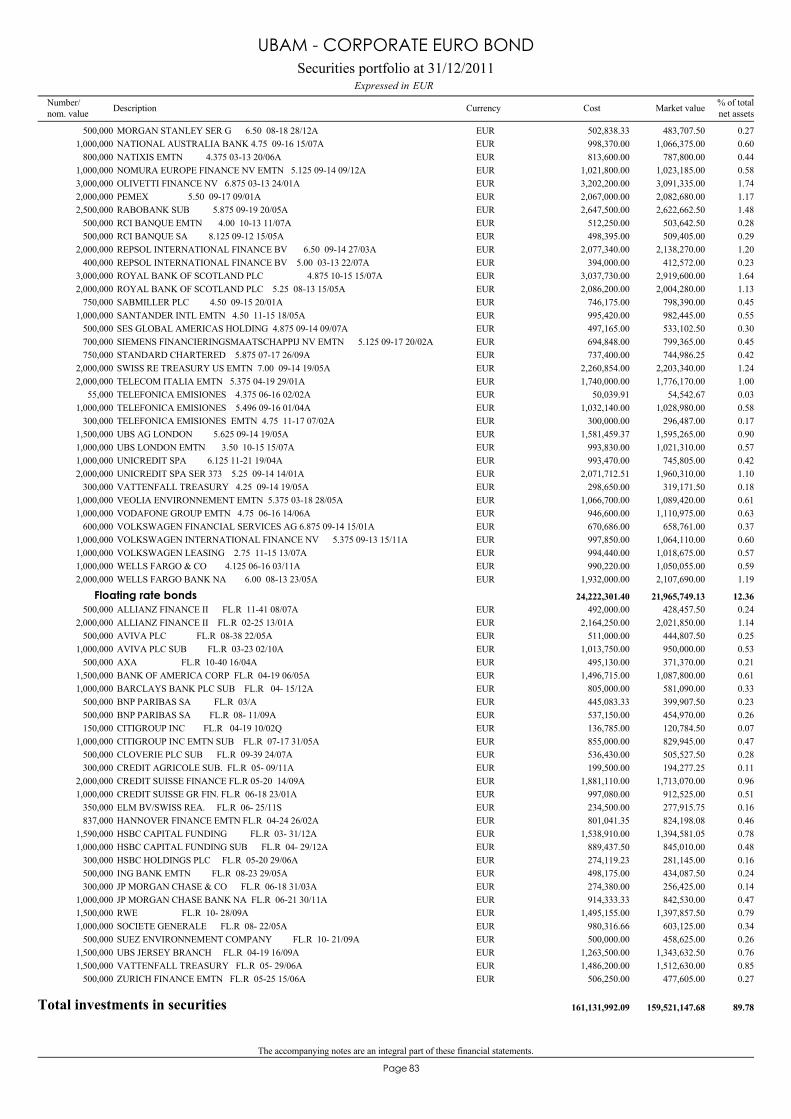
The accompanying notes are an integral part of these financial statements.
83Page
MORGAN STANLEY SER G 6.50 08-18 28/12A500,000 483,707.50 0.27EUR 502,838.33NATIONAL AUSTRALIA BANK 4.75 09-16 15/07A1,000,000 1,066,375.00 0.60EUR 998,370.00NATIXIS EMTN 4.375 03-13 20/06A800,000 787,800.00 0.44EUR 813,600.00NOMURA EUROPE FINANCE NV EMTN 5.125 09-14 09/12A1,000,000 1,023,185.00 0.58EUR 1,021,800.00OLIVETTI FINANCE NV 6.875 03-13 24/01A3,000,000 3,091,335.00 1.74EUR 3,202,200.00PEMEX 5.50 09-17 09/01A2,000,000 2,082,680.00 1.17EUR 2,067,000.00RABOBANK SUB 5.875 09-19 20/05A2,500,000 2,622,662.50 1.48EUR 2,647,500.00RCI BANQUE EMTN 4.00 10-13 11/07A500,000 503,642.50 0.28EUR 512,250.00RCI BANQUE SA 8.125 09-12 15/05A500,000 509,405.00 0.29EUR 498,395.00REPSOL INTERNATIONAL FINANCE BV 6.50 09-14 27/03A2,000,000 2,138,270.00 1.20EUR 2,077,340.00REPSOL INTERNATIONAL FINANCE BV 5.00 03-13 22/07A400,000 412,572.00 0.23EUR 394,000.00ROYAL BANK OF SCOTLAND PLC 4.875 10-15 15/07A3,000,000 2,919,600.00 1.64EUR 3,037,730.00ROYAL BANK OF SCOTLAND PLC 5.25 08-13 15/05A2,000,000 2,004,280.00 1.13EUR 2,086,200.00SABMILLER PLC 4.50 09-15 20/01A750,000 798,390.00 0.45EUR 746,175.00SANTANDER INTL EMTN 4.50 11-15 18/05A1,000,000 982,445.00 0.55EUR 995,420.00SES GLOBAL AMERICAS HOLDING 4.875 09-14 09/07A500,000 533,102.50 0.30EUR 497,165.00SIEMENS FINANCIERINGSMAATSCHAPPIJ NV EMTN 5.125 09-17 20/02A700,000 799,365.00 0.45EUR 694,848.00STANDARD CHARTERED 5.875 07-17 26/09A750,000 744,986.25 0.42EUR 737,400.00SWISS RE TREASURY US EMTN 7.00 09-14 19/05A2,000,000 2,203,340.00 1.24EUR 2,260,854.00TELECOM ITALIA EMTN 5.375 04-19 29/01A2,000,000 1,776,170.00 1.00EUR 1,740,000.00TELEFONICA EMISIONES 4.375 06-16 02/02A55,000 54,542.67 0.03EUR 50,039.91TELEFONICA EMISIONES 5.496 09-16 01/04A1,000,000 1,028,980.00 0.58EUR 1,032,140.00TELEFONICA EMISIONES EMTN 4.75 11-17 07/02A300,000 296,487.00 0.17EUR 300,000.00UBS AG LONDON 5.625 09-14 19/05A1,500,000 1,595,265.00 0.90EUR 1,581,459.37UBS LONDON EMTN 3.50 10-15 15/07A1,000,000 1,021,310.00 0.57EUR 993,830.00UNICREDIT SPA 6.125 11-21 19/04A1,000,000 745,805.00 0.42EUR 993,470.00UNICREDIT SPA SER 373 5.25 09-14 14/01A2,000,000 1,960,310.00 1.10EUR 2,071,712.51VATTENFALL TREASURY 4.25 09-14 19/05A300,000 319,171.50 0.18EUR 298,650.00VEOLIA ENVIRONNEMENT EMTN 5.375 03-18 28/05A1,000,000 1,089,420.00 0.61EUR 1,066,700.00VODAFONE GROUP EMTN 4.75 06-16 14/06A1,000,000 1,110,975.00 0.63EUR 946,600.00VOLKSWAGEN FINANCIAL SERVICES AG 6.875 09-14 15/01A600,000 658,761.00 0.37EUR 670,686.00VOLKSWAGEN INTERNATIONAL FINANCE NV 5.375 09-13 15/11A1,000,000 1,064,110.00 0.60EUR 997,850.00VOLKSWAGEN LEASING 2.75 11-15 13/07A1,000,000 1,018,675.00 0.57EUR 994,440.00WELLS FARGO & CO 4.125 06-16 03/11A1,000,000 1,050,055.00 0.59EUR 990,220.00WELLS FARGO BANK NA 6.00 08-13 23/05A2,000,000 2,107,690.00 1.19EUR 1,932,000.00
ALLIANZ FINANCE II FL.R 11-41 08/07A500,000 428,457.50 0.24EUR 492,000.00Floating rate bonds 21,965,749.13 12.3624,222,301.40
ALLIANZ FINANCE II FL.R 02-25 13/01A2,000,000 2,021,850.00 1.14EUR 2,164,250.00AVIVA PLC FL.R 08-38 22/05A500,000 444,807.50 0.25EUR 511,000.00AVIVA PLC SUB FL.R 03-23 02/10A1,000,000 950,000.00 0.53EUR 1,013,750.00AXA FL.R 10-40 16/04A500,000 371,370.00 0.21EUR 495,130.00BANK OF AMERICA CORP FL.R 04-19 06/05A1,500,000 1,087,800.00 0.61EUR 1,496,715.00BARCLAYS BANK PLC SUB FL.R 04- 15/12A1,000,000 581,090.00 0.33EUR 805,000.00BNP PARIBAS SA FL.R 03/A500,000 399,907.50 0.23EUR 445,083.33BNP PARIBAS SA FL.R 08- 11/09A500,000 454,970.00 0.26EUR 537,150.00CITIGROUP INC FL.R 04-19 10/02Q150,000 120,784.50 0.07EUR 136,785.00CITIGROUP INC EMTN SUB FL.R 07-17 31/05A1,000,000 829,945.00 0.47EUR 855,000.00CLOVERIE PLC SUB FL.R 09-39 24/07A500,000 505,527.50 0.28EUR 536,430.00CREDIT AGRICOLE SUB. FL.R 05- 09/11A300,000 194,277.25 0.11EUR 199,500.00CREDIT SUISSE FINANCE FL.R 05-20 14/09A2,000,000 1,713,070.00 0.96EUR 1,881,110.00CREDIT SUISSE GR FIN. FL.R 06-18 23/01A1,000,000 912,525.00 0.51EUR 997,080.00ELM BV/SWISS REA. FL.R 06- 25/11S350,000 277,915.75 0.16EUR 234,500.00HANNOVER FINANCE EMTN FL.R 04-24 26/02A837,000 824,198.08 0.46EUR 801,041.35HSBC CAPITAL FUNDING FL.R 03- 31/12A1,590,000 1,394,581.05 0.78EUR 1,538,910.00HSBC CAPITAL FUNDING SUB FL.R 04- 29/12A1,000,000 845,010.00 0.48EUR 889,437.50HSBC HOLDINGS PLC FL.R 05-20 29/06A300,000 281,145.00 0.16EUR 274,119.23ING BANK EMTN FL.R 08-23 29/05A500,000 434,087.50 0.24EUR 498,175.00JP MORGAN CHASE & CO FL.R 06-18 31/03A300,000 256,425.00 0.14EUR 274,380.00JP MORGAN CHASE BANK NA FL.R 06-21 30/11A1,000,000 842,530.00 0.47EUR 914,333.33RWE FL.R 10- 28/09A1,500,000 1,397,857.50 0.79EUR 1,495,155.00SOCIETE GENERALE FL.R 08- 22/05A1,000,000 603,125.00 0.34EUR 980,316.66SUEZ ENVIRONNEMENT COMPANY FL.R 10- 21/09A500,000 458,625.00 0.26EUR 500,000.00UBS JERSEY BRANCH FL.R 04-19 16/09A1,500,000 1,343,632.50 0.76EUR 1,263,500.00VATTENFALL TREASURY FL.R 05- 29/06A1,500,000 1,512,630.00 0.85EUR 1,486,200.00ZURICH FINANCE EMTN FL.R 05-25 15/06A500,000 477,605.00 0.27EUR 506,250.00
Total investments in securities 159,521,147.68 89.78161,131,992.09
Securities portfolio at 31/12/2011EURExpressed in
UBAM - CORPORATE EURO BOND
Number/nom. value Description Currency % of total
net assetsMarket valueCost
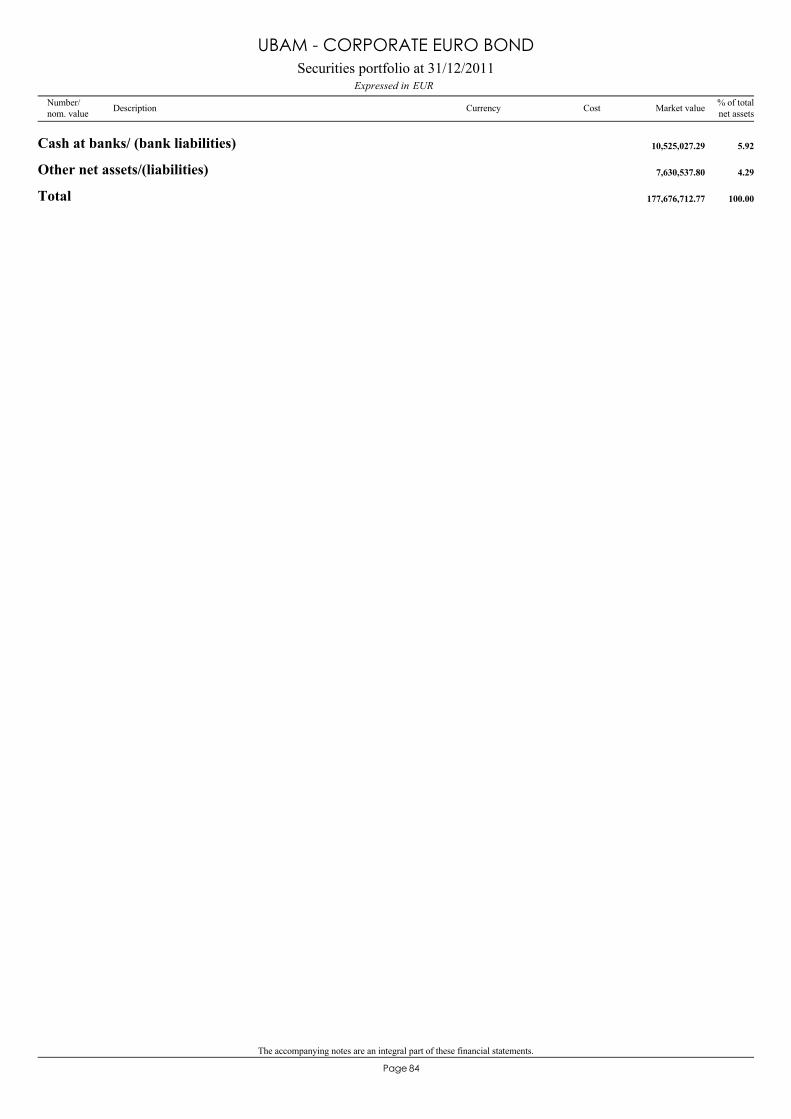
The accompanying notes are an integral part of these financial statements.
84Page
Cash at banks/ (bank liabilities) 10,525,027.29 5.92
Other net assets/(liabilities) 7,630,537.80 4.29
Total 177,676,712.77 100.00
Securities portfolio at 31/12/2011EURExpressed in
UBAM - CORPORATE EURO BOND
Number/nom. value Description Currency % of total
net assetsMarket valueCost
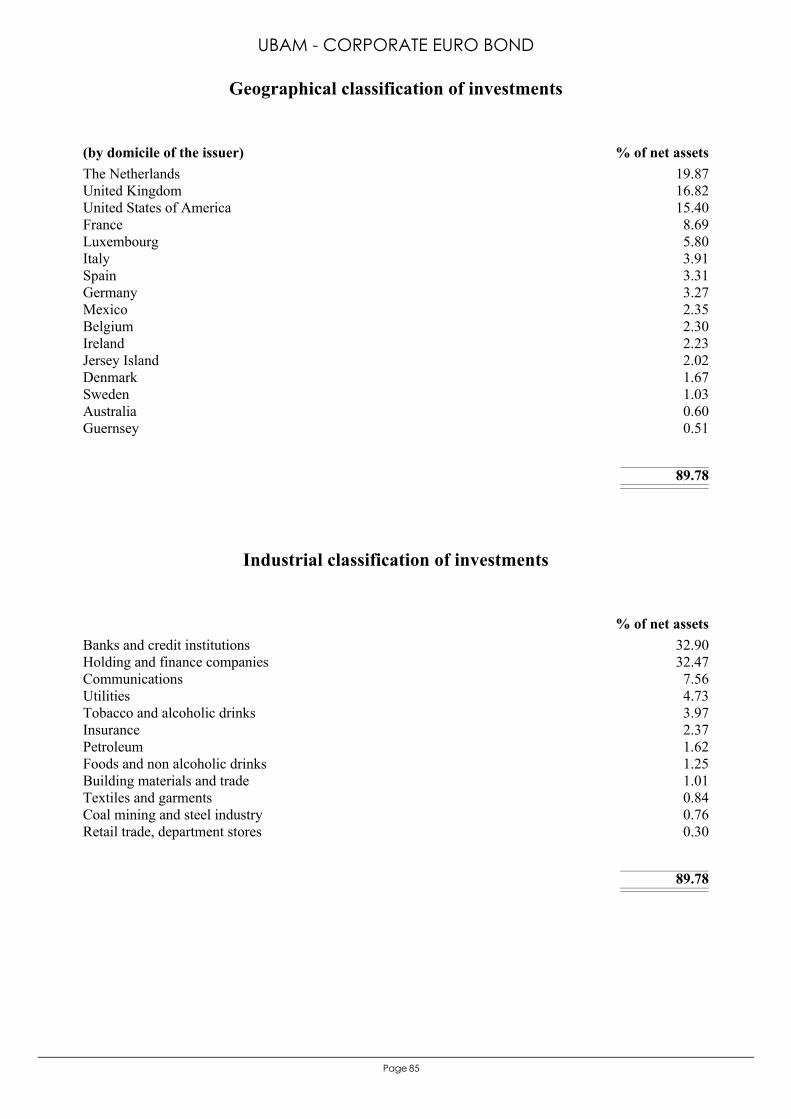
85Page
The Netherlands 19.87United Kingdom 16.82United States of America 15.40France 8.69Luxembourg 5.80Italy 3.91Spain 3.31Germany 3.27Mexico 2.35Belgium 2.30Ireland 2.23Jersey Island 2.02Denmark 1.67Sweden 1.03Australia 0.60Guernsey 0.51
89.78
(by domicile of the issuer) % of net assets
Geographical classification of investments
UBAM - CORPORATE EURO BOND
Banks and credit institutions 32.90Holding and finance companies 32.47Communications 7.56Utilities 4.73Tobacco and alcoholic drinks 3.97Insurance 2.37Petroleum 1.62Foods and non alcoholic drinks 1.25Building materials and trade 1.01Textiles and garments 0.84Coal mining and steel industry 0.76Retail trade, department stores 0.30
89.78
% of net assets
Industrial classification of investments
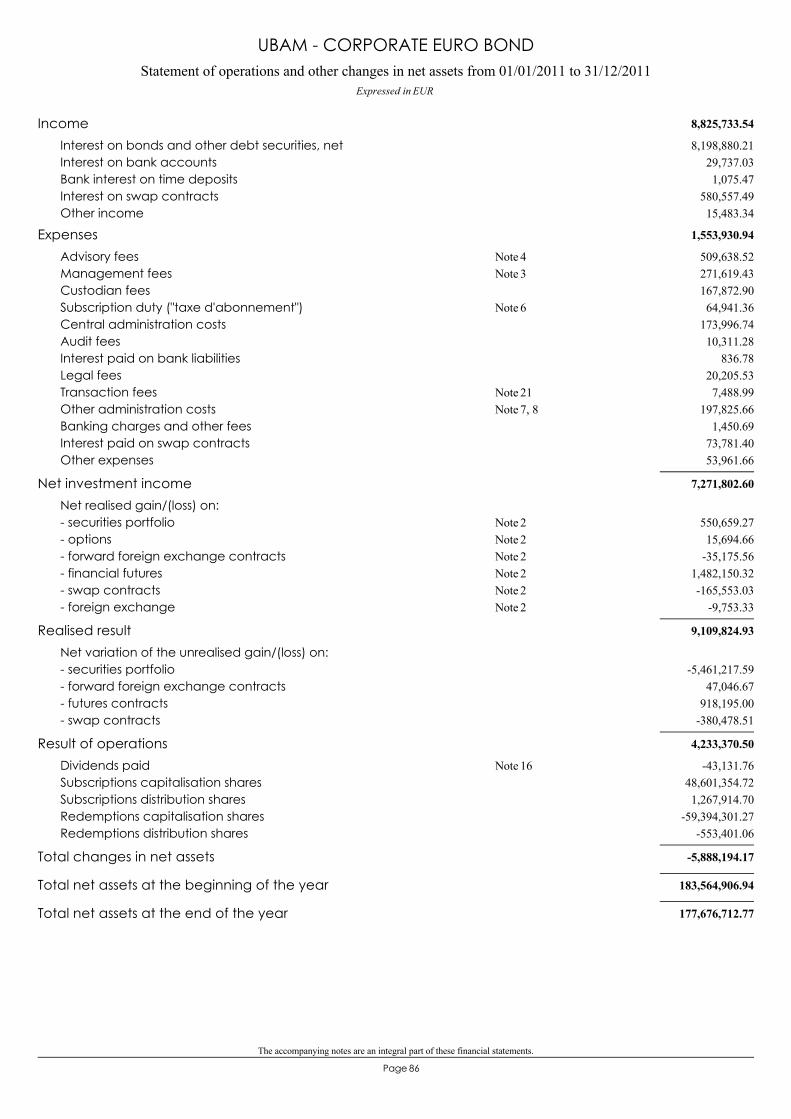
The accompanying notes are an integral part of these financial statements.
86Page
Statement of operations and other changes in net assets from 01/01/2011 to 31/12/2011Expressed in EUR
UBAM - CORPORATE EURO BOND
8,825,733.54Income8,198,880.21Interest on bonds and other debt securities, net
29,737.03Interest on bank accounts1,075.47Bank interest on time deposits
580,557.49Interest on swap contracts15,483.34Other income
1,553,930.94Expenses509,638.52Advisory fees 4Note271,619.43Management fees 3Note167,872.90Custodian fees64,941.36Subscription duty ("taxe d'abonnement") 6Note
173,996.74Central administration costs10,311.28Audit fees
836.78Interest paid on bank liabilities20,205.53Legal fees7,488.99Transaction fees 21Note
197,825.66Other administration costs 7, 8Note1,450.69Banking charges and other fees
73,781.40Interest paid on swap contracts53,961.66Other expenses
7,271,802.60Net investment incomeNet realised gain/(loss) on:
550,659.27- securities portfolio 2Note15,694.66- options 2Note
-35,175.56- forward foreign exchange contracts 2Note1,482,150.32- financial futures 2Note-165,553.03- swap contracts 2Note
-9,753.33- foreign exchange 2Note
9,109,824.93Realised resultNet variation of the unrealised gain/(loss) on:
-5,461,217.59- securities portfolio47,046.67- forward foreign exchange contracts
918,195.00- futures contracts-380,478.51- swap contracts
4,233,370.50Result of operations-43,131.76Dividends paid 16Note
48,601,354.72Subscriptions capitalisation shares1,267,914.70Subscriptions distribution shares
-59,394,301.27Redemptions capitalisation shares-553,401.06Redemptions distribution shares
-5,888,194.17Total changes in net assets
183,564,906.94Total net assets at the beginning of the year
177,676,712.77Total net assets at the end of the year
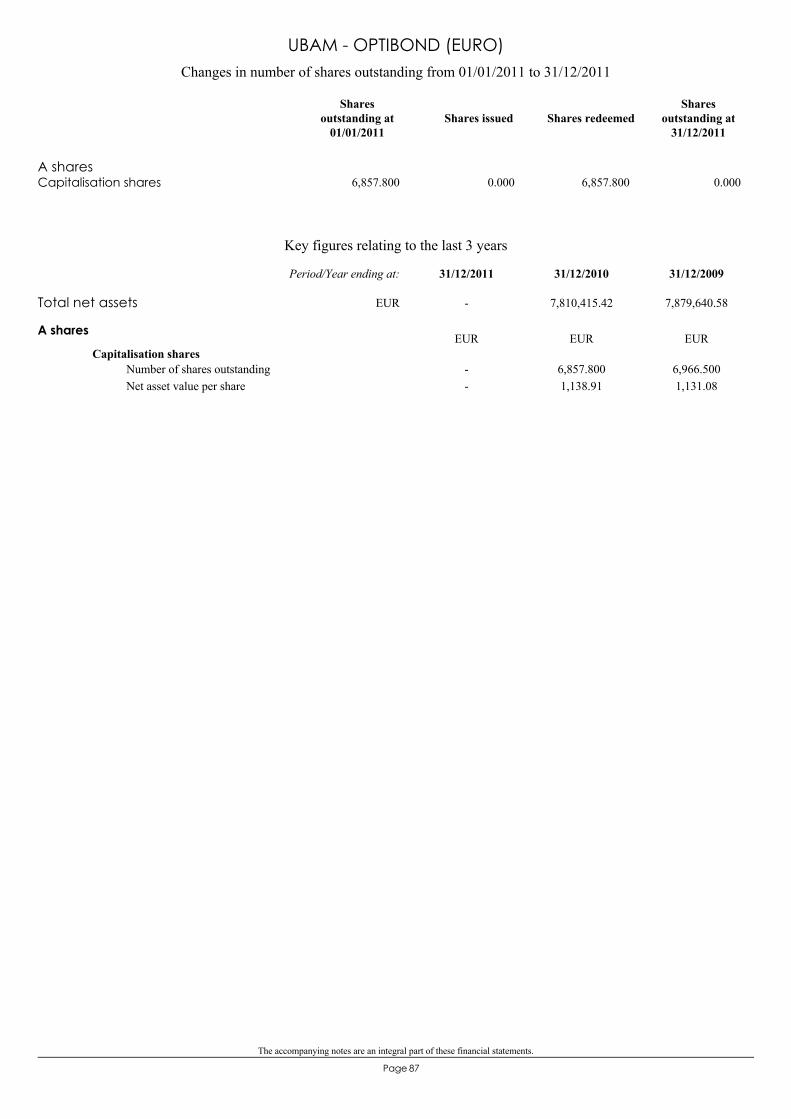
The accompanying notes are an integral part of these financial statements.
87Page
A sharesCapitalisation shares 6,857.800 0.000 6,857.800 0.000
Changes in number of shares outstanding from 01/01/2011 to 31/12/2011
Shares issued Shares redeemedShares
outstanding at31/12/2011
Sharesoutstanding at
01/01/2011
UBAM - OPTIBOND (EURO)
Key figures relating to the last 3 years
A shares
Capitalisation shares--
6,857.8001,138.91
6,966.5001,131.08
Number of shares outstandingNet asset value per share
EUR EUR EUR
Total net assets - 7,810,415.42 7,879,640.58
31/12/200931/12/201031/12/2011Period/Year ending at:
EUR
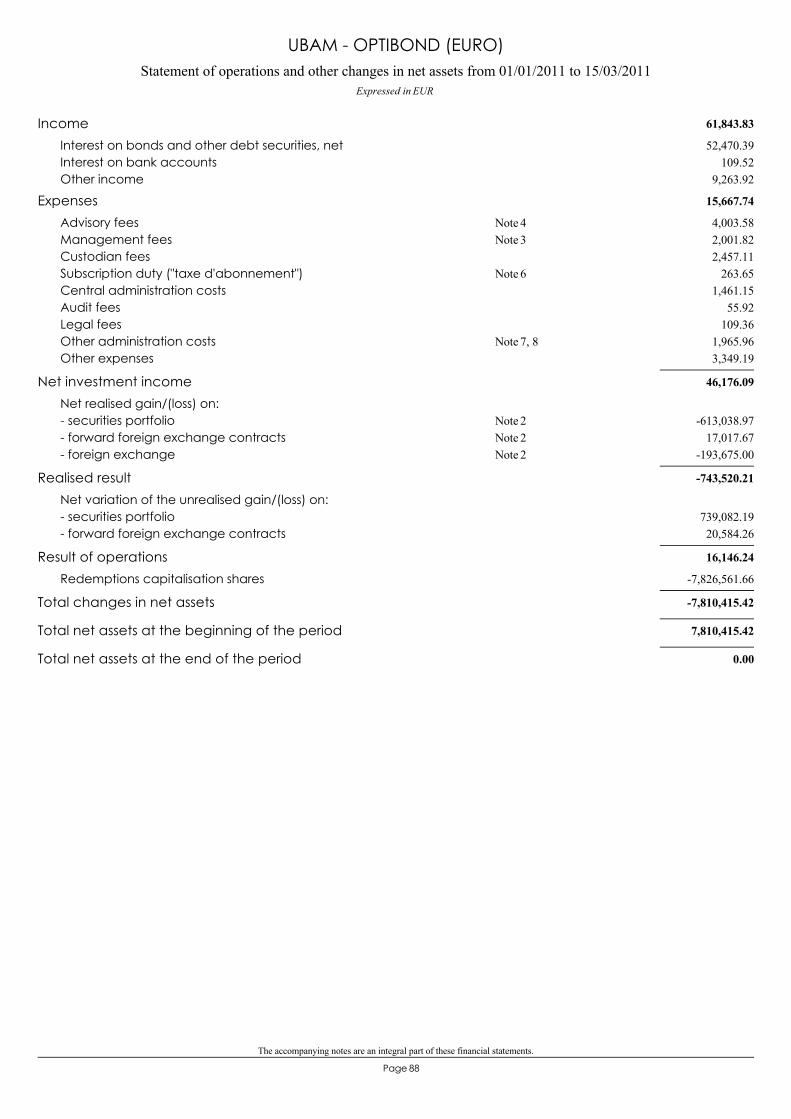
The accompanying notes are an integral part of these financial statements.
88Page
Statement of operations and other changes in net assets from 01/01/2011 to 15/03/2011Expressed in EUR
UBAM - OPTIBOND (EURO)
61,843.83Income52,470.39Interest on bonds and other debt securities, net
109.52Interest on bank accounts9,263.92Other income
15,667.74Expenses4,003.58Advisory fees 4Note2,001.82Management fees 3Note2,457.11Custodian fees
263.65Subscription duty ("taxe d'abonnement") 6Note1,461.15Central administration costs
55.92Audit fees109.36Legal fees
1,965.96Other administration costs 7, 8Note3,349.19Other expenses
46,176.09Net investment incomeNet realised gain/(loss) on:
-613,038.97- securities portfolio 2Note17,017.67- forward foreign exchange contracts 2Note
-193,675.00- foreign exchange 2Note
-743,520.21Realised resultNet variation of the unrealised gain/(loss) on:
739,082.19- securities portfolio20,584.26- forward foreign exchange contracts
16,146.24Result of operations-7,826,561.66Redemptions capitalisation shares
-7,810,415.42Total changes in net assets
7,810,415.42Total net assets at the beginning of the period
0.00Total net assets at the end of the period
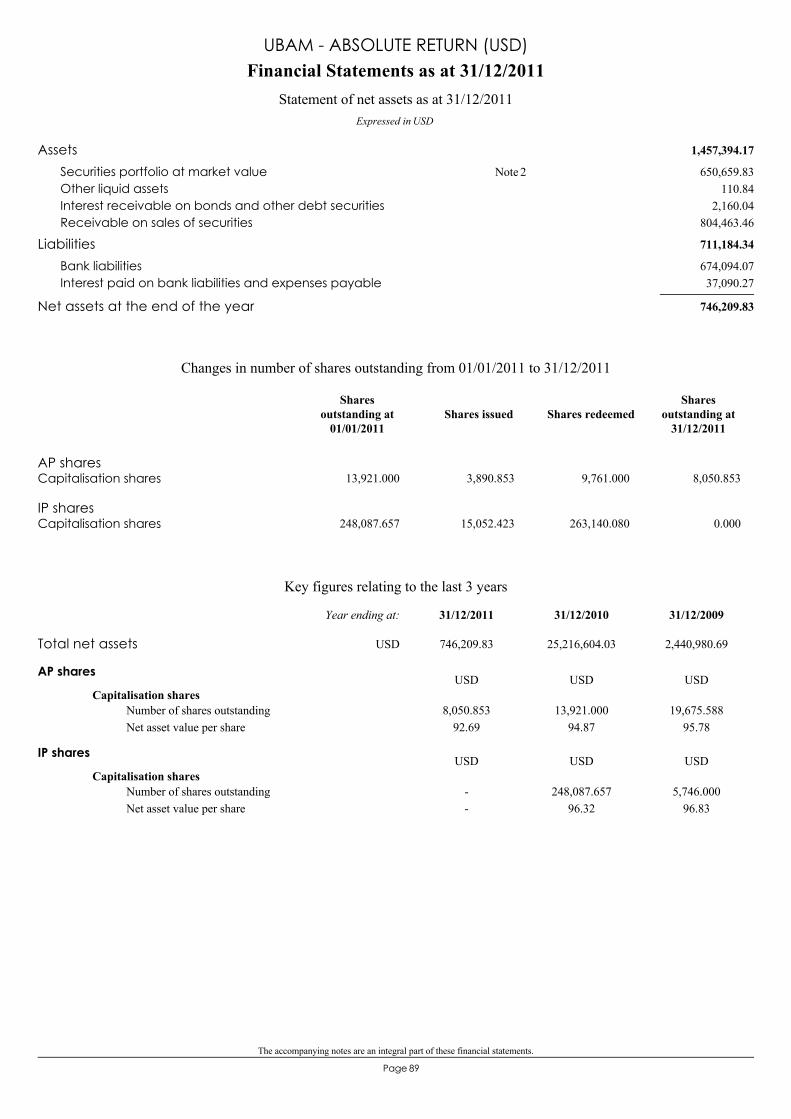
The accompanying notes are an integral part of these financial statements.
89Page
1,457,394.17Assets650,659.83Securities portfolio at market value 2Note
110.84Other liquid assets2,160.04Interest receivable on bonds and other debt securities
804,463.46Receivable on sales of securities
711,184.34Liabilities674,094.07Bank liabilities37,090.27Interest paid on bank liabilities and expenses payable
746,209.83Net assets at the end of the year
Financial Statements as at 31/12/2011
Expressed in USD
Statement of net assets as at 31/12/2011
UBAM - ABSOLUTE RETURN (USD)
AP sharesCapitalisation shares 13,921.000 3,890.853 9,761.000 8,050.853
IP sharesCapitalisation shares 248,087.657 15,052.423 263,140.080 0.000
Changes in number of shares outstanding from 01/01/2011 to 31/12/2011
Shares issued Shares redeemedShares
outstanding at31/12/2011
Sharesoutstanding at
01/01/2011
Key figures relating to the last 3 years
AP shares
Capitalisation shares8,050.853
92.6913,921.000
94.8719,675.588
95.78Number of shares outstandingNet asset value per share
USD USD USD
IP shares
Capitalisation shares--
248,087.65796.32
5,746.00096.83
Number of shares outstandingNet asset value per share
USD USD USD
Total net assets 746,209.83 25,216,604.03 2,440,980.69
31/12/200931/12/201031/12/2011Year ending at:
USD
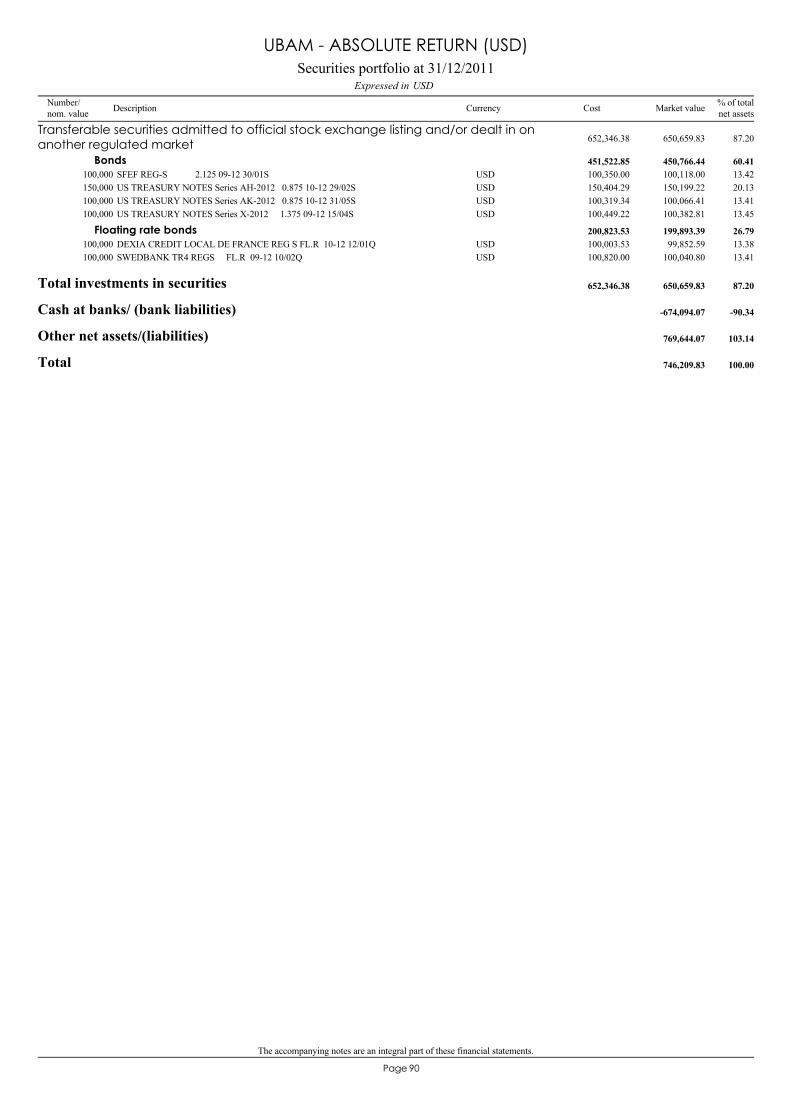
The accompanying notes are an integral part of these financial statements.
90Page
SFEF REG-S 2.125 09-12 30/01S100,000 100,118.00 13.42USD 100,350.00
Transferable securities admitted to official stock exchange listing and/or dealt in onanother regulated market 650,659.83 87.20652,346.38
Bonds 450,766.44 60.41451,522.85
US TREASURY NOTES Series AH-2012 0.875 10-12 29/02S150,000 150,199.22 20.13USD 150,404.29US TREASURY NOTES Series AK-2012 0.875 10-12 31/05S100,000 100,066.41 13.41USD 100,319.34US TREASURY NOTES Series X-2012 1.375 09-12 15/04S100,000 100,382.81 13.45USD 100,449.22
DEXIA CREDIT LOCAL DE FRANCE REG S FL.R 10-12 12/01Q100,000 99,852.59 13.38USD 100,003.53Floating rate bonds 199,893.39 26.79200,823.53
SWEDBANK TR4 REGS FL.R 09-12 10/02Q100,000 100,040.80 13.41USD 100,820.00
Total investments in securities 650,659.83 87.20652,346.38
Cash at banks/ (bank liabilities) -674,094.07 -90.34
Other net assets/(liabilities) 769,644.07 103.14
Total 746,209.83 100.00
Securities portfolio at 31/12/2011USDExpressed in
UBAM - ABSOLUTE RETURN (USD)
Number/nom. value Description Currency % of total
net assetsMarket valueCost
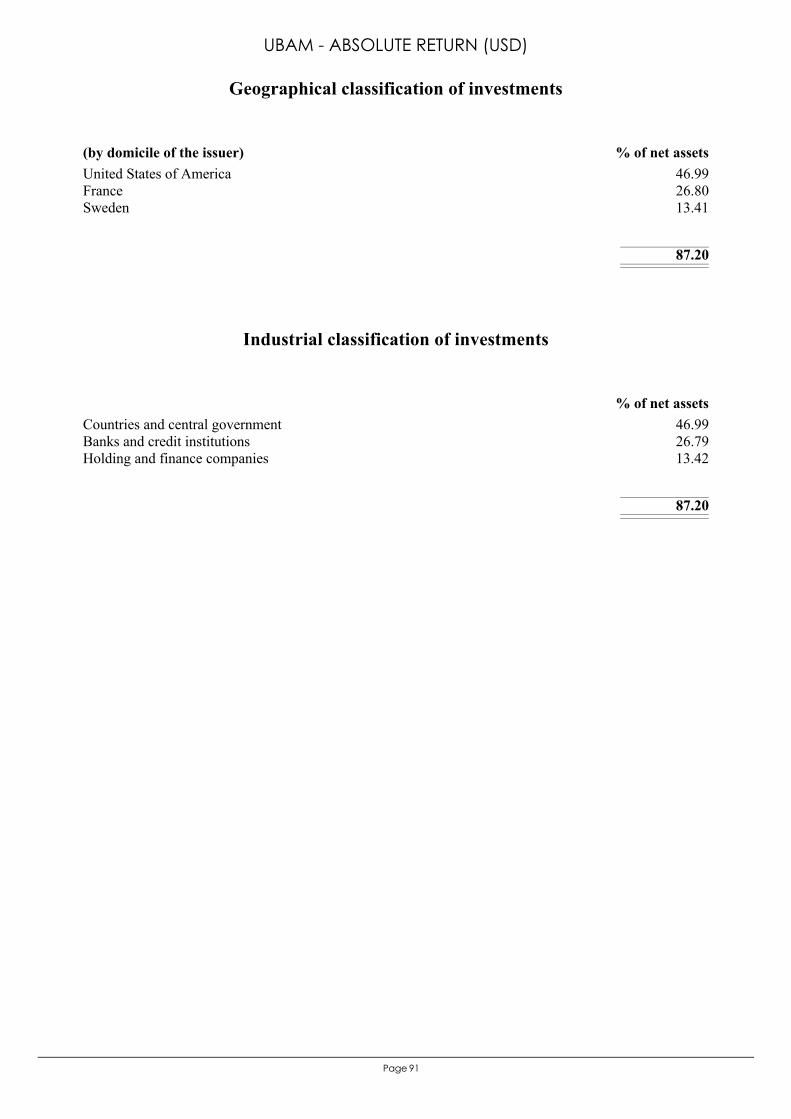
91Page
United States of America 46.99France 26.80Sweden 13.41
87.20
(by domicile of the issuer) % of net assets
Geographical classification of investments
UBAM - ABSOLUTE RETURN (USD)
Countries and central government 46.99Banks and credit institutions 26.79Holding and finance companies 13.42
87.20
% of net assets
Industrial classification of investments
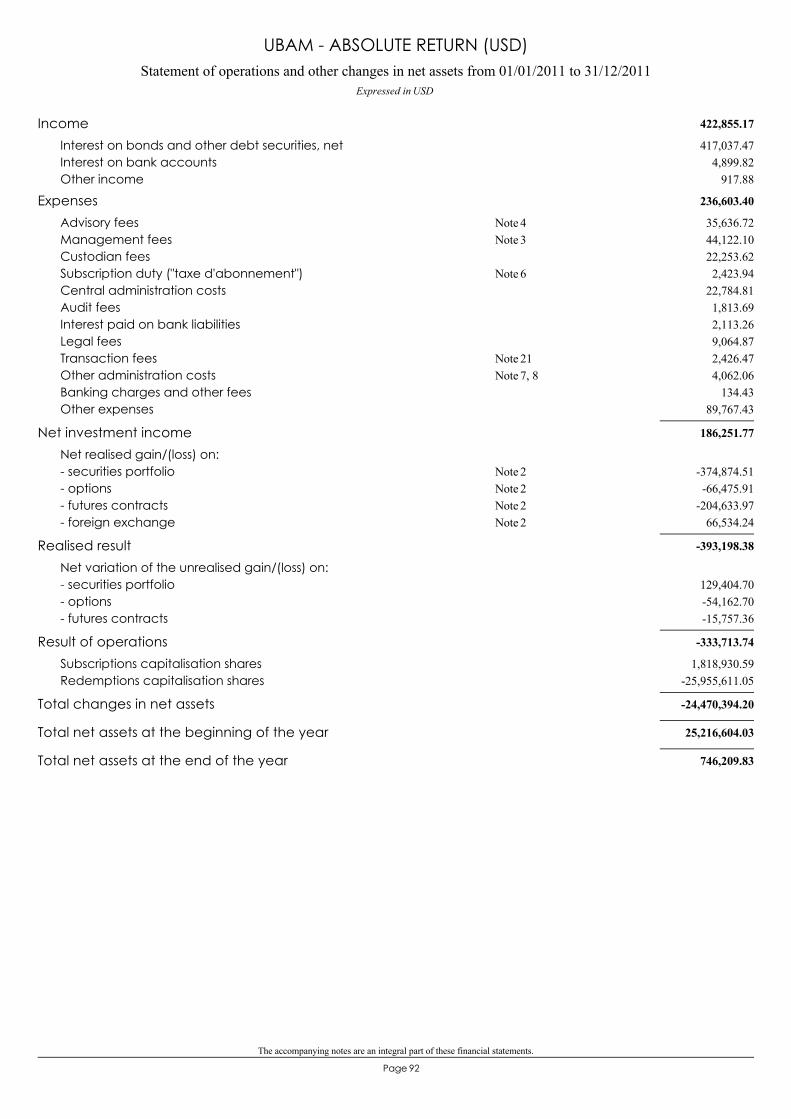
The accompanying notes are an integral part of these financial statements.
92Page
Statement of operations and other changes in net assets from 01/01/2011 to 31/12/2011Expressed in USD
UBAM - ABSOLUTE RETURN (USD)
422,855.17Income417,037.47Interest on bonds and other debt securities, net
4,899.82Interest on bank accounts917.88Other income
236,603.40Expenses35,636.72Advisory fees 4Note44,122.10Management fees 3Note22,253.62Custodian fees2,423.94Subscription duty ("taxe d'abonnement") 6Note
22,784.81Central administration costs1,813.69Audit fees2,113.26Interest paid on bank liabilities9,064.87Legal fees2,426.47Transaction fees 21Note4,062.06Other administration costs 7, 8Note
134.43Banking charges and other fees89,767.43Other expenses
186,251.77Net investment incomeNet realised gain/(loss) on:
-374,874.51- securities portfolio 2Note-66,475.91- options 2Note
-204,633.97- futures contracts 2Note66,534.24- foreign exchange 2Note
-393,198.38Realised resultNet variation of the unrealised gain/(loss) on:
129,404.70- securities portfolio-54,162.70- options-15,757.36- futures contracts
-333,713.74Result of operations1,818,930.59Subscriptions capitalisation shares
-25,955,611.05Redemptions capitalisation shares
-24,470,394.20Total changes in net assets
25,216,604.03Total net assets at the beginning of the year
746,209.83Total net assets at the end of the year
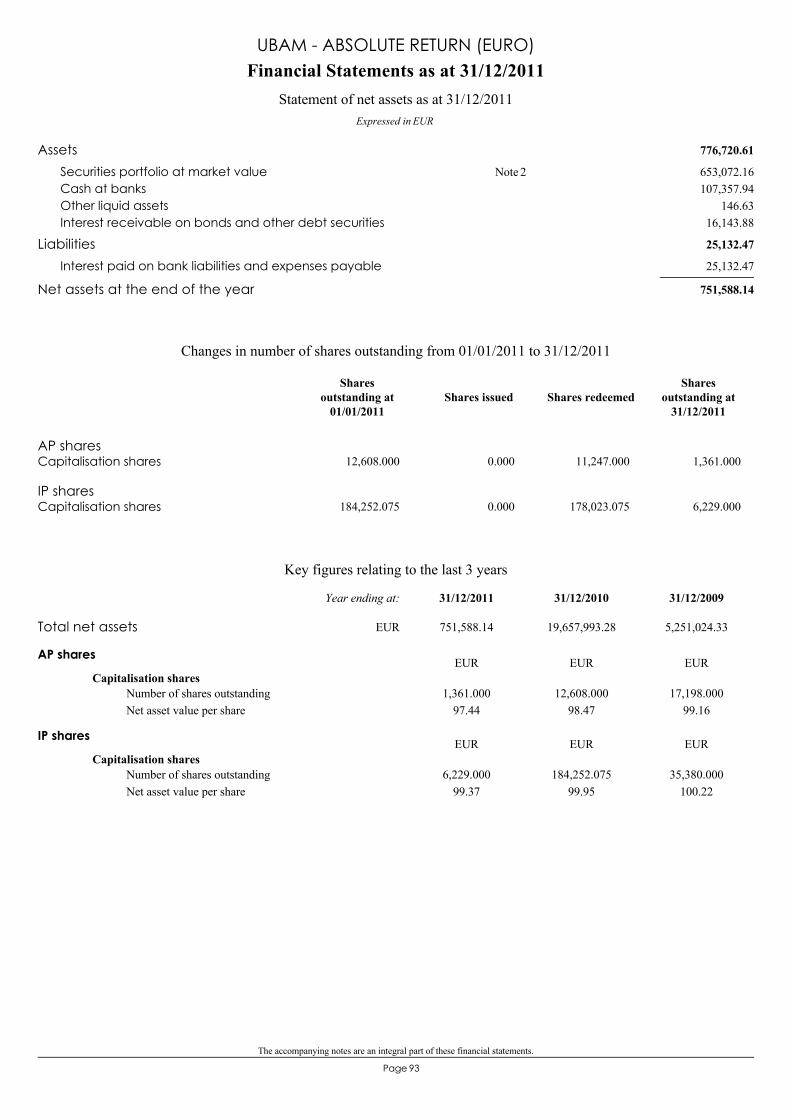
The accompanying notes are an integral part of these financial statements.
93Page
776,720.61Assets653,072.16Securities portfolio at market value 2Note107,357.94Cash at banks
146.63Other liquid assets16,143.88Interest receivable on bonds and other debt securities
25,132.47Liabilities25,132.47Interest paid on bank liabilities and expenses payable
751,588.14Net assets at the end of the year
Financial Statements as at 31/12/2011
Expressed in EUR
Statement of net assets as at 31/12/2011
UBAM - ABSOLUTE RETURN (EURO)
AP sharesCapitalisation shares 12,608.000 0.000 11,247.000 1,361.000
IP sharesCapitalisation shares 184,252.075 0.000 178,023.075 6,229.000
Changes in number of shares outstanding from 01/01/2011 to 31/12/2011
Shares issued Shares redeemedShares
outstanding at31/12/2011
Sharesoutstanding at
01/01/2011
Key figures relating to the last 3 years
AP shares
Capitalisation shares1,361.000
97.4412,608.000
98.4717,198.000
99.16Number of shares outstandingNet asset value per share
EUR EUR EUR
IP shares
Capitalisation shares6,229.000
99.37184,252.075
99.9535,380.000
100.22Number of shares outstandingNet asset value per share
EUR EUR EUR
Total net assets 751,588.14 19,657,993.28 5,251,024.33
31/12/200931/12/201031/12/2011Year ending at:
EUR
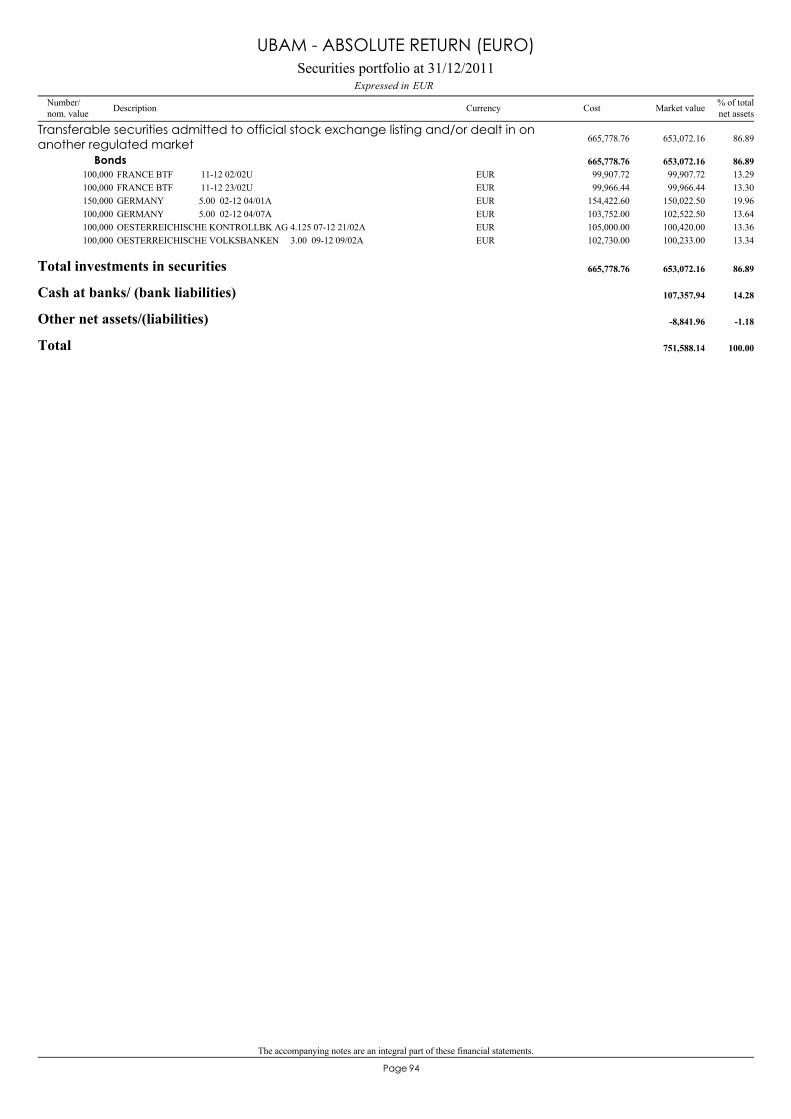
The accompanying notes are an integral part of these financial statements.
94Page
FRANCE BTF 11-12 02/02U100,000 99,907.72 13.29EUR 99,907.72
Transferable securities admitted to official stock exchange listing and/or dealt in onanother regulated market 653,072.16 86.89665,778.76
Bonds 653,072.16 86.89665,778.76
FRANCE BTF 11-12 23/02U100,000 99,966.44 13.30EUR 99,966.44GERMANY 5.00 02-12 04/01A150,000 150,022.50 19.96EUR 154,422.60GERMANY 5.00 02-12 04/07A100,000 102,522.50 13.64EUR 103,752.00OESTERREICHISCHE KONTROLLBK AG 4.125 07-12 21/02A100,000 100,420.00 13.36EUR 105,000.00OESTERREICHISCHE VOLKSBANKEN 3.00 09-12 09/02A100,000 100,233.00 13.34EUR 102,730.00
Total investments in securities 653,072.16 86.89665,778.76
Cash at banks/ (bank liabilities) 107,357.94 14.28
Other net assets/(liabilities) -8,841.96 -1.18
Total 751,588.14 100.00
Securities portfolio at 31/12/2011EURExpressed in
UBAM - ABSOLUTE RETURN (EURO)
Number/nom. value Description Currency % of total
net assetsMarket valueCost
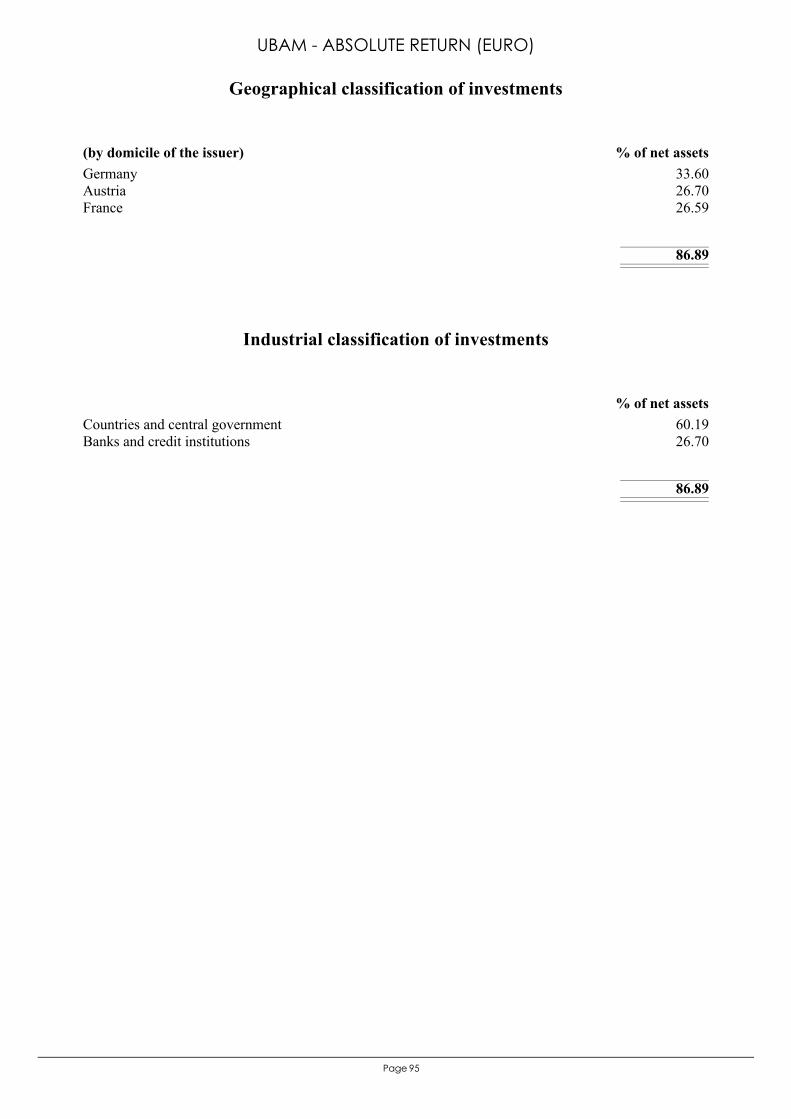
95Page
Germany 33.60Austria 26.70France 26.59
86.89
(by domicile of the issuer) % of net assets
Geographical classification of investments
UBAM - ABSOLUTE RETURN (EURO)
Countries and central government 60.19Banks and credit institutions 26.70
86.89
% of net assets
Industrial classification of investments
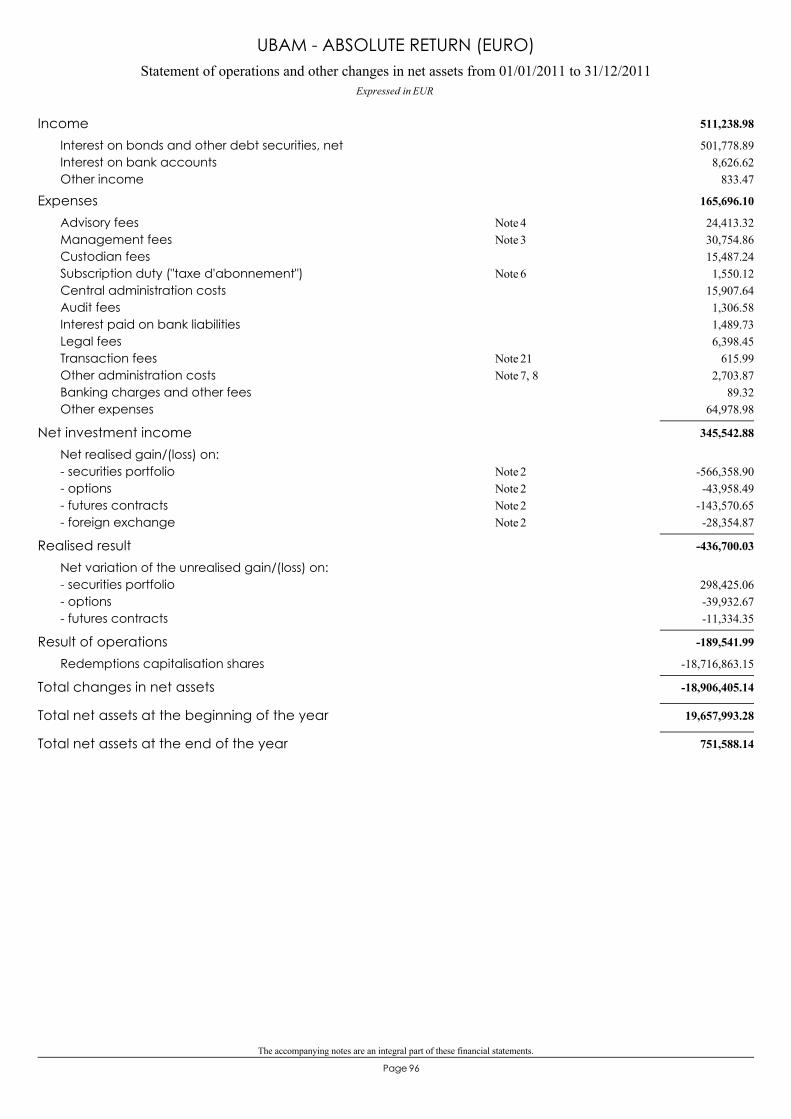
The accompanying notes are an integral part of these financial statements.
96Page
Statement of operations and other changes in net assets from 01/01/2011 to 31/12/2011Expressed in EUR
UBAM - ABSOLUTE RETURN (EURO)
511,238.98Income501,778.89Interest on bonds and other debt securities, net
8,626.62Interest on bank accounts833.47Other income
165,696.10Expenses24,413.32Advisory fees 4Note30,754.86Management fees 3Note15,487.24Custodian fees1,550.12Subscription duty ("taxe d'abonnement") 6Note
15,907.64Central administration costs1,306.58Audit fees1,489.73Interest paid on bank liabilities6,398.45Legal fees
615.99Transaction fees 21Note2,703.87Other administration costs 7, 8Note
89.32Banking charges and other fees64,978.98Other expenses
345,542.88Net investment incomeNet realised gain/(loss) on:
-566,358.90- securities portfolio 2Note-43,958.49- options 2Note
-143,570.65- futures contracts 2Note-28,354.87- foreign exchange 2Note
-436,700.03Realised resultNet variation of the unrealised gain/(loss) on:
298,425.06- securities portfolio-39,932.67- options-11,334.35- futures contracts
-189,541.99Result of operations-18,716,863.15Redemptions capitalisation shares
-18,906,405.14Total changes in net assets
19,657,993.28Total net assets at the beginning of the year
751,588.14Total net assets at the end of the year
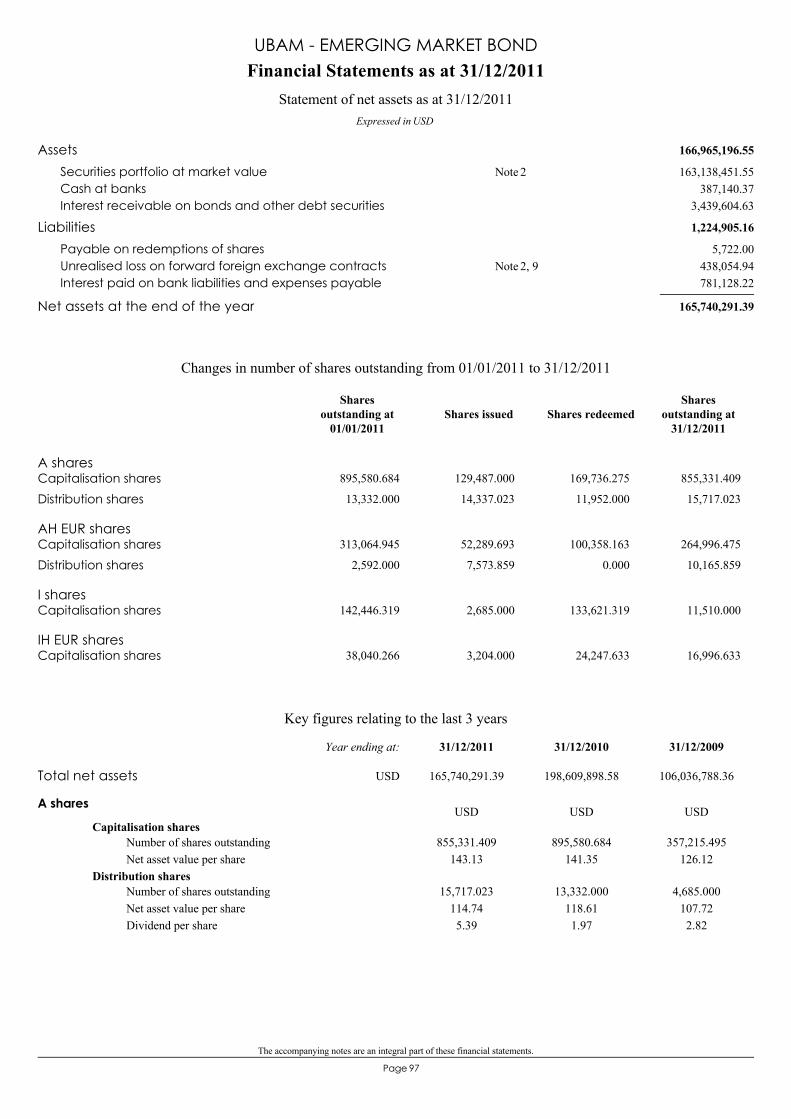
The accompanying notes are an integral part of these financial statements.
97Page
166,965,196.55Assets163,138,451.55Securities portfolio at market value 2Note
387,140.37Cash at banks3,439,604.63Interest receivable on bonds and other debt securities
1,224,905.16Liabilities5,722.00Payable on redemptions of shares
438,054.94Unrealised loss on forward foreign exchange contracts 2, 9Note781,128.22Interest paid on bank liabilities and expenses payable
165,740,291.39Net assets at the end of the year
Financial Statements as at 31/12/2011
Expressed in USD
Statement of net assets as at 31/12/2011
UBAM - EMERGING MARKET BOND
A sharesCapitalisation shares 895,580.684 129,487.000 169,736.275 855,331.409
Distribution shares 13,332.000 14,337.023 11,952.000 15,717.023
AH EUR sharesCapitalisation shares 313,064.945 52,289.693 100,358.163 264,996.475
Distribution shares 2,592.000 7,573.859 0.000 10,165.859
I sharesCapitalisation shares 142,446.319 2,685.000 133,621.319 11,510.000
IH EUR sharesCapitalisation shares 38,040.266 3,204.000 24,247.633 16,996.633
Changes in number of shares outstanding from 01/01/2011 to 31/12/2011
Shares issued Shares redeemedShares
outstanding at31/12/2011
Sharesoutstanding at
01/01/2011
Key figures relating to the last 3 years
A shares
Capitalisation shares855,331.409
143.13895,580.684
141.35357,215.495
126.12Number of shares outstandingNet asset value per share
Distribution shares15,717.023
114.745.39
13,332.000118.611.97
4,685.000107.722.82
Number of shares outstandingNet asset value per shareDividend per share
USD USD USD
Total net assets 165,740,291.39 198,609,898.58 106,036,788.36
31/12/200931/12/201031/12/2011Year ending at:
USD
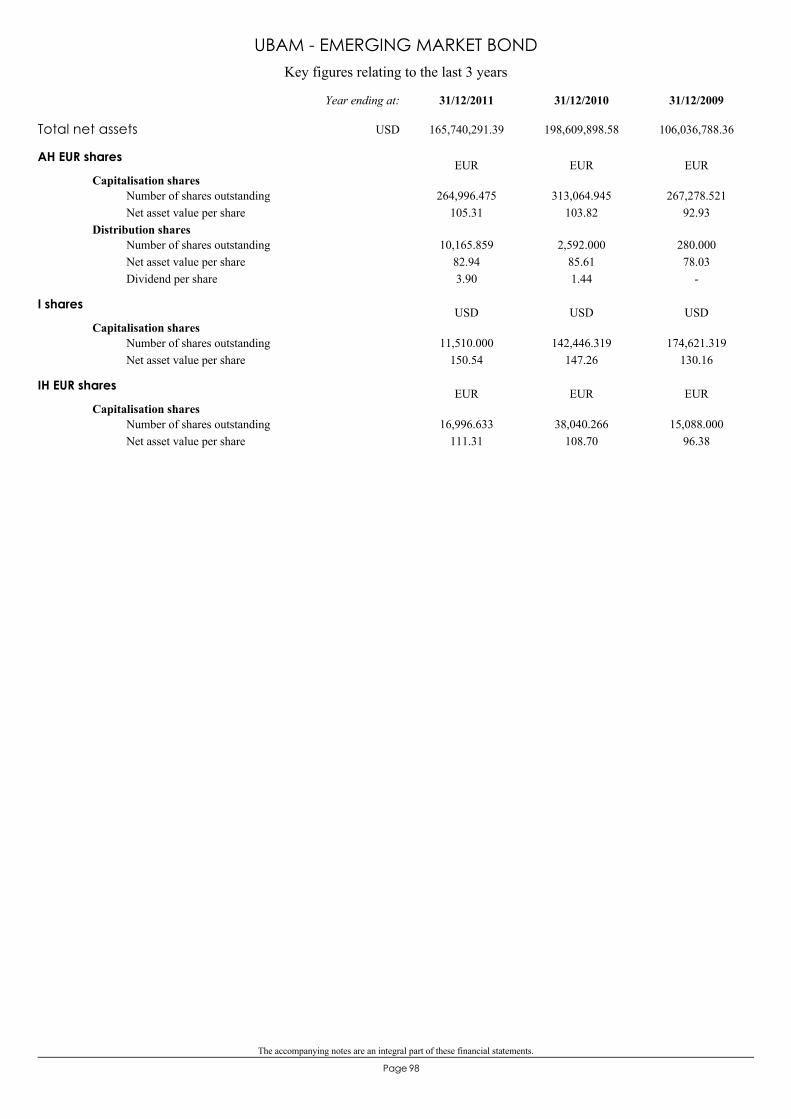
The accompanying notes are an integral part of these financial statements.
98Page
Key figures relating to the last 3 years
UBAM - EMERGING MARKET BOND
AH EUR shares
Capitalisation shares264,996.475
105.31313,064.945
103.82267,278.521
92.93Number of shares outstandingNet asset value per share
Distribution shares10,165.859
82.943.90
2,592.00085.611.44
280.00078.03
-
Number of shares outstandingNet asset value per shareDividend per share
EUR EUR EUR
I shares
Capitalisation shares11,510.000
150.54142,446.319
147.26174,621.319
130.16Number of shares outstandingNet asset value per share
USD USD USD
IH EUR shares
Capitalisation shares16,996.633
111.3138,040.266
108.7015,088.000
96.38Number of shares outstandingNet asset value per share
EUR EUR EUR
Total net assets 165,740,291.39 198,609,898.58 106,036,788.36
31/12/200931/12/201031/12/2011Year ending at:
USD
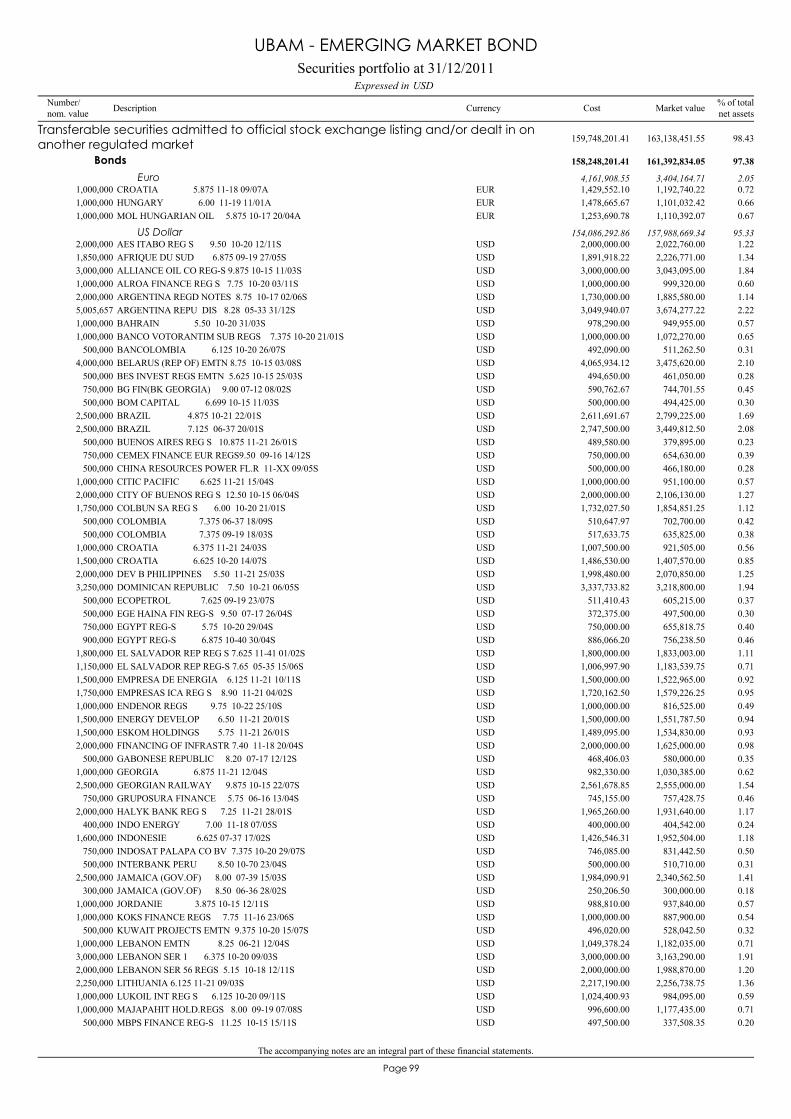
The accompanying notes are an integral part of these financial statements.
99Page
CROATIA 5.875 11-18 09/07A1,000,000 1,192,740.22 0.72EUR 1,429,552.10
Transferable securities admitted to official stock exchange listing and/or dealt in onanother regulated market 163,138,451.55 98.43159,748,201.41
Bonds 161,392,834.05 97.38158,248,201.41
Euro 3,404,164.71 2.054,161,908.55
HUNGARY 6.00 11-19 11/01A1,000,000 1,101,032.42 0.66EUR 1,478,665.67MOL HUNGARIAN OIL 5.875 10-17 20/04A1,000,000 1,110,392.07 0.67EUR 1,253,690.78
AES ITABO REG S 9.50 10-20 12/11S2,000,000 2,022,760.00 1.22USD 2,000,000.00US Dollar 157,988,669.34 95.33154,086,292.86
AFRIQUE DU SUD 6.875 09-19 27/05S1,850,000 2,226,771.00 1.34USD 1,891,918.22ALLIANCE OIL CO REG-S 9.875 10-15 11/03S3,000,000 3,043,095.00 1.84USD 3,000,000.00ALROA FINANCE REG S 7.75 10-20 03/11S1,000,000 999,320.00 0.60USD 1,000,000.00ARGENTINA REGD NOTES 8.75 10-17 02/06S2,000,000 1,885,580.00 1.14USD 1,730,000.00ARGENTINA REPU DIS 8.28 05-33 31/12S5,005,657 3,674,277.22 2.22USD 3,049,940.07BAHRAIN 5.50 10-20 31/03S1,000,000 949,955.00 0.57USD 978,290.00BANCO VOTORANTIM SUB REGS 7.375 10-20 21/01S1,000,000 1,072,270.00 0.65USD 1,000,000.00BANCOLOMBIA 6.125 10-20 26/07S500,000 511,262.50 0.31USD 492,090.00BELARUS (REP OF) EMTN 8.75 10-15 03/08S4,000,000 3,475,620.00 2.10USD 4,065,934.12BES INVEST REGS EMTN 5.625 10-15 25/03S500,000 461,050.00 0.28USD 494,650.00BG FIN(BK GEORGIA) 9.00 07-12 08/02S750,000 744,701.55 0.45USD 590,762.67BOM CAPITAL 6.699 10-15 11/03S500,000 494,425.00 0.30USD 500,000.00BRAZIL 4.875 10-21 22/01S2,500,000 2,799,225.00 1.69USD 2,611,691.67BRAZIL 7.125 06-37 20/01S2,500,000 3,449,812.50 2.08USD 2,747,500.00BUENOS AIRES REG S 10.875 11-21 26/01S500,000 379,895.00 0.23USD 489,580.00CEMEX FINANCE EUR REGS9.50 09-16 14/12S750,000 654,630.00 0.39USD 750,000.00CHINA RESOURCES POWER FL.R 11-XX 09/05S500,000 466,180.00 0.28USD 500,000.00CITIC PACIFIC 6.625 11-21 15/04S1,000,000 951,100.00 0.57USD 1,000,000.00CITY OF BUENOS REG S 12.50 10-15 06/04S2,000,000 2,106,130.00 1.27USD 2,000,000.00COLBUN SA REG S 6.00 10-20 21/01S1,750,000 1,854,851.25 1.12USD 1,732,027.50COLOMBIA 7.375 06-37 18/09S500,000 702,700.00 0.42USD 510,647.97COLOMBIA 7.375 09-19 18/03S500,000 635,825.00 0.38USD 517,633.75CROATIA 6.375 11-21 24/03S1,000,000 921,505.00 0.56USD 1,007,500.00CROATIA 6.625 10-20 14/07S1,500,000 1,407,570.00 0.85USD 1,486,530.00DEV B PHILIPPINES 5.50 11-21 25/03S2,000,000 2,070,850.00 1.25USD 1,998,480.00DOMINICAN REPUBLIC 7.50 10-21 06/05S3,250,000 3,218,800.00 1.94USD 3,337,733.82ECOPETROL 7.625 09-19 23/07S500,000 605,215.00 0.37USD 511,410.43EGE HAINA FIN REG-S 9.50 07-17 26/04S500,000 497,500.00 0.30USD 372,375.00EGYPT REG-S 5.75 10-20 29/04S750,000 655,818.75 0.40USD 750,000.00EGYPT REG-S 6.875 10-40 30/04S900,000 756,238.50 0.46USD 886,066.20EL SALVADOR REP REG S 7.625 11-41 01/02S1,800,000 1,833,003.00 1.11USD 1,800,000.00EL SALVADOR REP REG-S 7.65 05-35 15/06S1,150,000 1,183,539.75 0.71USD 1,006,997.90EMPRESA DE ENERGIA 6.125 11-21 10/11S1,500,000 1,522,965.00 0.92USD 1,500,000.00EMPRESAS ICA REG S 8.90 11-21 04/02S1,750,000 1,579,226.25 0.95USD 1,720,162.50ENDENOR REGS 9.75 10-22 25/10S1,000,000 816,525.00 0.49USD 1,000,000.00ENERGY DEVELOP 6.50 11-21 20/01S1,500,000 1,551,787.50 0.94USD 1,500,000.00ESKOM HOLDINGS 5.75 11-21 26/01S1,500,000 1,534,830.00 0.93USD 1,489,095.00FINANCING OF INFRASTR 7.40 11-18 20/04S2,000,000 1,625,000.00 0.98USD 2,000,000.00GABONESE REPUBLIC 8.20 07-17 12/12S500,000 580,000.00 0.35USD 468,406.03GEORGIA 6.875 11-21 12/04S1,000,000 1,030,385.00 0.62USD 982,330.00GEORGIAN RAILWAY 9.875 10-15 22/07S2,500,000 2,555,000.00 1.54USD 2,561,678.85GRUPOSURA FINANCE 5.75 06-16 13/04S750,000 757,428.75 0.46USD 745,155.00HALYK BANK REG S 7.25 11-21 28/01S2,000,000 1,931,640.00 1.17USD 1,965,260.00INDO ENERGY 7.00 11-18 07/05S400,000 404,542.00 0.24USD 400,000.00INDONESIE 6.625 07-37 17/02S1,600,000 1,952,504.00 1.18USD 1,426,546.31INDOSAT PALAPA CO BV 7.375 10-20 29/07S750,000 831,442.50 0.50USD 746,085.00INTERBANK PERU 8.50 10-70 23/04S500,000 510,710.00 0.31USD 500,000.00JAMAICA (GOV.OF) 8.00 07-39 15/03S2,500,000 2,340,562.50 1.41USD 1,984,090.91JAMAICA (GOV.OF) 8.50 06-36 28/02S300,000 300,000.00 0.18USD 250,206.50JORDANIE 3.875 10-15 12/11S1,000,000 937,840.00 0.57USD 988,810.00KOKS FINANCE REGS 7.75 11-16 23/06S1,000,000 887,900.00 0.54USD 1,000,000.00KUWAIT PROJECTS EMTN 9.375 10-20 15/07S500,000 528,042.50 0.32USD 496,020.00LEBANON EMTN 8.25 06-21 12/04S1,000,000 1,182,035.00 0.71USD 1,049,378.24LEBANON SER 1 6.375 10-20 09/03S3,000,000 3,163,290.00 1.91USD 3,000,000.00LEBANON SER 56 REGS 5.15 10-18 12/11S2,000,000 1,988,870.00 1.20USD 2,000,000.00LITHUANIA 6.125 11-21 09/03S2,250,000 2,256,738.75 1.36USD 2,217,190.00LUKOIL INT REG S 6.125 10-20 09/11S1,000,000 984,095.00 0.59USD 1,024,400.93MAJAPAHIT HOLD.REGS 8.00 09-19 07/08S1,000,000 1,177,435.00 0.71USD 996,600.00MBPS FINANCE REG-S 11.25 10-15 15/11S500,000 337,508.35 0.20USD 497,500.00
Securities portfolio at 31/12/2011USDExpressed in
UBAM - EMERGING MARKET BOND
Number/nom. value Description Currency % of total
net assetsMarket valueCost
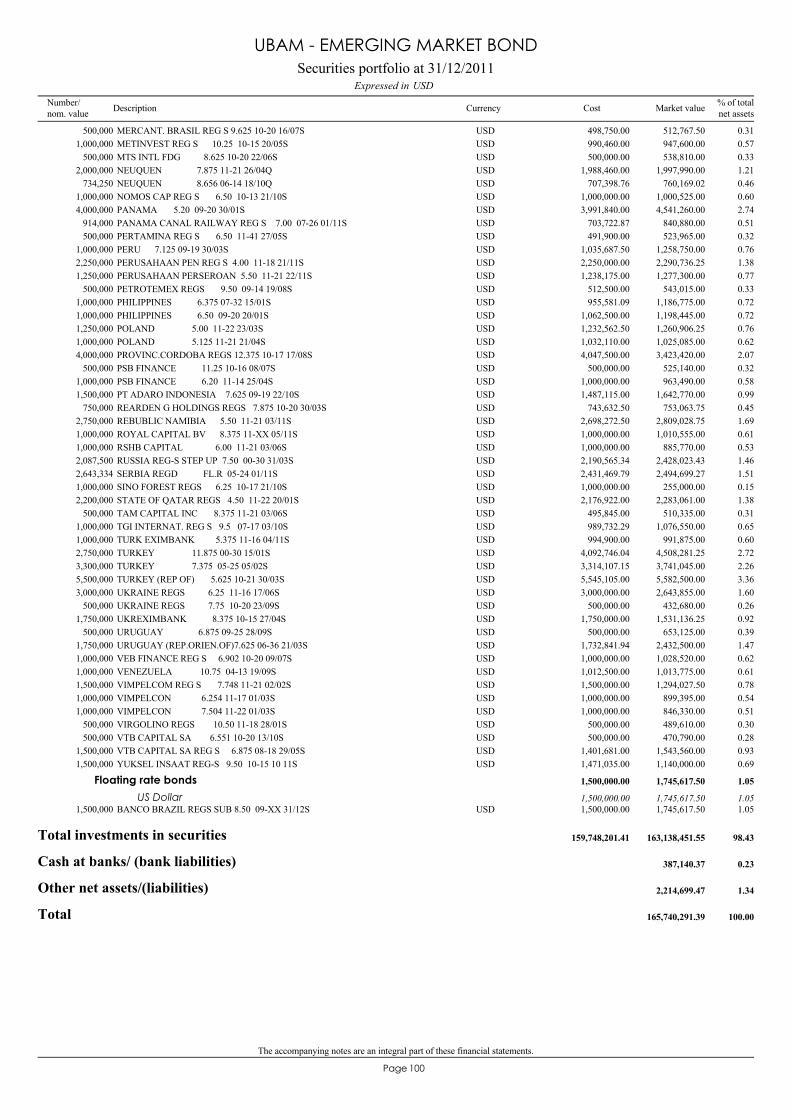
The accompanying notes are an integral part of these financial statements.
100Page
MERCANT. BRASIL REG S 9.625 10-20 16/07S500,000 512,767.50 0.31USD 498,750.00METINVEST REG S 10.25 10-15 20/05S1,000,000 947,600.00 0.57USD 990,460.00MTS INTL FDG 8.625 10-20 22/06S500,000 538,810.00 0.33USD 500,000.00NEUQUEN 7.875 11-21 26/04Q2,000,000 1,997,990.00 1.21USD 1,988,460.00NEUQUEN 8.656 06-14 18/10Q734,250 760,169.02 0.46USD 707,398.76NOMOS CAP REG S 6.50 10-13 21/10S1,000,000 1,000,525.00 0.60USD 1,000,000.00PANAMA 5.20 09-20 30/01S4,000,000 4,541,260.00 2.74USD 3,991,840.00PANAMA CANAL RAILWAY REG S 7.00 07-26 01/11S914,000 840,880.00 0.51USD 703,722.87PERTAMINA REG S 6.50 11-41 27/05S500,000 523,965.00 0.32USD 491,900.00PERU 7.125 09-19 30/03S1,000,000 1,258,750.00 0.76USD 1,035,687.50PERUSAHAAN PEN REG S 4.00 11-18 21/11S2,250,000 2,290,736.25 1.38USD 2,250,000.00PERUSAHAAN PERSEROAN 5.50 11-21 22/11S1,250,000 1,277,300.00 0.77USD 1,238,175.00PETROTEMEX REGS 9.50 09-14 19/08S500,000 543,015.00 0.33USD 512,500.00PHILIPPINES 6.375 07-32 15/01S1,000,000 1,186,775.00 0.72USD 955,581.09PHILIPPINES 6.50 09-20 20/01S1,000,000 1,198,445.00 0.72USD 1,062,500.00POLAND 5.00 11-22 23/03S1,250,000 1,260,906.25 0.76USD 1,232,562.50POLAND 5.125 11-21 21/04S1,000,000 1,025,085.00 0.62USD 1,032,110.00PROVINC.CORDOBA REGS 12.375 10-17 17/08S4,000,000 3,423,420.00 2.07USD 4,047,500.00PSB FINANCE 11.25 10-16 08/07S500,000 525,140.00 0.32USD 500,000.00PSB FINANCE 6.20 11-14 25/04S1,000,000 963,490.00 0.58USD 1,000,000.00PT ADARO INDONESIA 7.625 09-19 22/10S1,500,000 1,642,770.00 0.99USD 1,487,115.00REARDEN G HOLDINGS REGS 7.875 10-20 30/03S750,000 753,063.75 0.45USD 743,632.50REBUBLIC NAMIBIA 5.50 11-21 03/11S2,750,000 2,809,028.75 1.69USD 2,698,272.50ROYAL CAPITAL BV 8.375 11-XX 05/11S1,000,000 1,010,555.00 0.61USD 1,000,000.00RSHB CAPITAL 6.00 11-21 03/06S1,000,000 885,770.00 0.53USD 1,000,000.00RUSSIA REG-S STEP UP 7.50 00-30 31/03S2,087,500 2,428,023.43 1.46USD 2,190,565.34SERBIA REGD FL.R 05-24 01/11S2,643,334 2,494,699.27 1.51USD 2,431,469.79SINO FOREST REGS 6.25 10-17 21/10S1,000,000 255,000.00 0.15USD 1,000,000.00STATE OF QATAR REGS 4.50 11-22 20/01S2,200,000 2,283,061.00 1.38USD 2,176,922.00TAM CAPITAL INC 8.375 11-21 03/06S500,000 510,335.00 0.31USD 495,845.00TGI INTERNAT. REG S 9.5 07-17 03/10S1,000,000 1,076,550.00 0.65USD 989,732.29TURK EXIMBANK 5.375 11-16 04/11S1,000,000 991,875.00 0.60USD 994,900.00TURKEY 11.875 00-30 15/01S2,750,000 4,508,281.25 2.72USD 4,092,746.04TURKEY 7.375 05-25 05/02S3,300,000 3,741,045.00 2.26USD 3,314,107.15TURKEY (REP OF) 5.625 10-21 30/03S5,500,000 5,582,500.00 3.36USD 5,545,105.00UKRAINE REGS 6.25 11-16 17/06S3,000,000 2,643,855.00 1.60USD 3,000,000.00UKRAINE REGS 7.75 10-20 23/09S500,000 432,680.00 0.26USD 500,000.00UKREXIMBANK 8.375 10-15 27/04S1,750,000 1,531,136.25 0.92USD 1,750,000.00URUGUAY 6.875 09-25 28/09S500,000 653,125.00 0.39USD 500,000.00URUGUAY (REP.ORIEN.OF)7.625 06-36 21/03S1,750,000 2,432,500.00 1.47USD 1,732,841.94VEB FINANCE REG S 6.902 10-20 09/07S1,000,000 1,028,520.00 0.62USD 1,000,000.00VENEZUELA 10.75 04-13 19/09S1,000,000 1,013,775.00 0.61USD 1,012,500.00VIMPELCOM REG S 7.748 11-21 02/02S1,500,000 1,294,027.50 0.78USD 1,500,000.00VIMPELCON 6.254 11-17 01/03S1,000,000 899,395.00 0.54USD 1,000,000.00VIMPELCON 7.504 11-22 01/03S1,000,000 846,330.00 0.51USD 1,000,000.00VIRGOLINO REGS 10.50 11-18 28/01S500,000 489,610.00 0.30USD 500,000.00VTB CAPITAL SA 6.551 10-20 13/10S500,000 470,790.00 0.28USD 500,000.00VTB CAPITAL SA REG S 6.875 08-18 29/05S1,500,000 1,543,560.00 0.93USD 1,401,681.00YUKSEL INSAAT REG-S 9.50 10-15 10 11S1,500,000 1,140,000.00 0.69USD 1,471,035.00
BANCO BRAZIL REGS SUB 8.50 09-XX 31/12S1,500,000 1,745,617.50 1.05USD 1,500,000.00
Floating rate bonds 1,745,617.50 1.051,500,000.00
US Dollar 1,745,617.50 1.051,500,000.00
Total investments in securities 163,138,451.55 98.43159,748,201.41
Cash at banks/ (bank liabilities) 387,140.37 0.23
Other net assets/(liabilities) 2,214,699.47 1.34
Total 165,740,291.39 100.00
Securities portfolio at 31/12/2011USDExpressed in
UBAM - EMERGING MARKET BOND
Number/nom. value Description Currency % of total
net assetsMarket valueCost
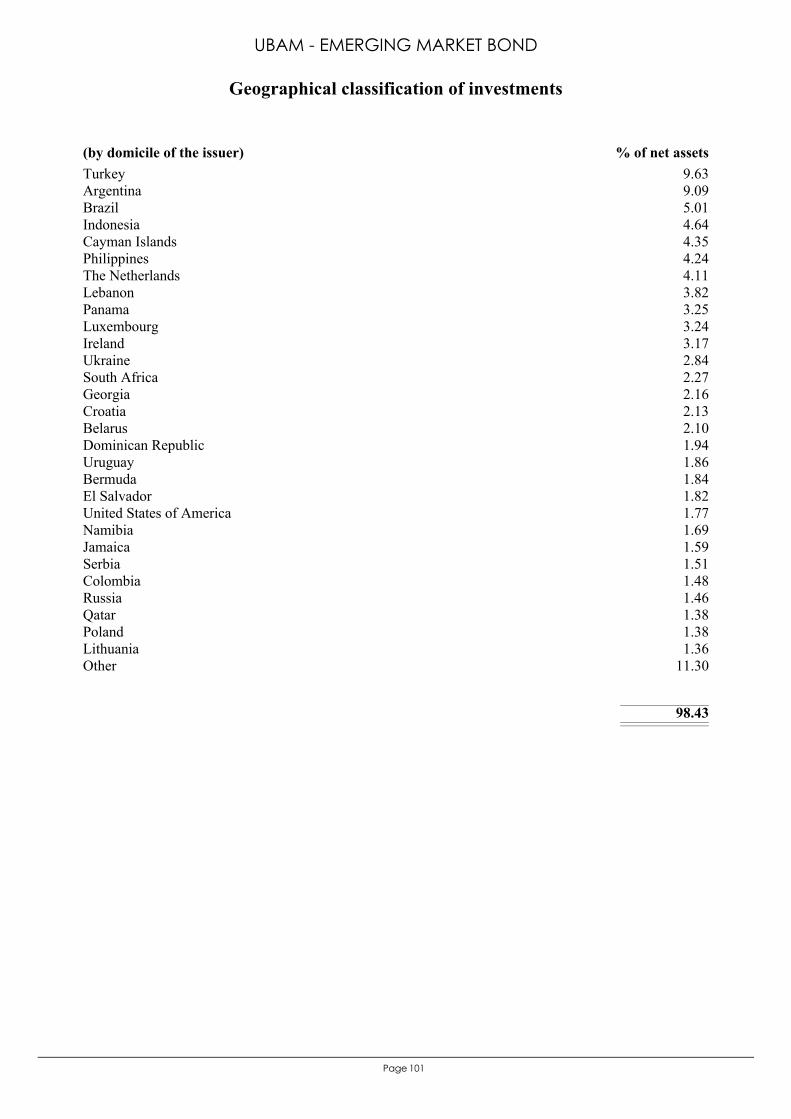
101Page
Turkey 9.63Argentina 9.09Brazil 5.01Indonesia 4.64Cayman Islands 4.35Philippines 4.24The Netherlands 4.11Lebanon 3.82Panama 3.25Luxembourg 3.24Ireland 3.17Ukraine 2.84South Africa 2.27Georgia 2.16Croatia 2.13Belarus 2.10Dominican Republic 1.94Uruguay 1.86Bermuda 1.84El Salvador 1.82United States of America 1.77Namibia 1.69Jamaica 1.59Serbia 1.51Colombia 1.48Russia 1.46Qatar 1.38Poland 1.38Lithuania 1.36Other 11.30
98.43
(by domicile of the issuer) % of net assets
Geographical classification of investments
UBAM - EMERGING MARKET BOND
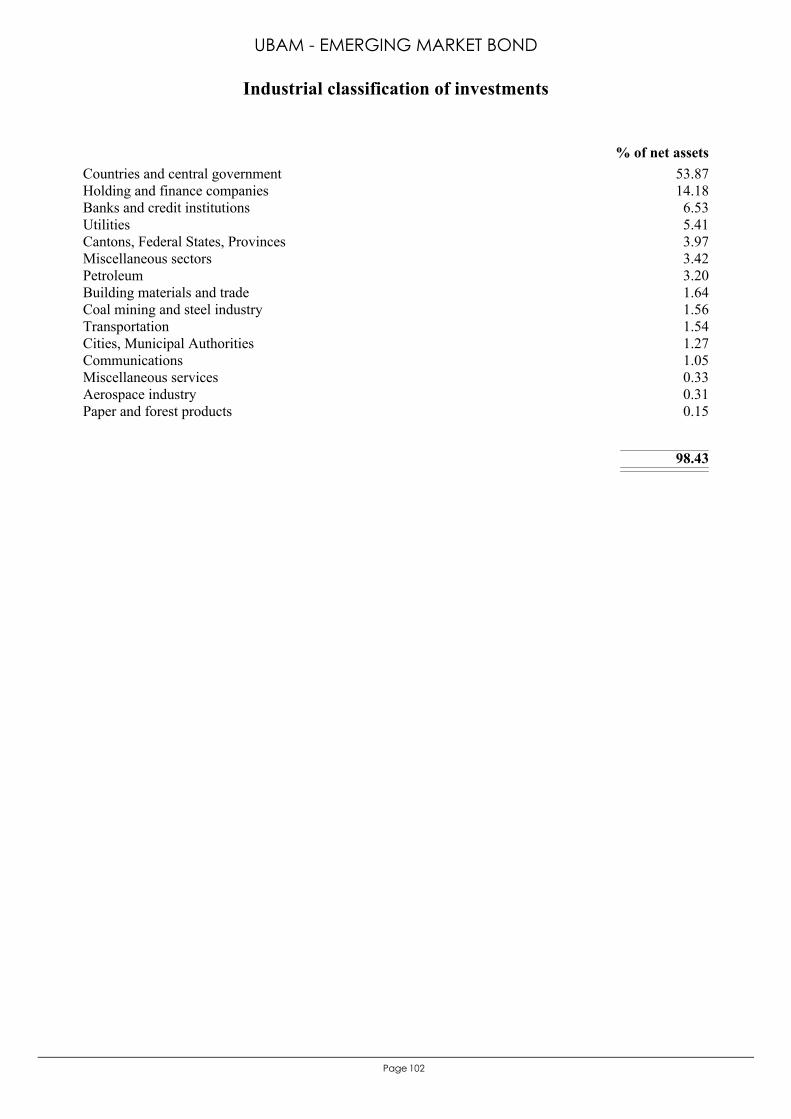
102Page
Countries and central government 53.87Holding and finance companies 14.18Banks and credit institutions 6.53Utilities 5.41Cantons, Federal States, Provinces 3.97Miscellaneous sectors 3.42Petroleum 3.20Building materials and trade 1.64Coal mining and steel industry 1.56Transportation 1.54Cities, Municipal Authorities 1.27Communications 1.05Miscellaneous services 0.33Aerospace industry 0.31Paper and forest products 0.15
98.43
% of net assets
Industrial classification of investments
UBAM - EMERGING MARKET BOND
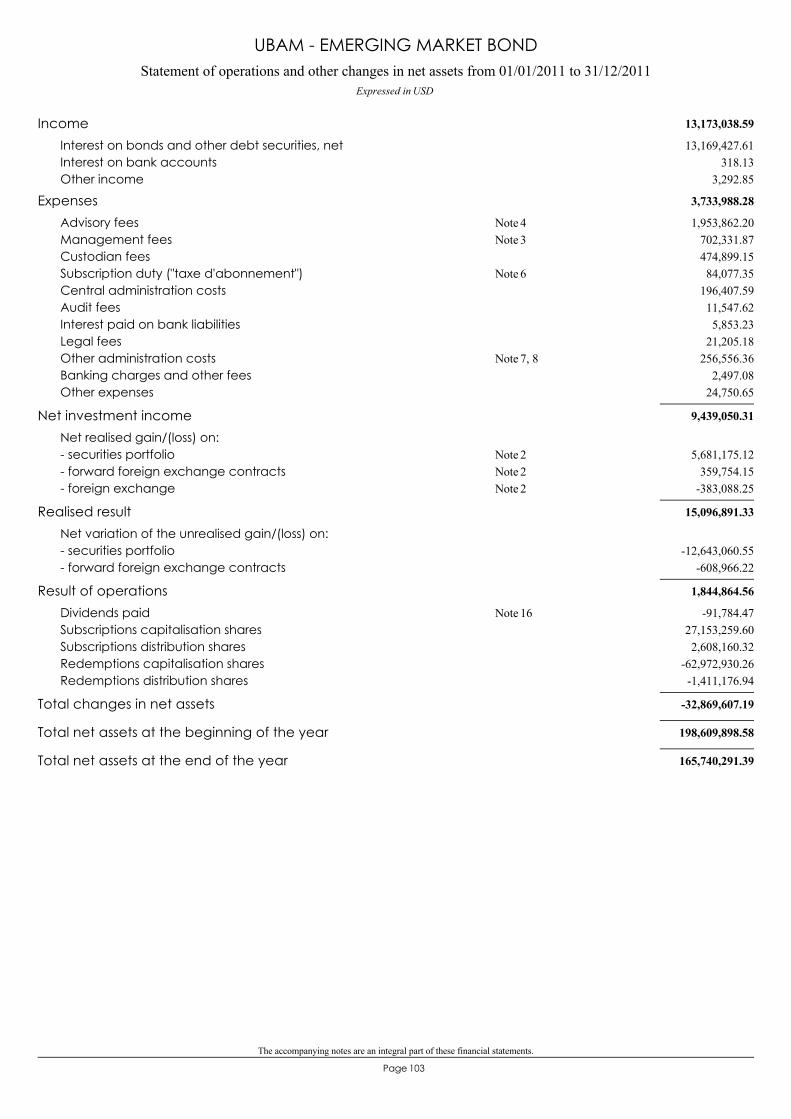
The accompanying notes are an integral part of these financial statements.
103Page
Statement of operations and other changes in net assets from 01/01/2011 to 31/12/2011Expressed in USD
UBAM - EMERGING MARKET BOND
13,173,038.59Income13,169,427.61Interest on bonds and other debt securities, net
318.13Interest on bank accounts3,292.85Other income
3,733,988.28Expenses1,953,862.20Advisory fees 4Note
702,331.87Management fees 3Note474,899.15Custodian fees84,077.35Subscription duty ("taxe d'abonnement") 6Note
196,407.59Central administration costs11,547.62Audit fees5,853.23Interest paid on bank liabilities
21,205.18Legal fees256,556.36Other administration costs 7, 8Note
2,497.08Banking charges and other fees24,750.65Other expenses
9,439,050.31Net investment incomeNet realised gain/(loss) on:
5,681,175.12- securities portfolio 2Note359,754.15- forward foreign exchange contracts 2Note
-383,088.25- foreign exchange 2Note
15,096,891.33Realised resultNet variation of the unrealised gain/(loss) on:
-12,643,060.55- securities portfolio-608,966.22- forward foreign exchange contracts
1,844,864.56Result of operations-91,784.47Dividends paid 16Note
27,153,259.60Subscriptions capitalisation shares2,608,160.32Subscriptions distribution shares
-62,972,930.26Redemptions capitalisation shares-1,411,176.94Redemptions distribution shares
-32,869,607.19Total changes in net assets
198,609,898.58Total net assets at the beginning of the year
165,740,291.39Total net assets at the end of the year
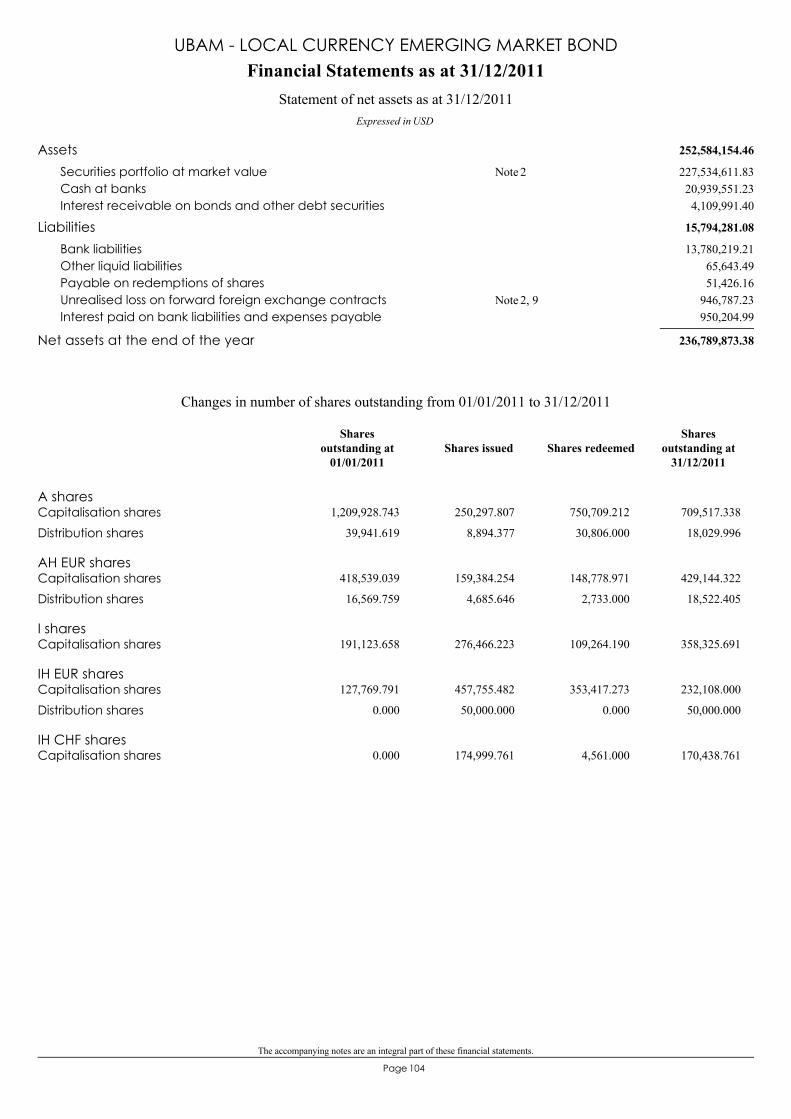
The accompanying notes are an integral part of these financial statements.
104Page
252,584,154.46Assets227,534,611.83Securities portfolio at market value 2Note20,939,551.23Cash at banks4,109,991.40Interest receivable on bonds and other debt securities
15,794,281.08Liabilities13,780,219.21Bank liabilities
65,643.49Other liquid liabilities51,426.16Payable on redemptions of shares
946,787.23Unrealised loss on forward foreign exchange contracts 2, 9Note950,204.99Interest paid on bank liabilities and expenses payable
236,789,873.38Net assets at the end of the year
Financial Statements as at 31/12/2011
Expressed in USD
Statement of net assets as at 31/12/2011
UBAM - LOCAL CURRENCY EMERGING MARKET BOND
A sharesCapitalisation shares 1,209,928.743 250,297.807 750,709.212 709,517.338
Distribution shares 39,941.619 8,894.377 30,806.000 18,029.996
AH EUR sharesCapitalisation shares 418,539.039 159,384.254 148,778.971 429,144.322
Distribution shares 16,569.759 4,685.646 2,733.000 18,522.405
I sharesCapitalisation shares 191,123.658 276,466.223 109,264.190 358,325.691
IH EUR sharesCapitalisation shares 127,769.791 457,755.482 353,417.273 232,108.000
Distribution shares 0.000 50,000.000 0.000 50,000.000
IH CHF sharesCapitalisation shares 0.000 174,999.761 4,561.000 170,438.761
Changes in number of shares outstanding from 01/01/2011 to 31/12/2011
Shares issued Shares redeemedShares
outstanding at31/12/2011
Sharesoutstanding at
01/01/2011
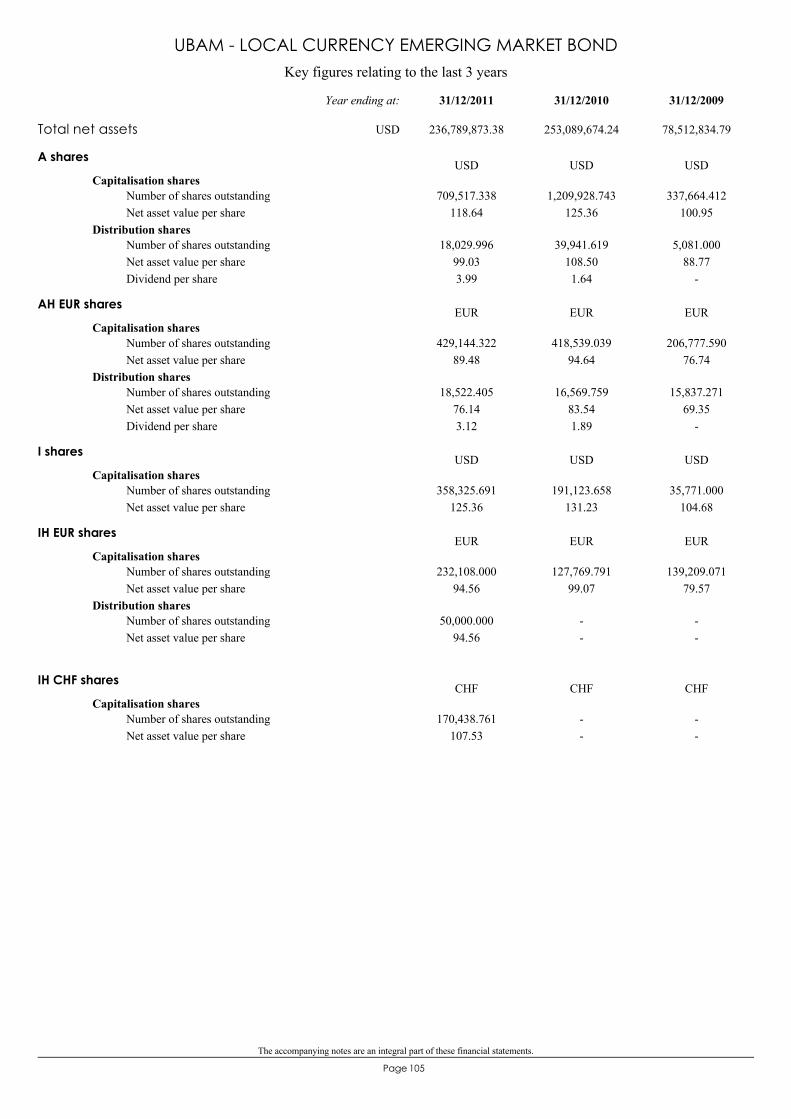
The accompanying notes are an integral part of these financial statements.
105Page
Key figures relating to the last 3 years
UBAM - LOCAL CURRENCY EMERGING MARKET BOND
A shares
Capitalisation shares709,517.338
118.641,209,928.743
125.36337,664.412
100.95Number of shares outstandingNet asset value per share
Distribution shares18,029.996
99.033.99
39,941.619108.501.64
5,081.00088.77
-
Number of shares outstandingNet asset value per shareDividend per share
USD USD USD
AH EUR shares
Capitalisation shares429,144.322
89.48418,539.039
94.64206,777.590
76.74Number of shares outstandingNet asset value per share
Distribution shares18,522.405
76.143.12
16,569.75983.541.89
15,837.27169.35
-
Number of shares outstandingNet asset value per shareDividend per share
EUR EUR EUR
I shares
Capitalisation shares358,325.691
125.36191,123.658
131.2335,771.000
104.68Number of shares outstandingNet asset value per share
USD USD USD
IH EUR shares
Capitalisation shares232,108.000
94.56127,769.791
99.07139,209.071
79.57Number of shares outstandingNet asset value per share
Distribution shares50,000.000
94.56--
--
Number of shares outstandingNet asset value per share
EUR EUR EUR
IH CHF shares
Capitalisation shares170,438.761
107.53--
--
Number of shares outstandingNet asset value per share
CHF CHF CHF
Total net assets 236,789,873.38 253,089,674.24 78,512,834.79
31/12/200931/12/201031/12/2011Year ending at:
USD
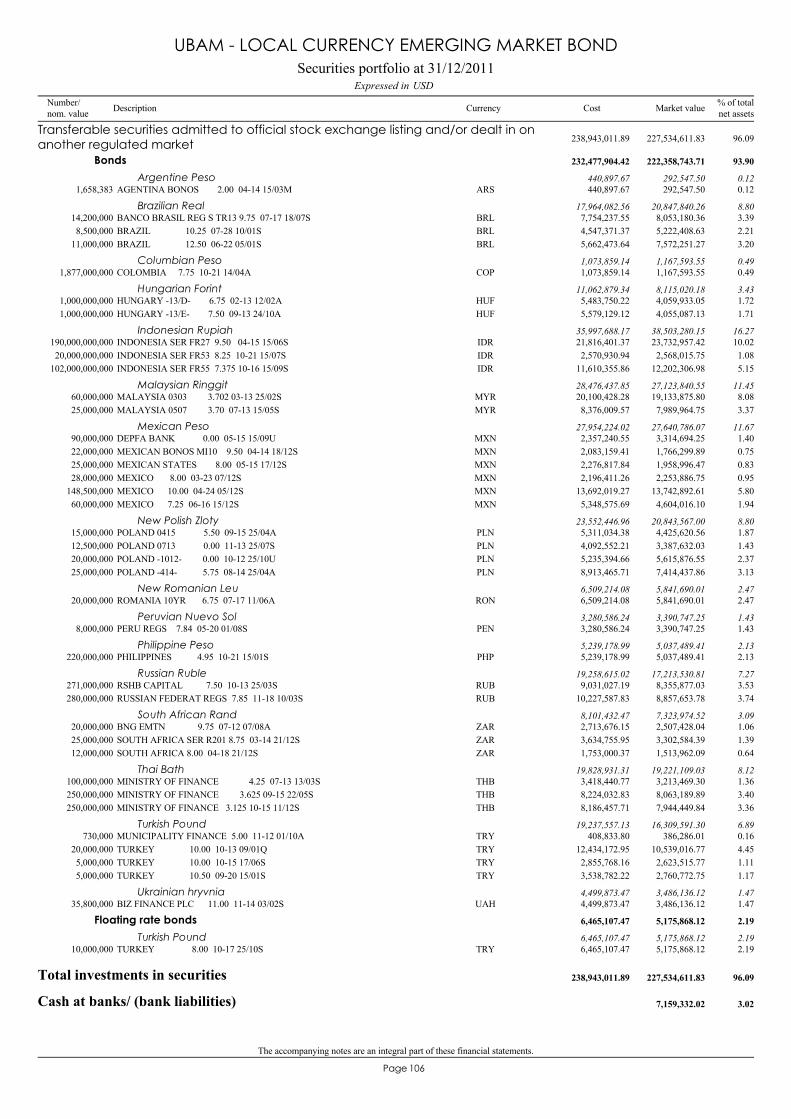
The accompanying notes are an integral part of these financial statements.
106Page
AGENTINA BONOS 2.00 04-14 15/03M1,658,383 292,547.50 0.12ARS 440,897.67
Transferable securities admitted to official stock exchange listing and/or dealt in onanother regulated market 227,534,611.83 96.09238,943,011.89
Bonds 222,358,743.71 93.90232,477,904.42
Argentine Peso 292,547.50 0.12440,897.67
BANCO BRASIL REG S TR13 9.75 07-17 18/07S14,200,000 8,053,180.36 3.39BRL 7,754,237.55Brazilian Real 20,847,840.26 8.8017,964,082.56
BRAZIL 10.25 07-28 10/01S8,500,000 5,222,408.63 2.21BRL 4,547,371.37BRAZIL 12.50 06-22 05/01S11,000,000 7,572,251.27 3.20BRL 5,662,473.64
COLOMBIA 7.75 10-21 14/04A1,877,000,000 1,167,593.55 0.49COP 1,073,859.14Columbian Peso 1,167,593.55 0.491,073,859.14
HUNGARY -13/D- 6.75 02-13 12/02A1,000,000,000 4,059,933.05 1.72HUF 5,483,750.22Hungarian Forint 8,115,020.18 3.4311,062,879.34
HUNGARY -13/E- 7.50 09-13 24/10A1,000,000,000 4,055,087.13 1.71HUF 5,579,129.12
INDONESIA SER FR27 9.50 04-15 15/06S190,000,000,000 23,732,957.42 10.02IDR 21,816,401.37Indonesian Rupiah 38,503,280.15 16.2735,997,688.17
INDONESIA SER FR53 8.25 10-21 15/07S20,000,000,000 2,568,015.75 1.08IDR 2,570,930.94INDONESIA SER FR55 7.375 10-16 15/09S102,000,000,000 12,202,306.98 5.15IDR 11,610,355.86
MALAYSIA 0303 3.702 03-13 25/02S60,000,000 19,133,875.80 8.08MYR 20,100,428.28Malaysian Ringgit 27,123,840.55 11.4528,476,437.85
MALAYSIA 0507 3.70 07-13 15/05S25,000,000 7,989,964.75 3.37MYR 8,376,009.57
DEPFA BANK 0.00 05-15 15/09U90,000,000 3,314,694.25 1.40MXN 2,357,240.55Mexican Peso 27,640,786.07 11.6727,954,224.02
MEXICAN BONOS MI10 9.50 04-14 18/12S22,000,000 1,766,299.89 0.75MXN 2,083,159.41MEXICAN STATES 8.00 05-15 17/12S25,000,000 1,958,996.47 0.83MXN 2,276,817.84MEXICO 8.00 03-23 07/12S28,000,000 2,253,886.75 0.95MXN 2,196,411.26MEXICO 10.00 04-24 05/12S148,500,000 13,742,892.61 5.80MXN 13,692,019.27MEXICO 7.25 06-16 15/12S60,000,000 4,604,016.10 1.94MXN 5,348,575.69
POLAND 0415 5.50 09-15 25/04A15,000,000 4,425,620.56 1.87PLN 5,311,034.38New Polish Zloty 20,843,567.00 8.8023,552,446.96
POLAND 0713 0.00 11-13 25/07S12,500,000 3,387,632.03 1.43PLN 4,092,552.21POLAND -1012- 0.00 10-12 25/10U20,000,000 5,615,876.55 2.37PLN 5,235,394.66POLAND -414- 5.75 08-14 25/04A25,000,000 7,414,437.86 3.13PLN 8,913,465.71
ROMANIA 10YR 6.75 07-17 11/06A20,000,000 5,841,690.01 2.47RON 6,509,214.08New Romanian Leu 5,841,690.01 2.476,509,214.08
PERU REGS 7.84 05-20 01/08S8,000,000 3,390,747.25 1.43PEN 3,280,586.24Peruvian Nuevo Sol 3,390,747.25 1.433,280,586.24
PHILIPPINES 4.95 10-21 15/01S220,000,000 5,037,489.41 2.13PHP 5,239,178.99Philippine Peso 5,037,489.41 2.135,239,178.99
RSHB CAPITAL 7.50 10-13 25/03S271,000,000 8,355,877.03 3.53RUB 9,031,027.19Russian Ruble 17,213,530.81 7.2719,258,615.02
RUSSIAN FEDERAT REGS 7.85 11-18 10/03S280,000,000 8,857,653.78 3.74RUB 10,227,587.83
BNG EMTN 9.75 07-12 07/08A20,000,000 2,507,428.04 1.06ZAR 2,713,676.15South African Rand 7,323,974.52 3.098,101,432.47
SOUTH AFRICA SER R201 8.75 03-14 21/12S25,000,000 3,302,584.39 1.39ZAR 3,634,755.95SOUTH AFRICA 8.00 04-18 21/12S12,000,000 1,513,962.09 0.64ZAR 1,753,000.37
MINISTRY OF FINANCE 4.25 07-13 13/03S100,000,000 3,213,469.30 1.36THB 3,418,440.77Thai Bath 19,221,109.03 8.1219,828,931.31
MINISTRY OF FINANCE 3.625 09-15 22/05S250,000,000 8,063,189.89 3.40THB 8,224,032.83MINISTRY OF FINANCE 3.125 10-15 11/12S250,000,000 7,944,449.84 3.36THB 8,186,457.71
MUNICIPALITY FINANCE 5.00 11-12 01/10A730,000 386,286.01 0.16TRY 408,833.80Turkish Pound 16,309,591.30 6.8919,237,557.13
TURKEY 10.00 10-13 09/01Q20,000,000 10,539,016.77 4.45TRY 12,434,172.95TURKEY 10.00 10-15 17/06S5,000,000 2,623,515.77 1.11TRY 2,855,768.16TURKEY 10.50 09-20 15/01S5,000,000 2,760,772.75 1.17TRY 3,538,782.22
BIZ FINANCE PLC 11.00 11-14 03/02S35,800,000 3,486,136.12 1.47UAH 4,499,873.47Ukrainian hryvnia 3,486,136.12 1.474,499,873.47
TURKEY 8.00 10-17 25/10S10,000,000 5,175,868.12 2.19TRY 6,465,107.47
Floating rate bonds 5,175,868.12 2.196,465,107.47
Turkish Pound 5,175,868.12 2.196,465,107.47
Total investments in securities 227,534,611.83 96.09238,943,011.89
Cash at banks/ (bank liabilities) 7,159,332.02 3.02
Securities portfolio at 31/12/2011USDExpressed in
UBAM - LOCAL CURRENCY EMERGING MARKET BOND
Number/nom. value Description Currency % of total
net assetsMarket valueCost
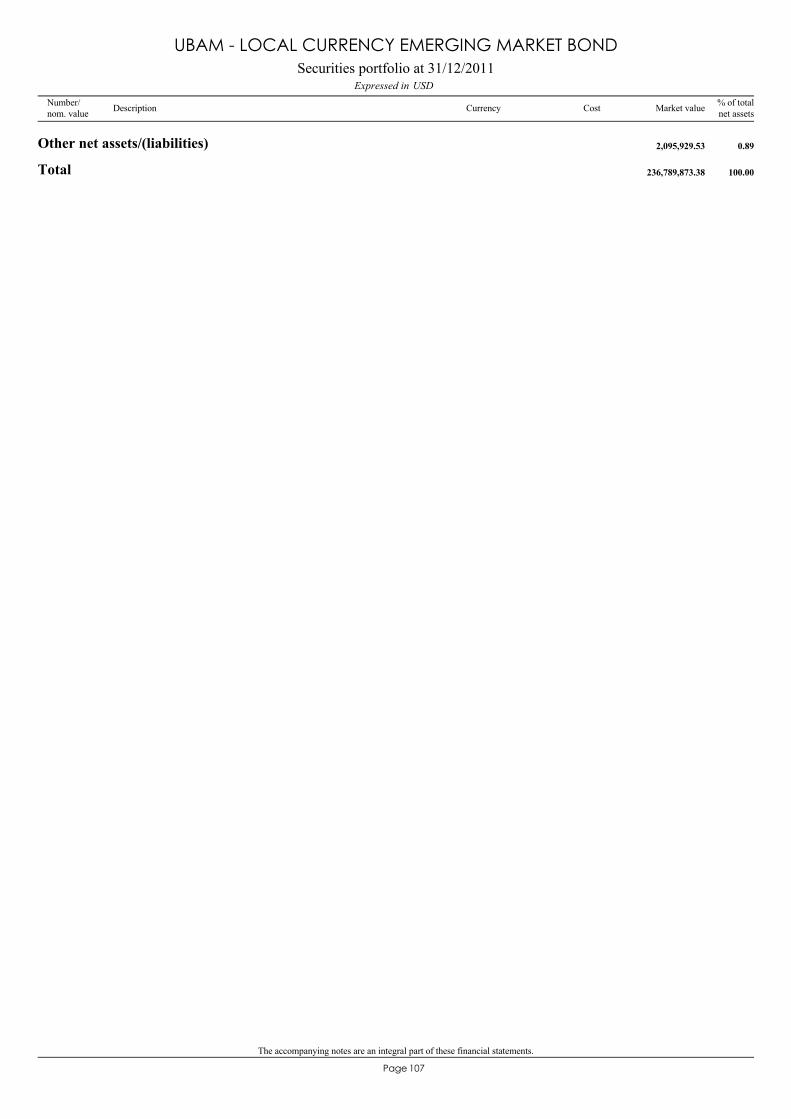
The accompanying notes are an integral part of these financial statements.
107Page
Other net assets/(liabilities) 2,095,929.53 0.89
Total 236,789,873.38 100.00
Securities portfolio at 31/12/2011USDExpressed in
UBAM - LOCAL CURRENCY EMERGING MARKET BOND
Number/nom. value Description Currency % of total
net assetsMarket valueCost
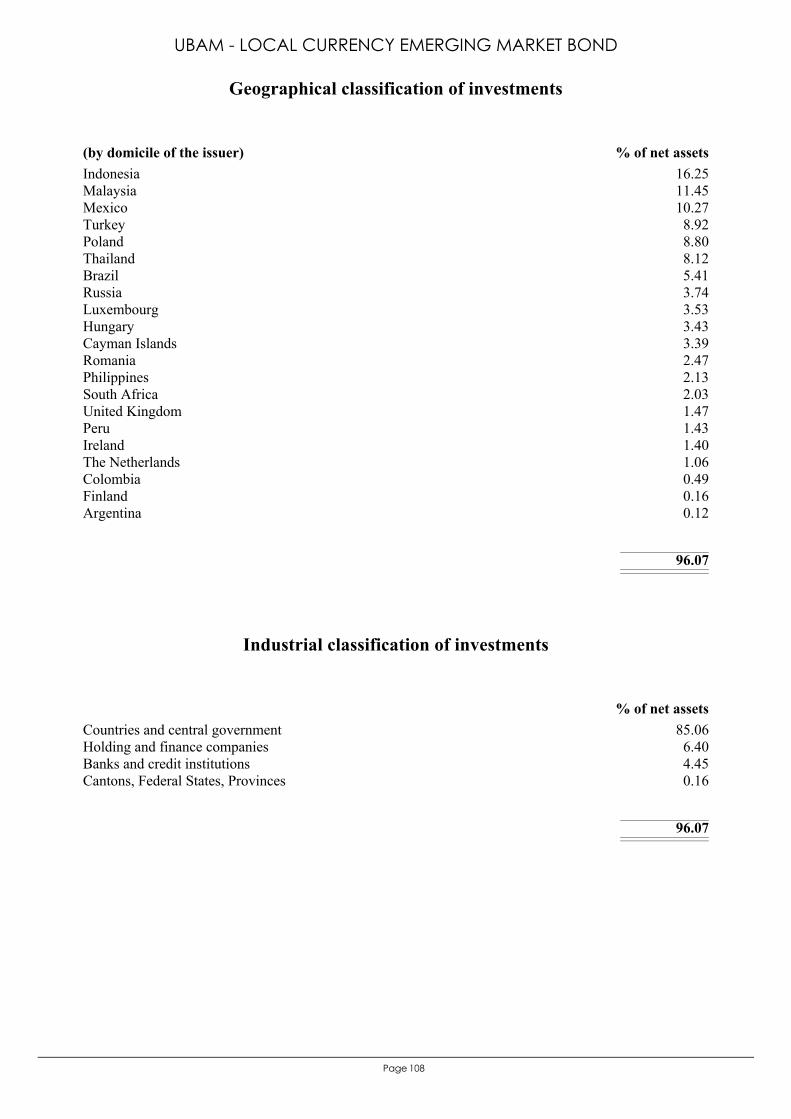
108Page
Indonesia 16.25Malaysia 11.45Mexico 10.27Turkey 8.92Poland 8.80Thailand 8.12Brazil 5.41Russia 3.74Luxembourg 3.53Hungary 3.43Cayman Islands 3.39Romania 2.47Philippines 2.13South Africa 2.03United Kingdom 1.47Peru 1.43Ireland 1.40The Netherlands 1.06Colombia 0.49Finland 0.16Argentina 0.12
96.07
(by domicile of the issuer) % of net assets
Geographical classification of investments
UBAM - LOCAL CURRENCY EMERGING MARKET BOND
Countries and central government 85.06Holding and finance companies 6.40Banks and credit institutions 4.45Cantons, Federal States, Provinces 0.16
96.07
% of net assets
Industrial classification of investments
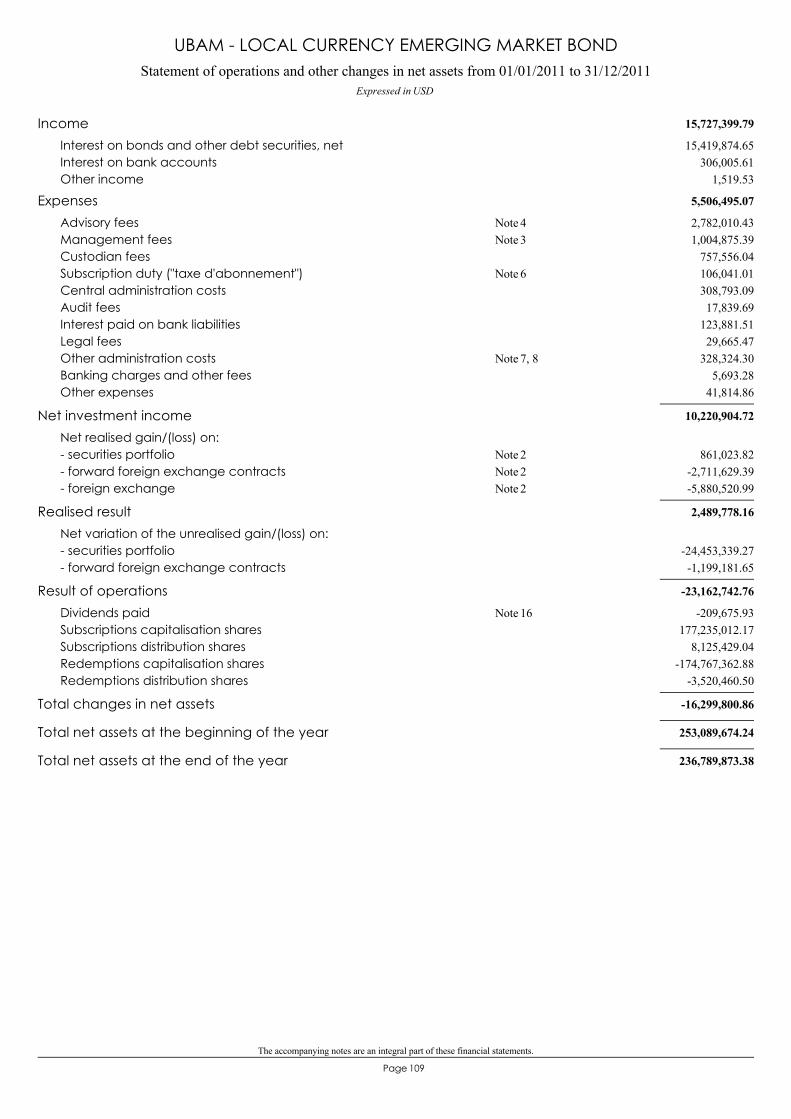
The accompanying notes are an integral part of these financial statements.
109Page
Statement of operations and other changes in net assets from 01/01/2011 to 31/12/2011Expressed in USD
UBAM - LOCAL CURRENCY EMERGING MARKET BOND
15,727,399.79Income15,419,874.65Interest on bonds and other debt securities, net
306,005.61Interest on bank accounts1,519.53Other income
5,506,495.07Expenses2,782,010.43Advisory fees 4Note1,004,875.39Management fees 3Note
757,556.04Custodian fees106,041.01Subscription duty ("taxe d'abonnement") 6Note308,793.09Central administration costs17,839.69Audit fees
123,881.51Interest paid on bank liabilities29,665.47Legal fees
328,324.30Other administration costs 7, 8Note5,693.28Banking charges and other fees
41,814.86Other expenses
10,220,904.72Net investment incomeNet realised gain/(loss) on:
861,023.82- securities portfolio 2Note-2,711,629.39- forward foreign exchange contracts 2Note-5,880,520.99- foreign exchange 2Note
2,489,778.16Realised resultNet variation of the unrealised gain/(loss) on:
-24,453,339.27- securities portfolio-1,199,181.65- forward foreign exchange contracts
-23,162,742.76Result of operations-209,675.93Dividends paid 16Note
177,235,012.17Subscriptions capitalisation shares8,125,429.04Subscriptions distribution shares
-174,767,362.88Redemptions capitalisation shares-3,520,460.50Redemptions distribution shares
-16,299,800.86Total changes in net assets
253,089,674.24Total net assets at the beginning of the year
236,789,873.38Total net assets at the end of the year
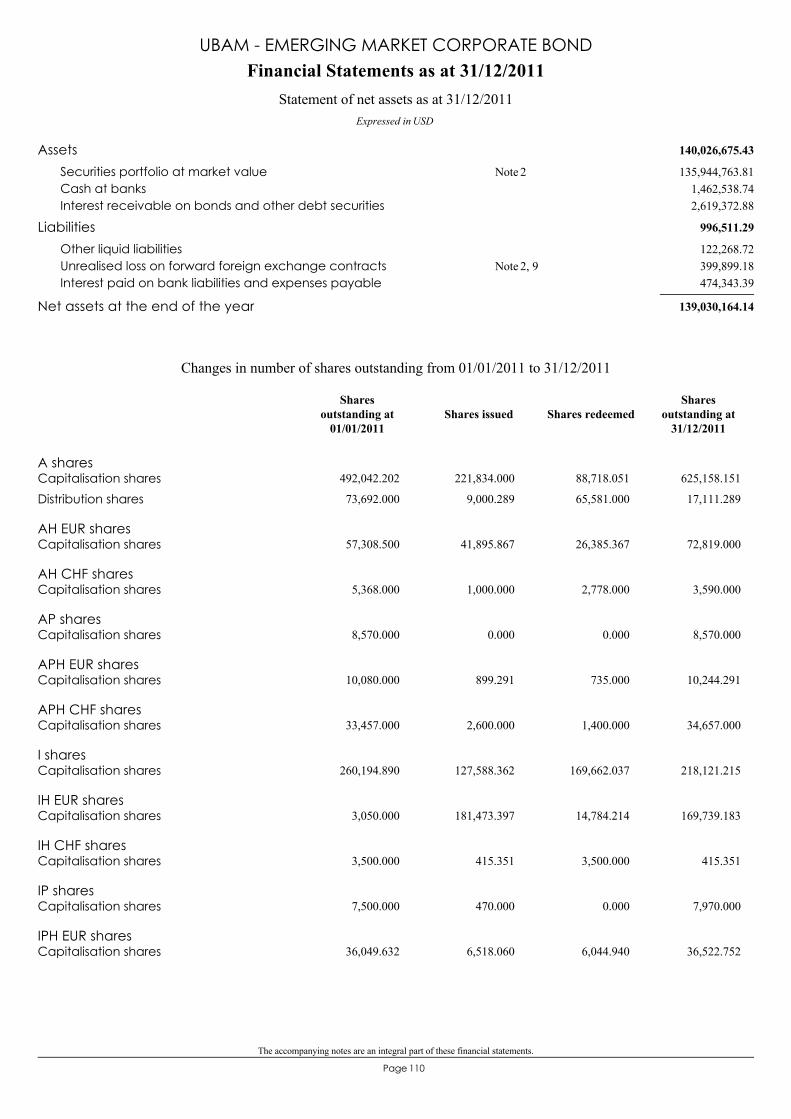
The accompanying notes are an integral part of these financial statements.
110Page
140,026,675.43Assets135,944,763.81Securities portfolio at market value 2Note
1,462,538.74Cash at banks2,619,372.88Interest receivable on bonds and other debt securities
996,511.29Liabilities122,268.72Other liquid liabilities399,899.18Unrealised loss on forward foreign exchange contracts 2, 9Note474,343.39Interest paid on bank liabilities and expenses payable
139,030,164.14Net assets at the end of the year
Financial Statements as at 31/12/2011
Expressed in USD
Statement of net assets as at 31/12/2011
UBAM - EMERGING MARKET CORPORATE BOND
A sharesCapitalisation shares 492,042.202 221,834.000 88,718.051 625,158.151
Distribution shares 73,692.000 9,000.289 65,581.000 17,111.289
AH EUR sharesCapitalisation shares 57,308.500 41,895.867 26,385.367 72,819.000
AH CHF sharesCapitalisation shares 5,368.000 1,000.000 2,778.000 3,590.000
AP sharesCapitalisation shares 8,570.000 0.000 0.000 8,570.000
APH EUR sharesCapitalisation shares 10,080.000 899.291 735.000 10,244.291
APH CHF sharesCapitalisation shares 33,457.000 2,600.000 1,400.000 34,657.000
I sharesCapitalisation shares 260,194.890 127,588.362 169,662.037 218,121.215
IH EUR sharesCapitalisation shares 3,050.000 181,473.397 14,784.214 169,739.183
IH CHF sharesCapitalisation shares 3,500.000 415.351 3,500.000 415.351
IP sharesCapitalisation shares 7,500.000 470.000 0.000 7,970.000
IPH EUR sharesCapitalisation shares 36,049.632 6,518.060 6,044.940 36,522.752
Changes in number of shares outstanding from 01/01/2011 to 31/12/2011
Shares issued Shares redeemedShares
outstanding at31/12/2011
Sharesoutstanding at
01/01/2011
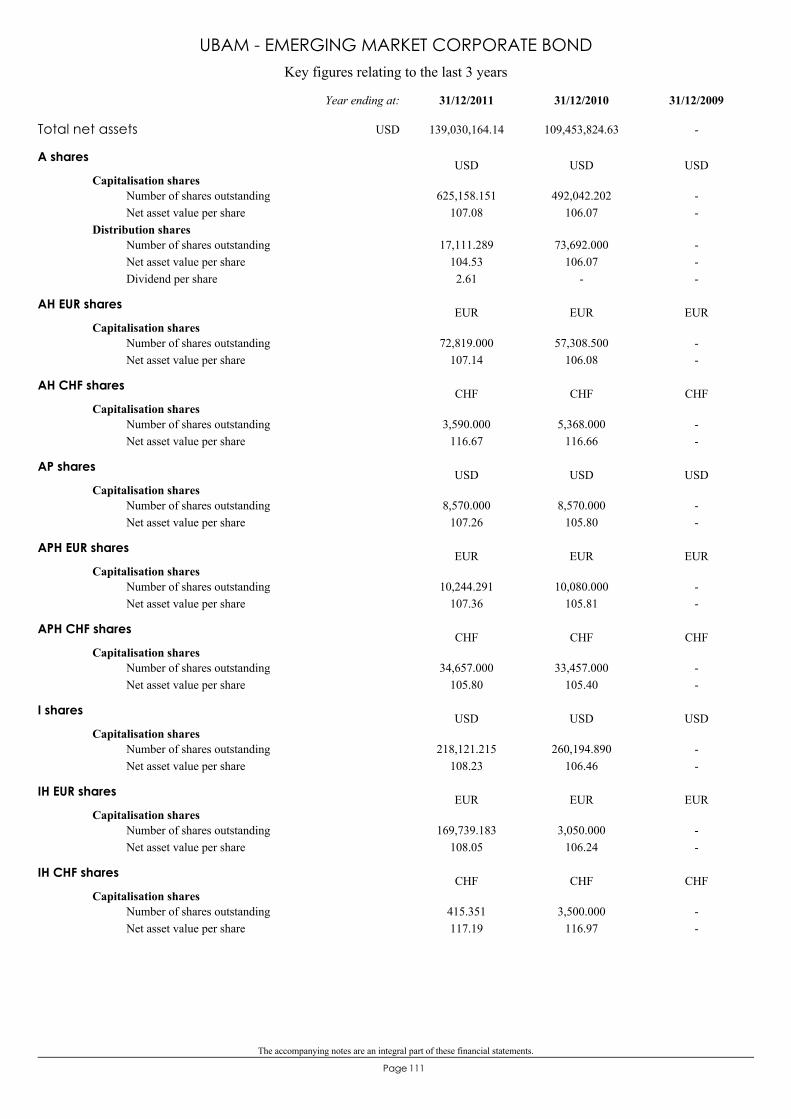
The accompanying notes are an integral part of these financial statements.
111Page
Key figures relating to the last 3 years
UBAM - EMERGING MARKET CORPORATE BOND
A shares
Capitalisation shares625,158.151
107.08492,042.202
106.07--
Number of shares outstandingNet asset value per share
Distribution shares17,111.289
104.532.61
73,692.000106.07
-
---
Number of shares outstandingNet asset value per shareDividend per share
USD USD USD
AH EUR shares
Capitalisation shares72,819.000
107.1457,308.500
106.08--
Number of shares outstandingNet asset value per share
EUR EUR EUR
AH CHF shares
Capitalisation shares3,590.000
116.675,368.000
116.66--
Number of shares outstandingNet asset value per share
CHF CHF CHF
AP shares
Capitalisation shares8,570.000
107.268,570.000
105.80--
Number of shares outstandingNet asset value per share
USD USD USD
APH EUR shares
Capitalisation shares10,244.291
107.3610,080.000
105.81--
Number of shares outstandingNet asset value per share
EUR EUR EUR
APH CHF shares
Capitalisation shares34,657.000
105.8033,457.000
105.40--
Number of shares outstandingNet asset value per share
CHF CHF CHF
I shares
Capitalisation shares218,121.215
108.23260,194.890
106.46--
Number of shares outstandingNet asset value per share
USD USD USD
IH EUR shares
Capitalisation shares169,739.183
108.053,050.000
106.24--
Number of shares outstandingNet asset value per share
EUR EUR EUR
IH CHF shares
Capitalisation shares415.351117.19
3,500.000116.97
--
Number of shares outstandingNet asset value per share
CHF CHF CHF
Total net assets 139,030,164.14 109,453,824.63 -
31/12/200931/12/201031/12/2011Year ending at:
USD
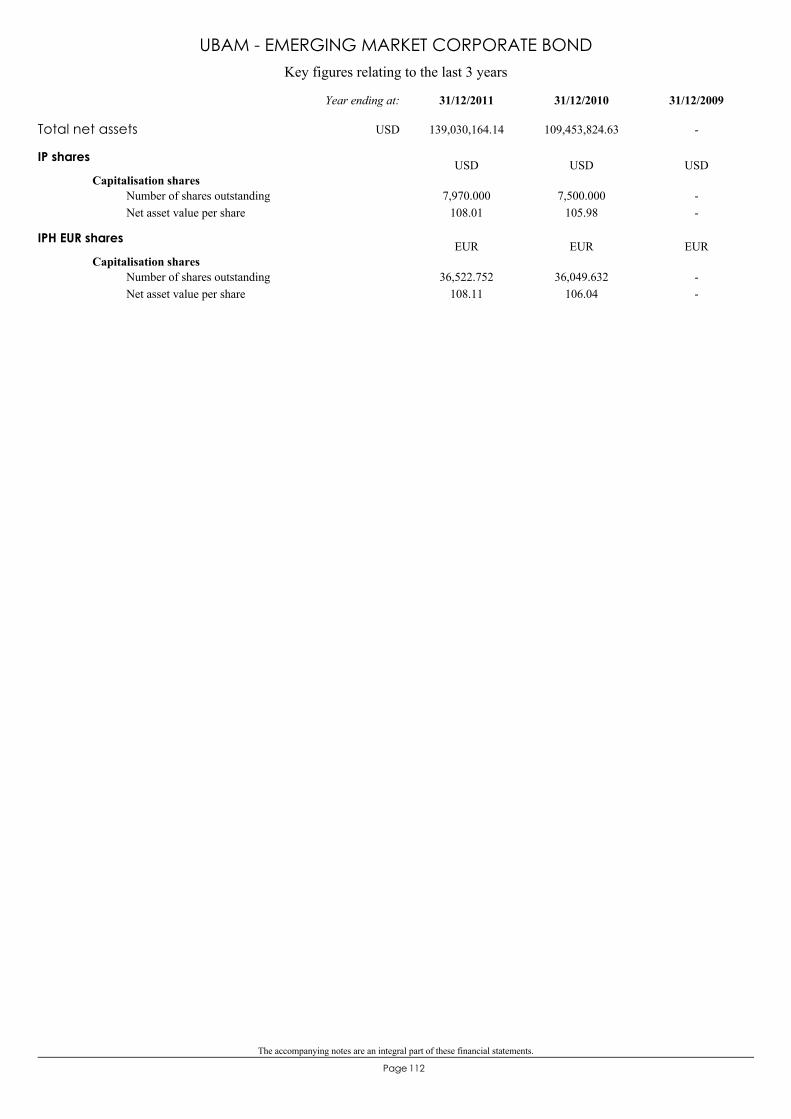
The accompanying notes are an integral part of these financial statements.
112Page
Key figures relating to the last 3 years
UBAM - EMERGING MARKET CORPORATE BOND
IP shares
Capitalisation shares7,970.000
108.017,500.000
105.98--
Number of shares outstandingNet asset value per share
USD USD USD
IPH EUR shares
Capitalisation shares36,522.752
108.1136,049.632
106.04--
Number of shares outstandingNet asset value per share
EUR EUR EUR
Total net assets 139,030,164.14 109,453,824.63 -
31/12/200931/12/201031/12/2011Year ending at:
USD
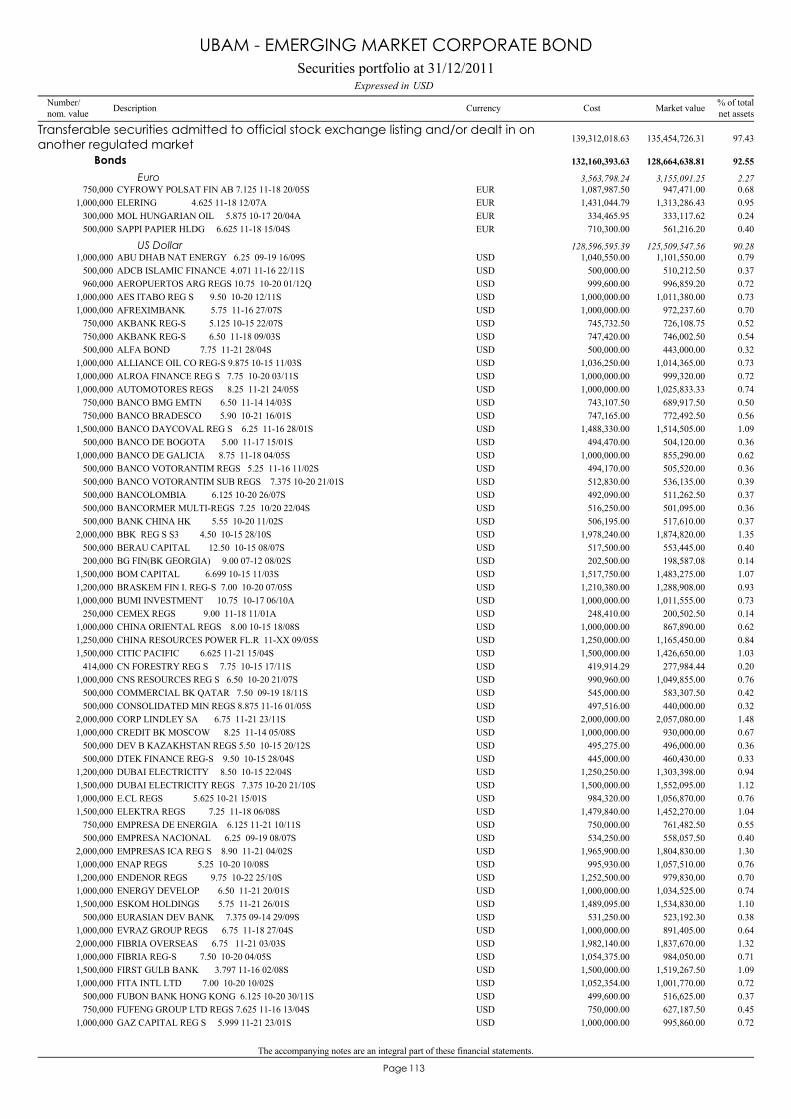
The accompanying notes are an integral part of these financial statements.
113Page
CYFROWY POLSAT FIN AB 7.125 11-18 20/05S750,000 947,471.00 0.68EUR 1,087,987.50
Transferable securities admitted to official stock exchange listing and/or dealt in onanother regulated market 135,454,726.31 97.43139,312,018.63
Bonds 128,664,638.81 92.55132,160,393.63
Euro 3,155,091.25 2.273,563,798.24
ELERING 4.625 11-18 12/07A1,000,000 1,313,286.43 0.95EUR 1,431,044.79MOL HUNGARIAN OIL 5.875 10-17 20/04A300,000 333,117.62 0.24EUR 334,465.95SAPPI PAPIER HLDG 6.625 11-18 15/04S500,000 561,216.20 0.40EUR 710,300.00
ABU DHAB NAT ENERGY 6.25 09-19 16/09S1,000,000 1,101,550.00 0.79USD 1,040,550.00US Dollar 125,509,547.56 90.28128,596,595.39
ADCB ISLAMIC FINANCE 4.071 11-16 22/11S500,000 510,212.50 0.37USD 500,000.00AEROPUERTOS ARG REGS 10.75 10-20 01/12Q960,000 996,859.20 0.72USD 999,600.00AES ITABO REG S 9.50 10-20 12/11S1,000,000 1,011,380.00 0.73USD 1,000,000.00AFREXIMBANK 5.75 11-16 27/07S1,000,000 972,237.60 0.70USD 1,000,000.00AKBANK REG-S 5.125 10-15 22/07S750,000 726,108.75 0.52USD 745,732.50AKBANK REG-S 6.50 11-18 09/03S750,000 746,002.50 0.54USD 747,420.00ALFA BOND 7.75 11-21 28/04S500,000 443,000.00 0.32USD 500,000.00ALLIANCE OIL CO REG-S 9.875 10-15 11/03S1,000,000 1,014,365.00 0.73USD 1,036,250.00ALROA FINANCE REG S 7.75 10-20 03/11S1,000,000 999,320.00 0.72USD 1,000,000.00AUTOMOTORES REGS 8.25 11-21 24/05S1,000,000 1,025,833.33 0.74USD 1,000,000.00BANCO BMG EMTN 6.50 11-14 14/03S750,000 689,917.50 0.50USD 743,107.50BANCO BRADESCO 5.90 10-21 16/01S750,000 772,492.50 0.56USD 747,165.00BANCO DAYCOVAL REG S 6.25 11-16 28/01S1,500,000 1,514,505.00 1.09USD 1,488,330.00BANCO DE BOGOTA 5.00 11-17 15/01S500,000 504,120.00 0.36USD 494,470.00BANCO DE GALICIA 8.75 11-18 04/05S1,000,000 855,290.00 0.62USD 1,000,000.00BANCO VOTORANTIM REGS 5.25 11-16 11/02S500,000 505,520.00 0.36USD 494,170.00BANCO VOTORANTIM SUB REGS 7.375 10-20 21/01S500,000 536,135.00 0.39USD 512,830.00BANCOLOMBIA 6.125 10-20 26/07S500,000 511,262.50 0.37USD 492,090.00BANCORMER MULTI-REGS 7.25 10/20 22/04S500,000 501,095.00 0.36USD 516,250.00BANK CHINA HK 5.55 10-20 11/02S500,000 517,610.00 0.37USD 506,195.00BBK REG S S3 4.50 10-15 28/10S2,000,000 1,874,820.00 1.35USD 1,978,240.00BERAU CAPITAL 12.50 10-15 08/07S500,000 553,445.00 0.40USD 517,500.00BG FIN(BK GEORGIA) 9.00 07-12 08/02S200,000 198,587.08 0.14USD 202,500.00BOM CAPITAL 6.699 10-15 11/03S1,500,000 1,483,275.00 1.07USD 1,517,750.00BRASKEM FIN I. REG-S 7.00 10-20 07/05S1,200,000 1,288,908.00 0.93USD 1,210,380.00BUMI INVESTMENT 10.75 10-17 06/10A1,000,000 1,011,555.00 0.73USD 1,000,000.00CEMEX REGS 9.00 11-18 11/01A250,000 200,502.50 0.14USD 248,410.00CHINA ORIENTAL REGS 8.00 10-15 18/08S1,000,000 867,890.00 0.62USD 1,000,000.00CHINA RESOURCES POWER FL.R 11-XX 09/05S1,250,000 1,165,450.00 0.84USD 1,250,000.00CITIC PACIFIC 6.625 11-21 15/04S1,500,000 1,426,650.00 1.03USD 1,500,000.00CN FORESTRY REG S 7.75 10-15 17/11S414,000 277,984.44 0.20USD 419,914.29CNS RESOURCES REG S 6.50 10-20 21/07S1,000,000 1,049,855.00 0.76USD 990,960.00COMMERCIAL BK QATAR 7.50 09-19 18/11S500,000 583,307.50 0.42USD 545,000.00CONSOLIDATED MIN REGS 8.875 11-16 01/05S500,000 440,000.00 0.32USD 497,516.00CORP LINDLEY SA 6.75 11-21 23/11S2,000,000 2,057,080.00 1.48USD 2,000,000.00CREDIT BK MOSCOW 8.25 11-14 05/08S1,000,000 930,000.00 0.67USD 1,000,000.00DEV B KAZAKHSTAN REGS 5.50 10-15 20/12S500,000 496,000.00 0.36USD 495,275.00DTEK FINANCE REG-S 9.50 10-15 28/04S500,000 460,430.00 0.33USD 445,000.00DUBAI ELECTRICITY 8.50 10-15 22/04S1,200,000 1,303,398.00 0.94USD 1,250,250.00DUBAI ELECTRICITY REGS 7.375 10-20 21/10S1,500,000 1,552,095.00 1.12USD 1,500,000.00E.CL REGS 5.625 10-21 15/01S1,000,000 1,056,870.00 0.76USD 984,320.00ELEKTRA REGS 7.25 11-18 06/08S1,500,000 1,452,270.00 1.04USD 1,479,840.00EMPRESA DE ENERGIA 6.125 11-21 10/11S750,000 761,482.50 0.55USD 750,000.00EMPRESA NACIONAL 6.25 09-19 08/07S500,000 558,057.50 0.40USD 534,250.00EMPRESAS ICA REG S 8.90 11-21 04/02S2,000,000 1,804,830.00 1.30USD 1,965,900.00ENAP REGS 5.25 10-20 10/08S1,000,000 1,057,510.00 0.76USD 995,930.00ENDENOR REGS 9.75 10-22 25/10S1,200,000 979,830.00 0.70USD 1,252,500.00ENERGY DEVELOP 6.50 11-21 20/01S1,000,000 1,034,525.00 0.74USD 1,000,000.00ESKOM HOLDINGS 5.75 11-21 26/01S1,500,000 1,534,830.00 1.10USD 1,489,095.00EURASIAN DEV BANK 7.375 09-14 29/09S500,000 523,192.30 0.38USD 531,250.00EVRAZ GROUP REGS 6.75 11-18 27/04S1,000,000 891,405.00 0.64USD 1,000,000.00FIBRIA OVERSEAS 6.75 11-21 03/03S2,000,000 1,837,670.00 1.32USD 1,982,140.00FIBRIA REG-S 7.50 10-20 04/05S1,000,000 984,050.00 0.71USD 1,054,375.00FIRST GULB BANK 3.797 11-16 02/08S1,500,000 1,519,267.50 1.09USD 1,500,000.00FITA INTL LTD 7.00 10-20 10/02S1,000,000 1,001,770.00 0.72USD 1,052,354.00FUBON BANK HONG KONG 6.125 10-20 30/11S500,000 516,625.00 0.37USD 499,600.00FUFENG GROUP LTD REGS 7.625 11-16 13/04S750,000 627,187.50 0.45USD 750,000.00GAZ CAPITAL REG S 5.999 11-21 23/01S1,000,000 995,860.00 0.72USD 1,000,000.00
Securities portfolio at 31/12/2011USDExpressed in
UBAM - EMERGING MARKET CORPORATE BOND
Number/nom. value Description Currency % of total
net assetsMarket valueCost
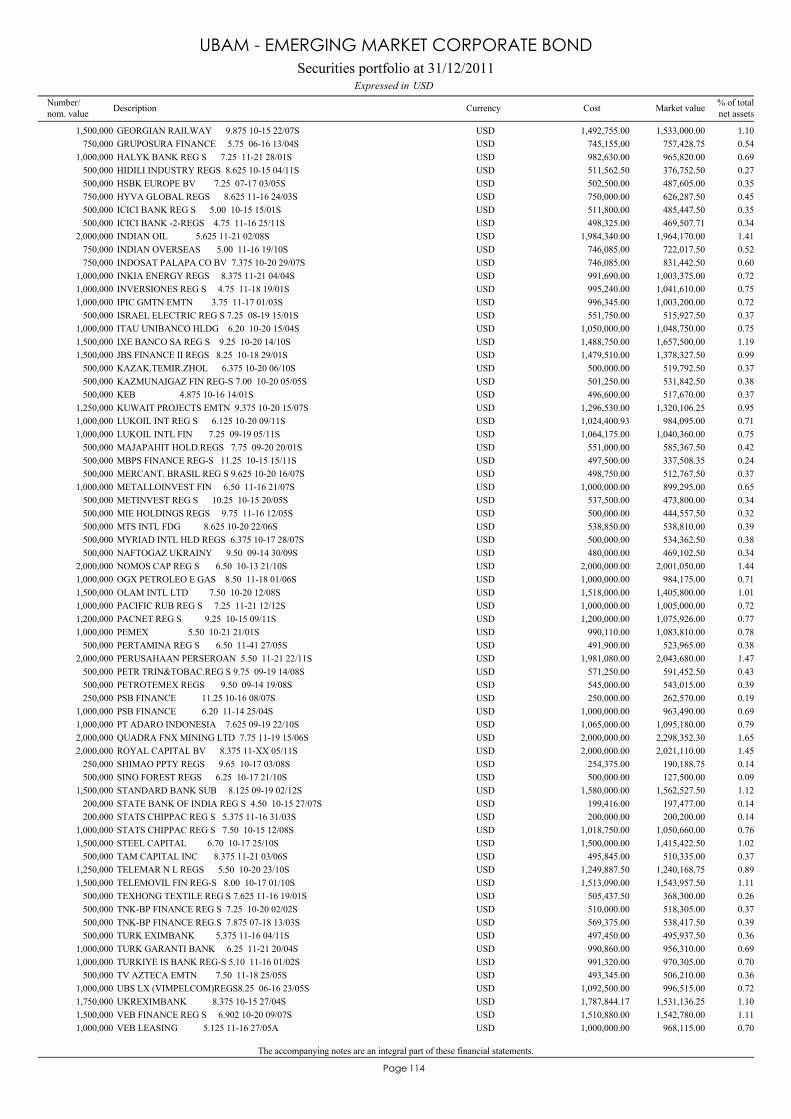
The accompanying notes are an integral part of these financial statements.
114Page
GEORGIAN RAILWAY 9.875 10-15 22/07S1,500,000 1,533,000.00 1.10USD 1,492,755.00GRUPOSURA FINANCE 5.75 06-16 13/04S750,000 757,428.75 0.54USD 745,155.00HALYK BANK REG S 7.25 11-21 28/01S1,000,000 965,820.00 0.69USD 982,630.00HIDILI INDUSTRY REGS 8.625 10-15 04/11S500,000 376,752.50 0.27USD 511,562.50HSBK EUROPE BV 7.25 07-17 03/05S500,000 487,605.00 0.35USD 502,500.00HYVA GLOBAL REGS 8.625 11-16 24/03S750,000 626,287.50 0.45USD 750,000.00ICICI BANK REG S 5.00 10-15 15/01S500,000 485,447.50 0.35USD 511,800.00ICICI BANK -2-REGS 4.75 11-16 25/11S500,000 469,507.71 0.34USD 498,325.00INDIAN OIL 5.625 11-21 02/08S2,000,000 1,964,170.00 1.41USD 1,984,340.00INDIAN OVERSEAS 5.00 11-16 19/10S750,000 722,017.50 0.52USD 746,085.00INDOSAT PALAPA CO BV 7.375 10-20 29/07S750,000 831,442.50 0.60USD 746,085.00INKIA ENERGY REGS 8.375 11-21 04/04S1,000,000 1,003,375.00 0.72USD 991,690.00INVERSIONES REG S 4.75 11-18 19/01S1,000,000 1,041,610.00 0.75USD 995,240.00IPIC GMTN EMTN 3.75 11-17 01/03S1,000,000 1,003,200.00 0.72USD 996,345.00ISRAEL ELECTRIC REG S 7.25 08-19 15/01S500,000 515,927.50 0.37USD 551,750.00ITAU UNIBANCO HLDG 6.20 10-20 15/04S1,000,000 1,048,750.00 0.75USD 1,050,000.00IXE BANCO SA REG S 9.25 10-20 14/10S1,500,000 1,657,500.00 1.19USD 1,488,750.00JBS FINANCE II REGS 8.25 10-18 29/01S1,500,000 1,378,327.50 0.99USD 1,479,510.00KAZAK.TEMIR.ZHOL 6.375 10-20 06/10S500,000 519,792.50 0.37USD 500,000.00KAZMUNAIGAZ FIN REG-S 7.00 10-20 05/05S500,000 531,842.50 0.38USD 501,250.00KEB 4.875 10-16 14/01S500,000 517,670.00 0.37USD 496,600.00KUWAIT PROJECTS EMTN 9.375 10-20 15/07S1,250,000 1,320,106.25 0.95USD 1,296,530.00LUKOIL INT REG S 6.125 10-20 09/11S1,000,000 984,095.00 0.71USD 1,024,400.93LUKOIL INTL FIN 7.25 09-19 05/11S1,000,000 1,040,360.00 0.75USD 1,064,175.00MAJAPAHIT HOLD.REGS 7.75 09-20 20/01S500,000 585,367.50 0.42USD 551,000.00MBPS FINANCE REG-S 11.25 10-15 15/11S500,000 337,508.35 0.24USD 497,500.00MERCANT. BRASIL REG S 9.625 10-20 16/07S500,000 512,767.50 0.37USD 498,750.00METALLOINVEST FIN 6.50 11-16 21/07S1,000,000 899,295.00 0.65USD 1,000,000.00METINVEST REG S 10.25 10-15 20/05S500,000 473,800.00 0.34USD 537,500.00MIE HOLDINGS REGS 9.75 11-16 12/05S500,000 444,557.50 0.32USD 500,000.00MTS INTL FDG 8.625 10-20 22/06S500,000 538,810.00 0.39USD 538,850.00MYRIAD INTL HLD REGS 6.375 10-17 28/07S500,000 534,362.50 0.38USD 500,000.00NAFTOGAZ UKRAINY 9.50 09-14 30/09S500,000 469,102.50 0.34USD 480,000.00NOMOS CAP REG S 6.50 10-13 21/10S2,000,000 2,001,050.00 1.44USD 2,000,000.00OGX PETROLEO E GAS 8.50 11-18 01/06S1,000,000 984,175.00 0.71USD 1,000,000.00OLAM INTL LTD 7.50 10-20 12/08S1,500,000 1,405,800.00 1.01USD 1,518,000.00PACIFIC RUB REG S 7.25 11-21 12/12S1,000,000 1,005,000.00 0.72USD 1,000,000.00PACNET REG S 9.25 10-15 09/11S1,200,000 1,075,926.00 0.77USD 1,200,000.00PEMEX 5.50 10-21 21/01S1,000,000 1,083,810.00 0.78USD 990,110.00PERTAMINA REG S 6.50 11-41 27/05S500,000 523,965.00 0.38USD 491,900.00PERUSAHAAN PERSEROAN 5.50 11-21 22/11S2,000,000 2,043,680.00 1.47USD 1,981,080.00PETR TRIN&TOBAC.REG S 9.75 09-19 14/08S500,000 591,452.50 0.43USD 571,250.00PETROTEMEX REGS 9.50 09-14 19/08S500,000 543,015.00 0.39USD 545,000.00PSB FINANCE 11.25 10-16 08/07S250,000 262,570.00 0.19USD 250,000.00PSB FINANCE 6.20 11-14 25/04S1,000,000 963,490.00 0.69USD 1,000,000.00PT ADARO INDONESIA 7.625 09-19 22/10S1,000,000 1,095,180.00 0.79USD 1,065,000.00QUADRA FNX MINING LTD 7.75 11-19 15/06S2,000,000 2,298,352.30 1.65USD 2,000,000.00ROYAL CAPITAL BV 8.375 11-XX 05/11S2,000,000 2,021,110.00 1.45USD 2,000,000.00SHIMAO PPTY REGS 9.65 10-17 03/08S250,000 190,188.75 0.14USD 254,375.00SINO FOREST REGS 6.25 10-17 21/10S500,000 127,500.00 0.09USD 500,000.00STANDARD BANK SUB 8.125 09-19 02/12S1,500,000 1,562,527.50 1.12USD 1,580,000.00STATE BANK OF INDIA REG S 4.50 10-15 27/07S200,000 197,477.00 0.14USD 199,416.00STATS CHIPPAC REG S 5.375 11-16 31/03S200,000 200,200.00 0.14USD 200,000.00STATS CHIPPAC REG S 7.50 10-15 12/08S1,000,000 1,050,660.00 0.76USD 1,018,750.00STEEL CAPITAL 6.70 10-17 25/10S1,500,000 1,415,422.50 1.02USD 1,500,000.00TAM CAPITAL INC 8.375 11-21 03/06S500,000 510,335.00 0.37USD 495,845.00TELEMAR N L REGS 5.50 10-20 23/10S1,250,000 1,240,168.75 0.89USD 1,249,887.50TELEMOVIL FIN REG-S 8.00 10-17 01/10S1,500,000 1,543,957.50 1.11USD 1,513,090.00TEXHONG TEXTILE REG S 7.625 11-16 19/01S500,000 368,300.00 0.26USD 505,437.50TNK-BP FINANCE REG S 7.25 10-20 02/02S500,000 518,305.00 0.37USD 510,000.00TNK-BP FINANCE REG.S 7.875 07-18 13/03S500,000 538,417.50 0.39USD 569,375.00TURK EXIMBANK 5.375 11-16 04/11S500,000 495,937.50 0.36USD 497,450.00TURK GARANTI BANK 6.25 11-21 20/04S1,000,000 956,310.00 0.69USD 990,860.00TURKIYE IS BANK REG-S 5.10 11-16 01/02S1,000,000 970,305.00 0.70USD 991,320.00TV AZTECA EMTN 7.50 11-18 25/05S500,000 506,210.00 0.36USD 493,345.00UBS LX (VIMPELCOM)REGS8.25 06-16 23/05S1,000,000 996,515.00 0.72USD 1,092,500.00UKREXIMBANK 8.375 10-15 27/04S1,750,000 1,531,136.25 1.10USD 1,787,844.17VEB FINANCE REG S 6.902 10-20 09/07S1,500,000 1,542,780.00 1.11USD 1,510,880.00VEB LEASING 5.125 11-16 27/05A1,000,000 968,115.00 0.70USD 1,000,000.00
Securities portfolio at 31/12/2011USDExpressed in
UBAM - EMERGING MARKET CORPORATE BOND
Number/nom. value Description Currency % of total
net assetsMarket valueCost
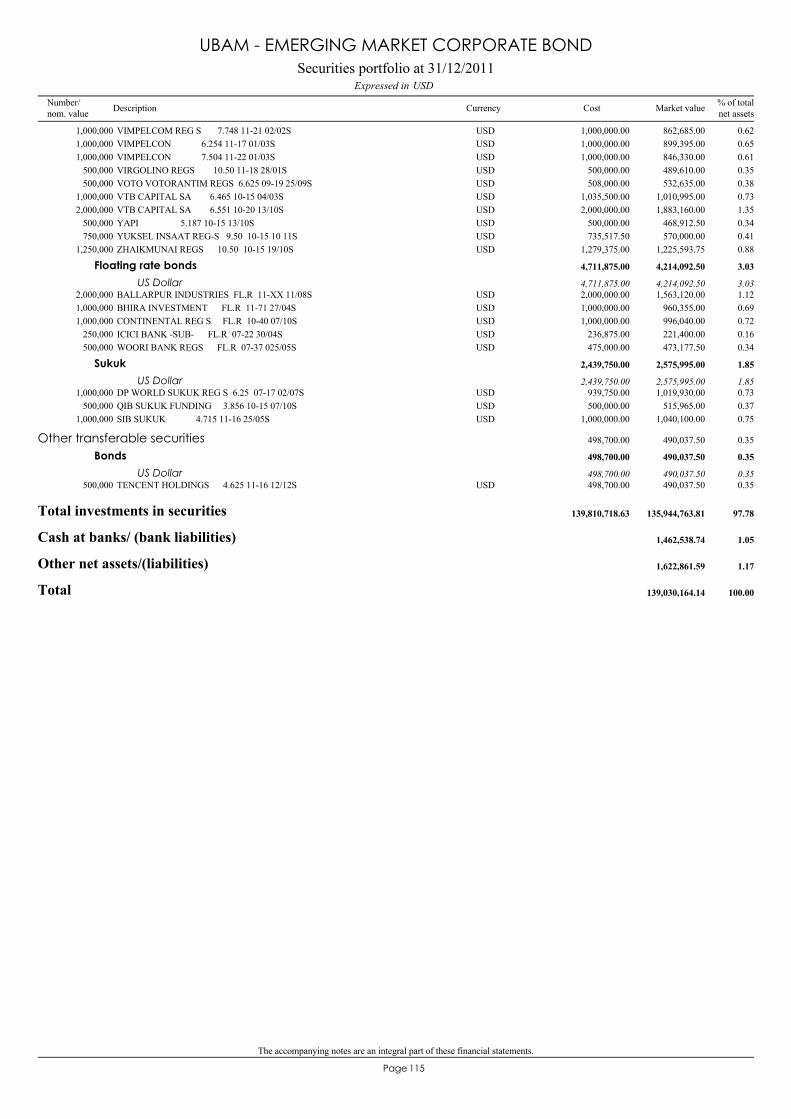
The accompanying notes are an integral part of these financial statements.
115Page
VIMPELCOM REG S 7.748 11-21 02/02S1,000,000 862,685.00 0.62USD 1,000,000.00VIMPELCON 6.254 11-17 01/03S1,000,000 899,395.00 0.65USD 1,000,000.00VIMPELCON 7.504 11-22 01/03S1,000,000 846,330.00 0.61USD 1,000,000.00VIRGOLINO REGS 10.50 11-18 28/01S500,000 489,610.00 0.35USD 500,000.00VOTO VOTORANTIM REGS 6.625 09-19 25/09S500,000 532,635.00 0.38USD 508,000.00VTB CAPITAL SA 6.465 10-15 04/03S1,000,000 1,010,995.00 0.73USD 1,035,500.00VTB CAPITAL SA 6.551 10-20 13/10S2,000,000 1,883,160.00 1.35USD 2,000,000.00YAPI 5.187 10-15 13/10S500,000 468,912.50 0.34USD 500,000.00YUKSEL INSAAT REG-S 9.50 10-15 10 11S750,000 570,000.00 0.41USD 735,517.50ZHAIKMUNAI REGS 10.50 10-15 19/10S1,250,000 1,225,593.75 0.88USD 1,279,375.00
BALLARPUR INDUSTRIES FL.R 11-XX 11/08S2,000,000 1,563,120.00 1.12USD 2,000,000.00
Floating rate bonds 4,214,092.50 3.034,711,875.00
US Dollar 4,214,092.50 3.034,711,875.00
BHIRA INVESTMENT FL.R 11-71 27/04S1,000,000 960,355.00 0.69USD 1,000,000.00CONTINENTAL REG S FL.R 10-40 07/10S1,000,000 996,040.00 0.72USD 1,000,000.00ICICI BANK -SUB- FL.R 07-22 30/04S250,000 221,400.00 0.16USD 236,875.00WOORI BANK REGS FL.R 07-37 025/05S500,000 473,177.50 0.34USD 475,000.00
DP WORLD SUKUK REG S 6.25 07-17 02/07S1,000,000 1,019,930.00 0.73USD 939,750.00
Sukuk 2,575,995.00 1.852,439,750.00
US Dollar 2,575,995.00 1.852,439,750.00
QIB SUKUK FUNDING 3.856 10-15 07/10S500,000 515,965.00 0.37USD 500,000.00SIB SUKUK 4.715 11-16 25/05S1,000,000 1,040,100.00 0.75USD 1,000,000.00
TENCENT HOLDINGS 4.625 11-16 12/12S500,000 490,037.50 0.35USD 498,700.00
Other transferable securities 490,037.50 0.35498,700.00
Bonds 490,037.50 0.35498,700.00
US Dollar 490,037.50 0.35498,700.00
Total investments in securities 135,944,763.81 97.78139,810,718.63
Cash at banks/ (bank liabilities) 1,462,538.74 1.05
Other net assets/(liabilities) 1,622,861.59 1.17
Total 139,030,164.14 100.00
Securities portfolio at 31/12/2011USDExpressed in
UBAM - EMERGING MARKET CORPORATE BOND
Number/nom. value Description Currency % of total
net assetsMarket valueCost
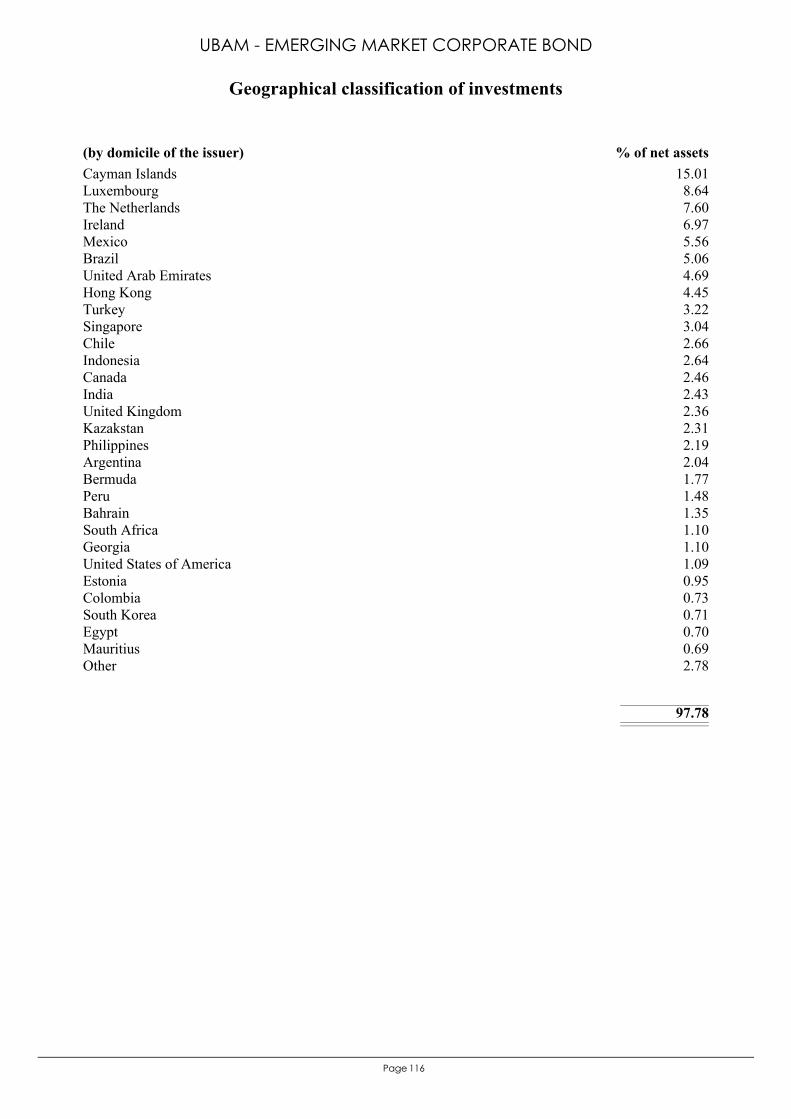
116Page
Cayman Islands 15.01Luxembourg 8.64The Netherlands 7.60Ireland 6.97Mexico 5.56Brazil 5.06United Arab Emirates 4.69Hong Kong 4.45Turkey 3.22Singapore 3.04Chile 2.66Indonesia 2.64Canada 2.46India 2.43United Kingdom 2.36Kazakstan 2.31Philippines 2.19Argentina 2.04Bermuda 1.77Peru 1.48Bahrain 1.35South Africa 1.10Georgia 1.10United States of America 1.09Estonia 0.95Colombia 0.73South Korea 0.71Egypt 0.70Mauritius 0.69Other 2.78
97.78
(by domicile of the issuer) % of net assets
Geographical classification of investments
UBAM - EMERGING MARKET CORPORATE BOND
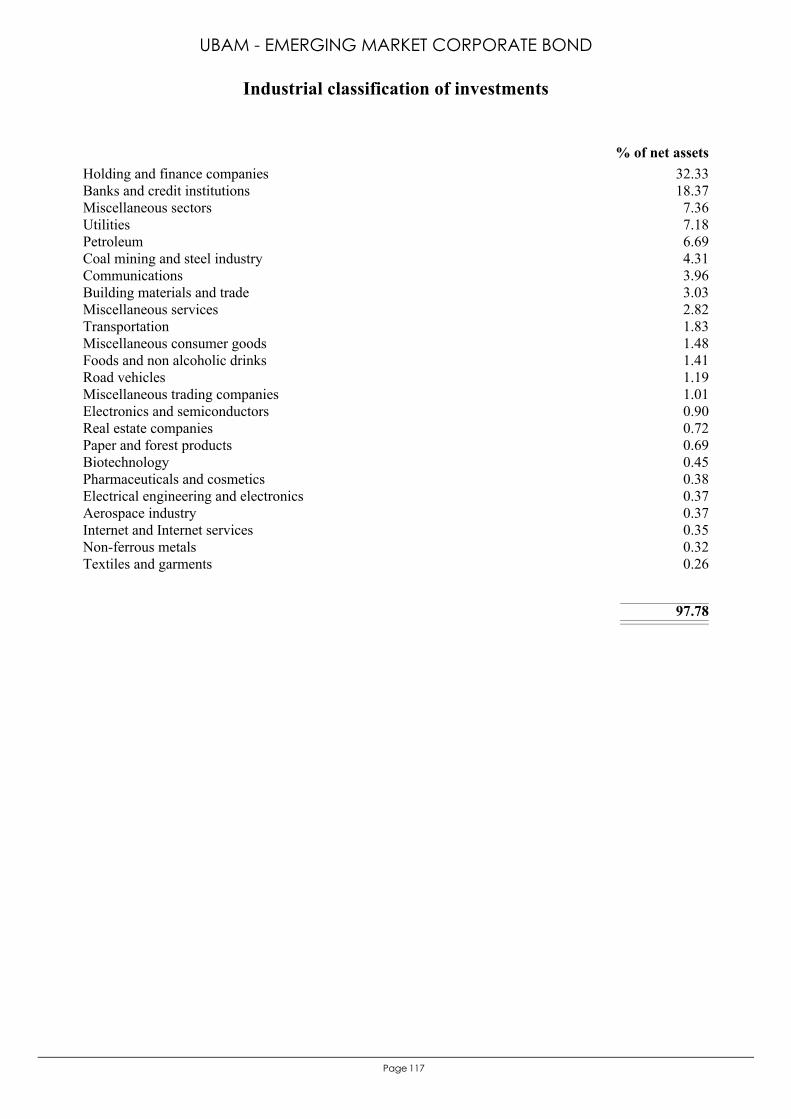
117Page
Holding and finance companies 32.33Banks and credit institutions 18.37Miscellaneous sectors 7.36Utilities 7.18Petroleum 6.69Coal mining and steel industry 4.31Communications 3.96Building materials and trade 3.03Miscellaneous services 2.82Transportation 1.83Miscellaneous consumer goods 1.48Foods and non alcoholic drinks 1.41Road vehicles 1.19Miscellaneous trading companies 1.01Electronics and semiconductors 0.90Real estate companies 0.72Paper and forest products 0.69Biotechnology 0.45Pharmaceuticals and cosmetics 0.38Electrical engineering and electronics 0.37Aerospace industry 0.37Internet and Internet services 0.35Non-ferrous metals 0.32Textiles and garments 0.26
97.78
% of net assets
Industrial classification of investments
UBAM - EMERGING MARKET CORPORATE BOND
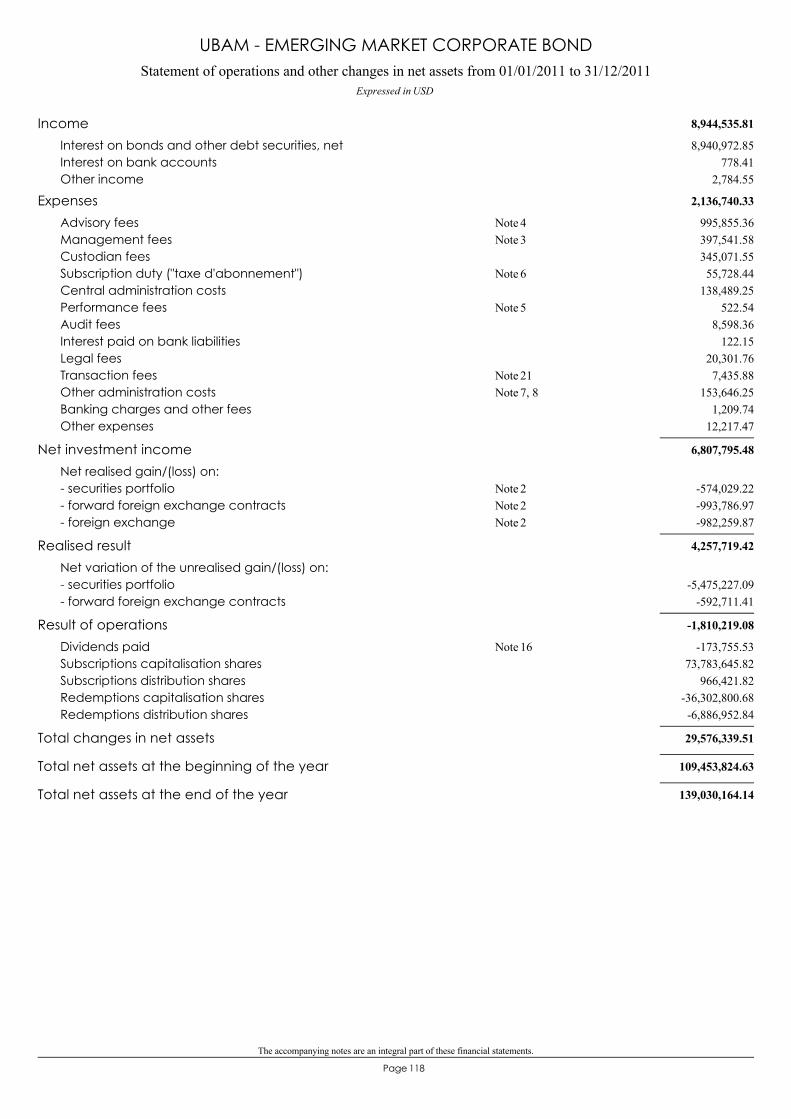
The accompanying notes are an integral part of these financial statements.
118Page
Statement of operations and other changes in net assets from 01/01/2011 to 31/12/2011Expressed in USD
UBAM - EMERGING MARKET CORPORATE BOND
8,944,535.81Income8,940,972.85Interest on bonds and other debt securities, net
778.41Interest on bank accounts2,784.55Other income
2,136,740.33Expenses995,855.36Advisory fees 4Note397,541.58Management fees 3Note345,071.55Custodian fees55,728.44Subscription duty ("taxe d'abonnement") 6Note
138,489.25Central administration costs522.54Performance fees 5Note
8,598.36Audit fees122.15Interest paid on bank liabilities
20,301.76Legal fees7,435.88Transaction fees 21Note
153,646.25Other administration costs 7, 8Note1,209.74Banking charges and other fees
12,217.47Other expenses
6,807,795.48Net investment incomeNet realised gain/(loss) on:
-574,029.22- securities portfolio 2Note-993,786.97- forward foreign exchange contracts 2Note-982,259.87- foreign exchange 2Note
4,257,719.42Realised resultNet variation of the unrealised gain/(loss) on:
-5,475,227.09- securities portfolio-592,711.41- forward foreign exchange contracts
-1,810,219.08Result of operations-173,755.53Dividends paid 16Note
73,783,645.82Subscriptions capitalisation shares966,421.82Subscriptions distribution shares
-36,302,800.68Redemptions capitalisation shares-6,886,952.84Redemptions distribution shares
29,576,339.51Total changes in net assets
109,453,824.63Total net assets at the beginning of the year
139,030,164.14Total net assets at the end of the year
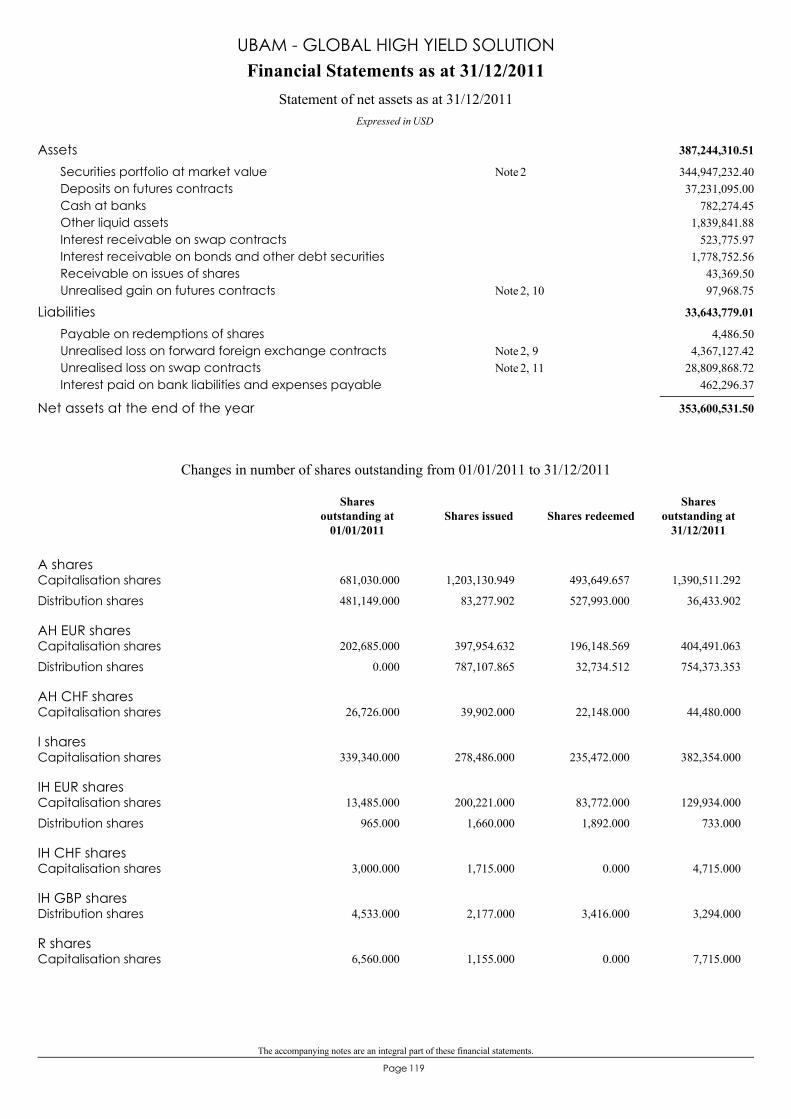
The accompanying notes are an integral part of these financial statements.
119Page
387,244,310.51Assets344,947,232.40Securities portfolio at market value 2Note37,231,095.00Deposits on futures contracts
782,274.45Cash at banks1,839,841.88Other liquid assets
523,775.97Interest receivable on swap contracts1,778,752.56Interest receivable on bonds and other debt securities
43,369.50Receivable on issues of shares97,968.75Unrealised gain on futures contracts 2, 10Note
33,643,779.01Liabilities4,486.50Payable on redemptions of shares
4,367,127.42Unrealised loss on forward foreign exchange contracts 2, 9Note28,809,868.72Unrealised loss on swap contracts 2, 11Note
462,296.37Interest paid on bank liabilities and expenses payable
353,600,531.50Net assets at the end of the year
Financial Statements as at 31/12/2011
Expressed in USD
Statement of net assets as at 31/12/2011
UBAM - GLOBAL HIGH YIELD SOLUTION
A sharesCapitalisation shares 681,030.000 1,203,130.949 493,649.657 1,390,511.292
Distribution shares 481,149.000 83,277.902 527,993.000 36,433.902
AH EUR sharesCapitalisation shares 202,685.000 397,954.632 196,148.569 404,491.063
Distribution shares 0.000 787,107.865 32,734.512 754,373.353
AH CHF sharesCapitalisation shares 26,726.000 39,902.000 22,148.000 44,480.000
I sharesCapitalisation shares 339,340.000 278,486.000 235,472.000 382,354.000
IH EUR sharesCapitalisation shares 13,485.000 200,221.000 83,772.000 129,934.000
Distribution shares 965.000 1,660.000 1,892.000 733.000
IH CHF sharesCapitalisation shares 3,000.000 1,715.000 0.000 4,715.000
IH GBP sharesDistribution shares 4,533.000 2,177.000 3,416.000 3,294.000
R sharesCapitalisation shares 6,560.000 1,155.000 0.000 7,715.000
Changes in number of shares outstanding from 01/01/2011 to 31/12/2011
Shares issued Shares redeemedShares
outstanding at31/12/2011
Sharesoutstanding at
01/01/2011
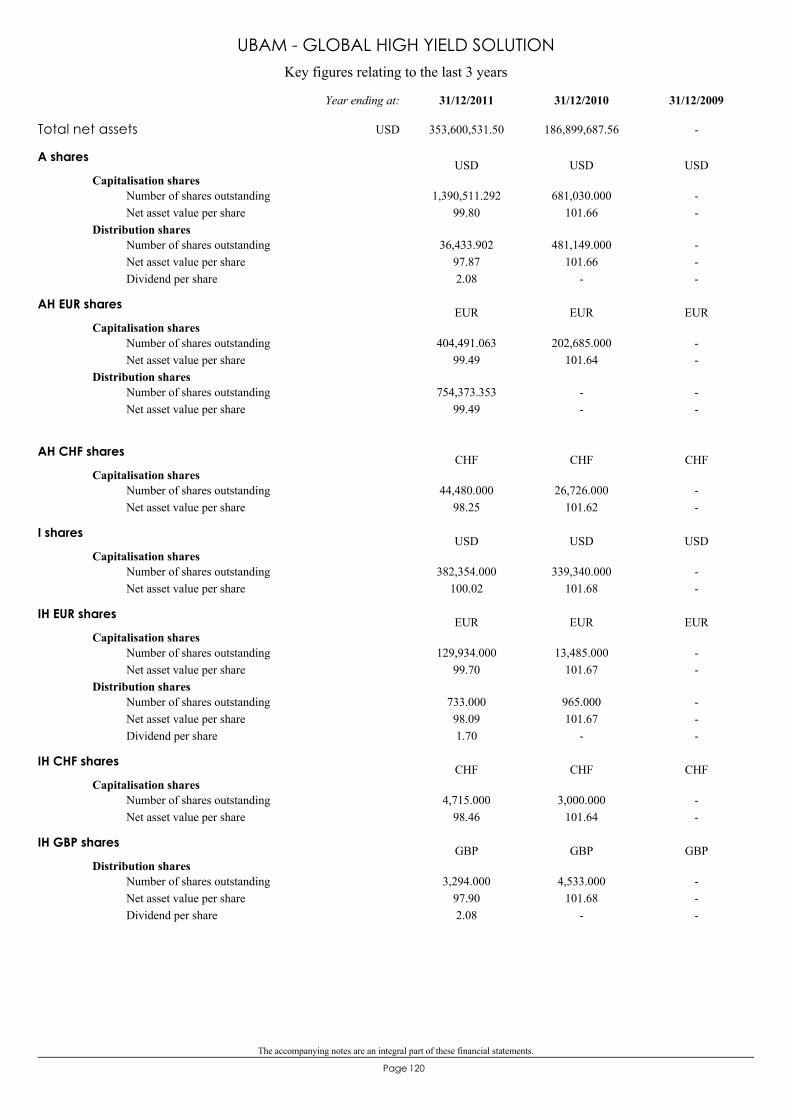
The accompanying notes are an integral part of these financial statements.
120Page
Key figures relating to the last 3 years
UBAM - GLOBAL HIGH YIELD SOLUTION
A shares
Capitalisation shares1,390,511.292
99.80681,030.000
101.66--
Number of shares outstandingNet asset value per share
Distribution shares36,433.902
97.872.08
481,149.000101.66
-
---
Number of shares outstandingNet asset value per shareDividend per share
USD USD USD
AH EUR shares
Capitalisation shares404,491.063
99.49202,685.000
101.64--
Number of shares outstandingNet asset value per share
Distribution shares754,373.353
99.49--
--
Number of shares outstandingNet asset value per share
EUR EUR EUR
AH CHF shares
Capitalisation shares44,480.000
98.2526,726.000
101.62--
Number of shares outstandingNet asset value per share
CHF CHF CHF
I shares
Capitalisation shares382,354.000
100.02339,340.000
101.68--
Number of shares outstandingNet asset value per share
USD USD USD
IH EUR shares
Capitalisation shares129,934.000
99.7013,485.000
101.67--
Number of shares outstandingNet asset value per share
Distribution shares733.00098.091.70
965.000101.67
-
---
Number of shares outstandingNet asset value per shareDividend per share
EUR EUR EUR
IH CHF shares
Capitalisation shares4,715.000
98.463,000.000
101.64--
Number of shares outstandingNet asset value per share
CHF CHF CHF
IH GBP shares
Distribution shares3,294.000
97.902.08
4,533.000101.68
-
---
Number of shares outstandingNet asset value per shareDividend per share
GBP GBP GBP
Total net assets 353,600,531.50 186,899,687.56 -
31/12/200931/12/201031/12/2011Year ending at:
USD
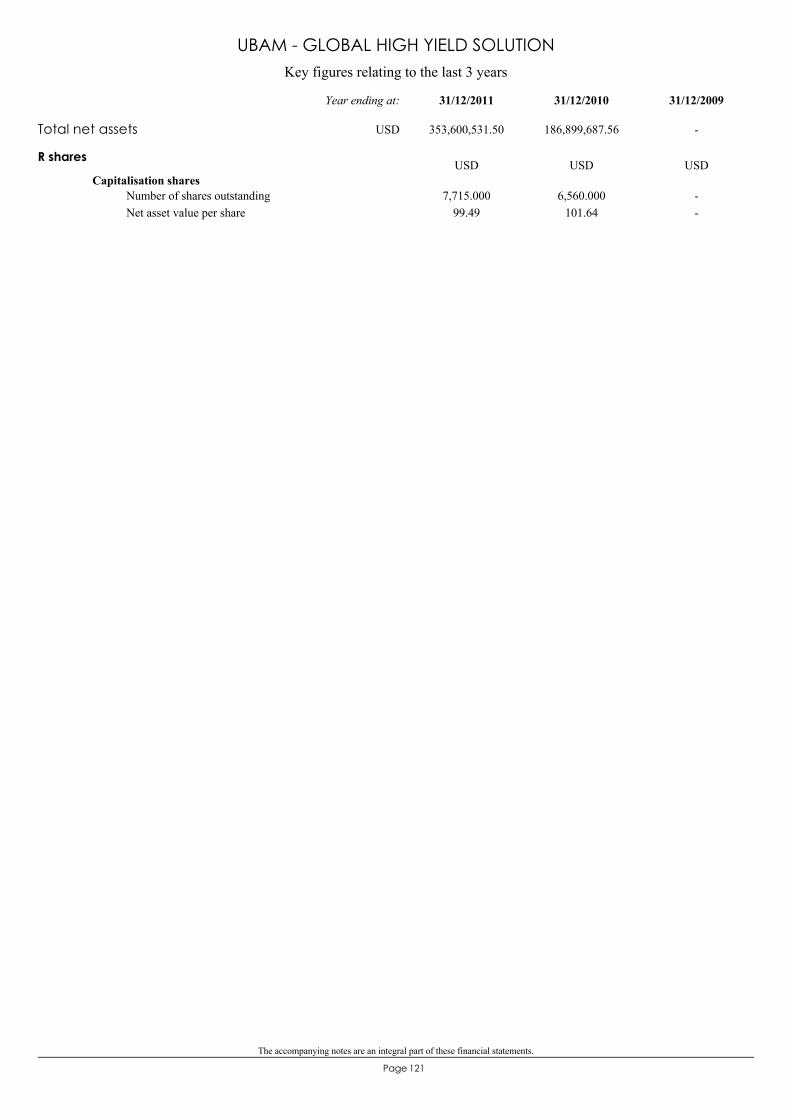
The accompanying notes are an integral part of these financial statements.
121Page
Key figures relating to the last 3 years
UBAM - GLOBAL HIGH YIELD SOLUTION
R shares
Capitalisation shares7,715.000
99.496,560.000
101.64--
Number of shares outstandingNet asset value per share
USD USD USD
Total net assets 353,600,531.50 186,899,687.56 -
31/12/200931/12/201031/12/2011Year ending at:
USD
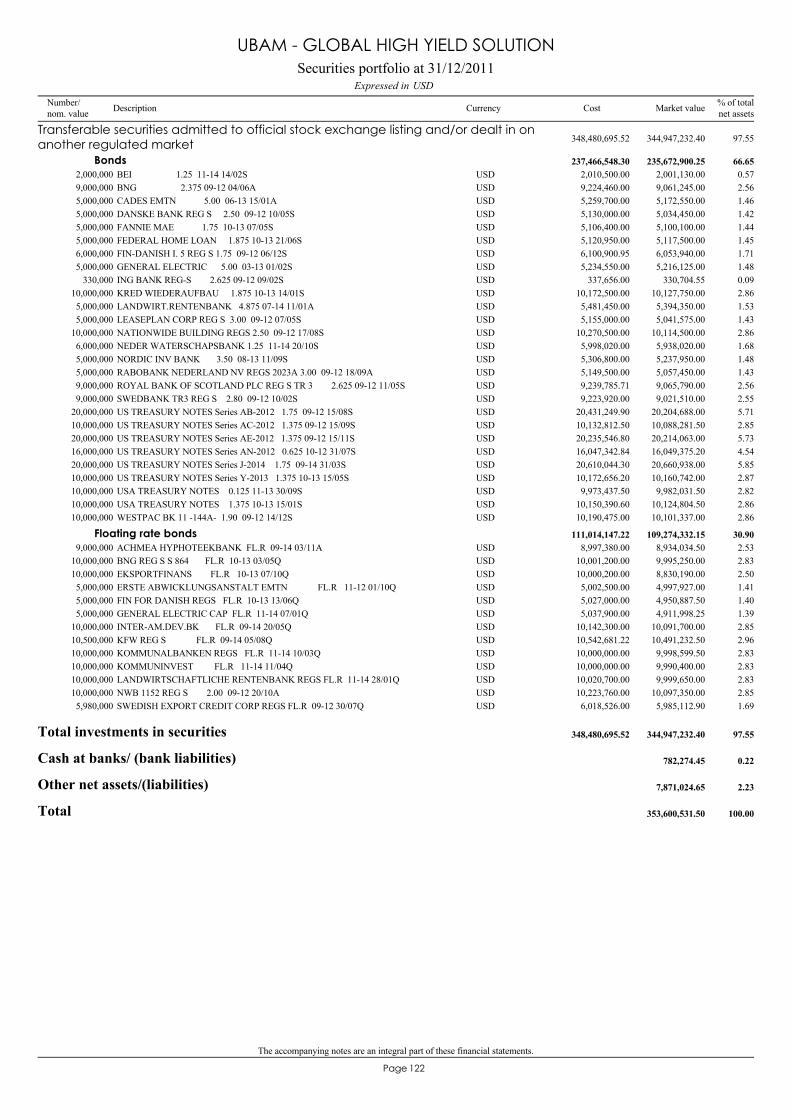
The accompanying notes are an integral part of these financial statements.
122Page
BEI 1.25 11-14 14/02S2,000,000 2,001,130.00 0.57USD 2,010,500.00
Transferable securities admitted to official stock exchange listing and/or dealt in onanother regulated market 344,947,232.40 97.55348,480,695.52
Bonds 235,672,900.25 66.65237,466,548.30
BNG 2.375 09-12 04/06A9,000,000 9,061,245.00 2.56USD 9,224,460.00CADES EMTN 5.00 06-13 15/01A5,000,000 5,172,550.00 1.46USD 5,259,700.00DANSKE BANK REG S 2.50 09-12 10/05S5,000,000 5,034,450.00 1.42USD 5,130,000.00FANNIE MAE 1.75 10-13 07/05S5,000,000 5,100,100.00 1.44USD 5,106,400.00FEDERAL HOME LOAN 1.875 10-13 21/06S5,000,000 5,117,500.00 1.45USD 5,120,950.00FIN-DANISH I. 5 REG S 1.75 09-12 06/12S6,000,000 6,053,940.00 1.71USD 6,100,900.95GENERAL ELECTRIC 5.00 03-13 01/02S5,000,000 5,216,125.00 1.48USD 5,234,550.00ING BANK REG-S 2.625 09-12 09/02S330,000 330,704.55 0.09USD 337,656.00KRED WIEDERAUFBAU 1.875 10-13 14/01S10,000,000 10,127,750.00 2.86USD 10,172,500.00LANDWIRT.RENTENBANK 4.875 07-14 11/01A5,000,000 5,394,350.00 1.53USD 5,481,450.00LEASEPLAN CORP REG S 3.00 09-12 07/05S5,000,000 5,041,575.00 1.43USD 5,155,000.00NATIONWIDE BUILDING REGS 2.50 09-12 17/08S10,000,000 10,114,500.00 2.86USD 10,270,500.00NEDER WATERSCHAPSBANK 1.25 11-14 20/10S6,000,000 5,938,020.00 1.68USD 5,998,020.00NORDIC INV BANK 3.50 08-13 11/09S5,000,000 5,237,950.00 1.48USD 5,306,800.00RABOBANK NEDERLAND NV REGS 2023A 3.00 09-12 18/09A5,000,000 5,057,450.00 1.43USD 5,149,500.00ROYAL BANK OF SCOTLAND PLC REG S TR 3 2.625 09-12 11/05S9,000,000 9,065,790.00 2.56USD 9,239,785.71SWEDBANK TR3 REG S 2.80 09-12 10/02S9,000,000 9,021,510.00 2.55USD 9,223,920.00US TREASURY NOTES Series AB-2012 1.75 09-12 15/08S20,000,000 20,204,688.00 5.71USD 20,431,249.90US TREASURY NOTES Series AC-2012 1.375 09-12 15/09S10,000,000 10,088,281.50 2.85USD 10,132,812.50US TREASURY NOTES Series AE-2012 1.375 09-12 15/11S20,000,000 20,214,063.00 5.73USD 20,235,546.80US TREASURY NOTES Series AN-2012 0.625 10-12 31/07S16,000,000 16,049,375.20 4.54USD 16,047,342.84US TREASURY NOTES Series J-2014 1.75 09-14 31/03S20,000,000 20,660,938.00 5.85USD 20,610,044.30US TREASURY NOTES Series Y-2013 1.375 10-13 15/05S10,000,000 10,160,742.00 2.87USD 10,172,656.20USA TREASURY NOTES 0.125 11-13 30/09S10,000,000 9,982,031.50 2.82USD 9,973,437.50USA TREASURY NOTES 1.375 10-13 15/01S10,000,000 10,124,804.50 2.86USD 10,150,390.60WESTPAC BK 11 -144A- 1.90 09-12 14/12S10,000,000 10,101,337.00 2.86USD 10,190,475.00
ACHMEA HYPHOTEEKBANK FL.R 09-14 03/11A9,000,000 8,934,034.50 2.53USD 8,997,380.00Floating rate bonds 109,274,332.15 30.90111,014,147.22
BNG REG S S 864 FL.R 10-13 03/05Q10,000,000 9,995,250.00 2.83USD 10,001,200.00EKSPORTFINANS FL.R 10-13 07/10Q10,000,000 8,830,190.00 2.50USD 10,000,200.00ERSTE ABWICKLUNGSANSTALT EMTN FL.R 11-12 01/10Q5,000,000 4,997,927.00 1.41USD 5,002,500.00FIN FOR DANISH REGS FL.R 10-13 13/06Q5,000,000 4,950,887.50 1.40USD 5,027,000.00GENERAL ELECTRIC CAP FL.R 11-14 07/01Q5,000,000 4,911,998.25 1.39USD 5,037,900.00INTER-AM.DEV.BK FL.R 09-14 20/05Q10,000,000 10,091,700.00 2.85USD 10,142,300.00KFW REG S FL.R 09-14 05/08Q10,500,000 10,491,232.50 2.96USD 10,542,681.22KOMMUNALBANKEN REGS FL.R 11-14 10/03Q10,000,000 9,998,599.50 2.83USD 10,000,000.00KOMMUNINVEST FL.R 11-14 11/04Q10,000,000 9,990,400.00 2.83USD 10,000,000.00LANDWIRTSCHAFTLICHE RENTENBANK REGS FL.R 11-14 28/01Q10,000,000 9,999,650.00 2.83USD 10,020,700.00NWB 1152 REG S 2.00 09-12 20/10A10,000,000 10,097,350.00 2.85USD 10,223,760.00SWEDISH EXPORT CREDIT CORP REGS FL.R 09-12 30/07Q5,980,000 5,985,112.90 1.69USD 6,018,526.00
Total investments in securities 344,947,232.40 97.55348,480,695.52
Cash at banks/ (bank liabilities) 782,274.45 0.22
Other net assets/(liabilities) 7,871,024.65 2.23
Total 353,600,531.50 100.00
Securities portfolio at 31/12/2011USDExpressed in
UBAM - GLOBAL HIGH YIELD SOLUTION
Number/nom. value Description Currency % of total
net assetsMarket valueCost
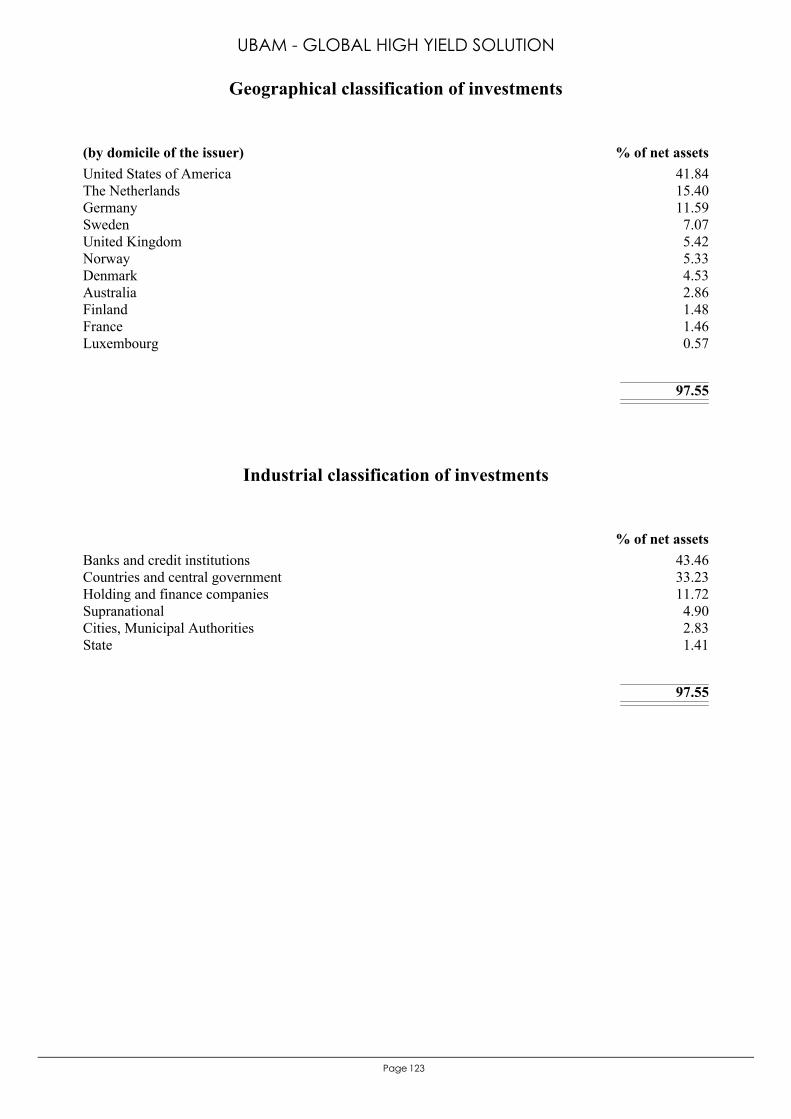
123Page
United States of America 41.84The Netherlands 15.40Germany 11.59Sweden 7.07United Kingdom 5.42Norway 5.33Denmark 4.53Australia 2.86Finland 1.48France 1.46Luxembourg 0.57
97.55
(by domicile of the issuer) % of net assets
Geographical classification of investments
UBAM - GLOBAL HIGH YIELD SOLUTION
Banks and credit institutions 43.46Countries and central government 33.23Holding and finance companies 11.72Supranational 4.90Cities, Municipal Authorities 2.83State 1.41
97.55
% of net assets
Industrial classification of investments
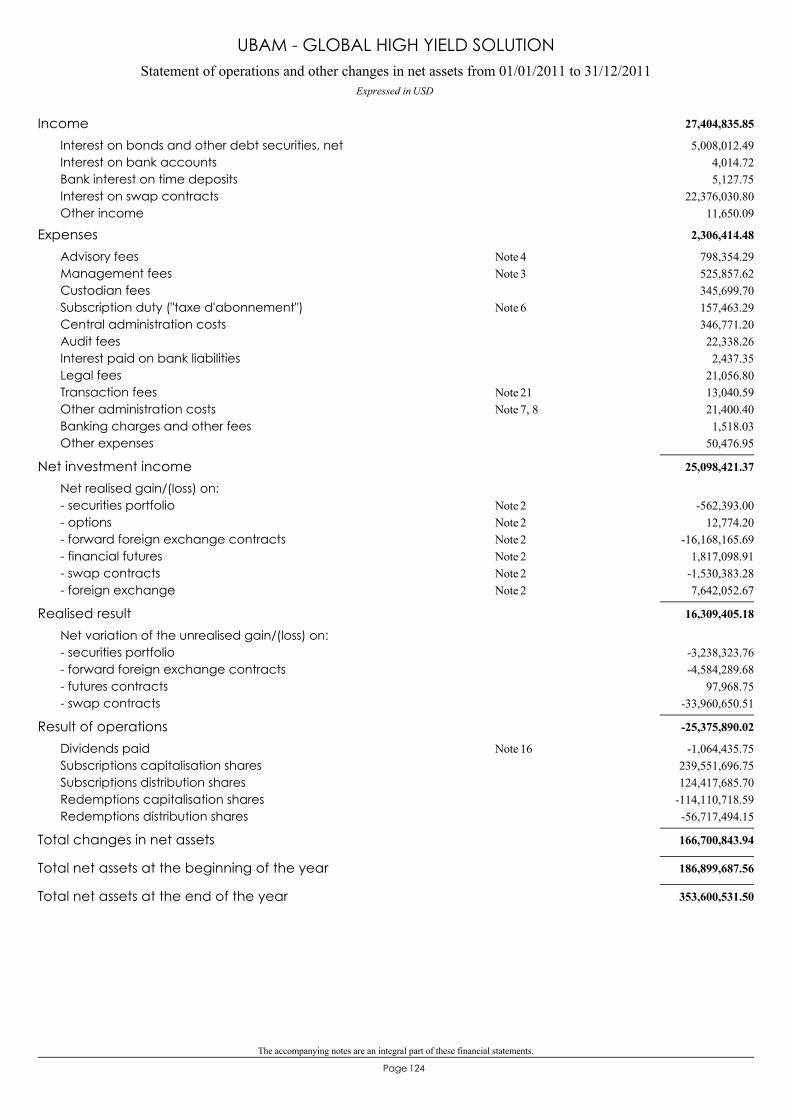
The accompanying notes are an integral part of these financial statements.
124Page
Statement of operations and other changes in net assets from 01/01/2011 to 31/12/2011Expressed in USD
UBAM - GLOBAL HIGH YIELD SOLUTION
27,404,835.85Income5,008,012.49Interest on bonds and other debt securities, net
4,014.72Interest on bank accounts5,127.75Bank interest on time deposits
22,376,030.80Interest on swap contracts11,650.09Other income
2,306,414.48Expenses798,354.29Advisory fees 4Note525,857.62Management fees 3Note345,699.70Custodian fees157,463.29Subscription duty ("taxe d'abonnement") 6Note346,771.20Central administration costs22,338.26Audit fees2,437.35Interest paid on bank liabilities
21,056.80Legal fees13,040.59Transaction fees 21Note21,400.40Other administration costs 7, 8Note1,518.03Banking charges and other fees
50,476.95Other expenses
25,098,421.37Net investment incomeNet realised gain/(loss) on:
-562,393.00- securities portfolio 2Note12,774.20- options 2Note
-16,168,165.69- forward foreign exchange contracts 2Note1,817,098.91- financial futures 2Note
-1,530,383.28- swap contracts 2Note7,642,052.67- foreign exchange 2Note
16,309,405.18Realised resultNet variation of the unrealised gain/(loss) on:
-3,238,323.76- securities portfolio-4,584,289.68- forward foreign exchange contracts
97,968.75- futures contracts-33,960,650.51- swap contracts
-25,375,890.02Result of operations-1,064,435.75Dividends paid 16Note
239,551,696.75Subscriptions capitalisation shares124,417,685.70Subscriptions distribution shares
-114,110,718.59Redemptions capitalisation shares-56,717,494.15Redemptions distribution shares
166,700,843.94Total changes in net assets
186,899,687.56Total net assets at the beginning of the year
353,600,531.50Total net assets at the end of the year
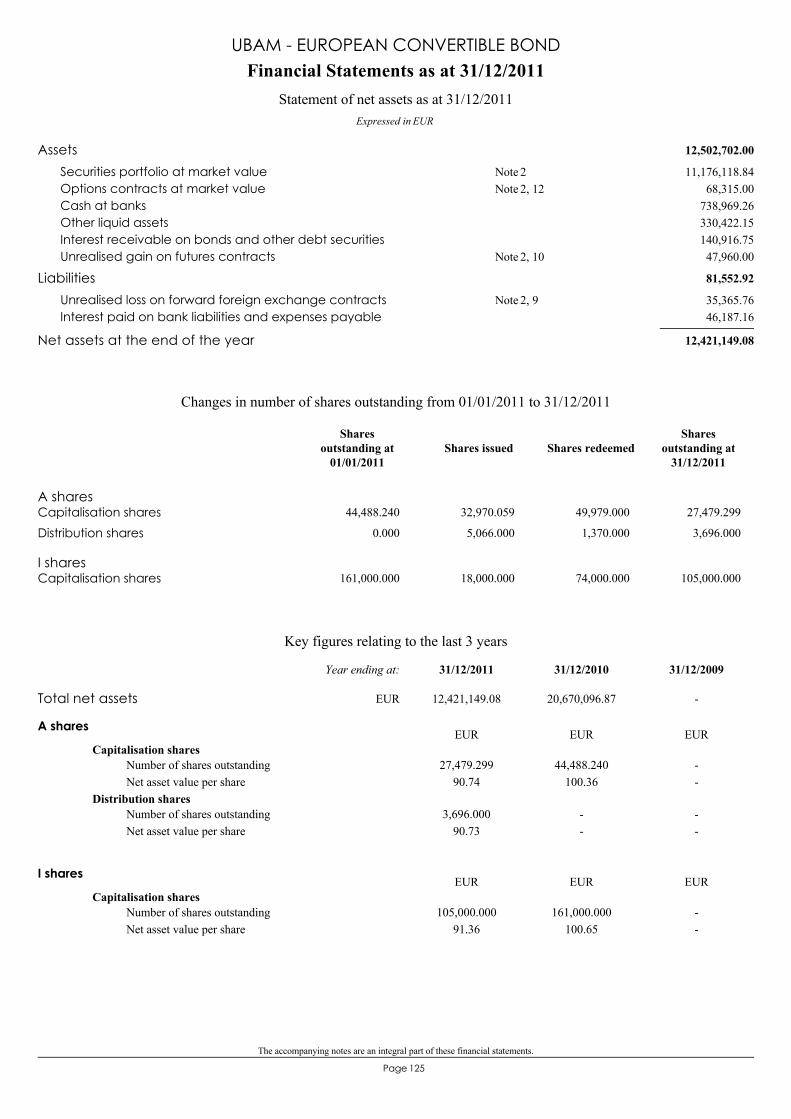
The accompanying notes are an integral part of these financial statements.
125Page
12,502,702.00Assets11,176,118.84Securities portfolio at market value 2Note
68,315.00Options contracts at market value 2, 12Note738,969.26Cash at banks330,422.15Other liquid assets140,916.75Interest receivable on bonds and other debt securities47,960.00Unrealised gain on futures contracts 2, 10Note
81,552.92Liabilities35,365.76Unrealised loss on forward foreign exchange contracts 2, 9Note46,187.16Interest paid on bank liabilities and expenses payable
12,421,149.08Net assets at the end of the year
Financial Statements as at 31/12/2011
Expressed in EUR
Statement of net assets as at 31/12/2011
UBAM - EUROPEAN CONVERTIBLE BOND
A sharesCapitalisation shares 44,488.240 32,970.059 49,979.000 27,479.299
Distribution shares 0.000 5,066.000 1,370.000 3,696.000
I sharesCapitalisation shares 161,000.000 18,000.000 74,000.000 105,000.000
Changes in number of shares outstanding from 01/01/2011 to 31/12/2011
Shares issued Shares redeemedShares
outstanding at31/12/2011
Sharesoutstanding at
01/01/2011
Key figures relating to the last 3 years
A shares
Capitalisation shares27,479.299
90.7444,488.240
100.36--
Number of shares outstandingNet asset value per share
Distribution shares3,696.000
90.73--
--
Number of shares outstandingNet asset value per share
EUR EUR EUR
I shares
Capitalisation shares105,000.000
91.36161,000.000
100.65--
Number of shares outstandingNet asset value per share
EUR EUR EUR
Total net assets 12,421,149.08 20,670,096.87 -
31/12/200931/12/201031/12/2011Year ending at:
EUR
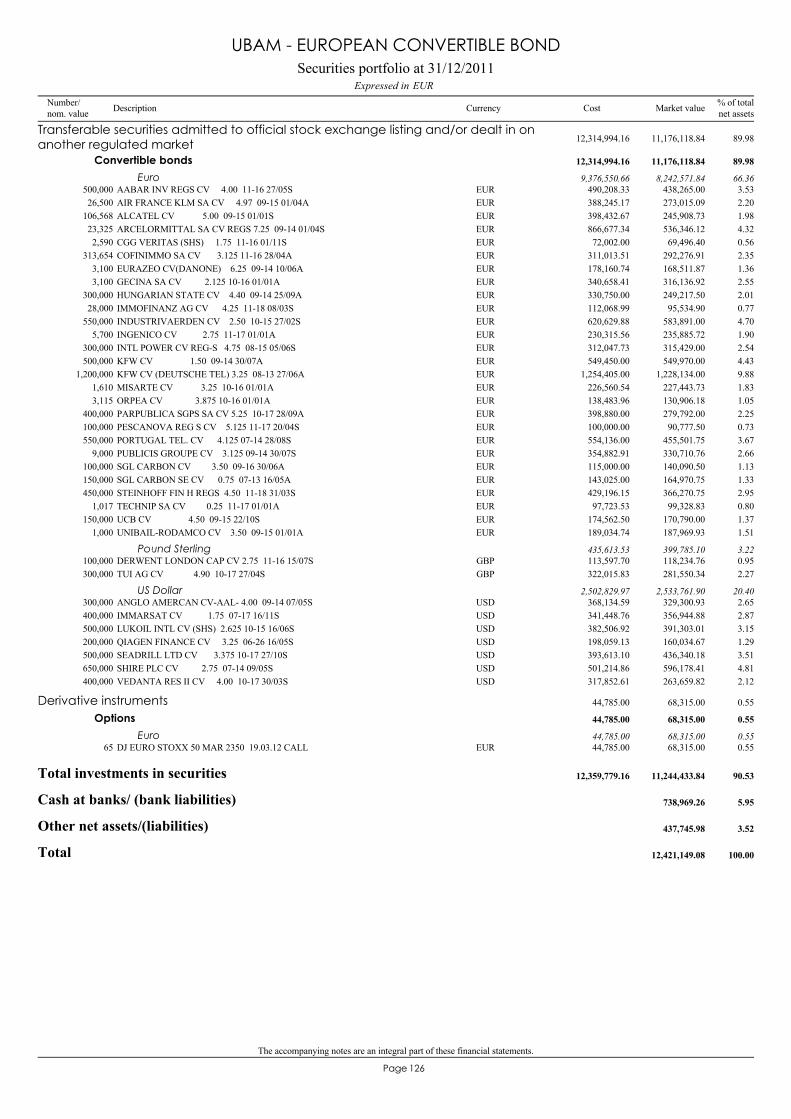
The accompanying notes are an integral part of these financial statements.
126Page
AABAR INV REGS CV 4.00 11-16 27/05S500,000 438,265.00 3.53EUR 490,208.33
Transferable securities admitted to official stock exchange listing and/or dealt in onanother regulated market 11,176,118.84 89.9812,314,994.16
Convertible bonds 11,176,118.84 89.9812,314,994.16
Euro 8,242,571.84 66.369,376,550.66
AIR FRANCE KLM SA CV 4.97 09-15 01/04A26,500 273,015.09 2.20EUR 388,245.17ALCATEL CV 5.00 09-15 01/01S106,568 245,908.73 1.98EUR 398,432.67ARCELORMITTAL SA CV REGS 7.25 09-14 01/04S23,325 536,346.12 4.32EUR 866,677.34CGG VERITAS (SHS) 1.75 11-16 01/11S2,590 69,496.40 0.56EUR 72,002.00COFINIMMO SA CV 3.125 11-16 28/04A313,654 292,276.91 2.35EUR 311,013.51EURAZEO CV(DANONE) 6.25 09-14 10/06A3,100 168,511.87 1.36EUR 178,160.74GECINA SA CV 2.125 10-16 01/01A3,100 316,136.92 2.55EUR 340,658.41HUNGARIAN STATE CV 4.40 09-14 25/09A300,000 249,217.50 2.01EUR 330,750.00IMMOFINANZ AG CV 4.25 11-18 08/03S28,000 95,534.90 0.77EUR 112,068.99INDUSTRIVAERDEN CV 2.50 10-15 27/02S550,000 583,891.00 4.70EUR 620,629.88INGENICO CV 2.75 11-17 01/01A5,700 235,885.72 1.90EUR 230,315.56INTL POWER CV REG-S 4.75 08-15 05/06S300,000 315,429.00 2.54EUR 312,047.73KFW CV 1.50 09-14 30/07A500,000 549,970.00 4.43EUR 549,450.00KFW CV (DEUTSCHE TEL) 3.25 08-13 27/06A1,200,000 1,228,134.00 9.88EUR 1,254,405.00MISARTE CV 3.25 10-16 01/01A1,610 227,443.73 1.83EUR 226,560.54ORPEA CV 3.875 10-16 01/01A3,115 130,906.18 1.05EUR 138,483.96PARPUBLICA SGPS SA CV 5.25 10-17 28/09A400,000 279,792.00 2.25EUR 398,880.00PESCANOVA REG S CV 5.125 11-17 20/04S100,000 90,777.50 0.73EUR 100,000.00PORTUGAL TEL. CV 4.125 07-14 28/08S550,000 455,501.75 3.67EUR 554,136.00PUBLICIS GROUPE CV 3.125 09-14 30/07S9,000 330,710.76 2.66EUR 354,882.91SGL CARBON CV 3.50 09-16 30/06A100,000 140,090.50 1.13EUR 115,000.00SGL CARBON SE CV 0.75 07-13 16/05A150,000 164,970.75 1.33EUR 143,025.00STEINHOFF FIN H REGS 4.50 11-18 31/03S450,000 366,270.75 2.95EUR 429,196.15TECHNIP SA CV 0.25 11-17 01/01A1,017 99,328.83 0.80EUR 97,723.53UCB CV 4.50 09-15 22/10S150,000 170,790.00 1.37EUR 174,562.50UNIBAIL-RODAMCO CV 3.50 09-15 01/01A1,000 187,969.93 1.51EUR 189,034.74
DERWENT LONDON CAP CV 2.75 11-16 15/07S100,000 118,234.76 0.95GBP 113,597.70Pound Sterling 399,785.10 3.22435,613.53
TUI AG CV 4.90 10-17 27/04S300,000 281,550.34 2.27GBP 322,015.83
ANGLO AMERCAN CV-AAL- 4.00 09-14 07/05S300,000 329,300.93 2.65USD 368,134.59US Dollar 2,533,761.90 20.402,502,829.97
IMMARSAT CV 1.75 07-17 16/11S400,000 356,944.88 2.87USD 341,448.76LUKOIL INTL CV (SHS) 2.625 10-15 16/06S500,000 391,303.01 3.15USD 382,506.92QIAGEN FINANCE CV 3.25 06-26 16/05S200,000 160,034.67 1.29USD 198,059.13SEADRILL LTD CV 3.375 10-17 27/10S500,000 436,340.18 3.51USD 393,613.10SHIRE PLC CV 2.75 07-14 09/05S650,000 596,178.41 4.81USD 501,214.86VEDANTA RES II CV 4.00 10-17 30/03S400,000 263,659.82 2.12USD 317,852.61
DJ EURO STOXX 50 MAR 2350 19.03.12 CALL65 68,315.00 0.55EUR 44,785.00
Derivative instruments 68,315.00 0.5544,785.00
Options 68,315.00 0.5544,785.00
Euro 68,315.00 0.5544,785.00
Total investments in securities 11,244,433.84 90.5312,359,779.16
Cash at banks/ (bank liabilities) 738,969.26 5.95
Other net assets/(liabilities) 437,745.98 3.52
Total 12,421,149.08 100.00
Securities portfolio at 31/12/2011EURExpressed in
UBAM - EUROPEAN CONVERTIBLE BOND
Number/nom. value Description Currency % of total
net assetsMarket valueCost
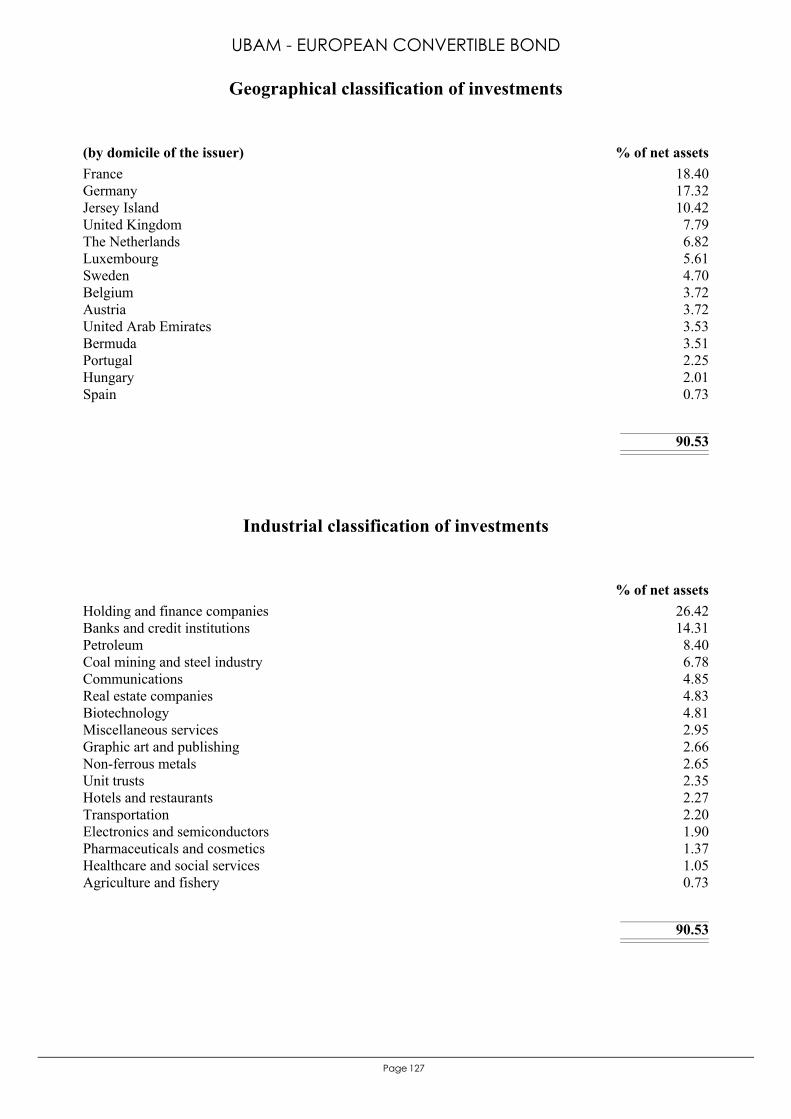
127Page
France 18.40Germany 17.32Jersey Island 10.42United Kingdom 7.79The Netherlands 6.82Luxembourg 5.61Sweden 4.70Belgium 3.72Austria 3.72United Arab Emirates 3.53Bermuda 3.51Portugal 2.25Hungary 2.01Spain 0.73
90.53
(by domicile of the issuer) % of net assets
Geographical classification of investments
UBAM - EUROPEAN CONVERTIBLE BOND
Holding and finance companies 26.42Banks and credit institutions 14.31Petroleum 8.40Coal mining and steel industry 6.78Communications 4.85Real estate companies 4.83Biotechnology 4.81Miscellaneous services 2.95Graphic art and publishing 2.66Non-ferrous metals 2.65Unit trusts 2.35Hotels and restaurants 2.27Transportation 2.20Electronics and semiconductors 1.90Pharmaceuticals and cosmetics 1.37Healthcare and social services 1.05Agriculture and fishery 0.73
90.53
% of net assets
Industrial classification of investments
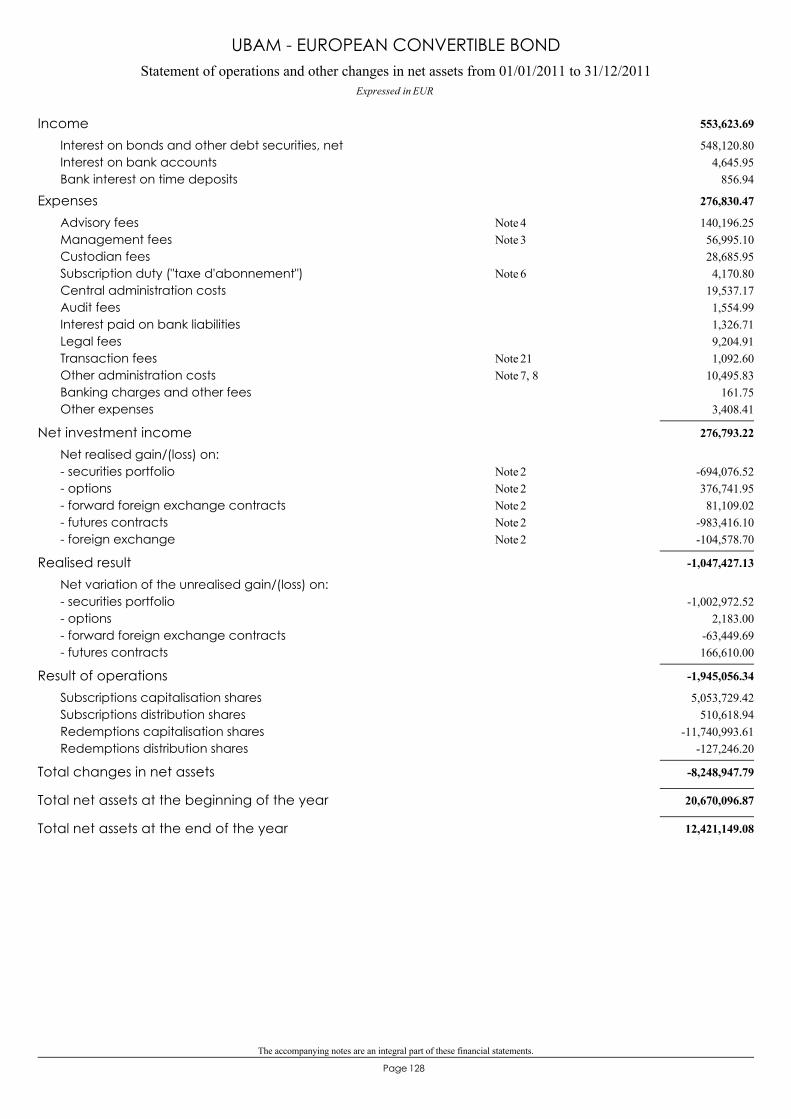
The accompanying notes are an integral part of these financial statements.
128Page
Statement of operations and other changes in net assets from 01/01/2011 to 31/12/2011Expressed in EUR
UBAM - EUROPEAN CONVERTIBLE BOND
553,623.69Income548,120.80Interest on bonds and other debt securities, net
4,645.95Interest on bank accounts856.94Bank interest on time deposits
276,830.47Expenses140,196.25Advisory fees 4Note56,995.10Management fees 3Note28,685.95Custodian fees4,170.80Subscription duty ("taxe d'abonnement") 6Note
19,537.17Central administration costs1,554.99Audit fees1,326.71Interest paid on bank liabilities9,204.91Legal fees1,092.60Transaction fees 21Note
10,495.83Other administration costs 7, 8Note161.75Banking charges and other fees
3,408.41Other expenses
276,793.22Net investment incomeNet realised gain/(loss) on:
-694,076.52- securities portfolio 2Note376,741.95- options 2Note81,109.02- forward foreign exchange contracts 2Note
-983,416.10- futures contracts 2Note-104,578.70- foreign exchange 2Note
-1,047,427.13Realised resultNet variation of the unrealised gain/(loss) on:
-1,002,972.52- securities portfolio2,183.00- options
-63,449.69- forward foreign exchange contracts166,610.00- futures contracts
-1,945,056.34Result of operations5,053,729.42Subscriptions capitalisation shares
510,618.94Subscriptions distribution shares-11,740,993.61Redemptions capitalisation shares
-127,246.20Redemptions distribution shares
-8,248,947.79Total changes in net assets
20,670,096.87Total net assets at the beginning of the year
12,421,149.08Total net assets at the end of the year
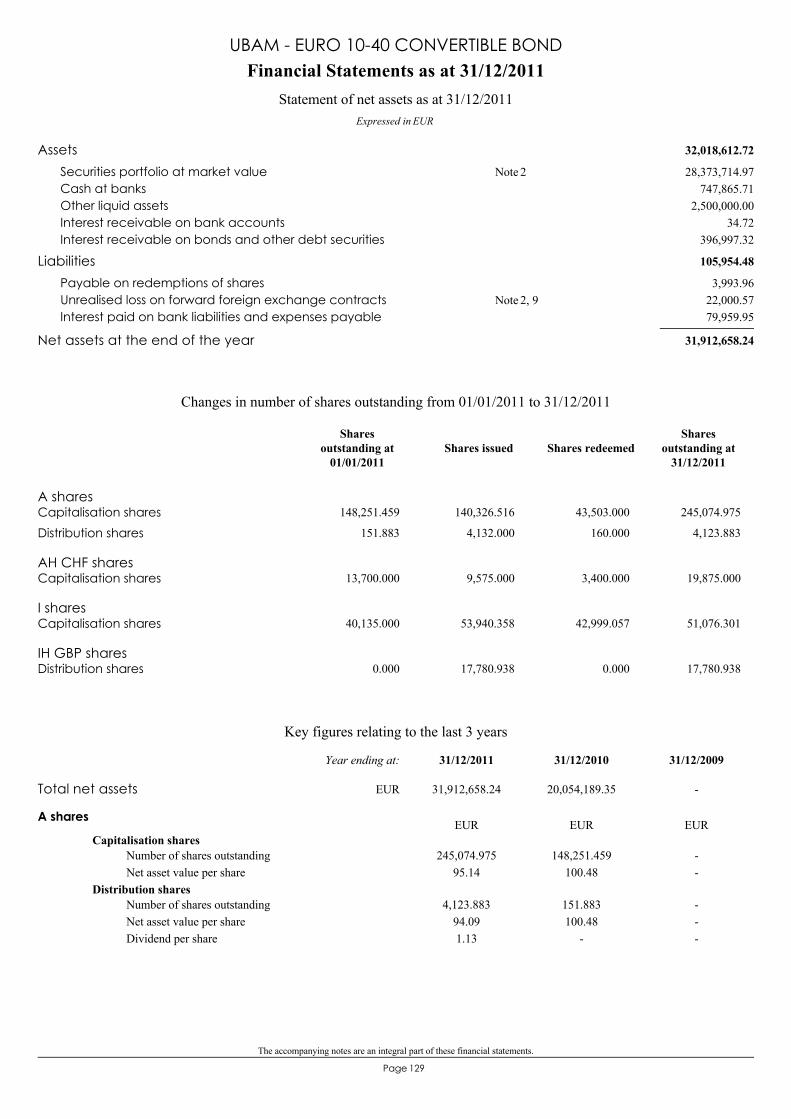
The accompanying notes are an integral part of these financial statements.
129Page
32,018,612.72Assets28,373,714.97Securities portfolio at market value 2Note
747,865.71Cash at banks2,500,000.00Other liquid assets
34.72Interest receivable on bank accounts396,997.32Interest receivable on bonds and other debt securities
105,954.48Liabilities3,993.96Payable on redemptions of shares
22,000.57Unrealised loss on forward foreign exchange contracts 2, 9Note79,959.95Interest paid on bank liabilities and expenses payable
31,912,658.24Net assets at the end of the year
Financial Statements as at 31/12/2011
Expressed in EUR
Statement of net assets as at 31/12/2011
UBAM - EURO 10-40 CONVERTIBLE BOND
A sharesCapitalisation shares 148,251.459 140,326.516 43,503.000 245,074.975
Distribution shares 151.883 4,132.000 160.000 4,123.883
AH CHF sharesCapitalisation shares 13,700.000 9,575.000 3,400.000 19,875.000
I sharesCapitalisation shares 40,135.000 53,940.358 42,999.057 51,076.301
IH GBP sharesDistribution shares 0.000 17,780.938 0.000 17,780.938
Changes in number of shares outstanding from 01/01/2011 to 31/12/2011
Shares issued Shares redeemedShares
outstanding at31/12/2011
Sharesoutstanding at
01/01/2011
Key figures relating to the last 3 years
A shares
Capitalisation shares245,074.975
95.14148,251.459
100.48--
Number of shares outstandingNet asset value per share
Distribution shares4,123.883
94.091.13
151.883100.48
-
---
Number of shares outstandingNet asset value per shareDividend per share
EUR EUR EUR
Total net assets 31,912,658.24 20,054,189.35 -
31/12/200931/12/201031/12/2011Year ending at:
EUR
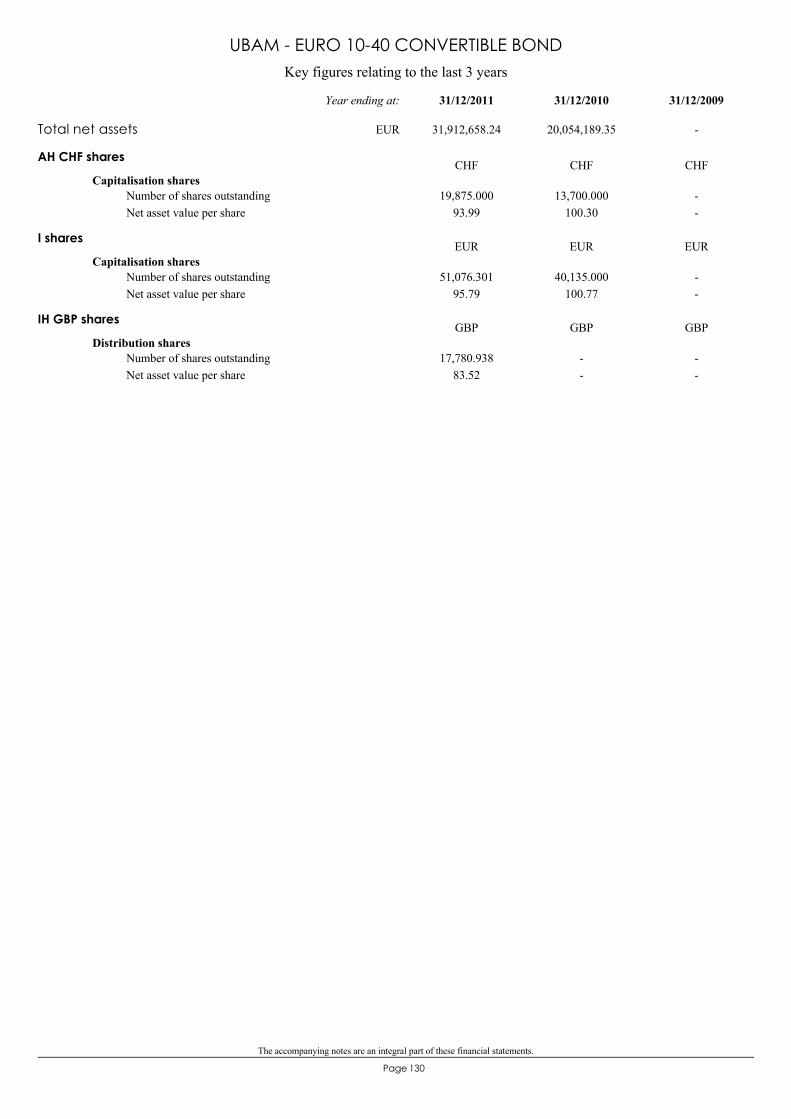
The accompanying notes are an integral part of these financial statements.
130Page
Key figures relating to the last 3 years
UBAM - EURO 10-40 CONVERTIBLE BOND
AH CHF shares
Capitalisation shares19,875.000
93.9913,700.000
100.30--
Number of shares outstandingNet asset value per share
CHF CHF CHF
I shares
Capitalisation shares51,076.301
95.7940,135.000
100.77--
Number of shares outstandingNet asset value per share
EUR EUR EUR
IH GBP shares
Distribution shares17,780.938
83.52--
--
Number of shares outstandingNet asset value per share
GBP GBP GBP
Total net assets 31,912,658.24 20,054,189.35 -
31/12/200931/12/201031/12/2011Year ending at:
EUR
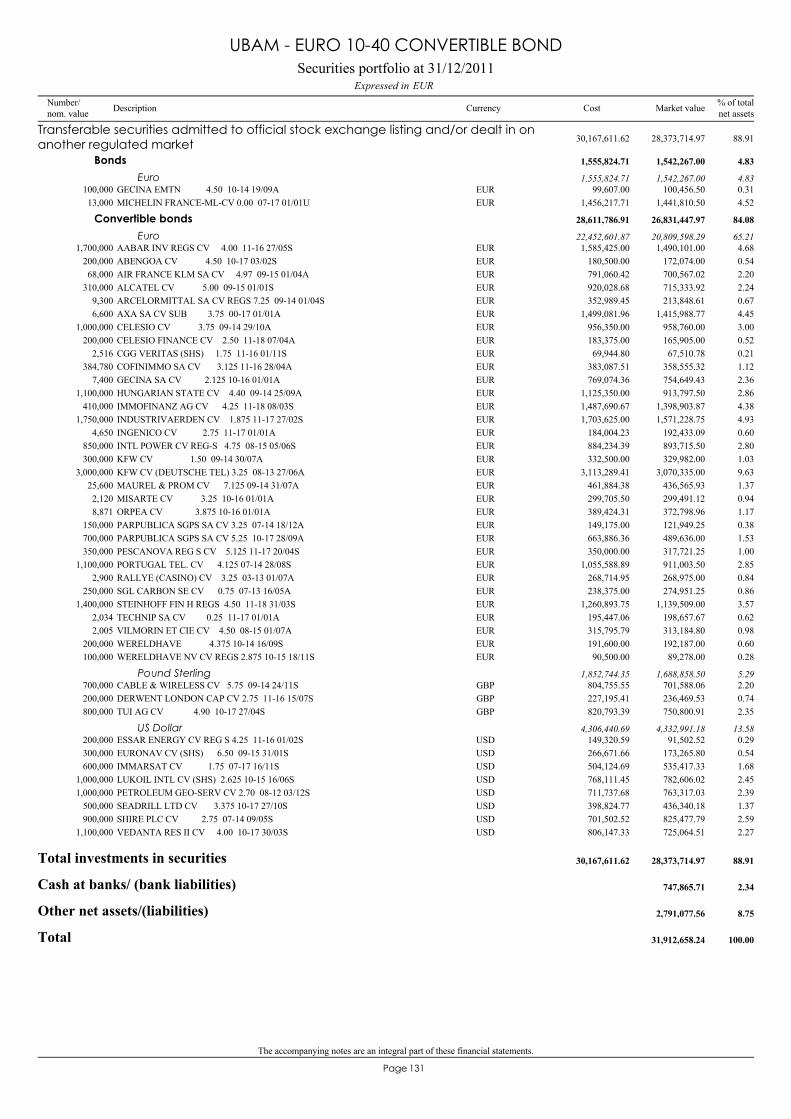
The accompanying notes are an integral part of these financial statements.
131Page
GECINA EMTN 4.50 10-14 19/09A100,000 100,456.50 0.31EUR 99,607.00
Transferable securities admitted to official stock exchange listing and/or dealt in onanother regulated market 28,373,714.97 88.9130,167,611.62
Bonds 1,542,267.00 4.831,555,824.71
Euro 1,542,267.00 4.831,555,824.71
MICHELIN FRANCE-ML-CV 0.00 07-17 01/01U13,000 1,441,810.50 4.52EUR 1,456,217.71
AABAR INV REGS CV 4.00 11-16 27/05S1,700,000 1,490,101.00 4.68EUR 1,585,425.00
Convertible bonds 26,831,447.97 84.0828,611,786.91
Euro 20,809,598.29 65.2122,452,601.87
ABENGOA CV 4.50 10-17 03/02S200,000 172,074.00 0.54EUR 180,500.00AIR FRANCE KLM SA CV 4.97 09-15 01/04A68,000 700,567.02 2.20EUR 791,060.42ALCATEL CV 5.00 09-15 01/01S310,000 715,333.92 2.24EUR 920,028.68ARCELORMITTAL SA CV REGS 7.25 09-14 01/04S9,300 213,848.61 0.67EUR 352,989.45AXA SA CV SUB 3.75 00-17 01/01A6,600 1,415,988.77 4.45EUR 1,499,081.96CELESIO CV 3.75 09-14 29/10A1,000,000 958,760.00 3.00EUR 956,350.00CELESIO FINANCE CV 2.50 11-18 07/04A200,000 165,905.00 0.52EUR 183,375.00CGG VERITAS (SHS) 1.75 11-16 01/11S2,516 67,510.78 0.21EUR 69,944.80COFINIMMO SA CV 3.125 11-16 28/04A384,780 358,555.32 1.12EUR 383,087.51GECINA SA CV 2.125 10-16 01/01A7,400 754,649.43 2.36EUR 769,074.36HUNGARIAN STATE CV 4.40 09-14 25/09A1,100,000 913,797.50 2.86EUR 1,125,350.00IMMOFINANZ AG CV 4.25 11-18 08/03S410,000 1,398,903.87 4.38EUR 1,487,690.67INDUSTRIVAERDEN CV 1.875 11-17 27/02S1,750,000 1,571,228.75 4.93EUR 1,703,625.00INGENICO CV 2.75 11-17 01/01A4,650 192,433.09 0.60EUR 184,004.23INTL POWER CV REG-S 4.75 08-15 05/06S850,000 893,715.50 2.80EUR 884,234.39KFW CV 1.50 09-14 30/07A300,000 329,982.00 1.03EUR 332,500.00KFW CV (DEUTSCHE TEL) 3.25 08-13 27/06A3,000,000 3,070,335.00 9.63EUR 3,113,289.41MAUREL & PROM CV 7.125 09-14 31/07A25,600 436,565.93 1.37EUR 461,884.38MISARTE CV 3.25 10-16 01/01A2,120 299,491.12 0.94EUR 299,705.50ORPEA CV 3.875 10-16 01/01A8,871 372,798.96 1.17EUR 389,424.31PARPUBLICA SGPS SA CV 3.25 07-14 18/12A150,000 121,949.25 0.38EUR 149,175.00PARPUBLICA SGPS SA CV 5.25 10-17 28/09A700,000 489,636.00 1.53EUR 663,886.36PESCANOVA REG S CV 5.125 11-17 20/04S350,000 317,721.25 1.00EUR 350,000.00PORTUGAL TEL. CV 4.125 07-14 28/08S1,100,000 911,003.50 2.85EUR 1,055,588.89RALLYE (CASINO) CV 3.25 03-13 01/07A2,900 268,975.00 0.84EUR 268,714.95SGL CARBON SE CV 0.75 07-13 16/05A250,000 274,951.25 0.86EUR 238,375.00STEINHOFF FIN H REGS 4.50 11-18 31/03S1,400,000 1,139,509.00 3.57EUR 1,260,893.75TECHNIP SA CV 0.25 11-17 01/01A2,034 198,657.67 0.62EUR 195,447.06VILMORIN ET CIE CV 4.50 08-15 01/07A2,005 313,184.80 0.98EUR 315,795.79WERELDHAVE 4.375 10-14 16/09S200,000 192,187.00 0.60EUR 191,600.00WERELDHAVE NV CV REGS 2.875 10-15 18/11S100,000 89,278.00 0.28EUR 90,500.00
CABLE & WIRELESS CV 5.75 09-14 24/11S700,000 701,588.06 2.20GBP 804,755.55Pound Sterling 1,688,858.50 5.291,852,744.35
DERWENT LONDON CAP CV 2.75 11-16 15/07S200,000 236,469.53 0.74GBP 227,195.41TUI AG CV 4.90 10-17 27/04S800,000 750,800.91 2.35GBP 820,793.39
ESSAR ENERGY CV REG S 4.25 11-16 01/02S200,000 91,502.52 0.29USD 149,320.59US Dollar 4,332,991.18 13.584,306,440.69
EURONAV CV (SHS) 6.50 09-15 31/01S300,000 173,265.80 0.54USD 266,671.66IMMARSAT CV 1.75 07-17 16/11S600,000 535,417.33 1.68USD 504,124.69LUKOIL INTL CV (SHS) 2.625 10-15 16/06S1,000,000 782,606.02 2.45USD 768,111.45PETROLEUM GEO-SERV CV 2.70 08-12 03/12S1,000,000 763,317.03 2.39USD 711,737.68SEADRILL LTD CV 3.375 10-17 27/10S500,000 436,340.18 1.37USD 398,824.77SHIRE PLC CV 2.75 07-14 09/05S900,000 825,477.79 2.59USD 701,502.52VEDANTA RES II CV 4.00 10-17 30/03S1,100,000 725,064.51 2.27USD 806,147.33
Total investments in securities 28,373,714.97 88.9130,167,611.62
Cash at banks/ (bank liabilities) 747,865.71 2.34
Other net assets/(liabilities) 2,791,077.56 8.75
Total 31,912,658.24 100.00
Securities portfolio at 31/12/2011EURExpressed in
UBAM - EURO 10-40 CONVERTIBLE BOND
Number/nom. value Description Currency % of total
net assetsMarket valueCost
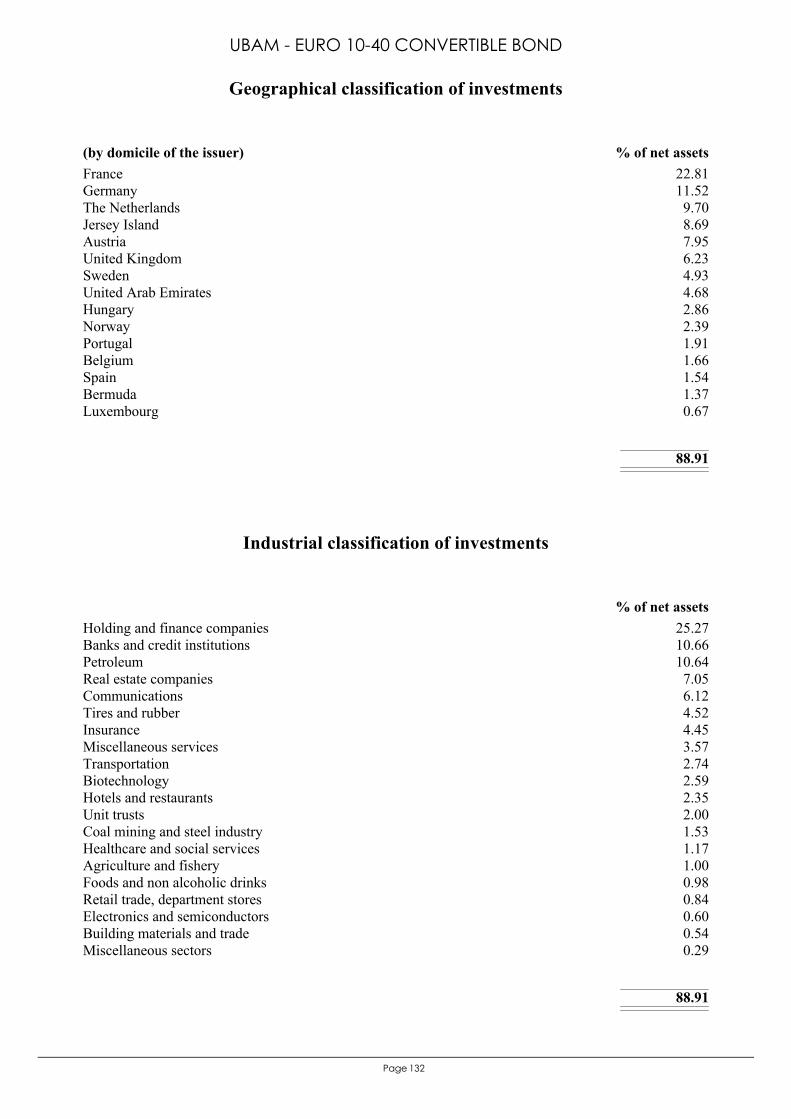
132Page
France 22.81Germany 11.52The Netherlands 9.70Jersey Island 8.69Austria 7.95United Kingdom 6.23Sweden 4.93United Arab Emirates 4.68Hungary 2.86Norway 2.39Portugal 1.91Belgium 1.66Spain 1.54Bermuda 1.37Luxembourg 0.67
88.91
(by domicile of the issuer) % of net assets
Geographical classification of investments
UBAM - EURO 10-40 CONVERTIBLE BOND
Holding and finance companies 25.27Banks and credit institutions 10.66Petroleum 10.64Real estate companies 7.05Communications 6.12Tires and rubber 4.52Insurance 4.45Miscellaneous services 3.57Transportation 2.74Biotechnology 2.59Hotels and restaurants 2.35Unit trusts 2.00Coal mining and steel industry 1.53Healthcare and social services 1.17Agriculture and fishery 1.00Foods and non alcoholic drinks 0.98Retail trade, department stores 0.84Electronics and semiconductors 0.60Building materials and trade 0.54Miscellaneous sectors 0.29
88.91
% of net assets
Industrial classification of investments
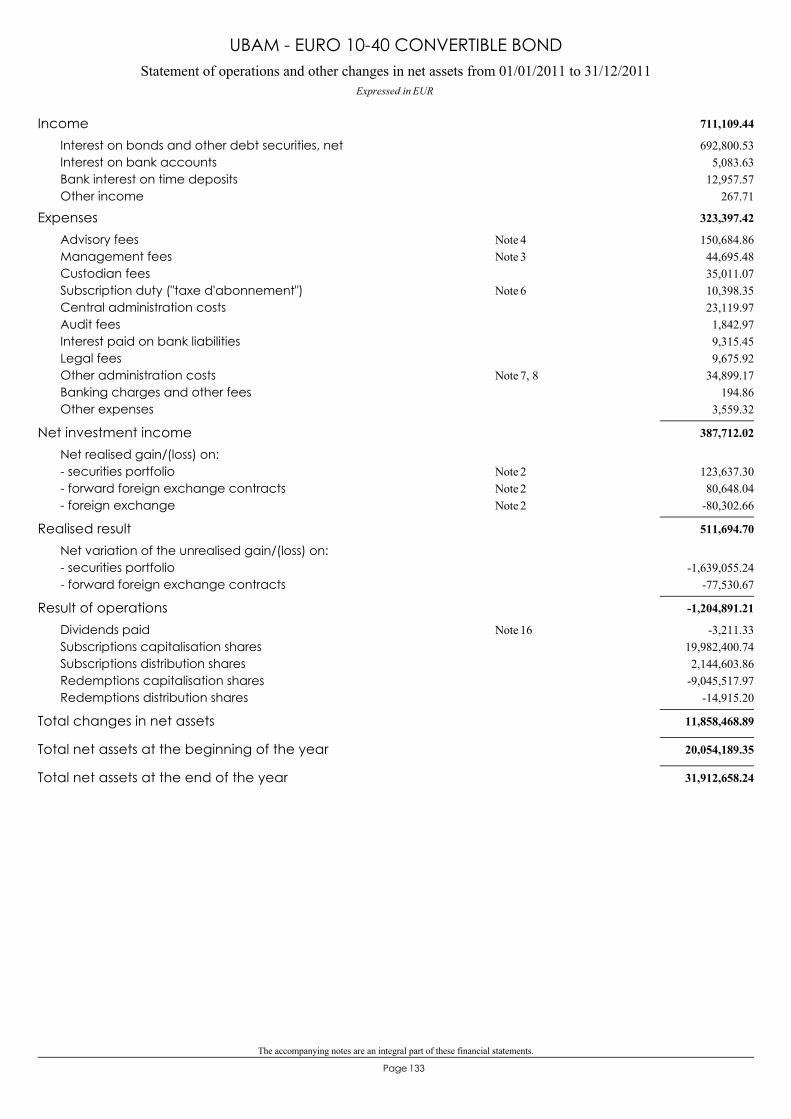
The accompanying notes are an integral part of these financial statements.
133Page
Statement of operations and other changes in net assets from 01/01/2011 to 31/12/2011Expressed in EUR
UBAM - EURO 10-40 CONVERTIBLE BOND
711,109.44Income692,800.53Interest on bonds and other debt securities, net
5,083.63Interest on bank accounts12,957.57Bank interest on time deposits
267.71Other income
323,397.42Expenses150,684.86Advisory fees 4Note44,695.48Management fees 3Note35,011.07Custodian fees10,398.35Subscription duty ("taxe d'abonnement") 6Note23,119.97Central administration costs1,842.97Audit fees9,315.45Interest paid on bank liabilities9,675.92Legal fees
34,899.17Other administration costs 7, 8Note194.86Banking charges and other fees
3,559.32Other expenses
387,712.02Net investment incomeNet realised gain/(loss) on:
123,637.30- securities portfolio 2Note80,648.04- forward foreign exchange contracts 2Note
-80,302.66- foreign exchange 2Note
511,694.70Realised resultNet variation of the unrealised gain/(loss) on:
-1,639,055.24- securities portfolio-77,530.67- forward foreign exchange contracts
-1,204,891.21Result of operations-3,211.33Dividends paid 16Note
19,982,400.74Subscriptions capitalisation shares2,144,603.86Subscriptions distribution shares
-9,045,517.97Redemptions capitalisation shares-14,915.20Redemptions distribution shares
11,858,468.89Total changes in net assets
20,054,189.35Total net assets at the beginning of the year
31,912,658.24Total net assets at the end of the year
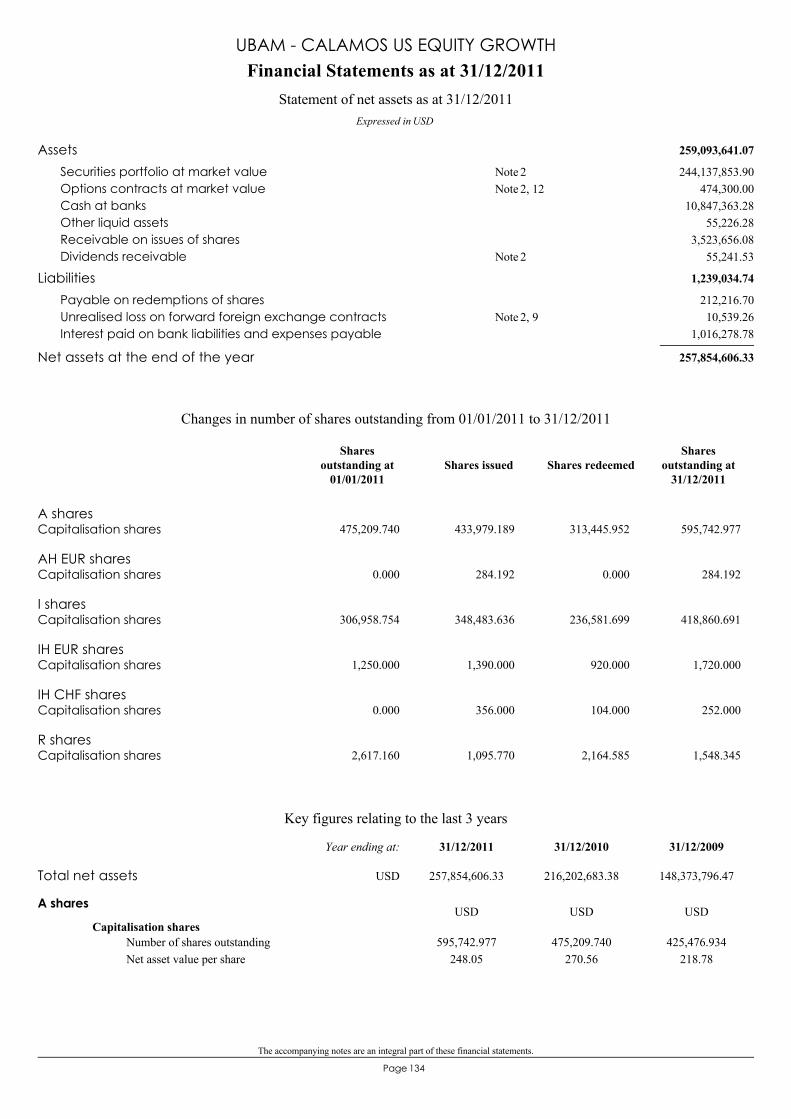
The accompanying notes are an integral part of these financial statements.
134Page
259,093,641.07Assets244,137,853.90Securities portfolio at market value 2Note
474,300.00Options contracts at market value 2, 12Note10,847,363.28Cash at banks
55,226.28Other liquid assets3,523,656.08Receivable on issues of shares
55,241.53Dividends receivable 2Note
1,239,034.74Liabilities212,216.70Payable on redemptions of shares10,539.26Unrealised loss on forward foreign exchange contracts 2, 9Note
1,016,278.78Interest paid on bank liabilities and expenses payable
257,854,606.33Net assets at the end of the year
Financial Statements as at 31/12/2011
Expressed in USD
Statement of net assets as at 31/12/2011
UBAM - CALAMOS US EQUITY GROWTH
A sharesCapitalisation shares 475,209.740 433,979.189 313,445.952 595,742.977
AH EUR sharesCapitalisation shares 0.000 284.192 0.000 284.192
I sharesCapitalisation shares 306,958.754 348,483.636 236,581.699 418,860.691
IH EUR sharesCapitalisation shares 1,250.000 1,390.000 920.000 1,720.000
IH CHF sharesCapitalisation shares 0.000 356.000 104.000 252.000
R sharesCapitalisation shares 2,617.160 1,095.770 2,164.585 1,548.345
Changes in number of shares outstanding from 01/01/2011 to 31/12/2011
Shares issued Shares redeemedShares
outstanding at31/12/2011
Sharesoutstanding at
01/01/2011
Key figures relating to the last 3 years
A shares
Capitalisation shares595,742.977
248.05475,209.740
270.56425,476.934
218.78Number of shares outstandingNet asset value per share
USD USD USD
Total net assets 257,854,606.33 216,202,683.38 148,373,796.47
31/12/200931/12/201031/12/2011Year ending at:
USD
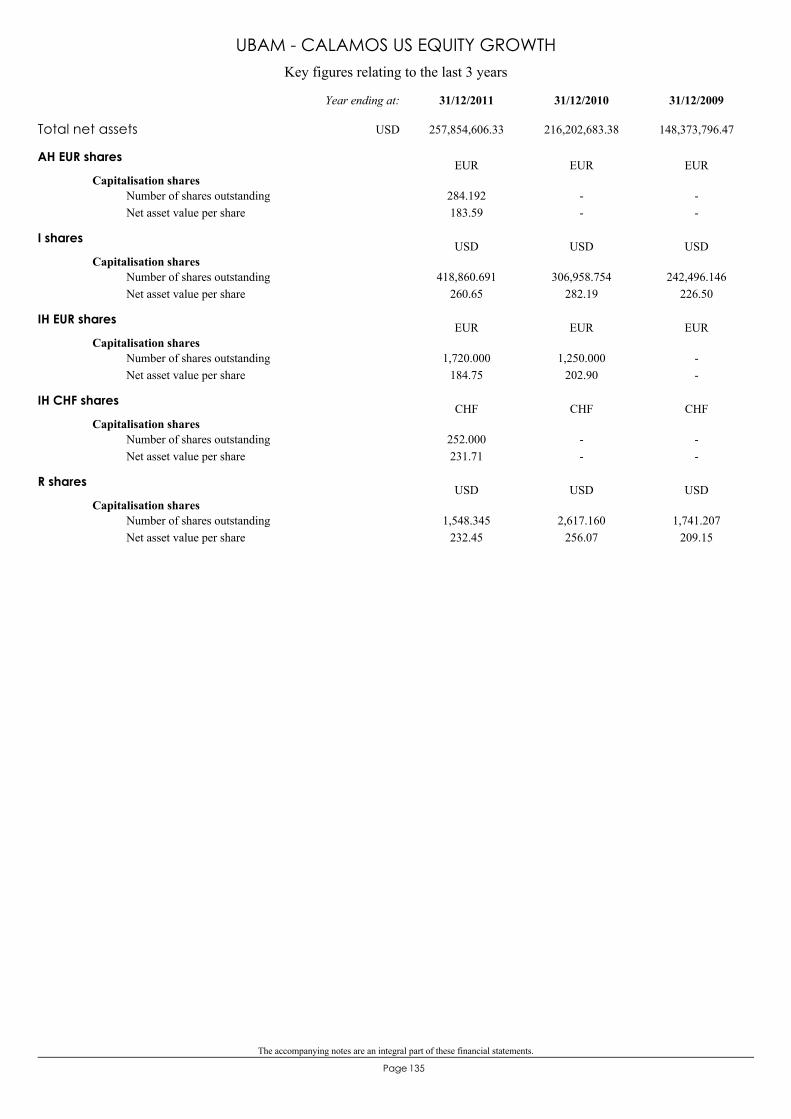
The accompanying notes are an integral part of these financial statements.
135Page
Key figures relating to the last 3 years
UBAM - CALAMOS US EQUITY GROWTH
AH EUR shares
Capitalisation shares284.192183.59
--
--
Number of shares outstandingNet asset value per share
EUR EUR EUR
I shares
Capitalisation shares418,860.691
260.65306,958.754
282.19242,496.146
226.50Number of shares outstandingNet asset value per share
USD USD USD
IH EUR shares
Capitalisation shares1,720.000
184.751,250.000
202.90--
Number of shares outstandingNet asset value per share
EUR EUR EUR
IH CHF shares
Capitalisation shares252.000231.71
--
--
Number of shares outstandingNet asset value per share
CHF CHF CHF
R shares
Capitalisation shares1,548.345
232.452,617.160
256.071,741.207
209.15Number of shares outstandingNet asset value per share
USD USD USD
Total net assets 257,854,606.33 216,202,683.38 148,373,796.47
31/12/200931/12/201031/12/2011Year ending at:
USD
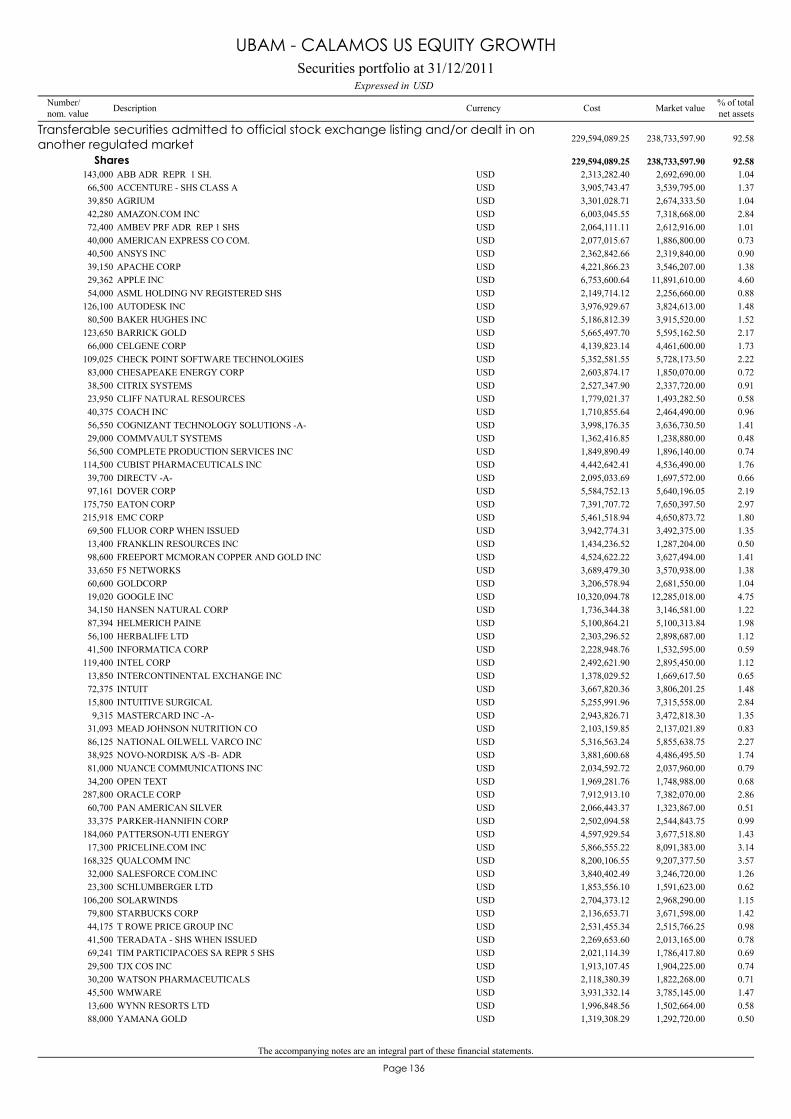
The accompanying notes are an integral part of these financial statements.
136Page
ABB ADR REPR 1 SH.143,000 2,692,690.00 1.04USD 2,313,282.40
Transferable securities admitted to official stock exchange listing and/or dealt in onanother regulated market 238,733,597.90 92.58229,594,089.25
Shares 238,733,597.90 92.58229,594,089.25
ACCENTURE - SHS CLASS A66,500 3,539,795.00 1.37USD 3,905,743.47AGRIUM39,850 2,674,333.50 1.04USD 3,301,028.71AMAZON.COM INC42,280 7,318,668.00 2.84USD 6,003,045.55AMBEV PRF ADR REP 1 SHS72,400 2,612,916.00 1.01USD 2,064,111.11AMERICAN EXPRESS CO COM.40,000 1,886,800.00 0.73USD 2,077,015.67ANSYS INC40,500 2,319,840.00 0.90USD 2,362,842.66APACHE CORP39,150 3,546,207.00 1.38USD 4,221,866.23APPLE INC29,362 11,891,610.00 4.60USD 6,753,600.64ASML HOLDING NV REGISTERED SHS54,000 2,256,660.00 0.88USD 2,149,714.12AUTODESK INC126,100 3,824,613.00 1.48USD 3,976,929.67BAKER HUGHES INC80,500 3,915,520.00 1.52USD 5,186,812.39BARRICK GOLD123,650 5,595,162.50 2.17USD 5,665,497.70CELGENE CORP66,000 4,461,600.00 1.73USD 4,139,823.14CHECK POINT SOFTWARE TECHNOLOGIES109,025 5,728,173.50 2.22USD 5,352,581.55CHESAPEAKE ENERGY CORP83,000 1,850,070.00 0.72USD 2,603,874.17CITRIX SYSTEMS38,500 2,337,720.00 0.91USD 2,527,347.90CLIFF NATURAL RESOURCES23,950 1,493,282.50 0.58USD 1,779,021.37COACH INC40,375 2,464,490.00 0.96USD 1,710,855.64COGNIZANT TECHNOLOGY SOLUTIONS -A-56,550 3,636,730.50 1.41USD 3,998,176.35COMMVAULT SYSTEMS29,000 1,238,880.00 0.48USD 1,362,416.85COMPLETE PRODUCTION SERVICES INC56,500 1,896,140.00 0.74USD 1,849,890.49CUBIST PHARMACEUTICALS INC114,500 4,536,490.00 1.76USD 4,442,642.41DIRECTV -A-39,700 1,697,572.00 0.66USD 2,095,033.69DOVER CORP97,161 5,640,196.05 2.19USD 5,584,752.13EATON CORP175,750 7,650,397.50 2.97USD 7,391,707.72EMC CORP215,918 4,650,873.72 1.80USD 5,461,518.94FLUOR CORP WHEN ISSUED69,500 3,492,375.00 1.35USD 3,942,774.31FRANKLIN RESOURCES INC13,400 1,287,204.00 0.50USD 1,434,236.52FREEPORT MCMORAN COPPER AND GOLD INC98,600 3,627,494.00 1.41USD 4,524,622.22F5 NETWORKS33,650 3,570,938.00 1.38USD 3,689,479.30GOLDCORP60,600 2,681,550.00 1.04USD 3,206,578.94GOOGLE INC19,020 12,285,018.00 4.75USD 10,320,094.78HANSEN NATURAL CORP34,150 3,146,581.00 1.22USD 1,736,344.38HELMERICH PAINE87,394 5,100,313.84 1.98USD 5,100,864.21HERBALIFE LTD56,100 2,898,687.00 1.12USD 2,303,296.52INFORMATICA CORP41,500 1,532,595.00 0.59USD 2,228,948.76INTEL CORP119,400 2,895,450.00 1.12USD 2,492,621.90INTERCONTINENTAL EXCHANGE INC13,850 1,669,617.50 0.65USD 1,378,029.52INTUIT72,375 3,806,201.25 1.48USD 3,667,820.36INTUITIVE SURGICAL15,800 7,315,558.00 2.84USD 5,255,991.96MASTERCARD INC -A-9,315 3,472,818.30 1.35USD 2,943,826.71MEAD JOHNSON NUTRITION CO31,093 2,137,021.89 0.83USD 2,103,159.85NATIONAL OILWELL VARCO INC86,125 5,855,638.75 2.27USD 5,316,563.24NOVO-NORDISK A/S -B- ADR38,925 4,486,495.50 1.74USD 3,881,600.68NUANCE COMMUNICATIONS INC81,000 2,037,960.00 0.79USD 2,034,592.72OPEN TEXT34,200 1,748,988.00 0.68USD 1,969,281.76ORACLE CORP287,800 7,382,070.00 2.86USD 7,912,913.10PAN AMERICAN SILVER60,700 1,323,867.00 0.51USD 2,066,443.37PARKER-HANNIFIN CORP33,375 2,544,843.75 0.99USD 2,502,094.58PATTERSON-UTI ENERGY184,060 3,677,518.80 1.43USD 4,597,929.54PRICELINE.COM INC17,300 8,091,383.00 3.14USD 5,866,555.22QUALCOMM INC168,325 9,207,377.50 3.57USD 8,200,106.55SALESFORCE COM.INC32,000 3,246,720.00 1.26USD 3,840,402.49SCHLUMBERGER LTD23,300 1,591,623.00 0.62USD 1,853,556.10SOLARWINDS106,200 2,968,290.00 1.15USD 2,704,373.12STARBUCKS CORP79,800 3,671,598.00 1.42USD 2,136,653.71T ROWE PRICE GROUP INC44,175 2,515,766.25 0.98USD 2,531,455.34TERADATA - SHS WHEN ISSUED41,500 2,013,165.00 0.78USD 2,269,653.60TIM PARTICIPACOES SA REPR 5 SHS69,241 1,786,417.80 0.69USD 2,021,114.39TJX COS INC29,500 1,904,225.00 0.74USD 1,913,107.45WATSON PHARMACEUTICALS30,200 1,822,268.00 0.71USD 2,118,380.39WMWARE45,500 3,785,145.00 1.47USD 3,931,332.14WYNN RESORTS LTD13,600 1,502,664.00 0.58USD 1,996,848.56YAMANA GOLD88,000 1,292,720.00 0.50USD 1,319,308.29
Securities portfolio at 31/12/2011USDExpressed in
UBAM - CALAMOS US EQUITY GROWTH
Number/nom. value Description Currency % of total
net assetsMarket valueCost
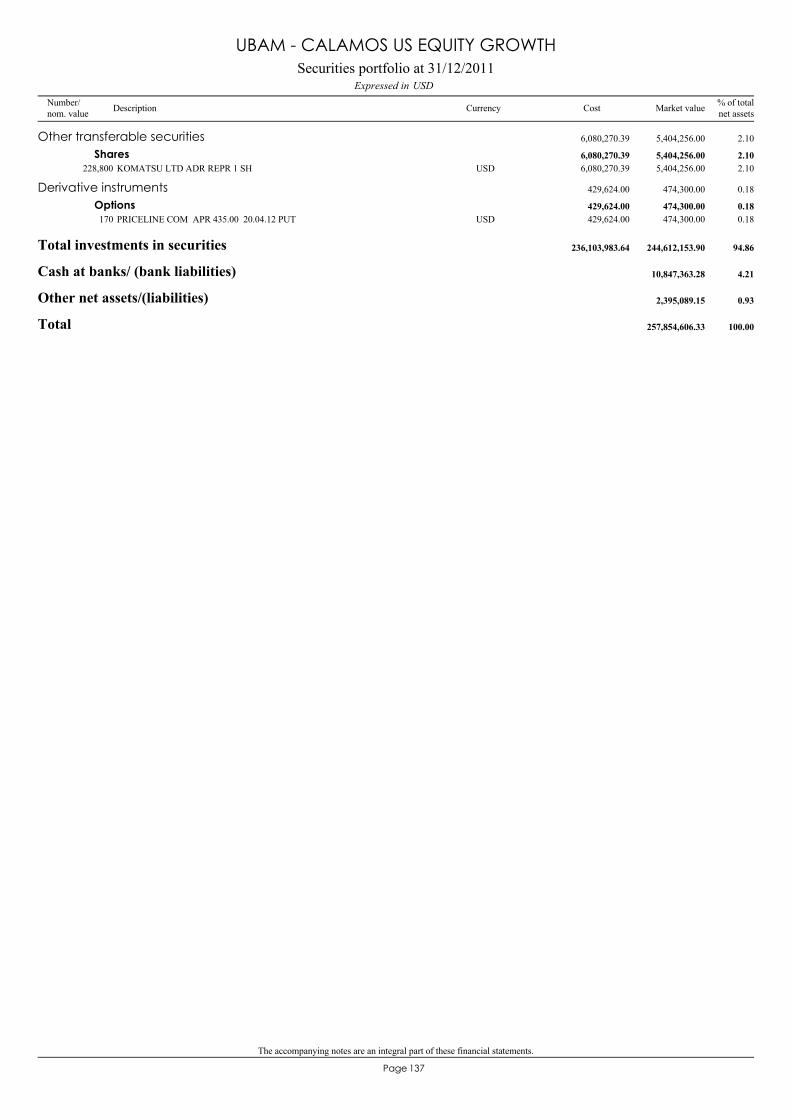
The accompanying notes are an integral part of these financial statements.
137Page
KOMATSU LTD ADR REPR 1 SH228,800 5,404,256.00 2.10USD 6,080,270.39
Other transferable securities 5,404,256.00 2.106,080,270.39
Shares 5,404,256.00 2.106,080,270.39
PRICELINE COM APR 435.00 20.04.12 PUT170 474,300.00 0.18USD 429,624.00
Derivative instruments 474,300.00 0.18429,624.00
Options 474,300.00 0.18429,624.00
Total investments in securities 244,612,153.90 94.86236,103,983.64
Cash at banks/ (bank liabilities) 10,847,363.28 4.21
Other net assets/(liabilities) 2,395,089.15 0.93
Total 257,854,606.33 100.00
Securities portfolio at 31/12/2011USDExpressed in
UBAM - CALAMOS US EQUITY GROWTH
Number/nom. value Description Currency % of total
net assetsMarket valueCost
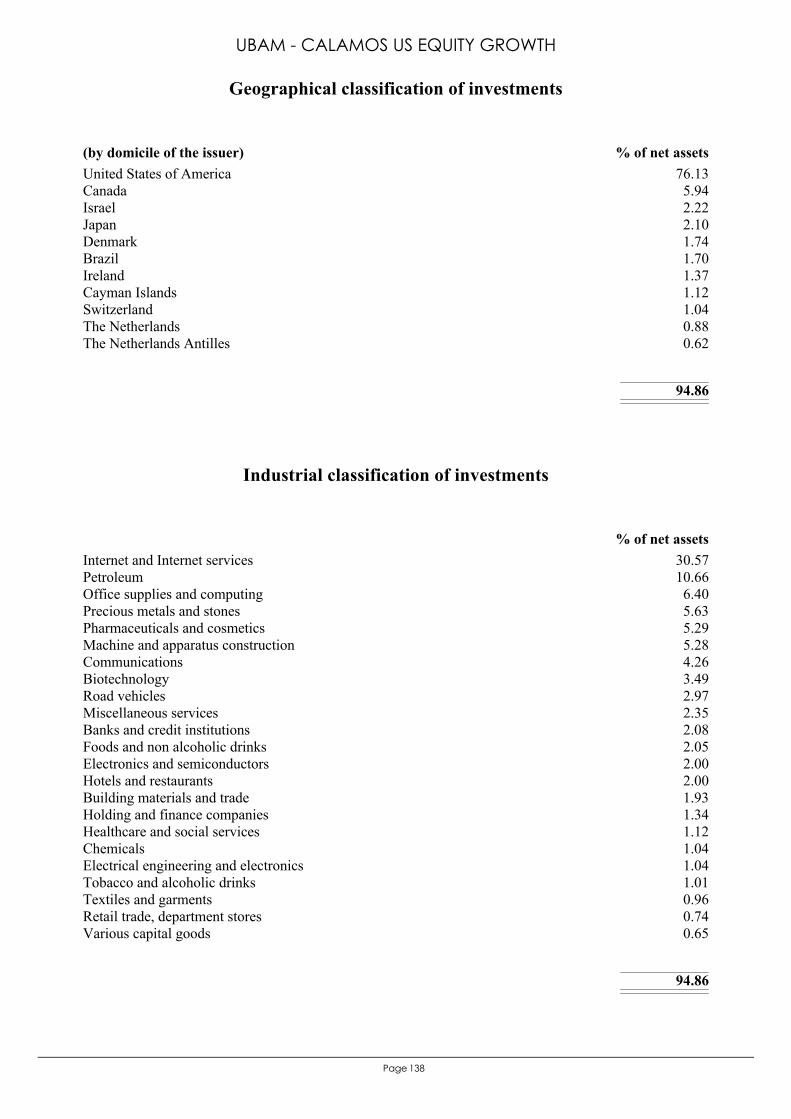
138Page
United States of America 76.13Canada 5.94Israel 2.22Japan 2.10Denmark 1.74Brazil 1.70Ireland 1.37Cayman Islands 1.12Switzerland 1.04The Netherlands 0.88The Netherlands Antilles 0.62
94.86
(by domicile of the issuer) % of net assets
Geographical classification of investments
UBAM - CALAMOS US EQUITY GROWTH
Internet and Internet services 30.57Petroleum 10.66Office supplies and computing 6.40Precious metals and stones 5.63Pharmaceuticals and cosmetics 5.29Machine and apparatus construction 5.28Communications 4.26Biotechnology 3.49Road vehicles 2.97Miscellaneous services 2.35Banks and credit institutions 2.08Foods and non alcoholic drinks 2.05Electronics and semiconductors 2.00Hotels and restaurants 2.00Building materials and trade 1.93Holding and finance companies 1.34Healthcare and social services 1.12Chemicals 1.04Electrical engineering and electronics 1.04Tobacco and alcoholic drinks 1.01Textiles and garments 0.96Retail trade, department stores 0.74Various capital goods 0.65
94.86
% of net assets
Industrial classification of investments
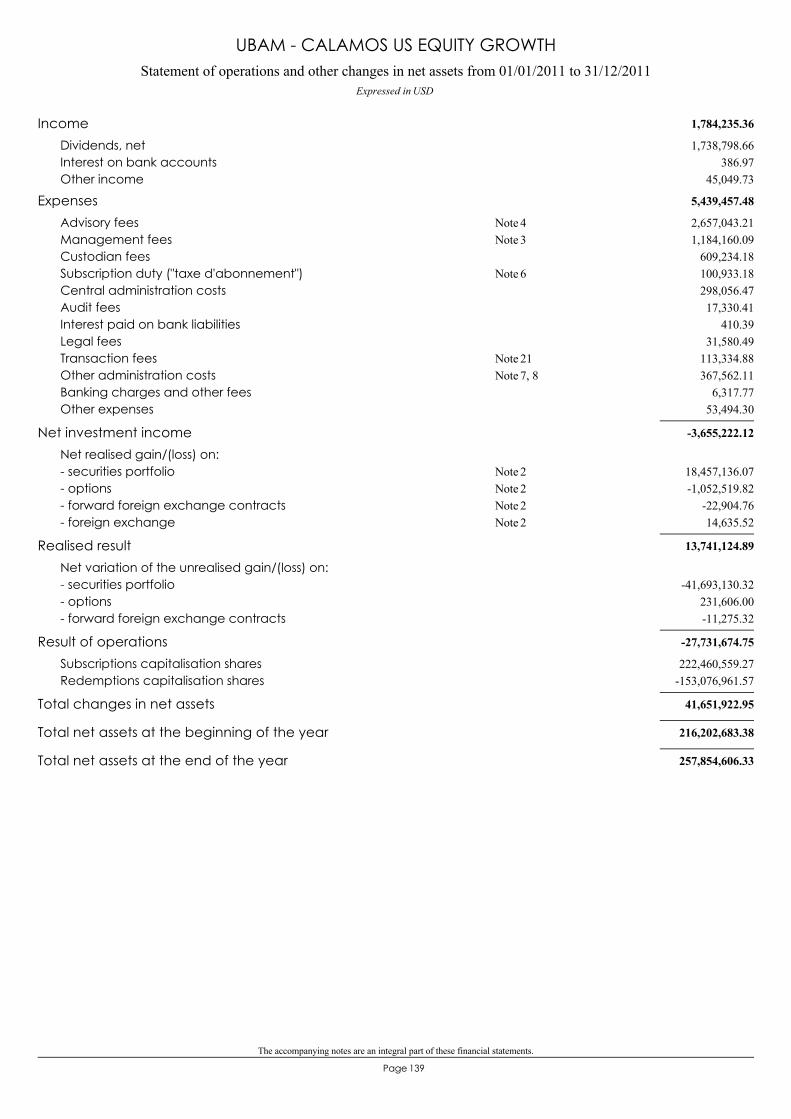
The accompanying notes are an integral part of these financial statements.
139Page
Statement of operations and other changes in net assets from 01/01/2011 to 31/12/2011Expressed in USD
UBAM - CALAMOS US EQUITY GROWTH
1,784,235.36Income1,738,798.66Dividends, net
386.97Interest on bank accounts45,049.73Other income
5,439,457.48Expenses2,657,043.21Advisory fees 4Note1,184,160.09Management fees 3Note
609,234.18Custodian fees100,933.18Subscription duty ("taxe d'abonnement") 6Note298,056.47Central administration costs17,330.41Audit fees
410.39Interest paid on bank liabilities31,580.49Legal fees
113,334.88Transaction fees 21Note367,562.11Other administration costs 7, 8Note
6,317.77Banking charges and other fees53,494.30Other expenses
-3,655,222.12Net investment incomeNet realised gain/(loss) on:
18,457,136.07- securities portfolio 2Note-1,052,519.82- options 2Note
-22,904.76- forward foreign exchange contracts 2Note14,635.52- foreign exchange 2Note
13,741,124.89Realised resultNet variation of the unrealised gain/(loss) on:
-41,693,130.32- securities portfolio231,606.00- options-11,275.32- forward foreign exchange contracts
-27,731,674.75Result of operations222,460,559.27Subscriptions capitalisation shares
-153,076,961.57Redemptions capitalisation shares
41,651,922.95Total changes in net assets
216,202,683.38Total net assets at the beginning of the year
257,854,606.33Total net assets at the end of the year
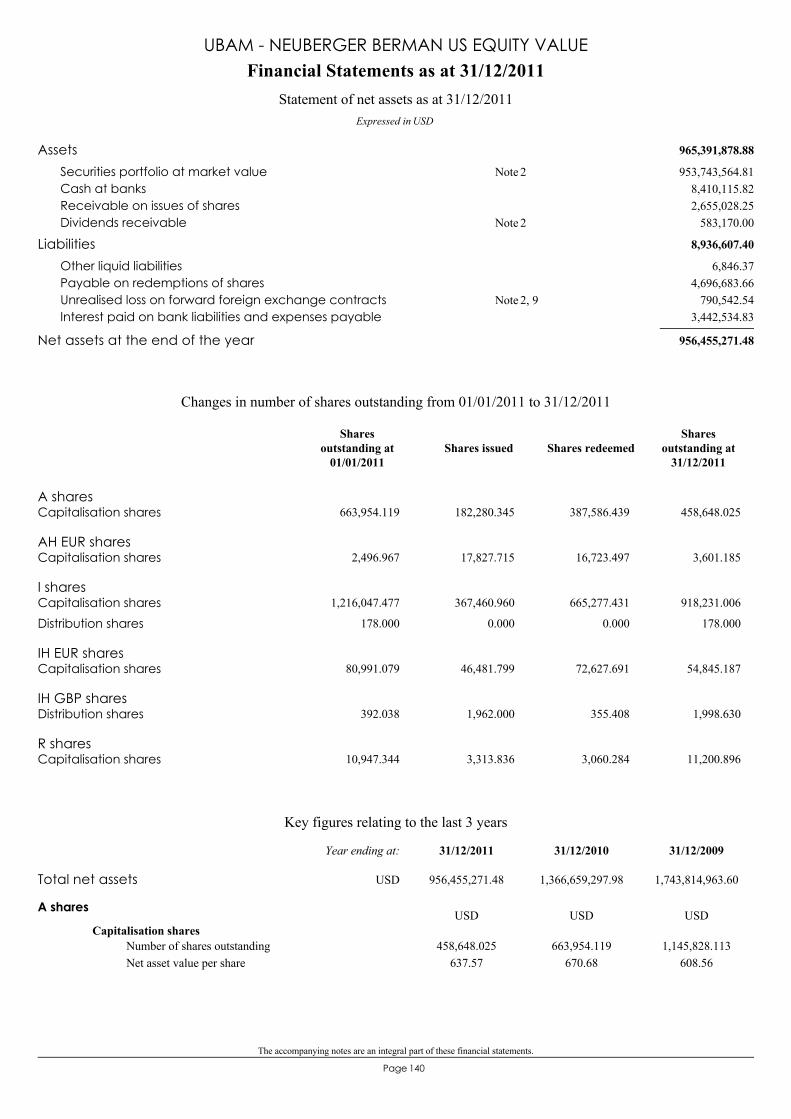
The accompanying notes are an integral part of these financial statements.
140Page
965,391,878.88Assets953,743,564.81Securities portfolio at market value 2Note
8,410,115.82Cash at banks2,655,028.25Receivable on issues of shares
583,170.00Dividends receivable 2Note
8,936,607.40Liabilities6,846.37Other liquid liabilities
4,696,683.66Payable on redemptions of shares790,542.54Unrealised loss on forward foreign exchange contracts 2, 9Note
3,442,534.83Interest paid on bank liabilities and expenses payable
956,455,271.48Net assets at the end of the year
Financial Statements as at 31/12/2011
Expressed in USD
Statement of net assets as at 31/12/2011
UBAM - NEUBERGER BERMAN US EQUITY VALUE
A sharesCapitalisation shares 663,954.119 182,280.345 387,586.439 458,648.025
AH EUR sharesCapitalisation shares 2,496.967 17,827.715 16,723.497 3,601.185
I sharesCapitalisation shares 1,216,047.477 367,460.960 665,277.431 918,231.006
Distribution shares 178.000 0.000 0.000 178.000
IH EUR sharesCapitalisation shares 80,991.079 46,481.799 72,627.691 54,845.187
IH GBP sharesDistribution shares 392.038 1,962.000 355.408 1,998.630
R sharesCapitalisation shares 10,947.344 3,313.836 3,060.284 11,200.896
Changes in number of shares outstanding from 01/01/2011 to 31/12/2011
Shares issued Shares redeemedShares
outstanding at31/12/2011
Sharesoutstanding at
01/01/2011
Key figures relating to the last 3 years
A shares
Capitalisation shares458,648.025
637.57663,954.119
670.681,145,828.113
608.56Number of shares outstandingNet asset value per share
USD USD USD
Total net assets 956,455,271.48 1,366,659,297.98 1,743,814,963.60
31/12/200931/12/201031/12/2011Year ending at:
USD
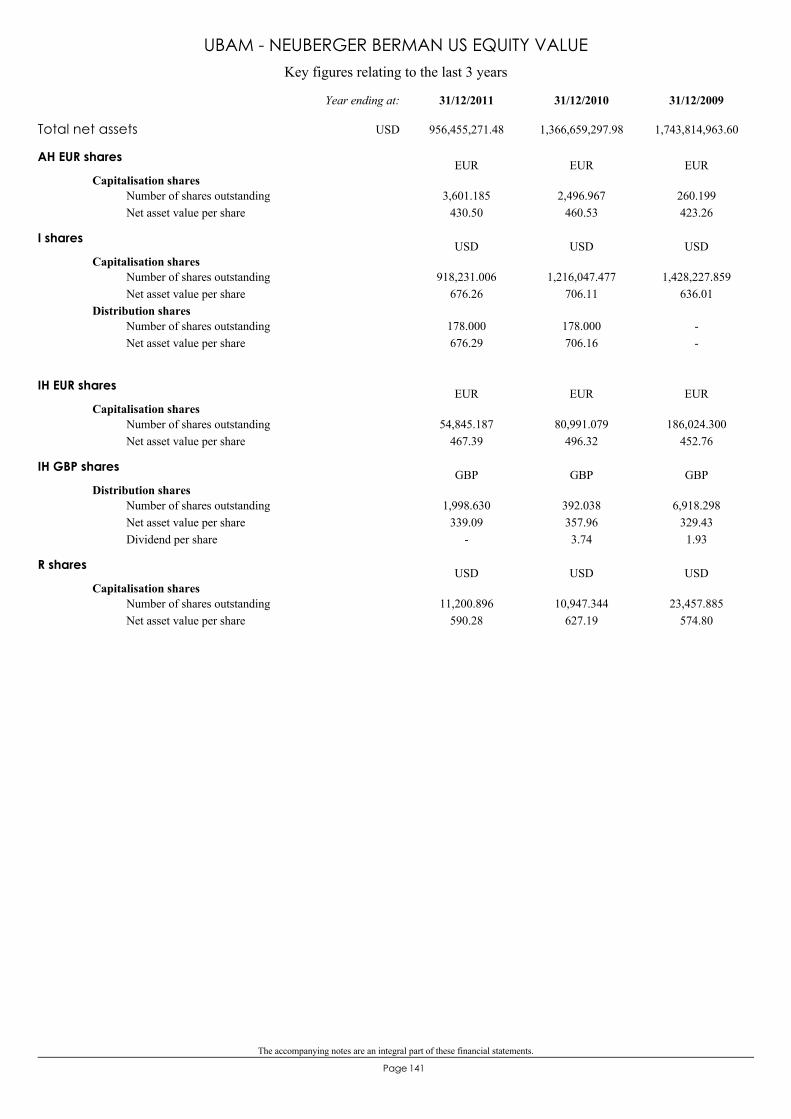
The accompanying notes are an integral part of these financial statements.
141Page
Key figures relating to the last 3 years
UBAM - NEUBERGER BERMAN US EQUITY VALUE
AH EUR shares
Capitalisation shares3,601.185
430.502,496.967
460.53260.199423.26
Number of shares outstandingNet asset value per share
EUR EUR EUR
I shares
Capitalisation shares918,231.006
676.261,216,047.477
706.111,428,227.859
636.01Number of shares outstandingNet asset value per share
Distribution shares178.000676.29
178.000706.16
--
Number of shares outstandingNet asset value per share
USD USD USD
IH EUR shares
Capitalisation shares54,845.187
467.3980,991.079
496.32186,024.300
452.76Number of shares outstandingNet asset value per share
EUR EUR EUR
IH GBP shares
Distribution shares1,998.630
339.09-
392.038357.963.74
6,918.298329.431.93
Number of shares outstandingNet asset value per shareDividend per share
GBP GBP GBP
R shares
Capitalisation shares11,200.896
590.2810,947.344
627.1923,457.885
574.80Number of shares outstandingNet asset value per share
USD USD USD
Total net assets 956,455,271.48 1,366,659,297.98 1,743,814,963.60
31/12/200931/12/201031/12/2011Year ending at:
USD
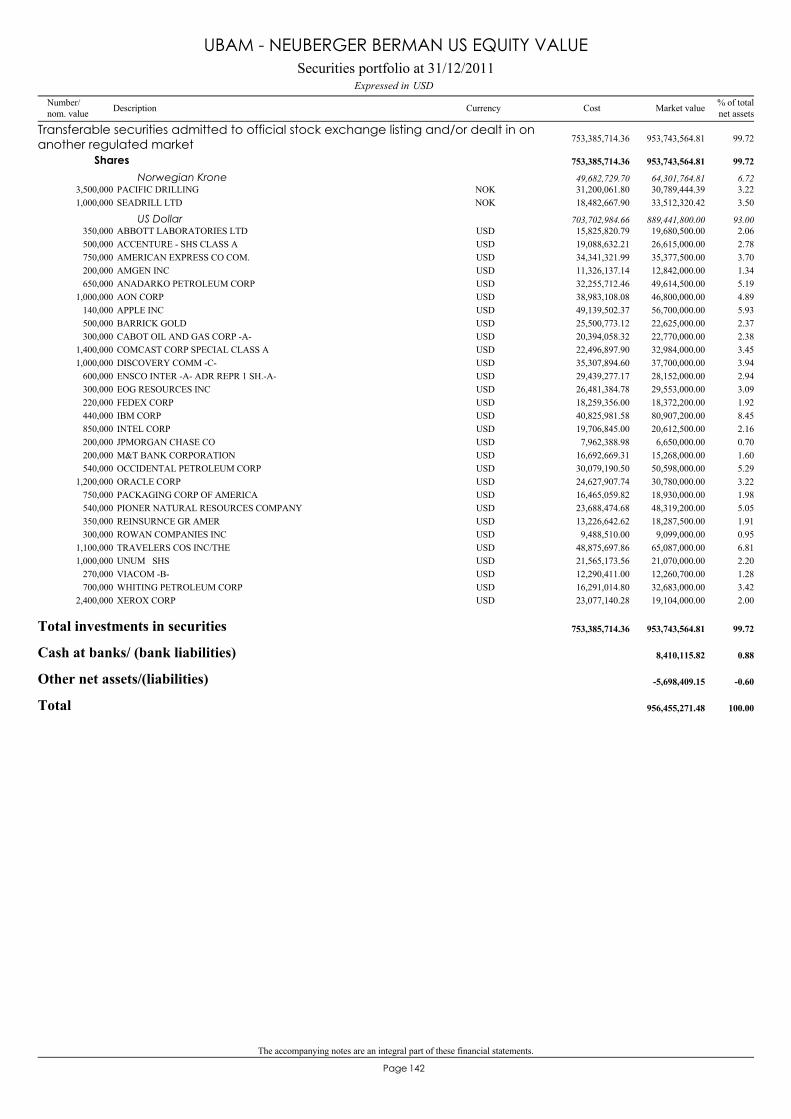
The accompanying notes are an integral part of these financial statements.
142Page
PACIFIC DRILLING3,500,000 30,789,444.39 3.22NOK 31,200,061.80
Transferable securities admitted to official stock exchange listing and/or dealt in onanother regulated market 953,743,564.81 99.72753,385,714.36
Shares 953,743,564.81 99.72753,385,714.36
Norwegian Krone 64,301,764.81 6.7249,682,729.70
SEADRILL LTD1,000,000 33,512,320.42 3.50NOK 18,482,667.90
ABBOTT LABORATORIES LTD350,000 19,680,500.00 2.06USD 15,825,820.79US Dollar 889,441,800.00 93.00703,702,984.66
ACCENTURE - SHS CLASS A500,000 26,615,000.00 2.78USD 19,088,632.21AMERICAN EXPRESS CO COM.750,000 35,377,500.00 3.70USD 34,341,321.99AMGEN INC200,000 12,842,000.00 1.34USD 11,326,137.14ANADARKO PETROLEUM CORP650,000 49,614,500.00 5.19USD 32,255,712.46AON CORP1,000,000 46,800,000.00 4.89USD 38,983,108.08APPLE INC140,000 56,700,000.00 5.93USD 49,139,502.37BARRICK GOLD500,000 22,625,000.00 2.37USD 25,500,773.12CABOT OIL AND GAS CORP -A-300,000 22,770,000.00 2.38USD 20,394,058.32COMCAST CORP SPECIAL CLASS A1,400,000 32,984,000.00 3.45USD 22,496,897.90DISCOVERY COMM -C-1,000,000 37,700,000.00 3.94USD 35,307,894.60ENSCO INTER -A- ADR REPR 1 SH.-A-600,000 28,152,000.00 2.94USD 29,439,277.17EOG RESOURCES INC300,000 29,553,000.00 3.09USD 26,481,384.78FEDEX CORP220,000 18,372,200.00 1.92USD 18,259,356.00IBM CORP440,000 80,907,200.00 8.45USD 40,825,981.58INTEL CORP850,000 20,612,500.00 2.16USD 19,706,845.00JPMORGAN CHASE CO200,000 6,650,000.00 0.70USD 7,962,388.98M&T BANK CORPORATION200,000 15,268,000.00 1.60USD 16,692,669.31OCCIDENTAL PETROLEUM CORP540,000 50,598,000.00 5.29USD 30,079,190.50ORACLE CORP1,200,000 30,780,000.00 3.22USD 24,627,907.74PACKAGING CORP OF AMERICA750,000 18,930,000.00 1.98USD 16,465,059.82PIONER NATURAL RESOURCES COMPANY540,000 48,319,200.00 5.05USD 23,688,474.68REINSURNCE GR AMER350,000 18,287,500.00 1.91USD 13,226,642.62ROWAN COMPANIES INC300,000 9,099,000.00 0.95USD 9,488,510.00TRAVELERS COS INC/THE1,100,000 65,087,000.00 6.81USD 48,875,697.86UNUM SHS1,000,000 21,070,000.00 2.20USD 21,565,173.56VIACOM -B-270,000 12,260,700.00 1.28USD 12,290,411.00WHITING PETROLEUM CORP700,000 32,683,000.00 3.42USD 16,291,014.80XEROX CORP2,400,000 19,104,000.00 2.00USD 23,077,140.28
Total investments in securities 953,743,564.81 99.72753,385,714.36
Cash at banks/ (bank liabilities) 8,410,115.82 0.88
Other net assets/(liabilities) -5,698,409.15 -0.60
Total 956,455,271.48 100.00
Securities portfolio at 31/12/2011USDExpressed in
UBAM - NEUBERGER BERMAN US EQUITY VALUE
Number/nom. value Description Currency % of total
net assetsMarket valueCost
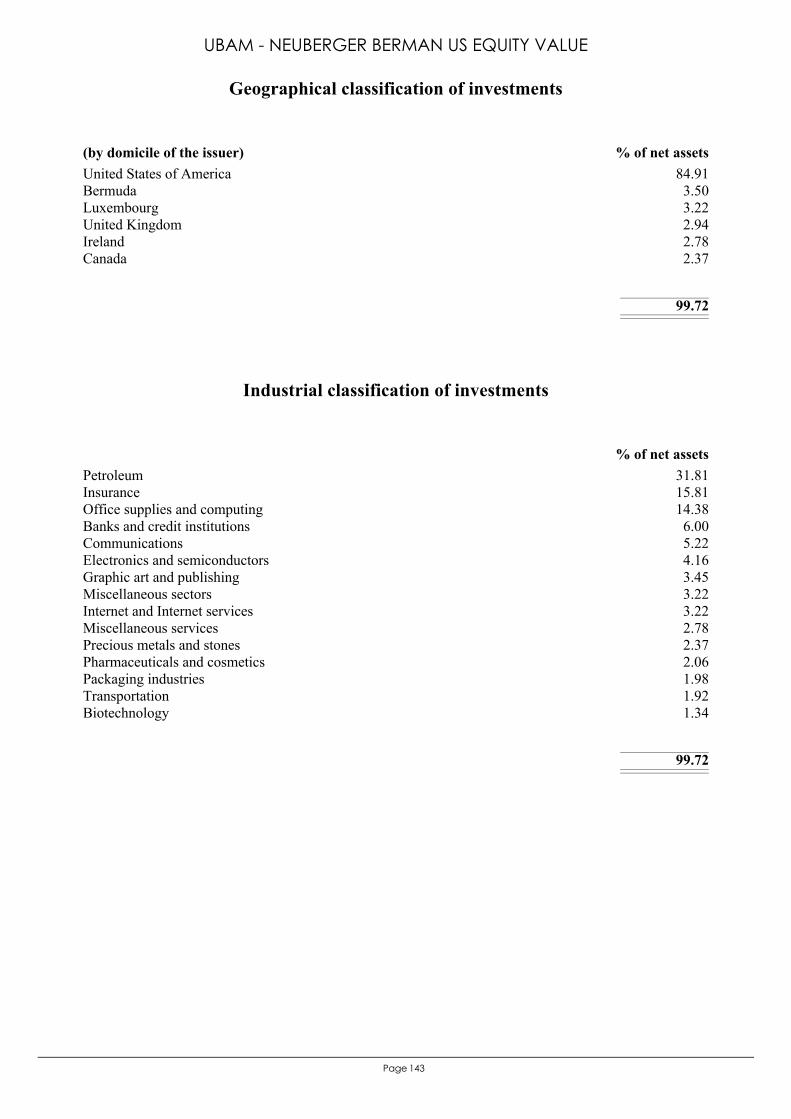
143Page
United States of America 84.91Bermuda 3.50Luxembourg 3.22United Kingdom 2.94Ireland 2.78Canada 2.37
99.72
(by domicile of the issuer) % of net assets
Geographical classification of investments
UBAM - NEUBERGER BERMAN US EQUITY VALUE
Petroleum 31.81Insurance 15.81Office supplies and computing 14.38Banks and credit institutions 6.00Communications 5.22Electronics and semiconductors 4.16Graphic art and publishing 3.45Miscellaneous sectors 3.22Internet and Internet services 3.22Miscellaneous services 2.78Precious metals and stones 2.37Pharmaceuticals and cosmetics 2.06Packaging industries 1.98Transportation 1.92Biotechnology 1.34
99.72
% of net assets
Industrial classification of investments
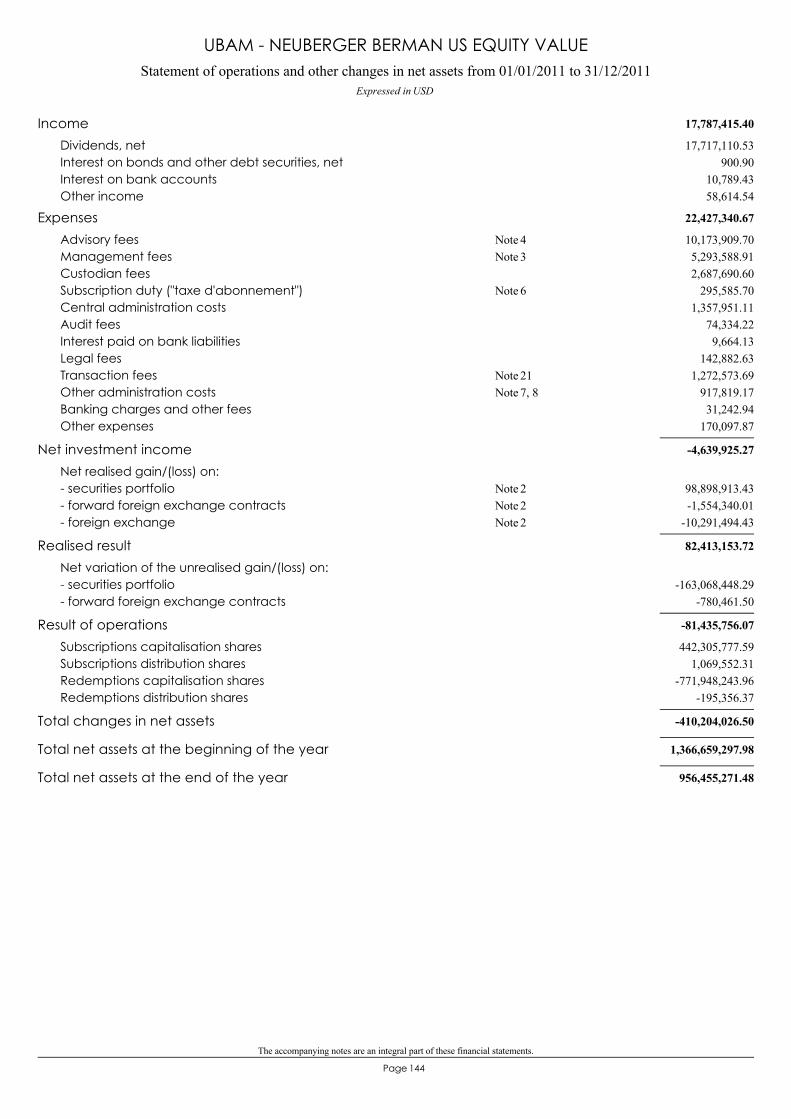
The accompanying notes are an integral part of these financial statements.
144Page
Statement of operations and other changes in net assets from 01/01/2011 to 31/12/2011Expressed in USD
UBAM - NEUBERGER BERMAN US EQUITY VALUE
17,787,415.40Income17,717,110.53Dividends, net
900.90Interest on bonds and other debt securities, net10,789.43Interest on bank accounts58,614.54Other income
22,427,340.67Expenses10,173,909.70Advisory fees 4Note5,293,588.91Management fees 3Note2,687,690.60Custodian fees
295,585.70Subscription duty ("taxe d'abonnement") 6Note1,357,951.11Central administration costs
74,334.22Audit fees9,664.13Interest paid on bank liabilities
142,882.63Legal fees1,272,573.69Transaction fees 21Note
917,819.17Other administration costs 7, 8Note31,242.94Banking charges and other fees
170,097.87Other expenses
-4,639,925.27Net investment incomeNet realised gain/(loss) on:
98,898,913.43- securities portfolio 2Note-1,554,340.01- forward foreign exchange contracts 2Note
-10,291,494.43- foreign exchange 2Note
82,413,153.72Realised resultNet variation of the unrealised gain/(loss) on:
-163,068,448.29- securities portfolio-780,461.50- forward foreign exchange contracts
-81,435,756.07Result of operations442,305,777.59Subscriptions capitalisation shares
1,069,552.31Subscriptions distribution shares-771,948,243.96Redemptions capitalisation shares
-195,356.37Redemptions distribution shares
-410,204,026.50Total changes in net assets
1,366,659,297.98Total net assets at the beginning of the year
956,455,271.48Total net assets at the end of the year
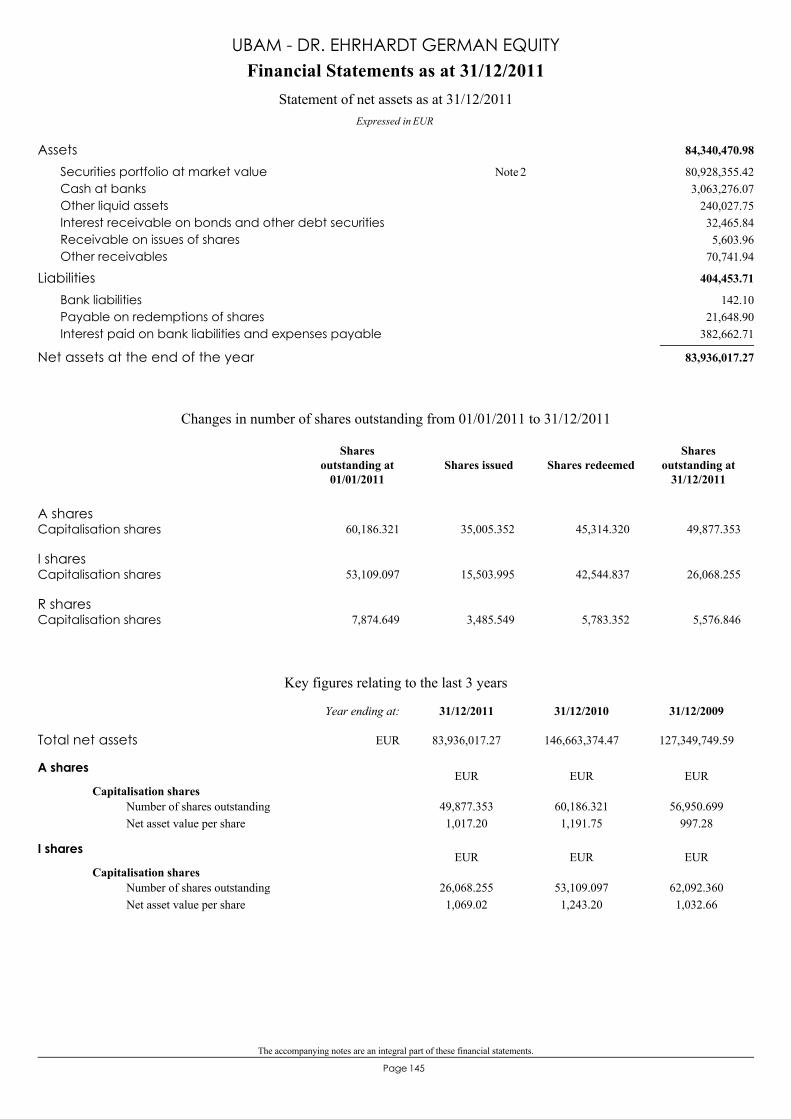
The accompanying notes are an integral part of these financial statements.
145Page
84,340,470.98Assets80,928,355.42Securities portfolio at market value 2Note3,063,276.07Cash at banks
240,027.75Other liquid assets32,465.84Interest receivable on bonds and other debt securities5,603.96Receivable on issues of shares
70,741.94Other receivables
404,453.71Liabilities142.10Bank liabilities
21,648.90Payable on redemptions of shares382,662.71Interest paid on bank liabilities and expenses payable
83,936,017.27Net assets at the end of the year
Financial Statements as at 31/12/2011
Expressed in EUR
Statement of net assets as at 31/12/2011
UBAM - DR. EHRHARDT GERMAN EQUITY
A sharesCapitalisation shares 60,186.321 35,005.352 45,314.320 49,877.353
I sharesCapitalisation shares 53,109.097 15,503.995 42,544.837 26,068.255
R sharesCapitalisation shares 7,874.649 3,485.549 5,783.352 5,576.846
Changes in number of shares outstanding from 01/01/2011 to 31/12/2011
Shares issued Shares redeemedShares
outstanding at31/12/2011
Sharesoutstanding at
01/01/2011
Key figures relating to the last 3 years
A shares
Capitalisation shares49,877.3531,017.20
60,186.3211,191.75
56,950.699997.28
Number of shares outstandingNet asset value per share
EUR EUR EUR
I shares
Capitalisation shares26,068.2551,069.02
53,109.0971,243.20
62,092.3601,032.66
Number of shares outstandingNet asset value per share
EUR EUR EUR
Total net assets 83,936,017.27 146,663,374.47 127,349,749.59
31/12/200931/12/201031/12/2011Year ending at:
EUR
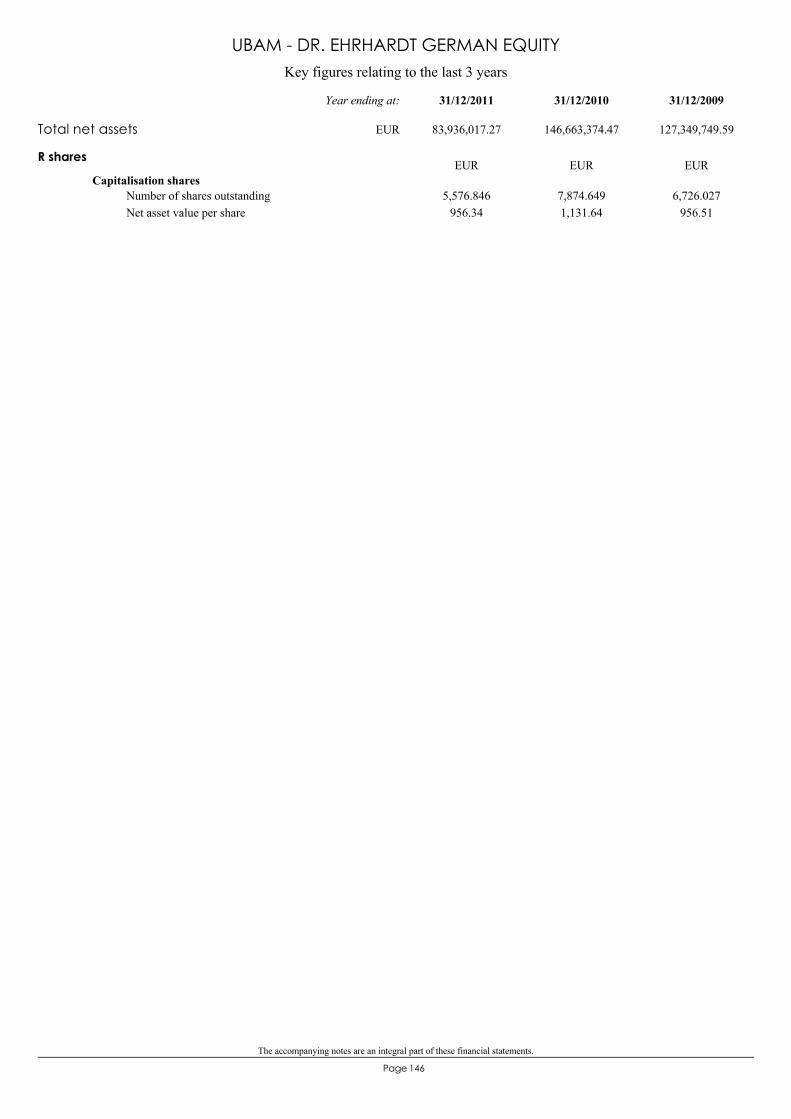
The accompanying notes are an integral part of these financial statements.
146Page
Key figures relating to the last 3 years
UBAM - DR. EHRHARDT GERMAN EQUITY
R shares
Capitalisation shares5,576.846
956.347,874.6491,131.64
6,726.027956.51
Number of shares outstandingNet asset value per share
EUR EUR EUR
Total net assets 83,936,017.27 146,663,374.47 127,349,749.59
31/12/200931/12/201031/12/2011Year ending at:
EUR
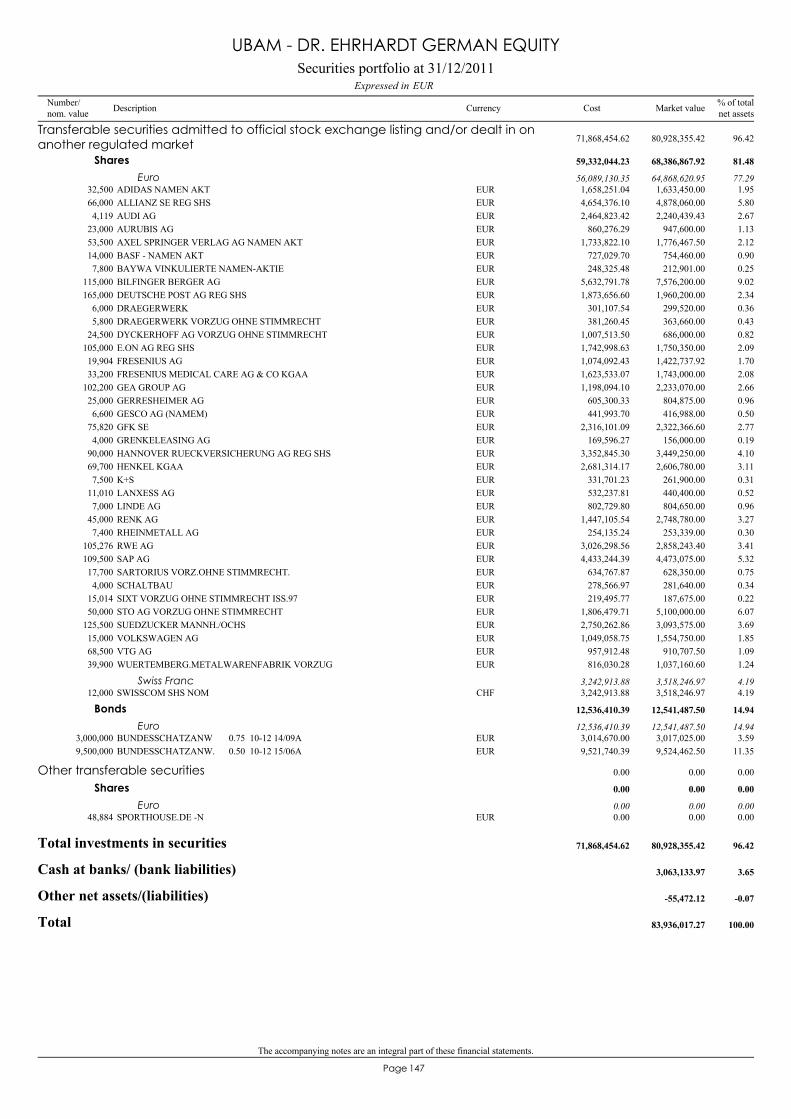
The accompanying notes are an integral part of these financial statements.
147Page
ADIDAS NAMEN AKT32,500 1,633,450.00 1.95EUR 1,658,251.04
Transferable securities admitted to official stock exchange listing and/or dealt in onanother regulated market 80,928,355.42 96.4271,868,454.62
Shares 68,386,867.92 81.4859,332,044.23
Euro 64,868,620.95 77.2956,089,130.35
ALLIANZ SE REG SHS66,000 4,878,060.00 5.80EUR 4,654,376.10AUDI AG4,119 2,240,439.43 2.67EUR 2,464,823.42AURUBIS AG23,000 947,600.00 1.13EUR 860,276.29AXEL SPRINGER VERLAG AG NAMEN AKT53,500 1,776,467.50 2.12EUR 1,733,822.10BASF - NAMEN AKT14,000 754,460.00 0.90EUR 727,029.70BAYWA VINKULIERTE NAMEN-AKTIE7,800 212,901.00 0.25EUR 248,325.48BILFINGER BERGER AG115,000 7,576,200.00 9.02EUR 5,632,791.78DEUTSCHE POST AG REG SHS165,000 1,960,200.00 2.34EUR 1,873,656.60DRAEGERWERK6,000 299,520.00 0.36EUR 301,107.54DRAEGERWERK VORZUG OHNE STIMMRECHT5,800 363,660.00 0.43EUR 381,260.45DYCKERHOFF AG VORZUG OHNE STIMMRECHT24,500 686,000.00 0.82EUR 1,007,513.50E.ON AG REG SHS105,000 1,750,350.00 2.09EUR 1,742,998.63FRESENIUS AG19,904 1,422,737.92 1.70EUR 1,074,092.43FRESENIUS MEDICAL CARE AG & CO KGAA33,200 1,743,000.00 2.08EUR 1,623,533.07GEA GROUP AG102,200 2,233,070.00 2.66EUR 1,198,094.10GERRESHEIMER AG25,000 804,875.00 0.96EUR 605,300.33GESCO AG (NAMEM)6,600 416,988.00 0.50EUR 441,993.70GFK SE75,820 2,322,366.60 2.77EUR 2,316,101.09GRENKELEASING AG4,000 156,000.00 0.19EUR 169,596.27HANNOVER RUECKVERSICHERUNG AG REG SHS90,000 3,449,250.00 4.10EUR 3,352,845.30HENKEL KGAA69,700 2,606,780.00 3.11EUR 2,681,314.17K+S7,500 261,900.00 0.31EUR 331,701.23LANXESS AG11,010 440,400.00 0.52EUR 532,237.81LINDE AG7,000 804,650.00 0.96EUR 802,729.80RENK AG45,000 2,748,780.00 3.27EUR 1,447,105.54RHEINMETALL AG7,400 253,339.00 0.30EUR 254,135.24RWE AG105,276 2,858,243.40 3.41EUR 3,026,298.56SAP AG109,500 4,473,075.00 5.32EUR 4,433,244.39SARTORIUS VORZ.OHNE STIMMRECHT.17,700 628,350.00 0.75EUR 634,767.87SCHALTBAU4,000 281,640.00 0.34EUR 278,566.97SIXT VORZUG OHNE STIMMRECHT ISS.9715,014 187,675.00 0.22EUR 219,495.77STO AG VORZUG OHNE STIMMRECHT50,000 5,100,000.00 6.07EUR 1,806,479.71SUEDZUCKER MANNH./OCHS125,500 3,093,575.00 3.69EUR 2,750,262.86VOLKSWAGEN AG15,000 1,554,750.00 1.85EUR 1,049,058.75VTG AG68,500 910,707.50 1.09EUR 957,912.48WUERTEMBERG.METALWARENFABRIK VORZUG39,900 1,037,160.60 1.24EUR 816,030.28
SWISSCOM SHS NOM12,000 3,518,246.97 4.19CHF 3,242,913.88Swiss Franc 3,518,246.97 4.193,242,913.88
BUNDESSCHATZANW 0.75 10-12 14/09A3,000,000 3,017,025.00 3.59EUR 3,014,670.00
Bonds 12,541,487.50 14.9412,536,410.39
Euro 12,541,487.50 14.9412,536,410.39
BUNDESSCHATZANW. 0.50 10-12 15/06A9,500,000 9,524,462.50 11.35EUR 9,521,740.39
SPORTHOUSE.DE -N48,884 0.00 0.00EUR 0.00
Other transferable securities 0.00 0.000.00
Shares 0.00 0.000.00
Euro 0.00 0.000.00
Total investments in securities 80,928,355.42 96.4271,868,454.62
Cash at banks/ (bank liabilities) 3,063,133.97 3.65
Other net assets/(liabilities) -55,472.12 -0.07
Total 83,936,017.27 100.00
Securities portfolio at 31/12/2011EURExpressed in
UBAM - DR. EHRHARDT GERMAN EQUITY
Number/nom. value Description Currency % of total
net assetsMarket valueCost
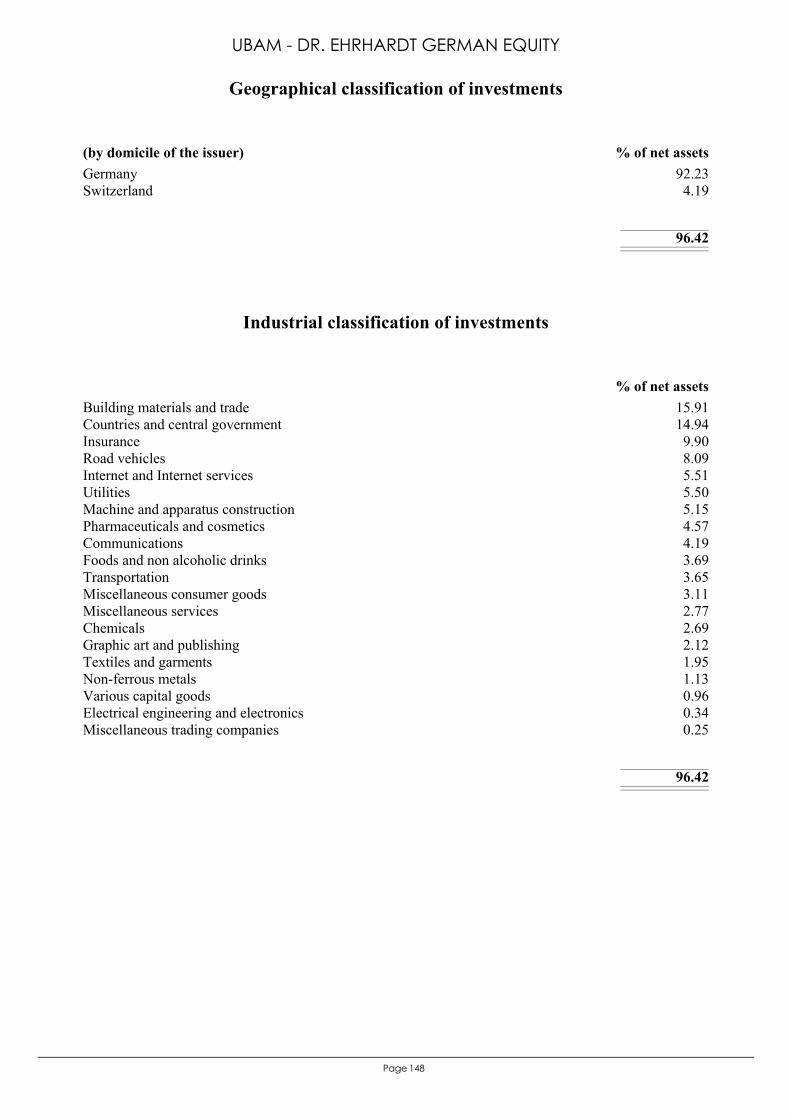
148Page
Germany 92.23Switzerland 4.19
96.42
(by domicile of the issuer) % of net assets
Geographical classification of investments
UBAM - DR. EHRHARDT GERMAN EQUITY
Building materials and trade 15.91Countries and central government 14.94Insurance 9.90Road vehicles 8.09Internet and Internet services 5.51Utilities 5.50Machine and apparatus construction 5.15Pharmaceuticals and cosmetics 4.57Communications 4.19Foods and non alcoholic drinks 3.69Transportation 3.65Miscellaneous consumer goods 3.11Miscellaneous services 2.77Chemicals 2.69Graphic art and publishing 2.12Textiles and garments 1.95Non-ferrous metals 1.13Various capital goods 0.96Electrical engineering and electronics 0.34Miscellaneous trading companies 0.25
96.42
% of net assets
Industrial classification of investments
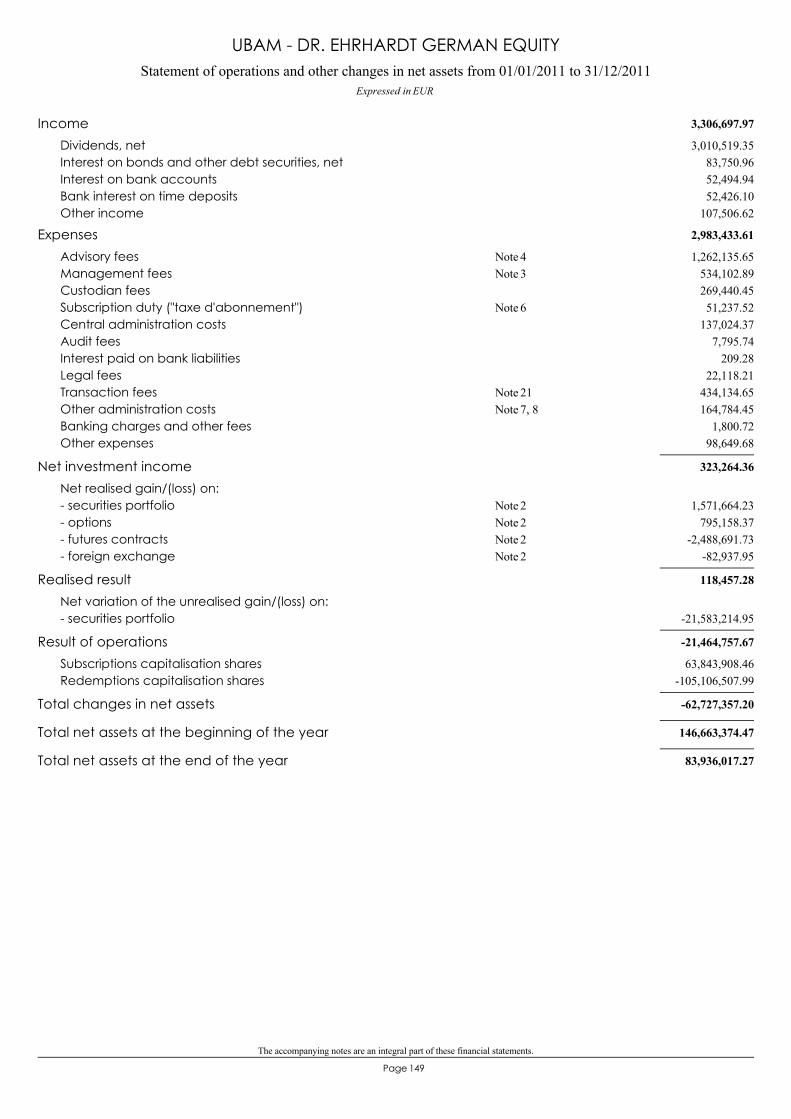
The accompanying notes are an integral part of these financial statements.
149Page
Statement of operations and other changes in net assets from 01/01/2011 to 31/12/2011Expressed in EUR
UBAM - DR. EHRHARDT GERMAN EQUITY
3,306,697.97Income3,010,519.35Dividends, net
83,750.96Interest on bonds and other debt securities, net52,494.94Interest on bank accounts52,426.10Bank interest on time deposits
107,506.62Other income
2,983,433.61Expenses1,262,135.65Advisory fees 4Note
534,102.89Management fees 3Note269,440.45Custodian fees51,237.52Subscription duty ("taxe d'abonnement") 6Note
137,024.37Central administration costs7,795.74Audit fees
209.28Interest paid on bank liabilities22,118.21Legal fees
434,134.65Transaction fees 21Note164,784.45Other administration costs 7, 8Note
1,800.72Banking charges and other fees98,649.68Other expenses
323,264.36Net investment incomeNet realised gain/(loss) on:
1,571,664.23- securities portfolio 2Note795,158.37- options 2Note
-2,488,691.73- futures contracts 2Note-82,937.95- foreign exchange 2Note
118,457.28Realised resultNet variation of the unrealised gain/(loss) on:
-21,583,214.95- securities portfolio
-21,464,757.67Result of operations63,843,908.46Subscriptions capitalisation shares
-105,106,507.99Redemptions capitalisation shares
-62,727,357.20Total changes in net assets
146,663,374.47Total net assets at the beginning of the year
83,936,017.27Total net assets at the end of the year
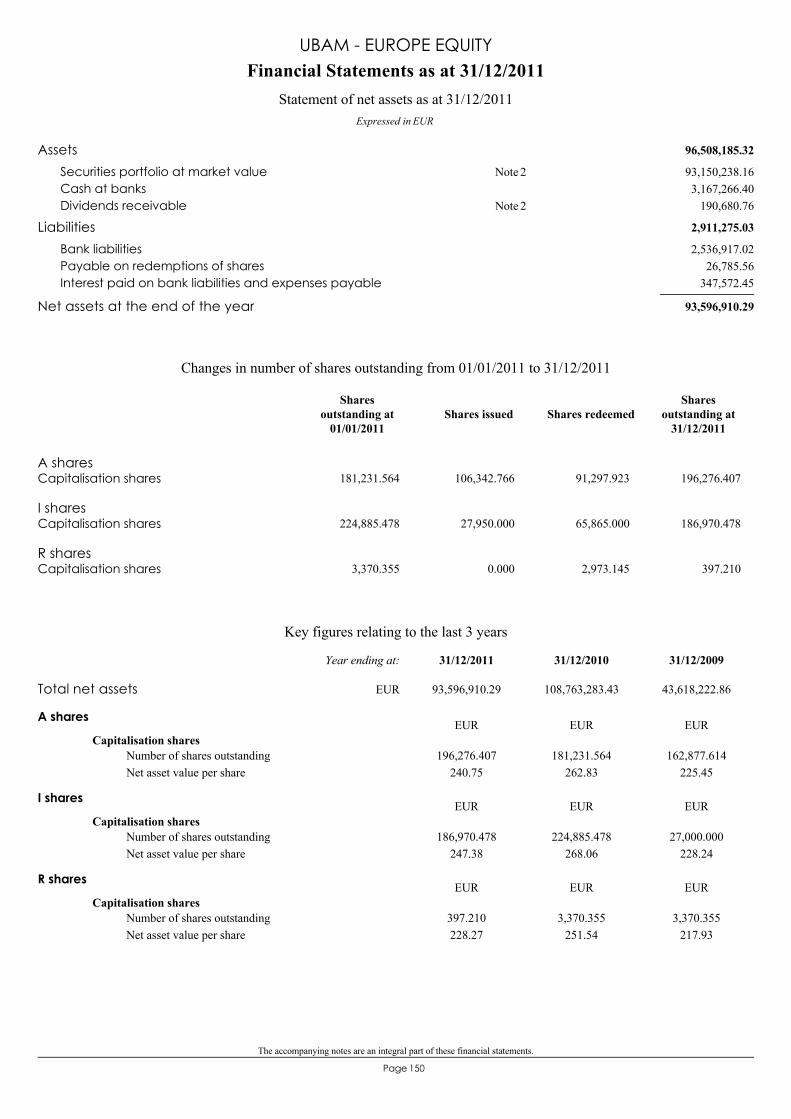
The accompanying notes are an integral part of these financial statements.
150Page
96,508,185.32Assets93,150,238.16Securities portfolio at market value 2Note3,167,266.40Cash at banks
190,680.76Dividends receivable 2Note
2,911,275.03Liabilities2,536,917.02Bank liabilities
26,785.56Payable on redemptions of shares347,572.45Interest paid on bank liabilities and expenses payable
93,596,910.29Net assets at the end of the year
Financial Statements as at 31/12/2011
Expressed in EUR
Statement of net assets as at 31/12/2011
UBAM - EUROPE EQUITY
A sharesCapitalisation shares 181,231.564 106,342.766 91,297.923 196,276.407
I sharesCapitalisation shares 224,885.478 27,950.000 65,865.000 186,970.478
R sharesCapitalisation shares 3,370.355 0.000 2,973.145 397.210
Changes in number of shares outstanding from 01/01/2011 to 31/12/2011
Shares issued Shares redeemedShares
outstanding at31/12/2011
Sharesoutstanding at
01/01/2011
Key figures relating to the last 3 years
A shares
Capitalisation shares196,276.407
240.75181,231.564
262.83162,877.614
225.45Number of shares outstandingNet asset value per share
EUR EUR EUR
I shares
Capitalisation shares186,970.478
247.38224,885.478
268.0627,000.000
228.24Number of shares outstandingNet asset value per share
EUR EUR EUR
R shares
Capitalisation shares397.210228.27
3,370.355251.54
3,370.355217.93
Number of shares outstandingNet asset value per share
EUR EUR EUR
Total net assets 93,596,910.29 108,763,283.43 43,618,222.86
31/12/200931/12/201031/12/2011Year ending at:
EUR
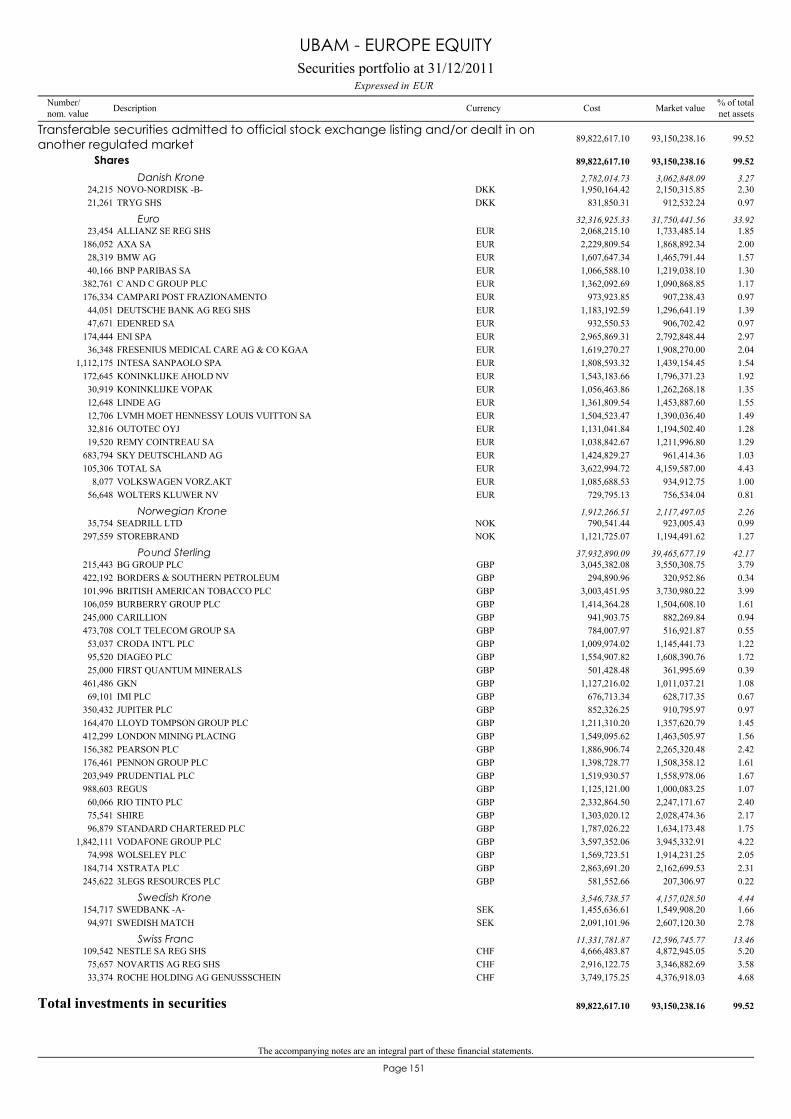
The accompanying notes are an integral part of these financial statements.
151Page
NOVO-NORDISK -B-24,215 2,150,315.85 2.30DKK 1,950,164.42
Transferable securities admitted to official stock exchange listing and/or dealt in onanother regulated market 93,150,238.16 99.5289,822,617.10
Shares 93,150,238.16 99.5289,822,617.10
Danish Krone 3,062,848.09 3.272,782,014.73
TRYG SHS21,261 912,532.24 0.97DKK 831,850.31
ALLIANZ SE REG SHS23,454 1,733,485.14 1.85EUR 2,068,215.10Euro 31,750,441.56 33.9232,316,925.33
AXA SA186,052 1,868,892.34 2.00EUR 2,229,809.54BMW AG28,319 1,465,791.44 1.57EUR 1,607,647.34BNP PARIBAS SA40,166 1,219,038.10 1.30EUR 1,066,588.10C AND C GROUP PLC382,761 1,090,868.85 1.17EUR 1,362,092.69CAMPARI POST FRAZIONAMENTO176,334 907,238.43 0.97EUR 973,923.85DEUTSCHE BANK AG REG SHS44,051 1,296,641.19 1.39EUR 1,183,192.59EDENRED SA47,671 906,702.42 0.97EUR 932,550.53ENI SPA174,444 2,792,848.44 2.97EUR 2,965,869.31FRESENIUS MEDICAL CARE AG & CO KGAA36,348 1,908,270.00 2.04EUR 1,619,270.27INTESA SANPAOLO SPA1,112,175 1,439,154.45 1.54EUR 1,808,593.32KONINKLIJKE AHOLD NV172,645 1,796,371.23 1.92EUR 1,543,183.66KONINKLIJKE VOPAK30,919 1,262,268.18 1.35EUR 1,056,463.86LINDE AG12,648 1,453,887.60 1.55EUR 1,361,809.54LVMH MOET HENNESSY LOUIS VUITTON SA12,706 1,390,036.40 1.49EUR 1,504,523.47OUTOTEC OYJ32,816 1,194,502.40 1.28EUR 1,131,041.84REMY COINTREAU SA19,520 1,211,996.80 1.29EUR 1,038,842.67SKY DEUTSCHLAND AG683,794 961,414.36 1.03EUR 1,424,829.27TOTAL SA105,306 4,159,587.00 4.43EUR 3,622,994.72VOLKSWAGEN VORZ.AKT8,077 934,912.75 1.00EUR 1,085,688.53WOLTERS KLUWER NV56,648 756,534.04 0.81EUR 729,795.13
SEADRILL LTD35,754 923,005.43 0.99NOK 790,541.44Norwegian Krone 2,117,497.05 2.261,912,266.51
STOREBRAND297,559 1,194,491.62 1.27NOK 1,121,725.07
BG GROUP PLC215,443 3,550,308.75 3.79GBP 3,045,382.08Pound Sterling 39,465,677.19 42.1737,932,890.09
BORDERS & SOUTHERN PETROLEUM422,192 320,952.86 0.34GBP 294,890.96BRITISH AMERICAN TOBACCO PLC101,996 3,730,980.22 3.99GBP 3,003,451.95BURBERRY GROUP PLC106,059 1,504,608.10 1.61GBP 1,414,364.28CARILLION245,000 882,269.84 0.94GBP 941,903.75COLT TELECOM GROUP SA473,708 516,921.87 0.55GBP 784,007.97CRODA INT'L PLC53,037 1,145,441.73 1.22GBP 1,009,974.02DIAGEO PLC95,520 1,608,390.76 1.72GBP 1,554,907.82FIRST QUANTUM MINERALS25,000 361,995.69 0.39GBP 501,428.48GKN461,486 1,011,037.21 1.08GBP 1,127,216.02IMI PLC69,101 628,717.35 0.67GBP 676,713.34JUPITER PLC350,432 910,795.97 0.97GBP 852,326.25LLOYD TOMPSON GROUP PLC164,470 1,357,620.79 1.45GBP 1,211,310.20LONDON MINING PLACING412,299 1,463,505.97 1.56GBP 1,549,095.62PEARSON PLC156,382 2,265,320.48 2.42GBP 1,886,906.74PENNON GROUP PLC176,461 1,508,358.12 1.61GBP 1,398,728.77PRUDENTIAL PLC203,949 1,558,978.06 1.67GBP 1,519,930.57REGUS988,603 1,000,083.25 1.07GBP 1,125,121.00RIO TINTO PLC60,066 2,247,171.67 2.40GBP 2,332,864.50SHIRE75,541 2,028,474.36 2.17GBP 1,303,020.12STANDARD CHARTERED PLC96,879 1,634,173.48 1.75GBP 1,787,026.22VODAFONE GROUP PLC1,842,111 3,945,332.91 4.22GBP 3,597,352.06WOLSELEY PLC74,998 1,914,231.25 2.05GBP 1,569,723.51XSTRATA PLC184,714 2,162,699.53 2.31GBP 2,863,691.203LEGS RESOURCES PLC245,622 207,306.97 0.22GBP 581,552.66
SWEDBANK -A-154,717 1,549,908.20 1.66SEK 1,455,636.61Swedish Krone 4,157,028.50 4.443,546,738.57
SWEDISH MATCH94,971 2,607,120.30 2.78SEK 2,091,101.96
NESTLE SA REG SHS109,542 4,872,945.05 5.20CHF 4,666,483.87Swiss Franc 12,596,745.77 13.4611,331,781.87
NOVARTIS AG REG SHS75,657 3,346,882.69 3.58CHF 2,916,122.75ROCHE HOLDING AG GENUSSSCHEIN33,374 4,376,918.03 4.68CHF 3,749,175.25
Total investments in securities 93,150,238.16 99.5289,822,617.10
Securities portfolio at 31/12/2011EURExpressed in
UBAM - EUROPE EQUITY
Number/nom. value Description Currency % of total
net assetsMarket valueCost
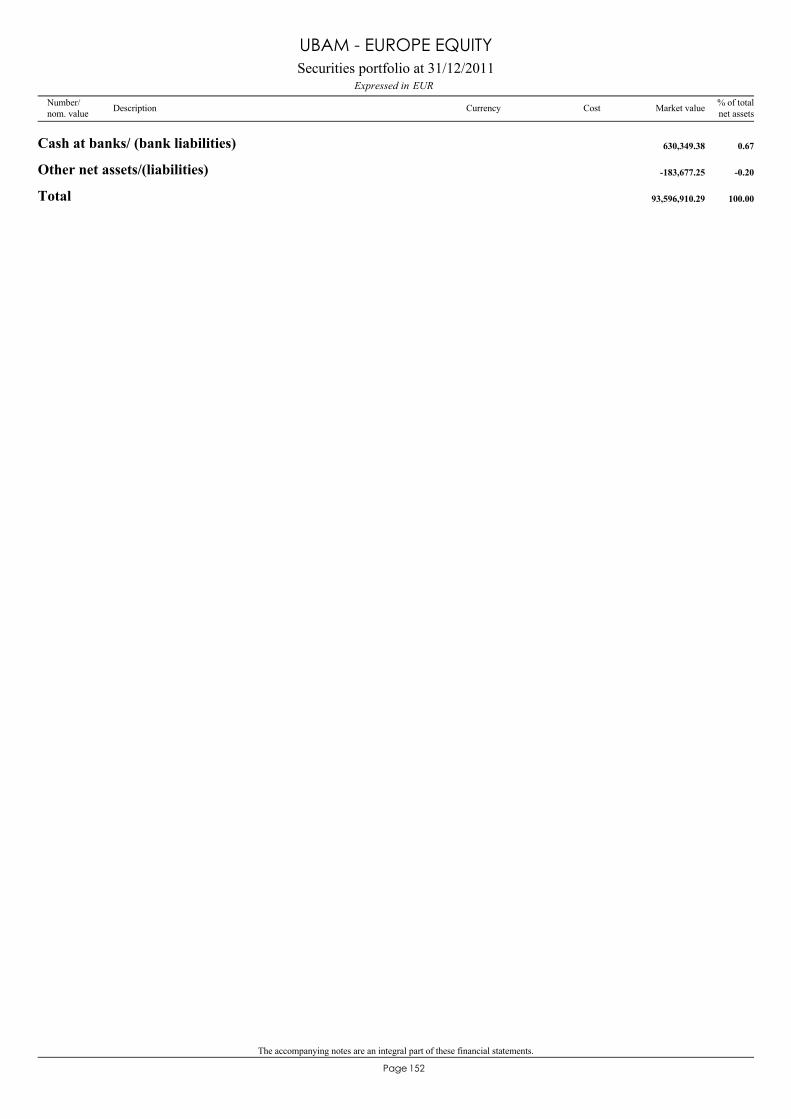
The accompanying notes are an integral part of these financial statements.
152Page
Cash at banks/ (bank liabilities) 630,349.38 0.67
Other net assets/(liabilities) -183,677.25 -0.20
Total 93,596,910.29 100.00
Securities portfolio at 31/12/2011EURExpressed in
UBAM - EUROPE EQUITY
Number/nom. value Description Currency % of total
net assetsMarket valueCost
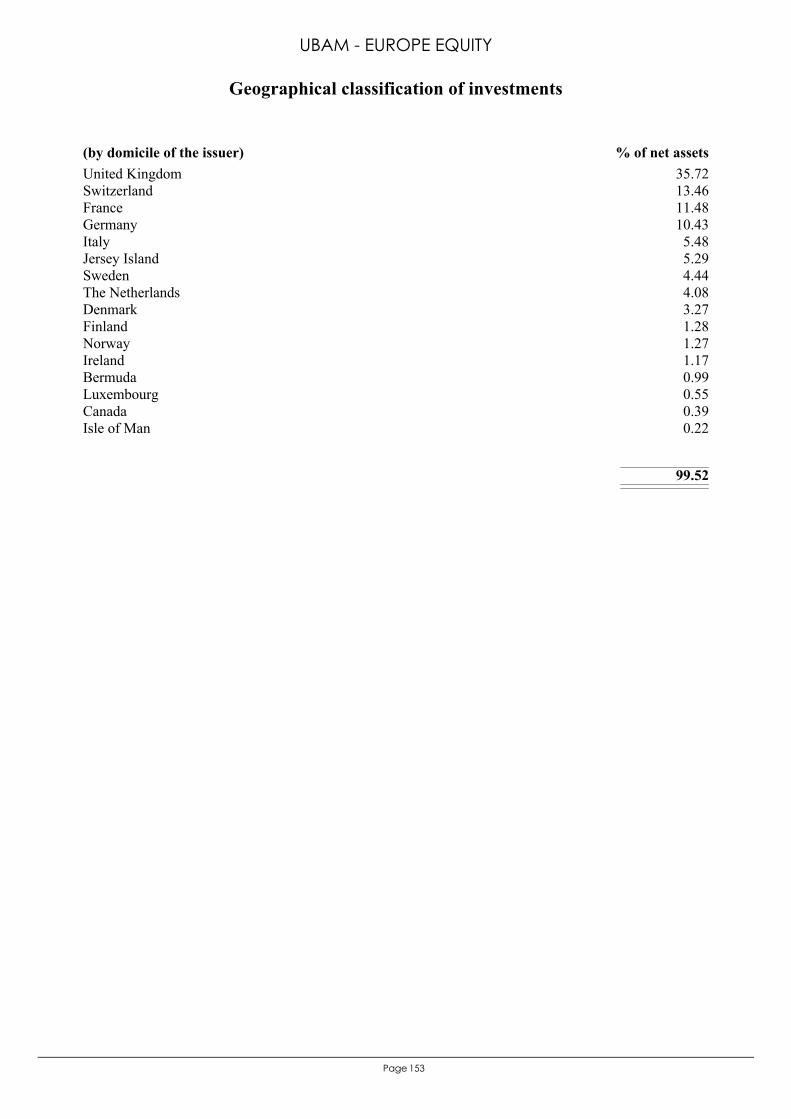
153Page
United Kingdom 35.72Switzerland 13.46France 11.48Germany 10.43Italy 5.48Jersey Island 5.29Sweden 4.44The Netherlands 4.08Denmark 3.27Finland 1.28Norway 1.27Ireland 1.17Bermuda 0.99Luxembourg 0.55Canada 0.39Isle of Man 0.22
99.52
(by domicile of the issuer) % of net assets
Geographical classification of investments
UBAM - EUROPE EQUITY
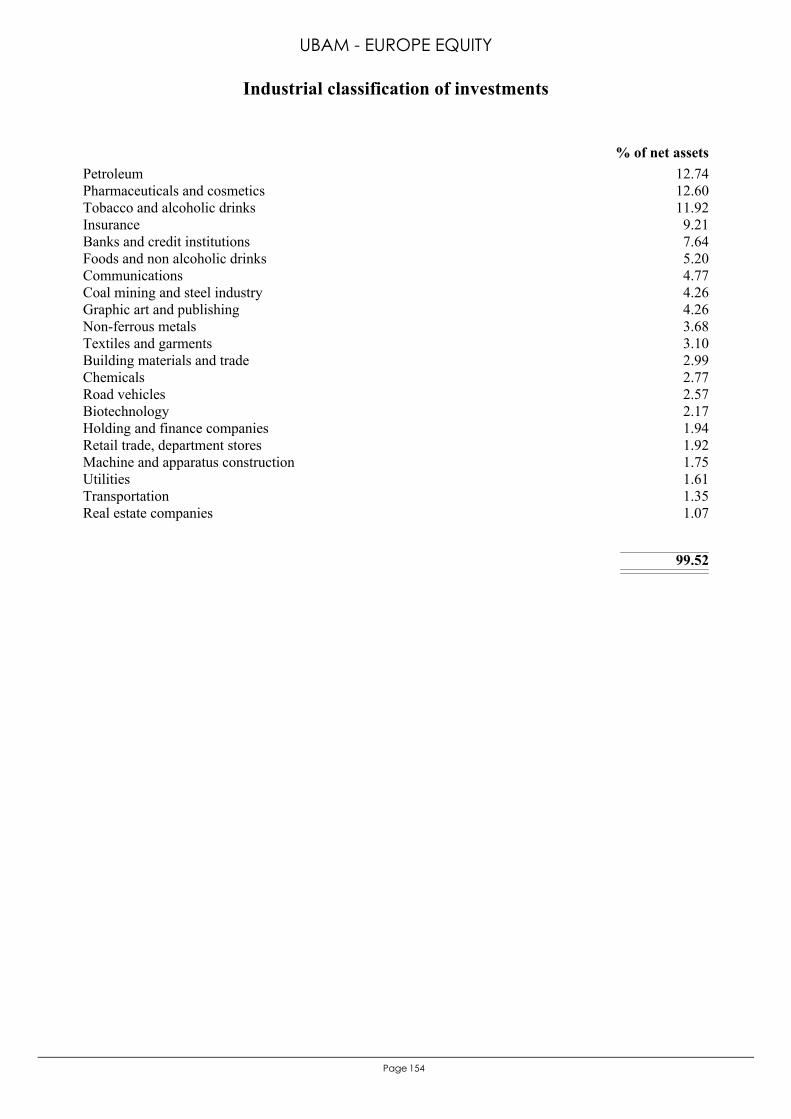
154Page
Petroleum 12.74Pharmaceuticals and cosmetics 12.60Tobacco and alcoholic drinks 11.92Insurance 9.21Banks and credit institutions 7.64Foods and non alcoholic drinks 5.20Communications 4.77Coal mining and steel industry 4.26Graphic art and publishing 4.26Non-ferrous metals 3.68Textiles and garments 3.10Building materials and trade 2.99Chemicals 2.77Road vehicles 2.57Biotechnology 2.17Holding and finance companies 1.94Retail trade, department stores 1.92Machine and apparatus construction 1.75Utilities 1.61Transportation 1.35Real estate companies 1.07
99.52
% of net assets
Industrial classification of investments
UBAM - EUROPE EQUITY
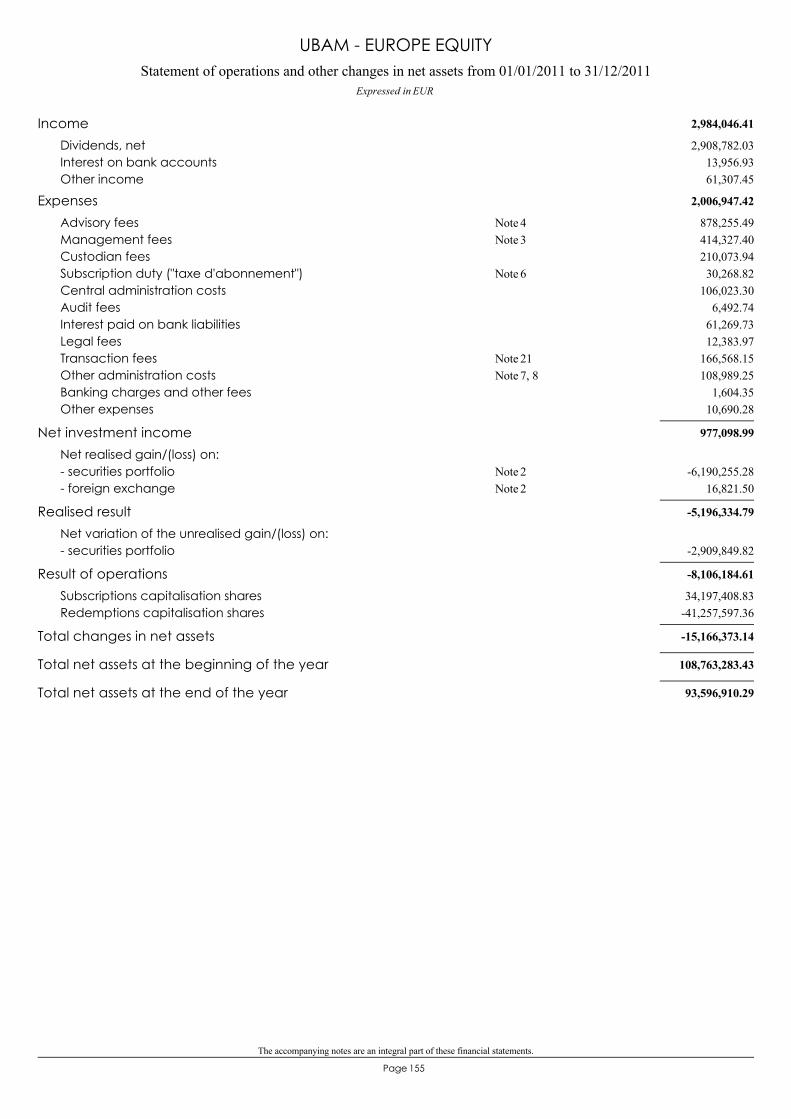
The accompanying notes are an integral part of these financial statements.
155Page
Statement of operations and other changes in net assets from 01/01/2011 to 31/12/2011Expressed in EUR
UBAM - EUROPE EQUITY
2,984,046.41Income2,908,782.03Dividends, net
13,956.93Interest on bank accounts61,307.45Other income
2,006,947.42Expenses878,255.49Advisory fees 4Note414,327.40Management fees 3Note210,073.94Custodian fees30,268.82Subscription duty ("taxe d'abonnement") 6Note
106,023.30Central administration costs6,492.74Audit fees
61,269.73Interest paid on bank liabilities12,383.97Legal fees
166,568.15Transaction fees 21Note108,989.25Other administration costs 7, 8Note
1,604.35Banking charges and other fees10,690.28Other expenses
977,098.99Net investment incomeNet realised gain/(loss) on:
-6,190,255.28- securities portfolio 2Note16,821.50- foreign exchange 2Note
-5,196,334.79Realised resultNet variation of the unrealised gain/(loss) on:
-2,909,849.82- securities portfolio
-8,106,184.61Result of operations34,197,408.83Subscriptions capitalisation shares
-41,257,597.36Redemptions capitalisation shares
-15,166,373.14Total changes in net assets
108,763,283.43Total net assets at the beginning of the year
93,596,910.29Total net assets at the end of the year
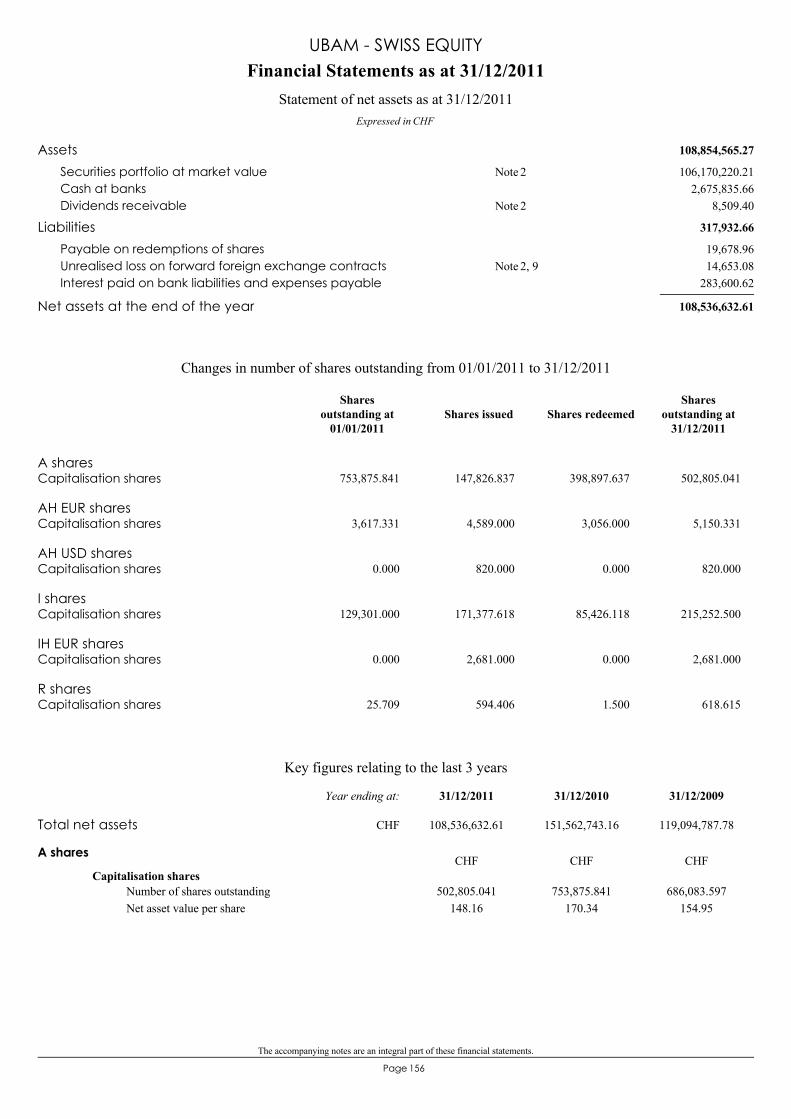
The accompanying notes are an integral part of these financial statements.
156Page
108,854,565.27Assets106,170,220.21Securities portfolio at market value 2Note
2,675,835.66Cash at banks8,509.40Dividends receivable 2Note
317,932.66Liabilities19,678.96Payable on redemptions of shares14,653.08Unrealised loss on forward foreign exchange contracts 2, 9Note
283,600.62Interest paid on bank liabilities and expenses payable
108,536,632.61Net assets at the end of the year
Financial Statements as at 31/12/2011
Expressed in CHF
Statement of net assets as at 31/12/2011
UBAM - SWISS EQUITY
A sharesCapitalisation shares 753,875.841 147,826.837 398,897.637 502,805.041
AH EUR sharesCapitalisation shares 3,617.331 4,589.000 3,056.000 5,150.331
AH USD sharesCapitalisation shares 0.000 820.000 0.000 820.000
I sharesCapitalisation shares 129,301.000 171,377.618 85,426.118 215,252.500
IH EUR sharesCapitalisation shares 0.000 2,681.000 0.000 2,681.000
R sharesCapitalisation shares 25.709 594.406 1.500 618.615
Changes in number of shares outstanding from 01/01/2011 to 31/12/2011
Shares issued Shares redeemedShares
outstanding at31/12/2011
Sharesoutstanding at
01/01/2011
Key figures relating to the last 3 years
A shares
Capitalisation shares502,805.041
148.16753,875.841
170.34686,083.597
154.95Number of shares outstandingNet asset value per share
CHF CHF CHF
Total net assets 108,536,632.61 151,562,743.16 119,094,787.78
31/12/200931/12/201031/12/2011Year ending at:
CHF
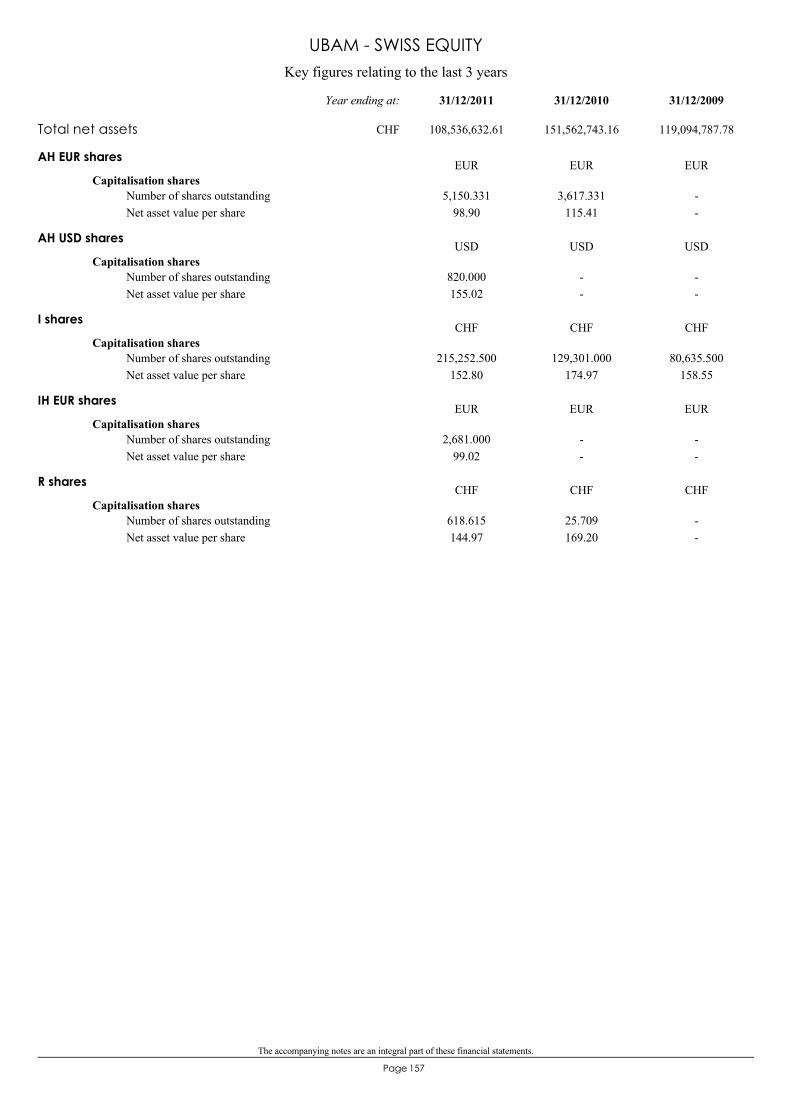
The accompanying notes are an integral part of these financial statements.
157Page
Key figures relating to the last 3 years
UBAM - SWISS EQUITY
AH EUR shares
Capitalisation shares5,150.331
98.903,617.331
115.41--
Number of shares outstandingNet asset value per share
EUR EUR EUR
AH USD shares
Capitalisation shares820.000155.02
--
--
Number of shares outstandingNet asset value per share
USD USD USD
I shares
Capitalisation shares215,252.500
152.80129,301.000
174.9780,635.500
158.55Number of shares outstandingNet asset value per share
CHF CHF CHF
IH EUR shares
Capitalisation shares2,681.000
99.02--
--
Number of shares outstandingNet asset value per share
EUR EUR EUR
R shares
Capitalisation shares618.615144.97
25.709169.20
--
Number of shares outstandingNet asset value per share
CHF CHF CHF
Total net assets 108,536,632.61 151,562,743.16 119,094,787.78
31/12/200931/12/201031/12/2011Year ending at:
CHF
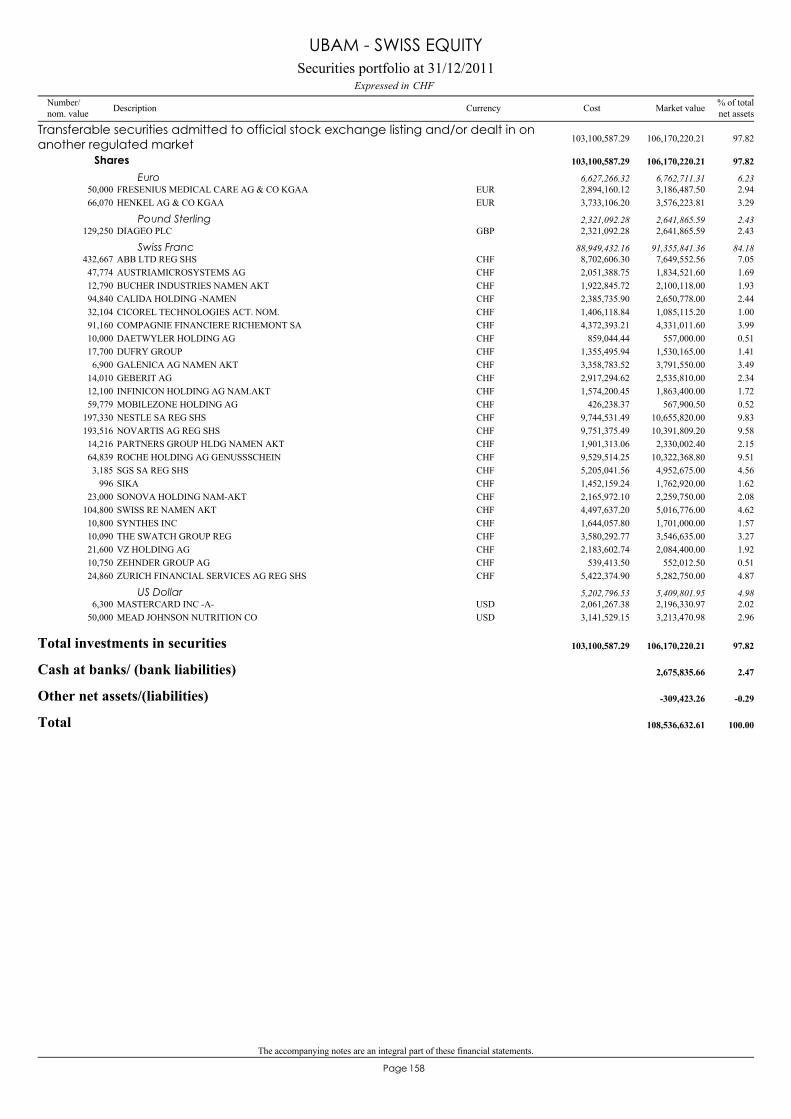
The accompanying notes are an integral part of these financial statements.
158Page
FRESENIUS MEDICAL CARE AG & CO KGAA50,000 3,186,487.50 2.94EUR 2,894,160.12
Transferable securities admitted to official stock exchange listing and/or dealt in onanother regulated market 106,170,220.21 97.82103,100,587.29
Shares 106,170,220.21 97.82103,100,587.29
Euro 6,762,711.31 6.236,627,266.32
HENKEL AG & CO KGAA66,070 3,576,223.81 3.29EUR 3,733,106.20
DIAGEO PLC129,250 2,641,865.59 2.43GBP 2,321,092.28Pound Sterling 2,641,865.59 2.432,321,092.28
ABB LTD REG SHS432,667 7,649,552.56 7.05CHF 8,702,606.30Swiss Franc 91,355,841.36 84.1888,949,432.16
AUSTRIAMICROSYSTEMS AG47,774 1,834,521.60 1.69CHF 2,051,388.75BUCHER INDUSTRIES NAMEN AKT12,790 2,100,118.00 1.93CHF 1,922,845.72CALIDA HOLDING -NAMEN94,840 2,650,778.00 2.44CHF 2,385,735.90CICOREL TECHNOLOGIES ACT. NOM.32,104 1,085,115.20 1.00CHF 1,406,118.84COMPAGNIE FINANCIERE RICHEMONT SA91,160 4,331,011.60 3.99CHF 4,372,393.21DAETWYLER HOLDING AG10,000 557,000.00 0.51CHF 859,044.44DUFRY GROUP17,700 1,530,165.00 1.41CHF 1,355,495.94GALENICA AG NAMEN AKT6,900 3,791,550.00 3.49CHF 3,358,783.52GEBERIT AG14,010 2,535,810.00 2.34CHF 2,917,294.62INFINICON HOLDING AG NAM.AKT12,100 1,863,400.00 1.72CHF 1,574,200.45MOBILEZONE HOLDING AG59,779 567,900.50 0.52CHF 426,238.37NESTLE SA REG SHS197,330 10,655,820.00 9.83CHF 9,744,531.49NOVARTIS AG REG SHS193,516 10,391,809.20 9.58CHF 9,751,375.49PARTNERS GROUP HLDG NAMEN AKT14,216 2,330,002.40 2.15CHF 1,901,313.06ROCHE HOLDING AG GENUSSSCHEIN64,839 10,322,368.80 9.51CHF 9,529,514.25SGS SA REG SHS3,185 4,952,675.00 4.56CHF 5,205,041.56SIKA996 1,762,920.00 1.62CHF 1,452,159.24SONOVA HOLDING NAM-AKT23,000 2,259,750.00 2.08CHF 2,165,972.10SWISS RE NAMEN AKT104,800 5,016,776.00 4.62CHF 4,497,637.20SYNTHES INC10,800 1,701,000.00 1.57CHF 1,644,057.80THE SWATCH GROUP REG10,090 3,546,635.00 3.27CHF 3,580,292.77VZ HOLDING AG21,600 2,084,400.00 1.92CHF 2,183,602.74ZEHNDER GROUP AG10,750 552,012.50 0.51CHF 539,413.50ZURICH FINANCIAL SERVICES AG REG SHS24,860 5,282,750.00 4.87CHF 5,422,374.90
MASTERCARD INC -A-6,300 2,196,330.97 2.02USD 2,061,267.38US Dollar 5,409,801.95 4.985,202,796.53
MEAD JOHNSON NUTRITION CO50,000 3,213,470.98 2.96USD 3,141,529.15
Total investments in securities 106,170,220.21 97.82103,100,587.29
Cash at banks/ (bank liabilities) 2,675,835.66 2.47
Other net assets/(liabilities) -309,423.26 -0.29
Total 108,536,632.61 100.00
Securities portfolio at 31/12/2011CHFExpressed in
UBAM - SWISS EQUITY
Number/nom. value Description Currency % of total
net assetsMarket valueCost
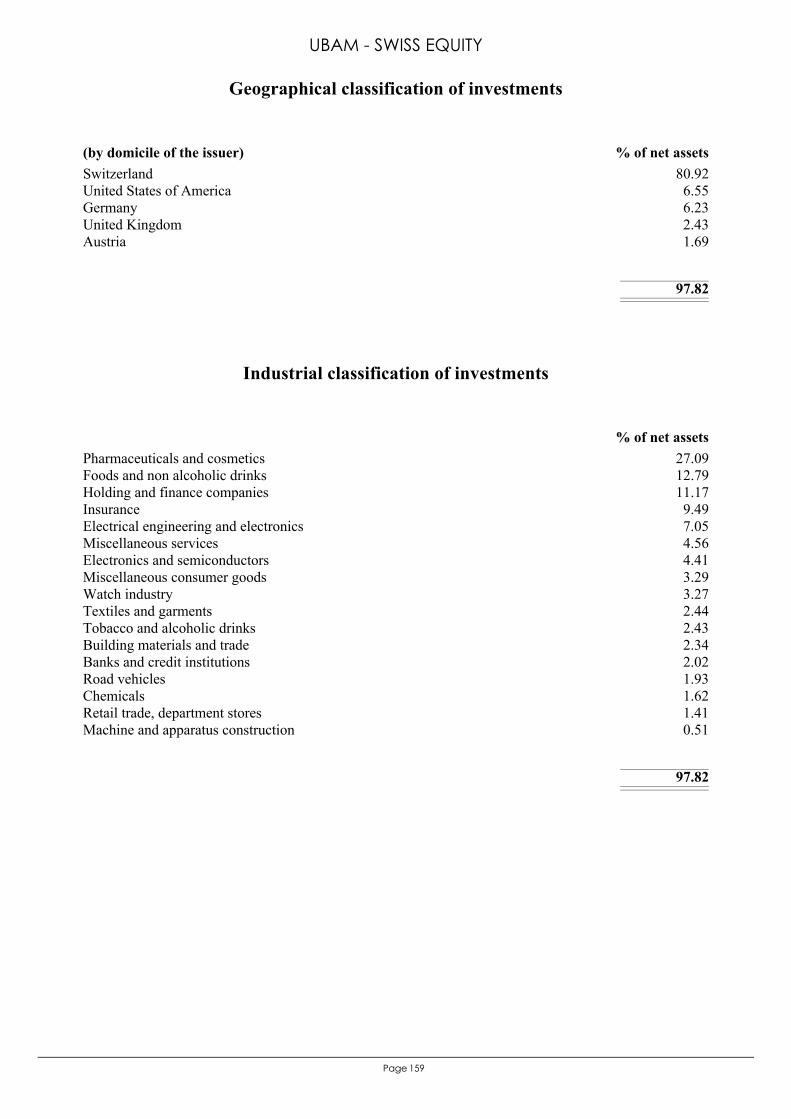
159Page
Switzerland 80.92United States of America 6.55Germany 6.23United Kingdom 2.43Austria 1.69
97.82
(by domicile of the issuer) % of net assets
Geographical classification of investments
UBAM - SWISS EQUITY
Pharmaceuticals and cosmetics 27.09Foods and non alcoholic drinks 12.79Holding and finance companies 11.17Insurance 9.49Electrical engineering and electronics 7.05Miscellaneous services 4.56Electronics and semiconductors 4.41Miscellaneous consumer goods 3.29Watch industry 3.27Textiles and garments 2.44Tobacco and alcoholic drinks 2.43Building materials and trade 2.34Banks and credit institutions 2.02Road vehicles 1.93Chemicals 1.62Retail trade, department stores 1.41Machine and apparatus construction 0.51
97.82
% of net assets
Industrial classification of investments
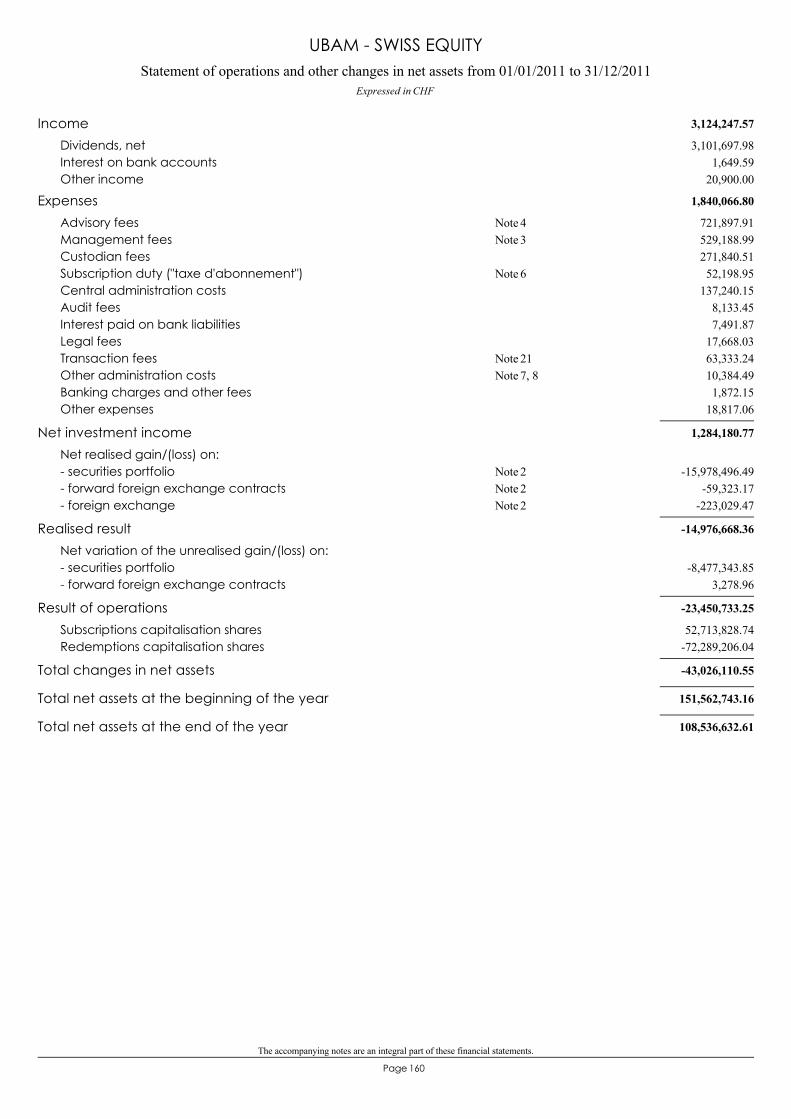
The accompanying notes are an integral part of these financial statements.
160Page
Statement of operations and other changes in net assets from 01/01/2011 to 31/12/2011Expressed in CHF
UBAM - SWISS EQUITY
3,124,247.57Income3,101,697.98Dividends, net
1,649.59Interest on bank accounts20,900.00Other income
1,840,066.80Expenses721,897.91Advisory fees 4Note529,188.99Management fees 3Note271,840.51Custodian fees52,198.95Subscription duty ("taxe d'abonnement") 6Note
137,240.15Central administration costs8,133.45Audit fees7,491.87Interest paid on bank liabilities
17,668.03Legal fees63,333.24Transaction fees 21Note10,384.49Other administration costs 7, 8Note1,872.15Banking charges and other fees
18,817.06Other expenses
1,284,180.77Net investment incomeNet realised gain/(loss) on:
-15,978,496.49- securities portfolio 2Note-59,323.17- forward foreign exchange contracts 2Note
-223,029.47- foreign exchange 2Note
-14,976,668.36Realised resultNet variation of the unrealised gain/(loss) on:
-8,477,343.85- securities portfolio3,278.96- forward foreign exchange contracts
-23,450,733.25Result of operations52,713,828.74Subscriptions capitalisation shares
-72,289,206.04Redemptions capitalisation shares
-43,026,110.55Total changes in net assets
151,562,743.16Total net assets at the beginning of the year
108,536,632.61Total net assets at the end of the year
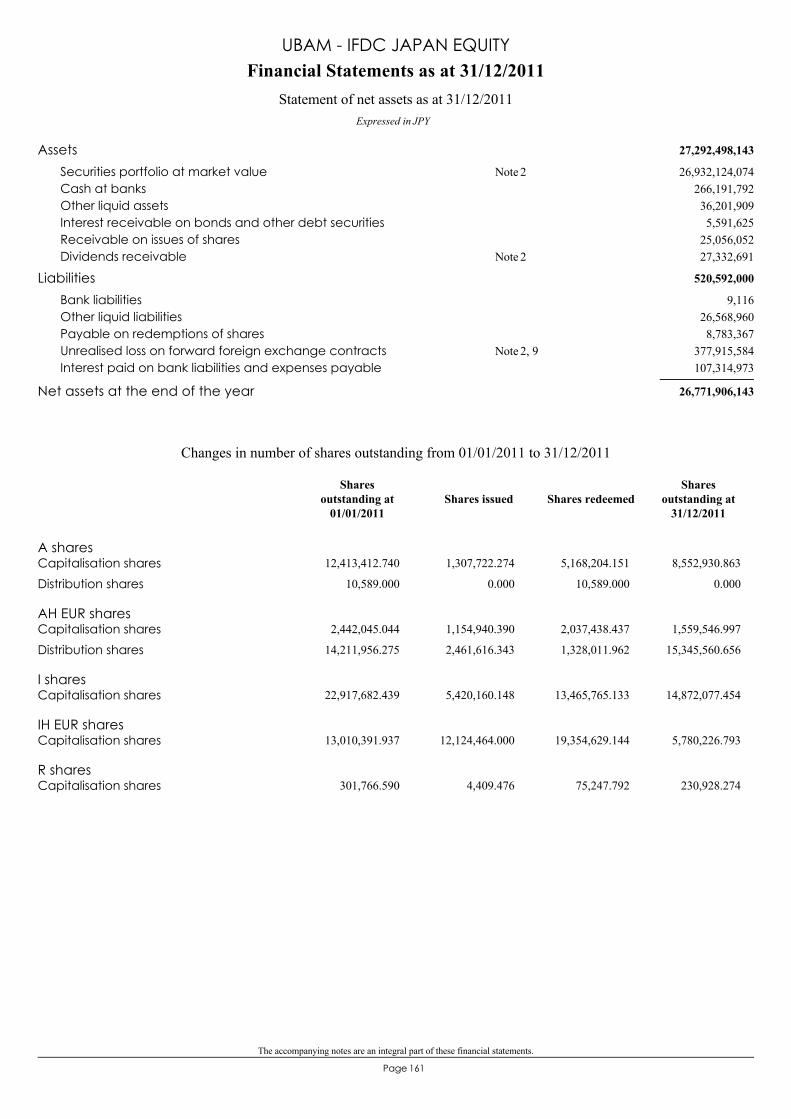
The accompanying notes are an integral part of these financial statements.
161Page
27,292,498,143Assets26,932,124,074Securities portfolio at market value 2Note
266,191,792Cash at banks36,201,909Other liquid assets5,591,625Interest receivable on bonds and other debt securities
25,056,052Receivable on issues of shares27,332,691Dividends receivable 2Note
520,592,000Liabilities9,116Bank liabilities
26,568,960Other liquid liabilities8,783,367Payable on redemptions of shares
377,915,584Unrealised loss on forward foreign exchange contracts 2, 9Note107,314,973Interest paid on bank liabilities and expenses payable
26,771,906,143Net assets at the end of the year
Financial Statements as at 31/12/2011
Expressed in JPY
Statement of net assets as at 31/12/2011
UBAM - IFDC JAPAN EQUITY
A sharesCapitalisation shares 12,413,412.740 1,307,722.274 5,168,204.151 8,552,930.863
Distribution shares 10,589.000 0.000 10,589.000 0.000
AH EUR sharesCapitalisation shares 2,442,045.044 1,154,940.390 2,037,438.437 1,559,546.997
Distribution shares 14,211,956.275 2,461,616.343 1,328,011.962 15,345,560.656
I sharesCapitalisation shares 22,917,682.439 5,420,160.148 13,465,765.133 14,872,077.454
IH EUR sharesCapitalisation shares 13,010,391.937 12,124,464.000 19,354,629.144 5,780,226.793
R sharesCapitalisation shares 301,766.590 4,409.476 75,247.792 230,928.274
Changes in number of shares outstanding from 01/01/2011 to 31/12/2011
Shares issued Shares redeemedShares
outstanding at31/12/2011
Sharesoutstanding at
01/01/2011
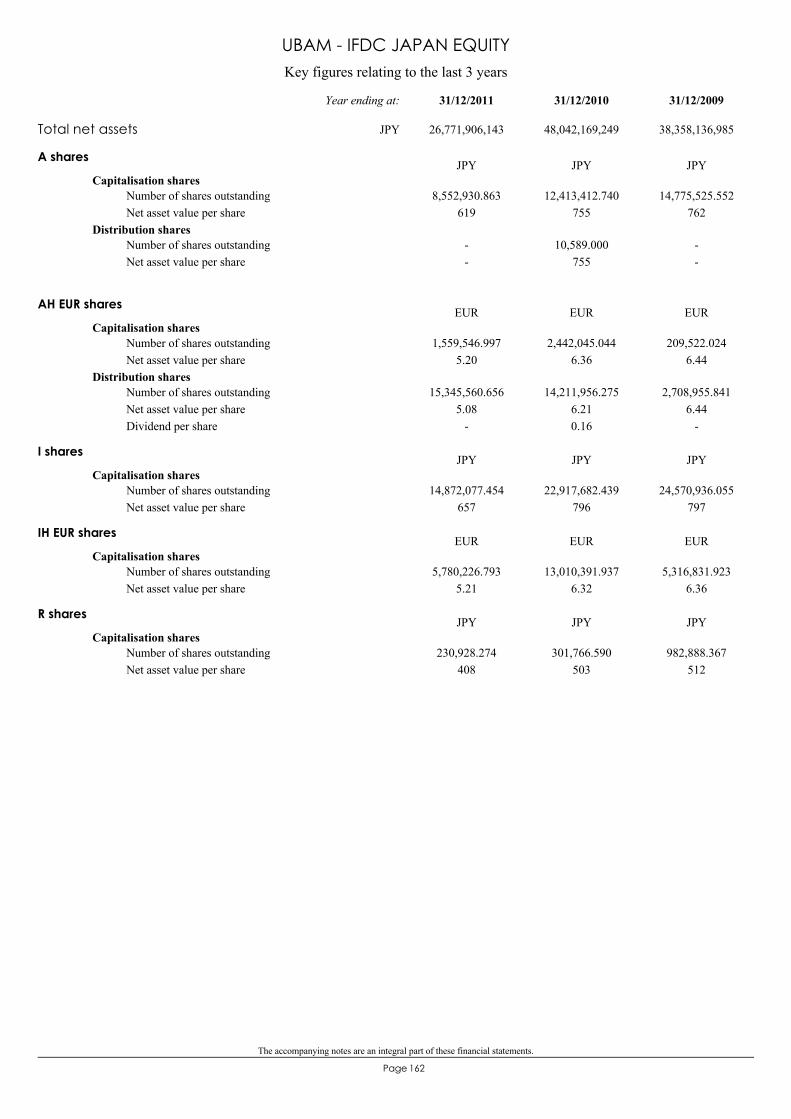
The accompanying notes are an integral part of these financial statements.
162Page
Key figures relating to the last 3 years
UBAM - IFDC JAPAN EQUITY
A shares
Capitalisation shares8,552,930.863
61912,413,412.740
75514,775,525.552
762Number of shares outstandingNet asset value per share
Distribution shares--
10,589.000755
--
Number of shares outstandingNet asset value per share
JPY JPY JPY
AH EUR shares
Capitalisation shares1,559,546.997
5.202,442,045.044
6.36209,522.024
6.44Number of shares outstandingNet asset value per share
Distribution shares15,345,560.656
5.08-
14,211,956.2756.210.16
2,708,955.8416.44
-
Number of shares outstandingNet asset value per shareDividend per share
EUR EUR EUR
I shares
Capitalisation shares14,872,077.454
65722,917,682.439
79624,570,936.055
797Number of shares outstandingNet asset value per share
JPY JPY JPY
IH EUR shares
Capitalisation shares5,780,226.793
5.2113,010,391.937
6.325,316,831.923
6.36Number of shares outstandingNet asset value per share
EUR EUR EUR
R shares
Capitalisation shares230,928.274
408301,766.590
503982,888.367
512Number of shares outstandingNet asset value per share
JPY JPY JPY
Total net assets 26,771,906,143 48,042,169,249 38,358,136,985
31/12/200931/12/201031/12/2011Year ending at:
JPY
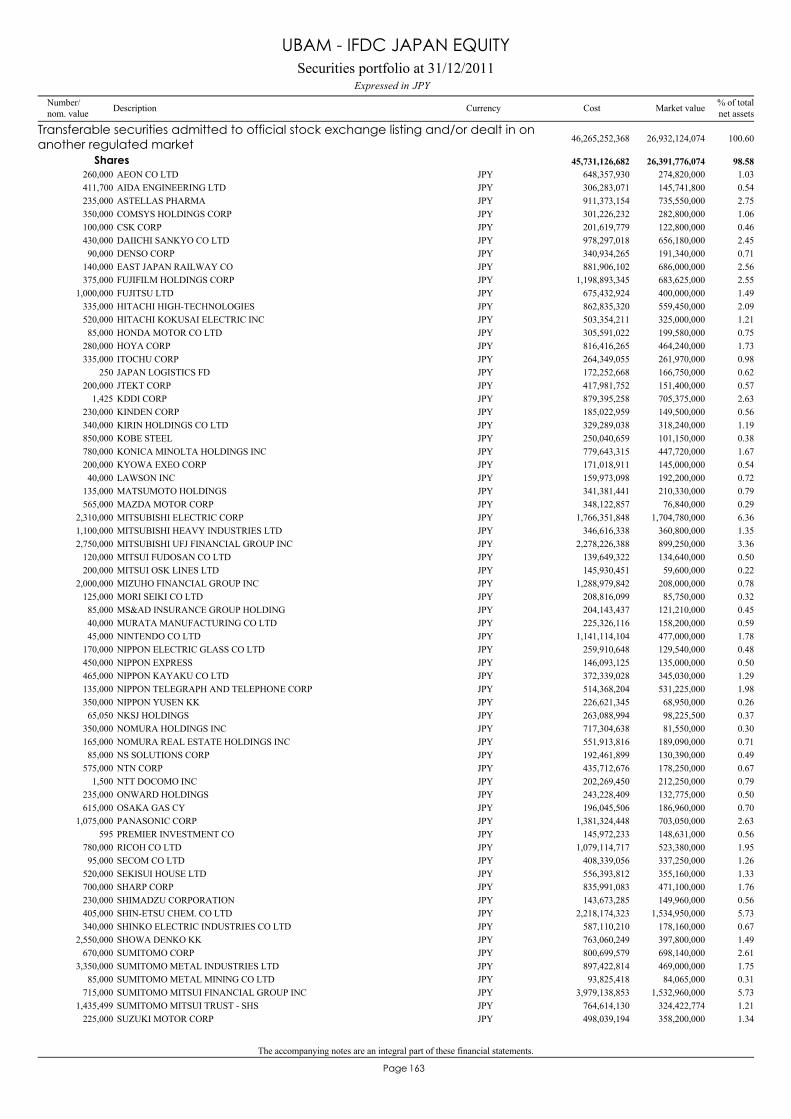
The accompanying notes are an integral part of these financial statements.
163Page
AEON CO LTD260,000 274,820,000 1.03JPY 648,357,930
Transferable securities admitted to official stock exchange listing and/or dealt in onanother regulated market 26,932,124,074 100.6046,265,252,368
Shares 26,391,776,074 98.5845,731,126,682
AIDA ENGINEERING LTD411,700 145,741,800 0.54JPY 306,283,071ASTELLAS PHARMA235,000 735,550,000 2.75JPY 911,373,154COMSYS HOLDINGS CORP350,000 282,800,000 1.06JPY 301,226,232CSK CORP100,000 122,800,000 0.46JPY 201,619,779DAIICHI SANKYO CO LTD430,000 656,180,000 2.45JPY 978,297,018DENSO CORP90,000 191,340,000 0.71JPY 340,934,265EAST JAPAN RAILWAY CO140,000 686,000,000 2.56JPY 881,906,102FUJIFILM HOLDINGS CORP375,000 683,625,000 2.55JPY 1,198,893,345FUJITSU LTD1,000,000 400,000,000 1.49JPY 675,432,924HITACHI HIGH-TECHNOLOGIES335,000 559,450,000 2.09JPY 862,835,320HITACHI KOKUSAI ELECTRIC INC520,000 325,000,000 1.21JPY 503,354,211HONDA MOTOR CO LTD85,000 199,580,000 0.75JPY 305,591,022HOYA CORP280,000 464,240,000 1.73JPY 816,416,265ITOCHU CORP335,000 261,970,000 0.98JPY 264,349,055JAPAN LOGISTICS FD250 166,750,000 0.62JPY 172,252,668JTEKT CORP200,000 151,400,000 0.57JPY 417,981,752KDDI CORP1,425 705,375,000 2.63JPY 879,395,258KINDEN CORP230,000 149,500,000 0.56JPY 185,022,959KIRIN HOLDINGS CO LTD340,000 318,240,000 1.19JPY 329,289,038KOBE STEEL850,000 101,150,000 0.38JPY 250,040,659KONICA MINOLTA HOLDINGS INC780,000 447,720,000 1.67JPY 779,643,315KYOWA EXEO CORP200,000 145,000,000 0.54JPY 171,018,911LAWSON INC40,000 192,200,000 0.72JPY 159,973,098MATSUMOTO HOLDINGS135,000 210,330,000 0.79JPY 341,381,441MAZDA MOTOR CORP565,000 76,840,000 0.29JPY 348,122,857MITSUBISHI ELECTRIC CORP2,310,000 1,704,780,000 6.36JPY 1,766,351,848MITSUBISHI HEAVY INDUSTRIES LTD1,100,000 360,800,000 1.35JPY 346,616,338MITSUBISHI UFJ FINANCIAL GROUP INC2,750,000 899,250,000 3.36JPY 2,278,226,388MITSUI FUDOSAN CO LTD120,000 134,640,000 0.50JPY 139,649,322MITSUI OSK LINES LTD200,000 59,600,000 0.22JPY 145,930,451MIZUHO FINANCIAL GROUP INC2,000,000 208,000,000 0.78JPY 1,288,979,842MORI SEIKI CO LTD125,000 85,750,000 0.32JPY 208,816,099MS&AD INSURANCE GROUP HOLDING85,000 121,210,000 0.45JPY 204,143,437MURATA MANUFACTURING CO LTD40,000 158,200,000 0.59JPY 225,326,116NINTENDO CO LTD45,000 477,000,000 1.78JPY 1,141,114,104NIPPON ELECTRIC GLASS CO LTD170,000 129,540,000 0.48JPY 259,910,648NIPPON EXPRESS450,000 135,000,000 0.50JPY 146,093,125NIPPON KAYAKU CO LTD465,000 345,030,000 1.29JPY 372,339,028NIPPON TELEGRAPH AND TELEPHONE CORP135,000 531,225,000 1.98JPY 514,368,204NIPPON YUSEN KK350,000 68,950,000 0.26JPY 226,621,345NKSJ HOLDINGS65,050 98,225,500 0.37JPY 263,088,994NOMURA HOLDINGS INC350,000 81,550,000 0.30JPY 717,304,638NOMURA REAL ESTATE HOLDINGS INC165,000 189,090,000 0.71JPY 551,913,816NS SOLUTIONS CORP85,000 130,390,000 0.49JPY 192,461,899NTN CORP575,000 178,250,000 0.67JPY 435,712,676NTT DOCOMO INC1,500 212,250,000 0.79JPY 202,269,450ONWARD HOLDINGS235,000 132,775,000 0.50JPY 243,228,409OSAKA GAS CY615,000 186,960,000 0.70JPY 196,045,506PANASONIC CORP1,075,000 703,050,000 2.63JPY 1,381,324,448PREMIER INVESTMENT CO595 148,631,000 0.56JPY 145,972,233RICOH CO LTD780,000 523,380,000 1.95JPY 1,079,114,717SECOM CO LTD95,000 337,250,000 1.26JPY 408,339,056SEKISUI HOUSE LTD520,000 355,160,000 1.33JPY 556,393,812SHARP CORP700,000 471,100,000 1.76JPY 835,991,083SHIMADZU CORPORATION230,000 149,960,000 0.56JPY 143,673,285SHIN-ETSU CHEM. CO LTD405,000 1,534,950,000 5.73JPY 2,218,174,323SHINKO ELECTRIC INDUSTRIES CO LTD340,000 178,160,000 0.67JPY 587,110,210SHOWA DENKO KK2,550,000 397,800,000 1.49JPY 763,060,249SUMITOMO CORP670,000 698,140,000 2.61JPY 800,699,579SUMITOMO METAL INDUSTRIES LTD3,350,000 469,000,000 1.75JPY 897,422,814SUMITOMO METAL MINING CO LTD85,000 84,065,000 0.31JPY 93,825,418SUMITOMO MITSUI FINANCIAL GROUP INC715,000 1,532,960,000 5.73JPY 3,979,138,853SUMITOMO MITSUI TRUST - SHS1,435,499 324,422,774 1.21JPY 764,614,130SUZUKI MOTOR CORP225,000 358,200,000 1.34JPY 498,039,194
Securities portfolio at 31/12/2011JPYExpressed in
UBAM - IFDC JAPAN EQUITY
Number/nom. value Description Currency % of total
net assetsMarket valueCost
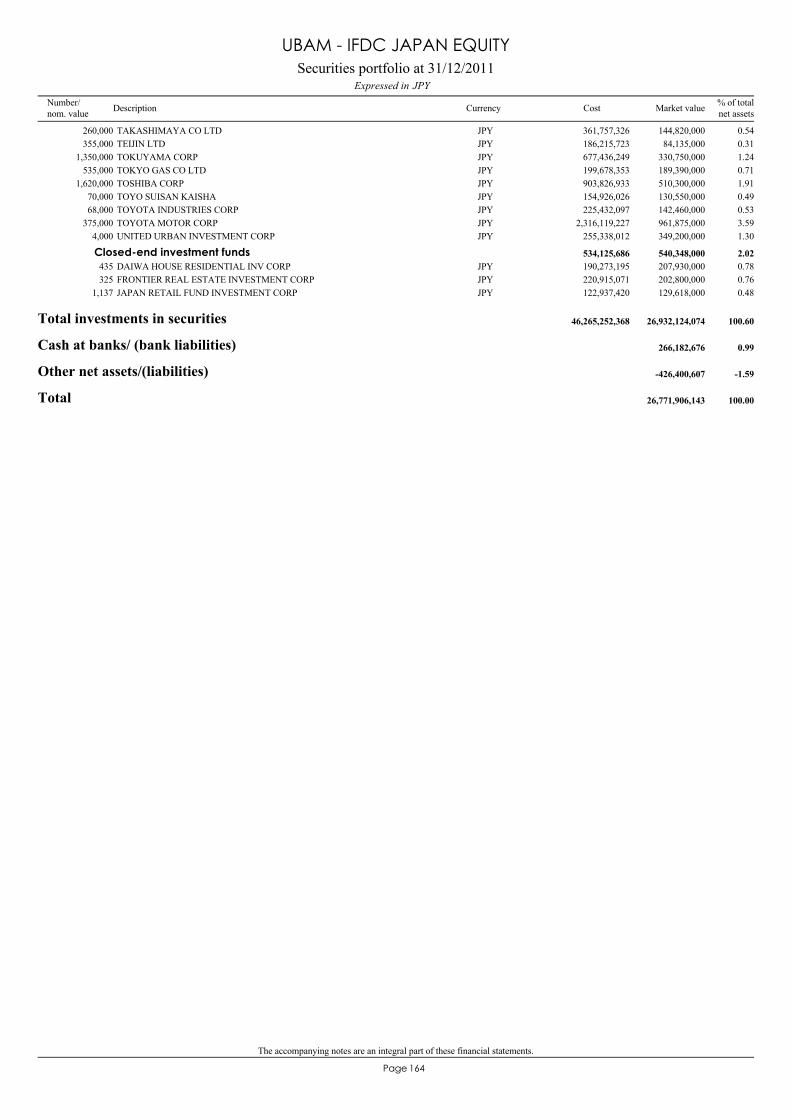
The accompanying notes are an integral part of these financial statements.
164Page
TAKASHIMAYA CO LTD260,000 144,820,000 0.54JPY 361,757,326TEIJIN LTD355,000 84,135,000 0.31JPY 186,215,723TOKUYAMA CORP1,350,000 330,750,000 1.24JPY 677,436,249TOKYO GAS CO LTD535,000 189,390,000 0.71JPY 199,678,353TOSHIBA CORP1,620,000 510,300,000 1.91JPY 903,826,933TOYO SUISAN KAISHA70,000 130,550,000 0.49JPY 154,926,026TOYOTA INDUSTRIES CORP68,000 142,460,000 0.53JPY 225,432,097TOYOTA MOTOR CORP375,000 961,875,000 3.59JPY 2,316,119,227UNITED URBAN INVESTMENT CORP4,000 349,200,000 1.30JPY 255,338,012
DAIWA HOUSE RESIDENTIAL INV CORP435 207,930,000 0.78JPY 190,273,195Closed-end investment funds 540,348,000 2.02534,125,686
FRONTIER REAL ESTATE INVESTMENT CORP325 202,800,000 0.76JPY 220,915,071JAPAN RETAIL FUND INVESTMENT CORP1,137 129,618,000 0.48JPY 122,937,420
Total investments in securities 26,932,124,074 100.6046,265,252,368
Cash at banks/ (bank liabilities) 266,182,676 0.99
Other net assets/(liabilities) -426,400,607 -1.59
Total 26,771,906,143 100.00
Securities portfolio at 31/12/2011JPYExpressed in
UBAM - IFDC JAPAN EQUITY
Number/nom. value Description Currency % of total
net assetsMarket valueCost
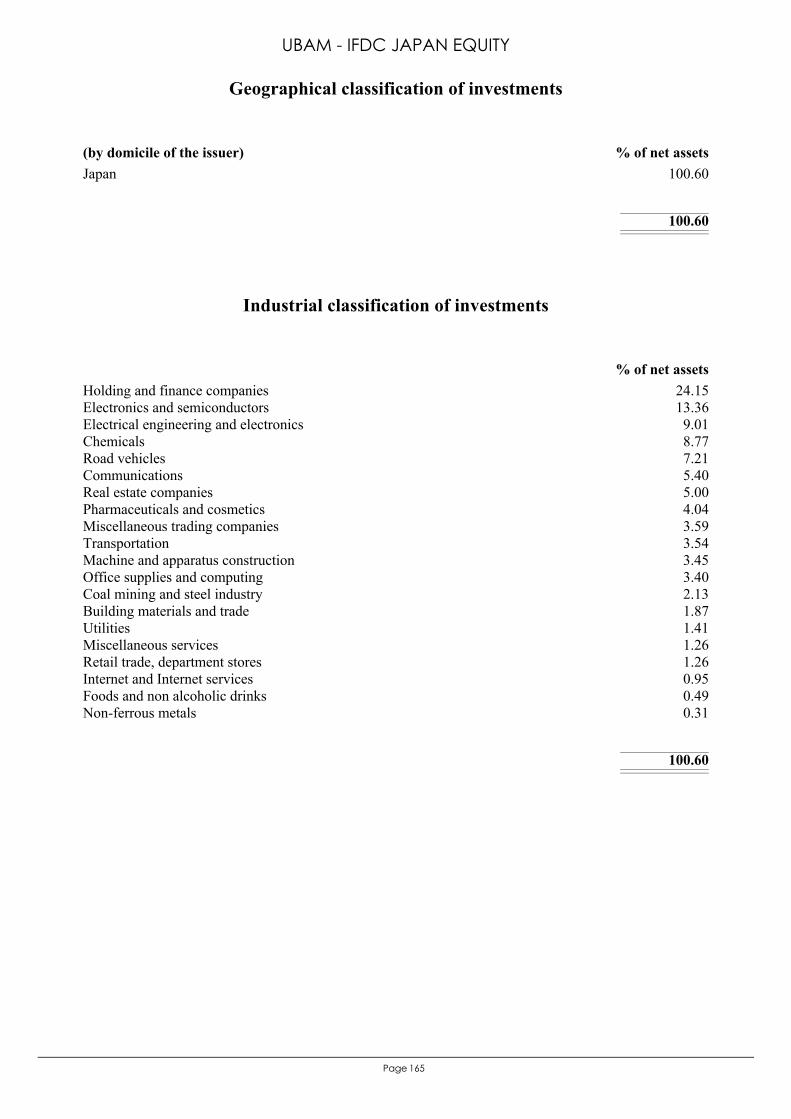
165Page
Japan 100.60
100.60
(by domicile of the issuer) % of net assets
Geographical classification of investments
UBAM - IFDC JAPAN EQUITY
Holding and finance companies 24.15Electronics and semiconductors 13.36Electrical engineering and electronics 9.01Chemicals 8.77Road vehicles 7.21Communications 5.40Real estate companies 5.00Pharmaceuticals and cosmetics 4.04Miscellaneous trading companies 3.59Transportation 3.54Machine and apparatus construction 3.45Office supplies and computing 3.40Coal mining and steel industry 2.13Building materials and trade 1.87Utilities 1.41Miscellaneous services 1.26Retail trade, department stores 1.26Internet and Internet services 0.95Foods and non alcoholic drinks 0.49Non-ferrous metals 0.31
100.60
% of net assets
Industrial classification of investments
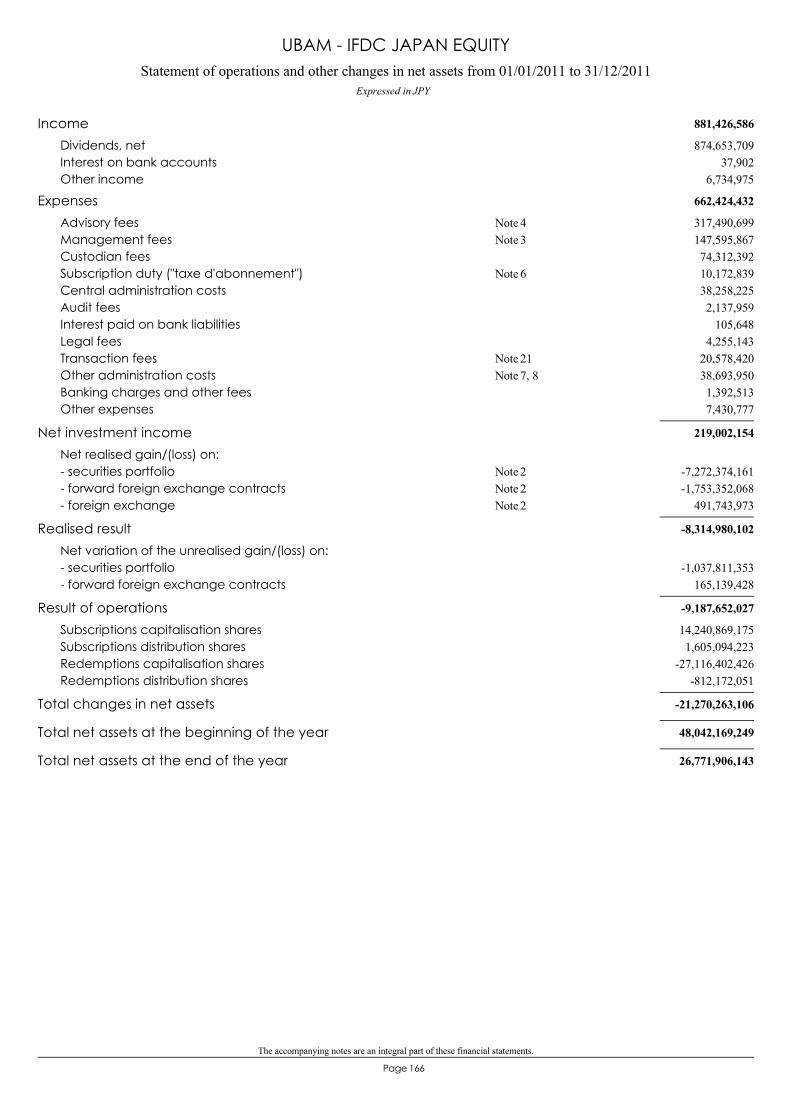
The accompanying notes are an integral part of these financial statements.
166Page
Statement of operations and other changes in net assets from 01/01/2011 to 31/12/2011Expressed in JPY
UBAM - IFDC JAPAN EQUITY
881,426,586Income874,653,709Dividends, net
37,902Interest on bank accounts6,734,975Other income
662,424,432Expenses317,490,699Advisory fees 4Note147,595,867Management fees 3Note74,312,392Custodian fees10,172,839Subscription duty ("taxe d'abonnement") 6Note38,258,225Central administration costs2,137,959Audit fees
105,648Interest paid on bank liabilities4,255,143Legal fees
20,578,420Transaction fees 21Note38,693,950Other administration costs 7, 8Note1,392,513Banking charges and other fees7,430,777Other expenses
219,002,154Net investment incomeNet realised gain/(loss) on:
-7,272,374,161- securities portfolio 2Note-1,753,352,068- forward foreign exchange contracts 2Note
491,743,973- foreign exchange 2Note
-8,314,980,102Realised resultNet variation of the unrealised gain/(loss) on:
-1,037,811,353- securities portfolio165,139,428- forward foreign exchange contracts
-9,187,652,027Result of operations14,240,869,175Subscriptions capitalisation shares1,605,094,223Subscriptions distribution shares
-27,116,402,426Redemptions capitalisation shares-812,172,051Redemptions distribution shares
-21,270,263,106Total changes in net assets
48,042,169,249Total net assets at the beginning of the year
26,771,906,143Total net assets at the end of the year
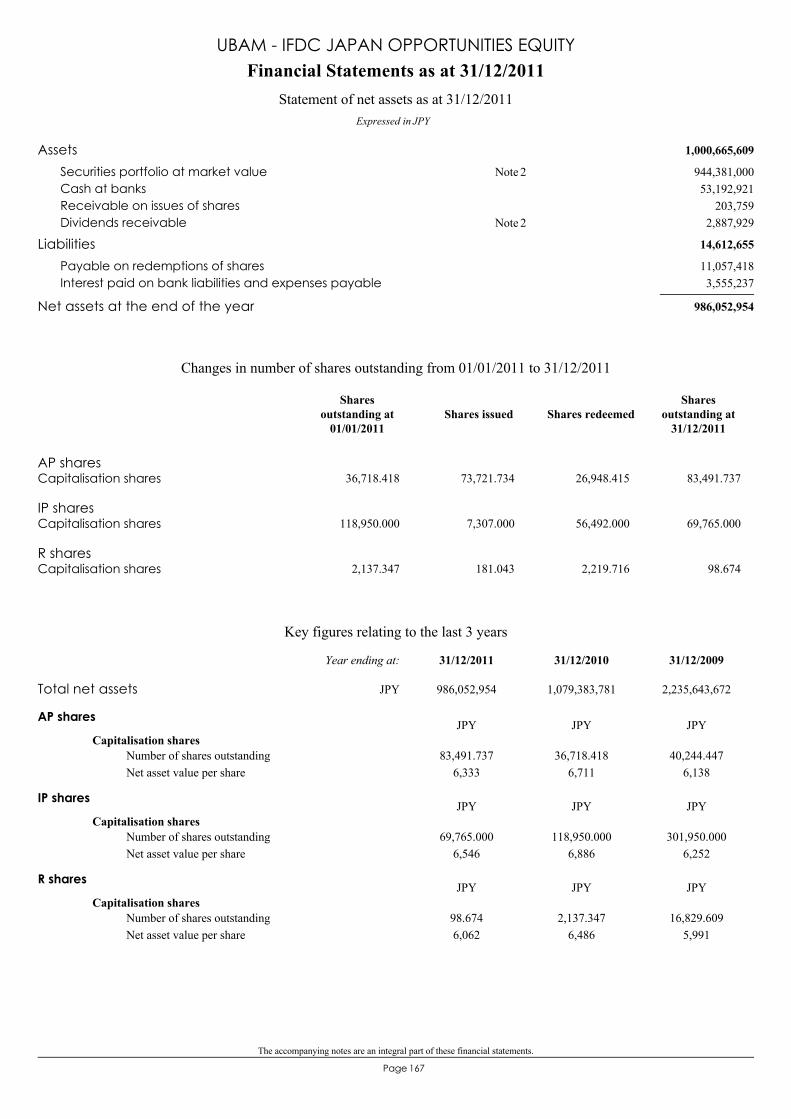
The accompanying notes are an integral part of these financial statements.
167Page
1,000,665,609Assets944,381,000Securities portfolio at market value 2Note53,192,921Cash at banks
203,759Receivable on issues of shares2,887,929Dividends receivable 2Note
14,612,655Liabilities11,057,418Payable on redemptions of shares3,555,237Interest paid on bank liabilities and expenses payable
986,052,954Net assets at the end of the year
Financial Statements as at 31/12/2011
Expressed in JPY
Statement of net assets as at 31/12/2011
UBAM - IFDC JAPAN OPPORTUNITIES EQUITY
AP sharesCapitalisation shares 36,718.418 73,721.734 26,948.415 83,491.737
IP sharesCapitalisation shares 118,950.000 7,307.000 56,492.000 69,765.000
R sharesCapitalisation shares 2,137.347 181.043 2,219.716 98.674
Changes in number of shares outstanding from 01/01/2011 to 31/12/2011
Shares issued Shares redeemedShares
outstanding at31/12/2011
Sharesoutstanding at
01/01/2011
Key figures relating to the last 3 years
AP shares
Capitalisation shares83,491.737
6,33336,718.418
6,71140,244.447
6,138Number of shares outstandingNet asset value per share
JPY JPY JPY
IP shares
Capitalisation shares69,765.000
6,546118,950.000
6,886301,950.000
6,252Number of shares outstandingNet asset value per share
JPY JPY JPY
R shares
Capitalisation shares98.6746,062
2,137.3476,486
16,829.6095,991
Number of shares outstandingNet asset value per share
JPY JPY JPY
Total net assets 986,052,954 1,079,383,781 2,235,643,672
31/12/200931/12/201031/12/2011Year ending at:
JPY
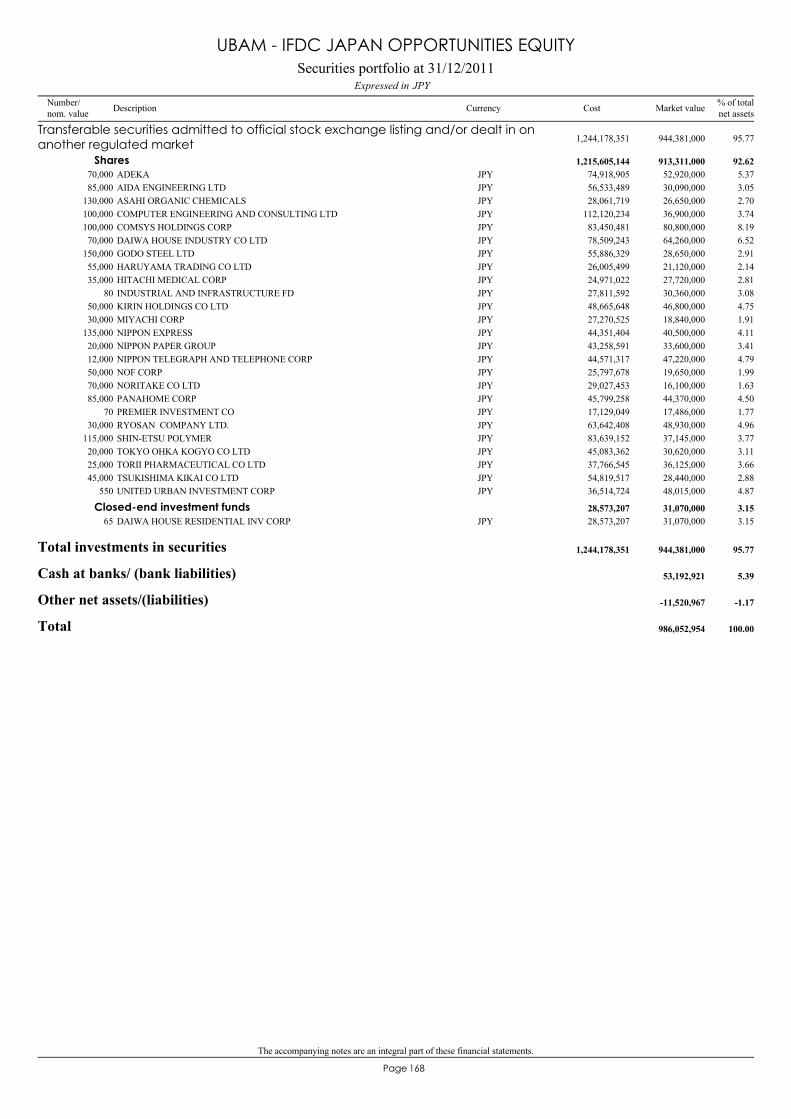
The accompanying notes are an integral part of these financial statements.
168Page
ADEKA70,000 52,920,000 5.37JPY 74,918,905
Transferable securities admitted to official stock exchange listing and/or dealt in onanother regulated market 944,381,000 95.771,244,178,351
Shares 913,311,000 92.621,215,605,144
AIDA ENGINEERING LTD85,000 30,090,000 3.05JPY 56,533,489ASAHI ORGANIC CHEMICALS130,000 26,650,000 2.70JPY 28,061,719COMPUTER ENGINEERING AND CONSULTING LTD100,000 36,900,000 3.74JPY 112,120,234COMSYS HOLDINGS CORP100,000 80,800,000 8.19JPY 83,450,481DAIWA HOUSE INDUSTRY CO LTD70,000 64,260,000 6.52JPY 78,509,243GODO STEEL LTD150,000 28,650,000 2.91JPY 55,886,329HARUYAMA TRADING CO LTD55,000 21,120,000 2.14JPY 26,005,499HITACHI MEDICAL CORP35,000 27,720,000 2.81JPY 24,971,022INDUSTRIAL AND INFRASTRUCTURE FD80 30,360,000 3.08JPY 27,811,592KIRIN HOLDINGS CO LTD50,000 46,800,000 4.75JPY 48,665,648MIYACHI CORP30,000 18,840,000 1.91JPY 27,270,525NIPPON EXPRESS135,000 40,500,000 4.11JPY 44,351,404NIPPON PAPER GROUP20,000 33,600,000 3.41JPY 43,258,591NIPPON TELEGRAPH AND TELEPHONE CORP12,000 47,220,000 4.79JPY 44,571,317NOF CORP50,000 19,650,000 1.99JPY 25,797,678NORITAKE CO LTD70,000 16,100,000 1.63JPY 29,027,453PANAHOME CORP85,000 44,370,000 4.50JPY 45,799,258PREMIER INVESTMENT CO70 17,486,000 1.77JPY 17,129,049RYOSAN COMPANY LTD.30,000 48,930,000 4.96JPY 63,642,408SHIN-ETSU POLYMER115,000 37,145,000 3.77JPY 83,639,152TOKYO OHKA KOGYO CO LTD20,000 30,620,000 3.11JPY 45,083,362TORII PHARMACEUTICAL CO LTD25,000 36,125,000 3.66JPY 37,766,545TSUKISHIMA KIKAI CO LTD45,000 28,440,000 2.88JPY 54,819,517UNITED URBAN INVESTMENT CORP550 48,015,000 4.87JPY 36,514,724
DAIWA HOUSE RESIDENTIAL INV CORP65 31,070,000 3.15JPY 28,573,207Closed-end investment funds 31,070,000 3.1528,573,207
Total investments in securities 944,381,000 95.771,244,178,351
Cash at banks/ (bank liabilities) 53,192,921 5.39
Other net assets/(liabilities) -11,520,967 -1.17
Total 986,052,954 100.00
Securities portfolio at 31/12/2011JPYExpressed in
UBAM - IFDC JAPAN OPPORTUNITIES EQUITY
Number/nom. value Description Currency % of total
net assetsMarket valueCost
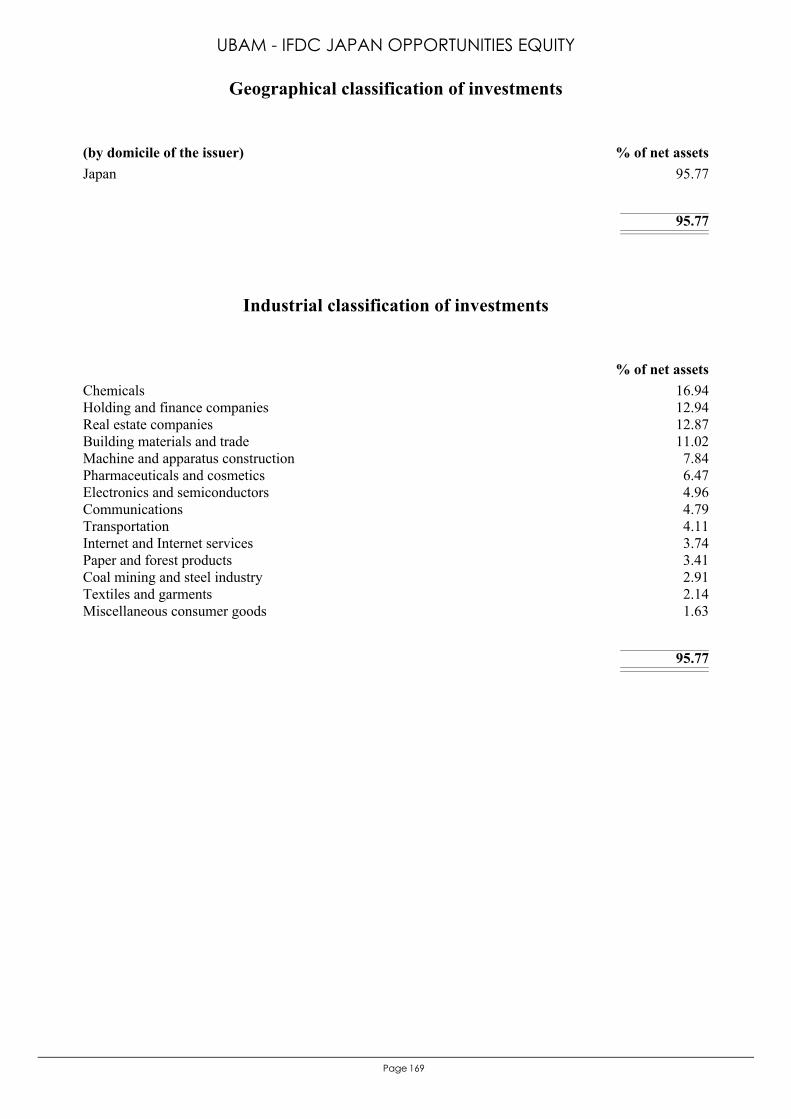
169Page
Japan 95.77
95.77
(by domicile of the issuer) % of net assets
Geographical classification of investments
UBAM - IFDC JAPAN OPPORTUNITIES EQUITY
Chemicals 16.94Holding and finance companies 12.94Real estate companies 12.87Building materials and trade 11.02Machine and apparatus construction 7.84Pharmaceuticals and cosmetics 6.47Electronics and semiconductors 4.96Communications 4.79Transportation 4.11Internet and Internet services 3.74Paper and forest products 3.41Coal mining and steel industry 2.91Textiles and garments 2.14Miscellaneous consumer goods 1.63
95.77
% of net assets
Industrial classification of investments
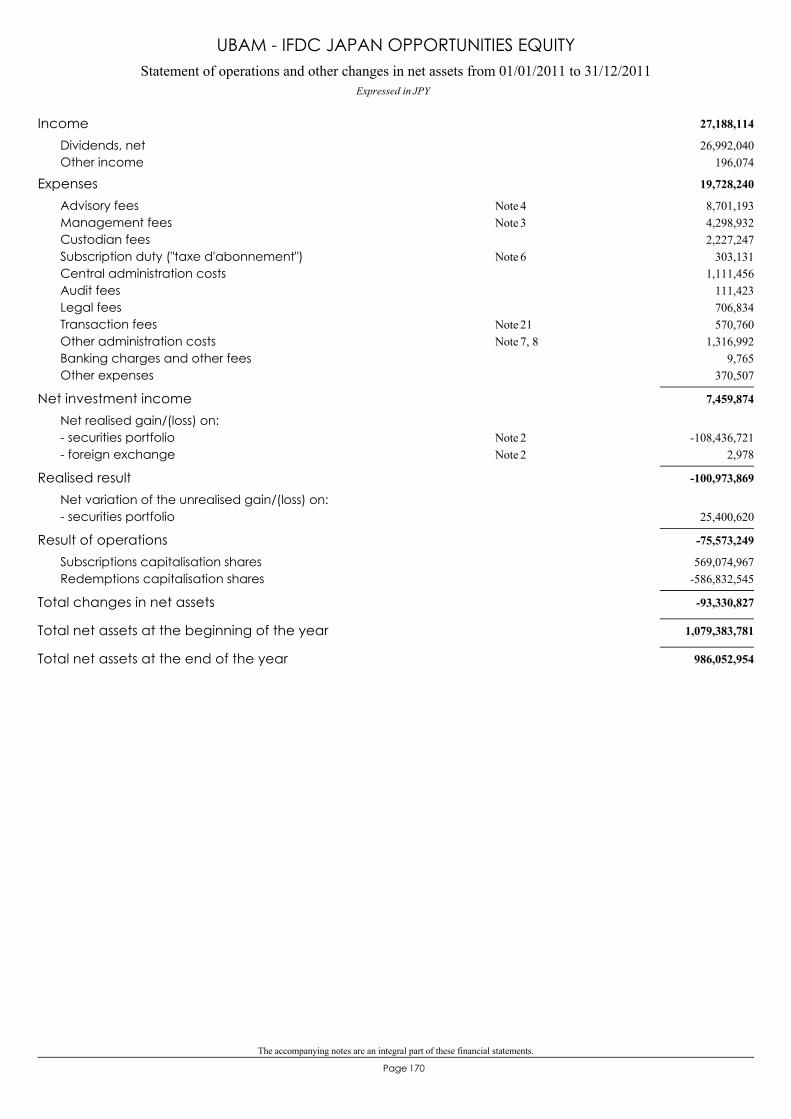
The accompanying notes are an integral part of these financial statements.
170Page
Statement of operations and other changes in net assets from 01/01/2011 to 31/12/2011Expressed in JPY
UBAM - IFDC JAPAN OPPORTUNITIES EQUITY
27,188,114Income26,992,040Dividends, net
196,074Other income
19,728,240Expenses8,701,193Advisory fees 4Note4,298,932Management fees 3Note2,227,247Custodian fees
303,131Subscription duty ("taxe d'abonnement") 6Note1,111,456Central administration costs
111,423Audit fees706,834Legal fees570,760Transaction fees 21Note
1,316,992Other administration costs 7, 8Note9,765Banking charges and other fees
370,507Other expenses
7,459,874Net investment incomeNet realised gain/(loss) on:
-108,436,721- securities portfolio 2Note2,978- foreign exchange 2Note
-100,973,869Realised resultNet variation of the unrealised gain/(loss) on:
25,400,620- securities portfolio
-75,573,249Result of operations569,074,967Subscriptions capitalisation shares
-586,832,545Redemptions capitalisation shares
-93,330,827Total changes in net assets
1,079,383,781Total net assets at the beginning of the year
986,052,954Total net assets at the end of the year
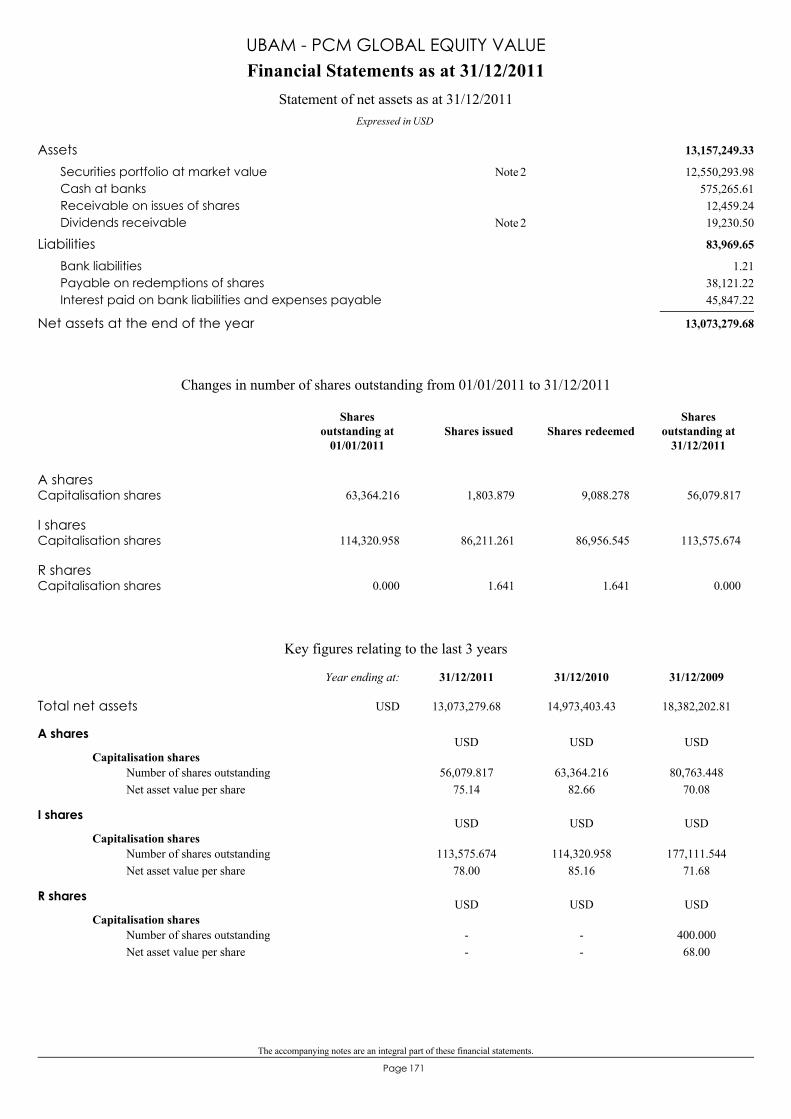
The accompanying notes are an integral part of these financial statements.
171Page
13,157,249.33Assets12,550,293.98Securities portfolio at market value 2Note
575,265.61Cash at banks12,459.24Receivable on issues of shares19,230.50Dividends receivable 2Note
83,969.65Liabilities1.21Bank liabilities
38,121.22Payable on redemptions of shares45,847.22Interest paid on bank liabilities and expenses payable
13,073,279.68Net assets at the end of the year
Financial Statements as at 31/12/2011
Expressed in USD
Statement of net assets as at 31/12/2011
UBAM - PCM GLOBAL EQUITY VALUE
A sharesCapitalisation shares 63,364.216 1,803.879 9,088.278 56,079.817
I sharesCapitalisation shares 114,320.958 86,211.261 86,956.545 113,575.674
R sharesCapitalisation shares 0.000 1.641 1.641 0.000
Changes in number of shares outstanding from 01/01/2011 to 31/12/2011
Shares issued Shares redeemedShares
outstanding at31/12/2011
Sharesoutstanding at
01/01/2011
Key figures relating to the last 3 years
A shares
Capitalisation shares56,079.817
75.1463,364.216
82.6680,763.448
70.08Number of shares outstandingNet asset value per share
USD USD USD
I shares
Capitalisation shares113,575.674
78.00114,320.958
85.16177,111.544
71.68Number of shares outstandingNet asset value per share
USD USD USD
R shares
Capitalisation shares--
--
400.00068.00
Number of shares outstandingNet asset value per share
USD USD USD
Total net assets 13,073,279.68 14,973,403.43 18,382,202.81
31/12/200931/12/201031/12/2011Year ending at:
USD
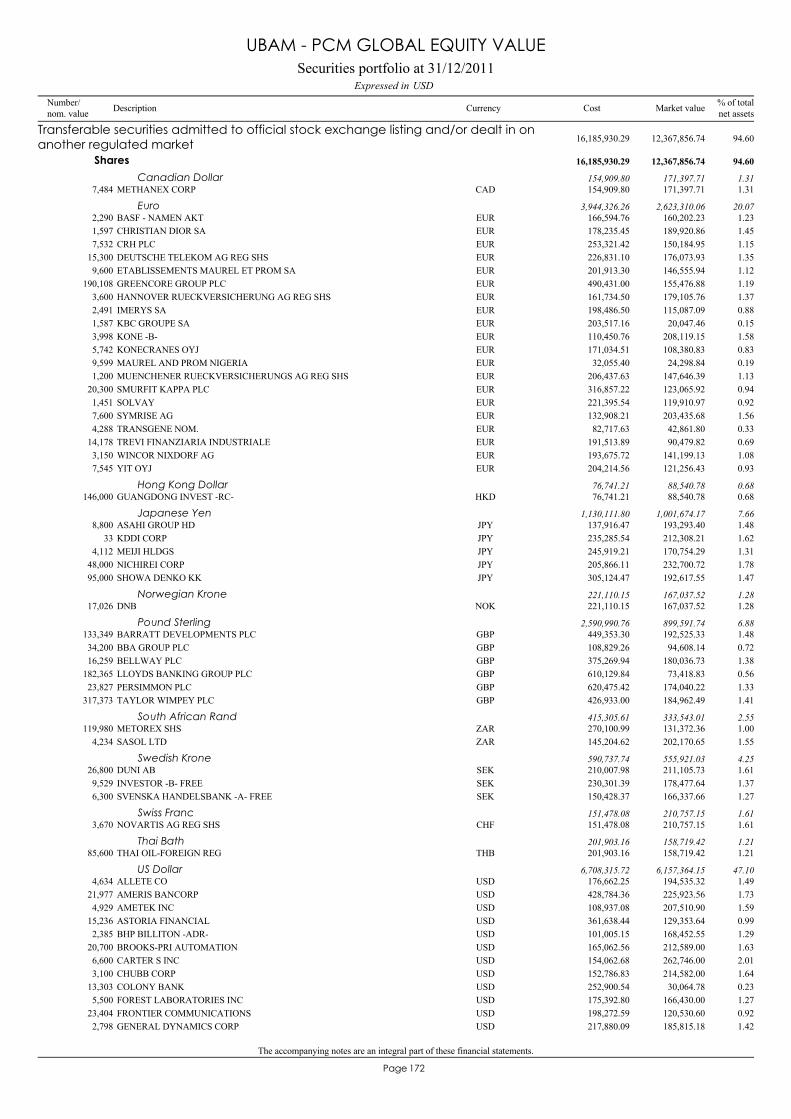
The accompanying notes are an integral part of these financial statements.
172Page
METHANEX CORP7,484 171,397.71 1.31CAD 154,909.80
Transferable securities admitted to official stock exchange listing and/or dealt in onanother regulated market 12,367,856.74 94.6016,185,930.29
Shares 12,367,856.74 94.6016,185,930.29
Canadian Dollar 171,397.71 1.31154,909.80
BASF - NAMEN AKT2,290 160,202.23 1.23EUR 166,594.76Euro 2,623,310.06 20.073,944,326.26
CHRISTIAN DIOR SA1,597 189,920.86 1.45EUR 178,235.45CRH PLC7,532 150,184.95 1.15EUR 253,321.42DEUTSCHE TELEKOM AG REG SHS15,300 176,073.93 1.35EUR 226,831.10ETABLISSEMENTS MAUREL ET PROM SA9,600 146,555.94 1.12EUR 201,913.30GREENCORE GROUP PLC190,108 155,476.88 1.19EUR 490,431.00HANNOVER RUECKVERSICHERUNG AG REG SHS3,600 179,105.76 1.37EUR 161,734.50IMERYS SA2,491 115,087.09 0.88EUR 198,486.50KBC GROUPE SA1,587 20,047.46 0.15EUR 203,517.16KONE -B-3,998 208,119.15 1.58EUR 110,450.76KONECRANES OYJ5,742 108,380.83 0.83EUR 171,034.51MAUREL AND PROM NIGERIA9,599 24,298.84 0.19EUR 32,055.40MUENCHENER RUECKVERSICHERUNGS AG REG SHS1,200 147,646.39 1.13EUR 206,437.63SMURFIT KAPPA PLC20,300 123,065.92 0.94EUR 316,857.22SOLVAY1,451 119,910.97 0.92EUR 221,395.54SYMRISE AG7,600 203,435.68 1.56EUR 132,908.21TRANSGENE NOM.4,288 42,861.80 0.33EUR 82,717.63TREVI FINANZIARIA INDUSTRIALE14,178 90,479.82 0.69EUR 191,513.89WINCOR NIXDORF AG3,150 141,199.13 1.08EUR 193,675.72YIT OYJ7,545 121,256.43 0.93EUR 204,214.56
GUANGDONG INVEST -RC-146,000 88,540.78 0.68HKD 76,741.21Hong Kong Dollar 88,540.78 0.6876,741.21
ASAHI GROUP HD8,800 193,293.40 1.48JPY 137,916.47Japanese Yen 1,001,674.17 7.661,130,111.80
KDDI CORP33 212,308.21 1.62JPY 235,285.54MEIJI HLDGS4,112 170,754.29 1.31JPY 245,919.21NICHIREI CORP48,000 232,700.72 1.78JPY 205,866.11SHOWA DENKO KK95,000 192,617.55 1.47JPY 305,124.47
DNB17,026 167,037.52 1.28NOK 221,110.15Norwegian Krone 167,037.52 1.28221,110.15
BARRATT DEVELOPMENTS PLC133,349 192,525.33 1.48GBP 449,353.30Pound Sterling 899,591.74 6.882,590,990.76
BBA GROUP PLC34,200 94,608.14 0.72GBP 108,829.26BELLWAY PLC16,259 180,036.73 1.38GBP 375,269.94LLOYDS BANKING GROUP PLC182,365 73,418.83 0.56GBP 610,129.84PERSIMMON PLC23,827 174,040.22 1.33GBP 620,475.42TAYLOR WIMPEY PLC317,373 184,962.49 1.41GBP 426,933.00
METOREX SHS119,980 131,372.36 1.00ZAR 270,100.99South African Rand 333,543.01 2.55415,305.61
SASOL LTD4,234 202,170.65 1.55ZAR 145,204.62
DUNI AB26,800 211,105.73 1.61SEK 210,007.98Swedish Krone 555,921.03 4.25590,737.74
INVESTOR -B- FREE9,529 178,477.64 1.37SEK 230,301.39SVENSKA HANDELSBANK -A- FREE6,300 166,337.66 1.27SEK 150,428.37
NOVARTIS AG REG SHS3,670 210,757.15 1.61CHF 151,478.08Swiss Franc 210,757.15 1.61151,478.08
THAI OIL-FOREIGN REG85,600 158,719.42 1.21THB 201,903.16Thai Bath 158,719.42 1.21201,903.16
ALLETE CO4,634 194,535.32 1.49USD 176,662.25US Dollar 6,157,364.15 47.106,708,315.72
AMERIS BANCORP21,977 225,923.56 1.73USD 428,784.36AMETEK INC4,929 207,510.90 1.59USD 108,937.08ASTORIA FINANCIAL15,236 129,353.64 0.99USD 361,638.44BHP BILLITON -ADR-2,385 168,452.55 1.29USD 101,005.15BROOKS-PRI AUTOMATION20,700 212,589.00 1.63USD 165,062.56CARTER S INC6,600 262,746.00 2.01USD 154,062.68CHUBB CORP3,100 214,582.00 1.64USD 152,786.83COLONY BANK13,303 30,064.78 0.23USD 252,900.54FOREST LABORATORIES INC5,500 166,430.00 1.27USD 175,392.80FRONTIER COMMUNICATIONS23,404 120,530.60 0.92USD 198,272.59GENERAL DYNAMICS CORP2,798 185,815.18 1.42USD 217,880.09
Securities portfolio at 31/12/2011USDExpressed in
UBAM - PCM GLOBAL EQUITY VALUE
Number/nom. value Description Currency % of total
net assetsMarket valueCost
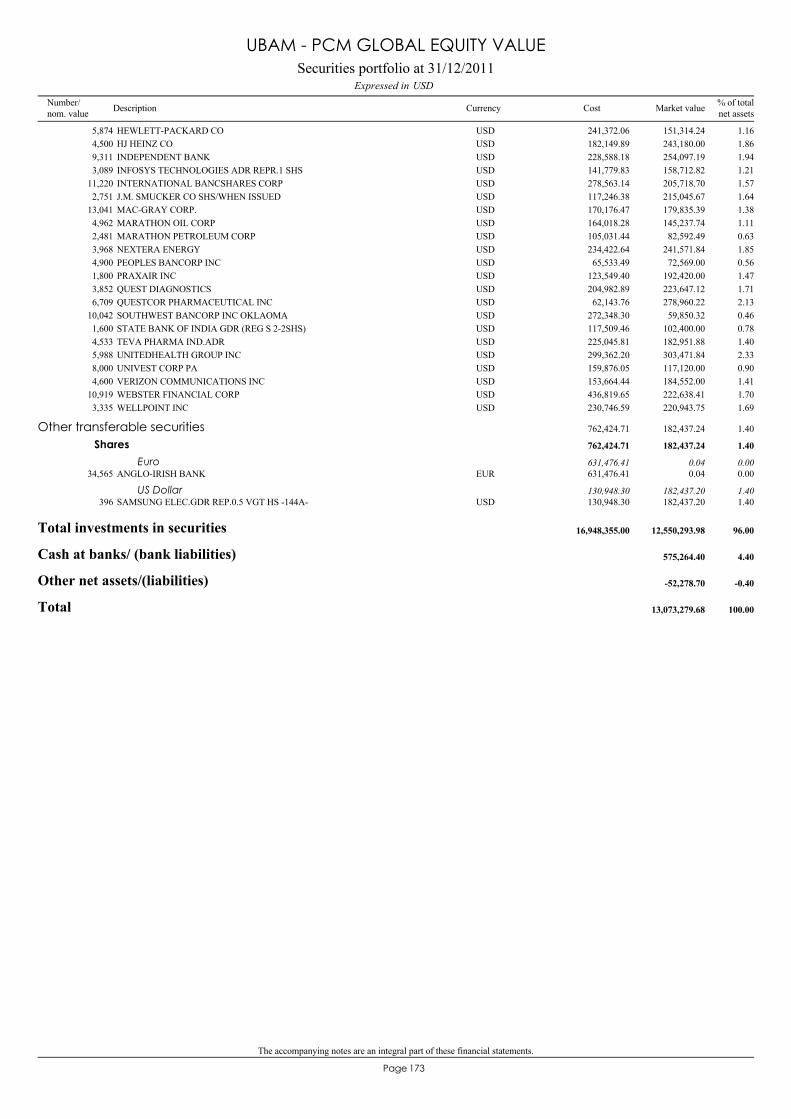
The accompanying notes are an integral part of these financial statements.
173Page
HEWLETT-PACKARD CO5,874 151,314.24 1.16USD 241,372.06HJ HEINZ CO4,500 243,180.00 1.86USD 182,149.89INDEPENDENT BANK9,311 254,097.19 1.94USD 228,588.18INFOSYS TECHNOLOGIES ADR REPR.1 SHS3,089 158,712.82 1.21USD 141,779.83INTERNATIONAL BANCSHARES CORP11,220 205,718.70 1.57USD 278,563.14J.M. SMUCKER CO SHS/WHEN ISSUED2,751 215,045.67 1.64USD 117,246.38MAC-GRAY CORP.13,041 179,835.39 1.38USD 170,176.47MARATHON OIL CORP4,962 145,237.74 1.11USD 164,018.28MARATHON PETROLEUM CORP2,481 82,592.49 0.63USD 105,031.44NEXTERA ENERGY3,968 241,571.84 1.85USD 234,422.64PEOPLES BANCORP INC4,900 72,569.00 0.56USD 65,533.49PRAXAIR INC1,800 192,420.00 1.47USD 123,549.40QUEST DIAGNOSTICS3,852 223,647.12 1.71USD 204,982.89QUESTCOR PHARMACEUTICAL INC6,709 278,960.22 2.13USD 62,143.76SOUTHWEST BANCORP INC OKLAOMA10,042 59,850.32 0.46USD 272,348.30STATE BANK OF INDIA GDR (REG S 2-2SHS)1,600 102,400.00 0.78USD 117,509.46TEVA PHARMA IND.ADR4,533 182,951.88 1.40USD 225,045.81UNITEDHEALTH GROUP INC5,988 303,471.84 2.33USD 299,362.20UNIVEST CORP PA8,000 117,120.00 0.90USD 159,876.05VERIZON COMMUNICATIONS INC4,600 184,552.00 1.41USD 153,664.44WEBSTER FINANCIAL CORP10,919 222,638.41 1.70USD 436,819.65WELLPOINT INC3,335 220,943.75 1.69USD 230,746.59
ANGLO-IRISH BANK34,565 0.04 0.00EUR 631,476.41
Other transferable securities 182,437.24 1.40762,424.71
Shares 182,437.24 1.40762,424.71
Euro 0.04 0.00631,476.41
SAMSUNG ELEC.GDR REP.0.5 VGT HS -144A-396 182,437.20 1.40USD 130,948.30US Dollar 182,437.20 1.40130,948.30
Total investments in securities 12,550,293.98 96.0016,948,355.00
Cash at banks/ (bank liabilities) 575,264.40 4.40
Other net assets/(liabilities) -52,278.70 -0.40
Total 13,073,279.68 100.00
Securities portfolio at 31/12/2011USDExpressed in
UBAM - PCM GLOBAL EQUITY VALUE
Number/nom. value Description Currency % of total
net assetsMarket valueCost
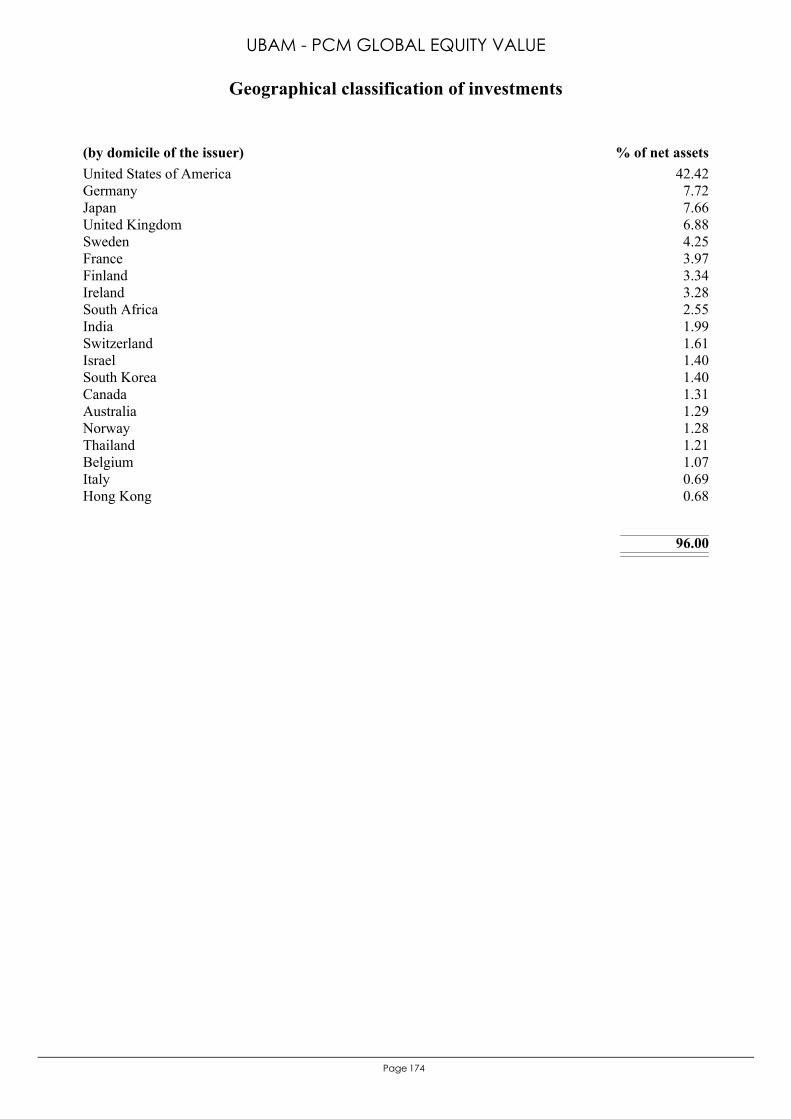
174Page
United States of America 42.42Germany 7.72Japan 7.66United Kingdom 6.88Sweden 4.25France 3.97Finland 3.34Ireland 3.28South Africa 2.55India 1.99Switzerland 1.61Israel 1.40South Korea 1.40Canada 1.31Australia 1.29Norway 1.28Thailand 1.21Belgium 1.07Italy 0.69Hong Kong 0.68
96.00
(by domicile of the issuer) % of net assets
Geographical classification of investments
UBAM - PCM GLOBAL EQUITY VALUE
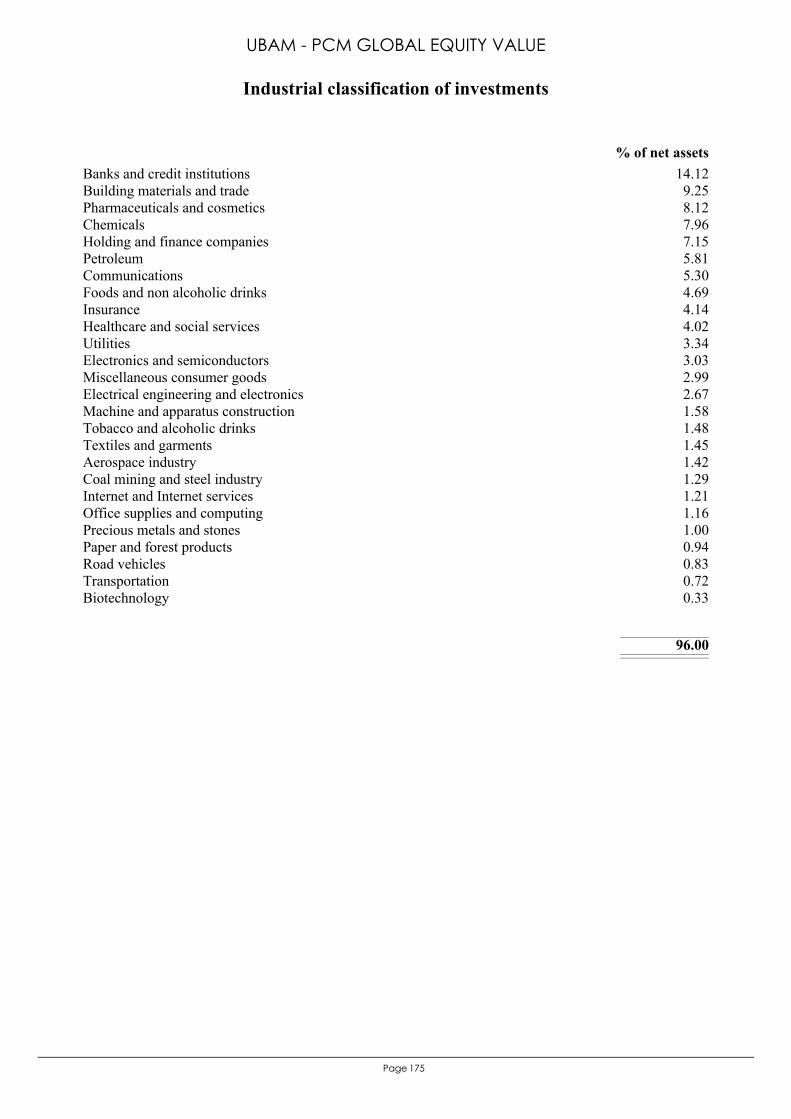
175Page
Banks and credit institutions 14.12Building materials and trade 9.25Pharmaceuticals and cosmetics 8.12Chemicals 7.96Holding and finance companies 7.15Petroleum 5.81Communications 5.30Foods and non alcoholic drinks 4.69Insurance 4.14Healthcare and social services 4.02Utilities 3.34Electronics and semiconductors 3.03Miscellaneous consumer goods 2.99Electrical engineering and electronics 2.67Machine and apparatus construction 1.58Tobacco and alcoholic drinks 1.48Textiles and garments 1.45Aerospace industry 1.42Coal mining and steel industry 1.29Internet and Internet services 1.21Office supplies and computing 1.16Precious metals and stones 1.00Paper and forest products 0.94Road vehicles 0.83Transportation 0.72Biotechnology 0.33
96.00
% of net assets
Industrial classification of investments
UBAM - PCM GLOBAL EQUITY VALUE
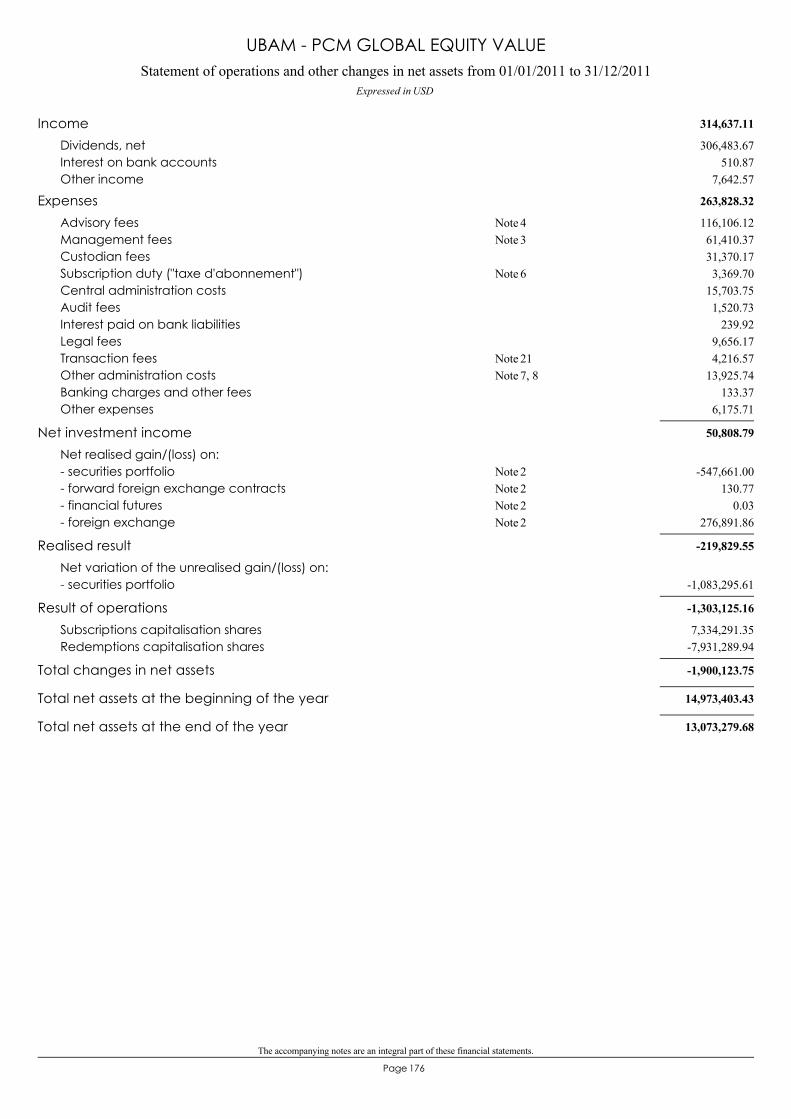
The accompanying notes are an integral part of these financial statements.
176Page
Statement of operations and other changes in net assets from 01/01/2011 to 31/12/2011Expressed in USD
UBAM - PCM GLOBAL EQUITY VALUE
314,637.11Income306,483.67Dividends, net
510.87Interest on bank accounts7,642.57Other income
263,828.32Expenses116,106.12Advisory fees 4Note61,410.37Management fees 3Note31,370.17Custodian fees3,369.70Subscription duty ("taxe d'abonnement") 6Note
15,703.75Central administration costs1,520.73Audit fees
239.92Interest paid on bank liabilities9,656.17Legal fees4,216.57Transaction fees 21Note
13,925.74Other administration costs 7, 8Note133.37Banking charges and other fees
6,175.71Other expenses
50,808.79Net investment incomeNet realised gain/(loss) on:
-547,661.00- securities portfolio 2Note130.77- forward foreign exchange contracts 2Note
0.03- financial futures 2Note276,891.86- foreign exchange 2Note
-219,829.55Realised resultNet variation of the unrealised gain/(loss) on:
-1,083,295.61- securities portfolio
-1,303,125.16Result of operations7,334,291.35Subscriptions capitalisation shares
-7,931,289.94Redemptions capitalisation shares
-1,900,123.75Total changes in net assets
14,973,403.43Total net assets at the beginning of the year
13,073,279.68Total net assets at the end of the year
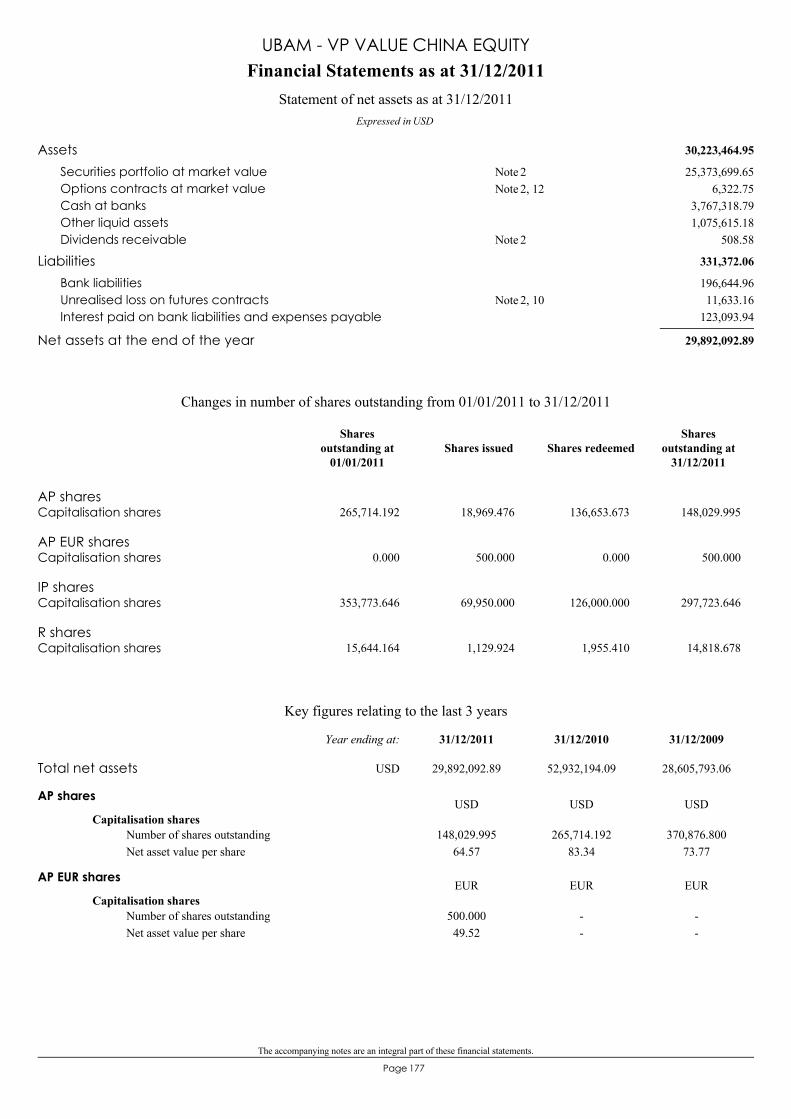
The accompanying notes are an integral part of these financial statements.
177Page
30,223,464.95Assets25,373,699.65Securities portfolio at market value 2Note
6,322.75Options contracts at market value 2, 12Note3,767,318.79Cash at banks1,075,615.18Other liquid assets
508.58Dividends receivable 2Note
331,372.06Liabilities196,644.96Bank liabilities11,633.16Unrealised loss on futures contracts 2, 10Note
123,093.94Interest paid on bank liabilities and expenses payable
29,892,092.89Net assets at the end of the year
Financial Statements as at 31/12/2011
Expressed in USD
Statement of net assets as at 31/12/2011
UBAM - VP VALUE CHINA EQUITY
AP sharesCapitalisation shares 265,714.192 18,969.476 136,653.673 148,029.995
AP EUR sharesCapitalisation shares 0.000 500.000 0.000 500.000
IP sharesCapitalisation shares 353,773.646 69,950.000 126,000.000 297,723.646
R sharesCapitalisation shares 15,644.164 1,129.924 1,955.410 14,818.678
Changes in number of shares outstanding from 01/01/2011 to 31/12/2011
Shares issued Shares redeemedShares
outstanding at31/12/2011
Sharesoutstanding at
01/01/2011
Key figures relating to the last 3 years
AP shares
Capitalisation shares148,029.995
64.57265,714.192
83.34370,876.800
73.77Number of shares outstandingNet asset value per share
USD USD USD
AP EUR shares
Capitalisation shares500.00049.52
--
--
Number of shares outstandingNet asset value per share
EUR EUR EUR
Total net assets 29,892,092.89 52,932,194.09 28,605,793.06
31/12/200931/12/201031/12/2011Year ending at:
USD
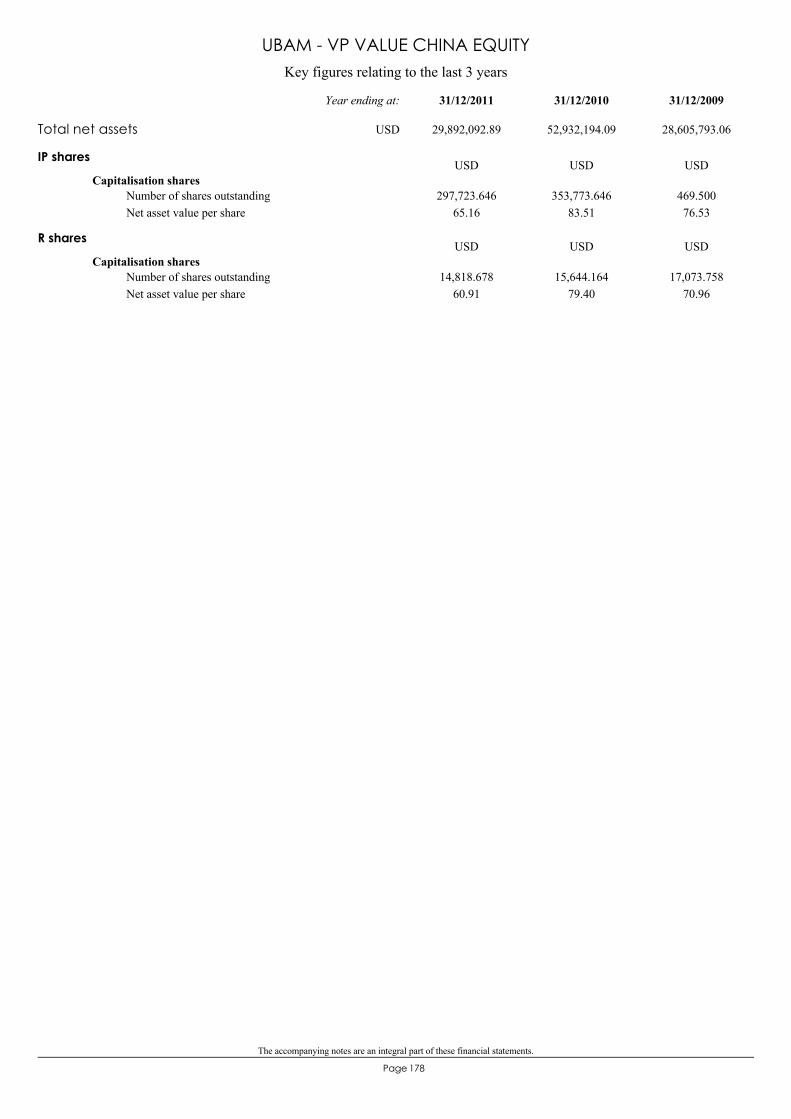
The accompanying notes are an integral part of these financial statements.
178Page
Key figures relating to the last 3 years
UBAM - VP VALUE CHINA EQUITY
IP shares
Capitalisation shares297,723.646
65.16353,773.646
83.51469.50076.53
Number of shares outstandingNet asset value per share
USD USD USD
R shares
Capitalisation shares14,818.678
60.9115,644.164
79.4017,073.758
70.96Number of shares outstandingNet asset value per share
USD USD USD
Total net assets 29,892,092.89 52,932,194.09 28,605,793.06
31/12/200931/12/201031/12/2011Year ending at:
USD
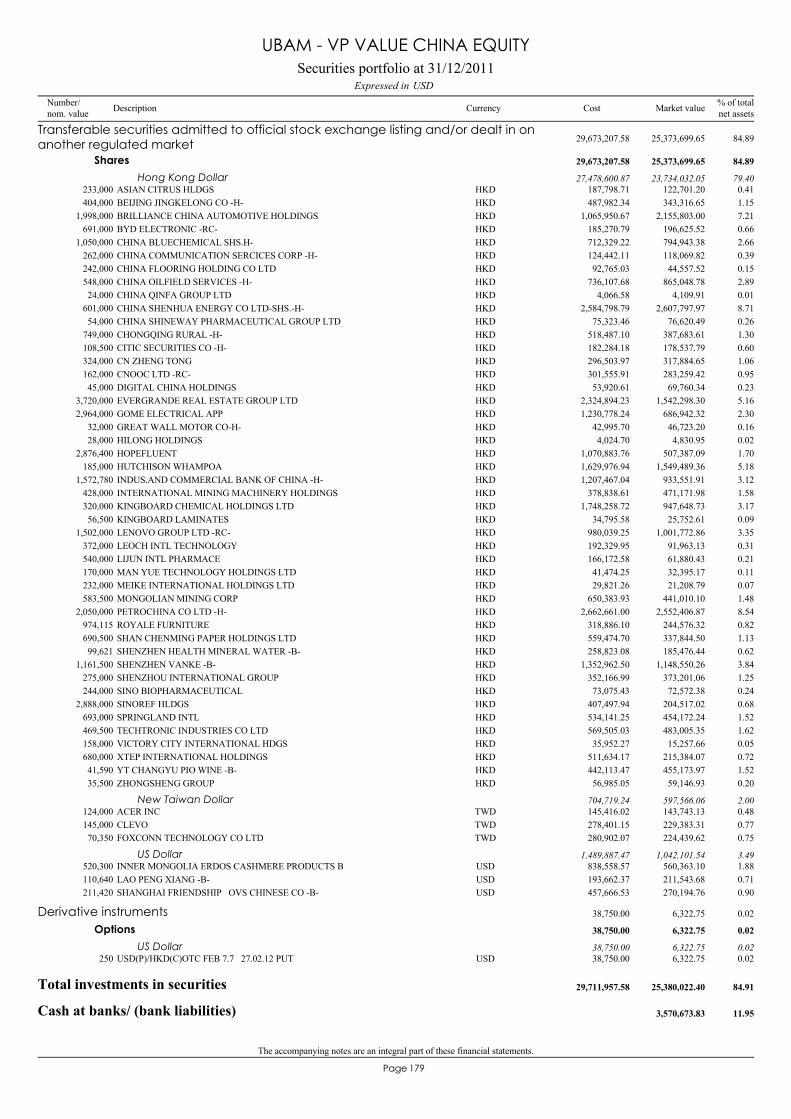
The accompanying notes are an integral part of these financial statements.
179Page
ASIAN CITRUS HLDGS233,000 122,701.20 0.41HKD 187,798.71
Transferable securities admitted to official stock exchange listing and/or dealt in onanother regulated market 25,373,699.65 84.8929,673,207.58
Shares 25,373,699.65 84.8929,673,207.58
Hong Kong Dollar 23,734,032.05 79.4027,478,600.87
BEIJING JINGKELONG CO -H-404,000 343,316.65 1.15HKD 487,982.34BRILLIANCE CHINA AUTOMOTIVE HOLDINGS1,998,000 2,155,803.00 7.21HKD 1,065,950.67BYD ELECTRONIC -RC-691,000 196,625.52 0.66HKD 185,270.79CHINA BLUECHEMICAL SHS.H-1,050,000 794,943.38 2.66HKD 712,329.22CHINA COMMUNICATION SERCICES CORP -H-262,000 118,069.82 0.39HKD 124,442.11CHINA FLOORING HOLDING CO LTD242,000 44,557.52 0.15HKD 92,765.03CHINA OILFIELD SERVICES -H-548,000 865,048.78 2.89HKD 736,107.68CHINA QINFA GROUP LTD24,000 4,109.91 0.01HKD 4,066.58CHINA SHENHUA ENERGY CO LTD-SHS.-H-601,000 2,607,797.97 8.71HKD 2,584,798.79CHINA SHINEWAY PHARMACEUTICAL GROUP LTD54,000 76,620.49 0.26HKD 75,323.46CHONGQING RURAL -H-749,000 387,683.61 1.30HKD 518,487.10CITIC SECURITIES CO -H-108,500 178,537.79 0.60HKD 182,284.18CN ZHENG TONG324,000 317,884.65 1.06HKD 296,503.97CNOOC LTD -RC-162,000 283,259.42 0.95HKD 301,555.91DIGITAL CHINA HOLDINGS45,000 69,760.34 0.23HKD 53,920.61EVERGRANDE REAL ESTATE GROUP LTD3,720,000 1,542,298.30 5.16HKD 2,324,894.23GOME ELECTRICAL APP2,964,000 686,942.32 2.30HKD 1,230,778.24GREAT WALL MOTOR CO-H-32,000 46,723.20 0.16HKD 42,995.70HILONG HOLDINGS28,000 4,830.95 0.02HKD 4,024.70HOPEFLUENT2,876,400 507,387.09 1.70HKD 1,070,883.76HUTCHISON WHAMPOA185,000 1,549,489.36 5.18HKD 1,629,976.94INDUS.AND COMMERCIAL BANK OF CHINA -H-1,572,780 933,551.91 3.12HKD 1,207,467.04INTERNATIONAL MINING MACHINERY HOLDINGS428,000 471,171.98 1.58HKD 378,838.61KINGBOARD CHEMICAL HOLDINGS LTD320,000 947,648.73 3.17HKD 1,748,258.72KINGBOARD LAMINATES56,500 25,752.61 0.09HKD 34,795.58LENOVO GROUP LTD -RC-1,502,000 1,001,772.86 3.35HKD 980,039.25LEOCH INTL TECHNOLOGY372,000 91,963.13 0.31HKD 192,329.95LIJUN INTL PHARMACE540,000 61,880.43 0.21HKD 166,172.58MAN YUE TECHNOLOGY HOLDINGS LTD170,000 32,395.17 0.11HKD 41,474.25MEIKE INTERNATIONAL HOLDINGS LTD232,000 21,208.79 0.07HKD 29,821.26MONGOLIAN MINING CORP583,500 441,010.10 1.48HKD 650,383.93PETROCHINA CO LTD -H-2,050,000 2,552,406.87 8.54HKD 2,662,661.00ROYALE FURNITURE974,115 244,576.32 0.82HKD 318,886.10SHAN CHENMING PAPER HOLDINGS LTD690,500 337,844.50 1.13HKD 559,474.70SHENZHEN HEALTH MINERAL WATER -B-99,621 185,476.44 0.62HKD 258,823.08SHENZHEN VANKE -B-1,161,500 1,148,550.26 3.84HKD 1,352,962.50SHENZHOU INTERNATIONAL GROUP275,000 373,201.06 1.25HKD 352,166.99SINO BIOPHARMACEUTICAL244,000 72,572.38 0.24HKD 73,075.43SINOREF HLDGS2,888,000 204,517.02 0.68HKD 407,497.94SPRINGLAND INTL693,000 454,172.24 1.52HKD 534,141.25TECHTRONIC INDUSTRIES CO LTD469,500 483,005.35 1.62HKD 569,505.03VICTORY CITY INTERNATIONAL HDGS158,000 15,257.66 0.05HKD 35,952.27XTEP INTERNATIONAL HOLDINGS680,000 215,384.07 0.72HKD 511,634.17YT CHANGYU PIO WINE -B-41,590 455,173.97 1.52HKD 442,113.47ZHONGSHENG GROUP35,500 59,146.93 0.20HKD 56,985.05
ACER INC124,000 143,743.13 0.48TWD 145,416.02New Taiwan Dollar 597,566.06 2.00704,719.24
CLEVO145,000 229,383.31 0.77TWD 278,401.15FOXCONN TECHNOLOGY CO LTD70,350 224,439.62 0.75TWD 280,902.07
INNER MONGOLIA ERDOS CASHMERE PRODUCTS B520,300 560,363.10 1.88USD 838,558.57US Dollar 1,042,101.54 3.491,489,887.47
LAO PENG XIANG -B-110,640 211,543.68 0.71USD 193,662.37SHANGHAI FRIENDSHIP OVS CHINESE CO -B-211,420 270,194.76 0.90USD 457,666.53
USD(P)/HKD(C)OTC FEB 7.7 27.02.12 PUT250 6,322.75 0.02USD 38,750.00
Derivative instruments 6,322.75 0.0238,750.00
Options 6,322.75 0.0238,750.00
US Dollar 6,322.75 0.0238,750.00
Total investments in securities 25,380,022.40 84.9129,711,957.58
Cash at banks/ (bank liabilities) 3,570,673.83 11.95
Securities portfolio at 31/12/2011USDExpressed in
UBAM - VP VALUE CHINA EQUITY
Number/nom. value Description Currency % of total
net assetsMarket valueCost
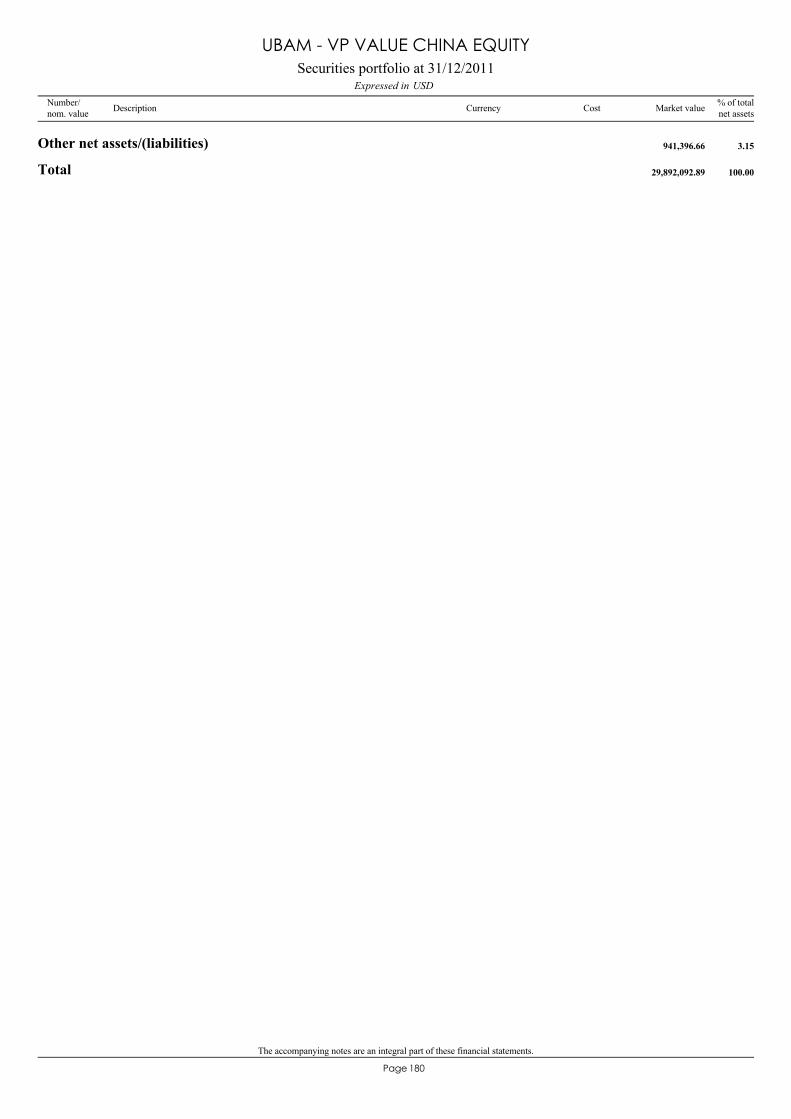
The accompanying notes are an integral part of these financial statements.
180Page
Other net assets/(liabilities) 941,396.66 3.15
Total 29,892,092.89 100.00
Securities portfolio at 31/12/2011USDExpressed in
UBAM - VP VALUE CHINA EQUITY
Number/nom. value Description Currency % of total
net assetsMarket valueCost
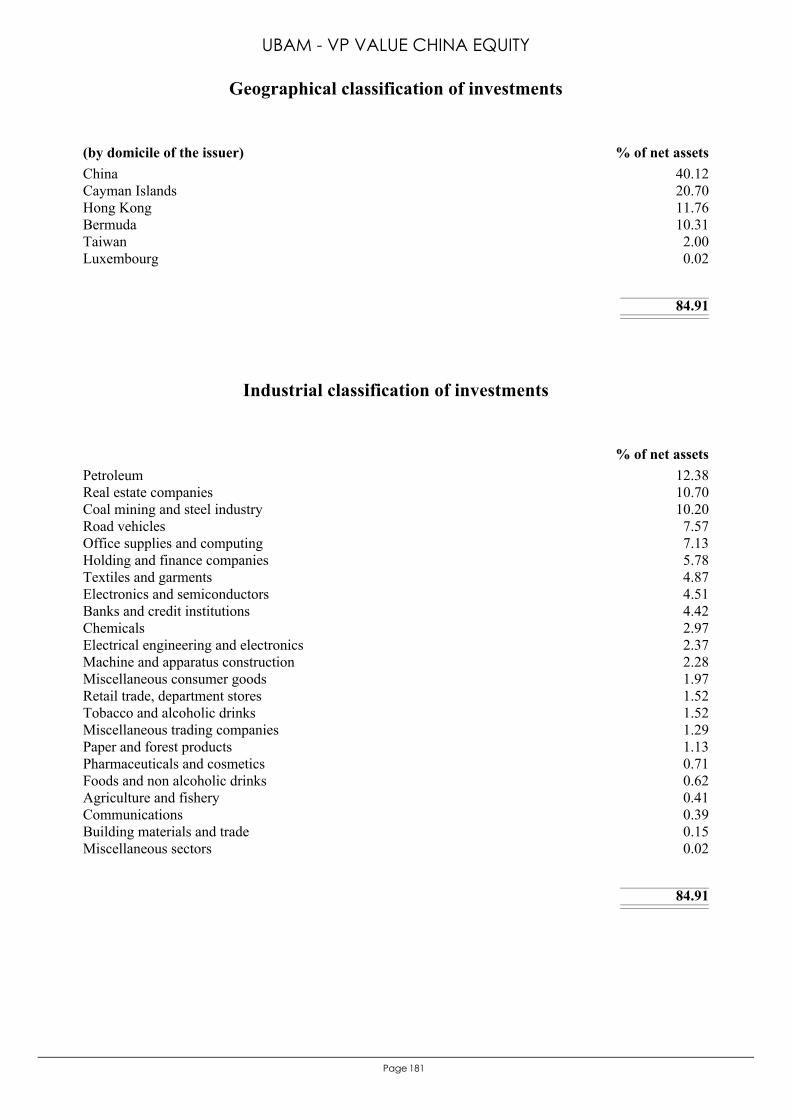
181Page
China 40.12Cayman Islands 20.70Hong Kong 11.76Bermuda 10.31Taiwan 2.00Luxembourg 0.02
84.91
(by domicile of the issuer) % of net assets
Geographical classification of investments
UBAM - VP VALUE CHINA EQUITY
Petroleum 12.38Real estate companies 10.70Coal mining and steel industry 10.20Road vehicles 7.57Office supplies and computing 7.13Holding and finance companies 5.78Textiles and garments 4.87Electronics and semiconductors 4.51Banks and credit institutions 4.42Chemicals 2.97Electrical engineering and electronics 2.37Machine and apparatus construction 2.28Miscellaneous consumer goods 1.97Retail trade, department stores 1.52Tobacco and alcoholic drinks 1.52Miscellaneous trading companies 1.29Paper and forest products 1.13Pharmaceuticals and cosmetics 0.71Foods and non alcoholic drinks 0.62Agriculture and fishery 0.41Communications 0.39Building materials and trade 0.15Miscellaneous sectors 0.02
84.91
% of net assets
Industrial classification of investments
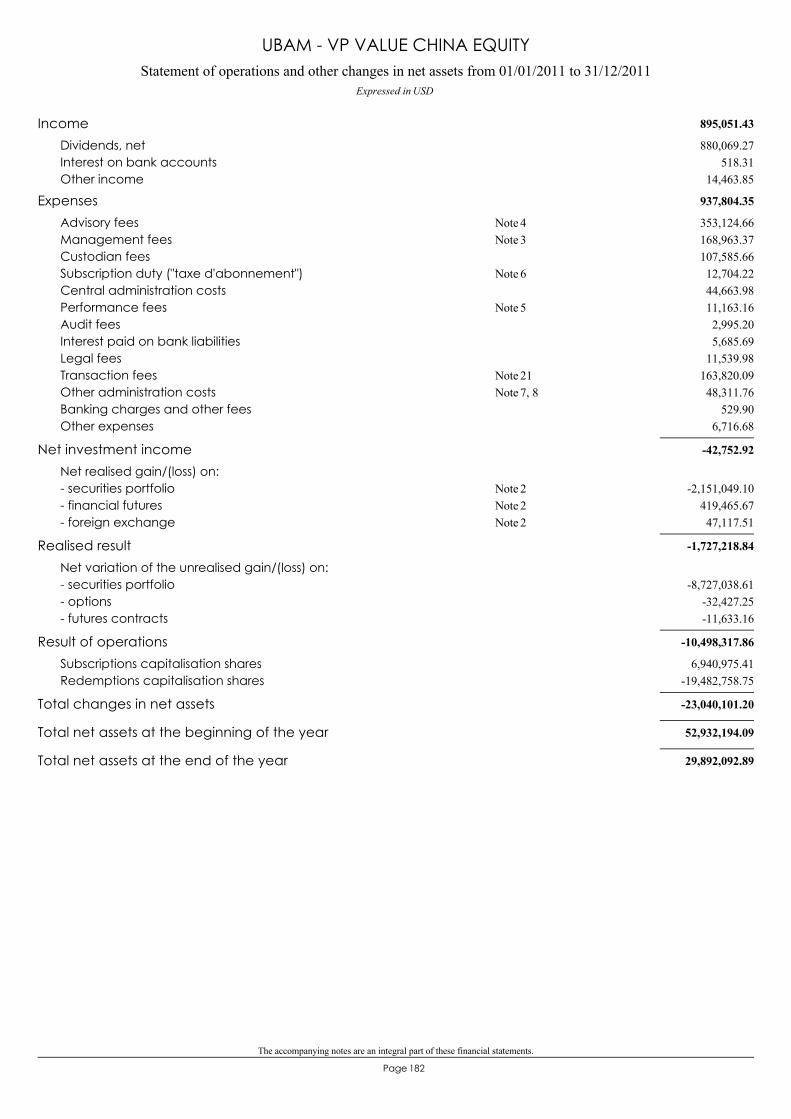
The accompanying notes are an integral part of these financial statements.
182Page
Statement of operations and other changes in net assets from 01/01/2011 to 31/12/2011Expressed in USD
UBAM - VP VALUE CHINA EQUITY
895,051.43Income880,069.27Dividends, net
518.31Interest on bank accounts14,463.85Other income
937,804.35Expenses353,124.66Advisory fees 4Note168,963.37Management fees 3Note107,585.66Custodian fees12,704.22Subscription duty ("taxe d'abonnement") 6Note44,663.98Central administration costs11,163.16Performance fees 5Note2,995.20Audit fees5,685.69Interest paid on bank liabilities
11,539.98Legal fees163,820.09Transaction fees 21Note48,311.76Other administration costs 7, 8Note
529.90Banking charges and other fees6,716.68Other expenses
-42,752.92Net investment incomeNet realised gain/(loss) on:
-2,151,049.10- securities portfolio 2Note419,465.67- financial futures 2Note47,117.51- foreign exchange 2Note
-1,727,218.84Realised resultNet variation of the unrealised gain/(loss) on:
-8,727,038.61- securities portfolio-32,427.25- options-11,633.16- futures contracts
-10,498,317.86Result of operations6,940,975.41Subscriptions capitalisation shares
-19,482,758.75Redemptions capitalisation shares
-23,040,101.20Total changes in net assets
52,932,194.09Total net assets at the beginning of the year
29,892,092.89Total net assets at the end of the year
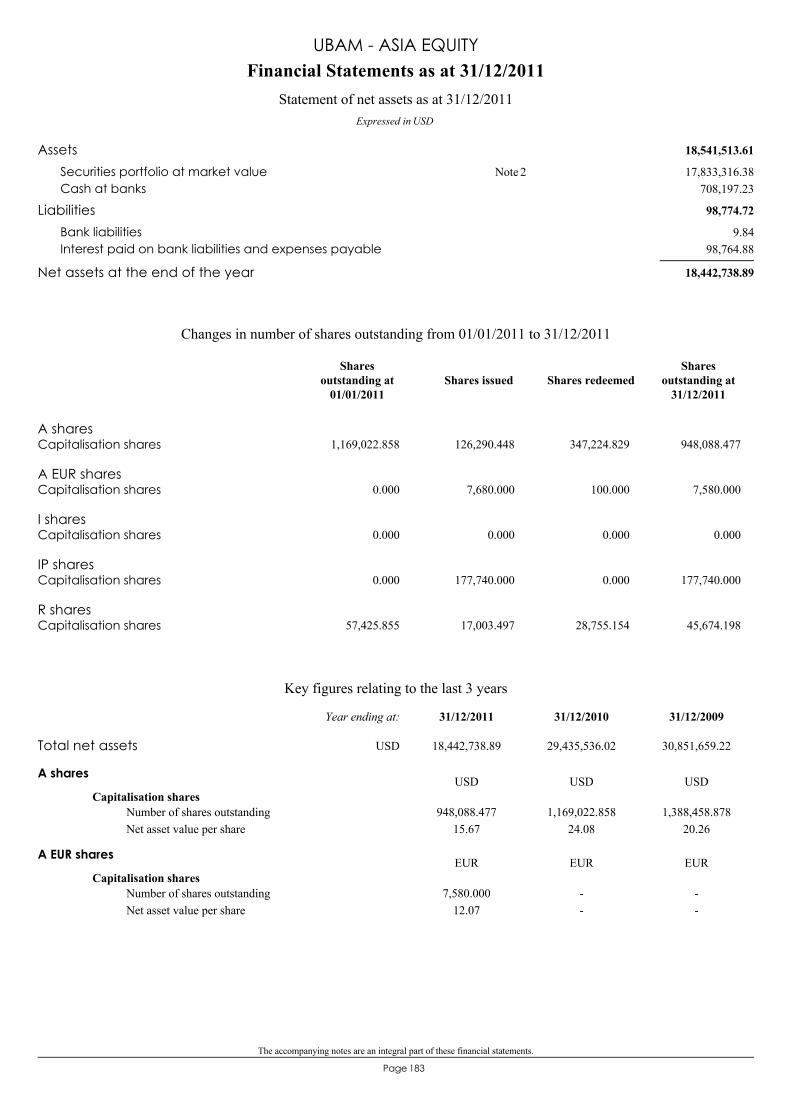
The accompanying notes are an integral part of these financial statements.
183Page
18,541,513.61Assets17,833,316.38Securities portfolio at market value 2Note
708,197.23Cash at banks
98,774.72Liabilities9.84Bank liabilities
98,764.88Interest paid on bank liabilities and expenses payable
18,442,738.89Net assets at the end of the year
Financial Statements as at 31/12/2011
Expressed in USD
Statement of net assets as at 31/12/2011
UBAM - ASIA EQUITY
A sharesCapitalisation shares 1,169,022.858 126,290.448 347,224.829 948,088.477
A EUR sharesCapitalisation shares 0.000 7,680.000 100.000 7,580.000
I sharesCapitalisation shares 0.000 0.000 0.000 0.000
IP sharesCapitalisation shares 0.000 177,740.000 0.000 177,740.000
R sharesCapitalisation shares 57,425.855 17,003.497 28,755.154 45,674.198
Changes in number of shares outstanding from 01/01/2011 to 31/12/2011
Shares issued Shares redeemedShares
outstanding at31/12/2011
Sharesoutstanding at
01/01/2011
Key figures relating to the last 3 years
A shares
Capitalisation shares948,088.477
15.671,169,022.858
24.081,388,458.878
20.26Number of shares outstandingNet asset value per share
USD USD USD
A EUR shares
Capitalisation shares7,580.000
12.07--
--
Number of shares outstandingNet asset value per share
EUR EUR EUR
Total net assets 18,442,738.89 29,435,536.02 30,851,659.22
31/12/200931/12/201031/12/2011Year ending at:
USD
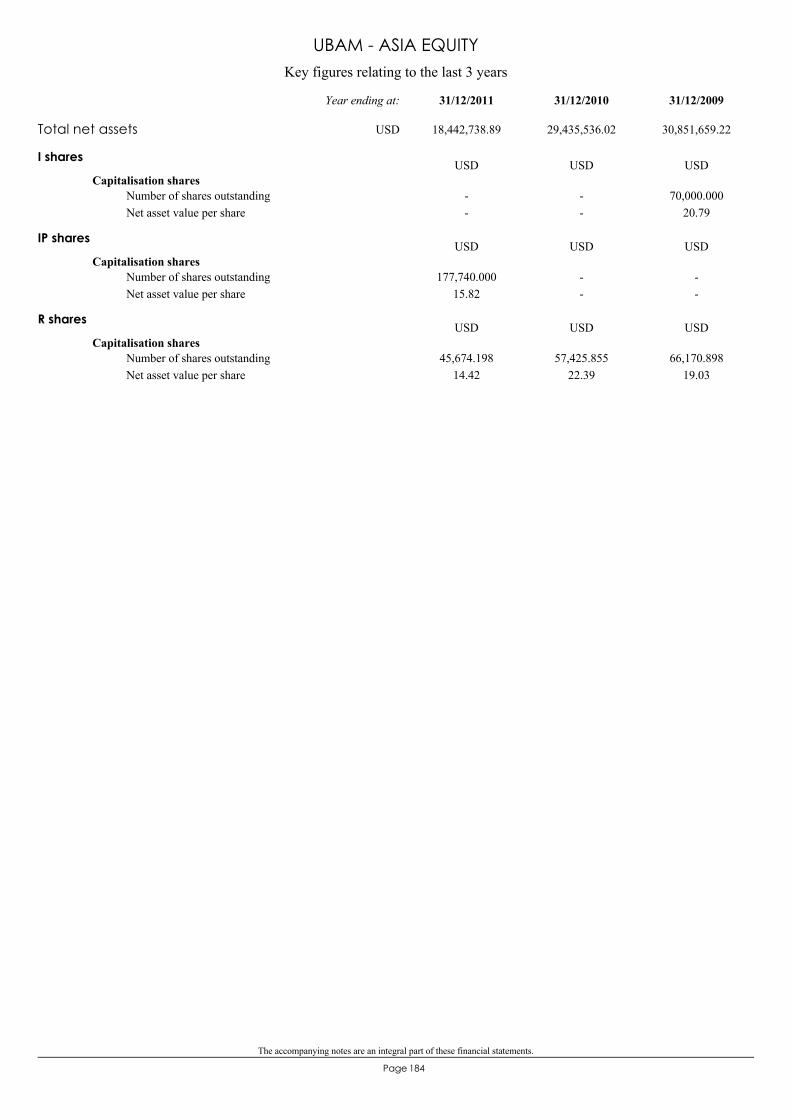
The accompanying notes are an integral part of these financial statements.
184Page
Key figures relating to the last 3 years
UBAM - ASIA EQUITY
I shares
Capitalisation shares--
--
70,000.00020.79
Number of shares outstandingNet asset value per share
USD USD USD
IP shares
Capitalisation shares177,740.000
15.82--
--
Number of shares outstandingNet asset value per share
USD USD USD
R shares
Capitalisation shares45,674.198
14.4257,425.855
22.3966,170.898
19.03Number of shares outstandingNet asset value per share
USD USD USD
Total net assets 18,442,738.89 29,435,536.02 30,851,659.22
31/12/200931/12/201031/12/2011Year ending at:
USD
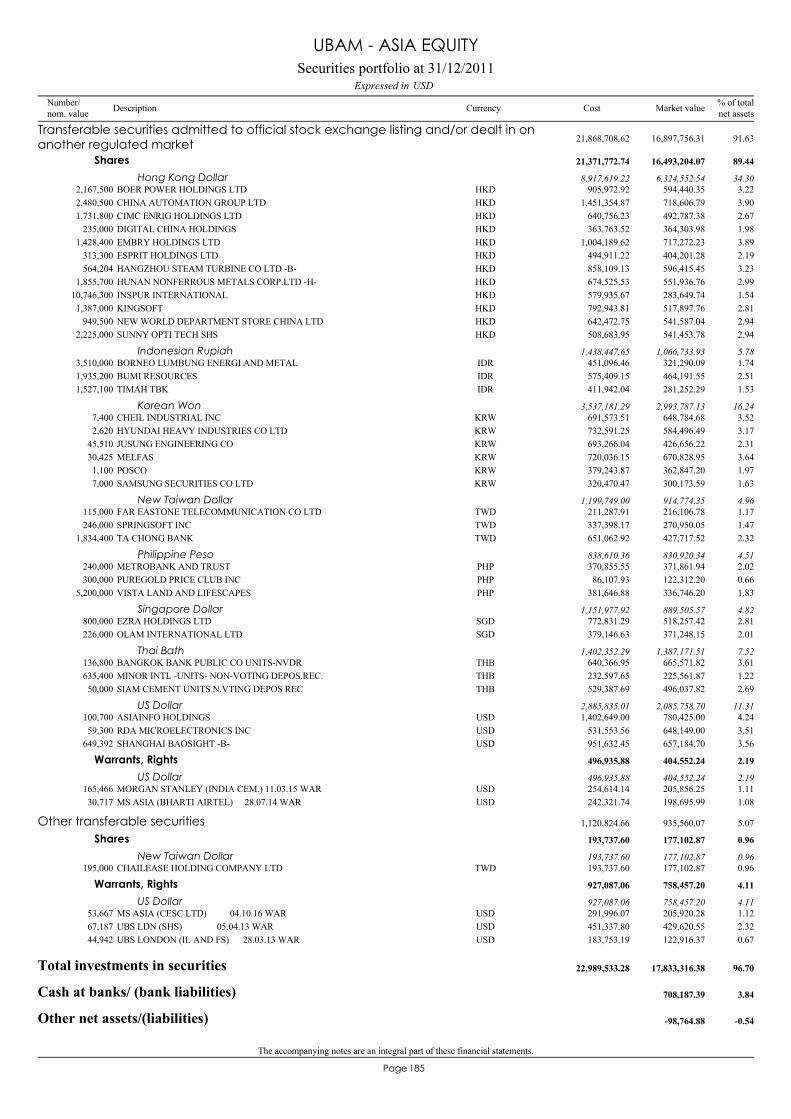
The accompanying notes are an integral part of these financial statements.
185Page
BOER POWER HOLDINGS LTD2,167,500 594,440.35 3.22HKD 905,972.92
Transferable securities admitted to official stock exchange listing and/or dealt in onanother regulated market 16,897,756.31 91.6321,868,708.62
Shares 16,493,204.07 89.4421,371,772.74
Hong Kong Dollar 6,324,552.54 34.308,917,619.22
CHINA AUTOMATION GROUP LTD2,480,500 718,606.79 3.90HKD 1,451,354.87CIMC ENRIG HOLDINGS LTD1,731,800 492,787.38 2.67HKD 640,756.23DIGITAL CHINA HOLDINGS235,000 364,303.98 1.98HKD 363,763.52EMBRY HOLDINGS LTD1,428,400 717,272.23 3.89HKD 1,004,189.62ESPRIT HOLDINGS LTD313,300 404,201.28 2.19HKD 494,911.22HANGZHOU STEAM TURBINE CO LTD -B-564,204 596,415.45 3.23HKD 858,109.13HUNAN NONFERROUS METALS CORP.LTD -H-1,855,700 551,936.76 2.99HKD 674,525.53INSPUR INTERNATIONAL10,746,300 283,649.74 1.54HKD 579,935.67KINGSOFT1,387,000 517,897.76 2.81HKD 792,943.81NEW WORLD DEPARTMENT STORE CHINA LTD949,500 541,587.04 2.94HKD 642,472.75SUNNY OPTI TECH SHS2,225,000 541,453.78 2.94HKD 508,683.95
BORNEO LUMBUNG ENERGI AND METAL3,510,000 321,290.09 1.74IDR 451,096.46Indonesian Rupiah 1,066,733.93 5.781,438,447.65
BUMI RESOURCES1,935,200 464,191.55 2.51IDR 575,409.15TIMAH TBK1,527,100 281,252.29 1.53IDR 411,942.04
CHEIL INDUSTRIAL INC7,400 648,784.68 3.52KRW 691,573.51Korean Won 2,993,787.13 16.243,537,181.29
HYUNDAI HEAVY INDUSTRIES CO LTD2,620 584,496.49 3.17KRW 732,591.25JUSUNG ENGINEERING CO45,510 426,656.22 2.31KRW 693,266.04MELFAS30,425 670,828.95 3.64KRW 720,036.15POSCO1,100 362,847.20 1.97KRW 379,243.87SAMSUNG SECURITIES CO LTD7,000 300,173.59 1.63KRW 320,470.47
FAR EASTONE TELECOMMUNICATION CO LTD115,000 216,106.78 1.17TWD 211,287.91New Taiwan Dollar 914,774.35 4.961,199,749.00
SPRINGSOFT INC246,000 270,950.05 1.47TWD 337,398.17TA CHONG BANK1,834,400 427,717.52 2.32TWD 651,062.92
METROBANK AND TRUST240,000 371,861.94 2.02PHP 370,855.55Philippine Peso 830,920.34 4.51838,610.36
PUREGOLD PRICE CLUB INC300,000 122,312.20 0.66PHP 86,107.93VISTA LAND AND LIFESCAPES5,200,000 336,746.20 1.83PHP 381,646.88
EZRA HOLDINGS LTD800,000 518,257.42 2.81SGD 772,831.29Singapore Dollar 889,505.57 4.821,151,977.92
OLAM INTERNATIONAL LTD226,000 371,248.15 2.01SGD 379,146.63
BANGKOK BANK PUBLIC CO UNITS-NVDR136,800 665,571.82 3.61THB 640,366.95Thai Bath 1,387,171.51 7.521,402,352.29
MINOR INTL -UNITS- NON-VOTING DEPOS.REC.635,400 225,561.87 1.22THB 232,597.65SIAM CEMENT UNITS N.VTING DEPOS REC50,000 496,037.82 2.69THB 529,387.69
ASIAINFO HOLDINGS100,700 780,425.00 4.24USD 1,402,649.00US Dollar 2,085,758.70 11.312,885,835.01
RDA MICROELECTRONICS INC59,300 648,149.00 3.51USD 531,553.56SHANGHAI BAOSIGHT -B-649,392 657,184.70 3.56USD 951,632.45
MORGAN STANLEY (INDIA CEM.) 11.03.15 WAR165,466 205,856.25 1.11USD 254,614.14
Warrants, Rights 404,552.24 2.19496,935.88
US Dollar 404,552.24 2.19496,935.88
MS ASIA (BHARTI AIRTEL) 28.07.14 WAR30,717 198,695.99 1.08USD 242,321.74
CHAILEASE HOLDING COMPANY LTD195,000 177,102.87 0.96TWD 193,737.60
Other transferable securities 935,560.07 5.071,120,824.66
Shares 177,102.87 0.96193,737.60
New Taiwan Dollar 177,102.87 0.96193,737.60
MS ASIA (CESC LTD) 04.10.16 WAR53,667 205,920.28 1.12USD 291,996.07
Warrants, Rights 758,457.20 4.11927,087.06
US Dollar 758,457.20 4.11927,087.06
UBS LDN (SHS) 05.04.13 WAR67,187 429,620.55 2.32USD 451,337.80UBS LONDON (IL AND FS) 28.03.13 WAR44,942 122,916.37 0.67USD 183,753.19
Total investments in securities 17,833,316.38 96.7022,989,533.28
Cash at banks/ (bank liabilities) 708,187.39 3.84
Other net assets/(liabilities) -98,764.88 -0.54
Securities portfolio at 31/12/2011USDExpressed in
UBAM - ASIA EQUITY
Number/nom. value Description Currency % of total
net assetsMarket valueCost
The accompanying notes are an integral part of these financial statements.
186Page
Total 18,442,738.89 100.00
Securities portfolio at 31/12/2011USDExpressed in
UBAM - ASIA EQUITY
Number/nom. value Description Currency % of total
net assetsMarket valueCost
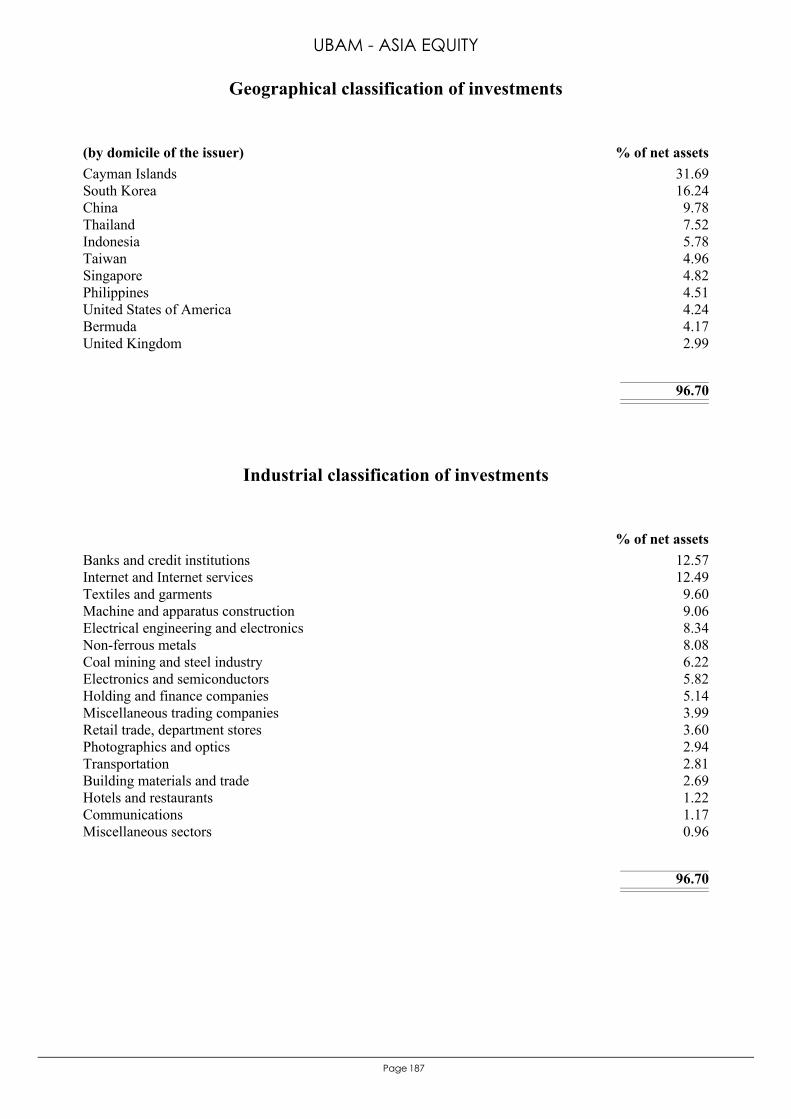
187Page
Cayman Islands 31.69South Korea 16.24China 9.78Thailand 7.52Indonesia 5.78Taiwan 4.96Singapore 4.82Philippines 4.51United States of America 4.24Bermuda 4.17United Kingdom 2.99
96.70
(by domicile of the issuer) % of net assets
Geographical classification of investments
UBAM - ASIA EQUITY
Banks and credit institutions 12.57Internet and Internet services 12.49Textiles and garments 9.60Machine and apparatus construction 9.06Electrical engineering and electronics 8.34Non-ferrous metals 8.08Coal mining and steel industry 6.22Electronics and semiconductors 5.82Holding and finance companies 5.14Miscellaneous trading companies 3.99Retail trade, department stores 3.60Photographics and optics 2.94Transportation 2.81Building materials and trade 2.69Hotels and restaurants 1.22Communications 1.17Miscellaneous sectors 0.96
96.70
% of net assets
Industrial classification of investments
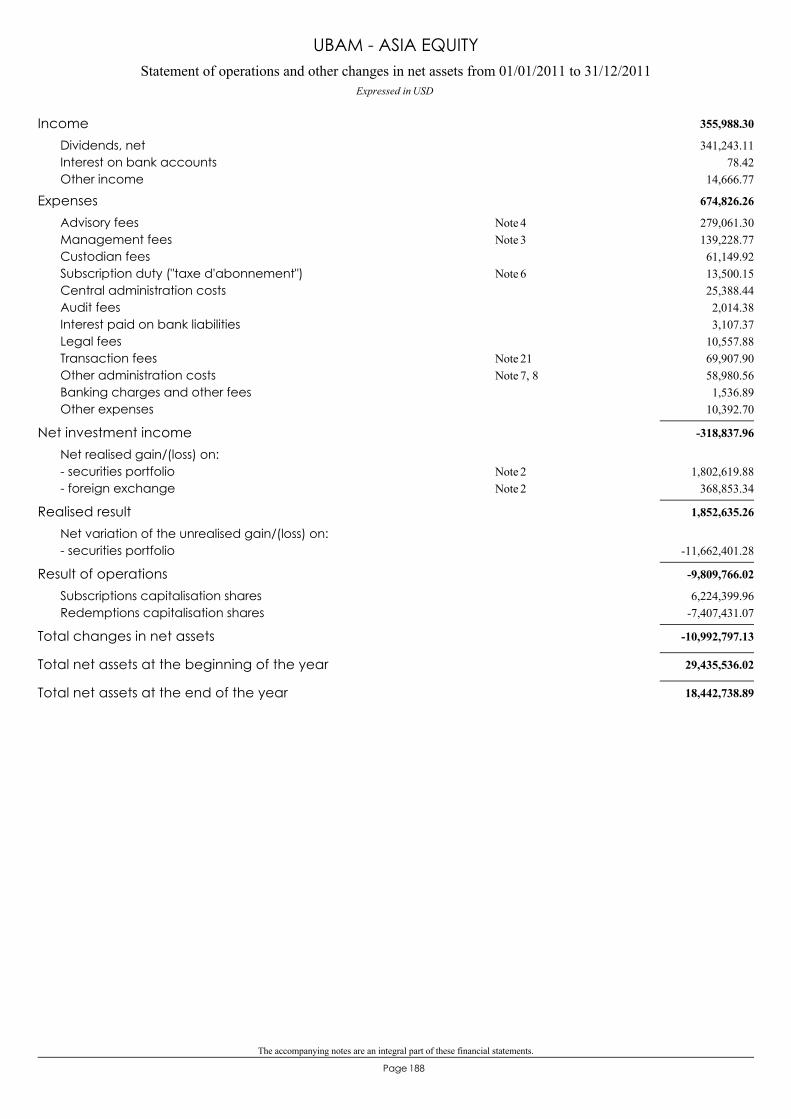
The accompanying notes are an integral part of these financial statements.
188Page
Statement of operations and other changes in net assets from 01/01/2011 to 31/12/2011Expressed in USD
UBAM - ASIA EQUITY
355,988.30Income341,243.11Dividends, net
78.42Interest on bank accounts14,666.77Other income
674,826.26Expenses279,061.30Advisory fees 4Note139,228.77Management fees 3Note61,149.92Custodian fees13,500.15Subscription duty ("taxe d'abonnement") 6Note25,388.44Central administration costs2,014.38Audit fees3,107.37Interest paid on bank liabilities
10,557.88Legal fees69,907.90Transaction fees 21Note58,980.56Other administration costs 7, 8Note1,536.89Banking charges and other fees
10,392.70Other expenses
-318,837.96Net investment incomeNet realised gain/(loss) on:
1,802,619.88- securities portfolio 2Note368,853.34- foreign exchange 2Note
1,852,635.26Realised resultNet variation of the unrealised gain/(loss) on:
-11,662,401.28- securities portfolio
-9,809,766.02Result of operations6,224,399.96Subscriptions capitalisation shares
-7,407,431.07Redemptions capitalisation shares
-10,992,797.13Total changes in net assets
29,435,536.02Total net assets at the beginning of the year
18,442,738.89Total net assets at the end of the year
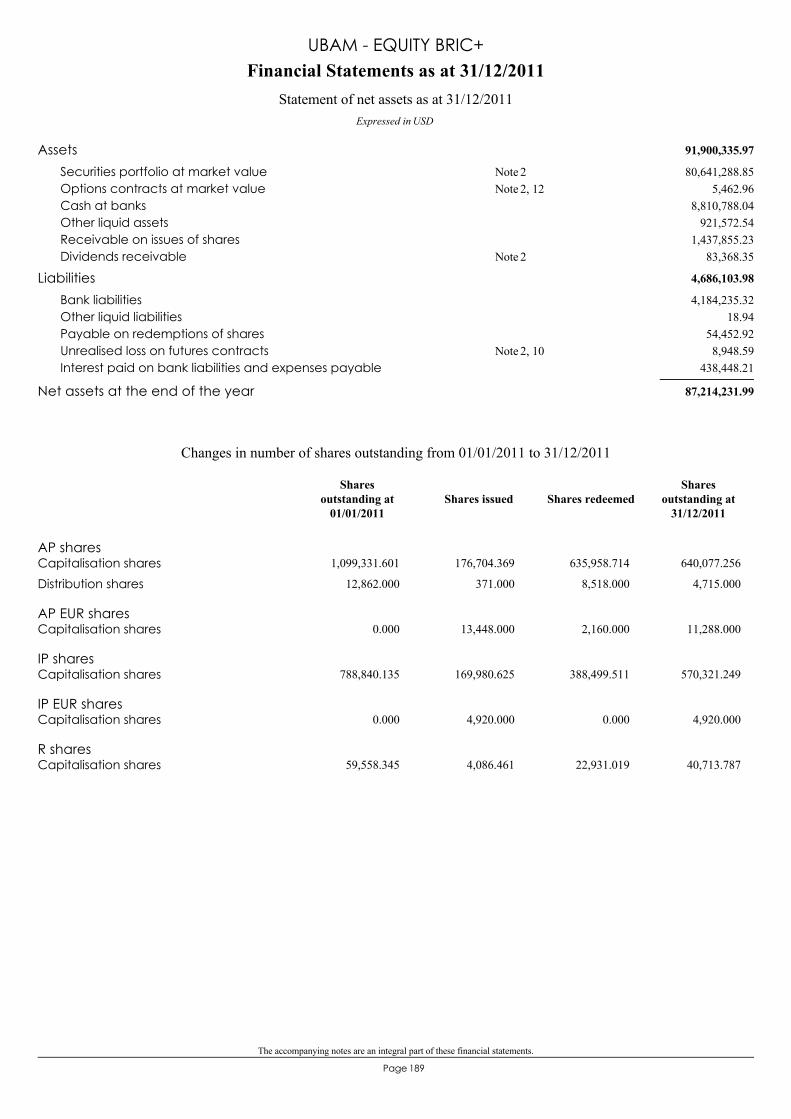
The accompanying notes are an integral part of these financial statements.
189Page
91,900,335.97Assets80,641,288.85Securities portfolio at market value 2Note
5,462.96Options contracts at market value 2, 12Note8,810,788.04Cash at banks
921,572.54Other liquid assets1,437,855.23Receivable on issues of shares
83,368.35Dividends receivable 2Note
4,686,103.98Liabilities4,184,235.32Bank liabilities
18.94Other liquid liabilities54,452.92Payable on redemptions of shares8,948.59Unrealised loss on futures contracts 2, 10Note
438,448.21Interest paid on bank liabilities and expenses payable
87,214,231.99Net assets at the end of the year
Financial Statements as at 31/12/2011
Expressed in USD
Statement of net assets as at 31/12/2011
UBAM - EQUITY BRIC+
AP sharesCapitalisation shares 1,099,331.601 176,704.369 635,958.714 640,077.256
Distribution shares 12,862.000 371.000 8,518.000 4,715.000
AP EUR sharesCapitalisation shares 0.000 13,448.000 2,160.000 11,288.000
IP sharesCapitalisation shares 788,840.135 169,980.625 388,499.511 570,321.249
IP EUR sharesCapitalisation shares 0.000 4,920.000 0.000 4,920.000
R sharesCapitalisation shares 59,558.345 4,086.461 22,931.019 40,713.787
Changes in number of shares outstanding from 01/01/2011 to 31/12/2011
Shares issued Shares redeemedShares
outstanding at31/12/2011
Sharesoutstanding at
01/01/2011
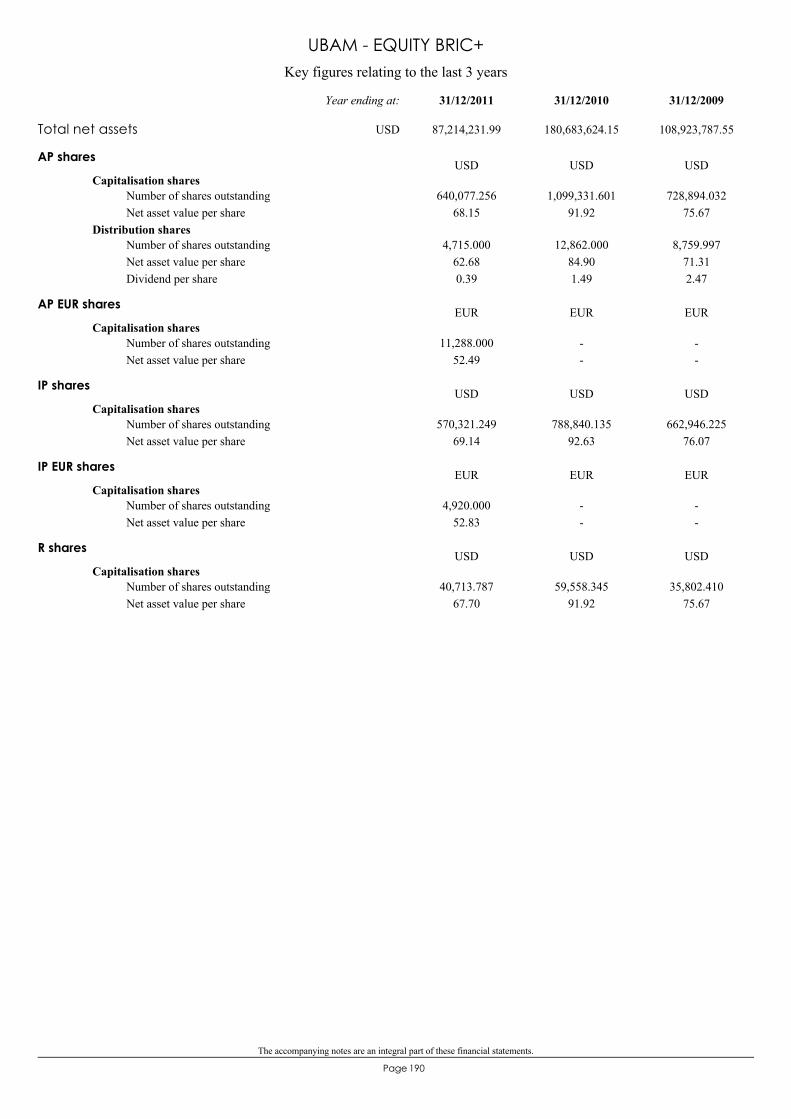
The accompanying notes are an integral part of these financial statements.
190Page
Key figures relating to the last 3 years
UBAM - EQUITY BRIC+
AP shares
Capitalisation shares640,077.256
68.151,099,331.601
91.92728,894.032
75.67Number of shares outstandingNet asset value per share
Distribution shares4,715.000
62.680.39
12,862.00084.901.49
8,759.99771.312.47
Number of shares outstandingNet asset value per shareDividend per share
USD USD USD
AP EUR shares
Capitalisation shares11,288.000
52.49--
--
Number of shares outstandingNet asset value per share
EUR EUR EUR
IP shares
Capitalisation shares570,321.249
69.14788,840.135
92.63662,946.225
76.07Number of shares outstandingNet asset value per share
USD USD USD
IP EUR shares
Capitalisation shares4,920.000
52.83--
--
Number of shares outstandingNet asset value per share
EUR EUR EUR
R shares
Capitalisation shares40,713.787
67.7059,558.345
91.9235,802.410
75.67Number of shares outstandingNet asset value per share
USD USD USD
Total net assets 87,214,231.99 180,683,624.15 108,923,787.55
31/12/200931/12/201031/12/2011Year ending at:
USD
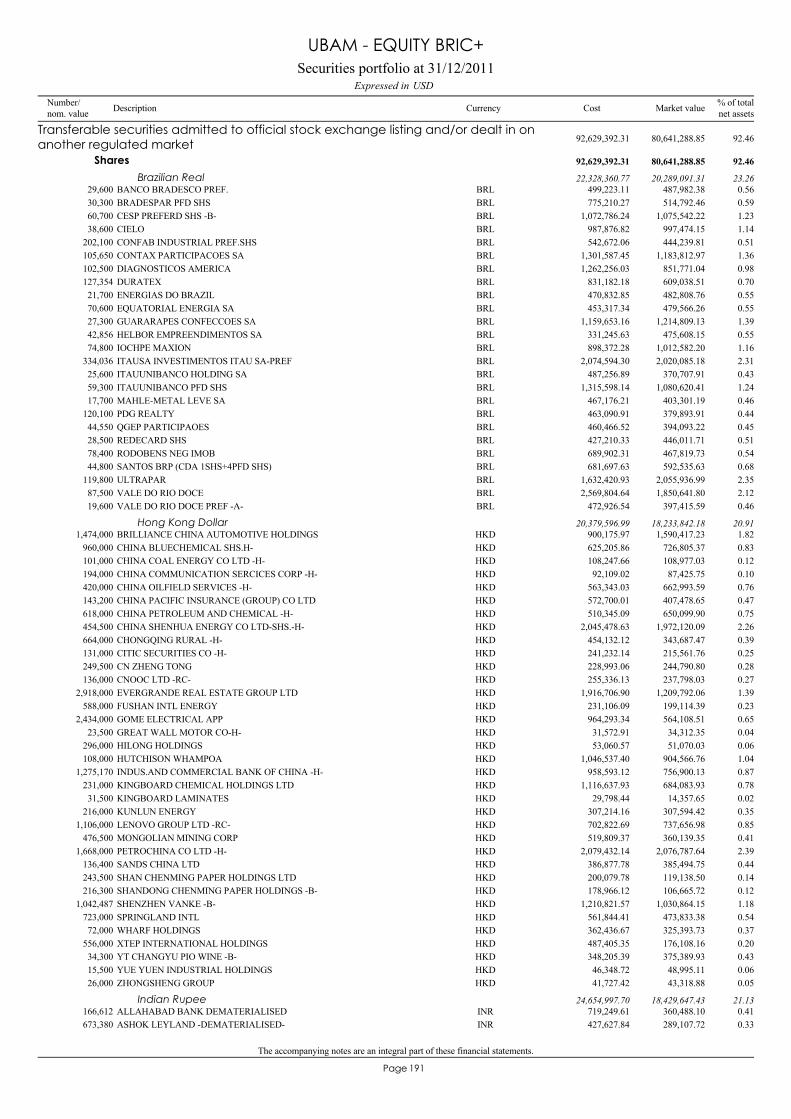
The accompanying notes are an integral part of these financial statements.
191Page
BANCO BRADESCO PREF.29,600 487,982.38 0.56BRL 499,223.11
Transferable securities admitted to official stock exchange listing and/or dealt in onanother regulated market 80,641,288.85 92.4692,629,392.31
Shares 80,641,288.85 92.4692,629,392.31
Brazilian Real 20,289,091.31 23.2622,328,360.77
BRADESPAR PFD SHS30,300 514,792.46 0.59BRL 775,210.27CESP PREFERD SHS -B-60,700 1,075,542.22 1.23BRL 1,072,786.24CIELO38,600 997,474.15 1.14BRL 987,876.82CONFAB INDUSTRIAL PREF.SHS202,100 444,239.81 0.51BRL 542,672.06CONTAX PARTICIPACOES SA105,650 1,183,812.97 1.36BRL 1,301,587.45DIAGNOSTICOS AMERICA102,500 851,771.04 0.98BRL 1,262,256.03DURATEX127,354 609,038.51 0.70BRL 831,182.18ENERGIAS DO BRAZIL21,700 482,808.76 0.55BRL 470,832.85EQUATORIAL ENERGIA SA70,600 479,566.26 0.55BRL 453,317.34GUARARAPES CONFECCOES SA27,300 1,214,809.13 1.39BRL 1,159,653.16HELBOR EMPREENDIMENTOS SA42,856 475,608.15 0.55BRL 331,245.63IOCHPE MAXION74,800 1,012,582.20 1.16BRL 898,372.28ITAUSA INVESTIMENTOS ITAU SA-PREF334,036 2,020,085.18 2.31BRL 2,074,594.30ITAUUNIBANCO HOLDING SA25,600 370,707.91 0.43BRL 487,256.89ITAUUNIBANCO PFD SHS59,300 1,080,620.41 1.24BRL 1,315,598.14MAHLE-METAL LEVE SA17,700 403,301.19 0.46BRL 467,176.21PDG REALTY120,100 379,893.91 0.44BRL 463,090.91QGEP PARTICIPAOES44,550 394,093.22 0.45BRL 460,466.52REDECARD SHS28,500 446,011.71 0.51BRL 427,210.33RODOBENS NEG IMOB78,400 467,819.73 0.54BRL 689,902.31SANTOS BRP (CDA 1SHS+4PFD SHS)44,800 592,535.63 0.68BRL 681,697.63ULTRAPAR119,800 2,055,936.99 2.35BRL 1,632,420.93VALE DO RIO DOCE87,500 1,850,641.80 2.12BRL 2,569,804.64VALE DO RIO DOCE PREF -A-19,600 397,415.59 0.46BRL 472,926.54
BRILLIANCE CHINA AUTOMOTIVE HOLDINGS1,474,000 1,590,417.23 1.82HKD 900,175.97Hong Kong Dollar 18,233,842.18 20.9120,379,596.99
CHINA BLUECHEMICAL SHS.H-960,000 726,805.37 0.83HKD 625,205.86CHINA COAL ENERGY CO LTD -H-101,000 108,977.03 0.12HKD 108,247.66CHINA COMMUNICATION SERCICES CORP -H-194,000 87,425.75 0.10HKD 92,109.02CHINA OILFIELD SERVICES -H-420,000 662,993.59 0.76HKD 563,343.03CHINA PACIFIC INSURANCE (GROUP) CO LTD143,200 407,478.65 0.47HKD 572,700.01CHINA PETROLEUM AND CHEMICAL -H-618,000 650,099.90 0.75HKD 510,345.09CHINA SHENHUA ENERGY CO LTD-SHS.-H-454,500 1,972,120.09 2.26HKD 2,045,478.63CHONGQING RURAL -H-664,000 343,687.47 0.39HKD 454,132.12CITIC SECURITIES CO -H-131,000 215,561.76 0.25HKD 241,232.14CN ZHENG TONG249,500 244,790.80 0.28HKD 228,993.06CNOOC LTD -RC-136,000 237,798.03 0.27HKD 255,336.13EVERGRANDE REAL ESTATE GROUP LTD2,918,000 1,209,792.06 1.39HKD 1,916,706.90FUSHAN INTL ENERGY588,000 199,114.39 0.23HKD 231,106.09GOME ELECTRICAL APP2,434,000 564,108.51 0.65HKD 964,293.34GREAT WALL MOTOR CO-H-23,500 34,312.35 0.04HKD 31,572.91HILONG HOLDINGS296,000 51,070.03 0.06HKD 53,060.57HUTCHISON WHAMPOA108,000 904,566.76 1.04HKD 1,046,537.40INDUS.AND COMMERCIAL BANK OF CHINA -H-1,275,170 756,900.13 0.87HKD 958,593.12KINGBOARD CHEMICAL HOLDINGS LTD231,000 684,083.93 0.78HKD 1,116,637.93KINGBOARD LAMINATES31,500 14,357.65 0.02HKD 29,798.44KUNLUN ENERGY216,000 307,594.42 0.35HKD 307,214.16LENOVO GROUP LTD -RC-1,106,000 737,656.98 0.85HKD 702,822.69MONGOLIAN MINING CORP476,500 360,139.35 0.41HKD 519,809.37PETROCHINA CO LTD -H-1,668,000 2,076,787.64 2.39HKD 2,079,432.14SANDS CHINA LTD136,400 385,494.75 0.44HKD 386,877.78SHAN CHENMING PAPER HOLDINGS LTD243,500 119,138.50 0.14HKD 200,079.78SHANDONG CHENMING PAPER HOLDINGS -B-216,300 106,665.72 0.12HKD 178,966.12SHENZHEN VANKE -B-1,042,487 1,030,864.15 1.18HKD 1,210,821.57SPRINGLAND INTL723,000 473,833.38 0.54HKD 561,844.41WHARF HOLDINGS72,000 325,393.73 0.37HKD 362,436.67XTEP INTERNATIONAL HOLDINGS556,000 176,108.16 0.20HKD 487,405.35YT CHANGYU PIO WINE -B-34,300 375,389.93 0.43HKD 348,205.39YUE YUEN INDUSTRIAL HOLDINGS15,500 48,995.11 0.06HKD 46,348.72ZHONGSHENG GROUP26,000 43,318.88 0.05HKD 41,727.42
ALLAHABAD BANK DEMATERIALISED166,612 360,488.10 0.41INR 719,249.61Indian Rupee 18,429,647.43 21.1324,654,997.70
ASHOK LEYLAND -DEMATERIALISED-673,380 289,107.72 0.33INR 427,627.84
Securities portfolio at 31/12/2011USDExpressed in
UBAM - EQUITY BRIC+
Number/nom. value Description Currency % of total
net assetsMarket valueCost
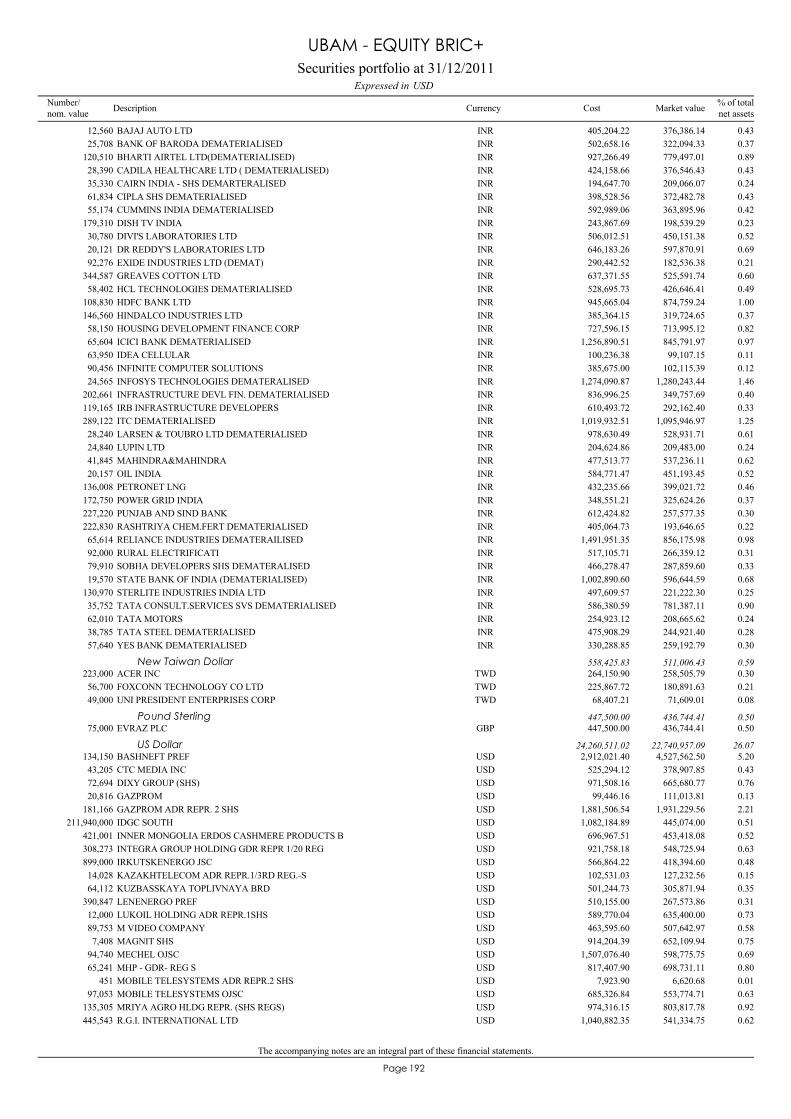
The accompanying notes are an integral part of these financial statements.
192Page
BAJAJ AUTO LTD12,560 376,386.14 0.43INR 405,204.22BANK OF BARODA DEMATERIALISED25,708 322,094.33 0.37INR 502,658.16BHARTI AIRTEL LTD(DEMATERIALISED)120,510 779,497.01 0.89INR 927,266.49CADILA HEALTHCARE LTD ( DEMATERIALISED)28,390 376,546.43 0.43INR 424,158.66CAIRN INDIA - SHS DEMARTERALISED35,330 209,066.07 0.24INR 194,647.70CIPLA SHS DEMATERIALISED61,834 372,482.78 0.43INR 398,528.56CUMMINS INDIA DEMATERIALISED55,174 363,895.96 0.42INR 592,989.06DISH TV INDIA179,310 198,539.29 0.23INR 243,867.69DIVI'S LABORATORIES LTD30,780 450,151.38 0.52INR 506,012.51DR REDDY'S LABORATORIES LTD20,121 597,870.91 0.69INR 646,183.26EXIDE INDUSTRIES LTD (DEMAT)92,276 182,536.38 0.21INR 290,442.52GREAVES COTTON LTD344,587 525,591.74 0.60INR 637,371.55HCL TECHNOLOGIES DEMATERIALISED58,402 426,646.41 0.49INR 528,695.73HDFC BANK LTD108,830 874,759.24 1.00INR 945,665.04HINDALCO INDUSTRIES LTD146,560 319,724.65 0.37INR 385,364.15HOUSING DEVELOPMENT FINANCE CORP58,150 713,995.12 0.82INR 727,596.15ICICI BANK DEMATERIALISED65,604 845,791.97 0.97INR 1,256,890.51IDEA CELLULAR63,950 99,107.15 0.11INR 100,236.38INFINITE COMPUTER SOLUTIONS90,456 102,115.39 0.12INR 385,675.00INFOSYS TECHNOLOGIES DEMATERALISED24,565 1,280,243.44 1.46INR 1,274,090.87INFRASTRUCTURE DEVL FIN. DEMATERIALISED202,661 349,757.69 0.40INR 836,996.25IRB INFRASTRUCTURE DEVELOPERS119,165 292,162.40 0.33INR 610,493.72ITC DEMATERIALISED289,122 1,095,946.97 1.25INR 1,019,932.51LARSEN & TOUBRO LTD DEMATERIALISED28,240 528,931.71 0.61INR 978,630.49LUPIN LTD24,840 209,483.00 0.24INR 204,624.86MAHINDRA&MAHINDRA41,845 537,236.11 0.62INR 477,513.77OIL INDIA20,157 451,193.45 0.52INR 584,771.47PETRONET LNG136,008 399,021.72 0.46INR 432,235.66POWER GRID INDIA172,750 325,624.26 0.37INR 348,551.21PUNJAB AND SIND BANK227,220 257,577.35 0.30INR 612,424.82RASHTRIYA CHEM.FERT DEMATERIALISED222,830 193,646.65 0.22INR 405,064.73RELIANCE INDUSTRIES DEMATERAILISED65,614 856,175.98 0.98INR 1,491,951.35RURAL ELECTRIFICATI92,000 266,359.12 0.31INR 517,105.71SOBHA DEVELOPERS SHS DEMATERALISED79,910 287,859.60 0.33INR 466,278.47STATE BANK OF INDIA (DEMATERIALISED)19,570 596,644.59 0.68INR 1,002,890.60STERLITE INDUSTRIES INDIA LTD130,970 221,222.30 0.25INR 497,609.57TATA CONSULT.SERVICES SVS DEMATERIALISED35,752 781,387.11 0.90INR 586,380.59TATA MOTORS62,010 208,665.62 0.24INR 254,923.12TATA STEEL DEMATERIALISED38,785 244,921.40 0.28INR 475,908.29YES BANK DEMATERIALISED57,640 259,192.79 0.30INR 330,288.85
ACER INC223,000 258,505.79 0.30TWD 264,150.90New Taiwan Dollar 511,006.43 0.59558,425.83
FOXCONN TECHNOLOGY CO LTD56,700 180,891.63 0.21TWD 225,867.72UNI PRESIDENT ENTERPRISES CORP49,000 71,609.01 0.08TWD 68,407.21
EVRAZ PLC75,000 436,744.41 0.50GBP 447,500.00Pound Sterling 436,744.41 0.50447,500.00
BASHNEFT PREF134,150 4,527,562.50 5.20USD 2,912,021.40US Dollar 22,740,957.09 26.0724,260,511.02
CTC MEDIA INC43,205 378,907.85 0.43USD 525,294.12DIXY GROUP (SHS)72,694 665,680.77 0.76USD 971,508.16GAZPROM20,816 111,013.81 0.13USD 99,446.16GAZPROM ADR REPR. 2 SHS181,166 1,931,229.56 2.21USD 1,881,506.54IDGC SOUTH211,940,000 445,074.00 0.51USD 1,082,184.89INNER MONGOLIA ERDOS CASHMERE PRODUCTS B421,001 453,418.08 0.52USD 696,967.51INTEGRA GROUP HOLDING GDR REPR 1/20 REG308,273 548,725.94 0.63USD 921,758.18IRKUTSKENERGO JSC899,000 418,394.60 0.48USD 566,864.22KAZAKHTELECOM ADR REPR.1/3RD REG.-S14,028 127,232.56 0.15USD 102,531.03KUZBASSKAYA TOPLIVNAYA BRD64,112 305,871.94 0.35USD 501,244.73LENENERGO PREF390,847 267,573.86 0.31USD 510,155.00LUKOIL HOLDING ADR REPR.1SHS12,000 635,400.00 0.73USD 589,770.04M VIDEO COMPANY89,753 507,642.97 0.58USD 463,595.60MAGNIT SHS7,408 652,109.94 0.75USD 914,204.39MECHEL OJSC94,740 598,775.75 0.69USD 1,507,076.40MHP - GDR- REG S65,241 698,731.11 0.80USD 817,407.90MOBILE TELESYSTEMS ADR REPR.2 SHS451 6,620.68 0.01USD 7,923.90MOBILE TELESYSTEMS OJSC97,053 553,774.71 0.63USD 685,326.84MRIYA AGRO HLDG REPR. (SHS REGS)135,305 803,817.78 0.92USD 974,316.15R.G.I. INTERNATIONAL LTD445,543 541,334.75 0.62USD 1,040,882.35
Securities portfolio at 31/12/2011USDExpressed in
UBAM - EQUITY BRIC+
Number/nom. value Description Currency % of total
net assetsMarket valueCost
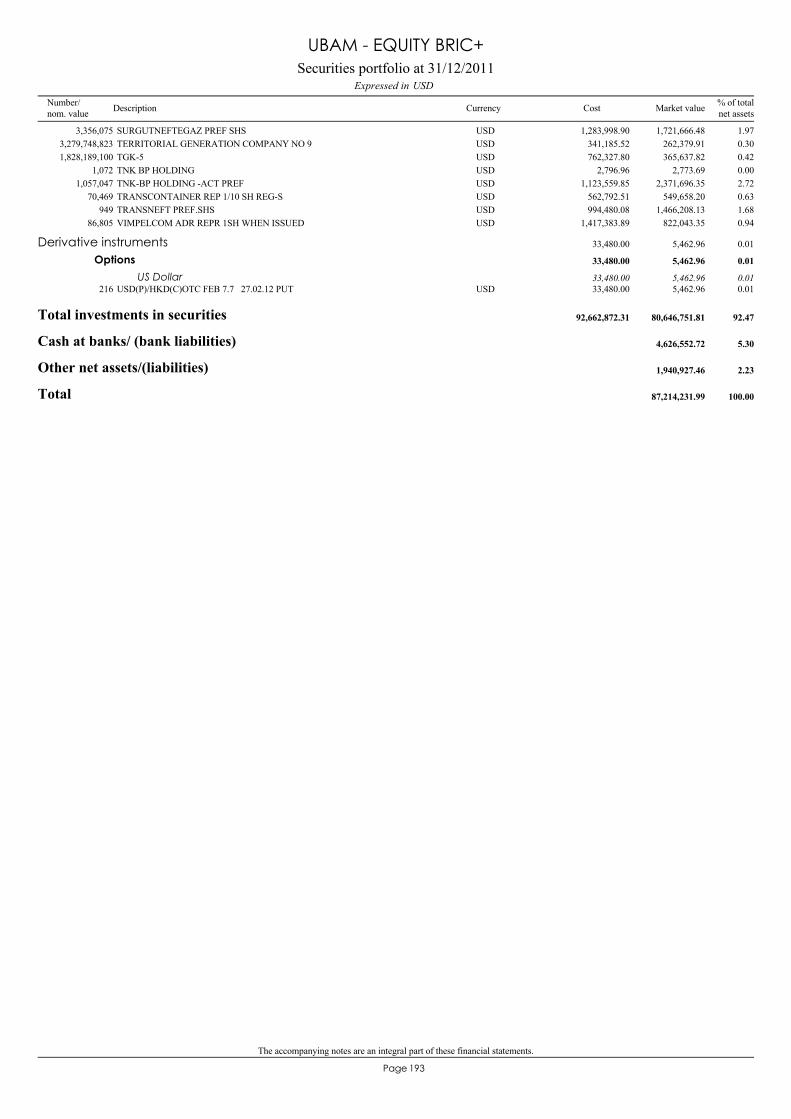
The accompanying notes are an integral part of these financial statements.
193Page
SURGUTNEFTEGAZ PREF SHS3,356,075 1,721,666.48 1.97USD 1,283,998.90TERRITORIAL GENERATION COMPANY NO 93,279,748,823 262,379.91 0.30USD 341,185.52TGK-51,828,189,100 365,637.82 0.42USD 762,327.80TNK BP HOLDING1,072 2,773.69 0.00USD 2,796.96TNK-BP HOLDING -ACT PREF1,057,047 2,371,696.35 2.72USD 1,123,559.85TRANSCONTAINER REP 1/10 SH REG-S70,469 549,658.20 0.63USD 562,792.51TRANSNEFT PREF.SHS949 1,466,208.13 1.68USD 994,480.08VIMPELCOM ADR REPR 1SH WHEN ISSUED86,805 822,043.35 0.94USD 1,417,383.89
USD(P)/HKD(C)OTC FEB 7.7 27.02.12 PUT216 5,462.96 0.01USD 33,480.00
Derivative instruments 5,462.96 0.0133,480.00
Options 5,462.96 0.0133,480.00
US Dollar 5,462.96 0.0133,480.00
Total investments in securities 80,646,751.81 92.4792,662,872.31
Cash at banks/ (bank liabilities) 4,626,552.72 5.30
Other net assets/(liabilities) 1,940,927.46 2.23
Total 87,214,231.99 100.00
Securities portfolio at 31/12/2011USDExpressed in
UBAM - EQUITY BRIC+
Number/nom. value Description Currency % of total
net assetsMarket valueCost
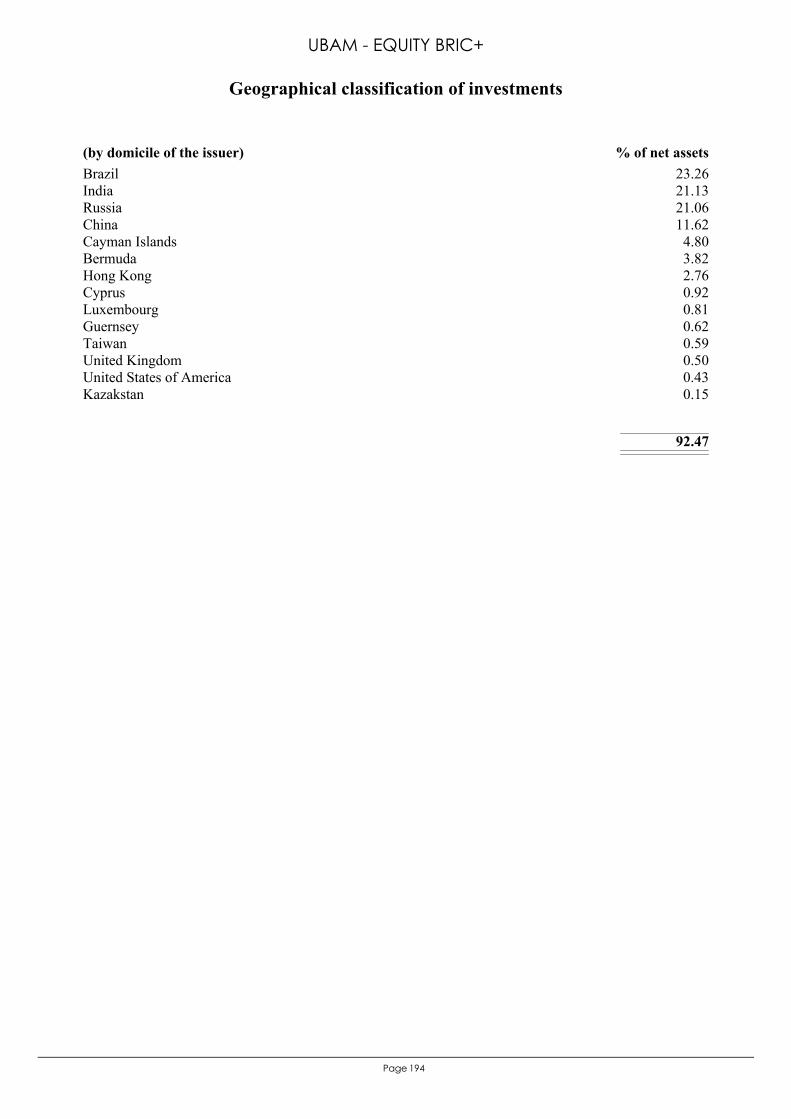
194Page
Brazil 23.26India 21.13Russia 21.06China 11.62Cayman Islands 4.80Bermuda 3.82Hong Kong 2.76Cyprus 0.92Luxembourg 0.81Guernsey 0.62Taiwan 0.59United Kingdom 0.50United States of America 0.43Kazakstan 0.15
92.47
(by domicile of the issuer) % of net assets
Geographical classification of investments
UBAM - EQUITY BRIC+
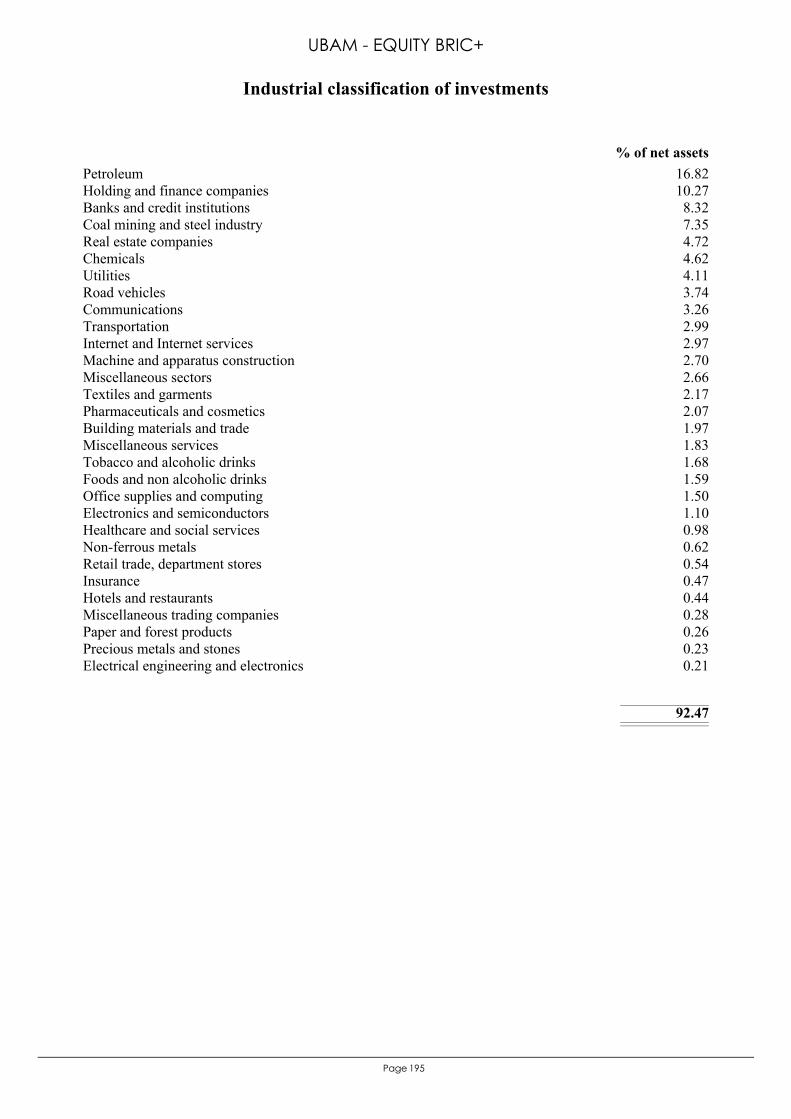
195Page
Petroleum 16.82Holding and finance companies 10.27Banks and credit institutions 8.32Coal mining and steel industry 7.35Real estate companies 4.72Chemicals 4.62Utilities 4.11Road vehicles 3.74Communications 3.26Transportation 2.99Internet and Internet services 2.97Machine and apparatus construction 2.70Miscellaneous sectors 2.66Textiles and garments 2.17Pharmaceuticals and cosmetics 2.07Building materials and trade 1.97Miscellaneous services 1.83Tobacco and alcoholic drinks 1.68Foods and non alcoholic drinks 1.59Office supplies and computing 1.50Electronics and semiconductors 1.10Healthcare and social services 0.98Non-ferrous metals 0.62Retail trade, department stores 0.54Insurance 0.47Hotels and restaurants 0.44Miscellaneous trading companies 0.28Paper and forest products 0.26Precious metals and stones 0.23Electrical engineering and electronics 0.21
92.47
% of net assets
Industrial classification of investments
UBAM - EQUITY BRIC+
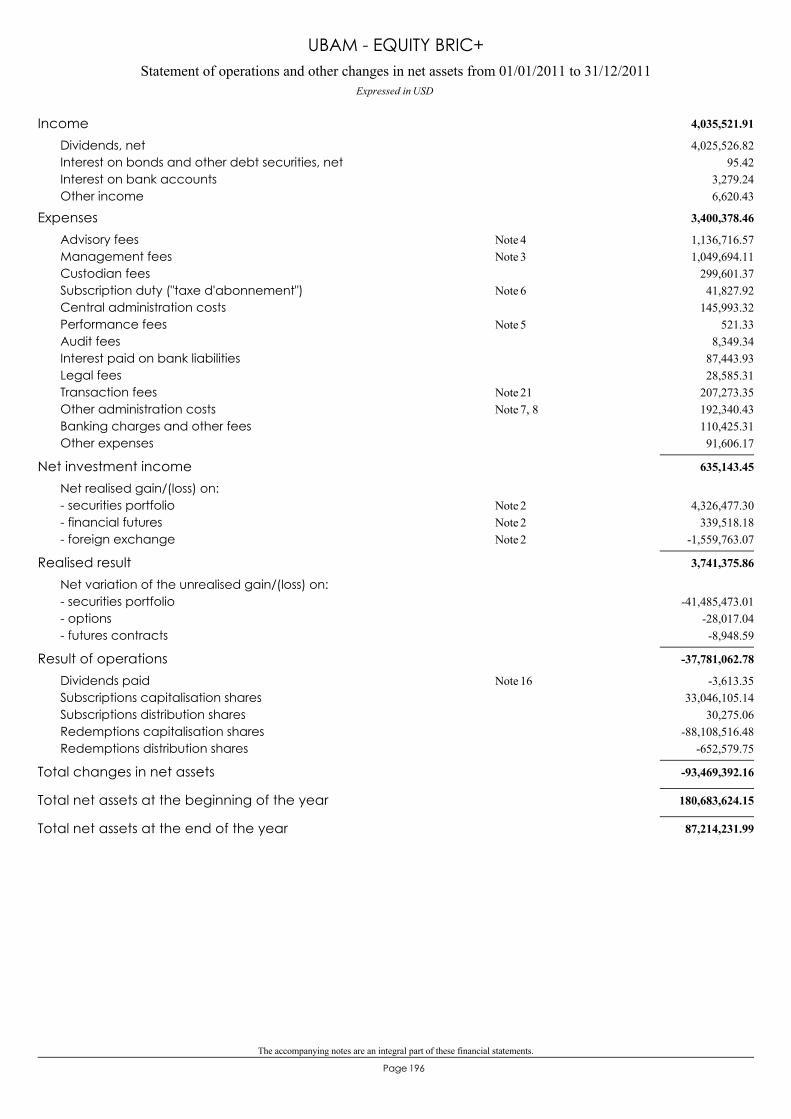
The accompanying notes are an integral part of these financial statements.
196Page
Statement of operations and other changes in net assets from 01/01/2011 to 31/12/2011Expressed in USD
UBAM - EQUITY BRIC+
4,035,521.91Income4,025,526.82Dividends, net
95.42Interest on bonds and other debt securities, net3,279.24Interest on bank accounts6,620.43Other income
3,400,378.46Expenses1,136,716.57Advisory fees 4Note1,049,694.11Management fees 3Note
299,601.37Custodian fees41,827.92Subscription duty ("taxe d'abonnement") 6Note
145,993.32Central administration costs521.33Performance fees 5Note
8,349.34Audit fees87,443.93Interest paid on bank liabilities28,585.31Legal fees
207,273.35Transaction fees 21Note192,340.43Other administration costs 7, 8Note110,425.31Banking charges and other fees91,606.17Other expenses
635,143.45Net investment incomeNet realised gain/(loss) on:
4,326,477.30- securities portfolio 2Note339,518.18- financial futures 2Note
-1,559,763.07- foreign exchange 2Note
3,741,375.86Realised resultNet variation of the unrealised gain/(loss) on:
-41,485,473.01- securities portfolio-28,017.04- options-8,948.59- futures contracts
-37,781,062.78Result of operations-3,613.35Dividends paid 16Note
33,046,105.14Subscriptions capitalisation shares30,275.06Subscriptions distribution shares
-88,108,516.48Redemptions capitalisation shares-652,579.75Redemptions distribution shares
-93,469,392.16Total changes in net assets
180,683,624.15Total net assets at the beginning of the year
87,214,231.99Total net assets at the end of the year
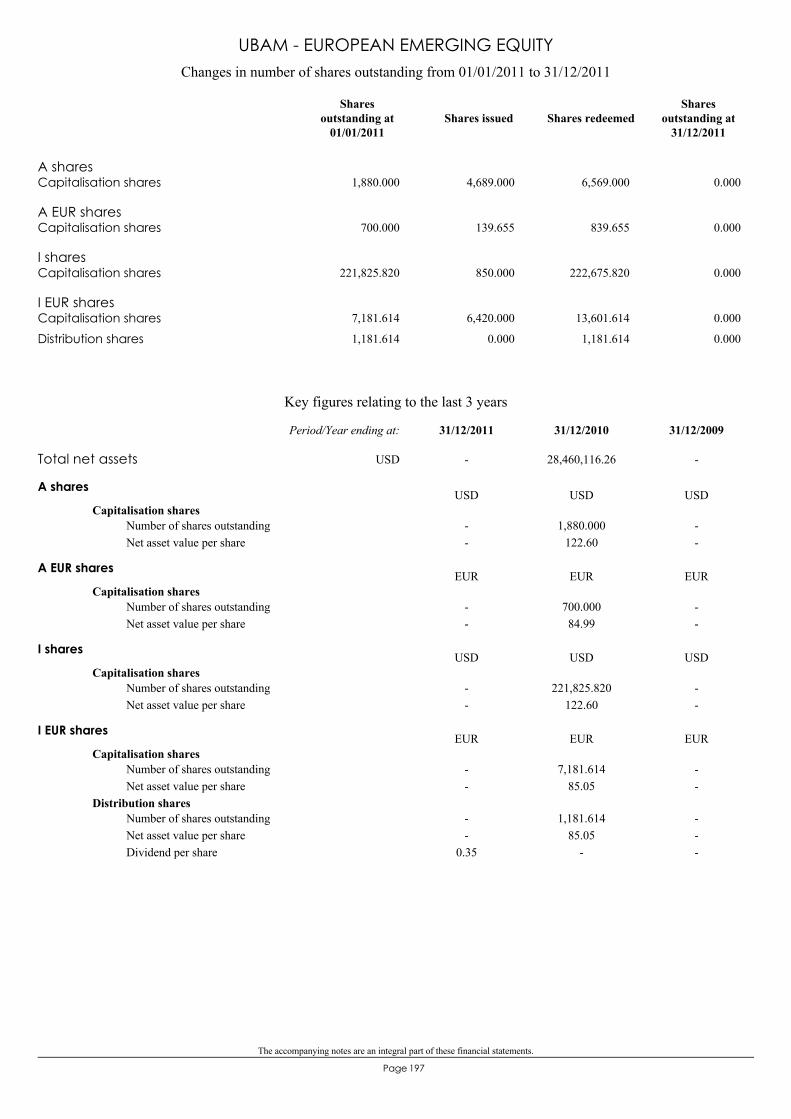
The accompanying notes are an integral part of these financial statements.
197Page
A sharesCapitalisation shares 1,880.000 4,689.000 6,569.000 0.000
A EUR sharesCapitalisation shares 700.000 139.655 839.655 0.000
I sharesCapitalisation shares 221,825.820 850.000 222,675.820 0.000
I EUR sharesCapitalisation shares 7,181.614 6,420.000 13,601.614 0.000
Distribution shares 1,181.614 0.000 1,181.614 0.000
Changes in number of shares outstanding from 01/01/2011 to 31/12/2011
Shares issued Shares redeemedShares
outstanding at31/12/2011
Sharesoutstanding at
01/01/2011
UBAM - EUROPEAN EMERGING EQUITY
Key figures relating to the last 3 years
A shares
Capitalisation shares--
1,880.000122.60
--
Number of shares outstandingNet asset value per share
USD USD USD
A EUR shares
Capitalisation shares--
700.00084.99
--
Number of shares outstandingNet asset value per share
EUR EUR EUR
I shares
Capitalisation shares--
221,825.820122.60
--
Number of shares outstandingNet asset value per share
USD USD USD
I EUR shares
Capitalisation shares--
7,181.61485.05
--
Number of shares outstandingNet asset value per share
Distribution shares--
0.35
1,181.61485.05
-
---
Number of shares outstandingNet asset value per shareDividend per share
EUR EUR EUR
Total net assets - 28,460,116.26 -
31/12/200931/12/201031/12/2011Period/Year ending at:
USD
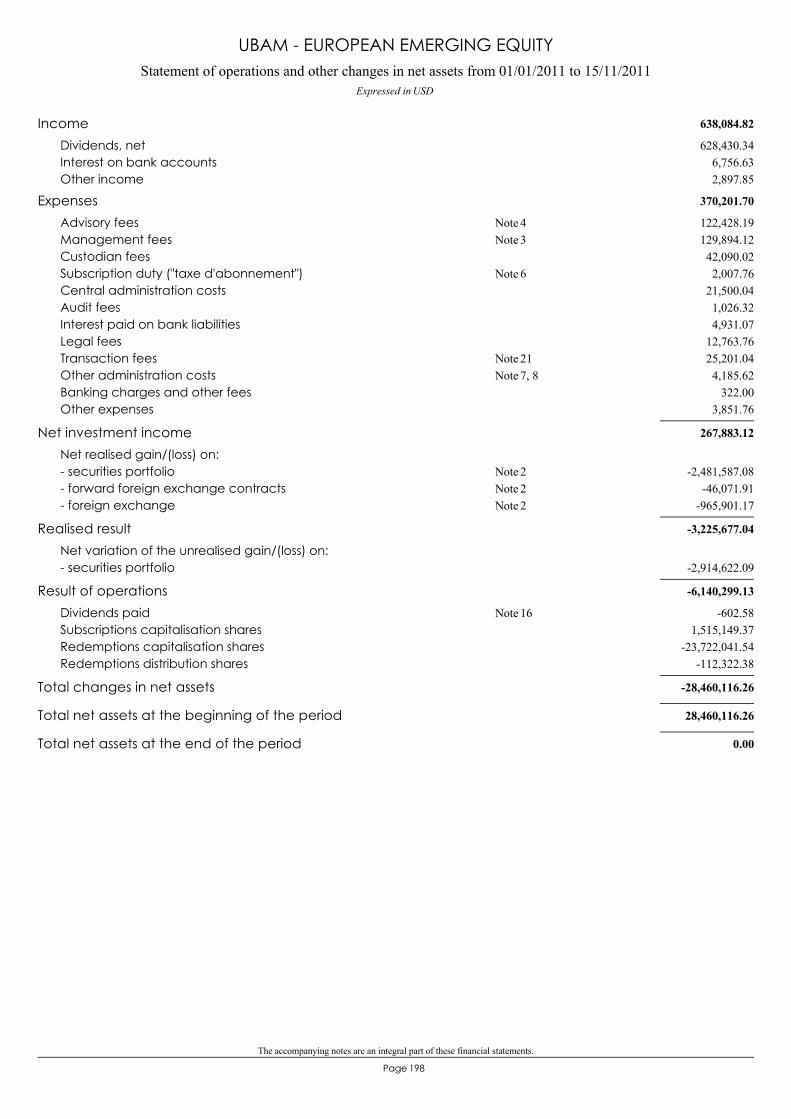
The accompanying notes are an integral part of these financial statements.
198Page
Statement of operations and other changes in net assets from 01/01/2011 to 15/11/2011Expressed in USD
UBAM - EUROPEAN EMERGING EQUITY
638,084.82Income628,430.34Dividends, net
6,756.63Interest on bank accounts2,897.85Other income
370,201.70Expenses122,428.19Advisory fees 4Note129,894.12Management fees 3Note42,090.02Custodian fees2,007.76Subscription duty ("taxe d'abonnement") 6Note
21,500.04Central administration costs1,026.32Audit fees4,931.07Interest paid on bank liabilities
12,763.76Legal fees25,201.04Transaction fees 21Note4,185.62Other administration costs 7, 8Note
322.00Banking charges and other fees3,851.76Other expenses
267,883.12Net investment incomeNet realised gain/(loss) on:
-2,481,587.08- securities portfolio 2Note-46,071.91- forward foreign exchange contracts 2Note
-965,901.17- foreign exchange 2Note
-3,225,677.04Realised resultNet variation of the unrealised gain/(loss) on:
-2,914,622.09- securities portfolio
-6,140,299.13Result of operations-602.58Dividends paid 16Note
1,515,149.37Subscriptions capitalisation shares-23,722,041.54Redemptions capitalisation shares
-112,322.38Redemptions distribution shares
-28,460,116.26Total changes in net assets
28,460,116.26Total net assets at the beginning of the period
0.00Total net assets at the end of the period
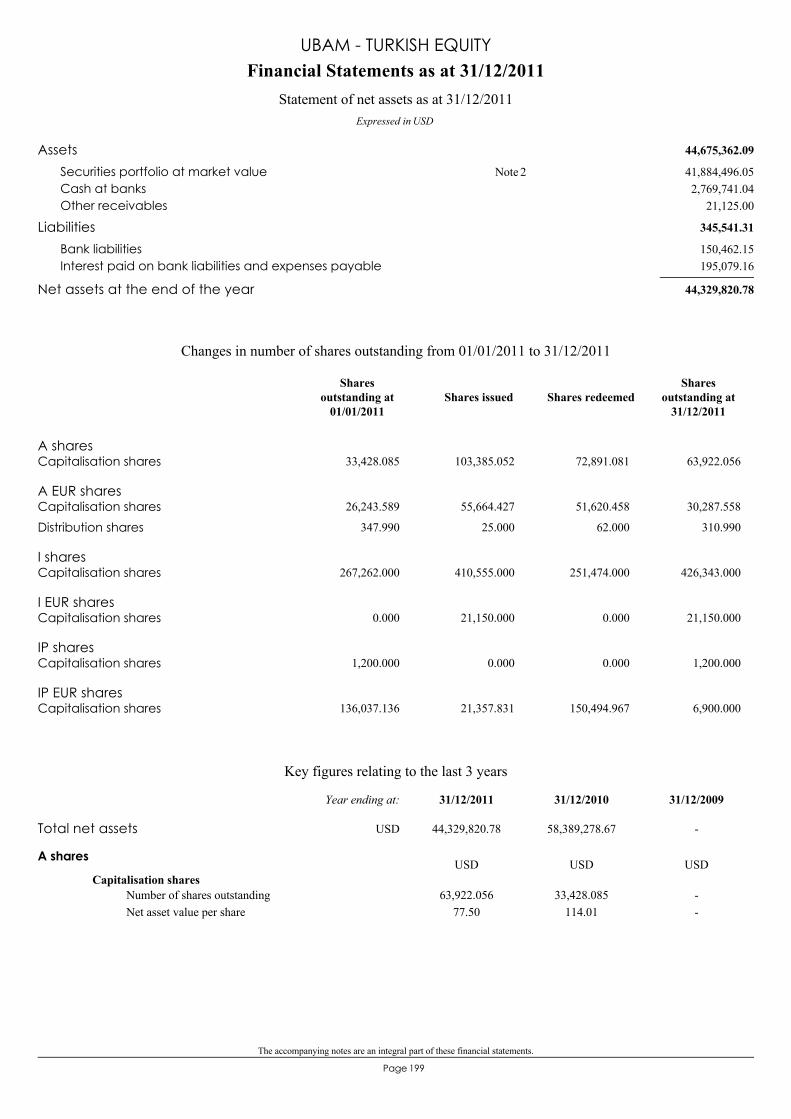
The accompanying notes are an integral part of these financial statements.
199Page
44,675,362.09Assets41,884,496.05Securities portfolio at market value 2Note2,769,741.04Cash at banks
21,125.00Other receivables
345,541.31Liabilities150,462.15Bank liabilities195,079.16Interest paid on bank liabilities and expenses payable
44,329,820.78Net assets at the end of the year
Financial Statements as at 31/12/2011
Expressed in USD
Statement of net assets as at 31/12/2011
UBAM - TURKISH EQUITY
A sharesCapitalisation shares 33,428.085 103,385.052 72,891.081 63,922.056
A EUR sharesCapitalisation shares 26,243.589 55,664.427 51,620.458 30,287.558
Distribution shares 347.990 25.000 62.000 310.990
I sharesCapitalisation shares 267,262.000 410,555.000 251,474.000 426,343.000
I EUR sharesCapitalisation shares 0.000 21,150.000 0.000 21,150.000
IP sharesCapitalisation shares 1,200.000 0.000 0.000 1,200.000
IP EUR sharesCapitalisation shares 136,037.136 21,357.831 150,494.967 6,900.000
Changes in number of shares outstanding from 01/01/2011 to 31/12/2011
Shares issued Shares redeemedShares
outstanding at31/12/2011
Sharesoutstanding at
01/01/2011
Key figures relating to the last 3 years
A shares
Capitalisation shares63,922.056
77.5033,428.085
114.01--
Number of shares outstandingNet asset value per share
USD USD USD
Total net assets 44,329,820.78 58,389,278.67 -
31/12/200931/12/201031/12/2011Year ending at:
USD
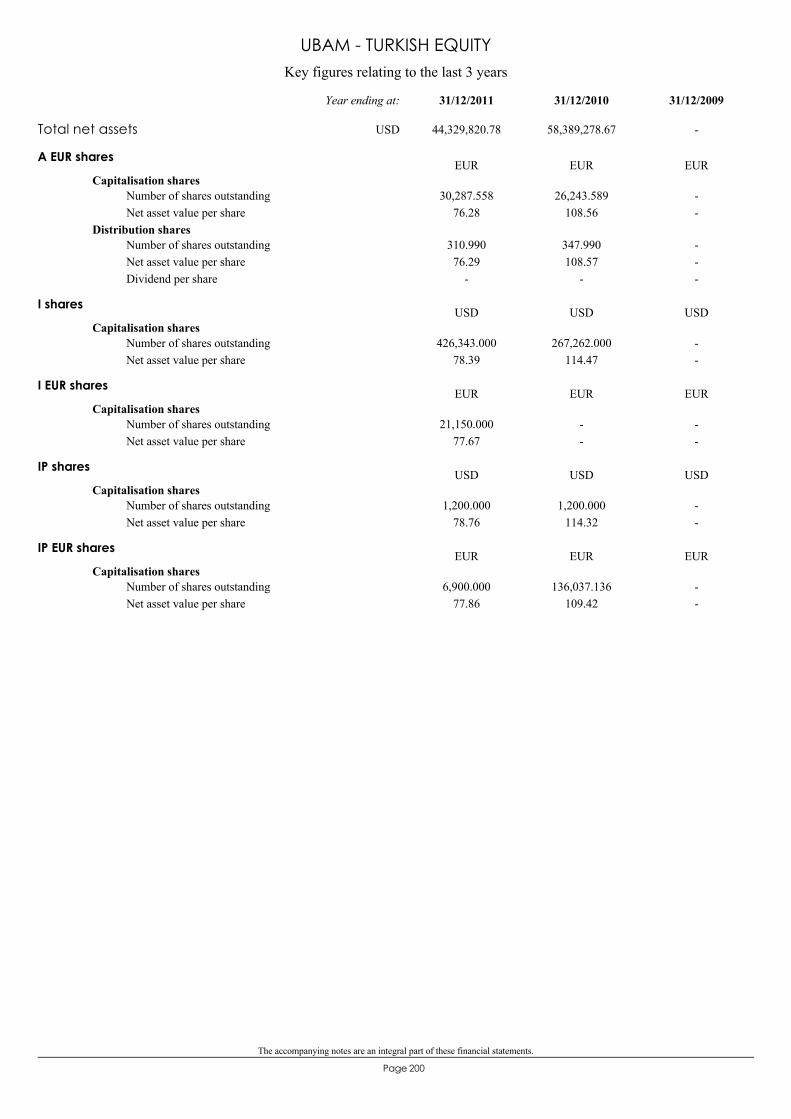
The accompanying notes are an integral part of these financial statements.
200Page
Key figures relating to the last 3 years
UBAM - TURKISH EQUITY
A EUR shares
Capitalisation shares30,287.558
76.2826,243.589
108.56--
Number of shares outstandingNet asset value per share
Distribution shares310.99076.29
-
347.990108.57
-
---
Number of shares outstandingNet asset value per shareDividend per share
EUR EUR EUR
I shares
Capitalisation shares426,343.000
78.39267,262.000
114.47--
Number of shares outstandingNet asset value per share
USD USD USD
I EUR shares
Capitalisation shares21,150.000
77.67--
--
Number of shares outstandingNet asset value per share
EUR EUR EUR
IP shares
Capitalisation shares1,200.000
78.761,200.000
114.32--
Number of shares outstandingNet asset value per share
USD USD USD
IP EUR shares
Capitalisation shares6,900.000
77.86136,037.136
109.42--
Number of shares outstandingNet asset value per share
EUR EUR EUR
Total net assets 44,329,820.78 58,389,278.67 -
31/12/200931/12/201031/12/2011Year ending at:
USD
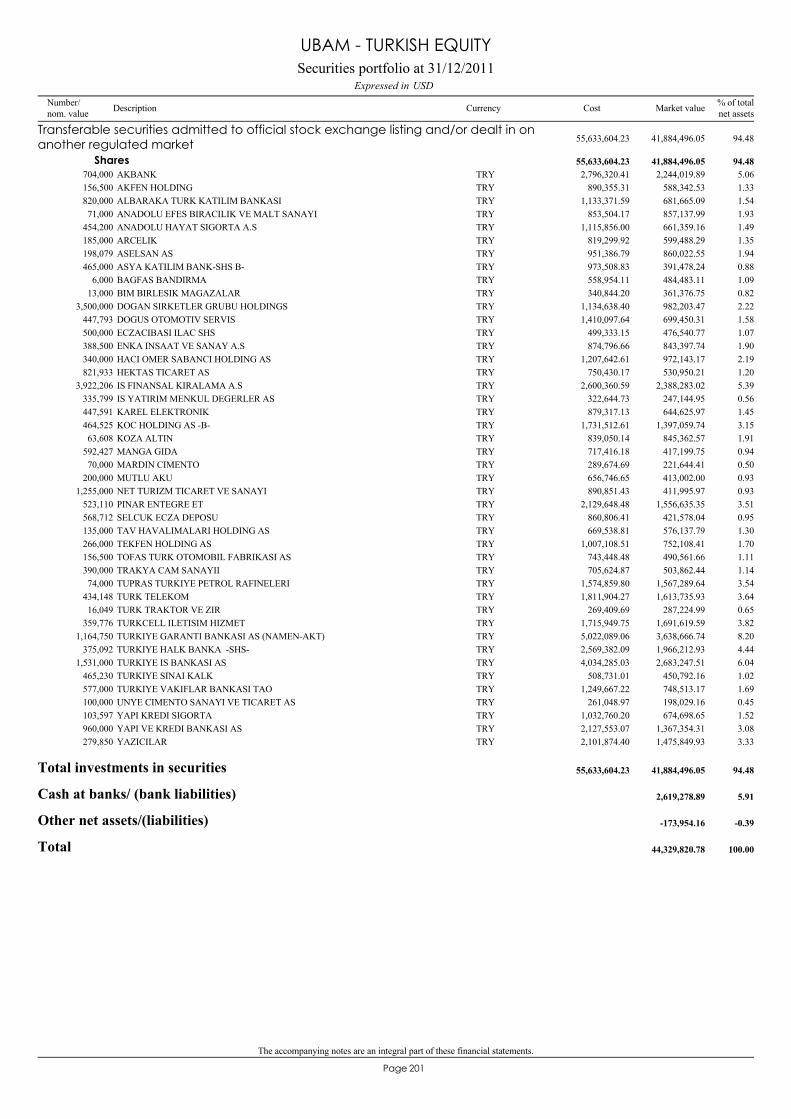
The accompanying notes are an integral part of these financial statements.
201Page
AKBANK704,000 2,244,019.89 5.06TRY 2,796,320.41
Transferable securities admitted to official stock exchange listing and/or dealt in onanother regulated market 41,884,496.05 94.4855,633,604.23
Shares 41,884,496.05 94.4855,633,604.23
AKFEN HOLDING156,500 588,342.53 1.33TRY 890,355.31ALBARAKA TURK KATILIM BANKASI820,000 681,665.09 1.54TRY 1,133,371.59ANADOLU EFES BIRACILIK VE MALT SANAYI71,000 857,137.99 1.93TRY 853,504.17ANADOLU HAYAT SIGORTA A.S454,200 661,359.16 1.49TRY 1,115,856.00ARCELIK185,000 599,488.29 1.35TRY 819,299.92ASELSAN AS198,079 860,022.55 1.94TRY 951,386.79ASYA KATILIM BANK-SHS B-465,000 391,478.24 0.88TRY 973,508.83BAGFAS BANDIRMA6,000 484,483.11 1.09TRY 558,954.11BIM BIRLESIK MAGAZALAR13,000 361,376.75 0.82TRY 340,844.20DOGAN SIRKETLER GRUBU HOLDINGS3,500,000 982,203.47 2.22TRY 1,134,638.40DOGUS OTOMOTIV SERVIS447,793 699,450.31 1.58TRY 1,410,097.64ECZACIBASI ILAC SHS500,000 476,540.77 1.07TRY 499,333.15ENKA INSAAT VE SANAY A.S388,500 843,397.74 1.90TRY 874,796.66HACI OMER SABANCI HOLDING AS340,000 972,143.17 2.19TRY 1,207,642.61HEKTAS TICARET AS821,933 530,950.21 1.20TRY 750,430.17IS FINANSAL KIRALAMA A.S3,922,206 2,388,283.02 5.39TRY 2,600,360.59IS YATIRIM MENKUL DEGERLER AS335,799 247,144.95 0.56TRY 322,644.73KAREL ELEKTRONIK447,591 644,625.97 1.45TRY 879,317.13KOC HOLDING AS -B-464,525 1,397,059.74 3.15TRY 1,731,512.61KOZA ALTIN63,608 845,362.57 1.91TRY 839,050.14MANGA GIDA592,427 417,199.75 0.94TRY 717,416.18MARDIN CIMENTO70,000 221,644.41 0.50TRY 289,674.69MUTLU AKU200,000 413,002.00 0.93TRY 656,746.65NET TURIZM TICARET VE SANAYI1,255,000 411,995.97 0.93TRY 890,851.43PINAR ENTEGRE ET523,110 1,556,635.35 3.51TRY 2,129,648.48SELCUK ECZA DEPOSU568,712 421,578.04 0.95TRY 860,806.41TAV HAVALIMALARI HOLDING AS135,000 576,137.79 1.30TRY 669,538.81TEKFEN HOLDING AS266,000 752,108.41 1.70TRY 1,007,108.51TOFAS TURK OTOMOBIL FABRIKASI AS156,500 490,561.66 1.11TRY 743,448.48TRAKYA CAM SANAYII390,000 503,862.44 1.14TRY 705,624.87TUPRAS TURKIYE PETROL RAFINELERI74,000 1,567,289.64 3.54TRY 1,574,859.80TURK TELEKOM434,148 1,613,735.93 3.64TRY 1,811,904.27TURK TRAKTOR VE ZIR16,049 287,224.99 0.65TRY 269,409.69TURKCELL ILETISIM HIZMET359,776 1,691,619.59 3.82TRY 1,715,949.75TURKIYE GARANTI BANKASI AS (NAMEN-AKT)1,164,750 3,638,666.74 8.20TRY 5,022,089.06TURKIYE HALK BANKA -SHS-375,092 1,966,212.93 4.44TRY 2,569,382.09TURKIYE IS BANKASI AS1,531,000 2,683,247.51 6.04TRY 4,034,285.03TURKIYE SINAI KALK465,230 450,792.16 1.02TRY 508,731.01TURKIYE VAKIFLAR BANKASI TAO577,000 748,513.17 1.69TRY 1,249,667.22UNYE CIMENTO SANAYI VE TICARET AS100,000 198,029.16 0.45TRY 261,048.97YAPI KREDI SIGORTA103,597 674,698.65 1.52TRY 1,032,760.20YAPI VE KREDI BANKASI AS960,000 1,367,354.31 3.08TRY 2,127,553.07YAZICILAR279,850 1,475,849.93 3.33TRY 2,101,874.40
Total investments in securities 41,884,496.05 94.4855,633,604.23
Cash at banks/ (bank liabilities) 2,619,278.89 5.91
Other net assets/(liabilities) -173,954.16 -0.39
Total 44,329,820.78 100.00
Securities portfolio at 31/12/2011USDExpressed in
UBAM - TURKISH EQUITY
Number/nom. value Description Currency % of total
net assetsMarket valueCost
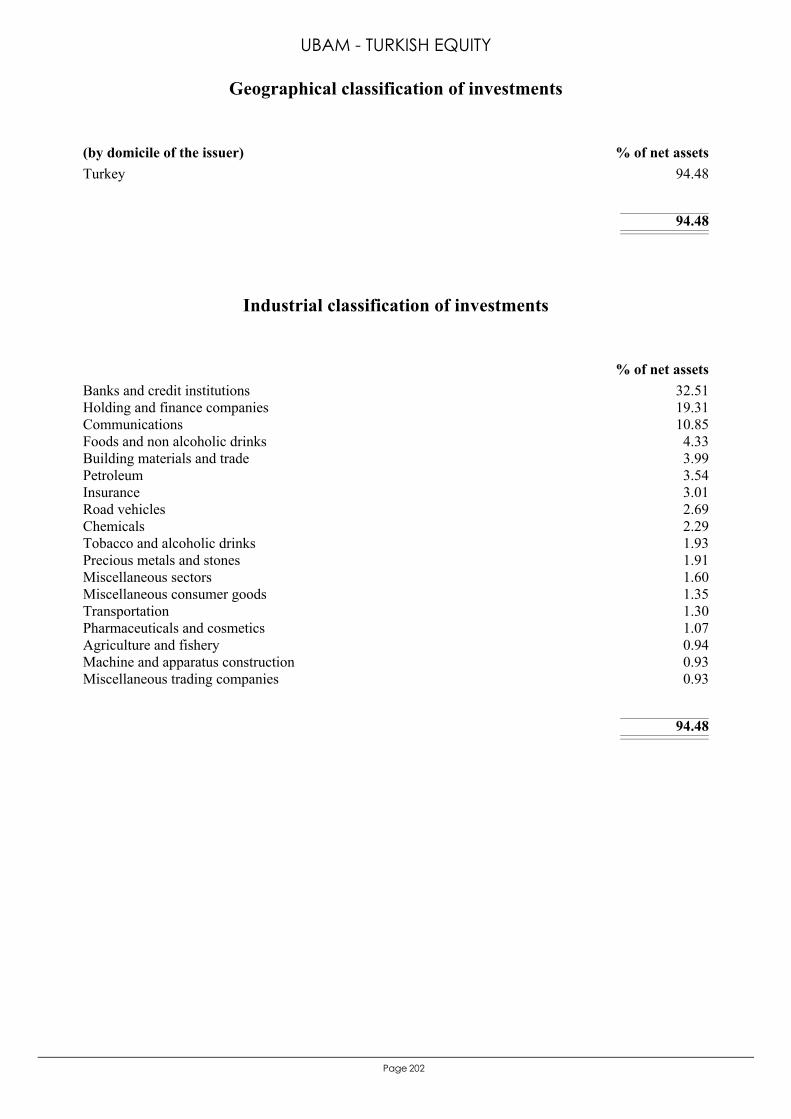
202Page
Turkey 94.48
94.48
(by domicile of the issuer) % of net assets
Geographical classification of investments
UBAM - TURKISH EQUITY
Banks and credit institutions 32.51Holding and finance companies 19.31Communications 10.85Foods and non alcoholic drinks 4.33Building materials and trade 3.99Petroleum 3.54Insurance 3.01Road vehicles 2.69Chemicals 2.29Tobacco and alcoholic drinks 1.93Precious metals and stones 1.91Miscellaneous sectors 1.60Miscellaneous consumer goods 1.35Transportation 1.30Pharmaceuticals and cosmetics 1.07Agriculture and fishery 0.94Machine and apparatus construction 0.93Miscellaneous trading companies 0.93
94.48
% of net assets
Industrial classification of investments
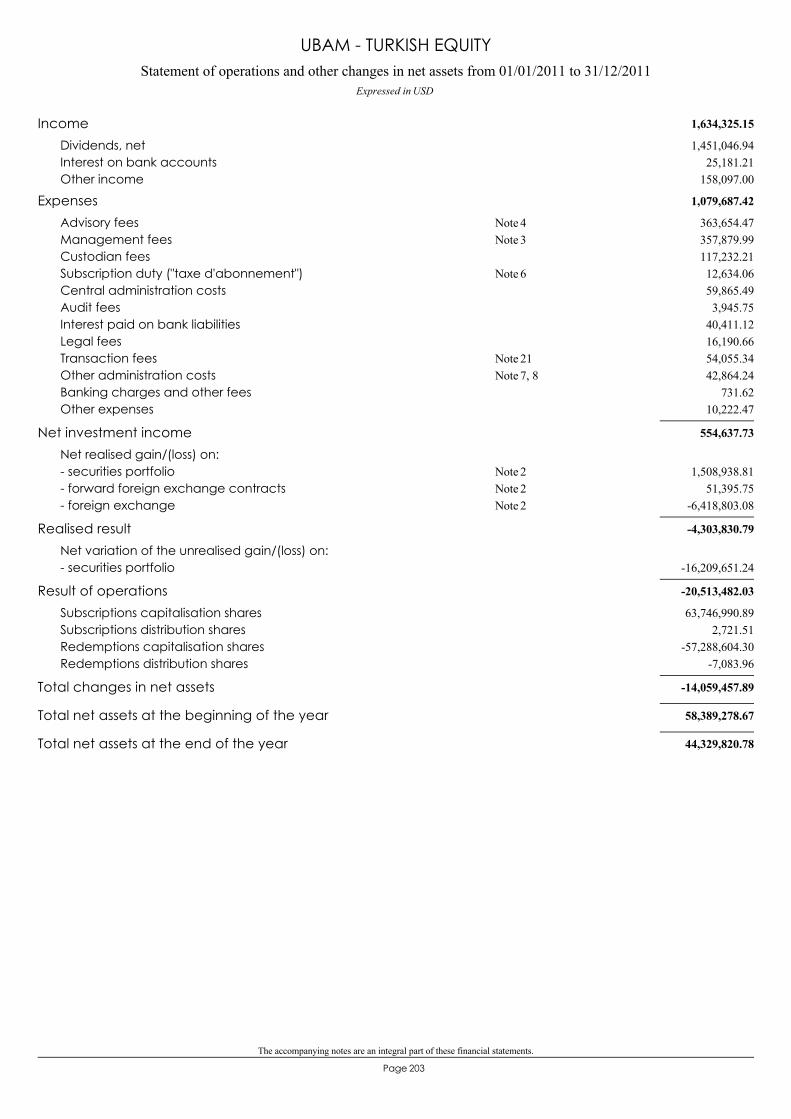
The accompanying notes are an integral part of these financial statements.
203Page
Statement of operations and other changes in net assets from 01/01/2011 to 31/12/2011Expressed in USD
UBAM - TURKISH EQUITY
1,634,325.15Income1,451,046.94Dividends, net
25,181.21Interest on bank accounts158,097.00Other income
1,079,687.42Expenses363,654.47Advisory fees 4Note357,879.99Management fees 3Note117,232.21Custodian fees12,634.06Subscription duty ("taxe d'abonnement") 6Note59,865.49Central administration costs3,945.75Audit fees
40,411.12Interest paid on bank liabilities16,190.66Legal fees54,055.34Transaction fees 21Note42,864.24Other administration costs 7, 8Note
731.62Banking charges and other fees10,222.47Other expenses
554,637.73Net investment incomeNet realised gain/(loss) on:
1,508,938.81- securities portfolio 2Note51,395.75- forward foreign exchange contracts 2Note
-6,418,803.08- foreign exchange 2Note
-4,303,830.79Realised resultNet variation of the unrealised gain/(loss) on:
-16,209,651.24- securities portfolio
-20,513,482.03Result of operations63,746,990.89Subscriptions capitalisation shares
2,721.51Subscriptions distribution shares-57,288,604.30Redemptions capitalisation shares
-7,083.96Redemptions distribution shares
-14,059,457.89Total changes in net assets
58,389,278.67Total net assets at the beginning of the year
44,329,820.78Total net assets at the end of the year
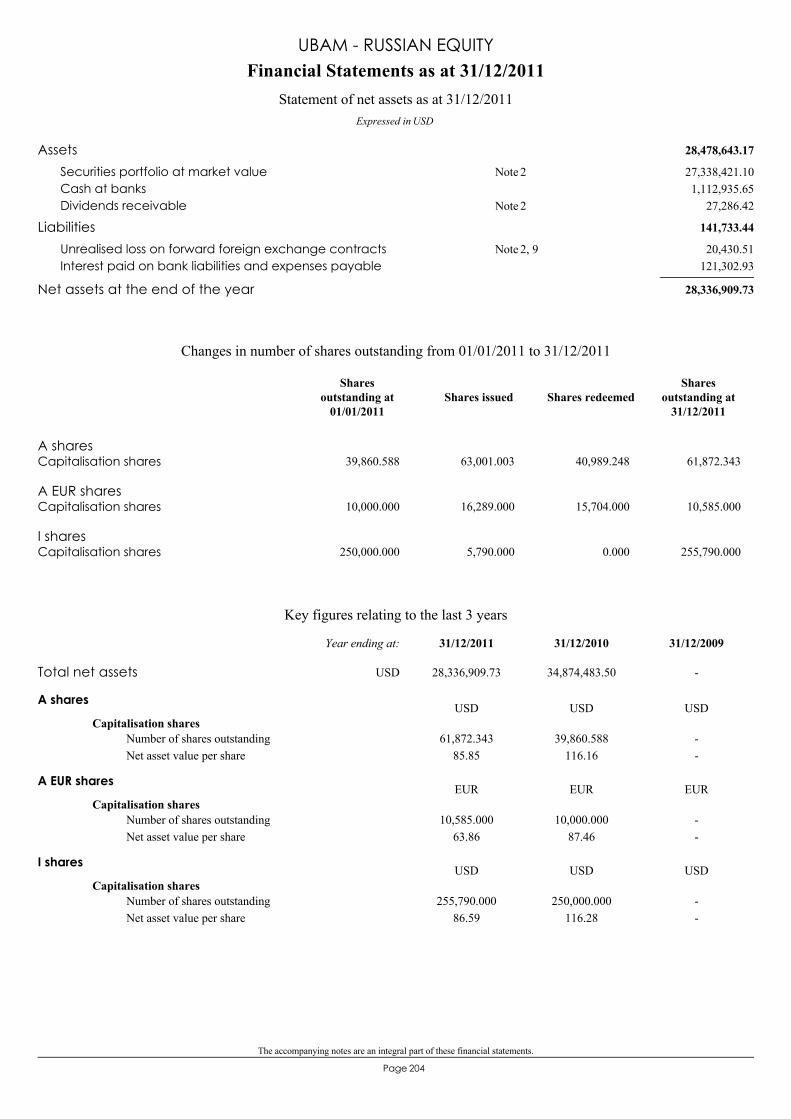
The accompanying notes are an integral part of these financial statements.
204Page
28,478,643.17Assets27,338,421.10Securities portfolio at market value 2Note1,112,935.65Cash at banks
27,286.42Dividends receivable 2Note
141,733.44Liabilities20,430.51Unrealised loss on forward foreign exchange contracts 2, 9Note
121,302.93Interest paid on bank liabilities and expenses payable
28,336,909.73Net assets at the end of the year
Financial Statements as at 31/12/2011
Expressed in USD
Statement of net assets as at 31/12/2011
UBAM - RUSSIAN EQUITY
A sharesCapitalisation shares 39,860.588 63,001.003 40,989.248 61,872.343
A EUR sharesCapitalisation shares 10,000.000 16,289.000 15,704.000 10,585.000
I sharesCapitalisation shares 250,000.000 5,790.000 0.000 255,790.000
Changes in number of shares outstanding from 01/01/2011 to 31/12/2011
Shares issued Shares redeemedShares
outstanding at31/12/2011
Sharesoutstanding at
01/01/2011
Key figures relating to the last 3 years
A shares
Capitalisation shares61,872.343
85.8539,860.588
116.16--
Number of shares outstandingNet asset value per share
USD USD USD
A EUR shares
Capitalisation shares10,585.000
63.8610,000.000
87.46--
Number of shares outstandingNet asset value per share
EUR EUR EUR
I shares
Capitalisation shares255,790.000
86.59250,000.000
116.28--
Number of shares outstandingNet asset value per share
USD USD USD
Total net assets 28,336,909.73 34,874,483.50 -
31/12/200931/12/201031/12/2011Year ending at:
USD
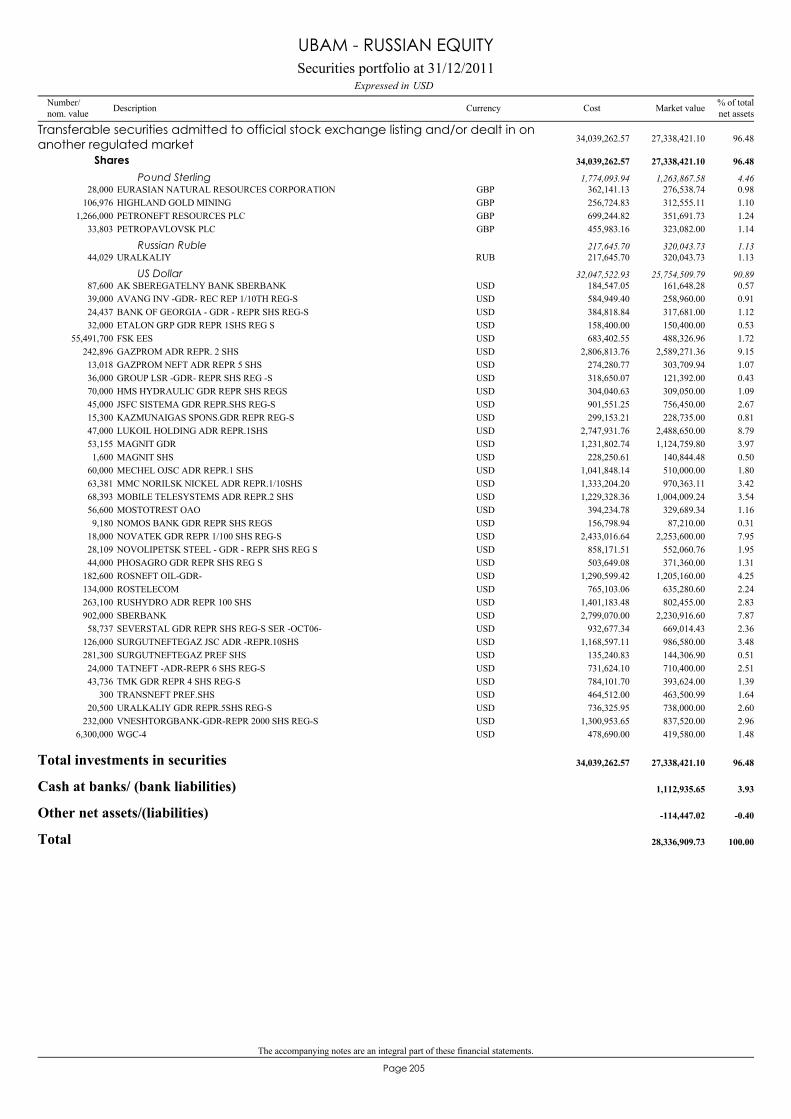
The accompanying notes are an integral part of these financial statements.
205Page
EURASIAN NATURAL RESOURCES CORPORATION28,000 276,538.74 0.98GBP 362,141.13
Transferable securities admitted to official stock exchange listing and/or dealt in onanother regulated market 27,338,421.10 96.4834,039,262.57
Shares 27,338,421.10 96.4834,039,262.57
Pound Sterling 1,263,867.58 4.461,774,093.94
HIGHLAND GOLD MINING106,976 312,555.11 1.10GBP 256,724.83PETRONEFT RESOURCES PLC1,266,000 351,691.73 1.24GBP 699,244.82PETROPAVLOVSK PLC33,803 323,082.00 1.14GBP 455,983.16
URALKALIY44,029 320,043.73 1.13RUB 217,645.70Russian Ruble 320,043.73 1.13217,645.70
AK SBEREGATELNY BANK SBERBANK87,600 161,648.28 0.57USD 184,547.05US Dollar 25,754,509.79 90.8932,047,522.93
AVANG INV -GDR- REC REP 1/10TH REG-S39,000 258,960.00 0.91USD 584,949.40BANK OF GEORGIA - GDR - REPR SHS REG-S24,437 317,681.00 1.12USD 384,818.84ETALON GRP GDR REPR 1SHS REG S32,000 150,400.00 0.53USD 158,400.00FSK EES55,491,700 488,326.96 1.72USD 683,402.55GAZPROM ADR REPR. 2 SHS242,896 2,589,271.36 9.15USD 2,806,813.76GAZPROM NEFT ADR REPR 5 SHS13,018 303,709.94 1.07USD 274,280.77GROUP LSR -GDR- REPR SHS REG -S36,000 121,392.00 0.43USD 318,650.07HMS HYDRAULIC GDR REPR SHS REGS70,000 309,050.00 1.09USD 304,040.63JSFC SISTEMA GDR REPR.SHS REG-S45,000 756,450.00 2.67USD 901,551.25KAZMUNAIGAS SPONS.GDR REPR REG-S15,300 228,735.00 0.81USD 299,153.21LUKOIL HOLDING ADR REPR.1SHS47,000 2,488,650.00 8.79USD 2,747,931.76MAGNIT GDR53,155 1,124,759.80 3.97USD 1,231,802.74MAGNIT SHS1,600 140,844.48 0.50USD 228,250.61MECHEL OJSC ADR REPR.1 SHS60,000 510,000.00 1.80USD 1,041,848.14MMC NORILSK NICKEL ADR REPR.1/10SHS63,381 970,363.11 3.42USD 1,333,204.20MOBILE TELESYSTEMS ADR REPR.2 SHS68,393 1,004,009.24 3.54USD 1,229,328.36MOSTOTREST OAO56,600 329,689.34 1.16USD 394,234.78NOMOS BANK GDR REPR SHS REGS9,180 87,210.00 0.31USD 156,798.94NOVATEK GDR REPR 1/100 SHS REG-S18,000 2,253,600.00 7.95USD 2,433,016.64NOVOLIPETSK STEEL - GDR - REPR SHS REG S28,109 552,060.76 1.95USD 858,171.51PHOSAGRO GDR REPR SHS REG S44,000 371,360.00 1.31USD 503,649.08ROSNEFT OIL-GDR-182,600 1,205,160.00 4.25USD 1,290,599.42ROSTELECOM134,000 635,280.60 2.24USD 765,103.06RUSHYDRO ADR REPR 100 SHS263,100 802,455.00 2.83USD 1,401,183.48SBERBANK902,000 2,230,916.60 7.87USD 2,799,070.00SEVERSTAL GDR REPR SHS REG-S SER -OCT06-58,737 669,014.43 2.36USD 932,677.34SURGUTNEFTEGAZ JSC ADR -REPR.10SHS126,000 986,580.00 3.48USD 1,168,597.11SURGUTNEFTEGAZ PREF SHS281,300 144,306.90 0.51USD 135,240.83TATNEFT -ADR-REPR 6 SHS REG-S24,000 710,400.00 2.51USD 731,624.10TMK GDR REPR 4 SHS REG-S43,736 393,624.00 1.39USD 784,101.70TRANSNEFT PREF.SHS300 463,500.99 1.64USD 464,512.00URALKALIY GDR REPR.5SHS REG-S20,500 738,000.00 2.60USD 736,325.95VNESHTORGBANK-GDR-REPR 2000 SHS REG-S232,000 837,520.00 2.96USD 1,300,953.65WGC-46,300,000 419,580.00 1.48USD 478,690.00
Total investments in securities 27,338,421.10 96.4834,039,262.57
Cash at banks/ (bank liabilities) 1,112,935.65 3.93
Other net assets/(liabilities) -114,447.02 -0.40
Total 28,336,909.73 100.00
Securities portfolio at 31/12/2011USDExpressed in
UBAM - RUSSIAN EQUITY
Number/nom. value Description Currency % of total
net assetsMarket valueCost
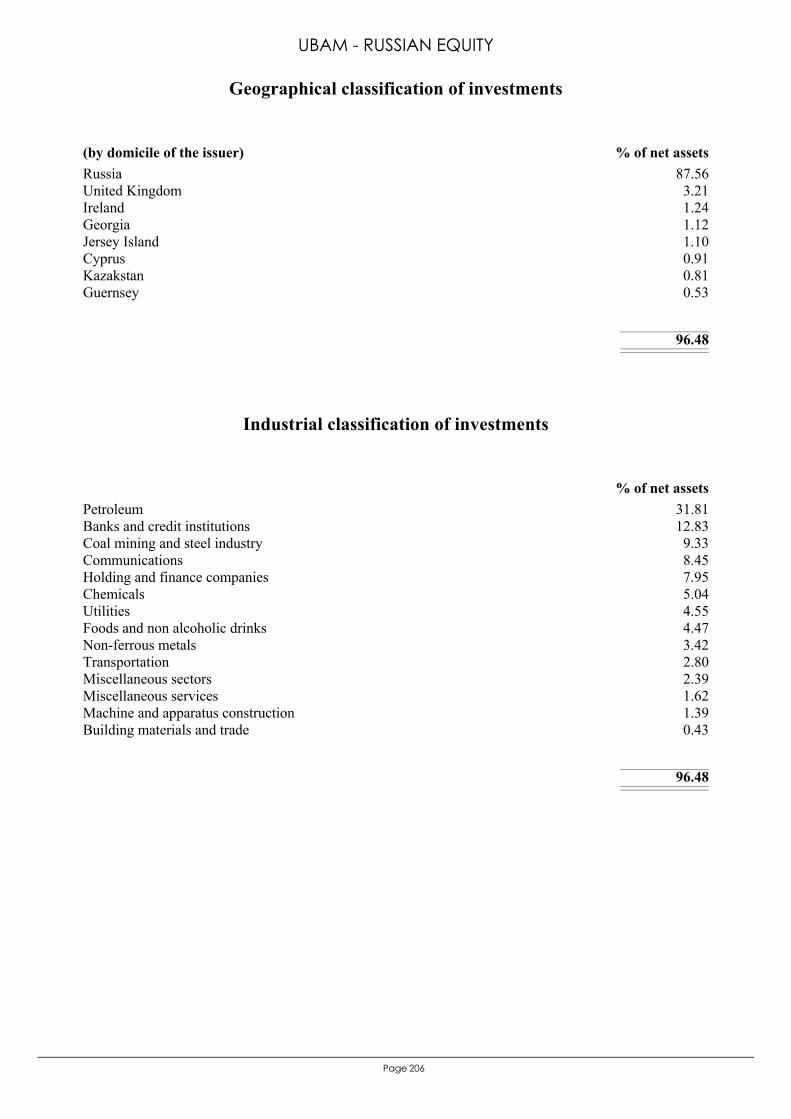
206Page
Russia 87.56United Kingdom 3.21Ireland 1.24Georgia 1.12Jersey Island 1.10Cyprus 0.91Kazakstan 0.81Guernsey 0.53
96.48
(by domicile of the issuer) % of net assets
Geographical classification of investments
UBAM - RUSSIAN EQUITY
Petroleum 31.81Banks and credit institutions 12.83Coal mining and steel industry 9.33Communications 8.45Holding and finance companies 7.95Chemicals 5.04Utilities 4.55Foods and non alcoholic drinks 4.47Non-ferrous metals 3.42Transportation 2.80Miscellaneous sectors 2.39Miscellaneous services 1.62Machine and apparatus construction 1.39Building materials and trade 0.43
96.48
% of net assets
Industrial classification of investments

The accompanying notes are an integral part of these financial statements.
207Page
Statement of operations and other changes in net assets from 01/01/2011 to 31/12/2011Expressed in USD
UBAM - RUSSIAN EQUITY
694,985.71Income693,372.56Dividends, net
52.59Interest on bank accounts1,560.56Other income
758,190.69Expenses280,303.83Advisory fees 4Note245,014.60Management fees 3Note97,487.06Custodian fees7,871.09Subscription duty ("taxe d'abonnement") 6Note
38,973.24Central administration costs4,160.34Audit fees
43.84Interest paid on bank liabilities3,558.33Legal fees
41,699.01Transaction fees 21Note29,342.21Other administration costs 7, 8Note
121.41Banking charges and other fees9,615.73Other expenses
-63,204.98Net investment incomeNet realised gain/(loss) on:
-1,019,375.27- securities portfolio 2Note-67,980.10- forward foreign exchange contracts 2Note69,262.59- foreign exchange 2Note
-1,081,297.76Realised resultNet variation of the unrealised gain/(loss) on:
-10,440,335.39- securities portfolio-40,233.65- forward foreign exchange contracts
-11,561,866.80Result of operations10,566,377.32Subscriptions capitalisation shares-5,542,084.29Redemptions capitalisation shares
-6,537,573.77Total changes in net assets
34,874,483.50Total net assets at the beginning of the year
28,336,909.73Total net assets at the end of the year
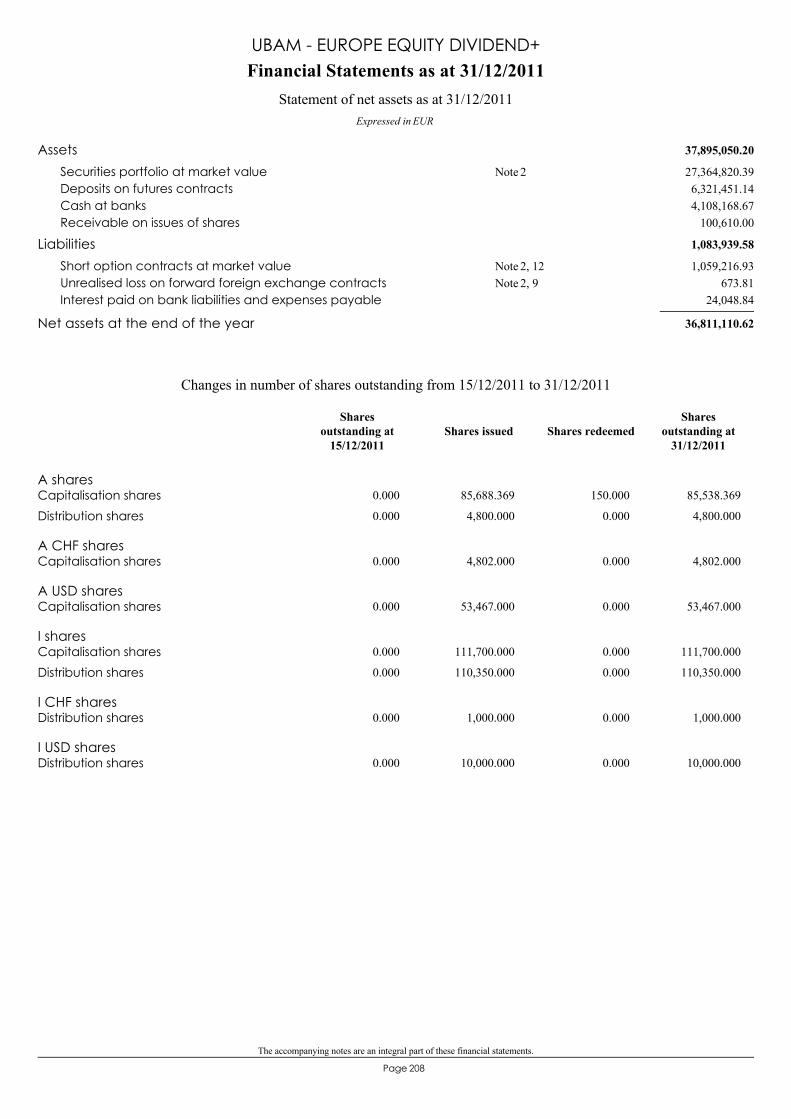
The accompanying notes are an integral part of these financial statements.
208Page
37,895,050.20Assets27,364,820.39Securities portfolio at market value 2Note6,321,451.14Deposits on futures contracts4,108,168.67Cash at banks
100,610.00Receivable on issues of shares
1,083,939.58Liabilities1,059,216.93Short option contracts at market value 2, 12Note
673.81Unrealised loss on forward foreign exchange contracts 2, 9Note24,048.84Interest paid on bank liabilities and expenses payable
36,811,110.62Net assets at the end of the year
Financial Statements as at 31/12/2011
Expressed in EUR
Statement of net assets as at 31/12/2011
UBAM - EUROPE EQUITY DIVIDEND+
A sharesCapitalisation shares 0.000 85,688.369 150.000 85,538.369
Distribution shares 0.000 4,800.000 0.000 4,800.000
A CHF sharesCapitalisation shares 0.000 4,802.000 0.000 4,802.000
A USD sharesCapitalisation shares 0.000 53,467.000 0.000 53,467.000
I sharesCapitalisation shares 0.000 111,700.000 0.000 111,700.000
Distribution shares 0.000 110,350.000 0.000 110,350.000
I CHF sharesDistribution shares 0.000 1,000.000 0.000 1,000.000
I USD sharesDistribution shares 0.000 10,000.000 0.000 10,000.000
Changes in number of shares outstanding from 15/12/2011 to 31/12/2011
Shares issued Shares redeemedShares
outstanding at31/12/2011
Sharesoutstanding at
15/12/2011
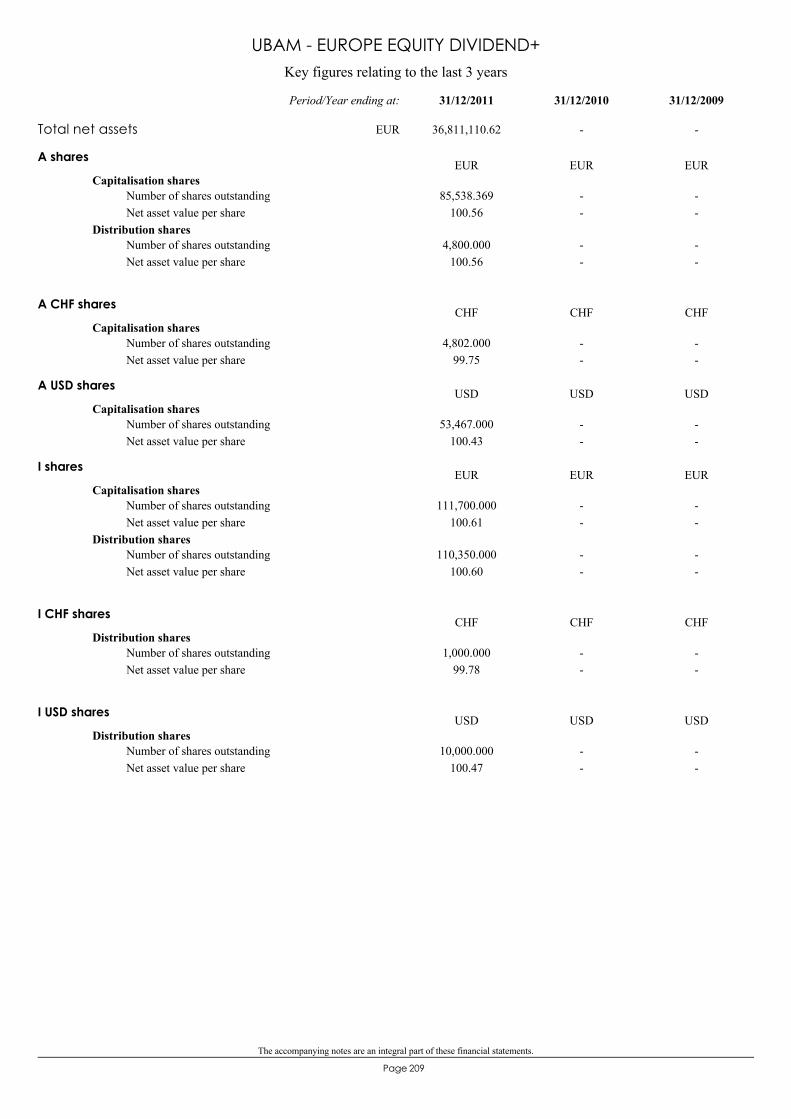
The accompanying notes are an integral part of these financial statements.
209Page
Key figures relating to the last 3 years
UBAM - EUROPE EQUITY DIVIDEND+
A shares
Capitalisation shares85,538.369
100.56--
--
Number of shares outstandingNet asset value per share
Distribution shares4,800.000
100.56--
--
Number of shares outstandingNet asset value per share
EUR EUR EUR
A CHF shares
Capitalisation shares4,802.000
99.75--
--
Number of shares outstandingNet asset value per share
CHF CHF CHF
A USD shares
Capitalisation shares53,467.000
100.43--
--
Number of shares outstandingNet asset value per share
USD USD USD
I shares
Capitalisation shares111,700.000
100.61--
--
Number of shares outstandingNet asset value per share
Distribution shares110,350.000
100.60--
--
Number of shares outstandingNet asset value per share
EUR EUR EUR
I CHF shares
Distribution shares1,000.000
99.78--
--
Number of shares outstandingNet asset value per share
CHF CHF CHF
I USD shares
Distribution shares10,000.000
100.47--
--
Number of shares outstandingNet asset value per share
USD USD USD
Total net assets 36,811,110.62 - -
31/12/200931/12/201031/12/2011Period/Year ending at:
EUR
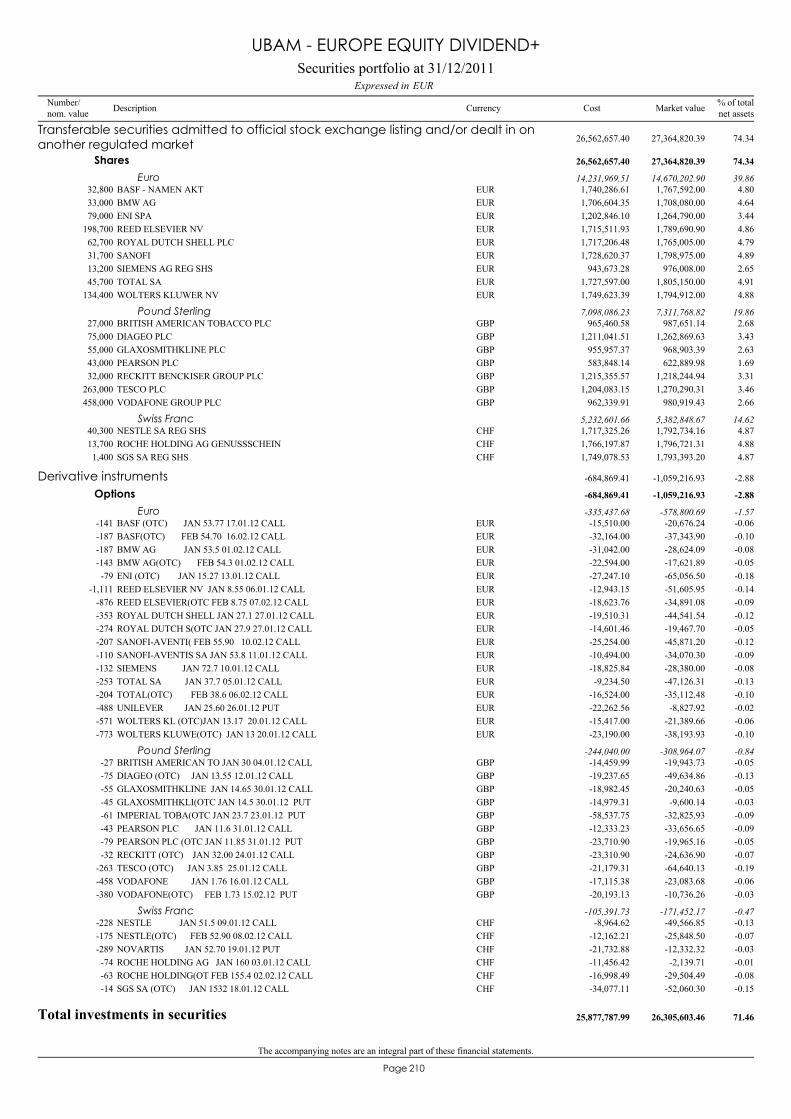
The accompanying notes are an integral part of these financial statements.
210Page
BASF - NAMEN AKT32,800 1,767,592.00 4.80EUR 1,740,286.61
Transferable securities admitted to official stock exchange listing and/or dealt in onanother regulated market 27,364,820.39 74.3426,562,657.40
Shares 27,364,820.39 74.3426,562,657.40
Euro 14,670,202.90 39.8614,231,969.51
BMW AG33,000 1,708,080.00 4.64EUR 1,706,604.35ENI SPA79,000 1,264,790.00 3.44EUR 1,202,846.10REED ELSEVIER NV198,700 1,789,690.90 4.86EUR 1,715,511.93ROYAL DUTCH SHELL PLC62,700 1,765,005.00 4.79EUR 1,717,206.48SANOFI31,700 1,798,975.00 4.89EUR 1,728,620.37SIEMENS AG REG SHS13,200 976,008.00 2.65EUR 943,673.28TOTAL SA45,700 1,805,150.00 4.91EUR 1,727,597.00WOLTERS KLUWER NV134,400 1,794,912.00 4.88EUR 1,749,623.39
BRITISH AMERICAN TOBACCO PLC27,000 987,651.14 2.68GBP 965,460.58Pound Sterling 7,311,768.82 19.867,098,086.23
DIAGEO PLC75,000 1,262,869.63 3.43GBP 1,211,041.51GLAXOSMITHKLINE PLC55,000 968,903.39 2.63GBP 955,957.37PEARSON PLC43,000 622,889.98 1.69GBP 583,848.14RECKITT BENCKISER GROUP PLC32,000 1,218,244.94 3.31GBP 1,215,355.57TESCO PLC263,000 1,270,290.31 3.46GBP 1,204,083.15VODAFONE GROUP PLC458,000 980,919.43 2.66GBP 962,339.91
NESTLE SA REG SHS40,300 1,792,734.16 4.87CHF 1,717,325.26Swiss Franc 5,382,848.67 14.625,232,601.66
ROCHE HOLDING AG GENUSSSCHEIN13,700 1,796,721.31 4.88CHF 1,766,197.87SGS SA REG SHS1,400 1,793,393.20 4.87CHF 1,749,078.53
BASF (OTC) JAN 53.77 17.01.12 CALL-141 -20,676.24 -0.06EUR -15,510.00
Derivative instruments -1,059,216.93 -2.88-684,869.41
Options -1,059,216.93 -2.88-684,869.41
Euro -578,800.69 -1.57-335,437.68
BASF(OTC) FEB 54.70 16.02.12 CALL-187 -37,343.90 -0.10EUR -32,164.00BMW AG JAN 53.5 01.02.12 CALL-187 -28,624.09 -0.08EUR -31,042.00BMW AG(OTC) FEB 54.3 01.02.12 CALL-143 -17,621.89 -0.05EUR -22,594.00ENI (OTC) JAN 15.27 13.01.12 CALL-79 -65,056.50 -0.18EUR -27,247.10REED ELSEVIER NV JAN 8.55 06.01.12 CALL-1,111 -51,605.95 -0.14EUR -12,943.15REED ELSEVIER(OTC FEB 8.75 07.02.12 CALL-876 -34,891.08 -0.09EUR -18,623.76ROYAL DUTCH SHELL JAN 27.1 27.01.12 CALL-353 -44,541.54 -0.12EUR -19,510.31ROYAL DUTCH S(OTC JAN 27.9 27.01.12 CALL-274 -19,467.70 -0.05EUR -14,601.46SANOFI-AVENTI( FEB 55.90 10.02.12 CALL-207 -45,871.20 -0.12EUR -25,254.00SANOFI-AVENTIS SA JAN 53.8 11.01.12 CALL-110 -34,070.30 -0.09EUR -10,494.00SIEMENS JAN 72.7 10.01.12 CALL-132 -28,380.00 -0.08EUR -18,825.84TOTAL SA JAN 37.7 05.01.12 CALL-253 -47,126.31 -0.13EUR -9,234.50TOTAL(OTC) FEB 38.6 06.02.12 CALL-204 -35,112.48 -0.10EUR -16,524.00UNILEVER JAN 25.60 26.01.12 PUT-488 -8,827.92 -0.02EUR -22,262.56WOLTERS KL (OTC)JAN 13.17 20.01.12 CALL-571 -21,389.66 -0.06EUR -15,417.00WOLTERS KLUWE(OTC) JAN 13 20.01.12 CALL-773 -38,193.93 -0.10EUR -23,190.00
BRITISH AMERICAN TO JAN 30 04.01.12 CALL-27 -19,943.73 -0.05GBP -14,459.99Pound Sterling -308,964.07 -0.84-244,040.00
DIAGEO (OTC) JAN 13.55 12.01.12 CALL-75 -49,634.86 -0.13GBP -19,237.65GLAXOSMITHKLINE JAN 14.65 30.01.12 CALL-55 -20,240.63 -0.05GBP -18,982.45GLAXOSMITHKLI(OTC JAN 14.5 30.01.12 PUT-45 -9,600.14 -0.03GBP -14,979.31IMPERIAL TOBA(OTC JAN 23.7 23.01.12 PUT-61 -32,825.93 -0.09GBP -58,537.75PEARSON PLC JAN 11.6 31.01.12 CALL-43 -33,656.65 -0.09GBP -12,333.23PEARSON PLC (OTC JAN 11.85 31.01.12 PUT-79 -19,965.16 -0.05GBP -23,710.90RECKITT (OTC) JAN 32.00 24.01.12 CALL-32 -24,636.90 -0.07GBP -23,310.90TESCO (OTC) JAN 3.85 25.01.12 CALL-263 -64,640.13 -0.19GBP -21,179.31VODAFONE JAN 1.76 16.01.12 CALL-458 -23,083.68 -0.06GBP -17,115.38VODAFONE(OTC) FEB 1.73 15.02.12 PUT-380 -10,736.26 -0.03GBP -20,193.13
NESTLE JAN 51.5 09.01.12 CALL-228 -49,566.85 -0.13CHF -8,964.62Swiss Franc -171,452.17 -0.47-105,391.73
NESTLE(OTC) FEB 52.90 08.02.12 CALL-175 -25,848.50 -0.07CHF -12,162.21NOVARTIS JAN 52.70 19.01.12 PUT-289 -12,332.32 -0.03CHF -21,732.88ROCHE HOLDING AG JAN 160 03.01.12 CALL-74 -2,139.71 -0.01CHF -11,456.42ROCHE HOLDING(OT FEB 155.4 02.02.12 CALL-63 -29,504.49 -0.08CHF -16,998.49SGS SA (OTC) JAN 1532 18.01.12 CALL-14 -52,060.30 -0.15CHF -34,077.11
Total investments in securities 26,305,603.46 71.4625,877,787.99
Securities portfolio at 31/12/2011EURExpressed in
UBAM - EUROPE EQUITY DIVIDEND+
Number/nom. value Description Currency % of total
net assetsMarket valueCost

The accompanying notes are an integral part of these financial statements.
211Page
Cash at banks/ (bank liabilities) 4,108,168.67 11.16
Other net assets/(liabilities) 6,397,338.49 17.38
Total 36,811,110.62 100.00
Securities portfolio at 31/12/2011EURExpressed in
UBAM - EUROPE EQUITY DIVIDEND+
Number/nom. value Description Currency % of total
net assetsMarket valueCost

212Page
United Kingdom 24.65Switzerland 14.62Germany 12.09France 9.80The Netherlands 9.72Italy 3.44Other -2.86
71.46
(by domicile of the issuer) % of net assets
Geographical classification of investments
UBAM - EUROPE EQUITY DIVIDEND+
Petroleum 13.14Pharmaceuticals and cosmetics 12.40Graphic art and publishing 11.43Tobacco and alcoholic drinks 6.11Foods and non alcoholic drinks 4.87Miscellaneous services 4.85Chemicals 4.80Road vehicles 4.64Retail trade, department stores 3.46Miscellaneous consumer goods 3.31Communications 2.66Various capital goods 2.65Other -2.86
71.46
% of net assets
Industrial classification of investments
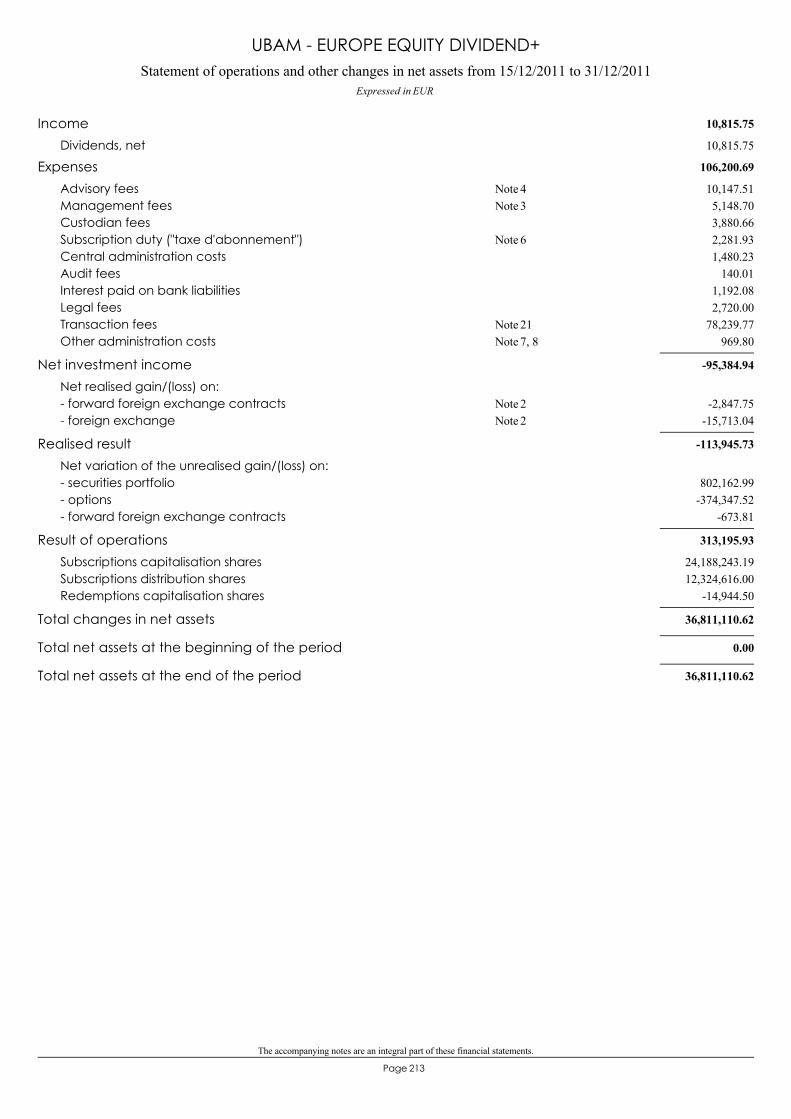
The accompanying notes are an integral part of these financial statements.
213Page
Statement of operations and other changes in net assets from 15/12/2011 to 31/12/2011Expressed in EUR
UBAM - EUROPE EQUITY DIVIDEND+
10,815.75Income10,815.75Dividends, net
106,200.69Expenses10,147.51Advisory fees 4Note5,148.70Management fees 3Note3,880.66Custodian fees2,281.93Subscription duty ("taxe d'abonnement") 6Note1,480.23Central administration costs
140.01Audit fees1,192.08Interest paid on bank liabilities2,720.00Legal fees
78,239.77Transaction fees 21Note969.80Other administration costs 7, 8Note
-95,384.94Net investment incomeNet realised gain/(loss) on:
-2,847.75- forward foreign exchange contracts 2Note-15,713.04- foreign exchange 2Note
-113,945.73Realised resultNet variation of the unrealised gain/(loss) on:
802,162.99- securities portfolio-374,347.52- options
-673.81- forward foreign exchange contracts
313,195.93Result of operations24,188,243.19Subscriptions capitalisation shares12,324,616.00Subscriptions distribution shares
-14,944.50Redemptions capitalisation shares
36,811,110.62Total changes in net assets
0.00Total net assets at the beginning of the period
36,811,110.62Total net assets at the end of the period
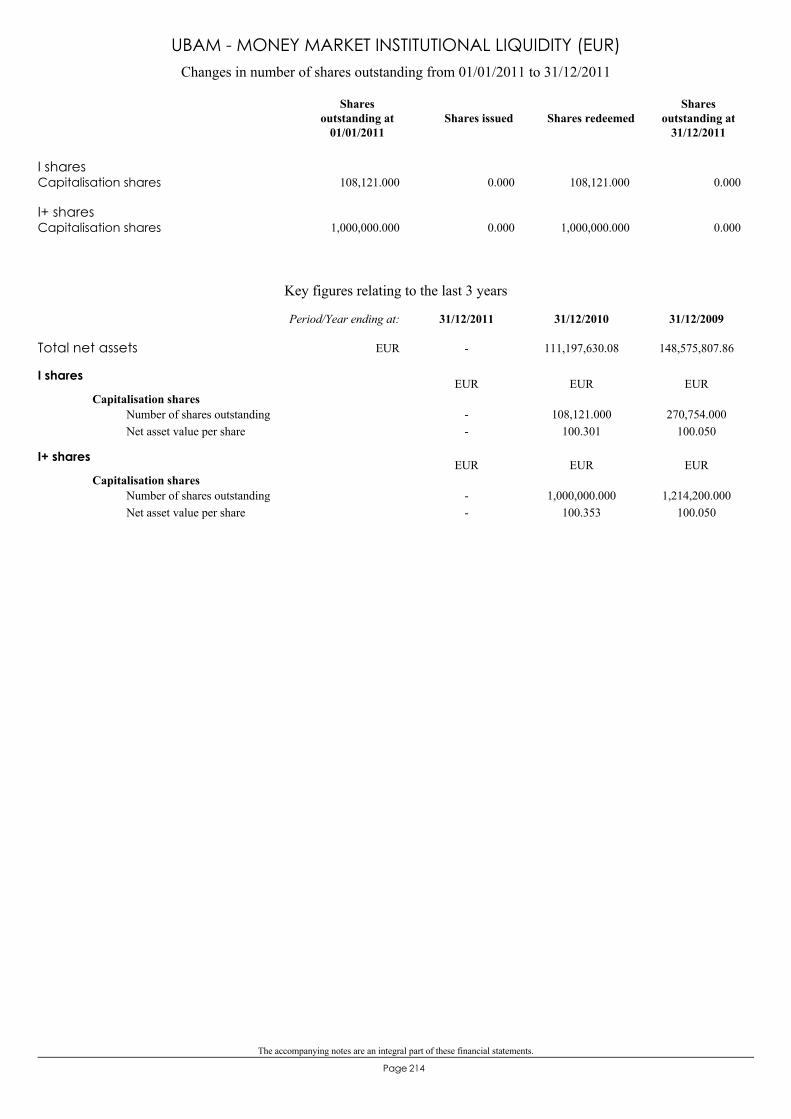
The accompanying notes are an integral part of these financial statements.
214Page
I sharesCapitalisation shares 108,121.000 0.000 108,121.000 0.000
I+ sharesCapitalisation shares 1,000,000.000 0.000 1,000,000.000 0.000
Changes in number of shares outstanding from 01/01/2011 to 31/12/2011
Shares issued Shares redeemedShares
outstanding at31/12/2011
Sharesoutstanding at
01/01/2011
UBAM - MONEY MARKET INSTITUTIONAL LIQUIDITY (EUR)
Key figures relating to the last 3 years
I shares
Capitalisation shares--
108,121.000100.301
270,754.000100.050
Number of shares outstandingNet asset value per share
EUR EUR EUR
I+ shares
Capitalisation shares--
1,000,000.000100.353
1,214,200.000100.050
Number of shares outstandingNet asset value per share
EUR EUR EUR
Total net assets - 111,197,630.08 148,575,807.86
31/12/200931/12/201031/12/2011Period/Year ending at:
EUR
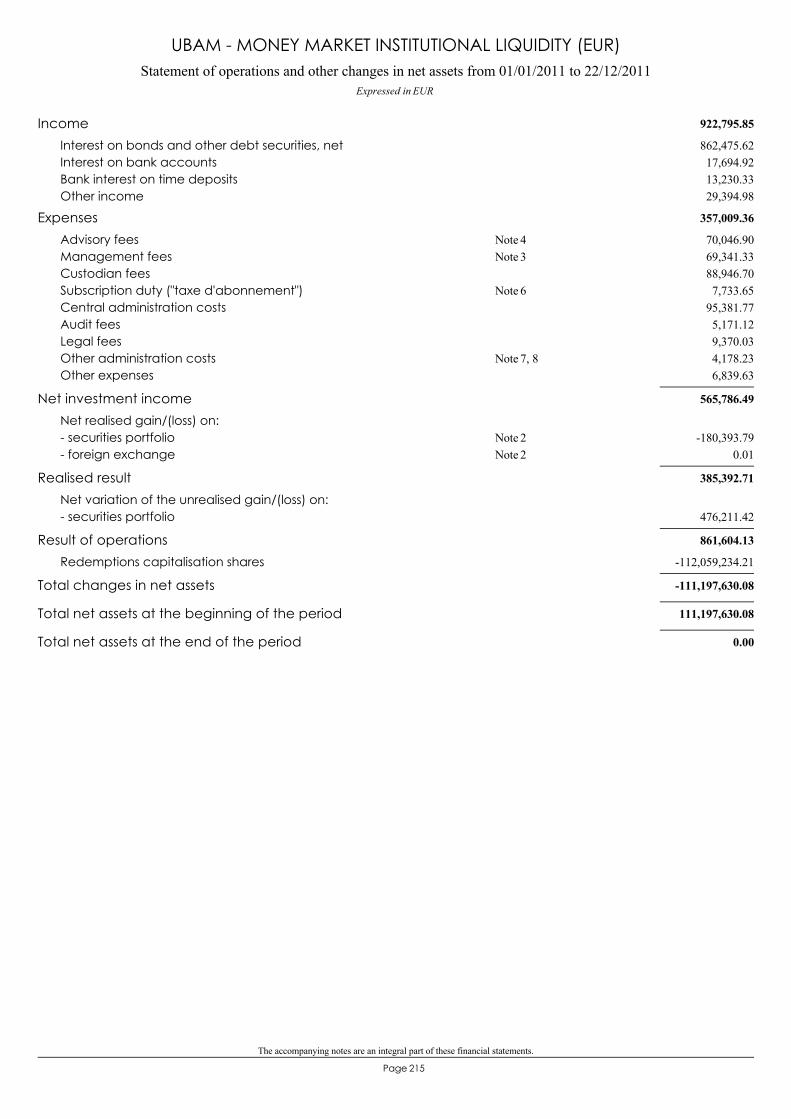
The accompanying notes are an integral part of these financial statements.
215Page
Statement of operations and other changes in net assets from 01/01/2011 to 22/12/2011Expressed in EUR
UBAM - MONEY MARKET INSTITUTIONAL LIQUIDITY (EUR)
922,795.85Income862,475.62Interest on bonds and other debt securities, net17,694.92Interest on bank accounts13,230.33Bank interest on time deposits29,394.98Other income
357,009.36Expenses70,046.90Advisory fees 4Note69,341.33Management fees 3Note88,946.70Custodian fees7,733.65Subscription duty ("taxe d'abonnement") 6Note
95,381.77Central administration costs5,171.12Audit fees9,370.03Legal fees4,178.23Other administration costs 7, 8Note6,839.63Other expenses
565,786.49Net investment incomeNet realised gain/(loss) on:
-180,393.79- securities portfolio 2Note0.01- foreign exchange 2Note
385,392.71Realised resultNet variation of the unrealised gain/(loss) on:
476,211.42- securities portfolio
861,604.13Result of operations-112,059,234.21Redemptions capitalisation shares
-111,197,630.08Total changes in net assets
111,197,630.08Total net assets at the beginning of the period
0.00Total net assets at the end of the period
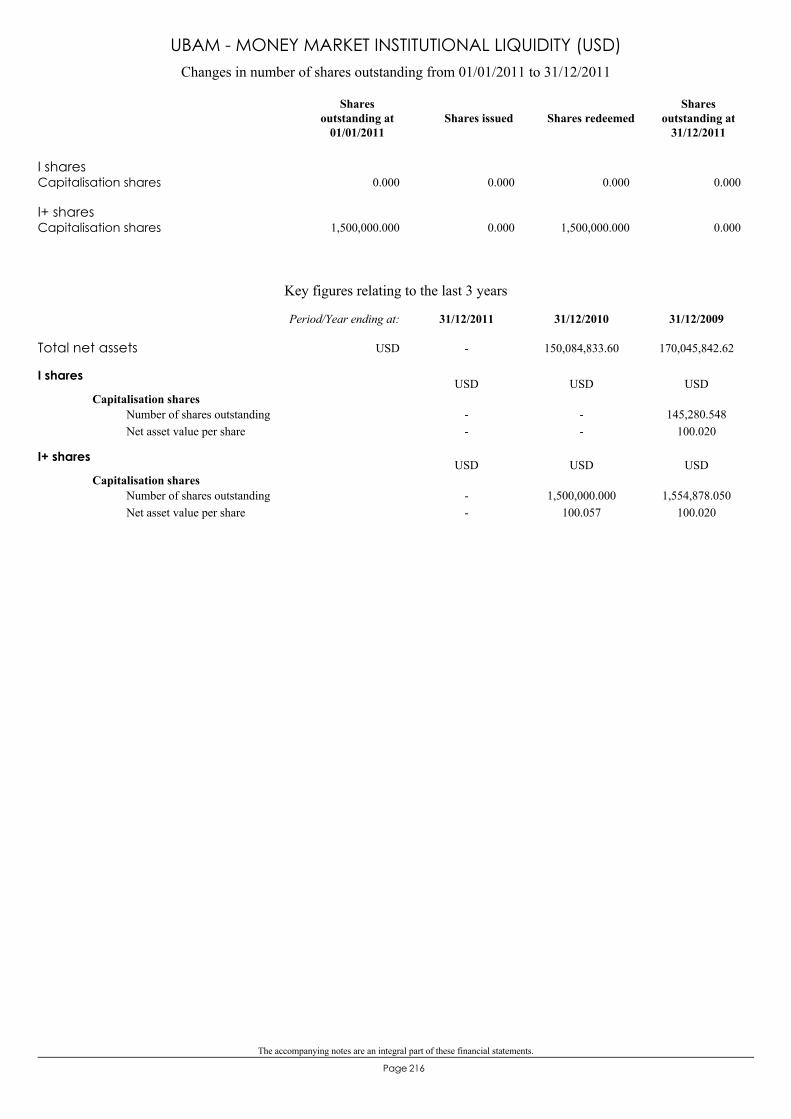
The accompanying notes are an integral part of these financial statements.
216Page
I sharesCapitalisation shares 0.000 0.000 0.000 0.000
I+ sharesCapitalisation shares 1,500,000.000 0.000 1,500,000.000 0.000
Changes in number of shares outstanding from 01/01/2011 to 31/12/2011
Shares issued Shares redeemedShares
outstanding at31/12/2011
Sharesoutstanding at
01/01/2011
UBAM - MONEY MARKET INSTITUTIONAL LIQUIDITY (USD)
Key figures relating to the last 3 years
I shares
Capitalisation shares--
--
145,280.548100.020
Number of shares outstandingNet asset value per share
USD USD USD
I+ shares
Capitalisation shares--
1,500,000.000100.057
1,554,878.050100.020
Number of shares outstandingNet asset value per share
USD USD USD
Total net assets - 150,084,833.60 170,045,842.62
31/12/200931/12/201031/12/2011Period/Year ending at:
USD
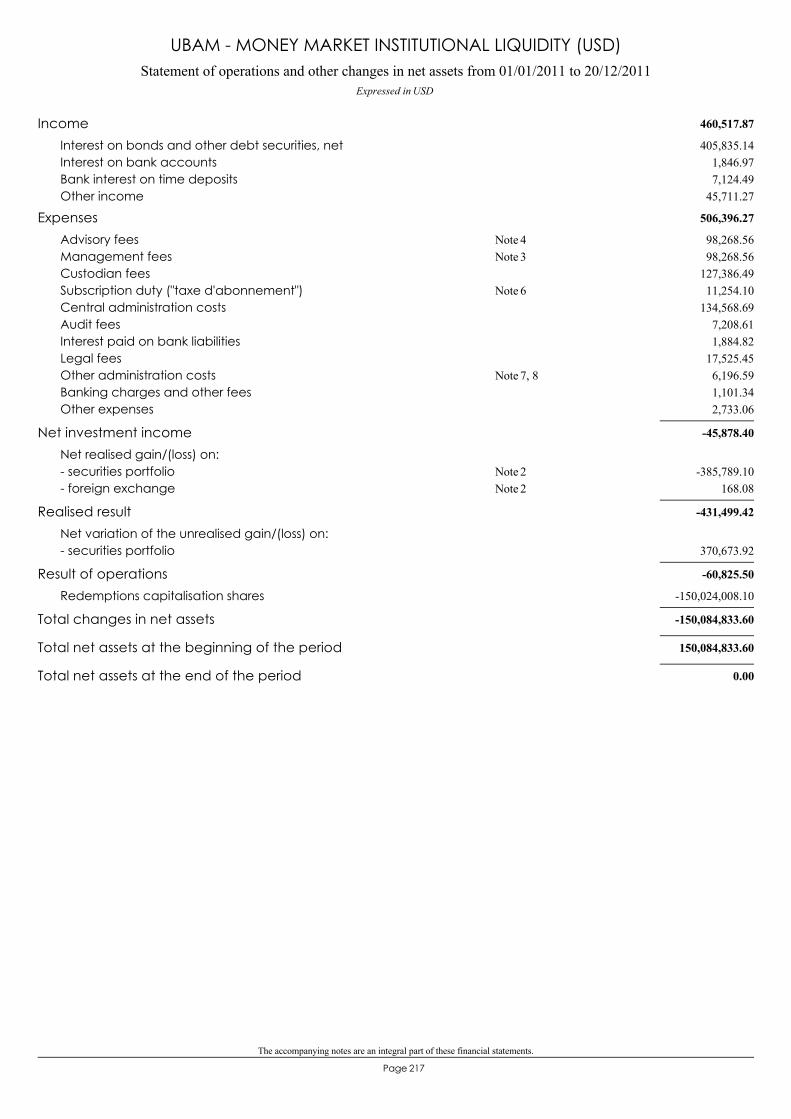
The accompanying notes are an integral part of these financial statements.
217Page
Statement of operations and other changes in net assets from 01/01/2011 to 20/12/2011Expressed in USD
UBAM - MONEY MARKET INSTITUTIONAL LIQUIDITY (USD)
460,517.87Income405,835.14Interest on bonds and other debt securities, net
1,846.97Interest on bank accounts7,124.49Bank interest on time deposits
45,711.27Other income
506,396.27Expenses98,268.56Advisory fees 4Note98,268.56Management fees 3Note
127,386.49Custodian fees11,254.10Subscription duty ("taxe d'abonnement") 6Note
134,568.69Central administration costs7,208.61Audit fees1,884.82Interest paid on bank liabilities
17,525.45Legal fees6,196.59Other administration costs 7, 8Note1,101.34Banking charges and other fees2,733.06Other expenses
-45,878.40Net investment incomeNet realised gain/(loss) on:
-385,789.10- securities portfolio 2Note168.08- foreign exchange 2Note
-431,499.42Realised resultNet variation of the unrealised gain/(loss) on:
370,673.92- securities portfolio
-60,825.50Result of operations-150,024,008.10Redemptions capitalisation shares
-150,084,833.60Total changes in net assets
150,084,833.60Total net assets at the beginning of the period
0.00Total net assets at the end of the period
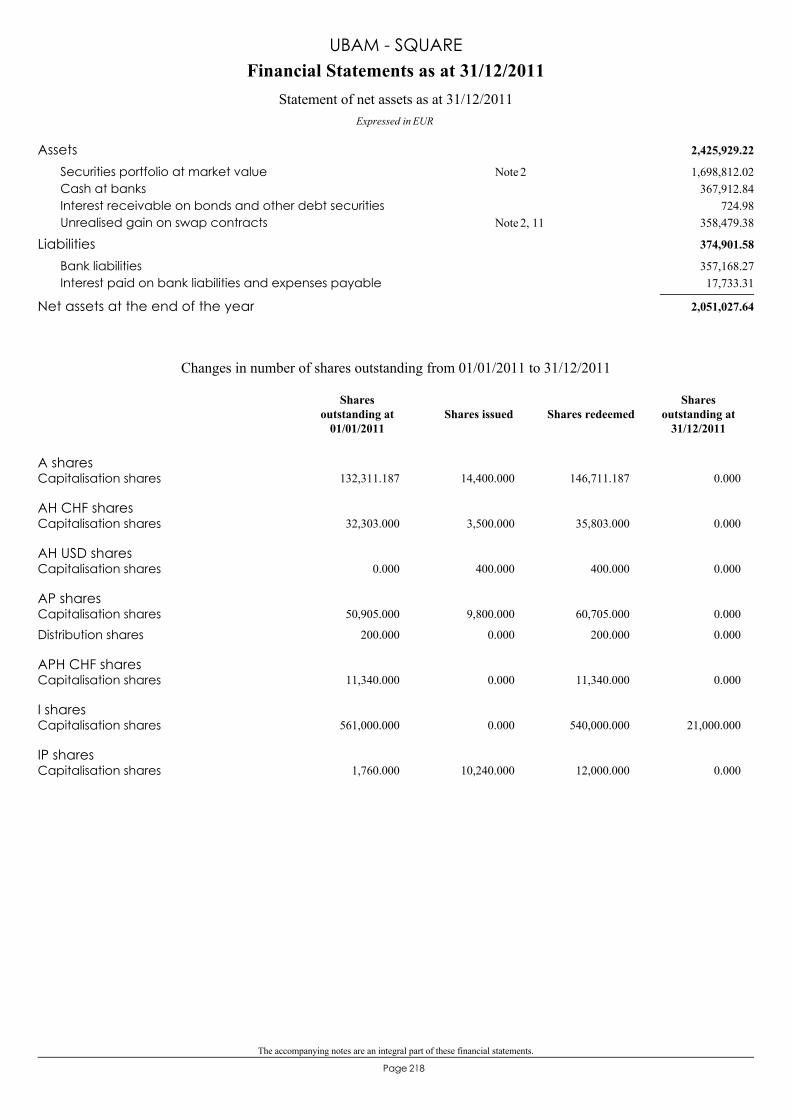
The accompanying notes are an integral part of these financial statements.
218Page
2,425,929.22Assets1,698,812.02Securities portfolio at market value 2Note
367,912.84Cash at banks724.98Interest receivable on bonds and other debt securities
358,479.38Unrealised gain on swap contracts 2, 11Note
374,901.58Liabilities357,168.27Bank liabilities17,733.31Interest paid on bank liabilities and expenses payable
2,051,027.64Net assets at the end of the year
Financial Statements as at 31/12/2011
Expressed in EUR
Statement of net assets as at 31/12/2011
UBAM - SQUARE
A sharesCapitalisation shares 132,311.187 14,400.000 146,711.187 0.000
AH CHF sharesCapitalisation shares 32,303.000 3,500.000 35,803.000 0.000
AH USD sharesCapitalisation shares 0.000 400.000 400.000 0.000
AP sharesCapitalisation shares 50,905.000 9,800.000 60,705.000 0.000
Distribution shares 200.000 0.000 200.000 0.000
APH CHF sharesCapitalisation shares 11,340.000 0.000 11,340.000 0.000
I sharesCapitalisation shares 561,000.000 0.000 540,000.000 21,000.000
IP sharesCapitalisation shares 1,760.000 10,240.000 12,000.000 0.000
Changes in number of shares outstanding from 01/01/2011 to 31/12/2011
Shares issued Shares redeemedShares
outstanding at31/12/2011
Sharesoutstanding at
01/01/2011
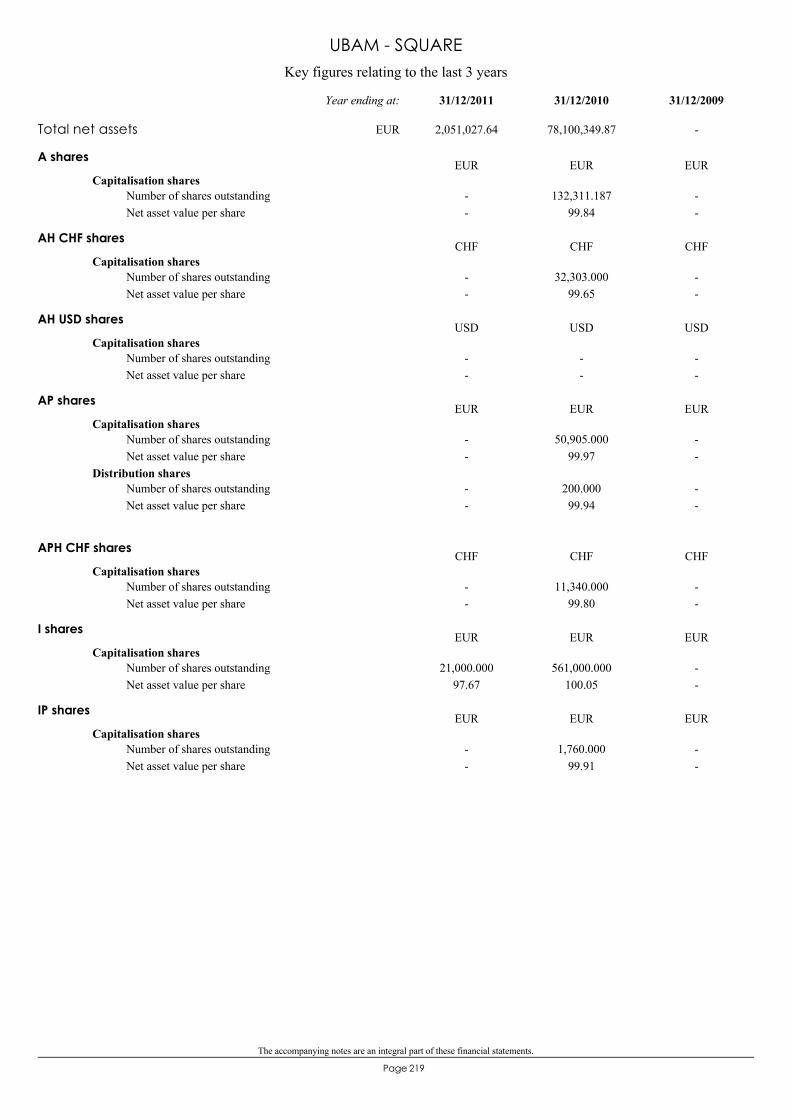
The accompanying notes are an integral part of these financial statements.
219Page
Key figures relating to the last 3 years
UBAM - SQUARE
A shares
Capitalisation shares--
132,311.18799.84
--
Number of shares outstandingNet asset value per share
EUR EUR EUR
AH CHF shares
Capitalisation shares--
32,303.00099.65
--
Number of shares outstandingNet asset value per share
CHF CHF CHF
AH USD shares
Capitalisation shares--
--
--
Number of shares outstandingNet asset value per share
USD USD USD
AP shares
Capitalisation shares--
50,905.00099.97
--
Number of shares outstandingNet asset value per share
Distribution shares--
200.00099.94
--
Number of shares outstandingNet asset value per share
EUR EUR EUR
APH CHF shares
Capitalisation shares--
11,340.00099.80
--
Number of shares outstandingNet asset value per share
CHF CHF CHF
I shares
Capitalisation shares21,000.000
97.67561,000.000
100.05--
Number of shares outstandingNet asset value per share
EUR EUR EUR
IP shares
Capitalisation shares--
1,760.00099.91
--
Number of shares outstandingNet asset value per share
EUR EUR EUR
Total net assets 2,051,027.64 78,100,349.87 -
31/12/200931/12/201031/12/2011Year ending at:
EUR

The accompanying notes are an integral part of these financial statements.
220Page
FRANCE BTF 11-12 02/02U400,000 399,620.11 19.48EUR 399,620.11
Transferable securities admitted to official stock exchange listing and/or dealt in onanother regulated market 1,698,812.02 82.831,698,812.02
Bonds 1,698,812.02 82.831,698,812.02
FRANCE BTF 11-12 05/01U100,000 99,889.92 4.87EUR 99,889.92FRANCE BTF 11-12 19/01U400,000 399,709.10 19.49EUR 399,709.10FRANCE BTF 11-12 26/01U100,000 99,881.00 4.87EUR 99,881.00GERMAN TREASURY BILLS 11-12 11/01U400,000 399,913.06 19.50EUR 399,913.06GERMAN TREASURY BILLS 11-12 27/06U200,000 199,887.83 9.75EUR 199,887.83ITALY BOT (12 MESI) 11-12 31/01U100,000 99,911.00 4.87EUR 99,911.00
Total investments in securities 1,698,812.02 82.831,698,812.02
Cash at banks/ (bank liabilities) 10,744.57 0.52
Other net assets/(liabilities) 341,471.05 16.65
Total 2,051,027.64 100.00
Securities portfolio at 31/12/2011EURExpressed in
UBAM - SQUARE
Number/nom. value Description Currency % of total
net assetsMarket valueCost
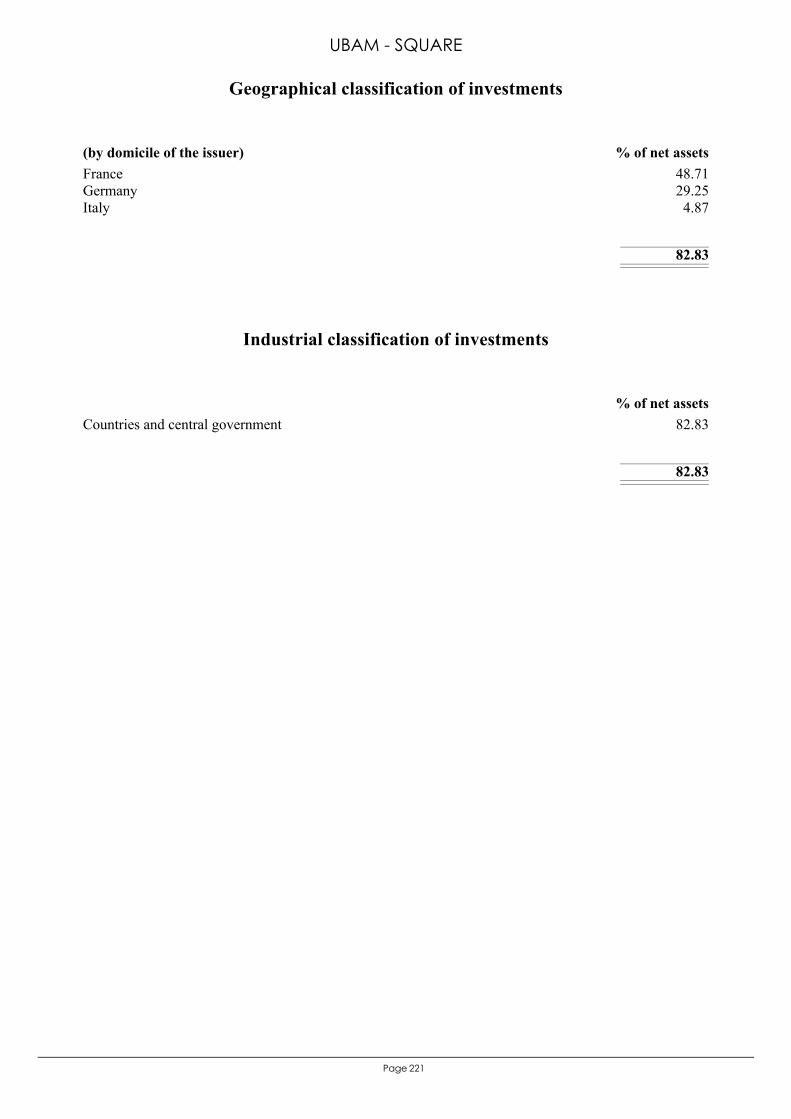
221Page
France 48.71Germany 29.25Italy 4.87
82.83
(by domicile of the issuer) % of net assets
Geographical classification of investments
UBAM - SQUARE
Countries and central government 82.83
82.83
% of net assets
Industrial classification of investments
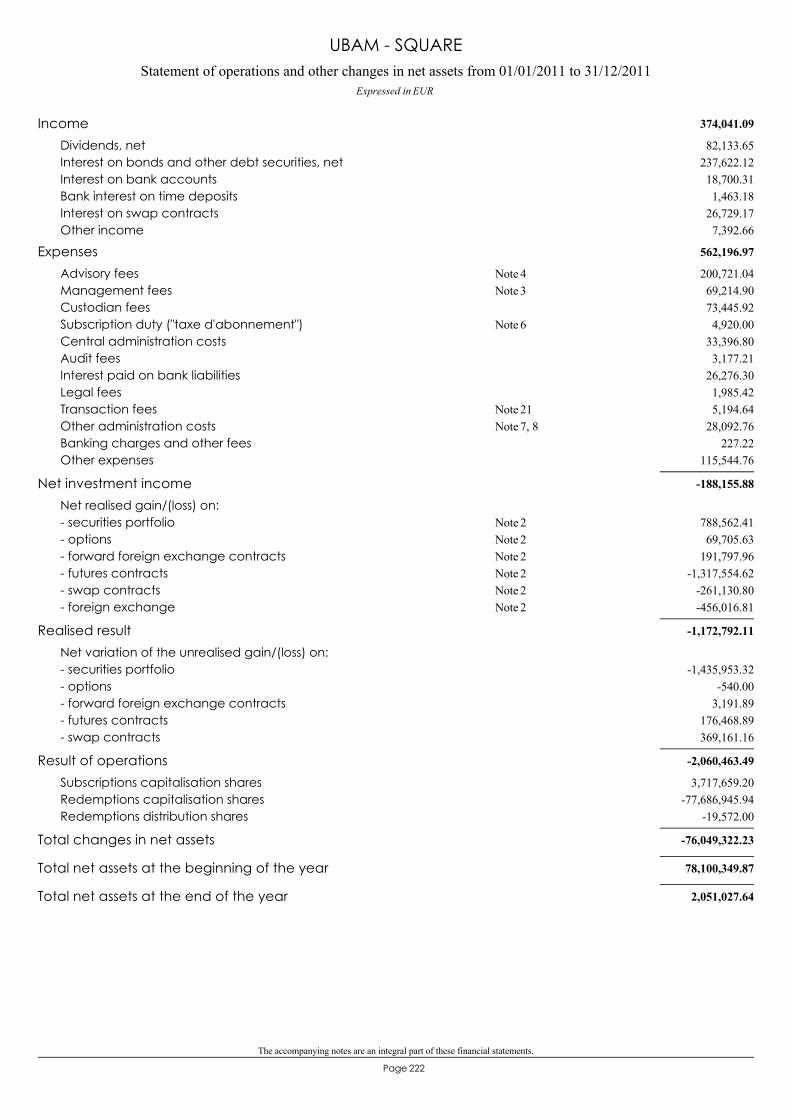
The accompanying notes are an integral part of these financial statements.
222Page
Statement of operations and other changes in net assets from 01/01/2011 to 31/12/2011Expressed in EUR
UBAM - SQUARE
374,041.09Income82,133.65Dividends, net
237,622.12Interest on bonds and other debt securities, net18,700.31Interest on bank accounts1,463.18Bank interest on time deposits
26,729.17Interest on swap contracts7,392.66Other income
562,196.97Expenses200,721.04Advisory fees 4Note69,214.90Management fees 3Note73,445.92Custodian fees4,920.00Subscription duty ("taxe d'abonnement") 6Note
33,396.80Central administration costs3,177.21Audit fees
26,276.30Interest paid on bank liabilities1,985.42Legal fees5,194.64Transaction fees 21Note
28,092.76Other administration costs 7, 8Note227.22Banking charges and other fees
115,544.76Other expenses
-188,155.88Net investment incomeNet realised gain/(loss) on:
788,562.41- securities portfolio 2Note69,705.63- options 2Note
191,797.96- forward foreign exchange contracts 2Note-1,317,554.62- futures contracts 2Note
-261,130.80- swap contracts 2Note-456,016.81- foreign exchange 2Note
-1,172,792.11Realised resultNet variation of the unrealised gain/(loss) on:
-1,435,953.32- securities portfolio-540.00- options
3,191.89- forward foreign exchange contracts176,468.89- futures contracts369,161.16- swap contracts
-2,060,463.49Result of operations3,717,659.20Subscriptions capitalisation shares
-77,686,945.94Redemptions capitalisation shares-19,572.00Redemptions distribution shares
-76,049,322.23Total changes in net assets
78,100,349.87Total net assets at the beginning of the year
2,051,027.64Total net assets at the end of the year
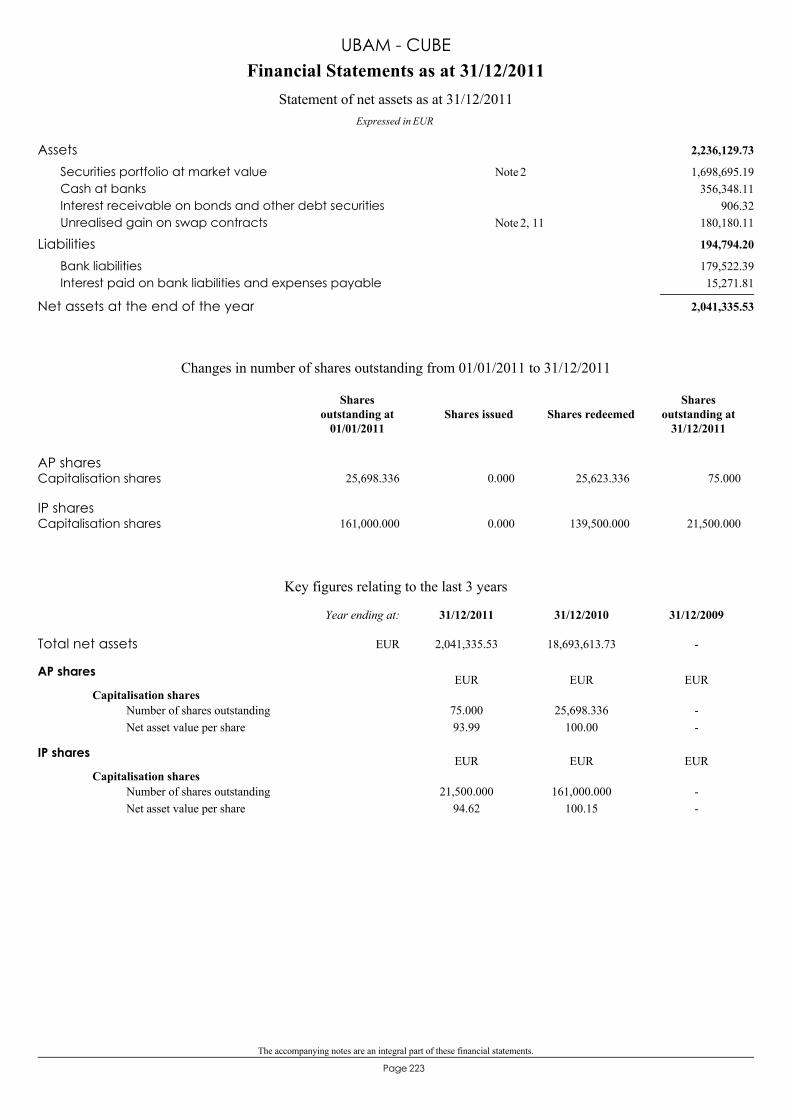
The accompanying notes are an integral part of these financial statements.
223Page
2,236,129.73Assets1,698,695.19Securities portfolio at market value 2Note
356,348.11Cash at banks906.32Interest receivable on bonds and other debt securities
180,180.11Unrealised gain on swap contracts 2, 11Note
194,794.20Liabilities179,522.39Bank liabilities15,271.81Interest paid on bank liabilities and expenses payable
2,041,335.53Net assets at the end of the year
Financial Statements as at 31/12/2011
Expressed in EUR
Statement of net assets as at 31/12/2011
UBAM - CUBE
AP sharesCapitalisation shares 25,698.336 0.000 25,623.336 75.000
IP sharesCapitalisation shares 161,000.000 0.000 139,500.000 21,500.000
Changes in number of shares outstanding from 01/01/2011 to 31/12/2011
Shares issued Shares redeemedShares
outstanding at31/12/2011
Sharesoutstanding at
01/01/2011
Key figures relating to the last 3 years
AP shares
Capitalisation shares75.00093.99
25,698.336100.00
--
Number of shares outstandingNet asset value per share
EUR EUR EUR
IP shares
Capitalisation shares21,500.000
94.62161,000.000
100.15--
Number of shares outstandingNet asset value per share
EUR EUR EUR
Total net assets 2,041,335.53 18,693,613.73 -
31/12/200931/12/201031/12/2011Year ending at:
EUR
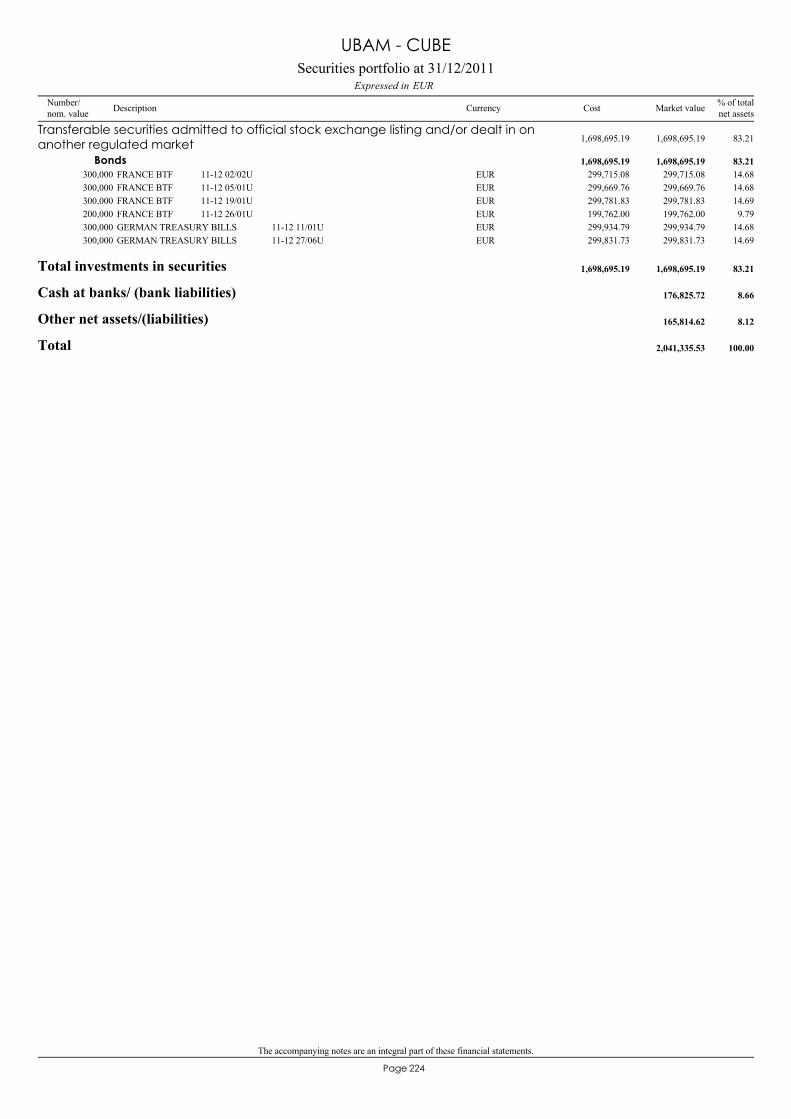
The accompanying notes are an integral part of these financial statements.
224Page
FRANCE BTF 11-12 02/02U300,000 299,715.08 14.68EUR 299,715.08
Transferable securities admitted to official stock exchange listing and/or dealt in onanother regulated market 1,698,695.19 83.211,698,695.19
Bonds 1,698,695.19 83.211,698,695.19
FRANCE BTF 11-12 05/01U300,000 299,669.76 14.68EUR 299,669.76FRANCE BTF 11-12 19/01U300,000 299,781.83 14.69EUR 299,781.83FRANCE BTF 11-12 26/01U200,000 199,762.00 9.79EUR 199,762.00GERMAN TREASURY BILLS 11-12 11/01U300,000 299,934.79 14.68EUR 299,934.79GERMAN TREASURY BILLS 11-12 27/06U300,000 299,831.73 14.69EUR 299,831.73
Total investments in securities 1,698,695.19 83.211,698,695.19
Cash at banks/ (bank liabilities) 176,825.72 8.66
Other net assets/(liabilities) 165,814.62 8.12
Total 2,041,335.53 100.00
Securities portfolio at 31/12/2011EURExpressed in
UBAM - CUBE
Number/nom. value Description Currency % of total
net assetsMarket valueCost
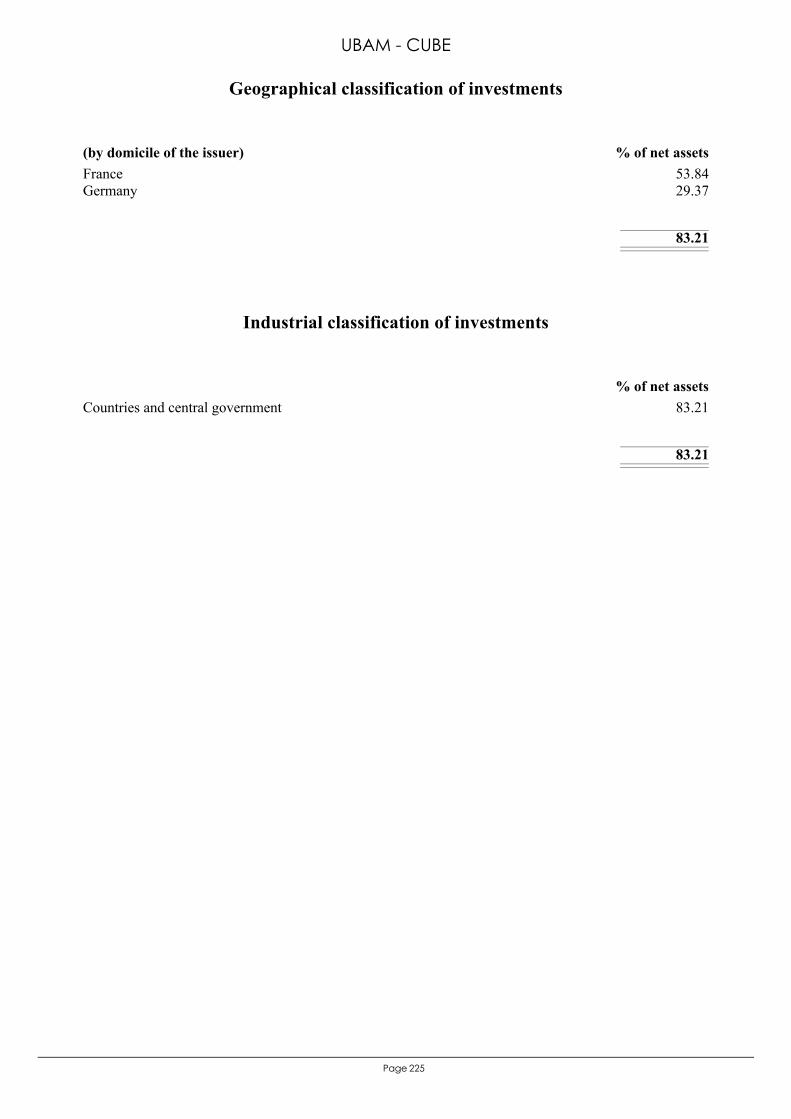
225Page
France 53.84Germany 29.37
83.21
(by domicile of the issuer) % of net assets
Geographical classification of investments
UBAM - CUBE
Countries and central government 83.21
83.21
% of net assets
Industrial classification of investments
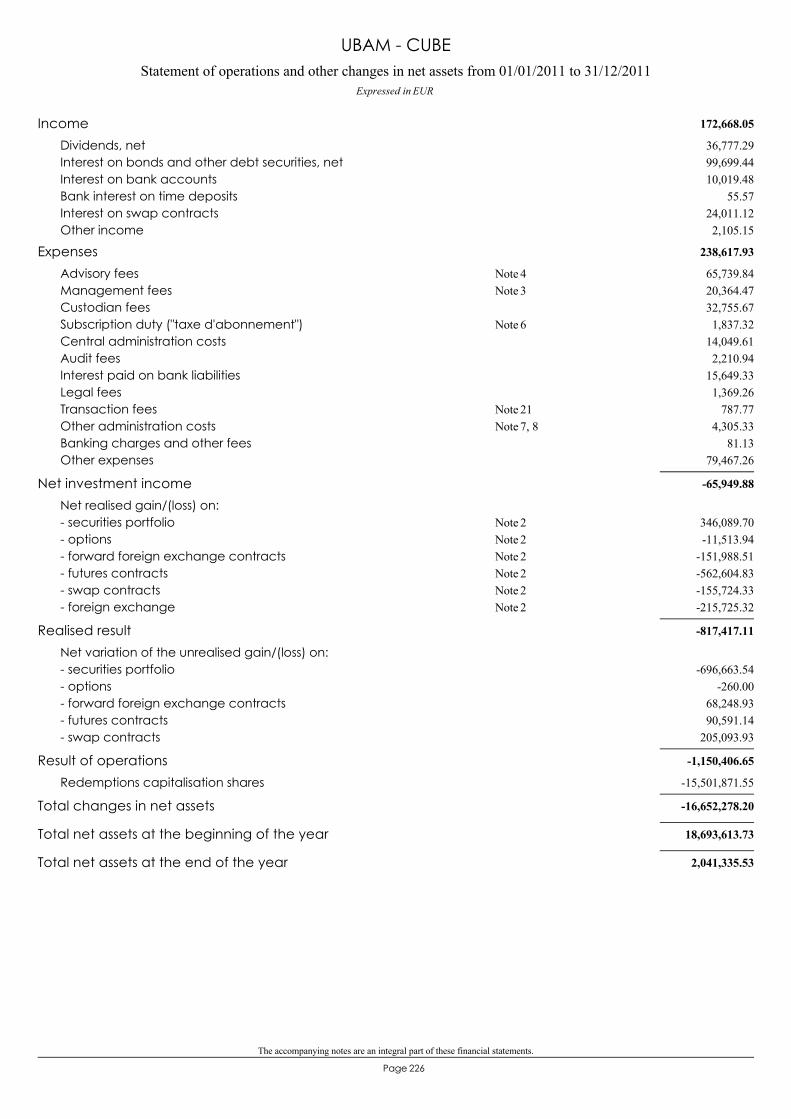
The accompanying notes are an integral part of these financial statements.
226Page
Statement of operations and other changes in net assets from 01/01/2011 to 31/12/2011Expressed in EUR
UBAM - CUBE
172,668.05Income36,777.29Dividends, net99,699.44Interest on bonds and other debt securities, net10,019.48Interest on bank accounts
55.57Bank interest on time deposits24,011.12Interest on swap contracts2,105.15Other income
238,617.93Expenses65,739.84Advisory fees 4Note20,364.47Management fees 3Note32,755.67Custodian fees1,837.32Subscription duty ("taxe d'abonnement") 6Note
14,049.61Central administration costs2,210.94Audit fees
15,649.33Interest paid on bank liabilities1,369.26Legal fees
787.77Transaction fees 21Note4,305.33Other administration costs 7, 8Note
81.13Banking charges and other fees79,467.26Other expenses
-65,949.88Net investment incomeNet realised gain/(loss) on:
346,089.70- securities portfolio 2Note-11,513.94- options 2Note
-151,988.51- forward foreign exchange contracts 2Note-562,604.83- futures contracts 2Note-155,724.33- swap contracts 2Note-215,725.32- foreign exchange 2Note
-817,417.11Realised resultNet variation of the unrealised gain/(loss) on:
-696,663.54- securities portfolio-260.00- options
68,248.93- forward foreign exchange contracts90,591.14- futures contracts
205,093.93- swap contracts
-1,150,406.65Result of operations-15,501,871.55Redemptions capitalisation shares
-16,652,278.20Total changes in net assets
18,693,613.73Total net assets at the beginning of the year
2,041,335.53Total net assets at the end of the year
UBAM
Notes to the financial statements as at 31st December 2011
Page 227
Note 1 - General Information UBAM (hereinafter the "SICAV") is a variable capital investment company incorporated in Luxembourg on 6th December 1990 in accordance with the legislation of the Grand Duchy of Luxembourg, subject to part I of the amended law of 20th December 2002 (the "2002 Law") until 30th June 2011, and in Part I of the law of 17th December 2010 (the "2010 Law") since 1st July 2011.
On 19th December 2011, The Extraordinary General Meeting of shareholders amended the articles of incorporation mainly with the aim of bringing the SICAV into conformity with the law of 2010 on undertakings for collective investment. The SICAV complies with articles 27 of the 2010 Law so the SICAV has the status of a self managed SICAV. The objective of the SICAV is to offer its shareholders the possibility to invest in an investment vehicle oriented towards the growth of capital invested in various transferable securities. The SICAV offers investors a choice between various sub-funds, each having different investment objectives. Each sub-fund constitutes a distinct set of assets, represented by different classes of shares. The SICAV thus constitutes a company with multiple sub-funds. The Board of Directors may at any time and in conformity with the articles of incorporation, issue classes of shares falling within other sub-funds, whose investment aims differ from those of already existing sub-funds. At the date of the report, the following sub-funds are active:
- UBAM - DYNAMIC US DOLLAR BOND expressed in USD - UBAM - DYNAMIC EURO BOND expressed in EUR - UBAM - YIELD CURVE US DOLLAR BOND expressed in USD - UBAM - YIELD CURVE EURO BOND expressed in EUR - UBAM - YIELD CURVE STERLING BOND expressed in GBP - UBAM - GLOBAL BOND (CHF) expressed in CHF - UBAM - CORPORATE US DOLLAR BOND expressed in USD - UBAM - CORPORATE EURO BOND expressed in EUR - UBAM - ABSOLUTE RETURN (USD) expressed in USD - UBAM - ABSOLUTE RETURN (EUR) expressed in EUR - UBAM - EMERGING MARKET BOND (formerly UBAM - EMERGING MARKET BOND (USD))
expressed in USD
- UBAM - LOCAL CURRENCY EMERGING MARKET BOND (formerly UBAM - LOCAL CURRENCY EMERGING MARKET BOND (USD))
expressed in USD
- UBAM - EMERGING MARKET CORPORATE BOND (formerly UBAM - EMERGING MARKET CORPORATE BOND (USD))
expressed in USD
- UBAM - GLOBAL HIGH YIELD SOLUTION expressed in USD - UBAM - EUROPEAN CONVERTIBLE BOND expressed in EUR - UBAM - EURO 10-40 CONVERTIBLE BOND expressed in EUR - UBAM - CALAMOS US EQUITY GROWTH expressed in USD - UBAM - NEUBERGER BERMAN US EQUITY VALUE expressed in USD - UBAM - DR. EHRHARDT GERMAN EQUITY expressed in EUR - UBAM - EUROPE EQUITY expressed in EUR - UBAM - SWISS EQUITY expressed in CHF - UBAM - IFDC JAPAN EQUITY expressed in JPY - UBAM - IFDC JAPAN OPPORTUNITES EQUITY expressed in JPY - UBAM - PCM GLOBAL EQUITY VALUE expressed in USD - UBAM - VP VALUE CHINA EQUITY expressed in USD - UBAM - ASIA EQUITY (formerly UBAM - SOUTH PACIFIC AND ASIA EQUITY)
expressed in USD
- UBAM - EQUITY BRIC+ expressed in USD - UBAM - TURKISH EQUITY expressed in USD
UBAM
Notes to the financial statements (continued) as at 31st December 2011
Page 228
- UBAM - RUSSIAN EQUITY expressed in USD - UBAM - EUROPE EQUITY DIVIDEND+ expressed in EUR - UBAM - MONEY MARKET INSTITUTIONAL LIQUIDITY (EUR) expressed in EUR - UBAM - MONEY MARKET INSTITUTIONAL LIQUIDITY (USD) expressed in USD - UBAM - SQUARE expressed in EUR - UBAM - CUBE expressed in EUR
During the year following events have occured:
- The sub-fund UBAM - OPTIBOND (EURO) has merged with the sub-fund UBAM - DYNAMIC EURO BOND with effect from 15th March 2011.
- The sub-fund UBAM - EUROPEAN EMERGING EQUITY has been liquidated with effect from 15th November 2011.
- The sub-fund UBAM - EUROPE EQUITY DIVIDEND+ was launched 15th December 2011. - The net assets of sub-funds UBAM - MONEY MARKET INSTITUTIONAL LIQUIDITY (USD) and
UBAM - MONEY MARKET INSTITUTIONAL LIQUIDITY (EUR) have been fully redeemed. These sub-funds remain dormant.
At the date of the report, the types of shares which can be issued are shown in the table below. The types of shares which include the letter “P” in their name bear a performance fee. Classes in currencies other than the base currency of each sub-fund will be offered in EUR/CHF/USD/SEK/GBP. Depending on the sub-funds, the currency risk for the shares denominated in EUR/CHF/USD/SEK/GBP against the base currency of the sub-fund may or may not be hedged. The hedged shares will be covered largely by hedging transactions. All the costs ans risks resulting from hedging transactions against the EUR/CHF/USD/SEK/GBP will be borne by the shares denominated in these currencies respectively. The shares, hedged against currency risk, are denominated with the letter “H”. The table below lists the types of shares available by sub-fund
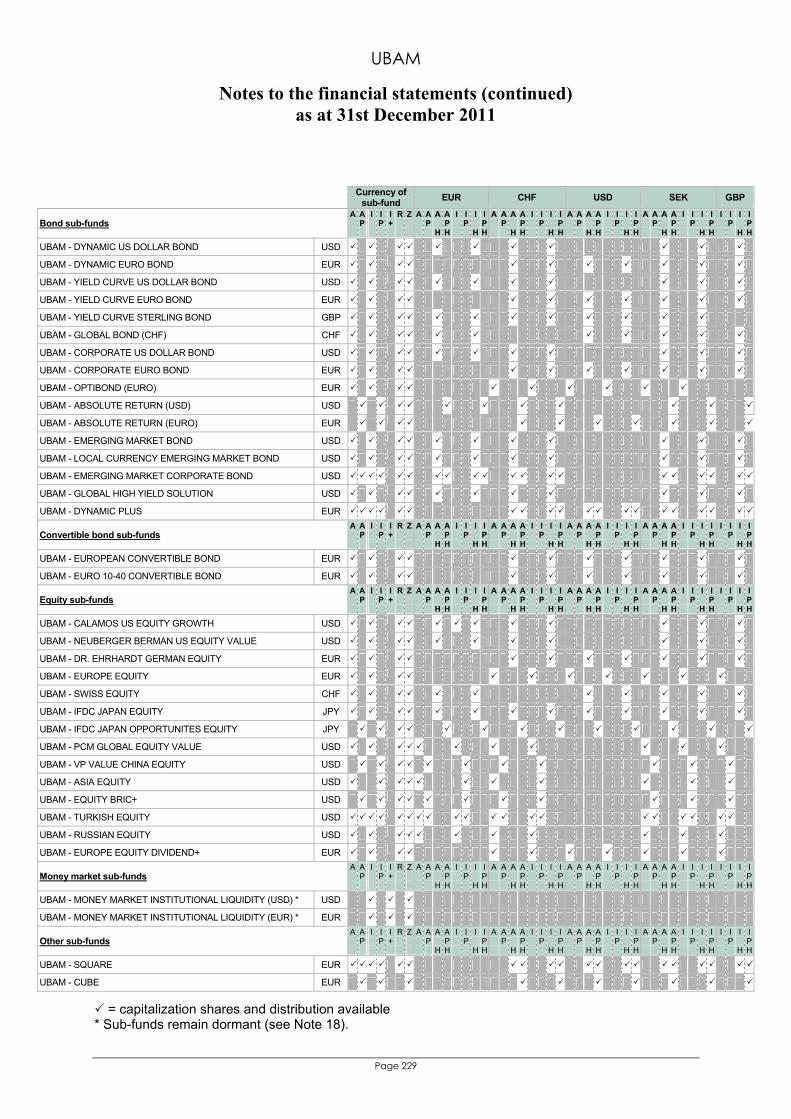
UBAM
Notes to the financial statements (continued) as at 31st December 2011
Page 229
Currency of
sub-fund EUR CHF USD SEK GBP
Bond sub-funds A
AP
I
IP
I+
R
Z
A
AP
A
H
APH
I
IP
I
H
IPH
A
AP
A
H
APH
I
IP
I
H
I P H
A
A P
A
H
A P H
I
I P
I
H
I P H
A
AP
A
H
APH
I
IP
I
H
IPH
I
IP
I
H
IPH
UBAM - DYNAMIC US DOLLAR BOND USD
UBAM - DYNAMIC EURO BOND EUR
UBAM - YIELD CURVE US DOLLAR BOND USD
UBAM - YIELD CURVE EURO BOND EUR
UBAM - YIELD CURVE STERLING BOND GBP
UBAM - GLOBAL BOND (CHF) CHF
UBAM - CORPORATE US DOLLAR BOND USD
UBAM - CORPORATE EURO BOND EUR
UBAM - OPTIBOND (EURO) EUR
UBAM - ABSOLUTE RETURN (USD) USD
UBAM - ABSOLUTE RETURN (EURO) EUR
UBAM - EMERGING MARKET BOND USD
UBAM - LOCAL CURRENCY EMERGING MARKET BOND USD
UBAM - EMERGING MARKET CORPORATE BOND USD
UBAM - GLOBAL HIGH YIELD SOLUTION USD
UBAM - DYNAMIC PLUS EUR
Convertible bond sub-funds A
AP
I
IP
I+
R
Z
A
AP
A
H
APH
I
IP
I
H
IPH
A
AP
A
H
APH
I
IP
I
H
I P H
A
A P
A
H
A P H
I
I P
I
H
I P H
A
AP
A
H
APH
I
IP
I
H
IPH
I
IP
I
H
IPH
UBAM - EUROPEAN CONVERTIBLE BOND EUR
UBAM - EURO 10-40 CONVERTIBLE BOND EUR
Equity sub-funds A
AP
I
IP
I+
R
Z
A
AP
A
H
APH
I
IP
I
H
IPH
A
AP
A
H
APH
I
IP
I
H
I P H
A
A P
A
H
A P H
I
I P
I
H
I P H
A
AP
A
H
APH
I
IP
I
H
IPH
I
IP
I
H
IPH
UBAM - CALAMOS US EQUITY GROWTH USD
UBAM - NEUBERGER BERMAN US EQUITY VALUE USD
UBAM - DR. EHRHARDT GERMAN EQUITY EUR
UBAM - EUROPE EQUITY EUR
UBAM - SWISS EQUITY CHF
UBAM - IFDC JAPAN EQUITY JPY
UBAM - IFDC JAPAN OPPORTUNITES EQUITY JPY
UBAM - PCM GLOBAL EQUITY VALUE USD
UBAM - VP VALUE CHINA EQUITY USD
UBAM - ASIA EQUITY USD
UBAM - EQUITY BRIC+ USD
UBAM - TURKISH EQUITY USD
UBAM - RUSSIAN EQUITY USD
UBAM - EUROPE EQUITY DIVIDEND+ EUR
Money market sub-funds A
AP
I
IP
I+
R
Z
A
AP
A
H
APH
I
IP
I
H
IPH
A
AP
A
H
APH
I
IP
I
H
I P H
A
A P
A
H
A P H
I
I P
I
H
I P H
A
AP
A
H
APH
I
IP
I
H
IPH
I
IP
I
H
IPH
UBAM - MONEY MARKET INSTITUTIONAL LIQUIDITY (USD) * USD
UBAM - MONEY MARKET INSTITUTIONAL LIQUIDITY (EUR) * EUR
Other sub-funds A
AP
I
IP
I+
R
Z
A
AP
A
H
APH
I
IP
I
H
IPH
A
AP
A
H
APH
I
IP
I
H
I P H
A
A P
A
H
A P H
I
I P
I
H
I P H
A
AP
A
H
APH
I
IP
I
H
IPH
I
IP
I
H
IPH
UBAM - SQUARE EUR
UBAM - CUBE EUR
= capitalization shares and distribution available * Sub-funds remain dormant (see Note 18).
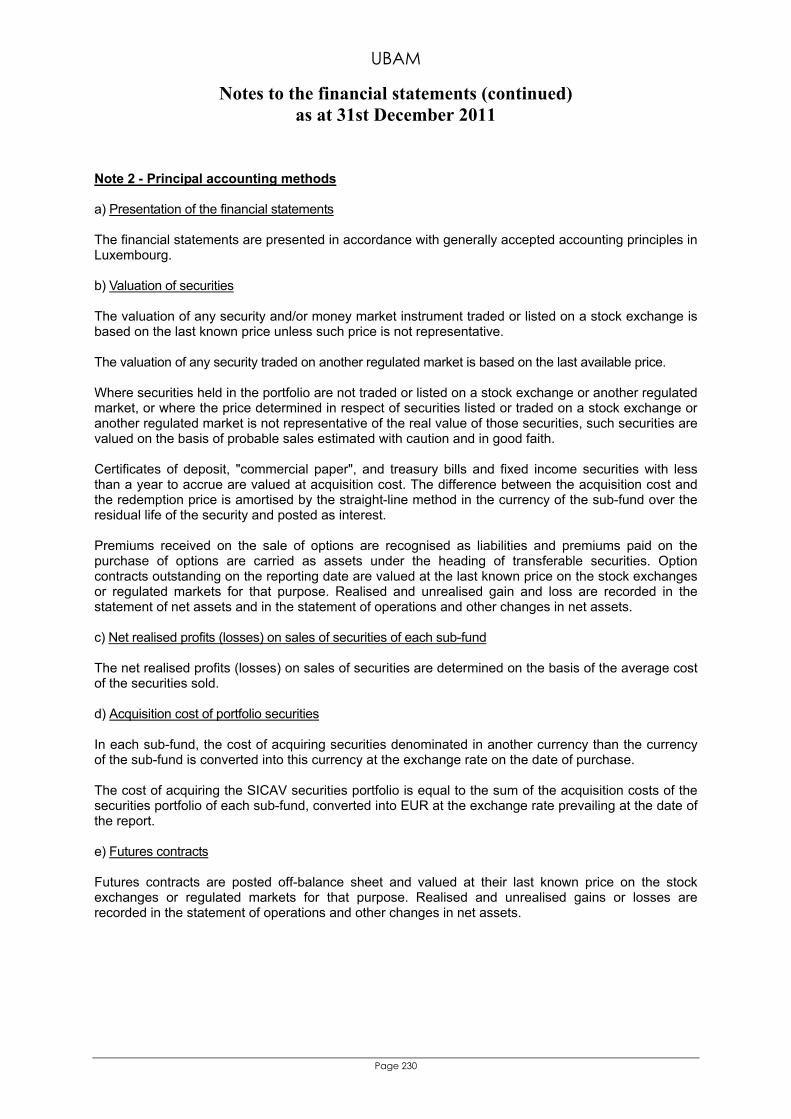
UBAM
Notes to the financial statements (continued) as at 31st December 2011
Page 230
Note 2 - Principal accounting methods a) Presentation of the financial statements The financial statements are presented in accordance with generally accepted accounting principles in Luxembourg. b) Valuation of securities The valuation of any security and/or money market instrument traded or listed on a stock exchange is based on the last known price unless such price is not representative. The valuation of any security traded on another regulated market is based on the last available price. Where securities held in the portfolio are not traded or listed on a stock exchange or another regulated market, or where the price determined in respect of securities listed or traded on a stock exchange or another regulated market is not representative of the real value of those securities, such securities are valued on the basis of probable sales estimated with caution and in good faith. Certificates of deposit, "commercial paper", and treasury bills and fixed income securities with less than a year to accrue are valued at acquisition cost. The difference between the acquisition cost and the redemption price is amortised by the straight-line method in the currency of the sub-fund over the residual life of the security and posted as interest. Premiums received on the sale of options are recognised as liabilities and premiums paid on the purchase of options are carried as assets under the heading of transferable securities. Option contracts outstanding on the reporting date are valued at the last known price on the stock exchanges or regulated markets for that purpose. Realised and unrealised gain and loss are recorded in the statement of net assets and in the statement of operations and other changes in net assets. c) Net realised profits (losses) on sales of securities of each sub-fund The net realised profits (losses) on sales of securities are determined on the basis of the average cost of the securities sold. d) Acquisition cost of portfolio securities In each sub-fund, the cost of acquiring securities denominated in another currency than the currency of the sub-fund is converted into this currency at the exchange rate on the date of purchase. The cost of acquiring the SICAV securities portfolio is equal to the sum of the acquisition costs of the securities portfolio of each sub-fund, converted into EUR at the exchange rate prevailing at the date of the report. e) Futures contracts Futures contracts are posted off-balance sheet and valued at their last known price on the stock exchanges or regulated markets for that purpose. Realised and unrealised gains or losses are recorded in the statement of operations and other changes in net assets.
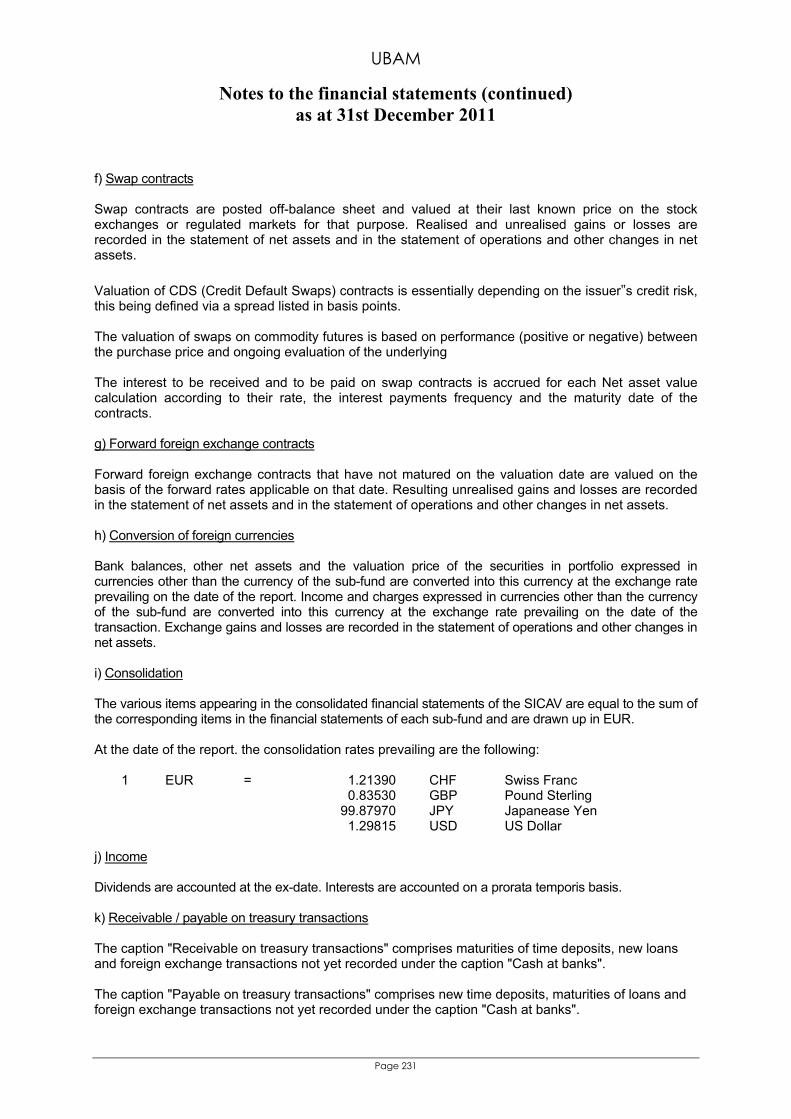
UBAM
Notes to the financial statements (continued) as at 31st December 2011
Page 231
f) Swap contracts Swap contracts are posted off-balance sheet and valued at their last known price on the stock exchanges or regulated markets for that purpose. Realised and unrealised gains or losses are recorded in the statement of net assets and in the statement of operations and other changes in net assets. Valuation of CDS (Credit Default Swaps) contracts is essentially depending on the issuer‟s credit risk, this being defined via a spread listed in basis points. The valuation of swaps on commodity futures is based on performance (positive or negative) between the purchase price and ongoing evaluation of the underlying The interest to be received and to be paid on swap contracts is accrued for each Net asset value calculation according to their rate, the interest payments frequency and the maturity date of the contracts. g) Forward foreign exchange contracts Forward foreign exchange contracts that have not matured on the valuation date are valued on the basis of the forward rates applicable on that date. Resulting unrealised gains and losses are recorded in the statement of net assets and in the statement of operations and other changes in net assets. h) Conversion of foreign currencies Bank balances, other net assets and the valuation price of the securities in portfolio expressed in currencies other than the currency of the sub-fund are converted into this currency at the exchange rate prevailing on the date of the report. Income and charges expressed in currencies other than the currency of the sub-fund are converted into this currency at the exchange rate prevailing on the date of the transaction. Exchange gains and losses are recorded in the statement of operations and other changes in net assets. i) Consolidation
The various items appearing in the consolidated financial statements of the SICAV are equal to the sum of the corresponding items in the financial statements of each sub-fund and are drawn up in EUR.
At the date of the report. the consolidation rates prevailing are the following: 1 EUR = 1.21390 CHF Swiss Franc 0.83530 GBP Pound Sterling 99.87970 JPY Japanease Yen 1.29815 USD US Dollar
j) Income
Dividends are accounted at the ex-date. Interests are accounted on a prorata temporis basis.
k) Receivable / payable on treasury transactions
The caption "Receivable on treasury transactions" comprises maturities of time deposits, new loans and foreign exchange transactions not yet recorded under the caption "Cash at banks". The caption "Payable on treasury transactions" comprises new time deposits, maturities of loans and foreign exchange transactions not yet recorded under the caption "Cash at banks".
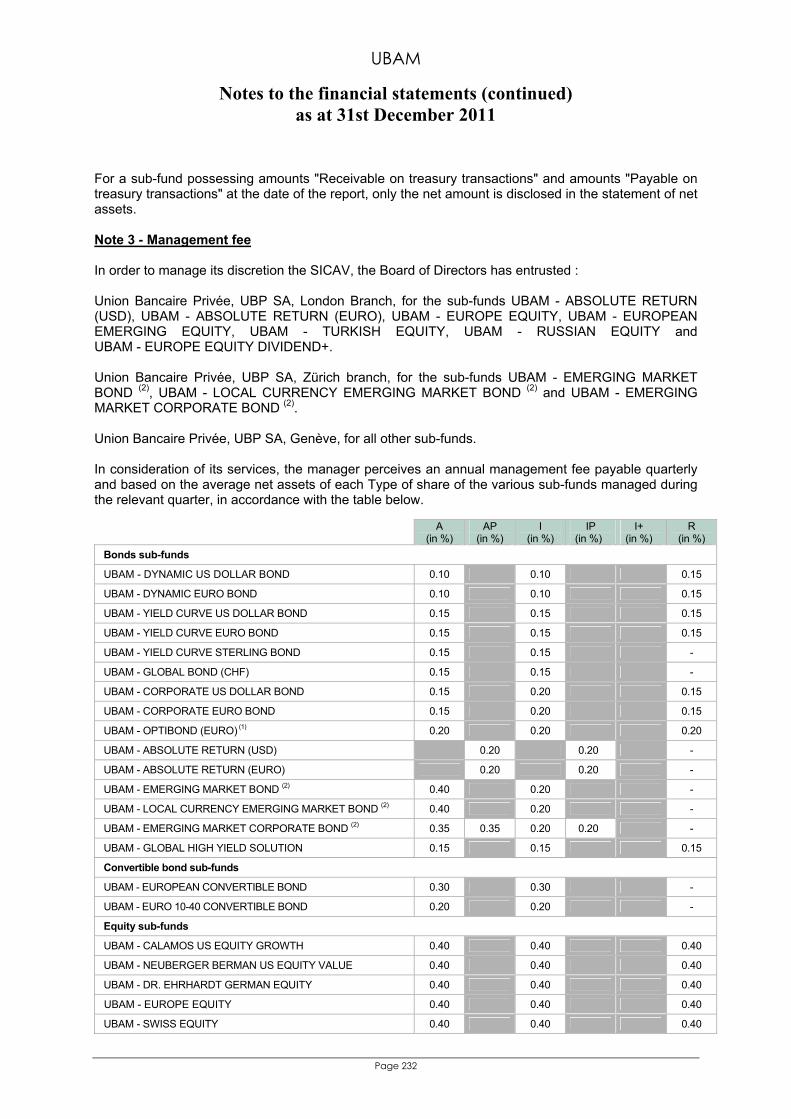
UBAM
Notes to the financial statements (continued) as at 31st December 2011
Page 232
For a sub-fund possessing amounts "Receivable on treasury transactions" and amounts "Payable on treasury transactions" at the date of the report, only the net amount is disclosed in the statement of net assets. Note 3 - Management fee In order to manage its discretion the SICAV, the Board of Directors has entrusted : Union Bancaire Privée, UBP SA, London Branch, for the sub-funds UBAM - ABSOLUTE RETURN (USD), UBAM - ABSOLUTE RETURN (EURO), UBAM - EUROPE EQUITY, UBAM - EUROPEAN EMERGING EQUITY, UBAM - TURKISH EQUITY, UBAM - RUSSIAN EQUITY and UBAM - EUROPE EQUITY DIVIDEND+. Union Bancaire Privée, UBP SA, Zürich branch, for the sub-funds UBAM - EMERGING MARKET BOND (2), UBAM - LOCAL CURRENCY EMERGING MARKET BOND (2) and UBAM - EMERGING MARKET CORPORATE BOND (2). Union Bancaire Privée, UBP SA, Genève, for all other sub-funds. In consideration of its services, the manager perceives an annual management fee payable quarterly and based on the average net assets of each Type of share of the various sub-funds managed during the relevant quarter, in accordance with the table below.
A (in %)
AP (in %)
I (in %)
IP (in %)
I+ (in %)
R (in %)
Bonds sub-funds
UBAM - DYNAMIC US DOLLAR BOND 0.10 0.10 0.15
UBAM - DYNAMIC EURO BOND 0.10 0.10 0.15
UBAM - YIELD CURVE US DOLLAR BOND 0.15 0.15 0.15
UBAM - YIELD CURVE EURO BOND 0.15 0.15 0.15
UBAM - YIELD CURVE STERLING BOND 0.15 0.15 -
UBAM - GLOBAL BOND (CHF) 0.15 0.15 -
UBAM - CORPORATE US DOLLAR BOND 0.15 0.20 0.15
UBAM - CORPORATE EURO BOND 0.15 0.20 0.15
UBAM - OPTIBOND (EURO) (1) 0.20 0.20 0.20
UBAM - ABSOLUTE RETURN (USD) 0.20 0.20 -
UBAM - ABSOLUTE RETURN (EURO) 0.20 0.20 -
UBAM - EMERGING MARKET BOND (2) 0.40 0.20 -
UBAM - LOCAL CURRENCY EMERGING MARKET BOND (2) 0.40 0.20 -
UBAM - EMERGING MARKET CORPORATE BOND (2) 0.35 0.35 0.20 0.20 -
UBAM - GLOBAL HIGH YIELD SOLUTION 0.15 0.15 0.15
Convertible bond sub-funds
UBAM - EUROPEAN CONVERTIBLE BOND 0.30 0.30 -
UBAM - EURO 10-40 CONVERTIBLE BOND 0.20 0.20 -
Equity sub-funds
UBAM - CALAMOS US EQUITY GROWTH 0.40 0.40 0.40
UBAM - NEUBERGER BERMAN US EQUITY VALUE 0.40 0.40 0.40
UBAM - DR. EHRHARDT GERMAN EQUITY 0.40 0.40 0.40
UBAM - EUROPE EQUITY 0.40 0.40 0.40
UBAM - SWISS EQUITY 0.40 0.40 0.40
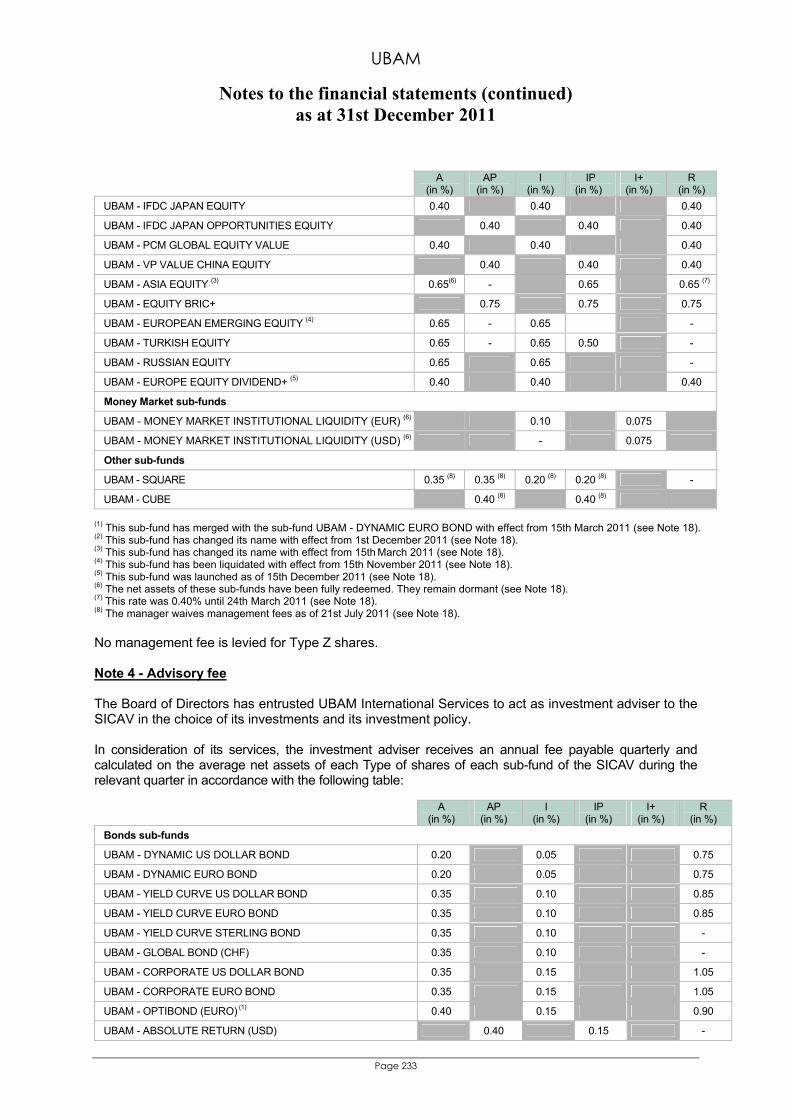
UBAM
Notes to the financial statements (continued) as at 31st December 2011
Page 233
A (in %)
AP (in %)
I (in %)
IP (in %)
I+ (in %)
R (in %)
UBAM - IFDC JAPAN EQUITY 0.40 0.40 0.40
UBAM - IFDC JAPAN OPPORTUNITIES EQUITY 0.40 0.40 0.40
UBAM - PCM GLOBAL EQUITY VALUE 0.40 0.40 0.40
UBAM - VP VALUE CHINA EQUITY 0.40 0.40 0.40
UBAM - ASIA EQUITY (3) 0.65(6) - 0.65 0.65 (7)
UBAM - EQUITY BRIC+ 0.75 0.75 0.75
UBAM - EUROPEAN EMERGING EQUITY (4) 0.65 - 0.65 -
UBAM - TURKISH EQUITY 0.65 - 0.65 0.50 -
UBAM - RUSSIAN EQUITY 0.65 0.65 -
UBAM - EUROPE EQUITY DIVIDEND+ (5) 0.40 0.40 0.40
Money Market sub-funds
UBAM - MONEY MARKET INSTITUTIONAL LIQUIDITY (EUR) (6) 0.10 0.075
UBAM - MONEY MARKET INSTITUTIONAL LIQUIDITY (USD) (6) - 0.075
Other sub-funds
UBAM - SQUARE 0.35 (8) 0.35 (8) 0.20 (8) 0.20 (8) -
UBAM - CUBE 0.40 (8) 0.40 (8) (1) This sub-fund has merged with the sub-fund UBAM - DYNAMIC EURO BOND with effect from 15th March 2011 (see Note 18). (2) This sub-fund has changed its name with effect from 1st December 2011 (see Note 18). (3) This sub-fund has changed its name with effect from 15th March 2011 (see Note 18). (4) This sub-fund has been liquidated with effect from 15th November 2011 (see Note 18). (5) This sub-fund was launched as of 15th December 2011 (see Note 18). (6) The net assets of these sub-funds have been fully redeemed. They remain dormant (see Note 18). (7) This rate was 0.40% until 24th March 2011 (see Note 18). (8) The manager waives management fees as of 21st July 2011 (see Note 18). No management fee is levied for Type Z shares. Note 4 - Advisory fee The Board of Directors has entrusted UBAM International Services to act as investment adviser to the SICAV in the choice of its investments and its investment policy. In consideration of its services, the investment adviser receives an annual fee payable quarterly and calculated on the average net assets of each Type of shares of each sub-fund of the SICAV during the relevant quarter in accordance with the following table:
A (in %)
AP (in %)
I (in %)
IP (in %)
I+ (in %)
R (in %)
Bonds sub-funds
UBAM - DYNAMIC US DOLLAR BOND 0.20 0.05 0.75
UBAM - DYNAMIC EURO BOND 0.20 0.05 0.75
UBAM - YIELD CURVE US DOLLAR BOND 0.35 0.10 0.85
UBAM - YIELD CURVE EURO BOND 0.35 0.10 0.85
UBAM - YIELD CURVE STERLING BOND 0.35 0.10 -
UBAM - GLOBAL BOND (CHF) 0.35 0.10 -
UBAM - CORPORATE US DOLLAR BOND 0.35 0.15 1.05
UBAM - CORPORATE EURO BOND 0.35 0.15 1.05
UBAM - OPTIBOND (EURO) (1) 0.40 0.15 0.90
UBAM - ABSOLUTE RETURN (USD) 0.40 0.15 -
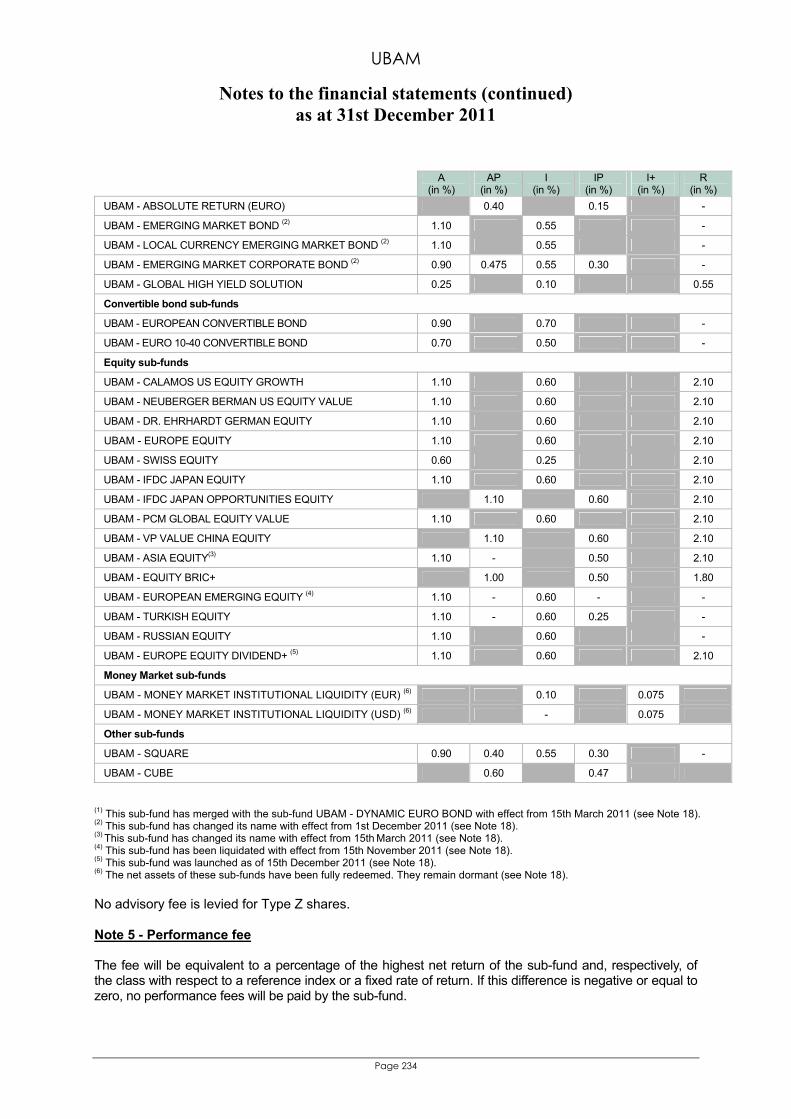
UBAM
Notes to the financial statements (continued) as at 31st December 2011
Page 234
A (in %)
AP (in %)
I (in %)
IP (in %)
I+ (in %)
R (in %)
UBAM - ABSOLUTE RETURN (EURO) 0.40 0.15 -
UBAM - EMERGING MARKET BOND (2) 1.10 0.55 -
UBAM - LOCAL CURRENCY EMERGING MARKET BOND (2) 1.10 0.55 -
UBAM - EMERGING MARKET CORPORATE BOND (2) 0.90 0.475 0.55 0.30 -
UBAM - GLOBAL HIGH YIELD SOLUTION 0.25 0.10 0.55
Convertible bond sub-funds
UBAM - EUROPEAN CONVERTIBLE BOND 0.90 0.70 -
UBAM - EURO 10-40 CONVERTIBLE BOND 0.70 0.50 -
Equity sub-funds
UBAM - CALAMOS US EQUITY GROWTH 1.10 0.60 2.10
UBAM - NEUBERGER BERMAN US EQUITY VALUE 1.10 0.60 2.10
UBAM - DR. EHRHARDT GERMAN EQUITY 1.10 0.60 2.10
UBAM - EUROPE EQUITY 1.10 0.60 2.10
UBAM - SWISS EQUITY 0.60 0.25 2.10
UBAM - IFDC JAPAN EQUITY 1.10 0.60 2.10
UBAM - IFDC JAPAN OPPORTUNITIES EQUITY 1.10 0.60 2.10
UBAM - PCM GLOBAL EQUITY VALUE 1.10 0.60 2.10
UBAM - VP VALUE CHINA EQUITY 1.10 0.60 2.10
UBAM - ASIA EQUITY(3) 1.10 - 0.50 2.10
UBAM - EQUITY BRIC+ 1.00 0.50 1.80
UBAM - EUROPEAN EMERGING EQUITY (4) 1.10 - 0.60 - -
UBAM - TURKISH EQUITY 1.10 - 0.60 0.25 -
UBAM - RUSSIAN EQUITY 1.10 0.60 -
UBAM - EUROPE EQUITY DIVIDEND+ (5) 1.10 0.60 2.10
Money Market sub-funds
UBAM - MONEY MARKET INSTITUTIONAL LIQUIDITY (EUR) (6) 0.10 0.075
UBAM - MONEY MARKET INSTITUTIONAL LIQUIDITY (USD) (6) - 0.075
Other sub-funds
UBAM - SQUARE 0.90 0.40 0.55 0.30 -
UBAM - CUBE 0.60 0.47
(1) This sub-fund has merged with the sub-fund UBAM - DYNAMIC EURO BOND with effect from 15th March 2011 (see Note 18). (2) This sub-fund has changed its name with effect from 1st December 2011 (see Note 18). (3) This sub-fund has changed its name with effect from 15th March 2011 (see Note 18). (4) This sub-fund has been liquidated with effect from 15th November 2011 (see Note 18). (5) This sub-fund was launched as of 15th December 2011 (see Note 18). (6) The net assets of these sub-funds have been fully redeemed. They remain dormant (see Note 18).
No advisory fee is levied for Type Z shares. Note 5 - Performance fee
The fee will be equivalent to a percentage of the highest net return of the sub-fund and, respectively, of the class with respect to a reference index or a fixed rate of return. If this difference is negative or equal to zero, no performance fees will be paid by the sub-fund.
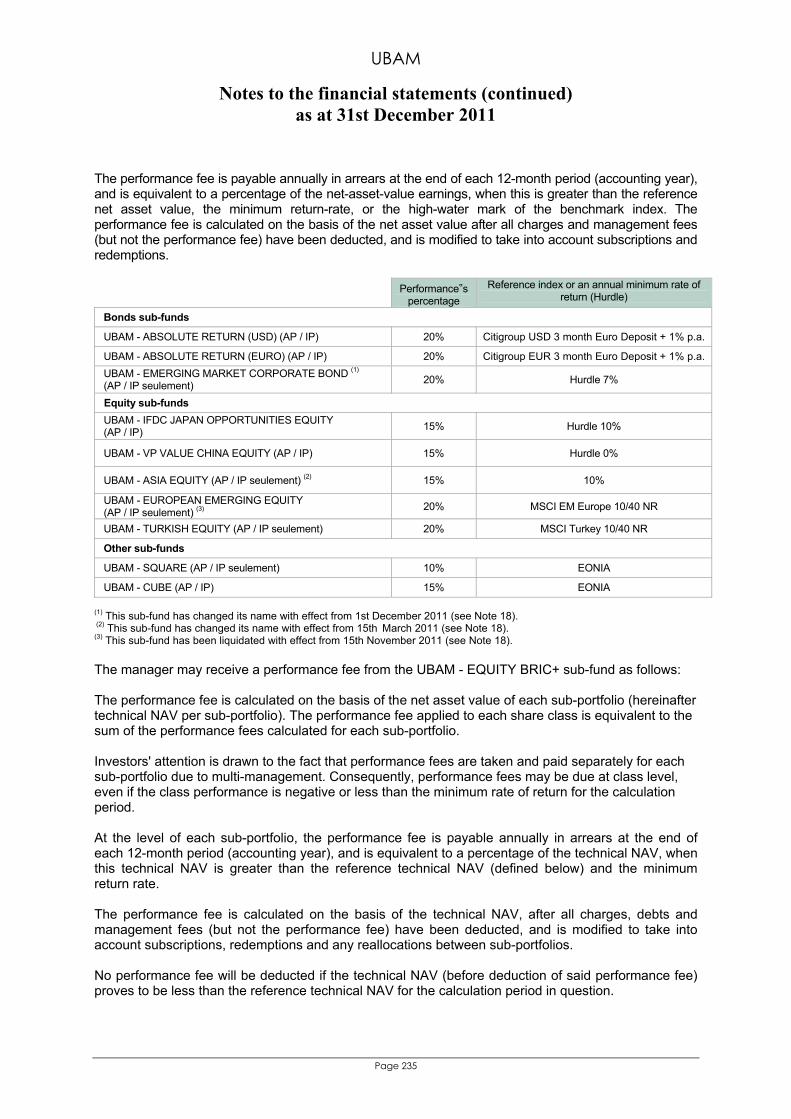
UBAM
Notes to the financial statements (continued) as at 31st December 2011
Page 235
The performance fee is payable annually in arrears at the end of each 12-month period (accounting year), and is equivalent to a percentage of the net-asset-value earnings, when this is greater than the reference net asset value, the minimum return-rate, or the high-water mark of the benchmark index. The performance fee is calculated on the basis of the net asset value after all charges and management fees (but not the performance fee) have been deducted, and is modified to take into account subscriptions and redemptions. Performance‟s
percentage Reference index or an annual minimum rate of
return (Hurdle)
Bonds sub-funds
UBAM - ABSOLUTE RETURN (USD) (AP / IP) 20% Citigroup USD 3 month Euro Deposit + 1% p.a.
UBAM - ABSOLUTE RETURN (EURO) (AP / IP) 20% Citigroup EUR 3 month Euro Deposit + 1% p.a. UBAM - EMERGING MARKET CORPORATE BOND (1)
(AP / IP seulement) 20% Hurdle 7%
Equity sub-funds UBAM - IFDC JAPAN OPPORTUNITIES EQUITY (AP / IP) 15% Hurdle 10%
UBAM - VP VALUE CHINA EQUITY (AP / IP) 15% Hurdle 0%
UBAM - ASIA EQUITY (AP / IP seulement) (2) 15% 10%
UBAM - EUROPEAN EMERGING EQUITY (AP / IP seulement) (3) 20% MSCI EM Europe 10/40 NR
UBAM - TURKISH EQUITY (AP / IP seulement) 20% MSCI Turkey 10/40 NR
Other sub-funds
UBAM - SQUARE (AP / IP seulement) 10% EONIA
UBAM - CUBE (AP / IP) 15% EONIA
(1) This sub-fund has changed its name with effect from 1st December 2011 (see Note 18). (2) This sub-fund has changed its name with effect from 15th March 2011 (see Note 18). (3) This sub-fund has been liquidated with effect from 15th November 2011 (see Note 18). The manager may receive a performance fee from the UBAM - EQUITY BRIC+ sub-fund as follows: The performance fee is calculated on the basis of the net asset value of each sub-portfolio (hereinafter technical NAV per sub-portfolio). The performance fee applied to each share class is equivalent to the sum of the performance fees calculated for each sub-portfolio. Investors' attention is drawn to the fact that performance fees are taken and paid separately for each sub-portfolio due to multi-management. Consequently, performance fees may be due at class level, even if the class performance is negative or less than the minimum rate of return for the calculation period. At the level of each sub-portfolio, the performance fee is payable annually in arrears at the end of each 12-month period (accounting year), and is equivalent to a percentage of the technical NAV, when this technical NAV is greater than the reference technical NAV (defined below) and the minimum return rate. The performance fee is calculated on the basis of the technical NAV, after all charges, debts and management fees (but not the performance fee) have been deducted, and is modified to take into account subscriptions, redemptions and any reallocations between sub-portfolios. No performance fee will be deducted if the technical NAV (before deduction of said performance fee) proves to be less than the reference technical NAV for the calculation period in question.
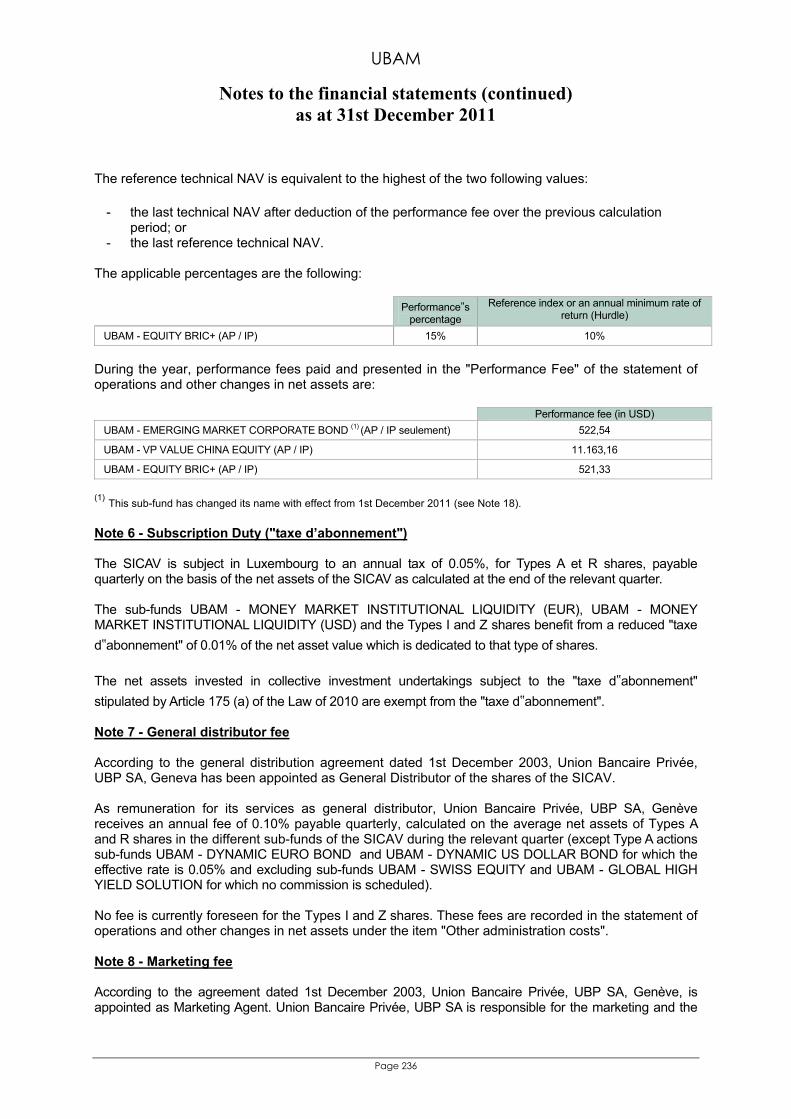
UBAM
Notes to the financial statements (continued) as at 31st December 2011
Page 236
The reference technical NAV is equivalent to the highest of the two following values: - the last technical NAV after deduction of the performance fee over the previous calculation
period; or - the last reference technical NAV.
The applicable percentages are the following:
Performance‟s percentage
Reference index or an annual minimum rate of return (Hurdle)
UBAM - EQUITY BRIC+ (AP / IP) 15% 10%
During the year, performance fees paid and presented in the "Performance Fee" of the statement of operations and other changes in net assets are: Performance fee (in USD) UBAM - EMERGING MARKET CORPORATE BOND (1) (AP / IP seulement) 522,54
UBAM - VP VALUE CHINA EQUITY (AP / IP) 11.163,16
UBAM - EQUITY BRIC+ (AP / IP) 521,33
(1) This sub-fund has changed its name with effect from 1st December 2011 (see Note 18). Note 6 - Subscription Duty ("taxe d’abonnement") The SICAV is subject in Luxembourg to an annual tax of 0.05%, for Types A et R shares, payable quarterly on the basis of the net assets of the SICAV as calculated at the end of the relevant quarter. The sub-funds UBAM - MONEY MARKET INSTITUTIONAL LIQUIDITY (EUR), UBAM - MONEY MARKET INSTITUTIONAL LIQUIDITY (USD) and the Types I and Z shares benefit from a reduced "taxe d‟abonnement" of 0.01% of the net asset value which is dedicated to that type of shares. The net assets invested in collective investment undertakings subject to the "taxe d‟abonnement" stipulated by Article 175 (a) of the Law of 2010 are exempt from the "taxe d‟abonnement". Note 7 - General distributor fee According to the general distribution agreement dated 1st December 2003, Union Bancaire Privée, UBP SA, Geneva has been appointed as General Distributor of the shares of the SICAV. As remuneration for its services as general distributor, Union Bancaire Privée, UBP SA, Genève receives an annual fee of 0.10% payable quarterly, calculated on the average net assets of Types A and R shares in the different sub-funds of the SICAV during the relevant quarter (except Type A actions sub-funds UBAM - DYNAMIC EURO BOND and UBAM - DYNAMIC US DOLLAR BOND for which the effective rate is 0.05% and excluding sub-funds UBAM - SWISS EQUITY and UBAM - GLOBAL HIGH YIELD SOLUTION for which no commission is scheduled). No fee is currently foreseen for the Types I and Z shares. These fees are recorded in the statement of operations and other changes in net assets under the item "Other administration costs". Note 8 - Marketing fee According to the agreement dated 1st December 2003, Union Bancaire Privée, UBP SA, Genève, is appointed as Marketing Agent. Union Bancaire Privée, UBP SA is responsible for the marketing and the
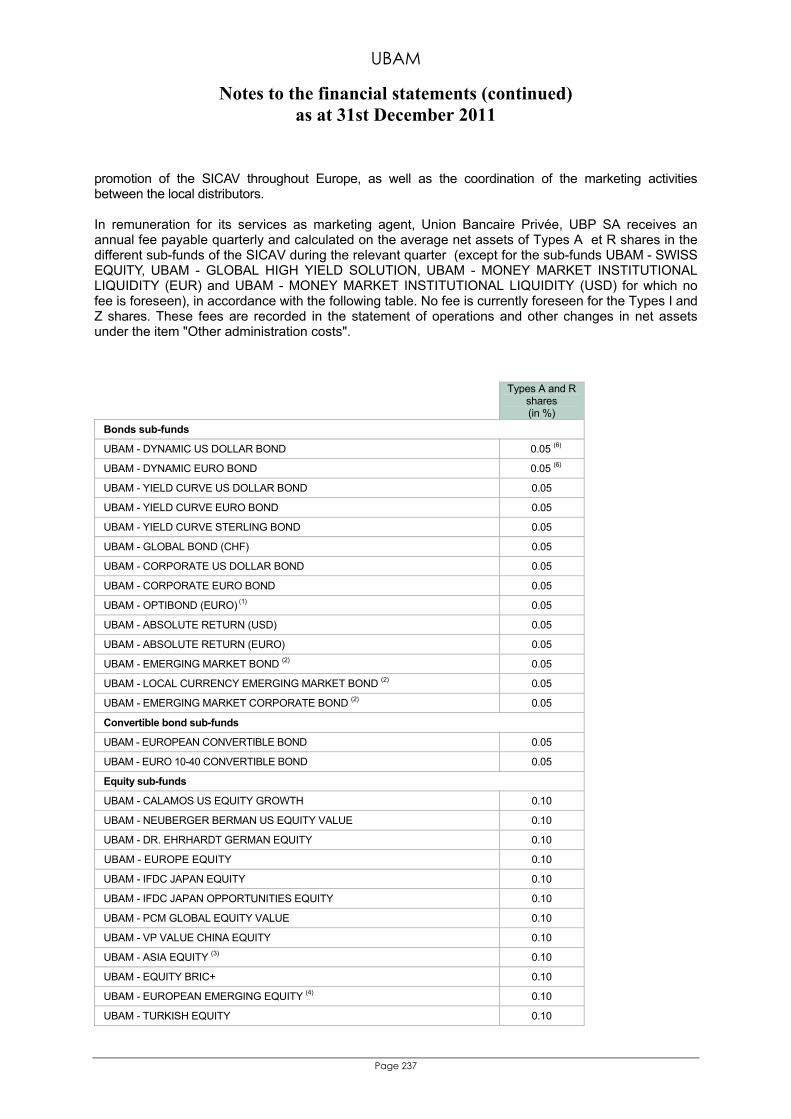
UBAM
Notes to the financial statements (continued) as at 31st December 2011
Page 237
promotion of the SICAV throughout Europe, as well as the coordination of the marketing activities between the local distributors.
In remuneration for its services as marketing agent, Union Bancaire Privée, UBP SA receives an annual fee payable quarterly and calculated on the average net assets of Types A et R shares in the different sub-funds of the SICAV during the relevant quarter (except for the sub-funds UBAM - SWISS EQUITY, UBAM - GLOBAL HIGH YIELD SOLUTION, UBAM - MONEY MARKET INSTITUTIONAL LIQUIDITY (EUR) and UBAM - MONEY MARKET INSTITUTIONAL LIQUIDITY (USD) for which no fee is foreseen), in accordance with the following table. No fee is currently foreseen for the Types I and Z shares. These fees are recorded in the statement of operations and other changes in net assets under the item "Other administration costs". Types A and R
shares (in %)
Bonds sub-funds
UBAM - DYNAMIC US DOLLAR BOND 0.05 (6)
UBAM - DYNAMIC EURO BOND 0.05 (6)
UBAM - YIELD CURVE US DOLLAR BOND 0.05
UBAM - YIELD CURVE EURO BOND 0.05
UBAM - YIELD CURVE STERLING BOND 0.05
UBAM - GLOBAL BOND (CHF) 0.05
UBAM - CORPORATE US DOLLAR BOND 0.05
UBAM - CORPORATE EURO BOND 0.05
UBAM - OPTIBOND (EURO) (1) 0.05
UBAM - ABSOLUTE RETURN (USD) 0.05
UBAM - ABSOLUTE RETURN (EURO) 0.05
UBAM - EMERGING MARKET BOND (2) 0.05
UBAM - LOCAL CURRENCY EMERGING MARKET BOND (2) 0.05
UBAM - EMERGING MARKET CORPORATE BOND (2) 0.05
Convertible bond sub-funds
UBAM - EUROPEAN CONVERTIBLE BOND 0.05
UBAM - EURO 10-40 CONVERTIBLE BOND 0.05
Equity sub-funds
UBAM - CALAMOS US EQUITY GROWTH 0.10
UBAM - NEUBERGER BERMAN US EQUITY VALUE 0.10
UBAM - DR. EHRHARDT GERMAN EQUITY 0.10
UBAM - EUROPE EQUITY 0.10
UBAM - IFDC JAPAN EQUITY 0.10
UBAM - IFDC JAPAN OPPORTUNITIES EQUITY 0.10
UBAM - PCM GLOBAL EQUITY VALUE 0.10
UBAM - VP VALUE CHINA EQUITY 0.10
UBAM - ASIA EQUITY (3) 0.10
UBAM - EQUITY BRIC+ 0.10
UBAM - EUROPEAN EMERGING EQUITY (4) 0.10
UBAM - TURKISH EQUITY 0.10
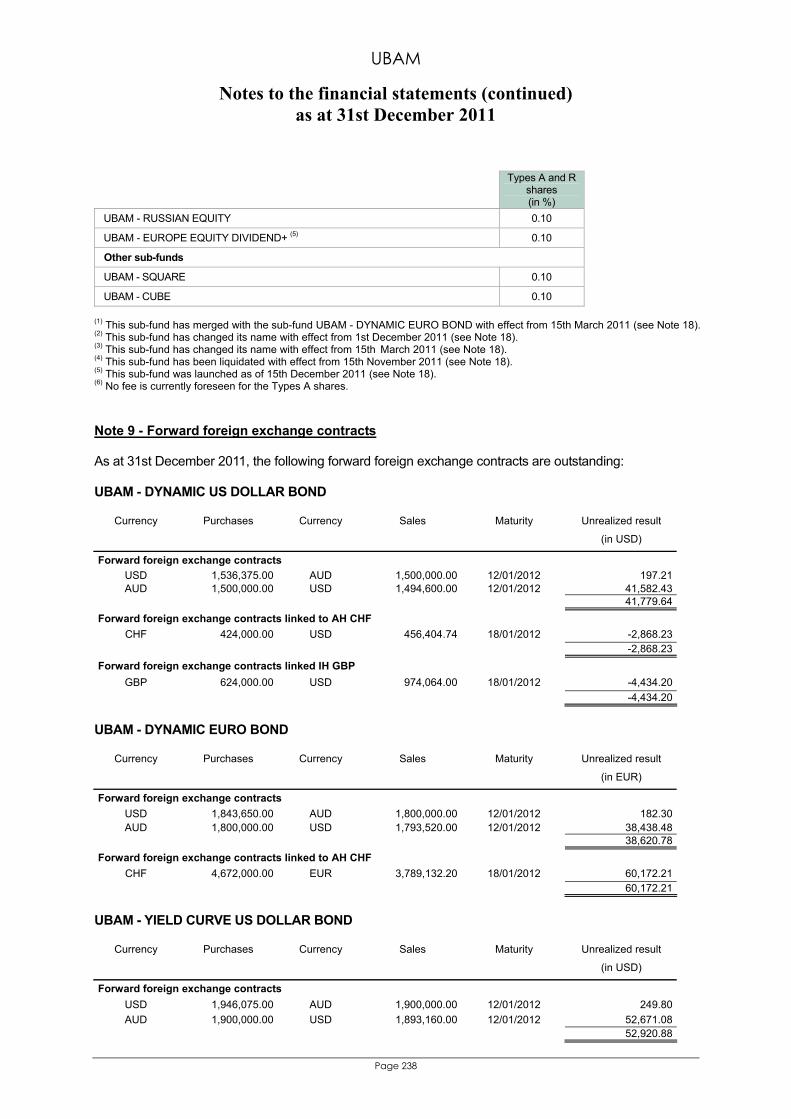
UBAM
Notes to the financial statements (continued) as at 31st December 2011
Page 238
Types A and R shares (in %)
UBAM - RUSSIAN EQUITY 0.10
UBAM - EUROPE EQUITY DIVIDEND+ (5) 0.10
Other sub-funds
UBAM - SQUARE 0.10
UBAM - CUBE 0.10
(1) This sub-fund has merged with the sub-fund UBAM - DYNAMIC EURO BOND with effect from 15th March 2011 (see Note 18). (2) This sub-fund has changed its name with effect from 1st December 2011 (see Note 18). (3) This sub-fund has changed its name with effect from 15th March 2011 (see Note 18). (4) This sub-fund has been liquidated with effect from 15th November 2011 (see Note 18). (5) This sub-fund was launched as of 15th December 2011 (see Note 18). (6) No fee is currently foreseen for the Types A shares. Note 9 - Forward foreign exchange contracts As at 31st December 2011, the following forward foreign exchange contracts are outstanding: UBAM - DYNAMIC US DOLLAR BOND
Unrealized result Currency Purchases Currency Sales
Maturity
(in USD)
Forward foreign exchange contracts USD 1,536,375.00 AUD 1,500,000.00 12/01/2012 197.21 AUD 1,500,000.00 USD 1,494,600.00 12/01/2012 41,582.43 41,779.64Forward foreign exchange contracts linked to AH CHF CHF 424,000.00 USD 456,404.74 18/01/2012 -2,868.23 -2,868.23Forward foreign exchange contracts linked IH GBP GBP 624,000.00 USD 974,064.00 18/01/2012 -4,434.20 -4,434.20
UBAM - DYNAMIC EURO BOND
Unrealized result Currency Purchases Currency Sales
Maturity
(in EUR)
Forward foreign exchange contracts USD 1,843,650.00 AUD 1,800,000.00 12/01/2012 182.30 AUD 1,800,000.00 USD 1,793,520.00 12/01/2012 38,438.48 38,620.78Forward foreign exchange contracts linked to AH CHF CHF 4,672,000.00 EUR 3,789,132.20 18/01/2012 60,172.21 60,172.21
UBAM - YIELD CURVE US DOLLAR BOND
Unrealized result Currency Purchases Currency Sales
Maturity
(in USD)
Forward foreign exchange contracts USD 1,946,075.00 AUD 1,900,000.00 12/01/2012 249.80 AUD 1,900,000.00 USD 1,893,160.00 12/01/2012 52,671.08 52,920.88
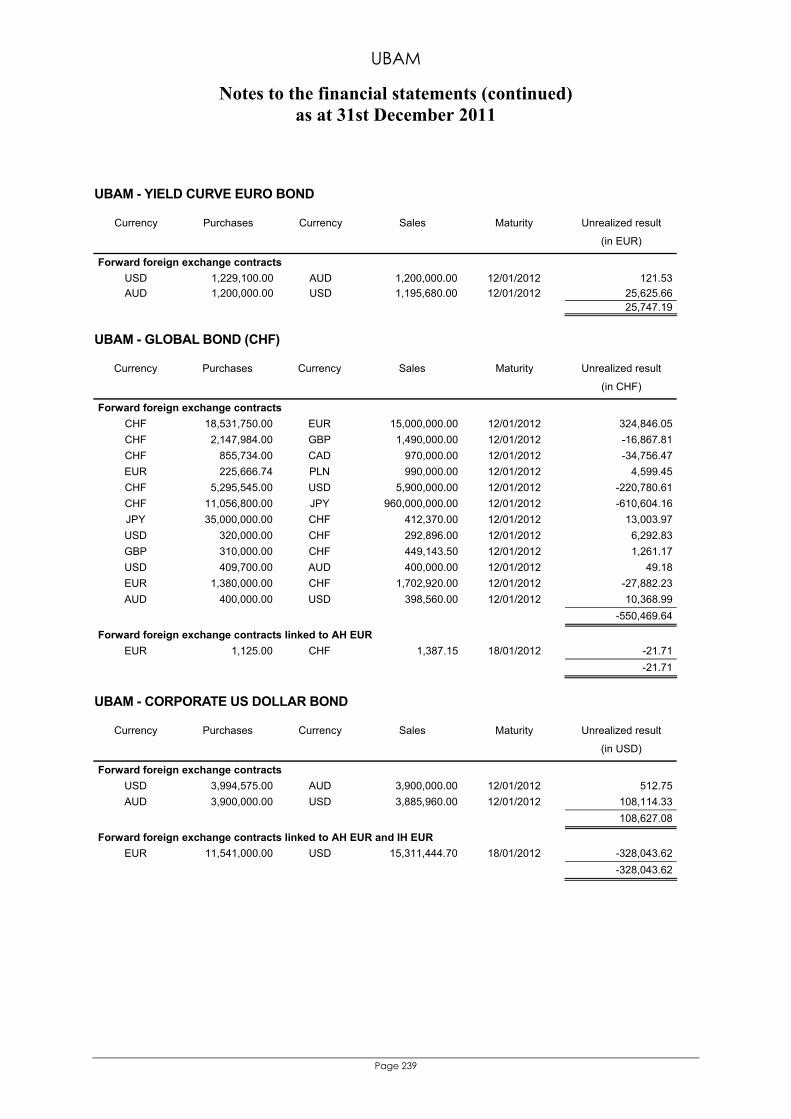
UBAM
Notes to the financial statements (continued) as at 31st December 2011
Page 239
UBAM - YIELD CURVE EURO BOND
Unrealized result Currency Purchases Currency Sales
Maturity
(in EUR)
Forward foreign exchange contracts USD 1,229,100.00 AUD 1,200,000.00 12/01/2012 121.53 AUD 1,200,000.00 USD 1,195,680.00 12/01/2012 25,625.66 25,747.19
UBAM - GLOBAL BOND (CHF)
Unrealized result Currency Purchases Currency Sales
Maturity
(in CHF)
Forward foreign exchange contracts CHF 18,531,750.00 EUR 15,000,000.00 12/01/2012 324,846.05 CHF 2,147,984.00 GBP 1,490,000.00 12/01/2012 -16,867.81 CHF 855,734.00 CAD 970,000.00 12/01/2012 -34,756.47 EUR 225,666.74 PLN 990,000.00 12/01/2012 4,599.45 CHF 5,295,545.00 USD 5,900,000.00 12/01/2012 -220,780.61 CHF 11,056,800.00 JPY 960,000,000.00 12/01/2012 -610,604.16 JPY 35,000,000.00 CHF 412,370.00 12/01/2012 13,003.97 USD 320,000.00 CHF 292,896.00 12/01/2012 6,292.83 GBP 310,000.00 CHF 449,143.50 12/01/2012 1,261.17 USD 409,700.00 AUD 400,000.00 12/01/2012 49.18 EUR 1,380,000.00 CHF 1,702,920.00 12/01/2012 -27,882.23 AUD 400,000.00 USD 398,560.00 12/01/2012 10,368.99 -550,469.64
Forward foreign exchange contracts linked to AH EUR EUR 1,125.00 CHF 1,387.15 18/01/2012 -21.71 -21.71
UBAM - CORPORATE US DOLLAR BOND
Unrealized result Currency Purchases Currency Sales
Maturity
(in USD)
Forward foreign exchange contracts USD 3,994,575.00 AUD 3,900,000.00 12/01/2012 512.75 AUD 3,900,000.00 USD 3,885,960.00 12/01/2012 108,114.33 108,627.08
Forward foreign exchange contracts linked to AH EUR and IH EUR EUR 11,541,000.00 USD 15,311,444.70 18/01/2012 -328,043.62 -328,043.62
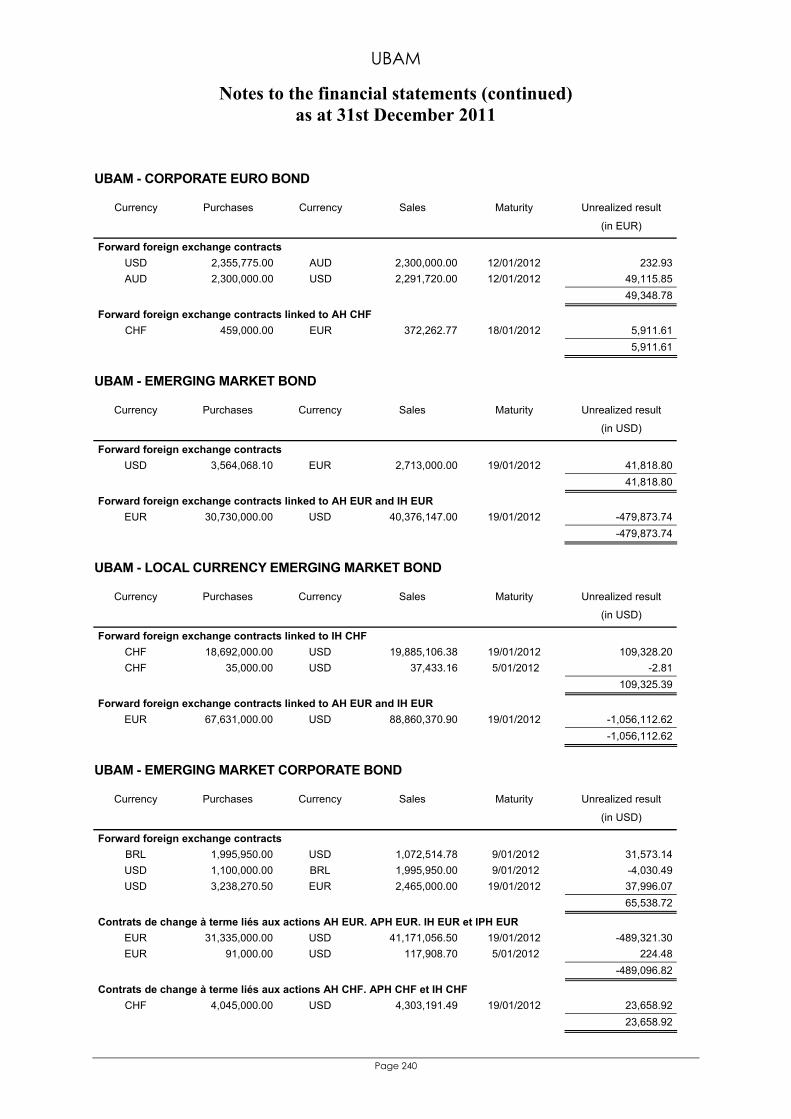
UBAM
Notes to the financial statements (continued) as at 31st December 2011
Page 240
UBAM - CORPORATE EURO BOND
Unrealized result Currency Purchases Currency Sales
Maturity
(in EUR)
Forward foreign exchange contracts USD 2,355,775.00 AUD 2,300,000.00 12/01/2012 232.93 AUD 2,300,000.00 USD 2,291,720.00 12/01/2012 49,115.85 49,348.78
Forward foreign exchange contracts linked to AH CHF CHF 459,000.00 EUR 372,262.77 18/01/2012 5,911.61 5,911.61
UBAM - EMERGING MARKET BOND
Unrealized result Currency Purchases Currency Sales
Maturity
(in USD)
Forward foreign exchange contracts USD 3,564,068.10 EUR 2,713,000.00 19/01/2012 41,818.80 41,818.80
Forward foreign exchange contracts linked to AH EUR and IH EUR EUR 30,730,000.00 USD 40,376,147.00 19/01/2012 -479,873.74 -479,873.74
UBAM - LOCAL CURRENCY EMERGING MARKET BOND
Unrealized result Currency Purchases Currency Sales
Maturity
(in USD)
Forward foreign exchange contracts linked to IH CHF CHF 18,692,000.00 USD 19,885,106.38 19/01/2012 109,328.20 CHF 35,000.00 USD 37,433.16 5/01/2012 -2.81 109,325.39
Forward foreign exchange contracts linked to AH EUR and IH EUR EUR 67,631,000.00 USD 88,860,370.90 19/01/2012 -1,056,112.62 -1,056,112.62
UBAM - EMERGING MARKET CORPORATE BOND
Unrealized result Currency Purchases Currency Sales
Maturity
(in USD)
Forward foreign exchange contracts BRL 1,995,950.00 USD 1,072,514.78 9/01/2012 31,573.14 USD 1,100,000.00 BRL 1,995,950.00 9/01/2012 -4,030.49 USD 3,238,270.50 EUR 2,465,000.00 19/01/2012 37,996.07 65,538.72
Contrats de change à terme liés aux actions AH EUR. APH EUR. IH EUR et IPH EUR EUR 31,335,000.00 USD 41,171,056.50 19/01/2012 -489,321.30 EUR 91,000.00 USD 117,908.70 5/01/2012 224.48 -489,096.82
Contrats de change à terme liés aux actions AH CHF. APH CHF et IH CHF CHF 4,045,000.00 USD 4,303,191.49 19/01/2012 23,658.92 23,658.92
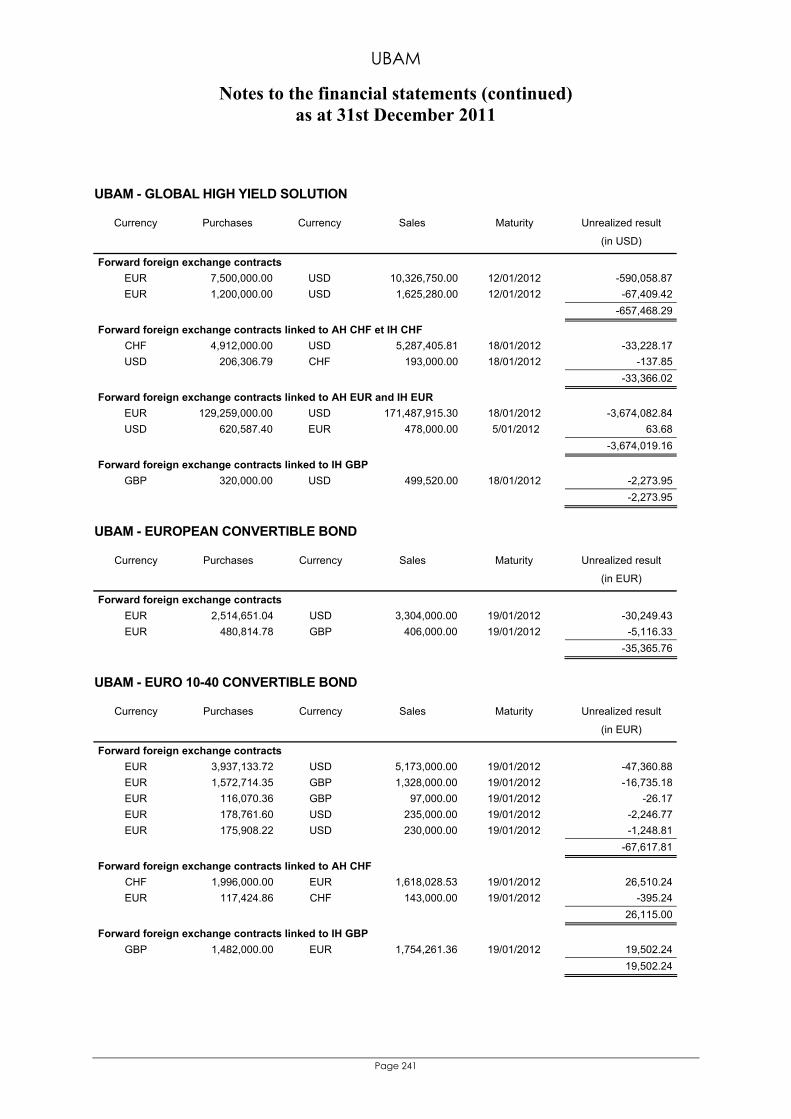
UBAM
Notes to the financial statements (continued) as at 31st December 2011
Page 241
UBAM - GLOBAL HIGH YIELD SOLUTION
Unrealized result Currency Purchases Currency Sales
Maturity
(in USD)
Forward foreign exchange contracts EUR 7,500,000.00 USD 10,326,750.00 12/01/2012 -590,058.87 EUR 1,200,000.00 USD 1,625,280.00 12/01/2012 -67,409.42 -657,468.29
Forward foreign exchange contracts linked to AH CHF et IH CHF CHF 4,912,000.00 USD 5,287,405.81 18/01/2012 -33,228.17 USD 206,306.79 CHF 193,000.00 18/01/2012 -137.85 -33,366.02
Forward foreign exchange contracts linked to AH EUR and IH EUR EUR 129,259,000.00 USD 171,487,915.30 18/01/2012 -3,674,082.84 USD 620,587.40 EUR 478,000.00 5/01/2012 63.68 -3,674,019.16
Forward foreign exchange contracts linked to IH GBP GBP 320,000.00 USD 499,520.00 18/01/2012 -2,273.95 -2,273.95
UBAM - EUROPEAN CONVERTIBLE BOND
Unrealized result Currency Purchases Currency Sales
Maturity
(in EUR)
Forward foreign exchange contracts EUR 2,514,651.04 USD 3,304,000.00 19/01/2012 -30,249.43 EUR 480,814.78 GBP 406,000.00 19/01/2012 -5,116.33 -35,365.76
UBAM - EURO 10-40 CONVERTIBLE BOND
Unrealized result Currency Purchases Currency Sales
Maturity
(in EUR)
Forward foreign exchange contracts EUR 3,937,133.72 USD 5,173,000.00 19/01/2012 -47,360.88 EUR 1,572,714.35 GBP 1,328,000.00 19/01/2012 -16,735.18 EUR 116,070.36 GBP 97,000.00 19/01/2012 -26.17 EUR 178,761.60 USD 235,000.00 19/01/2012 -2,246.77 EUR 175,908.22 USD 230,000.00 19/01/2012 -1,248.81 -67,617.81
Forward foreign exchange contracts linked to AH CHF CHF 1,996,000.00 EUR 1,618,028.53 19/01/2012 26,510.24 EUR 117,424.86 CHF 143,000.00 19/01/2012 -395.24 26,115.00
Forward foreign exchange contracts linked to IH GBP GBP 1,482,000.00 EUR 1,754,261.36 19/01/2012 19,502.24 19,502.24
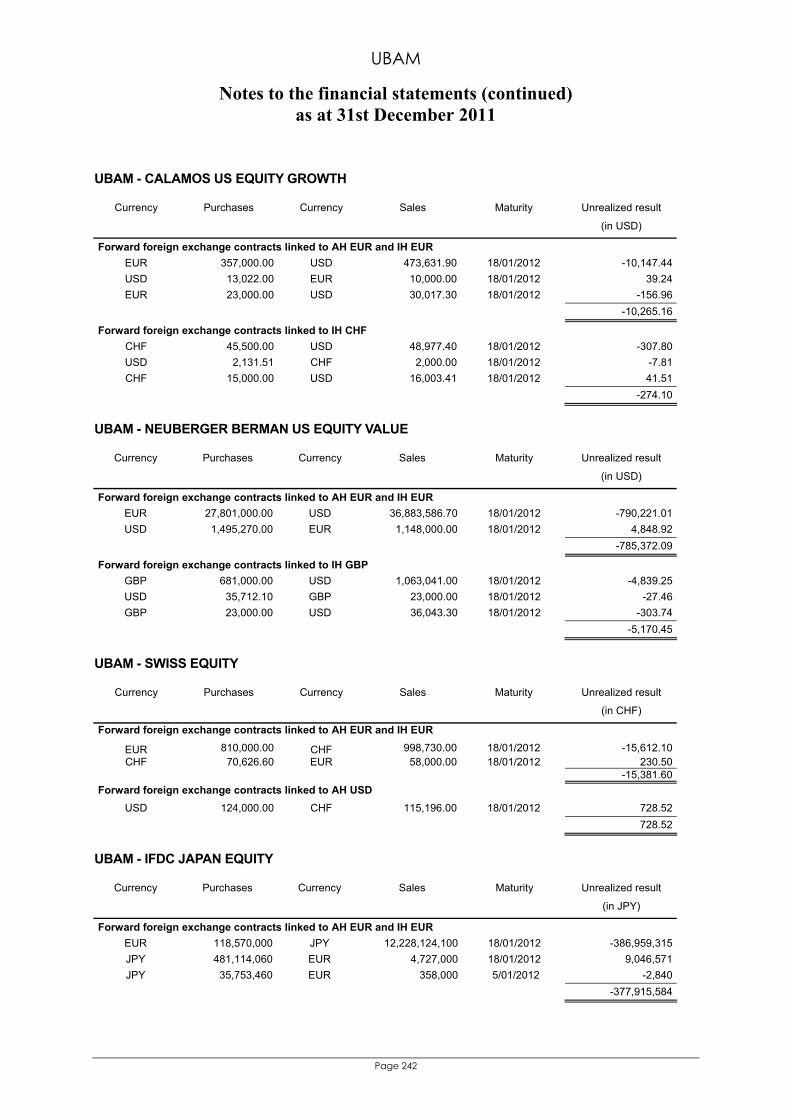
UBAM
Notes to the financial statements (continued) as at 31st December 2011
Page 242
UBAM - CALAMOS US EQUITY GROWTH
Unrealized result Currency Purchases Currency Sales
Maturity
(in USD)
Forward foreign exchange contracts linked to AH EUR and IH EUR EUR 357,000.00 USD 473,631.90 18/01/2012 -10,147.44 USD 13,022.00 EUR 10,000.00 18/01/2012 39.24 EUR 23,000.00 USD 30,017.30 18/01/2012 -156.96 -10,265.16
Forward foreign exchange contracts linked to IH CHF CHF 45,500.00 USD 48,977.40 18/01/2012 -307.80 USD 2,131.51 CHF 2,000.00 18/01/2012 -7.81 CHF 15,000.00 USD 16,003.41 18/01/2012 41.51 -274.10
UBAM - NEUBERGER BERMAN US EQUITY VALUE
Unrealized result Currency Purchases Currency Sales
Maturity
(in USD)
Forward foreign exchange contracts linked to AH EUR and IH EUR EUR 27,801,000.00 USD 36,883,586.70 18/01/2012 -790,221.01 USD 1,495,270.00 EUR 1,148,000.00 18/01/2012 4,848.92 -785,372.09
Forward foreign exchange contracts linked to IH GBP GBP 681,000.00 USD 1,063,041.00 18/01/2012 -4,839.25 USD 35,712.10 GBP 23,000.00 18/01/2012 -27.46 GBP 23,000.00 USD 36,043.30 18/01/2012 -303.74 -5,170.45
UBAM - SWISS EQUITY
Unrealized result Currency Purchases Currency Sales
Maturity
(in CHF)
Forward foreign exchange contracts linked to AH EUR and IH EUR EUR 810,000.00 CHF 998,730.00 18/01/2012 -15,612.10 CHF 70,626.60 EUR 58,000.00 18/01/2012 230.50 -15,381.60Forward foreign exchange contracts linked to AH USD USD 124,000.00 CHF 115,196.00 18/01/2012 728.52 728.52
UBAM - IFDC JAPAN EQUITY
Unrealized result Currency Purchases Currency Sales
Maturity
(in JPY)
Forward foreign exchange contracts linked to AH EUR and IH EUR EUR 118,570,000 JPY 12,228,124,100 18/01/2012 -386,959,315 JPY 481,114,060 EUR 4,727,000 18/01/2012 9,046,571 JPY 35,753,460 EUR 358,000 5/01/2012 -2,840 -377,915,584
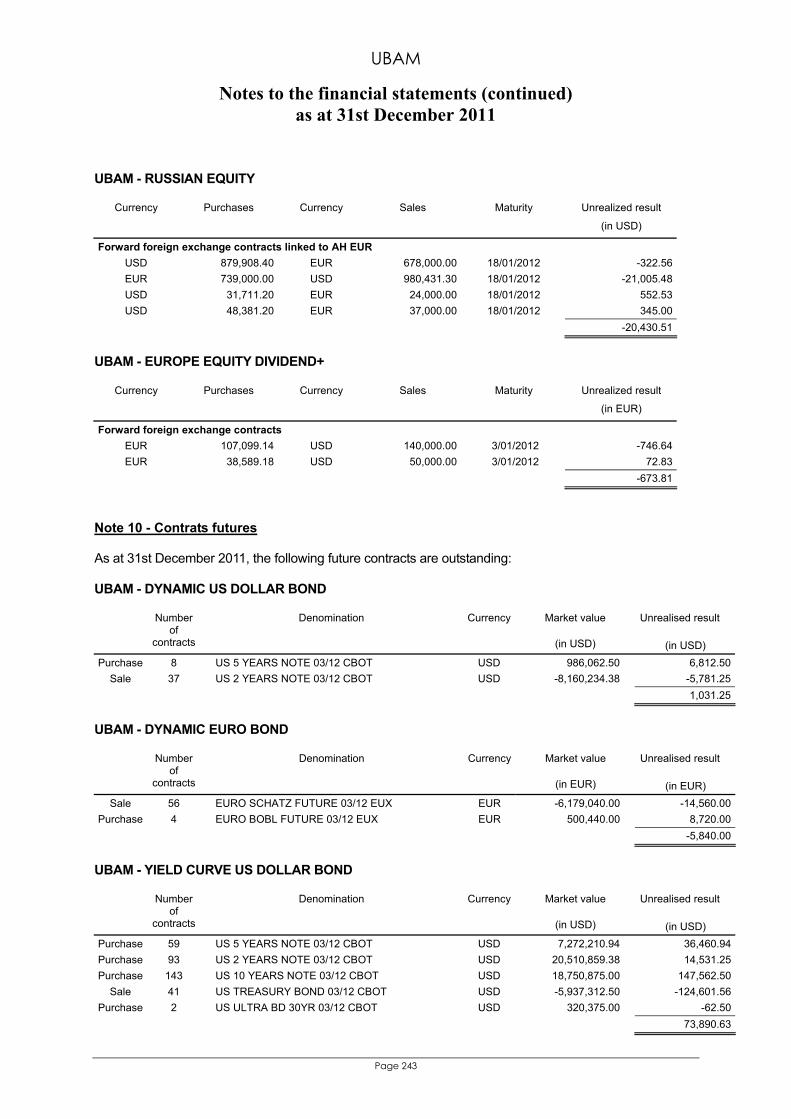
UBAM
Notes to the financial statements (continued) as at 31st December 2011
Page 243
UBAM - RUSSIAN EQUITY
Unrealized result Currency Purchases Currency Sales
Maturity
(in USD)
Forward foreign exchange contracts linked to AH EUR USD 879,908.40 EUR 678,000.00 18/01/2012 -322.56 EUR 739,000.00 USD 980,431.30 18/01/2012 -21,005.48 USD 31,711.20 EUR 24,000.00 18/01/2012 552.53 USD 48,381.20 EUR 37,000.00 18/01/2012 345.00 -20,430.51
UBAM - EUROPE EQUITY DIVIDEND+
Unrealized result Currency Purchases Currency Sales
Maturity
(in EUR)
Forward foreign exchange contracts EUR 107,099.14 USD 140,000.00 3/01/2012 -746.64 EUR 38,589.18 USD 50,000.00 3/01/2012 72.83 -673.81
Note 10 - Contrats futures As at 31st December 2011, the following future contracts are outstanding: UBAM - DYNAMIC US DOLLAR BOND
Market value
Unrealised result
Number of
contracts
Denomination Currency
(in USD)
(in USD) Purchase 8 US 5 YEARS NOTE 03/12 CBOT USD 986,062.50 6,812.50
Sale 37 US 2 YEARS NOTE 03/12 CBOT USD -8,160,234.38 -5,781.25 1,031.25
UBAM - DYNAMIC EURO BOND
Market value
Unrealised result
Number of
contracts
Denomination Currency
(in EUR)
(in EUR) Sale 56 EURO SCHATZ FUTURE 03/12 EUX EUR -6,179,040.00 -14,560.00
Purchase 4 EURO BOBL FUTURE 03/12 EUX EUR 500,440.00 8,720.00 -5,840.00
UBAM - YIELD CURVE US DOLLAR BOND
Market value
Unrealised result
Number of
contracts
Denomination Currency
(in USD)
(in USD) Purchase 59 US 5 YEARS NOTE 03/12 CBOT USD 7,272,210.94 36,460.94 Purchase 93 US 2 YEARS NOTE 03/12 CBOT USD 20,510,859.38 14,531.25 Purchase 143 US 10 YEARS NOTE 03/12 CBOT USD 18,750,875.00 147,562.50
Sale 41 US TREASURY BOND 03/12 CBOT USD -5,937,312.50 -124,601.56 Purchase 2 US ULTRA BD 30YR 03/12 CBOT USD 320,375.00 -62.50 73,890.63
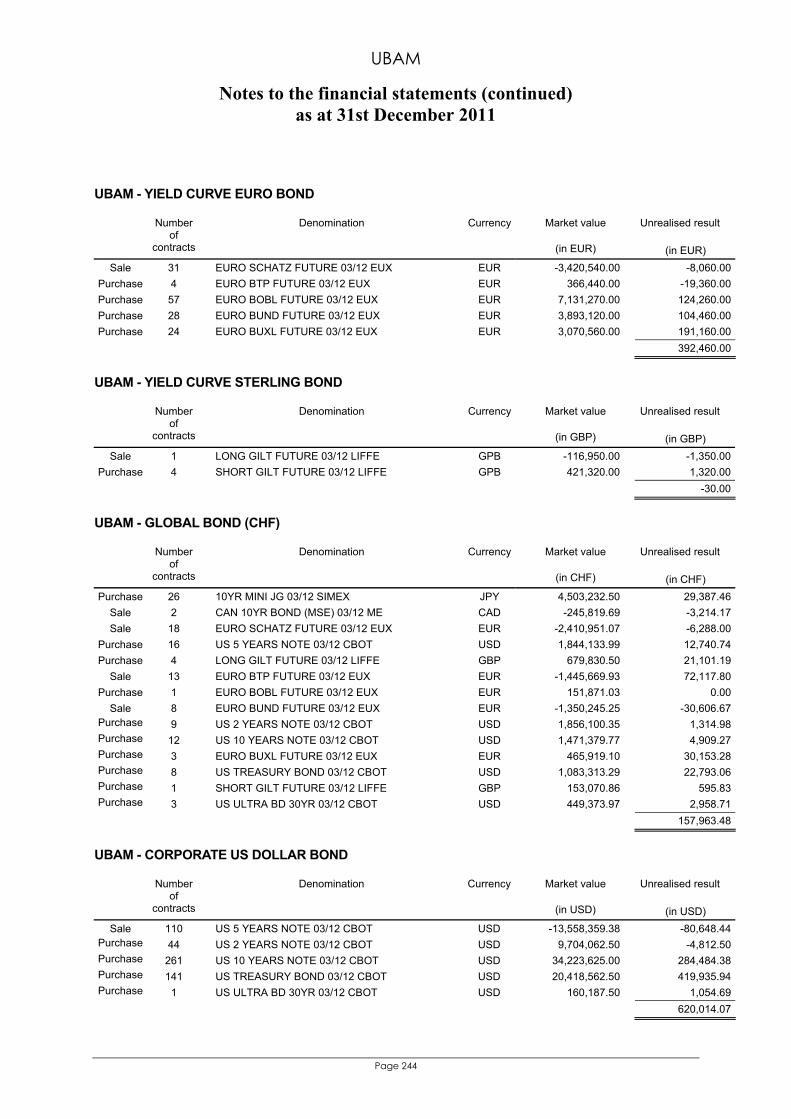
UBAM
Notes to the financial statements (continued) as at 31st December 2011
Page 244
UBAM - YIELD CURVE EURO BOND
Market value
Unrealised result
Number of
contracts
Denomination Currency
(in EUR)
(in EUR) Sale 31 EURO SCHATZ FUTURE 03/12 EUX EUR -3,420,540.00 -8,060.00
Purchase 4 EURO BTP FUTURE 03/12 EUX EUR 366,440.00 -19,360.00 Purchase 57 EURO BOBL FUTURE 03/12 EUX EUR 7,131,270.00 124,260.00 Purchase 28 EURO BUND FUTURE 03/12 EUX EUR 3,893,120.00 104,460.00 Purchase 24 EURO BUXL FUTURE 03/12 EUX EUR 3,070,560.00 191,160.00 392,460.00
UBAM - YIELD CURVE STERLING BOND
Market value
Unrealised result
Number of
contracts
Denomination Currency
(in GBP)
(in GBP) Sale 1 LONG GILT FUTURE 03/12 LIFFE GPB -116,950.00 -1,350.00
Purchase 4 SHORT GILT FUTURE 03/12 LIFFE GPB 421,320.00 1,320.00 -30.00
UBAM - GLOBAL BOND (CHF)
Market value
Unrealised result
Number of
contracts
Denomination Currency
(in CHF)
(in CHF) Purchase 26 10YR MINI JG 03/12 SIMEX JPY 4,503,232.50 29,387.46
Sale 2 CAN 10YR BOND (MSE) 03/12 ME CAD -245,819.69 -3,214.17 Sale 18 EURO SCHATZ FUTURE 03/12 EUX EUR -2,410,951.07 -6,288.00
Purchase 16 US 5 YEARS NOTE 03/12 CBOT USD 1,844,133.99 12,740.74 Purchase 4 LONG GILT FUTURE 03/12 LIFFE GBP 679,830.50 21,101.19
Sale 13 EURO BTP FUTURE 03/12 EUX EUR -1,445,669.93 72,117.80 Purchase 1 EURO BOBL FUTURE 03/12 EUX EUR 151,871.03 0.00
Sale 8 EURO BUND FUTURE 03/12 EUX EUR -1,350,245.25 -30,606.67 Purchase 9 US 2 YEARS NOTE 03/12 CBOT USD 1,856,100.35 1,314.98 Purchase 12 US 10 YEARS NOTE 03/12 CBOT USD 1,471,379.77 4,909.27 Purchase 3 EURO BUXL FUTURE 03/12 EUX EUR 465,919.10 30,153.28 Purchase 8 US TREASURY BOND 03/12 CBOT USD 1,083,313.29 22,793.06 Purchase 1 SHORT GILT FUTURE 03/12 LIFFE GBP 153,070.86 595.83 Purchase 3 US ULTRA BD 30YR 03/12 CBOT USD 449,373.97 2,958.71 157,963.48
UBAM - CORPORATE US DOLLAR BOND
Market value
Unrealised result
Number of
contracts
Denomination Currency
(in USD)
(in USD) Sale 110 US 5 YEARS NOTE 03/12 CBOT USD -13,558,359.38 -80,648.44
Purchase 44 US 2 YEARS NOTE 03/12 CBOT USD 9,704,062.50 -4,812.50 Purchase 261 US 10 YEARS NOTE 03/12 CBOT USD 34,223,625.00 284,484.38 Purchase 141 US TREASURY BOND 03/12 CBOT USD 20,418,562.50 419,935.94 Purchase 1 US ULTRA BD 30YR 03/12 CBOT USD 160,187.50 1,054.69 620,014.07
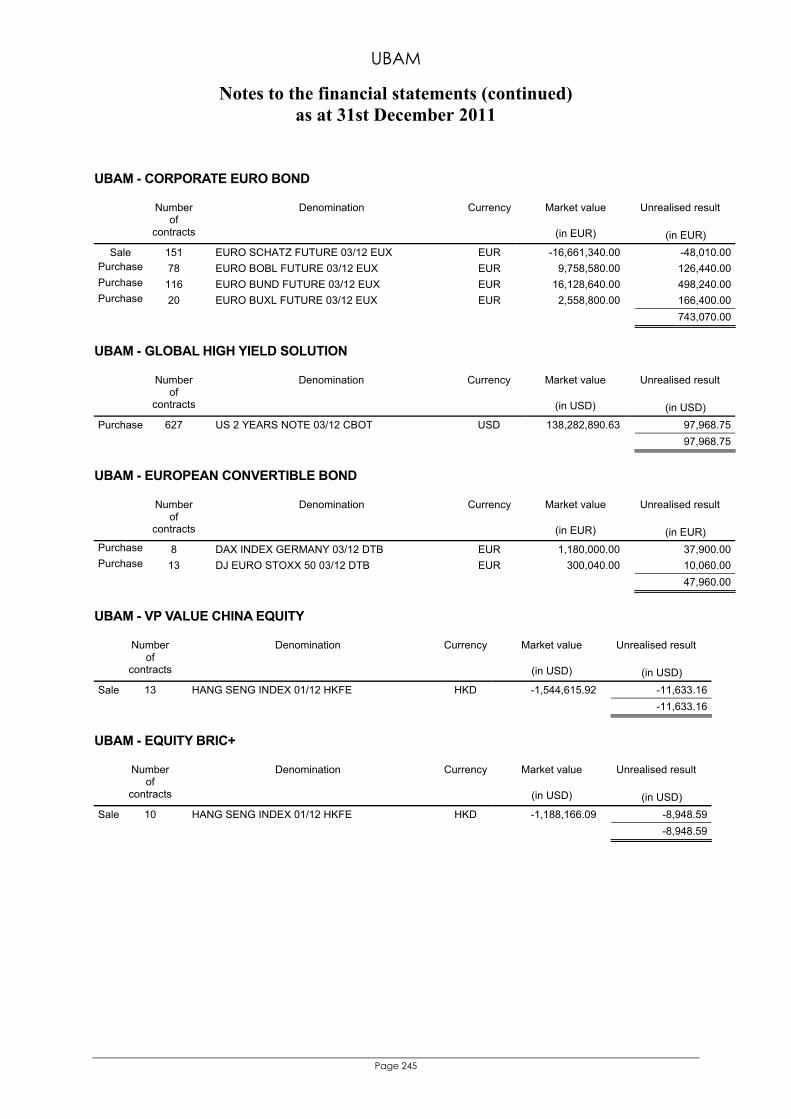
UBAM
Notes to the financial statements (continued) as at 31st December 2011
Page 245
UBAM - CORPORATE EURO BOND
Market value
Unrealised result
Number of
contracts
Denomination Currency
(in EUR)
(in EUR) Sale 151 EURO SCHATZ FUTURE 03/12 EUX EUR -16,661,340.00 -48,010.00
Purchase 78 EURO BOBL FUTURE 03/12 EUX EUR 9,758,580.00 126,440.00 Purchase 116 EURO BUND FUTURE 03/12 EUX EUR 16,128,640.00 498,240.00 Purchase 20 EURO BUXL FUTURE 03/12 EUX EUR 2,558,800.00 166,400.00 743,070.00
UBAM - GLOBAL HIGH YIELD SOLUTION
Market value
Unrealised result
Number of
contracts
Denomination Currency
(in USD)
(in USD) Purchase 627 US 2 YEARS NOTE 03/12 CBOT USD 138,282,890.63 97,968.75 97,968.75
UBAM - EUROPEAN CONVERTIBLE BOND
Market value
Unrealised result
Number of
contracts
Denomination Currency
(in EUR)
(in EUR) Purchase 8 DAX INDEX GERMANY 03/12 DTB EUR 1,180,000.00 37,900.00 Purchase 13 DJ EURO STOXX 50 03/12 DTB EUR 300,040.00 10,060.00 47,960.00
UBAM - VP VALUE CHINA EQUITY
Market value
Unrealised result
Number of
contracts
Denomination Currency
(in USD)
(in USD) Sale 13 HANG SENG INDEX 01/12 HKFE HKD -1,544,615.92 -11,633.16 -11,633.16
UBAM - EQUITY BRIC+
Market value
Unrealised result
Number of
contracts
Denomination Currency
(in USD)
(in USD) Sale 10 HANG SENG INDEX 01/12 HKFE HKD -1,188,166.09 -8,948.59 -8,948.59
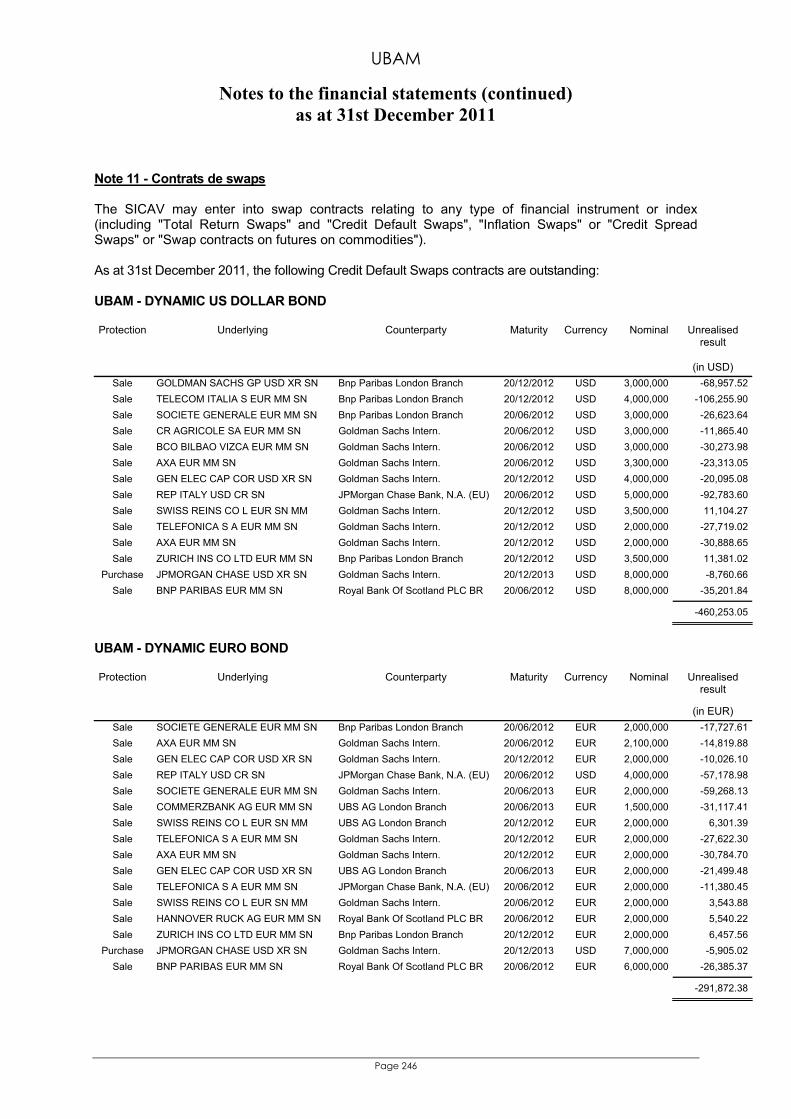
UBAM
Notes to the financial statements (continued) as at 31st December 2011
Page 246
Note 11 - Contrats de swaps The SICAV may enter into swap contracts relating to any type of financial instrument or index (including "Total Return Swaps" and "Credit Default Swaps", "Inflation Swaps" or "Credit Spread Swaps" or "Swap contracts on futures on commodities"). As at 31st December 2011, the following Credit Default Swaps contracts are outstanding: UBAM - DYNAMIC US DOLLAR BOND
Underlying Unrealised result
Protection
Counterparty Maturity Currency Nominal
(in USD) Sale GOLDMAN SACHS GP USD XR SN Bnp Paribas London Branch 20/12/2012 USD 3,000,000 -68,957.52 Sale TELECOM ITALIA S EUR MM SN Bnp Paribas London Branch 20/12/2012 USD 4,000,000 -106,255.90 Sale SOCIETE GENERALE EUR MM SN Bnp Paribas London Branch 20/06/2012 USD 3,000,000 -26,623.64 Sale CR AGRICOLE SA EUR MM SN Goldman Sachs Intern. 20/06/2012 USD 3,000,000 -11,865.40 Sale BCO BILBAO VIZCA EUR MM SN Goldman Sachs Intern. 20/06/2012 USD 3,000,000 -30,273.98 Sale AXA EUR MM SN Goldman Sachs Intern. 20/06/2012 USD 3,300,000 -23,313.05 Sale GEN ELEC CAP COR USD XR SN Goldman Sachs Intern. 20/12/2012 USD 4,000,000 -20,095.08 Sale REP ITALY USD CR SN JPMorgan Chase Bank, N.A. (EU) 20/06/2012 USD 5,000,000 -92,783.60 Sale SWISS REINS CO L EUR SN MM Goldman Sachs Intern. 20/12/2012 USD 3,500,000 11,104.27 Sale TELEFONICA S A EUR MM SN Goldman Sachs Intern. 20/12/2012 USD 2,000,000 -27,719.02 Sale AXA EUR MM SN Goldman Sachs Intern. 20/12/2012 USD 2,000,000 -30,888.65 Sale ZURICH INS CO LTD EUR MM SN Bnp Paribas London Branch 20/12/2012 USD 3,500,000 11,381.02
Purchase JPMORGAN CHASE USD XR SN Goldman Sachs Intern. 20/12/2013 USD 8,000,000 -8,760.66 Sale BNP PARIBAS EUR MM SN Royal Bank Of Scotland PLC BR 20/06/2012 USD 8,000,000 -35,201.84
-460,253.05
UBAM - DYNAMIC EURO BOND
Underlying Unrealised result
Protection
Counterparty Maturity Currency Nominal
(in EUR) Sale SOCIETE GENERALE EUR MM SN Bnp Paribas London Branch 20/06/2012 EUR 2,000,000 -17,727.61 Sale AXA EUR MM SN Goldman Sachs Intern. 20/06/2012 EUR 2,100,000 -14,819.88 Sale GEN ELEC CAP COR USD XR SN Goldman Sachs Intern. 20/12/2012 EUR 2,000,000 -10,026.10Sale REP ITALY USD CR SN JPMorgan Chase Bank, N.A. (EU) 20/06/2012 USD 4,000,000 -57,178.98 Sale SOCIETE GENERALE EUR MM SN Goldman Sachs Intern. 20/06/2013 EUR 2,000,000 -59,268.13 Sale COMMERZBANK AG EUR MM SN UBS AG London Branch 20/06/2013 EUR 1,500,000 -31,117.41 Sale SWISS REINS CO L EUR SN MM UBS AG London Branch 20/12/2012 EUR 2,000,000 6,301.39 Sale TELEFONICA S A EUR MM SN Goldman Sachs Intern. 20/12/2012 EUR 2,000,000 -27,622.30 Sale AXA EUR MM SN Goldman Sachs Intern. 20/12/2012 EUR 2,000,000 -30,784.70Sale GEN ELEC CAP COR USD XR SN UBS AG London Branch 20/06/2013 EUR 2,000,000 -21,499.48 Sale TELEFONICA S A EUR MM SN JPMorgan Chase Bank, N.A. (EU) 20/06/2012 EUR 2,000,000 -11,380.45 Sale SWISS REINS CO L EUR SN MM Goldman Sachs Intern. 20/06/2012 EUR 2,000,000 3,543.88 Sale HANNOVER RUCK AG EUR MM SN Royal Bank Of Scotland PLC BR 20/06/2012 EUR 2,000,000 5,540.22Sale ZURICH INS CO LTD EUR MM SN Bnp Paribas London Branch 20/12/2012 EUR 2,000,000 6,457.56
Purchase JPMORGAN CHASE USD XR SN Goldman Sachs Intern. 20/12/2013 USD 7,000,000 -5,905.02 Sale BNP PARIBAS EUR MM SN Royal Bank Of Scotland PLC BR 20/06/2012 EUR 6,000,000 -26,385.37
-291,872.38
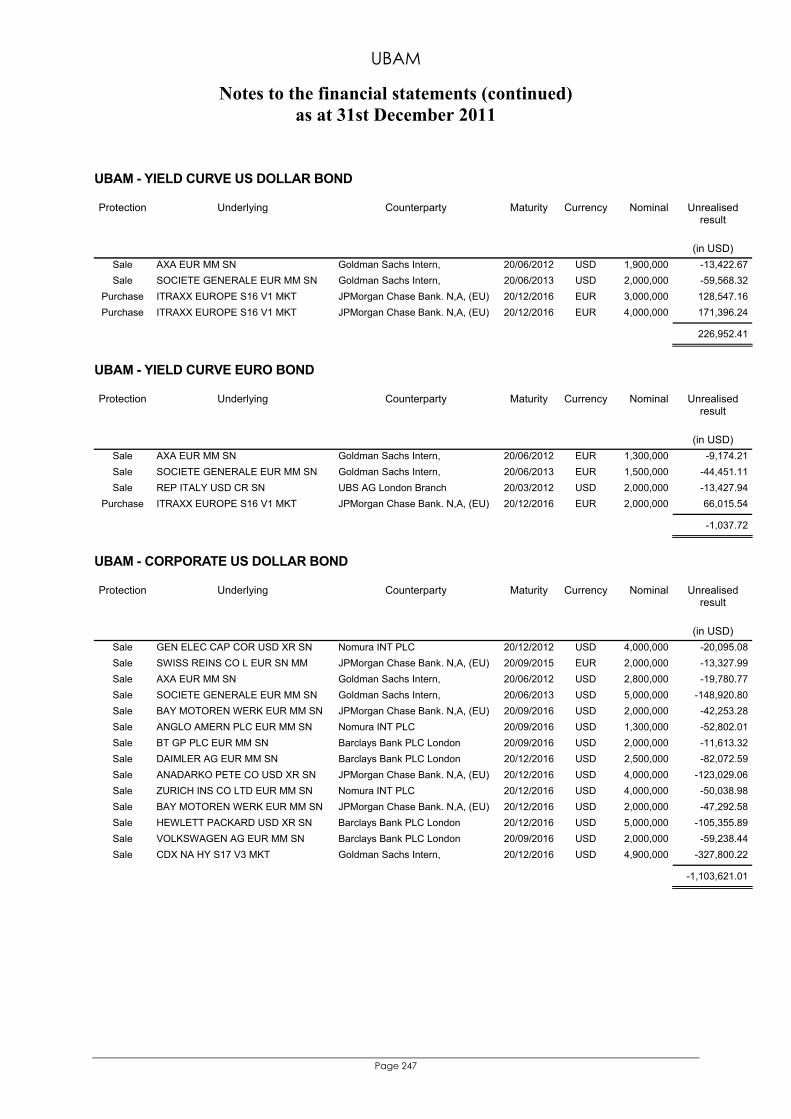
UBAM
Notes to the financial statements (continued) as at 31st December 2011
Page 247
UBAM - YIELD CURVE US DOLLAR BOND
Underlying Unrealised result
Protection
Counterparty Maturity Currency Nominal
(in USD) Sale AXA EUR MM SN Goldman Sachs Intern, 20/06/2012 USD 1,900,000 -13,422.67 Sale SOCIETE GENERALE EUR MM SN Goldman Sachs Intern, 20/06/2013 USD 2,000,000 -59,568.32
Purchase ITRAXX EUROPE S16 V1 MKT JPMorgan Chase Bank. N,A, (EU) 20/12/2016 EUR 3,000,000 128,547.16 Purchase ITRAXX EUROPE S16 V1 MKT JPMorgan Chase Bank. N,A, (EU) 20/12/2016 EUR 4,000,000 171,396.24
226,952.41
UBAM - YIELD CURVE EURO BOND
Underlying Unrealised result
Protection
Counterparty Maturity Currency Nominal
(in USD) Sale AXA EUR MM SN Goldman Sachs Intern, 20/06/2012 EUR 1,300,000 -9,174.21 Sale SOCIETE GENERALE EUR MM SN Goldman Sachs Intern, 20/06/2013 EUR 1,500,000 -44,451.11 Sale REP ITALY USD CR SN UBS AG London Branch 20/03/2012 USD 2,000,000 -13,427.94
Purchase ITRAXX EUROPE S16 V1 MKT JPMorgan Chase Bank. N,A, (EU) 20/12/2016 EUR 2,000,000 66,015.54
-1,037.72
UBAM - CORPORATE US DOLLAR BOND
Underlying Unrealised result
Protection
Counterparty Maturity Currency Nominal
(in USD) Sale GEN ELEC CAP COR USD XR SN Nomura INT PLC 20/12/2012 USD 4,000,000 -20,095.08 Sale SWISS REINS CO L EUR SN MM JPMorgan Chase Bank. N,A, (EU) 20/09/2015 EUR 2,000,000 -13,327.99 Sale AXA EUR MM SN Goldman Sachs Intern, 20/06/2012 USD 2,800,000 -19,780.77 Sale SOCIETE GENERALE EUR MM SN Goldman Sachs Intern, 20/06/2013 USD 5,000,000 -148,920.80 Sale BAY MOTOREN WERK EUR MM SN JPMorgan Chase Bank. N,A, (EU) 20/09/2016 USD 2,000,000 -42,253.28 Sale ANGLO AMERN PLC EUR MM SN Nomura INT PLC 20/09/2016 USD 1,300,000 -52,802.01 Sale BT GP PLC EUR MM SN Barclays Bank PLC London 20/09/2016 USD 2,000,000 -11,613.32 Sale DAIMLER AG EUR MM SN Barclays Bank PLC London 20/12/2016 USD 2,500,000 -82,072.59 Sale ANADARKO PETE CO USD XR SN JPMorgan Chase Bank. N,A, (EU) 20/12/2016 USD 4,000,000 -123,029.06Sale ZURICH INS CO LTD EUR MM SN Nomura INT PLC 20/12/2016 USD 4,000,000 -50,038.98Sale BAY MOTOREN WERK EUR MM SN JPMorgan Chase Bank. N,A, (EU) 20/12/2016 USD 2,000,000 -47,292.58Sale HEWLETT PACKARD USD XR SN Barclays Bank PLC London 20/12/2016 USD 5,000,000 -105,355.89 Sale VOLKSWAGEN AG EUR MM SN Barclays Bank PLC London 20/09/2016 USD 2,000,000 -59,238.44 Sale CDX NA HY S17 V3 MKT Goldman Sachs Intern, 20/12/2016 USD 4,900,000 -327,800.22
-1,103,621.01
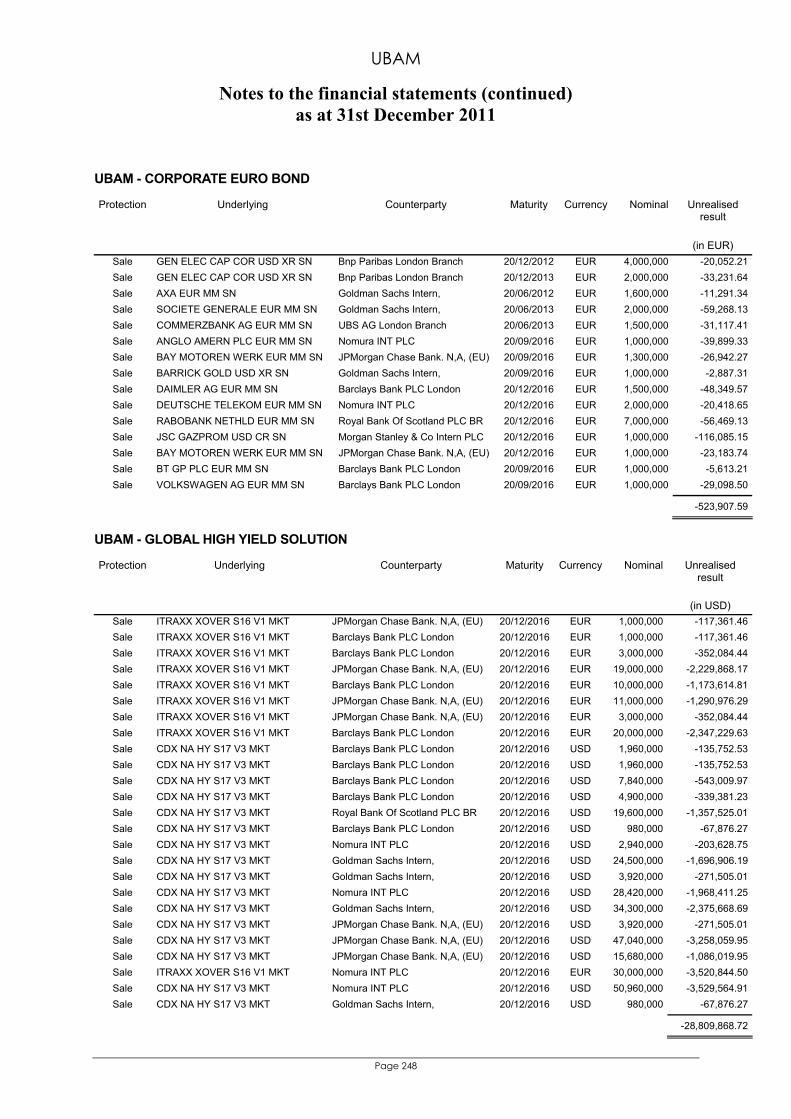
UBAM
Notes to the financial statements (continued) as at 31st December 2011
Page 248
UBAM - CORPORATE EURO BOND
Underlying Unrealised result
Protection
Counterparty Maturity Currency Nominal
(in EUR) Sale GEN ELEC CAP COR USD XR SN Bnp Paribas London Branch 20/12/2012 EUR 4,000,000 -20,052.21 Sale GEN ELEC CAP COR USD XR SN Bnp Paribas London Branch 20/12/2013 EUR 2,000,000 -33,231.64 Sale AXA EUR MM SN Goldman Sachs Intern, 20/06/2012 EUR 1,600,000 -11,291.34 Sale SOCIETE GENERALE EUR MM SN Goldman Sachs Intern, 20/06/2013 EUR 2,000,000 -59,268.13 Sale COMMERZBANK AG EUR MM SN UBS AG London Branch 20/06/2013 EUR 1,500,000 -31,117.41 Sale ANGLO AMERN PLC EUR MM SN Nomura INT PLC 20/09/2016 EUR 1,000,000 -39,899.33 Sale BAY MOTOREN WERK EUR MM SN JPMorgan Chase Bank. N,A, (EU) 20/09/2016 EUR 1,300,000 -26,942.27 Sale BARRICK GOLD USD XR SN Goldman Sachs Intern, 20/09/2016 EUR 1,000,000 -2,887.31 Sale DAIMLER AG EUR MM SN Barclays Bank PLC London 20/12/2016 EUR 1,500,000 -48,349.57Sale DEUTSCHE TELEKOM EUR MM SN Nomura INT PLC 20/12/2016 EUR 2,000,000 -20,418.65 Sale RABOBANK NETHLD EUR MM SN Royal Bank Of Scotland PLC BR 20/12/2016 EUR 7,000,000 -56,469.13 Sale JSC GAZPROM USD CR SN Morgan Stanley & Co Intern PLC 20/12/2016 EUR 1,000,000 -116,085.15 Sale BAY MOTOREN WERK EUR MM SN JPMorgan Chase Bank. N,A, (EU) 20/12/2016 EUR 1,000,000 -23,183.74Sale BT GP PLC EUR MM SN Barclays Bank PLC London 20/09/2016 EUR 1,000,000 -5,613.21Sale VOLKSWAGEN AG EUR MM SN Barclays Bank PLC London 20/09/2016 EUR 1,000,000 -29,098.50
-523,907.59
UBAM - GLOBAL HIGH YIELD SOLUTION
Underlying Unrealised result
Protection
Counterparty Maturity Currency Nominal
(in USD) Sale ITRAXX XOVER S16 V1 MKT JPMorgan Chase Bank. N,A, (EU) 20/12/2016 EUR 1,000,000 -117,361.46 Sale ITRAXX XOVER S16 V1 MKT Barclays Bank PLC London 20/12/2016 EUR 1,000,000 -117,361.46 Sale ITRAXX XOVER S16 V1 MKT Barclays Bank PLC London 20/12/2016 EUR 3,000,000 -352,084.44 Sale ITRAXX XOVER S16 V1 MKT JPMorgan Chase Bank. N,A, (EU) 20/12/2016 EUR 19,000,000 -2,229,868.17 Sale ITRAXX XOVER S16 V1 MKT Barclays Bank PLC London 20/12/2016 EUR 10,000,000 -1,173,614.81 Sale ITRAXX XOVER S16 V1 MKT JPMorgan Chase Bank. N,A, (EU) 20/12/2016 EUR 11,000,000 -1,290,976.29 Sale ITRAXX XOVER S16 V1 MKT JPMorgan Chase Bank. N,A, (EU) 20/12/2016 EUR 3,000,000 -352,084.44 Sale ITRAXX XOVER S16 V1 MKT Barclays Bank PLC London 20/12/2016 EUR 20,000,000 -2,347,229.63 Sale CDX NA HY S17 V3 MKT Barclays Bank PLC London 20/12/2016 USD 1,960,000 -135,752.53 Sale CDX NA HY S17 V3 MKT Barclays Bank PLC London 20/12/2016 USD 1,960,000 -135,752.53 Sale CDX NA HY S17 V3 MKT Barclays Bank PLC London 20/12/2016 USD 7,840,000 -543,009.97 Sale CDX NA HY S17 V3 MKT Barclays Bank PLC London 20/12/2016 USD 4,900,000 -339,381.23 Sale CDX NA HY S17 V3 MKT Royal Bank Of Scotland PLC BR 20/12/2016 USD 19,600,000 -1,357,525.01 Sale CDX NA HY S17 V3 MKT Barclays Bank PLC London 20/12/2016 USD 980,000 -67,876.27 Sale CDX NA HY S17 V3 MKT Nomura INT PLC 20/12/2016 USD 2,940,000 -203,628.75 Sale CDX NA HY S17 V3 MKT Goldman Sachs Intern, 20/12/2016 USD 24,500,000 -1,696,906.19 Sale CDX NA HY S17 V3 MKT Goldman Sachs Intern, 20/12/2016 USD 3,920,000 -271,505.01 Sale CDX NA HY S17 V3 MKT Nomura INT PLC 20/12/2016 USD 28,420,000 -1,968,411.25 Sale CDX NA HY S17 V3 MKT Goldman Sachs Intern, 20/12/2016 USD 34,300,000 -2,375,668.69 Sale CDX NA HY S17 V3 MKT JPMorgan Chase Bank. N,A, (EU) 20/12/2016 USD 3,920,000 -271,505.01 Sale CDX NA HY S17 V3 MKT JPMorgan Chase Bank. N,A, (EU) 20/12/2016 USD 47,040,000 -3,258,059.95 Sale CDX NA HY S17 V3 MKT JPMorgan Chase Bank. N,A, (EU) 20/12/2016 USD 15,680,000 -1,086,019.95 Sale ITRAXX XOVER S16 V1 MKT Nomura INT PLC 20/12/2016 EUR 30,000,000 -3,520,844.50 Sale CDX NA HY S17 V3 MKT Nomura INT PLC 20/12/2016 USD 50,960,000 -3,529,564.91 Sale CDX NA HY S17 V3 MKT Goldman Sachs Intern, 20/12/2016 USD 980,000 -67,876.27
-28,809,868.72
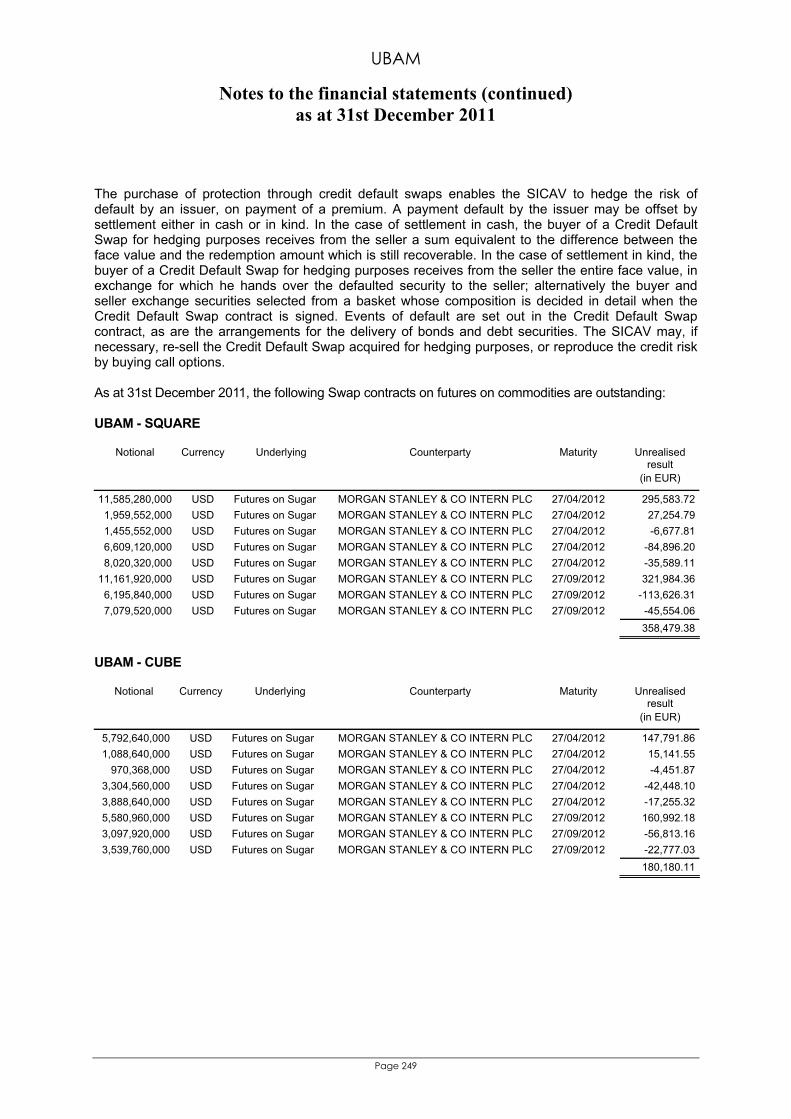
UBAM
Notes to the financial statements (continued) as at 31st December 2011
Page 249
The purchase of protection through credit default swaps enables the SICAV to hedge the risk of default by an issuer, on payment of a premium. A payment default by the issuer may be offset by settlement either in cash or in kind. In the case of settlement in cash, the buyer of a Credit Default Swap for hedging purposes receives from the seller a sum equivalent to the difference between the face value and the redemption amount which is still recoverable. In the case of settlement in kind, the buyer of a Credit Default Swap for hedging purposes receives from the seller the entire face value, in exchange for which he hands over the defaulted security to the seller; alternatively the buyer and seller exchange securities selected from a basket whose composition is decided in detail when the Credit Default Swap contract is signed. Events of default are set out in the Credit Default Swap contract, as are the arrangements for the delivery of bonds and debt securities. The SICAV may, if necessary, re-sell the Credit Default Swap acquired for hedging purposes, or reproduce the credit risk by buying call options. As at 31st December 2011, the following Swap contracts on futures on commodities are outstanding: UBAM - SQUARE
Unrealised result
Notional Currency Underlying Counterparty Maturity
(in EUR)
11,585,280,000 USD Futures on Sugar MORGAN STANLEY & CO INTERN PLC 27/04/2012 295,583.72 1,959,552,000 USD Futures on Sugar MORGAN STANLEY & CO INTERN PLC 27/04/2012 27,254.79 1,455,552,000 USD Futures on Sugar MORGAN STANLEY & CO INTERN PLC 27/04/2012 -6,677.81 6,609,120,000 USD Futures on Sugar MORGAN STANLEY & CO INTERN PLC 27/04/2012 -84,896.20 8,020,320,000 USD Futures on Sugar MORGAN STANLEY & CO INTERN PLC 27/04/2012 -35,589.11
11,161,920,000 USD Futures on Sugar MORGAN STANLEY & CO INTERN PLC 27/09/2012 321,984.36 6,195,840,000 USD Futures on Sugar MORGAN STANLEY & CO INTERN PLC 27/09/2012 -113,626.31 7,079,520,000 USD Futures on Sugar MORGAN STANLEY & CO INTERN PLC 27/09/2012 -45,554.06
358,479.38
UBAM - CUBE
Unrealised result
Notional Currency Underlying Counterparty Maturity
(in EUR)
5,792,640,000 USD Futures on Sugar MORGAN STANLEY & CO INTERN PLC 27/04/2012 147,791.86 1,088,640,000 USD Futures on Sugar MORGAN STANLEY & CO INTERN PLC 27/04/2012 15,141.55
970,368,000 USD Futures on Sugar MORGAN STANLEY & CO INTERN PLC 27/04/2012 -4,451.87 3,304,560,000 USD Futures on Sugar MORGAN STANLEY & CO INTERN PLC 27/04/2012 -42,448.10 3,888,640,000 USD Futures on Sugar MORGAN STANLEY & CO INTERN PLC 27/04/2012 -17,255.32 5,580,960,000 USD Futures on Sugar MORGAN STANLEY & CO INTERN PLC 27/09/2012 160,992.18 3,097,920,000 USD Futures on Sugar MORGAN STANLEY & CO INTERN PLC 27/09/2012 -56,813.16 3,539,760,000 USD Futures on Sugar MORGAN STANLEY & CO INTERN PLC 27/09/2012 -22,777.03
180,180.11
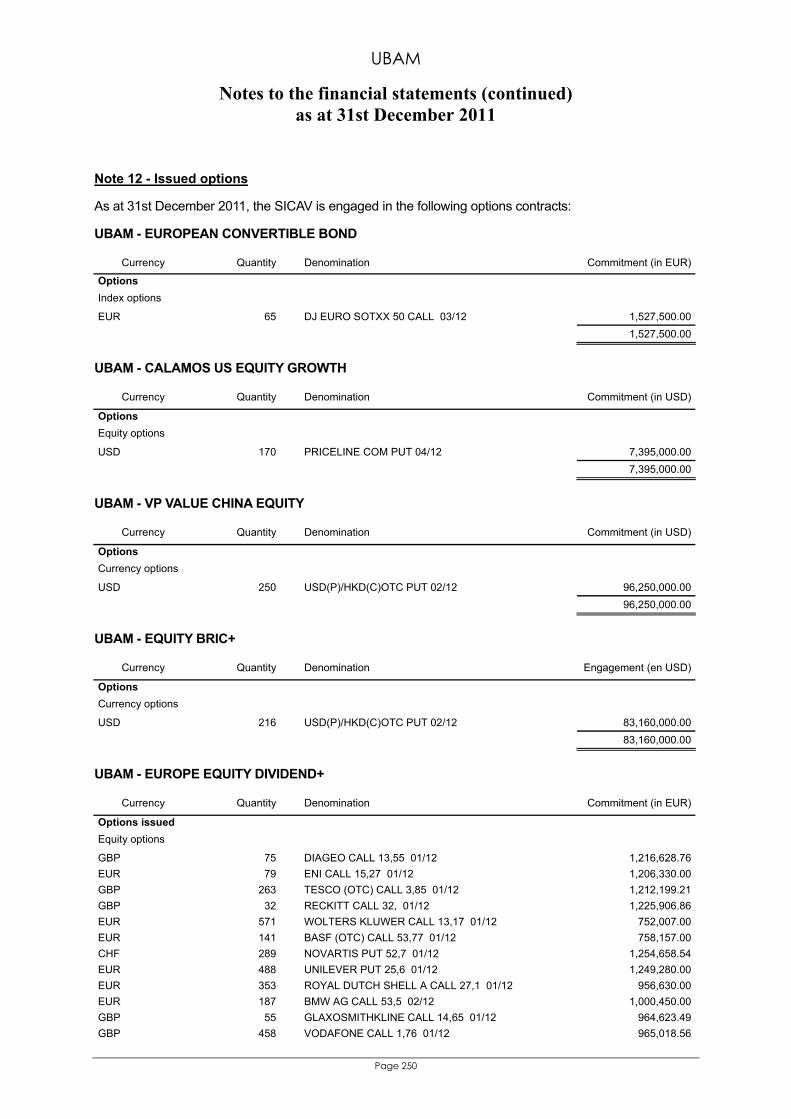
UBAM
Notes to the financial statements (continued) as at 31st December 2011
Page 250
Note 12 - Issued options As at 31st December 2011, the SICAV is engaged in the following options contracts: UBAM - EUROPEAN CONVERTIBLE BOND
Currency Quantity Denomination Commitment (in EUR)
Options Index options
EUR 65 DJ EURO SOTXX 50 CALL 03/12 1,527,500.00 1,527,500.00
UBAM - CALAMOS US EQUITY GROWTH
Currency Quantity Denomination Commitment (in USD)
Options Equity options
USD 170 PRICELINE COM PUT 04/12 7,395,000.00 7,395,000.00
UBAM - VP VALUE CHINA EQUITY
Currency Quantity Denomination Commitment (in USD)
Options Currency options
USD 250 USD(P)/HKD(C)OTC PUT 02/12 96,250,000.00 96,250,000.00
UBAM - EQUITY BRIC+
Currency Quantity Denomination Engagement (en USD)
Options Currency options
USD 216 USD(P)/HKD(C)OTC PUT 02/12 83,160,000.00 83,160,000.00
UBAM - EUROPE EQUITY DIVIDEND+
Currency Quantity Denomination Commitment (in EUR)
Options issued Equity options
GBP 75 DIAGEO CALL 13,55 01/12 1,216,628.76EUR 79 ENI CALL 15,27 01/12 1,206,330.00GBP 263 TESCO (OTC) CALL 3,85 01/12 1,212,199.21GBP 32 RECKITT CALL 32, 01/12 1,225,906.86EUR 571 WOLTERS KLUWER CALL 13,17 01/12 752,007.00EUR 141 BASF (OTC) CALL 53,77 01/12 758,157.00CHF 289 NOVARTIS PUT 52,7 01/12 1,254,658.54EUR 488 UNILEVER PUT 25,6 01/12 1,249,280.00EUR 353 ROYAL DUTCH SHELL A CALL 27,1 01/12 956,630.00EUR 187 BMW AG CALL 53,5 02/12 1,000,450.00GBP 55 GLAXOSMITHKLINE CALL 14,65 01/12 964,623.49GBP 458 VODAFONE CALL 1,76 01/12 965,018.56
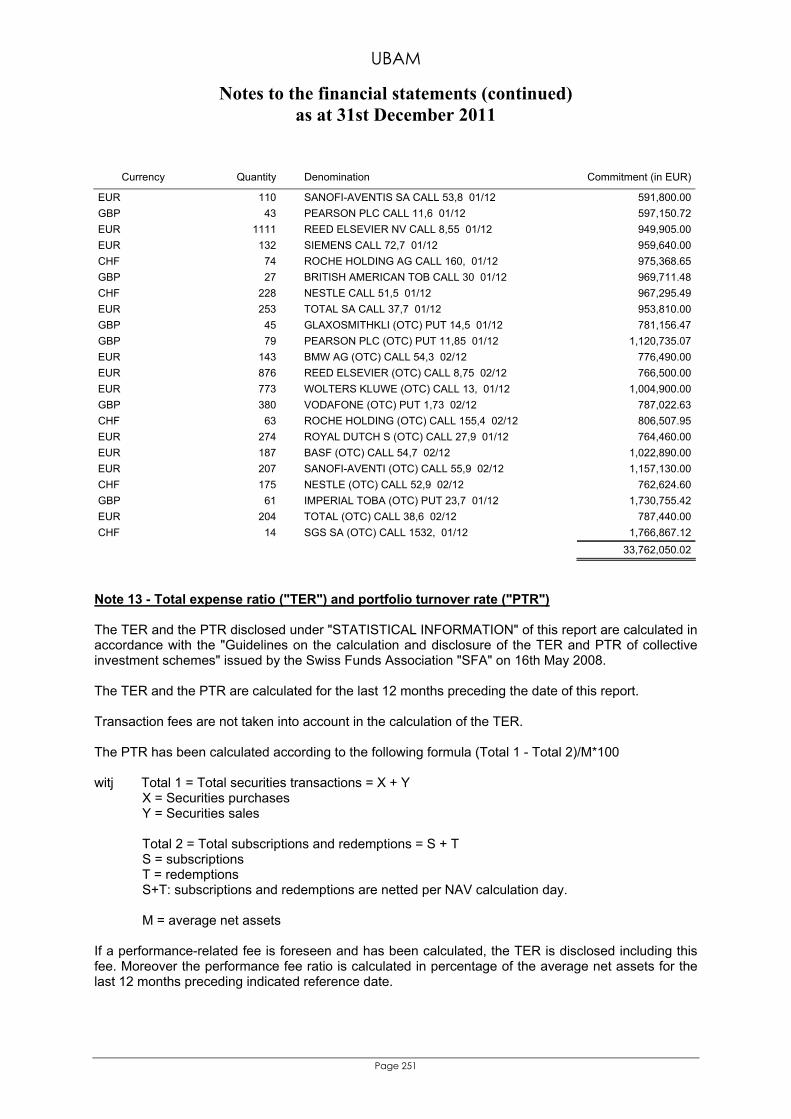
UBAM
Notes to the financial statements (continued) as at 31st December 2011
Page 251
Currency Quantity Denomination Commitment (in EUR)
EUR 110 SANOFI-AVENTIS SA CALL 53,8 01/12 591,800.00GBP 43 PEARSON PLC CALL 11,6 01/12 597,150.72EUR 1111 REED ELSEVIER NV CALL 8,55 01/12 949,905.00EUR 132 SIEMENS CALL 72,7 01/12 959,640.00CHF 74 ROCHE HOLDING AG CALL 160, 01/12 975,368.65GBP 27 BRITISH AMERICAN TOB CALL 30 01/12 969,711.48CHF 228 NESTLE CALL 51,5 01/12 967,295.49EUR 253 TOTAL SA CALL 37,7 01/12 953,810.00GBP 45 GLAXOSMITHKLI (OTC) PUT 14,5 01/12 781,156.47GBP 79 PEARSON PLC (OTC) PUT 11,85 01/12 1,120,735.07EUR 143 BMW AG (OTC) CALL 54,3 02/12 776,490.00EUR 876 REED ELSEVIER (OTC) CALL 8,75 02/12 766,500.00EUR 773 WOLTERS KLUWE (OTC) CALL 13, 01/12 1,004,900.00GBP 380 VODAFONE (OTC) PUT 1,73 02/12 787,022.63CHF 63 ROCHE HOLDING (OTC) CALL 155,4 02/12 806,507.95EUR 274 ROYAL DUTCH S (OTC) CALL 27,9 01/12 764,460.00EUR 187 BASF (OTC) CALL 54,7 02/12 1,022,890.00EUR 207 SANOFI-AVENTI (OTC) CALL 55,9 02/12 1,157,130.00CHF 175 NESTLE (OTC) CALL 52,9 02/12 762,624.60GBP 61 IMPERIAL TOBA (OTC) PUT 23,7 01/12 1,730,755.42EUR 204 TOTAL (OTC) CALL 38,6 02/12 787,440.00CHF 14 SGS SA (OTC) CALL 1532, 01/12 1,766,867.12 33,762,050.02
Note 13 - Total expense ratio ("TER") and portfolio turnover rate ("PTR") The TER and the PTR disclosed under "STATISTICAL INFORMATION" of this report are calculated in accordance with the "Guidelines on the calculation and disclosure of the TER and PTR of collective investment schemes" issued by the Swiss Funds Association "SFA" on 16th May 2008. The TER and the PTR are calculated for the last 12 months preceding the date of this report. Transaction fees are not taken into account in the calculation of the TER. The PTR has been calculated according to the following formula (Total 1 - Total 2)/M*100 witj Total 1 = Total securities transactions = X + Y
X = Securities purchases Y = Securities sales
Total 2 = Total subscriptions and redemptions = S + T S = subscriptions T = redemptions S+T: subscriptions and redemptions are netted per NAV calculation day. M = average net assets
If a performance-related fee is foreseen and has been calculated, the TER is disclosed including this fee. Moreover the performance fee ratio is calculated in percentage of the average net assets for the last 12 months preceding indicated reference date.
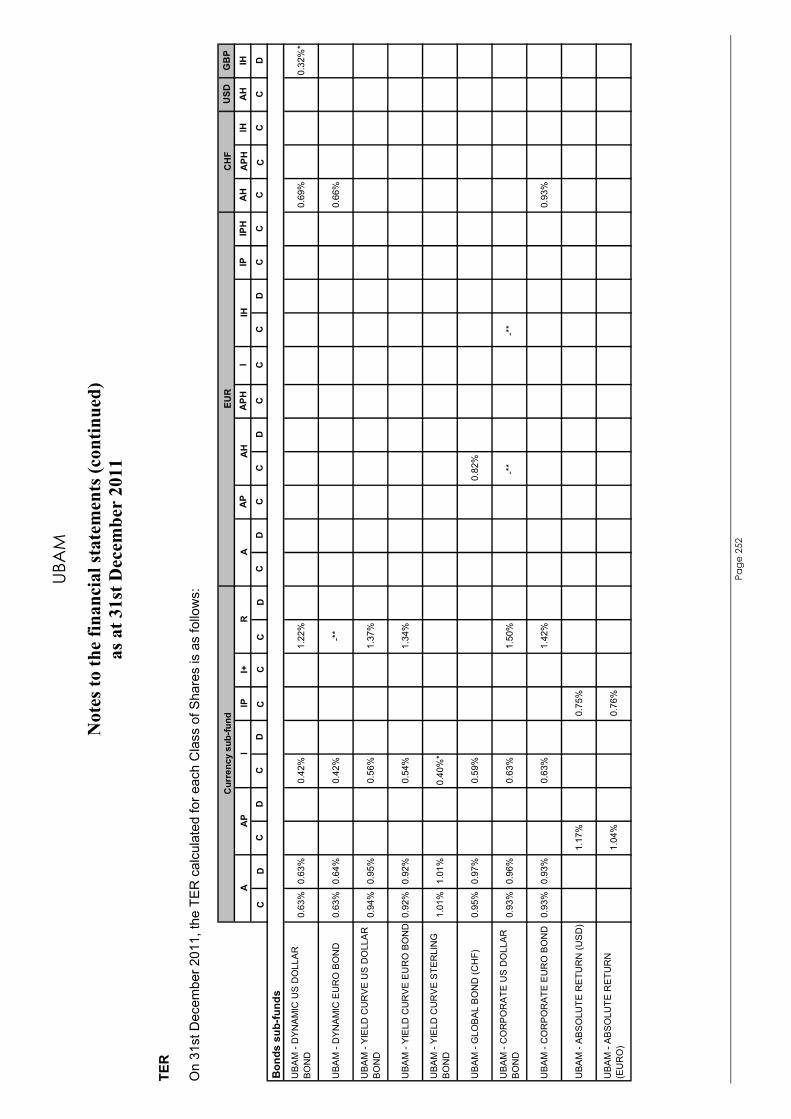
UBA
M
Not
es to
the
finan
cial
stat
emen
ts (c
ontin
ued)
as
at 3
1st D
ecem
ber
2011
Page
252
TER
O
n 31
st D
ecem
ber 2
011,
the
TER
cal
cula
ted
for e
ach
Cla
ss o
f Sha
res
is a
s fo
llow
s:
U
SDG
BP
IPI+
AP
APH
IIP
IPH
AH
APH
IHA
HIH
CD
C
DC
D
C
CC
D
C
DC
C
DC
C
CD
CC
C
C
C
CD
UB
AM
- D
YNA
MIC
US
DO
LLA
R
BO
ND
0.63
%0.
63%
0.42
%1.
22%
0.69
%0.
32%
*
UB
AM
- D
YNA
MIC
EU
RO
BO
ND
0.63
%0.
64%
0.42
%-*
*0.
66%
UB
AM
- YI
ELD
CU
RV
E U
S D
OLL
AR
B
ON
D0.
94%
0.95
%0.
56%
1.37
%
UB
AM
- YI
ELD
CU
RV
E E
UR
O B
ON
D0.
92%
0.92
%0.
54%
1.34
%
UB
AM
- YI
ELD
CU
RV
E S
TER
LIN
G
BO
ND
1.01
%1.
01%
0.40
%*
UB
AM
- G
LOB
AL
BO
ND
(CH
F)0.
95%
0.97
%0.
59%
0.82
%
UB
AM
- C
OR
PO
RA
TE U
S D
OLL
AR
B
ON
D0.
93%
0.96
%0.
63%
1.50
%-*
* -*
*
UB
AM
- C
OR
PO
RA
TE E
UR
O B
ON
D0.
93%
0.93
%0.
63%
1.42
%0.
93%
UB
AM
- A
BS
OLU
TE R
ETU
RN
(US
D)
1.17
%0.
75%
UB
AM
- A
BS
OLU
TE R
ETU
RN
(E
UR
O)
1.04
%0.
76%
Bon
ds s
ub-fu
nds
Cur
renc
y su
b-fu
ndEU
RC
HF
AA
PI
RA
AH
IH
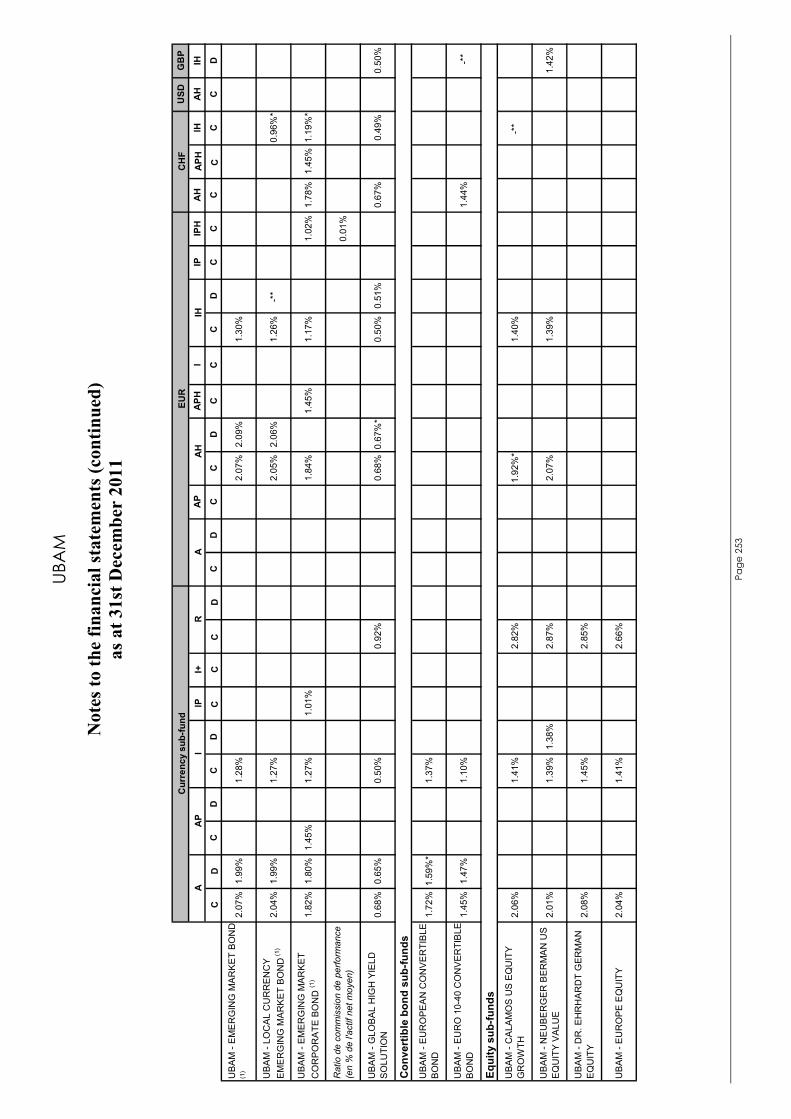
UBA
M
Not
es to
the
finan
cial
stat
emen
ts (c
ontin
ued)
as
at 3
1st D
ecem
ber
2011
Page
253
USD
GB
P
IPI+
AP
APH
IIP
IPH
AH
APH
IHA
HIH
CD
C
DC
D
C
CC
D
C
DC
C
DC
C
CD
CC
C
C
C
CD
UB
AM
- E
ME
RG
ING
MA
RK
ET
BO
ND
(1
) 2.
07%
1.99
%1.
28%
2.07
%2.
09%
1.30
%
UB
AM
- LO
CA
L C
UR
RE
NC
Y E
ME
RG
ING
MA
RK
ET
BO
ND
(1)
2.04
%1.
99%
1.27
%2.
05%
2.06
%1.
26%
-**
0.96
%*
UB
AM
- E
ME
RG
ING
MA
RK
ET
CO
RP
OR
ATE
BO
ND
(1)
1.82
%1.
80%
1.45
%1.
27%
1.01
%1.
84%
1.45
%1.
17%
1.02
%1.
78%
1.45
%1.
19%
*
Rat
io d
e co
mm
issi
on d
e pe
rform
ance
(e
n %
de
l'act
if ne
t moy
en)
0.01
%
UB
AM
- G
LOB
AL
HIG
H Y
IELD
S
OLU
TIO
N0.
68%
0.65
%0.
50%
0.92
%0.
68%
0.67
%*
0.50
%0.
51%
0.67
%0.
49%
0.50
%
UB
AM
- E
UR
OP
EA
N C
ON
VE
RTI
BLE
B
ON
D1.
72%
1.59
%*
1.37
%
UB
AM
- E
UR
O 1
0-40
CO
NV
ER
TIB
LE
BO
ND
1.45
%1.
47%
1.10
%1.
44%
-**
UB
AM
- C
ALA
MO
S U
S E
QU
ITY
GR
OW
TH2.
06%
1.41
%2.
82%
1.92
%*
1.40
%-*
*
UB
AM
- N
EU
BE
RG
ER
BE
RM
AN
US
E
QU
ITY
VA
LUE
2.01
%1.
39%
1.38
%2.
87%
2.07
%1.
39%
1.42
%
UB
AM
- D
R. E
HR
HA
RD
T G
ER
MA
N
EQ
UIT
Y2.
08%
1.45
%2.
85%
UB
AM
- E
UR
OP
E E
QU
ITY
2.04
%1.
41%
2.66
%
Equi
ty s
ub-fu
nds
Con
vert
ible
bon
d su
b-fu
nds
Cur
renc
y su
b-fu
ndEU
RC
HF
AA
HIH
AA
PI
R
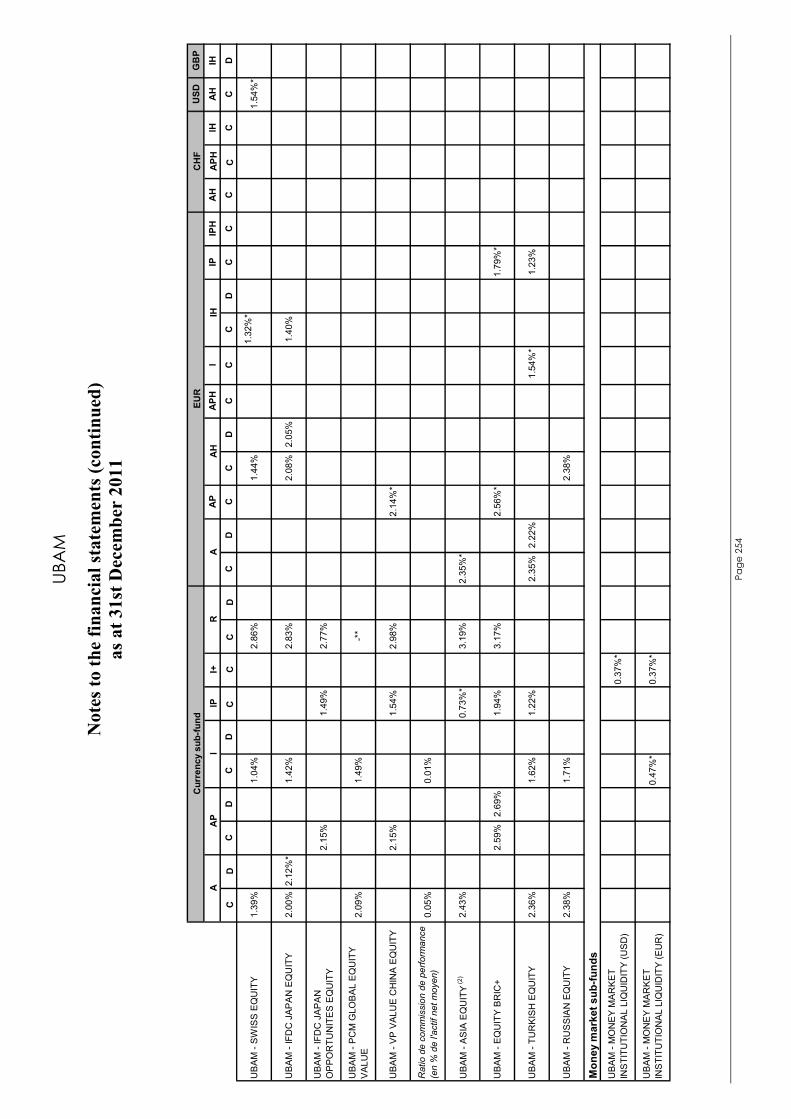
UBA
M
Not
es to
the
finan
cial
stat
emen
ts (c
ontin
ued)
as
at 3
1st D
ecem
ber
2011
Page
254
U
SDG
BP
IPI+
AP
APH
IIP
IPH
AH
APH
IHA
HIH
CD
C
DC
D
C
CC
D
C
DC
C
DC
C
CD
CC
C
C
C
CD
UB
AM
- S
WIS
S E
QU
ITY
1.39
%1.
04%
2.86
%1.
44%
1.32
%*
1.
54%
*
UB
AM
- IF
DC
JA
PA
N E
QU
ITY
2.00
%2.
12%
*1.
42%
2.83
%2.
08%
2.05
%1.
40%
UB
AM
- IF
DC
JA
PA
N
OP
PO
RTU
NIT
ES
EQ
UIT
Y2.
15%
1.49
%2.
77%
UB
AM
- P
CM
GLO
BA
L E
QU
ITY
VA
LUE
2.09
%1.
49%
-**
UB
AM
- V
P V
ALU
E C
HIN
A E
QU
ITY
2.15
%1.
54%
2.98
%2.
14%
*
Rat
io d
e co
mm
issi
on d
e pe
rform
ance
(e
n %
de
l'act
if ne
t moy
en)
0.05
%0.
01%
UB
AM
- A
SIA
EQ
UIT
Y (2)
2.43
%0.
73%
*3.
19%
2.35
%*
UB
AM
- E
QU
ITY
BR
IC+
2.59
%2.
69%
1.94
%3.
17%
2.56
%*
1.79
%*
UB
AM
- TU
RK
ISH
EQ
UIT
Y2.
36%
1.62
%1.
22%
2.35
%2.
22%
1.5
4%*
1.23
%
UB
AM
- R
US
SIA
N E
QU
ITY
2.38
%1.
71%
2.38
%
UB
AM
- M
ON
EY
MA
RK
ET
INS
TITU
TIO
NA
L LI
QU
IDIT
Y (U
SD
)0.
37%
*
UB
AM
- M
ON
EY
MA
RK
ET
INS
TITU
TIO
NA
L LI
QU
IDIT
Y (E
UR
)0.
47%
*0.
37%
*
IH
Cur
renc
y su
b-fu
ndEU
RC
HF
AA
PI
RA
AH
Mon
ey m
arke
t sub
-fund
s
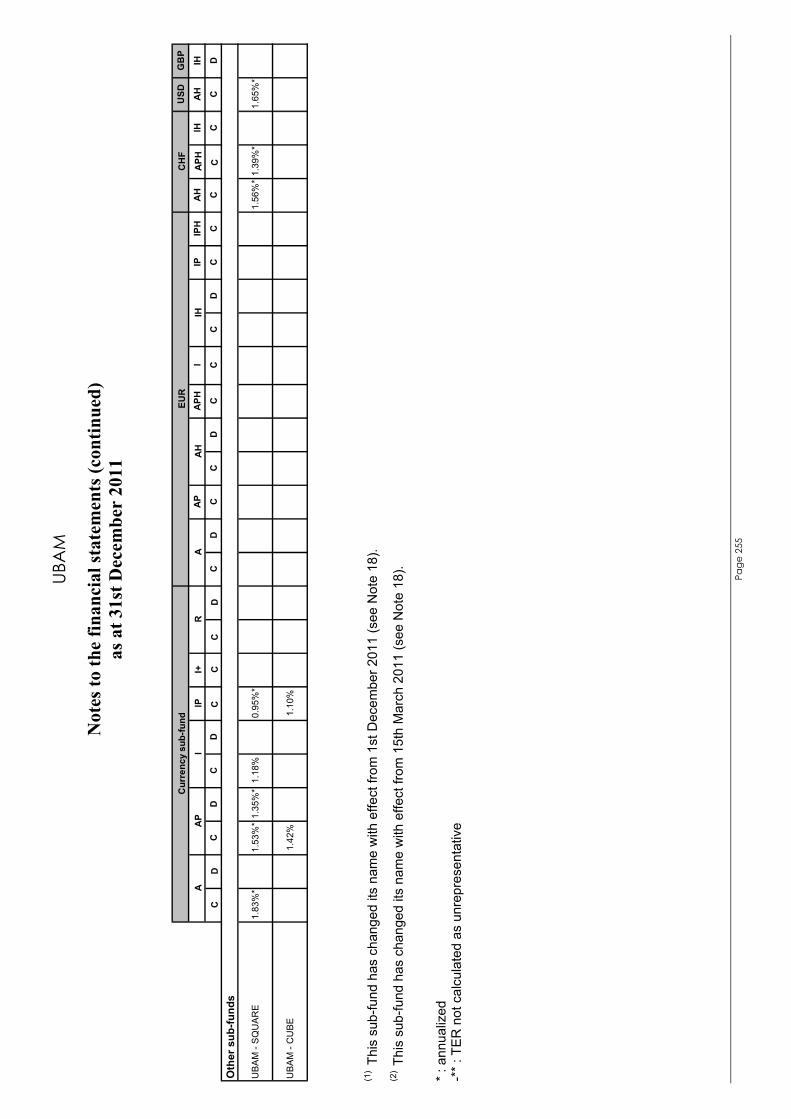
UBA
M
Not
es to
the
finan
cial
stat
emen
ts (c
ontin
ued)
as
at 3
1st D
ecem
ber
2011
Page
255
USD
GB
P
IPI+
AP
APH
IIP
IPH
AH
APH
IHA
HIH
CD
C
DC
D
C
CC
D
C
DC
C
DC
C
CD
CC
C
C
C
CD
UB
AM
- S
QU
AR
E1.
83%
*1.
53%
*1.
35%
*1.
18%
0.95
%*
1.56
%*
1.39
%*
1.65
%*
UB
AM
- C
UB
E1.
42%
1.10
%
Oth
er s
ub-fu
nds
Cur
renc
y su
b-fu
ndEU
RC
HF
AA
PI
RA
AH
IH
(1
) Thi
s su
b-fu
nd h
as c
hang
ed it
s na
me
with
effe
ct fr
om 1
st D
ecem
ber 2
011
(see
Not
e 18
). (2
) Th
is s
ub-fu
nd h
as c
hang
ed it
s na
me
with
effe
ct fr
om 1
5th
Mar
ch 2
011
(see
Not
e 18
). * :
ann
ualiz
ed
-** :
TE
R n
ot c
alcu
late
d as
unr
epre
sent
ativ
e
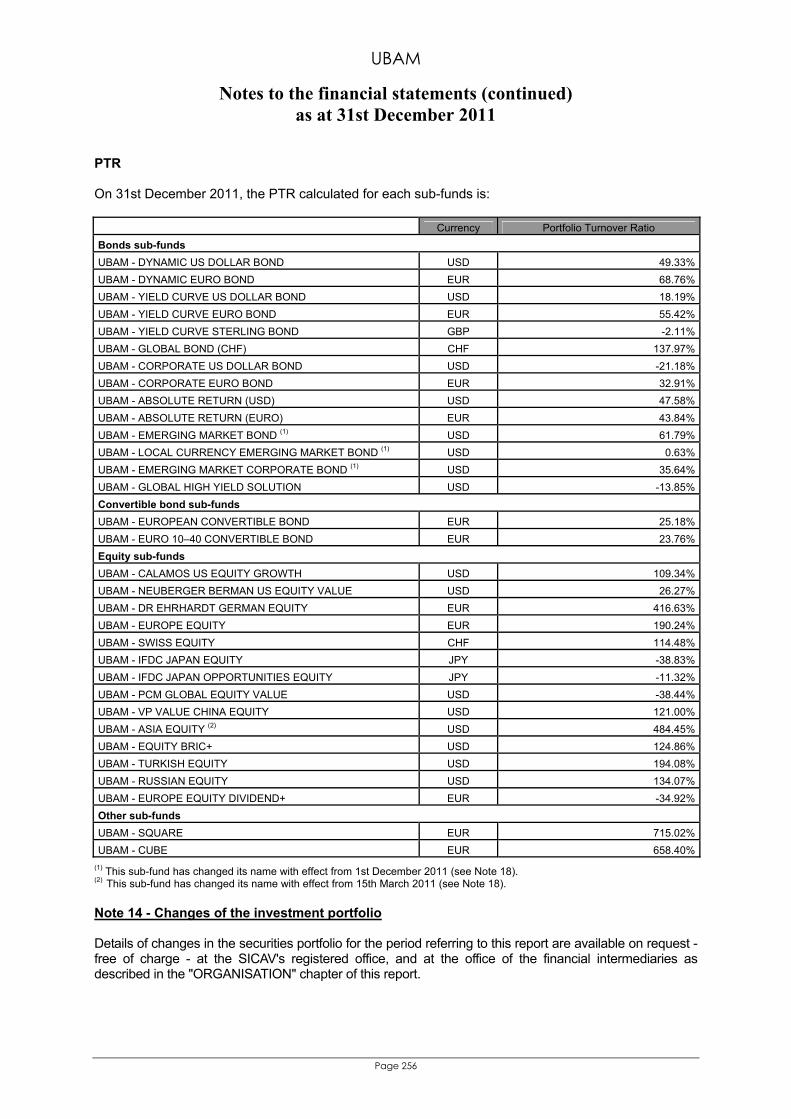
UBAM
Notes to the financial statements (continued) as at 31st December 2011
Page 256
PTR On 31st December 2011, the PTR calculated for each sub-funds is:
Currency Portfolio Turnover Ratio Bonds sub-funds UBAM - DYNAMIC US DOLLAR BOND USD 49.33%UBAM - DYNAMIC EURO BOND EUR 68.76%UBAM - YIELD CURVE US DOLLAR BOND USD 18.19%UBAM - YIELD CURVE EURO BOND EUR 55.42%UBAM - YIELD CURVE STERLING BOND GBP -2.11%UBAM - GLOBAL BOND (CHF) CHF 137.97%UBAM - CORPORATE US DOLLAR BOND USD -21.18%UBAM - CORPORATE EURO BOND EUR 32.91%UBAM - ABSOLUTE RETURN (USD) USD 47.58%UBAM - ABSOLUTE RETURN (EURO) EUR 43.84%UBAM - EMERGING MARKET BOND (1) USD 61.79%UBAM - LOCAL CURRENCY EMERGING MARKET BOND (1) USD 0.63%UBAM - EMERGING MARKET CORPORATE BOND (1) USD 35.64%UBAM - GLOBAL HIGH YIELD SOLUTION USD -13.85%Convertible bond sub-funds UBAM - EUROPEAN CONVERTIBLE BOND EUR 25.18%UBAM - EURO 10–40 CONVERTIBLE BOND EUR 23.76%Equity sub-funds UBAM - CALAMOS US EQUITY GROWTH USD 109.34%UBAM - NEUBERGER BERMAN US EQUITY VALUE USD 26.27%UBAM - DR EHRHARDT GERMAN EQUITY EUR 416.63%UBAM - EUROPE EQUITY EUR 190.24%UBAM - SWISS EQUITY CHF 114.48%UBAM - IFDC JAPAN EQUITY JPY -38.83%UBAM - IFDC JAPAN OPPORTUNITIES EQUITY JPY -11.32%UBAM - PCM GLOBAL EQUITY VALUE USD -38.44%UBAM - VP VALUE CHINA EQUITY USD 121.00%UBAM - ASIA EQUITY (2) USD 484.45%UBAM - EQUITY BRIC+ USD 124.86%UBAM - TURKISH EQUITY USD 194.08%UBAM - RUSSIAN EQUITY USD 134.07%UBAM - EUROPE EQUITY DIVIDEND+ EUR -34.92%Other sub-funds UBAM - SQUARE EUR 715.02%UBAM - CUBE EUR 658.40% (1) This sub-fund has changed its name with effect from 1st December 2011 (see Note 18). (2) This sub-fund has changed its name with effect from 15th March 2011 (see Note 18). Note 14 - Changes of the investment portfolio Details of changes in the securities portfolio for the period referring to this report are available on request - free of charge - at the SICAV's registered office, and at the office of the financial intermediaries as described in the "ORGANISATION" chapter of this report.
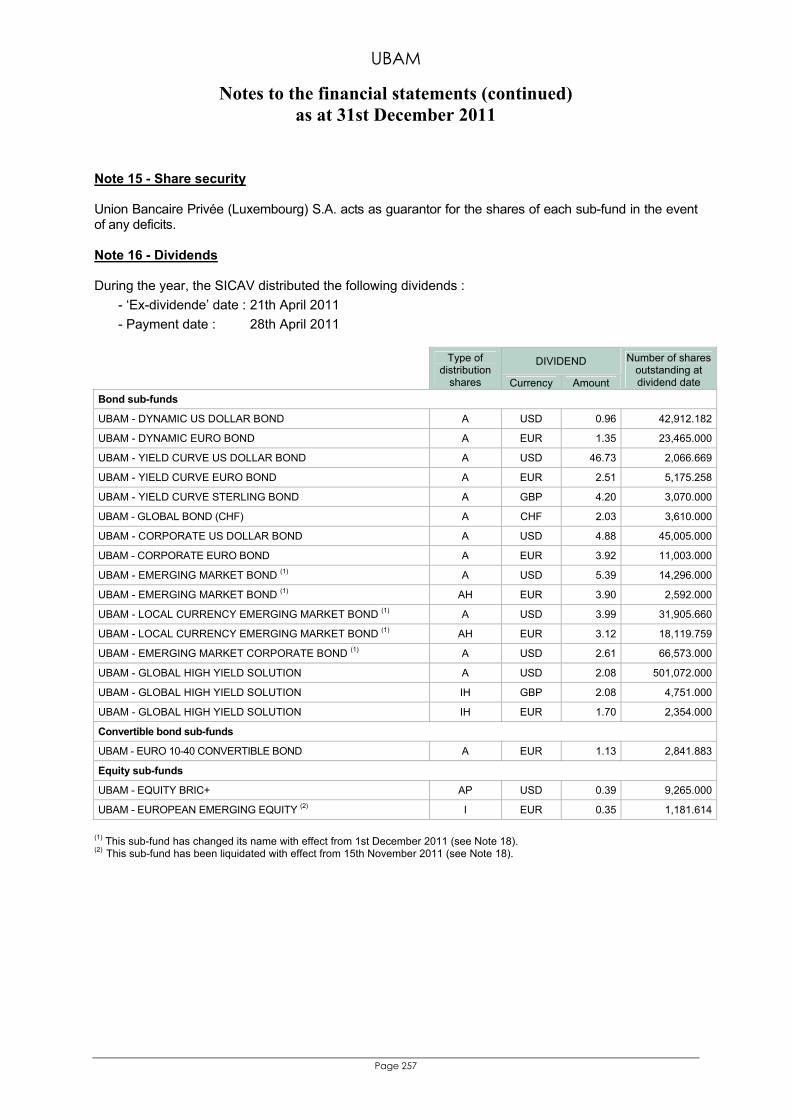
UBAM
Notes to the financial statements (continued) as at 31st December 2011
Page 257
Note 15 - Share security Union Bancaire Privée (Luxembourg) S.A. acts as guarantor for the shares of each sub-fund in the event of any deficits. Note 16 - Dividends During the year, the SICAV distributed the following dividends :
- ‘Ex-dividende’ date : 21th April 2011 - Payment date : 28th April 2011
DIVIDEND
Type of distribution
shares Currency Amount
Number of shares outstanding at dividend date
Bond sub-funds
UBAM - DYNAMIC US DOLLAR BOND A USD 0.96 42,912.182
UBAM - DYNAMIC EURO BOND A EUR 1.35 23,465.000
UBAM - YIELD CURVE US DOLLAR BOND A USD 46.73 2,066.669
UBAM - YIELD CURVE EURO BOND A EUR 2.51 5,175.258
UBAM - YIELD CURVE STERLING BOND A GBP 4.20 3,070.000
UBAM - GLOBAL BOND (CHF) A CHF 2.03 3,610.000
UBAM - CORPORATE US DOLLAR BOND A USD 4.88 45,005.000
UBAM - CORPORATE EURO BOND A EUR 3.92 11,003.000
UBAM - EMERGING MARKET BOND (1) A USD 5.39 14,296.000
UBAM - EMERGING MARKET BOND (1) AH EUR 3.90 2,592.000
UBAM - LOCAL CURRENCY EMERGING MARKET BOND (1) A USD 3.99 31,905.660
UBAM - LOCAL CURRENCY EMERGING MARKET BOND (1) AH EUR 3.12 18,119.759
UBAM - EMERGING MARKET CORPORATE BOND (1) A USD 2.61 66,573.000
UBAM - GLOBAL HIGH YIELD SOLUTION A USD 2.08 501,072.000
UBAM - GLOBAL HIGH YIELD SOLUTION IH GBP 2.08 4,751.000
UBAM - GLOBAL HIGH YIELD SOLUTION IH EUR 1.70 2,354.000
Convertible bond sub-funds
UBAM - EURO 10-40 CONVERTIBLE BOND A EUR 1.13 2,841.883
Equity sub-funds
UBAM - EQUITY BRIC+ AP USD 0.39 9,265.000
UBAM - EUROPEAN EMERGING EQUITY (2) I EUR 0.35 1,181.614
(1) This sub-fund has changed its name with effect from 1st December 2011 (see Note 18). (2) This sub-fund has been liquidated with effect from 15th November 2011 (see Note 18).
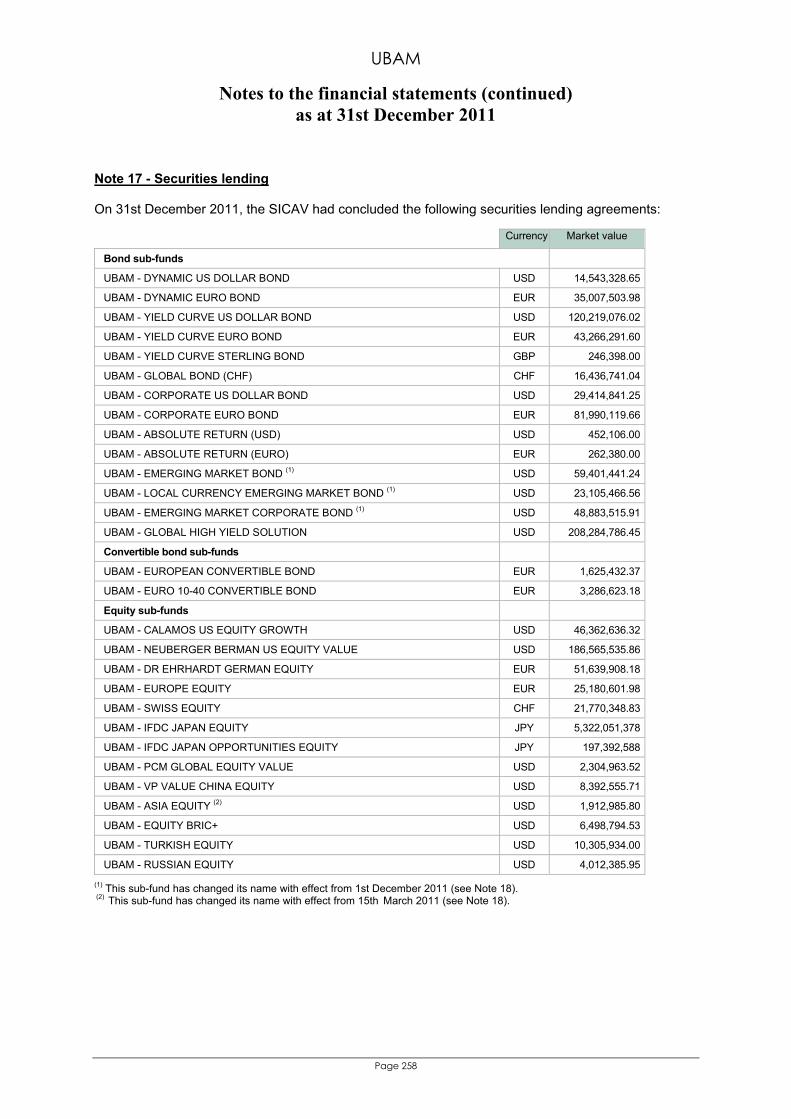
UBAM
Notes to the financial statements (continued) as at 31st December 2011
Page 258
Note 17 - Securities lending On 31st December 2011, the SICAV had concluded the following securities lending agreements: Currency Market value
Bond sub-funds
UBAM - DYNAMIC US DOLLAR BOND USD 14,543,328.65
UBAM - DYNAMIC EURO BOND EUR 35,007,503.98
UBAM - YIELD CURVE US DOLLAR BOND USD 120,219,076.02
UBAM - YIELD CURVE EURO BOND EUR 43,266,291.60
UBAM - YIELD CURVE STERLING BOND GBP 246,398.00
UBAM - GLOBAL BOND (CHF) CHF 16,436,741.04
UBAM - CORPORATE US DOLLAR BOND USD 29,414,841.25
UBAM - CORPORATE EURO BOND EUR 81,990,119.66
UBAM - ABSOLUTE RETURN (USD) USD 452,106.00
UBAM - ABSOLUTE RETURN (EURO) EUR 262,380.00
UBAM - EMERGING MARKET BOND (1) USD 59,401,441.24
UBAM - LOCAL CURRENCY EMERGING MARKET BOND (1) USD 23,105,466.56
UBAM - EMERGING MARKET CORPORATE BOND (1) USD 48,883,515.91
UBAM - GLOBAL HIGH YIELD SOLUTION USD 208,284,786.45
Convertible bond sub-funds
UBAM - EUROPEAN CONVERTIBLE BOND EUR 1,625,432.37
UBAM - EURO 10-40 CONVERTIBLE BOND EUR 3,286,623.18
Equity sub-funds
UBAM - CALAMOS US EQUITY GROWTH USD 46,362,636.32
UBAM - NEUBERGER BERMAN US EQUITY VALUE USD 186,565,535.86
UBAM - DR EHRHARDT GERMAN EQUITY EUR 51,639,908.18
UBAM - EUROPE EQUITY EUR 25,180,601.98
UBAM - SWISS EQUITY CHF 21,770,348.83
UBAM - IFDC JAPAN EQUITY JPY 5,322,051,378
UBAM - IFDC JAPAN OPPORTUNITIES EQUITY JPY 197,392,588
UBAM - PCM GLOBAL EQUITY VALUE USD 2,304,963.52
UBAM - VP VALUE CHINA EQUITY USD 8,392,555.71
UBAM - ASIA EQUITY (2) USD 1,912,985.80
UBAM - EQUITY BRIC+ USD 6,498,794.53
UBAM - TURKISH EQUITY USD 10,305,934.00
UBAM - RUSSIAN EQUITY USD 4,012,385.95 (1) This sub-fund has changed its name with effect from 1st December 2011 (see Note 18). (2) This sub-fund has changed its name with effect from 15th March 2011 (see Note 18).
UBAM
Notes to the financial statements (continued) as at 31st December 2011
Page 259
Note 18 - Events On 14th January 2011, the Board of Directors of the SICAV decided to co-opt Mrs Emmy Labovitch as new member of the Board of Directors of UBAM, replacing Mr. André Gigon, resigned, and to appoint her as Chairman of the Board of Directors. On 10th February 2011, the Board of Directors of the SICAV took the following decisions:
- transfer of the central administration, registrar and transfer agent functions from European Fund Administration (EFA) to CACEIS Bank Luxembourg (‘CACEIS’), with effect from 1st March 2011;
- merging the UBAM - OPTIBOND (EURO) and UBAM - DYNAMIC EURO BOND subfunds, with effect from 15th March 2011, the former being absorbed by the latter;
- possibility for the UBAM - SQUARE and UBAM - CUBE sub-funds to invest also in majority in securities with the same features as shares, from 15th March 2011;
- from 15th March 2011, the net asset value of the UBAM - EQUITY BRIC+ sub-fund will be calculated daily;
- change of name of the UBAM - SOUTH PACIFIC AND ASIA EQUITY subfund to UBAM - ASIA EQUITY with effect from 15th March 2011, following a change of the management delegation;
- increase of the management fee of Type A and R shares of the UBAM - ASIA EQUITY sub-fund from 25th March 2011
On 20th July 2011, Union Bancaire Privée, UBP SA waived its management fee for the sub-funds UBAM -SQUARE and UBAM -CUBE with respect to the planned liquidation. On 5th August 2011, the Board of Directors of the SICAV decided to activate the repayment spreading mechanism in response to redemption requests for the sub-fund UBAM -TURKISH EQUITY. On 24th October 2011, the Board of Directors of the SICAV took the following decisions:
- change the name of the sub-funds UBAM - EMERGING MARKET BOND (USD) UBAM - LOCAL CURRENCY EMERGING MARKET BOND (USD) and UBAM - EMERGING MARKET CORPORATE BOND (USD) in, respectively, UBAM - EMERGING MARKET BOND, UBAM - LOCAL CURRENCY EMERGING MARKET BOND and UBAM - EMERGING MARKET CORPORATE BOND with effect as of 1st December 2011.
- liquidate the sub-fund UBAM - EUROPEAN EMERGING EQUITY with effect from 15th November 2011.
On 28th November 2011, the Board of Directors of the SICAV took the following decisions:
- launch of a new "Equity" sub-fund called UBAM - EUROPE EQUITY DIVIDEND+, the first net asset value being dated 16th December 2011;
- increase the maximum rate of the management fee and advisory fee for the A class of the sub-fund UBAM - EMERGING MARKET CORPORATE BOND effective on 30th December 2011.
Finally, the net assets of the sub-funds UBAM - MONEY MARKET INSTITUTIONAL LIQUIDITY (USD) and UBAM - MONEY MARKET INSTITUTIONAL LIQUIDITY (EUR) were fully redeemed on the basis of their respective net asset value dated 20th December and 22nd December 2011. These two sub-funds are not liquidated and remain dormant.
UBAM
Notes to the financial statements (continued) as at 31st December 2011
Page 260
Note 19 - Subsequent events On 28th November 2011, the Board of Directors of the SICAV took the following decisions:
- launch of a new "Equity" sub-fund called UBAM - DYNAMIC PLUS the first net asset value being dated 27th January 2012;
- change the frequency for calculating the net asset value of the sub-fund UBAM - IFDC JAPAN OPPORTUNITIES EQUITY from weekly to daily effective as of 2nd January (only applicable from the NAV of 4th January 2012 due to public holidays in Japan).
On 15th December 2011, the Board of Directors of the SICAV decided to merge, with effect from 27th January 2012, the sub-funds UBAM - ABSOLUTE RETURN (USD) and UBAM - ABSOLUTE RETURN (EURO). They were absorbed by a new sub-fund called UBAM - DYNAMIC PLUS to be created. However, noting the total redemption of the shares of sub-funds UBAM - ABSOLUTE RETURN (USD) and UBAM - ABSOLUTE RETURN (EUR), the Board of Directors of the SICAV decided on 8th February 2012 to cancel the launch of the sub-fund UBAM - DYNAMIC PLUS and to liquidate the above-mentioned sub-funds by setting the calculation date of the last net asset values as follows:
- UBAM - ABSOLUTE RETURN (EUR): 12th January 2012 for A class of shares and 19th January 2012 for I class of shares
- UBAM - ABSOLUTE RETURN (USD): 27th January 2012 for A class of shares and 28th December 2011 for I class of shares.
On 23rd December 2011, the Board of Directors of the SICAV amended, with effect from 1st January 2012, the effective rate of the following commissions:
- management and advisory fees for Type A shares of the sub-fund UBAM - EMERGING MARKET CORPORATE BOND. These rates are increased to 0.40% and 1.10% per annum, respectively, calculated on the average net assets during the relevant quarter.
- advisory fees of Type I shares of sub-funds UBAM - EUROPEAN CONVERTIBLE BOND and UBAM - EURO 10-40 CONVERTIBLE BOND. These rates are decreased to 0.60% and 0.40% per annum, respectively, calculated on the average net assets during the relevant quarter.
On the same date, the Board of Directors of the SICAV took the decision to merge a sub-fund of the SICAV UBP MULTIFUNDS II, namely UBP MULTIFUNDS II - RUSSIAN EQUITY, by absorption into the sub-fund UBAM - RUSSIAN EQUITY with effect from 31st January 2012. On 8th February 2012, noting the total redemption of shares of sub-funds UBAM - MONEY MARKET INSTITUTIONAL LIQUIDITY (USD) and UBAM - MONEY MARKET INSTITUTIONAL LIQUIDITY (EUR) (see note 18), the Board of Directors of the SICAV decided to formalise their liquidation in fixing the date of calculation of the last net asset values as follows:
- UBAM - MONEY MARKET INSTITUTIONAL LIQUIDITY (USD): 20th December 2011 for the I+ class of shares
- UBAM - MONEY MARKET INSTITUTIONAL LIQUIDITY (EUR): 21st March 2011 for the I class of shares and 22nd December 2011 for the I+ class of shares.
Finally, on 14th February 2012, the Board of Directors, decided by a circular resolution to merge a sub-fund of SICAV UBP MULTIFUNDS, namely UBP MULTIFUNDS - Europe Equity (EUR), by absorption into the sub-fund UBAM - EUROPE EQUITY with effect from 26th March 2012.
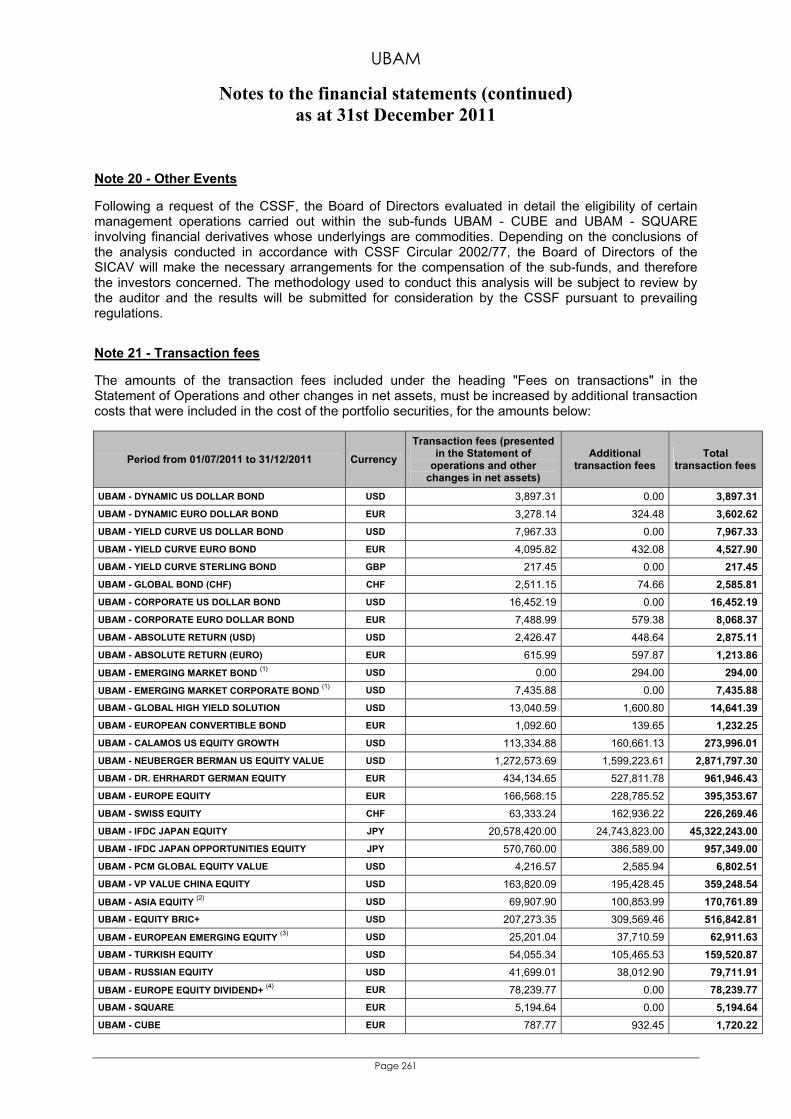
UBAM
Notes to the financial statements (continued) as at 31st December 2011
Page 261
Note 20 - Other Events Following a request of the CSSF, the Board of Directors evaluated in detail the eligibility of certain management operations carried out within the sub-funds UBAM - CUBE and UBAM - SQUARE involving financial derivatives whose underlyings are commodities. Depending on the conclusions of the analysis conducted in accordance with CSSF Circular 2002/77, the Board of Directors of the SICAV will make the necessary arrangements for the compensation of the sub-funds, and therefore the investors concerned. The methodology used to conduct this analysis will be subject to review by the auditor and the results will be submitted for consideration by the CSSF pursuant to prevailing regulations. Note 21 - Transaction fees The amounts of the transaction fees included under the heading "Fees on transactions" in the Statement of Operations and other changes in net assets, must be increased by additional transaction costs that were included in the cost of the portfolio securities, for the amounts below:
Period from 01/07/2011 to 31/12/2011 Currency Transaction fees (presented
in the Statement of operations and other
changes in net assets)
Additional transaction fees
Total transaction fees
UBAM - DYNAMIC US DOLLAR BOND USD 3,897.31 0.00 3,897.31UBAM - DYNAMIC EURO DOLLAR BOND EUR 3,278.14 324.48 3,602.62UBAM - YIELD CURVE US DOLLAR BOND USD 7,967.33 0.00 7,967.33UBAM - YIELD CURVE EURO BOND EUR 4,095.82 432.08 4,527.90UBAM - YIELD CURVE STERLING BOND GBP 217.45 0.00 217.45UBAM - GLOBAL BOND (CHF) CHF 2,511.15 74.66 2,585.81UBAM - CORPORATE US DOLLAR BOND USD 16,452.19 0.00 16,452.19UBAM - CORPORATE EURO DOLLAR BOND EUR 7,488.99 579.38 8,068.37UBAM - ABSOLUTE RETURN (USD) USD 2,426.47 448.64 2,875.11UBAM - ABSOLUTE RETURN (EURO) EUR 615.99 597.87 1,213.86UBAM - EMERGING MARKET BOND (1) USD 0.00 294.00 294.00UBAM - EMERGING MARKET CORPORATE BOND (1) USD 7,435.88 0.00 7,435.88UBAM - GLOBAL HIGH YIELD SOLUTION USD 13,040.59 1,600.80 14,641.39UBAM - EUROPEAN CONVERTIBLE BOND EUR 1,092.60 139.65 1,232.25UBAM - CALAMOS US EQUITY GROWTH USD 113,334.88 160,661.13 273,996.01UBAM - NEUBERGER BERMAN US EQUITY VALUE USD 1,272,573.69 1,599,223.61 2,871,797.30UBAM - DR. EHRHARDT GERMAN EQUITY EUR 434,134.65 527,811.78 961,946.43UBAM - EUROPE EQUITY EUR 166,568.15 228,785.52 395,353.67UBAM - SWISS EQUITY CHF 63,333.24 162,936.22 226,269.46UBAM - IFDC JAPAN EQUITY JPY 20,578,420.00 24,743,823.00 45,322,243.00UBAM - IFDC JAPAN OPPORTUNITIES EQUITY JPY 570,760.00 386,589.00 957,349.00UBAM - PCM GLOBAL EQUITY VALUE USD 4,216.57 2,585.94 6,802.51UBAM - VP VALUE CHINA EQUITY USD 163,820.09 195,428.45 359,248.54UBAM - ASIA EQUITY (2) USD 69,907.90 100,853.99 170,761.89UBAM - EQUITY BRIC+ USD 207,273.35 309,569.46 516,842.81UBAM - EUROPEAN EMERGING EQUITY (3) USD 25,201.04 37,710.59 62,911.63UBAM - TURKISH EQUITY USD 54,055.34 105,465.53 159,520.87UBAM - RUSSIAN EQUITY USD 41,699.01 38,012.90 79,711.91UBAM - EUROPE EQUITY DIVIDEND+ (4) EUR 78,239.77 0.00 78,239.77UBAM - SQUARE EUR 5,194.64 0.00 5,194.64UBAM - CUBE EUR 787.77 932.45 1,720.22
UBAM
Notes to the financial statements (continued) as at 31st December 2011
Page 262
(1) This sub-fund has changed its name with effect from 1st December 2011 (see Note 18). (2) This sub-fund has changed its name with effect from 15th March 2011 (see Note 18). (3) This sub-fund has been liquidated with effect from 15th November 2011 (see Note 18). (4) This sub-fund was launched as of 15th December 2011 (see Note 18). For the period 1st January 2011 to 30th June, 2011, part of transaction fees is included in the heading "Other expenses" in the statement of operations and other changes in net assets.
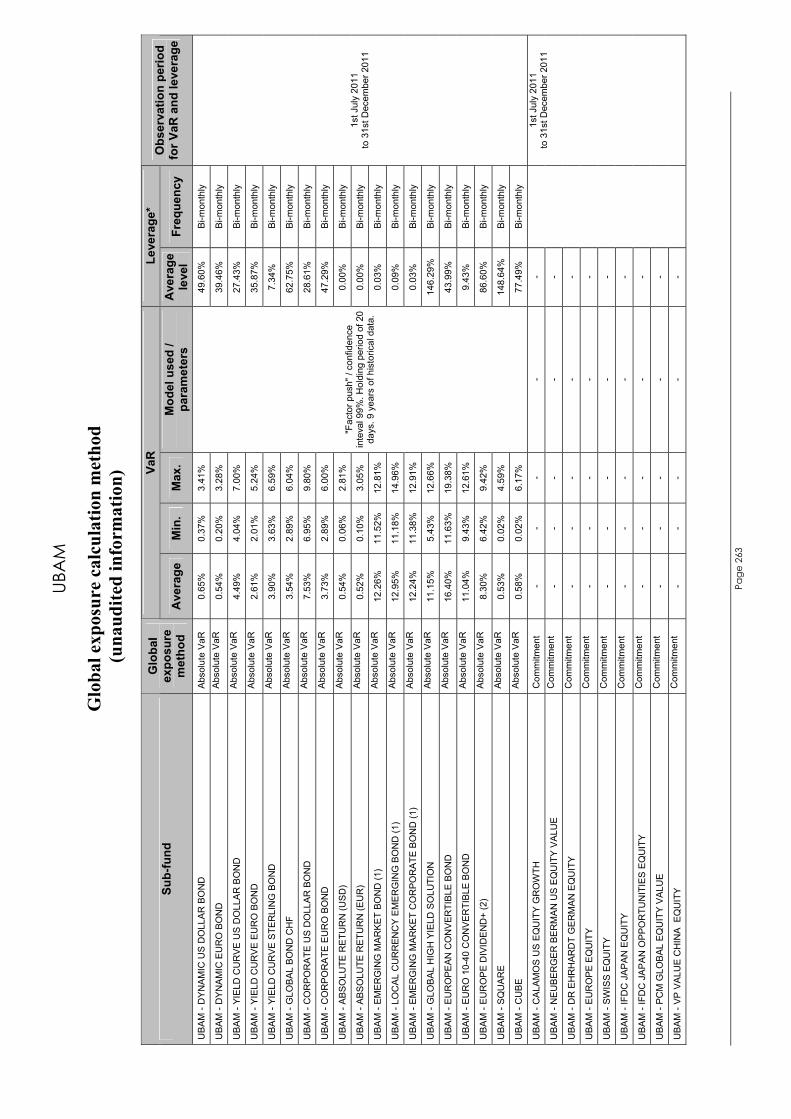
UBA
M
Glo
bal e
xpos
ure
calc
ulat
ion
met
hod
(una
udite
d in
form
atio
n)
Page
263
VaR
Le
vera
ge*
Sub-
fund
G
loba
l ex
posu
re
met
hod
Ave
rage
M
in.
Max
. M
odel
use
d /
para
met
ers
Ave
rage
le
vel
Freq
uenc
y O
bser
vatio
n pe
riod
for V
aR a
nd le
vera
ge
UBA
M -
DYN
AMIC
US
DO
LLAR
BO
ND
Ab
solu
te V
aR
0.65
%
0.37
%
3.41
%
49.6
0%
Bi-m
onth
ly
UBA
M -
DYN
AMIC
EU
RO
BO
ND
A
bsol
ute
VaR
0.
54%
0.
20%
3.
28%
39
.46%
B
i-mon
thly
UBA
M -
YIEL
D C
UR
VE U
S D
OLL
AR B
ON
D
Abs
olut
e V
aR
4.49
%
4.04
%
7.00
%
27.4
3%
Bi-m
onth
ly
UBA
M -
YIEL
D C
UR
VE E
UR
O B
ON
D
Abs
olut
e V
aR
2.61
%
2.01
%
5.24
%
35.8
7%
Bi-m
onth
ly
UBA
M -
YIEL
D C
UR
VE S
TER
LIN
G B
ON
D
Abs
olut
e V
aR
3.90
%
3.63
%
6.59
%
7.34
%
Bi-m
onth
ly
UBA
M -
GLO
BAL
BON
D C
HF
Abs
olut
e V
aR
3.54
%
2.89
%
6.04
%
62.7
5%
Bi-m
onth
ly
UBA
M -
CO
RPO
RAT
E U
S D
OLL
AR B
ON
D
Abs
olut
e V
aR
7.53
%
6.95
%
9.80
%
28.6
1%
Bi-m
onth
ly
UBA
M -
CO
RPO
RAT
E EU
RO
BO
ND
A
bsol
ute
VaR
3.
73%
2.
89%
6.
00%
47
.29%
B
i-mon
thly
UBA
M -
ABSO
LUTE
RET
UR
N (U
SD)
Abs
olut
e V
aR
0.54
%
0.06
%
2.81
%
0.00
%
Bi-m
onth
ly
UBA
M -
ABSO
LUTE
RET
UR
N (E
UR
) A
bsol
ute
VaR
0.
52%
0.
10%
3.
05%
0.
00%
B
i-mon
thly
UB
AM
- E
ME
RG
ING
MA
RK
ET
BON
D (1
) A
bsol
ute
VaR
12
.26%
11
.52%
12
.81%
0.
03%
B
i-mon
thly
UBA
M -
LOC
AL C
UR
REN
CY
EMER
GIN
G B
ON
D (1
) A
bsol
ute
VaR
12
.95%
11
.18%
14
.96%
0.
09%
B
i-mon
thly
UB
AM
- E
ME
RG
ING
MA
RKE
T C
OR
POR
ATE
BON
D (1
) A
bsol
ute
VaR
12
.24%
11
.38%
12
.91%
0.
03%
B
i-mon
thly
UB
AM
- G
LOB
AL
HIG
H Y
IELD
SO
LUTI
ON
A
bsol
ute
VaR
11
.15%
5.
43%
12
.66%
14
6.29
%
Bi-m
onth
ly
UB
AM
- E
UR
OPE
AN C
ON
VE
RTI
BLE
BO
ND
A
bsol
ute
VaR
16
.40%
11
.63%
19
.38%
43
.99%
B
i-mon
thly
UB
AM
- E
UR
O 1
0-40
CO
NV
ER
TIB
LE B
ON
D
Abs
olut
e V
aR
11.0
4%
9.43
%
12.6
1%
9.43
%
Bi-m
onth
ly
UBA
M -
EUR
OPE
DIV
IDEN
D+
(2)
Abs
olut
e V
aR
8.30
%
6.42
%
9.42
%
86.6
0%
Bi-m
onth
ly
UBA
M -
SQU
ARE
Abs
olut
e V
aR
0.53
%
0.02
%
4.59
%
148.
64%
B
i-mon
thly
UB
AM
- C
UB
E
Abs
olut
e V
aR
0.58
%
0.02
%
6.17
%
"Fac
tor p
ush"
/ co
nfid
ence
in
teva
l 99%
. Hol
ding
per
iod
of 2
0 da
ys. 9
yea
rs o
f his
toric
al d
ata.
77.4
9%
Bi-m
onth
ly
1st J
uly
2011
to
31s
t Dec
embe
r 201
1
UBA
M -
CAL
AMO
S U
S EQ
UIT
Y G
RO
WTH
C
omm
itmen
t -
- -
- -
UBA
M -
NEU
BER
GER
BER
MAN
US
EQU
ITY
VALU
E C
omm
itmen
t -
- -
- -
UBA
M -
DR
EH
RH
ARD
T G
ERM
AN E
QU
ITY
Com
mitm
ent
- -
- -
-
UB
AM
- E
UR
OPE
EQ
UIT
Y C
omm
itmen
t -
- -
- -
UB
AM
- SW
ISS
EQ
UIT
Y C
omm
itmen
t -
- -
- -
UBA
M -
IFD
C J
APAN
EQ
UIT
Y C
omm
itmen
t -
- -
- -
UBA
M -
IFD
C J
APAN
OPP
OR
TUN
ITIE
S EQ
UIT
Y C
omm
itmen
t -
- -
- -
UB
AM
- P
CM
GLO
BA
L EQ
UIT
Y V
ALU
E
Com
mitm
ent
- -
- -
-
UB
AM
- VP
VA
LUE
CH
INA
EQ
UIT
Y C
omm
itmen
t -
- -
- -
1st J
uly
2011
to
31s
t Dec
embe
r 201
1
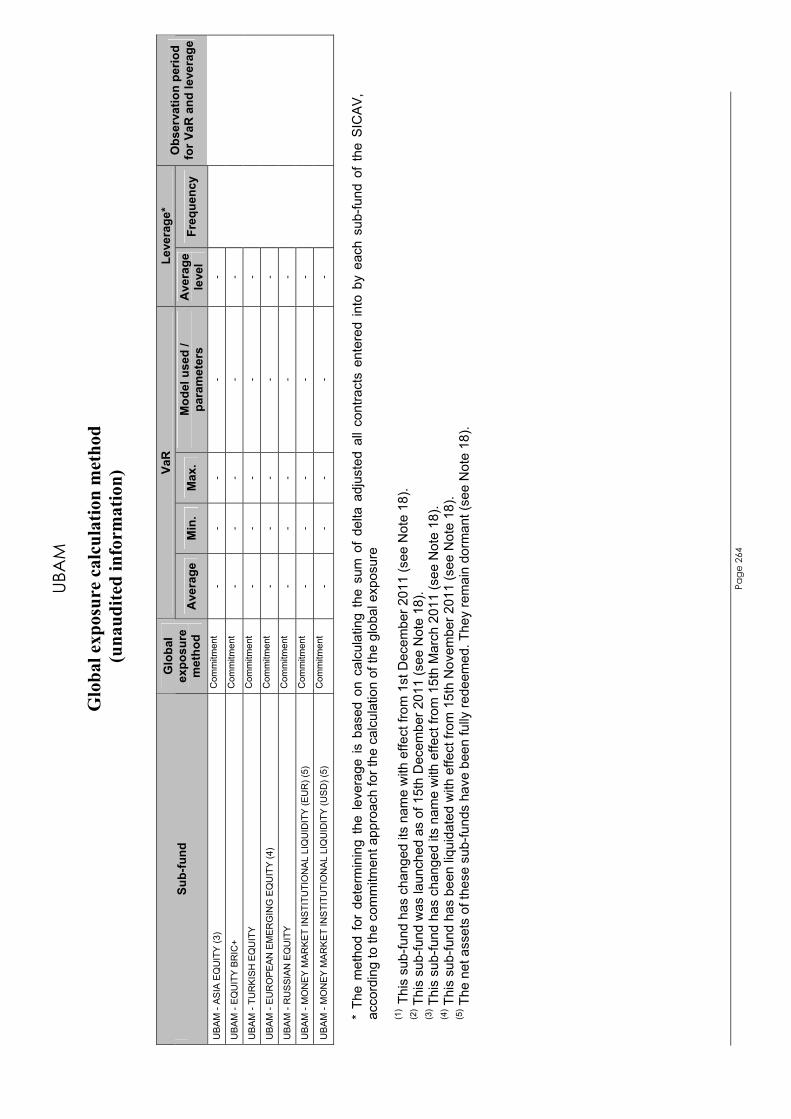
UBA
M
Glo
bal e
xpos
ure
calc
ulat
ion
met
hod
(una
udite
d in
form
atio
n)
Page
264
VaR
Le
vera
ge*
Sub-
fund
G
loba
l ex
posu
re
met
hod
Ave
rage
M
in.
Max
. M
odel
use
d /
para
met
ers
Ave
rage
le
vel
Freq
uenc
y O
bser
vatio
n pe
riod
for V
aR a
nd le
vera
ge
UB
AM
- AS
IA E
QU
ITY
(3)
Com
mitm
ent
- -
- -
-
UB
AM
- EQ
UIT
Y BR
IC+
Com
mitm
ent
- -
- -
-
UBA
M -
TUR
KIS
H E
QU
ITY
Com
mitm
ent
- -
- -
-
UB
AM
- E
UR
OPE
AN E
ME
RG
ING
EQ
UIT
Y (4
) C
omm
itmen
t -
- -
- -
UBA
M -
RU
SSIA
N E
QU
ITY
Com
mitm
ent
- -
- -
-
UBA
M -
MO
NEY
MA
RKE
T IN
STIT
UTI
ON
AL L
IQU
IDIT
Y (E
UR
) (5)
C
omm
itmen
t -
- -
- -
UB
AM
- M
ON
EY
MA
RK
ET
INS
TITU
TIO
NA
L LI
QU
IDIT
Y (U
SD
) (5)
C
omm
itmen
t -
- -
- -
*
The
met
hod
for
dete
rmin
ing
the
leve
rage
is b
ased
on
calc
ulat
ing
the
sum
of
delta
adj
uste
d al
l con
tract
s en
tere
d in
to b
y ea
ch s
ub-fu
nd o
f th
e S
ICA
V,
acco
rdin
g to
the
com
mitm
ent a
ppro
ach
for t
he c
alcu
latio
n of
the
glob
al e
xpos
ure
(1
) Thi
s su
b-fu
nd h
as c
hang
ed it
s na
me
with
effe
ct fr
om 1
st D
ecem
ber 2
011
(see
Not
e 18
). (2
) Thi
s su
b-fu
nd w
as la
unch
ed a
s of
15t
h D
ecem
ber 2
011
(see
Not
e 18
). (3
) Thi
s su
b-fu
nd h
as c
hang
ed it
s na
me
with
effe
ct fr
om 1
5th
Mar
ch 2
011
(see
Not
e 18
). (4
) Thi
s su
b-fu
nd h
as b
een
liqui
date
d w
ith e
ffect
from
15t
h N
ovem
ber 2
011
(see
Not
e 18
).
(5) T
he n
et a
sset
s of
thes
e su
b-fu
nds
have
bee
n fu
lly re
deem
ed. T
hey
rem
ain
dorm
ant (
see
Not
e 18
).