Validating the use of 137Cs measurements to estimate rates of soil redistribution by wind
11
This article was originally published in a journal published by Elsevier, and the attached copy is provided by Elsevier for the author’s benefit and for the benefit of the author’s institution, for non-commercial research and educational use including without limitation use in instruction at your institution, sending it to specific colleagues that you know, and providing a copy to your institution’s administrator. All other uses, reproduction and distribution, including without limitation commercial reprints, selling or licensing copies or access, or posting on open internet sites, your personal or institution’s website or repository, are prohibited. For exceptions, permission may be sought for such use through Elsevier’s permissions site at: http://www.elsevier.com/locate/permissionusematerial
Transcript of Validating the use of 137Cs measurements to estimate rates of soil redistribution by wind

This article was originally published in a journal published byElsevier, and the attached copy is provided by Elsevier for the
author’s benefit and for the benefit of the author’s institution, fornon-commercial research and educational use including without
limitation use in instruction at your institution, sending it to specificcolleagues that you know, and providing a copy to your institution’s
administrator.
All other uses, reproduction and distribution, including withoutlimitation commercial reprints, selling or licensing copies or access,
or posting on open internet sites, your personal or institution’swebsite or repository, are prohibited. For exceptions, permission
may be sought for such use through Elsevier’s permissions site at:
http://www.elsevier.com/locate/permissionusematerial

Autho
r's
pers
onal
co
py
Validating the use of 137Cs measurements to estimate rates of soilredistribution by wind
R. Scott Van Pelt a,⁎, Ted M. Zobeck b, Jerry C. Ritchie c, Thomas E. Gill d
a USDA-Agricultural Research Service, 302 W. I-20, Big Spring, TX 79720, United Statesb USDA-Agricultural Research Service, Lubbock, TX, United Statesc USDA-Agricultural Research Service, Beltsville, MD, United States
d Department of Geological Sciences, University of Texas at El Paso, El Paso, TX, United States
Received 2 June 2006; received in revised form 3 November 2006; accepted 24 November 2006
Abstract
Wind erosion has degraded over one-half billion hectares of land worldwide. 137Cesium (137Cs) has been used as a tracer to study long-termrates of soil redistribution by water and, to a lesser extent, by wind. Early studies assumed that the decline in 137Cs activity for a potentially erodedsoil relative to that for an uneroded soil was linearly proportional to soil loss. More recently, models have emerged that consider the effects of soilcultivation and the particle surface area-dependent partitioning of 137Cs on soils. We investigated the partitioning of 137Cs in wind-erodedsediments and with soil surface samples sieved into contiguous ranges of particle sizes. We also compared the 137Cs activities and stratification ofseveral adjacent soils with known wind erosion and deposition histories. Finally, we tested 137Cs-based soil loss models with measured data fromsites with documented histories. 137Cs activities and mean particle diameters of aeolian samples agreed well with the 137Cs activities andrespective mean diameters of the sieved surface soil samples. Good agreement between model estimations and measured data indicated that 137Csmodels developed to estimate soil redistribution by water were also applicable to soil redistribution by wind provided that the models contained anappropriate particle size correction parameter.© 2006 Elsevier B.V. All rights reserved.
Keywords: 137Cs; Wind erosion; Particle size correction; Erosion rate models
Wind erosion is a soil degrading process that affects overone-half billion hectares of land worldwide and is a majorcausative factor in desertification (Lal, 1994). Wind erosion is awinnowing process that selectively removes the finer, mostfertile and chemically active portions of the soil. Increasingworld population over the last century and the resulting increaseof anthropogenic activity has led to accelerating rates of winderosion on every continent except Antarctica (Lal, 1994). Short-term studies in wind tunnels and at the field scale have resultedin an understanding of the processes and controlling factors ofwind erosion. This body of knowledge has been used to developpredictive wind erosion models such as the Wind ErosionEquation (Woodruff and Siddoway, 1965), the Revised Wind
Erosion Equation (Fryrear et al., 1998) and others. While thesemodels have been employed to estimate the long-term soil lossin agricultural fields, their accuracy varies with location andyear (Van Pelt and Zobeck, 2004; Van Pelt et al., 2004). In spiteof these advances, few quantitative estimates of past soil erosionrates exist.
Above-ground nuclear weapons testing during the 1950s and1960s resulted in the release of radioactive cesium-137 (137Cs)to the atmosphere. The first measurable quantities of 137Csfallout were reported in 1954 and subsequent pulses in 1958and, most notably, 1963 are responsible for almost all the 137Csfallout received to date (Ritchie and McHenry, 1990). Thepassage of the Nuclear Test Ban Treaty in 1963 effectivelyhalted additional 137Cs inputs to the atmosphere, the atmo-spheric levels of 137Cs fell rapidly and, by the late 1970s, 137Csfallout had essentially ended (Walling and He, 1999). Thus,
Catena 70 (2007) 455–464www.elsevier.com/locate/catena
⁎ Corresponding author. Tel.: +1 432 263 0293; fax: +1 432 263 3154.E-mail address: [email protected] (R.S. Van Pelt).
0341-8162/$ - see front matter © 2006 Elsevier B.V. All rights reserved.doi:10.1016/j.catena.2006.11.014
Autho
r's
pers
onal
co
py
most 137Cs fallout occurred prior to 1964. The Chernobylaccident of 1986 provided a new source of 137Cs deposition inEurope and Western Asia. Atmospheric 137Cs was distributedglobally within the stratosphere and rainfall was primarilyresponsible for its deposition on the earth's surface where itbecame very strongly adsorbed by clay minerals in the soil(Schultz et al., 1960). Once adsorbed, chemical or biologicalremoval of 137Cs from soil particles is insignificant and it isassumed that only physical processes moving soil particles areinvolved in 137Cs transport (Ritchie and McHenry, 1990;Chappell et al., 1998). The amount of 137Cs in a bulk sample ofsoil is commonly quantified in terms of Bq kg−1 and referred toas 137Cs activity. The amount of 137Cs deposited on orremaining on a landscape is commonly quantified in terms ofBq m−2 and referred to as 137Cs inventory. The strongadsorption of 137Cs to soil particles, its initially uniformdeposition on local landscapes and a relatively long half-life of30.17 years make it a very attractive tracer for studying soilmovement (Ritchie and McHenry, 1990; Walling and Quine,1991).
For several decades, 137Cs has been used as a tracer to studymedium-term (30–50 years) patterns of water erosion anddeposition of soils on the field and watershed scales. In many ofthese studies, loss or gain of 137Cs in the soil profile wasassumed to be directly proportional to the loss or gain of soil(de Jong et al., 1982; Walling and Quine, 1990) especially inplowed agricultural fields with an evenly mixed Ap horizon.Gravimetric and mass balance models have also been employedin cultivated fields to estimate rates of water erosion anddeposition from 137Cs activities in the soil profile (Walling andHe, 1999). In undisturbed soils, the 137Cs activities declineexponentially with depth in the profile, and models that equatesoil loss as a log or natural logarithmic function of the decreasein 137Cs inventory have been employed (Zhang et al., 1990;Chappell et al., 1996). Recently, digital terrain models andtopographic surveys have been used in conjunction with 137Csinventories to describe the spatial and temporal patterns oferosion and deposition (Chappell, 1996; Ritchie, 2000).
Long-term rates and patterns of sediment redistribution bywind have also been estimated using changes in 137Csinventories. Sutherland et al. (1991) investigated severalcultivated fields in Canada and used a linear proportionalmodel to estimate long-term wind erosion rates from differencesof 137Cs inventories in those fields and adjacent unerodedreference sites. In the Sahel region of Africa, 137Cs activitiesand landscape stratification have been used with the logarithm-based mass balance model of Zhang et al. (1990) to estimatewind erosion rates and a linear proportional model to estimatedeposition rates on a landscape scale (Chappell, 1996; Chappellet al., 1998). Basher and Webb (1997) used a differentlogarithmic model to estimate sediment redistribution betweenbare areas and grass tussocks in New Zealand. Vanden Bygaartand Protz (2001) reported that clay, organic matter and siltcontent were correlated with 137Cs retention in the upper solumand that the depth of the 137Cs peak accumulation in a profilecould be used to estimate the rate of burial from migratingdunes. They further noted 137Cs accumulation in the sand dunes
in spite of very low clay contents. More recently, Chappell andWarren (2003) investigated the spatial distribution of 137Cs onthe landscape and implications for the use of mass-balancemodels to determine soil redistribution by wind. They modifieda mass balance model to operate on a daily time scale so thattemporal changes in land use and management could be used topredict spatially dependent changes in 137Cs inventory.
Wind-eroded sediments move in three modes during anerosion event. In general, the coarser particles (N103 μm) movein creep mode along the soil surface, as they are too massive toleave the surface. Particles 102–103 μm in diameter tend tomove in saltation mode, alternately ejecting from the surface,flowing with the wind, and returning via gravity to strike thesurface. The third mode of sediment transport, suspension, iscomposed primarily of soil particles less than 102 μm indiameter. These particles may be lifted many meters above theeroding surface and may travel great distances before returningto earth (Bagnold, 1941). Recently, Chen and Fryrear (2002)reported that the mean and 95th percentile diameters of particlescaptured during an erosion event from the soil surface to aheight of almost 16 m decreased in a logarithm-based functionwith height. It is commonly observed that much of the sedimentmoving in the creep or saltation mode is deposited in or near theedges of the eroding field while the sediment moving in thesuspension mode may be carried great distances before beingdeposited.
Wind erosion is widely regarded to be a winnowing processthat preferentially removes the finer, more chemically activeportions of the soil. Soil textural analysis of cultivated fieldssubject to wind erosion has shown a decrease of clay, silt andorganic matter in the surface horizon over time (Lyles andTatarko, 1986). Several studies have shown that sediments insuspension mode are composed of the finer fractions of the soiland carry disproportionate amounts of soil organic matter andsoil nutrients (Laprade, 1957; Zobeck and Fryrear, 1986a,b; Gillet al., 2000). Because most 137Cs is bound to the clay, silt andorganic fractions of the soil, it would follow that estimates forsoil loss based on changes in 137Cs activity may tend tooverestimate the rate of soil loss if not corrected for the particlediameters transported from the field and resulting change insurface texture. Walling and He (1999) proposed improvingseveral 137Cs inventory-based models of soil water erosion byincorporating a particle size correction parameter that wouldaccount for the higher surface area to volume ratios of smallerdiameter particles. These models have recently been publishedand made available for computer simulations in Visual Basic(Walling and He, 2001).
Although it is well understood that 137Cs is transported onthe physical soil particles, many factors may influence itsactivity and distribution in a soil profile. The assumption ofeven distribution across the local landscape is based on severalyears of normally distributed temporal and spatial patterns ofrainfall so that the average annual rainfall depth would be metfor the approximate 10-year period of maximum fallout from1956 to 1966. This assumption is not valid for many areas asdecadal-scale droughts or pluvial periods resulted in rainfalldepths that deviated from average. Compounding this source of
456 R.S. Van Pelt et al. / Catena 70 (2007) 455–464
Autho
r's
pers
onal
co
py
variability is the uneven infiltration of rainfall due to differencesin microtopography or soil physical factors (Kachanoski et al.,1985). In semi-arid regions, dust is often present in theatmosphere, and deposition onto the soil surface and vegetationis a difficultly quantified certainty (Chappell, 1999), as is theminor contribution of overland flow and associated watererosion. Further, the deposition is highly influenced by thepatterns of vegetation at even small spatial scales (Chappellet al., 1998; Ritchie et al., 2003).
We initiated this study to determine how partitioning of137Cs in wind eroding sediments would affect the 137Csinventories of soils with known erosion and depositionhistories. We used the simple linear proportional model andthe improved linear proportion and mass balance modelsincorporating the particle size correction factor to determinehow accurately these models predicted the rates of soil loss anddeposition in comparison to field measurements. We alsowanted to investigate using aeolian samples collected at 1 mabove an eroding surface for determining appropriate particlesize correction factor values for wind eroding sandy loam soils.
1. Methods
1.1. Study site
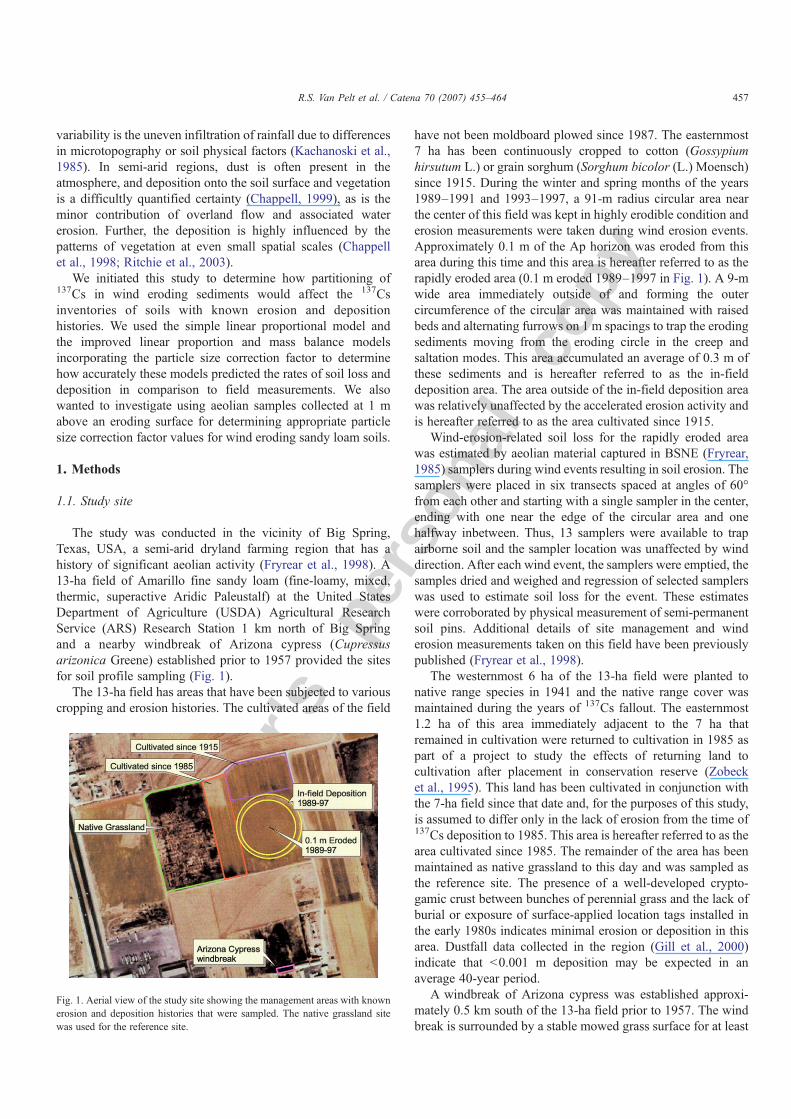
The study was conducted in the vicinity of Big Spring,Texas, USA, a semi-arid dryland farming region that has ahistory of significant aeolian activity (Fryrear et al., 1998). A13-ha field of Amarillo fine sandy loam (fine-loamy, mixed,thermic, superactive Aridic Paleustalf) at the United StatesDepartment of Agriculture (USDA) Agricultural ResearchService (ARS) Research Station 1 km north of Big Springand a nearby windbreak of Arizona cypress (Cupressusarizonica Greene) established prior to 1957 provided the sitesfor soil profile sampling (Fig. 1).
The 13-ha field has areas that have been subjected to variouscropping and erosion histories. The cultivated areas of the field
have not been moldboard plowed since 1987. The easternmost7 ha has been continuously cropped to cotton (Gossypiumhirsutum L.) or grain sorghum (Sorghum bicolor (L.) Moensch)since 1915. During the winter and spring months of the years1989–1991 and 1993–1997, a 91-m radius circular area nearthe center of this field was kept in highly erodible condition anderosion measurements were taken during wind erosion events.Approximately 0.1 m of the Ap horizon was eroded from thisarea during this time and this area is hereafter referred to as therapidly eroded area (0.1 m eroded 1989–1997 in Fig. 1). A 9-mwide area immediately outside of and forming the outercircumference of the circular area was maintained with raisedbeds and alternating furrows on 1 m spacings to trap the erodingsediments moving from the eroding circle in the creep andsaltation modes. This area accumulated an average of 0.3 m ofthese sediments and is hereafter referred to as the in-fielddeposition area. The area outside of the in-field deposition areawas relatively unaffected by the accelerated erosion activity andis hereafter referred to as the area cultivated since 1915.
Wind-erosion-related soil loss for the rapidly eroded areawas estimated by aeolian material captured in BSNE (Fryrear,1985) samplers during wind events resulting in soil erosion. Thesamplers were placed in six transects spaced at angles of 60°from each other and starting with a single sampler in the center,ending with one near the edge of the circular area and onehalfway inbetween. Thus, 13 samplers were available to trapairborne soil and the sampler location was unaffected by winddirection. After each wind event, the samplers were emptied, thesamples dried and weighed and regression of selected samplerswas used to estimate soil loss for the event. These estimateswere corroborated by physical measurement of semi-permanentsoil pins. Additional details of site management and winderosion measurements taken on this field have been previouslypublished (Fryrear et al., 1998).
The westernmost 6 ha of the 13-ha field were planted tonative range species in 1941 and the native range cover wasmaintained during the years of 137Cs fallout. The easternmost1.2 ha of this area immediately adjacent to the 7 ha thatremained in cultivation were returned to cultivation in 1985 aspart of a project to study the effects of returning land tocultivation after placement in conservation reserve (Zobecket al., 1995). This land has been cultivated in conjunction withthe 7-ha field since that date and, for the purposes of this study,is assumed to differ only in the lack of erosion from the time of137Cs deposition to 1985. This area is hereafter referred to as thearea cultivated since 1985. The remainder of the area has beenmaintained as native grassland to this day and was sampled asthe reference site. The presence of a well-developed crypto-gamic crust between bunches of perennial grass and the lack ofburial or exposure of surface-applied location tags installed inthe early 1980s indicates minimal erosion or deposition in thisarea. Dustfall data collected in the region (Gill et al., 2000)indicate that b0.001 m deposition may be expected in anaverage 40-year period.
A windbreak of Arizona cypress was established approxi-mately 0.5 km south of the 13-ha field prior to 1957. The windbreak is surrounded by a stable mowed grass surface for at least
Fig. 1. Aerial view of the study site showing the management areas with knownerosion and deposition histories that were sampled. The native grassland sitewas used for the reference site.
457R.S. Van Pelt et al. / Catena 70 (2007) 455–464

Autho
r's
pers
onal
co
py
100 m in all directions except to the east where it joins abuilding that also pre-dates 1957. Since there is no bare soilclose to the windbreak, it may safely be assumed that sedimentdeposited under the canopy came from that moving in thesuspension mode that was either filtered by impact with thecanopy or was deposited in downward eddies within the canopy.Measurements taken from a pipe storage rack placed under thewindbreak in the late 1950s would indicate that approximately0.07 m of sediment has been deposited under the windbreakcanopy.
1.2. Sample collection, preparation and analysis
The sampled areas have been subject to careful managementcommensurate with their use as research fields. Areas that haveflooded or that have been subjected to water erosion have beenmapped and diversions constructed as necessary to prevent orlimit recurrence. These maps were consulted prior to sampling toinsure that all known non-wind-erosion-related factors that mightredistribute soil and affect 137Cs activity would be minimized.
Soils in the above areas were cored to a depth of 0.6 m with ahydraulically driven soil coring tube and stainless steel splitspoon sampler that produces a 0.0413-m diameter core with across-section surface area of 0.00134 m2. Six cores were takenat each of three different locations in all sampling units. Thecores were cut at precisely 0.05, 0.1, 0.15, 0.3 and 0.45 m fromthe surface end and the sections were composited by depth,mixed, sieved through a 0.002-m opening sieve and dried toconstant weight at 90 °C to insure an oven dry sample weight ofat least 1 kg for the 137Cs analysis. A large composite scoopsample consisting of 10 individual 0.12 m by 0.30 m areas ofthe top 0.05 m from the area cultivated since 1985 was collectedand mechanically sieved sequentially through 500, 250, 150,100, 75 and 53 μm opening stainless screens. Soil materialsretained by the 500-μm screen were retained for weight and thesamples retained on each screen and passing the 53-μm screenwere dried to constant weight at 90 °C. Loose sand on thesurface of the field (abrader) that washed out of the soil during aheavy rainstorm in 2001 was collected in the eroded area, driedat 90 °C and retained for analysis. Aeolian samples werecollected during a moderately strong aeolian event in 1994 thatresulted in an estimated 0.5 t ha−1 of soil loss. Samples werecollected using 13 masts of Big Spring Number Eight (BSNE)samplers (Fryrear, 1985) set at heights of 0.05, 0.1, 0.2, 0.5 and1 m above the surface in the rapidly eroding area andcomposited to yield a sample of at least 1 kg for 137Cs analysis.
Several samples were collected and composited from thevortex chambers upstream from the air filter elements in farmtractors. These sediments are usually in the silt size range andare entrained by mechanical disturbance of tillage implementsand tires and are lifted to heights of 2 m in the relatively lowturbulence surrounding a moving tractor. These samples werecollected to investigate the 137Cs activity of very fine soilparticles eroding from the soil in sub-erosive wind velocities.Composite samples were also collected from the attics of nearbybuildings, one built in 1930 that was expected to contain bothpre- and post-fallout dust, and the other built in 1954 that was
expected to contain only post-fallout dust. The dust in theseattics represented eroded sediments that had been lifted to aheight of at least 6 m and transported several kilometers prior todeposition. The mass of theses samples allowed splitting of thesamples on a spinning riffler to create replicate samples formeasurement error analysis.
Approximately 1 kg of each dried sample was used todetermine 137Cs activities in terms of Becquerels per kg(Bq kg−1). The 1-kg samples were placed in pre-weighed 1 literMarinelli beakers, re-weighed to determine exact sample weightand sealed for gamma ray analyses. The procedure used forgamma ray analyses has previously been published (Ritchie,2000). Inventories of 137Cs for soil profiles in terms of Bq m−2
were determined by dividing the sample 137Cs activityexpressed as Bq kg−1 by the surface area of soil required,given the soil bulk density and core length, for the sample toweigh 1 kg.
1.3. 137Cs inventory-based models of soil redistribution
The simplest of the 137Cs inventory-based models used toestimate soil redistribution rates is the linear proportionalmodel. The model is expressed as:
R ¼ 10Bd Aref−A
Aref
ðt−1963Þ ð1Þ
where:
R mean annual soil loss (t ha−1 year−1);B bulk density of the soil (kg m−3);d depth of tillage or cultivation layer (m);Aref the 137Cs inventory of an uneroded reference site
(Bq m−2);A the 137Cs inventory of the eroded site (Bq m−2); andt the year of sample collection.
This model is considered appropriate for cultivated soils inwhich the entire 137Cs inventory in the profile has beenthoroughly mixed throughout the depths of cultivation. Thissimple model assumes that all the 137Cs arrived in 1963, theyear in which most of the fallout was deposited on the surface,the activity of 137Cs at the surface available for erosion remainsrelatively constant through time and that the loss or gain of137Cs in the profile is linearly and directly proportional to theloss of soil in the profile. For areas of sediment deposition, thismodel is expressed as:
R V¼ 10Bd A−Aref
Aref
ðt−1963Þ ð2Þ
where:
R′ mean annual sediment deposition (t ha−1 year−1).
These simple models have been widely used by researchersinvestigating soil redistribution rates from 137Cs inventories(Walling and He, 2001).
458 R.S. Van Pelt et al. / Catena 70 (2007) 455–464

Autho
r's
pers
onal
co
py
One of the limitations of the simple linear proportion modelas presented above is that it assumes equal movement of 137Cson a soil mass basis without consideration for the surface areasof the particles on which the 137Cs is adsorbed. An improvedform of the model has been proposed (He and Walling, 1996)that incorporates a particle size correction parameter, P, placedas a multiplier of (t−1963) in the denominator. The particle sizecorrection parameter takes into account the specific surface areaof the mobilized sediment relative to that of the source soil. It isexpressed simply as:
P ¼ Sms
Ssl
� �v
ð3Þ
where:
P particle size correction parameter (unitless);Sms specific surface area of mobilized sediment (m2 g−1);Ssl specific surface area of the source soil (m2 g−1); andv a constant with a value of ∼0.65.
From Eq. (3), it may be readily inferred that if the sedimentparticles emanating from an eroding soil or deposited on asurface were finer than the bulk of the source soil, Pwould havea value greater than 1.0. Conversely, if the sediment particlesdeposited on a surface were coarser than the bulk of the sourcesoil, P would have a value less than 1.0.
A more sophisticated model for estimating soil redistributionrates based on 137Cs inventory is the mass balance model (MassBalance 1) that takes into account the gradual decrease in thesurface 137Cs activity at an eroding site due to incorporation of137Cs-deficient soil from below the zone of accumulation bytillage (Zhang et al., 1990). This model has been further refinedby incorporating the time variant rate of 137Cs fallout sinceinitial detection in1954, a parameter to account for loss of 137Csprior to incorporation by tillage and a particle size correctionparameter to account for preferential redistribution (Walling andHe, 1999). This improved mass balance model is expressed as:
A tð Þ ¼ A t0ð Þe− P⁎Rdþkð Þ t−t0ð Þ
þZ t
t01−Pg 1−e−
RHð Þ� �� �
I t Vð Þe− P⁎Rdþkð Þ t−t Vð Þdt V; ð4Þ
where:
A 137Cs inventory at the time indicated (Bq m−2);t year of sampling;t0 year cultivation began;t′ year that the 137Cs deposition began (generally1954);d cumulative mass depth representing the average
cultivation depth (kg m−2);λ decay constant for 137Cs (year−1);I(t′) annual 137Cs deposition flux (Bq m−2 year−1);γ proportion of the annual 137Cs flux susceptible to loss
by erosion before incorporation into the soil profile;and
H is the relaxation mass depth of the initial distribution offallout 137Cs in the soil profile (kg m−2).
A(t0) may be estimated by:
Aðt0Þ ¼Z t0
1954Iðt VÞe−kðt V−t0Þdt V: ð5Þ
Eq. (4) is solved numerically to yield an estimate of R. Weused this refined mass balance model (Mass Balance 2) toestimate the rates of soil redistribution in the cultivated soilprofiles we investigated. We also used the improved linearproportional model with a particle size correction parameter toestimate the rate of sediment deposition at the windbreak sitethat had not been tilled. These two models were implementedwith the use of the software written in Visual Basic by Wallingand He (2001). The linear proportional model was used for thewindbreak site because the mass balance model 2 as coded inthe software package requires an input for tillage depth N0 mand is thus unsuited to undisturbed soil profiles.
2. Results and discussion
2.1. Sieved surface soil and aeolian sediments
From the replicated samples of attic dust, we determined thecoefficient of variability due to 137Cs activity measurementerror to be a mean of only 1.75%. The 137Cs activity in thesieved surface soil sample from the area cultivated since 1985was found to increase with decreasing particle size (Fig. 2). Theloose, water washed sand abrader that was vacuumed from thecrusted soil surface had a 137Cs activity of only 0.65±0.01 Bqkg−1, less than half the measured activity of the 250- to 500-μm-sieved sample. While the two samples had similar particlesize distributions, it is possible that the dry sieved sample mayretain surface coatings of silt and clay sized particles that werewashed from the natural surface sand abrader. Visual inspectionof the two samples indicated that this is the case. Water-washedabrader is most often the first material to move during an aeolianevent, but as the abrader moves over the surface, it causes the
Fig. 2. 137Cs activity as a function of particle size class for samples dry sievedfrom the surface 0.05 m of the area cultivated since 1985.
459R.S. Van Pelt et al. / Catena 70 (2007) 455–464

Autho
r's
pers
onal
co
py
release of surface sediments that are more likely to have suchsurface coatings and, with repeated contact with the surface,may collect some dust coatings itself. The dry sieved material isprobably more representative of aeolian materials in this sizeclass moving over the landscape.
Tractor air cleaner fines that were entrained by mechanicaldisturbance of the soil and lifted to a height of 2 m had a 137Csactivity nearly twice that noted for the sub-53-μm-sievedsample and, further, attic sediments collected from a buildingconstructed in 1954 had a 137Cs activity nearly six times that forthe sub-53-μm-sieved sample. This would indicate that 137Csactivity in aeolian sediments continues to increase as the meanparticle diameter decreases.
The BSNE samples collected during a moderately strongaeolian event in April 1994 demonstrate an increase of 137Csactivity with height in the first meter above the eroding soilsurface (Fig. 3). The 137Cs activities agree well with those notedfor the dry sieved surface soil samples in size classes between53 μm and 150 μm. From particle size distribution data givenfor samples captured at these approximate heights above thesame field during similar events (Chen and Fryrear, 1996),particle median diameter decreases with height and thus the137Cs activities of samples collected at heights greater than 1 mwould be larger. Partitioning the sub-53-μm dry sieved surfacesoil samples into size classes ranging from less than 10 to 40–
50 μm may allow agreement of 137Cs activities with samplescaptured at greater heights above an eroding surface as well asaeolian sediments collected in attics kilometers downwind fromthe source.
2.2. Soil profiles
The 137Cs activity in the native rangeland site decreases withdepth in the soil profile in a logarithmic manner (Figs. 4 and 5).Since there is no visual evidence of significant erosion ordeposition at this site, we believe the lower 137Cs activity notedin the 0- to 0.05-m layer is due to eluviation and subsequentenrichment of clay minerals with depth in the profile andpreferential capture of the 137Cs in infiltrating rainfall by thisclay-enriched layer. This phenomenon is consistent with thenatural history of an alfisol and would also agree with thefindings of Chappell et al. (1998). An alternative hypothesiswould be transport of the 137Cs on soil organic matter and finesmixed by the activity of arthropods and insects present in thesoil surface. The cultivated portions of the field show, asexpected, relatively uniform 137Cs activity distribution in theupper 0.3 m of the profile caused by the mixing of this layer bytillage. It is readily apparent that the additional 20 years of winderosion (1965–1985) in the field area cultivated since 1915have reduced the 137Cs activity at all depths of the Ap horizoncompared with the area only cultivated since 1985. Unfortu-nately, there are no pre-1985 topographic surveys comparingthese two areas that would allow relative depths of soil loss to becalculated. The rapidly eroded area of the field demonstratesboth lower 137Cs activity at each depth in the profile and ashallower depth to soil with no 137Cs activity.
2.3. Application of the linear proportional model
The total 137Cs inventory of the native rangeland referencesite was 1575.5±27.5 Bq m−2 (Table 1). This measured activityis considerably greater than the model prediction of 1307.8 Bqm−2 based upon latitude, mean annual rainfall and 137Cs decayrate. It is unclear why there is more 137Cs present than predictedin the model, but as noted by Chappell (1999) it is difficult tolocated a reliable reference site in a semi-arid or even a humidenvironment due to the presence of dust. If we assume very fine
Fig. 3. 137Cs activities of wind-eroded sediments captured in BSNE samplers atfive heights above an eroding surface in the rapidly eroded area during amoderately strong aeolian event in April 1994.
Fig. 4. 137Cs activity profiles by depth for the reference site (Native Grassland)and three cultivated areas with different erosion histories.
Fig. 5. 137Cs activity profiles by depth for the reference site (Native Grassland),one eroded site and two depositional areas.
460 R.S. Van Pelt et al. / Catena 70 (2007) 455–464

Autho
r's
pers
onal
co
pydust deposition similar to that deposited in the attic of a nearbychurch during the years 1954 to the sampling date, it wouldimply that 5.5±0.1 mm of deposition had occurred on thereference site. Given the proximity of eroding surfaces and theheight of the grass in the grassland, this would not be impossibleor improbable.
A summary of linear proportional model predicted and fieldmeasured erosion or deposition rates for each of the field areas ispresented in Table 2. The total 137Cs inventory of the area cultivatedsince 1985 is 1224.2±21.4 Bqm−2, 351.3±6.1 Bqm−2 (22%) lessthan the reference site. If the total 137Cs inputwas distributed evenlythroughout the upper 0.3 m by tillage prior to the surface beingsubjected to wind erosion sand assuming a bulk density of the tilledareas of 1370 kg m−3, this loss of 137Cs activity would suggest0.068±0.001m of soil loss or 0.0045±0.0001m (61.7±1.1 t ha−1)lost per annum.
The total 137Cs inventory of the area cultivated since 1915was 825.0±14.4 Bq m−2, 750.5±13.1 Bq m−2 (48%) less thanthe reference site. Assuming the same inputs to the proportionalmodel including an assumed bulk density of 1370 kg m−3,this loss would suggest 0.14±0.002 m of soil loss or0.0041±0.00007 m (56.2±1.0 t ha−1) lost per annum. Theseestimated rates for the two areas agree favorably.
Obtaining agreement between physically measured deposi-tion rates and those derived from 137Cs inventories wassomewhat problematic. We first needed to estimate theinventory at the beginning of the in-field deposition. Comparingthe rapidly eroded area with that cultivated since 1915 andassuming that the long-term erosion rate remained constantin the relatively uneroded area during this period and in bothareas since 1997, the measured 137Cs inventory difference of608.2±10.6 Bq m−2 (58%) would suggest an additional0.173±0.0030 m (2370±41.3 t ha−1) soil loss. This isconsiderably more soil loss than the 0.1 m (1370.0 t ha−1)measured during the 8-year period.
Using the same assumptions as for the comparison ofthe rapidly eroded area with that cultivated since 1915, the694.6±12.1 Bq m−2 (66%) increase in 137Cs inventory of thein-field deposition area would suggest 0.197±0.0034 m(2856.5±49.8 t ha−1) of deposition during the 8-year period.This depth is less than 65% of the physically measureddeposition. The plot of 137Cs activity versus depth presented inFig. 5 would suggest a depth of deposition close to the physicalmeasurement of 0.3 m. In fact, careful comparison of Figs. 4and 5 reveal that the 137Cs activity observed in the 0.3- to 0.45-m layer (centered at the 0.375-m depth) for the in-field
deposition area is nearly identical to the activity observed inthe 0.1- to 0.15-m layer (centered at the 0.125-m depth) of theadjacent area cultivated since 1915. Both areas share pre-1989management and erosion histories. The material deposited inthis zone was primarily coarse and medium sand with expected137Cs activities lower than that of the bulk soil.
From the nearly doubled 137Cs inventory in the soil profileunder the Arizona cypress windbreak, when compared to the137Cs inventory of the native rangeland reference site (Table 1),it would appear that nearly the entire 0.3 m layer in which the137Cs fallout was adsorbed had been deposited at that site.The proportional model indicated 0.298±0.0052 m of deposi-tion which would amount to 0.006±0.0001 m per annum(82.2±1.4 t ha−1 year−1). From Fig. 5 and data in Table 1,however, it would appear that only 0.05–0.1 m of material withvery high 137Cs activity had been deposited on that site. Burial ofa small pipe rack set on the surface at about the time 137Cs falloutbegan indicates only 0.07 m of deposition at this site. Theprotection of this surface from bare soil areas subject to saltationand creep and the height of foliage above the ground suggest thatthe materials deposited at this location were finer materialsmoving in suspension mode that were filtered out by thewindbreak canopy. Other researchers have found shrub and treecanopies to be very effective filters of fines (Chappell, 1996;Baumann et al., 1998; Chappell, 2003; Ritchie et al., 2003).
2.4. Application of improved models with particle sizecorrection parameters
We used the 137Cs inventory data presented in Table 1 toapply the improved models of Walling and He (2001) that
Table 2Estimates of erosion or deposition rates based on the proportional model
Location Y PE/D ME/D
t ha−1 year−1
Cultivated since 1985 16 −61.7±1.1Cultivated since 1915 38 −56.2±1.00.1 m eroded, 1989–1997 30 −56.2±1.0
8 −296.3±5.2 −172.4In-field deposition 30 −56.2±1.0
8 +357.1±6.2 +517.1Under windbreak 38 +82.2±1.4 +25.2
Shown for each location are the number of post-fallout years (Y) of erosion ordeposition at a given rate using 1963 as the fallout date, predicted erosion ordeposition rates (PE/D) and measured erosion or deposition rates (ME/D).Negative rates indicate net erosion and positive rates indicate net deposition.
Table 1137Cs activities±1.745% measurement error expressed as Bq m−2 by location and depth of sample
Depth (m) Native rangeland Cultivated since 1985 Cultivated since 1915 0.1 m eroded, 1989–1997 In-field deposition Under windbreak
0.0–0.05 494.7±8.6 185.8±3.2 125.1±2.2 90.9±1.6 114.4±2.0 858.1±15.00.05–0.1 586.3±1.0 181.3±3.2 112.8±2.0 85.6±1.5 68.8±1.2 1030.6±18.00.1–0.15 343.9±6.0 212.4±3.7 151.5±2.6 40.3±0.7 98.6±1.7 706.9±12.30.15–0.3 150.6±2.6 644.7±11.3 435.6±7.6 0.0 595.3±10.4 528.9±9.20.3–0.45 0.0 0.0 0.0 0.0 642.5±11.2 15.4±0.30.45–0.6 0.0 0.0 0.0 0.0 0.0 0.0Total 1575.5±27.5 1224.2±21.4 825.0±14.4 216.8±3.8 1519.6±26.5 3139.9±54.8
461R.S. Van Pelt et al. / Catena 70 (2007) 455–464
Autho
r's
pers
onal
co
py
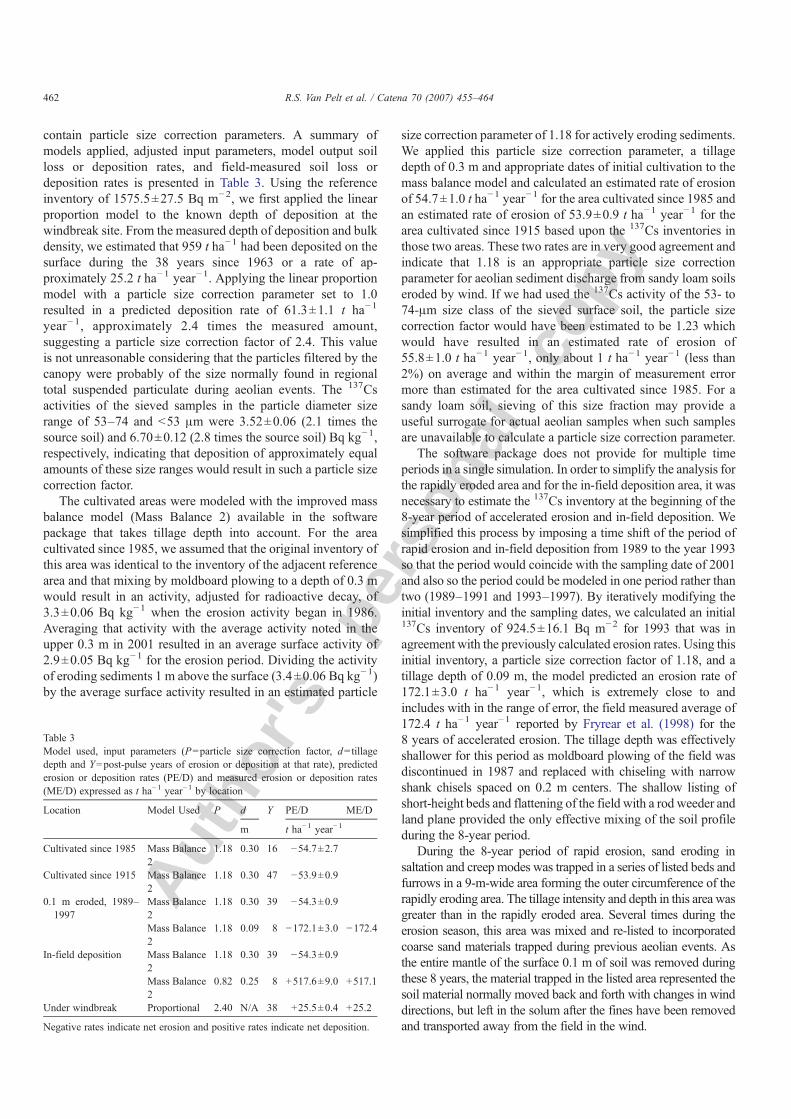
contain particle size correction parameters. A summary ofmodels applied, adjusted input parameters, model output soilloss or deposition rates, and field-measured soil loss ordeposition rates is presented in Table 3. Using the referenceinventory of 1575.5±27.5 Bq m−2, we first applied the linearproportion model to the known depth of deposition at thewindbreak site. From the measured depth of deposition and bulkdensity, we estimated that 959 t ha−1 had been deposited on thesurface during the 38 years since 1963 or a rate of ap-proximately 25.2 t ha−1 year−1. Applying the linear proportionmodel with a particle size correction parameter set to 1.0resulted in a predicted deposition rate of 61.3±1.1 t ha−1
year− 1, approximately 2.4 times the measured amount,suggesting a particle size correction factor of 2.4. This valueis not unreasonable considering that the particles filtered by thecanopy were probably of the size normally found in regionaltotal suspended particulate during aeolian events. The 137Csactivities of the sieved samples in the particle diameter sizerange of 53–74 and b53 μm were 3.52±0.06 (2.1 times thesource soil) and 6.70±0.12 (2.8 times the source soil) Bq kg−1,respectively, indicating that deposition of approximately equalamounts of these size ranges would result in such a particle sizecorrection factor.
The cultivated areas were modeled with the improved massbalance model (Mass Balance 2) available in the softwarepackage that takes tillage depth into account. For the areacultivated since 1985, we assumed that the original inventory ofthis area was identical to the inventory of the adjacent referencearea and that mixing by moldboard plowing to a depth of 0.3 mwould result in an activity, adjusted for radioactive decay, of3.3±0.06 Bq kg−1 when the erosion activity began in 1986.Averaging that activity with the average activity noted in theupper 0.3 m in 2001 resulted in an average surface activity of2.9±0.05 Bq kg−1 for the erosion period. Dividing the activityof eroding sediments 1 m above the surface (3.4±0.06 Bq kg−1)by the average surface activity resulted in an estimated particle
size correction parameter of 1.18 for actively eroding sediments.We applied this particle size correction parameter, a tillagedepth of 0.3 m and appropriate dates of initial cultivation to themass balance model and calculated an estimated rate of erosionof 54.7±1.0 t ha−1 year−1 for the area cultivated since 1985 andan estimated rate of erosion of 53.9±0.9 t ha−1 year−1 for thearea cultivated since 1915 based upon the 137Cs inventories inthose two areas. These two rates are in very good agreement andindicate that 1.18 is an appropriate particle size correctionparameter for aeolian sediment discharge from sandy loam soilseroded by wind. If we had used the 137Cs activity of the 53- to74-μm size class of the sieved surface soil, the particle sizecorrection factor would have been estimated to be 1.23 whichwould have resulted in an estimated rate of erosion of55.8±1.0 t ha−1 year−1, only about 1 t ha−1 year−1 (less than2%) on average and within the margin of measurement errormore than estimated for the area cultivated since 1985. For asandy loam soil, sieving of this size fraction may provide auseful surrogate for actual aeolian samples when such samplesare unavailable to calculate a particle size correction parameter.
The software package does not provide for multiple timeperiods in a single simulation. In order to simplify the analysis forthe rapidly eroded area and for the in-field deposition area, it wasnecessary to estimate the 137Cs inventory at the beginning of the8-year period of accelerated erosion and in-field deposition. Wesimplified this process by imposing a time shift of the period ofrapid erosion and in-field deposition from 1989 to the year 1993so that the period would coincide with the sampling date of 2001and also so the period could be modeled in one period rather thantwo (1989–1991 and 1993–1997). By iteratively modifying theinitial inventory and the sampling dates, we calculated an initial137Cs inventory of 924.5±16.1 Bq m−2 for 1993 that was inagreement with the previously calculated erosion rates. Using thisinitial inventory, a particle size correction factor of 1.18, and atillage depth of 0.09 m, the model predicted an erosion rate of172.1±3.0 t ha−1 year−1, which is extremely close to andincludes with in the range of error, the field measured average of172.4 t ha−1 year−1 reported by Fryrear et al. (1998) for the8 years of accelerated erosion. The tillage depth was effectivelyshallower for this period as moldboard plowing of the field wasdiscontinued in 1987 and replaced with chiseling with narrowshank chisels spaced on 0.2 m centers. The shallow listing ofshort-height beds and flattening of the field with a rod weeder andland plane provided the only effective mixing of the soil profileduring the 8-year period.
During the 8-year period of rapid erosion, sand eroding insaltation and creep modes was trapped in a series of listed beds andfurrows in a 9-m-wide area forming the outer circumference of therapidly eroding area. The tillage intensity and depth in this area wasgreater than in the rapidly eroded area. Several times during theerosion season, this area was mixed and re-listed to incorporatedcoarse sand materials trapped during previous aeolian events. Asthe entire mantle of the surface 0.1 m of soil was removed duringthese 8 years, the material trapped in the listed area represented thesoil material normally moved back and forth with changes in winddirections, but left in the solum after the fines have been removedand transported away from the field in the wind.
Table 3Model used, input parameters (P=particle size correction factor, d=tillagedepth and Y=post-pulse years of erosion or deposition at that rate), predictederosion or deposition rates (PE/D) and measured erosion or deposition rates(ME/D) expressed as t ha−1 year−1 by location
Location Model Used P d Y PE/D ME/D
m t ha−1 year−1
Cultivated since 1985 Mass Balance2
1.18 0.30 16 −54.7±2.7
Cultivated since 1915 Mass Balance2
1.18 0.30 47 −53.9±0.9
0.1 m eroded, 1989–1997
Mass Balance2
1.18 0.30 39 −54.3±0.9
Mass Balance2
1.18 0.09 8 −172.1±3.0 −172.4
In-field deposition Mass Balance2
1.18 0.30 39 −54.3±0.9
Mass Balance2
0.82 0.25 8 +517.6±9.0 +517.1
Under windbreak Proportional 2.40 N/A 38 +25.5±0.4 +25.2
Negative rates indicate net erosion and positive rates indicate net deposition.
462 R.S. Van Pelt et al. / Catena 70 (2007) 455–464

Autho
r's
pers
onal
co
py
Because we had found 1.18 to be an appropriate particle sizecorrection parameter for the sediment discharge, we reasonedthat most of the material from which these particles had beenwinnowed was deposited in the listed rows. Since 1.18 is 18%larger than 1.0, we subtracted 0.18 from 1.0 and obtained 0.82as the particle size correction parameter. Using the startinginventory of 924.5±16.1 Bq m−2 for 1993, the particle sizecorrection parameter of 0.82, and a tillage depth of 0.25 m, themodel calculated a deposition rate of 517.6±9.0 t ha−1 year−1,a value very close to and including within the margin ofmeasurement error, the measured value of 517.1 t ha−1 year−1.
3. Conclusions
From the 137Cs activities of the dry sieved surface soilparticle size classes, aeolian sediments collected in the 1-mlayer above an eroding surface, soil fines collected from tractorair cleaners, fine dust collected from an attic and profiles of soilswith known erosion and deposition histories, it is apparent thatmost 137Cs is bound to the finer soil particles that are removedfrom the field in suspension mode during wind erosion events. Itis also apparent that soil loss depths and long-term soil loss ratesbased on linear proportional models may be over-estimated anddepths of deposition based upon linear proportional models of137Cs inventories may be over- or under-estimated dependingon the particle diameters deposited. When limited to the use ofthe linear proportional model, it is apparent that comparisons ofthe depths to soil with no 137Cs activity is a more reliable indexof deposition depth than 137Cs inventory alone.
Excellent agreement between predicted and measurederosion or deposition rates was obtained with an improvedlinear proportional model incorporating a particle size correc-tion parameter for an untilled depositional environment.Excellent agreement with measured values were obtained withan improved mass balance model incorporating the particle sizecorrection parameter and tillage depth for several tilled fieldareas with differing erosion and deposition histories. It isapparent that these models, developed for estimating rates ofsoil redistribution by water, are also useful for estimating ratesof soil redistribution by wind provided that an appropriateparticle size correction parameter can be estimated for theaffected soil.
References
Bagnold, R.A., 1941. The Physics of Blown Sand and Desert Dunes. Methuen,London.
Basher, L.R., Webb, T.H., 1997. Wind erosion rates on terraces in the MackenzieBasin. J. R. Soc. N.Z. 27, 499–512.
Baumann, S.L., Kyle, P.R., Harrison, J.B.J., 1998. Characterization of the desertloess on the Carrizozo lava flow, south-central NewMexico. In: Busacca, A.(Ed.), Dust Aerosols, Loess Soils, and Global Change. College Agric. HomeEcon Misc. Publ. MISC0190. Washington State University, Pullman, WA,pp. 128–130.
Chappell, A., 1996. Modelling the spatial variation of processes in theredistribution of soil: digital terrain models and 137Cs in southwest Niger.Geomorphology 17, 249–261.
Chappell, A., 1999. The limitations for measuring soil redistribution using 137Csin semi-arid environments. Geomorphology 29, 135–152.
Chappell, A., Warren, A., 2003. Spatial scales of 137Cs-derived soil flux by windin a large arable area of south-east England. Catena 52, 209–234.
Chappell, A., Oliver, M.A., Warren, A., Agnew, C.T., Charlton, M., 1996.Examining the factors controlling the spatial scale of variation in soilredistribution processes from southwest Niger. In: Anderson, M.G., Brooks,S.M. (Eds.), Advances in Hillslope Processes, vol. 1. John Wiley and Sons,New York, pp. 429–449.
Chappell, A., Warren, A., Oliver, M.A., Charlton, M., 1998. The utility of 137Csfor measuring soil redistribution rates in southwest Niger. Geoderma 81,313–337.
Chen, W., Fryrear, D.W., 1996. Grain-size distributions of wind-eroded materialabove a flat bare soil. Phys. Geogr. 17, 554–584.
Chen, W., Fryrear, D.W., 2002. Sedimentary characteristics of a haboob duststorm. Atmos. Res. 61, 75–85.
de Jong, E., Villar, H., Bettany, J.R., 1982. Preliminary investigations on the useof 137Cs to estimate erosion in Saskatchewan. Can. J. Soil Sci. 62, 673–683.
Fryrear, D.W., 1985. A field dust sampler. J. Soil Water Conserv. 41, 117–120.Fryrear, D.W., Saleh, A., Bilbro, J.D., Schomberg, H.M., Stout, J.E., Zobeck, T.M.,
1998. Revised Wind Erosion Equation. USDA-ARS-SPA-CSRL Tech. Bul.No. 1. http://www.csrl.ars.usda.gov/wewc/rweq.
Gill, T.E., Reynolds, R.L., Zobeck, T.M., 2000. Measurements of current andhistoric settled dusts in west Texas. Proc. 93rd Ann. Mtg. Air and WasteMgt. Assoc., Salt Lake City, UT, UT, June, 2000. Air andWaste Mgt. Assoc.Pub. VIP-49, Paper, vol. 175. 15 pp.
He, Q., Walling, D.E., 1996. Interpreting the particle size effect in the adsorptionof 137Cs and unsupported 210Pb by mineral soils and sediments. J. Environ.Radioact. 30, 117–137.
Kachanoski, R.G., Rolston, D.E., de Jong, E., 1985. Spatial variability of acultivated soil as affected past and present microtopography. Soil Sci. Soc.Am. J. 49, 1082–1087.
Lal, R., 1994. Soil erosion by wind and water: problems and prospects, In: Lal,R. (Ed.), Soil Erosion Research Methods, 2nd ed. Soil andWater Cons. Soc.,Ankeny, IA. pp. 1–9.
Laprade, K.E., 1957. Dust storm sediments of the Lubbock area, Texas. Bull.Am. Assoc. Pet. Geol. 41, 709–726.
Lyles, L., Tatarko, J., 1986. Wind erosion effects on soil texture and organicmatter. J. Soil Water Conserv. 41, 191–193.
Ritchie, J.C., 2000. Combining 137Cs and topographic surveys for measuringsoil erosion/deposition patterns in a rapidly accreting area. Acta Geol. Hisp.35, 207–212.
Ritchie, J.C., McHenry, J.R., 1990. Application of radioactive fallout cesium-137 for measuring soil erosion and sediment accumulation rates andpatterns: a review. J. Environ. Qual. 19, 215–233.
Ritchie, J.C., Herrick, J.E., Ritchie, C.A., 2003. Variability in soil redistributionin the northern Chihuahuan Desert based on 137Cs measurements. J. AridEnviron. 55, 737–746.
Schultz, R.K., Overstreet, R., Barshad, I., 1960. On the soil chemistry of cesium137. Soil Sci. 89, 16–27.
Sutherland, R.A., Kowalchuk, T., de Jong, E., 1991. Cesium-137 estimate ofsediment redistribution by wind. Soil Sci. 151, 387–396.
Van Pelt, R.S., Zobeck, T.M., 2004. Validation of the wind erosion equation(WEQ) for discrete periods. Environ. Model. Softw. 19, 199–203.
Van Pelt, R.S., Zobeck, T.M., Potter, K.N., Stout, J.E., Popham, T.W., 2004.Validation of the wind erosion stochastic simulator (WESS) and the revisedwind erosion equation (RWEQ) for single events. Environ. Model. Softw.19, 191–198.
Vanden Bygaart, A.J., Protz, R., 2001. Bomb-fallout 137Cs as a marker ofgeomorphic stability in dune sands and soils, Pinery Provincial Park,Ontario, Canada. Earth Surf. Processes Landf. 26, 689–700.
Walling, D.E., He, Q., 1999. Improved models for estimating soil erosion ratesfrom cesium-137 measurements. J. Environ. Qual. 28, 611–622.
Walling, D.E., He, Q., 2001. Models for converting 137Cs measurements toestimates of soil redistribution on cultivated and uncultivated soils, andestimating bomb-derived 137Cs inventory (Including Software for ModelImplementation). A Contribution to the International Atomic EnergyAgency Coordinated Research Programmes on Soil Erosion (D1.50.05)and Sedimentation (F3.10.01). Department of Geography, Exeter University,Exeter, UK.
463R.S. Van Pelt et al. / Catena 70 (2007) 455–464

Autho
r's
pers
onal
co
py
Walling, D.E., Quine, T.A., 1990. Calibration of caesium-137 measurements toprovide quantitative erosion rate data. Land Degrad. Rehabil. 2, 161–175.
Walling, D.E., Quine, T.A., 1991. Use of 137Cs measurements to investigate soilerosion on arable fields in the UK: potential applications and limitations.J. Soil Sci. 42, 147–165.
Woodruff, N.P., Siddoway, F.H., 1965. Awind erosion equation. SSSA Proc. 29,602–608.
Zhang, X.B., Higgit, D.L., Walling, D.E., 1990. A preliminary assessment of thepotential for using caesium-137 to estimate rates of soil erosion in the LoessPlateau of China. Hydrol. Sci. J. 35, 267–276.
Zobeck, T.M., Fryrear, D.W., 1986a. Chemical and physical characteristics ofwindblown sediment. I. Quantities and physical characteristics. Trans.ASAE 29, 1032–1036.
Zobeck, T.M., Fryrear, D.W., 1986b. Chemical and physical characteristics ofwindblown sediment. II. Chemical characteristics and total soil and nutrientdischarge. Trans. ASAE 29, 1037–1041.
Zobeck, T.M., Rolong, N.A., Fryrear, D.W., Bilbro, J.D., Allen, B.L., 1995.Properties and productivity of recently tilled grass sod and 70-year cultivatedsoil. J. Soil Water Conserv. 50, 210–215.
464 R.S. Van Pelt et al. / Catena 70 (2007) 455–464