
Validating CEST imaging in a model of neurodegenerative disease

BioMed CentralBMC Bioinformatics
ss
Open AcceResearchValidating module network learning algorithms using simulated dataTom Michoel*†1, Steven Maere†1, Eric Bonnet1, Anagha Joshi1, Yvan Saeys1, Tim Van den Bulcke2, Koenraad Van Leemput3, Piet van Remortel3, Martin Kuiper1, Kathleen Marchal2,4 and Yves Van de Peer1Address: 1Bioinformatics & Evolutionary Genomics, Department of Plant Systems Biology, VIB/Ghent University, Technologiepark 927, B-9052 Ghent, Belgium, 2ESAT-SCD, K.U.Leuven, Kasteelpark Arenberg 10, B-3001 Leuven, Belgium, 3ISLab, Department of Mathematics and Computer Science, University of Antwerp, Middelheimlaan 1, B-2020 Antwerpen, Belgium and 4CMPG, Department Microbial and Molecular Systems, K.U.Leuven, Kasteelpark Arenberg 20, B-3001 Leuven, Belgium
Email: Tom Michoel* - [email protected]; Steven Maere - [email protected]; Eric Bonnet - [email protected]; Anagha Joshi - [email protected]; Yvan Saeys - [email protected]; Tim Van den Bulcke - [email protected]; Koenraad Van Leemput - [email protected]; Piet van Remortel - [email protected]; Martin Kuiper - [email protected]; Kathleen Marchal - [email protected]; Yves Van de Peer - [email protected]
* Corresponding author †Equal contributors
AbstractBackground: In recent years, several authors have used probabilistic graphical models to learn expression modules andtheir regulatory programs from gene expression data. Despite the demonstrated success of such algorithms inuncovering biologically relevant regulatory relations, further developments in the area are hampered by a lack of toolsto compare the performance of alternative module network learning strategies. Here, we demonstrate the use of thesynthetic data generator SynTReN for the purpose of testing and comparing module network learning algorithms. Weintroduce a software package for learning module networks, called LeMoNe, which incorporates a novel strategy forlearning regulatory programs. Novelties include the use of a bottom-up Bayesian hierarchical clustering to construct theregulatory programs, and the use of a conditional entropy measure to assign regulators to the regulation program nodes.Using SynTReN data, we test the performance of LeMoNe in a completely controlled situation and assess the effect ofthe methodological changes we made with respect to an existing software package, namely Genomica. Additionally, weassess the effect of various parameters, such as the size of the data set and the amount of noise, on the inferenceperformance.
Results: Overall, application of Genomica and LeMoNe to simulated data sets gave comparable results. However,LeMoNe offers some advantages, one of them being that the learning process is considerably faster for larger data sets.Additionally, we show that the location of the regulators in the LeMoNe regulation programs and their conditionalentropy may be used to prioritize regulators for functional validation, and that the combination of the bottom-upclustering strategy with the conditional entropy-based assignment of regulators improves the handling of missing orhidden regulators.
from Probabilistic Modeling and Machine Learning in Structural and Systems BiologyTuusula, Finland. 17–18 June 2006
Published: 3 May 2007
BMC Bioinformatics 2007, 8(Suppl 2):S5 doi:10.1186/1471-2105-8-S2-S5
<supplement> <title> <p>Probabilistic Modeling and Machine Learning in Structural and Systems Biology</p> </title> <editor>Samuel Kaski, Juho Rousu, Esko Ukkonen</editor> <note>Research</note> </supplement>
This article is available from: http://www.biomedcentral.com/1471-2105/8/S2/S5
© 2007 Michoel et al; licensee BioMed Central Ltd. This is an open access article distributed under the terms of the Creative Commons Attribution License (http://creativecommons.org/licenses/by/2.0), which permits unrestricted use, distribution, and reproduction in any medium, provided the original work is properly cited.
Page 1 of 15(page number not for citation purposes)
BMC Bioinformatics 2007, 8(Suppl 2):S5 http://www.biomedcentral.com/1471-2105/8/S2/S5
Conclusion: We show that data simulators such as SynTReN are very well suited for the purpose of developing, testingand improving module network algorithms. We used SynTReN data to develop and test an alternative module networklearning strategy, which is incorporated in the software package LeMoNe, and we provide evidence that this alternativestrategy has several advantages with respect to existing methods.
BackgroundFor the past 45 years, research in molecular biology hasbeen based predominantly on reductionist thinking, try-ing to unravel the complex workings of living organismsby investigating genes or proteins one at a time. In recentyears, molecular biologists have come to view the cellfrom a different, more global perspective. With the adventof fully sequenced genomes and high-throughput func-tional genomics technologies, it has become possible tomonitor molecular properties such as gene expression lev-els or protein-DNA interactions across thousands of genessimultaneously. As a consequence, it has become feasibleto study genes, proteins and their interactions in the con-text of biological systems rather than in isolation. Thisnovel paradigm has been named 'systems biology' [1].
One of the goals of the systems approach to molecularbiology is to reverse engineer the regulatory networksunderlying cell function. Particularly transcriptional regu-latory networks have received a lot of attention, mainlybecause of the availability of large amounts of relevantexperimental data. Several studies use expression data,promoter motif data, chromatin immunoprecipitation(ChIP) data and/or prior functional information (e.g. GOclassifications [2] or known regulatory network struc-tures) in conjunction to elucidate transcriptional regula-tory networks [3-17]. Most of these methods try to unravelthe control logic underlying specific expression patterns.This type of analysis typically requires elaborate computa-tional frameworks. In particular probabilistic graphicalmodels are considered a natural mathematical frameworkfor inferring regulatory networks [8]. Probabilistic graph-ical models, the best-known representatives being Baye-sian networks, represent the system under study in termsof conditional probability distributions describing theobservations for each of the variables (genes) as a functionof a limited number of parent variables (regulators),thereby reconstructing the regulatory network underlyingthe observations. Friedman et al. pioneered the use ofBayesian networks to learn regulatory networks fromexpression data [3,4]. In these early studies, each gene inthe resulting Bayesian network is associated with its indi-vidual regulation program, i.e., its own set of parents andconditional probability distribution. A key limitation ofthis approach is that a vast number of structural featuresand distribution parameters need to be learned given onlya limited number of expression profiles. In other words,the problem of finding back the real network structure is
typically heavily underdetermined. An attractive way toremedy this issue is to take advantage of the inherentmodularity of biological networks [18], specifically thefact that groups of genes acting in concert are often regu-lated by the same regulators. Segal et al. [6,19] firstexploited this idea by proposing module networks as amathematical model for regulatory networks. Modulenetworks are probabilistic graphical models in whichgroups of genes, called modules, share the same parentsand conditional distributions. As the number of parame-ters to be estimated in a module network is much smallerthan in a full Bayesian network, the currently availablegene expression data sets can be large enough for the pur-pose of learning module networks [6,11,12,19].
Despite the demonstrated success of module networklearning algorithms in finding biologically relevant regu-latory relations [6,11,12,19], there is only limited infor-mation about the actual recall and precision of suchalgorithms [12] and how these performance measures areinfluenced by the use of alternative module networklearning strategies. Having the means to answer the latterquestion is key to the further development and improve-ment of the module networks formalism.
The purpose of the present study is twofold. First, weintroduce a novel software package for learning modulenetworks, called LeMoNe, which is based on the generalmethodology outlined in Segal et al. [6] but incorporatesan alternative strategy for inferring regulation programs.
Second, we demonstrate the use of SynTReN [20], a datasimulator that creates synthetic regulatory networks andproduces simulated gene expression data, for the purposeof testing and comparing module network learning algo-rithms. We use SynTReN data to assess the performance ofLeMoNe and to compare the behavior of alternative mod-ule network learning strategies. Additionally, we assess theeffect of various parameters, such as the size of the data setand the amount of noise, on the inference performance.For comparison, we also use LeMoNe to analyze realexpression data for S. cerevisiae [21] and investigate towhat extent the quality of the module networks learnedon real data can be automatically assessed using struc-tured biological information such as GO information andChIP-chip data [9].
Page 2 of 15(page number not for citation purposes)

BMC Bioinformatics 2007, 8(Suppl 2):S5 http://www.biomedcentral.com/1471-2105/8/S2/S5
MethodsData setsWe used SynTReN [20] to generate simulated data sets fora gene network with 1000 genes of which 105 act as regu-lators. The topology of the network is subsampled froman E. coli transcriptional network [29] by cluster addition,resulting in a network with 2361 edges. All parameters ofSynTReN were set to default values, except number of cor-related inputs, which was set to 50%. SynTReN generatedexpression values ranging from 0 (no expression) to 1(maximal expression) which we normalized to log2 ratiovalues by picking one of the experiments as the control.Except where indicated otherwise, the list of true regula-tors was given as the list of potential regulators for LeM-oNe and Genomica.
For the tests performed on real data, we used an expres-sion compendium for S. cerevisiae containing expressiondata for 173 different experimental stress conditions [21].The data were obtained in prenormalized and preproc-essed form. We used the mean log2 values of the expres-sion ratios (perturbation vs. control).
To assess the quality of the regulatory programs learnedfrom real data, we used data on genome-wide binding andphylogenetically conserved motifs for 102 transcriptionfactors from Harbison et al. [9]. For a given transcriptionfactor, only genes that were bound with high confidence(significance level α = 0.005) and showed motif conserva-tion in at least one other Saccharomyces species (besides S.cerevisiae) were considered true targets.
Module networksModule networks are a special kind of Bayesian networksand were introduced by Segal et al. [6,30]. To each gene iwe associate a random variable Xi which can take contin-uous values and corresponds to the gene's expressionlevel. The distribution of Xi depends on the expressionlevel of a set of parent genes Pai chosen from a list ofpotential regulators. If the network formed by drawingdirected edges from parent genes to children genes is acy-clic, we can define a joint probability distribution for theexpression levels of all genes as a product of conditionaldistributions,
This is the standard Bayesian network formalism.
In a module network we assume that genes are partitionedinto different sets called modules, such that genes in thesame module share the same parameters in the distribu-tion function (1). Hence a module network is defined by
a partition of {1,...,N} into K <<> N modules k such
that = {1,...,N} and k ∩ k' = ∅ for k ≠ k', a
collection of parent genes ∏k for each module k, and a
joint probability distribution
The conditional distribution pk of the expression level of
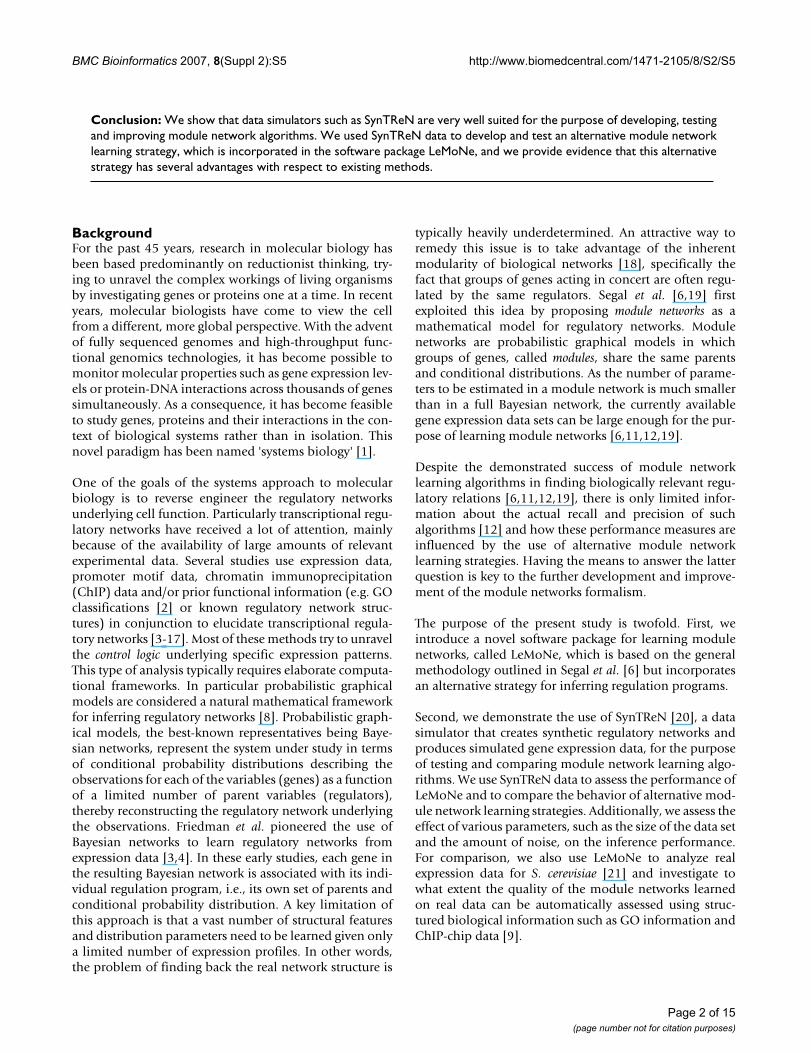
the genes in module k is normal with mean and standarddeviation depending on the expression values of the par-ents of the module through a regression tree that is calledthe regulation program of the module. The tests on theinternal nodes of the regression tree are of the form for some split value s, where x is the expression value ofthe parent associated to the node (Figure 1).
The Bayesian score is obtained by taking the log of themarginal probability of the data likelihood over theparameters of the normal distributions at the leaves of theregression trees with a normal-gamma prior (see [30] andAdditional file 1 for more details; the actual expression forthe score is in eq. (S5)). Its main property is that it decom-poses as a sum of leaf scores of the different modules:
where � denotes the experiments that end up at leaf �
after traversing the regression tree. A normal-gamma priorensures that Sk( �) can be solved explicitly as a function
of the sufficient statistics (number of data points, meanand standard deviation) of the leaves of the regression tree(see Additional file 1).
Learning module regulation programs
For a given assignment of genes to modules, finding amaximum for the Bayesian score (3) consists of findingthe optimal partitioning of experiments into 'leaves' � foreach module separately, i.e., find a collection of subsets
� ⊂ {1,...,M} such that (� � = {1,...,M}, � ∩ � = ∅
for � ≠ �', and
is maximal. In particular we do not have to define the par-ent sets ∏k of the modules in order to find an optimal par-tition.
p x x p x x jN i i ji
N( ,..., ) ( |{ : }).1
1
1= ∈ ( )=∏ Pai
∪k
Kk=1
p x x p x x jN k i jik
K
k
( ,..., ) ( |{ : }).11
2= ∈ ∏ ( )∈=∏∏ k
x s �
S S= = ( )∑ ∑∑kk
kk
S ( ), 3
Sk kS= ( )∑ ( ) 4
Page 3 of 15(page number not for citation purposes)
BMC Bioinformatics 2007, 8(Suppl 2):S5 http://www.biomedcentral.com/1471-2105/8/S2/S5
We use a bottom-up hierarchical clustering method toheuristically find a high-scoring partition. At each step ofthe process we have a collection of binary trees Tα which
represent subsets α of experiments. The binary split of
Tα into its children and corresponds to a partition
of the set α into two sets: α = ∪ . The initial
collection consists of trivial trees without children repre-senting single experiments. To proceed from one collec-
tion of trees to the next, the pair of trees with highestmerge score is merged into a new tree, and the collectionof binary trees decreases by one, eventually leading to onehierarchical tree T0 representing the complete experiment
set 0 = {1,...,M}. The simplest merge score is given by
the possible gain in Bayesian score by merging two exper-iment sets:
Tα1
Tα2
α1α2
r S S Sk k kα α α α α α1 2 1 2 1 25, ( ) ( ) ( ).= ∪ − − ( )
Sample module learned from the Gasch data setFigure 1Sample module learned from the Gasch data set. Sample module learned from the Gasch data set [21]. Red and green hues indicate upregulation resp. downregulation. The pairs (x, y) under each split in the regulation tree represent the Bayesian score gain over the split, normalized on the number of genes in the complete network (x), and the regulator assignment entropy (y).
Page 4 of 15(page number not for citation purposes)

BMC Bioinformatics 2007, 8(Suppl 2):S5 http://www.biomedcentral.com/1471-2105/8/S2/S5
In Additional file 1 we define an alternative merge scorerelated to the Bayesian hierarchical clustering method of[31]. This merge score takes into account the substructure
of the trees below and in addition to the Bayesian
score difference (5), and tends to produce more balancedtrees. In the final step, we need to cut the hierarchical treeT0. To this end we traverse the tree from the root towards
its leaves. If we are at a subtree node Tα with children
and , we compute the score difference (5). If this dif-
ference is negative, the total score is improved by keepingthe split Tα, and we move on to test each of its children
nodes. If the difference is positive, the total score isimproved by not making the split Tα, and we remove its
children nodes from the tree. The experiment set α
becomes one of the leaves of the regulation program, con-tributing one term in the sum (4).
The pseudocode for the regulation program learning algo-rithm is given in Figure S3 in Additional file 1. In [6,30],regulation programs are learned top-down by consideringall possible splits on all current leaves with all potentialregulators, so regulation trees and regulator assignmentsare learned simultaneously. As a result missing regulatorsor noise in the regulator data might lead to a suboptimalpartitioning of the experiments in a module. In ourapproach we have focused on finding an optimal parti-tion of the module regardless of the set of potential regu-lators. A module collects the data of many genes andtherefore this partition will be less affected by noise ormissing data than when it is determined by exact splits onsingle regulators.
Regulator assignment
At a given internal node Tα of the regulation tree T0, the
experiment set α is partitioned into two distinct sets
and according to the tree structure. Given a reg-
ulator r and split value s, we can also partition α into
two sets
where xr,m is the expression value of regulator r in experi-ment m.
Consider now two random variables: E which can take the
values α1 or α2, and R which can take the values 1 or 2,
with probabilities defined by simple counting, p(E = α1) =
| |/| α|, p(R = 1) = | 1|/| α|, etc. We are interested
in the uncertainty in E given knowledge (through thedata) of R, i.e., in the conditional entropy [32]
H(E | R) = p1h(q1) + p2h(q2), (6)
where pi = p(R = i), h is the binary entropy function
h(q) = -q log(q) - (1 - q) log(1 - q),
and qi are the conditional probabilities
In the presence of missing data, the probabilities pi and qineed to be modified to take into account this extra uncer-tainty, details are given in Additional file 1.
The conditional entropy is nonnegative and reaches itsminimum value 0 when q1 = 0 or 1 (and consequently q2
= 1, resp. 0), which means the and partitions areequal and the regulator – split value pair 'explains' thesplit in the regulation tree exactly. Hence we assign to eachinternal node of a regulation tree the regulator – splitvalue pair which minimizes the conditional entropy (6).Since this assignment has to be done only once, after themodule networks score has converged, the best regulator– split value pairs can be found by simply enumeratingover all possibilities, even for relatively large data sets. Theactual algorithm for assigning regulators to all nodesoperates first on nodes closer to the roots of the treeswhere the most significant splits are located, and takesinto account acyclicity constraints on the module net-work. It is presented in pseudocode in Figure S4 in Addi-tional file 1.
Learning module networksTo find an optimal module network, learning of regula-tion trees is alternated with reassigning genes to othermodules until convergence of the Bayesian score. Moduleinitialization can be done using any clustering algorithm.Here, we used k-means [33], and reassigning is done likein [30] by making all single-gene moves from one moduleto another which improve the total score.
Network comparisonTo obtain a gene network from a module network, we putdirected edges from the regulators of a module to all thegenes in that module. We compare inferred to true net-work by computing the number of edges that are true pos-itive (tp), false positive (fp) and false negative (fn).
Tα1Tα2
Tα1
Tα2
α1
α2
1
2
= ∈ ≤= ∈ >
{ : }
{ : },,
,
m x s
m x sr m
r m
α
α
α1
q p E R i iii
i= = = =
∩=( | )
| |
| |, , .α α
11 1 2
Page 5 of 15(page number not for citation purposes)

BMC Bioinformatics 2007, 8(Suppl 2):S5 http://www.biomedcentral.com/1471-2105/8/S2/S5
Standard measures for the inference quality are precisionand recall. Precision (denoted P) is defined as the fractionof edges in the inferred module network that is correct,and recall (denoted R) as the fraction of edges in the truenetwork that is correctly inferred, i.e.,
The F-measure, defined as the harmonic mean of preci-
sion and recall, , can be used as a single meas-
ure for inference quality.
The module content for different module networks can becompared by computing for each module in one networkhow many genes of it are also grouped together in onemodule in the other network, and averaging over thenumber of modules. We call this the average module over-lap.
GO overrepresentation analysisGO enrichment P-values for all modules were determinedusing the BiNGO tool [34], which was incorporated intothe LeMoNe package. The overrepresentation of GO Bio-logical Process categories was tested using hypergeometrictests and the resulting P-values were corrected for multipletesting using a False Discovery Rate correction.
SoftwareThe latest version of SynTReN can be downloaded from[35] and the latest version of Genomica from [27]. LeM-oNe is implemented in Java and available for download insource or executable form [36].
Results and discussionImplementation differences in LeMoNe versus GenomicaAs a starting point for the development of LeMoNe, we re-implemented the methodology described by Segal et al.[6], which is incorporated in the Genomica software pack-age. Briefly, Genomica takes as input a gene expressiondata set and a list of potential regulators. After an initialclustering step, the algorithm iteratively constructs a regu-latory program for each of the modules (clusters) in theform of a regression tree, and then reassigns each gene tothe module whose program best predicts the gene'sexpression behavior. These two steps are repeated untilconvergence is reached. In this process, the algorithmattempts to maximize a Bayesian score function that eval-uates the model's fit to the data [6].
We used the same overall strategy and the same Bayesianscore function in LeMoNe. However, with respect to theoriginal methods described by Segal et al. [6], LeMoNeincorporates an alternative strategy for inferring regula-
tory programs that offers some advantages (see Methods).First, LeMoNe uses a Bayesian hierarchical clustering strat-egy to learn the regulation trees for the modules from thebottom up instead of from the top down. Furthermore,contrary to Genomica [6], the partitioning of expressiondata inside a module is not dependent on the expressionprofiles of the potential regulators, but only on the mod-ule data itself. This should allow the program to betterhandle missing or 'hidden' regulators (see further). As anadditional advantage, the assignment of regulators to reg-ulation program nodes can be postponed until after thefinal convergence of the Bayesian score, which leads toconsiderable time savings (see further).
A second modification in LeMoNe is that regulators areassigned to the splits in the regulation tree (data splits)based on an information theoretic measure, namely theconditional entropy of the partition of the regulator'sexpression profile dictated by the data split, given the par-tition imposed by a particular split value (see Methods).As a consequence, a data split does not impose, butmerely prefers, a clean partition of the best-matching reg-ulator's expression values around a certain split value. Incomparison with Genomica, where only such clean parti-tions are used, this strategy has the advantage that poten-tial noise in the regulator's expression is taken intoaccount. Additionally, the conditional entropy can beused to estimate the quality of the regulator assignment,and thus suggest missing potential regulators for splitswithout a low-entropy regulator. Information theory hasbeen used before to analyze and cluster gene expressiondata [13,22-26]. Our method introduces elements ofinformation theory into the module networks formalism.
In the following sections, we use SynTReN data to testLeMoNe in a completely controlled situation in whichsimulated microarray data is analyzed for a known under-lying regulatory network of reasonable size, and we assessthe performance effects of the aforementioned methodo-logical changes with respect to Genomica [6]. The LeM-oNe package and the source code are freely availableunder the GPL license (see Software section).
ModularityA fundamental assumption of the module networks for-malism is that real biological networks have a modularstructure [18] that is reflected in the gene expression data,and therefore groups of genes can share the same param-eters in the mathematical description of the network. InLeMoNe, as in other module network learning programs[6,11], the desired number of modules has to be given asan input parameter to the inference program, and a mainquestion is how the optimal module number has to bedetermined.
P R=+
=+
tptp fp
tptp fn
.
FPR
P R=
+2
Page 6 of 15(page number not for citation purposes)

BMC Bioinformatics 2007, 8(Suppl 2):S5 http://www.biomedcentral.com/1471-2105/8/S2/S5
Fewer modules means lower computational cost andmore data points per module. This results in a better esti-mation of parameters, but possibly entails oversimplify-ing the network and missing important regulatoryrelations. More modules means more specific optimiza-tion of the network at higher computational cost. Whenmodules become too small, there could be too few datapoints per module for a reliable estimation of the param-eters. In this section we use the Bayesian score to estimatethe optimal number of modules.
Throughout this manuscript, we make use of a SynTReN-generated synthetic network encompassing 1000 genes ofwhich 105 act as regulators (see Methods). Unless other-wise stated, we use all 105 regulators in this network aspotential regulators while inferring module networks. Fig-ure 2 shows the Bayesian score, normalized by thenumber of genes times the number of experiments, forthis network and different numbers of experiments. In allthree panels, the score reaches a maximum. The top panel(data set with 10 experiments), which has a true maxi-mum for the score, illustrates that the network inferenceproblem is underdetermined for very small data sets.Increasing the number of modules beyond the location ofthe maximum lowers the fit of the model to the data. Forlarger data sets (middle and bottom panel, 100, resp. 300experiments), the score saturates and after a certain pointthe model does not improve anymore by increasing thenumber of modules. Hence, the optimal number of mod-ules should be situated around the point where the Baye-sian score starts to level off. For increasing number ofexperiments, the optimal number shifts to the right. Thissuggests that increasing amounts of data enable the algo-rithm to uncover smaller and more finetuned modules.However, the rightbound shift of the optimum becomesless pronounced for increasing number of experiments.This reflects the fact that only a limited number of mod-ules are inherently present in the true network.
We define the number of modules in the true network asthe number of gene sets having the same set of regulators(taking into account activator or repressor type). Thisnumber is 286 for the 1000 gene synthetic network weconsider here, among which there are 180 with at least 3genes and 126 with at least 5 genes. The saturation behav-ior of the score curves for 100 and 300 experiments in Fig-ure 2 more or less reflects the modularity in the truenetwork.
Network inference performanceA more detailed analysis of network inference perform-ance is obtained by comparing the set of regulator to geneedges in the true (synthetic) network and in the inferredmodule network. We use standard measures such as recall,precision, and F-measure (see Methods).
Figure 3 shows the recall as a function of the number ofmodules for different numbers of experiments. The loca-tion of the recall maxima seems to agree well with the sat-uration points of the corresponding Bayesian score curves(Figure 2). As expected the maximal recall, and hence thetotal number of true positives, increases for data sets withmore experiments, saturating between 30 and 35% fordata sets with ≥100 experiments.
A similar saturation with increasing number of experi-ments is seen for the precision curves (Figure S1 in Addi-tional file 1) and the F-measure curves (Figure S2 inAdditional file 1). Whereas the precision continues toincrease with the number of modules, the F-measure sat-urates, but does so at a higher number of modules thanthe Bayesian score. Taking into account the modular com-position of the true network (see previous section), theBayesian score and the recall curves seem to generate bet-ter estimates of the optimal number of modules than theF-measure curves.
We also investigated whether the inferred regulation pro-grams provide any information regarding the quality ofthe regulators. When analyzing real data, such informa-tion could be useful to prioritize regulators for experimen-tal validation. A first property which we tried to relate to aregulator's quality is its hierarchical location in the regula-tion program. It seems that regulators deeper in the regu-lation tree become progressively less relevant. Figure 4illustrates this effect by showing separately the precisionsfor the roots of the regulation trees (level 0), the childrenof the roots (level 1), and the grandchildren (level 2) fordata sets with 100, 200, and 300 experiments. The preci-sions for the various regulatory levels remain within eachothers standard deviation across the tested range of exper-iments, but the precision clearly diminishes with increas-ing levels in the regulation program. For each data set andinferred module network we created an additional net-work where each module is assigned a random regulatorset of the same size as in the inferred network. The preci-sion for these random regulation programs is shown inthe bottom most curves in Figure 4. For regulation levelsbeyond level 2, the precisions fall in this region of randomassignments and they add almost exclusively false posi-tives (results not shown). In general, we can say that thetop regulators are far more likely to represent true regula-tory interactions.
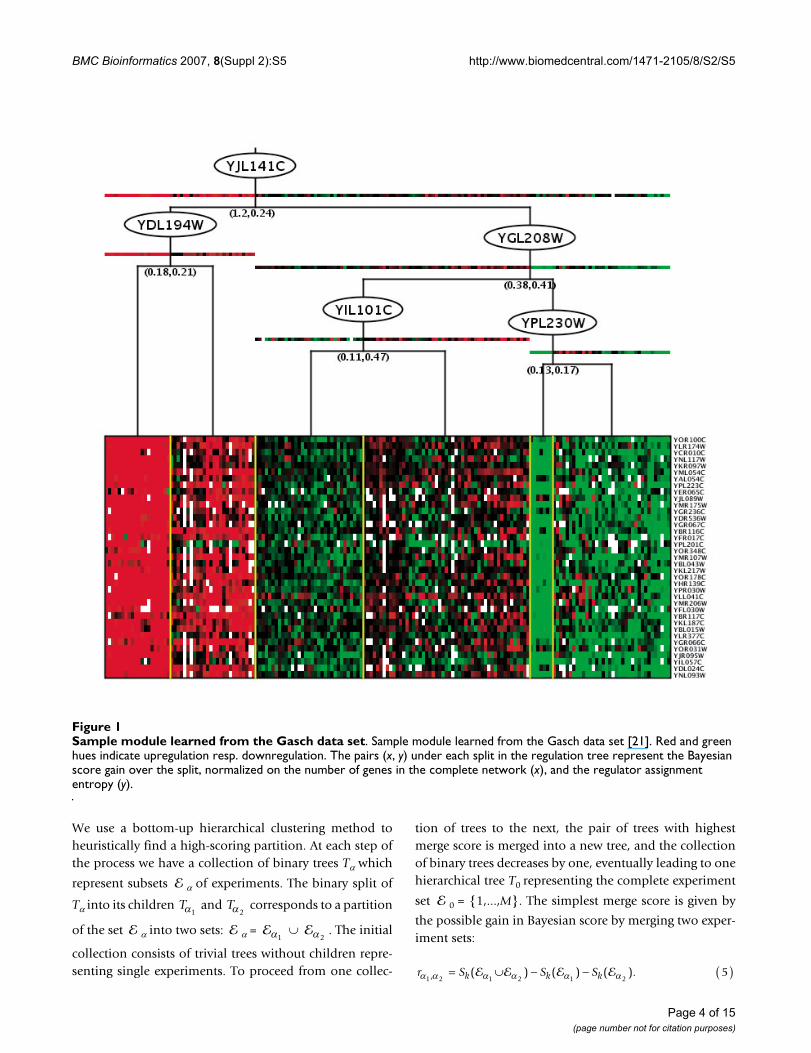
An additional layer of information is provided by the reg-ulator assignment entropies. A low value of the entropycorresponds to a regulator matching well with a split inthe expression pattern of the regulated module. Hence weexpect regulators with low entropy to have a higher prob-ability to be true regulators. This is illustrated in Figure 5.For the data set with 100 experiments and 150 modules,
Page 7 of 15(page number not for citation purposes)

BMC Bioinformatics 2007, 8(Suppl 2):S5 http://www.biomedcentral.com/1471-2105/8/S2/S5
the subnetwork generated by all regulators with anentropy lower than, e.g., 0.1 has precision 0.334, almosttwice as high as the precision of 0.176 for the whole mod-ule network. For the subnetwork generated by the regula-tors at the roots of the regulation trees, the precisionincreases from 0.42 to 0.53 by introducing the sameentropy cut-off. Other data sets show similar behavior(data not shown).
Performance of LeMoNe versus GenomicaNext, we compared the performance of LeMoNe andGenomica [6,27]. Both programs heuristically search foran optimal module network and are therefore bound to
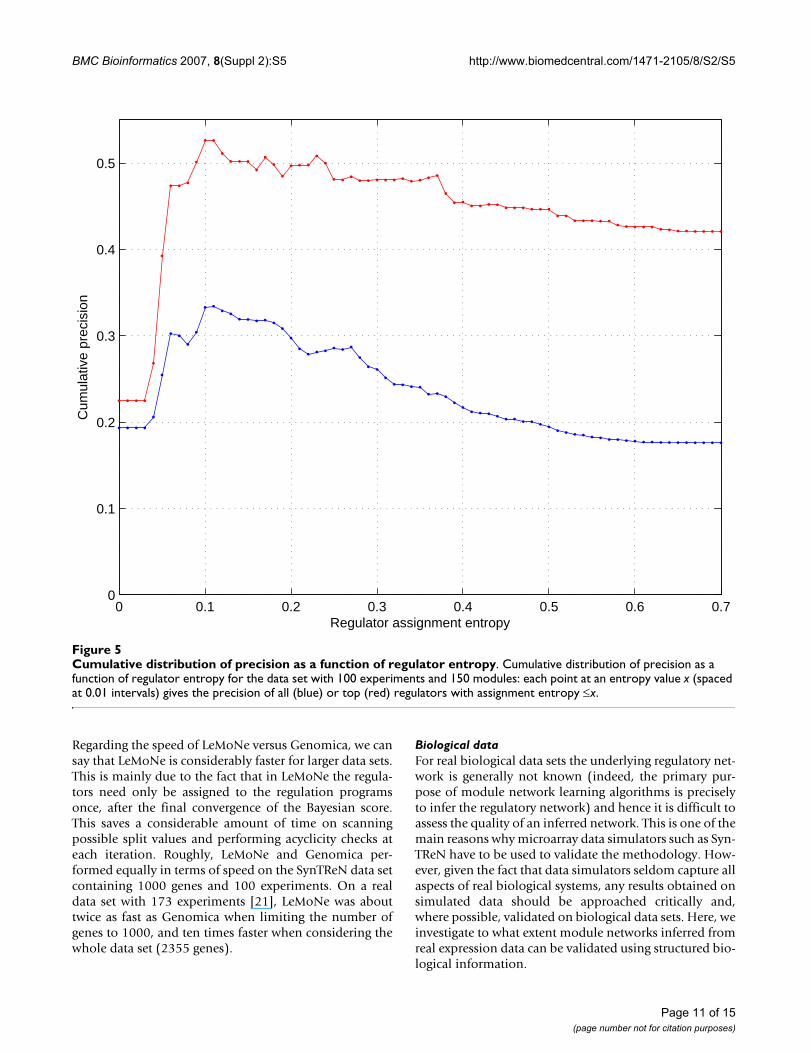
end up at a (different) local maximum of the Bayesianscore. We simulated 10 different data sets with 100 exper-iments for the same 1000 gene network as before andinferred a network with 150 modules (corresponding tothe point where the score function in Figure 2 starts to sat-urate). The average precisions are 0.196 ± 0.015, resp.0.155 ± 0.013, and average recalls 0.255 ± 0.016, resp.0.381 ± 0.021, for LeMoNe, resp. Genomica. The averageF-measure is 0.222 ± 0.015, resp. 0.220 ± 0.016. The sim-ilarity in performance at the level of the whole modulenetwork, with a bias for higher precision in LeMoNe andhigher recall in Genomica, is further seen in Figure 6,where we plot recall – precision pairs for both programs at
Bayesian score as a function of the number of modules and experimentsFigure 2Bayesian score as a function of the number of modules and experiments. Bayesian score as a function of the number of modules for data sets with 10, 100 and 300 experiments (top to bottom). The score is normalized by the number of genes times the number of experiments. The curves are least squares fits of the data to a linear non-polynomial model of the form
with x the number of modules and n = 6.
0 50 100 150 200 250 300 350 400 450 500−1.6
−1.4
−1.2
−1
−0.8
Number of modules
Sco
re (
10 e
xp)
0 50 100 150 200 250 300 350 400 450 500−2
−1.5
−1
−0.5
Number of modules
Sco
re (
100
exp)
0 50 100 150 200 250 300 350 400 450 500−2
−1.5
−1
−0.5
Number of modules
Sco
re (
300
exp)
a a x ekk x
kn
01 500
1+ − −
=∑ /
Page 8 of 15(page number not for citation purposes)

BMC Bioinformatics 2007, 8(Suppl 2):S5 http://www.biomedcentral.com/1471-2105/8/S2/S5
different noise levels. For each of the plotted series, lowernoise levels correspond to points in the upper right of theseries plot, and higher noise levels to points in the bottomleft, illustrating a general decrease in performance formore noisy data.
The average module overlap between the module net-works generated by LeMoNe and Genomica is 0.46 ± 0.02.Both programs, although featuring similar performance,attain a different local maximum of the Bayesian score,and the differences in the corresponding module net-works can be quite substantial. In general we can say thatboth module network inference programs suffer from a
high number of false positive edges. When using LeMoNe,false positives can to some extent be filtered out by look-ing only at the highest levels in the regulation tree (Figure4). To see whether this is also the case for Genomica, wecalculated the recall and precision for the subnetworksgenerated by the top regulators alone (Figure 6).
The recall for these subnetworks is generally lower as theycontain far fewer edges than the complete module net-work. For LeMoNe this decrease in recall is compensatedby a large increase in precision. For Genomica thedecrease in recall is bigger, with only a slight increase inprecision. There is no analogue of the assignment entropy
Recall as a function of the number of modules and experimentsFigure 3Recall as a function of the number of modules and experiments. Recall as a function of the number of modules for data sets with 10 (magenta), 50 (cyan), 100 (red), 200 (green), and 300 (blue) experiments. The curves are least squares fits of
the data to a linear non-polynomial model of the form with x the number of modules and n = 3.
0 50 100 150 200 250 300 350 400 450 5000
0.05
0.1
0.15
0.2
0.25
0.3
0.35
0.4
Number of modules
Rec
all
a a x ekk x
kn
01 500
1+ − −
=∑ /
Page 9 of 15(page number not for citation purposes)

BMC Bioinformatics 2007, 8(Suppl 2):S5 http://www.biomedcentral.com/1471-2105/8/S2/S5
in Genomica, so we cannot compare the gain in precisionby imposing an entropy cut-off.
One of the major differences in LeMoNe with respect toGenomica is the fact that the regulatory tree structureslearned by LeMoNe are only dependent on the expressiondata inside the module, and not on the expression profilesof potential regulators. We hypothesized that this mightallow LeMoNe to better handle missing or hidden regula-tors, a situation which might for instance occur if the trueregulator is missing from the list of potential regulators. Inorder to test this hypothesis, we simulated 10 different
data sets with 100 experiments for the same 1000 genenetwork and inferred module networks with 150 modulesusing both LeMoNe and Genomica. In each of the tenruns we randomly left out 20% of the potential regulatorsfrom the regulator list (i.e., we used 84 instead of 105potential regulators). The average F-measure of the result-ing networks is 0.183 ± 0.025 for LeMoNe, versus 0.126 ±0.012 for Genomica. Compared to the results when takinginto account all 105 potential regulators (see above), theperformance drop for LeMoNe is clearly less pronounced(17.6%) than for Genomica (42.7%), indicating thatLeMoNe is indeed better at handling missing regulators.
Precision at different regulation tree levelsFigure 4Precision at different regulation tree levels. Precision as a function of the number of modules for subnetworks generated by regulation tree levels 0 (roots), 1 and 2, and for random assignments of regulators to regulation tree nodes (top to bottom) for data sets with 100 (red), 200 (green) and 300 (blue) experiments. The curves are least squares fits of the data to a linear
non-polynomial model of the form with x the number of modules and n = 3.
0 50 100 150 200 250 300 350 400 450 5000
0.1
0.2
0.3
0.4
0.5
Number of modules
Pre
cisi
on
a a x ekk x
kn
01 500
1+ − −
=∑ /
Page 10 of 15(page number not for citation purposes)
BMC Bioinformatics 2007, 8(Suppl 2):S5 http://www.biomedcentral.com/1471-2105/8/S2/S5
Regarding the speed of LeMoNe versus Genomica, we cansay that LeMoNe is considerably faster for larger data sets.This is mainly due to the fact that in LeMoNe the regula-tors need only be assigned to the regulation programsonce, after the final convergence of the Bayesian score.This saves a considerable amount of time on scanningpossible split values and performing acyclicity checks ateach iteration. Roughly, LeMoNe and Genomica per-formed equally in terms of speed on the SynTReN data setcontaining 1000 genes and 100 experiments. On a realdata set with 173 experiments [21], LeMoNe was abouttwice as fast as Genomica when limiting the number ofgenes to 1000, and ten times faster when considering thewhole data set (2355 genes).
Biological dataFor real biological data sets the underlying regulatory net-work is generally not known (indeed, the primary pur-pose of module network learning algorithms is preciselyto infer the regulatory network) and hence it is difficult toassess the quality of an inferred network. This is one of themain reasons why microarray data simulators such as Syn-TReN have to be used to validate the methodology. How-ever, given the fact that data simulators seldom capture allaspects of real biological systems, any results obtained onsimulated data should be approached critically and,where possible, validated on biological data sets. Here, weinvestigate to what extent module networks inferred fromreal expression data can be validated using structured bio-logical information.
Cumulative distribution of precision as a function of regulator entropyFigure 5Cumulative distribution of precision as a function of regulator entropy. Cumulative distribution of precision as a function of regulator entropy for the data set with 100 experiments and 150 modules: each point at an entropy value x (spaced at 0.01 intervals) gives the precision of all (blue) or top (red) regulators with assignment entropy ≤x.
0 0.1 0.2 0.3 0.4 0.5 0.6 0.70
0.1
0.2
0.3
0.4
0.5
Regulator assignment entropy
Cum
ulat
ive
prec
isio
n
Page 11 of 15(page number not for citation purposes)
BMC Bioinformatics 2007, 8(Suppl 2):S5 http://www.biomedcentral.com/1471-2105/8/S2/S5
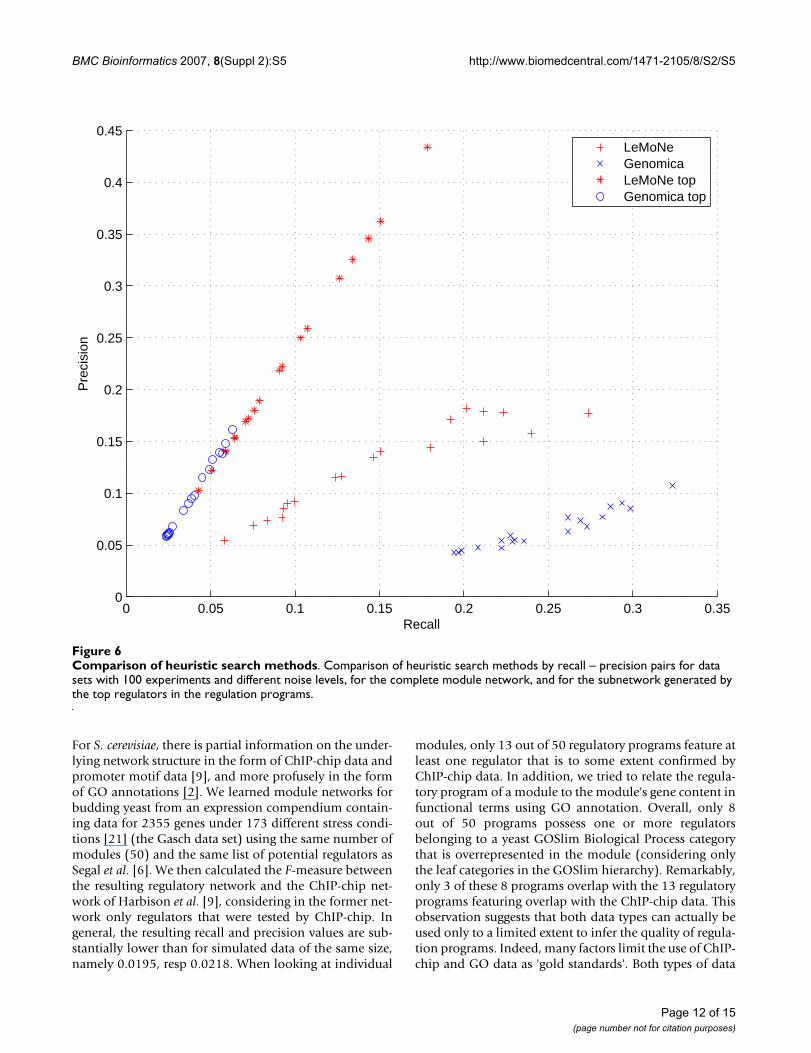
For S. cerevisiae, there is partial information on the under-lying network structure in the form of ChIP-chip data andpromoter motif data [9], and more profusely in the formof GO annotations [2]. We learned module networks forbudding yeast from an expression compendium contain-ing data for 2355 genes under 173 different stress condi-tions [21] (the Gasch data set) using the same number ofmodules (50) and the same list of potential regulators asSegal et al. [6]. We then calculated the F-measure betweenthe resulting regulatory network and the ChIP-chip net-work of Harbison et al. [9], considering in the former net-work only regulators that were tested by ChIP-chip. Ingeneral, the resulting recall and precision values are sub-stantially lower than for simulated data of the same size,namely 0.0195, resp 0.0218. When looking at individual
modules, only 13 out of 50 regulatory programs feature atleast one regulator that is to some extent confirmed byChIP-chip data. In addition, we tried to relate the regula-tory program of a module to the module's gene content infunctional terms using GO annotation. Overall, only 8out of 50 programs possess one or more regulatorsbelonging to a yeast GOSlim Biological Process categorythat is overrepresented in the module (considering onlythe leaf categories in the GOSlim hierarchy). Remarkably,only 3 of these 8 programs overlap with the 13 regulatoryprograms featuring overlap with the ChIP-chip data. Thisobservation suggests that both data types can actually beused only to a limited extent to infer the quality of regula-tion programs. Indeed, many factors limit the use of ChIP-chip and GO data as 'gold standards'. Both types of data
Comparison of heuristic search methodsFigure 6Comparison of heuristic search methods. Comparison of heuristic search methods by recall – precision pairs for data sets with 100 experiments and different noise levels, for the complete module network, and for the subnetwork generated by the top regulators in the regulation programs.
0 0.05 0.1 0.15 0.2 0.25 0.3 0.350
0.05
0.1
0.15
0.2
0.25
0.3
0.35
0.4
0.45
Recall
Pre
cisi
on
LeMoNeGenomicaLeMoNe topGenomica top
Page 12 of 15(page number not for citation purposes)
BMC Bioinformatics 2007, 8(Suppl 2):S5 http://www.biomedcentral.com/1471-2105/8/S2/S5
are noisy and offer incomplete information. For example,Harbison et al. [9] mainly profiled transcription factorbinding in rich medium conditions, whereas the Gaschdata set contains primarily stress conditions. The parts ofthe transcriptional network that are active under theseconditions may substantially differ [9,10]. Moreover, theexpression profile of a transcription factor is often notdirectly related to the expression profile of its targets, forexample due to post-translational regulation of transcrip-tion factor activity. As a consequence, indirect regulatorssuch as upstream signal transducers may feature in theregulation programs instead of the direct regulators, i.e.,the transcription factors [6].
As for GO, many regulators appear not to be annotated tothe GO Biological Process categories of their target genes.Taking these factors into account, the limited overlap withthe available ChIP-chip and GO data does not necessarilyreflect the quality of the inferred regulatory programs.
On the contrary, we established that the regulatory pro-grams do in fact contain a considerable amount of rele-vant and potentially valuable information. Indeed, bymanually investigating individual modules in moredetail, we could in many cases qualitatively relate the reg-ulators to the module's gene content. For example, themodule shown in Figure 1 is enriched in a.o. genesinvolved in the main pathways of carbohydrate metabo-lism (P = 1.0596E - 4), energy derivation by oxidation oforganic compounds (P = 1.2046E - 4) and alcohol biosyn-thesis (P = 1.3185E - 2). None of the 5 regulators of thismodule could be related to the module's gene contentbased on ChIP-chip or GO information. However, basedon their description in the Saccharomyces Genome Data-base (SGD) [28], all 5 regulators could be linked to glu-cose sensing or the response to (glucose) starvation,processes that can arguably influence the expression ofcarbohydrate metabolism genes.
However, one must keep in mind that it remains impossi-ble to infer complete and accurate regulatory networksfrom gene expression data alone. Expression data onlyprovides information on one regulatory level, namely thetranscriptional level. Information on (post-)translationalregulation is lacking. The current expression-based mod-ule network algorithms (e.g. [6], this study) try to remedythis problem by including signal transducers in the list ofpotential regulators in addition to transcription factors, inthe hope to capture some of this non-transcriptional reg-ulation from the expression profiles of key signal trans-ducers. However, this trick can only be expected touncover a fraction of such non-transcriptional regulatoryinteractions, and moreover the direct targets of these reg-ulatory interactions are not identified. A potential remedyfor this shortcoming would be to include other types of
data, such as data on protein expression levels and proteinphosphorylation, in the module network learning frame-work. Unfortunately, such data are not yet available on alarge scale.
In summary, our results indicate that structured biologicalinformation such as ChIP-chip data or GO can not (yet)be used to measure the performance of module networkalgorithms in an automated way. This is a strong argu-ment for using data simulators such as SynTReN for thepurpose of developing, testing and improving such algo-rithms.
ConclusionWe developed a module network learning algorithmcalled LeMoNe and tested its performance on simulatedexpression data sets generated by SynTReN [20]. Wefound that the Bayesian score can be used to infer the opti-mal number of modules, and that the inference perform-ance increases as a function of the number of simulatedexperiments but saturates well below 1.
We also used SynTReN data to assess the effects of themethodological changes we made in LeMoNe with respectto the original methods used in Genomica [6]. Overall,application of Genomica and LeMoNe to various simu-lated data sets gave comparable results, with a biastowards higher recall for Genomica and higher precisionfor LeMoNe. However, LeMoNe offers some advantagesover the original framework of Segal et al. [6], one of thembeing that the learning process is considerably faster.Another advantage of LeMoNe is the fact that the algo-rithm 'lets the data decide' when learning the regulatorytree structure. The partitioning of expression data inside amodule is not dependent on the expression profiles of thepotential regulators, but only on the module data itself. Asa consequence, the assignment of 'bad' regulators (interms of assignment entropy) to 'good' module splits (interms of Bayesian score) might suggest missing or hiddenregulators. This situation might occur if the true regulatoris missing from the list of potential regulators, or if theexpression of the targets cannot be related directly to theexpression of the regulator, e.g., due to posttranslationalregulation of the regulator's activity. We have also shownthat filtering the module network by the location of regu-lators in the regulation program or by introducing anentropy cut-off improves the inference performance.When inferring regulatory programs from real data, thesecriteria may prove useful to prioritize regulators for exper-imental validation.
Finally, we explored the extent to which module networksinferred from real expression data could be validatedusing structured biological information. For that purpose,we learned module networks from a microarray compen-
Page 13 of 15(page number not for citation purposes)
BMC Bioinformatics 2007, 8(Suppl 2):S5 http://www.biomedcentral.com/1471-2105/8/S2/S5
dium of stress experiments on budding yeast [21]. Wefound that the resulting regulatory programs overlappedonly marginally with the available ChIP-chip data andGO information. However, more detailed manual analy-sis uncovered that the learned regulation programs arenevertheless biologically relevant, suggesting that an auto-mated assessment of the performance of module networkalgorithms using structured biological information suchas ChIP-chip data or GO is ineffective. This underscoresthe importance of using data simulators such as SynTReNfor the purpose of testing and improving module networklearning algorithms.
Authors' contributionsT.M. and S.M. designed the study, developed software,analyzed the data and wrote the paper. E.B. and A.J.designed the study, developed software and analyzed thedata. Y.S. designed the study and developed software.T.V.d.B. and K.V.L. developed software. P.v.R., M.K., K.M.and Y.V.d.P. designed the study and supervised theproject.
Additional material
AcknowledgementsWe thank Eran Segal for explanation about the Genomica algorithm, and Gary Bader and Ruth Isserlin for refactoring the BiNGO code which allowed its incorporation into LeMoNe. T.M. and S.M. are Postdoctoral Fel-lows of the Research Foundation Flanders (Belgium), A.J. is supported by an Early Stage Marie Curie fellowship. This work is partially supported by: IWT projects: GBOU-SQUAD-20160; Research Council KULeuven: GOA-Ambiorics, CoE EF/05/007 SymBioSys; FWO projects: G.0413.03, and G.0241.04.
This article has been published as part of BMC Bioinformatics Volume 8, Sup-plement 2, 2007: Probabilistic Modeling and Machine Learning in Structural and Systems Biology. The full contents of the supplement are available online at http://www.biomedcentral.com/1471-2105/8?issue=S2.
References1. Ideker T, Galitski T, Hood L: A new approach to decoding life:
systems biology. Annu Rev Genomics Hum Genet 2001, 2:343-372.2. Ashburner M, Ball CA, Blake JA, Botstein D, Butler H, Cherry JM,
Davis AP, Dolinski K, Dwight SS, Eppig JT, Harris MA, Hill DP, Issel-Tarver L, Kasarskis A, Lewis S, Matese JC, Richardson JE, Ringwald M,Rubin GM, Sherlock G: Gene ontology: tool for the unificationof biology. The Gene Ontology Consortium. Nat Genet 2000,25:25-29.
3. Friedman N, Linial M, Nachman I, Pe'er D: Using Bayesian net-works to analyze expression data. J Comput Biol 2000, 7:601-620.
4. Pe'er D, Regev A, Elidan G, Friedman N: Inferring subnetworksfrom perturbed expression profiles. Bioinformatics 2001,17(Suppl 1):S215-S224.
5. Bar-Joseph Z, Gerber GK, Lee TI, Rinaldi NJ, Yoo JY, Robert F, Gor-don DB, Fraenkel E, Jaakkola TS, Young RA, Gifford DK: Computa-tional discovery of gene modules and regulatory networks.Nat Biotechnol 2003, 21:1337-1342.
6. Segal E, Shapira M, Regev A, Pe'er D, Botstein D, Koller D, FriedmanN: Module networks: identifying regulatory modules andtheir condition-specific regulators from gene expressiondata. Nat Genet 2003, 34:166-167.
7. Beer MA, Tavazoie S: Predicting gene expression fromsequence. Cell 2004, 117:185-198.
8. Friedman N: Inferring cellular networks using probabilisticgraphical models. Science 2004, 303:799-805.
9. Harbison CT, Gordon DB, Lee TI, Rinaldi NJ, Macisaac KD, DanfordTW, Hannett NM, Tagne JB, Reynolds DB, Yoo J, Jennings EG, Zei-tlinger J, Pokholok DK, Kellis M, Rolfe PA, Takusagawa KT, Lander ES,Gifford DK, Fraenkel E, Young RA: Transcriptional regulatorycode of a eukaryotic genome. Nature 2004, 431:99-104.
10. Luscombe NM, Madan Babu M, Yu H, Snyder M, Teichmann SA, Ger-stein M: Genomic analysis of regulatory network dynamicsreveals large topological changes. Nature 2004, 431:308-312.
11. Xu X, Wang L, Ding D: Learning module networks fromgenome-wide location and expression data. FEBS Lett 2004,578:297-304.
12. Battle A, Segal E, Koller D: Probabilistic discovery of overlap-ping cellular processes and their regulation. J Comput Biol 2005,12:909-927.
13. Basso K, Margolin AA, Stolovitzky G, Klein U, Dalla-Favera R, CalifanoA: Reverse engineering of regulatory networks in human Bcells. Nat Genet 2005, 37:382-390.
14. Garten Y, Kaplan S, Pilpel Y: Extraction of transcription regula-tory signals from genome-wide DNA-protein interactiondata. Nucleic Acids Res 2005, 33:605-615.
15. Petti AA, Church GM: A network of transcriptionally coordi-nated functional modules in Saccharomyces cerevisiae.Genome Res 2005, 15:1298-1306.
16. Lemmens K, Dhollander T, De Bie T, Monsieurs P, Engelen K, SmetsB, Winderickx J, De Moor B, Marchal K: Inferring transcriptionalmodules from ChIP-chip, motif and microarray data. GenomeBiol 2006, 7:R37.
17. Van den Bulcke T, Lemmens K, Van de Peer Y, Marchal K: Inferringtranscriptional networks by mining 'omics' data. Current Bioin-formatics 2006, 1:301-313.
18. Hartwell LH, Hopfield JJ, Leibler S, Murray AW: From molecularto modular cell biology. Nature 1999, 402:C47-C52.
19. Segal E, Friedman N, Kaminski N, Regev A, Koller D: From signa-tures to models: understanding cancer using microarrays.Nat Genet 2005, 37:S38-S45.
20. Van den Bulcke T, Van Leemput K, Naudts B, van Remortel P, Ma H,Verschoren A, De Moor B, Marchal K: SynTReN: a generator ofsynthetic gene expression data for design and analysis ofstructure learning algorithms. BMC Bioinformatics 2006, 7:43.
21. Gasch AP, Spellman PT, Kao CM, Carmel-Harel O, Eisen MB, StorzG, Botstein D, Brown PO: Genomic expression programs in theresponse of yeast cells to environmental changes. Mol Biol Cell2000, 11:4241-4257.
22. Butte AJ, Kohane IS: Mutual information relevance networks:functional genomic clustering using pairwise entropy meas-urements. Pac Symp Biocomput 2000, 5:418-429.
23. Butte A, Tamayo P, Slonim D, Golub T, Kohane I: Discovering func-tional relationships between RNA expression and chemo-therapeutic susceptibility using relevance networks. PNAS2000, 97:12182-12186.
24. Pe'er D, Regev A, A T: Minreg: Inferring an active regulator set.Bioinformatics 2002, 18(Suppl 1):S258-S267.
25. Sinkkonen J, Kaski S: Clustering based on conditional distribu-tions in an auxiliary space. Neural Comput 2002, 14:217-239.
26. Kasturi J, Acharya R, Ramanathan M: An information theoreticapproach for analyzing temporal patterns of gene expres-sion. Bioinformatics 2003, 19:449-458.
27. Genomica [http://genomica.weizmann.ac.il]
Additional file 1Contains 2 additional figures for the precision and F-measure as a func-tion of the number of modules and experiments, as well as more details about the Bayesian score and about the algorithm for learning module reg-ulation programs.Click here for file[http://www.biomedcentral.com/content/supplementary/1471-2105-8-S2-S5-S1.pdf]
Page 14 of 15(page number not for citation purposes)

BMC Bioinformatics 2007, 8(Suppl 2):S5 http://www.biomedcentral.com/1471-2105/8/S2/S5
Publish with BioMed Central and every scientist can read your work free of charge
"BioMed Central will be the most significant development for disseminating the results of biomedical research in our lifetime."
Sir Paul Nurse, Cancer Research UK
Your research papers will be:
available free of charge to the entire biomedical community
peer reviewed and published immediately upon acceptance
cited in PubMed and archived on PubMed Central
yours — you keep the copyright
Submit your manuscript here:http://www.biomedcentral.com/info/publishing_adv.asp
BioMedcentral
28. Saccharomyces Genome Database [http://www.yeastgenome.org/]
29. Ma HW, Kumar B, Ditges U, Gunzer F, Buer J, Zeng AP: Anextended transcriptional regulatory network of Escherichiacoli and analysis of its hierarchical structure and networkmotifs. Nucleic Acids Res 2004, 32:6643-6649.
30. Segal E, Pe'er D, Regev A, Koller D, Friedman N: Learning modulenetworks. Journal of Machine Learning Research 2005, 6:557-588.
31. Heller KA, Ghahramani Z: Bayesian hierarchical clustering. Pro-ceedings of the twenty-second International Conference on Machine Learn-ing 2005.
32. Shannon CE: A mathematical theory of communication. TheBell System Technical Journal 1948, 27:379-423 [http://cm.bell-labs.com/cm/ms/what/shannonday/paper.html]. 623–656
33. de Hoon MJL, Imoto S, Nolan J, Miyano S: Open source clusteringsoftware. Bioinformatics 2004, 20:1453-1454.
34. Maere S, Heymans K, Kuiper M: BiNGO: a Cytoscape plugin toassess overrepresentation of gene ontology categories inbiological networks. Bioinformatics 2005, 21:3448-3449.
35. SynTReN [http://homes.esat.kuleuven.be/~kmarchal/SynTReN]36. LeMoNe [http://bioinformatics.psb.ugent.be/LeMoNe/down
load.htm]
Page 15 of 15(page number not for citation purposes)
Copyright © 2022 FDOKUMEN