Constructing and validating a new measure of ingroup identification.
Upload
khangminh22Category
view
1download
0
Validating polyphenol intake estimates from a food-frequencyquestionnaire by using repeated 24-h dietary recalls and a uniquemethod-of-triads approach with 2 biomarkers1–3
Nasira M Burkholder-Cooley, Sujatha S Rajaram, Ella H Haddad, Keiji Oda, Gary E Fraser, and Karen Jaceldo-Siegl*
School of Public Health, Loma Linda University, Loma Linda, CA
ABSTRACTBackground: The assessment of polyphenol intake in free-livingsubjects is challenging, mostly because of the difficulty in accu-rately measuring phenolic content and the wide presence of pheno-lics in foods.Objective: The aims of this study were to evaluate the validity ofpolyphenol intake estimated from food-frequency questionnaires(FFQs) by using the mean of 6 measurements of a 24-h dietaryrecall (24-HR) as a reference and to apply a unique method-of-triadsapproach to assess validity coefficients (VCs) between latent “true”dietary estimates, total urinary polyphenol (TUP) excretion, anda surrogate biomarker (plasma carotenoids).Design: Dietary intake data from 899 adults of the Adventist HealthStudy 2 (AHS-2; 43% blacks and 67% women) were obtained.Pearson correlation coefficients (r), corrected for attenuation fromwithin-person variation in the recalls, were calculated between24-HRs and FFQs and between 24-HRs and TUPs. VCs and 95% CIsbetween true intake and polyphenol intakes from FFQs, 24-HRs,and the biomarkers TUPs and plasma carotenoids were calculated.Results:Mean6 SD polyphenol intakes were 7176 646 mg/d fromFFQs and 402 6 345 mg/d from 24-HRs. The total polyphenolintake from 24-HRs was correlated with FFQs in crude (r = 0.51,P, 0.001) and deattenuated (r = 0.63; 95% CI: 0.61, 0.69) models.In the triad model, the VC between the FFQs and theoretical trueintake was 0.46 (95% CI: 0.20, 0.93) and between 24-HRs and trueintake was 0.61 (95% CI: 0.38, 1.00).Conclusions: The AHS-2 FFQ is a reasonable indicator of total poly-phenol intake in the AHS-2 cohort. Urinary polyphenol excretion islimited by genetic variance, metabolism, and bioavailability and shouldbe used in addition to rather than as a replacement for dietary intakeassessment. Am J Clin Nutr 2017;105:685–94.
Keywords: Adventist Health Study 2, method of triads, phyto-chemicals, polyphenols, urinary polyphenols
INTRODUCTION
Polyphenols are a large group of phytochemicals abundant inplants (1) that have shown various health functions in humans,including anti-inflammatory, antiobesity, and anticarcinogeniceffects (2). Epidemiologic evidence indicates that polyphenolintake is associated with a reduced risk of chronic diseases,including type 2 diabetes and cardiovascular diseases (3–5).
Quantifying polyphenol intake is challenging and susceptible tosystematic and random errors related to the variability in thepolyphenol content of foods, error related to dietary self-report,and differences in absorption and metabolism between individ-uals (6). Because of the inherent limitations of dietary self-report, which include the likely possibility that errors of 2 dietaryassessment tools are correlated, the use of $1 biomarker is par-ticularly advantageous for validation studies (7).
The Folin-Ciocalteu assay of polyphenols in urine samples isconsidered a specific biomarker for total polyphenol intake andmay also serve as a marker of dietary fruit and vegetable intake(8, 9). The use of total urinary polyphenol (TUP)4 concen-tration as a biomarker is comparable to plasma measurementsof polyphenols (10) and is currently the most well-studied andpromising biomarker of total polyphenol intake (11). Polyphenolsundergo microbial conversion through oxidation, hydroxylation,and conjugation, so that the diverse original compounds sharecommon metabolites (12–14). Not all polyphenol compoundsare excreted in urine (15); however, a variety of phenoliccompounds reach maximum concentrations in urine w2.5 hafter ingestion (16). Although total polyphenols measured by24-h urine volume is the preferred urinary biomarker of poly-phenol intake, the 4- or 12-h volume corrected by urinary creat-inine is also a suitable biomarker of total polyphenols and mayserve as a reliable tool to study relations between polyphenolintake and health (17).
Similar to polyphenols, the major dietary carotenoids (i.e.,b-carotene, a-carotene, lycopene, lutein and zeaxanthin, and
1 Supported by National Cancer Institute grant 1U01CA152939, the
McLean Endowment, and a Hulda Crooks grant.2 The funding agencies played no role in the design, implementation,
analysis, and interpretation of these data.3 Supplemental Table 1 is available from the “Online Supporting Material”
link in the online posting of the article and from the same link in the online
table of contents at http://ajcn.nutrition.org.
*To whom correspondence should be addressed. E-mail: kjaceldo@llu.
edu.
Received April 27, 2016. Accepted for publication December 21, 2016.
First published online January 25, 2017; doi: 10.3945/ajcn.116.137174.
4 Abbreviations used: AHS-2, Adventist Health Study 2; FFQ, food-
frequency questionnaire; TDP, total dietary polyphenol; TUP, total urinary
polyphenol; VC, validity coefficient; 24-HR, 24-h dietary recall.
Am J Clin Nutr 2017;105:685–94. Printed in USA. � 2017 American Society for Nutrition 685
Dow
nloaded from https://academ
ic.oup.com/ajcn/article/105/3/685/4569696 by guest on 13 July 2022

b-cryptoxanthin) are concentrated in fruit and vegetables (18).Plasma carotenoids and urinary flavonoids have been used to-gether as biomarkers of fruit, vegetable, and juice intakes inprevious validation studies (19). Other studies have shown cor-relations between intakes of polyphenol-rich food groups, such ascitrus, coffee, wine, and vegetables, and plasma b-cryptoxanthinconcentrations (20) or dietary carotenoid intake (21). Plasmaconcentrations of carotenoids can be quantified by using HPLC(22), and this biomarker is considered a valid and reliable mea-sure of w1–2 wk of carotenoid intake (23–25).
The method of triads (26) is an application of factor analysisin which the correlation of the estimate by using the dietaryassessment tool and a person’s theoretical true usual intakeis estimated from 3 pairwise correlations between the food-frequency questionnaire (FFQ), the reference method, and abiomarker. This technique assumes that a positive correlationoccurs between intake estimates and the latent true intake andthat random errors in dietary assessments are not correlated (26,27). In the present secondary analysis of the Adventist HealthStudy 2 (AHS-2) calibration study, a modified approach to themethod of triads with the use of 2 concentration biomarkers (28)is applied to validate polyphenol intake estimated from theAHS-2 FFQ in a sample population with a wide range of dietaryintakes.
METHODS
Study population
The AHS-2 is a prospective cohort of .96,000 Seventh-DayAdventist men and women recruited from the United States andCanada between 2002 and 2007. The study is designed primarilyto investigate relations between diet and health outcomes. Theprofile and recruitment methods of the cohort have been pre-viously described (29). In brief, each participant completed a50-page, self-administered AHS-2 questionnaire at baseline thataimed to assess diet, physical activity, supplement use, andmedical history. Participants were asked to report weight andheight in the baseline questionnaire, and these values were usedto calculate BMI. The level of education was determined bycategories of the highest level of education completed. Historyof cigarette smoking and alcohol consumption was categorizedon the basis of current or past use. Physical activity status wasbased on the average number of hours per week spent engagingin energetic physical exercise combined with physical activitylevel at work. To validate AHS-2 data on self-reported diet andphysical activity, a calibration substudy was conducted between2002 and 2007, which is described in full detail elsewhere (30).In addition to the baseline AHS-2 Diet and Lifestyle Ques-tionnaire, participants of the AHS-2 calibration study (n = 1011)provided 2 sets of three 24-h dietary recalls (24-HRs) and anFFQ similar to that completed at baseline. In the middle of the24-HR sets, subjects attended a clinic at their church where anovernight urine sample, blood sample, and body-compositionmeasurements were collected. The calibration showed no sig-nificant differences in the distribution of dietary pattern, edu-cation, sex, or age between the substudy sample and the parentcohort (30). The AHS-2 is a health-oriented population withvery low rates of smoking (1%) and alcohol intake (6.6%;usually at very low quantities) (31), as well as dietary patterns
ranging from vegan to omnivorous. The diversity in diets in-troduces varying intakes of polyphenol-rich foods, includingfruit and vegetables, grains, soy products, and other vegetarianprotein sources. Participants included in this analysis are mem-bers of the AHS-2 calibration study (n = 906; see Figure 1). Thecalibration study was approved by the Loma Linda Universityinstitutional review board, and all of the participants gave theirwritten informed consent.
Dietary assessment
The 24-HRs were collected from AHS-2 calibration studyparticipants by unannounced telephone interview with the useof a multiple-pass approach to gather information about food,supplements, and beverages consumed during the past 24 h.During the first 2 mo, three 24-HRs were obtained (i.e., intakesfor 1 Saturday, 1 Sunday, and 1 weekday); w6 mo later, thisprocess was repeated. The aim was to obtain 2 sets of recalls,each representing a synthetic week (a total of six 24-HRs), fromeach subject (30). The 24-HRs were gathered in 2 blocks 5–6 moapart, and the FFQs and biomarkers were collected at clinicstimed between the 2 recall blocks. The Nutrition Data Systemfor Research version 4.06 or 5.0 (The Nutrition CoordinatingCenter) was used for 24-HR data entry.
During a 6-mo period between 24-HR sets, participants com-pleted a self-administered FFQ. Responses were reviewed, andincomplete information was clarified by telephone follow-up.The FFQ is a 22-page instrument that contains a food list of204 hard-coded items, write-ins for 46 open-ended items, and 54questions about food preparation methods. The survey providesinformation on food item, frequency of consumption, andportion size, which are necessary to estimate mean daily foodand nutrient intakes. Questionnaires were scanned by using theNilson Candle Scanner 5000i Image Scanner with ScanTools Plussoftware (Pearson NCS) to archive an electronic copy of data.
Polyphenol food-composition database
The polyphenol content of foods in the AHS-2 cohort wasproduced by using a combination of all available data onpolyphenol concentrations in foods derived from chromatogra-phy analysis. The concentrations of polyphenols in various foodswere gathered from the Phenol-Explorer 3.6 database (32) and theUSDA flavonoid version 3.1 (33) and isoflavones version 2.0 (34)databases, and the individual research literature was consulted forpolyphenol concentrations of a select few foods [e.g., okra (35),rice flour (36), and oat bran and millet (12)]. Of the completedata, w78% were from Phenol-Explorer, 21% were from USDAdatabases, and 1% were from individual studies. The USDAisoflavones database provided data for a variety of soy foods,which allowed more comprehensive estimates of polyphenolintake in the AHS-2. The data obtained refer to intact poly-phenols (i.e., glycosides and esters) for most compounds, exceptfor values that were obtained from analysis by using chroma-tography after hydrolysis or from USDA databases. For foodsthat contained lignans and phenolic acids that are only detect-able after hydrolysis (i.e., beans, olives, and cereals), data ob-tained by using chromatography after hydrolysis were alsogathered. Foods with unknown polyphenol concentrations (e.g.,cottonseed oil, wheat gluten, coconut milk, and cola) were
686 BURKHOLDER-COOLEY ET AL.
Dow
nloaded from https://academ
ic.oup.com/ajcn/article/105/3/685/4569696 by guest on 13 July 2022
considered to have no polyphenols. Polyphenol concentrationsfor foods in our database were standardized to milligrams per100 g, and the data acquired for individual foods were expandedto incorporate the calculation of recipes as well as estimations ofmissing values.
Estimating polyphenol intake
Total dietary polyphenol (TDP) intake is the sum of all fla-vonoids, phenolic acids, stilbenes, lignans, and other phenolics infoods consumed (Supplemental Table 1). The TDP intake foreach participant was estimated by using the following: TDPfrom FFQ = S Pn 3 Fn 3 Gn 3 Sn, where P = milligrams ofphenolic compounds per 100 g foodn, F = the reported frequencyof intake of foodn, G = the standard serving size of foodn ingrams, and S = the reported servings of foodn. Foods recorded in24-HRs and our polyphenol food-composition data werematched, and TDP intake was calculated on the basis of theportions reported, so that TDPs from 24-HRs = S Pn 3 Gn,where P = milligrams of phenolic compounds per 100 g foodnand G = the reported portion sizes of foodn in grams.
Urinary polyphenols
The Folin-Ciocalteu method was used to determine totalpolyphenol concentration in 12-h overnight urine samples ofAHS-2 calibration study participants (n = 967) by using mixed-mode anion-exchange and reversed-phase solvent (Oasis MAX)
cartridges (Waters Corporation) for solid-phase extraction (10).The Folin-Ciocalteu method was used because it provides thebest recovery for total polyphenols and is a relatively simple andefficient technique that allows for the analysis of many samplesat one time. Gallic acid was the chosen standard because it ismost often used and is both a stable and pure substance. Inaddition, the response to gallic acid has been shown to beequivalent to most other phenolics when measuring polyphenolsin food on a mass basis (17, 37, 38). The solid-phase cleanupbefore the Folin-Ciocalteu assay prevents interference of othersubstances such as ascorbic acid, aromatic amines, iron, organicacids, sugar, and sulfur dioxide present in urine (9).
The 12-h overnight urine samples were collected by partici-pants between 2002 and 2007 and processed by AHS-2 clinicstaff. Urine volume was recorded, and then two 90-mL specimencups were each filled to obtain #70-mL aliquots; 1 mL of 35%hydrochloric acid was added to 1 aliquot before freezing toprevent oxidation of labile compounds (39). In 2015, urinesamples were thawed in a refrigerator at w1.68C, mixed ona vortex machine for 10 s each, and then centrifuged for 10 minat 48C at 2350 3 g. All of the samples and standards werehandled with minimal exposure to light. Synthetic urine wasprepared by using 25 g pure urea in 500 mL distilled water.Standard gallic acid dilutions at concentrations of 50, 25, and12.5 mg/L in synthetic urine were created for the calibration ofeach assay. The 50-mg/L concentration was made from 100 mLstock gallic acid plus 1900 mL synthetic urine, which was di-luted 1:1 with synthetic urine to make the 25 and 12.5 mg/L
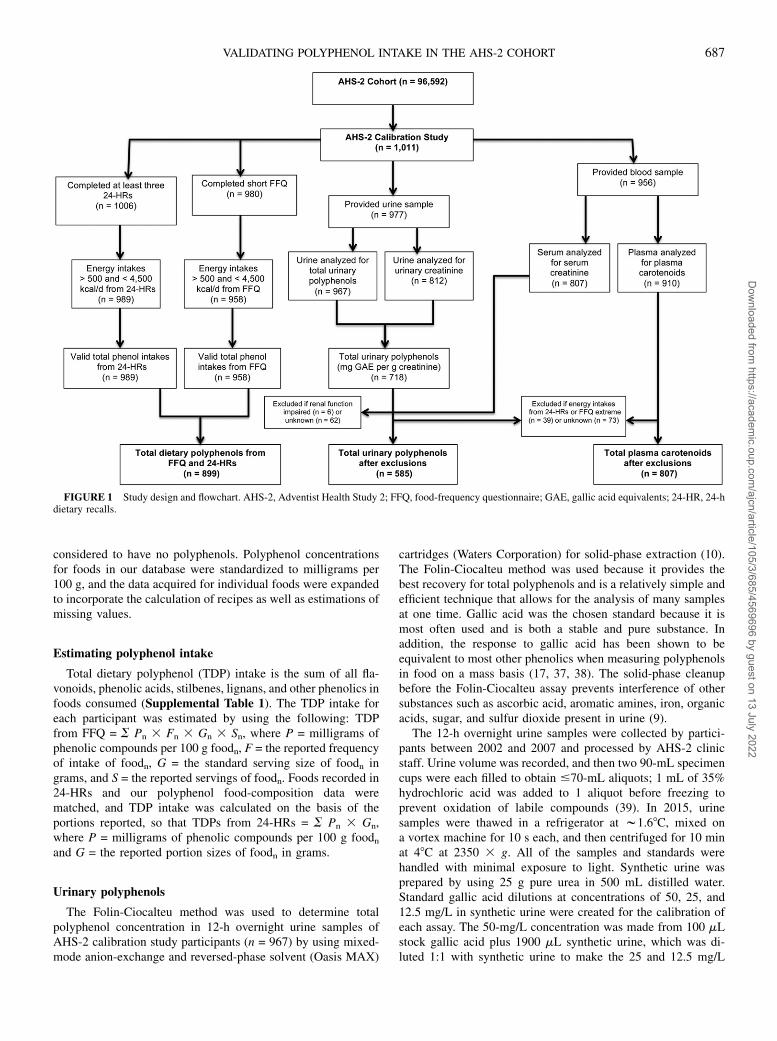
FIGURE 1 Study design and flowchart. AHS-2, Adventist Health Study 2; FFQ, food-frequency questionnaire; GAE, gallic acid equivalents; 24-HR, 24-hdietary recalls.
VALIDATING POLYPHENOL INTAKE IN THE AHS-2 COHORT 687
Dow
nloaded from https://academ
ic.oup.com/ajcn/article/105/3/685/4569696 by guest on 13 July 2022
dilutions. To equilibrate the cartridges, 1 mL 98% methanol and1 mL sodium acetate (50 mmol/L, pH 7) were loaded. Urinesamples were diluted 1:1 with distilled water, and then 1 mL ofeach diluted sample was loaded and rinsed with sodium acetate(50 mmol/L, pH 7) in 5% methanol. Phenolic compounds wereeluted with 1900 mL 2% formic acid in methanol.
Standard concentrations of 50, 25, and 12.5 mg gallic acid/Lwere analyzed on each plate. After purification, 15 mL elutedfractions was added to 4 wells of the Thermo microtiter 96-wellplate (Waters Corporation) so that 20 samples were run on eachplate. Each well was mixed with 170 mL distilled water, andthen 12 mL Folin-Ciocalteu reagent was added to each well. Themultichannel pipette reduced differences in the times of theFolin-Ciocalteu reaction between the 8 lines of the 96-well plateso that the reaction time was similar for all samples analyzed onthe same plate. Sodium carbonate was added to each well to ini-tiate the reaction, and the plate was held in the dark for 60 min.After the reaction delay, 73 mL distilled water was depositedinto each well and absorbance was measured at 765 nM inultraviolet-visible spectroscopy in the Bio-Tek Synergy HTspectrometer (BioTek Instruments Inc.). Concentrations of totalpolyphenol equivalents were adjusted for dilutions, and meanTUP values were calculated by using creatinine correction. Re-peatability was evaluated for quality assurance, and the CVs forintra- and interassays were 2.75% and 2.97%, respectively.
Urinary creatinine concentrations were determined previouslyin 2008 by the Cancer Research Center of Hawaii with a clinicalauto-analyzer (Roche-Cobas MiraPlus; Roche Diagnostics) byusing a test kit based on the Jaffe reaction (Randox Laboratories).Limits of detection for all analytes were 10 nmol creatinine/L or2–50 pg creatinine/mg. Urinary polyphenol concentrations wereadjusted for creatinine concentrations, and TUPs were expressedas milligrams of gallic acid equivalents per gram of creatinine.Renal function was estimated by using the Cockcroft-Faultequation (40): estimated glomerular filtration rate = (140 2 age)weight 3 0.85 (if female)/(serum creatinine 3 72). Participantswere categorized as having normal renal function if $60 mL/minor as having impaired renal function if ,60 mL/min.
Plasma carotenoids
After fasting blood samples were drawn from AHS-2 cali-bration study participants, plasma was centrifuged immediatelyand transported to Loma Linda University on frozen gel packswithin 30 h of collection, and samples were stored on liquidnitrogen. In 2008, plasma b- carotene, a-carotene, lycopene,lutein, and zeaxanthin were quantified at the UCLA Center forHuman Nutrition from these blood samples by using HPLC. TheAgilent 1050 HPLC (Agilent Technology) with multiple wave-length detectors was used for this analysis. A YMC carotenoidscolumn (Waters Corporation), 2503 4.6 mm, with a Vydac C18guard column (Alltech) was used, and carotenoids were detectedat 445 nm. The CVs for the intra-assay pooled plasma sample were7.4% for lutein, 10.3% for b-carotene, 11.5% for b-cryptoxanthin,12.2% for lycopene, and 14.2% for a-carotene (41).
Statistical analysis
The variables TUPs and plasma carotenoids were transformedby using log(x + 1) for statistical tests to approximate normality
and to avoid zero values. Because renal function varies withcreatinine excretion, participants with impaired renal function(i.e., estimated glomerular filtration rate ,60 mL/min accordingto the Cockcroft-Fault equation) were excluded from analyses(n = 6) involving the TUP biomarker. Polyphenol intakes fromfood groups estimated by 24-HR and the FFQ were energy-adjusted by using a partitioned energy-adjustment method, inwhich data that are initially zero remain zero and energy ad-justment is performed on nonzero data only. A similar approachhas been described elsewhere (42). Briefly, a log(x + 1) trans-formation was applied to nonzero data before energy adjust-ment. Then, let y = energy-adjusted residual + mean of log(x + 1),which we used as the energy-adjusted values on the logarithmicscale for nonzero data. Original zero values remained as zero.For the 24-HR, the transformed values from each recall wereweighted to produce a synthetic week [(Saturday intake + Sundayintake + 53 weekday intake)/7]. Finally, synthetic weeks 1 and 2were averaged to produce the energy-adjusted mean daily poly-phenol intake on the logarithmic scale.
The mean 6 SD polyphenol intake was estimated for eachdietary assessment method. Unadjusted, deattenuated, and par-tial correlations (also deattenuated) with adjustments for age,race, sex, and BMI were determined between each dietary as-sessment, and the biomarkers TUPs and plasma carotenoids. Inrace-specific analysis, race was excluded from the model. Cor-relations between 24-HRs and FFQs, TUPs, plasma carotenoids,
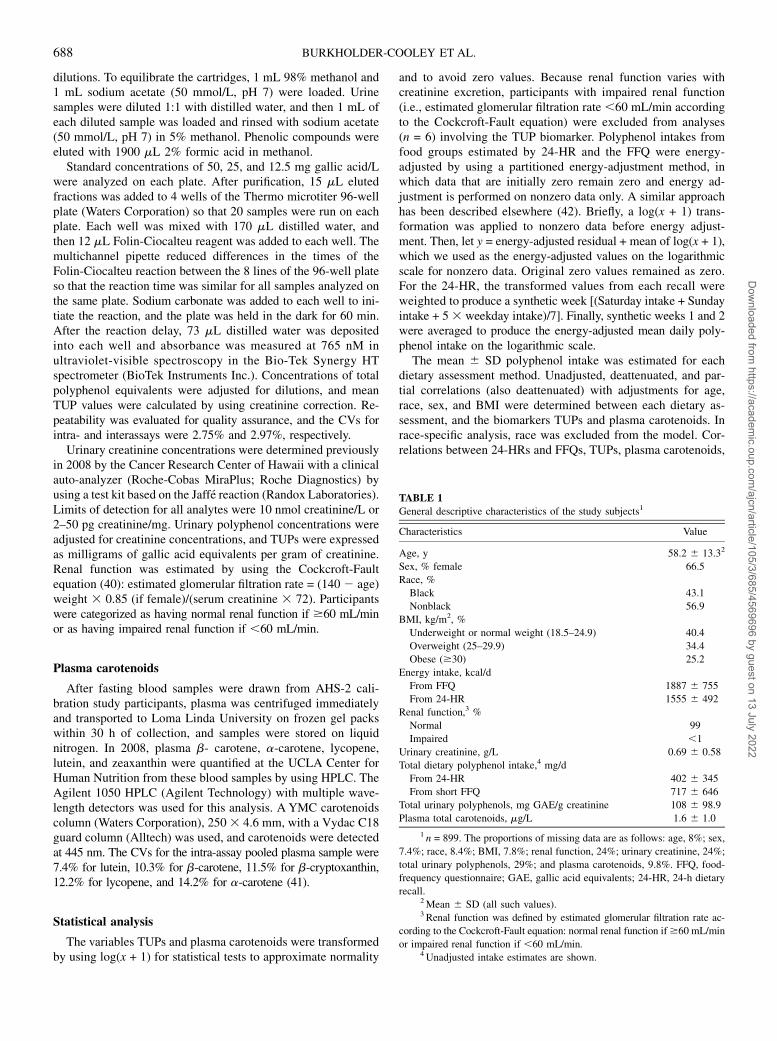
TABLE 1
General descriptive characteristics of the study subjects1
Characteristics Value
Age, y 58.2 6 13.32
Sex, % female 66.5
Race, %
Black 43.1
Nonblack 56.9
BMI, kg/m2, %
Underweight or normal weight (18.5–24.9) 40.4
Overweight (25–29.9) 34.4
Obese ($30) 25.2
Energy intake, kcal/d
From FFQ 1887 6 755
From 24-HR 1555 6 492
Renal function,3 %
Normal 99
Impaired ,1
Urinary creatinine, g/L 0.69 6 0.58
Total dietary polyphenol intake,4 mg/d
From 24-HR 402 6 345
From short FFQ 717 6 646
Total urinary polyphenols, mg GAE/g creatinine 108 6 98.9
Plasma total carotenoids, mg/L 1.6 6 1.0
1 n = 899. The proportions of missing data are as follows: age, 8%; sex,
7.4%; race, 8.4%; BMI, 7.8%; renal function, 24%; urinary creatinine, 24%;
total urinary polyphenols, 29%; and plasma carotenoids, 9.8%. FFQ, food-
frequency questionnaire; GAE, gallic acid equivalents; 24-HR, 24-h dietary
recall.2Mean 6 SD (all such values).3 Renal function was defined by estimated glomerular filtration rate ac-
cording to the Cockcroft-Fault equation: normal renal function if$60 mL/min
or impaired renal function if ,60 mL/min.4 Unadjusted intake estimates are shown.
688 BURKHOLDER-COOLEY ET AL.
Dow
nloaded from https://academ
ic.oup.com/ajcn/article/105/3/685/4569696 by guest on 13 July 2022

and polyphenol intakes from select food groups were correctedfor attenuation due to within-person variation in the recalls (43).A partitioned deattenuation (42) was applied, so that where allsix 24-HRs are zero values, the within-person variance is zero ornearly zero, so that no within-person adjustment for error isnecessary. The deattenuated values were obtained by removingthe deattenuating effects of random, within-person errors of therecall weeks when correlating recalls with questionnaire data, asdescribed by Willett (44). The following formula was used forcorrelating FFQ (Q) and recall (R) data:
rcðQ;RÞ ¼ r0ðQ;RÞffiffiffiffiffiffiffiffiffiffiffiffiffiffiffiffiffiffiffiffiffiffiffiffiffiffiffiffiffiffiffiffiffiffiffiffiffiffiffiffiffiffiffiffiffiffiffiffiffiffiffiffiffiffiffiffiffiffiffiffiffiffiffiffiffiffiffiffiffiffiffiffiffiffiffiffiffiffi1þ P2
nz 3varðRnzwÞ=2
varðRÞ2P2nz 3 varðRnzwÞ
�2
sð1Þ
where r0 = the uncorrected correlation, rc = the corrected cor-relation, Pnz = the proportion of nonzeros, and Rnzw = thewithin-person variance of nonzeros from recalls.
If at least one 24-HR week contained nonzero data, the within-person variance was corrected and deattenuated correlationsbetween total polyphenol intake and polyphenol intakes fromselect food groups from 24-HRs compared with FFQs wereestimated. The 95% CIs for corrected validity coefficients (VCs)were calculated by using bootstrap 2000 resampling and the bias-corrected and accelerated bootstrap (BCa) method (45). Themethod of triads was applied to compute VCs between theoreticaltrue intake and the biomarkers and polyphenol intakes from FFQsand 24-HRs (which were also deattenuated). Here we includeeither the 24-HRs (R) or the FFQs (Q) as dietary estimators and2 independent biomarkers of intake, total urinary polyphenols (M)and plasma carotenoids (P), as biomarkers. Where r is an esti-mated correlation coefficient, the VCs are calculated as follows:
VCXT ¼ffiffiffiffiffiffiffiffiffiffiffiffiffiffiffiffiffiffiffiffiffiffiffiffiffiffiffiffiffiffiffiffi"ðrXP 3 rXMÞ
rMP
#vuut ; X ¼ R orQ ð2Þ
VCMT ¼ffiffiffiffiffiffiffiffiffiffiffiffiffiffiffiffiffiffiffiffiffiffiffiffiffiffiffiffiffiffiffiffiffi"ðrMX 3 rMP Þ
rXP
#vuut ;
X ¼ R orQ ðdifferent estimators of the same quantitiesÞ ð3Þ
VCPT ¼ffiffiffiffiffiffiffiffiffiffiffiffiffiffiffiffiffiffiffiffiffiffiffiffiffiffiffiffiffiffiffiffi"ðrPX 3 rPMÞ
rXM
#vuut ;
X ¼ R orQ ðdifferent estimators of the same quantitiesÞ: ð4Þ
Analyses were completed by using IBM SPSS version 2.1 (IBMCorporation) and R version 3.2.2 (R Foundation for StatisticalComputing).
RESULTS
The mean unadjusted polyphenol intake estimates were 717 6646 mg/d from FFQs and 4026 345 mg/d from 24-HRs; the meanTUP concentration was 108 6 98.9 mg gallic acid equivalents/gcreatinine (Table 1). Correlations between energy-adjusted T
ABLE2
Uncorrected,unadjusted
deattenuated,andadjusted
deattenuated
correlationsbetweenenergy-adjusted
TDPsfrom
24-H
RsandTDPsfrom
FFQs,TUPbiomarker,andtotalplasm
acarotenoids,stratified
by
race
1
TDPs(FFQ),
mg/d
TUPs,2mgGAE/g
urinarycreatinine
Plasm
acarotenoids,2
mg/L
Uncorrected
correlation
Deattenuated
unadjusted
correlation(95%
CI)
Deattenuated
adjusted
correlation(95%
CI)3Uncorrected
correlation
Deattenuated
unadjusted
correlation(95%
CI)
Deattenuated
adjusted
correlation(95%
CI)3Uncorrected
correlation
Deattenuated
unadjusted
correlation(95%
CI)
Deattenuated
adjusted
correlation(95%
CI)3
TDPs(24-H
R),4mg/d
All(n
=823)
0.51*
0.64(0.55,0.71)
0.63(0.61,0.69)
0.15*
0.19(0.09,0.29)
0.20(0.13,0.32)
0.14*
0.18(0.10,0.27)
0.18(0.12,0.27)
Nonblacks(n
=468)
0.58*
0.71(0.54,0.81)
0.71(0.64,0.81)
0.14*
0.16(0.04,0.27)
0.17(0.07,0.30)
0.12*
0.14(0.03,0.26)
0.13(0.03,0.24)
Blacks(n
=355)
0.38*
0.52(0.36,0.66)
0.52(0.47,0.66)
0.17*
0.23(0.05,0.45)
0.23(0.09,0.42)
0.21*
0.28(0.13,0.42)
0.29(0.20,0.44)
1TDPsfrom
24-H
RsorFFQsforuncorrected,deattenuated
unadjusted,and
adjusted
deattenuated
correlationswereenergyadjusted.*P,
0.001
(2-tailed).FFQ,food-frequency
questionnaire;GAE,gallic
acid
equivalents;TDP,
totaldietary
polyphenol;TUP,
totalurinarypolyphenol;24-H
R,24-h
dietary
recall.
2Transform
edbyusingnatural
log+1.
3Adjusted
forage,
race,sex,andBMI.Forrace-specificanalysis,race
was
removed
from
themodel.
4Correctedforattenuationdueto
within-personerrorin
therecalls.Bias-correctedandacceleratedbootstrap
CIs
werebased
on2000resampling.
VALIDATING POLYPHENOL INTAKE IN THE AHS-2 COHORT 689
Dow
nloaded from https://academ
ic.oup.com/ajcn/article/105/3/685/4569696 by guest on 13 July 2022
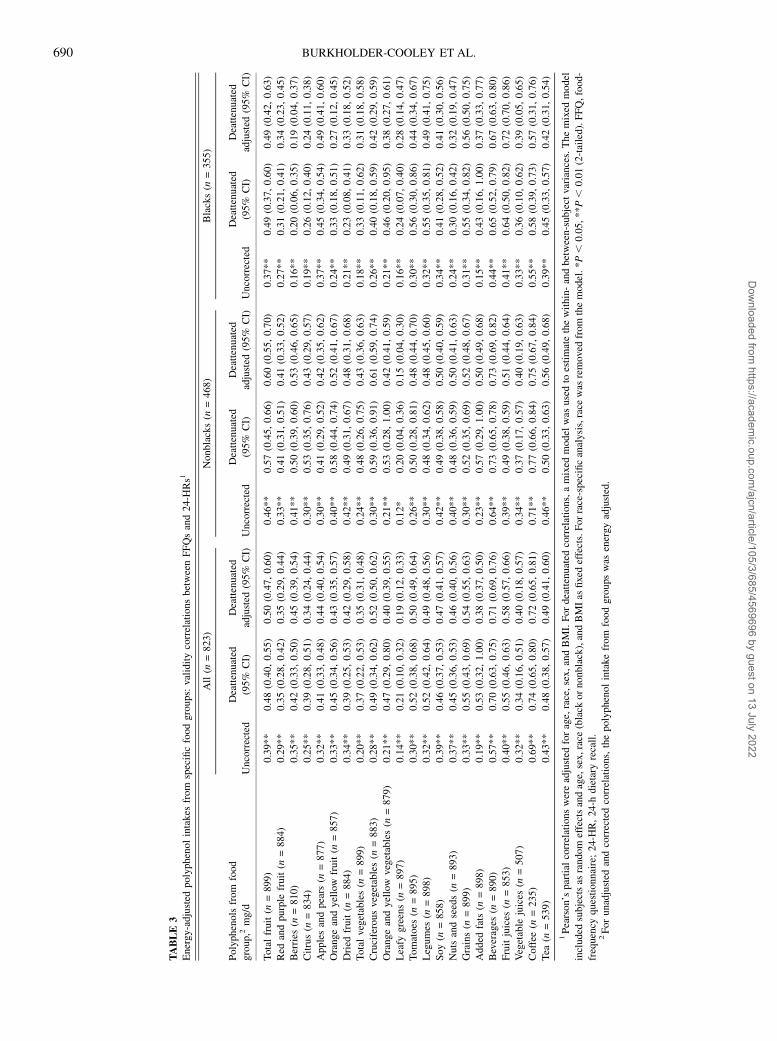
TABLE3
Energy-adjusted
polyphenolintakes
from
specificfoodgroups:validitycorrelationsbetweenFFQsand24-H
Rs1
All(n
=823)
Nonblacks(n
=468)
Blacks(n
=355)
Polyphenolsfrom
food
group,2mg/d
Uncorrected
Deattenuated
(95%
CI)
Deattenuated
adjusted
(95%
CI)
Uncorrected
Deattenuated
(95%
CI)
Deattenuated
adjusted
(95%
CI)
Uncorrected
Deattenuated
(95%
CI)
Deattenuated
adjusted
(95%
CI)
Totalfruit(n
=899)
0.39**
0.48(0.40,0.55)
0.50(0.47,0.60)
0.46**
0.57(0.45,0.66)
0.60(0.55,0.70)
0.37**
0.49(0.37,0.60)
0.49(0.42,0.63)
Red
andpurple
fruit(n
=884)
0.29**
0.35(0.28,0.42)
0.35(0.29,0.44)
0.33**
0.41(0.31,0.51)
0.41(0.33,0.52)
0.27**
0.31(0.21,0.41)
0.34(0.23,0.45)
Berries
(n=810)
0.35**
0.42(0.33,0.50)
0.45(0.39,0.54)
0.41**
0.50(0.39,0.60)
0.53(0.46,0.65)
0.16**
0.20(0.06,0.35)
0.19(0.04,0.37)
Citrus(n
=834)
0.25**
0.39(0.28,0.51)
0.34(0.24,0.44)
0.30**
0.53(0.35,0.76)
0.43(0.29,0.57)
0.19**
0.26(0.12,0.40)
0.24(0.11,0.38)
Applesandpears
(n=877)
0.32**
0.41(0.33,0.48)
0.44(0.40,0.54)
0.30**
0.41(0.29,0.52)
0.42(0.35,0.62)
0.37**
0.45(0.34,0.54)
0.49(0.41,0.60)
Orangeandyellow
fruit(n
=857)
0.33**
0.45(0.34,0.56)
0.43(0.35,0.57)
0.40**
0.58(0.44,0.74)
0.52(0.41,0.67)
0.24**
0.33(0.18,0.51)
0.27(0.12,0.45)
Dried
fruit(n
=884)
0.34**
0.39(0.25,0.53)
0.42(0.29,0.58)
0.42**
0.49(0.31,0.67)
0.48(0.31,0.68)
0.21**
0.23(0.08,0.41)
0.33(0.18,0.52)
Totalvegetables(n
=899)
0.20**
0.37(0.22,0.53)
0.35(0.31,0.48)
0.24**
0.48(0.26,0.75)
0.43(0.36,0.63)
0.18**
0.33(0.11,0.62)
0.31(0.18,0.58)
Cruciferousvegetables(n
=883)
0.28**
0.49(0.34,0.62)
0.52(0.50,0.62)
0.30**
0.59(0.36,0.91)
0.61(0.59,0.74)
0.26**
0.40(0.18,0.59)
0.42(0.29,0.59)
Orangeandyellow
vegetables(n
=879)
0.21**
0.47(0.29,0.80)
0.40(0.39,0.55)
0.21**
0.53(0.28,1.00)
0.42(0.41,0.59)
0.21**
0.46(0.20,0.95)
0.38(0.27,0.61)
Leafy
greens(n
=897)
0.14**
0.21(0.10,0.32)
0.19(0.12,0.33)
0.12*
0.20(0.04,0.36)
0.15(0.04,0.30)
0.16**
0.24(0.07,0.40)
0.28(0.14,0.47)
Tomatoes
(n=895)
0.30**
0.52(0.38,0.68)
0.50(0.49,0.64)
0.26**
0.50(0.28,0.81)
0.48(0.44,0.70)
0.30**
0.56(0.30,0.86)
0.44(0.34,0.67)
Legumes
(n=898)
0.32**
0.52(0.42,0.64)
0.49(0.48,0.56)
0.30**
0.48(0.34,0.62)
0.48(0.45,0.60)
0.32**
0.55(0.35,0.81)
0.49(0.41,0.75)
Soy(n
=858)
0.39**
0.46(0.37,0.53)
0.47(0.41,0.57)
0.42**
0.49(0.38,0.58)
0.50(0.40,0.59)
0.34**
0.41(0.28,0.52)
0.41(0.30,0.56)
Nutsandseeds(n
=893)
0.37**
0.45(0.36,0.53)
0.46(0.40,0.56)
0.40**
0.48(0.36,0.59)
0.50(0.41,0.63)
0.24**
0.30(0.16,0.42)
0.32(0.19,0.47)
Grains(n
=899)
0.33**
0.55(0.43,0.69)
0.54(0.55,0.63)
0.30**
0.52(0.35,0.69)
0.52(0.48,0.67)
0.31**
0.55(0.34,0.82)
0.56(0.50,0.75)
Added
fats(n
=898)
0.19**
0.53(0.32,1.00)
0.38(0.37,0.50)
0.23**
0.57(0.29,1.00)
0.50(0.49,0.68)
0.15**
0.43(0.16,1.00)
0.37(0.33,0.77)
Beverages
(n=890)
0.57**
0.70(0.63,0.75)
0.71(0.69,0.76)
0.64**
0.73(0.65,0.78)
0.73(0.69,0.82)
0.44**
0.65(0.52,0.79)
0.67(0.63,0.80)
Fruitjuices
(n=853)
0.40**
0.55(0.46,0.63)
0.58(0.57,0.66)
0.39**
0.49(0.38,0.59)
0.51(0.44,0.64)
0.41**
0.64(0.50,0.82)
0.72(0.70,0.86)
Vegetable
juices
(n=507)
0.32**
0.34(0.16,0.51)
0.40(0.18,0.57)
0.34**
0.37(0.17,0.57)
0.40(0.19,0.63)
0.33**
0.36(0.10,0.62)
0.39(0.05,0.65)
Coffee
(n=235)
0.69**
0.74(0.65,0.80)
0.72(0.65,0.81)
0.71**
0.77(0.66,0.84)
0.75(0.67,0.84)
0.55**
0.58(0.39,0.73)
0.57(0.31,0.76)
Tea
(n=539)
0.43**
0.48(0.38,0.57)
0.49(0.41,0.60)
0.46**
0.50(0.33,0.63)
0.56(0.49,0.68)
0.39**
0.45(0.33,0.57)
0.42(0.31,0.54)
1Pearson’spartial
correlationswereadjusted
forage,race,sex,andBMI.Fordeattenuated
correlations,amixed
model
was
usedto
estimatethewithin-andbetween-subject
variances.Themixed
model
included
subjectsas
random
effectsandage,sex,race
(black
ornonblack),andBMIas
fixedeffects.Forrace-specificanalysis,race
was
removed
from
themodel.*P,
0.05,
**P,
0.01(2-tailed).FFQ,food-
frequency
questionnaire;24-H
R,24-h
dietary
recall.
2Forunadjusted
andcorrectedcorrelations,thepolyphenolintakefrom
foodgroups
was
energy
adjusted.
690 BURKHOLDER-COOLEY ET AL.
Dow
nloaded from https://academ
ic.oup.com/ajcn/article/105/3/685/4569696 by guest on 13 July 2022
polyphenol intakes from 24-HRs with FFQs, TUPs, and plasmacarotenoids in crude models and after correction for attenuationdue to within-person variation in 24-HRs, with further adjustmentfor differences in age, race, sex, and BMI, are shown in Table 2.In race-specific analysis, correlations between TDPs from 24-HRsand FFQs improved after deattenuation in the recalls in nonblackand black subjects by 18% and 27%, respectively. Correlationsbetween TDPs from 24-HRs and biomarkers were higher amongblack subjects than in nonblacks.
Uncorrected and deattenuated partial correlations betweenFFQ and 24-HR measurements of polyphenol intakes from selectfood groups, with adjustments for age, race, sex, and BMI, wereall significant (Table 3). Correlations between polyphenol in-takes from select food groups as estimated by 24-HRs and FFQsranged from 0.19 to 0.72 in all subjects after deattenuation andadjustment for covariates. The highest correlations were ob-served for polyphenols from coffee (0.72; 95% CI: 0.65, 0.81)and fruit juice (0.58; 95% CI: 0.57, 0.66). The mean of thedeattenuated adjusted correlations between 24-HR and FFQmeasurements for polyphenol intakes from various food groupswas 0.46, which indicated reasonable validity of the FFQ. Themean deattenuated adjusted correlation was higher for nonblack(0.50) than for black (0.41) subjects (data not shown in Table 3).
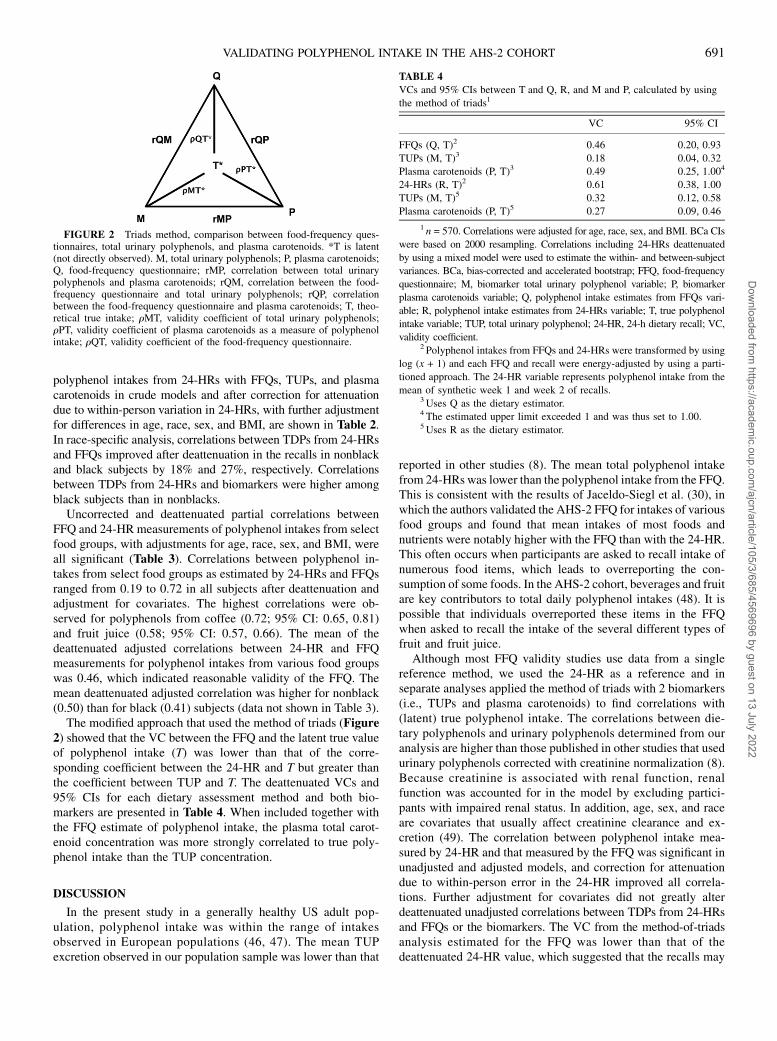
The modified approach that used the method of triads (Figure2) showed that the VC between the FFQ and the latent true valueof polyphenol intake (T) was lower than that of the corre-sponding coefficient between the 24-HR and T but greater thanthe coefficient between TUP and T. The deattenuated VCs and95% CIs for each dietary assessment method and both bio-markers are presented in Table 4. When included together withthe FFQ estimate of polyphenol intake, the plasma total carot-enoid concentration was more strongly correlated to true poly-phenol intake than the TUP concentration.
DISCUSSION
In the present study in a generally healthy US adult pop-ulation, polyphenol intake was within the range of intakesobserved in European populations (46, 47). The mean TUPexcretion observed in our population sample was lower than that
reported in other studies (8). The mean total polyphenol intakefrom 24-HRs was lower than the polyphenol intake from the FFQ.This is consistent with the results of Jaceldo-Siegl et al. (30), inwhich the authors validated the AHS-2 FFQ for intakes of variousfood groups and found that mean intakes of most foods andnutrients were notably higher with the FFQ than with the 24-HR.This often occurs when participants are asked to recall intake ofnumerous food items, which leads to overreporting the con-sumption of some foods. In the AHS-2 cohort, beverages and fruitare key contributors to total daily polyphenol intakes (48). It ispossible that individuals overreported these items in the FFQwhen asked to recall the intake of the several different types offruit and fruit juice.
Although most FFQ validity studies use data from a singlereference method, we used the 24-HR as a reference and inseparate analyses applied the method of triads with 2 biomarkers(i.e., TUPs and plasma carotenoids) to find correlations with(latent) true polyphenol intake. The correlations between die-tary polyphenols and urinary polyphenols determined from ouranalysis are higher than those published in other studies that usedurinary polyphenols corrected with creatinine normalization (8).Because creatinine is associated with renal function, renalfunction was accounted for in the model by excluding partici-pants with impaired renal status. In addition, age, sex, and raceare covariates that usually affect creatinine clearance and ex-cretion (49). The correlation between polyphenol intake mea-sured by 24-HR and that measured by the FFQ was significant inunadjusted and adjusted models, and correction for attenuationdue to within-person error in the 24-HR improved all correla-tions. Further adjustment for covariates did not greatly alterdeattenuated unadjusted correlations between TDPs from 24-HRsand FFQs or the biomarkers. The VC from the method-of-triadsanalysis estimated for the FFQ was lower than that of thedeattenuated 24-HR value, which suggested that the recalls may
FIGURE 2 Triads method, comparison between food-frequency ques-tionnaires, total urinary polyphenols, and plasma carotenoids. *T is latent(not directly observed). M, total urinary polyphenols; P, plasma carotenoids;Q, food-frequency questionnaire; rMP, correlation between total urinarypolyphenols and plasma carotenoids; rQM, correlation between the food-frequency questionnaire and total urinary polyphenols; rQP, correlationbetween the food-frequency questionnaire and plasma carotenoids; T, theo-retical true intake; rMT, validity coefficient of total urinary polyphenols;rPT, validity coefficient of plasma carotenoids as a measure of polyphenolintake; rQT, validity coefficient of the food-frequency questionnaire.
TABLE 4
VCs and 95% CIs between T and Q, R, and M and P, calculated by using
the method of triads1
VC 95% CI
FFQs (Q, T)2 0.46 0.20, 0.93
TUPs (M, T)3 0.18 0.04, 0.32
Plasma carotenoids (P, T)3 0.49 0.25, 1.004
24-HRs (R, T)2 0.61 0.38, 1.00
TUPs (M, T)5 0.32 0.12, 0.58
Plasma carotenoids (P, T)5 0.27 0.09, 0.46
1 n = 570. Correlations were adjusted for age, race, sex, and BMI. BCa CIs
were based on 2000 resampling. Correlations including 24-HRs deattenuated
by using a mixed model were used to estimate the within- and between-subject
variances. BCa, bias-corrected and accelerated bootstrap; FFQ, food-frequency
questionnaire; M, biomarker total urinary polyphenol variable; P, biomarker
plasma carotenoids variable; Q, polyphenol intake estimates from FFQs vari-
able; R, polyphenol intake estimates from 24-HRs variable; T, true polyphenol
intake variable; TUP, total urinary polyphenol; 24-HR, 24-h dietary recall; VC,
validity coefficient.2 Polyphenol intakes from FFQs and 24-HRs were transformed by using
log (x + 1) and each FFQ and recall were energy-adjusted by using a parti-
tioned approach. The 24-HR variable represents polyphenol intake from the
mean of synthetic week 1 and week 2 of recalls.3 Uses Q as the dietary estimator.4 The estimated upper limit exceeded 1 and was thus set to 1.00.5 Uses R as the dietary estimator.
VALIDATING POLYPHENOL INTAKE IN THE AHS-2 COHORT 691
Dow
nloaded from https://academ
ic.oup.com/ajcn/article/105/3/685/4569696 by guest on 13 July 2022
have superior validity when assessing polyphenol intake, but thewide CIs permit alternative conclusions. Our sample size in thisanalysis was smaller than that generally recommended when esti-mating VCs (28), which may have influenced the interval estimates.By using 2 biomarkers and 1 dietary assessment tool in each triadmodel, we overcame the unrealistic assumption that errors associ-ated with FFQs and 24-HRs are unrelated (28), which is inherent ina naive interpretation of standard correlation coefficients.
The relatively low correlations between polyphenol intake andurinary polyphenols may be explained by individual differencesin the metabolism of polyphenols and their excretion in urine.Large variations in polyphenol pharmacokinetics have beenobserved, ranging from virtually zero polyphenols showing up inurine to a 5-fold increase in polyphenol excretion in urine afterthe ingestion of identical amounts of a polyphenol-containingfood (50). Therefore, it is reasonable to assume that polyphenolmetabolism may vary substantially in the general population.Another limitation of measuring polyphenols in urine is that somephenolic compounds use alternative excretion routes (e.g., bile)and are not recovered in urine (37). Phenolic compounds fromfood and beverages have shown structural changes before ex-cretion in urine (51), so the total phenolic compounds reflected bydietary intake measurements are likely to be different from whatis measured in urine. In addition, the food composition and thechemical form of the polyphenol in the food may alter the dose-response relation between polyphenol intake and urine concen-tration (19, 20, 26). The bioavailability of individual phenoliccompounds also varies: for example, citrus polyphenols are moreaccessible (52), whereas polyphenols bound to fiber fractions offoods are less available (15, 53).
Of the major food groups examined, beverage polyphenolsproduced the highest correlation for both nonblack and blackparticipants. Coffee and fruit juices represent the greatest con-tributors to polyphenol intake in this cohort (48), and the phenoliccompounds from low-fiber beverages (e.g., coffee, juice) tend tobe more accessible than those linked to fiber fractions of a food(15). The food groups with the lowest performance included leafygreens and added fats, perhaps because these foods are ofteneaten as mixed dishes or because they are consumed less fre-quently than beverages (54).
Strengths and limitations
The primary strengths of the present validation study includethe relatively large sample of participants and the use of amodified method-of-triads approach that used 2 independentbiomarkers to assess the validity of the FFQ for assessingpolyphenol intake. Furthermore, we used up to six 24-HRs asa reference to validate dietary intake. The concentration of TUPsestimated by using creatinine-corrected 12-h urine samples an-alyzed by Folin-Ciocalteu assay is considered to be an acceptablebiomarker of total polyphenol intake (8). Plasma carotenoidconcentration is also a reasonable proxy indicator of the intake ofpolyphenol-rich foods, because both carotenoids and polyphenolsare concentrated in fruit, fruit juices, and vegetables. Althoughconcentration biomarkers cannot be translated into absoluteamounts of intake, they do correlate to dietary polyphenol intake.In this study, TUPs and plasma carotenoids are from differenttissue types (urine and plasma) and vary in their half-life: plasmacarotenoids represent the preceding 1–2 wk of dietary exposure
(55) and urinary polyphenols indicate a period of 1–2 d of intake(38). Thus, associated measurement errors are less likely to becorrelated. In addition, because recalls were gathered in 2 blocks5 to 6 mo apart and the biomarkers were collected between the 2recall blocks, measurements were likely not close enough to beaffected by short-term correlations. It is important to note thatconcentration biomarkers have inherent limitations, includinglow reproducibility, alternative excretion routes, and suscepti-bility to interindividual variation in physiology and environmentthat may affect the detection of metabolites (37). Due to the sizeand geographic spread of our calibration cohort (n w 1011),repeated sampling of TUPs and plasma carotenoids was notpractical, although deattenuation of the biomarkers was notrelevant to the method that we used. One additional assumptionof the method of triads is that different assessment methods havelinear relations with underlying true intake. Finally, the refer-ence period differs between the FFQ and the 24-HR.
Conclusions
To our knowledge, our findings provide a novel objective as-sessment of polyphenol intake in a North American population ofpersons with diverse dietary intakes. The positive correlationobserved between the FFQ estimates and the 24-HR shows that theFFQ is a reasonable indicator of total polyphenol intake in theAHS-2 cohort. In addition, the AHS-2 FFQ has relatively goodvalidity for polyphenol intake frommany food groups, particularlyfor beverages and other foods that represent good dietary sourcesof polyphenols in the cohort. The application of a modifiedmethod-of-triads model that used 2 biomarkers provided an ad-ditional means of validation. The VCs suggest that the total urinarypolyphenol biomarker does not perform as well as the FFQ, andtherefore should be used to supplement rather than substitute forintake data when assessing polyphenol consumption. Exploringassociations between polyphenol intake and health outcomes inthis cohort and identifying alternative biomarkers of polyphenolintake are reasonable goals of future research.
We thank Rita Amen for her assistance in laboratory analysis in measuring
total polyphenols in urine samples. We also acknowledge Susanna Henning
and her laboratory at the University of California–Los Angeles for assessing
total plasma carotenoids.
The authors’ responsibilities were as follows—NMB-C, SSR, EHH, GEF,
and KJ-S: designed the research; NMB-C and EHH: conducted laboratory
analyses; NMB-C and KO: analyzed the data; SSR, EHH, GEF, and KJ-S:
assisted with data interpretation; NMB-C: wrote the manuscript; and all
authors: read and approved the final manuscript. None of the authors re-
ported a conflict of interest related to the study.
REFERENCES1. Manach C, Scalbert A, Morand C, Remesy C, Jimenez L. Polyphenols:
food sources and bioavailability. Am J Clin Nutr 2004;79:727–47.2. Vauzour D, Rodriguez-Mateos A, Corona G, Oruna-Concha MJ,
Spencer J. Polyphenols and human health: prevention of disease andmechanisms of action. Nutrients 2010;2:1106–31.
3. Arts IC, Hollman P. Polyphenols and disease risk in epidemiologicstudies. Am J Clin Nutr 2005;81(Suppl):317S–25S.
4. Tomas-Barberan FA, Andres-Lacueva C. Polyphenols and health:current state and progress. J Agric Food Chem 2012;60:8773–5.
5. Tresserra-Rimbau A, Medina-Remon A, Perez-Jimenez J, Martınez-Gonzalez M, Covas M, Corella D, Salas-Salvado J, Gomez-Gracia E,Lapetra J, Aros F. Dietary intake and major food sources of poly-phenols in a Spanish population at high cardiovascular risk: thePREDIMED study. Nutr Metab Cardiovas 2013;23:953–9.
692 BURKHOLDER-COOLEY ET AL.
Dow
nloaded from https://academ
ic.oup.com/ajcn/article/105/3/685/4569696 by guest on 13 July 2022
6. Voutilainen S, Nurmi T, Mursu J, Rissanen T. Carotenoids and car-diovascular health. Am J Clin Nutr 2006;83:1265–71.
7. Zamora-Ros R, Forouhi NG, Sharp SJ, Gonzalez CA, Buijsse B,Guevara M, van der Schouw YT, Amiano P, Boeing H, Bredsdorff L,et al. Dietary intakes of individual flavanols and flavonols are inverselyassociated with incident type 2 diabetes in European populations.J Nutr 2014;144:335–43.
8. Zamora-Ros R, Rabassa M, Cherubini A, Urpi-Sarda M, Llorach R,Bandinelli S, Ferrucci L, Andres-Lacueva C. Comparison of 24-hvolume and creatinine-corrected total urinary polyphenol as a bio-marker of total dietary polyphenols in the Invecchiare InCHIANTIstudy. Anal Chim Acta 2011;704:110–5.
9. Roura E, Andres-Lacueva C, Estruch R, Lamuela-Raventos RM. Totalpolyphenol intake estimated by a modified Folin-Ciocalteu assay ofurine. Clin Chem 2006;52:749–52.
10. Medina-Remon A, Barrionuevo-Gonzalez A, Zamora-Ros R, Andres-Lacueva C, Estruch R, Martınez-Gonzalez M-A, Diez-Espino J, Lamuela-Raventos RM. Rapid Folin-Ciocalteu method using microtiter 96-wellplate cartridges for solid phase extraction to assess urinary total phenoliccompounds, as a biomarker of total polyphenols intake. Anal Chim Acta2009;634:54–60.
11. Zamora-Ros R, Rabassa M, Cherubini A, Urpi-Sarda M, Bandinelli S,Ferrucci L, Andres-Lacueva C. High concentrations of a urinary bio-marker of polyphenol intake are associated with decreased mortality inolder adults. J Nutr 2013;143:1445–50.
12. Mattila P, Pihlava J-m, Hellstrom J. Contents of phenolic acids, alkyl-and alkenylresorcinols, and avenanthramides in commercial grainproducts. J Agric Food Chem 2005;53:8290–5.
13. Moco S, Martin F, Rezzi S. Metabolomics view on but microbiomemodulation by polyphenol-rich foods. J Proteome Res 2012;11:4781–90.
14. Rechner AR, Smith M, Kuhnle G, Gibson G, Debnam E, Srai S. Co-lonic metabolism of dietary polyphenols: influence of structure onmicrobial fermentation products. Free Radic Biol Med 2004;36:212–25.
15. Scalbert A, Williamson G. Dietary intake and bioavailability of poly-phenols. J Nutr 2000;130(Suppl):2073S–85S.
16. Manach C, Williamson G, Morand C, Scalbert A, Remesy C.Bioavailability and bioefficacy of polyphenols in humans: review of97 bioavailability studies. Am J Clin Nutr 2005;81(Suppl):230S–42S.
17. Zamora-Ros R, Knaze V, Lujan-Barroso L, Romieu I, Scalbert A,Slimani N, Hjartaker A, Engeset D, Skeie G, Overvad K, et al. Dif-ferences in dietary intakes, food sources and determinants of totalflavonoids between Mediterranean and non-Mediterranean countriesparticipating in the European Prospective Investigation into Cancer andNutrition (EPIC) study. Br J Nutr 2013;109:1498–507.
18. Johnson EJ. The role of carotenoids in human health. Nutr Clin Care2002;5:56–65.
19. Carlsen MH, Karlsen A, Lillegaard ITL, Gran JM, Drevon CA,Blomhoff R, Andersen LF. Relative validity of fruit and vegetable in-take estimated from an FFQ, using carotenoid and flavonoid bio-markers and the method of triads. Br J Nutr 2011;105:1530–8.
20. Al-Delaimy WK, Slimani N, Ferrari P, Key T, Spencer E, Johansson I,Johansson G, Mattisson I, Wirfalt E, Sieri S, et al. Plasma carotenoidsas biomarkers of intake of fruits and vegetables: ecological-level cor-relations in the European Prospective Investigation into Cancer andNutrition (EPIC). Eur J Clin Nutr 2005;59:1397–408.
21. Svilaas A, Sakhi AK, Andersen LF, Svilaas T, Strom EC, Jacobs DR,Ose L, Blomhoff R. Intakes of antioxidants in coffee, wine, and veg-etables are correlated with plasma carotenoids in humans. J Nutr 2004;134:562–7.
22. Craft NE. Carotenoid reversed-phase high-performance liquid chro-matography methods: reference compendium. Methods Enzymol 1992;213:185–205.
23. Al-Delaimy WK, Natarajan L, Sun X, Rock C, Pierce J, Pierce J,Faerber S, Newman V, Flatt S, Kealey S. Reliability of plasma carot-enoid biomarkers and its relation to study power. Epidemiology 2008;19:338–44.
24. El-Sohemy A, Baylin A, Kabagambe E, Ascherio A, Spiegelman D,Campos H. Individual carotenoid concentrations in adipose tissue andplasma as biomarkers of dietary intake. Am J Clin Nutr 2002;76:172–9.
25. Rock CL, Swendseid ME, Jacob RA, McKee RW. Plasma carotenoid levelsin human subjects fed a low carotenoid diet. J Nutr 1992;122:96–100.
26. Ocke MC, Kaaks RJ. Biochemical markers as additional measurementsin dietary validity studies: application of the method of triads withexamples from the European Prospective Investigation into Cancer andNutrition. Am J Clin Nutr 1997;65(Suppl):1240S–5S.
27. Daures JP, Gerber M, Scali J, Astre C, Bonifacj C, Kaaks R. Validationof a food-frequency questionnaire using multiple-day records andbiochemical markers: application of the triads method. J EpidemiolBiostat 2000;5:109–15.
28. Fraser GE, Butler TL, Shavlik D. Correlations between estimated andtrue dietary intakes: using two instrumental variables. Ann Epidemiol2005;15:509–18.
29. Butler TL, Fraser GE, Beeson WL, Knutsen SF, Herring RP, Chan J,Sabate J, Montgomery S, Haddad E, Preston-Martin S, et al. Cohortprofile: the Adventist Health Study-2 (AHS-2). Int J Epidemiol 2008;37:260–5.
30. Jaceldo-Siegl K, Knutsen S, Sabate J, Beeson W, Chan J, Herring R,Butler T, Haddad E, Bennett H, Montgomery S, et al. Validation ofnutrient intake using an FFQ and repeated 24 h recalls in black andwhite subjects of the Adventist Health Study-2 (AHS-2). Public HealthNutr 2010;13:812–9.
31. Fraser G. Diet, life expectancy, and chronic disease: studies of Seventh-Day Adventists and other vegetarians. New York: Oxford UniversityPress; 2003.
32. Neveu V, Perez-Jimenez J, Vos F, Crespy V, du Chaffaut L, Mennen L,Knox C, Eisner R, Cruz J, Wishart D, et al. Phenol-Explorer: an onlinecomprehensive database on polyphenol contents in foods. Database(Oxford) 2010;2010:bap024.
33. Bhagwat S, Haytowitz DB, Holden JM. Database for flavonoid contentof selected foods. Release 3.1. 2014. Beltsville (MD): USDA. [cited2015 Dec 15]. Available from: https://www.ars.usda.gov/ARSUserFiles/80400525/Data/Flav/Flav_R03-1.pdf.
34. Bhagwat S, Haytowitz DB, Holden JM. USDA database for the iso-flavone content of selected foods. Release 2.0. 2008. Beltsville (MD):USDA. [cited 2015 Dec 15]. Available from: https://www.ars.usda.gov/ARSUserFiles/80400525/Data/isoflav/Isoflav_R2.pdf.
35. Arapitsas P. Identification and quantification of polyphenolic com-pounds from okra seeds and skins. Food Chem 2008;110:1041–5.
36. Nakamura K, Kayahara H, Tian S. Analysis of phenolic compounds inwhite rice, brown rice, and germinated brown rice. J Agric Food Chem2004;52:4808–13.
37. Spencer JP, Abd El Mohsen M, Minihane A, Mathers J. Biomarkers ofthe intake of dietary polyphenols: strengths, limitations and applicationin nutrition research. Br J Nutr 2008;99:12–22.
38. Perez-Jimenez J, Hubert J, Hooper L, Cassidy A, Manach C, WilliamsonG, Scalbert A. Urinary metabolites as biomarkers of polyphenol intake inhumans: a systematic review. Am J Clin Nutr 2010;92:801–9.
39. Jaceldo-Siegl K, Fraser GE, Chan J, Franke A, Sabate J. Validation ofsoy protein estimates from a food-frequency questionnaire with re-peated 24-h recalls and isoflavonoid excretion in overnight urine ina Western population with a wide range of soy intakes. Am J Clin Nutr2008;87:1422–7.
40. Michels WM, Grootendorst DC, Verduijn M, Elliott EG, Dekker FW,Krediet RT. Performance of the Cockcroft-Gault, MDRD, and newCKD-EPI formulas in relation to GFR, age, and body size. Clin J AmSoc Nephrol 2010;5:1003–9.
41. Fraser GE, Jaceldo-Siegl K, Henning S, Fan J, Knutsen S, Haddad E,Sabate J, Beeson L, Bennett H. Biomarkers of dietary intake are cor-related with corresponding measures from repeated dietary recalls andfood-frequency questionnaires in the Adventist Health Study-2. J Nutr2016;146:586–94.
42. Jaceldo-Siegl K, Fan J, Sabate J, Knutsen SF, Haddad E, Beeson WL,Herring RP, Butler TL, Bennett H, Fraser GE. Race-specific validationof food intake obtained from a comprehensive FFQ: the AdventistHealth Study-2. Public Health Nutr 2011;14:1988–97.
43. Willett WC, Howe GR, Kushi LH. Adjustment for total energy intakein epidemiologic studies. Am J Clin Nutr 1997;65:1220S–8S.
44. Willett WC. Nutritional epidemiology. 2nd ed. New York: OxfordUniversity Press; 1998.
45. Efron B, Tibshirani R. An introduction to the bootstrap. New York:Chapman and Hall; 1993.
46. Gonzalez S, Fernandez M, Cuervo A, Lasheras C. Dietary intake ofpolyphenols and major food sources in an institutionalised elderlypopulation. J Hum Nutr Diet 2014;27:176–83.
VALIDATING POLYPHENOL INTAKE IN THE AHS-2 COHORT 693
Dow
nloaded from https://academ
ic.oup.com/ajcn/article/105/3/685/4569696 by guest on 13 July 2022
47. Ovaskainen M-L, Torronen R, Koponen JM, Sinkko H, Hellstrom J,
Reinivuo H, Mattila P. Dietary intake and major food sources of
polyphenols in Finnish adults. J Nutr 2008;138:562–6.48. Burkholder-Cooley N, Rajaram S, Haddad E, Fraser G, Jaceldo-Siegl
K. Comparison of polyphenol intakes according to distinct dietary
patterns and food sources in the Adventist Health Study-2 cohort. Br J
Nutr 2016;115:2162–9.49. Kesteloot H, Joossens J. On the determinants of the creatinine clear-
ance: a population study. J Hum Hypertens 1996;10:245–9.50. Wruss J, Lanzerstorfer P, Huemer S, Himmelsbach M, Mangge H,
Hoglinger O, Weghuber D, Weghuber J. Differences in pharmacoki-
netics of apple polyphenols after standardized oral consumption of
unprocessed apple juice. Nutr J 2015;14: 32.
51. Olthof MR, Hollman P, Buijsman M, van Amelsvoort J, Katan M.Chlorogenic acid, quercetin-3-rutinoside and black tea phenols areextensively metabolized in humans. J Nutr 2003;133:1806–14.
52. Mennen LI, Sapinho D, Ito H, Bertrais S, Galan P, Hercberg S, ScalbertA. Urinary flavonoids and phenolic acids as biomarkers of intake forpolyphenol-rich foods. Br J Nutr 2006;96:191–8.
53. Saura-Calixto F, Go~ni I. Antioxidant capacity of the Spanish Medi-terranean diet. Food Chem 2006;94:442–7.
54. Orlich MJ, Jaceldo-Siegl K, Sabate J, Fan J, Singh P, Fraser GE. Pat-terns of food consumption among vegetarians and non-vegetarians. BrJ Nutr 2014;112:1644–53.
55. Eroglu A, Harrison EH. Carotenoid metabolism in mammals, includingman: formation, occurrence, and function of apocarotenoids. J Lip Res2013;54:1719–30.
694 BURKHOLDER-COOLEY ET AL.
Dow
nloaded from https://academ
ic.oup.com/ajcn/article/105/3/685/4569696 by guest on 13 July 2022
Copyright © 2022 FDOKUMEN