Developing and Validating a Method for Separating Flavonoid ...
Upload
nottinghamCategory
view
4download
0
Validating CEST imaging in a model of neurodegenerative disease
Maria Yanez Lopez, Ryan Bendell, Philippine Geiszler, Marie Christine Pardon, Dorothee Auer, Henryk Faas
School of Medicine and School of Biomedical SciencesThe University of Nottingham
BackgroundCEST has the potential to monitor molecular markers of disease with improved spatial resolution over MR Spectroscopy.Elevated myo-inositol (Ins) levels are a marker of neuroinflammation and increase with progression of Alzheimer´s disease .Ins levels have been studied using CEST1, but the method has not been validated in vivo with any other technique Questions remain about the contribution of different metabolites to the CEST signal.
1 Haris et al, NeuroImage 2011
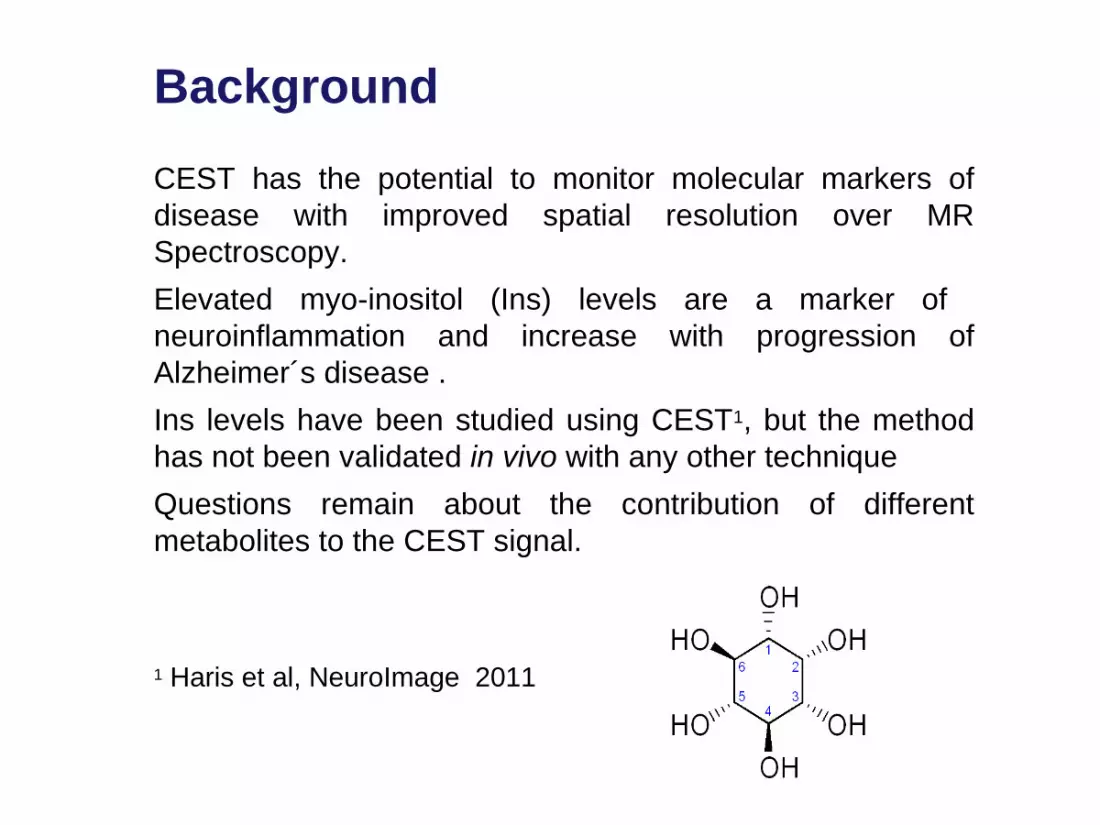
Aims Validate the CEST method for imaging myo-inositol in
vivo through comparison with MRS. Assess Ins levels in a mouse model of Alzheimer's
disease (AD) presenting age related neuroinflammation.
Methods
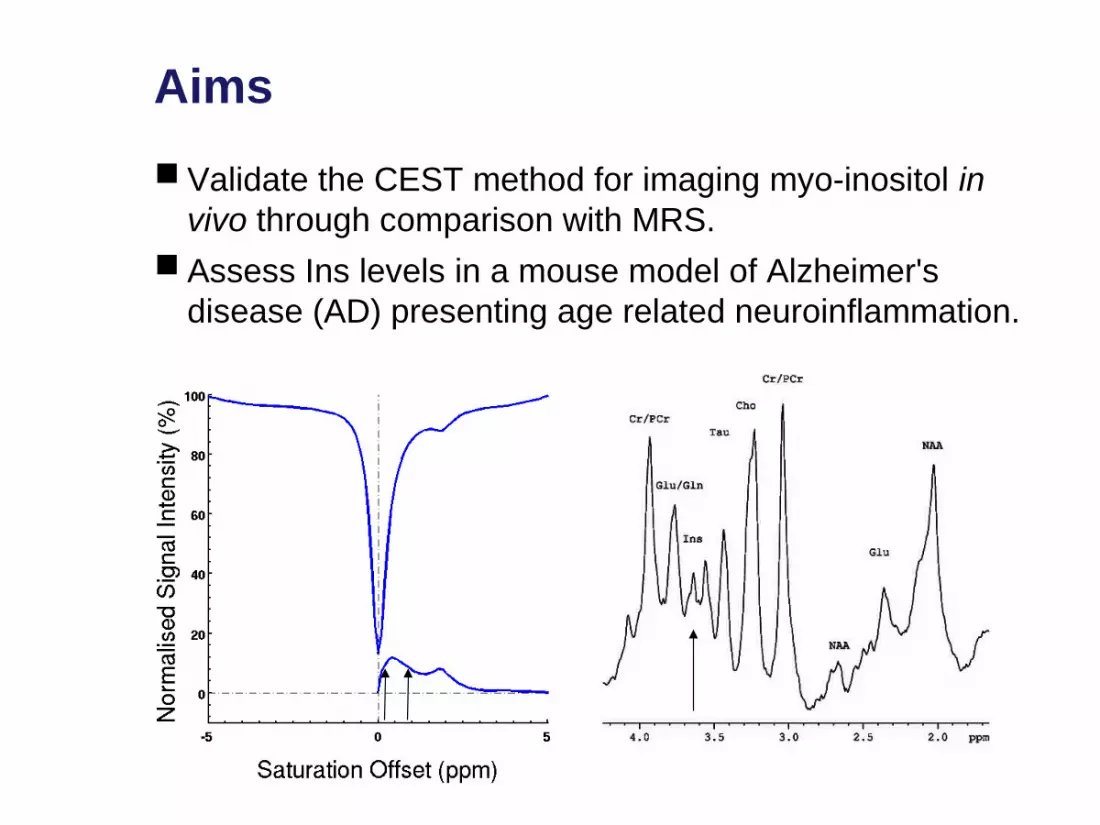
Animal model: 10 AD mice (APPswe/PS1dE9, 3-20 months), 3 wild-type mice (WT, 3-7mo)MRS: 7T Bruker, PRESS (TE=13ms,TR=2.5s, 21 min, 2.5mm voxel, hippocampus and thalamus)CEST simulation: two-pool model (water/metabolite pool exchange), MatlabCEST imaging: Varian 9.4T, 7T Bruker preclinical scannersAnalysis: Matlab (B0 correction: WASSR), LC model (MRS), statistics ( Pearson correlation coefficient)

Results – in vitro
The Ins CEST effect in vitro is linearly dependent on Ins concentration and is in agreement with the results of the simulation.
CEST effect dependence on metabolite concentration:

At physiological concentrations and pH, the CEST signals from creatine, glutamate and myo-inositol overlap.
Results – in vitro
Metabolites contributing to the CEST signal

Results – in vivo MRS
MRS data exclusion criteria: shimming linewidth ≤ 0.05 ppm
From Marjanska et al, PNAS 2005

Results – in vivo CEST
Z spectra, CEST asymmetry curves, CEST map:
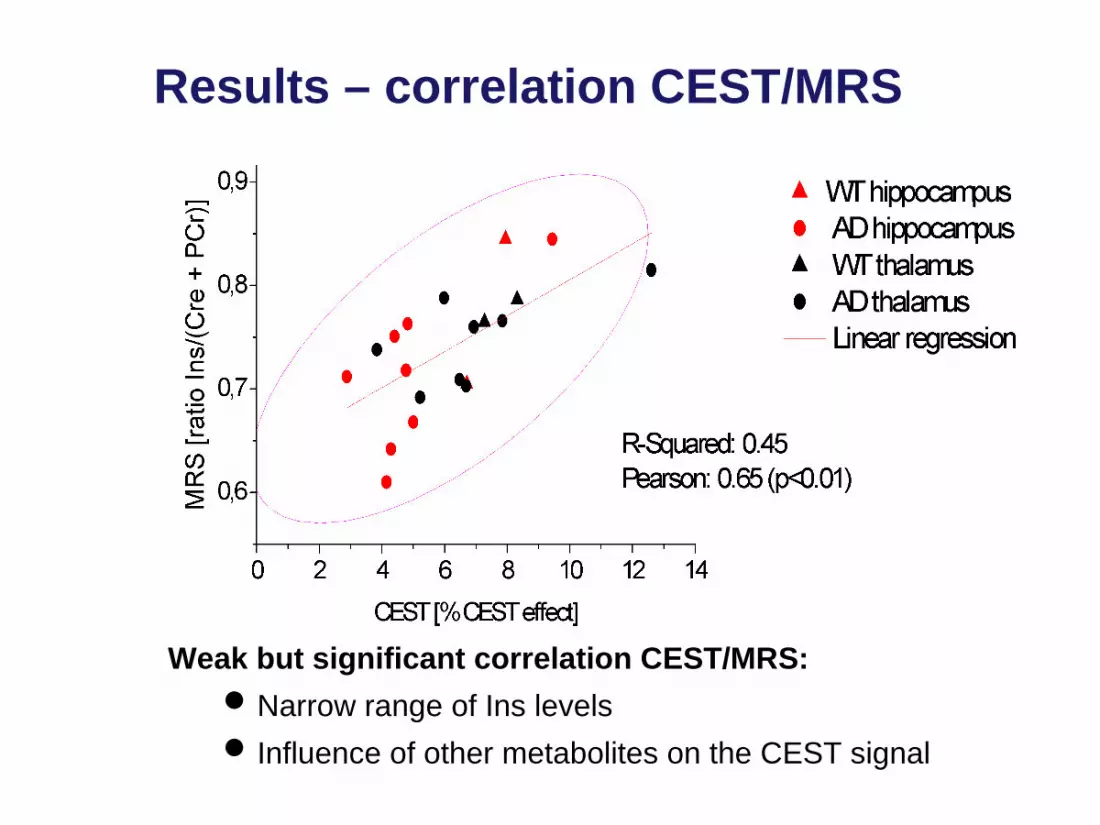
Results – correlation CEST/MRS
Weak but significant correlation CEST/MRS:Narrow range of Ins levels Influence of other metabolites on the CEST signal
Conclusions
Our simulated and in vitro CEST observations were in agreement with each other and earlier publications (Haris 2011).
The CEST signal in vivo could only be partly attributed to Ins (as measured by MRS) and showed a weak correlation with MRS.
Preliminary data at a later time point (+ 4 months) indicate an increase in both the in vivo CEST signal and MRS Ins levels.
These findings indicate the potential of CEST as an endogenous imaging biomarker in neurodegenerative disorders.

Thank you for your attention!
Copyright © 2022 FDOKUMEN