Defining and Validating a Feature-Driven Requirements Engineering Approach
Upload
khangminh22Category
view
0download
0
Developing and Validating a Measure of Self-Efficacy in Teaching using Science
Inquiry Skills
Syakima Ilyana binti Ibrahim
Submitted in accordance with the requirements for the degree of Doctor of Philosophy
The University of Leeds
School of Education
October 2018

The candidate confirms that the work submitted is her own and that appropriate credit
has been given where reference has been made to the work of others.
This copy has been supplied on the understanding that it is copyright material and that
no quotation from this thesis may be published without proper acknowledgement.
The right of Syakima Ilyana binti Ibrahim to be identified as Author of this work has
been asserted by her in accordance with the Copyright, Design and Patten Act 1988.
©2018 The University of Leeds and Syakima Ilyana binti Ibrahim

iii
Acknowledgements
In the name of Allah the Most Gracious and the Most Merciful
Alhamdulillah, all praises to Allah for all His blessing in this PhD journey and for giving
me strengths to complete this thesis. This journey is made possible through the
endless support and encouragement from many people. To them goes my greatest
thanks.
First, I would like to thank my main supervisor, Dr Matt Homer, for his tremendous
support and guidance in every possible way throughout the journey. His insight, words
of encouragement and willingness to share his expertise and time made the
completion of this thesis possible. I would also like to extend my thanks to my co-
supervisor, Professor Jim Ryder, for his valuable guidance and constructive feed
backs for the improvement of this thesis. I have been very fortunate to work with such
a great team.
My sincere thanks also goes to the Ministry of Education, Malaysia for the opportunity
and financial assistance throughout this PhD endeavour. I would like to thank all my
friends at Institute of Teacher Education, who assist me during the field works and to
all the participants, who participated in the study. Without their co-cooperation it would
not be possible to conduct this study.
Most importantly, my sincere appreciation goes to my beloved husband, Mohd Hafiz
bin Baharuddin for his love, patience and endless support as well as his sacrifices
throughout this journey. Thank you to all my children; Auni, Amir and Azwa for being
my source of strength throughout this roller coaster journey. Thank you for the
understanding and never ending love. Finally, I would like to dedicate these years of
hard work to my loving mother, Azizah binti Abdul for her unconditional love,
encouragement and endless prayers in my entire life. To all my friends here in Leeds
and in Malaysia thank you for your support and help.

iv
Abstract
From 2011 teacher education curricula in Malaysia have been required to emphasise
the teaching of science using science inquiry skills. However, the performance of
science pre-service teachers using these skills is an under-researched area. It is
acknowledged in the teacher development literature that personal beliefs mediate
the knowledge and practice of pre-service teachers in their classroom. This study
explores how the self-efficacy beliefs of science pre-service teachers in Malaysia
relate to teaching performance using science inquiry skills.
This thesis presents the development and validation of a measure of teacher’s self-
efficacy: Self-efficacy in Teaching using Science Inquiry Skills (SETSIS). The
conceptual framework used in this study consists of three factors: knowledge
efficacy (KE), personal teaching efficacy (PTE) and outcomes belief expectancy
(OBE). Using a multi-methods research approach the study developed the SETSIS
instrument comprising 72 items using a five-point rating scale. The SETSIS
instrument was piloted using a cross-sectional survey of 325 pre-service teachers at
13 Institutes of Teacher Education across Malaysia. Factor analysis confirmed the
contribution of the three factors with high reliabilities (α>0.9). The SETSIS also met
the Rasch rating scale model requirement in terms of reliability, dimensionality,
difficulty and item discrimination but, needs to include more difficult to affirm items to
distinguish the high self-efficacy level. A concurrent validation using a separate
knowledge test and teaching practice assessment confirms weak associations but
were able to establish the models to infer knowledge and teaching practice
performance among the samples.
Overall, the findings confirm new conceptualisations of teacher self-efficacy among
pre-service teachers using the three factors proposed in the SETSIS. The empirical
evidence supports the utilisation of the factors of the SETSIS in assessing the belief
component of pre-service teachers in teacher education. However, the study
suggests different utilisation of the factors to infer pre-service teachers’ performance
in content knowledge and teaching practice.

v
Table of Contents
Acknowledgements ..................................................................................... iii
Abstract ........................................................................................................ iv
Chapter 1 Introduction ................................................................................ 1
1.1 Introduction ...................................................................................... 1
1.2 The study background ..................................................................... 1
1.2.1 Science curriculum reform in Malaysia ................................... 1
1.2.2 Defining science inquiry skills in the classroom ...................... 2
1.2.3 The role of science inquiry skills in promoting scientific literacy in
learning ................................................................................... 4
1.3 Teacher education curriculum in Malaysia ....................................... 5
1.3.1 Science inquiry skills in teacher education ............................. 8
1.4 Problem statement ........................................................................... 9
1.5 Focus of the study ......................................................................... 10
Chapter 2 Literature Review ..................................................................... 12
2.1 Introduction .................................................................................... 12
2.2 Theoretical and empirical review of teacher’s self-efficacy (TSE) .. 12
2.2.1 Bandura’s Self-efficacy Theory ............................................. 12
2.2.2 Conceptual perspectives on the underpinning teacher self-efficacy (TSE) measure development ................................................ 16
2.2.2.1 TSE measure development in teaching science ........... 18
2.2.3 Empirical evidence of TSE role in teaching practice ............. 19
2.2.3.1 Impact of TSE on student learning ................................ 19
2.2.3.2 Impact of TSE on teacher’s performance ...................... 20
2.2.4 Summary .............................................................................. 21
2.3 Theoretical and conceptual framework of my study ....................... 22
2.3.1 Theoretical review of teacher knowledge ............................. 22
2.3.1.1 Pedagogical teacher knowledge to measure teaching practice ...................................................................................... 23
2.3.2 The integrated model of TSE ................................................ 24
2.3.2.1 The role of knowledge in the TSE belief measure ........ 26
2.3.3 Summary .............................................................................. 28
2.4 Study construct and conceptual model .......................................... 29
2.4.1 Knowledge Efficacy (KE) ...................................................... 29
2.4.2 Personal Teaching Efficacy (PTE) ........................................ 30

vi
2.4.3 Outcome Belief Efficacy (OBE) ............................................ 31
2.5 Summary ....................................................................................... 32
Chapter 3 Methodology ............................................................................ 36
3.1 Introduction .................................................................................... 36
3.2 Research objectives ...................................................................... 36
3.2.1 Research questions .............................................................. 37
3.3 Research Design ........................................................................... 39
3.3.1 Development and validation process .................................... 42
3.3.1.1 Building block I - Construct mapping ............................. 42
3.3.1.2 Building block II - Item design ....................................... 44
3.3.1.3 Building block III - Outcome space ................................ 45
3.3.1.4 Building block IV - Measurement model ........................ 45
3.4 Research methods ......................................................................... 46
3.4.1 Literature review ................................................................... 47
3.4.2 Expert validation ................................................................... 47
3.4.2.1 Fuzzy Delphi Method (FDM) ......................................... 48
3.4.3 Factor analysis ..................................................................... 49
3.4.4 Rasch Model ........................................................................ 50
3.4.5 Correlation and Regression OLS .......................................... 51
3.5 The instruments ............................................................................. 52
3.5.1 Self-Efficacy in Teaching using Science Inquiry Skills Instruments (SETSIS) .............................................................................. 53
3.5.2 Test of Integrated Science Process Skills (TISP) ................. 53
3.6 Data collection and the sample ...................................................... 55
3.6.1 Face and content validation .................................................. 55
3.6.2 Pre-test ................................................................................. 56
3.6.3 Main research ....................................................................... 56
3.6.4 Score for teaching practice assessment ............................... 57
3.7 Ethics ............................................................................................. 57
3.7.1 Main ethical issues ............................................................... 58
3.7.2 Managing data protection ..................................................... 59
3.7.3 Informed consent .................................................................. 59
3.7.4 Anonymity ............................................................................. 60
Chapter 4 Constructing the SETSIS ........................................................ 61
4.1 Overview ........................................................................................ 61

vii
4.2 Constructing Factors of the SETSIS .............................................. 61
4.2.1 Definition of factors ............................................................... 62
4.2.1.1 Definition of Knowledge Efficacy (KE) ........................... 63
4.2.1.2 Definition of Personal Teaching Efficacy (PTE) ............ 64
4.2.1.3 Definition of Outcome Belief Efficacy (OBE) ................. 65
4.3 The Construct ................................................................................ 66
4.3.1 The Construct Map ............................................................... 68
4.4 Item design .................................................................................... 70
4.4.1 Development of items hierarchy ........................................... 72
4.4.2 Response to Items................................................................ 76
4.5 Items Construction ......................................................................... 77
4.5.1 Generating items .................................................................. 77
4.5.1.1 Sources of items ........................................................... 78
4.6 Content and Format Validation ...................................................... 79
4.6.1 Expert Review ...................................................................... 79
4.6.1.1 Results and Analysis of the Item Content Survey ......... 81
4.6.1.2 Knowledge Efficacy (KE) .............................................. 82
4.6.1.3 Personal Teaching Efficacy (PTE) ................................ 83
4.6.1.4 Outcomes Belief Efficacy (OBE) ................................... 84
4.6.1.5 Items Revision .............................................................. 85
4.6.2 Pre-Test Survey Result ........................................................ 87
4.6.2.1 Descriptive Statistics ..................................................... 87
4.6.2.2 Result of the Pre-Test Survey Responses .................... 88
4.7 Summary of Chapter Findings ....................................................... 92
Chapter 5 Developing the SETSIS measure ............................................ 93
5.1 Introduction .................................................................................... 93
5.2 The respondents ............................................................................ 94
5.2.1 Who are the respondents? ................................................... 94
5.3 Analysis of responses .................................................................... 95
5.3.1 Descriptive statistics ............................................................. 95
5.3.2 Outliers ................................................................................. 96
5.3.3 Reliability and normality of the responses data .................... 98
5.3.4 Responses according to subscales ...................................... 99
5.3.5 Inferential statistics ............................................................. 104
5.3.5.1 Analysis across the group of semesters ..................... 105

viii
5.3.5.2 Interaction between groups of factors ......................... 108
5.4 The SETSIS - Analysis of structure ............................................. 111
5.4.1 Factor structure .................................................................. 112
5.4.2 Factor rotation .................................................................... 113
5.4.3 Factor Interpretation ........................................................... 114
5.4.4 Summated scale ................................................................. 115
5.5 Summary of findings .................................................................... 117
Chapter 6 Validating the Model of SETSIS ............................................ 119
6.1 Properties of measure ................................................................. 119
6.1.1 Item measure ..................................................................... 119
6.1.1.1 Item measure in KE subscale ..................................... 121
6.1.1.2 Item measure in PTE subscale ................................... 122
6.1.1.3 Item measures in OBE subscale ................................. 124
6.1.2 Person measure ................................................................. 125
6.1.3 Dimensionality of the model ............................................... 127
6.1.3.1 The model variance .................................................... 128
6.1.3.2 Correlation of person measures in the model ............. 132
6.1.4 Summary ............................................................................ 133
6.2 The Model Structure .................................................................... 134
6.2.1 Mapping person-item relationships ..................................... 135
6.2.1.1 Characteristic of item hierarchy .................................. 139
6.2.2 Category measure for rating scale...................................... 144
6.2.2.1 Category functionality in the measure ......................... 144
6.2.2.2 Category measure to inform estimate responses ....... 145
6.2.3 Summary ............................................................................ 152
Chapter 7 Evaluation of the SETSIS ...................................................... 153
7.1 Association of the SETSIS and the content knowledge ............... 153
7.1.1 Test of Integrated Science Process Skills (TISP) ............... 153
7.1.1.1 Fit analysis using Rasch ............................................. 157
7.1.2 Correlation between the SETSIS and the TISP .................. 158
7.1.3 Predictive model to infer content knowledge performance . 160
7.1.4 Applying the predictive model ............................................. 162
7.2 Association of the SETSIS and science teaching practice ........... 163
7.2.1 Professional Teaching Practice Assessment ...................... 163

ix
7.2.2 Correlation between the SETSIS and teaching practice assessment 166
7.2.3 Predictive model to infer practice performance .................. 167
7.2.4 Applying the predictive model ............................................. 168
7.3 Summary findings of the chapter ................................................. 170
Chapter 8 Discussion and conclusion .................................................. 172
8.1 Introduction .................................................................................. 172
8.2 Contribution of my study .............................................................. 172
8.2.1 Overview on contribution of the findings ............................. 172
8.2.2 Objective one: To define and conceptualise the SETSIS construct
based on the concept of TSE in a PST education context .. 173
8.2.3 Objective two: To determine the psychometric qualities of a measure of self-efficacy in teaching science using science inquiry skills .................................................................................... 174
8.2.4 Objective three: To operationalised and develop a psychometrically defensible measurement model of the SETSIS .................. 176
8.2.5 Objective four: To infer PSTs development using the measurement model of the SETSIS .......................................................... 177
8.3 The study implications ................................................................. 181
8.3.1 Implication for teacher educators ....................................... 181
8.3.2 Implication for policy-makers in PST education .................. 183
8.4 Limitations of my study ................................................................ 184
8.4.1 Limitations and future suggestions of the study .................. 184
8.4.2 Future suggestions ............................................................. 185
8.5 Concluding thoughts .................................................................... 185
List of References ................................................................................... 188
Appendix A Experts Information Sheet …………………………………… 200
Appendix B Ethics Approval…………………………………………………..204
Appendix C Participant Consent Form and Information Sheet……………205
Appendix D Instrument the SETSIS ..........................................................208
Appendix E Experts Survey of the SETSIS................................................214
Appendix F 72 items of the SETSIS.......................................................... 234
Appendix G Factor Loading using Promax Rotation ………………………...235
Appendix H Result of Item Difficulty Measure .............................................239

x
List of Tables
Table 1 Definition of Science Process Skills (Malaysia Ministry of Education 2003) ..................................................................................................... 3
Table 2 The components in core courses for BoTP specialising in primary science education ............................................................................... 7
Table 3 Data sources for every research question mention .................. 38
Table 4 Summary of research design of the study................................. 43
Table 5 Fuzzy spectrum for five-point Likert scale ................................ 48
Table 6 Domains of the TISP .................................................................... 55
Table 7 Enrolment of science PSTs in ITE campuses all over Malaysia57
Table 8 Summary of the three factors in the construct ......................... 63
Table 9 Level description of item hierarchy of KE ................................. 73
Table 10 Level description of item hierarchy of PTE ............................. 73
Table 11 Level description of item hierarchy of OBE ............................ 74
Table 12 Intensity and direction of categories of responses present in five-point rating scale .............................................................................. 77
Table 13 Sources of items pool................................................................ 78
Table 14 Expert panel list ......................................................................... 80
Table 15 Response statistics for the items reviewed by the expert panel in the Expert Survey .............................................................................. 82
Table 16 Analysis result of item panelling for KE .................................. 83
Table 17 Analysis result of item panelling for PTE ................................ 84
Table 18 Analysis result of item panelling for OBE................................ 85
Table 19 Item revised for 75% less expected consensus. ..................... 86
Table 20 Items before and after the content validity process ............... 86
Table 21 Demographic information ......................................................... 87
Table 22 Person Reliability for the SETSIS ............................................. 89
Table 23 Fit statistic for items with unpredictable responses .............. 90
Table 24 Fit statistics for removed items ................................................ 90
Table 25 Items construction of two phases ............................................ 92
Table 26 Background information of the respondents............................94
Table 27 Summary statistics of responses in the SETSIS measure ..... 95
Table 28 Univariate, bivariate and multivariate potential outliers profile97
Table 29 Reliability and normality test of the SETSIS data ................... 98

xi
Table 30 Mean and range of responses’ score in KE, PTE and OBE .. 101
Table 31 Profiling of relationship between subscales: values below the diagonal are bivariate correlations, with corresponding scatterplot above the diagonal. Diagonal portrays the distribution of each subscale .......................................................................................................... 103
Table 32 Result for mean differences analysis ..................................... 105
Table 33 Univariate test results for factor of semester ........................ 106
Table 34 Post-hoc contrast result in groups of semesters ................. 107
Table 35 Multivariate test for interaction of group of semesters with other factors .............................................................................................. 109
Table 36 Result of univariate ANOVA analysis for significant interaction
between factors group of semester and groups of ethnicity ...... 110
Table 37 Correlation matrix for three factors in the EFA with Promax oblique rotation ............................................................................................. 113
Table 38 Removed items according to factor loading interpretation . 114
Table 39 Exploratory Factor Analysis (EFA) ......................................... 115
Table 40 Three factors solution interpreted into three subscales ...... 116
Table 41 A summary of findings in Chapter 5 ...................................... 118
Table 42 Summary of the SETSIS Analysis Result – 66 items (n=324)120
Table 43 Item measure of KE sub-scale ................................................ 121
Table 44 Item of PTE sub-scale .............................................................. 123
Table 45 Items of OBE sub-scale ........................................................... 125
Table 46 Summary of the SETSIS Analysis Result – Persons (n=324) 125
Table 47 Summary of model estimation measure without misfit cases (N=290) ............................................................................................. 126
Table 48 Dominant items in first added group (Cluster 1) ................... 130
Table 49 Dominated items in the middle variance................................ 131
Table 50 Person measure relationship between the three clusters .... 132
Table 51 Table of 11 redundancy items ................................................. 138
Table 52 Items associated with high item hierarchy ............................ 141
Table 53 Nine out of 42 items associated with mean item level .......... 142
Table 54 Items associate with low difficulty ......................................... 143
Table 55 Category frequency and average measure for five rating scale of the SETSIS ....................................................................................... 145
Table 56 Result of five well-functioning categories in the SETSIS ..... 146
Table 57 Response probability at five levels of ability ......................... 147
Table 58 Person ability according to factors ........................................ 148

xii
Table 59 Calibration of measure rank using the predicted score in complete measures of the SETSIS ................................................................. 150
Table 60 Descriptive statistics for score performance in the TISP across cohorts ............................................................................................. 154
Table 61 Descriptive statistics for score performance in the TISP ..... 155
Table 62 Summary of fit statistics for 25 items of the TISP ................. 157
Table 63 Correlation between subscales across the TISP and the SETSIS .......................................................................................................... 159
Table 64 Relationship of performances in the TISP with factors in the SETSIS ............................................................................................. 160
Table 65 Results of regression model summary to infer content knowledge
performance .................................................................................... 160
Table 66 Multiple regression predictors of the working model to infer content knowledge performance ................................................... 161
Table 67 Descriptive table for Practicum II and Internship .................. 165
Table 68 Descriptive analysis of Professional Practice score ............ 166
Table 69 Correlation of Professional Practice with the SETSIS model166
Table 70 Results of regression model summary to infer Professional Practice ............................................................................................ 167
Table 71 Multiple regression predictors of the working model to infer professional practice ...................................................................... 168

xiii
List of Figures
Figure 1 Social cognitive theory emphasising reciprocal influences of behavioural, environment and personal factor in cognitive judgement ............................................................................................................ 13
Figure 2 Relation between self-efficacy and outcome expectancy (Bandura, 1998). Self-efficacy may vary in terms level, strength and generality while outcomes expectancy may become positive or negative incentives. ......................................................................................... 14
Figure 3 Interaction of teachers’ cognitive process which results in teachers’ efficacy judgments (source: Tschannen-Moran, Hoy and Hoy (1998)) ................................................................................................ 26
Figure 4 Conceptual framework for the study ........................................ 34
Figure 5 Overview of the study phases in development and validation of the SETSIS ............................................................................................... 41
Figure 6 Construct map for the SETSIS development ........................... 68
Figure 7 Wright map: distribution of person ability (left) and item difficulty (right) .................................................................................................. 91
Figure 8 (Left) Histogram of the SETSIS responses and (right) a box and whisker plot ....................................................................................... 96
Figure 9 Q-Q plot for overall the SETSIS (upper left), KE (upper right), PTE (lower left) and OBE (lower right) .................................................... 99
Figure 10 Frequency (in percentage) of responses in category across the subscales KE (top) PTE (middle) and OBE (bottom) ................... 100
Figure 11 Error bar graph score for KE, PTE and OBE with 95% confidence interval (CI) ...................................................................................... 104
Figure 12 Mean score for KE, PTE and OBE across groups of semesters .......................................................................................................... 108
Figure 13 Interaction between group of semesters and ethnicity groups109
Figure 14 Eigenvalue plot for scree test criterion ................................ 112
Figure 15 Standardised variance parameter component scree plot ... 128
Figure 16 Standard Residual Plot with three dominated cluster groups129
Figure 17 Wright map (Winsteps 4.0) .................................................... 136
Figure 18 Frequency of responses to items (in percentage) according to category ........................................................................................... 140
Figure 19 Category probability curve .................................................... 147
Figure 20 Test Characteristic Curve for the complete SETSIS measure152
xiv
Figure 21 True score ranking for group of semesters ......................... 151
Figure 22 Frequency distribution of the TISP achievement ................ 154
Figure 23 TISP score distribution across the group of semesters ..... 156
Figure 24 Scores across group of semesters between the TISP and the SETSIS ............................................................................................. 159
Figure 25 Model prediction of SIS knowledge for semester 5 ............. 162
Figure 26 Model prediction of SIS knowledge for semester 8 ............. 163
Figure 27 Frequency of score of Professional Practices for Practicum phase II (above) and Internship (below) ................................................... 164
Figure 28 Performance in Professional Practice .................................. 165
Figure 29 Model prediction in Practicum II (semester 6) ..................... 169
Figure 30 Model prediction in Internship (semester 8) ........................ 169

xv
List of Abbreviations
ANOVA - Analysis of variance
BoTP- Bachelor of Teacher Programme
EFA - exploratory factor analysis
EFA - Exploratory Factor Analysis
FDM - Fuzzy Delphi Method
GTE - General teaching efficacy
ITE - Institute of Teacher Education
KE - Knowledge efficacy
MOE - Malaysia Ministry of Education
OBE - Outcomes Belief Efficacy
PCAR - Principle Component Analysis Residual
PCK - pedagogical content knowledge
PTE - Personal Teaching Efficacy
PST - Pre-service teacher
RSM - Rating Scale Model
SD - Standard deviation
SETSIS- Self-efficacy in Teaching using Science Inquiry Skills
TCC -Test characteristic curve
TISP - Test of Integrated Science Process Skills
TSE - Teacher self-efficacy
TSI - Teaching Science as Inquiry measure

1
Chapter 1 Introduction
1.1 Introduction
This thesis presents a study in the development and validation of an instrument to
measure self-efficacy in teaching using science inquiry skills called the SETSIS. The
development of the SETSIS to measure belief was inspired by the transformation in
education policy in Malaysia. The new policy of the Malaysian Ministry of Education (MOE)
aspires to increase the participation of students in the science classroom through a skills-
based approach. The introduction of a new primary science curriculum to include the
process of science instead of only science content outcomes through learning requires a
significant shift in classroom teaching approach and practices. The study of the
development of the SETSIS aims to measure belief development in implementing the
practice changes focusing on pre-service teachers (PSTs). This chapter introduces the
background context towards this study, its rationale and its objectives.
1.2 The study background
1.2.1 Science curriculum reform in Malaysia
The current science curriculum in Malaysia is largely shaped by a combination of
internal and external global factors (Turiman et al. 2012). Compared to other
subjects in the curriculum, changes in the science curriculum generally occur at a
much faster pace due to the significant impact created by science and technology
advancement in human civilisation (Adey 2001;Smith et al. 2012). The new
Malaysian primary science curriculum has emphasised the acquisition of scientific
skills (process and manipulative skills) and thinking skills as well as understanding
the basic principles of science with scientific attitudes and values., According to
policy-makers and researchers, there is an urgent sense today that a science skill-
based approach is more important than acquiring content for science literacy at
school (Malaysia Blue Print 2013; Wicht 2016).
In 2011, a new curriculum for primary schools, the standards-based Primary School
Standard Curriculum (KSSR), was launched to restructure the old integrated
curriculum, Integrated Curriculum for Primary School (KBSR). The transformation
into KSSR aims to upgrade scientific literacy in school children for better
development of scientific understanding. The new primary science curriculum asks
teachers to change their instruction-oriented approach to be more process-oriented.
Teachers are asked to facilitate student understanding of the concept by using

2
science inquiry skills rather than via a concept explanation by the teacher. To date,
science inquiry skills have become an important component in the new science
curriculum and have become one of the new approaches to teaching science in a
more effective and meaningful way (Malaysia Ministry of Education 2014).
The new curriculum (i.e. KSSR) has been designed using a modular curriculum that
stresses content and learning standards, rather than merely outcomes as in the old
curriculum (i.e. KBSR). With the implementation of KSSR, science teachers must be
well equipped with the necessary knowledge and skills so that what is outlined in the
curriculum is being realised in the classroom. Although teachers are expected to
stress the process of science rather than the science concepts as outcomes in
science classrooms, there is no explicitly stated expectation for teachers to meet
these standards. This issue creates a challenge for teacher educators and PSTs to
make changes in practice, appropriate to this newly reformed curriculum.
There has been lots of research that defines the work in teacher knowledge within the
science content-based approach. In Malaysia, the primary curriculum has emphasised
the acquisition of scientific skills (process and manipulative skills) and thinking skills
as well as understanding the basic principles of science with scientific attitudes and
values.
1.2.2 Defining science inquiry skills in the classroom
This study defined science inquiry skills as collective of science process skills by
these skills are implemented during inquiry for the instructional setting in science
classrooms. The transferability of the science process skills in the classroom
depends on the learning context. In a science inquiry instructional setting, science
process skills are the skills that always specifically frame what students should learn
in the particular context of a science pedagogical setting (Millar & Driver 1987).
Science inquiry skills are the courses of action science researchers use in scientific
explorations, the mental mode of acquiring science concepts, and the didactic
processes in lecture rooms (Millar, 1987). They are also known as science process
skills, a set of broadly transferable abilities, applicable to many scientific disciplines
and reflective of the works of scientists (AAAS, 1967). In the new Malaysian primary
science curriculum context, science process skills are defined as skills that enable
students to become involved in science learning more effectively. These skills are
assessed by the standards based on the ability of students to perform the skills
during science activities. The definitions of science process skills in the Malaysian
primary science curriculum are given in Table 1 (Malaysia Ministry of Education
2003).

3
No SPS Definition
1 Observing Using the sense of hearing, touch, smell, taste and sight to collect information about an object or a phenomenon.
2 Classifying Using observations to group objects or events according to similarities or differences.
3 Measuring and using numbers Making quantitative observations using numbers and tools with standardised units. Measuring makes observation more accurate.
4 Inferring Using past experiences or previously collected data to draw conclusions and explain events.
5 Predicting Stating the outcome of a future event based on prior knowledge gained through experiences or collected data.
6 Communicating Using words or graphic symbols such as tables, graphs, figures or models to describe an action, object or event.
7 Using space-time relationship Describing changes in parameter with time. Examples of parameters are location, direction, shape, size, volume, weight and mass.
8 Interpreting data Giving rational explanations about an object, event or pattern derived from collected data.
9 Defining operationally Defining concepts by describing what must be done and what should be observed.
10 Controlling variables
Identifying the fixed variables, manipulated variable, and responding variable in an investigation. The manipulated variable is changed to observe its relationship with the responding variable. At the same time, the fixed variables are kept constant.
11 Hypothesising
Making a general statement about the relationship between a manipulated variable and a responding variable in order to explain an event or observation. This statement can be tested to determine its validity.
12 Experimenting
Planning and conducting activities to test a certain hypothesis. These activities include collecting, analysing and interpreting data and making conclusions.
Table 1 Definition of Science Process Skills (Malaysia Ministry of Education 2003)

4
Osman (2012) in her view of the early science curriculum in Malaysia, states that the
current science curriculum reform efforts have re-focused on the necessity of
teaching students to make use of scientific knowledge to solve problems. Science
teachers are challenged to use inquiry skills as their pedagogical approach to
facilitate the development of cognitive development in the context of science
learning. Therefore, the generic components of these skills are defined by science
process skills and teachers can implement the skills in their inquiry teaching
instruction for organising a more systematic approach to science in the primary level.
Implementing a skill-based approach to science instruction need to emphasise what
children are able to do. Science process skills are defined as a set of broadly
transferable abilities, appropriate to many science disciplines and reflective of the
behaviour of scientists. These skills are grouped into two types: basic and integrated.
The basic process skills are observing, inferring, measuring and using numbers,
communicating, classifying, predicting and using the space/time relationship, while
the integrated process skills are controlling variables, defining operationally,
hypothesis and interpreting data. The basic (simpler) process skills provide a
foundation for learning the integrated (more complex) skills.
In the empirical evidence presented in Smith et al. (2012), science teachers in a
primary school in America agreed that scientific literacy in classroom practice can be
viewed through how children learn to ‘taking apart issues; analysing; sorting;
reconstructing; defining; explaining; redefining ideas; …….; categorizing; using
deeper thinking strategies; and making connections’ (Smith et al. 2012, p.145). The
compilation of all these skills is what we call science process skills, which are always
associated with science inquiry (Chiapetta and Koballa 2006). Thus, in the context of
primary science classrooms in Malaysia, science process skills listed in Table 1 are
used to frame the features of science inquiry skills of this study.
1.2.3 The role of science inquiry skills in promoting scientific literacy in
learning
Scientific literacy means being able to make informed and balanced judgements
about how science impacts on students’ lives and how to use scientific knowledge to
solve problems (American Association for Advancement of Science, 1993). The
major goal of science curricula is to promote scientific literacy to enable people to
understand reports and discussion about science in the media (Millar and Osborne,
1998; DeBoer, 2000). Further, it is believed that the fundamental sense of scientific
literacy is more than the ability to read and write about science, thus suggesting that
the science curriculum should focus on the skills and applications that flow from
science (Shortland, 1988).

5
In his systematic review, Ryder (2001) shows that, besides subject matter
knowledge, individuals need knowledge about science to critically engage with
everyday scientific issues. Further, Ryder indicates the significance of learning
scientific skills including assessing the quality of data, interpreting data and the
validity of scientific interpretation. These arguments suggest that the development of
process skills in science education are important because of their role in the
development and pursuit of scientific knowledge and not just because they are
valuable skills in their own right. Supporting this view, Huppert, Lomask, and
Lazarowitz (2002) argue that learning scientific skills, known as science process
skills, is a major goal of science education, since those skills are not only needed by
scientists but by every citizen in order to become a scientifically literate person who
can function in a global society.
In the empirical study to investigate how the cognitive domain is affected by scientific
skills among primary students in Turkey, Özgelen (2012) found that scientific skills
are related to cognitive development in providing support in students’ thinking,
reasoning, inquiry, evaluation and problem-solving skills, as well as their creative
thinking. This finding supports Adey’s research (2001) which found that teaching
scientific skills are necessary in the primary school because of the important role of
the scientific method in accelerating the cognitive development to a higher level of
science learning.
The section pointed to the role of science inquiry skills in reforming science literacy,
especially in the science curriculum in Malaysia. It seems that teacher education has
a major role in providing PSTs with essential training in order to support curriculum
reform. The next section will look into the context of teacher education in Malaysia.
1.3 Teacher education curriculum in Malaysia
One of the MOE policies detailed in the Malaysia Education Blueprint (2013-2025) is
to enhance the teaching profession by improving the quality of teachers. The
Institute of Teacher Education Malaysia (ITE) has been given the responsibility to
conduct the Bachelor of Teaching Programme (BoTP). Through this programme, the
MOE wishes to reform the teaching profession in Malaysia as this programme was
raised in status from a diploma to a bachelor degree qualification for primary
teachers. The aim of this programme is to produce high quality primary school
teachers with the knowledge, skills, and competencies to become effective teachers
(Faridah et al. 2012).
The programme was started in 2007 as a four-year teacher education degree
programme with one year of the foundation specialised in various primary subject

6
areas (e.g. primary science education, primary mathematics education, primary
English language education, primary special education). The programme is run by
ITE throughout 27 campuses all over Malaysia. The aim of the BoTP is mainly to
produce quality primary teachers that have specialised in their subjects together with
the knowledge of general teachers. The curriculum design in BoTP is parallel with
the concept of teacher knowledge (Shulman 1986, 1987) that is widely used in the
teacher education area (Grossman, 1990; Ben-Peretz, 2011). Details on the concept
of teacher knowledge can be viewed in Chapter 2.
The BoTP curriculum is structured into three components which are core courses (65
percent of the total 133 credits), elective courses (18 percent) and compulsory
courses (17 percent). The curriculum design for core courses includes professional
studies, professional practice and major subject courses, which are the essential
teacher knowledge to be used and developed by the PSTs in their professional
teaching practice (Moore, 2014). Table 2 below shows the components in core
courses for BoTP specialising in primary science education.
PSTs are required to complete all the core courses within eight semesters of study.
Professional studies provide exposure in basic teacher knowledge (i.e. general
instructional and pedagogical knowledge) with a total of 27 credits. Major courses
are offered to provide students with science content knowledge up to degree level
and pedagogical content knowledge (PCK) in the context of teaching science in
primary school. The major courses allocate a total of 45 credits, with one course
named Thinking and Working Scientifically offering the module specifically on
implementing science process skills.
The professional practice provides the ‘in-site exposure’ for PSTs to turn the
knowledge analysis into action in real school situations based on the professional
teaching standards. Professional practice provides 14 credits, in which students are
required to undergo a 32-week of professional practice which is implemented
through three forms: namely,
• School-based Experience (PBS) is carried out for four weeks (4W) without
credit through courses in professional, major and elective studies.
• Teaching Practical at school (Practicum) is carried out for 24 weeks,
distributed in three phases.
• The internship is carried out for four weeks in the eighth semester.

7
Table 2 The components in core courses for BoTP specialising in primary science education
Courses Module Credits Semester
Professional Studies
Philosophy and education in Malaysia 3 1
Child development 3 1
Learning and the learner 3 2
Behaviour and classroom management 3 3
Technology in Teaching and Learning 3 4
Culture and learning 3 5
Guidance and counselling for children 3 7
Leadership and professional development 3 8
Teacher and current challenges 3 8
Professional Practice
School Based Experience-Professional studies
1
School Based Experience-Majoring studies 2
School Based Experience-Elective 1 studies
3
School Based Experience-Elective 2 studies
4
Practicum I 2
(4 weeks) 5
Practicum II 4
(8 weeks) 6
Practicum III 6
(12 weeks) 7
Internship 2
(4 weeks) 8
Major Course
Life and life processes 3 1
Children learning science 3 1
Explore the material 3 2
Pedagogy and curriculum for primary science
3 2
Physics context base 3 3
Thinking and working scientifically 3 3
Ecosystem and biodiversity 3 4
Lesson plan for primary science 3 4
Energetic chemistry 3 5
Earth and space 3 5
Assessment in teaching science 3 6
Source and science lab management 3 6
Action research I 3 7
Science, technology and community 3 8
Action research II 3 8

8
The BoTP curriculum has been designed to give the opportunities for teacher
candidates to practice the theoretical grounded tools systematically (Grossman,
Smagorinsky and Valencia, 1999). These experiences are educative and productive
for PSTs to analyse, apply and reflect on the connection of subject matter and
teaching outcomes, so that they will learn to be flexible and meet the specific
teaching contexts (Ball and Bass 2000). However, Hairah and Keong (2011) found
that PSTs on BoTP were not doing well in application and reflection in their teaching
outcomes, especially in the context of teaching SPS during their professional
practice. Although the teacher training programme may inspire teaching practices,
there are other factors beyond the cognitive performance that influence the practice
of PSTs.
1.3.1 Science inquiry skills in teacher education
New pre-service science teachers came into the first semester of BoTP training with
various perceptions of their potential ability in the specific tasks of teaching using
science inquiry skills. They came with perceived expectations in science teaching
approaches observed during their school experiences. Considering the nature of
changes in the national science primary curriculum from KBSR to KSSR, preparing
PSTs for the shift from content-based learning into skill-based teaching is important
to teacher education.
Tan (1996) has reviewed the level of achievement in integrated science process skills
among science trainees at two teaching colleges in Penang. He reported that the
achievement of integrated science process skills among trainees is low compared with
the achievements of students in similar studies conducted in the United States using
the same testing instrument (Burns, Okey and Wise, 1985). This may be true, as
analysis by Hairiah and Chin (2011) shows that trainees recorded the science process
skills in the teaching plan but did not execute this plan in the classroom. Surprisingly,
their reflection notes never mention this problem because they had not given attention
to the importance of process skills, even though the need of the skills was stressed
during teacher training.
In summary, it can be argued that a common approach to science teacher education
offers a mix of content, pedagogy and contexts but without explicitly stating what
knowledge novices are supposed to construct or how to utilise this knowledge. With
attention to the BoTP for primary science major courses, the courses offered
certainly emphasised the content and pedagogical knowledge of teaching using
science inquiry skills in the curriculum, but the PSTs are poorly utilising the skills in
their classroom practices or worse not even noticing it during classroom teaching
practices. Perhaps, with the identification of PSTs’ personal belief in using the skills

9
during classroom teaching practices, teacher educators can offer strategies with an
explicit mechanism to affirm the teaching using science inquiry skills.
1.4 Problem statement
The latest primary science curriculum in Malaysia has emphasised the acquisition of
scientific process skills as well as the understanding of basic principles of scientific
concepts. This transformation attempts to upgrade the scientific literacy in schools
to enable students to develop better scientific inquiry skills (Norris and Phillips 2003;
Osman 2012). This reform explicitly asks teachers to change their teaching
strategies by shifting from direct instruction to facilitating learning through inquiry
instructions.
However, these changes have not yet been sufficiently reflected in the teacher
education curriculum. PSTs have not reflected sufficient knowledge to surface their
teaching using science inquiry skills explicitly during their practice (Balfakih, 2010;
Mbewe, Chabalengula and Mumba, 2010; Chabalengula, Mumba and Mbewe,
2012). Whilst they were unable to provide a correct definition, conceptually, of the
skills, they exhibited relatively good performance involving the skills in novel
situations. It seems that the contexts exhibited within teaching and learning
situations help teachers and PSTs to show better competency in science inquiry
skills.
Competency of PSTs in the specific application of science inquiry skills but not in the
content of conceptual knowledge can partially be explained by their teacher
knowledge. Teacher knowledge describes teachers’ professional knowledge derived
from teaching practice as well as from schooling activities. Pre –service teachers
translate their conceptual knowledge of science inquiry skills into the performance of
science inquiry skills through their personal experience, which is highly
contextualised and influenced by teaching interactions and experiences (Van Driel,
De Jong and Verloop, 2002). How PSTs think and translate their knowledge to use in
classroom teaching practices seems to be a consequence of the way they develop
their belief in the possessed teacher knowledge.
Many researchers agree that successful teachers draw on specialised knowledge in
their instructional work (i.e. teacher knowledge) with students, but specifying and
measuring this knowledge has proven elusive in the teacher education programme
(Pajares 1992; Abd-el-khalick et al. 1997;Cochran-Smith 2004; Ravindran et al.
2005). Although it is important to have the intellectual ability and capability to analyse
their experiences in classrooms during teacher training, it shows that there are other
factors that influence the transformation of the cognitive performances (i.e.

10
knowledge of teaching received in training) into action (i.e. practice of teaching). It
seems that, the practice experiences for PSTs that obtained from the theoretical
training (e.g. teaching courses, micro teaching, teaching courses’ presentation and
teaching courses’ assignments) are not reflected in practice of teaching in
classrooms within the real school environment (Hairiah and Keong 2011; Rauf et al.
2013) .
Previously, studies show that multi-perspective experiences and belief (i.e. school
experiences, epistemological belief and teaching experiences) have an effect in
PSTs’ practice (Hutner and Markman 2016; Lebak 2015; Duit and Treagust 2003;
Kane et al. 2002; Van Driel et al. 2001). Thus, this current study explores self-belief
factors that influence the transformation of theory learned into practice in the context
of teaching using science inquiry skills. This study was conducted among the pre-
service science teachers in the Institute of Teacher Education (ITE) in Malaysia.
1.5 Focus of the study
In teacher education, development of PSTs is assessed using two main components
of teacher knowledge. The first component is the cognitive test, where PSTs are
tested using their knowledge attainment, and the second component is teaching
practice performances (Park, 2011; Veal, 2012). However, it suggests that when
PSTs are expected to depend on and be accountable for their own learning process
during teaching practice, their belief plays a major role in the decision about
curriculum and teaching tasks (Pajares, 1992).
This study intends to assess the beliefs of PSTs in implementing a skill-based
approach in primary science instruction. Using the concept of self-efficacy, the study
explores three elements of teacher development through the application of
educational measurement techniques. The aims of this study are to
i) Develop and validate a self-efficacy instrument that includes knowledge
efficacy, practice efficacy and belief in the context of teaching SPS among
prospective science teachers in Malaysia
ii) Identify and understand whether self-efficacy traits (i.e. self-efficacy in
knowledge, self-efficacy in personal practice and outcome expectancy) can
infer teacher knowledge development in the component of knowledge and
practice in PST education.
The study of development in the SETSIS reflects the model of teacher’s self-efficacy
in the specific task of teaching using science inquiry skills. As Germann (1994)
claims, through inquiry experiences, teachers help students not only to learn about

11
science but also to think logically, ask reasonable questions, seek appropriate
answers, and solve daily problems. The measure from the instrument is assumed to
indicate the characteristics for successful implementation of teaching with science
inquiry instruction in classroom for prospective science teachers as intended in the
reformed primary science curriculum of Malaysia.
Teacher education may provide sufficient knowledge and opportunities for pre-
service teachers to practice teaching according to KSSR needs. However, to what
extent these PSTs will persistently continue practicing the policy in future science
classroom depend on their perceived beliefs in their own capability of teaching. The
SETSIS is able to provide individual information about the perceived beliefs of
teaching using science inquiry skills. The information can help teacher educators to
identify the beliefs of individual PSTs in the implementation of the reform policy. This
information can provide early intervention to strengthen PSTs’ perceive beliefs in the
capability of teaching using science inquiry skills. The beliefs can play a major role in
affecting personal persistence in teaching using science inquiry skills in the science
classroom in Malaysia, as expected in the reform policy of KSSR. The next chapter
describes the importance of self-efficacy in teaching using science inquiry skills in
the existing literature.

12
Chapter 2 Literature Review
2.1 Introduction
In this chapter I present a review of the literature to explore the argument that the
underlying construct, self-efficacy in teaching using science inquiry skills has a role in
improving science teaching practice in PST education. This chapter begins with a review
of the prominent theory of self-efficacy, followed by tracing the teachers’ self-efficacy
(TSE) measure development and empirical evidence to provide the significant influence
of TSE measures in student and teacher performance. Next, I trace the development of
the teachers’ efficacy assessment concept from its emergence up to the present to
clarify its conceptualisation with the critiques on the existing factors of TSE belief, in
which I also suggest current developments in the TSE measure concept literature. Then
I conceptualise my study framework based on prior teacher efficacy definitions,
conceptualisations and theorisation, incorporating the elements of best practices in
teacher efficacy assessment for PSTs. Finally, I define the framework within self-efficacy
in teaching using science inquiry skills and present justification for the need to develop a
new self-efficacy tool aligned to the principle of teacher education development.
2.2 Theoretical and empirical review of teacher’s self-efficacy
(TSE)
A role of self-efficacy in a teacher’s teaching practice needs to be theoretically and
empirically reviewed to provide strong evidence of contributions to teachers’ self-
efficacy, especially in quality of the PSTs’ teaching practice. The strength of the
theories of self-efficacy that align with the empirical evidence will be discussed later.
2.2.1 Bandura’s Self-efficacy Theory
Self-efficacy defines as ‘a person’s belief that they can be successful when carrying
out the particular task’ (dictionary.cambridge.org). A perceived self-efficacy refers to
people's beliefs about their capability to exercise control over their own activities.
Albert Bandura defines self-efficacy as personal judgement of ‘one's capabilities to
organize and execute the courses of action required to manage prospective
situations’ (Bandura 1997, p.2). He conceptualise the role of self-efficacy to infer
future behaviour in general.

13
Bandura’s definition is rooted in the social cognitive theory view on human agency,
which suggests that individuals are responsibly engaged with their own
development, within reciprocal causation relationships between environment,
behaviour and personal factors. The driven action that can make things happen
from the cognitive interaction of the three factors (Bandura 1986) was clarified in a
model of triadic reciprocal determinism. The model used in Woods and Bandura
(1989) is adapted into Figure 1 to explains the cognitive interaction between the
three elements in determining human behaviours or performance in certain task.
The model in Figure 1 shows the possibility to determine human behaviours through
cognitive judgement of the three factors. Strategies for increasing performance in a
task can be aimed at improving the three factors indicated. For example, in order to
improve the practice of teaching among teachers, the trainer can work to improve
teachers’ self-efficacy in teaching (behavioural factors), improve their knowledge and
attitudes towards teaching (personal factors) and/ or improve the expectation of the
social community (environmental factor). This triadic reciprocal model interaction
creates cognitive judgement for changes in behaviour.
Bandura has advanced the concept in self-efficacy theory. Self-efficacy, which is a
component of social cognitive theory refers to people’s belief about their capabilities
to execute a specific task within a given context. The cognitive judgement
contributed to the predictive power of certain levels of behaviour, which arose from
personal factors and environment factors (i.e. outcome expectancy) (Bandura 1977,
1998). The relationship of Bandura’s self-efficacy theory is portrayed in Figure 2.
In Figure 2, while self-efficacy is a cognitive judgement about one’s capability of
doing a task based on personal factors (i.e. self-reflection of personal competency)
within the environmental sources, it also holds on to the relationship with outcome
Behavioural Factors
(e.g. skills, practice, self-efficacy)
Personal Factors
(e.g. knowledge, expectation, attitudes)
Environmental Factors
(e.g. social norms, access in community, influence to others)
Figure 1 Social cognitive theory emphasising reciprocal influences of behavioural, environment and personal factors in cognitive judgement

14
expectancy as a basis in predicting the capability of a person to perform a certain
level of behaviour in future.
Outcome expectancy is distinguished from self-efficacy because self-efficacy
indicates the perceived intensity in the ability to do a behaviour in completing a task,
while outcome expectancy is a judgement about the likelihood of outcomes from the
behaviour. Given an example of self-efficacy ‘I believe that I can cheer up the class
by telling jokes’, self-efficacy is about perceived belief of the capability of telling jokes
(i.e. to do a behaviour) in order to cheer the class (i.e a task). The likelihood of
outcomes expectancy is about the belief that the behaviour (i.e. telling jokes) can be
lead to positive or negative outcomes in physical, social or self-evaluative incentives
(e.g. I believe that students do not like their teachers to tell jokes during lesson).
According to Bandura’s theory, self-efficacy causally influences outcome
expectancy, but not vice versa: “People’s judgement about how well they will perform
largely determine what outcomes they expect their action to produce” (Bandura
1998, p.53). This belief judgement is based on the perceived capability to coordinate
and orchestrate the skills and capabilities in the context of competing for specific
demands and impediments. People’s perceptions of whether they are capable of
successfully performing certain behaviours through the expectancy distinguish self-
efficacy from general self-belief. Perseverance can produce the desired results, and
this success then increases self-efficacy judgements.
The relation between self-efficacy and outcome expectancy explains self-efficacy as
a belief that is goal-directed for specific tasks and domains, distinguishes it from
Figure 2 Relation between self-efficacy and outcome expectancy (Bandura, 1998). Self-efficacy may vary in terms level, strength and generality while outcomes expectancy may become positive or negative incentives.
Person Factor
Behaviour
Outcome
Outcome expectancy
Self-efficacy

15
general self-belief that only involves the willingness to carry out certain behaviour
(Bandura 1997). With the expectancy on the outcome factors, people with high self-
efficacy are more likely to believe they can overcome the challenges, recover from
setbacks and disappointments, and do well in prospective tasks. While people with
low self-efficacy tend to have low belief in doing well in the prospective challenges,
which leads to avoiding the tasks.
This theorised relationship, in Figure 2, has been widely accepted in the area of self-
efficacy measures (Maddux, Norton and Stoltenberg 1986; Tschannen-Moran and
Hoy 2001; Siwatu 2007). However, numbers of empirical studies have demonstrated
that outcome expectancy influences self-efficacy ratings, then called into the
question of validity of the self-efficacy theory (Kirsch 1982, 1985, 1986, 1995;
Teasdale 1978; Wolpe 1978 in Williams 2010). Bandura countered this critique with
evidence involving correlational studies showing that self-efficacy is predictive of
behaviour even when the effects of outcome expectancy were statistically controlled
(Bandura 1984 in Williams 2010). He asserted that self-efficacy judgements are valid
but can still be influenced by outcome expectations.
Development in self-efficacy judgement contributed from four sources that postulated
self-efficacy and outcome expectancy factors (Bandura 1997). Mastery experiences,
vicarious experiences, verbal persuasion and physiological arousal were stated as
the main sources of the expectation. The mastery experiences develop a strong
sense of efficacy through previous success in dealing with a particular challenge.
The experiences of repeated success performance can build a resilient sense of
efficacy from similar situations and contribute to a powerful sense of self-efficacy.
Contradictory to success experiences that contribute to an increase in self-efficacy,
failure in past experiences can contribute to decreased levels of self-efficacy.
On the other hand, people with little previous experiences develop a sense of
efficacy with the observation of successful behaviour of model performance or
vicarious experiences. Vicarious experiences encourage the belief that people are
able to imitate the success of the model performance, especially when there is a
similarity to the model. Observation of behaviour on certain tasks can affect levels of
self-efficacy, in which seeing success or failure of the model in the tasks can
contribute to the level of self-efficacy.
Moreover, verbal persuasion can have a built-in sense of efficacy when people are
told about their capability to handle certain situations. Social persuasion received
from other persons can manifest positive or negative encouragement. ‘People who
are persuaded verbally that they possess the capability to master given tasks are
likely to mobilise greater effort and sustain it…’ (Bandura 1997, p. 101). In the

16
context of teacher practice, social persuasion usually comes from social interaction,
especially from teacher trainers and peers.
Lastly, physiological arousal can lead to the development of self-efficacy. People’s
perception with their physical function can influence their belief. Lack of physiology
perception (e.g. having speech problem or excessive body mass), which might be
interpreted as inability by a person can feed negative responses reflected in low
levels of self-efficacy rather than the normal perception of physiology that feeds
perfectly positive responses for high levels of self-efficacy. In teacher training, these
sources interacted within teachers’ professional knowledge, which then can be seen
in teachers’ behaviour in classroom teaching. The model of self-efficacy that explains
reciprocal interaction of cognitive judgement between the personal and
environmental factors can be used to preliminarily assess competency in the
teaching profession. The following is discussed as to how Bandura’s self-efficacy
theory has connected in self-efficacy concept measures for teachers.
2.2.2 Conceptual perspectives on the underpinning teacher self-efficacy
(TSE) measure development
Teacher self-efficacy (TSE) belief was first introduced by Research ANd
Development (RAND) Corporation. RAND’s researchers introduced two items that
measure the internal factors and external factors influencing a teacher’s ability to
teach (Armor et al. 1976). It was conceptualised using an internal-external scale
inspired by Rotter’s theory of social learning (1966). The internal scale in RAND’s
project indicates teacher’s belief in accomplishing teaching activities in difficult
contexts within classroom teaching. The external scale measures a teacher’s belief
in the environmental factors that overshadow teaching ability and inhibit learning.
The combination of these two factors yielded the teacher efficacy construct. This
study asserted that the internal factor belief has a greater impact than the belief in
external factors.
Later, Gibson and Dembo (1984) developed a 30-item instrument, that measured
teacher efficacy more extensively and reliably, called the Teacher Efficacy Scale.
The study of the Teacher Efficacy Scale was motivated by RAND’s factors (Armor et
al. 1976) that corresponded with the concept of self-efficacy theory (Bandura 1977).
Factor analysis confirmed that there were two factors: the internal factor called
personal teaching efficacy (PTE) and the external factor called general teaching
efficacy (GTE), which both show high reliability.

17
In the Teacher Efficacy Scale, PTE corresponds to specific items (e.g. “If I really try, I
can get through to even the most difficult and unmotivated students” (p.573)) that
represent a teacher’s sense of personal responsibility in student learning. GTE
corresponds to items (e.g. “ When it comes right down to it, a teacher really can't do
much because most of a student's motivation and performance depends on his or
her home environment”(p.574)) that reflect a teacher’s belief about the general
relationship between teaching and learning. Gibson and Dembo argue that these two
respective factors emerged corresponding with self-efficacy and outcome
expectancy, as suggested by Bandura (1977). As a result, the self-efficacy factor is
widely known as PTE and outcome expectancy is widely known as GTE in TSE
belief measures.
Although the Teacher Efficacy Scale has been used often as a teacher efficacy
instrument, there is the issue of inconsistency in the meaning and instability in factor
structure of PTE and GTE (Henson 2001; Tschannen-Moran an Hoy 2001; Williams,
2010). Hoy and Woolfork (1993) employed their short version of Teacher Efficacy
Scale with a 10-item measure and found reliabilities in five PTE items and five GTE
items, which were within the range of the longer version of the measure. The
measure predicts that teachers with higher scores in PTE and GTE would persist in
teaching tasks longer, give a greater academic focus in the classroom and would be
active and assured in their responses to the students. Indeed, Allinder (1994) in her
study of the relationship between teacher’s self-efficacy and instructional practices
found that PTE relates to instructional experimentation while GTE refers more to
clarity and enthusiasm in teaching.
Researchers inadvertently combined PTE with other factors, which lead to instability
of the factor structure in self-efficacy measures. Using the 16-item version of
Teacher Efficacy Scale, Soodak and Podell (1993) found that one GTE item was
loaded onto the PTE factor, and that another item did not have a strong enough
loading on either factor to be included. In another study, four school factors were
found to be significantly associated with teacher efficacy: receiving positive feedback
on teacher performance, collaboration with other teachers, parental involvement in
the school, and schoolwide coordination of student behaviour (Rosenholtz 1989).
These results empirically questioned the validity of Bandura’s theory of two
distinctive factors of self-efficacy (i.e. PTE) and outcome expectancy (i.e. GTE) as
stated in 2.2.1.
Addressing these issues, Tschannen-Moran et al. (1998) have extended the two-
dimensional concept of Bandura in their integrated model of teacher efficacy. This
teacher efficacy model integrates sources of information in a specific setting with the

18
cognitive process in order to make efficacy judgements. The efficacy judgements are
made based on two corresponding factors, GTE and PTE, that are embedded in the
analysis of teaching tasks and the assessment of personal teaching competence.
This model is explained in detail later in section 1.3.1.
2.2.2.1 TSE measure development in teaching science
TSE is believed to be context and subject-matter specific (Pajares 1992; Roberts
and Henson 2000; Meinhardt et al. 2014). The Teacher Efficacy Scale measure for
general teaching behaviours may overlook the specific content of teaching. In the
attempt to address this issue, Riggs and Enochs (1990) developed the Science
Teaching Efficacy Belief Instrument (STEBI) for teachers (STEBI-A) and STEBI-B for
PSTs. These science-specific items were modelled after two scales that have been
used in Gibson and Dembo (1984) in regards of science teaching and the learning
was believed too general for a context of in-service and PSTs. Studies in STEBI-A
and STEBI-B have found two unrelated factors that were consistent with the factors
concept of PTE and GTE (Riggs and Enochs 1990).
In extended studies of STEBI-A and STEBI-B, teachers with high scores of PTE
reported were more likely to spend time teaching to develop the science concept
being considered and were related to higher science teaching performance (Riggs
and Jesunathadas 1993; Riggs et al. 1994). The studies on the second factor related
to the quality of teaching science but Riggs (1995) found that GTE will improve only
with those whose belief was weak to begin with.
Other research has questioned the elusive measure of outcome expectancy factor in
STEBI-B (Tschannen-Moran and Hoy 2001; Bleicher 2004) because of the instability
in factor structure. Roberts and Henson (2000) proposed an alternative instrument,
called Self-Efficacy Teaching and Knowledge Instrument Science Teachers
(SETAKIST), to measure science teachers’ self-efficacy to address these concerns.
The development of SETAKIST used Gibson and Dambo’s measure as a starting
point, retained the PTE items (rewording them into a science teaching context) but
introduced knowledge efficacy (KE) to assess another teacher efficacy dimension.
The idea of knowledge efficacy construct was based largely on the concept of
Pedagogical Content Knowledge (PCK) (Shulman, 1986). However, in a revised
version of SETAKIST in item wording and scaling (SETAKIST-R), Pruski et al. (2013)
revealed that the person-item separation indices (reliability) were low because of
poor item wording. Thus, the study suggested SETAKIST’s items needed
development before further usage.
To conclude, the development in TSE belief measures, especially in quantitative
measures, still needs to be improved. The review of the theoretical aspect of self-

19
efficacy belief has been a foundation in TSE belief measures and have shown a
significant role in measuring teaching behaviour for teachers and PSTs. It has also
been further shown the role of knowledge factor in measuring TSE belief. The next
section will discuss the empirical evidence that suggests the important influences of
TSE measures in teaching science.
2.2.3 Empirical evidence of TSE role in teaching practice
Self-efficacy is a belief that someone can successfully perform a behaviour and has
attracted much empirical research. It asserts that self-efficacy has a powerful
influence on behaviour and performance changes. A range of research studies
highlighted the important role of teachers’ self-efficacy in students’ learning and
teaching practice.
2.2.3.1 Impact of TSE on student learning
Self-efficacy has emerged as a highly effective predictor of students’ motivation and
learning. As a performance-based measure of perceived capability, self-efficacy
beliefs have been found to be sensitive to subtle changes in the students’
performance context, to interact with self-regulated learning processes, and to
mediate students’ academic achievements (Zimmerman 2000).
Since the TSE belief measure concept was promoted by the RAND Corporation
(Armor et al. 1976; Berman, McLaughlin, Bass, Pauly, and Zellman 1977) and the
subsequent research into the TSE measure, a number of studies have pointed to the
influence of TSE beliefs on children's cognitive achievements and success at school
(Moore and Esselman 1992, 1994; Muijs and Reynolds 2001; Ross 1992, 1998).
TSE beliefs may influence a student's achievement in several ways. Teachers with
high self-efficacy beliefs are more likely than teachers with a low sense of self-
efficacy to implement didactic innovations in the classroom and to use classroom
management approaches and adequate teaching methods that encourage students'
autonomy and reduce custodial control (Cousins and Walker 1995a, 1995b; Guskey
1988), to take responsibility for students with special learning needs (Allinder 1994;
Jordan, Krcaali-Iftar, and Diamond 1993), to manage classroom problems (Chacon
2005; Korevaar 1990), and to keep students on task (Podell and Soodak 1993).
Furthermore, teachers’ perceived self-efficacy has been found to be associated with
enhanced student motivation (Ashton and Webb 1986; Roeser, Arbreton, and
Anderman 1993), increased self-esteem (Borton 1991), strong self-direction (Rose
and Medway 1981), ease in managing school transitions (Midgley, Feldlaufer and
Eccles 1989), and more positive attitudes toward school (Miskel, McDonald, and

20
Bloom 1983). The teacher's self-efficacy may also contribute to promoting a
student's sense of efficacy, fostering their involvement in class activities and their
efforts in facing difficulties (Ross 1998; Ross, Hogaboam-Gray, and Hannay 2001).
In addition, other findings suggest a reciprocal effect between a teacher's perceived
self-efficacy and a student's achievement, showing that teacher's perceived self-
efficacy is particularly high in schools with high-achieving and well-behaved students
(Raudenbush, Rowan, and Cheong 1992; Ross 1998). As teachers of talented and
disciplined students are more likely to be successful in their activities and tasks than
teachers of students who present learning or disciplinary problems, the repeated
experiences of success with students may enrich their experience and contribute to
their robust sense of efficacy.
2.2.3.2 Impact of TSE on teacher’s performance
With regard to teaching practice, the evidence suggests that teachers’ behaviour in
classrooms is highly influenced by their perceptions about own ability to teach (self-
efficacy) and the belief that their teaching strategies would be effective (outcomes
expectancy). Although a person’s beliefs about their capabilities are not the same as
their actual ability, they are closely related. Teacher's self-efficacy beliefs do not, of
course, operate in isolation from other psychosocial determinants that affect their
motivation and performance such as their professional aspirations, the recognition
and respect they perceive to be accorded and, ultimately, the satisfaction they draw
from their profession.
Previous findings support the critical influence of a teacher's self-efficacy beliefs on
their performance and motivation (Bandura 1997; Ross 1998; Tschannen-Moran,
and Woolfolk Hoy, 2001; Tschannen-Moran, Woolfolk Hoy and Hoy 1998; Woolfolk
and Hoy, 1990; Woolfolk, Rosoff and Hoy, 1990; Woolfolk Hoy and Davis, 2006). It
also shows that teachers’ behaviours, such as willingness to take a risk, persistence
in tasks and the use of innovation are related to the degree of self-efficacy in
individual teachers Compared to teachers who doubt their efficacy, teachers with a
good sense of self-efficacy are more inclined to appreciate other school constituents'
contributions to the functioning of the school, to view the principal, colleagues, staff,
students and parents as behaving in accordance with their obligations, and to
perceive the whole school as a system capable of pursuing its mission (Goddard et
al. 2004; Takashi 2011).
Previous research has also found that teachers' sense of efficacy is related to their
satisfaction with their choice of profession and their competence as rated by school
superintendents (Trentham, Silvern, and Brogdon 1985). A strong sense of teacher's
self-efficacy promotes a firm commitment to the profession and collaborative

21
relationships with colleagues and parents (Coladarci 1992; Hoover-Dempsey,
Bassler and Brissie 1992; Imants and VanZoelen, 1995), contributing fruitfully to the
promotion of a rich and stimulating learning environment. Recent findings have
shown that teachers' self-efficacy beliefs have a crucial role in affecting and
sustaining their commitment to school and their job satisfaction (Caprara et al. 2003;
Caprara, Barbaranelli, Borgogni, and Steca, 2003). It is likely that job satisfaction
accompanies teachers' sense of efficacy and contributes towards sustaining their
efforts in pursuing children's optimal scholastic attainments.
2.2.4 Summary
In general, TSE belief is rooted in a view that individuals are agents that are
proactively engaged in their own development and can make things happen by their
action (Pajares 1992). Thus, within the context of social cognitive theory, self-
efficacy belief is able to determine teaching performance based on the perceived
judgement of capabilities to organise and execute courses of action required to attain
designated types of performance. Bandura’s self-efficacy theory suggests that
outcome and efficacy expectations are differentiated by two factors.
i) The judgement in personal capability to execute courses into action (self-
efficacy)
ii) The judgement in the consequences lead by the action (outcome
expectancy)
In the development of the concept underpinning TSE measure, it seems that
Bandura’s definition of self-efficacy can meet the concept of TSE belief as goal-
directed and task-specific. This was well portrayed in the literature of the TSE
measure in science teaching within the two factors that reflected the factors of self-
efficacy and outcome expectancy.
The evidence supports the role of TSE in the area of student learning and teacher
performances. TSE measures point significant impacts on the teacher’s
professionalism. It seems that the concept of the existing TSE measure is
concurrently similar to the theory of Bandura’s self-efficacy. Thus, the TSE concept
is chosen as a fundamental concept to be used in developing an instrument which
has the possibility of predicting teacher behaviour in teaching practice. The next
section will explore the conceptual framework used in the study.

22
2.3 Theoretical and conceptual framework of my study
The study aims to develop an extensive model of TSE measures in the context of
teacher education, focusing on the use of science inquiry skills in the classroom as a
way of supporting student learning in science. This section will highlight the two
concurrent concepts used in this research framework: teacher knowledge, and TSE.
Firstly, I drew on a broader literature of teacher knowledge with the rationale to
explore the importance of teacher knowledge in teacher education development.
Next, I look into the prominent model of TSE measures and explore contemporary
literature about the role of the knowledge factor in measuring teaching development
using TSE belief. Finally, the convergence of characters in teacher knowledge and in
measuring teacher’s practice in TSE are used to develop a construct of my study
using the three important elements in PST development.
2.3.1 Theoretical review of teacher knowledge
According to Shulman (1986, 1987), effective teaching practice requires the
development of teacher knowledge in the areas of i) content knowledge, ii)
professional knowledge of teaching (i.e. general knowledge related to historical,
philosophical and psychological aspects of schooling, students and education), iii)
pedagogical knowledge (i.e. general effective teaching concept, theories and
research) and iv) pedagogical content knowledge (PCK) (i.e. the teaching method
used in subject learning). This knowledge is developed in a teacher preparation
programme with the aim for the prospective teachers to become ‘knowledgeable
about subject matter and pedagogy and who made decisions, constructed
responsive curriculum, and knew how to continue learning throughout the
professional lifespan’ (Cochran-Smith 2004, p. 296). Teachers should be equipped
with the base teacher knowledge during teacher training in order for them to perform
teaching practice specifically and flexibly in subjects with different contextual,
situational and personal influences professionally.
Among the four areas of teacher knowledge mentioned above, the concept of PCK is
largely used as the teacher knowledge model for the teacher education programme.
Abell (2008) and Kind (2009), in their review articles on teacher knowledge, argue
that this concept is widely accepted as standard professional knowledge. PCK
indicates the unique domain of knowledge for teaching in a specific context.
In the context of science learning, PCK is the knowledge of instructional strategies
used to make scientific concepts comprehensible to the students by using specific
teaching strategies (van Driel et al. 2014). PCK connects knowledge and practice
with the two dimensions of teacher knowledge (i.e. instructional knowledge and

23
content knowledge), upon which PSTs will cognitively construct their action
behaviour in teaching (Cochran-Smith 2004). Both of these studies agree with
Shulman (1987), that PCK distinguishes the understanding of the content specialist
from that of the pedagogy; and differentiate a scientist’s knowledge from a science
teacher’s knowledge.
2.3.1.1 Pedagogical teacher knowledge to measure teaching practice
In the science education field, there are considerable efforts to identify and measure
a teacher’s knowledge that PSTs bring to classroom practice. Park et al. (2011) have
developed a quantitative measure of PCK in teacher practice. The instrument
developed has used two components from PCKs: instructional knowledge, and
content knowledge. These dimensions are validated and suggested as the factors
upon which PSTs will cognitively construct their action behaviour in teaching (Park et
al. 2011). It is argued that PCK is concerned with the way that subject matter
knowledge is transformed from the mind of teachers into instruction for the teaching
task requirement.
In the effort to develop a model for a new teachers ‘professional vision’, Seidel and
Sturmer (2014) have used a video-based instrument to assess the classroom
practice from PSTs’ perspective. The study model suggests that teachers’
professional practice can be inferred through the cognitive process of PSTs. The
empirical evidence in the study shows that PSTs have the ability to predict the
quality of teaching instruction in the given teaching task (in the video-based
instrument). Their judgement about the requirement and goals are influenced by
knowledge, belief and experience perceived by PSTs during their teacher training
programme. It is concluded that the PCK may underpin the element of prediction that
contributes to PSTs’ professional practice view.
Further, in assessing teachers’ professional enhancement in teaching primary
science, Hafizan et al. (2012) conducted a survey of 329 primary teachers in
Malaysia to measure their SPS teaching performance in relation to their knowledge
of SPS content. The results of the survey indicated that the teacher competency
level of SPS is good at the practical stage of SPS but not conceptually. This
empirical data support the conclusion given by van Driel et al. (1998) in the grounded
theory research among 12 science teachers with more than five years of teaching
experience in teaching chemical equilibrium. The research showed that teachers
develop their PCK in the classroom with their own knowledge from everyday
practices. This explains why teachers can perform well in the classroom without the

24
full understanding of the concept, as obtained from the survey study of Hafizan et al.
(2012).
However, performing well in a classroom with limited knowledge of SPS will not allow
teachers to explicitly teach SPS in the classroom. According to the study by Harlen
and Holroyd ( 2007), teachers with a lack of knowledge in the science and
technology subject area have employed instructional knowledge using various
teaching strategies for coping. These teaching practices, when applied regularly
have severely limiting impact on the students. Thus, it shows that the two elements
of PCK, i) instructional knowledge and ii) content knowledge are needed to complete
teachers’ knowledge and allow teachers to explicitly teach SPS in the classroom.
The abilities in teaching practice refer to how PSTs think and translate their
knowledge in the context of teaching in classrooms. These abilities seem to be a
consequence of the way they develop their PCK (as shown in Magnusson et al.
1999; Loughran et al. 2008; Berg 2009; Park et al. 2011). Targeted instruction in a
specific content area, through a good practice of PCK, can enhance a teacher’s
confidence in delivering meaningful lessons, thus increasing self-efficacy. Greater
teacher self-efficacy results in not only more positive attitudes about teaching but
also a higher level of confidence in specific content teaching abilities (Guskey 1984).
The next section will explain and justify the factors involved in the study and provide
a framework for the study development measure of SETSIS, which is used to infer
performance in teaching practice.
2.3.2 The integrated model of TSE
Self-efficacy is chosen to portray the possibility of predicting teacher’s behaviour in
teaching practice from a complex belief of cognitive factors. As mentioned above,
Bandura’s self-efficacy theory holds on to the relationship of outcome expectancy as
a basis for predicting the capability of a person to perform a certain level of
behaviour. However, there is evidence showing that the two factors influence each
other. Trying to overcome the issue, the prominent study of Tschannen-Moran et al.
(1998) in teachers’ self-efficacy identified the two distinctive factors as self-efficacy
determinants in their teacher efficacy model in Figure.
In the integrated model of teacher efficacy, Tschannen-Moran and colleagues
cognitively analysed the interrelation of the two factors that emerged in teacher
efficacy measures. They suggested analysing teacher tasks (outcome expectancy)
and assessing personal competence (self-efficacy) within the specific context of
teaching. The component of analysing the teacher task assesses the strengths and

25
weaknesses in relation to the requirements of the task. It indicates a reflection on a
general belief about teaching effect in a specific context rather than to measure likely
consequences of action (Hoy and Spero 2005). Further, the second component,
assessment of personal teaching competency, assess personal capabilities in traits
that are used to balance personal weaknesses in order to execute particular courses
of action (Bandura 1977; Tschannen-Moran et al. 1998). The interaction between
these two factors emerges in most of the self-efficacy instruments and is widely used
to form a judgements about self-efficacy for the teaching task at hand.
In their conceptual model of TSE belief, the first component is a judgement as to
whether the person is able to organise and execute the necessary action to
accomplish a specific task at the desired level. It derives from the cognitive process
of assessing personal capabilities, such as skills, knowledge, strategies and
personal traits, which corresponds to the self-efficacy factor of Bandura. In the study
this component will be referred to as the PTE factor, which reflects self-efficacy in
the personal trait of teaching practices based on the judgement in the capability of
executing teaching practices/activities using science inquiry skills in the classroom.
The second component develops from the cognitive process of analysing a teaching
task and its context. In the study, the second component refers to the outcome belief
efficacy (OBE) corresponding to the outcome expectancy of Bandura within the
specific task of teaching using science inquiry skills. The factor OBE in this study
assesses the likely consequences from the action done based on specific tasks on
PTE. Both of the dimensions result from the cognitive process of integrating
information from sources into the analysis of judgement of favourable teaching
practices using science inquiry skills in classroom teaching.
Figure 3 illustrates the cyclical nature of a conceptual model of teacher efficacy
measuring. This model features a comprehensive model that was claimed to capture
the goal-oriented, task and context-specific nature of TSE belief (Bandura 1996).
This model recognises that the teacher assesses their self-efficacy beliefs through
analysing the teaching task and its context in relation to their self-perception of
competence (i.e. the skills, the knowledge, strategies and other cognitive and
affective resources in that particular context). The self-efficacy then determines the
behaviours teachers produced in various goals or restraints.
Besides reconciling the theoretical issue and operational definition of self-efficacy in
the measurement model, this integrated model attempts to hold constant while
emphasizing the specific task in the phrases. The aforementioned sources of self-
efficacy suggest that teachers’ behaviours in classrooms can be highly influenced by
their own perceptions of their ability to teach (i.e. PTE) as well as the belief that their

26
teaching strategies would be effective (i.e. OBE). The influence of environmental and
behavioural factors such as belief, knowledge and practice have such weight in
behavioural decisions and need to be mentioned within task and domain-specific
(Bandura 1986).
Figure 3 Interaction of teachers’ cognitive processes which results in teachers’ efficacy judgments (source: Tschannen-Moran, Hoy and Hoy (1998))
This integrated model of teacher efficacy holds some promise for operationalising
self-efficacy in a way that is independent of outcome expectancies and thus
consistent with self-efficacy theory. This efficacy information in the specific context of
a teaching task can influence how teachers translate their knowledge understanding
into teaching performance in the classroom (Tschannen-Moran and Hoy 2007).
Thus, the factors that emerged from the model were used as part of the study of the
SETSIS measure. The next section reviews the literature on the emerging role of
knowledge efficacy (KE) in TSE measures.
2.3.2.1 The role of knowledge in the TSE belief measure
Self-efficacy belief is an important issue for primary PSTs. Researchers have found
negative experiences in science subjects during schooling developed a poor attitude
towards science teaching practices (Pajares 1992; Wolf-Watz 2000). Poor science
knowledge also contributes to a lack of ability in teaching primary science subjects.
PSTs with poor ability in teacher knowledge (content knowledge and practice) can
be expected to teach science poorly using reading- and writing-based strategies or
avoiding it altogether (Allinder 1994; Harlen and Holroyd 2007; Rauf et al. 2013).

27
Research has found that science content knowledge in teacher education courses is
able to lift the effect on PSTs’ confidence to teach science (Deehan, Danaia and
McKinnon 2017). A well-planned model of science teaching courses can develop
positive changes in self-efficacy of teaching. The positive consolidation of the effects
in self-efficacy can also be enhanced with teaching practice (Hudson, Skamp and
Brooks 2005; Palmer 2006). Assessing perceived knowledge about teaching should
be considered for the TSE measure as this factor has shown it can contribute in the
development of the TSE measure.
Further, in criticising the limitation model of Tschannen-Moran et al. (1998), Fives
(2003) refutes, as the model was depicted, that the cognitive processing of
psychological sources takes place prior to the assessment of personal abilities
(skills, knowledge and others cognitive and belief systems) and that there is no
interaction between the sources and teacher’s knowledge and belief (refer to Figure).
He argues that the model was not able to connect the sources of experiences with a
teacher’s beliefs about teaching knowledge from their experiences. Thus, this model
required additional factors that can address interaction in belief and teacher’s
knowledge experiences.
Pajares (1992) describes the connection between belief and knowledge as highly
complex and intricate and discusses that belief corresponds to a filter through which
new knowledge is interpreted. Bandura (1986) conceptualises the role of self-
efficacy as fostering action as well as ‘a filtering mechanism for self-referent
information in the self-maintaining process’ (p.356). Drawing from both, TSE belief
can be described as mediating between knowledge and action (Fives 2003). It
seems that the knowledge factor can be seen as an important factor of the TSE
belief measure.
Moreover, the spiralling cycle of the model has been described by Wheatley (2005,
2002) as implausible. The model was described as the greater efficacy leading to
greater effort and persistence, and the reverse is also true. Wheatley argues that the
model fails to incorporate the idea of experiencing low efficacy can support
development in self-efficacy. He explains that teachers need to experience doubt to
reflect and learn to help overcome low self-efficacy belief. Thus, Wheatley (2001)
suggests that the extensive model of TSE measures should account for the factor in
teacher learning; thus, self-efficacy doubts measured through the model can be
beneficial to support teacher education.
Further, Wyatt (2014) argues that the concept and definition of the existing model of
TSE quantitative measure was rather confusing. Tschannen-Moran and Woolfolk
Hoys (2001) defined task-specific as what teachers actually do to bring about

28
desired outcomes in students’ engagement and learning, and yet, as TSE belief is
task-specific, it should be the teacher’s individual belief in their capability to perform
specific tasks at a specific level of quality in a specific situation (Dellinger et al. 2008
in Wyatt 2014). It was suggested that the TSE belief measure should take the
contrary perspective to Tschannen-Moran and Woolfolk Hoys (2001) in developing
TSE belief of quantitative measure. He insists that the measure should be developed
as an agent-means definition (i.e. belief about ability to take actions) rather than an
agent-ends definition (i.e. ability to bring about desired outcomes).
This insight gains supports with empirical evidence in teaching practices of PSTs
from Settlage et al. (2009) and Wyatt (2010). In his report, Settlage reports of PSTs
who held inexperience with science teaching practice in the classroom but held high
levels of confidence in their prior methods courses blinded them to the self-doubt
that might benefit them professionally. Thus, self-efficacy doubt related to
performance on specific tasks can be beneficial with reflection to the related learning
factors as then learning can be improved. This means, by incorporating important
elements of teaching development (i.e. knowledge, practice and belief) the TSE
measure model can produce beneficial outcome information in teacher knowledge
development.
2.3.3 Summary
Instead of using two components, PTE and OBE, as indicated in the prominent
model of TSE reviewed above, this study included KE in measuring self-efficacy in
teaching using science inquiry skills. The SETSIS adapts a contemporary definition
of the TSE model originated in Tschannen-Moran et al. (1998) with the addition of
the knowledge component of KE. The study indicated KE as additional to SETSIS
because it was important to acknowledge PCK as professional knowledge
experiences that underpinning PSTs’ teaching performance. The items will be
revised in Chapter 4 to reflect the process-oriented teaching approach in the science
classroom.
The SETSIS reflects the model of TSE in specific tasks of teaching using science
inquiry skills. As Germann (1994) claims, through inquiry experiences, teachers help
students not only to learn about science but also to think logically, ask reasonable
questions, seek appropriate answers, and solve daily problems. The measure from
the instrument assumes to indicate the characteristics for successful implementation
of teaching with science inquiry skills instruction in a classroom of prospective
science teachers.
Measuring the self-efficacy in teaching science inquiry skills will not only yield the
expectation that potentially could project into a performance but can also project a

29
teaching development in PST’s education. In order to validate the self-efficacy, the
belief measure can align with teacher knowledge development in PSTs, the study
includes evaluation of the SETSIS with measures of two components of teacher
knowledge. The SETSIS, developed as a belief component assessment, would be
tested with the two-measure component of teacher knowledge, which is a knowledge
test (Shahali and Halim 2010) and teaching practice assessments. Theoretically,
these two components would have a positive relationship in the TSE measure as
mentioned by Bandura’s theory of cognitive social learning. The next section
explores the significance of the study conceptual based on the existing literature.
2.4 Study construct and conceptual model
The SETSIS is developed to reflect on the self-efficacy in regard to teaching science
using SPS with three contributing factors that emerge from measures of self-efficacy
in teaching science. These factors will be represented by three dimensions, which
are knowledge efficacy (KE), personal teaching efficacy (PTE), and outcome belief
efficacy (OBE). The following section will review the concept and meaning of the
study’s dimensions used in the existing teacher self-efficacy measures. Further, this
section will explain the conceptual model used in the development of SETSIS based
on the literature explored.
2.4.1 Knowledge Efficacy (KE)
The knowledge efficacy (KE) scale has been first employed along with the PTE scale
in SETAKIST (Roberts and Henson 2000). KE was one of the attempts to re-develop
the outcome expectancy scale, due to the issue of instability in factor structure
argued in section 2.2.2 above. Roberts and Henson (2000) proposed a measure of
science teacher’s self-efficacy to be looked at from the perspective of PCK
(Shulman, 1986), consisting of instructional (pedagogy) constructs and knowledge of
subject matter construct. In the study, the KE scale is introduced to represent the
self-efficacy towards subject matter knowledge, while the remains PTE scale (from
the Teacher Efficacy Scale of Gibson and Dembo (1984)) reflects the instructional
efficacy. The study analysis of the sample of 274 science teachers who were
involved in training had confirmed that knowledge efficacy is one of the two
components in a science teacher’s self-efficacy measure. The confirmatory factor
analysis yielded the two-factor model have a good fit to the data (CFI = .937, NFI =
.876, TLI = .927, GFI = .917, RMSEA = .057). Thus, Roberts and Henson (2000)
emphasize that the KE complements the PTE by concentrating ‘the concept of
content knowledge is part and parcel with….teaching ability’ (p.12).

30
In their project of evaluating teacher professional development, Pruski et al. (2013)
revised items wording and response format of SETAKIST (SETAKIST-R) in order to
measure science teacher’s self-efficacy component. The analysis on data collected
from 334 science teachers that attended a teaching conference confirmed KE is one
of the two factors that fit the measurement model, which is consistent with the two-
factor model suggested by Roberts and Henson (2000). However, Pruski et al.
(2013) suggest further research in item development in order to capture the entire
range of underlying dimension of KE.
Self-efficacy in knowledge (KE) may influence the development of learning
conceptual as well as instructional approaches used. The belief about the nature of
knowledge and knowledge acquisitions has been addressed in many studies into
epistemology belief in teacher education (Aypay 2010; Cheng et al. 2009; Ravindran
et al. 2005; Schommer 1990). In an empirical study among Hong Kong PSTs, Chan
and Elliott (2004) revealed that PST’s belief about knowledge has a significant
impact on their concept of learning. PSTs’ belief in learning effort and process has a
significant relationship to the conceptions of learning to understand and learning as a
means to an end, which is expected to bring success in academic achievement. The
study suggests that the perceived belief is a ramification on PSTs’ aforementioned
knowledge in teacher education programmes and are expected to continue as well in
their future classroom teaching practice (Chan and Elliott, 2004). Thus, the evidence
gives sufficient conceptual ground to support KE as one of the factors in self-
efficacy, to some extent still used to predict certain behaviour in teaching practice.
2.4.2 Personal Teaching Efficacy (PTE)
Many researchers associated PTE with self-efficacy construct (Zimmerman et al.
1992; Robin & Henson 2001; Smolleck et al. 2006; DeBacker et al. 2008). PTE
reflects Bandura’s definition of self-efficacy (Bandura 1977, 1996, 2006). PTE has
been constructed with items that asked about current competency (e.g. when I teach
science, I possess the ability to allow students to devise their own problems to
investigate (Smolleck, Zembal-Saul and Yoder 2006)), current functioning (e.g. I
generally teach science ineffectively (Riggs & Knochs 1990)) and future potential
(e.g. If a student did not remember the information I gave her in a previous lesson, I
feel assured that I would know how to increase her retention in the next lesson
(Tschannen-Moran, Hoy and Hoy 1998)).
In RAND studies (Rotter 1966), PTE is associated with the internal scale of teacher
efficacy. Internal scales were measured more in teachers’ specific and individual
accomplishments rather than the accomplishment in general. This factor is expended
in much research of teacher efficacy ( Toland & Usher 2015; Barros et al. 2010;

31
Robin and Henson 2001; Riggs and Enochs 1990), where PTE has been used to
predict teacher’s behaviour with the most accuracy. However, researchers have
constructed PTE differently from the self-efficacy described by Bandura (1977).
As a form of self-efficacy construct, PTE associated with a prediction of the capability
in designated future performance. Thus, the PTE assessment should not be
presented in present performance or past functioning (Pintrich and Schunk 1996 in
Tschannen-Moran et al. 1998). However, in order to assess a judgement of future
capability Tschannen-Moran et al. (1998) suggested that PTE is used in order to
assess personal teaching competence rather than self-efficacy.
In the integrated model of teacher efficacy, Tschannen-Moran et al. (1998) suggest
that assessment on personal competence with teaching tasks reflects PTE. Thus, to
measure the teacher’s self-efficacy, PTE should be developed with items that assess
self-perception of teaching competence and an individual’s judgement on their
current ability and strategies in regards the teaching task. Self-perception of teaching
competence assesses the perception of current functioning, that contribute to the
prediction of future capability. Besides, an individual’s judgement on the current
ability and strategies can assess the level of perceived competence in order to meet
the demands of a particular teaching task.
2.4.3 Outcome Belief Efficacy (OBE)
The OBE was first introduced by RAND’s researchers in teacher efficacy measure
(Armor et al., 1976) known as GTE. In the RAND instrument that used Rotter’s
theory of social learning (Rotter 1966), teacher efficacy was conceived as the extent
to which teachers believed that they could control the establishment of their own
action under the two factors: internal and external factors. GTE was defined as a
teacher’s belief in the power of external factors (e.g. values placed at home in
students, students’ social and economic factors and students’ emotional and
cognitive needs) compared to the influence of teachers and schools.
Later, Bandura (1977) uses social cognitive theory to introduce outcome expectancy
in self-efficacy theory. He proposes outcome expectancy as the second kind of
expectation that gives the predictive power of the first expectation, which is self-
efficacy. As self-efficacy is about the perceived belief in the capability to perform
tasks at an expected level, the outcome expectancy can add more predictive power
through assessment to the extent of the performance produces a desirable outcome
at the expected level. When applied to the study of teacher self-efficacy, Gibson and
Dembo (1984) define that “teachers who believe student learning can be influenced

32
by effective teaching (outcome expectancy beliefs) and who also have confidence in
their own teaching abilities (self-efficacy beliefs) should persist longer, provide a
greater academic focus in the classroom, and exhibit different types of feedback
other than teachers who have lower expectations concerning their ability to influence
student learning” (Gibson and Dembo 1984, p. 570).
Attempting to draw the reconciling of RAND’s teacher efficacy measure conceptual
and Bandura’s self-efficacy theory, Gibson and Dembo (1984) suggested GTE as a
second factor to reflect the outcome expectancy in their teaching efficacy instrument
(i.e. Teacher Efficacy Scale). They describe outcome expectancy, essentially
referring to GTE at the degree in which teachers believe that environment (external
factors) could be controlled, thus labelling it as teaching efficacy. Further to that,
Riggs and Enochs (1999) use GTE in their science teachers’ efficacy measure,
STEBI. They explain that GTE is an expected outcome to be accomplished that an
individual teacher could expect from their own teaching. Therefore, they have
labelled this factor as Science Teaching Outcome Expectancy .
In an effort to clarify the meaning of the self-efficacy construct in teaching
effectiveness, Tschannen-Moran et al. (1998) draws a new meaning to GTE from the
integrated model of teacher efficacy. Their model proposes an element of task
analysis that evaluates specific elements based on the teaching situation. This
element in OBE related concept of GTE introduced, but different in the way that it
refers to the assessment of the four principal sources in the teaching environment.
This is consistent with the concept of reciprocal causation in self-efficacy, in which
teacher’s self-efficacy belief stems from the dynamic relationship of environment,
behaviour and personal factors (Bandura 1997).
In summary, the OBE factor is the analysis of belief in teachers’ task within its
context, which assesses the strengths and weaknesses in relation to the requirement
of the task. Hoy and Spero (2005) in their study found that OBE rose during teacher
training but fell during the first year of teaching experience due to lack of support. It
indicates a reflection on the general belief about the teaching effect in a specific
context rather than measuring the likely consequences of an action. Thus, the OBE
in this study represents the belief in the teaching effect in regards of teaching
science process skills.
2.5 Summary
The above review acknowledges the possibility of inferring teaching practice of using
science inquiry skills by using a self-efficacy belief concept. The SETSIS was
developed to measure self-efficacy in the particular context of teaching science using
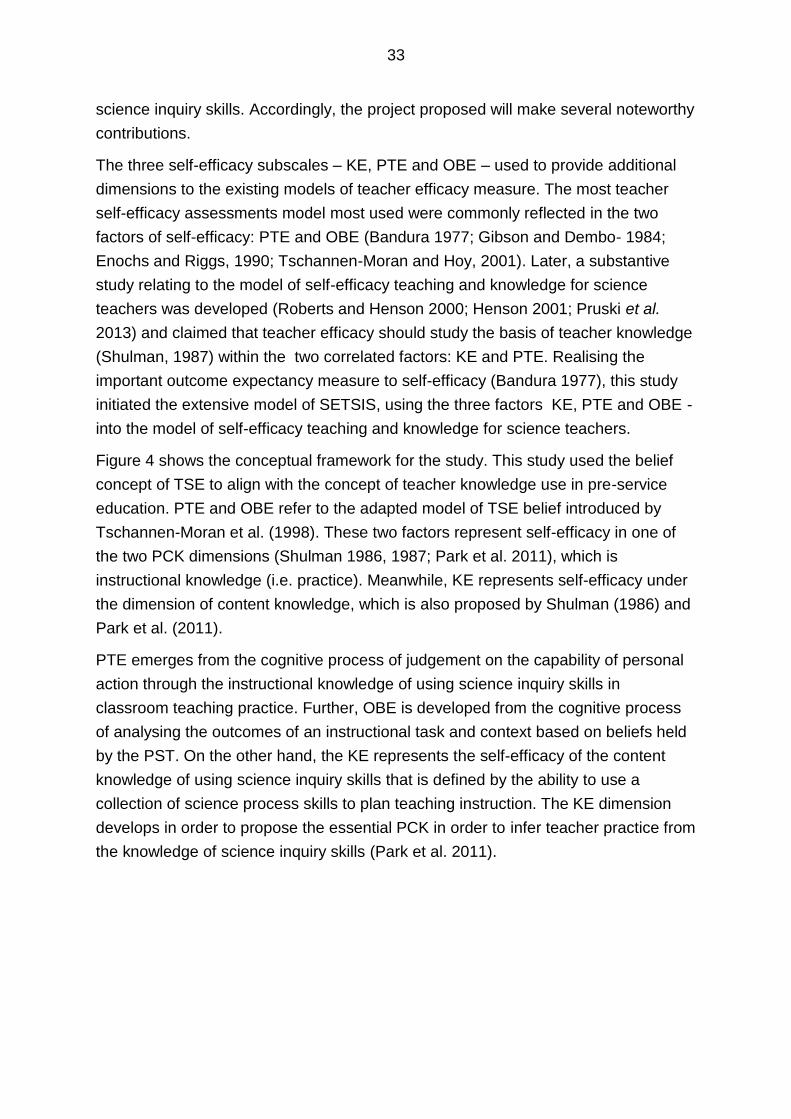
33
science inquiry skills. Accordingly, the project proposed will make several noteworthy
contributions.
The three self-efficacy subscales – KE, PTE and OBE – used to provide additional
dimensions to the existing models of teacher efficacy measure. The most teacher
self-efficacy assessments model most used were commonly reflected in the two
factors of self-efficacy: PTE and OBE (Bandura 1977; Gibson and Dembo- 1984;
Enochs and Riggs, 1990; Tschannen-Moran and Hoy, 2001). Later, a substantive
study relating to the model of self-efficacy teaching and knowledge for science
teachers was developed (Roberts and Henson 2000; Henson 2001; Pruski et al.
2013) and claimed that teacher efficacy should study the basis of teacher knowledge
(Shulman, 1987) within the two correlated factors: KE and PTE. Realising the
important outcome expectancy measure to self-efficacy (Bandura 1977), this study
initiated the extensive model of SETSIS, using the three factors KE, PTE and OBE -
into the model of self-efficacy teaching and knowledge for science teachers.
Figure 4 shows the conceptual framework for the study. This study used the belief
concept of TSE to align with the concept of teacher knowledge use in pre-service
education. PTE and OBE refer to the adapted model of TSE belief introduced by
Tschannen-Moran et al. (1998). These two factors represent self-efficacy in one of
the two PCK dimensions (Shulman 1986, 1987; Park et al. 2011), which is
instructional knowledge (i.e. practice). Meanwhile, KE represents self-efficacy under
the dimension of content knowledge, which is also proposed by Shulman (1986) and
Park et al. (2011).
PTE emerges from the cognitive process of judgement on the capability of personal
action through the instructional knowledge of using science inquiry skills in
classroom teaching practice. Further, OBE is developed from the cognitive process
of analysing the outcomes of an instructional task and context based on beliefs held
by the PST. On the other hand, the KE represents the self-efficacy of the content
knowledge of using science inquiry skills that is defined by the ability to use a
collection of science process skills to plan teaching instruction. The KE dimension
develops in order to propose the essential PCK in order to infer teacher practice from
the knowledge of science inquiry skills (Park et al. 2011).

34
Figure 4 Conceptual framework for the study
It is believed that teacher self-efficacy and PCK should be measured within the
specific context (Tschannen-Moran any Hoy 2001), but what and how specific the
level of the context still needs to be developed. Thus, this project will measure
teaching self-efficacy in the context of teaching science inquiry skills because of the
important role of science inquiry skills, which has been explained in the introduction
chapter. Research on the self-efficacy of PSTs would provide teacher educators with
essential information on the perceived knowledge, which is useful in helping them
develop a more balanced view of PCK in the implementation of a reformed science
curriculum. Moreover, by understanding the self-efficacy factors that might influence
prospective teachers in deciding on specific teaching tasks in the classroom, might
help teacher educators to influence their trainees more into a better model of
teaching using science inquiry skills.
The project now provides a link between three important key factors in TSE belief
development: self-efficacy in knowledge (KE), self-efficacy in teaching practice (PTE)
and expectancy belief about the teaching outcomes (OBE). The SETSIS measure
only yields the expectation that potentially could be projected into performance.
These three components of self-efficacy belief lead to inferring teaching practice
developments using the two components of teacher knowledge assessment.
Self-Efficacy in Teaching using SIS (SETSIS) as belief
component
Personal Teaching Efficacy (PTE)
Outcome Belief Efficacy (OBE)
Knowledge Efficacy (KE)
Teacher Knowledge
(Shulman
1986, 1987)
to measure teaching development
Teaching practice component
Knowledge component

35
In order to validate the study measure, the study included two measure components
of teacher knowledge. The SETSIS, developed as a belief component assessment
would be tested with the two measures component of teacher knowledge which is a
knowledge test (Shahali and Halim 2010) and teaching practice assessments.
Theoretically, these two components would have a positive relationship with TSE
measure as mention by Bandura’s theory of cognitive social learning. The following
chapter will demonstrate the method and research design plans to meet the purpose
of the conceptual framework above.

36
Chapter 3 Methodology
3.1 Introduction
This chapter focuses on the research design and methodology of my study. The
aims are to describe the research design and provide justification for the methods
used in the study. The next section, 3.2, presents the research objectives and
questions for the study. Then, section 3.3 explains the research design and sampling
method with an emphasis on the instrument development procedure using construct
measure approach (Wilson, 2005). This is followed in section 3.4, which explains the
research methods and describes how these were employed in the study. Section 3.5
describes the instrument s used during the research field and section 3.6 describes the data
collection phases, which I covered while being in the research field. Finally, section 3.7
discusses the steps taken to enhance the quality of this study.
3.2 Research objectives
My research focuses on developing and validating a defensible measure to assess
primary science PSTs’ self-efficacy in teaching using science inquiry skills, and to
analyse the resulting data from this instrument and a range of other sources. The
aim is to build a measurement model that seeks to explain the three dimensions
(knowledge, belief and practice) underpinning the three variables of self-efficacy in
teaching using science inquiry skills, and most importantly, focuses on those three
variables that need to be assessed in order to claim a valid measure of potential
ability in teaching science using science inquiry skills. The specific interrelated goals
of this study are as follows:
1. To define and conceptualise self-efficacy in teaching using science inquiry
skills based on the concept of teacher self-efficacy in teacher knowledge
development
2. To determine the psychometric qualities of the development measure of Self-
Efficacy in Teaching using Science Inquiry Skills inventory (SETSIS)
3. To operationalised and develop psychometrically defensible measures for the
SETSIS model
4. To evaluate the measure of SETSIS with other related measures (e.g. test of
SPS and practical assessment)

37
3.2.1 Research questions
This study is designed to answer the following research questions (RQ):
1. What are the belief factors of self-efficacy in teaching using science inquiry
skills?
• The focus of this question is to define and justify the theoretical
construct of the SETSIS: how well the selected factors are able to
interpret and represent the construct of belief when measuring self-
efficacy in teaching using science inquiry skills. This is the initial
process of developing the instrument. This phase includes the literature
review as the main source of the interpretation and justification of the
theoretical construct of the SETSIS that is used to measure the belief
of self-efficacy in teaching science using science inquiry skills. On the
other hand, the theory justification is also used to define the variable
factors and limitations. Once defined, the items pool are selected
based on the observable attributes relative to the defined factors’
characteristics (Veal and MaKinster, 1999a; Wilson, 2005). Chapter 4
will report the answer for the RQ.
2. What are the psychometric properties of the SETSIS when used with PSTs in
Malaysia and to what extent are the selected factors of self-efficacy in
teaching using science inquiry skills (i.e. belief in personal knowledge (KE),
belief in personal practice (PTE) and belief in outcomes expectancy (OBE)
related?
• The methods and analysis for the responses data are used to justify
the reliability and validation of the SETSIS. Statistical evidence is used
to explore the degree of correlation across the three factors defined in
RQ (1). Chapter 5 will report the statistical results in answering this
RQ.
3. To what extent can a valid measurement model of teachers’ self-efficacy in
teaching using science inquiry skills to be constructed based on the selected
subscales (KE, OBE and PTE)?
• This part will evaluate the selected subscales’ responses in the model
of self-efficacy in teaching science using science inquiry skills and
validate the measurement model of RQ(1).

38
4. To what extent are the different subscales (i.e. KE, PTE and OBE) valid and
reliable in measuring self-efficacy in teaching science using science inquiry
skills among pre-service science teachers in Malaysia?
• Analysis of the inter-item validity of the selected factors in order to
evaluate the empirical evidence that reflects the construct process. The
score interpretation for every subscale should be rationally consistent
with the construct task, which is to infer self-efficacy in teaching science
using science inquiry skills. This part will examine the inter-item
relationship to validate the internal structure of SETSIS using the Rasch
model.
5. To what extent does a valid measurement model of SETSIS relate to other
components of teacher knowledge assessment in teaching science among
PSTs?
• The generalizability/ correlation of the score of the SETSIS measure (as
the belief factor) with related external/other measures (i.e. tests in the
knowledge of SPS and teaching practice assessment) will be assessed in
terms of the relationship between the selected factors in teacher
knowledge development (i.e. knowledge, practice and belief).
Table 3 shows the data source(s) for every research question mention above.
Table 3 Data sources for every research question mention
Data source RQ1 RQ2 RQ3 RQ4 RQ5
Literature
Existing instruments (Tschannen-Moran, Hoy
and Hoy, 1998; Roberts and Henson, 2000)
Experts judgement
Data responses in Pre-Test
Data responses in Main Research
Score responses from Test of Integrated Science
Process Skills (TISP)(Shahali and Halim, 2010)
Score attainments from ITE Practicum
assessments (secondary data)

39
3.3 Research Design
This study adopted a multi-method research design. The multi-method design
involves multiple types of research methods that are relatively complete on their own
and then, used together, form a complete research process (Morse, 2003). Each
method in this study was planned and conducted to answer a particular sub-
question, and the results were used and triangulated to form the whole study.
The study was designed to comprise three phases. Phase one focuses on pre-
development of the SETSIS, which includes the process of constructing the SETSIS.
Phase two of the study focuses on developing the SETSIS using the data collected
in the main research. Phase three in the study consists of much of the analysis of the
validation and evaluation of the SETSIS. The three phases were interrelated in the
process of completing the study. Figure 5 illustrates the overview of the study
design.
The first phase of the study used a theoretical approach to identify the concept to be
used in the SETSIS. The concept was then reflected in the construct framework of
the SETSIS using the three factors of self-efficacy (i.e. KE, PTE and OBE). The
construct framework was used to guide the next processes of the project. Although
there is a strong theoretical rationale in describing the construct framework for the
SETSIS, the meaning of the factors in the construct should be validated in the
representation of content and need to be empirically grounded. Thus, the first phase
of the study incorporated a panel of experts’ judgement screening all the items
designed for the SETSIS. This approach was utilised to get practical insight from the
experts in validating the content design of the SETSIS. Then, the pre-test survey and
small group interview were used to gather empirical data on the content relevance
and representatives of the items in the emerging SETSIS. The results from the pre-
test were used to answer RQ1 and to inform the second phase of the study.
The second phase of the study involved main research data collection. Drawing on
the theory and research evidence, together with the practical insights of the experts
and a sample of respondents, the main SETSIS instrument with 72 items was used
in the main research. It involves 325 science PSTs from 12 campuses of ITE all over
Malaysia. The main data collection consists of two surveys, conducted on the same
participants using two different instruments. The first survey was to obtain responses
in assessing self-efficacy belief in teaching using science inquiry skills with the
developed SETSIS, and the second assessed knowledge performance on a set of
integrated science processes associated with science inquiry skills using the Test of
Integrated Science Process Skills (TISP) for the purpose of answering RQ5. An
empirical approach was employed on the main research data from the developed
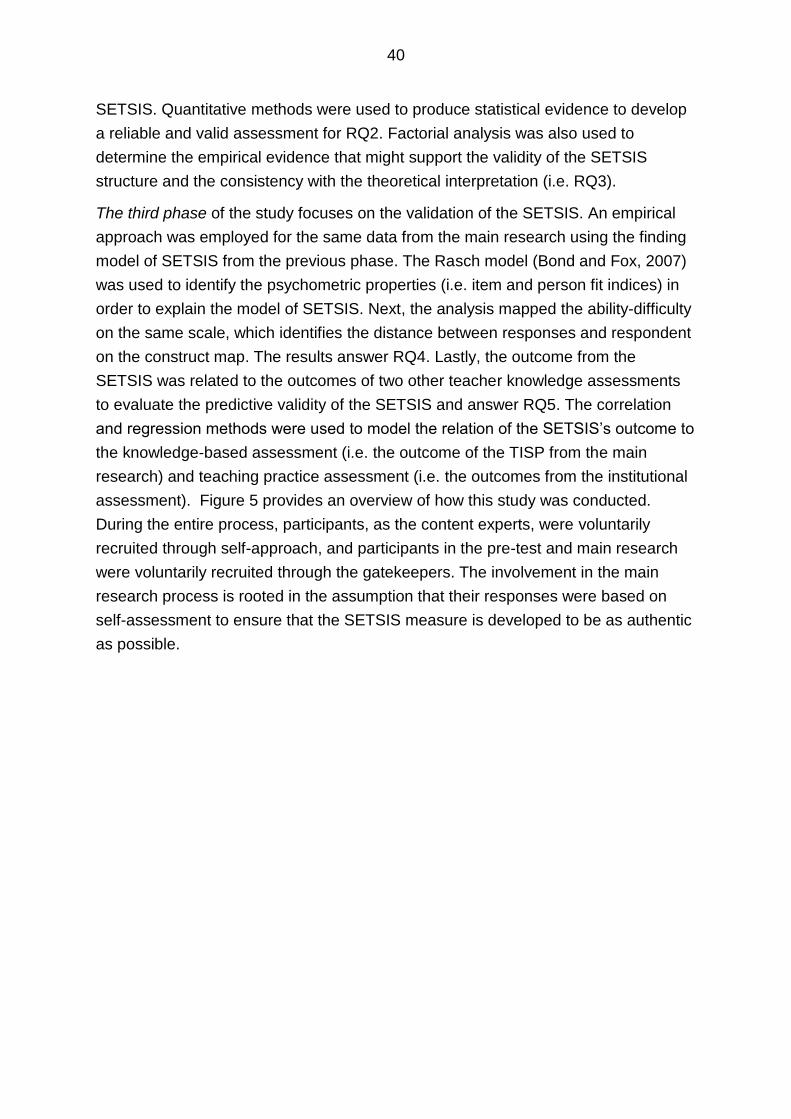
40
SETSIS. Quantitative methods were used to produce statistical evidence to develop
a reliable and valid assessment for RQ2. Factorial analysis was also used to
determine the empirical evidence that might support the validity of the SETSIS
structure and the consistency with the theoretical interpretation (i.e. RQ3).
The third phase of the study focuses on the validation of the SETSIS. An empirical
approach was employed for the same data from the main research using the finding
model of SETSIS from the previous phase. The Rasch model (Bond and Fox, 2007)
was used to identify the psychometric properties (i.e. item and person fit indices) in
order to explain the model of SETSIS. Next, the analysis mapped the ability-difficulty
on the same scale, which identifies the distance between responses and respondent
on the construct map. The results answer RQ4. Lastly, the outcome from the
SETSIS was related to the outcomes of two other teacher knowledge assessments
to evaluate the predictive validity of the SETSIS and answer RQ5. The correlation
and regression methods were used to model the relation of the SETSIS’s outcome to
the knowledge-based assessment (i.e. the outcome of the TISP from the main
research) and teaching practice assessment (i.e. the outcomes from the institutional
assessment). Figure 5 provides an overview of how this study was conducted.
During the entire process, participants, as the content experts, were voluntarily
recruited through self-approach, and participants in the pre-test and main research
were voluntarily recruited through the gatekeepers. The involvement in the main
research process is rooted in the assumption that their responses were based on
self-assessment to ensure that the SETSIS measure is developed to be as authentic
as possible.

41
41
Figure 5 Overview of the study phases in development and validation of the SETSIS
KE
PTE
OBE
Factor
Analysis SETSIS
Rasch Model
Correlation
and
Regression
Literature
review
Experts’
validation
Knowledge
test
assessment
(the TISP)
Teaching
practice
assessment
(Institutional
assessment)
PHASE 1 PHASE 2 PHASE 3
Descriptive
and
inferential
analysis

42
3.3.1 Development and validation process
This study adapted the iterative process of a construct modelling approach (Wilson
2005) in the process of instrument development and validation. These elements
were integrated into the three phases of the study. The construct modelling approach
consists of four building blocks that were used iteratively but not necessarily in
sequence throughout the three study phases, as suggested in Table 4. The table
shows these four building blocks were designed to integrate into the three phases of
this study. These four building blocks are now spelled out in greater details.
3.3.1.1 Building block I - Construct mapping
According to Graziano and Raulin (2000), a construct “is an idea constructed by the
researcher to explain events observed in a particular situation. Once formulated,
constructs are used as if they are true to predict relationships between variables in
situations that had not previously been observed” (p.419). This first building block is
used to help the instrument developer to focus on the essential latent factors of what
is to be measured, mapped on the construct map. The construct map visualised a
consistent definition of the latent variable and ordered the item responses into a
series of levels (Wilson, 2005). It can be considered the theoretical framework that
guides the instrument’s design. The construct map of the study can be referred to in
Figure 6.
The construct mapping was the initial step to determine the rationale for the chosen
factors representing the construct of the SETSIS and the significance of the study. A
rationale content analysis of the literature text and documents of the BoTP
curriculum were used in order to establish the construct mapping and to interpret the
factors selected in measuring the construct.
The construct map describes the continuum of the construct from high to low self-
efficacy in teaching using science inquiry skills. It was then used to guide the design
and development of the instrument. The instrument was developed to describe and
define the continuum with qualitatively distinct levels, so it will able to identify the
levels of respondents on the construct. The construct map is the important first step
in establishing the validity and reliability of an instrument (Brown and Wilson, 2011)

43
Table 4 Summary of research design of the study
Study Phase Building block Construct Modelling Activity Method Research Question(s)
Literature review
Variable
interpretation
Items pooling
Experts review of
the items
Conducting
interview for
technical qualities
of SETSPS.
Focus
group
interview
Establishing the
responses to the
SETSIS
Descriptive
and
inferentian
analysis
Evaluate the
SETSIS outcome
with concurrent
validation using
i) Knowledge Test
Assessment
(TISP)
ii) Teaching
Practise
assessment
Correlation
and
Regrassion
RQ5
Validating the
factors contribution
with the scales
interpretation
Factorial
Analysis
Pre-Test using paper & pencil
survey
Establising item mapping and
administering the main research
for the SETSIS using
Main research using paper &
pencil survey
Phase 3
Validating and
Evaluating the
SETSIS
IV Measurement model
III Outcome space
II Item Design
RQ1
RQ2 & RQ3
Phase 1
Constructing
the SETSIS
Phase 2
Developing the
SETSIS
III Outcome space
II Item design
Internal-structure
validity for content
relevance and
representativeness
of the scale and
establising items
mapping
Rasch
Model
Developing
measurement
model and relate
back to the
theoretical
construct of
construct map for
construct validity of
SETSPS.
Rasch
ModelRQ4
I Construct MappingContent
Analysis
Fuzzy
Delphi
Method
ii)Teaching Practice Assessment
SETSIS

44
3.3.1.2 Building block II - Item design
Item design is a construction of tasks and contexts that assess the construct. The
tasks and contexts were constructed in terms of statements that represent
observation, which can stimulate responses about the construct that are generically
called items. The items were designed according to three criteria references: high
item, mean item and easy item, which provide the interpretation of the item level
within the construct. Each level describes characteristics of items that form groups
along the continuum of the construct. Further details are described in section 4.4.1.
In this study, item design was included in Phase 1 and Phase 2 of the study. These
include a series of decisions to decide items that adequately represented the
construct. It started with the item pool, in which the specific items were sampled for
the SETSIS and sent for translation process (see the explanation below).
All the items, in both languages, were reviewed by the experts for the purpose of
assessing the content validity of the items. The Fuzzy Delphi Method (FDM) was
used for analysing the experts’ judgement and obtained consensus for the reviewed
items. The consensus judgement was then cross-referenced with the relevance and
the association of the construct framework.
Then, the resulting items were administrated in the pre-test survey. Using a paper-
and-pencil method, this survey aims to get pre-responses from the PSTs in the
instrument. Feedback was sought in a small group interview, which consisted of six
participants from the pre-test, in relation to the clarity of the items and the overall
accessibility of the instruments.
The back-translation technique (Brislin 1970) was used to translate all the sample
items of the SETSIS from the source language (English) into the target language
(Malay). First, a certified translator with a science education background was chosen
to translate the items in forward translation. The two versions were compared and
some iterations were made in the target language based on suggestions received
from the content experts panel (see 3.6.1) and pre-test survey (see 3.6.2). Then, it
was given to another translator for back translation (i.e. back into the source
language). The two source language versions were compared and evaluated. There
were some discrepancies in the words used, but they had semantic equivalence.
The information gathered in Phase 1 was used to sort the items and design the
instrument for the main research survey in Phase 2.

45
3.3.1.3 Building block III - Outcome space
The outcome space was used to study scores and category responses for the
measure. Scores from the gathered items’ responses were categorized and the
scores were the indicators of the construct, which lead to the outcome space
(Wilson, 2005). The outcome space corresponds to the development of the scoring
scale regarding the observed responses, where the individuals are on the construct
map based on the context of the measure. The lower level of the construct should
correspond with lower item scores and vice versa. The categories that define the
outcome space are qualitatively distinct, and this can be validated with the
quantitative evidence.
In this study, the outcome space was initially used during constructing response
options in Phase 1. The outcome space was defined in five, qualitatively distinct
categories related to confidence levels of self-efficacy in teaching using science
inquiry skills (see explanation in section 4.4.2). The categories defined should be
represented in the quantitative evidence. Analysis of Rasch model on pre-test data
examined unpredictable responses that did not fit the model and at the same time
provided pre-information on the quantitative value (i.e. reliability and separation) of
responses and the level of response categories (i.e. scoring of item-response
categories). This will be further elaborated in section 4.6.2.
Outcome space was also used during Phase 2. In this phase, the process related the
mean score from the data observed to the response categories created in Phase 1.
The quantitative evidence related the score to the categories proposed and whether
the interpretation of the responses could be generalised into the population. Finally,
factor analysis (Field, 2013) was used to examine the representation of the items in
the construct through the responses’ variances. The factor analysis was able to
identify key features of the responses in the items. The result of grouping items was
related to the construct framework to confirm the representative of the measure.
3.3.1.4 Building block IV - Measurement model
The final phase used the process of measurement model in order to validate and
evaluate the SETSIS. Measurement model served as a process to relate scored
outcomes and to compare the outcome space to the original construct (Wilson,
2005). The measurement model helps to model individual responses which are then
related back into the construct map. Further, it was able to evaluate the score which
interpreted the construct and guided the use of the score in practical application.
For this study, in order to validate the SETSIS as a measurement model, the method
used should first be able to fit response data statistically and secondly able to

46
validate the characteristics of the model according to the measurement framework
(Wilson, 2003). The Rasch model was chosen for the formal measurement model
used to validate the model of the SETSIS because it is able to explain response data
and provide a probability model able to interpret the continuum between the items
and the outcomes of the construct. A scaling approach based on the Rasch model is
sensitive to the issue of a broader conception of construct validity (i.e.
unidimensionality). The data should be able to validate the model through the
construct representative with relevant variance (Messick, 1994). If the data meets
the requirements of the model and the model’s implications, it contributes to
evidence for the construct validity of the measure.
In the final phase of the study, the responses from the main research were used
within the contributed items from the factor analysis result. The rating scale model of
Rasch was used to validate the data and further characterise the items and
responses within the model structure. Next, the responses option was also validated,
and the result was used to interpret the probability scored into the estimated true
score for practicality purpose. Lastly, the correlation and regression analyses were
used to evaluate the scores from the item response in conjunction with the associate
knowledge test and practice assessment.
3.4 Research methods
Figure 5 illustrates the study phases and the methods used in every phase
mentioned. Phase 1 consists of the two methods used to construct the SETSIS. The
literature review was used to signify the three factors chosen to measure the latent
variable of the SETSIS. Content validation of the constructed SETSIS was verified
using a panel of experts and their consensus was acquired using the Delphi method.
Phase 2 consists of the method used to develop the SETSIS. The data from the
main research was analysed using descriptive and inferential statistics for any
abnormality and outliers. Then, the data was analysed using factor analysis to
confirm the contributed factors in the SETSIS.
Phase 3 involves the methods used to validate the model of measurement in the
SETSIS. Using the Rasch model, the data was analysed for content, substantive,
structural, and generalisability of the construct. The external and consequential
aspects of the construct validity was checked using the correlation and regression
method. The methods used in the research is now explained in detail.

47
3.4.1 Literature review
In the literature review, I used content analysis as the research method, which allows
the qualitative data collected in the research to be analysed systematically and
reliably so that generalisations can be made from them in relation to the categories
of interest to the researcher (Haggarty, 1996). The relationships among concepts
that occurred in the contemporary literature of TSE and teacher knowledge in the
field of teacher training were studied. The relational analysis was built based on the
concepts proposing the framework of the study.
3.4.2 Expert validation
The general perspective of content validation was sought from the experts in the
item pool. The aim of the expert validation was to ensure that the SETSIS contained
items that related to the construct and that these items were able to discriminate the
levels of self-efficacy in teaching using science inquiry skills.
In this method, experts were reviewing the items content in order to
1. evaluate how the content of each item specifies the factor’s domain
functioning
2. evaluate how the content of each item is tailored to the activity domain and
assess ways that self-efficacy operates within the selected activity
3. evaluate how the levels of items reflect the task demands in domain function
However, the expectation was not limited to the above, as this process also aimed to
gain a wider perspective from the experts.
A survey consisting of all the item pool was sent out to a panel of experts. The goal
of the survey was to gain expert consensus on the need of the three factors (i.e. KE,
PTE and OBE) in measuring self-efficacy in teaching using science inquiry skills. In
the survey, experts needed to rate to what extent each item measured one of the
three factors using a five-point scale (with 1 point being ‘entirely disagree’ and 5
being ‘entirely agree’). The experts were encouraged to provide comments and
suggestions for each item or offer their own lists of possible items for each domain.
For the survey and the information sheet handed out to the panel of experts, please
refer to Appendix A and Appendix E.
Analysis of consensus for the 99 items pooled in the survey was conducted using the
Fuzzy Delphi Method (FDM) (Habibi, Jahantigh and Sarafrazi, 2015). This technique
uses a fuzzy approach to overcome the limitations of using the traditional Delphi
method, which enables summarising and sorting items in one round, compared with
the traditional Delphi method.

48
3.4.2.1 Fuzzy Delphi Method (FDM)
FDM was used to address experts’ agreement on items screening in the SETSIS. A
single round of the survey was conducted with the ten chosen experts in the field.
The criteria used in choosing the experts in this research and their details are listed
in section 4.6.1. The experts were given the item pool, and they rated their
agreement using the five-point scale (1 to 5) on the items, according to the construct.
The responses received from all the experts were entered into the Microsoft Excel
computer programme using the score of the five-point scale, and then transferred
into the triangular fuzzy spectrum as shown in Table 5.
The fuzzy number spectrum can be used to quantify the ambiguity of responses in
forecasting the items with the three-probability spectrum in each score. For instance,
experts who scored 5 for agreement on an item were considered to be within a
spectrum of 60 percent to 100 percent confident in their agreement. Experts who
scored 3 for agreement on an item were considered to be within a spectrum of 60
percent to 20 percent confident in their agreement and experts who scored 1 for
agreement on an item were considered to be within a spectrum of 20 percent to 0
percent confident in their agreement. Thus, by converting the score agreement in the
fuzzy spectrum, the outcomes are more consistent with explaining the response
characteristics of each individual expert within the spectra of percentage of
agreement. In every spectrum, the responses given by the experts were converted to
a wider range of the percentage agreements (see Table 5). By converting the score
into the spectrum, the agreements were more consistent and the consensus among
experts was easier to meet.
Table 5 Fuzzy spectrum for five-point Likert scale
Score for five point scale
FUZZY SPECTRUM (n1,n2,n3)
5 0.6 0.8 1
4 0.4 0.6 0.8
3 0.2 0.4 0.6
2 0 0.2 0.4
1 0 0 0.2
The analysis of FDM was conducted according to Cheng and Lin (2002). From the
fuzzified expert responses (n1, n2, n3), the values were aggregated (m1, m2, m3),
and the distance between two fuzzy numbers were calculated as a threshold value
(d) (𝑑 = √1
3⌊(𝑚1 − 𝑛1)2 + (𝑚2 − 𝑛2)2 + (𝑚3 − 𝑛3)2⌋). For d≤0.2, the item was considered to

49
have the consensus from the experts, and for d>0.2, it was considered for the item to
be removed or reworded with the concern of the experts who did not agree. Next,
the percentage was calculated to get a 75-percent group consensus, which is the
agreed percentage of consensus commonly used in the traditional Delphi method.
After that, the defuzzification process is conducted, which is a method to find the
average triangular fuzzy value. Defuzzification scores were used to rank the factors
according to the priority characteristic. All analysis for this part was conducted using
Microsoft Excel 2013.
3.4.3 Factor analysis
Factor analysis was conducted on the data gathered from the main research. This
study using IBM SPSS Statistics 23.0 (IBM Corp, 2015) to conduct the analysis. The
analysis was chosen on the basis that it was able to summarise the data so that
relationships and patterns were easily interpreted and understood. From the
interpretation of the contributed factors based on the analysis result, the analysis
was able to validate the contribution of the three subscales in the SETSIS to answer
RQ3.
This study used exploratory factor analysis (EFA) as a first step to uncover complex
patterns by exploring the dataset and testing prediction of the SETSIS. First, the
correlations between each item in the correlation matrix was determined to ensure
no multicollinearity existed in the observed data. In cases of bivariate correlation
scores more than 0.8, both items should be considered for removal (Field, 2013, p.
686).
Next, the data were further analysed using the principal axis factoring method as the
data were to be used for further analysis of the sample population (Samuels, 2016).
The number of factors was determined by using Keiser Criterion. The criterion for a
factor was accepted at an eigenvalue higher than 0.5 (Keiser, 1974), which signifies
the presence of factors. Investigation of the scree plot also provided a graphical way
to examine the number of factors.
Then, the factor rotation was applied to find the strongest correlation between items
and the latent factors. The items that generally form the factors should be correlated
more than the correlation of the factors (Gie Yong and Pearce, 2013). Thus, this
study uses Promax, an oblique rotation method that allows a degree of correlation
between the factors in order to improve the intercorrelation between the items within
the factors.

50
Factor loadings in items were checked for factor suppression or retention. Items with
factor loading less than 0.35 were ignored because of the less variance shared.
Cross factor loadings should then be considered using the described cut-off rules. All
retained factors should have at least three items with loading greater than 0.4. The
proportion of the total variance explained by the retained factors should be at least
50 percent (Hair et al., 2010)
The factors extracted by EFA were validated subjectively using the theoretical
interpretability. The items comprising each factor were thoroughly analysed for
consistency and similarities across the factors. Items not coherent with the factor’s
items must be removed for the meaningful application of theory. The factors were
interpreted based on the similarities of the consisting items. The definitions of each
factor were given based on the latent factors provided within the three definitions of
factors in the SETSIS that defined the meaningfulness of the variables.
3.4.4 Rasch Model
Rasch modelling was used to analyse the SETSIS for the data obtained in the pre-
test and the main research. The analysis of the pre-test data (n=31) was conducted
using MINISTEP Version 3.92.1 (Linacre, 2015) while the analysis of the data
(n=325) in the main research was conducted using WINSTEPS 4.0 (Linacre, 2017).
The data gathered were analysed using the rating scale model (RSM). The analysis
used the following criteria in selecting good items and revising problematic items and
further validated the model used.
1. Fit indexes. The fit index was used as an indicator for items that fit the Rasch
model well. It indicates the contribution of the item to the construct measure of
the model. The fit indexes were given in mean fit square value (MNSQ). Two
fit indices including infit and outfit MNSQ were used to examine the items. Infit
MNSQ gives information-weighted data, which is more sensitive to response
patterns observed near item difficulty. Outfit MNSQ gives information on the
outlier fit which is more sensitive to the pattern observed in unexpected
outlying responses. Generally, MNSQ = 1.0 is a perfect fit to the model;
however, in reality it is acceptable to include items which have fit indices close
to 1.0 and within the acceptable range.
2. Separation and reliability index. The RSM provides item and person
separation indices for assessing item functioning. The item separation index
indicates how well items can be discriminated by the person, while the person
separation index indicates how well persons can be separated by the items.

51
3. Dimensionality. Principal components analysis of residuals (PCAR) was used
to assess if there were meaningful structures of secondary dimensions in the
measure. It analysed from the unexplained variance after the Rasch
dimension had been removed from ordinal data. Unidimensionality was tested
by looking at patterns in the residuals. First contrast of PCAR indicates the
first component in the correlation matrix of the residuals. These are the
standardised person-item differences between the observed data and what is
expected by the model for every person’s response to every item (Pallant and
Tennant, 2007). After extracting the Rasch dimension there should be no
further patterns in the data. Unidimensionality of an instrument is supported
when the Rasch dimension explains more than 40 percent variance in the
data, and the first contrast of the Rasch residual explains less than 5 percent
variance of the data (Li et al., 2016).
4. Wright map of scale. The targeting of item difficulty to person ability was
visually inspected using the person-item map in the Wright map of scale.
These two parameters (person and item measure) were mapped onto the
same logit scale. Optimal targeting occurs when the items are able to cover
the full range of person ability in the map. Thus, the mean item and the mean
person should be close together. The differences between the means lead to
poor item targeting in the measure.
5. Category structure. Category structure analyses the corresponding level of
ability score works based on an appropriate level of difficulty. It examines
whether the structure of response categories provided was clear and within
the appropriate range of responses so that the high performing person can
choose the high response category and the low performing person can
choose the low response category. The RSM was used to examine that
successive categories were located in the expected order. Step measure,
average measure, category fit statistics and category probability curve were
used to assess category functioning.
3.4.5 Correlation and Regression OLS
Correlation analysis was used to estimate the correlation coefficient of the sample.
Using the Pearson product-moment correlation coefficient, the strength and direction
of the relationship between the two variables was denoted as r. The correlation
coefficient, r, ranges between -1 to +1, which quantifies the direction and strength of
the linear relationship between the two variables. The positive correlation infers a
parallel association when one variable with a high level is associated with the other
high-level variable. The negative correlation infers a contradictory association when
the higher variable associated with the lower variable. The sign indicates the
52
direction of the association while the magnitude indicates the strength of the
association.
The regression analysis was used for evaluating multiple independent variables. As
a result, it was particularly useful for assessing and adjusting for confounding. It can
also be used to assess the presence of effect modification. Multiple linear regression
analysis is an extension of simple linear regression analysis and used to assess the
association between two or more independent variables and a single continuous
dependent variable. The multiple linear regression equation is as follows:
,
where is the predicted or expected value of the dependent variable, X1 through
Xp is p distinct independent or predictor variables, b0 is the value of Y when all of the
independent variables are equal to zero. Statistical tests can be performed to assess
whether each regression coefficient is significantly different from zero.
In the multiple linear regression equation, b1 is the estimated regression coefficient
that quantifies the association between the risk factor X1 and the outcome, adjusted
for X2 (b2 is the estimated regression coefficient that quantifies the association
between the potential confounder and the outcome). Each regression coefficient
represents the change in Y relative to a one-unit change in the respective
independent variable
Once a variable is identified as a confounder, we can then use multiple linear
regression analysis to estimate the association between the risk factor and the
outcome adjusting for that confounder. The test of significance of the regression
coefficient associated with the risk factor can be used to assess whether the
association between the risk factor is statistically significant after accounting for one
or more confounding variables.
3.5 The instruments
Two different instruments were used in this study. The first was the SETSIS, which
was formed in order to measure self-efficacy of PSTs in regards of teaching SPS
using the three self-efficacy constructs. The second instrument is an existing
validated instrument named the TISP (Shahali and Halim, 2010). It is used to
validate the SETSIS in measuring the content knowledge of science inquiry skills.
The details about each instrument and the consisting constructs are addressed in
the following.

53
3.5.1 Self-Efficacy in Teaching using Science Inquiry Skills Instruments
(SETSIS)
The SETSIS was the main instrument used to study the construct of self-efficacy in
teaching SPS. Three dimensions, KE, PTE and OBE were used separately in pre-
existing instruments to represent the underlying traits in measuring teacher self-
efficacy in teaching science (Roberts and Henson, 2000; Tschannen-Moran and
Hoy, 2001). In this study, the three dimensions are used to describe the construct of
self-efficacy in regards to teaching using science inquiry skills among science PSTs.
The items chosen to measure these dimensions were based on items from
previously validated instruments. However, because there is no existing instrument
that relates specifically to teaching using science inquiry skills, the researcher has
chosen items from several research instruments to create the items pool for this
study. Most of these instruments focused on the constructs of teacher efficacy, self-
efficacy in teaching and knowledge of science, self-efficacy in teaching science
inquiry, self-efficacy in teaching physics, and self-motivation in learning science.
While developing this instrument, the purpose remained clear that the items included
would measure PSTs’ self-assessments of their belief and attitude towards teaching
science through science inquiry skills, not their knowledge of teaching science
through science inquiry skills. When necessary, item wording of existing measures
was adapted to fit within the context of teaching using science inquiry skills.
Additionally, new items were written in order to capture the potentially important
dimension of teacher’s self-efficacy in teaching SPS that were not includable in the
pre-existing instrument. Details of the items of the SETSIS are described in section
4.5.
The SETSIS instrument was developed and used in two phases of the study. Firstly,
this instrument was used in the pre-test study and secondly, it was used in the main
research study. The details of the data of each study are described in Chapters 4
and 5.
3.5.2 Test of Integrated Science Process Skills (TISP)
The TISP was developed to assess the acquisition of integrated SPS specific to the
science content defined in the Malaysian primary school science curriculum (Shahali
and Halim, 2010). This paper-and-pencil test was first administered to 101year six
primary school students with 30 initial items varied across five integrated SPS
components (i.e. formulating hypotheses, controlling variables, defining
operationally, interpreting data, and designing experiment). This study yielded a test

54
reliability of 0.80; however, five items were discarded. In the later study by Hafizan et
al. (2012), the TISP was used to examine the acquisition level of the integrated SPS
(operational) of 329 primary science teachers in Malaysia. The instrument was then
refined with 25 multiple-choice items with the same five components (five items in
each component) with the construct reliability values ranged from 0.34 to 0.53.
The TISP was chosen because the consisting items contain conceptual materials on
the Malaysia primary science curriculum as well as requiring the application of
components of integrated SPS. The primary consideration relies on the validity of
measuring the knowledge of SPS in primary school science. It is hoped that the test
score should provide an accurate assessment of the PST’s ability to perform science
inquiry skills in the primary science tasks, so that it can be used to cross-validate the
predictive power of knowledge efficacy in the measurement model of the SETSIS.
The skills of inquiry are based on seven basic skills of science process skills (i.e.
observing, classifying, measuring and using numbers, inferring, predicting,
communicating, and using space-time relationships) (Padilla, 1990) that were
applied to form the integrated skills of SPS (controlling variables, defining
operationally, experimenting, interpreting data, and making hypothesis). The science
inquiry skills in the context of this study were defined as performance in using the
knowledge of integrated science process skills. In order to become competent in
using science inquiry skills as classroom instruction, PSTs should be knowledgeable
of how to apply and use the correct SPS in respective novel situations.
Performance in using integrated SPS was tested using five sub-scales that consists
of a total of 25 items in the TISP. Each sub-scale measures knowledge in using an
integrated scientific skill. Table 6 lists the definition for each of the five integrated
SPS in the TISP. Every sub-scale consists of five multiple-choice questions about
novel situations that involve each respective integrated skill. In the analysis, every
correct answered was scored with ‘1’ (one) while every wrong answer scored ‘0’
(zero). The total scores of the five constructs of integrated SPS were accumulated to
determine the score of the TISP. The score of the TISP was used to represent the
knowledge of inquiry skills held by individual respondents.
The TISP was conducted together with the SETSIS survey. All respondents are
PSTs (PST) majoring in teaching primary science; the same individuals responded to
the SETSIS. Respondents chose to answer the TISP before or after the SETSIS, in
their own time. Individual responses in the TISP and the SETSIS were identified
using the same student’s number given on both survey papers.
The sample was presumed to have adequate knowledge of science process skills
due to their admission on the programme (Bachelor of Teacher Programme)
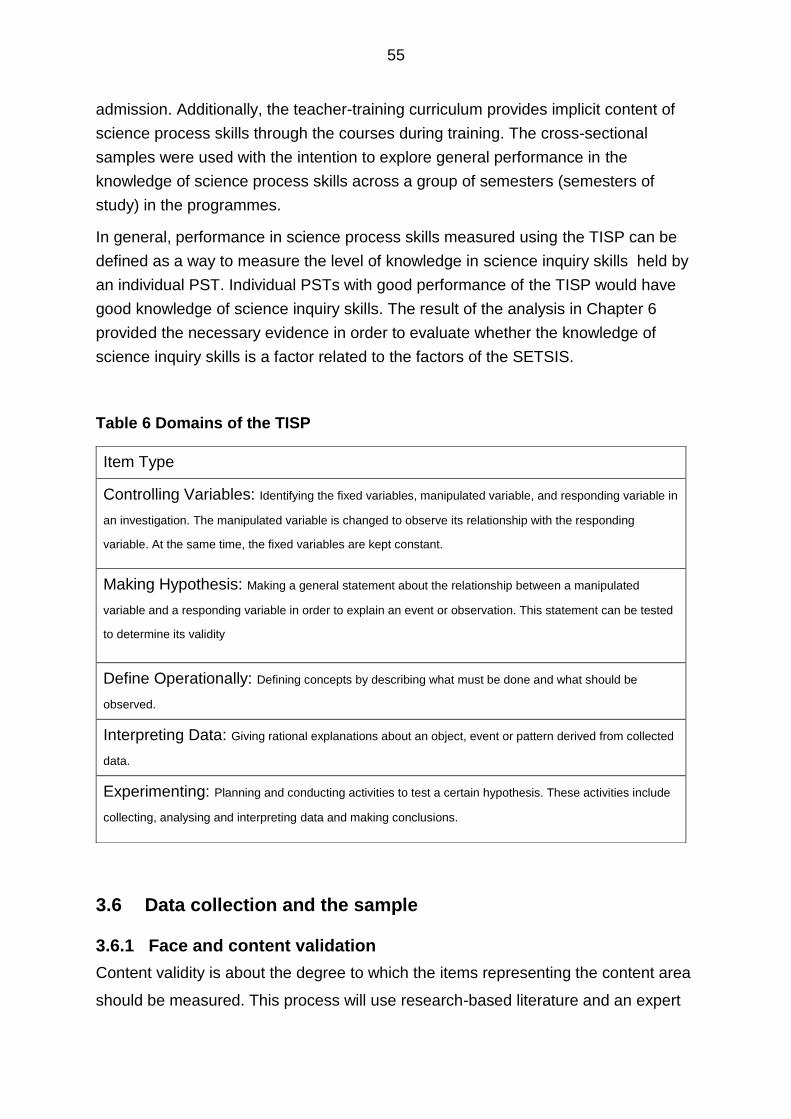
55
admission. Additionally, the teacher-training curriculum provides implicit content of
science process skills through the courses during training. The cross-sectional
samples were used with the intention to explore general performance in the
knowledge of science process skills across a group of semesters (semesters of
study) in the programmes.
In general, performance in science process skills measured using the TISP can be
defined as a way to measure the level of knowledge in science inquiry skills held by
an individual PST. Individual PSTs with good performance of the TISP would have
good knowledge of science inquiry skills. The result of the analysis in Chapter 6
provided the necessary evidence in order to evaluate whether the knowledge of
science inquiry skills is a factor related to the factors of the SETSIS.
Table 6 Domains of the TISP
3.6 Data collection and the sample
3.6.1 Face and content validation
Content validity is about the degree to which the items representing the content area
should be measured. This process will use research-based literature and an expert
Item Type
Controlling Variables: Identifying the fixed variables, manipulated variable, and responding variable in
an investigation. The manipulated variable is changed to observe its relationship with the responding
variable. At the same time, the fixed variables are kept constant.
Making Hypothesis: Making a general statement about the relationship between a manipulated
variable and a responding variable in order to explain an event or observation. This statement can be tested
to determine its validity
Define Operationally: Defining concepts by describing what must be done and what should be
observed.
Interpreting Data: Giving rational explanations about an object, event or pattern derived from collected
data.
Experimenting: Planning and conducting activities to test a certain hypothesis. These activities include
collecting, analysing and interpreting data and making conclusions.

56
panel (i.e., experts in subject matter, experts in instrument development). The results
will inform the development of the items in the SETSIS first place.
3.6.2 Pre-test
The first round of item piloting aims to show if there is a need to undergo a change in
terms of item type and the difficulty of the items used. Isaac and Michael (1995) and
Hill (1998) suggested 10 to 30 participants for pilots in survey research, which in this
study meant recruiting participants (N=31) who made up 9 percent of the total
number of PSTs enrolled at ITE when the study was conducted. Participation was
voluntary, and no demographic data was collected at that time. After piloting, three
respondents (10 percent of the sample) were recruited to participate in an interview.
The group interview was used to explore the thinking of the respondents as they
worked through the items. It allowed them to verbalise their decision-making and the
rationale behind each response choice and helped to identify any inappropriate
reading levels (i.e.reading expression received do not match the intended meaning)
and ambiguous phrasing.
3.6.3 Main research
In the second round of item piloting, the revised items were administered to the study
population using a cross-sectional sampling procedure (i.e. samples were taken from all
levels of science PSTs from all levels of science at ITE). The demographic of
participants in this sample presented as the first part of the SETSIS before the main
items. Further, the SPS cognitive test assessment (Shahali and Halim, 2010) were
employed on the same sample. The score of the practicum attainment of the sample
was used with the participants’ consent.
In this study, the survey population is defined as individuals who are currently
enrolled in a teacher education programme majoring in primary science education in
Malaysia. The purposive sampling was decided because these PSTs will graduate
from ITE and will implement the new science curriculum in Malaysian primary
schools. It also will be more informative for the purpose of developing the SETSIS.
Table 7 shows the number of students that have enrolled for the Bachelor of
Teaching Programme (BoTP), which specialises in primary science education in 13
campuses of ITE using pseudonyms listed. The Pre-Test survey was conducted in
one of the campuses (i.e. campus KT) with 31 respondents as a sample. These
respondents were not included in the main research phase.

57
Table 7 Enrolment of science PSTs in ITE campuses all over Malaysia
No. ITE Campus Semester 1 Semester 3 Semester 5 Semester 6 Semester 7
Semester
8 TOTAL
1 BL 21 11 32
2 TW 16 16 32
3 KT 16 15 31
4 KB 11 11
5 SM 15 22 37
6 TA 18 18
7 TI 19 12 31
8 RM 13 13
9 PT 13 17 16 46
10 IP 10 18 28
11 PP 12 19 16 47
12 TB 10 37 47
13 TR 15 15
TOTAL 89 48 62 71 11 76 388
The main research study used a cross-sectional sample as the participants to
address various levels of experience of primary science teacher training in Malaysia
based on their period of study (semester). In the main research study, the surveys
were offered to all available respondents; however, the responses were obtained
from 325 voluntarily participants. The details were listed in Chapter 5.
3.6.4 Score for teaching practice assessment
This study used the secondary data of the scores for Professional Practice obtained
from the Department of Exams and Senate. An official application has been
forwarded through ITE and the contacted person in-charge have offered limited data
to be accessed for two courses, PRK3024 – Practicum II and INT3012 - Internship. I
have only accessed the final scores and grades of the assessments. From all the
data that have been offered, I managed to link 103 scores to the participants of my
study through their student identification numbers. I used the scores to triangulate
and validate the SETSIS with the teaching practice assessments conducted by the
training institution. Further details are presented in Chapter 7.
3.7 Ethics
My research data were gathered using surveys, focus group interviews and data
analysis that covered the science PSTs that enrolled with ITE. The participants
involved in this research are more than 18 years old and the data gathered were in

58
the form of the written, self-response questionnaires, written notes (from focus group
interviews) and databased documents that did not involve risk. The ethical approval
was received from ESSL, Environment and LUBS (AREA) Faculty Research Ethics
Committee, University of Leeds on 20 October 2015. The approval letter can be
found in Appendix 2. There are a number of ethical issues to consider and these
were addressed in the following subsection.
3.7.1 Main ethical issues
Firstly, the main ethical issues in my study relate to the acceptance (permission) issue.
Since the study took place in Malaysia and involve teacher trainees at ITE, I gained
permission through the Economic Planning Unit (EPU) at the Prime Minister's
Department in Malaysia. The approval letters from the EPU were essential for me to
gain permission from the ITE department for easy access to conduct my research.
The EPU was contacted via email to seek approval for the research area and design.
After getting the feedback and approval from the EPU, the Education Planning and
Research Department (EPRD) was contacted to gain access to the Institute of
Teacher Education (ITE). After getting the consent from the ITE for the three surveys
(i.e. pilot survey, research survey and cognitive performance test survey), only then
was I allowed to distribute the questionnaires and conduct the interviews as planned.
In addition, I also sought consent from ITE to grant access to data archives for the
professional practice scores of the participants involved. The data were needed to
answer part of my RQ5.
Secondly, having a higher rank authorisation eventually made my prospective
participants feel compelled to participate. As my surveys were distributed through the
gate-keepers, such as the head of department, teacher educators and tutors or with
their consent, the participants felt obliged to participate in the survey because they
had been asked or advised by the gate-keepers to take part. This might have
affected the quality of the information they provided. To address this concern, I
asked for voluntary consent from participants personally during the administration of
the survey and only recruited those who openly expressed their willingness to
participate.
Additionally, I considered incentives in order to maximise the engagement and
responses in the surveys. These incentives were inducements to compensate for the
absence of factors that otherwise might stimulate cooperation (i.e. interest in the
topic of the survey or a sense of civic obligation). One small incentive involved a
souvenir pen that was given to attract participants to spend their time on this study.
In order to maximise the responses when completing the two surveys (the SETSIS
and the TISP), I offered the chance for participants who completed both surveys to

59
enter lucky draws for 50 fast-food vouchers worth RM10 (approximately £1.50) each.
It has been shown that, in a study that involves no more risk than the ordinary
amount, the size of incentive becomes irrelevant on ethical grounds (Singer and
Couper, 2009). Thus, in this study, the incentive would not affect the responses to
the study.
3.7.2 Managing data protection
Any electronic data were stored in a password protected secure network location
allocated to myself at the University of Leeds. No data were stored in thumb drives
or laptops. Any personal data were stored in a password-protected secure network
location at the University of Leeds, which can be accessed only from my home
computer and personal laptops – the access route is password protected through a
secure log-in which matches the on-site process and times out after five minutes’
inactivity. The hard copies of the three surveys, writing notes that will be used to
record the interview for technical qualities during the pre-test, and the documents of
secondary data analysis (i.e. teaching practical scores received from ITE), were
stored in a locked filing cabinet in a lockable office at the University of Leeds and
were kept on site at all times.
3.7.3 Informed consent
Information sheets (see Appendix 3) and verbal inputs were provided for all
participants before any phase of the research (i.e. pilot survey and main research
surveys). The participants were given information about the questionnaires in
advance which stated that submission of the surveys indicated that they have given
their consent for their responses to be collated and analysed. Additionally, they were
asked if they were willing for their data to be archived and made available for further
research during the research survey. They were assured that their responses and
teaching practical scores would not be available in the public domain.
In order to use the interview effectively, an initial meeting took place with the
participants who volunteered to be interviewed, before the pilot survey. The meeting
was to brief them about the purpose of the interview, which is to improve the
technical qualities of the survey. Participants were reminded at the start point of the
pilot survey of their right to withdraw from the study without the need to give reasons.
60
3.7.4 Anonymity
This research involves two surveys and a data archive on teaching practice scores to
be analysed and cross-validated with each other. For that purpose, the participants
needed to be identified with a formal and acceptable identification using their student
number. To avoid exposing participants or revealing their identities, new systematic
identification numbers were assigned during the process of data entry. The
participants were assured that their identity would not be revealed in any part of the
research. It was made clear to all participants that their responses would be
respected and their anonymity guarantee.

61
Chapter 4 Constructing the SETSIS
4.1 Overview
This chapter explains the framework used in constructing the SETSIS. In the model
of SETSIS, the three components of teacher knowledge (i.e. knowledge, practice
and belief) are represented by three self-efficacy factors call Knowledge Efficacy
(KE), Personal Teaching Efficacy (PTE) and Outcome Belief Efficacy (OBE). The
factors were structured into hypothesis criterion-references levels of responses to
explain the elusive construct. The factors mapped the measurement of self-efficacy,
specifically in the theme of teaching science using science inquiry skills that correlate
to the development of PSTs in their teacher knowledge. The characteristics from the
definition of the factors establish the model structure. It is then used as a guide to
design the items of the SETSIS.
Next, the items used in the SETSIS operationally define the factors and of their
distinctive characters that stated in the construct above. The items shall be carefully
chosen and developed to reflect the intended construct. All the items would measure
the development of teacher knowledge according to the theme of the factors. The
items then underwent expert review for evidence of the validity of the items’ content.
The results of the experts’ judgements were analysed using Fuzzy Delphi method to
ensure the validity of the items constructed. The last section presents an
examination of the reliability of the measures in the pre-test survey. The pre-test
survey observed the participation of 31 samples in the construct’s items and the
items format. The information from the data was used to improve the measure.
4.2 Constructing Factors of the SETSIS
Outcomes from the SETSIS are meant to be used in inferring competence in
teaching using science inquiry skills in science classroom from the perspective of
self-belief. Teaching competency in the science classroom is derived from the
recognition of teacher knowledge development (Shulman, 1986, 1987; Darling-
Hammond, 2006; Ben-Peretz, 2011). Thus, hypothetically, competence in teaching
in the science classroom using the new curriculum among PSTs can be measured
from the components of teacher knowledge in specific tasks, which is teaching using
science inquiry skills. In regards to measuring the development of teacher
knowledge among PSTs, the SETSIS was developed specifically to measure self-

62
efficacy in teaching using science inquiry skills (Ministry of Education 2013). As
mentioned in the previous chapter (referring to the theoretical framework), this study
defines self-efficacy in teaching using science inquiry skills within the three factors:
KE, PTE and OBE. The definition given corresponds to teacher knowledge
development in teaching using science inquiry skills.
In this study, TSE belief is used as a key construct in measuring the SETSIS in the
science classroom (Bandura, 1994; Roberts and Henson, 2000; Tschannen-Moran
and Hoy, 2001). Much of the research into self-efficacy in academic achievement
and health psychology competence has agreed that self-efficacy has important
characteristics in measuring competency in performing specific tasks to attain
designated outcomes (Zimmerman, Bandura and Martinez-Pons, 1992; Albion,
1998; Zimmerman, 2000; Caprara et al., 2006; Siwatu, 2007; Cassidy, 2015), which
supports the concept of the prominent model of TSE belief by Tschannen-Moran et
al. (1998). However, as discussed in section 2.3, this study adapted the concept of
the model within the contemporary definition that emphasises the perceived ability to
take action (agent-mean) rather than bringing about desired outcomes (agent-end).
Moreover, this study defines self-efficacy belief with characteristics that extensively
include the role of teacher knowledge as an additional factor. The study definition of
self-efficacy is an appropriate element to be integrated with the concept of teacher
knowledge to describe development in teacher learning (Wheatley, 2002). The
SETSIS designs to measure self-efficacy in teaching using science inquiry skills
correspond with PSTs’ potential ability to perform specific teaching tasks using
science inquiry skills in primary science as required by the current curriculum.
The present study blends elements of self-efficacy and psychometric theory to
measure self-efficacy, specifically in teaching using science inquiry skills among
PST. The element of self-efficacy in the measure is defined by the three factors. The
factors are constructed in three different subscales which measure perceived ability
in delivering the tasks accordingly. The three subscales were psychometrically
combined and interpreted as a measure of self-efficacy in teaching science using
science inquiry skills.
4.2.1 Definition of factors
Table 8 below summarises the definitions of the three factors used in the
development of the SETSIS. Items in the three factors were chosen based on the
definition and the traits measured. All the traits reflected an outcome for self-efficacy
in teaching science using science inquiry skills. The outcomes were interpreted
within the three factor traits’ limits.

63
Table 8 Summary of the three factors in the construct
Component/
factor
Knowledge/ KE Practice/ PTE Belief/ OBE
Trait
measured
Degree of a PST
judgement in
poses the
science inquiry
skills knowledge
required to
organise and
conduct science
inquiry strategies
for science
teaching.
Degree of a PST
judgement on
personal capability
in using the
science inquiry
skills knowledge to
confront the
complexity of
teaching science
using science
inquiry strategy in
classroom context
Degree of a PST
judgement on belief
in learning good
science through
inquiry strategies
aided by the
knowledge of
science inquiry
skills.
Interpretation
of factor
PST perceived
ability in content
and instructional
knowledge of
science inquiry
skills when
teaching science.
PST perceived
ability in practicing
the science inquiry
skills knowledge
for teaching in the
science
classroom.
PST belief in the
value of learning
science by using
science inquiry
skills
4.2.1.1 Definition of Knowledge Efficacy (KE)
KE is introduced to represent the factor of self-efficacy in the component of
knowledge of science inquiry skills. The KE scale is aimed at assessing personal
belief in ability using the science inquiry skills knowledge information to support the
process-content teaching approach. The KE scale neither tests understanding of
explicit science inquiry skills nor how to use science inquiry skills explicitly in
experiments. Instead, the KE scale is about ability in using sufficient knowledge of
science inquiry skills for teaching science. Overall, the KE scale measures perceived
ability in science inquiry skills knowledge for teaching science that is possessed by
an individual PST.
KE measures meaningful knowledge of science inquiry skills for teaching. KE is
about knowing explicit science inquiry skills and, moreover, knowing how to use

64
science inquiry skills knowledge in teaching science. These two traits – content
knowledge of science inquiry skills and instructional knowledge of science inquiry
skills –are reflected in the example of the following KE item.
I understand about measurement and space sufficiently to help students
understand the concept of length using self-measure activity (i.e. arranging
paper clips/ sticks).
The item assesses the explicit conceptual understanding of the concept of skills of
measurement and space that are being used (i.e. content knowledge) and the
concept of learning using self-measuring activity (i.e. instructional knowledge). Both
knowledge exist as science inquiry skills knowledge required for teaching science.
Thus, items in KE indicate the science inquiry skills knowledge that consists of
content and instructional knowledge, which enable the PST to use science inquiry
skills meaningfully for teaching.
In this study, the science inquiry skills knowledge refers to the use of 12 science
process skills (SPS) in a science inquiry: seven basic SPS and another five
integrated SPS (Malaysia Ministry of Education, 2013) (i.e. observation,
classification, measurement and using numbers, inference, communication,
predicting, using space-time relationship, interpreting data, defining operationally,
controlling variables, hypothesizing and experimenting) that are required for effective
planning of inquiry strategies. On the whole, KE refers to the personal judgement of
PSTs in their position of the required science inquiry skills knowledge.
4.2.1.2 Definition of Personal Teaching Efficacy (PTE)
PTE is introduced to represent self-efficacy towards components of the practice of
teaching using science inquiry skills in science classrooms. PTE refers to personal
feelings about conducting teaching using science inquiry skills in a classroom. It
assesses the judgement of personal capabilities in skills, knowledge and personal
attitudes to anticipate classroom teaching. Furthermore, the PTE scale also
considers anticipation in contextual factors such as the climate within the school and
supportiveness of superior teachers. Thus, in general, the PTE scale assesses self-
perception of personal teaching ability within teaching tasks and teaching contexts.
As noted, PTE assessments are somewhat similar to KE in terms of the science
inquiry skills knowledge, but PTE includes specific aspects of the classroom
situation. PTE assesses the capability to anticipate elements of tasks in a classroom,
referring specifically to teaching using science inquiry skills during classroom
learning. The measured trait is reflected in one of the following PTE items.

65
When a science process is difficult to explain, I will use an investigative
approach to assist the students’ understanding.
The item reflects anticipation of difficulties in the nature of science using a
pedagogical of inquiry science (investigation) approach. It is intended to asses
personal capability in engaging with the classroom’s elements (i.e. nature of science,
pedagogy, curriculum and students’ knowledge) when teaching science in a
classroom.
Along with the teaching tasks, the PTE scale also reflects the capability to anticipate
aspects of contextual factors. This is reflected in the following item.
I choose to show inquiry methods suggested by the latest curriculum to
the headmaster.
In the item above, PTE assesses personal capability to anticipate supportiveness
from a superior teacher in the school. Overall, PTE is meant to assess the highest
level of PCK Taxonomy attributes (Veal and MaKinster, 1999b), which is the
capability to integrate with the elements that occur during the tasks of teaching
classroom science.
By the combination of self-efficacy and personal capabilities, PTE scale was created
to reflect the judgement of PSTs on their personal ability using the knowledge to
confront the complexity of teaching science using science inquiry strategy in a
classroom context. The PTE scale was aimed to assess personal ability in using the
science inquiry skills knowledge and, at the same time, capture the overarching
abilities to teach it in the context of the science classroom. This means that if a PST
has confidence in their ability to executing the knowledge of science inquiry skills in a
classroom then that PST has a good potential of using science inquiry skills to teach
science in a real classroom setting.
4.2.1.3 Definition of Outcome Belief Efficacy (OBE)
In this study, OBE is used to measure the belief of effectiveness in using science
inquiry skills for teaching science. The definition of OBE derived from the belief
component of teacher knowledge. Belief components have important rules in
developing teaching behaviours in the classroom (Magnusson, Krajcia and Borko,
1999; Kane, Sandretto and Heath, 2002; Marra, 2005).OBE is seen as a
fundamental component in teacher development.
The OBE scale in this project was designed to measure PSTs’ perceived belief in the
value of using science inquiry skills, which encourages better teaching and learning
outcomes. OBE’s items reflect a belief in learning good science through inquiry

66
strategies aided by the knowledge of science inquiry skills. This is reflected in one of
the following OBE items.
I believe that investigative skills are needed for students to success in
learning science at higher levels.
The item reflects beliefs about the requirement of science inquiry skills knowledge for
success from personal experience in learning science. It assesses general belief
relating to outcomes from experiences of learning using science inquiry skills.
Moreover, the OBE scale assesses personal belief based on respondent’s
experiences of the learning outcomes rather than personal belief in the
respondent’s ability to producing the learning outcomes as posted in PTE. This is
reflected in one of the OBE items, as follows.
I believe that a science inquiry strategy is the best method for teaching
science.
The item assesses personal belief in the advantage of science inquiry skills
knowledge for teaching rather than belief in the personal ability to implement science
inquiry skills knowledge for teaching. Overall, OBE is aimed at assessing general
belief in the value of using science inquiry skills for teaching science, which leads to
self-motivation in the future.
OBE is defined slightly differently from KE and PTE. While KE and PE are about the
judgement of self-possession and self-capability while using the science inquiry skills
knowledge, OBE is concerned with opinions on the belief about advantages of
science inquiry skills knowledge in learning science. Thus, in general, OBE assesses
personal beliefs in the advantages of using science inquiry skills in learning science.
OBE was constructed to complement but not to influence KE and PTE (Bandura
1994).
4.3 The Construct
The construct refers to the concept of intended measure in this study. Mindful of the
literature, the factors used in assessing the perceived ability of an individual PST are
assumed to psychometrically measure one construct of self-efficacy in teaching
science using science inquiry skills. The construct outcome intends to become a self-
belief assessment that infers competence in teaching science using science inquiry
skills in the new curriculum.

67
Based on the curriculum used for BoTP, the study construct was arranged to
represent a hypothesised level of the self-efficacy of the respondents from early
admission to the end of the programme. It derived from the concept of teacher
knowledge in the PSTs’ education. At the early stage in the PSTs’ education, a PST
constructs belief in the effectiveness of using science inquiry skills from their school
experiences. The beliefs are used to strengthen the knowledge learned (i.e. content
knowledge and pedagogical knowledge) during the training programme. Then, by
reinforcing belief and knowledge, PSTs are able to craft personal practices in
classroom teaching (Abd-el-khalick, Bell and Lederman, 1997; Magnusson, Krajcia
and Borko, 1999; Veal and MaKinster, 1999b; Cochran-Smith, 2004; Veal, 2012).
Thus, my hypothesis is that the level of self-efficacy in using science inquiry skills
when teaching science follows the hierarchy order from traits related to OBE up to
traits related to KE to the top with traits related to PTE (i.e. from low level to high
level). The order represents the framework of my measurement model, which is used
to estimate responses for the construct development.
In summary, the traits from the three factors describe the development of teacher
knowledge embedded along the construct continuum. For instance, the KE factor
consists of relevant items in assessing traits in the science inquiry skills knowledge.
The PTE factor characterises assessments that are relevant to assessing responses
in terms of traits in the ability of personal practice in teaching using science inquiry
skills in the science classroom. The OBE factor assesses traits of perceived
responses that are relevant to the capability of believing in the effectiveness of
knowledge of science inquiry skills in learning science. As a whole, the perceived
capabilities in the traits measured from the three factors represent the construct’s
concept of self-efficacy in teaching science using science inquiry skills.
Respondents’ positions in the framework are described based on their responses to
the factors. Hypothetically, the estimation of responses in the construct characterise
the level of self-efficacy of an individual PST. Various confident degrees of
responses within the three factors define the development in self-efficacy in teaching
science using science inquiry skills. Different degrees of confidence in responses
given in the items note the depth of the perceived abilities held by an individual PST
within the three factors. The combination of responses in the three factors’ traits
establish layers of perceived abilities to teach science using science inquiry skills in
the SETSIS. Characteristics that emerge from this complex combination of
responses determine the outcome measured along the construct continuum. The
outcomes are characterised in the level of self-efficacy in teaching science using
science inquiry skills, which are clarified as the construct outcomes. I will now
describe these levels of outcomes in detail using the construct map.

68
4.3.1 The Construct Map
The construct map (Brown and Wilson, 2011) visualises the hypothesis on the level
of teaching using science inquiry skills model maps across the three factors. Figure 6
shows the relations of the item hierarchy between the three factors mapped on
overall development around the theme of teaching using science inquiry skills. The
model hypothesises response outcomes divided into descriptive levels of self-
efficacy in teaching science using science inquiry skills. The descriptive levels would
give clear guidance in creating suitable assessments to measure the intended
construct. It helps in establishing construct validity during the process of developing
the SETSIS especially in designing items and developing the model.
Figure 6 Construct map for the SETSIS development
The construct map visualises a measurement framework from the hypothesised
model of progression on self-efficacy in teaching science using science inquiry skills.
It is drawn on the proposed estimation order of the factors that are developed by
PSTs during teacher education training. The order (from the bottom to the top:
OBE→ KE→PTE) is then descriptively fabricated into the measurement framework.
The relationship between estimations of responses to items and the outcomes level
on the continuum of self-efficacy in the construct is drawn in Figure 6.
The self-efficacy in the construct continuum is described and defined with five
qualitatively distinct levels with the bidirectional arrow in Figure 6 representing
greater and fewer amounts of self-efficacy as per the measure. The PST with the
lowest response to self-efficacy in the construct measure is defined as not perceiving
Respondent Direction Responses to items Interpretation to construct
high responsses for average to affirm
items in OBE
L1- perceived ability to recognise
effectiveness SIS in science
classroom
Direction of
decreasing potential
ability of using SIS in
teaching science
high responses for easy to affirm
items in OBE
high responses for;
difficult to affirm items in OBE and
easy to affirm items in KE
L2- perceived ability to promote good
influence of SIS in teaching science
classroom
High responses for
difficult to affirm items in OBE,
difficult to affirm items in KE, and
difficult to affirm items in PTE
Direction of
increasing potential
ability of using SIS in
teaching science
L5- perceived ability to adapt SIS in
method and strategies in science
classroom teaching to enhance
student learning
high responses for;
difficult to affirm items in OBE,
difficult to affirm items in KE, and
average to affirm items in PTE
L4-perceived ability to enhance
knowledge bases on using more SIS
in teaching science classroom
high responses for;
difficult to affirm items in OBE,
average to affirm items in KE and
easy to affirm items in PTE
L3- perceived ability to use SIS in
teaching science classroom

69
any confidence in personal ability, as represented by the traits of the three factors.
The self-efficacy of PST increases by increment with perceived confidence in
personal ability according to the traits of the factors. Complex responses in the
factors are cumulated and described in five levels representing the continuum of self-
efficacy in the single construct.
The continuum level is important for positioning and interpreting a PST’s self-efficacy
in teaching science using science inquiry skills. With low cumulative responses in
OBE, KE and PTE, a PST is placed at the bottom level of self-efficacy in the
construct map. Showing high affirmation of items that indicate low belief in the
outcomes of science inquiry skills in science learning, low ability in knowledge of
teaching science inquiry skills and low ability in practicing teaching using science
inquiry skills in classroom, a PST is hypothesised as having ability in recognising
science inquiry skills learning but with low possibility of using the SIS knowledge
when teaching classroom science. Thus, the bottom level of the construct map is
described as level one (L1) with a perceived ability in recognising effectiveness of
science inquiry skills in learning, which reflects the lowest self-efficacy in teaching
science using science inquiry skills.
Level two (L2) from the bottom of the construct defines self-efficacy with high
affirmations of items that indicate high ability in OBE but low in KE and PTE. L2
describe respondents with high belief in the effectiveness of science inquiry skills
outcomes but without confidence in their ability in the knowledge of teaching science
inquiry skills and ability of practicing teaching using science inquiry skills in the
classroom. In the construct measure, L2 is mapped as self-efficacy in promoting
good influence of using science inquiry skills in teaching science.
Level three (L3) of the construct defines self-efficacy with high affirmation of items
that indicate high ability in OBE, average ability in KE and low ability in PTE. At L3, a
respondent is described as showing good belief in the benefit of using science
inquiry skills in learning with confidence in their basic knowledge of science inquiry
skills to teach but, still not confident in their ability in teaching science using science
inquiry skills in the classroom. In the construct map, L3 is characterised as having
self-efficacy in using science inquiry skills in teaching classroom science.
Level four (L4) of the construct defines self-efficacy with high affirmations of items
that indicate high ability in OBE and KE but average ability in PTE. At L4, a
respondent is hypothesised with good belief in the benefits of science inquiry skills
with sufficient knowledge of science inquiry skills to complete learning goals or solve
teaching problems in the classroom. However, the personal practice confidence at
this level may come through reflections afterwards. On measuring the self-efficacy,

70
the L4 is mapped as having potential to enhance the knowledge bases and using
more science inquiry skills in teaching classroom science.
Level five (L5) of the construct is the top layer that defines the self-efficacy with high
affirmations of items that indicate high ability in the three factors: OBE, KE and PTE.
At L5, a respondent is hypothesised as possessing definite confidence in the belief in
the good learning outcomes from using science inquiry skills, confidence in their
knowledge of science inquiry skills and confidence in their capability of practicing
science inquiry skills in teaching classroom science. Their belief has enhanced the
knowledge of science inquiry skills with the possibility of using the instructional
method that stimulates science learning. In the construct map, the L5 is mapped as
having potential to adapt science inquiry skills in teaching science and enhance
students’ learning by using science inquiry skills.
In summary, the construct map represents an explicit model of the SETSIS. The
construct five layers mapped the order of the hypothesised responses across the
three factors. The pre-specified orders reflect the development of self-efficacy in
teaching using science inquiry skills as it corresponds to the different hierarchy of
items. The theoretical concept of the construct manifested in practice with the item
hierarchy design will now be discussed.
4.4 Item design
In designing items to measure the construct of the SETSIS, I decided to make
individual items correspond to specific ability in teaching science using science
inquiry skills. Each item corresponds to a specific level of task affirmation. Items that
correspond to certain levels of ability can supply in-depth information about the traits
measured. For instance, items are designed into three levels of hierarchy, which
consist of three groups of items with easy, mean and hard task statements to affirm.
Adapting the model of teacher professional development (Juttner et al. 2013), the
item hierarchy can correspond to three different levels of tasks of teacher knowledge
according to the factors’ traits.
Item hierarchy refers to the item design within the three difficulty levels mentioned.
The difficulties of the items (i.e. easy item, mean item and high item) are portrayed
using different levels of tasks that assess ability in teaching science inquiry skills. For
instance, the easy items are designed to characterise the low-trait (basic level) tasks
in teaching using science inquiry skills. High-confidence responses in perceived
ability to execute the tasks of easy items inform about self-efficacy at the basic level
of teacher knowledge, which reflects that the respondents meet the basic criteria in
teaching using science inquiry skills. However, low-confidence responses in

71
perceived ability to execute the tasks in easy items reflect that the respondents do
not meet the basic criteria of the ability hypothesised.
The model of Juttner et al. (2013) describes ‘knowing that’ as the basic level in
development of teacher knowledge. The content knowledge corresponds with ability
of describing and explaining the lesson. Easy items are designed to assess this
basic level of ability required for teaching using science inquiry skills. The easy items
describe the trait of ‘knowing that’ which refers to meaningful science inquiry skills
content knowledge, a requirement needed for teaching science lessons. Thus, these
easy items are operationally designed to correspond with the basic level ability in
teacher training development, which corresponds to a low level of the construct’s
self-efficacy: the ability to promote teaching science using science inquiry skills.
Mean items are designed to correspond with the average level of knowledge in the
model of teacher professional development. This level requires knowledge of
students, which is needed to teach lessons in classrooms. The mean items are
designed to describe trait of ‘knowing how’ (Juttner et al. 2013), which reflects the
ability of interaction between cognitive decision and students’ necessity in the action
of teaching science using science inquiry skills in the classroom. In this study, the
mean items are operationally designed to correspond with an average level of self-
efficacy, which is ability to demonstrate teaching science using science inquiry
skills.
High items are designed to correspond with high levels of the model of teacher
professional development. This level requires teachers to be able to integrate
elements of PCK (i.e. context, environment, nature of science, assessment, social
culturalism, pedagogic, curriculum and classroom management) in science learning.
The high items describe features of ‘knowing how and why’ (Juttner et al. 2013) in
teaching using science inquiry skills. The items are designed to reflect improvised
practice due to teaching engagement. In this study, the high items are operationally
designed to assess high self-efficacy, which is the ability to stimulate science
learning by teaching using science inquiry skills.
In general, the items hierarchy is operationally used to characterise the items in the
hypothesised order of factors that correspond with the construct measured. The
hierarchy represents the structure of development in teacher knowledge, especially
in teaching using science inquiry skills. The relationships between the respondent
ability and the items establish a framework structure for the measurement model.
The structure will be validated using empirical evidence in the main pilot study (see
Chapter 6). Next, the construction of the item hierarchy will now be discussed.

72
4.4.1 Development of items hierarchy
Relationships between items and respondents are described in terms of relative
ability based on item hierarchy perception. This section explains the development of
the items hierarchy within the three factors. The above trichotomy that characterises
concept of ability is used in the item hierarchy, with slightly different definitions due to
distinct characteristics displayed by each factor. Items are constructed based on the
hypothesised characteristics that reflect the level of ability in the SETSIS. Table 9,
table 10 and table 11 describe the relationships in factors of KE, PTE and OBE,
respectively. By using the items hierarchy design, qualitative information on factors
of teacher knowledge development along the construct can be gained through
outcomes’ responses (see analysis results in Chapter 6).
Table 9 shows item hierarchy of the factor KE described in the corresponding ability.
The high items in KE assess respondents showing high ability in making plans (i.e.
knowing how) and decisions regarding effective use of science inquiry skills (i.e.
knowing why) in science activities. The following item is one of the high item.
I have the necessary scientific process skills to determine the best
manner through which children can obtain scientific evidence.
It assesses possession of science inquiry skills that is used to stimulate pedagogy in
science learning. This high item highlights characteristics of KE (i.e. the knowledge
of science inquiry skills) in terms of tasks for high ability, integrating content
knowledge and instructional knowledge with the knowledge of students.
The mean item in KE is hypothesised to correspond with average ability. The mean
items anticipate tasks of knowing how to use the knowledge of science inquiry skills
to solve problems or to achieve learning goals in teaching. For example, the
following mean item, “I am able to construct the guidelines for communicating results
and explanation for students”, assesses possession of knowledge of science inquiry
skills to be used with students. This mean item highlights characteristics of KE (i.e.
instructional knowledge of science inquiry skills) in terms of tasks of average ability,
interacting cognitive decisions with students’ requirements.

73
Table 9 Level description of item hierarchy of KE
Item level Level description relates to KE
High High ability in KE - PST is confident in their capability in enriching
and stimulating instruction/method/strategies in regards to
teaching using science inquiry skills
Mean Average ability in KE - PST is confident in their capability in
interacting thought and decisions using science inquiry skills in
lessons in science.
Easy Low ability in KE - PST is confident in their capability to promote
comprehension in science subject by using science inquiry skills.
The easy item in KE indicates that respondents have low ability in terms of KE traits.
The items assess the ability to know what, in that they are able to identify,
understand and plan to use knowledge of science inquiry skills. For example, the
following easy item, “I am able to describe my observation with a quantitative
statement”, assesses recognition of knowledge of science inquiry skills. This easy
item highlights characteristics of KE (i.e. content knowledge of science inquiry skills)
in terms of tasks of low ability, describing the knowledge (i.e. knowing what).
Table 10 Level description of item hierarchy of PTE
Item level Level description relates to PTE
High High ability in PTE - PST is confident in the possibility that using
instruction/ method/ strategies of science inquiry skills can enrich
and stimulate students learning science.
Mean Average ability in PTE - PST is confident in the possibility that
practice of science inquiry skills in classroom can affect teaching
and learning outcomes.
Easy Low ability in PTE - PST is confident in the possibility that science
inquiry skills can demonstrate/promote comprehension in the
science subject

74
Table 10 shows the item hierarchy of factor PTE described in terms of the
correspond abilities. High items in PTE indicate high-ability tasks with the ability to
use instruction/method/teaching strategies based on science inquiry skills to
stimulate science learning. The following item is one of the high items.
Whether the science content is difficult or not, I am sure that I can teach it
using the science process approach.
It assesses personal inclination of using science inquiry skills to complete teaching
tasks. This high item highlights teaching competency in integrating science inquiry
skills within the nature of science and the curriculum (i.e. know how and why).
Mean items in PTE are hypothesised as the items that correspond to the average-
ability tasks of integrating planning and execution of science inquiry skills during
teaching action. For example, the following hypothesised mean item, “When a
student has trouble understanding a science concept, I prefer to use scientific
process approach to help him/her to better understand it”, assesses inclination of
using science inquiry skills to aid students’ learning. This mean item highlights the
characteristic of PTE of knowing how to interact within the knowledge of the student.
Easy items in PTE indicate tasks with low ability which support learning
comprehension using science inquiry skills. For example, the following item, “I am
able to encourage my students to independently examine resources in attempt to
connect their explanations to scientific knowledge”, assesses the recognition of
science inquiry skills usage in lessons. This easy item highlights the characteristic of
PTE (i.e. promote the usage of science inquiry skills for learning) with knowing why,
using science inquiry skills to complete tasks.
Table 11 Level description of item hierarchy of OBE
Item level Level description relates to OBE items
High High ability in OBE- PST is confident in plans and decisions
about use of science inquiry skills lead to effective science
classroom activity.
Mean Average ability in OBE - PST is confident that science inquiry
skills can solve teaching problem/achieve learning goal.
Easy Low ability in OBE - PST is confident in recognising science
inquiry skills advantages in science learning.

75
Table 11 shows the item hierarchy of OBE describing the correspond ability. High
items in OBE indicate tasks with high ability in instruction/ method/strategy using
science inquiry skills that can enrich and encourage students learning science. The
following item is one of the high items.
I believe that science inquiry skills creates an opportunity to satisfy
children’s curiosity when learning science.
It assesses the belief that science inquiry skills usage leads to good learning
outcomes. This high item highlights characteristics of OBE in terms of knowing how
and why integrating science inquiry skills in classroom stimulates science learning.
Mean items in OBE are hypothesised as the items that correspond to an average
ability to believe that practice of science inquiry skills in classrooms can affect the
outcome of learning science. For example, the following mean item, “I think that
teaching science by using science process skills is important because children can
learn and understand science concepts better in class”, assesses the belief that
demonstrating science inquiry skills in classrooms helps students to understand
better. This mean item highlights the characteristics of OBE in terms of average
ability in belief of knowing how science inquiry skills learning interacts with students’
needs.
Easy items in OBE indicate tasks associated with low ability of belief. It assess tasks
with the possibility of science inquiry skills supporting understanding in the subject of
science. For example, the following easy item, “In science, I think it is important for
children to learn to solve problems”, assesses recognition of science inquiry skills in
science learning. This easy item highlights characteristics of OBE in terms of low
ability in belief, shown by only describing the importance of science inquiry skills in
learning science.
The items in the measure are developed with the three levels of item hierarchy
corresponding to the characteristics from the three factors. This items hierarchy is
hypothesised to assess the three levels of ability in respondents. Empirical evidence
from Chapter 6 will inform the validity of the item hierarchy characteristics and at
once give qualitative information to add to the factors that develop along the self-
efficacy in teaching using science inquiry skills. The response format for the items
will now be discussed.

76
4.4.2 Response to Items
For all the items, a fixed format of response options is developed to represent the
range of the hypothesised responses. The response options in fixed format are
chosen to adequately reflect the expression of the respondents to the items. Using
fixed format options in obtaining responses might limit the information given, but they
describe responses which are significant in the context of the construct measured.
Different responses are expected for every item in correspondence with the various
potential abilities in teaching science using science inquiry skills. To measure these
abilities, multiple closed-ended items are used to portray tasks drawn upon pre-
specific levels of abilities, as above. Tasks are portrayed in the items for measuring
pre-specified components (i.e. factors) of the underlying construct. Responses to
the items reflect the respondents’ perceptions of confidence in their ability to execute
the tasks that have been portrayed in the items.
A rating scale with five-point options establishes the range of possible choices that
indicate the variability of the perceived confidence in ability to accomplish tasks. The
five-points rating scale is used to categorise response properties in terms of
confidence in a quantitative measurement continuum. The response options are
described from the lowest confidence (i.e. not confident at all) to the highest
confidence (i.e. definitely confident). The five-points rating scale is appropriate in
representing the gradation range of perceived ability in teaching tasks using science
inquiry skills (Toland and Usher, 2015), in which the ability is noted in the construct
map visualisation (see Figure 6).
Category options and descriptions represent the magnitude and direction of the five-
point rating scale in Table 12. The numerical options for the five categories are used
in the instrument to identify the magnitude of the responses in the rating scale. The
category descriptions with numerical options are placed in the survey instrument as
visual supplements (see Appendix 4 – instrument the SETSIS) to help respondents
indicate their magnitude of response in the provided scale.
The rating scale is labelled from category option 1 (lowest confidence) to category
option 5 (highest confidence). The category options indicate continuity of learning
progress in ability to teach using science inquiry skills. The progress in ability shows
the unipolar direction of perceived ability progression. With the unipolar rating scale,
respondents are asked to indicate the rating option that best reflects their confidence
in ability measured by the item, without a neutral option.

77
The five category options above relate responses to the self-efficacy progress level
explained above by using the scoring order. Responses to the items are scored from
1 – not confident at all – to 5 – definitely confident. The scoring orders are
interpreted as indicated in Table 12 according to the construct map. The scores are
used to quantify responses into measuring the factors. A total score of responses
from all items is summed up to represent the measure and use in a Rasch model
estimation to measure the self-efficacy of teaching science using science inquiry
skills. The reliability of the five categories to propose an estimation of the
respondent’s ability is tested in section 6.2.2.1 (i.e.Category functionality).
Table 12 Intensity and direction of categories of responses present in five-point rating scale
Category Option Category description
1 not confident at all
2 not confident
3 slightly confident
4 confident
5 definitely confident
In summary, the common information regarding abilities that need to be assessed by
items in each factor are generally described using the item characteristics in the
hierarchy. The response abilities in the factors explicitly clarify the component
structure of the construct. The descriptions help to guide item construction for the
SETSIS instrument. The items are connected to the responses using the five
categories option in the rating scale. The response options correlate the perceive
abilities in the construct’s components (i.e. the three factors) with the measure of the
SETSIS. The same direction and intensity are used in five category responses of the
rating scale measuring the same continuum of the construct.
4.5 Items Construction
4.5.1 Generating items
Items generated in the SETSIS correspond to the construct’s component with an
appropriate level of the items’ hierarchy. The items are chosen to assess not only
which of the factors’ characteristics represent the underlying construct but also
assess the depth in measuring the self-efficacy in the construct. Items generated in
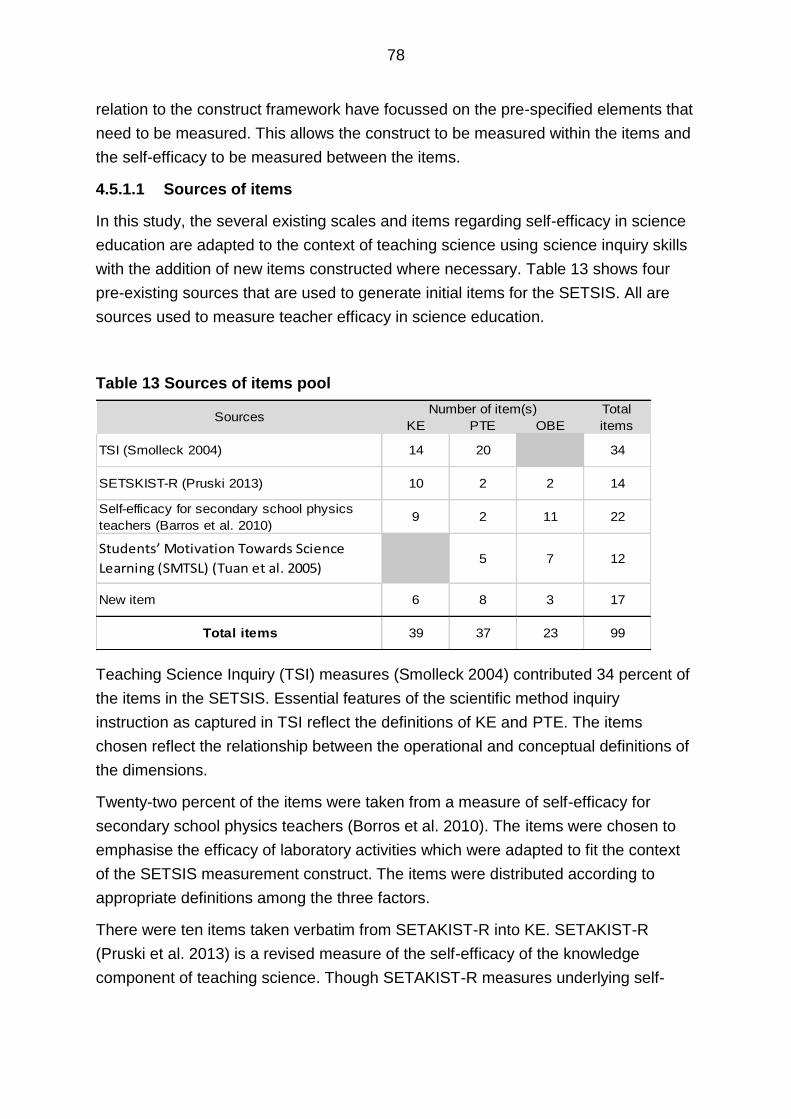
78
relation to the construct framework have focussed on the pre-specified elements that
need to be measured. This allows the construct to be measured within the items and
the self-efficacy to be measured between the items.
4.5.1.1 Sources of items
In this study, the several existing scales and items regarding self-efficacy in science
education are adapted to the context of teaching science using science inquiry skills
with the addition of new items constructed where necessary. Table 13 shows four
pre-existing sources that are used to generate initial items for the SETSIS. All are
sources used to measure teacher efficacy in science education.
Table 13 Sources of items pool
Teaching Science Inquiry (TSI) measures (Smolleck 2004) contributed 34 percent of
the items in the SETSIS. Essential features of the scientific method inquiry
instruction as captured in TSI reflect the definitions of KE and PTE. The items
chosen reflect the relationship between the operational and conceptual definitions of
the dimensions.
Twenty-two percent of the items were taken from a measure of self-efficacy for
secondary school physics teachers (Borros et al. 2010). The items were chosen to
emphasise the efficacy of laboratory activities which were adapted to fit the context
of the SETSIS measurement construct. The items were distributed according to
appropriate definitions among the three factors.
There were ten items taken verbatim from SETAKIST-R into KE. SETAKIST-R
(Pruski et al. 2013) is a revised measure of the self-efficacy of the knowledge
component of teaching science. Though SETAKIST-R measures underlying self-
KE PTE OBE
TSI (Smolleck 2004) 14 20 34
SETSKIST-R (Pruski 2013) 10 2 2 14
Self-efficacy for secondary school physics
teachers (Barros et al. 2010)9 2 11 22
Students’ Motivation Towards Science
Learning (SMTSL) (Tuan et al. 2005) 5 7 12
New item 6 8 3 17
Total items 39 37 23 99
SourcesNumber of item(s) Total
items

79
efficacy in knowledge, there were four items adapted into PTE and OBE to suit the
operational concept of the factors.
Items were adapted from the self-efficacy scale of a measure called Students’
Motivation towards Science Learning (SMTSL) (Tuan et al. 2005) to reflect PTE and
OBE. Five items were adapted into PTE in order to describe personal hindrances in
completing teaching tasks; another seven items were adapted into OBE to reflect
influence of beliefs of the efficacy in science learning, which are congruent with the
definition of OBE.
Additionally, new items in KE were constructed to meet all the SPS that were not
highlighted in the pre-existing sources. The new items for PTE and OBE were
constructed to specify the challenges of teaching inquiry science in the context of the
Malaysian primary science curriculum. All items are developed and chosen to
manifest the theoretical factors into realisation of the construct of the SETSIS.
4.6 Content and Format Validation
In this section, the items pool for the three factors generated (refer to Chapter 3) was
used to establish items for the SETSIS measure. All the items are arranged
according to the hierarchy within the three factors. A questionnaire survey consisting
of all 99 items in the pool was sent for translation into the Malay language.
The back-translation technique (Brislin 1970) was used to translate all the sample
items of the SETSIS from the source language (English) into the target language
(Malay). First, a certified translator with science education background was chosen
to translate the items in forward translation. The bilanguages versions were
compared and some iterations were made in target language based on suggestion
received from the content experts panel (see 3.6.1)and pre-test survey (3.6.2). Then,
it was given to another translator for backward translation (i.e. back into source
language). The two source language versions were compared and evaluated. There
are some discrepencies in the words used, but are semantic equavelence.The final
questionnaires were composed in a dual-language format (Malay and English) for a
complete set for experts use in content validation .
4.6.1 Expert Review
Expert review is one of the construction phases of the SETSIS. The panel consists of
10 experts with a range of relevant expertise (represent in alphabet listed in Table

80
14), chosen on the basis of expertise in knowledge and teaching experience in the
field of science teacher training for more than 10 years. The expert panel provides
general insights regarding face validity and content validity of the items listed for the
intended measure purpose of the SETSIS. A survey consisting of 99 statements
from the items pool above (see Appendix 5) is given out to the experts for their
judgement. The survey of item consent aims to gain experts consensus on the need
of listed items for KE, PTE and OBE. Obtaining expert consent for the items would
establish the validity of contents in items used in the measure.
Table 14 Expert panel list
Expert
panel
Area of expertise
A Science Education research
B Science Education practice
C Science Teacher Training
D Science Teacher Training/Science laboratory and resources
management
E Science Teacher Training/Science laboratory and resources
management
F Biology Education/Science Teacher Training
G Science Teacher Training/Physics education
H STEM Education (Science Process Skills, Science
Education, Learning Environment, Assessment and
Evaluation) research
I Education measurement/Science Teacher
Training/Curriculum design
J Science Teacher Training/Continuous Professional
Development
The agreement on the items screening criteria are rated using a five-point Likert
scale. Each expert evaluates the relevance of items in terms of the item’s
functionality to the factors’ purposes, activity statements that correspond with the
factors’ purposes and statements are appropriate within the item hierarchy
measured. They express their agreement in five categories of the Likert scale (1=

81
entirely disagree, 2 = disagree, 3 = neither agree nor disagree, 4 = agree, and 5 =
entirely agree). Experts also have the opportunity to express their opinions regarding
the content and terms used in the listed items according to the factors by writing
comments and suggesting items that they think fit the purposes. The details about
the design and method of expert review were described in Chapter 3.
4.6.1.1 Results and Analysis of the Item Content Survey
Table 15 shows that the median scores (i.e. referring to the five categories of Likert
scale) in all items are above category 3, whereas the interquartile scores range from
0 to 2.25. The median scores for all items except for K20 show majority agreement
with category 4 = agree and category 5 = entirely agree with statements listed in the
survey. However, the interquartile values reflect different levels of opinions exist
among the experts. The interquartile scores determine level of consensus as follows:
Interquartile 0 to 1.00; high consensus level,
Interquartile 1.01 to 1.99; average consensus level, and
Interquartile 2.00 and above; no consensus level.
(Habibi, Jahantigh and Sarafrazi, 2015)
The median scores show a majority opinion about the relevant items while
interquartile scores shows the relationships between the items with individual
opinions. For example, item K4 (“I feel comfortable with my experimenting
knowledge in order to improvise if the scientific apparatus needed is not available”)
shows a median score at 5 which means that the majority of the experts scored
‘entirely agree’ in the statement of K4. However, the interquartile value of 2.0 reflects
that not all the experts have agreed with the majority opinion; thus, there is no
consensus level achieved in the statement of K4. The above results in Table 15 give
indicative information on the experts’ agreement in the items pool. The result here is
subjective as some experts’ opinions are not reflected in the others. The next
analysis is conducted to determine the complete opinion and accurate results from
the expert panel.
Following a similar methodology to Cheng and Lin (2002), analysis using fuzzy
Delphi method (FDM) below (section 4.6.1.2, section 4.6.1.3 and section 4.6.1.4) use
the fuzzy score to yield a distance (d) between an individual fuzzy score and group
average fuzzy score (see details in Chapter 3). The expected range of consensus
should yield d less than or same as the threshold value of 2.0 (d≤0.2). An acceptable
consensus value of d reflects agreement of the individual experts with the item
statement, which aligns with the group range consensus. Table 16, Table 17 and
Table 18 show the frequency and percentage of experts that state opinions within

82
the expected range of the group panel consensus (d≤0.2) in the items’ statements
according to the factors.
Table 15 Response statistics for the items reviewed by the expert panel in the Expert Survey
4.6.1.2 Knowledge Efficacy (KE)
Table 16 FDM analysis shows all items except K4 have received consensus in the
content of items’ statements. However, the percentage of group consensus is
calculated, showing more than 75 percent consensus among the expert panel shows
items are acceptable for the SETSIS. Only 25 items of KE achieved more than the
75 percent panel group consensus for having good content validity from the expert
panel.
The panel of experts have shown high group agreement on 25 items. The items are
considered as items with valid content with which to measure the KE factor. The
items are retained for pre-test phase survey of the SETSIS. In contrast, 14 items
(K1, K4, K10, K11, K15, K17, K18, K20, K22, K25, K26, K27, K33 and K34) which
Item Median Interquartile Item Median Interquartile Item Median Interquartile
K1 4.0 0.5 K34 4.5 1.3 P28 5.0 0.3
K2 5.0 1.0 K35 4.5 1.3 P29 5.0 0.3
K3 5.0 0.0 K36 5.0 1.0 P30 5.0 1.0
K4 5.0 2.0 K37 5.0 1.0 P31 5.0 1.0
K5 5.0 1.0 K38 5.0 1.0 P32 4.5 1.0
K6 5.0 1.0 K39 5.0 1.0 P33 5.0 2.0
K7 5.0 1.0 P1 5.0 1.0 P34 4.5 2.3
K8 4.5 1.0 P2 5.0 1.0 P35 5.0 2.0
K9 4.0 1.3 P3 5.0 2.3 P36 4.0 1.0
K10 4.5 2.5 P4 4.5 2.3 P37 5.0 1.0
K11 4.5 2.3 P5 5.0 1.0 B1 5.0 0.3
K12 4.5 1.0 P6 5.0 1.0 B2 5.0 0.0
K13 5.0 1.0 P7 5.0 1.0 B3 5.0 0.3
K14 5.0 1.0 P8 4.5 1.3 B4 5.0 1.0
K15 4.0 0.5 P9 5.0 1.3 B5 4.5 1.3
K16 5.0 1.0 P10 5.0 0.3 B6 5.0 1.0
K17 4.0 2.3 P11 5.0 1.5 B7 5.0 1.0
K18 4.5 2.5 P12 4.5 1.0 B8 4.0 0.5
K19 4.0 1.3 P13 5.0 1.0 B9 4.0 1.0
K20 3.5 2.3 P14 5.0 1.5 B10 4.5 1.0
K21 4.5 1.3 P15 4.0 1.3 B11 5.0 2.3
K22 4.0 2.0 P16 5.0 1.0 B12 5.0 1.0
K23 4.0 1.0 P17 4.5 2.0 B13 4.5 1.5
K24 5.0 1.0 P18 4.5 1.0 B14 4.5 1.0
K25 4.0 2.0 P19 5.0 0.3 B15 4.5 1.5
K26 4.5 2.3 P20 5.0 0.3 B16 4.0 1.3
K27 4.5 2.3 P21 5.0 1.0 B17 4.5 1.3
K28 5.0 1.0 P22 5.0 1.0 B18 4.0 1.3
K29 5.0 1.0 P23 4.5 1.0 B19 4.0 1.0
K30 5.0 1.0 P24 5.0 1.0 B20 5.0 1.0
K31 5.0 1.0 P25 5.0 1.0 B21 5.0 1.0
K32 4.5 1.3 P26 4.5 1.3 B22 5.0 1.0
K33 4.0 2.0 P27 4.5 1.0 B23 4.5 1.0

83
show less than 75 percent of expert consensus are revised based on written
comments received from the expert survey.
Table 16 Analysis result of item panelling for KE
Item Consensus
with d ≤ 0.2
Percentage consensus
with d ≤ 0.2 Item
Consensus with d ≤
0.2
Percentage consensus
with d ≤ 0.2
K1 7 70% K21 8 80% K2 10 100% K22 3 30% K3 10 100% K23 10 100% K4 0 0% K24 9 90% K5 10 100% K25 3 30% K6 9 90% K26 2 20% K7 10 100% K27 2 20% K8 10 100% K28 10 100% K9 8 80% K29 9 90%
K10 2 20% K30 9 90% K11 2 20% K31 9 90% K12 9 90% K32 8 80% K13 9 90% K33 3 30% K14 10 100% K34 3 30% K15 6 60% K35 8 80% K16 10 100% K36 9 90% K17 4 40% K37 10 100% K18 3 30% K38 10 100% K19 8 80% K39 9 90% K20 6 60%
4.6.1.3 Personal Teaching Efficacy (PTE)
Table 17 shows all 37 item statements of PTE have received various consensus
from experts. The frequency and percentage of acceptable consensus shows that 29
items statements have been accepted by more than 75 percent of the panel with
good content validity. The analysis shows there are eight (8) items that did not gain
enough group majority consensus (more than 75 percent) on measuring the content
as needed for the PTE factor. These eight items show less than 75 percent of the
panel consensus and are revised based on comments given by the experts.

84
Table 17 Analysis result of item panelling for PTE
4.6.1.4 Outcomes Belief Efficacy (OBE)
Table 18 shows 18 items of OBE with various frequencies and the percentage of
experts that have opinions within the expected range consensus (d≤0.2). The
frequency and percentage of acceptable consensus shows that 17 item statements
have been accepted by more than 75 percent of the panel with good content validity.
The analysis shows there are six (6) items that did not gain enough group majority
consensus (more than 75 percent) on measuring the content as needed for the OBE
factor. These six items show less than 75 percent of the panel consensus and are
revised with concern to the comments given by experts.
ItemConsensus with
d ≤ 0.2
Percentage
consensus with d
≤ 0.2
ItemConsensus with
d ≤ 0.2
Percentage
consensus with d
≤ 0.2
P1 10 100% P21 10 100%
P2 10 100% P22 9 90%
P3 1 10% P23 9 90%
P4 2 20% P24 10 100%
P5 9 90% P25 10 100%
P6 9 90% P26 8 90%
P7 9 90% P27 10 100%
P8 8 80% P28 10 100%
P9 8 80% P29 10 100%
P10 10 100% P30 10 100%
P11 8 80% P31 10 100%
P12 10 100% P32 9 100%
P13 9 90% P33 7 80%
P14 2 20% P34 2 20%
P15 4 40% P35 6 70%
P16 10 100% P36 10 100%
P17 2 20% P37 10 100%
P18 9 90%
P19 10 100%
P20 10 100%

85
Table 18 Analysis result of item panelling for OBE
4.6.1.5 Items Revision
Table 19 lists number implications for items with less than 75 percent consensus.
The total to be revised is 28 items, consisting of items from KE, PTE and OBE. All
these items received less than 75 percent consensus except for K4. Decisions on
the necessity for the items to be removed or reworded are made according to
concerns given by the comments/suggestions in the survey.
The items’ statements are decided to be reworded based on the comments given,
including the following:
• Items have problems in translation. Malay version items did not reflect
precise meaning of the English version, especially in the terms used.
• Please reword.
• Malay versions are too long and hard to understand.
• Simplify the questions.
• Please specify the ability of SPS.
• Use terms that describe the Malaysia context.
Based on the comments received, items which received suggestions on terms to use
are amended and the items with language problems are reworded. Seven (7) items
out of 14 (K1, K4, K10, K17, K18, K22 and K26), it was decided, were reworded
based on the comments received.
ItemConsensus with
d ≤ 0.2
Percentage
consensus with d
≤ 0.2
B1 9 90%
B2 9 90%
B3 10 100%
B4 10 100%
B5 9 80%
B6 9 90%
B7 9 90%
B8 8 80%
B9 10 100%
B10 10 100%
B11 3 70%
B12 10 100%
B13 3 30%
B14 10 100%
B15 3 30%
B16 4 40%
B17 8 90%
B18 4 40%
B19 6 60%
B20 10 100%
B21 10 100%
B22 9 90%
B23 9 90%

86
For instance, Items P3 and P17 were reworded into clearer sentences, while P15
was reworded using terms that described the context of Malaysia. Item B13 was
reworded to reflect the concept more clearly. Items B15 and B18 was reworded in
order to reflect the belief domain instead of the knowledge and practice domain
However, Item P35 (60% consensus) was retained as it shows ability in specific
knowledge of using SPS (communication) and Item B16 was retained, even only
60% consensus, for psychometric reasons (to see how a negatively worded item
compare to a positively worded item).
On the other hand, seven (7) other items (K11, K15, K20, K25, K27, K33 and K34)
were discarded; Items P4, P14, P33 and P34 were rejected; and Items B11 and B19
were discarded on the basis of redundancy based on the comments as follow:
• Questions are not clear.
• Items not measuring the objective.
• More than one factors measured in one items
• Redundancy items
• Not reflecting the practice in a Malaysia context
Table 19 Item revised for 75% less expected consensus.
Table 20 shows items before the content validity process and the resulting items that
will be used in the pre-test survey. The pre-test of the SETSIS contains three factors
approved by ten experts with a total of 87 items achieving consensus in content
validity. The pre-test survey was conducted on a small part of the sample that
represents pre-service science teachers in Malaysia.
Table 20 Items before and after the content validity process
Items SETSIS KE PTE OBE Total
Items pool 39 37 23 99
Items pre-test 32 34 21 87
Item KE PTE OBE Total
Removed 7 4 2 13
Rephrased and retained 7 4 4 15
Consensus less than 75% 14 8 6 28
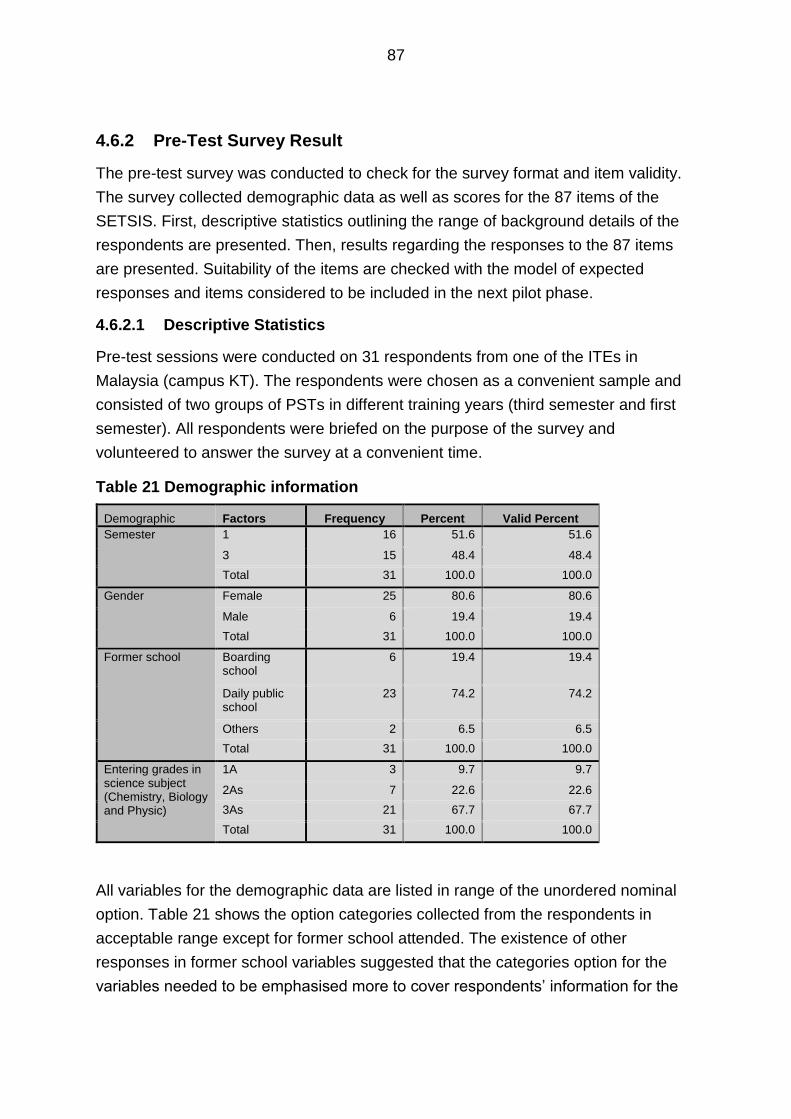
87
4.6.2 Pre-Test Survey Result
The pre-test survey was conducted to check for the survey format and item validity.
The survey collected demographic data as well as scores for the 87 items of the
SETSIS. First, descriptive statistics outlining the range of background details of the
respondents are presented. Then, results regarding the responses to the 87 items
are presented. Suitability of the items are checked with the model of expected
responses and items considered to be included in the next pilot phase.
4.6.2.1 Descriptive Statistics
Pre-test sessions were conducted on 31 respondents from one of the ITEs in
Malaysia (campus KT). The respondents were chosen as a convenient sample and
consisted of two groups of PSTs in different training years (third semester and first
semester). All respondents were briefed on the purpose of the survey and
volunteered to answer the survey at a convenient time.
Table 21 Demographic information
Demographic Factors Frequency Percent Valid Percent
Semester 1 16 51.6 51.6
3 15 48.4 48.4
Total 31 100.0 100.0
Gender Female 25 80.6 80.6
Male 6 19.4 19.4
Total 31 100.0 100.0
Former school Boarding school
6 19.4 19.4
Daily public school
23 74.2 74.2
Others 2 6.5 6.5
Total 31 100.0 100.0
Entering grades in science subject (Chemistry, Biology and Physic)
1A 3 9.7 9.7
2As 7 22.6 22.6
3As 21 67.7 67.7
Total 31 100.0 100.0
All variables for the demographic data are listed in range of the unordered nominal
option. Table 21 shows the option categories collected from the respondents in
acceptable range except for former school attended. The existence of other
responses in former school variables suggested that the categories option for the
variables needed to be emphasised more to cover respondents’ information for the

88
variable. All the others variables (Semester, Gender and Entering grades in science
subjects) show appropriate responses as intended.
4.6.2.2 Result of the Pre-Test Survey Responses
The results discussed are based on responses collected from pre-test
questionnaires consisting of a total of 87 items from the three factors; KE (32 items),
PTE (34 items) and OBE (21 items). All respondents managed to complete the
questionnaires including the demographic details in less than 30 minutes. This time
duration is taken into consideration for time allocation in the next study, the main
pilot.
The responses data for all items collected are checked using the rating-scale model
of Rasch analysis. Psychometric properties of the 87 items on the pre-test responses
(31 respondents) are examined using MINISTEP Version 3.92.1. Summary statistics
generated by Rasch analysis in Table 22 show that all 31 respondents completed all
the items. Person1 mean measure at 1.43 (SD=0.92) indicates that average ability
among respondents are 1.43 units more than mean item difficulty (item mean
measure at 0 (SD = 0.81)). High separation of person (5.18) with high reliability
(0.98) indicates that the items are enough to differentiate the sample into seven
strata groups of ability performers. The person reliability is also used as a test
reliability for Cronbach Alpha KR-20 and indicates that the measure (test) targets the
relevant sample well (Bond and Fox, 2007). However, easy item separation (< 3.00)
with less than <0.90 item reliability implies that the sample size was not enough to
confirm the three groups of item difficulty hierarchy. Thus, the data in the pre-test will
now be used to check items that are appropriate for the model but not to distinguish
the position of the items in hierarchy.
1 For result and data analysis using Rasch, person refers to the respondents of the
collected data. Throughout the thesis, it will be used interchangeably.

89
Table 22 Person Reliability for the SETSIS
Compatibility of the data to the expected mathematical model of Rasch was checked
using fit statistics. Table 23 lists parameters in fit statistics for items that produce
unpredictable responses according to the Rasch model. Parameter point measure
correlation (PtMeaCorr) in the items except for B13 show negative value in the linear
relationships of the pre-test items. The negative values indicate the opposite
direction of measure exists in these items. A check on the pre-test items identified
these items as negative statement items with reversed codes entered in the data.
Thus, it could be argued that negative statements might mislead respondents’
responses. This suggests that all negative statement items should be rephrased.
All items in Table 23 show MNSQ values higher than 1.40 (MNSQ>1.40), which
indicates unreasonable noise produced in the responses (Linacre 2002). Extensive
checking on these items show that only B13 has statistically significant data (-
2.0<Zstd<2.0) with a MNSQ value of 1.5, slightly above the suggestion value of
acceptable noise. With a strong, positive correlation showing in PtMeaCorr, Item B13
was retained for next stage.
MNSQ ZSTD
Mean 1.43 1.04 -0.10
SD 0.92 0.46 2.90
Separation 5.18
Reliability 0.96
Item (87 measured)
Measure MNSQ ZSTD
Mean 0.00 1.00 -0.30
SD 0.81 0.70 2.00
Separation 2.64
Reliability 0.87
Infit
Infit
Measure
Person (31 measured)

90
Table 23 Fit statistic for items with unpredictable responses
Table 24 lists 12 items with positive and strong PtMeaCorr values that indicate that a
single underlying construct is being measured by the items. However, values of
MNSQ in all the items show lower than the reasonable MNSQ range accepted
(0.6<MNSQ<1.4) in rating scale models (Wright and Linacre 1994). It means that all
the items produce redundancy responses which are easily predicted and less
productive for measurement (Linacre 2002) in which case the data show they are not
statistically significant (Zstd<2.0) to the measure. This suggests that all 12 of the
items should be considered for removal in piloting.
Table 24 Fit statistics for removed items
ITEM
LABEL
PT-MEA
CORRMNSQ ZSTD DECISION
P3 -0.3 1.9 3.0Rephrase
(Technically removed)
P6 -0.6 2.3 4.1 Rephrase
P9 -0.4 2.4 4.4 Rephrase
P34 -0.2 4.2 7.6 Rephrase
B3 0.2 3.8 6.8 Rephrase
B12 0.0 3.3 6.0 Rephrase
B13 0.6 1.5 1.7 Retain
B14 -0.2 3.9 7.1 Rephrase
Item
LabelPtMeaCorr MNSQ ZSTD Implication
K1 0.7 0.5 -2.2 Remove
K12 0.7 0.5 -2.4 Remove
K20 0.7 0.5 -2.4 Remove
K23 0.7 0.5 -2.3 Remove
K27 0.8 0.5 -2.1 Remove
K31 0.7 0.5 -2.5 Remove
P1 0.8 0.4 -2.9 Remove
P26 0.7 0.5 -2.5 Remove
P29 0.8 0.4 -2.8 Remove
B1 0.9 0.6 -2.1 Remove
B7 0.8 0.6 -2.1 Remove
B9 0.8 0.6 -2.1 Remove

91
Figure 7 shows a Wright map that represents conjointly person ability and item
difficulty plotted on the same scale. The map visualises the ability estimation of each
person (marks by ‘x’ on left of the map) to the difficulty estimation of each items
(marks using item labels on the right of the map) based on the responses given to
the items. The distribution of items overlaps the distribution of person, indicating that
the difficulty ranges of the items listed in the survey appropriately target the abilities
of the respondents. It could, however, be argued that the horizontal gaps between
the items show there were not enough high items to differentiate persons of top
abilities of the map. Further investigation will be conducted with a bigger sample in
the pilot study.
In summary, the result of the Rasch analysis of the re-test survey data suggests a
total of 72 items selected with four variables of demographics included for piloting
(see the attachment for full questionnaires of the Main Pilot Survey.) Table 25 shows
the development of items for the SETSIS in the three phases of item construction.
PERSON - MAP - ITEM <more>|<rare> 4 + | | | T| P6 3 XX + X | XX | X S| P3 P9 XX | 2 XX + B14 XXX | XXX |T X M| B12 K18 P34 XXX | 1 X + XX |S K10 K17 K2 K7 P10 P11 X S| K13 K25 K31 K6 P14 XXX | B3 K1 K5 K9 P17 X | K12 K14 K15 K24 K26 K27 K30 K8 P18 P23 0 X +M K11 K3 K32 K4 P12 P15 P16 P22 P26 P29 P31 P33 P8 X | K16 K21 K23 K28 P1 P13 P2 P24 P25 P30 P7 X T| K22 K29 P28 | B18 B19 B20 B7 B8 K19 P19 P20 P21 P32 P4 |S B10 B16 B17 B9 P27 P5 -1 + B11 B13 B15 B21 B4 B6 K20 | B1 B2 B5 | |T | -2 + <less>|<frequ>
Figure 7 Wright map: distribution of person ability (left) and item difficulty (right)

92
Table 25 Items construction of two phases
4.7 Summary of Chapter Findings
This chapter provides the initial framework to construct the measure of the SETSIS.
The proposed factors emerged from contemporary research in TSE belief that have
been defined and used to establish a construct framework for the SETSIS
instrument. The framework through which the construct map hypothesises the items-
responses of the SETSIS using the three factors to measure the latent variable. The
construct map was developed to estimate level of self-efficacy in teaching using
science inquiry skills that corresponds to the development of learning to teach in
teacher education. It estimated the measurements of the construct of self-efficacy in
teaching using science inquiry skills from the lower level that predicted belief of OBE
to belief of KE and finally in belief of PTE. The estimated items-responses mapped in
the construct continuum is able to reflect the development of the measure in
teaching using science inquiry skills.
The construct map is able to guide the item generation and construct the responses
options for the SETSIS. The items were rigorously generated based on the three
levels of the item hierarchy to measure the proposed ability as mentioned in the
construct framework. The items and responses options were generated to represent
the continuity of the construct. It is important for meaningful measurement responses
of intended variables.
Finally, this study was able to present evidence of the validity of the content of
construction of the SETSIS instrument. Through an iterative process, items designed
to measure the construct were reviewed by experts in areas of science education
and science teacher training. Evidence presented confirmed that experts agreed to
the initial 87 items used to measure the construct. The initial items were then given
to 31 respondents in pre-test surveys. The responses suggested high test reliability
at 0.96. Evidence in the data survey using the Rasch model fits the statistic,
suggesting that 72 items were productive in the measurement. The 72 items were
used in the main study in Phase 2.
Result of Analysis KE PTE OBE Total
Experts review 32 34 21 87
Pre-Test 26 28 18 72

93
Chapter 5 Developing the SETSIS measure
This chapter presents the analysis and results from the data collected for the main
study of the SETSIS. Results from this provide the first groundworks in testing the
feasibility of the instrument in measuring the intended variables within the targeted
population. The outcomes arising are combined to inform the model development.
5.1 Introduction
In this phase, a total of 72 items were administered to 325 respondents who are
enrolled in the Bachelor of Teacher Programme (BoTP), majoring in science primary
education. In the surveys, the SETSIS instrument consists of four parts of
questionnaires. Parts I to III include items from the three subscales of the SETSIS
accordingly. Part I comprises 26 items (K1 to K26) of the subscale of Knowledge
Efficacy (KE) which measure the self-efficacy component in the science inquiry skills
knowledge. Part II comprises 28 items (P1 to P28) of the subscale of Personal
Teaching Efficacy (PTE), which measures the self-efficacy in teaching practice. Part
III comprises 18 items (B1 to B18) of the subscale of Output Belief Efficacy (OBE)
which measure the perceived belief in outcome values of learning using science
inquiry skills. Additionally, Part IV of the instrument consists questionnaires about
background information of respondents.
This chapter mainly provides the report and the analysis to answer the study’s RQ2
– What are the psychometric properties of the SETSIS when used with science
PSTs in Malaysia? In section 5.2, the demographic information about the participants
is presented. Then in section 5.3, descriptive and inferential statistics were
performed to reveal information about the responses in a general trend of self-
efficacy in teaching using science inquiry skills, scoring differences in the SETSIS
across the group levels of pre-service science teachers in Malaysia and the group of
background factors’ interaction that might exist in the responses given to the
SETSIS. Next, in section 5.4 exploratory factor analysis (EFA) was performed to
determine the factors that explain the latent construct of the SETSIS from the
interrelated items constructed earlier. Finally, the summary of the key findings will be
presented in section 5.5.

94
5.2 The respondents
5.2.1 Who are the respondents?
The data show that the respondents in the main survey were made up of PSTs from
various groups and levels that represent the population of PSTs majoring in Primary
Science Education in Malaysia. The group levels were defined by the semester of
study. The BoTP offers a total of eight semesters of study in total to complete the
training. The admission to the programme, however, was offered in cohorts (groups)
of semesters and did not happen for every semester of study. The recruitment for
BoTP majoring in Primary Science Education was granted as projected by MOE in
teachers requirement in the field (primary science education) . At the present time of
the study, the BoTP has six cohorts of PSTs in semesters 1, 3, 5, 6, 7 and 8
majoring in Primary Science Education study (source: Department of Exams and
Senate, Institute of Teacher Education of Malaysia 2016).
. Table 26 Background information of the respondents
Demographic Factors Frequency Percent
Semester 1 65 20.0
3 44 13.5
5 61 18.7
6 70 21.5
7 10 3.1
8 74 22.7
Total 325 100.0
Gender Female 227 69.8
Male 98 30.2
Total 325 100.0
Ethnic Malay 104 32.0
Chinese 133 40.9
Indian 52 16.0
Others 35 10.8
Total 324 99.7
School attended Boarding school 37 11.4
Daily public school 221 68.0
SMJK 41 12.6
Others 24 7.4
Total 323 99.4
Science qualification (Chemistry, Biology and Physic)
1’A’ 47 14.5
2’A’s 88 27.1
All ‘A’s 138 42.5
None A in science subject
51 15.7
Total 324 99.7

95
Table 26 represents the background information of the cross-sectional sample of
respondents for the study. The frequency table shows a total of 325 respondents
from across 12 campuses of ITE in the current year of study, June 2016. In total, the
respondents group of semester 7 is represented only by approximately 3% of the
sample as it was sufficient to represent the total of 19 pre-service science teachers
that were currently in semester 7 for the programme all over Malaysia. Further,
almost 70 percent of the respondents were female compared to only just over 30
percent of male PSTs. This ratio is approximately similar to those surveys of
Teacher’s Sense of Efficacy Scale in PSTs (Tschannen-Moran and Hoy 2001; Duffin
et al. 2012).
Additionally, the table shows information on the backgrounds in ethnicity, former
school attended and grades in three science subjects (Physics, Biology and
Chemistry) in the Malaysia Certificate of Education (SPM), which is equivalent to the
British GSCE. These background characteristics will inform my research as
independent factors that might or might not influence responses in the measure in
later analysis. Next, the data of responses to items are tested for statistical
representation of the SETSIS.
5.3 Analysis of responses
5.3.1 Descriptive statistics
Table 27 Summary statistics of responses in the SETSIS measure
Minimum (Min)
Maximum (Max)
Mean (M) Standard Deviation
(SD)
Cumulative score 157.00 356.00 278.65 41.15
Mean score 2.18 4.94 3.87 0.57
Table 27 shows the summary of statistics responses to the items tested in the
SETSIS. The responses were scored based on the rating category chosen. The total
cumulative score for all the items in the SETSIS is 360 (72 items x 5 categories). The
respondents’ cumulative scores show a wide range of responses from the minimum
157 to the maximum 356. The mean score range indicated that responses vary from
the minimum (average) response in category 2 (2.18), which represents the
response of not confident, to the maximum (average) response in category 5 (4.94),
which represents the response of definitely confident to the items administrated.
Overall, the result indicates that the data collected using the instrument developed is

96
able to reflect various confidence levels within the range of categories provided in
assessing self-efficacy among the respondents in teaching using science inquiry
skills.
Figure 8 illustrates the distribution of the 325 responses in mean score. The
histogram shows the frequency of responses with significant shape of normal
distribution (Shipiro-Wilk test = 0.98, df=325, p<0.001). Visual analysis on the error
bar on the right side of Figure 8 indicates that distribution of the data is fairly
symmetric (Median = 3.92). The figure, however, marks two extreme responses at
the bottom. A close check on the mean score (M) of the two individual responses
confirmed the responses are within the acceptable range (-2.0 <M<+2.0) (Field,
2013) and not considered as outliers.
5.3.2 Outliers
The visual analysis in Figure 8 did not find sufficient evidence for the outliers. For the
SETSIS, which consists of three subscales, potential outliers are detected and decided
from examination of every subscale from the perspectives of univariate, bivariate and
multivariate variables (Hair et al., 2010), as shown in Table 28. Within the perspective
of the univariate, outliers were identified from the standard distribution of observed
scores (Z score) in each subscale. The outliers listed in Table 28were cases that fall
at the lowest or highest standards more than ±2.5 of Z-score.
Figure 8 (Left) Histogram of the SETSIS responses and (right) a box and whisker plot

97
From the perspective of bivariate, the scatterplot from each set of subscales were
examined for outlier detection. Observation cases that distinctively fell out of typical
distribution were identified and listed as potential outliers inTable 28. For multivariate
perspectives, outliers were inspected using Mahalanobis distance (MD) analysis. This
diagnostic method measures the position of each observation compared with the
centre of all observations on a set of three subscales. The potential outliers listed in
Table 28 exceeded critical chi-square value of 16.27 at degree of freedom (df=3) and
alpha level=0.001 (critical chi-square value (df=3)16.27, p<0.001) (Pallant, 2013).
Table 28 Univariate, bivariate and multivariate potential outliers profile
The univariate observation found that samples PT9 and PT42 occurred in more than
one variable and were repeatedly detected in bivariate and multivariate detections. It
was also noted that PT43 and TR3 were detected in only one variable in the
univariate but also occurred repeatedly in bivariate and multivariate detection
analysis. Meanwhile, PT25 contained the observation that uniquely affected the
combination subscales in bivariate and multivariate analysis but not in univariate.
All the potential outliers offer uniqueness of information to the study, but as the main
aim of the study is to explore and assess the validity and reliability of the
measurement model, the decisions are based on the representatives of the
measured population (Field, 2013). From a practical standpoint, the extraordinary
observations that appeared repeatedly across subscales represent unique elements
of population. Thus, this analysis will include all the outliers except TR3. TR3 had the
most extreme, lowest value in KE that affected the bivariate measures of sets that
combined with KE (KE with PTE and KE with OBE) and again appeared in
multivariate detection, massively exceeding the critical chi-square value. Therefore,
TR3 will be omitted from further analysis and considered as an extraordinary event,
which only accounts for the uniqueness of observation but does not represent the
population. Thus, the next analysis will now on use responses from 324 respondents
(n=324) without responses from TR3, unless otherwise notified.
Case MD
KE KE with PTE TR25 16.95
PTE KE with OBE PT42 17.25
OBE PTE with OBE PT43 17.89
TR3 107.01
PT9, PT43, PT42,BL10, IP8
PT2,PT17, IP9, IP7, TB18 PT9,PT42,PT43,PT25
TR3,PT9,PT42,PT25
PT9,PT43,PT42,TR3TR3 , PT9, PT42, PT1
Univariate Outliers Bivariate Outliers Multivariate Outliers
Cases with standardised value
exceeding ±2.5
Cases fall outside the typical
distribution
Cases with a value of Mahalanobis distance (MD)
exceeding Critical Chi-Square value 16.27BivariateVariable

98
5.3.3 Reliability and normality of the responses data
Table 29 Reliability and normality test of the SETSIS data
Subscales/ scale Reliability,α (Cronbach’s
Alpha) Skewness Kurtosis
Shapiro-Wilk Normality Test
Statistic Df P value
KE 0.96 -0.42 -0.14 0.98 324 .00
PTE 0.97 -0.40 -0.01 0.99 324 .00
OBE 0.96 -0.74 -0.11 0.93 324 .00
Overall the SETSIS 0.98 -0.45 -0.14 0.98 324 .00
The reliability of the response data within the targeted sample in the study are
checked using Cronbach’s alpha consistency measure, and the results are shown in
Table 29. The Cronbach’s alpha coefficients for the SETSIS including individual
subscales show excellent reliability (α>0.9) (Kline, 2005). This means that the
SETSIS has shown consistency in the measure taken. The total of 72 items have
shown good internal consistency as a scale. The high reliability in three subscales
also indicates good internal consistency between the items accordingly. The results
confidently reflect that the SETSIS instrument used in the study is able to produce a
consistent measure within the sample distribution and thus can be generalised for
the targeted population.
Additionally, Table 29 provides the results of the normality test. The Shapiro-Wilk
test is used to detect the normality of responses from the data distribution. The
negative skewness values for all the subscales reflect that the data inclined toward
the higher category of responses. Figure 8 shows visualisation checks for the data
distributions. The histograms show a visible inclination to the right especially in OBE.
Instead, the kurtosis values are approximately 0 which apparently show a light tails
in the data distribution. The data then were checked further for normality.
Cross checking with the Q-Q (quartile-quartile) plot in Figure 9 for each subscale and
the overall scores illustrated that the data are distributed along the normal line and
do not divert far from the normal line. A normality test has then confirmed a
significant departure from the normal distribution of the data in the SETSIS and the
three subscales at p< 0.05. These results are statistically allowed for the outcomes
of the SETSIS to be generalised and compared to the targeted population (Glass et
al. 1972). Next, inferential statistics will be used based on the descriptive data of
responses to describe and make inference in the population.

99
5.3.4 Responses according to subscales
Figure 10 shows the frequency of responses to the items using the same rating scale
with five categories of responses (see section 4.3.3) across the three subscales. The
frequency graph has illustrated patterns of responses in the items accordingly. Even
though there are variations in responses throughout the five rating categories, the
responses pattern shows very high affirmation in the three higher categories, which
are categories 3, 4 and 5. The pattern of the responses in the later categories is
clearer at the bottom part of
Figure 10, for the items in the OBE subscale. The majority of the items in OBE
received more than 95 percent response affirmation in category 3 and above. The
pattern of the responses indicates that most responses showed a perceived high
level of confidence in their self-efficacy in teaching science using science inquiry
skills, especially for their self-efficacy of OBE.
Figure 9 Q-Q plot for overall the SETSIS (upper left), KE (upper right), PTE (lower left) and OBE (lower right)

100
Figure 10 Frequency (in percentage) of responses in category across the subscales KE (top) PTE (middle) and OBE (bottom)

101
The pattern of the responses above has been confirmed with the statistic of mean
scores in Table 30. The results show that the highest mean score was in OBE,
followed by PTE and then KE. The result in this study suggests a higher mean score
of outcomes expectancy in teaching using science inquiry skills compared to the
mean scores in outcomes expectancy scales in the TSI study (mean=3.85,s.d.=0.40)
(Smolleck, Zembal-Saul and Yoder, 2006).
However, the mean score in KE shows the widest difference in score range, which
demonstrates that the responses show more variability range in KE compared to
PTE and OBE. This can be an early indication of KE as one of the prominent
features in self-efficacy measure among PSTs.
Table 30 Mean and range of responses’ score in KE, PTE and OBE
Sub-scales
Mean(SD) Range
Minimum Maximum Difference
KE 3.72 (0.65) 3.40 4.10 0.70
PTE 3.76(0.63) 3.53 3.99 0.46
OBE 4.27(0.60) 4.00 4.30 0.30
Referring to the rating scale, the mean score statistics indicate the general category
endorsed by the respondents in each subscale. The response variability in KE is
reflected from the minimum (mean) score at above 3.00 to the maximum at just over
4.00. This result indicates the responses were in general in between the category 3
(slightly confident) and category 4 (confident). Perhaps, the responses in KE show
uncertainty in self-perception of the knowledge of teaching using SIS, which might
reflect PSTs’ learning phase during the training programme (Palmer, 2011).
In parallel, the responses in PTE with mean scores below 4.0 indicates that in
general, the respondents’ perceived their personal capability in teaching were below
the category 4.0 (confident), which reflects below confident level. Contrarily, the
responses in OBE demonstrate mean scores above category 4.0, indicating that, in
general, the respondents’ OBE was above the confident level. The patterns reflect
that PSTs perceived that their personal capability in practicing science inquiry skills
in the classroom (as reflected in PTE) was not as confident as their perceived
confidence in their belief in the value of learning using science inquiry skills in the
classroom (as reflected in OBE).
The response data from the items were analysed for relationship across the
subscales. Table 31 summarises the results with the bivariate profile accordingly.

102
Firstly, the table diagonally profiles the distribution illustrated using the histogram. As
expected, the responses disperse with negative skewness on normality distributions
except for OBE, which shows as non-symmetrical but within the normal line
distribution, as discussed in the above result.
The relationship between the three subscales, KE, PTE and OBE, was assessed
using Pearson product moment coefficient and scattered plot. The resulting
coefficients are shown below the table’s diagonal line. The relationships between the
variables is then illustrated in the scatter plots above the table’s diagonal. The results
indicate the three bivariate relationships that are significantly positively correlated
with various strength. The analysis demonstrated that the strength between KE and
PTE (r= 0.82 (p<0.01) is the strongest of the three. They closely align in the scatter
plot with a linear pattern indicating that the data have a strong association between
the two components of self-efficacy. On the other hand, the scatter plots involving
OBE shows a quite scattered points when associating between KE and PTE.
However, both bivariate plots show a positive, with a linear pattern that gradually
concentrates towards the upper end. Pearson coefficients have statistically
determined that OBE has a stronger association with PTE rather than KE. The
coefficient between OBE-PTE shows a higher relation magnitude, r=.70 (p<0.01),
compared with the OBE-KE relation magnitude at r = 0.58 (p<0.01).

103
Table 31 Profiling of relationship between subscales: values below the diagonal are bivariate correlations, with corresponding scatterplot above the diagonal. Diagonal portrays the distribution of each subscale
KE PTE OBE
These results reflect that PSTs’ perceived belief of outcomes learning of using
science inquiry skills (i.e. OBE), has a stronger relationship with the perceived
capability of teaching practice using science inquiry skills (i.e. PTE), than it is with
perceived ability in the knowledge possession (KE). However, all the correlations
suggest large-effect size correlation between the three subscales (Cohan 1998).
Thus, it can be presumed that self-efficacy in the three subscales is positively
0.82
0.58
0.70
KE
PTE
OBE

104
proportional with a high relevance across the three proposed factors in the model.
Next, the inferential statistics will be used to examine the response trend interaction
across the groups of respondents in the three subscales.
5.3.5 Inferential statistics
The plotted location of the mean scores with the uncertainties can be seen in Figure
11. It shows the difference in the mean scores with approximate reliability and
variation of responses across the three subscales. However, the gaps between the
error bars plotted indicate that the mean differences are not likely due to sampling
errors or chance. Perhaps, there are potential effect factors with significant
differences between the mean scores.
Figure 11 Error bar graph score for KE, PTE and OBE with 95% confidence interval (CI)
A one-way repeated measure using analysis of variance (ANOVA) was conducted to
test overall differences between the three means in the SETSIS. The results in Table
32 indicate significant differences in the mean score for at least two of the subscales,
Wilks’ Lambda=0.165, F (1.825, 591.244) = 906.278, p <0.01 with 73.7 percent of
variance explained. Follow-up comparisons indicate that in each pairwise
comparison differences are significant, p<0.05. The mean score for KE
(mean=96.38, s.d. = 16.87) is significantly different from the mean score for PTE
(mean=105.45, s.d. =17.78); t= -15.80, p= 0.001. A second pair sample t-test
comparing the mean score for KE is significantly different from the mean score for
OBE (mean= 76.82, s.d. =10.83); t= 25.57, p=0.001. A third pair t-test indicates the
mean score for PTE (mean=105.45, s.d. =17.78) is significantly different from the
mean score for OBE; t= 40.37, p=0.001.

105
Table 32 Result for mean differences analysis
Paired Samples Test
Paired subscales
Paired Differences
t df Sig. (2-tailed) Mean
Std. Deviation
Std. Error Mean
95% Confidence Interval of the
Difference
Lower Upper
KE - PTE -9.07 10.35 0.57 -10.20 -7.94 -15.80 324 .000
KE - OBE 19.56 13.79 0.76 18.06 21.07 25.57 324 .000
PTE - OBE
28.63 12.79 0.71 27.24 30.03 40.37 324 .000
The results confirm that the mean differences between the three pairs of subscales
are significant. The differences in mean scores shown in Figure 11 have significant in
the scores effect. Across the three mean scores, the statistic test shows the biggest
mean scores effect is between PTE and OBE, followed by differences in KE and
OBE. It means that the differences in PTE to OBE have more effect than KE to OBE,
while the smallest effect in mean scores difference is between KE and PTE.
5.3.5.1 Analysis across the group of semesters
The theoretical framework of the SETSIS is based on the assumption that the
curriculum of BoTP was tailored to provide an essential development in the
knowledge of PSTs starting at the early level (semesters 1, 2, 3 and 4) and to be
used and developed in the later semesters (semesters 5, 6, 7 and 8). During the
professional teaching practice that takes place in the later semesters of the
programme, PSTs should developed their knowledge with practice of real situation in
teaching.
With the assumption that pre-service primary science teachers (PSTs) develop their
teacher knowledge through each level of semester, the analysis will tests the null
hypothesis with self-efficacy in knowledge of science inquiry skills (i.e. which is
measured using the KE subscale), self-efficacy in practice teaching science using
science inquiry skills (i.e. which is measured by the PTE subscale) and self-efficacy
in the belief of learning using science inquiry skills (i.e. which is measured by the
OBE subscale). In other words, this study has an assumption (null hypothesis) that
there are no differences between groups of semesters in the three subscales: KE,
PTE and OBE.
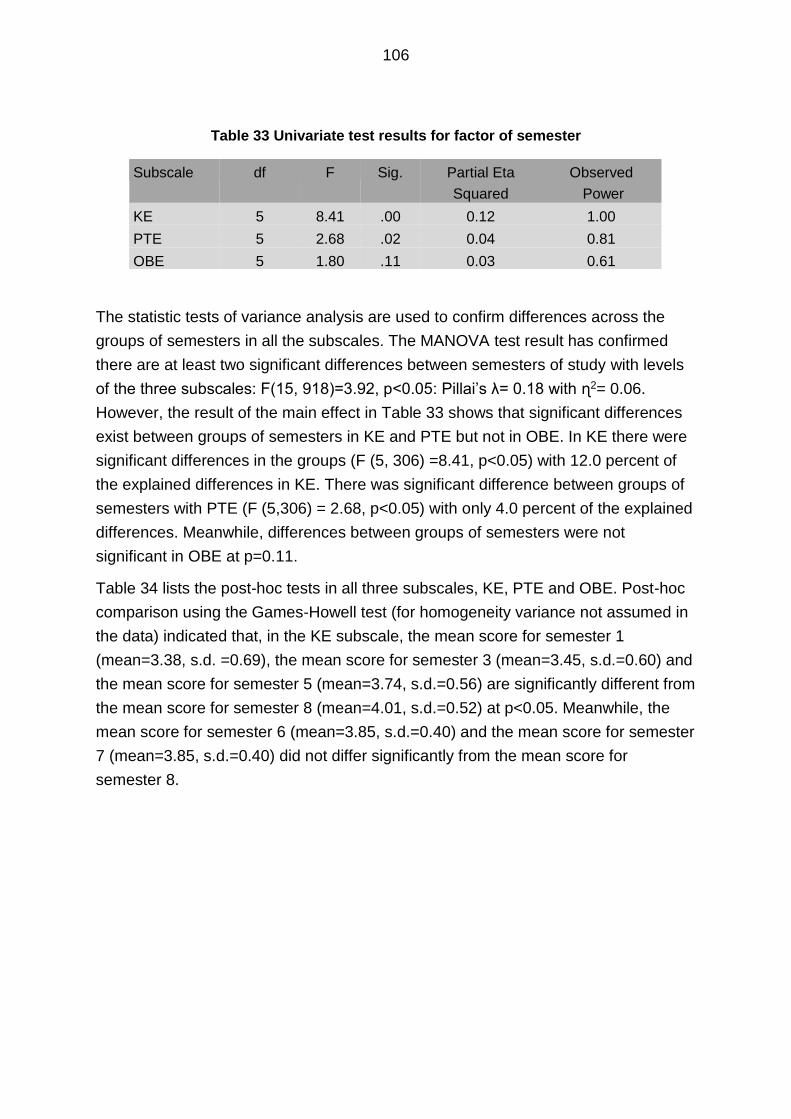
106
Table 33 Univariate test results for factor of semester
The statistic tests of variance analysis are used to confirm differences across the
groups of semesters in all the subscales. The MANOVA test result has confirmed
there are at least two significant differences between semesters of study with levels
of the three subscales: F(15, 918)=3.92, p<0.05: Pillai’s λ= 0.18 with ɳ2= 0.06.
However, the result of the main effect in Table 33 shows that significant differences
exist between groups of semesters in KE and PTE but not in OBE. In KE there were
significant differences in the groups (F (5, 306) =8.41, p<0.05) with 12.0 percent of
the explained differences in KE. There was significant difference between groups of
semesters with PTE (F (5,306) = 2.68, p<0.05) with only 4.0 percent of the explained
differences. Meanwhile, differences between groups of semesters were not
significant in OBE at p=0.11.
Table 34 lists the post-hoc tests in all three subscales, KE, PTE and OBE. Post-hoc
comparison using the Games-Howell test (for homogeneity variance not assumed in
the data) indicated that, in the KE subscale, the mean score for semester 1
(mean=3.38, s.d. =0.69), the mean score for semester 3 (mean=3.45, s.d.=0.60) and
the mean score for semester 5 (mean=3.74, s.d.=0.56) are significantly different from
the mean score for semester 8 (mean=4.01, s.d.=0.52) at p<0.05. Meanwhile, the
mean score for semester 6 (mean=3.85, s.d.=0.40) and the mean score for semester
7 (mean=3.85, s.d.=0.40) did not differ significantly from the mean score for
semester 8.
Subscale df F Sig. Partial Eta
Squared
Observed
Power
KE 5 8.41 .00 0.12 1.00
PTE 5 2.68 .02 0.04 0.81
OBE 5 1.80 .11 0.03 0.61

107
Table 34 Post-hoc contrast result in groups of semesters
Semester Simple Contrast Subscale
KE PTE
Semester 1 vs. Semester 8
Contrast Estimate -12.146 -8.065
Std. Error 2.488 2.791
Sig. 0.000 0.004
Semester 3 vs. Semester 8
Contrast Estimate -14.253 -8.333
Std. Error 2.695 3.023
Sig. 0.000 0.006
Semester 5 vs. Semester 8
Contrast Estimate -6.541 -6.282
Std. Error 2.452 2.750
Sig. 0.008 0.023
Semester 6 vs. Semester 8
Contrast Estimate -3.123 -2.652
Std. Error 2.350 2.636
Sig. 0.185 0.315
Semester 7 vs. Semester 8
Contrast Estimate -4.453 -2.133
Std. Error 4.743 5.320
Sig. 0.348 0.689
The post-hoc test also indicates that in PTE, the mean score for semester 1
(mean=3.53, s.d.=0.71), the mean score for semester 3 (mean=3.66, s.d.=0.63) and
the mean score for semester 5 (mean=3.72, s.d.=0.58) are significantly different from
the mean score for semester 8 (mean=3.98, s.d.=0.55) at p<0.05. Meanwhile, the
mean score for semester 6 (mean=3.83, s.d.=0.64) and the mean score for semester
7 (mean=3.90, s.d.=0.55) did not differ significantly from the mean score for
semester 8.

108
The graph plotted for the group mean score in Figure 12 illustrates the differences
amongst the group of semesters in all the subscales. The plotted graph
demonstrates the group mean score increment between semesters 3 and 5 and
between semesters 7 and 8 in KE. The graph plotted for PTE shows a linear
increase from semester 1 to semester 8 in the mean score. The plotted graph for
OBE semester group mean scores shows a tremendous increment in semester 6 but
a setback in semester 7 and again an increase in semester 8. This suggest that
perhaps there are effects of group of semesters in subscales of the SETSIS and the
analysis results conducted above have empirically confirmed that.
5.3.5.2 Interaction between groups of factors
This study focuses on investigating the main effect of the semester groups and their
interaction with the other background factors. The interaction of independent factors
may contribute to the relationship between responses in the SETSIS and the
semester they are in. Two-ways MANOVA analysis was used to find the interactions
that might exist between the group of semesters and other factors (i.e. gender,
ethnicity, school attended and science qualification).
Figure 12 Mean score for KE, PTE and OBE across groups of semesters
1 3 5 6 7 8
KE 3.38 3.45 3.74 3.84 3.85 4.01
PTE 3.53 3.66 3.72 3.83 3.90 3.98
OBE 4.07 4.19 4.20 4.41 4.21 4.40
3.003.103.203.303.403.503.603.703.803.904.004.104.204.304.404.50
MEA
N S
CO
RE
GROUP OF SEMESTERS

109
Figure 13 shows lines of the group of semesters intersect with the ethnicity groups at
more than one intersection. These show that there is an interaction between the
group of semester and ethnicity groups. Table 35 confirms the interaction with the
result of a significant interaction effect between semesters and ethnicity groups at
p=0.03 (p<0.05). However, the interaction between the group of semesters and the
other factors are shown not significant. The statistics result reveals there is only one
significant interaction occurred, which is between the group of semesters and the
ethnicity factor.
Table 35 Multivariate test for interaction of group of semesters with other factors
Figure 13 Interaction between group of semesters and ethnicity groups
Value FHypothesis
dfError df Sig.
Partial
Eta
Squared
Intercept Pillai's
Trace.96 1374.689b 3.00 181.00 .00 .96
Sem *
Ethnicity
Pillai's
Trace.26 1.55 33.00 549.00 .03 .09
a. Design: Intercept + Sem * Gender + Sem * Ethnicity + Sem * Qualif ication + Sem * School
b. Exact statistic
c. The statistic is an upper bound on F that yields a low er bound on the signif icance level.
d. Computed using alpha = .05
Effect

110
Further, the results of the univariate ANOVA stated in Table 36 shows the effect
across the three subscales. By using Bonferroni procedure to test each ANOVA in
the three subscales at the 0.016 adjusted alpha level (Field, 2013), the interaction
effect is statistically significant with responses in the two subscales of the SETSIS,
which are KE and PTE at p<0.001. These results show that the significant
differences in mean score of KE and PTE across the group of semesters are also
significantly dependent on the ethnicity.
In summary, the data demonstrate high reliability in gaining information from the
sample using the SETSIS with particular information within the three factors
measured. Noticeably, the SETSIS is compatible with TSI (Smolleck, Zembal-Saul
and Yoder, 2006) as the obtained standardised mean scores of the present study
are within the range of the mean of the five components of self-efficacy in the
essential elements of inquiry of Smolleck’s (range M=3.79 to 4.16).
Table 36 Result of univariate ANOVA analysis for significant interaction between factors group of semester and groups of ethnicity
Type III
Sum of
Squares
dfMean
SquareF Sig.
Partial Eta
Squared
Noncent.
Paramete
r
Observed
Powerd
KE 74.029a 136 .54 1.84 .000 .58 250.57 1.00
PTE 74.462b 136 .55 1.85 .000 .58 251.62 1.00
OBE 55.322c 136 .41 1.23 .092 .48 167.93 1.00
KE 902.33 1 902.33 3054.11 .000 .94 3054.11 1.00
PTE 935.18 1 935.18 3160.18 .000 .95 3160.18 1.00
OBE 1185.28 1 1185.28 3597.87 .000 .95 3597.87 1.00
KE 8.79 11 .80 2.70 .00 .14 29.74 .97
PTE 11.83 11 1.08 3.63 .00 .18 39.98 1.00
OBE 3.37 11 .31 .93 .51 .05 10.24 .51
KE 54.07 183 .30
PTE 54.15 183 .30
OBE 60.29 183 .33
KE 4557.77 320
PTE 4658.54 320
OBE 5935.82 320
KE 128.10 319
PTE 128.62 319
OBE 115.61 319
Sem *
Ethnicity
Error
Total
Corrected
Total
a. R Squared = .578 (Adjusted R Squared = .264)
b. R Squared = .579 (Adjusted R Squared = .266)
Source
Corrected
Model
Intercept
c. R Squared = .479 (Adjusted R Squared = .091)
d. Computed using alpha = .05

111
As predicted, the relationship is strong in the subscales between KE and PTE
compared to the moderate correlation between the two subscales with OBE. This
relation perhaps because the two components are the base of teacher knowledge
(Shulman 1987; Richey and Klein 2005; Park et al. 2011; Gess-Newsome et al.
2016) that are widely used in the present curriculum of BoTP and have an important
role in PSTs’ self-efficacy. Moreover, the extended relations with OBE also indicate
that PST efficacy in teacher knowledge traits intertwine with the expectancy of
outcomes belief(Pajares, 1992; Magnusson, Krajcia and Borko, 1999; Veal, 2012).
The relationship variability between responses across the three subscales KE-PTE,
OBE-PTE and OBE-KE were able to show association across the three factors in
model.
Main effect of semester is as predicted, however the interaction of the semester with
ethnicity is new and might relate to the context in that BoTP programme was
dedicated across multiple races.
5.4 The SETSIS - Analysis of structure
This part of the study would be the exploratory study, aiming to derive the factor
structure of the SETSIS based on the responses received from the participants. Prior
to the factor analysis application, the checks were taken on internal reliability and
validity. One outlier (TR3) was detected and omitted leaving 324 samples for the
analysis on 72 items. The reliability using Cronbach’s Alpha test to the 72 items
yielded a score of 0.98 (72 items, α = 0.98, scale mean = 278.86, S.D = 41.39) and
was thus rated as excellent (Kline 2000). The Kaiser-Meyer-Olkin Measure of
Sampling Adequacy (KMO) index is 0.97 (KMO>0.50), thus qualifying the data for
the analysis. The Bartlett’s test of sphericity 𝜒2(2556) = 18296.27, p=0.001 (p<0.05)
shows that there is a significant pattern in relationships between items and thus
confirms the usefulness of factor analysis.
I am using EFA consisting of Principal Axis Factoring (PAF) extraction method and
rotation performed with 72 items (see Appendix 6). The PAF method analyses the
72 observed items (variables) and determines factors that explain the co-variances
of the variables. It extracts estimation factors from communalities based on the
common variance of a variable shared with other variables. This method was
considered the most appropriate due to the focus of my study, which is to identify the
latent constructs from interrelated sets of items that may represent the SETSIS.

112
5.4.1 Factor structure
Analysis of factor extraction demonstrates shared variance (communalities) in each
variable varying with range 0.45 to 0.70. By using Kaiser Criterion with Eigenvalue
more than 1.0, the data are reducing into seven factors criterion. The three first
factors explained 45.5 percent, 6.7 percent and 2.3 percent of the variability
accounted for by these factors, respectively. The fourth, fifth, sixth and seventh
factors had Eigenvalues just over one, with a total of 4.7 percent of the variance that
was accounted for by the last four factors.
On the other hand, the scree test criterion with cut-off Eigenvalue at 2.0 reduced the
data into a three-factor solution. Figure 14 shows the scree test with Eigenvalues
plotted on the line graph. Inspection of the scree plot shows three ‘obvious’ factors
that have substantial amounts of common variance above the cut-off Eigenvalue.
The smooth decrease in Eigenvalue appears to level off after the third Eigenvalue to
the right of the plot can be presumed as factorial scree or debris (Cattell, 1966). This
means after the third factor, the successive factors account for very small variances,
too small to be considered as meaningful. Moreover, the three-factor solution
corresponds to the predetermined number of factors based on the research
objectives, which fit the criteria for the number of factors to extract.
Figure 14 Eigenvalue plot for scree test criterion
The three-factor solution is chosen based on theoretical applications explaining a
cumulative variance of 54.5 percent after extraction. The factor-loading matrix
produces unrotated-loadings for each variable on each factor. In this study, the
Latent root (eigenvalue)
criterion

113
significant factor loading based on sample size (n>250) at significant level 0.35
(BMDP Statistical Software, in Hair et al. 2010: 117) is used. Examining the
unrotated factor-loading matrix shows that all variables (72 variables) are loading
significantly (factor loading >0.35) under the first factor with a loading range 0.56 to
0.77. There is also significant factor loading (factor loading>0.35) accounted for by
17 variables for the second factor (factor 2) with a loading range 0.37 to 0.49.
However, the maximum loading in the third factor is 0.28, with no significant loading
accounted for by any variables for the third factor (factor 3). Thus, using unrotated
extraction resulted in the largest amount of variance accounted for factor 1 but left
only a small amount of variance accounted for by the sequences factors.
The initial unrotated solution demonstrated the variance extraction accounted for by
each variable but not yet sufficient to obtain meaningful contribution from the
variables in the factor structure. It was difficult to identify distinctive factors with
unrotated extraction. A further factor rotation is needed to form a simple structure for
meaningful interpretation (Hair et al. 2010). The next section explains the analysis of
the factor solution in order to get a simple structure for it.
5.4.2 Factor rotation
I am using Promax, a process using oblique rotation to manipulate extracted
variance to load simple factor solution. Oblique rotation was chosen as it allows the
factors to correlate. This method was implied to simplify the factor solution into
meaningful and pragmatic interpretation.
Although oblique rotation method is able to improve the intercorrelation between
items’ factors, the factor interpretation is difficult based on the nature of dependency.
Considerable correlation between factors was first examined to confirm the essential
usage of oblique rotation. Table 37 below shows the correlation between the driven
factors resulted from Promax rotation. The correlations between the three factors are
range 0.78 to 0.58. Since all the correlations are above 0.32, the factor variances are
claimed to overlapping more than 10 percent (Tabachnick and Fidell 2007). The
overlap variances are consider enough to justify the correlation between factors and
suggest usage of oblique rotation method to simplify the structure.
Table 37 Correlation matrix for three factors in the EFA with Promax oblique rotation
1 2 3
1 1.00 0.58 0.78
2 0.58 1.00 0.64
3 0.78 0.64 1.00
Factor

114
The result of factor solution using Promax rotation explains a total of 54.26 percent
of the variables’ variance. The variance accounted for by factor 1, factor 2 and factor
3 after rotation are explained by the sum of square loading 28.62, 22.40 and 27.82,
respectively. This explains that the variance distribution among the three factors after
the rotation are evenly dispersed compared with the initial unrotated extraction.
The rotated factor loading in the pattern matrix (see Appendix G) represent the
loading of variance accounted for by each variable for every factor. The loading
values also represent correlations between the variables with the factors. For a
substantive interpretation, the output factors loading above 0.35 with no significant
cross loading are considered for factor interpretation of the factor result.
5.4.3 Factor Interpretation
Table 38 shows six items that are not included in the factor structure based on the
factor loading interpretation. Inspection of loading reveal two items with no significant
loading in all three factors. Item P5 has a maximum factor loading 0.31 and item
P17 maximum loading 0.34. These items are removed as it might not give
meaningful description to any of the three factors. Further inspection discovered item
B11 has two significant loadings in different factors (factor 2 and factor 3). A close
check in communality loading explains 43 percent of the variance shared by B11 for
the two factors. This means that B11 shared less than half of its unique variance and
yet it also shows ambiguity between the two factors. Thus, item B11 is considered
for removal.
The inspection in factor 1 indicates significant primary loading in item P9 (factor
loading 0.43) and item P15 (factor loading 0.41). However, a closer inspection
reveals that these items have consistent cross loading more than 75 percent of the
primary loading. Item P2 also shows significant primary loading 0.36 for factor 3 but
has a high cross loading (more than 75 percent of primary loading) in factor 1. Even
though all three items have cross factor loadings that are not significant (loading<
0.35), with the high cross loading items lower cut-off loading values are acceptable in
the decision (Samuels, 2016). Thus, items P9, P15 and P2 are considered for
removal based on the ambiguity of variance that is shared on more than one factor.
For the final stage, a principal axis factoring is used to explain factors that cause the
observed variables. The remaining 66 items scores are rotated used Promax rotation
(assuming there is a relationship among the three factors) with three factors. Results
of the factor analysis are shown in Table 39. Analysis with 66 items explaining 54.70
percent of the variance, which is more variance explained compared with the 72
items analysis. A smaller range sum of square loadings shows better variance
distribution of each of the factors with 66 items. All items have primary significant

115
loading over 0.4. There was no cross-loading in the three subscales items. The items
are listed under three factors according to the significant loading results in Table 39.
Table 38 Removed items according to factor loading interpretation
Table 39 Exploratory Factor Analysis (EFA)
5.4.4 Summated scale
The interpretation of the factors considering only 66 items from 72 were listed with
significant loadings with no cross loadings and acceptable communality loadings
(Hair et al., 2010). From the loading order and number of items, it was found that
factor 1 listed all 28 items with a loading range 0.41 to 0.91. The factor 1 consists of
all 26 items of KE with an additional two items from the PTE subscale (P3 and P4).
High-loading items were dominated by KE items. Item P3 loads with 0.53 for factor 1
while P4 loads with 0.43 for factor 1. A close inspection on the wording of item P3 (I
can provide explanation to my students about the activity of the science process) and
P4 (I am able to plan science process activities with provided modules) are
concerned about knowledge in explaining and planning inquiry skills. Thus, all 28
Factors Eigenvalue % of
Variance
Cumulative % of
variance
Rotation
sum of
squared
loadings
1 29.87 45.26 45.26 26.15
2 4.66 7.05 52.31 20.60
3 1.57 2.38 54.70 24.97
Label Item Factor 1 Factor 2 Factor 3
P9I can provide proof needed to support an
investigation by students.0.43 0.02 0.34
P15I believe I can teach science concepts easily
using the science investigation approach.0.41 0.13 0.31
P2
When a science process is difficult to
explain, I will use the investigative approach
to assist the students' understanding.
0.34 0.07 0.36
B11I believe that the science investigation
approach is an applicable teaching strategy.-0.03 0.39 0.35
P17
I believe I can encourage students to get
involved during science investigation activities
in class.
0.22 0.22 0.34
P5
I choose to provide data from real
experiments as instructional materials rather
than data from workbooks.
0.28 0.10 0.31

116
items are concluded as items in Knowledge Efficacy. The reliability of 28 items of KE
is α=0.97 with item mean = 3.73.
The perception held by participants about belief are reflected in factor 2. All 17 items
on belief were highly loading in range 0.60 to 0.84 for factor 2. This factor can be
interpreted as a variable that measure self-efficacy in belief of outcome of teaching
and learning by using inquiry skills. There was no item from other subscales loading
in the same factor. Since the factor was dominated by items in the OBE subscale,
the factor 2 was labelled as Outcome Belief Efficacy (OBE). The reliability of 17
items OBE is α= 0.96 with item mean = 4.28.
As for factor 3, all items loading for this factor were from the PTE subscale. There
were 21 items in PTE clustering under factor 3 which reflects that all these items
underlying a factor directed to self-efficacy in ability of doing tasks of teaching using
inquiry skills. Considering overall items were dominated by PTE items, this factor
was labelled as Practice Teaching Efficacy and all 21 items were used in the
summated scale of PTE. The reliability of the PTE scale with 21 items is α = 0.96
with item mean = 3.75. Table 40 summarises the factor solution with the three
factors interpretation.
Table 40 Three factors solution interpreted into three subscales
In summary, the result of this factor analysis has provided probabilistic power in
validating a structure of the SETSIS measure. The factor solution provides a clear
understanding of latent factors that are reflected through the observed variables
(items). The three summated scales are produced from 66 items, which validate the
SETSIS as a three-factor measurement model. Even though the SETSIS is a three-
factor model, the existence of a general factor with several small group factors (i.e.
multidimensionality) does not mean that the total score is a poor indicator of the
SETSIS as a common factor that runs through all the 66 items. This suggests that
the total score of the SETSIS should be carefully interpreted/construed and the
external interaction might have different correlation with different aspects of factors.
The issue should then be further investigated and addressed empirically rather than
Factor ItemsNumber of
ItemsScale Reliability
Summated
scales (sub-
scales)
Factor 1 K1 to K26, P3 and P4 28 0.97Knowledge
Efficacy (KE)
Factor 2 B1 to B10, B12 to B18 17 0.96Outcome Belief
Efficacy (OBE)
Factor 3 P1, P6 to P8,P10 to P16, P18 to P28 21 0.96
Practice
Teaching
Efficacy (PTE)

117
assuming small factors will misdirect the common trait of the SETSIS. The next
section will investigate empirically and practically the impact of the observed items in
the Rasch measurement model.
5.5 Summary of findings
The findings from this chapter provide psychometric evidence on the usability of the
SETSIS in measuring levels of self-efficacy in teaching using SIS among the sample
of pre-service science teachers in Malaysia. The findings from descriptive and
inferential analysis provide information to evaluate reliability in terms of the
equivalence, stability and consistency of the SETSIS. The descriptive analysis
showed that the SETSIS is able to identify levels of self-efficacy in teaching using
science inquiry skills. The respondents have expressed various levels of confidence
from not confident to definitely confident in the items provided in the SETSIS with a
normal distribution. Overall mean scores show good confidence among PSTs in self-
efficacy in teaching using science inquiry skills and the confidence level in the self-
efficacy increases from KE to PTE and to OBE. The SETSIS shows high internal
consistency with KE, PTE and OBE having Cronbach’s Alpha values more than 0.9.
Moreover, the Pearson correlations show that the three subscales have stability in
their bivariate relationships with Pearson coefficients, r = 0.82 (KE-PTE), 0.70(KE-
OBE) and 0.58(PTE-OBE).
Meanwhile, the inferential statistics provide analysis of the agreement regarding the
SETSIS scores. The ANOVA analysis shows that the gap in the mean scores of the
SETSIS across KE, PTE and OBE was significantly different, which confirmed the
differences in the responses across the three subscales. The findings reflect that the
three subscales are able to measure different factors of self-efficacy in teaching
using science inquiry skills. Further analysis confirmed that the level of semesters
has been the main effect in the mean scores of KE and PTE. The study also found
that, instead of the group of semesters, the score of self-efficacy in teaching using
science inquiry skills in KE and PTE also depends on the interaction with the
ethnicity factor. The findings have empirically shown that level of study in BoTP has
been the main effect in the score of the SETSIS, especially in KE and PTE. This
reflects that the SETSIS manages to measure significant development in self-
efficacy of knowledge and personal practice across the level of study of the training
programme.
Finally, in the factorial analysis of the SETSIS, the study has confirmed there are
three factors contributing that explain 54 percent of the responses’ variances. The

118
interpretation based on the item-factor allocation confirmed the three factors as KE,
PTE and OBE. This has empirically validated the existence of the factors in the study
framework. Table 41 summarises the findings in this chapter. The next chapter
analyses the model responses to validate the SETSIS as a measurement model and
uses it to infer the science teaching practice development.
Table 41 A summary of findings in Chapter 5
No Findings
1 The descriptive analysis
• Responses frequency indicates that the SETSIS is able to measure
various responses within the five-category rating scale.
• Normality tests and visual inspections indicate normal distributions in
the responses received for the overall the SETSIS and in KE, PTE
and OBE.
• Mean score of the responses indicates the highest confidence of self-
efficacy in teaching using science inquiry skills in subscale OBE, then
in subscale PTE and lastly in subscale KE.
• The SETSIS and the three subscales, KE, PTE and OBE have
gained high reliability in the study with α> 0.90
• The SETSIS is able to establish strong relationships across the three
factors of KE, PTE and OBE indicate early evidence in the
association of the three-factor model.
2 The inferential analysis indicates that
• Repeated measure ANOVA confirms there are significant differences
of scores across groups of semesters in the three subscales: KE,
PTE and OBE.
• MANOVA analysis confirms there are significant differences in the
mean scores of KE and PTE in interaction between groups of
semesters and ethnicity groups.
3 Results from EFA indicate that
• There are three factors contributing to the SETSIS that explain 54
percent of the variance.
• The SETSIS established a structure validity with 66 items from the
three subscales.

119
Chapter 6 Validating the Model of SETSIS
6.1 Properties of measure
This section is a part of the analysis to answer my third research question. I am
using the Rasch model to investigate the contribution of items and responses to the
SETSIS in defining the hypothetical model used in the study. The analysis of
relations and the magnitude of the responses to the items in the subscales can
provide meaningful information to validate the elements of the overall model of the
SETSIS. The information helps to improve the model and moreover can provide an
empirical framework to validate the usability of the model in measuring the intended
variables of the study.
The following sections use the Rasch analysis to establish the model proposed from
the evidence in the psychometric characteristics of the SETSIS instrument. Firstly,
measures of responses with fit statistics are examined to determine whether the data
fit the Rasch model. Then, this analysis examines the difficulty level of the
hypothesised items based on the responses observed. The function of the rating
scale is checked upon providing validation of the category of responses.
6.1.1 Item measure
Items in the SETSIS were constructed based on the hypothesised levels of items
(see the construct mapping in Chapter 4). The analysis was conducted to validate
the item levels in the model. Sixty-six items from the SETSIS and 324 responses
(persons) were used to produce fit analysis results. The items were measured using
a difficulty parameter relative to the responses’ ability using fit analysis. The level of
agreement on items (difficulty measure) ranked in a scale and interpreted from easy
to agree items to hard (negative to positive measure). The measure scale unit use is
log odd unit (logit) with the mean of item difficulty as ‘0’ and used as the reference
point in the logit scale. Table 42 shows the summary of measure and fit statistics for
66 items of the SETSIS in logit scale units.

120
Table 42 Summary of the SETSIS Analysis Result – 66 items (n=324)
All 66 items in the SETSIS have high item reliability with good item separation. The
item reliability in the SETSIS is 0.98, indicating high reliability items with 7.76 of
estimated separations. It means that the items have high reliability in measuring the
persons with wide difficulty ranges. Items were estimated to have spread into a
separation index of 7.76 with 11 separate strata groups. This reflects that the items
have managed to form the intended levels of items hierarchy in the measure. Thus, it
is possible to have the three levels of item hierarchy as intended – high, mean and
easy levels of items (i.e. item separation > 3).
Overall, the items are distributed in range 2.59 (logit) within 1.17 logit to -1.42 logit.
The mean of item measure at 0.00 (SD =0.73) (logit) is used as the scale’s reference
point. The distance suggests that more items are located below the mean level,
which reveals that the measure contains more items with difficulty level below the
mean than items with difficulty level above the mean.
The overall data on the items significantly fit the model. Fit analysis using MNSQ
indices indicate that the data is compatible with the model. The mean measure
shows critical MNSQ value in the range 0.5 to 1.6 (Curtis, 2004) for infit and outfit
analysis. These imply that all 66 items’ variation is acceptable according to the
model expectation. However, the infit ZSTD and outfit ZSTD for the highest measure
and the lowest measure show out of the range values (-2.00 < ZSTD <+2.00),
warning of erratic responses that not significant to the items measure. Misfit person
measures are checked in a later section to examine the implication of erratic
responses to the properties of measurement. These fit analysis results for the item
measure suggest that even though some responses are erratic to the top and bottom
items, but it supports the overall contention that items of the SETSIS spread well
with more easy items on the measure.
MNSQ ZSTD MNSQ ZSTD
MEAN 0.00 1.00 0.00 1.00 -0.10
SD 0.73 0.14 1.70 0.13 1.60
MAX. 1.17 1.33 3.80 1.28 2.90
MIN. -1.42 0.68 -4.70 0.75 -3.60
7.76 0.98
MEASUREINFIT OUTFIT
ITEM SEPARATION ITEM RELIABILITY

121
6.1.1.1 Item measure in KE subscale
Table 43 Item measure of KE sub-scale
The KE subscale is the factor that is hypothesised to measure efficacy trait of the
science inquiry skills knowledge. There are 28 items (K1 to K26, P3 and P4) that are
statistically predicted to measure the trait (see section 5.4). Table 43 of the point
measure correlation (PTMEACorr.) shows positive values above 0.6 in all items,
indicating that the items are working together measuring the same trait. The infit and
outfit mean square indices show a reasonable value in between 0.6 to 1.4 in all
items. This indicates that all the observed items in KE fit according to the Rasch
model.
A close inspection of the fit analysis in the table reveals that 24 items in KE are
measured above mean difficulty measure (0.00 logit) and only four items out of 28
items are measured below the overall mean measure. Examining the measure
reveals that the three top items of KE were measured at above 1.00 logit. The items
Difficulty PTMEA
ITEM Measure CORR.
K1 0.81 0.10 0.99 1.00 0.66
K2 -0.05 0.10 1.15 1.17 0.67
K3 -0.56 0.10 1.13 1.20 0.66
K4 0.46 0.10 1.14 1.18 0.68
K5 0.48 0.10 0.89 0.89 0.74
K6 1.27 0.10 0.99 0.99 0.69
K7 0.47 0.10 1.16 1.15 0.64
K8 1.31 0.10 1.03 1.02 0.69
K9 1.06 0.10 0.98 0.97 0.72
K10 0.80 0.10 1.04 1.05 0.66
K11 0.68 0.10 1.12 1.11 0.72
K12 0.26 0.10 1.10 1.07 0.67
K13 0.85 0.10 0.94 0.95 0.74
K14 0.05 0.10 1.05 1.03 0.72
K15 0.86 0.10 1.17 1.15 0.70
K16 0.85 0.10 1.10 1.11 0.67
K17 -0.66 0.10 0.92 0.98 0.69
K18 0.45 0.10 0.91 0.92 0.73
K19 0.12 0.10 1.04 1.12 0.70
K20 -0.02 0.10 1.27 1.25 0.65
K21 0.14 0.10 0.95 0.96 0.69
K22 0.59 0.10 0.91 0.91 0.75
K23 0.06 0.10 0.96 0.96 0.69
K24 0.12 0.10 1.13 1.12 0.70
K25 0.71 0.10 0.97 0.96 0.71
K26 0.78 0.10 0.95 0.94 0.73
P3 0.10 0.10 0.74 0.81 0.73
P4 -0.21 0.10 0.95 1.04 0.71
S.E.Infit
MNSQ
Outfit
MNSQ

122
K8, K6 and K9 were measured at 1.31, 1.27 and 1.06, respectively. In the subscale,
these items were the most difficult items of KE to affirm and described as high level
items. The high items measure high ability that corresponds to the highest level of
self-efficacy in the knowledge of teaching using science inquiry skills that can be
measured by the constructed items in KE.
Meanwhile, items K14 and K2 are the items with difficulty measure at 0.05 logit and -
0.05 logit respectively, the nearest measures to the mean. Both items and the items
around the mean were the middle items described at the mean item level that
measure average ability in KE. These items correspond to the average level of self-
efficacy in the knowledge of teaching using science inquiry skills that can be
measured by the constructed items in KE.
Lastly, the lowest difficulty measure was in item K17 (I am confident to teach a
scientific concept which I understand through experiments) at -0.57 logit. The item
was described at the easy item level that measures low ability in in KE. The item
corresponds to the low level of self-efficacy in the knowledge of teaching using
science inquiry skills that can be measured by the constructed items in KE. The
range between the highest difficulty measure and the lowest difficulty measure of
items in KE is 1.74 logit, which reflects the range of ability that can be measured by
the constructed items of KE.
6.1.1.2 Item measure in PTE subscale
Table 44 shows the detail of the Rasch measure of all items of PTE. All 21 items
show fitting the Rasch model (0.6<MNSQ<1.4). The PTMEACorr. values for all items
are positive with loading more than 0.6 indicating 21 items are working well in
measuring one trait of PTE.
A close inspection of the fit analysis in Table 44 reveals that 19 items in PTE
measured above the mean difficulty measure and only two out of 21 items are
measured below the mean difficulty measure. Examining the measure reveals that
only one item of PTE was measured above 1.00 logit. Item P11 was measured at
1.04 logit, the most difficult item of PTE to agree and described as at the high item
level. The high items measure high ability that corresponds to the highest level of
self-efficacy in the personal teaching practice in teaching using science inquiry skills
that can be measured by the constructed items of PTE.

123
Table 44 Item of PTE sub-scale
Next, examination on the nearest measures to the mean difficulty measure reveals
items P18 and P21 with difficulty measure at 0.01 logit and -0.03 logit, respectively.
Both items and the items around the mean were the middle items described at the
mean item level that measures average ability in PTE. These items correspond to
the average level of self-efficacy in the personal teaching practice in teaching using
science inquiry skills that can be measured by the constructed items of PTE.
Lastly, the lowest difficulty measure in PTE was in item P22 (If given the opportunity,
I will encourage students to give various explanations from the same observation) at
-0.14 logit. The item was described at the easy item level that measures low ability in
PTE. The item corresponds to the low level of self-efficacy in the personal teaching
practice in teaching using science inquiry skills that can be measured by the
constructed items of PTE. The range between the highest difficulty measure and the
lowest difficulty measure of items in PTE is 1.18 logit, which reflects the range of
ability that can be measured by the constructed items of PTE.
Difficulty PTMEA
ITEM Measure CORR.
P1 0.48 0.10 0.85 0.84 0.75
P6 0.95 0.10 1.02 1.03 0.70
P7 0.65 0.10 1.01 1.02 0.71
P8 0.62 0.10 0.91 0.91 0.73
P10 0.87 0.10 1.04 1.03 0.72
P11 1.04 0.10 0.77 0.77 0.76
P12 0.29 0.10 0.81 0.82 0.76
P13 0.35 0.10 0.78 0.78 0.77
P14 0.54 0.10 0.83 0.82 0.76
P16 0.32 0.10 1.03 1.07 0.67
P18 0.01 0.10 0.89 0.91 0.72
P19 0.22 0.10 0.99 0.97 0.69
P20 0.19 0.10 0.93 0.93 0.70
P21 -0.03 0.10 0.99 0.99 0.69
P22 -0.14 0.10 0.89 0.86 0.74
P23 0.65 0.10 0.84 0.85 0.74
P24 0.37 0.10 1.04 1.01 0.70
P25 0.39 0.10 0.93 0.92 0.71
P26 0.15 0.10 0.83 0.82 0.73
P27 0.48 0.10 0.86 0.86 0.76
P28 0.28 0.10 1.12 1.09 0.73
S.E.Infit
MNSQ
Outfit
MNSQ

124
6.1.1.3 Item measures in OBE subscale
An inspection of Table 45 reveals that the PTMEACorr. shows positive values above
0.6 in all items, indicating that the items work well together in measuring the same
trait. The infit and outfit mean square indices show a reasonable value in between
0.6 to 1.4 in all items. This indicates that all the observed items in OBE are
compatible with the model.
Further inspection of the difficulty measures in Table 45 reveals all 17 items in OBE
were measured below the mean difficulty measure. Item B14 is the most difficult item
to affirm in OBE at -0.70 logit of difficulty measure. This item is described as a high
item that measures high ability in OBE. Instead of corresponding to a high level of
self-efficacy in outcomes expectancy of teaching using science inquiry skills, item
B14’s difficulty measure is way below the easy item level for KE and PTE.
On the other hand, item B6 was inspected as the easiest item to affirm at -1.47 logit.
This item is supposed to measure low ability in OBE and should correspond to the
low level of outcomes expectancy of teaching using science inquiry skills. The range
between B14 and B6 is 0.77 logit. This range indicates that the items constructed in
OBE are only able to measure low range of self-efficacy in OBE at the easy item
level.
Overall, 66 items suggest the three subscales fit reasonably to the model with a
good range of measure. Values of PTMEACorr. for all 66 items are positive with
loading more than 0.6. These quantitative evidences support that, even though the
subscales consist of three different factors, the model can be used together in
measuring one latent trait, which is self-efficacy in teaching using science inquiry
skills. The items constructed for the SETSIS were able to measure intended
variables at the three differences item level – high, average and easy item levels, as
proposed.

125
Table 45 Items of OBE sub-scale
6.1.2 Person measure
Table 46 Summary of the SETSIS Analysis Result – Persons (n=324)
Person measure observes the variation of a person’s abilities relative to the items
difficulty. Table 46 summarises the results of the sample person measure (n=324) on
the 66 items. The measure shows high person reliability and good person
separation. Person reliability 0.98 (equivalent to test reliability Cronbach alpha KR-
20) indicates that the sample has wide ability measured with good length of rating
scale. Person separation 6.47 indicates good person classification with possibility to
distinguish respondents into more than high and low performers (i.e. person
separation > 2).
On the same scale as the item measure, mean of person measure located at 2.15
(logit) above the mean of item measure (0 logit). Maximum person measure was
located at 6.33 units above the mean item difficulty measure, which recommends a
MNSQ ZSTD MNSQ ZSTD
MEAN 2.15 1.00 -0.30 1.00 -0.30
SD 1.46 0.44 2.60 0.45 2.60
MAX. 6.33 2.57 6.80 2.65 7.00
MIN. -1.76 0.21 -7.30 0.23 -7.10
6.47 0.98PERSON SEPARATION PERSON RELIABILITY
OUTFITINFITMEASURE
Difficulty PTMEA
ITEM Measure CORR.
B1 -1.15 0.11 1.20 1.13 0.65
B2 -1.14 0.11 0.99 1.11 0.65
B3 -1.43 0.11 0.95 0.96 0.66
B4 -1.25 0.11 1.11 1.06 0.64
B5 -1.32 0.11 1.04 1.03 0.67
B6 -1.47 0.11 1.05 1.02 0.65
B7 -1.17 0.11 0.95 1.20 0.65
B8 -1.33 0.11 1.15 1.18 0.63
B9 -0.85 0.11 1.25 1.23 0.63
B10 -1.60 0.11 1.12 1.16 0.61
B12 -0.96 0.11 1.01 0.99 0.68
B13 -1.03 0.11 0.92 0.90 0.69
B14 -0.70 0.10 1.07 1.04 0.68
B15 -1.04 0.11 0.97 0.94 0.70
B16 -1.28 0.11 0.94 0.91 0.70
B17 -1.33 0.11 1.10 1.19 0.64
B18 -1.46 0.11 0.93 0.85 0.71
S.E.Infit
MNSQ
Outfit
MNSQ

126
wide range of abilities spread above mean item difficulty. Minimum person measure
at -1.76 (logit) shows a smaller range of abilities are spread below the mean.
Accordingly, the higher the abilities of respondents are higher, the more than that
can be measured by the items.
Nevertheless, the responses pattern matches the expected model significantly. Infit
MNSQ and outfit MNSQ for mean measure show value of 1.00 indicate that the
observed data fits the model with significant ZSTD (-2.0<ZSTD<2.0). However, the
maximum infit MNSQ 2.57 (MNSQ>1.6) and minimum infit MNSQ 0.21 (MNSQ<0.5)
are not in range of the critical0 value. The results suggest responses that not fit the
model are contributed by misfit persons (Bond and Fox, 2007).
The high values of MNSQ (MNSQ>1.6) suggest the existence of random responses
that lead to underfit cases. On the other hand, the low values of MNSQ (MNSQ<0.5)
suggest responses that are overly consistent with the respond pattern lead to overfit
cases. Inclusion of underfit cases of pattered responses and careless responses
contribute noises that may compromise the calibration precision of the measurement
properties (Curtis, 2004). Possible overfit responses that came from social
acceptance and desirability and intermediate category responses (Anderson, 1997)
contribute less noises than underfit cases. Overfit cases are not good measure but
do not degrade the measurement (Bond and Fox, 2007). Practically, overfit
responses can indicate feasible views of respondents compared to underfit
responses. Thus, detail inspection of misfit cases is conducted and 34 underfit cases
are excluded for model estimation measures (N=290) report in Table 47.
PERSON (N=290)
MEASURE
INFIT OUTFIT
MNSQ ZSTD MNSQ ZSTD
MEAN 2.48 1.00 -0.30 1.00 -0.20
SD 1.66 0.36 2.30 0.37 2.3
SEPARATION 7.03
RELIABILITY 0.98
ITEM (66 ITEMS)
MEAN 0.00 1.00 -0.10 1.00 0.00
SD 0.81 0.12 1.40 0.12 1.40
SEPARATION 7.71
RELIABILITY 0.98
Table 47 Summary of model estimation measure without misfit cases (N=290)

127
Table 47 shows the summary of the fit analysis result after discarded underfit cases.
The result showed compatibility data to the model. The fit statistics for infit and outfit
show that the data significantly fits the model well with infit and outfit indices showing
values in acceptable range at MNSQ = 1.00 with significant ZSTD (-2<ZSTD<2).
Reducing the sample size to 290 responses does not affect person and item
reliability as it remains the same at 0.98. Separation in person ability (person
separation = 7.03) and item difficulty (item separation = 7.71) show increasing
dispersion in the item parameter. Increment in mean item SD to 0.82 logit increases
the effectiveness of the measurement upon separation of items along the scale
(Wright andand Masters 1982, pp 90-91).
However, increment of the persons estimate with the removal of underfit cases have
lowered the estimates of item position. The lower location of items estimate suggests
it is easier to endorse items at the positive end of the scale. After cross-plotting the
person estimate results fromTable 47 to the person estimate resulting from Table 46,
the removal of underfit cases didn’t produce noticeable changes in the person
measure. Thus, at this stage of calibration, the underfit cases are highlighted but
remaining for the next analysis.
6.1.3 Dimensionality of the model
Analysis of the Rasch PCAR decomposes the model’s variance to test for
unidimensionality in measuring one latent variable. The Rasch model extracts
variances of a latent variable in the measure. After the extraction, the variance
residuals are not supposed to form any pattern (i.e. factor). The hypothesis: if the
item’s variance measures one latent variable, then the items’ residuals are random
noises. Besides investigating the assertion of the three factors’ existence as
unidimensional, the analysis also identifies the core of items contributing toward the
characteristics of the factors’ contrasts.

128
6.1.3.1 The model variance
Figure 15 illustrates decomposition of variance components in a scree plot. The top
part of the scree plot shows location of parameter measured by the model while the
bottom part shows components of unexplained variances (U). Variance in the data
indicates that the model has explained 55% of measured variance (M), which is
approximately parallel to the result of EFA in 5.4.3. Rasch person ability (P) explains
33 percent of the measured variance and Rasch item difficulty (I) explains 22 percent
of the measured variance.
The result shows five factors (U1 to U5) for total of 45% of the residual variance. The
first and the second factors (U1 and U2) explain more than 2 % of the residual
variance that indicates noticeable strength of more than three items for additional
measure to the model (Kline, 2005). The following three factors of residual show
subdued items strengths to disregard.
The first factor in the residuals explains 5.3% (U1) of the variance in the data
indicates strength of about 6 items (out of 66 items) formed in as an additional factor
(contrast). Second contrast (U2) has 2.6% of variance that derived 4 items strength
for another additional contrast. The factor sensitivity ratio (U1 divided by P) yields
0.15 for first contrast and 0.08 by second contrast respectively. These mean that
15% and 8% of the model stability affected by the two additional factors respectively
(Wright andand Stone 2004).
Variance component
Parameter
TV Total raw variance in observations MV Raw variance explained by measures PV Raw variance explained by persons IV Raw Variance explained by items UV Raw unexplained variance (total) U1 Unexplained variance in 1st contrast U2 Unexplained variance in 2nd contrast U3 Unexplained variance in 3rd contrast U4 Unexplained variance in 4th contrast U5 Unexplained variance in 5th contrast
+--+--+--+--+--+--+--+--+--+--+--+
100%+ T +
| |
V 63%+ +
A | M |
R 40%+ U +
I | P |
A 25%+ +
N | I |
C 16%+ +
E | |
10%+ +
L | |
O 6%+ +
G | 1 |
| 4%+ +
S | |
C 3%+ 2 +
A | |
L 2%+ 3 +
E | 4 5 |
D 1%+ +
| |
0.5%+ +
+--+--+--+--+--+--+--+--+--+--+--+
TV MV PV IV UV U1 U2 U3 U4 U5
VARIANCE COMPONENTS
Figure 15 Standardised variance parameter component scree plot

129
The map in figure 16 illustrates position of the items’ residuals of the data by plotting
item difficulty measure (x-axis) against magnitude of factor residual (standardised
residual) loading (y-axis) of each item in the measure. Instead of random spread in
the residual plot, the map reveals distinctive pattern of items at the top left of the
map dominated by six items (label A, F, D, E, B, C) in the circle and other 11 items in
Cluster 1. The group of items in Cluster 1 have the highest residual loading and
negative item difficulty measure. All items in cluster 1 were identified as items from
OBE subscale. Close inspection on the items residual loading identify the six
dominated items (B10, B1, B4, B6, B8, B16) and were used to represent the group
character analysis next. The statistical concepts of the six dominated items in
Cluster 1 (first contrast) are presented in Table 48 below.
-3 -2 -1 0 1 2 3 4 5 6 7
-+-----+-----+-----+-----+-----+-----+-----+-----+-----+-----+- CLUSTER
.7 + | +
| A | | 1
.6 + DEFCB | + 1
C | IHJGK | | 1
O .5 + ONLM | + 1
N | P Q | | 1
T .4 + | +
R | | |
A .3 + | +
S | | |
T .2 + | +
| R| | 2
.1 + S |T + 2
| | U | 2
L .0 +------------------WYVXZ--------------------------------------+ 2
O | 2 2 | 2
A -.1 + 1|2 11 + 2
D | 1 |1 1 1 | 3
I -.2 + 1 ywptzx + 3
N | sqv our | 3
G -.3 + |mlknij + 3
| | gh | 3
-.4 + | df e c + 3
| | b a | 3
-+-----+-----+-----+-----+-----+-----+-----+-----+-----+-----+-
-3 -2 -1 0 1 2 3 4 5 6 7
ITEM MEASURE
Figure 16 Standard Residual Plot with three dominated cluster groups

130
Items listed in Table 48 were the items marked in the top circle in Figure 16. All the
items seem to measure belief on consequences of inquiry approach in student
learning and belief on consequences of inquiry skills focus on teachers. With the
highest loading of residual, the items reflect least variance that accounted for the
measure. It means that items in cluster 1 explained least trait of the SETSIS
measure among the sample.
The variances were expected in OBE factor because it was characterised as a
complement of the self-efficacy trait measure (Bandura, 1994). The items’ statement
using third person referred to student and ‘teachers’ instead of self-referred might
lower the variance accounted for this self-efficacy measure. All the six items have
negative value of items measure suggest that all the items’ statements were easy to
agree with.
Next, Figure 16 shows the other two groups of items residuals identified at middle of
map. Items that form pattern at the top middle of the map were grouped and
identified as cluster 2. Items that form pattern at the bottom of the map were grouped
and identified as cluster 3. These two grouped of items were discrete from cluster 1.
Random pattern among items at the middle suggest that the items measuring same
latent variable.
Table 48 Dominant items in first added group (Cluster 1)
Residual
loading
Item
measure
B10In science, I think it is important that students are
involved in investigation activities.0.66 -1.60
B1
I think that the use of Science Process Skills (SPS) is
important in science investigations because students can
learn and understand science concepts better in class.
0.62 -1.15
B4I am confident that activities involving science processes
nurture students to be more interested in science.0.62 -1.25
B6I think that teaching science through investigations is
important because it stimulates the students to think.0.62 -1.47
B8Teaching science through the investigative approach will
attract students’ attention to learning science.0.58 -1.33
B16I believe that mastering the SPS will help teachers to
teach using science investigation approach.0.58 -1.28
Item

131
The residual in the items of Cluster 2 reflect low variance that accounted for the
measure. The top four items (P22, K3, P26 and P25) were marked in the middle
circle as dominated items from cluster 2 and sampled for the character analysis in
Table 49.
On the other hand, six bottom items (K6, K11, K8, K25, K9 and K26) were marked in
the bottom circle as items with the lowest residual loading in cluster 3. The six
bottom items reflect the highest variance accounted for the measure and were
sampled for the next analyse of group character in Table 49.
Table 49 Dominated items in the middle variance
Item Residual loading
Item measure
K6 I have knowledge in constructing scientific ideas to provide guidelines for students to explain their scientific results.
-0.45 1.27
K11 I know I possess sufficient SPS knowledge to teach science through scientific investigations to primary school students.
-0.41 0.68
K8 I have knowledge in guiding students to plan their own problems to solve.
-0.38 1.31
K25 I am confident I have sufficient investigation skills to teach important scientific concepts effectively.
-0.38 0.71
K9 I know how to provide guidance so that students can develop their own issues to solve through scientific investigation.
-0.36 1.06
K26 I can always answer scientific enquiries from students using my understanding of the science process.
-0.36 0.78
P25 I want to guide the students to self-evaluate the consistency between their explanation and the scientific ideas given to them.
0.07 0.39
P26 I plan time to give students a chance to explain their investigations and discovery in class.
0.09 0.15
K3 I understand SPS is a basis to assist students in collecting data to answer their questions.
0.11 -0.56
P22 If given opportunity, I will encourage students to give various explanations from the same observation.
0.15 -0.14
Table 49 presents the 10 dominated items arranged from the lowest residual loading
to the highest residual loading at the middle of the map. Evaluation on the items
description explain distinct characteristic of the items. The six items (the lowest circle
in Figure 16) were measuring the KE factor including the three items (K8, K6 and K9)
which were described as the high items in KE subscale in section 6.1.1.1 above.
These items consist the lowest residual variance that reflect the highest items that
able to explain the variance in the SETSIS. All the items’ statements focus on
measuring perceived confident in knowledge of teaching science using skills of

132
inquiry. Meanwhile the other four items at bottom of Table 49 (P25, P26, K3 and
P22) show higher residual variance from the six top items. All the items’ statements
have similarity in stating the implementation of teaching using skills of science
inquiry. While the items P25, P26 and P22 stated about instructional implementation
in teaching using skills of inquiry, K3 stated about basic knowledge needs in
implementing teaching using skills of inquiry. Thus, these four dominated items
marked at the centre of map in Figure 16 explain the trait of the SETSIS that much
represent the implementation of teaching using science inquiry skills in mixture of
items that represent more into PTE factor.
Checking on the item measures show that the difficulty measure for top items in
contrast 2 were lower compared to items in contrast 3 but the level of difficulty is not
far apart. However, the vertical differences in the residual loading explain that these
two groups contrast with each other and have a different subtle factor underneath.
Inspection of full list of items residual loading reveal that cluster 2 has most of the
items that come from PTE subscale and items in cluster 3 are mostly from KE
subscale. This result supports that every subscale has dominated by items
characterised according to the proposed factors as proposed in Chapter 4.
In conclusion, the empirical result in data variance suggest that OBE (cluster 1), PTE
(cluster 2) and KE (cluster 3) exists as the three factors in the SETSIS measurement
model with different measure characteristics. These three factors have established
measurement characteristics as intended at the beginning of measure construction.
However, items’ variance position plot suggests that the OBE items in cluster 3 has
possibility to measure a second dimension. Thus, further commonality for the items’
clusters were investigated for it dimensionality based on correlation of person
measure error now.
6.1.3.2 Correlation of person measures in the model
Table 50 Person measure relationship between the three clusters
Table 50 shows the relationship of the three clusters based on the person measures.
The Person correlation (r) indicates the direction and degree of linear correlation in
the three clusters have positive correlations with the different magnitudes. This
Person Pearson
Clusters Correlation
1-3 0.61 0.68
1-2 0.73 0.80
2-3 0.87 0.91
Disattenuated
Correlation
*Cluster 1 measure trait of OBE, Cluster 2 measures trait of PTE, Cluster 3 measures trait of KE
133
statistics evidence shows that the three factors described using the three clusters
measure the same direction but the degree of correlations vary between the clusters.
Sample correlation coefficients between OBE and KE (r = 0.61), OBE and PTE
(r=0.73) and PTE and KE (r= 0.87) show moderate to strong correlation.
The disattenuated correlation results explain that the three measures in Table are
correlated. The disattenuated correlation coefficient does not exceed unity
(disattenuated correlation = 1.00) with values just below 0.7, which is near unity,
revealing that the correlations of OBE-KE and OBE-PTE are low due to randomly
distributed errors (Schumacker 1996). The evidence suggests that OBE do not have
strong correlations with PTE and KE but are still significantly correlated to the
factors. On the basis of sample corrected correlation coefficients being near unity, it
is not strong enough to conclude that OBE items measure different dimensions than
the SETSIS.
6.1.4 Summary
Section 6.1 was reported to answer the RQ3. The analysis was conducted using the
Rasch model as a comparison model. It was reported in three different Rasch model
parameters – item measure, person measure and dimensionality measure – to judge
the appropriateness of the SETSIS for the sample group.
Good distribution of item difficulty in the measure
The item parameter is reported to examine the spread of the item difficulties and was
used to judge whether the items constructed in the SETSIS were targeted to the
level of desired ability in teaching using science inquiry skills based on the three
selected subscales (i.e. KE, PTE and OBE). The results shows good distribution of
item difficulty. The high item reliability at 0.98 indicates that the item parameter has
measured level of item difficulty relative to the measure of the sample ability. The
item separation confirmed that all the items can be discriminated into more than
seven groups of separations. Thus, this result indicates the possibility of the
existence of the three levels of item difficulty, as desired. Instead, the items
distributed well with more easy items in the SETSIS. Analysis of item in all the
subscales show that each subscale has a good spread range with the item measure
ranges varying more than the standard deviation (SD) of the mean item.
Sample provides good range of ability
Analysis of the person measure can explain the level of ability (trait) estimation
among the sample. The parameter informed about reliability in the estimation of the
trait level in teaching using science inquiry skills for the sample group used in this

134
study. The result of high person reliability at 0.98 provided that the sample was able
to provide a wide range of the trait level based on the items provided in the SETSIS.
The sample distinguished group of traits for more than six separation groups that
lead to positive possibility to differentiate traits of teaching using science inquiry skills
in the three proposed levels. However, the model estimated that the sample has a
higher level of trait in teaching using science inquiry skills than that can be measured
by the items in the SETSIS. This result is expected as the members of the sample
group chosen for this study have strong backgrounds in science and were trained to
teach science using science inquiry skills.
Moreover, the analysis indicated the existence of random responses that might
contribute to the noise of measurement. Further, the random responses were
detected and unweighted for measurement calibration. Instead, the new calibration
without the random responses did not affect the reliability of the measure; thus, the
whole sample (N=324) was retained for the next analysis.
The three factors measure a single SETSIS dimension
Using Rasch analysis of dimensionality, this study intended to explain the
information provided by the SETSIS over the trait measured. Using the
characteristics provided by items that explained a pattern of variances for the
measure, this study is able to describe the contribution of the items to explain
information in the SETSIS. The analysis concludes that the items chosen from the
random residual in the model can explain the three factors’ characteristics. All three
factors function as expected in terms of measurement characteristics.
Further analysis of commonality among the items in OBE and items in KE and PTE
suggested that there is not enough evidence to suggest that the SETSIS is
constructed with more than one dimensional variable. Thus, in conclusion, all three
factors are able to measure a latent trait underlying the SETSIS measurement
model.
6.2 The Model Structure
This section investigates the validity of the three factors as a measurement model in
measuring ability of teaching science using science inquiry skills. First, the validity of
the internal structure of the measure is checked, based on the hierarchy of targeting
items to each person’s ability measure. Item hierarchy analysis explains the validity
of the construct mapping proposed at the beginning of the project. Next, the five-
point Likert scale used in the measure is evaluated for appropriateness and
functionality of each category in measuring the ability of sample. Interpretation of the

135
measure based on the raw score of the measure gives the validity score and
purpose of the measure.
6.2.1 Mapping person-item relationships
Analysis of location of items and person parameters is conducted to evaluate
construct validity for 66 items in the SETSIS. A graphical representation of the
relationship between item difficulty and person ability was plotted on the same scale,
as shown in the Wright map in Figure 17 below. The plot displaying a vertical
histogram of item difficulty estimates on the left and a vertical histogram of person
ability estimates on the right. The map identified item difficulty distribution using the
label rare at the top and the label frequent at the bottom. On the right side, the top of
person distribution was identified with the label more and the bottom of person
distribution with the label less. The person location distributed from top to bottom of
the map indicates that the sample shows the various abilities of the measure.
On the left side of the map in Figure 17 items were positioned according to the
difficulty measure in the scale of logit. The distribution of the items shows a good
spread that can be grouped into three levels of difficulty. The mean item difficulty
measured at 0 logit is marked with ‘M’ (in circle) and is used as a reference point of
the scale. The levels can be identified with the marks along the left side of the middle
dash line. The ‘S’ and ‘T’ markers indicate levels of item difficulty, respectively within
one sample and two sample SDs from the item mean, M. Items that sit closer to the
top are the high items with high levels of affirmation to agree, while items that sit
closer to the bottom are the items with easy affirmation to agree with.

136
Figure 17 Wright map (Winsteps 4.0)

137
On the other side, the abilities are grouped and the level marked on the right side of
the middle dash line. The ‘M’ marker indicates the mean level of ability of the
sample. The ‘S’ marker indicates the level of ability in the SETSIS within one SD of
the mean sample, while the ‘T’ marks level of ability within two SD of the mean
sample. The persons with the most ability in teaching using science inquiry skills are
located closer to the top and those with the least ability in teaching using science
inquiry skills are located closer to the bottom part of the map. The result from the
map above suggests that ability in the SETSIS among the sample is spread widely
and that can be measured and grouped accordingly.
The levels were used to infer the ability of the sample relative to the level of item
difficulty in the SETSIS measure. Section 4.4.1 proposed three levels of item
hierarchy to measure level of ability in teaching using science inquiry skills among
the targeted sample. Within the item and the person distribution on the map in Figure
17, three levels of the items can be drawn upon. The item levels were based on item
difficulty on the right side of the map relative to person ability measure .
The high person ability in teaching using science inquiry skills located above the
mean sample SD 0.82 logit. This probability indicated that the items above the mean
were more difficult to affirm compared to the items below the mean. Thus the items
above the mean are categorised with the high level of item difficulty.
Persons located within ±0.82 logit (± the mean sample SD) have the average ability
in teaching using science inquiry skills. This probability indicated that the items within
the range were easier to affirm than the items above the positive mean (i.e. +0.82
logit) but were harder than item below the negative mean (i.e.-0.82 logit). The items
located within the range are categorised as the items with the mean level of item
difficulty.
Person located below -0.82 logit have low level of person ability in teaching using
science inquiry skills. This probability indicated that the items located below -0.82
logit are the easiest to affirm compared to the above items. Thus, the items below
the mean sample SD at -0.82 logit are categorised as the easy items.
All the items from the three subscales progress well along the scale give reasonable
evidence that the three factors have defined trait of the SETSIS measure well. There
was no gap in between the items indicating that the items uniformly measure
difficulty along the continuum. This means major factors that influence the underlying
trait have been covered by the measure. However, there were overlapping items
measuring the same difficulty level. These overlapping items seem to measure
similar portions of the trait and might give the same measure information.

138
A detailed inspection of the item difficulty measure (see Appendix 8) reveals 11
items that measure at the same difficulty presented in Table 51 below. The table lists
the overlapping items that measure at redundancy difficulties. Items K13 and K16
measure ability at 0.85 logit, explaining the same underlying trait in two different
science inquiry skills. Items P7 and P23 measure ability in practicing teaching using
science inquiry skills at 0.65 logit with the statements that explain the different
instruction approach used in practice. Three items P1, P27 and K5 measure the trait
at 0.48 difficulty but the statements expose three different strategies used for the
same investigation approach. At 0.1 logit measure, items K19 and K24 measure
perception of the knowledge ability in two different contexts: increasing skills and
using skills to increase learning. Lastly, items B8 and B17 measure the item at -1.33
logit from information on belief of using science inquiry skills affecting learning from
different perspectives: students and teachers. These items seem to measure the
same difficulty; however, close analysis of the items statement shows different
contexts of measure.
0.85 K13With the SPS knowledge that I have, I can form scientific
inquiries needed for students to make a study.
K16My experimental skills are sufficient to explain the function of
experiments to students.
0.65 P7I try to use one set of data from worksheets to assist students
in the analysis process.
P23I can guide students to give a consistent explanation on the
proofs from the observation of the experiment.
0.48 K5
I can combine SPS knowledge to the subject's content to
encourage students' participation in scientific investigation
activities.
P1
When an activity of science process is challenging to
implement, I will arrange every step in the activity using the
investigative approach.
P27I am able to guide students to deliver their explanations using
clear scientific terminologies.
0.10 K19I am constantly searching for effective SPS methods to teach
science.
K24I am able to impose an inquiry to get students' attention to
solve it.
-1.33 B8Teaching science through the investigative approach will attract
students’ attention to learning science.
B17I am confident that teachers who understand and master SPS
can teach science smoothly and efficiently.
Difficulty
measureItem Statement
Table 51 Table of 11 redundancy items

139
At this stage of initial calibration, the redundancy items’ character information and
differences should be highlighted but the items remain through the process.
Removing the individual redundancy items can increase efficiency of the measure
but result in less calibration precision. In future, the benefit of calibration and the
items information can be considered for shorter and effective measure of SETSIS.
A closer look at the overall position of the two estimate parameters show that the
person mean sits above the high level of item difficulty. This indicates that most
items in the measure explained the lower portion of ability. Theoretically, optimal
targeting measures can be obtained with the same measure of mean person ability
and mean item difficulty (i.e. mean for both parameter at 0 logit): however research
in psychological perspective have shown that mean item below one logit of the mean
person can target a better measure (Boone, Yale and Staver, 2014) . Thus, from the
measures plotted in this study, it seems that the high level of items interacts only
with near-the-average person ability but not enough to explain the ability over the
hardest items K8 and K6 in difficulty measure. This analysis indicates that the
SETSIS measure lacks high level of items to discriminate the high ability person on
top of the map. Thus, it is clearly that the measure needs more difficult items to
measure the high ability hierarchy of the sample.
On the other end, further visual inspection of Figure 17 shows that the distribution of
difficulty (item) and ability (person) were not evenly distributed. The model estimated
more than seven items separation with the wide spread of sample’s ability (in section
6.1.1). However, more than three quarters of the items sat within one SD of the
mean item and at the bottom of the map. Instead, less than 10 percent of the sample
were estimated as within this level of average and low ability in teaching using
science inquiry skills. Even the lowest ability persons have more probability to agree
with the statement in the easiest items, B10 and B6. This evidence suggested that
the study needs more samples of average ability and low ability persons to
distinguish the items at the level of mean item difficulty and easy item difficulty level.
At this stage of study, these levels would provide information in items’ level
characteristics that can be used to validate the proposed construct and beneficial for
future item design. The next section further analyses the characteristics in each of
the item difficulty levels and the responses.
6.2.1.1 Characteristic of item hierarchy
Analysis of item hierarchy gives information to develop reasonable characteristics for
the difficulty levels. The high level of item hierarchy are the most difficult items to
agree with least respondents endorse in top category of rating scale. The least of

140
item hierarchy level consists the easiest items to agree with most respondents
endorse the top category. The hierarchy of items develop upon responses given by
the sample. Figure 18 presents the frequency of responses in the items according to
a five-point Likert scale from category 1 (not confident at all) to category 5 (definitely
confident), arranged from highest hierarchy (top graph) to lowest hierarchy (bottom
graph) of item measure.
Figure 18 Frequency of responses to items (in percentage) according to category
Within the item distribution in the map in Figure 17, three items’ hierarchy are drawn
upon marks of one sample SD above and below the upon mean item difficulty. Items
with difficulty measuring above one sample SD (0.81 logit) are used to measure the
highest person ability of the SETSIS label as the high level of items. Items within
±0.81 logit are categorised as the mean level of items, and the items below -0.82
logit are categorised as the low level of items.

141
6.2.1.1.1 High level of item difficulty
High level items consist of nine: K8, K6, K9, P11, P6, P10, K15, K16 and K13, listed
inTable 52. These items contain hard statements to agree with. The frequency graph
above shows only 8 percent to 12 percent of respondents chose the highest
category, definitely confident with the item statement, but 44 to 54 percent of
respondents chose the lower three categories for these items. It means that these
items are associated with high difficulty in the SETSIS, whereas only respondents
that are really confident in their ability teaching using science inquiry skills will agree
with the statements.
Item Statement Difficulty measure
K8 I have knowledge in guiding students to plan their own problems to solve.
1.31
K6 I have knowledge in constructing scientific ideas to provide guidelines for students to explain their scientific results.
1.27
K9 I know how to provide guidance so that students can develop their own issues to solve through scientific investigation.
1.06
P11 I can guide students to ask significant scientific questions. 1.04
P6 I know how to provide suitable data to be analysed by students.
0.95
P10 I am confident of teaching through the approach of scientific investigations regardless whether the content is easy or difficult.
0.87
K15 In the absence of scientific apparatus, I am comfortable in using my own knowledge on experiments to adapt my teaching process.
0.86
K16 My experimental skills are sufficient to explain the function of experiments to students.
0.85
K13 With the SPS knowledge that I have, I can form scientific inquiries needed for students to make a study.
0.85
The three highest measure items and the three bottom items were from the KE
subscale. The other three items were from the PTE subscale. Highest item K8 states
about ability of sufficient knowledge to clear plan a guide (i.e. enriching integrated
SPS knowledge and effectively use it) to stimulate students (i.e. plan own problems)
in learning the science. Item P11 (PTE sub-scale) states capability of implementing
an instruction approach (i.e. ability of giving guidance) that stimulates strategy of
asking questions (i.e. significant scientific questions). The characteristics exhibited
through the high items is similar those as mapped in the proposed framework of item
design (see Chapter 4.3). Despite their difference in underlying factors, these item
Table 52 Items associated with high item hierarchy

142
statements identify capability to enrich trait in teaching using science inquiry skills
and use it to stimulate students’ learning.
The observation on person location in Figure 17 shows 77 percent (157) of
respondents are above the level of items K6 and K8, and thus have a higher
probability to endorse more than category 4 in all the items. It reflects that most of
the respondents show confidence in the overall trait. However, the discrimination of
person ability in the SETSIS is not clear at levels higher than items K6 and K8. Thus,
the SETSIS needs more suitable targeted items in KE to estimate the higher ability
of respondents above that level.
6.2.1.1.2 Mean level of item difficulty
There are 42 items from KE, PTE and OBE located at the mean level of items. The
items in this level are located within one SD from the mean item measure. The level
can be separate into two parts: items above the mean measure, and items below the
mean measure. The items above the mean consist of 27 items from the KE and PTE
subscales, while the items at the bottom of this level consist of six items from all
subscales. Nine items located near the mean location on the scale are chosen to
represent overall characteristic of items at the mean level.Table 53 represents items
associated with mean item hierarchy.
Table 53 Nine out of 42 items associated with mean item level
Item StatementDifficulty
measure
K19I am constantly searching for effective SPS methods to teach
science.0.12
K24I am able to impose an inquiry to get students' attention to
solve it.0.12
P3I can provide explanation to my students about the activity of
science process.0.10
K23I know how to use information given to predict a coming
observation.0.06
K14I am knowledgeable in implementing experiments in my
teachings.0.05
P18I am fostering student to review and ask questions on other
students' results0.01
K20
I understand about measurement and space to help students
understand the concept of length using self-measure (i.e
arranging paper clips/sticks).
-0.02
P21I ask my students to provide steps or procedures when
delivering their scientific results to class.-0.03
K2
I understand about SPS which is required to guide students
towards attaining scientific evidence through scientific
investigations.
-0.05
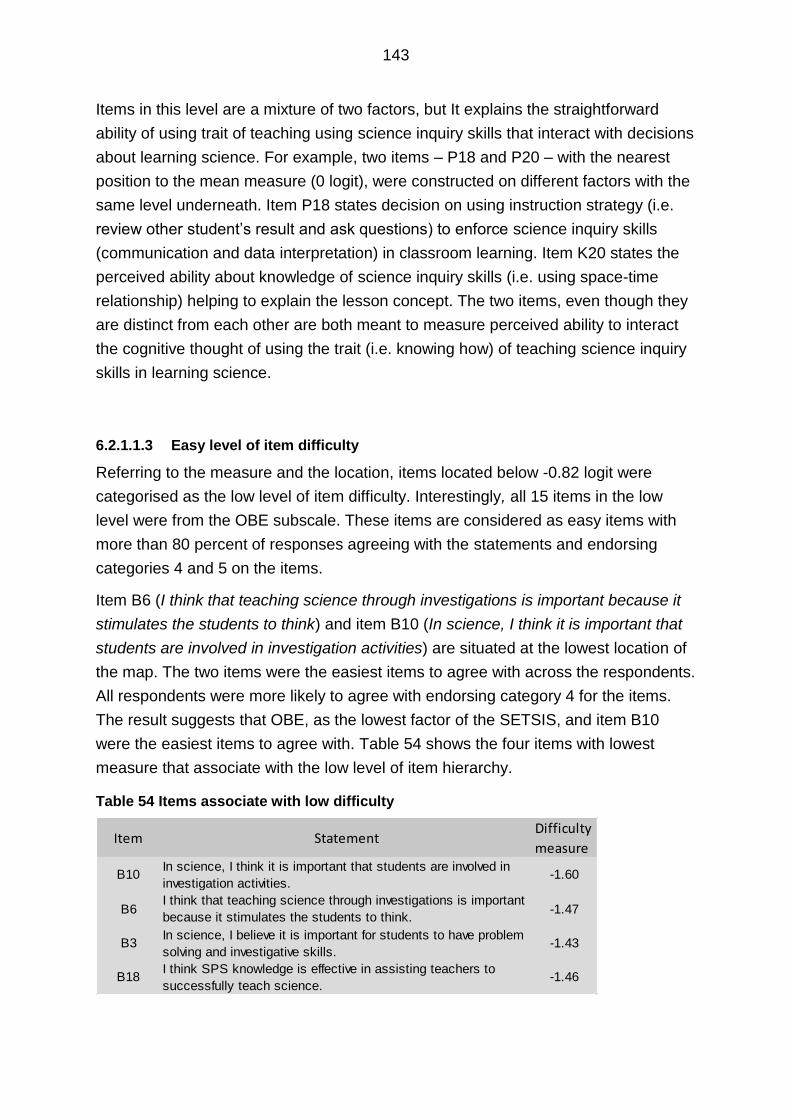
143
Items in this level are a mixture of two factors, but It explains the straightforward
ability of using trait of teaching using science inquiry skills that interact with decisions
about learning science. For example, two items – P18 and P20 – with the nearest
position to the mean measure (0 logit), were constructed on different factors with the
same level underneath. Item P18 states decision on using instruction strategy (i.e.
review other student’s result and ask questions) to enforce science inquiry skills
(communication and data interpretation) in classroom learning. Item K20 states the
perceived ability about knowledge of science inquiry skills (i.e. using space-time
relationship) helping to explain the lesson concept. The two items, even though they
are distinct from each other are both meant to measure perceived ability to interact
the cognitive thought of using the trait (i.e. knowing how) of teaching science inquiry
skills in learning science.
6.2.1.1.3 Easy level of item difficulty
Referring to the measure and the location, items located below -0.82 logit were
categorised as the low level of item difficulty. Interestingly, all 15 items in the low
level were from the OBE subscale. These items are considered as easy items with
more than 80 percent of responses agreeing with the statements and endorsing
categories 4 and 5 on the items.
Item B6 (I think that teaching science through investigations is important because it
stimulates the students to think) and item B10 (In science, I think it is important that
students are involved in investigation activities) are situated at the lowest location of
the map. The two items were the easiest items to agree with across the respondents.
All respondents were more likely to agree with endorsing category 4 for the items.
The result suggests that OBE, as the lowest factor of the SETSIS, and item B10
were the easiest items to agree with. Table 54 shows the four items with lowest
measure that associate with the low level of item hierarchy.
Table 54 Items associate with low difficulty
Item StatementDifficulty
measure
B10In science, I think it is important that students are involved in
investigation activities.-1.60
B6I think that teaching science through investigations is important
because it stimulates the students to think.-1.47
B3In science, I believe it is important for students to have problem
solving and investigative skills.-1.43
B18I think SPS knowledge is effective in assisting teachers to
successfully teach science.-1.46

144
Items at the low level indicate characteristics in recognition capability of belief that
the trait of teaching using science inquiry skills promote learning science. Item B10
states cognitive belief (I think) in students benefitting from learning science through
involvement in the trait of teaching using science inquiry skills (investigation
activities). The characteristic of the trait in OBE is located at the low level of the
SETSIS scale as a complementary factor of the SETSIS (Bandura, 1993). There are
only four persons measured as a person with low ability with 15 items in the easy
level of item difficulty. At this level, the four persons show more than 50 percent
probability of endorsing category 2, while others have shown 50 percent and greater
probability of endorsing category 4 for the above item difficulty level. The probability
based on responses to the easy items empirically shows that this level is the lowest
level in the SETSIS across the sample taken. However, there were not enough
persons to be able to distinguish ability at this level and lower. Perhaps, future
samples with different area of teaching background would propagate better results at
that level and below.
6.2.2 Category measure for rating scale
This analysis of category structure was empirically tested on how the respondents
used the rating scale. It assessed functionality of the five categories of the rating
scale used in the SETSIS relative to the trait estimation. The scale was assessed
using the distribution of responses across the five-point rating structure (category
structure) from category 1 to category 5 across all the items. The statistical results
from category function were used to describe the items and provide reliability of trait
estimation according to the responses. The information on category structure over
the trait range clarified the meaning of the data collected and provided validity for the
measure’s interpretation.
6.2.2.1 Category functionality in the measure
This section analysed the reliability of the category options provided in the SETSIS in
estimating the person ability according to the sample distribution above. The function
of the categories was examined using frequency and average measures in all five
response categories. Table 55 lists the response count across the categories with a
slightly skewed distribution and minimal observation count of 32 responses in
category 1. The responses provide enough observation (the minimal recommended
responses of 0) for stable threshold estimation in the categories (Linacre, 1999).

145
Table 55 Category frequency and average measure for five rating scale of the SETSIS
Average measure estimates person ability based on responses. Table 55 shows that
average measure increases monotonically across the five categories used in the
measure. On average, persons who endorse category 1 have the lowest average
ability estimate at -1.35 logit compared with a person who endorses category 5, who
have the highest average ability estimate at 4.12 logit. The increment empirically
suggests that respondents who perceive they have a stronger ability to execute the
stated tasks (in the item statement) endorse a higher rating category while
respondents that perceive they have a weaker ability to execute the stated tasks
endorse the lower rating category. The result highlights that the responses to the
five-rating scale design (category 1= not confident at all, category 2= not confident,
category 3 = slightly confident, category 4 = confident and category 5 = definitely
confident) in the measure works in continuum order, as expected.
6.2.2.2 Category measure to inform estimate responses
The analysis in this section provides information of the rating scale categories over
the abilities measured in the SETSIS. Table 56 explains the estimates of person
measure relative to the item measure according to the category measure. It lists the
Rasch parameters in the five categories used in the rating scale of the measure. The
responses were highest observed in category 4 with the lowest in category 1,
adequate for providing category information over the estimates ability (Bond and Fox
2007). Fit statistics show well the range of the infit MNSQ and the outfit MNSQ that
lie within the critical value suggested (0.5<MNSQ<1.6). These indicate that every
category works productively in the measure, with all five categories providing good
information into the measurement process and the items are described accordingly
(Linacre and Wright 1989). Thus, the five categories of the rating scale are adequate
to explain responses in the sample.
CATEGORY OBSERVED
LABEL COUNT
1 32 -1.35
2 646 -0.12
3 3171 1.16
4 5598 2.52
5 4010 4.12
AVERAGE MEASURE

146
The Andrich threshold in Table 56 is a parameter to differentiate one category to the
adjacent category. The threshold value reflects the estimate’s ability point where
there is a 50:50 chance of choosing the two adjacent categories. The increment of
the threshold values (-4.04<-1.19<1.32<3.91) indicates a well-functioning five
category rating scale in the SETSIS. The magnitude of distances between the
adjacent thresholds (-4.04 to -1.9 = 2.14 logit, -1.19 to 1.32 =2.51 logits, 1.32 to 3.91
= 2.59 logits) indicates a distinct position for the underlying category. The gaps’
magnitudes were enough (>1.4 logits, < 5.0 logits) and the increasing magnitude
reflects the appropriate step of difficulty in the number of category options and the
interpretation of the rating scale in the SETSIS (Linacre, 2001).
Table 56 Result of five well-functioning categories in the SETSIS
The category measure is a response structure that explains the estimation of certain
abilities perceived as the highest probability of each category. It provides information
on the perceived ability of the category measured. The category measure in Table
56 increases monotonically to reflect personal ability from the lowest at -5.18 for
category 1 – not confident at all – to the highest at 5.08 for category 5 – definitely
confident. This indicates that all categories for all items were structured in alignment
of the order of person ability and function as intended. Using the same rating scale
across the measure, the characteristics of the response structure can provide an
indication of the trait measured in each item, as shown in Figure 19.
6.2.2.2.1 Category measure to estimate level of ability
Figure 19 illustrates the response structure in logit scale. The probability curve
summarises responses to the category option of the measure. Intersections of
adjacent categories were the Andrich thresholds (Table 56), which have drawn equal
probability of responses between the two categories.

147
Figure 19 Category probability curve
The response structure shows the way in which the estimated probability in
categories 1 to 5 on the SETSIS scale vary with ability. Given that, the graph can
estimate the probability of selecting response, given estimated ability. Estimation
probabilities for average category responses to each subscale for five ability levels
are shown in Table 57 below.
Table 57 Response probability at five levels of ability
Ability estimate Response Category
Level Logits 1-not
confident at all
2- not confident
3- seems confident
4-confident
5- definitely confident
M+2SD 5.80 0.00 0.00 0.00 0.20 0.80
M+SD 4.14 0.00 0.00 0.00 0.40 0.60
M 2.48 0.00 0.00 0.25 0.60 0.15
M-SD 0.82 0.00 0.10 0.55 0.35 0.00
M-2SD -0.84 0.00 0.35 0.55 0.10 0.00
From Table 57, on average, persons with estimated ability located above mean are
expected to answer category 4 or 5. The highest person estimated ability at level
M+2SD have 80 percent probability of endorsing category 5 compares to a person at
the lower level of ability, M+SD, with 60 percent probability of endorsing category 5.
Person with estimated ability at mean level M were expected to have most 60
percent probability endorsing category. If not, they were likely to endorse more of the
P -+-----+-----+-----+-----+-----+-----+-----+-----+-----+-----+-
R 1.0 + +
O | |
B | |
A | |
B .8 + 5+
I |11 55 |
L | 1 5 |
I | 1 2222222 55 |
T .6 + 11 22 22 333333 444444 5 +
Y | 1 2 22 33 33 44 44 5 |
.5 + *2 2 3 3 4 445 +
O | 2 1 3* ** 54 |
F .4 + 2 1 3 2 4 3 5 44 +
| 22 1 3 22 4 3 5 4 |
R | 2 11 33 2 4 33 55 44 |
E |22 1 3 2 44 3 5 4 |
S .2 + 1133 2* ** 44+
P | 3311 44 22 5 3 |
O | 33 11 444 22 555 333 |
N | 33333 11***4 **** 3333 |
S .0 +**********************555***********1111*********************+
E -+-----+-----+-----+-----+-----+-----+-----+-----+-----+-----+-
-5 -4 -3 -2 -1 0 1 2 3 4 5
ABILITY
Y

148
lower category 3 rather than category 5 or above. Persons with ability estimated
lower than mean were expected to endorse more in category 3, with 55 percent
probability. Persons at level M-SD have more likelihood of endorsing category 4 with
35 percent probability than category 2 at 20 percent probability. Inversely, a person
at lowest level M-2SD would have less hesitation in endorsing category 2 than
category 4. This analysis of responses gives empirical evidence for category
functionality and moreover assesses the reliability of the person responses
measured. Interpretation of response structure suits the ability level and gives good
evidence that the SETSIS is valid in measuring the sample’s level, as mapped in
Figure 17.
6.2.2.2.2 Category rank measure in the subscale estimation
The analysis focuses on using the probability information of the estimate average
measure above to provide validity in content interpretation in the three factors of the
SETSIS. Table 58 extracts the average of the estimate person measure for groups of
semesters in the three-factor variables. With the available information on category
threshold and response structure above, interpretation of the average ability sample
with different backgrounds (i.e. group of semesters) can be provided.
On average, estimation of ability in factor KE and PTE are approximately the same
but less than the average ability estimation in OBE. The average estimate ability in
KE and PTE shows values that can be interpreted in the range of slightly confident to
confident, while measuring in OBE can be interpreted in the range of confident to
definitely confident in the SETSIS.
Table 58 Person ability according to factors
Group semester 1 shows least average estimate ability in KE and PTE that exceeds
the threshold of not confident but is less than the threshold of categories 3-4 (>-1.19
logit, <1.32 logit) (see Table 56). The information explains that on average, PSTs in
group semester 1 are slightly confident (category 3) in KE and PTE. Other groups of
semesters show average ability in confidence level but do not exceed to definitely
confident within KE and PTE.
Abilities of the sample are higher in the OBE than ability in KE and PTE. Three early
groups, semester 1, semester 3 and semester 5, show more confidence in OBE.
Semester 1 Semester 3 Semester 5 Semester 6 Semester 7 Semester 8
KE 1.23 1.52 1.93 2.3 2.24 2.55
PTE 1.22 1.52 1.93 2.3 2.24 2.55
OBE 2.83 3.13 3.53 3.9 3.84 4.15
Sub-scale
Level of abilty (in logit)

149
Groups semester 6 and semester 7 show value just below the threshold of 3.91 logit.
It seems that the two groups on average, share a fair level of confident and definitely
confident in the factor of belief measured by OBE. The semester 8 group are way
past the confident level, with their average abilities estimation more into definitely
confident. The interpretation of the category rank onto the ability level provides a
good baseline scale of the factors that contribute to the trait measure. The scale
shows a well-functioning interpretation that measures the trait as intended.
6.2.2.2.3 Category rank measure into real score estimation
The response structure provides information to assess the validity in the measure
interpretation according to the measure characteristic. Using the category threshold
estimate (see Figure 19) rank of ability in the measure is used to predict real scores
using complete measure characteristic curve. Figure 20 show category measure
information integrated into test characteristic curve (TCC) for complete measure
interpretation.
Analysis using TCC graph assist calibration of ability measures into predicted on
measure score. TCC linearly predicts the test score based on estimated ability
measure. Category measure information helps to interpret measure score on the
same baseline scale as the ability measure. The lowest threshold measure (-4.1
logit) is calibrated at predicted score 97. The lower score than that can be interpreted
as not confident at all in the SETSIS. The highest threshold (at 3.91) is calibrated at
predicted score 285. Higher than that score is interpreted as definitely confident in
the SETSIS. The equivalent characteristic on measure form have produce equivalent
score (see Table 59 below) that useful for PST score and proficiency classification in
the SETSIS.
Using rank estimation for the true score obtained in the SETSIS summarised in
Table 59, the sample’s performance was ranked and charted according to the
semesters group, as shown in Figure 21. The pie chart represents the percentage of
performance in the SETSIS according to the five-measure rank from the lowest rank
– not confident at all in teaching using science inquiry skills; to the highest rank –
definitely confident in teaching using science inquiry skills. It can be seen that the
percentages of the lower ranks were decreasing across semesters of study while
percentage for the higher ranks were increasing across semesters of study. This
result seems to reflect the development in self-efficacy in teaching using science
inquiry skills among pre-service science teachers in the training of BoTP.

150
RAW SCORE-MEASURE OGIVE FOR COMPLETE MEASURE
-+-----+-----+-----+-----+-----+-----+-----+-----+-----+-----+-
330 + * * E +
325 + **** +
320 + ** +
315 + ** +
309.5 + * +
304.5 + * +
299.5 + * +
294.5 + * +
289.5 + ** +
284.5 + ** +
279 + * +
274 + ** +
269 + ** +
264 + * +
259 + ** +
254 + * +
249 + * +
243.5 + ** +
238.5 + * +
233.5 + ** +
E228.5 + ** +
X223.5 + * +
P218.5 + ** +
E 213 + * +
C 208 + ** +
T 203 + * +
E 198 + * +
D 193 + ** +
188 + * +
S 183 + ** +
C177.5 + * +
O172.5 + * +
R167.5 + ** +
E162.5 + * +
157.5 + ** +
152.5 + ** +
147 + * +
142 + ** +
137 + ** +
132 + * +
127 + ** +
122 + ** +
117 + * +
111.5 + ** +
106.5 + ** +
101.5 + ** +
96.5 + ** +
91.5 + ** +
86.5 + ** +
81 + ** +
76 + *** +
71 + **** +
66 + E * * +
-+-----+-----+-----+-----+-----+-----+-----+-----+-----+-----+-
-10 -8 -6 -4 -2 0 2 4 6 8 10
MEASURE (logit)
Average person score
Figure 20 Test Characteristic Curve for the complete SETSIS measure

151
Table 59 Calibration of measure rank using the predicted score in complete measures of the SETSIS
Measure rank Predicted true score range
Definitely confident 285 to 330
Confident 254 to 286
Slight confident 163 to 253
Not confident 97 to 162
Not confident at all 66 to 96
Figure 21 True score ranking for group of semesters

152
6.2.3 Summary
This chapter was intended to validate the SETSIS in the model structure. Firstly, the
analysis was conducted of the structure of the level of items difficulty proposed that
was used to measure level of trait in teaching using science inquiry skills. The
distribution of the item difficulty–person ability map obtained from the study shows
that the targeting items are not spread well across the sample traits, especially
measuring the top traits of the sample. The measure lacks high level items to
measure persons with high trait of ability in teaching using science inquiry skills. The
current items consist most of the mean and easy level items for targeting samples
with average and low trait of ability in teaching using science inquiry skills. Instead,
all items function well along the measure continuum and explain the three level
characteristics of difficulty measure, as proposed. The information from the
characteristics of the item difficulty level has given three distinctive traits that
validated the construct structure of the SETSIS in measuring the continuum trait of
teaching using science inquiry skills.
Secondly, the analysis of the category measure proves that the rating scale with five
category options is viable to reflect the responses structure in the measure. The five-
point categories used in the measure were functioning as a mechanism of getting
measurable response. All categories behave as expected and contribute information
to differentiated levels of the trait of ability in teaching using science inquiry skills
measured by the SETSIS. The estimation of responses from the rating scale were
able to be interpreted by the score of the measure and most importantly able to
classify the trait of teaching using science inquiry skills among the sample tested.

153
Chapter 7 Evaluation of the SETSIS
The SETSIS was modelled to measure traits of the pre-service science teachers’
self-efficacy perspective in teaching using science inquiry skills. This was based on
the influences related to the teacher’s knowledge, practice and belief factors. It
examines the relationship of performance between the SETSIS and other existing
teacher knowledge assessments used in Malaysia. The relationships were examined
using two sets of external assessments: i) Test of Integrated Science Process Skills
(TISP), which assesses content knowledge in teaching using science inquiry skills;
and ii) the assessment of Professional Practices courses that assess science
teaching practice in real class situation during BoTP training. The results from this
section will be used to answer my final research question.
7.1 Association of the SETSIS and the content knowledge
7.1.1 Test of Integrated Science Process Skills (TISP)
The TISP consists of 25 items that are conducted on the same 326 PSTs (N=326)
that also participated in the SETSIS survey. The total score of the TISP is 25 with
mean score M=21.38 (S.D. =2.96). Analysis from valid responses (N=325) show the
TISP scale is consistent as a good measure (Cronbach’s alpha = 0.73). As shown in
Figure 22, more than 50 percent of respondents scored above mean with most
responses (19.3 percent) scoring 24.00 (Mode= 24). This reflects the good
knowledge of science inquiry skills among the respondents.
Table 60 reflects the descriptive statistics associated with the pre-service teachers’
performance in inquiry skills knowledge during the teacher training with accordance
to the semester attended. It can be seen that the highest mean (M =21.91) in inquiry
skills knowledge performance was during semester 8 while the lowest mean
(M=19.80) was during semester 5. However, semester 5 has the widest spread out
among the group compared to the other group. This group of PSTs showed negative
skewness and reflected the tendency to score more than the mean score. Therefore,
the overall pattern of performance in inquiry skills knowledge was approximately the
same in every group of semesters and it does not dependened on the number of
semesters of training the PSTs had attended. This result seems to suggest that the
knowledge might be developed or co-existed before the teachers attended the
training programme.

154
Figure 22 Frequency distribution of the TISP achievement
Table 60 Descriptive statistics for score performance in the TISP across cohorts
Semester
group
Number of
sample, N
Mean score,
M
SD Skewness Kurtosis
1 82 21.65 2.04 -0.67 -0.13
3 28 21.89 1.95 -0.58 0.29
5 60 19.80 4.78 -1.65 2.31
6 70 21.67 2.32 -0.72 0.14
7 9 21.22 4.32 -1.65 0.69
8 75 21.91 2.11 -1.29 0.28
Analysis of mean of scores across the group of semesters in Figure 22 shows
differences in the means. The histograms show achievement levels in the TISP
across semesters were good. The scores distribution in all histograms were leaning
towards the right where most of respondents achieved more than 20 scores in the

155
TISP. Despite This contradicts with Hairiah and Chin (2010) finding when they
reported that the performance levels of PSTs in integrated science process skills
knowledge were between moderate and low. However, the mode scores range
across the semesters in this study (mode range =22 to 24) and this reflects that the
knowledge possessed by the PSTs was very good.
Analysis of the five subscales of the TISP revealed a pattern of scores that were
contradicted by the previous findings. Table 61 of descriptive statistics indicates a
good level of knowledge in controlling variables skill (mean = 4.82) and interpreting
data skill (mean = 4.32). These findings were contradicted as reported in Hairiah and
Chin (2010) and Tan and Chin (2001).
Thus, the analysis of the five subscales of the TISP indicates a good level of
knowledge in controlling the variables skill (mean=4.82 and interpreting data skill
(mean=4.32). The score percentage also indicated two other subscales: making
hypotheses and defining operationally have more than 80 percent scoring above 4
with mean= 4.11 and mean =4.64, respectively. Experimenting skill, on the other
hand, shows a moderate level of performance with mean = 3.49 with 45 percent of
respondents scoring less than 4. The indication shows that PSTs have better
knowledge in making hypotheses and defining operationally compared with
experimenting skills. This results also contracdicted with respect those reported by
Hairiah and Chin (2010) and Hafizan et Al. (2012).
Table 61 Descriptive statistics for score performance in the TISP
Integrated SPS No. of Items Minimum Maximum Mean
Std. Deviation
Controlling variables 5 0 5 4.82 0.62
Hypothesising
5 0 5 4.11 1.06 Define Operationally
5 1 5 4.32 0.82 Interpreting Data
5 0 5 4.64 0.72
Experimenting 5 0 5 3.49 1.07
Total 25 5 25 21.38 2.95

Figure 23 TISP score distribution across the group of semesters

157
7.1.1.1 Fit analysis using Rasch
Table 62 shows the summary of measure and fit statistics for 25 items of the TISP
using Rasch analysis. The overall, items have good item reliability and good item
separation. The item reliability in the TISP is 0.97, indicating high reliability items with
seven strata groups of estimated separations (separation=5.31). It means that the
TISP has high reliability in item location with a wide difficulty range.
Table 62 Summary of fit statistics for 25 items of the TISP
MEASURE
INFIT OUTFIT
PERSON (N=311) MNSQ ZSTD MNSQ ZSTD
MEAN 2.56 0.99 0.10 0.86 0.10
SD 1.10 0.29 0.80 0.84 0.80
SEPARATION 1.04
RELIABILITY 0.52
ITEM (25 ITEMS)
MEAN 0.00 0.96 0.20 0.86 0.00
SD 1.37 0.12 1.00 0.42 2.20
SEPARATION 5.31
RELIABILITY 0.97
In this study, the overall data on the items significantly fit the model. Fit analysis
using MNSQ indices indicates that the data is compatible with the model. The mean
measure shows a critical MNSQ value for dichotomous models in range 0.7 to 1.3
(Bond and Fox, 2007) for infit and outfit analysis. These imply that all 25 item
variations are acceptable according to the model expectation.
However, reliability of person is lower than reliability of items. Person reliability of
0.52 shows poor reliability in the separation of person ability in the sample. The
sample has almost the same ability when measured using the TISP. Practically, as
the samples chosen were specifically training to be science teachers and have good
background in sciences, it is expected that the sample persons have the same good
knowledge in integrated science process skills.
The results of the the 25 items used in this study are considered acceptable and
significantly compatible with the MNSQ value for dichotomus model and in line with
the model range of (0.7 to 1.3) expectations as suggested in Bond and Fox (2007).
In contrary, the reliability of person shows poor reliability which is lower than the
reliability of items with the value of 0.52. The sample chosen in this study, has
almost the same ability when measured using the TISP. Nevertheless, since the
sample chosen for the study were specifiically trained to become a science subject

158
teacher and with a good science subject knowledge and background, it is therefore
expected that the samples have the same good knowledge in integrated science
process skills.
7.1.2 Correlation between the SETSIS and the TISP
Past studies have proven that content knowledge can influence the ability in
practicng teaching in the classrooms (as shown in Magnusson et al. 1999; Loughran
et al. 2008; Berg 2009; Park et al. 2011) thus it can affect self-efficacy development
in teaching. Similarly, Guskey (1998) also believed that teacher’s self-efficacy is able
to infer not only the ability of teaching using science inquiry skills but also the ability
to infer the teacher’s content knowledge. Therefore, in this study the SETSIS was
developed and used to measure the teacher’s self-efficacy in using science inquiry
skills. The hypothesis was tested to measure if the SETSIS is capable of predicting
the confidence of the respondents’ specific content knowledge of science inquiry skill
using the TISP.
The SETSIS was developed to measure teacher’s self-efficacy in teaching using
science inquiry skills, which in theory is believed to be able to infer not only the ability
of teaching using science inquiry skills but also the ability in the teacher’s content
knowledge (Guskey 1988). In this section tests the hypothesis that the SETSIS
measurement is capable of predicting the confidence of respondents in the specific
content knowledge of science inquiry skills using the score in the TISP.
Correlation and multiple regression analyses were then conducted to examine the
relationship between PSTs’ scores in the TISP and the potential predictors from the
SETSIS measure. The overall average score percentage in the two measures, the
SETSIS and the TISP, were plotted in Figure 24 . Visual inspection shows that
scores in self-efficacy steadily increase across semesters while the scores in the
content knowledge does not show much change across the group semesters except
for group semester 5 (SEM 5). However, it can be seen that the mean percentage of
the TISP was above the mean percentage of the SETSIS for all the group of
semesters. Analysis of correlation and model regression next will determine the
score association between the two measures.

159
Figure 24 Scores across group of semesters between the TISP and the SETSIS
Bivariate correlations between the five subscales of the TISP and the three
subscales of the SETSIS are listed in Table 63. Pearson correlations show weak
correlation between the two measures’ subscales. However, there were significant
correlations between all the TISP subscales with OBE except for the subscale
interpreting data.
Table 63 Correlation between subscales across the TISP and the SETSIS
KE PTE OBE
Controlling variables .021 .042 .161**
Hypothesising .083 .031 .200**
Define Operationally .049 .046 .218**
Interpreting Data -.022 -.024 .107
Experimenting .042 .051 .142*
*. Correlation is significant at the 0.05 level (2-tailed). ** Correlation is significant at the 0.01 level (2-tailed).
The correlation analysis for overall scores of the TISP and the three predictors
(subscales) in the SETSIS gained the same expected results as listed in Table 64.
All predictors and the TISP were positively correlated with significantly weak
correlation in OBE.
50
55
60
65
70
75
80
85
90
95
100
S E M 1 S E M 3 S E M 5 S E M 6 S E M 7 S E M 8
AV
ERA
GE
PER
CEN
TAG
E O
F SC
OR
E
GROUP OF SEMESTERS
SETSIS
TISP

160
Table 64 Relationship of performances in the TISP with factors in the SETSIS
Correlation KE PTE OBE
TISP 0.06 0.04 .24**
**. Correlation is significant at the 0.01 level (2-tailed).
The result indicates that the correlations between the traits in the SETSIS with TISP
were weak. Among all the traits’ correlation in the specific content knowledge of
SPS, OBE shows a significant but, with a positive weak correlation. As this result
might inform that the content knowledge of SPS contributes to the trait of OBE in
teaching using science inquiry skills, the strength of the correlation was very weak to
infer.
7.1.3 Predictive model to infer content knowledge performance
Multiple regression was used to examine the relationship between the predictors in
the SETSIS and TISP scores as dependent variables for content knowledge
performance. Three multiple regression models were tested. Model 1 has three
possible predictors (i.e. KE, PTE and OBE), Model 2 has two possible predictors (i.e.
KE and PTE) and Model 3 has only the OBE predictor. The residual plots for all the
models show random patterns that indicate the line is a good fit for the data and the
a regression model appropriate for the data regression models.
Table 65 lists the results of regression model summary for all the models.
Table 65 Results of regression model summary to infer content knowledge performance
Model R Adjusted R
square Standard
Error F-test Significant
Model 1 0.306 0.085 3.044 11.067 0.000
Model 2 0.302 0.085 3.043 16.133 0.000
Model 3 0.241 0.055 3.093 19.974 0.000
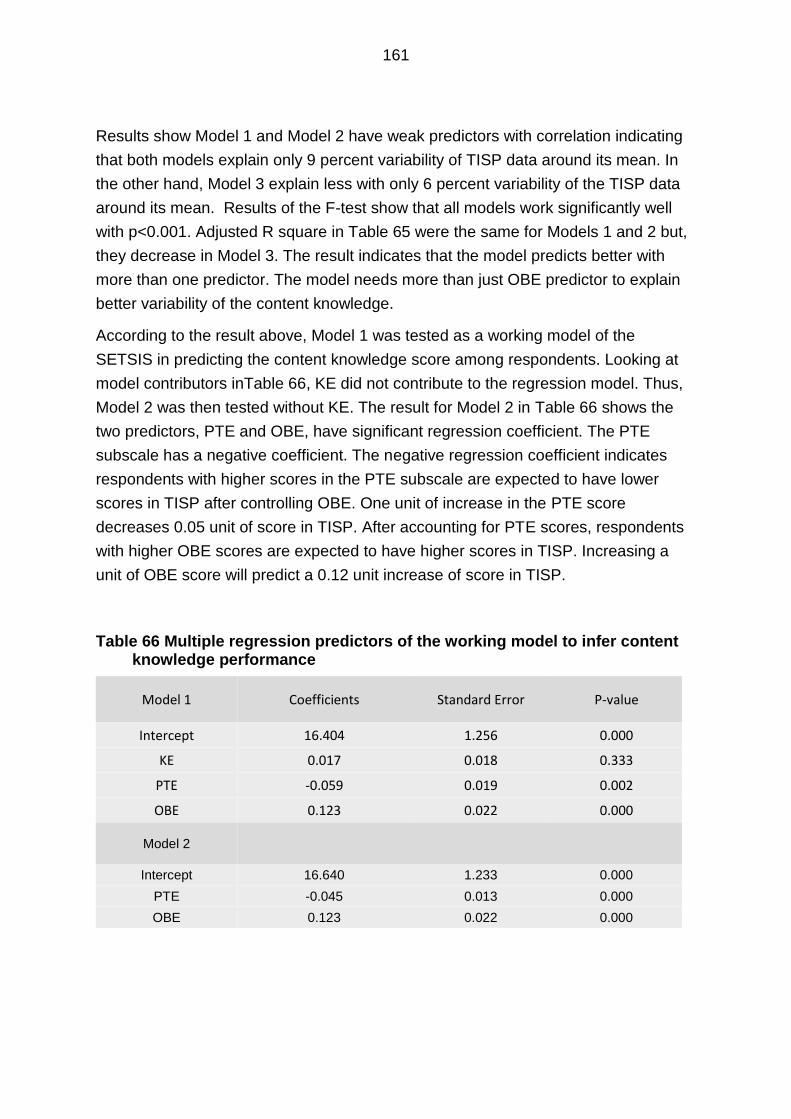
161
Results show Model 1 and Model 2 have weak predictors with correlation indicating
that both models explain only 9 percent variability of TISP data around its mean. In
the other hand, Model 3 explain less with only 6 percent variability of the TISP data
around its mean. Results of the F-test show that all models work significantly well
with p<0.001. Adjusted R square in Table 65 were the same for Models 1 and 2 but,
they decrease in Model 3. The result indicates that the model predicts better with
more than one predictor. The model needs more than just OBE predictor to explain
better variability of the content knowledge.
According to the result above, Model 1 was tested as a working model of the
SETSIS in predicting the content knowledge score among respondents. Looking at
model contributors inTable 66, KE did not contribute to the regression model. Thus,
Model 2 was then tested without KE. The result for Model 2 in Table 66 shows the
two predictors, PTE and OBE, have significant regression coefficient. The PTE
subscale has a negative coefficient. The negative regression coefficient indicates
respondents with higher scores in the PTE subscale are expected to have lower
scores in TISP after controlling OBE. One unit of increase in the PTE score
decreases 0.05 unit of score in TISP. After accounting for PTE scores, respondents
with higher OBE scores are expected to have higher scores in TISP. Increasing a
unit of OBE score will predict a 0.12 unit increase of score in TISP.
Table 66 Multiple regression predictors of the working model to infer content knowledge performance
Model 1 Coefficients Standard Error P-value
Intercept 16.404 1.256 0.000
KE 0.017 0.018 0.333
PTE -0.059 0.019 0.002
OBE 0.123 0.022 0.000
Model 2
Intercept 16.640 1.233 0.000
PTE -0.045 0.013 0.000
OBE 0.123 0.022 0.000

162
7.1.4 Applying the predictive model
Multiple regression analysis shows that model of the SETSIS with PTE factor and
OBE factor were contributing significantly in predicting score of the content
knowledge among respondents. The coefficient results were used in the working
model as follows.
𝑇𝐼𝑆𝑃 = 16.64 + 0.12𝑂𝐵𝐸 − 0.05 𝑃𝑇𝐸
This model works but only estimates about 9 percent of variability with the TISP
score. Checking on the validity of the model with the observed data, the predictive
model was used with the TISP data of the two groups: the group of semester 5 with
the lowest mean score in the TISP, and the group of semester 8 with the highest
mean score in the TISP. The predictive scores of the model were plotted against the
observed scores of the two groups.
Figure 25 Model prediction of science inquiry skills knowledge for semester 5
Figure 25 shows the model was applied to 60 respondents of semester 5. The
predictive score of the TISP then plotted with the observed score of the TISP. The
scattered plot shows positive correlation with low variance. A visual inspection shows
that the model apparently has a good correlation with plotted points scattered near
the best fit line. However, the R square value shows a low variability of 2 percent
indicating that there is too much low variance in predicting the content knowledge.
y = 3.4927x - 55.401R² = 0.1617
15
17
19
21
23
25
27
29
31
33
35
18 19 20 21 22 23 24 25
Ob
serv
ed T
ISP
sco
re
Prediction of TISP score

163
Figure 26 Model prediction of science inquiry skills knowledge for semester 8
Figure 26 shows the model applied to 74 respondents from the semester 8 group.
The predictive score of the TISP is then plotted with the observed score of the TISP.
The scattered plot shows positive correlation with variances approximately the same
with the group above. Visual inspection shows the model apparently has a good
correlation with plotted points scattered near the best fit line. The R square value
shows variability at 2 percent, which is too low to indicate the content knowledge
performance.
7.2 Association of the SETSIS and science teaching practice
7.2.1 Professional Teaching Practice Assessment
In the BoTP curriculum, Professional Practice comprises formal modules for PSTs
practicing their teaching in real situation. These modules are conducted in real
primary science classes during the final four semesters of the BoTP programme.
These modules are part of the ITE curriculum used to assess in-site practices. PSTs
need to undergo three phases of modules of Practicum in semesters 5, 6 and 7, and
a module of Internship in semester 8 at designated schools.
During the practicum, a PST needs to teach for at least eight periods in science
classes every week. Teacher trainers and guidance teachers from the schools
observe the teaching sessions in real classes and conduct supervision of nine times
in every phase. Joint assessments on teaching performances are based on
y = 1.3877x - 7.9666R² = 0.1331
15
17
19
21
23
25
27
18 19 20 21 22 23 24 25
Ob
serv
ed T
ISP
sco
re
TISP prediction score
Model prediction
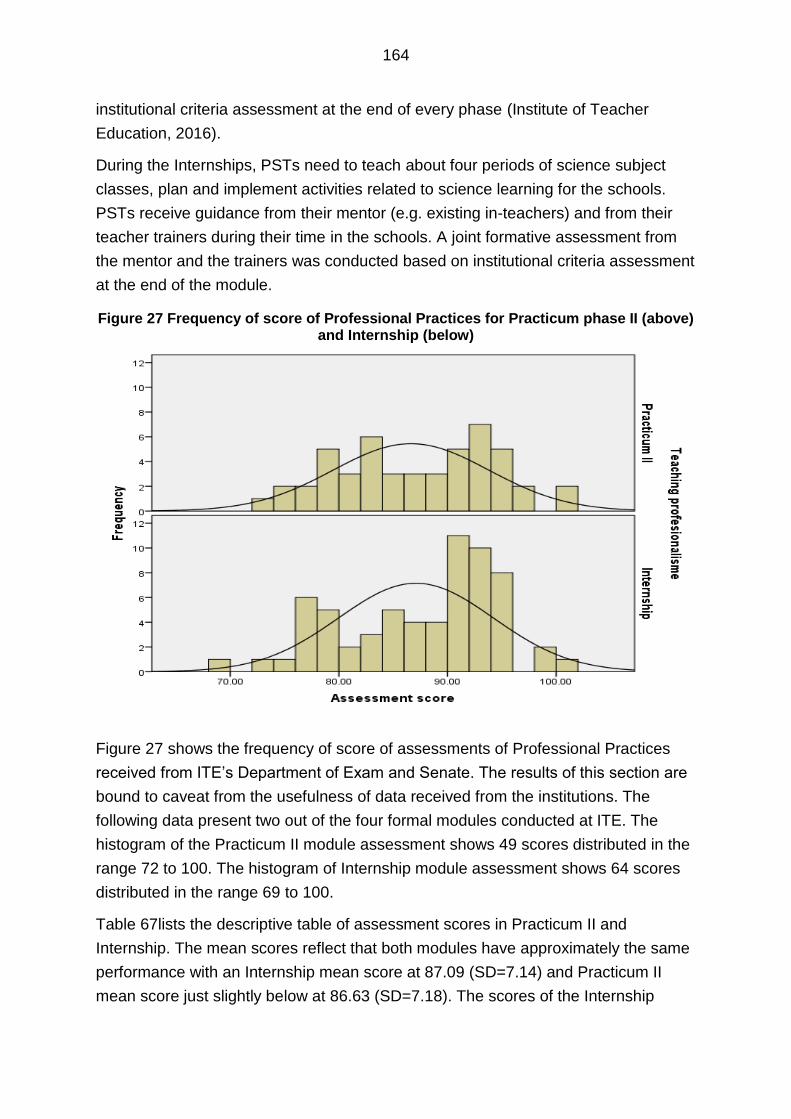
164
institutional criteria assessment at the end of every phase (Institute of Teacher
Education, 2016).
During the Internships, PSTs need to teach about four periods of science subject
classes, plan and implement activities related to science learning for the schools.
PSTs receive guidance from their mentor (e.g. existing in-teachers) and from their
teacher trainers during their time in the schools. A joint formative assessment from
the mentor and the trainers was conducted based on institutional criteria assessment
at the end of the module.
Figure 27 Frequency of score of Professional Practices for Practicum phase II (above) and Internship (below)
Figure 27 shows the frequency of score of assessments of Professional Practices
received from ITE’s Department of Exam and Senate. The results of this section are
bound to caveat from the usefulness of data received from the institutions. The
following data present two out of the four formal modules conducted at ITE. The
histogram of the Practicum II module assessment shows 49 scores distributed in the
range 72 to 100. The histogram of Internship module assessment shows 64 scores
distributed in the range 69 to 100.
Table 67lists the descriptive table of assessment scores in Practicum II and
Internship. The mean scores reflect that both modules have approximately the same
performance with an Internship mean score at 87.09 (SD=7.14) and Practicum II
mean score just slightly below at 86.63 (SD=7.18). The scores of the Internship

165
module have a slightly wider range with significantly normal distribution compared to
the Practicum II module, which were not significantly normal.
Table 67 Descriptive table for Practicum II and Internship
Due to the following analysis of multiple regression, the scores for Practicum II and
Internship were combined and label as Professional Practice. Figure 28 shows the
histogram of the combined scores of the two assessments called Professional
Practice. Visual inspection shows good distribution of the sample in the assessment
score.
Figure 28 Performance in Professional Practice
The combination of 113 samples from the two module assessments were used for
this analysis. Descriptive analysis in Table 68 shows the result of mean performance
in Professional Practice within the range of the SD of the two mean scores from
Table 67. A normality test shows a significant result (p<0.01). The result concludes
that the combination data was appropriate to represent the performance of the two
modules using Professional Practice.
Statistic df Sig.
Practicum II49 86.63 7.18 1.03 72.00 100.00 0.97 49.00 0.21
Internship64 87.09 7.14 0.89 69.00 100.00 0.95 64.00 0.01
Shapiro-WilkN Mean
Std.
ErrorSD
Minimum
score
Maximum
score

166
Table 68 Descriptive analysis of Professional Practice score
7.2.2 Correlation between the SETSIS and teaching practice
assessment
The SETSIS measurement model were developed theoretically using the concept of
self-efficacy believe to predict capability in performing the task of teaching science
using science inquiry skills. Using the concept in the model, this section tests the
hypothesis that the SETSIS measure is capable in predicting the performance of
respondents in the practice of teaching science (i.e. the assessment score of
Professional Practice).
Correlation and multiple regression analyses were conducted to examine the
relationship between PSTs’ assessment scores of Professional Practice and
potential predictors from the SETSIS measure. The results are used to discuss
potential utilisation of the SETSIS model in the area of science teaching practice.
Bivariate correlation between performances in professional teaching practice with the
three theoretical factors model of the SETSIS are listed in Table 69. Pearson
correlations show non-significant correlation between the practice and any
components of the SETSIS. However, it can be seen that each of the practice scores
correlate very weakly with the predictors. All predictors were positively correlated
except PTE, indicating higher traits in predictors tending to have higher performance
in practice except for the PTE trait.
Table 69 Correlation of Professional Practice with the SETSIS model
Two multiple regression models were tested. Model 1 has three possible predictors
(i.e. KE, PTE and OBE) and Model 2 has two possible predictors (i.e. KE and PTE).
Statistic df Sig.
Teaching Practicum 113.00 86.89 7.13 69.00 100.00 0.96 113.00 0.00
Shapiro-WilkN Mean SD
Minimum
score
Maximum
score
KE PTE OBE
Professional Practice
0.104 -0.018 0.009
Professional
Practice

167
Checking on residual plots of both models show random patterns that indicate that
the data can be used with the regression models. Table 70 lists the results of
regression model summary for Models 1 and 2. Results show both models have
weak predictor correlation indicating that both models explain only 5 percent of the
variability of the performance data around its mean.
Table 70 Results of regression model summary to infer Professional Practice
Model R Adjusted R
square Standard
Error F-test Significant
Model 1 0.225 0.015 7.077 1.434 0.228
Model 2 0.226 0.034 7.010 2.969 0.055
Results of adjusted R square in Table 70 increase in Model 2 instead of Model 1.
The result indicates that the model predicting better without OBE. F-test shows that
Model 1 does not significantly work, F (3,109) = 1.43, p>0.05. Model 2 shows a
better working model with F-test result is just slightly over significant F (2,110) =
2.97, p=0.055.
7.2.3 Predictive model to infer practice performance
Multiple regression was used to examine the relationship between a predictor and
dependent variable (i.e. Practice Performance) after controlling the other variable in
the model. According to the result in the above section, Model 2 is considered as a
working model of the SETSIS in predicting practice scores among respondents.
Looking at model contributors inTable 71, KE has a significant positive regression
coefficient, indicating respondents with higher scores in the KE subscale are
expected to have higher performance scores in professional practice after controlling
PTE. One unit of increase in KE score increase 0.22 unit of performance of
professional practice. On the other hand, the PTE subscale has a negative
coefficient as suggested from its correlation. This indicates that after accounting for
KE scores, respondents with higher PTE scores are expected to have lower scores
in professional performance. Increasing a unit of PTE scores will predict 0.22 unit
decrease of score in Professional Practice.

168
Table 71 Multiple regression predictors of the working model to infer professional practice
Model 2 Coefficients Standard Error Significant
Intercept 83.550 4.880 0.001
KE 0.220 0.090 0.020
PTE -0.220 0.100 0.030
7.2.4 Applying the predictive model
Multiple regression analysis shows that models of the SETSIS with KE factor and
PTE factor contribute significantly in predicting scores of professional practice
among respondents. The coefficient results are used in the working model as
follows:
𝑃𝑟𝑎𝑐𝑡𝑖𝑐𝑒 = 83.55 + 0.22 𝐾𝐸 − 0.22 𝑃𝑇𝐸
This model seems to work but only estimates about 5 percent of variability of
professional practice. Checking on the validity of the model with the observed data,
the predictive model was used with the data of the two group assessments:
Practicum II and Internship. The predictive scores of the model were plotted against
the observed scores of the two groups.
Figure 29 shows the model applied to 49 respondents (see Practicum II in Error!
Reference source not found.) in semester 6 group. The predictive score is then
plotted with the observed scores of Practicum II. The scattered plot shows positive
correlation with low variance. Visual inspection shows that the model apparently has
a good correlation with the plotted points that were scattered near the best fit line.
However, the R square value shows low variability of 3 percent, indicating that it has
too much low variance in the model.
Figure 30 shows the model applied to 64 respondents (see Internship in Table 67) in
semester 8 group. The predictive score then plotted with the observed score of
Internship. The scattered plot shows positive correlation with variance slightly higher
than the group above. Visual inspection shows that the plotted points are closer at
higher observed score but scattered further at the lower observed score. The R
square value shows higher variability at 5% but considering too low in indicating
practice.

169
Figure 30 Model prediction in Internship (semester 8)
y = 0.71x + 41.45R² = 0.052
60
65
70
75
80
85
90
95
100
105
60 62 64 66 68 70 72
Ob
serv
atio
n s
core
Model predictive score
y = 0.53x + 52.34R² = 0.034
60
65
70
75
80
85
90
95
100
105
110
60 62 64 66 68 70 72
Ob
serv
atio
n s
core
Model predictive score
Figure 29 Model prediction in Practicum II (semester 6)

170
7.3 Summary findings of the chapter
The findings demonstrated that there are weak correlations between the SETSIS
and the two measures. In the measure of content knowledge, the score of the TISP
has low but significant correlation with the OBE. Although the correlation might not
establish a strong association, it does inform a tendency of performance in the
content knowledge test (i.e. the TISP) influencing the belief about the outcomes of
using science inquiry skills in science learning.
The predictive model of the SETSIS also significantly shows contribution of OBE,
together with PTE in inferring the content knowledge. However, the model shows
contrast contribution of the two traits. While OBE have a positive contribution, PTE
have a negative contribution that infer the content knowledge. Even though the
working model shows low variability in inferring the content knowledge within the two
groups’ score, the analysis revealed that the OBE and PTE have the possibility to
infer the content knowledge of PST.
Furthermore, KE interstingly was foundnot to contribute to the teacher’s content
knowledge performance. This may be due to the fact that PSTs develop their
knowledge in teaching using their own sets of experiences from their own everyday
practices in the classroom and not only from their existing content knowledge (van
Driel, Verloop and de Vos, 1998). The PSTs have to cope with the requirements to
teach the science subject using science inquiry skills regardless of their level of
understanding of the content knowledge. Thus, they might also be performing in the
classroom without a full understanding of the content knowledge of the science
subject (Harlen and Holroyd, 2007; Hafizan, Halim and Meerah, 2012)
The findings revealed the association between the SETSIS and teaching practice were low
between the three predictors of the SETSIS with the score in Professional Practice. The
score of Professional Practice correlated negatively with PTE. The model predicts practice
with two contributing factors; KE and PTE. It seems that OBE has no contribution in
predicting practice.
This model identifies efficacy in knowledge of teaching (KE) and efficacy in personal
teaching capability (PTE) ; two efficacy element of underpinning PCK contribute to PSTs’
professional practice (Seidel and Sturmer, 2014) . Uniquely, the model infers positiive
contribution of KE instead negatively contribution of PTE. Shulman (1986) in his explanation
of strategic knowledge in the teaching practice field, describes “it is in the very nature of
the practical or policy fields that individual principles (knowledge of teaching ) are
fated to clash on particular occasion (in practice)”(p.13).

171
The silent resistance which was portrayed through the contradict contributors in the practice
indicated that Professional Practice courses offer chances for PSTs to develop their teacher
knowledge. However, the factor of belief in the output of using science inquiry skills as
suggested in the reform policy was still lacking. As a result, even though PSTs posed the
‘theory’ of teaching using science inquiry skills in training, that might not be enough to
expect inculcation of science inquiry skills during classroom teaching practices.

172
Chapter 8 Discussion and conclusion
8.1 Introduction
In this chapter, I discuss the main findings from my study related to the development
and validation of the SETSIS, which emphasise the study’s contribution to theory
and practice. The first section discusses the contribution of the study findings in the
area of instrument design and development, and the substantive findings in order to
achieve the objectives of the study. The second section discusses the significance of
the findings related to PST education, especially for the Institute of Teacher
Education (ITE) in Malaysia. The third section discusses the limitations of the study
with suggestions for future research using its findings. Finally, this chapter concludes
with a personal reflection on the study.
8.2 Contribution of my study
This study aimed to develop a theory-driven, valid and reliable instrument that allows
the measuring of self-efficacy for the specific task of teaching using science inquiry
skills in the specific specifically in the context of the PST education field. The SETSIS
is an attempt to develop a TSE tool with a theoretical concept that has emerged from
recent literature. It is defined by the three subscales, KE, PTE and OBE in the
particular task of using science inquiry skills. Previous chapters (Chapters 4, 5, 6 and
7) were dedicated to answering the RQs of the study, and this chapter will further
discuss the findings’ contribution to the study objectives accordingly.
8.2.1 Overview on contribution of the findings
The SETSIS is developed extensively from the teacher efficacy model (Tschannen-
Moran, Hoy and Hoy, 1998), and this study initiates integration between the teacher
efficacy model and the substantive teacher efficacy measure within the challenges
and issues of TSE measures in teaching development (Wyatt, 2014) and knowledge
for teachers (Roberts and Henson 2000). Within the three factors of self-efficacy, this
study proposes the SETSIS as a viable model for TSE measurement within the
particular task and domain. As this study aims at exploring the combination of the
three subscales in the model, it also discusses the validity of the SETSIS
measurement in aligning along with the concept of PST development in teaching
science.

173
The discussions of the findings are presented according to the objectives of the
study. The finding stated in section 8.2.2 emphasises the concept of the three factors
developed from the literature and applied in the SETSIS. The concept is able to
define the TSE measure in alignment with teacher development in the context of
teacher education. The discussion provides the conceptual insights that the SETSIS
can work as a model for TSE measures in the specific task of teaching science using
science inquiry skills.
Next, section 8.2.3 discusses the statistical evidence that emphasises the reliability
and validity of the proposed SETSIS. The findings are used to clarify the construct
validation of the SETSIS, especially in the three factors and their contributions in the
refinement of TSE model literature. Then, section 8.2.4 discusses the SETSIS as a
statistically acceptable model of measurement. The findings provide empirical
evidence that the SETSIS has improved the operationalisation of teacher knowledge
in models of TSE measurement (Roberts and Henson 2000; Pruski et al. 2013).
Lastly, section 8.2.5 discusses the substantive findings that emphasise the relation
of the SETSIS measures with the existing teacher knowledge assessments
consisting of a subject knowledge test and the institutional practice assessments. It
suggests that the SETSIS might contribute to evidence of an early concept of belief
assessment that can infer the PSTs development in teaching.
8.2.2 Objective one: To define and conceptualise the SETSIS construct
based on the concept of TSE in a PST education context
Research in TSE measures development and provides ambiguous concepts on the
specificity of task and context measures. Prominently, the model of TSE quantitative
measures emphasises the role of agent-end rather than the concept of agent-means
(Bandura 1986; Tschannen-Moran and Hoy 2001; Wyatt 2014). This study improves
the concept of TSE by developing a quantitative tool that assesses belief in the
ability to take action in teaching using science inquiry skills rather than a belief in
ability to bring out the outcomes of science inquiry skills. The study of the SETSIS
has demonstrated work to establish a TSE concept that assesses the specific task of
teaching using science inquiry skills in the specific context of PST development. This
study has enabled the underlying principle to be identified more clearly in the specific
task that aligns with the context of teachers’ knowledge development of PSTs (Veal,
2012; Juttner et al., 2013) in the construct framework of the SETSIS presented in
Chapter 4. Generally, the SETSIS is developed using the three representatives of
subscales, as noted below.

174
• The belief that I know what I need to know to teach using science inquiry skills: KE represents belief in possession of the science inquiry skills knowledge by an individual PST.
• The belief that I can effectively use science inquiry skills in teaching classroom science: PTE represents belief in personal capability in translating the knowledge into action.
• The belief that using science inquiry skills can improve students learning in science: OBE represents belief in the values of science inquiry skills teaching in science learning.
The items constructed for the SETSIS in this study demonstrate good content validity
from the consensus of ten experts in the area. The items have high recognition from
the experts for all the three subscales (see section 4.5.1). The consensus supports
the containing construct and gains the experts’ recognition about the importance of
the interaction of the three self-efficacy factors in the context of the PSTs’ education
development.
The three subscales represent the knowledge from both theoretical and practical
perspectives that are inextricably linked to the belief of PSTs while teaching. PSTs
believed in developing their knowledge of teaching not only from the successful
outcomes but also in the classroom teaching process (Abd-el-khalick, Bell and
Lederman, 1997; Van Driel, De Jong and Verloop, 2002; Kind, 2009). With the
attempt to explore PSTs beliefs concerning agent-means beliefs as they interact with
agent-ends beliefs (Wyatt 2014), this study has applied the teacher knowledge
perspective to the three factors of the SETSIS. The experts’ finding has given the
positive consensus to the further possibility of KE as one of the factors in TSE
(Wheatley 2012; Wyatt 2010), in addition to PTE and OBE, which have been
highlighted in models commonly used in TSE measuring (Kleinsasser, 2014).
Further, in the findings of section 4.5.2, the pre-test survey empirically confirmed the
constructed instrument at the item-level. Statistical evidences of item polarity and
item fit demonstrate the combination of items in the construct which was measured
in the same direction and, as expected in the responses, determined using
parameters of the Rasch model analysis. That means all the result items were
checked to ensure they were working well together in measuring one underlying
variable, which is self-efficacy in teaching using science inquiry skills.
8.2.3 Objective two: To determine the psychometric qualities of a
measure of self-efficacy in teaching science using science inquiry
skills
The SETSIS shows high reliability in the responses gained. Early descriptive findings
in the average mean scores of normality distribution (z-score) are closely matched to
175
the mean scores of self-efficacy in five components of essential elements of inquiry
(Smolleck, Zembal-Saul and Yoder, 2006). In the context of the specific task in using
science inquiry skills, this in part reflects close similarity to the self-efficacy
judgement about science inquiry skills with PST samples from Smolleck‘s research
in the US.
Furthermore, this study provides significant findings in differences for mean scores
across the subscales of KE, PTE and OBE. Comparatively, the mean score shows
proximity to the previous research into self-efficacy in teaching using inquiry
(Smolleck, Zembal-Saul and Yoder, 2006). However, respondents have differences
in judgement of self-efficacy across the three factors proposed in this current study,
perhaps this is because in this study it emphasises more on self-efficacy in the
action of teaching using science inquiry skills rather than self-efficacy in making
learning engagements using science inquiry. The features in the three factors seem
important for exploration in the context of PST development with the task of using
science inquiry skills as a teaching method (Wheatley, 2005). Thus, the SETSIS
seems to be able to provide reliable information with regards to self-efficacy as the
outcomes of the three important factors.
The next findings will examine the main features of the three theoretical factors
developed together to measure the self-efficacy construct. Exploratory factor
analysis (EFA) is used to empirically examine the existence of the factors in the
SETSIS’s structure. The analysis supports the contributions of the 66 items,
clustered together to form three factors with good inter-correlation. The three
contributed factors explained a total of 54.70 percent variance of the measure, which
implies better indication of factorial validity instead of the two-factor measure
consisting of PTE and OBE that is commonly used in science teacher efficacy
(Gibson and Dembo 1984). Additionally, the reliability results in the SETSIS
demonstrate a strong construct validity at > 0.90, which is far better for general
reliability than the two factors of the Teacher Efficacy Scale of Gibson and Dembo
(1984) (Henson, 2001). The results of the SETSIS also point out the highest factor,
which based on the contributed items is interpreted as KE and explains 45.26
percent of response variance. This finding clearly supports the idea that the KE
factor has an intriguing role of self-efficacy in the subject knowledge (Wheatley,
2005; Palmer, 2011), adding a significant factor into the existing TSE model. In the
sense of factorial study, the SETSIS provides empirical validation to explain a better
refinement of the three-factor validity sample.

176
8.2.4 Objective three: To operationalised and develop a
psychometrically defensible measurement model of the SETSIS
In this section, I will discuss the establishment of the SETSIS as a valid
measurement model based on the findings using the Rasch model analysis. Given
that the SETSIS response data were proven reliable and fit to the Rasch model, the
results of the analysis are discussed as evidences to a working model of the
SETSIS.
At the item level, the results of person reliability at 0.98 with six persons separation
and the items reliability at 0.98 with seven item separations indicated that the
SETSIS has valid items to measure self-efficacy in teaching using science inquiry
skills among the sample respondents. The results provide evidences of an ability of
the SETSIS to discriminate a respondent’s level of self-efficacy based on responses
given to the items. The operationalisation of the level of self-efficacy discrimination
is now explained.
The analysis in the relationship between respondents and the items responded to
using the Wright map (Figure 17) has discriminated three levels of self-efficacy
based on the items’ level to the relative position of respondents.The respondents
located at the bottom position relative to the easy item level are described as having
low level of self-efficacy. The respondents located at the level of the mean items are
described as at the average level of self-efficacy, while respondents at the level of
the high items and above are described as respondents with high levels of self-
efficacy. The level discrimination on the map reports the level of self-efficacy based
on probability responses to the items level measure. Although the result
acknowledges more items are needed to measure and discriminate the responses at
the top position of the map, it discerns the three levels of items that are
characterised to measure each level of self-efficacy in teaching using science inquiry
skills.This structure analysis at the item level has empirically proven that the SETSIS
is a functional tool to assess and discriminate self-efficacy in PST education.Thus,
the patterns that emerged can be generalised to describe levels of self-efficacy in
teaching using science inquiry skills in the targeted population.
Additionally, the five-points rating scale is used also to contribute to the
operationalisation of the measurement model. The findings in section 6.2.2 provide
evidence that the constructed model can facilitate the interpretation validity using the
rating scale model. The finding empirically shows that the same five-points rating
scale used across the SETSIS was able to function as expected and explained all
the responses well in every category. Results provide tentative evidence that PSTs’

177
responses to the SETSIS are best matched using five-point category descriptors
(Bandura 2006; Toland and Usher 2015).The study also demonstrates utilisation of
the rating scale model and traces the interpretation of the model-based level into the
real score estimation (Irribarra et al., 2015). The finding is able to identify empirical
boundaries between the model-based level and estimates ranks for the true score.
The result indicates in the true scores of five ranks able to identify generally increase
of self-efficacy level across semesters. Empirically, the true score ranking result
visualised in Figure 21 shows the top ranks comprising the majority of the higher
groups of semesters while lower ranks consist of relatively low groups of semesters.
It explains that high self- efficacy during the programme influences PSTs’
characteristics in developing a sense of efficacy in teaching skills (Deehan, Danaia
and McKinnon, 2017). This suggests that the present study has managed to assess
the personal responses and empirically validate and operationalised the SETSIS to
measure self-efficacy in teaching using science inquiry skills over the course of the
PSTs education programme.
Subsequently, the SETSIS is developed to support teaching development in PST
education that is conducted parallel to the model introduced in SETAKIST (Roberts
and Henson 2000). Though SETAKIST provides the direction of the concept of self-
efficacy assessing specialisation in teacher knowledge, the work provided little
concrete direction in the operationalisation of the concept, especially in the
construction of items and the scaling (Pruski et al., 2013). This study, on the other
hand, was able to provide confidence for the validity of the items and the scaling to
be used as a personal belief component in assessing the PSTs’ teacher knowledge
development. The findings empirically synchronise the items tasks, score scale and
the measurement model across the three factors of KE, PTE and OBE (Brown and
Wilson 2011), thus validating the SETSIS as a working model of TSE measure.
8.2.5 Objective four: To infer PSTs development using the
measurement model of the SETSIS
This study has provided the evidence that the subject knowledge for teaching is
interconnected with the views reflected in KE, PTE and OBE. In the concurrent validity
test for specific subject knowledge of science inquiry skills (i.e. the TISP) , the SETSIS
revealed positive but very weak relationships between self-efficacy in teaching using
SIS and the subject knowledge tested. The findings also provided a significant
emphasis on expectancy of belief in teaching outcomes (i.e. OBE) being weak which
is related to the subject knowledge possessed. The findings reveal the important role

178
of belief in developing teacher’s specific owned knowledge (i.e. in teaching using
science inquiry skills), a similar discovery found in Pajares (1992).
The predictive model infers performance of content knowledge with a linear trend and
significant to two predictive factors. It explains for the small variability of the response
data but indicates that the predictor factors (i.e. PTE and OBE) can provide information
on the predictive variable. This information suggests PTE and OBE are among the
contributing factors to infer the content knowledge performance with contradicting
contribution.The predictive model informs that the content knowledge increased
expectancy belief in teaching outcomes but decreased their personal teaching
practice.
In the context of the performance of PST’s content knowledge, this predictive model
infers that the subject knowledge can increase the belief in outcomes of using
science inquiry skills, but this is not reflected in PST’s belief about their personal
capability of teaching using the skills in classroom. This finding addressed that the
existing assessments of content knowledge used in the current programme, seem to
well reflect the belief on the outcomes of teaching but are not enough to reflect the
personal belief in teaching capability. It suggests the content knowledge is able to
develop belief in good outcomes by using the skills but at the same time increases
doubt in personal capability of using the skills in the science classrooms.
This study further investigated the contribution of the SETSIS components in relation
to science teaching performance using data of teaching practice assessment provided
by the ITE. The findings reveal there is no significant correlations between the teaching
practice in all the factors. The correlations were positive except for PTE.
Subsequently, it provided further evidence in the context of the teaching practices in
Malaysia by the multiple regressions model. The predictive model suggests that the
PSTs’ performance in teaching practices is dependent on a positive factor of KE.
However, after considering the contribution of the KE, PTE contributes negatively to
the practice performance.
The predictive model explains the observed issues in the context of the performance
of Malaysian pre-service and novice teachers’ performance in using science inquiries
in the classrooms. Thus, PSTs were able to state the importance of using science
inquiry skills in the classroom but not incoporating them during classroom teaching a
similar outcome were found in the studies of Hairiah and Keong (2011) and Rauf
(2013). It seems that PSTs and novice teachers failed to implement the planned
science inquiry skills task in the classroom because they personally did not have the
belief and self-confidence to use the task (i.e. negative contributor of PTE) even

179
though they have the belief that they had the knowledge about it (i.e. positive
contributor of KE). Thus, this study seems to inform the lack of factors for the
unsuccessful implementation of PST knowledge in the teaching practice of using
science inquiry skills in the classroom.
The findings from this current study have drawn attention to the extent that subject
knowledge and practice knowledge growth in PSTs mirrors their growth of self-
efficacy. This study has highlighted differences and similarity in results which from
previous literature related to self-efficacy and the relationship of the subject knowledge
and practice knowledge of teachers. Thomson et al. (2017) for instance found that
there are a strong link between self-efficacy in teaching science to subject knowledge,
and instructional knowledge in PSTs’ education; yet the practice performance is a
better predictor of future self-efficacy. In the other hand, Wyatt (2010) found that they
are unevenly developed growth of teacher knowledge and TSE in a PST partly
because of the constraints imposed by the curriculum and its context.
In the context of the new curriculum implementation in Malaysia, the findings call for
some explanations about belief in personal teaching capability in using science inquiry
skills. PSTs’ perceived belief in the knowledge possession and belief in the value of
the outcomes of using inquiry skills in teaching science.This is well reflected with their
growth in the teaching task and the subject knowledge, but it is not the same direction
as their growth of belief in their personal capability of teaching. It seems that the two
types of assessments used by ITE enable to develop the growth of the teacher’s belief
in knowledge efficacy and their belief in outcomes efficacy, nevertheless shows
negative results on the belief of the their personal efficacy.
The findings in the predictive of the SETSIS reveal that the SETSIS model in this
study is able to predict the content knowledge performance (i.e. the TISP) and the
teaching practice assessments of pre-service teachers. However, the results in this
study has a weak association with the findings Bandura (1977) had conceptualised.
Bandura discovered the association between PTE and OBE as the predictive factors
to explain the specific performance. Nevertheless, the models developed in this
study had significant information in the contribution of perceived personal teaching
capability (i.e. PTE) and the belief in the outcomes (i.e. OBE) to infer the content
knowledge performance in difference directions.
Even though Bandura (1977) has conceptualised the role of self-efficacy within the
two factors (i.e. PTE and OBE) to infer future behaviour, noticeable results found in
the predictive models using multiple regression model were only able to explain the
association of PTE and OBE in the specific content knowledge performance. There

180
were weak association but, the models have given significant information in the
contribution of perceived personal teaching capability (i.e. PTE) and the belief in the
outcomes (i.e. OBE) to infer the content knowledge performance in different
directions.
This results may support the findings of in Riggs & Jesunathadas (1993) and Riggs
et al. (1994), where they uncovered PTE contributed with the higher performances
and OBE reacted only with the weak believe. In this study, the content knowledge
tested (i.e. knowledge of SPS in teaching science) were fundamentally knowledge
learned during school days and not during the programme. The PSTs might
performed in the fundamental knowledge of SPS but still develop their belief of the
outcomes of the teaching science using the knowledge.Thus, in order to infer content
knowledge of the teaching programme, this study suggests PTE and OBE to be used
as a measure factors in TSE.
In the other hand, the model revealed that the two factors of self-efficacy, KE and
PTE significantly inferred teaching practice performance. This supports the idea
suggested in Robert & Henson (2000) to measure TSE based on the concept of
PCK. Likely that the two factors of KE and PTE are consistent with the teacher
knowledge model used in the teacher training programme. KE and PTE are able to
infer the teaching performance among PSTs. Nevertheless, the findings were unable
to explain the significant contribution of OBE and inferred the teaching practice
performance. Since the teaching performance were assessed towards the end of
BoTP, the OBE might have been self-developed and too strong to be considered in
the model. Thus, in order to infer teaching practice performance, this study suggests
KE and PTE to be used as a measure factors of TSE.
To conclude, this study presented valid evidence of the three factors as the general
construct of the SETSIS instrument. Through a rigorous process, the construct
framework of the measure was validated with the main pilot study. It has explained
the SETSIS as a measurement model that seeks to explain three factors
(knowledge, belief and practice) underpinning self-efficacy in teaching using science
inquiry skills. This study was able to provide validity for the SETSIS through
evaluation of the psychometric properties of the instrument. The findings
acknowledged that the three factors extend the model of teacher efficacy, which
informs the self-efficacy in teaching using science inquiry skills but the models utilise
different sets of factors to infer performance in context of knowledge and practice of
teaching. However, the limit has been set, based on the interpretation of theory and
findings in the context of PST education in Malaysia. The validation of the score

181
interpretation was based on the context rather than the usage of the score in
general.
8.3 The study implications
The construction of the SETSIS aims to support the effective transformation of the
new science primary curriculum. The SETSIS is designed to be able to identify levels
of self-efficacy in teaching using science inquiry skills among PSTs. The result can
provide an initial description of PSTs’ future capabilities in implementing the
curriculum in classrooms.
8.3.1 Implication for teacher educators
Firstly, the study was able to establish a valid and reliable TSE tool to measure self-
efficacy in specific context of task. In working towards preparing PSTs to implement
the reform-based strategies in the classroom, the SETSIS helps teacher educators
to identify the level of self-efficacy in the subject knowledge (KE) in the individual
PST, and in advance identify the perceived capability in teaching practice (PTE) of
using science inquiry skills. The additional information of OBE can also be used to
assess PSTs’ ground beliefs and perceptions about the teaching task given in the
training duration. Teacher educators can easily get straight-forward information
about the PSTs belief from the SETSIS throughout the training programme. Having
the assessment information in the level of self-efficacy can create awareness about
the PSTs’ personal beliefs in the reform strategies. It is important to acknowledge the
PSTs’ beliefs (self-efficacy) as it brings about necessary reform-based pedagogy
strategies (Lumpe et al., 2012). PSTs need to feel that they are capable of
implementing reform strategies successfully. With information at hand, and one way
to make PSTs feel capable to implement the strategies is to promote adequate
training in the reform strategies.
Secondly, the predictive models of the SETSIS suggests negative impact on the
confidence of personal teaching practice to PSTs’ knowledge of science inquiry skills
and PSTs’ teaching practice. The correlation models (section 7.1.1.3 and section
7.1.2.3) from the substantive findings reflect belief of PSTs in teacher knowledge of
teaching science using science inquiry skills. It explains about contrary belief factors
that may not be detected from the cognitive test (Hafizan, Halim and Meerah, 2012)
or practice assessment (Hairiah and Keong 2011).
The direct-measure of the self-efficacy in teaching using science inquiry skills seems
to provide an alternative measure for the constraint of contrary outcomes between
PSTs’ belief position with their knowledge possession, and with their teaching

182
practice performance. The contrary direction of contributed self-efficacy factors in
inferring ITE teaching practices in the findings of this study should be checked. It
informs teacher educators of the lack of factors in belief for the unsuccessful
implementation of PSTs knowledge in teaching practice of using science inquiry
skills in the classroom. As Wheatley (2002, p.9) asserts ‘disequilibrium inherently
causes and involves uncertainty’, that means concern about reforms that require
teacher educators to make fundamental changes to practice that do not align with
the curriculum will not make the implementation successful. Therefore, teacher
educators should be concerned whether reform-teaching strategies learned during
training match PSTs’ beliefs in their capability to implement the knowledge. Having
the access to find out the level of the PSTs’ self-efficacy can help teacher educators
to identify cases and provide support to challenge the existence beliefs and
strengthen the source of self-efficacy, which may result in positive development in
implementing policy practice.
Information gathered from the three components of the measure can may be able to
facilitate teacher educators to infer future potential implementation of the teaching
knowledge learned in the science inquiry classroom. For instance, if the outcomes
show high efficacy in OBE but not with KE and PTE, teacher educators may develop
a strategy to help provide confidence in using science inquiry skills in their classroom
teaching while strengthening the subject knowledge and the teaching practice
mastery. On the contrary outcomes, teacher educators may provide open
discussions to challenge their outcome expectancy belief and develop positive belief
persuasion in using science inquiry skills rather than focusing solely on the cognitive
development in the training provided. It is important to maintain positive levels of
self-efficacy belief as it is essential to make PST less likely to give up when
encountering difficulty to deliver science using science inquiry skills in their future
teaching career (Pajares, 1992; Bandura, 1994; Zimmerman, 2000) and at once,
give them the positive impact to their development in the teaching of science. Thus,
it is recommended for the teacher educators to assess the affective component
along with training assessment for personal evaluation, which is important for PSTs’
education development (Darling-Hammond, 2006).
Lastly, the study argues that the SETSIS promotes links to PSTs development in
teacher’s knowledge. It shows general positive increment in self-efficacy during
training; yet, it is also able to identify evidence of doubt caused by the “reality shock”
of teaching experiences indicated by decreasing self-efficacy beliefs (Ruys, Van
Keer Hilde and Aelterman Antonia, 2011). Teacher educators should be aware of the
present efficacy doubts because it may lead to less effort and giving up more easily

183
in the reform-base strategies (Tschannen-Moran, Hoy and Hoy, 1998). Teacher
educators could help with effort of activities that can encourage reflective thinking
(Henson, 2001). Through reflection, PSTs can use various of self-efficacy sources
(Bandura, 1986) to build experiences to succeed in the reform-task.
8.3.2 Implication for policy-makers in PST education
The findings from this study indicated that self-efficacy in teaching using science
inquiry skills varies from not confident, slightly confident, and confident to definitely
confident. In addition, the evidence shows that the PSTs’ self-efficacy has increased
significantly by the end of their training. With regards to the context of PST education
in Malaysia, PSTs are required to complete 24 weeks of in-site classroom teaching
practice and a four-week internship towards the end of the BoTP programme. During
this, the PSTs develop conscious awareness in their teaching decisions as they are
expected to depend on the in-site school guidance and are accountable for their own
learning process during the classroom practice. They therefore increase self-efficacy
towards the end of the programme as a result of this awareness and the
requirements of the specific curriculum unit (Darling-Hammond, Newton and Wei,
2013). Through the self-efficacy information, the importance of teaching practice
experiences among PSTs should be emphasised in the curriculum along with the
subject knowledge learned.
Instead Despite of the setback after the experience with the classroom teaching
practices, PSTs are able to strengthen their perceived ability in teacher knowledge. It
shows the importance of classroom teaching experiences in creating awareness of
their potential in using the teacher knowledge and the importance of a well-
supported training programme to strengthen their self-efficacy in teaching (van Driel,
Beijaard and Verloop, 2001; Darling-Hammond, 2006). It was encouraging to see
PSTs becoming aware of their self-efficacy doubt (Wheatley, 2002) as soon as they
entered the programme. They can get the support needed from the training
programmes earlier and learn to handle their doubts during the training rather than
when they becoming novices. Thus, it is important to expose teaching practice
experiences in the teacher education curriculum at the early stage of training.
Moreover, policy-makers may consider using a tool such as the SETSIS to measure
the belief component of teacher knowledge in the BoTP assessment curriculum. The
self-efficacy level can infer the teachers’ resilience towards implementing the
transformed curriculum in Malaysia. PSTs’ positive self-efficacy combines with doubt
in their capability to often foster great effort, motivation and achievement (Wheatley,
2002); thus, introducing the assessment into the curriculum may help to create

184
awareness of self-efficacy and gain effort in getting the best help during the training
programme. The information about the level of self-efficacy can contribute to
developing the future confidence in implementing science inquiry skills in the science
classroom for PSTs’ future teaching careers, personally, and the reform of science
learning, generally.
8.4 Limitations of my study
8.4.1 Limitations and future suggestions of the study
As promising as the SETSIS appears, it has some potential limitations. In this study,
the pilot data were collected from a sample studying a major course of primary
science education, planning to become primary science teachers in ITE across
Malaysia. Thus, the findings are true in the context of the applied study programme.
A more heterogeneous sample consisting of diverse PST teaching options is needed
if the SETSIS finding needs to be applied to a larger population of PSTs.
The study has shown that the items have given reliable, excellent internal
consistency and validity with the numerous items constructed. However, analysis of
the main pilot study also suggests that the items were not well-targeted in measuring
the perceived ability of teaching science using science inquiry skills, especially in the
higher level of self-efficacy. When using the SETSIS to evaluate the level of self-
efficacy in teaching using science inquiry skills, the findings have proximity in
discriminating the lower to average level of samples than the samples with the higher
level of self-efficacy.
Nevertheless, the SETSIS generalisation was limited by the specific task of teaching
using science inquiry skills in the self-efficacy model suggested. When applying this
instrument and the findings, users should be aware of these caveats. The result of
the main pilot study has generated a massive amount of rich data, which have been
selected to present the contribution of self-efficacy in the factors underlying the
particular task for the study purpose. In regard to generalising the use of the
measure, future research may use the finding of the model to construct a wider
science teaching task.
Another limitation is caused by the cross-sectional design of the study. At the same
time, limited access to institutional professional teaching practice attainment may
limit the role of the self-efficacy factors as the predictive contributors of the
implementation of PST education at a low variance rate. Tests of the reciprocal
effects model must be based on longitudinal data with repeated measures of
performance attainments in the subject knowledge and the teaching practices. The

185
question whether the PSTs’ achievements cause their self-efficacy factors, or
whether it is their self-efficacy factors that cause their achievements (Marsh &
Craven, 2006), cannot be answered with the data obtained from the study.
8.4.2 Future suggestions
To further validate this instrument, a more heterogeneous sample consisting of
diverse PST teaching options is needed. This way, the sample represents the
population that the items are intended to measure, especially at the lower level of
self-efficacy of OBE, which would be wider as their sources of self-efficacy in belief
would be different, so that the instruments can be used in a broader context of
teachers with other option backgrounds in PST education but who still need to teach
science.
The findings in this study have shown early evidence that the measurement model
suggested in the study can be developed further to assess development in teacher’s
knowledge, especially in the subject and instructional knowledge. The result in
Figure 21 shows a relative growth of self-efficacy across the group of semesters
across the programme. The related evidence can be a proxy that self-efficacy can
infer growth of a teacher’s knowledge gained during the teacher training programme.
Further research should consider studying the different points of time in the growth of
the SETSIS and their relation to the teacher knowledge assessment. The
comprehensive model that includes the three areas of self-efficacy relevant to the
elements in teacher development can be further constructed and validated to identify
the longitudinal growth of these factors in individual PSTs throughout the
programme. Besides this, the model could investigate and identify the level of self-
efficacy in particular factors that might influence the growth of teacher’s knowledge
for individual PSTs.
8.5 Concluding thoughts
This thesis had initially been proposed as a result of my experiences as a science
subject teacher. Instead of learning to teach using science inquiry skills for science
learning during my training, I had seldom used the approach in my teaching. I
stressed the content more than the process when practicing teaching science. At
that time, I believed it is the best and easiest way to teach science as it was what I
had learned from my school experiences and what was practiced by most of the
senior peer science subject teachers. However, when I started to work for ITE and
followed senior science teacher trainers and attended seminars about the role of

186
science inquiry skills in science literacy, I realised that I had been teaching the
students to learn for the assessment, as I had been taught in my school days.
Now, with the transformation in the primary science curriculum, I felt that it is
important to identify future potential ability of PSTs for implementing the approach in
the science classroom accordingly. It has been proven that acquisition in the
cognitive component of teacher knowledge does not necessarily translate into
inculcating that knowledge in the real classroom (Hairiah and Keong 2011; Rauf et
al. 2013). Thus, implementing such a measurement instrument, one that measures
future teachers’ potential ability in delivering the tasks and also identifies their
perception of capability in specific teacher knowledge would be a huge help. The
self-perception result can inform stakeholders of ITE of how to form the necessary
strategies to produce future teachers that can resiliently support the transformation
of the science curriculum in primary schools all over Malaysia.
Having realised how the role of belief could have changed my past teaching
practices, I try to find a concept that can assess the affective component at the level
of PST education. Rather than a complex and multidimensional construct, literature
has offered robust validity and reliable arguments for measuring self-efficacy in PSTs
and teachers, and the relationship to infer perseverance in the teaching career
(Maddux 2009; Williams 2010; Kleinsasser 2014; Menon and Sadler 2016; Thomson
et al. 2017). For instance, the teacher efficacy model (Tschannen-Moran and Hoy
2001) demonstrated the capacity to assess science teacher knowledge at various
levels of their teaching career (Pruski et al. 2013; Smolleck et al. 2006; Bleicher
2004; Roberts and Henson 2000; Riggs and Enochs 1990). Thus, I took the
challenge to develop the instrument and psychometrically defend the construct’s
validity using the extensive methods.
The process of developing the instrument was challenging, especially in
communicating the elusive construct of the SETSIS. I have learned a lot throughout
the study, especially about finding the suitable method to incorporate the
multidimensional variables into a construct of the SETSIS. Throughout the study, I
found that construct modelling in Wilson (2005) was very helpful for embodying the
variables in the measuring construct of the SETSIS. The Rasch model used was a
derivative model but it gave adequate evidence to challenge the concept of the
model proposed and at the same time suggested an alternative model solution for
the unidimensionality of the construct. I recommend the method for instrument
developers as the approach used was convenient and flexible for constructing a
defensible measure.

187
Additionally, the validity evidence of the measure produced substantive findings in
regard of PSTs’ perceptions of teacher knowledge. Results showed that perceived
belief about the value of the knowledge has a positive relationship to PSTs’
knowledge performance but does not contribute to the assessment of the curriculum
of ITE. It indicated the role of belief in the cognitive component of PST but their
practices of teacher knowledge have ignored this aspect. Thus, it is suggested that
ITE should include assessment of belief/affective components like the one
uncovered in this study for constructive and comprehensive information of teacher
knowledge development.

188
List of References
AAAS, A. A. of the A. of S. (1967) Science-A Process Approach (SAPA). Washington: AAAS.
Abd-el-khalick, F., Bell, R. L. and Lederman, N. G. (1997) ‘The Nature of Science and Instructional Practice : Making the Unnatural Natural’.
Abell, S. K. (2008) ‘Twenty Years Later: Does pedagogical content knowledge remain a useful idea?’, International Journal of Science Education, 30(10), pp. 1405–1416. doi: 10.1080/09500690802187041.
Adey, P. (2001) ‘160 years of science education: an uncertain link between theory and practice’, School Science Review, 82(300), pp. 41–48. Available at: https://www.ase.org.uk/journals/...review/.../3/.../SSR300Mar2001p41.pd.
Albion, P. R. (1998) ‘Self-Efficacy Beliefs as an Indicator of Teachers ’ Preparedness for Teaching with Technology The Importance of Teachers ’ Beliefs’.
Allinder, R. M. (1994) ‘The Relationship Between Efficacy and the Instructional Practices of Special Education Teachers and Consultants’, Teacher Education and Special Education, 17(2), pp. 86–95. doi: 10.1177/088840649401700203.
American Association for Advancement of Science (1993) Benchmarks for science literacy. Oxford University Press.
Anderson, L. W. (1997) ‘Measurement of Attitudes’, in Keeves, J. P. (ed.) Educational research, methodology and measurement: an international handbook. Oxford: Pergamon, pp. 885–895.
Armor, D., Conry-Osegura, P., Cox, M., King, N., McDonnel, L., Pascal, A., Pauly, E. and Zellman, G. (1976) Analysis of the School Preferred Reading Program in Selected Los Angeles Minority Schools. Available at: http://eric.ed.gov/?id=ED130243.
Aypay, A. (2010) ‘Teacher education student’s epistemological beliefs and their conceptions about teaching and learning’, Procedia - Social and Behavioral Sciences, 2(2), pp. 2599–2604. doi: 10.1016/j.sbspro.2010.03.380.
Balfakih, N. M. (2010) ‘The assessment of the UAE’s in-service and pre-service Elementary science teachers in the integrated science process skills’, in Procedia - Social and Behavioral Sciences, pp. 3711–3715.
Ball, D. and Bass, H. (2000) ‘Interweaving content and pedagogy in teaching and learning to teach: knowing and using mathematics’, Multiple perspectives on the teaching and learning of mathematics, pp. 83–104.
Bandura, a. (1996) ‘Social cognitive theory of human development’, in Husen, T. and Postlethwaite, T. N. (eds) International Encyclopedia of Education. 2nd edn. Oxford: Pergamon Press, pp. 5513–5518.
Bandura, A. (1977) ‘Self-efficacy: toward a unifying theory of behavioral change.’, Psychological review, 84(2), pp. 191–215. doi: 10.1037/0033-295X.84.2.191.
Bandura, A. (1986) Social foundations of thought and action: A social cognitive

189
theory. New York: Prentice-Hall.
Bandura, A. (1993) ‘Perceived Self-Efficacy in Cognitive Development and Functioning.pdf’, Educational Psychologist, 28(2), pp. 117–148.
Bandura, A. (1994) ‘Self-Efficacy’, Encyclopedia of human behavior, 4(1994), pp. 71–81. doi: 10.1002/9780470479216.corpsy0836.
Bandura, A. (1997) Self-Efficacy : The exercise of control. NY.
Bandura, A. (1998) ‘Personal and collective efficacy in human adaptation and change’, Advances in Psychological Science: Vol 1: Personal, Social, and Cultural Aspects, pp. 51–71.
Bandura, A. (2006) ‘Guide for constructing self-efficacy scales’, Self-efficacy beliefs of adolescents, pp. 307–337.
Bandura, A. (2010) ‘Perceived Self-Efficacy in Cognitive Development and Functioning Perceived Self-Efficacy in Cognitive Development and Functioning’, EDUCATIONAL PSYCHOLOGIST, 28(2), 1 17-148 Copyright o 1993, Lawrence Erlbaum Associates, Inc. Perceived, 1o(August 2013), pp. 37–41. doi: 10.1207/s15326985ep2802.
Barros, M. A., Laburú, C. E. and Da Silva, F. R. (2010) ‘An instrument for measuring self-efficacy beliefs of secondary school physics teachers’, Procedia - Social and Behavioral Sciences, 2(2), pp. 3129–3133. doi: 10.1016/j.sbspro.2010.03.476.
Ben-Peretz, M. (2011) ‘Teacher knowledge: What is it? How do we uncover it? What are its implications for schooling?’, Teaching and Teacher Education, pp. 3–9. doi: 10.1016/j.tate.2010.07.015.
Berg, E. Van Den (2009) ‘The PCK of Laboratory Teaching : Turning Manipulation of Equipment’, in Jong, O. de and Halim, L. (eds) Teachers’ Professional Knowledge in Science and Mathematics Education: Views from Malaysia and Abroad. Bangi: Faculty of Education, Universiti Kebangsaan Malaysia, pp. 85–110.
Bleicher, R. E. (2004) ‘Revisiting the STEBI-B : Measuring Self-Efficacy in Preservice Elementary Teachers’, School Science and Mathematics, 104(December), pp. 383–391.
Bond, T. and Fox, C. (2007) (2007). Applying the Rasch model: Fundamental measurement in the human sciences (2nd). Mahwah, NJ: LEA.
Boone, W. J., Yale, M. S. and Staver, J. R. (2014) Rasch analysis in the human sciences, Rasch Analysis in the Human Sciences. doi: 10.1007/978-94-007-6857-4.
Brown, N. J. S. and Wilson, M. (2011) ‘A Model of Cognition: The Missing Cornerstone of Assessment’, Educational Psychology Review, 23(2), pp. 221–234. doi: 10.1007/s10648-011-9161-z.
Caprara, G. V., Barbaranelli, C., Steca, P. and Malone, P. S. (2006) ‘Teachers’ self-efficacy beliefs as determinants of job satisfaction and students’ academic achievement: A study at the school level’, Journal of School Psychology, 44(6), pp. 473–490. doi: 10.1016/j.jsp.2006.09.001.
Cassidy, S. (2015) ‘Resilience Building in Students: The Role of Academic Self-Efficacy.’, Frontiers in psychology, 6(November), p. 1781. doi: 10.3389/fpsyg.2015.01781.

190
Cattell, R. B. (1966) ‘The scree test for the numbers of factors’, Multivariate Behavioral Research, 1(July), pp. 245–276. doi: 10.1207/s15327906mbr0102.
Chabalengula, V. M., Mumba, F. and Mbewe, S. (2012) ‘How pre-service teachers’ understand and perform science process skills’, Eurasia Journal of Mathematics, Science and Technology Education, 8(3), pp. 167–176.
Chan, K. W. and Elliott, R. G. (2004) ‘Relational analysis of personal epistemology and conceptions about teaching and learning’, Teaching and Teacher Education, 20(8), pp. 817–831. doi: 10.1016/j.tate.2004.09.002.
Cheng, C. H. and Lin, Y. (2002) ‘Evaluating the best main battle tank using fuzzy decision theory with linguistic criteria evaluation’, European Journal of Operational Research, 142(1), pp. 174–186. doi: 10.1016/S0377-2217(01)00280-6.
Cheng, M. M. H., Chan, K.-W., Tang, S. Y. F. and Cheng, A. Y. N. (2009) ‘Pre-service teacher education students’ epistemological beliefs and their conceptions of teaching’, Teaching and Teacher Education. Elsevier Ltd, 25(2), pp. 319–327. doi: 10.1016/j.tate.2008.09.018.
Cochran-Smith, M. (2004) ‘The problem of teacher education’, Journal of Teacher Education, 55(4), pp. 295–299. doi: 10.1177/0022487104268057.
Curtis, D. D. (2004) ‘Person misfit in attitude surveys: Influences, impacts and implications’, International Education Journal, 5(2), pp. 125–143.
Darling-Hammond, L. (2006) ‘Constructing 21st-Century Teacher Education’, Journal of Teacher Education, 57(3), pp. 300–314. doi: 10.1177/0022487105285962.
Darling-Hammond, L., Newton, S. P. and Wei, R. C. (2013) ‘Developing and assessing beginning teacher effectiveness: The potential of performance assessments’, Educational Assessment, Evaluation and Accountability, 25(3), pp. 179–204. doi: 10.1007/s11092-013-9163-0.
DeBacker, T. K., Crowson, H. M., Beesley, A. D., Thoma, S. J. and Hestevold, N. L. (2008) ‘The Challenge of Measuring Epistemic Beliefs: An Analysis of Three Self-Report Instruments’, The Journal of Experimental Education, 76(3), pp. 281–312. doi: 10.3200/JEXE.76.3.281-314.
DeBoer, G. E. (2000) ‘Scientific literacy: Another look at its historical and contemporary meanings and its relationship to science education reform’, Journal of Research in Science Teaching, 37, pp. 582–601.
Deehan, J., Danaia, L. and McKinnon, D. H. (2017) ‘A longitudinal investigation of the science teaching efficacy beliefs and science experiences of a cohort of preservice elementary teachers’, International Journal of Science Education. Taylor & Francis, 39(18), pp. 2548–2573. doi: 10.1080/09500693.2017.1393706.
van Driel, J. H., Beijaard, D. and Verloop, N. (2001) ‘Professional development and reform in science education: The role of teachers’ practical knowledge’, Journal of Research in Science Teaching, 38(2), pp. 137–158. doi: 10.1002/1098-2736(200102)38:2<137::AID-TEA1001>3.0.CO;2-U.
van Driel, J. H., Berry, A. and Meirink, J. (2014) ‘Research on science teacher knowledge’, in Abell, S. K. and Lederman, N. G. (eds) Handbook of research on science education. Lawrence Erlbaum Associate, pp. 848–870.

191
Van Driel, J. H., De Jong, O. and Verloop, N. (2002) ‘The Development of Preservice Chemistry Teachers’ Pedagogical Content Knowledge’, Science Education, 86(4), pp. 572–590. doi: 10.1002/sce.10010.
van Driel, J. H., Verloop, N. and de Vos, W. (1998) ‘Developing science teachers’ pedagogical content knowledge’, Journal of Research in Science Teaching, 35(6), pp. 673–695. doi: 10.1002/(SICI)1098-2736(199808)35:6<673::AID-TEA5>3.0.CO;2-J.
Duffin, L. C., French, B. F. and Patrick, H. (2012) ‘The Teachers’ Sense of Efficacy Scale: Confirming the factor structure with beginning pre-service teachers’, Teaching and Teacher Education. Pergamon, 28(6), pp. 827–834. doi: 10.1016/J.TATE.2012.03.004.
Duit, R. and Treagust, D. F. (2003) ‘Conceptual change: A powerful framework for improving science teaching and learning’, International Journal of Science Education, 25(6), pp. 671–688. doi: 10.1080/09500690305016.
Enochs, L. G. and Riggs, I. M. (1990) ‘Further Development of an Elementary Science Teaching Efficacy Belief Instrument: A Preservice Elementary Scale’, School Science and Mathematics, 90(8), pp. 694–706. doi: 10.1111/j.1949-8594.1990.tb12048.x.
Field, A. (2013) ‘Andy Field - Discovering Statistics Using SPSS’, Lavoisier.Fr. doi: 10.1111/j.1365-2648.2007.04270_1.x.
Fives, H. (2003) ‘What is Teacher Efficacy and How does it Relate to Teachers’ Knowledge?: A Theoretical Review’, American Educational Research Association Annual Conference, (April), pp. 1–57.
Gess-Newsome, J., Taylor, J. A., Carlson, J., Gardner, A. L., Wilson, C. D. and Stuhlsatz, M. A. M. (2016) ‘Teacher pedagogical content knowledge, practice, and student achievement†’, International Journal of Science Education. Taylor & Francis, 0(0), pp. 1–20. doi: 10.1080/09500693.2016.1265158.
Gibson, S. and Dembo, M. H. (1984) ‘Teacher efficacy: A construct validation.’, Journal of Educational Psychology, 76(4), pp. 569–582. doi: 10.1037/0022-0663.76.4.569.
Gie Yong, A. and Pearce, S. (2013) ‘A Beginner’s Guide to Factor Analysis: Focusing on Exploratory Factor Analysis’, Tutorials in Quantitative Methods for Psychology, 9(2), pp. 79–94. doi: 10.20982/tqmp.09.2.p079.
Glass, G. V., Peckham, P. D., & Sanders, J. R. (1972). Consequences of failure to meet assumptions underlying the fixed effects analyses of variance and covariance. Review of educational research, 42(3), 237-288.
Grossman, P. L. (1990) The making of a teacher: Teacher knowledge and teacher education. , .No Title. Teachers College, Columbia University: Teachers College Press.
Habibi, A., Jahantigh, F. F. and Sarafrazi, A. (2015) ‘Fuzzy Delphi Technique for Forecasting and Screening Items’, Asian Journal of Research in Business Economics and Management, 5(2), pp. 130–143. doi: 10.1007/BF00027519s.
Hafizan, E., Halim, L. and Meerah, T. S. (2012) Perception, Conceptual Knowledge and Competency Level of Integrated Science Process Skill Towards Planning a

192
Professional Enhancement Programme, Sains Malaysiana. Available at: http://www.ukm.my/jsm/pdf_files/SM-PDF-41-7-2012/16 Edy Hafizan.pdf (Accessed: 13 January 2015).
Haggarty, L. (1996) ‘What is content analysis?’, Medical Teacher, 18(2), pp. 99–101.
Hair, J. F., Black, W. C., Babin, B. J. and Anderson, R. E. (2010) Multivariate Data Analysis: A Global Perspective. Seventh. New York: Pearson International.
Hairiah, M. and Keong, C. C. (2011) ‘Tinjauan tahap pencapaian dan pelaksanaan kemahiran proses sains dalam kalangan guru pelatih PISMP’, in Seminar Pembudayaan Penyelidikan IPG Zon Utara. Memartabatkan IPG Menerusi Budaya Penyelidikan Inovasi Berterusan. Pulau Pinang. Available at: https://www.academia.edu/5943255/INTEGRASI_PEMBELAJARAN_KEMAHIRAN_PROSES_SAINS_UNTUK_PELAJAR_PPG.
Harlen, W. and Holroyd, C. (2007) ‘Primary teachers’ understanding of concepts of science: impact on confidence and teaching’, International Journal of Science Education, 19(1), pp. 93–105. doi: 10.1080/0950069970190107.
Henson, R. K. (2001) ‘Teacher Self-efficacy : Substantive Implications and Measurement Dilemmas’, (2).
Hoy, A. W. and Spero, R. B. (2005) ‘Changes in teacher efficacy during the early years of teaching: A comparison of four measures’, Teaching and Teacher Education, 21(4), pp. 343–356. doi: 10.1016/j.tate.2005.01.007.
Hudson, P., Skamp, K. and Brooks, L. (2005) ‘Development of an instrument: Mentoring for effective primary science teaching’, Science Education, 89(4), pp. 657–674. doi: 10.1002/sce.20025.
IBM Corp (2015) ‘IBM SPSS Statistics for Windows’. Armonk, NY: IBM Corp.
Institute of Teacher Education, M. (2016) Garis Panduan Perlaksanaan Amali Professional. Ministry of Education Malaysia.
Irribarra, D. T., Diakow, R., Freund, R. and Wilson, M. (2015) ‘Modeling for Directly Setting Theory- Based Performance Levels’, Psychological Test and Assessment Modelling, 57(3), pp. 396–422.
Juttner, M., Boone, W., Park, S. and Neuhaus, B. J. (2013) ‘Development and use of a test instrument to measure biology teachers’ content knowledge (CK) and pedagogical content knowledge (PCK)’, Educational Assessment, Evaluation and Accountability, 25(1), pp. 45–67. doi: 10.1007/s11092-013-9157-y.
Jüttner, M. and Neuhaus, B. J. (2012) ‘Development of Items for a Pedagogical Content Knowledge Test Based on Empirical Analysis of Pupils’ Errors’, International Journal of Science Education, 34(February 2015), pp. 1125–1143. doi: 10.1080/09500693.2011.606511.
Kane, R., Sandretto, S. and Heath, C. (2002) ‘Telling Half the Story: A Critical Review of Research on the Teaching Beliefs and Practices of University Academics’, Review of Educational Research, 72(2), pp. 177–228. doi: 10.3102/00346543072002177.
Kind, V. (2009) Pedagogical content knowledge in science education: perspectives and potential for progress, Studies in Science Education. doi:

193
10.1080/03057260903142285.
Kleinsasser, R. C. (2014) ‘Teacher efficacy in Teaching and Teacher Education’, Teaching and Teacher Education, 44, pp. 168–179. doi: 10.1016/j.tate.2014.07.007.
Kline, R. B. (2005) ‘Principles and practice of structural equation modeling’, Methodology in the Social Sciences, 2, p. 366. doi: 10.1038/156278a0.
Li, C.-Y., Romero, S., Bonilha, H. S., Simpson, K. N., Simpson, A. N., Hong, I. and Velozo, C. A. (2016) ‘Linking Existing Instruments to Develop an Activity of Daily Living Item Bank.’, Evaluation & the health professions, pp. 1–19. doi: 10.1177/0163278716676873.
Linacre, J. M. (1999) ‘Investigating rating scale category utility’, Journal of Outcome Measurement, 3(2), pp. 103–122.
Linacre, J. M. (2001) Category, Step and Threshold: Definitions & Disordering, Rasch Measurement Transactions. Available at: https://www.rasch.org/rmt/rmt151g.htm (Accessed: 23 June 2017).
Linacre, J. M. (2015) ‘Ministep’. Bearverton, OR: Winsteps.com.
Linacre, J. M. (2017) ‘Winsteps’. Oregon: www.winsteps.com.
Linacre, J. M. and Wright, B. W. (1989) ‘The “length” of a logit’, Rasch Measurement Transaction, 3(2), pp. 54–55.
Loughran, J., Mulhall, P. and Berry, A. (2008) ‘Exploring Pedagogical Content Knowledge in Science Teacher Education’, International Journal of Science Education, 30(10), pp. 1301–1320. doi: 10.1080/09500690802187009.
Lumpe, A., Czerniak, C., Haney, C. and Beltyukova., S. (2012) ‘Beliefs about Teaching Science: The Relationship between Elementary Teachers’ Participation in Professional Development and Student Achievement’, International Journal of Science Education, 34(2), pp. 153–166.
Maddux, J. E. (2009) Self-Efficacy: The Power of Believing You Can, Handbook of positive psychology. Edited by C. R. Snyder and S. J. Lopez. New York: Oxford University Press. doi: 10.1093/oxfordhb/9780195187243.013.0031.
Maddux, J. E., Norton, L. W. and Stoltenberg, C. D. (1986) ‘Self-efficacy expectancy, outcome expectancy, and outcome value: Relative effects on behavioral intentions’, Journal of Personality and Social Psychology, 51(4), pp. 783–789. doi: 10.1037/0022-3514.51.4.783.
Magnusson, S., Krajcia, J. and Borko, H. (1999) ‘Nature, sources and development of PCK for science teaching’, in Gess-Newsomen, J. and Lederman, N. G. (eds) PCK and Science Education. Netherlands: Kluwer Academic Publisher, pp. 95–132.
Marra, R. (2005) ‘Teacher beliefs: The impact of the design of constructivist learning environments on instructor epistemologies’, Learning Environments Research, 8(2), pp. 135–155. doi: 10.1007/s10984-005-7249-4.
Mbewe, S., Chabalengula, V. M. and Mumba, F. (2010) ‘PRE-SERVICE teachers ’ Familiarity , Interest and Conceptual UNDERSTANDING of Science process skills’, 22, pp. 76–86.
Meinhardt, C., Rabe, T. and Krey, O. (2014) ‘PRE-SERVICE TEACHERS’ SELF-

194
EFFICACY BELIEFS FOR TEACHING PHYSICS’, in E-Book Proceedings of the ESERA 2013 Conference: Science Education Research For Evidence-based Teaching and Coherence in Learning, pp. 244–250. Available at: http://www.esera.org/media/esera2013/claudia_meinhardt_10feb2014.pdf (Accessed: 14 April 2015).
Menon, D. and Sadler, T. D. (2016) ‘Preservice Elementary Teachers’ Science Self-Efficacy Beliefs and Science Content Knowledge’, Journal of Science Teacher Education. Springer Netherlands, 27(6), pp. 649–673. doi: 10.1007/s10972-016-9479-y.
Messick, S. (1994) Validity of psychological assessment: Validation of inference from persons’ responses and performances as scientific inquiry into score meaning. Princeton, New Jersey. Available at: http://files.eric.ed.gov/fulltext/ED380496.pdf (Accessed: 19 March 2015).
Millar, R. and Driver, R. (1987) Beyond Processes, Studies in Science Education. doi: 10.1080/03057268708559938.
Millar, R. and Osborne, J. (1998) Beyond 2000, Science And Technology. King’s College. Available at: http://scholar.google.com/scholar?hl=en&btnG=Search&q=intitle:Beyond+2000#0.
Moore, K. D. (2014) Effective Instruction strategies: from theory to practice. 4th editio. Sage Publication. Available at: https://books.google.co.uk/books?hl=en&lr=&id=qA5EBAAAQBAJ&oi=fnd&pg=PR1&dq=theory+into+teaching+practice+moore+2014&ots=ucYGvs-MPJ&sig=SKHMNqA8w32hw-Z0dqLh3Y9SvaM#v=onepage&q=theory into teaching practice moore 2014&f=false.
Morse, J. M. (2003) ‘Principles of mixed methods and multimethod research design’, in Tashakkore, A. and Teddlie, C. (eds) Handbook of mixed methods in social & behavioral research. Thousand Oaks, CA: Sage, pp. 189–208.
Muijs,D. and Reynolds,D.(2001) Effective teaching : evidences and practice, Thousand Oaks, CA: Sage Publication, London.
Norris, S. P. and Phillips, L. M. (2003) ‘How Literacy in Its Fundamental Sense Is Central to Scientific Literacy’, Science Education, 87(2), pp. 224–240. doi: 10.1002/sce.10066.
Osman, K. (2012) ‘Primary Science: Knowing about the World through Science Process Skills’, Asian Social Science, 8(16), pp. 1–7. doi: 10.5539/ass.v8n16p1.
Özgelen, S. (2012) ‘Students’ Science Process Skills within a Cognitive Domain Framework’, EURASIA Journal of Mathematics, Science & Technology Education, 8(4), pp. 283–292. doi: 10.12973/eurasia.2012.846a.
Padilla, M. J. (1990) Science process skills, Research Matters to the science teachers-NARST. Available at: https://www.narst.org/publications/research/skill.cfm.
Pajares, M. F. (1992) ‘Teachers ’ Beliefs and Educational Research : Cleaning Up a Messy Construct’, Review of Educational Research, 62(3), pp. 307–332.
Pallant, J. (2013) SPSS survival manual: a step by step guide to data analysis using SPSS, Step by step guide to data analysis using the SPSS program.

195
Pallant, J. F. and Tennant, A. (2007) ‘An introduction to the Rasch measurement model: An example using the Hospital Anxiety and Depression Scale (HADS)’, British Journal of Clinical Psychology, 46(1), pp. 1–18. doi: 10.1348/014466506X96931.
Palmer, D. (2006) ‘Durability of changes in self-efficacy of preservice primary teachers’, International Journal of Science Education, 28(6), pp. 655–671. doi: 10.1080/09500690500404599.
Palmer, D. (2011) ‘Sources of efficacy information in an inservice program for elementry teachers’, Science Education, 95(4), pp. 577–600.
Park, S., Jang, J.-Y., Chen, Y.-C. and Jung, J. (2011) ‘Is pedagogical content knowledge (PCK) necessary for reformed science teaching? Evidence from an empirical study.’, Research in Science Education, 41, pp. 245–260.
Pruski, L. a, Blanco, S. L., Riggs, R. a, Grimes, K. K., Fordtran, C. W., Barbola, G. M., Cornell, J. E. and Lichtenstein, M. J. (2013) ‘Construct Validation of the Self-Efficacy Teaching and Knowledge Instrument for Science Teachers-Revised (SETAKIST-R): Lessons Learned.’, Journal of science teacher education, 24(7), pp. 1133–1156. doi: 10.1007/s10972-013-9351-2.
Rauf, R. A. A., Rasul, M. S., Mansor, A. N., Othman, Z. and Lyndon, N. (2013) ‘Inculcation of Science Process Skills in a Science Classroom’, Asian Social Science, 9(8), pp. 47–57. doi: 10.5539/ass.v9n8p47.
Ravindran, B., Greene, B. a. and Debacker, T. K. (2005) ‘Predicting Preservice Teachers’ Cognitive Engagement With Goals and Epistemological Beliefs’, The Journal of Educational Research, 98(4), pp. 222–233. doi: 10.3200/JOER.98.4.222-233.
Richey, R. C. and Klein, J. D. (2005) ‘Developmental research methods: Creating knowledge from instructional design and development practice’, Journal of Computing in Higher Education, 16(2), pp. 23–38. doi: 10.1007/BF02961473.
Riggs, I. M. and Enochs, L. G. (1990) ‘Toward the development of an elementary teacher’ s science teaching efficacy belief instrument’, Science Education, 74(6), pp. 625–637. doi: 10.1002/sce.3730740605.
Roberts, J. K. and Henson, R. K. (2000) ‘Self-Efficacy Teaching and Knowledge Instrument for Science Teachers (SETAKIST): A Proposal for a New Efficacy’.
Ruys, I., Van Keer Hilde, H. and Aelterman Antonia, A. (2011) ‘Student teachers’ skills in the implementation of collaborative learning: A multilevel approach’, Teaching and Teacher Education. Elsevier Ltd, 27(7), pp. 1090–1100. doi: 10.1016/j.tate.2011.05.005.
Ryder, J. (2001) ‘Identifying Science Understanding for Functional Scientific Literacy’, Studies in Science Education, 36(1), pp. 1–44. doi: 10.1080/03057260108560166.
Samuels, P. (2016) ‘Advice on Exploratory Factor Analysis’, (June). doi: 10.13140/RG.2.1.5013.9766.
Schommer, M. (1990) ‘Effects of beliefs about the nature of knowledge on comprehension.’, Journal of Educational Psychology, 82(3), pp. 498–504. doi: 10.1037/0022-0663.82.3.498.

196
Schumacker, R. E. (1996) ‘Disattenuating correlation coefficients’, Rasch Measurement Transaction, 10(1), p. 479.
Seidel, T. and Sturmer, K. (2014) ‘Modeling and Measuring the Structure of Professional Vision in Preservice Teachers’, American Educational Research Journal, 51(4), pp. 739–771. doi: 10.3102/0002831214531321.
Shahali, E. H. M. and Halim, L. (2010) ‘Development and validation of a test of integrated science process skills’, Procedia - Social and Behavioral Sciences, 9, pp. 142–146. Available at: http://ac.els-cdn.com/S1877042810022329/1-s2.0-S1877042810022329-main.pdf?_tid=d3840892-9744-11e4-81e2-00000aab0f26&acdnat=1420728439_c94a466aa27b16989d2d7718dfb0b4c9 (Accessed: 8 January 2015).
Shortland, M. (1988) ‘Advocating Science: Literacy and Public Understanding.’, Impact of Science on Society, 38(4), pp. 305–316.
Shulman, L. E. E. S. (1986) ‘Those who understand : Knowledge growth in teaching’, Educational Rese, 15(2), pp. 4–14.
Shulman, L. S. (1987) ‘Knowledge and teaching: Foundations of the new reform’, Harvard Educational Review, 57(1), pp. 1–21.
Singer, E. and Couper, M. P. (2009) ‘Do Incentives Exert Undue Influence on Survey Participation? Experimental Evidence’, J Empir Res Hum Res Ethics, 3(3), pp. 49–56. doi: 10.1525/jer.2008.3.3.49.Do.
Siwatu, K. O. (2007) ‘Preservice teachers’ culturally responsive teaching self-efficacy and outcome expectancy beliefs’, Teaching and Teacher Education, 23(7), pp. 1086–1101. doi: 10.1016/j.tate.2006.07.011.
Smith, K. V., Loughran, J., Berry, A. and Dimitrakopoulos, C. (2012) ‘Developing Scientific Literacy in a Primary School’, International Journal of Science Education, 34(1), pp. 127–152. doi: 10.1080/09500693.2011.565088.
Smolleck, L. D., Zembal-Saul, C. and Yoder, E. P. (2006) ‘The Development and Validation of an Instrument to Measure Preservice Teachers’ Self-Efficacy in Regard to The Teaching of Science as Inquiry’, Journal of Science Teacher Education, 17(2), pp. 137–163. doi: 10.1007/s10972-006-9015-6.
Tabachnick, B. G. and Fidell, L. S. (2007) Using Multivariate Statistics. 5th edn. Upper Saddle River, NJ: Pearson International.
Thomson, M. M., DiFrancesca, D., Carrier, S. and Lee, C. (2017) ‘Teaching efficacy: exploring relationships between mathematics and science self-efficacy beliefs, PCK and domain knowledge among preservice teachers from the United States’, Teacher Development. Routledge, 21(1), pp. 1–20. doi: 10.1080/13664530.2016.1204355.
Toland, M. D. and Usher, E. L. (2015) ‘Assessing Mathematics Self-Efficacy: How Many Categories Do We Really Need?’, The Journal of Early Adolescence. doi: 10.1177/0272431615588952.
Tschannen-Moran, M., Hoy, a. W. and Hoy, W. K. (1998) ‘Teacher Efficacy: Its Meaning and Measure’, Review of Educational Research, 68(2), pp. 202–248. doi: 10.3102/00346543068002202.
Tschannen-Moran, M. and Hoy, A. W. (2001) ‘Teacher efficacy: capturing an elusive

197
construct’, Teaching and Teacher Education, 17(7), pp. 783–805. doi: 10.1016/S0742-051X(01)00036-1.
Tschannen-Moran, M. and Hoy, A. W. (2007) ‘The differential antecedents of self-efficacy beliefs of novice and experienced teachers’, Teaching and Teacher Education, 23(6), pp. 944–956. doi: 10.1016/j.tate.2006.05.003.
Turiman, P., Omar, J., Daud, A. M. and Osman, K. (2012) ‘Fostering the 21st Century Skills through Scientific Literacy and Science Process Skills’, Procedia - Social and Behavioral Sciences, 59, pp. 110–116. doi: 10.1016/j.sbspro.2012.09.253.
Veal, W. R. (2012) ‘Beliefs and knowledge in chemistry teacher development’, International Journal of Science Education, 26(3), pp. 329–351. doi: 10.1080/0950069032000097389.
Veal, W. R. and MaKinster, J. (1999a) ‘Pedagogical content knowledge taxonomies’, Electronic Journal of Science Education. Available at: http://ejse.southwestern.edu/article/viewArticle/7615/5382.
Veal, W. R. and MaKinster, J. (1999b) ‘Pedagogical content knowledge taxonomies’, Electronic Journal of Science Education. Available at: http://ejse.southwestern.edu/article/viewArticle/7615/5382.
Wheatley, K. F. (2002) ‘The potential benefits of teacher efficacy doubts for educational reform’, Teaching and Teacher Education, 18(1), pp. 5–22. doi: 10.1016/S0742-051X(01)00047-6.
Wheatley, K. F. (2005) ‘The case for reconceptualizing teacher efficacy research’, Teaching and Teacher Education, 21(7), pp. 747–766.
Wood, R., & Bandura, A. (1989). Social cognitive theory of organizational management. Academy of Management Review, 14, 361-384.
Sara Wicht (2016), Not just the facts: Why focusing on skills is better for students and educators, [Blog] ASCD Inservice Available at http://inservice.ascd.org/not-just-the-facts-why-focusing-on-skills-is-better-for-students-and-educators/
Williams, D. M. (2010) ‘Outcome Expectancy and Self-Efficacy: Theoretical Implications of an Unresolved Contradiction’, Personality and Social Psychology Review, 14(4), pp. 417–425. doi: 10.1177/1088868310368802.
Wilson, M. (2003) ‘On choosing a model for measuring’, Methods of Psycholgical Research Online, 8(3), pp. 123–144.
Wilson, M. (2005) Constructing Measures: An Item Response Modeling Approach. Mahwah, N.J.: Lawrence Erlbaum Associate.
Wolf-Watz, M. (2000) ‘Student Teachers’ Beliefs about Science’, Journal of In-Service Education, 26(2), pp. 403–413. doi: 10.1080/13674580000200122.
Wright, B. D. and Masters, G. N. (1982) Rating Scale Analysis. Chicago: Mesa Press.
Wright, B. D. and Stone, M. H. (2004) Making Measures. Chicago: Phaneron Press.
Wyatt, M. (2010) ‘An English teacher ’ s developing self -efficacy beliefs in using

198
groupwork’, System, 38(4), pp. 603–613. Available at: http://www.sciencedirect.com/science/article/pii/S0346251X10001120.
Wyatt, M. (2014) ‘Towards a re-conceptualization of teachers’ self-efficacy beliefs: tackling enduring problems with the quantitative research and moving on’, International Journal of Research & Method in Education, 37(2), pp. 166–189. doi: 10.1080/1743727X.2012.742050.
Zimmerman, B. J. (2000) ‘Self-Efficacy: An Essential Motive to Learn’, Contemporary Educational Psychology, 25(1), pp. 82–91. doi: 10.1006/ceps.1999.1016.
Zimmerman, B. J., Bandura, a. and Martinez-Pons, M. (1992) ‘Self-Motivation for Academic Attainment: The Role of Self-Efficacy Beliefs and Personal Goal Setting’, American Educational Research Journal, 29(3), pp. 663–676. doi: 10.3102/00028312029003663.

199
Appendix A Experts Information Sheet
Experts Survey Information Sheet
Developing and Validating a Measure of Self-Efficacy in Teaching Science Using Science
Inquiry Skills
My name is Syakima Ilyana Ibrahim. I am a PhD student from University of Leeds, United
Kingdom. Before you decide to take part or not it is important for you to understand why
the research is being done and how it is developed. Please take time to read the
following information. Ask me if there is anything that is not clear or if you would like
more information. Thank you for reading this.
The purpose of the research
In 2011, a new science curriculum for primary school in Malaysia is transformed to
upgrade the scientific literacy in school children. To date, science process skills (SPS)
has become an important component in the new science curriculum and become one of
the skills needed to teach science in a more effective and meaningful way (Malaysia
Ministry of Education 2014). SPS are the science inquiry skills that are used to teach
science content using process-based approaches. The aim of this research is to develop
a valid instrument (i.e. questionnaire) to seek insights from individual pre-service
teachers (PST) about their self-efficacy in using SPS to teach science, and to measure
how this develops during teacher training. This research intends to infer competency of
PST in teaching science through measuring their self-efficacy (i.e. belief about self-
capability) in this.
The definition of construct
This project aims to develop and validate a measure to infer competence of pre-service
teachers (PST) in teaching science. The measure intends to assess PST perceived
capability in using science inquiry skills in classroom teaching by using three key aspects
or domains; knowledge, practice and belief named as Knowledge Efficacy (KE), Personal
Teaching Efficacy (PTE) and Outcome Belief Efficacy (OBE). This inter-correlated
measure will be used to rate self-efficacy in teaching science using science inquiry skills
among PST.

200
Knowledge Efficacy (KE)
Knowledge efficacy measures the degree to which pre-service teachers (PST) believe
that they have knowledge of science inquiry skills including twelve SPS (observation,
classification, measurement and using number, inference, communication, predicting,
using space-time relationship, interpreting data, define operationally, controlling
variables, hypothesizing and experimenting (Malaysia Ministry of Education 2013) that
enables them to organise and conduct science inquiry strategies in the classroom. The
table below shows exemplar KE items.
Item type Example of item Comment
A good KE
item
I possess understanding about operationally
define variables for guiding my students
towards explanation that are consistent with
experimental and observation evidence
This item reflects
knowledge of define
operationally in
assist students in
science inquiry
method.
A poor KE
item
I know how to use SPS well in teaching
science
This item refer to
self-efficacy in using
SPS in teaching and
better in PTE
section.
Personal Teaching Efficacy (PTE)
Personal teaching efficacy (PTE) refer to self-efficacy in the domain of personal teaching
practice. PTE reflects judgement of pre-service teacher (PST) that they are confident
with their own ability in practice teaching science using science inquiry strategy.
Item type Example of item Comment
Good PTE
item
I am confident that I have the necessary
skills of scientific process to teach
science inquiry in classroom
This item reflects
personal confident in
capability of teaching
science inquiry by
using the skills
needed.
Poor PTE item I am confident that SPS can be used to
teach science
This item did not
reflect personal
preference in using

201
SPS during teaching
practices.
Outcome Belief Efficacy (OBE)
Outcome belief Efficacy (OBE) refer to PST belief in the usage of SPS in science inquiry
strategies that lead to effective teaching and learning of science. It concerns about the
general belief based on PST experiences rather than personal belief in ability of
producing the experiences. Table below shows stems use to describe the definition of
OBE.
Item type Example of item Comment
Good OBE
item
(in
learning)
I believe that SPS create opportunity to
satisfy children curiosity when learning
science
This item intends to
assess belief in
value of SPS that
can satisfy curiosity
in learning.
Poor OBE
item (in
learning)
In science, I think it is important for children to
learn SPS.
(The fit stem would be - I think it is important
for children to use SPS during inquiry
activities so that they can learn science
effectively)
This item intends to
assess belief but in
the important of
learning SPS.
Fit stem to
describe
OBE (in
teaching)
I am confident that using SPS in inquiry
strategies can improve the effectiveness of
my teaching practices in science class.
This item intends to
assess belief that
effective teaching
can be produced by
using SPS. It’s refer
to preference to use
it due to PST general
belief that it is good
practicing.

202
Unfit stem
to describe
OBE (in
teaching)
Even when I try very hard to use SPS, I do
not teach science as well as I would like.
(The fit stem would be - I want to use SPS to
improve my science teaching practice)
This item reflects
practice domain in
ability of producing
good teaching by
using SPS
Summary
To establish a set of valid instrument in measuring what it intended to measure, a
general perspective of content validation on items must be gained first. A questionnaire
survey consist all the item pool will be sent out to experts and academicians in different
field. The goal of the expert questionnaire survey is to gain expert consensus on items
that reflect KE, PTE and OTE in measuring self-efficacy in using science inquiry skills to
teach science.
In the survey, you need to rate to what extent each item measured one of the three
domains using a 5-point scale (with 1 point being entirely disagree and 5 point being
entirely agree). The experts also will be encouraged to provide comments and
suggestions for each item or offer your own lists of possible item for each domain.
Your responses will be used to inform fieldwork instruments, a PhD thesis, future reports,
conference presentations and/or poster presentations but your work will be anonymous
in any reporting. Your expertise, dedication and time is most appreciated.
Thank you very much for taking your time reading this information sheet and taking part
in the study. For any inquiries do contact me at [email protected] or +447542817270.
This PhD study is being supervised by Dr Matt Homer ( [email protected])
and Professor Jim Ryder ([email protected]).

203
Appendix B Ethics Approval

204
Appendix C Participant Consent Form and Information Sheet
CONSENT FORM
Title of research project:
Developing and Validating A Measure of Self-Efficacy in Teaching Science Using
Science Process Skills
Name of researcher:
Syakima Ilyana Ibrahim
Please write your initials next to the statement you agree
with
I confirm that I have read and understand the information sheet dated (date) explaining the above research project and I have had the opportunity to ask questions about the project. I agree to take part in the project.
I understand that my participation is voluntary and that I am free to withdraw at any time without giving any reason and without there being any negative consequences. In addition, should I not wish to answer any particular question or questions, I am free to decline.
I give permission for my score in Practicum, Practicum II or Practicum II (whichever is the latest) to be used (by the permission of ITE’s Examination and Senate Department) in the research.
I understand that my responses will be kept strictly confidential. (I understand that my name will not be linked with the research materials, and I will not be identified or identifiable in the report or reports that result from the research.)
I agree for the data collected to be used in the researcher’s PhD thesis, future reports, conference presentations and/or poster presentations.
I agree to take part in the above research project.
Name of participant
Participant’s signature
Date

205
Information Sheet
Developing and Validating a Measure of Self-Efficacy in Teaching Science using Science
Process Skills
My name is Syakima Ilyana Ibrahim. I am a PhD student from University of Leeds, United
Kingdom. Before you decide to take part or not it is important for you to understand why the
research is being done and what it will involve. Please take time to read the following information
carefully and discuss it with others if you wish. Ask me if there is anything that is not clear or if
you would like more information. Take time to decide whether or not you wish to take part. Thank
you for reading this.
The purpose of the research
This research intended to develop an instrument to seek insights from individual pre-service
teachers about their self-efficacy (i.e. belief about self-capability) in teaching science process skills
(SPS) and how it develops during teacher training. The aim of this research is to explore the pre-
service teachers’ self-efficacy in teaching SPS by measuring three different traits, which are
knowledge, belief and practice. The result of this study will be very useful not only to the policy
makers and teacher educators but also to the pre-service teachers as well for the success of the
professional training and development of teacher training programme in Malaysia. Thus, I would
like to invite the science pre-service teachers to participate by completing the two sets of surveys
as listed below based on the experiences during teacher training programme;
i) The Measure of Self-efficacy in Teaching Science Process Skills (SETSPS)
I would very much like this to be a positive experience for you and hope that you may
want to complete the survey provided to the end. In the first phase of the study, you will
need to complete a questionnaire about your self-efficacy in teaching SPS which
contains two parts; questions section with five scale response and demographic and
information section. This may take 15-20 minutes to complete.
ii) The Test of Basic and Integrated Science Process Skills
The second survey of the study will be a test of your knowledge in basic and integrated
SPS, which may take about 30 minutes to one hour. This will in NO WAY be associated

206
to your grade in your teacher training courses. The score in this test, will be used to part
of validating your response in above measure.
In additional to these, the data of score from the Practicum courses (subject to the approval of
Department of Exams and Senate of ITE) will be used for the purpose of validating these three
dimensions. The score of the Practicum assessment, together with score from the test in (ii) will be
used to validate the measure in (i). The participant who volunteered may withdraw at any phase of
the study. All the data gathered in this research will only be used for the research purposes and will
be kept strictly confidential.
The duration of the study
This study will take place from March until July 2016 and I will be inviting all science pre-service
teachers in Malaysian Institute of Teacher Education to take part.
Your rights
If you decide to take part you will be given this information sheet to keep and be asked to sign a
consent form. You can still withdraw at any time without it affecting any benefits that you are
entitled to in any way. You do not have to give a reason. If there are any questions or topics which
you feel uncomfortable, then you can choose to end the survey. Whilst there are no immediate
benefits for those people participating in this study, it is hoped that this study will give an
opportunity to you to help to improve the learning experiences in teacher training programme by
sharing your belief, knowledge and practice experience regarding teaching SPS. All the information
that are collected during this study will be kept strictly confidential. The result will be published
however you will not be identified in any report or publication. You will be given a copy of this
information sheet and a signed consent form to keep.
Thank you very much for taking your time reading this information sheet and taking part in the
study. For any inquiries do contact me at [email protected] or 01123804470.
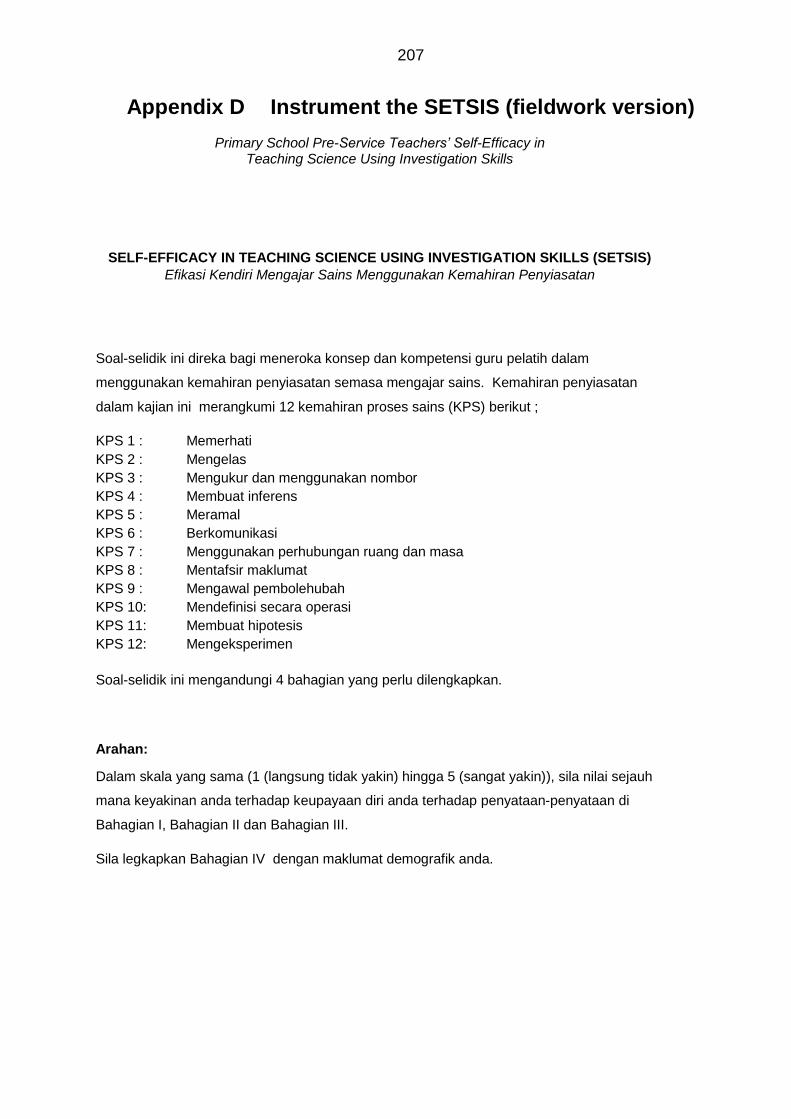
207
Appendix D Instrument the SETSIS (fieldwork version)
Primary School Pre-Service Teachers’ Self-Efficacy in Teaching Science Using Investigation Skills
SELF-EFFICACY IN TEACHING SCIENCE USING INVESTIGATION SKILLS (SETSIS)
Efikasi Kendiri Mengajar Sains Menggunakan Kemahiran Penyiasatan
Soal-selidik ini direka bagi meneroka konsep dan kompetensi guru pelatih dalam
menggunakan kemahiran penyiasatan semasa mengajar sains. Kemahiran penyiasatan
dalam kajian ini merangkumi 12 kemahiran proses sains (KPS) berikut ;
KPS 1 : Memerhati
KPS 2 : Mengelas
KPS 3 : Mengukur dan menggunakan nombor
KPS 4 : Membuat inferens
KPS 5 : Meramal
KPS 6 : Berkomunikasi
KPS 7 : Menggunakan perhubungan ruang dan masa
KPS 8 : Mentafsir maklumat
KPS 9 : Mengawal pembolehubah
KPS 10: Mendefinisi secara operasi
KPS 11: Membuat hipotesis
KPS 12: Mengeksperimen
Soal-selidik ini mengandungi 4 bahagian yang perlu dilengkapkan.
Arahan:
Dalam skala yang sama (1 (langsung tidak yakin) hingga 5 (sangat yakin)), sila nilai sejauh
mana keyakinan anda terhadap keupayaan diri anda terhadap penyataan-penyataan di
Bahagian I, Bahagian II dan Bahagian III.
Sila legkapkan Bahagian IV dengan maklumat demografik anda.
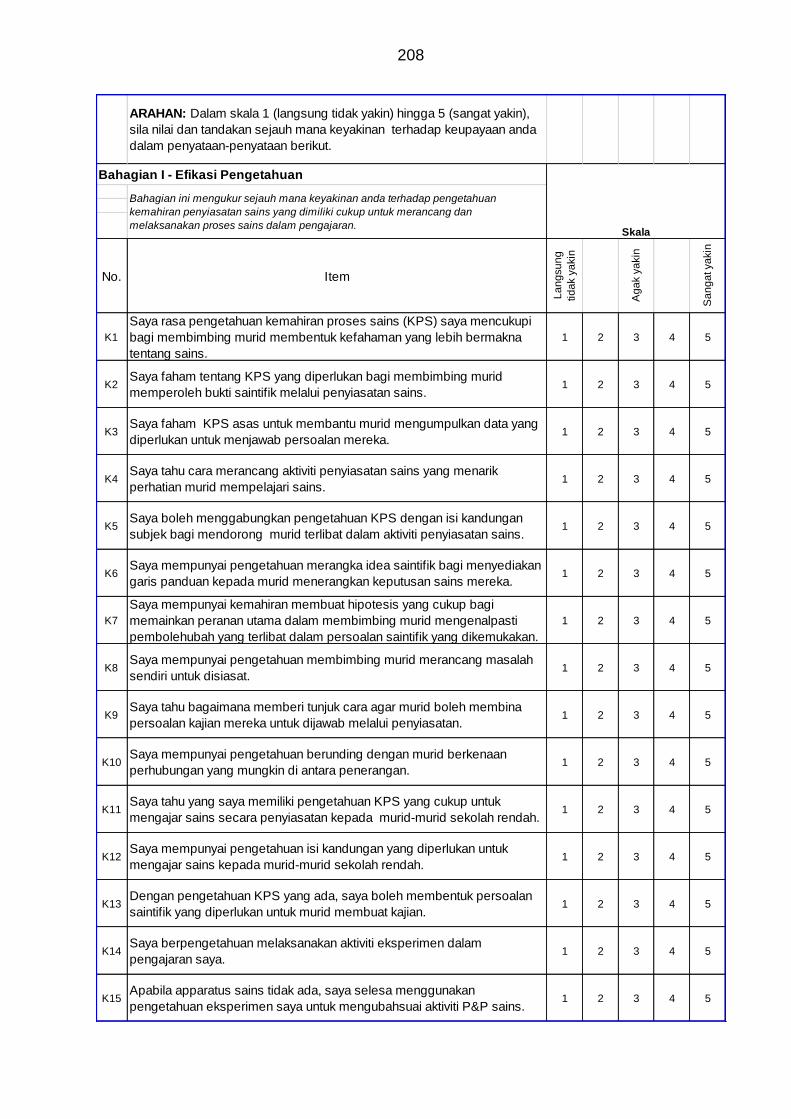
208
ARAHAN: Dalam skala 1 (langsung tidak yakin) hingga 5 (sangat yakin),
sila nilai dan tandakan sejauh mana keyakinan terhadap keupayaan anda
dalam penyataan-penyataan berikut.
No. Item
La
ng
su
ng
tid
ak y
akin
Ag
ak y
akin
Sa
ng
at ya
kin
K1
Saya rasa pengetahuan kemahiran proses sains (KPS) saya mencukupi
bagi membimbing murid membentuk kefahaman yang lebih bermakna
tentang sains.
1 2 3 4 5
K2Saya faham tentang KPS yang diperlukan bagi membimbing murid
memperoleh bukti saintifik melalui penyiasatan sains.1 2 3 4 5
K3Saya faham KPS asas untuk membantu murid mengumpulkan data yang
diperlukan untuk menjawab persoalan mereka.1 2 3 4 5
K4Saya tahu cara merancang aktiviti penyiasatan sains yang menarik
perhatian murid mempelajari sains.1 2 3 4 5
K5Saya boleh menggabungkan pengetahuan KPS dengan isi kandungan
subjek bagi mendorong murid terlibat dalam aktiviti penyiasatan sains.1 2 3 4 5
K6Saya mempunyai pengetahuan merangka idea saintifik bagi menyediakan
garis panduan kepada murid menerangkan keputusan sains mereka.1 2 3 4 5
K7
Saya mempunyai kemahiran membuat hipotesis yang cukup bagi
memainkan peranan utama dalam membimbing murid mengenalpasti
pembolehubah yang terlibat dalam persoalan saintifik yang dikemukakan.
1 2 3 4 5
K8Saya mempunyai pengetahuan membimbing murid merancang masalah
sendiri untuk disiasat.1 2 3 4 5
K9Saya tahu bagaimana memberi tunjuk cara agar murid boleh membina
persoalan kajian mereka untuk dijawab melalui penyiasatan. 1 2 3 4 5
K10Saya mempunyai pengetahuan berunding dengan murid berkenaan
perhubungan yang mungkin di antara penerangan.1 2 3 4 5
K11Saya tahu yang saya memiliki pengetahuan KPS yang cukup untuk
mengajar sains secara penyiasatan kepada murid-murid sekolah rendah.1 2 3 4 5
K12Saya mempunyai pengetahuan isi kandungan yang diperlukan untuk
mengajar sains kepada murid-murid sekolah rendah.1 2 3 4 5
K13Dengan pengetahuan KPS yang ada, saya boleh membentuk persoalan
saintifik yang diperlukan untuk murid membuat kajian.1 2 3 4 5
K14Saya berpengetahuan melaksanakan aktiviti eksperimen dalam
pengajaran saya.1 2 3 4 5
K15Apabila apparatus sains tidak ada, saya selesa menggunakan
pengetahuan eksperimen saya untuk mengubahsuai aktiviti P&P sains.1 2 3 4 5
Bahagian ini mengukur sejauh mana keyakinan anda terhadap pengetahuan
kemahiran penyiasatan sains yang dimiliki cukup untuk merancang dan
melaksanakan proses sains dalam pengajaran.
Bahagian I - Efikasi Pengetahuan
Skala

209
K16Kemahiran eksperimen saya cukup bagi menerangkan fungsi
eksperimen kepada murid.1 2 3 4 5
K17Saya yakin untuk mengajar sesuatu konsep sains yang pernah saya
faham melalui eksperimen.1 2 3 4 5
K18
Apabila murid sukar memahami sesuatu konsep sains, saya yakin
pengetahuan saya dalam KPS dapat membantu mereka memahami
konsep tersebut.
1 2 3 4 5
K19Saya berterusan mencari cara penggunaan KPS yang berkesan bagi
mengajar sains.1 2 3 4 5
K20
Saya faham tentang pengukuran dan ruang bagi membantu murid
memahami konsep panjang menggunakan model pengukuran sendiri (i.e.
mengatur klip kertas / lidi).
1 2 3 4 5
K21Saya berupaya menghuraikan pemerhatian saya dengan pernyataan
kuantitatif 1 2 3 4 5
K22Saya boleh menghuraikan pemerhatian saya dalam pelbagai bentuk
penerangan bermakna.1 2 3 4 5
K23Saya tahu menggunakan maklumat diperoleh untuk meramal pemerhatian
yang akan datang.1 2 3 4 5
K24Saya boleh mengemukakan soalan/ masalah bagi menimbulkan minat
murid untuk menyelesaikannya.1 2 3 4 5
K25Saya yakin mempunyai kemahiran penyiasatan yang cukup bagi mengajar
konsep sains penting dengan berkesan.1 2 3 4 5
K26Saya sentiasa boleh menjawab soalan sains murid menggunakan
kefahaman saya dalam proses sains.1 2 3 4 5
Bahagian ini mengukur sejauh mana anda yakin dengan keupayaan
sendiri untuk mengamalkan pendekatan penyiasatan sains dalam
pengajaran anda.
P1Apabila aktiviti proses sains sukar untuk dilaksanakan, saya akan
menyusun setiap langkah aktiviti menggunakan pendekatan penyiasatan.1 2 3 4 5
P2Apabila aktiviti proses sains sukar diterangkan, saya menggunakan
pendekatan penyiasatan untuk membantu murid memahaminya.1 2 3 4 5
P3Saya boleh memberikan penerangan kepada murid saya tentang aktiviti
berkaitan proses sains.1 2 3 4 5
P4Saya berupaya merancang aktiviti proses sains dengan menggunakan
modul yang disediakan.1 2 3 4 5
P5Saya memilih menyediakan data daripada eksperimen sebenar sebagai
bahan instruksional berbanding menggunakan data daripada buku kerja.1 2 3 4 5
P6 Saya tahu cara menyediakan data sesuai untuk dianalisis murid. 1 2 3 4 5
P7Saya berupaya untuk menggunakan satu set data daripada lembaran
kerja bagi membantu murid dalam proses analisis.1 2 3 4 5
P8Saya berupaya untuk membimbing murid memberikan pelbagai cadangan
bagi membentuk penerangan daripada data.1 2 3 4 5
Bahagian II - Efikasi Pengajaran Kendiri
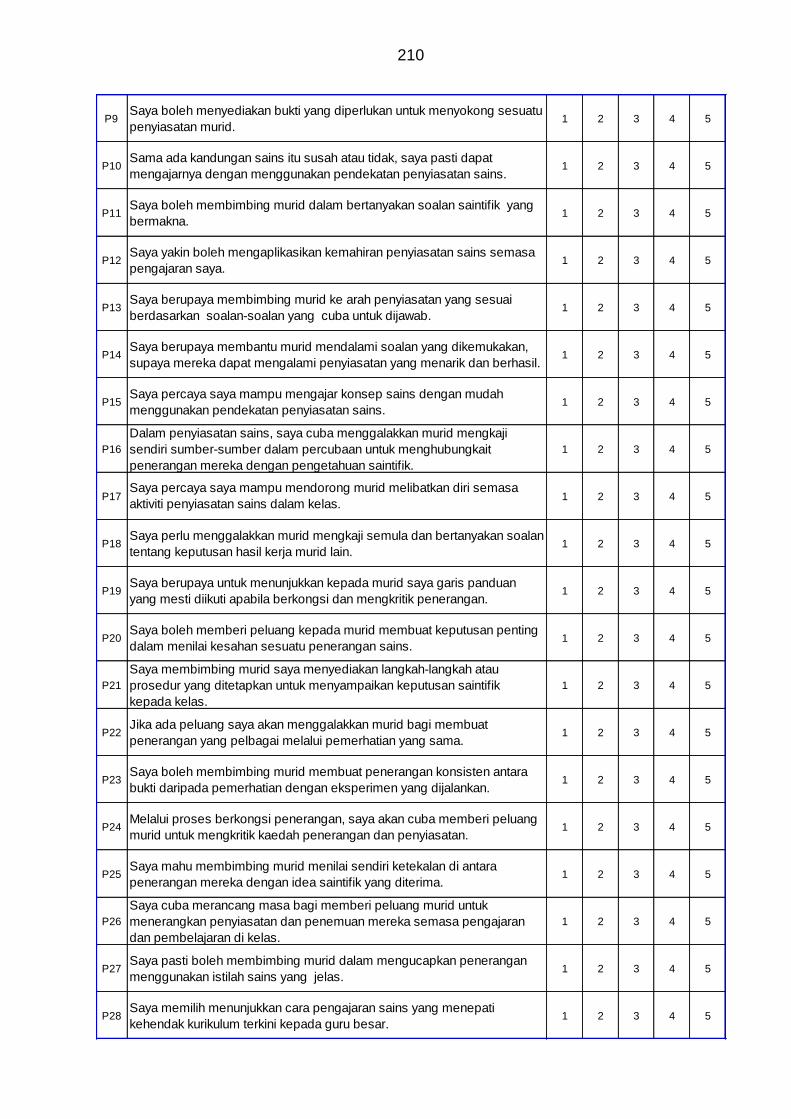
210
P9Saya boleh menyediakan bukti yang diperlukan untuk menyokong sesuatu
penyiasatan murid.1 2 3 4 5
P10Sama ada kandungan sains itu susah atau tidak, saya pasti dapat
mengajarnya dengan menggunakan pendekatan penyiasatan sains. 1 2 3 4 5
P11Saya boleh membimbing murid dalam bertanyakan soalan saintifik yang
bermakna.1 2 3 4 5
P12Saya yakin boleh mengaplikasikan kemahiran penyiasatan sains semasa
pengajaran saya.1 2 3 4 5
P13Saya berupaya membimbing murid ke arah penyiasatan yang sesuai
berdasarkan soalan-soalan yang cuba untuk dijawab.1 2 3 4 5
P14Saya berupaya membantu murid mendalami soalan yang dikemukakan,
supaya mereka dapat mengalami penyiasatan yang menarik dan berhasil.1 2 3 4 5
P15Saya percaya saya mampu mengajar konsep sains dengan mudah
menggunakan pendekatan penyiasatan sains.1 2 3 4 5
P16
Dalam penyiasatan sains, saya cuba menggalakkan murid mengkaji
sendiri sumber-sumber dalam percubaan untuk menghubungkait
penerangan mereka dengan pengetahuan saintifik.
1 2 3 4 5
P17Saya percaya saya mampu mendorong murid melibatkan diri semasa
aktiviti penyiasatan sains dalam kelas.1 2 3 4 5
P18Saya perlu menggalakkan murid mengkaji semula dan bertanyakan soalan
tentang keputusan hasil kerja murid lain.1 2 3 4 5
P19Saya berupaya untuk menunjukkan kepada murid saya garis panduan
yang mesti diikuti apabila berkongsi dan mengkritik penerangan.1 2 3 4 5
P20Saya boleh memberi peluang kepada murid membuat keputusan penting
dalam menilai kesahan sesuatu penerangan sains.1 2 3 4 5
P21
Saya membimbing murid saya menyediakan langkah-langkah atau
prosedur yang ditetapkan untuk menyampaikan keputusan saintifik
kepada kelas.
1 2 3 4 5
P22Jika ada peluang saya akan menggalakkan murid bagi membuat
penerangan yang pelbagai melalui pemerhatian yang sama.1 2 3 4 5
P23Saya boleh membimbing murid membuat penerangan konsisten antara
bukti daripada pemerhatian dengan eksperimen yang dijalankan.1 2 3 4 5
P24Melalui proses berkongsi penerangan, saya akan cuba memberi peluang
murid untuk mengkritik kaedah penerangan dan penyiasatan.1 2 3 4 5
P25Saya mahu membimbing murid menilai sendiri ketekalan di antara
penerangan mereka dengan idea saintifik yang diterima.1 2 3 4 5
P26
Saya cuba merancang masa bagi memberi peluang murid untuk
menerangkan penyiasatan dan penemuan mereka semasa pengajaran
dan pembelajaran di kelas.
1 2 3 4 5
P27Saya pasti boleh membimbing murid dalam mengucapkan penerangan
menggunakan istilah sains yang jelas.1 2 3 4 5
P28Saya memilih menunjukkan cara pengajaran sains yang menepati
kehendak kurikulum terkini kepada guru besar.1 2 3 4 5

211
Bahagian ini mengukur mengetahui sejauh mana anda yakin dengan
pengaruh kemahiran penyiasatan terhadap keberkesanan pengajaran
dan pembelajaran sains.
B1
Saya fikir bahawa penggunaan Kemahiran proses sains (KPS) penting
dalam penyiasatan sains kerana murid-murid boleh mempelajari dan
memahami konsep sains dengan lebih baik di dalam kelas.
1 2 3 4 5
B2Penggunaan KPS dalam penyiasatan sains dapat membantu
pembelajaran sains seperti yang kehendaki.1 2 3 4 5
B3Dalam sains , saya fikir adalah penting bagi murid belajar kemahiran
menyiasat masalah.1 2 3 4 5
B4Saya yakin aktiviti melibatkan proses sains boleh mendorong murid untuk
berminat dalam matapelajaran sains.1 2 3 4 5
B5Saya percaya bahawa kemahiran penyiasatan diperlukan untuk murid
berjaya dalam pembelajaran sains pada peringkat yang lebih tinggi.1 2 3 4 5
B6Saya fikir bahawa pengajaran sains dengan menggunakan penyiasatan
penting kerana ia boleh merangsang murid berfikir1 2 3 4 5
B7Saya percaya bahawa aktiviti penyiasatan sains membantu murid untuk
memahami konsep abstrak dalam sains.1 2 3 4 5
B8Pengajaran sains melalui pendekatan penyiasatan akan menarik minat
murid terhadap pembelajaran sains.1 2 3 4 5
B9Saya percaya kumpulan murid berkeupayaan rendah berminat untuk
mempelajari sains dengan aktiviti penyiasatan1 2 3 4 5
B10Dalam sains , saya fikir adalah penting bagi murid untuk terlibat dalam
aktiviti penyiasatan.1 2 3 4 5
B11Saya percaya bahawa pendekatan penyiasatan sains merupakan strategi
pengajaran yang mudah dilaksanakan.1 2 3 4 5
B12Saya percaya bahawa pendekatan penyiasatan sains ialah cara yang lebih
baik untuk mengajar sains.1 2 3 4 5
B13Saya rasa guru yang mengunakan penyiasatan sains dalam strategi
pengajaran boleh meningkatkan pencapaian murid dalam sains.1 2 3 4 5
B14Pengajaran sains dengan menggunakan pendekatan penyiasatan akan
membolehkan konsep sains dapat dipelajari oleh semua murid.1 2 3 4 5
B15Saya yakin bahawa strategi pendekatan penyiasatan sains dapat
memperbaiki keberkesanan pengajaran sains dalam kelas.1 2 3 4 5
B16Saya percaya penguasaan KPS membantu guru mengajar menggunakan
pendekatan penyiasatan sains.1 2 3 4 5
B17Saya yakin bahawa guru yang memahami dan menguasai KPS dapat
mengajar sains dengan lancar dan berkesan.1 2 3 4 5
B18Saya rasa pengetahuan KPS berkesan membantu kejayaan guru
mengajar sains1 2 3 4 5
Bahagian III - Efikasi Kepercayaan Hasil

212
BAHAGIAN IV MAKLUMAT DEMOGRAFIK
Lengkapkan maklumat di bawah.
NO ITEM INFORMATION
1 No pelajar
2 IPG Kampus
2 Semester PISMP
3 Jantina [ ] Lelaki [ ] Perempuan
4 Kaum [ ] Melayu [ ] Cina [ ] India
[ ] Lain-lain (nyatakan)___________
5 Keputusan subjek sains SPM
_______(Biologi) ________ (Kimia) __________ (Fizik)
_________ ( matapelajaran sains selain dinyatakan)
6 Jenis sekolah menengah yang anda hadiri.
[ ] Sekolah menengah berasrama penuh
[ ] Sekolah menengah kebangsaan
[ ] Sekolah menengah jenis kebangsaan
[ ] Lain-lain …………………………………………………. (nyatakan)
7 Adakah anda berpengalaman mengajar sebelum ini?
[ ] Ya [ ] Tidak

213
Appendix E Expert’s Survey of the SETSIS
Expert Survey of
Self-Efficacy in Teaching Using Science Inquiry Skills Instrument
(SETSIS)
This questionnaire is designed to gain expert perspectives on the content and need
of items in domains to measure primary school pre-service teachers’ self-efficacy in
teaching using science inquiry skills
PART 1: Demographic Information of Experts
Please fill in the information
NO ITEM INFORMATION
1 Institution
2 Gender [ ] Male [ ] Female
3 Specialization
4 Level of professional experience
PART II: SETSIS Item Pool Survey
Instructions:
Please evaluate each of the item that have been listed under the three domains.
On a scale from 1 (entirely disagree) to 5 (entirely agree), please rate to what extent each item measured the domain functioning.
1 2 3 4 5
entirely disagree
somewhat disagree
neither agree nor disagree
somewhat agree
entirely agree
You are encourage to provide comments and suggestions for each item or offer your
own lists of possible item for each domain.

214
ARAHAN : Berikan pendapat anda merujuk kepada kesesuaian item K1 hingga K39 berdasarkan definisi dimensi Knowledge Efficacy (KE).
Sila tandakan ( / ) pendapat anda dalam skala 1 hingga 5 di ruangan yang disediakan.
Anda digalakkan memberi pandangan dan cadangan terhadap setiap item atau mencadangkan item baru yang sesuai untuk setiap dimensi/ domain.
DOMAIN KNOWLEDGE: KNOWLEDGE EFFICACY (KE)
Skala KE diperkenalkan bagi mengukur efikasi kendiri dalam pengetahuan isi kandungan pengajaran KPS.
Definisi dimensi KE mengambil kira keyakinan guru pelatih dalam menjelmakan pemahaman kerja sains dalam aktiviti menggunakan pengetahuan KPS.
Ianya merujuk kepada pengetahuan kemahiran sains inkuiri termasuk 12 KPS (memerhati, mengelas, mengukur dan menggunakan nombor, membuat inferens,
meramal, berkomunikasi, menggunakan perhubungan ruang dan masa, mentafsirkan maklumat, mendefinisi secara operasi, mengawal pemboleh ubah,
membuat hipotesis, mengeksperimen (Malaysia Ministry of Education 2013)) yang diperlukan untuk merancang dan melaksanakan strategi inkuiri sains.
Pengetahuan kemahiran sains inkuiri juga ditakrifkan sebagai kemahiran yang membolehkan guru pelatih merangka dan menjawab soalan saintifik dan masalah
saintifik secara sistematik.
Item
Numbe
r
Item Skala Comment/
suggestion
1 2 3 4 5
Sa
ng
at tida
k
se
tuju
Tid
ak s
etu
ju
Tid
ak p
asti
Se
tuju
Sa
ng
at se
tuju
K1 Saya mempunyai pengetahuan yang diperlukan untuk memberi respon kepada soalan daripada
murid tentang sains sekolah rendah
I have knowledge needed to respond questions from pupils about primary science
K2 Saya memiliki pengetahuan membuat inferens yang diperlukan untuk memberikan murid hubung
kait yang mungkin di antara pemerhatian sains dengan kesimpulan mereka.
I possess necessary knowledge of inference to provide pupils with the possible connections
between science observation and their conclusion.

215
K3 Saya yakin pengetahuan kemahiran proses sains saya mencukupi bagi membimbing murid ke
arah idea yang diterima secara saintifik yang membolehkan mereka membentuk kefahaman yang
lebih bermakna tentang sains.
I am confident in my knowledge of SPS to guide pupils toward scientifically accepted ideas upon
which they can develop more meaningful understanding of science.
K4 Saya berasa selesa dengan pengetahuan mengeksperimen saya bagi mengubahsuai pendekatan
pengajaran sekiranya peralatan sainstifik yang diperlukan tidak disediakan.
I feel comfortable with my experimenting knowledge in order to improvise if scientific apparatus
needed are not available.
K5 Apabila murid menghadapi kesukaran memahami sesuatu konsep sains, saya berasa yakin
mempunyai pengetahuan KPS bagi membantu mereka untuk memahaminya menggunakan
pendekatan inkuiri saintifik.
When pupils has trouble understanding a science concept, I am confident in my knowledge of
SPS to help them to better understand it by using science inquiry approach
K6 Saya mempunyai kefahaman dalam KPS yang diperlukan bagi menentukan cara terbaik untuk
kanak –kanak boleh memeperolehi bukti saintifik.I have the necessary understanding of SPS to
determine the best manner through which children can obtain scientific evidence.
K7 Saya memahami asas KPS untuk dapat membantu murid mengumpulkan data berkenaan yang
diperlukan untuk menjawab persoalan mereka.
I understand the basic of SPS to help pupils to gather the appropriate data necessary for
answering their questions
K8 Saya mempunyai kefahaman KPS bagi menyediakan sendiri kebanyakan daripada persoalan
saintifik yang diperlukan untuk penyiasatan pelajar.
I have knowledge in SPS to create the majority of the scientific questions needed for students to
investigate.

216
K9 Saya yakin mempunyai pengetahuan KPS yang cukup bagi mengajar konsep sains yang penting
dengan berkesan.
I have knowledge of SPS in order to teach important science concepts effectively
K10 Saya sentiasa berusaha mencari cara penggunaan KPS yang lebih baik bagi mengajar sains.
I am continually finding better way to use SPS in teaching science
K11 Saya lazimnya berupaya menjawab soalan sains pelajar menggunakan pemahaman saya dalam
proses sains.I am typically able to answer pupils' science questions using my undersanding in
scientific process.
K12 Saya tahu cara merancang aktiviti penyiasatan sains menjadikan murid berminat dengan
pembelajaran sains.
I know how to plan science invastigation activity to make students interested in scienc learning
K13 Saya tahu mengintegrasikan pengetahuan isi kandungan topik saya dengan KPS bagi mendorong
murid terlibat dalam aktiviti inkuiri sains.
I know how to join my subject matter knowledge with SPS to motivate students into scientific
proceess activities.
K14 Saya mempunyai pengetahuan untuk merangka idea saintifik bagi menyediakan garis panduan
kepada murid menyampaikan keputusan dan penerangan mereka.
I have necessary knowledge to formulate scientific ideas to help pupils with the guidelines for
communicating their results and explanations.
K15 Saya yakin berpengetahuan dalam membuat inferensi, meramal dan berkomunikasi untuk
menawarkan/menunjukkan pendekatan bagi menghasilkan penerangan daripada bukti.
I have knowledge of inference, predicting and communication to be able to offer/show
approaches for generating explanations from evidence.

217
K16 Saya mempunyai kemahiran membuat hipotesis yang cukup bagi memainkan peranan utama
dalam membimbing pelajar mengenalpasti soalan saintifik.I have necessary skills in hypothesising
to able to play the primary role in guiding pupils identify scientific questions.
K17 Saya yakin untuk mengajar sesuatu konsep sains yang pernah saya belajar melalui pengetahuan
eksperimen saya.
A I feel confident in teaching science concept that I have learn through my knowledge of
experimenting.
K18 Saya mempunyai pengetahuan isi kandungan dan pengetahuan KPS bagi membenarkan murid
meransang sendiri masalah untuk disiasat dalam aktiviti saintifik.
I possess the knowledge of content and SPS to allow students to devise their own problems to
investigate.
K19 Saya berpengetahuan memberikan tunjuk cara agar para pelajar boleh menumpukan persoalan
mereka kepada soalan yang boleh dikendalikan untuk kajian.
I have knowledge to provide demonstrations through which students can focus their queries into
manageable questions for investigation.
K20 Saya tidak yakin berupaya untuk menggunakan pengetahuan KPS apabila mengajar pelajaran
sains kepada pelajar saya
I do not feel capable to use knowledge of SPS when I teach scince lesson to my students.(-)
K21 Saya berupaya meramal dengan mengaitkan pemerhatian saya dengan pengalaman
sebelumnya.I am able to make prediction by link my observation with my previous experiences.

218
K22 Saya berpengetahuan untuk memberikan pelajar saya hubung kait yang ada antara proses dan
pengetahuan saintifik di mana melaluinya mereka boleh mengaitkan penerangan mereka.
I have knowledge to provide my students with possible connections to scientific knowledge
through which they can relate their explanations.
K23 Saya mempunyai pengetahuan eksperimen tetapi merasa sukar menerangkan kepada para
pelajar cara eksperimen sains berfungsi
I have knowledge in experimenting but encounter difficulties in explaining to students how the
science experiments work.
K24 Saya memahami konsep proses saintifik dengan cukup baik untuk mengajar inkuiri sains dengan
berkesan.
I understand scientific process concept well enough to teach science inquiry effectively
K25 Apabila mengajar sains, saya biasanya mengetahui persolan/masalah pelajar
When teaching science, I usually knows student questions/ problems
K26 Saya berharap mempunyai kefahaman yang lebih baik tentang konsep sains yang saya ajar.I
wish I had a better understanding of the science concept I teach.
K27 Saya yakin mempunyai pengetahuan KPS yang lebih baik berbanding pengetahuan konsep sains
untuk mengajar sains sekolah rendah.
I have better knowledge of SPS compare to knowledge of science concept that enable me to
teach science in primary school.
K28 Saya tahu yang saya memiliki pengetahuan KPS yang cukup untuk mengajar secarainkuiri sains
kepada murid-murid sekolah rendah.
I know that I possess the necessary knowledge of SPS to teach science inquiry to primary pupils.

219
K29 Saya mempunyai pengetahuan isi kandungan yang diperlukan untuk mengajar sains kepada
murid-murid sekolah rendah.
I possess the necessary subject matter knowledge to teach science to primary pupils.
K30 Saya berpengetahuan melaksanakan aktiviti eksperimen dalam pengajaran saya.
I knowledgable in implementing experimental activities in my teaching
K31 Saya berupaya menghuraikan pemerhatian saya dengan pernyataan kuantitatif I am able to
describe my observation with quantitative statement
K32 Saya berupaya menghuraikan pemerhatian saya dalam pelbagai bentuk penerangan bermakna.
I am able to describe my observation using various meaningful presentation..
K33 Saya berupaya menetapkan aturan berdasarkan kepada persamaan, perbezaan dan saling
berhubungan.
I am able to imposing order based on similarities, differences and interrelationship
K34 Saya berupaya menghasilkan sistem pengelasan berdasarkan kepada perbandingan dan
perbezaan sifat.
I am able to develop a classification system based on compare and contrast attribute.
K35 Saya mempunyai keupayaan pengetahuan untuk berunding dengan pelajar berkenaan
perhubungan yang mungkin di antara penerangan.
I am able in regards of knowledge to negotiate with students possible connections
between/among explanations.
K36 Saya tahu menggunakan maklumat untuk meramal pemerhatian yang akan datang.
I do know to use information to forecast future observation

220
K37 Saya mempunyai kefahaman dalam pengukuran untuk membantu murid memahami konsep
panjang menggunakan model pengukuran sendiri (i.e. mengatur klip kertas / lidi). I have
understanding in measurement to help pupils learn the concept of length through creating model
of measurement (i.e. line up paper clips/ tooth picks).
K38 Saya tahu mengemukakan soalan/ masalah bagi menimbulkan minat murid untuk
menyelesaiakannya.
I knowl how to confront pupils with questions/ problems that they want to resolve.
K39 Saya tahu cara merancang aktiviti pemerhatian dengan bantuan peralatan dan lima deria.
I know how plan observation activity with the aid of instruments and five senses.

221
ARAHAN : Berikan pendapat anda merujuk kepada kesesuaian item P1 hingga P36 berdasarkan definisi dimensi personal teaching efficacy
(PTE).
Sila tandakan ( / ) pendapat anda dalam skala 1 hingga 5 di ruangan yang disediakan.
Anda digalakkan memberi pandangan dan cadangan terhadap setiap item atau mencadangkan item baru yang sesuai untuk setiap dimensi/
domain. DOMAIN PRACTICE: PERSONAL TEACHING EFFICACY (PTE)
Dimensi personal teaching efficacy (PTE) merujuk kepada efikasi kendiri dalam domain praktis.
PSE didefinisi sebagai pertimbangan individu guru pelatih dalam keyakinan diri terhadap kebolehan mereka menggunakan pendekatan KPS dalam
pengajaran sains.
Setiap item dimensi adalah mengikut tahap kesukaran yang dibangunkan melalui hipotesis pencapaian responden berdasarkan PCK taxonomy
(Veal & MaKinster 1999). Item
Number
Item Skala Comment/ suggestion
1 2 3 4 x
Sa
nga
t tid
ak
se
tuju
T
ida
k s
etu
ju
Tid
ak p
asti
Se
tuju
P1 Saya yakin berupaya menggunakan KPS dengan baik semasa
mengajar sains.
I am sure that I able to use SPS well in teaching science
P2 Apabila mendapati kandungan sains itu susah, saya lebih suka
menggunakan pendekatan proses sains untuk murid memahaminya
dengan lebih baik.
When I find the science content difficult, I prefer to use science
process approach to make students understand it better.

222
P3 Saya yakin yang saya mempunyai kemahiran yang diperlukan untuk
mengajar proses saintifik.
I am confident that I have the necessary skills to teach scientific
process
P4 Melalui syarahan dan penggunaan buku teks, saya berupaya untuk
menyediakan bukti yang diperlukan untuk murid membentuk
penerangan saintifik .
Using the lecture and textbook, I am able to provide my students with
all evidence required to form scientific explanations.
P5 Saya berupaya untuk merancang aktiviti kemahiran proses dengan
menggunakan lembaran kerja yang sedia ada.
I am able to plan process skills activity by using the existing
worksheet.
P6 Saya berupaya untuk menyediakan para pelajar saya data yang
diperlukan untuk menyokong sesuatu penyiasatan.I am able to
provide my students with the data needed to support an investigation.
P7 Saya berupaya untuk menyediakan para pelajar saya bukti untuk
dianalisis.
I am able to provide my students with evidence to be analyzed.
P8 Saya berupaya untuk menggunakan lembaran kerja sebagai bahan
instruksional bagi menyediakan satu set data di dalam kelas.
I am able to utilize worksheets as an instructional tool for providing a
data set

223
P9 Saya berupaya untuk menggunakan satu set data daripada
lembaran kerja bagi membantu pelajar dalam proses analisis.
I am able to utilize the data set in worksheets to walk students
through the analysis process.
P10 Saya berupaya untuk membimbing murid menilai sendiri ketekalan di
antara penerangan mereka dengan idea saintifik yang diterima.
I am able to guide students to independently evaluate the consistency
between their own explanations and scientifically accepted ideas.
P11 Apabila aktiviti saintifik sukar untuk dilaksanakan, saya lebih suka
menyusun langkah-langkah aktiviti dengan terperinci.
When science activities are difficult to execute, I prefer to organise
the activities in detail steps.
P12 Apabila aktiviti proses saintifik sukar dilaksanakan, saya suka
menjelaskan konsep sains terus kepada pelajar.When science
activities are difficult to execute, I prefer to explain the science
concept straight away to students.
P13 Saya berupaya untuk merancang masa bagi para pelajar saya untuk
menerangkan penyiasatan dan penemuan mereka semasa
pengajaran dan pembelajaran di kelas.
I am able to plan time for my students to describe their investigations
and findings to others during classroom teaching and learning.

224
P14 Apabila pelajar menghadapi masalah memahami sesuatu konsep
sains, saya lebih suka menggunakan pendekatan proses saintifik
untuk membantunya memahami dengan lebih baik.
When a student has trouble understanding a science concept, I prefer
to use scientific process approach to help him/her to better
understand it .
P15 Sekiranya diberi pilihan, saya tidak akan mengundang guru besar
untuk menilai cara pengajaran sains saya.
Given a choice, I would not invite the principle to evaluate my science
teaching practice(-)
P16 Sama ada kandungan sains itu susah atau tidak, saya pasti dapat
mengajarnya dengan menggunakan pendekatan proses sains.
Whether the science content is difficult or not, I can teach it using
science process approach
P17 Saya berupaya memberi peluang kepada murid membuat keputusan
kritikal melalui penilaian kesahan penerangan saintifik.I am able to
provide opportunities for students to become the critical decision
makers when evaluating the validity of scientific explanations.
P18 Melalui proses berkongsi penerangan, saya berupaya untuk
menyediakan para pelajar dengan peluang untuk mengkritik kaedah
penerangan dan penyiasatan.
Through the process of sharing explanations, I am able to provide
students with the opportunity to critique explanations and
investigation methods.
P19 Saya berupaya membimbing para pelajar dalam bertanyakan soalan
saintifik yang bermakna.
I am able to guide students in asking scientific questions that are
meaningful.

225
P20 Saya berupaya untuk membimbing para pelajar ke arah penyiasatan
yang sesuai berdasarkan soalan-soalan yang cuba untuk dijawab.
I am able to guide students toward appropriate investigations
depending on the questions they are attempting to answer.
P21 Saya berupaya membantu para pelajar mendalami soalan yang
dikemukakan oleh guru atau daripada bahan pengajaran, supaya
mereka dapat mengalami penyiasatan yang menarik dan berhasil.
I am able to help students refine questions posed by the teacher or
from instructional materials, so they can experience interesting and
productive investigations.
P22 Saya berupaya untuk membimbing para pelajar dalam mengucapkan
penerangan menggunakan istilah yang jelas.I am able to coach
students in the articulation of explanations using clear terms.
P23 Saya berupaya untuk menunjukkan kepada pelajar saya langkah-
langkah atau prosedur yang ditetapkan untuk menyampaikan
keputusan saintifik kepada kelas.
I am able to model for my students prescribed steps or procedures for
communicating scientific results to the class.
P24 Saya berupaya untuk menunjukkan kepada pelajar saya garis
panduan yang mesti diikuti apabila berkongsi dan mengkritik
penerangan.
I am able to model for my students the guidelines to be followed
when sharing and critiquing explanations.
P25 Saya berupaya untuk memudahkan penyiasatan respon terbuka dan
berjangka panjang, dalam usaha untuk memberikan peluang kepada
pelajar mengumpulkan bukti.
I am able to facilitate open-ended, long-term student investigations in
an attempt to provide opportunities for students to gather evidence.

226
P26 Semasa merancang aktiviti sains, saya lebih suka menggunakan
modul kemahiran proses sains yang sedia ada berbanding
memikirkannya sendiri.
During planning science activities, I prefer to use the existing science
process skills modul rather than think for myself.
P27 Saya berupaya untuk membimbing murid memberikan pelbagai
cadangan bagi membentuk penerangan daripada data..
I am able guide pupils to offer multiple suggestions for creating
explanations from data.
P28 Saya berupaya memberikan peluang kepada para pelajar bagi
membuat penerangan yang pelbagai melalui pemerhatian yang
sama.I am able to provide students with the opportunity to construct
alternative explanations for the same observations.
P29 Saya berupaya menggalakkan para pelajar saya mengkaji sendiri
sumber-sumber dalam percubaan untuk menghubung kait
penerangan mereka dengan pengetahuan saintifik.
I am able to encourage my students to independently examine
resources in an attempt to connect their explanations to scientific
knowledge.
P30 Saya berupaya membimbing para pelajar untuk mewajarkan kaedah
dan penerangan mereka berdasarkan bukti yang diperoleh.
I am able to guide the students justify their method and explanation
based on their own evidence.
P31 Saya yakin berupaya mendorong pelajar saya melibatkan diri semasa
aktiviti inkuiri sains dalam kelas.
I am able to motivate my students to participate during inquiry
activities in class

227
P32 Saya berkeupayaaan untuk menggalakkan para pelajar mengkaji
semula dan bertanyakan soalan tentang keputusan hasil kerja pelajar
lain.
I encompass the ability to encourage students to review and ask
questions about the results of other students’ work.
P33 Saya mempunyai keupayaan untuk meramal persoalan saintifik murid
melalui pengalaman bermakna yang saya kongsikan .I possess the
ability to predict pupils' scientific questions from meaningful common
experiences provided .
P34 Saya tidak begitu efektif dalam membuat aktiviti proses saintifik.
I am not very effective in developing scientific process activities.
P35 Saya berupaya memberikan penerangan kepada pelajar saya
tentang aktiviti proses saintifik.
I am able to provide my students with explanations in scientific
process activities
P36 Saya sukar untuk menerangkan kepada pelajar sebab ujikaji sains
berfungsi.
I find it difficult to explain to students why science experiments work

228
ARAHAN : Berikan pendapat anda merujuk kepada kesesuaian item B1 hingga B23 berdasarkan definisi dimensi outcome belief efficacy (OBE).
Sila tandakan ( / ) pendapat anda dalam skala 1 hingga 5 di ruangan yang disediakan.
Anda digalakkan memberi pandangan dan cadangan terhadap setiap item atau mencadangkan item baru yang sesuai untuk setiap dimensi/ domain.
Domain Belief: Outcome belief efficacy (OBE)
Definisi-Outcome belief efficacy (OBE) dibangunkan untuk mengukur domain kepercayaan terhadap pengaruh kemahiran proses sains (KPS) dalam hasil
pengajaran dan pembelajaran sains.
OBE merujuk kepada penilaian guru pelatih terhadap kepercayaan mereka menghasilkan pengajaran sains yang baik menggunakan KPS.
OBE juga merujuk kepada kepercayaan terhadap KPS dapat membantu hasil pembelajaran melalui pendekatan proses sains.
Setiap item dibangunkan mengikut tiga tahap pencapaian melalui hipotesis pencapaian responden berdasarkan PCK taxonomy (Veal & MaKinster 1999)
Item
Num
ber
Item Skala Comment/
suggestion 1 2 3 4 5
San
gat tid
ak
setu
ju
Tid
ak s
etu
ju
Tid
ak p
asti
Setu
ju
San
gat setu
ju
B1 Saya percaya bahawa penguasaan KPS mewujudkan peluang untuk memenuhi sifat ingin
tahu kanak-kanak apabila mempelajari sains.
I believe that mastery of SPS create oppurtunity to satisfy children curiousity when learning
science.
B2 Saya percaya bahawa kemahiran penyiasatan diperlukan untuk murid berjaya dalam
pembelajaran sains pada peringkat yang lebih tinggi.
I believe investigative skills are needed for pupils to success in their higher level science
learning

229
B3 Pengalaman murid dalam sains berkaitan langsung dengan keberkesanan guru mereka
menggunakan pendekatan inkuiri dalam pengajaran sains.
The pupils experience in science is directly related to the effectiveness of their teacher in
using inquiri approach in teaching science.
B4 Saya fikir bahawa pengajaran sains dengan menggunakan inkuiri penting kerana ia boleh
merangsang kanak-kanak untuk berfikir
I think that teaching science by using inquiry is important because it can stimulate children to
think
B5 Aktiviti proses sains melalui pendekatan inkuiri boleh memperkayakan pengalaman murid
dalam memmuridi sains.
Science process activities through inquiry approach can enriching pupils' experience in
learning science
B6 Guru yang mengunakan inkuiri sains dalam strategi pengajaran boleh meningkatkan
pencapaian murid dalam sains.
Teacher who used science inquiy in teaching strategies can improve student's achievement in
science.
B7 Aktiviti inkuiri sains boleh mendorong murid untuk memmuridi konsep sains.Science inquiry
activities can motivate pupils to learn science concept.
B8 Para pelajar dalam kumpulan berkeupayaan rendah tidak akan berminat untuk mempelajari
sains dengan aktiviti sains inkuiri
pupils in low ability group will not be interested in learning science with science inquiry
activities

230
B9 Pengajaran sains dengan menggunakan pendekatan sians inkuiri akan membolehkan konsep
sains dapat dipelajari oleh semua murid.
By teaching science using scientific process approach, science concepts are accessible for all
pupils
B10 Saya fikir bahawa penggunaan KPS dalam inkuiri sains penting kerana kanak-kanak boleh
mempelajari dan memahami konsep sains dengan lebih baik di dalam kelas.
I think that by using SPS in inquiry approach is important because children can learn and
understand science concept better in class.
B11 Usaha penting seseorang guru menggunakan pendekatan inkuiri dalam mengajar sains akan
menghasilkan perubahan kecil dalam pencapaian murid.
A teacher s significant effort to use inquiry approach in teach science will produces little
change in pupils performance.
B12 Saya yakin bahawa strategi pendekatan inkuiri sains dapat memperbaiki keberkesanan
pengajaran sains dalam kelas.
I am confident that science inquiry approach strategies can improve the effectiveness of
teaching science in class.
B13 Saya percaya kaedah pengajaran menggunakan inkuiri sains membantu penguasaan KPSI
believe that teaching science by using science inquiry helps to master SPS.

231
B14 Saya yakin bahawa guru yang memahami dan menguasai KPS dapat mengajar sains dengan
lancar dan berkesan.
I am confident that teachers who understand and master SPS can teach science smoothly
and effectively.
B15 Tidak kira seberapa banyak usaha yang saya lakukan, saya tidak akan berjaya mengunakan
pendekatan inkuiri sains disebabkan kurang penguasaan KPS.
No matter how much effort I put in, I will not success in using science inquiry approach
because of poor ability in SPS.
B16 Saya percaya bahawa pendekatan inkuiri sains merupakan strategi pengajaran yang sukar
untuk digunakan.
I believe that science inquiry approach is a difficult teaching strategies to use.(-)
B17 Saya percaya bahawa pendekatan inkuiri sains ialah cara yang lebih baik untuk mengajar
sains.
I believe that science inquiry approach is a better way to teach science.
B18 Penggunaan KPS dalam inkuiri sains tidak dapat membantu saya mengajar konsep sains
sebaik yang saya kehendaki.
The usage of SPS in science inquiry will not help me to teach science as well as I would like
B19 Saya tidak yakin bahawa pendekatan inkuiri sains merupakan strategi yang baik dalam
mengajar konsep sains yang rumit. I am not confident that science inquiry approach are good
strategies in teaching difficult science concept.

232
B20 Saya percaya bahawa aktiviti inkuiri sains membantu murid untuk memahami konsep abstrak
dalam sains.
I believe that science inquiry activities help pupils to understand abstract concepts in science.
B21 Pengajaran sains melalui pendekatan inkuiri sains akan menarik minat murid terhadap
pembelajaran sains..
Teaching science by using science inquiry approach will attract pupils in learning science.
B22 Dalam sains , saya fikir adalah penting bagi kanak-kanak untuk terlibat dalam aktiviti inkuiri
sains.
In science, I think it is important for children to participate in inquiry activities.
B23 Dalam sains , saya fikir adalah penting bagi kanak-kanak untuk belajar kemahiran menyiasat
masalah.
In science, I think it is important for children learn skills to investigate problem.

233
Appendix F 72 items of the SETSIS
Code Item Code Item Code Item
K1I feel my knowledge in SPS is sufficient to guide my
students to form a more meaningful understanding of
science.K25
I am confident I have sufficient investigation skil ls to
teach important scientific concepts effectively.P23
I can guide students to give a consistent explanation on the
proofs from the observation of the experiment.
K2I understand about SPS which is required to guide
students towards attaining scientific evidence
through scientific investigations.K26
I can always answer scientific enquiries from students
using my understanding of the science process.P24
Through explanation, I will try to offer opportunities for
students to criticize the methods of explanation and
investigation.
K3I understand SPS is a basis to assist students in
collecting data to answer their questions.P1
When an activity of science process is challenging to
implement, I will arrange every step in the activity using
the investigative approach.P25
I want to guide the students to self-evaluate the consistency
between their explanation and the scientific ideas given to
them.
K4I know how to plan interesting scientific
investigations to attract the students to learn
science.P2
When a science process is difficult to explain, I will use
the investigative approach to assist the students'
understanding.P26
I plan time to give students a chance to explain their
investigations and discovery in class.
K5I can combine SPS knowledge to the subject's content
to encourage students' participation in scientific
investigation activities.P3
I can provide explanation to my students about the
activity of the science process.P27
I am able to guide students to deliver their explanations
using clear scientific terminologies.
K6I have knowledge in constructing scientific ideas to
provide guidelines for students to explain their
scientific results.P4
I am able to plan science process activities with provided
modules.P28
I choose to show the best method of teaching science
according to the latest curriculum to the headmaster.
K7I have sufficient skil ls to create a hypothesis to play
the main role in guiding students to identify
variables involved in the scientific issues.P5
I choose to provide data from real experiments as
instructional materials rather than data from workbooks.B1
I think that the use of Science Process Skil ls (SPS) is
important in science investigations because students can
learn and understand science concepts better in class.
K8I have knowledge in guiding students to plan their
own problems to solve.P6
I know how to provide suitable data to be analysed by
students.B2
The use of SPS in science investigations is able to assist the
learning of science as desired.
K9I know how to provide guidance so that students can
develop their own issues to solve through scientific
investigation.P7
I try to use one set of data from worksheets to assist
students in the analysis process.B3
In science, I believe it is important for students to have
problem solving and investigative skil ls.
K10I know to deal with students on the possible relations
through explanations.P8
I am able to guide students to give various suggestions to
form explanation from the data.B4
I am confident that activities involving science processes
nurture students to be more interested in science.
K11I know I possess sufficient SPS knowledge to teach
science through scientific investigations to primary
school students.P9
I can provide proof needed to support an investigation by
students.B5
I believe that investigative skil ls are needed for students to
be successful in learning science on higher levels.
K12I have sufficient knowledge on the content needed to
teach science to primary school students.P10
I am confident of teaching through the approach of
scientific investigations regardless whether the content
is easy or difficult.B6
I think that teaching science through investigations is
important because it stimulates the students to think.
K13With the SPS knowledge that I have, I can form
scientific inquiries needed for students to make a
study.P11
I can guide students to ask significant scientific
questions.B7
I believe that investigative science activities assist students
to understand abstract concepts in science.
K14I am knowledgeable in implementing experiments in
my teachings.P12
I am confident I can apply science investigation skil ls in
my teaching.B8
Teaching science through the investigative approach will
attract students’ attention to learning science.
K15In absence of scientific apparatus, I am comfortable
in using my own knowledge on experiments to adapt
my teaching process.P13
I am able to guide and direct students to appropriate
investigations based on the questions that they try to
answer.B9
I believe that low ability students will be more interested
and curious in learning science with the investigation
activities.
K16My experimental skil ls are sufficient to explain the
function of experiments to students.P14
I am able to help students to study in depth on questions
given, so that they can experience a great and successful
investigation.B10
In science, I think it is important that students are involved
in investigation activities.
K17I am confident to teach a scientific concept which I
understand through experiments.P15
I believe I can teach science concepts easily using the
science investigation approach.B11
I believe that the science investigation approach is an
applicable teaching strategy.
K18When students struggle with understanding scientific
concepts, I am confident my knowledge of SPS is able
to assist with their understanding.P16
In a science investigation, I try to encourage students to
study the sources themselves to relate their explanation
to their scientific knowledge.B12
I believe that science investigation is a better method in
teaching science.
K19I am constantly searching for effective SPS methods
to teach science.P17
I believe I can encourage students to get involved during
science investigation activities in class.B13
I think that teachers who employ science investigations as a
teaching strategy are able to increase the achievements of
students in science.
K20I understand about measurement and space to help
students understand the concept of length using self-
measure (i.e arranging paper clips/sticks).P18
I am fostering students to review and ask questions on
other students' resultsB14
Teaching science using the investigative approach enables
all students to learn science concepts.
K21I am able to explain my observations with a
quantitative statement.P19
I am able to show my students the guidelines to be
followed when sharing and criticizing explanation.B15
I am confident that this science investigation approach can
improve the efficiency of teaching and learning science in
class.
K22I am able to explain my observations in a variety of
significant explanation methods.P20
I can give chances to students to make important
decisions in verifying a scientific explanation.B16
I believe that mastering the SPS will help teachers to teach
using science investigation approach.
K23I know how to use information given to predict a
coming observation.P21
I ask my students to provide steps or procedures when
delivering their scientific results to class.B17
I am confident that teachers who understand and master SPS
can teach science smoothly and efficiently.
K24I am able to impose an enquiry to get students'
attention to solve it.P22
If given opportunity, I will encourage students to give
various explanations from the same observation.B18
I think SPS knowledge is effective in assisting teachers to
successfully teach science.

234
Appendix G Factor Loading using Promax Rotation
Item Label
Loading
Action Factor 1 Factor 2 Factor 3
K11 0.91 0.00 -0.16
Retain in Factor 1
K12 0.81 0.00 -0.12
Retain in Factor 1
K22 0.77 -0.04 0.03
Retain in Factor 1
K21 0.75 0.06 -0.10 Retain in Factor 1
K6 0.75 -0.16 0.09 Retain in Factor 1
K23 0.73 0.05 -0.07 Retain in Factor 1
K1 0.71 0.11 -0.10
Retain in Factor 1
K16 0.70 -0.03 0.05
Retain in Factor 1
K7 0.69 0.08 -0.10
Retain in Factor 1
K13 0.69 -0.06 0.13 Retain in Factor 1
K5 0.68 0.08 0.03
Retain in Factor 1
K14 0.66 0.00 0.11
Retain in Factor 1
K10 0.66 -0.04 0.03 Retain in Factor 1
K18 0.65 0.06 0.08
Retain in Factor 1
K8 0.63 -0.17 0.20 Retain in Factor 1
K2 0.62 0.26 -0.14
Retain in Factor 1
K25 0.62 -0.11 0.24 Retain in Factor 1

235
K24 0.61 -0.02 0.15 Retain in Factor 1
K26 0.60 -0.06 0.22 Retain in Factor 1
K4 0.60 -0.03 0.12 Retain in Factor 1
K17 0.59 0.14 0.02 Retain in Factor 1
K3 0.56 0.32 -0.14 Retain in Factor 1
P3 0.56 0.12 0.14 Retain in Factor 1
K9 0.53 -0.09 0.30
Retain in Factor 1
K20 0.53 0.04 0.12
Retain in Factor 1
K15 0.49 -0.07 0.29
Retain in Factor 1
P4 0.46 0.17 0.14 Retain in Factor 1
K19 0.45 0.05 0.23 Retain in Factor 1
P9 0.43 0.02 0.34 slightly to significant cross loading (oblimin).Omitted
P15 0.41 0.13 0.31 Retain in Factor 1
B10 -0.18 0.84 0.06 Ratain in Factor 2
B4 0.01 0.82 -0.06 Ratain in Factor 2
B6 0.07 0.82 -0.09 Ratain in Factor 2
B16 0.15 0.80 -0.12 Ratain in Factor 2
B1 0.03 0.79 -0.07
Ratain in Factor 2
B8 0.00 0.78 -0.01 Ratain in Factor 2
B2 0.07 0.76 -0.05 Ratain in Factor 2
B18 0.00 0.75 0.07 Ratain in Factor 2
B3 0.06 0.75 -0.05 Ratain in Factor 2
B5 0.04 0.74 0.02 Ratain in Factor 2
B17 0.08 0.74 -0.08 Ratain in Factor 2
B7 0.03 0.74 0.01 Ratain in Factor 2

236
B12 -0.08 0.68 0.17 Ratain in Factor 2
B9 0.01 0.68 0.03 Ratain in Factor 2
B13 -0.09 0.64 0.23
Ratain in Factor 2
B15 -0.09 0.62 0.28 Ratain in Factor 2
B14 -0.16 0.60 0.30 Ratain in Factor 2
B11 -0.03 0.39 0.35 cross loading. Omitted
P24 -0.05 -0.02 0.80
Retain in Factor 3
P25 -0.14 0.14 0.74
Retain in Factor 3
P28 0.09 0.05 0.65 Retain in Factor 3
P26 -0.03 0.18 0.64 Retain in Factor 3
P11 0.27 -0.12 0.64 Retain in Factor 3
P19 0.13 -0.06 0.64 Retain in Factor 3
P18 0.13 0.03 0.62 Retain in Factor 3
P23 0.13 0.03 0.62 Retain in Factor 3
P22 0.04 0.14 0.62 Retain in Factor 3
P27 0.14 0.07 0.60 Retain in Factor 3
P20 0.08 0.08 0.59 Retain in Factor 3
P8 0.31 -0.10 0.56 Retain in Factor 3
P10 0.30 -0.09 0.54
Retain in Factor 3
P14 0.24 0.03 0.51
Retain in Factor 3
P21 0.14 0.10 0.51 Retain in Factor 3
P16 0.17 0.05 0.50
Retain in Factor 3
P1 0.29 0.01 0.49
Retain in Factor 3
P12 0.22 0.14 0.49 Retain in Factor 3

237
P7 0.33 -0.05 0.48 Retain in Factor 3
P6 0.31 -0.04 0.46 Retain in Factor 3
P13 0.33 0.07 0.43
Retain in Factor 3
P2 0.34 0.07 0.36 slightly to significant cross loading(Oblimin).Omitted
P17 0.22 0.22 0.34 Not significant. Omitted
P5 0.28 0.10 0.31 Not significant. Ommited

238
Appendix H Result of Item Difficulty Measure
ENTRY TOTAL TOTAL MODEL INFIT OUTFIT PTMEA
NUMBER SCORE COUNT MEASURE S.E. MNSQ ZSTD MNSQ ZSTD CORR. ITEM
6 1104 324 1.17 0.08 0.96 -0.5 0.95 -0.6 0.67 K6 8 1104 324 1.17 0.08 1.01 0.2 1 0.1 0.66 K8 9 1138 324 0.92 0.09 0.93 -0.9 0.91 -1.2 0.7 K9
30 1141 324 0.9 0.09 1 0.1 1.01 0.2 0.68 P6 34 1143 324 0.89 0.09 0.83 -2.4 0.82 -2.4 0.74 P11
1 1152 323 0.8 0.09 0.96 -0.5 0.96 -0.4 0.65 K1 33 1157 324 0.78 0.09 1.06 0.8 1.06 0.8 0.7 P10 16 1159 324 0.77 0.09 0.98 -0.2 0.99 -0.1 0.67 K16
10 1162 324 0.75 0.09 1.08 1.1 1.1 1.3 0.62 K10 13 1163 323 0.72 0.09 0.88 -1.6 0.89 -1.4 0.71 K13 15 1163 323 0.72 0.09 1.15 1.9 1.13 1.7 0.67 K15 11 1167 324 0.71 0.09 1.03 0.5 1.03 0.4 0.71 K11 25 1179 324 0.62 0.09 0.9 -1.3 0.9 -1.4 0.7 K25 26 1180 324 0.62 0.09 0.89 -1.4 0.89 -1.5 0.71 K26 44 1184 324 0.59 0.09 0.82 -2.5 0.82 -2.4 0.71 P23 31 1188 324 0.56 0.09 0.97 -0.4 1 0.1 0.69 P7 32 1184 323 0.56 0.09 0.89 -1.5 0.88 -1.5 0.73 P8
22 1189 324 0.55 0.09 0.96 -0.4 0.95 -0.6 0.72 K22 5 1191 321 0.44 0.09 0.82 -2.5 0.82 -2.5 0.73 K5
18 1203 324 0.44 0.09 0.89 -1.4 0.91 -1.2 0.72 K18 27 1204 324 0.44 0.09 0.81 -2.6 0.84 -2.2 0.73 P1 37 1204 324 0.44 0.09 0.85 -2.1 0.86 -1.8 0.72 P14

239
7 1206 324 0.42 0.09 1.07 0.9 1.06 0.8 0.64 K7 4 1210 324 0.39 0.09 1.14 1.7 1.18 2.2 0.65 K4
48 1210 324 0.39 0.09 0.82 -2.5 0.81 -2.6 0.74 P27 36 1213 324 0.37 0.09 0.75 -3.6 0.75 -3.6 0.76 P13 12 1221 324 0.31 0.09 1.09 1.2 1.07 0.9 0.65 K12 45 1225 324 0.28 0.09 1.03 0.4 1 0.1 0.68 P24 46 1226 324 0.27 0.09 0.99 -0.1 0.99 -0.1 0.66 P25
38 1228 324 0.26 0.09 1.02 0.3 1.06 0.7 0.65 P16 35 1229 324 0.25 0.09 0.81 -2.7 0.81 -2.6 0.75 P12 40 1234 324 0.21 0.09 1 0 1.01 0.2 0.66 P19 49 1235 324 0.2 0.09 1.07 1 1.05 0.7 0.72 P28 41 1238 324 0.18 0.09 0.9 -1.4 0.9 -1.3 0.68 P20 19 1241 324 0.16 0.09 1.09 1.1 1.14 1.8 0.67 K19 21 1243 324 0.14 0.09 0.95 -0.6 0.96 -0.5 0.66 K21 14 1248 324 0.1 0.09 1.03 0.4 1 0.1 0.71 K14 24 1245 323 0.09 0.09 1.06 0.8 1.06 0.7 0.68 K24
28 1250 324 0.09 0.09 0.68 -4.7 0.76 -3.4 0.73 P3 47 1250 324 0.09 0.09 0.84 -2.1 0.82 -2.4 0.71 P26 23 1251 324 0.08 0.09 0.98 -0.2 0.97 -0.3 0.66 K23 42 1255 324 0.05 0.09 0.99 -0.1 0.99 -0.1 0.67 P21 20 1258 324 0.02 0.09 1.25 3 1.25 2.9 0.63 K20 39 1260 324 0.01 0.09 0.84 -2.2 0.85 -1.9 0.71 P18
2 1269 324 -0.06 0.09 1.14 1.8 1.15 1.8 0.65 K2 29 1282 324 -0.17 0.09 0.93 -0.9 1.01 0.1 0.68 P4
43 1283 324 -0.17 0.09 0.94 -0.8 0.9 -1.2 0.71 P22 3 1321 323 -0.52 0.09 1.08 1 1.13 1.5 0.64 K3
62 1328 324 -0.55 0.09 1.23 2.7 1.17 1.9 0.61 B14 17 1331 324 -0.57 0.09 0.96 -0.5 0.99 -0.1 0.67 K17 58 1351 324 -0.74 0.09 1.28 3.4 1.26 2.8 0.58 B9

240
60 1354 324 -0.77 0.09 1.16 2 1.11 1.3 0.61 B12 61 1358 324 -0.81 0.09 1.13 1.6 1.07 0.8 0.62 B13 63 1372 324 -0.93 0.1 0.98 -0.3 0.95 -0.6 0.65 B15 51 1386 324 -1.06 0.1 0.99 -0.1 1.07 0.8 0.61 B2 56 1389 324 -1.09 0.1 1.01 0.2 1.19 1.9 0.6 B7 53 1390 324 -1.1 0.1 1.19 2.3 1.11 1.1 0.6 B4 50 1393 324 -1.13 0.1 1.33 3.8 1.23 2.3 0.58 B1
64 1396 324 -1.16 0.1 0.97 -0.3 0.92 -0.7 0.66 B16 65 1397 324 -1.17 0.1 1.2 2.4 1.28 2.6 0.57 B17 57 1403 324 -1.23 0.1 1.09 1.1 1.11 1.1 0.6 B8 66 1408 324 -1.28 0.1 1.07 0.8 1.03 0.3 0.65 B18 52 1410 324 -1.3 0.1 1.03 0.4 1.02 0.2 0.6 B3 54 1412 324 -1.32 0.1 1.04 0.5 1.01 0.1 0.63 B5 55 1413 324 -1.33 0.1 1.04 0.5 1 0 0.62 B6 59 1422 324 -1.42 0.1 1.32 3.6 1.27 2.3 0.55 B10
MEAN 1256.1 323.9 0 0.09 1 0 1 -0.1
P.SD 89.1 0.5 0.72 0 0.13 1.7 0.13 1.5

241
Copyright © 2022 FDOKUMEN


