Validating Trip Travel Time Provided by Smartphone ...
11
Jordan Journal of Civil Engineering, Volume 14, No. 4, 2020 ‐ 500 - © 2020 JUST. All Rights Reserved. Received on 10/5/2020. Accepted for Publication on 1/7/2020. Validating Trip Travel Time Provided by Smartphone Navigation Applications in Jordan Ahmad H. Alomari 1)* , Bashar H. Al-Omari 2) and Abdallah B. Al-Hamdan 3) 1) Assistant Professor of Civil Engineering, Yarmouk University (YU), P.O. Box 566 - Irbid 21163, Jordan. * Corresponding Author. E-Mail: [email protected] 2) Professor of Civil Engineering, Jordan University of Science & Technology (JUST), P.O. Box 3030 - Irbid 22110, Jordan. E-Mail: [email protected] 3) Research Assistant, Jordan University of Science & Technology (JUST), P.O. Box 3030 - Irbid 22110, Jordan. E-Mail: [email protected] ABSTRACT This research aimed to validate the trip travel time provided by three selected navigation applications, through examining the error in the Estimated Time of Arrival (ETA) provided. The ETA was compared with the actual travel time measured from 204 selected urban and rural road segments in Jordan. The overall trip travel time accuracy was 70%, 57% and 52% for the Google Maps, Here-WeGo and Waze applications, respectively. Analysis results showed that the three applications’ ETA measures vary from the actual trip time with different error levels ranging from minor errors of less than 10% to significant errors of more than 40%. It was found that Google Maps has the most distinguished accuracy, yet the provided information by Google Maps contains a certain amount of error in the ETA. Also, ANOVA test showed that there was no statistically significant differences between Google Maps and Waze-ETA mean errors, while Here-ETA mean error significantly differs from those of both applications. The significant contribution of this research is the detailed evaluation process of the estimated journey times using field data collected by trained drivers instead of crowdsourcing data. The usage of such applications will attract the attention of individuals, organizations and agencies in different related sectors. KEYWORDS: Navigation applications, Estimated time of arrival, Google maps, Here-WeGo, Waze. INTRODUCTION Artificial intelligence is employed in Navigation Applications (NAs) and Intelligent Transportation Systems (ITSs) to estimate traffic conditions, such as speed, travel time and delay at specified road segments that can be utilized for designing optimal driving routes (Liebig et al., 2017). The user can view traffic conditions as color-coded segments, where the application predefines the color code, so that the user may plan the trip based on this information and the obtained traffic data can be utilized by the application itself to give a “route advice” to the user. The reliability of information provided by these applications is the critical factor of the success and spread of them, because road users are looking to get correct information. Navigation reliability using smartphones can be evaluated by several techniques, such as questionnaires with application users, interviews, traffic sensors installed by government and private companies, field data collection and even using simulation to compare and validate the obtained results. One of the essential features in NAs is traffic condition information, which can be either real-time or historical data collected from application users while they are moving. Real-time data is used when there are active users at a road segment at a time, whereas historical data is used when there are no active users at that time, which represents the best past prediction of traffic conditions. Smart routing algorithms were developed to improve the calculations and their predictions using both real-time and historical traffic experience. Currently, NAs are developed in many countries
-
Upload
khangminh22 -
Category
Documents
-
view
0 -
download
0
Transcript of Validating Trip Travel Time Provided by Smartphone ...
Jordan Journal of Civil Engineering, Volume 14, No. 4, 2020
‐ 500 - © 2020 JUST. All Rights Reserved.
Received on 10/5/2020. Accepted for Publication on 1/7/2020.
Validating Trip Travel Time Provided by Smartphone Navigation
Applications in Jordan
Ahmad H. Alomari 1)*, Bashar H. Al-Omari 2) and Abdallah B. Al-Hamdan 3)
1) Assistant Professor of Civil Engineering, Yarmouk University (YU), P.O. Box 566 - Irbid 21163, Jordan. * Corresponding Author. E-Mail: [email protected]
2) Professor of Civil Engineering, Jordan University of Science & Technology (JUST), P.O. Box 3030 - Irbid 22110, Jordan. E-Mail: [email protected]
3) Research Assistant, Jordan University of Science & Technology (JUST), P.O. Box 3030 - Irbid 22110, Jordan. E-Mail: [email protected]
ABSTRACT
This research aimed to validate the trip travel time provided by three selected navigation applications, through
examining the error in the Estimated Time of Arrival (ETA) provided. The ETA was compared with the actual
travel time measured from 204 selected urban and rural road segments in Jordan. The overall trip travel time
accuracy was 70%, 57% and 52% for the Google Maps, Here-WeGo and Waze applications, respectively.
Analysis results showed that the three applications’ ETA measures vary from the actual trip time with different
error levels ranging from minor errors of less than 10% to significant errors of more than 40%. It was found
that Google Maps has the most distinguished accuracy, yet the provided information by Google Maps contains
a certain amount of error in the ETA. Also, ANOVA test showed that there was no statistically significant
differences between Google Maps and Waze-ETA mean errors, while Here-ETA mean error significantly
differs from those of both applications. The significant contribution of this research is the detailed evaluation
process of the estimated journey times using field data collected by trained drivers instead of crowdsourcing
data. The usage of such applications will attract the attention of individuals, organizations and agencies in
different related sectors.
KEYWORDS: Navigation applications, Estimated time of arrival, Google maps, Here-WeGo, Waze.
INTRODUCTION
Artificial intelligence is employed in Navigation
Applications (NAs) and Intelligent Transportation
Systems (ITSs) to estimate traffic conditions, such as
speed, travel time and delay at specified road segments
that can be utilized for designing optimal driving routes
(Liebig et al., 2017). The user can view traffic conditions
as color-coded segments, where the application
predefines the color code, so that the user may plan the
trip based on this information and the obtained traffic
data can be utilized by the application itself to give a
“route advice” to the user.
The reliability of information provided by these
applications is the critical factor of the success and
spread of them, because road users are looking to get
correct information. Navigation reliability using
smartphones can be evaluated by several techniques,
such as questionnaires with application users,
interviews, traffic sensors installed by government and
private companies, field data collection and even using
simulation to compare and validate the obtained results.
One of the essential features in NAs is traffic
condition information, which can be either real-time or
historical data collected from application users while
they are moving. Real-time data is used when there are
active users at a road segment at a time, whereas
historical data is used when there are no active users at
that time, which represents the best past prediction of
traffic conditions. Smart routing algorithms were
developed to improve the calculations and their
predictions using both real-time and historical traffic
experience.
Currently, NAs are developed in many countries
Jordan Journal of Civil Engineering, Volume 14, No. 4, 2020
- 501 -
around the world; some of them are operated to serve a
specified geographical area, while others are limited to
use by specific users. Additionally, many of these
applications are available to use for free. By now, there
is a variety of NAs which were developed by different
companies and developers all over the world. For this
research, a set of three popular NAs were investigated:
Google Maps, Here-WeGo and Waze.
Traffic Studies Based on Data Provided by NAs Many researchers have investigated different data
types that are extracted from various NA features. The
data provided by those features is considered to have
high value in the fields of traffic monitoring, traffic
management and safety studies. It is also a valuable
resource for building reliable Advanced Traveler
Information Systems (ATISs) that can serve in many
roles to improve the performance of the transport
process.
NAs are the product of merging mapping, global
positioning system (GPS) and smartphone technologies.
One of the most used applications is Google Maps; it
was downloaded more than 5000 million times on
Android devices only (Google Maps, 2020). It supports
many different navigating features (Google Developers,
2020) and is available to use in more than 220 countries
(Google Play Store, 2020A). Many studies were
conducted using Google Maps traffic data, maps and
routing features. Petrovska and Stevanovic (2015; 2016)
have employed Google Maps traffic data in developing
a visualization tool that can be used for live traffic and
congestion analysis. Another system for displaying
traffic conditions was presented by Zhou et al. (2015),
who have evaluated the output of their urban traffic
monitoring system by making a comparison between
official field traffic data and Google Maps traffic data.
In general, the estimated traffic speed by the system was
closer to the official traffic data than Google Maps.
Similarly, Pant et al. (2015) have used several public
data sources to obtain traffic data to estimate traffic
conditions. They have used Google Maps traffic data to
evaluate the output of their system (TrafficKarma),
which can be used for monitoring and visualizing traffic
conditions. Nair et al. (2019) have collected traffic data
for 29 cities for 40 days using Google Maps to study the
traffic conditions over different cities. Moving from
occupied field traffic studies to environmental studies,
Google Maps were used to obtain traffic data in addition
to manual traffic counts to study the contribution of
traffic exposure to air pollution (Banica et al., 2017).
Another widely used NA is Waze, which has been
downloaded by more than 115 million users (Waze,
2020). It was adopted by Fire et al. (2012) with valuable
information to make transportation more comfortable
and more familiar. Waze application allows users to
report accidents’ locations, nearby police units, traffic
jams and speed traps, which improves traffic delay
prediction and assigns alternative routes to reduce
congestion. Waze application was also employed to
identify the intersections and areas which are expected
to have a higher rate of accidents, in order to implement
improvements to avoid these risks. Amin-Naseri et al.
(2018) have studied crowdsourced data from Waze and
compared it with data from common traffic management
data sources. The findings of this research pointed out
that Waze-crowdsourced data is an excellent source of
broad coverage for traffic monitoring and has reasonable
geographic accuracy. In the field of data validation,
Goodall and Lee (2019) used traffic mounted cameras
along an urban freeway section to extract the real
accidents and incident number and locations and
compare the results with Waze accident and incident
real-time reports. They concluded that the cameras
confirmed 13 out of 40 accidents and two reports were
found to be false. Also, about 49% of incidents were
confirmed by the cameras; hence there are many data
sources which are involved in Waze. Sensors –if
available-, GPS data and users’ reports are the data
sources for Waze. After validation and evaluation
processes, this data may be used for traffic management
and monitoring purposes when it reaches an acceptable
level of reliability.
One more commonly used NA is Here-WeGO
(HERE, 2020). It was downloaded more than 10 million
times on Android devices only and about 100 million
users are using Here maps (HERE, 2020; Google Play
Store, 2020B). Saputra et al. (2018) have compared the
three NAs; Google Maps, Here-WeGO and Wisepilot
(Wisepilot, 2020), depending on Pingdom (SolarWinds,
2019) and GTMetrik (GTMetrik, 2019) to evaluate
efficiency, where the three applications have shown a
“good” performance on a scale of low, medium and
good. Also, all of them scored 100 percent in the
reliability test, while for testing functionality, usability
Validating Trip Travel… Ahmad H. Alomari, Bashar H. Al-Omari and Abdallah B. Al-Hamdan
- 502 -
and cartography, questionnaires were used and the
results showed 100% success for Google Maps and
Here-WeGo and 98% for Wisepilot. In terms of
usability, Google has scored 70.62%, which is classified
as good. Here-WeGo scored 55.97%, which is classified
as acceptable and Wisepilot scored 43.40%, which is
classified as low. Finally, in the evaluation of the
applications’ cartographical elements and
representation, Wisepilot recorded the highest score
with 70%, followed by Google Maps with 64% and then
Here-WeGo with 42%. Also, Cheung and Sengupta
(2016) have evaluated 20 NAs in terms of different
aspects, such as high-level features, usability and
popularity. Here-WeGo and Google Maps were among
the top five in high-level features and popularity aspects,
but in the usability evaluation, Google Maps occupied
the 7th place and Here-WeGo occupied the 9th. On the
other hand, Rettore et al. (2019) have used car traces
with Here-WeGo traffic data accompanied by Traffic
Data Enrichment Sensor (TraDES) in order to widen the
coverage of traffic data in the case of absence of real-
time traffic data from traveling cars at specified regions.
Many traffic studies use travel time estimation as a
significant measure of effectiveness in the evaluation
process. Such studies include, but are not limited to, the
bus rapid transit (BRT) systems (Imam and Jamrah,
2012; Alomari et al., 2016; Al-Deek et al., 2017), transit
signal priority (TSP) systems (Consoli et al., 2015),
traffic control devices and intelligent transportation
system infrastructure (ITS) upgrades (Consoli et al.,
2013), traffic management in central business districts
(CBDs) (Al-Omari et al., 2013) and traffic simulation
software validations (Al-Omari and Ta’amneh, 2007).
NA Development and Validation In the field of NA development and validation,
Mena-Yedra et al. (2017) have proposed an “Adarules”
system and compared the traffic prediction of this
machine learning-based framework with simple and
complex statistical models. The developed system,
Adarules, had adapted with significant incoming data
streams and different types of changes associated with
several factors, such as season of the year, time and
different road network changes. Also, this adaption
takes place in a short time, where the accuracy of
prediction increases as the amount of incoming data
increases. Also, Barata et al. (2014) have developed My
Traffic Manager (MTM), which uses data sent from
drivers who are using MTM. Thus, the application
shares the received data among all application users,
which helps the drivers who are using MTM know the
conditions of the specified road at a specific time. So, if
there was a traffic congestion at a road segment, the
driver may avoid it according to the route advice
provided by MTM.
The use of NAs is not limited to single users; they
are also widely used by traffic managers, traffic
operators, utility companies, goods’ distributors and
many various agencies from both public and private
sectors. Santos et al. (2011) have developed an
application for vehicle routing, which was built based on
Google Maps data (maps and traffic data). Different
types of users used the developed application and it has
provided accurate vehicle routes under different
conditions. Tam and Lam (2013) have presented a
methodology to validate the Speed Map Panel (SMP)
system. It was conducted to validate the SMP system
using floating car surveys to collect journey times and
traffic speeds on specified paths after determining the
sample size, then the SMP data was compared to actual
measured data. All data points have been checked and it
was found that all the data met the targeted accuracy
level (±20% error) in both traffic speed and journey time
estimation. Additionally, Herrera et al. (2010) have
conducted a study to evaluate traffic data obtained via
GPS-enabled mobile phones. They proved that using
GPS-enabled mobile phones is feasible as a real-time
traffic monitoring system by providing velocities of
traffic on freeways, in addition to the high level of
accuracy presented by this system.
In this research, traffic data collection was facilitated
using the smartphone location feature, which was also
used in different studies before, such as García-Albertos
et al. (2019), who have used digital fingerprints of
mobile phones to perform an accessibility study. This
study has shown that this type of data has the advantage
of addressing accessibility dynamically. Zhu and
Gonder (2018) have studied the task of detecting driving
cycles from wearable GPS data and focused on
distinguishing driving cycles from other motorized trips.
The numerical experiment showed that the accuracy rate
of driving cycle detection reaches 89%. Tosi et al.
(2014) have presented an approach for collecting,
processing and predicting real-time vehicular traffic
Jordan Journal of Civil Engineering, Volume 14, No. 4, 2020
- 503 -
conditions using cellular network data and provided a
regression model to describe the correlation between a
cellular network and real vehicular traffic situation.
PROBLEM STATEMENT AND
RESEARCH OBJECTIVES
Many studies on NA reliability and accuracy have
been conducted over the last two decades. However,
there is a lack of validation of traffic information
obtained by NAs depending on field measured data. This
study aimed at evaluating and validating the traffic
information and Estimated Time of Arrival (ETA)
provided by NAs through comparing a set of
applications: Google Maps, Waze and Here-WeGo,
based on collected field data from Jordan.
The significant contributions of this research are the
detailed evaluation and validation of ETA provided by
NAs using data collected by trained drivers instead of
crowdsourcing data. Hence, the data used in validation
will be more accurate and reliable, which gives a strong
indication of the level of reliability of the NAs. So, the
usage of such applications will attract the attention of
individuals, organizations and agencies in different
related sectors.
METHODOLOGY A total of six NAs were installed, including Google
Maps, Here-WeGo, Waze, Maps.Me (MAPS.ME,
2019), Sygic (Sygic, 2019) and Wisepilot. Many test
trips were conducted to choose the most accurate
applications to conduct a more detailed comparison,
which has resulted in choosing Google Maps, Here-
WeGo and Waze. Study locations included selected
urban and rural roads in Irbid city, northern Jordan. The
posted speed limits at all roads were collected from the
field.
The study drivers were trained for data collection by
driving their cars following specific rules, such as
driving at the maximum possible and safe speed without
exceeding the road speed limit. Also, the drivers were
instructed to comply with all applied traffic rules in
Jordan. The reduction of the speed is only due to traffic
delays, traffic signals, roundabouts, crossing
pedestrians, on-street parking or any (road, traffic or
control) conditions which may force the driver to slow
down. Free flow speeds were collected by cars running
on every road segment involved in this study with an
ultra GPS logger turned on to collect speed and location
data at every second.
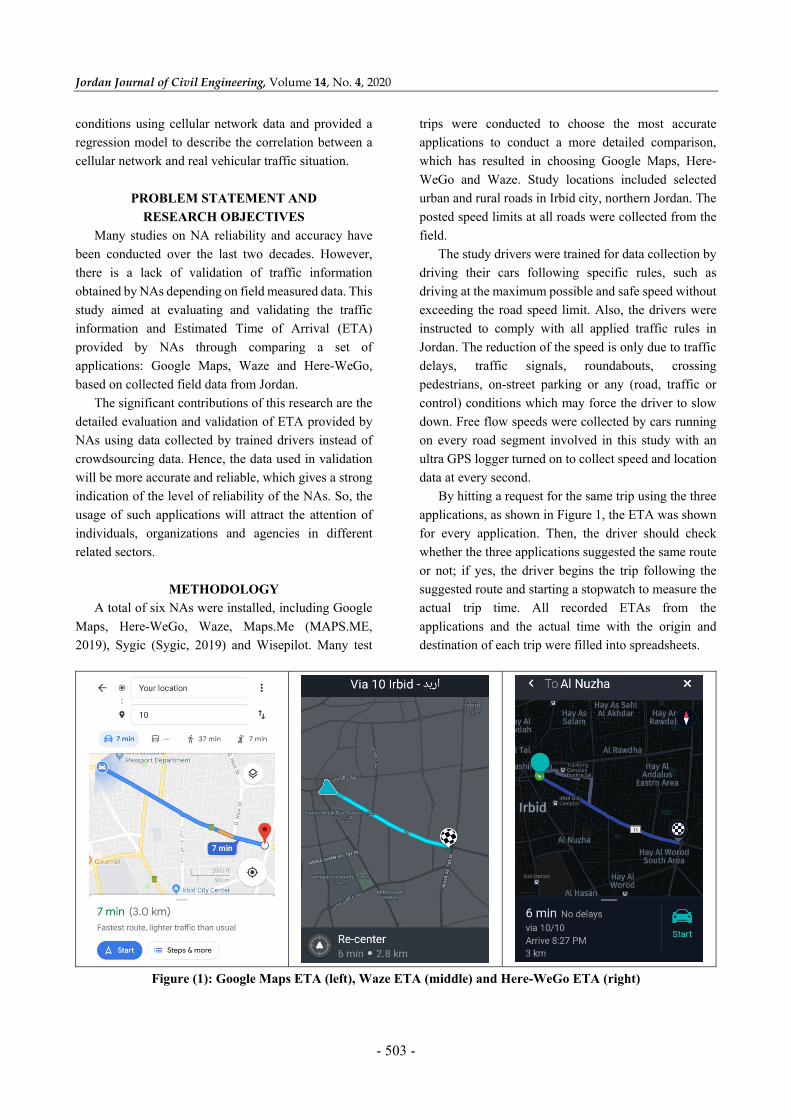
By hitting a request for the same trip using the three
applications, as shown in Figure 1, the ETA was shown
for every application. Then, the driver should check
whether the three applications suggested the same route
or not; if yes, the driver begins the trip following the
suggested route and starting a stopwatch to measure the
actual trip time. All recorded ETAs from the
applications and the actual time with the origin and
destination of each trip were filled into spreadsheets.
Figure (1): Google Maps ETA (left), Waze ETA (middle) and Here-WeGo ETA (right)
Validating Trip Travel… Ahmad H. Alomari, Bashar H. Al-Omari and Abdallah B. Al-Hamdan
- 504 -
The route between origin and destination has been
drawn on ArcMap (Esri, 2019); then, the spreadsheet
was joined to the spatial data.
ArcMap facilitates dealing with attribute data
(numerical and categorical) and spatial data (trip lengths
and trip paths). Also, it can conduct overlay analysis,
which is necessary to determine main variables, such as
the number of roundabouts, signalized intersections and
on-street parking that were traversed during each trip.
Later, the data was exported to an excel file to make the
importing process to SPSS (IBM, 2020) analysis
software possible.
For this research, data was collected from Irbid,
which is the second-largest governorate in Jordan, with
a population of 1,957,000 residents (DOS Jordan, 2019).
Data was collected from selected urban and rural roads
at various times of weekdays and weekends during the
period from February to September 2019.
RESULTS AND DISCUSSION
A total of 612 data points (204 data points for each
application) were collected to validate the trip time
provided by the three chosen applications. Each data
point included the ETA for a trip, such that each trip
ETA was claimed from the three applications to
facilitate the comparison process and to ensure that the
trip conditions are always the same.
The error in each ETA and the percentage error were
calculated using Equations 1 and 2, respectively. Table
1 provides a general overview of the collected data to
compare the error in ETA provided by each application.
Error = Actual Trip Time – ETA Provided by the
Application ....................................…...(1)
Error (%) = [ |Actual Trip Time – ETA| ∕
(Actual Trip Time) ] * 100% ............. (2)
Table 1. General overview about errors in ETA for each application
Application Here-WeGo Waze Google Maps Overall
Maximum Error (Min) 12.330 9.920 6.083 12.330
Minimum Error (Min) 0.020 0.020 0.020 0.020
Mean (Min) 1.790 1.735 1.240 1.588
Standard Deviation (Min) 1.935 1.433 0.967 1.518
Number of Trips 204 204 204 612
To have a more in-depth insight into the data, more
details were taken into consideration and a set of error
ranges were constructed. The percentage of errors for
each application was categorized based on these ranges.
Also, the cases of overestimated ETA were separated
from those of underestimated ETA cases.
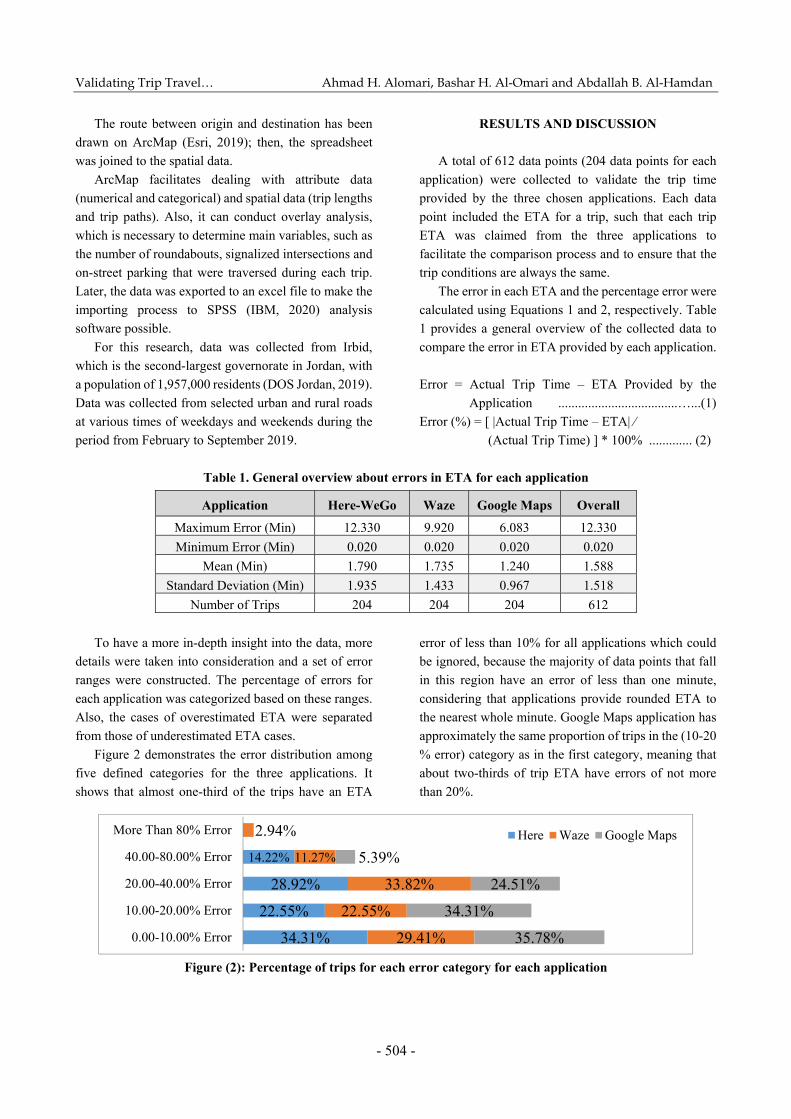
Figure 2 demonstrates the error distribution among
five defined categories for the three applications. It
shows that almost one-third of the trips have an ETA
error of less than 10% for all applications which could
be ignored, because the majority of data points that fall
in this region have an error of less than one minute,
considering that applications provide rounded ETA to
the nearest whole minute. Google Maps application has
approximately the same proportion of trips in the (10-20
% error) category as in the first category, meaning that
about two-thirds of trip ETA have errors of not more
than 20%.
Figure (2): Percentage of trips for each error category for each application
34.31%
22.55%
28.92%
14.22%
29.41%
22.55%
33.82%
11.27%
2.94%
35.78%
34.31%
24.51%
5.39%
0.00-10.00% Error
10.00-20.00% Error
20.00-40.00% Error
40.00-80.00% Error
More Than 80% Error Here Waze Google Maps
Jordan Journal of Civil Engineering, Volume 14, No. 4, 2020
- 505 -
It also has about 5% of trip ETA values in the (40-
80 % error) range with no trip ETA values of more than
80% error. Also, Here-WeGo application did not have
trip ETA values of more than 80% error, while Waze
application had about 3% of trip ETA values with more
than 80% error.
A large proportion of trips for the Waze application
were in the highest three error categories. On the
contrary, Google Maps had 95% of trips with an error of
less than 40% and Here-WeGo error did not exceed
80%. By assuming that ±20% is the maximum
acceptable error in travel time estimation provided by
the NAs, Google Maps scores 70.09% overall accuracy,
while Here-WeGo scores 56.86% overall accuracy and
Waze scores 51.96% overall accuracy. For the three
applications, the data highlighted that there is a
considerable amount of errors that are more than 20%,
so it is recommended to find the causes behind these
errors and fix them by NA developers to increase the
accuracy and reliability of the applications. Hence, it is
imperative to employ the presented methodology in this
study by NA developers in order to check for errors
(amount and frequency of errors) and validate the output
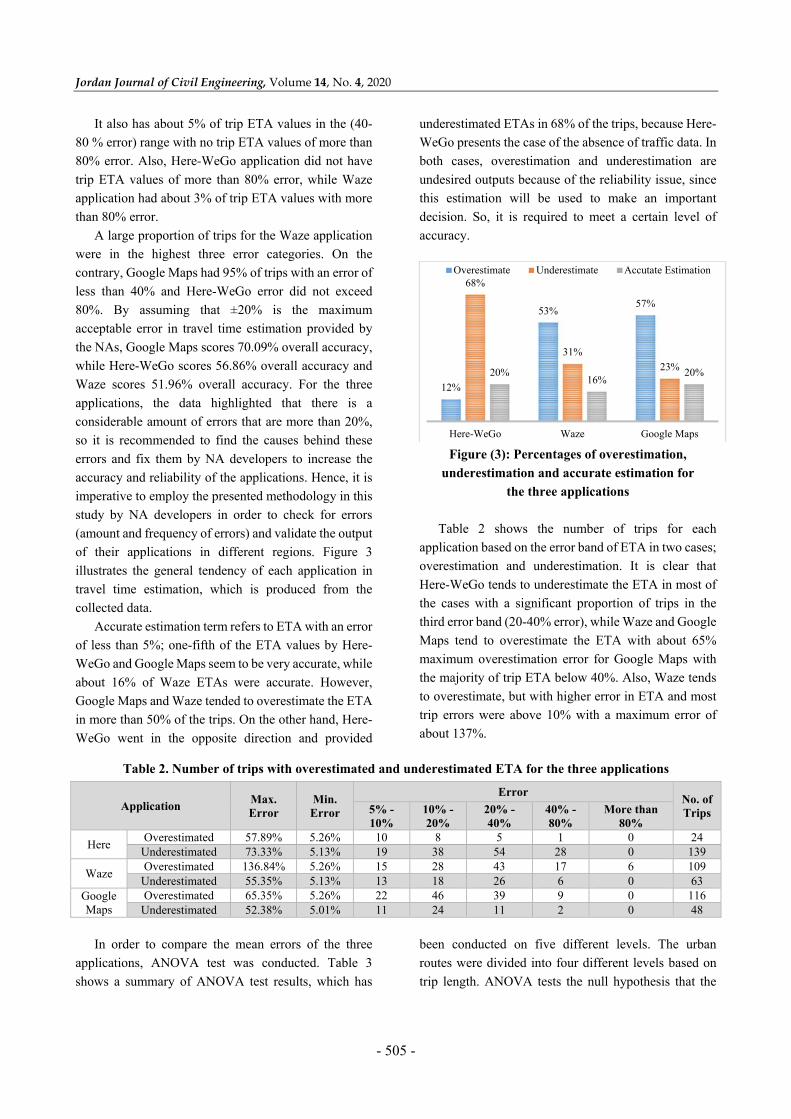
of their applications in different regions. Figure 3
illustrates the general tendency of each application in
travel time estimation, which is produced from the
collected data.
Accurate estimation term refers to ETA with an error
of less than 5%; one-fifth of the ETA values by Here-
WeGo and Google Maps seem to be very accurate, while
about 16% of Waze ETAs were accurate. However,
Google Maps and Waze tended to overestimate the ETA
in more than 50% of the trips. On the other hand, Here-
WeGo went in the opposite direction and provided
underestimated ETAs in 68% of the trips, because Here-
WeGo presents the case of the absence of traffic data. In
both cases, overestimation and underestimation are
undesired outputs because of the reliability issue, since
this estimation will be used to make an important
decision. So, it is required to meet a certain level of
accuracy.
Figure (3): Percentages of overestimation,
underestimation and accurate estimation for
the three applications
Table 2 shows the number of trips for each
application based on the error band of ETA in two cases;
overestimation and underestimation. It is clear that
Here-WeGo tends to underestimate the ETA in most of
the cases with a significant proportion of trips in the
third error band (20-40% error), while Waze and Google
Maps tend to overestimate the ETA with about 65%
maximum overestimation error for Google Maps with
the majority of trip ETA below 40%. Also, Waze tends
to overestimate, but with higher error in ETA and most
trip errors were above 10% with a maximum error of
about 137%.
Table 2. Number of trips with overestimated and underestimated ETA for the three applications
Application Max. Error
Min. Error
Error No. of Trips 5% -
10% 10% - 20%
20% - 40%
40% -80%
More than 80%
Here Overestimated 57.89% 5.26% 10 8 5 1 0 24
Underestimated 73.33% 5.13% 19 38 54 28 0 139
Waze Overestimated 136.84% 5.26% 15 28 43 17 6 109
Underestimated 55.35% 5.13% 13 18 26 6 0 63 Google Maps
Overestimated 65.35% 5.26% 22 46 39 9 0 116 Underestimated 52.38% 5.01% 11 24 11 2 0 48
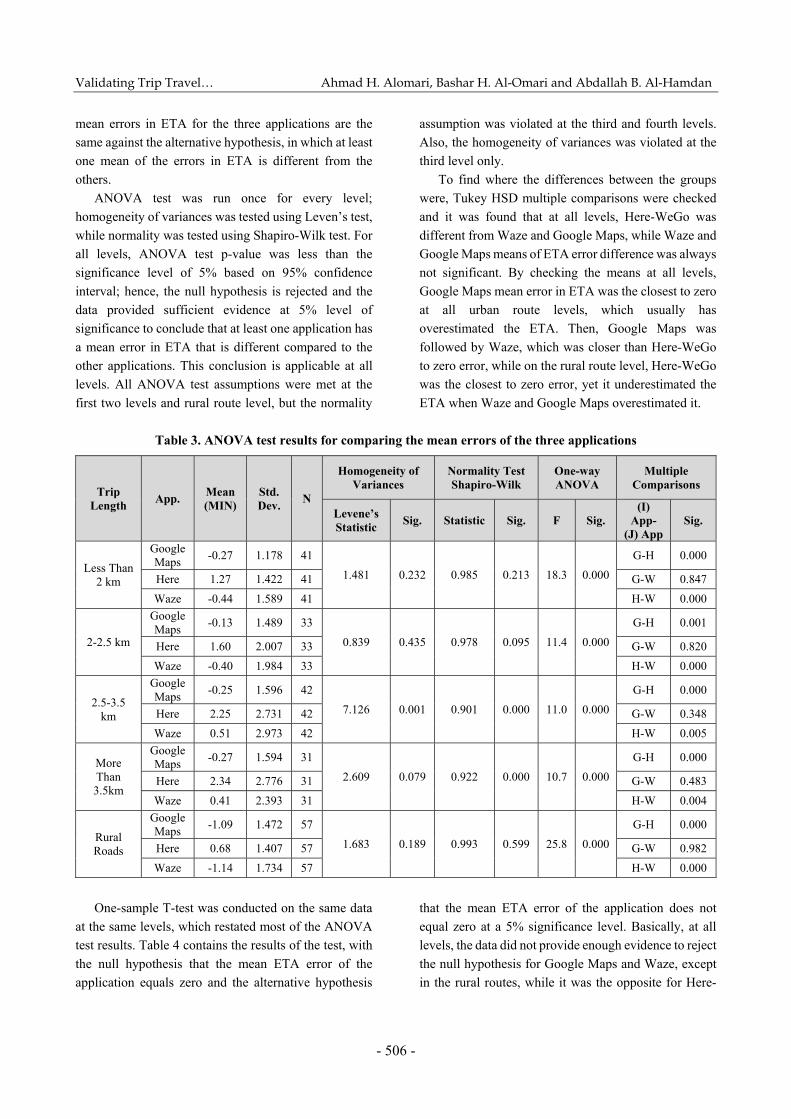
In order to compare the mean errors of the three
applications, ANOVA test was conducted. Table 3
shows a summary of ANOVA test results, which has
been conducted on five different levels. The urban
routes were divided into four different levels based on
trip length. ANOVA tests the null hypothesis that the
12%
53%57%
68%
31%
23%20%16%
20%
Here-WeGo Waze Google Maps
Overestimate Underestimate Accutate Estimation
Validating Trip Travel… Ahmad H. Alomari, Bashar H. Al-Omari and Abdallah B. Al-Hamdan
- 506 -
mean errors in ETA for the three applications are the
same against the alternative hypothesis, in which at least
one mean of the errors in ETA is different from the
others.
ANOVA test was run once for every level;
homogeneity of variances was tested using Leven’s test,
while normality was tested using Shapiro-Wilk test. For
all levels, ANOVA test p-value was less than the
significance level of 5% based on 95% confidence
interval; hence, the null hypothesis is rejected and the
data provided sufficient evidence at 5% level of
significance to conclude that at least one application has
a mean error in ETA that is different compared to the
other applications. This conclusion is applicable at all
levels. All ANOVA test assumptions were met at the
first two levels and rural route level, but the normality
assumption was violated at the third and fourth levels.
Also, the homogeneity of variances was violated at the
third level only.
To find where the differences between the groups
were, Tukey HSD multiple comparisons were checked
and it was found that at all levels, Here-WeGo was
different from Waze and Google Maps, while Waze and
Google Maps means of ETA error difference was always
not significant. By checking the means at all levels,
Google Maps mean error in ETA was the closest to zero
at all urban route levels, which usually has
overestimated the ETA. Then, Google Maps was
followed by Waze, which was closer than Here-WeGo
to zero error, while on the rural route level, Here-WeGo
was the closest to zero error, yet it underestimated the
ETA when Waze and Google Maps overestimated it.
Table 3. ANOVA test results for comparing the mean errors of the three applications
Trip Length
App. Mean (MIN)
Std. Dev.
N
Homogeneity of Variances
Normality Test Shapiro-Wilk
One-way ANOVA
Multiple Comparisons
Levene’s Statistic
Sig. Statistic Sig. F Sig. (I)
App- (J) App
Sig.
Less Than 2 km
Google Maps
-0.27 1.178 41
1.481 0.232 0.985 0.213 18.3 0.000
G-H 0.000
Here 1.27 1.422 41 G-W 0.847
Waze -0.44 1.589 41 H-W 0.000
2-2.5 km
Google Maps
-0.13 1.489 33
0.839 0.435 0.978 0.095 11.4 0.000
G-H 0.001
Here 1.60 2.007 33 G-W 0.820
Waze -0.40 1.984 33 H-W 0.000
2.5-3.5 km
Google Maps
-0.25 1.596 42
7.126 0.001 0.901 0.000 11.0 0.000
G-H 0.000
Here 2.25 2.731 42 G-W 0.348
Waze 0.51 2.973 42 H-W 0.005
More Than 3.5km
Google Maps
-0.27 1.594 31
2.609 0.079 0.922 0.000 10.7 0.000
G-H 0.000
Here 2.34 2.776 31 G-W 0.483
Waze 0.41 2.393 31 H-W 0.004
Rural Roads
Google Maps
-1.09 1.472 57
1.683 0.189 0.993 0.599 25.8 0.000
G-H 0.000
Here 0.68 1.407 57 G-W 0.982
Waze -1.14 1.734 57 H-W 0.000
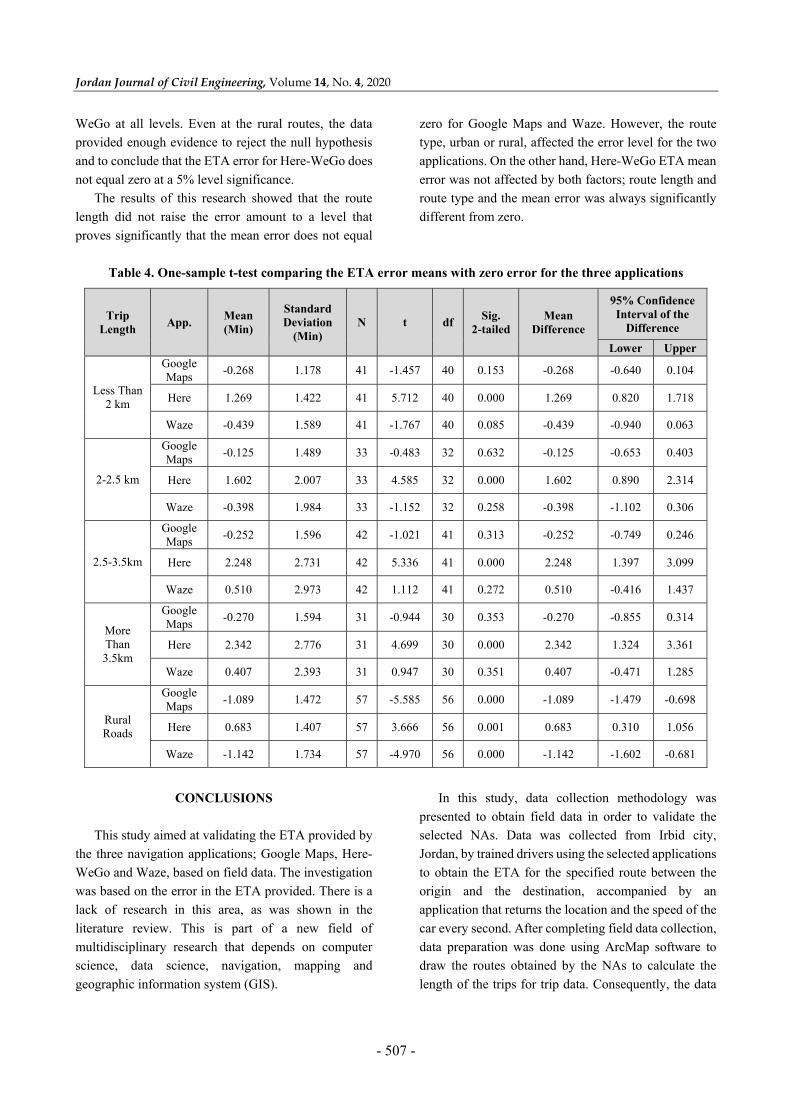
One-sample T-test was conducted on the same data
at the same levels, which restated most of the ANOVA
test results. Table 4 contains the results of the test, with
the null hypothesis that the mean ETA error of the
application equals zero and the alternative hypothesis
that the mean ETA error of the application does not
equal zero at a 5% significance level. Basically, at all
levels, the data did not provide enough evidence to reject
the null hypothesis for Google Maps and Waze, except
in the rural routes, while it was the opposite for Here-
Jordan Journal of Civil Engineering, Volume 14, No. 4, 2020
- 507 -
WeGo at all levels. Even at the rural routes, the data
provided enough evidence to reject the null hypothesis
and to conclude that the ETA error for Here-WeGo does
not equal zero at a 5% level significance.
The results of this research showed that the route
length did not raise the error amount to a level that
proves significantly that the mean error does not equal
zero for Google Maps and Waze. However, the route
type, urban or rural, affected the error level for the two
applications. On the other hand, Here-WeGo ETA mean
error was not affected by both factors; route length and
route type and the mean error was always significantly
different from zero.
Table 4. One-sample t-test comparing the ETA error means with zero error for the three applications
Trip Length
App. Mean (Min)
Standard Deviation
(Min) N t df
Sig. 2-tailed
Mean Difference
95% Confidence Interval of the
Difference
Lower Upper
Less Than 2 km
Google Maps
-0.268 1.178 41 -1.457 40 0.153 -0.268 -0.640 0.104
Here 1.269 1.422 41 5.712 40 0.000 1.269 0.820 1.718
Waze -0.439 1.589 41 -1.767 40 0.085 -0.439 -0.940 0.063
2-2.5 km
Google Maps
-0.125 1.489 33 -0.483 32 0.632 -0.125 -0.653 0.403
Here 1.602 2.007 33 4.585 32 0.000 1.602 0.890 2.314
Waze -0.398 1.984 33 -1.152 32 0.258 -0.398 -1.102 0.306
2.5-3.5km
Google Maps
-0.252 1.596 42 -1.021 41 0.313 -0.252 -0.749 0.246
Here 2.248 2.731 42 5.336 41 0.000 2.248 1.397 3.099
Waze 0.510 2.973 42 1.112 41 0.272 0.510 -0.416 1.437
More Than 3.5km
Google Maps
-0.270 1.594 31 -0.944 30 0.353 -0.270 -0.855 0.314
Here 2.342 2.776 31 4.699 30 0.000 2.342 1.324 3.361
Waze 0.407 2.393 31 0.947 30 0.351 0.407 -0.471 1.285
Rural Roads
Google Maps
-1.089 1.472 57 -5.585 56 0.000 -1.089 -1.479 -0.698
Here 0.683 1.407 57 3.666 56 0.001 0.683 0.310 1.056
Waze -1.142 1.734 57 -4.970 56 0.000 -1.142 -1.602 -0.681
CONCLUSIONS
This study aimed at validating the ETA provided by
the three navigation applications; Google Maps, Here-
WeGo and Waze, based on field data. The investigation
was based on the error in the ETA provided. There is a
lack of research in this area, as was shown in the
literature review. This is part of a new field of
multidisciplinary research that depends on computer
science, data science, navigation, mapping and
geographic information system (GIS).
In this study, data collection methodology was
presented to obtain field data in order to validate the
selected NAs. Data was collected from Irbid city,
Jordan, by trained drivers using the selected applications
to obtain the ETA for the specified route between the
origin and the destination, accompanied by an
application that returns the location and the speed of the
car every second. After completing field data collection,
data preparation was done using ArcMap software to
draw the routes obtained by the NAs to calculate the
length of the trips for trip data. Consequently, the data
Validating Trip Travel… Ahmad H. Alomari, Bashar H. Al-Omari and Abdallah B. Al-Hamdan
- 508 -
analysis phase started by three different NAs; Here-
WeGo, Waze and Google Maps. The data was validated
by comparing the NA-provided data with the collected
field data to test the results for accuracy.
The overall accuracy was 70%, 57% and 52% for
Google Maps, Here-WeGo and Waze, respectively.
Analysis results showed that the three applications’ ETA
measures vary from actual trip time with different error
levels ranging from minor errors that are less than 10%
to significant errors with more than 40%. This research
draws the path for future studies to investigate the
factors that contribute to these errors and to overcome or
reduce errors in these applications, so that the reliability
of these applications can be increased and their use may
be extended. Google Maps recorded the best accuracy
among the three applications, with about two-thirds of
trips having less than 20% error. Generally, Google
Maps and Waze tend to overestimate the ETA, while
Here-WeGo tends to underestimate the ETA.
ANOVA test for comparing the ETA mean errors for
the three applications proved that at all trip lengths, there
was no statistically significant difference between
Google Maps and Waze ETA mean errors, while Here-
WeGo ETA mean error significantly differs from both.
When testing whether the mean ETA error for each
application is equal to zero or not, Google Maps and
Waze ETA mean errors were significantly equal to zero
(more accurate) at all trip lengths on urban roads, but
they were not equal to zero at rural roads, while Here-
WeGo ETA mean error was always not equal to zero
(lower accuracy).
The determination of the error amount or level for
the NAs at a specified region is very crucial for both
users and NA developers. The users can decide to what
extent they can rely on such applications based on the
error level and error frequency. At the same time, NA
developers can enhance the provided data once they are
notified by the errors that exist in the traffic data they
provide to assure the quality of the traffic data presented
by the application to meet the requirements of various
users and to fix any possible problems. The results
obtained in this research are expected to attract the
attention of individuals, organizations and agencies in
the related sectors.
Finally, the methodology of this research can be used
as a technical note, to describe the technique that can be
applied broadly, in validating the selected navigation
applications. The step-by-step analysis employed in this
research can be utilized for future studies to investigate
more factors that may affect the validity of navigation
applications. Future research will be extended to cover
more roadways and locations in Jordan and around the
world to include all the possible characteristics and
variability regarding roads, intersections, vehicles and
drivers.
REFERENCES
Al-Deek, H., Sandt, A., Alomari, A., and Hussain, O.
(2017). “A technical note on evaluating the
effectiveness of bus rapid transit with transit signal
priority”. Journal of Intelligent Transportation Systems,
21 (3), 227-238.
Al-Omari, B.H., and Ta'amneh, M.M. (2007). “Validating
HCS and SIDRA software for estimating delay at
signalized intersections in Jordan”. Jordan Journal of
Civil Engineering, 1 (4), 375-392.
Al-Omari, B. H., Gharaybeh, F. A., and Alomari, A.H.
(2013). “Evaluation of traffic improvement options
using traffic simulation”. Journal of Control Science
and Engineering, 1 (2013), 38-45.
Alomari, A. H., Al-Deek, H., Sandt, A., Rogers Jr, J. H.,
and Hussain, O. (2016). “Regional evaluation of bus
rapid transit with and without transit signal priority”.
Transportation Research Record, 2554 (1), 46-59.
Amin-Naseri, M., Chakraborty, P., Sharma, A., Gilbert, S.
B., and Hong, M. (2018). “Evaluating the reliability,
coverage and added value of crowdsourced traffic
incident reports from Waze.” Transportation Research
Record, 2672 (43), 34-43.
Banica, A., Bobric, E. D., Cazacu, M. M., Timofte, A.,
Gurlui, S., and Breaban, I. G. (2017). “Integrated
assessment of exposure to traffic-related air pollution in
Iasi city, Romania.” Environmental Engineering &
Management Journal (EEMJ), 16 (9).
Barata, J., Ferro, R., and Ferreira, J. (2014). “My traffic
manager.” Procedia-Technology, 17, 209-216.
Jordan Journal of Civil Engineering, Volume 14, No. 4, 2020
- 509 -
Cheung, P., and Sengupta, U. (2016). “Analysis of journey
planner apps and best practice features.” Manchester
Metropolitan University, Manchester, England.
Consoli, F.A., Alomari, A. H., Al-Deek, H., Rogers Jr, J.
H., Sandt, A., Noori, M., …, and Hadi, M. (2015).
“Evaluation of conditional transit signal priority
technology for regional implementation”.
Transportation Research Record, 2484 (1), 140-148.
Consoli, F.A., Rogers, J., Al-Deek, H., Tatari, O., and
Alomari, A. (2013). “Smart event traffic management:
Impact on the Central Florida regional transportation
network and lessons learned”. Transportation Research
Record, 2396 (1), 107-116.
DOS, Department of Statistics, Jordan. (2019). “Estimated
population of 2019 and some selected data.” Retrieved
in January 2020, from http://dosweb.dos.gov.jo/
population/population-2/
ESRI. (2019). “Environmental Systems Research Institute:
Esri's ArcGIS suite of geospatial processing program.”
Retrieved in November 2019, from: https://desktop.
arcgis.com/en/arcmap/
Fire, M., Kagan, D., Puzis, R., Rokach, L., and Elovici, Y.
(2012). “Data mining opportunities in geosocial
networks for improving road safety.” In: 2012 IEEE
27th Convention of Electrical and Electronic Engineers,
1-4.
García-Albertos, P., Picornell, M., Salas-Olmedo, M. H.,
and Gutiérrez, J. (2019). “Exploring the potential of
mobile phone records and online route planners for
dynamic accessibility analysis.” Transportation
Research-Part A: Policy and Practice, 125, 294-307.
Goodall, N., and Lee, E. (2019). “Comparison of Waze
crash and disabled vehicle records with video ground
truth.” Transportation Research Interdisciplinary
Perspectives, 100019.
Google Developers. (2020). “Google Maps platform
documentation.” Retrieved in January 2020, from:
https://developers.google.com/maps/documentation
Google Maps. (2020). Retrieved from:
https://www.google.com/maps
Google Play Store. (2020A). “Maps - Navigate & Explore
- Apps on Google Play.” Retrieved in January 2020,
from: https://play.google.com/store/apps/details?id=
com.google.android.apps.maps
Google Play Store. (2020B). “HERE WeGo – City
Navigation - Apps on Google Play”. Retrieved in
January 2020, from: https://play.google.com/store/
apps/details?id=com.here.app.maps&hl=en
GTMetrik. (2019). “How fast does your website load? Find
out with GTmetrix”. Retrieved in October 2019, from:
http://gtmetrix.com/
HERE Technologies. (2020). Retrieved in January 2020,
from: https://www.here.com/
Herrera, J. C., Work, D.B., Herring, R., Ban, X. J.,
Jacobson, Q., and Bayen, A.M. (2010). “Evaluation of
traffic data obtained via GPS-enabled mobile phones:
The mobile century field experiment.” Transportation
Research- Part C: Emerging Technologies, 18 (4), 568-
583.
IBM SPSS Software. (2020). “Version 25”. Retrieved in
January 2020, from: https://www.ibm.com/products/
spss-statistics
Imam, R., and Jamrah, A. (2012). “Energy consumption
and environmental impacts of Bus Rapid Transit (BRT)
systems”. Jordan Journal of Civil Engineering, 1-12.
Liebig, T., Piatkowski, N., Bockermann, C., and Morik, K.
(2017). “Dynamic route planning with real-time traffic
predictions”. Information Systems, 64, 258-265.
MAPS.ME. (2019). Retrieved in December 2019, from:
https://maps.me/
Mena-Yedra, R., Gavaldà, R., and Casas, J. (2017).
“Adarules learning rules for real-time road-traffic
prediction”. Procedia-Transportation Research, 27, 11-
18.
Nair, D. J., Gilles, F., Chand, S., Saxena, N., and Dixit, V.
(2019). “Characterizing multicity urban traffic
conditions using crowdsourced data.” PLoS One, 14
(3), e0212845.
Pant, K., Talukder, D., and Biyani, P. (2015).
“TrafficKarma: Estimating effective traffic indicators
using public data”. In: Proceedings of the 2nd IKDD
Conference on Data Sciences, p. 6, ACM.
Petrovska, N., and Stevanovic, A. (2015). “Traffic
congestion analysis visualization tool”. In: 2015 IEEE
18th International Conference on Intelligent
Transportation Systems, 1489-1494.
Petrovska, N., Stevanovic, A., and Furht, B. (2016).
“Visualization tools for traffic congestion estimation”.
In: Innovative Web Applications for Analyzing Traffic
Operations. pp. 23-31. Springer, Cham.
Validating Trip Travel… Ahmad H. Alomari, Bashar H. Al-Omari and Abdallah B. Al-Hamdan
- 510 -
Rettore, P. H. L., Lopes, R. R. F., Maia, G., Villas, L. A.,
and Loureiro, A.A.F. (2019). “Towards a traffic data
enrichment sensor based on heterogeneous data fusion
for ITS”. In: 2019 15th International Conference on
Distributed Computing in Sensor Systems (DCOSS).
pp. 570-577, IEEE.
Santos, L., Coutinho-Rodrigues, J., and Antunes, C.H.
(2011). “A web spatial decision support system for
vehicle routing using Google Maps.” Decision Support
Systems, 51 (1), 1-9.
Saputra, O.A., Ramdani, F., and Saputra, M.C. (2018).
“Comparison analysis of Google Maps, Wisepilot and
Here-WeGo with user-centered design (UCD):
approach & cartography”. In: 2018 4th International
Symposium on Geoinformatics (ISyG). pp. 1-5. IEEE.
SolarWinds. (2019). “Pingdom tools.” Retrieved in
December 2019, from: http://tools.pingdom.com/
Sygic. (2019). “GPS Navigation”. Retrieved in December
2019, from: https://www.sygic.com/
Tam, M.L., and Lam, W. H. (2013). “Validation of ATIS
journey time and traffic speed estimates by floating car
survey”. Journal of the Eastern Asia Society for
Transportation Studies, 10, 131-146.
Tosi, D., Marzorati, S., and Pulvirenti, C. (2014).
“Vehicular traffic predictions from cellular network
data: A real world case study.” In: 2014 International
Conference on Connected Vehicles and Expo (ICCVE).
pp. 485-491. IEEE.
Waze. (2020). “Driving directions, traffic reports and
carpool rideshares by Waze”. Retrieved in January
2020, from: https://www.waze.com/
Wisepilot. (2020). “Appello Systems-Wisepilot.” Retrieved
in January 2020, from: http://www.appello.com/
wisepilot/
Zhou, P., Jiang, S., and Li, M. (2015). “Urban traffic
monitoring with the help of bus riders”. In: 2015 IEEE
35th International Conference on Distributed
Computing Systems, 21-30.
Zhu, L., and Gonder, J.D. (2018). “A driving cycle
detection approach using map service API.”
Transportation Research-Part C: Emerging
Technologies, 92, 349-363.