Validating the Nike+ Wireless Sport Kit for Estimating Pace, Distance ...
Upload
khangminh22Category
view
0download
0
foods
Article
Developing and Validating a Method for SeparatingFlavonoid Isomers in Common Buckwheat SproutsUsing HPLC-PDA
Davin Jang 1 , Young Sung Jung 2 , Mi-Seon Kim 1, Seung Eel Oh 3, Tae Gyu Nam 3,* andDae-Ok Kim 1,2,*
1 Graduate School of Biotechnology, Kyung Hee University, Yongin 17104, Korea; [email protected] (D.J.);[email protected] (M.-S.K.)
2 Department of Food Science and Biotechnology, Kyung Hee University, Yongin 17104, Korea;[email protected]
3 Korea Food Research Institute, Wanju 55365, Korea; [email protected]* Correspondence: [email protected] (T.G.N.); [email protected] (D.-O.K.);
Tel.: +82-31-201-3796 (D.-O.K.); Fax: +82-31-204-8116 (D.-O.K.)
Received: 10 September 2019; Accepted: 1 November 2019; Published: 4 November 2019 �����������������
Abstract: Buckwheat sprouts that are synthesized during the germination process are rich inflavonoids, including orientin, vitexin, rutin, and their isomers (isoorientin, isovitexin, andquercetin-3-O-robinobioside, respectively). The purpose of this study was to optimize and validatean analytical method for separating flavonoid isomers in common buckwheat sprout extract (CSE).Factors, such as range, linearity, precision, accuracy, limit of detection, and limit of quantification, wereevaluated for each standard using high-performance liquid chromatography (HPLC). On the basis ofresolution and symmetry, a column temperature of 40 ◦C with 0.1% (v/v) acidic water and acetonitrileas mobile phases, at a flow rate of 1 mL min−1 were determined to be the optimal analytical conditions.Calibration curves for orientin, isoorientin, vitexin, isovitexin, and rutin exhibited good linearity withcorrelation coefficients of 0.9999 over the 6.25–100.00µg mL−1 range. Recovery values of 96.67–103.60%confirmed that the method was accurate for all flavonoids. The relative standard deviations ofintra-day repeatability and inter-day reproducibility confirmed method preciseness, with values ofless than 5.21% and 5.40%, respectively. The developed method was used to analyze flavonoids inCSE, with isomers satisfactorily separated and simultaneously quantified. We demonstrated that thedeveloped HPLC method can be used to monitor flavonoids in buckwheat sprouts.
Keywords: common buckwheat sprout; flavonoid isomer; quercetin-3-O-robinobioside; validation;chromatographic separation
1. Introduction
Buckwheat is a pseudocereal belonging to the Polygonaceae family that grows rapidly and is tolerantto cold [1]. Buckwheat is found almost everywhere but is mainly grown in the northern hemisphere [2].Common buckwheat (Fagopyrum esculentum Möench) and tartary buckwheat (F. tataricum Gaertner) arethe most consumed buckwheat species [1]. Among the edible parts of common buckwheat, the sproutshave attracted considerable attention in recent years [3] as they are considered to be a popular healthfood and are widely consumed because of their bioactive compounds [4,5]. The sprout-germinationprocess induces the hydrolysis of triglycerides in the seeds and produces the energy required forvarious biochemical reactions through the tricarboxylic acid cycle [6], and the content of bioactivecompounds in the seeds increases through chemical reactions, for example, the flavone glycosidecontent is known to increase during the germination of common buckwheat [7,8]. Common buckwheat
Foods 2019, 8, 549; doi:10.3390/foods8110549 www.mdpi.com/journal/foods
Foods 2019, 8, 549 2 of 13
sprout (CS) has been studied for a variety of pro-health benefits, such as its antioxidant capacity [7,9]and anti-inflammatory effects [10,11].
CS has been reported to have more abundant flavone C-glucosides than those of the tartaryspecies [12]. The flavone C-glucosides in CS are present as orientin and isoorientin, from luteolin asthe parent, as well as vitexin and isovitexin, from apigenin as the parent (Figure S1). In addition, rutinis a representative flavonoid present in common buckwheat and CS [12]. A recent report revealed thatquercetin-3-O-robinobioside (Q3R), which is an isomer of rutin, exists in CS [8]. Q3R is known to bepresent in cotyledon and immature common buckwheat, rooibos, mature saskatoon fruit, and jujubefruit [8,13–15]. To summarize, the six main flavonoids found in CS exist as three sets of isomer pairs,with differences due to the position and form of the sugar.
Flavonoids and their glycosides can be used as quality control markers for many phytomedicinesand medicinal plants [16]. Various analytical techniques have been developed for the separation anddetection of flavonoid glycosides, in which the most-widely employed method is reversed-phasehigh-performance liquid chromatography (HPLC), coupled with photodiode array (PDA) detectionand/or mass spectrometry (MS) [14,16,17]. Qualitative analysis of flavonoids is possible using MS evenwhen baseline separation has not been secured. However, structural isomers cannot be distinguishedonly on the basis of MS/MS information because they have the same molecular weight and similarfragment patterns [16,18,19]. Therefore, flavonoid glycosides need to be separated in order to enabletheir accurate quantitative analysis in food. Previous studies reported the effects of column temperature,composition of mobile phase, and flow rate on the separation of a flavonoid isomer for qualitativeanalysis [20,21]. Even with a column temperature of 40 ◦C and the addition of acid to solvents,orientin and Q3R in CS were not separatable with isoorientin and rutin, respectively [7,9]. Q3R andrutin in mature saskatoon and jujube fruits were not completely separated and were not suitable forquantification [13,22]. Therefore, a suitable HPLC method for quantitatively analyzing flavonoidisomers present in CS is necessary.
In this study, we introduce an HPLC analysis method that simultaneously quantifies two typesof flavone-C-glycoside isomer and flavonol-O-glycoside isomer found in common buckwheat sproutextract (CSE). The HPLC conditions of the developed analytical method, including mobile phase, columntemperature, and flow rate, were optimized. The developed method was validated by determining therange, linearity, precision, accuracy, limit of detection (LOD), and limit of quantification (LOQ) foreach compound.
2. Materials and Methods
2.1. Chemicals and Reagents
Orientin, isoorientin, vitexin, and isovitexin (all with ≥99% purity) were purchased fromExtrasynthese (Genay, France). Rutin hydrate (≥94%), HPLC-grade formic acid (≥98%), and dimethylsulfoxide (DMSO) were obtained from Sigma Aldrich Co., LLC (St. Louis, MO, USA). HPLC-gradewater, methanol, and acetonitrile were purchased from Thermo Fisher Scientific (Waltham, MA, USA).
2.2. CSE Preparation
CS seeds were purchased from First Village Farmer’s Union under Hallasan Mountain (Jeju-do,Republic of Korea) in 2018. Seeds were planted for 6 days at 25 ◦C in a dark growth chamber. Sproutswere harvested and freeze-dried (FD 8518; Ilshin Lab Co., Ltd., Dongducheon, Korea) for 3 days.The CSE was obtained by mixing the dried buckwheat sprouts with 90% (v/v) aqueous methanol.The mixture was ultrasonicated for 30 min and the supernatant was acquired by centrifugation (2232× g)for 10 min and filtered through a 0.45-µm polyvinylidene fluoride syringe filter (Millipore, Billerica,MA, USA). The residue was re-extracted once using the procedure described above. The filtrate wasevaporated on a rotary evaporator (N-1000; Eyela, Tokyo, Japan) in a water bath at 40 ◦C. The extract
Foods 2019, 8, 549 3 of 13
was stored in a deep freezer (WSM-2700UC; Grand Woosung Inc., Seoul, Korea) at −50 ◦C andfreeze-dried (FD 8518) for 3 days. All experiments were performed in triplicate.
2.3. Flavonoids Analysis by Reversed-Phase HPLC
The 3 sets of isomer pairs were analyzed by modifying an existing method [8]. CSE and itsflavonoids were analyzed using HPLC (Alliance e2695; Waters, Milford, MA, USA) with the Empower3 software (Waters), a PDA detector (2998, Waters), and a ProntoSIL 120-5-C18-ace-EPS column(4.6 × 250 mm, 5.0 µm; Bischoff, Leonberg, Germany), with the flavonoids and extract monitored at360 nm. The column temperature was set to 40 ◦C and an injector volume of 5 µL was used. Gradientelution was carried out with 0.1% (v/v) formic acid in water (solvent A) and acetonitrile (solvent B).All solvents were filtered and degassed. A flow rate of 1.0 mL min−1 was used. The following binarymobile-phase linear gradients were used: 100% A at 0 min, 90% A at 4 min, 86% A at 20 min, 84% A at30 min, 84% A at 36 min, 80% A at 44 min, 80% A at 50 min, 75% A at 54 min, 30% A at 58 min, 30% Aat 62 min, 15% A at 66 min, 15% A at 70 min, 100% A at 72 min, and 100% A at 75 min. Flavonoids wereidentified by comparing their retention time and ultraviolet (UV) spectra with those of their respectivestandards. The Q3R was identified as in previous studies and was quantified using the calibrationcurve for rutin because the standard for Q3R is not commercially available [13,22].
2.4. Optimizing the Chromatography Conditions
The conditions for the separation of the flavonoids in CSE include the mobile phase, temperature,and flow rate. Water or 0.1% (v/v) formic acid in water as solvent A and methanol or acetonitrile assolvent B were used. The column temperatures were set to 20, 30, and 40 ◦C. The separation of the3 sets of isomer pairs was evaluated. Flow rates of 0.6, 0.8, and 1.0 mL min−1 were used. The columnand method used are listed in Section 2.3. The resolution (Rs) and symmetry factor were calculated asfollows [23]:
Rs = 1.18 × (tR2 − tR1)/(W2 + W1)
where tR2 − tR1 is the difference in retention time and W2 + W1 is the sum of the peak widths at half ofpeak height, and,
Symmetry factor = W0.05h/2f
where W0.05h is the peak width at 1/20th the peak height above the peak baseline, and f is the distancealong the horizontal line drawn from the leading edge of the peak to the vertical line drawn from wherethe peak dissects a horizontal line drawn at 1/20th of the peak height above the peak baseline (W0.05h).
2.5. Method Validation
The validation criteria are based on the guidelines published by the Ministry of Food and DrugSafety [23]. Spectral scans of peaks were performed with the PDA detector (2998, Waters) in order toverify method specificity. The linearity of each calibration curve, range, precision, accuracy, LOD, andLOQ were also evaluated.
2.5.1. Linearity
Stock solutions of standard compounds in CSE were prepared at a concentration of 10 mg mL−1
in DMSO and 10% (v/v) DMSO in methanol was used to dilute the stock solution to the appropriateconcentration. The concentration ranges of the standard compounds were appropriately set to includethe CSE to be analyzed through preliminary experiments. Linearity ranges were determined bydiluting the standard solutions to six different concentrations. The method was found to be linear in6.25–100.00 µg mL−1 range for all standard compounds. Each concentration was analyzed in triplicate.The analytical curve was obtained from the peak area corresponding to each standard compoundat six different concentrations. The linearity of each calibration curve is expressed by its correlationcoefficient (R).
Foods 2019, 8, 549 4 of 13
2.5.2. Accuracy, Precision, and Recovery
Accuracy was evaluated as the percent recovery (%) at three concentrations (25.00, 50.00, and100.00 µg mL−1) of spiked standard solutions and blanks (dilution solvent). Precision is expressed asthe relative standard deviation (RSD) of intra-day repeatability (analysis was performed on the sameday (n = 3) with the same instrument) and inter-day reproducibility (three different days (n = 3 × 3)using the same instrument).
2.5.3. Limits of Detection and Quantification
LODs and LOQs for the analyte flavonoids were calculated from the standard deviation ofthe response and the slope of the calibration curve. The standard curves were constructed in the0.61–20.00 µg mL−1. The LOD was calculated as 3.3 × σ/s (σ = standard deviation of the response,s = slope of the standard curve), while 10 × σ/s was used for the LOQ.
2.6. Statistical Analysis
Analysis was performed in triplicate and the results obtained are represented as means ± standarddeviations. One-way analysis of variance followed by the Tukey’s test (p < 0.05) was applied todetermine the significances of the differences among the means. Tests for statistical significance wereperformed using IBM SPSS software (Version 23; IBM SPSS Statistics Inc., Armonk, NY, USA).
3. Results and Discussion
3.1. Effects of Elution Conditions on Isomer Separation
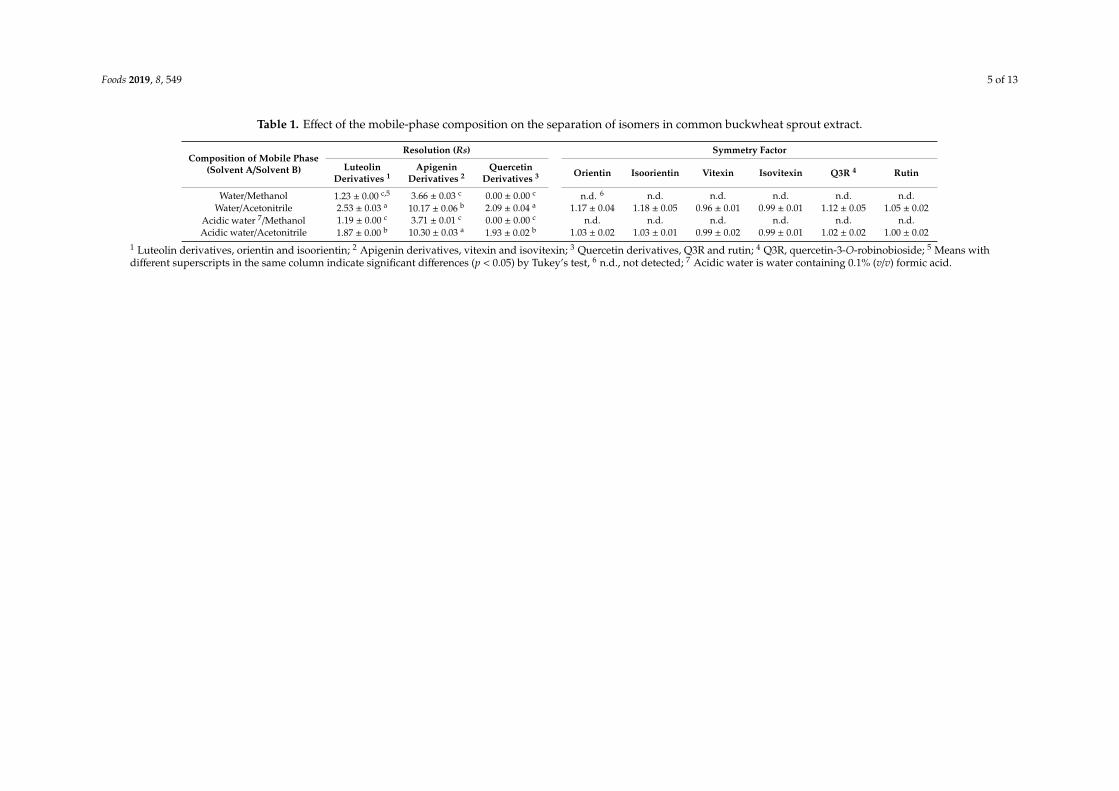
The mobile phase, temperature, and flow rate are significant isomer-separation factors inHPLC [24,25]. The data for the various isomers in CSE using different mobile phases are listedin Table 1, at a column temperature of 40 ◦C and a flow rate of 1.0 mL min−1. Rs, a quantitative valuethat indicates the degree of separation between adjacent components should be greater than 1.5 inorder to satisfy the baseline-separation criteria [23]. The data listed in Table 1 are for water as solventA and an organic solvent as B. Luteolin, apigenin, and quercetin derivatives include orientin andisoorientin, vitexin and isovitexin, and Q3R and rutin, respectively, and the Rs values for the luteolinand quercetin derivatives were less than 1.5 when methanol was used as solvent B. We conclude thatmethanol is not suitable as solvent B. On the other hand, all components were completely separatedusing acetonitrile, which has a higher elution strength than methanol and is universally used due to itsUV cutoff and viscosity [25]. Symmetry factors were calculated in order to determine whether or notproton (hydrogen ion) donor needs to be added to the water that accompanies the acetonitrile. Peaksappear to be more symmetric as the symmetry factor approaches unity [23] and values in the 0.99–1.03range were observed for all components using acidic water as mobile phases (Table 1). Peaks were notcompletely separated when methanol was used as a mobile phase, which means that symmetry factorscould not be calculated. Therefore, the optimal mobile phases for analyzing CSE are water containing0.1% (v/v) formic acid as solvent A and acetonitrile as solvent B.
Foods 2019, 8, 549 5 of 13
Table 1. Effect of the mobile-phase composition on the separation of isomers in common buckwheat sprout extract.
Composition of Mobile Phase(Solvent A/Solvent B)
Resolution (Rs) Symmetry Factor
LuteolinDerivatives 1
ApigeninDerivatives 2
QuercetinDerivatives 3 Orientin Isoorientin Vitexin Isovitexin Q3R 4 Rutin
Water/Methanol 1.23 ± 0.00 c,5 3.66 ± 0.03 c 0.00 ± 0.00 c n.d. 6 n.d. n.d. n.d. n.d. n.d.Water/Acetonitrile 2.53 ± 0.03 a 10.17 ± 0.06 b 2.09 ± 0.04 a 1.17 ± 0.04 1.18 ± 0.05 0.96 ± 0.01 0.99 ± 0.01 1.12 ± 0.05 1.05 ± 0.02
Acidic water 7/Methanol 1.19 ± 0.00 c 3.71 ± 0.01 c 0.00 ± 0.00 c n.d. n.d. n.d. n.d. n.d. n.d.Acidic water/Acetonitrile 1.87 ± 0.00 b 10.30 ± 0.03 a 1.93 ± 0.02 b 1.03 ± 0.02 1.03 ± 0.01 0.99 ± 0.02 0.99 ± 0.01 1.02 ± 0.02 1.00 ± 0.02
1 Luteolin derivatives, orientin and isoorientin; 2 Apigenin derivatives, vitexin and isovitexin; 3 Quercetin derivatives, Q3R and rutin; 4 Q3R, quercetin-3-O-robinobioside; 5 Means withdifferent superscripts in the same column indicate significant differences (p < 0.05) by Tukey’s test, 6 n.d., not detected; 7 Acidic water is water containing 0.1% (v/v) formic acid.
Foods 2019, 8, 549 6 of 13
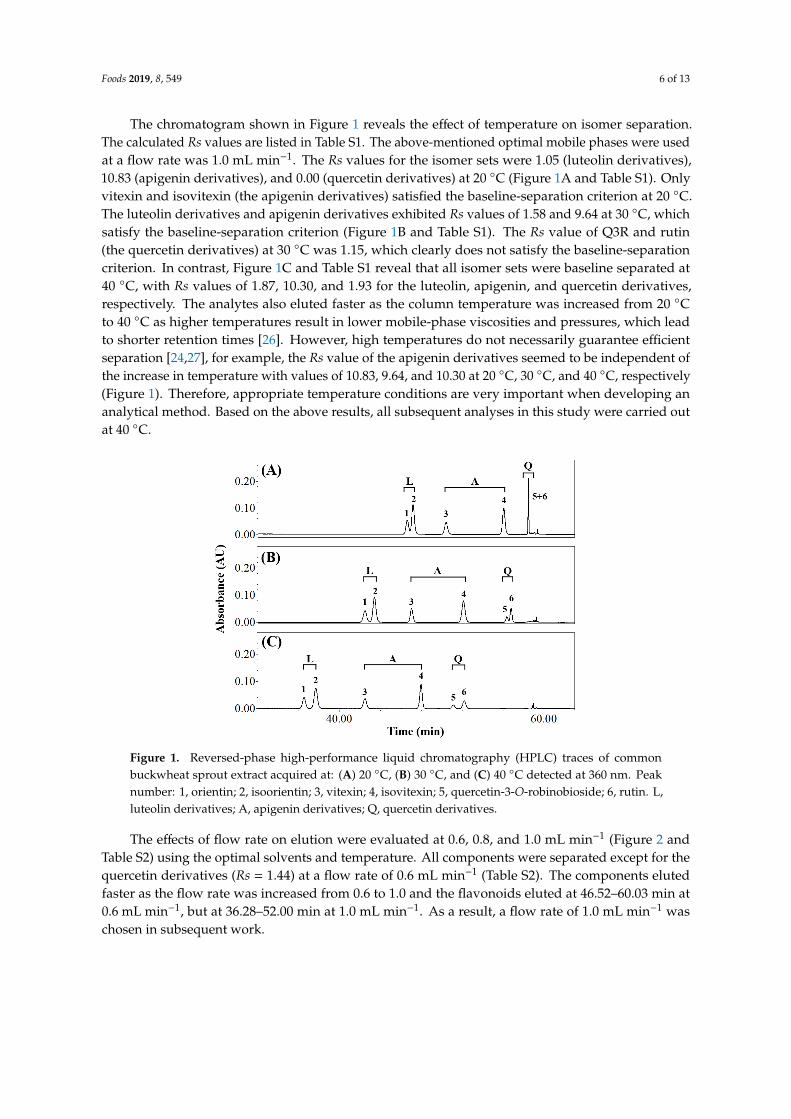
The chromatogram shown in Figure 1 reveals the effect of temperature on isomer separation.The calculated Rs values are listed in Table S1. The above-mentioned optimal mobile phases were usedat a flow rate was 1.0 mL min−1. The Rs values for the isomer sets were 1.05 (luteolin derivatives),10.83 (apigenin derivatives), and 0.00 (quercetin derivatives) at 20 ◦C (Figure 1A and Table S1). Onlyvitexin and isovitexin (the apigenin derivatives) satisfied the baseline-separation criterion at 20 ◦C.The luteolin derivatives and apigenin derivatives exhibited Rs values of 1.58 and 9.64 at 30 ◦C, whichsatisfy the baseline-separation criterion (Figure 1B and Table S1). The Rs value of Q3R and rutin(the quercetin derivatives) at 30 ◦C was 1.15, which clearly does not satisfy the baseline-separationcriterion. In contrast, Figure 1C and Table S1 reveal that all isomer sets were baseline separated at40 ◦C, with Rs values of 1.87, 10.30, and 1.93 for the luteolin, apigenin, and quercetin derivatives,respectively. The analytes also eluted faster as the column temperature was increased from 20 ◦Cto 40 ◦C as higher temperatures result in lower mobile-phase viscosities and pressures, which leadto shorter retention times [26]. However, high temperatures do not necessarily guarantee efficientseparation [24,27], for example, the Rs value of the apigenin derivatives seemed to be independent ofthe increase in temperature with values of 10.83, 9.64, and 10.30 at 20 ◦C, 30 ◦C, and 40 ◦C, respectively(Figure 1). Therefore, appropriate temperature conditions are very important when developing ananalytical method. Based on the above results, all subsequent analyses in this study were carried outat 40 ◦C.
Foods 2019, 8, x FOR PEER REVIEW 6 of 13
The chromatogram shown in Figure 1 reveals the effect of temperature on isomer separation. The calculated Rs values are listed in Table S1. The above-mentioned optimal mobile phases were used at a flow rate was 1.0 mL min−1. The Rs values for the isomer sets were 1.05 (luteolin derivatives), 10.83 (apigenin derivatives), and 0.00 (quercetin derivatives) at 20 °C (Figure 1A and Table S1). Only vitexin and isovitexin (the apigenin derivatives) satisfied the baseline-separation criterion at 20 °C. The luteolin derivatives and apigenin derivatives exhibited Rs values of 1.58 and 9.64 at 30 °C, which satisfy the baseline-separation criterion (Figure 1B and Table S1). The Rs value of Q3R and rutin (the quercetin derivatives) at 30 °C was 1.15, which clearly does not satisfy the baseline-separation criterion. In contrast, Figure 1C and Table S1 reveal that all isomer sets were baseline separated at 40 °C, with Rs values of 1.87, 10.30, and 1.93 for the luteolin, apigenin, and quercetin derivatives, respectively. The analytes also eluted faster as the column temperature was increased from 20 °C to 40 °C as higher temperatures result in lower mobile-phase viscosities and pressures, which lead to shorter retention times [26]. However, high temperatures do not necessarily guarantee efficient separation [24,27], for example, the Rs value of the apigenin derivatives seemed to be independent of the increase in temperature with values of 10.83, 9.64, and 10.30 at 20 °C, 30 °C, and 40 °C, respectively (Figure 1). Therefore, appropriate temperature conditions are very important when developing an analytical method. Based on the above results, all subsequent analyses in this study were carried out at 40 °C.
Figure 1. Reversed-phase high-performance liquid chromatography (HPLC) traces of common buckwheat sprout extract acquired at: (A) 20 °C, (B) 30 °C, and (C) 40 °C detected at 360 nm. Peak number: 1, orientin; 2, isoorientin; 3, vitexin; 4, isovitexin; 5, quercetin-3-O-robinobioside; 6, rutin. L, luteolin derivatives; A, apigenin derivatives; Q, quercetin derivatives.
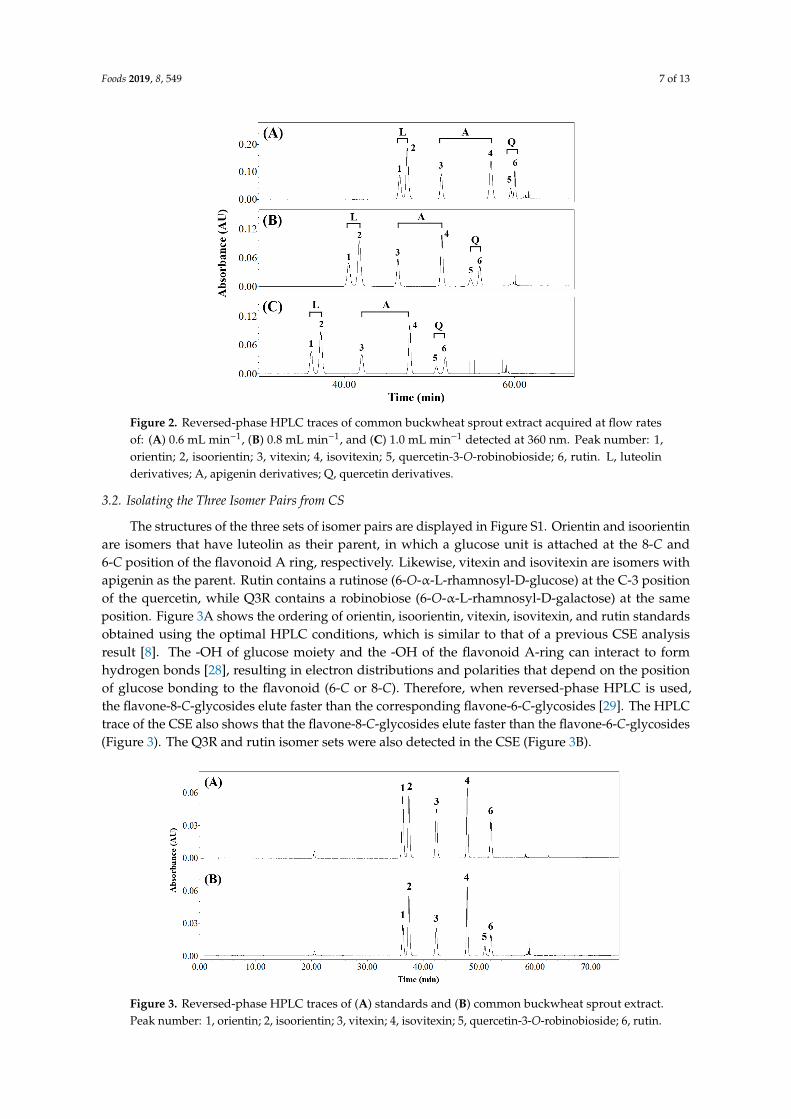
The effects of flow rate on elution were evaluated at 0.6, 0.8, and 1.0 mL min−1 (Figure 2 and Table S2) using the optimal solvents and temperature. All components were separated except for the quercetin derivatives (Rs = 1.44) at a flow rate of 0.6 mL min−1 (Table S2). The components eluted faster as the flow rate was increased from 0.6 to 1.0 and the flavonoids eluted at 46.52–60.03 min at 0.6 mL min-1, but at 36.28–52.00 min at 1.0 mL min−1. As a result, a flow rate of 1.0 mL min−1 was chosen in subsequent work.
Figure 1. Reversed-phase high-performance liquid chromatography (HPLC) traces of commonbuckwheat sprout extract acquired at: (A) 20 ◦C, (B) 30 ◦C, and (C) 40 ◦C detected at 360 nm. Peaknumber: 1, orientin; 2, isoorientin; 3, vitexin; 4, isovitexin; 5, quercetin-3-O-robinobioside; 6, rutin. L,luteolin derivatives; A, apigenin derivatives; Q, quercetin derivatives.
The effects of flow rate on elution were evaluated at 0.6, 0.8, and 1.0 mL min−1 (Figure 2 andTable S2) using the optimal solvents and temperature. All components were separated except for thequercetin derivatives (Rs = 1.44) at a flow rate of 0.6 mL min−1 (Table S2). The components elutedfaster as the flow rate was increased from 0.6 to 1.0 and the flavonoids eluted at 46.52–60.03 min at0.6 mL min−1, but at 36.28–52.00 min at 1.0 mL min−1. As a result, a flow rate of 1.0 mL min−1 waschosen in subsequent work.
Foods 2019, 8, 549 7 of 13
Foods 2019, 8, x FOR PEER REVIEW 7 of 13
Figure 2. Reversed-phase HPLC traces of common buckwheat sprout extract acquired at flow rates of: (A) 0.6 mL min−1, (B) 0.8 mL min−1, and (C) 1.0 mL min−1 detected at 360 nm. Peak number: 1, orientin; 2, isoorientin; 3, vitexin; 4, isovitexin; 5, quercetin-3-O-robinobioside; 6, rutin. L, luteolin derivatives; A, apigenin derivatives; Q, quercetin derivatives.
3.3. Isolating the Three Isomer Pairs from CS
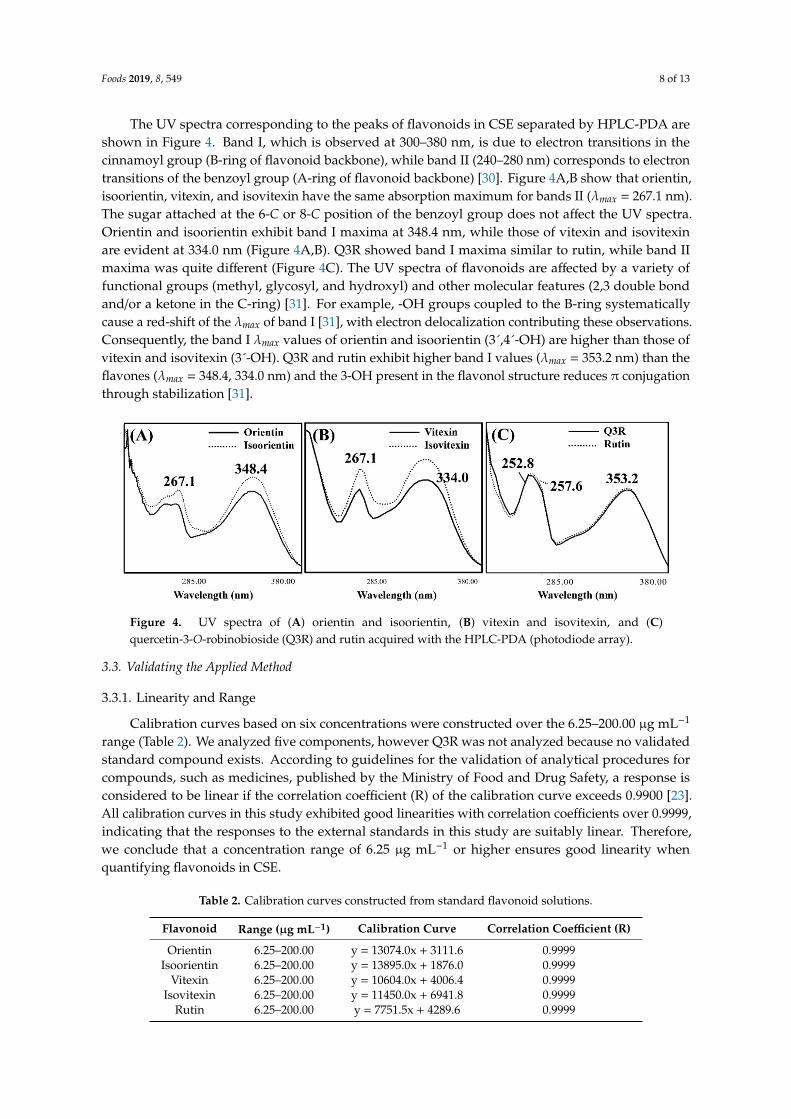
The structures of the three sets of isomer pairs are displayed in Figure S1. Orientin and isoorientin are isomers that have luteolin as their parent, in which a glucose unit is attached at the 8-C and 6-C position of the flavonoid A ring, respectively. Likewise, vitexin and isovitexin are isomers with apigenin as the parent. Rutin contains a rutinose (6-O-α-L-rhamnosyl-D-glucose) at the C-3 position of the quercetin, while Q3R contains a robinobiose (6-O-α-L-rhamnosyl-D-galactose) at the same position. Figure 3A shows the ordering of orientin, isoorientin, vitexin, isovitexin, and rutin standards obtained using the optimal HPLC conditions, which is similar to that of a previous CSE analysis result [8]. The -OH of glucose moiety and the -OH of the flavonoid A-ring can interact to form hydrogen bonds [28], resulting in electron distributions and polarities that depend on the position of glucose bonding to the flavonoid (6-C or 8-C). Therefore, when reversed-phase HPLC is used, the flavone-8-C-glycosides elute faster than the corresponding flavone-6-C-glycosides [29]. The HPLC trace of the CSE also shows that the flavone-8-C-glycosides elute faster than the flavone-6-C-glycosides (Figure 3). The Q3R and rutin isomer sets were also detected in the CSE (Figure 3B).
Figure 3. Reversed-phase HPLC traces of (A) standards and (B) common buckwheat sprout extract. Peak number: 1, orientin; 2, isoorientin; 3, vitexin; 4, isovitexin; 5, quercetin-3-O-robinobioside; 6, rutin.
Figure 2. Reversed-phase HPLC traces of common buckwheat sprout extract acquired at flow ratesof: (A) 0.6 mL min−1, (B) 0.8 mL min−1, and (C) 1.0 mL min−1 detected at 360 nm. Peak number: 1,orientin; 2, isoorientin; 3, vitexin; 4, isovitexin; 5, quercetin-3-O-robinobioside; 6, rutin. L, luteolinderivatives; A, apigenin derivatives; Q, quercetin derivatives.
3.2. Isolating the Three Isomer Pairs from CS
The structures of the three sets of isomer pairs are displayed in Figure S1. Orientin and isoorientinare isomers that have luteolin as their parent, in which a glucose unit is attached at the 8-C and6-C position of the flavonoid A ring, respectively. Likewise, vitexin and isovitexin are isomers withapigenin as the parent. Rutin contains a rutinose (6-O-α-L-rhamnosyl-D-glucose) at the C-3 positionof the quercetin, while Q3R contains a robinobiose (6-O-α-L-rhamnosyl-D-galactose) at the sameposition. Figure 3A shows the ordering of orientin, isoorientin, vitexin, isovitexin, and rutin standardsobtained using the optimal HPLC conditions, which is similar to that of a previous CSE analysisresult [8]. The -OH of glucose moiety and the -OH of the flavonoid A-ring can interact to formhydrogen bonds [28], resulting in electron distributions and polarities that depend on the positionof glucose bonding to the flavonoid (6-C or 8-C). Therefore, when reversed-phase HPLC is used,the flavone-8-C-glycosides elute faster than the corresponding flavone-6-C-glycosides [29]. The HPLCtrace of the CSE also shows that the flavone-8-C-glycosides elute faster than the flavone-6-C-glycosides(Figure 3). The Q3R and rutin isomer sets were also detected in the CSE (Figure 3B).
Foods 2019, 8, x FOR PEER REVIEW 7 of 13
Figure 2. Reversed-phase HPLC traces of common buckwheat sprout extract acquired at flow rates of: (A) 0.6 mL min−1, (B) 0.8 mL min−1, and (C) 1.0 mL min−1 detected at 360 nm. Peak number: 1, orientin; 2, isoorientin; 3, vitexin; 4, isovitexin; 5, quercetin-3-O-robinobioside; 6, rutin. L, luteolin derivatives; A, apigenin derivatives; Q, quercetin derivatives.
3.3. Isolating the Three Isomer Pairs from CS
The structures of the three sets of isomer pairs are displayed in Figure S1. Orientin and isoorientin are isomers that have luteolin as their parent, in which a glucose unit is attached at the 8-C and 6-C position of the flavonoid A ring, respectively. Likewise, vitexin and isovitexin are isomers with apigenin as the parent. Rutin contains a rutinose (6-O-α-L-rhamnosyl-D-glucose) at the C-3 position of the quercetin, while Q3R contains a robinobiose (6-O-α-L-rhamnosyl-D-galactose) at the same position. Figure 3A shows the ordering of orientin, isoorientin, vitexin, isovitexin, and rutin standards obtained using the optimal HPLC conditions, which is similar to that of a previous CSE analysis result [8]. The -OH of glucose moiety and the -OH of the flavonoid A-ring can interact to form hydrogen bonds [28], resulting in electron distributions and polarities that depend on the position of glucose bonding to the flavonoid (6-C or 8-C). Therefore, when reversed-phase HPLC is used, the flavone-8-C-glycosides elute faster than the corresponding flavone-6-C-glycosides [29]. The HPLC trace of the CSE also shows that the flavone-8-C-glycosides elute faster than the flavone-6-C-glycosides (Figure 3). The Q3R and rutin isomer sets were also detected in the CSE (Figure 3B).
Figure 3. Reversed-phase HPLC traces of (A) standards and (B) common buckwheat sprout extract. Peak number: 1, orientin; 2, isoorientin; 3, vitexin; 4, isovitexin; 5, quercetin-3-O-robinobioside; 6, rutin.
Figure 3. Reversed-phase HPLC traces of (A) standards and (B) common buckwheat sprout extract.Peak number: 1, orientin; 2, isoorientin; 3, vitexin; 4, isovitexin; 5, quercetin-3-O-robinobioside; 6, rutin.
Foods 2019, 8, 549 8 of 13
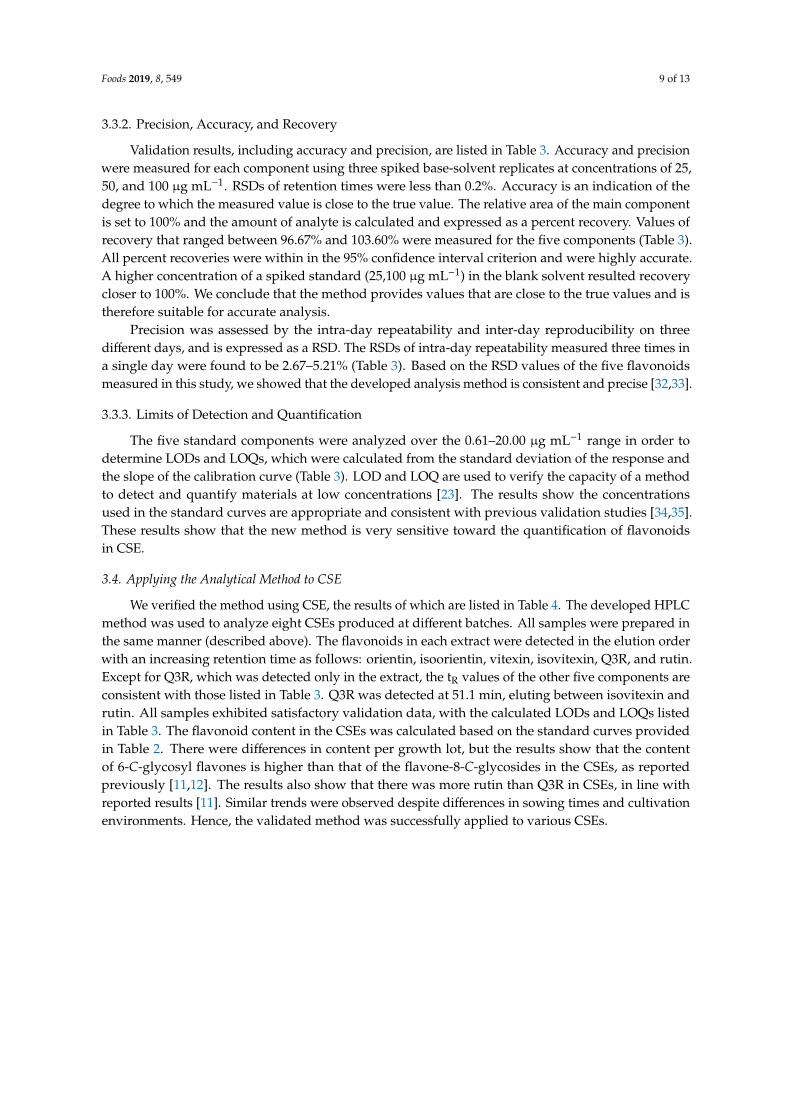
The UV spectra corresponding to the peaks of flavonoids in CSE separated by HPLC-PDA areshown in Figure 4. Band I, which is observed at 300–380 nm, is due to electron transitions in thecinnamoyl group (B-ring of flavonoid backbone), while band II (240–280 nm) corresponds to electrontransitions of the benzoyl group (A-ring of flavonoid backbone) [30]. Figure 4A,B show that orientin,isoorientin, vitexin, and isovitexin have the same absorption maximum for bands II (λmax = 267.1 nm).The sugar attached at the 6-C or 8-C position of the benzoyl group does not affect the UV spectra.Orientin and isoorientin exhibit band I maxima at 348.4 nm, while those of vitexin and isovitexinare evident at 334.0 nm (Figure 4A,B). Q3R showed band I maxima similar to rutin, while band IImaxima was quite different (Figure 4C). The UV spectra of flavonoids are affected by a variety offunctional groups (methyl, glycosyl, and hydroxyl) and other molecular features (2,3 double bondand/or a ketone in the C-ring) [31]. For example, -OH groups coupled to the B-ring systematicallycause a red-shift of the λmax of band I [31], with electron delocalization contributing these observations.Consequently, the band I λmax values of orientin and isoorientin (3´,4´-OH) are higher than those ofvitexin and isovitexin (3´-OH). Q3R and rutin exhibit higher band I values (λmax = 353.2 nm) than theflavones (λmax = 348.4, 334.0 nm) and the 3-OH present in the flavonol structure reduces π conjugationthrough stabilization [31].
Foods 2019, 8, x FOR PEER REVIEW 8 of 13
The UV spectra corresponding to the peaks of flavonoids in CSE separated by HPLC-PDA are shown in Figure 4. Band I, which is observed at 300–380 nm, is due to electron transitions in the cinnamoyl group (B-ring of flavonoid backbone), while band II (240–280 nm) corresponds to electron transitions of the benzoyl group (A-ring of flavonoid backbone) [30]. Figure 4A and 4B show that orientin, isoorientin, vitexin, and isovitexin have the same absorption maximum for bands II (λmax = 267.1 nm). The sugar attached at the 6-C or 8-C position of the benzoyl group does not affect the UV spectra. Orientin and isoorientin exhibit band I maxima at 348.4 nm, while those of vitexin and isovitexin are evident at 334.0 nm (Figure 4A and 4B). Q3R showed band I maxima similar to rutin, while band II maxima was quite different (Figure 4C). The UV spectra of flavonoids are affected by a variety of functional groups (methyl, glycosyl, and hydroxyl) and other molecular features (2,3 double bond and/or a ketone in the C-ring) [31]. For example, -OH groups coupled to the B-ring systematically cause a red-shift of the λmax of band I [31], with electron delocalization contributing these observations. Consequently, the band I λmax values of orientin and isoorientin (3´,4´-OH) are higher than those of vitexin and isovitexin (3´-OH). Q3R and rutin exhibit higher band I values (λmax = 353.2 nm) than the flavones (λmax = 348.4, 334.0 nm) and the 3-OH present in the flavonol structure reduces π conjugation through stabilization [31].
Figure 4. UV spectra of (A) orientin and isoorientin, (B) vitexin and isovitexin, and (C) quercetin-3-O-robinobioside (Q3R) and rutin acquired with the HPLC-PDA (photodiode array).
3.3. Validating the Applied Method
3.3.1. Linearity and Range
Calibration curves based on six concentrations were constructed over the 6.25–200.00 μg mL−1 range (Table 2). We analyzed five components, however Q3R was not analyzed because no validated standard compound exists. According to guidelines for the validation of analytical procedures for compounds, such as medicines, published by the Ministry of Food and Drug Safety, a response is considered to be linear if the correlation coefficient (R) of the calibration curve exceeds 0.9900 [23]. All calibration curves in this study exhibited good linearities with correlation coefficients over 0.9999, indicating that the responses to the external standards in this study are suitably linear. Therefore, we conclude that a concentration range of 6.25 μg mL−1 or higher ensures good linearity when quantifying flavonoids in CSE.
Table 2. Calibration curves constructed from standard flavonoid solutions.
Flavonoid Range (μg mL−1) Calibration Curve Correlation Coefficient (R) Orientin 6.25–200.00 y = 13074.0x + 3111.6 0.9999
Isoorientin 6.25–200.00 y = 13895.0x + 1876.0 0.9999 Vitexin 6.25–200.00 y = 10604.0x + 4006.4 0.9999
Isovitexin 6.25–200.00 y = 11450.0x + 6941.8 0.9999 Rutin 6.25–200.00 y = 7751.5x + 4289.6 0.9999
Figure 4. UV spectra of (A) orientin and isoorientin, (B) vitexin and isovitexin, and (C)quercetin-3-O-robinobioside (Q3R) and rutin acquired with the HPLC-PDA (photodiode array).
3.3. Validating the Applied Method
3.3.1. Linearity and Range
Calibration curves based on six concentrations were constructed over the 6.25–200.00 µg mL−1
range (Table 2). We analyzed five components, however Q3R was not analyzed because no validatedstandard compound exists. According to guidelines for the validation of analytical procedures forcompounds, such as medicines, published by the Ministry of Food and Drug Safety, a response isconsidered to be linear if the correlation coefficient (R) of the calibration curve exceeds 0.9900 [23].All calibration curves in this study exhibited good linearities with correlation coefficients over 0.9999,indicating that the responses to the external standards in this study are suitably linear. Therefore,we conclude that a concentration range of 6.25 µg mL−1 or higher ensures good linearity whenquantifying flavonoids in CSE.
Table 2. Calibration curves constructed from standard flavonoid solutions.
Flavonoid Range (µg mL−1) Calibration Curve Correlation Coefficient (R)
Orientin 6.25–200.00 y = 13074.0x + 3111.6 0.9999Isoorientin 6.25–200.00 y = 13895.0x + 1876.0 0.9999
Vitexin 6.25–200.00 y = 10604.0x + 4006.4 0.9999Isovitexin 6.25–200.00 y = 11450.0x + 6941.8 0.9999
Rutin 6.25–200.00 y = 7751.5x + 4289.6 0.9999
Foods 2019, 8, 549 9 of 13
3.3.2. Precision, Accuracy, and Recovery
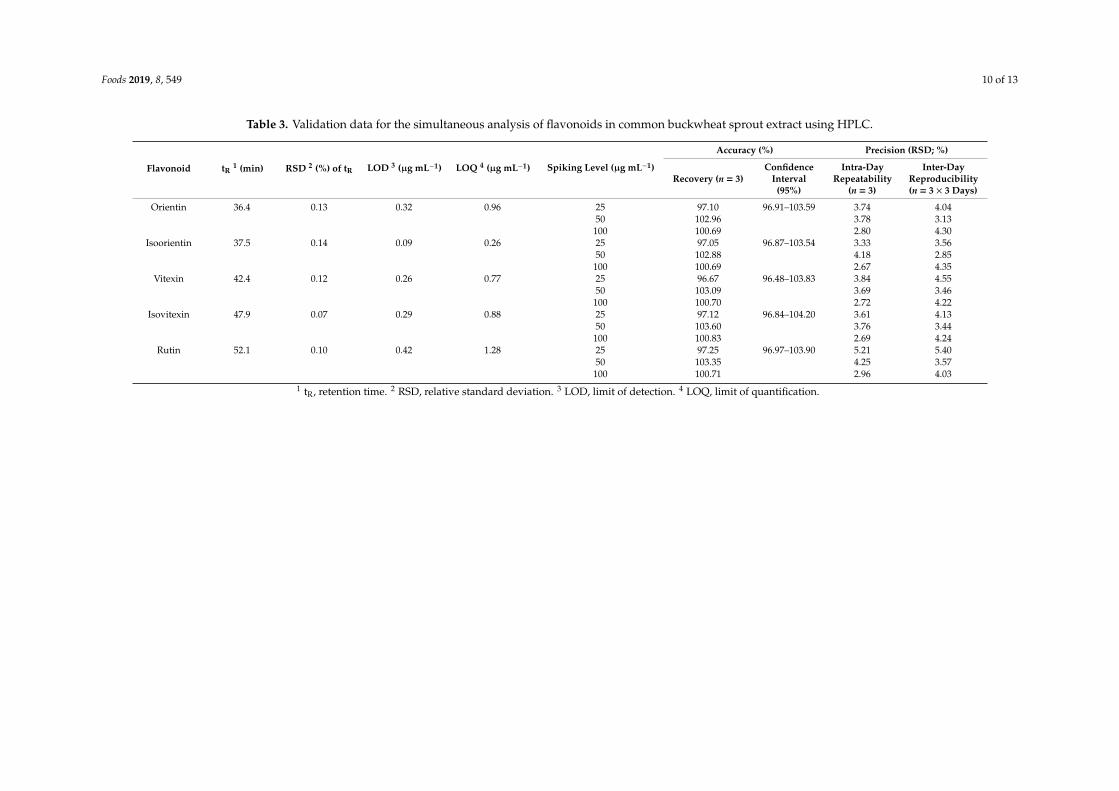
Validation results, including accuracy and precision, are listed in Table 3. Accuracy and precisionwere measured for each component using three spiked base-solvent replicates at concentrations of 25,50, and 100 µg mL−1. RSDs of retention times were less than 0.2%. Accuracy is an indication of thedegree to which the measured value is close to the true value. The relative area of the main componentis set to 100% and the amount of analyte is calculated and expressed as a percent recovery. Values ofrecovery that ranged between 96.67% and 103.60% were measured for the five components (Table 3).All percent recoveries were within in the 95% confidence interval criterion and were highly accurate.A higher concentration of a spiked standard (25,100 µg mL−1) in the blank solvent resulted recoverycloser to 100%. We conclude that the method provides values that are close to the true values and istherefore suitable for accurate analysis.
Precision was assessed by the intra-day repeatability and inter-day reproducibility on threedifferent days, and is expressed as a RSD. The RSDs of intra-day repeatability measured three times ina single day were found to be 2.67–5.21% (Table 3). Based on the RSD values of the five flavonoidsmeasured in this study, we showed that the developed analysis method is consistent and precise [32,33].
3.3.3. Limits of Detection and Quantification
The five standard components were analyzed over the 0.61–20.00 µg mL−1 range in order todetermine LODs and LOQs, which were calculated from the standard deviation of the response andthe slope of the calibration curve (Table 3). LOD and LOQ are used to verify the capacity of a methodto detect and quantify materials at low concentrations [23]. The results show the concentrationsused in the standard curves are appropriate and consistent with previous validation studies [34,35].These results show that the new method is very sensitive toward the quantification of flavonoidsin CSE.
3.4. Applying the Analytical Method to CSE
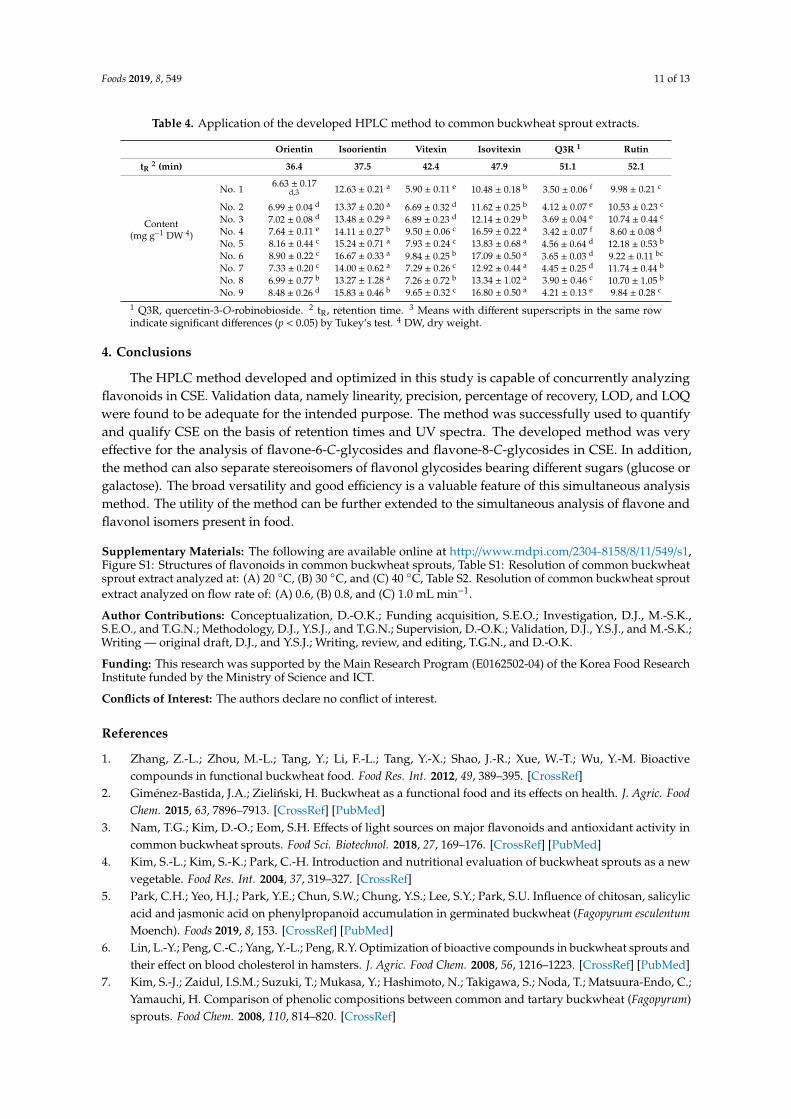
We verified the method using CSE, the results of which are listed in Table 4. The developed HPLCmethod was used to analyze eight CSEs produced at different batches. All samples were prepared inthe same manner (described above). The flavonoids in each extract were detected in the elution orderwith an increasing retention time as follows: orientin, isoorientin, vitexin, isovitexin, Q3R, and rutin.Except for Q3R, which was detected only in the extract, the tR values of the other five components areconsistent with those listed in Table 3. Q3R was detected at 51.1 min, eluting between isovitexin andrutin. All samples exhibited satisfactory validation data, with the calculated LODs and LOQs listedin Table 3. The flavonoid content in the CSEs was calculated based on the standard curves providedin Table 2. There were differences in content per growth lot, but the results show that the contentof 6-C-glycosyl flavones is higher than that of the flavone-8-C-glycosides in the CSEs, as reportedpreviously [11,12]. The results also show that there was more rutin than Q3R in CSEs, in line withreported results [11]. Similar trends were observed despite differences in sowing times and cultivationenvironments. Hence, the validated method was successfully applied to various CSEs.
Foods 2019, 8, 549 10 of 13
Table 3. Validation data for the simultaneous analysis of flavonoids in common buckwheat sprout extract using HPLC.
Flavonoid tR1 (min) RSD 2 (%) of tR LOD 3 (µg mL−1) LOQ 4 (µg mL−1) Spiking Level (µg mL−1)
Accuracy (%) Precision (RSD; %)
Recovery (n = 3)Confidence
Interval(95%)
Intra-DayRepeatability
(n = 3)
Inter-DayReproducibility(n = 3 × 3 Days)
Orientin 36.4 0.13 0.32 0.96 25 97.10 96.91–103.59 3.74 4.0450 102.96 3.78 3.13100 100.69 2.80 4.30
Isoorientin 37.5 0.14 0.09 0.26 25 97.05 96.87–103.54 3.33 3.5650 102.88 4.18 2.85100 100.69 2.67 4.35
Vitexin 42.4 0.12 0.26 0.77 25 96.67 96.48–103.83 3.84 4.5550 103.09 3.69 3.46100 100.70 2.72 4.22
Isovitexin 47.9 0.07 0.29 0.88 25 97.12 96.84–104.20 3.61 4.1350 103.60 3.76 3.44100 100.83 2.69 4.24
Rutin 52.1 0.10 0.42 1.28 25 97.25 96.97–103.90 5.21 5.4050 103.35 4.25 3.57100 100.71 2.96 4.03
1 tR, retention time. 2 RSD, relative standard deviation. 3 LOD, limit of detection. 4 LOQ, limit of quantification.
Foods 2019, 8, 549 11 of 13
Table 4. Application of the developed HPLC method to common buckwheat sprout extracts.
Orientin Isoorientin Vitexin Isovitexin Q3R 1 Rutin
tR2 (min) 36.4 37.5 42.4 47.9 51.1 52.1
Content(mg g−1 DW 4)
No. 1 6.63 ± 0.17d,3 12.63 ± 0.21 a 5.90 ± 0.11 e 10.48 ± 0.18 b 3.50 ± 0.06 f 9.98 ± 0.21 c
No. 2 6.99 ± 0.04 d 13.37 ± 0.20 a 6.69 ± 0.32 d 11.62 ± 0.25 b 4.12 ± 0.07 e 10.53 ± 0.23 c
No. 3 7.02 ± 0.08 d 13.48 ± 0.29 a 6.89 ± 0.23 d 12.14 ± 0.29 b 3.69 ± 0.04 e 10.74 ± 0.44 c
No. 4 7.64 ± 0.11 e 14.11 ± 0.27 b 9.50 ± 0.06 c 16.59 ± 0.22 a 3.42 ± 0.07 f 8.60 ± 0.08 d
No. 5 8.16 ± 0.44 c 15.24 ± 0.71 a 7.93 ± 0.24 c 13.83 ± 0.68 a 4.56 ± 0.64 d 12.18 ± 0.53 b
No. 6 8.90 ± 0.22 c 16.67 ± 0.33 a 9.84 ± 0.25 b 17.09 ± 0.50 a 3.65 ± 0.03 d 9.22 ± 0.11 bc
No. 7 7.33 ± 0.20 c 14.00 ± 0.62 a 7.29 ± 0.26 c 12.92 ± 0.44 a 4.45 ± 0.25 d 11.74 ± 0.44 b
No. 8 6.99 ± 0.77 b 13.27 ± 1.28 a 7.26 ± 0.72 b 13.34 ± 1.02 a 3.90 ± 0.46 c 10.70 ± 1.05 b
No. 9 8.48 ± 0.26 d 15.83 ± 0.46 b 9.65 ± 0.32 c 16.80 ± 0.50 a 4.21 ± 0.13 e 9.84 ± 0.28 c
1 Q3R, quercetin-3-O-robinobioside. 2 tR, retention time. 3 Means with different superscripts in the same rowindicate significant differences (p < 0.05) by Tukey’s test. 4 DW, dry weight.
4. Conclusions
The HPLC method developed and optimized in this study is capable of concurrently analyzingflavonoids in CSE. Validation data, namely linearity, precision, percentage of recovery, LOD, and LOQwere found to be adequate for the intended purpose. The method was successfully used to quantifyand qualify CSE on the basis of retention times and UV spectra. The developed method was veryeffective for the analysis of flavone-6-C-glycosides and flavone-8-C-glycosides in CSE. In addition,the method can also separate stereoisomers of flavonol glycosides bearing different sugars (glucose orgalactose). The broad versatility and good efficiency is a valuable feature of this simultaneous analysismethod. The utility of the method can be further extended to the simultaneous analysis of flavone andflavonol isomers present in food.
Supplementary Materials: The following are available online at http://www.mdpi.com/2304-8158/8/11/549/s1,Figure S1: Structures of flavonoids in common buckwheat sprouts, Table S1: Resolution of common buckwheatsprout extract analyzed at: (A) 20 ◦C, (B) 30 ◦C, and (C) 40 ◦C, Table S2. Resolution of common buckwheat sproutextract analyzed on flow rate of: (A) 0.6, (B) 0.8, and (C) 1.0 mL min−1.
Author Contributions: Conceptualization, D.-O.K.; Funding acquisition, S.E.O.; Investigation, D.J., M.-S.K.,S.E.O., and T.G.N.; Methodology, D.J., Y.S.J., and T.G.N.; Supervision, D.-O.K.; Validation, D.J., Y.S.J., and M.-S.K.;Writing — original draft, D.J., and Y.S.J.; Writing, review, and editing, T.G.N., and D.-O.K.
Funding: This research was supported by the Main Research Program (E0162502-04) of the Korea Food ResearchInstitute funded by the Ministry of Science and ICT.
Conflicts of Interest: The authors declare no conflict of interest.
References
1. Zhang, Z.-L.; Zhou, M.-L.; Tang, Y.; Li, F.-L.; Tang, Y.-X.; Shao, J.-R.; Xue, W.-T.; Wu, Y.-M. Bioactivecompounds in functional buckwheat food. Food Res. Int. 2012, 49, 389–395. [CrossRef]
2. Giménez-Bastida, J.A.; Zielinski, H. Buckwheat as a functional food and its effects on health. J. Agric. FoodChem. 2015, 63, 7896–7913. [CrossRef] [PubMed]
3. Nam, T.G.; Kim, D.-O.; Eom, S.H. Effects of light sources on major flavonoids and antioxidant activity incommon buckwheat sprouts. Food Sci. Biotechnol. 2018, 27, 169–176. [CrossRef] [PubMed]
4. Kim, S.-L.; Kim, S.-K.; Park, C.-H. Introduction and nutritional evaluation of buckwheat sprouts as a newvegetable. Food Res. Int. 2004, 37, 319–327. [CrossRef]
5. Park, C.H.; Yeo, H.J.; Park, Y.E.; Chun, S.W.; Chung, Y.S.; Lee, S.Y.; Park, S.U. Influence of chitosan, salicylicacid and jasmonic acid on phenylpropanoid accumulation in germinated buckwheat (Fagopyrum esculentumMoench). Foods 2019, 8, 153. [CrossRef] [PubMed]
6. Lin, L.-Y.; Peng, C.-C.; Yang, Y.-L.; Peng, R.Y. Optimization of bioactive compounds in buckwheat sprouts andtheir effect on blood cholesterol in hamsters. J. Agric. Food Chem. 2008, 56, 1216–1223. [CrossRef] [PubMed]
7. Kim, S.-J.; Zaidul, I.S.M.; Suzuki, T.; Mukasa, Y.; Hashimoto, N.; Takigawa, S.; Noda, T.; Matsuura-Endo, C.;Yamauchi, H. Comparison of phenolic compositions between common and tartary buckwheat (Fagopyrum)sprouts. Food Chem. 2008, 110, 814–820. [CrossRef]
Foods 2019, 8, 549 12 of 13
8. Nam, T.-G.; Lee, S.M.; Park, J.-H.; Kim, D.-O.; Baek, N.-I.; Eom, S.H. Flavonoid analysis of buckwheat sprouts.Food Chem. 2015, 170, 97–101. [CrossRef]
9. Liu, C.-L.; Chen, Y.-S.; Yang, J.-H.; Chiang, B.-H. Antioxidant activity of tartary (Fagopyrum tataricum (L.)Gaertn.) and common (Fagopyrum esculentum Moench) buckwheat sprouts. J. Agric. Food Chem. 2008, 56,173–178. [CrossRef]
10. Ishii, S.; Katsumura, T.; Shiozuka, C.; Ooyauchi, K.; Kawasaki, K.; Takigawa, S.; Fukushima, T.;Tokuji, Y.; Kinoshita, M.; Ohnishi, M.; et al. Anti-inflammatory effect of buckwheat sprouts inlipopolysaccharide-activated human colon cancer cells and mice. Biosci. Biotechnol. Biochem. 2008,72, 3148–3157. [CrossRef]
11. Nam, T.G.; Lim, T.-G.; Lee, B.H.; Lim, S.; Kang, H.; Eom, S.H.; Yoo, M.; Jang, H.W.; Kim, D.-O.Comparison of anti-inflammatory effects of flavonoid-rich common and tartary buckwheat sprout extractsin lipopolysaccharide-stimulated RAW 264.7 and peritoneal macrophages. Oxid. Med. Cell. Longev. 2017,2017, 9658030. [CrossRef] [PubMed]
12. Lee, M.-K.; Park, S.-H.; Kim, S.-J. A time-course study of flavonoids in buckwheats (Fagopyrum species).Korean J. Agric. Sci. 2011, 38, 87–94. [CrossRef]
13. Ozga, J.A.; Saeed, A.; Wismer, W.; Reinecke, D.M. Characterization of cyanidin-and quercetin-derivedflavonoids and other phenolics in mature saskatoon fruits (Amelanchier alnifolia Nutt.). J. Agric. Food Chem.2007, 55, 10414–10424. [CrossRef] [PubMed]
14. Pawlowska, A.M.; Camangi, F.; Bader, A.; Braca, A. Flavonoids of Zizyphus jujuba L. and Zizyphus spina-christi(L.) Willd (Rhamnaceae) fruits. Food Chem. 2009, 112, 858–862. [CrossRef]
15. Patel, O.; Muller, C.; Joubert, E.; Louw, J.; Rosenkranz, B.; Awortwe, C. Inhibitory interactions of Aspalathuslinearis (rooibos) extracts and compounds, aspalathin and Z-2-(β-d-glucopyranosyloxy)-3-phenylpropenoicacid, on cytochromes metabolizing hypoglycemic and hypolipidemic drugs. Molecules 2016, 21, 1515.[CrossRef]
16. Pereira, C.A.M.; Yariwake, J.H.; McCullagh, M. Distinction of the C-glycosylflavone isomer pairsorientin/isoorientin and vitexin/isovitexin using HPLC-MS exact mass measurement and in-source CID.Phytochem. Anal. 2005, 16, 295–301. [CrossRef]
17. Willems, J.L.; Khamis, M.M.; Saeid, W.M.; Purves, R.W.; Katselis, G.; Low, N.H.; El-Aneed, A. Analysis of aseries of chlorogenic acid isomers using differential ion mobility and tandem mass spectrometry. Anal. Chim.Acta 2016, 933, 164–174. [CrossRef]
18. Geng, P.; Sun, J.; Zhang, M.; Li, X.; Harnly, J.M.; Chen, P. Comprehensive characterization of C-glycosylflavones in wheat (Triticum aestivum L.) germ using UPLC-PDA-ESI/HRMSn and mass defect filtering. J. MassSpectrom. 2016, 51, 914–930. [CrossRef]
19. Stalikas, C.D. Extraction, separation, and detection methods for phenolic acids and flavonoids. J. Sep. Sci.2007, 30, 3268–3295. [CrossRef]
20. Yáñez, J.A.; Andrews, P.K.; Davies, N.M. Methods of analysis and separation of chiral flavonoids. J. Chromatogr.B 2007, 848, 159–181. [CrossRef]
21. Xu, F.; Liu, Y.; Zhang, Z.; Yang, C.; Tian, Y. Quasi-MSn identification of flavanone 7-glycoside isomers in DaChengqi Tang by high performance liquid chromatography-tandem mass spectrometry. Chin. Med. 2009,4, 15. [CrossRef] [PubMed]
22. Choi, S.-H.; Ahn, J.-B.; Kim, H.-J.; Im, N.-K.; Kozukue, N.; Levin, C.E.; Friedman, M. Changes in freeamino acid, protein, and flavonoid content in jujube (Ziziphus jujube) fruit during eight stages of growthand antioxidative and cancer cell inhibitory effects by extracts. J. Agric. Food Chem. 2012, 60, 10245–10255.[CrossRef] [PubMed]
23. Ministry of Food and Drug Safety. Analytical Method Guideline about Validation of Drugs andetc.; Ministry of Food and Drug Safety: Cheongju, Korea, 2015; pp. 1–51. Availableonline: http://www.nifds.go.kr/brd/m_15/view.do?seq=10030&srchFr=&srchTo=&srchWord=&srchTp=&itm_seq_1=0&itm_seq_2=0&multi_itm_seq=0&company_cd=&company_nm=&page=45 (accessed on 7 May 2019).
24. Xie, R.; Tu, M.; Wu, Y.; Adhikari, S. Improvement in HPLC separation of acetic acid and levulinic acid in theprofiling of biomass hydrolysate. Bioresour. Technol. 2011, 102, 4938–4942. [CrossRef] [PubMed]
25. Welch, C.J.; Brkovic, T.; Schafer, W.; Gong, X. Performance to burn? Re-evaluating the choice of acetonitrileas the platform solvent for analytical HPLC. Green Chem. 2009, 11, 1232–1238. [CrossRef]
Foods 2019, 8, 549 13 of 13
26. Giegold, S.; Teutenberg, T.; Tuerk, J.; Kiffmeyer, T.; Wenclawiak, B. Determination of sulfonamides andtrimethoprim using high temperature HPLC with simultaneous temperature and solvent gradient. J. Sep. Sci.2008, 31, 3497–3502. [CrossRef] [PubMed]
27. Plumb, R.; Mazzeo, J.R.; Grumbach, E.S.; Rainville, P.; Jones, M.; Wheat, T.; Neue, U.D.; Smith, B.; Johnson, K.A.The application of small porous particles, high temperatures, and high pressures to generate very highresolution LC and LC/MS separations. J. Sep. Sci. 2007, 30, 1158–1166. [CrossRef]
28. Praveena, R.; Sadasivam, K.; Deepha, V.; Sivakumar, R. Antioxidant potential of orientin: A combinedexperimental and DFT approach. J. Mol. Struct. 2014, 1061, 114–123. [CrossRef]
29. Marston, A.; Hostettmann, K. Separation and quantification of flavonoids. In Flavonoids: Chemistry,Biochemistry, and Applications; Andersen, O.M., Markham, K.R., Eds.; CRC Press: Boca Raton, FL, USA, 2005;pp. 1–36.
30. Naseem, B.; Sabri, A.; Hasan, A.; Shah, S.S. Interaction of flavonoids within organized molecular assembliesof anionic surfactant. Colloids Surf. B Biointerface 2004, 35, 7–13. [CrossRef]
31. Anouar, E.H.; Gierschner, J.; Duroux, J.-L.; Trouillas, P. UV/Visible spectra of natural polyphenols:A time-dependent density functional theory study. Food Chem. 2012, 131, 79–89. [CrossRef]
32. Jovanov, P.; Guzsvány, V.; Lazic, S.; Franko, M.; Sakac, M.; Šaric, L.; Kos, J. Development of HPLC-DADmethod for determination of neonicotinoids in honey. J. Food Compos. Anal. 2015, 40, 106–113. [CrossRef]
33. Lu, Q.-Y.; Lee, R.-P.; Huang, J.; Yang, J.; Henning, S.M.; Hong, X.; Heber, D.; Li, Z. Quantification of bioactiveconstituents and antioxidant activity of Chinese yellow wine. J. Food Compos. Anal. 2015, 44, 86–92. [CrossRef]
34. Coelho, E.M.; da Silva Padilha, C.V.; Miskinis, G.A.; de Sá, A.G.B.; Pereira, G.E.; de Azevêdo, L.C.; Lima, M.D.S.Simultaneous analysis of sugars and organic acids in wine and grape juices by HPLC: Method validationand characterization of products from northeast Brazil. J. Food Compos. Anal. 2018, 66, 160–167. [CrossRef]
35. Calabrò, M.L.; Galtieri, V.; Cutroneo, P.; Tommasini, S.; Ficarra, P.; Ficarra, R. Study of the extraction procedureby experimental design and validation of a LC method for determination of flavonoids in Citrus bergamiajuice. J. Pharm. Biomed. Anal. 2004, 35, 349–363. [CrossRef]
© 2019 by the authors. Licensee MDPI, Basel, Switzerland. This article is an open accessarticle distributed under the terms and conditions of the Creative Commons Attribution(CC BY) license (http://creativecommons.org/licenses/by/4.0/).
Copyright © 2022 FDOKUMEN