Validating the Nike+ Wireless Sport Kit for Estimating Pace, Distance ...
111
University of Texas at El Paso DigitalCommons@UTEP Open Access eses & Dissertations 2011-01-01 Validating the Nike+ Wireless Sport Kit for Estimating Pace, Distance, and Energy Expenditure during Treadmill Walking and Running Derek Joseph Acosta University of Texas at El Paso, [email protected] Follow this and additional works at: hps://digitalcommons.utep.edu/open_etd Part of the Biomechanics Commons , and the Physiology Commons is is brought to you for free and open access by DigitalCommons@UTEP. It has been accepted for inclusion in Open Access eses & Dissertations by an authorized administrator of DigitalCommons@UTEP. For more information, please contact [email protected]. Recommended Citation Acosta, Derek Joseph, "Validating the Nike+ Wireless Sport Kit for Estimating Pace, Distance, and Energy Expenditure during Treadmill Walking and Running" (2011). Open Access eses & Dissertations. 2220. hps://digitalcommons.utep.edu/open_etd/2220
-
Upload
khangminh22 -
Category
Documents
-
view
0 -
download
0
Transcript of Validating the Nike+ Wireless Sport Kit for Estimating Pace, Distance ...

University of Texas at El PasoDigitalCommons@UTEP
Open Access Theses & Dissertations
2011-01-01
Validating the Nike+ Wireless Sport Kit forEstimating Pace, Distance, and Energy Expenditureduring Treadmill Walking and RunningDerek Joseph AcostaUniversity of Texas at El Paso, [email protected]
Follow this and additional works at: https://digitalcommons.utep.edu/open_etdPart of the Biomechanics Commons, and the Physiology Commons
This is brought to you for free and open access by DigitalCommons@UTEP. It has been accepted for inclusion in Open Access Theses & Dissertationsby an authorized administrator of DigitalCommons@UTEP. For more information, please contact [email protected].
Recommended CitationAcosta, Derek Joseph, "Validating the Nike+ Wireless Sport Kit for Estimating Pace, Distance, and Energy Expenditure duringTreadmill Walking and Running" (2011). Open Access Theses & Dissertations. 2220.https://digitalcommons.utep.edu/open_etd/2220
VALIDATING THE NIKE+ WIRELESS SPORT KIT FOR ESTIMATING PACE, DISTANCE,
AND ENERGY EXPENDITURE DURING TREADMILL WALKING AND RUNNING
DEREK JOSEPH ACOSTA
Department of Kinesiology
APPROVED:
_________________________________________ George King, Ph.D., Chair
_________________________________________ Rebecca Reed-Jones, Ph.D.
_________________________________________ Joseph Tomaka, Ph.D.
_____________________________________ Benjamin C. Flores, Ph.D. Acting Dean of the Graduate School

Copyright© By
Derek Joseph Acosta 2011

VALIDATING THE NIKE+ WIRELESS SPORT KIT FOR ESTIMATING PACE, DISTANCE, AND ENERGY
EXPENDITURE DURING TREADMILL WALKING AND RUNNING
By
DEREK JOSEPH ACOSTA, B.S.
THESIS
Presented to the Faculty of the Graduate School of
The University of Texas at El Paso
in Partial Fulfillment
of the Requirements
for the Degree of
MASTER OF SCIENCE
Department of Kinesiology
THE UNIVERSITY OF TEXAS AT EL PASO
AUGUST 2011

iv
ACKNOWLEDGEMENTS
First off, I would like acknowledge my committee. Dr. King has always provided the time to
help me progress through this thesis process. I also wanted to thank Dr. Reed-Jones and Dr.
Tomaka for always providing assistance during times of short notice. I am grateful to have
selected such a unified committee.
I also would like to acknowledge the committee of The College of Health Sciences Graduate
Enhancement Research Fund. This thesis research would have not been possible without the
aid of the College. I am grateful to have been selected for funding. Thank you.
To the whole Kinesiology Department Faculty, for providing me with the invaluable
knowledge, guidance, and opportunity necessary for succeeding in this program. I am proud to
be a part of the Kinesiology Discipline.
To all of the friends I have made along the way. You all were a part of this process. To the
Graduate Kinesiology students, for being such a cohesive group of individuals inside and outside
of school. We have had some great times. Thank you for making the experience worthwhile.
Work is much more tolerable when you have great people around.
To my family, Mom, Dad, and my sister Kelly. Thank you for providing me the never-ending
love and support throughout this chapter of my educational career. I cannot express my
gratitude enough. To my family here in El Paso, for helping me transition into a new place when
I first arrived here. I love you all!

v
ABSTRACT
PURPOSE: To validate the accuracy of the Nike+ Wireless Sport Kit to estimate pace
(min/km), distance (km), energy expenditure (EE) (kcal/min) during treadmill walking and
running, and for two different sensor configurations. METHODS: Nine male and nine female
moderately endurance trained volunteers (mean ± age: 28.83 ± 1.90 y; height: 168.72 ± 1.86
cm; body mass: 62.19 ± 2.58 kg; VO2max: 54.36 ± 1.15 ml/kg/min) completed a) a maximal
oxygen consumption test and b) an accelerometer validation protocol including level treadmill
walking (53.6, 80.4, and 107.2 m/min); and level treadmill running (134.0, 160.8, 187.6, and
214.0 m/min). RESULTS: Each subsequent treadmill speed elicited a significant increase in
pace (p ≤ 0.037), distance (p < 0.001), and EE (p ≤ 0.020). The Nike+ significantly overestimated
pace and distance at walking speeds (53.6 and 80.4 m/min) by 23% and 9%, respectively; and
significantly underestimated pace and distance at higher running speeds (160.8, 187.6, and
214.0 m/min) by 6% (pace only – laces), 10% and 15%, respectively. The Nike+ underestimated
EE at each of the seven treadmill speeds; significantly by 24%, 10%, and 12% for 107.2, 187.6
and 214.0 m/min, respectively. There appears to be no marked difference between the laces
and midsole sensor configurations for pace, distance, or EE. CONCLUSION: Compared to
actual, estimates of EE were most accurate; speculating that the device’s prediction equation is
more suited for estimating EE. The sensor configuration affixed to the laces is a viable
alternative to that of purchasing a Nike+ compatible shoe.

vi
TABLE OF CONTENTS
Page
ACKNOWLEDGEMENTS ……………………………………………………………………….……………………… iv
ABSTRACT ……………………………………………………………………………………………………….............. v
TABLE OF CONTENTS …………………………………………………………………………………………………… vi
LIST OF TABLES …………………………………………………………….……………………………………………… x
LIST OF FIGURES …………………………………………………………….………………………..…………………… xi
Chapter 1: INTRODUCTION
1.1 Objective measures ………………………………………………….…………………………………………… 1
1.2 Nike+ Wireless Sport Kit …………………..………………………………….………………………………… 1
1.3 Accelerometry (piezoelectric) ………………………….……………………………………………………. 2
1.4 Sensor Configurations ………………………..……………………………….………………….……………… 2
1.5 Specific Aims …………….……………………………………………………….………………………………….. 3
1.6 Related Published Findings ……..……………………………………………………………………………… 3
1.7 Study Overview ……..………………………………………….…………………………………………………… 4
Chapter 2: LITERATURE REVIEW
2.1 Physical Activity Overview ………………………………………..………….………………………………. 5
2.2 History of Energy Expenditure: Then and Now ………………………………………………………. 6
2.2.1 History ………………………………………….…………………….………………………………………… 6
2.2.2 Doubly-Labeled Water ………………………….………………………….………………………….. 7
2.2.3 Indirect Calorimetry ………………………….….………………………………………….…………. 8
2.3 Accelerometry and Pedometry …………..…………………………………………………………….…… 10

vii
2.3.1 Accelerometers …………………………………………..…………….…………………………………. 10
2.3.2 Piezoelectric Accelerometry ……………………………….…………………….………….…….… 12
2.3.3 Pedometers ……………………………………………….………………………….…..…………….…… 15
2.4 Limitations of Accelerometry and Pedometry …………………………………….………………… 17
2.5 Accelerometry and Placement …..………………………………………………………….………………. 23
2.6 Determination of Accelerometer Counts ……………………………………………………………….. 27
2.7 Accelerometry and Sex ……………………………………..………………………………….……………….. 30
2.8 Accelerometry and Age ……………………………………………………………………….………………… 31
2.8.1 Infant ……………………………….…………………………………………………….……………………… 31
2.8.2 Young Children …………………………………………………………………….…….…………………. 32
2.8.3 Children and Adolescents ….………………………………………………….………………………. 33
2.8.4 Adults and Middle-Aged ………………………………………..…………………………….……….. 35
2.8.5 Older Adults ………………………………………………………………..……………………….……….. 36
2.9 Accelerometry and Body Composition ………………….………………………….……………………. 39
2.10 Conclusion ……………………………………………………………………….………………….………………. 44
2.11 Purpose …………………………………………………………………………………………………….…………. 47
Chapter 3: METHODS
3.1 Study Overview …………………………………….………….…………………………………….……………… 48
3.2 Participants ………………………………………………….………………………….....………………………… 48
3.3 Materials and Measures ……………………….…………………………………….………………………… 48
3.3.1 Maximal Oxygen Consumption Test ……………………….……..……………………………… 49
3.3.2 Calibration of TrueOne 2400 Metabolic Measurement System ………………….… 50

viii
3.3.3 Nike+ Wireless Sport Kit …………………………….……………………………….………………… 50
3.3.4 Calibration of the Nike+ ……………………………………………………………………..….……… 51
3.3.5 Validation Trial Protocol ………………………………………………..……………………………… 52
3.3.6 Calibration of COSMED K4 b2 ……………………………………………………….……………… 52
3.3.7 Synchronization of Units ………………………………………………….....………………………… 53
3.3.8 Independent and Dependent Variables ………………………………………………………… 54
3.3.9 Statistical Analysis ……………………………………………………….…………………………..…… 54
Chapter 4: RESULTS
4.1 Descriptive Statistics …………………………….………………………….…………………….……………… 55
4.2 Analysis of Variance …………………………………….………………………….....………………………… 56
4.3 Pace and Distance Sensor Estimates ……………..…….…………………….………………………… 57
4.3.1 Pace (Laces) ………………………..……………………………………………………………..………… 57
4.3.2 Pace (Midsole) …………………..……….………….……….…………………………….……………… 57
4.3.3 Distance (Laces) ………………………………………………………………....………………………… 57
4.3.4 Distance (Midsole) ………………………………………………………….….………………………… 58
4.4 Analysis of Covariance ………………………..………………………………………………..……..………… 58
4.5 Energy Expenditure Sensor Estimates …………………………………………….……………………… 59
4.5.1 EE (Laces) …………………………………….…………………………………………………..…………… 59
4.5.2 EE (Midsole) ……………………………………………………….………………………………………… 59
Chapter 5: DISCUSSION
5.1 Summary of Overall Findings ………………………………………………………………….……………… 66
5.1.1 Participants ……………………………….....………………………………………………………….…… 66
ix
5.1.2 Pace and Distance …………………………………………………………………………………..…… 67
5.1.3 Energy Expenditure ……………………………………………………………………………..………… 69
5.2 Limitations of the Current Study …………………………………………………………….……………… 72
5.3 Strengths of the Current Study ………………………....…………………………………………………… 73
5.4 Future Research ……………………………….……………………………………..….………………………… 74
5.5 Conclusion ………………………..…………………………………………..……………………………..………… 75
LIST OF REFERENCES …………….….………………………………………...……………………………..………… 77
APPENDIX: WORKING MATERIAL
Physical Activity/Health Questionnaire ………………………………………………………………………… 93
Consent Form ….……………………………………………………………………………………………..……………. 96
Thesis Defense Announcement ….…………………..…………………………………………………………… 97
CURRICULUM VITA …………………………………………………….…………………………….…………....…… 98

x
LIST OF TABLES
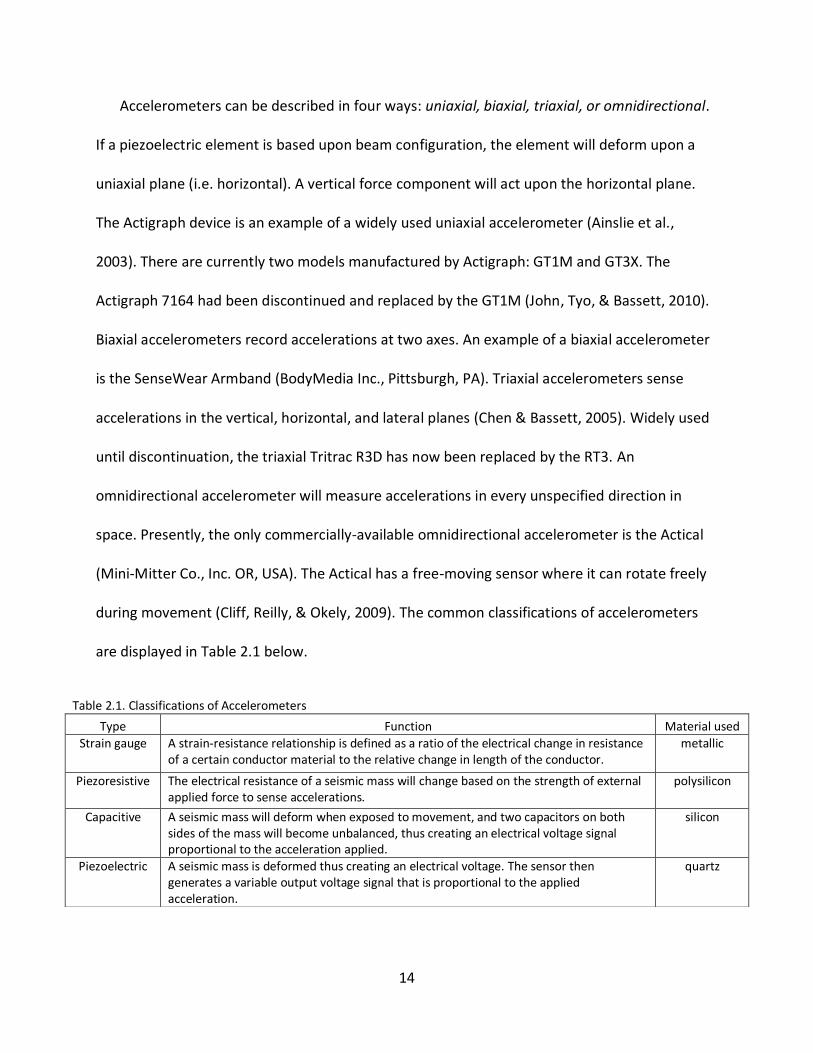
Table 2.1. Classifications of Accelerometers ………..……………………………..…………………..… 14
Table 2.2. Classifications of Pedometers ..……………..…………………………………………….…….. 17
Table 2.3. Limitations to Accelerometry and Pedometry ..…………………………………..……… 22
Table 2.4. Accelerometry and Monitor Placement ..…………………..………………………………. 26
Table 2.5. Accelerometry and Body Composition ...………………………………………….………... 43
Table 4.1. Mean (± SE) descriptive information for female and male participants ....…. 55
Table 4.2. Mean (± SE) Pace Estimated by the Nike+ and Actual Measured Pace .……... 60
Table 4.3. Mean (± SE) Distance Estimated by the Nike+ and Actual Measured Distance 61
Table 4.4. Mean (± SE) Energy Expenditure (EE) Estimated by the Nike+ and Actual
Measured EE ………………………………………………….………………………….……………………………... 62

xi
LIST OF FIGURES
Figure 1.1. Nike+ Wireless Sport Kit Components ….……………..……………..………………….… 1
Figure 1.2. Components of Transmitter …………………..………………….…………………………..… 2
Figure 1.3. Nike+ Midsole Configuration ………………………..………………..………………………… 3
Figure 1.4. Nike+ Laces Configuration ……………..………………………..……………………………….. 3
Figure 2.1. Two versions of an odometer and one version of a pedometer are shown .. 15
Figure 2.2. Displays the leveling effect of accelerometer output when reaching certain
speeds ………………………………………………………………………………………………..………..………...….. 17
Figure 3.1. iPod Nano (6th Generation) ..……………………………………………………..…………….... 51
Figure 3.2. Nike+ Midsole Configuration …………………………………………………………………….. 51
Figure 3.3. Nike+ Laces Configuration ………………………..………………………………………...…..... 51
Figure 4.1. Mean (± SE) pace estimated from the Nike+ and actual measured pace …... 60
Figure 4.2. Mean (± SE) distance estimated from the Nike+ and actual measured
distance …………….……………………………………………………………………………………………….………. 61
Figure 4.3. Mean (± SE) energy expenditure (EE) estimated from the Nike+ against actual
measured EE after controlling for body mass ……….…………………..……………………………….. 62
Figure 4.4. Mean difference, calculated bias, and limits of agreement for pace estimated
by the Nike+ and actual pace for the a) laces configuration and b) midsole
configuration …………………………………………………….……………………………………………………….. 63
Figure 4.5. Mean difference, calculated bias, and limits of agreement for distance
estimated by the Nike+ and actual distance for the a) laces configuration and b) midsole
configuration ……………………………………………………………………………….…………………………….. 64

xii
Figure 4.6. Mean difference, calculated bias, and limits of agreement for energy expenditure
(EE) estimated by the Nike+ and actual EE for the a) laces configuration and b) midsole
configuration ……………………………………..………………………………………………………………………. 65

1
Figure 1.1. Nike+ Wireless Sport Kit components
Chapter 1
INTRODUCTION
1.1 Objective Measures
With a prevailing obesity epidemic in the United States, measures have been taken to
improve the current health status of Americans. Specifically, objective measures to assess
physical activity. Increasingly popular devices such as accelerometers and pedometers have
helped the average individual meet established physical activity guidelines. According to
The American College of Sport Medicine (2010), significant health benefits can be obtained
by including a moderate amount of physical activity on most, if not all, days of the week.
1.2 Nike+ Wireless Sport Kit
Fitness giant, Nike, and technology giant, Apple, have
fashioned a device called the Nike+ Wireless Sport Kit (Figure
1.1). This device enables existing iPod Nano owners to
analyze their run. The Nike+ allows athletes of all skill levels
to observe their pace, distance, and energy expenditure
during walking or running. The product functions on the
principle of accelerometry.

2
Figure 1.2. Components of Transmitter
1.3 Accelerometry (Piezoelectric)
Specifically, the Nike+ uses piezoelectric accelerometry
and wireless engineering to measure changes in
acceleration during dynamic movements (Figure 1.2).
Piezoelectric accelerometry involves changes in electrical
voltage with acceleration (Chen & Bassett, 2005). The
piezoelectric crystal will generate a voltage signal that is
proportional to the applied acceleration, which is then translated into accelerometer counts via
specific algorithms (Chen & Bassett, 2005).
1.4 Sensor Configuration
Nike claims the sensor attains highest accuracy when placed in a Nike+ compatible shoe.
The compatible shoe models were designed to have the accelerometer unit inserted into the
midsole of the shoe (Figure 1.3). This configuration would seem appropriate because vertical
accelerations occur when there is contact between the foot and the ground. However,
competitor companies claim that a Nike+ compatible shoe is not required. In response, these
companies have devised sensor pouches that easily secure to the laces of any shoe (Figure 1.4).
The primary objective of the current study was to validate the accuracy of the Nike+ to estimate
pace (min/km), distance (km) and expenditure (EE) (kcal/min) during treadmill walking and
running, and for two different sensor configurations. The current research had formulated two
specific aims:

3
Figure 1.3. Nike+ midsole configuration
1.5 Specific Aims
Specific Aim 1: To validate the midsole sensor
configuration in a Nike+ compatible shoe by examining
pace, distance, and EE on a motor-driven treadmill at
seven different speeds, with indirect calorimetry (IC)
serving as the criterion measure.
Specific Aim 2: To validate the laces sensor
configuration on the same Nike+ compatible shoe by
examining pace, distance and EE on a motor-driven
treadmill at seven different speeds, with IC serving as
the criterion measure.
1.6 Related Published Findings
There has been one published finding on the Nike+ relating to Specific Aim 1 (Kane,
Simmons, John, Thompson, & Bassett, 2010) and one published finding relating closely to that
of Specific Aim 2 (Conger, Strath, & Bassett, 2005). The current study presented a unique
measurement protocol for the Nike+ which has not yet been introduced in the scientific body of
literature. Introducing a dual-configuration of the sensors provided a new means of using and
understanding the functions of the Nike+ (and perhaps other accelerometric devices).
Figure 1.4. Nike+ laces configuration

4
1.7 Study Overview
Eighteen volunteers (9 male, 9 female) between the ages of 18 and 45 years completed one
validation trial. Each participant completed a 10-minute stage of walking or running at seven
different speeds. The trial investigated the validity of the two sensor configurations for
estimating pace, distance, and EE during level walking and running on a motor-driven treadmill.
Metabolic values were measured by a COSMED K4 b2 portable metabolic measurement system
(COSMED, Italy).
It was hypothesized that the preferred midsole configuration would overestimate speed at
53.6 m/min (2 mph), underestimate speed at 107.2 m/min (4 mph), and accurately estimate
speed at 80.4 (3 mph), 134.0 (5 mph), 160.8 (6 mph), 187.6 (7 mph), and 214.0 m/min (8 mph).
The laces sensor configuration will overestimate speed at 53.6, 80.4, and 107.2 m/min,
underestimate speed at 187.6 and 214.0 m/min, and accurately measure speed at 134.0 and
160.8 m/min.

5
Chapter 2
LITERATURE REVIEW
2.1 Physical Activity Overview
The current proposal utilized an accelerometric device to measure physical activity (energy
expenditure) with Newton’s 2nd Law of motion serving as a platform for research initiation.
When using such devices, the main goal is to assess movements of the body in order to
successfully quantify measures of physical activity. It is important to mention that physical
activity and energy expenditure are not equal (Tudor-Locke, Williams, Reis, & Pluto, 2002). The
intensity of the movement has to be considered a meaningful aspect of physical activity (e.g.
walking vs. brisk walking). Most researchers agree on the validity of the assumption that
dynamic activities such as walking and running are the major contributors to physical activity in
normal daily life (Meijer et al., 1991).
Physical activity has been examined to understand the defining features of human
movement and the relationship of physical activity to diseases (Chen & Bassett, 2005). Accuracy
in quantifying physical activity is a crucial requirement when exploring factors that cause
disease. A high degree of accuracy will also help obtain statistics on the number of Americans
meeting exercise guidelines (Bassett et al., 2000).
Numerous methods have been used to measure physical activity in both short and long
term studies. These methods vary in their applicability, which is evident in epidemiological
research, intervention studies, clinical practice, and personal assessment (Chen & Bassett,
2005). Despite the array of physical activity assessments, a major limitation is the availability of
an objective, non-obtrusive method that accurately quantifies a wide range of activities.

6
Technological advancements have generated an increased interest in objective monitoring of
physical activity using body-stationed sensors (i.e. accelerometers and pedometers) (Le
Masurier & Tudor-Locke, 2003).
2.2 History of Energy Expenditure: Then and Now (special reference to IC and DLW)
2.2.1 History. The first recorded study of animal respiration occurred in the 1600’s. Robert
Boyle first noticed that mice sealed in bell jars expired at the same time as a burning flame
extinguished (Speakman, 1998). In 1668, John Mayrow observed that mice died when provided
with only one-fourteenth of the total air in a bell jar. Mayrow established the idea that the
ambient air consists of different parts; only some parts are usable for the process of respiration.
Mayrow constructed a chamber which could quantify the usable portion of air. This chamber
was the first recorded respirometer (Speakman, 1998).
Approximately a century later, in 1757, Joseph Black discovered carbon dioxide (CO2) and in
1774, Joseph Priestly discovered Oxygen (O2) (Speakman, 1998). Two French chemists (Antoine
Lavoisier and Armand Séguin), during the same period as Black and Priestly, found that larger
individuals consume more O2 than smaller individuals, and individuals at rest consume less O2
than those in movement. Additionally, Lavoisier and Séguin found that after consuming a meal,
O2 consumption was elevated even during rest. Lavoisier and Séguin’s findings led to their
benchmark creation of indirect calorimetry for measuring energy expenditure (Speakman,
1998).
By the end of the 18th century, chambers were becoming more sophisticated. Sealed
chambers were being replaced with open flow chambers. No longer would animals and/or
humans have to die to provide measurements for science. This was a huge leap towards

7
success, but no matter how well-designed chamber systems become, because of the limited
space of the chamber, accurate measurements of complex activities during free-living is limited
(Speakman, 1998). The inadequacies of traditional calorimetry have led to many attempts to
create methods associated with free-living activities (Speakman, 1998). For example, the
development of the Doubly Labeled Water (DLW) method has brought promising results in
estimating energy expenditure during periods lasting from 4-20 days (Ainslie, Reilly, &
Westerterp, 2003; Speakman, 1998). Additionally, indirect calorimetry has also become a
prominent method, with its ability to conduct real-time measurement of physical activity
(Campbell, Crocker, & McKenzie, 2002).
2.2.2 Doubly Labeled Water. During the late 1920’s and 1930’s, rare naturally occurring
isotopes of O2 and hydrogen were discovered. These isotopes were ideal tracers for the
behavior of O2 and hydrogen (Speakman, 1998). Lifson, Gordon, Visscher, and Nier (1949)
attempted to locate the source of O2 in respiratory CO2. Lifson and colleagues (1949) worked
with laboratory mice by performing two actions: injecting the mice with stable isotopes of O2 in
water, or forcing them to breathe O2-enriched air. The authors found that O2 in both body
water and in respiratory CO2 were completely equilibrated. In 1955, the DLW method was a
success (Lifson, Gordon, & McClintock, 1955).
Human testing with the DLW method was greatly delayed for two reasons: cost and the
current knowledge of energy balance disorders of the western hemisphere. To implement the
DLW technique in 1973 on a 70-kg individual would have cost approximately $50,000. By 1980,
the cost had declined to approximately $2,000 for a 70-kg individual (Speakman, 1998). The

8
first DLW measurement was performed on a human in 1980. During the 1990’s, the DLW
technique was used in approximately 70-90 publications per year (Speakman, 1998).
In the DLW method, Oxygen (18O isotope) and Hydrogen turnover are determined by two
items: flow of body water and CO2 production. Oxygen is determined by both, and Hydrogen
(2H isotope) is only determined by water flow. The difference between turnovers of 18O and 2H
would provide a measure of O2 consumption and CO2 production, thus indirectly yielding
energy expenditure (Speakman, 1998). Specifically, as energy is expended, CO2 and water are
produced. Carbon Dioxide is lost from the body by breathing, and water is lost in several forms
(breath, urine, and sweat). The 18O isotope is lost more rapidly from the body than 2H because
18O is dominated by both water and CO2. The difference between the removal rates of both
isotopes determines CO2 production. The determination of CO2 ultimately estimates EE (Ainslie
et al., 2003). For measurement periods lasting from 4-20 days, EE should ideally be measured
with the DLW method (Ainslie et al., 2003). The DLW method is currently considered the “gold
standard” for measuring gross EE (Speakman, 1998; Bassett, 2000; Ainslie et al., 2003;
Westerterp, 2009).
2.2.3 Indirect Calorimetry. Séguin and his mentor Lavoisier, both French chemists, were the
front runners in experimenting with O2 and energy expenditure. In 1777, Lavoisier used balance
scales to explain what other frontrunners in respiratory chemistry and exercise metabolism
could not: that an animal in a closed chamber consumed O2 and produced CO2 (Katch, McArdle,
& Katch, 1998).
Lavoisier had also teamed up with Pierre Simon de Laplace (French mathematician) in 1780
to discuss problems in respiration chemistry. Their experiments included respiration trials with
9
guinea pigs using an ice calorimeter. The main purpose of the experiments was to compare the
amount of heat in charcoal combustion with the body heat given off by a guinea pig during a
time interval. Lavoisier and Laplace concluded that the amount of heat and CO2 given off by the
guinea pig during respiration equaled that produced by the burning of charcoal (Rappaport,
1963). Therefore, Lavosier created his new theory that respiration was merely a slow
combustion process occurring in the lungs (Rappaport, 1963).
Additionally, during the guinea pig experiments, both scientists quantified the O2 consumed
and CO2 produced by metabolism (Holmes, 1985; Katch et al., 1998). Lavoisier linked two
essential components of physiology: external respiration and internal combustion. He
concluded that oxidative processes were affected not only by food intake, but also by
temperature and mechanical work (Katch et al., 1998).
In 1837, the German physiologist Heinrich Gustave Magnus argued Lavoisier’s theory on
external respiration and its connection with internal combustion within the lungs. Magnus
claimed that combustion must occur throughout the entire body, not only in the lungs (Katch et
al., 1998). It came to the attention of the scientific community that external respiration was
involved with the exchange of gaseous materials throughout the whole body and that oxidation
did not occur only in the lungs (Williams, 1908).
Experimentation dealing with the measurement of heat was minimal prior to the mid-
nineteenth century. This can be attributed to two reasons: heat was a vague concept that was
not well understood, and that the proper equipment remained unavailable (JRank Science &
Philosophy, 2010). Not until approximately the mid-nineteenth century, was the concept of
heat as an energy form clear. Comprehending the concept of heat was aided by individuals such

10
as James Boyle and others (JRank Science & Philosophy, 2010). In 1860, Pierre Eugène Berthelot
created the first bomb calorimeter (JRank Science & Philosophy, 2010). During the turn of the
20th century, the first modern respiration calorimeter surfaced (Atwater & Rosa, 1899).
During the 1960’s and 1970’s, technical innovations in indirect calorimetry surfaced.
Electronic devices such as gas analyzers and different forms of flowmeters were produced that
could be linked with a portable computer to create an automated analysis system (Macfarlane,
2001). Prior to the development of the automated system, the traditional method of indirect
calorimetry was the ‘Douglas bag’ method (Douglas, 1911). Presently, there are three types of
indirect calorimetry systems. They are classified as laboratory-based, semi-portable or fully
portable (Macfarlane, 2001).
In summary, expenditure experimentation has existed for over 400 years. The first recorded
animal respiration study in the early 1600’s served as a basis for energy expenditure research.
During turn of the 20th century, calorimetry had begun to receive attention due to new devices
that could measure respiration and quantify energy expenditure. The development of the
automated metabolic measurement system alleviates many inconveniences previously related
with conducting energy expenditure research. In present day, the two primary methods for
measuring EE are the “gold standard” DLW method and the popular indirect calorimetry
method. Doubly-labeled water and indirect calorimetry are the benchmark methods for
quantifying human energy expenditure today (Speakman, 1998; Yang & Hsu, 2010).
2.3 Accelerometry and Pedometry
2.3.1 Accelerometers. The measurement of acceleration operates under the principles of
Hooke’s Law and Newton’s 2nd Law of motion (Kavanagh & Menz, 2008). Accelerometers are

11
devices that measure body movements in terms of linear acceleration, which can estimate the
intensity of physical activity over time (Chen & Bassett, 2005). These devices can also sense
angular motion about one or several axes with the use of a gyroscope (Yang & Hsu, 2010).
Accelerometers not only measure the intensity of movement, but the amount of movement
(Ainslie et al., 2003). To reflect accurate energy costs, acceleration is preferred over speed. This
is because acceleration is proportional to the net external force applied. Accelerations can
generate a raw signal that can be processed later (digitally) into speed and distance with
respect to time (Chen & Bassett, 2005).
Traditionally, pedometers have been used to assess free-living physical activity in the
general population as simple step counters; however, accelerometer-based activity monitors
have become a popular alternative. The ability of accelerometers to estimate the intensity of an
activity, and record data continuously for extended periods of time makes them quite
advantageous over pedometers (Godfrey, Conway, Meagher, & ÓLaighin, 2008). Accelerometry
in human movement studies was evident in the 1950’s (Saunders, Inman, & Eberhart, 1953),
but due to the expensive nature of accelerometers, accelerometry studies did not re-surface
until approximately the early 1970’s (Godfrey et al., 2008). Morris (1973) mentioned that
accelerometry had several advantages over traditional kinephotography (Sutherland & Hagy,
1972) and electrogoniometry (Kettelkamp, Johnson, Smidt, Chao, & Walker, 1970). Earlier
studies utilized accelerometers to quantify human movement, but it was not until the 1980’s
that accelerometers were introduced as objective measures of physical activity. They have been
used in the validation of physical activity surveys, as outcome measures in intervention studies,
12
and in research designed to identify attributing factors associated with certain physical activity
behaviors (Matthews, 2005).
The common classes of accelerometers include strain gauge, piezoresistive, capacitive, and
piezoelectric (Kavanagh & Menz, 2008). The basic operating principle of strain gauge
accelerometers is that materials that are conductive to electricity have a strain-resistance
relationship (Window, 1992, p. 3). This relationship is defined as a ratio of the electrical change
in resistance of a certain conductor material to the relative change in length of the conductor.
Strain gauges deform elastically due to inertial forces (Morris, 1973).
Piezoresistive accelerometers sense accelerations from external forces much like
piezoelectric accelerometers. However, piezoresistive accelerometers do not include crystal
components like their piezoelectric counterparts. Piezoresistive devices use a substrate, mostly
a polysilicon seismic mass material whose electrical resistance will change based on the
strength of external applied force. Piezoresistive accelerometers are typically manufactured by
using micromachining technology (Huang et al., 2005; Godfrey et al., 2008).
Capacitive accelerometers function on the change of capacitance (Godfrey et al., 2008).
These accelerometers also include a silicon mass similar to piezoresistive accelerometers, which
is surrounded by several capacitors on each side. As this mass reacts to movement and is
deformed, the capacitors on either side become unbalanced (Godfrey et al., 2008), and create
an electrical voltage signal proportional to the acceleration applied (Kavanagh & Menz, 2008).
2.3.2 Piezoelectric Accelerometry. Piezoelectric accelerometry was the accelerometer class
of interest for the current study. Since the arrival of piezoelectric accelerometry in the 1940’s
and 1950’s, the interest for these devices has increased significantly. Early materials of

13
piezoelectric accelerometers included ferroelectric and nonferroelectric (i.e. quartz), and were
included in a coupled high pass circuit (piezoelectric transducer) (Walter, 1999). During the
early 1950’s, piezoelectric accelerometry was primarily geared towards military operations
(Walter, 1999). Until the 1980’s when accelerometers began to serve as objective measures of
physical activity, pedometers began to include internal accelerometers with a piezoelectric
crystal. Piezoelectric accelerometers are useful because they have high outputs for small
strains, and the potential for a large dynamic range (Chen & Bassett, 2005).
Traditionally, piezoelectric accelerometers had an enclosed horizontal lever beam with a
weight attached. When the accelerometers were introduced to acceleration, the horizontal
beam deformed and applied pressure to a piezoelectric crystal. The applied pressure to the
crystal created an electrical voltage proportional to the acceleration (Bassett, Mahar, Rowe, &
Morrow, 2008). However, the applied acceleration to the crystal may not always produce a
proportional voltage. “Sensor drift” and “leakage” are discussed in the following “Limitations of
Accelerometry and Pedometry (2.4)” section.
Newer integrated sensors have a seismic mass that sits directly above the piezoelectric
element. When the individual begins a movement, the sensor undergoes acceleration, and the
seismic mass deforms the piezoelectric element (Chen & Bassett, 2005). The element works on
the same principle as traditional accelerometry; an electrical voltage is created, and thus, the
sensor generates a variable output voltage signal that is proportional to the applied
acceleration (Chen & Bassett, 2005). These newer integrated sensors can log the raw (analog)
acceleration data; however, the raw acceleration signal must enter an analog-to-digital
converter. The signal will then be filtered and rectified (Chen & Bassett, 2005).
14
Accelerometers can be described in four ways: uniaxial, biaxial, triaxial, or omnidirectional.
If a piezoelectric element is based upon beam configuration, the element will deform upon a
uniaxial plane (i.e. horizontal). A vertical force component will act upon the horizontal plane.
The Actigraph device is an example of a widely used uniaxial accelerometer (Ainslie et al.,
2003). There are currently two models manufactured by Actigraph: GT1M and GT3X. The
Actigraph 7164 had been discontinued and replaced by the GT1M (John, Tyo, & Bassett, 2010).
Biaxial accelerometers record accelerations at two axes. An example of a biaxial accelerometer
is the SenseWear Armband (BodyMedia Inc., Pittsburgh, PA). Triaxial accelerometers sense
accelerations in the vertical, horizontal, and lateral planes (Chen & Bassett, 2005). Widely used
until discontinuation, the triaxial Tritrac R3D has now been replaced by the RT3. An
omnidirectional accelerometer will measure accelerations in every unspecified direction in
space. Presently, the only commercially-available omnidirectional accelerometer is the Actical
(Mini-Mitter Co., Inc. OR, USA). The Actical has a free-moving sensor where it can rotate freely
during movement (Cliff, Reilly, & Okely, 2009). The common classifications of accelerometers
are displayed in Table 2.1 below.
Table 2.1. Classifications of Accelerometers
Type Function Material used
Strain gauge A strain-resistance relationship is defined as a ratio of the electrical change in resistance of a certain conductor material to the relative change in length of the conductor.
metallic
Piezoresistive The electrical resistance of a seismic mass will change based on the strength of external applied force to sense accelerations.
polysilicon
Capacitive A seismic mass will deform when exposed to movement, and two capacitors on both sides of the mass will become unbalanced, thus creating an electrical voltage signal proportional to the acceleration applied.
silicon
Piezoelectric A seismic mass is deformed thus creating an electrical voltage. The sensor then generates a variable output voltage signal that is proportional to the applied acceleration.
quartz

15
2.3.3 Pedometers. The evolution of physical activity monitors has steadily entered into the
commercialized industry (Walter, 1999). However, long before the invention of electronically-
geared devices, Leonardo da Vinci fabricated a simple step counter and odometer for
measuring distances (Laurenza, Taddei, & Zanon, 2006). These devices were believed to help
aid the military, as da Vinci was the engineer for the leader of the mercenary soldiers, Cesare
Borgia (Laurenza et al., 2006). Three drawings from da Vinci detailing his plans for both devices
are shown below (Figure 2.1).
Figure 2.1. Two versions of an odometer and one version of a pedometer are shown (Laurenza et al., 2006).
Traditional models of pedometers consisted of analog interfaces, and now are being phased
out in favor of newer, advanced models, capable of estimating distance traveled and EE, which
is derived from step count information (Crouter, Schneider, Karabulut, & Bassett, 2003). Some
models contain embedded clocks and are capable of storing information for later viewing on
computers (Crouter et al., 2003). Three current classes of pedometers include spring-
suspended, magnetic reed proximity switch, and accelerometer (Crouter et al., 2003).
Spring-suspended pedometers include a spring-suspended horizontal lever arm that moves
up and down in response to vertical movement of the waist. This lever arm will open and close

16
an electrical circuit with each step taken (Crouter et al., 2003). The electrical charge produced is
proportional to the change in velocity (Abel, 2008).
Some pedometers use a glass-enclosed magnetic reed proximity switch (Crouter et al.,
2003) to quantify activity. This class of pedometers also operates on the principle of spring-
suspension. A magnet is attached to the spring-lever arm, and thus, a magnetic field causes two
crossing metallic elements to come in contact yielding a step being recorded (Schneider,
Crouter, & Bassett, 2004).
As previously mentioned in this literature review, the use of piezoelectric crystals and a
horizontal beam have presented functional aspects in the fields of accelerometry and
pedometry. Although most pedometers operate on the spring-suspension principle, many
modern pedometers have incorporated accelerometry into pedometers, by the use of
piezoelectric elements.
Pedometers are best suited for measuring walking and running because they are designed
to primarily detect vertical accelerations (Tudor-Locke et al., 2002). Pedometers are different
from accelerometers in the fact that they are not designed to record and/or discriminate
between pattern, intensity, and type of activity (Tudor-Locke et al., 2002). Pedometers remain
similar to uniaxial accelerometers in that both measure movement in the vertical plane
(Freedson & Miller, 2000). Pedometer output has increasingly become representative of
accelerometer measurements when the output is expressed as raw data (i.e. steps per day vs.
distance or counts vs. EE) (Tudor-Locke & Myers, 2001). Table 2.2 below displays the different
classifications of pedometers available.

17
Table 2.2. Classifications of Pedometers
Type Function
Spring-suspended Includes a spring-suspended horizontal lever arm that moves up and down in response to vertical movement of the waist. This lever arm will open and close an electrical circuit with each step taken. The electrical charge produced is proportional to the change in velocity.
Magnetic reed proximity switch Operates on the principle of spring-suspension. A magnet is attached to the spring-lever arm, and thus, a magnetic field causes two crossing metallic elements to come in contact yielding a step being recorded.
Accelerometer Most pedometers utilizing accelerometry incorporate piezoelectric elements to detect vertical accelerations.
2.4 Limitations of Accelerometry and Pedometry
The majority of popular pedometers and accelerometers tend to be less accurate in
predicting EE and differentiating between intensities at higher running speeds (Conger et al.,
2005). Specifically, many devices tend to underestimate EE during higher running speeds.
According to John et al. (2010), accelerometers tend to produce a leveling effect where activity
counts reach a peak at higher speeds (Figure 2.2).
Figure 2.2. Displays the leveling effect of accelerometer output when reaching certain speeds (John et al., 2010).

18
Brage, Wedderkopp, Franks, Andersen, and Froberg (2003) re-examined the CSA activity
monitor and found it unable to discriminate between running speeds of 9.0 km∙h-1 and 15 km∙h-
1. Haymes and Byrnes (1993) examined the Caltrac activity monitor and also found it to be
unable to discriminate between high running speeds (8.0 – 12.8 km∙h-1).
The GT1M Actigraph accelerometer increasingly underestimates activity as speed increases
because counts plateau at higher speeds (Rowlands, Stone, & Eston, 2007). Abel et al. (2008)
also found the Actigraph GT1M to underestimate EE during treadmill running at 6 and 7 mph.
The dual-axis SenseWear Pro2 Armband (BodyMedia, Inc.) accurately measured EE across
normal, slower walking speeds in a group of adolescent children, but as speed increased, there
was a tendency to underestimate EE (Arvidsson, Slinde, & Larsson, 2009).
According to Galvani, Andreoletti, Besi, and Faina (2007), the Actiheart (Cambridge
Neurotechnology, UK) provided reliable estimates of EE during daily-living low-intensity
activities, but tended to underestimate EE during moderate and vigorous exercise; the
SenseWear Pro2 Armband (BodyMedia, USA) produced a smaller underestimation error during
moderate and vigorous exercise than the Actiheart. However, in a laboratory setting including
treadmill walking and running, the Actiheart consistently underestimated EE at 2, 4, and 6 mph;
thus exhibiting that an activity monitor can underestimate counts at slower speeds as well
(Kang et al., 2007). King, Torres, Potter, Brooks, and Coleman (2004) compared five activity
monitors against indirect calorimetry (CSA, Tritrac-R3D, RT3, SenseWear Armband, and
Biotrainer-Pro) and generally found all monitors to overestimate EE at most speeds. The CSA
and SenseWear Armband exhibited the best estimate of total EE at 2 and 3 mph, the
SenseWear Armband provided the best estimates of total EE at 4, 5, and 6 mph, and the

19
TriTrac-R3D provided the best estimate of total EE at 7 and 8 mph. The RT3 provided similar
trends to that of the TriTrac-R3D, but showed lower correlations. Finally, the Biotrainer-Pro
provided poor estimates of EE at most speeds. Overall, the SenseWear Armband was the best
indicator of total EE at most speeds.
There has been one published finding on the Nike+ (Kane et al., 2010), and one published
finding relating to an accelerometer affixed to the laces of a shoe (Conger et al., 2005) closely in
relation to the Specific Aims of the current study. Kane et al. (2010) found that the Nike+
overestimated the speed of level treadmill walking at 55.0 m/min by 20% and underestimated
the speed at 107.0 m/min by 12%. The device accurately estimated speed at 82.0 m/min and at
all level running speeds. Estimates for distance were similar to that of speed. The Nike+
overestimated walking EE by 18-37%; however, it closely estimated running EE. One limitation
of the previously mentioned study is that the authors only collected data inside a laboratory on
a motor-driven treadmill. Further research should consider the device’s capability in an outdoor
environment simulating real-life conditions.
Conger et al. (2005) examined the FitSense FS-1 Speedometer (Wellesley Hills, MA, USA) for
estimating distance, speed, and EE indoors and on an outdoor 400-m track; similar to the
methodology and device placement of the current Nike+ validation study. The FitSense
conveniently attaches to the shoe laces. Overall findings showed that the FitSense
overestimated speed during treadmill walking at 8.0 km∙h-1 and underestimated EE at two
walking speeds (6.4 and 8.0 km∙h-1). No significant differences were observed for speed or EE
predictions while running at any speed. Regarding distance, the FitSense underestimated

20
running distance during track tests. In addition, the FitSense overestimated speed and
underestimated EE in the transition between walking and running.
It is important to note that accelerometers are not capable of quantifying differences
between terrains and/or hills. Montoye et al. (1983) mentioned that, although there is an
increase in VO2 with an increase in grade, traditionally, accelerometers cannot reflect this
change in energy expenditure at various inclines during walking/running. Specifically, at various
inclines there is no linear relationship between the vector magnitude and energy expenditure
(Terrier, Aminian, & Schutz, 2001). Kavouras, Sarras, Tsekouras, and Sidossis (2008) found the
RT3 accelerometer to significantly underestimate activity counts during treadmill walking at 4.0
and 6.0 km∙h-1 at 6% grade.
A major limitation of most piezoelectric accelerometers is that they can only detect dynamic
events. The phenomenon is called “leakage” (Chen & Bassett, 2005). During a static event there
is an initial output signal, but the signal will gradually decay over time. This time decay will
ultimately depend on the piezoelectric material or the time constant. The time constant is
based on two items within the device: capacitance and resistance (Togawa, Tamura, & Öberg,
1997). “Leakage” can cause an internal amplifier to “drift” into negative or positive saturation
depending on temperature change (Gautschi, 2002). The type of input device for the Nike+
amplifier was unknown, as well as what range was selected for the amplifier. This prevented
any further knowledge on observing sensor/voltage drift.
The pedometer is accurate for measuring steps while walking at a self-selected pace;
however, pedometers are limited in the way that they can only accurately measure distance for
one preset stride length (Bassett, Ainsworth, & Leggett, 1996). Several pedometers allow the

21
user to input stride length, which then provides reasonable estimates of distance during normal
walking speeds. However, pedometers tend to overestimate distance at slower speeds and
underestimate distance at fast speeds. This is predominantly due to variations in stride length
(Bassett et al., 2008). Upper-body movements appear not to be considered in traditional canti-
lever beam pedometers. Potentially, pedometers that include an internal accelerometer,
should consider multiple attachment sites along with a relative algorithm (to include the
movement produced by the arms). The studies reviewed in this section have been summarized
in Table 2.3.

22
Table 2.3. Limitations to Accelerometry and Pedometry
Author Year Population Device name Manufacturer Type Measurements Conclusions Notes
Rowlands et al. Abel et al.
2007 2008
10 male trained short and middle-distance runners
Actigraph GT1M Actigraph LLC, (Pensacola, FL, USA)
Uniaxial Activity counts, step counts, energy expenditure, sleep quality
Increasing underestimation of activity as speed increases, and counts plateau at higher speeds.
Replaced the Actigraph Model 7164
Galvani et al. 2007 8 physically-active females
Actiheart Cambridge Neurotechnology, (United Kingdom)
N/A Heart rate, inter-beat-interval, caloric expenditure
Provided reliable estimates of EE during daily-living low-intensity activities, but tended to underestimate EE during moderate and vigorous exercise.
Digitizes the ECG signal and determines the IBI from the R-to-R interval. Caloric expenditure is found by combining heart rate and activity through an algorithm.
Haymes & Byrnes 1993 10 females and 10 males who were moderately to well- trained.
Caltrac Muscle Dynamics Fitness Network (Torrance, CA, USA)
Uniaxial Activity counts, energy expenditure
Unable to discriminate between high running speeds (8.0 – 12.8 km∙h-1).
One of the front runners in early accelerometry research.
Brage et al. 2003 15 children (9-11 years) Computer Science
and Applications, Inc. (CSA) activity monitor
Computer Science and
Applications, Inc., (USA)
Uniaxial Energy expenditure,
Step counts, Activity counts
Unable to discriminate between
running speeds of 9.0 km∙h-1 and above.
Company bought out by
Actigraph, and thus, the following new model was the Actigraph 7164.
Conger et al. 2005 15 men, 9 women; moderately-active; age 18-45
FitSense FS-1 Speedometer
FitSense, Inc. (Wellesley Hills, MA, USA)
Uniaxial Distance, pace, speed, heart, caloric expenditure
Overestimated speed during treadmill walking at 8.0 km∙h-1 and underestimated EE at two walking speeds (6.4 and 8.0 km∙h-1).
Underestimated running distance during track tests.
Device attaches to the shoe laces. Detects accelerations in the horizontal plane.
Kane et al. 2010 11 males, 9 females recreational or competitive runners who ran at least three
times per week for 30 min or more per session.
Nike+ Sport Kit Nike, Inc. (Beaverton, OR, USA)
Triaxial Energy expenditure, distance, and speed
Overestimated the speed of level treadmill walking at 55 m∙min-1 by 20% and underestimated the speed at 107 m∙min-1 by 12%. Accurately
estimated speed at 82 m∙min-1 and at all level running speeds. The Nike+ overestimated walking EE by 18-37%; however, it closely estimated running EE.
Compatible with all iPod Nano generations, the iPod touch (2nd, 3rd, and 4th generations), and the
iPhone 3GS.
Kavouras et al. 2008 29 boys, 13 girls
recreationally-active children; age 10-14 years.
RT3 - Triaxial
Research Tracker
Stayhealthy Inc.,
Monrovia, CA
Triaxial Activity counts,
vector magnitude, energy expenditure
Underestimates activity counts during
treadmill walking at 4.0 and 6.0 km∙h-1 at 6% grade.
Previously the TriTrac R3D
Arvidsson et al. 2009 14 children; age 11-13 years
Sensewear Pro2 Armband
Bodymedia Inc., Pittsburgh, PA
Biaxial Energy expenditure, METs, step count, and sleep duration
Accurately measured EE across normal, slower walking speeds, but as speed increased, there was a
tendency to underestimate EE. *Speed was self-determined by participant.
Device capable of measuring skin temperature, heat flux,
and galvanic skin response.

23
2.5 Accelerometry and Placement
An important research question entails the proper location of activity-based monitors.
Where on the human body should the device be stationed to attain the most accurate estimate
of energy expenditure? It seems plausible that the accelerometer should be placed upon the
trunk of the body, near the center of gravity. The rationale is that the trunk represents the
highest percentage of body mass (Meijer et al., 1991; Yang & Hsu, 2010). It is important to note
that the trunk also represents substantial surface area, and there are anatomical locations that
may be appropriate. For whole-body movements, it would seem more appropriate to place a
sensor close to the center of mass (Meijer et al., 1991; Bouten, Koekkoek, Verduin, Kodde, &
Janssen, 1997).
However, it can be argued that placing physical activity monitors upon appendages seems
more appropriate. LaPorte et al. (1979) and Godfrey et al. (2008) suggest that accelerometers
should be attached to the parts of the body that produce the most activity (i.e. attaching
accelerometers to the ankle or shin for measuring walking and/or running accelerations).
Logically, this approach does seem acceptable because limbs perform the majority of
mechanical work during movements such as walking or running (Meijer et al., 1991). According
to Foster et al. (2005), acceleration signals from an ankle-mounted, dual-axis pedometer highly
correlate with various intensities during walking and running.
An argument against positioning physical activity monitors on appendages is due to the
asymmetrical nature of muscle mass within the dominant and non-dominant leg. This can
directly alter force output measures with different muscle force capabilities between legs
(Herzog, Nigg, Read, & Olsson, 1989). When attaching the device on the back or waist, the

24
assumption has to be made that these larger areas of the body have the greatest impact on
energy expenditure (Meijer et al., 1991). However, if a monitor is located at the waist, then it is
not capable of detecting low intensity, sedentary activity involving only arm movement; or
activity that has minimal acceleration at the waist (i.e. cycling). Bouten, Sauren, Verduin, &
Janssen (1997) reported that the lower back was the most efficient location for EE predictions
because of the close proximity to the center of gravity. Specifically, Moe-Nilssen (1998) placed a
triaxial accelerometer on the L3 vertebrae and found this location to closely reflect true lower
trunk accelerations. However, this location can be somewhat uncomfortable and obtrusive. The
lower region of the back tends to have low rotation of the transverse plane (Kavanagh & Menz,
2008).
Without regard for proper location, the accelerometer should be properly affixed to the
location to reduce rotational motion (Kavanagh & Menz, 2008), vibration, or movement upon
the skin (Bouten et al., 1997). Additionally, a properly-used algorithm is also an important
component of placement. For example, specific algorithms can help identify positions such as
standing erect and/or lying down. This can potentially help distinguish between times of
sleeping, sedentary behavior, and physical activity (Choi, Lui, Matthews, & Buchowski, 2010).
The tilt angle of the pedometer or accelerometer may also influence the recorded values.
Abel (2008) observed the influence of pedometer tilt angle on pedometer counts and
concluded that tilt angles 36.5° or greater decreased electronic pedometers’ (spring-levered)
accuracy, where piezoelectric pedometers were not affected by various tilt angles. Crouter,
Schneider, and Bassett (2005) confirmed these results reporting that spring-levered, electronic
pedometers were affected at tilt angles 15° or greater, whereas piezoelectric pedometers were

25
not affected by tilt. Conversely, Duncan, Schofield, Duncan, and Hinckson (2007) reported that
piezoelectric accelerometer-based pedometers were also affected by tilt angle. The specific
studies reviewed in this section have been summarized in Table 2.4.

26
Table 2.4. Accelerometry and Monitor Placement
Author Year Population Device Manufacturer Type Device
Measurements Conclusions
Foster et al. 2005 Healthy subjects (10 lean, 10 obese)
StepWatch Cyma Corporation (Seattle, WA, USA)
Biaxial Step counts Acceleration signals from the ankle-mounted, dual-axis pedometer highly correlated with various intensities during walking and running, against manual counting (r = 0.9995).
Moe-Nilssen 1998 8 normal, healthy subjects (male and female)
Triaxial piezoresistant accelerometer
Logger Technology HB (Malmö, Sweden)
Triaxial Acceleration vectors; estimates tilt angles
Placing a triaxial accelerometer on the L3 vertabrae closely reflected true lower trunk accelerations.
Abel 2008 No human subjects; authors used an isokinetic dynamometer with 16 horizontal-lever and 16 piezoelectric pedometers.
Horizontal-lever and piezoelectric pedometers
Not reported Not
reported Not reported
Tilt angles 36.5° or greater decreased electronic pedometers’ (spring-levered) accuracy, where piezoelectric pedometers were not affected by various tilt angles.
Crouter et al. 2005 20 men, 20 women; Age 18-70 years
New Lifestyles NL-2000 & Digiwalker SW-200
New Lifestyles, Inc. (Lees Summit, MO, USA) & Yamasa Tokei Keiki Co., LTD
Uniaxial (NL) and spring-levered
(DW)
Energy expenditure and step counts (NL); step counts (DW)
Spring-levered, electronic pedometers were affected when exposed to 15° or greater tilt angles. Piezoelectric pedometers were not affected by tilt.
Duncan et al. 2007 43 boys, 42 girls; age 5-11
New Lifestyles NL-2000
New Lifestyles, Inc. (Lees Summit, MO, USA)
Uniaxial Energy expenditure and step counts
The New Lifestyles NL-2000 piezoelectric accelerometer-based pedometer is affected by tilt angle during slow, moderate, and fast walking speeds (r = -0.298; p = .009; r = 0.258; p = 0.025, and r = -0.010; p = .935, respectively).

27
Posture recognition is another issue of discussion. Accelerometers can also distinguish
between postures by placing a single accelerometer at the waist or torso. However, a single-
accelerometer approach may be more difficult than a multi-accelerometer approach in
distinguishing between sitting and standing because both postures are upright (Karatonis,
Narayanan, Mathie, Lovell, & Cellar, 2006). Therefore, multiple accelerometers should be
utilized at different locations to observe orientations of certain body parts.
The Nike+ was designed to be located in the midsole of the shoe or attached to the
shoelaces. Therefore, the placement of the Nike+ is dictated by the manufacturer thereby
eliminating concerns of monitor placement for this study. However, it is important to mention
that manufacturer guidelines are not always void of limitations. The midsole sensor
configuration can not necessarily “fit the mold” for the differences in foot arches. Plus, this
sensor location might be susceptible to producing inconsistent data based on different running
styles or foot strikes.
2.6 Determination of Accelerometer Counts
One primary challenge in examining the accelerometer’s capabilities is to determine the
relationship between the raw accelerometer output and actual physical activity levels (Welk,
2005). Accelerometer data is commonly expressed as counts (Chen & Bassett, 2005; Godfrey et
al., 2008). These counts cannot be interpreted unless they are translated into quantitative
estimates (Troiano, 2006). Two available approaches assist with translating accelerometer
counts: linear and non-linear regression (Chen & Bassett, 2005). Most validation studies utilize
the linear approach to find a correlation between EE of an activity monitor and indirect
calorimetry (Chen & Bassett, 2005; Troiano, 2006). This occurs by implementing regression

28
methods to observe a relationship between two variables and by formulating prediction
equations (algorithms) to estimate EE from accelerometer output (Troiano, 2006). All current
regression approaches average the accelerometer counts over a certain user-specified time
interval (Lyden, Kozey, Staudenmeyer, & Freedson, 2010)
Prediction equations have been used extensively to improve estimates of EE in
accelerometer output. Lyden et al. (2010) reviewed nine published prediction models (1998-
2006) for adult populations and found them to often underestimate EE; specifically a higher
underestimation for daily-living activities than treadmill activities. One challenge with
predicting EE is that of improving classification for a wide range of intensities. Specifically, it
appears that high-intensity activities need utmost attention due to often being misclassified.
Lyden et al. (2010) present four limitations in translating accelerometer output to
meaningful physiological data. First, there is an assumed rigid relationship between counts and
EE when using linear regression. Second, many models are not sensitive enough to classify
sedentary activities from low-intensity activities. Third, there is an inadequate translation of
non-linear regression models. Lastly, the reliance of one accelerometer signal processed
averaged over a certain time interval may require closer attention.
A recent study conducted by Choi et al. (2010) validated a commonly-used algorithm for
Actigraph and modified the algorithm to decrease non-wear time misclassification. This is an
important issue due to the fact that length of wear time serves as the foundation for evaluating
time spent at various intensities. The modifications in Choi et al. (2010) included fine-tuning
thresholds and changing time-windows. The authors found that modifying the algorithm can
allow for better predictions of physical and sedentary activity.

29
The literature has substantial research regarding using prediction models to estimate EE
from accelerometer counts. The majority of the prediction models exhibit a tendency to
underestimate EE and misclassify activity intensity across all ranges (Lyden et al., 2010). In its
entirety, the process of translating accelerometer counts includes several crucial components:
sampling frequencies, digitizing raw data, selecting thresholds, and implementing algorithms
(Chen & Bassett, 2005).
Predicting activity occurs by measuring defined lengths, or segments, in a raw acceleration
signal. Each segment is composed of several data points, which are determined by the raw
signal’s sampling frequency and the time length of the segment. The number of data points
depends on the length of the actual segment (Bonomi, Goris, Yin, & Westerterp, 2009).
The raw signal can have either a positive or negative voltage. After filtering a voltage signal,
it is sampled at a certain pre-determined frequency (Hz) by the device. Sampling enables the
raw signal to be converted into a digital signal. Several items determine the amplitude of the
digital signal: the analog voltage signal, the degree of amplification, and an analog-to-digital
factor (Chen & Bassett, 2005).
After digitization, three approaches can be used to provide interpretation of the signals.
These include: a) a digital counting method that finds the number of times a signal crosses a
threshold, b) an algorithm method that finds maximum values during certain time periods, or
epochs to represent an activity count, and c) an integration algorithm method that sums and
averages raw activity counts during certain time periods.
In the last decade, accelerometer sensors have been used to identify human movements by
using classification algorithms (Bonomi et al., 2009). There are four commonly used algorithms
30
for classifying physical activity (Bonomi et al., 2009): decision trees (Bao & Intille, 2004), neural
networks (Zhang, Werner, Sun, Pi-Sunyer, & Boozer, 2003), Bayesian classifiers (Kern, Schiele, &
Schmidt, 2003; Allen, Ambikairajah, & Lovell, 2006), and hidden Markov models (Pober,
Staudenmayer, Raphael, & Freedson, 2006; Mannini & Sabatini, 2010). These algorithms
identify activity types by utilizing components of the acceleration signal. In addition, these
algorithms were created to also try and discriminate between activities.
Most commercially-available devices are provided with built-in calibration equations or
specific algorithms. Many companies have proprietary rights to their equations and algorithms
making it difficult for independent researchers to identify deviations in measurements. Many
units available to the public often undergo factory calibration, but quantifying the reliability of
such instruments has become extremely important as accelerometers are increasingly being
used for surveillance and large clinical testing (Welk, 2005).
2.7 Accelerometry and Sex
According to the literature, objective measures indicate sex differences in physical activity
(Davis & Fox, 2007) with males being more active among children (Trost et al., 2002; Rowlands
& Eston, 2005; Byrd-Williams, Kelly, Davis, Spruijt-Metz, & Goran, 2007; Troiano et al., 2008),
adolescents (Trost et al., 2002; Troiano et al., 2008), and adults (Troiano et al., 2008; Hawkins et
al., 2009). However, no literature was available observing biomechanical differences between
male and female on accelerometer output. It is postulated that accelerometers are not
sensitive enough to capture differences or deviations in gait patterns.

31
2.8 Accelerometry and Age (Children, Adolescents, Adults, Older Adults) Children are among the most active subset of the United States population, but the high,
intermittent activity produced by this population does not occur for extended periods of time.
Often, children engage in moderate-to-vigorous activity, and then follow with slower bouts
such as walking (Bailey et al., 1995). Additionally, children engage in certain sedentary activities
that supplement mental growth and development. These activities, which are not incorporated
into current physical activity guidelines, can include writing, painting, or drawing. Unlike
watching television, there are no guidelines to limit or stop performing the activities previously
mentioned because they are excellent developmental activities (Cliff et al., 2009).
Accelerometers may serve to help distinguish between a sedentary lifestyle and low-intensity
activities (Cliff et al., 2009) and to help capture unstructured, intermittent physical activity.
Additionally, because children and adolescents have difficulty recalling their activities,
accelerometers and motion sensor devices are becoming frequently used tools to measure
physical activity in young individuals (de Vries, Bakker, Hopman-Rock, Hirasing, & van
Mechelen, 2006).
2.8.1 Infant (< 12 months). Activity in the first six months of life is restricted to movements
such as grabbing, reaching, or turning the head. This often occurs while the infant is on his/her
stomach (Cliff et al., 2009). During the first year of life, motion sensors best suited for infants
may be omnidirectional accelerometers that are affixed to the thigh. These specific devices may
be beneficial in capturing activity during developmental stages of motion such as crawling,
where movement involves less vertical and more multi-directional motion (Cliff et al., 2009). It
is important to note that there have been no studies that explore motion sensor methodologies

32
on infants. However, researchers should account for certain attributes of infant behavior that
may hinder accurate accelerometer output during future studies (Cliff et al., 2009).
Infants frequently take naps, which are deemed as motionless activities (Cliff et al., 2009).
However, napping is considered healthy and necessary, and not a pattern of sedentary behavior
(Dwyer, Baur, & Hardy, 2009). Researchers should account for these periods of napping by
recording activity upon awaking from an overnight sleep. One challenge in recording infant
physical activity is due to the (approximately) 14-hour sleep duration of infants per night
(Iglowstein, Jenni, Molinari, & Largo, 2003). This leaves the researcher with minimal time for
collecting data during the day. Estimates of physical activity in infants may be primarily
influenced by sleeping patterns (Iglowstein et al., 2003).
2.8.2 Young children (1-5 years). The current availability of research on young children is
quite prolific, except for toddlers under three years of age. The absence of evidence in this
population makes creating specific methodologies for accelerometer use unfeasible. According
to Dwyer et al. (2009), pre-school children are developmentally ready to engage in organized
activities, which, in part, can assist researchers with the successful documentation of physical
activity measurements. When using motion sensors with younger children, multi-directional
accelerometers may serve as the most appropriate devices for measuring their activity.
Children tend to engage in short bursts of physical activity, which may be difficult for
researchers to measure.
When regarding accelerometer placement, the hip and back serve as the most common
placement areas. Actical accelerometers were reported to produce similar estimates of physical
activity when compared to VO2 when placed on the hip and back of children (r = 0.86 and r =

33
0.87, respectively) (McIver et al., 2005). Among Actigraph accelerometers, hip and umbilical
placements were correlated (r = 0.95), but activity counts per minute (cpm) were significantly
higher at the umbilicus (Toschke, von Kries, Rosenfeld, & Toschke, 2007).
Accelerometric measurements in younger children should utilize frequent time-sampling
(10-15 s epochs) to allow differentiation between activity intensities (Oliver, Schofield, & Kolt,
2007). However, Reilly et al. (2008) found no differences in estimates of sedentary behavior in
5-6 year olds when using 15, 30, 45, or 60 s epochs; although, they reported significant
differences between epochs for moderate-to-vigorous physical activity (15 s epochs yielded the
highest estimate of moderate-to-vigorous physical activity). According to the literature
reviewed, time-sampling with 15 s epochs is most common because children’s activity levels
tend to be sporadic and intermittent comprising short, intense bouts of activity (Cliff et al.,
2009).
2.8.3 Children & Adolescents (6-19 years). According to the Centers for Disease Control and
Prevention (CDC), adolescent individuals are characterized by an age range of 10-19 years.
However, for the purpose of this content section, children between the ages of 6 and 9 are also
included. Recent data using accelerometry suggest that adolescents have lower overall physical
activity levels than younger children (Troiano et al., 2008). Nyberg, Nordenfelt, Ekelund, and
Marcus (2009) suggest that overall physical activity declines at the age of 6. A recent article
suggested that physical activity levels increase between the ages of 3 and 8 years (Dencker &
Bo Anderson, 2008). A possible reason for the decline in overall physical activity is that older
children may have more scheduled time at school (Nyberg et al., 2009). Accelerometer
validation studies have occurred in children and adults, but studies to classify physical activity in

34
children have only been reported within the last 5-7 years (Reilly et al., 2003; Pfeiffer, McIver,
Dowda, Almeida, & Pate, 2006).
The primary challenge faced with children and adolescents includes accurate “wear-time” of
motion sensors. A study by Crocker, Holowachuk, & Kowalski (2001) showed that “wear-time”
of motion sensors was compromised by various items: forgetting to wear the sensor, physical
discomfort, involvement in aquatic programs, embarrassment among peers, and/or the inability
to wear the sensor during organized sporting events. Nyberg et al. (2009) mentioned that
wearing a wrist-mounted accelerometer could elicit a higher compliance from the individual
than wearing a traditional hip-mounted accelerometer. A 7-day study by Troiano et al. (2008)
observed that approximately 60-62% of a population of 611 adolescents (12-19 years) had wear
times of four or more days. To put into perspective, older adults (> 60 years) were the most
compliant (84%).
Several uniaxial and triaxial accelerometers used in studies for younger children have also
been commonly used in studies for older children and adolescents. The following studies have
observed moderate-to-high correlations between predicted energy expenditure and indirect
calorimetry. According to Rausdepp and Pall (1998) and Allor and Pivarnik (2001), the Caltrac
uniaxial accelerometer exhibits satisfactory intra-instrument reliability (r = 0.69 and r = 0.76,
respectively) in adolescents from 12-18 years of age. Additionally, Sallis, Buono, Roby, Carlson,
and Nelson (1990) found the Caltrac to exhibit a strong correlation (r = 0.82) between predicted
energy expenditure and indirect calorimetry in children and adolescents (8-13 years). The
Actigraph uniaxial accelerometer exhibits satisfactory validity in children and adolescents (8-18
years). Eston, Rowlands, and Ingledew (1998) found a high correlation (r = 0.78) between

35
predicted energy expenditure and indirect calorimetry in children and adolescents 8-11 years of
age when using the Actigraph accelerometer. The results from Trost et al. (1998) also exhibit a
relatively high correlation (r = 0.87) among children and adolescents between 10-14 years of
age when using the Actigraph accelerometer against indirect calorimetry measurements.
Multi-axial accelerometers have also exhibited high correlations between predicted energy
expenditure and indirect calorimetry. Tanaka, Tanaka, Kawahara, and Midorikawa (2007) used a
triaxial accelerometer (ActivTracer, GMS) and found a high correlation (r = 0.93) between
predicted energy expenditure and indirect calorimetry for free-living activities. Puyau, Adolph,
Vohra, Zakeri, and Butte (2004) compared the activity counts produced by the Actical and
Actiwatch with that of EE measured by indirect calorimetry (via respiratory room calorimeter)
and found high correlations (Actiwatch, r = 0.79; Actical, r = 0.83) in adolescent children ages 7
to 18 years.
2.8.4 Adults and Middle-Aged (20 to 44 years & 45 to 64 years). It has been well-
documented that a sedentary lifestyle increases the risk for cardiovascular disease in adult
populations. Current guidelines from the American College of Sports Medicine recommend that
all adults 18 to 65 years of age engage in moderate-intensity activity for a minimum of 30
minutes, 5 days per week, or vigorous activity for a minimum of 20 minutes, 3 days per week
(ACSM, 2010). It has been observed that accelerometer devices can help classify levels of
physical activity and have exhibited promising results in predicting energy expenditure in
adults. According to the available literature, most accelerometer studies analyze routine
physical activity levels in adult populations.

36
Welk, Blair, Wood, Jones, and Thompson (2000) evaluated the measured EE from three
different activity monitors: the CSA (uniaxial), Tritrac-R3D (triaxial), and BioTrainer (uniaxial)
during laboratory and field conditions. The results showed that all monitors underestimated
more static and/or complex activity patterns. As a whole, the correlations between the three
monitors and measured energy expenditure was higher in laboratory treadmill activity (r = 0.86)
than that of field activities (r = 0.55). Correlations among the different monitors were high for
both treadmill activity (r = 0.86) and lifestyle activities (r = 0.70), suggesting that the monitors
are capable of providing similar information. Welk, Almeida, and Morss (2003) found the
Biotrainer and Actitrac to be well correlated (Biotrainer, r = 0.74-0.88; Actitrac, r=0.81-0.91)
with indirect calorimetry during treadmill walking and running. However, the differences in
these monitors may be attributed to the accuracy of the calibration equations, and not the
actual monitors themselves (Welk et al., 2000).
Jakicic et al. (1999) tested the reliability of the Tritrac-R3D to measure energy expenditure
and found the reliability to be higher for walking and running (r = 0.76-0.92) than stepping,
sliding, or cycling (r = 0.54-0.88) in adults. Welk, Schaben, and Morrow (2004) also conducted a
reliability study observing four different activity monitors: Actigraph, BioTrainer Pro, Tritrac-
R3D, and Actical. The correlations between activity monitor counts and raw acceleration output
(G coefficients) ranged from r = 0.62-0.80, showing a moderate-to-high relationship. According
to the literature and previously mentioned studies, accelerometers have exhibited moderate to
high correlations in predicting physical activity.
2.8.5 Older Adults (65 years +). There are several issues that require attention towards
physical activity measurement in older adults, and how they are different from younger adults:

37
intensity and type of activity, basal metabolic rate and fat-free mass reductions, prevalent
chronic disease conditions, and memory and recall problems (Murphy, 2009). These issues may
contribute to errors in predicting energy expenditure in older adults.
Older adults are different than young adults when regarding the type and intensity of the
activities in which older adults engage. Specifically, older adults tend to engage in more lower-
intensity activities, as well as having higher levels of sedentary activity throughout the day
(Westerterp, 2008). This common trend of activity levels can be attributed to several
physiological changes: decreased flexibility, bone loss, muscle mass, and a weakened
cardiovascular system (Skinner, 2006). A reduced basal metabolic rate and an increase in
muscle atrophy become prevalent with increased age. Murphy (2009) attributed these two
issues with errors in calculating energy expenditure because original manufacturer algorithms
tend to be calibrated with younger adult populations.
Chronic conditions such as diabetes or osteoporosis may also affect the amount of physical
activity that older adults achieve. Menz, Lord, St. George, and Fitzpatrick (2004) found older
individuals with diabetic peripheral neuropathy to have reduced gait speeds and a decrease in
step frequency and length, thus affecting activity monitor counts. Lastly, problems with
memory may reduce the effectiveness of activity recall during short-term and/or longitudinal
physical activity studies. A newer generation device called the Actiwatch Spectrum is capable of
distinguishing sedentary activities from not wearing the monitor (Murphy, 2009). This feature
should help alleviate the problem of misclassifying physical activity levels.
Murphy (2009) mentioned the research gap in calibration reliability of accelerometric
devices for older adults. Although calibration issues might be most important in children due to

38
their sporadic movement bouts, a need to observe the activity of older adults exists. This will
ultimately help researchers increase the accuracy of predicting physical activity. Given the
limitations of self-report physical activity questionnaires, accelerometry may be a successful
objective measure for assessing physical activity in older adults.
A factor that can affect motion sensor output in older adults is an altered gait pattern
(Hawkins et al., 2009). Specifically, elderly individuals have gait patterns that are characterized
by a reduced trunk acceleration, walking speed, and step length (Culhane, O’Connor, Lyons, &
Lyons, 2005; Hartmann, Luzi, Murer, de Bie, & Bruin, 2008). These factors can reduce the ability
to recover from dynamic instabilities (McGibbon & Krebs, 2001). Additionally, these factors
being different from younger adults may skew accelerometer output.
An increase in age presents undeniable physiological changes that can reduce the
effectiveness of accelerometers’ measurement capabilities. The changes not only include
physical changes but neurological changes as well. Changes in body composition can directly
affect gait patterns, thus altering the center of mass and affecting accelerometer output. A
future direction should focus on creating age-related calibration equations for older adults
because most devices are calibrated with younger adults.
In summary, accelerometers have been used among a wide variety of different age groups,
and it is these specific age groups that offer unique challenges towards the use of these
devices. Research with infants is often complicated by their long-duration sleeping habits
leaving minimal time for data collection throughout the day. The sporadic, short bursts of
activity among young children (1-5 years) can often complicate data collection for researchers
because the length of activity may not be long enough to record substantial, meaningful data.

39
Older children and adolescents (6-19 years) often forget to wear accelerometric devices for the
entire data collection, thus presenting the challenge of accurate wear-time. Adults and middle-
aged individuals (20-64 years) show the most promising estimations of physical activity with
accelerometers most likely because most accelerometers are calibrated for this age group.
Lastly, older adults present challenges to accelerometer output due to the changes in physical
attributes that come with an increase in age.
2.9 Accelerometry and Body Composition
Overweight or obese individuals have several attributes that may interfere with the proper
use of activity monitors (Jacobi et al., 2007). Overweight and obese individuals have different
walking mechanics than normal weight individuals (Chen, Acra, Donahue, Sun, & Buchowski,
2004). Specifically, Chen et al. (2004) found a decrease in walking efficiency at normal speeds
with an increase in body fat for both males and females. Couple walking efficiency with body
composition attributes, and the problem is two-fold. First, it is expected that a decrease in
walking efficiency among overweight and obese individuals would elicit a higher actual EE.
Secondly, an excess of adipose tissue around the waistline can push against a waist-mounted
activity monitor, deviating it away from the original, fixed vertical alignment (i.e. 0°) and the
excess soft tissue may allow for greater extraneous movement. Repetitive obtrusive
movements from the adipose tissue against the device can hinder accurate estimations of
physical activity. A decrease in walking efficiency will lead to greater actual EE that the activity
monitor is unable to detect; therefore, underestimating EE. Excess adipose tissue can hinder
proper tilt angle, thus leading to an underestimation of EE. However, excess adiposity also leads

40
to a less stable placement of the monitor, thus causing more movement (unnecessary
vibrations), which ultimately leads to an overestimation of EE.
Papazoglou et al. (2006) found that the multi-sensor SenseWear Pro2 (Body Media, Inc.
Pittsburgh, PA) armband generally underestimated resting energy expenditure in obese
populations, and greatly overestimated energy expenditure during exercise when compared
with indirect calorimetry. The obese population requires close monitoring of accelerometer
placement so that the excess of adipose tissue will not interfere with measurement.
Specifically, adiposity interferes with measurement, often producing vibrations against the
device.
Accelerometer and pedometer output is affected by incorrectly placing the device on
overweight or obese individuals. An excess of adipose tissue around the mid-area (for males) or
hips and thighs (for females) may interrupt accurate measurements. Often, pedometers are
placed on a belt strap at the waistline where they are susceptible to being pushed away from
optimal vertical tilt angles by protruding waistlines (Shepherd, Toloza, McClung, & Schmalzried,
1999). The adipose tissue may also reduce the ability for pedometers to detect vertical
movements. This can occur due to unnecessary vibrations or an increase in friction caused by
obtrusive contact.
Shepherd et al. (1999) tested a dual-axis ankle mounted accelerometer to compare error
percentages of step counts in overweight and obese participants. The authors found that BMI
did not affect the dual-axis step activity monitor during brisk and slow walking on an outdoor
track; a finding that would appear to make ankle-mounted accelerometers more suited for
obese populations than a traditional pedometer. A possible reason for observing no effect of

41
BMI on accelerometer output may be due to the pre-determined established algorithms (i.e.
regarding calibration thresholds), or proper placement of the accelerometers (i.e. stationing the
motion sensor closer to, or directly on, a bony landmark) (Swartz, Bassett, Moore, Thompson, &
Strath, 2003).
Foster et al. (2005) compared the accuracy of two-waist mounted pedometers (a
piezoelectric pedometer and a spring-levered pedometer) and an ankle-mounted, dual-axis
accelerometer-based pedometer to count steps in lean and obese populations. The authors
found that the ankle-mounted pedometer accurately measured step count at 1, 2, and 3 mph,
where the waist-mounted pedometers only accurately measured step count at 3 mph for both
lean and obese. There were no differences in the accuracy of measurement between any of the
pedometers within the lean and obese. The main finding was that the dual-axis pedometer
accurately counted steps in both lean and obese individuals at slow velocities that are likely to
be the most relevant for free-living, sedentary individuals (Foster et al., 2005).
Crouter et al. (2005) found that a piezoelectric pedometer tends to be more accurate than a
spring-levered pedometer when counting steps in overweight and obese individuals. This was
especially true during slow walking speeds. The pedometer tilt angle may serve as the most
important factor in spring-levered pedometers for determining accurate step counts. Body
Mass Index and waist circumference may be of minimal importance. On the other hand,
piezoelectric pedometers appear to be minimally affected by the aforementioned variables.
According to the literature, data does not agree with the notion that BMI and waist
circumference has an effect on accelerometric output. However, accelerometer-based devices
would be better suited for obese and overweight individuals than traditional pedometers.

42
Further research is required in pin-pointing definitive factors that control for the effects of BMI
on accelerometer output. The studies reviewed in this section have been summarized in Table
2.5.

43
Table 2.5. Accelerometry and Body Composition
Author Year Population Device name Manufacturer Type Device
Measurements Conclusions
Papazoglou et al.
2006 142 obese individuals (BMI>30) (46.9 yrs); 25 healthy, lean and overweight individuals (18.5< BMI >30)(36.5 yrs)
SenseWear Pro2 Body Media, Inc. (Pittsburgh, PA, USA)
Biaxial Energy expenditure, METs, step count, and sleep duration
Generally underestimated resting energy expenditure in obese populations, and greatly overestimated energy expenditure during exercise when compared with indirect calorimetry
Shepherd et al. 1999 8 men and 21 women) (42.3 years) (Avg BMI: 27.9)
Stepwatch Cyma Corporation (Seatlle, WA, USA)
Biaxial Step counts BMI did not affect the dual-axis step activity monitor during brisk and slow walking on an outdoor track
Foster et al. 2005 20 healthy adults (21-51 yrs); 5 male and 5 female were lean (BMI < 25) and 5 male and 5 female were obese (BMI > 30)
Stepwatch Cyma Corporation (Seattle, WA, USA)
Biaxial Step counts The dual-axis accelerometer-based pedometer could accurately count steps in both lean and obese individuals at slow velocities that are likely to be the most relevant for free-living, sedentary individuals.
Crouter, Schneider, and Bassett Jr.
2005 20 men, 20 women; Ages 18-70 years
New Lifestyles NL-2000
New Lifestyles, Inc. (Lees Summit, MO, USA)
Uniaxial Energy expenditure and step counts
This accelerometer-based piezoelectric pedometer is more accurate than a spring-levered pedometer when counting steps in overweight and obese individuals. This was especially true during slow walking speeds.

44
2.10 Conclusion
The overall review of literature has shed light on the history of, and the current state of
several techniques to measure physical activity: indirect calorimetry, the gold standard doubly-
labeled water (Speakman, 1998; Bassett, 2000; Ainslie et al., 2003; Westerterp, 2009),
accelerometry, and pedometry. However, the current study relates primarily to accelerometry.
The available content is widespread, encompassing many different measurement devices; thus,
leading to a current need to validate recently released products.
It was not until the 1980’s that accelerometers were introduced as objective measures of
physical activity (Matthews, 2005), and have served as reliable and non-invasive techniques in
the present day. The application of accelerometers has not been restricted to assessing physical
activity alone. They also serve as functional devices in gait analysis, balance control, fall
detection and posture recognition research (Murphy, 2009). However, as widespread the
application of accelerometers might be, they do not come without their limitations.
The primary limitation of accelerometric devices was the inability to distinguish inclined
walking or running; specifically, to accurately measure EE on an inclined surface (Montoye et
al., 1983; Terrier et al., 2001; Kavouras et al., 2008). Future research should provide more
insight on devices that include altimeters (i.e. barometer) to sense changes in altitude. This
endeavor could thus help classify intensities during inclined walking.
Additionally, most accelerometers have difficulty with accurately measuring activity counts
at higher running speeds; for example, underestimating true EE (Haymes & Byrnes, 1993; Brage
et al., 2003; Conger et al., 2005; Rowlands et al., 2007; Abel et al., 2008; Arvidsson et al., 2009).
Accelerometers tend to produce a leveling effect where activity counts reach a peak at higher

45
speeds (Rowlands et al., 2007; John et al., 2010). A possible reason for this leveling effect might
be due to the vertical acceleration component of the body diminishing as running speed
increases (Le Masurier & Tudor-Locke, 2003). This could possibly be mediated by using new
calibration thresholds to manage the sensitivity of the device to record counts. Furthermore,
prediction equations should be developed in order to explain the full spectrum of physical
activity intensities.
The majority of the available research involving accelerometry has included adult
participants, and less research on infants, toddlers, and older adults. Research with adolescents
has been substantial. It has been noticed that with extreme young and old participants, issues
dealing with mental and physical attributes present unique challenges in accelerometry
research endeavors. An early developmental characteristic of infants, such as sleeping for an
average of 14 hours per day may make it difficult for researchers to measure meaningful daily
activity levels of infants (Iglowstein et al., 2003). A weakened musculoskeletal system (Skinner,
2006) and/or a diminished memory capacity (Murphy, 2009) may complicate the assessment of
physical activity in older adults which, is further confounded because most available objective
assessment tools were developed from young adult populations.
Another topic reviewed was the effect of body composition on accelerometer output.
According to the literature, overweight and/or obese individuals ultimately do not skew
accelerometer output (Shepherd et al., 1999; Crouter et al., 2005; Foster et al., 2005).
Accelerometer output appears to be skewed when there is no precaution in stationing the
activity monitor to the participant. Often, the higher content of adipose tissue on the individual
can push against the activity monitor, misaligning it away from a vertical position, as well as

46
placing unnecessary vibrations upon the device (Shepherd et al., 1999). If precautions are
made during preparation, prior to collecting data, accelerometers can be quite accurate in
measuring activity in normal weight, overweight and obese individuals.
In regards to monitor placement, most studies have adopted placing an activity monitor on
the waist of an individual. The common consensus is that the waist is close to the center of
mass of the body, and that the torso represents the most mass of the body (Meijer et al., 1991;
Bouten et al., 1997; Yang & Hsu, 2010). This location may serve best for representing whole-
body activity. Additionally, activity monitors can easily be mounted on the waistband or belt
clip, reducing any discomfort or constraint on the participant and movement, respectively.
Accelerometers can also be placed on appendages (LaPorte et al., 1979; Godfrey et al., 2008) to
analyze other activities (i.e. ankle-mounted accelerometer to measure gait patterns). Ankle-
mounted accelerometers are also capable of measuring speed, distance, steps, and energy
expenditure during bouts of walking or running (Foster et al., 2005).
Regarding shoe-mounted accelerometers, the Nike+ was the first commercially-available
device to station an accelerometer under the insole of a shoe. Recently, Adidas released the
miCoach Pacer System which also serves as a personal activity monitor. Adidas compatible
shoes are required to station the sensor under the insole much like the Nike device. Garmin
also offers the Forerunner 210 that contains a transmitter which attaches to the laces of a shoe.
In spite of these recently released devices, the aim of the current study was to validate the
Nike+.
The field of accelerometry is continuously expanding, with validation studies serving as the
most common form of research with these devices. New accelerometeric devices are often

47
being manufactured and released for commercial sales, which requires a continuous need to
assess the validity, reliability, and utility of these devices. Future studies should help focus on
providing results that can help independent researchers assess the full range of physical activity
intensities; specifically, the creation of accurate prediction equations that could classify these
intensities.
2.11 Purpose
The purpose of the current study was to validate the accuracy of the Nike+ Wireless Sport
Kit to estimate pace (min/km), distance (km) and EE (kcal/min) during treadmill walking and
running, and for two different sensor configurations.

48
Chapter 3
METHODS
3.1 Study Overview
The purpose of this study was to assess the accuracy of the Nike+ Wireless Sport Kit to
estimate pace, distance, and EE during level treadmill walking and running at seven different
speeds, and while in two configurations, under the midsole and attached to the shoelaces.
Participants reported to the laboratory on two separate occasions separated by a minimum of
48 hours. The first laboratory visit included the completion of study forms, anthropometric
measurements, and a maximal oxygen consumption test (VO2max). During the second laboratory
visit, each participant completed the Nike+ validation protocol.
3.2 Participants
Eighteen participants (9 male, 9 female) between the ages of 18 and 45 years volunteered
to participate. To ensure that each participant was able to complete the validation protocol,
inclusion criteria included that participants were engaging in at least 3 days a week of
moderate, endurance physical activity and could exhibit a minimum relative VO2max value of 50
ml/kg/min. Prior to data collection, the procedures, risks, and benefits were explained. Each
participant was allowed to ask questions and provided written informed consent on a form
approved by the Institutional Review Board of the University of Texas at El Paso.
3.3 Materials and Measures
For each of the two laboratory visits, participants reported for testing having refrained from
vigorous physical activity for 24 hours and having not consumed any food, caffeine, or calorie-
containing beverages for three hours prior. Anthropometric testing included measuring height

49
(cm), weight (kg), and body fat percentage (BF%), using a SECA 225 stadiometer (GMBH & Co.,
Germany), a Tanita WB-110A digital load cell scale (Tanita Corp., Japan), and the BOD POD (Life
Measurement Instruments, Concord, CA, USA), respectively. The COSMED K4 b2 (COSMED S.r.l.,
Rome, Italy) measured the metabolic values [Oxygen consumption (VO2), Carbon Dioxide
production (VCO2), Ventilation rate (VE), Respiratory Exchange Ratio (R), Fractional content of
expired Oxygen (FEO2), and Fractional content of expired Carbon Dioxide (FECO2)] during the
validation trial. A TrueOne 2400 metabolic measurement system (ParvoMedics, USA) was used
for testing maximal oxygen consumption.
3.3.1 Maximal Oxygen Consumption Test. Each participant performed a maximal oxygen
consumption test (VO2max) on a calibrated motor-driven treadmill (Track Master R32, Full Vision,
Inc.) to ensure each participant met the inclusion criteria. Prior to beginning the test, the
participants were allowed a warm-up period of approximately 10 minutes on the motor-driven
treadmill. Each participant was then connected to the TrueOne 2400 metabolic measurement
system (ParvoMedics, USA) via a 9-foot expired gas tube attached to a large, 2-way non-
rebreathing valve and mouthpiece. The preference of using a mouthpiece and rebreathing
valve instead of a facemask was to reduce the chance for gas leakage (McLaughlin, King,
Howley, Bassett, & Ainsworth, 2001). Noseclips were provided to isolate breathing at the
mouth. Heart rate was continuously monitored using a Polar heart rate transmitter and
receiver.
The test included 1-minute incremental stages. The initial speed for each participant was set
at 187.6 m/min (7.0 mph) with an initial grade of 0%. The speed increased 13.4 m/min (0.5
mph) each minute up to the highest speed of 214.0 m/min (8.0 mph). With each subsequent

50
minute, the grade increased by 1% until volitional exhaustion. This protocol was selected to
ensure that all subjects were able to maintain a running speed of 214.0 m/min and the
cardiorespiratory fitness to complete the validation protocol.
3.3.2 Calibration of TrueOne 2400 Metabolic Measurement System. The ParvoMedics
TrueOne 2400 metabolic cart was used during the first laboratory visit to measure maximum
oxygen consumption. According to Bassett et al. (2001), the TrueOne 2400 can accurately
measure gas exchange variables. Bassett and colleagues (2001) compared the Douglas Bag
method (DB) with the TrueOne 2400, and found high correlations of minute VE, VO2, and VCO2.
The TrueOne 2400 uses a Hans Rudolph 3813 (Hans Rudolph, Inc., Kansas City, MO) heated
linear pneumotach to measure ventilation. The pneumotach has a flow range of 0-800 L/min.
Prior to each testing session, the gas analyzers were calibrated according to the manufacturer’s
recommendations using a two-point calibration with gases of know concentration (16% O2; 4%
CO2). Additionally, the flow meter was calibrated using a 3.0 L Hans Rudolph 5530 series (Hans
Rudolph, Inc., Kansas City, MO) syringe. This involved a five-stroke calibration using different
flow rates for each stroke.
3.3.3 Nike+ Wireless Sport Kit. Nike and Apple designed this two-part wireless device to
determine pace, distance traveled, and caloric expenditure during walking and running. All iPod
Nano generations, the iPod touch (2nd, 3rd, and 4th generations), and the iPhone 3GS support
the Nike+. The current study used two compatible 6th generation iPod Nanos. Enabling the
Nike+ required an attached receiver to the iPod Nano. Following synchronization of the iPod
Nano and Nike+, the sensor was placed in the pre-determined cut-out under the left insole of a
Nike+ compatible shoe. Nike manufactured and tested the sensor to be of optimal accuracy in a

51
Figure 3.1. iPod Nano (6th
Generation) Figure 3.2. Nike+ midsole configuration
location under the left insole of the shoe. Various companies (Marware, Inc., Red Rock
Products, Inc., SwitchEasy Limited, and Tune Belt, Inc.) have manufactured soft-shell, neoprene
sensor pouches, as well as durable polycarbonate adapters that can affix the sensor to the
individual’s shoelaces to allow use with other shoe models.
The iPod Nano interface offered four distinct workouts: “open-ended,” “distance goal,”
“time goal,” or “calorie burning goal.” An “open-ended” workout could be selected if the
individual has no “time” or “distance” training goals. The “distance goal” workout offered
several pre-set distances, including a minimum distance of 1-mile. The “time goal” workout
offered several preset times, including a minimum 10-minute workout time. The “calorie-
burning goal” workout offered several preset caloric totals, including a minimum “calorie-burn”
workout of one-hundred calories. For this study, all validation trials were conducted with the
open-ended workout mode.
3.3.4 Calibration of the Nike+. The iPod Nano interface required the user to input three
anthropometric variables prior to any active calibration: height (inches or cm), weight (lbs or kg)
and gender. When the user entered the three variables, active calibration began. Calibration of
Figure 3.3. Nike+ laces configuration

52
the Nike+ required the user to walk and run a distance between 0.25 and 1.0 mile. These
guidelines allowed the device to effectively define the individual’s stride characteristics. Nike
derived proprietary prediction equations that account for “height,” “weight,” and “foot-to-
ground contact time” to provide estimates for distance traveled and calories expended. These
prediction equations remain proprietary to Nike. Two sensors and two iPod Nanos were
simultaneously used during the validation trial. Each sensor was linked to an iPod Nano
according to instructions from the device’s user manual. One sensor was placed in a pouch
(designed by Grantwood Technology, LLC) and affixed to the left shoe’s lower laces. A second
sensor was inserted under the left shoe’s insole. The Nike+ was calibrated for each participant
immediately prior to each validation trial.
3.3.5 Validation Trial Protocol. The validation trial included level walking and running inside
a climate-controlled laboratory on a Track Master motor-driven treadmill (Full Vision, Inc.,
Kansas). The duration of each exercise stage was 10-min and each of the seven stages had a
designated speed of 53.6 m/min (2.0 mph), 80.4 m/min (3.0 mph), 107.2 m/min (4.0 mph),
134.0 m/min (5.0 mph), 160.8 m/min (6.0 mph), 187.6 m/min (7.0 mph), and 214.0 m/min (8.0
mph). The K4 b2 recorded mean oxygen and carbon dioxide gas volumes for all 10 minutes of
each stage; however, the final 7 minutes of each stage were used to determine mean EE.
Treadmill speed was measured at minute 2 and 8 of each stage using a calibrated tachometer
(DT-107A, SHIMPO INSTRUMENTS, Illinois) and the average was recorded as actual speed for a
given stage. Actual distance was then calculated from speed and duration.
3.3.6 Calibration of COSMED K4 b2. The K4 b2 uses a COSMED oxygen analyzer (range 7-
24%) and a carbon dioxide analyzer (range 0-10%), and proprietary software. The flowmeter

53
uses a bidirectional digital turbine and an optoelectronic reader, and according to the
manufacturer, has a flow range of 0.08-20 L∙s and a ventilation range of 0-300 L∙min-1. The
flowmeter was attached to a rubber facemask (Hans Rudolph, Kansas City, MO) that covered
the participant’s nose and mouth. Following a recommended 45-minute warm-up, the K4 b2
was calibrated immediately prior to testing each participant according to the manufacturer’s
guidelines. Gas calibration required a unique gas mixture (5.0% CO2, 16.0% O2, balanced N)
which was analyzed through a sampling line by the COSMED prior to flowmeter calibration. The
K4 b2’s flowmeter was calibrated by attaching the turbine to a 3-L syringe (Hans Rudolph, Inc.,
Kansas City, MO). This involved a 10-stroke calibration simulating five inspiratory and five
expiratory strokes.
3.3.7 Synchronization of Units. To ensure that the data from all devices represented the
same collection interval, the internal clock of the Nike+ was synchronized within 1 sec of the
internal clock of the K4 b2, as well as a hand-held universal stopwatch and all data were time-
matched. Prior to testing, the K4 b2 recorded five minutes of resting metabolic values. On
exactly the fifth minute (displayed on the interface of the K4 b2), the Nike+ and the stop watch
began time collection. Upon synchronization at the fifth minute, the participant instantaneously
began the trial. With the participant standing stationary and straddling the running surface, the
treadmill belt was increased to the appropriate speed. For each stage, all devices began
recording simultaneously as the participant began exercise. At the end of each 10-min stage,
the treadmill belt was stopped and the participant stood stationary while recording by the
devices was simultaneously ended. This was necessary because the Nike+ records total values
across the collection time and is not capable of defined time resolution (i.e., only records total

54
value for 10-min stage and not capable of 1-min resolution). Estimated pace (min/km) and
distance (km) was recorded for the complete 10-min stage. Total estimated EE derived from
the Nike+ was divided by 10 and recorded as estimated EE (kcal/min).
3.3.8 Independent and Dependent Variables. The independent variables included the
criterion measurements of actual pace (min/km), actual distance traveled (km), and EE
(kcal/min) (measured by indirect calorimetry) for each stage. The dependent variables included
estimated pace, distance, and EE recorded by the Nike+. For EE, comparisons were examined
between the estimates from the Nike+ with that of actual EE from the K4 b2.
3.3.9 Statistical Analysis. Statistics were analyzed by using the software package SPSS
Version 18.0 (SPSS, Chicago, IL). For the 2 x 7 x 3 model, three different One-way ANOVA’s and
a One-way ANCOVA were conducted. The ANOVA’s were conducted to observe any significant
differences among descriptive data (age, height, weight, and VO2max) as well as between
estimated pace (min/km) and distance (km) with that of actual measured pace and distance for
both sensor configurations. Additionally, the ANOVA was conducted to observe if there was any
significant main effect for sex on sensor configuration. The ANCOVA was conducted to observe
any significant differences between estimated EE (kcal/min) and actual measured EE for both
sensor configurations. Body mass served as a covariate because EE is dependent on body mass.

55
Chapter 4
RESULTS
4.1 Descriptive Statistics
The current study recruited 22 participants; however, two females did not qualify, one
female withdrew, and one male participant withdrew. Therefore, 18 participants (9 females, 9
males) completed the study. Two participants did not complete the final two stages (187.6 and
214.0 m/min); therefore, for stages 1-5, n = 18, and for stages 1-7, n = 16.
A One-way ANOVA for descriptive data revealed that there were no significant differences
between males and females for age (p = 0.157) or VO2max (p = 0.072) (Table 4.1). However, there
were significant differences (F > 24.141; p < 0.001) observed between males and females for
both height and weight.
Table 4.1. Mean (± SE) descriptive information for female and male participants.
Group N Age Height Weight VO2max
(years) (cm) (kg) (ml∙kg∙min)
Females 9 31.56 ± 2.77 162.78 ± 1.76† 53.90 ± 1.89† 52.29 ± 1.80
Males 9 26.11 ± 2.41 174.67 ± 1.66† 70.49 ± 2.73† 56.42 ± 1.17
Total 18 28.83 ± 1.90 168.72 ± 1.86 62.19 ± 2.58 54.36 ± 1.15
† Significant difference between males and females (p < 0.001)

56
4.2 Analysis of Variance
The results of the ANOVA revealed no significant interaction between sensor configuration
and sex for pace (laces: F = 0.011; p = 0.917; midsole: F = 1.173; p = 0.296), distance (laces: F =
0.047; p = 0.832; midsole: F = 0.028; p = 0.870), or EE (laces: F = 1.388; p = 0.260; midsole: F =
0.197; p = 0.664). Further, there was no significant main effect of sex for pace (p = 0.471) or
distance (p = 0.620); therefore, males and females were combined for additional analyses of
pace and distance data. However, there was a significant main effect of sex for EE (laces: F =
14.775; p = 0.002; midsole: F = 13.211; p = 0.003; actual: F = 39.715; p < 0.001); therefore, EE
was analyzed separately using an ANCOVA with body mass entered as a covariate.
An additional ANOVA was conducted to determine if the Nike+ accurately discriminated
between each subsequent treadmill speed. There was a significant difference between each
recorded speed for both sensor configurations (pace: p ≤ 0.037; distance: p < 0.001). Table 4.2
and 4.3 display the mean pace (min/km) and distance (km) estimated by the Nike+ and actual
measured pace and distance, respectively.
Figure 4.1 illustrates mean (± SE) estimated pace (min/km) from the Nike+ compared to
actual measured pace. Significant differences occurred at 53.6 (p < 0.001), 80.4 (p ≤ 0.034),
187.6 (p ≤ 0.001), and 214.0 m/min (p < 0.001) between the laces configuration and actual
pace, and between the midsole configuration and actual pace. Additionally, there was a
significant difference between the laces sensor configuration and actual pace at 160.8 m/min (p
= 0.024). There were no significant differences (p ≥ 0.551) observed between the laces and
midsole sensor configurations at any speed.

57
Figure 4.2 illustrates mean (± SE) distance (km) estimated by the Nike+ against actual
measured distance. Significant differences occurred at 53.6 (p < 0.001), 80.4 (p ≤ 0.005), 187.6
(p ≤ 0.001), and 214.0 m/min (p < 0.001) between the laces configuration and actual distance,
and between the midsole configuration and actual distance. There were no significant
differences (p ≥ 0.678) observed between the laces and midsole configurations at any speed.
4.3 Pace and Distance Sensor Estimates
4.3.1 Pace (Laces)
The Nike+ laces configuration significantly overestimated actual pace at two walking speeds
and significantly underestimated actual pace at three running speeds. For the walking speeds
(53.6 and 80.4 m/min), the Nike+ overestimated actual pace by 22.8% (p < 0.001) and 7.5% (p =
0.034), respectively. For the running speeds (160.8, 187.6, and 214.0 m/min), the Nike+
underestimated actual pace by 6.1% (p = 0.024), 12.0% (p < 0.001), and 19.1% (p < 0.001),
respectively.
4.3.2 Pace (Midsole)
The Nike+ midsole configuration significantly overestimated actual pace at two walking
speeds and significantly underestimated actual pace at two running speeds. During walking
(53.6 and 80.4 m/min) the Nike+ overestimated actual pace by 22.6% (p < 0.001) and 9.6% (p <
0.001), respectively. During running (187.6 and 214.0 m/min) the Nike+ underestimated actual
pace by 10.5% (p < 0.001) and 17.8% (p < 0.001), respectively.
4.3.3 Distance (Laces)
The Nike+ laces configuration significantly overestimated actual distance at two walking
speeds and significantly underestimated actual distance at two running speeds. During walking

58
(53.6 and 80.4 m/min) the Nike+ overestimated actual distance by 31.5% (p < 0.001) and 9.9%
(p = 0.005), respectively. During running (187.6 and 214.0 m/min), the Nike+ underestimated
actual distance by 10.1% (p < 0.001) and 15.3% (p < 0.001), respectively.
4.3.4 Distance (Midsole)
The Nike+ midsole configuration significantly overestimated actual distance at two walking
speeds and significantly underestimated actual distance at two running speeds. During walking
(53.6 and 80.4 m/min), the Nike+ overestimated actual distance by 29.6% (p < 0.001) and 11.1%
(p < 0.001), respectively. During running (187.6 and 214.0 m/min), the Nike+ underestimated
actual distance by 9.0% (p = 0.001) and 13.9% (p < 0.001), respectively.
4.4 Analysis of Covariance
Initial analysis of EE data indicated a significant main effect of sex, where male EE was
significantly greater than female EE. In general, the body mass of males is greater than females,
and the energy cost of treadmill exercise is directly related to body mass. To control for the
difference in body mass between males and females, EE was analyzed using an ANCOVA with
body mass entered as the covariate. When controlled for body mass, the sex effect for EE was
lost for the laces (p = 0.804) and midsole (p = 0.949) configuration but remained for actual EE (p
= 0.005). Despite this, male and female data were collapsed into a single group. Table 4.4
displays the mean (± SE) EE (kcal/min) estimated by the Nike+ and actual measured EE. Figure
4.3 illustrates mean (± SE) EE (kcal/min) estimated by the Nike+ against actual measured EE
when body mass served as a covariate. Significant differences were observed for EE between
the laces configuration and actual EE at 107.2 (p < 0.001), 187.6 (p = 0.013), and 214.0 m/min (p
= 0.002), and between the midsole configuration and actual EE at 107.2 (p < 0.001) and 214.0
59
m/min (p = 0.022). There were no significant differences (p ≥ 0.451) between the two sensor
configurations at any speed. Energy expenditure was significantly different (p ≤ 0.020) between
each recorded speed for the laces and midsole configuration, and for actual.
For each variable, calculated bias was evaluated using Bland-Altman plots (Bland & Altman,
1986). Difference scores were calculated as actual value minus estimated values (y-axis) and the
mean difference was calculated as actual value minus estimated value divided by two (x-axis).
Limits of agreement are equal to two standard deviations above and below the mean
difference. Calculated bias, difference scores and limits of agreement are illustrated for pace
(Figure 4.4), distance (Figure 4.5), and EE (Figure 4.6) between the laces configuration and
actual (panel a) and between the midsole configuration and actual (panel b).
4.5 Energy Expenditure Sensor Estimates
4.5.1 EE (Laces)
The Nike+ laces configuration significantly underestimated actual EE at one walking speed
and at two running speeds. During walking (107.2 m/min), the Nike+ underestimated actual EE
by 23.4% (p < 0.001). During running (187.6 and 214.0 m/min), the Nike+ underestimated
actual EE by 10.0% (p = 0.013) and 12.9% (p = 0.002), respectively.
4.5.2 EE (Midsole)
The Nike+ midsole configuration significantly underestimated actual EE at one walking
speed and one running speed. During walking (107.2 m/min), the Nike+ underestimated actual
EE by 24.0% (p < 0.001). During running (214.0 m/min), the Nike+ underestimated actual EE by
11.1% (p = 0.022).

60
Table 4.2. Mean (± SE) Pace Estimated by the Nike+ and Actual Measured Pace.
Speed Laces Midsole Actual
(m/min) (min/km) (min/km) (min/km)
53.6 14.36 ± 0.43† 14.38 ± 0.27† 18.60 ± 0.08
80.4 11.41 ± 0.36† 11.16 ± 0.20† 12.34 ± 0.01
107.2 9.73 ± 0.38 9.76 ± 0.29 9.25 ± 0.01
134.0 7.45 ± 0.16 7.40 ± 0.16 7.41 ± 0.01
160.8 6.58 ± 0.13† 6.54 ± 0.13 6.20 ± 0.01
187.6 5.97 ± 0.11† 5.90 ± 0.12† 5.33 ± 0.01
214.0 5.54 ± 0.11† 5.48 ± 0.16† 4.65 ± 0.01
† Significantly different from actual (p ≤ 0.034)
Figure 4.1. Mean (± SE) pace estimated from the Nike+ and actual measured pace. * Significant difference between each adjacent speed (p ≤ 0.037) † Significant difference between laces and actual pace (p ≤ 0.034) ‡ Significant difference between midsole and actual pace (p ≤ 0.001)

61
Table 4.3. Mean (± SE) Distance Estimated by the Nike+ and Actual Measured Distance.
Speed Laces Midsole Actual
(m/min) (km) (km) (km)
53.6 0.71 ± 0.02 † 0.70 ± 0.01† 0.54 ± 0.00
80.4 0.89 ± 0.02 † 0.90 ± 0.02† 0.81 ± 0.00
107.2 1.05 ± 0.03 1.04 ± 0.03 1.08 ± 0.00
134.0 1.35 ± 0.03 1.37 ± 0.03 1.35 ± 0.00
160.8 1.53 ± 0.04 1.54 ± 0.04 1.61 ± 0.00
187.6 1.69 ± 0.04† 1.71 ± 0.04† 1.88 ± 0.00
214.0 1.82 ± 0.04† 1.85 ± 0.05† 2.15 ± 0.00
†Significantly different from actual (p ≤ 0.005)
Figure 4.2. Mean (± SE) distance estimated from the Nike+ against actual measured distance. *Significant difference between each adjacent speed (p < 0.001) † Significant difference between laces and actual distance (p ≤ 0.005) ‡ Significant difference between midsole and actual distance (p ≤ 0.001)

62
Table 4.4. Mean (± SE) Energy Expenditure (EE) Estimated by the Nike+ and Actual Measured EE.
Speed Laces Midsole Actual
(m/min) (kcal/min) (kcal/min) (kcal/min)
53.6 3.23 ± 0.08 3.21 ± 0.07 3.34 ± 0.13
80.4 4.06 ± 0.10 4.13 ± 0.07 4.34 ± 0.15
107.2 4.79 ± 0.14† 4.75 ± 0.11† 6.25 ± 0.20
134.0 8.56 ± 0.19 8.63 ± 0.20 9.19 ± 0.28
160.8 9.74 ± 0.17 9.83 ± 0.20 10.46 ± 0.29
187.6 10.72 ± 0.18† 10.90 ± 0.22 11.91 ± 0.32
214.0 11.52 ± 0.15† 11.76 ± 0.32† 13.23 ± 0.34
† Significantly different from actual (p ≤ 0.022) Note: Mean EE values were controlled for body mass.
Figure 4.3. Mean (± SE) energy expenditure (EE) from the Nike+ against actual measured EE after controlling for body mass. *Significant difference between each adjacent speed (p ≤ 0.020) † Significant difference between laces and actual EE (p ≤ 0.013) ‡ Significant difference between midsole and actual EE (p ≤ 0.022)

63
Figure 4.4. Mean difference, calculated bias, and limits of agreement for pace estimated by the Nike+ and actual pace for the a) laces configuration and b) midsole configuration.

64
Figure 4.5. Mean difference, calculated bias, and limits of agreement for distance estimated by the Nike+ and actual distance for the a) laces configuration and b) midsole
configuration.

65
Chapter 5 Figure 4.6. Mean difference, calculated bias, and limits of agreement for energy expenditure (EE) estimated by the Nike+ and actual EE for the a) laces configuration and b) midsole configuration.

66
Chapter 5
DISCUSSION
5.1 Summary of Overall Findings
The primary objective of the current study was to validate the accuracy of the Nike+
Wireless Sport Kit to estimate pace (min/km), distance (km), and energy expenditure (EE)
(kcal/min) during treadmill walking and running, and for two different sensor configurations.
Validity was investigated by comparing the Nike+ estimates of pace, distance, and EE with that
of the actual, criterion measurements of pace, distance, and EE. Actual EE was measured by
indirect calorimetry. Sixteen participants (8 females, 8 males) completed the entire validation
protocol (53.6 – 214.0 m/min) and two participants did not complete the last two running
stages (187.6 and 214.0 m/min) (n=18).
The major findings of these data indicate that the Nike+ consistently underestimated EE at
each of the seven treadmill speeds, and that each subsequent speed elicited a significant
increase in recorded EE. Additionally, the Nike+ significantly overestimated pace (i.e.,
overestimated speed) and distance at walking speeds and significantly underestimated pace
(i.e., underestimated speed) and distance at higher running speeds. Regarding the two sensor
configurations, there does not appear to be a marked difference in accuracy between a sensor
placed in the shoe midsole and one secured to the shoelaces.
5.1.1 Participants
There were significant differences (p < 0.001) observed between males and females for
both height and weight. This difference was anticipated because of the different physiological
characteristics between males and females. There were no significant differences between

67
males and females for age (p = 0.157) or VO2max (p = 0.072). The similar VO2max values between
males and females of this study is likely explained by the inclusion criteria where all participants
were required to express a VO2max greater than 50 mL/kg/min. This may have allowed for some
selection bias, as the overall relative fitness of the females may have been greater than that of
the males; however, it is unlikely that this potential selection bias affected any of the outcome
variables because the metabolic cost of treadmill exercise is most dependent on body mass and
intensity (i.e., speed and/or grade).
5.1.2 Pace and Distance
For the most part, the Nike+ device appears to accurately produce estimates from within
the calibration ranges (80.4 - 160.8 m/min for this study). Especially during slow walking (53.6
m/min) there was a mean overestimation of approximately 23% for pace and distance
estimates recorded both at the laces and midsole configurations. The percentages were almost
identical due to pace and distance being derived from each other. The current study is the only
known research simultaneously observing the Nike+ in two sensor configurations; however,
other studies with similar devices exist. Similar to the current finding, Kane et al. (2010) found
the Nike+ midsole sensor to overestimate walking pace at 55.0 m/min by 20%. Similar results
were found for distance. Conger et al. (2005) examined the FitSense FS-1 Speedometer and
found it able to closely estimate self-paced walking distance and slightly underestimate self-
paced running distance outdoors on a track. The FitSense appeared to overestimate speed
during fast treadmill walking at 8.0 km/h (5 mph).
For slow walking at 53.6 m/min, individuals may compensate for the slow treadmill speed
by increasing step frequency, thereby shortening stride length, as opposed to maintaining their

68
natural stride frequency and length. While the proprietary algorithm for the Nike+ is unknown,
if the device calculates pace or distance based on step count and an assumed stride length,
then an increased step frequency during slow walking would result in an overestimation of pace
and distance. The calibration procedure likely counts steps during the traveled distance to
estimate stride characteristics. A marked change in stride characteristics would result in over-
or underestimation of measurements relative to those expected from the calibration
procedure.
An interesting point is that the Nike recommended midsole location for the Nike+ device
provided very similar estimates to that of the laces configuration. During treadmill exercise,
individuals may focus on their stride pattern more than during free-exercise. It can be argued
that the sensor pouch affixed to the laces would allow arbitrary movements to be incorporated
into the estimated measurement value. This was not likely the case because each pouch was
carefully secured to the laces to minimize random movement prior to each testing session.
Further, the calibration procedure should have accounted for these movements. Additionally,
exposure of the Nike+ to extra movement in the laces configuration would have been detected
by a difference in estimated values compared to the midsole configuration.
During walking at 80.4 m/min (3 mph) there was a mean overestimation of approximately
9% for pace and distance estimates recorded both at the laces and midsole configuration.
Despite conducting the walking calibration procedure at 80.4 m/min, the estimates recorded at
both the laces and midsole configurations were still significantly different from actual measured
variables. This issue could be attributed to two items: calibration distance and/or the device

69
does not function properly. Nike requires a calibration procedure to be conducted during
walking and running, with a calibration distance of no less than one-quarter of a mile.
The Nike+ provided reasonable estimates of pace (at both sensor configurations) at 107.2 (4
mph) (p ≥ 0.320) and 134.0 m/min (5 mph) (p = 1.000). Traditionally, accelerometers have had
difficulty producing accurate estimates in the transition (5 mph) between walking and running
(Conger et al, 2005). This issue is thought to be directly associated with the type of algorithm or
prediction equation during software development. It appears that the Nike+ device (once
calibrated) can alleviate the problem of inaccurate estimations within the transitional stage.
During running speeds of 160.8, 187.6, and 214.0 m/min, there was a tendency for the
Nike+ to underestimate pace and distance. The Nike+ underestimated pace only during 160.8
m/min at the laces configuration (only) by 6%. The Nike+ also consistently underestimated
pace/distance by 10% and 15% for 187.6 and 214.0 m/min, respectively. These consistent
underestimations at higher running speeds can possibly be attributed to a mild leveling effect;
however, this can only be speculated because there was a significant difference between each
speed recorded by the Nike+.
5.1.3 Energy Expenditure
When examining the EE estimates from the Nike+, it is important to consider biomechanical
efficiency and running economy. It is well established that a more economical gait has a
reduced energy requirement compared to a less economical gait. However, it is not likely that
inter-individual differences in economy explain the error in estimated EE because the
calibration procedure should, if it functions as intended, account for differences in gait.
Variability in stride rate could also potentially account for changes in the energy cost of

70
treadmill exercise (Candau et al., 1998). An additional issue regards that of optimal stride
length/frequency. During walking/running, individuals will self-select an intensity that is
energetically optimal (Bertram & Ruina, 2001; Hunter & Smith, 2007). Deviations in energy
costs recorded by indirect calorimetry can be observed during speeds below or above the
optimal stride length/frequency.
During walking at 107.2 m/min (4 mph), the Nike+ significantly underestimated EE by a
mean of approximately 24% (p < 0.001). This is interesting because neither pace nor distance
were significantly different from actual measures at 107.2 m/min. In contrast to the current
study, Kane et al. (2010) observed an overestimation of EE by 18-37% during all walking speeds
(55.0, 82.0, and 107.2 m/min). Variations in walking and running economy are apparent
through indirect calorimetry, but accelerometers on the other hand may not be sensitive
enough to distinguish between individual differences. For instance, a shorter individual would
have a more difficult time keeping a walking pace that could easily be achieved by a jogging or
slower running motion. To counteract this task, the shorter individual would engage in a
quicker step-frequency; thus, increasing EE. Indirect calorimetry could account for this increase
in EE; however, the Nike+ may not be able to.
At a given speed, an increase in step frequency above that of a freely chosen step frequency
would result in an increase in energy expenditure (Cavagna et al., 1997). This issue could
potentially alter the device estimates. Taller individuals with a longer stride can more easily
accommodate faster walking speeds. Because running is a less economical movement than
walking, the protocol was standardized so that all participants walked at 107.2 m/min.

71
The Nike+ also significantly underestimated EE at higher running speeds by 10% (p = 0.013)
at 187.6 m/min (laces only) and by approximately 12% at 214.0 m/min (p < 0.022) (laces and
midsole). A leveling effect can only be speculated; however, the magnitude of change between
running speeds was very consistent. Therefore, EE errors are not likely attributable to a leveling
effect. In retrospect, King et al. (2004) found that the Biotrainer-Pro and RT3 were not sensitive
to changes in treadmill speed (for recording EE) at running speeds (> 134.0 m/min, and > 187.6
and 214.0 m/min, respectively); thus, displaying the presence of a leveling effect. In complete
agreement with the current study, Kane et al. (2010) also found the Nike+ to closely estimate
EE during level running (134.0, 161.0, and 188.0 m/min) at the midsole sensor configuration.
According to Candau et al. (1998), physiological and biomechanical variables can affect energy
cost when in a fatigued state (i.e. an increase in VO2 of respiratory muscles and/or an increase
in step variability); thus, possibly altering true estimates of EE from the Nike+. Since the Nike+
recorded fewer calories expended on the iPod Nano display than were actually used; in
actuality, the user would expend more calories (when compared to actual criterion EE) at any
given point during exercise.
Of particular interest is the pattern of Nike+ estimated EE (Figure 4.3). Directionally, the
Nike+ underestimated EE at all speeds above 80.4 m/min. At 53.6 and 80.4 m/min, the Nike+
recorded EE values similar to actual EE likely because the Nike+ overestimated distance at these
speeds; had the Nike+ accurately estimated distance, EE would have been substantially
underestimated. For those speeds where the Nike+ underestimated distance (≥ 160.8 m/min),
EE was also underestimated. However, the Nike+ also underestimated EE for speeds where
estimated distance was virtually identical to actual distance (107.2 and 134.0 m/min); although

72
these differences were not statistically significant. From this, it can be inferred that the Nike+
algorithm for EE needs revision.
5.2 Limitations of the Current Study
One limitation regards that of recording total distance during the 10-minute stage by the
tachometer. For this study, treadmill speed was recorded at minutes two and eight of each 10-
minute stage, and thus averaged the two values to produce a mean estimate of actual distance.
This could possibly ignore the consistency of treadmill speeds within stages and between
subjects for the same speed. However, it is not likely that treadmill speed variability attributed
to a meaningful error considering the extremely small standard error values for each speed.
An additional limitation was that the Nike+ calibration protocol should have been
administered during the initial laboratory visit instead of the day of the actual validation
protocol. Due to this, the participants were required to rest for 30 minutes after the calibration
protocol to help reduce any chance for inflated EE estimates during the actual validation
protocol. This was particularly relevant for the lowest stages (53.6 and 80.4 m/min). It is
important to mention that the calibration protocol was time-sensitive. The current author was
assuming that the body mass of the individual did not fluctuate drastically between the
calibration protocol and the actual validation protocol. Therefore, scheduling participants for
the validation protocol had to occur sooner than later after the calibration protocol.
The final limitation of the study was the restriction of sizes for the provided shoes. The
shoes purchased for this study were entirely male running shoes, with the smallest size of 6.5
available. This would mean that a female participant with a shoe size smaller than at 7.5 (in
women’s) would potentially have difficulty performing with a larger shoe. Specifically, this

73
occurred with one female participant, where stages 7 and 8 (187.6 and 214.0 m/min) could not
be completed due to feeling uncomfortable with a larger shoe.
5.3 Strengths of the Current Study
One strength of the current study was during that of calibration. The Nike+ was calibrated
and tested on the same motor-driven treadmill at walking and running speeds (80.4 and 160.8
m/min, respectively). The oxygen cost of flat treadmill work is less than flat over-ground work
because acceleration magnitudes on a treadmill are lower than that of over-ground work (Van
Caekenberghe et al., 2010). Additionally, linear inertia on a treadmill is zero when accelerating.
This absence of linear inertia would appear to aid the individual in progressing forward on a
treadmill (Christensen et al., 2000). It would be expected to observe a decrease in accuracy if
the Nike+ was calibrated on an outdoor track and tested on a treadmill.
This study implemented the exact calibration procedures displayed in the user’s manual.
The manufacturer’s guidelines only mentioned calibrating the device “during walking” and
“during running”. Furthermore, Nike’s guidelines mention that the Nike+ should be calibrated
between distances of one-quarter mile to 1-mile. The current study calibrated the Nike+ at one-
quarter mile; however, Nike does not specify that a 1-mile distance is better than one-quarter
mile. Nike only claims that the calibration distance should be between these two distances. It is
possible that a longer calibration distance is better, but there is currently no evidence to
suggest this to be true.
One additional strength was that of affixing the sensor pouches to the laces. The current
study placed the sensor pouches at the first two shoe-lace loops closest to the toes, on each
left shoe; thus aiming to reduce any possible effect of different sensor locations on the laces.
74
However, the current study did not specifically observe the effects of various positions of the
sensor pouch on Nike+ estimates. Potentially, a future research study could observe the effects
of sensor tilt and location on Nike+ estimates. Finally, prior to the start of each trial, the sensor
pouch was checked for any unnecessary movement (in any direction).
5.4 Future Research
There is presently a shortage in accelerometer validation studies performed on a standard
outdoor track. The shortage may be due to not knowing how the environment affects
accelerometers (i.e. humidity, ambient temperature, and/or surface temperature). As
previously mentioned, treadmill work has a lower oxygen cost than that of over-ground work. It
can be speculated if the Nike+ underestimates EE on a treadmill, then it would underestimate
EE even more during over-ground work. This can be due to the differences in physiological and
biomechanical variables between that of over-ground work and treadmill work. The field of
accelerometry is continuously expanding, with validation studies becoming increasingly
popular. New accelerometeric devices are often being manufactured and released for
commercial sales, which requires a continuous need to assess the validity, reliability, and utility
of these devices. Future studies should help focus on providing results that can help
independent researchers assess the full range of physical activity intensities; specifically, the
creation of accurate prediction equations that could classify these intensities.
In regards to the Nike+, future studies should aim to focus on different calibration
protocols. Perhaps, calibrating the Nike+ at 53.6 m/min and 214.0 m/min to see if a higher
calibration range would elicit a larger range of accurate output during walking and running
speeds. Additionally, purchasing several different types of sensor pouches to assess the

75
accuracy of velcro pouches versus that of more durable, plastic pouches. A methodological
consideration could be that of testing the different sensor pouches in calibrated versus
uncalibrated conditions.
5.5 Conclusion
Of the 42 mean data collections (including laces and midsole) for pace, distance, and EE
(configuration x speed x variable; 2 x 7 x 3), the Nike+ device produced 20 accurate collections;
resulting in 47.6% accuracy. Of the 20 collections, the laces configuration provided 9 (45%)
accurate collections and the midsole provided 11 (55%) accurate collections. When purely
observing the laces configuration, 9 of 21 possible estimates were accurate (42.8% accuracy).
When purely observing the midsole configuration, 11 of 21 possible estimates were accurate
(52.4%). Therefore the midsole sensor configuration is more accurate.
For the laces configuration, EE estimates had the highest accuracy (57.1%) throughout the
seven stages. Distance had the next highest accuracy (42.9%), and pace had the lowest accuracy
(28.6%). This is unfortunate for pace to have such a low accuracy because the primary function
behind the Nike+ is calculating foot-to-ground contact time. For the midsole configuration, EE
estimates had the highest accuracy (71.4%), and both pace and distance had 42.9% accuracy. It
can be speculated that the equations used within the Nike+ are more appropriate for predicting
energy expenditure.
The current author can recommend the Nike+ Wireless Sport Kit as a somewhat accurate
recreational device for individuals who prefer organizing workouts by energy expenditure costs
(i.e. number of calories expended). Predicting pace and distance accurately with that of actual
values was more difficult. The Nike+ exhibited unsatisfactory performance for the laces (42.8%)

76
and midsole configurations (52.4%). The current author can safely say that the individual
probably does not have to purchase a compatible shoe. The bottom line is that a consumer can
use other shoe brands (other than Nike) and a shoe-laces sensor pouch with the Nike+ device.
However, it is important to know that there are many different styles of sensor pouches
currently available; thus, potentially altering the accuracy of the Nike+ with different sensor
pouches (the current study only used one type of sensor pouch).
Regarding the practicality of the current study, saving money is not the only determinant
(i.e. purchasing a sensor pouch over a Nike+ compatible pair of shoes). Individuals may not
prefer the fit of Nike shoes; thus, using an alternate brand of shoes. Although not without
limitations, the Nike+ offers attractive capabilities that most accelerometers cannot provide.
Unlike many accelerometers that just estimate EE, the Nike+ can also provide estimates of pace
and distance (while simultaneously listening to music). In summary, the Nike+ is a reasonably-
priced piece of equipment; however, research is needed to further explore the accuracy of the
device.

77
LIST OF REFERENCES
Abel, M. (2008). The effect of pedometer tilt angle on pedometer accuracy. International
Journal of Fitness, 4(1), 51-57.
Abel, M. G., Hannon, J. C., Sell, K., Lillie, T., Conlin, G., & Anderson, D. (2008). Validation of the
Kenz Lifecorder EX and Actigraph GT1M accelerometers for walking and running in adults.
Applied Physiology, Nutrition, and Metabolism, 33(6), 1155-1164.
Ainslie, P. N., Reilly, T., & Westerterp, K. R. (2003). Estimating human energy expenditure: A
review of techniques with particular reference to doubly labeled water. Sports Medicine,
33(9), 683-698.
Allen, F. R., Ambikairajah E., Lovell N. H., & Celler, B. G. (2006). An adapted Gaussian mixture
model approach to accelerometry-based movement classification using time-domain
features. Proceedings of the Institute of Electrical and Electronics Engineers, 1, 3600-3603.
Allor, K. M & Pivarnik, J. M. (2001). Stability and convergent validity of three physical activity
assessments. Medicine and Science in Sports and Exercise, 33(4), 671-676.
American College of Sports Medicine. (2010). Guidelines for exercise testing and prescription
(8th ed.). Philadelphia: Lippincott Williams & Wilkins.
Arvidsson, D., Slinde, F., & Larsson, S. (2009). Energy cost in children assessed by multisensory
activity monitors. Medicine and Science in Sports and Exercise, 41(3), 603-611.
Atwater, W. O. & Rosa, E. B. (1899). A new respiration calorimeter and experiments on the
conservation of energy in the human body. The Physical Review, 9(3), 129-163.

78
Bailey, R. C., Olson, J., Pepper, S. L., Porszasz, J., Barstow, T. J., & Cooper, D. M. (1995). The level
and tempo of children’s physical activities: An observational study. Medicine and Science in
Sports and Exercise, 27(7), 1033-1041.
Bao, L. & Intille, S. S. (2004). Activity recognition from user-annotated acceleration data. In
Pervasive Computing (pp. 1-17). Cambridge, MA: Spring Berlin/Heidelberg Publishing.
Bassett, Jr., D. R. (2000). Validity and reliability issues in objective monitoring of physical
activity. Research Quarterly for Exercise and Sport, 71(2), S30-36.
Bassett, Jr., D. R., Ainsworth, B. E., & Leggett, S. R. (1996). Accuracy of five electronic
pedometers for measuring distance walked. Medicine and Science in Sports and Exercise,
28(8), 1071-1077.
Bassett, Jr., D. R., Ainsworth, B. E., & Swartz, A. M., Jr. (2000). Validity of four motion sensors in
measuring moderate intensity physical activity. Medicine and Science in Sports and
Exercise, 32(9), S471-480.
Bassett, Jr., D. R., Howley, E. T., Thompson, D. L., King, G. A., Strath, S. J., McLaughlin, J. E., &
Parr, B. B. (2001). Validity of inspiratory and expiratory methods of measuring gas
exchange with a computerized metabolic system. Journal of Applied Physiology, 91(1),
218-224.
Bassett, Jr., D. R., Mahar, M. T., Rowe, D. A., & Morrow, J. R., Jr. (2008). Walking and
measurement. Medicine and Science in Sports and Exercise, 40(7), S529-536.
Bertram, J. E. A. & Ruina, A. (2001). Multiple walking speed-frequency relations are predicted
by constrained optimization. Journal of Theoretical Biology, 209(4), 445-453.

79
Bonomi, A. G., Goris, A. H. C., Yin, B., & Westerterp, K. R. (2009). Detection of type, duration,
and intensity of physical activity using an accelerometer. Medicine and Science in Sports
and Exercise, 41(9), 1770-1777.
Bouten, C. V., Koekkoek, K. T., Verduin, M., Kodde, R., & Janssen, J. D. (1997). A triaxial
accelerometer and portable data processing unit for the assessment of daily physical
activity. IEEE Transactions on Bio-Medical Engineering, 44(3), 136-147.
Bouten, C. V., Sauren, A. A., Verduin, M., & Janssen, J. D. (1997). Effects of placement and
orientation of body-fixed accelerometers on the assessment of energy expenditure during
walking. Medical and Biological Engineering and Computing, 35(1), 50-56.
Brage, S., Wedderkopp, N., Andersen, L. B., & Froberg, K. (2003). Influence of step frequency on
movement intensity predictions with the CSA accelerometer: A field validation study in
children. Pediatric Exercise Science, 15(3), 277-287.
Byrd-Williams, C., Kelly, L. A., Davis, J. N., Spruijt-Metz, D., & Goran, M. I. (2007). Influence of
gender, BMI and Hispanic ethnicity on physical activity in children. International Journal of
Pediatric Obesity, 2(3), 159-166.
Campbell, K. L., Crocker, P. R. E., & McKenzie, D. C. (2002). Field evaluation of energy
expenditure in women using tritrac accelerometers. Medicine and Science in Sports and
Exercise, 34(10), 1667-1674.
Candau, R., Belli, A., Millet, G. Y., Georges, D., Barbier, B., & Rouillen, J. D. (1998). Energy cost
and running mechanics during a treadmill run to voluntary exhaustion in humans.
European Journal of Physiology and Occupational Physiology, 77(6), 479-485.

80
Cavagna, G. A., Mantovani, M., Willems, P. A., & Musch, G. (1997). The resonant step frequency
in human running. European Journal of Physiology, 434(6), 678-684.
Chen, K. Y., Acra, S. A., Donahue, C. L., Sun, M., & Buchowski, M. S. (2004). Efficiency of walking
and stepping: relationship to body fatness. Obesity Research, 12(6), 982-989.
Chen, K. Y. & Bassett, Jr., D. R. (2005). The technology of accelerometry-based activity monitors:
Current and future. Medicine and Science in Sports and Exercise, 37(11), S490-500.
Christensen, R. R., Hollerbach, J. M., Xu, Y., & Meek, S. G. (2000). Inertial-force feedback for the
treadport locomotion interface. Presence, 9(1), 1-14.
Choi, L., Liu, Z., Matthews, C. E., & Buchowksi, M. S. (2010). Validation of accelerometer wear
and nonwear time classification algorithm. Medicine and Science in Sports and Exercise,
doi: 10.1249/MSS.0b013e3181ed61a3.
Cliff, D. P., Reilly, J. J., & Okely, A. D. (2009). Methodological considerations in using
accelerometers to assess habitual physical activity in children aged 0–5 years. Journal of
Science and Medicine in Sport, 12(5), 557-567.
Conger, S. A., Strath, S. J., & Bassett, Jr., D. R. (2005). Validity and reliability of the FitSense FS-1
speedometer during walking and running. International Journal of Sports Medicine, 26(3),
208-213.
Crocker, P. R. E., Holowachuk, D. R., & Kowalski, K. C. (2001). Feasibility of using the Tritrac
motion sensor over a 7-day trial with older children. Pediatric Exercise Science, 13(1), 70-
81.

81
Crouter, S. E., Schneider, P. L., & Bassett, Jr., D. R. (2005). Spring-levered versus piezo-electric
pedometer accuracy in overweight and obese adults. Medicine and Science in Sports and
Exercise, 37(10), 1673-1679.
Crouter, S. E., Schneider, P. L., Karabulut, M., & Bassett, Jr., D. R. (2003). Validity of 10
electronic pedometers for measuring steps, distance, and energy cost. Medicine and
Science in Sports and Exercise, 35(8), 1455-1460.
Culhane, K. M., O’Connor, M., Lyons, D., & Lyons, G. M. (2005). Accelerometers in rehabilitation
medicine for older adults. Age and Ageing, 34(6), 556-560.
Davis, M. G. & Fox, K. R. (2007). Physical activity patterns assessed by accelerometry
in older people. European Journal of Applied Physiology, 100(5), 581-589.
Dencker, M. & Bo Anderson, L. (2008). Health-related aspects of objectively measured daily
physical activity in children. Clinical Physiology and Functional Imaging, 28(3), 133-144.
De Vries, S. I., Bakker, I., Hopman-Rock, M., Hirasing, R. A., & van Mechelen, W. (2006).
Clinimetric review of motion sensors in children and adolescents. Journal of Clinical
Epidemiology, 59(7), 670-680.
Douglas, C. G. (1911). A method for determining the total respiratory exchange in man. Journal
of Physiology, 42, 17-22.
Duncan J. S., Schofield G., Duncan E. K., & Hinckson E.A. (2007). Effects of age, walking
speed, and body composition on pedometer accuracy in children. Research Quarterly for
Exercise and Sport, 78(5), 420-428.
Dwyer, G. M., Baur, L. A., & Hardy, L. L. (2009). The challenge of understanding and assessing
physical activity in preschool-age children: Thinking beyond the framework of intensity,

82
duration and frequency of activity. Journal of Science and Medicine in Sport, 12(5), 534-
536.
Eston, R. G., Rowlands, A. V., & Ingledew, D. K. (1998). Validity of heart rate, pedometry and
accelerometry for predicting the energy cost of children's activities. Journal of Applied
Physiology, 84(1), 362-371.
Foster, R. C., Lanningham-Foster, L. M., Manohar, C., McCrady, S. K., Nysse, L. J., Kaufman, K. R.,
Padgett, D. J., & Levine, J. A. (2005). Precision and accuracy of an ankle-worn
accelerometer-based pedometer in step counting and energy expenditure. Preventive
Medicine, 41(3-4), 778-783.
Freedson, P. S. & Miller, K. (2000). Objective monitoring of physical activity using motion
sensors and heart rate. Research Quarterly for Exercise and Sport, 71(2), S21-29.
Galvani, C., Andreoletti, L., Besi, M., & Faina, M. (2007). Comparison of activity monitors
accuracy to estimate energy expenditure of daily living activities. Medicine and Science in
Sports and Exercise, 39(suppl. 5), 182.
Gautschi, G. (2002). Piezoelectric sensorics. Berlin, Germany: Springer-Verlag.
Godfrey, A., Conway, R., Meagher, D., & ÓLaighin, G. (2008). Direct measurement of human
movement by accelerometry. Medical Engineering and Physics, 30(10), 1364-1386.
Hartmann, A., Luzi, S., Murer, K., de Bie, R. A., & de Bruin, A. D. (2008). Concurrent validity of a
trunk tri-axial accelerometer system for gait analysis in older adults. Gait and Posture,
29(3), 444-448.
Hawkins, M. S., Storti, K. L., Richardson, C. R., King, W. C., Strath, S. J., Holleman, R. G., & Kriska,
A. M. (2009). Objectively measured physical activity of USA adults by sex, age, and

83
racial/ethnic groups: A cross-sectional study. International Journal of Behavioral Nutrition
and Physical Activity, 6(1), 31-37.
Haymes, E. M. & Byrnes, W. C. (1993). Walking and running energy expenditure estimated by
caltrac and indirect calorimetry. Medicine and Science in Sports and Exercise, 25(12), 1365-
1369.
Herzog, W., Nigg, B. M., Read, L. J., & Olsson, E. (1989). Asymmetries in ground reaction force
patterns in normal human gait. Medicine and Science in Sports and Exercise, 21(1), 110-
114.
Holmes, F. L. (1985). Lavosier and the chemistry of life: An exploration of scientific creativity.
Madison, WI: University of Wisconsin Press.
Huang, S., Li, X., Song, Z., Wang, Y., Yang, H., Che, L., & Jiao, J. (2005). A high performance
micro-machined piezoresistive accelerometer with axially stressed tiny beams. Journal of
Micromechanics and Microengineering, 15(5), 993-1000.
Hunter, I. & Smith, G. A. (2007). Preferred and optimal stride frequency, stiffness, and
economy: changes with fatigue during a 1-h high-intensity run. European Journal of Applied
Physiology, 100(6), 653-661.
Iglowstein, I., Jenni, O. G., Molinari, L., & Largo, R. H. (2003). Sleep duration from infancy to
adolescence: Reference values and generational trends. Pediatrics, 111(2), 302-307.
Jacobi, D., Perrin, A. E., Grosman, N., Doré, M. F., Normand, S., Oppert, J. M., & Simon, C.
(2007). Physical activity-related energy expenditure with the RT3 and TriTrac
accelerometers in overweight adults. Obesity, 15(4), 950-956.

84
Jakicic, J. M., Winters, C., Lagally, K., Ho, J., Robertson, R. J., & Wing, R. R. (1999). The accuracy
of the TriTrac-R3D accelerometer to estimate energy expenditure. Medicine and Science in
Sports and Exercise, 31(5), 747-754.
John, D., Tyo, B., & Bassett, Jr., D. R. (2010). Comparison of four Actigraph accelerometers
during walking and running. Medicine and Science in Sports and Exercise, 42(2), 368-374.
JRank Science & Philosophy Encyclopedia. (2010). Calorimetry – History. Retrieved on March 1,
2010 from http://science.jrank.org/pages/1147/Calorimetry-History.html
Kane, N. A., Simmons, M. C., John, D., Thompson, D. L., & Bassett, Jr., D. R. (2010). Validity of
the Nike + device during walking and running. International Journal of Sports Medicine,
31(2), 101-105.
Kang, M., Caputo, J., Farley, R., Barreira, T., Bettle, J. & Renfrow, M. (2007). Validation of the
Actiheart monitor in the laboratory setting. Medicine and Science in Sports and Exercise,
39(5), S180.
Karatonis, D. M., Narayanan, M. R., Mathie, M., Lovell, N. H., & Celler, B. G. (2006).
Implementation of a real-time human movement classifier using a triaxial accelerometer
for ambulatory monitoring. IEEE Transactions on Information Technology in Biomedicine,
10(1), 156-167.
Katch, F. I., McArdle, W. D., & Katch, V. L. (1998). Antoine Laurent Lavoisier (1743-1794).
Retrieved on March 1, 2010 from
http://www.sportsci.org/news/history/lavoisier/lavoisier.html
Kavanagh, J. J. & Menz, H. B. (2008). Accelerometry: A technique for quantifying movement
patterns during walking. Gait and Posture, 28(1), 1-15.

85
Kavouras, S. A., Sarras, S. E., Tsekouras, Y. E., & Sidossis, L. S. (2008). Assessment of energy
expenditure in children using the RT3 accelerometer. Journal of Sports Sciences, 26(9), 959-
966.
Kern, N., Schiele, B., & Schmidt, A. (2003). Multi-sensor activity context detection for wearable
computing. In Ambient Intelligence (pp. 220-232). Zurich, Switzerland: Spring
Berlin/Heidelberg Publishing.
Kettlekamp, D. B., Johnson, R. J., Smidt, G. L., Chao, E. Y. S., & Walker, M. (1970). An
electrogoniometric study of knee motion in normal gait. Journal of Bone and Joint Surgery,
52(4), 775-790.
King, G. A., Torres, N., Potter, C., Brooks, T. J., & Coleman, K. J. (2004). Comparison of activity
monitors to estimate energy cost of treadmill exercise. Medicine and Science in Sports and
Exercise, 36(7), 1244-1251.
LaPorte, R. E., Kuller, L. H., Kupfer, D. J., McPartland, R. J., Matthews, G., & Caspersen, C. (1979).
An objective measure of physical activity for epidemiologic research. American Journal of
Epidemiology, 109(2), 158-168.
Laurenza, D., Taddei, M., & Zanon, E., (2006). Leonardo’s machines: Da vinci’s inventions
revealed. Cincinnati, OH: David and Charles Publishing.
Le Masurier, G. C. & Tudor-Locke, C. (2003). Comparison of pedometer and accelerometer
accuracy under controlled conditions. Medicine and Science in Sports and Exercise, 35(5),
867-871.

86
Lifson, N., Gordon, G. B., Visscher, M. B., & Nier, A. O. (1949). The fate of utilized molecular
oxygen and the source of the oxygen of respiratory carbon dioxide, studied with the aid of
heavy oxygen. The Journal of Biological Chemistry, 180(2), 803-811.
Lifson N., Gordon, G. B., & McClintock, R. (1955). Measurement of total carbon dioxide
production by means of D218O. Journal of Applied Physiology, 7(6), 704-710.
Lyden, K., Kozey, S. L., Staudenmeyer, J. W., & Freedson, P. S. (2010). A comprehensive
evaluation of commonly used accelerometer energy expenditure and MET prediction
equations. European Journal of Applied Physiology, doi: 10.1007/s00421-010-1639-8.
MacFarlane, D. (2001). Automated metabolic gas analysis systems: A review. Sports Medicine,
31(12), 841-861.
Mannini, A. & Sabatini, A. M. (2010). Machine learning methods for classifying human physical
activity from on-body accelerometers. Sensors, 10(2), 1154-1175.
Matthews, C. E. (2005). Calibration of accelerometer output for adults. Medicine and Science in
Sports and Exercise, 37(11), S512-522.
McGibbon, C. A. & Krebs, D. E. (2001). Age-related changes in lower trunk coordination and
energy transfer during gait. Journal of Neurophysiology, 85(5), 1923-1931.
McIver, K. I., Pfeiffer, K. A., Almeida, J., Dowda, M., Pate, R. & Columbia, S. C. (2005). Validity of
the Actigraph and Actical accelerometers in 3- to 5-year-old children. Pediatric Exercise
Science, 17(1), 97.
McLaughlin, J. E., King, G. A., Howley, E. T., Bassett, Jr., D. R., & Ainsworth, B. E. (2001).
Validation of the COSMED K4 b2 portable metabolic system. International Journal of
Sports Medicine, 22(4), 280-284.

87
Meijer, G. A. L., Westerterp, K. R., Verhoeven, F. M. H., Koper, H. B. M., & ten Hoor, F. (1991).
Methods to assess physical activity with special reference to motion sensors and
accelerometers. IEEE Transactions on Bio-Medical Engineering, 38(3), 221-229.
Menz, H. B., Lord, S. R., St. George, R., & Fitzpatrick, R. C. (2004). Walking stability and
sensorimotor function in older people with diabetic peripheral neuropathy. Archives of
Physical Medicine and Rehabilitation, 85(2), 245-252.
Moe-Nilssen, R. (1998). A new method for evaluating motor control in gait under real-life
environmental conditions. Part 2: Gait analysis. Clinical Biomechanics, 13(4-5), 328-335.
Montoye, H. J., Washburn, R., Servais, S., Ertl, A., Webster, J. G., & Nagle, F. J. (1983).
Estimation of energy expenditure by a portable accelerometer. Medicine and Science in
Sports and Exercise, 15(5), 403-407.
Morris, J. R. W. (1973). Accelerometry – A technique for the measurement of human body
movements. Journal of Biomechanics, 6(6), 729-736.
Murphy, S. L. (2009). Review of physical activity measurement using accelerometers in older
adults: Considerations for research design and conduct. Preventive Medicine, 48(2), 108-
114.
Nyberg, G. A., Nordenfelt, A. M., Ekelund, U., & Marcus, C. (2009). Physical activity patterns
measured by accelerometry in 6- to 10-yr-old children. Medicine and Science in Sports and
Exercise, 41(10), 1842-1848.
Oliver, M., Schofield, G. M., & Kolt, G. S. (2007). Physical activity in preschoolers: Understanding
prevalence and measurement issues. Sports Medicine, 37(12), 1045-1070.

88
Papazoglou, D., Augello, G., Tagliagerri, M., Savia, G., Marzullo, P., Maltezos, E., & Liuzzi, A.
(2006). Evaluation of a multisensor armband in estimating energy expenditure in obese
individuals. Obesity, 14(12), 2217-2223.
Pfeiffer, K., McIver, K., Dowda, M., Almeida, M., & Pate, R. (2006). Validation and calibration of
the Actical accelerometer in preschool children. Medicine and Science in Sports and
Exercise, 38(1), 152-157.
Pober, D. M., Staudenmayer, J., Raphael, C., & Freedson, P. S. (2006). Development of novel
techniques to classify physical activity mode using accelerometers. Medicine and Science in
Sports and Exercise, 38(9), 1626-1634.
Puyau, M. R., Adolph, A. L., Vohra, F. A., Zakeri, I., & Butte, N. F. (2004). Prediction of activity
energy expenditure using accelerometers in children. Medicine and Science in Sports and
Exercise, 36(9), 1625-1631.
Rappaport, R. (1963). Antoine-Laurent Lavosier – A biographical sketch. The Journal of
Nutrition, 79(1), 1-8.
Rausdepp, L. & Pall, P. (1998). Reproducibility and stability of physical activity in children.
Pediatric Exercise Science, 10(4), 320–326.
Reilly, J. J., Coyle, J., Kelly, L., Burke, G., Grant, S., & Paton, J. Y. (2003). An objective method for
measurement of sedentary behavior in 3- to 4-year olds. Obesity Research, 11(10), 1155-
1158.
Reilly, J. J., Penpraze, V., Hislop, J., Davies, G., Grant, S., & Paton, J. Y. (2008). Objective
measurement of physical activity and sedentary behavior: Review with new data. Archives
in Disease in Childhood, 93(7), 614-619.

89
Rowlands, A. V. & Eston, R. G. (2005). Comparison of accelerometer and pedometer measures
of physical activity in boys and girls, ages 8-10 years. Research Quarterly for Exercise and
Sport, 76(3), 251-257.
Rowlands, A. V., Stone, M. R., & Eston, R. G. (2007). Influence of speed and step frequency
during walking and running on motion sensor output. Medicine and Science in Sports and
Exercise, 39(4), 716-727.
Sallis, J. F., Buono, M. J., Roby, J. J., Carlson, D., & Nelson, J. A. (1990). The Caltrac
accelerometer as a physical activity monitor for school-age children. Medicine and Science
in Sports and Exercise, 22(5), 698-703.
Saunders, J., Inman, V., & Eberhart, H. (1953). The major determinants in normal and
pathological gait. Journal of Bone and Joint Surgery, 35(3), 543-558.
Schneider, P. L., Crouter, S. E., & Bassett, Jr., D. R. (2004). Pedometer measures of free-living
physical activity: Comparison of 13 models. Medicine and Science in Sports and Exercise,
36(2), 331-335.
Shepherd, E. H., Toloza, E., McClung, C. D., & Schmalzried, T. P. (1999). Step activity monitor:
Increased accuracy in quantifying ambulatory activity. The Journal of Bone and Joint
Surgery, 17(5), 703-708.
Skinner, J. S. (2006). Aging for exercise testing and exercise prescription. In Skinner, J. S. (Ed.),
Exercise testing and exercise prescription for special cases: Theoretical basis and clinical
application. Philadelphia, PA: Lippincott, Williams & Williams, pp. 85-89.
Speakman, J. R. (1998). The history and theory of the doubly labeled water technique. American
Journal of Clinical Nutrition, 68(4), S932-938.

90
Sutherland, D. H. & Hagy, J. L. (1972). Measurement of gait movements from motion picture
film. Journal of Bone and Joint Surgery, 54(4), 787-797.
Swartz, A. M., Bassett, Jr., D. R., Moore, J. B., Thompson, D. L., & Strath, S. J. (2003). Effects of
body mass index on the accuracy of an electronic pedometer. International Journal of
Sports Medicine, 24(8), 588-592.
Tanaka, C., Tanaka, S., Kawahara, J., Midorikawa, T. (2007). Triaxial accelerometry for
assessment of physical activity in young children. Obesity, 15(5), 1233-1241.
Terrier, P., Aminian, K., & Schutz, Y. (2001). Can accelerometry accurately predict the energy
cost of uphill/downhill walking? Ergonomics, 44(1), 48-62.
Togawa, T., Tamura, T., & Öberg, Å. (1997). Biomedical transducers and instruments. Boca
Raton, Fl: CRC Press LLC.
Toschke, J. A., von Kries, R., Rosenfeld, E., & Toschke, A. M. (2007). Reliability of physical activity
measures from accelerometry among preschoolers in free-living conditions. Clinical
Nutrition, 26(4), 416-420.
Troiano, R. P. (2006). Translating accelerometer counts into energy expenditure: Advancing the
quest. Journal of Applied Physiology, 100(4), 1107-1108.
Troiano, R. P., Berrigan, D., Dodd, K. W., Mâsse, L. C., Tilert, T., & McDowell, M. (2008). Physical
activity in the United States measured by accelerometer. Medicine and Science in Sports
and Exercise, 40(1), 181-188.
Trost, S. G., Pate, R. R., Sallis, J. F., Freedson, P. S., Taylor, W. C., Dowda, M., & Sirard, J. (2002).
Age and gender differences in objectively measured physical activity in youth. Medicine
and Science in Sports and Exercise, 34(2), 350-355.

91
Trost, S. G., Ward, D. S., Moorehead, S. M., Watson, P. D., Riner, W., & Burke, J. R. (1998).
Validity of the computer science and applications (CSA) activity monitor in children.
Medicine and Science in Sports and Exercise, 30(4), 629-633.
Tudor-Locke, C. E. & Myers, A. M. (2001). Methodological considerations for researchers and
practitioners using pedometers to measure physical (ambulatory) activity. Research
Quarterly for Exercise and Sport, 72(1), 1-12.
Tudor-Locke, C. E., Williams, J. E., Reis, J. P., & Pluto, D. (2002). Utility of pedometers for
assessing physical activity: Convergent validity. Sports Medicine, 32(12), 795-808.
Van Caekenberghe, I., De Smet, K., Segers, V., & De Clercq, D. (2010). Overground vs. treadmill
walk-to-run transition. Gait & Posture, 31(4), 420-428.
Walter, P. L. (1999). Review: Fifty years plus of accelerometer history for shock and vibration
(1940–1996). Shock and Vibration, 6(4), 197-207.
Welk, G. J. (2005). Principles of design and analyses for the calibration of accelerometry-based
activity monitors. Medicine and Science in Sports and Exercise, 37(11), S501-511.
Welk, G. J., Almeida, J., & Morss, G. (2003). Laboratory calibration and validation of the
Biotrainer and Actitrac activity monitors. Medicine and Science in Sports and Exercise,
35(6), 1057-1064.
Welk, G. J., Blair, S. N., Wood, K., Jones, S., & Thompson, R. W. (2000). A comparative
evaluation of three accelerometry-based physical activity monitors. Medicine and Science
in Sports and Exercise, 32(suppl. 9), 489-497.

92
Welk, G. J., Schaben, J. A., & Morrow, Jr., J. R. (2004). Reliability of accelerometry-based activity
monitors: A generalizability study. Medicine and Science in Sports and Exercise, 36(9), 1637-
1645.
Westerterp, K. R. (2008). Physical activity as determinant of daily energy expenditure.
Physiology and Behavior, 93(4-5), 1039-1043.
Westerterp, K. R. (2009). Assessment of physical activity: A critical appraisal. European Journal
of Applied Physiology, 105(6), 823-828.
Williams, E. F. (Eds.). (1908). The popular science monthly (Cattell, J. M.). Vol 72. New York: The
Science Press.
Window, A. L. (1992). Strain gauge technology (2nd Ed.). London: Elsevier Science Publishers
LTD.
Yang, C. C. & Hsu, Y. L. (2010). A review of accelerometry-based wearable motion detectors for
physical activity monitoring. Sensors, 10(8), 7772-7788.
Zhang, K., Werner, P., Sun, M., Pi-Sunyer, X. F., & Boozer, C. N. (2003). Measurement of human
daily physical activity. Obesity Research, 11(1), 33-40.
APPENDIX:
WORKING MATERIAL
Health/Activity Status Questionnaire
Please complete the following questions as accurately as possible. Date of Birth: / / Age: yr.

93
Average number of hours worked per week: Less than 20 20-40 41-60 over 60 More than 25% of time spent at work/school is: (mark all that apply) Sitting at a desk Lifting or carrying loads Standing Walking Driving Medical History Please mark any who have died of heart attack before age 50 years: Father Mother Grandparent Brother Sister Please mark any who have had a stroke, blood clots, or pulmonary embolism: Father Mother Grandparent Brother Sister
Specify:
Date of your last physical exam: / / Date of your last physical fitness test: / / Please mark and date all surgeries you have had: Back / Heart / Kidney / Eyes / Joint / Neck / Ears / Hernia / Lung / Hysterectomy / Other / Please mark all of the following for which you have been diagnosed or treated by a physician or health professional: Alcoholism Emphysema Kidney problems Anemia, sickle cell Epilepsy Liver disease Anemia, other Eye problems Lung disease Asthma Gout Mental illness AIDS Hearing loss Neck strain Back Strain Heart problem Obesity Bleeding trait Heart murmur Phlebitis Bronchitis, chronic Hepatitis Rheumatoid arthritis Cancer High blood pressure

94
Cirrhosis, liver Hypoglycemia Stroke Concussion High Cholesterol Thyroid problem Congenital defect Infectious mononucleosis Ulcer Diabetes Joint problems Other Please mark all medications/supplements taken during the past 6 months: Blood thinner Epilepsy medication Other Diabetic Heart medication Other Diuretic High blood pressure medication Other Insulin Hormones Other Please mark any of the following symptoms you have had recently: Abdominal pain Frequent urination Arm or shoulder pain Leg pain/numbness Breathless with slight exertion Low blood sugar Blurred vision Low-back pain Blood in urine Palpitation or fast heart beat Burning sensations Shortness of breath Chest pain Significant emotional problem Cough up blood Swollen joints Difficulty walking Unusual fatigue with normal Dizziness activity Feel faint Weakness in arms Health-Related Behaviors Do you smoke? Yes No If yes, How much do you smoke per day? Cigarettes: 40 or more 20-39 10-19 1-9 Cigar or pipe only: 5 or more or any inhale Less than 5, none inhaled
Do you currently exercise regularly? Yes No What is your primary mode of exercise?

95
How long have you been participating in your current exercise program? How many days per week do you engage in your primary form of exercise? 0 1 2 3 4 5 6 7 How many days per week do you do interval training? 0 1 2 3 4 5 6 7 What is your average weekly mileage during the last 3 months? What is your average weekly mileage during the last month? What other forms of exercise do you participate in regularly? How many days per week? 1 2 3 4 5 6 7 1 2 3 4 5 6 7 1 2 3 4 5 6 7 1 2 3 4 5 6 7 1 2 3 4 5 6 7 On average, what is the length of a typical training session? ________________ Are you currently on a diet or program specifically designed to change your body weight? Yes No During the past 3 months have you been on a diet or program specifically designed to change your body weight? Yes No During the past 3 months has your body weight changed more than 4 pounds? Yes No
University of Texas at El Paso (UTEP) Institutional Review Board Informed Consent Form for Research Involving Human Subjects
Protocol Title: Validating the Nike+ Wireless Sport Kit and the Adidas miCoach Pacer system for
measuring speed, distance, and caloric expenditure in an indoor and outdoor environment.
Principal Investigator: Derek J. Acosta & Sean T. Miller
UTEP: Kinesiology

96
Authorization Statement
I have read each page of this paper about the study (or it was read to me). I know that being in this study is voluntary and I choose to be in this study. I know I can stop being in this study without penalty. I will get a copy of this consent form now and can get information on results of the study later if I wish.
Participant Name: Date:
Participant Signature: Time:
Consent form explained/witnessed by:
Signature
Printed name:
Date: Time:

97
Validating the Nike+ Wireless Sport Kit for
estimating pace, distance, and energy
expenditure in an indoor environment
Derek J Acosta
Date: Monday, August 1, 2011
Location: 136 CHSSON
Time: 1:00PM
MASTER OF SCIENCE THESIS DEFENSE

98
CURRICULUM VITA
Derek Acosta was born in Austin, Texas. The first child of Robert and Teresa Acosta, he
graduated from McNeil High School in Austin, TX in 2001, and entered The University of Texas
at Austin in the summer of 2001. After a year at the University, and a year at the Community
College, Derek transferred to The University of Texas at El Paso in 2004. Upon arriving to El
Paso, Derek found a job with the Institute for Policy and Economic Development (at UTEP) as a
part-time student job (lasting three years). He also worked as a Physical Therapy Technician
from August, 2007 – August, 2008. Upon finishing his Bachelors in Kinesiology in the spring of
2007, he then entered the Kinesiology Masters Program for the fall 2007 semester. During his
Masters, he was employed as a Graduate Teaching Assistant for various courses throughout the
Kinesiology curriculum. During his graduate studies, he conducted a thesis study with the
support of a College of Health Sciences Research Fund Award. His passion involves issues with
wellness and prevention.