Nike-Investment-Report.pdf - Alexis Newkirk
35
FY18/19 Strategic Investment Report Alexis Newkirk Angele Cherbonnier Anteneh Lisan Brogan Brasseaux Emily Fisher A Nike Women: Casey.
-
Upload
khangminh22 -
Category
Documents
-
view
0 -
download
0
Transcript of Nike-Investment-Report.pdf - Alexis Newkirk

FY18/19 Strategic Investment ReportAlexis NewkirkAngele CherbonnierAnteneh LisanBrogan BrasseauxEmily Fisher
ANike Women: Casey.

Introduction External Assessment Internal Assessment Financial Analysis Appendix
FY18/19 Strategic Investment Report 1
INTRODUCTION3 Executive Summary
EXTERNAL ASSESSMENT5 Porter’s Five Forces6 Opportunities and Threats7 Macro Forces8 Key Success Factors10 Bounce Back Factor
INTERNAL ASSESSMENT13 Competitive Advantages15 The New Retail16 Strengths and Weaknesses
FINANCIAL ANALYSIS18 Revenue20 Income Statement22 Balance Sheet
FINAL RECOMMENDATION
APPENDIX28 Porter’s Five Forces Cont.29 Macro Forces Cont.31 Works Cited33 Photography Credits
Final Recommendation
26 Why You Should Invest

Introduction External Assessment Internal Assessment Financial Analysis Appendix
FY18/19 Strategic Investment Report 2
Final Recommendation
INTRODUCTION
BRed Sweats.
Introduction External Assessment Internal Assessment Financial Analysis Appendix
FY18/19 Strategic Investment Report 3
EXECUTIVE SUMMARY
NIKE, INC. DESIGNS, DEVELOPS, MARKETS AND SELLS ATHLETIC FOOTWEAR, APPAREL, EQUIPMENT, ACCESSORIES AND SERVICES WORLDWIDE.
Since its establishment in 1964, Nike has grown from its start as Blue Ribbon Sports into the market leader for global athletic wear and equipment.i Rising to the top doesn’t come without challenges or criticisms, and Nike has persisted using strong public relations and research and development teams to develop it into a performance and pop culture trend maker. A culture of innovation has been prevalent from its start, when founder and former University of Portland track coach, Bill Bowerman, borrowed his family’s waffle iron one morning to create the prototype for what is now the famous Nike Waffle Outsole, which can be found on shoes like the Nike Air Force One and Air Max.ii Throughout this report, we will explore the internal environment, external environment and financial health of Nike, as well as how their roots have guided them into the global phenomenon they are today. These guiding factors will paint a vivid picture of why Nike is in a good position to enhance their shareholder’s wealth and why they are a good investment.
Final Recommendation
COMPANY PORTFOLIO
NIKE, Inc. portfolio brands include the NIKE brand, Jordan Brand, Hurley, and Converse, each with a powerful connection to consumers.iii
NIKE Brand is focused on performance athletic footwear, apparel, equipment, accessories and services across a wide range of sport categories, amplified with sport-inspired sportswear products carrying the Swoosh trademark, as well as other NIKE Brand trademarks.iii
Jordan Brand designs, distributes, and licenses athletic and casual footwear, apparel, and accessories perdominantly focused on basketball, using the Jumpman trademark.iii
Hurley designs and distributes a line of action sports and youth lifestyle apparel and accessories under the Hurley trademark.iii
Converse designs, distributes, and licenses casual sneakers, apparel, and accessories under the Converse, Chuck Taylor, All Star, One Star, Star Chevron, and Jack Purcell trademarks.iii

Introduction External Assessment Internal Assessment Financial Analysis
FY18/19 Strategic Investment Report 4
Final Recommendation
EXTERNALASSESSMENT
CNike Women: Gilda.

Introduction External Assessment Internal Assessment Financial Analysis Appendix
FY18/19 Strategic Investment Report 5
PORTER’S FIVE FORCES
For Nike to have achieved their unmatched success throughout the years, it requires an understanding of the dominant industry they compete in, which is the athletic footwear industry. This can be done by an analysis of the Porter’s Five Forces, where a complete summary can be found in the appendix. Two of the Porter’s Five Forces are key to understanding how Nike and other players in the industry operate.
THREAT OF COMPETITIVE RIVALRY
The threat of competitive rivalry is the strongest of the five forces.iv The biggest players in the industry include Nike, Adidas, ASICS, and Puma, and all of these companies compete in product development and related diversification to provide new options for consumers, customer service and quality, and aggressive sports marketing through advertising campaigns and endorsements.v The small number of large players leads to the taking of market share from one another, and can lead to process being driven down to maintain a more competitive edge.
THREAT OF NEW ENTRANTS
The threat of new entrants is one of the weakest forces due to the high barriers to entry. The brands in this industry are highly differentiated amongst one another and therefore have significant brand recognition. The existing companies have managed to make customers perceive their products as unique, which has, in turn, increased customer loyalty and switching costs. These costs are measured by money, time and uncertainty, so while newer entrants may have cheaper options, consumers may be more hesitant to try their products in terms of quality, customer service, availability and customization.vi These firms also have large capital investments, namely in operations, research and development, and marketing/advertising. Newer
Final Recommendation
entrants may not have the resources to invest on a similarly large-scale. Economies of scale also serve as a barrier to entry as these existing companies produce on a larger scale to reduce their costs per item. They are dedicated to newer technology for R&D, and access to various suppliers help them achieve this. Newer entrants may not have the resources to produce on this scale, and if they do, they may not have the customer base to purchase the products.v On the demand-side of economies of scale, consumers in the athletic footwear industry seek to be a part of a larger community so as to stay connected with other patrons and enthusiasts through digital spaces, such as mobile fitness apps and blogs. Newer entrants will not have these established communities which consumers may perceive as being a less reputable brand.
The extensive distributions channels that recognized brands have are also not readily available to entrants. The top competitors are not only able to bring their products directly to the consumer
in more personal ways through new initiatives, but they also utilize their own retail stores as well as third-party retailers, such as Foot Locker and Dick’s Sporting Goods.vii They also have been able to sponsor individual athletes, as well as collegiate and professional athletic teams. For instance, both Nike and Reebok (owned by Adidas) have been official NFL uniform sponsors, and able to sell official licensed NFL apparel.viii This robust analysis of the industry helps Nike to navigate their role as a global leader in the industry.
DNike Running ‘14 - ‘18.

Introduction External Assessment Internal Assessment Financial Analysis Appendix
FY18/19 Strategic Investment Report 6
OPPORTUNITIES AND THREATS
LARGE WOMEN’S MARKET
Looking externally at Nike’s environment, there are plenty of opportunities that Nike can, and is in the process to, take advantage of. Improving Nike’s product mix to focus more heavily on women’s apparel is where the company looks for new pockets of growth. Although women’s apparel only represents less than 25% of Nike’s total sales, the US women’s market for shoes and clothing is larger than men’s. The company’s investment is not just recognized on the income statement, however. Nike has established an outreach program where female athletes are sent to middle and high schools to speak to young girls about, and encouraging, their involvement in sports.ix
SUSTAINABILITY INNOVATION
More opportunities come in the form of utilizing their ability to foster creative and innovative ideas to increase sustainability efforts. This opportunity could prove Nike to be a leader within and across industries during a time where it is imperative for companies to incorporate corporate social responsibility into their strategy.x
EMERGING MARKETS
A third opportunity arises in emerging markets. Increasing presence in Asian and South American countries has potential to offset saturation in North America and build upon its strong global brand recognition.
Final Recommendation
EGym, FWorldwide, GBars, HTheater Masks, IBrainstorm, JExchange.
COUNTERFEIT GOODS
While Nike seeks many opportunities, the external environment is also home to threats that the company is subject to. A downside to Nike being the most valuable sports brand in the world is the threat of Nike counterfeit goods. This can affect the overall brand image and dilute brand equity while leading to reduced revenue generation and lower profits.xi
RAPIDLY CHANGING CONSUMER PREFERENCES
Other threats include the inability to anticipate consumer preferences and develop products based on the constantly changing consumer demand. This threat hinders revenues and profits as well.
FOREIGN EXCHANGE LOSSES
As Nike operates globally, the company is subject to the threat currency and foreign exchange risk. This translates into potential loss that could result from fluctuating foreign exchange rates due to the company’s exposure to foreign currency. While this is a major threat for most global companies, Nike does take action to mitigate the threat by operating a foreign currency adjustment program. The program manages this risk by paying overseas factories in a basket of currencies that are adjusted for rate fluctuations.xii

Introduction External Assessment Internal Assessment Financial Analysis Appendix
FY18/19 Strategic Investment Report 7
MACRO FORCES
Final Recommendation
Six macroeconomic factors that affect all businesses are political, economic, social, technological, legal and environmental. While these factors are all important, the most pressing of them are constantly changing as the world evolves and a company reacts. At this time, though all macro forces are inevitably interconnected, the factors that we believe most affect Nike’s business are political, economic and legal. While social, tech and environmental factors are also important, at this time they are seen as connected subsets of our three main macro factors discussed.
POLITICAL
As a global company, the ever-evolving political environment is of the most importance to Nike’s long-term and short-term success. Political macro factors include being subject to changes in tax and manufacturing laws and imports and exports.xiii Currently, changes in U.S. trade policies under the Trump administration, including new and potential tariffs or penalties on imported goods, may negatively affect Nike because of their reliance on foreign production activities. These political discussions and potential retaliatory actions by affected countries could affect Nike’s cost structure. These factors implicating international operations are usual and constant risks of doing business abroad. This includes changes in foreign and domestic trade policies, increase in import duties, anti-dumping measures, trade restrictions, quotas, safeguard measures, restrictions on the transfer of funds, and economic instability and terrorism.xii
ECONOMIC
Secondly, economic factors such as the threat of market collapse, available resources to explore emerging markets, and the fluctuating cost of labor in other countries make it imperative that Nike mitigates risk when it comes to converting currency and making strategic decisions on expansionary projects. As a global company, Nike conducts transactions in multiple currencies, which increases their exposure to fluctuations in currency exchange rates relative to the U.S. dollar. Looking at this risk, Nike admits that “continued volatility in the markets and exchange rates for foreign currencies and contracts in foreign currencies, including in response to certain policies advocated or implemented by the U.S. presidential administration, could have a significant impact on our reported operating results and financial condition.”xii
LEGAL
Looking at legal macro factors, tax breaks and legal repercussions for
marketing techniques are among the most crucial public events surrounding Nike. These risks are difficult to predict and prevent, however Nike monitors protectionist trends and developments throughout the world that may materially impact the industry and engages in administrative and judicial processes to mitigate trade restrictions. Nike is “actively monitoring actions that may result in additional anti-dumping measures and… monitoring for and advocating against other impediments that may limit or delay customs clearance for imports of footwear, apparel and equipment.”xii
Mixing legal and social factors, Nike admits, “Negative claims or publicity involving us, our products or any of our key employees’ endorsers, sponsors or suppliers could seriously damage our reputation and brand image, regardless of whether such claims are accurate. Social media, which accelerates and potentially amplifies the scope of negative publicity, can increase the challenges of responding to negative claims. Adverse publicity about regulatory or legal action against us, or by us, could also damage our reputation and brand image, undermine consumer confidence in us and reduce long-term demand for our products, even if the regulatory or legal action is unfounded or not material to our operations.”xii These damages resulting from social and legal repercussions have a direct effect on product sales, and therefore Nike’s financial condition as a whole could be adversely affected. However, we will see later on how Nike mitigates these risks and consistently bounces back in the face of adversity.

Introduction External Assessment Internal Assessment Financial Analysis Appendix
FY18/19 Strategic Investment Report 8
KEY SUCCESS FACTORS
For this industry the key factors to success rely heavily on the firm’s ability to manage outside factors. As stated previously, this industry is differentiated, meaning that brand loyalty is important to success. In order to keep loyalty, brands must be able to manage both the brand identity and the time to market. These two concepts are major factors for success, but in order to support these two other factors come to play. Those two factors are human capital retention and global distribution capabilities. Finally, a new factor is becoming necessary across the industry which can be defined by the direct-to-consumer market.
SPONSORSHIPS
Leading brands in this industry have become successful by partnering and sponsoring with different teams and athletes. This has allowed these brands
Final Recommendation
the unique ability of association with sports and athletes. In this industry, the consumer draws links between their favorite teams and idol athletes to these brands and makes purchasing decisions based on those associations. Nike and others in the industry must manage the brand image by managing their association with these athletes and teams. The better the athlete or team performs, the better the brand looks in the eyes of the consumers. Ideally, if a brand can secure successful partnerships across multiple sports, it will give the impression that these athletes success is due to the equipment worn. Brands in this industry make their money by selling products to the everyday athlete, and if they can install this ideology into the customer then they have won them over. However, the association that comes with partnerships is a double-edged sword in that these brands are now associating their image
directly with that of an individual person who may or may not have the same core values as that of the brand. In some cases, these athletes do not draw the best attention to themselves or the partner brands, and this does affect the consumer’s perception of the brands. Therefore, being able to manage these partnerships is a two-fold factor. On one hand the brand wants to associate itself with the athlete’s performance, but on the other the brand must be able to keep the association separate from the athlete’s personal life.
TIME TO MARKET
Time to market is a factor just as important as management of the brand perception. To compete consistently in this industry a firm must be able to identify new trends, re-produce them, then market and sell these trends all in a timely matter. As Nike puts it, “research,
KSerena Williams v. Carina Witthoeft at the 2018 U.S. Open.

design and development efforts are key factors” to their success.xii Identification of new trends in itself is a major factor as the difference between a trend and a fad is a nuanced concept, but the ability to tell the difference is the difference between success and failure. In addition to the subtle difference between fads and trends these firms are also dealing with the fact that an actual trend lifespan is shortened daily due to internet availability. The speed of dissemination caused by the internet is leading to an ever growing need to identify and differentiate trends faster and faster. A mastery of this is only the first step in this key factor, as turning a trend into a mass-produced product is an undertaking in and of itself. Firms must be able to produce these trends quickly, but also profitably. Not every trend can be mass produced and those that can may not even be a profitable undertaking, so overall the firm must be able to identify those that can. Once these concepts are identified the next steps are marketing, distribution and sale which are all difficult themselves. These last portions must all be done within a short time frame as the trends have a limited time in which they are at peak popularity. With time to market, firms are not only competing against the lifespan of the concept but are also competing against each other. The fastest brands at getting a concept to market are the ones that can enjoy the most revenues from the concept before the imitations are produced. The firm that is quickest from trend spotting to sales has a major advantage over the rest of the competition.
GLOBAL DISTRIBUTION
Two other major factors that can lead to success are global distribution capabilities and human capital retention. As mentioned above, time to market is an extremely important factor, but this also relies on the firm’s ability to deliver the product in a timely manner.
Introduction External Assessment Internal Assessment Financial Analysis Appendix
FY18/19 Strategic Investment Report 9
KEY SUCCESS FACTORS
Final Recommendation
Successful firms have developed a global infrastructure of distribution facilities and know that the operation of these facilities is extremely important to operating their overall strategies. These networks are not built overnight, and instead have been refined over time to become lean operations. Continued research and capital dedicated to improving these facilities is key to continuing to compete successfully.
RECRUITMENT
Another secondary factor is a firm’s ability to retain quality personnel. Nike explains it as “Our ability to recruit, retain and engage our personnel sufficiently, both to maintain our current business and to execute our strategic initiatives.”xii This retention is important as managing the brand image is not an easy undertaking, and past experience here can be extremely beneficial. The same can be said for those employees that are able to identify trends, as again this is not an easy task, especially when done without past experience. The need to retain these high-quality personnel is one way to make sure your firm stays ahead of the competition. This becomes even more important when you think about the fact that when a firm loses one of these employees it is likely them using their expertise to benefit a competitor.
EMERGING SUCCESS FACTOR: DIRECT-TO-CONSUMER
A final emerging key success factor in this industry is the ability to sell directly to consumers. As mentioned previously, this industry is moving more and more towards direct brand interaction. This includes the use of websites, apps and direct ownership of retail locations. As this trend continues, the ability of a firm to excel at direct-to-consumer strategy is going to play a more important role. This industry in the past was defined by third party retail sellers doing the actual leg work, but now the third-party industry is in decline. The firms in this industry are forced to find ways to skip over the third party and sell directly to the customer. Currently firms are using apps, websites, and owned retail locations to do this. The firm that manages these selling tools best will take an advantage within the industry.

BOUNCE BACK FACTOR
TIGER WOODSWithin this industry managing your brand image is a key success factor, and Nike has been one of the best at doing this. This can be seen in their ability to continuously sign new athletes and their consistent dominance of college football, NFL, and recent NBA sponsorship agreements. With that being said, Nike has had its fair share of controversial moments. These situations force Nike to show why it is the best at managing their brand, but they do much more than just manage the situation. Nike has a unique ability to bounce back quickly from these situations. When a controversial situation arises, a firm will typically see declines in many ways, including sales, perception and stock value. Like most other brands, Nike sees its fair share of controversies and has seen these declines as well, and sometimes much more aggressively.
Introduction External Assessment Internal Assessment Financial Analysis Appendix
FY18/19 Strategic Investment Report 10
Final Recommendation
LTiger Woods wins the 2019 Masters.
One example of this was when professional golfer Tiger Woods had a DUI and an infidelity whirlwind scandal that lasted nearly a month. Woods was one of the biggest names in sports at the time, and the face of the Nike Golf product line. The Tiger Woods incidents occurred in late 2009 and sent his image, as well as any brand associated with him, into disarray. Nike later estimated that $1.7 million in sales and nearly 105,000 customers had been lost during the course of the scandal.xiv Stock prices plummeted as Nike and other brands debated exactly what to do with Woods. Nike decided to remain steadfast with Woods, claiming they sponsored him for his on-the-field performance and not his off-the-field antics. The situation hit rock bottom when fellow sponsor Gatorade pulled their sponsorship, but still Nike remained. Nike relied on their ability to manage their brand and worked on
ways to improve both theirs and Tiger’s image. Surprisingly, within a month of the scandal being announced, Nike stock began to pick up, and before the end of the year had returned to pre-scandal levels. Tiger went on to struggle for a few years, but in 2019 returned to win his 5th masters. The estimated exposure of the original airing of his win is estimated to have received $22 million dollars’ worth of exposure.xv
NIKE STOCK PRICE: NOVEMBER 3, 2009 - DECEMBER 23, 2009xvi
CAR CRASH AND BEGINNING OF SCANDAL
GATORADE ENDS DRINK CONTRACT AND WOMAN
SPEAKS OUT ON TV
TIGER ANNOUNCES INDEFINITE LEAVE FROM GOLF
RECOVERY BEGINS IN LESS THAN ONE MONTH

Introduction External Assessment Internal Assessment Financial Analysis Appendix
FY18/19 Strategic Investment Report 11
Final Recommendation
MNike Colin Kaepernick Billboard.
NIKE STOCK PRICE: AUGUST 31, 2018 - SEPTEMBER 11, 2018xviii
NIKE ANNOUNCES SIGNING KAEPERNICK RECOVERY BEGINS WITHIN
DAYS OF AIRING
STOCK HITS ALL-TIME HIGH (AT THE TIME)
BOUNCE BACK FACTOR
COLIN KAEPERNICKA second situation in which Nike was miraculously able to bounce back was in their signing of controversial athlete Colin Kaepernick. In early September 2018, Nike announced the signing of Colin Kaepernick, the former NFL star who had controversially begun protesting the national anthem.
This was an extremely polarizing decision and led to many critics taking extreme measures to show their disapproval, including burning of Nike gear and boycotting of the brand. Later it would be revealed that Nike customer purchase likelihood dropped from 61% to 49% for consumers aged 65+.xvii
Nike again saw a massive dip in stock price immediately after the announcement but went to work managing their image. The decision itself had been made to pair with the new Nike Direct initiative and the companies desire to promote what was important to their core customers. This paid off as the brand saw consumer purchase likelihood in the 18-29 age group increase to over 70%. Sales grew 31% over the Labor Day weekend, and what seemed like a huge mistake had clearly turned around.xvii
As with Tiger and many others before, the stock found a way to bounce back to pre-controversy prices, and this time did so in less than a week. Ultimately, both of these examples not only show Nike’s keen ability to manage its brand image, but also show the unique quality of Nike stock being able to bounce back with extreme speed. This ability alone shows that Nike is surprisingly resilient to public perception, and is one reason why Nike is a company that should be invested in.
AD PREMIERES DURING NFL KICKOFF

Introduction External Assessment Internal Assessment Financial Analysis
FY18/19 Strategic Investment Report 12
Final Recommendation
INTERNALASSESSMENT
NXavier Taylor for Nike.
Appendix

Introduction External Assessment Internal Assessment Financial Analysis Appendix
FY18/19 Strategic Investment Report 13
COMPETITIVE ADVANTAGES
Final Recommendation
Nike is known as the top athletic footwear and apparel brand in the world, and they have been able to gain and maintain that reputation through a clearly defined vision, mission, and overarching strategy that link with one another. Their vision is to “Bring inspiration and innovation to every athlete in the world.” Nike believes that everyone with a body is an athlete, and that they can appeal to every type of person, from a casual fitness enthusiast to the world’s top athletes. They do this by working toward their goals of making innovative products that are sustainable and by fostering a creative and diverse global work team to stay at the forefront of the industries they compete in while catering to the needs of communities around the world.xix
These goals are achieved by Nike’s central strategy: to produce products that are deemed as “must-haves” in the public eye, to build deep connections with their customers, and deliver personal experiences through both digital and retail spaces.
OUR MISSION: BRING INSPIRATION AND INNOVATION TO EVERY ATHLETE*IN THE WORLD.*If you have a body, you are an athlete.

Introduction External Assessment Internal Assessment Financial Analysis Appendix
FY18/19 Strategic Investment Report 14
COMPETITIVE ADVANTAGES
These key business aspects of Nike have been and continue to be exhibited through their actions and milestones. In 1988, Nike launched the “Just Do It” campaign, which revamped their limited targeting from only professional and collegiate athletes to include any and everyone, regardless of age, gender, race and abilities. This campaign was used to incite personal inspiration for consumers to overcome their obstacles and proved to be successful; from 1988 to 1998, Nike increased their domestic market share from 18% to 43%. This served as a pivotal moment in the athletic footwear industry, as sneakers were not only perceived to be used for athletic purposes, but as considerable fashion choices.xx
Other notable achievements include the launch of Nike ID in 1999, which allowed for the mass customization of their products for consumers.xxi This technology is still prevalent today, as the launch of Nike+ in 2006 combined Nike and Apple products for workout tracking and community building, fostering a global movement towards connectivity in the health and wellness industry.xxii This has since evolved into the workout digital application lifestyle. Most recently, as aligned with their strategy and as evidence of their dedication to the digital space, Nike announced their new direct-to-consumer initiative known as the Direct Consumer Offense. This includes the organizational restructuring of a new branch called Nike Direct that aims to better serve their customers through personal and meaningful experiences powered by a new strategy implementation.xxiii
Final Recommendation
O Nike+ Run Club App for Apple Watch.

Introduction External Assessment Internal Assessment Financial Analysis Appendix
FY18/19 Strategic Investment Report 15
Final Recommendation
THE NEW RETAIL
NIKE DIRECTIn 2017, Nike announced their “Triple Double Strategy” which focuses on doubling the innovation, speed to market and direct customer connections at Nike through multiple initiatives. Nike Direct serves as Nike’s consumer-direct offense in an increasingly digital world that is beginning to phase out the traditional retail stores of the past. The company is not waiting for a new brand to disrupt the industry but disrupting it themselves.xxiv
This direct-to-consumer division is aimed to accelerate growth through product innovation, local key cities and one-to-one connections with customers. Nike is evolving based on the needs of the consumer by tightening
the relationship between physical and digital retail channels. Utilizing both of these channels, there is a built-in feedback loop of customer data that flows from its apps into its stores. Through this omnichannel approach in Nike Live stores located in New York and Shanghai, consumers can app-reserve sneakers to be picked up in store lockers, mobile checkout, and buy online. The goal is to create a frictionless experience where store merchandising strategies come from app user data in the area.xxv Nike has seen very positive outcomes as a result of this strategy, as the company posted their first billion-dollar e-commerce quarter in Q4 2018. Nike sees digital as not only a part of the shopping experience, but the foundation of it.
2x InnovationNike is moving from seeding to scaling faster. They will give consumers better choices to match their preferences and they will set a new expectation for style, creating a new aesthetic to wear in all moments of consumers’ lives.iii
2x SpeedNike is investing in digital end-to-end to serve an instiable consumer demand for new and fresh products. They are building new capabilities and analytics to deliver personalized products in real time, and are engaging with more partners, companywide, to move faster against their goals.iii
2x DirectThey want as many Nike touch points as possible to live up to consumer expectations. Nike is investing in its own channels and leading with digital.iii
Powered by Nike digital commerce data, and inspired by Nike’s newest retail concept, Nike Live, the Nike Speed Shop delivers on-the-go access to NYC favorites.P
Nike opened its newest Nike House of Innovation, a 68,000 sq. ft., six-level, cross-category premium Nike store located in New York City as part of their Nike Direct initiative.P
On the fifth floor is Nike Expert Studio, where consumers gain access to elevated service offerings through on-to-one appointments with Nike Experts (bookable through the Nike App or in-store).P

Introduction External Assessment Internal Assessment Financial Analysis Appendix
FY18/19 Strategic Investment Report 16
STRENGTHS AND WEAKNESSES
BRAND RECOGNITION
To look internally, Nike has many strengths that have set the company apart from competitors for decades. Nike’s primary strength is their brand recognition. There is significant amount of brand equity that comes from high quality products, high-class performance, reliability and innovative style. Recognition also comes in the form of appeal around the world tied to status among celebrities and sports professionals. The company stands out in a crowded sportswear retailing market by focusing on their audience, messaging and product lines. Nike’s brand strength allows the company flexibility to take risk or raise prices when necessary with their 31% share of the global athletic footwear market.
MARKETING AND ADVERTISING RESOURCES
Another strength that allows Nike to maintain their brand and reputation is their capability to allocate resources to marketing and advertising. The company has spent over $3 billion on marketing and advertising per year in 2016, 2017 and 2018. This high investment in marketing pays off as a source of competitive advantage while the company’s competitors are focused heavily on catching up to the most recognizable footwear brand in the world.
DIGITAL SALES
Nike’s current strategy is relying increasingly on digital and social media promotion. Keeping up with this need for unique touchpoints, Nike’s FY17 saw a 30% growth in digital commerce sales at $2.2 billion, numbers that only continue to grow.xii
Final Recommendation
QSunglasses, RPromotion, SOnline Shop, TWrench, UUnited States Flag, VRetail.
GLOBAL LABOR CONDITIONS
One of Nike’s internal weaknesses is the negative publicity Nike has received because of conditions in the overseas factories. Although Nike outsources its manufacturing aspects, all points in the supply chain are susceptible to harming the company’s brand image. To combat this, Nike has undertaken efforts to improve conditions for over one million contract workers.
U.S. MARKET DEPENDENCY
Another weakness is Nike’s reliance, or dependency, on sales from the United States market. Year over year, the US market has remained flat and is now declining in a saturated athleisure and footwear market. While this is a concern to Nike, the 42% of sales revenue that comes from the United States shows less reliance on the U.S. than competitors like Under Armor, who generates 85% of their sales revenue from the United States.xxvi
RELIANCE ON RETAIL
Other weaknesses arise from Nike’s reliance on third-party retail outlets, like Dick’s Sporting Goods or Foot Locker, and the declining revenues those companies are experiencing. Seventy percent of Nike’s stocks were sold directly to wholesale distribution in 2018, so continued reliance on third-party retailers could decrease sales revenue, increase accounts receivable, and increase bad-debt expense, all reducing cash flow.xxvii

Introduction External Assessment Internal Assessment Financial Analysis
FY18/19 Strategic Investment Report 17
Final Recommendation
FINANCIALANALYSIS
WMan soaring through air in Nike.
Appendix

Introduction External Assessment Internal Assessment Financial Analysis Appendix
FY18/19 Strategic Investment Report 18
REVENUE
As a whole, Nike Inc. has been enjoying stable increases in revenue year over year. In fiscal year 2018, Nike Inc. earned $36.4 billion in revenue, a 4% increase from FY2017.* These revenues include all Nike Brand revenues – footwear, apparel, equipment and global brand division – plus revenues from Converse and Corporate.
Nike Brand revenues increased a comparable 4% in FY18, from $32.2B to $34.5B. Of the four major segments in the Nike Brand, shoes remain the largest portion at 64.6% of brand revenues and 61.2% of Nike Inc. revenues. Shoe revenues broke $20B in 2017 and has since grown to $22.3B in FY18. Nike Brand apparel made up the second-largest portion of revenues at a 9% rise from $9.7B in FY17 to $10.7B in FY18. Apparel accounts for 31.1% of brand revenues and 29.5% of total revenues. Despite the increased Nike revenue, equipment has been on the decline since 2016. In FY18, equipment fell from $1.43B to $1.40B, a 4% drop. Equipment made up about 4.05% of brand revenues and 3.8% of total revenues, falling below Converse at 5.2%. The final Nike brand revenue, Global Brand Divisions, grew the most between FY17 and FY18, up to $88 million, a 12% increase. This division makes up only 0.2% of both revenues.xii
Between Nike Brand footwear, apparel and equipment, apparel is making the largest climb in revenues from FY2016 to FY2018 with an 18.37% increase. Footwear comes in close behind with 12.06% growth from FY16 to FY18. Much of this rise in Nike Brand revenue can be attributed to the 32.7% rise in sales through Nike Direct Operations. As Nike continues to invest into its new Nike Direct division, its sales to wholesale customers are slowing, with only a 6.2% growth from FY16.xii
Final Recommendation
NIKE, INC. CONSOLIDATED OPERATING RESULTS - REVENUESxii
Nike Brand Revenues by: (in millions)
TOTAL NIKE BRAND REVENUES
FY18 FY17 FY16
Footwear $22,268 $21,081 $19,871Apparel 10,733 9,654 9,067Equipment 1,396 1,425 1,496Global Brand Divisions (3) 88 73 73
$34,485 $32,233 $30,507Converse 1,886 2,042 1,955Corporate (4) 26 75 -86
TOTAL NIKE, INC. REVENUES $36,397 $34,350 $32,376
Supplemental Nike Brand Revenues Details:
TOTAL NIKE BRAND REVENUES
Nike Brand Revenues By:Sales to Wholesale Customers 23,969 23,078 22,577Sales through Nike Direct 10,428 9,082 7,857Global Brand Divisions (3) 88 73 73
$34,485 $32,233 $30,507
Nike Brand Revenues on a Wholesale Equivalent Basis:
Sales to Wholesale Customers 23,969 23,078 22,577Sales from Wholesale Operations to Nike Direct 6,332 5,616 4,672
TOTAL NIKE BRAND WHOLESALE EQUIVALENT REVENUES $30,301 $28,684 $27,249
Nike Brand Wholesale Equivalent Revenues by:
TOTAL NIKE BRAND WHOLESALE EQUIVALENT REVENUES
Men’s 17,114 16,041 15,410Women’s 6,915 6,644 6,296Young Athletes’ 4,906 4,838 4,560Others 1,366 1,171 983
$30,301 $28,694 $27,249
Nike Brand Wholesale Equivalent Revenues by:
Running 5,198 4,860 4,401Nike Basketball 1,494 1,292 1,378Jordan Brand 2,856 3,098 2,753Football (Soccer) 2,146 1,984 2,143Training 3,126 3,080 3,150Sportswear 10,018 8,988 8,129Others 5,463 5,392 5,295
TOTAL NIKE BRAND WHOLESALE EQUIVALENT REVENUES $30,301 $28,684 $27,249
*All percentages are excluding currency changes.

Introduction External Assessment Internal Assessment
FY18/19 Strategic Investment Report 19
REVENUE
On a global basis, Nike has worked to consolidate its existing geographic structure from six regions to four to accommodate its new Nike Direct division and Triple Double Strategy. Global regions now include North America; Asia Pacific & Latin America (APLA); Europe, Middle East & Africa (EMEA); and Greater China. Despite this consolidation, North America still makes up over 43.08% of total global brand revenues and may offset major changes in other regions. Nike Direct is targeting 12 major cities, across 10 major countries, which are expected to represent 80% of Nike’s projected growth through 2020.xii
XNike Launches Pro Hijab for Muslim Women Athletes.
Financial Analysis AppendixFinal Recommendation
COUNTRIES IN WHICH NIKE HAS STORES AND/OR A DIRECT ONLINE PRESENCExxviii
EUROPE, MIDDLE EAST AND AFRICA
GREATER CHINA
ASIA PACIFIC AND LATIN AMERICA
NORTH AMERICA

Introduction External Assessment Internal Assessment Financial Analysis Appendix
FY18/19 Strategic Investment Report 20
INCOME STATEMENT
Since the announcement of Nike Direct in mid-2017, Nike has committed substantial investment and resources into the new store-fronts. The new stores require fixed investment in equipment and leasehold improvements, information systems and personnel. Due to this continued investment, operating overhead expense saw an increase in every global region for FY18. For Nike as a whole, operating overhead has grown 10% since FY16, which represents Nike from its pre- Nike Direct stages to now. Demand creation expense has also seen an increase in FY18, albeit a little smaller at 9%.xii
As these costs are expected to continue to increase over the next few years, Nike’s financial health can be evaluated from its margins. Comparable to the apparel and textile industry, Nike is outperforming not only their direct competitors, but the entire industry. With a FY18 operating margin (OPM) of 12.21% and a recently reported Q3 FY19 margin of 12.40%, Nike has kept a stable and consistent margin over the past five years. It is not shown to be a very highly variable margin, indicating little risk for investors to be concerned. OPM is expected to rise from its FY18 number for FY19, as Nike Direct settles in and begins to bring in more revenue. For Nike, the most important measure is the gross margin (GPM). Gross margin has taken a slight dip since FY16, falling from 46.20% to 43.80% in FY18, but this is due to the rising cost of goods sold. Recent Q3 FY19 reports have given light to a 44.10% GPM for Nike, continuing to majorly outperform both the industry and the sector.
To boost revenues, Nike has reported raising the ASP (average selling price) for both footwear and apparel to make up for the declining unit sales. They are also moving away from third-party retailers to drive their new direct-to-consumer strategy. Nike saw a decline in the net profit margin in FY18, from 12.30% to 5.30%. Net profit margin is expected to
Final Recommendation
NIKE, INC. CONSOLIDATED INCOME STATEMENTxii
For Year Ended, May 31
Revenues $36,397 $34,350 $32,376Cost of sales 20,441 19,038 17,405Gross Profit 15,956 15,312 14,971Demand creation expense 3,577 3,341 3,278
(in millions, except per share data) FY18 FY17 FY16
Operating overhead expense 7,934 7,222 7,191Total selling and administrative expense 11,511 10,563 10,469Interest expense (income), net 54 59 19Other expense (income), net 66 (196) (140)Income before income taxes 4,325 4,886 4,623Income tax expense 2,392 646 863
NET INCOME $1,933 $4,240 $3,760
Earnings per common share:
Basic $1.19 $2.56 $2.21Diluted 1.17 2.51 2.16Dividends declared per common share 0.78 0.70 0.62
NIKE, INC. RETURN ON INVESTMENT (OPERATING)xii VS. COMPETITORS
INDUSTRY AVERAGE
FY16 FY15 FY14
Nike, Inc. 32.74% 32.36% 28.92%Under Armour 16.06 20.57 24.92Adidas 18.53 14.13 12.33Asics 9.79 10.32 7.80
19.28% 19.34% 18.49%
FY18 FY17
29.36% 32.40%-0.88 0.9618.96 26.444.34 7.46
12.95% 16.82%
climb back up in FY19 and continue its consistent growth as in the past. Nike Direct has played a major part in all of Nike’s financial health for FY18.xxix
With all the new investments for Nike Direct, Nike’s Return on Investment for their operating income can be assessed. Over the past 5 years, Nike has kept a relatively stable ROI. In FY18, ROI took a slight dip down to 29%, but remained higher than major competitors like Adidas (18.96%) and Under Armour
(-0.88%). This metric indicates Nike’s ability to utilize their investments well enough to gain a return while continuing to outperform their competitors’ year over year. The 3% decline is attributed to the decline in operating income for the recent fiscal year, which was greater than the decline in invested capital.

Introduction External Assessment Internal Assessment Financial Analysis Appendix
FY18/19 Strategic Investment Report 21
Final Recommendation
NIKE, INC. OPERATING MARGIN OVER TIMExii VS. COMPETITORS
A CLOSER LOOK
INCOME STATEMENT
Nike’s operating margin (OM) represents the percentage of profit they produce from operations. Nike shows a relatively stable OM over the past five years, continuously above average and higher than its competitors. It is not shown to be highly variable, indicating little risk change. Compared to its competitors, Nike’s OM shows that they are well managed and that they are efficiently managing their expenses to maximize profitability.
EBIT only declined in FY18 for North America, but due to the large proportion of revenues coming from this region, this offset the increases in other regions. EBIT decline is primarily due to the increased selling and administrative expenses from investments in Nike Direct. This shows that Nike is doing their core business well.
15.00%
10.00%
5.00%
0.00%
-5.00%2014 2015 2016 2017 2018
Nike, Inc. Under Armour Adidas Asics
Industry Average
NIKE, INC. RETURN ON INVESTMENT (OPERATING) OVER TIMExii VS. COMPETITORS
40.00%
30.00%
20.00%
10.00%
0.00%
2014 2015 2016 2017 2018-10.00%
Nike, Inc. Under Armour Adidas Asics
Industry Average
Nike has enjoyed a relatively stable return on investment (ROI) on their operating income over their competitors. This indicates that they can utilize their investments well enough to gain a return while outperforming others in the industry. Decline in FY18 is due to decline in operating income which was greater than the decline in invested capital.
Invested capital is an average of the current FY and FY prior. Invested capital declined in FY18 due to the decline in SE and increase in total debt.

Introduction External Assessment Internal Assessment Financial Analysis Appendix
FY18/19 Strategic Investment Report 22
BALANCE SHEET
Nike’s balance sheet for FY18 saw numerous adjustments, leading to a decline in total assets and liabilities. Nike saw an 11.6% increase in their cash and equivalent holdings, but with a large decline in short-term investments and accounts receivable, total assets saw a 3% overall decrease. On their liabilities, current liabilities rose due to Nike increasing their notes and accounts payable, but the most notable movement was the $2.6 billion decline in shareholders’ equity. This decline comes about from the two share repurchase programs that have been approved. In 2015, Nike’s Board of Directors approved a four-year, $12 billion share repurchase of their Class B common stock.
Pending the completion of this program, the Board has also just approved another four-year, $15 billion share repurchase. This program has played a large role in Nike’s ability for their shareholder’s equity to cover all outstanding debts in the event of a downturn. Nike’s total debt to equity ratio (D/E) has historically remained around 7% but has seen rapid growth since the approval of the repurchases in 2015 to a ratio of 39% in FY18. This rise is undoubtedly due to the sharp decline in shareholder’s equity coupled with the increasing notes payable to help finance Nike Direct.
Final Recommendation
NIKE, INC. CONSOLIDATED BALANCE SHEETxii
For Year Ended, May 31
Cash and equivalents $4,249 $3,808 $3,138Short-term investments 996 2,371 2,319Accounts receivable, gross 3,528 3,696 3,284Less: allowance for uncollectable accounts receivable
-30 -19 -43
(in millions) FY18 FY17 FY16
Accounts receivable, net 3,498 3,677 3,241Finished goods 5,261 5,055 4,838Inventories 5,261 5,055 4,838Deferred income taxes - - -Prepaid expenses and other current assets 1,130 1,150 1,489
TOTAL CURRENT ASSETS $15,134 $16,061 $15,025
Property, Plant and Equipment:
ASSETS
Current Assets:
Land 331 285 286Buildings 2,195 1,564 1,467Machinery, equipment and internal-use software 4,230 3,867 3,510Leasehold improvements 1,494 1,484 1,338Construction in process 641 758 437
TOTAL PROPERTY, PLANT AND EQUIPMENT, GROSS $8,891 $7,958 $7,038Less: accumulated depreciation -4,427 -3,969 -3,518
PROPERTY, PLANT AND EQUIPMENT, NET $4,454 $3,989 $3,520
Other Assets:
Identifiable intangible assets, net 285 283 281Goodwill 154 139 131Deferred income taxes and other assets 2,509 2,787 2,439
TOTAL ASSETS $22,536 $23,259 $21,396

Introduction External Assessment Internal Assessment Financial Analysis Appendix
FY18/19 Strategic Investment Report 23
BALANCE SHEET
Although the ratio is higher than competitors, like Adidas at 28% and Under Armour at 35%, Nike remains lower than the consumer non-durables sector average which is at almost 64%. In recent Q3 FY19 reports, Nike’s D/E ratio is on the decline (currently 31.8%), as this surge is expected to be a temporary reaction to the new investments and repurchase. Nike remains confident in their ability to service their debt through cash flow, and also use the leverage to increase equity returns. In addition, due to their increased D/E, Nike saw a record low in ROE for FY18 at 17.4%, but at Q3 FY19, ROE has recovered and is at a high of 45.8%. This is a measure of how much profit Nike generates using the money shareholders have invested. Generally, the industry average has been at 14.15% and 13.09% for the sector. Even at their lowest point, Nike was still outperforming the market.xxx
Final Recommendation
NIKE, INC. CONSOLIDATED BALANCE SHEETxii
For Year Ended, May 31
Current portion of long-term debt $6 $6 $44Notes payable 336 325 1Accounts payable 2,279 2,048 2,191Accrued compensation and benefits, excluding taxes
897 871 943
(in millions) FY18 FY17 FY16
Accrued endorsement compensation 425 396 393Accrued dividends payable 320 300 271Accrued import and logistics costs 268 257 198Accrued taxes other than income taxes 224 196 159Accrued fair value of derivatives 184 168 162
LIABILITIES AND SHAREHOLDER’S EQUITY PT.1
Current Liabilities:
Accrued advertising and marketing 140 125 119Accrual collateral received from counterparties to hedging instruments
23 - 105
Other accrued liabilities 788 698 687Accrued liabilities 3,269 3,011 3,037Income taxes payable 150 84 85
TOTAL CURRENT LIABILITIES $6,040 $5,474 $5,358
Long-term Debt:
Corporate bond payables $3,459 $3,456 $1,989Promissory notes - - 38Japanese Yen notes 15 21 27Less: current maturities -6 -6 -44
TOTAL LONG-TERM DEBT $3,468 $3,471 $2,010
Other long-term liabilities:
Deferred income taxes and other liabilities $3,216 $1,907 $1,770
TOTAL LIABILITIES $12,724 $10,852 $9,138
Introduction External Assessment Internal Assessment Financial Analysis Appendix
FY18/19 Strategic Investment Report 24
Final Recommendation
A CLOSER LOOK
BALANCE SHEET
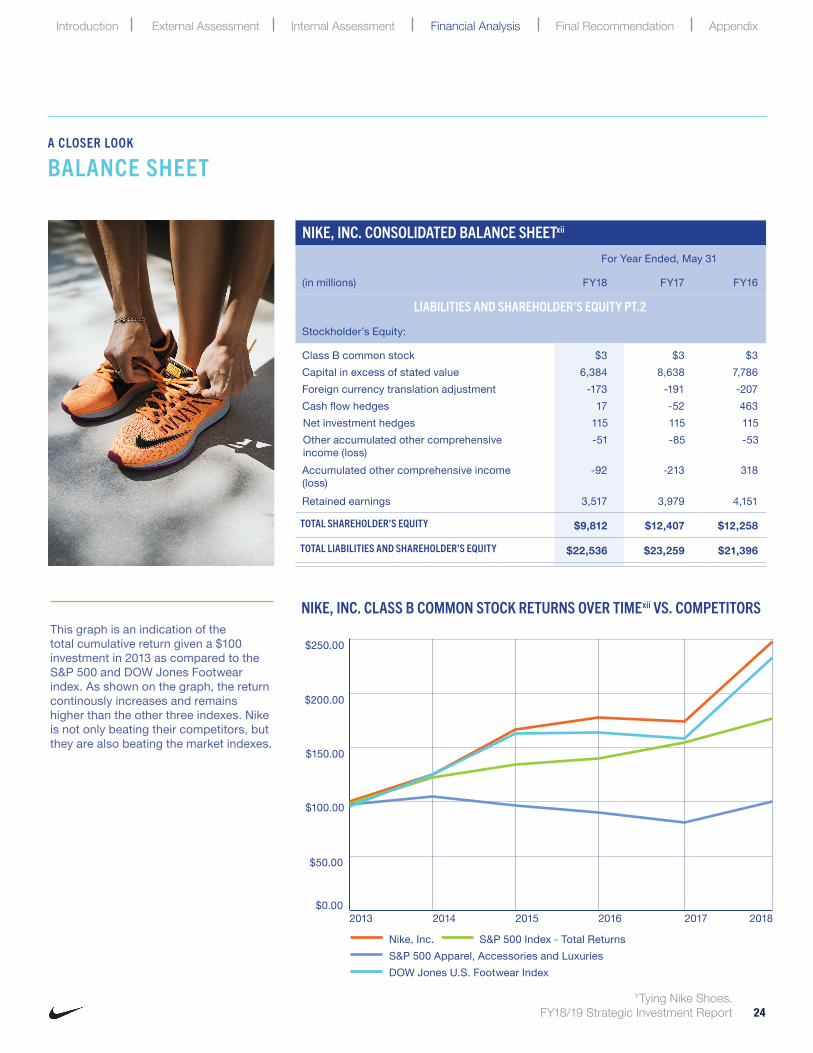
NIKE, INC. CLASS B COMMON STOCK RETURNS OVER TIMExii VS. COMPETITORS
$250.00
$200.00
$150.00
$100.00
$50.00
2013 2014 2015 2017 2018$0.00
Nike, Inc. S&P 500 Index - Total ReturnsS&P 500 Apparel, Accessories and LuxuriesDOW Jones U.S. Footwear Index
This graph is an indication of the total cumulative return given a $100 investment in 2013 as compared to the S&P 500 and DOW Jones Footwear index. As shown on the graph, the return continously increases and remains higher than the other three indexes. Nike is not only beating their competitors, but they are also beating the market indexes.
NIKE, INC. CONSOLIDATED BALANCE SHEETxii
For Year Ended, May 31
Class B common stock $3 $3 $3Capital in excess of stated value 6,384 8,638 7,786Foreign currency translation adjustment -173 -191 -207Cash flow hedges 17 -52 463
(in millions) FY18 FY17 FY16
Net investment hedges 115 115 115Other accumulated other comprehensive income (loss)
-51 -85 -53
Accumulated other comprehensive income (loss)
-92 -213 318
Retained earnings 3,517 3,979 4,151
LIABILITIES AND SHAREHOLDER’S EQUITY PT.2
Stockholder’s Equity:
TOTAL SHAREHOLDER’S EQUITY $9,812 $12,407 $12,258
TOTAL LIABILITIES AND SHAREHOLDER’S EQUITY $22,536 $23,259 $21,396
2016
YTying Nike Shoes.

Introduction External Assessment Internal Assessment Financial Analysis
FY18/19 Strategic Investment Report 25
Final Recommendation
FINAL RECOMMENDATION
ZNike Sports Bra Campaign Ft. Lena Meyer Landrut.
Appendix

Introduction External Assessment Internal Assessment Financial Analysis Appendix
FY18/19 Strategic Investment Report 26
WHY YOU SHOULD INVEST
Final Recommendation
It is not simply because Nike is the market leader that they qualify as a good investment. Their proven ability to fight constant criticism, manage perceptions, and evolve their brand through innovation and market disruption is what allows them to rise to the occasion. As we’ve discussed, Nike has a consistent track record of not only being able to recover after unforeseen challenges, but an ability to repeatedly surpass their record stock prices. This resilience and determination are not only something that Nike preaches to its customers but is a part of the company’s history and culture as a whole, making them a solid long-term bet in one’s portfolio.
“NIKE IS ABOUT INNOVATION, ABOUT HONESTY AND INTEGRITY, AND ABOUT COMPETITIVENESS. THOSE ARE THE THINGS THAT WE STAND FOR AND WE WANT OUR PEOPLE TO BELIEVE IN.”Phil Knight, Co-Founder, Nike, Inc.iii

Introduction External Assessment Internal Assessment Financial Analysis
FY18/19 Strategic Investment Report 27
Final Recommendation
APPENDIX
AANike Tech Pack Editorial Ft. Stefanie Giesinger.
Appendix

Introduction External Assessment Internal Assessment Financial Analysis Appendix
FY18/19 Strategic Investment Report 28
PORTER’S FIVE FORCES CONT.
BARGAINING POWER OF SUPPLIERS
The bargaining power of suppliers is a low-to-moderate force due to the availability of various suppliers and the effects suppliers may have on production. Most athletic footwear brands outsource their production from outside of the United States to reduce their production costs and are found near raw material sources. While suppliers may threaten buyers with increased prices or declining quality, there is an abundance of suppliers with access to the same raw materials needed, such as natural and synthetic rubber, plastic compounds and canvas.iv However, changing existing cost or quality still poses a risk as manufacturing sites may not be able to find adequate alternate sources in a timely manner due to cost or quality standards. This can lead firms in the market to experience production delays, which increases time-dependent costs. As more firms strive to meet consumer demand, these risks could negatively affect revenues and net income in both the short- and long-term.xii This force is also lessened as suppliers very rarely vertically integrate forward. That is, suppliers do not move to manufacture
Final Recommendation
and sell their own athletic shoe products; they are dependent on the corporations for business.
BARGAINING POWER OF BUYERS
The bargaining power of buyers is also a low-to-moderate force due to the abundance of individual consumers and the options available in the marketplace. As competitors in the industry move toward selling directly to end consumers, consumer loyalty increases in an already differentiated industry.vi Companies are also focused on developing new designs and products to maintain their large customer bases and decrease buyer power; this is to keep a focus on design, performance and quality and increase the number of individual buyers.vii However, buyer power increases as buyers become more knowledgeable and more options are available from other brands. Third-party retail buyers’ power is also decreasing as firms look to have a more direct path to end consumers. E-commerce and digital selling platforms have increased in popularity, and third-party retail sales have been on the decline.
THREAT OF SUBSTITUTES
The threat of substitutes is a weak force due to the fact that there is no technical substitute to athletic footwear. Other substitutes include casual shoes, boots and dress shoes. While these may sell at a lower price for consumers and present low switching costs, they do not serve the same purpose nor have the same function as a sneaker. For instance, the sporting industry requires footwear with durability and features such as strong grips and arch support. The threat of substitutes is also lessened due to consumers wanting the quality, customization and customer service they are accustomed to in the athletic footwear industry. However, there is a threat of counterfeit products being sold to consumers. For instance, Amazon had unauthorized Nike products for sale on their marketplace platform in 2017, along with counterfeit products.xxxi Nike had been hesitant to sell their products on Amazon due to it potentially damaging their brand; however, the present threat of imitation could not be ignored and Nike agreed to sell products through Amazon in exchange for Amazon’s regulation of counterfeit products through a certified brand registry.xxxii
ABNike - City Fast.

Introduction External Assessment Internal Assessment Financial Analysis Appendix
FY18/19 Strategic Investment Report 29
MACRO FORCES CONT.
SOCIAL
In terms of macro forces, social factors such as a worldwide increase in health consciousness and public criticism of production processes are moderate influencers of Nike’s business.xiii With the growing popularity of athleisure and the health conscious movement, Nike has capitalized on its strong influence of pop culture to help drive these trends. For example, in addition to their regular athletic clothing line, they also make and sell a premium sports brand, called Nike Sportswear, as well as a premium streetwear brand called Nike Lab. Nike Lab frequently collaborates with some of the most highly valued tastemakers such as Supreme, APC and Comme des Garçons. This use of pop culture figures in music, fashion and athletics as well as superior social listening tools have helped Nike to further widen the definition of an athlete and broaden their consumer base.xxxiii
On the flipside, Nike has been plagued by reports and criticism of sweatshops and child labor since the 1990s.xxxiv While Nike does not own or operate any of the footwear manufacturing facilities and depend upon independent contractors to manufacture all of their products, the intense scrutiny of their practices has been in the public eye for decades. However, since committing to fixing the problem in 1998, Nike has managed to turn its image around, once again showing their ability to bounce back from adversity. In 2005, Nike published a detailed 108-page report providing transparency to shareholders and customers by revealing conditions and pay in its factories and acknowledging remaining issues.xxxv
TECHNOLOGICAL
Technological factors such as the rapid dispersion of information via social media and growing use of data analytics to optimize relationships
Final Recommendation
with consumers and gain business insights are of relatively low risk to Nike’s overall business. While they do rely heavily on information technology to operate their business, Nike has the resources to be able to combat any foreseeable problems or interruptions such as security breaches, repairs or replacements.xii
DNike Running ‘14 - ‘18.

Introduction External Assessment Internal Assessment Financial Analysis Appendix
FY18/19 Strategic Investment Report 30
MACRO FORCES CONT.
ENVIRONMENTAL
The last macro force with a low impact on Nike’s business are environmental factors. Because of the growing transparency standard and informed customers, consumers are more and more interested in Nike’s sustainability efforts. In recent years, Nike has focused on halving its environmental impact while doubling its manufacturing rate, progressing towards a cleaner and leaner production system.xxxvi This initiative revolves primarily around three aims: minimize environmental footprint, transform manufacturing and unleash human potential. Nike has enacted this through the introduction of their Flyknit technology, which combines maximum athletic performance while producing 60% less waste than traditional cut-and-sew methods. In addition, more than 3
Final Recommendation
billion plastic bottles have been diverted from landfills and converted into recycled polyester for their clothing lines, such as the Nike Vapor football kits.x
Since the uncovering of several negative labor and environmental practices, Nike has made considerable steps to combat these perceptions and improve upon existing systems. Hannah Jones, Nike Chief Sustainability Officer and Vice President of their innovation accelerator said Nike “really started to look into what were the things within our business that we could change or do better, such as our purchasing practices, such as teaching designers how to design with sustainability in mind… [sustainability] moved from being a risk and reputation function to being a business lever function to being an innovation function.”xxxvii Because Nike has the
ACNike Cortez Campaign.
resources to allocate to innovation, they are able to mitigate many environmental risks and continue to set new standards for activewear manufacturing.

Introduction External Assessment Internal Assessment Financial Analysis Appendix
FY18/19 Strategic Investment Report 31
WORKS CITED
Final Recommendation
i “Nike, Inc.” Edited by Adam Augustyn, Encyclopaedia Britannica, Encyclopaedia Britannica, Inc., 5 July 2018, www.britannica.com/topic/Nike-Inc.
ii “History of Nike.” Kicks On Fire, KicksOnFire.com, www.kicksonfire.com/history-of-nike/.
iii “Nike FY16-17 Sustainable Business Report.” Nike, Inc., 2017, https://s1.q4cdn.com/806093406/files/doc_downloads/2018/06/NIKE-FY1617-Sustainable-Business-Report_FINAL.pdf.
iv Rowland, Christine. “Nike Inc. Five Forces Analysis (Porter’s Model).” Panmore Institute, Panmore Institute, 7 Feb. 2017, panmore.com/nike-inc-five-forces-analysis-porters-model.
v Pratap, Abhijeet. “Porter’s Five Forces Analysis of Nike.” Notesmatic, Notesmatic, 10 Dec. 2018, notesmatic.com/2017/03/porters-five-forces-analysis-of-nike/.
vi “NIKE, Inc. Porter Five Forces Analysis.” Fern Fort University, Fern Fort University, fernfortuniversity.com/term-papers/porter5/analysis/765-nike--inc-.php.
vii “Nike: Porter’s Five Forces Predicts Strong Profits.” Seeking Alpha, Seeking Alpha, 9 July 2015, seekingalpha.com/article/3314445-nike-porters-five-forces-predicts-strong-profits.
viii Garcia, Ahiza. “NFL and Nike Sign 8-Year Deal for Uniforms and Apparel.” CNNMoney, Cable News Network, 27 Mar. 2018, money.cnn.com/2018/03/27/news/companies/nike-nfl-gear-contract/index.html.
ix Danziger, Pamela N. “Nike Declares 2019 Its Year For Women.” Forbes, Forbes Magazine, 1 Mar. 2019, www.forbes.com/sites/pamdanziger/2019/03/01/nike-the-worlds-most-valuable-fashion-brand-declares-2019-its-year-for-women/#79385958419d.
x “Top Things to Know About Sustainable Innovation at Nike.” Nike News, Nike, Inc., 11 May 2016, news.nike.com/news/sustainable-innovation.
xi Kim, Susanna. “Nike Shoes Among Most Counterfeited Goods in the World.” ABC News, ABC News Network, 18 Apr. 2016, abcnews.go.com/Business/nike-shoes-counterfeited-goods-world/story?id=38485256.
xii “Annual Report on Form 10-K.” Nike, Inc., 24 July 2018, https://s1.q4cdn.com/806093406/files/doc_financials/2018/ar/docs/nike-2018-form-10K.pdf.
xiii Bush, Thomas. “A PESTLE Analysis of Nike.” PESTLE Analysis, 15 June 2016, pestleanalysis.com/pestle-analysis-of-nike/.
xiv Edwards, Jim. “Did Nike Really Gain From Tiger Woods’ Scandal, as the Numbers Suggest?” CBS News, CBS Interactive, 14 Dec. 2010, www.cbsnews.com/news/did-nike-really-gain-from-tiger-woods-scandal-as-the-numbers-suggest/.
ADNike Street.

Introduction External Assessment Internal Assessment Financial Analysis Appendix
FY18/19 Strategic Investment Report 32
WORKS CITED
Final Recommendation
xv Isidore, Chris. “Tiger Woods’ Masters Victory Made Nike a Winner.” CNN, Cable News Network, 15 Apr. 2019, www.cnn.com/2019/04/15/media/tiger-woods-nike-ad/index.html.
xvi “Nike Inc (NKE) Stocks Technical Chart 2009.” Barchart, Barchart.com, 2019.
xvii Sabin, Sam. “Nike’s Reputation Took a Hit After Kaepernick Ad. Now It’s Climbing Back.” Morning Consult, Morning Consult, 20 Sept. 2018, morningconsult.com/2018/09/20/nikes-reputation-took-a-hit-after-kaepernick-ad-now-its-bouncing-back/.
xviii “Nike Inc (NKE) Stocks Technical Chart 2018.” Barchart, Barchart.com, 2019.
xix “About Nike.” Nike, Nike, Inc., 2019, about.nike.com/.
xx Hutchins, Bob. “‘Just Do It’ Turns 25: Nike & The Most Profitable Tagline Of All Time.” Business 2 Community, Business 2 Community, 6 Sept. 2013, www.business2community.com/branding/just-turns-25-nike-profitable-tagline-time-0607709.
xxi “Redesigned NIKEiD Web Site Debuts.” Nike News, Nike, Inc., 21 Aug. 2008, news.nike.com/news/redesigned-nikeid-web-site-debuts.
xxii “Nike and Apple Team Up to Launch Nike+iPod.” Apple Newsroom, Apple Inc., 23 May 2006, www.apple.com/newsroom/2006/05/23Nike-and-Apple-Team-Up-to-Launch-Nike-iPod/.
xxiii “NIKE, Inc. Announces New Consumer Direct Offense: A Faster Pipeline to Serve Consumers Personally, At Scale.” Nike News, Nike, Inc., 15 June 2017, news.nike.com/news/nike-consumer-direct-offense.
xxiv Danziger, Pamela N. “Nike’s New Consumer Experience Distribution Strategy Hits The Ground Running.” Forbes, Forbes Magazine, 1 Dec. 2018, www.forbes.com/sites/pamdanziger/2018/12/01/nikes-new-consumer-experience-distribution-strategy-hits-the-ground-running/#5c153568f1d0.
xxv Milnes, Hilary. “In Effort to Grow Direct Sales, Nike Integrated Its App Strategy into Its Stores.” Digiday, Digiday, 26 Mar. 2019, digiday.com/retail/nike-integrated-app-strategy-stores/.
xxvi Balu, Nivedita, and Uday Sampath Kumar. “North America, Online Sales Power Nike’s Quarterly Results Beat.” Reuters, Thomson Reuters, 20 Dec. 2018, www.reuters.com/article/us-nike-results/north-america-online-sales-drive-nikes-quarterly-results-beat-idUSKCN1OJ2T3.
xxvii Danziger, Pamela N. “Winning The Sports Retail Race: Under Armour And Nike Hit The Wall.” Forbes, Forbes Magazine, 1 Nov. 2017, www.forbes.com/sites/pamdanziger/2017/11/01/winning-the-sports-retail-race-under-armour-and-nike-hit-the-wall/#193f41ec1a96.
xxviii “Location Finder.” Nike, Nike, Inc., www.nike.com/language_tunnel.
xxix “Nike Inc (NKE) Financials.” Reuters, Thomson Reuters, www.reuters.com/finance/stocks/financial-highlights/NKE.
xxx Larkin, Michael. “Nike Stock: Analyst Sees Huge Share Buybacks, Dividend Hikes.” Investor’s Business Daily, Investor’s Business Daily, 22 Jan. 2019, www.investors.com/news/nike-stock-analyst-upgrade-share-buyback-dividend-hikes-under-armour-stock/.
xxxi Soper, Spencer. “Amazon Will Sell Nike Shoes Directly Through Brand Registry.” Bloomberg, Bloomberg L.P., 21 June 2017, www.bloomberg.com/news/articles/2017-06-21/amazon-said-to-sell-nike-shoes-directly-through-brand-registry.
xxxii Germano, Sara, and Laura Stevens. “Nike to Sell Some Items Directly to Amazon.” The Wall Street Journal, Dow Jones & Company, Inc., 21 June 2017, www.wsj.com/articles/nike-to-sell-product-directly-to-amazon-1498067260.
xxxiii Green, Dennis. “How Nike Became One of the Coolest and Most Valuable Brands in the World.” Business Insider, Business Insider, 29 Mar. 2017, www.businessinsider.com/how-nike-defines-cool-2017-3.
xxxiv Bain, Marc. “Nike Is Facing a New Wave of Anti-Sweatshop Protests.” Quartz, Quartz, 1 Aug. 2017, qz.com/1042298/nike-is-facing-a-new-wave-of-anti-sweatshop-protests/.
xxxv Nisen, Max. “How Nike Solved Its Sweatshop Problem.” Business Insider, Business Insider, 9 May 2013, www.businessinsider.com/how-nike-solved-its-sweatshop-problem-2013-5.
xxxvi Pratap, Abhijeet. “Nike CSR and Sustainability.” Notesmatic, Notesmatic, 10 Dec. 2018, notesmatic.com/2018/02/nike-csr-and-sustainability/.
xxxvii Abnett, Kate. “Just Fix It: How Nike Learned to Embrace Sustainability.” The Business of Fashion, The Business of Fashion, 1 Nov. 2016, www.businessoffashion.com/articles/people/just-fix-it-hannah-jones-nike.

U “United States Flag” Icon made by Freepik on https://www.flaticon.com/free-icon/united-states-of-america_1729800.
V “Retail” Icon made by Freepik on https://www.flaticon.com/free-icon/shop_1067602.
W Barisonzi, Laura. “Man Soaring through Air in Nike.” Laura Barisonzi Photography, Laura Barisonzi, barisonzi.com/Fitness/16.
X Balla, Vivienne. “Nike Launches Pro Hijab for Muslim Women Athletes.” Fortune, Fortune Media IP Limited, 7 Mar. 2017, fortune.com/2017/03/07/nike-pro-hijab-muslim-athletes/.
Y Daub, David. “Tying Nike Shoes.” We Art, We Art Agency, weart.co/photographers/david-daub/#gallery/28.
Z Daub, David. “Nike Sports Bra Campaign Ft. Lena Meyer Landrut.” David Daub Photography, David Daub, daviddaub.com/nike-lena-meyer-landrut/.
AA Daub, David. “Nike Tech Pack Editorial Ft. Stefanie Giesinger.” David Daub Photography, David Daub, daviddaub.com/nike-tech-pack/.
AB Zahar, Mel. “Nike - City Fast.” Mel Zahar, Mel Zahar, melzahar.com/NIKE-CITY-FAST.
AC Maung, Sean. “Nike Cortez Campaign.” Sean Maung Photography, Sean Maung, seanmaung.com/.
AD Anderson, Nolis. “Nike Street.” Nolis Anderson Photography, Nolis Anderson, www.nolisanderson.com/nike.
L Shapiro, Michael. “Tiger Woods Wins the 2019 Masters.” Sports Illustrated, TI Gotham Inc., 14 Apr. 2019, www.si.com/golf/2019/04/14/tiger-woods-masters-win-nike-ad-major-championship-just-do-it.
M Suzuki, Lea. “Nike Colin Kaepernick Billboard.” SF Gate, Hearst Magazines, 7 Sept. 2018, www.sfgate.com/business/article/Nike-orders-rose-in-four-day-period-after-13212889.php.
N Batt, Andy. “Xavier Taylor for Nike.” Behance, Andy Batt, 6 Oct. 2017, www.behance.net/gallery/57499031/2018-Nike-Basketball-tennis-running-adidas-soccer.
O “Nike+ Run Club App for Apple Watch.” Apple Newsroom, Apple Inc., 24 Oct. 2016, www.apple.com/newsroom/2016/10/apple-watch-nike-plus-arrives-friday-october-28/.
P “Nike Opens Nike NYC House of Innovation: The Most Personal and Responsive Sport Retail Experience.” Business Wire, Berkshire Hathaway, 14 Nov. 2018, www.businesswire.com/news/home/20181114005859/en/Nike-Opens-Nike-NYC-House-Innovation-Personal.
Q “Sunglasses” Icon made by Smashicons on https://www.flaticon.com/free-icon/sunglasses_1675013.
R “Promotion” Icon made by Freepik on https://www.flaticon.com/free-icon/promotion_1077221.
S “Online Shop” Icon made by monkik on https://www.flaticon.com/free-icon/online-shop_993775.
T “Wrench” Icon made by Freepik on https://www.flaticon.com/free-icon/wrench_99801.
Introduction External Assessment Internal Assessment Financial Analysis Appendix
FY18/19 Strategic Investment Report 33
PHOTOGRAPHY CREDITS
Final Recommendation
A Acomb, James. “Nike Women: Casey.” James Acomb Photography, James Acomb, 2017, jamesacomb.com/Nike-Women:-Casey/thumbs.
B Shank, Niv. “Man Stretching on Beach in Red Nike Athletic Wear.” Niv Shank Photography, Niv Shank, www.nivshank.com/photography-2/nike-commission.
C Acomb, James. “Nike Women: Gilda.” James Acomb Photography, James Acomb, 2017, jamesacomb.com/Nike-Women:-Gilda/6.
D Daub, David. “Nike Running ‘14 - ‘18.” David Daub Photography, David Daub, daviddaub.com/nike-running/.
E “Gym” Icon made by dDara on https://www.flaticon.com/free-icon/woman_753045.
F “Worldwide” Icon made by turkkub on https://www.flaticon.com/free-icon/worldwide_814587.
G “Bars” Icon made by Good Ware on https://www.flaticon.com/free-icon/bars_547166.
H “Theater Masks” Icon made by Freepik on https://www.flaticon.com/free-icon/theater-masks_1077683.
I “Brainstorm” Icon made by Eucalyp on https://www.flaticon.com/free-icon/brainstorm_181361.
J “Exchange” Icon made by Icongeek26 on https://www.flaticon.com/free-icon/exchange_1641533.
K Szenes, Jason. “Serena Williams v. Carina Witthoeft at the 2018 U.S. Open.” The Washington Post, WP Company LLC, 30 Aug. 2018, www.washingtonpost.com/news/early-lead/wp/2018/08/30/lets-talk-about-serena-williamss-new-look-at-the-u-s-open/?noredirect=on&utm_term=.19c676d30430.

This report is work and property of Alexis Newkirk, Angele Cherbonnier, Anteneh Lisan, Brogan Brasseaux and Emily Fisher. 2019. alexisnewkirk.com. ADNike Street.